Late Cretaceous faunal dynamics in the Western Interior Seaway: The record from the Red Bird...
131
University of South Florida Scholar Commons Graduate eses and Dissertations Graduate School 2011 Late Cretaceous faunal dynamics in the Western Interior Seaway: e record from the Red Bird Section, eastern Wyoming Joshua Stephen Slaery University of South Florida, [email protected] Follow this and additional works at: hp://scholarcommons.usf.edu/etd Part of the American Studies Commons , Geology Commons , Other Ecology and Evolutionary Biology Commons , and the Paleontology Commons is esis is brought to you for free and open access by the Graduate School at Scholar Commons. It has been accepted for inclusion in Graduate eses and Dissertations by an authorized administrator of Scholar Commons. For more information, please contact [email protected]. Scholar Commons Citation Slaery, Joshua Stephen, "Late Cretaceous faunal dynamics in the Western Interior Seaway: e record from the Red Bird Section, eastern Wyoming" (2011). Graduate eses and Dissertations. hp://scholarcommons.usf.edu/etd/3350
Transcript of Late Cretaceous faunal dynamics in the Western Interior Seaway: The record from the Red Bird...
University of South FloridaScholar Commons
Graduate Theses and Dissertations Graduate School
2011
Late Cretaceous faunal dynamics in the WesternInterior Seaway: The record from the Red BirdSection, eastern WyomingJoshua Stephen SlatteryUniversity of South Florida, [email protected]
Follow this and additional works at: http://scholarcommons.usf.edu/etdPart of the American Studies Commons, Geology Commons, Other Ecology and Evolutionary
Biology Commons, and the Paleontology Commons
This Thesis is brought to you for free and open access by the Graduate School at Scholar Commons. It has been accepted for inclusion in GraduateTheses and Dissertations by an authorized administrator of Scholar Commons. For more information, please contact [email protected].
Scholar Commons CitationSlattery, Joshua Stephen, "Late Cretaceous faunal dynamics in the Western Interior Seaway: The record from the Red Bird Section,eastern Wyoming" (2011). Graduate Theses and Dissertations.http://scholarcommons.usf.edu/etd/3350

Late Cretaceous faunal dynamics in the Western Interior Seaway: The record from
the Red Bird Section, eastern Wyoming
by
Joshua S. Slattery
A thesis submitted in partial fulfillment of the requirements for the degree of
Master of Science Department of Geology
College of Arts and Sciences University of South Florida
Major Professor: Peter J. Harries, Ph. D. Gregory S. Herbert, Ph. D. Neil H. Landman, Ph. D.
Date of Approval: June 07, 2011
Keywords: Background Diversity, Campanian, Maastrichtian, Single Lithofacies, Pierre Shale, Epeiric Sea
Copyright © 2011, Joshua S. Slattery

DEDICATION
I would like to dedicate this thesis to my mom, who has always encouraged and
supported me in what ever interest and endeavor that I have persued. I would also like to
dedicate this thesis to Ashley Sandness for always being there for me and helping me out
along the way.

ACKNOWLEDGEMENTS
I would like to thank my advisor Dr. Peter J. Harries for his help and guidence
through out this project. Peter’s experience and knowledge of the Cretaceous Western
Interior Seaway, detailed editing skills, and patients made all difference during the
completition of this work. I would also like to thank my committee members Dr. Neil H.
Landman and Gregory S. Herbert for their help and suggestions with this study.
Appreciation is also given to Neal Larson, Donald Boyd, Casey McKinney, Bill Cobban,
Jocelyn Sessa, Jay Lillegraven, Mike Meyer, Andres Cardenas, Jennifer Sliko, and Matt
Jarrett for their help and suggestions. I would also like to thank Suzanne Slattery, Ashley
Sandness, Larry Bechtholdt, Ron Martin, JD and Lisa Williams, and Ronda Pfister for
their help in the field and with obtaining samples. I also appreciate the various Niobrara
County landowners for giving permission to carry out field work on their land. Funding
for this Project was provided by the Paleontological Society Charles J. Boucot Award,
AAPS John R. Welch Scholarship, AMNH Lerner Gray Fund, WGA J. David Love
Fellowship, Sigma XI, American Association of Petroleum Geologist Grant-in-Aid, and
Tampa Bay Fossil Club.
TABLE OF CONTENTS
List of Tables ..................................................................................................................... iii
List of Figures .................................................................................................................... iv
Abstract ............................................................................................................................. vii
Introduction..........................................................................................................................1
Geological Setting................................................................................................................3 Paleogeography........................................................................................................3 Stratigraphic and Geographical Setting ...................................................................5
Methods..............................................................................................................................10
Results................................................................................................................................14 Occurance of Fossils ..............................................................................................14
Fossiliferous Concretions and Concretion Horizons .................................14 Barren Concretions and Concretion Horizons ...........................................20
Preservation of Fossils Assemblages .....................................................................21 Diversity Patterns and Trends................................................................................25
Cluster Analysis .........................................................................................25 Fauna..........................................................................................................28
Bivalves..........................................................................................30 Gastropods .....................................................................................35 Cephalopods...................................................................................37 Scaphopods ....................................................................................39 Calcareous Worm Tubes................................................................39 Anthozoans ....................................................................................40 Arthropods .....................................................................................40 Brachiopods ...................................................................................41 Bryozoans ......................................................................................41 Vertebrates .....................................................................................41 Trace Fossils ..................................................................................42
Abundance Trends .....................................................................................43 Richness Trends .........................................................................................47 Ecological Niche Trends............................................................................49 Detrended Correspondence Analysis.........................................................51
i
Discussion..........................................................................................................................55 Taphonomy and Fidelity of Fossil Assemblages ...................................................55 Sampling Effects on Diversity ...............................................................................61 Interpretation of Faunal Patterns............................................................................61 Broader Implications..............................................................................................78
Conclusions........................................................................................................................83 Literature Cited ..................................................................................................................87 Appendix............................................................................................................................98
ii

LIST OF TABLES
Appendix 1: Number of specimens for each taxon identified in the 19 samples collected from the Red Bird Section, WY. ................................................98
iii
LIST OF FIGURES
Figure 1. Locality map showing the section that was studied. ...........................................4
Figure 2. Campanian and Maastrichtian lithostratigraphy, radiometric dates,
magnetostratgraphy, ammonite biostratigraphy, and inoceramid biostratigraphy for the area southwest of the Black Hills Uplift in Wyoming (Compiled from 1) Gill and Cobban, 1966; 2) Cobban et al., 2006; 3) Hicks et al., 1999; 4) Walaszczyk et al., 2001). ....................................6
Figure 3. Cretaceous strata near Red Bird, WY showing distribution of ammonite biozones and lithostratigraphic units. ..................................................................7
Figure 4. Litho-, chrono-, and biostratigraphy of upper Campanian-lower Maastrichtian strata at the Red Bird section, Wyoming (Radiometric Dates from Cobban et al., 2006). .........................................................................7
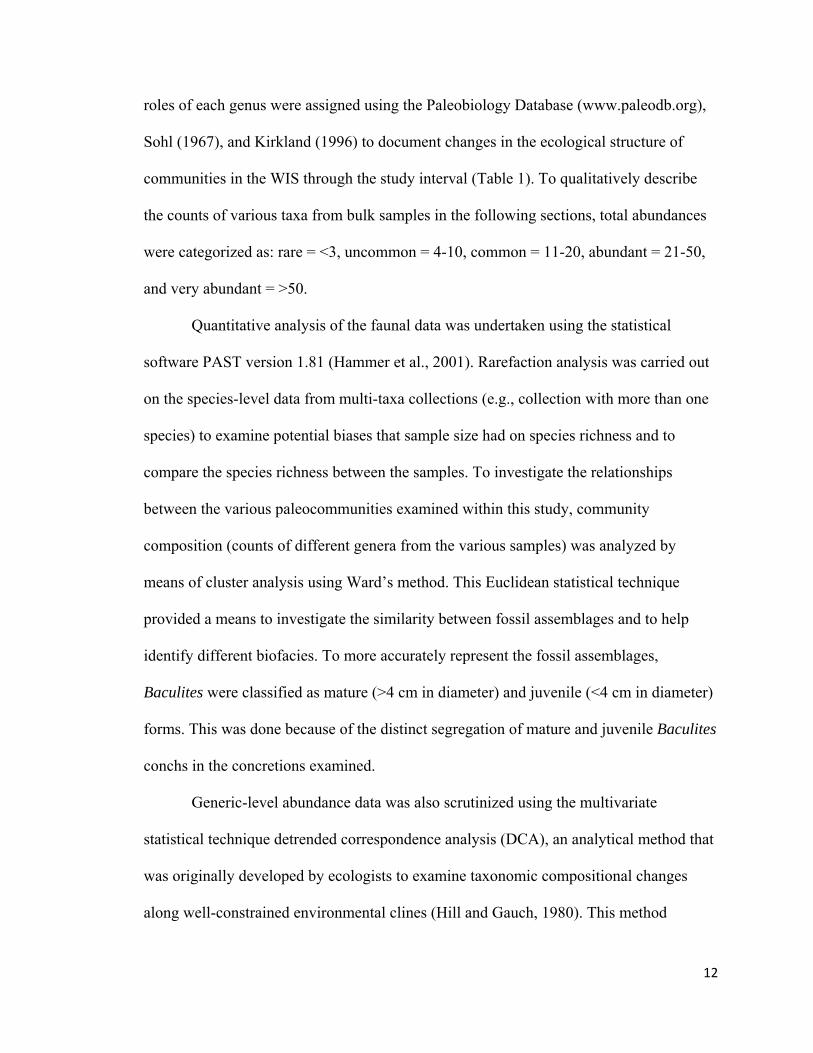
Figure 5. Highly fractured (on left) and unfractured orange colored carbonate-cemented concretions (on right) weathering out of the Baculites baculus/”Inoceramus” incurvus biozone of the upper unnamed shale member of the Pierre Shale.................................................................................15
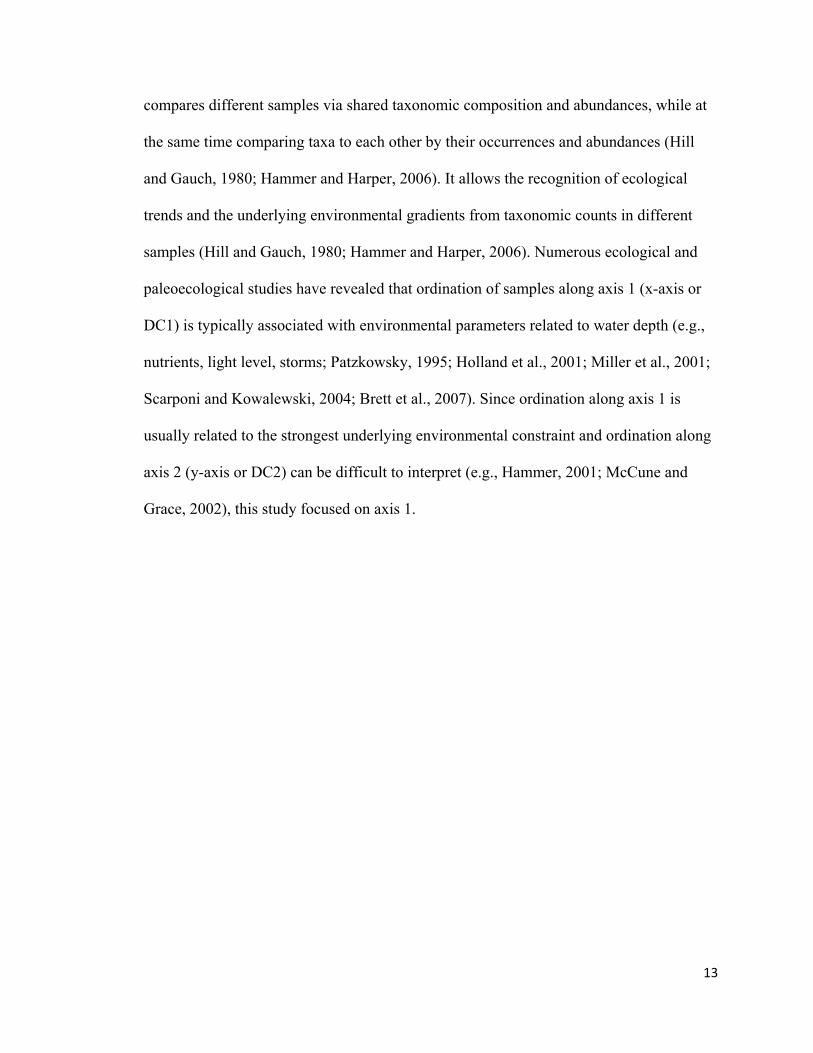
Figure 6. Current aligned specimens of Baculites eliasi within a sub-tabular carbonate- cemented concretion from the B. eliasi/”Inoceramus.” redbirdensis biozone at the base of the lower unnamed shale member of the Pierre Shale. ..................................................................................................16
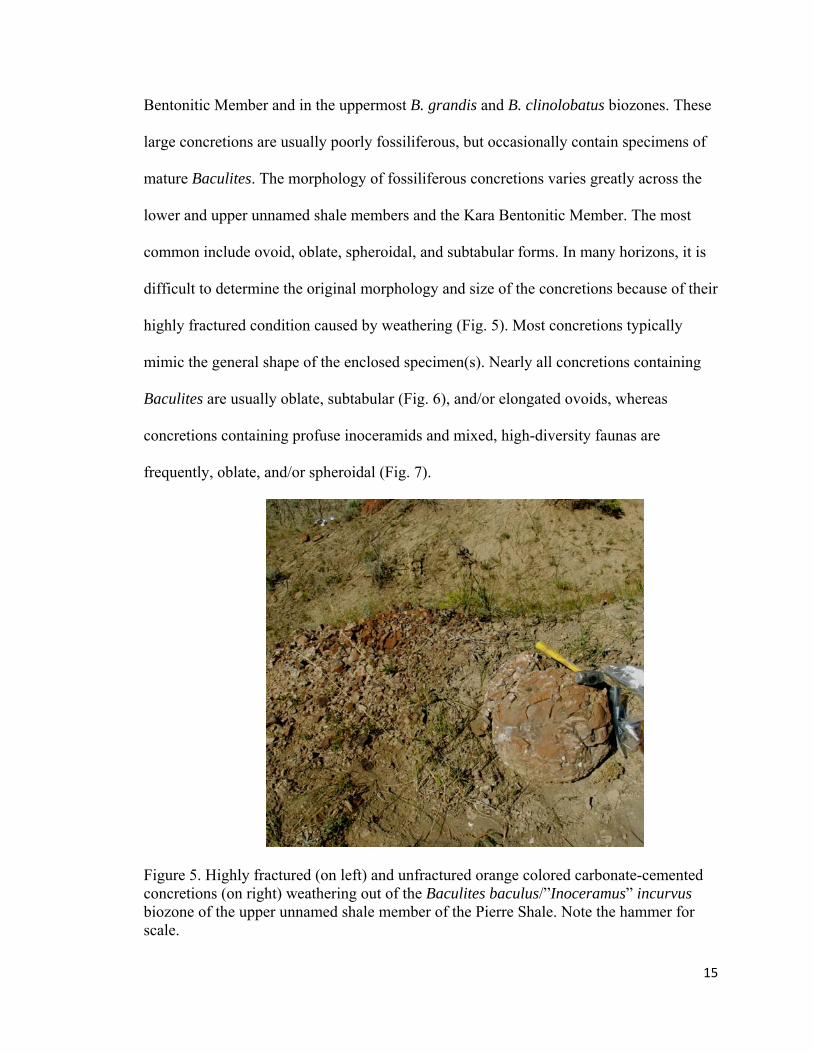
Figure 7. Inoceramid-rich carbonate concretion weathering out of the Baculites baculus/Endocostea typica biozone in the upper unnamed shale member of the Pierre Shale...............................................................................................16
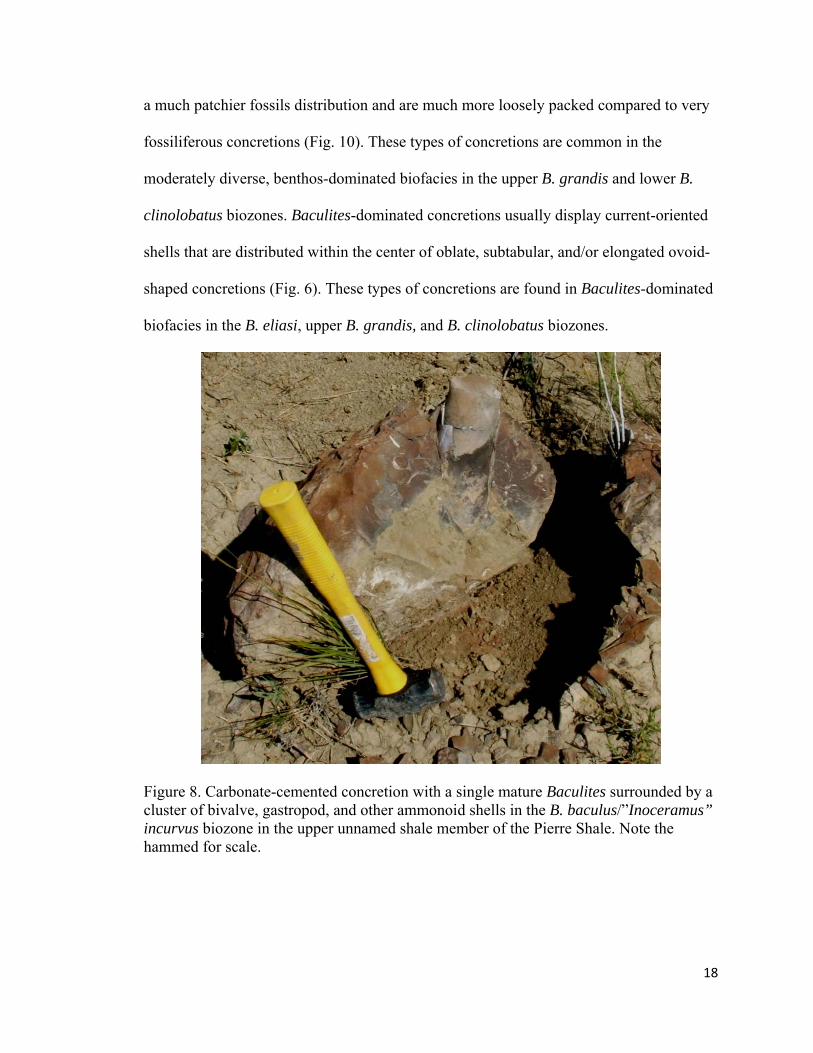
Figure 8. Carbonate-cemented concretion with single mature Baculites
surrounded by a cluster of bivalve, gastropod, and other ammonoid shells in the B. baculus/”Inoceramus” incurvus biozone in the upper unnamed shale member of the Pierre Shale. .......................................................18
iv
Figure 9. An extremely fossiliferous carbonate-cemented concretion showing the very dense packing and random orientation to the shells. .................................19
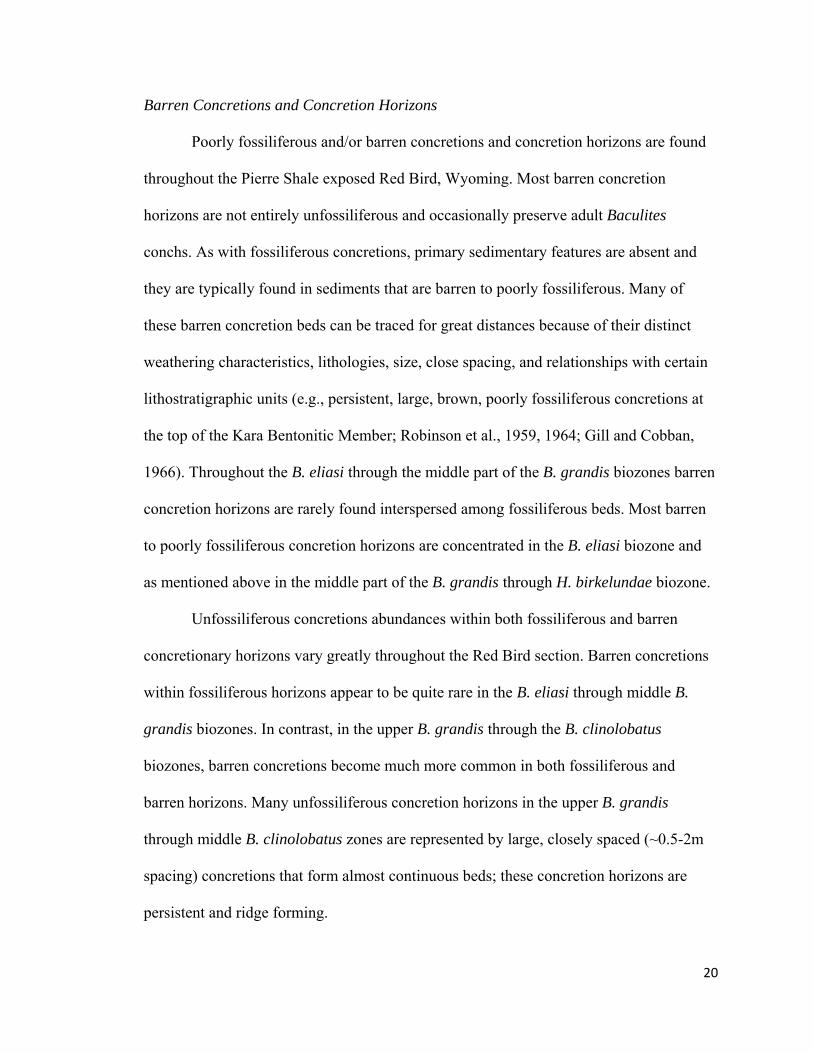
Figure 10. Poorly to moderately fossiliferous concretion displaying a loosely packed patchy distribution of fossil shells. ..................................................... 19
Figure 11. Cluster analysis of generic-level abundance data for the 19 samples collected from the Red Bird section.................................................................28
Figure 12. Stratigraphic ranges of the various species with Litho-, chrono-, and biostratigraphy of upper Campanian-lower Maastrichtian strata at the Red Bird section, Wyoming.............................................................................29
Figure 13. Key for faunal data shown in figure 14a and 14b Rare taxa (n<5 specimens) are colored black. ..........................................................................44
Figure 14a. Abundance trends for genera plotted with Litho-, chrono-, and biostratigraphy of upper Campanian-lower Maastrichtian strata at the Red Bird section, Wyoming.............................................................................45
Figure 14b. Relative Abundance trends for genera plotted with Litho-, chrono-, and biostratigraphy of upper Campanian-lower Maastrichtian strata at the Red Bird section, Wyoming. .....................................................................46
Figure 15. Species richness trends plotted with Litho-, chrono-, and biostratigraphy of upper Campanian-lower Maastrichtian strata at the Red Bird section, Wyoming.............................................................................48
Figure 16. A comparison of rarefied richness between the 12 multi-taxa samples collected from B. eliasi through B. clinolobatus biozones at the Red Bird section in Wyoming. ................................................................................49
Figure 17. Key for ecological niche data shown in figure 18b..........................................50
v
Figure 18. Ecological guild trends plotted with Litho-, chrono-, and biostratigraphy of upper Campanian-lower Maastrichtian strata at the Red Bird section, Wyoming. ...........................................................................51
Figure 19. DCA axis one and two scores for all samples (n = 19 samples) analyzed for this study. ....................................................................................52
Figure 20. DCA axis 1 and 2 scores for samples (A) and Taxa (B). Samples (n = 12) have been coded according to their occurrence within an ammonod/inoceramid biozone.........................................................................54
Figure 21. Upper Campanian through middle Maastrichtian ammonite biostratigraphy, inoceramid biostratigraphy, lithofacies for northern Wyoming, DC1 results from the Red Bird section graphed stratigraphically (Compiled from: 1) Cobban et al., 2006; 2) Gill and Cobban, 1973; 3) Kyrstinik and Dejarnett, 1995)............................................73
Figure 22. Approximate position of the western shoreline of the Western Interior Seaway during the upper most Campanian through lower Maastrichtian (B. eliasi through B. clinolobatus biozones) in southern Montana, western South Dakota, Wyoming, Colorado, and New Mexico (Based on unpublished shoreline maps, Cobban, pers. comm.). ........75
Figure 23. Faunas and water-mass conditions at Red Bird, WY during the late Campanian through early Maastrichtian (B. eliasi-B. clinolobatus time). ................................................................................................................76
vi

ABSTRACT
Studies examining bioevents (e.g., mass extinctions, faunal turnovers,
diversification events) usually only scrutinize a short interval prior to such events,
however, understanding their actual paleobiological implications requires a thorough
understanding of the background conditions. The objective of this study is to document
the background biodiversity dynamics in a single lithofacies of the Upper Cretaceous
Pierre Shale that was deposited in an offshore setting of the Western Interior Seaway
(WIS) and to place these changes into an environmental context. To assess the
background biodiversity dynamics, the concretionary faunas of the Baculites eliasi
through B. clinolobatus biozones of the Pierre Shale in eastern Wyoming were examined
to understand the structure of marine habitats in the WIS through an interval of ~2.5 Ma.
Both changes in the taxonomic composition of assemblages and the relative abundance of
the various species are interpreted to reflect ecological and environmental change through
the study interval.
The concretionary faunas are thought to represent relatively short-term, time-
averaged accumulations of dead and living animals on the muddy sea floor of the WIS
that were concentrated by storm or current activity. They are likely accurate
representations of the original skeletonized fauna of the WIS. The samples with lower
diversity and abundances show a relationship with intervals when water conditions were
deepest and the paleoshoreline was furthest to the west, while higher diversity and
abundances match periods when the paleoshoreline was the closest and shallow-water
vii
viii
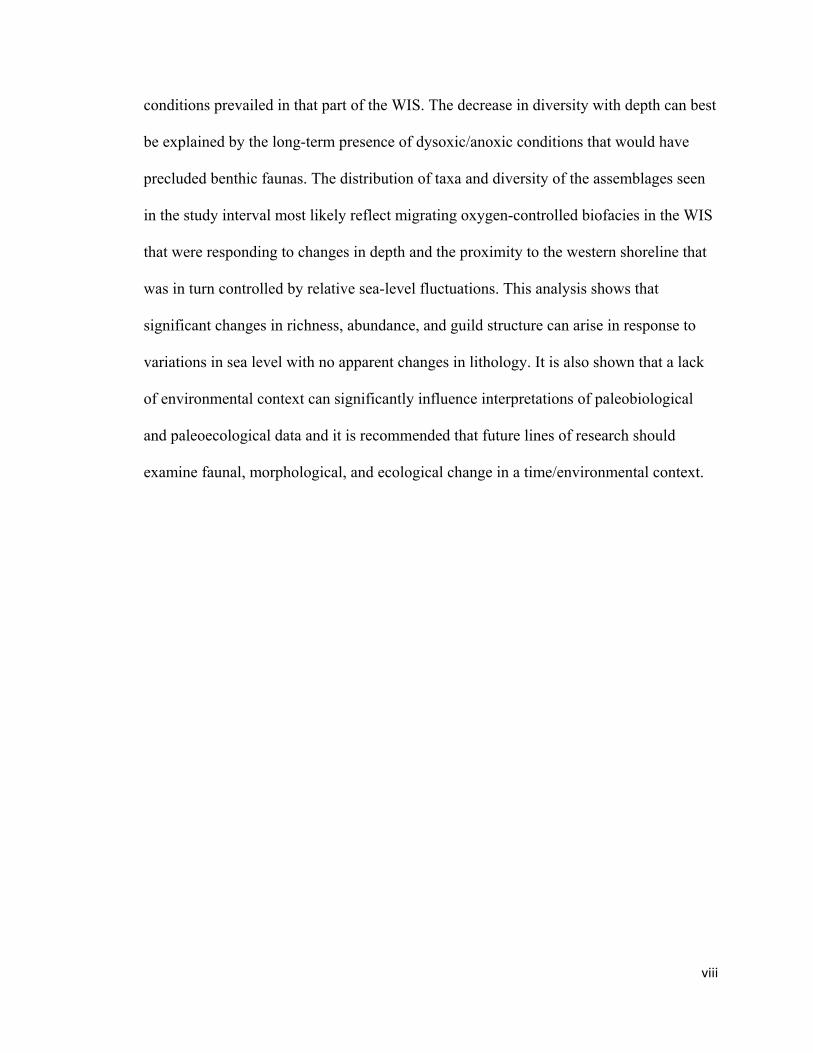
conditions prevailed in that part of the WIS. The decrease in diversity with depth can best
be explained by the long-term presence of dysoxic/anoxic conditions that would have
precluded benthic faunas. The distribution of taxa and diversity of the assemblages seen
in the study interval most likely reflect migrating oxygen-controlled biofacies in the WIS
that were responding to changes in depth and the proximity to the western shoreline that
was in turn controlled by relative sea-level fluctuations. This analysis shows that
significant changes in richness, abundance, and guild structure can arise in response to
variations in sea level with no apparent changes in lithology. It is also shown that a lack
of environmental context can significantly influence interpretations of paleobiological
and paleoecological data and it is recommended that future lines of research should
examine faunal, morphological, and ecological change in a time/environmental context.
INTRODUCTION
Understanding the true paleobiological and paleoecological significance of
bioevents such as regional extinctions, mass extinctions, faunal turnovers, and
diversification events requires a detailed understanding of background conditions.
However, most studies usually only examine a short interval prior to such bioevents (e.g.,
see Elder, 1987; Hansen et al., 1987, 1993) and thus have resulted in a poorer
understanding of their actual impact or significance upon biodiversity and the evolution
of faunas. To exacerbate this problem, most studies usually only examine regional or
global biologically critical events at the scale of an individual stratigraphic section or a
few closely spaced stratigraphic sections without trying to understand the underlying
environmental context in which faunal changes were occurring (Holland, 1997). As a
result of dynamic environmental conditions, changes in the stratigraphic distribution of
taxa, morphologies, and guild occupation at a single outcrop or a few closely spaced out
crops cannot and should not be directly interpreted to represent evolutionary responses
(Holland, 1997). To minimize the biases related to environmental change studies, it has
been suggested that the biologic dynamics associated with such events should be
examined in sections with relatively uniform lithofacies composition because these will
supposedly represent comparatively static environmental settings where faunas were not
significantly influenced by local environmental factors. However, it is well documented
that faunas can be extremely responsive indicators to even subtle environmental change
1

(e.g., Springer and Bambach, 1985; Miller, 1997; Brett et al., 2007a,b), and relatively few
studies to date have examined the degree of faunal change that can occur in a single
lithofacies (e.g., see Holland et al., 2001). Thus, a detailed familiarity of faunal
distributions within an environmental context in a single lithofacies prior to the known
bioevents is essential for understanding the true paleobiological and paleoecological
significance of these time intervals.
The primary goal of this study is to document the background biodiversity
dynamics in the monotonous lithofacies of the Upper Cretaceous Pierre Shale that was
deposited in an offshore setting of the Western Interior Seaway (WIS) during the late
Campanian and early Maastrichtian and to place these changes into an environmental
context. To assess the faunal dynamics in the WIS, the faunal distributions through four
biozones spanning the Baculites eliasi to B. clinolobatus zones in the Red Bird section in
eastern Wyoming are examined. Here, fossiliferous concretions were sampled from a
single, offshore clay-rich lithofacies of the Pierre Shale. This study will provide a basis
from which to investigate the paleoecological, paleobiological, and paleoenvironmental
context associated with Maastrichtian ocean/climate change and for the time interval
leading up to the K-Pg mass extinction event within offshore marine settings.
2
GEOLOGICAL SETTING
Paleogeography
During the Late Cretaceous, fine-grained clastic sediments and chalks were
deposited in the shallow, north-south-oriented epeiric seaway formed within the Western
Interior Basin (WIB). The WIB was an actively subsiding, asymmetric foreland basin that
was bounded to the west by the tectonically active Sevier Orogenic Thrust Belt, which
shed sediment into the foreland and resulted in an eastward-thinning clastic wedge (e.g.,
Gill and Cobban, 1973; Kauffman and Caldwell, 1993). The eastern margin was
relatively sediment starved and bordered by the low-lying, stable cratonic platform of
eastern North America (e.g., Gill and Cobban, 1973; Kauffman and Caldwell, 1993). The
basin covered much of west-central North America during the mid- through Late
Cretaceous, and, given the overall high sea levels, was flooded for majority of this
interval (Fig. 1; Kauffman and Caldwell, 1993). The paleoshoreline positions as well as
paleodepth of the WIS fluctuated both temporally and spatially within the basin as a
result of tectono-subsidence, load-induced subsidence, and tectono-eustacy (Kauffman
and Caldwell, 1993). The degree to which these processes influenced relative sea level
varied spatially across the WIB depending upon the local tectonic processes,
accommodation rates, and local sedimentation rates (Kyrstinik and Dejarnett, 1995).
During the Campanian and Maastrichtian, the study area was located at ~45º N and was
probably never closer than 80 km to the shoreline (Gill and Cobban, 1966), until the
middle Maastrichtian when the WIB was deformed by initial phases of the Laramide
3

Orogeny as well as eustatic-sea-level fall (Gill and Cobban, 1966; Miller et al., 1999,
2004). This resulted in a basinward shift in nearshore sedimentation culminating in the
deposition of the time-transgressive Fox Hills Formation (Robinson et al., 1964; Waage,
1967; Gill and Cobban, 1973) that prograded from the west to the east, and traditionally
was thought to have marked the end of Cretaceous marine sedimentation within in the
basin. This interpretation, however, has been placed into question by recent studies that
suggest that marine sedimentation in the WIB occurred at various intervals through the
latest Maastrichtian and into the earliest Paleogene (Hoganson and Murphy, 2002;
Hartman and Kirkland, 2002; Wroblewski, 2004; Wroblewski, 2008).
Figure 1. Locality map showing the section that was studied. A. Generalized map of the late Campanian (Baculites eliasi biozone) Western Interior Seaway (shoreline based on Gill and Cobban, 1973). Shaded areas show distribution of land during late Campanian. B. Map showing the location of the Red Bird (RB) section.
4
Stratigraphic and Geographic Setting
The Pierre Shale was deposited during an interval spanning the Campanian and
Maastrichtian stages of the Late Cretaceous, while the overlying Fox Hills Formation was
restricted to the Maastrichtian (Robinson et al., 1964, Waage, 1967; Landman and
Waage, 1993). These lithostratigraphic units and their lateral equivalents are well
exposed across the Western Interior of North America and vary from non-marine
sandstone facies to offshore silt and clay facies (Gill and Cobban, 1966). Recent work by
Martin et al. (2007) raised the status of the Pierre Shale in eastern Wyoming and South
Dakota from formational to group level and in turn raised its members to formational
status. To maintain consistency with previously published work on the Pierre Shale,
however, this paper retains the former nomenclature.
This study investigated the well-exposed and very fossiliferous Pierre Shale that
crops out within the Old Women Anticline near Red Bird, Niobrara County, Wyoming,
which is considered to be an informal reference section for the Pierre Shale as well as for
the Campanian-lower Maastrichtian ammonite and inoceramid biostratigraphy of the
WIB (Walaszczyk et al., 2001). At this locality, the Pierre Shale consists of 1100 m of
dark-gray to black shales and siltstones intercalated with numerous gray to orange-
weathering fossiliferous carbonate concretion horizons and generally thin bentonitic
units. Here, the unit conformably overlies the Coniacian-Santonian Niobrara Formation
and conformably underlies the middle Maastrichtian Fox Hills Formation (Fig. 2). Gill
and Cobban (1966) subdivided the Pierre Shale exposed at Red Bird into seven formal
and informal members that include (stratigraphically from bottom to top): Gammon
Ferruginous, Sharon Springs, Mitten Black Shale, Red Bird Silty, lower unnamed shale,
5
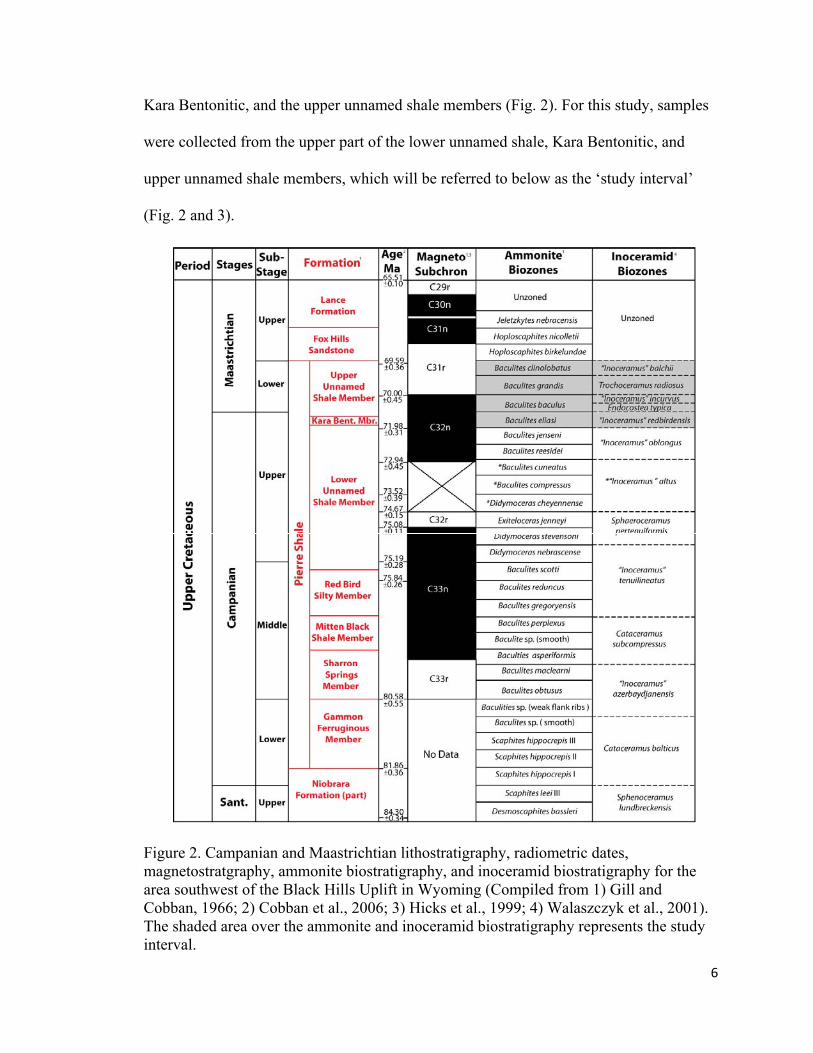
Kara Bentonitic, and the upper unnamed shale members (Fig. 2). For this study, samples
were collected from the upper part of the lower unnamed shale, Kara Bentonitic, and
upper unnamed shale members, which will be referred to below as the ‘study interval’
(Fig. 2 and 3).
Figure 2. Campanian and Maastrichtian lithostratigraphy, radiometric dates, magnetostratgraphy, ammonite biostratigraphy, and inoceramid biostratigraphy for the area southwest of the Black Hills Uplift in Wyoming (Compiled from 1) Gill and Cobban, 1966; 2) Cobban et al., 2006; 3) Hicks et al., 1999; 4) Walaszczyk et al., 2001). The shaded area over the ammonite and inoceramid biostratigraphy represents the study interval.
6
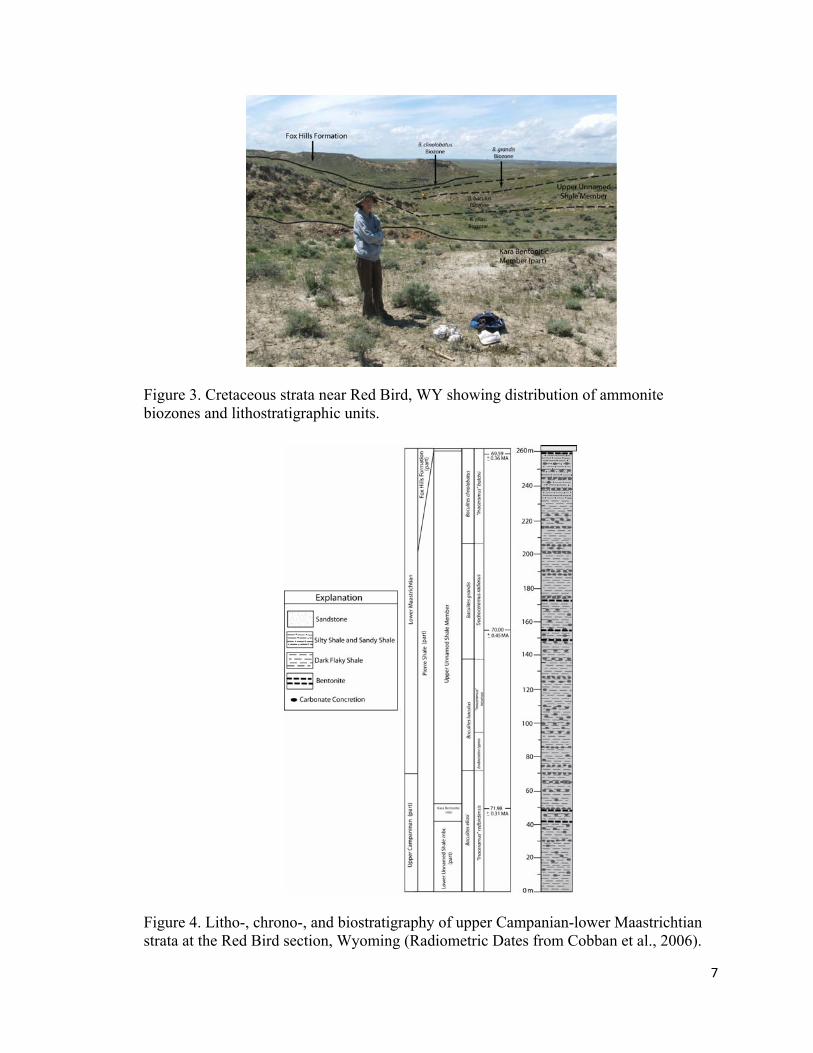
Figure 3. Cretaceous strata near Red Bird, WY showing distribution of ammonite biozones and lithostratigraphic units.
Figure 4. Litho-, chrono-, and biostratigraphy of upper Campanian-lower Maastrichtian strata at the Red Bird section, Wyoming (Radiometric Dates from Cobban et al., 2006).
7
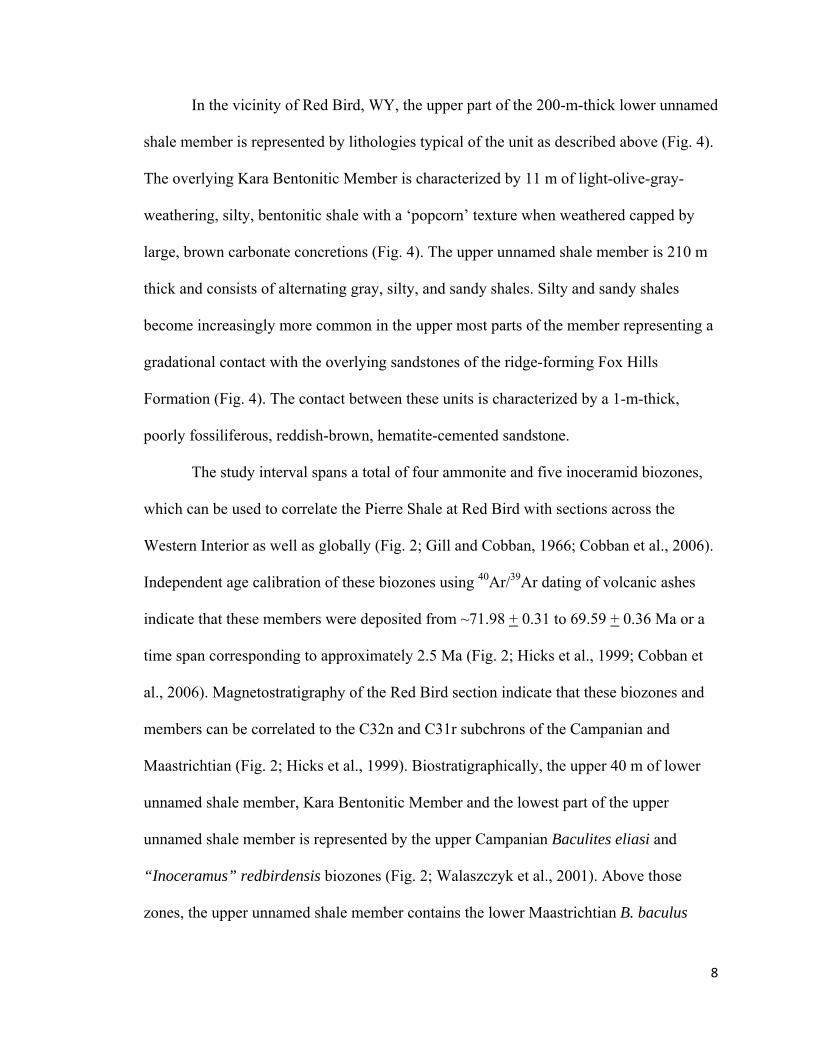
In the vicinity of Red Bird, WY, the upper part of the 200-m-thick lower unnamed
shale member is represented by lithologies typical of the unit as described above (Fig. 4).
The overlying Kara Bentonitic Member is characterized by 11 m of light-olive-gray-
weathering, silty, bentonitic shale with a ‘popcorn’ texture when weathered capped by
large, brown carbonate concretions (Fig. 4). The upper unnamed shale member is 210 m
thick and consists of alternating gray, silty, and sandy shales. Silty and sandy shales
become increasingly more common in the upper most parts of the member representing a
gradational contact with the overlying sandstones of the ridge-forming Fox Hills
Formation (Fig. 4). The contact between these units is characterized by a 1-m-thick,
poorly fossiliferous, reddish-brown, hematite-cemented sandstone.
The study interval spans a total of four ammonite and five inoceramid biozones,
which can be used to correlate the Pierre Shale at Red Bird with sections across the
Western Interior as well as globally (Fig. 2; Gill and Cobban, 1966; Cobban et al., 2006).
Independent age calibration of these biozones using 40Ar/39Ar dating of volcanic ashes
indicate that these members were deposited from ~71.98 + 0.31 to 69.59 + 0.36 Ma or a
time span corresponding to approximately 2.5 Ma (Fig. 2; Hicks et al., 1999; Cobban et
al., 2006). Magnetostratigraphy of the Red Bird section indicate that these biozones and
members can be correlated to the C32n and C31r subchrons of the Campanian and
Maastrichtian (Fig. 2; Hicks et al., 1999). Biostratigraphically, the upper 40 m of lower
unnamed shale member, Kara Bentonitic Member and the lowest part of the upper
unnamed shale member is represented by the upper Campanian Baculites eliasi and
“Inoceramus” redbirdensis biozones (Fig. 2; Walaszczyk et al., 2001). Above those
zones, the upper unnamed shale member contains the lower Maastrichtian B. baculus
8
biozone, which is divided into the lower Endocostea typica biozone and the upper “I.”
incurvus biozone (Fig. 2 and 4). The last occurrence of “I.” redbirdensis and first
occurrence of E. typica, which are also found at the Tercis section in France (Walaszczyk
et al., 2001), define the boundary between the Campanian-Maastrichtian (Cobban et al.,
2006). The middle portion the upper unnamed shale member correlates to the middle
lower Maastrichtian B. grandis and Trochoceramus radiosus biozones, whereas the upper
portion of the member spans the upper Lower Maastrichtian B. clinolobatus and “I.”
balchii biozones (Fig. 2 and 4; Walaszczyk et al., 2001). The baculitids and inoceramids
disappear well below the top of the upper unnamed shale member and are absent from the
overlying upper Maastrichtian Fox Hills Formation, which contains the Hoploscaphites
birkelundae biozone (Fig. 2).
9

METHODS
To examine faunal dynamics during the Campanian and Maastrichtian, changes in
faunal composition and community structure in the WIS were investigated. Individual or
partial, fossiliferous limestone concretions were bulk sampled from two concretionary
horizons from the upper 40 m of the lower unnamed shale member, from two
concretionary horizons within the 10 m thick Kara Bentonitic Member and from 12
concretionary horizons spanning the 210 m thick upper unnamed shale member (Fig. 4).
In addition, a qualitative survey was carried out along strike to document the abundance
of fossiliferous concretions within each concretionary horizon and to examine the lateral
variability in species richness and abundance. To minimize collection-related biases,
portions of carbonate-cemented concretions were placed into one-gallon bags to
standardized sample volumes for comparison between horizons and returned to the
laboratory for processing. In addition to the concretions, baculitids, scaphitids, and
inoceramids were collected to constrain the biostratigraphic position of the concretion
horizons.
In the laboratory, concretions were washed and then carefully dissected using
hammers, chisels, and pneumatic scribes to liberate the fossil specimens. The process of
removing intact specimens from concretions was very difficult and time consuming
because most shell material was softer than the extremely hard, encasing matrix.
Specimens preserved on the outer surface of concretions were typically dissolved away
during digenesis, leaving only external molds. These specimens were not included in the
10
analysis because of their poor preservation. Most taxa were identified to genus and
species using various sources, including Meek (1876), Stephenson (1941), Sohl (1967),
Speden (1971), Erikson (1971), Kirkland (1996), and Sava (2007). The abundance of
most taxa were tallied, and included bivalves, gastropods, ammonites, calcareous worm
tubes, bryozoans, brachiopods, anthozoans, crustaceans, and vertebrates. The abundance
of bryozoans was determined by counting segments that were one centimeter long,
following the methodology developed by Patzkowsky and Holland (1999). This method,
which did not offer a true measure of abundance, provided a means to examine the
relative significance of bryozoans during the Campanian and Maastrichtian in the WIS.
To determine the abundance of mollusks given fragmented or incomplete specimens,
only intact identifiable gastropod apices, and bivalve umbos were used so as not to
overestimate the number of individuals. To calculate the number of bivalve specimens
(SN) from disarticulated and articulated material the following metrics were used:
SN = Max(RV or LV) + A (1)
SN = [(RV + LV)/2] + A (2)
where RV and LV indicate the numbers of right and left valves, respectively, and A
designates the number of articulated specimens. The abundance of most bivalve genera
was calculated using the first equation, while the second equation was only used for
bivalve genera in which right or left valves were indistinguishable or difficult to
determine (e.g., Anomia, Ostrea, Syncylonema). Decapod crustacean pieces, ammonoid
jaws, and vertebrate skeletal elements, including fish scales, vertebrae, and bones, were
not included in the final tally because of their rarity and fragmentary nature. In addition
to determining taxonomic richness and abundances, habitat type, motility, and trophic
11
roles of each genus were assigned using the Paleobiology Database (www.paleodb.org),
Sohl (1967), and Kirkland (1996) to document changes in the ecological structure of
communities in the WIS through the study interval (Table 1). To qualitatively describe
the counts of various taxa from bulk samples in the following sections, total abundances
were categorized as: rare = <3, uncommon = 4-10, common = 11-20, abundant = 21-50,
and very abundant = >50.
Quantitative analysis of the faunal data was undertaken using the statistical
software PAST version 1.81 (Hammer et al., 2001). Rarefaction analysis was carried out
on the species-level data from multi-taxa collections (e.g., collection with more than one
species) to examine potential biases that sample size had on species richness and to
compare the species richness between the samples. To investigate the relationships
between the various paleocommunities examined within this study, community
composition (counts of different genera from the various samples) was analyzed by
means of cluster analysis using Ward’s method. This Euclidean statistical technique
provided a means to investigate the similarity between fossil assemblages and to help
identify different biofacies. To more accurately represent the fossil assemblages,
Baculites were classified as mature (>4 cm in diameter) and juvenile (<4 cm in diameter)
forms. This was done because of the distinct segregation of mature and juvenile Baculites
conchs in the concretions examined.
Generic-level abundance data was also scrutinized using the multivariate
statistical technique detrended correspondence analysis (DCA), an analytical method that
was originally developed by ecologists to examine taxonomic compositional changes
along well-constrained environmental clines (Hill and Gauch, 1980). This method
12
compares different samples via shared taxonomic composition and abundances, while at
the same time comparing taxa to each other by their occurrences and abundances (Hill
and Gauch, 1980; Hammer and Harper, 2006). It allows the recognition of ecological
trends and the underlying environmental gradients from taxonomic counts in different
samples (Hill and Gauch, 1980; Hammer and Harper, 2006). Numerous ecological and
paleoecological studies have revealed that ordination of samples along axis 1 (x-axis or
DC1) is typically associated with environmental parameters related to water depth (e.g.,
nutrients, light level, storms; Patzkowsky, 1995; Holland et al., 2001; Miller et al., 2001;
Scarponi and Kowalewski, 2004; Brett et al., 2007). Since ordination along axis 1 is
usually related to the strongest underlying environmental constraint and ordination along
axis 2 (y-axis or DC2) can be difficult to interpret (e.g., Hammer, 2001; McCune and
Grace, 2002), this study focused on axis 1.
13

RESULTS
Occurrence of Fossils
Fossiliferous Concretions and Concretion Horizons
The primary lithology in the Upper Cretaceous Pierre Shale where fossils are
concentrated are in carbonate-cemented concretions, which are found in laterally
persistent horizons and surrounded by poorly lithified shales and silty shales (Fig. 5; Gill
and Cobban, 1966; Waage, 1964, 1967, Reiskind, 1979). These surrounding sediments
are typically considered unfossiliferous (or barren) to poorly fossiliferous, which is
probably the result of weathering, collecting biases towards concretions, as well as the
combined effects that climate, circulation patterns, and basin configuration had on
biologically critical water mass properties, especially relative oxygenation, of the epeiric
sea (e.g., Epeiric Sea Effect; see Peters, 2007).
Many of these concretionary horizons in the Pierre Shale can be physically traced
north of the Old Women Creek anticline along the western edge of the Black Hills uplift
up to the Montana border (Robinson et al., 1959, 1964). It may be possible to correlate
these beds further to the east and west with transgressive surfaces in the nearshore strata
of the Lewis Shale as was done for the Cenomanian and Turonian stage boundary strata
in the southern Great Plains and American southwest by Elder et al., (1994).
The size of concretions can range from a few centimeters to >3 m in diameter,
although most fossiliferous concretions are usually <60 cm is diameter. The largest
concretions (~2-3 m in diameter) in the study interval are located at the top of the Kara
14
Bentonitic Member and in the uppermost B. grandis and B. clinolobatus biozones. These
large concretions are usually poorly fossiliferous, but occasionally contain specimens of
mature Baculites. The morphology of fossiliferous concretions varies greatly across the
lower and upper unnamed shale members and the Kara Bentonitic Member. The most
common include ovoid, oblate, spheroidal, and subtabular forms. In many horizons, it is
difficult to determine the original morphology and size of the concretions because of their
highly fractured condition caused by weathering (Fig. 5). Most concretions typically
mimic the general shape of the enclosed specimen(s). Nearly all concretions containing
Baculites are usually oblate, subtabular (Fig. 6), and/or elongated ovoids, whereas
concretions containing profuse inoceramids and mixed, high-diversity faunas are
frequently, oblate, and/or spheroidal (Fig. 7).
Figure 5. Highly fractured (on left) and unfractured orange colored carbonate-cemented concretions (on right) weathering out of the Baculites baculus/”Inoceramus” incurvus biozone of the upper unnamed shale member of the Pierre Shale. Note the hammer for scale.
15
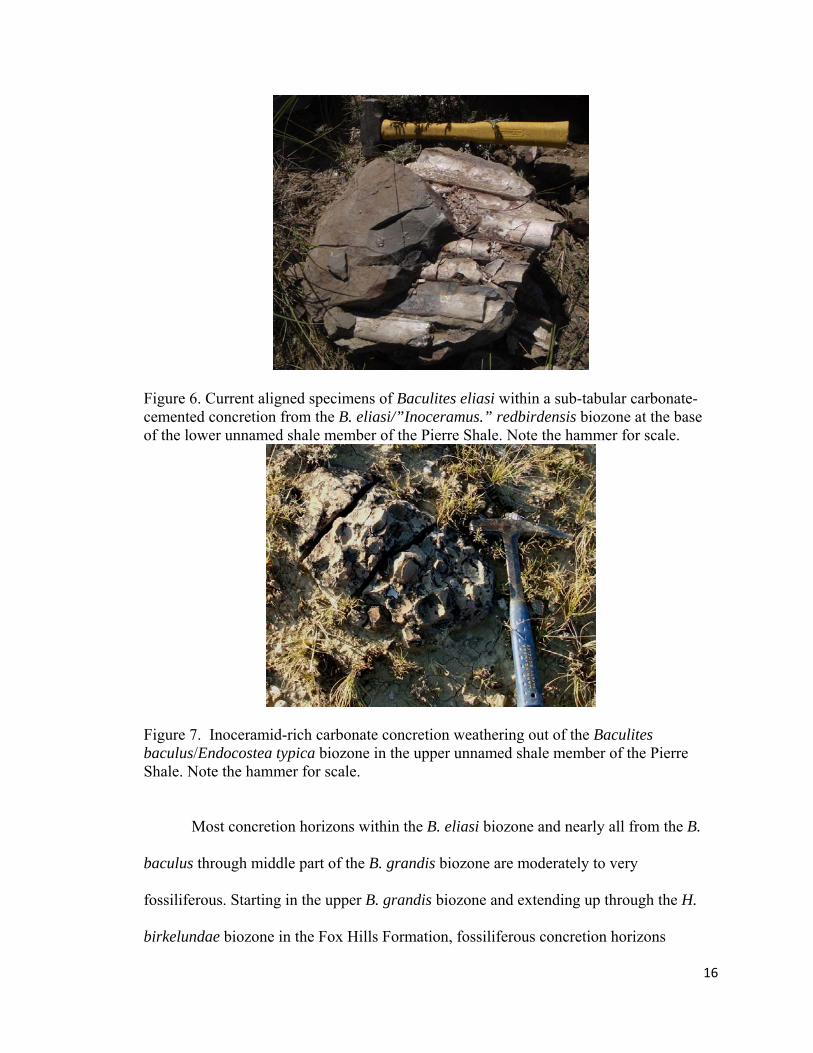
Figure 6. Current aligned specimens of Baculites eliasi within a sub-tabular carbonate- cemented concretion from the B. eliasi/”Inoceramus.” redbirdensis biozone at the base of the lower unnamed shale member of the Pierre Shale. Note the hammer for scale.
Figure 7. Inoceramid-rich carbonate concretion weathering out of the Baculites baculus/Endocostea typica biozone in the upper unnamed shale member of the Pierre Shale. Note the hammer for scale.
Most concretion horizons within the B. eliasi biozone and nearly all from the B.
baculus through middle part of the B. grandis biozone are moderately to very
fossiliferous. Starting in the upper B. grandis biozone and extending up through the H.
birkelundae biozone in the Fox Hills Formation, fossiliferous concretion horizons
16

become less common stratigraphically, whereas unfossiliferous concretionary horizons
become more common. The abundance of fossils from a concretionary horizon varies
greatly throughout the Red Bird section. Most of these horizons contain both fossiliferous
and unfossiliferous concretions in varying abundances. Lateral inspection along strike of
fossiliferous beds found that concretions abundance can vary anywhere from 20 to 100
fossiliferous concretions per 100 m transect. Furthermore, most faunas appear to be
taxonomically quite consistent among concretions and are dominated by the same
common genera. Most concretions within a single horizon are dominated by one to ten
taxa. As examples of this phenomena, every single concretion (n = 7) inspected in sample
interval RB2 contained a single adult Baculites conch, in sample interval RB6 every
concretion (n = 25) contained clusters of inoceramids, whereas in RB9 concretions (n =
15) contained a single mature Baculites conch surrounded by a cluster of bivalve,
gastropod, and other ammonoid shells (Fig. 8).
The distribution and orientation of fossils within concretions differ between
concretions and concretionary beds. Much of this variation is associated with the
abundance of fossils within the calcareous concretions. Most concretions in the Pierre
Shale at Red Bird show no sign of primary sedimentary structures that could provide
clues to their origin. This phenomenon is common among most concretion found in
offshore lithofacies (Tsuijita, 1995; Landman et al. 2010). Specimens within extremely
fossiliferous concretions, as the name implies, are very densely packed and randomly
oriented (Fig. 9). These types of concretions are common within the non-Baculites-
dominated biofacies in the B. eliasi, B. baculus through middle B. grandis, and upper B.
clinolobatus biozones. In contrast, poorly to moderately fossiliferous concretions display
17
a much patchier fossils distribution and are much more loosely packed compared to very
fossiliferous concretions (Fig. 10). These types of concretions are common in the
moderately diverse, benthos-dominated biofacies in the upper B. grandis and lower B.
clinolobatus biozones. Baculites-dominated concretions usually display current-oriented
shells that are distributed within the center of oblate, subtabular, and/or elongated ovoid-
shaped concretions (Fig. 6). These types of concretions are found in Baculites-dominated
biofacies in the B. eliasi, upper B. grandis, and B. clinolobatus biozones.
Figure 8. Carbonate-cemented concretion with a single mature Baculites surrounded by a cluster of bivalve, gastropod, and other ammonoid shells in the B. baculus/”Inoceramus” incurvus biozone in the upper unnamed shale member of the Pierre Shale. Note the hammed for scale.
18
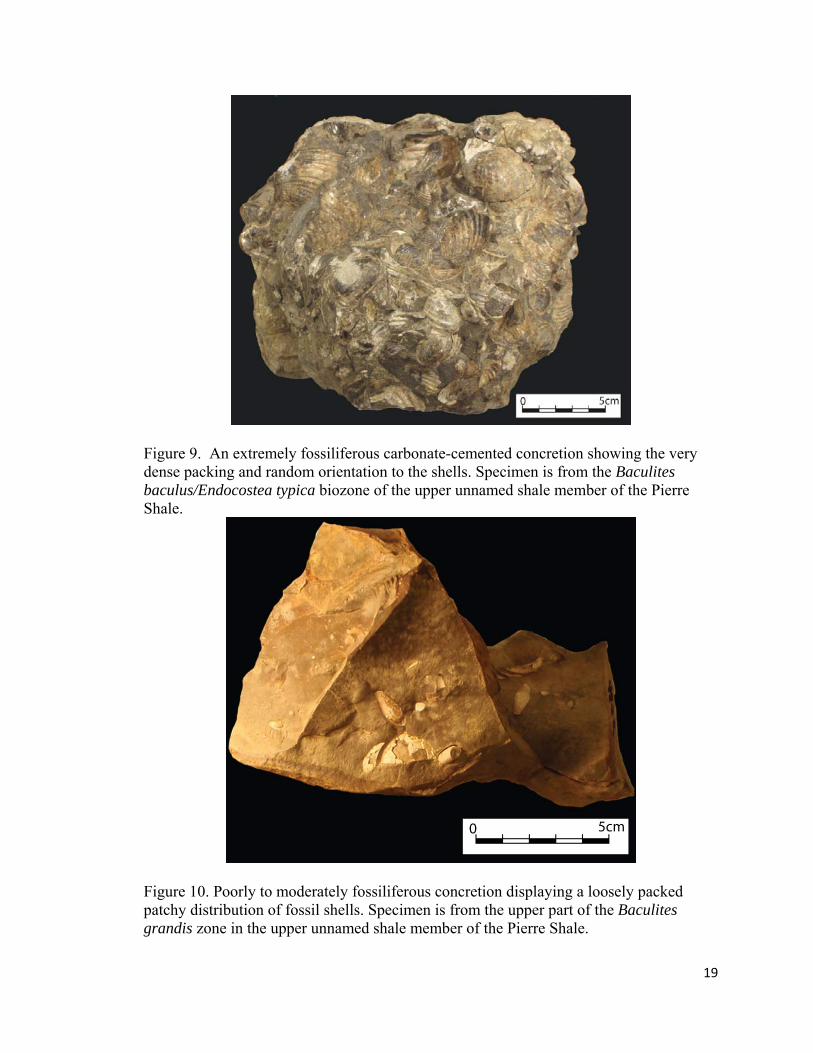
Figure 9. An extremely fossiliferous carbonate-cemented concretion showing the very dense packing and random orientation to the shells. Specimen is from the Baculites baculus/Endocostea typica biozone of the upper unnamed shale member of the Pierre Shale.
Figure 10. Poorly to moderately fossiliferous concretion displaying a loosely packed patchy distribution of fossil shells. Specimen is from the upper part of the Baculites grandis zone in the upper unnamed shale member of the Pierre Shale.
19
Barren Concretions and Concretion Horizons
Poorly fossiliferous and/or barren concretions and concretion horizons are found
throughout the Pierre Shale exposed Red Bird, Wyoming. Most barren concretion
horizons are not entirely unfossiliferous and occasionally preserve adult Baculites
conchs. As with fossiliferous concretions, primary sedimentary features are absent and
they are typically found in sediments that are barren to poorly fossiliferous. Many of
these barren concretion beds can be traced for great distances because of their distinct
weathering characteristics, lithologies, size, close spacing, and relationships with certain
lithostratigraphic units (e.g., persistent, large, brown, poorly fossiliferous concretions at
the top of the Kara Bentonitic Member; Robinson et al., 1959, 1964; Gill and Cobban,
1966). Throughout the B. eliasi through the middle part of the B. grandis biozones barren
concretion horizons are rarely found interspersed among fossiliferous beds. Most barren
to poorly fossiliferous concretion horizons are concentrated in the B. eliasi biozone and
as mentioned above in the middle part of the B. grandis through H. birkelundae biozone.
Unfossiliferous concretions abundances within both fossiliferous and barren
concretionary horizons vary greatly throughout the Red Bird section. Barren concretions
within fossiliferous horizons appear to be quite rare in the B. eliasi through middle B.
grandis biozones. In contrast, in the upper B. grandis through the B. clinolobatus
biozones, barren concretions become much more common in both fossiliferous and
barren horizons. Many unfossiliferous concretion horizons in the upper B. grandis
through middle B. clinolobatus zones are represented by large, closely spaced (~0.5-2m
spacing) concretions that form almost continuous beds; these concretion horizons are
persistent and ridge forming.
20
The morphology of barren concretions differs throughout the lower and upper
unnamed shale members and the Kara Bentonitic Member of the Pierre Shale. Most
unfossiliferous concretions, as with many fossiliferous concretions, are highly weathered
and fragmented which makes them morphologically unidentifiable. However, most
within barren concretions in the B. eliasi, upper B. grandis, lower B. clinolobatus
biozones appear to be subtabular in form. Unfossiliferous concretions in the upper part of
the B. clinolobatus biozone that are associated with silty and sandy lithofacies are oblate
shaped.
Barren concretions show a broad range of sizes and can vary from a few
centimeters to over three meters in diameter. In fossiliferous horizons spanning the B.
eliasi through B. clinolobatus biozones, the concretions are usually the same size as
fossiliferous concretions. Barren and poorly fossiliferous concretions in largely barren
horizons in the B. eliasi biozone vary from one to three meters in diameter, whereas in
the upper B. grandis through middle B. clinobatus they are typically 1-2 m in diameter,
whereas unfossiliferous concretions in the upper B. clinolobatus biozone are <1 m in
diameter.
Preservation of Fossil Assemblages
The preservation of most specimens within concretions from the Pierre Shale at
the Red Bird is usually excellent. Based on visual inspection and the work of Gill and
Cobban (1966), most mollusc shells within the internal portion of the concretions from
the Red Bird section are composed of altered and unaltered aragonite and/or calcite. In
contrast, shells preserved along the outside of the concretion are typically completely
dissolved leaving only steinkerns and external molds. Most non-molluscan specimens
21

usually show the same preservational characteristics as the molluscs from the same
concretions. The shell preservation degrades depending on the degree of weathering
and/or recrystallization the concretions and specimens have experienced. Many
fossiliferous concretions are highly weathered and cracked because of repeated cycles of
freezing and thawing. This weathering process causes fractures to form along planes of
weakness, which are usually along the contacts between the matrix, the fossil shells, and
the steinkerns of the fossils. This results in mollusc shells being highly fractured and even
exfoliated from their steinkerns in weathered concretions. Most shells are fairly easily
extracted from unweathered concretions with pneumatic hammers, except when the
concretions and the specimens have been recrystallized.
Bivalves, gastropods, and cephalopod body chambers are commonly infilled with
either cemented matrix and/or a mineral such as calcite, where as the phragmocones of
cephalopods can either be infilled with matrix, permineralized with calcite, mineral lined
with calcite or barite, and/or unfilled. Most specimens within the concretions are usually
uncompacted, although flattened specimens are observed around the margins and at the
bases of concretions.
The degree of articulation of bivalves varies across the study interval (Appendix
1). The shells of most epifaunal bivalves are frequently preserved disarticulated and are
only rarely found articulated. Occasionally, in certain horizons (RB3, epifaunal bivalves
are found in a “butterfly” orientation (valves are splayed open). In contrast, infaunal
bivalve shells are almost always articulated and are rarely found as single valves. Most
articulated valves of infaunal bivalves are either fully closed or slightly gaping. Semi-
22

infaunal bivalves (e.g., Crenella, Modiolus) can be found as both articulated and
disarticulated.
The degree of biostratinomic alteration of the fossil specimens in the concretions
varies depending upon the stratigraphic horizon, the taxa, and the degree of shell packing
in the concretion. Most infaunal bivalves (e.g., Malletia, Nuculana) are usually
excellently preserved and show little corrosion of their shells, whereas larger epifaunal
bivalves (e.g., inoceramids) display broken commissures, especially the removal of the
hinges, and are occasionally crushed. Many epifaunal pterioid (e.g., Phelopteria,
Tenuipteria) and pectinid (e.g., Oxytoma, Syncyclonema, Lyropecten) specimens’ possess
damaged auricles. The inner nacreous layer on most inoceramids and pteriids is usually
preserved without the outer prismatic layer. Gastropod specimens are usually very well
preserved and show little signs of damage. Most Baculites are broken and only preserve
small sections of the original shell length. Large mature body chambers of Baculites are
usually crushed, whereas the phragmocones are generally uncrushed. Small, juvenile
Baculites are commonly uncrushed unlike larger sub-mature and mature conchs and are
usually ≤10 cm long. The majority of scaphitids are represented by juvenile whorls that
are rarely crushed or damaged, whereas the less-common, adult scaphitids typically
display crushing along their side and venters. In contrast to Baculites, other tube-shaped
taxa such as scaphopods and serpulids are for the most part well-preserved and show no
signs of breakage or abrasion. The anthozoan Micrabacia is typically well preserved and
shows little signs of wear or breakage. The few branching bryozoans that were found
were broken into 1-2 cm parts.
23
The calcitic lower jaws of cephalopods are rare at the Red Bird section, but can
occasionally be found with a detailed examination of scaphitids-bearing concretions. In
the samples analyzed for this study, only six isolated lower jaws of Hoploscaphites were
discovered in the matrix not associated with an ammonite; these were found in samples
RB9 (n = 1), RB12 (n = 3), and RB19 (n = 2) from the B. baculus/”I.”incurvus through
B. clinolobatus biozones. The outer calcitic layer of the jaws was missing on all
specimens and chitinous layer was in direct contact with the matrix, without a gap.
Similar preservation characteristics were noted by Landman et al. (2010) in ammonite
jaws from a concretion found in the B. compressus-B. cuneatus biozones of the Pierre
Shale of South Dakota. All of the specimens were severely damaged, while only one was
in good condition. The single specimen that was in good condition came from sample
RB12 and was associated with numerous adult Hoploscaphites.
Epizoans and bioeroders, such as cirripids, bryozoans, worms with calcareous
shells, and shell boring bivalves are rare to non-existent on most specimens from the Red
Bird Section. Most mollusc specimens with pristine shells that were undamaged by the
preparation process showed no signs of encrusters and bioeroders. The attachment
marking made by bryozoans and other unknown taxa described by Gill and Cobban
(1966) are only apparent on weathered specimen and are never found on pristine shells
extracted directly from concretions. The only evidence for encrusters found in this study
included a bryozoan that covered the internal portion of a Baculites body chamber
(RB19); a partially coiled calcareous worm tube attached to the inside of the body
chamber of an adult Baculites (RB16); and encrusting Ostrea specimens attached to an
inoceramid shell fragment (RB18; Appendix 1).
24
Diversity Patterns and Trends
A total of 3245 specimens from nineteen samples representing 78 species within
52 genera are analyzed in this study of the upper Campanian and lower Maastrichtian
strata at Red Bird, WY. The faunal abundance in the individual samples ranged from one
to over 748 specimens, with an average of 171 ± 267 specimens per sample. Alpha
diversity (number of species per sample) varies from one to 43 species per sample, with
an average of 11 + 12 species per sample. In general, samples from the B. eliasi, upper B.
grandis, and lower B. clinolobatus biozones had the lowest taxonomic diversities and
abundances of specimens. In contrast, samples from the B. baculus/E. typica, B.
baculus/”I.” incurvus, lower B. grandis, and upper B. clinolobatus biozones are the most
taxonomically diverse and possessed the greatest number of specimens.
Cluster Analysis
Figure 11 shows the results of the cluster analysis of generic-level abundance data
of the 19 samples collected from the Red Bird section. The pattern of the dendrogram is a
result of the most dominant faunal components and the diversity characteristics (richness
and abundance) of each sample. The plot depicts two primary clusters, labeled 1 and 2
(Fig. 11). Cluster 2 is separated from cluster 1 by the dominance (n>50 specimens per
sample) of a few distinct genera – in particular juvenile Baculites, Hoploscaphites,
Protocardia, and Micrabacia – as well as the rarity or absence of inoceramids and adult
Baculites.
Nine subclusters are distinguished in Figure 11 based on a similarity of >-20 and
are defined by compositional differences between various assemblages. The pattern in
subclusters 1a-f are primarily controlled by the dominant faunal components, which
25
include Cataceramus?, “Inoceramus”, Nuculana, Malletia, Anomia, Baculites,
Hoploscaphites, Acmaea, and Oligoptycha (Fig. 11). Subcluster 1a (RB6) is separated
from other assemblages in cluster 1 by the very abundant individuals in the inoceramid
genus Cataceramus? (n = 245) and the common specimens of the Anomia (n = 12),
whereas subcluster 1b (RB9) is differentiated from the rest of the cluster by the very
abundant bivalve Nuculana (n = 143) and the gastropod Oligoptycha (n = 77). Subcluster
1c (RB3 and RB8) is defined by abundant to very abundant “Inoceramus” and
Cataceramus?. Abundant Cataceramus? (n = 45) and uncommon Discinisca (n = 9)
delineate subcluster 1d (RB7) from other subclusters. Low diversity and low total
abundances along with the occurrence of the nektic planktivorous ammonoid Baculites
defines subcluster 1e (RB1, RB2, RB4, RB5, RB11, RB13, RB15, and RB17), whereas
subcluster 1f (RB14, RB16, and RB18) reflects a moderately diverse assemblages with
low generic abundances. Subcluster 2a (RB19) is separated from 2b-c by the very
abundant bivalve genus Protocardia (n = 340 specimens) and juvenile Baculites (n = 52)
as well as Hoploscaphites (n = 33). Both subcluster 2b and 2c (RB10 and RB12) are
characterized by abundant juvenile Baculites (n = 236 and n = 185, respectively) and
Hoploscaphites (n = 79 and n = 179, respectively), however, subcluster 2c has a larger
number of the solitary coral Micrabacia (n = 197) that is rare within subcluster 2b (n =
1).
The clustering pattern was also examined from the perspective of the sample
horizon, biozone, and dominant faunal component (Fig. 11). In these terms, subclusters
1a, 1c, and 1d were dominated by inoceramids and contained samples from the B. eliasi
biozone and from closely spaced horizons in B. baculus/E. typica biozones. Subcluster 1b
26

represented the only sample from the B. baculus/”I”. incurvus biozone and is dominated
by Nuculana and Oligoptycha. Subcluster 1e was dominated primarily by Baculites-
bearing concretions from the B. eliasi, middle to upper B. grandis, and B. clinolobatus
biozones. Samples from subcluster 1f (Samples: RB14, RB16, and RB18) represent
closely spaced horizons separated by samples dominated by Baculites (samples: RB13,
RB15, and RB17) from the upper B. grandis and lower B. clinolobatus biozone. Within
subcluster 1f, sample RB18 can be differentiated from RB14 and RB16 by the occurrence
of the limpet Acmaea and specimens of juvenile Baculites, whereas RB14 and RB18 are
both dominated by the bivalves Malletia and “Inoceramus” as well as Micrabacia. The
Protocardia-dominated subcluster 2a represented samples from the upper most part of
the B. clinolobatus biozone, 17 m below the Fox Hills Formation, whereas the juvenile-
Baculites-dominated subclusters 2b and 2c were from the lower and middle parts of the
B. grandis biozone.
On the basis of the cluster analysis discussed above, the nine separate subclusters
are assigned to biofacies categories named for their dominant faunal component or
diversity characteristic: 1a = diverse-inoceramid-dominated biofacies; 1b = Nuculana-
Oligoptycha biofacies; 1c = inoceramid-dominated biofacies; 1d = Cataceramus?-
Discinisca biofacies; 1e = Baculites-dominated biofacies; 1f = moderately diverse,
benthos-dominated biofacies; 2a = Protocardia-dominated biofacies; 2b = juvenile-
Baculites-dominated biofacies; and 2c = Micrabacia-dominated biofacies.
27
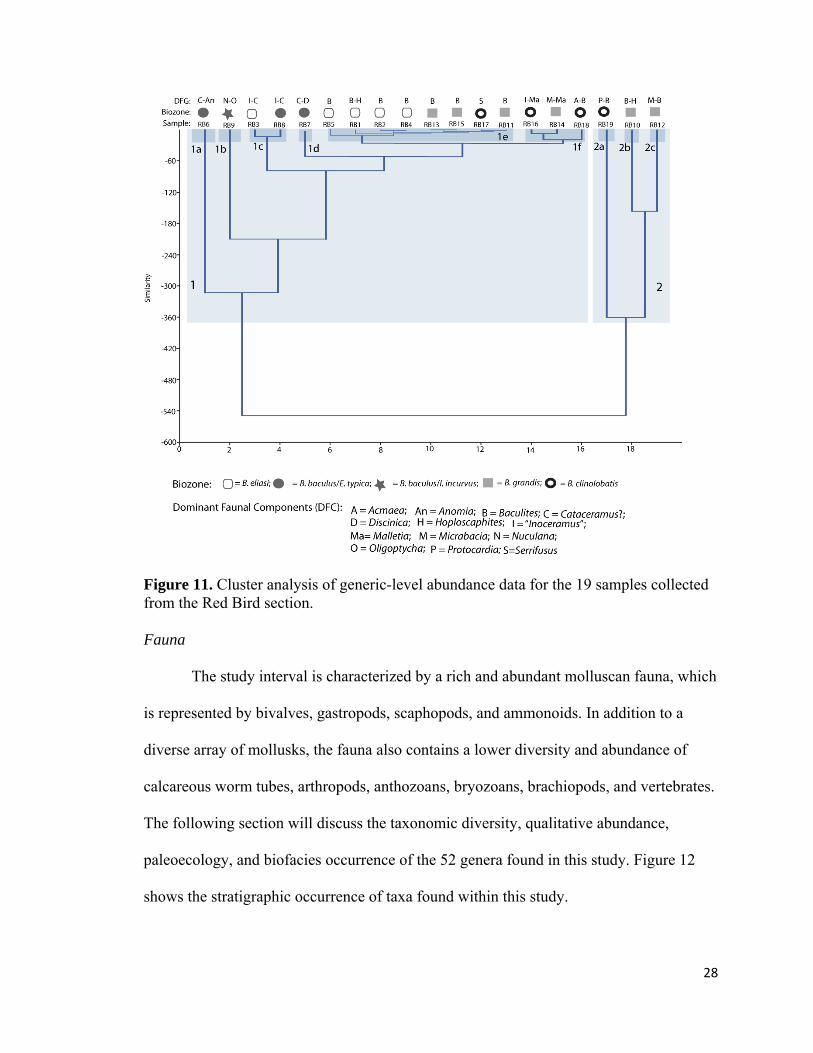
Figure 11. Cluster analysis of generic-level abundance data for the 19 samples collected from the Red Bird section. Fauna
The study interval is characterized by a rich and abundant molluscan fauna, which
is represented by bivalves, gastropods, scaphopods, and ammonoids. In addition to a
diverse array of mollusks, the fauna also contains a lower diversity and abundance of
calcareous worm tubes, arthropods, anthozoans, bryozoans, brachiopods, and vertebrates.
The following section will discuss the taxonomic diversity, qualitative abundance,
paleoecology, and biofacies occurrence of the 52 genera found in this study. Figure 12
shows the stratigraphic occurrence of taxa found within this study.
28
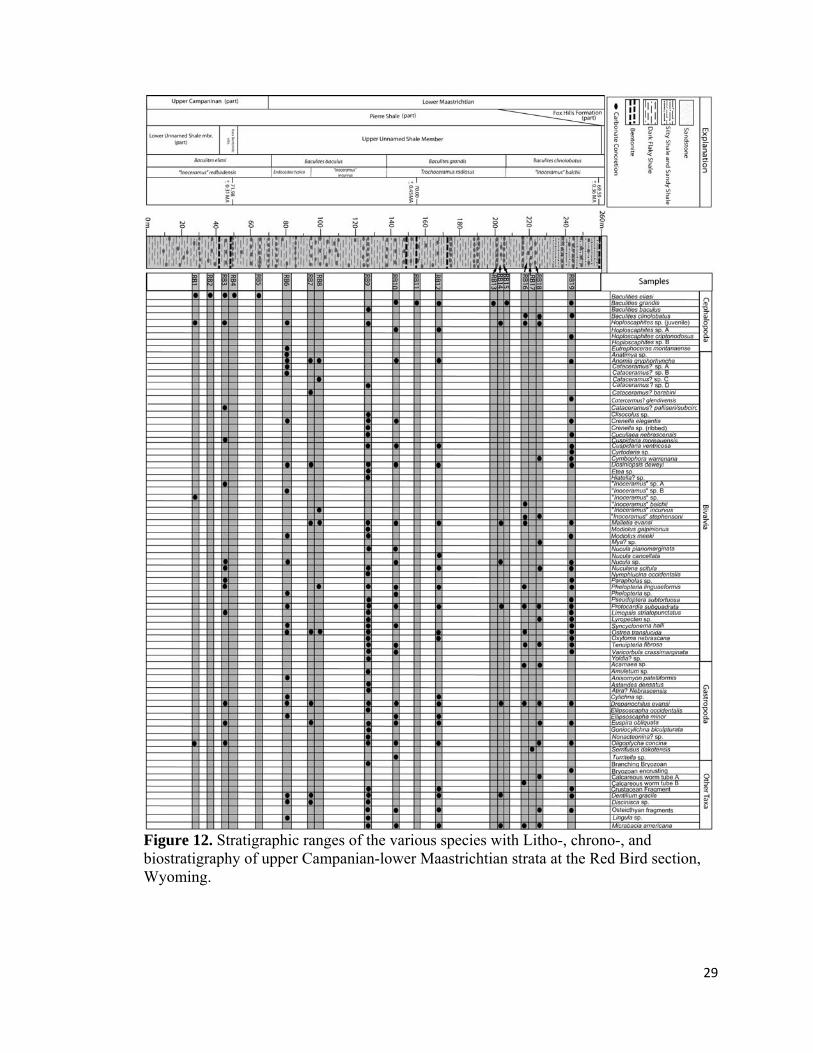
Figure 12. Stratigraphic ranges of the various species with Litho-, chrono-, and biostratigraphy of upper Campanian-lower Maastrichtian strata at the Red Bird section, Wyoming.
29

Bivalves. − Bivalves are the most diverse and abundant group of
macroinvertebrates found in the B. eliasi through B. clinolobatus biozones at the Red
Bird section. Approximately 34 genera and 47 species of bivalves are identified in the
samples (Fig. 12). The stratigraphic ranges of bivalve taxa found within this study are
shown in figure 12. Most bivalve taxa are monospecific except for the genera
Cataceramus?, “Inoceramus”, Phelopteria, Cuspidaria, Modiolus, Crenella, and Nucula
which are represented by more than one species (Fig. 12). The great majority of bivalve
genera range through out the section and are taxonomically identical to the bivalves in the
overlying Fox Hills Formation of South and North Dakota (e.g., Speden, 1971; Feldman,
1967). Bivalves show their greatest richness and abundances within diverse-inoceramid
dominated biofacies, Nuculana-Oligoptycha, Protocardia-dominated, juvenile-Baculites-
dominated, and Micrabacia-dominated biofacies. Bivalves are rare to uncommon and
only moderately diverse in the inoceramid-dominated biofacies, Cataceramus?-
Discinisca biofacies, and moderately-diverse, benthos-dominated biofacies. In contrast,
Baculites-dominated assemblages show an almost complete absence of bivalves and other
benthic inhabitants.
The epifaunal suspension-feeding inoceramids are by far the most abundant and
diverse bivalves in the Pierre Shale and are represented by 18 species within the genera
“Inoceramus”, Cataceramus?, Endocostea,, Trochoceramus, and Platyceramus in the
uppermost Campanian and lower Maastrichtian strata of the Western Interior
(Walaszczyk et al., 2000). Out of these, only six species of Cataceramus? and six species
“Inoceramus” occur in the 19 samples collected for this study (Fig. 12; Appendix 1).
Inoceramids are very abundant in the diverse-inoceramid dominated (RB6) and
30
inoceramid-dominated biofacies (RB3 and RB8); abundant in the Cataceramus?-
Discinisca-dominated (RB7) and Nuculana-Oligoptycha biofacies (RB9); and uncommon
to rare in the moderately diverse benthos-dominated (RB16 and RB18 and Protocardia-
dominated biofacies (RB19). Inoceramids are absent or rare in the Baculites dominated,
juvenile-Baculites dominated, and Micrabacia dominated biofacies of the study interval.
Stratigraphically, inoceramids range throughout the section and last occur approximately
5 m below the base of Fox Hills Formation within the B. clinolobatus biozone, although
Gill and Cobban (1966) did note the occurrence of inoceramids stratigrapically higher
within the limonitic sandstone bed that defines the base of Fox Hills Formation.
Inoceramids, with the exception of the enigmatic Tenuipteria, are unknown in the
overlying H. birkelundae biozone at Red Bird or in the H. nicolletti and Jeletzkytes
nebrascense biozones of North and South Dakota (pers. obs.; Ward et al., 1991; Ozanne
and Harries, 2002).
Other epifaunal, relatively immobile suspension-feeding bivalves are common
throughout the concretionary beds in the upper part of the Pierre Shale and are
represented by Ostrea, Anomia, the pteriids Pseudoptera, Tenuipteria, and Phelopteria,
as well as the pectinids Syncyclonema, Lyropecten, and Oxytoma (Fig. 12; Appendix 1).
All of these genera are monospecific except for Phelopteria which is represented by two
species (Fig. 12; Appendix 1). Within the study interval, Ostrea is rare to uncommon in
seven out of the eight non-Baculites-dominated biofacies (RB6, RB9, RB12, RB16, and
RB16; Fig. 12; Appendix 1). Most Ostrea are found disarticulated and unattached within
concretions and are occasionally found attached to inoceramid shells. The number of
Anomia specimens varied from uncommon to abundant and occurred in most non-
31

Baculites-dominated biofacies (RB6, RB7, RB8, RB9, RB10, RB12, and RB19; Fig. 12;
Appendix 1). Phelopteria and Tenuipteria are the second-most common pteriids in the
study interval and are rare to abundant in all non-Baculites-dominated biofacies (RB6,
RB7, RB8, RB9, RB10, RB12, RB16, RB18, and RB19; Fig. 12; Appendix 1).
Pseudoptera occurs only in sample RB9 within the Nuculana-Oligoptycha biofacies and
is represented by a single specimen. Pectinids are rare to common components within the
non-Baculites-dominated biofacies (RB3, RB6, RB9, RB10, RB18, and RB19; Fig. 12;
Appendix 1). Syncyclonema, Lyropecten, and Oxytoma reach their greatest abundances
within the Nuculana-Oligoptycha biofacies (RB9) and in the Protocardia-dominated
biofacies (RB19; Fig. 13; Appendix 1).
Semi-infaunal relatively immobile suspension-feeding bivalves are represented by
mytilacid genera Modiolus and Crenella (Fig. 12; Appendix 1). The two genera are
characterized by two species each and are only occur in the highest diversity biofacies in
the study interval. Crenella is rare to uncommon in the biofacies that encompass RB6,
RB9, RB10, and RB19, whereas Modiolus is rare to common in biofacies that include
samples RB6, RB9, and RB19 (Fig. 12; Appendix 1).
Infaunal suspension-feeding bivalves are moderately rare to abundant faunal
components in all non-Baculites-dominated biofacies of the lower Maastrichtian biozones
at Red Bird (Fig. 12; Appendix 1). They are represented by the venerid Dosionopsis, the
cardiacid Protocardia, the myacids Varicorbula, Mya?, and Anatimya, the hiatellacid
Crytodaria; the arcticid Etea, the mactracid Cymbophora, and the arcoid genera Limopsis
and Cucullaea. Specimens of Dosionopsis are rare to common in six out of the eight non-
Baculites dominated biofacies (RB6, RB7, RB9, RB10, RB12, and RB19; Figure 12;
32

Appendix 1). The genus Protocardia is rare to very abundant in six out of eight non-
Baculites-dominated biofacies (RB6, RB9, RB10, RB12, RB14, RB16, RB18, and
RB19). It is most abundant (n = 340) in RB19 from the uppermost part of the upper
unnamed shale member below the Fox Hills Formation where it is used to define the
Protocardia-dominated biofacies. Anatimya and Mya? are rare and are only found in the
diverse-inoceramid biofacies (RB6) and in the moderately-diverse, benthos dominated
biofacies (RB18), respectively. The diminutive Varicorbula is rare to abundant in three
out of the eight non-Baculites-dominated biofacies samples (RB9, RB10, and RB19).
Crytodaria and Cymbophora are rare faunal elements in the Protocardia-dominated
(RB19) and moderately diverse, benthos-dominated biofacies (RB18). The arcoids
Limopsis and Cucullaea are rare to abundant in the Nuculana-Oligoptycha (RB9) and
Protocardia dominated biofacies (RB19), respectively. Occasionally within the B.
baculus/I. incurvus biozone, lateral inspection of an individual horizon will reveal a
single concretion containing only Cucullaea nebrascensis among other concretions
dominated by Nuculana and Oligoptycha. Despite an absence from other sampled
horizons in this study, Limopsis and Cucullaea appear to be fairly common throughout
lower Maastrichtian strata in the Western Interior in higher diversity (n>15 species)
benthos dominated assemblages (Gill and Cobban, 1966; Speden, 1971).
The nuculids Nucula, Nuculana, Malletia, and Yoldia represent the only infaunal
deposit-feeding bivalves found in the study interval of the Pierre Shale at Red Bird
(Figure 12; Appendix 1). Nucula is represented by three species, whereas the other three
nuculid genera are monospecific (Fig. 12). As with infaunal suspension-feeding bivalves,
the genera Nucula, Nuculana, and Malletia are frequent components of most of the non-
33
Baculites-dominated biofacies (RB3, RB6, RB9, RB18, RB10, RB12, RB14, RB16,
RB18, and RB19). Only a single specimen of Yoldia was identified in sample RB9 in the
Nuculana-Oligoptycha biofacies (Fig. 12, Appendix 1).
Other bivalve clades within ecological guilds are rare within the study interval
and usually occur within various non-Baculites-dominated biofacies concretions. The
infaunal, mobile chemosymbiotc Nymphalucina is an uncommon macrofaunal element of
the Nuculana-Oligoptycha biofacies (RB9) of the B. baculus/I. incurvus biozone (Fig. 12;
Appendix 1). The infaunal, mobile carnivorous poromyacid bivalve Cuspidaria is rare to
uncommon in four out of eight non-Baculites-dominated biofacies (RB3, RB10, RB12,
RB19) and common in the Nuculana-Oligoptycha biofacies (RB9). Boring, suspension-
feeding bivalves, represented by the hiatellacid Hiatella (RB9) and the pholodacid
Parapholus (RB19; Fig. 12; Appendix 1), are rare in both the Nuculana-Oligoptycha
biofacies (RB9) and in the Protocardia dominated biofacies (RB19). Strangely, despite
wood fragments occurring in the concretions from the B. baculus/”I”. incurvus, lower B.
grandis, and upper B. clinolobatus biozones at Red Bird, the Parapholus and Hiatella
specimens were found loose in the concretions and not associated with wood.
Interestingly, the most common wood-boring bivalve, Opertochasma, was not identified
in the samples, although that is not to say it was not found in the study interval.
Teredolites, likely attributable to the genus, occurs in both samples RB3 from the B.
eliasi biozone and RB7 from B. baculus/”I.” incurvus biozone. Opertochasma specimens
and their wood borings are also found in other concretions in the same levels as RB9,
RB10, and RB19 in the B. baculus/”I.” incurvus and lower B. grandis biozones. The
genus is also fairly common in the concretions in the overlying Fox Hills Formation.
34
Gastropods. − Gastropods are found in all of the non-Baculites-dominated
biofacies and range throughout the study interval at Red Bird. In these samples, they are
represented by 13 genera and 14 species (Fig. 13); with Ellipsoscapha representing the
only non-monospecific clade (Fig. 13). The stratigraphic occurrences of gastropods found
within this study interval are shown in figure 13. They show their greatest diversity and
abundances in the B. baculus through lower B. grandis biozones and lowest diversity in
the B. eliasi, upper B. grandis, and B. clinolobatus biozones (Fig. 13; Appendix 1). The
most diverse gastropod assemblage is derived from the B. baculus/I. incurvus biozone,
which contained eight species (Fig. 13; Appendix 1). Euspira, Drepanochilus, and
Oligoptycha are by far the most common and stratigraphically widest ranging gastropods
in the Pierre Shale. Most other genera are only found in a few horizons and typically have
low abundances.
Epifaunal carnivorous gastropods are represented by the ringiculid Oligoptycha,
the acteocinids Cylichna and Goniocyclichna, the fasciolariid Serrifusus, the scaphandrid
Ellipsoscapha, the acteonid Nonacteonina, the turrid Amuletum, and the trichotropid
Astandes (Fig. 13; Appendix 1). Small (~3-5mm) Oligoptycha are rare to uncommon in
most non-Baculites dominated biofacies; however, within sample RB9 in the B.
baculus/I. incurvus biozone this gastropod is so abundant that it is the identifier for the
Nuculana-Oligoptycha biofacies. Ellipsoscapha is rare to uncommon and occurs within
the Nuculana-Oligoptycha biofacies (RB9), juvenile-Baculites dominated biofacies
(RB10), and Micrabacia-dominated biofacies (RB12; Fig. 13; Appendix 1).
Goniocylichna, Amuletum, Astandes, and Nonacteonina are rare and are only found in the
35
Nuculana-Oligoptycha biofacies (RB9; Fig. 12; Appendix 1). The genus Cylichna is rare
in the diverse-inoceramid dominated, Nuculana-Oligoptycha, and the Micrabacia-
dominated biofacies (Fig. 12; Appendix 1). In this study, the only specimen of Serrifusus
was retrieved from a Baculites-dominated biofacies (RB17; Fig. 12; Appendix 1),
however, this genus is known to occur through out the study interval usually in more
diverse horizons that are not dominated by mature Baculites (Gill and Cobban, 1966).
The single specimen of Serrifusus that was discovered comes from a virtually barren
concretion horizon. Lateral inspection of this horizon only produced rare specimens of
adult Baculites.
Epifaunal grazers are represented by the siphonariid Anisomyon, and a small
Acmaea (Fig. 12; Appendix 1). Anisomyon is uncommon and was only indentified in
sample RB6 from the diverse-inoceramid dominated biofacies (Fig. 12, Appendix 1). The
Acmaea specimens have been found attached to the shells of inoceramids in sample
RB18 from the moderately diverse, benthos-dominated biofacies (Fig. 12; Appendix 1).
Semi-infaunal, detrivore found in the study interval are characterized by the
aporrhaid Drepanochilus (Fig. 12; Appendix 1). Drepanochilus ranges throughout the
study interval and are rare to uncommon in most non-Baculites dominated biofacies
(RB3, RB5, RB7, RB12, RB14, RB16, RB18, RB19) and abundant in the Nuculana-
Oligoptycha (RB9) and juvenile-Baculites dominated biofacies (RB10; Fig. 12;
Appendix 1).
Infaunal gastropods are characterized in the samples by the carnivorous naticid
Euspira and the suspension-feeing/detritus-feeding Turritella (Fig. 12; Appendix 1). The
stratigraphically broad-ranging naticid Euspira is rare to common in all non-Baculites-
36
dominated biofacies and most abundant in the Nuculana-Oligoptycha biofacies (RB9). In
contrast to naticids, turritellids are very rare in the Pierre Shale. Only two specimens of
the genus Turritella have been found in sample RB10 in the juvenile-Baculites dominated
biofacies.
Cephalopods. − Cephalopods are second only to bivalves in terms of overall
abundance and show the broadest stratigraphic distribution of any taxonomic group in the
study interval at Red Bird. Their stratigraphic distribution among the samples analyzed
for this study is listed figure 12. Cephalopods are the best-studied group at the Red Bird
section because of their stratigraphic utility, abundance, and focus of previous
researchers. Only three genera and nine species of cephalopod have been identified
within the samples collected for this study and included Baculites, Hoploscaphites, and
Eutrephoceras (Fig. 12, Appendix 1).
The nektic, planktivorous ammonoid Baculites has the broadest stratigraphic
range of all cephalopods and occurs in almost all sampled horizons (Fig. 12; Appendix
1). Four separate Baculites species have been identified in the study interval at Red Bird
and comprise - from oldest to youngest - B. eliasi, B. baculus, B. grandis, and B.
clinolobatus – the zonal index taxa (Fig. 12; Appendix 1). Within many horizons
Baculites are the only taxon present and can occur in great abundance (Fig. 12; Appendix
1). Interestingly, Baculites-dominated horizons are characterized by an abundance of
mature Baculites, whereas benthos-dominated horizons are usually distinguished by the
occurrence of abundant to rare juvenile Baculites. Horizons characterized by mature
Baculites are considered the Baculites-dominated biofacies (Fig. 12). Variation in relative
abundance shows a pattern of re-occurring horizons dominated entirely by Baculites (Fig.
37
12; Appendix 1). A lateral inspection of concretionary beds suggests that this size
difference between Baculites-dominated assemblages and other types of assemblages is
characteristic of entire concretionary horizons and not simply of individual concretions.
Baculites are absent from a number of horizons typically dominated by benthic faunas.
The B. baculus/E. typica biozone has a notable paucity of Baculites, which is also
apparent in Gill and Cobban’s (1966) faunal list of the Red Bird section. A detailed
stratigraphic analysis and lateral inspection of the various concretion horizons within this
biozone only located a single juvenile specimen of B. baculus.
The demersal, planktivorous Hoploscaphites is the second most common
ammonite at the Red Bird section and ranges throughout the study interval (Fig. 12;
Appendix 1). Their greatest abundance occurs within the B. baculus and B. grandis
biozones. Hoploscaphites is very abundant to rare within most non-Baculites-dominated
biofacies (RB1, RB3, RB6, RB9, RB10, RB12, RB14, and RB19) and is only absent in
the Cataceramus?-Discinisca Biofacies as well as seven out of eight samples from the
Baculites-dominated biofacies (RB7; Fig. 12; Appendix 1). Most specimens are
represented by juveniles and are unidentifiable to the species level; however, three
distinct, undescribed species are identified in the samples. Certain intervals in the B.
grandis biozone are especially scaphitiferous and yield samples with hundreds of juvenile
Hoploscaphites (RB12; Fig. 12; Appendix 1).
The nautiloid Eutrephoceras is the only other cephalopod genus identified and is
represented by a single specimen of Eutrephoceras montanaensis that was found in
sample RB6 from the diverse-inoceramid biofacies near the base of B. baculus/E. typica
biozone (Fig. 12; Appendix 1). Based upon a stratigraphic and lateral inspection of the
38
various concretion horizons in the B. baculus/E. typica biozone, it is apparent that adult
Eutrephoceras are fairly common in this zone. The genus appears to be most common in
higher diversity, benthos-dominated biofacies with abundant inoceramids,
Hoploscaphites, and/or juvenile Baculites, similar to the diverse inoceramid biofacies or
the juvenile Baculites dominated biofacies.
Scaphopods. − Scaphopods are represented by a single taxon, Dentalium gracile,
which is found in six out of the nineteen samples collected from the study interval (Fig.
12; Appendix 1). Scaphopods are rare in the diverse-inoceramid-dominated biofacies
(RB6) and Cataceramus?-Discinisaca biofacies (RB7), uncommon in the Nuculana-
Oligoptycha biofacies (RB9) and Protocardia-dominated biofacies (RB19), and abundant
in the Micrabacia-dominated biofacies (RB12). Stratigraphically they range across the B.
baculus through the B. clinolobatus biozones. These infaunal detritivores are typically
associated at the Red Bird section with other infaunal bivalves and gastropods.
Calcareous Worm Tube. − Calcareous worm tubes are a minor elements of the
fauna at the Red Bird section and are represented by three forms described by Gill and
Cobban (1966) as: “(1) gradually tapering tubes attached along the one side to mollusks,
(2) tubes wound in spiral whorls, and (3) gently curved to nearly straight unattached
tubes.” Most calcareous worm tubes are rare to uncommon, but gently curved to nearly
straight unattached tubes occur in great abundance in certain reddish-brown concretions
in the lower part of the B. grandis biozone. Interestingly, these reddish-brown, calcareous
worm-tube-dominated concretions co-occur with sample horizon RB10 in the juvenile-
Baculites-dominated biofacies. In the material analyzed for this study, calcareous worm-
tube specimens occur in samples RB16 and RB18 from the moderately diverse, benthos-
39
dominated biofacies in the B. clinolobatus biozone (Fig. 12; Appendix 1). In sample
RB16 from the lower part of the B. clinolobatus biozone, a coiled calcareous tube is
attached to the inside of the body chamber of an adult Baculites conch. Slightly higher in
the section in sample RB18 in the middle part of the biozone, three gently curved to
nearly straight tubes have been found loose and unattached to any shells.
Anthozoans. − Anthozoans are typically thought of as a rare constituent of upper
Cretaceous faunas of the Western Interior; however, nonzooxanthellate solitary coral
genera Trococyathus and Micrabacia are locally common to abundant within many
horizons. At the Red Bird section, the microcarnivorous nonzooxanthellate solitary coral
Micrabacia americana is identified in six out of nineteen sampled horizons (RB9, RB10,
RB12, RB14, RB16, and RB18) and ranges from the B. baculus/I. incurvus biozone
through the middle part of the B. clinolobatus biozone (Fig. 12; Appendix 1). Micrabacia
is rare in the Nuculana-Oligoptycha biofacies; rare to uncommon in the moderately
diverse, benthos-dominated biofacies; rare in the juvenile-Baculites-dominated biofacies
and very abundant (n = 197 specimens) in the Micrabacia-dominated biofacies in the
upper part of the B. grandis biozone.
Arthropods. − Arthropods are an uncommon element of the fauna of the Pierre
Shale at Red Bird, WY and are characterized by disarticulated parts of decapod
crustaceans (RB9, RB12, RB19; Fig. 12; Appendix 1). Their rarity is probably due to
their small size and poor preservation potential. Disarticulated pieces of crabs are found
in the highest diversity biofacies from the B. baculus/I. incurvus biozone, upper B.
grandis biozone, and upper part of the B. clinolobatus biozone. The few specimens that
40
occur in the samples for this study are unidentifiable and have been simply classified as
“decapod crustaceans.”
Brachiopods. − Brachiopods are rare to uncommon within the Pierre Shale and
are represented in the study interval by the infaunal, suspension-feeding, inarticulate
brachiopods Lingula and epifaunal, suspension-feeding, inarticulate brachiopods
Discinisca, which have only been found in the B. baculus biozone (Fig. 12; Appendix 1).
Lingula is uncommon in sample RB9 from the Nuculana-Oligoptycha biofacies and is
rare in sample RB6, a diverse-inoceramid-dominated biofacies. The cap-like Discinisca is
rare in samples RB6 (n = 2) and RB9 (n = 1), which represents the diverse-inoceramid
dominated biofacies and the Nuculana-Oligoptycha biofacies, respectively. Discinisca is
the second-most-common (n = 9) faunal element in sample RB7, which is a
Cataceramus?-Discinisca biofacies. Interestingly, all specimens of Discinisca have been
found attached to the surface of inoceramid valves.
Bryozoans. − Bryozoan colonies are rare components of the fauna at the Red Bird
section and are represented as either fragments of branching forms or as epizoans
encrusting the inside of mollusc shells (Fig. 12; Appendix 1). Two specimens of an
unidentifiable branching form occur in sample RB9 from the Nuculana-Oligoptycha
biofacies from the B. baculus/I. incurvus biozone (Fig. 12). A single 1 cm2 unidentified
bryozoan encrusting the inside of a body chamber of Baculites occurs in sample RB19
from the Protocardia-dominated biofacies in the upper most part of the B. clinolobatus
biozone.
Vertebrates. − Vertebrates are extremely rare in the upper part of the Pierre Shale
at the Red Bird section, which is in striking contrast to the abundant marine reptile and
41
fish remains that are found in the middle Campanian Sharon Springs Member of the
Pierre Shale and Coniacian-Santonian Niobrara Formation (e.g., see Gill and Cobban,
1966; Breithaupt, 1985; Carpenter, 2006; Everhart, 2007). The vertebrate remains that
have been discovered include osteicthyan bones (RB9, RB12, and RB18), vertebrae (RB9
and RB12), teeth (RB9), and scales (RB9, RB10, RB12, RB18, and RB19; Fig. 12;
Appendix 1). Teeth, bones, and vertebrae are rare, while scales range from abundant to
rare in the samples that contain them. Despite occurring in many horizons and biofacies,
the fragmentary nature of the vertebrate material resulted in the exclusion of this data
from analysis.
Trace Fossils. − Trace fossils are rare to abundant in the study interval at the Red
Bird section and are represented by small (<5 mm diameter) unidentifiable burrows in
concretions, Teredolites in wood fragments, naticid gastropod drill holes or Oichnus
paraboloides on the valves of infaunal bivalves, pronounced internal ribs or hohlkehle
and ‘bubble’ deformities on the valves of pterioid bivalves that are interpreted as
evidence of parasitism (e.g., see Ozanne and Harries, 2002), and other shell abnormalities
possibly caused by unsuccessful predation occur on the valves of various other bivalves.
Small, unidentifiable borings are present in samples RB7 (n = 2) from Cataceramus?-
Discinisca biofacies and RB9 (N = 2) from the biofacies Nuculana-Oligoptycha
biofacies. Teredolites-bored wood fragments are present in RB3 (n = 1) from the
inoceramid-dominated biofacies and RB7 (N = 1) from Cataceramus?-Discinisca
biofacies. Naticid gastropod drill holes on the valves of infaunal bivalves are abundant (n
= 32) in RB9 from the Nuculana-Oligoptycha biofacies and rare in samples RB12 (n =
1), RB14 (n = 1), RB19 (n = 2). In RB9, valves of Nuculana showed the greatest number
42
of drill holes (n = 24) followed by Varicobula (n = 5), Cucullaea (n = 2), and Nucula (n =
1). Specimens of Nucula are the only taxa with drill holes in samples RB12 and RB14,
whereas Protocardia is the only taxon drilled in sample RB19. A single putative drill
hole is identified on an inoceramid valve in sample RB3 from the inoceramid-dominated
biofacies. Hohlkehles are identified on inoceramid valves in samples RB3, RB6, and RB7
and are rare (n = 2 per sample). A single Tenuipteria valve with an abnormality identical
to a Hohlkehle is present in sample RB12. ‘Bubble’ deformities are rare on the valves of
inoceramids from the study interval and are found in samples RB3 (n = 2 on one
specimen), RB7 (n = 2), RB8 (n = 3), and RB9 (n = 1). Other shell abnormalities are rare
to uncommon on inoceramid valves in samples RB3 (n = 1), RB6 (n = 1), RB7 (n = 3),
and RB8 (n = 2). Sample RB9 from the Nuculana-Oligoptycha biofacies has the greatest
number of inoceramids with shell abnormalities (n = 15). Shell abnormalities in other
taxa are quit rare and are identified on single specimen of Nuculana (n = 1) and single
specimen of Mellatia from the sample RB9.
Abundance Trends
Figure 13 is the key for Figure 14a that shows changes in total abundance per
genus for the study interval at the Red Bird section in Wyoming. Total abundance is
relatively low within the B. eliasi biozone samples, an interval dominated by baculitids
and/or inoceramids. Within the lower B. baculus/E. typica biozone, total abundances
increases and is dominated by very abundant inoceramids and a lesser quantity of
ammonoids, nautiloids, bivalves, gastropods, and scaphopods. Interestingly, baculitids,
which are common throughout the Pierre Shale, are almost completely absent from this
interval and are only rarely present within the concretions. Total abundances, reflecting a
43

broad array of macroinvertebrate groups continue to increase, and peak among benthic
faunal components within the upper B. baculus/”I.” incurvus and lower B. grandis
biozones. In contrast to the B. baculus/ E. typica biozone, inoceramids show a great
reduction in total abundances up to the B. clinolobatus biozone. The abundance of
ammonoids rises in tandem with increases in bivalves and gastropods. Within the upper
half of the B. grandis biozone and throughout approximately the lower half of the B.
clinolobatus biozone the total abundance of most taxa declines sharply and results in
values similar to that of the B. eliasi biozone. This interval also is dominated by
nonfossiliferous concretions, which stands in striking contrast to most concretionary
horizons exposed at the Red Bird Section. In the uppermost B. clinolobatus biozone,
below the contact with the overlying Fox Hills Formation, total abundances of
inoceramids, other bivalve genera, gastropods, and ammonoids increases.
Figure 13 Key for faunal data shown in figure 14a and 14b. Rare taxa (n<5 specimens) are colored black.
44
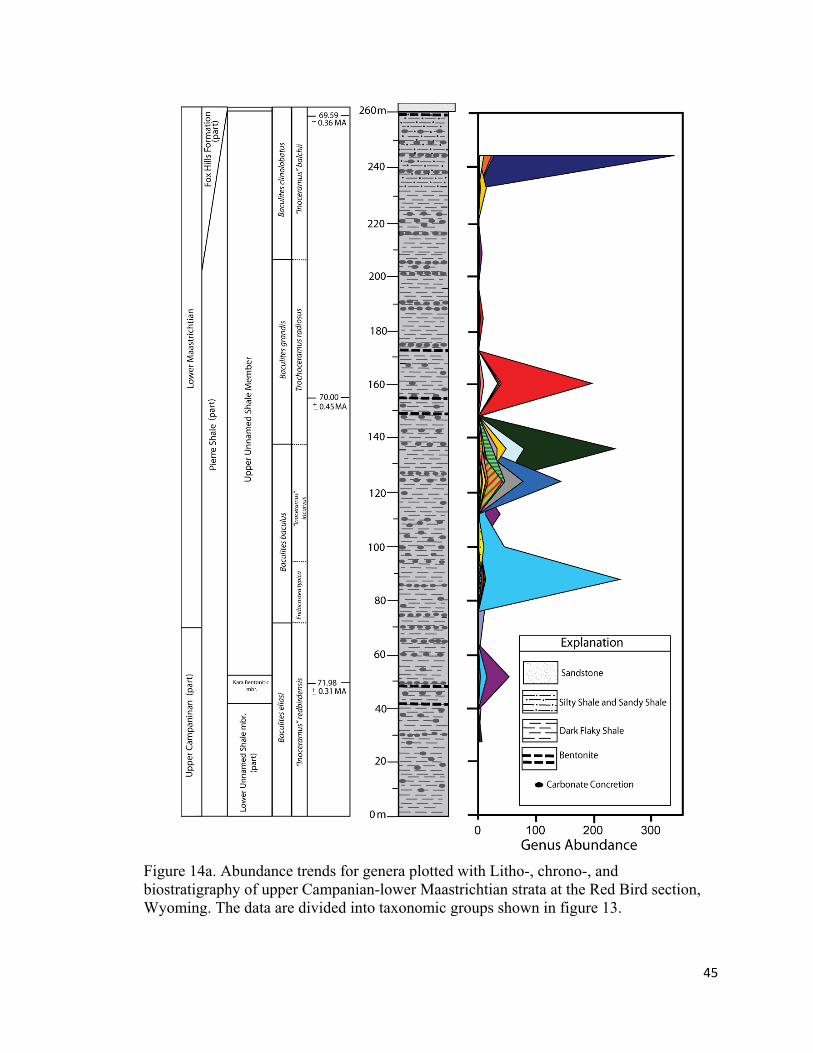
Figure 14a. Abundance trends for genera plotted with Litho-, chrono-, and biostratigraphy of upper Campanian-lower Maastrichtian strata at the Red Bird section, Wyoming. The data are divided into taxonomic groups shown in figure 13.
45

Figure 14b. Relative Abundance trends for genera plotted with Litho-, chrono-, and biostratigraphy of upper Campanian-lower Maastrichtian strata at the Red Bird section, Wyoming. The data are divided into taxonomic groups shown in figure 13. Relative abundances of the various genera are depicted in Figure 14b for the
interval of study. The most obvious pattern seen is the reoccurring intervals dominated
either by baculitids, inoceramids or mixed, high-diversity assemblages. The B. eliasi
biozone is characterized primarily by baculitid and/or inoceramid-dominated
assemblages. The overlying B. baculus/E. typica biozone is distinct, as mentioned above,
46
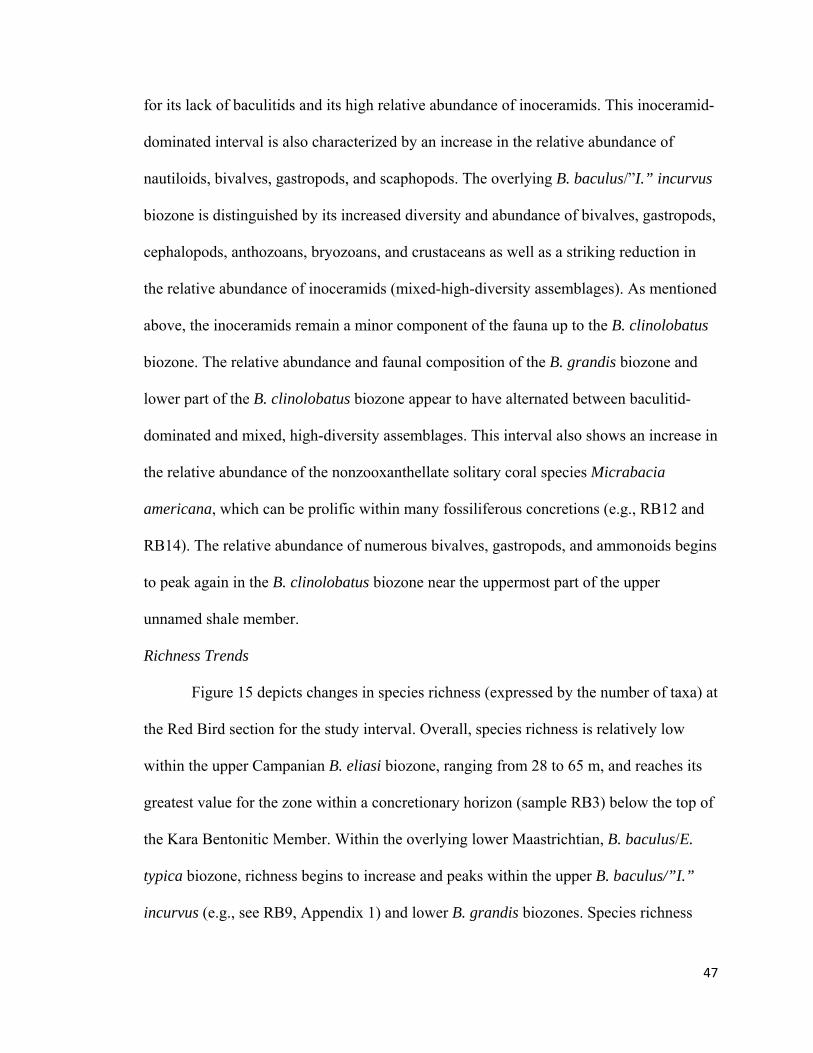
for its lack of baculitids and its high relative abundance of inoceramids. This inoceramid-
dominated interval is also characterized by an increase in the relative abundance of
nautiloids, bivalves, gastropods, and scaphopods. The overlying B. baculus/”I.” incurvus
biozone is distinguished by its increased diversity and abundance of bivalves, gastropods,
cephalopods, anthozoans, bryozoans, and crustaceans as well as a striking reduction in
the relative abundance of inoceramids (mixed-high-diversity assemblages). As mentioned
above, the inoceramids remain a minor component of the fauna up to the B. clinolobatus
biozone. The relative abundance and faunal composition of the B. grandis biozone and
lower part of the B. clinolobatus biozone appear to have alternated between baculitid-
dominated and mixed, high-diversity assemblages. This interval also shows an increase in
the relative abundance of the nonzooxanthellate solitary coral species Micrabacia
americana, which can be prolific within many fossiliferous concretions (e.g., RB12 and
RB14). The relative abundance of numerous bivalves, gastropods, and ammonoids begins
to peak again in the B. clinolobatus biozone near the uppermost part of the upper
unnamed shale member.
Richness Trends
Figure 15 depicts changes in species richness (expressed by the number of taxa) at
the Red Bird section for the study interval. Overall, species richness is relatively low
within the upper Campanian B. eliasi biozone, ranging from 28 to 65 m, and reaches its
greatest value for the zone within a concretionary horizon (sample RB3) below the top of
the Kara Bentonitic Member. Within the overlying lower Maastrichtian, B. baculus/E.
typica biozone, richness begins to increase and peaks within the upper B. baculus/”I.”
incurvus (e.g., see RB9, Appendix 1) and lower B. grandis biozones. Species richness
47
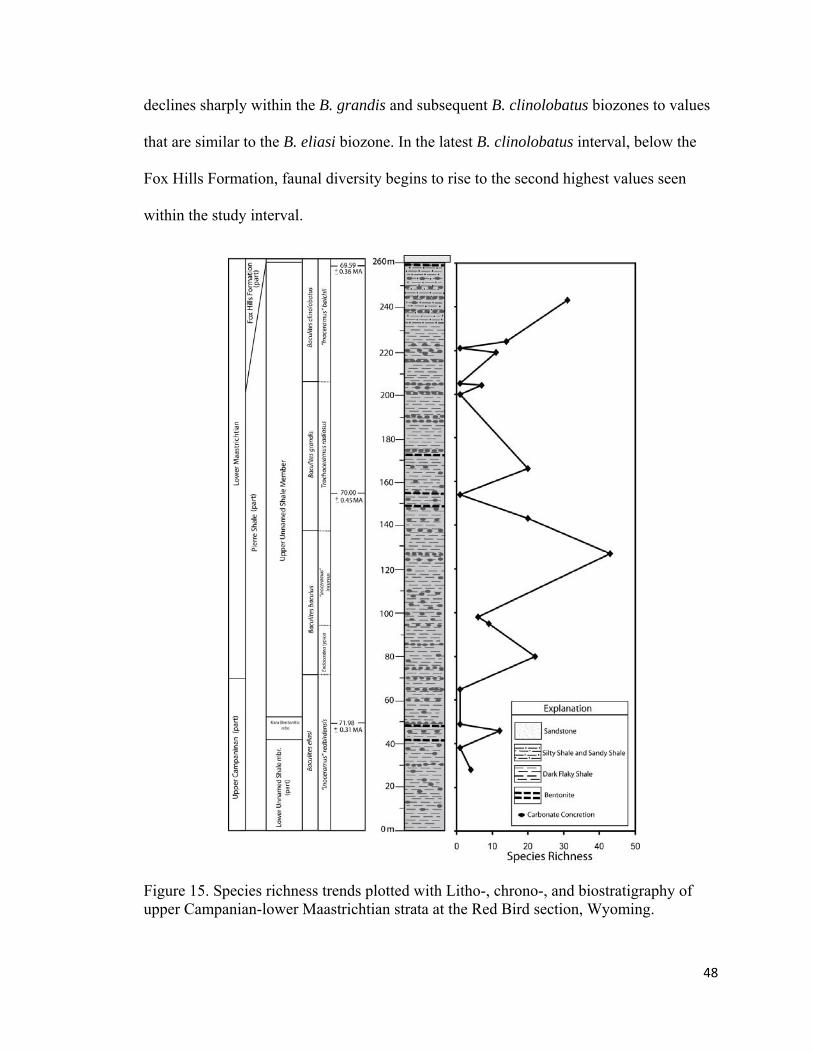
declines sharply within the B. grandis and subsequent B. clinolobatus biozones to values
that are similar to the B. eliasi biozone. In the latest B. clinolobatus interval, below the
Fox Hills Formation, faunal diversity begins to rise to the second highest values seen
within the study interval.
Figure 15. Species richness trends plotted with Litho-, chrono-, and biostratigraphy of upper Campanian-lower Maastrichtian strata at the Red Bird section, Wyoming.
48
Figure 16 shows species-level rarefaction curves for the 12 multi-taxa samples
collected from the study interval at the Red Bird section in Wyoming. This discussion is
limited to samples with >50 specimens as species richness in collections with lower
abundances will dominantly reflect differences in evenness. This resulted in the exclusion
of three samples: RB1, RB14, and RB16. The curves for samples RB3, RB7, RB8, and
RB18 are all still rising and are not approaching their asymptotes. In contrast, the curves
for samples RB6, RB9, RB10, RB12, and RB19 are all approaching their horizontal
asymptotes.
05
101520253035404550
0 100 200 300 400 500 600 700 800
Specimens
Taxa
RB19RB18RB16RB14RB12RB10RB9RB8RB7RB6RB3RB1
Figure 16. A comparison of rarefied richness between the 12 multi-taxa samples collected from B. eliasi through B. clinolobatus biozones at the Red Bird section in Wyoming.
Ecological Niche Trends
Upper Campanian through lower Maastrichtian changes in niche occupations are
shown in Figure 18. The most apparent large-scale trend is the recurrent switching
between nektic- and/or benthic-dominated assemblages. In particular, the B. eliasi
biozone has a relatively small number of occupied niches that are characterized by
assemblages dominated by either nektic planktivores or epifaunal suspension feeders.
49

The overlying B. baculus/E. typica biozone has approximately double the number of
filled benthic niches and relative disparity of nektic planktivores. The overlying B.
baculus/”I.” incuvus and lower B. grandis biozones share a similar pattern; however,
nektic planktivores appear to increase in relative abundance. The numbers of filled
ecological niches are reduced by nearly half within the upper B. grandis and lower B.
clinolobatus biozones and results in an ecological structure similar to the lower B. eliasi
biozone. This reduction in ecological diversity is characterized by recurring assemblages
distinguished by either entirely nektic planktivores or assemblages dominated by nektic
carnivore, epifaunal suspension feeders, and infaunal deposit feeders. The upper B.
clinolobatus biozone shows a return of faunal elements filling many of the ecological
niches that are occupied in the B. baculus/”I”. incurvus and lower B. grandis biozones.
Figure 17. Key for ecological niche data shown in figure 18.
50

Figure 18. Ecological guild trends plotted with Litho-, chrono-, and biostratigraphy of upper Campanian-lower Maastrichtian strata at the Red Bird section, Wyoming. The color codes for the ecological guilds are shown in figure 17.
Detrended Correspondence Analysis
Figure 19 shows the results of the DCA of generic-level abundance data for all 19
samples collected from the Red Bird section. The most apparent feature of this figure is
the drastic offset of single taxa samples relative to unresolvable cluster representing all
‘other samples’ along the low end of axis 2 of the bivariate plot. As a result of this feature
and to produce an understandable graph, single-taxon samples were excluded. These 51
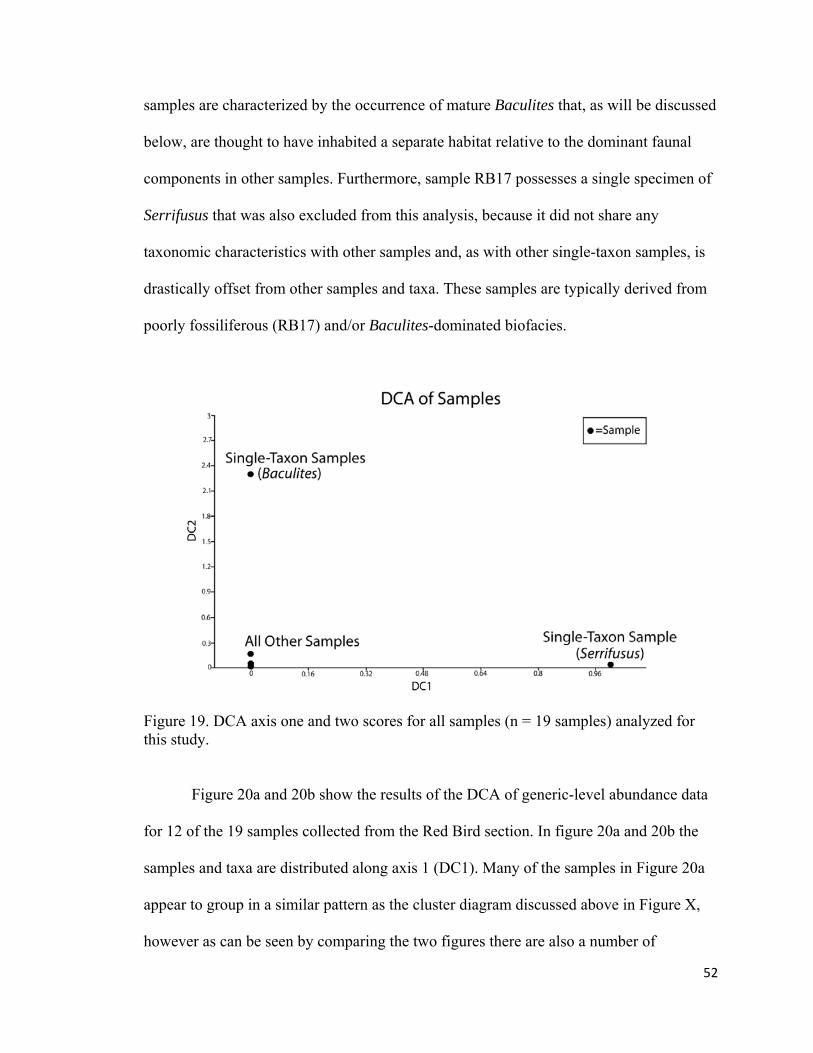
samples are characterized by the occurrence of mature Baculites that, as will be discussed
below, are thought to have inhabited a separate habitat relative to the dominant faunal
components in other samples. Furthermore, sample RB17 possesses a single specimen of
Serrifusus that was also excluded from this analysis, because it did not share any
taxonomic characteristics with other samples and, as with other single-taxon samples, is
drastically offset from other samples and taxa. These samples are typically derived from
poorly fossiliferous (RB17) and/or Baculites-dominated biofacies.
Figure 19. DCA axis one and two scores for all samples (n = 19 samples) analyzed for this study.
Figure 20a and 20b show the results of the DCA of generic-level abundance data
for 12 of the 19 samples collected from the Red Bird section. In figure 20a and 20b the
samples and taxa are distributed along axis 1 (DC1). Many of the samples in Figure 20a
appear to group in a similar pattern as the cluster diagram discussed above in Figure X,
however as can be seen by comparing the two figures there are also a number of
52

differences between the analyses. These disparities include samples that were found in
cluster 1 (RB1 and RB14) and 2 (RB10 and RB12) on Figure 19 (cluster diagram)
grouping more closely on the DCA plot (Fig. 20a). This can be explained by the shared
dominance of Micrabacia in RB14 and RB12, as well as the shared dominance of
juvenile Baculites and Hoploscaphites in RB10 and RB1 (Fig. 20b). Samples RB19,
RB12, RB14, RB1, RB10, and RB9 scored the lowest DC1 values (DCA values 0-1).
Four out six of these samples contain the highest diversities and abundances in the entire
study interval, which is in contrast to samples with higher DC1 scores that have lower
diversities and lower abundances. The absolute lowest value on DC1 is from RB19,
which also is stratigraphically the highest sample in the study interval and was the only
sample collected from the silty transitional lithofacies below the Fox Hills Sandstone in
the B. clinolobatus biozone. RB9 through RB14 represent samples from consecutively
ordered horizons spanning the B. baculus/incurvus through middle B. grandis biozone.
RB18 and RB16 plotted midway (between DCA Values 1-2) along the DC1 and
represent the moderately diverse, benthos-dominated biofacies from the lower B.
clinolobatus biozone. Sample RB3, RB6, RB7, and RB8 scored the highest on DC1. The
common component of all of these assemblages is their dominance of inoceramids, which
also plot high on DC1 (Fig. 20b). These samples represent diverse-inoceramid dominated
biofacies; inoceramid-dominated biofacies, and the “Inoceramus”-Discinisca biofacies
from the B. eliasi and B. baculus/E. typica biozone. Sample RB8 has the highest overall
DC1 score and possesses the lowest diversity and abundance of all the assemblages with
a dominance of inoceramids.
53

Figure 20. DCA axis 1 and 2 scores for samples (A) and Taxa (B). Samples (n = 12) have been coded according to their occurrence within an ammonoid/inoceramid biozone.
54

DISCUSSION
Taphonomy and Fidelity of Fossil Assemblages
Both Baculites-dominated and the more diverse benthos-dominated fossil
assemblages in the study interval show distinct taphonomic characteristics that are related
to the ecology and mode of death of the various preserved taxa, level of current energy in
the original environment, length of time the skeletal remains spent on the sea floor prior
to final burial, the depositional setting, and the post-burial diagenetic processes that
resulted in concretion formation. The following section will discuss the biostratinomic
and fossil diagenetic histories of different types of fossil assemblages preserved at the
Red Bird section and will briefly discuss the role of concretion formation in fossil
preservation.
Concretion horizons that are characterized by mature Baculites shells and a lack
or rarity of benthic faunal elements represent an accumulation of dead shells on the sea
floor. This interpretation is based on the inclusion of nektic Baculites into benthic settings
and the preservation of only partial Baculites’ conchs in such concretions. It has been
suggested that these nektic ammonites were initially killed by predation and/or by
stochastic events, such as storms or salinity changes due to river discharge into the sea,
then possibly floated until finally sinking to the seafloor when they became waterlogged
(Landman et al., 2010). After sinking to seafloor, Baculites conchs were accumulated by
current activity possibly into shallow depressions, as indicated by parallel alignment of
specimens in concretions. Similar interpretations for the accumulation of Baculites
55
conchs were also suggested by Tsujita (1995) and Landman et al. (2010). The lack or
rarity of epizoans encrusting Baculites specimens suggest fairly rapid burial and minimal
time averaging on the order of a few months or years; however, if the seafloor conditions
were inhospitable to epizoan settlement and growth because of low oxygen levels – as is
hypothesized for the WIS (e.g., see Sageman and Bina, 1997) – then the amount of time it
took these assemblages to form could represent much longer spans. Greater time
averaging however seems unlikely because even within dysoxic/anoxic basins
environmental conditions are very dynamic and would eventually permit the recruitment
of a greater number of taxa into these fossil assemblages over time, which is not seen. In
addition, the moderate to high sedimentation rates associated with areas proximal to the
Sheridan Delta, such as the Red Bird area (Gill and Cobban, 1966), would probably not
have permitted extensive time for temporal averaging of fossil assemblages. The absence
or rarity of preservable benthic macrofauna, the lack of evidence for bioturbation, the
preservation of a single nektic species composed of aragonite suggest that these
assemblages characterize the original ecosystem in which they were apart or more
appropriately were incorporated into.
Based upon preservational characteristics, concretions with diverse faunas
probably represent parautochthonous assemblages composed of a mixture of a living
community and an accumulation of dead shells lying on the sea floor similar to the “Type
C Assemblage” of Tsujita (1995). This is indicated by: 1) an absence of shells preserved
in life position with most randomly oriented in concretions; 2) a mixture of common
disarticulated and rare articulated epifaunal bivalves, indicating long dead and recently
dead bivalves possibly buried alive; 3) rare disarticulated and abundant articulated
56
infaunal bivalves with little to no abrasion or damage and some filled with sparry calcite,
which suggest they were entombed alive; 4) a mixture of both infaunal and epifaunal taxa
in fossil assemblages; 5) a mixture of moderately damaged (e.g., broken auricles, minor
chips along the commissure) and undamaged shells in assemblages; 6) the incorporation
of nektic juvenile Baculites and demersal Hoploscaphites from the water column on to
the sea floor; 7) rare to abundant fish scales; and 8) disarticulated crustacean fragments.
These observations suggest that living epifaunal taxa as well as dead ammonoids,
epifaunal bivalves, and gastropods were littering the sea floor. The dead shells probably
provided ‘taphonomic feed back’ (e.g., see Kidwell and Jablonski, 1983) allowing greater
numbers of species to be recruited onto the muddy sea floor and also providing a source
of protection against predation for existing inhabitants, such as crabs. Utilization of shells
for protection are indicated by the occasional rare discovery of well-preserved and fully
articulated crab specimens sitting under disarticulated convex-up valves of inoceramids
and inside the body chambers of Baculites at other sites across the Western Interior (JS,
pers. obs.). The broken and unbroken shells of juvenile Baculites and Hoploscaphites that
were killed by predators, changes in salinity, and other natural causes were probably
continually added to the sea floor in the more diverse assemblages. Endo- and epi-byssate
bivalves probably utilized shells and shell fragments as a type of “life preserver” during
their juvenile stage to attach to on the muddy sea floor until they were large enough to
rely upon their own morphological adaptations for these types of substrate conditions
(e.g., snowshoe morphology of Anomia).
The rarity of epizoans and the absence of bioerosion on shells of epifaunal taxa
suggest that most assemblages were on the seafloor only briefly, perhaps a few months to
57

years, before they were permanently buried. The absence of the prismatic layer on
pteriids and inoceramids indicates that the shells were sitting on the sea floor for a
sufficient amount of time for the organic matrix that held the prisms together to be
degraded, which would result in the loss of this layer with some current activity. The lack
of any significant abrasion to the nacreous layer of these shells suggests minimal current
energy. Similar preservation characteristics have been observed for Modern Atrina found
on beaches along the Gulf of Mexico (JS, pers. obs.). Recently dead Atrina washed onto
the beaches by winter storms always preserve their outer prismatic layer intact, whereas
shells that have been dead for longer, probably on the order of a few months to years
based upon the presence of small serpuliids and barnacles encrusting the inner part of
their shells and the nacreous layer that was exposed by the break down of the prismatic
layer – usually only retain the inner nacreous layer. The loss of the outer prismatic layer
on pteriids and inoceramids probably also results in a reduction in the abundance and
diversity of epizoans, as they are usually only attached to the outer prismatic layer of
recently dead shells on Atrina. However, even if the epizoans diversity is slightly biased,
the rarity of loose, unattached individuals in most concretions, the scarcity of epizoans
encrusting the portion of the nacreous layer exposed by the removal of the prismatic
layer, and the absence on the inner portion of nacreous layer of the shells (as is seen in
modern Atrina) suggest that their virtual absence is not a preservational artifact, but a true
signal of environmental conditions. Both dead and living/recently dead shallow infaunal
taxa were probably reworked by current scouring of sea floor sediments and mixed with
dead and living/recently dead epifaunal taxa. The preservational characteristics of these
more diverse benthos-dominated assemblages indicates that they are minimally time
58

averaged and are probably good representations of the skeletonized portion of the
community that they were apart of during the Cretaceous in the WIS.
A number of different hypotheses have been put forward to explain the
concentration of shells into discrete clusters. Fürsich (1982) suggested that shell clusters
were the result of selective, post-burial dissolution of originally more extensive shells
beds. This argument seems unlikely in the Pierre Shale because fossils are found both in
the concretions and in the shale. Most authors have interpreted shell clusters to be pre-
diagenetic features caused by the activity of predators (Reeside and Cobban, 1954, 1960),
ecological clustering (Waage, 1964, 1968), and/or physical processes such as current or
storm accumulation (Tsujita, 1995; Maeda and Seilacher, 1996; Zaton and Marynowski,
2004; Landman et al., 2010). Accumulation by currents or storms seems to be the best
explanation for the concentration of the shells clusters in the Pierre Shale based upon: 1)
parallel alignment of Baculites; 2) most specimens not preserved in life position; 3)
mixing of taxa with different habitat niches; 4) disarticulation of most epifaunal bivalves;
and 5) occurrence of small wood fragments and plant debris. Most authors who have
promoted a physical mechanism for shell concentrations have suggested that these may
have accumulated into irregularities on the sea floor produced by current induced
scouring around preexisting organic debris (e.g., shells, fish scales, wood fragments) or
into depressions (e.g., hummocks) formed by storm currents (Tsujita, 1995; Zaton and
Marynokski, 2004; Landman et al., 2010). This explanation probably also applies to the
concentration of shells in the Pierre Shale at Red Bird. The cause for the random
orientation of the shells in the clusters with more diverse faunas is probably the result of a
combination current winnowing and bioturbation.
59

Numerous studies have examined the genesis of concretions (Reeside and
Cobban, 1960; Waage, 1964; Gautier, 1982, Maeda, 1987, Carpenter et al., 1988). Most
of these studies suggest that concretion formation represent early-diagenetic events that
occurred at fairly shallow depths below the sediment-water interface. This hypothesis can
probably also be attributed to the concretions in the Pierre Shale at Red Bird. The primary
role of the concretions in the preservation of the fauna was the prevention of crushing,
which is much more prevalent in specimen found in the uncemented shale matrix.
In summary, the concretionary faunas at the Red Bird section probably represent a
time-averaged accumulation of dead and living animals on the muddy sea floor of the
WIS. Based upon preservational characteristics and a rarity of epizoans, the amount of
time averaging of the fossil assemblages is probably minimal and represents a span of a
few years to decades. The parallel alignment of the shells of Baculites and the mixture of
abundant disarticulated epifaunal shells and articulated infaunal shells indicate
parautochthonous assemblages that were partially reworked and concentrated by currents
into irregularities or depression on the sea floor. The random orientation of the specimens
in the shells concentration is probably the result of a combination of both the current
winnowing and the effects of bioturbation. After burial, shells were prevented from being
crushed by early diagenetic formation of the concretions at fairly shallow depths below
the sea floor. These concretionary faunas are interpreted to be accurate representations of
the original skeletonized diversity of the Western Interior seaway.
60

Sampling Effects on Diversity
Based on the shape of the curves for samples RB3, RB7, RB8, and RB18, it can
be said that these are under-sampled and are not adequate in size to estimate the original
taxonomic composition of their original benthic paleocommunities. In contrast, the
curves for samples RB6, RB9, RB10, RB12, and RB19 all approach the horizontal
asymptote, which suggest that these are sufficiently large enough to estimate their
respective taxonomic compositions. Based upon the trajectory of the particular curves,
species richness is lowest in the B. eliasi (RB3), B. baculus/E. typica (RB6 and RB7), and
lower B. baculus/”I.” incurvus biozones and then increases in the upper B. baculus/”I.”
incurvus biozone. This is followed by a decrease in species richness in the B. grandis
biozone and then an increase in the B. clinolobatus biozone.
Interpretation of Faunal Patterns
The diversity and faunal patterns documented in the study interval, the biofacies
identified using the cluster analysis, and the ordination of samples and taxa along DC1 on
the DCA plot reflect changes in the spatial distribution of taxa through time in response
to variation in environmental gradients. These changes in environmental gradients can
best be explained by fluctuations in water depth and the proximity to the WIS’s western
shoreline reflecting relative sea-level changes during the late Campanian and early
Maastrichtian, as indicated by several pieces of evidence that will be discussed below.
It has been well recognized that depth rarely exerts a direct influence on
taxonomic distribution in itself, but instead correlates with various chemical and physical
factors that more strongly influence these patterns (e.g., Ekdale, 1988; Holland et al.,
2001; Holland, 2005). Depth-correlated factors include: temperature, productivity,
61
salinity conditions, oxygen levels, frequency of storm disturbance, substrate conditions,
sunlight levels, water-column mixing, and even biotic interactions (Holland et al., 2001;
Holland, 2005). Which and to what degree these depth-correlated factors influence
taxonomic distributions depends upon whether they are acting within an open ocean, an
open shelf sea, or an epeiric sea given the differences in the physical setting, depth, depth
gradients, climate, and circulation patterns of these distinct marine environments.
The two primary types of shallow-marine settings preserved on cratons that
characterize ancient marine environments include open shelf seas that lined the edges of
continents and epeiric seas, such as WIS, which covered broad expanses of continental
interiors (Miller and Foote, 2009). Today most shallow-marine settings are represented
by open shelf seas; however, in the geological past when sea-levels were higher and
overall hypsography was lower, epeiric seas were the dominant marine environments on
continents. In epeiric seas, it has been hypothesized that the reduced taxonomic richness
compared to open shelf seas or “epeiric sea effect” (e.g., see Bambach, 1977; Peters,
2007), as it is commonly known, results from the influences that climate, geography, and
circulation patterns have over factors that influence richness, including turbidity
(proximity to shoreline and/or tectonic features), oxygen levels, and salinity conditions
(Peters, 2007). The relatively shallow depths (<100 m) and large areal extent of the
epeiric seas compared to open shelves during peak transgressions (~200 m) resulted in
sluggish circulation regimes, and a susceptibility to rapid changes in sea level (Allison
and Wells, 2006; Stanley, 2010). Changes in relative sea level would have also played
significant role in altering water-column mixing and modify the areal extent of these seas.
The faunas within these epeiric seas are considered to have been “perched” in the sense
62
that rapid changes in relative sea-level (and even depth) would have resulted in the
disappearance of their habitats, leading to possible extinctions (Johnson, 1974). These
environmental influences are important to keep in mind when trying to interpret the
diversity pattern in the WIS.
The depauperate biota of the WIS is characteristic of an epeiric sea and is not
representative of normal marine conditions typical of open-shelf environments found
along contemporaneous continental margins (Kauffman and Caldwell, 1993). Most
studies of WIS attribute the lower richness and faunal distributions within the basin to: 1)
dysoxic to anoxic mid- to bottom-water conditions as a result of water-mass stratification
(Sageman, 1989; Kauffman and Caldwell, 1993); 2) brackish surface waters derived from
runoff of the western and eastern landmasses and dense cool, bottom waters from the
Arctic Ocean (Kauffman and Caldwell, 1993); 3) high-sedimentation rates in nearshore
settings (Waage, 1967); and 4) substrate conditions (Rhoads et al., 1972; Elder, 1987).
Even within well-oxygenated shallow marine environments, these factors are thought to
have resulted in communities with lower taxonomic diversity compared to open-shelf
environments and to the virtual absence of sponges, articulate brachiopods, belemnites,
crinoids, and echinoids in the WIS (Kauffman and Caldwell, 1993). Recent discovery of
hard-ground taxa such as sponges, crinoids, and echinoids at fossilized seeps, the so-
called ‘teepee buttes’ (e.g., Landman et al., 2010), suggest that the substrate conditions in
the WIS might have also acted to exclude many of these forms.
It should be assumed that all of these factors played some role in regulating
richness patterns in the WIS, although, certain factors, such as bottom-water dysoxia and
anoxia were probably a more significant influence over the fauna in deeper parts of the
63

restricted WIB reflecting reduced water-column mixing (Savrda and Bottjer, 1989;
Sageman, 1989; Sageman and Bina, 1997). A number of different scenarios have been
proposed to explain the reduced oxygen levels apparent in the WIS as well as other
epeiric seas (e.g., Sageman, 1989; Tyson and Pearson, 1991; Sageman and Bina, 1997).
Current hypotheses suggest that prolonged seasonal stratification and reduced water
column-mixing in conjunction with increased demand for oxygen because of bacterial
decomposition of organic carbon derived from productivity in the photic zone (<60 m)
resulted in year round dysoxia and seasonal anoxia within or slightly above the sediment-
water interface (Tyson and Pearson, 1991; Sageman and Bina, 1997). In this scenario
oxygen levels were sufficiently high to prevent euxinic conditions (even seasonally)
allowing for settlement of low-oxygen adapted taxa (Sageman and Bina, 1997).
Occasionally minor changes in environmental parameters would increase oxygen levels
and permit habitation of increased richness on the sea bottom (Tyson and Pearson, 1991).
This particular scenario might explain the occurrence of laterally persistent fossiliferous
concretion horizons that are surrounded by poorly lithified, generally barren shales in
Cretaceous marine strata at Red Bird and across the western interior. Low-oxygen
conditions probably played a minor role in shallower parts of the basin as a result of
greater water column mixing through out the year associated with reduced depths
allowing for increased wave mixing (Tyson and Pearson, 1991).
Decreasing oxygen levels in marine strata can be recognized paleontologically by:
1) a decrease in epi- and infaunal richness potentially to zero dependent on the position of
the boundary between dysoxic and anoxic conditions; 2) a comparative increase in certain
ecological guilds such as epi- and shallow-infaunal suspension feeders at the expense of
64

other guilds (e.g., deep-infaunal or thick-shelled taxa); 3) a decrease in depth of
burrowing; and 4) the occurrence of only nektic and pelagic taxa in assemblages (Morris,
1980; Wignall and Myer, 1988; Wignall, 1993). Similar but not identical faunal
characteristics can also be caused by very soft-substrate conditions (Wignall, 1993).
Decreasing substrate firmness in marine strata can be discerned paleontologically by: 1)
decreasing macrofaunal diversity, but never to an abundance of zero; 2) a decrease in
burrowing depth and evidence of more blurred or unclear burrows; and 3) a change in the
faunal composition to known soft-bottom species (e.g., nuculids or species with
snowshoe morphologies such as anomiids; Rhoads and Young, 1970; Wignall, 1993). In
addition, another possible way to differentiate between low-oxygen conditions and soft
substrate conditions is the presence of epizoans, such as oysters, bryozoans, and serpulids
(Wignall, 1993). Epizoans abundances and diversity should decrease in relation to
oxygen levels, while there should be little change in more substrate controlled-
communities (Wignall, 1993). It should also be noted that epizoan diversity will also
decrease in relation to high-sedimentation rates. These patterns are important to keep in
mind when trying to interpret faunal data from an epeiric sea with a muddy sea floor
similar to the WIS.
In this study, ‘deep’ and ‘shallow’ are used in a relative sense, because the actual
depths and depth gradient of the WIS as well as of other epeiric seas are poorly
constrained. A few early studies suggested great depths and depth gradients for the WIS.
Eicher’s (1969) analyses of planktic: benthic ratios in foraminifers from the Cenomanian
Bridge Creek Limestone and of the land surface gradient that the sea transgressed
suggested a maximum depth for the central portion of the basin of 600 to 900 m.
65
Asquith’s (1970) study of submarine topography and depositional environments in the
WIS also suggest similar maximum depths. Most studies, however, have proposed much
more subtle bathymetric gradients and water depths for the WIS that ranged between 100
to 200 m (Hattin, 1971; Kauffman, 1977, 1985; Sageman and Arthur, 1994). Gill and
Cobban (1966) argued, based upon various sedimentologic, paleogeographic, and
taphonomic lines of evidence, that the upper part of the Pierre Shale at Red Bird was
deposited in maximum water depths that never exceeded 60 m. In his analysis of
foraminiferal assemblages of the Pierre Shale at Red Bird, Bergstresser (1983) proposed
that the unnamed shale members and the Kara Bentonitic Member were probably
deposited in mid-shelf depths ranging between 70 to 100 m. More recent work on the
Pierre Shale of South Dakota using dinoflagellates assemblages suggest that biofacies
characterized by abundant mature Baculites were never deeper than 50 m (Palamarczuk
and Landman, in review).
Baculites-dominated biofacies of the Pierre Shale are thought to represent the
deepest conditions during this phase of WIS deposition when benthic settings were
uninhabitable because of low-oxygen levels and/or soft substrates. This is suggested by
the occurrence of mature Baculites specimens in otherwise barren to poorly fossiliferous
concretionary horizons lacking benthic body- or trace-fossil evidence (Figs. 14a and
14b). The absence or rarity of epizoans encrusting the shells of Baculites suggests that
oxygen levels were the primary cause excluding benthic taxa rather then substrate
conditions. If substrate conditions were the primary factor excluding benthic taxa then
epizoans should be more prevalent. In addition, mature Baculites are thought to have
been nektic planktivores that inhabited the middle to upper part of the water column
66
(Westermann, 1996; Tsujita and Westermann, 1998; Kruta et al., 2011), which would
have decoupled them from the conditions on or near the sea floor. This interpretation is
primarily based upon their shell morphology, shell orientation during life, evidence of
predation by fish and reptiles, and facies independence (Westermann, 1996; Tsujita and
Westermann, 1998). This hypothesized mode of life is also supported by stable isotope
evidence from well-preserved Baculites specimens from the Pierre Shale that show
isotopic values that are distinct from benthic mollusks (Tourtelot and Rye, 1969; Wright,
1987; Tsujita and Westermann, 1998; He et al., 2005). In addition, recent studies of their
buccal-mass morphology and possible remains of prey have indicated that Baculites fed
on small animals (e.g., crustaceans, planktic larvae of gastropods) in the water columns
and were not adapted to feeding on benthic prey (Kruta et al., 2011). This biofacies is
equivalent to epifaunal biofacies 2 of Sageman and Bina (1997), which suggest that the
dysoxic and/or anoxic conditions extended a short distance into the water column but
below the water mass the Baculites inhabited.
The diverse-inoceramid-dominated, inoceramid-dominated, and “Inoceramus”-
Discinisca biofacies are considered to reflect relatively deep or dysoxic conditions, but
not as deep or oxygen deprived as the Baculites-dominated biofacies. These conditions
are indicated by: 1) the dominance and abundance of epifaunal, suspension-feeding
inoceramids (Figs. 14a, 14b, and 18); 2) the relatively lower abundances of other
epifaunal taxa (Fig. 18); 3) a lower diversity and abundance of shallow-infaunal taxa (Fig
18b); 4) an almost complete absence of deep-infaunal taxa (Fig.18); and 5) a rarity of
most epizoans except for Discinisca (Figs. 14a, 14b, and 18) Inoceramids are typically
thought to have been eurytopic opportunists based upon their species richness and great
67

abundance in low-faunal-diversity, organic-rich-shale facies, which suggests exploitation
of oxygen-deficient environments (Kauffman, 1982; Sageman, 1989; Harries and
Crampton, 1998; Kauffman et al., 2007). It has been suggested that utilization of these
distinct dysoxic habitats may have allowed the inoceramids to prosper because of lower
levels of predation and competition for food and space (Harries and Crampton, 1998;
Ozanne and Harries, 2002). The occurrence of the inarticulate brachiopod Discinisca also
hints at relatively deeper and oxygen deprived conditions in the diverse-inoceramid-
dominated and “Inoceramus”-Discinisca biofacies. These inarticulate brachiopods with
Paleozoic affinities are thought possibly to have been adapted to low-oxygen settings
similar to the anoxic conditions of the early Paleozoic when the inarticulate brachiopods
were most diverse (Harries, 1993). This brachiopod was promoted as a disaster species
by Harries (1993) because of its increase in numbers at the Cenomanian-Turonian (C-T)
boundary where faunal diversity drops to almost zero because of the anoxic conditions.
Harries (1993) argued that their population burst at the C-T boundary was the result of
the removal of their competitors as a result of reduced oxygen levels and a return to the
low oxygen conditions similar to Paleozoic seas. Related living forms to this brachiopod
are also known to occur in deep-water settings (Brunton and Hiller, 1990), where
predation intensity is thought to be greatly reduced. The occurrence of Discinisca
specimens on inoceramid valves also suggest that substrate conditions were soft enough
to limit the types and number of new taxa that were recruited into these biofacies.
However, based on the abundance of epifaunal taxa in these biofacies it cannot be
suggested that the substrates were ‘soupy’ but did provide some stability. These biofacies
68

are probably equivalent to Sageman and Bina (1997) Epifaunal Biofacies 5 or 6, which
are close to or at the dysoxic-oxic boundary in the sediment.
The moderately diverse, benthos-dominated biofacies likely represent mid-depths
and/or reduced oxygen environments that were probably not as deep nor as oxygen poor
as biofacies distinguished by inoceramids and Baculites. These conditions are indicated
by: 1) a reduced number of inoceramids (Figs. 14a and 14b); 2) higher species richness
among both infaunal and epifaunal taxa (Fig. 18); 3) low abundances (Fig.14a); and 4)
the presence of epizoans (Figs 14a and 14b; e.g., Acmaea, serpulids, and bryozoans).
Another line of evidence to suggest that these represent deeper and possibly dysoxic
conditions (assuming Walther’s Law) is the close stratigraphic proximity with numerous
Baculites-dominated biofacies characteristic of deeper/more oxygen limited
environments (Fig. 14a, and 14b). The moderately diverse, benthos-dominated biofacies
is probably transitional between Sageman and Bina (1997) Epifaunal Biofacies 5 or 6,
which is close to or at the dysoxic-oxic boundary in the sediment. Despite pronounced
differences between the moderately diverse, benthos-dominated biofacies and the
biofacies defined by inoceramids, the reason they are interpreted as the same Epifaunal
Faunal Biofacies of Sageman and Bina (1997) is their species richness and faunal
composition. Sageman and Bina (1997) biofacies model does utilize abundance data for
its classification, which is the primary difference between the moderately diverse,
benthos-dominated biofacies and the biofacies defined by inoceramids. The presence of
epizoans encrusting shells within these biofacies also suggest that substrate conditions
could possibly have also been a limiting factor in the reduced abundances displayed by
this faunal component.
69
The Nuculana-Oligoptycha, Protocardia-dominated, juvenile-Baculites-
dominated, and Micrabacia-dominated biofacies probably occurred in increasingly well-
oxygenated, shallower-water conditions as compared to all other biofacies examined.
This is indicated by high species richness and abundance of shallow-infaunal and
epifaunal mollusks (Figs. 14a, 14b, and 18). The absence and/or reduced number of the
opportunistic inoceramids (Fig.14a and 14b), which as mentioned above are hypothesized
to have thrived in dysoxic settings, also suggest better-oxygenated conditions. Greater
competition for food and higher abundances of predators in these shallow, well-
oxygenated environments would probably have reduced newly recruited inoceramid
larvae, thus resulting in lower abundances. The occurrence and abundance of the
mollusks Protocardia, Oxytoma, Oligoptycha and Ellipsoscapha in these samples also
hints at shallow water conditions based upon their abundance in the known shallow water
nearshore sand lithofacies of the coeval Lewis Shale in central Wyoming (e.g., see Sohl,
1967b). Nearly all bivalve (excluding the inoceramids) and ammonoid genera as well as
some of the gastropods within these biofacies are shared with the younger Fox Hills
Formation in South and North Dakota, which is known to have been deposited in a well-
oxygenated, shallow nearshore environment (Waage, 1966; Feldmann, 1967; Speden,
1971, Erickson, 1974, Landman and Waage, 1993). However, in contrast to molluscan-
dominated assemblages of the Fox Hills Formation, recruitment and settlement of larvae
in the study interval at Red Bird were probably not strongly influenced by sedimentation
rates until the latest stages of deposition of the Pierre Shale (e.g., Protocardia-dominated
biofacies in the B. clinolobatus biozone). These biofacies are probably equivalent
70
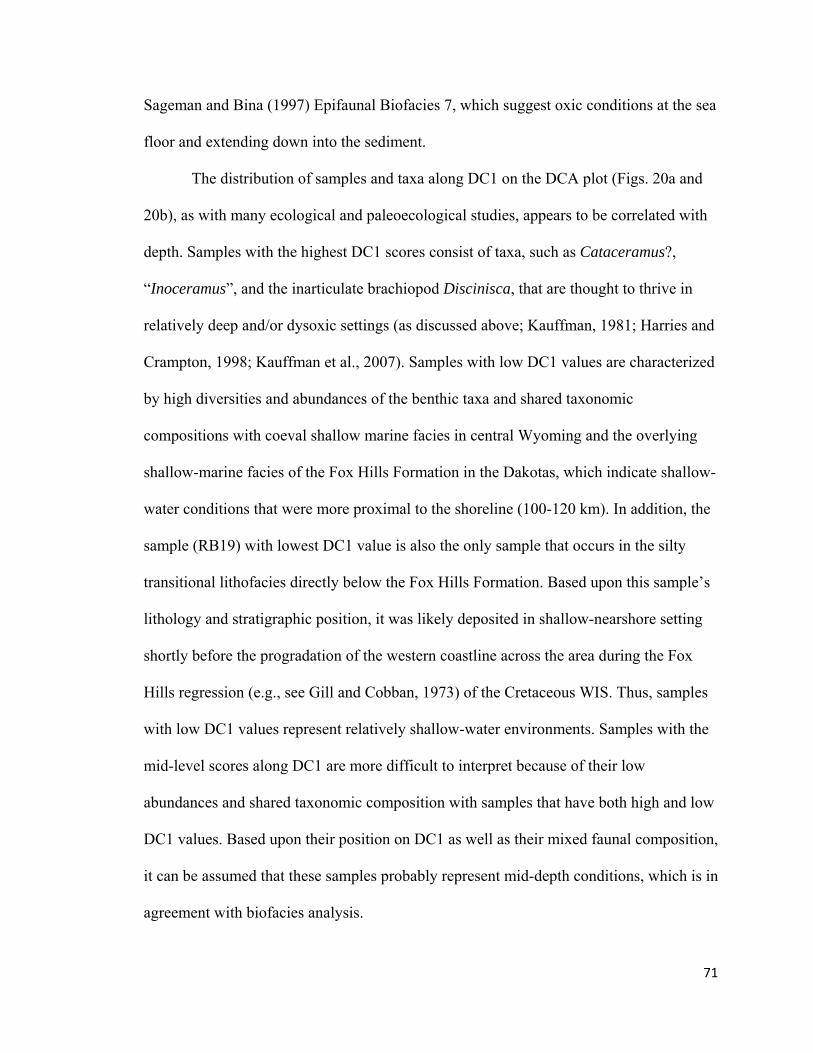
Sageman and Bina (1997) Epifaunal Biofacies 7, which suggest oxic conditions at the sea
floor and extending down into the sediment.
The distribution of samples and taxa along DC1 on the DCA plot (Figs. 20a and
20b), as with many ecological and paleoecological studies, appears to be correlated with
depth. Samples with the highest DC1 scores consist of taxa, such as Cataceramus?,
“Inoceramus”, and the inarticulate brachiopod Discinisca, that are thought to thrive in
relatively deep and/or dysoxic settings (as discussed above; Kauffman, 1981; Harries and
Crampton, 1998; Kauffman et al., 2007). Samples with low DC1 values are characterized
by high diversities and abundances of the benthic taxa and shared taxonomic
compositions with coeval shallow marine facies in central Wyoming and the overlying
shallow-marine facies of the Fox Hills Formation in the Dakotas, which indicate shallow-
water conditions that were more proximal to the shoreline (100-120 km). In addition, the
sample (RB19) with lowest DC1 value is also the only sample that occurs in the silty
transitional lithofacies directly below the Fox Hills Formation. Based upon this sample’s
lithology and stratigraphic position, it was likely deposited in shallow-nearshore setting
shortly before the progradation of the western coastline across the area during the Fox
Hills regression (e.g., see Gill and Cobban, 1973) of the Cretaceous WIS. Thus, samples
with low DC1 values represent relatively shallow-water environments. Samples with the
mid-level scores along DC1 are more difficult to interpret because of their low
abundances and shared taxonomic composition with samples that have both high and low
DC1 values. Based upon their position on DC1 as well as their mixed faunal composition,
it can be assumed that these samples probably represent mid-depth conditions, which is in
agreement with biofacies analysis.
71
When DC1 sample values are plotted stratigraphically, samples near the base of
the column have relatively high scores, which trend towards lower values at
approximately 100 m from the base of the study interval (Fig. 21). At 165 m, values
begin to trend towards average values and then, at 218 m, return to low DC1 scores (Fig.
21). When compared with the Cretaceous lithostratigraphy and paleogeography in
northern Wyoming, this pattern appears to be consistent with regional lithofacies changes
in nearshore strata to the west in north central Wyoming (Fig. 21 and 22). The high DC1
values - that indicate deep-water conditions near the bottom of the study interval -
correspond to the last major transgression of the WIS during the B. eliasi and B. baculus
biozones (Fig. 21 and 22; Gill and Cobban, 1973). The trend towards lower scores
(shallow-depths) at around 100 m correlates with the withdrawal of the WIS from
Montana as well as the progradation of the Sheridan Delta to the east, which resulted in
the deposition of a thick unnamed sandstone in the Lewis Shale in the Powder River
Basin during the B. grandis biozone (Fig. 21 and 22; Gill and Cobban, 1973). The shift to
mid-range DC1 scores (mid-depths) at 165 m is associated with transgression into
southern and eastern portion of central Wyoming during the late B. grandis and B.
clinolobatus biozones (Fig. 21 and 22; Gill and Cobban, 1973). The final trend towards
lower DC1 (shallow-water conditions) values in the upper most part of the study interval
is consistent with a shift to nearshore deposition as the WIS made its final regression
during the Cretaceous (Fig. 21 and 22; Waage, 1966; Gill and Cobban, 1966; Gill and
Cobban, 1973). The close correspondence between the local faunal patterns and the
lithostratigraphic ones suggests that changes in depth along with the various depth-
associated factors played a major role in controlling the biofacies seen at Red Bird.
72
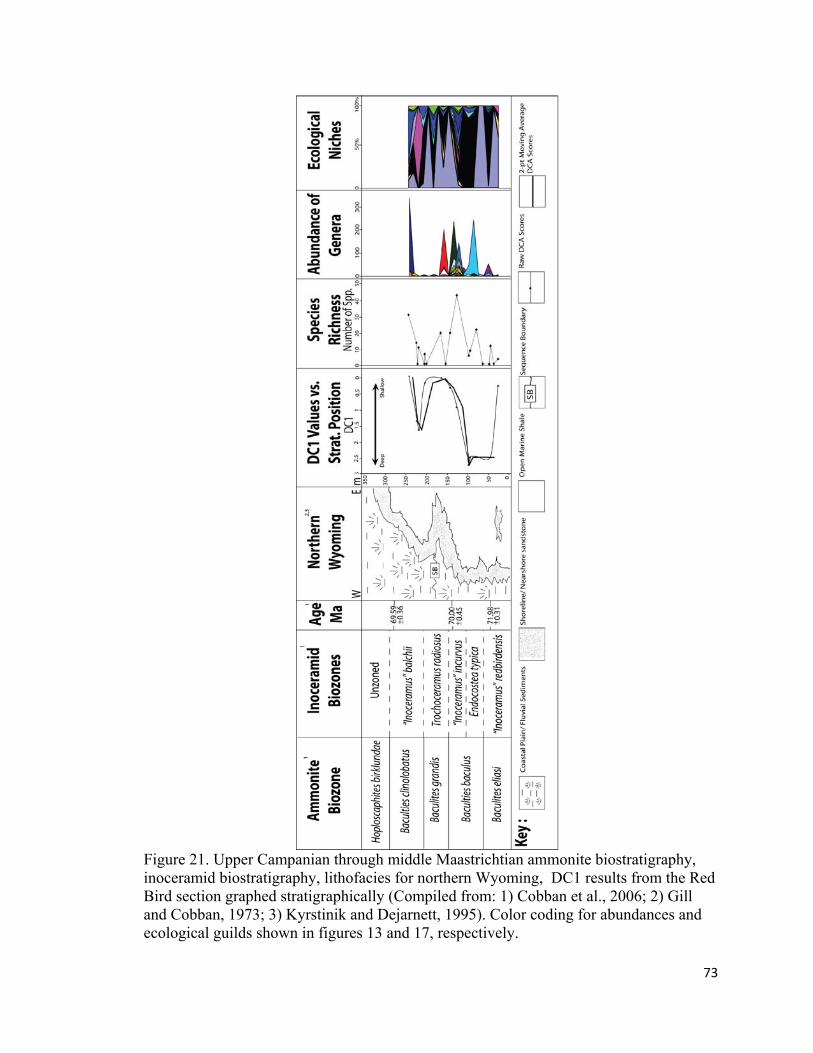
Figure 21. Upper Campanian through middle Maastrichtian ammonite biostratigraphy, inoceramid biostratigraphy, lithofacies for northern Wyoming, DC1 results from the Red Bird section graphed stratigraphically (Compiled from: 1) Cobban et al., 2006; 2) Gill and Cobban, 1973; 3) Kyrstinik and Dejarnett, 1995). Color coding for abundances and ecological guilds shown in figures 13 and 17, respectively.
73
Most studies examining biofacies usually compare them in conjunction with
lithology to constrain the underlying environmental influences (Holland et al., 2001).
Such an approach, however, has limited utility in examining the Red Bird section due to
the relative monotony of the lithofacies preserved in the study interval. The section is
predominantly shale with beds of early diagenetic concretions and occasional bentonites.
Silty and sandy shales only occur near the top of the section below the Fox Hills
Formation and are the only significant lithological change that can be directly correlated
with a biofacies (Protocardia-dominated biofacies in the B. clinolobatus biozone). The
close correspondence between faunal distributions in eastern Wyoming with lithofacies
changes 100 to 200 km to the west in central Wyoming (Fig. 22) suggest that faunal
association in offshore, shale lithofacies are reliable indicators of environmental patterns
and trends in the WIS even in the absence of lithologic change. This study also support
the hypothesis that fossil taxa are much more sensitive indicators of environmental
change than lithofacies (e.g., Springer and Bambach, 1985; Miller, 1997; Holland et al.,
2001; Brett et al., 2007a,b). Similar faunal associations (similar species compositions)
have been described or documented for the upper Campanian through lower
Maastrichtian Bear Paw Shale of Montana and Canada (Reiskind, 1971; Tsujita, 1995),
Pierre Shale in Montana (Robinson et al., 1964; Reiskind, 1971), and Pierre Shale along
the western edge of the Black Hills in Wyoming (Robinson et al., 1964; Ozanne and
Harries, 2002). These observations in combination with the data presented here indicate
that these various associations were arrayed in roughly shore-parallel belts that tracked
specific sets of environmental conditions through time in response to changes in depth
and proximity to shoreline during the Late Cretaceous.
74

Figure 22. Approximate position of the western shoreline of the Western Interior Seaway during the upper most Campanian through lower Maastrichtian (B. eliasi through B. clinolobatus biozones) in southern Montana, western South Dakota, Wyoming, Colorado, and New Mexico (Based on unpublished shoreline maps, Cobban, pers. comm.).
75
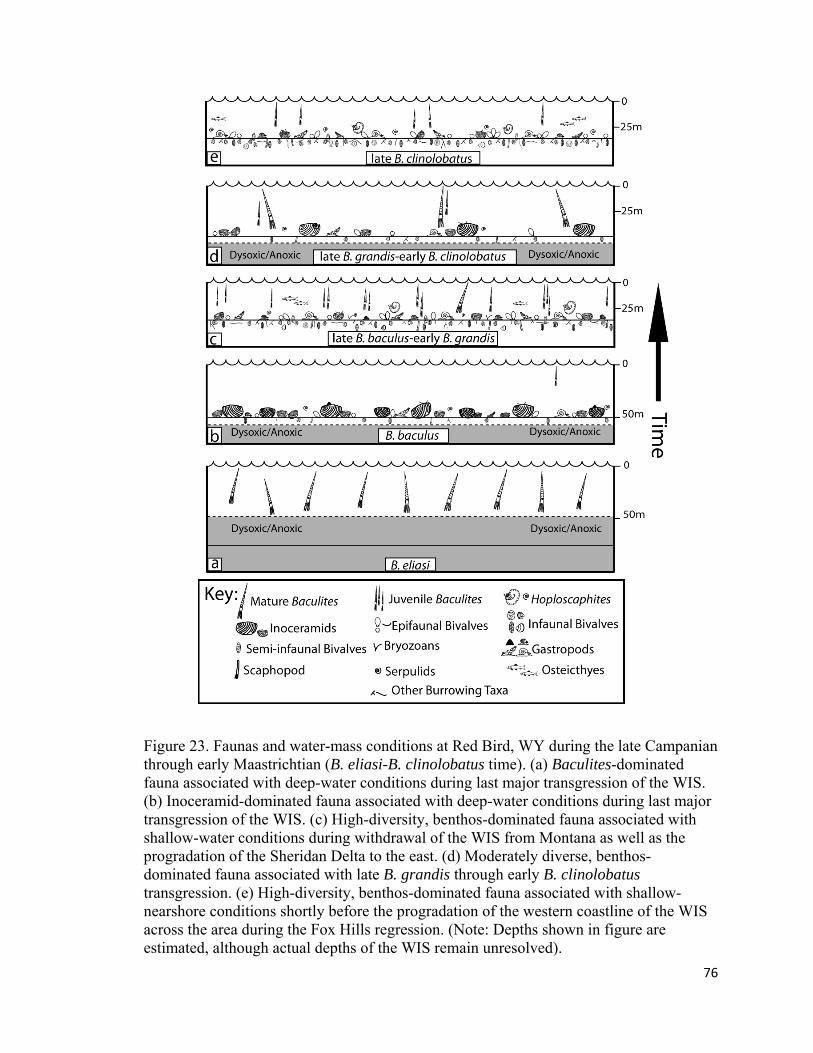
Figure 23. Faunas and water-mass conditions at Red Bird, WY during the late Campanian through early Maastrichtian (B. eliasi-B. clinolobatus time). (a) Baculites-dominated fauna associated with deep-water conditions during last major transgression of the WIS. (b) Inoceramid-dominated fauna associated with deep-water conditions during last major transgression of the WIS. (c) High-diversity, benthos-dominated fauna associated with shallow-water conditions during withdrawal of the WIS from Montana as well as the progradation of the Sheridan Delta to the east. (d) Moderately diverse, benthos-dominated fauna associated with late B. grandis through early B. clinolobatus transgression. (e) High-diversity, benthos-dominated fauna associated with shallow-nearshore conditions shortly before the progradation of the western coastline of the WIS across the area during the Fox Hills regression. (Note: Depths shown in figure are estimated, although actual depths of the WIS remain unresolved). 76
These changes in depth and the proximity to the shoreline correspond to major
changes in taxonomic composition, richness, abundances, and occupied ecological niches
(Fig. 21). Lower diversity (e.g., richness, ecological) and abundances show a relationship
with intervals when water conditions were deepest and the paleoshoreline was furthest to
the west, while higher diversity and abundances match periods when the paleoshoreline
was most proximal and shallow-water conditions predominated in eastern Wyoming (Fig.
21 and 22). The higher diversity associated with shallow-water conditions and lower
diversity associated with deeper-water conditions in the WIS might seem initially
counterintuitive because of the traditional notion that diversity increases along an onshore
to offshore or shallow to deep gradient. This well-accepted pattern is primarily based
upon the work of Sanders (1968), who showed that soft-sediment biodiversity increased
from shallow coastal settings down to 2000 m. This pattern of increasing diversity with
depth was also confirmed by Grassele and Maciolek (1992) study of faunas from deep
oceanic basins (1,500-2,100m in depth). An examination of species richness in benthic
communities throughout the Phanerozoic also revealed a similar pattern of increasing
diversity along an onshore-offshore gradient (Bambach, 1977). Despite this well-
accepted pattern documented along open-shelves and within oceanic basins, a number of
studies that have examined biodiversity dynamics within epeiric seas have shown a
similar pattern to the one presented in this study of decreasing diversity with increasing
depth (Elder, 1990; Sageman and Bina, 1997; Kauffman, 2003, Brett et al., 2007). Gray’s
(2001) analysis of a large number of marine biodiversity data sets questioned the
prevalence of increasing diversity with depth and showed that marine biodiversity
77
patterns along an onshore-offshore trend are much more variable than traditionally
thought.
The majority of studies have attributed these changes in diversity with depth to
evolutionary causes; however, for an epeiric sea, such as the WIS, an environmental
explanation is probably more suitable. The decrease in diversity with depth observed in
this study as well for others (Elder, 1990; Sageman and Bina, 1997; Kauffman, 2003;
Brett et al., 2007a, b) can best be explained by the long-term presence of conditions that
precluded faunas (Fig. 23). In particular, deeper, offshore areas in epeiric seas likely
experienced extensive, perhaps continual dysoxia with seasonal anoxia because of
reduced water column mixing and from the decomposition of organic material derived
from the photic zone. In contrast, shallow nearshore environments in epeiric seas, such as
the WIS, were probably better oxygenated because of greater water column mixing and
were able to sustain a larger number and abundances of infaunal and epifaunal taxa.
Sageman and Bina (1997) and Brett et al. (2007a) also proposed similar explanations for
diversity patterns they observed in Cenomanian Stage Strata in the Western Interior and
for the Devonian strata in New York, respectively.
Broader Implications
This analysis suggest that the distribution of taxa and diversity (e.g., richness,
abundance, ecological) of the assemblages seen in the upper Campanian and lower
Maastrichtian clay-rich lithofacies of the Pierre Shale in eastern Wyoming reflect
migrating oxygen related biofacies in the WIS that were responding to changes in depth
and the proximity to the western shoreline that was in turn controlled by relative sea-level
fluctuations. The variation in diversity documented for the study interval is significant
78
and attests to the degree of faunal alteration that can occur at a single section that was
deposited in an offshore environment. In the absence of significant lithofacies changes,
geochemical data, and stratigraphic correlation with coeval nearshore sections, the faunal
patterns and ranges seen in this study interval might be misinterpreted as temporal
changes in the faunal compositions or even a possible critical interval (e.g., bioevent,
faunal turnover, extinction) in the WIS. This can also lead to misinterpretations of the
controls influencing diversity patterns. As noted by Holland (1997), it is commonplace
among many studies examining global or regional biological perturbations to only focus
on a single section or a few closely spaced outcrops (e.g., Ward et al., 1991; Hansen et
al., 1993) without taking into consideration the effects that local non-preservation,
migration, and dynamic environmental conditions have on biotas. Studies that do not take
these possible effects into account will result in a heavily biased interpretation of the
biotic changes that occurred at their section.
Ozanne and Harries (2002) qualitatively described a similar diversity pattern from
the B. eliasi through B. grandis biozones near Newcastle, WY and Glendive, MT, which
in contrast to this study they interpreted as an overall oxygenation of once oxygen-
deficient habitats in WIS as a result of early Maastrichtian oceanographic change (e.g.,
Barrera et al., 1999; Barrera, 1994; Macleod and Huber, 1996). Although it is highly
plausible that this could be an explanation for the changes documented in this study and
theirs, the return of low diversity deeper-water faunas during the upper B. grandis and
lower B. clinolobatus biozone at Red Bird (zones that are missing to the north) and the
absence or rarity of high diversity benthos dominated biofacies in South Dakota through
out the study interval (JS, pers. obs.) suggest other wise. A more likely explanation based
79
upon the observations in this study is that these diversity patterns were the caused by a
shift in oxygen related biofacies in response to sea level fluctuations rather than
oxygenation of once oxygen-deficient habitats in the WIS. It is possible that oxygen-
deficient environments in the WIS became better oxygenated during this interval as a
result of changes in global oceanographic change but without further analysis at a broader
spatial scale this hypothesis will remain tentative.
This example shows that a lack of environmental context can significantly
influence interpretations of paleobiological and paleoecological data. A number of
studies have begun to take into consideration the influence that sequence architecture
plays in the pattern of the fossil record (Brett, 1995; 1998, Brett et al., 2007b; Holland,
1995, Patzkowsky and Holland, 1999). These studies assume that by tracking faunal
association through time in the context of environmental change that the biases related to
sequence architecture can be overcome; however, few studies have applied these
techniques to background and associated mass extinction intervals in order to understand
the context in which they occurred.
This is especially important because most mass extinction intervals during the
history of the Phanerozoic are known to be correlated with rapid changes in sea level
which, in turn, heavily influence sequence architecture (Hallam, 1989; Hallam and
Wignall, 1999). Regressions are typically thought to result in loss of habitat, whereas
transgressions are usually associated with the expansion of oxygen-depleted waters onto
the shelves (Wignall, 2004). The two major extinction events of the Late Cretaceous – the
C-T and the K-Pg events – are both known to be associated with major eustatic sea-level
changes. The C-T event is linked to a major sea-level rise that is hypothesized to have
80

expanded the oxygen minimum zone into shallow continental waters and resulted in the
extinction of ~50% of species (Elder, 1987, Harries and Little, 1999). In contrast, the K-
Pg event is associated with an initial sea-level fall followed by a rise immediately prior to
the boundary (Hallam and Wignall, 1999). Although not considered the cause of the K-
Pg mass extinction, rapid sea-level change has been hypothesized to have possibly
resulted in stressed faunas that were already predisposed to extinction when the bolide
impact occurred (Hallam and Wignall, 1999). However, whether these observed changes
during or prior to these mass extinction events represent normal background conditions or
atypical phenomena is poorly known because most studies only examine a short interval
preceding an extinction event.
Jablonski’s (1980) examination of the effects of sea-level change on faunas
warned against apparent versus real effects of sea-level change; however, few studies
have applied this reasoning to their methods and interpretations of faunal diversity and
distributions. Smith et al. (2001) argued that the C-T event and possibly other mass
extinctions connected to a major sea-level rise are probably the signature of
preservational megabiases related to shifts in shallow- to deep-water deposition rather
than true mass extinctions. Thus, as recommended by other studies (e.g., Jablonski, 1980;
Holland, 1997; Smith et al., 2001; Brett et al., 2007b), changes in faunal distributions
should be examined in a time/environmental context and not taken at face value. More
studies, such as the one undertaken here, are needed to examine background
extinction/origination dynamics to develop better models of how various environmental
factors can affect individual taxa, taxonomic diversity, and faunal distributions in the
stratigraphic record. As exemplified in this study, significant changes in richness,
81
abundance, and guild structure can arise in response to variations in sea level with no
apparent changes in lithology. Hypothetically, if the identical outcrops were more limited
in their stratigraphic and geographic scope, as many sections are in more vegetated and/or
less tectonically active areas, then some of the changes in faunal distributions based on
relatively isolated sections might be incorrectly interpreted as important temporal
changes in community composition within a relatively static environmental setting. This,
in turn, could mistakenly be construed as evidence of a regional or even global bioevent
triggered by biological and/or ecological perturbations. Future lines of research should try
to examine faunal, morphological, and ecological change in a time/environmental context
in order to develop models allowing faunal dynamics to be compared and contrasted
during normal background conditions and bioevents.
82
CONCLUSIONS
1. Concretionary faunas represent time-averaged accumulations of dead and living
animals on the muddy sea floor of the WIS. Based upon preservational characteristics and
a rarity of epizoans, the amount of time averaging of the fossil assemblages is probably
minimal and represents a span of a few years to decades. The parallel alignment of the
shells of Baculites and the mixture of abundant disarticulated epifaunal shells and
articulated infaunal shells indicate parautochthonous assemblages that were partially
reworked and concentrated by storms or currents into irregularities on the sea floor. The
random orientation of the specimens in the shell concentrations is probably the product of
both the current winnowing and the effects of bioturbation. Subsequent to burial, shells
were prevented from being crushed by early diagenetic growth of the concretions at fairly
shallow depths below the sediment water interface. These concretionary faunas are
interpreted to be accurate representations of the original skeletonized diversity of the
WIS.
2. Based upon the shape of the rarefaction curves, species richness is lowest in the B.
eliasi, B. baculus/E. typica, and lower B. baculus/”I.” incurvus biozones and then
increases in the upper B. baculus/”I.” incurvus biozone. This is followed by a decrease in
species richness in the B. grandis biozone and then an increase in the B. clinolobatus
biozone.
83

3. The diversity in the WIS was most likely controlled by low oxygen bottom-water
conditions, brackish surface waters derived from surrounding landmasses and the Arctic
Ocean, high-sedimentation rates in nearshore settings, and substrate conditions. Bottom-
water dysoxia and anoxia were probably the most significant influence over the fauna in
deeper parts of the WIS reflecting reduced water-column mixing. Occasionally minor
changes in environmental parameters would increase oxygen levels and permit habitation
of increased richness on the sea bottom, which might explain the occurrence of laterally
persistent fossiliferous concretion horizons that are surrounded by poorly lithified,
generally barren shales at the Red Bird section. Low-oxygen conditions probably played
a minor role in shallower parts of the basin as a result of greater water column mixing
through out the year associated with reduced depths allowing for increased wave mixing.
4. Nine biofacies are assigned to the 19 samples analyzed in this study using cluster
analysis and are named for their dominant faunal component or diversity characteristic.
The Baculites-dominated biofacies characterize the deepest conditions during this phase
of WIS deposition when benthic settings were uninhabitable because of low-oxygen
levels and/or soft substrates. The diverse-inoceramid-dominated, inoceramid-dominated,
and “Inoceramus”-Discinisca biofacies reflect relatively deep or dysoxic conditions, but
not as deep or oxygen deprived as the Baculites-dominated biofacies. The moderately
diverse, benthos-dominated biofacies characterize mid-depths and/or reduced oxygen
environments that were probably not as deep nor as oxygen poor as biofacies
distinguished by inoceramids and Baculites. The Nuculana-Oligoptycha, Protocardia-
dominated, juvenile-Baculites-dominated, and Micrabacia-dominated biofacies probably
84
occurred in the most well-oxygenated shallow-water conditions as compared to all other
biofacies examined.
5. The distribution of samples and taxa along DC1 axis on the DCA plot appears to
correlate with depth. When DC1 values are compared with the Cretaceous
lithostratigraphy and paleogeography in northern Wyoming, this pattern appears to be
consistent with regional lithofacies changes in nearshore strata to the west in north central
Wyoming.
5. The correspondence between faunal distributions in eastern Wyoming with lithofacies
changes in north central Wyoming suggest that faunal association in offshore, shale
lithofacies are reliable indicators of environmental patterns and trends in the WIS even
without significant lithologic change. This study also supports the hypothesis that fossil
taxa are much more sensitive indicators of environmental change than lithofacies.
6. Samples with lower diversity and abundances show a connection with intervals when
water conditions were deepest and the paleoshoreline was furthest to the west, whereas
higher diversity and abundances match periods when the paleoshoreline was the closest
and shallow-water conditions prevailed in this part of the WIS. The decrease in diversity
with depth observed in this study as well for others can best be explained by the long-
term presence of dysoxic/anoxic conditions that would have precluded more species.
Diversity and faunal distribution probably reflect migrating oxygen related biofacies that
were responding to changes in depth and the proximity to the western shoreline that was
in turn controlled by relative sea-level fluctuations.
85

7. This study shows that a lack of environmental context can significantly influence
interpretations of paleobiological and paleoecological data. Significant changes in
richness, abundance, and guild structure can arise in response to variations in sea level
with no apparent changes in lithology. Future lines of research should examine faunal,
morphological, and ecological change in a time/environmental context in order to
develop models allowing faunal dynamics to be compared and contrasted during normal
background conditions and bioevents.
86

LITERATURE CITED Allison, P. A., and Wells, M. R., 2006, Circulation in large ancient epicontinental seas:
What was different and why?: Palaios, v. 21, p. 513-515. Asquith, D. O., 1970, Depositional topography and major marine environments, Late
Cretaceous, Wyoming: AAPG Bulletin, v. 54, p. 1184–1224. Bambach, R. K., Species richness in marine benthic habitats through the Phanerozoic:
Paleobiology, v. 3, p. 152-167. Barrera, E., 1994, Global Environmental Changes Preceeding the Cretaceous-Tertiary
boundary: Early-Late Maastrichtian transition: Geology, v. 22, p. 877-880. Barrera, E., and Savin, S.M., 1999, Evolution of the late Campanian-Maastrichtian
Marine Climate and Oceans: in Barrera, E., and Johnson, C. C., eds., Evolution of the Cretaceous Ocean-Climate System, Geological Society of America, Special Paper, v. 332, p. 245-282.
Bergstresser, T. J., 1981, Foraminiferal biostratigraphy and paleobathymetry of the Pierre
Shale, Colorado, Kansas, and Wyoming: unpublished PhD dissertation, University of Wyoming. p.1-351.
Brett, C. E., 1995, Stratigraphy, biostratigraphy, and taphonomy in shallow marine
Environments, Palaios, v. 10, p. 597-616. Brett, C. E., 1998, Sequence stratigraphy, paleoecology, and evolution: Biotic clues and
responses to sea-level fluctuations: Palaios, v. 13, p. 241-262. Brett, C. E., Hendy, A. J., W., Bartholomew, A. J., Bonelli Jr., J. R., and Mclauphin, P.
I., 2007, Response of shallow marine biotas to sea-level fluctuations: A review of faunal replacement and the process of habitat tracking: Palaios, v. 22, p. 228-224.
Brett, C. E., Bartholomew, A. J., Baird, G. C., 2007,Biofacies recurrence in the middle
Devonian of New York State: An example with implications for Evolutionary Paleoecology: Palaios, v. 22, p. 306-324.
Brunton, C. H. C., and Hiller, N. 1990, Late Cainozoic brachiopods from the coast of
Namaqualand, South Africa: Paleontology, v. 33, p. 313-347.
87
Breithaupt, B.H., 1985, Nonmammalian vertebrate faunas from the Late Cretaceous of Wyoming, in Nelson, G., ed., The Cretaceous of Wyoming: Casper, Wyoming Geological Association, 36th Annual Field Guide Conference, Guidebook, p. 159-175.
Caldwell, W.G.E., and Kauffman, E.G., 1993, Evolution of the Western Interior Basin, in
Caldwell, W.G.E., and Kauffman, E.G., eds., Evolution of the Western Interior Basin: Geological Association of Canada Special Paper, v.39, p. 1-46.
Carpenter, S.J., Erickson, J.M., Lohmann, K.C., and Owen, M.R., 1988, Diagenesis of
Fossiliferous Concretions from the Upper Cretaceous Fox Hills Formation, North Dakota: Journal of Sedimentary Petrology, v. 58, p.706-723.
Carpenter, K., 2006, Comparative Vertebrate Taphonomy of the Pembina and Sharon
Springs Members (Middle Campanian) of the Pierre Shale, Western Interior: Paludicola, v. 5, p. 125-149.
Cobban, W.A., Walaszczyk, I., Obradovich, J.D., and McKinney, K.C., 2006, A USGS
Zonal Table for the Upper Cretaceous Middle Cenomanian-Maastrichtian of the Western Interior of the United States Based on Ammonites, Inoceramids, and Radiometric Ages: U. S. Geological Survey Open-File Report 1240, 50 p.
Eicher, D.L., 1969, Paleobathymetry of Cretaceous Greenhorn Sea in eastern Colorado,
AAPG Bulletin, v. 53, p. 1075-1090. Elder, W. P., Gustason, E. R., and Sageman, B. B., 1994, Correlation of basinal carbonate
cycles to nearshore parasequences in the Late Cretaceous Greenhorn seaway, Western Interior, USA. , GSA Bulletin, v. 106, p. 892-902.
Elder, W. P., 1987, The Paleoecology of the Cenomanian-Turonian (Cretaceous) Stage
Boundary Extinctions at Black Mesa, Arizona, Palaios, vol.2, p. 24-40. Elder, W.P., 1990, Soft-bottom paleocommunity dynamics in the Cenomanian- Turonian
boundary extinction interval of the Western Interior, United States: In Miller, W., eds., Paleocommunity temporal dynamics: the long-term development of multispecies assemblies, v. 5, p. 210-235.
Ekdale, A.A., 1988, Pitfalls of Paleobathymetric Interpretations Based on Trace Fossil
Assemblages, Palaios, v.3, p. 464-472. Erickson, J. M., 1974, Revision of the Gastropoda of the Fox Hills Formation, Upper
Cretaceous (Maestrichtian) of North Dakota, Bulletins of American Paleontology, v. 66, p.127–253.
Everhart, M. J., 2005, Oceans of Kansas: A Natural History of the Western Interior Sea:
Indiana University Press, 322p.
88
Fatherree, J.W., 1995, Isotope paleontology of selected mollusks from the upper Pierre
Shale (Late Campanian–Early Maastrichtian) of the Cretaceous Western Interior Seaway of North America: Unpublished M.S. Thesis, University of South Florida, Tampa, 70 p.
Feldman, R. M., 1967, Bivalvia and paleoecology of the Fox Hills Formation
(UpperCretaceous) of North Dakota: Unpublished PhD Disertation, University of North Dakota, p. 1-247.
Fürsich, F.T., 1982, Rhythmic bedding and shell bed formations it the Upper Jurassic of
East Greenland: In EINSELE, G., and SEILSCHER, A., eds., Cyclic and Event Stratification: Springer-Verlag, Berlin, p. 208-22.
Hallam, A., 1989, The case for sea-level change as a dominant causal factor in mass
extinction of marine invertebrates, Philosophical Transaction of the Royal Society of London, v. 325, p.437-455.
Hallam, A., and Wignall, P.B., 1999, Mass extinctions and sea-level changes, Earth
Science Reviews, v. 48, p. 217-250. Hammer, O. and Harper, D., 2006, Paleontological Data Analysis: Blackwell Publishing,
p. 1-351. Hansen, T. A., Upshaw III, B., Kauffman, E. G., and Gose, W., 1993, Patterns of
molluscan extinction and recovery across the Cretaceous-Tertiary boundary in east Texas; report on new outcrops, Cretaceous Research, v. 14, p. 685-706.
Hansen, T. A., Farrand, R. B., Montgomery, H. A., Billman, H. G., Bleschmidt, G., 1987,
Sedimentology and extinction patterns across the Cretaceous-Tertiary boundary interval in east Texas: Cretaceous Research, vol. 8, p. 229-252.
Hattin, E. D., 1971, Widespread, Syncronously deposited beds in Greenhorn Limestone
(Upper Cretaceous) of Kansas and southeastern Colorado, American Association of Petrolum Geologist Bulletin, v. 55, p. 110-119.
Hartman, J. H., and Kirkland, J. I., 2002, Brackish and Marine Mollusks of the Hell
Creek Formation of North Dakota: Evidence for a persisting Cretaceous Seaway: in Hartman, J. H., Johnson, K. R., and Nichols, D. J., eds. The Hell Creek Formation and the Cretaceous-Tertiary Boundary in the Northern Great Plains: An integrated Continental Record of the End of the Cretaceous: Geological Society of America Special Papers, v. 361, p. 271-296.
Harries, P. J. 1993, Dynamics of survival following Cenomanian-Turonian (Upper
Cretaceous) mass extinction event: Cretaceous Research, v. 14, p. 563-583.
89
Harries, P.J. and Crampton, J.S., 1998, The inoceramids: American Paleontologist v. 6, p. 2–6.
Harries, P.J., and Little, C. T.S., 1999, The early Toarcian (Early Jurassic) and the
Cenomanian–Turonian (Late Cretaceous) mass extinctions: similarities and contrasts, Palaeogeography, Palaeoclimatology, Palaeoecology, v. 154, p. 39-66.
He, S., Kyser, T.K., and Caldwell, W.G.E., 2005, Paleoenvironment of the Western
Interior Seaway inferred from d18O and d13C values from the Cretaceous Bearpaw marine cyclothem: Palaeogeography, Palaeoclimatology, Palaecoecology, v. 217, p. 67-85.
Hill, M. O., and Gauch, H. G., 1980, Detrended Correspondence Analysis: an improved
ordination technique: Vegetatio, v. 42, p. 47-58 Hoganson, J. W., and Murphy, E. C., 2002, Marine Breien Member (Maastrichtian) of the
Hell Creek Formation in North Dakota: Stratigraphy, vertebrate fossil record, and age: in Hartman, J. H., Johnson, K. R., and Nichols, D. J., eds. The Hell Creek Formation and the Cretaceous-Tertiary Boundary in the Northern Great Plains: An integrated Continental Record of the End of the Cretaceous: Geological Society of America Special Papers, v. 361, p. 247-270.
Holland, S.M., 1997, Using time/environmental analysis to recognize faunal events in the
Upper Ordovician of the Cincinnati Arch: In Brett, C.E. and Baird, G.C., eds., Paleontological Events: Stratigraphic, Ecological and Evolutionary Implications, Columbia University Press.
Holland, S.M., 1995, The stratigraphic distribution of fossils: Paleobiology, v. 21, p. 92–
109. Holland, S.M., 2005. The signatures of patches and gradients in ecological ordinations.
Palaios, v. 20,p. 573-580. Holland, S.M., Miller, A.I., Meyer, D., and Datillo, B.F., 2001, The detection and
importance of subtle biofacies within a single lithofacies: The Upper Ordovician Kope Formation of the Cincinnati, Ohio Region: Palaios, v. 16, p. 205–217.
Holland, S.M., and Patzkowsky, M.E., 2004, Ecosystem structure and stability: Middle
Upper Ordovician of central Kentucky, USA: Palaios, v. 19, p. 316–331. Holland, S. M., Meyer, D. L., and Miller, A. I., 2000, High-Resolution Correlation in
Apparently Monotonous Rocks: Upper Ordovician Kope Formation, Cincinnati Arch, Palaios, 15, 73-80.
90
Holland, S. M., A. I. Miller, D. L. Meyer, and B. F. Dattilo (2001), The detection and importance of subtle biofacies within a single lithofacies; the Upper Ordovician Kope Formation of the Cincinnati, Ohio region, PALAIOS, 16(3), 205-217.
Gill, J. R., and W.A. Cobban, 1966, The Red Bird Section of the Upper Cretaceous Pierre
Shale in Wyoming: USGS Professional Paper, v. 393-A, 1-73. Gill, J. R., and W.A. Cobban, 1973, Stratigraphy and geological history of the Montana
Group and equivalent rocks, Montana, Wyoming, and North and South Dakota. USGS Professional Paper, v. 776-A, 1-37.
Gill, J. R., Merewether, E. A. and Cobban, W. A., 1970, Stratigraphy and nomenclature
of some Upper Cretaceous and lower Tertiary rocks in south-central Wyoming: U.S. Geological Survey Professional Paper, v. 667, p. 1-50.
Gautier, D.L., 1982, Siderite Concretions: Indicators of Early Diagenesis in the Gammon
Shale (Cretaceous): Journal of Sedimentary Petrology, v. 52, p.859-871. Grassle, J.F., and Maciolek, N.J., 1992, Deep-sea species richness: regional and local
diversity estimates from quantitative bottom samples. American Naturalist v. 139, p. 313-341.
Gray, J.S., 2011, Marine diversity: the paradigms in patterns of species richness
examined, Scientia Maria, v. 65, p. 41-56. Jablonski, D., 1980, Apparent versus real biotic effects of transgression and regressions:
Paleobiology,v. 6, p. 397–407. Johnson, J.G., 1974, Extinction of perched faunas: Geology, v. 2, p. 479–482. Kauffman, E. G., 1977, Geological and biological overview: Western Interior Cretaceous
basin, in Kauffman, E. G., ed., Cretaceous Facies, Faunas, and Paleoenvironments Across the Western Interior Basin: Field Guide: North American Paleontological Convention II: Mountain Geologist, v. 14, p. 75-99.
Kauffman, E. G., 1985, Cretaceous evolution of the western Interior Basin of the United
States, in Pratt, L. M., Kauffman, E. G., and Zelt, F. B., eds., Fine Grained Deposits and Biofacies of the Cretaceous Western Interior Seaway: Evidence of cyclic Sedimentary Processes: Society of Economic: Society of Economic Paleontologist and Mineralogist, 1985 Mid Year Meeting, Field Trip Guide Book, p., iv-xiii.
Kauffman, E. G. 1982. The community structure of ‘‘Shell Islands’’ on oxygen-depleted
substrates in Mesozoic dark and laminated carbonates, p. 502–503. In G. Einsele and A. Seilacher eds., Cyclic and Event Stratigraphy. Springer-Verlag.
91
Kauffman, E. G., 1984, Ecological reappraisal of the German Posidonienschiefer, in Gray, Boucot, and Berry eds., Communities of the Past: Stroundsburg, Pennsylvania, Hutchinson Ross Publishing Co., p., 311-382.
Kauffman, E.G., 2003, Limestone Concretions as Near-Isochronous Surfaces: A
Cretaceous Example from the Western Interior of North America: In Harries, P.J., eds., High Resolution Approaches in Stratigraphic Paleontology, Kluwer Academic Publishers.
Kauffman, E. G., Harries, P. J., Meyer, C., and Villamil, T., Arango, C., and Jaecks, G.,
2007, Paleoecology of giant Inoceramidae, (Platyceramus) on a Santonian (Cretaceous) seafloor in Colorado: Journal of Paleontology, v. 81, p. 64-81.
Kidwell, S. M., and Jabolonski, D., 1983, Taphonomic feedback: Ecological
consequences of shell accumulation, p. 195-248: In: Tevesz, M. J.S., and McCall, P. L., eds., Biotic Interactions in the Recent and Fossil Benthic Communities, Plenum Press.
Kirkland, J. I., 1996, Paleontology of the Greenhorn Cyclothem (Cretaceous: Late
Cenomanian to middle Turonian) at Black Mesa, Northeastern Arizona: New Mexico Museum of Natural History and Science Bulletin, v. 9, p. 1-130.
Kruta, I., Landman, N..H., Rouget, I., Cecca, F., and Tafforeau, P., 2011, The Role of
Ammonites in the Mesozoic Marine Food Web Revealed by Jaw Preservation: Science, v.331, p. 70-72.
Krystinik, L. F., DeJarnett, B. B., 1995, Lateral variability of sequence Stratigraphic
framework in the Campanian and Lower Maastrichtian of the Western Interior Seaway: in van Wagoner, J. C., and Kauffman, Bertram, G. T., eds., Sequence Stratigraphy of Foreland Basin Deposits; Outcrop and Subsurface examples from the Cretaceous of North America: AAPG Memoir, v.64, p. 11-26.
Landman, N. H. and Waage, K. M. 1993, Scaphitid ammonites of the Upper Cretaceous
(Maastrichtian) Fox Hills Formation in South Dakota and Wyoming: American Museum of Natural History Bulletin, v. 215, p. 1-257.
Landman, N.H., W. J., Kennedy, W. A., Cobban, and N. L., Larson, 2010, Scaphites of
the ‘Nodosus Group’ from the Upper Cretaceous (Campanian) of the Western Interior of North America: AMNH Bulletin, v. 342, p.1-242.
MacLeod, K.G., and Huber, B.T., 1996, Reorganization of deep ocean circulation
accompanying a Late Cretaceous extinction event: Nature, v. 380, p. 422–425. Maeda, H., 1987, Taphonomy of Ammonites from the Cretaceous Yezo Group in Tappu
Area, Northewestern Hokkaido, Japan: Transactions and Proceedings of the Paleontological Society of Japan, New Series, v. 148, p. 285-305.
92

Maeda, H., and Seilacher, A., 1996, Ammonoid Taphonomy, p.543-578. In Landman N.H., Tanabe, K., and Davis, R.A., eds., Ammonoid Paleobiology, Plenum Press.
Martin, J.E., Bertog, J.L., and Parris, D. C., 2007, Revised Lithostratigraphy of the lower
Pierre Shale Group, (Campanian) of Central South Dakota, Including Newly Designated Members: In Martin J.E. and Parris, D.C. eds., The Geology and Paleontology of the late Cretaceous Marine Deposits of the Dakotas: GSA Special Paper, v. 427, p. 9-22.
McCune, B., and J. B. Grace, 2002, Analysis of Ecological Communities: MjM Software
Design, Gleneden Beach, p. 1-300. Meek, F.B., 1876, A report on the invertebrate Cretaceous and Tertiary fossils of the
upper Missouri country: United States Geological Survey of the Territories Report, v. 9, p. 1-629.
Miller, A. I., and Foote, M., 2009, Epicontinental seas versus Open-ocean settings: The
kinetics of Mass extinction and origination: Science, v. 326, p. 1106-1109. Miller, K. G., E. Barrera, R. K. Olsson, P. J. Sugarman, and S. M. Savin, 1999, Does ice
drive early Maastrichtian eustacy?: Geology, v. 27, p. 783–786. Miller, K. G., Kominz, M. A., Browning, J. V., Wright, J. D., Gregory S. Mountain, Katz,
M. E., Sugarman, P. J., Cramer, B. S., Christie-Blick, N., Pekar, S. F., 2004, The Phanerozoic Record of Global Sea-Level Change; Science, v. 310, p. 1293-1298.
Miller, A.I., Holland, S.M., Meyer, D.L., and Dattilo, B.F., 2001, The use of faunal
gradient analysis for intraregional correlation and assessment of changes in sea-floor topography in the type Cincinnatian: Journal of Geology, v. 109, p. 603–613.
Miller, A.I., 1997, Coordinated stasis or coincident relative stability?: Paleobiology, v.
23, p. 155–164. Morris, K. A., 1980, Comparison of major sequences of organic-rich mud deposition in
the British Jurassic. Journal of the Geological Society of London, v. 137, p. 157-170.
Ozanne, C. R., and Harries, P. J., 2002, Role of predation and parasitism in the extinction
of the inoceramid bivalves: An evaluation: Lethaia, v. 35, p. 1–19. Patzkowsky, M.E., 1995, Gradient analysis of Middle Ordovician brachiopod biofacies:
Biostratigraphic, biogeographic, and macroevolutionary implications: Palaios, v. 10, p. 154–179.
93

Patzkowsky, M.E., and Holland, S.M., 1999, Biofacies replacement in a sequence stratigraphic framework: Middle and Upper Ordovician of the Nashville Dome, Tennessee, USA: Palaios, v. 14, p. 301–323.
Peters, S. E., 2007, The Problem with the Paleozoic: Paleobiology, v. 33, p. 165-181. Reeside, J.B. Jr., and Cobban, W.A., 1954, Ammonite Accumulations in the Cretaceous
Mowry and Aspen Shales: Science, v. 119, p. 255. Reeside, J.B., Jr., and Cobban, W.A., 1960, Studies of the Mowry Shale (Cretaceous) and
Contemporary Formations in the United States and Canada: USGS Professional Paper, v. 355, p. 1-126.
Reiskind, J., 1975, Marine Concretionary Faunas of the Uppermost Bearpaw Shale
(Maestrichtian) in Eastern Montana and Southwestern Saskatchewan: GAC Special Paper, v. 13, p. 235-252.
Rhoads, D.C., and Young, D. K., 1970, The influence of deposit-feeding organisms on
bottom-sediment stability and community trophic structure: Journal Marine Research, v. 28, p. 150-178.
Rhoads, D. C. I. G., Speden, K. M., Waage, 1972, Trophic Group Analysis of Upper
Cretaceous (Maestrichtian) Bivalves assemblages from South Dakota: AAPG Bulletin, v. 56, p. 1100-1113.
Robinson, C.S., Mapel, W.J. & Begendahl, M.H. 1964: Stratigraphy and structure of the
northern and western flanks of the Black Hills Uplift, Wyoming, Montana, and South Dakota, U.S. Geological Survey, Professional Paper, v. 404, p. 1-134.
Robinson, C.S., Mapel, W.J., and Cobban, W. A., 1959, Pierre Shale along Western and
Northern Flanks of the Black Hills, Wyoming and Montana: AAPG Bulletin, v. 43, p. 101-123.
Sageman, B. B., and Arthur, M.A., 1994, Early Turonian Paleographic/ Paleobathemetric
map, Western Interior, US in Caputo, M.V., Peterson, J.A., Franczyk, K.J., eds., Mezezoic systems of the Rocky Mountain Region, USA: SEPM, Rocky Mountain Section, p.457-470.
Sageman, B. B., 1989, The benthic boundary biofacies model: Hartland Shale Member,
Greenhorn Formation (Cenomanian), Western Interior, North America: Palaeogeography, Palaeoclimatology, Palaeoecology, v. 74, p. 87—110.
Sageman, B. B., and Bina, C. R., 1997, Diversity and species abundance patterns in the
Late Cenomanian Black Shale Biofacies, Western Interior, U.S: Palaios, v. 12, p. 449-446.
94

Sanders, H.L., 1968, Marine benthic diversity: a comparative study. American Naturalist, v. 102, p. 243-282.
Sava, L. A., 2007, The molluscan and brachiopod fauna of the Late Cretaceous Pierre
Shale (Baculites compressus/Baculites cuneatus biozones) near Kremmling, Colorado, unpublished MS thesis University of South Florida.
Savrda, C. E., and Bottjer, D. J.,1989, Trace-fossil model for reconstructing oxygenation
histories of ancient marine bottom waters: application to Upper Cretaceous Niobrara Formation, Colorado: Palaeogeography, Palaeoclimatology, Palaeoecology,v. 49, p. 49-74.
Scarponi, D., and Kowalewski, M., 2004, Stratigraphic paleoecology: Bathymetric
signatures and sequence overprint of mollusk associations from late Quaternary sequences of the Po Plain, Italy: Geology, v. 32, p. 989–992.
Smith, A.B., Gale, A.S., and Monks, N.E.A., 2001, Sea-level change and rock-record bias
in the Cretaceous: a problem for extinction and biodiversity studies, Paleobiology, v. 27, p.241-253.
Springer, D.A., and Bambach, R.K., 1985, Gradient versus cluster analysis of fossil
assemblages: A comparison from the Ordovician of southwestern Virginia: Lethaia, v. 18, p. 181–198.
Stanley, S. M., 2010, Thermal barriers and the fate of perched faunas, Geology, v. 38, p.
31-34. Stephenson, L. W., 1941, The larger invertebrates of the Navarro Group of Texas
(exclusive of corals and crustaceans and exclusive of the fauna of the Escondido Formation), University of Texas Bulletin, v. 4101, p. 1-641.
Sohl, N. R., 1967a, Upper Cretaceous gastropods of from the Pierre Shale at Red Bird,
Wyoming: USGS Professional Paper, v. 393-B, 46 p. Sohl, N. R., 1967b, Upper Cretaceous gastropod assemblages of the Western Interior of
the United States: in A symposium on paleoenvironments of the Cretaceous seaway in the Western Interior: Geological Society of America Meeting, 140 p.
Speden, I.G. 1970, The Type Fox Hills Formation Cretaceous (Maestrichtian), South
Dakota, Part 2. Systematics of the Bivalvia; Peabody Museum of Natural History Bulletin, v. 33, p. 1-222.
Tsujita, C.J., 1995, Origin of concretion-hosted shell clusters in the Late Cretaceous
Bearpaw Formation, Southern Alberta, Canada: Palaios, v. 10, p. 408–423.
95
Tsujita, C. J., Westermann, G.E.G., 1998, Ammonoid habitats and habits in the Western Interior Seaway: a case study from the Upper Cretaceous Bearpaw Formation of southern Alberta, Canada: Palaeogeography, Palaeoclimatology, Palaeoecology, v. 144, p. 135-160.
Tourtelot, H.A., and Rye, R.O., 1969, Distribution of oxygen and carbon isotopes in the
fossils of Late Cretaceous age, Western Interior region of North America: Geological Society of America Bulletin, v. 80, p. 1903–1922.
Tyson, R. V., and Pearson, T. H., 1991a, Modern and ancient continental shelf anoxia: an
overview. Pp. 1–26 in Tyson R. V., and Pearson, T. H., eds., Modern and ancient continental shelf anoxia. Geological Society of London Special Publication, v. 58, p. 1–26.
Waage, K.M. 1964: The origin of repeated fossiliferous concretion layers in the Fox Hills
Formation. Kansas Geological Survey Bulletin 168, 541–563. Waage, K. M., 1967, The type Fox Hills Formation, Cretaceous (Maestrichtian), South
Dakota; Part 1, Stratigraphy and paleoenvironments: Peabody Museum of Natural History Bulletin, v. 27, p.1-175
Ward, P.D., Kennedy, W.J., MacLeod, K.G. & Mount, J.F. 1991: Ammonite and
inoceramid bivalve extinction patterns in Cretaceous/Tertiary. Geology 19, 1181–1184.
Walaszczyk, I., W.A., Cobban, and P. J., Harries, 2001, Inoceramids and inoceramid
biostratigraphy of the Campanian and Maastrichtian of the United States Western Interior Basin: Revue Paleobiology, v. 20, p. 117-234.
Wignall, P.B., and Myers, K. J., 1988, Interpreting benthic oxygen levels in mudrocks: a
new approach. Geology, v.16, p. 452-455. Wignall, P.B., 1993, Distinguishing between oxygen and substrate control in fossil
benthic assemblages, Journal of the Geological Society of London, v.150, p. 193-196.
Wignall, P.B., 2004, Causes of Mass Extinctions: In Taylor, P.D., eds., Extinction in the
History of Life, Cambridge University Press, p. 119-150. Wright, E.K., 1987, Stratification and Paleocirculation of the Late Cretaceous Western
Interior Seaway of North America: Geological Society of America Bulletin, v.99, p.480-490.
Wroblewski, A.F-J., 2008, Paleoenvironmental Significance of Cretaceous and Paleocene
Psilonichnus in southern Wyoming: Palaios, v. 23, p. 370–379.
96

Wroblewski, A.F-J., 2004, New Selachian paleofaunas from ‘‘fluvial’’ deposits of the Ferris and lower Hanna formations (Maastrichtian–Selandian: 66–58 Ma), southern Wyoming: Palaios, v. 19, p. 249–258.
Zaton, M., and Marynowski, L., 2004, Konzentrat-Lagerstätte-type carbonate concretions
from the uppermost Bajocian (Middle Jurassic) of the Czêstochowa area, South-Central Poland: Geological Quarterly, v.48, p. 339-350.
97
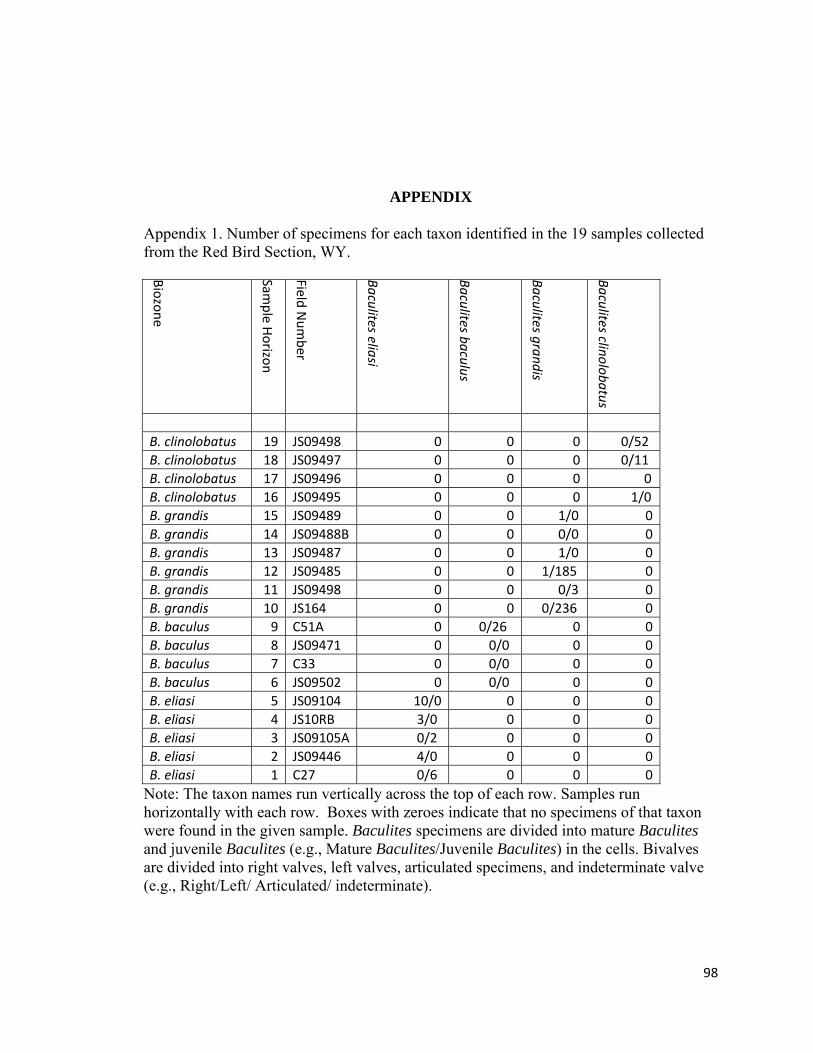
APPENDIX
Appendix 1. Number of specimens for each taxon identified in the 19 samples collected from the Red Bird Section, WY. Biozone
Sample H
orizon
Field Num
ber
Baculites eliasi
Baculites baculus
Baculites grandis
Baculites clinolobatus
B. clinolobatus 19 JS09498 0 0 0 0/52 B. clinolobatus 18 JS09497 0 0 0 0/11 B. clinolobatus 17 JS09496 0 0 0 0 B. clinolobatus 16 JS09495 0 0 0 1/0 B. grandis 15 JS09489 0 0 1/0 0 B. grandis 14 JS09488B 0 0 0/0 0 B. grandis 13 JS09487 0 0 1/0 0 B. grandis 12 JS09485 0 0 1/185 0 B. grandis 11 JS09498 0 0 0/3 0 B. grandis 10 JS164 0 0 0/236 0 B. baculus 9 C51A 0 0/26 0 0 B. baculus 8 JS09471 0 0/0 0 0 B. baculus 7 C33 0 0/0 0 0 B. baculus 6 JS09502 0 0/0 0 0 B. eliasi 5 JS09104 10/0 0 0 0 B. eliasi 4 JS10RB 3/0 0 0 0 B. eliasi 3 JS09105A 0/2 0 0 0 B. eliasi 2 JS09446 4/0 0 0 0 B. eliasi 1 C27 0/6 0 0 0
Note: The taxon names run vertically across the top of each row. Samples run horizontally with each row. Boxes with zeroes indicate that no specimens of that taxon were found in the given sample. Baculites specimens are divided into mature Baculites and juvenile Baculites (e.g., Mature Baculites/Juvenile Baculites) in the cells. Bivalves are divided into right valves, left valves, articulated specimens, and indeterminate valve (e.g., Right/Left/ Articulated/ indeterminate).
98
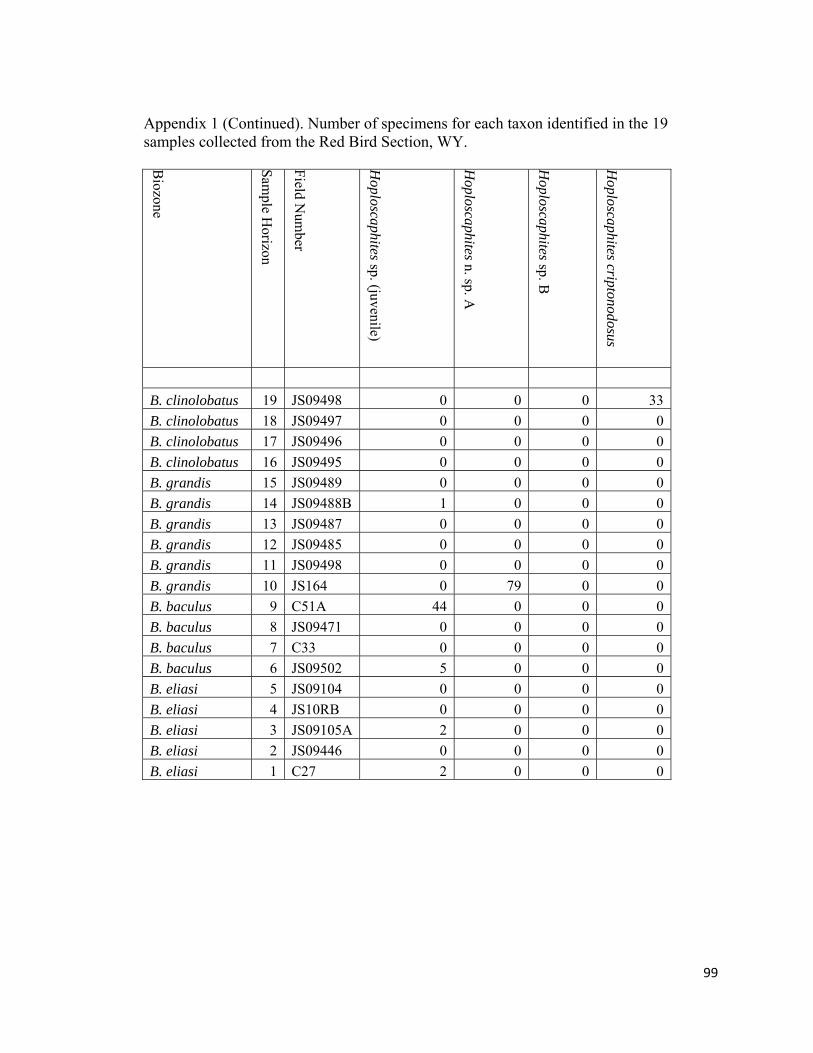
Appendix 1 (Continued). Number of specimens for each taxon identified in the 19 samples collected from the Red Bird Section, WY. B
iozone
Sample H
orizon
Field Num
ber
Hoploscaphites sp. (juvenile)
Hoploscaphites n. sp. A
Hoploscaphites sp. B
Hoploscaphites criptonodosus
B. clinolobatus 19 JS09498 0 0 0 33B. clinolobatus 18 JS09497 0 0 0 0B. clinolobatus 17 JS09496 0 0 0 0B. clinolobatus 16 JS09495 0 0 0 0B. grandis 15 JS09489 0 0 0 0B. grandis 14 JS09488B 1 0 0 0B. grandis 13 JS09487 0 0 0 0B. grandis 12 JS09485 0 0 0 0B. grandis 11 JS09498 0 0 0 0B. grandis 10 JS164 0 79 0 0B. baculus 9 C51A 44 0 0 0B. baculus 8 JS09471 0 0 0 0B. baculus 7 C33 0 0 0 0B. baculus 6 JS09502 5 0 0 0B. eliasi 5 JS09104 0 0 0 0B. eliasi 4 JS10RB 0 0 0 0B. eliasi 3 JS09105A 2 0 0 0B. eliasi 2 JS09446 0 0 0 0B. eliasi 1 C27 2 0 0 0
99
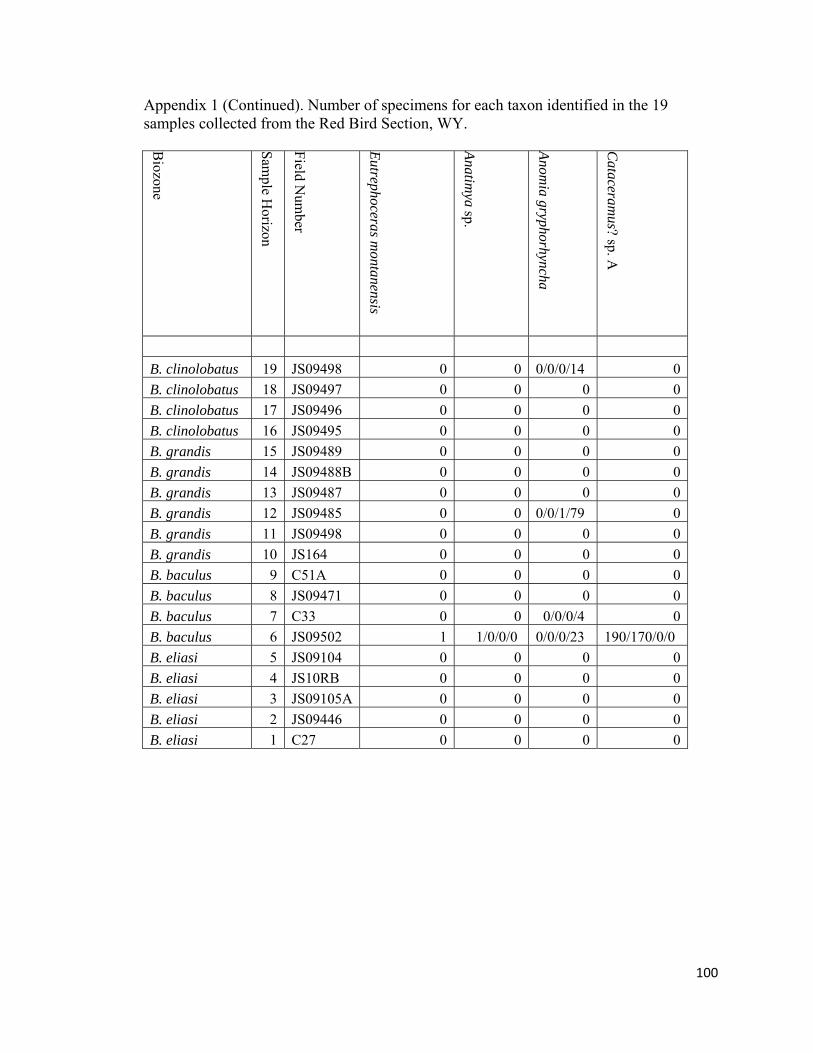
Appendix 1 (Continued). Number of specimens for each taxon identified in the 19 samples collected from the Red Bird Section, WY. B
iozone
Sample H
orizon
Field Num
ber
Eutrephoceras montanensis
Anatimya sp.
Anomia gryphorhyncha
Cataceram
us? sp. A
B. clinolobatus 19 JS09498 0 0 0/0/0/14 0B. clinolobatus 18 JS09497 0 0 0 0B. clinolobatus 17 JS09496 0 0 0 0B. clinolobatus 16 JS09495 0 0 0 0B. grandis 15 JS09489 0 0 0 0B. grandis 14 JS09488B 0 0 0 0B. grandis 13 JS09487 0 0 0 0B. grandis 12 JS09485 0 0 0/0/1/79 0B. grandis 11 JS09498 0 0 0 0B. grandis 10 JS164 0 0 0 0B. baculus 9 C51A 0 0 0 0B. baculus 8 JS09471 0 0 0 0B. baculus 7 C33 0 0 0/0/0/4 0B. baculus 6 JS09502 1 1/0/0/0 0/0/0/23 190/170/0/0 B. eliasi 5 JS09104 0 0 0 0B. eliasi 4 JS10RB 0 0 0 0B. eliasi 3 JS09105A 0 0 0 0B. eliasi 2 JS09446 0 0 0 0B. eliasi 1 C27 0 0 0 0
100
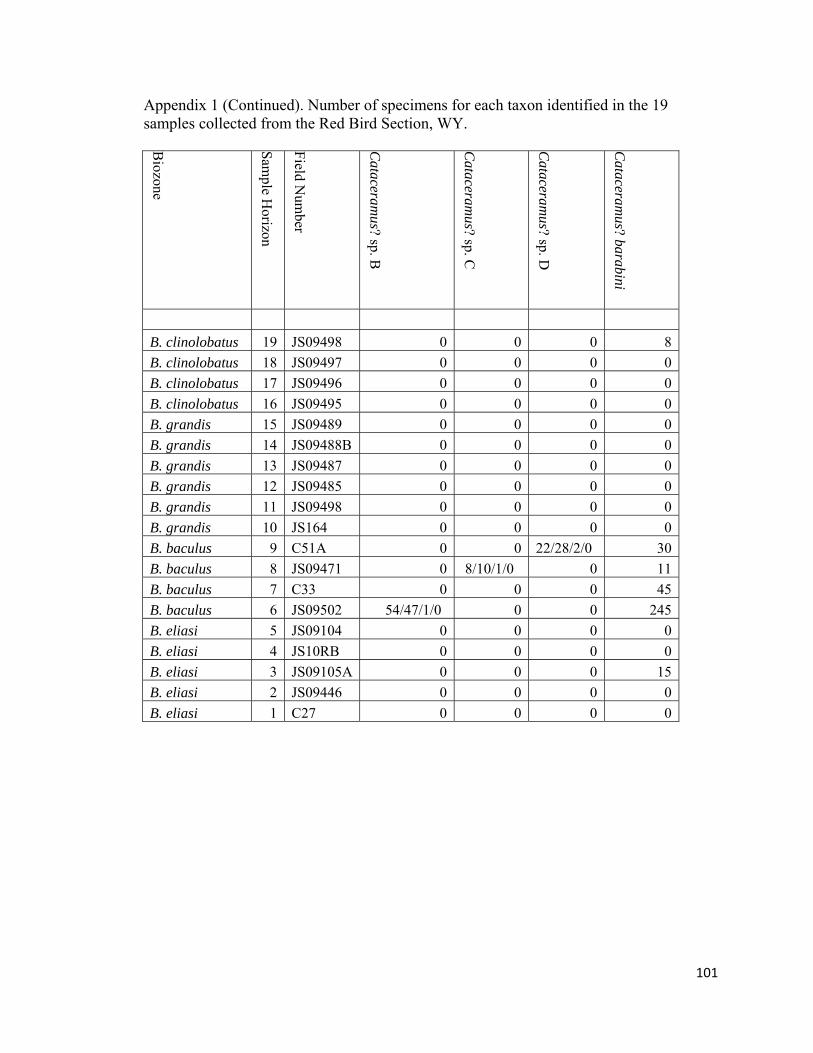
Appendix 1 (Continued). Number of specimens for each taxon identified in the 19 samples collected from the Red Bird Section, WY. B
iozone
Sample H
orizon
Field Num
ber
Cataceram
us? sp. B
Cataceram
us? sp. C
Cataceram
us? sp. D
Cataceram
us? barabini
B. clinolobatus 19 JS09498 0 0 0 8B. clinolobatus 18 JS09497 0 0 0 0B. clinolobatus 17 JS09496 0 0 0 0B. clinolobatus 16 JS09495 0 0 0 0B. grandis 15 JS09489 0 0 0 0B. grandis 14 JS09488B 0 0 0 0B. grandis 13 JS09487 0 0 0 0B. grandis 12 JS09485 0 0 0 0B. grandis 11 JS09498 0 0 0 0B. grandis 10 JS164 0 0 0 0B. baculus 9 C51A 0 0 22/28/2/0 30B. baculus 8 JS09471 0 8/10/1/0 0 11B. baculus 7 C33 0 0 0 45B. baculus 6 JS09502 54/47/1/0 0 0 245B. eliasi 5 JS09104 0 0 0 0B. eliasi 4 JS10RB 0 0 0 0B. eliasi 3 JS09105A 0 0 0 15B. eliasi 2 JS09446 0 0 0 0B. eliasi 1 C27 0 0 0 0
101
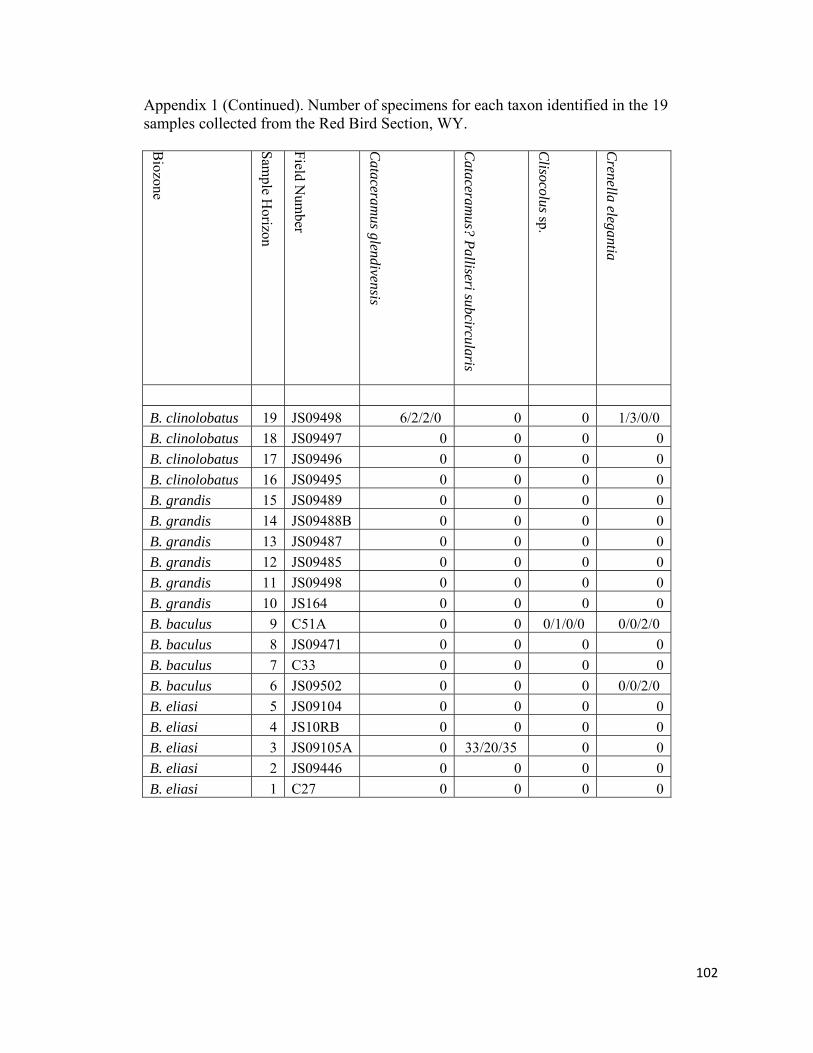
Appendix 1 (Continued). Number of specimens for each taxon identified in the 19 samples collected from the Red Bird Section, WY. B
iozone
Sample H
orizon
Field Num
ber
Cataceram
us glendivensis
Cataceram
us? Palliseri subcircularis
Clisocolus sp.
Crenella elegantia
B. clinolobatus 19 JS09498 6/2/2/0 0 0 1/3/0/0 B. clinolobatus 18 JS09497 0 0 0 0B. clinolobatus 17 JS09496 0 0 0 0B. clinolobatus 16 JS09495 0 0 0 0B. grandis 15 JS09489 0 0 0 0B. grandis 14 JS09488B 0 0 0 0B. grandis 13 JS09487 0 0 0 0B. grandis 12 JS09485 0 0 0 0B. grandis 11 JS09498 0 0 0 0B. grandis 10 JS164 0 0 0 0B. baculus 9 C51A 0 0 0/1/0/0 0/0/2/0 B. baculus 8 JS09471 0 0 0 0B. baculus 7 C33 0 0 0 0B. baculus 6 JS09502 0 0 0 0/0/2/0 B. eliasi 5 JS09104 0 0 0 0B. eliasi 4 JS10RB 0 0 0 0B. eliasi 3 JS09105A 0 33/20/35 0 0B. eliasi 2 JS09446 0 0 0 0B. eliasi 1 C27 0 0 0 0
102
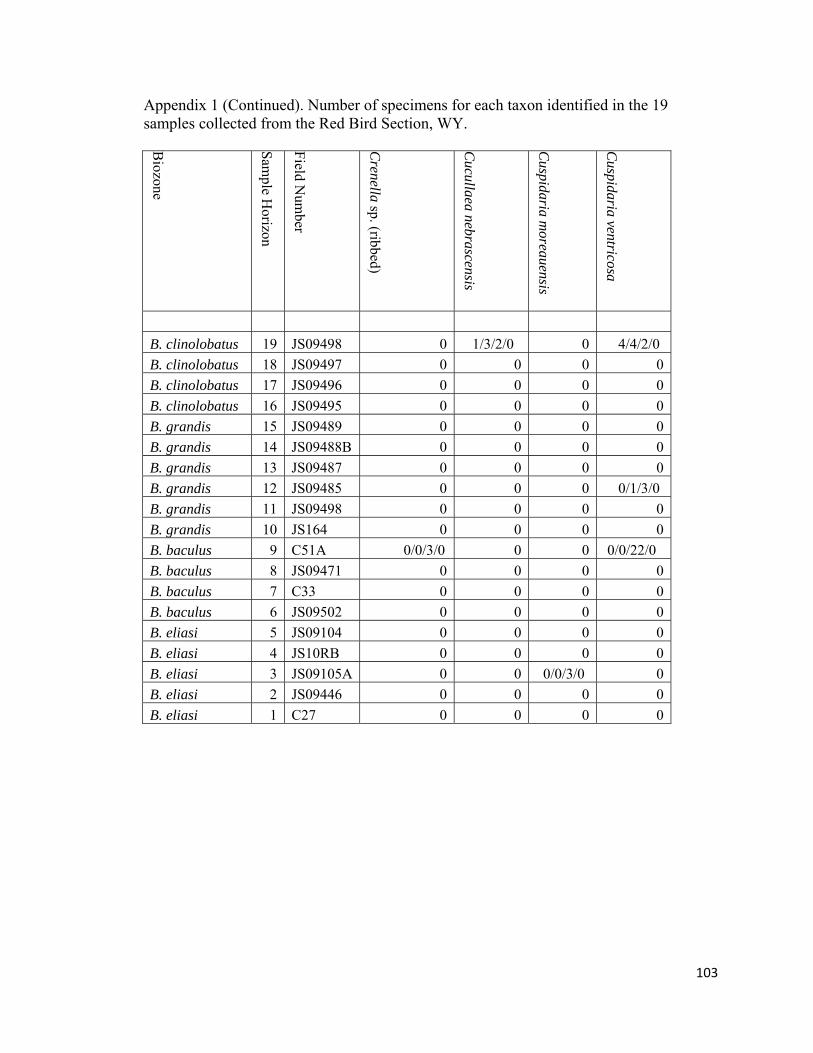
Appendix 1 (Continued). Number of specimens for each taxon identified in the 19 samples collected from the Red Bird Section, WY. B
iozone
Sample H
orizon
Field Num
ber
Crenella sp. (ribbed)
Cucullaea nebrascensis
Cuspidaria m
oreauensis
Cuspidaria ventricosa
B. clinolobatus 19 JS09498 0 1/3/2/0 0 4/4/2/0 B. clinolobatus 18 JS09497 0 0 0 0B. clinolobatus 17 JS09496 0 0 0 0B. clinolobatus 16 JS09495 0 0 0 0B. grandis 15 JS09489 0 0 0 0B. grandis 14 JS09488B 0 0 0 0B. grandis 13 JS09487 0 0 0 0B. grandis 12 JS09485 0 0 0 0/1/3/0 B. grandis 11 JS09498 0 0 0 0B. grandis 10 JS164 0 0 0 0B. baculus 9 C51A 0/0/3/0 0 0 0/0/22/0 B. baculus 8 JS09471 0 0 0 0B. baculus 7 C33 0 0 0 0B. baculus 6 JS09502 0 0 0 0B. eliasi 5 JS09104 0 0 0 0B. eliasi 4 JS10RB 0 0 0 0B. eliasi 3 JS09105A 0 0 0/0/3/0 0B. eliasi 2 JS09446 0 0 0 0B. eliasi 1 C27 0 0 0 0
103
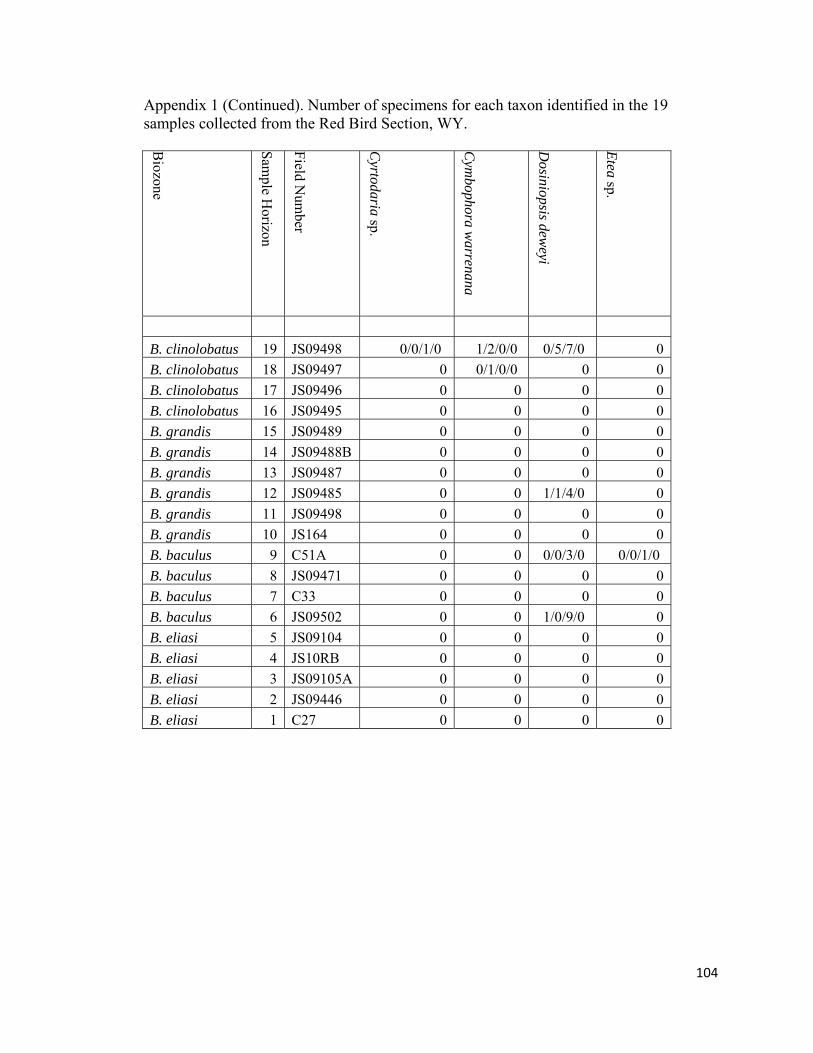
Appendix 1 (Continued). Number of specimens for each taxon identified in the 19 samples collected from the Red Bird Section, WY. B
iozone
Sample H
orizon
Field Num
ber
Cyrtodaria sp.
Cym
bophora warrenana
Dosiniopsis dew
eyi
Etea sp.
B. clinolobatus 19 JS09498 0/0/1/0 1/2/0/0 0/5/7/0 0B. clinolobatus 18 JS09497 0 0/1/0/0 0 0B. clinolobatus 17 JS09496 0 0 0 0B. clinolobatus 16 JS09495 0 0 0 0B. grandis 15 JS09489 0 0 0 0B. grandis 14 JS09488B 0 0 0 0B. grandis 13 JS09487 0 0 0 0B. grandis 12 JS09485 0 0 1/1/4/0 0B. grandis 11 JS09498 0 0 0 0B. grandis 10 JS164 0 0 0 0B. baculus 9 C51A 0 0 0/0/3/0 0/0/1/0 B. baculus 8 JS09471 0 0 0 0B. baculus 7 C33 0 0 0 0B. baculus 6 JS09502 0 0 1/0/9/0 0B. eliasi 5 JS09104 0 0 0 0B. eliasi 4 JS10RB 0 0 0 0B. eliasi 3 JS09105A 0 0 0 0B. eliasi 2 JS09446 0 0 0 0B. eliasi 1 C27 0 0 0 0
104
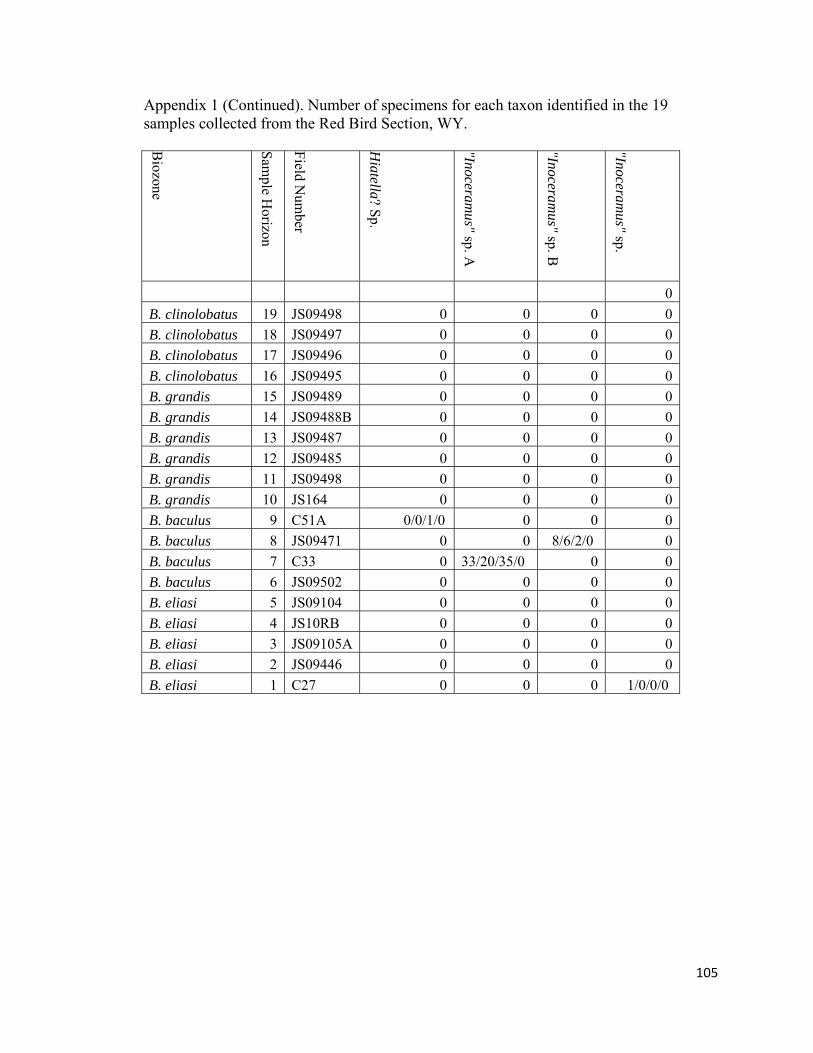
Appendix 1 (Continued). Number of specimens for each taxon identified in the 19 samples collected from the Red Bird Section, WY. B
iozone
Sample H
orizon
Field Num
ber
Hiatella? Sp.
"Inoceramus" sp. A
"Inoceramus" sp. B
"Inoceramus" sp.
0B. clinolobatus 19 JS09498 0 0 0 0B. clinolobatus 18 JS09497 0 0 0 0B. clinolobatus 17 JS09496 0 0 0 0B. clinolobatus 16 JS09495 0 0 0 0B. grandis 15 JS09489 0 0 0 0B. grandis 14 JS09488B 0 0 0 0B. grandis 13 JS09487 0 0 0 0B. grandis 12 JS09485 0 0 0 0B. grandis 11 JS09498 0 0 0 0B. grandis 10 JS164 0 0 0 0B. baculus 9 C51A 0/0/1/0 0 0 0B. baculus 8 JS09471 0 0 8/6/2/0 0B. baculus 7 C33 0 33/20/35/0 0 0B. baculus 6 JS09502 0 0 0 0B. eliasi 5 JS09104 0 0 0 0B. eliasi 4 JS10RB 0 0 0 0B. eliasi 3 JS09105A 0 0 0 0B. eliasi 2 JS09446 0 0 0 0B. eliasi 1 C27 0 0 0 1/0/0/0
105
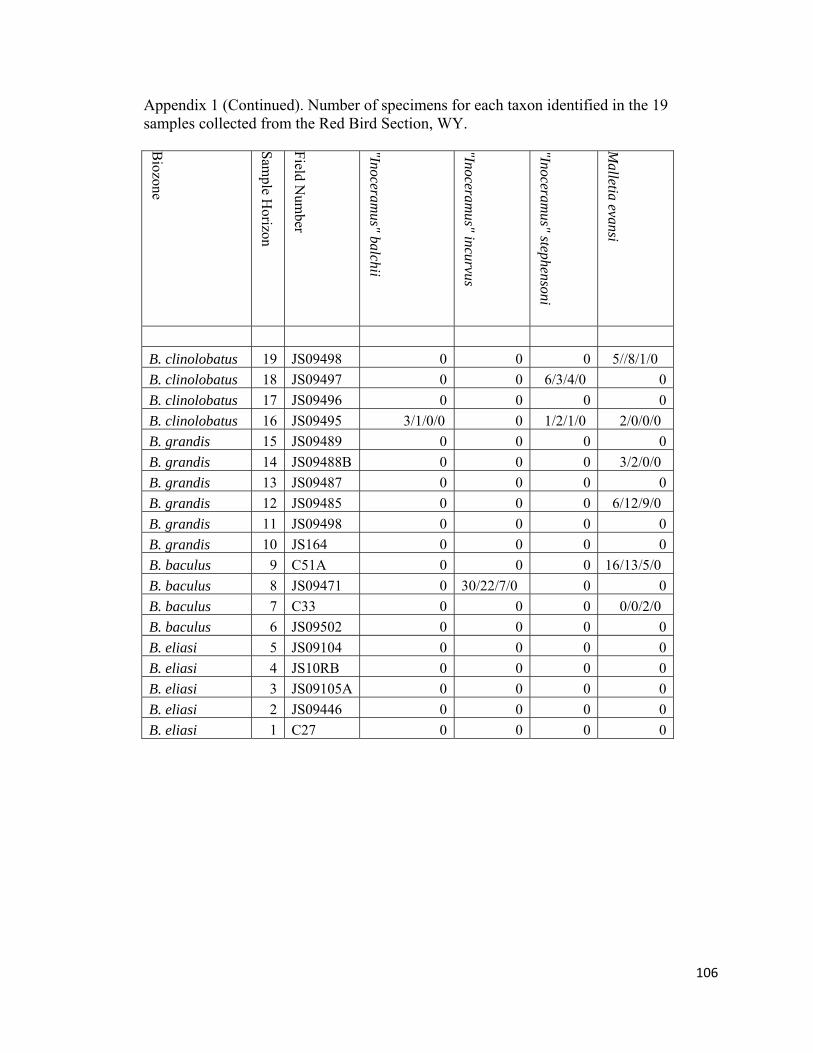
Appendix 1 (Continued). Number of specimens for each taxon identified in the 19 samples collected from the Red Bird Section, WY. B
iozone
Sample H
orizon
Field Num
ber
"Inoceramus" balchii
"Inoceramus" incurvus
"Inoceramus" stephensoni
Malletia evansi
B. clinolobatus 19 JS09498 0 0 0 5//8/1/0 B. clinolobatus 18 JS09497 0 0 6/3/4/0 0B. clinolobatus 17 JS09496 0 0 0 0B. clinolobatus 16 JS09495 3/1/0/0 0 1/2/1/0 2/0/0/0 B. grandis 15 JS09489 0 0 0 0B. grandis 14 JS09488B 0 0 0 3/2/0/0 B. grandis 13 JS09487 0 0 0 0B. grandis 12 JS09485 0 0 0 6/12/9/0 B. grandis 11 JS09498 0 0 0 0B. grandis 10 JS164 0 0 0 0B. baculus 9 C51A 0 0 0 16/13/5/0 B. baculus 8 JS09471 0 30/22/7/0 0 0B. baculus 7 C33 0 0 0 0/0/2/0 B. baculus 6 JS09502 0 0 0 0B. eliasi 5 JS09104 0 0 0 0B. eliasi 4 JS10RB 0 0 0 0B. eliasi 3 JS09105A 0 0 0 0B. eliasi 2 JS09446 0 0 0 0B. eliasi 1 C27 0 0 0 0
106
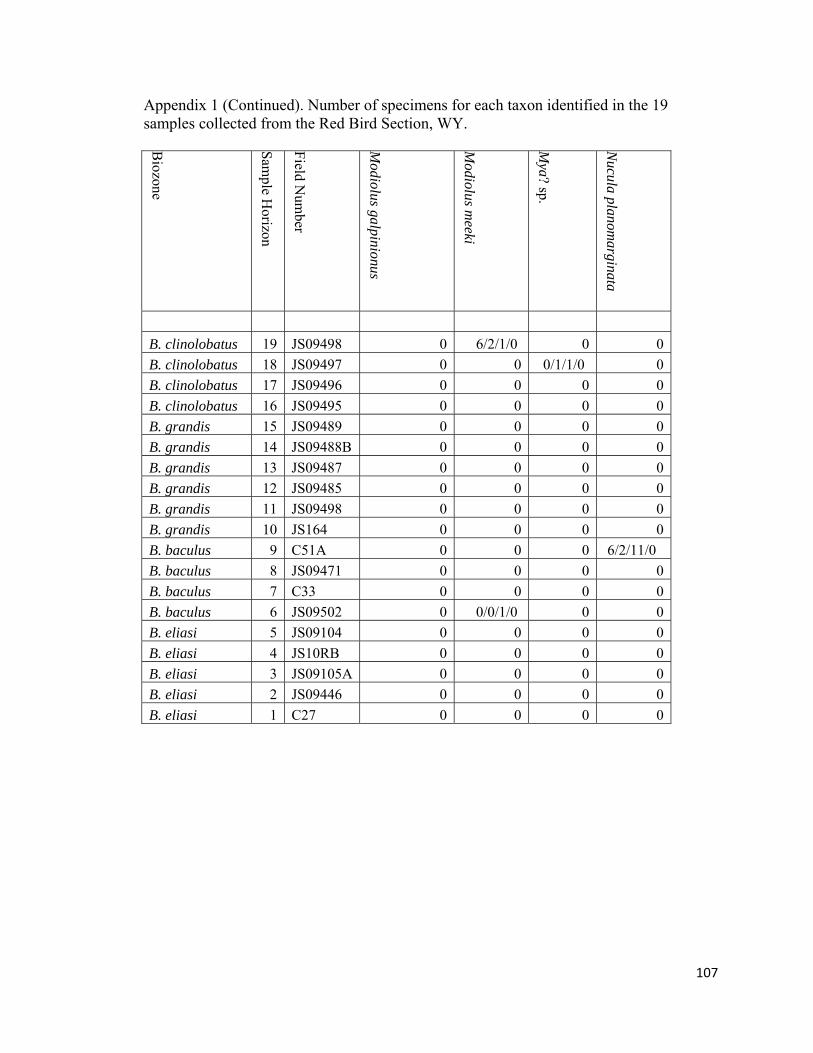
Appendix 1 (Continued). Number of specimens for each taxon identified in the 19 samples collected from the Red Bird Section, WY. B
iozone
Sample H
orizon
Field Num
ber
Modiolus galpinionus
Modiolus m
eeki
Mya? sp.
Nucula planom
arginata
B. clinolobatus 19 JS09498 0 6/2/1/0 0 0B. clinolobatus 18 JS09497 0 0 0/1/1/0 0B. clinolobatus 17 JS09496 0 0 0 0B. clinolobatus 16 JS09495 0 0 0 0B. grandis 15 JS09489 0 0 0 0B. grandis 14 JS09488B 0 0 0 0B. grandis 13 JS09487 0 0 0 0B. grandis 12 JS09485 0 0 0 0B. grandis 11 JS09498 0 0 0 0B. grandis 10 JS164 0 0 0 0B. baculus 9 C51A 0 0 0 6/2/11/0 B. baculus 8 JS09471 0 0 0 0B. baculus 7 C33 0 0 0 0B. baculus 6 JS09502 0 0/0/1/0 0 0B. eliasi 5 JS09104 0 0 0 0B. eliasi 4 JS10RB 0 0 0 0B. eliasi 3 JS09105A 0 0 0 0B. eliasi 2 JS09446 0 0 0 0B. eliasi 1 C27 0 0 0 0
107
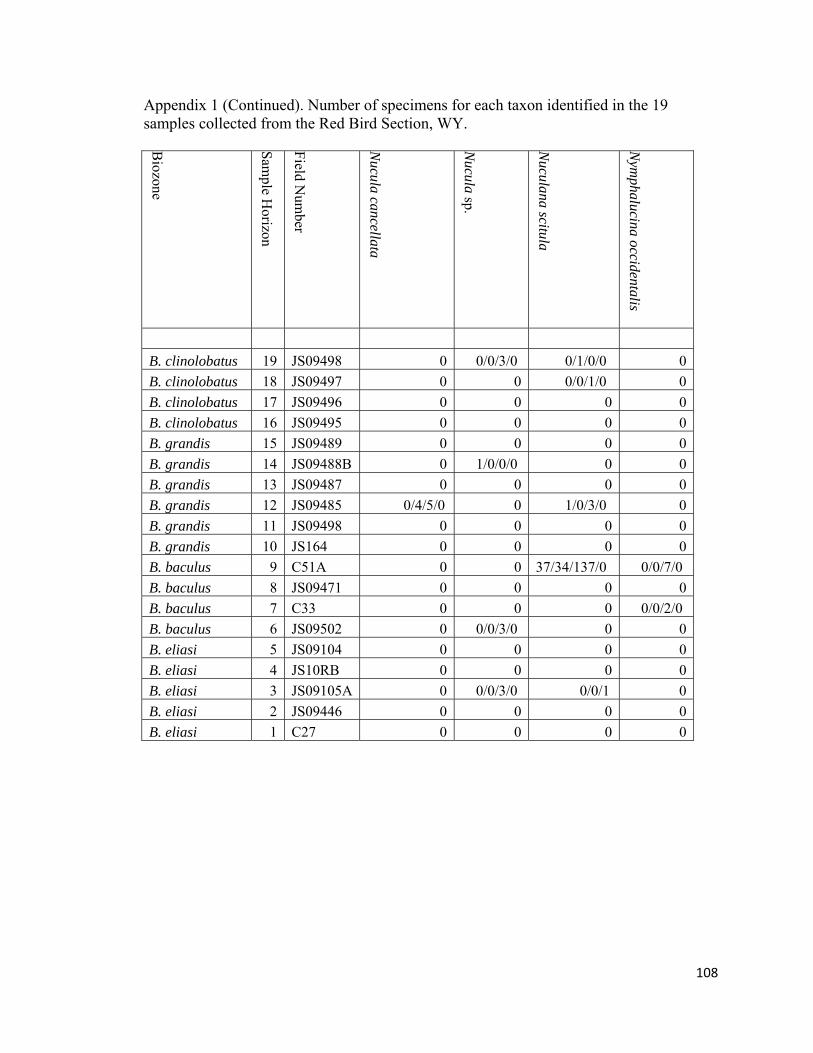
Appendix 1 (Continued). Number of specimens for each taxon identified in the 19 samples collected from the Red Bird Section, WY. B
iozone
Sample H
orizon
Field Num
ber
Nucula cancellata
Nucula sp.
Nuculana scitula
Nym
phalucina occidentalis
B. clinolobatus 19 JS09498 0 0/0/3/0 0/1/0/0 0B. clinolobatus 18 JS09497 0 0 0/0/1/0 0B. clinolobatus 17 JS09496 0 0 0 0B. clinolobatus 16 JS09495 0 0 0 0B. grandis 15 JS09489 0 0 0 0B. grandis 14 JS09488B 0 1/0/0/0 0 0B. grandis 13 JS09487 0 0 0 0B. grandis 12 JS09485 0/4/5/0 0 1/0/3/0 0B. grandis 11 JS09498 0 0 0 0B. grandis 10 JS164 0 0 0 0B. baculus 9 C51A 0 0 37/34/137/0 0/0/7/0 B. baculus 8 JS09471 0 0 0 0B. baculus 7 C33 0 0 0 0/0/2/0 B. baculus 6 JS09502 0 0/0/3/0 0 0B. eliasi 5 JS09104 0 0 0 0B. eliasi 4 JS10RB 0 0 0 0B. eliasi 3 JS09105A 0 0/0/3/0 0/0/1 0B. eliasi 2 JS09446 0 0 0 0B. eliasi 1 C27 0 0 0 0
108
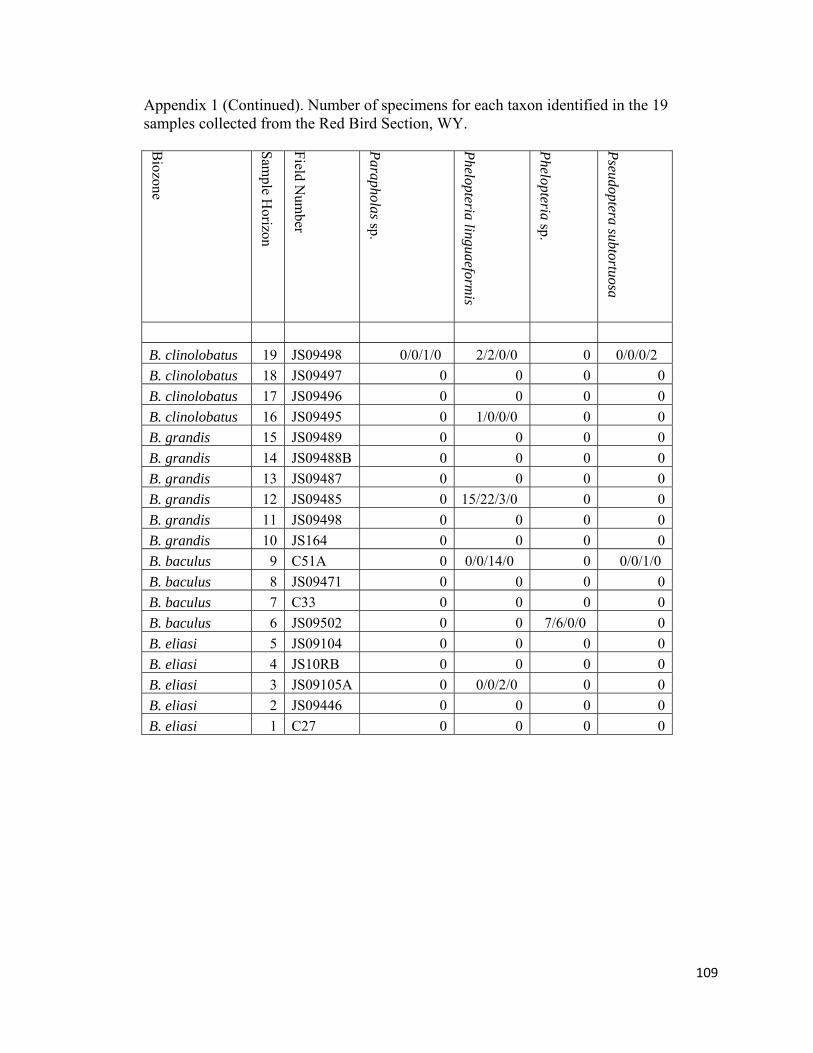
Appendix 1 (Continued). Number of specimens for each taxon identified in the 19 samples collected from the Red Bird Section, WY. B
iozone
Sample H
orizon
Field Num
ber
Parapholas sp.
Phelopteria linguaeformis
Phelopteria sp.
Pseudoptera subtortuosa
B. clinolobatus 19 JS09498 0/0/1/0 2/2/0/0 0 0/0/0/2 B. clinolobatus 18 JS09497 0 0 0 0B. clinolobatus 17 JS09496 0 0 0 0B. clinolobatus 16 JS09495 0 1/0/0/0 0 0B. grandis 15 JS09489 0 0 0 0B. grandis 14 JS09488B 0 0 0 0B. grandis 13 JS09487 0 0 0 0B. grandis 12 JS09485 0 15/22/3/0 0 0B. grandis 11 JS09498 0 0 0 0B. grandis 10 JS164 0 0 0 0B. baculus 9 C51A 0 0/0/14/0 0 0/0/1/0 B. baculus 8 JS09471 0 0 0 0B. baculus 7 C33 0 0 0 0B. baculus 6 JS09502 0 0 7/6/0/0 0B. eliasi 5 JS09104 0 0 0 0B. eliasi 4 JS10RB 0 0 0 0B. eliasi 3 JS09105A 0 0/0/2/0 0 0B. eliasi 2 JS09446 0 0 0 0B. eliasi 1 C27 0 0 0 0
109
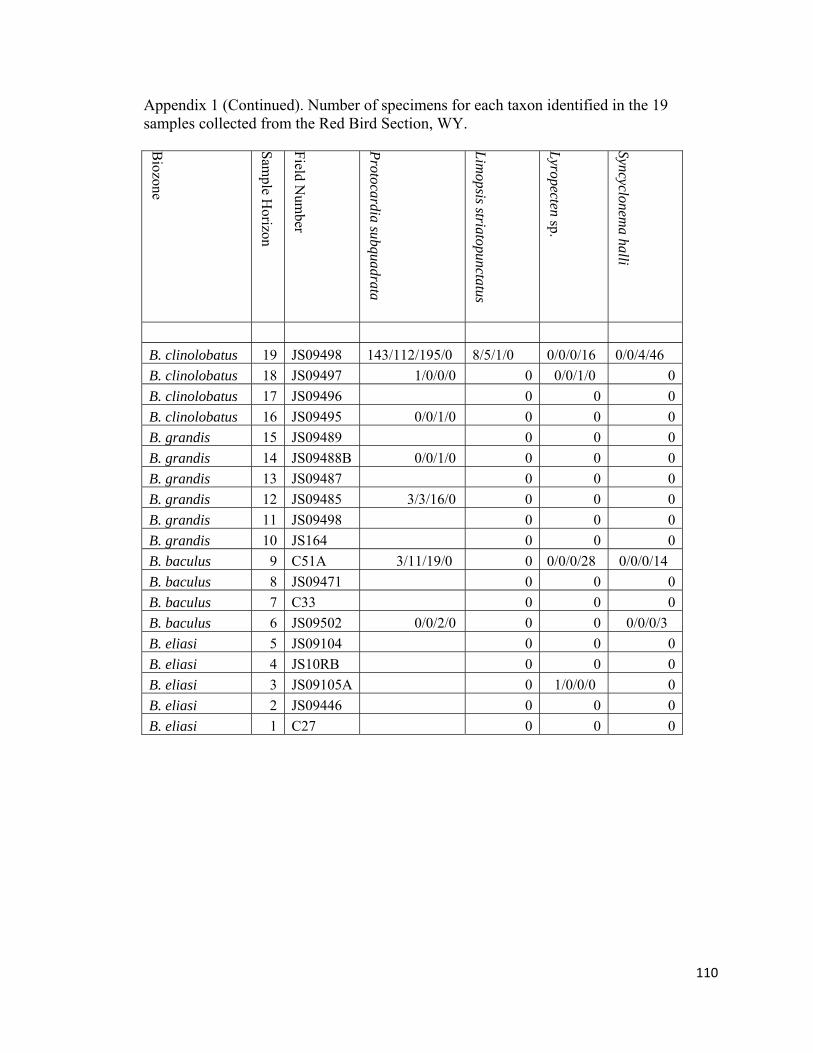
Appendix 1 (Continued). Number of specimens for each taxon identified in the 19 samples collected from the Red Bird Section, WY. B
iozone
Sample H
orizon
Field Num
ber
Protocardia subquadrata
Limopsis striatopunctatus
Lyropecten sp.
Syncyclonema halli
B. clinolobatus 19 JS09498 143/112/195/0 8/5/1/0 0/0/0/16 0/0/4/46 B. clinolobatus 18 JS09497 1/0/0/0 0 0/0/1/0 0B. clinolobatus 17 JS09496 0 0 0B. clinolobatus 16 JS09495 0/0/1/0 0 0 0B. grandis 15 JS09489 0 0 0B. grandis 14 JS09488B 0/0/1/0 0 0 0B. grandis 13 JS09487 0 0 0B. grandis 12 JS09485 3/3/16/0 0 0 0B. grandis 11 JS09498 0 0 0B. grandis 10 JS164 0 0 0B. baculus 9 C51A 3/11/19/0 0 0/0/0/28 0/0/0/14 B. baculus 8 JS09471 0 0 0B. baculus 7 C33 0 0 0B. baculus 6 JS09502 0/0/2/0 0 0 0/0/0/3 B. eliasi 5 JS09104 0 0 0B. eliasi 4 JS10RB 0 0 0B. eliasi 3 JS09105A 0 1/0/0/0 0B. eliasi 2 JS09446 0 0 0B. eliasi 1 C27 0 0 0
110
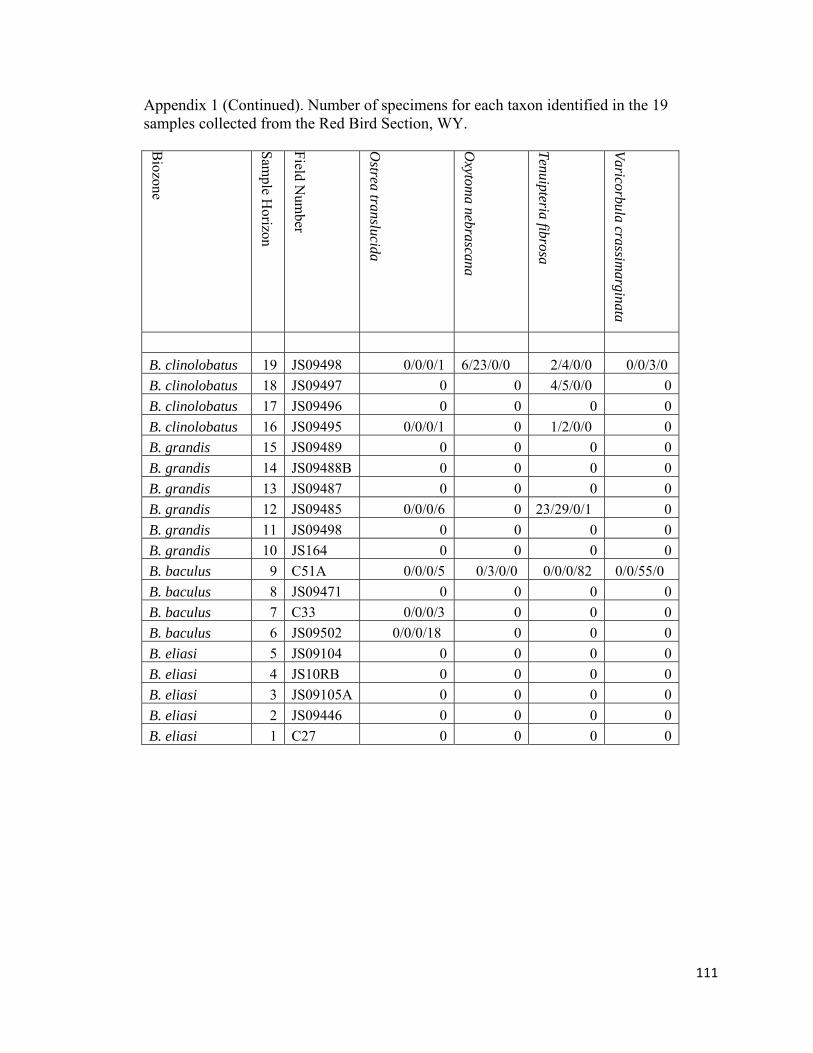
Appendix 1 (Continued). Number of specimens for each taxon identified in the 19 samples collected from the Red Bird Section, WY. B
iozone
Sample H
orizon
Field Num
ber
Ostrea translucida
Oxytom
a nebrascana
Tenuipteria fibrosa
Varicorbula crassimarginata
B. clinolobatus 19 JS09498 0/0/0/1 6/23/0/0 2/4/0/0 0/0/3/0 B. clinolobatus 18 JS09497 0 0 4/5/0/0 0B. clinolobatus 17 JS09496 0 0 0 0B. clinolobatus 16 JS09495 0/0/0/1 0 1/2/0/0 0B. grandis 15 JS09489 0 0 0 0B. grandis 14 JS09488B 0 0 0 0B. grandis 13 JS09487 0 0 0 0B. grandis 12 JS09485 0/0/0/6 0 23/29/0/1 0B. grandis 11 JS09498 0 0 0 0B. grandis 10 JS164 0 0 0 0B. baculus 9 C51A 0/0/0/5 0/3/0/0 0/0/0/82 0/0/55/0 B. baculus 8 JS09471 0 0 0 0B. baculus 7 C33 0/0/0/3 0 0 0B. baculus 6 JS09502 0/0/0/18 0 0 0B. eliasi 5 JS09104 0 0 0 0B. eliasi 4 JS10RB 0 0 0 0B. eliasi 3 JS09105A 0 0 0 0B. eliasi 2 JS09446 0 0 0 0B. eliasi 1 C27 0 0 0 0
111

Appendix 1 (Continued). Number of specimens for each taxon identified in the 19 samples collected from the Red Bird Section, WY. B
iozone
Sample H
orizon
Field Num
ber
Yoldia ? Sp.
Acamaea sp.
Amuletum
sp.
Anisomyon patelliform
is
B. clinolobatus 19 JS09498 0 0 0 0B. clinolobatus 18 JS09497 0 14 0 0B. clinolobatus 17 JS09496 0 0 0 0B. clinolobatus 16 JS09495 0 0 0 0B. grandis 15 JS09489 0 0 0 0B. grandis 14 JS09488B 0 0 0 0B. grandis 13 JS09487 0 0 0 0B. grandis 12 JS09485 0 0 0 0B. grandis 11 JS09498 0 0 0 0B. grandis 10 JS164 0 0 0 0B. baculus 9 C51A 0/0/1/0 0 1 0B. baculus 8 JS09471 0 0 0 0B. baculus 7 C33 0 0 0 0B. baculus 6 JS09502 0 0 0 5B. eliasi 5 JS09104 0 0 0 0B. eliasi 4 JS10RB 0 0 0 0B. eliasi 3 JS09105A 0 0 0 0B. eliasi 2 JS09446 0 0 0 0B. eliasi 1 C27 0 0 0 0
112
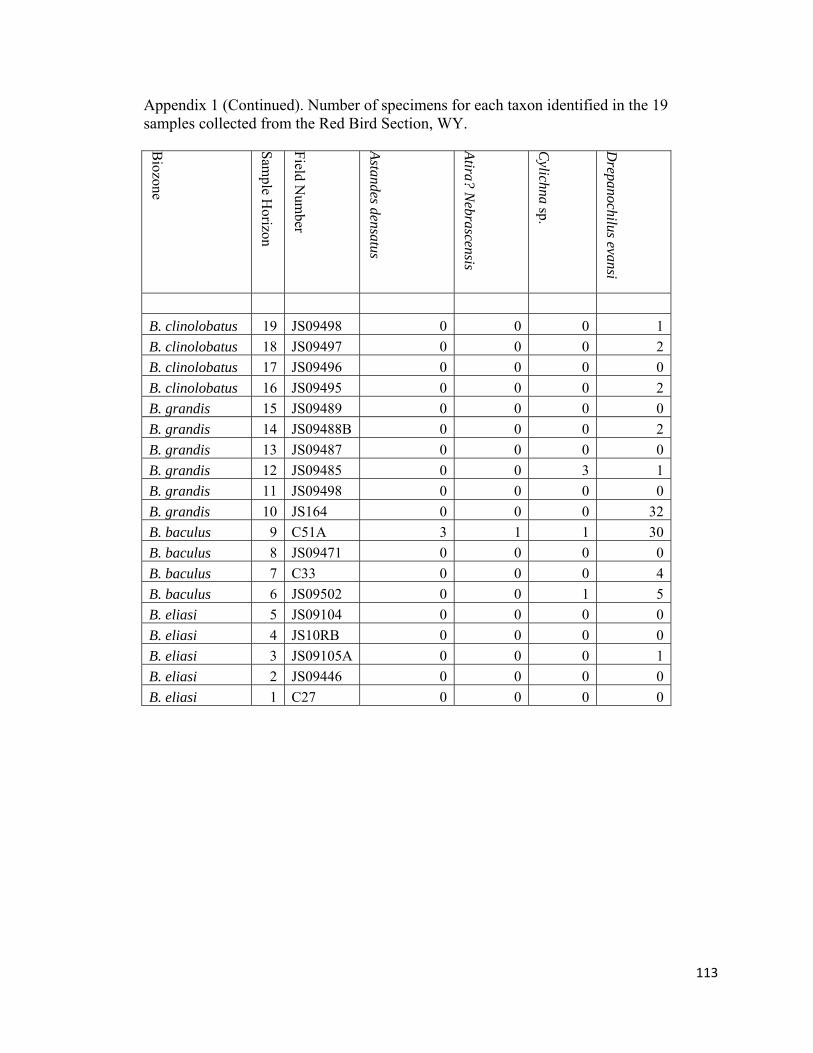
Appendix 1 (Continued). Number of specimens for each taxon identified in the 19 samples collected from the Red Bird Section, WY. B
iozone
Sample H
orizon
Field Num
ber
Astandes densatus
Atira? Nebrascensis
Cylichna sp.
Drepanochilus evansi
B. clinolobatus 19 JS09498 0 0 0 1B. clinolobatus 18 JS09497 0 0 0 2B. clinolobatus 17 JS09496 0 0 0 0B. clinolobatus 16 JS09495 0 0 0 2B. grandis 15 JS09489 0 0 0 0B. grandis 14 JS09488B 0 0 0 2B. grandis 13 JS09487 0 0 0 0B. grandis 12 JS09485 0 0 3 1B. grandis 11 JS09498 0 0 0 0B. grandis 10 JS164 0 0 0 32B. baculus 9 C51A 3 1 1 30B. baculus 8 JS09471 0 0 0 0B. baculus 7 C33 0 0 0 4B. baculus 6 JS09502 0 0 1 5B. eliasi 5 JS09104 0 0 0 0B. eliasi 4 JS10RB 0 0 0 0B. eliasi 3 JS09105A 0 0 0 1B. eliasi 2 JS09446 0 0 0 0B. eliasi 1 C27 0 0 0 0
113

Appendix 1 (Continued). Number of specimens for each taxon identified in the 19 samples collected from the Red Bird Section, WY. B
iozone
Sample H
orizon
Field Num
ber
Ellipsoscapha minor
Ellipsoscapha occidentalis
Euspira obliquata
Goniocylichna biculpturata
B. clinolobatus 19 JS09498 0 0 14 0B. clinolobatus 18 JS09497 0 0 3 0B. clinolobatus 17 JS09496 0 0 0 0B. clinolobatus 16 JS09495 0 0 0 0B. grandis 15 JS09489 0 0 0 0B. grandis 14 JS09488B 0 0 0 0B. grandis 13 JS09487 0 0 0 0B. grandis 12 JS09485 3 0 5 0B. grandis 11 JS09498 0 0 0 0B. grandis 10 JS164 7 0 3 0B. baculus 9 C51A 0 1 38 1B. baculus 8 JS09471 0 0 0 0B. baculus 7 C33 0 0 1 0B. baculus 6 JS09502 0 0 3 0B. eliasi 5 JS09104 0 0 0 0B. eliasi 4 JS10RB 0 0 0 0B. eliasi 3 JS09105A 0 0 1 0B. eliasi 2 JS09446 0 0 0 0B. eliasi 1 C27 0 0 0 0
114
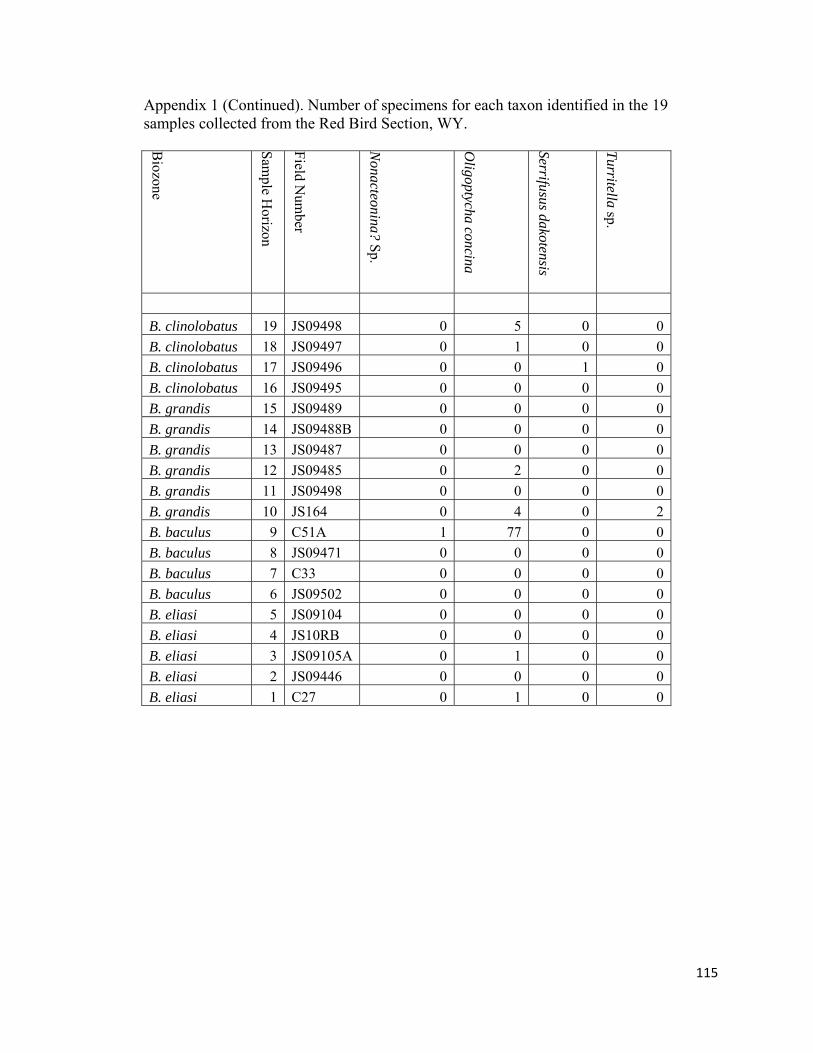
Appendix 1 (Continued). Number of specimens for each taxon identified in the 19 samples collected from the Red Bird Section, WY. B
iozone
Sample H
orizon
Field Num
ber
Nonacteonina? Sp.
Oligoptycha concina
Serrifusus dakotensis
Turritella sp.
B. clinolobatus 19 JS09498 0 5 0 0B. clinolobatus 18 JS09497 0 1 0 0B. clinolobatus 17 JS09496 0 0 1 0B. clinolobatus 16 JS09495 0 0 0 0B. grandis 15 JS09489 0 0 0 0B. grandis 14 JS09488B 0 0 0 0B. grandis 13 JS09487 0 0 0 0B. grandis 12 JS09485 0 2 0 0B. grandis 11 JS09498 0 0 0 0B. grandis 10 JS164 0 4 0 2B. baculus 9 C51A 1 77 0 0B. baculus 8 JS09471 0 0 0 0B. baculus 7 C33 0 0 0 0B. baculus 6 JS09502 0 0 0 0B. eliasi 5 JS09104 0 0 0 0B. eliasi 4 JS10RB 0 0 0 0B. eliasi 3 JS09105A 0 1 0 0B. eliasi 2 JS09446 0 0 0 0B. eliasi 1 C27 0 1 0 0
115
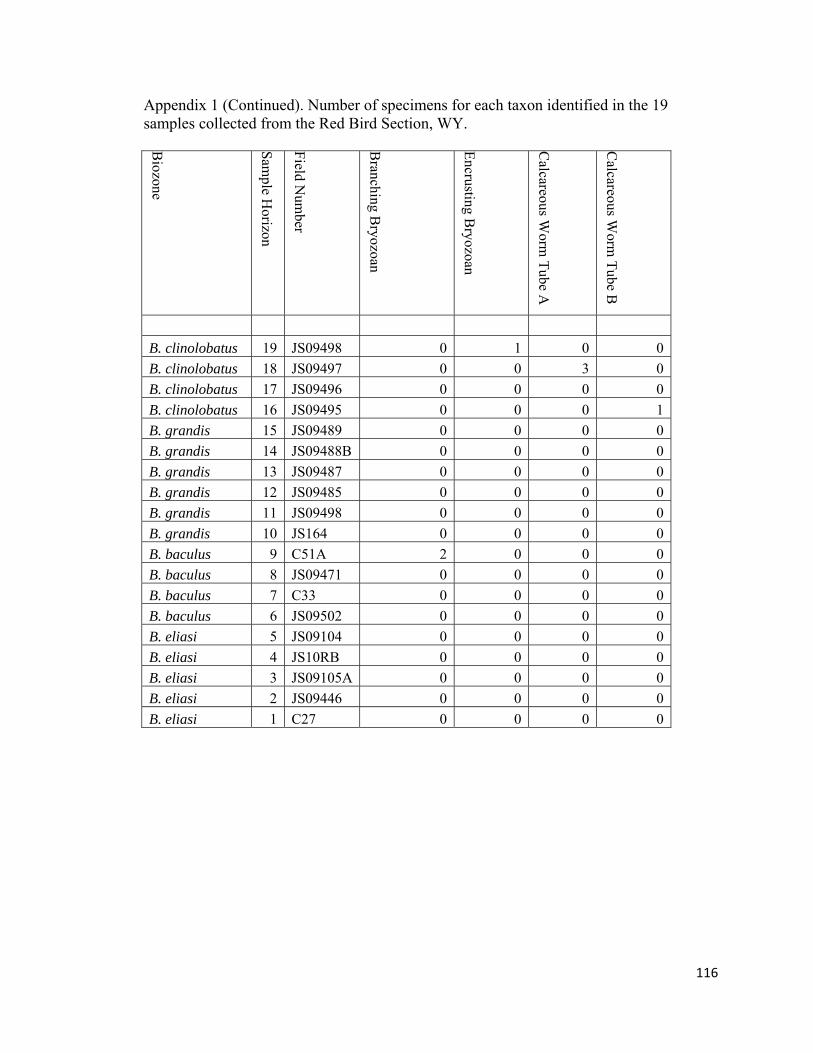
Appendix 1 (Continued). Number of specimens for each taxon identified in the 19 samples collected from the Red Bird Section, WY. B
iozone
Sample H
orizon
Field Num
ber
Branching B
ryozoan
Encrusting Bryozoan
Calcareous W
orm Tube A
Calcareous W
orm Tube B
B. clinolobatus 19 JS09498 0 1 0 0B. clinolobatus 18 JS09497 0 0 3 0B. clinolobatus 17 JS09496 0 0 0 0B. clinolobatus 16 JS09495 0 0 0 1B. grandis 15 JS09489 0 0 0 0B. grandis 14 JS09488B 0 0 0 0B. grandis 13 JS09487 0 0 0 0B. grandis 12 JS09485 0 0 0 0B. grandis 11 JS09498 0 0 0 0B. grandis 10 JS164 0 0 0 0B. baculus 9 C51A 2 0 0 0B. baculus 8 JS09471 0 0 0 0B. baculus 7 C33 0 0 0 0B. baculus 6 JS09502 0 0 0 0B. eliasi 5 JS09104 0 0 0 0B. eliasi 4 JS10RB 0 0 0 0B. eliasi 3 JS09105A 0 0 0 0B. eliasi 2 JS09446 0 0 0 0B. eliasi 1 C27 0 0 0 0
116

Appendix 1 (Continued). Number of specimens for each taxon identified in the 19 samples collected from the Red Bird Section, WY. B
iozone
Sample H
orizon
Field Num
ber
Dentalium
gracile
Discinisca sp.
Lingula sp.
Micrabacia am
ericana
B. clinolobatus 19 JS09498 7 0 0 0B. clinolobatus 18 JS09497 0 0 0 1B. clinolobatus 17 JS09496 0 0 0 0B. clinolobatus 16 JS09495 0 0 0 1B. grandis 15 JS09489 0 0 0 0B. grandis 14 JS09488B 2 0 0 8B. grandis 13 JS09487 0 0 0 0B. grandis 12 JS09485 33 0 0 197B. grandis 11 JS09498 0 0 0 0B. grandis 10 JS164 0 0 0 1B. baculus 9 C51A 10 1 5 2B. baculus 8 JS09471 0 0 0 0B. baculus 7 C33 1 9 0 0B. baculus 6 JS09502 2 2 1 0B. eliasi 5 JS09104 0 0 0 0B. eliasi 4 JS10RB 0 0 0 0B. eliasi 3 JS09105A 0 0 0 0B. eliasi 2 JS09446 0 0 0 0B. eliasi 1 C27 0 0 0 0
117
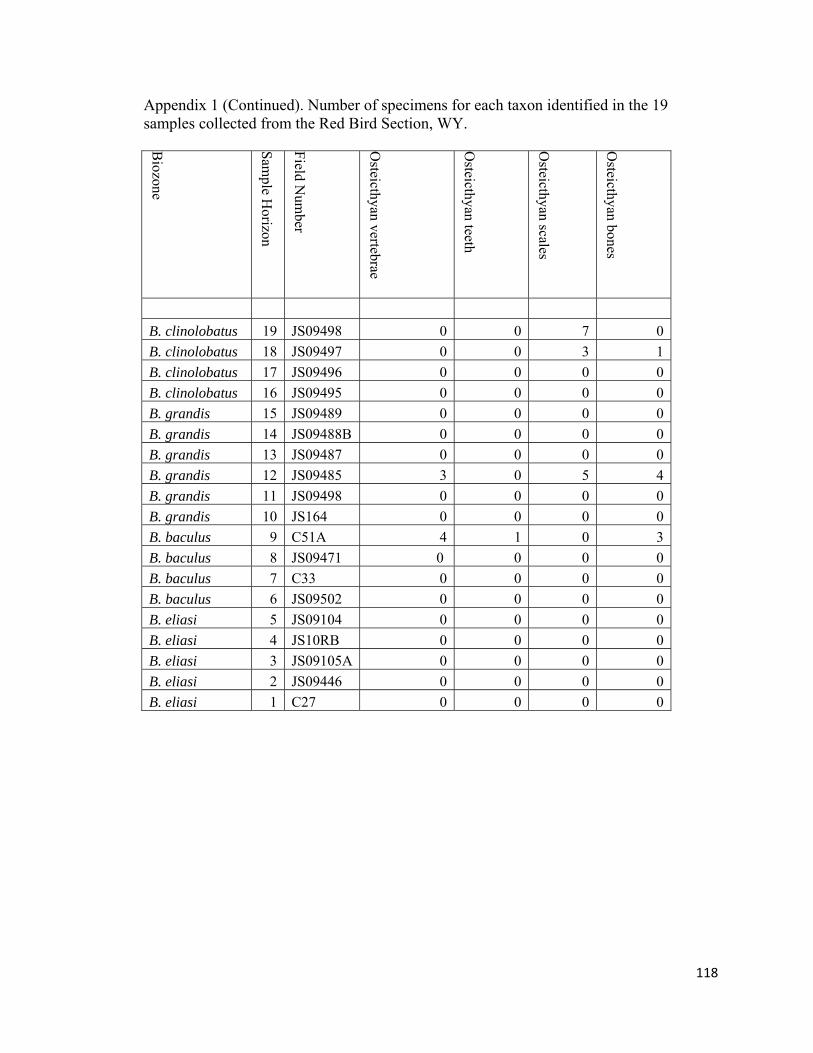
Appendix 1 (Continued). Number of specimens for each taxon identified in the 19 samples collected from the Red Bird Section, WY. B
iozone
Sample H
orizon
Field Num
ber
Osteicthyan vertebrae
Osteicthyan teeth
Osteicthyan scales
Osteicthyan bones
B. clinolobatus 19 JS09498 0 0 7 0B. clinolobatus 18 JS09497 0 0 3 1B. clinolobatus 17 JS09496 0 0 0 0B. clinolobatus 16 JS09495 0 0 0 0B. grandis 15 JS09489 0 0 0 0B. grandis 14 JS09488B 0 0 0 0B. grandis 13 JS09487 0 0 0 0B. grandis 12 JS09485 3 0 5 4B. grandis 11 JS09498 0 0 0 0B. grandis 10 JS164 0 0 0 0B. baculus 9 C51A 4 1 0 3B. baculus 8 JS09471 0 0 0 0B. baculus 7 C33 0 0 0 0B. baculus 6 JS09502 0 0 0 0B. eliasi 5 JS09104 0 0 0 0B. eliasi 4 JS10RB 0 0 0 0B. eliasi 3 JS09105A 0 0 0 0B. eliasi 2 JS09446 0 0 0 0B. eliasi 1 C27 0 0 0 0
118
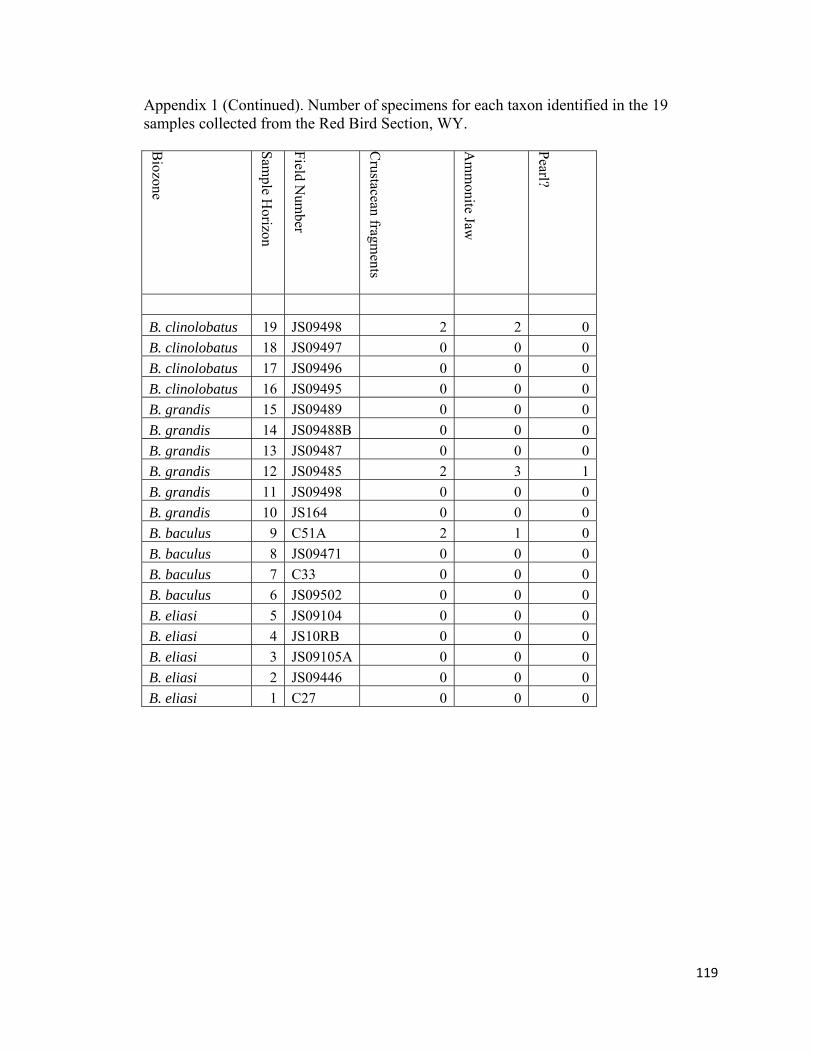
119
Appendix 1 (Continued). Number of specimens for each taxon identified in the 19 samples collected from the Red Bird Section, WY. B
iozone
Sample H
orizon
Field Num
ber
Crustacean fragm
ents
Am
monite Jaw
Pearl?
B. clinolobatus 19 JS09498 2 2 0 B. clinolobatus 18 JS09497 0 0 0 B. clinolobatus 17 JS09496 0 0 0 B. clinolobatus 16 JS09495 0 0 0 B. grandis 15 JS09489 0 0 0 B. grandis 14 JS09488B 0 0 0 B. grandis 13 JS09487 0 0 0 B. grandis 12 JS09485 2 3 1 B. grandis 11 JS09498 0 0 0 B. grandis 10 JS164 0 0 0 B. baculus 9 C51A 2 1 0 B. baculus 8 JS09471 0 0 0 B. baculus 7 C33 0 0 0 B. baculus 6 JS09502 0 0 0 B. eliasi 5 JS09104 0 0 0 B. eliasi 4 JS10RB 0 0 0 B. eliasi 3 JS09105A 0 0 0 B. eliasi 2 JS09446 0 0 0 B. eliasi 1 C27 0 0 0