D&D 3.5 Forgotten Realms - Lords of Darkness.pdf - Upload ...
Upload
independentCategory
view
0download
0
Late Cretaceous (Campanian) carbon isotope events, sea-levelchange and correlation of the Tethyan and Boreal realms
Ian Jarvis a;�, Amina Mabrouk a;b, Richard T.J. Moody a,Sandra de Cabrera a;c
a School of Earth Sciences and Geography, Centre for Earth and Environmental Science Research, Kingston University, Penrhyn Road,Kingston upon Thames, Surrey KT1 2EE, UK
b De¤partement de Ge¤ologie, Faculte¤ des Sciences de Tunis, Campus Universitaire, 1060 Tunis, Tunisiac PDVSA Exploracio¤n y Produccio¤n, Laboratorio Geologico, Puerto La Cruz, Venezuela
Received 22 March 2002; received in revised form 3 September 2002; accepted 20 September 2002
Abstract
Carbon stable-isotope stratigraphy provides unique insights into environmental change during the Campanian,the longest (83.5^71.3 Ma), but least well-understood stage of the Late Cretaceous. A new carbon isotope (N13C)profile for a 500-m-thick Campanian^basal Maastrichtian Tethyan pelagic^hemipelagic section near El Kef, northernTunisia, is calibrated using data from a biostratigraphically well-constrained succession at Kalaat Senan. The generalshapes of the Tunisian N13C reference curve and published Tethyan N13C profiles from Elles (Tunisia) and Bidart (SWFrance), and a Boreal curve for the Trunch borehole (eastern England), are remarkably similar in all three areas. Apositive carbon isotope event of +0.2x N
13C in the mid-Campanian dated at 78.7 Ma and a negative excursion of30.4x in the upper Campanian at 74.8 Ma can be correlated between Tunisia and England. A positive excursion of+0.3x at 83.7 Ma spans the Santonian^Campanian boundary. These isotope events enable precise inter-regionalcorrelations that are consistent with published nannofossil data. Review of Campanian sea-level data from NorthAfrica, the Middle East and northern Europe indicates that major shifts in N
13C profiles coincide with changes ineustatic sea-level. Relatively stable N13C values in the lower Campanian and their long-term fall through the upperCampanian reflect high and then falling eustatic sea-levels, and increased carbonate production. Short-term (V600kyr) positive excursions record greater organic productivity and/or organic matter preservation, and decreasedcarbonate fluxes during periods of rapid sea-level rise and the drowning of carbonate platforms. Excursions wereterminated by falling nutrient supply and increased carbonate deposition associated with epicontinental sea expansionand renewed carbonate platform growth during the late transgression and highstand. Negative excursions are linkedprincipally to reworking of marine and terrestrial organic matter during rapid sea-level fall. Carbon isotopestratigraphy is a powerful tool for correlation which can be used to test the validity of Campanian globalbiostratigraphic frameworks, and improve our understanding of the nature and timing of Late Cretaceous sea-levelchange.; 2002 Elsevier Science B.V. All rights reserved.
Keywords: Cretaceous; Tunisia; chemostratigraphy; sea-level; transgression; regression
0031-0182 / 02 / $ ^ see front matter ; 2002 Elsevier Science B.V. All rights reserved.PII: S 0 0 3 1 - 0 1 8 2 ( 0 2 ) 0 0 5 7 8 - 3
* Corresponding author. Fax: +44-20-8547-7497. E-mail address: [email protected] (I. Jarvis).
PALAEO 2948 13-11-02
Palaeogeography, Palaeoclimatology, Palaeoecology 188 (2002) 215^248
www.elsevier.com/locate/palaeo
1. Introduction
The Campanian (83.5^71.3 Ma; Gradstein etal., 1995) is the longest stage of the Late Creta-ceous, and represents a major turning point inEarth history. High and declining sea-levels(Haq et al., 1987; Hardenbol et al., 1998) wereaccompanied by falling global surface tempera-tures (Jenkyns et al., 1994; Barrera and Savin,1999; Clarke and Jenkyns, 1999; Huber et al.,2002) and increasing oceanic turnover (PremoliSilva and Sliter, 1999), leading to a transitionfrom typical Mesozoic to ‘modern’ oceanic circu-lation. Unfortunately, a detailed understanding ofCampanian environmental change has been se-verely hampered by di⁄culties associated with in-ter-regional correlation.A well-established biostratigraphy for the US
Western Interior based on ammonites (Hancock,1991; Kennedy et al., 1992; Cobban, 1994) andconstrained by radiometrically dated bentonites(Obradovich, 1994) is di⁄cult to correlate outsideNorth America due to the endemic nature of thefaunas. Similarly, a re¢ned biostratigraphy innorthern Germany based on macrofossil assem-blages, principally belemnites, echinoids, crinoidsand inoceramid bivalves (Schulz and Weitschat,1998; Scho«nfeld, 2000), cannot be applied outsideNW Europe. Finally, Tethyan successions insouthern Europe, North Africa, the MiddleEast, Central and South America have generallybeen subdivided and correlated using globotrun-canid planktonic foraminifera (Sliter, 1989; Ro-baszynski and Caron, 1995), which are rare orabsent in Boreal and Western Interior successions.With such severe biotic provincialism of key bio-stratigraphic index taxa, the global correlation ofregional biostratigraphic schemes has been hotlydebated and remains ambiguous.Chemostratigraphy employing carbon and oxy-
gen stable isotopes (e.g. Scholle and Arthur, 1980;Arthur et al., 1987; Gale et al., 1993; Jenkyns etal., 1994; Mitchell et al., 1996; Voigt and Hil-brecht, 1997; Voigt, 2000) and strontium isotopes(e.g. McArthur et al., 1992, 1993a, 1994, 2000;Steuber, 2001) has been shown to be a powerfultool for correlating and dating Upper Cretaceousstrata on a global scale. The method works partic-
ularly well for intervals, such as the Cenomanianand Turonian, where the isotope curves have beenprecisely calibrated against detailed biostratigra-phies (e.g. Arthur et al., 1987; Jarvis et al.,1988a,b, 2001; Voigt and Hilbrecht, 1997; Daveyand Jenkyns, 1999; Voigt, 2000; Keller et al.,2001; Wiese and Kaplan, 2001). However, theCampanian^Maastrichtian has proven problem-atic due to the ambiguity of biostratigraphic cor-relation, compounded by a lack of consensus onthe de¢nition of stage boundaries and subdivi-sions. Published diagrams that integrate macro-,micro- and nannofossil biostratigraphies o¡eridealised and commonly con£icting representa-tions of the temporal equivalence of biostrati-graphic boundaries and their relationship to stages(e.g. compare Bralower et al., 1995; Hardenbol etal., 1998), making the calibration of chemostrati-graphic pro¢les di⁄cult. Perhaps the biggest prob-lem has been the use of widely di¡erent criteria forde¢ning the Campanian^Maastrichtian boundary,which means that in many cases authors have notbeen comparing like with like. This problem willhopefully ¢nally be resolved following the rati¢ca-tion in 2001 of Tercis les Bains (SW France) as aglobal boundary standard stratotype section(Odin, 2001; Odin and Lamaurelle, 2001).In this paper, a new carbon stable-isotope pro-
¢le for a thick Tethyan Campanian^Maastricht-ian pelagic^hemipelagic section near El Kef,northern Tunisia, is correlated with pro¢les fromelsewhere in Tunisia, SW France, and a Borealsuccession in eastern England. It is argued thatmajor shifts in N
13C pro¢les relate to changes ineustatic sea-level, and as a consequence providerobust chronostratigraphic trends that o¡er po-tential for inter-continental correlation indepen-dent of biostratigraphy. The testing and re¢ne-ment of global correlations for the Campanianare essential to improve current palaeoclimaticand palaeoceanographic models that underpinour understanding of the termination of the Me-sozoic ‘greenhouse’ system.
2. Study material
The Campanian of northern Tunisia consists
PALAEO 2948 13-11-02
I. Jarvis et al. / Palaeogeography, Palaeoclimatology, Palaeoecology 188 (2002) 215^248216
largely of chalk facies (e.g. Negre, 1994), predom-inantly coccolith biomicrites comprising s 85%calcareous nannofossils with subordinate quanti-ties of foraminifera, calcispheres and macrofossildebris (mostly inoceramid bivalves, echinodermsand calci¢ed silicisponge spicules). Marls con-taining 30^40% clay minerals and other siliciclas-tic grains occur interbedded with chalks on adecimetre to 100-m scale. Tunisian chalks aremoderately cemented, with strongly developedovergrowths on nannofossils and some microspar,generating average porosities of 12% (typicalrange 6^19%) at outcrop (Negre and M’Rabet,1992, 1994; O’Hearn et al., 1993; Negre, 1994).Similar chalk and marl facies are developed in theCampanian of SW France (Clauser, 1987, 1994).Coeval NW European chalks typically contain
less clay and show bedding picked out by nodular£int (chert) bands, thin marl seams, beds of marlychalk, omission surfaces, nodular chalks andhardgrounds (Hancock, 1975; Bromley, 1979).Thick marl intervals are absent. Onshore Euro-pean chalks are generally poorly cemented andfriable, and typically retain porosities of s 35%(Hancock, 1993a); for eastern England an aver-age porosity of 38% with a range of 24^56% hasbeen reported (Bloom¢eld et al., 1995). Burial ce-ment is present largely as overgrowths on nanno-fossils that bridge grain contacts but only ob-scures ¢ne surface detail of coccoliths.
2.1. Tunisia
During the Campanian, Tunisia was situatedaround 15‡N (Fig. 1A) on the southern marginof the Tethys Ocean. In northern Tunisia, subsi-ding basins to the north-west and east of the Kas-serine High (Fig. 1B) accumulated thick sequencesof pelagic and hemipelagic chalks and marls, withthe lower Campanian^basal Maastrichtian AbiodChalk Formation locally exceeding 600 m inthickness (Burollet and Ellouz, 1984; Ben Ferjaniet al., 1990). The Abiod is absent from the Kas-serine High (Fig. 1B) which is bordered by thin(6 50 m thick) sequences of shallower-waterchalk facies including conglomeratic gravity £owdeposits (Negre, 1994) and local rudist patch reefs(e.g. Jebel el Kbar; Negre and Purser, 1989). It is
uncertain whether the High was emergent duringthe Campanian. To the south and west of theHigh, bioclastic sandy platform carbonates weredeposited. The sections discussed here all lie with-in the pelagic area of chalk sedimentation in theEl Kef Basin (Fig. 1B).
2.1.1. El KefUpper Cretaceous sediments crop out exten-
sively in the vicinity of El Kef (Fig. 1; Burollet,1956; M’Rabet et al., 1995), including the Creta-ceous^Tertiary boundary global stratotype, butexposures are discontinuous and can be di⁄cultto sample (Li et al., 1999, 2000). However, theCampanian is continuously exposed 1 km dueeast of El Kef town, immediately north of theroad on the hillside adjacent to El Djebil (betweengrid references x 395,50 y 320,25 and x 395,25 y321,10; see Dumon et al., 1953). Here, a single500-m-thick succession (Fig. 2) of Campanian tolowest Maastrichtian strata can be studied, in-cluding the upper beds of the Kef Shale (cf. Four-nie¤, 1978; =Aleg Shale of earlier workers), theentire Abiod Chalk, and the basal beds of theEl Haria Shale formations (Burollet et al., 1954;Burollet, 1956; Ben Ferjani et al., 1990; M’Rabetet al., 1995).The El Djebil succession was logged in detail
and sampled at 2-m intervals for isotopic studies.Stratigraphic positions are indicated in metresabove the base of our section (Fig. 2), whichstarts 21.5 m below the bottom of the AbiodChalk. At the base, the Kef Formation consistsof metre-thick medium grey marls interbeddedwith decimetre-thick marly chalks and limestones(chalkstones). The bottom of the Abiod Chalk ischaracterised by a marked increase in the fre-quency and thickness of the chalk beds and thin-ning upwards of the marls (e.g. Robaszynski etal., 2000, ¢g. 21).The Abiod Chalk has been traditionally subdi-
vided into three members (Burollet et al., 1954;Burollet, 1956; Ben Ferjani et al., 1990): lowerand upper chalks separated by a middle ‘shale’.Recently, Robaszynski et al. (2000), working inthe vicinity of Kalaat Senan, 50 km south-south-west of El Kef (Fig. 1B; see below), erectedseven subunits within the Abiod Formation: from
PALAEO 2948 13-11-02
I. Jarvis et al. / Palaeogeography, Palaeoclimatology, Palaeoecology 188 (2002) 215^248 217

bottom to top, the Assila, Haraoua, Mahdi, Akh-dar, Gourbeuj, Ncham and Gouss members. Fourof these represent transitional interbedded marl^chalk facies at the bases and tops of the lower(Haraoua) and upper (Ncham) chalk members,and are considered here to be of relatively localsigni¢cance. In this study, the traditional three-fold subdivision is retained, using rede¢ned Ha-raoua Chalk (base), Akhdar Marl and NchamChalk (summit) members as subunits of theAbiod Chalk Formation (Fig. 2). The bottoms
and tops of the two chalk members, which formmajor topographic features (‘barre infe¤rieure’ and‘barre supe¤rieure’ of the literature), are placed atthe main facies breaks where chalk or marl be-comes volumetrically the dominant lithology(Fig. 2), and are not located within marl pack-ages, as proposed by Robaszynski et al. (2000)for their Assila and Gorbeuj ‘members’. Rede-¢ned Assila, Mahdi, Gourbeuj and Gouss ‘beds’,with bottoms and tops de¢ned by changes in thedominant lithology from chalk to marl or vice
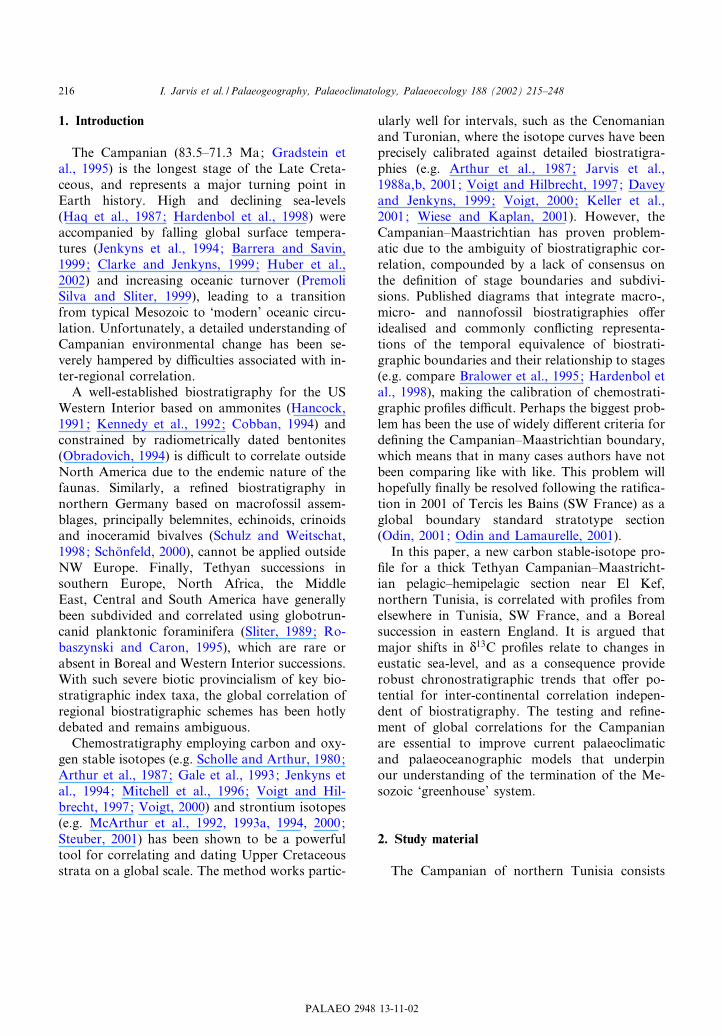
Fig. 1. Campanian palaeogeography and location of the study sections. (A) Palaeogeographic reconstruction of North Africa andEurope (modi¢ed from Hay et al., 1999; Voigt et al., 1999). Thin lines represent the outlines of continental blocks and conti-nents. Land areas indicated by thick lines and vertical hatching (based on Dercourt et al., 1986; Ronov et al., 1989; Tyson andFunnell, 1990). (B) Palaeogeography of northern Tunisia (location outlined in A) with the distribution of topographic highs andshallows indicated by thinning of the Abiod Formation and associated facies changes (based on Burollet and Ellouz, 1984; Marieet al., 1984; Boltenhagen, 1985; Ben Ferjani et al., 1990; Negre and M’Rabet, 1994; Robaszynski et al., 2000). The El Kef studysection lies 50 km north-north-east of the Kalaat Senan successions documented by Robaszynski et al. (2000) and 45 km NW ofElles (Li et al., 1999, 2000).
PALAEO 2948 13-11-02
I. Jarvis et al. / Palaeogeography, Palaeoclimatology, Palaeoecology 188 (2002) 215^248218

versa, are regarded as being subunits within thetwo chalk members.The Haraoua Chalk Member consists of white
chalks and light grey marly chalks interbedded ona decimetre scale (Fig. 2). A bed with abundantinoceramid bivalves occurs at 85 m, and a 15-cm-thick bed of brown current ripple-laminated cal-carenitic chalk containing redeposited shallow-water orbitoid benthic foraminifera occurs at 99m; the latter is interpreted as a calciturbidite. Theupper beds of the member become progressivelymore marly and the base of the Akhdar MarlMember at 166 m is marked by a sharp rise inclay content and an increase in the thickness ofthe marls to s 1 m.The Akhdar Marl Member (Fig. 2) consists of
metre-thick medium to dark blue-green to green-ish grey marls with decimetre-thick light greymarly chalk and prominent pale yellow limestone(chalkstone) interbeds, some of which exhibit aconcretionary texture. Mineralisation, boringand other clear evidence of hardground surfaceshave not been observed, but Diplocraterion andother burrows suggest sediment omission and¢rmground development prior to the precipitationof the concretionary cements in the limestones. Amarked increase in clay content occurs at 230 m,with dark blue-green marls dominating the middleportion of the member. Common inoceramid bi-valves [principally Endocostea cf. ghadamesensis(Tro«ger and Ro«hlich)] and occasional hetero-morph ammonites [Nostoceras (Bostrychoceras)polyplocum (Roemer)] occur, particularly in thelimestones.The base of the Ncham Chalk Member (Fig. 2)
is marked by a return to thinner medium greymarls, rhythmically interbedded on a decimetrescale with pale yellow chalks. The lower chalksin particular contain abundant very large (up to1 m) Zoophycos, common Planolites burrows, andscattered crinoid debris. Irregular echinoids (Ste-gaster) and large inoceramids (Trochoceramusspp.) are particularly common in the upper bedsof the member. A bed of abundant very largeinoceramids (Trochoceramus nahorianensis Kociu-bynskij) occurs around 2 m below the contactwith the thick-bedded medium grey marls of theoverlying El Haria Formation at 493 m, which is
poorly exposed and rather weathered in the studysection.
2.1.2. Kalaat SenanExtensive outcrops of Campanian strata occur
in the vicinity of Kef Majouba and Jebel Mzita,13 km east-north-east of Kalaat Senan (Fig. 1B).Various valley exposures were studied by Robas-zynski et al. (2000), who constructed a compositesection for the Upper Turonian^basal Palaeoceneof the area, and undertook a high-resolution bio-stratigraphic study, providing detailed ammonite,inoceramid bivalve, planktonic foraminifera andcalcareous nannofossil records tied to the litho-stratigraphy. The lithostratigraphy of the AbiodChalk at Kalaat Senan is very similar to that inthe El Kef area, enabling the correlation of thetwo sections (see below). Detailed descriptions ofthe former succession are provided in Robaszyn-ski et al. (2000).The stratigraphic ranges of the heteromorph
ammonite Nostoceras (Bostrychoceras) polyplocumand the planktonic foraminifera Radotruncanacalcarata (Cushman) at Kalaat Senan have beencon¢rmed (Robaszynski, 1999; Robaszynski etal., 2000; Fig. 2) as being similar to those in theEl Kef area (M’Rabet et al., 1995; this work), andthe ranges of the key ammonite taxa Nostoceras(N.) hyatti (Stephenson) and N. alternatum (Tuo-mey) have been established. However, contrary toprevious work (e.g. M’Rabet et al., 1995), theplanktonic foraminiferal index species Gansserinagansseri (Bolli) has been shown to extend downinto the upper Akhdar Marl, a short distanceabove the last occurrence of Rd. calcarata, ratherthan ¢rst occurring in the El Haria Formation.Furthermore, Globotruncana aegyptiaca Nakkady,another key Tethyan taxon, ¢rst occurs towardsthe top of the Globotruncana ventricosa IntervalZone, within the upper beds of the HaraouaChalk. Elsewhere in the Tethyan realm, separateGlobotruncanella havanensis and Globotruncanaaegyptiaca zones have been utilised (e.g. PremoliSilva and Sliter, 1994; Robaszynski and Caron,1995) to subdivide strata between the last appear-ance of Rd. calcarata and the ¢rst appearance ofGs. gansseri. These zones are di⁄cult to apply innorthern Tunisia because of the extended ranges
PALAEO 2948 13-11-02
I. Jarvis et al. / Palaeogeography, Palaeoclimatology, Palaeoecology 188 (2002) 215^248 219

Form
ation
Mem
ber
Scale
(m)
Micr
ofos
sil
sam
pleLit
holog
y
Amm
onite
sPlan
ktonic
fora
mini
fera
Litho
facies
El Kef (El Djebil)
sectionobscured
El H
aria
Akh
dar
Mar
lA
bio
d C
halk
Nch
am C
halk
Nanno
foss
ilsPlan
ktonic
fora
mini
fera
Amm
onite
s
Sectio
n
Litho
logy
Scale
(m)
Form
ation
Nanno
foss
il zon
e
Subzo
neZo
neSta
ge
Mem
ber
Kalaat Senan
CC
24A
rcha
eogl
obot
runc
ana
kefia
naR
d. c
acar
ata
TRZ
Gan
sser
ina
gans
seri
IZ
?C
C22
CC
21C
C20
CC
19
Har
aoua
As
Kef
Mh
Akh
dar
Gor
beu
jN
cham
Gs
CC
23TR
sz
Ab
iod
Cha
lkE
l Har
ia
Maa
stri
chti
an
Gw
Cam
pan
ian
G. v
entr
icos
a IZ
G. a
rca
PR
szG
v
500
450
400
350
300
250
200
150
100
50
0
GR
AS
NC
H
carbonate concretions
pyrite nodules
calciturbidite
last occurrence datum
first occurrence datumtirregular echinoid
ammonite
inoceramidscalcarenitewhite chalk
marl seam
marl
Zoophycos burrows
Diplocraterion burrow
500
450
400
350
300
250
200
150
100
50
0
Har
aoua
Cha
lkK
ef
marl - chalkinterbeds
rhythmically beddedwhite chalks -medium grey marlsabundant inoceramids
marl - chalk interbedsabundant Zoophycos
mediumgrey - green marls
dark blue-green marlswith thin yellow limestones
Rd. calcarata
?U. trifidus
B. parcaconstricta
R. magnus
Gt. angulata
A. kefiana?
rareGs. gansseri
R. hexacamerata
Rd. calcarata
Gl. havanensis
R. levis ?
U. trifidus
E. eximiusRd. calcarata
G. ventricosaG. aegyptiaca
G. falsostuarti
U. gothicusR. magnus
C. aculeus
B. hayi
t calciturbidite
inoceramid bed
rhythmically beddedwhite chalks andlight grey marly chalks
marl - chalkinterbeds
marlfacies
marl - chalkinterbeds
medium grey-green marlswith inoceramid-richmarly chalk interbeds
G. ventricosacommon
Rd. calcarata
T. orionatus
?U. trifidus
L. praequadratus
N. (
N.)
alte
rnat
um
N. (
N.)
hyat
tiN
. (B
.) p
olyp
locu
m
Gf
N. (
B.)
pol
yplo
cum
PALAEO 2948 13-11-02
I. Jarvis et al. / Palaeogeography, Palaeoclimatology, Palaeoecology 188 (2002) 215^248220
of the last two index species, and a thin ‘Globo-truncana falsostuarti Zone’ (Fig. 2) was used byRobaszynski et al. (2000) to characterise theequivalent interval.
2.1.3. EllesElles is situated 45 km south-east of El Kef, on
the southern side of the El Kef Basin approachinga marginal area where the formation is severelyreduced in thickness to 6 50 m (Fig. 1B). Li et al.(1999, 2000) studied a single 36-m-thick section inthe area spanning the Radotruncana calcarata^lowGansserina gansseri zones. The succession consistsof thick limestone beds interbedded with marls,followed by thick beds of marl interbedded withlimestones.
2.1.4. Correlation of the Tunisian sectionsThe Abiod Chalk succession at El Kef, El Dje-
bil (Fig. 2), is similar to, but thinner than (471 mcompared to 660 m) sections to the south of ElKef (M’Rabet et al., 1995), although in both casesthe Akhdar Marl constitutes nearly half of thesuccession, and the Haraoua and Ncham chalksare of similar thickness. By contrast, at KalaatSenan (Fig. 2), despite a similar overall thicknessto El Djebil (484 m, Robaszynski et al., 2000), thelower chalks and middle marls are much thinnerand the upper chalk is relatively thick. Compar-ison of the published (1 cm=5 m) lithological logsof Robaszynski et al. (2000, ¢g. 8b^d) for KalaatSenan with our ¢eld logs of the El Djebil sectionhas enabled the lithostratigraphic correlation of10 packages between the two sections (I^X inFig. 2), and suggests that more detailed workwould allow a bed-scale cyclostratigraphy to beestablished.Field observations of macrofossils at El Djebil
con¢rm the presence of Nostoceras (Bostrychoce-
ras) polyplocum in the uppermost Haraoua Chalkand lower Akhdar Marl (Fig. 2), and a prelimi-nary foraminiferal study of 15 washed samplesrecorded a diverse globotruncanid fauna through-out the section which included many key taxa,including Globotruncanita elevata (Brotzen), Glo-botruncana ventricosa White, Radotruncana calca-rata, Globotruncanella havanensis (Voorwijk) andGlobotruncana aegyptiaca. The incoming of abun-dant G. ventricosa and the extent of the Radotrun-cana calcarata Zone have been tentatively placedin the section (Fig. 2). Our biostratigraphic datacompare favourably with those of previous work-ers (Dalbiez, 1955; Bellier et al., 1983; Salaj andWiedmann, 1989; Negre, 1994; M’Rabet et al.,1995; Salaj, 1996) from the El Kef area, and areconsistent with the lithostratigraphic correlationto Kalaat Senan (Fig. 2). Discontinuous expo-sures of the Campanian^lower Maastrichtianaround El Kef, Hammam Melle'gue, studied byLi et al. (1999, 2000) were not described orsampled in detail and are di⁄cult to place accu-rately in the stratigraphy; data from these sec-tions will not be considered further. However,the lithostratigraphic correlation between KalaatSenan and El Djebil (Fig. 2) allows the positionsof key ammonite, planktonic foraminifera andcalcareous nannofossil events to be placed moreprecisely in our section, thereby establishing theirpositions relative to the carbon isotope stratigra-phy (Fig. 3).The upper Campanian at Elles was the focus of
detailed palaeontological and geochemical studiesby Li et al. (1999, 2000) who described a litholog-ical succession similar to the upper beds of theAkhdar Marl at El Kef and Kalaat Senan, thatalso spans the Radotruncana calcarata to basalGansserina gansseri zones (Fig. 2). The Globotrun-cana falsostuarti Zone (last occurrence datum,
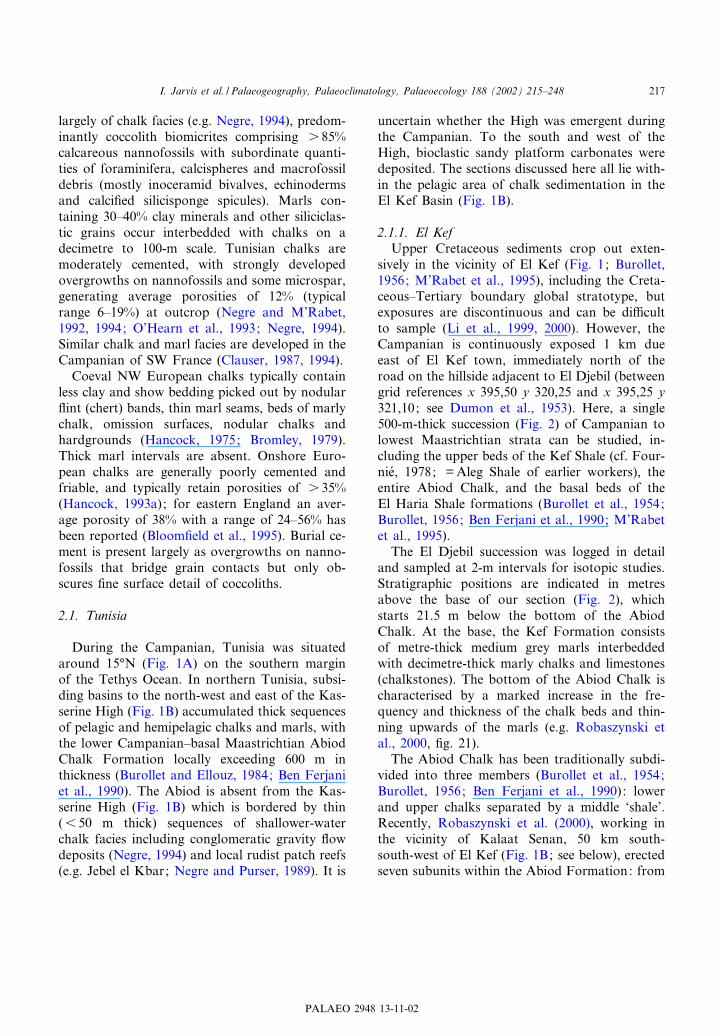
Fig. 2. Lithostratigraphic correlation and biostratigraphy of the Abiod Chalk (Campanian^basal Maastrichtian) between El Kef(El Djebil) and Kalaat Senan, northern Tunisia. Stratigraphic data for Kalaat Senan (composite section) from Robaszynski et al.(2000); see Fig. 1B for location. Numbers I^X refer to sediment packages which have been correlated between the sections. Lith-ostratigraphic terminology for Kalaat Senan unmodi¢ed from Robaszynski et al. (2000); El Kef section shows modi¢ed forma-tion and member boundaries (see text for details). Measured sections: AS=Oued Assila; GR=Oued Gourbeuj; NCH=OuedNcham; Stratigraphic abbreviations: As=Assila, Mh=Mahdi, Gs=Gouss members; Gv=Globotruncana ventricosa abundantPRsz (partial range subzone); Gw=Gansserina wiedenmayeri PRsz; TRsz= total range subzone; Gf=Globotruncana falsostuartiPRZ (partial range zone).
PALAEO 2948 13-11-02
I. Jarvis et al. / Palaeogeography, Palaeoclimatology, Palaeoecology 188 (2002) 215^248 221

PALAEO 2948 13-11-02
I. Jarvis et al. / Palaeogeography, Palaeoclimatology, Palaeoecology 188 (2002) 215^248222

LOD, Rd. calcarata to ¢rst occurrence datum,FOD, Gs. gansseri) is 26 m thick at Kalaat Senan(Robaszynski et al., 2000) and 20 m at Elles (Li etal., 1999, 2000). It is acknowledged that the FODof Gs. gansseri may be an unreliable marker be-cause the index species is uncommon at its ¢rstoccurrence. However, Rugoglobigerina hexacame-rata Bro«nnimann ¢rst appears in the mid-Globo-truncana falsostuarti Zone at both localities(Figs. 2 and 3), indicating that the base of theGansserina gansseri Zone has been placed consis-tently by the di¡erent authors. The biostrati-graphic correlation indicates that the Elles sectionstudied by Li et al. (1999, 2000) is only marginallythinner than the equivalent level at Kalaat Senanand is probably similar to that at El Kef, El Dje-bil.
2.2. Bidart, SW France
The Campanian^Maastrichtian succession atBidart, located a few kilometres south of Biarritzin the Atlantic Pyrenees, SW France, is situatednear both the Campanian stratotype area of theAquitaine Basin (Coquand, 1857) and the Cam-panian^Maastrichtian stage boundary stratotypeat Tercis les Bains (Odin, 2001), and provides aNorth Tethyan (Fig. 1A) reference section in pe-lagic facies. Sediments accumulated on the north-ern margin of the Palaeozoic Basque Massif(Clauser, 1994) in a platform environment justnorth of 30‡N palaeolatitude. The Maastrichtianand Cretaceous^Tertiary boundary successions atBidart have been studied in detail (e.g. Delacotteet al., 1985; Seyve, 1990; Nelson et al., 1991;
Ward and Kennedy, 1993; Haslett, 1994; Apella-niz et al., 1997; Vonhof and Smit, 1997), but theCampanian is less well known. The coastal cli¡sat Bidart display a faulted succession of lowerCampanian^Danian which can be pieced togetherto provide a relatively complete succession (Clau-ser, 1987, 1994), although the Campanian is cutby three faults which are acknowledged to causethe loss of an unknown thickness of section.To our knowledge, no detailed logs of the Cam-
panian section have been published. Clauser(1987, 1994) described a succession consisting(from bottom to top) of: (1) 37 m of dm^m-scaleinterbedded red to brownish yellow marly lime-stones and red marls, in faulted contact with:(2) 53 m of greenish grey marls, and (3) 30 m ofalternating green marly inoceramid-rich dm-thicklimestones and marls ; in faulted contact with: (4)8 m of interbedded burrowed white marly lime-stones and pale green marls. Ammonites andplanktonic foraminiferal zonal index species arerare or absent in the section, but a relatively de-tailed biostratigraphy has been produced usingcalcareous nannofossils (Manivit in Clauser,1987, 1994). These data indicate that the lowestCampanian is absent due to faulting and theCampanian^Maastrichtian boundary interval,based on the disappearance of the calcareous nan-nofossil Uniplanarius tri¢dus (Stradner) Prins andPerch-Nielsen (cf. Hardenbol et al., 1998), is lo-cated within the white marly limestones, describedabove. Key nannofossil species (Fig. 3) identi¢edwithin the Campanian^basal Maastrichtian inter-val included: Brionsonia parca constricta (Hattnerand Wise) Perch-Nielsen; Ceratolithoides aculeus
Fig. 3. Carbon isotope stratigraphy and correlation of the North African and European Campanian^basal Maastrichtian. El Kefisotope data are listed in Table 1. Carbon isotope pro¢les are solid lines, general trends at El Kef, Elles and Trunch are indicatedby ¢ve-point moving averages (thick grey lines); the lower resolution of the Bidart pro¢le precludes the de¢nition of short-termtrends. Note the variable vertical scales and the highly expanded succession at El Kef compared to elsewhere. The chemostrati-graphic correlation is indicated by the horizontal black and discontinuous grey lines; major isotope events are ornamented. Se-lected key nannofossil (black arrows showing ¢rst and last occurrence datums) and planktonic foraminifera (grey arrows) eventsare shown for comparison. El Kef biostratigraphy based on Robaszynski et al. (2000) and this study; Elles data from Li et al.(2000); Bidart data from Clauser (1994), breaks in the pro¢le are faulted contacts with unknown gaps in the succession. TrunchN13C from Jenkyns et al. (1994) with additional values (Table 2) for the Santonian^basal Campanian. Trunch stratigraphy basedon unpublished logs of Mr A.A. Morter, Gallois and Morter (1976), Burnett (1988, 1990), Wood et al. (1994), and reinterpreta-tion of e-log data; lithostratigraphic terminology after Peake and Hancock (1970), Wood (1988) and Johansen and Surlyk (1990).Mt=Marsupites testudinarius ; Bl=Belemnella lanceolata ; Sa= Santonian; Ma=Maastrichtian.
PALAEO 2948 13-11-02
I. Jarvis et al. / Palaeogeography, Palaeoclimatology, Palaeoecology 188 (2002) 215^248 223
(Stradner) Prins and Sissingh; Uniplanarius gothi-cus (De£andre) Prins and Perch-Nielsen; U. tri¢-dus ; and Lithraphidites praequadratus Roth.
2.3. Trunch, eastern England
Trunch in Norfolk, eastern England, is locatedon the north-eastern margin of the London^Bra-bant Massif, on the southern fringe of the NorthSea Basin (e.g. Cameron et al., 1992). Sedimenta-tion occurred in an open epicontinental environ-ment of the NW European Boreal Sea at around40‡N (Fig. 1A). Cretaceous sediments are poorlyexposed in the area but the Trunch borehole, a10-inch-diameter continuously cored well drilledin 1975 by the British Geological Survey (BGS;then the Institute of Geological Sciences), recov-ered what remains the most complete Upper Cre-taceous succession in the UK, sampling 467 m ofCenomanian^lower Maastrichtian Chalk, includ-ing 246 m of Campanian strata (Wood et al.,1994).The lithostratigraphy (Gallois and Morter,
1976; Wood et al., 1994), and the nannofossil(Burnett, 1988, 1990) and macrofossil (Wood etal., 1994) biostratigraphy of the Upper Creta-ceous at Trunch have been described, but no de-tailed lithological logs have been published. Forthis study the unpublished written and graphiclogs of Mr A.A. Morter (BGS) were combinedwith our interpretation of gamma, resistivity andsonic e-log data to generate a new detailed log ofthe succession (Fig. 3). Stratigraphic levels arereported as depths in metres below surface. Corerecovery was very poor to 80 m, good between 80and 210 m, and nearly continuous below 210 m.The lithostratigraphic units of the Norfolk
upper Campanian Chalk proposed by Peake andHancock (1961, 1970) and revised by Wood(1988) and Johansen and Surlyk (1990) can berecognised in the well (Fig. 3), and faunal records(Wood et al., 1994) delimit the extent of the ¢vetraditional Boreal macrofossil zones, de¢ned us-ing crinoids, echinoids and belemnites, within theuppermost Santonian^basal Maastrichtian inter-val. The latter have been equated to a Borealnannofossil zonation (CC/B zones of Burnett,1990) based on the FOD and LOD of key taxa
(Fig. 3). The base of the Maastrichtian has beenplaced at 61 m based largely on foraminiferal evi-dence (Wood et al., 1994), although a lower posi-tion of around 66 m is suggested by the nanno-fossil biostratigraphy and strontium isotope data(McArthur et al., 1992), albeit with a large marginof error.The Trunch succession (Fig. 3) contains an
abundance of nodular and semi-tabular £ints. Anumber of prominent marls seams occur in thebasal lower Campanian (e.g. Wells Marl) and inthe lower upper Campanian. The Santonian ischaracterised by beds of sponge, inoceramid andoyster debris. The basal 7 m of the Campanianincludes intervals of calcarenitic chalk rich in in-oceramid and oyster debris; the stage boundary isplaced at an omission surface overlain by a bed ofoysters. A nodular chalk overlain by a marly in-terval containing abundant oysters and O¡asterpilula (Lamarck) ( =O¡aster bed, Fig. 3) marksthe top of the O¡aster pilula Zone. A prominentphosphatised hardground surface (de¢ned here asTrunch Hardground 1) occurs at 209 m, and twofurther nodular hardgrounds (Trunch Hard-grounds 2 and 3) occur in the overlying 2 m ofchalk. A marked double gamma peak, coincidentperturbations in the resistivity and sonic pro¢les,and fragments of hard sponge-rich chalks from aninterval of poor core recovery indicate the pres-ence of the Catton Sponge Bed hardgrounds (cf.Peake and Hancock, 1970) around 155 m. A sim-ilar facies recovered from debris at the top of thecore and also marked by a large gamma peakindicates the position of the Trimingham SpongeBeds (cf. Peake and Hancock, 1970; Johansenand Surlyk, 1990) at 46 m.
3. Carbon isotope stratigraphy
Stable-isotope chemostratigraphy based on theanalysis of bulk sediments has been shown to be aremarkably reliable tool for the correlation ofUpper Cretaceous chalks (Scholle and Arthur,1980; Arthur et al., 1987; Gale et al., 1993; Jen-kyns et al., 1994; Mitchell et al., 1996; Voigt andHilbrecht, 1997; Voigt, 2000). Chalks are partic-ularly suitable for such work because: (1) they
PALAEO 2948 13-11-02
I. Jarvis et al. / Palaeogeography, Palaeoclimatology, Palaeoecology 188 (2002) 215^248224

have relatively uniform compositions, dominatedby ocean-surface-dwelling calcareous nannoplank-ton; (2) minimal early or late diagenesis a¡ectsthese primary low-Mg-calcite, organic-matter-lean,low-permeability sediments; (3) subaerial expo-sure horizons and early interaction with meteoric£uids are normally absent, as deposition occursexclusively in open ocean settings; and (4) succes-sions have generally undergone only relativelyshallow burial.The reliability of bulk sediment stable-isotope
chemostratigraphic data has been tested by com-paring these to curves obtained from planktonicforaminifera, inoceramid bivalves (e.g. Scho«nfeldet al., 1991), brachiopods and belemnites (e.g.Niebuhr and Joachimski, 2002; Voigt and Gale,2002) collected from the same chalk successions.These curves typically parallel the trends of bulksediments but with greater scatter. Systematic o¡-sets to higher values are observed for most oxygenisotope data obtained from diageneticallyscreened fossil material, probably because burialdiagenesis has a¡ected most bulk sediment N18Ovalues, but carbon isotope pro¢les generally dis-play no signi¢cant o¡set and have consistentshort- and long-term trends.Smoothed carbon and oxygen isotope curves
for bulk sediment samples from the Trunch bore-hole were presented by Scholle and Arthur(1980), who used it as one of their key sectionsto demonstrate the use of stable isotopes as astratigraphic and petroleum exploration tool.Stable-isotope pro¢les for Trunch at a 10-m sam-ple resolution were ¢gured by McArthur et al.(1993b, ¢g. 4) who generated a strontium isotopestratigraphic reference curve for the Late Creta-ceous based on their study, but made no detailedanalysis of the stable-isotope record. Jenkyns etal. (1994) published higher resolution (V1-msampling) N13C and N
18O curves for Campanian^Maastrichtian chalks at Trunch placed against askeleton stratigraphy, but did not correlate thesewith sections elsewhere, noting the ambiguity oftrends in coeval UK and German sections.Low-resolution (around 10^20-m spacing) car-
bon and oxygen isotope pro¢les for bulk sedimentsamples from the Campanian^Maastrichtian at ElKef were presented by Renard and Delacotte
(1982, ¢g. 5) and Clauser (1994, ¢g. 87). Limitedbiostratigraphic and lithological data were pro-vided. Li et al. (2000) published detailed (6 1-msampling) N13C curves for the Radotruncana cal-carata to Abathomphalus mayaroensis (top Maas-trichtian) zones of northern Tunisia, based on theanalysis of planktonic [Rugoglobigerina rugosa(Plummer)] and benthic [Anomalinoides acuta(Plummer)] foraminiferal tests. However, due topoor exposure in the southern El Kef sections,Campanian data were largely A. acuta values ob-tained from Elles (Fig. 3; Li et al., 2000, ¢g. 7),with Kef providing the source of most Maas-trichtian material. The curves were constrainedby summary lithologs, and FOD and LOD ofkey planktonic foraminifera.Clauser (1994, ¢gs. 40 and 41) presented N
13Cand N
18O curves at 1^3-m resolution for lowerCampanian to uppermost Maastrichtian sectionsat Bidart and tied these to a summary lithostra-tigraphy and detailed nannofossil records. How-ever, the faulted and discontinuous nature of thesuccession was acknowledged to produce severalpotential gaps in the composite section, includingtwo in the Campanian interval (Fig. 3).
3.1. Analytical methods
Due to the rarity of suitable fossils in the studysections, and the proven reliability of previouschalk carbon isotope studies, it was decided touse only bulk sediment samples for the presentwork. The entire Abiod Chalk Formation (Globo-truncana ventricosa^Gansserina gansseri zones) atEl Kef, El Djebil, was sampled at approximately2-m intervals (Table 1, 221 samples). For Trunch,seven samples (Table 2) were obtained at 2-mspacing from the uppermost Santonian (307^322m) to complement the published data of Jenkynset al. (1994). To ensure representative sampling,relatively large (50 g) bulk rock samples werepowdered and rinsed in ultra-pure water to re-move pore-water or sur¢cial salt contamination.Subsamples (50 mg) were washed with 10% H2O2followed by acetone to remove organic constitu-ents, and dried at 60‡C. Powders (500 Wg) werereacted with puri¢ed orthophosphoric acid at90‡C, and carbon and oxygen stable-isotope ra-
PALAEO 2948 13-11-02
I. Jarvis et al. / Palaeogeography, Palaeoclimatology, Palaeoecology 188 (2002) 215^248 225

Table 1El Kef (El Djebil) stable-isotope data
Height N13C N
18O Height N13C N
18O Height N13C N
18O(m) (x VPDB) (x VPDB) (m) (x VPDB) (x VPDB) (m) (x VPDB) (x VPDB)
23.70 1.79 32.54 183.70 1.70 32.49 347.35 1.58 32.8227.70 1.38 32.86 185.75 1.66 32.10 349.30 1.56 32.8030.05 1.61 32.43 188.10 1.82 32.70 351.25 1.32 32.6332.07 1.57 32.91 190.30 1.55 32.48 353.30 1.27 33.0434.75 1.58 32.83 192.00 1.86 32.40 355.50 1.09 32.5437.10 1.75 32.47 193.00 1.76 32.27 357.55 1.34 32.5139.60 1.74 32.35 195.25 1.70 32.29 359.50 1.33 32.2542.20 1.75 32.80 198.70 1.39 33.07 360.50 1.21 32.0044.40 1.71 32.83 201.70 1.72 32.73 362.70 0.89 31.9946.75 1.46 33.12 203.85 1.63 32.48 365.70 1.00 32.2849.15 1.70 32.69 206.00 1.78 32.32 367.80 1.48 31.9151.30 1.66 32.82 208.00 1.65 32.92 369.90 1.03 32.8553.50 1.22 32.85 211.25 1.79 32.47 371.70 1.31 32.6755.90 1.62 32.77 214.60 1.68 32.45 374.00 1.12 32.2058.15 1.73 32.63 216.85 1.74 32.29 376.85 1.51 31.8460.45 1.49 32.62 219.20 1.82 32.35 378.80 1.20 32.4562.65 1.57 32.68 222.00 1.71 32.66 380.70 1.39 32.3563.65 1.59 33.05 224.10 1.89 32.14 382.55 1.33 32.6565.70 1.55 32.91 226.00 1.71 32.73 384.50 1.29 32.9869.30 1.52 32.72 227.80 1.75 32.34 386.40 1.17 33.2471.20 1.70 32.94 229.90 1.72 32.31 388.50 1.48 32.8873.00 1.62 32.93 231.90 1.57 32.41 390.70 1.46 33.1374.90 1.65 32.99 234.20 1.64 31.67 392.70 1.34 33.3477.00 1.37 32.79 236.30 1.64 32.01 394.40 1.62 32.9778.90 1.65 32.77 238.60 1.69 32.37 396.80 1.26 33.2280.90 1.47 32.60 240.80 2.12 32.39 397.90 1.44 33.0082.80 1.80 32.84 243.40 1.85 32.60 401.05 1.63 33.5784.90 1.46 32.87 245.80 1.68 32.71 403.00 1.74 33.0086.75 1.31 32.33 247.90 1.55 32.31 405.10 1.49 33.2188.40 1.57 32.52 250.90 1.59 32.48 407.50 1.48 33.2591.90 1.42 33.05 253.00 1.66 32.38 409.50 1.67 33.1594.20 1.39 32.99 255.15 1.41 32.50 411.65 1.52 33.4196.50 1.54 32.89 257.50 1.77 32.74 413.45 1.52 33.6898.55 1.97 33.12 259.20 1.80 32.40 415.35 1.25 33.51100.50 1.40 32.74 261.40 1.71 32.56 417.40 1.52 33.23101.70 1.34 32.60 263.40 1.95 32.39 419.20 1.43 33.43103.90 1.45 32.79 265.45 1.24 32.33 421.25 1.52 33.35106.60 1.45 32.75 267.50 1.64 32.90 423.15 1.37 33.36108.50 1.79 32.66 269.75 1.51 32.44 426.10 1.62 33.09110.55 1.36 33.10 271.70 1.42 32.03 428.20 1.49 33.31111.60 1.55 32.98 273.80 1.68 32.79 430.10 1.51 33.20114.50 1.83 32.52 277.20 1.58 32.91 431.90 1.70 33.25116.55 0.88 33.13 279.40 1.41 32.64 434.20 1.56 33.32118.50 1.86 32.60 281.30 1.34 33.21 436.90 1.29 33.35120.45 1.54 32.94 283.20 1.40 31.79 439.50 1.65 33.12122.40 1.25 32.89 285.10 1.44 32.88 441.60 1.60 33.46124.40 1.51 33.04 286.90 1.57 32.26 443.50 1.69 33.07126.35 1.82 33.01 289.10 1.58 32.83 445.35 1.64 33.19128.00 1.71 33.06 290.20 1.48 32.79 447.10 1.32 33.38131.30 1.41 32.94 294.10 1.74 32.43 449.00 1.44 33.40133.25 1.69 32.73 297.10 1.88 32.71 452.00 1.70 33.31
PALAEO 2948 13-11-02
I. Jarvis et al. / Palaeogeography, Palaeoclimatology, Palaeoecology 188 (2002) 215^248226

tios were determined on-line using a VG Isocarbdevice and Prism mass spectrometer at the Uni-versity of Oxford, following the method of Jen-kyns et al. (1994). Results are reported in the N
notation, in parts per thousand or per mille (x)relative to the Vienna Pee Dee Belemnite (VPDB)international standard. Reproducibility was betterthan 0.1x for both carbon and oxygen.
3.2. Results
The carbon stable-isotope pro¢le obtained at ElKef is shown in Fig. 3 plotted against a compositestratigraphy for the area. Pro¢les for Elles, Bidartand Trunch are shown for comparison, with ver-tical scales adjusted to compensate for the di¡er-ent sediment thicknesses. The stratigraphy of theTrunch succession and key biostratigraphicmarker horizons are also shown.
3.2.1. DiagenesisOxygen isotope data (Tables 1 and 2) are not
presented stratigraphically because trends at El
Kef di¡er from those elsewhere. The poor agree-ment indicates variable diagenetic resetting ofN18O values in the Tunisian samples, since in oth-er Campanian sections oxygen isotopes have beendemonstrated to record a consistent, largely pa-laeoclimate, signal (Jenkyns et al., 1994; Clarkeand Jenkyns, 1999). Li et al. (2000) also con-cluded that their Tunisian Campanian^Maas-trichtian oxygen isotope data had been reset, de-spite the apparently good preservation offoraminiferal samples.Carbon isotopes are much less prone to diage-
netic alteration than oxygen isotopes (Hudson,1977; Anderson and Arthur, 1983; Banner andHanson, 1990; Marshall, 1992) because pore-waters in marine carbonate sediments generallycontain little organic matter, the carbon isotopesystem is rock-dominated, and carbon isotopesshow no signi¢cant temperature-controlled frac-tionation during burial. Notable exceptions occurin association with subaerial exposure surfaceswhere soil zone CO2 commonly drives bulk sedi-ment N13C to lower values, producing local nega-
Table 1 (Continued).
Height N13C N
18O Height N13C N
18O Height N13C N
18O(m) (x VPDB) (x VPDB) (m) (x VPDB) (x VPDB) (m) (x VPDB) (x VPDB)
135.30 1.47 33.05 299.30 1.71 32.49 454.00 1.61 33.09137.45 1.54 32.72 302.30 1.71 32.59 455.80 0.99 32.83139.10 1.65 32.86 304.60 1.61 32.33 457.80 1.57 33.32141.05 1.58 32.45 306.60 0.96 32.65 459.70 1.48 33.44143.40 1.63 32.70 308.50 1.33 32.81 461.70 1.71 33.03145.80 1.77 32.67 310.30 1.26 32.59 463.80 1.60 32.74148.20 1.41 32.95 312.40 1.61 32.90 465.60 1.70 33.00150.60 1.53 32.34 314.50 1.60 32.92 467.40 1.63 33.11152.65 1.78 32.44 316.80 1.70 33.04 469.05 1.48 33.19154.90 1.86 32.63 318.65 1.50 33.33 471.00 1.69 33.12157.00 1.80 32.49 320.70 1.29 32.71 472.70 1.79 33.35159.15 1.83 32.21 322.70 1.35 32.70 474.60 1.86 33.19161.50 1.81 32.05 324.70 0.90 33.12 476.20 1.87 33.04163.60 1.92 32.76 327.20 1.30 33.16 478.00 1.69 33.14165.70 1.92 32.68 329.30 1.75 32.83 480.00 1.37 32.53167.80 1.96 32.84 331.35 1.65 32.89 481.00 1.62 33.05170.10 1.70 32.63 333.45 1.17 33.04 482.50 1.73 32.81172.20 1.71 32.43 335.30 1.54 33.01 484.70 1.77 32.85174.10 1.76 32.41 337.25 1.82 32.56 486.25 1.73 32.95175.75 1.92 32.29 339.20 1.87 32.91 487.80 1.61 33.29177.80 2.09 32.74 341.20 1.81 33.07 489.50 1.46 33.08180.00 2.09 32.79 343.30 1.62 32.96 491.00 1.45 33.13181.10 1.77 32.45 345.35 1.32 32.40
PALAEO 2948 13-11-02
I. Jarvis et al. / Palaeogeography, Palaeoclimatology, Palaeoecology 188 (2002) 215^248 227

tive excursion of up to several per mille. However,exposure surfaces are absent in the study sections,where the robustness of the carbon isotope recordis further enhanced by low permeabilities (typi-cally 0.09 md in the Abiod Formation; O’Hearnet al., 1993) that severely limit £uid £ow in un-fractured sequences.A plot of N13C versus N18O for all samples is
shown in Fig. 4. Bulk sediments display valuesthat are comparable to Late Cretaceous pelagiccarbonates elsewhere (e.g. Scholle, 1977; JYrgen-sen, 1987; Jenkyns et al., 1994), but benthic fora-minifera values from Elles are generally lighterand more scattered. There is a modest negativecorrelation of N13C versus N18O for Trunch, andno signi¢cant correlation at other individual sites.The negative correlation at Trunch, the strati-graphically longest section, is believed to re£ecta primary trend of generally rising oxygen andfalling carbon isotope values through the Campa-nian (cf. Jenkyns et al., 1994), while the absenceof a positive correlation at the other sites suggeststhat diagenesis has not signi¢cantly a¡ected thecarbon isotope signal.The combined N
13C and N18O data set for all
sites (Fig. 4) de¢nes a broad array in which car-bon and oxygen are weakly positively correlated,and it is feasible that pervasive alteration of themore cemented Tunisian samples has reducedN13C values. However, the wide range in N
18O(nearly 5x) in the foraminifera samples fromElles is accompanied by remarkably little varia-tion in N
13C, and no covariance (Fig. 4). Further-
Table 2Trunch Santonian stable-isotope data
Depth N13C N
18O(m) (x VPDB) (x VPDB)
307.01a 2.85 32.11307.90 2.68 32.29308.00a 2.70 32.37309.00a 2.74 32.34309.90 2.77 32.69310.11a 2.70 32.52311.28a 2.63 32.41311.90 2.52 32.58314.90 2.46 32.63317.90 2.49 32.64319.90 2.43 32.54321.90 2.62 32.50a Values from Jenkyns et al. (1994).
Elles
Bulk sediment
Benthonic foraminifera
El Kef
TrunchBidart
-5.0 -4.0 -3.0 -2.0 -1.0 00
0.5
1.0
1.5
2.0
2.5
3.0
δ18O (‰VPDB)
δ13 C
(‰V
PD
B)
Fig. 4. Carbon versus oxygen stable-isotope cross plot. Data are for bulk sediment samples except Elles (stars), which are pickedbenthic foraminifera, Anomalinoides acuta. N13C and N
18O show a weak negative correlation at Trunch, and no signi¢cant cova-riance at the other sites, although the combined data display a positive correlation. Data sources: El Kef (¢lled circles), Table 1this study; Bidart (open circles), Clauser (1994); Trunch (crosses), Jenkyns et al. (1994) and Table 2 this study; Elles, Li et al.(2000).
PALAEO 2948 13-11-02
I. Jarvis et al. / Palaeogeography, Palaeoclimatology, Palaeoecology 188 (2002) 215^248228

more, a diagenetic study of the Abiod Chalk byO’Hearn et al. (1993), based on the stable-isotopeanalysis of 110 samples, reported similar bulksediment values for outcrop material to thepresent study, and characterised early- and late-stage fracture-¢lling calcites with isotope signa-tures averaging +2x N
13C and 38x N18O. De-
spite the wide compositional range (+1 to +3xN13C; 36 to 312x N
18O) displayed by the dia-genetic spars, no covariance was observed(O’Hearn et al., 1993, ¢g. 3). Based on compar-isons with chalk successions elsewhere, O’Hearnet al. (1993) concluded that cementation of theAbiod Formation occurred in a rock-dominated,closed to semi-closed diagenetic system, with bothmatrix and fracture-¢lling cements being derivedfrom pressure solution processes, unin£uenced byexternal basinal or meteoric £uids.The small range of N13C values in the bulk sedi-
ments (+1^+2x), stratigraphic trends that showno correspondence to lithology (Fig. 3) and cor-relate with coeval sequences elsewhere (see be-low), and the absence of any covariance withN18O, all support the view that the carbon isotoperecord at El Kef is relatively unaltered. The o¡settowards lower N13C values (Figs. 3 and 4) com-pared to the other two main sites may be a pri-mary characteristic of the succession. SeawatergCO2 from modern carbonate platforms (Baha-ma Banks and Florida) is depleted in 13C by asmuch as 4x relative to open-ocean water (Pat-terson and Walter, 1994). Unfortunately, such o¡-sets may not be re£ected in the marine carbonaterecord because aragonite muds, the dominant de-posits of modern shallow-water carbonate plat-forms, are enriched in 13C by roughly +2.7xrelative to bicarbonate (Romanek et al., 1992).This will reduce or even reverse the negativesignal imposed by variations in seawater compo-sition (Immenhauser et al., 2002). However,low-Mg-calcite-dominated systems like the chalksdescribed here would be expected to record sea-water variation, and indeed o¡sets towards lighterN13C values in Cretaceous platform carbonateshave been reported elsewhere (Weissert, 1989;Fo«llmi et al., 1994; Voigt and Hilbrecht, 1997;Gro«tsch et al., 1998).As with modern platforms, relative depletion in
13C at El Kef may be attributed to isotopicallylight CO2 input from respiration of marine andterrestrial organic matter during water-mass resi-dence on the platform. The relatively ‘noisy’ N13Cpro¢le at El Kef compared to the other sites (Fig.3), however, may indicate greater short-termvariation in local seawater 13C. Alternatively, al-teration caused by variable organic matter diagen-esis, greater burial depths, a more active tectonicsetting with local fracture systems carrying vary-ing pore-£uid compositions, and a wider range ofpetrophysical properties due to the higher andvarying proportions of marl, may all have in-duced more ‘noise’ in the carbon isotope recordat El Kef.
3.2.2. Chemostratigraphy, correlation and carbonisotope eventsThe carbon isotope curves are remarkably sim-
ilar in overall shape and amplitude despite theo¡set to lighter N13C values at El Kef comparedto Bidart and Trunch (Figs. 3 and 4). Even lowervalues characterise the benthic foraminiferal iso-tope record at Elles. A long-term trend towardslighter N13C values upwards from the base Cam-panian to the base Maastrichtian is indicated bythe Trunch pro¢le, the stratigraphically longestsection. In addition, distinct peaks, troughs (pos-itive and negative ‘excursions’), and points ofin£exion provide tie points for the chemostrati-graphic correlation shown in Fig. 3.There are no published macrofossil or micro-
fossil records common to all of the sections thatenable their direct correlation. However, limitednannofossil data are available (Burnett, 1990;McArthur et al., 1993b; Clauser, 1994; Robas-zynski et al., 2000). These provide some con-straints, but a general lack of nannofossil markerspecies in Boreal mid-Campanian successions,provincialism of many key taxa, and possible dia-chroneity of FODs and LODs between bioticprovinces (see e.g. Burnett et al., 1999, ¢g. 6.5)prevent precise correlation. Nonetheless, su⁄cientdata are available (Fig. 3) to test the isotope cor-relation. For example, the base of the Campanianat both El Kef and Bidart must lie some distancebelow the bases of the study sections because theFOD of Broinsonia parca s.l. occurs around 100 m
PALAEO 2948 13-11-02
I. Jarvis et al. / Palaeogeography, Palaeoclimatology, Palaeoecology 188 (2002) 215^248 229

LST
LST
TST
HST
HST3.3
3.4
3.5
4.1
4.2
4.3
4.4
TST
TST
LST
LST
HST
HST
HST
TST
HST
LST
HST
TST
LST
TST
Third ordercycles(UZA)
Eustatic curves Relative change of coastal onlapSystems
tracts
long termrising basinwardfalling
short term
NW Europe(Hancock, 1993)
Egypt(Lüning et al., 1998)
'Global'(Haq et al., 1987)
Sta
ge
Teth
ys
NW
E
urop
e
?
Ca/MSin
CaSin
Peak 2
Peak 3
Peak 1
Sa/CaSin
Regional sea-level curves
(Haq et al., 1987)
landward
75
80
85
71.3Ma
83.5Ma
Age(Ma)
Bl
Bel
emni
tella
muc
rona
ta s
.l.
Gan
sser
ina
gans
seri
Rd
. cal
cara
taG
. ven
tric
osa
Gf
Gon
iote
uthi
s q
uad
rata
U.
soci
alis
Off
aste
r p
ilula
M.
test
.
Sa
Low
er C
amp
ania
nU
pp
er C
amp
ania
nM
a
Biostratigraphy Carbon isotope stratigraphy
mid-Campanian eventmid-Campanian eventmid-Campanian event
1.5 2.0 2.5 3.0δ13C (‰VPDB)
Upper Campanian Upper Campanian eventevent
Upper Campanian event
Santonian/CampanianSantonian/Campanianboundary eventboundary event
Santonian/Campanianboundary event
Marsupites transgression
UK reference curve
mucronatatransgression
polyplocum regression
polyplocum transgression
PALAEO2948
13-11-02
I.Jarvis
etal./P
alaeogeography,Palaeoclim
atology,Palaeoecology
188(2002)
215^248230

below the base of the Abiod Chalk at KalaatSenan, and only a few metres of limestone con-taining Brionsonia parca constricta occurs betweenthe faulted base of the section at Bidart and the¢rst occurrence of Ceratolithoides aculeus. TheFOD of B. parca s.l. is a global lower Campanianmarker that occurs well above the base of thestage (Burnett et al., 1999), as seen at Trunch(Fig. 3), but generally occurs well below theFOD of Ceratolithoides.A number of other key nannofossil species are
common to the Tunisian and French successions,including Uniplanarius gothicus, Uniplanarius tri¢-dus, Ei¡ellithus eximius (Stover) Perch-Nielsen,Tranolithus orionatus (Reinhard) Reinhard andLithraphidites praequadratus. The FODs andLODs of these taxa in the sections (Fig. 3) areconsistent with the isotope correlation, despitethe sequence of biostratigraphic datums being dif-ferent in some cases. The combined biostrati-graphic and chemostratigraphic correlation sug-gests that a signi¢cant stratigraphic gap existsbetween the middle and upper faulted sectionsat Bidart. Fewer species are common to Trunchand the other sections, although the LOD ofReinhardtites anthophorus (De£andre) Perch-Niel-sen provides a tie point in the upper Campanian.The coincident LOD of E. eximius and FOD ofU. tri¢dus in the Tunisian and French sectionscontrasts with evidence for a late Campanian ex-tinction of the former species (Burnett et al.,1999), as seen at Trunch. The FOD of Reinhard-tites levis Prins and Sissingh is inconsistent be-
tween the three areas, as also indicated by Burnettet al. (1999). Such biostratigraphic anomalies re-quire further investigation. However, the limitedbiostratigraphic data are consistent with the car-bon stable-isotope correlation, although the latterprovides a means of higher resolution correlationbetween the three areas.In£exion points marking signi¢cant shifts in
carbon isotopic values have been used to de¢nethe bases of three major (solid black tie lines inFig. 3) ‘isotope events’ and eight additional minortie points (dashed grey lines in Fig. 3). These pro-vide a basis for correlating the four sections.Some lower-amplitude isotopic shifts within thesepackages almost certainly have correlation poten-tial, but further data will be required to provetheir utility. Major isotope ‘events’ are namedby reference to their stratigraphic level (e.g. San-tonian^Campanian Boundary Event). The tiepoints used for correlation (numbered 1^11 inFig. 3) are, from bottom to top:(1) A sharp increase in N13C occurs in the upper
Marsupites testudinarius Zone at Trunch. Carbonisotope values reach a maximum at the Santo-nian^Campanian boundary and de¢ne a broadpositive carbon isotope excursion that spans thestage boundary, the Santonian^Campanian Bound-ary Event.(2) Carbon isotope values fall through the basal
Campanian O¡aster pilula Zone at Trunch. Aminimum in the upper O¡aster pilula Zone pro-vides a potential tie point that marks a break inthe slope towards more constant values, produc-
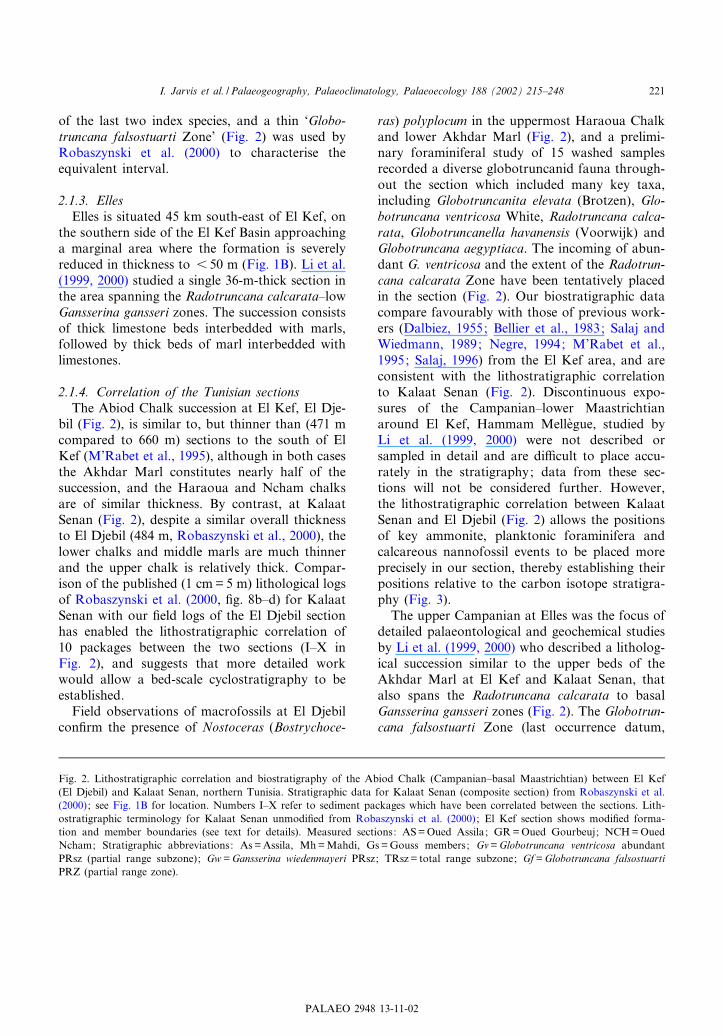
Fig. 5. Sea-level change versus carbon isotope stratigraphy. The carbon isotope curve is a ¢ve-point moving average of theTrunch data. The N
13C curve (thick grey line) is plotted against the time scale of Gradstein et al. (1995), calibrated using thebase Campanian (83.5 Ma) and base Maastrichtian (71.3 Ma) and assuming a constant sedimentation rate at Trunch. Isotopeevents and the bases of positive isotope shifts (horizontal dashed lines) and sudden falls in N
13C (dotted lines) are shown forreference. The relative positions of the NW European macrofossil and Tethyan planktonic foraminifera biostratigraphies arebased on the carbon isotope correlation shown in Fig. 3. The transgressive and regressive events (polygonal boxes) recognised inGermany (Niebuhr, 1995; Niebuhr et al., 2000) are shown for comparison. Peaks and troughs on the regional sea-level curveshave been placed relative to the appropriate biostratigraphy. Peaks 1^3 are transgressive maxima in NW Europe (Hancock,1993b). Sa/CaSin, CaSin and Ca/MaSin are the Santonian^Campanian, Campanian, and Campanian^Maastrichtian sequenceboundaries identi¢ed in Egypt (Lu«ning et al., 1998). The ‘eustatic’ curve (Haq et al., 1987) has been re-calibrated by placing thebase of TST3.4 at the bottom of the Santonian^Campanian Boundary Event, the base of TST4.1 at the base of the Mid-Campa-nian Event, and the base of TST4.4 at the top of the Upper Campanian Event, and scaling the remainder of the curve accord-ingly (see text for discussion). HST=highstand systems tract; LST= lowstand systems tract; SST= shelf-margin systems tract;TST= transgressive systems tract.
PALAEO 2948 13-11-02
I. Jarvis et al. / Palaeogeography, Palaeoclimatology, Palaeoecology 188 (2002) 215^248 231

ing a relative plateau in the isotope pro¢le thatcharacterises the remainder of the lower Campa-nian.(3) A N
13C maximum occurring in the lowerGonioteuthis quadrata Zone at Trunch probablycorrelates with peaks near the bases of the ElKef and Bidart sections.(4) A broad trough and associated minimum in
the upper Globotruncana arca PRsz (mid-Globo-truncana ventricosa Zone) at El Kef correlateswith a minimum in the mid-Gonioteuthis quadrataZone at Trunch, but is less evident at Bidart dueto the lower sampling resolution and faulting (in-dicated by the pro¢le break in Fig. 3).(5) A sharp increase in N
13C is evident near thebase of the Globotruncana ventricosa abundantPRsz (top Globotruncana ventricosa Zone) at ElKef, and on the basis of nannofossil records(Fig. 3) occurs at the same stratigraphic level atBidart. A similar N
13C shift coincides with thebase of the upper Campanian basal Belemnitellamucronata Zone at Trunch. The broad positiveisotope excursion above de¢nes the Mid-Campa-nian Event.(6) A reversal from decreasing to increasing
N13C values occurs in the uppermost Globotrunca-na ventricosa Zone at El Kef and in the lowerBelemnitella mucronata Zone at Trunch. A similarchange is noted at Bidart.(7) A N
13C trough in the basal Radotruncanacalcarata Zone at El Kef is correlated with amarked break in slope in the pro¢le of the lowerBelemnitella mucronata Zone at Trunch.(8) The Radotruncana calcarata Zone is charac-
terised by falling N13C values at both Kef and
Elles, prior to a major positive shift in the mid-Globotruncana falsostuarti Zone, close to the FODof Rugoglobigerina hexacamerata. The shapes ofthe curves at El Kef and Elles are in good agree-ment despite the lower values at the latter site,probably caused by the di¡erent sample types. Asimilar but less pronounced shift occurs in themid-Belemnitella mucronata Zone at Trunch.(9) A sharp break in slope and a shift towards
sharply decreasing N13C values occurs at the bot-
tom of the Gansserina gansseri Zone at El Kef andin the mid-Belemnitella mucronata Zone atTrunch. This level marks the base of a prominent
negative carbon isotope excursion, the UpperCampanian Event, at both localities.(10) A N
13C maximum and change to fallingN13C occur in the upper Gansserina gansseriZone at El Kef and near the top of the Belemni-tella mucronata Zone at Trunch.(11) Poor exposure at El Kef, poor sampling
resolution at Bidart, and poor core recovery atTrunch preclude a detailed evaluation of the car-bon isotope stratigraphy in the basal Maastricht-ian at the three study sites. However, a shift to-wards decreasing N
13C values appears to coincidewith the base of the Maastrichtian at Bidart andTrunch, and may correlate to the fall immediatelyabove the maximum identi¢ed at the top of thesection at El Kef.The isotope correlation places the Campanian^
Maastrichtian stage boundary, as de¢ned in Bo-real sections, somewhat higher in the Gansserinagansseri Zone at El Kef than indicated by Robas-zynski et al. (2000). Recent work on the newboundary stratotype at Tercis (Odin, 2001; Odinand Lamaurelle, 2001) indicates that the ¢rst ap-pearance of Gs. gansseri is regionally diachronous,but the stage boundary is coincident with the ¢rstoccurrence of Rugoglobigerina scotti Bro«nnimann,and occurs just below the ¢rst appearance of Con-tusotruncana contusa (Cushman). These speciesboth ¢rst occur 40 m above the base of the ElHaria Formation at Kalaat Senan (Robaszynskiet al., 2000), which would place the base of theMaastrichtian above the top of the studied inter-val at El Kef.
3.2.3. Dating carbon isotope eventsDetailed analysis of the carbon isotope stratig-
raphy requires a time framework. The UK sectionprovides the best reference section because it isstratigraphically the most complete and displaysa relatively smooth N
13C pro¢le. A further advan-tage is that this section comprises a uniformsuccession of £inty chalks with little lithologicalvariation. Eastern England was tectonically stableduring the Campanian and it is unlikely thatsedimentation rates varied signi¢cantly except ad-jacent to or within hardgrounds, where some con-densation and/or omission may occur. Constantsedimentation rates are con¢rmed by strontium
PALAEO 2948 13-11-02
I. Jarvis et al. / Palaeogeography, Palaeoclimatology, Palaeoecology 188 (2002) 215^248232

isotope data from the section (McArthur et al.,1993a,b). Calibrating the curve relative to theages of the Santonian^Campanian and Campa-nian^Maastrichtian boundaries (Gradstein et al.,1995) provides a time scale for the carbon isotopepro¢le. Signi¢cant facies variation at El Kef, anoisy N13C pro¢le, and deposition in a tectonicallyactive region (Burollet and Ellouz, 1984; Burollet,1991; Macgregor, 1996) make it less suitable forthese purposes, although chemostratigraphic cor-relation with Trunch is straightforward (Fig. 3).Gradstein et al. (1995) dated the Santonian^
Campanian boundary at 83.5 Z 0.5 Ma and theCampanian^Maastrichtian boundary at 71.3 Z0.5 Ma. The Campanian is 246 m thick at Trunch,yielding a sedimentation rate (uncorrected forcompaction) of 2 cm kyr31, which is typical ofLate Cretaceous chalks (Scholle et al., 1983). As-suming a constant sedimentation rate (which issupported by the near-perfect linearity of the Srisotope curve for Trunch that agrees closely withcoeval successions in northern Germany, McAr-thur et al., 1993a,b), the bases of the Gonioteuthisquadrata and Belemnitella mucronata zones aredated here at 81.8 Ma and 78.6 Ma, respectively,compared to values of 82.2 Ma and 80.7 Ma cal-culated by Hardenbol et al. (1998).The Santonian^Campanian Boundary Event
represents a positive carbon isotope excursion ofaround +0.3x and the Mid-Campanian Eventan excursion of about +0.2x N
13C. From theabove arguments, the base of the Santonian^Campanian Boundary Event is dated at 83.7 Maand the base of the Mid-Campanian Event at 78.7Ma, and both events have a duration of around600 kyr. A minimum error of Z 50 kyr on the last¢gure is induced by the 1-m sampling resolution.The Upper Campanian Event negative carbonisotope excursion of 30.4x lies at 74.8 Maand lasted for around 750 kyr, although there isgreater uncertainty in the duration of this eventbecause of poorer core recovery at this level in theTrunch reference borehole.
4. Geographical extent of the isotope events
The positive isotope excursion associated with
the Santonian^Campanian Boundary Event canbe recognised elsewhere in southern England(East Kent and Sussex; Jenkyns et al., 1994), innorthern Germany (Scho«nfeld et al., 1991) and inthe US Western Interior (Pratt et al., 1993). Thenegative excursion de¢ning the Upper CampanianEvent is also seen in the Norfolk data of Scholleand Arthur (1980). Jenkyns et al. (1995) docu-mented a negative N13C excursion in the ‘Campa-nian^Maastrichtian’ of the Marshall Islands,north-central Paci¢c. Their stratigraphic assign-ment of the excursion was based on the presenceof Globotruncana ventricosa and other planktonicforaminifera species and the FOD of Globotrun-canita stuarti de Lapparent and Globotruncana ae-gyptiaca around the level of the excursion. Basedon new interpretations of Campanian^Maas-trichtian biostratigraphy (Hardenbol et al., 1998;Odin, 2001), this excursion lies entirely within theupper Campanian, and probably correlates withthe Upper Campanian Event described here.Barrera and Savin (1999) summarised ocean
drilling sample data that de¢ne a N13C minimum
close to the Campanian^Maastrichtian bound-ary as recorded by both benthic and planktonicforaminiferal carbon isotope records from theSouth Atlantic, Indian and tropical Paci¢c oceans(e.g. Barrera and Savin, 1999, ¢gs. 6^7). This min-imum may also correspond to our Upper Cam-panian Event. It seems highly likely, therefore,that the Upper Campanian Event was of globalextent.
5. Carbon isotopes and sea-level
There is considerable evidence for a relation-ship between positive shifts in Cretaceous N
13Crecords and ¢rst-order (30-Myr scale) rises in eu-static sea-level (e.g. Scholle and Arthur, 1980;Berger and Vincent, 1986; Arthur et al., 1987;Weissert, 1989; Jenkyns et al., 1994; Mitchell etal., 1996; Voigt and Hilbrecht, 1997; Weissert etal., 1998). This association is generally attributedto changes in the partitioning of carbon betweenorganic and carbonate carbon sinks caused bysea-level rise. However, not all periods of sea-levelrise display associated isotopic increases (e.g. Jar-
PALAEO 2948 13-11-02
I. Jarvis et al. / Palaeogeography, Palaeoclimatology, Palaeoecology 188 (2002) 215^248 233

vis et al., 2001), and some apparently even dem-onstrate negative N13C shifts (Voigt, 2000), so therelationship is not straightforward.The Exxon ‘global’ Mesozoic^Cenozoic sea-
level curve of Haq et al. (1987, 1988), recentlyrecalibrated to the Gradstein et al. (1995) andBerggren et al. (1995) time scales by de Gracian-sky et al. (1998), has been used widely to assesspossible ‘eustatic’ in£uences on regional sequencestratigraphy and sea-level change. This is despitethe poor stratigraphic resolution of the referencecurve, which makes it impossible to test these re-lationships with any rigour (Miall, 1992, 1997;Miall and Miall, 2001, and references therein).Inadequate biostratigraphic control on the Cam-panian portion of the Exxon curve makes its useparticularly problematic (Hancock, 1993b). How-ever, biostratigraphically well-constrained region-al data exist for North Africa and the MiddleEast (e.g. Lewy, 1990; Lu«ning et al., 1998) andnorthern Europe (e.g. Hancock, 1989, 1993b,2000) that provide strong evidence of Late Creta-ceous sea-level change which can be compared toour carbon isotope data.
5.1. Campanian sea-level change
In Israel, facies changes demonstrate (Lewy,1990) a shallowing event followed by a markedtransgression around the Santonian^Campanianboundary. A mid-Campanian regression^trans-gression (upper Globotruncana ventricosa Zone?)is followed by high relative sea-levels in the Rado-truncana calcarata Zone, and a sea-level minimumoccurs in the upper Campanian, somewhat belowthe base of the Gansserina gansseri Zone. InEgypt, Lu«ning et al. (1998) described three majorCampanian sequences with sequence boundaries:(1) at the Santonian^Campanian boundary; (2) inthe mid-Campanian, high G. ventricosa Zone; and(3) in the upper Campanian, low Globotruncanafalsostuarti Zone. These were attributed to majorsea-level falls that were closely followed by majortransgressive pulses (Fig. 5). The last of thesefalls equates to a sequence boundary identi¢edthroughout central Egypt within the Nostoceras(Bostrychoceras)) polyplocum ammonite Zone(Glenn, 1990; Glenn and Arthur, 1990). Interpre-
tations of late Campanian sea-level change in Tu-nisia (Li et al., 2000) are di⁄cult to relate in detailto other work, but here also a broad regressivetrough has been identi¢ed in the upper Campa-nian immediately below the Gansserina gansseriZone.In NW Europe, three major transgressive max-
ima separated by intervals of lower sea-level wereidenti¢ed in the Campanian by Hancock (1989,1993b) using nodular chalks and hardgrounds todate regressive troughs, and mid-points betweenpairs of these to date transgressive peaks (some-what of an oversimpli¢cation because hard-grounds may form during both lowstands andphases of sea-level rise, Gale, 1996). The upper-most Santonian is characterised by a sea-levelminimum (Fig. 5), with a transgressive pulseacross the Santonian^Campanian boundary, anda sea-level maximum (Peak 1) in the lowest Cam-panian O¡aster pilula Zone. Sea-level peaks occurin the basal upper Campanian, very low in theBelemnitella mucronata Zone (Peak 2); and againin the upper Campanian, high in the same zone(Peak 3). The European sea-level maxima cor-relate with lithofacies changes in the US West-ern Interior and south-eastern USA (Hancock,1993b), particularly episodes of expanded pelagiccarbonate deposition, although local tectonic ef-fects in North America complicate interpreta-tions.Hart (1990, 1993) used a combination of plank-
tonic:benthic foraminifera ratios coupled withplanktonic foraminiferal morphogroups in succes-sions from southern and eastern England to mod-el Late Cretaceous sea-level change. Regressiveepisodes followed by major transgressive pulseswere recognised: (1) around the Santonian^Cam-panian boundary (base Rugoglobigerina pilulaTRZ: UK planktonic foraminiferal Zone UKP12); (2) in the mid-Campanian (low in the Globo-truncana rugosa IZ: UKP 13); (3) in the upperCampanian (base abundant Globotruncanella ha-vanensis IZ: UKP 15).The base of UKP 12 corresponds to the base of
the O¡aster pilula Zone of the macrofossil bio-stratigraphy, indicating that this transgression isequivalent to our Santonian^Campanian Bound-ary Event. The bottom of the Globotruncana ru-
PALAEO 2948 13-11-02
I. Jarvis et al. / Palaeogeography, Palaeoclimatology, Palaeoecology 188 (2002) 215^248234

gosa IZ (UKP 13) approximates to the base of theBelemnitella mucronata Zone in southern England(Hart et al., 1989, ¢g. 7.22), and is assumed toequate to the high Globotruncana ventricosaZone elsewhere (Hart, 1993, ¢g. 10). The mid-Campanian transgression therefore correspondsto the Mid-Campanian Event recognised here.This transgression has been interpreted (Hart,1990, 1993) as leading to a Campanian sea-levelmaximum that extends to the top of the Contuso-truncana plummerae TRZ (UKP 14), based onthe very high proportion (the highest above theTuronian) of planktonic foraminifera in this inter-val.The Upper Campanian Event is more problem-
atic. Globotruncanella havanensis, the index speciesof UKP 15, ranges down into the upper Radotrun-cana calcarata Zone in both Tunisia and SWFrance (Odin, 2001), suggesting that the upperCampanian transgression of Hart (1990, 1993)broadly corresponds to our Upper CampanianEvent. However, Hart et al. (1989, ¢g. 7.22) in-dicated that the base of UKP 15 approximates tothe base of the Maastrichtian Belemnella lanceo-lata Zone, which would place the transgressionmuch higher in the Trunch succession than theisotope event. This problem remains unresolvedas, despite further work, the exact timing of theforaminiferal changes accompanying the lateCampanian transgression is still uncertain (Hart,personal communication, 2002).A number of transgressive and regressive events
have been recognised in northern Germany byfacies changes and phases of £ooding of the Rhe-no-Bohemia Massif (Niebuhr, 1995; Niebuhr etal., 2000). Major episodes of sea-level rise are in-dicated by the: latest Santonian ‘Marsupitestransgression’; early Campanian ‘pilula transgres-sion’; and earliest late Campanian ‘mucronatatransgression’, that led to the onlap of glauconiticsands and then pelagic carbonates (chalks) ontothe Massif. A fall in sea-level during the lateCampanian ‘polyplocum regression’ produced asuccession of o¥apping continental and estuarinesiliciclastic sediments in the German Chalk basins.Macrofossil data indicate that these episodes ofsea-level change correspond exactly to our isotopeevents (Fig. 5).
5.2. Comparison of N13C and sea-level curves
A smoothed N13C pro¢le for Trunch is com-
pared with regional sea-level curves for NW Eu-rope (Hancock, 1993b) and Egypt (Lu«ning et al.,1998) in Fig. 5, calibrated using the biostrati-graphic data. Major transgressive and regressiveevents are named following the German terminol-ogy (Niebuhr, 1995; Niebuhr et al., 2000) with theaddition of a ‘polyplocum transgression’ to indi-cate the main phase of late Campanian eustaticsea-level rise (Hancock, 1993b, 2000), which is notdistinguished in northern Germany. There isbroad agreement between the NW Europe andthe Egypt curves with generally rising sea-levelsthrough the Campanian, and major earliest Cam-panian and mid-late Campanian transgressions. Amid-Campanian regression is well developed inEgypt.The positive carbon isotope excursion de¢ning
the Santonian^Campanian Boundary Event corre-sponds exactly with the Marsupites transgressionin Germany. A transgressive maximum spans thestage boundary, which both at Trunch and inGermany is characterised by an interval of calcar-enitic shelly chalks (‘Grobkreide’ facies of Ger-man workers, e.g. Schulz et al., 1984). Hancock(1993b) placed a minor sea-level peak at the stageboundary coincident with the N13C maximum, butindicated that a higher maximum (his Peak 1)occurs above, in the mid-O¡aster pilula Zone(equivalent to the pilula transgression in Ger-many; not clearly di¡erentiated by the isotopedata). In Egypt a sequence boundary (Sa/CaSin,Fig. 5) is coincident with the stage boundary de-¢ned using planktonic foraminifera and nanno-fossils (Lu«ning et al., 1998). Given the potentialdating errors involved (the exact position of theTethyan Dicarinella asymetrica^Globotruncanitaelevata planktonic foraminiferal boundary is un-certain with respect to the Boreal macrofossil bio-stratigraphy), it is probable that this sequenceboundary lies within the uppermost Santonian(as used here) and the subsequent sea-level risere£ects the Marsupites transgression of northernEurope.The mid-Campanian regression in Egypt and
subsequent sea-level rise corresponds to the mu-
PALAEO 2948 13-11-02
I. Jarvis et al. / Palaeogeography, Palaeoclimatology, Palaeoecology 188 (2002) 215^248 235

cronata transgression. At Trunch the base of thepositive isotope excursion of the Mid-CampanianEvent lies immediately below the Trunch Hard-grounds (Fig. 3), suggesting that these wereformed due to sediment starvation during sea-lev-el rise. This is supported by the observation thatthese hardgrounds have weakly phosphatised sur-faces: Gale (1996) di¡erentiated between glauco-nitised hardgrounds, which were interpreted asbeing indicators of maximum sea-level fall, andphosphatised hardgrounds which were character-istic of sea-level rise. In northern Germany, thebasal Belemnitella mucronata Zone represents themaximum extension of chalk facies onto massifsand is characterised by the deposition of purewhite chalks in adjacent basins (Niebuhr, 1995;Niebuhr et al., 2000). By contrast, in Tunisia theMid-Campanian Event coincides with a facieschange from chalks to marls (base of the AkhdarMarl ; Fig. 3).The base of the Upper Campanian Event cor-
relates with the polyplocum regression in Germanyand it is notable that a sequence boundaryidenti¢ed throughout central Egypt also occursin the Nostoceras (Bostrychoceras) polyplocumZone. An omission surface is coincident withthe N
13C minimum at Trunch. In Tunisia theUpper Campanian Event coincides with the ¢nalphase of marl sedimentation at the base of theGansserina gansseri Zone prior to a return tochalk deposition (Ncham Chalk; Fig. 3) above.Low sea-levels at this time in Tunisia are indi-cated by faunal and other data (Li et al., 1999).The top of the Upper Campanian Event prob-ably correlates with the widely recognised polyplo-cum transgression and the sea-level rise associatedwith Campanian Peak 3 of Hancock (1993b;Fig. 5).There is strong evidence for a correlation be-
tween Campanian positive carbon isotope excur-sions and phases of sea-level rise. The bases ofN13C excursions appear to correspond broadly tolowstands, with maxima in the lower parts oftransgressive system tracts, as noted in otherChalk successions (e.g. Gale, 1996; Mitchell etal., 1996; Jarvis et al., 2001). The three mainphases of Campanian sea-level change appear tobe synchronous in northern Europe and North
Africa, implying a dominance of eustatic over re-gional tectonic forcing.The Exxon curve (Fig. 5), being based funda-
mentally on seismic data and sequence architec-ture (Haq et al., 1987, 1988), might be argued toprovide a reasonable representation of the direc-tions, relative ages and magnitudes of sea-levelchange (but see the critique of Miall and Miall,2001), even if its time framework is limited byinadequate age control. The biostratigraphic basisfor the Campanian portion of the curve (Haq etal., 1987, 1988), in particular, is £awed because itassumes that the base of the Belemnella lanceolatabelemnite Zone of northern Europe, which ap-proximates to the FOD of Pachydiscus neubergi-cus (Hauer) that de¢nes the international stageboundary (Hancock and Gale, 1996; Christensenet al., 2000; Odin, 2001; Odin and Lamaurelle,2001), is equivalent to the top of the Radotrunca-na calcarata foraminiferal Zone of Tethyan suc-cessions. Our isotope correlation (Fig. 3) con¢rmsrecent evidence (e.g. Robaszynski and Caron,1995; Hardenbol et al., 1998; Robaszynski etal., 2000; Odin, 2001) that places the stageboundary much higher in Tethyan areas, withinthe lower Gansserina gansseri Zone.In Fig. 5 the Exxon curve has been recalibrated
using the carbon isotope pro¢le. This interpreta-tion is based on the assumption that the threemajor Campanian transgressive events discussedabove are the same as those recognised in theCampanian by Haq et al. (1987, 1988), and thatthe in£ection points on the rising N
13C curves as-sociated with these events approximate to the in-£ection points on the rising short-term sea-levelcurve, as observed in the Cenomanian and Turo-nian (Jenkyns et al., 1994; Gale, 1996; Mitchell etal., 1996; Davey and Jenkyns, 1999). We ac-knowledge that this is almost certainly a grossoversimpli¢cation, but the stratigraphic evidencediscussed above indicates that this is a reasonable¢rst approximation. Similar interpretations of therelationship between the Campanian ‘eustatic’curve and sequence stratigraphy have beenreached based on stratigraphic and sedimentolog-ical arguments (Niebuhr, 1995), although severaladditional sequences may be present elsewhere(Hardenbol et al., 1998), which are potentially
PALAEO 2948 13-11-02
I. Jarvis et al. / Palaeogeography, Palaeoclimatology, Palaeoecology 188 (2002) 215^248236

re£ected in the ¢ner structure of the isotope pro-¢les. However, data from additional sections willbe required to test the reproducibility of smallerpeaks and troughs in the Campanian N
13C curves.The overall shapes of the carbon isotope and
‘eustatic’ curves (Fig. 5) are comparable, althoughthe highest N13C values occur at the Santonian^Campanian Boundary Event, while highest sea-levels occur around the Mid-Campanian Event,and the lower Campanian portions of the curvesshow other di¡erences in detail. It is notable thatthe two main positive carbon isotope excursionsat the Santonian^Campanian boundary and Mid-Campanian Events both begin in lowstand sys-tems tracts (Fig. 5), while the bases of all otherthird-order (1-Myr scale) cycles are represented byshelf-margin systems tracts. This suggests thatmajor positive excursions are associated particu-larly with transgressions following periods of ma-jor sea-level fall. The upper Campanian isotopeand ‘eustatic’ sea-level pro¢les are remarkablysimilar, with a long-term fall in N
13C associatedwith falling ‘eustatic’ sea-levels, and four carbonisotope ‘cycles’ and four third-order ‘eustatic’cycles. Falling sea-levels in the late Campanianare not re£ected in the ‘regional’ NW Europeand Egypt curves (Fig. 5), although regressionsare documented in many areas, including north-ern Germany (Niebuhr, 1995), northern Spain(Floquet, 1998), central West Africa (Seiglie andBaker, 1984), northern South America (Eriksonand Pindell, 1998; Villamil, 1998) and the USWestern Interior (Hancock and Kau¡man,1979). This supports the suggestion that carbonisotope trends re£ect global rather than local pro-cesses.
5.3. Palaeoenvironmental interpretation of carbonisotope stratigraphy
Positive shifts of N13C in marine carbonate andorganic matter records are generally interpreted tore£ect the removal of large amounts of light car-bon from the oceans by the burial of 12C-richorganic matter (Schlanger and Jenkyns, 1976;Scholle and Arthur, 1980; Arthur et al., 1987).Large global positive N
13C excursions are com-monly associated with periods of enhanced organ-
ic carbon burial in black shales or organic-richcarbonates associated with oceanic anoxic events(OAEs), and are caused by increased marinephytoplankton productivity and/or increased pre-servation under anoxic waters. However, a syn-chronous decrease in pelagic carbonate £uxesand the drowning of carbonate platforms mayalso be important contributing factors (Weissertet al., 1998; Voigt, 2000). By contrast, negativeshifts have been linked to reduced burial andthe reworking of marine and terrestrial organic-rich strata.
5.3.1. Sea-level riseCretaceous sea-level rise led to considerably in-
creased areas of shallow epicontinental sea (e.g.Hancock and Kau¡man, 1979). Enhanced organicmatter preservation and burial in these shallow-water environments (Fig. 6) would explain thepositive relationship seen between long-termN13C and ‘eustatic’ sea-level curves (Scholle andArthur, 1980; Arthur et al., 1987). Indeed, simi-larities between the shape of the long-term Cam-panian N
13C pro¢le and the global ‘eustatic’ curve(Fig. 5) support the argument that N13C might beconsidered as an independent method for estimat-ing ¢rst-order eustatic sea-level, as proposed forthe Cenomanian^Turonian and Coniacian(Mitchell et al., 1996; Voigt and Hilbrecht,1997; Grant et al., 1999). However, rates of sea-level rise and fall rather than the magnitude ofsea-level change may be important in controllingthe amplitude of carbon isotope variation (e.g.Jenkyns et al., 1994), so an exact match shouldnot be expected.During periods of rapid sea-level rise accompa-
nying transgression, reworking of sediments andsoils on previous land areas may have promotedincreased nutrient £uxes to epicontinental seas(Fig. 6; Jenkyns et al., 1994; Hilbrecht et al.,1996; Erbacher and Thurow, 1997), which wouldhave supported increased productivity and furtherenhanced organic carbon burial rates. Higher nu-trient supply to surface waters would also havefavoured organic and siliceous plankton produc-tion and reduced calcareous plankton rain ratesbecause the latter prefer oligotrophic rather thaneutrophic conditions. If sea-level rise was rapid,
PALAEO 2948 13-11-02
I. Jarvis et al. / Palaeogeography, Palaeoclimatology, Palaeoecology 188 (2002) 215^248 237

PALAEO 2948 13-11-02
I. Jarvis et al. / Palaeogeography, Palaeoclimatology, Palaeoecology 188 (2002) 215^248238

carbonate platforms would have been £ooded andshallow-water carbonate factories closed down,further increasing the relative proportion of theorganic carbon £ux. Terrestrial environmentswould also be a¡ected by the transgression. High-er water tables during sea-level rise lead to in-creased peat accumulation in deltaic and othercoastal margin settings (Fig. 6). Associations ofcoal-bearing strata with transgressions are welldocumented (Vail, 1987; Kosters et al., 2000).As the rates of sea-level rise declined, and new
sediments covered the drowned land masses, thenutrient £ux would have decreased, reducing pro-ductivity and establishing a new equilibrium. Anincreased area of pelagic carbonate deposition, arelative increase in calcareous plankton produc-tion, and new carbonate platform developmentwould have changed the balance in favour ofthe inorganic carbon £ux and shifted N13C to low-er values (Fig. 6). It is noteworthy that the lateCampanian highstand is associated with an ex-pansion of carbonate platforms on the southernTethys margin (Masse et al., 1996; Steuber, 2002)and the maximum extension of the Chalk epicon-tinental Sea in northern Europe (Hancock, 2000),which may partly explain the long-term fall inN13C following the Mid-Campanian Event.Short-term positive isotope excursions may be
related to increased burial of organic matter dur-ing transgressions, but are limited by feedbacke¡ects during the later parts of the transgressionand highstand.
5.3.2. Sea-level fallDuring sea-level fall, rates of organic carbon
burial would have declined, and lower base levelswould have led to reworking of previously depos-ited organic-rich marine and terrestrial strata, re-turning isotopically light carbon to the atmo-
spheric and marine reservoirs (Fig. 6). Accom-panying changes in oceanic circulation mightalso have had an e¡ect. Increased oceanic circu-lation due to more e⁄cient deep-water formationduring times of low sea-level would enhance 12Crecycling which would increase the residence timeof 12C in the water column. This would increasethe size of the oceanic C reservoir, decrease theorganic carbon £ux into sediments, and furtherreduce seawater N13C values.Long-term regression associated with the late
Campanian eustatic sea-level fall (probably drivenby a sharp decline in oceanic crust productionrates; Larson, 1991; Kaiho and Saito, 1994),and orogenic uplift in the Americas, eastern Eu-rope and Asia (Gale, 2000), would be expected tohave increased silicate weathering and atmospher-ic CO2 drawdown (Raymo and Ruddiman, 1992).This would lead to lower N
13C in carbonates iffalling CO2 reduced photosynthetic isotopic frac-tion (Kump and Arthur, 1999). However, the sys-tem is relatively insensitive and a 10-fold decreasein Cretaceous atmospheric pCO2 to present-daylevels is required for a reduction of only 1.5xN13C (Ripperdan, 2001). This may have been am-pli¢ed slightly by enhanced weathering increasingthe riverine Ca2þ £ux to the oceans and inducinghigher rates of carbonate deposition to maintainequilibrium. An increased carbonate £ux is con-sistent with progressive deepening of the carbon-ate compensation depth by up to 2 km thoroughthe Campanian in the North Atlantic, Indian andPaci¢c oceans (Arthur et al., 1985).Substantially increased weathering rates and/or
a declining hydrothermal Sr £ux are indicated bya near-linear increase in Sr isotope ratios throughthe Campanian (McArthur et al., 2001). However,falling N
13C induced by increasing oxidation oforganic matter accompanying sea-level fall is
Fig. 6. Schematic illustration of major processes a¡ecting the carbon isotopic composition of Campanian seawater and their rela-tionship to sea-level change. Thick lines and black arrows indicate the dominant processes controlling the N
13C composition ofthe oceans and the atmosphere, and recorded in the marine carbonate record; thinner lines and white arrows are subsidiary pro-cesses. Carbon isotope excursions are caused principally by changes in the partitioning of carbon between the organic (Corg) andcarbonate (Ccarb) sinks, driven by eustatic sea-level change. Positive isotope excursions are linked to sea-level rise (bottom) andhigher Corg burial £uxes; declining N
13C following transgression is controlled principally by increased Ccarb burial at constant ordecreasing Corg burial rates (middle). During rapid sea-level fall, oxidation of organic matter may lead to a negative excursion(top). SW= seawater, CO2 = atmospheric carbon dioxide.
PALAEO 2948 13-11-02
I. Jarvis et al. / Palaeogeography, Palaeoclimatology, Palaeoecology 188 (2002) 215^248 239

likely to have been much more signi¢cant in mod-ulating marine N13C values (Fig. 6), and would actin the same direction. A positive feedback here isthat higher rates of organic matter oxidationwould have increased pCO2 and further increaseweathering rates. The relative signi¢cance of theseprocesses in the Campanian needs to be investi-gated, for example by comparing paired organiccarbon and carbonate carbon isotope data (cf.Kump and Arthur, 1999).A process that is being increasingly implicated
in the generation of negative carbon stable-iso-tope excursions in the geological record is therapid dissociation of gas hydrates in continentalmargin sediments (Dickens et al., 1995; Jenkynsand Wilson, 1999; Hesselbo et al., 2000; Jahren etal., 2001). Sources of methane, together withphysico-chemical conditions controlling the stabil-ity of gas hydrates, limit their distribution to aspeci¢c temperature^pressure window in conti-nental margin settings. It is estimated that around11 000 Gt ( = 1.1U1019 g) of C are currentlystored as methane hydrates (Kvenvolden, 1998),and it has been postulated that sea-level changeand associated changes in climate and oceanic cir-culation patterns may destabilise these depositsand lead to their dissociation and the liberationof methane to the oceans and atmosphere. Meth-ane is isotopically very light (N13C6365x) so ifliberated in signi¢cant qualities, it would lowerthe carbon isotope signature of the ocean^atmo-sphere system (Kvenvolden, 1998; Ripperdan,2001). Major negative N13C events (up to 35x)have been observed immediately preceding posi-tive excursions in the order of +3x associatedwith several oceanic anoxic events, including theJurassic Early Toarcian OAE (Hesselbo et al.,2000) and the Early Aptian Selli Event (Menegattiet al., 1998; Jahren et al., 2001). Liberation ofmethane preceding these events might resultfrom various processes including submarine slopefailure, sea-level fall or increased bottom temper-atures (Kvenvolden, 1998). The signi¢cance andconsequences of such releases remain hotly de-bated, but may include oxygen depletion in theoceans, pelagic carbonate dissolution, increasedCH4 (and following oxidation, CO2) in the atmo-sphere, and temporary global warming (Dickens
et al., 1995; Dickens, 2000), although climaticwarming preceding and driving hydrate dissocia-tion is also commonly proposed.The negative N13C excursion of 30.4x de¢n-
ing the Upper Campanian Event is a prominentfeature of the Campanian isotope curve but ismuch smaller than the negative excursions associ-ated with the Toarcian and Aptian events. Thereis also no clear evidence of major positive N
13Ccompensation (Fig. 3) or a marked temperaturerise (i.e. lower oxygen isotope values; see Jenkynset al., 1994, ¢g. 8) immediately following theUpper Campanian Event, both features that char-acterise the older events (e.g. Hesselbo et al.,2000; Jahren et al., 2001). Methane release asso-ciated with these events appears to relate to short-lived episodes in the order of 100 kyr; the UpperCampanian Event was much longer (see above),possibly 750 kyr. A contribution from gas hydratedissociation accompanying rapid sea-level fall(Fig. 6), however, remains a possibility and wouldexplain why only the Upper Campanian Eventdisplays such negative values.A pulse of volcanically derived CO2
(N13CW35x) might also be responsible (Ripper-dan, 2001) for the Upper Campanian Event, butthis would require a major volcanic episode forwhich there is no evidence, and in any case itwould promote only very small changes in theisotopic composition of the oceans (Kump andArthur, 1999). Sudden turnover of bottom waterenriched in CO2 derived from the decompositionof organic matter o¡ers another possible scenario(Knoll et al., 1996), but this should be associatedwith the widespread deposition of anoxic orstrongly dysaerobic sediments and a positiveN13C anomaly preceding the Upper CampanianEvent; neither of these occur. A global declinein oceanic productivity and/or preservation of or-ganic matter o¡ers another mechanism (Kumpand Arthur, 1999), but again there is no evidencefor such an event.It has been suggested (Voigt and Hilbrecht,
1997) that the sizes of N13C excursion may relateto the amount of increased sediment accumula-tion and sediment reworking accompanying trans-gressions and regressions, respectively, while dif-ference in background levels below and above the
PALAEO 2948 13-11-02
I. Jarvis et al. / Palaeogeography, Palaeoclimatology, Palaeoecology 188 (2002) 215^248240

excursions re£ect changes in the amount of organ-ic matter that remained buried before and afterthe events. On this basis, the Santonian^Cam-panian and Mid-Campanian Events indicaterelatively little sediment reworking during the pre-ceding regressions, moderately increased rates oforganic carbon burial during the Marsupites andmucronata transgressions, and the recycling ofequivalent amounts of organic carbon duringthe subsequent highstands and sea-level falls.The Upper Campanian Event on the other handwas very di¡erent, with extensive oxidation ofburied organic matter accompanying major sea-level fall during the polyplocum regression. Thisburied organic matter was replaced but not in-creased during the subsequent sea-level rise. Thesedi¡erences may relate to the regional nature of thelate Campanian polyplocum transgression (seeabove).
5.3.3. Alternative modelsThe positive correlation between sediment N13C
contents and sea-level, as demonstrated here forthe Campanian, may not always hold true. Others(e.g. Jeans et al., 1991) have proposed that N13Cincreases relate to regressions, arguing that ex-posed new land areas lead to increased weather-ing, higher nutrient £uxes and enhanced organiccarbon burial in the oceans. Alternatively, expo-sure and weathering of carbonate platforms dur-ing sea-level fall and a consequent relative declinein the riverine organic carbon £ux might also gen-erate a positive carbon isotope excursion (Kumpet al., 1999). In one model (Gro«cke et al., 1999),transgressions are correlated with N
13C decreasesdue to the addition of isotopically light mantle-derived CO2 released by increased oceanic crustproduction driving sea-level rise.Decreasing N
13C accompanying sea-level risemight be explained by a relative increase in inor-ganic carbon to organic carbon £uxes associatedwith the spread of shallow epicontinental sea andcarbonate platform development (Mckenzie,1990). However, rate of sea-level rise may be crit-ical here: rapid rise will drown carbonate plat-forms generating a positive excursion, slow risewill enable platform aggradation or progradationand will produce the opposite e¡ect.
The above relationships are inconsistent withobservations for the Cenomanian and Campa-nian, but they may explain the poorer match be-tween the N
13C and sea-level curves described inthe Turonian (Voigt and Hilbrecht, 1997; Voigt,2000). It is equally possible, however, that suchapparent disparities are caused by errors in corre-lation and dating, particularly in the constructionof coastal onlap and ‘eustatic’ sea-level curves.
5.3.4. Climate changeClimate change is being increasing linked to
positive N13C excursions associated with OAEs.
It has been suggested (Jenkyns, 1999; Jenkynsand Wilson, 1999; Jones and Jenkyns, 2001)that high global temperatures driven by increasedlevels of volcanogenic CO2 in the atmosphereprecede or are coincident with OAEs becausethey a¡ect weathering patterns on the continents,increase nutrient £uxes to the oceans, and theintensity of wind-driven upwelling, and therebyincrease phytoplankton productivity and organiccarbon burial. Temperatures of s 30‡C may alsoadversely a¡ect the development of carbonateproducers with photosynthetic symbionts, reduc-ing production in shallow-water carbonate facto-ries. Increased organic carbon burial and reducedcarbonate carbon £uxes induce the associatedpositive carbon isotope excursions in the sedimentrecord, but feedback (see e.g. Kump and Arthur,1999) causes excess CO2 drawdown and nutrientdepletion due to enhanced organic carbon burialwhich reduce global temperatures and terminatethe OAE. Dissociation and oxidation of gas hy-drates has also been implicated in the generationof the OAEs and their associated climate change(e.g. Hesselbo et al., 2000; Jahren et al., 2001;Padden et al., 2001).Oxygen isotope data indicate that the Campa-
nian is characterised by a long-term cooling trend(e.g. Jenkyns et al., 1994; Abreu et al., 1998;Clarke and Jenkyns, 1999). Superimposed onthis, discrete N
18O maxima followed by markedsteps towards more negative values occur a shortdistance above each of the carbon isotope eventsin the oxygen isotope pro¢le for Trunch (Jenkynset al., 1994, ¢g. 8). These trends suggest acceler-ated cooling and then temporary warming follow-
PALAEO 2948 13-11-02
I. Jarvis et al. / Palaeogeography, Palaeoclimatology, Palaeoecology 188 (2002) 215^248 241

ing each of the three main carbon isotope events.In the early Toarcian, early Aptian and Cenoma-nian^Turonian boundary OAEs (Jenkyns, 1999)warming precedes, and cooling follows eachevent. Additional high-resolution oxygen isotopedata from other areas are required to better docu-ment the short-term Campanian record, but itwould appear that here also carbon isotopeevents may show some relationship to climatechange.
6. Conclusions
(1) Two positive and one negative carbon iso-tope excursions (Santonian^Campanian Bound-ary, Mid-Campanian, and Upper CampanianEvents) can be recognised in Campanian chemo-stratigraphic pro¢les from Tunisia, south-westernFrance and eastern England. These events aredated at 83.7, 78.7 and 74.8 Ma and lasted 600^750 kyr. They provide a basis for correlating be-tween the Boreal and Tethyan biogeographicprovinces that is independent of biostratigraphy.(2) The isotope correlation con¢rms that the
base of the northern European upper CampanianBelemnitella mucronata Zone is equivalent to theuppermost Globotruncana ventricosa Zone in theTethyan realm, and that the Campanian^Maas-trichtian boundary as de¢ned by the base of theBelemnella lanceolata Zone lies within the Gans-serina gansseri Zone.(3) The long-term carbon isotope trend in Cam-
panian pelagic sections broadly follows ¢rst-order(30-Myr scale) eustatic sea-level. Relatively stablehigh values in the lower Campanian followed byfalling N13C in the upper Campanian re£ect stablehigh and then falling eustatic sea-levels, and in-creased carbonate production on late Campanianplatforms and in epicontinental seas.(4) Short-term positive shifts of +0.2^+0.3x in
the N13C pro¢les correspond to the bases of twomajor Campanian transgressions: the Marsupites(Santonian^Campanian Boundary Event) and mu-cronata (Mid-Campanian Event) transgressions.A negative shift (Upper Campanian Event) of30.4x N
13C is associated with the polyplocumregression. The subsequent transgression is
marked by a reversion to previous N13C values
but no positive excursion.(5) The Campanian transgressions equated to
three major third-order (1-Myr scale) eustaticcycles (UZA3.4, UZA4.1, UZA4.4).(6) Variations of N
13C in Campanian pelagicsediments are controlled principally by changesin the relative burial £uxes of organic carbonand carbonate carbon. Rates of oceanic turnover,residence times, and the sequestration and disso-ciation of gas hydrates on continental marginsmay contribute to the carbon isotope record.
Acknowledgements
Research support by BG Exploration and Pro-duction, the British Council (Tunis) and PDVSAis gratefully acknowledged. A.M. and S.d.C. ac-knowledge British Council Chevening Scholar-ships (TUN0100022, VEN0100034) during whichsome of this work was undertaken. Material andunpublished data from the Trunch borehole weremade available by the British Geological Survey.Prof. Habib Belayouni (University of Tunis) pro-vided logistical support and ¢eld assistance in Tu-nisia. Julie Cartlidge operated the PRISM massspectrometer at the University of Oxford wherethe isotopic data were generated. We thankProf. Malcolm Hart (University of Plymouth),Dr Adrian Immenhauser (Vrije Universiteit, Am-sterdam) and Prof. Finn Surlyk (University ofCopenhagen) for constructive reviews of themanuscript.
References
Abreu, V.S., Hardenbol, J., Haddad, G.A., Baum, G.R.,Droxler, A.W., Vail, P.R., 1998. Oxygen isotope synthesis:a Cretaceous ice-house? In: de Graciansky, P.-C., Harden-bol, J., Jacquin, T., Vail, P.R. (Eds.), Mesozoic and Ceno-zoic Sequence Stratigraphy of European Basins. SEPMSpec. Publ. 60, 75^80.
Anderson, T.F., Arthur, M.A., 1983. Stable isotopes of oxygenand carbon and their application to sedimentologic and en-vironmental problems. In: Arthur, M.A., Anderson, T.F.,Kaplan, I.R., Veizer, J., Land, L.S. (Eds.), Short Course.SEPM, pp. 1^151.
Apellaniz, E., Baceta, J.I., Bernaola-Bilbao, G., Nunez-Betelu,
PALAEO 2948 13-11-02
I. Jarvis et al. / Palaeogeography, Palaeoclimatology, Palaeoecology 188 (2002) 215^248242

K., Orue-Etxebarria, X., Payros, A., Pujalte, V., Robin, E.,Rocchia, R., 1997. Analysis of uppermost Cretaceous low-ermost Tertiary hemipelagic successions in the BasqueCountry (western Pyrenees): evidence for a sudden extinc-tion of more than half planktic foraminifer species at theK/T boundary. Bull. Soc. Ge¤ol. Fr. 168, 783^793.
Arthur, M.A., Dean, W.E., Schlanger, S.O., 1985. Variationsin the global carbon cycle during the Cretaceous related toclimate, volcanism and changes in atmospheric CO2. In:Sundquist, E.T., Broecker, W.S. (Eds.), The Carbon Cycleand Atmospheric CO2 : Natural Variations Archean toPresent. Am. Geophys. Union Monogr. 32, 504^529.
Arthur, M.A., Schlanger, S.O., Jenkyns, H.C., 1987. The Cen-omanian/Turonian Oceanic Anoxic Event, II: Palaeoceano-graphic controls on organic matter production and preser-vation. In: Brooks, J., Fleet, A.J. (Eds.), Marine PetroleumSource Rocks. Spec. Publ. Geol. Soc. London 26, 401^420.
Banner, J.L., Hanson, G.N., 1990. Calculation of simultaneousisotopic and trace-element variations during water^rock in-teraction with applications to carbonate diagenesis. Geo-chim. Cosmochim. Acta 54, 3123^3137.
Barrera, E., Savin, S.M., 1999. Evolution of late Campanian^Maastrichtian marine climates and oceans. In: Barrera, E.,Johnson, C.C. (Eds.), Evolution of the Cretaceous Ocean-Climate System. Spec. Pap. Geol. Soc. Am. 332, 245^282.
Bellier, J.P., Caron, M., Donze, P., Herm, D., Maamouri,A.L., Salaj, J., 1983. Le Campanien sommital et le Maas-trichtien de la coupe du Kef (Tunisie septentrionale): zona-tion sur la base des foraminife'res planctoniques. Zitteliana10, 609^611.
Ben Ferjani, A., Burollet, P.F., Merji, F., 1990. Petroleumgeology of Tunisia. Entrep. Tunis. Activ. Petrol. Mem. 1,194 pp.
Berger, W.H., Vincent, E., 1986. Deep-sea carbonates: readingthe carbon isotope signal. Geol. Rundsch. 75, 249^269.
Berggren, W.A., Kent, D.V., Swisher III, C.C., Aubry, M.-P.,1995. A revised Cenozoic geochronology and chronostratig-raphy. In: Berggren, W.A., Kent, D.V., Aubry, M.-P.,Hardenbol, J. (Eds.), Geochronology, Time Scales andGlobal Stratigraphic Correlation. SEPM Spec. Publ. 54,129^212.
Bloom¢eld, J.P., Brewerton, L.J., Allen, D.J., 1995. Regionaltrends in matrix porosity and dry density of the Chalk ofEngland. Q. J. Eng. Geol. 28, S131^S142.
Boltenhagen, C., 1985. Pale¤oge¤ographie de Cre¤tace¤ moyen dela Tunisie centrale. Actes 1er Congr. Nat. Sci. Terre Tunis,1981, 1, 97^114.
Bralower, T.J., Leckie, R.M., Sliter, W.V., Thierstein, H.R.,1995. An integrated Cretaceous microfossil biostratigraphy.In: Berggren, W.A., Kent, D.V., Aubry, M.-P., Hardenbol,J. (Eds.), Geochronology, Time Scales and Global Strati-graphic Correlation. SEPM Spec. Publ. 54, 65^79.
Bromley, R.G., 1979. Chalk and bryozoan limestone facies,sediments and depositional environments. In: Birklund, T.,Bromley, R.G. (Eds.), Cretaceous^Tertiary BoundaryEvents 1. The Maastrichtian and Danian of Denmark. Uni-versity of Copenhagen, Copenhagen, pp. 16^35.
Burnett, J.A., 1988. North-west European Late CretaceousCalcareous Nannofossils : Biostratigraphy and Selected Evo-lutionary Lineages. PhD Thesis, University College, Lon-don.
Burnett, J.A., 1990. A new nannofossil zonation scheme forthe Boreal Campanian. Int. Nanno. Assoc. Newsl. 12, 67^70.
Burnett, J.A., Gallagher, L.T., Hampton, M.J., 1999. UpperCretaceous. In: Bown, P.R. (Ed.), Calcareous NannofossilBiostratigraphy. British Micropalaeontological Society Pub-lication Series. Kluwer, Dordrecht, pp. 132^199.
Burollet, P.F., 1956. Contribution a' l’e¤tude stratigraphique dela Tunisie centrale. Ann. Min. Ge¤ol. (Tunisia), 18. Royaumede Tunis, Ministe're des Travaux Publics, Service des Mines,de l’Industrie et de l’Energie, Tunis, 352 pp.
Burollet, P.F., 1991. Structures and tectonics of Tunisia. Tec-tonophysics 195, 359^369.
Burollet, P.-F., Dumestre, A., Keppel, D., Salvador, A., 1954.Unite¤s stratigraphiques en Tunisie centrale, Association desServices Ge¤ologiques Africains Deuxie'me Partie QuestionsDiverses et Annexes. Congres Ge¤ologiques InternationalComptes Rendus de la Dix-Neuvie'me Session, Alger 1952,Fascicule 21. Congres Ge¤ologiques International, Algiers,pp. 243^254.
Burollet, P.F., Ellouz, N., 1984. L’e¤volution des bassins se¤di-mentaires de la Tunisie centrale et orientale. Bull. CentreRech. Explor.-Prod. Elf Aquitaine 10, 49^68.
Cameron, T.D.J., Crosby, A., Balson, P.S., Je¡ery, D.H., Lott,G.K., Bulat, J., Harrison, D.J., 1992. The Geology of theSouthern North Sea. United Kingdom O¡shore RegionalReport. HMSO for the British Geological Survey, London.
Christensen, W.K., Hancock, J.M., Peake, N.B., Kennedy,W.J., 2000. The base of the Maastrichtian. Bull. Geol.Soc. Denmark 47, 81^85.
Clarke, L.J., Jenkyns, H.C., 1999. New oxygen isotope evi-dence for long-term Cretaceous climatic change in theSouthern Hemisphere. Geology 27, 699^702.
Clauser, S., 1987. EŁ volution de la composition isotopique del’oxyge'ne des carbonates durant le Campanien^Maastrich-tien. Donne¤es pre¤liminaires issues de la se¤rie de Bidart (Py-re¤ne¤es-Atlantiques, France). CR Acad. Sci. Paris Se¤r. IIa304, 579^584.
Clauser, S., 1994. EŁ tudes Stratigraphiques du Campanien et duMaastrichtien de l’Europe Occidentale Co“te Basques, Cha-rentes (France), Limbourg (Pays-Bas). Biochronologie,Magne¤tostratigraphie, Stratigraphie Isotopique, Radiochro-nologie Compare¤e de Domaine Oce¤anique et des Re¤gionsStratotypiques. Contribution a' La Pale¤oclimatologie du Cre¤-tace¤ Superieur. Doc. BRGM 235, 243 pp.
Cobban, W.A., 1994. Diversity and distribution of Late Creta-ceous ammonites, Western Interior, United States. In: Cald-well, W.G.E., Kau¡man, E.G. (Eds.), Evolution of theWestern Interior Basin. Geol. Assoc. Canada Spec. Pap.39, 435^451.
Coquand, H., 1857. Position des Ostrea columba et biauriculatadans le groupe de la craie infe¤rieure. Bull. Soc. Ge¤ol. Fr. 14,745^766.
PALAEO 2948 13-11-02
I. Jarvis et al. / Palaeogeography, Palaeoclimatology, Palaeoecology 188 (2002) 215^248 243
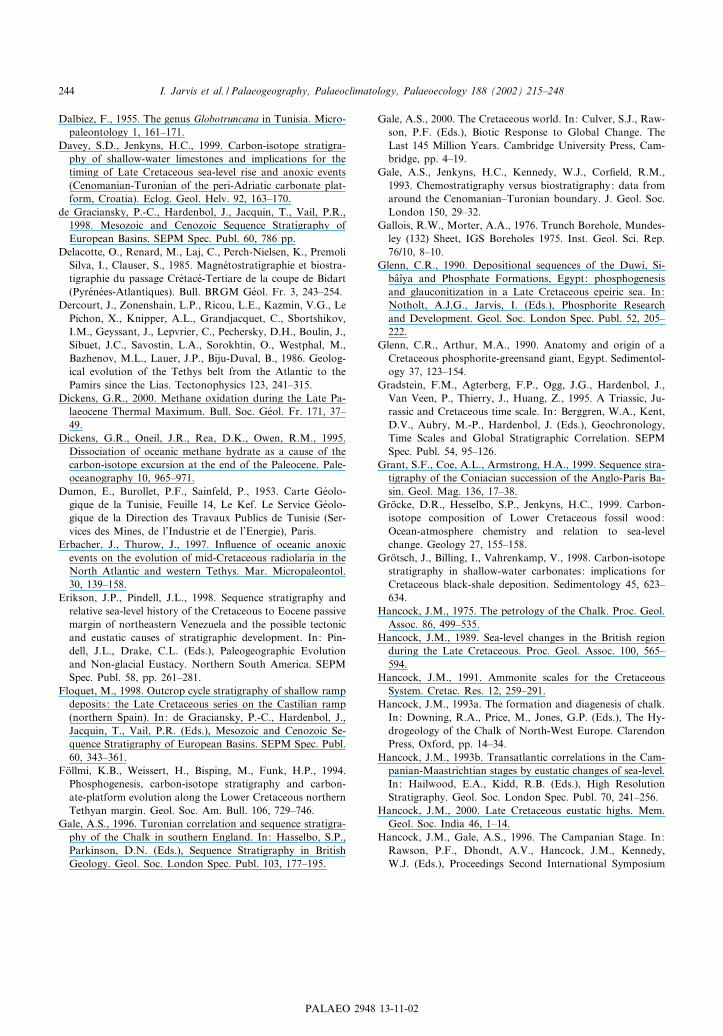
Dalbiez, F., 1955. The genus Globotruncana in Tunisia. Micro-paleontology 1, 161^171.
Davey, S.D., Jenkyns, H.C., 1999. Carbon-isotope stratigra-phy of shallow-water limestones and implications for thetiming of Late Cretaceous sea-level rise and anoxic events(Cenomanian-Turonian of the peri-Adriatic carbonate plat-form, Croatia). Eclog. Geol. Helv. 92, 163^170.
de Graciansky, P.-C., Hardenbol, J., Jacquin, T., Vail, P.R.,1998. Mesozoic and Cenozoic Sequence Stratigraphy ofEuropean Basins. SEPM Spec. Publ. 60, 786 pp.
Delacotte, O., Renard, M., Laj, C., Perch-Nielsen, K., PremoliSilva, I., Clauser, S., 1985. Magne¤tostratigraphie et biostra-tigraphie du passage Cre¤tace¤-Tertiare de la coupe de Bidart(Pyre¤ne¤es-Atlantiques). Bull. BRGM Ge¤ol. Fr. 3, 243^254.
Dercourt, J., Zonenshain, L.P., Ricou, L.E., Kazmin, V.G., LePichon, X., Knipper, A.L., Grandjacquet, C., Sbortshikov,I.M., Geyssant, J., Lepvrier, C., Pechersky, D.H., Boulin, J.,Sibuet, J.C., Savostin, L.A., Sorokhtin, O., Westphal, M.,Bazhenov, M.L., Lauer, J.P., Biju-Duval, B., 1986. Geolog-ical evolution of the Tethys belt from the Atlantic to thePamirs since the Lias. Tectonophysics 123, 241^315.
Dickens, G.R., 2000. Methane oxidation during the Late Pa-laeocene Thermal Maximum. Bull. Soc. Ge¤ol. Fr. 171, 37^49.
Dickens, G.R., Oneil, J.R., Rea, D.K., Owen, R.M., 1995.Dissociation of oceanic methane hydrate as a cause of thecarbon-isotope excursion at the end of the Paleocene. Pale-oceanography 10, 965^971.
Dumon, E., Burollet, P.F., Sainfeld, P., 1953. Carte Ge¤olo-gique de la Tunisie, Feuille 14, Le Kef. Le Service Ge¤olo-gique de la Direction des Travaux Publics de Tunisie (Ser-vices des Mines, de l’Industrie et de l’Energie), Paris.
Erbacher, J., Thurow, J., 1997. In£uence of oceanic anoxicevents on the evolution of mid-Cretaceous radiolaria in theNorth Atlantic and western Tethys. Mar. Micropaleontol.30, 139^158.
Erikson, J.P., Pindell, J.L., 1998. Sequence stratigraphy andrelative sea-level history of the Cretaceous to Eocene passivemargin of northeastern Venezuela and the possible tectonicand eustatic causes of stratigraphic development. In: Pin-dell, J.L., Drake, C.L. (Eds.), Paleogeographic Evolutionand Non-glacial Eustacy. Northern South America. SEPMSpec. Publ. 58, pp. 261^281.
Floquet, M., 1998. Outcrop cycle stratigraphy of shallow rampdeposits : the Late Cretaceous series on the Castilian ramp(northern Spain). In: de Graciansky, P.-C., Hardenbol, J.,Jacquin, T., Vail, P.R. (Eds.), Mesozoic and Cenozoic Se-quence Stratigraphy of European Basins. SEPM Spec. Publ.60, 343^361.
Fo« llmi, K.B., Weissert, H., Bisping, M., Funk, H.P., 1994.Phosphogenesis, carbon-isotope stratigraphy and carbon-ate-platform evolution along the Lower Cretaceous northernTethyan margin. Geol. Soc. Am. Bull. 106, 729^746.
Gale, A.S., 1996. Turonian correlation and sequence stratigra-phy of the Chalk in southern England. In: Hasselbo, S.P.,Parkinson, D.N. (Eds.), Sequence Stratigraphy in BritishGeology. Geol. Soc. London Spec. Publ. 103, 177^195.
Gale, A.S., 2000. The Cretaceous world. In: Culver, S.J., Raw-son, P.F. (Eds.), Biotic Response to Global Change. TheLast 145 Million Years. Cambridge University Press, Cam-bridge, pp. 4^19.
Gale, A.S., Jenkyns, H.C., Kennedy, W.J., Cor¢eld, R.M.,1993. Chemostratigraphy versus biostratigraphy: data fromaround the Cenomanian^Turonian boundary. J. Geol. Soc.London 150, 29^32.
Gallois, R.W., Morter, A.A., 1976. Trunch Borehole, Mundes-ley (132) Sheet, IGS Boreholes 1975. Inst. Geol. Sci. Rep.76/10, 8^10.
Glenn, C.R., 1990. Depositional sequences of the Duwi, Si-ba“|“ya and Phosphate Formations, Egypt: phosphogenesisand glauconitization in a Late Cretaceous epeiric sea. In:Notholt, A.J.G., Jarvis, I. (Eds.), Phosphorite Researchand Development. Geol. Soc. London Spec. Publ. 52, 205^222.
Glenn, C.R., Arthur, M.A., 1990. Anatomy and origin of aCretaceous phosphorite-greensand giant, Egypt. Sedimentol-ogy 37, 123^154.
Gradstein, F.M., Agterberg, F.P., Ogg, J.G., Hardenbol, J.,Van Veen, P., Thierry, J., Huang, Z., 1995. A Triassic, Ju-rassic and Cretaceous time scale. In: Berggren, W.A., Kent,D.V., Aubry, M.-P., Hardenbol, J. (Eds.), Geochronology,Time Scales and Global Stratigraphic Correlation. SEPMSpec. Publ. 54, 95^126.
Grant, S.F., Coe, A.L., Armstrong, H.A., 1999. Sequence stra-tigraphy of the Coniacian succession of the Anglo-Paris Ba-sin. Geol. Mag. 136, 17^38.
Gro«cke, D.R., Hesselbo, S.P., Jenkyns, H.C., 1999. Carbon-isotope composition of Lower Cretaceous fossil wood:Ocean-atmosphere chemistry and relation to sea-levelchange. Geology 27, 155^158.
Gro«tsch, J., Billing, I., Vahrenkamp, V., 1998. Carbon-isotopestratigraphy in shallow-water carbonates: implications forCretaceous black-shale deposition. Sedimentology 45, 623^634.
Hancock, J.M., 1975. The petrology of the Chalk. Proc. Geol.Assoc. 86, 499^535.
Hancock, J.M., 1989. Sea-level changes in the British regionduring the Late Cretaceous. Proc. Geol. Assoc. 100, 565^594.
Hancock, J.M., 1991. Ammonite scales for the CretaceousSystem. Cretac. Res. 12, 259^291.
Hancock, J.M., 1993a. The formation and diagenesis of chalk.In: Downing, R.A., Price, M., Jones, G.P. (Eds.), The Hy-drogeology of the Chalk of North-West Europe. ClarendonPress, Oxford, pp. 14^34.
Hancock, J.M., 1993b. Transatlantic correlations in the Cam-panian-Maastrichtian stages by eustatic changes of sea-level.In: Hailwood, E.A., Kidd, R.B. (Eds.), High ResolutionStratigraphy. Geol. Soc. London Spec. Publ. 70, 241^256.
Hancock, J.M., 2000. Late Cretaceous eustatic highs. Mem.Geol. Soc. India 46, 1^14.
Hancock, J.M., Gale, A.S., 1996. The Campanian Stage. In:Rawson, P.F., Dhondt, A.V., Hancock, J.M., Kennedy,W.J. (Eds.), Proceedings Second International Symposium
PALAEO 2948 13-11-02
I. Jarvis et al. / Palaeogeography, Palaeoclimatology, Palaeoecology 188 (2002) 215^248244

on Cretaceous Stage Boundaries, Brussels, 8^16 September1995. Bull. Inst. R. Sci. Nat. Belg. Sci. Terre 66 (Suppl.),103^109.
Hancock, J.M., Kau¡man, E.G., 1979. The great transgres-sions of the Late Cretaceous. J. Geol. Soc. London 136,175^186.
Haq, B.U., Hardenbol, J., Vail, P., 1988. Mesozoic and Ceno-zoic chronostratigraphy and cycles of sea-level change. In:Wilgus, C.K., Hastings, B.S., Ross, C.A., Posamentier, H.,Van Wagoner, J., Kendall, C.G.S.C. (Eds.), Sea-LevelChanges ^ An Integrated Approach. SEPM Spec. Publ.42, 71^108.
Haq, B.U., Hardenbol, J., Vail, P.R., 1987. Chronology of£uctuating sea levels since the Triassic. Science 235, 1156^1167.
Hardenbol, J., Thierry, J., Farley, M.B., Jacquin, T., de Gra-ciansky, P.-C., Vail, P.R., 1998. Mesozoic and Cenozoic se-quence chronostratigraphic framework in European basins.In: de Graciansky, P.-C., Hardenbol, J., Jacquin, T., Vail,P.R. (Eds.), Mesozoic and Cenozoic Sequence Stratigraphyof European Basins. SEPM Spec. Publ. 60, 3^13.
Hart, M.B., 1990. Cretaceous sea level changes and globaleustatic curves; evidence from SW England. Proc. UssherSoc. 7, 268^272.
Hart, M.B., 1993. Cretaceous foraminiferal events. In: Hail-wood, E.A., Kidd, R.B. (Eds.), High Resolution Stratigra-phy. Geol. Soc. London Spec. Publ. 70, 227^240.
Hart, M.B., Bailey, H.W., Crittenden, S., Fletcher, B.N., Price,R.J., Swiecicki, A., 1989. Cretaceous. In: Jenkins, D.G.,Murray, J.W. (Eds.), Stratigraphical Atlas of Fossil Forami-nifera. Ellis Horwood for the British MicropalaeontologicalSociety, Chichester, pp. 273^371.
Haslett, S.K., 1994. Planktonic foraminiferal biostratigraphyand paleoceanography of the Cretaceous^Tertiary boundarysection at Bidart, south-west France. Cretac. Res. 15, 179^192.
Hay, W.W., DeConto, R.M., Wold, C.N., Wilson, K.M.,Voigt, E., Schulz, M., Wold, A.R., Dullo, W.-C., Ronov,A.B., Balukhovsky, A.N., So«ding, E., 1999. Alternativeglobal Cretaceous paleogeography. In: Barrera, E., Johnson,C.C. (Eds.), Evolution of the Cretaceous Ocean-ClimateSystem. Spec. Pap. Geol. Soc. Am. 332, 1^47.
Hesselbo, S.P., Gro«cke, D.R., Jenkyns, H.C., Bjerrum, C.J.,Farrimond, P., Bell, H.S.M., Green, O.R., 2000. Massivedissociation of gas hydrate during a Jurassic oceanic anoxicevent. Nature 406, 392^395.
Hilbrecht, H., Frieg, C., Tro«ger, K.-A., Voigt, S., Voigt, T.,1996. Shallow water facies during the Cenomanian-Turoniananoxic event: Bio-events, isotopes, and sea level in southernGermany. Cretac. Res. 17, 229^253.
Huber, B.T., Norris, R.D., MacLeod, K.G., 2002. Deep-seapaleotemperature record of extreme warmth during the Cre-taceous. Geology 30, 123^126.
Hudson, J.D., 1977. Stable isotopes and limestone lithi¢cation.J. Geol. Soc. London 133, 637^660.
Immenhauser, A., Kenter, J.A.M., Ganssen, G., Bahamonde,J.R., Van Vliet, A., Saher, M.H., 2002. Origin and signi¢-
cance of isotope shifts in Pennsylvanian carbonates (Astu-rias, NW Spain). J. Sediment. Res. 72, 82^94.
Jahren, A.H., Arens, N.C., Sarmiento, G., Guerrero, J.,Amundson, R., 2001. Terrestrial record of methane hydratedissociation in the Early Cretaceous. Geology 29, 159^162.
Jarvis, I., Carson, G.A., Cooper, M.K.E., Hart, M.B., Leary,P.N., Tocher, B.A., Horne, D., Rosenfeld, A., 1988a. Micro-fossil assemblages and the Cenomanian^Turonian (late Cre-taceous) oceanic anoxic event. Cretac. Res. 9, 3^103.
Jarvis, I., Carson, G.A., Hart, M.B., Leary, P.N., Tocher,B.A., 1988b. The Cenomanian^Turonian (late Cretaceous)anoxic event in SW England: evidence from Hooken Cli¡snear Beer, SE Devon. Newsl. Stratigr. 18, 147^164.
Jarvis, I., Murphy, A.M., Gale, A.S., 2001. Geochemistry ofpelagic and hemipelagic carbonates: criteria for identifyingsystems tracts and sea-level change. J. Geol. Soc. London158, 685^696.
Jeans, C.V., Long, D., Hall, M.A., Bland, D.J., Cornford, C.,1991. The geochemistry of the Plenus Marls at Dover, Eng-land: evidence of £uctuating oceanographic conditions andof glacial control during the development of the Cenoma-nian-Turonian N
13C anomaly. Geol. Mag. 128, 603^632.Jenkyns, H.C., 1999. Mesozoic anoxic events and palaeocli-mate. Zbl. Geol. Pala«ontol. 1, 943^949.
Jenkyns, H.C., Gale, A.S., Cor¢eld, R.M., 1994. Carbon- andoxygen-isotope stratigraphy of the English Chalk and ItalianScalia and its palaeoclimatic signi¢cance. Geol. Mag. 131,1^34.
Jenkyns, H.C., Mutterlose, J., Sliter, W.V., 1995. Upper Creta-ceous carbon- and oxygen-isotope stratigraphy of deep-water sediments from the north-central Paci¢c (Site 869,£ank of Pikinni-Wodejebato, Marshall Islands). In: Winter-er, E.L., Sager, W.W., Firth, J.V., Sinton, J.M. (Eds.). Proc.ODP Sci. Results, 105^108.
Jenkyns, H.C., Wilson, P.A., 1999. Stratigraphy, paleoceanog-raphy, and evolution of Cretaceous Paci¢c guyots: Relicsfrom a greenhouse earth. Am. J. Sci. 299, 341^392.
Johansen, M.B., Surlyk, F., 1990. Brachiopods and the stra-tigraphy of the Upper Campanian and Lower MaastrichtianChalk of Norfolk. Palaeontology 33, 823^872.
Jones, C.E., Jenkyns, H.C., 2001. Seawater strontium isotopes,oceanic anoxic events, and sea£oor hydrothermal activity inthe Jurassic and Cretaceous. Am. J. Sci. 301, 112^149.
JYrgensen, N.O., 1987. Carbon and oxygen isotope composi-tions of Upper Cretaceous chalk from the Danish Subbasinand the North Sea Central Graben. Sedimentology 34, 559^570.
Kaiho, K., Saito, S., 1994. Oceanic crust production during thelast 100 Myr. Terra Nova 6, 376^384.
Keller, G., Han, Q., Adatte, T., Burns, S.J., 2001. Palaeoenvir-onment of the Cenomanian^Turonian transition at East-bourne, England. Cretac. Res. 22, 391^422.
Kennedy, W.J., Cobban, W.A., Scott, G.R., 1992. Ammonitecorrelation of the uppermost Campanian of Western Eu-rope, the U.S. Gulf Coast, Atlantic Seaboard and WesternInterior and the numerical age of the base of the Maastricht-ian. Geol. Mag. 129, 497^500.
PALAEO 2948 13-11-02
I. Jarvis et al. / Palaeogeography, Palaeoclimatology, Palaeoecology 188 (2002) 215^248 245

Knoll, A.H., Bambach, R.K., Can¢eld, D.E., Grotzinger, J.P.,1996. Comparative earth history and Late Permian massextinction. Science 273, 452^457.
Kosters, E.C., VanderZwaan, G.J., Jorissen, F.J., 2000. Pro-duction, preservation and prediction of source-rock facies indeltaic settings. Int. J. Coal Geol. 43, 13^26.
Kump, L.R., Arthur, M.A., 1999. Interpreting carbon-isotopeexcursions: carbonates and organic matter. Chem. Geol.161, 181^198.
Kump, L.R., Arthur, M.A., Patzkowsky, M.E., Gibbs, M.T.,Pinkus, D.S., Sheehan, P.M., 1999. A weathering hypothesisfor glaciation at high atmospheric pCO(2) during the LateOrdovician. Palaeogeogr. Palaeoclimatol. Palaeoecol. 152,173^187.
Kvenvolden, K.A., 1998. A primer on the geological occur-rence of gas hydrate. In: Henriet, J.-P., Mienert, J. (Eds.),Gas Hydrates: Relevance to World Margin Stability andClimate Change. Geol. Soc. London Spec. Publ. 137, 9^30.
Larson, R.L., 1991. Geological consequences of superplumes.Geology 19, 963^966.
Lewy, Z., 1990. Transgressions, regressions and relative sea-level changes on the Cretaceous shelf of Israel and adjacentcountries. A critical evaluation of Cretaceous global sea levelcorrelations. Paleoceanography 5, 619^637.
Li, L.Q., Keller, G., Adatte, T., Stinnesbeck, W., 2000. LateCretaceous sea-level changes in Tunisia: a multi-disciplinaryapproach. J. Geol. Soc. London 157, 447^458.
Li, L.Q., Keller, G., Stinnesbeck, W., 1999. The Late Campa-nian and Maastrichtian in northwestern Tunisia: palaeoen-vironmental inferences from lithology, macrofauna andbenthic foraminifera. Cretac. Res. 20, 231^252.
Lu«ning, S., Marzouk, A.M., Morsi, A.M., Kuss, J., 1998. Se-quence stratigraphy of the Upper Cretaceous of south-eastSinai, Egypt. Cretac. Res. 19, 153^196.
Macgregor, D.S., 1996. The hydrocarbon systems of NorthAfrica. Mar. Petrol. Geol. 13, 329^340.
Mackenzie, F.T., 1990. Sea level change, sediment mass and£ux and chemostratigraphy. In: Ginsburg, R.N., Beaudoin,B. (Eds.), Cretaceous Resources, Events and Rhythms.Kluwer, Dordrecht, pp. 289^304.
Marie, J., Trouve¤, P., Desforges, G., Dufaure, P., 1984. Nou-veaux e¤le¤ments de pale¤oge¤ographie du Cre¤tace¤ de Tunisie.Notes Me¤m. TOTAL 19, 7^37.
Marshall, J.D., 1992. Climatic and oceanographic isotopic sig-nals from the carbonate rock record and their preservation.Geol. Mag. 129, 143^160.
Masse, J.-P., Philip, J., Camion, G., 1996. The CretaceousTethys. In: Nairn, A.E.M., Ricou, L.-E., Vrielynk, B., Der-court, J. (Eds.), The Ocean Basins and Margins, Vol. 8. TheTethys Ocean. Plenum Press, New York, pp. 215^236.
McArthur, J.M., Crame, J.A., Thirlwall, M.F., 2000. De¢ni-tion of Late Cretaceous stage boundaries in Antarctica usingstrontium isotope stratigraphy. J. Geol. 108, 623^640.
McArthur, J.M., Howarth, R.J., Bailey, T.R., 2001. Strontiumisotope stratigraphy: LOWESS version 3: Best ¢t to themarine Sr-isotope curve for 0^509 Ma and accompanying
look-up table for deriving numerical age. J. Geol. 109,155^170.
McArthur, J.M., Kennedy, W.J., Chen, M., Thirlwall, M.F.,Gale, A.S., 1994. Strontium isotope stratigraphy for LateCretaceous time ^ direct numerical calibration of the Srisotope curve based on the United States Western Interior.Palaeogeogr. Palaeoclimatol. Palaeoecol. 108, 95^119.
McArthur, J.M., Kennedy, W.J., Gale, A.S., Thirlwall, M.F.,Chen, M., Burnett, J., Hancock, J.M., 1992. Strontium iso-tope stratigraphy in the Late Cretaceous^intercontinentalcorrelation of the Campanian^Maastrichtian boundary. Ter-ra Nova 4, 385^393.
McArthur, J.M., Thirlwall, M.F., Chen, M., Gale, A.S., Ken-nedy, W.J., 1993a. Strontium isotope stratigraphy in theLate Cretaceous^numerical calibration of the Sr isotopecurve and intercontinental correlation for the Campanian.Paleoceanography 8, 859^873.
McArthur, J.M., Thirlwall, M.F., Gale, A.S., Kennedy, W.J.,Burnett, J.A., Mattey, D., Lord, A.R., 1993b. Strontiumisotope stratigraphy for the Late Cretaceous: a new curve,based on the English Chalk. In: Hailwood, E.A., Kidd, R.B.(Eds.), High Resolution Stratigraphy. Geol. Soc. LondonSpec. Publ. 70, 195^209.
Menegatti, A.P., Weissert, H., Brown, R.S., Tyson, R.V., Far-rimond, P., Strasser, A., Caron, M., 1998. High-resolutionN13C stratigraphy through the early Aptian ‘Livello Selli’ ofthe Alpine Tethys. Paleoceanography 13, 530^545.
Miall, A.D., 1992. The Exxon global cycle chart: an event forevery occasion? Geology 20, 787^790.
Miall, A.D., 1997. The Geology of Stratigraphic Sequences.Springer-Verlag, Berlin, 433 pp.
Miall, A.D., Miall, C.E., 2001. Sequence stratigraphy as ascienti¢c enterprise: the evolution and persistence of con-£icting paradigms. Earth-Sci. Rev. 54, 321^348.
Mitchell, S.F., Paul, C.R.C., Gale, A.S., 1996. Carbon isotopesand sequence stratigraphy. In: Howell, J.A., Aitken, J.F.(Eds.), High Resolution Sequence Stratigraphy: Innovationsand Applications. Geol. Soc. London Spec. Publ. 104, 11^24.
M’Rabet, A., Mejri, F., Burollet, P.F., Memmi, L., Chan-dooul, H., 1995. Catalog of Type Sections in Tunisia. Creta-ceous. Entrep. Tunis. Activ. Petrol. Mem. 8A, 123 pp.
Negre, M.H., 1994. Les De¤po“ts de Platforme a' Bassin de Cre¤-tace¤ Supe¤rieur en Tunisie Centro-septentrionale (FormationAbiod et Facie's Associe¤s). Stratigraphie, Se¤dimentation,Diagene'se et Inte¤re“t Pe¤trolier. Doctorat e's-Sciences Thesis,University of Tunisia, Tunis, 649 pp.
Negre, M.H., M’Rabet, A., 1992. Ame¤lioration des caracte¤ris-tiques pe¤trophysiques des calcaires crayeaux pe¤lagiques parles processus de dolomitisation^dedolomitisation. Exempledes carbonates du Se¤nonien supe¤rieur de Tunisie centrale.CR Acad. Sci. Paris Se¤r. IIa 315, 1003^1009.
Negre, M.H., M’Rabet, A., 1994. The Abiod facies. Reparti-tion and reservoir aspects. In: Chine, A., Ben Hassine, K.(Eds.), Proceedings of the 4th Tunisian Petroleum Explora-tion Conference (Tunis, May 1994). Entreprises Tunisiennesd’Activite¤s Petrolie'res, Tunis, pp. 495^507.
PALAEO 2948 13-11-02
I. Jarvis et al. / Palaeogeography, Palaeoclimatology, Palaeoecology 188 (2002) 215^248246

Negre, M.H., Purser, B.H., 1989. Les monticules se¤noniens a'rudistes de Jebel el Kebar, Tunisie centrale: anatomie, dia-gene'se et ge¤ome¤trie. Ge¤ol. Me¤diterr. 16, 99^119.
Nelson, B.K., Macleod, G.K., Ward, P.D., 1991. Rapidchange in strontium isotopic composition of sea-water be-fore the Cretaceous/Tertiary boundary. Nature 351, 644^647.
Niebuhr, B., 1995. Fazies-Di¡erenzierungen und ihre Steuer-ungsfaktoren in der ho«heren Oberkreide von Niedersachen/Sachsen-Anhalt (N-Deutschland). Ber. Geowiss. Abh. A174, 1^131.
Niebuhr, B., Joachimski, M.M., 2002. Stable isotope and traceelement geochemistry of Upper Cretaceous carbonates andbelemnite rostra (Middle Campanian, north Germany).Geobios 35, 51^64.
Niebuhr, B., Wood, C.J., Ernst, G., 2000. Isolierte Oberkreide- vorkommen zwischen Wiehengebirge und Harz. In: Hiss,M., Scho«nfeld, J., Thiermann, A. (Eds.), Stratigraphie vonDeutschland III. Die Kreide der Bundesrepublik Deutsch-land. Courier Forsch.inst. Senckenberg 226, 101^109.
Obradovich, J.G., 1994. A Cretaceous time scale. In: Caldwell,W.G.E., Kau¡man, E.G. (Eds.), Evolution of the WesternInterior Basin. Geol. Assoc. Canada Spec. Pap. 39, 379^396.
Odin, G.S. (Ed.), 2001. The Campanian^Maastrichtian StageBoundary. Characterisation at Tercis les Bains (France) andCorrelation with Europe and other Continents. Develop-ments in Palaeontology and Stratigraphy, 19. Elsevier, Am-sterdam, 881 pp.
Odin, G.S., Lamaurelle, M.A., 2001. The global Campanian^Maastrichtian stage boundary. Episodes 24, 229^238.
O’Hearn, T.C., Ratcli¡e, K.T., Moody, R.T.J., 1993. Stablecarbon and oxygen isotopes for the Abiod Formation(Late Cretaceous), Tunisia. In: Ben Hassine, K.B., El Borgi,M. (Eds.), Fractured Reservoir Seminar, Tunis, September1st^4th 1993. Entreprises Tunisiennes d’Activite¤s Petrolie'res,Tunis, pp. 41^49.
Padden, M., Weissert, H., de Rafelis, M., 2001. Evidence forLate Jurassic release of methane from gas hydrate. Geology29, 223^226.
Patterson, W.P., Walter, L.M., 1994. Depletion of 13C in sea-water gCO2 on modern carbonate platforms: signi¢cancefor the carbon isotopic record of carbonates. Geology 22,885^888.
Peake, N.B., Hancock, J.M., 1961. The Upper Cretaceous ofNorfolk. Trans. Norfolk Norwich Nat. Soc. 19, 293^339.
Peake, N.B., Hancock, J.M., 1970. The Upper Cretaceous ofNorfolk. In: Larwood, G.P., Funnell, B.M. (Eds.), TheGeology of Norfolk. Geological Society of Norfolk, Nor-wich, pp. 293^339.
Pratt, L., Arthur, M.A., Dean, W.E., Scholle, P.A., 1993. Pa-leoceanographic cycles and events during the Late Creta-ceous in the Western Interior Seaway of North America.In: Caldwell, W.G.E., Kau¡man, E.G. (Eds.), CretaceousEvolution of the Western Interior Basin of North America.Geol. Assoc. Canada Spec. Pap. 39, 333^353.
Premoli Silva, I., Sliter, W.V., 1994. Cretaceous planktonicforaminiferal biostratigraphy and evolutionary trends from
the Bottaccione section, Gubbio, Italy. Palaeontogr. Ital. 82,1^89.
Premoli Silva, I., Sliter, W.V., 1999. Cretaceous paleoceanog-raphy: evidence from planktonic foraminiferal evolution.In: Barrera, E., Johnson, C.C. (Eds.), Evolution of the Cre-taceous Ocean^Climate System. Spec. Pap. Geol. Soc. Am.332, 301^328.
Raymo, M.E., Ruddiman, W.F., 1992. Tectonic forcing ofLate Cenozoic climate. Nature 359, 117^122.
Renard, M., Delacotte, O.R.L., 1982. Le strontium et les iso-topes stables dans les carbonates totaux de quelques sites del’Atlantique et de la Te¤thys. Bull. Soc. Ge¤ol. Fr. 24, 519^534.
Ripperdan, R.L., 2001. Stratigraphic variation in marine car-bonate carbon isotope ratios. In: Valley, J.W., Cole, D.R.(Eds.), Stable Isotope Geochemistry. Rev. Mineral. Geo-chem. 43, 637^662.
Robaszyniski, F., 1999. Cretaceous stage boundaries in centralTunisia: how to follow the Brussels 1995 symposium recom-mendations. Bull. Inst. R. Sci. Nat. Belg. Suppl. A 69, 161^165.
Robaszynski, F., Caron, M., 1995. Foraminife'res planctoni-ques du Cre¤tace¤ : commentaire de la zonation Europe ^Me¤diterrane¤e zonation. Bull. Soc. Ge¤ol. Fr. 166, 681^692.
Robaszynski, F., Gonza¤les Donoso, J.M., Linares, D., Ame¤-dro, F., Caron, M., Dupuis, C., Dhondt, A.V., Gartner, S.,2000. Le Cre¤tace¤ Supe¤rieur de la re¤gion de Kalaat Senanregion, Tunisie centrale. Litho-biostratigraphie inte¤gre¤ezones d’ammonites, de foraminife'res planctonique et de nan-nofossiles du Turonian Supe¤rieur au Maastrichtien. Bull.Centre Rech. Explor.-Prod. Elf Aquitaine 22, 359^490.
Romanek, C.S., Grossman, E.L., Morse, J.W., 1992. Carbonisotopic fractionation in synthetic aragonite and calcite: ef-fects of temperature and precipitation rate. Geochim. Cos-mochim. Acta 56, 419^430.
Ronov, A.B., Khain, V.E., Balukhovsky, A.N., 1989. Atlas ofLithological Paleogeographical Maps of the World: Meso-zoic and Cenozoic of Continents and Oceans. Editorial Pub-lishing Group, Moscow, 79 pp.
Salaj, J., 1996. Tunisian Upper Cretaceous hypostratotypes aspossible candidates of Tethyan stratotypes including strato-type boundaries. Zem. Naft. 40, 245^308.
Salaj, J., Wiedmann, J., 1989. The Campanian^Maastrichtianboundary in the El Kef section, Tunisia. In: Wiedmann, J.(Ed.), Cretaceous of the Western Tethys. Proceedings of the3rd International Cretaceous Symposium Tu«bingen 1987. E.Schweizerbart’sche Verlagsbuchhandlung, Stuttgart, pp.299^315.
Schlanger, S.O., Jenkyns, H.C., 1976. Cretaceous oceanic an-oxic events: causes and consequences. Geol. Mijnb. 55, 179^184.
Scholle, P.A., 1977. Chalk diagenesis and its relation to petro-leum exploration ^ oil from chalks, a modern miracle?AAPG Bull. 61, 982^1009.
Scholle, P.A., Arthur, M.A., 1980. Carbon isotope £uctuationin Cretaceous pelagic limestones: potential stratigraphic andpetroleum exploration tool. AAPG Bull. 64, 67^87.
PALAEO 2948 13-11-02
I. Jarvis et al. / Palaeogeography, Palaeoclimatology, Palaeoecology 188 (2002) 215^248 247

Scholle, P.A., Arthur, M.A., Ekdale, A.A., 1983. Pelagic envi-ronment. In: Scholle, P.A., Bebout, D.G., Moore, C.H.(Eds.), Carbonate Depositional Environments. AAPGMem. 33, 619^691.
Scho«nfeld, J., 2000. Campan. In: Hiss, M., Scho«nfeld, J.,Thiermann, A. (Eds.), Stratigraphie von Deutschland III.Die Kreide der Bundesrepublik Deutschland. CourierForsch.inst. Senckenberg 226, 42^45.
Scho«nfeld, J., Sirocko, F., JYrgensen, N.O., 1991. Oxygen iso-tope composition of Upper Cretaceous chalk at La«gerdorf(NW Germany): its original environmental signal and pa-laeotemperature interpretation. Cretac. Res. 12, 27^46.
Schulz, M.-G., Ernst, G., Ernst, H., Schmid, F., 1984. Co-niacian to Maastrichtian stage boundaries in the standardsections for the Upper Cretaceous white chalk of N.W. Ger-many (La«gerdorf^Kronsmoor^Hemmoor): De¢nitions andproposals. Bull. Geol. Soc. Denmark 33, 203^215.
Schulz, M.G., Weitschat, W., 1998. The White Chalk (Conia-cian^Maastrichtian) of La«gerdorf and Kronsmoor (N-Ger-many). In: Mutterlose, J., Bornemann, A., Rauer, S.,Spaeth, C., Wood, C.J. (Eds.), Key Localities of the North-west European Cretaceous. Bochumer Geologische undGeotechnische Arbeiten, 48. Ruhr-Universita«t Bochum, Bo-chum, pp. 21^37.
Seiglie, G.A., Baker, M.B., 1984. Relative sea-level changesduring the middle and Late Cretaceous from Zaire to Ca-meroon (central West Africa). In: Schlee, J.S. (Ed.), Inter-regional Unconformities and Hydrocarbon Accumulation.AAPG Mem. 36, 81^88.
Seyve, C., 1990. Nannofossil biostratigraphy of the Creta-ceous^Tertiary boundary in the French Basque country.Bull. Centre Rech. Explor.-Prod. Elf Aquitaine 14, 553^572.
Sliter, W.V., 1989. Biostratigraphic zonation of Cretaceousplanktonic foraminifers examined in thin section. J. Fora-minifer. Res. 19, 1^99.
Steuber, T., 2001. Strontium isotope stratigraphy of Turonian^Campanian Gosau-type rudist formations in the NorthernCalcareous and Central Alps (Austria and Germany). Cre-tac. Res. 22, 429^441.
Steuber, T., 2002. Plate tectonic control on the evolution ofCretaceous platform-carbonate production. Geology 30,259^262.
Tyson, R.V., Funnell, B.M., 1990. European shorelines. Stageby stage. In: Ginsburg, R.N., Beaudoin, B. (Eds.), Creta-ceous Resources, Events and Rhythms. Kluwer, Dordrecht,pp. 237^272.
Vail, P.R., 1987. Seismic stratigraphic interpretation proce-dure. In: Bally, A.W. (Ed.), AAPG Stud. Geol. 27, 1^10.
Villamil, T., 1998. Chronology, relative sea-level history and anew sequence stratigraphic model for basinal Cretaceousfacies of Colombia. In: Pindell, J.L., Drake, C.L. (Eds.),Paleogeographic Evolution and Non-glacial Eustacy. North-ern South America. SEPM Spec. Publ. 58, 161^216.
Voigt, E., Hay, W.W., Ho«£ing, R., DeConto, R.M., 1999.Biogeographic distribution of late Early to Late Cretaceousrudist-reefs in the Mediterranean as climate indicators. In:Barrera, E., Johnson, C.C. (Eds.), Evolution of the Creta-ceous Ocean-Climate System. Spec. Pap. Geol. Soc. Am.332, 91^103.
Voigt, S., 2000. Cenomanian^Turonian composite N13C curvefor Western and Central Europe: the role of organic andinorganic carbon £uxes. Palaeogeogr. Palaeoclimatol. Pa-laeoecol. 160, 91^104.
Voigt, S., Gale, A.S., 2002. Evidence for rapid climate coolingduring positive N13C excursions within the Middle and LateCenomanian derived from oxygen isotope data of brachio-pods and belemnites. In: Bralower, T.J., Bice, K.L., Huber,B.T., Leckie, R.M., Sageman, B.B., Duncan, R.A. (Eds.),Workshop on Cretaceous Climate and Ocean Dynamics.JOVUSSAP and National Science Foundation, Florissant,CO, p. 84.
Voigt, S., Hilbrecht, H., 1997. Late Cretaceous carbon isotopestratigraphy in Europe: correlation and relations with sealevel and sediment stability. Palaeogeogr. Palaeoclimatol.Palaeoecol. 134, 39^59.
Vonhof, H.B., Smit, J., 1997. High-resolution late Maastricht-ian^early Danian oceanic 87Sr/86Sr record: implications forCretaceous^Tertiary boundary events. Geology 25, 347^350.
Ward, P.D., Kennedy, W.J., 1993. Maastrichtian ammonitesfrom the Biscay region (France, Spain). J. Paleontol. 67, 1^58.
Weissert, H., 1989. Carbon-isotope stratigraphy, a monitor ofpaleoenvironmental change: a case study from the EarlyCretaceous. Surv. Geophys. 10, 1^61.
Weissert, H., Lini, A., Fo«llmi, K.B., Kuhn, O., 1998. Correla-tion of Early Cretaceous carbon isotope stratigraphy andplatform drowning events: a possible link? Palaeogeogr. Pa-laeoclimatol. Palaeoecol. 137, 189^203.
Wiese, F., Kaplan, U., 2001. The potential of the Lengerichsection (Mu«nster Basin, northern Germany) as a possiblecandidate Global boundary Stratotype Section and Point(GSSP) for the Middle/Upper Turonian boundary. Cretac.Res. 22, 549^563.
Wood, C.J., 1988. The stratigraphy of the Chalk of Norwich.Bull. Geol. Soc. Norfolk 38, 3^120.
Wood, C.J., Morter, A.A., Gallois, R.W., 1994. Appendix 1.Upper Cretaceous stratigraphy of the Trunch borehole.TG23SE8. In: Arthurton, R.S., Booth, S.J., Morigi, A.N.,Abbott, M.A.W., Wood, C.J. (Eds.), Geology of the Coun-try around Great Yarmouth. Memoir for 1:50, 000 Sheet162 (England and Wales) with an Appendix on the TrunchBorehole by Wood and Morter. HMSO, London, pp. 105^110.
PALAEO 2948 13-11-02
I. Jarvis et al. / Palaeogeography, Palaeoclimatology, Palaeoecology 188 (2002) 215^248248
Copyright © 2022 FDOKUMEN