A paleolatitude reconstruction of the South Armenian Block (Lesser Caucasus) for the Late...
55
A paleolatitude reconstruction of the South Armenian Block (Lesser Cauca- sus) for the Late Cretaceous: Constraints on the Tethyan realm Maud J.M. Meijers, Brigitte Smith, Uwe Kirscher, Marily Mensink, Marc Sosson, Yann Rolland, Araik Grigoryan, Lilit Sahakyan, Ara Avagyan, Cor Langereis, Carla M ¨ uller PII: S0040-1951(15)00056-6 DOI: doi: 10.1016/j.tecto.2015.01.012 Reference: TECTO 126527 To appear in: Tectonophysics Received date: 21 July 2014 Revised date: 10 January 2015 Accepted date: 31 January 2015 Please cite this article as: Meijers, Maud J.M., Smith, Brigitte, Kirscher, Uwe, Mensink, Marily, Sosson, Marc, Rolland, Yann, Grigoryan, Araik, Sahakyan, Lilit, Avagyan, Ara, Langereis, Cor, M¨ uller, Carla, A paleolatitude reconstruction of the South Armenian Block (Lesser Caucasus) for the Late Cretaceous: Constraints on the Tethyan realm, Tectonophysics (2015), doi: 10.1016/j.tecto.2015.01.012 This is a PDF file of an unedited manuscript that has been accepted for publication. As a service to our customers we are providing this early version of the manuscript. The manuscript will undergo copyediting, typesetting, and review of the resulting proof before it is published in its final form. Please note that during the production process errors may be discovered which could affect the content, and all legal disclaimers that apply to the journal pertain.
Transcript of A paleolatitude reconstruction of the South Armenian Block (Lesser Caucasus) for the Late...
�������� ����� ��
A paleolatitude reconstruction of the South Armenian Block (Lesser Cauca-sus) for the Late Cretaceous: Constraints on the Tethyan realm
Maud J.M. Meijers, Brigitte Smith, Uwe Kirscher, Marily Mensink,Marc Sosson, Yann Rolland, Araik Grigoryan, Lilit Sahakyan, Ara Avagyan,Cor Langereis, Carla Muller
PII: S0040-1951(15)00056-6DOI: doi: 10.1016/j.tecto.2015.01.012Reference: TECTO 126527
To appear in: Tectonophysics
Received date: 21 July 2014Revised date: 10 January 2015Accepted date: 31 January 2015
Please cite this article as: Meijers, Maud J.M., Smith, Brigitte, Kirscher, Uwe, Mensink,Marily, Sosson, Marc, Rolland, Yann, Grigoryan, Araik, Sahakyan, Lilit, Avagyan, Ara,Langereis, Cor, Muller, Carla, A paleolatitude reconstruction of the South ArmenianBlock (Lesser Caucasus) for the Late Cretaceous: Constraints on the Tethyan realm,Tectonophysics (2015), doi: 10.1016/j.tecto.2015.01.012
This is a PDF file of an unedited manuscript that has been accepted for publication.As a service to our customers we are providing this early version of the manuscript.The manuscript will undergo copyediting, typesetting, and review of the resulting proofbefore it is published in its final form. Please note that during the production processerrors may be discovered which could affect the content, and all legal disclaimers thatapply to the journal pertain.
ACC
EPTE
D M
ANU
SCR
IPT
ACCEPTED MANUSCRIPT
1
A paleolatitude reconstruction of the South Armenian Block (Lesser Caucasus) for the Late
Cretaceous: constraints on the Tethyan realm
Maud J.M. Meijers1,2
, Brigitte Smith3, Uwe Kirscher
4, Marily Mensink
5, Marc Sosson
1, Yann
Rolland1, Araik Grigoryan
6, Lilit Sahakyan
6, Ara Avagyan
6, Cor Langereis
5 and Carla Müller
7
1Université de Nice Sophia Antipolis, UMR Géoazur, CNRS, IRD, Observatoire de la Côte d’Azur, 250
rue Albert Einstein, 06560 Valbonne, France
2University of Minnesota, Dept of Earth Sciences, 291 Shepherd Labs, 100 Union Street SE,
Minneapolis, MN 55455, USA
3Université Montpellier 2, INSU-CNRS, Laboratoire Géosciences Montpellier, place E. Bataillon,
34095 Montpellier cedex 5, France
4Ludwig-Maximilians-Universität München, Department of Earth and Environmental Sciences,
Theresienstrasse 41, 80333 München, Germany
5Utrecht University, Paleomagnetic Laboratory ‘Fort Hoofddijk’, Faculty of Geosciences,
Budapestlaan 17, 3584CD Utrecht, The Netherlands
6Institute of Geological Sciences, National Academy of Sciences of Armenia, 24a Baghramian avenue,
Yerevan, 0019, Armenia
7PL 66-431 Santok, Ludzislawice, Poland
Corresponding author:
Maud J.M. Meijers
Email: [email protected]
+1 612 607 3546
ACC
EPTE
D M
ANU
SCR
IPT
ACCEPTED MANUSCRIPT
2
Abstract
The continental South Armenian Block ‒ part of the Anatolide-Tauride South Armenian microplate ‒
of Gondwana origin rifted from the African margin after the Triassic and collided with the Eurasian
margin after the Late Cretaceous. During the Late Cretaceous, two northward dipping subduction
zones were simultaneously active in the northern Neo-Tethys between the South Armenian Block in
the south and the Eurasian margin in the north: oceanic subduction took place below the continental
Eurasian margin and intra-oceanic subduction resulted in ophiolite obduction onto the South Armenian
Block in the Late Cretaceous.
The paleolatitude position of the South Armenian Block before its collision with Eurasia
within paleogeographic reconstructions is poorly determined and limited to one study. This earlier
study places the South Armenian Block at the African margin in the Early Jurassic. To reconstruct the
paleolatitude history of the South Armenian Block, we sampled Upper Devonian-Permian and
Cretaceous sedimentary rocks in Armenia. The sampled Paleozoic rocks have likely been
remagnetized. Results from two out of three sites sampled in Upper Cretaceous strata pass fold tests
and probably all three carry a primary paleomagnetic signal. The sampled sedimentary rocks were
potentially affected by inclination shallowing. Therefore, two sites that consist of a large number of
samples (>100) were corrected for inclination shallowing using the elongation/inclination method.
These are the first paleomagnetic data that quantify the South Armenian Block’s position in
the Tethys ocean between post-Early Jurassic rifting from the African margin and post-Cretaceous
collision with Eurasia. A locality sampled in Lower Campanian Eurasian margin sedimentary rocks
and corrected for inclination shallowing, confirms that the corresponding paleolatitude falls on the
Eurasian paleolatitude curve. The north-south distance between the South Armenian Block and the
Eurasian margin just after Coniacian-Santonian ophiolite obduction was at most 1000 km.

ACC
EPTE
D M
ANU
SCR
IPT
ACCEPTED MANUSCRIPT
3
1. Introduction
The Tethys ocean was wedged between the northern and southern domains of the youngest
supercontinent Pangea. Breakup of the supercontinent started in the earliest Jurassic (~200 Ma) by
opening of the central Atlantic ocean (Heezen, 1960; Dietz 1961; Richards et al., 1989; Müller et al.,
1993; Norton, 2000; Sahabi et al., 2004; Deenen et al., 2010; Labails et al., 2010). Simultaneously,
continental fragments such as the Anatolide-Tauride South Armenian (ATA) microplate rifted off the
African margin and converged with Eurasia, relics of which presently occupy large parts of the region
from Turkey to Armenia. Plate circuits based on paleomagnetic data show that Africa and Eurasia
started converging after ~200 Ma (Besse and Courtillot, 2002; Torsvik et al., 2012) and rifting along
the African margin was accommodated by subduction below the southern Eurasian margin and within
the Tethys ocean. The ATA microplate probably rifted away from the African margin in the early
Mesozoic, opening the southern branch of Neo-Tethys to its south (Barrier and Vrielynck, 2008). It
collided with the Eurasian margin in the Paleocene to Eocene, closing the northern branch of the Neo-
Tethys ocean to its north (Sosson et al., 2010; Robertson et al., 2014). The northeastern part of ATA is
presently located in the Lesser Caucasus at the former southern Eurasian continental margin (Fig. 1).
This northeastern part of ATA is generally referred to as the South Armenian Block (SAB; Knipper
and Khain, 1980; Monin and Zonenshain, 1987). We mostly refer to the SAB in this paper, because
we present data from the Armenian Lesser Caucasus.
There is no clear geologic evidence for the timing of rifting of the SAB from the African margin.
Recently Hässig et al., (2014) presented structural, metamorphic and isotopic age data that imply
southward subduction below the SAB from ~160-123 Ma (Late Jurassic to Early Cretaceous). The
forces related to this subduction zone could have driven SAB-Africa rifting. A paleomagnetic study
carried out on Jurassic volcanic rocks of the SAB (Bazhenov et al., 1996) gives quantitative
constraints and shows that the SAB was positioned at the African margin in the Early Jurassic. Typical
errors in paleomagnetic data sets (at best several degrees in paleolatitude or ~300-500 km) would not
allow the recognition of an early rifting stage in the Early Jurassic. Therefore rifting is generally
assumed to have started during or after the Early Jurassic. No paleomagnetic data constrain the
position of the SAB in the Tethys ocean after rifting from the African margin initiated. Closure of the
northern branch of the Neo-Tethyan ocean located between the SAB and the Eurasian margin was a
two-stage process (Rolland et al., 2009a; Sosson et al., 2010). Northward directed intra-oceanic
subduction north of the SAB led to calc-alkaline back-arc magmatism followed by ophiolite obduction
onto the SAB (Galoyan et al., 2007; Hässig et al., 2013) in the Cenomanian to Santonian time interval
(Sosson et al., 2010; Danelian et al., 2014). From the Middle Jurassic to the Late Cretaceous one other
northward dipping subduction zone was active south of Eurasia, resulting in large volume magmatic
activity on the active Eurasian margin (the Somkheto-Karabakh island arc; Fig. 1; Adamia et al.,
ACC
EPTE
D M
ANU
SCR
IPT
ACCEPTED MANUSCRIPT
4
1980). Consumption of the northern Neo-Tethyan oceanic lithosphere finally led to the collision of the
SAB with Eurasia.
Sosson et al. (2010) propose a Paleocene age for the start of collision, based on
tectonostratigraphic evidence. Middle Eocene strata unconformably cover the SAB, the ophiolitic
Sevan-Akera (or Sevan-Hakari) suture zone and the Eurasian margin, marking the amalgamation of
the SAB with Eurasia. Okay and Şahintürk (1997), Robinson et al. (1995) and Robertson et al. (2014)
propose a Paleocene to Eocene collision age based on the tectonostratigraphy of the eastern Pontides.
A significantly older (Campanian) collision age is proposed by Rolland et al. (2009a; 2012), founded
on the presence of Eurasian basement-derived blocks in the Coniacian-Santonian formations on top of
the obducted ophiolite and on the onset of subduction to the south of the ATA microplate around 95
Ma. Evidence for active subduction from continuing arc magmatism on the Eurasian margin during
the Maastrichtian in the Lesser Caucasus (Adamia et al., 2011) and the Paleocene in the eastern
Pontides (Okay and Şahintürk, 1997; Altherr et al., 2008), however, contradicts an older Campanian
collision.
To reconstruct Tethyan plate kinematics through time, paleomagnetic data from continental
blocks (such as the SAB) that do not move independently within the Tethyan ocean could provide a
paleo-age grid of the Tethys ocean. Reconstructions of the western Tethyan realm are a challenge due
to the limited north-south width of the Tethys ocean that leads to resolution issues when comparing
paleomagnetic data from continental blocks and latitude-age curves and their associated errors of the
major continents. Here, we present paleomagnetic data from the SAB and its sedimentary cover from
Upper Devonian to Upper Cretaceous rocks as well as paleomagnetic data from Upper Cretaceous
sedimentary rocks from the Eurasian margin. The Devonian to Triassic sedimentary rocks were
probably remagnetized. Results from the Upper Cretaceous sedimentary rocks were corrected for
inclination shallowing and compared to the position of the Eurasian and African margins in order to
quantify the position of the SAB within the Tethyan realm and to estimate the age of collision
initiation.
2. Geology of the South Armenian Block (SAB)
The SAB is part of the Lesser Caucasus and is well exposed in Armenia (Fig. 1). Its rifting history is
very poorly known due to the absence of clear geologic evidence for rifting and is estimated to have
occurred after the Early Jurassic, based on a paleomagnetic study by Bazhenov et al. (1996). In
contrast to the Caledonian-Variscan Eurasian basement (Adamia et al., 1983; Adamia, 1984;
Zakariadze et al., 1998), the SAB has a Proterozoic metamorphic basement of Gondwana affinity
(Aghamalyan 1978, 1998; Belov & Sokolov 1973; Knipper and Khain, 1980; Knipper et al., 1986;
Karyakin, 1989). The SAB is separated by the Sevan-Akera suture zone from the former southern
Eurasian margin (Fig. 2a). To the east, it is bounded by the Iranian terranes. The southern boundary of
ACC
EPTE
D M
ANU
SCR
IPT
ACCEPTED MANUSCRIPT
5
the SAB is defined by the Bitlis-Zagros suture zone (Fig. 1) and to the west of the SAB is the Turkish
Anatolide-Tauride Block (ATB). Estimated rifting initiation ages of the ATB from the African margin
vary from Late Permian to Late Triassic (e.g. Moix et al., 2008; Robertson et al., 2004; Şengör and
Yilmaz, 1981; Stampfli and Borel et al., 2002). The SAB and the ATB have often been described as
two terranes. There are however several reasons to assume that the SAB is the eastern continuation of
the ATB and represents the continental part of the Anatolide-Tauride-South Armenian (ATA)
microplate (Okay and Tüysüz, 1999; Barrier and Vrielynck, 2008; Rolland et al., 2012). First, the SAB
and ATB both have a basement of Gondwana origin. Second, the SAB and ATB have a similar
position with respect to surrounding suture zones: the Izmir-Ankara-Erzincan suture zone (IAES, Fig.
1) and its eastern extension (the Amassia-Sevan-Akera suture zone; Fig 2a) to the north and the Bitlis-
Zagros suture zone to the south. Last, there is no clear geologic boundary between the ATB and SAB
that would have potentially juxtaposed the two blocks (e.g. an ophiolite marking a former subduction
zone or a large-scale lithospheric strike-slip fault). Therefore, a common rifting-history of ATA is
likely.
The metamorphic basement of the SAB mainly consists of gneisses, micaschists and leucogranite
intrusions (Aghamalyan, 1998; Hässig et al., 2014) and is overlain by non-metamorphic Paleozoic
sedimentary rocks (Paffenholtz 1959; Karyakin 1989). Paleozoic strata include Upper Devonian
(Frasnian-Famennian) quartzites, sandstones and argillites, overlain by Lower Carboniferous reef
limestones. The Early Carboniferous is overlain by Permian platform type limestones and marls and
Triassic limestones that grade upward into Upper Triassic detrital deposits (Abramyan, 1951;
Grigoryan, 1990). The contact between the Paleozoic deposits and the basement is not exposed.
Siltstones of Bathonian age overlain by Callovian limestones are exposed 20 km to the south of
Yeghegnadzor (Mandalyan, 1990). Exposures of Jurassic sequences are located in Nakhchivan
(Azerbaijan) and in Iran where a 500 m-thick Lower and Middle Jurassic sedimentary sequence
overlies Upper Triassic strata. Lower Cretaceous deposits are absent on the SAB and the Triassic-
Jurassic deposits are unconformably overlain by Cenomanian reefal limestones that are covered by
marls (Eghoyan 1955; Paffenholtz 1959; Sokolov 1977; Hakobyan 1978 Danelian et al., 2014). In the
main area of our paleomagnetic study around the town of Vedi, the Cenomanian limestones are
overlain by Upper Cenomanian flysch (Sosson et al., 2010) and Upper Coniacian to Santonian
olistostromes that formed in front of the obducted ophiolitic nappes.
The entire Upper Devonian to early Late Cretaceous (Santonian) series covering the basement of
the SAB is overlain by an ophiolite sequence of Middle to Late Jurassic age (178-155 Ma; radiolarian
ages by Danelian et al. (2008, 2010; 2012) and Asatryan et al. (2012); 40
Ar/39
Ar ages by Galoyan et al.
(2009), Rolland et al. (2010) and Hässig et al. (2013)). The ophiolite sequence is unconformably
overlain by oceanic island basalts (OIBs) and arc-type volcanics (Galoyan et al., 2007, 2009; Galoyan
2008) of Early Cretaceous age (Belov et al., 1991; Rolland et al., 2011; Asatryan et al., 2012),
ACC
EPTE
D M
ANU
SCR
IPT
ACCEPTED MANUSCRIPT
6
evidencing intra-oceanic plume and arc volcanism. The ophiolites, OIBs and arc-type volcanics are
unconformably covered by Upper Coniacian to Santonian sedimentary strata (Sosson et al., 2010).
These transgressive sedimentary rocks pass from conglomerates (that partially rework the underlying
sequences) to reefal limestones, siltstones and pink pelagic clay-rich thin-bedded limestones. In the
Vedi area, Campanian and Maastrichtian deposits are limited.
In the area of the Sevan-Akera suture zone Paleocene deposits are practically absent, probably as
a result of erosion, whereas southward thick Paleocene molasse deposits unconformably overlie the
ophiolitic sequence in the Vedi area. Unconformable atop the Paleocene deposits, late Middle Eocene
and Oligocene deposits on the SAB comprise sedimentary and volcanogenic series. These are in turn
disconformably overlain by Miocene sedimentary and volcanic rocks (Sosson et al., 2010).
The Eurasian foreland of the SAB is exposed in an orocline (Bazhenov and Burtman, 2002) that
covers the entire Lesser Caucasus. From west to east, this northward convex orocline extends from the
eastern Pontides in easternmost Turkey, to the Lesser Caucasus in Georgia and Armenia, and to the
western part of Azerbaijan (see Fig. 1). The volcano-sedimentary cover of the eastern Pontides and the
Lesser Caucasus rests on top of a Variscan basement (Topuz et al., 2010; Adamia et al., 2011).
Rotations associated with orocline formation have been identified in Cretaceous and Eocene rocks
(Bazhenov and Burtman, 2002). Timing of orocline formation is unknown due to a lack of
paleomagnetic data from younger rocks.
3. Paleomagnetic sampling and methods
3.1 Paleomagnetic sampling
We sampled ten sites (mostly limestones) from the sedimentary cover of the SAB in the Vedi-
Yeghegnadzor area (Fig.2a-b; see GPS coordinates and description in Table 1). These include nine
sampling sites on the SAB in Famennian (one), Tournaisian (two), Permian (two) and Cretaceous
(three) rocks. One site covers the Permian-Triassic boundary. No Jurassic and Lower Cretaceous rocks
were sampled because of the absence of exposed rocks suitable for paleomagnetism of this age in the
Vedi-Yeghegnadzor area. Furthermore we sampled one Cretaceous locality (P in Fig. 2a), consisting
of six sites (P-combined in Table 1) plus two individual sites (P5 and P7 in Table 1, represented by P
on the map in Fig. 2a) in Eurasian margin sediments ~35 kilometers north of the city of Sevan (Fig.
2a). Wherever possible, we sampled strata with different bedding orientations in order to perform a
fold test (P_combined, AD and AM). In total 757 individual paleomagnetic samples (i.e. cores) were
collected. Samples were drilled using a motor drill and oriented with a magnetic compass. Sample
orientations and bedding planes were corrected for the present-day declination of ~5.5ºE. For NRM
demagnetization measurements, samples were cut into standard size specimens (2.54 cm diameter, 2.2
cm height). The number of cores sampled per site is indicated in Table 1, as well as the number of
demagnetized individual specimens per site.
ACC
EPTE
D M
ANU
SCR
IPT
ACCEPTED MANUSCRIPT
7
Ages of the Paleozoic and lowermost Triassic rocks are based on conodont content,
chondrichthye teeth and brachiopoda (Arakelyan, 1950; Abramyan, 1951; Arakelyan, 1964; Ginter et
al., 2011 and Grigoryan et al., 2012). Ages assigned to the Cretaceous rocks are based on
nannoplankton content. To compare our results to the latitude versus age curves derived from the
apparent polar wander (APW) path we derived numerical ages for Paleozoic and Triassic sampling
sites following the time scale of Menning et al. (2006). For the Cretaceous and younger sites we
correlated the nannoplankton zones to the time scales of Ogg et al. (2004) and Luterbacher et al.
(2004).
3.2 Methods
Out of the 757 collected cores we demagnetized 766 specimens using alternating field (332
specimens) and thermal (434 specimens) progressive stepwise demagnetization treatments (Table 1).
Prior to alternating field (AF) demagnetization, all samples were heated up to 150ºC to 1) remove a
viscous remanent magnetization (VRM) component, 2) remove possible stress in magnetite grains
caused by surface oxidation at low temperatures (Van Velzen and Zijderveld, 1995; Gong et al., 2008)
and 3) demagnetize goethite (often carrying the VRM). Thermal demagnetization of the NRM was
measured on 2G DC SQUID cryogenic magnetometers at Utrecht University, the Netherlands (noise
level 3x10-12
Am2) and at Ludwig-Maximilians-Universität (LMU) Munich, Germany (noise level 10
-
12 Am
2). AF demagnetization was carried out on the in-house developed robotized magnetometer
(noise level 10-12
Am2) at Utrecht University. Demagnetization of the NRM is displayed in orthogonal
vector diagrams (Zijderveld, 1967) in Figure 3. Characteristic remanent magnetization (ChRM)
directions were determined using principal component analysis (Kirschvink, 1980). For most
specimens, five to seven successive demagnetization steps were included for the calculation of the
ChRM direction.
To determine the magnetic mineralogy of the rocks, two types of thermomagnetic curves were
obtained. For Santonian samples from sites AD and AK, the susceptibility versus temperature (K/T)
was monitored in a 0.38 mT field on an Agico KLY-3S Kappabridge, equipped with a CS-L low
temperature device and a CS-3 Furnace Apparatus at the University of Montpellier II, France. The
powdered samples were sieved into 0.125 to 0.8 mm grain sizes. They were first heated from liquid
Nitrogen to room temperature, then heated and cooled in air or/and in argon up to successively 200,
350, 500, 600 and 700°C to determine the temperature at which possible chemical changes occur. At
the end of this cycle, a low temperature heating run was performed again on the same powder. For the
Campanian rocks of locality P-combined, the thermomagnetic curves were performed in high field
(~500 mT) using a variable field translation balance (VFTB, Petersen Instruments, LMU Munich;
Krasa et al., 2007). All rock magnetic results are presented in Figure 4.
ACC
EPTE
D M
ANU
SCR
IPT
ACCEPTED MANUSCRIPT
8
At the Institute for Rock Magnetism (University of Minnesota, USA), low temperature
experiments were carried out on subsamples (~0.5 g rock chips) of paleomagnetic cores from sites AD
and AK on a Quantum Designs Magnetic Property Measurement System (MPMS) cryogenic
magnetometer (sensitivity 10-10
Am2). Prior to measurements in the MPMS, the subsamples were given
a 2.5T isothermal remanent magnetization (IRM) to optimize centering of the subsample with respect
to the superconducting quantum interference device (SQUID), except for one subsample of AK06
(Fig. 4l) that was heated at 150ºC prior to the experiment to demagnetize goetithe. In a Field Cooled -
Zero Field Cooled (FCZFC) experiment, subsamples were cooled from room temperature (RT) to 20
K, first in a 2.5 T field and then in zero field (ZF), and given a 2.5 T isothermal remanent
magnetization (IRM) at 20 K. The magnetization was measured on warming to room temperature in
zero field (Fig. 4j). Following this step, a room temperature saturation isothermal remanent
magnetization (RTSIRM) experiment was carried out, after imparting a 2.5 T IRM on each subsample
at room temperature. Measurements of the magnetization were obtained upon cooling to 20 K and
subsequent warming to 300 K, both in zero field. The NRM upon cooling and warming in zero field
from room temperature down to 20K was measured on a number of subsamples. An example is given
in Fig. 4l (AK06).
Site mean directions (Fig. 5) were calculated from the individual ChRM directions using Fisher
(1953) statistics. The virtual geomagnetic poles (VGPs) corresponding to each individual ChRM
direction were also calculated. For sites AD, AK and locality P-combined they are displayed in Figure
7. On each site a fixed 45º cut-off was applied to the VGPs to remove outliers. The errors in
declination (Dx) and inclination (Ix) are calculated from the A95 (95% confidence angle on the
mean VGP) following Butler (1992). Because the directional distributions become more elongated
toward lower latitudes (Creer et al., 1959; Tauxe and Kent, 2004; Tauxe et al., 2008; Deenen et al.,
2011), this approach more realistically describes the associated errors.
Sites AH and AG contain specimens (four and six respectively) that yield NRM directions that
are intermediate between two overlapping temperature or coercivity components. To determine the
ChRM directions for these specimens we used the great circle approach of McFadden and McElhinny
(1988). This method determines the direction that lies closest on the great circle to the average
direction from well-determined ChRM directions. The great circles are indicated in Figure 5n and r.
The bedding orientation of the outcrops at sites AM, AD and three sites of locality P-combined (P3,
P4, P6) varies within ~10-100 meter scale, due to small-scale folding. Bedding orientation also varies
between the individual sites sampled at locality P-combined (sampled up to ~4 km apart). This
allowed us to carry out fold tests on AM, AD and locality P-combined (Fig. 6; Tauxe and Watson,
1994). Fold tests were carried out following two different procedures: (1) by using all individual
ChRM directions and their corresponding bedding planes, and (2) by using the mean ChRM direction
of all the specimens that were taken from layers with the same bedding plane orientation. This last
ACC
EPTE
D M
ANU
SCR
IPT
ACCEPTED MANUSCRIPT
9
procedure gives equal weight to each different bedding plane orientation, disregarding the number of
samples in each group. In both cases, however, the results of the fold test are very similar.
On locality P-combined we carried out the reversal test of McFadden and McElhinny (1990) and
their classification (A, B, C, indeterminate) based on their critical angle γc and the angle γ between the
means. The program uses Monte Carlo simulation, thereby effectively applying the (Watson, 1983) Vw
statistic test.
All samples in this study were collected from sedimentary rocks. Paleomagnetic data from
sedimentary rocks can be corrected for the paleohorizontal and can properly average out secular
variation of the Earth’s magnetic field, providing the sampled stratigraphic succession covers
sufficient time, i.e. ~10 kyr (when encountering an excursion interval, this may well be >100 kyr;
Merrill and McFadden, 2003). Contrary to igneous rocks, data from sedimentary rocks are notably
prone to inclination shallowing, which leads to an underestimation of paleolatitude. Inclination
shallowing has been recognized for decades and resulted in numerous studies examining how rocks
acquire their remanence, studying the effects of dewatering and compaction on sediments during
burial and developing methods that correct for inclination shallowing. Inclination shallowing in
marine carbonates, however, is not always identified – potentially due to the effect of delayed
acquisition of remanence (Van Hoof and Langereis, 1991), after dewatering and compaction.
Nevertheless, Celaya and Clement (1988) showed unequivocal evidence for inclination shallowing in
Deep Sea Drilling Project (DSDP) cores with Miocene to recent sediments from the North Atlantic. In
this particular study, inclination shallowing was only observed in sediments with a carbonate content
>80% and the magnitude of shallowing increased with core depth as a result of compaction. An
overview of additional studies that recognized inclination shallowing in carbonates can be found in
Kodama (2012). The overview includes a variety of sediments such as carbonate concretions within
North American Upper Cretaceous rocks (Kim and Kodama, 2004), Carboniferous and Jurassic-
Cretaceous marine limestones in the Donbas region (Meijers et al., 2010a) and the circum-Black Sea
region (Meijers et al., 2010b; c), and DSDP limestone samples from the Pacific plate (Hodych and
Bijaksana, 1993). The study on DSDP cores by Hodych and Bijaksana (1993) concludes that
inclination shallowing is likely caused by compaction, similar to the conclusions of Celaya and
Clement (1988).
Inclination shallowing in detrital sedimentary rocks is widely observed and has been extensively
studied in depositional experiments (e.g. Tauxe and Kent, 1984; Tan et al., 2002; Bilardello, 2013).
Depositional processes on detrital sediments can be simulated in a laboratory environment to some
extent, but simulating carbonate precipitation is very challenging and therefore complicates
understanding the potential influence of depositional processes on inclination shallowing in
limestones. For our understanding of depositional effects on inclination shallowing in carbonates, we
therefore have to rely on studies performed on detrital sediments. Compaction experiments by Anson
ACC
EPTE
D M
ANU
SCR
IPT
ACCEPTED MANUSCRIPT
10
and Kodama (1987) on acicular and equi-dimensional magnetite led to the hypothesis that shallowing
resulted from magnetite particles sticking to clay particles by electrostatic attraction. This forces the
magnetite particles to rotate with the clay particles during loading of the sediment. This hypothesis
was confirmed by SEM inspection in a study by Sun and Kodama (1992) that furthermore pointed out
the importance of clay content: the flattening factor decreases (i.e. inclination shallowing increases)
with increasing clay content. This could be important for this study. The marine carbonates to which
we apply an inclination shallowing correction are clay-rich limestones.
Approaches used to correct for inclination shallowing are based on various rock magnetic and
statistical parameters (Jackson et al., 1991; Tan and Kodama 2003; Tauxe and Kent, 2004). We apply
the statistical elongation/inclination (E/I) method of Tauxe et al. (2008) to correct for inclination
shallowing. This model is based on the TK03.GAD field model, which in turn is based on the
assumption that the Earth’s magnetic field averaged over a time interval long enough to average out
the secular variation resembles that of a geocentric axial dipole (GAD). Because the E/I method
analyzes the distribution of individual directions, it requires a large data set as input (with N typically
>100). Therefore, we could only apply this method to three data sets, namely sites AD, AK and
locality P-combined (Fig. 7).
4. Results
Initial intensities at 20ºC range from 200 to 7000 µA/m for sites P, AI, AF, AC, AD and AK. Sites that
were thermally demagnetized up to 150ºC prior to AF demagnetization yield initial intensities ranging
between 200-5000 µA/m after the initial step of 150ºC (sites AL, AH, AG and AE). Site AM yields
very low initial intensities of 10-70 µA/m (after 150ºC). The mean ChRMs before (nt) and after (tc)
tilt correction are given in Table 1 and are displayed in Figure 5. The presence of a high coercivity
mineral, after initial thermal demagnetization at 150ºC, prevented full AF demagnetization of the
NRM of specimens from sites AD and AK (e.g. Fig. 3k). Therefore we demagnetized nearly all
specimens from sites AD and AK thermally. In our sampling process, we intended to correct all
sampled sediments for inclination shallowing using the E/I method. We therefore sampled a relatively
large number of cores per site/locality during the first field season. During a second field season we
increased the number of cores, specifically for sites AD, AK and locality P-combined (for which we
obtained good results), to allow running the statistical model.
4.1 Paleozoic sites – SAB sediments
Samples from six sites within the Paleozoic cover of the SAB were taken from the Vedi region (Fig.
2b). Rocks at most sampled Paleozoic limestones levels appear to be recrystallized. Only site AF+AI
seemed to be partially recrystallized. We calculated the (tilt corrected) mean ChRM directions
discussed below based on AF demagnetization, after the application of an initial thermal
ACC
EPTE
D M
ANU
SCR
IPT
ACCEPTED MANUSCRIPT
11
demagnetization step at 150ºC. Site AL (Famennian) consist of black nodular limestones with
bivalves, and the ChRM directions were isolated between 10 mT and ~40 mT (Fig. 3s). One specimen
yielded a reverse ChRM component. After correction for bedding tilt, the mean ChRM direction for
this site (N=15) is D= 68.0º, I= 52.5º (Fig. 5s; Table 1). Site AH - grey limestone (Tournaisian) -
yields a mean ChRM direction of (N= 12) D= 118.1º, I= 48.0º (Fig. 5r, Table 1) that was isolated
between 25 mT and ~65 mT (Fig. 3r). The ChRM directions of the other Tournaisian site AE - also
grey limestones but intruded by sills of unknown age - were typically isolated between 15 mT and ~80
mT (Fig. 3q) and the mean for this site (N= 12) is D= 42.7º, I= 17.1º (Fig. 5q, Table 1). Samples from
site AM, presumably of Permian age, were taken from grey limestones. The sampling site consists of
two parts with different bedding orientations. The structural relation between the two parts is not
obvious in the field (i.e. faulting versus folding). The ChRM was typically isolated between 5 mT and
~50 mT (Fig. 3p). Before tilt correction, there are two distinct groups with different ChRM directions
(Fig. 5p). Tilt correction of the individual ChRM directions and a fold test lead us to conclude that the
southernmost, south-dipping part must be overturned. Site AM passes both fold tests that were carried
out (Fig. 6i and r) and after tilt correction the mean ChRM direction (N=14) is D= 105.2º, I= -69.9º
(Fig. 5p, Table 1). Site AF+AI is a section through the Permo-Triassic boundary (site AF refers to the
Permian interval and site AI to the Triassic interval). The samples from site AF consist of grey
limestones and those from site AI of grey and pink (marly) limestones. In total, 41 specimens were
demagnetized, 26 using AF demagnetization and 15 using thermal demagnetization (Fig. 3o). The
mean ChRM direction (N= 33) is D= 35.8º, I= 82.3º (Fig. 5o, Table 1). Site AG was sampled in grey
limestones of Permian age and the ChRM was typically isolated between ~25 mT and ~60 mT (Fig.
3m). The mean ChRM after tilt correction (N= 18) is D= 77.0º, I= 51.8º (Fig. 5n, Table 1).
4.2 Cretaceous sites – Eurasian margin sediments
Samples from eight sites were taken from Eurasian margin sedimentary rocks north of Lake Sevan (P,
Fig. 2a). Six of the eight sites (P1, P1A, P2, P3, P4 and P6) were taken in very close proximity to each
other along an E-W profile of ~4 km on one mountain and within the same Lower Campanian
succession. These clayey white pelagic limestones with beds of 1-30 cm thickness are intercalated
with thin (mm-scale) layers of marl (Fig. 5j). Sites P5 and P7 were sampled in volcano-sedimentary
rocks and white limestones of probably Late Cretaceous age. The ages of P5 (Coniacian) and P7
(Santonian-Maastrichtian) are deduced from the geologic map (Kharazian and Sargsyan, 2005; scale
1:500.000) and are therefore not considered very reliable.
Four specimens of site P5 were thermally demagnetized (Fig. 3d). The mean ChRM direction
of site P5 before tilt correction is very close to the present-day geocentric axial dipole (GAD) field
direction and the mean ChRM direction after tilt correction (N= 4) is D= 192.9º, I= 46.2º (Fig. 5h,
Table 1), which would either imply a southern hemisphere position (paleolatitude of 27°S) at the time
ACC
EPTE
D M
ANU
SCR
IPT
ACCEPTED MANUSCRIPT
12
of deposition or a 180º post-deposition rotation. We render both scenarios unlikely, and conclude that
the non-tilt corrected ChRM direction represents the present-day GAD field. Five specimens of site P7
were thermally demagnetized (Fig. 3g). The mean ChRM direction after tilt correction (N= 5) is D=
2.3º, I= 72.0º (Fig 5i, Table 1). However, the results from this site were not further considered,
because of the absence of reliable age constraints.
We combined the six sites (P1, P1A, P2, P3, P4 and P6) as locality P-combined. In total, 125
samples were taken from this locality. A total of 178 specimens were demagnetized, of which 63 using
thermal demagnetization and 115 using AF demagnetization. Typical demagnetization diagrams are
shown in Fig. 3 a-c and e-f. Approximately half of the specimens show a low temperature (~20º-
200ºC) or low coercive force (5 mT-15 mT) component that represents a present-day GAD field
overprint that could be sufficiently isolated (Fig. 8d). In the other half of the samples this component
was likely present, but not retrievable due to the initial step of 150ºC. The high temperature / high
coercive force component was typically isolated between 200º/300ºC and 480º/540ºC or 15 mT and 55
mT (after heating to 150ºC). Therefore the magnetic carrier of the ChRM is likely (Ti-poor) magnetite.
This is supported by thermomagnetic curves ran in high field (0.5 T, Fig. 4o) and by hysteresis data
(Fig. 4p). In some samples, however, the paramagnetic contribution may be dominant (Fig. 4q). All
samples from site P4 carry a reverse polarity high temperature / high coercive force component (Fig.
5e), as well as two samples (three specimens) from site P2 (Fig. 5c) that are confined to the base of the
sampled stratigraphic interval. Considering the geographic location of the sites and the overall bedding
orientation, it is therefore very likely that the locality P-combined was sampled around the reversal
transition from chron C33r to C33n (~80 Ma). All individual site mean directions can be found in Fig.
5a-f and Table 1. The site mean direction for locality P-combined (N= 150) after tilt correction is: D=
21.5º, I= 47.9º (Fig. 5g, Table 1).
The fold test on all individual ChRM directions (Fig.6a-c) results in tightest clustering (95%
bootstrap level) between 75% and 97% untilting while the fold test on the mean ChRM directions per
individual bedding plane (Fig. 6j-l) gives the tightest clustering between 85% and 114%. The reversal
test between the normal and reverse means is negative (γ= 5.1º > γc= 3.6º). Nevertheless, we interpret
the high temperature / high coercive force component as a primary ChRM direction, based on the
positive fold test. Correction for inclination shallowing on the full data set of P-combined with the E/I
method (Tauxe et al., 2008), leads to a corrected inclination of (N= 150) I= 61.2º (with a 95%
confidence interval (52.1, 73.4); see Supplementary data). This correction is significant. When
examining the variation in ChRM directions of the individual sites that constitute locality P-combined
more carefully, the declinations of P6 seem to be divided in two subgroups: one with a direction close
to the mean ChRM direction for locality P-combined and one which has northern declinations. We
therefore carried out a number of runs omitting P-sites one-by-one in order to determine whether the
results are robust (see Supplementary data). This resulted in a preferred E/I run that omits site P6,
ACC
EPTE
D M
ANU
SCR
IPT
ACCEPTED MANUSCRIPT
13
leading to the following results: N= 129, I= 48.5º<55.6º<65.9º. This correction of 7.5º is significant
(Fig. 7n).
4.3 Cretaceous sites – SAB sediments
In the Vedi area we sampled three sites in Upper Cretaceous rocks from the SAB: sites AC, AD and
AK. Site AC was sampled in grey clayey fine sandstones of Cenomanian age. The limited extent of
the outcrop and its poor quality did not allow us to sample more than 34 cores. Ten specimens were
demagnetized using thermal demagnetization (Fig. 3l). Twenty-two specimens were demagnetized
using AF demagnetization. About half of the samples yield a low temperature / low coercive force
component (ranging respectively 100ºC-200ºC and 150ºC-20 mT) that is statistically similar to the
present-day GAD field at the sampling location (Fig. 8b). The mean ChRM direction that was isolated
between 235ºC and 500ºC or 15 mT and 70 mT (after 150ºC) after tilt correction (N= 30) is: D= 52.0º
and I= 50.7º (Table 1, Fig. 5m).
Sites AK and AD were both sampled in pink pelagic limestones of Santonian age. The thin
bedded (~1-10 cm), friable and clay-rich limestones alternate with thin (mm-scale) marl layers (see
Fig. 5t). We collected 102 cores from site AK of which three specimens were demagnetized using AF
demagnetization and 106 specimens were thermally demagnetized. Typical demagnetization diagrams
for site AK can be found in Fig. 3j and k. Most samples from site AK yield a low temperature (~20ºC-
200/250ºC) or low coercive force component (~150ºC-10 mT; Fig. 8a) that is possibly an intermediate
direction between the present-day GAD field at the site location and the ChRM direction. The ChRM
direction was isolated between ~200/250ºC and 570/600ºC. All samples yield normal polarity, which
is in agreement with their deposition and magnetic acquisition during the Cretaceous Normal
Superchron. The mean ChRM direction after tilt correction (N= 105) is D= 74.8º, I= 42.0º (Fig. 5l,
Table 1). Within-site variation of bedding orientations is too low to carry out a reliable fold test.
However, we note that the individual ChRM directions are slightly more tightly clustered after
correction for bedding tilt (ktc = 45.4) than before (knt = 38.0; see Table 1). Correction for inclination
shallowing with the E/I method (Tauxe et al., 2008), leads to a corrected inclination (N= 105) of I=
43.8º<53.8º<67.2º (Fig. 7r). This correction of ~12º is significant at the 95% confidence level of the
bootstrap model.
From site AD, eight specimens were demagnetized using AF demagnetization and 168
specimens were thermally demagnetized. The demagnetization response can be divided in two groups:
(1) specimens that yield a low temperature component (~20-250ºC) and a high temperature component
(~250-600ºC) that defines a stable endpoint trajectory to the origin (Fig. 3h) and (2) a group of
specimens that sometimes yield a low temperature component (~20-200ºC) plus a medium
temperature component (~200-400ºC) and a high temperature component (~400-570ºC) that does not
define a stable endpoint trajectory (Fig. 3i). This high temperature component cannot be demagnetized
ACC
EPTE
D M
ANU
SCR
IPT
ACCEPTED MANUSCRIPT
14
any further because of formation of new magnetic minerals at ~600ºC. The low temperature
component in both groups of samples is close to the present-day GAD field at the sampling location
(Fig. 8c). The high temperature component of the first group of samples that demagnetizes to the
origin always yields a normal polarity. Similar to site AK, this normal polarity is expected for
sediments that were deposited during the Cretaceous Normal Superchron. The mean ChRM direction
for the first group of samples after tilt correction (N= 112) is D= 63.6º, I= 47.1º (Table 1, Fig. 5k).
This mean ChRM direction is in relatively good agreement with the mean ChRM direction of nearby
site AK. Using the high temperature ChRM directions, we carried out fold tests following the two
different procedures described in the Methods section. Both fold tests are positive (Fig. 6 d-f and m-o).
Therefore, we interpret the high temperature component in the specimens from group one as a primary
ChRM direction. Correction for inclination shallowing with the E/I method of this primary ChRM
direction (Tauxe et al., 2008), leads to a corrected inclination (N= 112) of I= 46.7º<51.2º<61.8º (Fig.
7p). This correction of ~4º is (just) not significant at the level of the 95% bootstrap error of the model.
The medium and high temperatures components from the second group of samples are most
likely secondary in origin and thus remagnetized. Both components, as well as the primary ChRM
direction of the first group of samples, are plotted in Figure 8e-f in in-situ and tilt corrected
coordinates. The two great circles through all the individual medium (MT) and high temperature (HT)
directions of samples from group 2 are also plotted in Figure 8e-f. These great circles lie close to each
other and the mean ChRM direction of the first group lies close to both great circles, notably after tilt
correction. Therefore, we interpret the medium and high temperature components of group 2 as
intermediate directions between a reverse polarity overprint and the primary normal ChRM direction.
The origin of this reverse overprint is unknown. As can be seen in Figure 8e, these secondary
remagnetizations do not originate from a reverse pre-Brunhes GAD field (given that the
paleolatitudinal motion and rotational history over the past ~1 Myr is negligible) because the two great
circles do not include a reverse polarity GAD field direction (red open star in Fig. 8e).
The pink pelagic limestones of sites AK and AD have a complex magnetic mineralogy. All
samples contain goethite, based on the increase in spontaneous magnetization between 300K and 10K
in the room temperature (RT) saturation isothermal remanent magnetization (SIRM) curves (Fig. 4a, c,
k, l and n), the large differences between the ZFC (Zero Field Cooled) curve and FC (Field Cooled)
curve (Fig. 4j; Liu et al., 2006) and an up to ~50% intensity drop of the NRM after heating the samples
to 100ºC.
The presence of magnetite is demonstrated by a low coercivity (LC) component in the
backfield curves (Fig. 4. e and i), the drop in susceptibility in the K/T curves around its Curie
temperature of 580ºC, the reversibility (Fig. 4b, 4m) or quasi reversibility (Fig. 4f, 4g) of the K/T
curves recorded in air (down to -196ºC) and the ‘splitting’ of the RT SIRM warming and cooling
curves (e.g. Fig. 4c, l and n) around the Verwey transition (~110-120K). The overall weak expression
ACC
EPTE
D M
ANU
SCR
IPT
ACCEPTED MANUSCRIPT
15
of the Verwey transition in our low T experiments may be explained by the presence of
superparamagnetic magnetite grains (Moskowitz et al., 1989). The high coercivity mineral that
prevents full AF demagnetization (after initial heating at 150ºC) of the NRM is likely hematite, in
agreement with the pink color of the sediments. This is further supported by the decrease in the
distance between the low temperature NRM demagnetization and NRM rewarming curves (after an
initial thermal demagnetization of sample AK06 at 150ºC) below the Morin transition (250K) in Fig.
4l. Sample AK06 also shows the presence of pyrrhotite by the drop in remanence below ~60K in the
low temperature demagnetization experiments. The presence of pyrrhotite in this sample is however
blurred by the other magnetic minerals in the K/T curve (Fig. 4g).
Some of the remanence in most samples is however carried by a magnetic mineral that does
not display any transition in the temperature-range of the MPMS measurements. The relative variation
in magnetization in the low temperature experiments (i.e. the MPMS data) is very small. Therefore,
some of the remanence is probably carried by maghemite, (which displays the same behavior as
magnetite in the backfield curves) that possibly formed as an oxidation rim around the magnetite
particles.
5. Discussion
5.1 Calculated paleolatitudes
5.1.1 Paleozoic sites – SAB sediments
In the Paleozoic we predict the SAB to be part of Gondwana and located at its northern margin.
Considering the possible ambiguity of the magnetic polarity of our data (due to the large rotations
observed in most Cretaceous sites, see below), we calculated paleolatitudes assuming that the sampled
sedimentary rocks could have been deposited either at southern or northern latitudes (Fig. 9a). For
both possibilities, the paleolatitudes in the Permian and Triassic derived from sites AG, AM and
AF+AI are unrealistically high for the Paleozoic, with AF+AI plotting close to the pole. On the
northern, as well as on the southern hemisphere, the sites would fall within the Laurussian or
Gondwana continent, respectively. The rocks from sites AM and AG were deposited during the
Permo-Carboniferous Reverse Superchron (PCRS) and should therefore yield reverse polarities unless
we coincidentally sampled one of the few subchrons – which is very unrealistic. For example, if the
rocks at site AM have recorded a reverse polarity, they would have been deposited on the northern
hemisphere and would have undergone a large counterclockwise rotation. For site AG, on the
contrary, a reverse polarity remanence would imply a southern hemisphere origin and a large
counterclockwise rotation. Clearly this is an impossible option for two nearby sites of similar age.
Therefore, we infer that sites AG, AM and AF+AI have been remagnetized. Because site AM yields a
positive fold test (Fig. 6), this suggests that the secondary magnetizations must have a pre-tilting
origin. The single reverse polarity direction in site AL – although approximately antipodal to the
ACC
EPTE
D M
ANU
SCR
IPT
ACCEPTED MANUSCRIPT
16
normal polarity directions – does not provide any further constraints. For the remaining three sites in
Paleozoic rocks (Famennian AL, Tournaisian AH and AE), a position in the northern hemisphere is
unlikely (Fig. 9a). Assuming a southern hemisphere origin, the paleolatitudes from sites AL and AH
plot at the northern margin of Gondwana, while site AE falls within the Paleo-Tethys ocean which
separated Laurussia from Gondwana (c.f. Torsvik et al., 2012). Therefore, we cannot exclude the
possibility that sites AL and AH carry a primary magnetization component of reverse polarity,
acquired respectively during Famennian and Tournaisian times. However, we must take into account
that the pre-Lower Carboniferous and Devonian APW paths are poorly determined because of the low
number of available data sets of sufficient quality. Because the three sites sampled in the youngest
Paleozoic rocks have been remagnetized, we surmise that the paleomagnetic signal from the oldest
three Paleozoic sites is also secondary. Therefore, none of the six Paleozoic sites will be considered
any further. Remagnetization may be related to Coniacian-Santonian ophiolite obduction and in the
case of site AE to the intrusion of the sills.
5.1.2 Cretaceous sites – SAB and Eurasian margin sediments
The results from the Cretaceous Eurasian margin sedimentary rocks show that the rocks from site P5
are likely remagnetized. Data from site P7 will not be considered because of unreliable age constraints.
The paleolatitudes of the Cretaceous sites/locality (AC, AD, AK and P-combined) that we infer to
carry a primary ChRM magnetization and the paleolatitudes corrected for inclination shallowing (AD,
AK and P-combined) are given in Figure 9a and c and Table 1. The paleolatitudes for each Cretaceous
site are plotted on the Eurasian paleolatitude versus age curve, derived from the most recent Global
Apparent Polar Wander Path (GAPWaP) of Torsvik et al. (2012). In this GAPWaP, all data from
detrital sedimentary rocks that were not corrected for inclination shallowing in the original studies
were corrected for inclination shallowing assuming an average flattening factor of 0.6, following King
(1955):
tan Iobs = f tan If (1)
The value of f= 0.6 is a ‘best guess’ however, because values provided in a compilation by Bilardello
and Kodama (2010) range from 0.40-0.83 for hematite bearing rocks and from 0.54-0.79 for magnetite
bearing rocks. The introduction of a fixed flattening factor of 0.6 to the GAPWaP introduces some
uncertainty, but is at present the most realistic approximation.
As mentioned earlier, reliable paleolatitude reconstructions since the Cretaceous in this part of
the Tethyan realm are challenging, because of the relatively narrow remnant oceanic basin and the
uncertainties in the pole paths and data. In Figure 9b the width of the oceanic Tethyan domain between
Africa and Eurasia at the position of Armenia derived from the GAPWaP (Torsvik et al., 2012) is
displayed as a function of time. For the Cretaceous to Present, errors derived from the A95 of the
GAPWaP are typically on the order of ± 500-600 km, which translates to a maximum total uncertainty
ACC
EPTE
D M
ANU
SCR
IPT
ACCEPTED MANUSCRIPT
17
of 1200 km. Between 170 and 140 Ma the error margins are even larger, because of the absence of
reliable Middle-Upper Jurassic poles; the maximum uncertainty may even reach up to several
thousands of kilometers between 140 and 150 Ma (i.e. around the Jurassic-Cretaceous boundary).
Furthermore, the paleolatitude error of paleomagnetic data sets is optimally on the order of ± 2º-3º, but
the error resulting from the bootstrap of the E/I method is larger (see Table 1, Figures 7, 9). In our
study area, the north-south width of the Tethys ocean is fairly constant between 320 Ma and 190 Ma
(Fig. 9b). In the Early Jurassic the north-south width of the oceanic basin between Africa and Eurasia
begins to decrease with a relatively uniform rate from (roughly) 3500 ± 500 km at 200 Ma to 1500 ±
500 km at 80 Ma. Paleomagnetic data from our study region that are used for paleolatitude
reconstructions should therefore be interpreted with these considerations in mind. The interpretation of
geologic observations has led to different views on the timing of SAB-Eurasia collision. Sosson et al.
(2010) argue for collision of the SAB with Eurasia in the Paleocene to Middle Eocene and support the
existence of a remnant oceanic basin between the SAB and the Eurasian margin in the Late Cretaceous
by 1) ongoing arc magmatic activity that ceases before the Maastrichtian on the Eurasian margin
(Adamia et al., 2011), resulting from the subduction of oceanic lithosphere below Eurasia and 2) the
occurrence of remnant oceanic crust covered by pelagic Campanian-Maastrichtian limestones to the
north of the obduction front. They would further argue that a southwest vergent tectonic event affects
the ophiolites, volcanic arc and the Paleocene foreland basin before the deposition of late-Middle to
Late Eocene as a result of collision. Rolland et al. (2012), however, propose closure of the oceanic
basin between the SAB and Eurasia in the Late Cretaceous, at ~80-75 Ma, only several millions of
years after ophiolite obduction. This Campanian age is based on 1) the onset of subduction south of
the ATA microplate around 95 Ma, 2) the presence of crystalline blocks likely derived from the
Eurasian margin in the Coniacian-Santonian flysch below the Campanian-Maastrichtian limestones
and 3) the final stage of epidote-amphibolite-grade deformation in the Stepanavan blueschists at 74-71
Ma, suggesting the amalgamation of the SAB with the Eurasian margin at that time (Rolland et al.,
2009a). The occurrence of arc-related volcanic rocks of Maastrichtian to Paleocene age in the eastern
Pontides and the Lesser Caucasus, as well as tectonostratigraphic data (Robinson et al., 1995; Okay
and Şahintürk, 1997; Altherr et al., 2008; Sosson et al., 2010; Adamia et al., 2011; Robertson et al.,
2014) that support a Paleocene to Eocene collision age are however in conflict with a Campanian
collision age. However, we must keep in mind here that actual collision ages may vary along the
former Eurasian margin. Variations could result from pre-defined geometries of the continental
margins (i.e. Eurasia and the ATA microplate) and the effect of oblique subduction. The collision of
the Kırşehir Block (Fig. 1) with the Eurasian margin in the central Pontides in the latest Cretaceous or
Paleocene (Meijers et al., 2010c; Lefebvre et al., 2013) possibly obscures the record of ATA-Eurasia
collision in the central Pontides.

ACC
EPTE
D M
ANU
SCR
IPT
ACCEPTED MANUSCRIPT
18
When comparing our data to the Eurasian curve, we take both the error at the 95% confidence
level on the Eurasian curve (shaded area on Fig. 9a and c) and the 95% bootstrap error resulting from
the E/I method (sites P, AD, AK) or ΔIx (site AC) into account. After correction for inclination
shallowing, locality P-combined, which was sampled in Eurasian margin sedimentary rocks, falls
within error on the Eurasian curve. This is also the case for the Cretaceous sites from the SAB: the
corrected paleolatitudes of the two Santonian (~85 Ma) sites AD and AK and the uncorrected
paleolatitude of the Cenomanian (~97 Ma) site AC are south of locality P-combined, but not
statistically different from the paleolatitude of the Eurasian curve. Therefore, we cannot distinguish
our data from the Eurasian paleolatitude versus age curve. This suggests that the SAB could have been
already accreted to Eurasia by the Cenomanian/Santonian. However, if we take into account the errors
associated with the paleolatitude versus age curves of Fig 9c and the errors associated with our data,
the maximum possible distance between SAB and Eurasia for each one of our Cretaceous sites can be
calculated. This maximum distance is given by the difference between the upper limit of the shaded
envelop on the Eurasian curve and the lower limit of the error bar associated with each site. For site
AC (~97 Ma) this is ~1200 km. For sites AK and AD (~85 Ma) this is respectively ~1100 and 900 km,
so on average ~1000 km, after correction for inclination shallowing with the E/I method and taking the
bootstrap error into account. This maximum ~1000 km N-S distance is illustrated in a cross-section in
Fig. 10.
Alternatively we can estimate the maximum possible distance between SAB and Eurasia by
comparing the paleolatitudes calculated from locality P-combined (originally belonging to the
Eurasian margin) and sites AD and AK (of Gondwana origin) after E/I correction. The paleolatitudes
of sites AD and AK (SAB) are very similar (31.9°N and 34.3°N respectively) and an approximate
average of these values would be ~33.1°N for these Santonian sites. Compared to the paleolatitude of
locality P-combined (36.1°N; which is ~4.5 Ma younger) the difference is ~3°. This corresponds to a
N-S width of ~350 km (uncorrected for shortening within the orogenic belt), which would suggest a
very limited remnant basin between the SAB and Eurasia after ophiolite obduction. Although our
results are in slightly better agreement with an ocean closure in the Late Cretaceous, our data do not
really allow us to determine the age of continental collision.
A limited number of available studies from the Pontides could potentially constrain the
paleolatitude of the southern Eurasian margin in the Santonian-Coniacian (e.g. van der Voo, 1968;
Channell et al., 1996; Hisarlı, 2011). Practically all published studies were however (partially) carried
out on sedimentary rocks and those data sets were not corrected for inclination shallowing. Only two
data sets from the central Pontides were corrected for inclination shallowing (Meijers et al., 2010c).
The corrected data suggest that the southern margin of Eurasia in the central Pontides was located at
lower latitudes in the Coniacian-Santonian (λ= 26.6º and λ= 31.3º, respectively) than in present-day
Armenia in the Lower Campanian (locality P-combined, λ= 36.1º). Statistically, the paleolatitudes are
ACC
EPTE
D M
ANU
SCR
IPT
ACCEPTED MANUSCRIPT
19
however indistinguishable (95% bootstrap error) from each other and from the Eurasian paleolatitude
curve and we therefore did not incorporate these data directly into the paleogeographic reconstructions
discussed below, although they would leave some space for a more southerly margin of Eurasia
westward of present-day Armenia and Georgia (provided that the time gap between the deposition of
the Coniacian-Santonian rocks (sampled in Turkey) and the Lower Campanian rocks (sampled in
Armenia) is negligible).
Two paleogeographic reconstructions (Fig. 11) illustrate the possible position of the SAB with
respect to the African/Arabian and Eurasian margins at ~84 Ma (latest Santonian). The westward
continuation of the SAB into the Anatolides and Taurides (i.e. the ATA microplate), as well as the
position of obducted ophiolites, subduction zones and volcanic arcs is based on the paleogeographic
reconstructions by Barrier and Vrielynck (2008), Sosson et al. (2010) and Hässig et al. (2013). The
paleogeography in the Late Cretaceous is illustrated in two subfigures (Fig. 11). In Fig. 11a, the
northern location of the ATA in the latest Santonian is shown, i.e. at the southern margin of Eurasia,
considering the calculated paleolatitudes of sites AD and AK (Table 1). Fig. 11b shows the southern
location of the ATA in the Santonian based on the maximum possible distance between the SAB and
Eurasia derived from sites AD and AK. The orientation of the ATA microplate is poorly determined.
The only paleomagnetic data from Bazhenov et al. (1996) suggest a ~20º clockwise rotation of the
SAB since the Early Jurassic, hence the ENE-WSW ‘strike’ of ATA in the Tethys ocean (Figs. 11a
and b) compared to its present more E-W ‘strike’, leading to a westward widening oceanic basin
between ATA and Eurasia. Data from the western extent of ATA (western and west-central Taurides)
show variable results (Meijers et al., 2011 and references therein), and the orientation of ATA is
poorly defined. The uncertainty of the orientation of ATA within the Tethyan realm as well as its exact
paleolatitude leads us to present the two different options in Fig. 11. The geometric reconstruction of
the plutons of the Central Anatolian Crystalline Complex that are part of the Kırşehir Block (Lefebvre
et al., 2013) requires an oceanic basin between ATA and the Eurasian margin that widens westward,
when adopting a Late Cretaceous collision age of the SAB with Eurasia. This could be interpreted as
support for an ENE-WSW oriented ATA. Geologic data show however stronger evidence for a
Paleocene collision age. Lefebvre (2011) presents evidence for an eastward dipping subduction zone
below the Kırşehir Block in the Late Cretaceous, based on a study of its metamorphic and magmatic
rocks, as well as a paleomagnetic reconstruction of the magmatic belts (Lefebvre et al., 2013). This
complicates the paleogeography of the Tethyan realm in the Late Cretaceous, because the southward
continuation of this subduction zone and its possible link to other subduction zones is unclear and
needs to be constrained by new data, hence the question mark in both proposed paleogeographic
reconstructions.
5.2 Vertical axis rotations
ACC
EPTE
D M
ANU
SCR
IPT
ACCEPTED MANUSCRIPT
20
Bazhenov and Burtman (2002) defined the eastern Pontides-Lesser Caucasus (Fig. 1) as a northward
convex orocline based on a paleomagnetic study on Cretaceous to Eocene sedimentary rocks. Their
hypothesis was confirmed by new data from the eastern Pontides by Hisarlı et al. (2011). The
Cretaceous and Eocene rocks from both limbs of the orocline have been rotated (see arrows in Fig. 1),
implying that orocline formation took place after the Eocene. Orocline formation in the eastern
Pontides-Lesser Caucasus fold and thrust belt therefore postdates latest Cretaceous or Paleocene
orocline formation related to collision of the Kırşehir Block of African affinity with the Eurasian
margin in the central Pontides (Meijers et al., 2010c). To date the age of the eastern Pontides-Lesser
Caucasus orocline, a study of rocks deposited after the Eocene is necessary and at present we can only
compare our results to the findings of Bazhenov and Burtman (2002). Their study includes data from
Bazhenov and Burtman (1989) and Bolshakov and Solodovnikov (1981) that were obtained in the
eastern, clockwise (CW) rotated limb of the orocline in Armenia. Assuming that the rotation pole is
close to the site, a vertical axis rotation experienced by this site can be estimated. In the eastern limb of
the orocline in Armenia, the expected Cretaceous declination for Eurasia is ~10°. Compared with the
expected direction, the synthesis of Bazhenov and Burtman (2002) shows CW rotations ranging from
~4 to 46° in Upper Cretaceous rocks from this part of the orocline. Note that in the western part of the
Lesser Caucasus, Bazhenov and Burtman (2002) observed mixed rotations (i.e. clockwise,
counterclockwise and zero rotations) in rocks of Middle Eocene age. Our four sites in Upper
Cretaceous sedimentary rocks show CW rotations. For locality P on the Eurasian margin the rotation is
11.5° CW, in agreement with the data presented in Bazhenov and Burtman (2002). The three sites
sampled on the SAB (AC, AD and AK) show larger CW rotations of 42°, 54° and 65° respectively.
This possibly implies that the sedimentary rocks deposited on the SAB were also affected by oroclinal
bending in the eastern Pontides-Lesser Caucasus fold-and-thrust belt. To better understand the cause
of oroclinal bending in this region, data bearing on the history and evolution of post-Eocene rotations
in this region are needed.
6. Conclusions
We show that six sites in Paleozoic rocks analyzed in this study have been (AG, AM, AF+AI) or likely
have been (AL, AH, AE) remagnetized, possibly as a result of ophiolite obduction in the Coniacian-
Santonian. Therefore these results are not suitable for paleogeographic reconstructions. Four
sites/localities in Upper Cretaceous strata however, carry a primary remanence, supported by positive
fold tests in site AD and locality P. The extensive sampling (>100 samples) of two Santonian sites
from the SAB (sites AD and AK) and from the Lower Campanian locality P from the Eurasian margin
allow us to statistically correct the inclination error commonly recorded in sediments and the
associated underestimated paleolatitudes, using the E/I method of Tauxe and Kent (2004). The
corrected paleolatitudes for these three sites/localities fall on the paleolatitude curve for Eurasia,

ACC
EPTE
D M
ANU
SCR
IPT
ACCEPTED MANUSCRIPT
21
deduced from the GAPWaP (Torsvik et al., 2012). This would suggest that the oceanic domain
between SAB and Eurasia was already closed by the Santonian, which is not in agreement with most
geologic data that time the collision. However, if we take the error bars associated with the SAB sites
(AD and AK), as well as the errors on the reference paleolatitude curves for Eurasia into account, a
maximum possible width of ~1000 km between SAB and Eurasia in the Santonian is possible.
We provide a tentative estimate on this width by comparing the N-S distance between locality
P-combined (belonging to the Eurasian margin) and sites AD and AK (belonging to the SAB), which
leads to a maximum N-S width of ~350 km (uncorrected for shortening within the orogenic belt). The
resolution of the pole path and our paleomagnetic data do therefore not allow us to distinguish
between a model that suggests near-simultaneous closure of the oceanic basin between the SAB and
the Eurasian margin, and ophiolite obduction onto the SAB by the Late Cretaceous (Rolland et al.,
2012) and geologic data that support the presence of a narrow remnant oceanic basin between the SAB
and the Eurasian margin until the Paleocene (Robinson et al., 1995; Okay and Şahintürk, 1997; Altherr
et al., 2008; Sosson et al., 2010; Adamia et al., 2011; Robertson et al., 2014).
The clockwise vertical axis rotations documented by the paleomagnetic data from Upper
Cretaceous strata of this study are in line with the results presented by Bazhenov and Burtman (2002)
that lead to the hypothesis that the arcuate shape of the Lesser Caucasus is caused by oroclinal
bending.
7. Acknowledgements
The field work and analyses were supported by the Darius Programme. The authors would specifically
like to thank the coordination and support of E. Barrier and M.F. Brunet. MJMM would like to thank
the Henri Poincaré Postdoctoral Fellowship under which this research was carried out at the
Observatoire de la Côte d’Azur (Nice). The authors would like to thank the following persons for their
assistance in the field: Gayané Asatryan, Musegh Mkrtchyan, Sargis Vardanyan and drivers Hayro,
Marat and Stephan. We also thank the staff at the Institute for Rock Magnetism at the University of
Minnesota and especially Mike Jackson and Dario Bilardello for their help in carrying out and
interpreting part of the rock magnetic measurements and Douwe van Hinsbergen for providing the
paleogeographic reconstruction of the major continents. UK would like to acknowledge Ivan
Gabrielyan and Tigran Lorsabyan for their help during a first reconnaissance field work. The authors
would like to thank John Geissman and Aral Okay for their helpful comments and constructive
reviews, as well as three reviewers of an earlier version of this manuscript: Jérôme Gattacceca, Rob
van der Voo and an anonymous reviewer.
8. References
ACC
EPTE
D M
ANU
SCR
IPT
ACCEPTED MANUSCRIPT
22
Abramyan, M.S., 1951. The stratigraphy and fauna of Brachiopoda in the Late Famennian and
Etroeungt (Paleozoic) deposits in the Armenian SSR. Archive of the IGS of the Academy of
Sciences of the Armenian SSR (in Russian).
Adamia, S., Bergougnan, H., Fourquin, C., Haghipour, A., Lordkipanidze, M., Özgül, N., Ricou, L.,
Zakariadze, G., 1980. The Alpine Middle East between the Aegean and the Oman traverses.
26th International Geological Congress Paris C5:122–136.
Adamia, S.A. (Editor), 1984. Prealpine basement of the Caucasus - composition, structure, and
formation. Tectonika I metallogenia Kavkaza, 86, Metsniereba, Tbilisi, 3-104 pp.
Adamia, S.A., Kekelia, M. and Tsimakuridze, 1983. Pre-Variscan and Variscan granitoids of the
Caucasus. IGCP Newsletter, 5: 5-10.
Adamia, S., Zakariadze, G., Chkhotua, T., Sadradze, N., Tsereteli, N., Chabukiani, A., Gventsadze, A.,
2011. Geology of the Caucasus: A Review. Turkish Journal of Earth Sciences, 20, 489–544,
doi:10.3906/yer-1005-11
Aghamalyan, V.A., 1978. The old metamorphic complexes of the territory of Armenian SSR and their
tectonic disposition, Proceedings of Reports of the Second Regional Petrographic Symposium
on Caucasus, Crimea and Carpathians, Tbilisi, 109-115 (in Russian).
Aghamalyan, V.A., 1998. The Basement Crystalline of Armenia, Yerevan (in Russian).
Altherr, R., Topuz, G., Siebel, W., Şen, C., Meyer, H.-P., Satır, M., Lahaye, Y. Geochemical and Sr–
Nd–Pb isotopic characteristics of Paleocene plagioleucitites from the Eastern Pontides (NE
Turkey). Lithos, 105, 149-161, doi:10.1016/j.lithos.2008.03.001
Anson, G. L. & Kodama, K. P., 1987. Compaction-induced inclination shallowing of the post-
depositional remanent magnetization in a synthetic sediment. Geophys. J. R. astr. Soc., 88,
673–692.
Arakelyan, R.A., 1950. The stratigraphy of Paleozoic deposits in southwestern Armenia and adjacent
areas of Nakhijevan ASSR. Archive of the IGS of the Academy of Sciences of the Armenian
SSR.
Arakelyan, R.A., 1964. The Paleozoic-Mesozoic. The Geology of the Armenian SSR: Stratigraphy.
Publishing House of the Academy of Sciences of the Armenian SSR, 21-63 (in Russian).
Asatryan, G., Danelian, T., Seyler, M., Sahakyan, L., Galoyan, G., Sosson, M., Avagyan, A., Hubert,
B., Person, A., Vantalon, S., 2012. Latest Jurassic-Early Cretaceous Radiolarian assemblages
constrain episodes of submarine volcanic activity in the Tethyan oceanic realm of the Sevan
ophiolites (Armenia). In: Danelian, T., Goričan, S. (Eds.), Radiolarian biochronology as a key
to tectono-stratigraphic reconstructions. Bulletin de la Société Géologique de France 183, 319-
330.
ACC
EPTE
D M
ANU
SCR
IPT
ACCEPTED MANUSCRIPT
23
Barrier, E. & Vrielynck, B. 2008. Palaeotectonic map of the Middle East, Atlas of 14 maps,
Tectonosedimentary-Palinspastic maps from Late Norian to Pliocene. Commission for the
Geologic Map of the World (CCMW, CCGM), Paris, France.
Bazhenov, M. and Burtman, V.S., 1989. Paleomagnetism of Upper Cretaceous rocks from the
Caucasus and its implications for tectonics. In: Sengor, A.M.C. (Ed.), Tectonic Evolution of
the Tethyan Region. Kluwer Academic Publishing, Dordrecht, 217– 239
Bazhenov, M., Burtman, V.S. and Levashova, N., 1996. Lower and Middle Jurassic paleomagnetic
results from the south Lesser Caucasus and the evolution of the Mesozoic Tethys Ocean. Earth
and Planetary Science Letters, 141: 79-89.
Bazhenov, M.L. and Burtman, V.S., 2002. Eocene paleomagnetism of the Caucasus (southwest
Georgia): oroclinal bending in the Arabian syntaxis. Tectonophysics, 344(3-4): 247-259.
Belov, A.A. and Sokolov, S.D., 1973. Relics of Mesozoic oceanic crust among the crystalline
complexes of the Miskhana massif of Armenia. Sovertskaya Geologia, 8: 26-41 (in Russian).
Belov, A.A., Bragin, N.Yu., Vishnevskaya, V.S., Satian, M. and Sokolov, S.D., 1991. New data about
the age of the ophiolites of Vedi (Armenia). Reports of the USSR Academy of Science, 321:
784-787 (in Russian).
Besse, J. and Courtillot, V., 2002. Apparent and true polar wander and the geometry of the
geomagnetic field in the last 200 million years. Journal of Geophysical Research, 107(B11):
doi:10.1029/2000JB000050.
Bilardello, D. and Kodama, K.P., 2010. Rock magnetic evidence for inclination shallowing in the
early Carboniferous Deer Lake Group red beds of western Newfoundland. Geophysical
Journal International, 181:275-289, doi: 10.1111/j.1365-246X.2010.04537.x
Bilardello, D., 2013. Understanding DRM acquisition of plates and spheres: a first comparative
experimental approach. Geophysical Journal International, 195 (1): 148-158. doi:
10.1093/gji/ggt240
Bolshakov, A.S. and Solodovnikov, G.M., 1981. Intensity of the geomagnetic field in the Late
Cretaceous. Izv. Akad. Nauk SSSR, Ser. Fiz. Zemli 10, 58– 68 (in Russian).
Butler, R.F., 1992. Paleomagnetism: Magnetic domains to geologic terranes. Blackwell Scientific
Publications, Boston, 319 pp.
Channell, J. E. T., Tüysüz, O. Bektaş, O., Şengör, A.M.C., 1996. Jurassic‐Cretaceous paleomagnetism
and paleogeography of the Pontides (Turkey). Tectonics, 15, 201–212,
doi:10.1029/95TC02290.
Celaya, M.A. and Clement, B.M., 1988. Inclination shallowing in deep sea sediments from the North
Atlantic. Geophysical Research Letters 15: doi: 10.1029/GL015i001p00052.
Creer, K.M., Irving, E. and Nairn, A.E.M., 1959. Paleomagnetism of the Great Whin Sill. Geophysical
Journal of the Royal Astronomical Society, 2: 306-323.
ACC
EPTE
D M
ANU
SCR
IPT
ACCEPTED MANUSCRIPT
24
Danelian, T., Asatryan, G., Sosson, M., Person, A., Sahakyan, L. and Galoyan, G., 2008. Discovery of
two distinct Middle Jurassic Radiolarian assemblages in the sedimentary cover of the Vedi
ophiolite (Lesser Caucasus, Armenia). Comptes Rendus Palevol, 7: 324-334.
Danelian, T., Asatryan, G., Sahakyan, L., Galoyan, Gh., Sosson, M., Avagyan, A., 2010. New and
revised Radiolarian biochronology for the sedimentary cover of ophiolites in the Lesser
Caucasus (Armenia). In: M. Sosson, N. Kaymakci, R.A. Stephenson, F. Bergerat and V.
Starostenko (Editors), Sedimentary Basin Tectonics from the Black Sea and the Caucasus to
the Arabian Platform. Geological Society Special Publications, London, 340: 383-391.
Danelian, T., Asatryan, G., Galoyan, G., Sosson, M., Sahakyan, L., Caridroit, M., Avagyan, A., 2012.
Geological history of ophiolites in the Lesser Caucasus and correlation with the Izmir-Ankara-
Erzincan suture zone: insights from radiolarian biochronology. In: Danelian, T., Goričan, S.
(Eds.), Radiolarian biochronology as a key to tectono-stratigraphic reconstructions. Bulletin de
la Société Géologique de France, 183, 331-342.
Danelian, T., Zambetakis-Lekkas, A., Galoyan, G., Sosson, M., Asatryan, G., Sahakyan, L., Hubbert,
B., Grigoryan, A., 2014. Reconstructing Upper Cretaceous (Cenomanian) paleoenvironments
in Armenia based on Radiolaria and benthic Foraminifera; implications for the geodynamic
evolution of the Tethyan realm in the Lesser Caucasus, Palaeogeography, Palaeoclimatology,
Palaeoecology, 413, 123-132, doi: 10.1016/j.palaeo.2014.03.011
Deenen, M.H.L., Ruhl, M., Bonis, N.R., Krijgsman, W., Kuerschner, W.M., Reitsma, M., van Bergen,
M.J., 2010. A new chronology for the end-Triassic mass extinction, Earth and Planetary
Science Letters, 291, 113-125
Deenen, M.H.L., Langereis, C.G., van Hinsbergen, D.J.J. and Biggin, A.J., 2011. Geomagnetic secular
variation and the statistics of palaeomagnetic directions, Geophys. J. Int., 186: 509-520
Dietz, R.S., 1961. Continent and ocean basin evolution by spreading of the sea floor. Nature, 190,
854–857.
Eghoyan, V.L., 1955. The Upper-Cretaceous Deposits of the South-Western Part of Armenian SSR.
Izdatelstvo National Academy of Sciences Armenia SSR (in Russian).
Fisher, D.A., 1953. Dispersion on a sphere. Proc. R. Soc. London, Serie A 217: 295-305.
Galoyan, G., Rolland, Y., Sosson, M., Corsini, M. and Melkonian, R., 2007. Evidence for superposed
MORB, oceanic plateau and volcanis arc series in the Lesser Caucasus (Stepanavan,
Armenia). Comptes Rendus Geosciences, 339: 482-492.
Galoyan, G., 2008. Etudes Pétrologiques, Géochimiques et Géochronologiques des Ophiolites du Petit
Caucase (Arménie), PhD Thesis, University of Nice-Sophia Antipolis.
Galoyan, G., Rolland, Y., Sosson, M., Corsini, M., Billo, S., Verati, C. and Melkonyan, R., 2009.
Geology, geochemistry and 40
Ar/39
Ar dating of Sevan ophiolites (Lesser Caucasus, Armenia):
ACC
EPTE
D M
ANU
SCR
IPT
ACCEPTED MANUSCRIPT
25
Evidence for Jurassic Back-arc opening and hot spot event between the South Armenian Block
and Eurasia. Journal of Asian Earth Sciences, 34: 135-153.
Ginter, M., Hairapetian, V. and Grigorian, A., 2011. Chondrichthyan microfossils from the Famennian
and Tournaisian of Armenia. Acta Geologica Polonica, 61(2): 153-173.
Gong, Z., Langereis, C.G. and Mullender, T.A.T., 2008. The rotation of Iberia during the Aptian and
the opening of the Bay of Biscay. Earth and Planetary Science Letters, 273(1-2): 80-93.
Grigoryan, A., 1990. The Conodonts of the Permian-Triassic limit in Armenia, PhD thesis, University
of Moscow (in Russian).
Grigoryan, A., Alekseev, A.S. and Yoahimski, M., 2012. Discontinuation on the boundary between
Middle and Upper Permian in Armenia (Abstract), Annual meeting (conference) of the section
paleontology. Moscow Society of Nature Investigators, Section of Paleontology.
Paleontological Institute of Borisyak A. A., Russian Academy of Sciences, Moscow, 25-26.
Gutierrez-Alonso, G., Fernandez-Suarez, J., Weil, A.B., Murphy, J.B., Nance, R.D., Corfu, F. and
Johnston, S.T., 2008. Self-subduction of the Pangaean global plate. Nature Geosciences, 1:
549-553.
Hakobyan, V.T., 1978. Biostratigraphy of the Upper Cretaceous Deposits of Armenian SSR.
Izdatelstvo National Academy of Sciences Armenia SSR (in Russian).
Hässig, M., Rolland, Y., Sosson, M., Galoyan, G., Müller, C., Avagyan, A., Sahakyan, L., 2013.
Geology and structure of the Amasia ophiolites, NW Sevan-Akera suture zone, Lesser
Caucasus, Insights for a large-scale obduction in Armenia and NE Turkey. Tectonophysics,
588: 135-153, doi: 10.1016/j.tecto.2012.12.003.
Hässig, M., Rolland, Y., Sahakyan, L. Sosson, M., Galoyan, G., Avagyan, A., Bosch, D., Müller, C.,
2014. Multi-stage metamorphism in the South Armenian Block during the Late Jurassic to
Early Cretaceous: Tectonics over south-dipping subduction of Northern branch of Neotethys.
Journal of Asian Earth Sciences, doi:10.1016/j.jseaes.2014.07.018
Heezen, B.C., 1960. The rift in the ocean floor. Scientific American, 203, 98–110.
Hodych, J.P. and Bijaksana, S., 1993. Can remanence anisotropy detect paleomagnetic inclination
shallowing due to compaction? A case study using cretaceous deep‐sea limestones. Journal of
Geophysical Research 98: doi: 10.1029/93JA02022. issn: 0148-0227.
Hisarlı, Z.M., 2011, New paleomagnetic constraints on the late Cretaceous and early Cenozoictectonic
history of the Eastern Pontides, Journal of Geodynamics, 52, 114-128, doi:
10.1016/j.jog.2010.12.004.
Jackson, M., Banerjee, S.K., Marvin, J.A., Lu, R.&Gruber,W., 1991. Detrital remanence inclination
errors and anhysteretic remanence anisotropy: quantitative model and experimental results,
Geophys. J. Int., 104, 95–103.
ACC
EPTE
D M
ANU
SCR
IPT
ACCEPTED MANUSCRIPT
26
Karyakin, Y.V., 1989. Geodynamics of the formation of the volcanic complexes of the Lesser
Caucasus, Moscow 'Nauka'.
Kim, B. and Kodama, K.P. (2004). A compaction correction for the paleomagnetism of the Nanaimo
Group sedimentary rocks: Implications for the Baja British Columbia hypothesis. Journal of
Geophysical Research 109: doi: 10.1029/2003JB002696.
King, R.F., 1955. The remanent magnetism of artificially deposited sediments, Geophysical Journal
International, 7: 155-134.
Kirschvink, J.L., 1980. The least-square line and plane and the analysis of paleomagnetic data.
Geophysical journal of the Royal Astronomical Society, 62: 699-718.
Knipper, A.L. and Khain, E.V., 1980. Structural position of ophiolites of the Caucasus. Ofioliti,
2(Special Issue): 297-314.
Knipper, A.L., Ricou, L.-E. and Dercourt, J., 1986. Ophiolites as indicators of the geodynamic
evolution of the Tethyan ocean. Tectonophysics, 123: 213-240.
Kodama, K.P., 2012. Paleomagnetism of sedimentary rocks: process and interpretation. Wiley-
Blackwell, 157pp.
Krasa, D., Petersen, K., Petersen, N., 2007. Variable field translation balance. Encyclopedia of Earth
Sciences Series. In: Gubbins, D., Herrero-Bervera, E. (Eds.), Encyclopedia of Geomagnetism
and Paleomagnetism.
Kharazian (Author Ed.) and Sargsyan (Ed.), 2005. Geological Map of Republic of Armenia. Yerevan:
Ministry of Nature Protection of Republic of Armenia, Geological Agency, map: National
government publication.
Labails, C., Olivet, J.L., Aslanian, D. and Roest, W.R., 2010. An alternative early opening scenario for
the Central Atlantic Ocean. Earth and Planetary Science letters, 297(3-4): 355-368,
doi:10.1016/j.epsl.2010.06.024.
Lefebvre, C.J.C., 2011, The tectonics of the Central Anatolian crystalline complex: a structural,
metamorphic and paleomagnetic study, PhD thesis, Utrecht University, ISBN 978-90-6266-
283-8
Lefebvre, C., Meijers, M. J. M., Kaymakci, N., Peynircioglu, A., Langereis, C. G. and van
Hinsbergen, D. J. J., 2013, Reconstructing the geometry of central Anatolia during the late
Cretaceous: Large-scale Cenozoic rotations and deformation between the Pontides and
Taurides, Earth and Planetary Science Letters, 366, 83-98, doi: 10.1016/j.epsl.2013.01.003
Liu, Q., Yu,Y., Torrent, J., Roberts, A.P., Pan, Y., Zhu, R., 2006. Characteristic low-temperature
magnetic properties of aluminous goethite [α-(Fe,Al)OOH] explained. J. Geophys. Res. 111,
B12S34, http://dx.doi.org/10.1029/2006JB004560.
Luterbacher, H.P., Ali, J.R., Brinkhuis, H., Gradstein, F.M., Hooker, J.J., Monechi, S., Ogg, J.G.,
Powell, J., Röhl, U., Sanfilippo, A. and Schmitz, B., 2004. The Paleogene Period. In: F.M.
ACC
EPTE
D M
ANU
SCR
IPT
ACCEPTED MANUSCRIPT
27
Gradstein, J.G. Ogg and A.G. Smith (Editors), A Geologic Time Scale 2004. Cambridge
University Press, Cambridge, 384-408.
Mandalyan, R., 1990. The Late Jurassic and Neocomian sedimentology and litho-genesis in Armenia.
Publishing House of the AS of the Armenian SSR, Yerevan, 173 p (in Russian).
McFadden, P.L. and McElhinny, L.W., 1988. The combined analysis of remagnetization circles and
direct observations in palaeomagnetism. Earth and Planetary Science Letters, 87: 161-172.
McFadden, P. L., McElhinny, M. W., 1990. Classification of the reversal test in palaeomagnetism,
Geophysical Journal International, 103, 725–729.
Meijers, M.J.M., Hamers, M.F., Van Hinsbergen, D.J.J., Van der Meer, D.G., Kitchka, A., Langereis,
C.G. and Stephenson, R.A., 2010a. New late Paleozoic paleopoles from the Donbas Foldbelt
(Ukraine): implications for the Pangea A vs. B controversy, Earth and Planetary Science
Letters, 297, 18-33.
Meijers, M.J.M., Langereis, C.G., Van Hinsbergen, D.J.J., Kaymakci, N., Stephenson, R.A. and
Altiner, D., 2010b. Jurassic-Cretaceous low paleolatitudes from the circum-Black Sea region
(Crimea and Pontides) due to True Polar Wander, Earth and Planetary Science Letters, 296,
210-226.
Meijers, M.J.M., Kaymakci, N., Van Hinsbergen, D.J.J., Langereis, C.G., Stephenson, R.A. and
Hippolyte, J.-C., 2010c. Late Cretaceous to Paleocene oroclinal bending in the Central
Pontides (Turkey), Tectonics, 29, TC4016, doi:10.1029/2009TC002620.
Meijers, M.J.M., Van Hinsbergen, D.J.J., M.J. Dekkers, Altiner, D., Kaymakci, N., Langereis, C.G.,
2011. Pervasive Palaeogene remagnetization of the central Taurides fold-and-thrust belt
(southern Turkey) and implications for rotations in the Isparta Angle, Geophysical Journal
International, 184, 1090-1112, doi: 10.1111/j.1365-246X.2010.04919.x
Monin, A. S. and Zonenshain, L. P. (eds) 1987. History of the Ocean Tethys. Moscow Institute of
Oceanology (in Russian).
Menning, M., Alekseev, A.S., Chuvashov, B.I., Davydov, V.I., Devuyst, F.-X., Forke, H.C., Grunt,.A.,
Hance, L., Heckel, P.H., Izokh, N.G., Jin, Y.-G., Jones, P.J., Kotlyar, G.V., Kozur, H.W.,
Nemyrovska, T.I., Schneider, J.W., Wang, X.-D., Weddige, K., Weyer, D., Work, D.M., 2006.
Global time scale and regional stratigraphic reference scales of Central and West Europe, East
Europe, Tethys, South China, and North America as used in the Devonian–Carboniferous–
Permian Correlation Chart 2003 (DCP 2003).Palaeogeogr. Palaeoclimatol. Palaeoecol. 240:
318–372, doi:10.1016/j.palaeo.2006.03.058.
Merrill, R.T., and McFadden, P.L., 2003. The geomagnetic axial dipole field assumption, Physics of
the Earth and Planetary Interiors, 139, 171-185.
ACC
EPTE
D M
ANU
SCR
IPT
ACCEPTED MANUSCRIPT
28
Moix, P., Beccaletto, L., Kozur, H.W., Hochard, C., Rosselet, F. and Stampfli, G.M., 2008. A New
Classification of the Turkish Terranes and Sutures and its Implications for the Paleotectonic
History of the Region. Tectonophysics, 451, 7-39.
Müller, R.D., Royer, J.-Y., Lawver, L.A., 1993. Revised plate motions relative to the hotspots from
combined Atlantic and Indian Ocean hotspot tracks. Geology , 21 (3), 275–278.
Moskowitz, B. M., Frankel, R. B., Bazylinski, D.A., Jannasch, H. W. And Lovley, D. R., 1989. A
comparison of magnetite particles produced anaerobically by magnetotactic and dissimilatory
iron‐reducing bacteria, Geophys. Res. Lett., 16: 665–668, doi:10.1029/GL016i007p00665.
Nalivkin, P.V. (ed.) 1976. Geological Map of Caucasus at 1/500 000 scale. Ministry of geology,
USSR, Cief.Norton, I.O., 2000. Global hotspot reference frames in plate motion. In: Richards,
M.A., Gordon, R.G., van der Hilst, R.D. (Eds.), The History and Dynamics of Global Plate
Motion, 339–357.
Ogg, J.G., Agterberg, F.P. and Gradstein, F.M., 2004. The Cretaceous Period. In: F.M. Gradstein, J.G.
Ogg and A.G. Smith (Editors), A Geologic Time Scale 2004. Cambridge University Press,
Cambridge, 344-383.
Okay, A.I. and Şahintürk, Ö., 1997. Geology of the Eastern Pontides. In: Robinson, A.G. (Ed.),
Regional and petroleum geology of the Black Sea and surrounding region. AAPG Memoir,
291–311.Okay, A. I., and Tüysüz, O., 1999. Tethyan sutures of northern Turkey. In: Durand,
B., Jolivet, L., Horváth, F., and Séranne, M., (Eds.), The Mediterranean Basins: Tertiary
Extension Within the Alpine Orogen, Geological Society of London, Special Publications,
156, 475–515
Paffenholtz, K.N., 1959. Geological history of the Caucasus. Izdatelstvo NAS Armenia SSR (in
Russian), 506 p.
Robertson, A.H.F., Ustaomer, T., Pickett, E.A., Collins, A.S., Andrew, T. and Dixon, J.E., 2004.
Testing models of Late Palaeozoic-Early Mesozoic orogeny in Western Turkey: support for an
evolving open-Tethys model. Journal of the Geological Society, London, 161: 501-511.
Robertson, A.H.F., Parlak, O., Ustaomer, T., Taslıd, K. İnand, N., Dumitricae, P., & Karaoğlan, F.,
2014. Subduction, ophiolite genesis and collision history of Tethys adjacent to the Eurasian
continental margin: new evidence from the Eastern Pontides, Turkey, Geodinamica Acta,
DOI: 10.1080/09853111.2013.877240
Richards, M.A., Duncan, R.A., Courtillot, V.E., 1989. Flood basalts and hotspot tracks: plume heads
and tails. Science , 246, 103–107.
Robinson, A.G., Banks, C.J., Rutherford, M.M., Hirst, J.P.P., 1995. Stratigraphic and structural
development of the Eastern Pontides, Turkey. Journal of the Geological Society, London, 152,
861-872, doi: 10.1144/gsjgs.152.5.0861
ACC
EPTE
D M
ANU
SCR
IPT
ACCEPTED MANUSCRIPT
29
Rolland, Y., Billo, S., Corsini, M., Sosson, M. and Galoyan, G., 2009a. Blueschists of the Amassia-
Stepanavan Suture Zone (Armenia): linking Tethys subduction history from E-Turkey to W-
Iran. International Journal of Earth Sciences, 98(3): 533-550, DOI 10.1007/s00531-007-0286-
8.
Rolland, Y., Galoyan, Gh., Bosch, D., Sosson, M., Corsini, M., Fornari, M., Vérati, C., 2009b.
Jurassic Back-arc and hot-spot related series in the Armenian ophiolites - Implications for the
obduction process. Lithos 112: 163-187.
Rolland Y., Galoyan G., Sosson, M., Melkonian R., Avagyan A., 2010. The Armenian ophiolites :
insights for Jurassic Back-arc formation, Lower Cretaceous hot-spot magmatism, and Upper
Cretaceous obduction over the South Armenian Block. In: M.Sosson, N. Kaymakci, R.
Stephenson, F. Bergerat and V. Storatchenoko (eds.) Sedimentary basin tectonics from the
Black Sea and Caucasus to the Arabian Platform. Geological Society of London, Special
Publication 340: 353–382.
Rolland, Y., Sosson, M., Adamia, Sh., Sadradze, N., 2011. Prolonged Variscan to Alpine history of an
active Eurasian margin (Georgia, Armenia) revealed by 40Ar/39Ar dating. Gondwana
Research 20: 798-815.
Rolland, Y., Perincek, D., Kaymakci, N., Sosson, M., Barrier, E. and Avagyan, A., 2012. Evidence for
∼80–75 Ma subduction jump during Anatolide–Tauride–Armenian block accretion and ∼48
Ma Arabia–Eurasia collision in Lesser Caucasus–East Anatolia. Journal of Geodynamics, 56-
57: 76-85.
Sahabi, M., Aslanian, D. and Olivet, J.-L., 2004. A new starting point for the history of the central
Atlantic. Comptes Rendus Geoscience, 336(12): 1041-1052.
Şengör, A.M.C. and Yilmaz, Y., 1981. Tethyan evolution of Turkey: A plate tectonic approach.
Tectonophysics, 75(3-4): 181-241.
Sokolov, S.D., 1977. The Olistostromes and Ophiolitic Nappes of the Lesser Caucasus. Izdatelstvo
'Nauka', Moscow (in Russian).
Sosson, M., Rolland, Y., Muller, C., Danelian, T., Melkonyan, R., Kekelia, M., Adamia, S.A.,
Babazadeh, V., Kangarli, T., Avagyan, A., Galoyan, G. and Mosar, J., 2010. Subduction,
obduction and collision in the Lesser Caucasus (Armenia, Azerbaijan, Georgia), new insights.
In: M. Sosson, N. Kaymakci, R.A. Stephenson, F. Bergerat and V. Starostenko (Editors),
Sedimentary basin tectonics from the Black Sea and Caucasus to the Arabian Platform.
Geological Society of London, Special Publications, London, 340: 329-352, DOI:
10.1144/SP340.14 0305-8719/10.
Stampfli, G.M. and Borel, G.D., 2002. A plate tectonic model for the Paleozoic and Mesozoic
constrained by dynamic plate boundaries and restored synthetic oceanic isochrons. Earth and
Planetary Science Letters, 196(1-2): 17-33.

ACC
EPTE
D M
ANU
SCR
IPT
ACCEPTED MANUSCRIPT
30
Sun, W. W. and K. P. Kodama, 1992. Magnetic anistropy, scanning electron microscopy, and X-ray
pole figure goniometry study of inclination shallowing in a compacting clay-rich sediment,
Jour. Geophys. Res., 97, 19599-19615.
Tan, X., Kodama, K.P., Fang, D., 2002. Laboratory depositional and compaction-caused inclination
errors carried by haematite and their implications in identifying inclination error of natural
remanence in red beds. Geophys. J. Int. 151, 475–486.
Tan, X. & Kodama, K.P., 2003. An analytical solution for correcting paleomagnetic inclination error,
Geophys. J. Int., 152, 228–236.
Tauxe, L. and Watson, G.S., 1994. The foldtest: an eigen analysis approach. Earth and Planetary
Science Letters, 122: 331-341.
Tauxe, L, Kent D.V., 1984. Properties of a Detrital Remanence Carried by Hematite from Study of
Modern River Deposits and Laboratory Redeposition Experiments. Geophysical Journal of the
Royal Astronomical Society. 76:543-561.
Tauxe, L. and Kent, D.V., 2004. A simplified statistical model for the geomagnetic field and the
detection of shallow bias in paleomagnetic inclinations: Was the ancient magnetic field
dipolar? In: J.E.T. Channell, D.V. Kent, W. Lowrie and J.G. Meert (Editors), Timescales of
the Paleomagnetic Field. AGU Geophysical Monograph, Washington, 145: 101-115.
Tauxe, L., Kodama, K.P. and Kent, D.V., 2008. Testing corrections for paleomagnetic inclination
error in sedimentary rocks: A comparative approach. Physics of the Earth and Planetary
Interiors, 169: 152-165.
Torsvik, T.H. et al., 2012. Phanerozoic polar wander, palaeogeography and dynamics. Earth-Science
Reviews, 114: 325-368.
Topuz, G., Altherr, R., Siebel, W., Schwarz, W.H., Zack, T., Hasözbek, A., Barth, M., Satır, M., Şen,
C., 2010. Carboniferous high-potassium I-type granitoid magmatism in the Eastern Pontides:
The Gümüşhane pluton (NE Turkey). Lithos, 116, 92–110, doi:10.1016/j.lithos.2010.01.003
Van der Voo, R. (1968), Jurassic, Cretaceous and Eocene pole positions from northeastern Turkey,
Tectonophysics, 6, 251–269, doi:10.1016/0040-1951(68) 90053-X.
Van Hoof, A.A.M. and Langereis, C.G., 1991. Reversal records in marine marls and delayed
acquisition of remanent magnetization. Nature, 351, 223-224
Van Velzen, A.J. and Zijderveld, J.D.A., 1995. Effects of weathering on single domain magnetite in
early Pliocene marls. Geophysical Journal International, 121: 267-278.
Zakariadze, G.S., Karpenko, S.F., Bazylev, B.A., Adamia, S.A. and Oberhaensli, R.E., 1998.
Petrology, geochemistry, and Sm-Nd age of the pre-late Variscan paleooceanic complex of the
Dzirula salient, Transcaucasian massif. Petrology 6: 388-408 (translated from Petrologiya, 6,
422-444).
ACC
EPTE
D M
ANU
SCR
IPT
ACCEPTED MANUSCRIPT
31
Zijderveld, J.D.A., 1967. A. C. demagnetization of rocks: analysis of results. In: D.W. Collinson, K.M.
Creer and S.K. Runcorn (Editors), Methods in Palaeomagnetism. Elsevier, Amsterdam, New
York, 254–286.
Captions
Figure 1
Tectonic map of the Black and Caspian sea region. AF= Arax Fault, ATB= Anatolide-Tauride Block,
CAF= Central Anatolian Fault, EAF= East Anatolian Fault, IAES= Izmir-Ankara-Erzincan suture,
KB= Kırşehir Block, GC= Greater Caucasus, LC= Lesser Caucasus, MM= Menderes Massif, NAF=
North Anatolian Fault, R= Lake Rezaiyeh, SAB= South Armenian Block, V= Lake Van. Dotted white
line roughly indicates the trace of the oroclines through the central Pontides and eastern Pontides-
Lesser Caucasus. Black circular arrows in the central Pontides and eastern Pontide-Lesser Caucasus
indicate the sense of rotation in both limbs of the orocline. The central Pontide orocline formed in the
latest Cretaceous to Early Paleocene (Meijers et al., 2010c). Formation of the eastern Pontides-Lesser
Caucasus orocline postdates Eocene time (Bazhenov et al., 2002).
Figure 2
a) Structural map of the Lesser Caucasus modified from Nalivkin (1976) and Sosson et al. (2010)
including our sampling locations. Rectangle is the zoomed area in Fig. 2b. Note that the geologic
information is generalized and that ages of the sampled rocks are not always in agreement with the age
on the map (locality P-combined was sampled in upper Cretaceous rocks, whereas they were
seemingly sampled in Jurassic rocks according to the map). b) Structural map of the Vedi area
showing the relative positions of the sampling locations in the region after Sosson et al. (2010).
Figure 3
a-s) Orthogonal vector diagrams (Zijderveld, 1967), showing characteristic demagnetization diagrams
for the sampled sites. Closed (open) circles indicate the projection on the horizontal (vertical) plane.
Alternating field and thermal demagnetization steps are indicated. All diagrams are displayed
after bedding tilt correction. Examples of samples from which specimens were AF and thermally
demagnetized are included for comparison of both techniques, see a-b) and e-f).
Figure 4
Thermomagnetic and hysteresis properties of samples of Upper Cretaceous rocks from sites AD (a-f),
AK (g-n) and P (o-q). b, f, g, m) Susceptibility as a function of temperature, from liquid nitrogen (-
196°C) to 700°C, in air or in Argon; o, q) high field (0.5T) thermomagnetic curves; d, h, p) hysteresis
ACC
EPTE
D M
ANU
SCR
IPT
ACCEPTED MANUSCRIPT
32
cycles (induced and remanent magnetizations); e and i) backfield determination of Hrc; a, c, k, n) low
temperature variation (300-20K-300K) of a Room Temperature (RT) IRM acquired in 2.5 T; j) Field
Cooled (FC) and Zero Field Cooled (ZFC) of an IRM acquired in 2.5 T at 20K. The sample is first
cooled in a 2.5T field, then the remanence is measured upon heating (blue curve) followed by cooling
in zero field. After reaching the minimum temperature (20K) it is given an IRM of 2.5T and the
remanence is measured upon heating (red curve). The other two RT curves are duplicates of the
experiment in Fig.4k; l) low temperature demagnetization of a sample that was initially heated at
150ºC to demagnetize goethite. demag = demagnetization.
Figure 5
a-i and k-s) Equal area projections of the ChRM directions of all sampled sites (Table 1). Open
(closed) symbols denote projection on upper (lower) hemisphere. Large closed black circles
surrounded by green circles indicate respectively the mean directions and their cone of confidence
(α95) before (nt) and after (tc) tilt correction. Red circles indicate the individual directions rejected
after applying a 45º cut-off on the virtual geomagnetic poles. For site AH and AG, grey lines indicate
the great circles that were used to calculate the best fitting ChRM directions, with the corresponding
calculated directions in blue (McFadden & McElhinny 1988).
j and t) Pictures of representative parts of the outcrops of locality P-combined and site AK,
respectively.
Figure 6
Non-parametric fold tests (Tauxe and Watson, 1994) on locality P-combined, site AD and site AK. a-i)
Fold tests carried out on all individual ChRM directions within a locality/site. j-r) Fold tests carried
out on the mean ChRM direction calculated for all specimens with the same bedding plane orientation.
a,d,g,j,m,p) Equal area plots of the ChRM before correction for bedding tilt (geographic coordinates)
and b,e,h,k,n,q) after correction for bedding tilt (100% tilt correction). c,f,i,l,o,r) Results of the fold
test based on 500 bootstrapped examples of the first eigenvalues (τ1) upon progressive unfolding. The
95% bootstrap error is given above the diagrams.
Figure 7
Equal-area projections of the individual VGP directions before (a, c, e) and after (g, i, k) E/I
correction. Equal-area projections of the individual ChRM directions before (b, d, f) and after (h, j, l)
E/I correction (symbols as in Fig. 5) (Tauxe et al., 2008) after applying a 45º cut-off on the
geomagnetic poles (red circle) with corresponding elongation vs. inclination (m, o, q) and fraction (of
5000 bootstraps) vs. inclination plots (n, p, r) for locality P and sites AD and AK. In the elongation vs.
inclination plots the E/I for the TK03.GAD model (green line) and for the datasets (red barbed line)
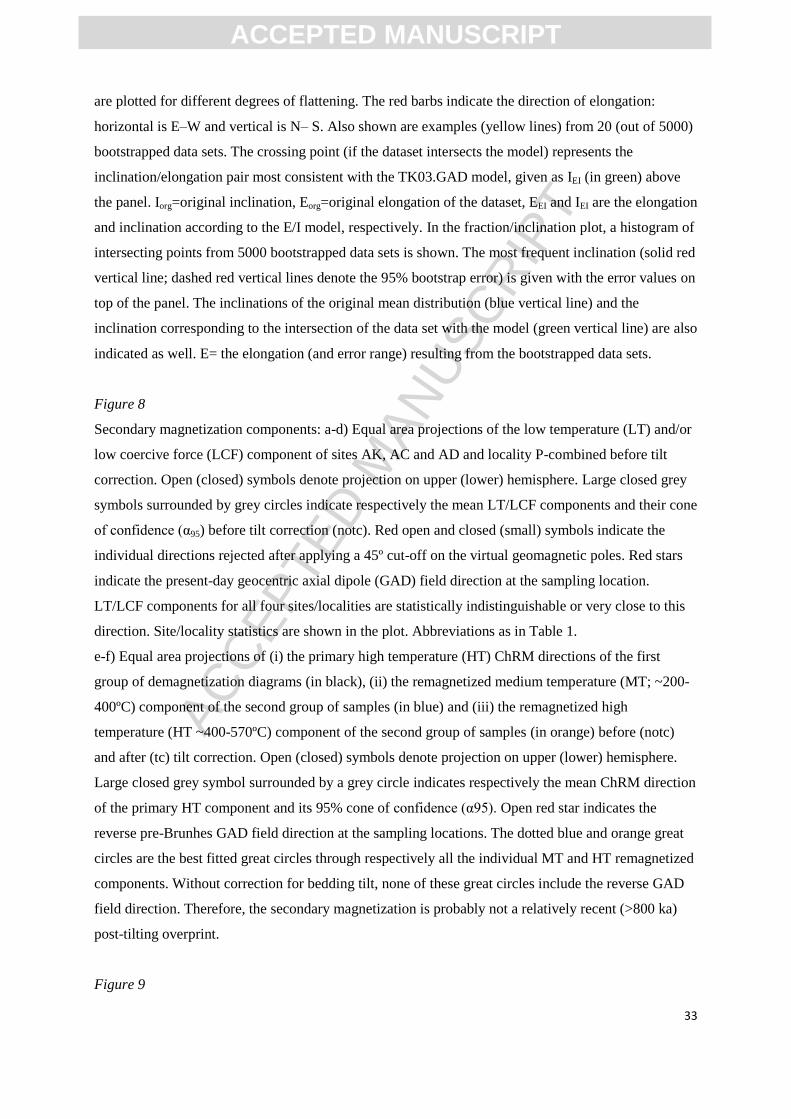
ACC
EPTE
D M
ANU
SCR
IPT
ACCEPTED MANUSCRIPT
33
are plotted for different degrees of flattening. The red barbs indicate the direction of elongation:
horizontal is E–W and vertical is N– S. Also shown are examples (yellow lines) from 20 (out of 5000)
bootstrapped data sets. The crossing point (if the dataset intersects the model) represents the
inclination/elongation pair most consistent with the TK03.GAD model, given as IEI (in green) above
the panel. Iorg=original inclination, Eorg=original elongation of the dataset, EEI and IEI are the elongation
and inclination according to the E/I model, respectively. In the fraction/inclination plot, a histogram of
intersecting points from 5000 bootstrapped data sets is shown. The most frequent inclination (solid red
vertical line; dashed red vertical lines denote the 95% bootstrap error) is given with the error values on
top of the panel. The inclinations of the original mean distribution (blue vertical line) and the
inclination corresponding to the intersection of the data set with the model (green vertical line) are also
indicated as well. E= the elongation (and error range) resulting from the bootstrapped data sets.
Figure 8
Secondary magnetization components: a-d) Equal area projections of the low temperature (LT) and/or
low coercive force (LCF) component of sites AK, AC and AD and locality P-combined before tilt
correction. Open (closed) symbols denote projection on upper (lower) hemisphere. Large closed grey
symbols surrounded by grey circles indicate respectively the mean LT/LCF components and their cone
of confidence (α95) before tilt correction (notc). Red open and closed (small) symbols indicate the
individual directions rejected after applying a 45º cut-off on the virtual geomagnetic poles. Red stars
indicate the present-day geocentric axial dipole (GAD) field direction at the sampling location.
LT/LCF components for all four sites/localities are statistically indistinguishable or very close to this
direction. Site/locality statistics are shown in the plot. Abbreviations as in Table 1.
e-f) Equal area projections of (i) the primary high temperature (HT) ChRM directions of the first
group of demagnetization diagrams (in black), (ii) the remagnetized medium temperature (MT; ~200-
400ºC) component of the second group of samples (in blue) and (iii) the remagnetized high
temperature (HT ~400-570ºC) component of the second group of samples (in orange) before (notc)
and after (tc) tilt correction. Open (closed) symbols denote projection on upper (lower) hemisphere.
Large closed grey symbol surrounded by a grey circle indicates respectively the mean ChRM direction
of the primary HT component and its 95% cone of confidence (α95). Open red star indicates the
reverse pre-Brunhes GAD field direction at the sampling locations. The dotted blue and orange great
circles are the best fitted great circles through respectively all the individual MT and HT remagnetized
components. Without correction for bedding tilt, none of these great circles include the reverse GAD
field direction. Therefore, the secondary magnetization is probably not a relatively recent (>800 ka)
post-tilting overprint.
Figure 9
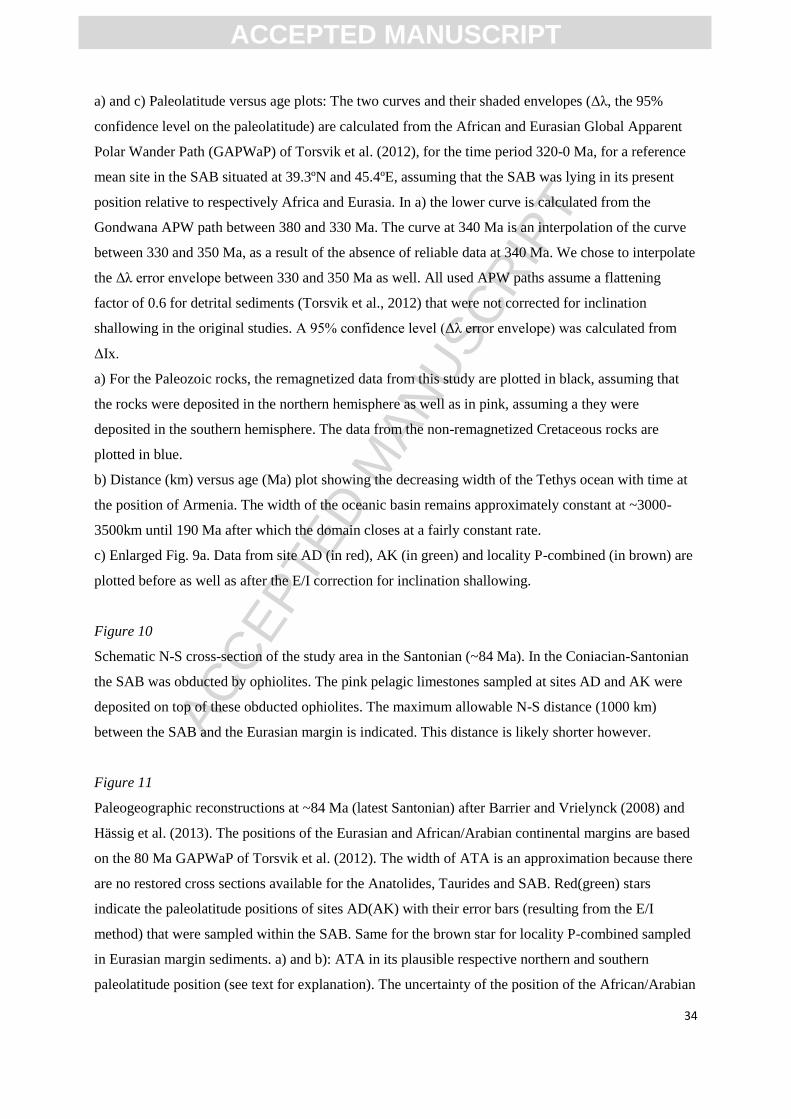
ACC
EPTE
D M
ANU
SCR
IPT
ACCEPTED MANUSCRIPT
34
a) and c) Paleolatitude versus age plots: The two curves and their shaded envelopes (Δλ, the 95%
confidence level on the paleolatitude) are calculated from the African and Eurasian Global Apparent
Polar Wander Path (GAPWaP) of Torsvik et al. (2012), for the time period 320-0 Ma, for a reference
mean site in the SAB situated at 39.3ºN and 45.4ºE, assuming that the SAB was lying in its present
position relative to respectively Africa and Eurasia. In a) the lower curve is calculated from the
Gondwana APW path between 380 and 330 Ma. The curve at 340 Ma is an interpolation of the curve
between 330 and 350 Ma, as a result of the absence of reliable data at 340 Ma. We chose to interpolate
the Δλ error envelope between 330 and 350 Ma as well. All used APW paths assume a flattening
factor of 0.6 for detrital sediments (Torsvik et al., 2012) that were not corrected for inclination
shallowing in the original studies. A 95% confidence level (Δλ error envelope) was calculated from
ΔIx.
a) For the Paleozoic rocks, the remagnetized data from this study are plotted in black, assuming that
the rocks were deposited in the northern hemisphere as well as in pink, assuming a they were
deposited in the southern hemisphere. The data from the non-remagnetized Cretaceous rocks are
plotted in blue.
b) Distance (km) versus age (Ma) plot showing the decreasing width of the Tethys ocean with time at
the position of Armenia. The width of the oceanic basin remains approximately constant at ~3000-
3500km until 190 Ma after which the domain closes at a fairly constant rate.
c) Enlarged Fig. 9a. Data from site AD (in red), AK (in green) and locality P-combined (in brown) are
plotted before as well as after the E/I correction for inclination shallowing.
Figure 10
Schematic N-S cross-section of the study area in the Santonian (~84 Ma). In the Coniacian-Santonian
the SAB was obducted by ophiolites. The pink pelagic limestones sampled at sites AD and AK were
deposited on top of these obducted ophiolites. The maximum allowable N-S distance (1000 km)
between the SAB and the Eurasian margin is indicated. This distance is likely shorter however.
Figure 11
Paleogeographic reconstructions at ~84 Ma (latest Santonian) after Barrier and Vrielynck (2008) and
Hässig et al. (2013). The positions of the Eurasian and African/Arabian continental margins are based
on the 80 Ma GAPWaP of Torsvik et al. (2012). The width of ATA is an approximation because there
are no restored cross sections available for the Anatolides, Taurides and SAB. Red(green) stars
indicate the paleolatitude positions of sites AD(AK) with their error bars (resulting from the E/I
method) that were sampled within the SAB. Same for the brown star for locality P-combined sampled
in Eurasian margin sediments. a) and b): ATA in its plausible respective northern and southern
paleolatitude position (see text for explanation). The uncertainty of the position of the African/Arabian
ACC
EPTE
D M
ANU
SCR
IPT
ACCEPTED MANUSCRIPT
35
and Eurasian continents derived from the GAPWaP is not displayed in this figure. This leads to a
smaller N-S distance in b) than the calculated maximum of ~1000 km.
Table 1
Overview of all paleomagnetic results. Site, Rock type, Age (stage), Site lat.= site latitude, Site
long.=site longitude, Age (numerical, from the latest version of the Geological Time Scale, GTS 2008
(Ogg et al., 2008) for the Mesozoic sites and from Menning et al. (2006) for the Paleozoic sites),
ΔAge= age error, Nsamp= number of cores sampled, Naf= number of specimens demagnetized using AF
demagnetization, Nth= number of specimens demagnetized using thermal demagnetization, Ngc=
number of ChRM directions determined with great-circles, N/N45= number of specimens of which a
ChRM direction was determined/number of specimens remaining after the application of a fixed 45º
cut-off on the VGPs, DEC= mean declination, ΔDx= declination error determined from the A95 of the
poles, INC= mean inclination, ΔIx= inclination error determined from the A95 of the poles, k=
precision parameter and α95= cone of the 95% confidence limit for the ChRM directions, K= precision
parameter and A95= cone of confidence of the mean VGP, λ= paleolatitude of the site.
TK03= results from the E/I model of Tauxe and Kent (2004) for sites AK, AD and P after applying a
fixed 45º cut-off (AK45, AD45, P45) on the datasets. INC- and INC+ is the 95% bootstrap error range of
the most frequent inclination (INC) resulting from 5000 bootstraps. Corresponding paleolatitude
ranges (PALAT) are calculated from the inclinations.

ACC
EPTE
D M
ANU
SCR
IPT
ACCEPTED MANUSCRIPT
36
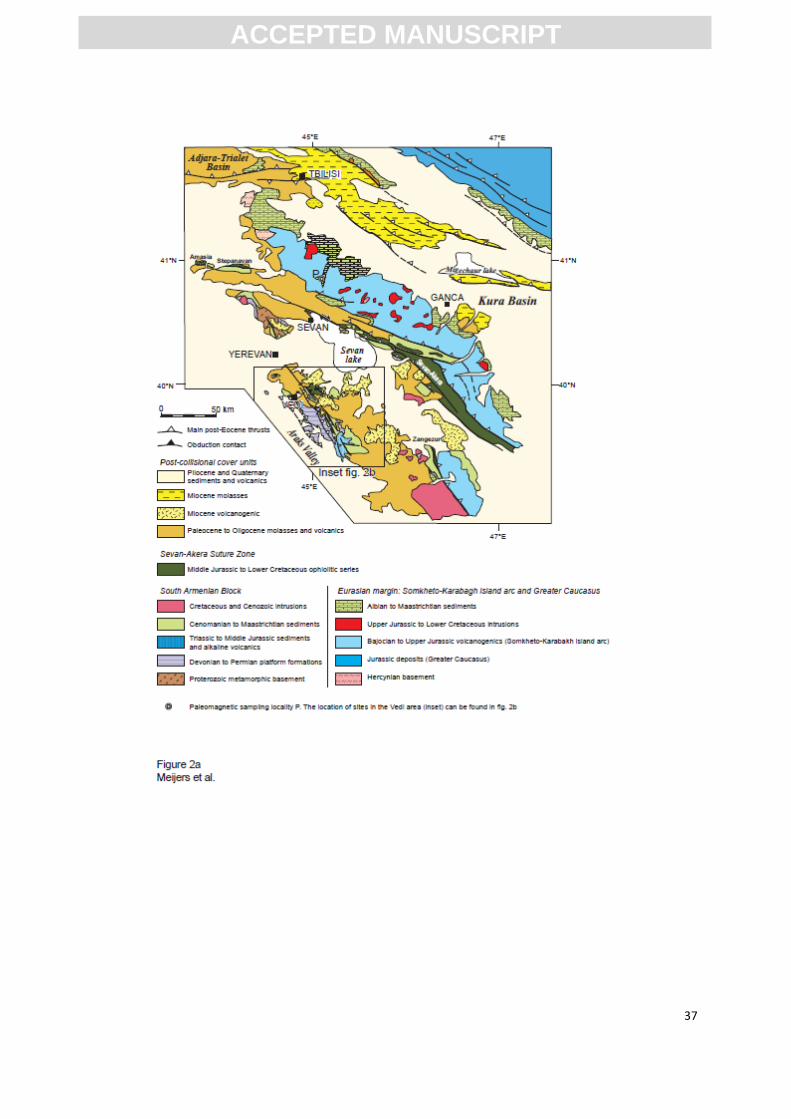
ACC
EPTE
D M
ANU
SCR
IPT
ACCEPTED MANUSCRIPT
37
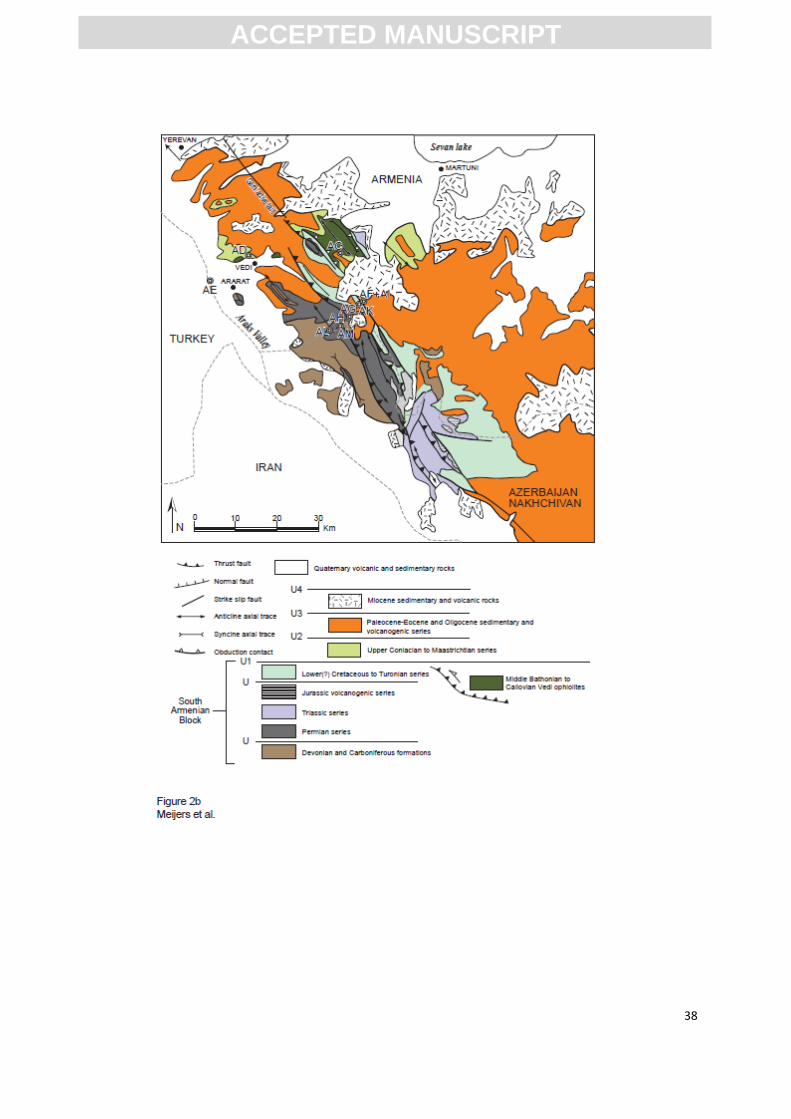
ACC
EPTE
D M
ANU
SCR
IPT
ACCEPTED MANUSCRIPT
38
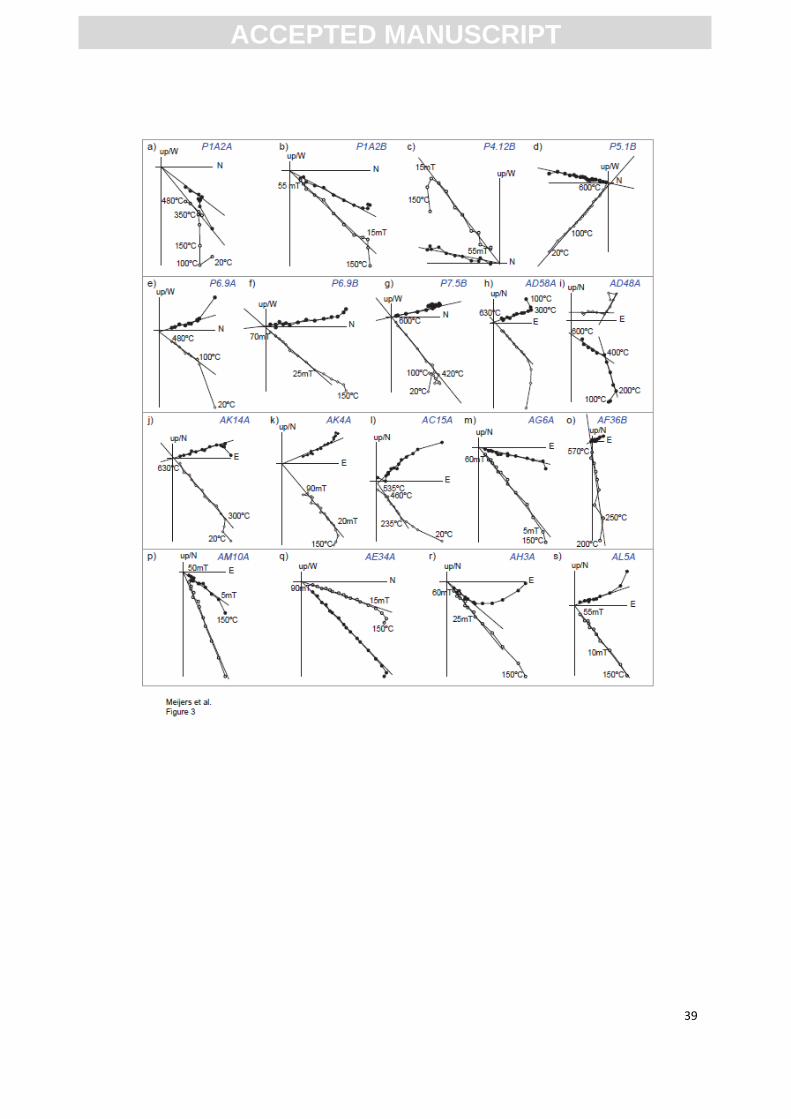
ACC
EPTE
D M
ANU
SCR
IPT
ACCEPTED MANUSCRIPT
39
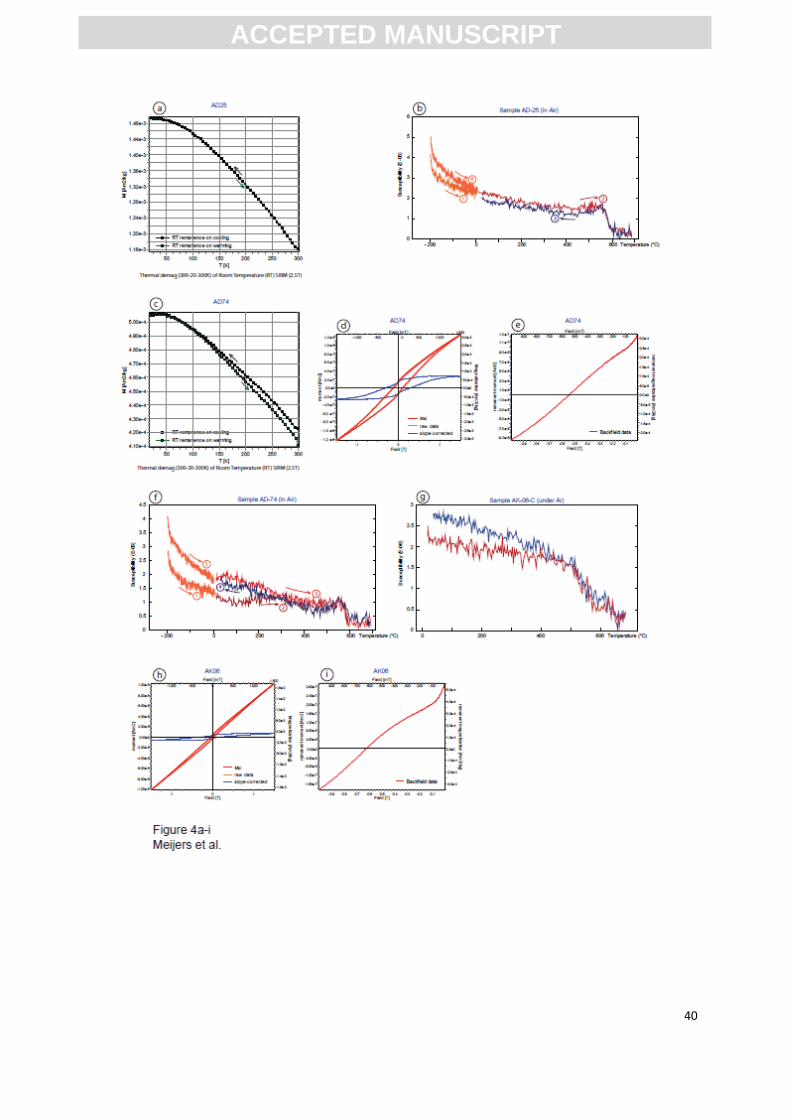
ACC
EPTE
D M
ANU
SCR
IPT
ACCEPTED MANUSCRIPT
40

ACC
EPTE
D M
ANU
SCR
IPT
ACCEPTED MANUSCRIPT
41

ACC
EPTE
D M
ANU
SCR
IPT
ACCEPTED MANUSCRIPT
42
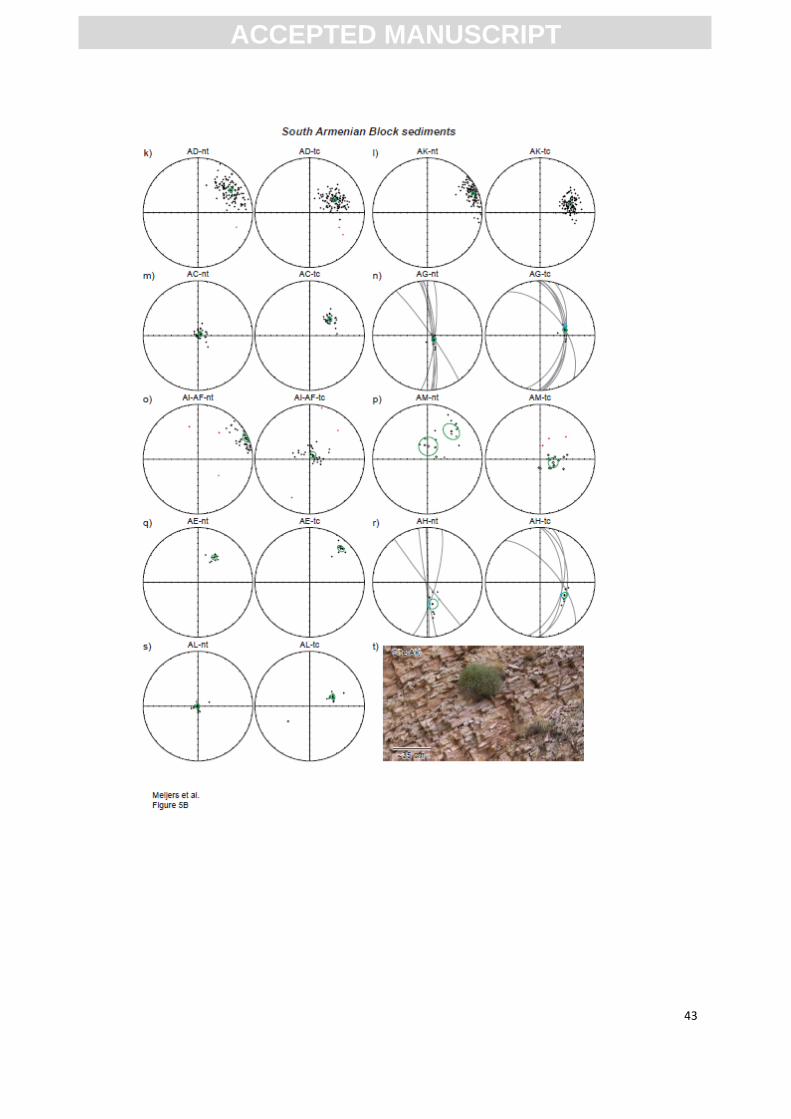
ACC
EPTE
D M
ANU
SCR
IPT
ACCEPTED MANUSCRIPT
43
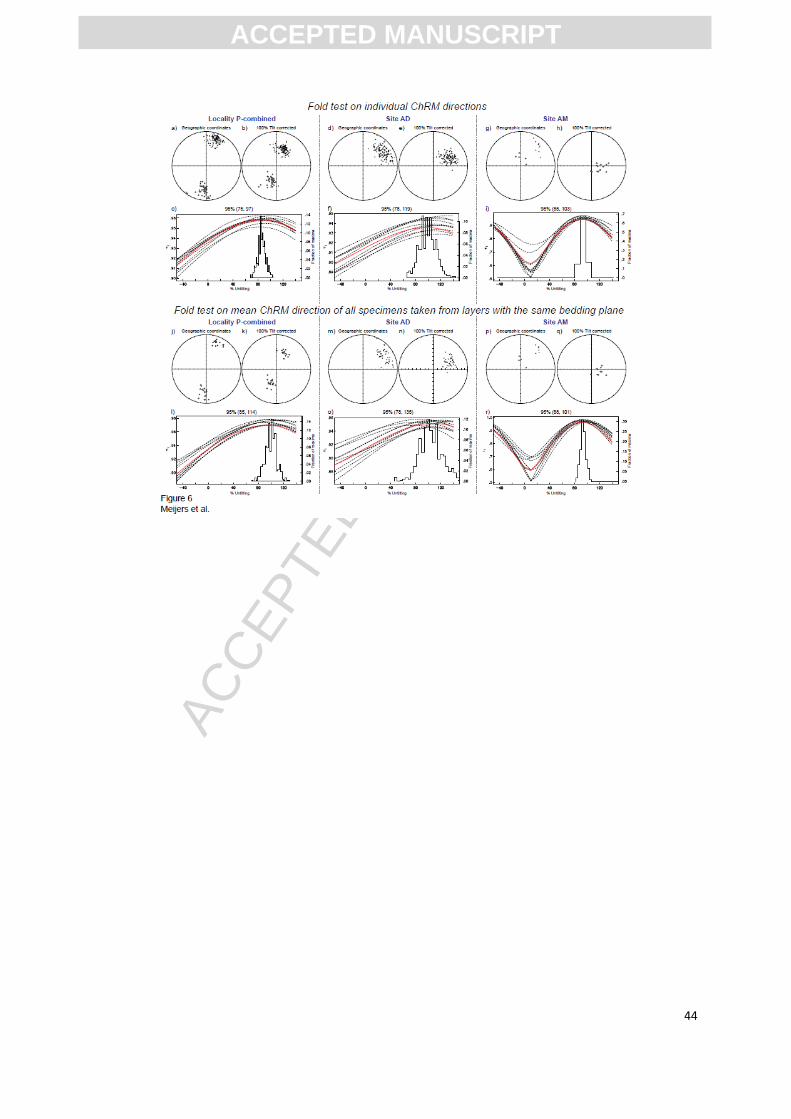
ACC
EPTE
D M
ANU
SCR
IPT
ACCEPTED MANUSCRIPT
44
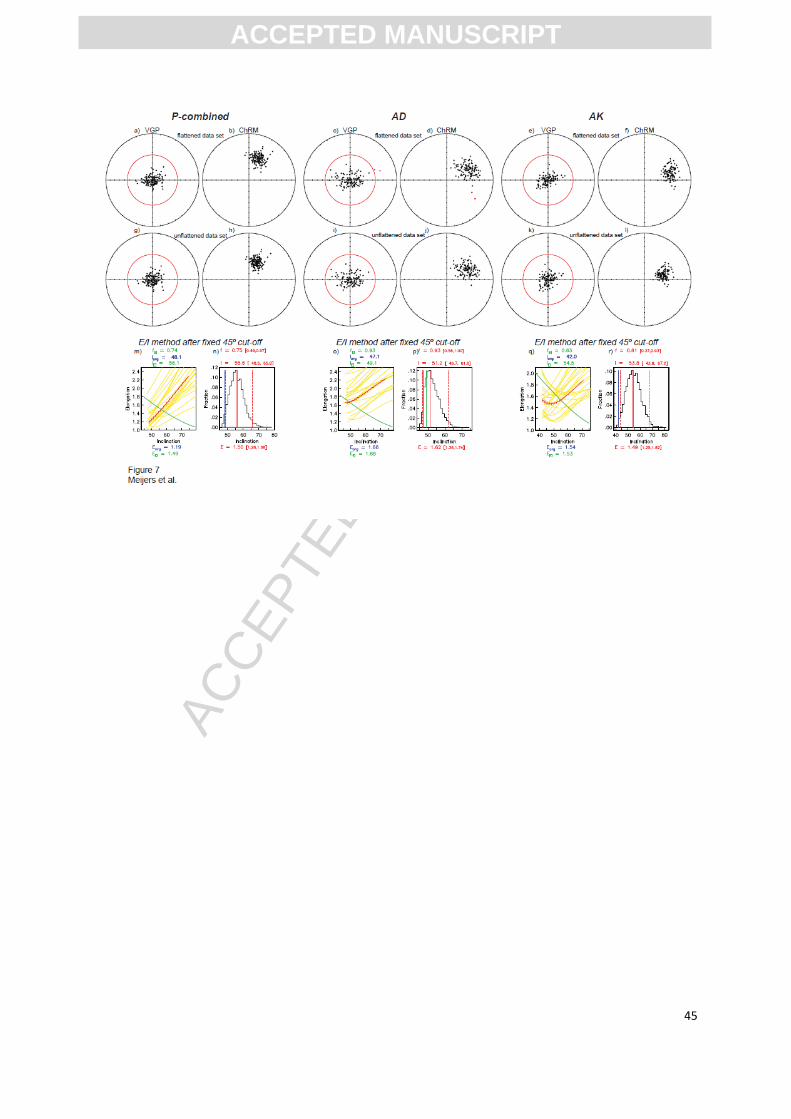
ACC
EPTE
D M
ANU
SCR
IPT
ACCEPTED MANUSCRIPT
45
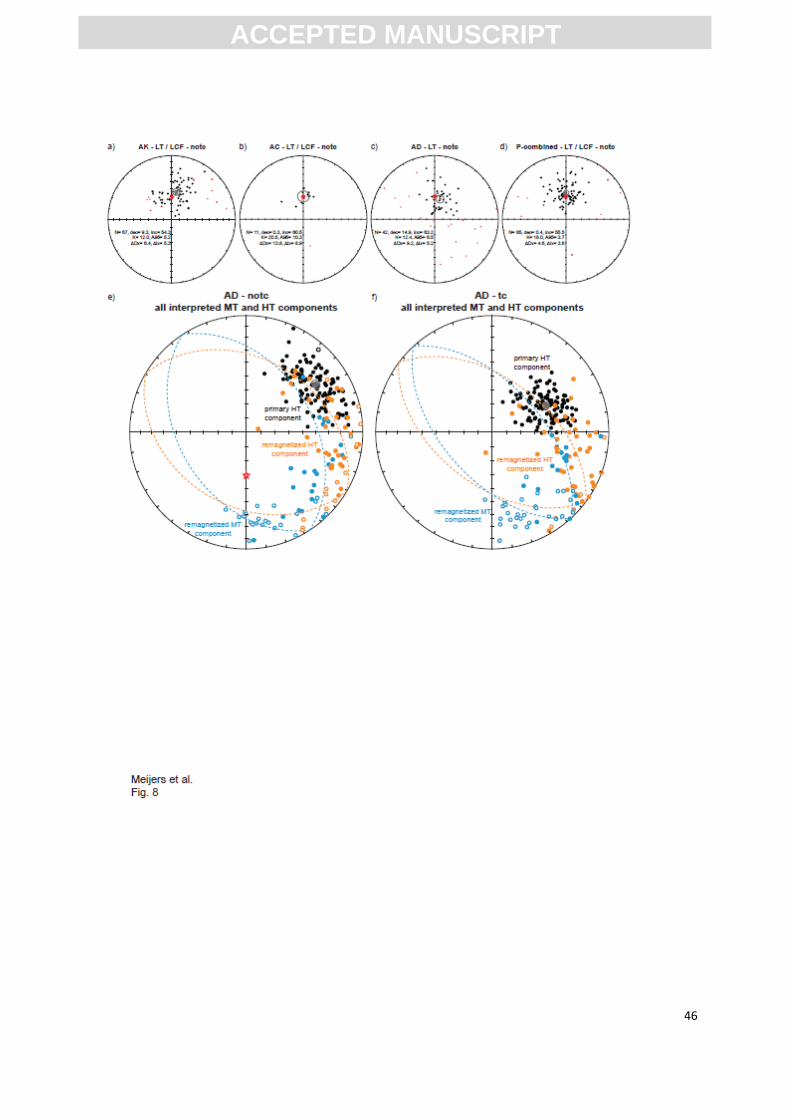
ACC
EPTE
D M
ANU
SCR
IPT
ACCEPTED MANUSCRIPT
46
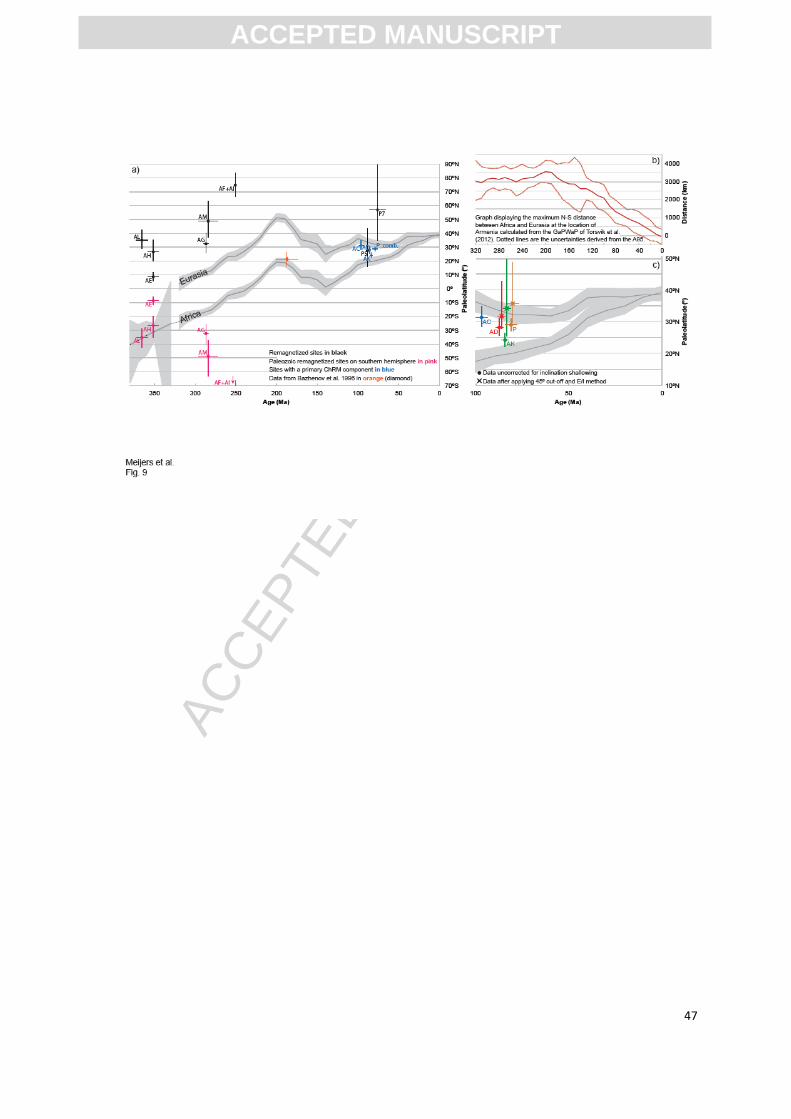
ACC
EPTE
D M
ANU
SCR
IPT
ACCEPTED MANUSCRIPT
47

ACC
EPTE
D M
ANU
SCR
IPT
ACCEPTED MANUSCRIPT
48
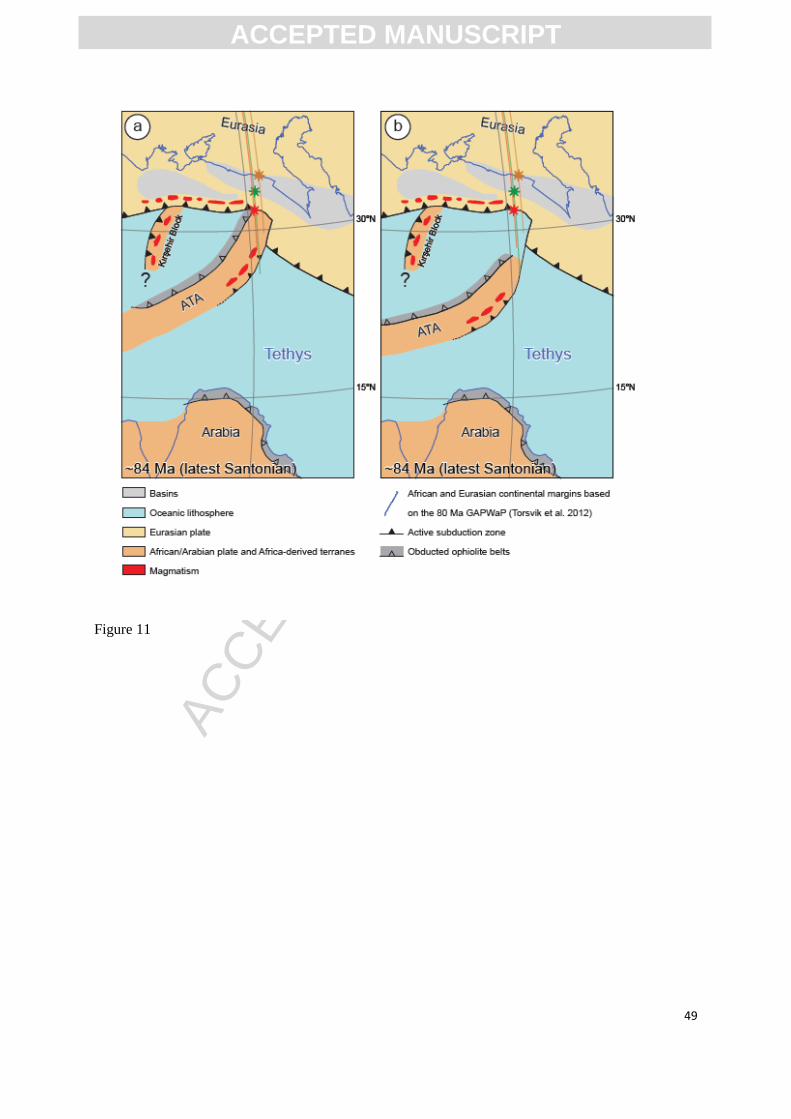
ACC
EPTE
D M
ANU
SCR
IPT
ACCEPTED MANUSCRIPT
49
Figure 11
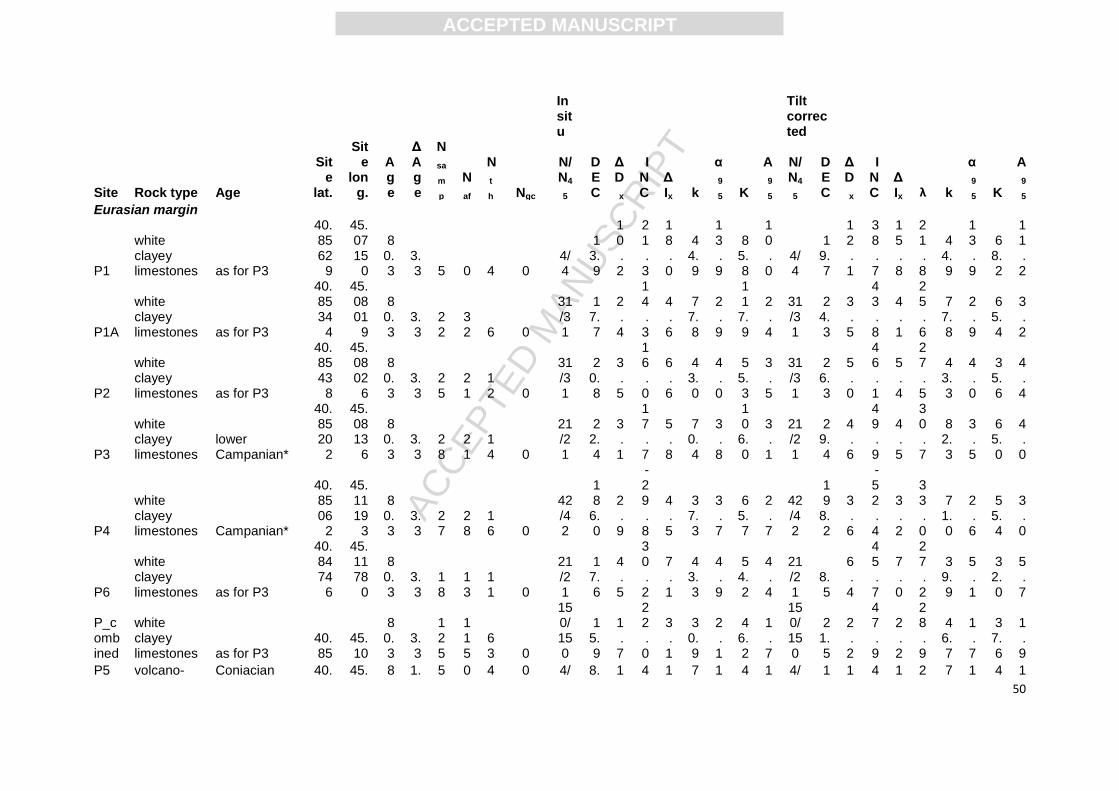
ACC
EPTE
D M
ANU
SCR
IPT
ACCEPTED MANUSCRIPT
50
In situ
Tilt corrected
Site Rock type Age
Site
lat.
Site
long.
Age
ΔAge
N
sa
m
p N
af
N
t
h Ngc
N/N4
5
DEC
ΔD
x
INC
ΔIx k
α
9
5 K
A
9
5
N/N4
5
DEC
ΔD
x
INC
ΔIx λ k
α
9
5 K
A
9
5
Eurasian margin
P1
white clayey limestones as for P3
40.8562
9
45.0715
0
80.3
3.3 5 0 4 0
4/4
13.9
10.2
21.3
18.0
44.9
13.9
85.8
10.0
4/4
19.7
12.1
38.7
15.8
21.8
44.9
13.9
68.2
11.2
P1A
white clayey limestones as for P3
40.8534
4
45.0801
9
80.3
3.3
22
32 6 0
31/31
17.7
2.4
14.3
4.6
77.8
2.9
11
7.9
2.4
31/31
24.3
3.5
43.8
4.1
25.6
77.8
2.9
65.4
3.2
P2
white clayey limestones as for P3
40.8543
8
45.0802
6
80.3
3.3
25
21
12 0
31/31
20.8
3.5
16.0
6.6
43.0
4.0
55.3
3.5
31/31
26.3
5.0
46.1
5.4
27.5
43.3
4.0
35.6
4.4
P3
white clayey limestones
lower Campanian*
40.8520
2
45.0813
6
80.3
3.3
28
21
14 0
21/21
22.4
3.1
17.7
5.8
70.4
3.8
10
6.0
3.1
21/21
29.4
4.6
49.9
4.5
30.7
82.3
3.5
65.0
4.0
P4
white clayey limestones Campanian*
40.8506
2
45.1119
3
80.3
3.3
27
28
16 0
42/42
18
6.0
2.9
-29.8
4.5
37.3
3.7
65.7
2.7
42/42
19
8.2
3.6
-52.4
3.2
33.0
71.0
2.6
55.4
3.0
P6
white clayey limestones as for P3
40.8474
6
45.1178
0
80.3
3.3
18
13
11 0
21/21
17.6
4.5
30.2
7.1
43.3
4.9
54.2
4.4
21/21
8.5
6.4
45.7
7.0
27.2
39.9
5.1
32.0
5.7
P_combined
white clayey limestones as for P3
40.85
45.10
80.3
3.3
125
115
63 0
150/150
15.9
1.7
22.0
3.1
30.9
2.1
46.2
1.7
150/150
21.5
2.2
47.9
2.2
28.9
46.7
1.7
37.6
1.9
P5 volcano- Coniacian 40. 45. 8 1. 5 0 4 0 4/ 8. 1 4 1 7 1 4 1 4/ 1 1 4 1 2 7 1 4 1
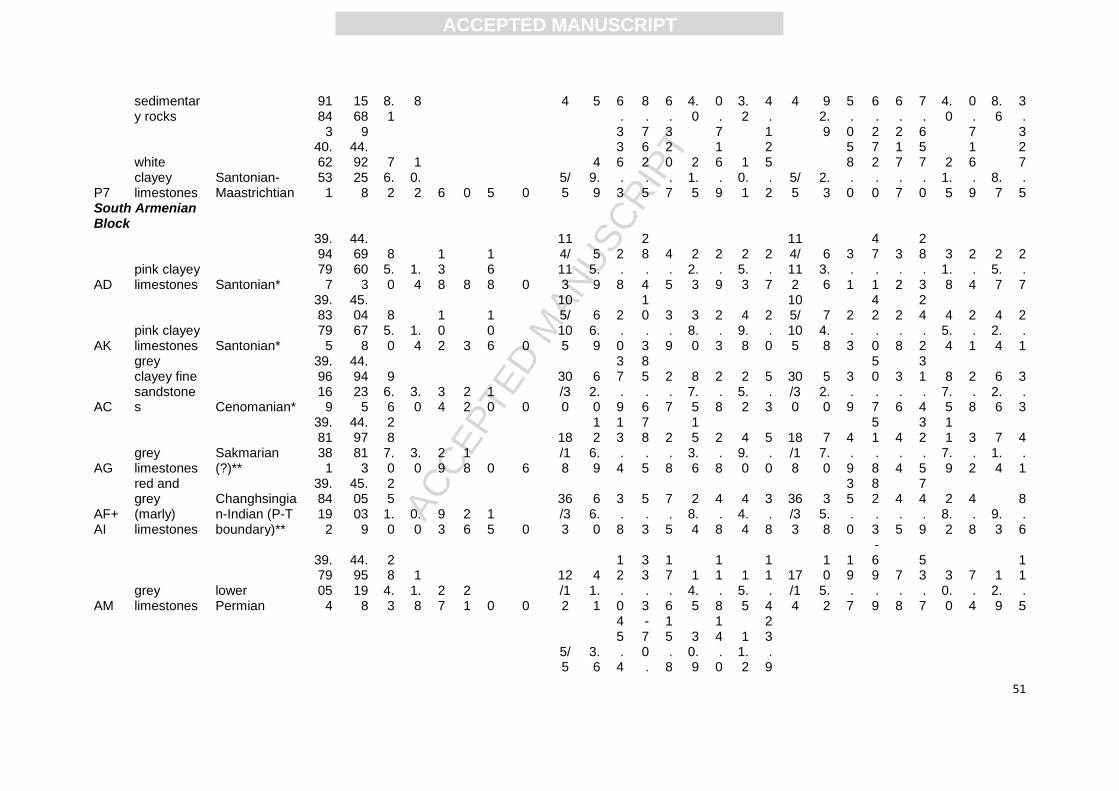
ACC
EPTE
D M
ANU
SCR
IPT
ACCEPTED MANUSCRIPT
51
sedimentary rocks
9184
3
1568
9
8.1
8 4 5 6.3
8.7
6.3
4.0
0.7
3.2
4.1
4 92.9
5.0
6.2
6.2
7.6
4.0
0.7
8.6
3.3
P7
white clayey limestones
Santonian-Maastrichtian
40.6253
1
44.9225
8
76.2
10.2 6 0 5 0
5/5
49.9
36.3
62.5
20.7
21.5
16.9
10.1
25.2
5/5
2.3
58.0
72.0
17.7
57.0
21.5
16.9
8.7
27.5
South Armenian Block
AD pink clayey limestones Santonian*
39.9479
7
44.6960
3
85.0
1.4
138 8
168 0
114/113
55.9
2.8
28.4
4.5
22.3
2.9
25.3
2.7
114/112
63.6
3.1
47.1
3.2
28.3
31.8
2.4
25.7
2.7
AK pink clayey limestones Santonian*
39.8379
5
45.0467
8
85.0
1.4
102 3
106 0
105/105
66.9
2.0
10.3
3.9
38.0
2.3
49.8
2.0
105/105
74.8
2.3
42.0
2.8
24.2
45.4
2.1
42.4
2.1
AC
grey clayey fine sandstones Cenomanian*
39.9616
9
44.9423
5
96.6
3.0
34
22
10 0
30/30
62.0
37.9
85.6
2.7
87.5
2.8
25.2
5.3
30/30
52.0
3.9
50.7
3.6
31.4
87.5
2.8
62.6
3.3
AG grey limestones
Sakmarian (?)**
39.8138
1
44.9781
3
28
7.0
3.0
29
18 0 6
18/18
12
6.9
13.4
78.5
2.8
15
3.6
2.8
49.0
5.0
18/18
77.0
4.9
51.8
4.4
32.5
11
7.9
3.2
71.4
4.1
AF+AI
red and grey (marly) limestones
Changhsingian-Indian (P-T boundary)**
39.8419
2
45.0503
9
25
1.0
0.0
93
26
15 0
36/33
66.0
3.8
5.3
7.5
28.4
4.8
44.4
3.8
36/33
35.8
35.0
82.3
4.5
74.9
28.2
4.8
9.3
8.6
AM grey limestones
lower Permian
39.7905
4
44.9519
8
28
4.3
11.8
27
21 0 0
12/12
41.1
12.0
33.3
17.6
14.5
11.8
15.5
11.4
17/14
10
5.2
19.7
-69.9
7.8
53.7
30.0
7.4
12.9
11.5
5/5
3.6
45.4
-70.
15.8
30.9
14.0
11.2
23.9
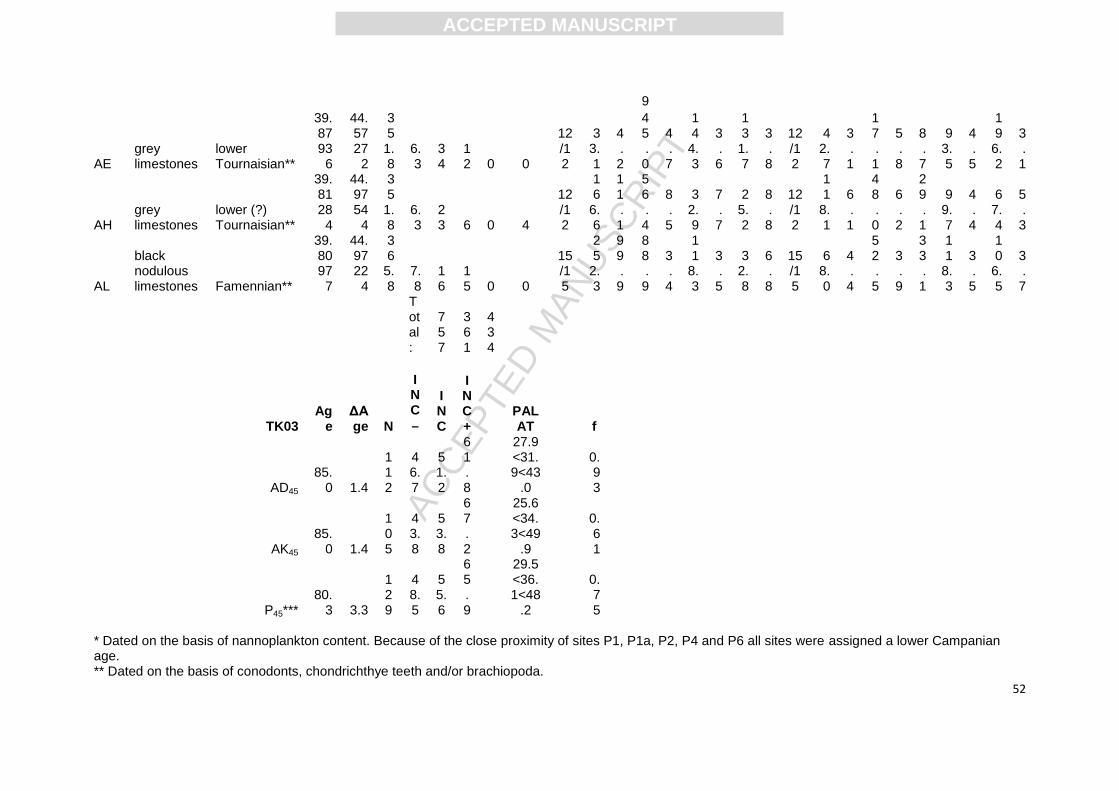
ACC
EPTE
D M
ANU
SCR
IPT
ACCEPTED MANUSCRIPT
52
9
AE grey limestones
lower Tournaisian**
39.8793
6
44.5727
2
35
1.8
6.3
34
12 0 0
12/12
33.1
4.2
45.0
4.7
14
4.3
3.6
13
1.7
3.8
12/12
42.7
3.1
17.1
5.8
8.7
93.5
4.5
19
6.2
3.1
AH grey limestones
lower (?) Tournaisian**
39.8128
4
44.9754
4
35
1.8
6.3
23 6 0 4
12/12
16
6.6
11.1
56.4
8.5
32.9
7.7
25.2
8.8
12/12
11
8.1
6.1
48.0
6.2
29.1
99.7
4.4
67.4
5.3
AL
black nodulous limestones Famennian**
39.8097
7
44.9722
4
36
5.8
7.8
16
15 0 0
15/15
25
2.3
99.9
88.9
3.4
11
8.3
3.5
32.8
6.8
15/15
68.0
4.4
52.5
3.9
33.1
11
8.3
3.5
10
6.5
3.7
Total:
757
361
434
TK03
Age
ΔAge N
INC
INC
INC+
PALAT
f
AD45
85.0 1.4
112
46.7
51.2
61.8
27.9<31.9<43
.0
0.93
AK45
85.0 1.4
105
43.8
53.8
67.2
25.6<34.3<49
.9
0.61
P45***
80.3 3.3
129
48.5
55.6
65.9
29.5<36.1<48
.2
0.75
* Dated on the basis of nannoplankton content. Because of the close proximity of sites P1, P1a, P2, P4 and P6 all sites were assigned a lower Campanian age. ** Dated on the basis of conodonts, chondrichthye teeth and/or brachiopoda.

ACC
EPTE
D M
ANU
SCR
IPT
ACCEPTED MANUSCRIPT
53
*** For reasons dicussed in the text and in the supplementary data, site P6 was not taken int account for correction of inclination shallowing with the E/I method Table 1 Meijers et al.
ACC
EPTE
D M
ANU
SCR
IPT
ACCEPTED MANUSCRIPT
54
Highlights
Six sites in Paleozoic sedimentary SAB rocks have (likely) been remagnetized.
Data from Upper Cretaceous rocks were corrected for inclination shallowing.
Maximum ~1000 km at 85 Ma between SAB and Eurasia when comparing SAB data to
latitude vs. age curves (derived from pole path).
Maximum ~350 km distance (at ~85-80 Ma) by direct comparison of SAB and Eurasia data.
Clockwise rotations of ~85-80 Ma old strata are in line with earlier studies.