One Thousand Questions in California Agriculture Answered - elibrary
CPD5, 1521–1552, 2009
Temperaturevariability in Northern
Europe
H. Seppa et al.
Title Page
Abstract Introduction
Conclusions References
Tables Figures
J I
J I
Back Close
Full Screen / Esc
Printer-friendly Version
Interactive Discussion
Clim. Past Discuss., 5, 1521–1552, 2009www.clim-past-discuss.net/5/1521/2009/© Author(s) 2009. This work is distributed underthe Creative Commons Attribution 3.0 License.
Climateof the Past
Discussions
Climate of the Past Discussions is the access reviewed discussion forum of Climate of the Past
Last nine-thousand years of temperaturevariability in Northern EuropeH. Seppa1, A. E. Bjune2, R. J. Telford2, H. J. B. Birks3,4, and S. Veski5
1Department of Geology, P.O. Box 65, 00014, University of Helsinki, Helsinki, Finland2Bjerknes Centre for Climate Research, c/o Department of Biology, University of Bergen,Allegaten 41, 5007 Bergen, Norway3Department of Biology, University of Bergen, Allegaten 41, 5007 Bergen, Norway4Environmental Change Research Centre, University College London, Gower Street,London WC1E 6BT, UK5Institute of Geology, Tallinn University of Technology, Ehitajate tee 5, 19086 Tallinn, Estonia
Received: 27 April 2009 – Accepted: 4 May 2009 – Published: 27 May 2009
Correspondence to: H. Seppa ([email protected])
Published by Copernicus Publications on behalf of the European Geosciences Union.
1521
CPD5, 1521–1552, 2009
Temperaturevariability in Northern
Europe
H. Seppa et al.
Title Page
Abstract Introduction
Conclusions References
Tables Figures
J I
J I
Back Close
Full Screen / Esc
Printer-friendly Version
Interactive Discussion
Abstract
The threat of future global warming has generated a major interest in quantifying pastclimate variability on centennial and millennial time-scales. However, palaeoclimato-logical records are often noisy and arguments about past variability are only possibleif they are based on reproducible features in several reliably dated datasets. Here5
we focus on the last 9000 years, explore the results of 35 Holocene pollen-basedJuly mean and annual mean temperature reconstructions from Northern Europe bystacking them to create summary curves, and compare them with a high-resolution,summary chironomid-based temperature record and other independent palaeoclimaterecords. The stacked records show that the “Holocene Thermal Maximum” in the re-10
gion dates to 8000 to 4800 cal yr BP and that the “8.2 event” and the “Little Ice Age” at500–100 cal yr BP are the clearest cold episodes during the Holocene. In addition, amore detailed analysis of the last 5000 years pinpoints centennial-scale climate vari-ability with cold anomalies at 3800–3000 and 500–100 cal yr BP, a long, warmer pe-riod around 2000 cal yr BP, and a marked warming since the mid 19th century. The15
colder (warmer) anomalies are associated with increased (decreased) humidity overthe Northern European mainland, consistent with the modern high correlation betweencold (warm) and humid (dry) modes of summer weather in the region. A compari-son with the key proxy records reflecting the main forcing factors does not supportthe hypothesis that solar variability is the cause of the late-Holocene centennial-scale20
temperature changes. We suggest that the reconstructed anomalies are typical ofNorthern Europe and their occurrence may be related to the oceanic and atmosphericcirculation variability in the North Atlantic–North-European region.
1 Introduction
The climate of Northern Europe is characterized by high multi-scale variability, related25
to the changing modes and intensities of the atmospheric and oceanic circulation pro-
1522
CPD5, 1521–1552, 2009
Temperaturevariability in Northern
Europe
H. Seppa et al.
Title Page
Abstract Introduction
Conclusions References
Tables Figures
J I
J I
Back Close
Full Screen / Esc
Printer-friendly Version
Interactive Discussion
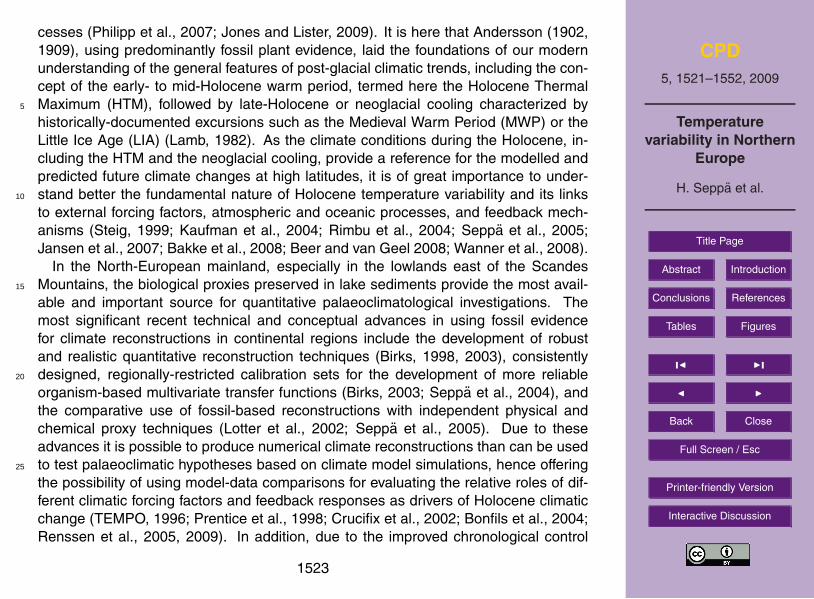
cesses (Philipp et al., 2007; Jones and Lister, 2009). It is here that Andersson (1902,1909), using predominantly fossil plant evidence, laid the foundations of our modernunderstanding of the general features of post-glacial climatic trends, including the con-cept of the early- to mid-Holocene warm period, termed here the Holocene ThermalMaximum (HTM), followed by late-Holocene or neoglacial cooling characterized by5
historically-documented excursions such as the Medieval Warm Period (MWP) or theLittle Ice Age (LIA) (Lamb, 1982). As the climate conditions during the Holocene, in-cluding the HTM and the neoglacial cooling, provide a reference for the modelled andpredicted future climate changes at high latitudes, it is of great importance to under-stand better the fundamental nature of Holocene temperature variability and its links10
to external forcing factors, atmospheric and oceanic processes, and feedback mech-anisms (Steig, 1999; Kaufman et al., 2004; Rimbu et al., 2004; Seppa et al., 2005;Jansen et al., 2007; Bakke et al., 2008; Beer and van Geel 2008; Wanner et al., 2008).
In the North-European mainland, especially in the lowlands east of the ScandesMountains, the biological proxies preserved in lake sediments provide the most avail-15
able and important source for quantitative palaeoclimatological investigations. Themost significant recent technical and conceptual advances in using fossil evidencefor climate reconstructions in continental regions include the development of robustand realistic quantitative reconstruction techniques (Birks, 1998, 2003), consistentlydesigned, regionally-restricted calibration sets for the development of more reliable20
organism-based multivariate transfer functions (Birks, 2003; Seppa et al., 2004), andthe comparative use of fossil-based reconstructions with independent physical andchemical proxy techniques (Lotter et al., 2002; Seppa et al., 2005). Due to theseadvances it is possible to produce numerical climate reconstructions than can be usedto test palaeoclimatic hypotheses based on climate model simulations, hence offering25
the possibility of using model-data comparisons for evaluating the relative roles of dif-ferent climatic forcing factors and feedback responses as drivers of Holocene climaticchange (TEMPO, 1996; Prentice et al., 1998; Crucifix et al., 2002; Bonfils et al., 2004;Renssen et al., 2005, 2009). In addition, due to the improved chronological control
1523
CPD5, 1521–1552, 2009
Temperaturevariability in Northern
Europe
H. Seppa et al.
Title Page
Abstract Introduction
Conclusions References
Tables Figures
J I
J I
Back Close
Full Screen / Esc
Printer-friendly Version
Interactive Discussion
and increased time resolution of the reconstructions it is becoming possible to identifyand evaluate statistically the occurrence of centennial-scale warmer and colder peri-ods and to compare reliably the details of the continental palaeoclimatic records withthose from marine and ice-core records and the output of climate simulations focusingon fine-scale Holocene variability (Renssen et al., 2006; Jongma et al. 2007).5
During the last decade intense efforts have taken place in Northern Europe to cre-ate, expand, and improve organism-based calibration models and to produce newquantitative reconstructions so as to increase the accuracy and spatial coverage ofthe palaeoclimate records. Here we summarize the results of pollen-based Holocenetemperature reconstructions along two transects in Northern Europe, ranging from the10
Norwegian Atlantic coast to 26◦ E in Estonia and Finland and from 57◦ N in SouthernFennoscandia to 70◦ N in the boreal-arctic boundary in Northern Fennoscandia. Thesetransects are designed to allow us to investigate regional patterns in climate historyrelated to the pronounced south-north temperature gradient and west-east oceanicity-continentality gradient of Northern Europe (Giesecke et al., 2008). In addition, inclusion15
of several temporally-detailed and consistently-generated palaeoclimatic reconstruc-tions provides an opportunity to test the hypotheses about the broad-scale variability ofthe Holocene climate. An influential but controversial hypothesis suggests that, in ad-dition to the orbitally-forced secular temperature changes, Holocene climate has beenrepeatedly punctuated by cold events, occurring at roughly 1500-year intervals (Bond20
et al., 1997, 2001), representing a damped version of the glacial 1470-yr cyclicity, andbeing possibly connected to reductions in solar output (Bond et al., 2001). Evidencefor these repeated cold events, however, is not present in many of the high-resolutionmarine and terrestrial climate reconstructions from the North Atlantic and its easternseaboard and the generality of these records has therefore been questioned and in-25
tensively discussed (Seppa and Birks, 2002; Risebrobakken et al., 2003; Schulz etal., 2004; Turney et al., 2005; Jansen et al., 2007; Wanner et al., 2008). The newwell-dated, high-resolution data sets presented here provide therefore an opportunityto assess the potential occurrence of the hypothesized cold episodes and cycles in the
1524
CPD5, 1521–1552, 2009
Temperaturevariability in Northern
Europe
H. Seppa et al.
Title Page
Abstract Introduction
Conclusions References
Tables Figures
J I
J I
Back Close
Full Screen / Esc
Printer-friendly Version
Interactive Discussion
North-European continental climate history.
2 Area, material and methods
2.1 Pollen-based temperature reconstructions
We carried out pollen-based quantitative climate reconstructions from 35 pollen strati-graphies obtained from lake sediments (Table 1). All lakes were selected and sam-5
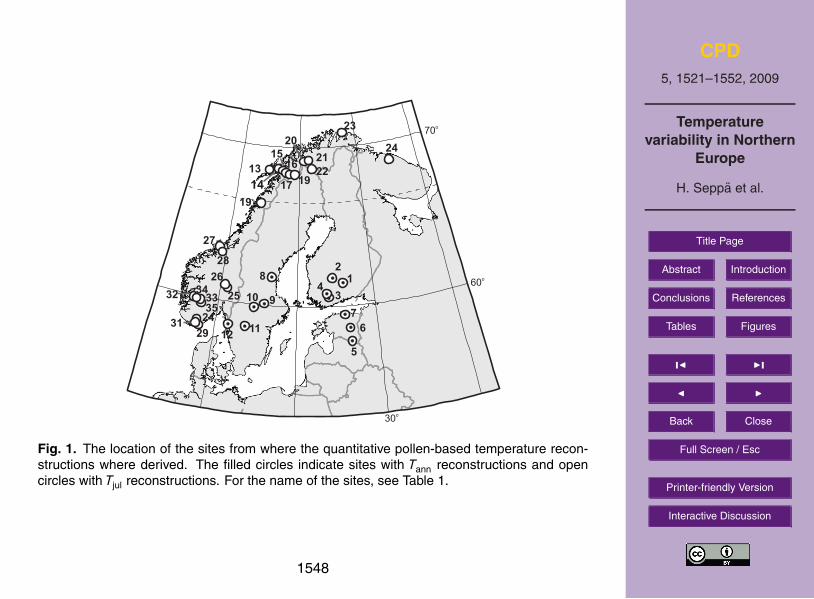
pled using consistent criteria (Seppa and Birks, 2001; Seppa et al., 2004). Annualmean temperature (Tann) was reconstructed from 12 lakes located in the lowland eastof the Scandes Mountians, in Central Fennoscandia and Estonia, between 57◦–62◦ N,in the gradual boundary between the northern temperate zone and southern borealzone (Fig. 1). July mean temperature (Tjul) was reconstructed from 23 lakes located10
between 68◦–70◦ N in the North-Fennoscandian tree-line region and in the ecotonalregions in Western and Southern Norway (Fig. 1). The altitudinal (alpine) ecotone inSouthern Norway, the latitudinal (arctic) ecotone in Northern Fennoscandia and theboreal-temperate ecotone in Southern Fennoscandia and the Baltic countries are pre-dominantly temperature-controlled and represent suitable settings for using pollen data15
for investigating long-term temperature changes.The calibration model used for reconstructing the Tjul values consists of 321 modern
surface-sediment samples of which 283 from Norway, 11 from Svalbard (Norway), and27 from Northern Sweden (Seppa and Birks, 2001; Birks et al., unpublished). Themodel used for Tann reconstructions comprises 113 samples from Finland, 24 samples20
from Estonia and 36 samples from Sweden (Antonsson et al., 2006). Modern Tjul andTann values were estimated using the 1961–1990 Climate Normals data from grids ofnearby meteorological stations in Norway, Sweden, Finland, and Estonia. For moredetailed information on site selection, fieldwork and modern climate data, see Seppaand Birks (2001) and Seppa et al. (2004).25
Modern pollen-climate transfer functions were developed using weighted-averaging
1525
CPD5, 1521–1552, 2009
Temperaturevariability in Northern
Europe
H. Seppa et al.
Title Page
Abstract Introduction
Conclusions References
Tables Figures
J I
J I
Back Close
Full Screen / Esc
Printer-friendly Version
Interactive Discussion
partial least squares (WA-PLS) regression (ter Braak and Juggins, 1993). All terrestrialpollen and spore taxa were used in the transfer function. Their percentages were trans-formed to square-roots in an attempt to optimize the “signal” to “noise” ratio and to stabi-lize the variances. WA-PLS was selected because it has been shown in many empiricaland several theoretical studies to perform as well as or even better than other regres-5
sion and calibration procedures commonly used to develop organism-environmentaltransfer functions (see ter Braak et al., 1993; Birks, 1995, 1998).
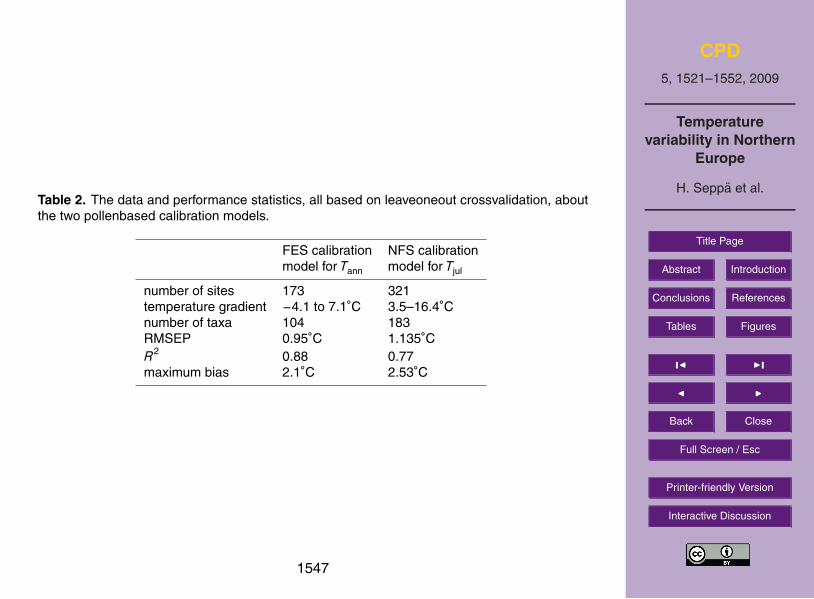
The performance of the WA-PLS transfer function models are reported (Table 2) asthe root mean square error of prediction (RMSEP), the coefficient of determination (R2)between observed and predicted values, and the maximum bias (ter Braak and Jug-10
gins, 1993), all based on leave-one-out cross-validation or jack-knifing (ter Braak andJuggins, 1993; Birks, 1995). Two-component WA-PLS models were selected (Table 2)on the basis of low RMSEP, low maximum bias, and the smallest number of “useful”components (Birks, 1998). More details of the modern pollen-climate data-sets aregiven in Seppa and Birks (2001), Seppa et al. (2004), and Antonsson et al. (2006).15
The reason for reconstructing Tjul for the high-latitude sites in Northern Fennoscandiaand the high-altitude sites in Western and Southern Norway and Tann for the lowlandsites in Central and Southern Fennoscandia is that in the tree-line sites the growingseason is confined to three or four summer months (MJJA) and a vegetation-basedproxy such as pollen arguably reflects predominantly summer temperature conditions.20
This is not the case in the Central and Southern Fennoscandian lowlands, where thegrowing season is considerably longer, starting often in March or April and continuingto October (Walther and Linderholm., 2006). In addition, winter climatic conditions areimportant for the distribution and regeneration of many plant species, especially thoserestricted to the most oceanic parts along the west coast of Fennoscandia (Dahl, 1998;25
Giesecke et al., 2008). Thus the pollen records represent a mixture of taxa with differ-ent temperature requirements in relation to the seasons. Annual mean temperature isthus probably a more appropriate climatic parameter to be reconstructed from pollendata in Southern and Central Fennoscandia than July mean temperature (Seppa et al.,
1526
CPD5, 1521–1552, 2009
Temperaturevariability in Northern
Europe
H. Seppa et al.
Title Page
Abstract Introduction
Conclusions References
Tables Figures
J I
J I
Back Close
Full Screen / Esc
Printer-friendly Version
Interactive Discussion
2004).
2.2 Age-depth models
The chronology for 33 of the 35 lake-sediment cores is based in AMS radiocarbondating. The number of dates per core ranges from 4 to 13 (Table 1). All ages were cali-brated to calendar years using CALIB4.3 (Stuiver and Reimer, 1993) or CALIB5.0 (Stu-5
iver et al., 2005) software and INTCAL98 (Stuiver et al., 1998) or INTCAL04 (Reimeret al., 2004) calibration data. For sites 1, 3, 8–23 and 25–35 the age-depth modelsare based on a mixed effect weighted regression procedure within the framework ofgeneralized additive models (Heegaard, 2003; Heegaard et al., 2005). For sites 4, 6,7, 10, and 24 the age-depth model was obtained by fitting a second-order polynomial10
curve (third-order with lake 24) to the calibrated dates. Lakes 2 and 5 are particularlyimportant in the present context due to their high sample resolution (Table 1). Lake 2 isan annually laminated lake and has therefore an accurate chronology for the last 9000years (Ojala and Tiljander, 2003). Lake 5 is partly annually laminated but the varvechronology is floating. The chronology and age-depth model for the lake were derived15
by correlating the palaeomagnetic secular variation (PSV) curve with the clear anchorpoints of the PSV curve of lake 2. The obtained chronology is supported by AMS dates(Veski et al., 2004)
The sediment cores were collected in 1990s and early 2000s and the uppermost0–1 cm of the sediment is believed to represent the present-day.20
3 Results and discussion
3.1 General climatic trends
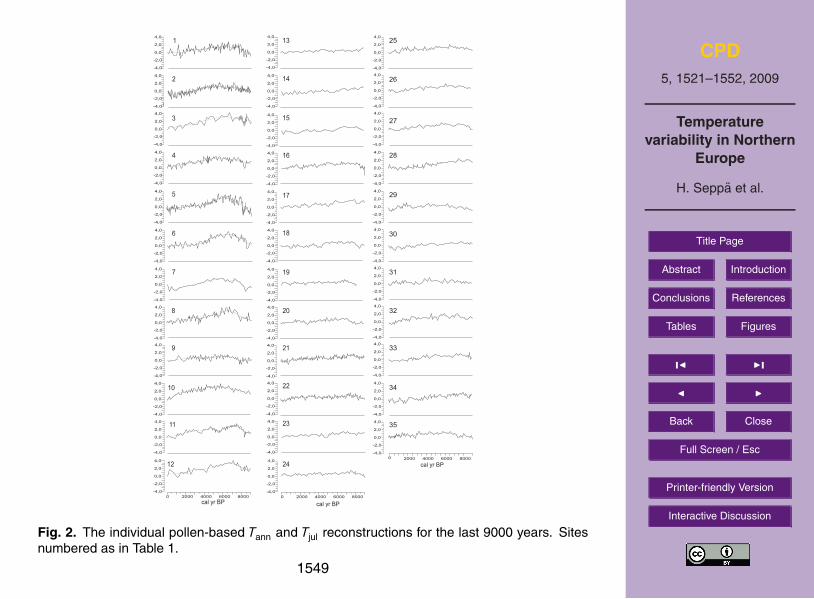
We first examine the implications of the general temperature trends. Figure 2 por-trays the results of the individual Tann and Tjul reconstructions for the last 9000 years.
1527
CPD5, 1521–1552, 2009
Temperaturevariability in Northern
Europe
H. Seppa et al.
Title Page
Abstract Introduction
Conclusions References
Tables Figures
J I
J I
Back Close
Full Screen / Esc
Printer-friendly Version
Interactive Discussion
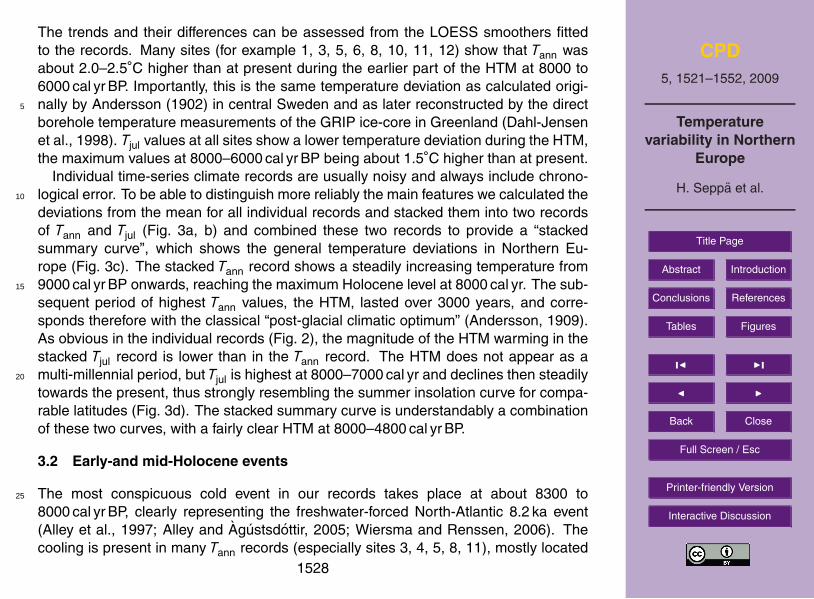
The trends and their differences can be assessed from the LOESS smoothers fittedto the records. Many sites (for example 1, 3, 5, 6, 8, 10, 11, 12) show that Tann wasabout 2.0–2.5◦C higher than at present during the earlier part of the HTM at 8000 to6000 cal yr BP. Importantly, this is the same temperature deviation as calculated origi-nally by Andersson (1902) in central Sweden and as later reconstructed by the direct5
borehole temperature measurements of the GRIP ice-core in Greenland (Dahl-Jensenet al., 1998). Tjul values at all sites show a lower temperature deviation during the HTM,the maximum values at 8000–6000 cal yr BP being about 1.5◦C higher than at present.
Individual time-series climate records are usually noisy and always include chrono-logical error. To be able to distinguish more reliably the main features we calculated the10
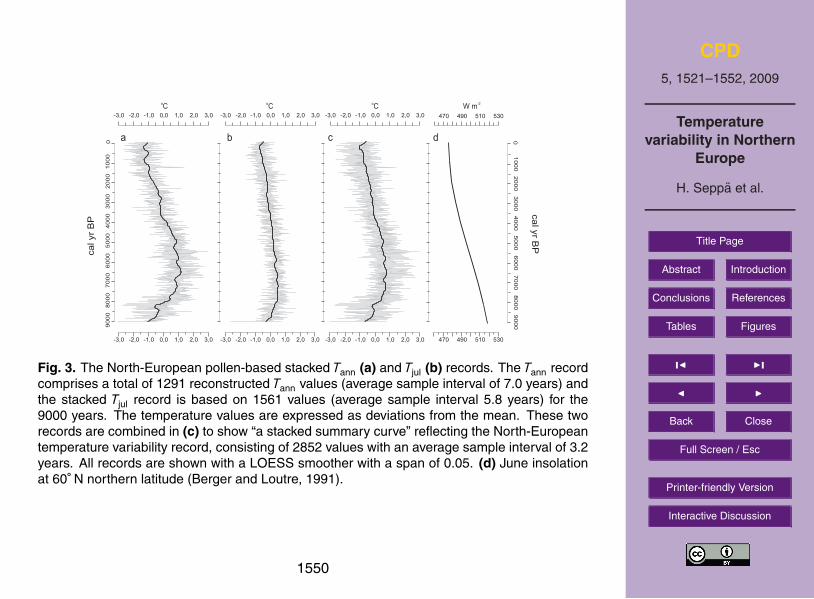
deviations from the mean for all individual records and stacked them into two recordsof Tann and Tjul (Fig. 3a, b) and combined these two records to provide a “stackedsummary curve”, which shows the general temperature deviations in Northern Eu-rope (Fig. 3c). The stacked Tann record shows a steadily increasing temperature from9000 cal yr BP onwards, reaching the maximum Holocene level at 8000 cal yr. The sub-15
sequent period of highest Tann values, the HTM, lasted over 3000 years, and corre-sponds therefore with the classical “post-glacial climatic optimum” (Andersson, 1909).As obvious in the individual records (Fig. 2), the magnitude of the HTM warming in thestacked Tjul record is lower than in the Tann record. The HTM does not appear as amulti-millennial period, but Tjul is highest at 8000–7000 cal yr and declines then steadily20
towards the present, thus strongly resembling the summer insolation curve for compa-rable latitudes (Fig. 3d). The stacked summary curve is understandably a combinationof these two curves, with a fairly clear HTM at 8000–4800 cal yr BP.
3.2 Early-and mid-Holocene events
The most conspicuous cold event in our records takes place at about 8300 to25
8000 cal yr BP, clearly representing the freshwater-forced North-Atlantic 8.2 ka event(Alley et al., 1997; Alley and Agustsdottir, 2005; Wiersma and Renssen, 2006). Thecooling is present in many Tann records (especially sites 3, 4, 5, 8, 11), mostly located
1528

CPD5, 1521–1552, 2009
Temperaturevariability in Northern
Europe
H. Seppa et al.
Title Page
Abstract Introduction
Conclusions References
Tables Figures
J I
J I
Back Close
Full Screen / Esc
Printer-friendly Version
Interactive Discussion
in the ecotone of the temperate and boreal zones, where thermophilous tree taxa oc-cur near their northern range limit. The high-resolution records from this region showa cooling of about 1.0◦C, followed by abrupt, high-magnitude warming of about 2.0◦Cin less than 50 years (Veski et al., 2004). No or weak evidence for the cooling canbe observed in the Tjul records obtained from Norway, the northern tree-line region,5
or in the stacked Tjul record (Figs. 2 and 3b). Seppa et al. (2007) discuss this spatialpattern and its possible causes. One factor that may explain the clearer evidence inthe south is that both evidence and simulations of the 8.2 ka event suggest that thecooling took place mostly during the winter on the eastern North Atlantic seaboard (Al-ley and Agustsdottir, 2005; Wiersma and Renssen, 2006). In the southern part of our10
study region the vegetative growth pattern, regeneration and pollen productivity aremore sensitive to winter and early spring temperatures than in Northern Fennoscan-dia. However, the relatively weak evidence for the cooling on the Norwegian west coastand Southern Norway (sites 25–35 in Fig. 2), where a strong cooling is suggested bymodels (Wiersma and Renssen, 2006), is not fully consistent with this explanation and15
thus requires further attention in the future.The stacked Tann record shows some variability during the HTM (Fig. 3a), with colder
periods at about 7000 and 5300 cal yr BP. These wiggles are not replicated in the Tjulrecord, suggesting that they may not represent regionally significant climatic events.However, Sommer et al. (2009) showed that the regional extirpation of the European20
pond turtle, a temperate species intolerant of cold summer, happened in Fennoscan-dia at about 5500 cal yr BP, probably due to a cold spell. Moreover, evidence for alarge regional cooling at 5800–5100 cal yr BP has been reported from the North At-lantic and Central Europe (O’Brien et al., 1995; Oppo et al. 2003; Magny and Haas,2004; Moros et al., 2004; Vollweiler et al., 2006), and the strong signal in the Green-25
land glaciochemical proxies may be linked to an enchanced Eurasian high (Mayewskiet al., 1997), suggesting that the cooling may have been associated with a decreasedstrength of the westerly circulation in Northern Europe.
1529
CPD5, 1521–1552, 2009
Temperaturevariability in Northern
Europe
H. Seppa et al.
Title Page
Abstract Introduction
Conclusions References
Tables Figures
J I
J I
Back Close
Full Screen / Esc
Printer-friendly Version
Interactive Discussion
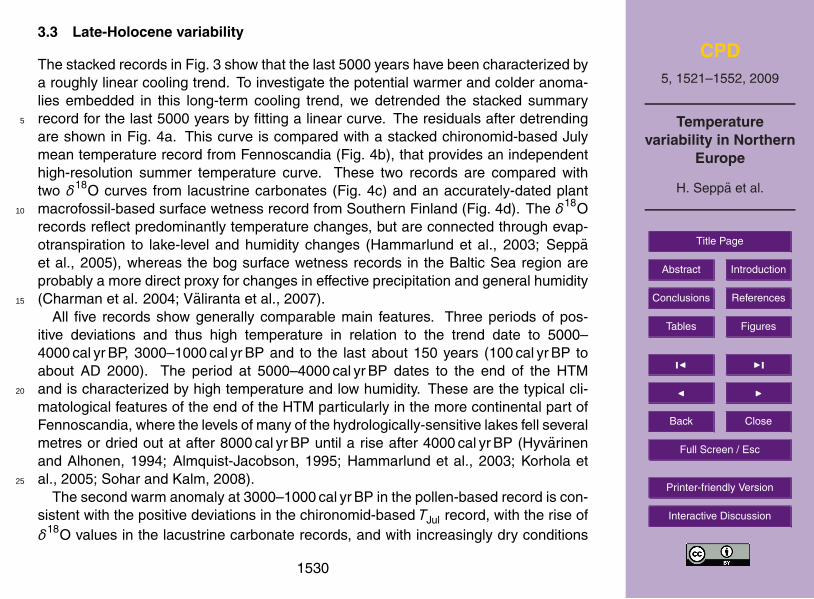
3.3 Late-Holocene variability
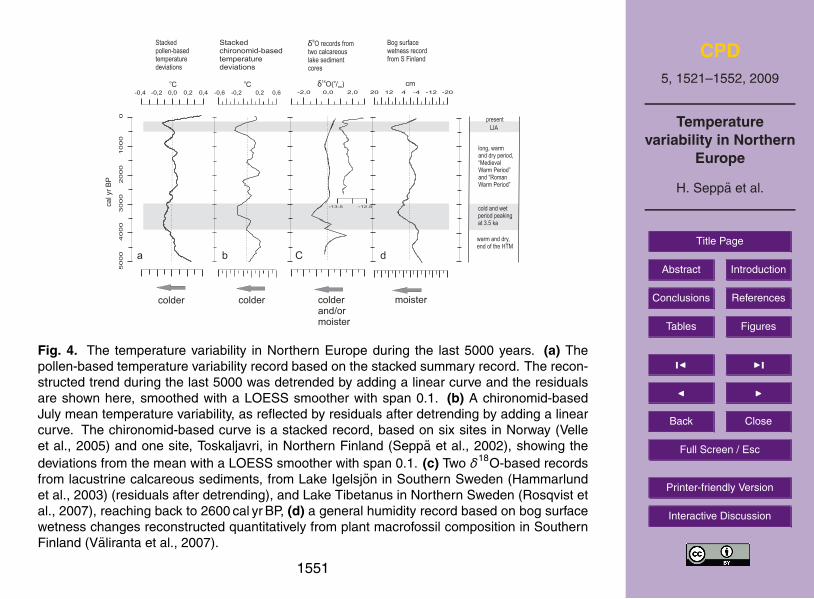
The stacked records in Fig. 3 show that the last 5000 years have been characterized bya roughly linear cooling trend. To investigate the potential warmer and colder anoma-lies embedded in this long-term cooling trend, we detrended the stacked summaryrecord for the last 5000 years by fitting a linear curve. The residuals after detrending5
are shown in Fig. 4a. This curve is compared with a stacked chironomid-based Julymean temperature record from Fennoscandia (Fig. 4b), that provides an independenthigh-resolution summer temperature curve. These two records are compared withtwo δ18O curves from lacustrine carbonates (Fig. 4c) and an accurately-dated plantmacrofossil-based surface wetness record from Southern Finland (Fig. 4d). The δ18O10
records reflect predominantly temperature changes, but are connected through evap-otranspiration to lake-level and humidity changes (Hammarlund et al., 2003; Seppaet al., 2005), whereas the bog surface wetness records in the Baltic Sea region areprobably a more direct proxy for changes in effective precipitation and general humidity(Charman et al. 2004; Valiranta et al., 2007).15
All five records show generally comparable main features. Three periods of pos-itive deviations and thus high temperature in relation to the trend date to 5000–4000 cal yr BP, 3000–1000 cal yr BP and to the last about 150 years (100 cal yr BP toabout AD 2000). The period at 5000–4000 cal yr BP dates to the end of the HTMand is characterized by high temperature and low humidity. These are the typical cli-20
matological features of the end of the HTM particularly in the more continental part ofFennoscandia, where the levels of many of the hydrologically-sensitive lakes fell severalmetres or dried out at after 8000 cal yr BP until a rise after 4000 cal yr BP (Hyvarinenand Alhonen, 1994; Almquist-Jacobson, 1995; Hammarlund et al., 2003; Korhola etal., 2005; Sohar and Kalm, 2008).25
The second warm anomaly at 3000–1000 cal yr BP in the pollen-based record is con-sistent with the positive deviations in the chironomid-based TJul record, with the rise ofδ18O values in the lacustrine carbonate records, and with increasingly dry conditions
1530
CPD5, 1521–1552, 2009
Temperaturevariability in Northern
Europe
H. Seppa et al.
Title Page
Abstract Introduction
Conclusions References
Tables Figures
J I
J I
Back Close
Full Screen / Esc
Printer-friendly Version
Interactive Discussion
in the surface wetness reconstruction. This period, which seems to peak at around2000 cal yr BP, has not been widely investigated or documented earlier in Northern Eu-rope. In central Europe this period appears as a ca. 2000-year long period of relativelyhigh temperature and low humidity. In the Alps, for example, glaciological evidencesupported by archaeological finds suggests a marked alpine glacier retreat peaking at5
2100–1800 cal yr BP, reflecting thus warm and dry conditions (Jorin et al., 2006; Gros-jean et al., 2007). In general, the warm period can be connected with the Roman WarmPeriod, dating to around 2000 cal yr BP, and with the Medieval Warm Period at about1000 cal yr BP (Mann, 2007). These two periods are sometimes separated by a shortercolder spell that may have centred on 1500–1400 cal yr BP (Grudd, 2008; Larsen et al.,10
2008), but this historically documented cold spell (“Dark Age Cold Period”) may havebeen triggered by a volcanic eruption and may be thus too short to be even detectedby our stacked data.
It is noteworthy that the MWP cannot be clearly observed in the stacked pollen-basedrecord, nor in the chironomid-based record (Fig. 4). Both records show a generally15
warm trend with a transition to a colder period starting in the pollen-record already at1100 cal yr BP and in the chironomid-record at 900 cal yr BP. These features supportmany earlier investigations according to which the MWP is not reflected as a clearpeak in Northern Europe, but rather represents the final centuries of a longer warm pe-riod before the onset of cooling at 1000–800 cal yr BP towards the lower temperatures20
during the LIA (Bradley et al., 2003; Bjune et al., 2009).The third period with positive temperature deviations dates to last about 150 years.
This post-LIA warming has been recorded in many proxy-based reconstructions, forexample in the Fennoscandian tree-line region (Weckstrom et al., 2006; Rosqvist etal., 2007; Bjune et al., 2009). It agrees with historical data about summer and win-25
ter temperature trends during the previous five centuries in the region. For example,the longest meteorological records from Sweden show a winter warming since early1700s (Bergstrom and Moberg, 2002) and the historical records of ice break-up datesfrom the Baltic Sea show a winter and spring warming starting already at 1700s and
1531
CPD5, 1521–1552, 2009
Temperaturevariability in Northern
Europe
H. Seppa et al.
Title Page
Abstract Introduction
Conclusions References
Tables Figures
J I
J I
Back Close
Full Screen / Esc
Printer-friendly Version
Interactive Discussion
intensifying from the mid 1800s to the present (Tarand and Nordli, 2001). On the basisof their pollen-based reconstructions from 11 sites in the Fennoscandian tree-line re-gion, Bjune et al. (2009) argued that during the 20th century summers were warmestsince about 1000 cal yr BP. The same recent warming pattern can be observed in thepresent, more extensive Tjul reconstruction (Fig. 3b) and in the Tann reconstruction re-5
flecting only central and Southern Fennoscandia and the Baltic region (Fig. 3a). Thewarming that began in the 1800s and reversed the long-term cooling trend has there-fore been a large-scale phenomenon in Northern Europe, and probably even in thewhole circum-arctic region (Kaufman et al., 2009).
Two colder anomalies can be identified during the last 5000 years, dating to 3800–10
3000 cal yr BP and to 500–100 cal yr BP. Many records from Northern Europe give evi-dence of the onset of a cooling trend at about 4500–4000 year cal yr BP, but few previ-ous studies emphatically identify a colder anomaly at 3800–3000 cal yr BP. Some proxyrecords, for example from Northern Sweden (Rosen et al., 2002) and Finland (Ojalaand Tiljander, 2003), suggest a colder period around 3500 cal yr BP and high-resolution15
sedimentary analyses focusing on the HTM–neoglaciation transition in Southern Swe-den pinpoint a cold period at 4000–3500 cal yr, with most severe aquatic responsepeaking at 3800 cal yr BP (Jessen et al., 2005). This colder event also has equivalencein some records in Northern Europe and North Atlantic (Nesje et al., 2001; Charmanet al., 2006). The bog surface wetness record (Fig. 4d) shows that the lower temper-20
ature was associated with increased humidity at 3500–3200 cal yr BP (Valiranta et al.,2007). This is consistent with the evidence of Rundgren (2008) who interpreted com-bined peat-stratigraphical records in Sweden to reflect particularly moist condition, a“wet-shift” peaking at 3300 cal yr.
The last cold anomaly at 500–100 cal yr BP corresponds with the LIA, the most fre-25
quently identified cold period in proxy records from Northern Europe. In general, ourreconstructed timing and magnitude of the LIA agrees with the results of the more de-tailed investigations based on dendrochronological data from Northern Fennoscandia(Grudd, 2008) and with the peak of the LIA in Europe, dated from late 1500s to early
1532
CPD5, 1521–1552, 2009
Temperaturevariability in Northern
Europe
H. Seppa et al.
Title Page
Abstract Introduction
Conclusions References
Tables Figures
J I
J I
Back Close
Full Screen / Esc
Printer-friendly Version
Interactive Discussion
1800s (Bradley and Jones, 1993; Moberg et al., 2005). This agreement is notewor-thy because it shows that despite the human influence on vegetation composition andland-cover the pollen-based records still capture the main climate trends in the ecotonalareas. This may be partly due to the direct influence of climate on pollen productivitynear species distribution limits (Hicks, 1999; Seppa et al., 2007) and partly because5
most of our sites have been selected from such settings where human influence hasbeen less intense than in the more densely inhabited and cultivated regions. This isparticularly true for the sites located in Northern Fennoscandia where the evidence forLIA is clearest (Bjune et al., 2009).
3.4 Forcing factors10
A remarkable feature in the climate variability during the last 5000 years is the consis-tency between the proxies reflecting temperature and humidity. During the last 5000years the warm anomalies have been associated with dry conditions and cold anoma-lies with humid conditions. This is undoubtedly partly due to the higher evapotranspi-ration associated with higher temperature, but is probably partly a result of the nature15
of the key atmospheric circulation processes in the region. At present in Northern Eu-rope, highest summer temperature anomalies are linked to the anticyclonic circulationtype, with the blocking anticyclone as its extreme form, characterized by a long-livedhigh pressure system centred over Scandinavia, causing weak westerly flow and lead-ing thus to reduced precipitation (Chen and Hellstrom, 1999; Busuioc et al., 2001;20
Antonsson et al., 2008; Carrill et al., 2008). Antonsson et al. (2008) suggested thatthe markedly long warm and dry mid-Holocene period at 8000–5000 cal yr BP in North-ern Europe was associated with predominantly anticyclonic summer circulation. Thepresent evidence suggests that this connection between high summer temperature,low humidity and, by inference, anticyclonic circulation may explain even the centen-25
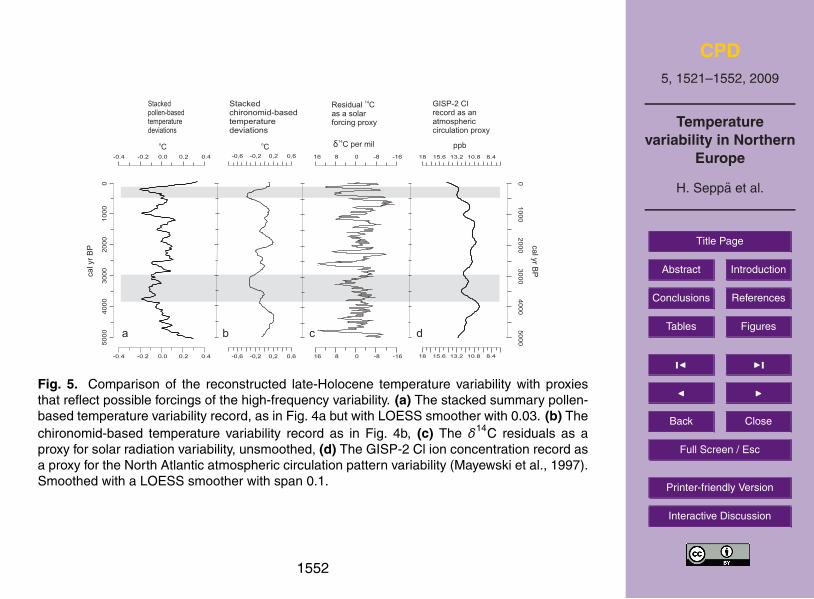
nial to multi-centennial- scale climate variability during the late Holocene. The GISP-2ice-core Cl ion concentration record is often inferred as a proxy for the large-scalecirculation type changes over the North-Atlantic-Eurasian region (Fig. 5d). There is
1533
CPD5, 1521–1552, 2009
Temperaturevariability in Northern
Europe
H. Seppa et al.
Title Page
Abstract Introduction
Conclusions References
Tables Figures
J I
J I
Back Close
Full Screen / Esc
Printer-friendly Version
Interactive Discussion
some correlation, albeit weak, between the Cl record and our temperature record, butthis support for the suggested circulation dynamics is tentative at most, especially be-cause the relationship between the ice-core Cl concentration and Eurasian circulationin relatively poorly constrained.
The assessment of the forcing factors behind the inferred climatic and circulation5
changes is more complicated, but some preliminary assessment can be done bycomparing the reconstructed patterns with the proxy records reflecting the magnitudechanges in the main forcings. The roughly linear cooling trend during the last 5000years most likely reflects the high-latitude temperature response to the decline of thesummer and annual insolation values (Wanner et al., 2008; Renssen et al., 2009).10
The suggested deviations from this trend, such as the LIA or the cool period at 3800–3000 cal yr BP, result therefore from the influence of forcing factors other than insolation,with solar irradiation changes and volcanic aerosol, land-cover, and greenhouse gasforcings as the most likely candidates (Wanner et al., 2008). The detrended deviationof the atmospheric 14C/12C ratio record is generally interpreted as a proxy for solar irra-15
diance variability during the Holocene (Weber et al., 2004; Beer and van Geel, 2008).In general, the correlation between our temperature records and solar irradiance vari-ability is poor (Fig. 5). Neither the cold anomalies nor the warm anomalies appear tobe connected with positive or negative anomalies in the detrended δ14C data: the LIAmaybe an exception to this. The peak of LIA centres in the North-European records20
to 450–100 cal yr BP, consistent with a positive δ14C anomaly, and it may have beenbrought about by the coincidence of low NH orbital forcing during the late-Holocene,with unusually low solar activity and a high number of major volcanic eruptions (Wanneret al., 2008).
4 Conclusions25
We combined 35 pollen-based July mean and annual mean reconstructions fromNorthern Europe to investigate the temperature variability during the last 9000 years.
1534
CPD5, 1521–1552, 2009
Temperaturevariability in Northern
Europe
H. Seppa et al.
Title Page
Abstract Introduction
Conclusions References
Tables Figures
J I
J I
Back Close
Full Screen / Esc
Printer-friendly Version
Interactive Discussion
The records range from the Norwegian Atlantic coast to 26◦ E in Estonia and Finlandand from 57◦ N in Southern Fennoscandia to 70◦ N in the North. Most of the recordscentre on the temperate-boreal boundary in the south, the boreal-arctic boundary inNorthern Fennoscandia or the boreal-alpine boundary in the Norwegian mountains.They are therefore sensitively located to capture temperature-driven changes in vege-5
tation composition, vegetative growth patterns, and pollen productivity.Our results show the well-established pattern of HTM, followed by a roughly linear
cooling during the last 5000 years. The coolings at 8200 cal yr BP (“8.2 ka event”) andat 500–100 cal yr BP (“LIA”) are the most significant abrupt events. The “8.2 ka event” isparticularly clear in our stacked Tann record from the Baltic region, whereas the LIA oc-10
curs in the whole study region, particularly in the arctic and alpine regions with minimalhuman interference.
To examine more closely the temperature variability during the last 5000 years wecompared our pollen-based detrended temperature record with a stacked chironomid-based July mean temperature record based on the data from seven sites from15
Fennoscandia. The general features of these two independent records support eachother and suggest that, in addition to the cold anomaly during the LIA, another longerlate-Holocene cold anomaly dates to 3800–3000 cal yr BP. This anomaly is supportedby some high-resolution records, but has not been widely reported earlier. These twocold anomalies are separated by a long warm spell peaking at 2000 cal yr BP, tenta-20
tively correlated here with the “Roman Warm Period” reported from Central Europe.The steady late-Holocene cooling trend has been reversed during the last 150 year.This post-LIA warming is consistent with the long-term meteorological and historicalrecords from the region and represents the strongest warming trend since the warmingat 8000 cal yr BP, after the 8.2 ka event.25
We suggest that the most direct driver of the late-Holocene anomalies has beenchanges in the dominant atmospheric circulation type. This seems likely in an area,where the modern temperature and precipitation values are highly variable dependingon the changing circulation patterns. The anticyclonic circulation type, currently associ-
1535
CPD5, 1521–1552, 2009
Temperaturevariability in Northern
Europe
H. Seppa et al.
Title Page
Abstract Introduction
Conclusions References
Tables Figures
J I
J I
Back Close
Full Screen / Esc
Printer-friendly Version
Interactive Discussion
ated with the highest summer temperature, is a strong candidate as the mechanism be-hind the warm and dry late-Holocene anomalies. A more detailed analysis of the linksbetween the reconstructed temperature patterns, inferred circulation changes, and thekey late-Holocene forcing factors, such as the variability in ocean surface tempera-tures, solar irradiance, aerosols, greenhouse gas concentrations, and more complex5
combinations of these and other forcings, requires a more coherent analysis involvingmodel experiments and will be a major palaeoclimatological task in the future.
Acknowledgements. The authors acknowledge D. Hammarlund, N. Rosqvist, M. Valiranta andG. Velle for providing data and M. Tonello for comments. Financial support for H. S. wasprovided by The Academy of Finland (HOT-project) and NordForsk (NEPAL-network). This is a10
publication from the Bjerknes Centre for Climate Research.
References
Alley, R. B. and Agustsdottir, A. M.: The 8k event: cause and consequences of a majorHolocene abrupt climate change, Quaternary Sci. Rev., 10–11, 1123–1149, 2005.
Alley, R. B., Mayewski, P. A., Sowers, T., Stuiver, M., Taylor, K. C., and Clark, P. U.: Holocene15
climatic instability: A prominent, widespread event 8200 yr ago, Geology, 25, 483–486, 1997.Almquist-Jacobson, H.: Lake-level fluctuations at Ljustjarnen, central Sweden and their im-
plications for the Holocene climate of Scandinavia, Palaeogeogr. Palaeocl., 118, 269–290,1995.
Andersson, G.: Hasseln i Sverige fordom och nu, Sveriges Geologiska Undersokning, Ser. C.,20
3, 1–168, 1902.Andersson, G.: The climate of Sweden in the Late-Quaternary period, Sveriges geologiska
undersokning, Ser. C., 3, 1–88, 1909.Antonsson, K. and Seppa, H.: Holocene temperatures in Bohuslan, Southwestern Sweden: a
quantitative reconstruction from fossil pollen data, Boreas, 36, 400–410, 2007.25
Antonsson, K., Brooks, S. J., Seppa, H., Telford, R. J., and Birks, H. J. B.: Quantitativepalaeotemperature records inferred from fossil chironomid and pollen assemblages fromLake Gilltjarnen, northern central Sweden, J. Quaternary Sci., 21, 831–841, 2006.
1536
CPD5, 1521–1552, 2009
Temperaturevariability in Northern
Europe
H. Seppa et al.
Title Page
Abstract Introduction
Conclusions References
Tables Figures
J I
J I
Back Close
Full Screen / Esc
Printer-friendly Version
Interactive Discussion
Antonsson, K., Chen, D., and Seppa, H.: Anticyclonic atmospheric circulation as an analoguefor the warm and dry mid-Holocene summer climate in central Scandinavia, Clim. Past, 4,215–224, 2008, http://www.clim-past.net/4/215/2008/.
Bakke, J., Lie, Ø., Dahl, S. O., Nesje, A., and Bjune, A. E.: Strength and spatial patterns of theHolocene wintertime westerlies in the NE Atlantic region, Global Planet. Change, 60, 28–41,5
2008.Beer, J. and van Geel, B.: Holocene climate change and the evidence for solar and other
forcings, in: Natural climate variability and global warming: a Holocene perspective, editedby: Battarbee, R. W. and Binney, H. A., Wiley-Blackwell, Chichester, 138–162, 2008.
Berger, A. and Loutre, M.-F.: Insolation values for the climate of the last 10 000 000 years,10
Quaternary Sci. Rev., 10, 297–317, 1991.Bergstrom, H. and Moberg, A.: Daily air temperature and pressure series from Uppsala (1722–
1998), Climatic Change, 53, 213–252, 2002.Birks, H. J. B.: Quantitative palaeoenvironmental reconstructions, in: Statistical modeling of
quaternary science data, Technical Guide 5, edited by: Maddy, D. and Brew, J. S., Quater-15
nary Research Association, Cambridge, 161–254, 1995.Birks, H. J. B.: Numerical tools in quantitative palaeolimnology – progress, potentialities, and
problems, J. Paleolimnol., 20, 301–332, 1998.Birks, H. J. B.: Quantitative palaeoenvironmental reconstructions from Holocene biological
data., in: Global Change in the Holocene, edited by: Mackay, A., Battarbee, R. W., Birks, H.20
J. B., and Oldfield, F., Arnold, London, 342–357, 2003.Birks, H. J. B. and Seppa, H.: Pollen-based reconstructions of late-Quaternary climate in Eu-
rope – progress, problems, and pitfalls, Acta Palaeobotanica 44, 317–334, 2004.Bjune, A. E. and Birks, H. J. B.: Holocene vegetation dynamics and inferred climate changes
at Svanavatnet, Mo i Rana, northern Norway, Boreas, 37, 146–156, 2008.25
Bjune, A. E., Birks, H. J. B., and Seppa, H.: Holocene vegetation and climate history on a conti-nental – oceanic transect in northern Fennoscandia based on pollen and plant macrofossils,Boreas, 33, 211–223, 2004.
Bjune, A. E., Seppa, H., and Birks, H. J. B.: Quantitative summer-temperature reconstructionsfor the last 2000 years based on pollen-stratigraphical data from northern Fennoscandia, J.30
Paleolimnol., 41, 43–56, 2009.Bond, G., Showers, W., Cheseby, M., Lotti, R., Almasi, P., deMenocal, P., Priore, P., Cullen, H.,
Hajdas, I., and Bonani, G.: A pervasive millennial-scale cycle in North Atlantic Holocene and
1537
CPD5, 1521–1552, 2009
Temperaturevariability in Northern
Europe
H. Seppa et al.
Title Page
Abstract Introduction
Conclusions References
Tables Figures
J I
J I
Back Close
Full Screen / Esc
Printer-friendly Version
Interactive Discussion
glacial climates, Science, 278, 1257–1266, 1997.Bond, G., Kromer, B., Beer, J., Muscheler, R., Evans, M. N., Showers, W., Hoffman, S., Lotti-
Bond, R., Hajdas, I., and Bonani, G.: Persistent Solar Influence on North Atlantic ClimateDuring the Holocene, Science, 294, 2130–2136, 2001.
Bonfils, C., de Noblet-Docoudre, N., Guiot, J., and Bartlein, P.: Some mechanims of mid-5
Holocene climate change in Europe, inferred from comparing PMIP models to data, Clim.Dynam., 23, 79–98, 2004.
Bradley, R. S. and Jones, P. D.: “Little Ice Age” summer temperature variations: their natureand relevance to recent global warming trend, Holocene, 3, 387–396, 1993.
Bradley, R. S., Hughes, M. K., and Diaz, H. F.: Climate in Medieval Time, Science, 302, 404–10
405, 2003.Busuioc, A., Chen, D., and Hellstrom, C.: Temporal and spatial variability of precipitation in
Sweden and its link with the large scale atmospheric circulation, Tellus, 53A, 348–367, 2001.Carrill, A. F., Gualdi, S. Cherchi, A., and Navarra, A.: Heatwaves in Europe: areas of homoge-
neous variability and links with the regional to large-scale atmospheric and SSTs anomalies,15
Clim. Dynam., 30, 77–98, 2008.Charman, D. J., Brown, A. D., Hendon, D., and Karofeld, E.: Testing the relationship between
Holocene peatland palaeoclimate reconstructions and instrumental data at two Europeansites, Quaternary Sci. Rev., 23, 137–143, 2004.
Charman, D. J., Blundell, A., Chiverrell, R. C., Hendon, D., and Langdon, P. G.: Compilation of20
non-annually resolved Holocene proxy climate records: stacked Holocene peatland palaeo-water table reconstructions from northern Britain, Quaternary Sci. Rev., 25, 336–350, 2006.
Chen, D. and Hellstrom, C.: The influence of the North Atlantic Oscillation on the regionaltemperature variability in Sweden: spatial and temporal variations, Tellus, 51A, 505–516,1999.25
Crucifix, M., Loutre, M.-F., Tulkens, P., Fichefet, T., and Berger, A.: Climate evolution during theHolocene: a study with an Earth system model of intermediate complexity, Clim. Dynam.,19, 43–60, 2002.
Dahl, E.: The Phytogeoraphy of Northern Europe, Cambridge University Press, Cambridge,297 pp., 1998.30
Dahl-Jensen, D., Monsegaard, K, Gundestrup, N., Clow, G. D., Johnsen, S. J., Hansen, A. W.,and Balling, N.: Past Temperatures Directly from the Greenland Ice Sheet, Science, 282,268–271, 1998.
1538
CPD5, 1521–1552, 2009
Temperaturevariability in Northern
Europe
H. Seppa et al.
Title Page
Abstract Introduction
Conclusions References
Tables Figures
J I
J I
Back Close
Full Screen / Esc
Printer-friendly Version
Interactive Discussion
Eide, W., Birks, H. H., Bigelow, N. H., Peglar, S. M., and Birks, H. J. B.: Holocene forestdevelopment along the Setesdal valley, southern Norway, reconstructed from macrofossiland pollen evidence, Veg. Hist. Archaeobot., 15, 65–85, 2006.
Giesecke, T., Bjune, A. E., Chiverrell, R. C., Seppa, H., Ojala, A. E. K., and Birks, H. J. B.:Exploring Holocene continentality changes in Fennoscandia using present and past tree5
distributions, Quaternary Sci. Rev., 27, 1296–1308, 2008.Grosjean, M., Suter, P. J., Trachsel, M., and Wanner, H.: Ice-borne prehistoric finds in the Swiss
Alps reflect Holocene glacier fluctuations, J. Quaternary Sci., 22, 203–207, 2007.Grudd, H.: Tornetrask tree-ring width and density AD 500–2004: a test of climatic sensitivity
and a new 1500-year reconstruction of north Fennoscandian summers, Clim. Dynam., 31,10
843–857, 2008Hammarlund, D., Bjorck, S., Buchardt, B., Israelson, C., and Thomsen, C. T.: Rapid hydrological
changes during the Holocene revealed by stable isotope records of lacustrine carbonatesfrom Lake Igelsjon, southern Sweden, Quaternary Sci. Rev., 22, 353–370, 2003.
Heegaard, E.: CagedepthR.txt – R function for age-depth relationship estimation, http://www.15
bio.uu.nl/∼palaeo/Congressen/Holivar/Literature Holivar2003.htm, 2003.Heegaard, E., Birks, H. J. B., and Telford, R. J.: Relationships between calibrated ages and
depth in stratigraphical sequences: an estimation procedure by mixed-effect regression,Holocene, 15, 612–618, 2005.
Heikkila, M. and Seppa, H.: A 11 000 yr palaeotemperature reconstruction from the southern20
boreal zone in Finland, Quaternary Sci. Rev., 22, 541–554, 2003.Hicks, S.: The relationship between climate and annual pollen deposition at northern tree-lines,
Chemosphere – Global Change Science, 1, 403–416, 1999.Hyvarinen, H. and Alhonen, P.: Holocene lake-level changes in the Fennoscandian tree-line
region, western Finnish Lapland: diatom and cladoceran evidence, Holocene, 4, 251–258,25
1994.Jansen, E., Overpeck, J., Briffa, K. R., Duplessy, J.-C., Joos, F., Masson-Delmotte, V., Olago,
D., Otto-Bliesner, B., Peltier, W. R., Rahmstorf, S., Ramesh, R., Raynaud, D., Rind, D.,Solomina, O., Villalba, R., and Zhang, D.: Palaeoclimate, in: Climate Change 2007: ThePhysical Science Basis, Contribution of Working Group I to the Fourth Assessment Report of30
the Intergovernmental Panel on Climate Change, edited by: Solomon, S., Qin, D., Manning,M., Chen, Z., Marquis, M., Averyt, K. B., Tignor, M., and Miller, H. L., Cambridge UniversityPress, Cambridge, United Kingdom and New York, NY, USA, 433–497, 2007.
1539
CPD5, 1521–1552, 2009
Temperaturevariability in Northern
Europe
H. Seppa et al.
Title Page
Abstract Introduction
Conclusions References
Tables Figures
J I
J I
Back Close
Full Screen / Esc
Printer-friendly Version
Interactive Discussion
Jessen, C. A., Rundgren, M., Bjorck, S., and Hammarlund, D.: Abrupt climatic changes and anunstable transition into a late Holocene Thermal Decline: a multiproxy lacustrine record fromsouthern Sweden, J. Quaternary Sci., 20, 349–362, 2005.
Jones, P. D. and Lister, D. H.: The influence of the circulation on surface temperature andprecipitation patterns over Europe*, Clim. Past Discuss., 5, 535–555, 2009,5
http://www.clim-past-discuss.net/5/535/2009/.Jongma, J. Prange, M., Renssen, H., and Schulz, M.: Amplification of Holocene multicentennial
climate forcing by mode transitions in North Atlantic overturning circulation, Geophys. Res.Lett., 34, LI5706, doi:10.1029/2007/GL030642, 2007.
Jorin, U. E., Stocker, T. F., and Schluchter, C.: Multicentury glacier fluctuations in the Swiss10
Alps during the Holocene, Holocene, 16, 697–704, 2006.Kaufman, D. S., Ager, T. A., Anderson, N. J., Anderson, P. M., Andrews, J. T., Bartlein, P. T.,
Brubaker, L. B., Coats, L. L., Cwynar, L. C., Duvall, M. L., Dyke, A. S., Edwards, M. E., Eisner,W. R., Gajewski, K., Geirsdottir, A., Hu, F. S., Jennings, A. E., Kaplan, M. R., Kerwin, M. W.,Lozhkin, A. V., MacDonald, G. M., Miller, G. H., Mock, C. J., Oswald, W. W., Otto-Bliesner, B.15
L., Porinchu, D. F., Ruhland, K., Smol, J. P., Steig, E. J., and Wolfe, B. B.: Holocene thermalmaximum in the western Arctic (0–180◦ W), Quaternary Sci. Rev., 23, 529–560, 2004.
Kaufman, D. S., Schneider, D. P., McKay, N. P., Ammann, C. M., Bradley, R. S., Miller, G. H.,Overpeck, J. T, and JOPL-SI authors: Long-term Arctic Cooling was Reversed by Recent,Climate Change, submitted, 2009.20
Korhola, A., Tikkanen, M., and Weckstrom, J.: Quantification of Holocene lake-level changes inFinnish Lapland using a cladocera-lake depth transfer function, J. Paleolimnol., 34, 175–190,2005.
Lamb, H. H.: Climate, History and the Modern World, Methuen, London, 387 pp., 1982.Larsen, L. B., Vinther, B. M., Briffa, K. R., Melvin, T. M., Clausen, H. B., Jones, P. D., Siggaard-25
Andersen, M. L., Hammer, C. U., Eronen, M., Grudd, H., Gunnarsson, B. E., Hantemirov, R.M., Naurzbaev, M. M., and Nicolussi, K.: New ice core evidence for a volcanic cause of theAD 536 dust veil, Geophys. Res. Lett., 35, L04708, doi:10.1029/2007GL032450, 2008.
Lotter, A. F., Birks, H. J. B., Eicher, U., Hofmann, W., Schwander, J., and Wick, L.: YoungerDryas and Allerød summer temperatures at Gerzensee (Switzerland) inferred from fossil30
pollen and cladoceran assemblages, Palaeogeogr. Palaeocl., 159, 349–361, 2000.Magny, M. and Haas, J.-N.: A major widespread climatic change around 5300 cal. yr BP at the
time of the Alpine Iceman, J. Quaternary Sci., 19, 423–430, 2004.
1540
CPD5, 1521–1552, 2009
Temperaturevariability in Northern
Europe
H. Seppa et al.
Title Page
Abstract Introduction
Conclusions References
Tables Figures
J I
J I
Back Close
Full Screen / Esc
Printer-friendly Version
Interactive Discussion
Mann, M. E.: Climate Over the Past Two Millennia, Annu. Rev. Earth Pl. Sc., 35, 111–136,2007.
Mayewski, P. A., Meeker, L. D., Twickler, M. S., Whitlow, S., Yang, Q., Lyons, W. B., and Prentice,M.: Major features and forcing of high-latitude northern hemisphere atmospheric circulationusing a 110 000-year long glaciochemical series, J. Geophys. Res-Oceans., 102, 26345–5
26366, 1997.Moberg, A., Sonechkin, D., Holmgren, K., Datsenko, N. M., and Karlen, W.: Highly variable
Northern Hemisphere temperatures reconstructed from low- and high-resolution proxy data,Nature, 433, 613–617, 2005.
Moros, M., Emeis, K., Risebrobakken, B., Snowball, I., Kuijpers, A., McManus, J., and Jansen,10
E.: Sea surface temperatures and ice rafting in the Holocene North Atlantic: climate influ-ences on northern Europe and Greenland, Quaternary Sci. Rev., 23, 2113–2126, 2004..
Nesje, A., Matthews, J. A., Dahl, S. O., Berrisford, M. S., and Andersson, C.: Holocene glacierfluctuations of Flatebreen and winter-precipitation changes in the Jostedalsbreen region,Holocene, 11, 267–280, 2001.15
O’Brien, S. R., Mayewski, P. A, Meeker, L. D., Meese, D. A., Twickler, M. S., and Whitlow, S. I.:Complexity of Holocene climate as reconstructed from a Greenland ice core, Science 270,1962–1964, 1995.
Ojala, A. E. K. and Tiljander, M.: Testing the fidelity of sediment chronology: comparison ofvarve and paleomagnetic results from Holocene lake sediments from central Finland, Qua-20
ternary Sci. Rev., 22, 1787–1803, 2003.Ojala, A. E. K., Alenius, T., Seppa, H., and Giesecke, T.: Integrated varve and pollen-based
temperature reconstruction from Finland: evidence for Holocene seasonal temperature pat-terns at high latitudes, Holocene, 18, 529–538, 2008.
Oppo, D. W., McManus, J. F., and Cullen, J. L.: Deepwater variability in the Holocene epoch,25
Nature, 422, 277–278, 2003.Philipp, A., Della-Marta, P. M., Jacobeit, J., Fereday, D. R., Jones, P. D., Moberg, A., and
Wanner, H.: Long-term variability of daily North Atlantic-European pressure patterns since1850 classified by simulated annealing clustering, J. Climate, 20, 4065–4095, 2007.
Prentice, I. C., Harrison, S. P., Jolly, D., and Guiot, J.: The climate and biomes of Europe at30
6000 yr BP: Comparison of model simulations and pollen-based reconstructions, QuaternarySci. Rev., 17, 659–668, 1998.
Reimer, P. J., Baillie, M. G. L., Bard, E., Bayliss, A., Beck, J. W., Bertrand, C. J. H., Blackwell,
1541
CPD5, 1521–1552, 2009
Temperaturevariability in Northern
Europe
H. Seppa et al.
Title Page
Abstract Introduction
Conclusions References
Tables Figures
J I
J I
Back Close
Full Screen / Esc
Printer-friendly Version
Interactive Discussion
P. G., Buck, C. E., Burr, G. S., Cutler, K. B., Damon, P. E., Edwards, R. L., Fairbanks, R.G., Friedrich, M., Guilderson, T. P., Hogg, A. G., Hughen, K. A., Kromer, B., McCormac, G.,Manning, S., Bronk Ramsey, C., Reimer, R. W., Remmele, S., Southon, J. R., Stuiver, M.,Talamo, S., Taylor, F. W., van der Plicht, J., and Weyhenmeyer, C. E.: INTCAL04 terrestrialradiocarbon age calibration, 0–26 cal KYR BP, Radiocarbon, 46, 1029–1058, 2004.5
Renssen, H., Goosse, H., Fichefet, T., Brovkin, V., Driesschaert, E., and Wolk, F.: Simulatingthe Holocene climate evolution at northern high latitudes using a coupled atmosphere-seaice-ocean-vegetation model, Clim. Dynam., 24, 23–43, 2005.
Renssen, H., Goosse, H., and Muscheler, R.: Coupled climate model simulation of Holocenecooling events: oceanic feedback amplifies solar forcing, Clim. Past, 2, 79–90, 2006,10
http://www.clim-past.net/2/79/2006/.Renssen, H., Seppa, H., Heiri, O., Fichefet, T., Goosse, H., and Roche, D. M.: The spa-
tial and temporal complexity of the Holocene Thermal Maximum, Nature Geoscience,doi:10.1038/NGEO513, in press, 2009.
Rimbu, N., Lohmann, G., Lorenz, S. J., Kim, J. H., and Schneider, R. R.: Holocene climate15
variability as derived from alkenone sea surface temperature and coupled ocean-atmospheremodel experiments, Clim. Dynam., 23, 215–227, 2004.
Risebrobakken, B., Jansen, E., Andersson, C., Mjelde E., and Hevrøy, K.: A high-resolutionstudy of Holocene paleoclimatic and paleoceanographic changes in the Nordic Seas, Paleo-ceanography, 18, 1–14, 2003.20
Rosen, P., Segerstrom, U., Eriksson, L., Renberg, I., and Birks, H. J. B.: Holocene climaticchanges reconstructed from diatoms, chironomids, pollen and near-infrared spectroscopy atan alpine lake (Sjuodjijaure) in northern Sweden, Holocene, 11, 551–567, 2001.
Rosqvist, G. C., Leng, M. J., and Jonsson, C.: North Atlantic region atmospheric circulation dy-namics inferred from a late-Holocene lacustrine carbonate isotope record, northern Swedish25
Lapland, Holocene, 17, 867–873, 2007.Rundgren, M.: Stratigraphy of peatlands in central and northern Sweden: evidence of Holocene
climate change and peat accumulation, GFF, 130, 95–107, 2008.Sarmaja-Korjonen, K. and Seppa, H.: Abrupt and consistent responses of aquatic and terres-
trial ecosystems to the 8200 cal. yr BP cold event: a lacustrine record from Lake Arapisto,30
Finland, Holocene, 17, 455–464, 2007.Schulz, M., Paul, A., and Timmermann, A.: Glacial-interglacial contrast in climate variablity
at centennial-to-millennial timescales: observations and conceptual model, Quaternary Sci.
1542
CPD5, 1521–1552, 2009
Temperaturevariability in Northern
Europe
H. Seppa et al.
Title Page
Abstract Introduction
Conclusions References
Tables Figures
J I
J I
Back Close
Full Screen / Esc
Printer-friendly Version
Interactive Discussion
Rev., 23, 2219–2230, 2004.Seppa, H.: Postglacial trends in palynological richness in the northern Fennoscandian tree-line
area and their ecological interpretation, Holocene, 8, 43–53, 1998.Seppa, H. and Birks, H. J. B.: July mean temperature and annual precipitation trends during
the Holocene in the Fennoscandian tree-line area: pollen based reconstructions, Holocene,5
11, 527–539, 2001.Seppa, H. and Birks, H. J. B.: Holocene climate reconstructions from the Fennoscandian tree-
line area based on pollen data from Toskaljavri, Quaternary Res., 57, 191–199, 2002.Seppa, H., Nyman, M., Korhola, A., and Weckstrom, J.: Changes of tree-lines and alpine
vegetation in relation to post-glacial Clim Dynam in northern Fennoscandia based on pollen10
and chironomid records, J. Quaternary Sci., 17, 287–301, 2002.Seppa, H. and Poska, A.: Holocene annual mean temperature changes in Estonia and their
relationship to solar insolation and atmospheric circulation patterns, Quaternary Res., 61,22–31, 2004.
Seppa, H., Birks, H. J. B., Odland, A., Poska, A., and Veski, S.: A modern pollen-climate15
calibration set from northern Europe: testing and developing a tool for palaeoclimatologicalreconstructions, J. Biogeogr., 31, 251–267, 2004.
Seppa, H., Hammarlund, D., and Antonsson, K.: Low-frequency and high-frequency changesin temperature and effective humidity during the Holocene in south-central Sweden: implica-tions for atmospheric and oceanic forcings of climate, Clim. Dynam., 25, 285–297, 2005.20
Seppa, H., Birks, H. J. B., Giesecke, T., Hammarlund, D., Alenius, T., Antonsson, K., Bjune,A. E., Heikkila, M., MacDonald, G. M., Ojala, A. E. K., Telford, R. J., and Veski, S.: Spatialstructure of the 8200 cal yr BP event in northern Europe, Clim. Past, 3, 225–236, 2007,http://www.clim-past.net/3/225/2007/.
Seppa, H., MacDonald, G. M., Birks, H. J. B, Gervais, B. R., and Snyder, J. A.: Late-Quaternary25
summer temperature changes in the North-European tree-line region, Quaternary Res., 69,404–412, 2008.
Sohar, K. and Kalm, V.: A 12.8-ka-long palaeoenvironmental record revealed by subfossil os-tracod data from lacustrine freshwater tufa in Lake Sinijarv, northern Estonia, J. Paleolimnol.,40, 809–821, 2008.30
Sommer, R. S., Lindqvist, C., Persson, A., Bringsøe, H., Rhodin, A. G., Schneeweiss, N.,Siroky, P., Bachmann, L., and Fritz, U.: Unexpected early extinction of the European pondturtle (Emys orbicularis) in Sweden and climatic impacts on its Holocene range, Mol. Ecol.,
1543
CPD5, 1521–1552, 2009
Temperaturevariability in Northern
Europe
H. Seppa et al.
Title Page
Abstract Introduction
Conclusions References
Tables Figures
J I
J I
Back Close
Full Screen / Esc
Printer-friendly Version
Interactive Discussion
18, 1252–1262, 2009.Steig, E.: Mid-Holocene Climate Change, Science, 286, 148–149, 1999.Stuiver, M. and Reimer, P.: Extended 14C data base and revised CALIB 3.0 14C age calibration
program, Radiocarbon, 35, 215–230, 1993.Stuiver, M., Reimer, P. J., and Reimer, R. W.: CALIB 5.0 (http://calib.qub.ac.uk/calib/), 2005.5
Stuiver, M., Reimer, P. J., Bard, E., Burr, G. S., Hughen, K. A, Kromer, B., McCormac, G.,van der Plicht, J., and Spurk, M.: INTCAL98 Radiocarbon Age Calibration, Radiocarbon, 40,1041–1083, 1998.
Tarand, A. and Nordli, P. Ø.: The Tallinn temperature series reconstructed back half a millen-nium by use of proxy data, Climatic Change, 48, 189–199, 2001.10
TEMPO-members, Kutzbach, J. E., Bartlein, P. J., Foley, J. A., Harrison, S. P., Hostetler, S.W., Liu, Z., Prentice, I. C., and Webb III, T.: Potential role of vegetation feedback in theclimate sensitivity of high-latitude regions: a case study at 6000 years before present, GlobalBiogeochem. Cy., 10, 727–736, 1996.
ter Braak, C. J. F. and Juggins, S.: Weighted averaging partial least squares regression (WA-15
PLS): an improved method for reconstructing environmental variables from species assem-blages, Hydrobiologia, 269–270, 485–502, 1993.
ter Braak, C. J. F., Juggins, S., Birks, H. J. B., and van der Voet, H.: Weighted averagingpartial least squares regression (WA-PLS): definition and comparison with other methods forspecies-environmental calibration, in: Multivariate environmental statistics, edited by: Patil,20
G. P. and Rao, C. R., Elsevier, Amsterdam, 525–560, 1993.Turney, C., Baillie, M., Clemens, S., Brown, D., Palmer, J., Pilcher, J., Reimer, P., and
Leuschner, H. H.: Testing solar forcing of pervasive Holocene climate cycles, J. QuaternarySci., 20, 511–518, 2005.
Valiranta, M., Korhola, A., Seppa, H., Sarmaja-Korjonen, K., Tuittila, E.-S., Laine, J., and Alm,25
J.: High-resolution reconstruction of wetness dynamics in a southern boreal raised bog,Finland, during the late Holocene: a quantitative approach, Holocene, 17, 1093–1107, 2007.
Walther, A. and Linderholm, H. W.: A comparison of growing season indices for the GreaterBaltic Area, Int. J. Biometeorol., 51, 107–118, 2006.
Wanner, H., Beer, J., Butikofer, J., Crowley, T. J., Cubasch, U., Fluckiger, J., Goosse, H.,30
Grosjean, M., Joos, F., Kaplan, J. O., Kuttel, M., Muller, S. A., Prentice, I. C., Solomina, O.,Stocker, T. F., Tarasov, P., Wagner, M., and Widmann, M.: Mid-to Late Holocene climatechange: an overview, Quaternary Sci. Rev., 27, 1791–1828, 2008.
1544
CPD5, 1521–1552, 2009
Temperaturevariability in Northern
Europe
H. Seppa et al.
Title Page
Abstract Introduction
Conclusions References
Tables Figures
J I
J I
Back Close
Full Screen / Esc
Printer-friendly Version
Interactive Discussion
Weber, S. L., Crowley, T. J., and van der Schrier, G.: Solar irradiance forcing of centennialclimate variability during the Holocene, Clim. Dynam., 22, 539–553, 2004.
Weckstrom, J., Korhola, A., Erasto, P., and Holmstrom, L.: Temperature patterns over the eightpast centuries in Northern Fennoscandia inferred from sedimentary diatoms, QuaternaryRes., 66, 78–86, 2006.5
Velle, G., Brooks, S. J., Birks, H. J. B., and Willassen, E.: Chironomids as a tool for inferringHolocene climate: an assessment based on six sites in southern Scandinavia, QuaternarySci. Rev., 24, 1429–1462, 2005.
Veski, S., Seppa, H., and Ojala, A. E. K.: Cold event at 8200 yr B.P. recorded in annuallylaminated lake sediments in eastern Europe, Geology, 32, 681–684, 2004.10
Wiersma, A. P. and Renssen, H.: Model-data comparison for the 8.2 ka BP event: Confirmationof a forcing mechanism by catastrophic drainage of Laurentide Lakes, Quaternary Sci. Rev.,25, 63–88, 2006.
Vollweiler, N., Scholz, D., Muhlinghaus, C., Mangini, A., and Spotl, C.: A precisely dated cli-mate record for the last 9 kyr from three high alpine stalagmites, Spannagel Cave, Austria,15
Geophys. Res. Lett., 33, L20703, doi:10.1029/2006GL027662, 2006.
1545
CPD5, 1521–1552, 2009
Temperaturevariability in Northern
Europe
H. Seppa et al.
Title Page
Abstract Introduction
Conclusions References
Tables Figures
J I
J I
Back Close
Full Screen / Esc
Printer-friendly Version
Interactive Discussion
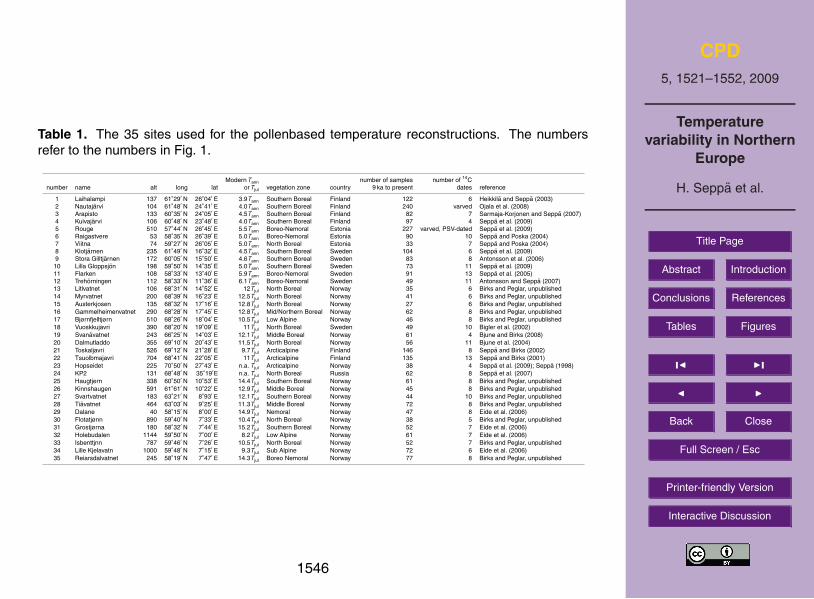
Table 1. The 35 sites used for the pollenbased temperature reconstructions. The numbersrefer to the numbers in Fig. 1.
Modern Tann number of samples number of 14Cnumber name alt long lat or Tjul vegetation zone country 9 ka to present dates reference
1 Laihalampi 137 61◦29′ N 26◦04′ E 3.9 Tann Southern Boreal Finland 122 6 Heikkila and Seppa (2003)2 Nautajarvi 104 61◦48′ N 24◦41′ E 4.0 Tann Southern Boreal Finland 240 varved Ojala et al. (2008)3 Arapisto 133 60◦35′ N 24◦05′ E 4.5 Tann Southern Boreal Finland 82 7 Sarmaja-Korjonen and Seppa (2007)4 Kuivajarvi 106 60◦48′ N 23◦48′ E 4.0 Tann Southern Boreal Finland 97 4 Seppa et al. (2009)5 Rouge 510 57◦44′ N 26◦45′ E 5.5 Tann Boreo-Nemoral Estonia 227 varved, PSV-dated Seppa et al. (2009)6 Raigastvere 53 58◦35′ N 26◦39′ E 5.0 Tann Boreo-Nemoral Estonia 90 10 Seppa and Poska (2004)7 Viitna 74 59◦27′ N 26◦05′ E 5.0 Tann North Boreal Estonia 33 7 Seppa and Poska (2004)8 Klotjarnen 235 61◦49′ N 16◦32′ E 4.5 Tann Southern Boreal Sweden 104 6 Seppa et al. (2009)9 Stora Gilltjarnen 172 60◦05′ N 15◦50′ E 4.6 Tann Southern Boreal Sweden 83 8 Antonsson et al. (2006)
10 Lilla Gloppsjon 198 59◦50′ N 14◦35′ E 5.0 Tann Southern Boreal Sweden 73 11 Seppa et al. (2009)11 Flarken 108 58◦33′ N 13◦40′ E 5.9 Tann Boreo-Nemoral Sweden 91 13 Seppa et al. (2005)12 Trehorningen 112 58◦33′ N 11◦36′ E 6.1 Tann Boreo-Nemoral Sweden 49 11 Antonsson and Seppa (2007)13 Litlvatnet 106 68◦31′ N 14◦52′ E 12 Tjul North Boreal Norway 35 6 Birks and Peglar, unpublished14 Myrvatnet 200 68◦39′ N 16◦23′ E 12.5 Tjul North Boreal Norway 41 6 Birks and Peglar, unpublished15 Austerkjosen 135 68◦32′ N 17◦16′ E 12.8 Tjul North Boreal Norway 27 6 Birks and Peglar, unpublished16 Gammelheimenvatnet 290 68◦28′ N 17◦45′ E 12.8 Tjul Mid/Northern Boreal Norway 62 8 Birks and Peglar, unpublished17 Bjørnfjelltjørn 510 68◦26′ N 18◦04′ E 10.5 Tjul Low Alpine Norway 46 8 Birks and Peglar, unpublished18 Vuoskkujavri 390 68◦20′ N 19◦09′ E 11 Tjul North Boreal Sweden 49 10 Bigler et al. (2002)19 Svanavatnet 243 66◦25′ N 14◦03′ E 12.1 Tjul Middle Boreal Norway 61 4 Bjune and Birks (2008)20 Dalmutladdo 355 69◦10′ N 20◦43′ E 11.5 Tjul North Boreal Norway 56 11 Bjune et al. (2004)21 Toskaljavri 526 69◦12′ N 21◦28′ E 9.7 Tjul Arcticalpine Finland 146 8 Seppa and Birks (2002)22 Tsuolbmajavri 704 68◦41′ N 22◦05′ E 11 Tjul Arcticalpine Finland 135 13 Seppa and Birks (2001)23 Hopseidet 225 70◦50′ N 27◦43′ E n.a. Tjul Arcticalpine Norway 38 4 Seppa et al. (2009); Seppa (1998)24 KP2 131 68◦48′ N 35◦19′E n.a. Tjul North Boreal Russia 62 8 Seppa et al. (2007)25 Haugtjern 338 60◦50′ N 10◦53′ E 14.4 Tjul Southern Boreal Norway 61 8 Birks and Peglar, unpublished26 Kinnshaugen 591 61◦61′ N 10◦22′ E 12.9 Tjul Middle Boreal Norway 45 8 Birks and Peglar, unpublished27 Svartvatnet 183 63◦21′ N 8◦93′ E 12.1 Tjul Southern Boreal Norway 44 10 Birks and Peglar, unpublished28 Tiavatnet 464 63◦03′ N 9◦25′ E 11.3 Tjul Middle Boreal Norway 72 8 Birks and Peglar, unpublished29 Dalane 40 58◦15′ N 8◦00′ E 14.9 Tjul Nemoral Norway 47 8 Eide et al. (2006)30 Flotatjønn 890 59◦40′ N 7◦33′ E 10.4 Tjul North Boreal Norway 38 5 Birks and Peglar, unpublished31 Grostjørna 180 58◦32′ N 7◦44′ E 15.2 Tjul Southern Boreal Norway 52 7 Eide et al. (2006)32 Holebudalen 1144 59◦50′ N 7◦00′ E 8.2 Tjul Low Alpine Norway 61 7 Eide et al. (2006)33 Isbenttjnn 787 59◦46′ N 7◦26′ E 10.5 Tjul North Boreal Norway 52 7 Birks and Peglar, unpublished34 Lille Kjelavatn 1000 59◦48′ N 7◦15′ E 9.3 Tjul Sub Alpine Norway 72 6 Eide et al. (2006)35 Reiarsdalvatnet 245 58◦19′ N 7◦47′ E 14.3 Tjul Boreo Nemoral Norway 77 8 Birks and Peglar, unpublished
1546
CPD5, 1521–1552, 2009
Temperaturevariability in Northern
Europe
H. Seppa et al.
Title Page
Abstract Introduction
Conclusions References
Tables Figures
J I
J I
Back Close
Full Screen / Esc
Printer-friendly Version
Interactive Discussion
Table 2. The data and performance statistics, all based on leaveoneout crossvalidation, aboutthe two pollenbased calibration models.
FES calibration NFS calibrationmodel for Tann model for Tjul
number of sites 173 321temperature gradient −4.1 to 7.1◦C 3.5–16.4◦Cnumber of taxa 104 183RMSEP 0.95◦C 1.135◦CR2 0.88 0.77maximum bias 2.1◦C 2.53◦C
1547
CPD5, 1521–1552, 2009
Temperaturevariability in Northern
Europe
H. Seppa et al.
Title Page
Abstract Introduction
Conclusions References
Tables Figures
J I
J I
Back Close
Full Screen / Esc
Printer-friendly Version
Interactive Discussion
1
1
2
43
5
30o
60o
70o
6
8
910
1112
13
15
14 1719
22
21
20
23
24
19
27
28
26
25
31
29
24
3234
33
35
16
7
Fig. 1. The location of the sites from where the quantitative pollen-based temperature recon-structions where derived. The filled circles indicate sites with Tann reconstructions and opencircles with Tjul reconstructions. For the name of the sites, see Table 1.
1548
CPD5, 1521–1552, 2009
Temperaturevariability in Northern
Europe
H. Seppa et al.
Title Page
Abstract Introduction
Conclusions References
Tables Figures
J I
J I
Back Close
Full Screen / Esc
Printer-friendly Version
Interactive Discussion
-4,0
-2,0
0,0
2,0
4,0
-4,0
-2,0
0,0
2,0
4,0
-4,0
-2,0
0,0
2,0
4,0
-4,0
-2,0
0,0
2,0
4,0
-4,0
-2,0
0,0
2,0
4,0
-4,0
-2,0
0,0
2,0
4,0
-4,0
-2,0
0,0
2,0
4,0
-4,0
-2,0
0,0
2,0
4,0
-4,0
-2,0
0,0
2,0
4,0
-4,0
-2,0
0,0
2,0
4,0
-4,0
-2,0
0,0
2,0
4,0
0 2000 4000 6000 8000
-4,0
-2,0
0,0
2,0
4,0
-4,0
-2,0
0,0
2,0
4,0
-4,0
-2,0
0,0
2,0
4,0
-4,0
-2,0
0,0
2,0
4,0
-4,0
-2,0
0,0
2,0
4,0
-4,0
-2,0
0,0
2,0
4,0
-4,0
-2,0
0,0
2,0
4,0
-4,0
-2,0
0,0
2,0
4,0
-4,0
-2,0
0,0
2,0
4,0
-4,0
-2,0
0,0
2,0
4,0
-4,0
-2,0
0,0
2,0
4,0
-4,0
-2,0
0,0
2,0
4,0
0 2000 4000 6000 8000
-4,0
-2,0
0,0
2,0
4,0
1 13
14
15
16
17
18
19
20
21
22
23
24
2
3
4
5
6
7
8
9
10
11
12
cal yr BP cal yr BP
0
-4,0
-2,0
0,0
2,0
4,0
-4,0
-2,0
0,0
2,0
4,0
-4,0
-2,0
0,0
2,0
4,0
-4,0
-2,0
0,0
2,0
4,0
-4,0
-2,0
0,0
2,0
4,0
-4,0
-2,0
0,0
2,0
4,0
-4,0
-2,0
0,0
2,0
4,0
-4,0
-2,0
0,0
2,0
4,0
-4,0
-2,0
0,0
2,0
4,0
-4,0
-2,0
0,0
2,0
4,0
-4,0
-2,0
0,0
2,0
35
34
33
32
31
30
29
28
27
26
4,0
25
2000
cal yr BP4000 6000 8000
Fig. 2. The individual pollen-based Tann and Tjul reconstructions for the last 9000 years. Sitesnumbered as in Table 1.
1549
CPD5, 1521–1552, 2009
Temperaturevariability in Northern
Europe
H. Seppa et al.
Title Page
Abstract Introduction
Conclusions References
Tables Figures
J I
J I
Back Close
Full Screen / Esc
Printer-friendly Version
Interactive Discussion
0 0
10
00 1
00
0
20
00 2
00
0
30
00 3
00
0
40
00 4
00
0
50
00 5
00
0
60
00 6
00
0
70
00 7
00
0
80
00 80
00
90
00 9
00
0
-3,0
-3,0
-2,0
-2,0
-1,0
-1,0
0,0
0,0
1,0
1,0
2,0
2,0
3,0
3,0
-3,0
-3,0
-2,0
-2,0
-1,0
-1,0
0,0
0,0
1,0
1,0
2,0
2,0
3,0
3,0
-3,0
-3,0
-2,0
-2,0
-1,0
-1,0
0,0
0,0
1,0
1,0
2,0
2,0
3,0 470
470
490
490
510
510
530
5303,0
ca
lyr
BP
ca
lyr
BP
a
oC
oC
oC W m
-2
b c d
Fig. 3. The North-European pollen-based stacked Tann (a) and Tjul (b) records. The Tann recordcomprises a total of 1291 reconstructed Tann values (average sample interval of 7.0 years) andthe stacked Tjul record is based on 1561 values (average sample interval 5.8 years) for the9000 years. The temperature values are expressed as deviations from the mean. These tworecords are combined in (c) to show “a stacked summary curve” reflecting the North-Europeantemperature variability record, consisting of 2852 values with an average sample interval of 3.2years. All records are shown with a LOESS smoother with a span of 0.05. (d) June insolationat 60◦ N northern latitude (Berger and Loutre, 1991).
1550
CPD5, 1521–1552, 2009
Temperaturevariability in Northern
Europe
H. Seppa et al.
Title Page
Abstract Introduction
Conclusions References
Tables Figures
J I
J I
Back Close
Full Screen / Esc
Printer-friendly Version
Interactive Discussion
Stackedchironomid-basedtemperaturedeviations
0
1000
2000
3000
4000
5000
-0,4 -0,2 0,0 0,2 0,4 -2,0 0,0 2,0 -20-12-441220
-13,5 -12,5
Stackedpollen-basedtemperaturedeviations
18O records from
two calcareouslake sedimentcores
Bog surfacewetness recordfrom S Finland
long, warmand dry period,“MedievalWarm Period”and “RomanWarm Period”
LIA
present
cold and wetperiod peakingat 3.5 ka
warm and dry,end of the HTM
0,60,2-0,2-0,6
a b C d
oC
oC
18 oO( / )oo
cm
colder colder colderand/ormoister
moister
calyr
BP
δ
δ
Fig. 4. The temperature variability in Northern Europe during the last 5000 years. (a) Thepollen-based temperature variability record based on the stacked summary record. The recon-structed trend during the last 5000 was detrended by adding a linear curve and the residualsare shown here, smoothed with a LOESS smoother with span 0.1. (b) A chironomid-basedJuly mean temperature variability, as reflected by residuals after detrending by adding a linearcurve. The chironomid-based curve is a stacked record, based on six sites in Norway (Velleet al., 2005) and one site, Toskaljavri, in Northern Finland (Seppa et al., 2002), showing thedeviations from the mean with a LOESS smoother with span 0.1. (c) Two δ18O-based recordsfrom lacustrine calcareous sediments, from Lake Igelsjon in Southern Sweden (Hammarlundet al., 2003) (residuals after detrending), and Lake Tibetanus in Northern Sweden (Rosqvist etal., 2007), reaching back to 2600 cal yr BP, (d) a general humidity record based on bog surfacewetness changes reconstructed quantitatively from plant macrofossil composition in SouthernFinland (Valiranta et al., 2007).
1551
CPD5, 1521–1552, 2009
Temperaturevariability in Northern
Europe
H. Seppa et al.
Title Page
Abstract Introduction
Conclusions References
Tables Figures
J I
J I
Back Close
Full Screen / Esc
Printer-friendly Version
Interactive Discussion
18
18
15.6
15.6
13.2
13.2
10.8
10.8
8.4
8.4
0 0
1000
1000
2000
2000
3000
3000
4000
4000
5000
5000
0,6 16
16
8
8
0
0
-8
-8
-16
-160,6
0,2
0,2
0.4
0.4
0.2
0.2
0.0
0.0
-0.2
-0.2
-0.4
-0.4
-0,2
-0,2
-0,6
-0,6
Residual Cas a solarforcing proxy
14 GISP-2 Clrecord as anatmosphericcirculation proxy
ca
lyr
BP
ca
lyr
BP
Stackedpollen-basedtemperaturedeviations
Stackedchironomid-basedtemperaturedeviations
oC
oC
14C per mil ppb
a b c d
δ
Fig. 5. Comparison of the reconstructed late-Holocene temperature variability with proxiesthat reflect possible forcings of the high-frequency variability. (a) The stacked summary pollen-based temperature variability record, as in Fig. 4a but with LOESS smoother with 0.03. (b) Thechironomid-based temperature variability record as in Fig. 4b, (c) The δ14C residuals as aproxy for solar radiation variability, unsmoothed, (d) The GISP-2 Cl ion concentration record asa proxy for the North Atlantic atmospheric circulation pattern variability (Mayewski et al., 1997).Smoothed with a LOESS smoother with span 0.1.
1552
Copyright © 2022 FDOKUMEN