LASERLAB-EUROPE The Integrated Initiative of European ...
16
LASERLAB-EUROPE The Integrated Initiative of European Laser Research Infrastructures III Grant Agreement number: 284464 WP33 European Research Objectives on Lasers for Industry, Technology and Energy (EURO-LITE) Deliverable number D33.8 Report on performance of 1 kHz high contrast OPCPA system generating multi-mJ few cycle pulses Lead Beneficiary: VILNIAUS UNIVERSITETAS - VULRC Due date: 30/11/2015 Date of delivery: 21/11/2015 Project webpage: www.laserlab-europe.eu Deliverable Nature R = Report, P = Prototype, D = Demonstrator, O = Other R Dissemination Level PU = Public PP = Restricted to other programme participants (incl. the Commission Services) RE = Restricted to a group specified by the consortium (incl. the Commission Services) CO = Confidential, only for members of the consortium (incl. the Commission Services) PP
-
Upload
khangminh22 -
Category
Documents
-
view
2 -
download
0
Transcript of LASERLAB-EUROPE The Integrated Initiative of European ...
LASERLAB-EUROPE
The Integrated Initiative of European Laser Research Infrastructures III
Grant Agreement number: 284464
WP33 European Research Objectives on Lasers for Industry, Technology and Energy
(EURO-LITE)
Deliverable number D33.8 Report on performance of 1 kHz high contrast OPCPA system
generating multi-mJ few cycle pulses
Lead Beneficiary:
VILNIAUS UNIVERSITETAS - VULRC
Due date: 30/11/2015
Date of delivery: 21/11/2015
Project webpage: www.laserlab-europe.eu
Deliverable Nature R = Report, P = Prototype, D = Demonstrator, O = Other R Dissemination Level PU = Public PP = Restricted to other programme participants (incl. the Commission Services) RE = Restricted to a group specified by the consortium (incl. the Commission
Services) CO = Confidential, only for members of the consortium (incl. the Commission
Services)
PP
Deliverable number 33.8 LASERLAB-EUROPE (284464)
2
Abstract / Executive Summary We report on our recent achievements obtained in Laser Research Center of Vilnius University (VULRC) on development of a CEP-stable 1 kHz repetition rate TW-class OPCPA system driven by femtosecond Yb:KGW and picosecond Nd:YAG pump sources. Seed pulses with spectra spanning over an octave are produced in a continuum generator pumped by CEP-stable pulses from a difference frequency generator operated at 1.3-1.6 µm. After amplification in femtosecond NOPA, pulses with energy up to 70 µJ, spectra supporting durations of ~5 fs are obtained and sub-120 mrad CEP jitter at the output of system frontend is demonstrated. The properties of amplified parametric fluorescence that deteriorates output pulses contrast were examined for the two possible geometric configurations of broadband non-collinear parametric amplification in femtosecond NOPA. Results on development of power amplification OPCPA stages and pulse compression down to ~8 fs are presented. B. Deliverable Report
1 Introduction
In recent years, optical parametric chirped-pulse amplification (OPCPA) has matured as a powerful tool for generating few-cycle high-intensity pulses and is becoming a competitive alternative to Ti:Sapphire-based laser systems as sources of few cycle TW peak power pulses for various applications in strong-field and attosecond science research. Few cycle pulse generation by a number of OPCPA systems with central wavelengths covering spectral range from the visible to the Mid-IR has been reported. Additional opportunities for extension of amplification bandwidth arise from the possibility to build amplification chain using different color pumps or employing crystals with complementary amplification bands. High resistance to optical damage, lack of energy storage and low parasitic absorption in nonlinear crystals has allowed for scaling of few-cycle OPCPAs up to 16 TW peak power and 22 W of average power in table-top setups and development of the OPCPA system delivering few cycle pulses with PW peak power at repetition rate of 10 Hz is under way. At present, one of the well-marked trends in this field is the development of few cycle OPCPA systems capable to provide TW peak powers and high average power simultaneously. OPCPA technology also has an advantage over Ti:Sapphire systems in terms of output pulse contrast that is a crucial parameter for strong-field experiments. OPCPA allows for significant reduction of background intensity outside the temporal window of pump pulse. On the other hand, pulse contrast achievable by parametric amplifiers is limited by amplified parametric fluorescence (APF). It has been shown that the amount of this incompressible noise can be minimized by careful design of the first amplification stage, enhancement of seed pulse energy, optimization of the ratio of pump and seed pulse durations and their temporal profile. Carrier envelope phase (CEP) control is another essential prerequisite for a number of the few cycle laser applications in strong-field research, in particular for experiments on generation of isolated attosecond pulses. Nowadays, both active and passive CEP stabilization is well established technique providing CEP control of different types of laser systems. However, only several CEP stable few cycle OPCPA systems producing CEP-stable pulses with energies exceeding 1 mJ have been reported. In this report we present the design principles and recent achievements on development of CEP-stable OPCPA system that is based on tandem femtosecond and picosecond non- collinear parametric amplifiers seeded by passively stabilized broadband pulses from continuum generator. The system upon completion is expected to deliver sub-10 fs, 8-9 mJ pulses at 1 kHz repetition rate.
2 Objectives The main objective is a development OPCPA system driven by tandem femtosecond Yb:KGW and picosecond Nd:YAG lasers for generation of CEP stabilized multi-mJ sub-10 fs
Deliverable number 33.8 LASERLAB-EUROPE (284464)
3
pulses at 1 kHz repetition rate employing nonlinear optics methods for pulse contrast enhancement.
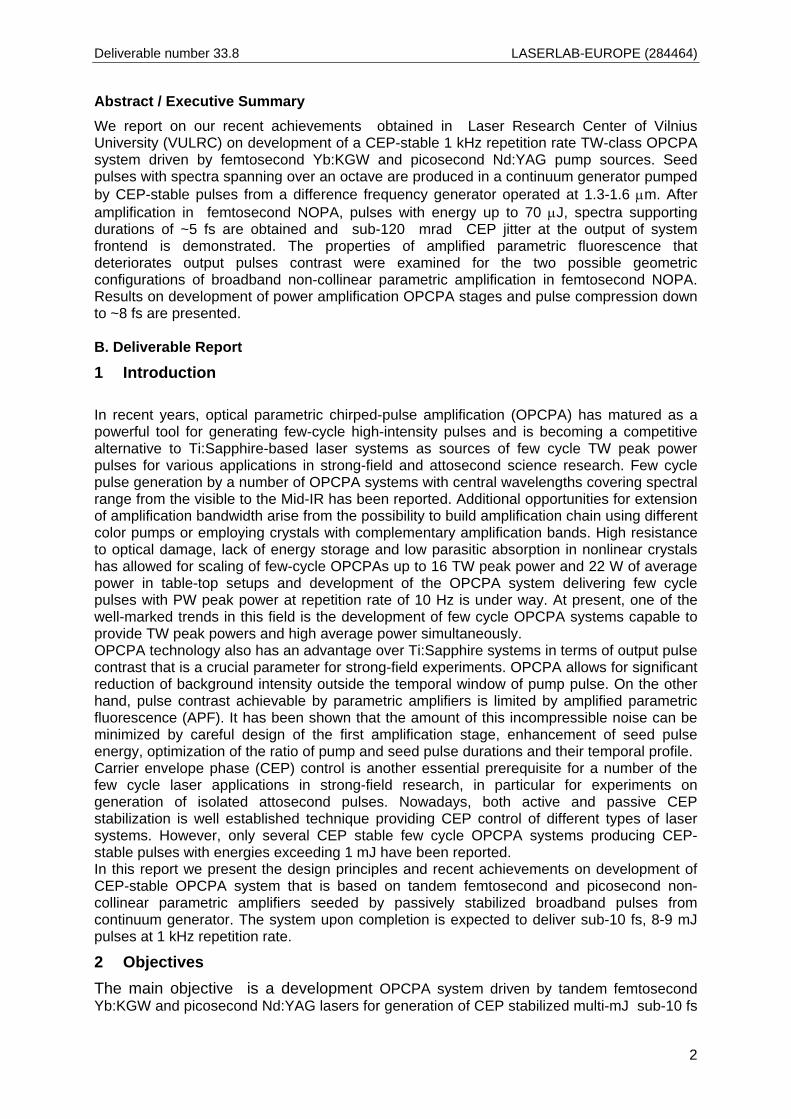
3 Work performed / results / description OPCPA system design The general layout of the TW-class OPCPA that is under development in Laser Research Center of Vilnius University is presented in figure 1. The frontend consists of continuum generators and non-collinear parametric amplification stages driven by femtosecond Yb:KGW master oscillator-power amplifier system (Pharos, Light Conversion Ltd.). It produces passively CEP-stabilized broadband seed pulses with tens of microjoules of energy. The three-stage power amplifier, in combination with pulse stretching/ compression setups, is designed to produce multi-mJ few-cycle pulses. High energy picosecond pump pulses are produced by a 1 kHz repetition rate, all-diode-pumped Nd:YAG amplifier system (Ekspla, Ltd.). This system, that is currently approaching completion, will provide 40 mJ pulses at 532 nm with Gaussian temporal shape and super-Gaussian spatial profile for the pumping of final low gain, high energy OPCPA stage. The high gain pre-amplification stages will be pumped by flat-top pulses shaped using a cascaded second harmonic generation technique. Regarding pulse stretching and compression, we employ the down-chirped pulse amplification scheme, where pulses are negatively chirped prior to amplification and compressed in bulk glasses after being amplified. The main rationale for this decision is the potentially higher throughput of properly AR-coated glasses, as compared to a diffraction grating compressor. In our setup, most of the stretching is performed by a grism pair because of the good match of the dispersion shapes of glasses and grisms. An acousto-optic programmable dispersive filter (Dazzler, Fastlite Inc.) is inserted after the first picosecond amplification stage for fine dispersion control. Amplified pulses will be compressed in bulk glasses down to about 400 fs, and finally compressed to minimum duration by positive dispersion chirped mirrors.
Figure 1. Principal layout of the OPCPA setup. RA, regenerative amplifier; SHG, second harmonic generator; WLG, white light generator; DFG, difference frequency generator; AOPDF, acousto-optic programmable dispersive filter. This brief description reflects several conceptual ideas that we have adopted in our OPCPA system design. The spectrum of the mode-locked Yb:KGW oscillator pulses overlaps well with the spectral amplification bands of Yb:KGW and Nd:YAG amplifiers. Therefore, all-optical synchronization of our system is straightforward and reliable. The choice of sequential
Deliverable number 33.8 LASERLAB-EUROPE (284464)
4
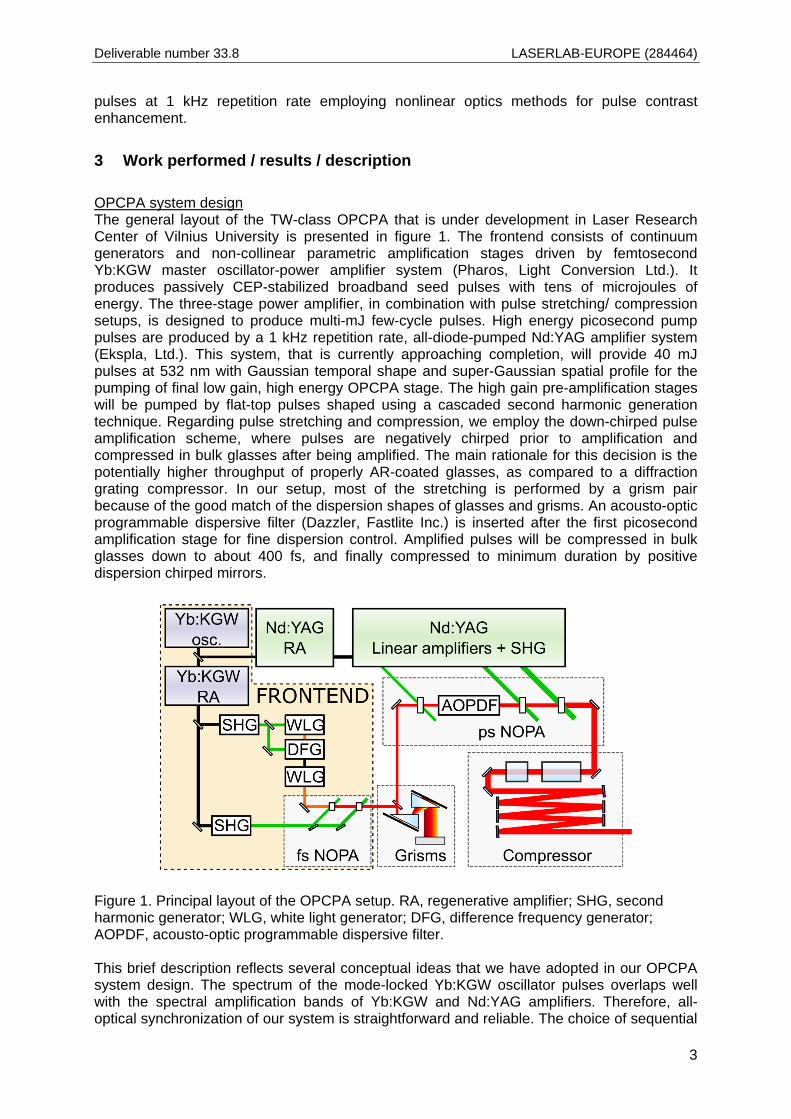
femtosecond and picosecond multistage non-collinear parametric amplifier (NOPA) setup combines the advantages of short pulse implementation (thinner crystals, broader parametric amplification bandwidths) with potentially higher energies from picosecond NOPA. This approach provides a lot of flexibility in signal spectrum shaping as slightly different part of the pulse spectrum may be amplified in each stage, allows for distribution of overall gain and spatial signal filtering between stages. The flat-top shaped picosecond NOPA pump pulses permit using a seed-to-pump pulse duration ratio close to unity, which is known to aid in suppressing APF, while simultaneously maximizing energy conversion efficiency without loss of bandwidth. The femtosecond frontend produces passively CEP stabilized broadband seed pulses and also serves for improvement of output pulse contrast. In our system configuration, APF is the only source of background noise. At the OPCPA system output it resides within the time window defined by the duration of the femtosecond pump pulse, since the contribution of APF arising in picosecond NOPA seeded by microjoule level pulses is practically negligible. All things considered, we can reasonably expect intensity contrast on the order of 1010 on the picosecond scale without using additional measures for temporal pulse cleaning. CEP-stable pulse generation CEP stability is a key parameter for strong-field laser drivers. Previously, we have achieved good CEP control of a femtosecond OPA by stabilizing the carrier-envelope offset frequency of the Yb:KGW oscillator. While this is an established method for CEP control, it requires complex electronics and generating a continuum from the Yb:KGW oscillator pulse in a photonic crystal fiber, which we found to be too inconvenient for everyday use. We realized that we could get better and more reproducible results using the passive stabilization method based on difference frequency generation (DFG) when the difference frequency is generated between two pulses with the same CEP.
Figure 2. Principal layout of the DFG setup Our DFG setup is depicted schematically in fig. 2. The setup is pumped by 515 nm, 70 µJ pulses. A fraction of the pump beam energy (3 µJ, 0.8 µJ after aperture) is focused into a sapphire plate to generate a continuum, whose long-wave wing is amplified in a 2 mm BBO crystal by another part (13 µJ) of the incoming beam, simultaneously generating a CEP-stable idler pulse with ~200 nJ energy. Careful optimization of the continuum generation conditions (numerical aperture and the position of the sapphire with respect to the focus) was required to produce enough seed energy in the 850- 900 nm range, which is necessary to achieve the desired idler wavelength of 1.3-1.4 µm. Furthermore, the continuum pulse had to be chirped to match the duration of the somewhat chirped pump. This is achieved by transmitting the continuum through a 10 mm ZnSe window before DFG. Amplification is performed in collinear geometry to avoid angular dispersion of the idler. The idler pulses are sent back to the BBO crystal to be further amplified to >4 µJ by the remaining part of the
Deliverable number 33.8 LASERLAB-EUROPE (284464)
5
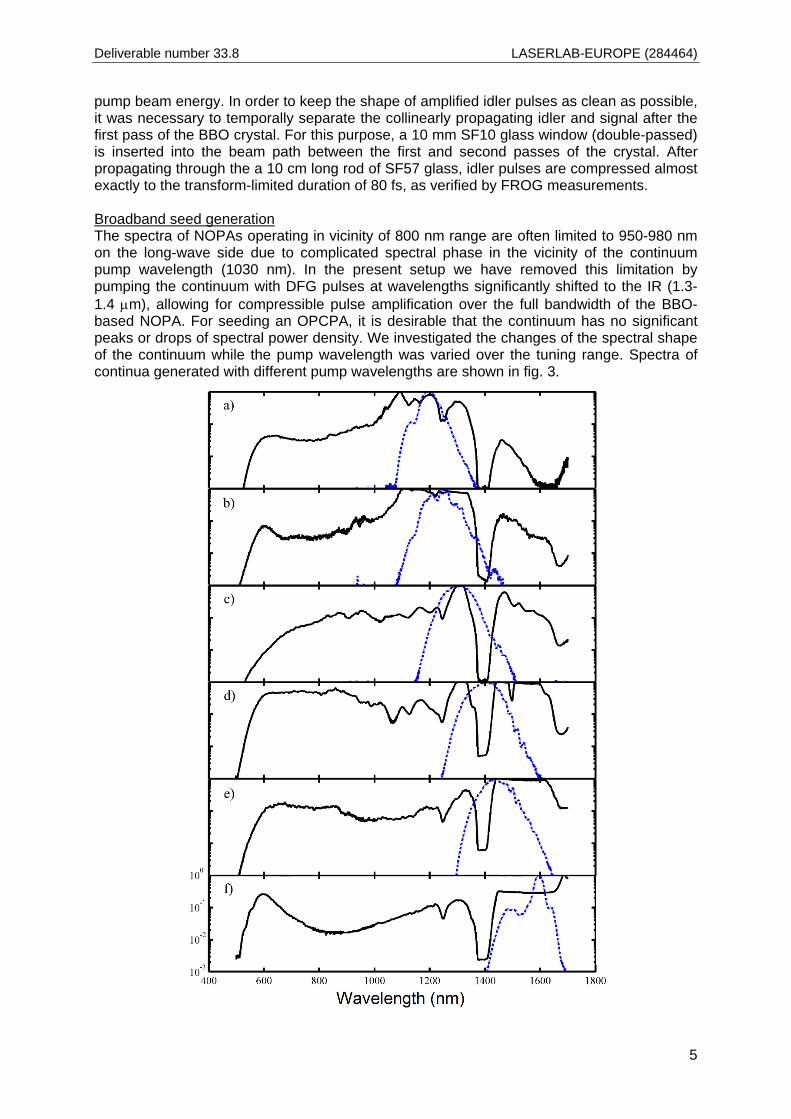
pump beam energy. In order to keep the shape of amplified idler pulses as clean as possible, it was necessary to temporally separate the collinearly propagating idler and signal after the first pass of the BBO crystal. For this purpose, a 10 mm SF10 glass window (double-passed) is inserted into the beam path between the first and second passes of the crystal. After propagating through the a 10 cm long rod of SF57 glass, idler pulses are compressed almost exactly to the transform-limited duration of 80 fs, as verified by FROG measurements. Broadband seed generation The spectra of NOPAs operating in vicinity of 800 nm range are often limited to 950-980 nm on the long-wave side due to complicated spectral phase in the vicinity of the continuum pump wavelength (1030 nm). In the present setup we have removed this limitation by pumping the continuum with DFG pulses at wavelengths significantly shifted to the IR (1.3-1.4 µm), allowing for compressible pulse amplification over the full bandwidth of the BBO-based NOPA. For seeding an OPCPA, it is desirable that the continuum has no significant peaks or drops of spectral power density. We investigated the changes of the spectral shape of the continuum while the pump wavelength was varied over the tuning range. Spectra of continua generated with different pump wavelengths are shown in fig. 3.
Deliverable number 33.8 LASERLAB-EUROPE (284464)
6
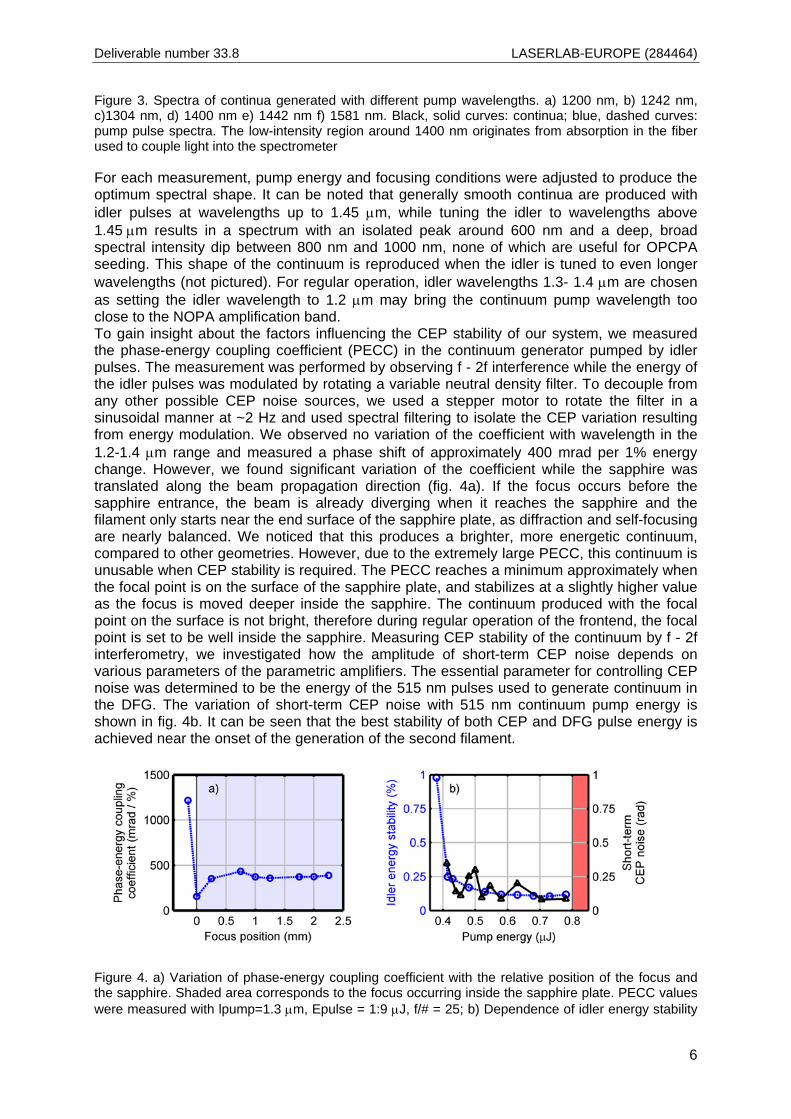
Figure 3. Spectra of continua generated with different pump wavelengths. a) 1200 nm, b) 1242 nm, c)1304 nm, d) 1400 nm e) 1442 nm f) 1581 nm. Black, solid curves: continua; blue, dashed curves: pump pulse spectra. The low-intensity region around 1400 nm originates from absorption in the fiber used to couple light into the spectrometer For each measurement, pump energy and focusing conditions were adjusted to produce the optimum spectral shape. It can be noted that generally smooth continua are produced with idler pulses at wavelengths up to 1.45 µm, while tuning the idler to wavelengths above 1.45 µm results in a spectrum with an isolated peak around 600 nm and a deep, broad spectral intensity dip between 800 nm and 1000 nm, none of which are useful for OPCPA seeding. This shape of the continuum is reproduced when the idler is tuned to even longer wavelengths (not pictured). For regular operation, idler wavelengths 1.3- 1.4 µm are chosen as setting the idler wavelength to 1.2 µm may bring the continuum pump wavelength too close to the NOPA amplification band. To gain insight about the factors influencing the CEP stability of our system, we measured the phase-energy coupling coefficient (PECC) in the continuum generator pumped by idler pulses. The measurement was performed by observing f - 2f interference while the energy of the idler pulses was modulated by rotating a variable neutral density filter. To decouple from any other possible CEP noise sources, we used a stepper motor to rotate the filter in a sinusoidal manner at ~2 Hz and used spectral filtering to isolate the CEP variation resulting from energy modulation. We observed no variation of the coefficient with wavelength in the 1.2-1.4 µm range and measured a phase shift of approximately 400 mrad per 1% energy change. However, we found significant variation of the coefficient while the sapphire was translated along the beam propagation direction (fig. 4a). If the focus occurs before the sapphire entrance, the beam is already diverging when it reaches the sapphire and the filament only starts near the end surface of the sapphire plate, as diffraction and self-focusing are nearly balanced. We noticed that this produces a brighter, more energetic continuum, compared to other geometries. However, due to the extremely large PECC, this continuum is unusable when CEP stability is required. The PECC reaches a minimum approximately when the focal point is on the surface of the sapphire plate, and stabilizes at a slightly higher value as the focus is moved deeper inside the sapphire. The continuum produced with the focal point on the surface is not bright, therefore during regular operation of the frontend, the focal point is set to be well inside the sapphire. Measuring CEP stability of the continuum by f - 2f interferometry, we investigated how the amplitude of short-term CEP noise depends on various parameters of the parametric amplifiers. The essential parameter for controlling CEP noise was determined to be the energy of the 515 nm pulses used to generate continuum in the DFG. The variation of short-term CEP noise with 515 nm continuum pump energy is shown in fig. 4b. It can be seen that the best stability of both CEP and DFG pulse energy is achieved near the onset of the generation of the second filament.
Figure 4. a) Variation of phase-energy coupling coefficient with the relative position of the focus and the sapphire. Shaded area corresponds to the focus occurring inside the sapphire plate. PECC values were measured with lpump=1.3 µm, Epulse = 1:9 µJ, f/# = 25; b) Dependence of idler energy stability
Deliverable number 33.8 LASERLAB-EUROPE (284464)
7
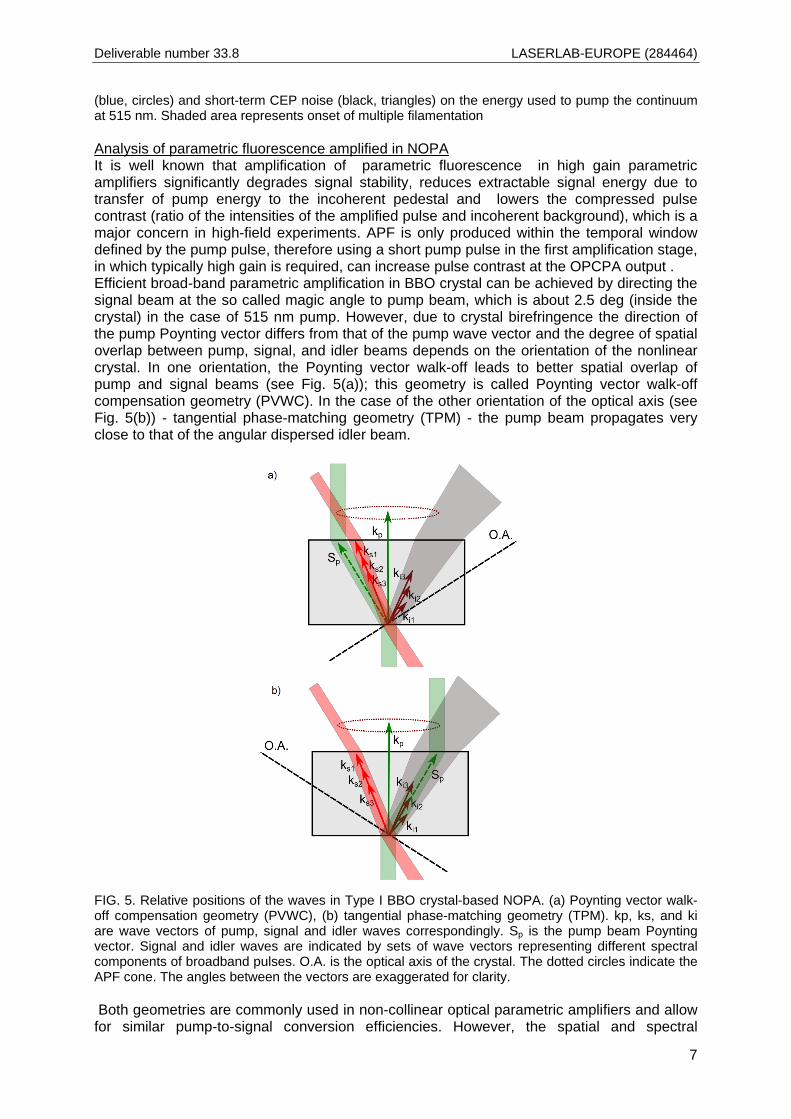
(blue, circles) and short-term CEP noise (black, triangles) on the energy used to pump the continuum at 515 nm. Shaded area represents onset of multiple filamentation Analysis of parametric fluorescence amplified in NOPA It is well known that amplification of parametric fluorescence in high gain parametric amplifiers significantly degrades signal stability, reduces extractable signal energy due to transfer of pump energy to the incoherent pedestal and lowers the compressed pulse contrast (ratio of the intensities of the amplified pulse and incoherent background), which is a major concern in high-field experiments. APF is only produced within the temporal window defined by the pump pulse, therefore using a short pump pulse in the first amplification stage, in which typically high gain is required, can increase pulse contrast at the OPCPA output . Efficient broad-band parametric amplification in BBO crystal can be achieved by directing the signal beam at the so called magic angle to pump beam, which is about 2.5 deg (inside the crystal) in the case of 515 nm pump. However, due to crystal birefringence the direction of the pump Poynting vector differs from that of the pump wave vector and the degree of spatial overlap between pump, signal, and idler beams depends on the orientation of the nonlinear crystal. In one orientation, the Poynting vector walk-off leads to better spatial overlap of pump and signal beams (see Fig. 5(a)); this geometry is called Poynting vector walk-off compensation geometry (PVWC). In the case of the other orientation of the optical axis (see Fig. 5(b)) - tangential phase-matching geometry (TPM) - the pump beam propagates very close to that of the angular dispersed idler beam.
FIG. 5. Relative positions of the waves in Type I BBO crystal-based NOPA. (a) Poynting vector walk-off compensation geometry (PVWC), (b) tangential phase-matching geometry (TPM). kp, ks, and ki are wave vectors of pump, signal and idler waves correspondingly. Sp is the pump beam Poynting vector. Signal and idler waves are indicated by sets of wave vectors representing different spectral components of broadband pulses. O.A. is the optical axis of the crystal. The dotted circles indicate the APF cone. The angles between the vectors are exaggerated for clarity. Both geometries are commonly used in non-collinear optical parametric amplifiers and allow for similar pump-to-signal conversion efficiencies. However, the spatial and spectral
Deliverable number 33.8 LASERLAB-EUROPE (284464)
8
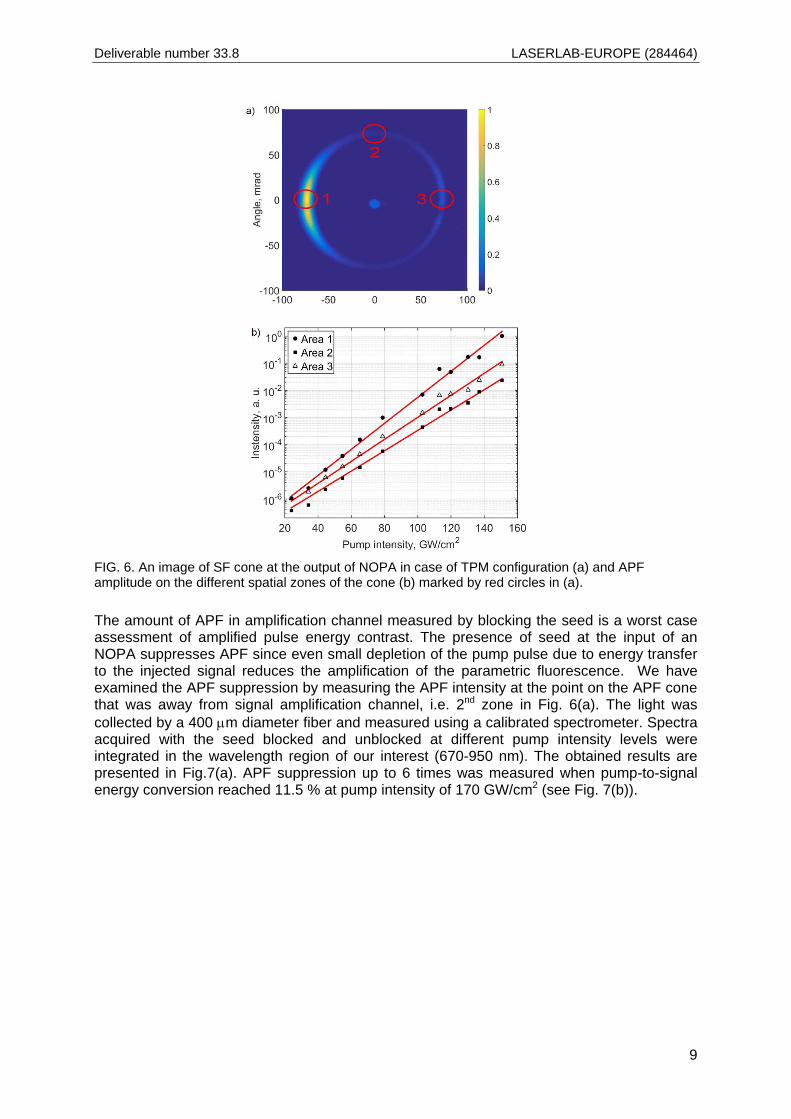
parameters of the amplified signal differ appreciably due to specific spatio-temporal pulse shaping dynamics and different parasitic frequency mixing processes in PVWC and TPM geometries. The differences are more pronounced when narrow beams and short pulses are used in parametric amplifiers. As the contrast of an OPCPA system output is usually defined by the first amplification stage, the common practice is to design these first stages to operate with minimum beam sizes in order to enhance the ratio of the seed and quantum noise photons in the amplification channel. Different spatio-temporal parametric amplification conditions in PVWC and TPM amplification configurations may also lead to different APF levels at the output of OPA. However, to the best of our knowledge, this issue has not yet been examined. In our setup an Yb:KGW diode-pumped solid state laser generating 200 fs pulses at 1030 nm at a repetition rate of 1 kHz was used. A small part of the pulse energy (~1 µJ) was split off and focused into a 4 mm sapphire plate to generate a white-light continuum (WLC) seed. A waveplate-polarizer attenuator was used to finely tune the pump energy for optimum WLC generation, which led to WLC spectrum being highly stable on both shot- to-shot and day-to-day timescales. The larger part of the pulse energy was frequency doubled in a 0.7 mm BBO crystal, producing pump pulses for the NOPA. Parametric amplification was carried out in a 2.5 mm type-I BBO crystal into which pump beam was focused to a spot size of 110 µm at FWHM. The size of the seed beam was 250 µm at FWHM. Phase matching angle of the crystal and the noncollinearity angle were fine-tuned for efficient signal amplification in the 670-950 nm spectral range. In our set up the continuum seed pulse with an energy content of ~5 nJ in the 670-950 nm spectral band could be amplified up to 0.6 µJ at pump intensity level of 170 GW/cm2 with conversion efficiency of 11.5%. When the seed is blocked, the cone of APF is clearly observed at high pump intensity levels. The half-angle of the cone centered on the pump beam is set to ~4.1 deg (~71 mrad) by tuning the phase matching angle of the crystal. Since the refraction index of BBO crystal is ~1.66 at 800 nm, this corresponds to an internal signal- pump noncollinearity angle of ~2.5 deg that is called the magic angle and provides the broadest spectral amplification band. An image of APF spatial distribution) is presented in Fig. 6(a). We have measured the dependence of APF on pump intensity at different angles on the cone (1, 2, 3 marked in Fig. 6(a)). The results are presented in Fig. 6(b) show, as expected, the exponential APF intensity dependence on pump intensity for all three measured directions on the cone.
Deliverable number 33.8 LASERLAB-EUROPE (284464)
9
FIG. 6. An image of SF cone at the output of NOPA in case of TPM configuration (a) and APF amplitude on the different spatial zones of the cone (b) marked by red circles in (a).
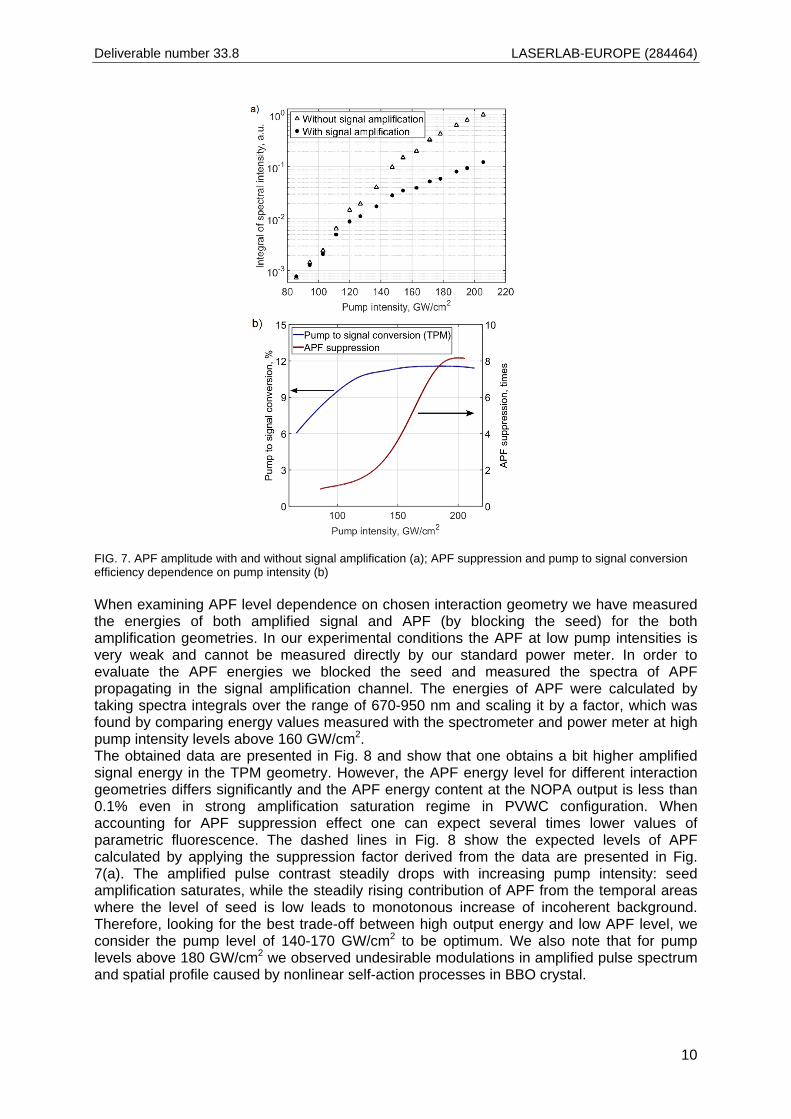
The amount of APF in amplification channel measured by blocking the seed is a worst case assessment of amplified pulse energy contrast. The presence of seed at the input of an NOPA suppresses APF since even small depletion of the pump pulse due to energy transfer to the injected signal reduces the amplification of the parametric fluorescence. We have examined the APF suppression by measuring the APF intensity at the point on the APF cone that was away from signal amplification channel, i.e. 2nd zone in Fig. 6(a). The light was collected by a 400 µm diameter fiber and measured using a calibrated spectrometer. Spectra acquired with the seed blocked and unblocked at different pump intensity levels were integrated in the wavelength region of our interest (670-950 nm). The obtained results are presented in Fig.7(a). APF suppression up to 6 times was measured when pump-to-signal energy conversion reached 11.5 % at pump intensity of 170 GW/cm2 (see Fig. 7(b)).
Deliverable number 33.8 LASERLAB-EUROPE (284464)
10
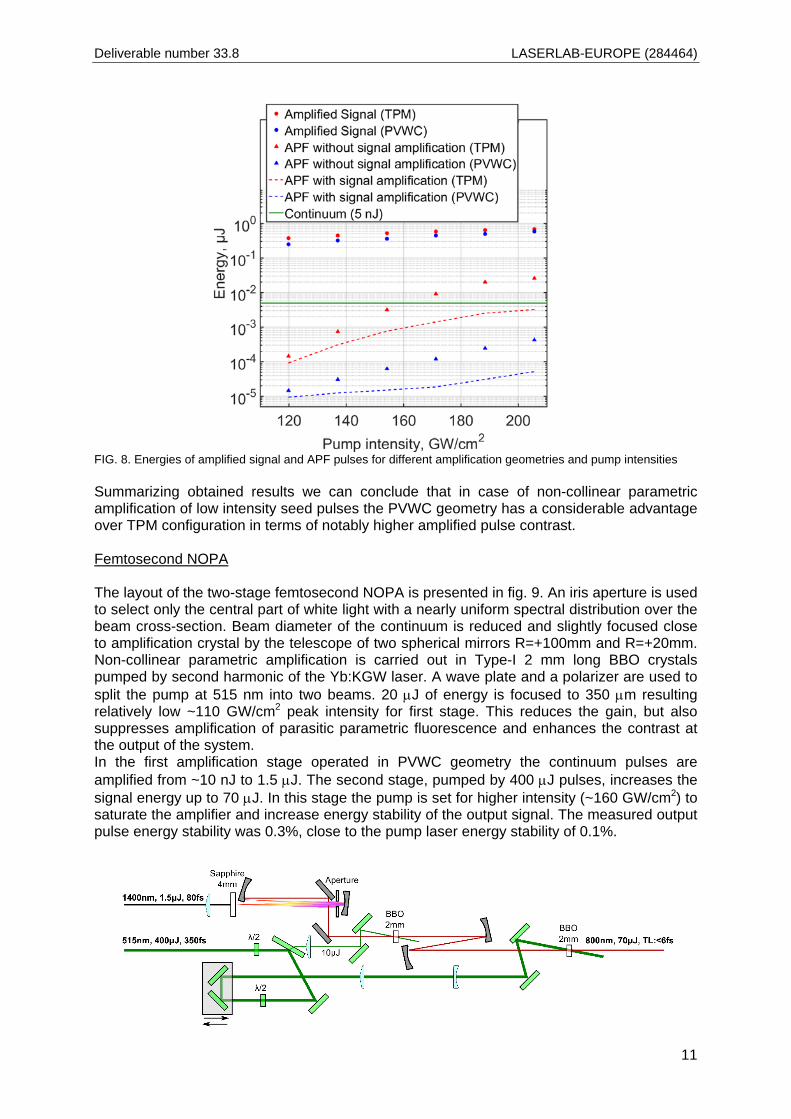
FIG. 7. APF amplitude with and without signal amplification (a); APF suppression and pump to signal conversion efficiency dependence on pump intensity (b) When examining APF level dependence on chosen interaction geometry we have measured the energies of both amplified signal and APF (by blocking the seed) for the both amplification geometries. In our experimental conditions the APF at low pump intensities is very weak and cannot be measured directly by our standard power meter. In order to evaluate the APF energies we blocked the seed and measured the spectra of APF propagating in the signal amplification channel. The energies of APF were calculated by taking spectra integrals over the range of 670-950 nm and scaling it by a factor, which was found by comparing energy values measured with the spectrometer and power meter at high pump intensity levels above 160 GW/cm2. The obtained data are presented in Fig. 8 and show that one obtains a bit higher amplified signal energy in the TPM geometry. However, the APF energy level for different interaction geometries differs significantly and the APF energy content at the NOPA output is less than 0.1% even in strong amplification saturation regime in PVWC configuration. When accounting for APF suppression effect one can expect several times lower values of parametric fluorescence. The dashed lines in Fig. 8 show the expected levels of APF calculated by applying the suppression factor derived from the data are presented in Fig. 7(a). The amplified pulse contrast steadily drops with increasing pump intensity: seed amplification saturates, while the steadily rising contribution of APF from the temporal areas where the level of seed is low leads to monotonous increase of incoherent background. Therefore, looking for the best trade-off between high output energy and low APF level, we consider the pump level of 140-170 GW/cm2 to be optimum. We also note that for pump levels above 180 GW/cm2 we observed undesirable modulations in amplified pulse spectrum and spatial profile caused by nonlinear self-action processes in BBO crystal.
Deliverable number 33.8 LASERLAB-EUROPE (284464)
11
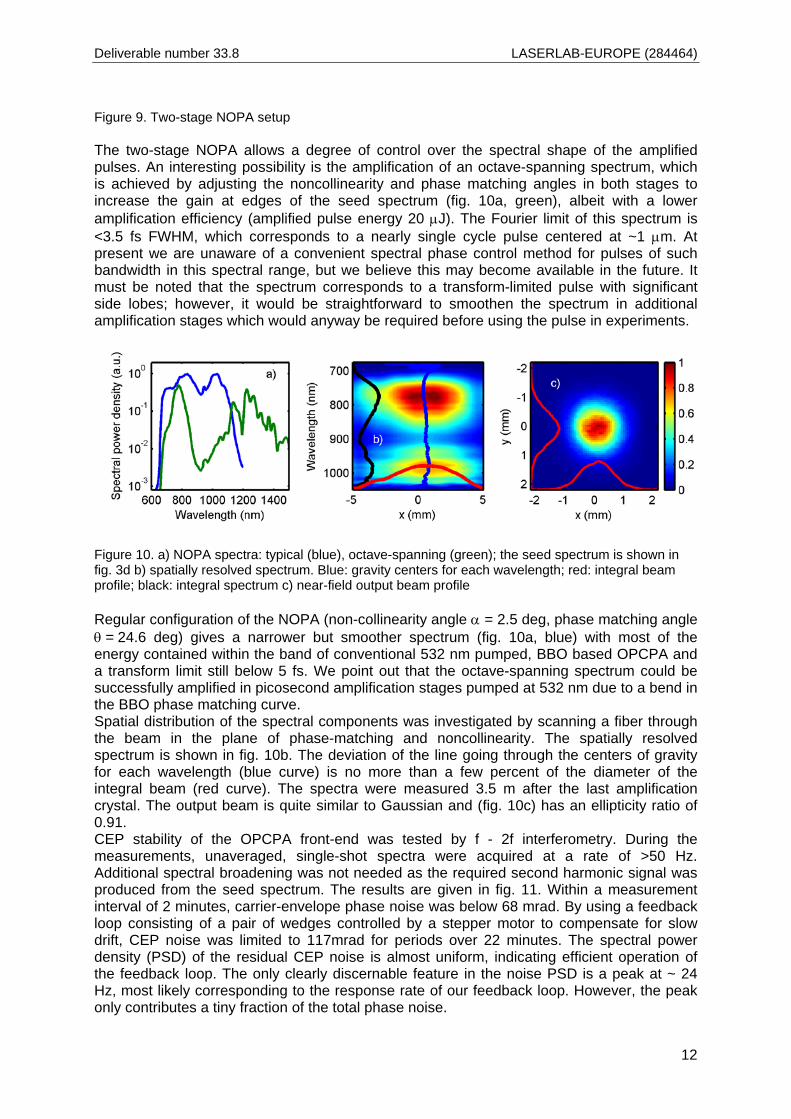
FIG. 8. Energies of amplified signal and APF pulses for different amplification geometries and pump intensities Summarizing obtained results we can conclude that in case of non-collinear parametric amplification of low intensity seed pulses the PVWC geometry has a considerable advantage over TPM configuration in terms of notably higher amplified pulse contrast. Femtosecond NOPA The layout of the two-stage femtosecond NOPA is presented in fig. 9. An iris aperture is used to select only the central part of white light with a nearly uniform spectral distribution over the beam cross-section. Beam diameter of the continuum is reduced and slightly focused close to amplification crystal by the telescope of two spherical mirrors R=+100mm and R=+20mm. Non-collinear parametric amplification is carried out in Type-I 2 mm long BBO crystals pumped by second harmonic of the Yb:KGW laser. A wave plate and a polarizer are used to split the pump at 515 nm into two beams. 20 µJ of energy is focused to 350 µm resulting relatively low ~110 GW/cm2 peak intensity for first stage. This reduces the gain, but also suppresses amplification of parasitic parametric fluorescence and enhances the contrast at the output of the system. In the first amplification stage operated in PVWC geometry the continuum pulses are amplified from ~10 nJ to 1.5 µJ. The second stage, pumped by 400 µJ pulses, increases the signal energy up to 70 µJ. In this stage the pump is set for higher intensity (~160 GW/cm2) to saturate the amplifier and increase energy stability of the output signal. The measured output pulse energy stability was 0.3%, close to the pump laser energy stability of 0.1%.
Deliverable number 33.8 LASERLAB-EUROPE (284464)
12
Figure 9. Two-stage NOPA setup The two-stage NOPA allows a degree of control over the spectral shape of the amplified pulses. An interesting possibility is the amplification of an octave-spanning spectrum, which is achieved by adjusting the noncollinearity and phase matching angles in both stages to increase the gain at edges of the seed spectrum (fig. 10a, green), albeit with a lower amplification efficiency (amplified pulse energy 20 µJ). The Fourier limit of this spectrum is <3.5 fs FWHM, which corresponds to a nearly single cycle pulse centered at ~1 µm. At present we are unaware of a convenient spectral phase control method for pulses of such bandwidth in this spectral range, but we believe this may become available in the future. It must be noted that the spectrum corresponds to a transform-limited pulse with significant side lobes; however, it would be straightforward to smoothen the spectrum in additional amplification stages which would anyway be required before using the pulse in experiments.
Figure 10. a) NOPA spectra: typical (blue), octave-spanning (green); the seed spectrum is shown in fig. 3d b) spatially resolved spectrum. Blue: gravity centers for each wavelength; red: integral beam profile; black: integral spectrum c) near-field output beam profile Regular configuration of the NOPA (non-collinearity angle α = 2.5 deg, phase matching angle θ = 24.6 deg) gives a narrower but smoother spectrum (fig. 10a, blue) with most of the energy contained within the band of conventional 532 nm pumped, BBO based OPCPA and a transform limit still below 5 fs. We point out that the octave-spanning spectrum could be successfully amplified in picosecond amplification stages pumped at 532 nm due to a bend in the BBO phase matching curve. Spatial distribution of the spectral components was investigated by scanning a fiber through the beam in the plane of phase-matching and noncollinearity. The spatially resolved spectrum is shown in fig. 10b. The deviation of the line going through the centers of gravity for each wavelength (blue curve) is no more than a few percent of the diameter of the integral beam (red curve). The spectra were measured 3.5 m after the last amplification crystal. The output beam is quite similar to Gaussian and (fig. 10c) has an ellipticity ratio of 0.91. CEP stability of the OPCPA front-end was tested by f - 2f interferometry. During the measurements, unaveraged, single-shot spectra were acquired at a rate of >50 Hz. Additional spectral broadening was not needed as the required second harmonic signal was produced from the seed spectrum. The results are given in fig. 11. Within a measurement interval of 2 minutes, carrier-envelope phase noise was below 68 mrad. By using a feedback loop consisting of a pair of wedges controlled by a stepper motor to compensate for slow drift, CEP noise was limited to 117mrad for periods over 22 minutes. The spectral power density (PSD) of the residual CEP noise is almost uniform, indicating efficient operation of the feedback loop. The only clearly discernable feature in the noise PSD is a peak at ~ 24 Hz, most likely corresponding to the response rate of our feedback loop. However, the peak only contributes a tiny fraction of the total phase noise.

Deliverable number 33.8 LASERLAB-EUROPE (284464)
13
Figure 11. a) f - 2f interferogram measured without active CEP stabilization; b) CEP values retrieved from the interferogram in a); c) CEP measurement taken with slow feedback loop turned on; d) CEP noise power spectral density and integrated phase noise At the moment the femtosecond front end of the OPCPA system (Fig.12 consisting of continuum generators, DFG and NOPA stages driven by femtosecond Yb:KGW master oscillator-power amplifier system (its footprint is ~ 1m2) is fully operational and produces passively CEP-stabilized pulses with energy up to 70 µJ and spectrum corresponding to transform limited pulses of ~ 5 fs. Output pulse energy stability is around 0.3 % and CEP jitter is below 120 mrad.
Figure 12 . View the front end. Development of OPCPA power amplifier, pulse stretching and compression set-ups. Three stages of OPCPA power amplifier are pumped by pulses from all-diode-pumped, 1 kHz repetition rate Nd:YAG amplifier system. This system (Fig.13) is seeded by femtosecond pulses from Yb:KGW oscillator ensuring a robust all optical synchronization of front end and power amplifier. Nd:YAG amplifier system consists of two stage regenerative amplifier and several linear amplifiers has two high power output channels each delivering pulses at 1064 nm with energy up to ~ 35 mJ. Spatial intensity profile is presented in Fig.13b. System also has one additional low power output emitting pulses of ~ 3 mJ. The
Deliverable number 33.8 LASERLAB-EUROPE (284464)
14
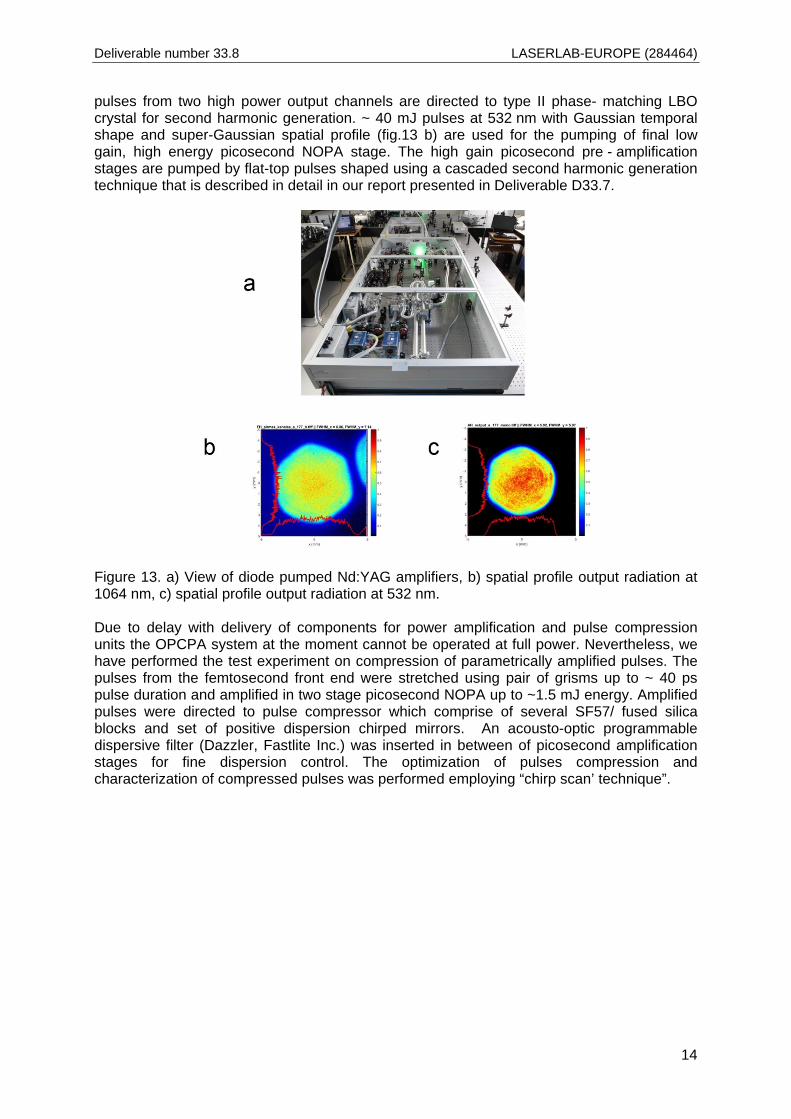
pulses from two high power output channels are directed to type II phase- matching LBO crystal for second harmonic generation. ~ 40 mJ pulses at 532 nm with Gaussian temporal shape and super-Gaussian spatial profile (fig.13 b) are used for the pumping of final low gain, high energy picosecond NOPA stage. The high gain picosecond pre - amplification stages are pumped by flat-top pulses shaped using a cascaded second harmonic generation technique that is described in detail in our report presented in Deliverable D33.7.
Figure 13. a) View of diode pumped Nd:YAG amplifiers, b) spatial profile output radiation at 1064 nm, c) spatial profile output radiation at 532 nm. Due to delay with delivery of components for power amplification and pulse compression units the OPCPA system at the moment cannot be operated at full power. Nevertheless, we have performed the test experiment on compression of parametrically amplified pulses. The pulses from the femtosecond front end were stretched using pair of grisms up to ~ 40 ps pulse duration and amplified in two stage picosecond NOPA up to ~1.5 mJ energy. Amplified pulses were directed to pulse compressor which comprise of several SF57/ fused silica blocks and set of positive dispersion chirped mirrors. An acousto-optic programmable dispersive filter (Dazzler, Fastlite Inc.) was inserted in between of picosecond amplification stages for fine dispersion control. The optimization of pulses compression and characterization of compressed pulses was performed employing “chirp scan’ technique”.
Deliverable number 33.8 LASERLAB-EUROPE (284464)
15
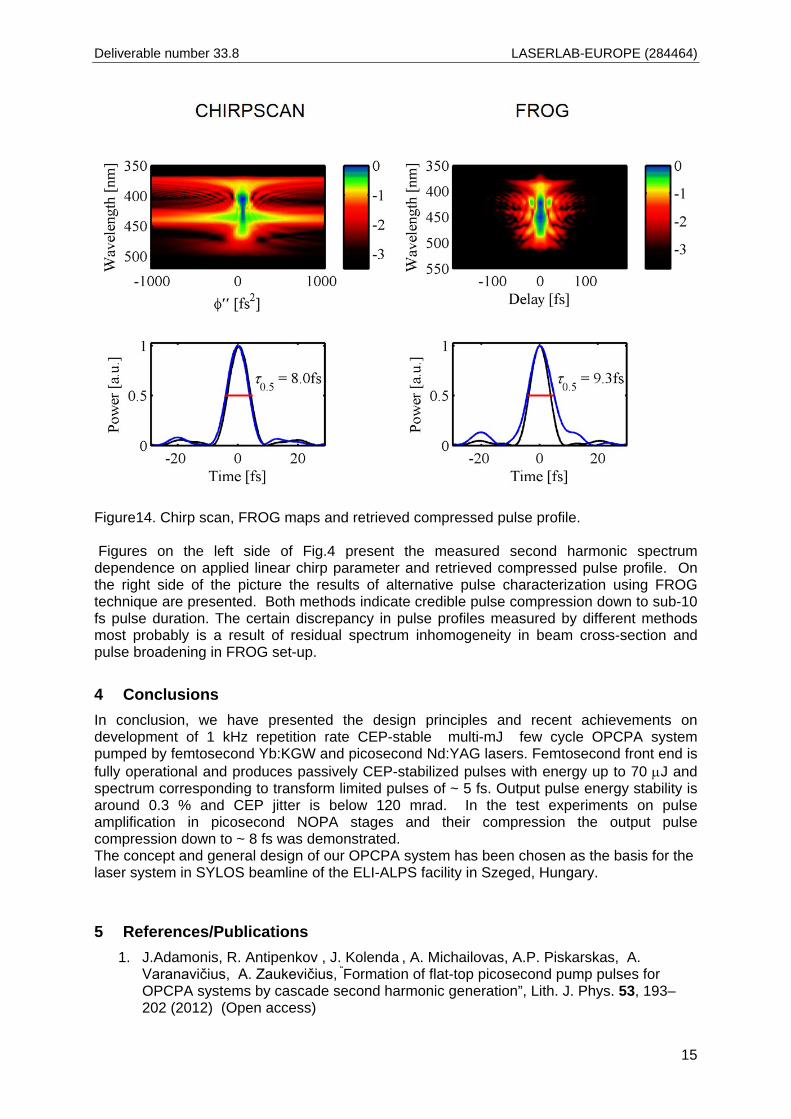
Figure14. Chirp scan, FROG maps and retrieved compressed pulse profile. Figures on the left side of Fig.4 present the measured second harmonic spectrum dependence on applied linear chirp parameter and retrieved compressed pulse profile. On the right side of the picture the results of alternative pulse characterization using FROG technique are presented. Both methods indicate credible pulse compression down to sub-10 fs pulse duration. The certain discrepancy in pulse profiles measured by different methods most probably is a result of residual spectrum inhomogeneity in beam cross-section and pulse broadening in FROG set-up.
4 Conclusions In conclusion, we have presented the design principles and recent achievements on development of 1 kHz repetition rate CEP-stable multi-mJ few cycle OPCPA system pumped by femtosecond Yb:KGW and picosecond Nd:YAG lasers. Femtosecond front end is fully operational and produces passively CEP-stabilized pulses with energy up to 70 µJ and spectrum corresponding to transform limited pulses of ~ 5 fs. Output pulse energy stability is around 0.3 % and CEP jitter is below 120 mrad. In the test experiments on pulse amplification in picosecond NOPA stages and their compression the output pulse compression down to ~ 8 fs was demonstrated. The concept and general design of our OPCPA system has been chosen as the basis for the laser system in SYLOS beamline of the ELI-ALPS facility in Szeged, Hungary.
5 References/Publications 1. J.Adamonis, R. Antipenkov , J. Kolenda , A. Michailovas, A.P. Piskarskas, A.
Varanavičius, A. Zaukevičius, “Formation of flat-top picosecond pump pulses for OPCPA systems by cascade second harmonic generation”, Lith. J. Phys. 53, 193–202 (2012) (Open access)
Deliverable number 33.8 LASERLAB-EUROPE (284464)
16
2. T. Stanislauskas, R. Budriūnas, R.Antipenkov, A. Zaukevičius, J. Adamonis, A. Michailovas, L. Giniūnas, R.Danielius, A.Piskarskas, A.Varanavičius, “Table top TW-class OPCPA system driven by tandem femtosecond Yb:KGW and picosecond Nd:YAG lasers”, OPTICS EXPRESS, 22,1865-1870( 2014) DOI:10.1364/OE.22.001865 (open access)
3. T. Balčiūnas, T. Flöry, A. Baltuška, T.Stanislauskas, R. Antipenkov, A. Varanavičius, G.Steinmeyer, “Direct carrier-envelope phase control of an amplified laser system” Opt. Lett., 39, Issue 6, 1669-1672 (2014) DOI: 10.1364/OL.39.001669
4. R. Budriūnas, T. Stanislauskas , A. Varanavičius, Passively CEP-stabilized frontend for few cycle terawatt OPCPA system, J. Opt.,17, 094008 (2015) DOI:10.1088/2040-8978/17/9/094008
5. T. Stanislauskas, I.Balčiūnas, V.Tamuliene, R.Budriūnas, A.Varanavičius, Analysis of
parametric fluorescence amplified in noncollinear optical parametric amplifier pumped by second harmonic of femtosecond Yb:KGW laser.( Accepted for publication in Lith. J. Phys.) (open access)