Laser induced shock waves for composites adhesive bond testing
11
A study of composite material damage induced by laser shock waves Romain Ecault a,⇑ , Michel Boustie a , Fabienne Touchard a , Frédéric Pons a , Laurent Berthe b , Laurence Chocinski-Arnault a , Bastien Ehrhart c , Clemens Bockenheimer d a Institut PPRIME, CNRS-ENSMA-Université de Poitiers, Département Physique et Mécanique des Matériaux – ENSMA, 1, Av. Clément Ader, B.P. 40109, 86961 Futuroscope Cedex, France b PIMM, CNRS-ENSAM Paristech, 151 Bd de l’Hopital, 75013 PARIS Cedex, France c Fraunhofer Institute for Non-Destructive Test Methods (IZFP), Campus E3.1, 66123 Saarbruecken, Germany d Airbus Operations SAS, Leader SHM & ENDT Technology, A350 Materials & Processes (ESKW), Site de Saint Martin du Touch, 31060 Toulouse Cedex 9, France article info Article history: Received 21 December 2012 Received in revised form 21 May 2013 Accepted 26 May 2013 Available online 7 June 2013 Keywords: A. Layered structures B. Damage tolerance B. Delamination D. Optical microscopy abstract A laser shock wave technique has been used to study the damage tolerance of T800/M21 CFRP (Carbon Fiber Reinforced Polymer) composite material with different lay_ups. Different levels of damage have been created according to various laser irradiation conditions. Several characterization methods such as Optical Microscopy, X-ray Radiography, or Interferometric Confocal Microscopy have been used to quantify these defects. The nature of the defects induced by the shock wave propagation has been stud- ied. The sensitivity of the composite material damage to the shock conditions has been shown and quan- tified. Moreover, the experimental results gathered with each technique have been compared to each other and it leads to a better understanding of the CFRP behavior under high dynamic loading. These ori- ginal results have enabled the definition of a specific damage criterion for CFRP under dynamic loading. Ó 2013 Elsevier Ltd. All rights reserved. 1. Introduction Nowadays, composite materials are used in aeronautics for their good mechanical properties and their low weight. Increasing their part in aircraft structures is a compulsory step to achieve a better eco-efficiency. The gain could be important, especially thanks to new assembly technologies as bonding which is meant to replace the current techniques like riveting or bolting [1,2]. These methods are expensive, and are not well-adapted to com- posite materials since complex machining has to be set up (drilling leading to delamination or fiber breakage) [3–5]. Moreover, the use of the bonding technique would enable a significant weight light- ening of the aeronautic structures, which means an aircraft con- sumption reduction. However, several implementation problems can penalize the bonding process, while manufacturing or during the aircraft lifetime. The bond quality can be weakened by a bad curing cycle, a surface contamination before bonding, etc. [6,7]. Moreover, there is no non-destructive technique currently avail- able to quantify the bonding mechanical resistance. Facing this is- sue, a European Project has been started in November 2010: ENCOMB (Extended Nondestructive testing for COMposite Bonds). New methods are developed to enable first the characterization of the composite surface state before bonding, and then, the certifica- tion of the bonding mechanical quality. One of the developed methods is the laser shock wave technique first developed by Vos- sen and Gupta [8,9]. This technique can create a short but intense inside tensile loading on bonded materials. If these stresses are well-located into an interface, the bond line resistance can thus be tested. The LASAT technique was developed for many cases, especially for metal assemblies or metal coatings, for which it is now well understood [10]. Under some conditions, this technique has already been successfully used to test different bonding strengths of composite assemblies [11–13]. Nevertheless, more investigations remain necessary in order to optimize the technique and to better understand the associated complex physical phe- nomena. In particular, the composite material dynamic response to laser shocks has to be understood to develop a technique effi- cient for any kind of bonded composite assembly [14]. From another point of view, the aeronautical composite struc- tures can be subjected to high energy impacts during their lifetime. Indeed, some external loadings can induce high levels of stress with a high strain rate, such as high velocity impacts of various kinds of projectiles (birds, ice stones, etc.). Under some conditions, the laser shocks induce stress levels comparable to the ones in- duced by high velocity impact. The laser shock wave technique presented in this paper can also be used as a way to test and dam- age composite material [14–16]. 1359-835X/$ - see front matter Ó 2013 Elsevier Ltd. All rights reserved. http://dx.doi.org/10.1016/j.compositesa.2013.05.015 ⇑ Corresponding author. Tel.: +33 549498188. E-mail addresses: [email protected] (R. Ecault), [email protected] (M. Boustie), [email protected] (F. Touchard), [email protected] (F. Pons), [email protected] (L. Berthe), [email protected] (L. Chocinski-Arnault), [email protected] (B. Ehrhart), clemens. [email protected] (C. Bockenheimer). Composites: Part A 53 (2013) 54–64 Contents lists available at SciVerse ScienceDirect Composites: Part A journal homepage: www.elsevier.com/locate/compositesa
Transcript of Laser induced shock waves for composites adhesive bond testing

Composites: Part A 53 (2013) 54–64
Contents lists available at SciVerse ScienceDirect
Composites: Part A
journal homepage: www.elsevier .com/locate /composi tesa
A study of composite material damage induced by laser shock waves
1359-835X/$ - see front matter � 2013 Elsevier Ltd. All rights reserved.http://dx.doi.org/10.1016/j.compositesa.2013.05.015
⇑ Corresponding author. Tel.: +33 549498188.E-mail addresses: [email protected] (R. Ecault), [email protected]
(M. Boustie), [email protected] (F. Touchard), [email protected](F. Pons), [email protected] (L. Berthe), [email protected](L. Chocinski-Arnault), [email protected] (B. Ehrhart), [email protected] (C. Bockenheimer).
Romain Ecault a,⇑, Michel Boustie a, Fabienne Touchard a, Frédéric Pons a, Laurent Berthe b,Laurence Chocinski-Arnault a, Bastien Ehrhart c, Clemens Bockenheimer d
a Institut PPRIME, CNRS-ENSMA-Université de Poitiers, Département Physique et Mécanique des Matériaux – ENSMA, 1, Av. Clément Ader, B.P. 40109, 86961 Futuroscope Cedex, Franceb PIMM, CNRS-ENSAM Paristech, 151 Bd de l’Hopital, 75013 PARIS Cedex, Francec Fraunhofer Institute for Non-Destructive Test Methods (IZFP), Campus E3.1, 66123 Saarbruecken, Germanyd Airbus Operations SAS, Leader SHM & ENDT Technology, A350 Materials & Processes (ESKW), Site de Saint Martin du Touch, 31060 Toulouse Cedex 9, France
a r t i c l e i n f o
Article history:Received 21 December 2012Received in revised form 21 May 2013Accepted 26 May 2013Available online 7 June 2013
Keywords:A. Layered structuresB. Damage toleranceB. DelaminationD. Optical microscopy
a b s t r a c t
A laser shock wave technique has been used to study the damage tolerance of T800/M21 CFRP (CarbonFiber Reinforced Polymer) composite material with different lay_ups. Different levels of damage havebeen created according to various laser irradiation conditions. Several characterization methods suchas Optical Microscopy, X-ray Radiography, or Interferometric Confocal Microscopy have been used toquantify these defects. The nature of the defects induced by the shock wave propagation has been stud-ied. The sensitivity of the composite material damage to the shock conditions has been shown and quan-tified. Moreover, the experimental results gathered with each technique have been compared to eachother and it leads to a better understanding of the CFRP behavior under high dynamic loading. These ori-ginal results have enabled the definition of a specific damage criterion for CFRP under dynamic loading.
� 2013 Elsevier Ltd. All rights reserved.
1. Introduction
Nowadays, composite materials are used in aeronautics fortheir good mechanical properties and their low weight. Increasingtheir part in aircraft structures is a compulsory step to achieve abetter eco-efficiency. The gain could be important, especiallythanks to new assembly technologies as bonding which is meantto replace the current techniques like riveting or bolting [1,2].These methods are expensive, and are not well-adapted to com-posite materials since complex machining has to be set up (drillingleading to delamination or fiber breakage) [3–5]. Moreover, the useof the bonding technique would enable a significant weight light-ening of the aeronautic structures, which means an aircraft con-sumption reduction. However, several implementation problemscan penalize the bonding process, while manufacturing or duringthe aircraft lifetime. The bond quality can be weakened by a badcuring cycle, a surface contamination before bonding, etc. [6,7].Moreover, there is no non-destructive technique currently avail-able to quantify the bonding mechanical resistance. Facing this is-sue, a European Project has been started in November 2010:
ENCOMB (Extended Nondestructive testing for COMposite Bonds).New methods are developed to enable first the characterization ofthe composite surface state before bonding, and then, the certifica-tion of the bonding mechanical quality. One of the developedmethods is the laser shock wave technique first developed by Vos-sen and Gupta [8,9]. This technique can create a short but intenseinside tensile loading on bonded materials. If these stresses arewell-located into an interface, the bond line resistance can thusbe tested. The LASAT technique was developed for many cases,especially for metal assemblies or metal coatings, for which it isnow well understood [10]. Under some conditions, this techniquehas already been successfully used to test different bondingstrengths of composite assemblies [11–13]. Nevertheless, moreinvestigations remain necessary in order to optimize the techniqueand to better understand the associated complex physical phe-nomena. In particular, the composite material dynamic responseto laser shocks has to be understood to develop a technique effi-cient for any kind of bonded composite assembly [14].
From another point of view, the aeronautical composite struc-tures can be subjected to high energy impacts during their lifetime.Indeed, some external loadings can induce high levels of stresswith a high strain rate, such as high velocity impacts of variouskinds of projectiles (birds, ice stones, etc.). Under some conditions,the laser shocks induce stress levels comparable to the ones in-duced by high velocity impact. The laser shock wave techniquepresented in this paper can also be used as a way to test and dam-age composite material [14–16].

R. Ecault et al. / Composites: Part A 53 (2013) 54–64 55
In both case, a first step is to study the dynamic response of thecomposite material, which is key information for the applicationspresented. The laser shocks are used as a laboratory tool able toproduce different levels of damage inside the composite material.This technique differs from others as drop weight systems. Theyare used to produce impacts on composite samples at low energyand long solicitation duration compared to what can be done usinga laser shock setup. In case of classic impact loading on CFRP com-posite, multi delamination and transverse cracks can be observedunder the loading area. The propagation of the delaminationsmainly depends on the stacking sequence [17–20]. Many numeri-cal models are developed to restitute the composite behavior inthese cases of loading. The recent damage models are able to sim-ulate the delamination propagation and the ply cracks initiationand propagation. The 3D models results are useful to understandthe dynamic behavior of the composite by comparing simulationand experimental results [21–25]. In this study, laser shocks havebeen performed on CFRP T800/M21 composite materials. Severaldiagnostics providing complementary information have beentested to analyze the damage extent and nature resulting fromthe laser shock wave propagation. Especially, the use of Interfero-metric confocal microscopy has been extended to the shockcomposite sample in order to quantify their residual deformation.With these post-shock test methods, the main features of thesedefects have been obtained: location, anisotropy, main dimensions.The laser shock wave technique has been used as a characteriza-tion method to establish the damage threshold of the CFRP com-posite material tested and the experimental data gathered couldprovide useful information to optimize numerical modelingresults.
2. Material investigated
A T800/M21 (Hexcel) composite material has been used in thisinvestigation. It is well-known as a classic composite material foraeronautical applications, more specifically for structures whichare prone to impacts. It is made of a non-conventional matrix,mixed from a thermoset epoxy resin and thermoplastic noduleswhose mechanical behavior should enhance the global compositeshock resistance. On the tested samples, this composition has beenchecked using DSC (Differential Scanning Calorimetry) character-ization. The glass transition of the epoxy was evaluated around194 �C and the thermoplastic phase has been identified from theendothermic melting peak close to 212 �C. Micrographs of a6 mm thick T800/M21 sample are presented in Fig. 1a–c with three
Fig. 1. Optical micrographs (a–c) of a 6 mm thick T800/M21 sample. (For interpretatioversion of this article).
different magnifications. This sample is made of 33 pre-impreg-nated plies assembled with different orientations [45�/0�/0�/�45�/0�/0�/45�/0�/0�/�45�/0�/�45�/0�/0�/45�/0�/0
�
0:5] S and curedby autoclave.
On Fig. 1, the thermoplastic nodules can be observed mostly be-tween the plies as round dark grey shapes, but are sometimes pres-ent inside the plies, forming channels or veins (see Fig. 1a and b).Their approximated diameter has been evaluated in the range[10–20 lm] (see Fig. 1c). The pre-impregnated plies are about180 lm, but the presence of the thermoplastic nodules induces astrong deviation of the ply thickness. This 6 mm thick T800/M21material has provided all the samples tested in this study.
3. The laser shock wave technique
The laser shock wave technique consists in a high power laserirradiation of a target. When focused on a material, this irradiationresults in plasma sublimation on its surface. The plasma expansesrapidly, which induces a shock wave into the material by reaction.The shock wave is then propagating through the thickness towardthe target back face, according to properties depending on thematerial characteristics. Reaching the sample back face, the reflec-tion of this shock wave creates a release wave propagating back-ward. This release wave is crossing the incident unloading wavecoming from the front face and initiated by the end of the loading(see in Fig. 2). It is the crossing of these two release waves whichcan lead to a local high tension area which could damage the mate-rial if the stress level is high enough compared to its damagethreshold. In fact, the tensile stress level is directly linked to thelaser shock amplitude whereas its location mainly depends onthe material properties and the pulse characteristics. In order toamplify the pressure level on the sample, a water confinementhas been used to enhance the plasma expansion effect [26]. There-fore, the damage initiation for a given material can be controlled bychanging the laser source parameters, especially the energy levelfor the stress intensity, and the pulse duration for the position ofthis stress area.
All the samples have been coated with aluminum paintingbefore laser irradiation in order to produce a more controlled shockloading. Indeed, if the laser interaction with the aluminum has al-ready been deeply investigated, very few investigations have beenconducted on the laser interaction on composite materials [27–30].Consequently, the correlation between the laser intensity and thecorresponding pressure loading on the sample front face is welldocumented for aluminum.
n of the references to color in this figure legend, the reader is referred to the web
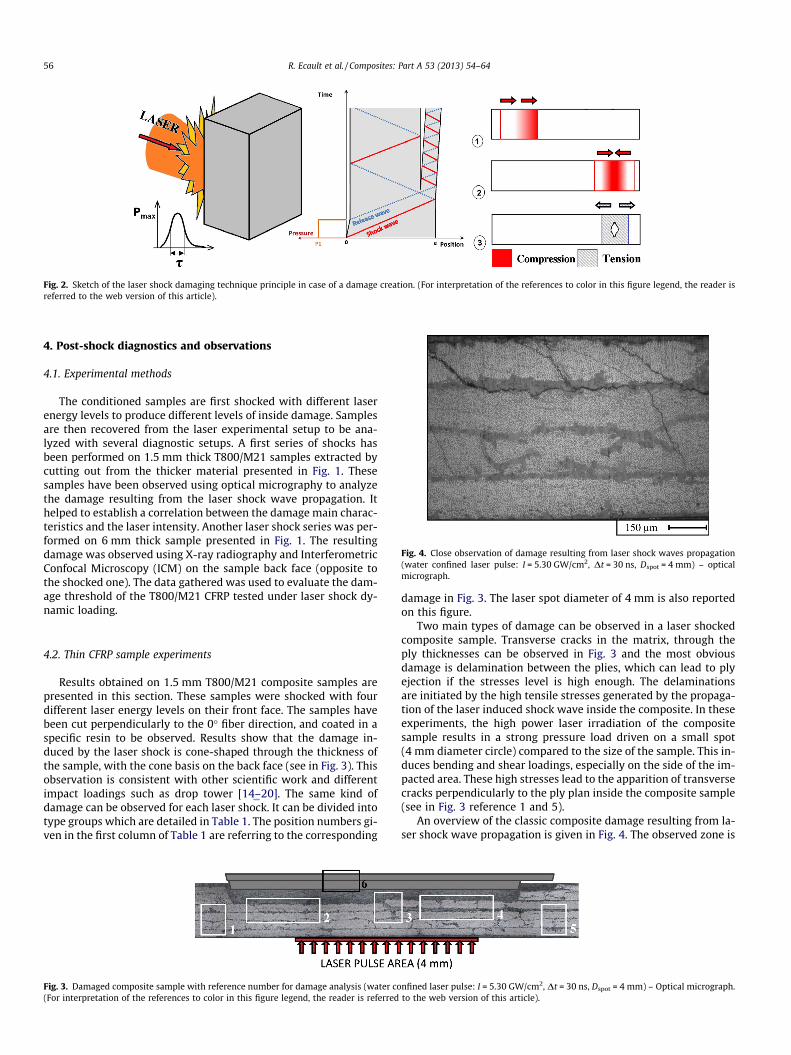
Fig. 2. Sketch of the laser shock damaging technique principle in case of a damage creation. (For interpretation of the references to color in this figure legend, the reader isreferred to the web version of this article).
Fig. 4. Close observation of damage resulting from laser shock waves propagation(water confined laser pulse: I = 5.30 GW/cm2, Dt = 30 ns, Dspot = 4 mm) – opticalmicrograph.
56 R. Ecault et al. / Composites: Part A 53 (2013) 54–64
4. Post-shock diagnostics and observations
4.1. Experimental methods
The conditioned samples are first shocked with different laserenergy levels to produce different levels of inside damage. Samplesare then recovered from the laser experimental setup to be ana-lyzed with several diagnostic setups. A first series of shocks hasbeen performed on 1.5 mm thick T800/M21 samples extracted bycutting out from the thicker material presented in Fig. 1. Thesesamples have been observed using optical micrography to analyzethe damage resulting from the laser shock wave propagation. Ithelped to establish a correlation between the damage main charac-teristics and the laser intensity. Another laser shock series was per-formed on 6 mm thick sample presented in Fig. 1. The resultingdamage was observed using X-ray radiography and InterferometricConfocal Microscopy (ICM) on the sample back face (opposite tothe shocked one). The data gathered was used to evaluate the dam-age threshold of the T800/M21 CFRP tested under laser shock dy-namic loading.
4.2. Thin CFRP sample experiments
Results obtained on 1.5 mm T800/M21 composite samples arepresented in this section. These samples were shocked with fourdifferent laser energy levels on their front face. The samples havebeen cut perpendicularly to the 0� fiber direction, and coated in aspecific resin to be observed. Results show that the damage in-duced by the laser shock is cone-shaped through the thickness ofthe sample, with the cone basis on the back face (see in Fig. 3). Thisobservation is consistent with other scientific work and differentimpact loadings such as drop tower [14–20]. The same kind ofdamage can be observed for each laser shock. It can be divided intotype groups which are detailed in Table 1. The position numbers gi-ven in the first column of Table 1 are referring to the corresponding
Fig. 3. Damaged composite sample with reference number for damage analysis (water co(For interpretation of the references to color in this figure legend, the reader is referred
damage in Fig. 3. The laser spot diameter of 4 mm is also reportedon this figure.
Two main types of damage can be observed in a laser shockedcomposite sample. Transverse cracks in the matrix, through theply thicknesses can be observed in Fig. 3 and the most obviousdamage is delamination between the plies, which can lead to plyejection if the stresses level is high enough. The delaminationsare initiated by the high tensile stresses generated by the propaga-tion of the laser induced shock wave inside the composite. In theseexperiments, the high power laser irradiation of the compositesample results in a strong pressure load driven on a small spot(4 mm diameter circle) compared to the size of the sample. This in-duces bending and shear loadings, especially on the side of the im-pacted area. These high stresses lead to the apparition of transversecracks perpendicularly to the ply plan inside the composite sample(see in Fig. 3 reference 1 and 5).
An overview of the classic composite damage resulting from la-ser shock wave propagation is given in Fig. 4. The observed zone is
nfined laser pulse: I = 5.30 GW/cm2, Dt = 30 ns, Dspot = 4 mm) – Optical micrograph.to the web version of this article).

Table 1List of the common damage observed.
Damagenumber
Short description of the observed damage
1 and 5 Transverse cracks through several plies close to a zone of highthermoplastic nodule concentration. Located on the edges ofthe loaded area
2 Local delamination with transverse cracks through theconsidered ply
3 Important damage with both ply failure and delamination,observed close to a zone of high thermoplastic noduleconcentration
4 Two kinds of delamination1. Delamination with a ply ejection on the back face side. Thedelamination geometric profile can be observed2. Delamination without full ply ejection. Observation of theinter-ply after laser shock impact
6 Ejected plies
R. Ecault et al. / Composites: Part A 53 (2013) 54–64 57
located under the impact loading area (reference number 2 inTable 1 and Fig. 3). A ply delamination can clearly be identified,as well as transverse cracks inside the top ply. The cracks insidethe ply have propagated between the fibers. According to other
Fig. 5a. Correlation between the laser intensity and the damage depth inside the compoof four laser shocks on T800/M21 CFRP target, 1.5 mm thick). (For interpretation of the refarticle).
Fig. 5b. Correlation between the laser intensity and the delamination width inside the cothe same four laser shocks on T800/M21 CFRP target, 1.5 mm thick, presented in Fig. 5referred to the web version of this article).
scientific works, these cracks through the plies are prior to thecracks leading to delamination. In the laser case treated in this pa-per, it can be assumed too as the high tensile stress area is propa-gating from the back face to the front face (from top to bottom inFig. 4). So the plies are loaded before the inter-plies and can bedamaged first. The plies that were just above the damaged onehave been ejected during the laser shock test due to the high levelof tensile stress (see in Figs. 3 and 4). As the tensile loading level isprogressively softened because of the energy dissipation resultingfrom the previous delaminations, the stresses were not strong en-ough to eject this ply but high enough to damage it.
The profile of the crack leading to delamination can be linked tothe presence of thermoplastic nodules inside the composite matrixM21. Indeed, the crack is following the ply surface geometry mean-while it goes around the thermoplastic nodules. Moreover, cracksgoing through the nodules have never been observed on the manyshocked samples analyzed. Two hypotheses can be made: the firstone complies with the main goal of these nodules which is to en-hance the shock resistance of composite material. Their presencemakes the crack propagation harder because it is increasing thedistance to cover before leading to delamination. The second onerelies on the fact that adding nodules inside the matrix content
site target with the associated micrographies (results obtained by optical inspectionerences to color in this figure legend, the reader is referred to the web version of this
mposite target for two different inter-ply (Results obtained by optical inspection ofa). (For interpretation of the references to color in this figure legend, the reader is

58 R. Ecault et al. / Composites: Part A 53 (2013) 54–64
can locally increase the stress concentration which can explainwhy the cracks are propagating around these thermoplastic nod-ules. Finally, the thermoplastic nodules seem to enhance the shockresistance of composite material. Their presence could slow downthe crack propagation and thus prevent from an early delaminationin case of high intensity impact. This conclusion is also consistentwith another work performed to compare the laser shock resis-tance of a T800/M21 CFRP with a T300/914 CFRP, made with a clas-sic epoxy resin [16].
The observations performed have also highlighted the existingcorrelation between the laser intensity and the damage extent in-side the composite targets. Different damage parameters can beobserved thanks to optical micrographies (observations and resultspresented in Figs. 5a and 5b and 6) and linked to the laser shockparameters. In Fig. 5a, the damage depth is plotted against the laserintensity. The damage depth is representing the distance existingbetween the sample back face and the furthest observed delamina-tion inside the composite. These measurements have been per-formed on four different micrographies of an impacted T800/M21CFRP target also presented in Fig. 5a. It can be noticed that thedelamination depth is increasing with the laser intensity. Indeed,the tensile stresses generated by the shock wave propagation aredirectly linked to the laser energy, meaning the laser intensity ifboth the focalized diameter and the pulse duration remain con-stant. The level of stresses is thus higher for higher energy pulse.In case of the lowest laser shock, the tensile stresses, located closeto the back face, are just high enough to create a small delamina-tion in the last inter-ply (see in Fig. 5a, first micrography). Whenthe laser intensity is increased, the highest stresses remain locatedclose to the back face, but there is enough energy left propagatingbackward to delaminate a deepest inter-ply (see in Fig. 5a, secondmicrography and following ones).
The same kind of correlation can be found between the laserintensity and the delamination width for a given inter-ply (see inFig. 5b). For highest laser intensity loadings, the tensile stresses ini-tiating the delamination are stronger, which facilitate the damagepropagation and finally lead to a wider delamination. The sametrend can be observed for several inter-plies. The delaminationgrowth is shifted to higher intensity for the plies located deeperin the composite, which is consistent with the correlation betweenthe laser intensity and the delamination depth.
The crack density evolution has also been studied. Using themicrographies presented in Fig. 5a, the number of transversecracks inside all the plies was counted over a 10 mm length cen-tered on the laser impact axis for each laser shocks. Consequently,cracks induced by the laser shock wave propagation and cracksresulting from the flexure component of the loading are both takeninto account (see Table 1 and Fig. 3). The number of cracks wasdivided by the 10 mm length to obtain the crack density. As
Fig. 6. Correlation between the laser intensity and crack density inside the composite1.5 mm thick). (For interpretation of the references to color in this figure legend, the re
expected, it is increasing with the laser intensity. One more time,the highest laser intensity induces the highest level of damagewhich agrees with the previous observations.
Finally, all the damage extent parameters seem to increase withthe laser intensity. In this case of thin CFRP T800/M21 compositetarget, a clear correlation is established between the laser intensityirradiating the material and the resulting inside damage. Moreover,a quantification of this correlation has been obtained thanks tothese original laser shock results on composite targets.
4.3. Thick CFRP sample measurements
Laser shocks were also performed on the 6 mm thick T800/M21CFRP samples. Four different laser pulse intensities (similar to theprevious ones) have been applied. As this type of samples wasmuch thicker than the previous one, the damage induced by theshock waves propagation inside the material did not spall it com-pletely (compared to the samples presented in Fig. 3). Indeed, thelaser shock wave amplitude is more decayed through the materialthickness since there is a longer distance to cross before reachingthe back face. In this case, the resulting damage is characterizedby small blisters on the sample back face, which were measuredusing Interferometric confocal microscopy and X-ray radiography(see in Fig. 7a–c).
Interferometric confocal microscopy is based on optical inter-ferometry to convert the flux intensity into height information. Itis generally used to characterize the surface profile of smallestgeometries. In the case presented here, several measurement areashave been needed in order to get the global blister shape. For eachpixel located on the back face ply plan by an (x, y) coordinate, aheight information is added. The measurement is obtained in theform of a matrix (x, y, z) and can be represented in the plan (x, y)using a color scale for the z coordinate as shown in Fig. 7. In thisexample, an elliptical shape can be observed. The anisotropic char-acteristic of the delamination propagation is evidenced by thisshape, in spite the axisymmetric loading, but directly linked withthe ply orientation. This observation can be confirmed by theX-ray radiography measurement as shown by Fig. 7b and c.
The cross sections of the back face deformation are presented inFig. 8 and the corresponding ICM measurements are introducedfirst in Fig. 9. These cross sections were performed perpendicularlyto the 0� direction. The two measurement techniques are consis-tent. Indeed, the delamination width observed in Fig. 8 for eachshock is corresponding to the one which can be evaluated in the0� direction by taking the 0 lm isoheight ICM measurements.The comparisons of the different experimental values are givenin Table 2. An accurate study of the ICM experimental results hasbeen performed by using a statistical analysis, considering theexperimental data as statistical series. First, it has been checked
plies (results obtained by optical inspection of four T800/M21 CFRP target shocks,ader is referred to the web version of this article).

Fig. 7. (a) Interferometric confocal microcopy measurement of a back face deformation resulting from a laser shock on a 6 mm thick T800/M21 composite sample. (b)Corresponding X-ray radiography of the same sample. (c) Comparison between the X-ray radiography measurement and the Interferometric confocal microscopymeasurement of the same back face deformation after post-treatment (Water confined laser pulse: I = 5.30 GW/cm2, Dt = 30 ns, Dspot = 4 mm). (For interpretation of thereferences to colour in this figure legend, the reader is referred to the web version of this article.)
R. Ecault et al. / Composites: Part A 53 (2013) 54–64 59
that the shape of isoheight is true ellipse. [x, y] data are extractedfrom the [x, y, z] obtained by ICM, for a given z, meaning a givenheight. The idea is to show that the correlation between the xand the y data, for all the given heights, is an ellipse. For that,the covariance matrix R whose expression is given in Eq. (1) is
Fig. 8. Cross section micrographies corresponding to the back face deformation measurpulse: Dt = 30 ns, Dspot = 4 mm). (For interpretation of the references to color in this figu
calculated. The R matrix is traducing the correlation between thex and the y data. The main directions of the statistical series xand y are thus given by the eigenvectors of the R matrix. For each[x, y] series, the eigenvectors can be calculated using the followingequation:
ed by ICM and analyzed in the following figures referred 9. (Water confined laserre legend, the reader is referred to the web version of this article).

Fig. 9. ICM post treated results for three different laser shock intensities. For different height levels, the (x, y) data highlighting the elliptical back face deformation and theassociated major and minor axes calculated by statistical analysis are plotted (water confined laser pulse: Dt = 30 ns, Dspot = 4 mm). (For interpretation of the references tocolor in this figure legend, the reader is referred to the web version of this article).
Table 2Comparison of the delamination width in the 90� direction measured on microgra-phies and by ICM.
I (GW/cm2) Delamination perpendicularly to the 0� direction
Micrographies (lm) ICM (lm) Deviation (%)
5.30 5095 4713 7.54.65 4240 4384 3.43.43 3680 3719 1.1
60 R. Ecault et al. / Composites: Part A 53 (2013) 54–64
R¼r2
x Rrxry
Rrxry r2y
0B@
1CA with
rx : standard deviation of the x datary : standard deviation of the y dataR : Correlation coefficient
8><>: ð1Þ
First, the Eq. (2) is solved for each series to determine theireigenvalues noted k1 and k2. Once calculated, these eigenvaluescan be used to determine the two eigenvectors named U and V ofeach statistical series using the following equation:
DetðR�KIÞ ¼ 0 withK ¼ ½k1; k2� : vector of eigenvaluesI : Identity matrix of dimension 2
�
ð2Þ
R � U ¼ k1 � UR � V ¼ k2 � V
�with
U : eigenvector associated to k1
V : eigenvector associated to k2
�
ð3 and 4Þ
As explained previously, the two vectors U and V give the maindirections for the statistical series [x, y]. It was checked that thesevectors were orthogonal for each isoheight series of each lasershock, showing that it could correspond to an elliptical distribu-tion. Then, the two main axes of the statistical [x, y] series can bededuced using the eigenvectors as director vector. A point whichis known to be on each axis has to be chosen to plot the axes. Inthis case, if the two main axes are respectively the minor and themajor axes of the ellipse searched, they are passing by the ellipsecenter. This center point is obtained by calculating the average ofall x data as first coordinate, and the average of all y data as secondcoordinate. All these axes are plotted with their isoheights statisti-cal data [x, y] in Fig. 9. It can be observed that the calculated axesare well corresponding to the major and minor axes of each [x, y]contour lines, and for each laser shock deformation. Finally, theaxes got from the eigenvectors can be used to calculate theoreticalsemi-major and semi-minor axes. The intersection point between
the axes and the [x, y] contour line is picked for each series andused to calculate the axes length. Then, the semi-major andsemi-minor axes lengths, respectively noted a and b, are used tobuild the corresponding theoretical elliptical shape with the Eq.(5). For each x value, the corresponding y value is calculated withthe parameters a and b using Eq. (5) for each series. The obtainedellipses are then rotated using a classic transformation given in Eq.(6), and translated in the (x, y) plan to be compared to the experi-mental isoheight data.
x2
a2 þy2
b2 ¼ 1 witha : semi-major axis lengthb : semi-minor axis length
�ð5Þ
z! zeih ð6Þ
S ¼ p � a � b ð7Þ
Some comparisons are given in Fig. 10 for four different iso-height levels measured by ICM on the sample shocked with thehighest laser intensity level. The calculated ellipses are fitting quitewell with the experimental contour lines. The agreement is evenbetter for the high z values contour-lines, when a few differencescan be observed at low height (see z = 0 lm chart in Fig. 10). Thisis probably due to edges effects which are more significant closerto the back face normal height. Finally, the good agreement be-tween theoretical calculation of the elliptical curves and experi-mental data enables some model analysis. Three different studiesare presented in Figs. 11a, 11b and 11c. The evolution of thesemi-major and semi-minor axes lengths with the height level isfirst presented in Fig. 11a. It can be noticed that for each lasershock both parameters are decreasing when the height level ofcontour lines is decreasing. The evolutions are linear with a goodcorrelation (see the correlation equations Fig. 11a). It gives precisequantitative data on the blister shape created at the sample backface by the laser shocks. Another interesting parameter is the dam-age area. It can be calculated using Eq. (7). The evolution of thedamage surface area with the height level of the back face defor-mation is presented in Fig. 11b. Logically, it decreases with the alti-tude. Curves can be modeled by a quadratic equation as presentedin Fig. 11b. Finally, the angles cmi and cma to the horizontal axis ofboth minor and major axes respectively can be plotted as a func-tion of the back face deformation height. These angles are definedin Fig. 10, on the last chart. Their evolution according to the heightdeformation for each laser shock are presented in Fig. 11c. A small

Fig. 10. Comparison between the experimental isoheight lines and the theoretical elliptical shapes calculated using the experimental parameters of the statistical series, forfour different isoheight levels measured by ICM on the highest shocked sample. (Water confined laser pulse: I = 5.30 GW/cm2, Dt = 30 ns, Dspot = 4 mm). (For interpretation ofthe references to color in this figure legend, the reader is referred to the web version of this article).
Fig. 11a. Evolution of the semi-minor (dash line) and semi-major axes (plain line)lengths against the height of the contour line with the associated correlations, forthe different laser intensities. (For interpretation of the references to color in thisfigure legend, the reader is referred to the web version of this article).
Fig. 11b. Evolution of the in-plane deformation surface defined by the contour lineagainst the height level of the contour line with the associated correlation, for thedifferent laser intensities. (For interpretation of the references to color in this figurelegend, the reader is referred to the web version of this article).
Fig. 11c. Evolution of the angles cma and cmi between the major and minor axes andthe horizontal axis against the height of the contour line, for the different laserintensities. (For interpretation of the references to color in this figure legend, thereader is referred to the web version of this article).
R. Ecault et al. / Composites: Part A 53 (2013) 54–64 61
rotation of the elliptical contour line of about 15� can be noticed onboth axes. This rotation is probably traducing the history of thedelamination propagation between the closest plies to the backface. As it can be seen in the Fig. 8, the delamination occurred closeto the back face between two 0� plies. The delamination
propagated in the 0� direction, but the back face ply is in the+45� direction. This could explain why the deformation orientationat the top of ellipse is closest to the 0� direction than the deforma-tion orientation at the bottom of the blister. Moreover, the bendingcomponent of the loading could also have an influence. Once dela-minated, the plate bended is non-symmetrical, since it is only com-posed of two plies in the 0� and 45� directions. The bending of thisnon-symmetrical plate can increase this unconventional character-istic of the delamination.
This mathematical analysis can then be used to study the exist-ing correlation between the composite back face deformation andthe laser intensity. Indeed, by using the major and minor axes de-duced from the statistical analysis, blister profiles were extractedfrom the ICM measurements, especially along these two axes ofthe elliptical shape (respectively referred 1 and 2 in Fig. 7a). A com-parison between these two profiles is given in Fig. 12, which allowsquantifying the anisotropy of the back face deformation. Theseprofiles can also be used to correlate the back face deformationwith the laser intensity used to irradiate the composite target asshown in Fig. 13. On this figure, the minor and major axes profileswere plotted for the three highest laser shock levels. The back faceprofile obtained with the lowest one was measured as a completelyflat surface, and was not reported on these charts (see laser shock

Table 3Experimental and model parameters for the back face deformation profiles.
Experiments Models
I (GW/cm2) hmax (lm) = A D (h/2) (lm) A (lm) b (lm) c (lm)
Major axes5.30 44.5 6500 44.5 5700 26004.65 31.8 5150 31.8 5800 21003.43 20.9 4325 20.9 5800 17001.83 0 0 0 0 0
Minor axes5.30 42.7 3475 42.7 3700 14004.65 31.4 2925 31.4 3700 12003.43 18.3 2600 18.3 2600 10001.83 0 0 0 0 0
62 R. Ecault et al. / Composites: Part A 53 (2013) 54–64
parameters in Table 3). Two experimental parameters can be gath-ered on each profile: the maximum height and the width at mid-height, both reported in Table 3. These parameters were used tofit models on the experimental profiles. Indeed, each experimentalprofile obtained from ICM can be fitted using Gaussian function aspresented in Fig. 9, characterized by A, b and c parameters. Thiskind of function was already used to fit experimental deformationin case of other types of loading on CFPR [31]. The three modelparameters corresponding to the optimized fittings are given inTable 3. The ‘‘A’’ parameter is chosen to be equal to the maximumheight measured experimentally, and ‘‘c’’ is adjusted to fit thewaviness of the deformation profiles. ‘‘b’’ parameter is just usedto adjust the position of the symmetrical axis of the model.
The ‘‘A’’ and ‘‘c’’ parameters can then be used to represent theexisting correlation between the back face deformation and thelaser intensity level. These correlations are presented in Fig. 14.The damage growth, here represented by the maximum heightand the waviness parameters, is increasing with the laser intensitylevel. Moreover, the evolution linking the maximum height to thelaser intensity seems to be linear with a good correlation (see inFig. 14). Thanks to these charts, it can be assumed that the damagethreshold on the T800/M21 composite sample tested is close to2 GW/cm2. The determination of its exact position would requiremore laser shock experiments to refine the bottom of the curve
Fig. 12. Comparison between the major and the minor axes of the elliptical back facepresented in Figs. 7a–c and 9. (Water confined laser pulse: I = 5.30 GW/cm2, Dt = 30 ns, Dreader is referred to the web version of this article).
Fig. 13. Comparison between the profiles along the major and the minor axes of the ellipDt = 30 ns, Dspot = 4 mm). (For interpretation of the references to color in this figure lege
and deduce precisely the behavior at low laser intensity. Crosssection micrographies have also proved that the inside delamina-tion sizes agree with the back face deformation height (see microg-raphies in Fig. 8). The lowest shock showing no back facedeformation was not delaminated either. The highest back facedeformation corresponds to the longer delamination width andso on. These results show that there is a direct link between the in-side delamination size and the back face blister height.
deformation extracted from the Interferometric confocal microcopy measurementspot = 4 mm). (For interpretation of the references to color in this figure legend, the
tical back face deformation for different laser intensities (water confined laser pulse:nd, the reader is referred to the web version of this article).

Fig. 14. Correlations between the laser intensity and the main back face deformation parameters (water confined laser pulse: Dt = 30 ns, Dspot = 4 mm). (For interpretation ofthe references to color in this figure legend, the reader is referred to the web version of this article).
Fig. 15. Evolution of the damage surface area for a given height (z = 10 lm) againstthe laser intensity, with the associated correlation. Damage threshold determina-tion. (For interpretation of the references to color in this figure legend, the reader isreferred to the web version of this article).
R. Ecault et al. / Composites: Part A 53 (2013) 54–64 63
Finally, the calculated surface area can also be plotted againstthe laser intensity for a given height using the a and b length(see Eq. (7)). In the chart presented in Fig. 15, the damage surfacearea at z = 10 lm is plotted for different laser intensities. The globaltrend of the obtained curve is quadratic (see the correlation equa-tions in Fig. 15). Fig. 15 also shows that this type of chart provides agood way for the damage threshold determination. The three lastcorrelations between the composite damage features and the laserintensity allow the creation of charts to compare different compos-ite material dynamically loaded. As it has been evaluated in Fig. 14,the damage threshold for the studied T800/M21 composite is con-firmed to be around 2 GW/cm2.
5. Conclusions
The laser shock wave technique has been tested on classicalaeronautic composite T800/M21 samples of different thicknesses.This technique results in an intense but really short dynamic load-ing, which enable the sample recovery for post-mortem analysis.The damage resulting from the laser shock wave propagationinside the material has thus been studied using several diagnos-tics: optical micrography, X-ray radiographies and InterferometricConfocal Microscopy measurements. The anisotropic damageparameters have been shown as well as the influence of the laser
intensity level on the damage main dimensions. A first possibledamage scenario for the T800/M21 composite under high laserirradiation was formulated. In particular, the effect of thermoplas-tic nodules on the cracks propagation is clearly experimentally evi-denced. Moreover, the laser shocks performed on thick T800/M21sample have enabled a better understanding of the dynamicbehavior of the composite. More precisely, the resulting back facedeformation has been studied using Interferometric confocalmicroscopy. The relatively new technique has given original datato study the composite damage. The elliptical characteristics of thisdeformation were determined by use of a statistical analysis of thedata gathered. The models established to fit the experimental dataprovide parameters allowing the correlation between the back facedeformation and the laser shock intensity. More investigationsremain to be performed before reaching a full comprehension ofthe composite behavior under high strain rate solicitation. Never-theless, this original data can be used to plot charts which wouldenable the comparison of the damage tolerance of different com-posite material. To this aim, other composite materials can alsobe studied to compare their dynamic behavior and their shockresistance to the T800/M21 results. All the data gathered provideinteresting information for numerical investigations.
Acknowledgments
The team would like to thank all the Pprime staff who contrib-uted to this investigation, especially by helping on the differentexperimental setups. The research leading to these results has re-ceived funding from the European Union’s Seventh FrameworkProgram (FP7/2007-2013) under Grant agreement No ACP0-GA-2010-266226 (ENCOMB, Extended Non-Destructive Testing ofComposite Bonds).
References
[1] Ehrhart B, Valeske B, Muller C. Methods for the quality assessment of adhesivebonded CFRP structures – a resumé. In: 2nd International Symposium on NDTin, Aerospace; 2010.
[2] Stöven T. Rivetless Aircraft Assembly – A Dream or Feasibility Concept,EUCOMAS, Berlin; 2010.
[3] Catché S, Piquet R, Lachaud F, Castanié B, Bénaben A. Interaction betweensurface texture after drilling and bearing behaviour of UD carbon/epoxystructures. In: 17ème Journée Nationnales des Composites (JNC). Poitiers,France; June 2011.
[4] Généreux L-A, Viens M, Lebrun G. In: Comparison of ultrasonic testing andinfrared thermography for the detection of machining defects in compositematerials. In: 26th ASC Annual Technical Conference. Montreal, Canada,September 27th; 2011.

64 R. Ecault et al. / Composites: Part A 53 (2013) 54–64
[5] Miyake T, Tanaka T, Ftamura M. Evaluation of machining damage arounddrilled holes in CFRPs using Micro-Raman spectroscopy. In: 15th EuropeanConference on Composite Materials (ECCM15). Venice, Italy. June 24–28th;2012.
[6] Ehrhart B, Valeske B, Ecault R, Boustie M, Berthe L, Bockenheimer C. ExtendedNDT for the quality assessment of adhesive bonded CFRP structures, In: SmartMaterial, Structures & NDT in Aerospace Conference. Montreal, Canada,November 2–4th; 2011.
[7] Markus S, Tornow C. Extended Non-destructive testing of composite bonds. In:The SAE 2011 Aerotech Congress & Exposition. October 18; 2011.
[8] Vossen JL. Adhesion measurement of thin films, thick film, and bulk coatings.ASTM Spec Tech Publ 1978;1978(640):122–31.
[9] Yuan J, Gupta V. Measurement of interface strength by the modified laserspallation technique. I. Experiment and simulation of the spallation process. JAppl Phys 1993;74:2388–97.
[10] Braccini M, Dupeux M. In: ISTE, Wiley (Eds.), Mechanics of solid interfaces;2012.
[11] Bossi R, Housen K, Walters CT, Sokol D. Laser bond testing. Mater Eval2009;67:819–27.
[12] Boustie M, Gay E, Berthe L, Arrigoni M, Radhakrishnan J, de Résséguier T,Blouin A, Monchalin J.P, Kruger S, Perton M, Johnston A, Cole R, Buzaud E. Lasershock adhesion test (LASAT) of composite materials for aerospace industry. In:23rd Int. Conf. on Surface Modification Technologies (SMT23). Chennai, India.2–5 Nov; 2009.
[13] Perton M, Blouin A, Monchalin J-P. Adhesive bond testing of carbon–epoxycomposites by laser shockwave. J Phys D: Appl Phys 2010;44:034012.
[14] Ecault R, Boustie M, Touchard F, Berthe L, Chocinski-Arnault L, Ehrhart B,Bockenheimer C. Damage of composite materials by use of laser driven shockwaves. In: 26th ASC Annual Technical Conference. Montreal, Canada.September 27th; 2011.
[15] Ecault R, Boustie M, Berthe L, Touchard F. Laser Shock Waves: A way to testand damage composite materials for aeronautic applications. In: InternationalHigh-Power Laser Ablation Conference. Santa Fe, USA. April 30th–May 3rd;2012.
[16] Ecault R, Boustie M, Berthe L, Touchard F, Ehrhart B, Bockenheimer C. Lasershock wave technique for damage threshold determination of aeronauticcomposite materials, presented to ECCM15. In: 15th European conference oncomposite materials. Venice, Italy. 24th–28th June 2012.
[17] Abdallah EA, Bouvet C, Rivallant S, Broll B, Barrau J-J. Experimental analysis ofdamage creation and permanent indentation on highly oriented plates.Compos Sci Technol 2009;69:1238–45.
[18] Lachaud F, Espinosa C, Michel L. Impact damage of carbone-epoxy laminates.In: 17th JNC Conference. Journée Nationale des Composites. June 15–17th;2011.
[19] Petit S, Bouvet C, Bergerot A, Barrau J-J. Impact and compression after impactexperimental study of a composite laminate with a cork thermal shield.Compos Sci Technol 2007;67:3286–99.
[20] Hongkarnjanakul N, Bouvet C, Rivallant S. The effect of stacking sequence onthe low-velocity impact response of composite laminates, ECCM15. In: 15thEuropean conference on composite materials. Venice, Italy. 24th–28th June2012.
[21] Yen C-F. Ballistic impact modeling of composite materials. In: 7thInternational LS-DYNA Users conference.
[22] Loikkanen M, Praveen G, Powell D. Simulation of ballistic impact on compositepanels. In: 10th International LS-DYNA Users conference.
[23] Craven R, Iannucci L, Olsson R. Delamination buckling: a finite element studywoth realistic delamination shapes, multiple delaminations and fibre fracturecracks. Composite Part A 2010;41:684–92.
[24] Schipperen J.H.A. Validation of a progressive failure prediction tool for adynamically loaded three dimensional composite ship structure, ECCM15. In:15th European conference on composite materials. Venice, Italy. 24th–28thJune 2012.
[25] Yoshimura A, Nagakura K, Okabe T, Kusano H, Yamada M, Tanabe Y,Ogasawara T, Nakatani H, Ogihara S. 3D simulation of high-velocity impactdamage progress in the CFRP laminates, ECCM15. In: 15th Europeanconference on composite materials. Venice, Italy. 24th–28th June 2012.
[26] Berthe L, Fabbro R, Peyre P, Tollier L, Bartnicki E. J Appl Phy 1997;82:2826–32.[27] Gay E 2011 Doctoral thesis (Arts et Métiers ParisTech, France). <http://
tel.archives-ouvertes.fr/docs/00/66/75/60/PDF/These_GAY2011.pdf>.[28] Gay E, Berthe L, Boustie M, Arrigoni M, Mercier P, Bénier J. Experimental study
of composite damage under laser shock. In: 17th Journée Nationale desComposite. Poitiers, France; 2011.
[29] Gilath I, Eliezer S, Shkolnik S. J Compos Mat 1990;24:1138–51.[30] Laporte D, Malaise F, Boustie M, Chevalier J-M, Buzaud E, Thessieux C. Dynamic
behaviour of two adhesive materials. In: 18 thDYMAT Technical Meeting,Strasbourg. France 2010.
[31] El-Hajjar RF, Petersen DR. Gaussian function characterization of unnotchedtension behavior in a carbon/epoxy composite containing localized fiberwaviness. Compos Struct 2011. http://dx.doi.org/10.1016/j.compstruct.2011.03.09.