Larval fish distribution in two different hydrographic situations in the Gulf of Cádiz
14
Deep-Sea Research II 53 (2006) 1377–1390 Larval fish distribution in two different hydrographic situations in the Gulf of Ca´diz I.A. Catala´n a, , J.P. Rubı´n b , G. Navarro c , L. Prieto c a Centro de Investigacio´n y Formacio´n Pesquera y Acuı´cola El Torun˜o, Junta de Andalucı´a, C/Nac. IV, Km 654, 11500 El Puerto de Santa Marı´a, Ca´diz, Spain b Centro Costero de Ma´laga, Instituto Espan˜ol de Oceanografı´a, Muelle Pesquero S/N, APDO 285, 29640 Fuengirola, Ma´laga, Spain c Departamento de Oceanografı´a, Instituto de Ciencias Marinas de Andalucı´a (CSIC), 11510 Puerto Real, Ca´diz, Spain Received 1 February 2005; accepted 1 April 2006 Available online 8 August 2006 Abstract Ichthyoplankton assemblages and individual larval distributions of several mesopelagic and shelf-associated species were studied in two consecutive spring surveys in the Gulf of Ca´ diz (2001), covering both coastal and oceanic domains. The two surveys were characterised by markedly different hydrographical conditions, partly attributable to a shift from westerly to easterly winds. At the scale studied, larvae of coastal and shelf-dwelling species were always clearly separated from mesopelagic species, probably as a result of well-defined coastal-oceanic habitats related to a wide shelf and the prevailing currents. However, underlying these associations, short-term hydrographic changes induced by wind forcing seemed able to severely affect the distribution patterns of the early stages of some shelf-associated species. In particular, species like the European anchovy Engraulis encrasicolus were transported off the usual areas of maximal concentrations following a strengthened northwestern coastal countercurrent. r 2006 Elsevier Ltd. All rights reserved. Keywords: Ichthyoplankton; Larval assemblages; Physical oceanography; Wind-driven circulation; Transport processes; Engraulis encrasicolus 1. Introduction Hydrographic processes and their modulation by climatic forces affect the spawning habitat and behaviour of adults of most fish species, as well as the survival of their larvae (Lasker, 1981; Sa´ nchez- Velasco et al., 2002). Processes and structures including picnoclines, eddies and river plumes act as retention or concentration mechanisms (e.g., Govoni and Pietrafesa, 1994; Sabate´s and Olivar, 1996) that may promote survival (Kiørboe et al., 1988). Although biological processes also affect the horizontal distribution patterns of plankton, coupled physical–biological mechanisms are prob- ably more important than purely biological forcing (Mackas et al., 1985). Advection is also regarded as a key mechanism explaining not only larval distribution and abundance but also survival (e.g., Hjort, 1914; Cowen et al., 1993; Boehlert and Mundy, 1994; Hare et al., 2002). Coastal advective processes can severely affect populations of com- mercially important species like small pelagics. ARTICLE IN PRESS www.elsevier.com/locate/dsr2 0967-0645/$ - see front matter r 2006 Elsevier Ltd. All rights reserved. doi:10.1016/j.dsr2.2006.04.010 Corresponding author. Tel.: +34 68619 6029: fax: +34 97142 7350. E-mail address: [email protected] (I.A. Catala´n).
Transcript of Larval fish distribution in two different hydrographic situations in the Gulf of Cádiz
ARTICLE IN PRESS
0967-0645/$ - see
doi:10.1016/j.ds
�Correspondifax: +3497142
E-mail addre
Deep-Sea Research II 53 (2006) 1377–1390
www.elsevier.com/locate/dsr2
Larval fish distribution in two different hydrographicsituations in the Gulf of Cadiz
I.A. Catalana,�, J.P. Rubınb, G. Navarroc, L. Prietoc
aCentro de Investigacion y Formacion Pesquera y Acuıcola El Toruno, Junta de Andalucıa,
C/Nac. IV, Km 654, 11500 El Puerto de Santa Marıa, Cadiz, SpainbCentro Costero de Malaga, Instituto Espanol de Oceanografıa, Muelle Pesquero S/N, APDO 285, 29640 Fuengirola, Malaga, Spain
cDepartamento de Oceanografıa, Instituto de Ciencias Marinas de Andalucıa (CSIC), 11510 Puerto Real, Cadiz, Spain
Received 1 February 2005; accepted 1 April 2006
Available online 8 August 2006
Abstract
Ichthyoplankton assemblages and individual larval distributions of several mesopelagic and shelf-associated species were
studied in two consecutive spring surveys in the Gulf of Cadiz (2001), covering both coastal and oceanic domains. The two
surveys were characterised by markedly different hydrographical conditions, partly attributable to a shift from westerly to
easterly winds. At the scale studied, larvae of coastal and shelf-dwelling species were always clearly separated from
mesopelagic species, probably as a result of well-defined coastal-oceanic habitats related to a wide shelf and the prevailing
currents. However, underlying these associations, short-term hydrographic changes induced by wind forcing seemed able
to severely affect the distribution patterns of the early stages of some shelf-associated species. In particular, species like the
European anchovy Engraulis encrasicolus were transported off the usual areas of maximal concentrations following a
strengthened northwestern coastal countercurrent.
r 2006 Elsevier Ltd. All rights reserved.
Keywords: Ichthyoplankton; Larval assemblages; Physical oceanography; Wind-driven circulation; Transport processes; Engraulis
encrasicolus
1. Introduction
Hydrographic processes and their modulation byclimatic forces affect the spawning habitat andbehaviour of adults of most fish species, as well asthe survival of their larvae (Lasker, 1981; Sanchez-Velasco et al., 2002). Processes and structuresincluding picnoclines, eddies and river plumes actas retention or concentration mechanisms (e.g.,
front matter r 2006 Elsevier Ltd. All rights reserved
r2.2006.04.010
ng author. Tel.: +3468619 6029:
7350.
ss: [email protected] (I.A. Catalan).
Govoni and Pietrafesa, 1994; Sabates and Olivar,1996) that may promote survival (Kiørboe et al.,1988). Although biological processes also affect thehorizontal distribution patterns of plankton,coupled physical–biological mechanisms are prob-ably more important than purely biological forcing(Mackas et al., 1985). Advection is also regarded asa key mechanism explaining not only larvaldistribution and abundance but also survival (e.g.,Hjort, 1914; Cowen et al., 1993; Boehlert andMundy, 1994; Hare et al., 2002). Coastal advectiveprocesses can severely affect populations of com-mercially important species like small pelagics.
.
ARTICLE IN PRESSI.A. Catalan et al. / Deep-Sea Research II 53 (2006) 1377–13901378
These biological-physical couplings can be asso-ciated to mechanisms like wind-forcing (Olivar andShelton, 1993; Ruiz et al., 2006) or continentalwater runoff (Sabates et al., 2001).
The Gulf of Cadiz is characterised by both ahistorically relatively unknown hydrographic frame-work and a tradition of economic fish exploitationof its shelf. The former has been in part palliated bythe recent studies of Vargas et al. (2003), Garcıa-Lafuente et al. (2006), Criado-Aldeanueva et al.(2006), Ruiz et al. (2006) and Navarro et al. (2006).The importance of fishery activity in the Gulf ofCadiz (ICES region IXa) has been repeatedlyaddressed, and is characterised by the great diversityof exploited species (Sobrino et al., 1994), whichuse the highly productive shelf as developing habitatfor early life stages (Catalan et al., 2006; Drakeet al., 2002). Surprisingly, the interest of fisheriesexploitation in this area was not followed byresearch aimed to characterize the ichthyoplanktondistribution, a key factor to the consequent fisheriesyield, until Rubın et al. (1997). In the latter studythe distribution of early life stages of differentfish species was described in the continental shelfarea between the Guadiana River mouth and theStrait of Gibraltar for a cruise in July 1994.That work was followed by a similar cruise in July1995 (Rubın et al., 1999) and another in July 1997,whose studied area reached further west, from CapeSanta Marıa, to the Strait of Gibraltar (Garcıa etal., 2002). These studies showed that the Gulf ofCadiz is a particularly suitable habitat for thespawning of the European anchovy (Engraulis
encrasicolus, L.), one of the key fishery species inthe area (Millan, 1992). Recently, studies of shelfand shelf-slope early life assemblages in the areahave proved that species make different use of thehabitat in accordance to both prevailing environ-mental conditions and species-specific characteris-tics (Rubın and Mafalda, 2004; Baldo et al., 2006).None of these studies, however, sampled represen-tatively all the area of the Gulf comprising boththe eastern and westernmost oceanic and coastaldomains.
The objectives of the present work involve (i) thedescription of the ichthyoplankton assemblages intwo consecutive spring surveys covering oceanic andshelf waters of the Gulf of Cadiz, and (ii) theanalysis of existing links among the hydrographicfeatures, climatic forces, and the changes in bothfish larval assemblages and distributions of indivi-dual taxa.
2. Material and methods
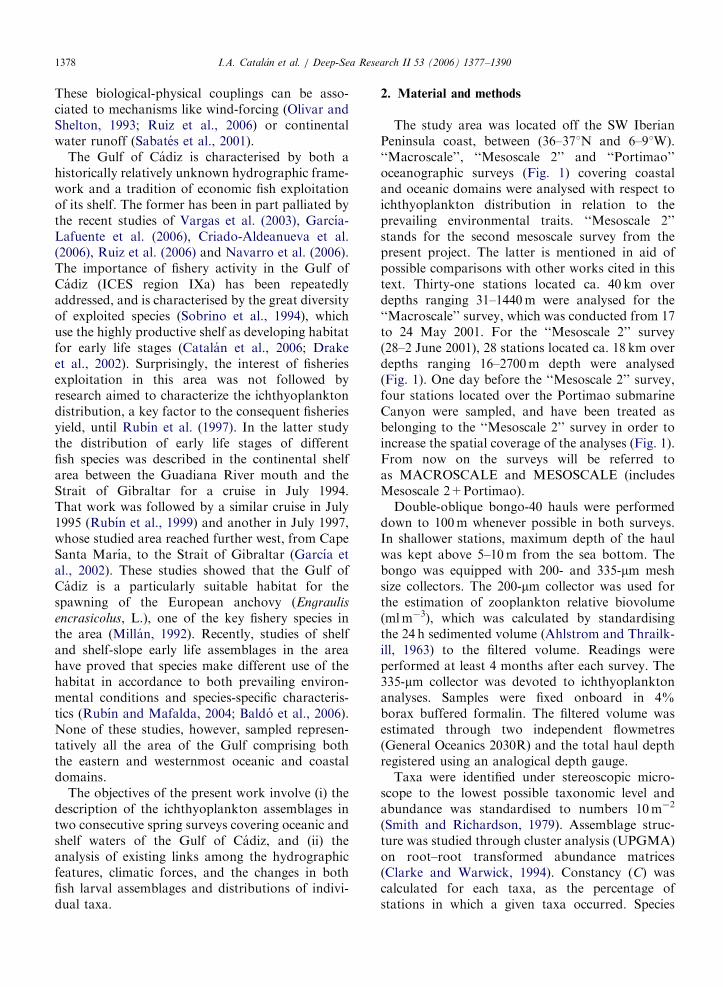
The study area was located off the SW IberianPeninsula coast, between (36–371N and 6–91W).‘‘Macroscale’’, ‘‘Mesoscale 2’’ and ‘‘Portimao’’oceanographic surveys (Fig. 1) covering coastaland oceanic domains were analysed with respect toichthyoplankton distribution in relation to theprevailing environmental traits. ‘‘Mesoscale 2’’stands for the second mesoscale survey from thepresent project. The latter is mentioned in aid ofpossible comparisons with other works cited in thistext. Thirty-one stations located ca. 40 km overdepths ranging 31–1440m were analysed for the‘‘Macroscale’’ survey, which was conducted from 17to 24 May 2001. For the ‘‘Mesoscale 2’’ survey(28–2 June 2001), 28 stations located ca. 18 km overdepths ranging 16–2700m depth were analysed(Fig. 1). One day before the ‘‘Mesoscale 2’’ survey,four stations located over the Portimao submarineCanyon were sampled, and have been treated asbelonging to the ‘‘Mesoscale 2’’ survey in order toincrease the spatial coverage of the analyses (Fig. 1).From now on the surveys will be referred toas MACROSCALE and MESOSCALE (includesMesoscale 2+Portimao).
Double-oblique bongo-40 hauls were performeddown to 100m whenever possible in both surveys.In shallower stations, maximum depth of the haulwas kept above 5–10m from the sea bottom. Thebongo was equipped with 200- and 335-mm meshsize collectors. The 200-mm collector was used forthe estimation of zooplankton relative biovolume(mlm�3), which was calculated by standardisingthe 24 h sedimented volume (Ahlstrom and Thrailk-ill, 1963) to the filtered volume. Readings wereperformed at least 4 months after each survey. The335-mm collector was devoted to ichthyoplanktonanalyses. Samples were fixed onboard in 4%borax buffered formalin. The filtered volume wasestimated through two independent flowmetres(General Oceanics 2030R) and the total haul depthregistered using an analogical depth gauge.
Taxa were identified under stereoscopic micro-scope to the lowest possible taxonomic level andabundance was standardised to numbers 10m�2
(Smith and Richardson, 1979). Assemblage struc-ture was studied through cluster analysis (UPGMA)on root–root transformed abundance matrices(Clarke and Warwick, 1994). Constancy (C) wascalculated for each taxa, as the percentage ofstations in which a given taxa occurred. Species
ARTICLE IN PRESS
301
303
305
307308
310
312
314315
317
319
321322
324
326
328329
331
333
338339350351 363
365
367
370
372
508518
528538
CSMCSV
GR
GuR
CT
Huelva
-9W -8.5 -8 -7.5 -7 -6.5 -6
-9 -8.5 -8 -7.5 -7 -6.5 -6
36
36.5
37
N
W
N
201
203
205
206
207
209
211
213
215
217
218
220
222
224
226
228
230
232
234
236
238
240
242
244
246
247
249
251
253
255
257
Macroscale
CSMCSV
GR
GuR
CT
Cadiz
HuelvaSPAINSPAIN
301
303
305
307308
310
312
314315
317
319
321322
324
326
328329
331
333
338339350351 363
365
367
370
372
508518
528538
Mesoscale 2 + Portimao
CSMCSV
GR
GuR
CT
Cadiz
Huelva
201
203
205
206
207
209
211
213
215
217
218
220
222
224
226
228
230
232
234
236
238
240
242
244
246
247
249
251
253
255
257
Macroscale
CSMCSV
GR
GuR
CT
Cadiz
HuelvaSPAINSPAINSPAINSPAIN
36
36.5
37
Fig. 1. Location of the sampling area and grid of stations of the surveys analysed (Macroscale and Mesoscale 2+Portimao). Other
geographical features mentioned in the text are shown. CSV, CSM and CT refer to Cape San Vicente, Cape Santa Marıa and Cape
Trafalgar. GR and GuR stand for Guadalquivir and Guadiana River mouths. The straight line roughly indicates the submarine canyon of
Portimao. Bathymetry over 500m is not shown.
I.A. Catalan et al. / Deep-Sea Research II 53 (2006) 1377–1390 1379
with Co10% were considered rare and wereremoved from the analyses. Groups resulting fromthe cluster analyses were mapped, and the relativeabundance and contribution to within-group simi-larity analysed using the SIMPER routine (PRI-MER v. 5.0.4.). The abundance of representativetaxa also was mapped for each survey.
The approach to the study of ichthyoplanktonassemblages and their relationship with environ-mental factors involved several steps. A first generaldescription of the environmental patterns in thearea was performed, followed by an independentanalysis of ichthyoplankton distribution and abun-dance and a final link among the observed results.Quantification of the relationships between envir-onmental variables and both ichthyoplankton as-semblages and total larval abundances wasconducted in two ways. The relationship betweenbiotic and abiotic matrices was assessed through theBIO-ENV procedure (Clarke and Ainsworth, 1993),which selects environmental variables ‘‘best explain-ing’’ assemblage pattern, by maximising a weighted
Spearman rank coefficient (rw) between abundancesimilarity matrix and an environmental similaritymatrix (Euclidean distance) based on normalisedselected variables. The ordination method for thisanalysis is based on a non-metric multi dimensionalscaling (MDS) (where s ¼ stress and indicates eitherexcellent representation (so0:05), good ordination(so0:1), still useful ordination (so0:2) or close toarbitrariness (s40:3), (Clarke and Warwick, 1994)).Also, the effect of single environmental variables ontotal larval abundance was explored through Spear-man’s correlation (Rs). Environmental variablesused for quantitative relations included temperature(1C, 10m), salinity (10m), turbidity (r.u, relativeunits, 10m), total chlorophyll (10m, mgm�3), thedepth of the isopycnal of 26.66 (kgm�3) (which isthe depth of the isopycnal separating the deepestlimit of the Surface Atlantic Water (SAW) and theshallowest limit of the North Atlantic CentralWater (NACW) and is the depth where nutrientconcentration starts to be not limiting for phyto-plankton growth; Navarro et al., 2006), total depth
ARTICLE IN PRESSI.A. Catalan et al. / Deep-Sea Research II 53 (2006) 1377–13901380
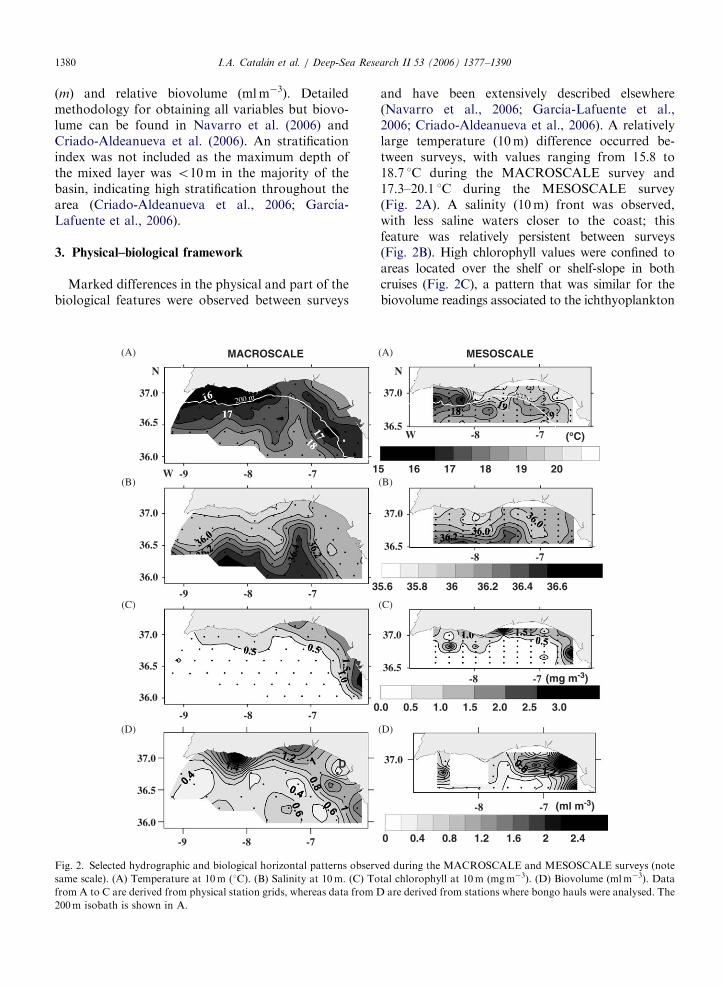
(m) and relative biovolume (mlm�3). Detailedmethodology for obtaining all variables but biovo-lume can be found in Navarro et al. (2006) andCriado-Aldeanueva et al. (2006). An stratificationindex was not included as the maximum depth ofthe mixed layer was o10m in the majority of thebasin, indicating high stratification throughout thearea (Criado-Aldeanueva et al., 2006; Garcıa-Lafuente et al., 2006).
3. Physical–biological framework
Marked differences in the physical and part of thebiological features were observed between surveys
-9
N
W -8 -7
-9 -8 -7
-9 -8 -7
-9 -8 -7
36.0
36.5
37.0
36.0
36.5
37.0
36.0
36.5
37.0
36.0
36.5
37.0
1
3
0
D
MACROSCALE
(D)
(C)
(B)
(A)
200 m
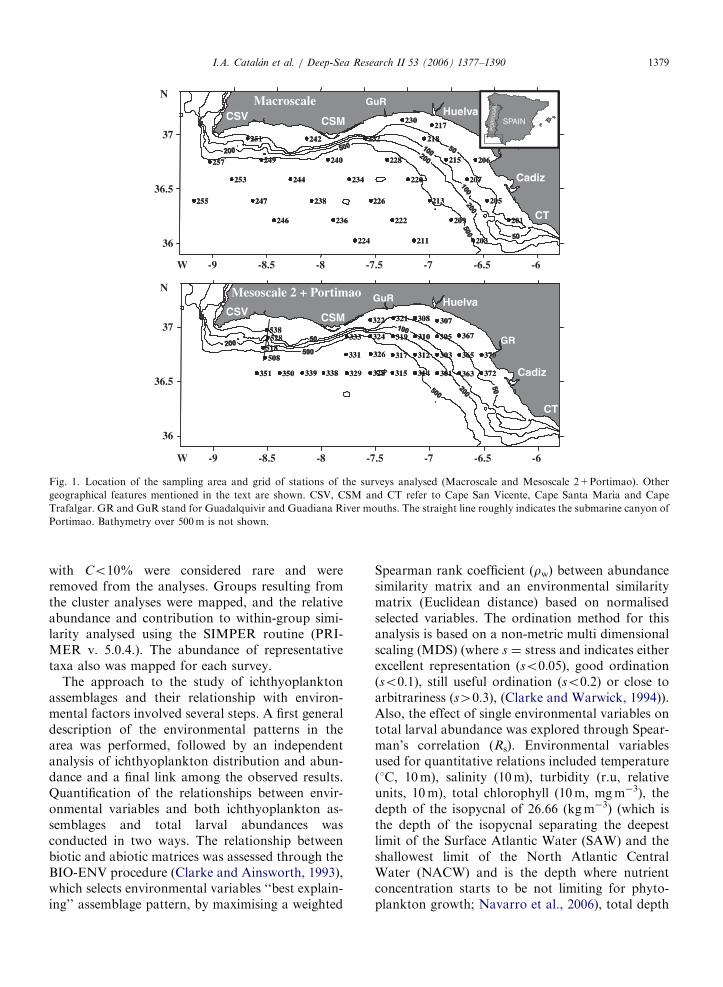
Fig. 2. Selected hydrographic and biological horizontal patterns observ
same scale). (A) Temperature at 10m (1C). (B) Salinity at 10m. (C) To
from A to C are derived from physical station grids, whereas data from D
200m isobath is shown in A.
and have been extensively described elsewhere(Navarro et al., 2006; Garcıa-Lafuente et al.,2006; Criado-Aldeanueva et al., 2006). A relativelylarge temperature (10m) difference occurred be-tween surveys, with values ranging from 15.8 to18.7 1C during the MACROSCALE survey and17.3–20.1 1C during the MESOSCALE survey(Fig. 2A). A salinity (10m) front was observed,with less saline waters closer to the coast; thisfeature was relatively persistent between surveys(Fig. 2B). High chlorophyll values were confined toareas located over the shelf or shelf-slope in bothcruises (Fig. 2C), a pattern that was similar for thebiovolume readings associated to the ichthyoplankton
W
N
-8 -7
-8 -7
-8 -7
-8 -7
36.5
37.0
36.5
37.0
36.5
37.0
5 16 17 18 19 20
5.6 35.8 36 36.2 36.4 36.6
.0 0.5 1.0 1.5 2.0 2.5 3.0
MESOSCALE
(D)
(C)
(B)
(A)
37.0
0 0.4 0.8 1.2 1.6 2.42
(°°C)
(mg m-3)
(ml m-3)
200 m
ed during the MACROSCALE and MESOSCALE surveys (note
tal chlorophyll at 10m (mgm�3). (D) Biovolume (mlm�3). Data
are derived from stations where bongo hauls were analysed. The
ARTICLE IN PRESS
36
-9 -8.5 -8 -7.5 -6.5-7
-9 -8.5 -8 -7.5 -6.5-7
36.5
Number of taxa A
A
A
A
A
B3
B1
A
AA
B2
B1
B1
B1
B4
A
B3
B1
B1
B1
B4
A
B1
B1
B1
B2
A
B1
B2
Macroscale
CSMCSV
GR
GuRHuelva
A BA B
MACROSCALE
200 m
200 m
200 m
B
37
36
36.5
37
Number of taxa ANumber of taxa A
A
A
A
A
B3
B1
A
AA
B2
B1
B1
B1
B4
A
B3
B1
B1
B1
B4
A
B1
B1
B1
B2
A
B1
B2
Macroscale
CSMCSV
GR
GuRHuelva
A BA B
MACROSCALE
200 m
200 m
200 m
BB
N
N
W
W
Number of taxa A
A
A
A
A
B3
B1
A
AA
B2
B1
B1
B1
B4
A
B3
B1
B1
B1
B4
A
B1
B1
B1
B2
A
B1
B2
Macroscale
CSMCSV
G
GuRHuelva
A BA B
MACROSCALE
200 m
200 m
200 m
B
Number of taxa ANumber of taxa(A)
A
A
A
A
B3
B1
A
AA
B2
B1
B1
B1
B4
A
B3
B1
B1
B1
B4
A
B1
B1
B1
B2
A
B1
B2
Macroscale
CSMCSV
GR
GuRHuelva
A BA
B 1 B 2 B 3 B 4
Bra
y-C
urtis
sim
ilari
ty
B
MACROSCALE
200 m
200 m
200 m
Number of larvae/10m2
N
W
-9 -8.5 -8 -7.5 -6.5-7
36
36.5
37
N
WW
0
20
40
60
80
100
Stations
206
217
201
230
242
251
215
218
205
207
226
246
234
211
255
224
238
247
244
222
236
220
249
257
209
232
228
240
213
(B)
(C)
(D)
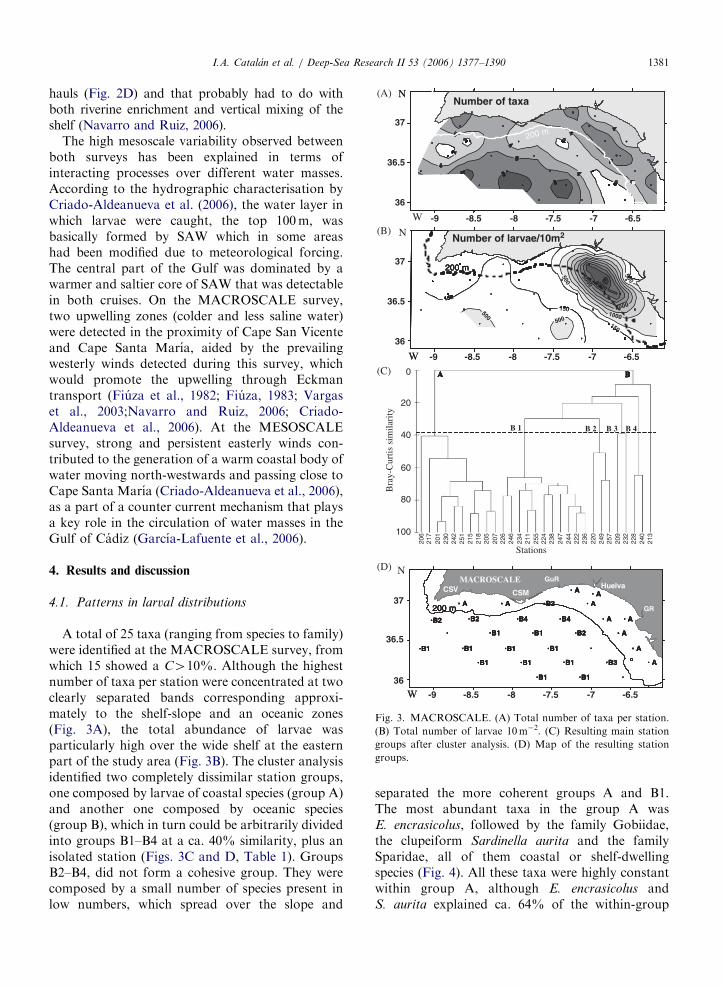
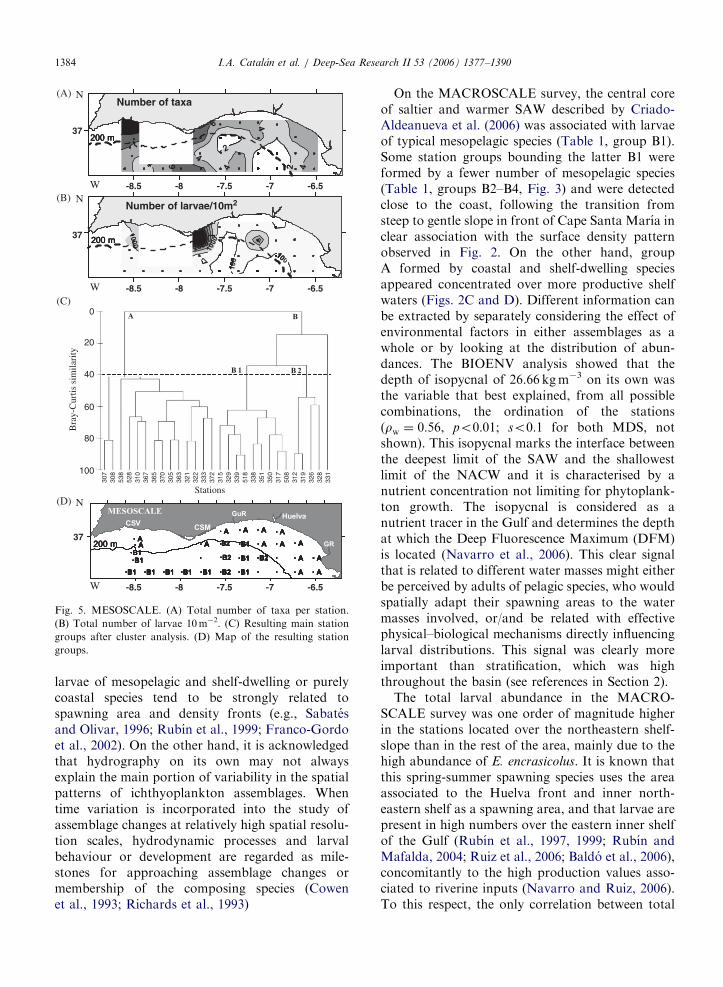
Fig. 3. MACROSCALE. (A) Total number of taxa per station.
(B) Total number of larvae 10m�2. (C) Resulting main station
groups after cluster analysis. (D) Map of the resulting station
groups.
I.A. Catalan et al. / Deep-Sea Research II 53 (2006) 1377–1390 1381
hauls (Fig. 2D) and that probably had to do withboth riverine enrichment and vertical mixing of theshelf (Navarro and Ruiz, 2006).
The high mesoscale variability observed betweenboth surveys has been explained in terms ofinteracting processes over different water masses.According to the hydrographic characterisation byCriado-Aldeanueva et al. (2006), the water layer inwhich larvae were caught, the top 100m, wasbasically formed by SAW which in some areashad been modified due to meteorological forcing.The central part of the Gulf was dominated by awarmer and saltier core of SAW that was detectablein both cruises. On the MACROSCALE survey,two upwelling zones (colder and less saline water)were detected in the proximity of Cape San Vicenteand Cape Santa Marıa, aided by the prevailingwesterly winds detected during this survey, whichwould promote the upwelling through Eckmantransport (Fiuza et al., 1982; Fiuza, 1983; Vargaset al., 2003;Navarro and Ruiz, 2006; Criado-Aldeanueva et al., 2006). At the MESOSCALEsurvey, strong and persistent easterly winds con-tributed to the generation of a warm coastal body ofwater moving north-westwards and passing close toCape Santa Marıa (Criado-Aldeanueva et al., 2006),as a part of a counter current mechanism that playsa key role in the circulation of water masses in theGulf of Cadiz (Garcıa-Lafuente et al., 2006).
4. Results and discussion
4.1. Patterns in larval distributions
A total of 25 taxa (ranging from species to family)were identified at the MACROSCALE survey, fromwhich 15 showed a C410%. Although the highestnumber of taxa per station were concentrated at twoclearly separated bands corresponding approxi-mately to the shelf-slope and an oceanic zones(Fig. 3A), the total abundance of larvae wasparticularly high over the wide shelf at the easternpart of the study area (Fig. 3B). The cluster analysisidentified two completely dissimilar station groups,one composed by larvae of coastal species (group A)and another one composed by oceanic species(group B), which in turn could be arbitrarily dividedinto groups B1–B4 at a ca. 40% similarity, plus anisolated station (Figs. 3C and D, Table 1). GroupsB2–B4, did not form a cohesive group. They werecomposed by a small number of species present inlow numbers, which spread over the slope and
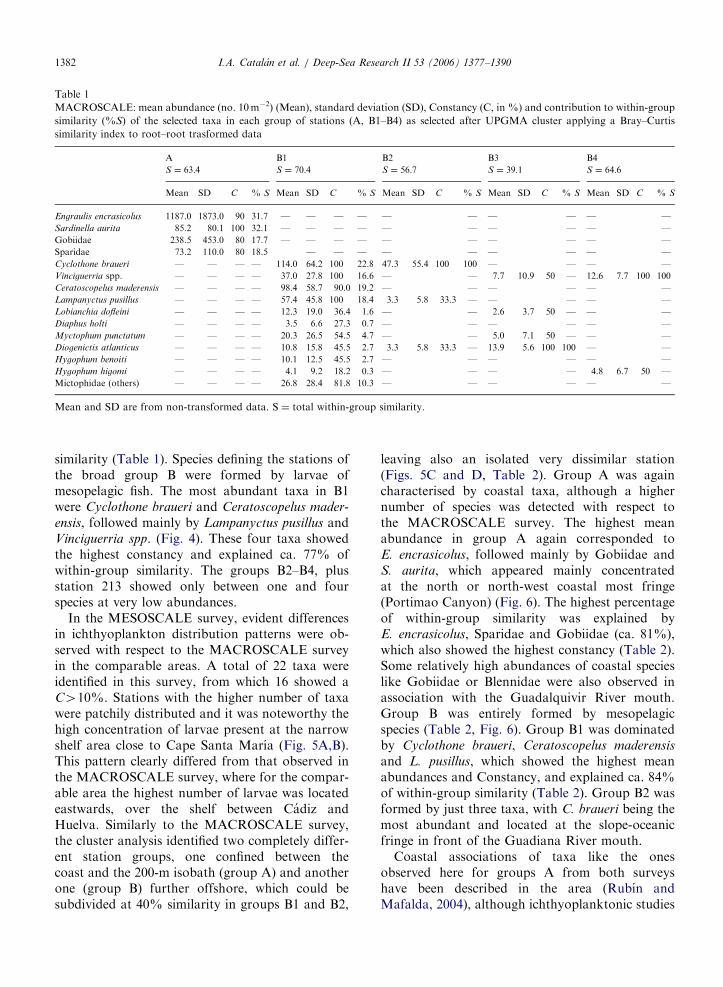
separated the more coherent groups A and B1.The most abundant taxa in the group A wasE. encrasicolus, followed by the family Gobiidae,the clupeiform Sardinella aurita and the familySparidae, all of them coastal or shelf-dwellingspecies (Fig. 4). All these taxa were highly constantwithin group A, although E. encrasicolus andS. aurita explained ca. 64% of the within-group
ARTICLE IN PRESS
Table 1
MACROSCALE: mean abundance (no. 10m�2) (Mean), standard deviation (SD), Constancy (C, in %) and contribution to within-group
similarity (%S) of the selected taxa in each group of stations (A, B1–B4) as selected after UPGMA cluster applying a Bray–Curtis
similarity index to root–root trasformed data
A B1 B2 B3 B4
S ¼ 63:4 S ¼ 70:4 S ¼ 56:7 S ¼ 39:1 S ¼ 64:6
Mean SD C % S Mean SD C % S Mean SD C % S Mean SD C % S Mean SD C % S
Engraulis encrasicolus 1187.0 1873.0 90 31.7 — — — — — — — — — —
Sardinella aurita 85.2 80.1 100 32.1 — — — — — — — — — —
Gobiidae 238.5 453.0 80 17.7 — — — — — — — — — —
Sparidae 73.2 110.0 80 18.5 — — — — — — — — —
Cyclothone braueri — — — — 114.0 64.2 100 22.8 47.3 55.4 100 100 — — — —
Vinciguerria spp. — — — — 37.0 27.8 100 16.6 — — 7.7 10.9 50 — 12.6 7.7 100 100
Ceratoscopelus maderensis — — — — 98.4 58.7 90.0 19.2 — — — — — —
Lampanyctus pusillus — — — — 57.4 45.8 100 18.4 3.3 5.8 33.3 — — — — —
Lobianchia dofleini — — — — 12.3 19.0 36.4 1.6 — — 2.6 3.7 50 — — —
Diaphus holti — — — — 3.5 6.6 27.3 0.7 — — — — — —
Myctophum punctatum — — — — 20.3 26.5 54.5 4.7 — — 5.0 7.1 50 — — —
Diogenictis atlanticus — — — — 10.8 15.8 45.5 2.7 3.3 5.8 33.3 — 13.9 5.6 100 100 — —
Hygophum benoiti — — — — 10.1 12.5 45.5 2.7 — — — — — —
Hygophum higomi — — — — 4.1 9.2 18.2 0.3 — — — — 4.8 6.7 50 —
Mictophidae (others) — — — — 26.8 28.4 81.8 10.3 — — — — — —
Mean and SD are from non-transformed data. S ¼ total within-group similarity.
I.A. Catalan et al. / Deep-Sea Research II 53 (2006) 1377–13901382
similarity (Table 1). Species defining the stations ofthe broad group B were formed by larvae ofmesopelagic fish. The most abundant taxa in B1were Cyclothone braueri and Ceratoscopelus mader-
ensis, followed mainly by Lampanyctus pusillus andVinciguerria spp. (Fig. 4). These four taxa showedthe highest constancy and explained ca. 77% ofwithin-group similarity. The groups B2–B4, plusstation 213 showed only between one and fourspecies at very low abundances.
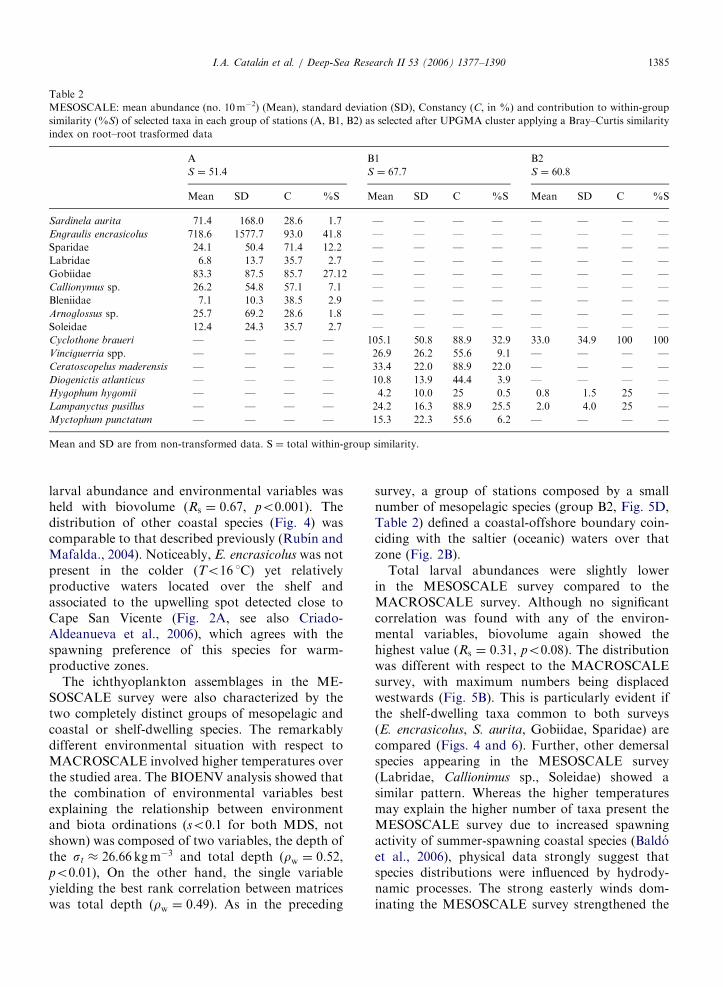
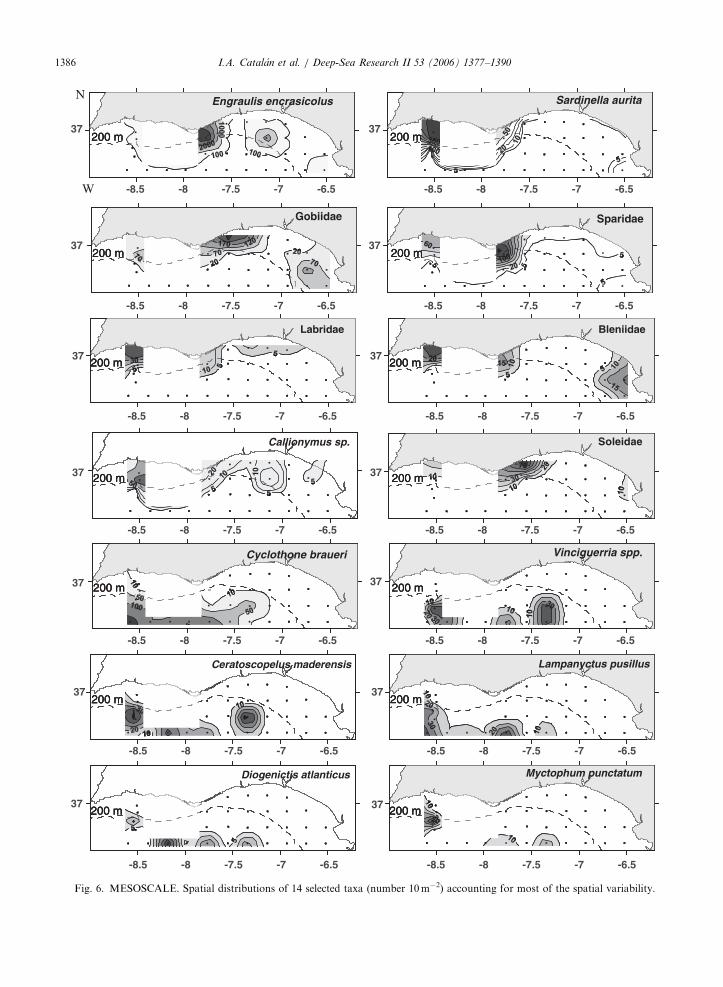
In the MESOSCALE survey, evident differencesin ichthyoplankton distribution patterns were ob-served with respect to the MACROSCALE surveyin the comparable areas. A total of 22 taxa wereidentified in this survey, from which 16 showed aC410%. Stations with the higher number of taxawere patchily distributed and it was noteworthy thehigh concentration of larvae present at the narrowshelf area close to Cape Santa Marıa (Fig. 5A,B).This pattern clearly differed from that observed inthe MACROSCALE survey, where for the compar-able area the highest number of larvae was locatedeastwards, over the shelf between Cadiz andHuelva. Similarly to the MACROSCALE survey,the cluster analysis identified two completely differ-ent station groups, one confined between thecoast and the 200-m isobath (group A) and anotherone (group B) further offshore, which could besubdivided at 40% similarity in groups B1 and B2,
leaving also an isolated very dissimilar station(Figs. 5C and D, Table 2). Group A was againcharacterised by coastal taxa, although a highernumber of species was detected with respect tothe MACROSCALE survey. The highest meanabundance in group A again corresponded toE. encrasicolus, followed mainly by Gobiidae andS. aurita, which appeared mainly concentratedat the north or north-west coastal most fringe(Portimao Canyon) (Fig. 6). The highest percentageof within-group similarity was explained byE. encrasicolus, Sparidae and Gobiidae (ca. 81%),which also showed the highest constancy (Table 2).Some relatively high abundances of coastal specieslike Gobiidae or Blennidae were also observed inassociation with the Guadalquivir River mouth.Group B was entirely formed by mesopelagicspecies (Table 2, Fig. 6). Group B1 was dominatedby Cyclothone braueri, Ceratoscopelus maderensis
and L. pusillus, which showed the highest meanabundances and Constancy, and explained ca. 84%of within-group similarity (Table 2). Group B2 wasformed by just three taxa, with C. braueri being themost abundant and located at the slope-oceanicfringe in front of the Guadiana River mouth.
Coastal associations of taxa like the onesobserved here for groups A from both surveyshave been described in the area (Rubın andMafalda, 2004), although ichthyoplanktonic studies
ARTICLE IN PRESS
Gobiidae
W
Gobiidae
SparidaeGobiidae
Engraulis encrasicolus
Cyclothone braueri Vinciguerria spp.
Ceratoscopelus maderensis Lampanyctus pusillus
Sardinella aurita
N
W
37
-9 -8.5 -8 -7.5 -7 -6.5
36
36.5
37
-9 -8.5 -8 -7.5 -7 -6.5
36
36.5
37
-9 -8.5 -8 -7.5 -7 -6.5
36
36.5
37
-9 -8.5 -8 -7.5 -7 -6.5
36
36.5
37
-9 -8.5 -8 -7.5 -7 -6.5
36
36.5
37
-9 -8.5 -8 -7.5 -7 -6.5
36
36.5
37
-9 -8.5 -8 -7.5 -7 -6.5
36
36.5
37
-9 -8.5 -8 -7.5 -7 -6.5
36
36.5
200m
200m
200m
200m200m
200m
200m
200m
Fig. 4. MACROSCALE. Spatial distributions of eight selected taxa (number 10m�2) accounting for most of the spatial variability.
I.A. Catalan et al. / Deep-Sea Research II 53 (2006) 1377–1390 1383
on assemblages including oceanic stations arealmost absent. In general, the composition of taxaobserved between the broad groups A and B islargely comparable with other works conducted inSpanish waters (Sabates and Olivar, 1996; Rubın etal., 1997; Olivar et al., 1998). As for the main speciesin terms of abundance and constancy, E. encrasico-
lus, it is worth noting the high averages andmaximum values recorded, peaking at ca. 4670and 5579 larvae 10m�2 at the MACROSCALE andMESOSCALE surveys, respectively. These valuescontrast with the peaks of 541–320 larvae 10m�2
recorded in July 1994 and 1995 (Rubın et al., 1997,
1999), although are similar to the values registeredin July 1997 (Garcıa et al., 2002).
4.2. Relationship with environmental variables
There was a clear spatial association between theichthyoplankton assemblages and the hydrographicfeatures. The general coastal-oceanic broad separa-tion between associations of taxa was maintainedbetween surveys (Fig. 3 and 5) despite the importantenvironmental differences detected (Fig. 2). Theseresults are in agreement with the vast majority ofthe literature that shows how the distributions of
ARTICLE IN PRESS
B2 A
AA
A
B2
B1
B1
B1
AA
B2
B2B1
A
B1B1B1B1 A
A
A
A
A
B1
B1
AA
Mesoscale 2 + Portimao
CSMCSV
GR
GuR Huelva D
200 m
200 m
200 m
MESOSCALE
N er
B2 A
AA
A
B2
B1
B1
B1
AA
B2
B2B1
A
B1B1B1B1 A
A
A
A
A
B1
B1
AA
Mesoscale 2 + Portimao
CSMCSV
GR
GuR Huelva
B2 A
AA
A
B2
B1
B1
B1
AA
B2
B2B1
A
B1B1B1B1 A
A
A
A
A
B1
B1
AA
Mesoscale 2 + Portimao
CSMCSV
GR
GuR Huelva D
200 m
200 m
200 m
MESOSCALE
erer
B2 A
AA
A
B2
B1
B1
B1
AA
B2
B2B1
A
B1B1B1B1 A
A
A
A
A
B1
B1
AA
Mesoscale 2 + Portimao
CSMCSV
GR
GuR Huelva D
200 m
200 m
200 m
MESOSCALE
er
B2 A
AA
A
B2
B1
B1
B1
AA
B2
B2B1
A
B1B1B1B1 A
A
A
A
A
B1
B1
AA
Mesoscale 2 + Portimao
CSMCSV
GR
GuR Huelva
B2 A
AA
A
B2
B1
B1
B1
AA
B2
B2B1
A
B1B1B1B1 A
A
A
A
A
B1
B1
AA
Mesoscale 2 + Portimao
CSMCSV
GR
GuR Huelva
A
B 1 B 2
B
200 m
200 m
200 m
MESOSCALE
er
-8.5 -8 -7.5 -6.5-7
37
W
-8.5 -8 -7.5 -6.5-7W
Number of taxa(A)
Bra
y-C
urtis
sim
ilari
ty
Number of larvae/10m2
N
37
N
-8.5 -8 -7.5 -6.5-7W
37
N
0
20
40
60
80
100
Stations
307
308
538
528
310
367
365
370
305
363
321
322
333
372
315
329
339
518
338
351
350
317
508
312
319
326
328
331
(B)
(C)
(D)
Fig. 5. MESOSCALE. (A) Total number of taxa per station.
(B) Total number of larvae 10m�2. (C) Resulting main station
groups after cluster analysis. (D) Map of the resulting station
groups.
I.A. Catalan et al. / Deep-Sea Research II 53 (2006) 1377–13901384
larvae of mesopelagic and shelf-dwelling or purelycoastal species tend to be strongly related tospawning area and density fronts (e.g., Sabatesand Olivar, 1996; Rubın et al., 1999; Franco-Gordoet al., 2002). On the other hand, it is acknowledgedthat hydrography on its own may not alwaysexplain the main portion of variability in the spatialpatterns of ichthyoplankton assemblages. Whentime variation is incorporated into the study ofassemblage changes at relatively high spatial resolu-tion scales, hydrodynamic processes and larvalbehaviour or development are regarded as mile-stones for approaching assemblage changes ormembership of the composing species (Cowenet al., 1993; Richards et al., 1993)
On the MACROSCALE survey, the central coreof saltier and warmer SAW described by Criado-Aldeanueva et al. (2006) was associated with larvaeof typical mesopelagic species (Table 1, group B1).Some station groups bounding the latter B1 wereformed by a fewer number of mesopelagic species(Table 1, groups B2–B4, Fig. 3) and were detectedclose to the coast, following the transition fromsteep to gentle slope in front of Cape Santa Marıa inclear association with the surface density patternobserved in Fig. 2. On the other hand, groupA formed by coastal and shelf-dwelling speciesappeared concentrated over more productive shelfwaters (Figs. 2C and D). Different information canbe extracted by separately considering the effect ofenvironmental factors in either assemblages as awhole or by looking at the distribution of abun-dances. The BIOENV analysis showed that thedepth of isopycnal of 26.66 kgm�3 on its own wasthe variable that best explained, from all possiblecombinations, the ordination of the stations(rw ¼ 0:56, po0:01; so0:1 for both MDS, notshown). This isopycnal marks the interface betweenthe deepest limit of the SAW and the shallowestlimit of the NACW and it is characterised by anutrient concentration not limiting for phytoplank-ton growth. The isopycnal is considered as anutrient tracer in the Gulf and determines the depthat which the Deep Fluorescence Maximum (DFM)is located (Navarro et al., 2006). This clear signalthat is related to different water masses might eitherbe perceived by adults of pelagic species, who wouldspatially adapt their spawning areas to the watermasses involved, or/and be related with effectivephysical–biological mechanisms directly influencinglarval distributions. This signal was clearly moreimportant than stratification, which was highthroughout the basin (see references in Section 2).
The total larval abundance in the MACRO-SCALE survey was one order of magnitude higherin the stations located over the northeastern shelf-slope than in the rest of the area, mainly due to thehigh abundance of E. encrasicolus. It is known thatthis spring-summer spawning species uses the areaassociated to the Huelva front and inner north-eastern shelf as a spawning area, and that larvae arepresent in high numbers over the eastern inner shelfof the Gulf (Rubın et al., 1997, 1999; Rubın andMafalda, 2004; Ruiz et al., 2006; Baldo et al., 2006),concomitantly to the high production values asso-ciated to riverine inputs (Navarro and Ruiz, 2006).To this respect, the only correlation between total
ARTICLE IN PRESS
Table 2
MESOSCALE: mean abundance (no. 10m�2) (Mean), standard deviation (SD), Constancy (C, in %) and contribution to within-group
similarity (%S) of selected taxa in each group of stations (A, B1, B2) as selected after UPGMA cluster applying a Bray–Curtis similarity
index on root–root trasformed data
A B1 B2
S ¼ 51:4 S ¼ 67:7 S ¼ 60:8
Mean SD C %S Mean SD C %S Mean SD C %S
Sardinela aurita 71.4 168.0 28.6 1.7 — — — — — — — —
Engraulis encrasicolus 718.6 1577.7 93.0 41.8 — — — — — — — —
Sparidae 24.1 50.4 71.4 12.2 — — — — — — — —
Labridae 6.8 13.7 35.7 2.7 — — — — — — — —
Gobiidae 83.3 87.5 85.7 27.12 — — — — — — — —
Callionymus sp. 26.2 54.8 57.1 7.1 — — — — — — — —
Bleniidae 7.1 10.3 38.5 2.9 — — — — — — — —
Arnoglossus sp. 25.7 69.2 28.6 1.8 — — — — — — — —
Soleidae 12.4 24.3 35.7 2.7 — — — — — — — —
Cyclothone braueri — — — — 105.1 50.8 88.9 32.9 33.0 34.9 100 100
Vinciguerria spp. — — — — 26.9 26.2 55.6 9.1 — — — —
Ceratoscopelus maderensis — — — — 33.4 22.0 88.9 22.0 — — — —
Diogenictis atlanticus — — — — 10.8 13.9 44.4 3.9 — — — —
Hygophum hygomii — — — — 4.2 10.0 25 0.5 0.8 1.5 25 —
Lampanyctus pusillus — — — — 24.2 16.3 88.9 25.5 2.0 4.0 25 —
Myctophum punctatum — — — — 15.3 22.3 55.6 6.2 — — — —
Mean and SD are from non-transformed data. S ¼ total within-group similarity.
I.A. Catalan et al. / Deep-Sea Research II 53 (2006) 1377–1390 1385
larval abundance and environmental variables washeld with biovolume (Rs ¼ 0:67, po0:001). Thedistribution of other coastal species (Fig. 4) wascomparable to that described previously (Rubın andMafalda., 2004). Noticeably, E. encrasicolus was notpresent in the colder (To16 1C) yet relativelyproductive waters located over the shelf andassociated to the upwelling spot detected close toCape San Vicente (Fig. 2A, see also Criado-Aldeanueva et al., 2006), which agrees with thespawning preference of this species for warm-productive zones.
The ichthyoplankton assemblages in the ME-SOSCALE survey were also characterized by thetwo completely distinct groups of mesopelagic andcoastal or shelf-dwelling species. The remarkablydifferent environmental situation with respect toMACROSCALE involved higher temperatures overthe studied area. The BIOENV analysis showed thatthe combination of environmental variables bestexplaining the relationship between environmentand biota ordinations (so0:1 for both MDS, notshown) was composed of two variables, the depth ofthe st � 26:66 kgm�3 and total depth (rw ¼ 0:52,po0:01), On the other hand, the single variableyielding the best rank correlation between matriceswas total depth (rw ¼ 0:49). As in the preceding
survey, a group of stations composed by a smallnumber of mesopelagic species (group B2, Fig. 5D,Table 2) defined a coastal-offshore boundary coin-ciding with the saltier (oceanic) waters over thatzone (Fig. 2B).
Total larval abundances were slightly lowerin the MESOSCALE survey compared to theMACROSCALE survey. Although no significantcorrelation was found with any of the environ-mental variables, biovolume again showed thehighest value (Rs ¼ 0:31, po0:08). The distributionwas different with respect to the MACROSCALEsurvey, with maximum numbers being displacedwestwards (Fig. 5B). This is particularly evident ifthe shelf-dwelling taxa common to both surveys(E. encrasicolus, S. aurita, Gobiidae, Sparidae) arecompared (Figs. 4 and 6). Further, other demersalspecies appearing in the MESOSCALE survey(Labridae, Callionimus sp., Soleidae) showed asimilar pattern. Whereas the higher temperaturesmay explain the higher number of taxa present theMESOSCALE survey due to increased spawningactivity of summer-spawning coastal species (Baldoet al., 2006), physical data strongly suggest thatspecies distributions were influenced by hydrody-namic processes. The strong easterly winds dom-inating the MESOSCALE survey strengthened the
ARTICLE IN PRESS
200 m
200 m
200 m
200 m
200 m
200 m
200 m
200 m
200 m
200 m
200 m
200 m
200 m
200 m
200 m
200 m
200 m
200 m
200 m
200 m
200 m
200 m
200 m
200 m
200 m
200 m
200 m
200 m
Callionymus sp.
Ceratoscopelus maderensis
Diogenictis atlanticus Myctophum punctatum
200 m
200 m
200 m
200 m
200 m
200 m
200 m
200 m
200 m
200 m
200 m
200 m
200 m
200 m
SparidaeGobiidae
Engraulis encrasicolus
Cyclothone braueri Vinciguerria spp.
Sardinella auritaN
W
37
-8.5 -8 -7.5 -7 -6.5
37
-8.5 -8 -7.5 -7 -6.5
37
-8.5 -8 -7.5 -7 -6.5
37
-8.5 -8 -7.5 -7 -6.5
37
-8.5 -8 -7.5 -7 -6.5
37
-8.5 -8 -7.5 -7 -6.5
37
-8.5 -8 -7.5 -7 -6.5
37
-8.5 -8 -7.5 -7 -6.5
37
-8.5 -8 -7.5 -7 -6.5
37
-8.5 -8 -7.5 -7 -6.5
37
-8.5 -8 -7.5 -7 -6.5
37
-8.5 -8 -7.5 -7 -6.5
37
-8.5 -8 -7.5 -7 -6.5
37
-8.5 -8 -7.5 -7 -6.5
Soleidae
Labridae Bleniidae
Lampanyctus pusillus
Fig. 6. MESOSCALE. Spatial distributions of 14 selected taxa (number 10m�2) accounting for most of the spatial variability.
I.A. Catalan et al. / Deep-Sea Research II 53 (2006) 1377–13901386
ARTICLE IN PRESSI.A. Catalan et al. / Deep-Sea Research II 53 (2006) 1377–1390 1387
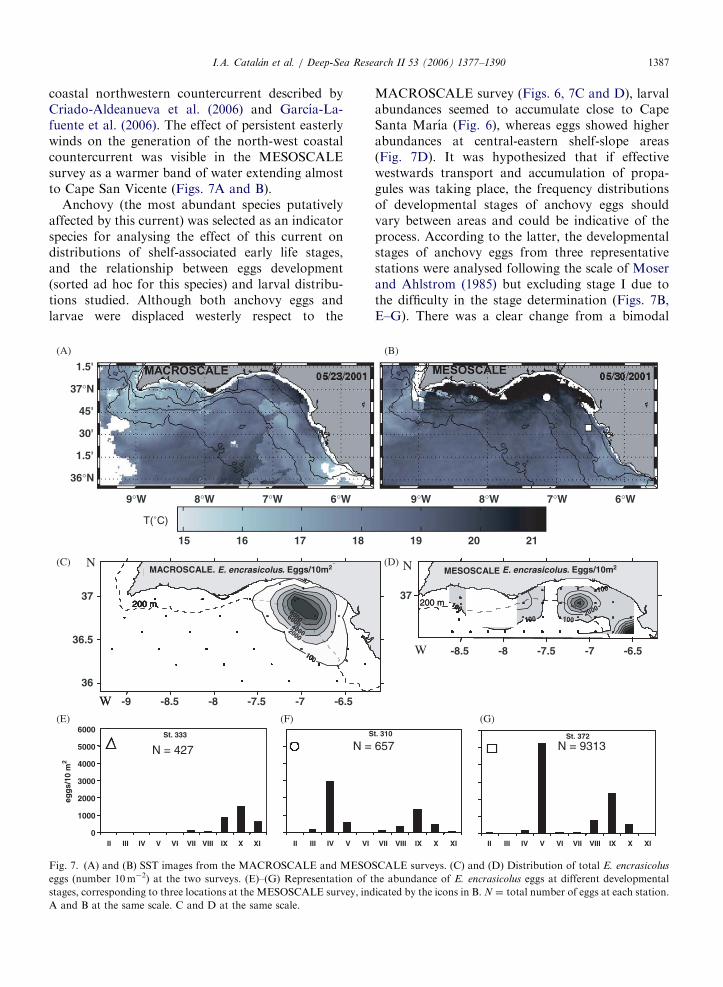
coastal northwestern countercurrent described byCriado-Aldeanueva et al. (2006) and Garcıa-La-fuente et al. (2006). The effect of persistent easterlywinds on the generation of the north-west coastalcountercurrent was visible in the MESOSCALEsurvey as a warmer band of water extending almostto Cape San Vicente (Figs. 7A and B).
Anchovy (the most abundant species putativelyaffected by this current) was selected as an indicatorspecies for analysing the effect of this current ondistributions of shelf-associated early life stages,and the relationship between eggs development(sorted ad hoc for this species) and larval distribu-tions studied. Although both anchovy eggs andlarvae were displaced westerly respect to the
SSt. 333
CMACROSCALE. E. encrasicolus. Eggs/10m2
200 m
Macroscale. E. encrasicolus. Eggs /10m2
cCMACROSCALE. E. encrasicolus. Eggs/10m2
Macroscale. E. encrasicolus. Eggs /10m2
cCMACROSCALE. E. encrasicolus. Eggs/10m2
200 m
II III IV V VI VII VIII IX X XI II III IV V VI
N = 427 N =
CMACROSCALE. E. encrasicolus. Eggs/10m2
200 m
Macroscale. E. encrasicolus. Eggs /10m2
cCMACROSCALE. E. encrasicolus. Eggs/10m2
Macroscale. E. encrasicolus. Eggs /10m2
cCMACROSCALE. E. encrasicolus. Eggs/10m2
200 m
CMACROSCALE. E. encrasicolus. Eggs/10m2
200 m
Macroscale. E. encrasicolus. Eggs /10m2
cCMACROSCALE. E. encrasicolus. Eggs/10m2
Macroscale. E. encrasicolus. Eggs /10m2
c(C)
(E) (F)
(A)
MACROSCALE. E. encrasicolus. Eggs/10m2
200 m
T(˚C)
W
N
W
37
-9 -8.5 -8 -7.5 -7 -6.5
36
37°N
36°N
9°W
15 16 17 18
8°W 7°W 6°W
1.5'
45'
30'
1.5'
36.5
0
1000
2000
3000
4000
5000
6000
egg
s/10
m2
Fig. 7. (A) and (B) SST images from the MACROSCALE and MESO
eggs (number 10m�2) at the two surveys. (E)–(G) Representation of t
stages, corresponding to three locations at the MESOSCALE survey, ind
A and B at the same scale. C and D at the same scale.
MACROSCALE survey (Figs. 6, 7C and D), larvalabundances seemed to accumulate close to CapeSanta Marıa (Fig. 6), whereas eggs showed higherabundances at central-eastern shelf-slope areas(Fig. 7D). It was hypothesized that if effectivewestwards transport and accumulation of propa-gules was taking place, the frequency distributionsof developmental stages of anchovy eggs shouldvary between areas and could be indicative of theprocess. According to the latter, the developmentalstages of anchovy eggs from three representativestations were analysed following the scale of Moserand Ahlstrom (1985) but excluding stage I due tothe difficulty in the stage determination (Figs. 7B,E–G). There was a clear change from a bimodal
t. 310 St. 372
Mesoscale 2 + Portimao. E. encrasicolus. Eggs /10m2
DMESOSCALE E. encrasicolus. Eggs/10m2
200 m
VII VIII IX X XI II III IV V VI VII VIII IX X XI
657 N = 9313
Mesoscale 2 + Mesoscale 2 + Portimao. E. encrasicolus. EMESOSCALE E. encrasicolus. Eggs/10m2
200 m
(G)
(D)
(B)
N
37
W -8.5 -8 -7.5 -7 -6.5
19 20 21
9°W 8°W 7°W 6°W
SCALE surveys. (C) and (D) Distribution of total E. encrasicolus
he abundance of E. encrasicolus eggs at different developmental
icated by the icons in B. N ¼ total number of eggs at each station.
ARTICLE IN PRESSI.A. Catalan et al. / Deep-Sea Research II 53 (2006) 1377–13901388
distribution at the easternmost station, dominatedby stages V and IX, to a unimodal distribution atthe westernmost station, formed by eggs of ad-vanced stages (mode ¼ stage X). Age (days) of themodes was estimated through the application of themodel by Lo (1985) to rearing data from Regner(1985), according to the scheme in Palomera (1989).Temperature considered was that at 5m. The agesof the modes corresponded to Age 1 (stages IV andV) and Age 2 (stages IX and X). The mean velocityof the countercurrent between the two eastern andwesternmost analysed stations (ca. 10–15 cm s�1)yielded an estimated displacement time of 4–6 days.This is within the order of magnitude of theobtained developing time for the anchovy eggs,and suggests an effect of the countercurrent on thewestern displacement of the eggs and larvae. Thesedata support the view of some authors who statethat persistent easterly winds could cause larval driftinto open sea in a fashion that might significantlyaffect anchovy recruitment in the area (Ruiz et al.,2006). The present results agree with the notion ofthe importance of flow-induced mechanisms for theputative expatriation of fish larvae (Cowen et al.,1993; Hare et al., 2002; Garcıa-Lafuente et al.,2002).
5. Concluding remarks
In this work it is shown the existence of a markedspatial and temporal heterogeneity in the distribu-tion of fish larvae in the Gulf of Cadiz during twoconsecutive spring surveys. At the scale studied,larvae of coastal or shelf-dwelling species are clearlyseparated from mesopelagic species, probably as aresult of well-defined coastal-oceanic habitats asso-ciated to the wide shelf and prevailing currents. Thedistribution of the st � 26:66 kgm�3 as a tracer ofthe DFM location, together with depth, were themost important variables separating the mainlarval assemblages. Underlying these associations,short-term hydrographic changes induced bywind forcing seem able to severely affect thedistribution patterns of some species, in particularthose associated to the shelf like E. encrasicolus,which can be transported off the areas wheresurvival is thought to be promoted.
Acknowledgements
The authors are thankful to I. Palomera for heradvice. We thank the captain, crew and technicians
of the R/V Hesperides for support in the fieldand to scientific fellows involved in the cruisefor their assistance. This work was supported byproject MAR99-0643-C03 and CTM2005-01091/MAR. G.N. by a Ph.D. fellowship from theSpanish Ministry of Sciences and Technologyand a research Grant to L.P. by the ‘‘Consejerıade Educacion y Ciencia’’ (Junta de Andalucıa).Remote sensing images have been processed inOcean Color Remote Sensing Service (SeTCO) atICMAN-CSIC.
References
Ahlstrom, E.H., Thrailkill, J.R., 1963. Plankton volume loss with
time of preservation. Reports of the California Cooperative
Oceanic Fisheries Investigations 9, 57–73.
Baldo, F., Garcıa-Isarch, E., Jimenez, M.P., Romero, Z.,
Sanchez-Lamadrid, A., Catalan, I.A., 2006. Spatial and
temporal distribution of the early life stages of three
commercial species in the North Eastern shelf of the Gulf of
Cadiz. Deep Sea Research II, this issue [doi:10.1016/
j.dsr2.2006.04.004].
Boehlert, G.W., Mundy, B.C., 1994. Vertical and onshore-
offshore distribution distribution patterns of tuna larvae in
relation to physical habitat features. Marine Ecology Progress
Series 107, 1–13.
Catalan, I.A., Jimenez, M.T., Alconchel, J.L., Munoz, J.L., 2006.
Spatial and temporal changes of coastal demersal assemblages
in the Gulf of Cadiz (SW Spain) in relation to environmental
traits. Deep Sea Research II, this issue [doi:10.1016/
j.dsr2.2006.04.005].
Clarke, R.H., Ainsworth, M., 1993. A method of linking
multivariate community structure to environmental variables.
Marine Ecology Progress Series 92, 205–219.
Clarke, K.R., Warwick, R.M., 1994. Change in Marine Com-
munities: An Approach to Statistical Analysis and Interpreta-
tion. Natural Environment Research Council, UK.
Cowen, R.K., Hare, J.A., Fahay, M.P., 1993. Beyond hydro-
graphy: can physical processes explain larval fish assemblages
within the middle Atlantic Bay? Bulletin of Marine Science 53,
567–587.
Criado-Aldeanueva, F., Garcıa-Lafuente, J, Vargas, J.M., Del
Rıo, J., Vazquez, A., Reul, A., Sanchez, A., 2006. Distribu-
tion and circulation of water masses in the Gulf of Cadiz from
in situ observations. Deep Sea Research II, this issue
[doi:10.1016/j.dsr2.2006.04.012].
Drake, P., Arias, A.M., Baldo, F., Cuesta, J.A., Rodriguez, A.,
Silva-Garcıa, A., Sobrino, I., Garcıa-Gonzalez, D., Fernan-
dez-Delgado, C., 2002. Spatial and temporal variation of the
nekton and hyperbenthos from a temperate European estuary
with a regulated freshwater inflow. Estuaries 25, 451–468.
Fiuza, A.F.D., de Macedo, M.E., Guerreiro, M.R., 1982.
Climatological space and time variation o the Portuguese
coastal upwelling. Oceanologica Acta 5, 31–40.
Fiuza, A.F.D., 1983. Upwelling patterns off Portugal. In: Suess,
E., Thiede, J. (Eds.), Coastal Upwelling. Plenum, New York,
pp. 85–98.
ARTICLE IN PRESSI.A. Catalan et al. / Deep-Sea Research II 53 (2006) 1377–1390 1389
Franco-Gordo, C., Godinez-Dominguez, E., Suarez-Morales, E.,
2002. Larval fish assemblages in waters off the central
Pacific coast of Mexico. Journal of Plankton Research 24,
775–784.
Garcıa, C.M., Prieto, L., Vargas, M., Echevarrıa, F., Garcıa-
Lafuente, J., Ruiz, J., Rubin, J.P., 2002. Hydrodynamics and
the spatial distribution of plankton and TEP in the Gulf of
Cadiz (SW Iberian Peninsula). Journal of Plankton Research
24, 817–833.
Garcıa-Lafuente, J., Garcıa, A., Mazzola, S., Quintanilla, L.,
Delgado, J., Cuttita, A., Patti, B., 2002. Hydrographic
phenomena influencing early life stages of the Sicilian
Channel anchovy. Fisheries Oceanography 11, 31–44.
Garcıa-Lafuente, J., Delgado, J., Criado-Aldeanueva, F., Bruno,
M., Rıo, J., Vargas, J.M., 2006. Water masses circulation in
the continental shelf of the Gula of Cadiz. Deep Sea Research
II, this issue [doi:10.1016/j.dsr2.2006.04.011].
Govoni, J.J., Pietrafesa, L.J., 1994. Eulerian views of layered
water currents, vertical distribution of some larval fishes, and
inferred advective transport over the continental shelf off
North Carolina, USA, in winter. Fisheries Oceanography 3,
120–132.
Hare, J.A., Churchill, J.H., Cowen, R.K., Berger, T.J., Cornillon,
P.C., Dragos, P., Glenn, S.M., Govoni, J.J., Lee, T.N., 2002.
Routes and rates of larval fish transport from the southeast to
the northeast United States continental shelf. Limnology and
Oceanography 47, 1774–1789.
Hjort, J., 1914. Fluctuations in the great fisheries of
northern Europe viewed in the light of biological research.
Rapports et Proces Verbaux des Reunions du Conseil
Permanent International pour l’Exploration de la Mer 20,
1–228.
Kiørboe, T., Munk, P., Richardson, K., Christensen, V., Paulsen,
H., 1988. Plankton dynamics and larval herring growth, drift
and survival in a frontal area. Marine Ecology Progress Series
44, 205–219.
Lasker, R., 1981. Marine fish larvae. Morphology, ecology, and
relation to fisheries. University of Washington Press, Seattle,
131pp.
Lo, N.C.H., 1985. A model for temperature-dependent northern
anchovy egg development and an automated procedure
for the assignment of age to staged eggs. In: Lasker,
R. (Ed.), An Egg Production Method for Estimating
Spawning Biomass of Pelagic Fish: Application to the
Northern Anchovy (Engraulis mordax). US Department
of Commerce, NOAA Technical Reports, NMFS 36,
pp. 43–50.
Mackas, D.L., Denman, K.L., Abbot, M.R., 1985. Plankton
patchiness: biology in the physical vernacular. Bulletin of
Marine Science 37, 652–674.
Millan, M., 1992. Descripcion de la pesquerıa de cerco
en la Region Suratlantica Espanola y Atlantico-Norte
Marroquı. Informes Tecnicos Instituto Espanol Oceanografıa
136, 70pp.
Moser, H.G., Ahlstrom, E.H., 1985. Staging anchovy
eggs. In: Lasker, R. (ed.), An Egg Production Method
for Estimating Spawning Biomass of Pelagic Fish: Applica-
tion to the Northern Anchovy (Engraulis mordax). US
Department of Commerce, NOAA Technical Reports.
NMFS 36, 37–41.
Navarro, G., Ruiz, J., 2006. Spatial and temporal variability of
phytoplankton in the Gulf of Cadiz through remote sensing
images. Deep Sea Research II, this issue [doi:10.1016/
j.dsr2.2006.04.014].
Navarro, G., Ruiz, J., Huertas, I.E., Garcıa, C.M., Criado-
Aldeanueva, F., Echevarrıa, F., 2006. Basin scale structures
governing the position of the deep fluorescence maximum in
the Gulf of Cadiz. Deep Sea Research II, this issue
[doi:10.1016/j.dsr2.2006.04.013].
Olivar, M.P., Shelton, P.A., 1993. Larvae fish assemblages
of the Benguela current. Bulletin of Marine Sciences 53,
450–474.
Olivar, M.P., Sabates, A., Abello, P., Garcıa, M., 1998.
Transitory hydrographic structures and distribution of fish
larvae and neustonic crustaceans in the north-western
Mediterranean. Oceanologica Acta 21, 95–104.
Palomera, I., 1989. Primeras fases del desarrollo de la anchoa
(E. encrasicolus) en la costa catalana. Ph.D. Thesis.
Universidad de Barcelona, Spain, 271pp.
Regner, S., 1985. Ecology of planktonic stages of the anchovy
(E. encrasicolus) in the central Adriatic. Acta Adriatica 26,
1–113.
Richards, W.J., McGowan, M.F., Leming, T., Lamkin, J.T.,
Kelley, S., 1993. Larval fish assemblages at the loop current
boundary in the Gulf of Mexico. Bulletin of Marine Science
53, 475–537.
Rubın, J.P., Mafalda J.R.P., 2004. Abnormal domination
of gilt sardine (Sardinella aurita) in the middle shelf
ichthyoplankton community of Gulf of Cadiz (SW
Iberian Peninsula) in summer: related changes in the
hydrologic structure and implications in the larval fish
and mesozooplankton assemblages found. ICES CM 2004.
Q:23.
Rubın, J.P., Cano, N., Arrate, P., Garcıa-Lafuente, J., Escanez,
J., Vargas, M., Alonso-Santos, J.C., Hernandez, F., 1997. El
ictioplancton, el mesozooplancton y la hidrologıa en el golfo
de Cadiz, Estrecho de Gibraltar y sector noroeste del mar de
Alboran, en julio de 1994. Informes Tecnicos Instituto
Espanol de Oceanografıa 167, 44pp.
Rubın, J.P., Cano, N., Prieto, L., Garcıa, C.M., Ruiz, J.,
Echevarrıa, F., Corzo, A., Galvez, J.A., Lozano, F., Alonso-
Santos, J.C., Escanez, J., Juarez, A., Zabala, L., Hernandez,
F., Garcıa-Lafuente, J., Vargas, M., 1999. La estructura del
ecosistema pelagico en relacion con las condiciones oceano-
graficas y topograficas en el golfo de Cadiz, estrecho
de Gibraltar y mar de Alboran (sector NW), en julio de
1995. Informes Tecnicos Instituto Espanol de Oceanografıa
175, 73pp.
Ruiz, J., Garcia-Isarch, E., Huertas, I.E., Prieto L., Juarez, A.,
Munoz J.L., Sanchez-Lamadrid, A., Rodrıguez, S., Naranjo,
J.M. and Baldo, F., 2006. Meteorological forcing and ocean
dynamics controlling Engraulis encrasicolus early life stages
and catches in the Gulf of Cadiz. Deep Sea Research II, this
issue [doi:10.1016/j.dsr2.2006.04.007].
Sabates, A., Olivar, M.P., 1996. Variation of larval fish
distributions associated with the variability in the location
of a shelf slope front. Marine Ecology Progress Series 135,
11–20.
Sabates, A., Salat, J., Olivar, M.P., 2001. Advection of
continental water as an export mechanism for anchovy,
Engraulis encrasicolus, larvae. Scientia Marina 65, 77–87.
Sanchez-Velasco, L., Valdez-Holguın, J.E., Shirasagoa, B.,
Cisneros-Matac, M.A., Zaratea, A., 2002. Changes in the
Spawning Environment of Sardinops caeruleus in the Gulf of
ARTICLE IN PRESSI.A. Catalan et al. / Deep-Sea Research II 53 (2006) 1377–13901390
California during El Nino 1997–1998. Estuarine, Coastal and
Shelf Science 54, 207–217.
Smith, P.E., Richardson, S.L., 1979. Tecnicas modelo para
prospecciones de huevos y larvas de peces pelagicos. FAO.
Documentos Tecnicos de Pesca 175, 107pp.
Sobrino, I., Jimenez, M.P., Ramos, F., Baro, J., 1994. Descrip-
cion de las pesqueriıas demersales de la region suratlantica
espanola. Informes Tecnicos del instituto Espanol de Ocea-
nografıa 151, 79.
Vargas, J.M., Garcıa-Lafuente, J., Delgado, J., Criado, F., 2003.
Seasonal and windinduced variability of sea surface tempera-
ture patterns in the Gulf of Cadiz. Journal of Marine Systems
38, 205–219.