PUB DATE Different formats are used for organizing ... - ERIC
Upload
khangminh22Category
view
0download
0
DOCU ENT RESUME
ED 054 777AUTHOR Lach, Ivan J.
JC 710 242
TITLE A Study of Lak- Land College Transfer Students.INSTITUTION Lake Land Coll. , Mattoon, Ill.PUB DATE Aug 71NOTE 22p.
EDRS PRICEDESCRIPTORS
IDENTIFIERS
ABSTRACT
ME-SO.65 Hc-$3.29*Followup Studies; *Graduate Surveys; *JuniorColleges; Multiple Regression Analysi . *PredictorVariables; *Transfer Students*Illinois
This is a report of an extensive follow-up study ofLake Land College transfer students at Eastern Illinois University.An analysis of their grade point average (CPA) term by term reveals adrop in GPA the first term after transfer and subsequent recovery.This phenomenon, known as ',transfer shock, is compared with resultsobtained in national studies. An attempt to develop amultiple-variable regression equation for the prediction of successafter transfer by use of a multiple stepwise regression revealedthat, after using the GPA at the junior college as the firstvariable, additional variables were not significant. The studyindicates that ACT scores and high school rank are significantpredictors of success in a college transfer program at a juniorcollege, but, after two years, the junior college GPA is the onlysignificant predictor of success in the upper-level universities.This finding has many implications for the admission policies ofjunior college transfer students to 4-year institutions.(Author/MN)
U.S. DEPARTMENT OF HEALTH,EDUCATION & WELFAREOFFICE OF EDUCATION
THIS DOCUMENT HAs BEEN REPRO-DuCED EXACTLY AS RECEIVED FRomTHE PERSON OR ORGANIZATION ORIG-INATING IT PoINTS OF VIEW OR OPIN-IONS STATED DO NOT NECESSARILYREPRESENT OFFICIAL OFFICE OF EDLLCA11011 POSITION OR POLICY.
A STUDY OF LAKE LAND COLLEGE TRANSFER STUDENTS
By
Ivan 3. Lech
Director of Admissions, Records and Research
LAKE LAND COLLEGE
NATTOON, ILLINOIS
August 1971
UNIVERSITY OF CALIF.
LOS ANGELES
NOV 1 0 1971
CLEARINGHOUSE FORJUNIOR COLLEGE
INFORMATION
INTRODUCTION
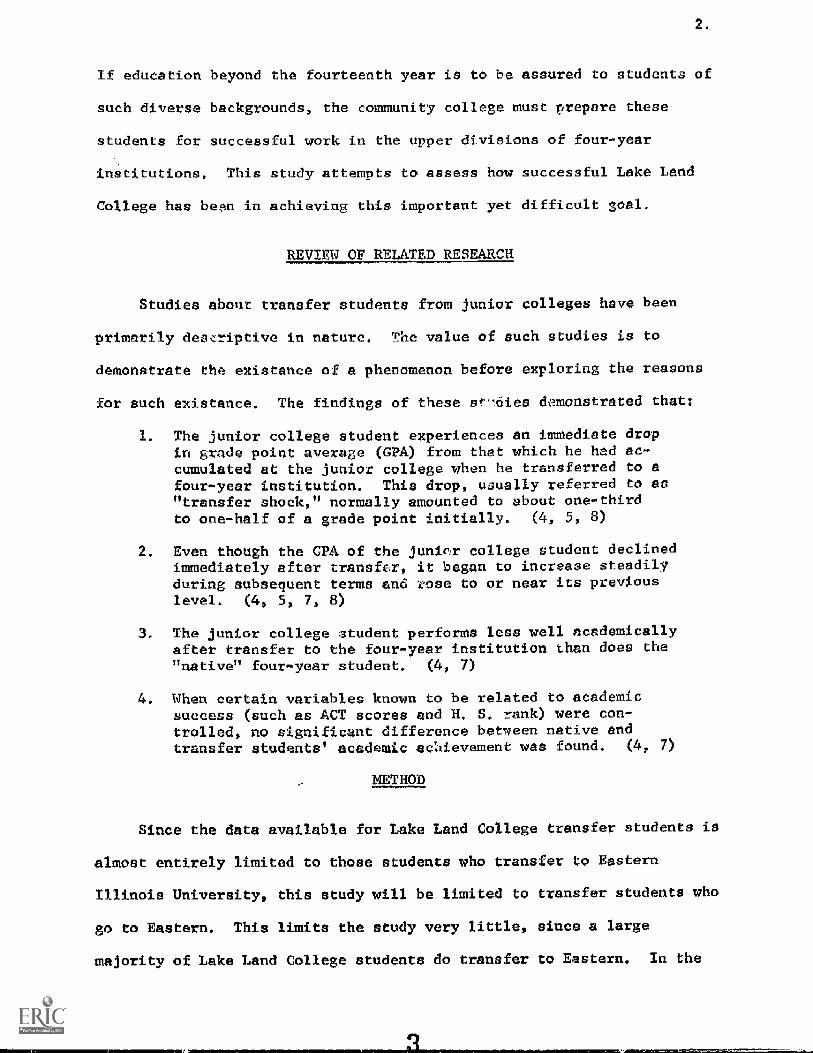
The great influx of junior colleges in the state during the past
decade has substantially incre- ed the number of students who complete
their fir-t two years of higher edu-ation at a junior college and then
transfer to a four.year institution to finish their degrees. Recent
limitations on enrollment at the lower division levels at the state
universities are forcing more and more students into the junior colleges
for the first two years of college :-rk. With such a large proportion
of college students seeking four year degrees via doing their first
two years of work at a community college, the responsibility of pro-
viding a quality transfer program by the junior colleges is of vital
concern.
The junior eolleges are expected t- do many things for many
people There seems to be no exception in the transfer program.
Students are admitted from all levels of academic ability and with
diverse backgrounds. Lake Land College being a community college
accepts many students into its transfer program who can not meet the
hi h admission standards at the state universities as well as students
who are dropped for low scholarship from these universities. In
addition, it accepts students of high academie ability that choose to
come to a community college after graduating from high school- house-
wives who want to continue their college education after their children
are in school or away from hom_ veterans of military aervice, and
adults who want to change their occupations.
2
2.
If education beyond the fourteenth year is to be assured to students of
such diverse backgrounds, the community college must prepare these
students for successful work in the upper divisions of four-year
institutions. This study attempts to assess how successful Lake Land
College has bean in achieving this important yet difficult goal.
REVIEW OF RELATED RESEARCH
Studies about transfer students from junior colleges have been
primarily desriptive in nature. The value of such studies is to
demonstrate the existence of a pheno enon before exploring the reasons
for such existence. The findings of these s 6ies ds.monstrated that:
1. The junior college student experiences an immediate dropin grade point average (GPA) from that which he had ac-cumulated at the junior college when he transferred to afour-year institution. This drop, u3ually referred to as"transfer shock," normally amounted to about one-thirdto one-half of a grade point initially. (4, 5, 8)
Even though the CPA of the junier college student declinedimmediately after transfer, it began to increase steadilyduring subsequent terms and eose to or near its previouslevel. (4, 5, 7, 8)
The junior college student performs less well academicallyafter transfer to the four-year institution Ulan does the"native" four-year student. (4, 7)
4. When certain variables known to be related to academicsuccess (such as ACT scores and H. S. rank) were con-trolled, no significant difference between native endtransfer students' academic achievement was found. (4, 7)
METHOD
Since the data available for Lake Land College transfer students is
almost entirely limited to those students who transfer to Eastern
Illinois University, this study will be limited to transfer students who
go to Eastern. This limits the study very little, since a large
ority of Lake Land College students do transfer to Eastern. In the
Fall of 1970, 146 Lake Land College students were at Eastern out of a
total of 220 transfer students. Transfer students from Fall 1969
through Spring 1971 are included in this study. The following is a
summary of the procedure and analyses that -ere made:
1. A transfer student data form was designed to record all the
pertinent data on each student. The form was designed sothat it could be up-dated each term and so that the infor-mation could be converted to punched IBM cards for machineanalys s. (See copy of form in appendix)
2. IBM punched cards were prepared containing the pertinentinformation on each student.
The variables that were obtained for each transfer studentwere sex, ACT composite score, percentile high school rank,credit hours earned at Lake Land College, Lake Land Collegecumulative grade point average, Lake Land College curriculum,Lake Land College program, academic status at Lake LandCollege, transfer term and year, Eastern's GPA each term,and Eastern's academic status each term.
4. The measure of success used was the grade point averagereceived after transfer at Eastern Illinois University.Several different analyses were performed on the abovedata and exemined to see how well they related to successafter transfer. Other analyses were performed to determinethe extent of "transfer shock" and recovery.
5. The variables contained on IBM cards for each student wereexamined for their predictive ability by a stepwise multipleregression which was run on the BIOMED-02R computer program.
ANALYSIS OF THE DATA
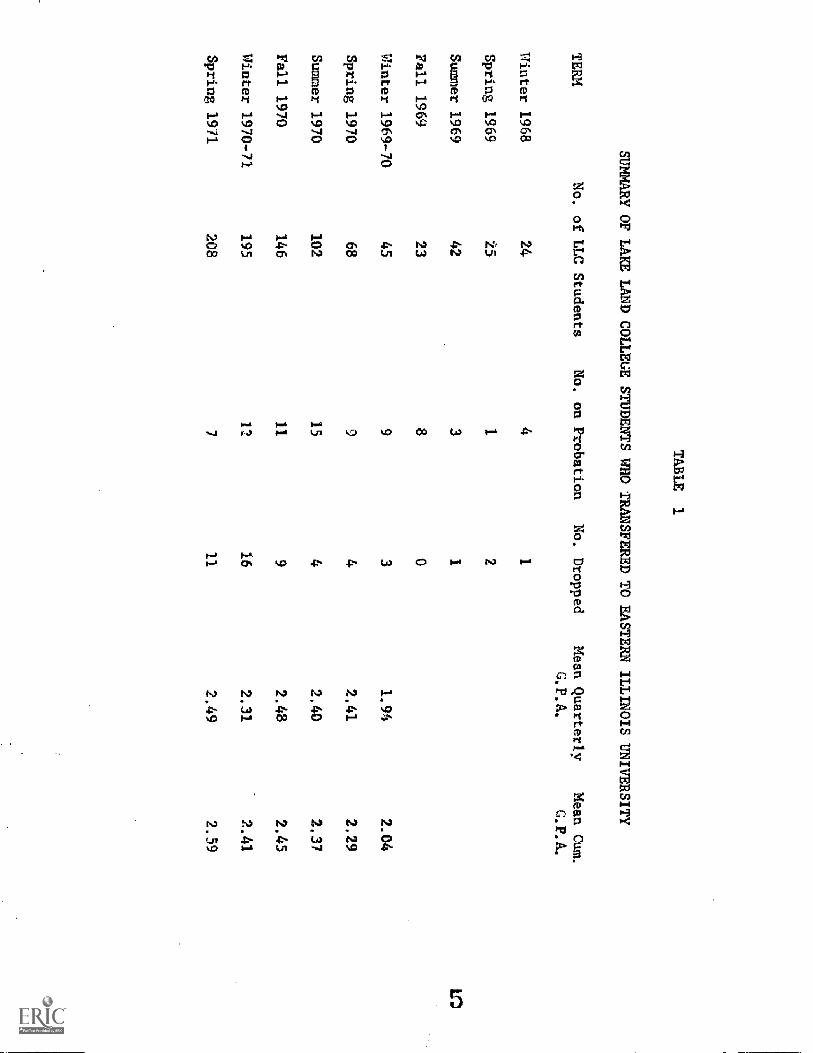
The first ':able is a summary of the number of Lake Land College
students at Eastern each term showing the number of students on pro-
betion and the number dropped as well as the mean quarterly GPA and
the mean cumulative GPA for those quarters for which data were a-
vailable. This summary shows a substantial increase in the number of
TABLE
1
SUMMARY OF LAKE LAND COLLEGE STUDENTS WHO 'IRAN FERED TO EASTERN ILLINOIS UNIVERSITY
TE
RM
Winter 1968
Spring 1969
No. of LLC Students,
24
15
No. on Probation
4
No. Dropped
1
Mean Quarterly
Mean Cum.
G.P. A.
Summer 1969
42
3
Fall 1969
93
nter 1969-70
45
93
1.94
2,04
Spring 1970
68
42.41
2.29
Summer 1970
102
15
42.40
2.37
Fall 1970
146
11
92.48
2.45
Winter 1970-71
195
12
16
2.31
Spring 1971
208
711
2.49
2.59
4.
students from Lake Land attending Eastern. There were 208 Lake Land
transfers at Eastern in the Spring of 1971 as compared to only 68
orze year earlier. Also shown is an increase in the average grade
point average received. The increases in GPA can probably be explained
by the fact that there is an increasing proportion of stedents who
have been at Eastern for several terms; thus building up the number
of transfers who are seniors at Eastern and hence offsetting the large
drop in GPA experienced by new transfers.
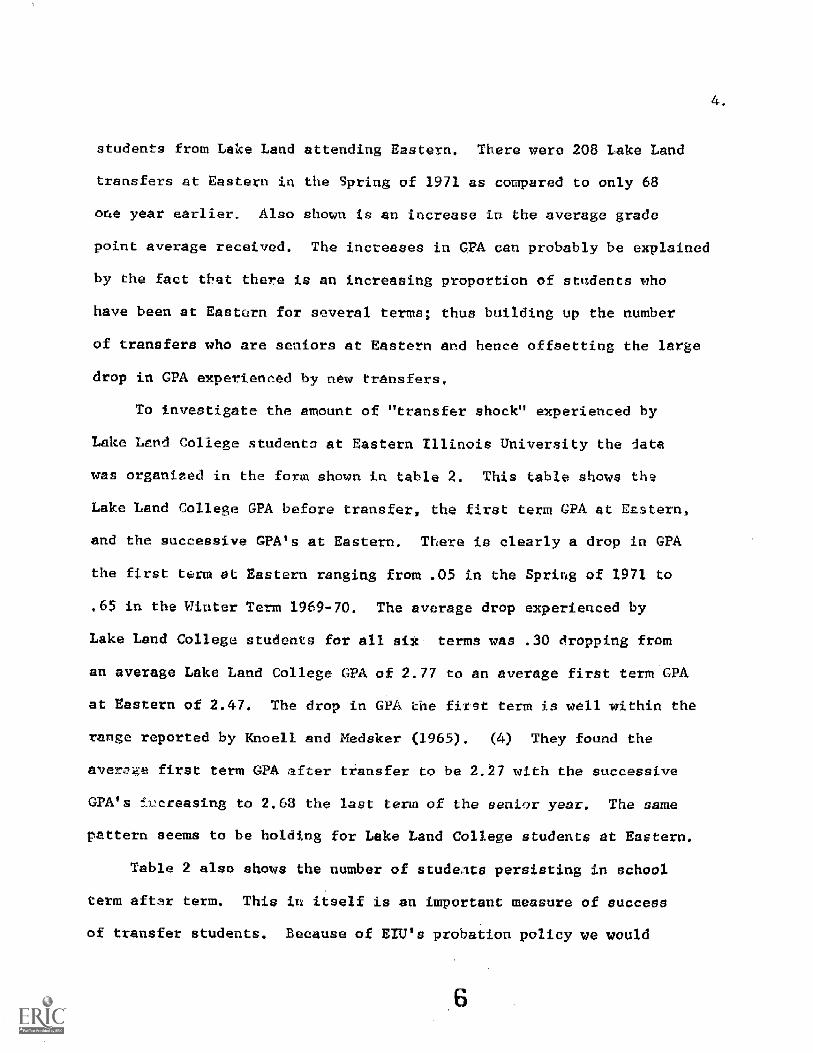
To investigate the amount of "transfer shock" experienced by
Lake Land College students at Eastern Illinois University the data
was organized in the form shown in table 2. This table shows the
Lake Land College GPA before transfer, the first term GPA at Eastern,
and the successive CPA's at Eastern. There is clearly a drop in GPA
the first term at Eastern ranging from .05 in the Spring of 1971 to
.65 in the Winter Term 1969-70. The average drop experienced by
Lake Land College students for all six terms was .30 dropping from
an average Lake Land College GPA of 2.77 to an average first term GPA
at Eastern of 2.47. The drop in GPA ene firet term is well within the
range reported by Knoell and Medaker (1965). (4) They found the
avereg first term GPA r transfer to be 2.27 with the successive
GPA's creasing to 2,63 the last term of the seni-er year. The same
ttern seems to be holding for Lake Land College students at Eastern.
Table 2 al-o shows the number of studeats persisting in school
term aftnr term. This in itself is an important measure of success
f transfer students. Because of EIU's probation policy we would
3.00
2.90
4..80
'4.70
2.60.
4.50
a o
2.20
2.10
2.00
77
2 51
7-
7
JR. COLI
1st2nd.
3rd.C
h.
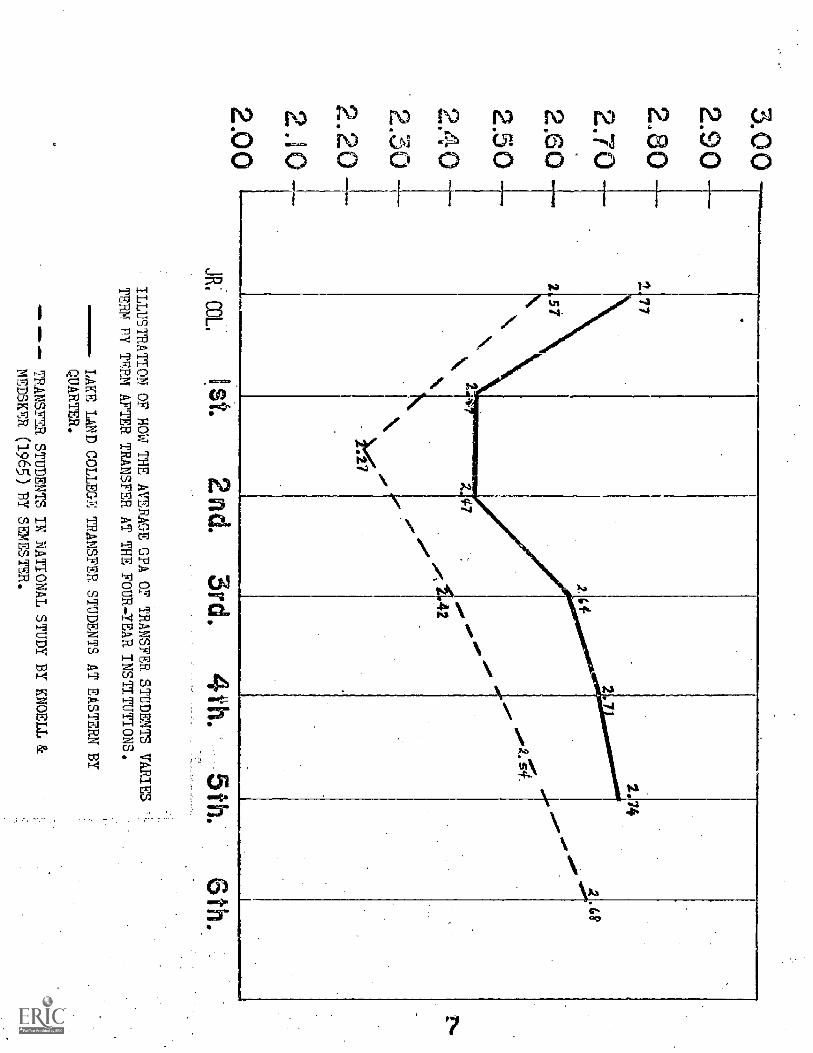
ILLUSTRATION OF. HOI. THE. AVERAGE GPA OF TRANSFER STUDENTS VARIES
TERM. PT TERM. AFTER, TRANSFER, AI THE FOUR4TAR. INSTITUTIONS,
dINE
MIM
MIN
IMIN
Iin
1611M4
LAKE LAID COLLEGE, TRANSFER STUDENTS AT EASTERN BY
QUARTER.
TRANSFER STUDENTS IN NATIONAL STUDY BY KNOELL &
MEDSKER (1965) BY SEMESTER.
6th..
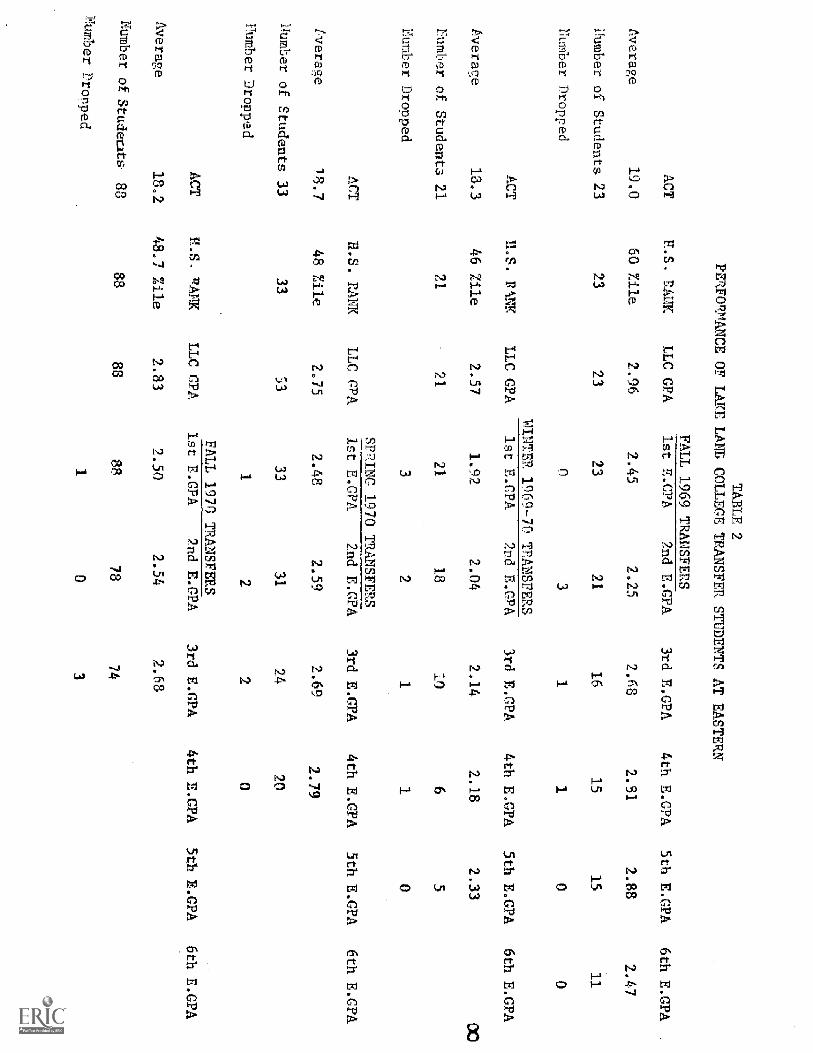
TABLE 2
PERFORmANCE OF LAKE LANE COLLEGE TRANSFER STUDENTS AT EASTERN
FALL 1969 TRANSFERS
ACT
P.S. RANK.
LLC GPA.
1st. E.CPA
2nd E.GPA.
3rd. E.GPA
4th. E.CPA.
5th E.CPA
6th. E.GPA
Average.
19.0
60 Zile
2.96
2-45
2.25
2.68
2.9,1
2.88
2-47
Fumber of Students. 23
23
23
23
21
16
15
15
11
'Number Dropped
11
00
WINTER 1969-70 TRANSFERS,
ACT
U.S. BNNK.
LLC GPA
1st E-CPA
2nd E,GPA.
3rd E,CPA
4th E.GPA
5th E,GPA
6th E,GPA
Average
18.3
46 Zile
2.57
1-92.
2.04
rumber of Students 21
21
-
21
21
18
06
5
2-14.
2-18
2-33
Number Dropped
32
11
SPINC
1970 TR
AN
SFER
SACT
H.S. RANK
LLC CPA
1st E.CPA
2nd E.CPA
3rd E.GPA
4th LOA
5th E.GPA
6th E.GPA
Iveraoc
18.7
48 Zile
2.75
2.48
2.59
2.69
2.79
1JumLer of Students 33
33
33
33
31
24
90
Further Dropped
22
0
FALL 1978 TRANSFERS
ACT
H.S.. RANK
LLC CPA.,
1st F-GRA
7nd E.GPA.
3rd E.GPA
4th EXPA
5t.b.E-GPA.
6th E.GPA
Average
18.2
48.7 Zile
2.83.
2.50
2.54
2.68
Number of Students.
83
88
88
88
78
74.
Fumber nropped
1.
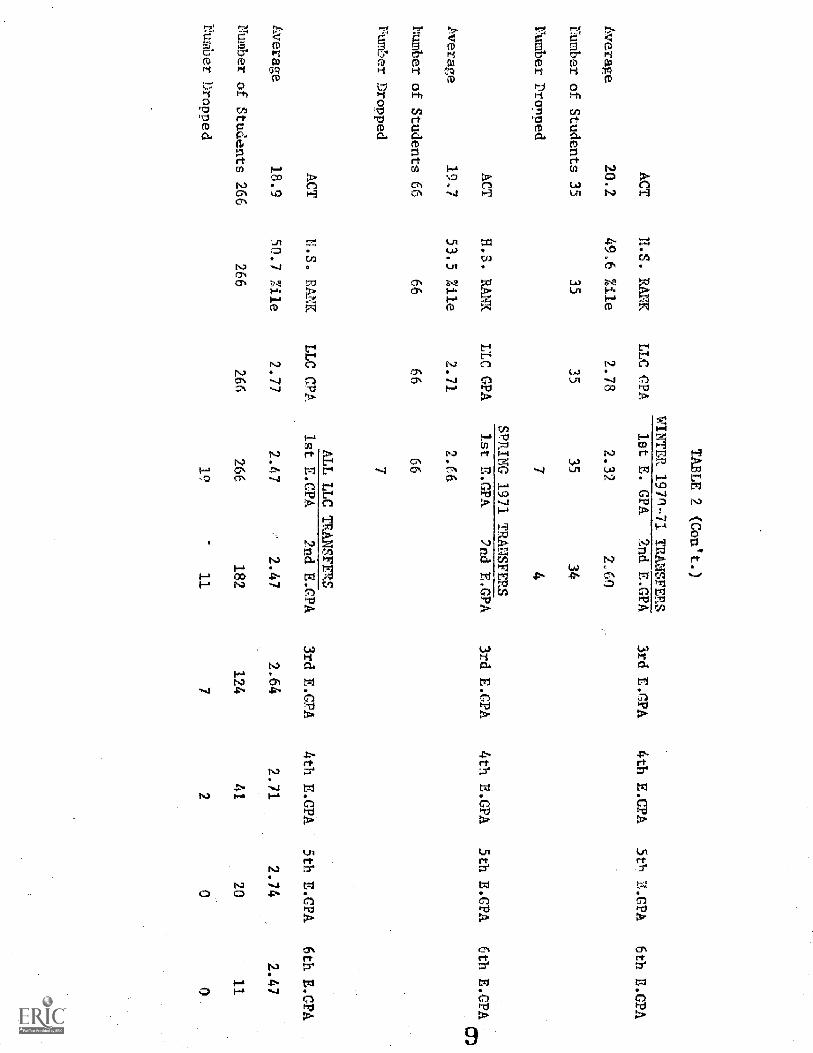
TABLE 2 (Con't..)
WINTER 197n-71 TRANSFERS,
ACT
H.S. RANK
LLC CFA
1st E. GPA
2nd E-CPA
3rd. E.CPA
4th E.CPA,
5t17 E.GPA
6th E.CPA
Average
20.2
49.6 Ioile.
2.78
2.32
2.60
Number of Students. 35
35
35
35
34
Number Dronped
74
SPRING 1971 TRANSFERS
ACT
H.S. RANK
LLC CPA
1st E.GPA
2nd E.GPA
3rd E.GPA
4th E.GPA
5th E.CPA
6th E.CPACO
tverage
19,7
53.5 %ile
2.71
2.66
Inumber of Students 66
66
66
66
Iluther Dropped
7
ALL, LLC TRANSFERS
ACT
U.S. RANK
LLC CPA
1st. EXPA
2nd EXPA
3rd E,CPA
4th E.CPA
.
5th. E,CPA
6th EXPA
Average
18.9
50.7 Zile
2.77
2-47
.'
2-47
2.64
2.71
2,74
.2,47
'
Number of Audents 266
266.
266
266.
182
124
41
20
11
himber 1;ropped
19
11
72
.
5.
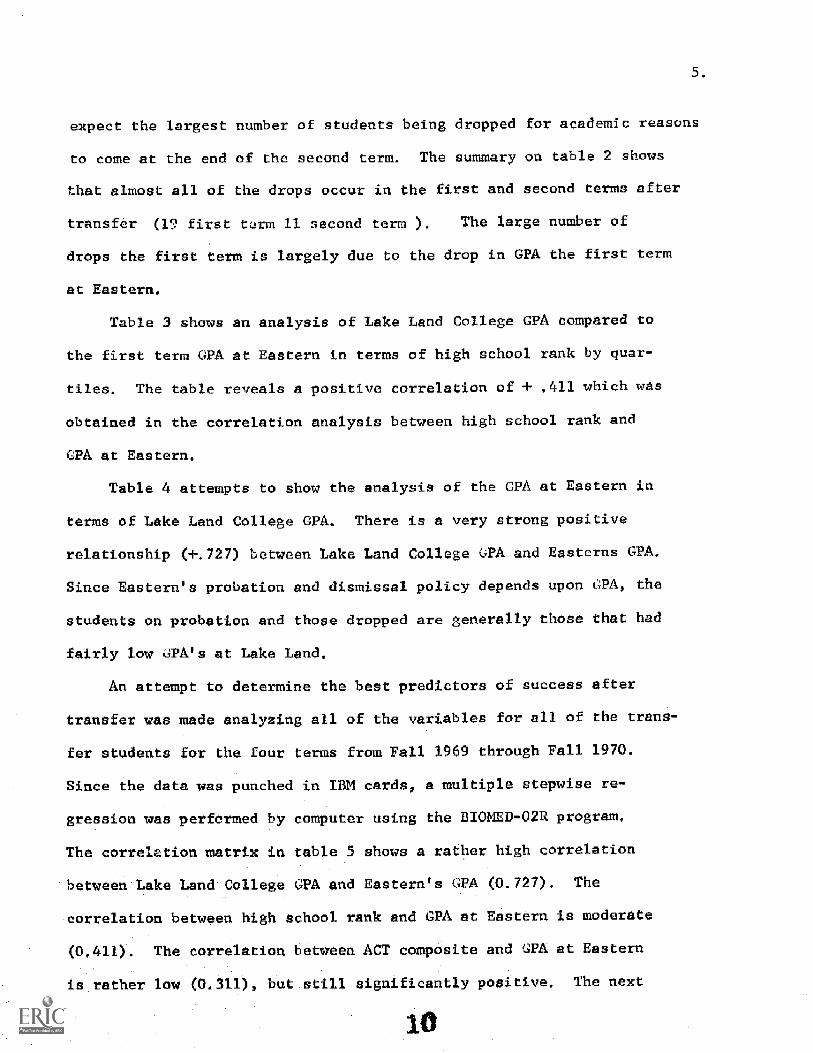
expect the largeat number of students being dropped for academic reasons
to come at the end of the second term. The summary on table 2 shows
that almost all of the drops occur in the first and second terms after
transfer (19 first ttJrm 11 second term ) The large number of
drops the first term is largely due to the drop in GPA the first term
at Eastern.
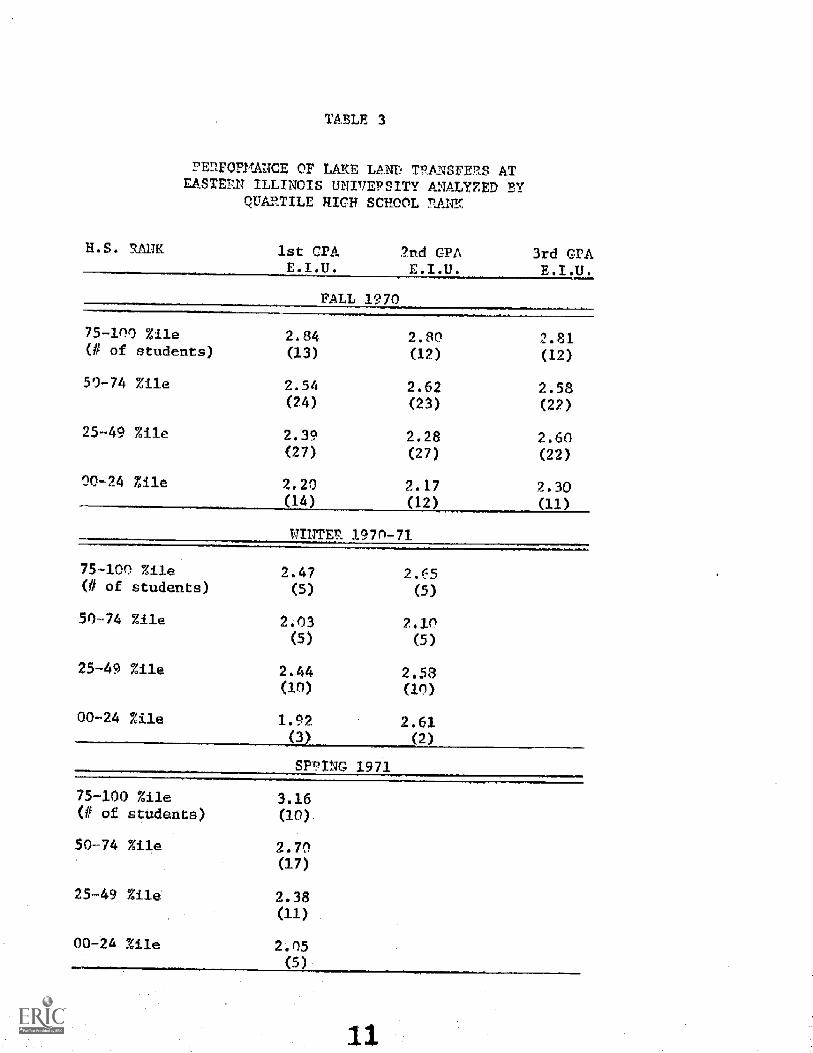
Table 3 shows an analysis of Lake Land College GPA compared to
the first term GPA at Eastern in terms of high school rank by quar-
tiles. The table reveals a positive correlation of + 411 which w s
obtained in the correlation analysis between high school rank and
GPA at Eastern,
Table 4 attempts to show the analysis of the GPA at Eastern in
terms of Lake Land College GPA. There is a very strong positive
relationship (+.727) between Lake Land College GPA and Eastcrns GPA,
Since Eastern's probation and dismissal policy depends upon LTA, the
students on probation and those dropped are generally those that had
fairly low LTA's at Lake Land.
An attempt to determine the best predictors of success after
transfer was made analyzing all of the variables for all of the trans-
fer students for the four terms from Fall 1969 through Fall 1970.
Since the data was punched in IBM cards, a multiple stepwise re-
gression was performed by computer using the BI0MED-02R program.
The correl tion matrix in table 5 shows a rather high correlation
between Lake Land College GPA and Eastern GPA (0.727). The
correlation between high school rank and GPA at Eastern is moder e
(0 411). The correlation between ACT composite and GPA at Eastern
rather low (0.311), out still significantly positive. The next
10
PERFOFMANCE OF LAKE LAND TPANSEES ATEASTERN ILLINOIS UNIVEPSITY ANALYZED BY
QUARTILE HIGH SCHOOL RANK
H.S. RANK 1st crAE.I.U.
2nd GPAE.I.U.
3rd GrAE.I ,
FALL 1970
75-100 %ile 2.84 2.80 2.81(# of students) (13) (12) (12)
50-74 %ile 2.54 2.62 2.58(24) (23) (22)
25-49 %ile 2.3. 2.28 2.60(27) (27) (22)
00-14 Zile 2.20 2.17 2.30(14) (12) (11
11NT 197 -71
75-100 %ile 2.47 2.65(?I of students) (5) (5)
50-74 %ile 2.03 2.10
25-49 %1.1e
00-24 %ile
(5) (5)
2.44 2.53(in) (in)
2.61(2)
1971
75-100 ale 3.16(# of students) (m)
50-74 %i1e
25-49 Zile
00-24 %ile
2..70(17)
2.38(11)
2-.05(5)
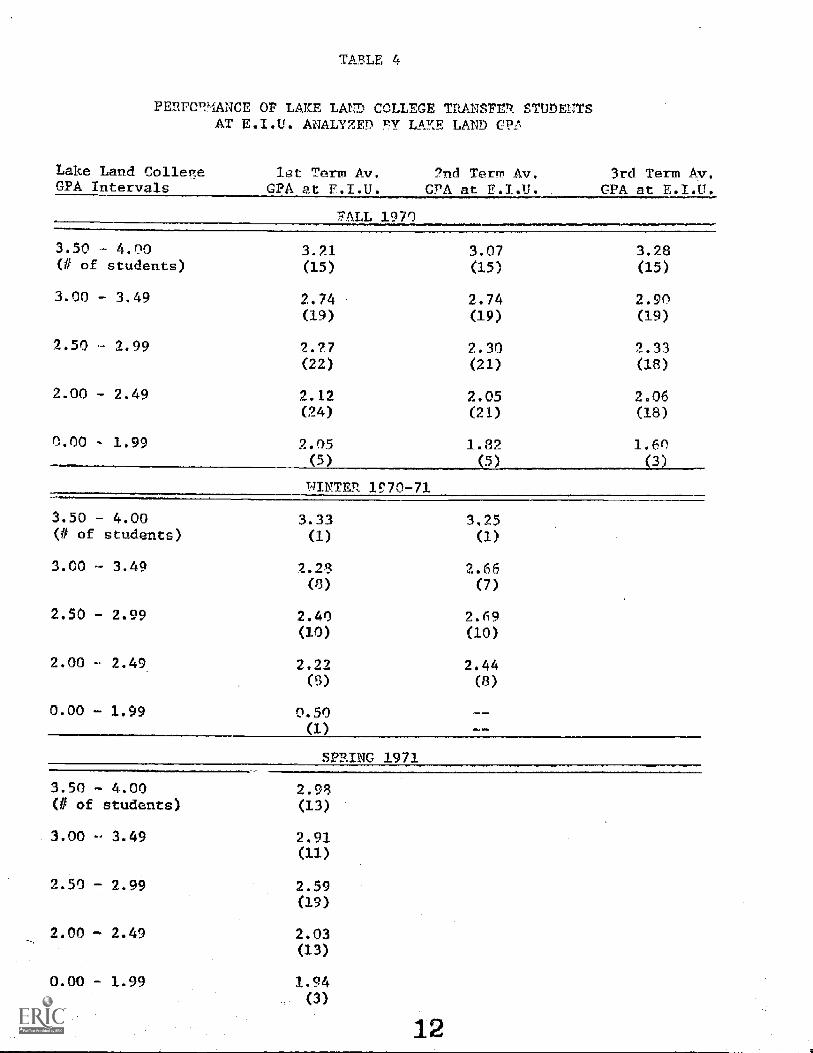
TABLE 4
PEUCEIMANCE OF LAKE LAND COLLEGE MAME'? STUDEKTSAT E.I.U. ANALYZEn PIT LAvE LAND CP!
Lake Land ColleReGPA Intervals
let Term Av.CPA at F.I.U.
?nd Term Av.CrA at F.T.U.
3rd Term Av.GPA at E.I.U.
-PALL 1970
3.50 - 4.00 3.21 3.07 3.28(# of studen (15) (15) (15)
3.00 3.49 2.74 2.74 2.90(19) (19) (19)
2.50 2.99 2.27 2.30 2.33(22) (21) (18)
2.00 - 2.49 2.12 2.05 2.06(24) (21) (18)
0.00 - 1.99 2.05 1.82 1.60
PINTER 1 7n-7
3.50 - 4.00 3.33(1 of students) (1) (1)
3.00 3.49 2.28 2.66( ) (7)
2.50 - 2.99 2.40 2.69(10) (10)
2.00 2.49 2.2? 2.44(9) ('3)
0.00 - 1.99 0.50
SPRING 1971
3.50 - 4.00(# of students)
3.00 3.49
5 2.99
2.00 - 2.49
0.00 - 1.99
2.98(13)
2.91(11)
2.59(19)
2.03(13)
1.94(3)
12
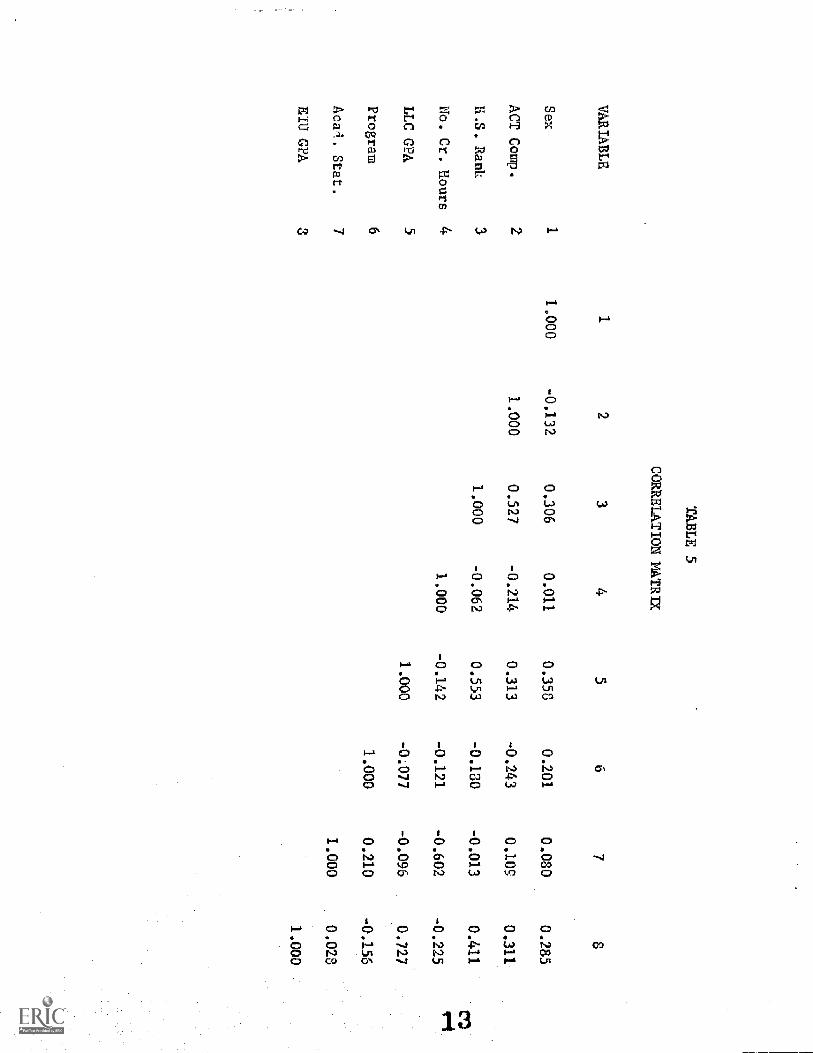
TABLE 5
CORRELATION MATRIX
VARIABLE
12
34
56
7'
SeN
11.000
4.132
0.306
0.011
0.353
0.201
0.080
0.285
ACT Comp.
21.000
0.527
-0.214.
0.313
-0.243
0.109
0.311-
H.S. Ranh
31.000
-0.062.
0.553
-0.130
-0.013
0.411
-
NO. Cr. Hours.
41-000
-0.142.
-0.121
.-0.602,
-0.225
LLC GPA
51.000
-0.077
-0.096
0.727.
Program
61.000
0.210
-0.156
Aczi. Stat.
71.000
.0.028.
.
EIU GPA
31.000
..
6.
highest relationshin (.285) was obtained hy correlating the sex of the
student with astern's CPA. The higher CPA's going to the females.
The relationship between the number of quarter hours of courses com-
pleted at Lake Land College and Eastern's G.P.A. was (-.225) slightly
negative. Although this seem d like a surprising result at first, it was
also substantiated in other studies. The cause of this is that students
originally admitted to Eastern (with high academic abilities) often
come to Lake Land for only one quarter when they get into difficulty
at Eastern. These students often go back to Eastern and do very well.
Also included in the group of transfer students who have only a few
hours at Lake Land are those students who met EIU's admission re-
quirements and enter EIU after only a quarter or two at Lake Land
College.
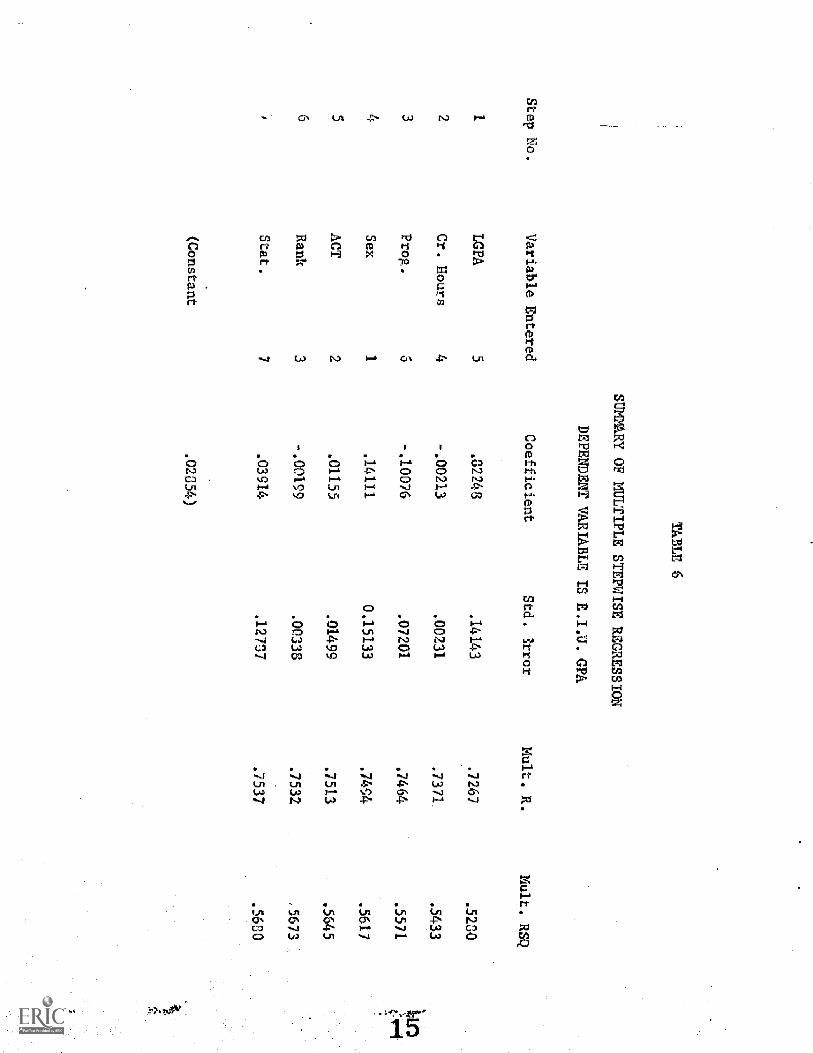
Table 6 is a summary of the multiple stepwise regression. Each
step shows the best predictor of Eastern's GPA, whith was the
dependent variable. Thus the best one predictor chosen was Lake Land
GPA, the best two Lake Land GPA and number of credit hours earned
at Lake Land and so on. The reason that high school rank and ACT
scores were not good predictors is that they inter-correlated vith
Lake Land GPA which was the best predictor. Taking into consideration
the increase in standard error and in multiple R squared it would
ake little sense to use any other variable other than Lake Land
College GPA as a predictor of success after transfer. This makes
the prediction of first term GPA at Eastern dependent on only one
variable, Lake Land College GPA, The predition eouation is:
TkBLE 6
SUMMARY OF MULTIPLE STEPWISE REGRESSION
Step No.
Variable Entered
LGEO.
5
DEPENDENT VARIkBLE IS
Coefficient
.02248
GPA
Std. kror
.14143
Mult. R.
.7267
Mult. RSQ
.5230
2Cr. Hours
4-.00213
.00231
.7371
.5433
3Prop.
3-.10076
.07201
.7464
.5571
4Sex
1.14111
0.15133
.74 g4
.5617
5ACT
2.01155
.01499
.7513
.5645
6Rank
3-.00199
.00338
.7532
,5673
Stat.
7.03914
.12737
.7537
.5600
(Constant
.02354)
7
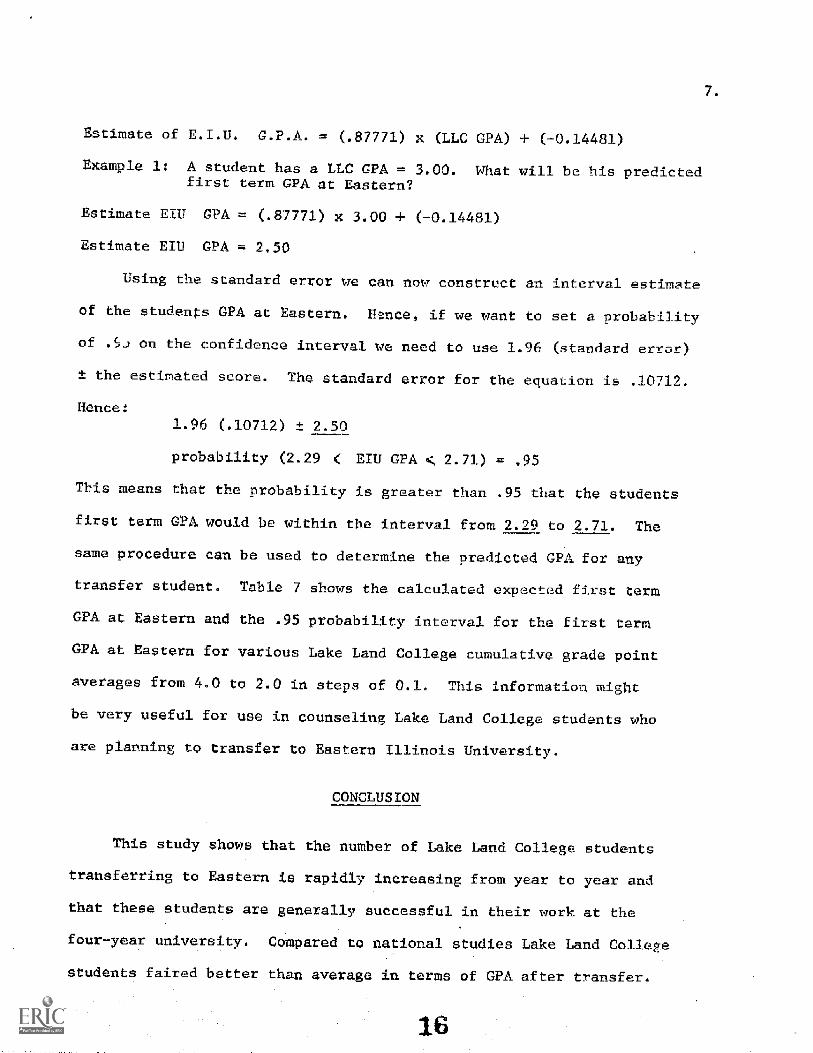
Estimate of E.I.U. G.P.A. = (.87771) x (LLC GPA) + (-0.14481)
Example 1: A student has a LLC GPA = 3.00. What will be his predictedfirst term GPA at Eastern?
Estimate EIU GPA = (.87771) x 3.00 + (-0.14481)
Estimate EIU GPA = 2.50
Using the standard error we can now cons ruc an interval estimate
of the student- GPA at Eastern. Hence, if we want to set a probability
of on the confidence interval we need to use 1.96 (standard error)
± the estimat d score. The standard error for the equation is .10712.
Hence:
1.96 (.10712) ± 2.50
probability (2.29 < EIU GPA 2.71) = .95
This means that the probability is greater than .95 that the students
first term GPA would be within the interval from 2.29 to 2.71 The
same procedure can be used to determine the predicted GPA for any
transfer student. Table 7 sho s the calculated expected first term
GPA at Eastern and the .95 probability interval for the first term
GPA at Eastern for various Lake Land College cumulative grade point
averages from 4.0 to 2.0 in steps of 0.1. This information might
be very useful for use in counseling Lake Land Coll ge students who
are planning to transfer to Eastern IllInois University.
CONCLUSION
This study shows that the number of Lake Land College students
transferring to Eastern is rapidly increasing from year to year and
that these students are generally successful in their work at the
four-year university. Compared to national studies Lake Land College
students faired better than average in terms of GPA after transfer.
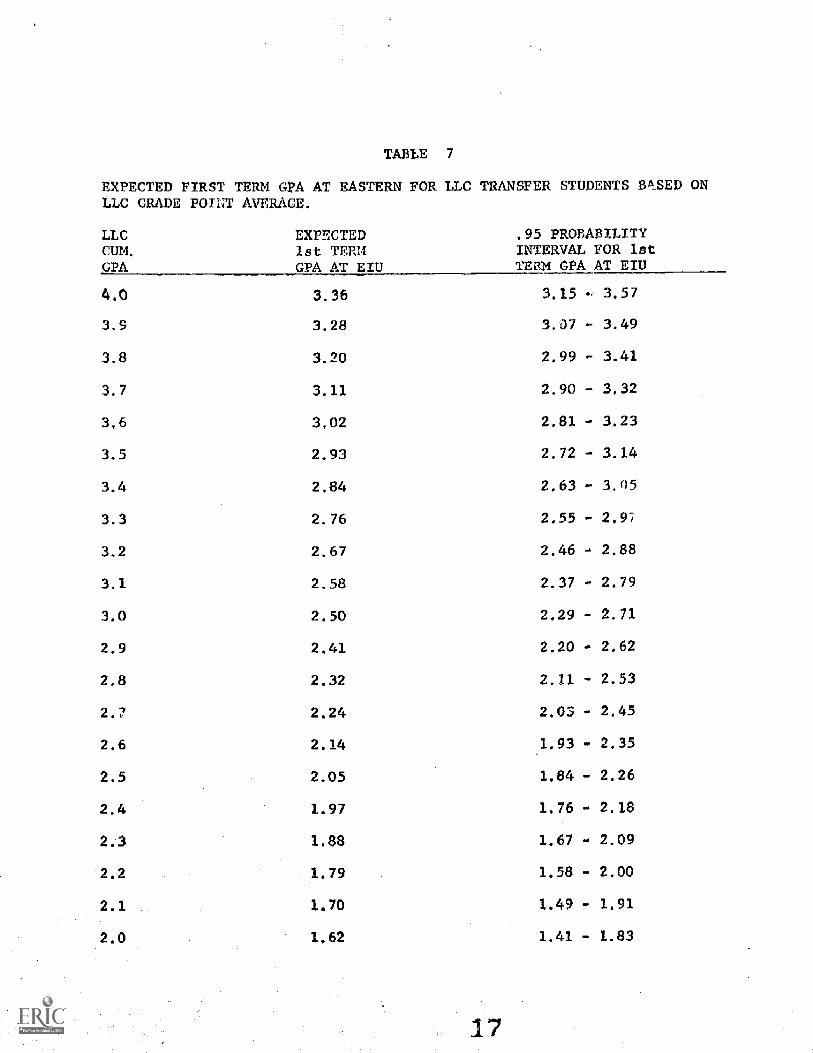
TABLE
EXPECTED FIRST TERM GPA AT EASTERN FOR LLC TRANSFER STUDENTS BASED ONLLC GRADE POINT AVERAGE.
LLCCUM.GPA
EXPECTED1st TERMGPA AT EIU
.95 PROBABILITYINTERVAL FOR 1stTEMA GPA AT EIU
4.0 36 3.15 - 3.57
3.9 3.28 3.07 - 3 49
3.8 3.20 2 99 - 3.41
3.7 3.11 2.90 - 3,32
3.6 3.02 2,81 - 3.23
3.5 2.93 2.72 - 3.14
3.4 2.84 2,63 3.05
3.3 2.76 2.55 - 2.97
3.2 2.67 2.46 - 2.88
3, 1 2.58 2.37 - 2.79
3. 0 2.50 2.29 - 2.71
2.9 2.41 2.20 - 2.62
2.8 2.32 2.11 - 2.53
2.7 2.24 2.03 - 2.45
2.6 2.14 1.93 - 2.35
2.5 2.05 1.84 - 2.26
2.4 1.97 1.76 - 2.18
2,3 1.88 1.67 - 2.09
2 2 1.79 1.58 - 2.00
2.1 1.70 1.49 - 1.91
2.0 1.62 1.41 - 1.83
8.
They did experience a short) drop in GPA the first term after transfer
which is similar to that found nationally. The drop in CPA was .30
the first term. The CIA of the transfer students continued to improve
after the first two terms reaching the same level as before transfer
by che fifth term.
An analysis of the relationship between the varIous characte istics
and grade point average at Eastern showed that Lake Land College grade
point average had the highest correlation (.727) followed by high school
rank (.411) and ACT composite score (.311). An attempt to find a
prediction equation which would make use of several variables revealed
that grade point average at thejunior college was the only signifi-
cant predictive variable. ACT scores and high school rank did not
help the prediction significantly because both of these variabl s
intercorrelated with grade point average at the junior college. This
finding which was revealed by a multiple step-wise regression see s to
be very significant in terms of the implications that it has with
res ect to admission policies for junior college transfer students. It
seems that ACT scores and high school rank are significant predictors
of success in a college transfer program at a junior college; however,
after two years the junior college grade point average is the only
significant predi tor of success in the upper-level universities. This
particular point has been over-looked in the traditional studies dealing
with transfer students.
RECOMMENDATIONS
On the basis of this study I would suggest that a state wide
study of college transfer students be made with particular emphasis on
9.
determininE the variables which are the best predictors of success
after transfer. This would lit essitate a multiple step-wise regression
analysis. It seems that such a study is urgently needed to make sure
that the admission policies at the universities for transfer students
ars based on fact rather than on assumptions.
BIBLIOGRAPHY
Cross, Patricia K. The Junior College Student: A Research De-_scrio.tion. Princeton: Educational Testing Service, 1968.
2. Illinois Junior College Board. Performance of Transfer Stue,lAtsWithin Illinois Institutions of Higher Education: Pre-
liminary BaRort No. 1. Springfield: The Department, Feb-ruary 24, 1969.
3. Illinois Junior College Board. Performance of Transfer StudentsWithin Illinois Institutions of Higher Education: Pre-
liminary Raaert No. 2. Springfield: The Department, April 1,
1969.
4. Knoell, Dorothy M. and Medsker, Leland L., From Junior to SeniorCollege: A National Study of the Transfer Student. AmericanCouncil on Education, Washington, D. C., 1965.
5. O'Banion, Terry. "The Junior College Transfer Student," Unpublishedpaper, University of Illinois, 1969.
6. Swank* Richard M. "An Analysis of the Academic Achievement of
Transfer Students at Illinois State University," Unpublisheddoctoral dissertation, Purdue University, 1969.
7. Venerable, Wilbur R. and Osborn, Daniel S. A Comparison of A-chievement Eetween Native and Transfer Students at Illiziois
State Univereiy: 1966-1968 Unpublished Report I. S. U.
Office of Admissions and Records, 1969.
8. Wermers, Don. "Student Perceptions of Causes o, Transfer Shock,"
Unpublished paper, University of Illinois, 1969.
9. Wrenn, C. j. "The Development of Student Personnel Work in theUnited States and Some Guidelines for the Future," in J. W.
Minter, ed., The Individual and the System: PersonalizingNiAner Education. Bould-r, Colo.: Western InterstateCommission for Higher Education, 1967.
20

APPENDIX
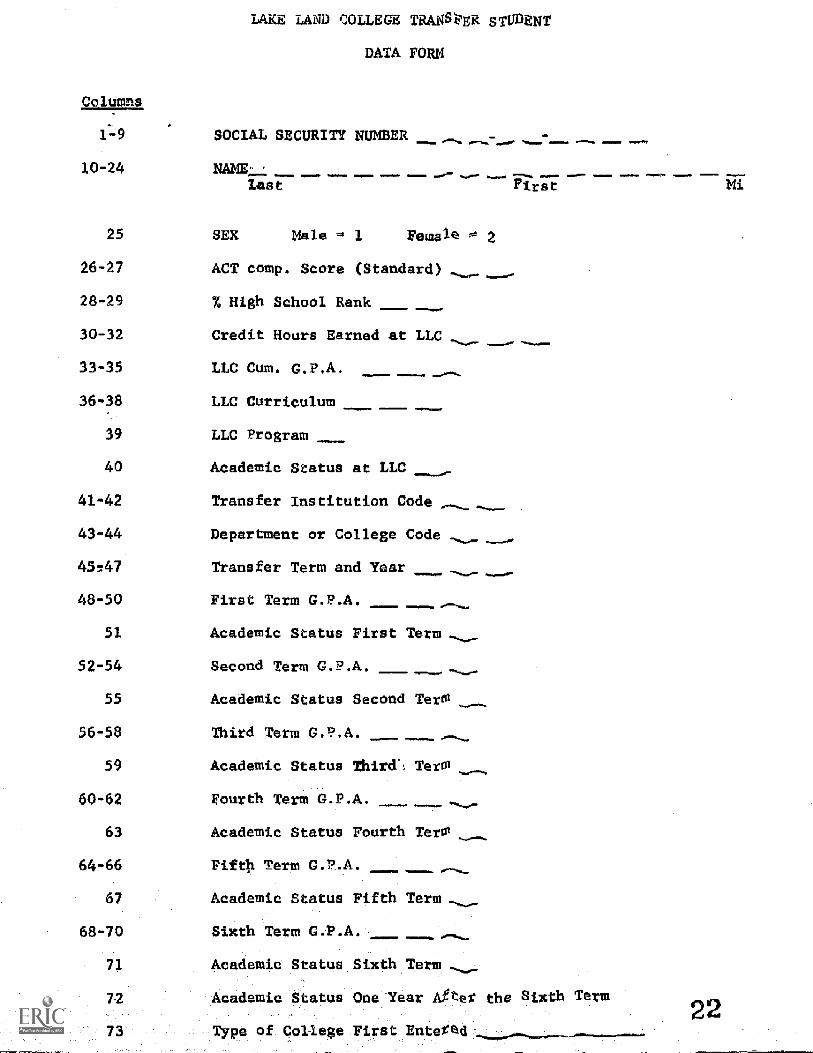
LAKE LAND COLLEGE TRAN _R sTVDENT
DATA FORM
Columns
1-9 SOCIAL SECURITY NUMBER
10-24 NANE MiF
Last
25 SEX Male 1 Female
26-27
28-29
30-32
33-35 LLC Cum. C.P.A.
36-38 LLC Curriculum
39 LLC Program
40 Academic Status at LLC
41-42 Transfer Institution Code
43-44
4547
48-50 First Term C.P.A.
51 Academic Status First Term
52-54 Second -erm G.P.A.
55 Academic Status Second Term
56-58 Third Term C.P.A.
59
60-62
63
64-66 Fifth Term C.P.A.
ACT comp. Score (Standard)
% High School Rank
Credit Hours Earned at LLC _
Department or College Code
Transfer Term and Year
Academic Status Third.1 TerM
Fourth Term C.P.A.
Academie Status Fourth TerM
67
68-70
71
Academie Status Fifth Term
Sixth Term G.P.A.
Academie Status Sixth Term
2
72 Academic Status One Year Afte the Sixth Term
Type of College First Entered
Copyright © 2022 FDOKUMEN