NPLM report.cdr - Lagos Business School Sustainability Centre
Upload
khangminh22Category
view
0download
0
What we know about Lagos State Finances

About BudgIT
BudgIT is a civic organisation driven to make the Nigerian budget and public data more understandable and accessible across every literacy span. BudgIT’s innovation within the public circle comes with a creative use of government data by either presenting these in simple tweets, interactive formats or infographic displays. Our primary goal is to use creative technology to intersect civic engagement and institutional reform.
Lead Partner : Oluseun Onigbinde
Research Team: Atiku Samuel, Ayomide Faleye, Olaniyi Olaleye, Thaddeus Jolayemi, Oyebola Agunloye, Ama Bassey Henry Omokhaye
Creative Development: Segun Adeniyi and Folahan Johnson
Contact: [email protected] +234-803-727-6668, +234-908-333-1633
Address: 55, Moleye Street, Sabo, Yaba, Lagos, Nigeria.
© 2018
Disclaimer: This document has been produced by BudgIT to provide information on budgets and public data issues. BudgIT hereby certifies that all the views expressed in this document accurately reflect our analytical views that we believe are reliable and fact- based.
Whilst reasonable care has been taken in preparing this document, no responsibility or liability is accepted for errors or for any views expressed herein by BudgIT for actions taken as a result of information provided in this Report.

Overview

Lagos State was created by virtue of the State (Creation and Transitional Provisions) Decree No. 14 of 1967 on 27 May 1967, which restructured Nigeria into 12 States. Prior to t h i s , Lagos Mun i c i pa l i t y had been administered by the federal government (FG), through the Federal Ministry of Lagos Affairs as the regional authority, while the Lagos City Council governed the City of Lagos.
The metropolitan areas (previously referred to as Colony Provinces) of Ikeja, Agege, Mushin, Ikorodu, Epe and Badagry were administered by the then Western Region. The State became an administrative entity on 11 April 1968, with Lagos Island serving the dual role of State and Federal Capital.
However, in 1976, Lagos Island ceased to be the capital; Ikeja assumed that role. The seat of the federal government was subsequently relocated to Abuja on 12 December 1991, and Lagos also ceased to be Nigeria’s political capital.
Lagos nevertheless remains Nigeria’s economic, manufacturing, financial and commercial hub, also ranking among Africa’s top cities along the same yardsticks.
POPULATION
According to the 2006 census conducted by the National Population Commission (NPC), Lagos has a population of over nine million, of a national estimate of 150 million.
The population growth has a rate of about
600,000 per annum, with a density of approximately 4,193 persons per sq. km. In the urban areas of the Lagos metropolis, the average population density is over 20,000 people per sq. km.
Current demographic trend analysis reveals that Lagos’ population growth rate of 8% has resulted in its harbouring 36.8% (an estimated 49.8 million) of Nigeria’s 150 million urban population (World Bank, 1996).
The implication is that whereas Nigeria’s population growth is approximately 4-5% and stands globally at 2%, Lagos’ population is growing ten times faster than that of New York and Los Angeles (USA), with grave
1implications for urban sustainability .
History Land Mass 2797.72 Sq Km
Water Area 779.56 Sq Km
2013
2014
2015
11,772,524
11,401,767
2012 11,042,686
2016 12,550,598
12,155,337
Source: Nigerian Bureau of Statistics (NBS), Central Bank of Nigeria (CBN)
Estimated Population Figures
4

Motor Vehicles Registration Statistics
2010 105,147
2015 25,958
Motor Cycles
2010 936,604
2015
Motor Vehicles
833,957
Number of Boats by Ownership & Passengers (2015)
Boats
136Passengers
1,403,100
Number of Ferries by Ownership & Passengers (2015)
Ferries
167
Passengers
25,676,923
Source: Lagos State Government
5

Lagos is a State every other in Nigeria may envy, considering the size of its tax revenue relative to its centrally-collected revenue. Compared to many of its peers, Lagos is highly industrialised, being the nation’s economic capital and home to a booming port system. The State government relies on statutory allocations to undertake projects and implement programmes, as highlighted in its budget. Statutory allocations make up about 21.67% of Total revenue for the state government, while the balance is generated internally.
The economic structure of Lagos state gives it a considerable advantage, in terms of internally-generated revenue (IGR) uptake. In 2016, Lagos accounted for approximately 37% of Total IGR collected by all States, reinforcing the optimal financial position Lagos enjoys.
It is important to note at this point that more details on Lagos’ financial statements are notoriously kept opaque, with scant useful information.
The State does not publish its detailed budget, budget implementation reports, audited statements and other critical documents needed for holistic, independent assessment.
The low level of transparency in Lagos’ finances is reflected in the quality of service and abysmal range of infrastructure in the state; the paradox of Lagos is its reality as a place where rubbish dumps grow on streets, in tandem with six-figure skyscrapers. Despite its huge revenue uptake,
1https://www.fmdqotc.com/wp-content/uploads/2017/07/LASG-Series-2-Bond-Prospectus.pdf2https://www.cbn.gov.ng/Out/2017/SD/eCopy%20of%202016%20Statistical%20Bulletin_Real%20Sector%20 Statistics_Final.xlsx (Tab C5.2)3Telecoms Data: Active Voice and Internet per State, Porting and Tariff Information (Q4 2017) - ppg 59http://www.nigerianstat.gov.ng/download/729 4Telecoms Data: Active Voice and Internet per State, Porting and Tariff Information (Q4 2017) - ppg 60
Lagos Telecommunications Statistics as at Q4 2017
Active Internet Lines
13,631,562
13.81%of total active internet
lines in Nigeria
Active Voice
19,417,181
13.39%of total active voice
lines in Nigeria
Source: NCC, NBS
Finances
6
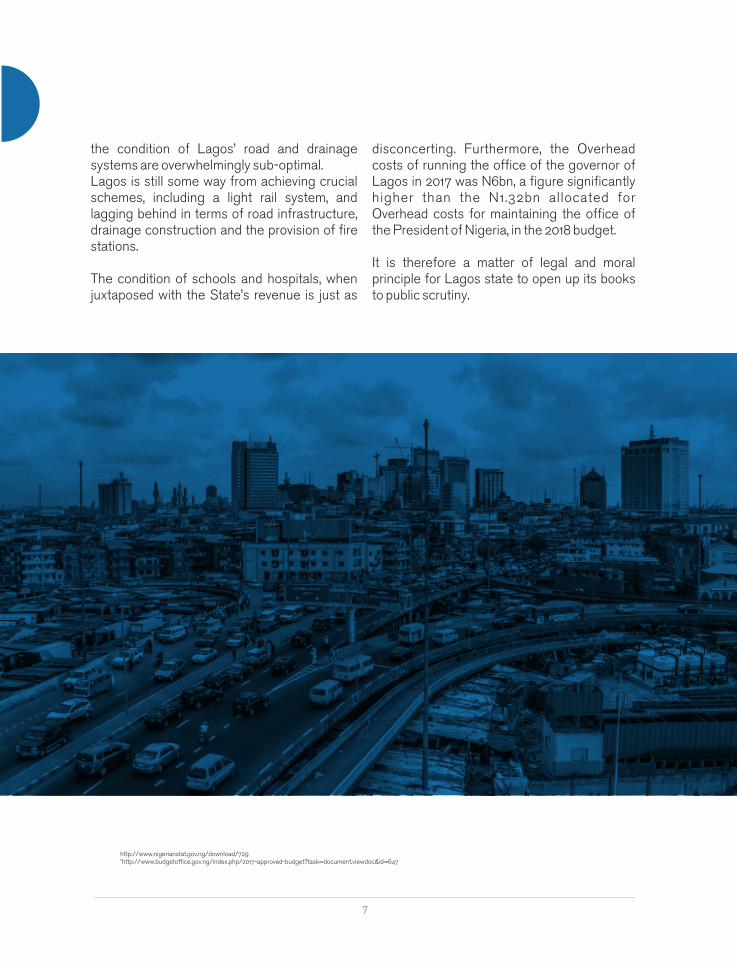
the condition of Lagos’ road and drainage systems are overwhelmingly sub-optimal. Lagos is still some way from achieving crucial schemes, including a light rail system, and lagging behind in terms of road infrastructure, drainage construction and the provision of fire stations.
The condition of schools and hospitals, when juxtaposed with the State’s revenue is just as
http://www.nigerianstat.gov.ng/download/7295http://www.budgetoffice.gov.ng/index.php/2017-approved-budget?task=document.viewdoc&id=647
disconcerting. Furthermore, the Overhead costs of running the office of the governor of Lagos in 2017 was N6bn, a figure significantly higher than the N1.32bn allocated for Overhead costs for maintaining the office of the President of Nigeria, in the 2018 budget.
It is therefore a matter of legal and moral principle for Lagos state to open up its books to public scrutiny.
7

Lagos 2018 Budget Fiscal Framework

Lagos’ 2018 spending plans suggest she may be borrowing heavily through the year. The southwestern Nigerian State is planning to spend approximately N1.046tn, with 66.8% (or N699.082bn) going into Capital items, while the balance will be spent on Recurrent items, including the servicing of public debts, payment of salaries and emoluments of workers and other associated Overhead costs At N1.046tn, Lagos’ expansionist spending plan for fiscal year 2018 is up 28.65%, from 2017 levels of N813bn. Capital expenditure projections in 2018 stand at N699.082bn, a rise from N436.26bn in 2017.
What and how the State will spend the N1.046tn on is locked away from public debate and assessment. Lagos is hoping for a Revenue uptake of N897bn, which is significantly higher than 2017 projections of N642bn. Disaggregated information on the State’s revenue projections for 2018 has again not being made public.
In 2017, Lagos’ budget was anchored on Internally-generated Revenue projections of N450.87bn, Federal transfers of N166.54bn and Capital receipts of N25.44bn.
With revenue projected at N897bn and the 2018 spending plan built around N1.046tn, the deficit for Lagos is pegged at N149bn, which will most likely be closed by borrowing, and sales of government properties. Preliminary information released to the public on the 2018 budget states that the projects therein include the construction of the Agege Pen Cinema flyover; construction of alternative routes
6 https://www.premiumtimesng.com/regional/ssouth-west/257126-lagos-assembly-passes-n1-046-trillion-budget-2018.html
through Oke-Ira in Eti-Osa to Epe-Lekki Expressway; the construction of an 8km Regional Road to serve as an alternative route to connect Victoria Garden City (VGC) with Freedom Road in Lekki Phase 1; the completion of the ongoing reconstruction of Oshodi International Airport Road into a 10-lane road and the construction of a Bus Rapid Transit (BRT) lane from Oshodi to Abule-Egba.
According to a sectoral breakdown of the budget, General Public Services are earmarked to gulp N171.623bn, representing 16.41%; Public Order and Safety comes to N46.612bn (4.46%); Economic Affairs at N473 .87bn (45 .3%) ; Env i ronmenta l Protection at N54.582bn (5.22%), while Housing and Community Amenities got N59.904bn (5.73%).
The Health sector got N92.676bn (8.86%); Recreation, Culture and Religion got N12.511bn (1.2%) Education was pegged at N126.302bn (12.07%), while Social Protection got N8.042bn (0.77%).
Under the budget, there are provisions for the completion of five new Art Theatres; establishment of a Heritage Centre at the former Federal Presidential State House recent l y handed ove r to the S ta te Government; a world class museum between the former Presidential Lodge and the State House, Marina; construction of four new stadia in Igbogbo, Epe, Badagry and Ajeromi Ifelodun (Ajegunle) and completion of the ongoing Epe and Badagry Marina projects. On
Fiscal Framework
9

N149bn
Deficit
N897bnRevenue
N347.04bn
Recurrent Expenditure
N699.08bn
Capital Expenditure
Budget Size
N1.046tn
2018 Lagos State Budget
Source: Lagos State Government
Housing, there are provisions that include the completion of projects, particularly those at Gbagada, Igbogbo, Iponri, Igando, Omole Phase I, Sangotedo and Ajara-Badagry under the Rent-to-Own policy.
However, the breakdown of the budget, and amounts voted for each project, along with total amounts spent in periods past remain unclear and unaccessible by the wider public.
10

Revenue

Lagos’ Revenue projection for the 2018 financial year is set at N897bn, a 39.72% increase over 2017 estimates.
The State’s projected Revenue for 2016 was N542.9bn, while Actual Revenue for Lagos in 2015, 2014, 2013 and 2012 was N384.4bn, N408.1bn, N316.2bn and N310.4bn respectively.
Cumulatively, Lagos’ Revenue between 1999 and 2006 was N419.4bn; the State collected a total of N2.44tn between 2007 and 2015.
Currently, data on actual collections in 2016 and 2017 remains unavailable.
Revenue
Composition of Lagos State Revenue based on 2015 Actual Receipt
A History of Lagos State Revenue
Source: Lagos State Government, OAGF
N175.43bn
45.64%
19.27%
N74.08bn
21.57%
N82.9bn
2.48%N9.52bn
2.39%N9.197bn
8.66%
N33.27bn
PAYE
Direct Assessment Road Tax
Federal Transfers
Other Revenue (IGR)
Other Revenue
12
2000
2001
2002
1999
1998
2005
2006
2007
2004
2003
2008
2011
2012
2013
2010
2009
2016
2017
2018
2015
2014
Source: Lagos State Government, BudgIT Research*Budget Figures
N39.8bn
N27.1bn
N22.2bn
N13.5bn
N93.7bn
N79.7bn
N62.8bn
N52.3bn
N118.8bn
N41.8bn
N179.3bn
N310.4bn
N281.1bn
N221.7bn
N220.9bn
N316.2bn
N408.1bn
N384.4bn
N542.9bn*
N642bn*
N897bn*
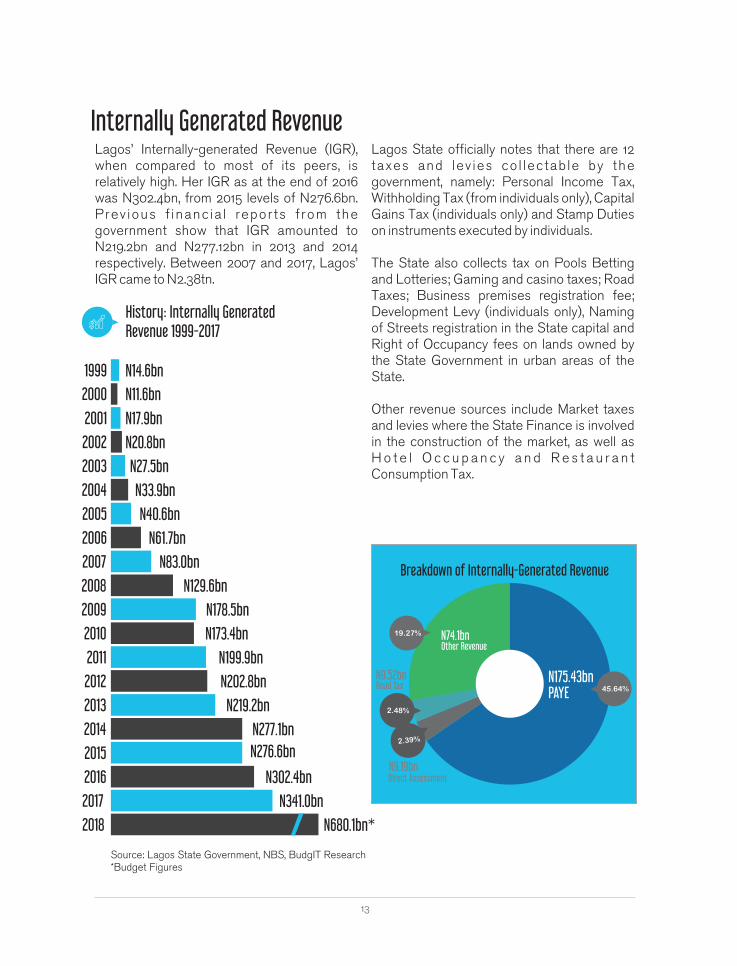
Lagos’ Internally-generated Revenue (IGR), when compared to most of its peers, is relatively high. Her IGR as at the end of 2016 was N302.4bn, from 2015 levels of N276.6bn. Prev ious f inanc ia l repor ts f rom the government show that IGR amounted to N219.2bn and N277.12bn in 2013 and 2014 respectively. Between 2007 and 2017, Lagos’ IGR came to N2.38tn.
Lagos State officially notes that there are 12 taxes and lev ies co l lectab le by the government, namely: Personal Income Tax, Withholding Tax (from individuals only), Capital Gains Tax (individuals only) and Stamp Duties on instruments executed by individuals.
The State also collects tax on Pools Betting and Lotteries; Gaming and casino taxes; Road Taxes; Business premises registration fee; Development Levy (individuals only), Naming of Streets registration in the State capital and Right of Occupancy fees on lands owned by the State Government in urban areas of the State.
Other revenue sources include Market taxes and levies where the State Finance is involved in the construction of the market, as well as H o t e l O c c u p a n c y a n d R e s t a u r a n t Consumption Tax.
History: Internally Generated Revenue 1999-2017
Breakdown of Internally-Generated Revenue
19.27%
N175.43bn45.64%PAYE
2.39%
2.48%
N74.1bnOther Revenue
N9.52bnRoad Tax
N9.19bnDirect Assessment
Internally Generated Revenue
13
2001
2002
2003
N20.8bn
N17.9bn
2000 N11.6bn
1999 N14.6bn
2006
2007
2008
N83.0bn
N61.7bn
2005 N40.6bn
2004 N33.9bn
2009
N129.6bn
N27.5bn
2012
2013
2014
2011
2010
2017
2018
2016
2015
N219.2bn
N202.8bn
N199.9bn
N173.4bn
N277.1bn
N276.6bn
N302.4bn
N178.5bn
N341.0bn
N680.1bn*
Source: Lagos State Government, NBS, BudgIT Research*Budget Figures

PAYE
Pay As You Earn (PAYE) is a form of personal income tax that refers to tax deducted directly from the wages and salaries of employees operating in the formal sector.
Lagos’ total receipt under personal income tax (on incomes of individuals), which was N 1 9 0 . 6 6 b n i n 2 0 1 6 , a c c o u n t e d f o r approximately 63.3% of Total IGR that year. In 2010, 2011 and 2012, receipts under personal income tax (PAYE) was N104 .68bn , N120.25bn, N172.44bn respectively. Figures for 2018 remain outstanding and unclear.
On average, 64.8% of IGR for Lagos state came from PAYE between 2010 and 2016.
History: PAYE
2012
2013 N/A
N172.44bn
2011 N120.25bn
2010 104.68bn
2015
2016 N190.66bn*
N175.43bn
2014 N153.61bn
Direct Assessment
Direct Assessment may relate to a form of personal income tax used to assess tax for self-employed individuals. With the self-assessed tax scheme, a new taxpayer can assess him/herself, and pay the calculated amount. Direct assessment may also relate to those taxes imposed on businesses, especially (informal) by the State authorities, based on the size of their activities.
Lagos’ total receipt under direct assessment - was pegged at N6.62bn in 2016. In 2010, 2011 and 2012, revenue gotten under direct assessment was N7.51bn and N7.97bn respectively.
Personal Income Tax
History: Direct Assessment collected
2014
2013
N9.39bn
2015 N9.197bn
2016 N6.616bn*
2011
2010 N7.51bn
N7.97bn
2012 N/A
N1.89bn
Source: NBS*Jan-June, 2016
Source: NBS*Jan-June, 2016
14

Road Tax
Road taxes are daily levies paid by commercial transporters operating within Nigeria’s states.
In Lagos, total receipt under Road Tax was approximately N9.54bn in 2016, accounting for about 3.16% of total Internally-generated Revenue.
In 2010, 2011, 2012 and 2015 receipts from Road Tax was N7.51bn, N7.97bn, N4.36bn and N9.516bn respectively.
Preliminary reports from the Nigeria Bureau of Statistics show that revenue from Road tax in Lagos was N9.54bn, between January and June 2016.
History: Road Tax Collection
2012
2013 N/A
N4.36bn
2011 N7.97bn
2010 N7.51bn
2015
2016 N9.54bn*
N9.52bn
2014 N4.58bn
Other Taxes
These include various taxe such as levies on market traders, land registration and other land-related fees, as well as development levies on individuals, pool betting/lottery/gaming fees and stamp duties on individuals.
History: Other Taxes
2012
2013 N/A
N40.51bn
2011 N74.54bn
2010 N37.78bn
2015
2016 N21.56bn*
N74.08bn
2014 N/A
*Jan-June, 2016
*Jan-June, 2016
15
Source: Lagos State Government, BudgIT Research
Source: Lagos State Government, BudgIT Research

2016
2017 N89.69bn
N76.78bn
2015 N82.91bn
2014 N105.57bn
Source: Office of the Attorney General of the Federation (OAGF); BudgIT Research
Federal Transfers Under FAAC
The States received about N89.69bn in 2017 from the federation account, facilitated via the Federal Account Allocation Committee (FAAC). In 2014, 2015 and 2016, the total amount received from FAAC came in at N105.57bn, N82.91bn, N76.77bn respectively.
The composition of federal transfers includes revenue from company income tax, tariffs on import, Value Added Tax and revenue for the oil sector.
History: Net FAAC Allocations
2009
2010 N87.89bn
N75.0bn
2008 71.35bn
2007 N48.62bn
2012
2013 N117.72bn
N118.59bn
2011 N111.66bn
16
2018 N177bn*
*Budget Projection
\

Value Added Tax
Value Added Tax (VAT) was introduced in France in 1968; since then, over 150 countries worldwide have adopted some form of VAT.
On average, countries from the Organisation for Economic Co-operation and Development (OECD) cohort collect about 32% of their total revenue from VAT and 27% from personal income taxes. This relatively new tax has become a crucial revenue source among OECD-member countries.
Nigeria is projecting a VAT uptake of N207.86bn in fiscal year 2018; but the federal government's share of VAT revenue was N106.74bn and N104.66bn in 2014 and 2015 respectively. Clearly, expectations for revenue collection numbers appear to be way beyond the actual reality, in terms of what the government receives. On one hand, revenue from VAT seems to be growing, despite Nigeria recently crawling out of economic recession. However, the perception in the wider economy is that Household Consumption expenditure is declining, with salaries paid out to employees also plumbing lower depths, while the economy's capacity to create jobs is strained,
History: Value Added Tax
2009
2010 N47.29bn
N39.96bn
2008 N32.17bn
2007 N22.64bn
2012
2013 N68.84bn
N61.39bn
2011 N51.02bn
2016
2017 N80.23bn
N75.44bn
2015 N65.82bn
2014 N72.62bn
Breakdowndue to structural and policy challenges.
With regards to VAT figures, Lagos State received approximately N80.23bn in 2017.
For 2015 and 2016, Lagos received a total of N65.8bn and N75.43bn respectively.
Source: Office of the Attorney General of the Federation (OAGF), Lagos State Government, BudgIT Research
2018 N103.2bn*
*Budget Projection

Statutory Revenue
Statutory revenue allocation to Lagos state in 2017 was approximately N43.19bn; a rise of 27.5%, from N33.87bn in 2016.
In 2015, 2014 and 2013, Statutory revenue was N45 .03bn , N59 .85bn and N70 .94bn respectively.
Statutory revenue for any State is the money it is entitled to from the Federation Account. Oil revenue, Company income tax , Customs-related revenue (excluding VAT) are paid directly into the Federation Account.
After a deduction of 13% of the revenue accruing to the Federation Account directly from any natural resources, what is left
History of Statutory Revenue
2009
2010 N48.21bn
N37.64bn
2008 N47.99bn
2007 N35.76bn
2012
2013 N70.94bn
N66.99bn
2011 N69.86bn
2016
2017 N43.19bn
N33.87bn
2015 N45.03bn
2014 N59.85bn
Source: OAGF, Lagos State Government
becomes Statutory revenue, which is then shared among the federal, state and local governments, using a composite sharing formular.
Lagos state is entitled to some share of oil revenue, company income tax, revenue from tariff on incomes and other categories of revenue that are federally-collected and allocated, at the monthly FAAC meetings.
18
2018 N57.5bn*
*Budget Projection

Why is Lagos' FAAC Reducing?
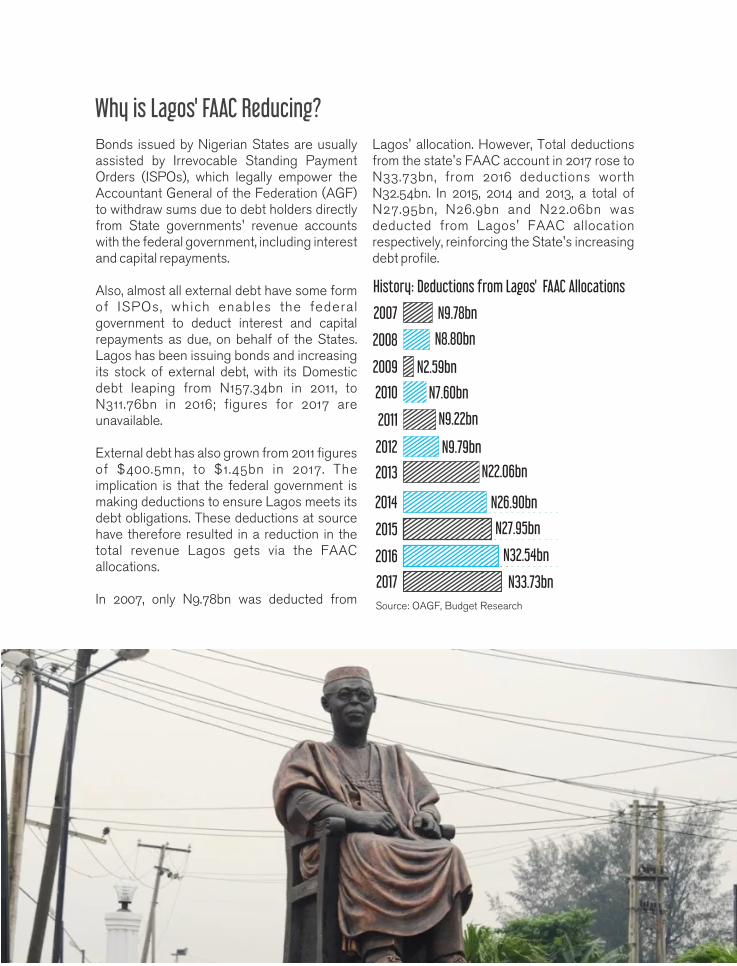
History: Deductions from Lagos' FAAC Allocations
2009
2010 N7.60bn
N2.59bn
2008 N8.80bn
2007 N9.78bn
2012
2013 N22.06bn
N9.79bn
2011 N9.22bn
2016
2017 N33.73bn
N32.54bn
2015 N27.95bn
2014 N26.90bn
Source: OAGF, Budget Research
Bonds issued by Nigerian States are usually assisted by Irrevocable Standing Payment Orders (ISPOs), which legally empower the Accountant General of the Federation (AGF) to withdraw sums due to debt holders directly from State governments' revenue accounts with the federal government, including interest and capital repayments.
Also, almost all external debt have some form of ISPOs, which enables the federal government to deduct interest and capital repayments as due, on behalf of the States. Lagos has been issuing bonds and increasing its stock of external debt, with its Domestic debt leaping from N157.34bn in 2011, to N311.76bn in 2016; figures for 2017 are unavailable.
External debt has also grown from 2011 figures of $400.5mn, to $1.45bn in 2017. The implication is that the federal government is making deductions to ensure Lagos meets its debt obligations. These deductions at source have therefore resulted in a reduction in the total revenue Lagos gets via the FAAC allocations.
In 2007, only N9.78bn was deducted from
Lagos' allocation. However, Total deductions from the state's FAAC account in 2017 rose to N33.73bn, from 2016 deductions worth N32.54bn. In 2015, 2014 and 2013, a total of N27.95bn, N26.9bn and N22.06bn was deducted from Lagos' FAAC allocation respectively, reinforcing the State's increasing debt profile.
Why is Lagos' FAAC Reducing?

Debt

Domestic Debt Profile
Lagos has the highest domestic debt profile
among all 36 States in Nigeria; Total debt was
N311bn, as at year-end 2016. Debt in 2015, 2014
and 2013 amounted to N218.54bn, N268.07bn,
N278.87bn respectively.
External Debt
Between 2012 and 2014, Lagos' external debt
rose by 89.85%, from $611m, to $1.16bn. The
State's total external debt in 2015 and 2016 was
at $1.2bn and $1.17bn respectively. Lagos State
has the highest foreign debt profile among its
equals, followed by Kaduna, Edo and Cross River
States.
DEBTDebt
History: Domestic Debt Profile
2013
2014 N268.07bn
N278.87bn
2012 N230.43bn
2011 N157.54bn
2016 N311.76bn
2015 N218.54bn
Source: Debt Management Office (DMO),
CBN, Budget Research
History: External Debt Profile
2012
2013 $938.14m
$611.25m
2011 $491.85m
2015
2016 $1.38bn
$1.21bn
2014 $1.17bn
2017 $1.47bn Source: DMO, CBN, Budget Research
2017 N363.29bn
Expenditure

Personnel Costs
Lagos spent approximately N91bn in 2015, or
22.89% of Total expenditure, on the salaries
and remuneration of its civil workers; up from
N78.8bn in 2014 and N75.6bn in 2013.
Between 2005 and 2015, these personnel
costs for Lagos grew by 386.7%.
Actual spending on personnel costs for 2016
and 2017 are as yet unavailable.
History: Actual Personnel Costs
Source: Lagos State Government; BudgIT Research
24
2000
2001
2002
N13.9bn
N12.9bn
1999 N9.4bn
1998 N8.5bn
2005
2006
2007
N21.2bn
N18.7bn
2004 N16.5bn
2003 N14.5bn
2008
N30.5bn
N15bn
2009 N42.8bn
N40.5bn
2011
2012
2013
2010
2014
N62.4bn
N66.4bn
N57.7bn
N78.8bn
N75.6bn
2015 N91bn
2016
2017 N104.7bn*
N125.2bn*
2018 N112.2bn*
*Budget Projection

History: Public Debt Servicing Public Debt Servicing
The cost of servicing debt taken on by the Lagos government, relative to its revenue, is more or less flat.
About 12.9% of Lagos' revenue was spent servicing outstanding debt in 2015; public debt servicing costs have risen from N4.5bn in 2009, to N35.9bn in 2018.
Public debt servicing costs came to N22.9bn, N17bn, N33.2bn and N1.9bn in 2014, 2013, 2012 and 2011 respectively. Actual cost of servicing outstanding debts for Lagos state in 2016 and 2017 remains unclear, due to the State n e g l e c t i n g t o p u b l i s h i t s b u d g e t implementation reports.
2000
2001
2002
N7.3bn
N300m
1999 N200m
1998 N400m
N2.6bn
2005
2006
2007
N13.3bn
N14bn
2004 N12.2bn
2003 N8.8bn
2008
N28.2bn
2009 N4.5bn
N20.9bn
2011
2012
2013
2010
2014
N33.2bn
N1.9bn
N5.2bn
N22.9bn
N17bn
2015 N20.8bn
Source: Lagos State Government; BudgIT Research
2016
2017 N30.9bn*
N13.2bn*
2018 N35.9bn*
*Budget Projection

Overhead costs and Subvention Available data suggests the Overhead costs of maintaining Lagos' government has somewhat exhibited a downward trend, from 2014 levels of N104.1bn to N96.9bn in 2015.
Lagos spent N105.1bn, N138.2bn, N80.8bn and N83.2bn on Overheads in 2013, 2012, 2011 and 2010 respectively, while figures for 2016 and 2017 are unknown. Furthermore , the breakdown of Lagos’ 2018 overhead cost projections is not publicly available.
Essentially, what the State plans to spend on stationery and computer consumables, newspapers and periodicals, international and domestic travels, utility bills and general maintenance remains secret.
History: Overhead costs and subvention
Source: Lagos State Government; BudgIT Research
26
N14.3bn
N15.8bn
N47.6bn
N26.8bn
N20.2bn
N15.3bn
N49.3bn
N73.5bn
N45.2bn
N138.2bn
N83.2bn
N104.1bn
N105.1bn
N96.9bn
N80.8bn
2001
2002
2005
2006
2007
2004
2003
2008
2009
2011
2012
2010
2014
2015
2013
N170.4bn*
N103.7bn*
N198.9bn*
2017
2018
2016
*Budget Projection

Capital Expenditure The Capital expenditure portion of Lagos' 2015 spendings was N160bn; a N5bn increase over 2014 capital spending, which accounted for 40.24% of Actual spending.
Capital spending in 2013, 2012, 2011 and 2010 was N274.6bn, N268.5bn, N230.8bn and N245.2bn respectively. Information on the 2016 and 2017 budget implementation report is not available, and the breakdown of the State's 2018 budget remains excluded from public knowledge.
Preliminary information released to the public on Lagos' 2018 budget included proposed spending on projects such as the construction o f the Agege Pen C inema f l yove r ; construction on alternative routes through Oke-Ira in Eti-Osa to Epe-Lekki Expressway; the construction of an 8km Regional Road to serve as alternative route to connect Victoria Garden City (VGC) with Freedom Road in Lekki Phase 1; the completion of the ongoing reconstruction of Oshodi International Airport Road into a 10-lane road and the construction of a BRT Lane from Oshodi to Abule-Egba.
27
Source: Lagos State Government; BudgIT Research *Budget Projection
History: Capital Spending
2009 N235.7bn
2011
2012
2013
2010
2014
N230.8bn
N165bn
2015 N160bn
2000
2001
2002
N3.9bn
N8.1bn
1999 N3.3bn
1998 N5.7bn
2005
2006
2007
N50.1bn
N19.2bn
2004 N9.7bn
2003 N8.5bn
2008
N6.1bn
N155.2bn
N78.4bn
N268.5bn
N274.6bn
N245.2bn
2016
2017 N507.8bn*
2018 N699.1bn*
N386.9bn*
//
/

History: Capital Expenditure as a Percentage of Total Spending
1999
2000
2001
30.92%
17.46%
1998 28.06%
2004
2005
2006
24.40%
16.55%
2003 18.05%
2002 15.44%
2007
37.90%
9.90%
2010
2011
2012
2009
2008
2015
2014
2013
Source: Lagos State Government, BudgIT Research
60.75%
62.66%
66.12%
59.28%
58.14%
40.79%
42.06bn
53.45%
40.42%
LAGBUS
1309
Routes
57
Passengers
62,387,434
Transportation Statistics
28

29
From the foregoing, the unequivocal, recurring theme is that Lagos State's finances and specifically its utilisation and spending of taxpayers funds remain mainly opaque, uncoordinated, and brazen. The government has persistently shown an inability to acknowledge the presence or wishes of the same Lagosians in whose names these monies are disbursed and collected.
This situation is exacerbated by the non-capacity of the Lagos Assembly to encourage or enforce conditions that mandate the Lagos state government to articulate its policies, present a detailed budget and/or submit standardised performance measurement indicators. Lawmakers have presided over a sustained culture where governors appear to sit back and routinely award contracts without accountability.
A wanton disregard for the sanctity of public funds in Nigeria's richest state by total government revenue means that even when tax revenues climb to all-time highs and outgrow agreed benchmarks, Lagos will rather continue to agitate for more tax, drawdown on previous savings, or resort to heavy debts accumulation - debts which will be paid in years to come by children currently under the age of five.
Worldwide, transparency is increasingly viewed by leaders and the led as central to curbing corruption and other dysfunctions within developing countries.
A deliberate attempt by any government to keep key information, including its detailed
b u d g e t d o c u m e n t s a n d b u d g e t implementation reports, away from the public is widely regarded as an attempt to nurture and foster a corrupt system for the benefit of the ruling elite and their cronies.
Over the last decade, Lagos State's accounts have taken on a worrisome trend; the amount of public funds being handled has grown, but so has secrecy and an outright refusal to adhere to the basic tenets of democracy that state the public has a right to know.
With over N3.8tn spent by Lagos State governments between 1999 and 2015 amid little or no documentation and verifiable trails backing such spendings, we use this medium to call for a holistic audit of the State's finances.
We urge the Lagos government to submit to the fundamental principles of democracy, which include publ ishing key budget documents, including the detailed proposed budget for Lagos State, the enacted budget, budget implementation reports, financial statements for Lagos, and the Audit reports. It is equally necessary for Lagos to publish all contract agreements entered into and carried over within each relevant financial year.
We reiterate that it is important for taxpayers, civil society organisations, development partners, international organisation to take note and be aware. Lagos is increasingly normalising opacity in governance, despite being a prominent State; a development that could set dire precedents for other States, and contribute to a devastating retardation of Nigeria's hard-won democracy.
Conclusion

www.yourbudgit.com
Simplifying the
Nigerian Budget At BudgIT, we believe it is the RIGHT of every citizen to have access to, and understand public budgets. We also believe budgets must be efficiently implemented for the GOOD of the people.
Copyright © 2022 FDOKUMEN