2020 State of States new New.cdr - BudgIT
140
The 2020 Revised Edition
-
Upload
khangminh22 -
Category
Documents
-
view
1 -
download
0
Transcript of 2020 State of States new New.cdr - BudgIT
The 2020 Revised Edition
BudgIT is a civic organisation driven to make the Nigerian budget and public data more understandable and accessible across every literacy span. BudgIT’s innovation within the public circle comes with a creative use of government data by either presenting these in simple tweets, interactive formats or infographic displays. Our primary goal is to use creative technology to intersect civic engagement and institutional reform.
CONTRIBUTORS
Principal Lead: Gabriel Okeowo
Research and Policy Advisory Team: Abel Akeni, Olaniyi Olaleye, Oluwatosin Iseniyi, Oyebola Agunloye, Damilola Onemano.
Data Visualization/Design Concept: Segun Adeniyi, Damilola Ogundipe, Godsfavour Amedari, Folahan Johnson
© 2020
Disclaimer: This document has been produced by BudgIT to provide information on budgets and public data issues. BudgIT hereby certifies that all the views expressed in this document accurately reflect our analytical views that we believe are reliable and fact- based.
Whilst reasonable care has been taken in preparing this document, no responsibility or liability is accepted for errors or for any views expressed herein by BudgIT for actions taken as a result of information provided in this Report.
Abou
t
Budg
IT
Contact: [email protected] +234-803-727-6668, +234-908-333-1633Address: 55, Moleye Street, Sabo, Yaba, Lagos, Nigeria.This report is supported by Bill and Melinda Gates Foundation.
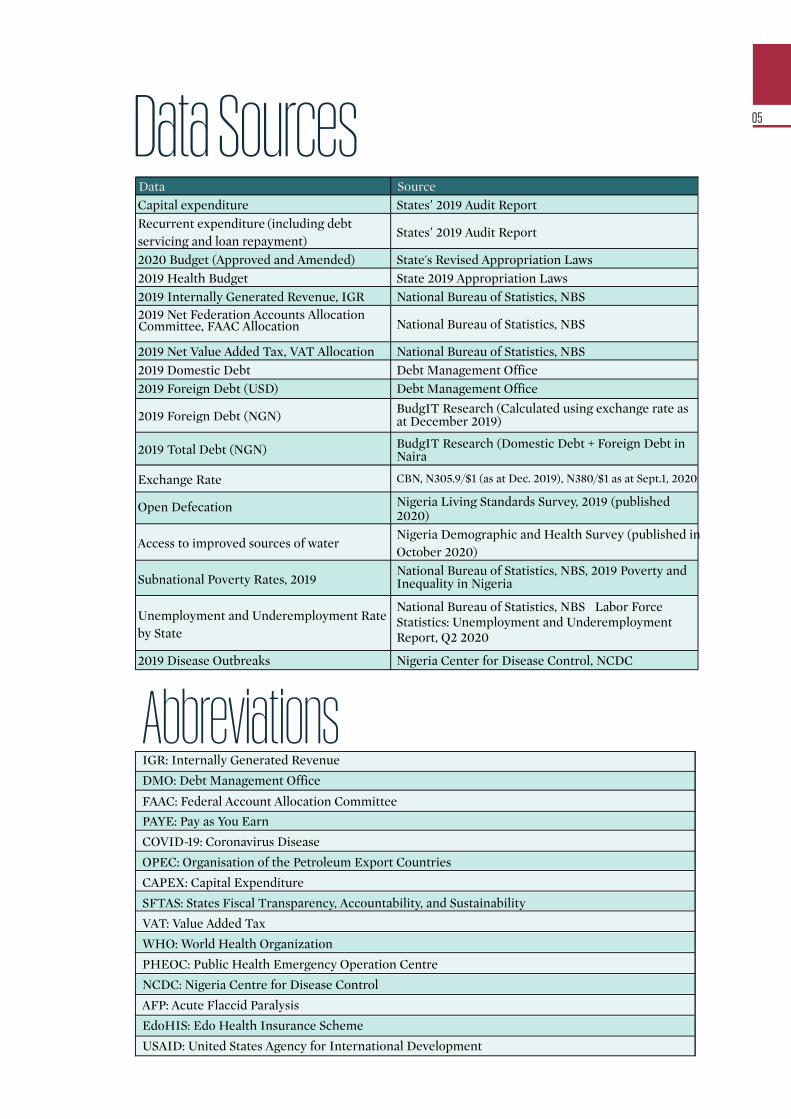
Data SourcesData SourceCapital expenditure States’ 2019 Audit ReportRecurrent expenditure (including debt servicing and loan repayment)
States’ 2019 Audit Report
2020 Budget (Approved and Amended) State's Revised Appropriation Laws2019 Health Budget
State 2019 Appropriation Laws
2019 Internally Generated Revenue, IGR National Bureau of Statistics, NBS2019 Net Federation Accounts Allocation Committee, FAAC Allocation National Bureau of Statistics, NBS
2019 Net Value Added Tax, VAT Allocation National Bureau of Statistics, NBS2019 Domestic Debt
Debt Management Office
2019 Foreign Debt (USD) Debt Management Office
2019 Foreign Debt (NGN)BudgIT Research (Calculated using exchange rate as at December 2019)
2019 Total Debt (NGN) BudgIT Research (Domestic Debt + Foreign Debt in Naira
Exchange Rate CBN, N305.9/$1 (as at Dec. 2019), N380/$1 as at Sept.1, 2020
Open Defecation Nigeria Living Standards Survey, 2019 (published 2020)
Access to improved sources of water
Nigeria Demographic and Health Survey (published in October 2020)
Subnational Poverty Rates, 2019National Bureau of Statistics, NBS, 2019 Poverty and Inequality in Nigeria�
Unemployment and Underemployment Rate by State
National Bureau of Statistics, NBS �Labor Force Statistics: Unemployment and Underemployment Report, Q2 2020
2019 Disease Outbreaks Nigeria Center for Disease Control, NCDC
AbbreviationsIGR: Internally Generated Revenue
DMO: Debt Management Office
FAAC: Federal Account Allocation Committee
PAYE: Pay as You Earn
COVID-19: Coronavirus Disease
OPEC: Organisation of the Petroleum Export Countries
CAPEX: Capital Expenditure
SFTAS: States Fiscal Transparency, Accountability, and Sustainability
VAT: Value Added Tax
WHO: World Health Organization
PHEOC: Public Health Emergency Operation Centre
NCDC: Nigeria Centre for Disease Control
AFP: Acute Flaccid Paralysis
EdoHIS: Edo Health Insurance Scheme
USAID: United States Agency for International Development
05
Total Revenue: Total revenue of States refers to the combination of internally generated revenue and Gross allocations from FAAC (Federal Account Allocation Committee).
Total Available Revenue: Total available revenue of states refers to the combination of Internally Generated Revenue and Net FAAC (Federal Account Allocation Committee) allocations - after any obligatory deductions have been made from a state's Gross FAAC at source.
Recurrent Expenditure: Refers to recurring payments: wages and salaries for civil servants; overhead costs (electricity bills, purchase of diesel); consolidated revenue account charges ; t ransfers (to loca l government, for example); interest payments on existing loans; and other (subsidies, for example).
Personnel Cost: include salaries, allowance and other benefits that the Government pays to its workers (civil servants).
Overhead Cost: These are any regular expenses which are not paid directly to a civil servant or other government workers, including amounts bi l led directly to customers. Overheads must be paid for regularly. Examples are electricity bills, water bills, the buying of diesel for generators, or the money spent on travelling during work, by civil servants.
Capital Expenditure: Capital Expenditure is money spent by the government to acquire or build fixed capital assets, land or intangible assets. Capital Expenditure is how much is used for projects like the building of schools, hospi ta ls , roads, or buying securi ty
equipment. Capital Expenditure is sometimes called �Capex.�
Internally Generated Revenue, IGR: Sum of all revenues a state generates independent of revenue from federally collected revenue.
Debt Ceiling: Limit beyond which a State is not allowed to borrow further
IGR per capita: The amount of internally generated revenue of a state when divided by
the state’s population.
Capital Expenditure per capita: The total amount of internally generated revenue of a
state when divided by the state’s population.
Recurrent Surplus: The extra amount of a
State’s revenue left after fulfilling its recurrent obligations and loan repayments schedules most of which need to be honoured.
Recurrent Shortfall: The extra amount of revenue a state has left from its total revenue after fulfilling its recurrent obligations and loan repayments schedules.
E c o n o m i c S e c t o r : Mo n e y s p e n t o n infrastructure to improve the economy like roads, airports and ports, etc.
Social Sector: Money spent on human capital development through investments in sectors like Education and Health
Definitions of Fiscal Terms and Context
Note: If the approved budget does not Include a breakdown of debt payments, Interest Payments may be replaced with Debt Servicing cost.
06
A bleak outlook
Soaring debt burden, imprudent fiscal planning, and nearly a decade of misplaced expenditure priorities have beaten a clear path to fiscal crisis for a majority of Nigeria’s 36 states. In the 2020 Fiscal Sustainability Index, some states rank higher than others, but most are still below the sustainability point, except for Rivers state which occupies the number #1 position on the index; it is able to meet its recurrent expenditure with only internally generated revenue, IGR and value added tax, VAT. It also has a total revenue greater than its total debt and prioritises capital over recurrent expenditure.
States already face significant human d e v e l o p m e n t i s s u e s — p o v e r t y , unemployment underemployment, avoidable disease outbreaks (excluding COVID-19) and a host of third-world problems. To solve these issues, each state needs to, first and foremost, be a sustainable subnational entity—that is, the state is generating enough revenue to pay its workers, its creditors and still have s ignif icant leftover to cover capital expenditure interventions for solving development issues.
States are in distress
From our analysis, for 8 states in the country, their respective total revenue was not enough to fund their recurrent expenditure obligations (salaries, overhead, debt service obligations) and meet their respective loan repayment schedules that were due in 2019. The worst hit of these 8 states are Osun, Bauchi, Plateau, Gombe, Adamawa, Ekiti, Kogi and Oyo state. This could indicate early signs of distress particularly for states in this category who have very low revenue generation capacities. Without cutting down certain components of their recurrent
expenditure or radically growing their internally generated revenue, the affected states may have to borrow to fund parts of their recurrent expenditure.
Misplaced priorities, soaring debts
Based on their fiscal analysis, only five states in the country are prioritising capital expenditure over recurrent obligations —Rivers, Kaduna, Akwa Ibom, Ebonyi and Kebbi. However, the quality of the capital expenditure still leaves much to be desired as explored in the narratives for the respective state profiles. The remaining thirty-one (31) states in the country prioritised recurrent expenditure according to their 2019 financial statements. Recurrent expenditures are not necessarily a bad thing especially when skewed towards sectors like health and education which have expenses like payment of teachers and doctors salaries that are recurrent in nature. However, of the states in this category, 11 had overhead costs that were larger than their capital expenditures. These 11 states are: Adamawa, Bauchi, Bayelsa, Benue, Ekiti, Kano, Kogi, Kwara, Nassarawa Plateau, Taraba.
The total debt for all 36 states surged by 162.87% or N3.34tn, from N2.05tn in 2014 to N5.39tn in 2019, with 10 states accounting for approximately half or N1.68tn of this increase. Eight of these states were from the South—Lagos, Rivers, Akwa Ibom, Imo, Kogi, Edo, Osun and Cross River—while two of the states were from the North, Kaduna and Adamawa; of the states in this debt category, Kogi and Adamawa are also in the category of states who spent more on overhead costs for the government than on capital expenditures that directly benefit the people.
Executive Summary
07

Narrowing options
Options for further borrowing are reducing for Nigerian states due to safeguards and debt cei l ings put in place by the federal government to prevent states from slipping into debt crisis. The revised 2020 borrowing guidelines published by Nigeria’s Debt Management Office reference Section 223 (1b) of the 2007 Investments and Securities Act (ISA) which requires that for states to borrow from the capital market in any fiscal year, their total debt must not be more than 50% of their previous year’s total revenue. For fiscal year 2020, all 36 states will need to pass through the eye of the needle to raise fund from the capital market as they now have total debts as at 2019 which breached this debt ceiling.
However, the majority of Nigerian states, except Cross River, are still within the debt ceiling that allows them to take on more debt from other sources. The ceiling for external borrowing is set at a state’s total debt burden not exceeding 250% of their total revenue in or the previous year. Cross River’s total debt of N230.88bn as at December was 298.06% of its total revenue of N77.46bn. The safeguards for borrowing from the capital market are stricter for states because inability to pay back capital market investors could more quickly trigger a reputational crisis for a country.
Exchange rate volatilities recently triggered by COVID-19 induced shocks have worsened the situation for states that currently have large foreign debt and have hopefully crystallised the risks for those who plan to incur more. The naira suffered a recent
25.98% devaluation from N305.9/$1 as at December 2019 to N380/1USD as at September 2020. The implication of this for states is that for every $1 in foreign debt a state owes, it now needs to raise an extra N74.1 from taxpayers to pay it back. The worst hit are the 5 states with the highest foreign debt burden: Lagos ($1.4bn) Kaduna ($554.78m) Edo ($275.92m) Cross River ($208.96m) and Bauchi ($133.90m). Lagos state for example now needs to raise at least N103.46bn additionally from taxpayers over the lifespan of the same $1.4bn foreign debt stock to pay it back due to the devalued naira. That ’s less money available for development projects.
The way forward
States have seen some improvement in their IGR between 2014 and 2019, however there is still a need to put systems in place for aggressive IGR growth within their states especially as falling crude oil prices, OPEC production cuts and other COVID-19 induced headwinds are set to impact federally collected over the next two years.
This paints a bleak outlook for Nigerian states who depend on FAAC allocation for their survival, although dwindling federal revenue will affect all states differently; Lagos, Ogun and Rivers state will be least affected as they relied on federally collected revenue (Net FAAC) for only 22.82%, 35.31% and 53.02% of their total revenues respectively. Three states Bayelsa, Borno and Katsina will be worst hit by dwindling revenue as they relied on Net FAAC for 89.56%, 88.30% and 88.16% of their total revenues respectively in 2019.
08

Index A
45%
Index B
35%
Index C
10%
Index D
10%
The Research Methodology
Index A looks at the ability of states to meet their recurrent expenditure obligation with their internally generated revenue and VAT. The composition changed from that of previous years, it now excludes 13% derivation revenue which is accounted for in Index B.
Index B reviews the states� ability to cover all recurrent expenditure obligations with their total revenue (Internally generated revenue + Net FAAC) without resorting to borrowing.
Index C focuses on states’ ability to manage their debts sustainably. It examines the extent to which the State’s total debt stock today can theoretically be paid off if it uses all their revenue in a single year under review. Index D evaluates the degree to which each
State is prioritising capital expenditure which ultimately have the capacity to increase the States assets and potential revenue inflows in the long term compared to how it invests in recurrent expenditure.
BudgIT’s sustainability ranking evaluates the fiscal health of states and gives an estimation of states who are already in distress or those who are
likely to slip into fiscal distress considering their debt burden, expenditure patterns and revenue inflows. It is anchored on four key indices (each with
different weights) that form the overall sustainability index.
Notes: For 2020 we had a methodology review session with selected stakeholders from the government and development actors. Certain changes were made to the weights and composition of the indices for our Fiscal Sustainability Ranking.
The weight for Index A has been increased from 35% to 45%, while the weight for Index B has been reduced from 50% to 35%. The goal is to reward those States who have a higher degree of fiscal independence from federally collected revenue, thus encouraging lower ranking states to aspire to radically improve their internally generated revenue.
The composition of our recurrent expenditure has been extended to include loan repayments; the rationale is to ensure alignment with standard public expenditure framework of debt and non-debt recurrent expenditure. Also, two-year averages for all source data for the indices were used to minimise fluctuation due to sudden oil revenue swings or one-off receipts. In addition, a new sub-index, Index D was also included to account for capital expenditures states make.
09

very year, our State of States report has Ea sub-theme focusing on an area of development which States need to
improve on. This year�s edition explores how well states are financing their health sector and preparing to combat disease outbreaks.
Disease outbreaks have the potential to strike the heart of most state government's internally generated revenue, majority of which is made up of income taxes (PAYE) and direct assessments, though there are at least 12 other tax options to generate revenue. Sick citizens either cannot work at all or to their full abilities thus reducing the income pool that is available for the state government to tax. Also their caregivers (family and relatives who may often attend to them unpaid) lose productive man hours in doing so, thus shrinking the taxable income pool further.
The near instantaneous fiscal and economic impact—falling crude oil prices, state-wide lockdowns, dwindling federal revenue, resultant naira devaluation of the novel SARS-CoV-2 virus popularly known as COVID-19 which currently has 54,247 cases* in Nigeria (and no known vaccine or cure yet established) has crystallised to policy makers how diseases can cripple economic activities. However, the health systems in Nigeria s 36 states are ’currently battling at least six other equally deadly diseases which already have vaccines and in some cases; known treatments. In 2019, 36 states recorded 94,500 cases of the deadly Cerebrospinal meningitis (CSM), measles, lassa fever, yellow fever, monkeypox and cholera combined.
Although these six diseases may not have an instantaneously dramatic economic effect as SARS-CoV-2, the COVID-19 induced shocks have affected federally collected revenue from crude oil, which the majority of the states
typically rely on to complement their Internally Generated Revenue (IGR). It is therefore in the enlightened self interest of state governments to not only grow their IGR but to also preserve current and future internally generated revenue from the negative economic effects of diseases by investing in the appropriate health systems through their budgets or other sustainable methods for domestic resource mobilisation.
Nigeria Centre for Disease Control, NCDC is the federal government s agency saddled with ’t h e r e s p o n s i b i l i t y o f c o o r d i n a t i n g interventions to prevent, detect and control d i s e a s e o u t b re a k s n a t i o n w i d e. St a t e governments have an equal responsibility in funding systems that complement the federal government's effort. How well is each state government playing this role?
To answer this, we ask 6 questions split into two categories. Category A is a series of 3 questions that attempts to find out if a state is investing in strengthening its health system and epidemic preparedness, Water, Sanitation and Hygiene (WASH) conditions through its budget. We also attempt to find out if the state is investing in systems that reduce high Out-Of-Pocket expenditures at the point of treatment, a key risk factor that discourages potentially infected citizens from using health facilities, potentially spreading diseases if they go untreated. Category B is another series of 3 questions attempting to find out how the budgeted investments made over the years and in the fiscal year evaluated have translated to quality outcomes in terms of disease control (exc luding COVID -19) and improved Sanitation, Water and Hygiene conditions. A scoring matrix used in evaluating the 36 states and the outcome can be found in the Rankings� segment at the end of this publication.
Sub theme: Health Financing and Epidemic Preparedness at the subnational level
* as at Sept 1, 2020
10
Abia StateGodʼs Own State
2014 2015 2016 2017 2018 2019
12.37bn
2014 2015 2016 2017 2018 2019
54.97bn 55.33bn
6-Year Growth Analyis (2014 - 2019)
IGR-5.33%
Net FAAC
IGR
19.38%Net FAAC
N From N54.97bn - N52.04bn
67.17bn
73.92bn
30.40bn
41.52bn
63.94bn
91.58bn
97.09bn
98.31bn
2014
2015
2017
2019
2016
2018
Debt Stock 2019 Debt Growth
(2014 - 2019)
223.43%
Debt Size
most indebted in the country
21st
Total Debt Trend (2014 - 2019)
11
N68.76bn $96.59mDomestic
DebtExternal
Debt
Per Capita Analysis
Per Capita Per Capita Per CapitaN11,530
N2,598 N24,323
Health BudgetActual Expenditure 2019 (NGN)
Capital Expenditure
Recurrent Expenditure
67.17bn46.60bn
N
Net FAAC Proportion 77.89%
IGR Proportion 22.11%
Shortfall
-0.36bn
Debt
13.35bn 12.69bn
14.92bn 14.83bn 14.77bn
40.08bn
30.72bn38.88bn
52.04bn
Revenue Analysis (NGN’bn)
Actual Capital Expenditure Total Debt
(NGN)
Total Revenue*
Recurrent Expenditure**
Structure of State Available Revenue (2019) 2019 Ability to meet Recurrent Expenditure (NGN’bn)
*Total Revenue here is defined as the sum of the State's Gross FAAC allocation and Internally Generated Revenue (IGR) using data obtained from NBS. In some states, this may differ from a State's available revenue which is the sum of its net FAAC and Internally Generated Revenue (IGR).�
** Includes loan repayments
Note:
Abia ranks 25th in the 2020 Fiscal Sustainability Index. Weighed down by its growing
debt profile and burdensome recurrent expenses, financing its recurrent obligation and investment activities will prove a difficult task with its total available revenue.
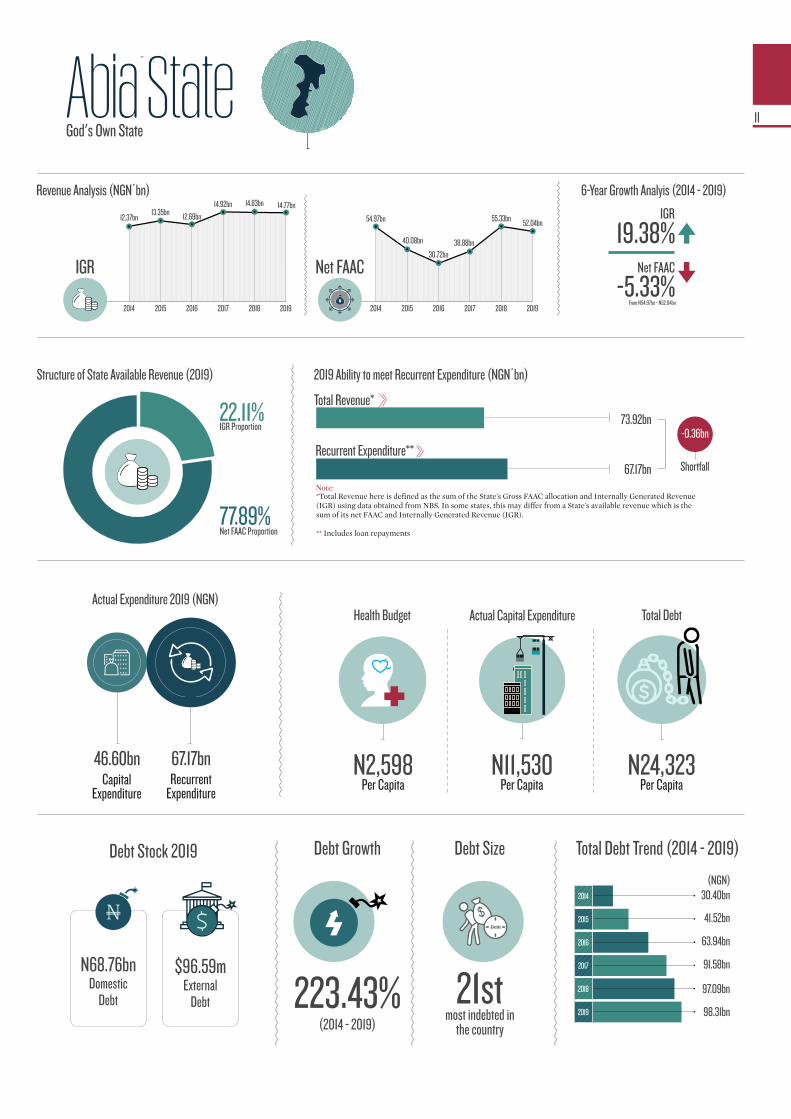
In 2019, the state’s total available revenue of N66.81bn was far flung from its total expenditure of N113.77bn. Its recurrent expenditure bill of N67.17bn exceeded the total revenue by N360m with absolutely nothing but a deficit left to finance capital expenditure.
In 2019 Internally generated revenue brought in N14.77bn, just 22.11% out of the total N66.81bn earned by the state while net FAAC from federal ly collected revenue yielded N52.04bn, or 77.89%, making the state vulnerable to sudden collapse in FG�s revenue.
Although its IGR expanded by 19.38% in the last six years, from N12.37bn in 2014 to N14.77bn in 2019. However, this is not enough as its IGR is still very small, ranking 23rd by size amongst all states in the country.
Pre-COVID-19, Abia state’s revenue from net FAAC saw a -5.94% dip from N55.33bn in 2018 to N52.04bn in 2019, a glaring signal for the state to increase its IGR collection or risk slipping into more debt, especially as deductions to service existing debt continue to mount.
Abia’s internally generated revenue of N14.77bn is the second smallest in the South-East, better only than the dismal N7.46bn brought in by Ebonyi state in the 2019 fiscal year. This is suboptimal c o n s i d e r i n g t h e i n d u s t r i a l environment in Aba and other parts of
the state.
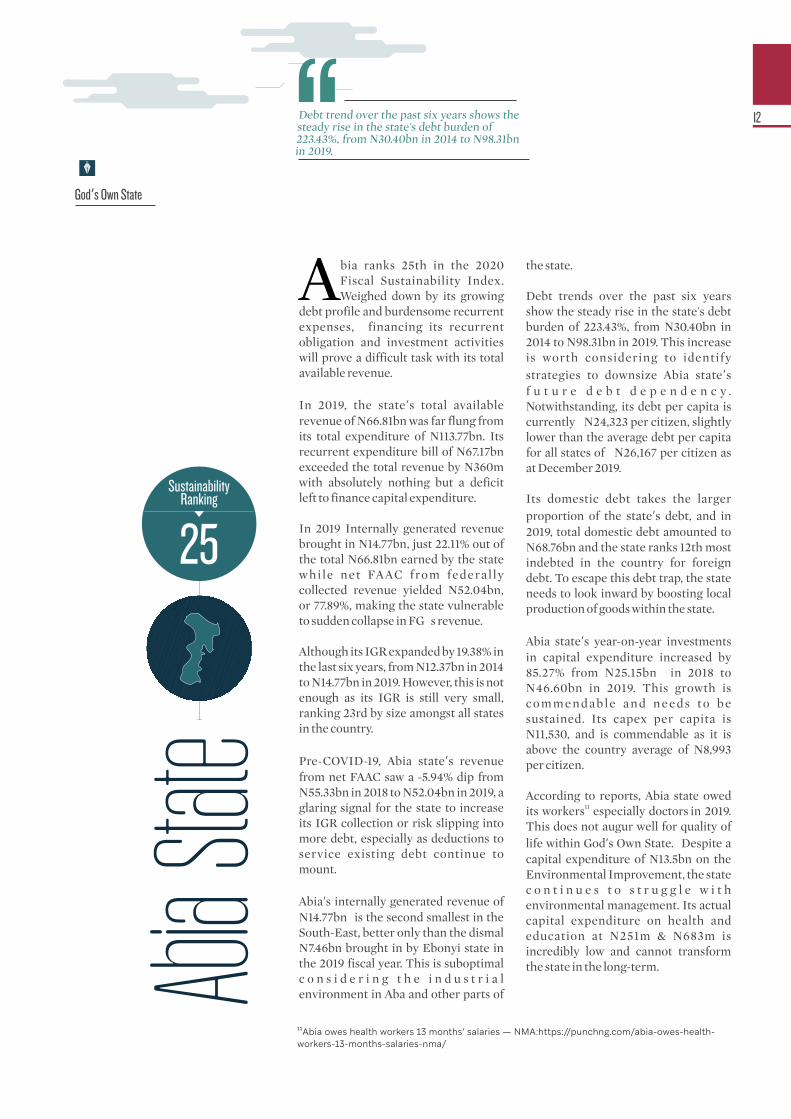
Debt trends over the past six years show the steady rise in the state's debt burden of 223.43%, from N30.40bn in 2014 to N98.31bn in 2019. This increase is worth considering to identify strategies to downsize Abia state’s f u t u r e d e b t d e p e n d e n c y . Notwithstanding, its debt per capita is currently �N24,323 per citizen, slightly lower than the average debt per capita for all states of �N26,167 per citizen as at December 2019.
Its domestic debt takes the larger proportion of the state’s debt, and in 2019, total domestic debt amounted to N68.76bn and the state ranks 12th most indebted in the country for foreign debt. To escape this debt trap, the state needs to look inward by boosting local production of goods within the state.
Abia state’s year-on-year investments in capital expenditure increased by 85.27% from N25.15bn in 2018 to N46.60bn in 2019. This growth is c o m m e n d a b l e a n d n e e d s t o b e sustained. Its capex per capita is N11,530, and is commendable as it is above the country average of N8,993 per citizen.
According to reports, Abia state owed 11 its workers especially doctors in 2019.
This does not augur well for quality of life within God’s Own State. Despite a capital expenditure of N13.5bn on the Environmental Improvement, the state c o n t i n u e s t o s t r u g g l e w i t h environmental management. Its actual capital expenditure on health and education at N251m & N683m is incredibly low and cannot transform the state in the long-term.
God’s Own State
Debt trend over the past six years shows the steady rise in the state's debt burden of 223.43%, from N30.40bn in 2014 to N98.31bn in 2019.
Abia
State
25Sustainability
Ranking
¹¹Abia owes health workers 13 months’ salaries — NMA:https://punchng.com/abia-owes-health-workers-13-months-salaries-nma/
12
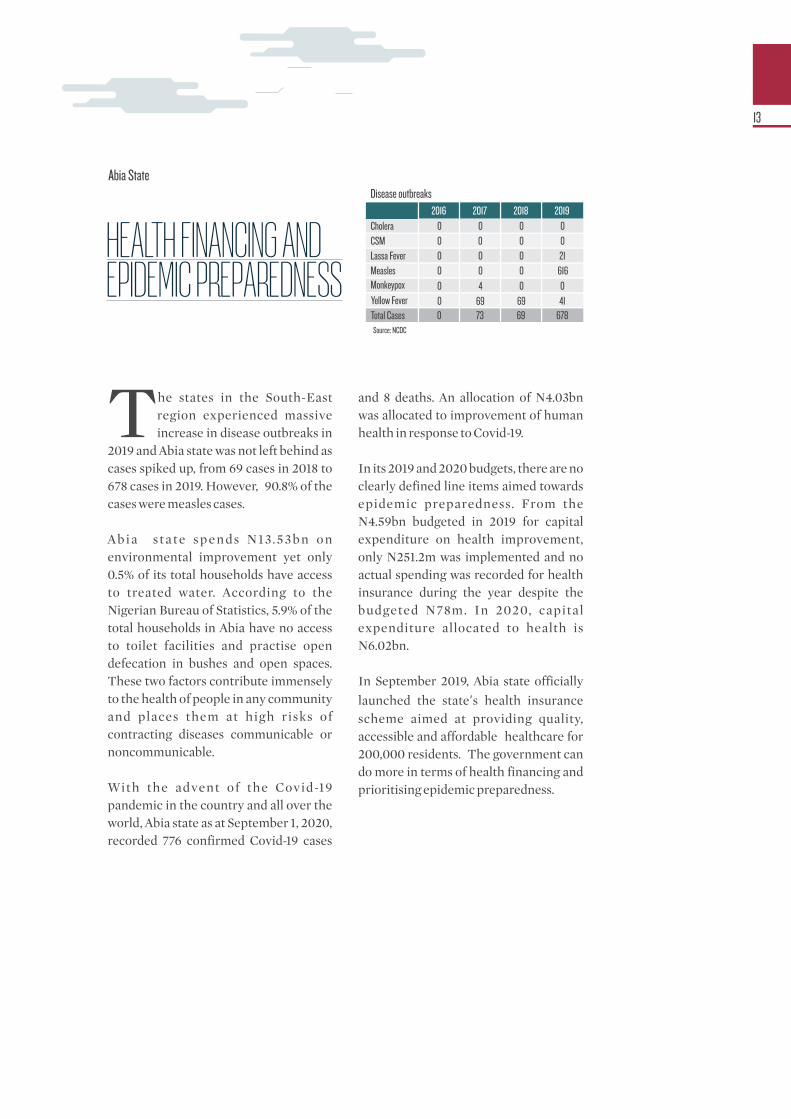
he states in the South-East Tregion experienced massive increase in disease outbreaks in
2019 and Abia state was not left behind as cases spiked up, from 69 cases in 2018 to 678 cases in 2019. However, 90.8% of the cases were measles cases.
Abia s ta te spends N13.53bn on environmental improvement yet only 0.5% of its total households have access to treated water. According to the Nigerian Bureau of Statistics, 5.9% of the total households in Abia have no access to toilet facilities and practise open defecation in bushes and open spaces. These two factors contribute immensely to the health of people in any community and places them at high risks of contracting diseases communicable or noncommunicable.
With the advent of the Covid-19 pandemic in the country and all over the world, Abia state as at September 1, 2020, recorded 776 confirmed Covid-19 cases
and 8 deaths. An allocation of N4.03bn was allocated to improvement of human health in response to Covid-19.
In its 2019 and 2020 budgets, there are no clearly defined line items aimed towards epidemic preparedness. From the N4.59bn budgeted in 2019 for capital expenditure on health improvement, only N251.2m was implemented and no actual spending was recorded for health insurance during the year despite the budgeted N78m. In 2020, capital expenditure allocated to health is N6.02bn.
In September 2019, Abia state officially
launched the state’s health insurance scheme aimed at providing quality, accessible and affordable healthcare for 200,000 residents. The government can do more in terms of health financing and prioritising epidemic preparedness.
HEALTH FINANCING AND EPIDEMIC PREPAREDNESS
Abia State
2016Cholera 0CSM 0Lassa Fever 0Measles 0Monkeypox 0Yellow Fever 0Total Cases 0
2017 2018 20190 0 00 0 00 0 210 0 6164 0 0
69 69 4173 69 678
Disease outbreaks
Source: NCDC
13
Adamawa State
2014 2015 2016 2017 2018 2019
4.99bn
2014 2015 2016 2017 2018 2019
50.92bn 49.51bn
6-Year Growth Analyis (2014 - 2019)
IGR-5.06%
Net FAAC
IGR
94.31%Net FAAC
N From N50.92bn - N43.34bn
73.07bn
64.50bn
33.74bn
56.65bn
83.28bn
98.43bn
119.49bn
135.68bn
2014
2015
2017
2019
2016
2018
Debt Growth
(2014 - 2019)
302.17%
Debt Size
most indebted in the country
15th
Total Debt Trend (2014 - 2019)
N102.41bn $108.76mDomestic
DebtExternal
Debt
Per Capita Analysis
N4,472
N4,531 N29,276
Capital Expenditure
Recurrent Expenditure
73.07bn20.73bn
N
Net FAAC Proportion 83.28%
IGR Proportion 16.72%
Shortfall
-8.58bn
Debt
4.45bn5.79bn
6.20bn 6.20bn
9.70bn
37.75bn
29.76bn37.44bn
48.34bn
Highest Peak of the Nation
Revenue Analysis (NGN’bn)
Debt Stock 2019
Per Capita Per Capita Per Capita
Health BudgetActual Expenditure 2019 (NGN)
Actual Capital Expenditure Total Debt
(NGN)
14
Total Revenue*
Recurrent Expenditure**
Structure of State Available Revenue (2019) 2019 Ability to meet Recurrent Expenditure (NGN’bn)
*Total Revenue here is defined as the sum of the State's Gross FAAC allocation and Internally Generated Revenue (IGR) using data obtained from NBS. In some states, this may differ from a State's available revenue which is the sum of its net FAAC and Internally Generated Revenue (IGR).�
** Includes loan repayments
Note:
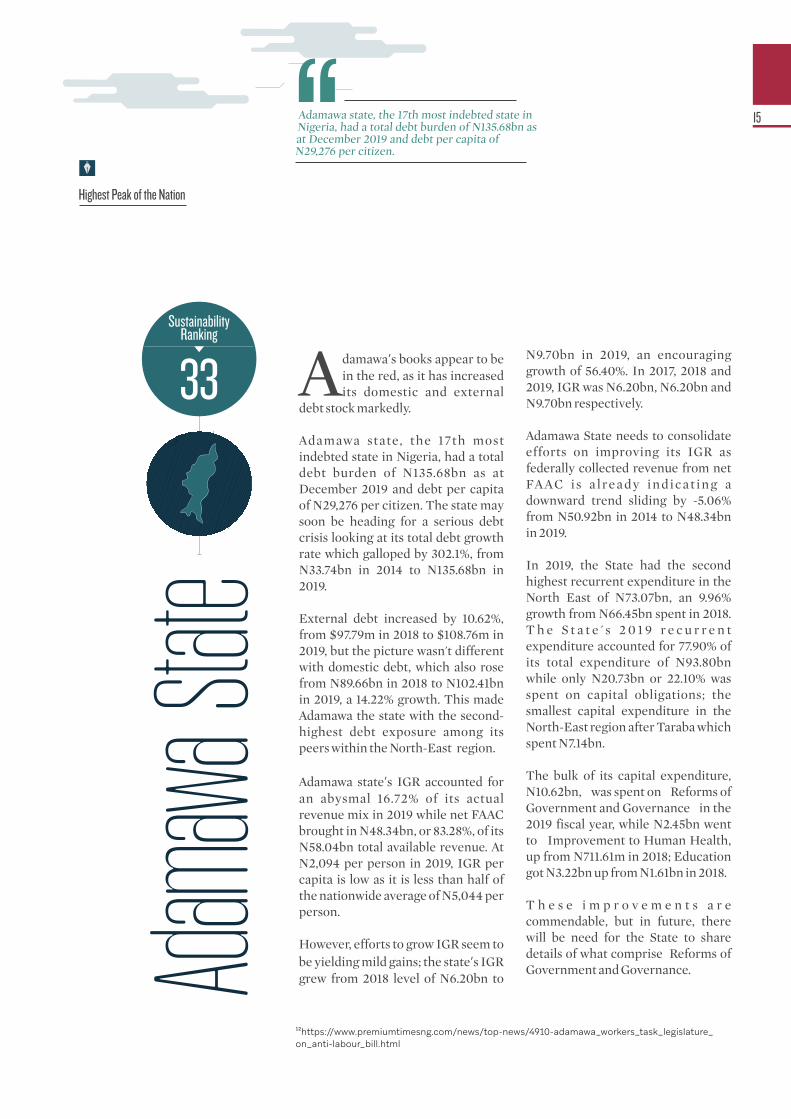
damawa’s books appear to be Ain the red, as it has increased its domestic and external
debt stock markedly.
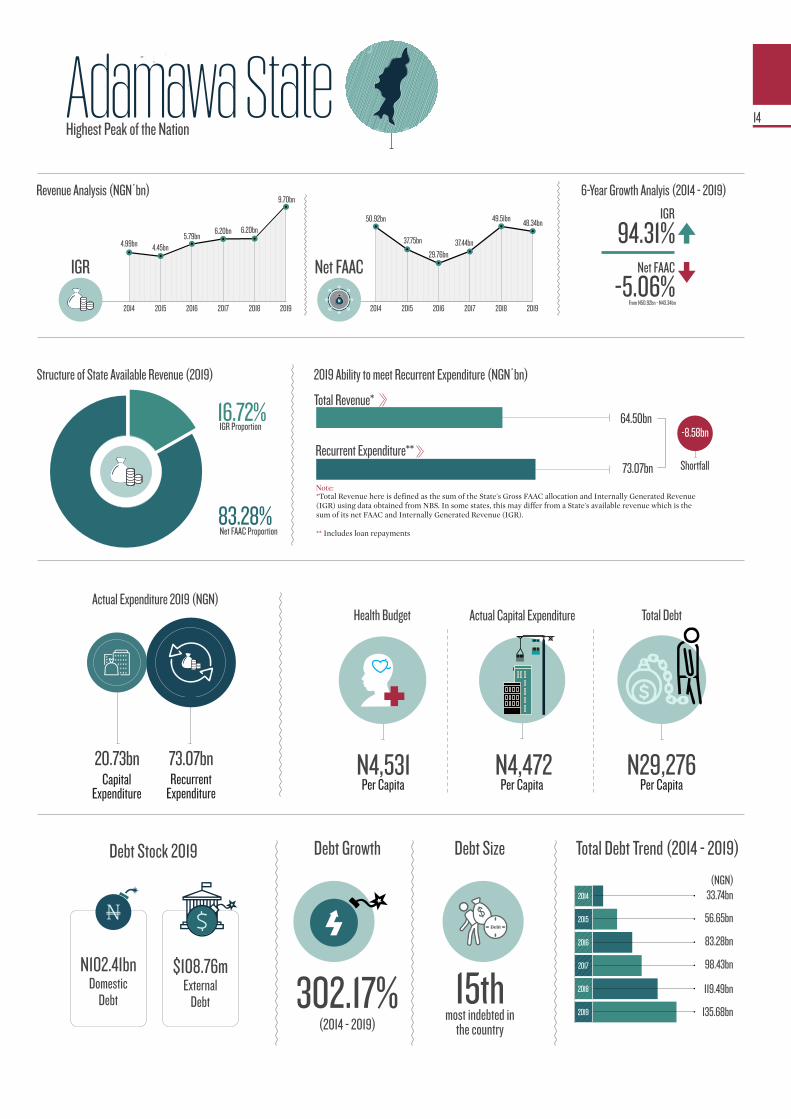
Adamawa state, the 17th most indebted state in Nigeria, had a total debt burden of N135.68bn as at December 2019 and debt per capita of N29,276 per citizen. The state may soon be heading for a serious debt crisis looking at its total debt growth rate which galloped by 302.1%, from N33.74bn in 2014 to N135.68bn in 2019.
External debt increased by 10.62%, from $97.79m in 2018 to $108.76m in 2019, but the picture wasn't different with domestic debt, which also rose from N89.66bn in 2018 to N102.41bn in 2019, a 14.22% growth. This made Adamawa the state with the second-highest debt exposure among its peers within the North-East region.
Adamawa state’s IGR accounted for an abysmal 16.72% of its actual revenue mix in 2019 while net FAAC brought in N48.34bn, or 83.28%, of its N58.04bn total available revenue. At N2,094 per person in 2019, IGR per capita is low as it is less than half of the nationwide average of N5,044 per person.
However, efforts to grow IGR seem to be yielding mild gains; the state’s IGR grew from 2018 level of N6.20bn to
N9.70bn in 2019, an encouraging growth of 56.40%. In 2017, 2018 and 2019, IGR was N6.20bn, N6.20bn and N9.70bn respectively.
Adamawa State needs to consolidate efforts on improving its IGR as federally collected revenue from net FAAC i s a l ready indicat ing a downward trend sliding by -5.06% from N50.92bn in 2014 to N48.34bn in 2019.
In 2019, the State had the second highest recurrent expenditure in the North East of N73.07bn, an 9.96% growth from N66.45bn spent in 2018. T h e S t a t e ' s 2 0 1 9 r e c u r r e n t expenditure accounted for 77.90% of its total expenditure of N93.80bn while only N20.73bn or 22.10% was spent on capital obligations; the smallest capital expenditure in the North-East region after Taraba which spent N7.14bn.
The bulk of its capital expenditure, N10.62bn, was spent on �Reforms of Government and Governance� in the 2019 fiscal year, while N2.45bn went to �Improvement to Human Health, up from N711.61m in 2018; Education got N3.22bn up from N1.61bn in 2018.
T h e s e i m p r o v e m e n t s a r e commendable, but in future, there will be need for the State to share details of what comprise�Reforms of Government and Governance.
Highest Peak of the Nation
Adamawa state, the 17th most indebted state in Nigeria, had a total debt burden of N135.68bn as at December 2019 and debt per capita of N29,276 per citizen.
Adam
awa S
tate
33Sustainability
Ranking
¹²https://www.premiumtimesng.com/news/top-news/4910-adamawa_workers_task_legislature_on_anti-labour_bill.html
15
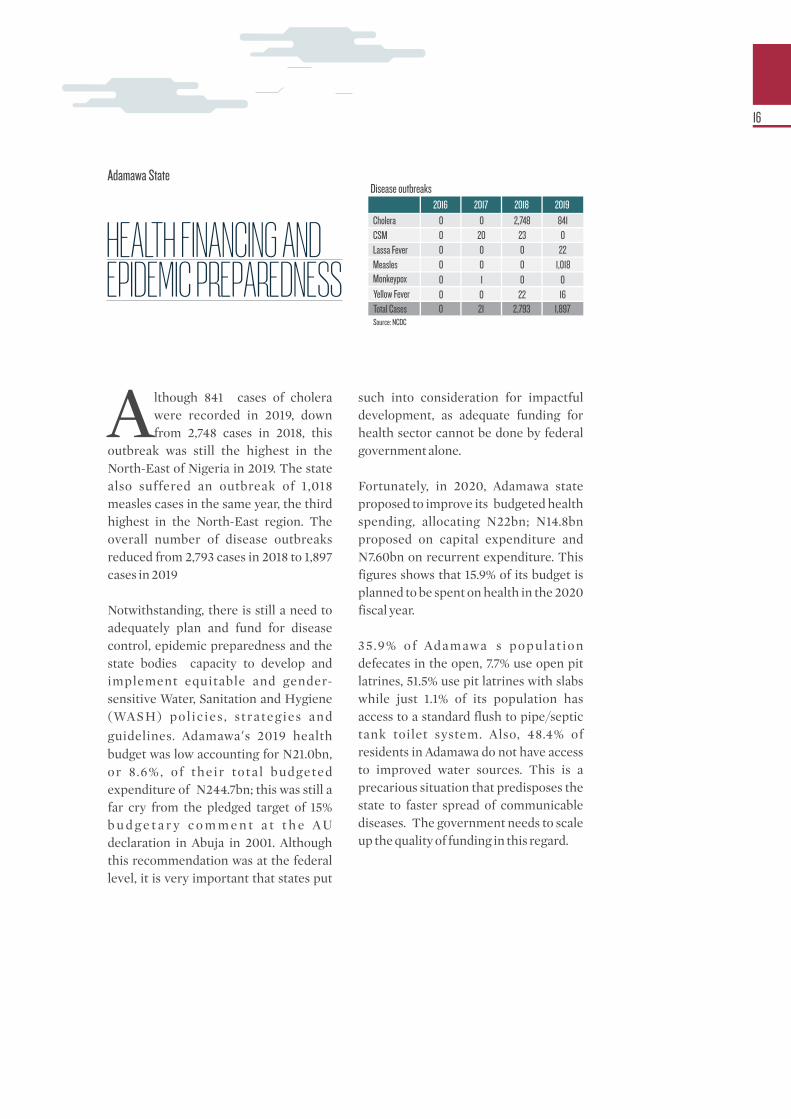
lthough 841 cases of cholera Awere recorded in 2019, down from 2,748 cases in 2018, this
outbreak was still the highest in the North-East of Nigeria in 2019. The state also suffered an outbreak of 1,018 measles cases in the same year, the third highest in the North-East region. The overall number of disease outbreaks reduced from 2,793 cases in 2018 to 1,897 cases in 2019
Notwithstanding, there is still a need to adequately plan and fund for disease control, epidemic preparedness and the state bodies� capacity to develop and implement equitable and gender-sensitive Water, Sanitation and Hygiene (WASH) pol ic ies , s trategies and
guidelines. Adamawa’s 2019 health budget was low accounting for N21.0bn, or 8.6%, of their total budgeted expenditure of N244.7bn; this was still a far cry from the pledged target of 15% b u d g e t a r y c o m m e n t a t t h e AU declaration in Abuja in 2001. Although this recommendation was at the federal level, it is very important that states put
such into consideration for impactful development, as adequate funding for health sector cannot be done by federal government alone.
Fortunately, in 2020, Adamawa state proposed to improve its budgeted health spending, allocating N22bn; N14.8bn proposed on capital expenditure and N7.60bn on recurrent expenditure. This figures shows that 15.9% of its budget is planned to be spent on health in the 2020 fiscal year.
35.9% of Adamawa�s populat ion defecates in the open, 7.7% use open pit latrines, 51.5% use pit latrines with slabs while just 1.1% of its population has access to a standard flush to pipe/septic tank toilet system. Also, 48.4% of residents in Adamawa do not have access to improved water sources. This is a precarious situation that predisposes the state to faster spread of communicable diseases. The government needs to scale up the quality of funding in this regard.
Adamawa State
2016
Cholera 0CSM 0Lassa Fever 0Measles 0Monkeypox 0Yellow Fever 0Total Cases 0
2017 2018 2019
0 2,748 84120 23 00 0 220 0 1,0181 0 00 22 1621 2,793 1,897
HEALTH FINANCING AND EPIDEMIC PREPAREDNESS
Disease outbreaks
Source: NCDC
16
Akwa-Ibom State
2014 2015 2016 2017 2018 2019
IGR 15.68bn
2014 2015 2016 2017 2018 2019
Net Faac
258.32bn
202.37bn
6-Year Growth Analyis (2014 - 2019)
-33.43%
Net FAAC
IGR
105.98%
N From N258.52bn - N171.97bn
127.08bn
218.14bn
90.94bn
157.73bn
168.18bn
202.68bn
212.59bn
252.02bn
2014
2015
2017
2019
2016
2018
Debt Growth
(2014 - 2019)
177.13%
Debt Size
most indebted in the country
4th
Total Debt Trend (2014 - 2019)
N237.34bn $47.98mDomestic
DebtExternal
Debt
Per Capita Analysis
N32,587
�N2,358 N41,512
Capital Expenditure
Recurrent Expenditure
127.08bn197.83bn
N
Net FAAC Proportion 84.19%
IGR Proportion 15.81%
Excess
91.06bn
Debt
14.79bn
23.27bn
15.96bn
24.21bn
32.29bn 163.96bn
104.44bn
143.61bn
171.98bn
Land of Promise
Revenue Analysis (NGN’bn)
Debt Stock 2019
Per Capita Per Capita Per Capita
Health BudgetActual Expenditure 2019 (NGN)
Actual Capital Expenditure Total Debt
(NGN)
17
Total Revenue*
Recurrent Expenditure**
Structure of State Available Revenue (2019) 2019 Ability to meet Recurrent Expenditure (NGN’bn)
*Total Revenue here is defined as the sum of the State's Gross FAAC allocation and Internally Generated Revenue (IGR) using data obtained from NBS. In some states, this may differ from a State's available revenue which is the sum of its net FAAC and Internally Generated Revenue (IGR).�
** Includes loan repayments
Note:

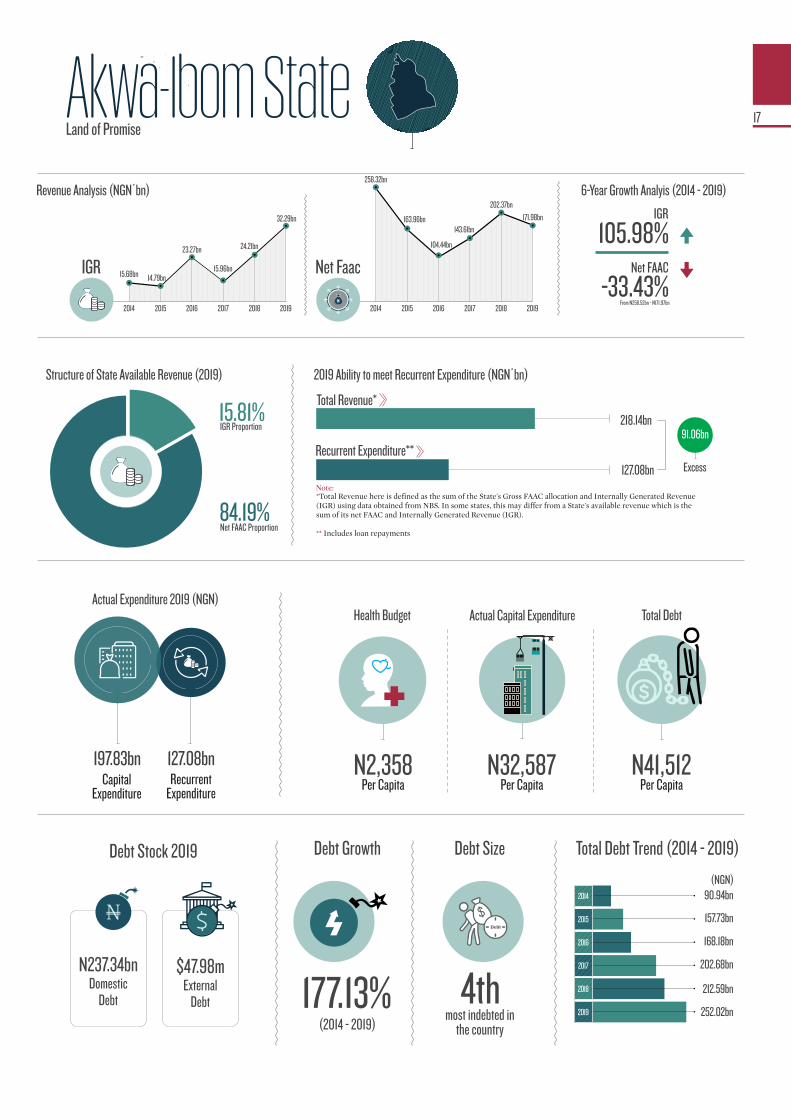
kwa Ibom ranks 20th in the A2 0 2 0 S t a t e s � F i s c a l Sustainability Index. Just like
the oil-rich states of Delta and Bayelsa, its fiscal sustainability performance was weighed down largely by a growing recurrent expendi ture nurtured by past intertemporal fiscal choices which prioritised overhead costs and other operating expenses as the state overflowed with additional 13%
derivation revenue—fruits of the
resource control advocacy of the early
2000’s.
The state ’s tota l debt burden ballooned by 177.13%, from N90.94bn in 2014 to N252.02bn in 2019. Indeed, this is slower than the average debt growth rate of 274% for all states within the same period. Nevertheless, the state stood as the fourth most indebted state in Nigeria as at December 2019.
I t s d o m e s t i c d e b t b u r d e n mushroomed by 190.30%, from N81.76bn in 2014 to N237.34bn in 2019. Commendably, its foreign debt profile dropped by -18.53%, from $58.89m in 2014 to $47.98m in 2019, making it slightly less prone to exchange rate volatility via increased debt servicing costs each time the Naira is devalued.
Citizens in Akwa-Ibom need to engage their elected and appointed officials at the sub-national levels to ensure that future debts are put to best use; this will ultimately translate to improved quality of life.
IGR as a share of total revenue stands
at 17.38%, making this state’s plans susceptible to shocks to the federal revenue. The state's IGR enlarged by 33.37%, from N15.68bn in 2018 to N32.29bn in 2019. Consequently, it met the 20% basic IGR growth target necessary to receive the $1m grant incentive offered by the World Bank
9supported SFTAS programme to Nigerian states; that is if the revenue data from the National Bureau for Statistics is used for the evaluation.
If this oil-rich state hopes to keep the promise of a better life to millions of its indigenes and tourists, it needs to rethink its debt strategy, make sharp cuts to its overhead costs and indeed, revamp its entire fiscal strategy.
The quality of its capital expenditure needs to be seriously interrogated on the actual benefit to the people. According to its 2019 audit report, the State Government House spent N22.61bn on capital expenditure, Ministry of Special Duties (N18.58bn), Se c re t a r y t o t h e G ov e r n m e n t (N10.38bn), Office of the Accountant-General (N35.99bn) while the entire social sector which includes capital expenditure for health and education had a total of N8.19bn.
Land of Promise
The quality of its capital expenditure needs to be seriously interrogated on the actual benefit to the people
9States Fiscal Transparency, Accountability, and Sustainability. For more: https://www.sftas.org.ng/about/
Akwa
-Ibom
State
20Sustainability
Ranking
18

he Land of Promise� has had its Town share of disease outbreaks with the most severe being
measles of which the state recorded 259 cases in 2019. It recorded 19 cases of yellow fever in 2019, down from 43 in 2018. As at September 1, 2020, the state had 278 cases of COVID-19.
Poor sanitation and hygiene situation in this oil-rich state means the risk of spread of communicable diseases still exists but is slightly mitigated. This is because 22.7% of citizens resident in the s t a t e s t i l l g e t t h e i r wa t e r f ro m unimproved sources of drinking water, while 5.1% of households still practise open defecation, limiting the degree to which the state can control disease spread.
Nevertheless, it should be noted that its performance on both indicators for sanitation and hygiene were the best in the South-South. Over the years, Akwa Ibom has invested some money in improving the Water, Sanitation, H y g i e n e ( W A S H ) s i t u a t i o n , notwithstanding there is still more work
that needs to be done.
The state budgeted N14.31bn for health in 2019 and also reported on its official website that it provides free healthcare to pregnant women, children under 5 and the aged. Overall, with 286 cases of lassa fever, measles, monkeypox and yellow fever, it recorded the lowest number of disease outbreaks in the South-South in 2019. Delta state shows that strategic health investments have commensurate impact.
Akwa Ibom has a State Public Health Emergency Operations Centre for coordinating operational information a n d re s o u rc e s f o r t h e s t ra t e g i c management of public health events and emergencies.
The state also receives support from i n t e r n a t i o n a l d e v e l o p m e n t organisations, most recently benefiting from a retraining exercise by the WHO and its partners for disease surveillance offices from the state for early detection of measles, yellow fever and COVID-19.
⁹https://aksphcda.akwaibomstate.gov.ng/governor-emmanuels-commitment-to-healthcare/ ¹⁰https://akwaibomstate.gov.ng/tag/presents-n670-718bn-budget-for-2019/
Akwa - Ibom
2016
Cholera 0CSM 0Lassa Fever 11Measles 0Monkeypox 0Yellow Fever 0Total Cases 11
2017 2018 2019
0 0 00 0 00 0 40 0 25912 0 419 43 1931 43 286
Disease outbreak profile
HEALTH FINANCING AND EPIDEMIC PREPAREDNESS
19
Anambra State
2014 2015 2016 2017 2018 2019
IGR
10.45bn
2014 2015 2016 2017 2018 2019
Net Faac
55.25bn 6-Year Growth Analyis (2014 - 2019)
3.24%
Net FAAC
IGR
152.23%
N From N52.20bn - N53.89bn
55.55bn
82.64bn
9.92bn
15.28bn
19.86bn
28.80bn
66.15bn
66.98bn
2014
2015
2017
2019
2016
2018
Debt Growth
(2014 - 2019)
575.33%
Debt Size
most indebted in the country
32nd
Total Debt Trend (2014 - 2019)
N33.92bn $108.08mDomestic
DebtExternal
Debt
Per Capita Analysis
N8,235
�N2,062 N11,141
Capital Expenditure
Recurrent Expenditure
55.55bn49.51bn
N
Net FAAC Proportion 67.15%
IGR Proportion 32.85%
Excess
27.09bn
Debt
14.79bn
15.24bn
17.37bn
19.31bn
26.37bn
40.38bn
32.69bn
41.34bn
53.89bn
Light of the Nation
52.20bnRevenue Analysis (NGN’bn)
Debt Stock 2019
Per Capita Per Capita Per Capita
Health BudgetActual Expenditure 2019 (NGN)
Actual Capital Expenditure Total Debt
(NGN)
20
Total Revenue*
Recurrent Expenditure**
Structure of State Available Revenue (2019) 2019 Ability to meet Recurrent Expenditure (NGN’bn)
*Total Revenue here is defined as the sum of the State's Gross FAAC allocation and Internally Generated Revenue (IGR) using data obtained from NBS. In some states, this may differ from a State's available revenue which is the sum of its net FAAC and Internally Generated Revenue (IGR).�
** Includes loan repayments
Note:
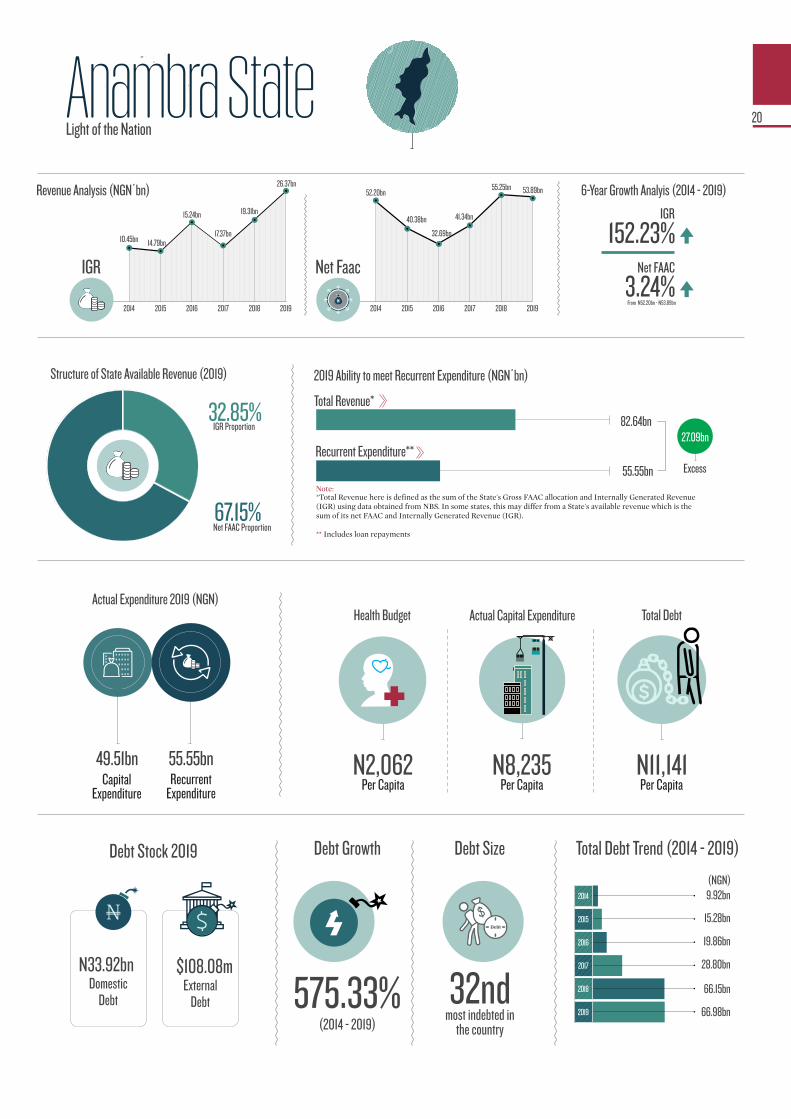
n the country, Anambra state Iranks 2nd in the 2020 Fiscal Sustainability Index and had the
best performance in the entire South-East. Buoyed by its low debt burden, t h i s f e a t i s p r a i s e w o r t h y . Notwithstanding, the state could not fully implement its budget in 2019 with its total revenue alone; total expenditure in 2019 amounted to N105.06bn and total available revenue summed up to N80.26bn with a deficit of N24.8bn. Deficits are typically financed by loans.
Trend analysis indicates that the state ’s dependence on federal allocations is reducing; 83.32% of the state’s total available revenue came from net FAAC in 2014 while in 2019 only N53.89bn, 67.15%, of the state’s total N80.26bn available revenue came from net FAAC and N26.37bn, or 32.85%, was derived from IGR. Overall, over the last six fiscal years, an average of 72.73% of the state’s r e v e n u e c a m e f r o m f e d e r a l allocations.
Year-on-year, there has been a 36.59% increase in internally generated revenue between 2018 and 2019 as the state pulled in N19.31bn and N26.37bn respectively in both years. It currently has the 18th largest IGR in the country, leaving enough room for improvement. It is commendable that Anambra got over N7.7bn from interest earnings on its investments, the main reason for its jump in internal revenues.
Total debt baggage for Anambra at the end of 2019 came to N66.98bn, a 575.33% increase from N9.92bn in 2014. Nevertheless, it is one of the
least indebted states in the country ranking 32nd by size, just slightly higher than that of Ebonyi State. Anambra has an undoubtedly low debt burden compared to other states with debt per capita of N11,141 per citizen. It is also one of the five states in the country whose total revenue in 2019 exceeded their total debt burden. The others are: Rivers, Delta, Sokoto, Yobe and Jigawa.
Recurrent expenditure recorded in Anambra’s audit report for 2018 and 2019 were N47.37bn and N55.55bn respectively, a 17.27% jump in the cost of governance for the state.
Capital expenditure per capita of N8,235 per citizen in Anambra state is slightly below the country average of N8,993, nonetheless, the state seems to be spending a reasonable ratio of its expenditure on investments in infrastructure which is critical for the growth and makes up 53% of the total e x p e n d i t u r e w h i l e c a p i t a l expenditure got 47% of the total. However, there is still room to join the ranks of Kaduna, Rivers, Akwa Ibom and Ebonyi State who invest more in capex than in recurrent expenditure.
Though Anambra spent N49.5bn on capital expenditure in 2019, the largest chunk was spent on �reform of g ove r n m e n t a n d g ove r n a n c e � (N14bn) and roads (N20.5bn). The capita l expenditure on health (N1.2bn) and education (N3.3bn) are too small for any strong intervention in human capital development. To hold its place as the Light of the Nation, investments in health and education need to be prioritised by the state.
Light of the Nation
Trend analysis indicates that the state’s dependence on federal allocations is reducing; 83.32% of the state’stotal revenue came from net FAAC in 2014
Anam
bra St
ate
2Sustainability
Ranking
21

s the Anambra state government Iprepared for an epidemic? In 2019, disease outbreak in Anambra state
experienced a spike of 250% from 231 cases to 828 cases; 683 of which were measles cases.
Sanitation, good hygiene and quality water is of great importance for a state working towards reducing the number of disease outbreaks in the state annually. Of the total households in the state only 4.6% has access to treated water and 11.8% practise open defecation in bushes and open fields causing contamination in the environment. This is an unhealthy number and the state needs to take drastic measures to improve the sanitation and water quality in the state.
As at September 1, 2020 the total confirmed Covid-19 cases in Anambra state was recorded at 216 cases with the first cases confirmed on April 10th 2020. Although the total cases in Anambra is low compared to other states, some measures needed to be taken in response to the rising spread of the virus. With the support from private institutions, efforts have been made to
equip the state to contain the virus and treat infected patients.
WHO provided support to Anambra state through the training of personnels from 21 LGAs to boost Covid-19 testing capacity. Fidelity Bank donated an Isolation centre to Anambra state, also Coalition Against COVID-19 (CACOVID) donated a 100 bed isolation. The state government needs to put out funds for the maintenance of these facilities and also do more in terms of its response to epidemics
Anambra state’s allocation to health in 2019 was N13.250bn but an actual of N1.26bn was spent, of which N892.55m was spent on health insurance. In 2020, allocation to health improvement in the revised budget is N5.59bn and to health insurance N475m. With the current rise of health issues in the country and the state, Anambra needs to prioritise its health spendings. More than this, line items should be clearly stated with r e f e r e n c e t o t h e p r e v e n t i o n a n d management of disease outbreaks, so as not to be caught unawares.
Anambra State
³⁵https://www.afro.who.int/news/who-supports-anambra-state-boost-covid-19-testing-capacity-trains-cohort-health-workers
³⁶https://businessday.ng/coronavirus/article/cacovid-donates-100-bed-isolation-centre-to-anambra-state-government/
³⁷https://www.fidelitybank.ng/fidelity-bank-donates-isolation-centre/
2016
Cholera 0CSM 0Lassa Fever 0Measles 0Monkeypox 0Yellow Fever 0Total Cases 0
2017 2018 2019
0 23 00 0 00 0 100 0 6830 0 1
62 208 13462 231 828
HEALTH FINANCING AND EPIDEMIC PREPAREDNESS
Disease outbreaks
Source: NCDC
22

Bauchi State
2014 2015 2016 2017 2018 2019
IGR
4.85bn
2014 2015 2016 2017 2018 2019
Net Faac
54.02bn 6-Year Growth Analyis (2014 - 2019)
-8.55%
Net FAAC
IGR
141.00%
N From N52.20bn - N53.89bn
78.54bn
76.87bn
41.66bn
74.09bn
94.50bn
107.50bn
133.23bn
142.38bn
2014
2015
2017
2019
2016
2018
Debt Growth
(2014 - 2019)
241.80%
Debt Size
most indebted in the country
13th
Total Debt Trend (2014 - 2019)
N101.42bn $133.90mDomestic
DebtExternal
Debt
Per Capita Analysis
N3,510
�N3,840 N19,668
Capital Expenditure
Recurrent Expenditure
78.54bn25.41bn
N
Net FAAC Proportion 81.74%
IGR Proportion 18.26%
Shortfall
-1.67bn
Debt
5.39bn
8.68bn
4.37bn
9.69bn
11.70bn
41.21bn
32.42bn
39.53bn
52.36bn
Pearl of Tourism
57.25bnRevenue Analysis (NGN’bn)
Debt Stock 2019
Per Capita Per Capita Per Capita
Health BudgetActual Expenditure 2019 (NGN)
Actual Capital Expenditure Total Debt
(NGN)
23
Total Revenue*
Recurrent Expenditure**
Structure of State Available Revenue (2019) 2019 Ability to meet Recurrent Expenditure (NGN’bn)
*Total Revenue here is defined as the sum of the State's Gross FAAC allocation and Internally Generated Revenue (IGR) using data obtained from NBS. In some states, this may differ from a State's available revenue which is the sum of its net FAAC and Internally Generated Revenue (IGR).�
** Includes loan repayments
Note:
Bauchi state ranks 30th in the 2 0 2 0 S t a t e s F i s c a l Sustainability Index. Its total
debt at the end of fiscal year 2019 peaked at N142.38bn, while domestic debt grew to N101 .42bn from N28.00bn in 2014, a significant increase of 262.23%. A state like Bauchi incurring such huge debt increases doubts on how this magnitude of debt will be repaid given its low revenue generation capacity.
Bauchi’s external debt as at 2019 was $133.8m, down -0.03% from 2018 level of $133.9m. As of 2018, per capita analysis indicates that the State owes an estimated sum of N29,276 per citizen higher than the country median of N25,421 per capita, a precarious position to be in.
Commendable efforts have also been s h o w n b y t h e B a u c h i S t a t e Government as its IGR has grown at an encouraging pace from N4.85bn in 2014 to N11.70bn in 2019.
Also in 2019, the state outperformed its counterparts in the North-Eastern region having grown its IGR by 20.70% from N9.69bn in 2018 to N11.70bn in 2019. Notwithstanding, there is still the need for more work to grow its IGR as the state’s IGR currently ranks 26th by size, one of the smallest among Nigerian states in 2019. Our findings showed that it
grew a component of its IGR known as Repayments� from N361m in 2018 to N4.21bn in 2019.
Bauchi is one of the most vulnerable State’s to the effects of COVID-19 induced distortions to FG’s revenue. In 2019, N52.36bn, or 81.74%, of the state’s N64.05bn available revenue came from the federal government while N11.70bn, or 18.26%, was obtained from its IGR.
Bauchi state has an additional viable means of increasing its IGR. �The Pearl of Tourism� has many tourist facilities such as Yankari Game Reserve, and Wikki Warm Springs which the state can leverage to boost its economy.
The state prioritised recurrent o b l i g a t i o n s i n 2 0 1 9, g u l p i n g N78.54bn, or 75.56%, of its N103.96bn total expenditure while its capital obligations received N25.41bn, or 24.44%. Bauchi state can make significant gains if it reins in its N25.88bn overhead cost, the highest in the North-East region and which is also 1.84% higher than its capital expenditure of N25.41bn.
Bauchi will need to rework its fiscal policy so as to be �for the people� not for the �few. Bauchi needs to tilt its capital expenditure on the social sector which received N5.79bn in 2019.
Pearl of Tourism
The state prioritised recurrent obligations in 2019, gulping N78.54bn, or 75.56%, of its N103.96bn total expenditure while its capital obligations received N25.41bn, or 24.44%.
Bauc
hi Sta
te
30Sustainability
Ranking
24
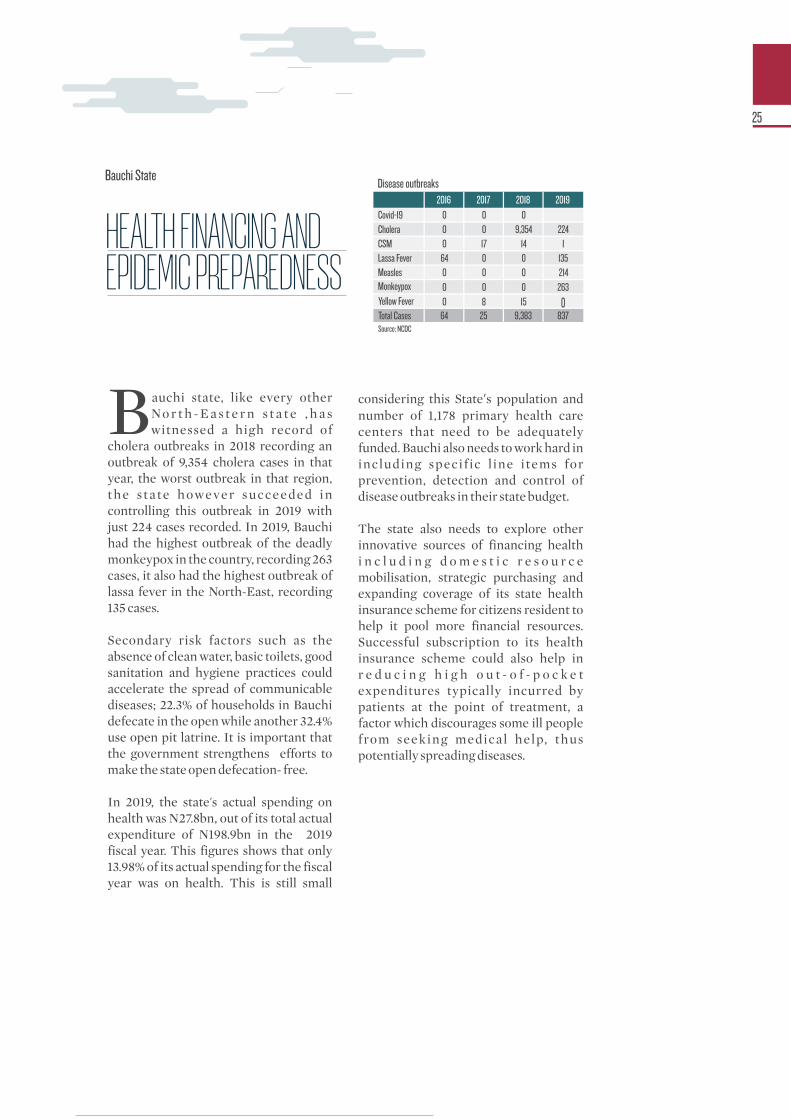
auchi state, like every other BNo r t h - E a s t e r n s t a t e , h a s witnessed a high record of
cholera outbreaks in 2018 recording an outbreak of 9,354 cholera cases in that year, the worst outbreak in that region, the s ta te however succeeded in controlling this outbreak in 2019 with just 224 cases recorded. In 2019, Bauchi had the highest outbreak of the deadly monkeypox in the country, recording 263 cases, it also had the highest outbreak of lassa fever in the North-East, recording 135 cases.
Secondary risk factors such as the absence of clean water, basic toilets, good sanitation and hygiene practices could accelerate the spread of communicable diseases; 22.3% of households in Bauchi defecate in the open while another 32.4% use open pit latrine. It is important that the government strengthens efforts to make the state open defecation- free.
In 2019, the state's actual spending on health was N27.8bn, out of its total actual expenditure of N198.9bn in the 2019 fiscal year. This figures shows that only 13.98% of its actual spending for the fiscal year was on health. This is still small
considering this State’s population and number of 1,178 primary health care centers that need to be adequately funded. Bauchi also needs to work hard in including specif ic l ine items for prevention, detection and control of disease outbreaks in their state budget.
The state also needs to explore other innovative sources of financing health i n c l u d i n g d o m e s t i c r e s o u r c e mobilisation, strategic purchasing and expanding coverage of its state health insurance scheme for citizens resident to help it pool more financial resources. Successful subscription to its health insurance scheme could also help in r e d u c i n g h i g h o u t - o f - p o c k e t expenditures typically incurred by patients at the point of treatment, a factor which discourages some ill people from seeking medical help, thus potentially spreading diseases.
HEALTH FINANCING AND EPIDEMIC PREPAREDNESS
Bauchi State
2016
Covid-19 0Cholera 0CSM 0Lassa Fever 64Measles 0Monkeypox 0Yellow Fever 0Total Cases 64
2017 2018 2019
0 00 9,354 22417 14 10 0 1350 0 2140 0 2638 15 0
25 9,383 837
Disease outbreaks
Source: NCDC
25
Bayelsa State
2014 2015 2016 2017 2018 2019
IGR
10.96bn
2014 2015 2016 2017 2018 2019
Net Faac
153.10bn6-Year Growth Analyis (2014 - 2019)
-7.15%
Net FAAC
IGR
49.14%
N From N150.91bn - N140.12bn
147.16bn
173.93bn
97.11bn
110.62bn
150.08bn
144.03bn
147.32bn
166.15bn
2014
2015
2017
2019
2016
2018
Debt Growth
(2014 - 2019)
71.08%
Debt Size
most indebted in the country
11th
Total Debt Trend (2014 - 2019)
N147.93 $59.55mDomestic
DebtExternal
Debt
Per Capita Analysis
N16,965
N7,111 N66,859Capital
ExpenditureRecurrent
Expenditure
147.16bn42.16bn
N
Net FAAC Proportion 89.56%
IGR Proportion 10.44%
Excess
26.76bn
Debt
8.71bn7.91bn
12.52bn 13.64bn
16.34bn
88.31bn
58.06bn
105.26bn
140.13bn
Glory of all Land
150.91bnRevenue Analysis (NGN’bn)
Debt Stock 2019
Per Capita Per Capita Per Capita
Health BudgetActual Expenditure 2019 (NGN)
Actual Capital Expenditure Total Debt
(NGN)
26
Total Revenue*
Recurrent Expenditure**
Structure of State Available Revenue (2019) 2019 Ability to meet Recurrent Expenditure (NGN’bn)
*Total Revenue here is defined as the sum of the State's Gross FAAC allocation and Internally Generated Revenue (IGR) using data obtained from NBS. In some states, this may differ from a State's available revenue which is the sum of its net FAAC and Internally Generated Revenue (IGR).�
** Includes loan repayments
Note:
Baye
lsa St
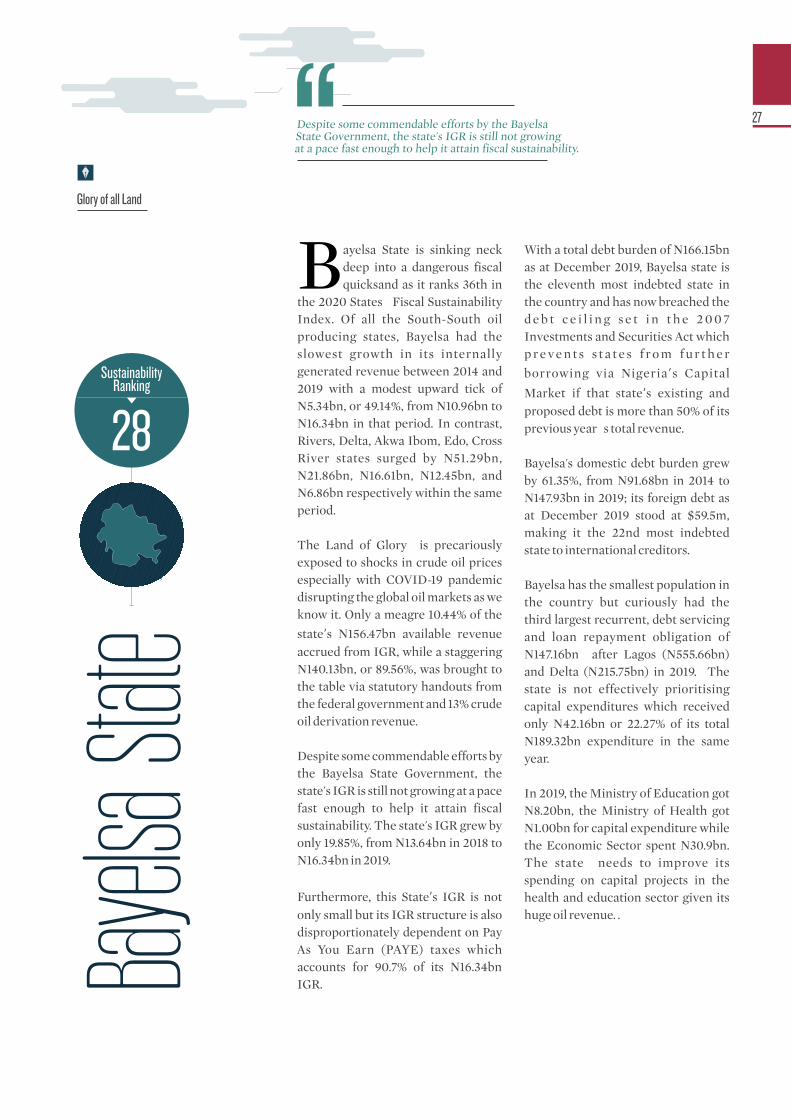
ateBayelsa State is sinking neck
deep into a dangerous fiscal quicksand as it ranks 36th in
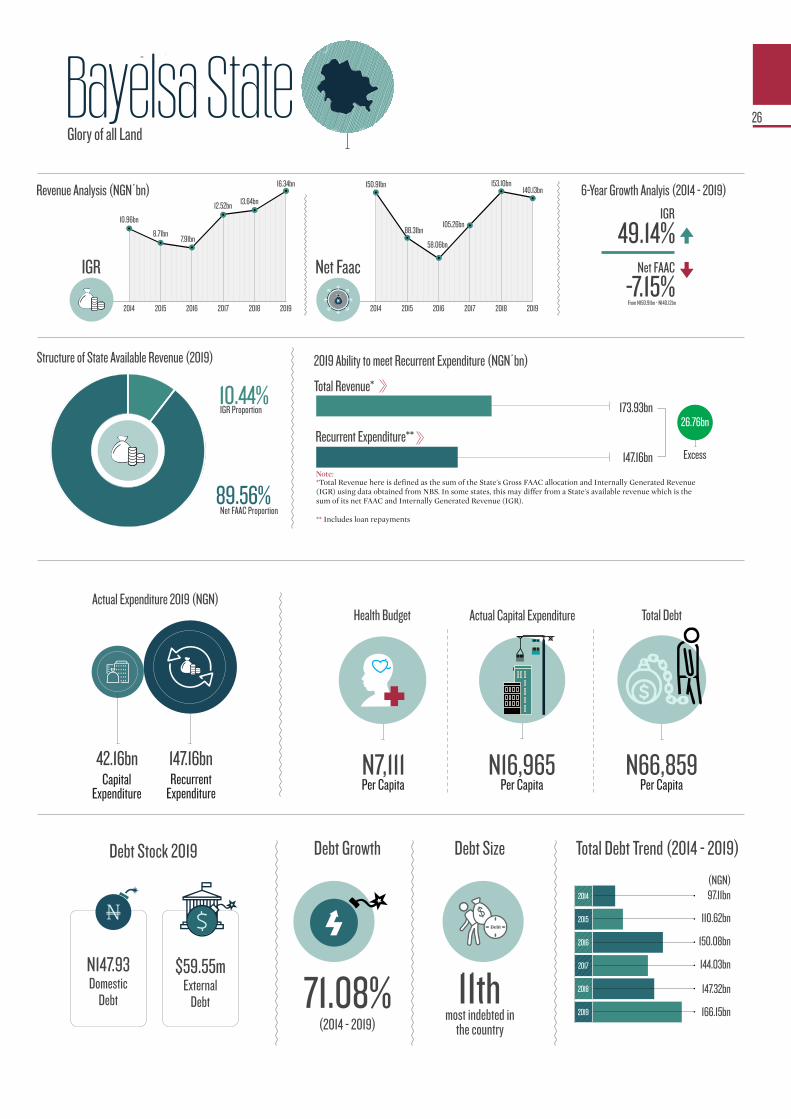
the 2020 States� Fiscal Sustainability Index. Of all the South-South oil producing states, Bayelsa had the slowest growth in its internally generated revenue between 2014 and 2019 with a modest upward tick of N5.34bn, or 49.14%, from N10.96bn to N16.34bn in that period. In contrast, Rivers, Delta, Akwa Ibom, Edo, Cross River states surged by N51.29bn, N21.86bn, N16.61bn, N12.45bn, and N6.86bn respectively within the same period.
The Land of Glory� is precariously exposed to shocks in crude oil prices especially with COVID-19 pandemic disrupting the global oil markets as we know it. Only a meagre 10.44% of the
state’s N156.47bn available revenue accrued from IGR, while a staggering N140.13bn, or 89.56%, was brought to the table via statutory handouts from the federal government and 13% crude oil derivation revenue.
Despite some commendable efforts by the Bayelsa State Government, the state's IGR is still not growing at a pace fast enough to help it attain fiscal sustainability. The state's IGR grew by only 19.85%, from N13.64bn in 2018 to N16.34bn in 2019.
Furthermore, this State’s IGR is not only small but its IGR structure is also disproportionately dependent on Pay As You Earn (PAYE) taxes which accounts for 90.7% of its N16.34bn IGR.
With a total debt burden of N166.15bn as at December 2019, Bayelsa state is the eleventh most indebted state in the country and has now breached the d e b t c e i l i n g s e t i n t h e 2 0 0 7 Investments and Securities Act which p r e v e n t s s t a t e s f r o m f u r t h e r
borrowing via Nigeria’s Capital
Market if that state’s existing and proposed debt is more than 50% of its previous year�s total revenue.
Bayelsa's domestic debt burden grew by 61.35%, from N91.68bn in 2014 to N147.93bn in 2019; its foreign debt as at December 2019 stood at $59.5m, making it the 22nd most indebted state to international creditors.
Bayelsa has the smallest population in the country but curiously had the third largest recurrent, debt servicing and loan repayment obligation of N147.16bn after Lagos (N555.66bn) and Delta (N215.75bn) in 2019. The state is not effectively prioritising capital expenditures which received only N42.16bn or 22.27% of its total N189.32bn expenditure in the same year.
In 2019, the Ministry of Education got N8.20bn, the Ministry of Health got N1.00bn for capital expenditure while the Economic Sector spent N30.9bn. The state needs to improve its spending on capital projects in the health and education sector given its huge oil revenue. .
Glory of all Land
28Sustainability
Ranking
Despite some commendable efforts by the Bayelsa State Government, the state's IGR is still not growing at a pace fast enough to help it attain fiscal sustainability.
27
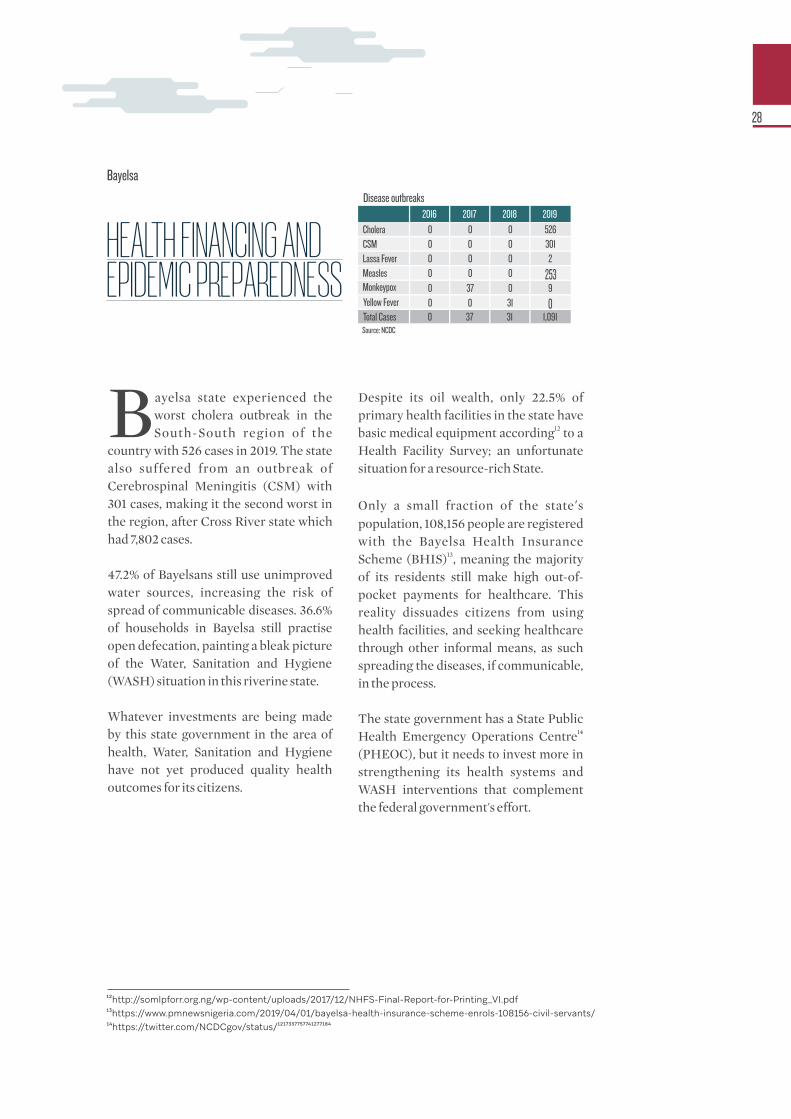
ayelsa state experienced the Bworst cholera outbreak in the South-South region of the
country with 526 cases in 2019. The state also suffered from an outbreak of Cerebrospinal Meningitis (CSM) with 301 cases, making it the second worst in the region, after Cross River state which had 7,802 cases.
47.2% of Bayelsans still use unimproved water sources, increasing the risk of spread of communicable diseases. 36.6% of households in Bayelsa still practise open defecation, painting a bleak picture of the Water, Sanitation and Hygiene (WASH) situation in this riverine state.
Whatever investments are being made by this state government in the area of health, Water, Sanitation and Hygiene have not yet produced quality health outcomes for its citizens.
Despite its oil wealth, only 22.5% of primary health facilities in the state have
12basic medical equipment according to a Health Facility Survey; an unfortunate situation for a resource-rich State.
Only a small fraction of the state’s population, 108,156 people are registered with the Bayelsa Health Insurance
13Scheme (BHIS) , meaning the majority of its residents still make high out-of-pocket payments for healthcare. This reality dissuades citizens from using health facilities, and seeking healthcare through other informal means, as such spreading the diseases, if communicable, in the process.
The state government has a State Public 14Health Emergency Operations Centre
(PHEOC), but it needs to invest more in strengthening its health systems and WASH interventions that complement the federal government's effort.
¹²http://somlpforr.org.ng/wp-content/uploads/2017/12/NHFS-Final-Report-for-Printing_VI.pdf
Bayelsa
¹³https://www.pmnewsnigeria.com/2019/04/01/bayelsa-health-insurance-scheme-enrols-108156-civil-servants/¹⁴https://twitter.com/NCDCgov/status/¹²¹⁷³³⁷⁷⁵⁷⁷⁴¹²⁷⁷¹⁸⁴
HEALTH FINANCING AND EPIDEMIC PREPAREDNESS
2016
Cholera 0CSM 0Lassa Fever 0Measles 0Monkeypox 0Yellow Fever 0Total Cases 0
2017 2018 2019
0 0 5260 0 3010 0 20 0 25337 0 90 31 0
37 31 1,091
Disease outbreaks
Source: NCDC
28
Benue State
2014 2015 2016 2017 2018 2019
IGR
8.28bn
2014 2015 2016 2017 2018 2019
Net Faac
55.44bn6-Year Growth Analyis (2014 - 2019)
2.93%
Net FAAC
IGR
115.47%
N From N150.91bn - N140.12bn
78.78bn
79.22bn
22.93bn
46.82bn
72.28bn
85.76bn
109.43bn
108.96bn
2014
2015
2017
2019
2016
2018
Debt Growth
(2014 - 2019)
375.16%
Debt Size
most indebted in the country
19th
Total Debt Trend (2014 - 2019)
N98.73bn $33.42mDomestic
DebtExternal
Debt
Per Capita Analysis
N2,014N3,279 N17,343
Capital Expenditure
Recurrent Expenditure
78.78bn12.66bn
N
Net FAAC Proportion 75.27%
IGR Proportion 24.73%
Excess
0.44bn
Debt
7.63bn9.56bn
12.40bn 11.22bn
17.85bn
37.82bn29.71bn
39.80bn
54.34bn
Food Basket of the Nation
52.79bnRevenue Analysis (NGN’bn)
Debt Stock 2019
Per Capita Per Capita Per Capita
Health BudgetActual Expenditure 2019 (NGN)
Actual Capital Expenditure Total Debt
(NGN)
29
Total Revenue*
Recurrent Expenditure**
Structure of State Available Revenue (2019) 2019 Ability to meet Recurrent Expenditure (NGN’bn)
*Total Revenue here is defined as the sum of the State's Gross FAAC allocation and Internally Generated Revenue (IGR) using data obtained from NBS. In some states, this may differ from a State's available revenue which is the sum of its net FAAC and Internally Generated Revenue (IGR).�
** Includes loan repayments
Note:
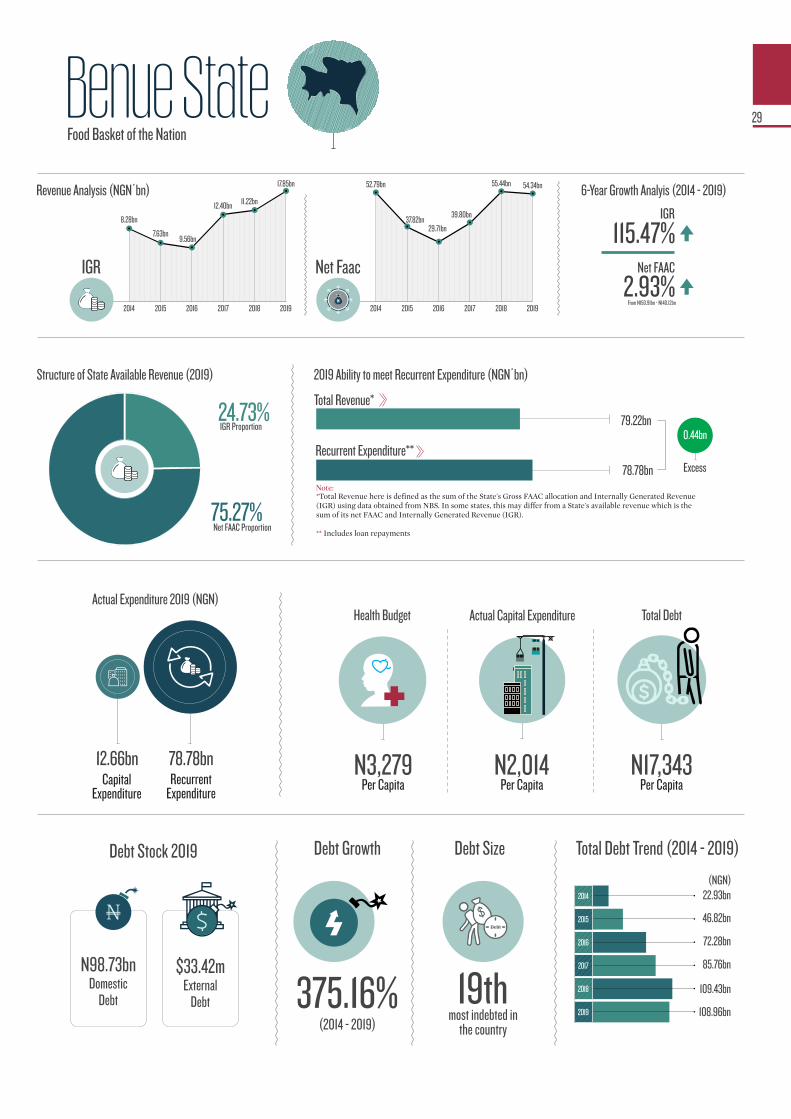
Benue state which ranks 32nd i n t h e 2 0 2 0 F i s c a l Sustainability Index will do
well to checkmate its rising debt profile, as this north-central state continues to find itself entering uncharted debt stock territories.
As of December 31, 2019, the Debt Management Office (DMO) put the state ’s total debt portfol io at N109.62bn. The state’s domestic debt which as at the end of 2016 was estimated to be N63.53bn, has since risen to N98.73bn in 2019, as recorded by the DMO. External debt on the other hand, within the same period, reduced from $34.68m in 2016 to $33.42m, as at the end of 2019.
The state’s capital expenditure per capita stands at �N2,014 per citizen, the lowest in Niger ia . Capex accounted for N12.66bn or 13.84% of t h e s t a t e ’ s N 9 1 . 4 4 b n t o t a l ex p e n d i t u r e w h i l e r e c u r r e n t expenditure gulped a staggering N78.78bn which was N6.59bn more than its total available revenue of N72.19bn, a situation that could tip Benue state further into debt.
From the State�s capital expenditure, t h e S o c i a l S e c t o r ( i n c l u d i n g education and health) got N241m while the economic sector received N6.67bn, �prior year adjustments� r e c o r d e d N 5 . 6 9 b n a n d t h e administrative sector received N37m. Benue ’s IGR keeps oscillating between growth and decline, most notably between 2014 and 2019. In simpler terms, the state’s IGR has
both increased (notably in 2014, 2016 & 2017) and also decreased (notably in 2015 and 2018).
The north-central state was able to amass an IGR of N7.63bn, N9.56bn and N12.40bn in 2015, 2016 and 2017 respectively. Internally generated revenue however dipped in 2018, anchoring at N11.22bn but saw an uptick by 59.16% to N17.85bn in 2019. However, this growth is not sufficient to bail the state out of its current fiscal crisis.
Unfortunately, federation handouts continue to account for the larger percentage of the state's total revenue; Its 2019 IGR accounted for only 24.73% of its total available revenue of N72.19bn, this is a mild but commendable improvement from 2018 where its IGR accounted for 16.83% of its total N66.66bn revenue.
In clear terms, this state cannot s u c c e s s f u l l y m e e t i t s s t a t e expenditure obligations without reliance on the federal government. This is a critical concern especially in recent times due to dwindling federally collected funds, which directly affects amounts shared to states as FAAC allocations.
As the food basket of the nation, Benue state would have to delve deeper into utilising its agricultural resources to bolster its IGR, also taking into account the fact that a large majori ty of i ts working population are directly, or indirectly, engaged in its agricultural sector.
Food Basket of the Nation
The north-central state was able to amass an IGR of N7.63bn, N9.56bn and N12.40bn in 2015, 2016 and 2017 respectively.
Benu
e Stat
e
32Sustainability
Ranking
30

n 2019, Benue state recorded a total Iof 369 cases of varying infectious diseases including yellow fever,
measles and lassa fever. Measles cases witnessed a spike, from a low level of 16 cases in 2016 to 221 new cases in 2019--the second highest in the North-Central region. Yellow fever, lassa fever and Cerebrospinal Meningitis each had 112, 19 and 17 cases respectively.
Before the spread of the novel COVID-19 virus around the world, the country as a whole in 2019 had to deal with the outbreak of yellow fever, with cases being confirmed around the north-central part of the country as far back as September 2017. Based on the risk assessment conducted by the WHO, the yellow fever outbreak transmissions in Benue represented an escalation of the disease transmission posing higher likelihood for yellow fever to spread due to a large number of unimmunised population residing in the states.
Benue state has committed 9.3% of its total budget of N189.48bn to its health
sector for the 2020 fiscal year. With total allocation for health coming in at N17.6bn, the figure represents a decrease in allocation for health when compared to the previous year when N20.6bn--about 10.48% of its budget was allocated to health sector, an increase from the 8.2% budget allocation towards health in their 2018 budget. In the last three years, total budgetary allocation towards health in Benue state has fallen short of the recommended commitment of at least 15% of the total state budget allocation for subnational government.
Although Benue is one of the 9 states in the country which recorded less than 500 total cases each of the total 94,843 disease cases recorded in 2019 for cholera, CSM, yellow fever, monkeypox, lassa fever and measles, the state still needs to pay attention to its Water, Sanitation and Hygiene situation. 44.8% of households in Benue still practise open defecation while 11.4% use open pit latrines. 26.9% do not have access to improved sources of water.
Benue State
³⁸https://ncdc.gov.ng/news/189/the-ncdc-is-aware-of-a-suspected-outbreak-of-yellow-fever-in-ebonyi-state
2016
Cholera 0CSM 0Lassa Fever 0Measles 0Monkeypox 0Yellow Fever 0Total Cases 0
2017 2018 2019
0 0 00 0 170 0 1916 0 2212 0 0
30 110 11248 110 369
Disease outbreak profile
HEALTH FINANCING AND EPIDEMIC PREPAREDNESS
31
Borno State
2014 2015 2016 2017 2018 2019
IGR2.76bn
2014 2015 2016 2017 2018 2019
Net Faac
63.27bn6-Year Growth Analyis (2014 - 2019)
-2.40%
Net FAAC
IGR
196.12%
N From N63.23bn - N61.71bn
51.37bn
74.66bn
25.90bn
26.81bn
36.50bn
60.93bn
74.98bn
88.83bn
2014
2015
2017
2019
2016
2018
Debt Growth
(2014 - 2019)
242.98%
Debt Size
most indebted in the country
25th
Total Debt Trend (2014 - 2019)
83.60bn $17.11mDomestic
DebtExternal
Debt
Per Capita Analysis
N5,921
N2,327 N13,689
Capital Expenditure
Recurrent Expenditure
51.37bn38.42bn
N
Net FAAC Proportion 88.30%
IGR Proportion 11.70%
Excess
23.29bn
Debt
3.53bn2.68bn
4.98bn
6.52bn
8.18bn
48.24bn
36.93bn
46.54bn
61.71bn
Home of Peace
63.23bnRevenue Analysis (NGN’bn)
Debt Stock 2019
Per Capita Per Capita Per Capita
Health BudgetActual Expenditure 2019 (NGN)
Actual Capital Expenditure Total Debt
(NGN)
32
Total Revenue*
Recurrent Expenditure**
Structure of State Available Revenue (2019) 2019 Ability to meet Recurrent Expenditure (NGN’bn)
*Total Revenue here is defined as the sum of the State's Gross FAAC allocation and Internally Generated Revenue (IGR) using data obtained from NBS. In some states, this may differ from a State's available revenue which is the sum of its net FAAC and Internally Generated Revenue (IGR).�
** Includes loan repayments
Note:
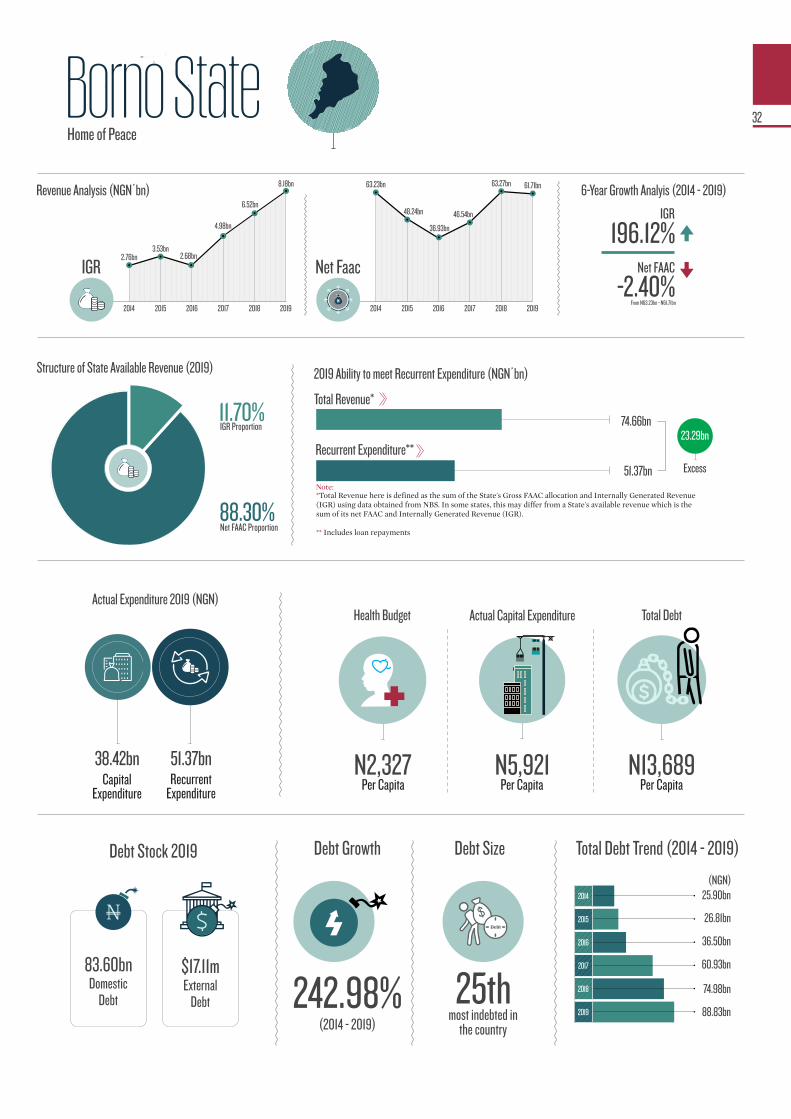
Bo r n o i s i n a d i s t i n c t l y unfortunate position due to persistent attacks by terrorist
organisations that cause the state to incur otherwise avoidable expenses while also crippling the state�s ability to significantly improve its internally g e n e r a t e d r e v e n u e a m i d s t overwhelming human development issues.
Borno’s total available revenue in 2019 was N69.89bn; its fiscal plan was highly dependent on statutory r e v e n u e f r o m t h e f e d e r a l government which brought in N61.71bn, or 88.30%, of the state’s available revenue while N8.18bn, or 11.70%, came from internally generated revenue.
The state’s meagre IGR grew by a commendable 196.12%, from N2.76bn i n 2 0 14 t o N 8 . 1 8 b n i n 2 0 1 9. Nevertheless, its IGR per capita is N1,260 per capita, the lowest among its peers, while its total IGR ranks 32nd in Nigeria, one of the smallest by size in the country.
In pre-COVID-19 Nigeria, revenue from FG on which the state relies declined by -2.46% from N63.27bn in 2018 to N61.71bn in 2019. This downward sl ide may continue especially with recent COVID-19 distortions to the FG’s revenue. In the nearest future, this state may find itself incurring more debt or struggling with its expenditure obligations as it grapples with reviving its local economy and insurgency.
As at December 2019, overall, the state�s total debt was approximately N88.83bn, a 242.98% increase from N25.90bn in 2014. Notwithstanding, it is still among the 15 States in the country with the smallest debt profiles.
Borno’s domestic debt rose at an average rate of 22.25%, f rom N68.38bn in 2018 to N83.60bn in 2019. However, its foreign debt stock has seen a decline by -20.86%, from $21.62m in 2018 to $17.11m in 2019.
B o r n o p r i o r i t i s e s r e c u r r e n t expenditure; its 2019, recurrent expenditure was N51.37bn which was 1.34 times its capital expenditure of N38.42bn - better than the country average. On the average, Nigerian states� expenditure on recurrent obligations in 2019 was 2.73 times t h e i r c a p i t a l e x p e n d i t u r e . Nevertheless , Borno ’s capita l expenditure is still the highest in the North-East region.
Borno state, Nigeria’s second-largest by land mass, is planning N110.04bn total expenditure in 2020. To meet this target, �The Home of Peace� needs to be peaceful enough for the local economy to thrive so that its IGR may increase. Also, Borno needs to ar t icu late a v i s ion around sustainable trade within its borders to boost employment in a post-crisis environment.
Home of Peace
In the nearest future, this state may find itself Incurring more debt or struggling with its expenditure obligations as it grapples with reviving its local economy and insurgency.
Borno
State
15Sustainability
Ranking
33
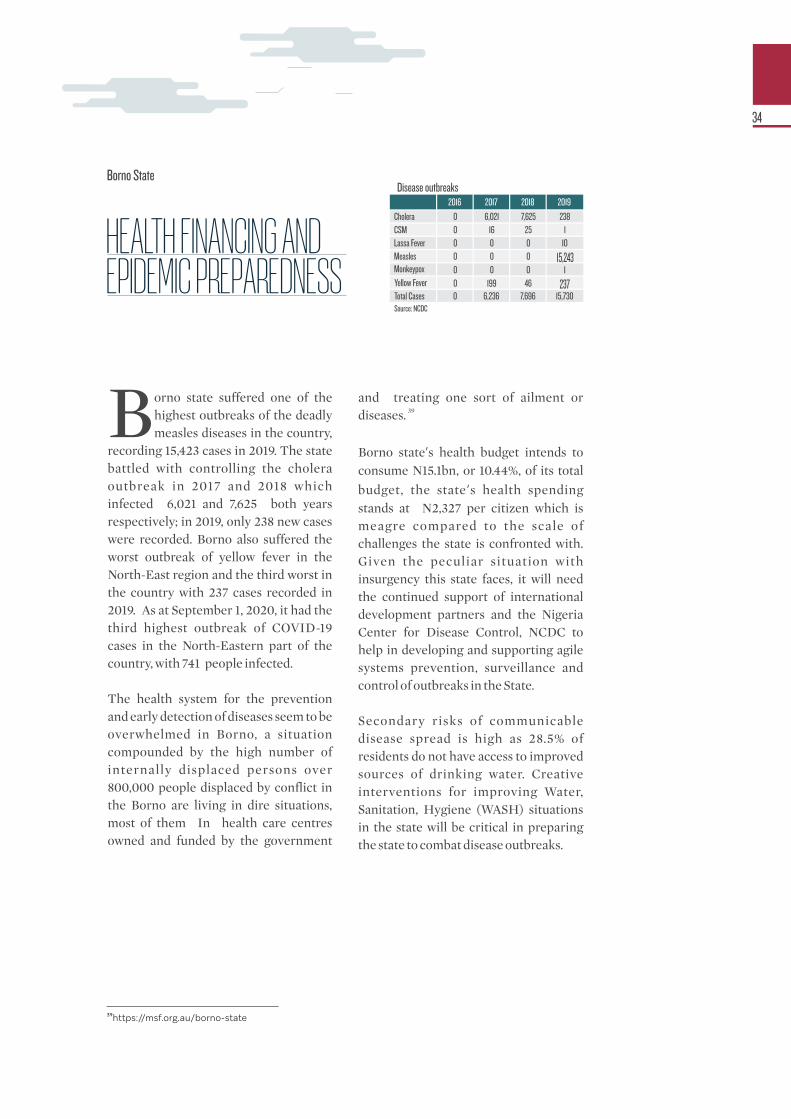
orno state suffered one of the Bhighest outbreaks of the deadly measles diseases in the country,
recording 15,423 cases in 2019. The state battled with controlling the cholera outbreak in 2017 and 2018 which infected 6,021 and 7,625 both years respectively; in 2019, only 238 new cases were recorded. Borno also suffered the worst outbreak of yellow fever in the North-East region and the third worst in the country with 237 cases recorded in 2019. As at September 1, 2020, it had the third highest outbreak of COVID-19 cases in the North-Eastern part of the country, with 741 people infected.
The health system for the prevention and early detection of diseases seem to be overwhelmed in Borno, a situation compounded by the high number of internally displaced persons over 800,000 people displaced by conflict in the Borno are living in dire situations, most of them In health care centres owned and funded by the government
and treating one sort of ailment or 39diseases.
Borno state’s health budget intends to consume N15.1bn, or 10.44%, of its total
budget, the state’s health spending stands at N2,327 per citizen which is meagre compared to the scale of challenges the state is confronted with. Given the peculiar situation with insurgency this state faces, it will need the continued support of international development partners and the Nigeria Center for Disease Control, NCDC to help in developing and supporting agile systems prevention, surveillance and control of outbreaks in the State.
Secondary risks of communicable disease spread is high as 28.5% of residents do not have access to improved sources of drinking water. Creative interventions for improving Water, Sanitation, Hygiene (WASH) situations in the state will be critical in preparing the state to combat disease outbreaks.
HEALTH FINANCING AND EPIDEMIC PREPAREDNESS
Borno State
³⁹https://msf.org.au/borno-state
2016
Cholera 0CSM 0Lassa Fever 0Measles 0Monkeypox 0Yellow Fever 0Total Cases 0
2017 2018 2019
6,021 7,625 23816 25 10 0 100 0 15,2430 0 1
199 46 2376,236 7,696 15,730
Disease outbreaks
Source: NCDC
34

Cross River State
2014 2015 2016 2017 2018 2019
IGR
15.74bn
2014 2015 2016 2017 2018 2019
Net Faac
36.95bn
6-Year Growth Analyis (2014 - 2019)
-27.06%
Net FAAC
IGR
43.58%
N From N63.23bn - N61.71bn
71.07bn
77.46bn
129.41bn
141.80bn
157.15bn
176.83bn
225.55bn
230.88bn
2014
2015
2017
2019
2016
2018
Debt Growth
(2014 - 2019)
78.41%
Debt Size
most indebted in the country
6th
Total Debt Trend (2014 - 2019)
N166.95bn $208.96mDomestic
DebtExternal
Debt
Per Capita Analysis
N6,879
N15,719 N54,740
Capital Expenditure
Recurrent Expenditure
71.07bn29.01bn
N
Net FAAC Proportion 61.64%
IGR Proportion 38.36%
Shortfall
6.39bn
Debt
13.57bn14.78bn
18.10bn 17.55bn
22.60bn
30.04bn
17.35bn23.45bn
36.31bn
The Peopleʼs Paradise
49.78bnRevenue Analysis (NGN’bn)
Debt Stock 2019
Per Capita Per Capita Per Capita
Health BudgetActual Expenditure 2019 (NGN)
Actual Capital Expenditure Total Debt
(NGN)
35
Total Revenue*
Recurrent Expenditure**
Structure of State Available Revenue (2019) 2019 Ability to meet Recurrent Expenditure (NGN’bn)
*Total Revenue here is defined as the sum of the State's Gross FAAC allocation and Internally Generated Revenue (IGR) using data obtained from NBS. In some states, this may differ from a State's available revenue which is the sum of its net FAAC and Internally Generated Revenue (IGR).�
** Includes loan repayments
Note:

he People's Paradise�, Cross TRiver state, sits on the 14th position on the States� Fiscal
Sustainability Index. The state is w e i g h e d d o w n l a r g e l y b y i t s skyrocket ing debt burden, low internally generated revenue, and recurrent expenditure profile that could use some more prudent shavings.
3The state’s debt burden shot up by 78.41%, from N129.41bn in 2014 to
4N230.88bn in 2019, sailing recklessly into uncharted fiscal waters. In Q3
52020 the state slashed its budget from N1.1trillion to N147bn; although, the government indicated this drastic cut was due to the COVID-19 pandemic, in reality the cut is equally reflective of general disinterest from creditors to lend it more money given its risky fiscal situation.
Its IGR appreciated by 28.74%, from N15.74bn in 2018 to N22.60bn in 2019; this is commendable growth but not good enough to bail it out of its current fiscal problems especially as its statutory revenue from federal government through Net FAAC dwindled by -27.06% from N49.78bn in 2014 to N36.31bn in 2019.
Pay As You Earn (PAYE) accounted for N6.5bn or 28.78% of its total N22.60bn IGR, road taxes brought in N850.36m or 4.43% while other taxes N11.75bn or 51.98%.
The state needs to strengthen its collaboration with FG to ensure that the 673km coastal rail line passing
6through Obudu-Calabar-Lagos- Warri 7becomes a reality. This will boost the
state’s tourism profile through its f a m o u s O b u d u R e s o r t s a n d internationally acclaimed Calabar Fe s t i v a l , t h u s c o n t r i b u t i n g t o strengthening its local economy.
Cross River state also needs to ramp up investment in its people; its 2019 capex stood at �N6,879 per capita, whereas it had a recurrent expenditure of more than twice that amount at N16,850 per capita. Recall that in 2016, in one fell swoop, the governor announced the
8appointment of 6,000 political aides ; intertemporal choices like this that add
to a state’s recurrent obligations and operating expenses often hurt future availability of revenue for capital expenditure.
Cross River continues a ridiculous budget assumption that is in wide variance with its actual numbers and the state needs to rein in its bogus projects that require full private sector investments. For example, the state planned to spend a record N1.04tn on capital expenditure, but in actual terms it was only able to finance projects with N29bn, highlighting a 2.78% capital budget performance.
The People’s Paradise
Cross River state also needs to ramp up investment in its people; its 2019 capex stood at �6,879 per capita, whereas it had a recurrent expenditure of more than twice that amount at N16,850 per capita.
3http://www.crossriverstate.gov.ng/images/Debt-Management-Documents/2019-ANNUAL-REPORT-FINAL.pdf4This analysis used official estimates from the Debt Management Office and an exchange rate as of N305.9 for foreign debt components as at December 2019. Cross River state in its own official 2019 Annual Debt Management Report lists its total debt at N260.99bn. This will put the state�s debt growth at 101.68% from its total debt position of N129.41bn in 2014 to N260.99bn in 20195https://www.premiumtimesng.com/regional/south-south-regional/405359-covid-19-cross-river-slashes-2020-budget-from-n1-1tr-to-n147-1bn.html6https://nipc.gov.ng/2017/10/04/federal-government-setup-plans-construction-ten-new-rail-lines/7https://www.pulse.ng/news/local/5-reasons-why-the-obudu-international-airport-is-a-hoax/y4fl9718https://punchng.com/ayade-appoint-6000-aides-2017/
Cross
-River
State
14Sustainability
Ranking
36
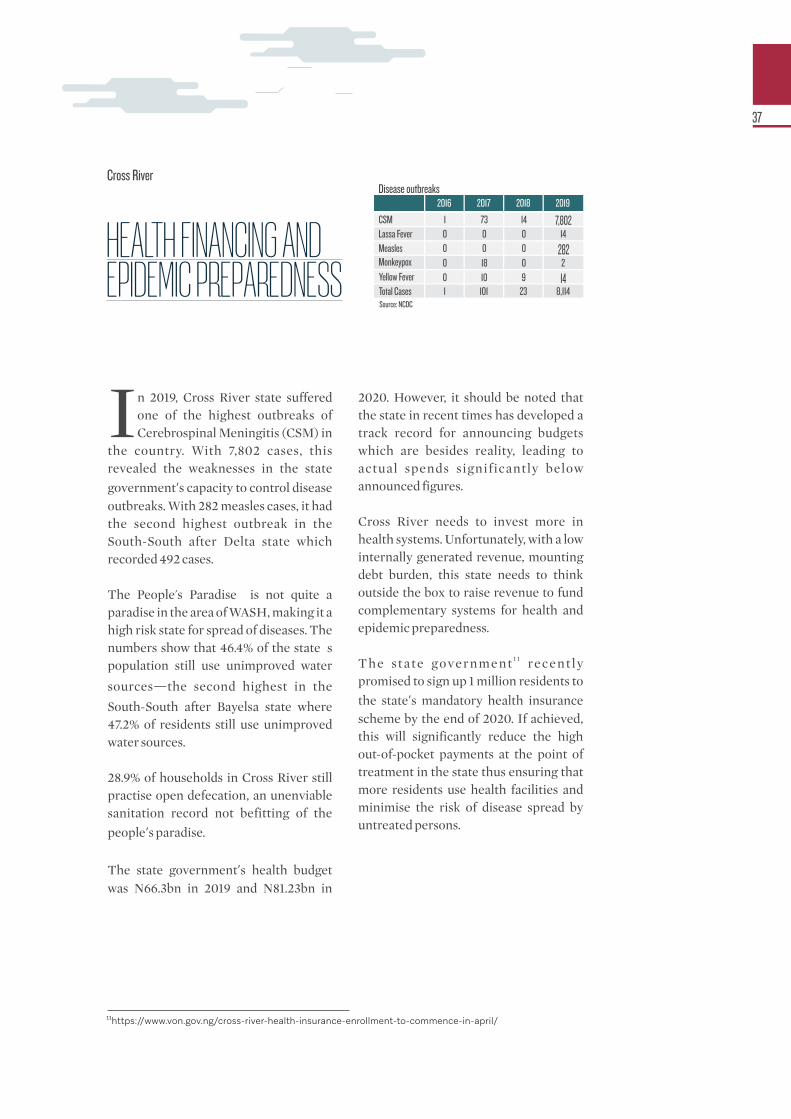
n 2019, Cross River state suffered Ione of the highest outbreaks of Cerebrospinal Meningitis (CSM) in
the country. With 7,802 cases, this revealed the weaknesses in the state
government’s capacity to control disease outbreaks. With 282 measles cases, it had the second highest outbreak in the South-South after Delta state which recorded 492 cases.
The People's Paradise� is not quite a paradise in the area of WASH, making it a high risk state for spread of diseases. The numbers show that 46.4% of the state�s population still use unimproved water
sources—the second highest in the
South-South after Bayelsa state where 47.2% of residents still use unimproved water sources.
28.9% of households in Cross River still practise open defecation, an unenviable sanitation record not befitting of the
people’s paradise.
The state government’s health budget was N66.3bn in 2019 and N81.23bn in
2020. However, it should be noted that the state in recent times has developed a track record for announcing budgets which are besides reality, leading to actual spends significantly below announced figures.
Cross River needs to invest more in health systems. Unfortunately, with a low internally generated revenue, mounting debt burden, this state needs to think outside the box to raise revenue to fund complementary systems for health and epidemic preparedness.
1 1The state government recent ly promised to sign up 1 million residents to
the state’s mandatory health insurance scheme by the end of 2020. If achieved, this will significantly reduce the high out-of-pocket payments at the point of treatment in the state thus ensuring that more residents use health facilities and minimise the risk of disease spread by untreated persons.
¹¹https://www.von.gov.ng/cross-river-health-insurance-enrollment-to-commence-in-april/
Cross River
2016
CSM 1Lassa Fever 0Measles 0Monkeypox 0Yellow Fever 0Total Cases 1
2017 2018 2019
73 14 7,8020 0 140 0 28218 0 210 9 14101 23 8,114
HEALTH FINANCING AND EPIDEMIC PREPAREDNESS
Disease outbreaks
Source: NCDC
37
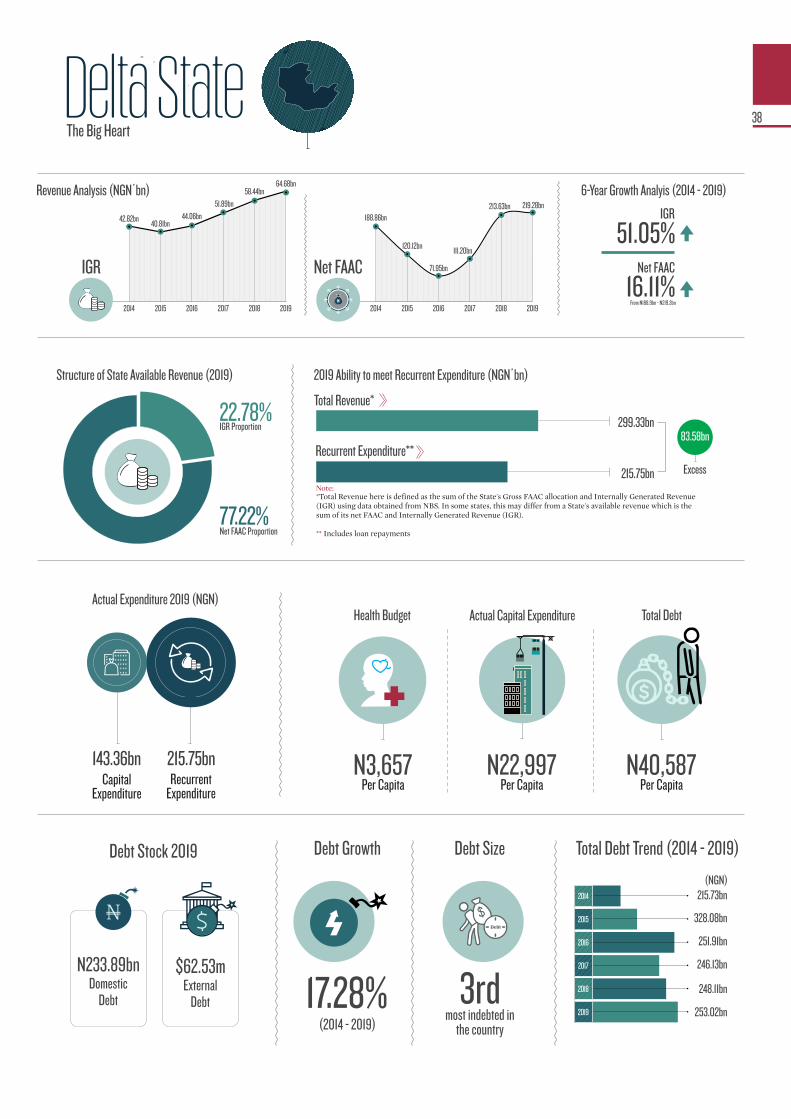
Delta StateThe Big Heart
2014 2015 2016 2017 2018 2019
Net FAAC
188.86bn
120.12bn
71.95bn
111.20bn
213.63bn 219.28bn
6-Year Growth Analyis (2014 - 2019)
16.11%Net FAAC
IGR
51.05%
From N188.9bn - N219.3bn
215.75bn
299.33bn
215.73bn
328.08bn
251.91bn
246.13bn
248.11bn
253.02bn
2014
2015
2017
2019
2016
2018
Debt Growth
(2014 - 2019)
17.28%
Debt Size
most indebted in the country
3rd
Total Debt Trend (2014 - 2019)
N233.89bn $62.53mDomestic
DebtExternal
Debt
N22,997N3,657 N40,587Capital
ExpenditureRecurrent
Expenditure
215.75bn143.36bn
N
Net FAAC Proportion 77.22%
IGR Proportion 22.78%
Excess
83.58bn
Debt
N
2014 2015 2016 2017 2018 2019
IGR
42.82bn40.81bn
44.06bn
51.89bn
58.44bn64.68bn
Revenue Analysis (NGN’bn)
Debt Stock 2019
Per Capita Per Capita Per Capita
Health BudgetActual Expenditure 2019 (NGN)
Actual Capital Expenditure Total Debt
(NGN)
38
Total Revenue*
Recurrent Expenditure**
Structure of State Available Revenue (2019) 2019 Ability to meet Recurrent Expenditure (NGN’bn)
*Total Revenue here is defined as the sum of the State's Gross FAAC allocation and Internally Generated Revenue (IGR) using data obtained from NBS. In some states, this may differ from a State's available revenue which is the sum of its net FAAC and Internally Generated Revenue (IGR).�
** Includes loan repayments
Note:
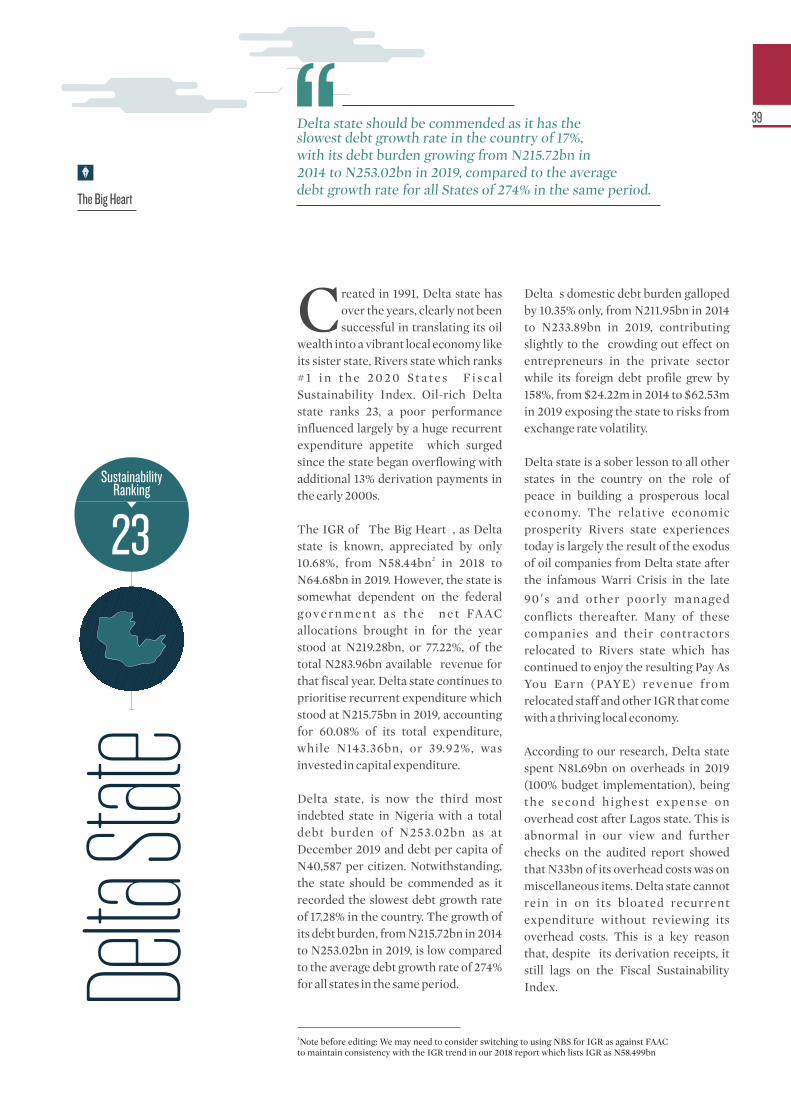
Delta
Statereated in 1991, Delta state has Cover the years, clearly not been successful in translating its oil
wealth into a vibrant local economy like its sister state, Rivers state which ranks # 1 i n t h e 2 0 2 0 S t a t e s � F i s c a l Sustainability Index. Oil-rich Delta state ranks 23, a poor performance influenced largely by a huge recurrent expenditure appetite which surged since the state began overflowing with additional 13% derivation payments in the early 2000s.
The IGR of �The Big Heart�, as Delta state is known, appreciated by only
210.68%, from N58.44bn in 2018 to N64.68bn in 2019. However, the state is somewhat dependent on the federal g ov e r n m e n t a s t h e n e t FA AC allocations brought in for the year stood at N219.28bn, or 77.22%, of the total N283.96bn available revenue for that fiscal year. Delta state continues to prioritise recurrent expenditure which stood at N215.75bn in 2019, accounting for 60.08% of its total expenditure, while N143.36bn, or 39.92%, was invested in capital expenditure.
Delta state, is now the third most indebted state in Nigeria with a total debt burden of N253.02bn as at December 2019 and debt per capita of N40,587 per citizen. Notwithstanding, the state should be commended as it recorded the slowest debt growth rate of 17.28% in the country. The growth of its debt burden, from N215.72bn in 2014 to N253.02bn in 2019, is low compared to the average debt growth rate of 274% for all states in the same period.
Delta�s domestic debt burden galloped by 10.35% only, from N211.95bn in 2014 to N233.89bn in 2019, contributing slightly to the crowding out effect on entrepreneurs in the private sector while its foreign debt profile grew by 158%, from $24.22m in 2014 to $62.53m in 2019 exposing the state to risks from exchange rate volatility.
Delta state is a sober lesson to all other states in the country on the role of peace in building a prosperous local economy. The relative economic prosperity Rivers state experiences today is largely the result of the exodus of oil companies from Delta state after the infamous Warri Crisis in the late
90 ’s and other poorly managed conflicts thereafter. Many of these companies and their contractors relocated to Rivers state which has continued to enjoy the resulting Pay As You Earn (PAYE) revenue from relocated staff and other IGR that come with a thriving local economy.
According to our research, Delta state spent N81.69bn on overheads in 2019 (100% budget implementation), being the second highest expense on overhead cost after Lagos state. This is abnormal in our view and further checks on the audited report showed that N33bn of its overhead costs was on miscellaneous items. Delta state cannot rein in on its bloated recurrent expenditure without reviewing its overhead costs. This is a key reason that, despite its derivation receipts, it still lags on the Fiscal Sustainability Index.
The Big Heart
23Sustainability
Ranking
Delta state should be commended as it has the slowest debt growth rate in the country of 17%, with its debt burden growing from N215.72bn in 2014 to N253.02bn in 2019, compared to the average debt growth rate for all States of 274% in the same period.
2Note before editing: We may need to consider switching to using NBS for IGR as against FAAC to maintain consistency with the IGR trend in our 2018 report which lists IGR as N58.499bn
39
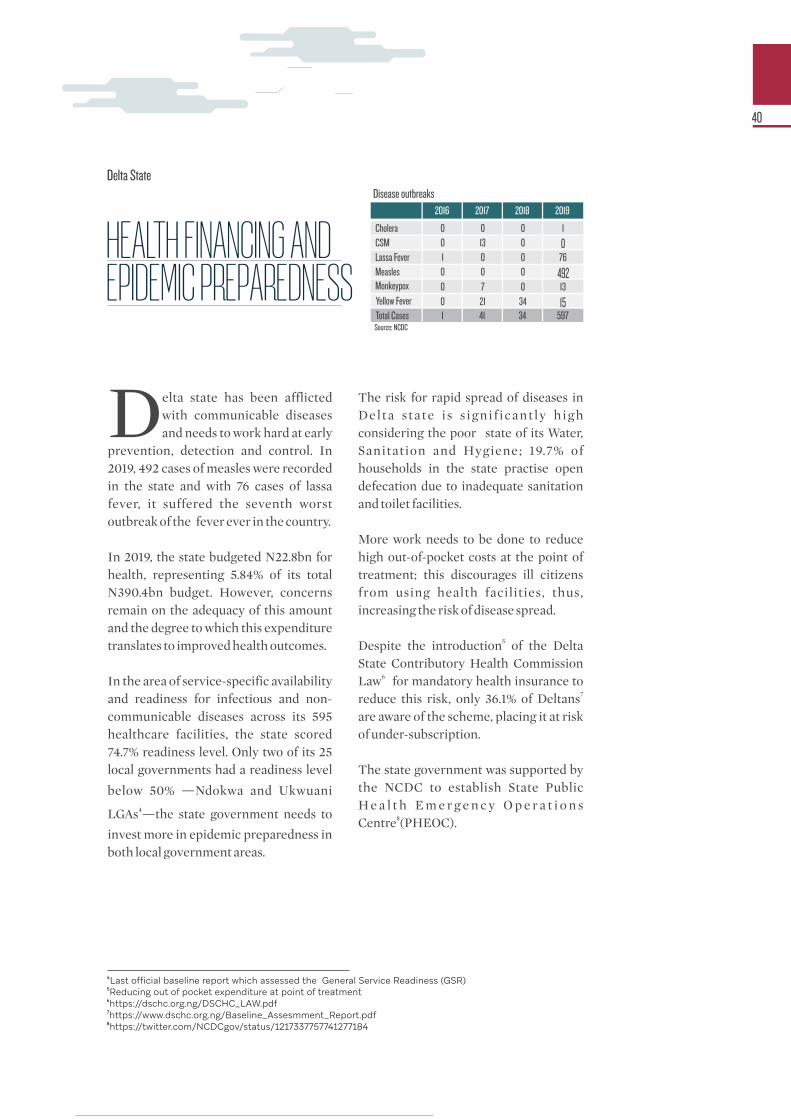
elta state has been afflicted Dwith communicable diseases and needs to work hard at early
prevention, detection and control. In 2019, 492 cases of measles were recorded in the state and with 76 cases of lassa fever, it suffered the seventh worst outbreak of the fever ever in the country.
In 2019, the state budgeted N22.8bn for health, representing 5.84% of its total N390.4bn budget. However, concerns remain on the adequacy of this amount and the degree to which this expenditure translates to improved health outcomes.
In the area of service-specific availability and readiness for infectious and non-communicable diseases across its 595 healthcare facilities, the state scored 74.7% readiness level. Only two of its 25 local governments had a readiness level
below 50% —Ndokwa and Ukwuani 4LGAs —the state government needs to
invest more in epidemic preparedness in both local government areas.
The risk for rapid spread of diseases in Delta state i s s igni f icant ly high considering the poor state of its Water, Sanitation and Hygiene; 19.7% of households in the state practise open defecation due to inadequate sanitation and toilet facilities.
More work needs to be done to reduce high out-of-pocket costs at the point of treatment; this discourages ill citizens from using health facilities, thus, increasing the risk of disease spread.
5Despite the introduction of the Delta State Contributory Health Commission
6Law for mandatory health insurance to 7reduce this risk, only 36.1% of Deltans
are aware of the scheme, placing it at risk of under-subscription.
The state government was supported by the NCDC to establish State Public H e a l t h E m e r g e n c y O p e r a t i o n s
8Centre (PHEOC).
HEALTH FINANCING AND EPIDEMIC PREPAREDNESS
⁴Last official baseline report which assessed the General Service Readiness (GSR) ⁵Reducing out of pocket expenditure at point of treatment ⁶https://dschc.org.ng/DSCHC_LAW.pdf
Delta State
⁷https://www.dschc.org.ng/Baseline_Assesmment_Report.pdf ⁸https://twitter.com/NCDCgov/status/1217337757741277184
2016
Cholera 0CSM 0Lassa Fever 1Measles 0Monkeypox 0Yellow Fever 0Total Cases 1
2017 2018 2019
0 0 113 0 00 0 760 0 4927 0 1321 34 1541 34 597
Disease outbreaks
Source: NCDC
40
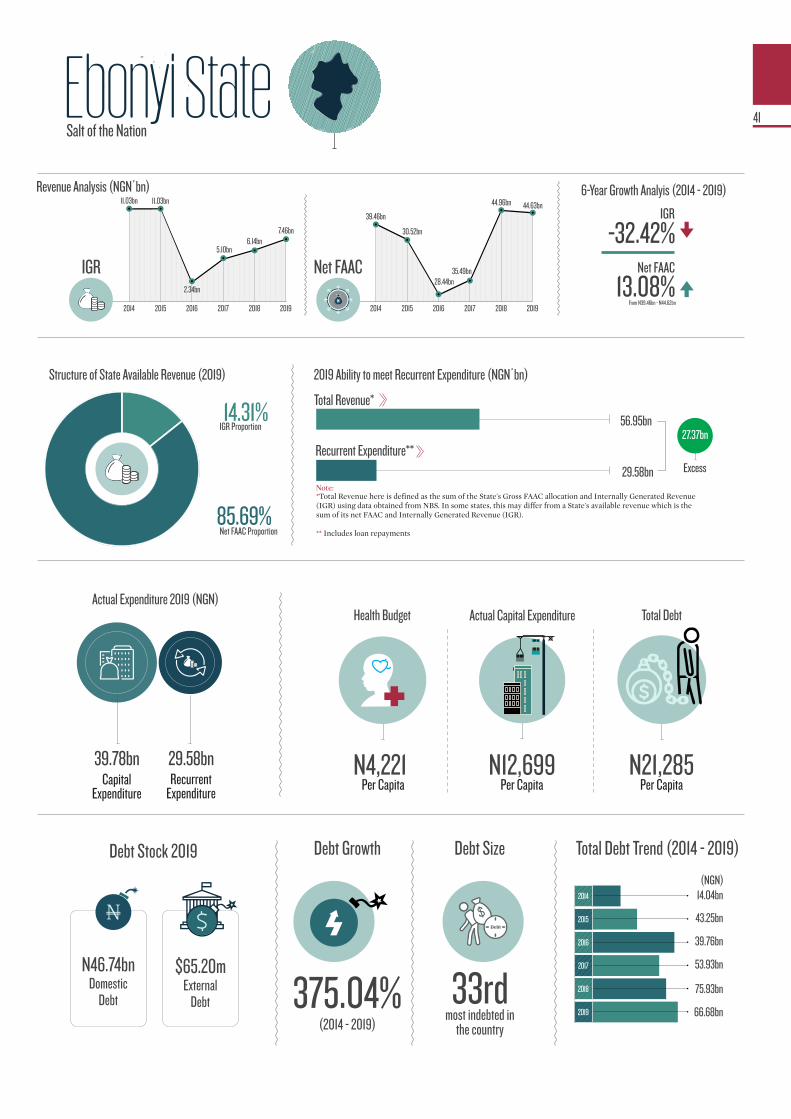
Ebonyi StateSalt of the Nation
2014 2015 2016 2017 2018 2019
Net FAAC 35.49bn
6-Year Growth Analyis (2014 - 2019)
13.08%Net FAAC
IGR
-32.42%
From N39.46bn - N44.62bn
29.58bn
56.95bn
14.04bn
43.25bn
39.76bn
53.93bn
75.93bn
66.68bn
2014
2015
2017
2019
2016
2018
Debt Growth
(2014 - 2019)
375.04%
Debt Size
most indebted in the country
33rd
Total Debt Trend (2014 - 2019)
N46.74bn $65.20mDomestic
DebtExternal
Debt
N12,699N4,221 N21,285Capital
ExpenditureRecurrent
Expenditure
29.58bn39.78bn
N
Net FAAC Proportion 85.69%
IGR Proportion 14.31%
Excess
27.37bn
Debt
N
2014 2015 2016 2017 2018 2019
IGR
11.03bn 11.03bn
2.34bn
5.10bn6.14bn
7.46bn 30.52bn
39.46bn
28.44bn
44.96bn 44.63bn
Revenue Analysis (NGN’bn)
Debt Stock 2019
Per Capita Per Capita Per Capita
Health BudgetActual Expenditure 2019 (NGN)
Actual Capital Expenditure Total Debt
(NGN)
41
Total Revenue*
Recurrent Expenditure**
Structure of State Available Revenue (2019) 2019 Ability to meet Recurrent Expenditure (NGN’bn)
*Total Revenue here is defined as the sum of the State's Gross FAAC allocation and Internally Generated Revenue (IGR) using data obtained from NBS. In some states, this may differ from a State's available revenue which is the sum of its net FAAC and Internally Generated Revenue (IGR).�
** Includes loan repayments
Note:
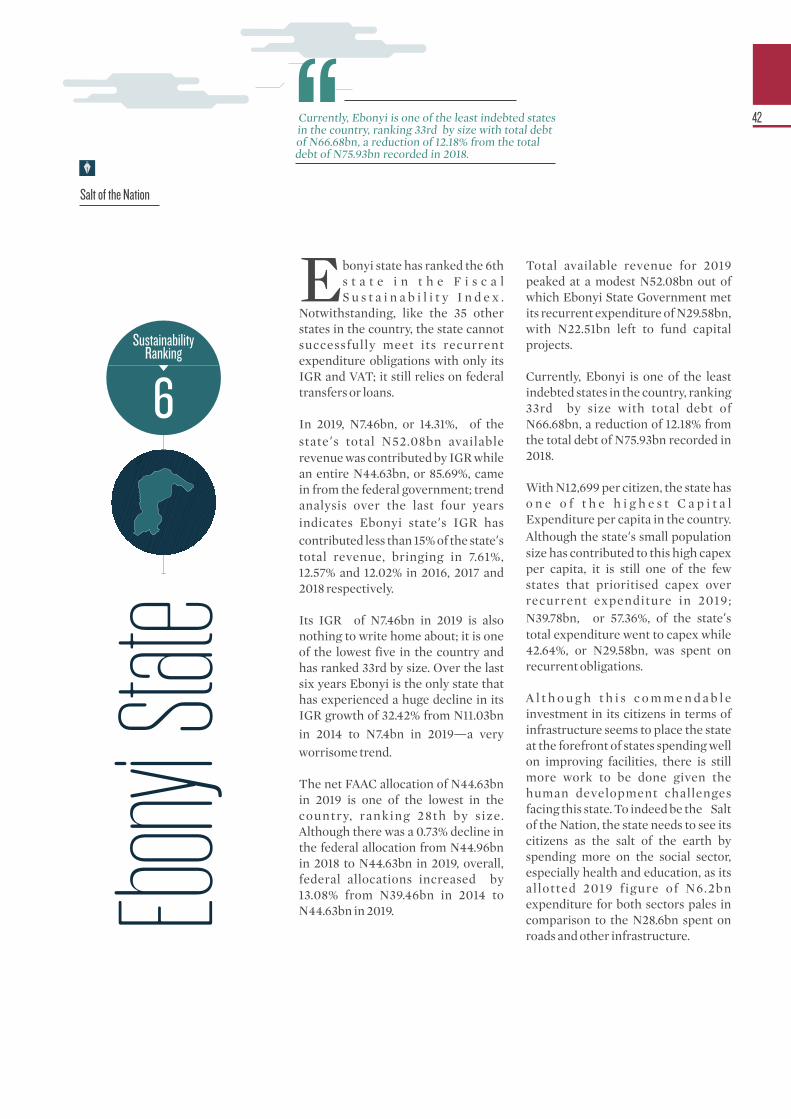
bonyi state has ranked the 6th Es t a t e i n t h e F i s c a l S u s t a i n a b i l i t y I n d e x .
Notwithstanding, like the 35 other states in the country, the state cannot successfully meet its recurrent expenditure obligations with only its IGR and VAT; it still relies on federal transfers or loans.
In 2019, N7.46bn, or 14.31%, of the state’s total N52.08bn available revenue was contributed by IGR while an entire N44.63bn, or 85.69%, came in from the federal government; trend analysis over the last four years indicates Ebonyi state’s IGR has contributed less than 15% of the state’s total revenue, bringing in 7.61%, 12.57% and 12.02% in 2016, 2017 and 2018 respectively.
Its IGR of N7.46bn in 2019 is also nothing to write home about; it is one of the lowest five in the country and has ranked 33rd by size. Over the last six years Ebonyi is the only state that has experienced a huge decline in its IGR growth of 32.42% from N11.03bn in 2014 to N7.4bn in 2019—a very worrisome trend.
The net FAAC allocation of N44.63bn in 2019 is one of the lowest in the country, ranking 28th by size. Although there was a 0.73% decline in the federal allocation from N44.96bn in 2018 to N44.63bn in 2019, overall, federal allocations increased by 13.08% from N39.46bn in 2014 to N44.63bn in 2019.
Total available revenue for 2019 peaked at a modest N52.08bn out of which Ebonyi State Government met its recurrent expenditure of N29.58bn, with N22.51bn left to fund capital projects.
Currently, Ebonyi is one of the least indebted states in the country, ranking 33rd by size with total debt of N66.68bn, a reduction of 12.18% from the total debt of N75.93bn recorded in 2018.
With N12,699 per citizen, the state has o n e o f t h e h i g h e s t C a p i t a l Expenditure per capita in the country. Although the state’s small population size has contributed to this high capex per capita, it is still one of the few states that prioritised capex over recurrent expenditure in 2019; N39.78bn, or 57.36%, of the state’s total expenditure went to capex while 42.64%, or N29.58bn, was spent on recurrent obligations.
A l t h o u g h t h i s c o m m e n d a b l e investment in its citizens in terms of infrastructure seems to place the state at the forefront of states spending well on improving facilities, there is still more work to be done given the human development challenges facing this state. To indeed be the �Salt of the Nation, the state needs to see its citizens as the salt of the earth by spending more on the social sector, especially health and education, as its al lotted 2019 figure of N6.2bn expenditure for both sectors pales in comparison to the N28.6bn spent on roads and other infrastructure.
Salt of the Nation
Currently, Ebonyi is one of the least indebted states in the country, ranking 33rd by size with total debt of N66.68bn, a reduction of 12.18% from the total debt of N75.93bn recorded in 2018.
Ebon
yi Sta
te
6Sustainability
Ranking
42

n 2019, Ebonyi state had the highest Irecorded Cerebrospinal Meningitis cases of 16,916 cases. This high
number of CSM cases makes one ask: Is the state government taking any measures to vaccinate its people? The total number of outbreak cases within a year jumped from 218 cases to 17, 696 cases. The state also experienced a larger number of lassa fever, measles and yellow fever cases during the year. The Ebonyi State Epidemiology Team in support of WHO, NCDC and NPHCDA led a response campaign to investigate the case definition for yellow fever, tracking
38contact persons and risk management.
Proper hygiene and sanitation is the utmost way to prevent these diseases from spreading. Ebonyi state has 61% of its total household practising open defecation with no toilet facilities, this is the highest so far in the country. It is also alarming that only 2.6% of its total households have access to treated water especially with their increased cholera
cases. With pollution everywhere and inadequate access to quality water, the people of Ebonyi state will perpetually be at the risk of diseases.
1,001 cases were confirmed for Covid-19 as at September 1, 2020 and 27 deaths since the index case was reported on the 26th of April. Under the Ministry of Health, a new agency called Covid-19 Crisis Management was included in the
state’s revised budget and was allocated the sum of N603m.
This includes allowance to health workers, disinfection of public places, hotel accommodation of health workers, training for health workers, supply of facemask, drugs, testing kits and disposables. The state government had also actioned plans to renovate 13 general h o s p i t a l s w i t h i n t h e s t a t e t o accommodate more cases as it increases.
HEALTH FINANCING AND EPIDEMIC PREPAREDNESS
Ebonyi State
³⁸https://ncdc.gov.ng/news/189/the-ncdc-is-aware-of-a-suspected-outbreak-of-yellow-fever-in-ebonyi-state
2016
Cholera 0CSM 0Lassa Fever 16Measles 0Monkeypox 0Yellow Fever 0Total Cases 16
2017 2018 2019
0 182 90 0 16,9160 0 3720 0 2311 0 0
18 36 16819 218 17,696
Disease outbreaks
Source: NCDC
43
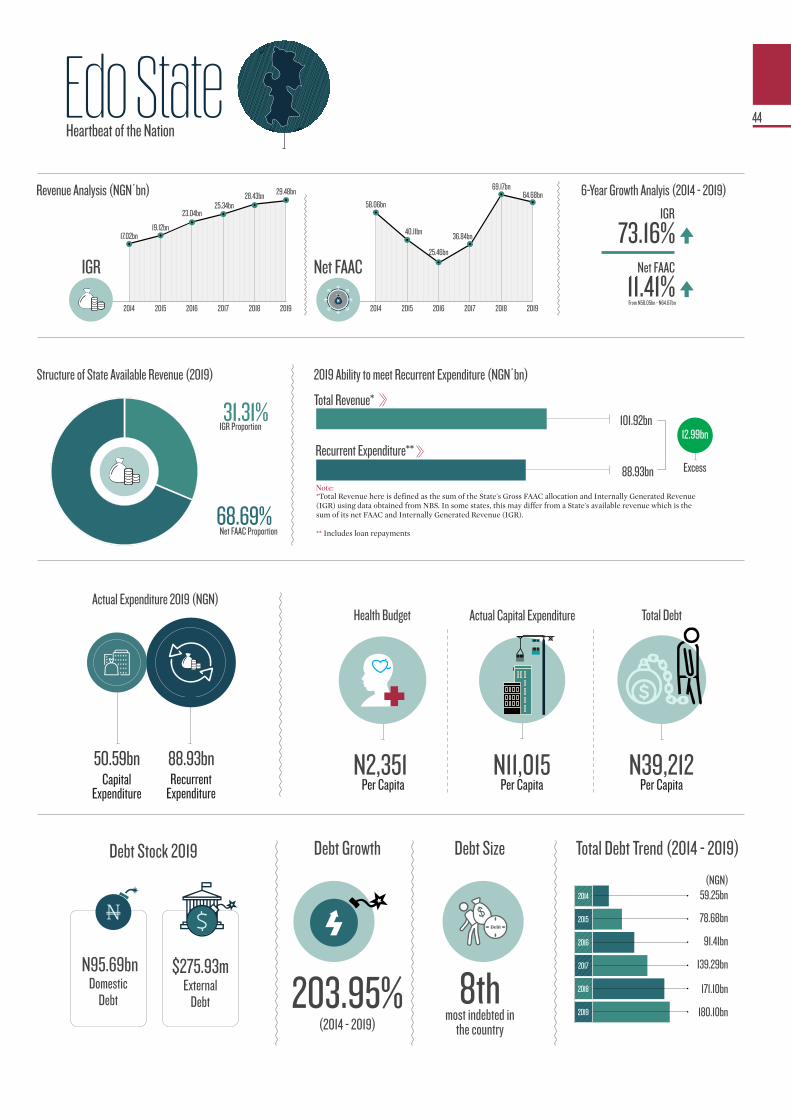
Edo StateHeartbeat of the Nation
2014 2015 2016 2017 2018 2019
Net FAAC
36.84bn
6-Year Growth Analyis (2014 - 2019)
11.41%Net FAAC
IGR
73.16%
From N58.05bn - N64.67bn
88.93bn
101.92bn
59.25bn
78.68bn
91.41bn
139.29bn
171.10bn
180.10bn
2014
2015
2017
2019
2016
2018
Debt Growth
(2014 - 2019)
203.95%
Debt Size
most indebted in the country
8th
Total Debt Trend (2014 - 2019)
N95.69bn $275.93mDomestic
DebtExternal
Debt
N11,015N2,351 N39,212Capital
ExpenditureRecurrent
Expenditure
88.93bn50.59bn
N
Net FAAC Proportion 68.69%
IGR Proportion 31.31%
Excess
12.99bn
Debt
N
2014 2015 2016 2017 2018 2019
IGR
17.02bn19.12bn
23.04bn25.34bn
28.43bn 29.48bn
40.11bn
58.06bn
25.46bn
69.17bn64.68bnRevenue Analysis (NGN’bn)
Debt Stock 2019
Per Capita Per Capita Per Capita
Health BudgetActual Expenditure 2019 (NGN)
Actual Capital Expenditure Total Debt
(NGN)
44
Total Revenue*
Recurrent Expenditure**
Structure of State Available Revenue (2019) 2019 Ability to meet Recurrent Expenditure (NGN’bn)
*Total Revenue here is defined as the sum of the State's Gross FAAC allocation and Internally Generated Revenue (IGR) using data obtained from NBS. In some states, this may differ from a State's available revenue which is the sum of its net FAAC and Internally Generated Revenue (IGR).�
** Includes loan repayments
Note:
he �Heartbeat of the Nation� Tranks 13th on the 2020 Fiscal S u s t a i n a b i l i t y I n d e x .
Regardless, it is still one of the states in the country which will be unable to meet its recurrent expenditure obligations using its internally generated revenue and revenue from value added tax alone; it has to rely on statutory disbursements from the federal government.
In 2019, N64.68bn, or 68.69%, of the state�s total N94.16bn available revenue came from the federal government via net FAAC, while N29.48bn, or 31.31%, was from its IGR. This state needs to do more to change this, as shocks to the federal government revenues in a post-COVID-19 world would significantly affect its spending plans. In 2019, declining revenue from the federal government and Edo’s projected capital receipts had a knock-on effect on its actual capital expenditure which dipped from N58.77bn in 2018 to N50.59bn in 2019, a 13.92% decline.
The state government needs to closely watch its overhead costs which, despite declining year-on-year Net FAAC revenue, jumped by N3.87bn, or 15.38%, from N25.17bn to N29.04bn in 2019 according to data from the state’s auditor general report.
It is worth noting that Edo witnessed a slight upward bump in its IGR by 3.70%, from N28.43bn in 2018 to N29.48bn in 2019.
This is good progress but the state needs to retool its IGR strategies especially in the light of dwindling net FAAC allocations which slipped by -6.04%, from N69.17bn in 2018 to N64.68bn in 2019.
T h e E d o S t a t e I n v e s t m e n t Promotion Office is making decent efforts to attract investment capital to the state to shore up the local economy. The state has been successful in attracting big-ticket investors in the past; it currently h o s t s t h e 4 6 1 M W A z u ra - E d o Independent Power Plant (IPP), which is Nigeria’s first large-scale project financed IPP.
Year-on-year, the state’s total debt burden grew by a modest 5.26%, from N171.10bn in 2018 to N180.10bn in 2019, making it the 8th most indebted state in the country overall. In terms of foreign debt, with $275.93m, it is the third most indebted in the country, making its fiscals one of the most exposed to exchange rate volatility risks.
To prevent a political heartbreak in the heartbeat of the nation, it is important for aspiring political office holders to develop solution-driven campaigns to resolve Edo’s fiscal concerns. Even then, citizens need to always engage their legislators to ensure they get value for money from these debts.
Heartbeat of the Nation
In 2019, N64.68bn, or 68.69%, of the state�s total N94.16bn revenue came from the federal government via net FAAC, while N29.48bn, or 31.31%, was from its IGR.
Edo S
tate
13Sustainability
Ranking
45

do state is not investing enough Ein preventing, detecting and controlling disease outbreaks.
With 2,594 cases of lassa fever, Edo state suffered one of the highest outbreaks of the viral hemorrhagic fever in 2019. As at August 30, 2020 it had the third highest outbreak of COVID-19 cases in the country, with 2,578 people infected.
This state has a significant risk of communicable disease spread, as 26.2% of households in Edo practise open defecation, a situation which could accelerate the spread of communicable diseases.
N9.99bn, or 5.57%, of its total 2020 budgeted expenditure was allocated to health and at least another N1.05bn a l located to improve the Water, Sanitation, Hygiene (WASH) situation in the state. The state needs to invest more to complement the efforts of the federal government through the NCDC as well as other international development partners actively supporting it in this area.
In the area of disease outbreak detection and control, Edo was one of the 22 states supported by NCDC to establish a State Public Health Emergency Operations
1Centre (PHEOC) between 2017 and 2019. Disease surveillance officers from Edo were part of the 3,874 officers recently retrained and mobilised by World Health Organization (WHO) and its partners to detect COVID-19 cases, A c u t e F l a c c i d Pa r a l y s i s ( A F P ) , meningitis, cholera, yellow fever, measles among others in hospitals and
2communities .
3The Edo Health Insurance Scheme (Edo-HIS) which promises to insure 1million citizens by the end of 2021 is still in its infancy. As such risks from high out-of-pocket expenditure at the point of treatment which often dissuade patients who might have been infected by various diseases from utilising health facilities still persist. Consequently, the inability to easily pay for treatment increases the potential for diseases to spread faster in Edo.
HEALTH FINANCING AND EPIDEMIC PREPAREDNESS
¹https://twitter.com/NCDCgov/status/1217337757741277184 ²https://www.afro.who.int/news/covid-19-response-southern-nigeria-boosts-surveillance-other-diseases ³https://allafrica.com/stories/201912190829.html
Edo State2016
Cholera 0CSM 0Lassa Fever 249Measles 0Monkeypox 0Yellow Fever 0Total Cases 249
2017 2018 2019
0 0 00 0 00 0 2,5940 0 2507 0 0
56 230 8263 230 2,926
Disease outbreaks
Source: NCDC
46
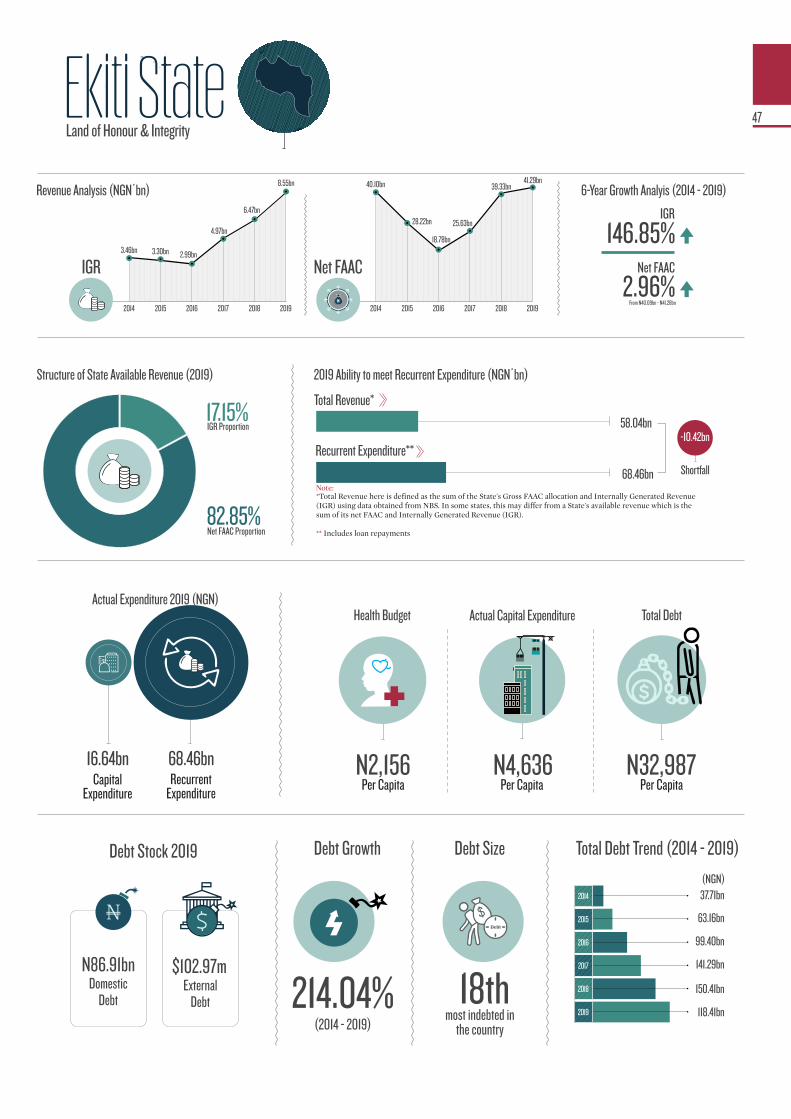
Ekiti StateLand of Honour & Integrity
2014 2015 2016 2017 2018 2019
Net FAAC
25.63bn
6-Year Growth Analyis (2014 - 2019)
2.96%Net FAAC
IGR
146.85%
From N40.09bn - N41.28bn
68.46bn
58.04bn
37.71bn
63.16bn
99.40bn
141.29bn
150.41bn
118.41bn
2014
2015
2017
2019
2016
2018
Debt Growth
(2014 - 2019)
214.04%
Debt Size
most indebted in the country
18th
Total Debt Trend (2014 - 2019)
N86.91bn $102.97mDomestic
DebtExternal
Debt
N4,636N2,156 N32,987Capital
ExpenditureRecurrent
Expenditure
68.46bn16.64bn
N
Net FAAC Proportion 82.85%
IGR Proportion 17.15%
Shortfall
-10.42bn
Debt
N
2014 2015 2016 2017 2018 2019
IGR3.46bn 3.30bn 2.99bn
4.97bn
6.47bn
8.55bn
28.22bn
40.10bn
18.78bn
39.33bn41.29bn
Revenue Analysis (NGN’bn)
Debt Stock 2019
Per Capita Per Capita Per Capita
Health BudgetActual Expenditure 2019 (NGN)
Actual Capital Expenditure Total Debt
(NGN)
47
Total Revenue*
Recurrent Expenditure**
Structure of State Available Revenue (2019) 2019 Ability to meet Recurrent Expenditure (NGN’bn)
*Total Revenue here is defined as the sum of the State's Gross FAAC allocation and Internally Generated Revenue (IGR) using data obtained from NBS. In some states, this may differ from a State's available revenue which is the sum of its net FAAC and Internally Generated Revenue (IGR).�
** Includes loan repayments
Note:
The appraisa l of Ekit i ’s revenue structure in the last two years shows that it has
cont inua l ly depended on the statutory allocation as a result of its inability to independently raise its r e v e n u e i n t e r n a l l y. I n 2 0 1 9, N41.29bn, or 82.85%, of its total N49.83bn revenue accrual came from the federal government.
This has continued to impede the state’s capacity to meet its increasing expenditure obligations. The state’s total net FAAC allocation at the end of 2019 came to N41.29bn, a 4.98% increment of N39.32bn that was accrued to the state in 2018. It is also pertinent to note that the state got N16bn from aids and grants in 2019.
The state witnessed a 32.19% year-on-year IGR growth, from N6.47bn in 2018 to N8.55bn in 2019, the 29th in the country by size, only better than seven other states: Katsina, Yobe, Borno, Ebonyi, Kebbi, Gombe, Taraba. This abysmally low internally generated revenue size in 2019 contributed to the state’s ranking as 34th out of all the 36 states in the 2020 States� Fiscal Sustainability Index.
The state�s total debt stock at the end of 2019 came to N118.41bn, a significant reduction from 2018 figures of N150.41bn. The breakdown of its 2019 debt stock brings its domestic debt to N86.91bn and its external borrowings to $102.91m.
One of the most severe problems facing the state can be attributed to its inability to drive its revenue generation internally to meet his aspirations and developmental goals.
As the state records low revenue, the consequence of this will be a decline in the development of its socio-economic activities which will force the state to end up borrowing more to fund its capital and recurrent components.
Ekiti state’s recurrent expenditure in 2019 stood at N68.45bn with a s i g n i f i c a n t p o r t i o n b e i n g i t s personnel cost, including social benefits, at N24.05bn while its overhead costs stood at N20.64bn. The state spent N16.6bn from its capital expenditure with only N1.295bn spent on the social sector. T h i s r e q u i r e s s i g n i f i c a n t improvement, compared to N13.23bn spent on the economic sector.
The state needs to accelerate its IGR growth; this requires an increase in i n v e s t m e n t s i n t h e s t a t e , strengthening the institutional capacity of the revenue agency as well as formalisation of businesses.
The Land of Honour and Integrity� needs to maximise its available resources to enhance the drive for foreign investment to boost its IGR mobilisation.
Land of Honor and Integrity
The state needs to accelerate its IGR growth; this requires an increase in investments in the state, strengthening the institutional capacity of the revenue agency as well as formalisation of businesses.
Ekiti S
tate
35Sustainability
Ranking
48

14 cases of yellow fever were recorded in 2019 in Ekiti, one of the five lowest by any state in Nigeria, down from 37 cases it registered in 2018. The state also had 8 new cases of lassa fever and 650 cases of the highly contagious viral disease, measles. As part of its measures to prevent the spread of lassa fever, the state established Lassa Fever Emergency Operations Centres.
In addition, it also provided designated facilities with the primary aim of receiving any suspected cases of lassa fever for immediate treatment. The state also flagged off the Yellow Fever
22Vaccination Programme . Also, based on the 2019 outbreak of measles in the
23state , in partnership with the World Health Organization, the United Nations
Children’s Endowment Fund, and the African Field Epidemiology Network, the state started an aggressive campaign
and vaccination of children between the ages of nine months and fifteen months.
The Ekiti state health budget for 2019 represents only N7.74bn, or 6.0%, of its
total budget of N129.9bn. The state’s allocation to the sector still remains much below the Abuja Declaration of at least 15% of the total budget to the health sector with his health expenditure per capita arriving at only N2,156.
47.6% of households in Ekiti practise open defecation, the highest in the South-West, while 19.8% of residents in Ekiti do not have access to improved sources of drinking water, two dangerous trends that could speed up the spread of communicable diseases. The state government urgently needs to invest in interventions and policies that improve the Water and Sanitation Hygiene situation in the state.
HEALTH FINANCING AND EPIDEMIC PREPAREDNESS
Ekiti State
22https://lassafever.info/resources/lassa-fever-outbreak-southwestern-nigeria-ekiti-state-response-amidst-economic-recession23 https://allafrica.com/stories/201911150189.html
2016
Cholera 0CSM 0Lassa Fever 10Measles 0Monkeypox 0Yellow Fever 0Total Cases 10
2017 2018 2019
0 0 00 0 01 0 80 0 6507 0 08 37 1416 37 672
Disease outbreaks
Source: NCDC
49
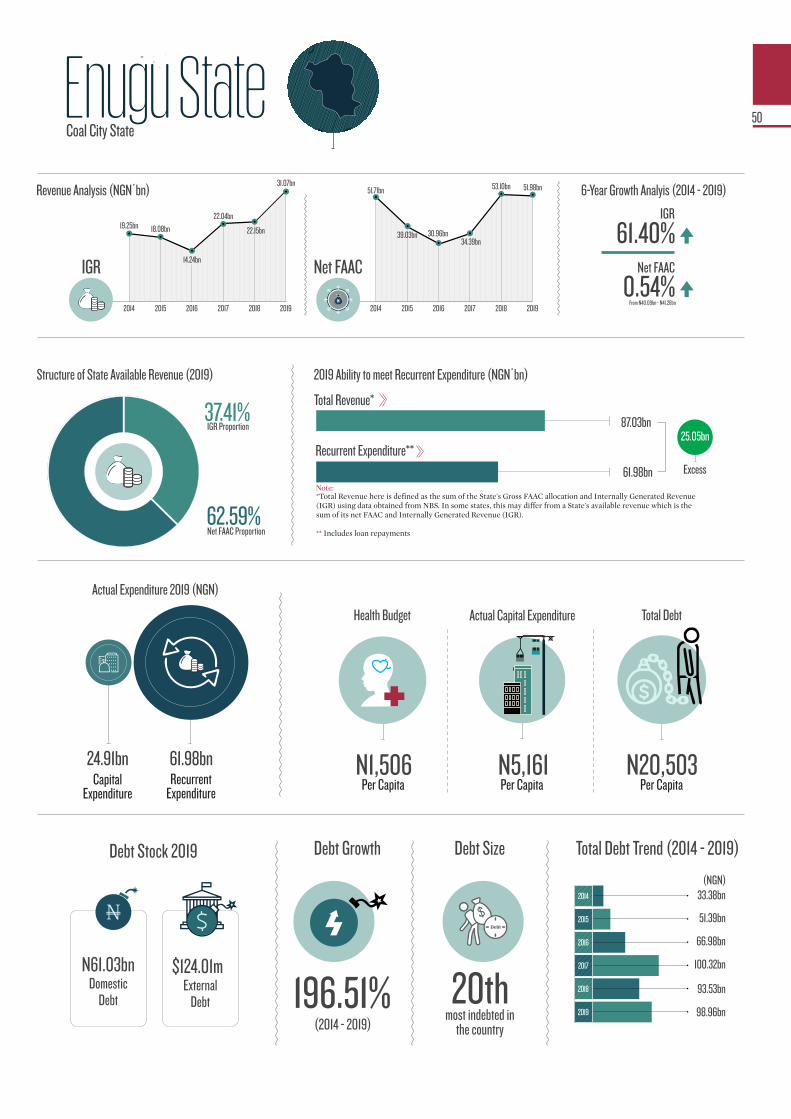
Enugu StateCoal City State
2014 2015 2016 2017 2018 2019
Net FAAC
34.39bn
6-Year Growth Analyis (2014 - 2019)
0.54%Net FAAC
IGR
61.40%
From N40.09bn - N41.28bn
61.98bn
87.03bn
33.38bn
51.39bn
66.98bn
100.32bn
93.53bn
98.96bn
2014
2015
2017
2019
2016
2018
Debt Growth
(2014 - 2019)
196.51%
Debt Size
most indebted in the country
20th
Total Debt Trend (2014 - 2019)
N61.03bn $124.01mDomestic
DebtExternal
Debt
N5,161N1,506 N20,503Capital
ExpenditureRecurrent
Expenditure
61.98bn24.91bn
N
Net FAAC Proportion 62.59%
IGR Proportion 37.41%
Excess
25.05bn
Debt
N
2014 2015 2016 2017 2018 2019
IGR
19.25bn 18.08bn
14.24bn
22.04bn
22.15bn
31.07bn
39.03bn
51.71bn
30.96bn
53.10bn 51.98bnRevenue Analysis (NGN’bn)
Debt Stock 2019
Per Capita Per Capita Per Capita
Health Budget
Actual Expenditure 2019 (NGN)
Actual Capital Expenditure Total Debt
(NGN)
50
Total Revenue*
Recurrent Expenditure**
Structure of State Available Revenue (2019) 2019 Ability to meet Recurrent Expenditure (NGN’bn)
*Total Revenue here is defined as the sum of the State's Gross FAAC allocation and Internally Generated Revenue (IGR) using data obtained from NBS. In some states, this may differ from a State's available revenue which is the sum of its net FAAC and Internally Generated Revenue (IGR).�
** Includes loan repayments
Note:
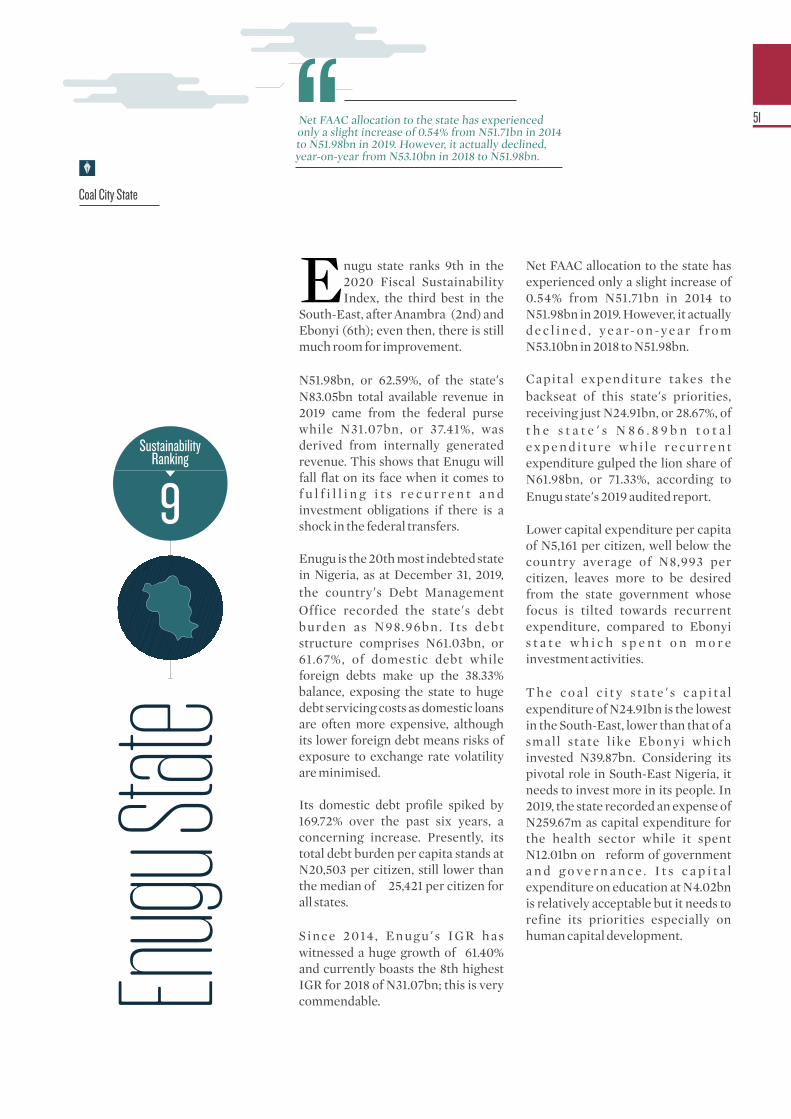
Enugu state ranks 9th in the 2020 Fiscal Sustainability Index, the third best in the
South-East, after Anambra (2nd) and Ebonyi (6th); even then, there is still much room for improvement.
N51.98bn, or 62.59%, of the state’s N83.05bn total available revenue in 2019 came from the federal purse while N31.07bn, or 37.41%, was derived from internally generated revenue. This shows that Enugu will fall flat on its face when it comes to f u l f i l l i n g i t s r e c u r r e n t a n d investment obligations if there is a shock in the federal transfers.
Enugu is the 20th most indebted state in Nigeria, as at December 31, 2019, the country’s Debt Management Office recorded the state’s debt burden as N98.96bn. Its debt structure comprises N61.03bn, or 61.67%, of domestic debt while foreign debts make up the 38.33% balance, exposing the state to huge debt servicing costs as domestic loans are often more expensive, although its lower foreign debt means risks of exposure to exchange rate volatility are minimised.
Its domestic debt profile spiked by 169.72% over the past six years, a concerning increase. Presently, its total debt burden per capita stands at N20,503 per citizen, still lower than the median of �25,421 per citizen for all states.
S ince 2014, Enugu ’s IGR has witnessed a huge growth of 61.40% and currently boasts the 8th highest IGR for 2018 of N31.07bn; this is very commendable.
Net FAAC allocation to the state has experienced only a slight increase of 0.54% from N51.71bn in 2014 to N51.98bn in 2019. However, it actually d e c l i n e d , y e a r- o n - y e a r f r o m N53.10bn in 2018 to N51.98bn.
Capital expenditure takes the backseat of this state’s priorities, receiving just N24.91bn, or 28.67%, of t h e s t a t e ’ s N 8 6 . 8 9 b n t o t a l ex p e n d i t u r e w h i l e r e c u r r e n t expenditure gulped the lion share of N61.98bn, or 71.33%, according to Enugu state’s 2019 audited report.
Lower capital expenditure per capita of N5,161 per citizen, well below the country average of N8,993 per citizen, leaves more to be desired from the state government whose focus is tilted towards recurrent expenditure, compared to Ebonyi s t a t e w h i c h s p e n t o n m o r e investment activities.
T h e c o a l c i t y s t a t e ’ s c a p i t a l expenditure of N24.91bn is the lowest in the South-East, lower than that of a small state l ike Ebonyi which invested N39.87bn. Considering its pivotal role in South-East Nigeria, it needs to invest more in its people. In 2019, the state recorded an expense of N259.67m as capital expenditure for the health sector while it spent N12.01bn on �reform of government a n d g o v e r n a n c e . I t s c a p i t a l expenditure on education at N4.02bn is relatively acceptable but it needs to refine its priorities especially on human capital development.
Coal City State
Net FAAC allocation to the state has experienced only a slight increase of 0.54% from N51.71bn in 2014 to N51.98bn in 2019. However, it actually declined, year-on-year from N53.10bn in 2018 to N51.98bn.
Enug
u Stat
e
9Sustainability
Ranking
51

ccording to the Nigerian Centre Af o r D i s e a s e a n d C o n t ro l , reported disease outbreaks in
Enugu state grew from 112 cases in 2018 to 531 cases in 2019 with 446 cases attributed to measles.
Enugu state has a high percentage of 45.4% of its total households practising open defecation, thus polluting the environment and making it unhealthy to dwell, diseases thrive in unhealthy spaces. As such, more attention should be placed on upgrading environmental sanitation and hygiene within the state. A l l o c a t i o n s t o e n v i r o n m e n t a l improvement should be efficiently spent to impact the health of the state. Also disease cases spike can be attributed to poor quality of water; Enugu state has only 5.9% of its total household with access to treated water.
As soon as the first case of Covid-19 was recorded in Nigeria, the Enugu state Covid-19 Multi-Sectoral Rapid Response Team was funded with the sum of N350m for the purchase of drugs, equipment and consumables for the treatment of Covid-
19. The ultramodern Enugu State Medical Diagnostic Centre was also equipped to be a Covid-19 treatment and isolation centre. In the 2020 Covid-19 revised budget, N600m was allocated for the construction of isolation centres and N 5 0 0 m f o r t h e p u rc h a s e o f l a b equipment. The state government has also allocated N100m to combat any health emergency. As at September 31, 2020, the total number of confirmed cases in the state amounted to 1,162 and there were 21 deaths.
Line items with regards to epidemic preparedness are not defined in the present and previous budgets of the state. Though allocations to the health sector in the 2020 revised budget amounts to N4.66bn, in 2019, of the N3.79bn allocated to health improvement capital e x p e n d i t u r e , o n l y N 2 5 9 m w a s implemented. Hence, Enugu state will have to take strategic measures to i m p r o v e h e a l t h f i n a n c i n g a n d implementation.
HEALTH FINANCING AND E PIDEMIC PREPAREDNESS
Enugu State
2016
Cholera 0CSM 0Lassa Fever 0Measles 0Monkeypox 0Yellow Fever 0Total Cases 0
2017 2018 2019
0 0 00 0 00 0 280 0 4462 0 1
55 112 5657 112 531
Disease outbreaks
Source: NCDC
52
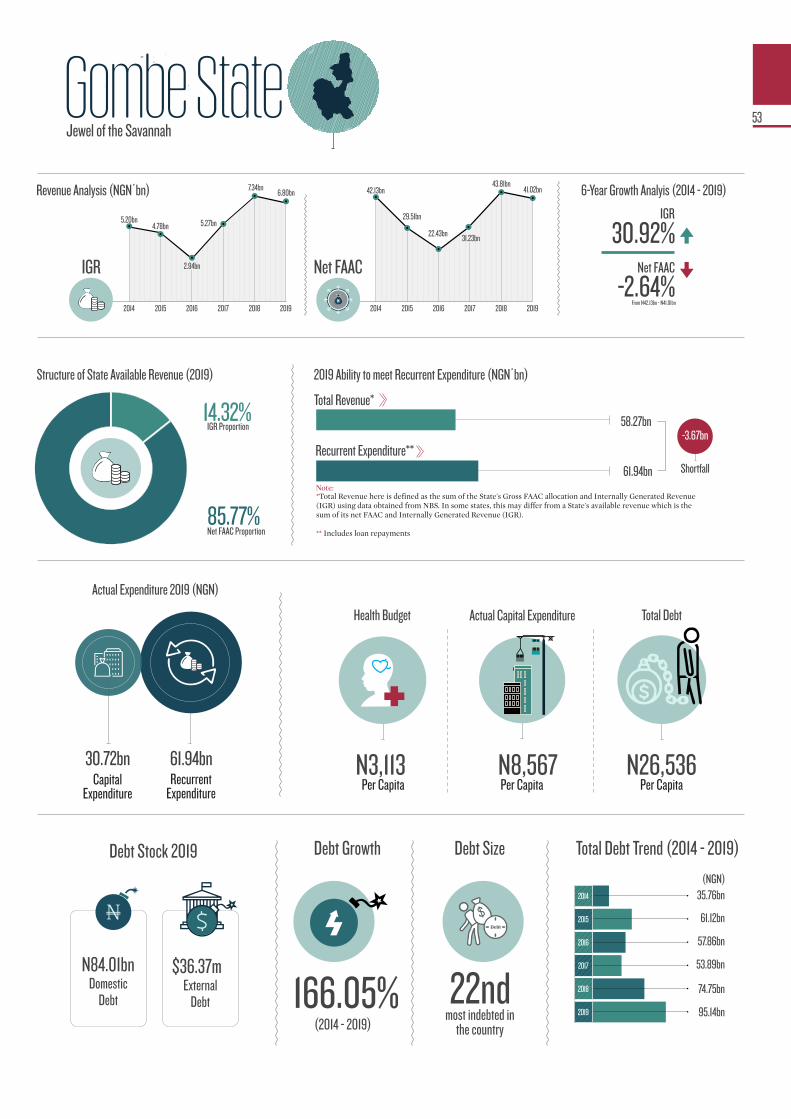
Gombe StateJewel of the Savannah
2014 2015 2016 2017 2018 2019
Net FAAC
31.23bn
6-Year Growth Analyis (2014 - 2019)
-2.64%Net FAAC
IGR
30.92%
From N42.13bn - N41.01bn
35.76bn
61.12bn
57.86bn
53.89bn
74.75bn
95.14bn
2014
2015
2017
2019
2016
2018
Debt Growth
(2014 - 2019)
166.05%
Debt Size
most indebted in the country
22nd
Total Debt Trend (2014 - 2019)
N84.01bn $36.37mDomestic
DebtExternal
Debt
N8,567N3,113 N26,536Capital
ExpenditureRecurrent
Expenditure
61.94bn30.72bn
N
Net FAAC Proportion 85.77%
IGR Proportion 14.32%
61.94bn
58.27bn
Shortfall
-3.67bn
Debt
N
2014 2015 2016 2017 2018 2019
IGR
5.20bn4.78bn
2.94bn
5.27bn
7.34bn6.80bn
29.51bn
42.13bn
22.43bn
43.81bn41.02bnRevenue Analysis (NGN’bn)
Debt Stock 2019
Per Capita Per Capita Per Capita
Health Budget
Actual Expenditure 2019 (NGN)
Actual Capital Expenditure Total Debt
(NGN)
53
Total Revenue*
Recurrent Expenditure**
Structure of State Available Revenue (2019) 2019 Ability to meet Recurrent Expenditure (NGN’bn)
*Total Revenue here is defined as the sum of the State's Gross FAAC allocation and Internally Generated Revenue (IGR) using data obtained from NBS. In some states, this may differ from a State's available revenue which is the sum of its net FAAC and Internally Generated Revenue (IGR).�
** Includes loan repayments
Note:

Gombe state’s domestic debt saw a year-on-year growth of 32.64% from N63.34bn in
2018 to N84.01bn in 2019. If this continues, recurrent expenditure may skyrocket, as the resulting debt servicing costs will crowd out capital projects in the near future.
External debt declined by -8.04%, from $39.55m in 2018 to $36.37m in 2019, reducing the state’s exposure to risks from exchange rate volatility.
The state�s 2019 IGR of N6.80bn was one of the smallest in Nigeria, only bigger than Taraba with an IGR of N6.53bn; an unattractive situation that pushed Gombe into the category of financially unviable subnational entities in need of a fiscal strategy revamp.
Gombe’s dependence on the federal government for fiscal survival is pronounced; federally collected revenue brought in N41.02bn, or 85.77%, of the state’s total available revenue while IGR brought in the balance N6.80bn, or 14.23%.
Gombe state’s IGR dipped by -7.36%, from N7.34bn in 2018 to N6.80bn in the 2019 fiscal year making it the 3rd year since 2014 when its revenue saw a decline. The other two years are 2015 and 2016 when the state’s IGR reduced by -7.93% and -38.52% respectively.
Net FAAC also dipped by -6.36%, from N43.81bn in 2018 to N41.02bn in 2019. With COVID-19 pandemic inducing fiscal realities that have hit hard at the federal government’s source of revenue, this state ’s revenue may see a further decline in the coming fiscal cycles.
Despite its fiscal woes, the state prioritises recurrent expenditure over capital expenditures. In 2019, recurrent expenditure consumed 6 6 .8 5 % o f i t s t o t a l N 9 2.6 6 b n e x p e n d i t u r e w h i l e c a p i t a l expenditure got just 33.15%. Its 2019 capital expenditure per capita came to �8,567 per citizen, slightly below the state-wide average of �8,993 per citizen.
While Gombe spent N61.94bn on recurrent expenditure, its total expenditure on capital items in 2019 was N30.72bn, the second highest capex in the North East. However, to truly be the �Jewel of the Savannah, Gombe state needs to interrogate the quality of its capital spending; in 2019, N279.6m was spent on healthcare while N12.2bn was spent on roads and N6bn on �reform of government and governance.
Jewel of Savannah
External debt declined by -8.04%, from $39.55m in 2018 to $36.37m in 2019, reducing the state’s exposure to risks from exchange rate volatility.
Gomb
e Stat
e29
Sustainability Ranking
54

he state recorded 226 cases of Tmeasles in 2019, there was also an increase in the number of
yellow fever cases from 9 in 2018 to 25 in 2019. For Cerebrospinal Meningitis and lassa fever, 24 and 25 cases were recorded respectively in 2019. As at September 1, 2020, it had 723 cases of COVID-19 in the country.
In 2019, the state budgeted N11.16bn for the health budget representing 9.12% of its total budget N122.4bn. However, concerns remain on the adequacy of this amount and the degree to which this expenditure translates to improved h e a l t h o u t c o m e s . T h e s t a t e h a s commenced the implementation of its community health insurance scheme which will be managed by the Gombe State Primary Healthcare Development A g e n c y ( G S P H D A ) . T h i s i s commendable and would help the government mobi l i se addi t ional resources for financing health and other items that help improve epidemic preparedness.
Gombe still faces a high risk of a fast spread of disease considering the poor Water, Sanitation and Hygiene. 14% of households in the state practise open defecation due to deficient sanitation and toilet competence and also only 3.6% of its population has access to piped borne water.
Findings from the perception of parents of the polio eradication programme in Gombe indicate that a small but
42noticeable fraction of parents surveyed (7.3%) believed that vaccines were mixed with harmful substances hence some reluctance to release their children for vaccines. This perception may also be true for how some parents in the state view vaccination for other diseases hence Gombe State Government should continue to strengthen campaigns aimed at getting parents to understand the benefits of immunisation to the early treatments of diseases in modern facilities.
Gombe State
⁴²https://www.researchgate.net/publication/271753134_Parents'_awareness_and_perception_of_the_polio_eradication_programme_in_Gombe_Local_Government_Area_Gombe_State_Nigeria
2016
Cholera 0CSM 0Lassa Fever 12Measles 0Monkeypox 0Yellow Fever 0Total Cases 12
2017 2018 2019
0 552 00 3 240 0 250 0 2260 0 06 9 256 564 300
HEALTH FINANCING AND EPIDEMIC PREPAREDNESS
Disease outbreaks
Source: NCDC
55
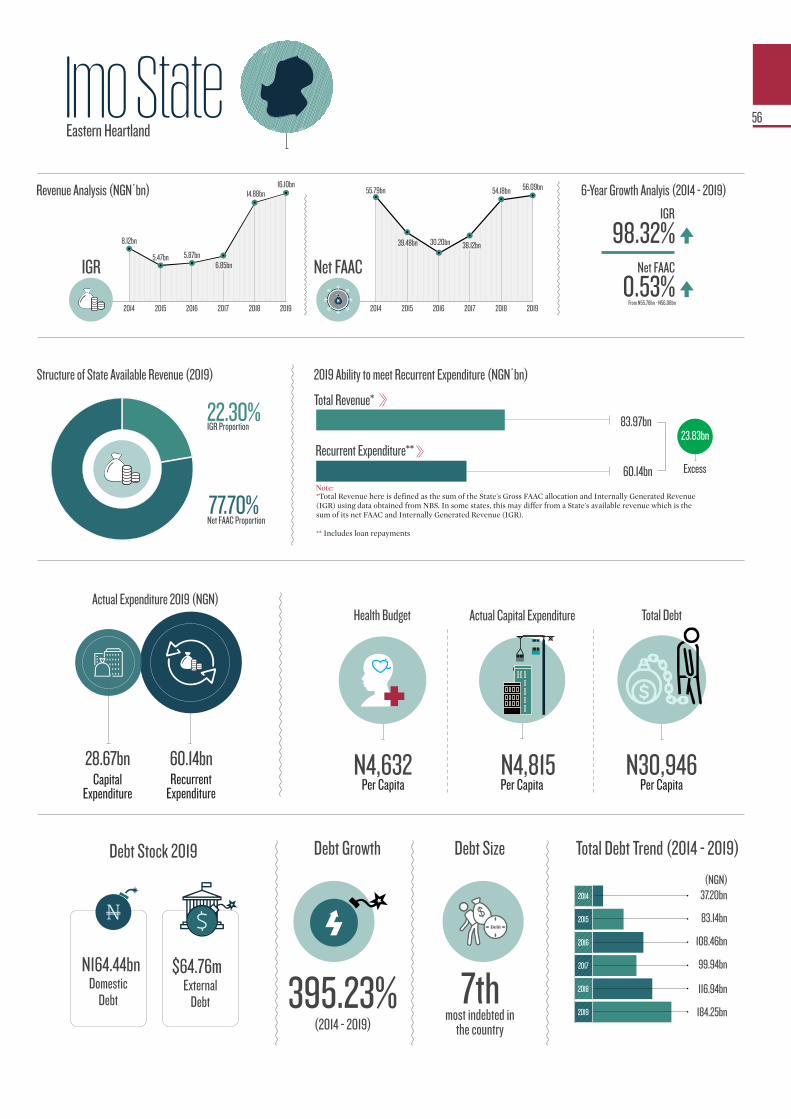
Imo StateEastern Heartland
2014 2015 2016 2017 2018 2019
Net FAAC38.12bn
6-Year Growth Analyis (2014 - 2019)
0.53%Net FAAC
IGR
98.32%
From N55.78bn - N56.08bn
60.14bn
83.97bn
37.20bn
83.14bn
108.46bn
99.94bn
116.94bn
184.25bn
2014
2015
2017
2019
2016
2018
Debt Growth
(2014 - 2019)
395.23%
Debt Size
most indebted in the country
7th
Total Debt Trend (2014 - 2019)
N164.44bn $64.76mDomestic
DebtExternal
Debt
N4,815N4,632 N30,946Capital
ExpenditureRecurrent
Expenditure
60.14bn28.67bn
N
Net FAAC Proportion 77.70%
IGR Proportion 22.30%
Excess
23.83bn
Debt
N
2014 2015 2016 2017 2018 2019
IGR
8.12bn
5.47bn 5.87bn6.85bn
14.88bn16.10bn
39.48bn
55.79bn
30.20bn
54.18bn 56.09bnRevenue Analysis (NGN’bn)
Debt Stock 2019
Per Capita Per Capita Per Capita
Health BudgetActual Expenditure 2019 (NGN)
Actual Capital Expenditure Total Debt
(NGN)
56
Total Revenue*
Recurrent Expenditure**
Structure of State Available Revenue (2019) 2019 Ability to meet Recurrent Expenditure (NGN’bn)
*Total Revenue here is defined as the sum of the State's Gross FAAC allocation and Internally Generated Revenue (IGR) using data obtained from NBS. In some states, this may differ from a State's available revenue which is the sum of its net FAAC and Internally Generated Revenue (IGR).�
** Includes loan repayments
Note:
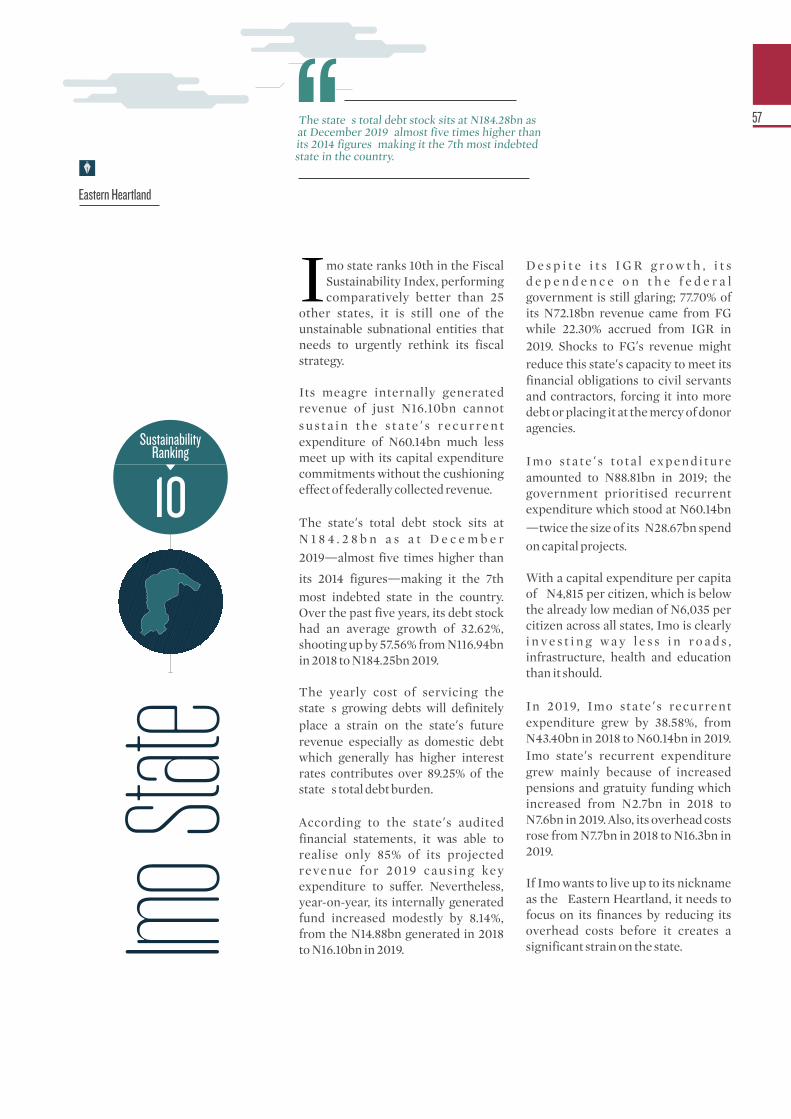
Imo state ranks 10th in the Fiscal Sustainability Index, performing comparatively better than 25
other states, it is still one of the unstainable subnational entities that needs to urgently rethink its fiscal strategy.
Its meagre internally generated revenue of just N16.10bn cannot s u s t a i n t h e s t a t e ’ s r e c u r r e n t expenditure of N60.14bn much less meet up with its capital expenditure commitments without the cushioning effect of federally collected revenue.
The state’s total debt stock sits at N 1 8 4 . 2 8 b n a s a t D e c e m b e r 2019—almost five times higher than
its 2014 figures—making it the 7th most indebted state in the country. Over the past five years, its debt stock had an average growth of 32.62%, shooting up by 57.56% from N116.94bn in 2018 to N184.25bn 2019.
The yearly cost of servicing the state�s growing debts will definitely place a strain on the state’s future revenue especially as domestic debt which generally has higher interest rates contributes over 89.25% of the state�s total debt burden.
According to the state’s audited financial statements, it was able to realise only 85% of its projected revenue for 2019 caus ing key expenditure to suffer. Nevertheless, year-on-year, its internally generated fund increased modestly by 8.14%, from the N14.88bn generated in 2018 to N16.10bn in 2019.
D e s p i t e i t s I G R g r o w t h , i t s d e p e n d e n c e o n t h e f e d e r a l government is still glaring; 77.70% of its N72.18bn revenue came from FG while 22.30% accrued from IGR in 2019. Shocks to FG’s revenue might reduce this state’s capacity to meet its financial obligations to civil servants and contractors, forcing it into more debt or placing it at the mercy of donor agencies.
I m o s t a t e ’s t o t a l ex p e n d i t u re amounted to N88.81bn in 2019; the government prioritised recurrent expenditure which stood at N60.14bn —twice the size of its N28.67bn spend on capital projects.
With a capital expenditure per capita of �N4,815 per citizen, which is below the already low median of N6,035 per citizen across all states, Imo is clearly i n v e s t i n g w a y l e s s i n r o a d s , infrastructure, health and education than it should.
In 2019, Imo state ’s recurrent expenditure grew by 38.58%, from N43.40bn in 2018 to N60.14bn in 2019. Imo state’s recurrent expenditure grew mainly because of increased pensions and gratuity funding which increased from N2.7bn in 2018 to N7.6bn in 2019. Also, its overhead costs rose from N7.7bn in 2018 to N16.3bn in 2019.
If Imo wants to live up to its nickname as the �Eastern Heartland, it needs to focus on its finances by reducing its overhead costs before it creates a significant strain on the state.
Eastern Heartland
The state�s total debt stock sits at N184.28bn as at December 2019�almost five times higher than its 2014 figures�making it the 7th most indebted state in the country.
Imo S
tate
10Sustainability
Ranking
57
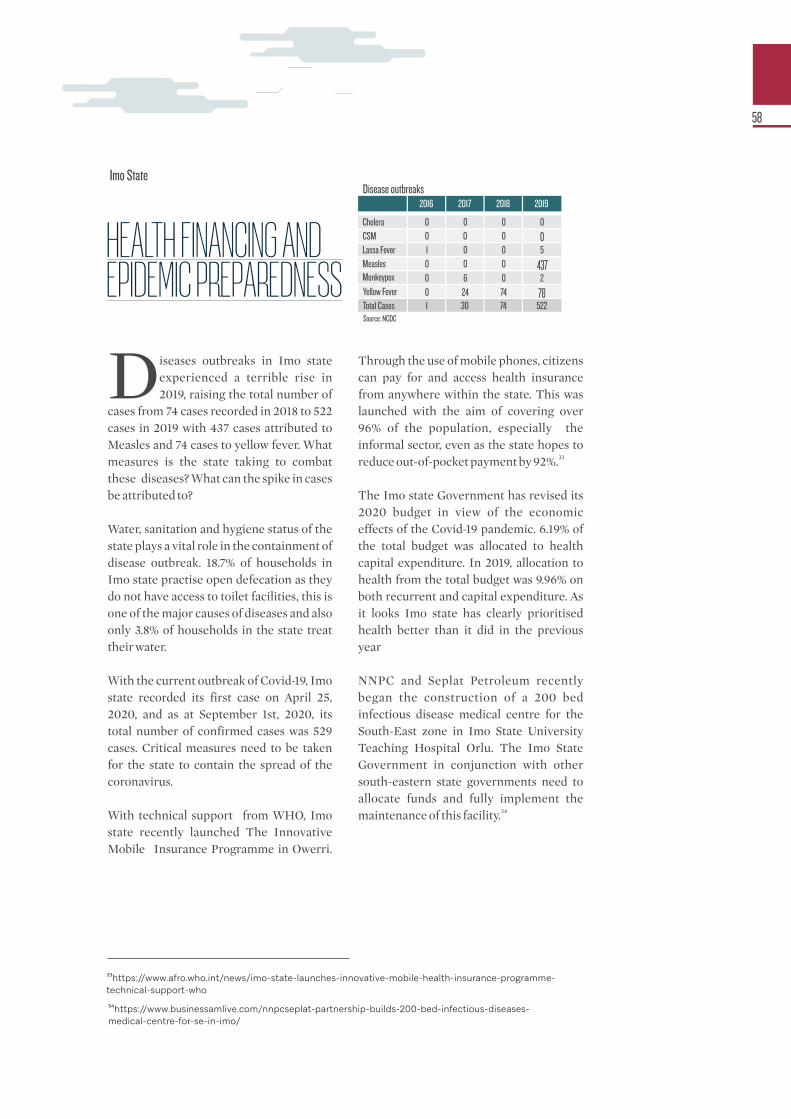
iseases outbreaks in Imo state Dexperienced a terrible rise in 2019, raising the total number of
cases from 74 cases recorded in 2018 to 522 cases in 2019 with 437 cases attributed to Measles and 74 cases to yellow fever. What measures is the state taking to combat these diseases? What can the spike in cases be attributed to?
Water, sanitation and hygiene status of the state plays a vital role in the containment of disease outbreak. 18.7% of households in Imo state practise open defecation as they do not have access to toilet facilities, this is one of the major causes of diseases and also only 3.8% of households in the state treat their water.
With the current outbreak of Covid-19, Imo state recorded its first case on April 25, 2020, and as at September 1st, 2020, its total number of confirmed cases was 529 cases. Critical measures need to be taken for the state to contain the spread of the coronavirus.
With technical support from WHO, Imo state recently launched The Innovative Mobile Insurance Programme in Owerri.
Through the use of mobile phones, citizens can pay for and access health insurance from anywhere within the state. This was launched with the aim of covering over 96% of the population, especially the informal sector, even as the state hopes to
33reduce out-of-pocket payment by 92%.
The Imo state Government has revised its 2020 budget in view of the economic effects of the Covid-19 pandemic. 6.19% of the total budget was allocated to health capital expenditure. In 2019, allocation to health from the total budget was 9.96% on both recurrent and capital expenditure. As it looks Imo state has clearly prioritised health better than it did in the previous year
NNPC and Seplat Petroleum recently began the construction of a 200 bed infectious disease medical centre for the South-East zone in Imo State University Teaching Hospital Orlu. The Imo State Government in conjunction with other south-eastern state governments need to allocate funds and fully implement the
34maintenance of this facility.
Imo State
³³https://www.afro.who.int/news/imo-state-launches-innovative-mobile-health-insurance-programme-technical-support-who
³⁴https://www.businessamlive.com/nnpcseplat-partnership-builds-200-bed-infectious-diseases-medical-centre-for-se-in-imo/
HEALTH FINANCING AND EPIDEMIC PREPAREDNESS
2016
Cholera 0CSM 0Lassa Fever 1Measles 0Monkeypox 0Yellow Fever 0Total Cases 1
2017 2018 2019
0 0 00 0 00 0 50 0 4376 0 2
24 74 7830 74 522
Disease outbreaks
Source: NCDC
58
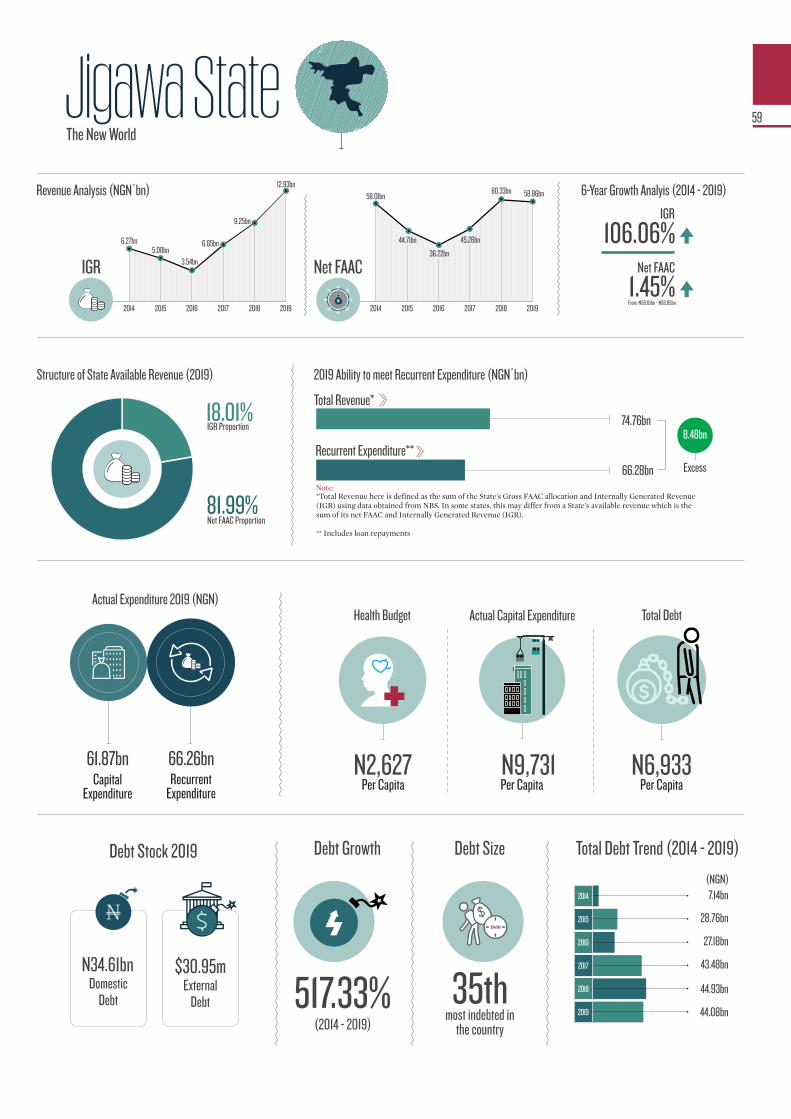
Jigawa StateThe New World
2014 2015 2016 2017 2018 2019
Net FAAC
45.26bn
6-Year Growth Analyis (2014 - 2019)
1.45%Net FAAC
IGR
106.06%
From N58.01bn - N58.85bn
66.28bn
74.76bn
7.14bn
28.76bn
27.18bn
43.48bn
44.93bn
44.08bn
2014
2015
2017
2019
2016
2018
Debt Growth
(2014 - 2019)
517.33%
Debt Size
most indebted in the country
35th
Total Debt Trend (2014 - 2019)
N34.61bn $30.95mDomestic
DebtExternal
Debt
N9,731N2,627 N6,933Capital
ExpenditureRecurrent
Expenditure
66.26bn61.87bn
N
Net FAAC Proportion 81.99%
IGR Proportion 18.01%
Excess
8.48bn
Debt
N
2014 2015 2016 2017 2018 2019
IGR
6.27bn5.08bn
3.54bn
6.65bn
9.25bn
12.93bn
44.71bn
58.01bn
36.22bn
60.33bn 58.86bnRevenue Analysis (NGN’bn)
Debt Stock 2019
Per Capita Per Capita Per Capita
Health BudgetActual Expenditure 2019 (NGN)
Actual Capital Expenditure Total Debt
(NGN)
59
Total Revenue*
Recurrent Expenditure**
Structure of State Available Revenue (2019) 2019 Ability to meet Recurrent Expenditure (NGN’bn)
*Total Revenue here is defined as the sum of the State's Gross FAAC allocation and Internally Generated Revenue (IGR) using data obtained from NBS. In some states, this may differ from a State's available revenue which is the sum of its net FAAC and Internally Generated Revenue (IGR).�
** Includes loan repayments
Note:
igawa state ranks 17th in the J2 0 2 0 S t a t e s � F i s c a l Sustainability Index. The state is
overburdened by its reliance on disbursements from the federal government to meet its recurrent expenditure obligations. Jigawa may be far from its �New World� nickname due to its comparatively low internally generated revenue, as 82% of the state’s N71.78bn total available revenue came from the federal government while a meagre N12.93bn, or 18%, was derived from its IGR.
A l t h o u g h t h i s s t a t e ’ s f i s c a l p e r f o r m a n c e c o u l d u s e s o m e improvement, it�s slightly better than other states like Kogi, Cross Rivers and Osun who will still be unable to meet t h e i r r e c u r r e n t e x p e n d i t u r e obligations even with their statutory a l l o c a t i o n s f r o m F G a n d I G R combined.
Revenue from the federal government via statutory handouts dwindled by -2.44%, from N60.33bn in 2018 to N58.86bn in 2019. This situation may not get better anytime soon given the recent COVID-19-induced headwinds facing crude oil prices, and by extension, the country’s federally collected revenue. Commendably, its IGR grew by 39.80%, from N9.25bn in 2018 to N12.93bn in 2019. Nevertheless, the state still sits at the bottom of the league of all states; when ranked purely by its 2019 IGR size, Jigawa sits at 24th position.
To survive and thrive as a viable subnational entity, Jigawa state will need to consolidate its internal revenue generation efforts and rapidly boost its local economy, especially
g i v e n i t s h u m a n d ev e l o p m e n t challenges, or it may find itself buried in a steep pile of debt.
In the six years from 2014 to 2019, the state�s total debt burden ballooned by 517.33%, from N7.14bn to N44.08bn as at December 2019. Jigawa state is one of the least indebted states in the country; this could mean one of two things — either the state has a low appetite for debt as an option to fund its expenditure obligations or the state is struggling to get the attention of creditors due to its unattractive fiscals and impending financial woes. Its total debt is currently greater than 50% of its total revenue of N71.78bn in 2019, breaching the debt ceiling set in the 2007 Investments and Securities Act for borrowing from Nigeria’s Capital Market for the state’s 2020 fiscal year.
In 2019, Jigawa state prioritised recurrent expenditure; its capital expenditure stood at N61.87bn, or 48%, of its total expenditure while recurrent expenditure gulped the majority N66.28bn, or 52%, of the total expenditure. Nonetheless, capital expenditure per citizen stood at N9,731 per citizen; slightly higher than the country average of N8,993 per citizen.
While it is commendable that Jigawa state spent N20.74bn on capital expenditure related to the social sector, it needs to do more in terms of t r a n s p a r e n c y o n t h e a c t u a l infrastructure funds spent, especially on roads (N26.87bn). Funding for specific roads and projects were not disaggregated in its public reports. This is not a good sign for a state that called itself the new world.
The New World
In the six years from 2014 to 2019, the state’s total debt burden ballooned by 517.33%, from N7.14bn to N44.08bn as at December 2019.
Jigaw
a Stat
e
17Sustainability
Ranking
60
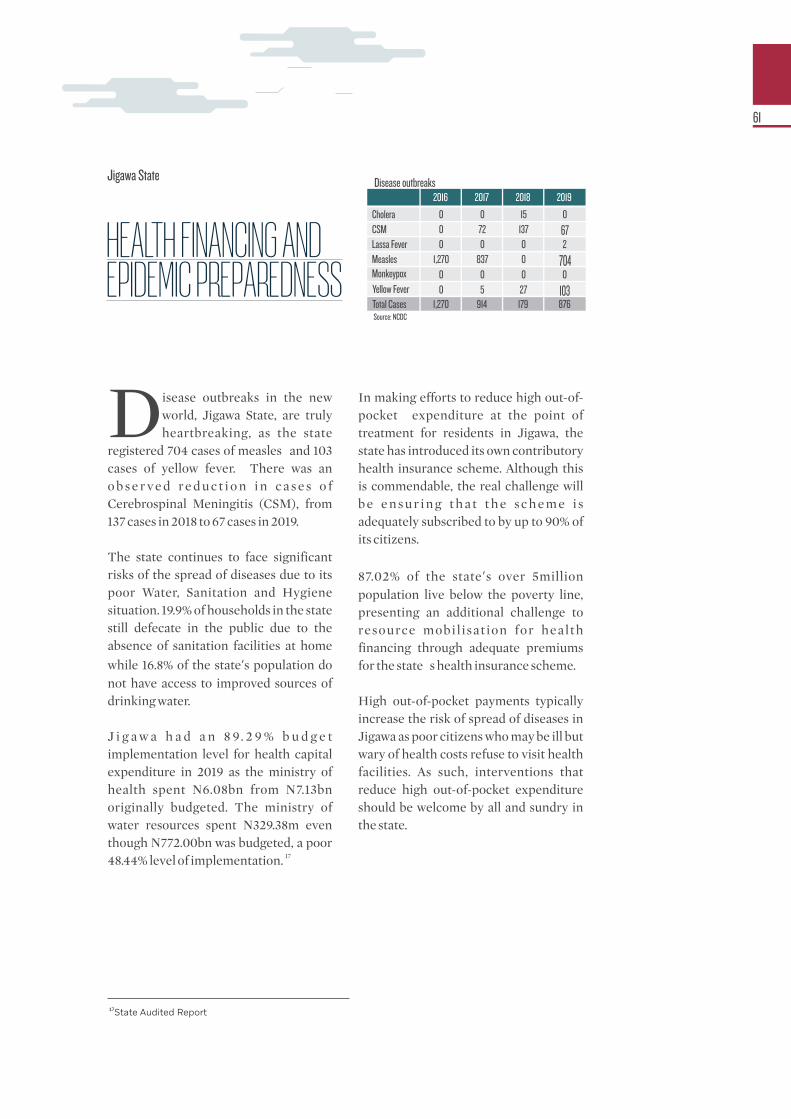
isease outbreaks in the new Dworld, Jigawa State, are truly heartbreaking, as the state
registered 704 cases of measles and 103 cases of yellow fever. There was an o b s e r v e d r e d u c t i o n i n c a s e s o f Cerebrospinal Meningitis (CSM), from 137 cases in 2018 to 67 cases in 2019.
The state continues to face significant risks of the spread of diseases due to its poor Water, Sanitation and Hygiene situation. 19.9% of households in the state still defecate in the public due to the absence of sanitation facilities at home
while 16.8% of the state’s population do not have access to improved sources of drinking water.
J i g a w a h a d a n 8 9. 2 9 % b u d g e t implementation level for health capital expenditure in 2019 as the ministry of health spent N6.08bn from N7.13bn originally budgeted. The ministry of water resources spent N329.38m even though N772.00bn was budgeted, a poor
1748.44% level of implementation.
In making efforts to reduce high out-of-pocket expenditure at the point of treatment for residents in Jigawa, the state has introduced its own contributory health insurance scheme. Although this is commendable, the real challenge will b e e n s u r i n g t h a t t h e s c h e m e i s adequately subscribed to by up to 90% of its citizens.
87.02% of the state’s over 5million population live below the poverty line, presenting an additional challenge to resource mobil isation for health financing through adequate premiums for the state�s health insurance scheme.
High out-of-pocket payments typically increase the risk of spread of diseases in Jigawa as poor citizens who may be ill but wary of health costs refuse to visit health facilities. As such, interventions that reduce high out-of-pocket expenditure should be welcome by all and sundry in the state.
Jigawa State
¹⁷State Audited Report
2016
Cholera 0CSM 0Lassa Fever 0Measles 1,270Monkeypox 0Yellow Fever 0Total Cases 1,270
2017 2018 2019
0 15 072 137 670 0 2
837 0 7040 0 05 27 103
914 179 876
HEALTH FINANCING AND EPIDEMIC PREPAREDNESS
Disease outbreaks
Source: NCDC
61
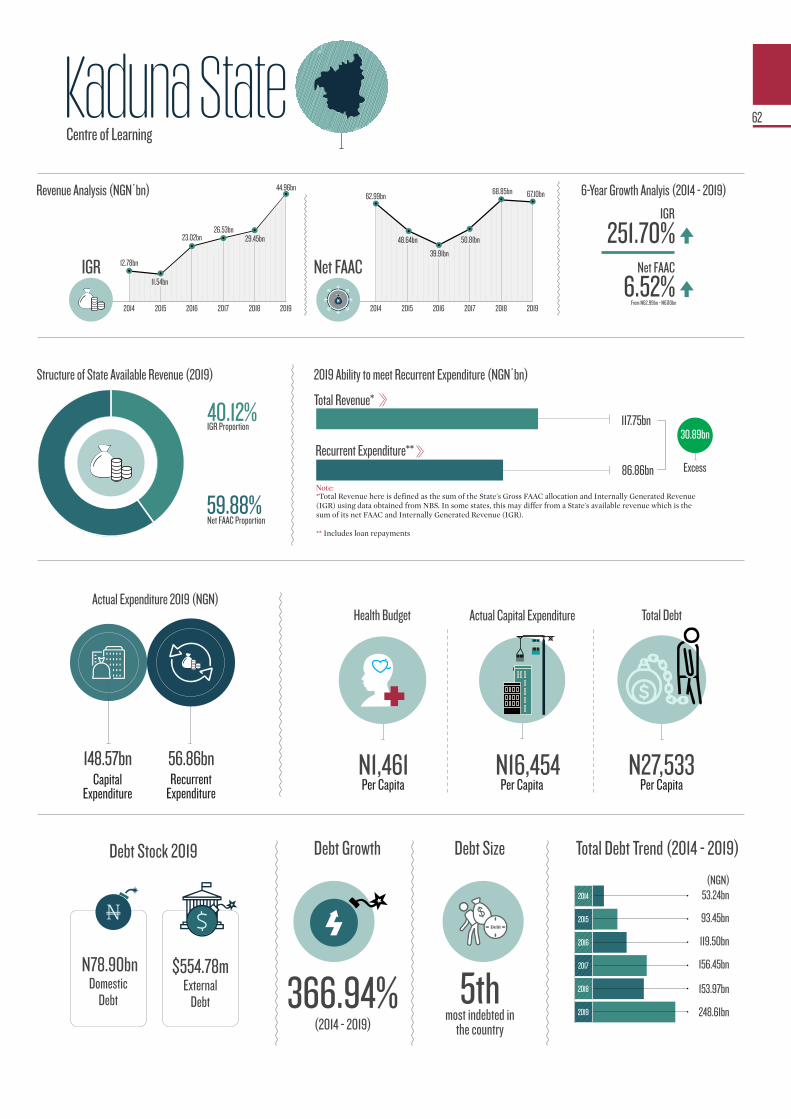
Kaduna StateCentre of Learning
2014 2015 2016 2017 2018 2019
Net FAAC
50.81bn
6-Year Growth Analyis (2014 - 2019)
6.52%Net FAAC
IGR
251.70%
From N62.99bn - N67.10bn
53.24bn
93.45bn
119.50bn
156.45bn
153.97bn
248.61bn
2014
2015
2017
2019
2016
2018
Debt Growth
(2014 - 2019)
366.94%
Debt Size
most indebted in the country
5th
Total Debt Trend (2014 - 2019)
N78.90bn $554.78mDomestic
DebtExternal
Debt
N16,454N1,461 N27,533Capital
ExpenditureRecurrent
Expenditure
56.86bn148.57bn
N
Net FAAC Proportion 59.88%
IGR Proportion 40.12%
86.86bn
117.75bn
Excess
30.89bn
Debt
N
2014 2015 2016 2017 2018 2019
IGR 12.78bn
11.54bn
23.02bn26.53bn
29.45bn
44.96bn
48.64bn
62.99bn
39.91bn
68.85bn 67.10bnRevenue Analysis (NGN’bn)
Debt Stock 2019
Per Capita Per Capita Per Capita
Health BudgetActual Expenditure 2019 (NGN)
Actual Capital Expenditure Total Debt
(NGN)
62
Total Revenue*
Recurrent Expenditure**
Structure of State Available Revenue (2019) 2019 Ability to meet Recurrent Expenditure (NGN’bn)
*Total Revenue here is defined as the sum of the State's Gross FAAC allocation and Internally Generated Revenue (IGR) using data obtained from NBS. In some states, this may differ from a State's available revenue which is the sum of its net FAAC and Internally Generated Revenue (IGR).�
** Includes loan repayments
Note:
he Centre of Learning� sits Ton the 7th position in the 2 0 2 0 S t a t e s � F i s c a l
Sustainability Index. The state is encumbered largely by its rising debt profile and an inability to meet its recurrent expenditure obligations through its internally generated revenue and value added tax without relying on statutory handouts from the federal government.
Kaduna state’s total debt burden swelled by 61.47% or N94.64bn from N153.97bn in 2018 to N248.61bn in 2019; the highest debt surge in the country within that period. A significant component of the debt surge was due to the uptake of foreign loans which increased by 136.67% from $227.25m in 2018 to $554.78m in 2019. This doubling of its foreign loans leaves the state more exposed than ever to exchange rate volatilities and inflation risks due to the woes of the Nigerian naira. The state’s debt structure now comprises 68.26% of foreign loans and 31.74% of domestic loans.
Overall, the state is the fifth most indebted state in the country, exceeded by Lagos, Rivers, Delta and Akwa Ibom with total debt burdens of N871.33bn, N290.93bn, N253.02bn and N252.02bn respectively.
T h e s t a t e ’ s i n t e r n a l rev e n u e generation strategies are paying off handsomely as its IGR experienced a commendable upward tick of 52.67% from N29.45bn in 2018 to N44.96bn in 2019.
H o w e v e r, K a d u n a ’ s r e v e n u e structure is still somewhat dependent on the federal government; 59.88% of the state ’s N112.06bn available revenue in 2019 came from the federal government while 40.12% represents revenue generated internally from its local economy.
A c c o rd i n g t o K a d u n a St a t e ’ s Infrastructure Masterplan, the state needs at least N8.09tn to address renovation and construction of its existing 9,500km road network and at least N20tn to close the state’s infrastructure gap by 2050. Given its admirably ambitious infrastructure development plan, the state needs to sustain this IGR growth rate.
It is commendable that the state s p e n t N 1 4 8 . 5 7 b n o n c a p i t a l expenditure in 2019, being the fourth highest capital expenditure in the country. However, further checks showed the state government borrowed N60.8bn to shore up its financing for its capital items. The state also had a high recurrent surplus of N62bn enabling its position to fund capital expenditure.
It is also good that the state is rigorously improving its IGR position but further review also showed that it earned N11bn as tax audit arrears in 2019. It would be seen if Kaduna state can maintain its current IGR growth trajectory, a metric that keeps improving its position on our State of States ranking.
Centre of Learning
It is also good that the state is rigorously improving its IGR position but further review also showed that it earned N11bn as tax audit arrears in 2019.
Kadu
na St
ate
7Sustainability
Ranking
63

aduna successfully combated Kcholera in the 2019 fiscal year, w i t h 0 c a s e s r e g i s t e r e d
compared to 401 cases in 2018 and 172 cases in 2017. The state grappled with 582 cases of measles, 49 cases of lassa fever and 14 cases of Cerebrospinal Meningitis (CSM), the lowest number of CSM cases in the North-West.
Water, Sanitation and Hygiene (WASH) situation in the state remains below global standards, increasing the risk of spread of contagious diseases; 10.3% of h o u s e h o l d s s t i l l p ra c t i s e o p e n defecation due to unavailable sanitation
facilities, while 33.9% of the state’s population do not have access to improved sources of drinking water.
The state is making efforts to improve this situation through projects like the AfDB-supported Zaria Water Supply and Expansion Project, construction of additional 1,350 hand pump boreholes and the construction of 3,432 blocks of gender-sensitive sanitation facilities in
16nstitutions and public places.
N11.43bn was budgeted for the health capital expenditure in 2019, while the g o v e r n m e n t s p e n t N 1 1 . 1 5 b n , a commendable 97.56% implementation level. Source - State Audit Report
Kaduna state needs more money than it is currently able to commit through its budget for heal th and epidemic preparedness. To mobilise non-debt resources for financing health, the state introduced the State Health Insurance Scheme managed by Kaduna State Contributory Health Management Authority.
If successfully implemented, the state’s health insurance programme will also reduce the burden of high out-of-pocket expenditure at the point of treatment which discourages potentially ill citizens from seeking treatment, increasing the risk of spread from untreated persons.
Kaduna State
¹⁶State Audited Report
2016
Covid-19 0Cholera 0CSM 0Lassa Fever 0Measles 0Monkeypox 0Yellow Fever 0Total Cases 0
2017 2018 2019
0 0172 401 092 0 140 0 491 0 5822 0 06 26 27
273 427 672
HEALTH FINANCING AND EPIDEMIC PREPAREDNESS
Disease outbreaks
Source: NCDC
64
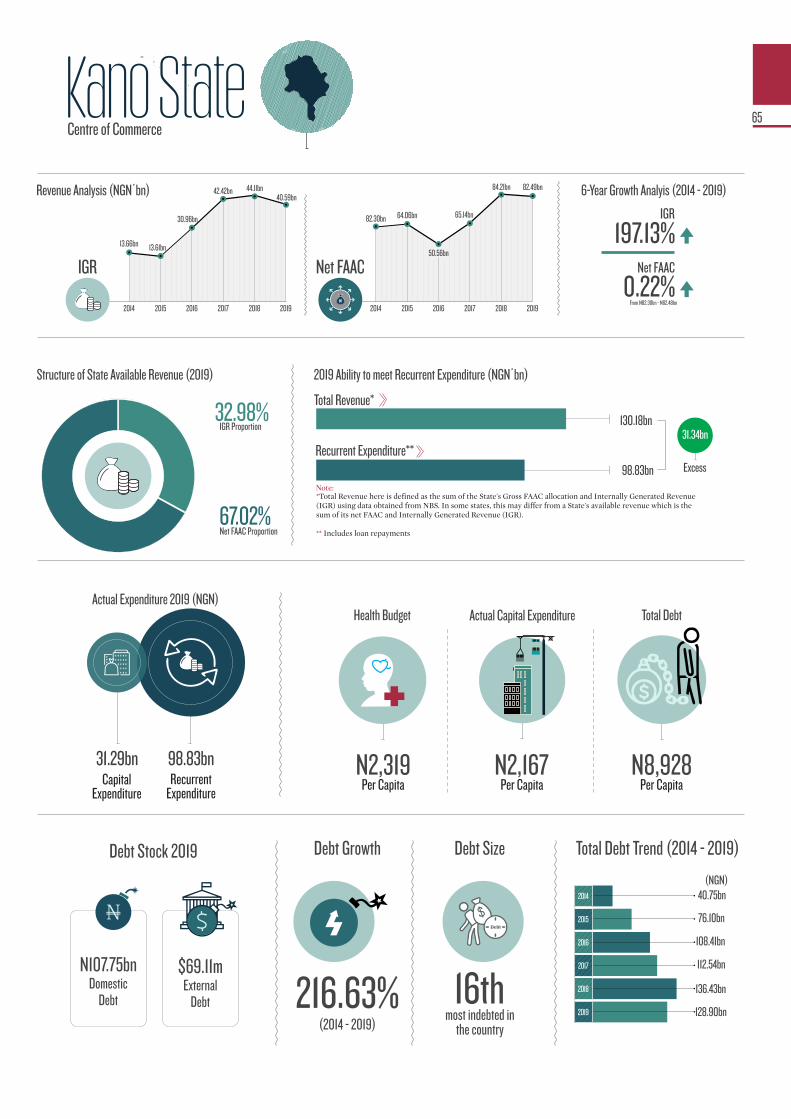
Kano State
2014 2015 2016 2017 2018 2019
82.30bn
84.21bn 6-Year Growth Analyis (2014 - 2019)
0.22%
Net FAAC
IGR
197.13%
From N82.30bn - N82.48bn
98.83bn
130.18bn
40.75bn
76.10bn
108.41bn
112.54bn
136.43bn
128.90bn
2014
2015
2017
2019
2016
2018
Debt Growth
(2014 - 2019)
216.63%
Debt Size
most indebted in the country
16th
Total Debt Trend (2014 - 2019)
N107.75bn $69.11mDomestic
DebtExternal
Debt
Per Capita Analysis
�N2,167
N2,319 N8,928
Capital Expenditure
Recurrent Expenditure
98.83bn31.29bn
N
Net FAAC Proportion 67.02%
IGR Proportion 32.98%
Excess
31.34bn
Debt
2014 2015 2016 2017 2018 2019
Net FAAC
13.66bn
N
13.61bn
30.96bn
42.42bn 44.11bn40.59bn
64.06bn
50.56bn
65.14bn
82.49bn
Centre of Commerce
IGR
Revenue Analysis (NGN’bn)
Debt Stock 2019
Per Capita Per Capita Per Capita
Health BudgetActual Expenditure 2019 (NGN)
Actual Capital Expenditure Total Debt
(NGN)
65
Total Revenue*
Recurrent Expenditure**
Structure of State Available Revenue (2019) 2019 Ability to meet Recurrent Expenditure (NGN’bn)
*Total Revenue here is defined as the sum of the State's Gross FAAC allocation and Internally Generated Revenue (IGR) using data obtained from NBS. In some states, this may differ from a State's available revenue which is the sum of its net FAAC and Internally Generated Revenue (IGR).�
** Includes loan repayments
Note:
ano’s total debt burden Kswelled by 216.31%, from a modest N40.75bn in 2014 to
N128.90bn as at December 2019. Domestic debts were the biggest drivers of its debt growth; they make up 83.60% of the total debt structure while foreign debts comprise just 16.40%.
Nigeria’s most populous Northern state, Kano, is still heavily dependent on the federal government to meet its obligations; 67.02% or N82.49bn of its N123.08bn total available revenue in 2 0 1 9 c a m e f r o m t h e f e d e r a l government through net FAAC while N40.59bn, or 32.98%, was obtained from internally generated revenue.
Lagos state’s N398.73bn internally generated revenue alone is nearly three and half times Kano state’s total available revenue of N123.08bn; clearly Kano still has many miles to go to catch up with Lagos. �The Centre of Commerce� needs to do more to live up to its name.
The state suffered a -7.97% setback in i t s IGR which dec l ined f rom N44.11bn in 2018 to N40.59bn in 2019. Its IGR per capita a lso amounted to �2,812 per citizen in the 2019 fiscal year, way below the country’s average of N5,044 per citizen for all states.
R e v e n u e f r o m t h e f e d e r a l government via net FAAC dipped by -2.04%, from N84.21bn in 2018 to N82.49bn in 2019. This is a warning sign for Kano state to buckle up its IGR collection, especially with the world ’s own black swan event, COVID-19, that continues to threaten federal government’s revenue, which makes up a majority of the state’s total available revenue.
Kano also needs to whip its priorities back into shape as the overwhelming bulk of its 2019 total expenditure, N98.83bn, or 75.95%, of its N130.12bn total expenditure went into covering overhead costs, salaries and other recurrent expenses, leaving a minute N31.29bn, or 24.05%, for capital expenditure.
In our view, a state such as Kano with its huge population and young demographic composition cannot spend so low on capital expenditure, compared to N148bn by Kaduna state over the same period. While the state might be cautious about debt, it needs to find urgent means to expand its IGR and also ramp up funding from the aid community to bolster its expense especially in the social sector put at N10.9bn in 2019.
Centre of Commerce
Kano�s total debt burden swelled by 216.31%, from a modest N40.75bn in 2014 to N128.90bn as at December 2019
Kano
State
5Sustainability
Ranking
66
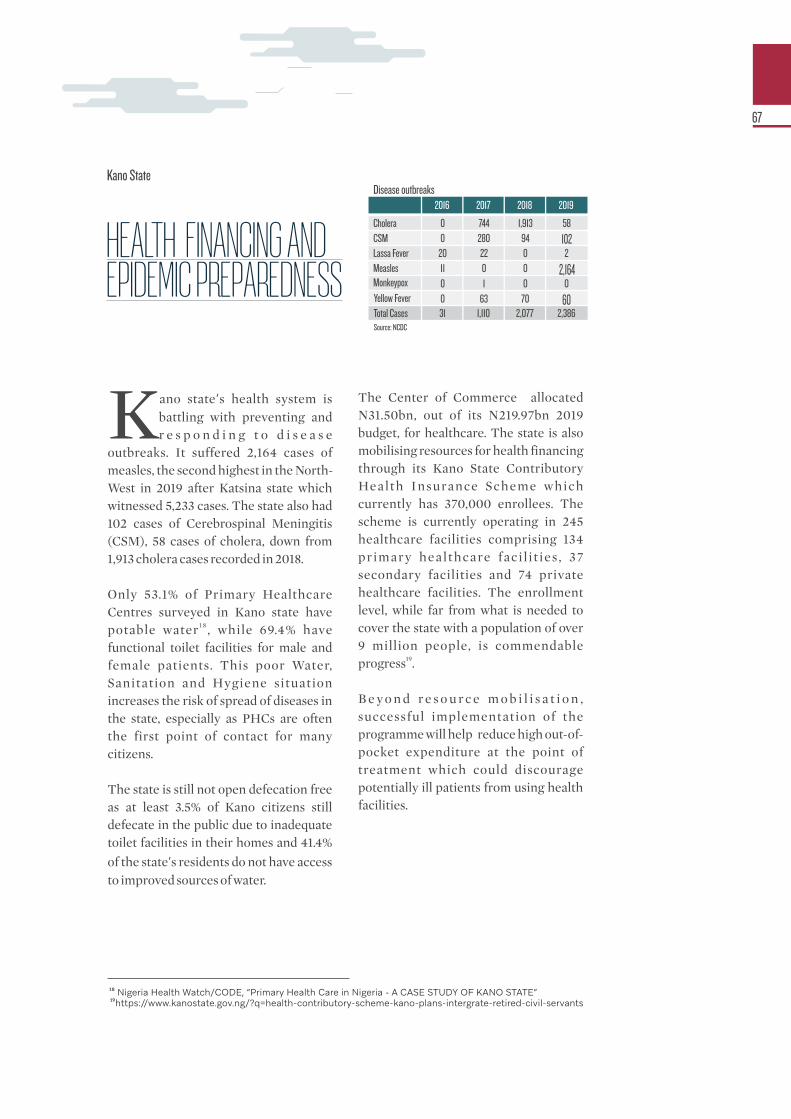
ano state’s health system is Kbattling with preventing and r e s p o n d i n g t o d i s e a s e
outbreaks. It suffered 2,164 cases of measles, the second highest in the North-West in 2019 after Katsina state which witnessed 5,233 cases. The state also had 102 cases of Cerebrospinal Meningitis (CSM), 58 cases of cholera, down from 1,913 cholera cases recorded in 2018.
Only 53.1% of Primary Healthcare Centres surveyed in Kano state have
1 8potable water , while 69.4% have functional toilet facilities for male and female patients. This poor Water, Sanitation and Hygiene situation increases the risk of spread of diseases in the state, especially as PHCs are often the first point of contact for many citizens.
The state is still not open defecation free as at least 3.5% of Kano citizens still defecate in the public due to inadequate toilet facilities in their homes and 41.4%
of the state’s residents do not have access to improved sources of water.
The Center of Commerce� allocated N31.50bn, out of its N219.97bn 2019 budget, for healthcare. The state is also mobilising resources for health financing through its Kano State Contributory Health Insurance Scheme which currently has 370,000 enrollees. The scheme is currently operating in 245 healthcare facilities comprising 134 primary healthcare faci l i t ies, 37 secondary facilities and 74 private healthcare facilities. The enrollment level, while far from what is needed to cover the state with a population of over 9 million people, is commendable
19progress .
B e y o n d r e s o u r c e m o b i l i s a t i o n , successful implementation of the programme will help reduce high out-of-pocket expenditure at the point of treatment which could discourage potentially ill patients from using health facilities.
Kano State
¹⁸ Nigeria Health Watch/CODE, “Primary Health Care in Nigeria - A CASE STUDY OF KANO STATE”¹⁹https://www.kanostate.gov.ng/?q=health-contributory-scheme-kano-plans-intergrate-retired-civil-servants
2016
Cholera 0CSM 0Lassa Fever 20Measles 11Monkeypox 0Yellow Fever 0Total Cases 31
2017 2018 2019
744 1,913 58280 94 10222 0 20 0 2,1641 0 0
63 70 601,110 2,077 2,386
HEALTH FINANCING AND EPIDEMIC PREPAREDNESS
Disease outbreaks
Source: NCDC
67
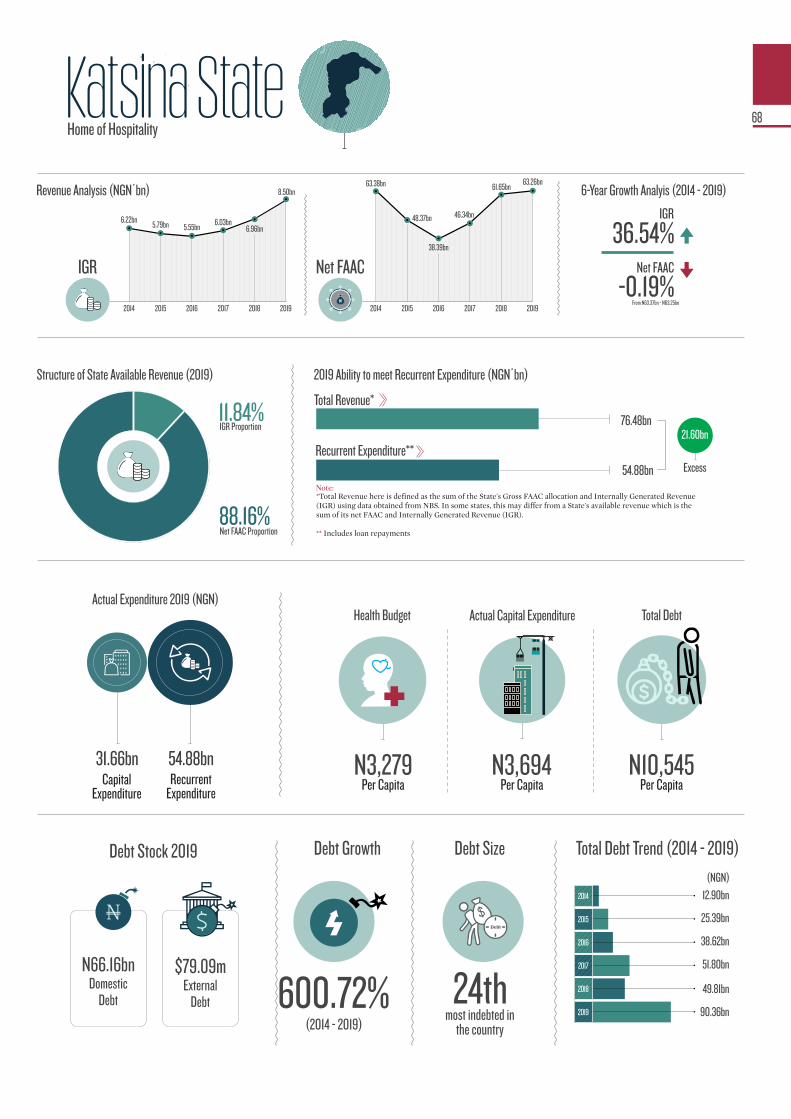
Katsina State
2014 2015 2016 2017 2018 2019
63.38bn 61.65bn 6-Year Growth Analyis (2014 - 2019)
-0.19%
Net FAAC
IGR
36.54%
From N63.37bn - N63.25bn
54.88bn
76.48bn
12.90bn
25.39bn
38.62bn
51.80bn
49.81bn
90.36bn
2014
2015
2017
2019
2016
2018
Debt Growth
(2014 - 2019)
600.72%
Debt Size
most indebted in the country
24th
Total Debt Trend (2014 - 2019)
N66.16bn $79.09mDomestic
DebtExternal
Debt
Per Capita Analysis
N3,694
N3,279 N10,545
Capital Expenditure
Recurrent Expenditure
54.88bn31.66bn
N
Net FAAC Proportion 88.16%
IGR Proportion 11.84%
Excess
21.60bn
Debt
2014 2015 2016 2017 2018 2019
Net FAAC
6.22bn
N
5.79bn 5.55bn6.03bn
6.96bn
8.50bn
48.37bn
38.39bn
46.34bn
63.26bn
Home of Hospitality
IGR
Revenue Analysis (NGN’bn)
Debt Stock 2019
Per Capita Per Capita Per Capita
Health BudgetActual Expenditure 2019 (NGN)
Actual Capital Expenditure Total Debt
(NGN)
68
Total Revenue*
Recurrent Expenditure**
Structure of State Available Revenue (2019) 2019 Ability to meet Recurrent Expenditure (NGN’bn)
*Total Revenue here is defined as the sum of the State's Gross FAAC allocation and Internally Generated Revenue (IGR) using data obtained from NBS. In some states, this may differ from a State's available revenue which is the sum of its net FAAC and Internally Generated Revenue (IGR).�
** Includes loan repayments
Note:
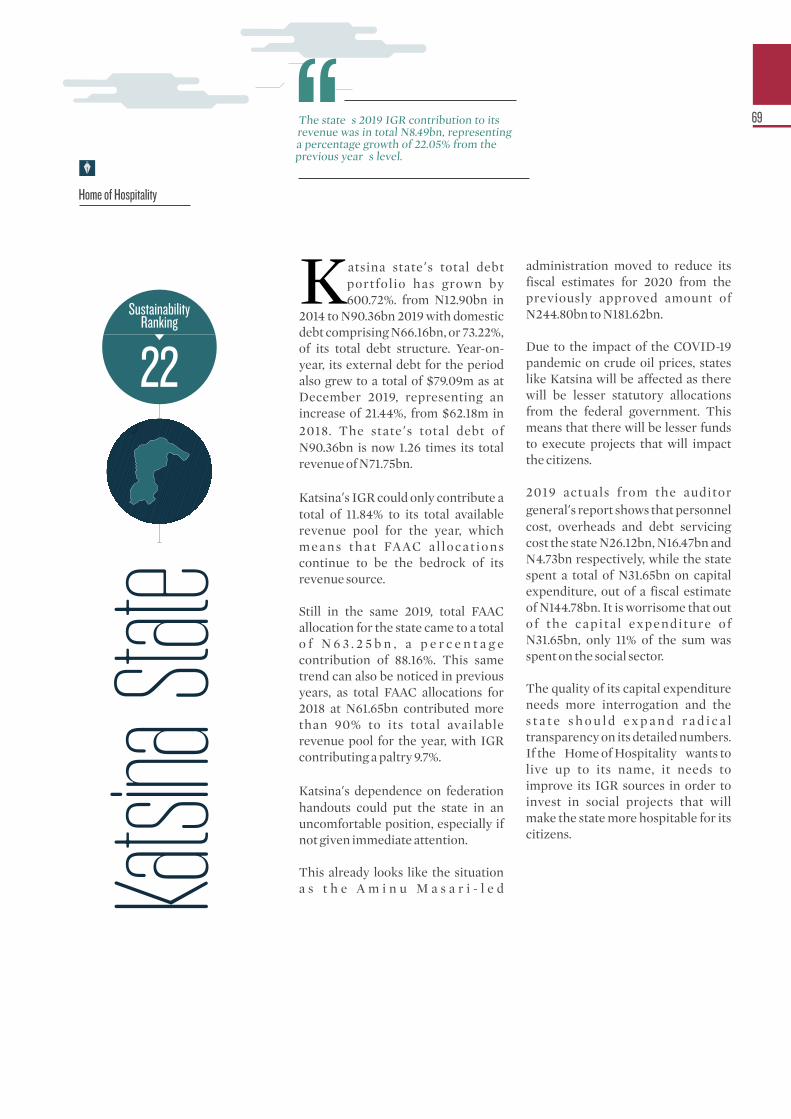
Katsina state’s total debt portfolio has grown by 600.72%. from N12.90bn in
2014 to N90.36bn 2019 with domestic debt comprising N66.16bn, or 73.22%, of its total debt structure. Year-on-year, its external debt for the period also grew to a total of $79.09m as at December 2019, representing an increase of 21.44%, from $62.18m in 2018. The state ’s total debt of N90.36bn is now 1.26 times its total revenue of N71.75bn.
Katsina’s IGR could only contribute a total of 11.84% to its total available revenue pool for the year, which means that FAAC a l locat ions continue to be the bedrock of its revenue source.
Still in the same 2019, total FAAC allocation for the state came to a total o f N 6 3 . 2 5 b n , a p e r c e n t a g e contribution of 88.16%. This same trend can also be noticed in previous years, as total FAAC allocations for 2018 at N61.65bn contributed more than 90% to its total available revenue pool for the year, with IGR contributing a paltry 9.7%.
Katsina’s dependence on federation handouts could put the state in an uncomfortable position, especially if not given immediate attention.
This already looks like the situation a s t h e A m i n u M a s a r i - l e d
administration moved to reduce its fiscal estimates for 2020 from the previously approved amount of N244.80bn to N181.62bn.
Due to the impact of the COVID-19 pandemic on crude oil prices, states like Katsina will be affected as there will be lesser statutory allocations from the federal government. This means that there will be lesser funds to execute projects that will impact the citizens.
2019 actuals from the auditor general’s report shows that personnel cost, overheads and debt servicing cost the state N26.12bn, N16.47bn and N4.73bn respectively, while the state spent a total of N31.65bn on capital expenditure, out of a fiscal estimate of N144.78bn. It is worrisome that out of the capita l expenditure of N31.65bn, only 11% of the sum was spent on the social sector.
The quality of its capital expenditure needs more interrogation and the s t a t e s h o u l d e x p a n d r a d i c a l transparency on its detailed numbers. If the �Home of Hospitality� wants to live up to its name, it needs to improve its IGR sources in order to invest in social projects that will make the state more hospitable for its citizens.
Home of Hospitality
The state�s 2019 IGR contribution to its revenue was in total N8.49bn, representing a percentage growth of 22.05% from the previous year�s level.
Katsi
na St
ate
22Sustainability
Ranking
69

he Katsina state health system Twas nearly overrun by disease outbreaks in 2019; the state
recorded a total of about 7,389 cases of cholera, yellow fever, Cerebrospinal Meningitis, lassa fever, measles and monkeypox--the highest in the North-West. The state recorded a whopping 5,233 cases of measles, while diseases like Cerebrospinal Meningitis, yellow fever, and cholera recorded 1,396, 617 and 131 respectively. It also recorded 11 cases of lassa fever and 1 case of monkeypox.
To paint an even more grim picture of the health situation in Katsina, between 2016 and 2019, the state recorded a total number of 17,172 cases of infectious diseases.
The risk of spread of diseases is very high in this State due to a high percentage of
Katsina’s population residing mostly in the more rural areas of the State with lack of access to basic amenities like water, proper sanitation, and public health access; 8.5% of households practice open defecation due to inadequate sanitation facilities in their dwellings, 51.3% use open pit latrines. 36.4% of residents in the State do not have access to improved sources of water.
One of the key factors weakening this
state’s level of preparedness is the huge gulf between what the state government allocates in its budget for health and the actual spend on health. In 2019, the state government earmarked a total of N20.91bn as its capital expenditure estimate for the health sector, but in reality, the state government only managed to spend a total of N3.44bn on health sector capital expenditure.
In almost a replica fashion, the state government has budgeted a fiscal estimate above N20bn (N23.06bn) as its capital expenditure for its health sector. Going by
the previous year’s trend, implementation may not be up to 20%.
A lot of deaths recorded in the state yearly are attributable to diseases that are in every sense preventable. However, low l e v e l s o f l i t e r a c y a r o u n d r u r a l communities in the state and high poverty rate means many citizens may not be aware of methods for prevention or may not be able to afford them out-of-pocket without intervention of the government or international development partners.
Katsina State
2016
Cholera 0CSM 0Lassa Fever 0Measles 1Monkeypox 0Yellow Fever 0Total Cases 1
2017 2018 2019
0 7,314 131916 1,215 1,3960 0 110 0 5,2332 0 1
45 230 617963 8,819 7,389
HEALTH FINANCING AND EPIDEMIC PREPAREDNESS
Disease outbreaks
Source: NCDC
70
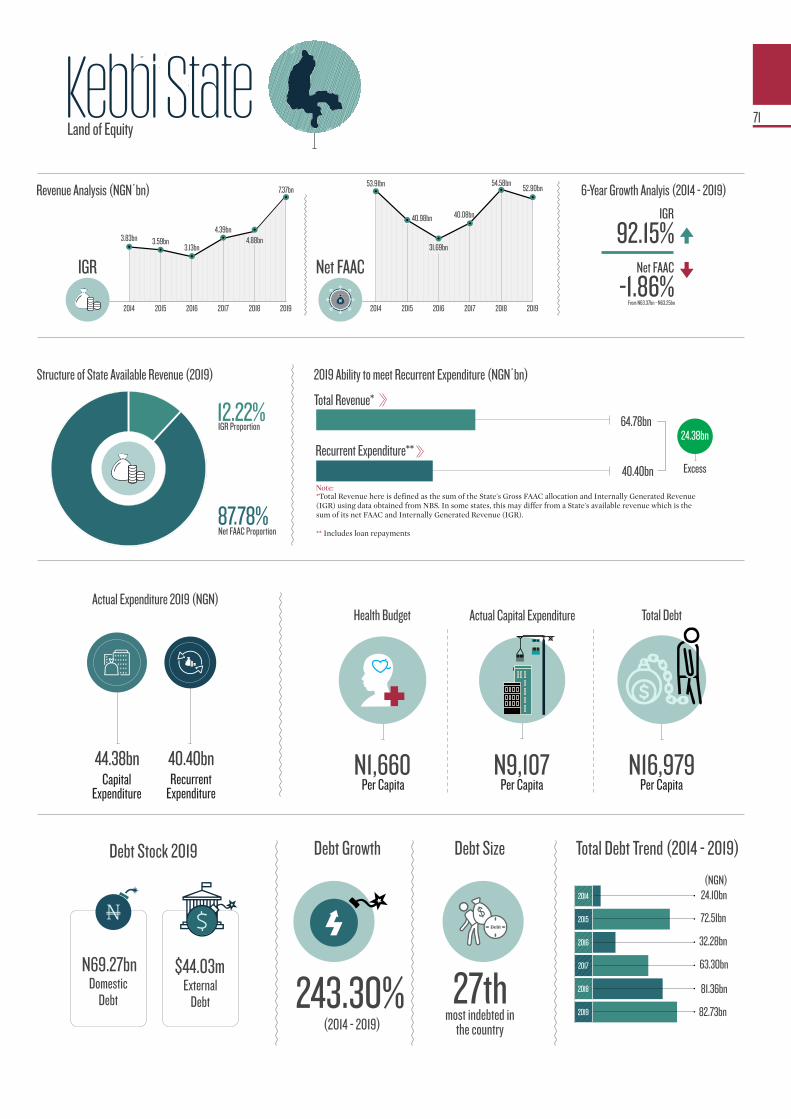
Kebbi State
2014 2015 2016 2017 2018 2019
53.91bn 54.58bn6-Year Growth Analyis (2014 - 2019)
-1.86%
Net FAAC
IGR
92.15%
From N63.37bn - N63.25bn
40.40bn
64.78bn
24.10bn
72.51bn
32.28bn
63.30bn
81.36bn
82.73bn
2014
2015
2017
2019
2016
2018
Debt Growth
(2014 - 2019)
243.30%
Debt Size
most indebted in the country
27th
Total Debt Trend (2014 - 2019)
N69.27bn $44.03mDomestic
DebtExternal
Debt
Per Capita Analysis
N9,107
N1,660 N16,979
Capital Expenditure
Recurrent Expenditure
40.40bn44.38bn
N
Net FAAC Proportion 87.78%
IGR Proportion 12.22%
Excess
24.38bn
Debt
2014 2015 2016 2017 2018 2019
Net FAAC
3.83bn
N
3.59bn3.13bn
4.39bn4.88bn
7.37bn
40.98bn
31.69bn
40.08bn
52.90bn
Land of Equity
IGR
Revenue Analysis (NGN’bn)
Debt Stock 2019
Per Capita Per Capita Per Capita
Health BudgetActual Expenditure 2019 (NGN)
Actual Capital Expenditure Total Debt
(NGN)
71
Total Revenue*
Recurrent Expenditure**
Structure of State Available Revenue (2019) 2019 Ability to meet Recurrent Expenditure (NGN’bn)
*Total Revenue here is defined as the sum of the State's Gross FAAC allocation and Internally Generated Revenue (IGR) using data obtained from NBS. In some states, this may differ from a State's available revenue which is the sum of its net FAAC and Internally Generated Revenue (IGR).�
** Includes loan repayments
Note:
If Kebbi state is looking to reduce i t s t o t a l d e b t s i z e , i t s d e v e l o p m e n t o f m o r e
sustainable financing streams for its development plans will need to be structurally implemented. As it stands, the state is indebted in the region of N82.73bn as at the end of 2019, while its total debt stock over the years has grown by 243.30% between 2014 and 2019.
The domestic debt for the northern state has also risen by 301.04%, rising from the 2017 level of N48.72bn, to N69.26bn. In total, domestic debt was at its lowest in 2016, dropping remarkably from N63.79bn in 2015 to N20.65bn. External debt on the other reduced slightly as at December 2019 to US$44.03m from the 2018 level of US$45.60m.
Finding a link between the state’s increased total debt portfolio over the last couple of years can somewhat b e t r a c e d t o t h e s t a t e ’ s overdependence on statutory a l l o c a t i o n s f r o m t h e f e d e r a l government and also the state's failure to significantly grow.
In 2019, Kebbi state’s total IGR of N7.37bn accounted for 12.22% of its total N60.27bn available revenue for the year while Net FAAC allocation constituted a large portion 87.78%, or N52.90bn, of the total revenue pool.
On a positive note, the state was able to grow its IGR by 50.91% from N4.88bn in 2018 to N7.37bn in 2019. However, it still has one of the smallest IGR in the country, ranking 34th by size amongst all states.
It is certain that FAAC allocations to the state will most likely experience a s h o r t f a l l , t a k i n g t h e c u r re n t economic realities into context. Falling oil prices, compounded with the ripple effects of the COVID-19 pandemic on the global markets will affect revenue streams of the federal government, which unfortunately wil l trickle down to the state governments.
Pre-COVID-19 net FAAC to Kebbi had experienced a decline by 3.07%, from N54.58bn in 2018 to N52.90bn in 2019. It is therefore no surprise that the state government moved to revise its 2020 budget from an initial fiscal estimate of N138.14bn down to N90.13bn to mirror the post-COVID-19 fiscal realities which has affected federally collected revenue.
In 2019, Kebbi prioritised recurrent expenditure with N40.41bn or 47.65%, of its total N84.78bn devoted to recurrent obligations while capital expenditure gulped N44.38bn or 52.35%.
Land of Equity
Finding a link between the state�s increased total debt portfolio over the last couple of years can somewhat be traced to the state’s overdependence on statutory allocations from the federal government and also the state's failure to significantly grow.
Kebb
i Stat
e
11Sustainability
Ranking
72

ebbi recorded about 545 cases Kof yellow fever, the second highest in the North-West, it
also suffered an outbreak of measles with 487 cases recorded. 27 cases of lassa fever we re re p o r t e d w h i l e n o c a s e o f monkeypox or cholera was observed in the state. Between 2016 and 2019, Kebbi state has had a total of 4,802 recorded cases of infectious diseases, with cholera having the highest outbreak in that 4-year span.
46.9% of households engage in open defecation due to non-availability of proper toilet facilities. With low access to pipe-borne water, infectious diseases like cholera can and will easily spread especially in rural areas. 51.3% of the population in Kebbi state do not have access to improved sources of water, a s i tuat ion that should worry the authorities concerned with preparing the state for any potential disease outbreak.
Healthcare financing by the state government is not helping matters, c o n s i d e r i n g h o w l o w t h e s t a t e government is committing to its health sector. In 2019, the state government committed a total of N8.09bn to its health sector, with N4.09bn earmarked for its recurrent obligations and another N4bn for i ts capital expenditure. This allocation was just 6.6% of its total annual fiscal estimates, and as such, put the state within the bottom 10 states, with regards to healthcare prioritisation.
In 2020, of its total fiscal estimate of N138.13bn for the fiscal year, Kebbi is proposing to spend just 6.98% of the total budget (N9.64bn) on its health sector. Putting the economic situation of Nigeria, as well as the Kebbi state due to the effect of the COVID-19 pandemic into context, the amount the state is projecting to spend on health may be significantly reduced.
Kebbi State
2016
Cholera 0CSM 0Lassa Fever 0Measles 983Monkeypox 0Yellow Fever 0Total Cases 983
2017 2018 2019
1,627 198 0132 87 1000 0 276 0 4870 0 0
140 470 5451,905 755 1,159
HEALTH FINANCING AND EPIDEMIC PREPAREDNESS
Disease outbreaks
Source: NCDC
73

Kogi State
2014 2015 2016 2017 2018 2019
54.82bn 53.38bn6-Year Growth Analyis (2014 - 2019)
-4.53%
Net FAAC
IGR
149.46%
From N54.81bn - N52.33bn
15.89bn
48.51bn
79.44bn
112.43bn
94.56bn
141.80bn
2014
2015
2017
2019
2016
2018
Debt Growth
(2014 - 2019)
729.59%
Debt Size
most indebted in the country
14th
Total Debt Trend (2014 - 2019)
N132.46bn $30.51mDomestic
DebtExternal
Debt
Per Capita Analysis
N5,841
N2,595 N28,969
Capital Expenditure
Recurrent Expenditure
102.14bn28.59bn
N
Net FAAC Proportion 76.15%
IGR Proportion 23.85%
102.14bn
76.19bn
Shortfall
-25.95bn
Debt
2014 2015 2016 2017 2018 2019
Net FAAC6.57bn
N
6.78bn
9.57bn11.24bn
11.33bn
16.39bn
40.42bn
31.81bn
39.65bn
52.34bn
The Confluence State
IGR
Revenue Analysis (NGN’bn)
Debt Stock 2019
Per Capita Per Capita Per Capita
Health BudgetActual Expenditure 2019 (NGN)
Actual Capital Expenditure Total Debt
(NGN)
74
Total Revenue*
Recurrent Expenditure**
Structure of State Available Revenue (2019) 2019 Ability to meet Recurrent Expenditure (NGN’bn)
*Total Revenue here is defined as the sum of the State's Gross FAAC allocation and Internally Generated Revenue (IGR) using data obtained from NBS. In some states, this may differ from a State's available revenue which is the sum of its net FAAC and Internally Generated Revenue (IGR).�
** Includes loan repayments
Note:
iscal year 2019 saw the north-Fcentral state ’s total debt burden grow significantly by
N47.2bn, or 49.96%, from the previous year’s figures; coming to a total of N141.80bn. In 2019, Kogi state closed the year with a domestic debt stock of N132.46bn, while its external debt came to a total of $30.506m.
Domestic debt constitutes 93.42%, the bulk of its total debt burden, while foreign debt accounts for 6.58% of the rest. Save for the fiscal year 2018, Kogi state’s total debt stock has been on the rise; surging by 205.38%, 63.75%, 41.52% and 49.96% in 2015, 2016, 2017 and 2019 fiscal years respectively. In 2018 however, Kogi's total debt reduced by 15.89% to N94.56bn from N112.43bn in 2017.
The revenue picture for Kogi state, just like other states in the north-central geopolitical zone of Nigeria, remains bleak. FAAC allocations from the coffers of the central government c o n t i n u e t o d wa r f t h e s t a t e ’ s internally generated revenue as the mainstay of the state’s finances, accounting for as high as N53.38bn, or 82.49%, of the state�s total N64.71bn revenue in 2018 and N52.34bn, or 76.15%, of its total 2019 available revenue. IGR brought in just 17.51% a n d 2 3.8 5 % i n 2 0 1 8 a n d 2 0 1 9 respectively.
With respect to IGR, the state witnessed its most notable rise in revenue generated internally between the year 2015 and 2016, with IGR increasing by as high as 41.21%. In 2018, the state’s IGR was in the region of N11.33bn, which came as an infinitesimal 0.80% increase from the
N11.24bn generated in 2017; by 2019, Kogi state’s IGR saw 44.60% uptick from N11.33bn in 2018 to N16.39bn. Weaning itself off the over reliance on FAAC allocation will be paramount for the state in the near future, if it hopes to achieve sustainability especially as yearly FAAC allocations to the state over the years has f luctuated, witnessing an overall decrease of -4.53% between from N54.82bn in 2014 to N52.34bn in 2019.
A review of the state ’s budget performance in 2019 shows that Kogi state’s total revenue of N68.73bn could not cover its recurrent expenditure, debt servic ing and repayment obligations of N102.14bn. The State has come under media fire recently due to news reports of it owing salaries and gratuities as well as non-payment of full salaries to its civil service.
The ripple effects of the COVID-19 pandemic across the world forced a number of governments to review their fiscal strategies, even �The Confluence State� needs a total overhaul of its fiscals.
According to its audited financial statement, N41bn was received as capital receipts (debt and grants) in 2 0 1 9 w h i c h i n c l u d e s N 1 9.6 b n borrowed from the FG bailout to states, N10.6bn from long-term borrowings and N6.8bn as CBN budget support facility.
Kogi state cannot always lean on loans as life support, it needs to find a mechanism to clear its backlog of recurrent obligations and also rein in further on overhead costs which stood at N29.83bn, the 8th largest in the country in 2019.
The Confluence State
A review of the state�s budget performance in 2019 shows that Kogi state�s total revenue of N68.73bn could not cover its recurrent expenditure, debt servicing and repayment obligations of N102.14bn.
Kogi
State
29Sustainability
Ranking
75

n the last four years, Kogi can boast Iof a relatively low number of total infectious diseases cases. In 2019,
the state had a collective total of 213 cases of infectious diseases. A breakdown of this figure shows that measles accounted for the highest percentage of total cases in 2019, while yellow fever and lassa fever a c c o u n t e d f o r 3 6 a n d 3 3 c a s e s respectively.
In 2018, the north- central state witnessed a spike in cholera cases, which as at the end of the year, was recorded at 102 cases, but surprisingly, the state recorded no cases of cholera in 2019. Measles spike within the state could be noticed, particularly between 2017, where the state recorded just 6 cases to 144 cases in 2019.
In 2019, Kogi state planned to spend a total of N12.7bn on health within the state, which came to 8.7% of its total budget of N146.7bn, however, allocation estimates on health for the 2020 fiscal year was seen as an improvement, as the state government planned to spend
N16.2bn. This is still small considering that the state has about 947 health facilities to cater for and an estimated total population of over 4.95 million people who need health services.
The Water, Sanitation and Hygiene situation in Kogi is gloomy; 58.4% of h o u s e h o l d s s t i l l p ra c t i s e o p e n defecation due to the absence of toilets or sanitation facilities within the buildings. 34.7% of Kogi state indigenes still do not have access to improved sources of drinking water. These conditions can often contribute to the rapid spread of communicable diseases, making it difficult for health systems to contain disease outbreaks when they occur.
To mobilise additional resources for financing health and reduce the out-of-pocket expenditure incurred by Kogi residents at the point of treatment, the state recently launched its health insurance scheme. The government needs to make more efforts to ensure that the scheme is fully subscribed.
Kogi State
2016
Cholera 0CSM 0Lassa Fever 2Measles 0Monkeypox 0Yellow Fever 0Total Cases 2
2017 2018 2019
0 102 00 0 00 0 336 0 1440 0 0
50 71 3656 173 213
HEALTH FINANCING AND EPIDEMIC PREPAREDNESS
Disease outbreaks
Source: NCDC
76
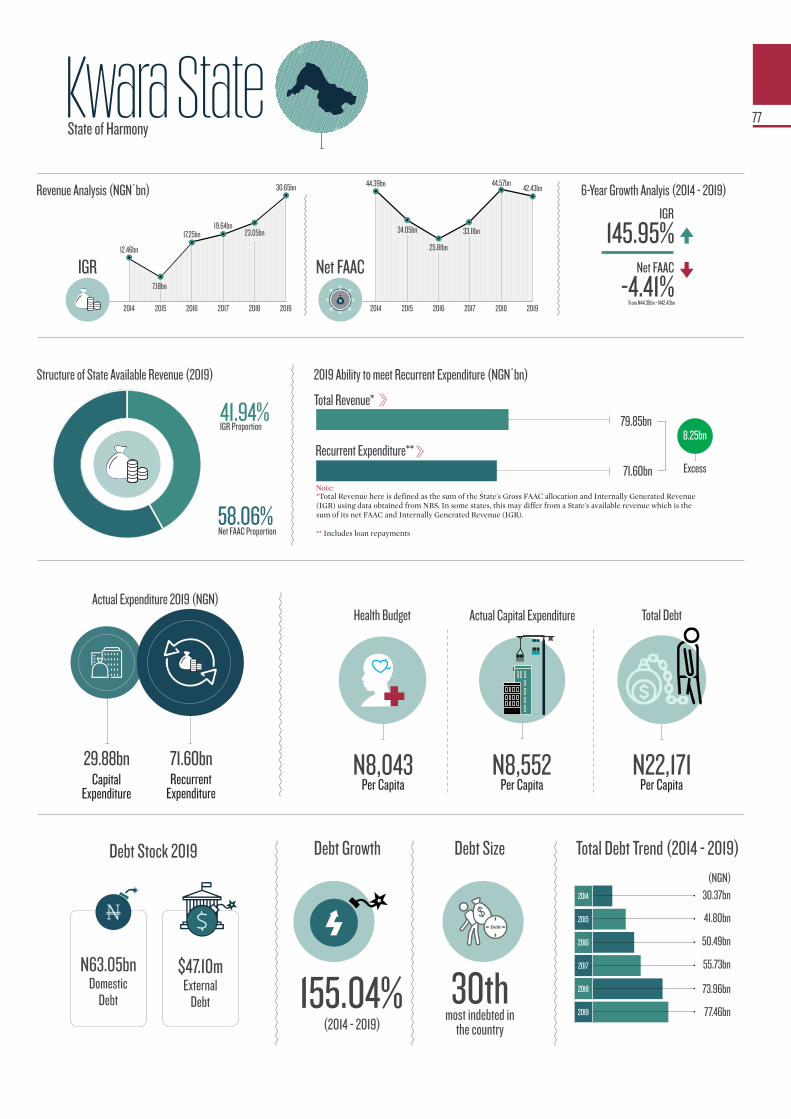
Kwara State
2014 2015 2016 2017 2018 2019
44.39bn 44.57bn6-Year Growth Analyis (2014 - 2019)
-4.41%
Net FAAC
IGR
145.95%
From N44.38bn - N42.43bn
71.60bn
79.85bn
30.37bn
41.80bn
50.49bn
55.73bn
73.96bn
77.46bn
2014
2015
2017
2019
2016
2018
Debt Growth
(2014 - 2019)
155.04%
Debt Size
most indebted in the country
30th
Total Debt Trend (2014 - 2019)
N63.05bn $47.10mDomestic
DebtExternal
Debt
Per Capita Analysis
N8,552 N8,043 N22,171
Capital Expenditure
Recurrent Expenditure
71.60bn29.88bn
N
Net FAAC Proportion 58.06%
IGR Proportion 41.94%
Excess
8.25bn
Debt
2014 2015 2016 2017 2018 2019
Net FAAC12.46bn
N
7.18bn
17.25bn19.64bn
23.05bn
30.65bn
34.05bn
25.81bn
33.11bn
42.43bn
State of Harmony
IGR
Revenue Analysis (NGN’bn)
Debt Stock 2019
Per Capita Per Capita Per Capita
Health BudgetActual Expenditure 2019 (NGN)
Actual Capital Expenditure Total Debt
(NGN)
77
Total Revenue*
Recurrent Expenditure**
Structure of State Available Revenue (2019) 2019 Ability to meet Recurrent Expenditure (NGN’bn)
*Total Revenue here is defined as the sum of the State's Gross FAAC allocation and Internally Generated Revenue (IGR) using data obtained from NBS. In some states, this may differ from a State's available revenue which is the sum of its net FAAC and Internally Generated Revenue (IGR).�
** Includes loan repayments
Note:
wara state ’s total debt Kb u rd e n h a s b e e n o n a constant rise in the last five
years, and sadly, it is not showing any signs of slowing down with its total revenue pool barely able to cover its expenditure obligations.
The state’s towering debt profile c a s t s a g r i m s h a d o w o n i t s sustainability; Kwara state s total ’debt stock as at December 2019 stood at N77.46bn. Domestic debt which constitutes the bulk of its total debt profile came to a total of N63.04bn, or 81.40%, of its total debt while its external debt anchored at $47.10m.
Between 2018 and 2019, the north-central state s IGR increased by ’32.98% from N23.05bn to a total of N30.64bn as at the end of 2019. Inasmuch as its �homegrown� revenue is encouraging, Kwara state would need to continue building on the positives it has witnessed in the area of IGR generation, especially if the state hopes to steer its finances away from overdependence on FAAC allocation.
In 2018, FAAC allocation accounted for about N44.57bn, or 65.92%, of its total N67.62bn revenue availablepool, while in 2019, due to a shortfall in federal allocation and a growth in the state s IGR, it accounted for ’58.06% of its total revenue availableN73.08bn pool for the year.
A shortfall in its expected revenue from both internally generated sources and of course, FAAC allocation, means that meeting its recurrent and capital expenditure obligations for the fiscal year could
pose a major challenge to the north-central state.
In 2019, the state government s ’estimated budget size was a total of N157.82bn, with a revenue projection in the region of N103bn. However, based on figures from its audited statement for the 2019 fiscal year, the state could only implement its expenditure to the tune of N101.47bn w i t h i t s c a p i t a l e x p e n d i t u r e component suffering the most from implementation gap; actual capital expenditure for the year was N29.57bn, down from an estimated N57.11bn represent ing 51 .78% implementation.
A s a re s u l t o f t h e C OV I D -1 9 pandemic, and as a necessary step to respond to the economic challenges caused by its ripple effects, the Kwara State Government revised its 2020 fiscal estimates to reflect the new reality. Its new fiscal estimate is N114.79bn; a 29.4% reduction from the previously approved estimate of N162.48bn.
The revised budget means that recurrent expenditure estimates now comes to N67.8bn, down from the previously approved estimate of N73bn, while capital expenditure falls to N46.9bn, down from N89.4bn.
Managing its governance cost is most critical for Kwara state. Inasmuch as there are positives in its IGR streams, the confluence state needs to pull more resources from its IGR to face future economic surges. Even then, there may be some lessons to learn from Kwara state on how it raised an extra N5bn from its direct taxes within a year.
State of Harmony
Kwara state would need to continue building on the positives it has witnessed in the area of IGR generation, especially if the state hopes to steer its finances away from overdependence on FAAC allocation.
Kwara
State
12Sustainability
Ranking
78

wara state has had its share of Kinfectious disease cases; it recorded 256 cases of cholera,
CSM, lassa evfer, measles, monkeypox and yellow fever in 2019--the second lowest in the North-West region. The state recorded 162 cases of measles, 50 cases of yellow fever and 39 cases of Cerebrospinal Meningitis in 2019. Adding the recent spread of the novel COVID-19 pandemic to the mix, Kwara state as of the end of August 2020 had recorded a total number of 966 cases, with as many as 25 deaths.
The Water, Sanitation and Hygiene (WASH) situation in the state could use a lot of improvement; 36.6% of residents in Kwara do not have access to improved sources of drinking water while 56% of residents defecate in the open due to the unavailability of sanitation/toilet facilities in their dwellings. The state needs to commit more resources to policies that improve this situation.
In 2019, Kwara state planned to spend a total of N28.1bn on its health sector, which at that time represented 17.8% of
its N157.8bn total budget, with N22.74bn estimated to be spent on health sector capital expenditure, but in reality could only spend a total of N13.28bn on its health capital expenditure.
Initially, the approved estimate for the 2020 fiscal year showed that Kwara planned to spend a total of N27.7bn, or about 17%, of its total budget of N162.4bn but due to a revision of its budget for the year (citing the effects of COVID-19 on the states finances) the state government of Kwara now expects to spend N19.1bn on capital expenditures in the health sector, with an extra N2.61bn allocation earmarked as a COVID-19 response expenditure.
The state government’s introduction of a heal th insurance scheme for i t s indigenes can be viewed as a step in the right direction with regards to healthcare delivery in the state, and a direct response by the government towards simultaneously reducing high out-of-pocket expenditure at the point of treatment and mobilising additional resources for funding health.
Kwara State
2016
Cholera 0CSM 0Lassa Fever 0Measles 0Monkeypox 0Yellow Fever 0Total Cases 0
2017 2018 2019
1,577 10 00 0 390 0 5
8 0 1622 0 0
110 15 501,697 25 256
HEALTH FINANCING AND EPIDEMIC PREPAREDNESS
Disease outbreaks
Source: NCDC
79
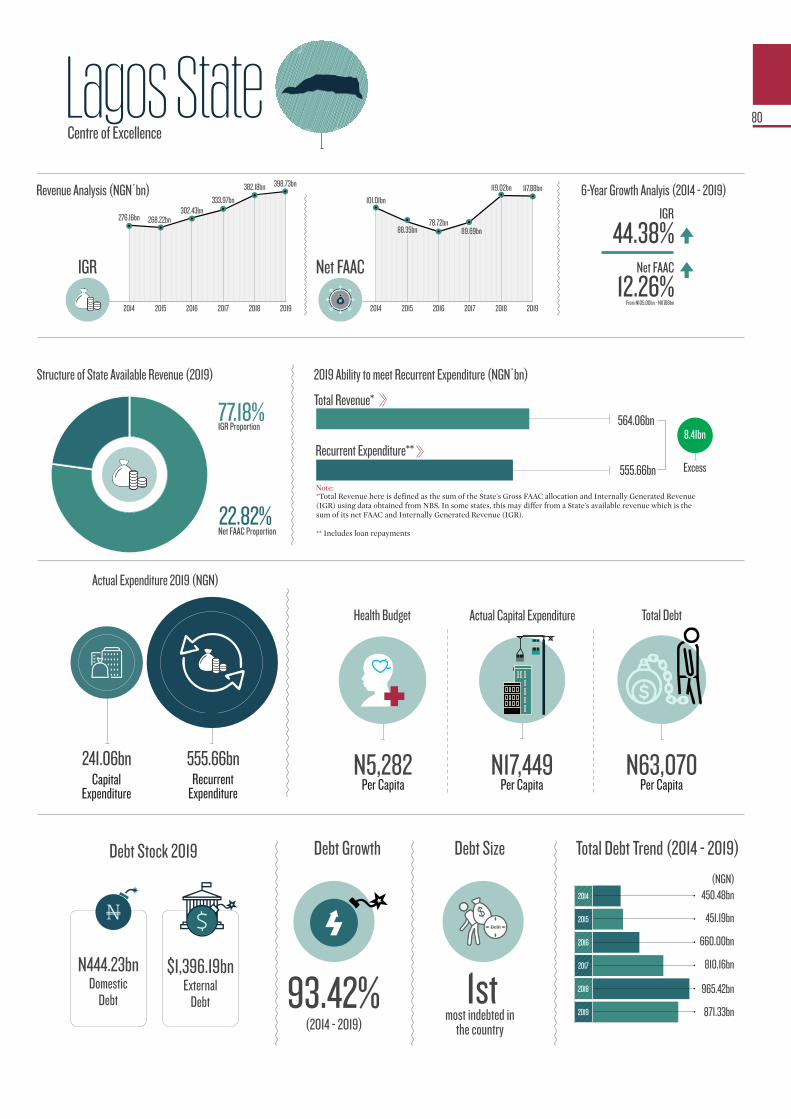
Lagos State
2014 2015 2016 2017 2018 2019
101.01bn
119.02bn 6-Year Growth Analyis (2014 - 2019)
12.26%
Net FAAC
IGR
44.38%
From N105.00bn - N117.88bn
555.66bn
564.06bn
450.48bn
451.19bn
660.00bn
810.16bn
965.42bn
871.33bn
2014
2015
2017
2019
2016
2018
Debt Growth
(2014 - 2019)
93.42%
Debt Size
most indebted in the country
1st
Total Debt Trend (2014 - 2019)
N444.23bn $1,396.19bnDomestic
DebtExternal
Debt
Per Capita Analysis
N17,449 N5,282 N63,070
Capital Expenditure
Recurrent Expenditure
555.66bn241.06bn
N
Net FAAC Proportion 22.82%
IGR Proportion 77.18%
Excess
8.41bn
Debt
2014 2015 2016 2017 2018 2019
Net FAAC
276.16bn
N
268.22bn302.43bn
333.97bn
382.18bn 398.73bn
88.35bn78.72bn
89.69bn
117.88bn
Centre of Excellence
IGR
Revenue Analysis (NGN’bn)
Debt Stock 2019
Per Capita Per Capita Per Capita
Health Budget
Actual Expenditure 2019 (NGN)
Actual Capital Expenditure Total Debt
(NGN)
80
Total Revenue*
Recurrent Expenditure**
Structure of State Available Revenue (2019) 2019 Ability to meet Recurrent Expenditure (NGN’bn)
*Total Revenue here is defined as the sum of the State's Gross FAAC allocation and Internally Generated Revenue (IGR) using data obtained from NBS. In some states, this may differ from a State's available revenue which is the sum of its net FAAC and Internally Generated Revenue (IGR).�
** Includes loan repayments
Note:
Lagos State continues to be one of the top states in Nigeria with high allocations from
the federal government. As at the end of December 2019, Lagos total net FAAC col lection amounted to N117.9bn. Despite being considered high, it was lower than that of other oil-producing States of Delta, Akwa-Ibom, Rivers and Bayelsa which earned N219.28bn, N171 .98bn, N 1 5 8 . 4 5 b n a n d N 1 4 0 . 1 3 b n respectively.
Commendably, Lagos state has a much lower reliance on federal allocation as the majority of its available revenue is derived from its internal ly generated revenue, primarily from taxation. At the end of 2019, Lagos state’s total IGR arrived at N398.73bn, or 77.18%, of its total N516.62bn available revenue pool w h i l e n e t F A A C b r o u g h t i n 22.82%—the only state in the country to achieve this feat.
The Centre of Excellence� saw an I G R i n c re a s e o f 4. 3 3 % , f ro m N382.18bn in 2018 to N398.73bn in 2019. The N16.88bn increase is more than the total 2019 IGR of Gombe (N6.80bn) and Taraba (N6.53bn) put together. However, it is important to note that Lagos state’s IGR growth might be slowing down as the current pandemic might have immense impact on its 2020 numbers.
Just as Lagos state’s revenue has been growing over the years, it is also worth noting that the state takes the lead in debt stock with a total debt burden of N871.33bn in 2019.
This is despite a decrease of -9.75% in its total debt stock, from N965.42bn in 2018 to N871.33bn in 2019. The state’s debt structure comprises 49.02% domestic debt and 50.98% foreign debt, exposing Lagos State precariously to exchange rate volatilities.
According to the state’s financial reports, total recurrent expenditure obligations, debt servicing and loan repayment gulped N555.65bn or 6 9.7 % o f i t s t o t a l N 7 9 6 .7 1 b n expenditure in 2019 while its capital e x p e n d i t u r e t o t a l l e d a b o u t N241.06bn or 30.26%.
Lagos state spent N153bn on debt servicing and loan repayment in 2018, this increased to a total of N212bn in 2019, with N152bn spent on repayments while N60bn was spent on public debt charges. This is far higher than its personnel costs of N119bn and also close to its capital expenditure at N241bn.
Analysis of its capital expenditure showed that it spent N14.5bn on the health and education sectors while N108bn on economic affairs—roads and infrastructure.
Previous estimates by the Lagos State Government indicate the state will
1 3need a sum of about $50bn--approximately N19.25tn between 2018 and 2023--to f inance its infrastructural deficit; a tough challenge.
Centre of Excellence
Lagos
State
4Sustainability
Ranking
Commendably, Lagos state has a much lower reliance on federal allocation as the majority of its revenue is derived from its internally generated revenue, primarily from taxation.
13https://businessday.ng/opinion/article/the-time-is-ripe-for-lagos-infrastructure-development-fund/
81
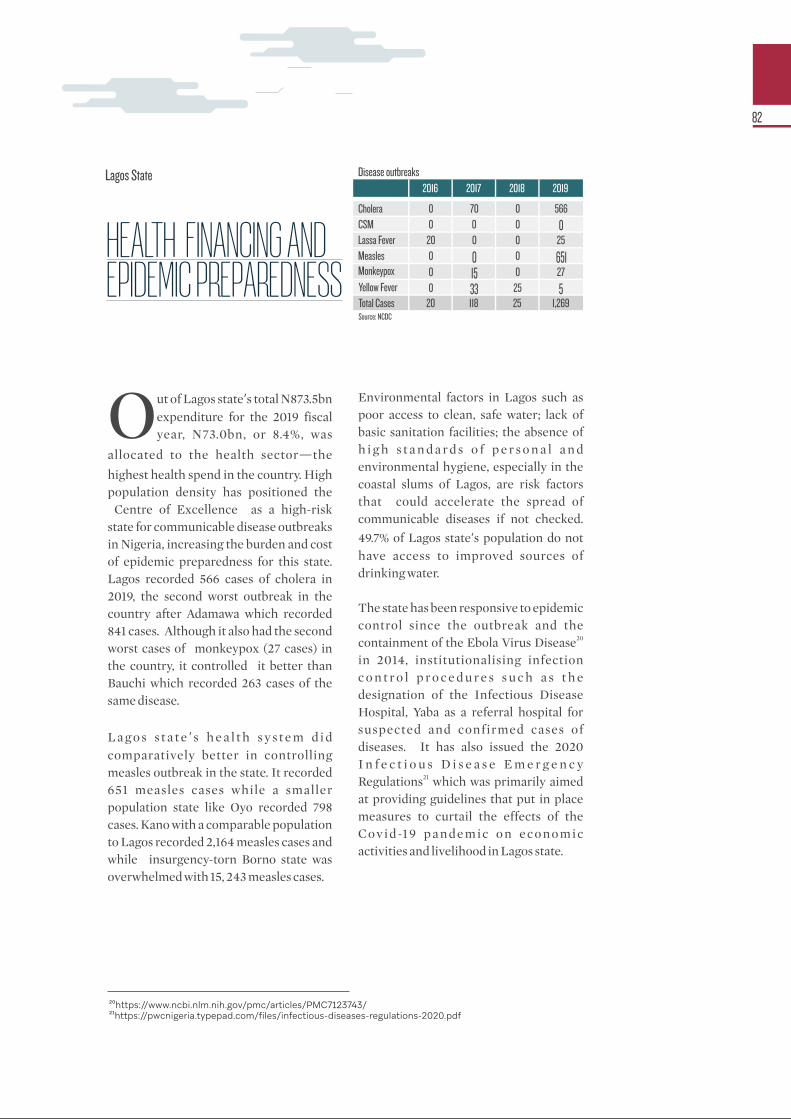
ut of Lagos state’s total N873.5bn Oexpenditure for the 2019 fiscal year, N73.0bn, or 8.4%, was
allocated to the health sector—the
highest health spend in the country. High population density has positioned the �Centre of Excellence� as a high-risk state for communicable disease outbreaks in Nigeria, increasing the burden and cost of epidemic preparedness for this state. Lagos recorded 566 cases of cholera in 2019, the second worst outbreak in the country after Adamawa which recorded 841 cases. Although it also had the second worst cases of monkeypox (27 cases) in the country, it controlled it better than Bauchi which recorded 263 cases of the same disease.
L a g o s s t a t e ’ s h e a l t h s y s t e m d i d comparatively better in controlling measles outbreak in the state. It recorded 651 measles cases while a smaller population state like Oyo recorded 798 cases. Kano with a comparable population to Lagos recorded 2,164 measles cases and while insurgency-torn Borno state was overwhelmed with 15, 243 measles cases.
Environmental factors in Lagos such as poor access to clean, safe water; lack of basic sanitation facilities; the absence of h i g h s t a n d a r d s o f p e r s o n a l a n d environmental hygiene, especially in the coastal slums of Lagos, are risk factors that could accelerate the spread of communicable diseases if not checked.
49.7% of Lagos state’s population do not have access to improved sources of drinking water.
The state has been responsive to epidemic control since the outbreak and the
20containment of the Ebola Virus Disease in 2014, institutionalising infection c o n t r o l p r o c e d u r e s s u c h a s t h e designation of the Infectious Disease Hospital, Yaba as a referral hospital for suspected and confirmed cases of diseases. It has also issued the 2020 I n f e c t i o u s D i s e a s e E m e r g e n c y
21Regulations which was primarily aimed at providing guidelines that put in place measures to curtail the effects of the Covid-19 pandemic on economic activities and livelihood in Lagos state.
Lagos State
²⁰https://www.ncbi.nlm.nih.gov/pmc/articles/PMC7123743/ ²¹https://pwcnigeria.typepad.com/files/infectious-diseases-regulations-2020.pdf
2016
Cholera 0CSM 0Lassa Fever 20Measles 0Monkeypox 0Yellow Fever 0Total Cases 20
2017 2018 2019
70 0 5660 0 00 0 25
0 0 65115 0 27
33 25 5118 25 1,269
HEALTH FINANCING AND EPIDEMIC PREPAREDNESS
Disease outbreaks
Source: NCDC
82
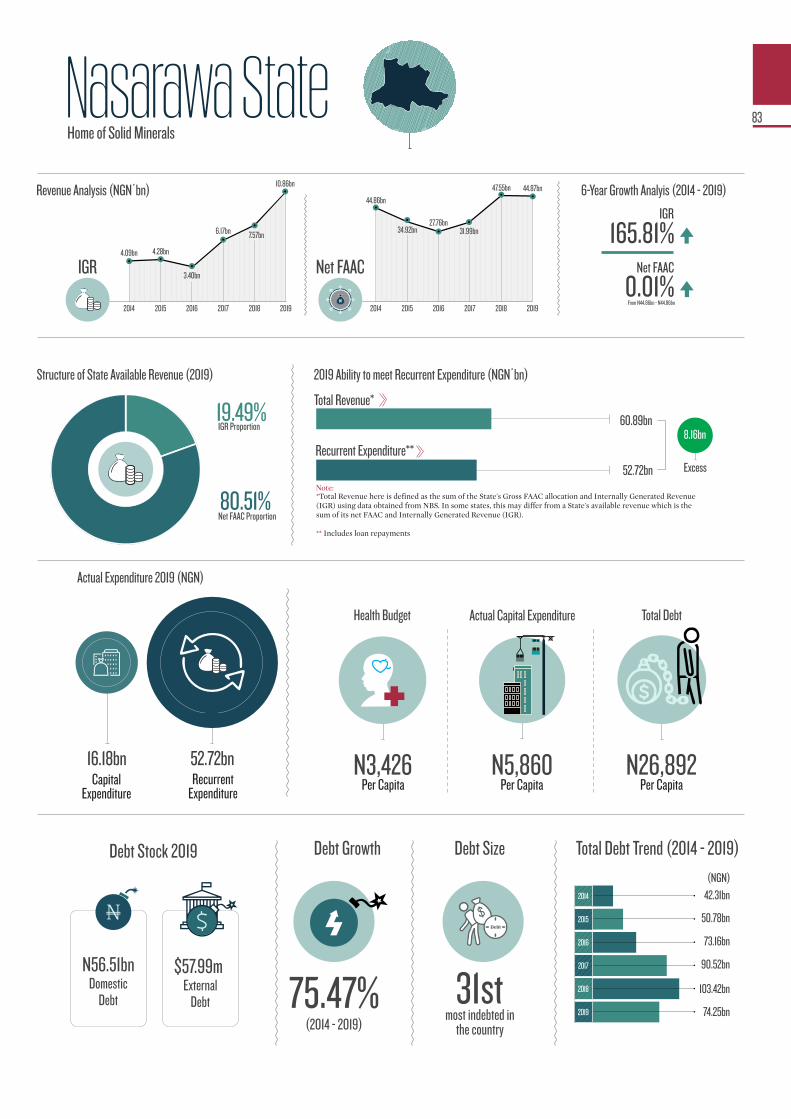
Nasarawa State
2014 2015 2016 2017 2018 2019
44.86bn
47.55bn 6-Year Growth Analyis (2014 - 2019)
0.01%
Net FAAC
IGR
165.81%
From N44.86bn - N44.86bn
52.72bn
60.89bn
42.31bn
50.78bn
73.16bn
90.52bn
103.42bn
74.25bn
2014
2015
2017
2019
2016
2018
Debt Growth
(2014 - 2019)
75.47%
Debt Size
most indebted in the country
31st
Total Debt Trend (2014 - 2019)
N56.51bn $57.99mDomestic
DebtExternal
Debt
Per Capita Analysis
N5,860 N3,426 N26,892
Capital Expenditure
Recurrent Expenditure
52.72bn16.18bn
N
Net FAAC Proportion 80.51%
IGR Proportion 19.49%
Excess
8.16bn
Debt
2014 2015 2016 2017 2018 2019
Net FAAC4.09bn
N
4.28bn
3.40bn
6.17bn
10.86bn
34.92bn27.76bn
31.99bn
44.87bn
Home of Solid Minerals
IGR
7.57bn
Revenue Analysis (NGN’bn)
Debt Stock 2019
Per Capita Per Capita Per Capita
Health Budget
Actual Expenditure 2019 (NGN)
Actual Capital Expenditure Total Debt
(NGN)
83
Total Revenue*
Recurrent Expenditure**
Structure of State Available Revenue (2019) 2019 Ability to meet Recurrent Expenditure (NGN’bn)
*Total Revenue here is defined as the sum of the State's Gross FAAC allocation and Internally Generated Revenue (IGR) using data obtained from NBS. In some states, this may differ from a State's available revenue which is the sum of its net FAAC and Internally Generated Revenue (IGR).�
** Includes loan repayments
Note:
As it stands, Nasarawa state’s total debt portfolio exceeded its total revenue in 2019. The
north-central state’s total debt stock by December 2019 came to a total of N74.25bn; a 28.20% reduction from i t s 2 0 1 8 t o t a l d e b t f i g u r e o f N103.42bn.
In 2018, the total debt figure was at its highest point in the last five years at N103.41bn, this dropped to N74.25bn in 2019. Nevertheless, its actual total revenue came to a total of N55.72bn, e x c e e d i n g a c r i t i c a l d e b t management ceiling which restricts states from borrowing from the capital market once their total debt to revenue ratio is (1:2) that is 50% of the previous year�s total revenue.
On the revenue side, Nasarawa state’s m a i n s t a y o f i t s r e v e n u e unsurprisingly comprises FAAC allocations accounting for N44.87bn, or 80.51%, of its actual available revenue pool of N55.72bn while IGR constituted a paltry N10.86bn, or 19.49%.
That said, the state which primarily has an agriculture based economy was able to grow its internally g e n e r a t e d r e v e n u e b y a commendable 165.81% from N4.09bn in 2014 to N10.86bn in 2019. While this may be commendable, Nasarawa state, also known as �Home of Solid Minerals�, needs to make this title count in its fiscal numbers.
2020 will be a huge test for the state, especially in the area of revenue generation and growth, putting into context the economic effects of the
C O V I D - 1 9 p a n d e m i c o n governments�the ability to generate adequate revenue to fund their budgets.
A breakdown of Nasarawa’s actual recurrent expenditure for the 2019 fiscal year shows that the state government was able to meet its personnel cost obligations to the tune of N25.79bn, while its overhead costs gulped N20bn.
Another glance at Nasarawa’s 2019 fiscal year shows that the actual total recurrent expenditure spent in 2019, N52.72bn, is 18.65% higher than 2018 obligations of N44.43bn. A rising cost of recurrent expenditure means that Nasarawa will likely struggle to meet i t s 2 0 2 0 m o n t h l y r e c u r r e n t expenditure, especially as the pandemic will affect both statutory a l l o c a t i o n s f r o m t h e f e d e r a l government and the state’s internal revenue generation capacity.
Looking back at the 2019 fiscal year, Nasarawa spent N52.72bn of its budgeted N63.41bn recurrent e x p e n d i t u r e , a n 8 3 . 1 4 % implementation level. On the other hand, the state achieved about 47.20% implementation level for capital expenditure, with only N16.17bn spent out of the budgeted N34.26bn.
Making significant cuts to its recurrent expenditure fiscal bill, especially its overhead costs, as well as aggressively augmenting its IGR generation, would be important steps for the state to take in order to remain financially stable.
Home of Solid Minerals
That said, the state which primarily has an agriculture based economy was able to grow its internally generated revenue by a commendable 165.81% from N4.09bn in 2014 to N10.86bn in 2019.
Nasa
rawa S
tate
21Sustainability
Ranking
84

n 2019, Nasarawa state had as many Ias 195 reported cases of measles, 93 cases of yellow fever and 35 cases of
the acute viral haemorrhagic lassa fever. The prevalence of these communicable diseases can be attributed to poor sanitation in many communities. Between 2017 and 2019, the northern state has had as many as 808 recorded and reported cases of varying infectious d i s e a s e s r a n g i n g f r o m c a s e s o f monkeypox, measles, cerebrospinal meningitis to more infectious diseases like lassa fever and cholera.
46.1% of households in Nasarawa state practise open defecation, while 25.2% of the population do not have access to improved sources of drinking water. The s t a t e g ove r n m e n t s t i l l n e e d s t o implement interventions in Water Sanitation and Hygiene as this could make certain diseases more difficult to control in the event of outbreaks.
The state government’s response to its health challenges will be critical to the wellbeing of its populace, as they are the
ones at the receiving end of the health delivery spectrum. In 2020, Nasarawa budgeted N9.64bn of its total budget of N108.44bn to its health sector. This is quite low, especially when you put into context that the state has 1,283 primary healthcare centres. To ensure a positive
shift in Nasarawa’s health sector, state will need to finance at least 15% of its total appropriation to its health sector. The state will also benefit from a universal healthcare scheme which will ensure health coverage for its population of about 2.5 million people.
With COVID-19 coming into the mix, the state may find itself battling various epidemic wars� within the state if it does nothing to improve the state of its healthcare delivery. The NCDC at the end of August 2020 put the total number of COVID-19 cases in Nasarawa at 434, with a high number of public health workers reported to have contracted the virus.
Nasarawa State
2016
Cholera 0CSM 0Lassa Fever 79Measles 0Monkeypox 0Yellow Fever 0Total Cases 79
2017 2018 2019
137 71 015 0 346 0 35
9 0 1952 0 0
41 82 93250 153 326
HEALTH FINANCING AND EPIDEMIC PREPAREDNESS
Disease outbreaks
Source: NCDC
85
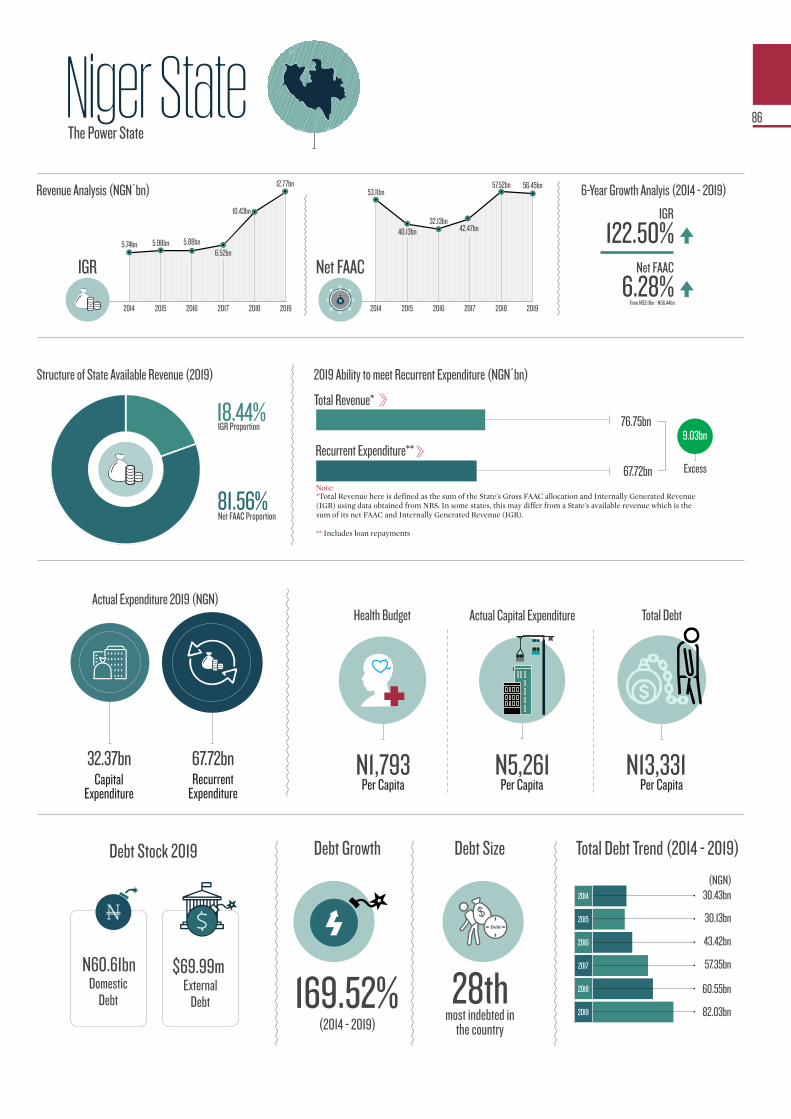
Niger State
2014 2015 2016 2017 2018 2019
53.11bn57.52bn 6-Year Growth Analyis (2014 - 2019)
6.28%
Net FAAC
IGR
122.50%
From N53.11bn - N56.44bn
67.72bn
76.75bn
30.43bn
30.13bn
43.42bn
57.35bn
60.55bn
82.03bn
2014
2015
2017
2019
2016
2018
Debt Growth
(2014 - 2019)
169.52%
Debt Size
most indebted in the country
28th
Total Debt Trend (2014 - 2019)
N60.61bn $69.99mDomestic
DebtExternal
Debt
Per Capita Analysis
N5,261N1,793 N13,331
Capital Expenditure
Recurrent Expenditure
67.72bn32.37bn
N
Net FAAC Proportion 81.56%
IGR Proportion 18.44%
Excess
9.03bn
Debt
2014 2015 2016 2017 2018 2019
Net FAAC5.74bn
N
5.98bn 5.88bn6.52bn
12.77bn
40.13bn32.13bn
42.47bn
56.45bn
The Power State
IGR
10.43bn
Revenue Analysis (NGN’bn)
Debt Stock 2019
Per Capita Per Capita Per Capita
Health BudgetActual Expenditure 2019 (NGN)
Actual Capital Expenditure Total Debt
(NGN)
86
Total Revenue*
Recurrent Expenditure**
Structure of State Available Revenue (2019) 2019 Ability to meet Recurrent Expenditure (NGN’bn)
*Total Revenue here is defined as the sum of the State's Gross FAAC allocation and Internally Generated Revenue (IGR) using data obtained from NBS. In some states, this may differ from a State's available revenue which is the sum of its net FAAC and Internally Generated Revenue (IGR).�
** Includes loan repayments
Note:
iger state ’s total debt Nburden has been on an upward trajectory within
the last six years, with a notable rise of 35.47% from N60.55bn in 2018 to N82.03bn in 2019, notably due to an upward shift in the domestic debt component of its total debt.
Further analysis of the state’s debt prof i le indicates that Niger ’s domestic debt rose by 44.90%, from N41.83bn in 2018 to N60.61bn in 2019. In a similar fashion, the state’s external debt saw a moderate increase of 14.10% from N61.35bn to N69.99bn in the same period.
A juxtaposition of Niger�s total debt stock as at the end of 2019 with its total revenue of N69.21bn for that same period paints a grim picture; the total debt is now 118.51% of its total revenue.
FAAC allocation on the other hand, has accounted for the majority of its revenue pool over the years . Contributing as high as 84.93% of the state�s total N67.95bn available revenue in 2018 and 81.56% of the total N69.21bn revenue in 2019.
Pre-COVID-19, FAAC allocation reduced by -1.87%, from N57.52bn in 2018 to N56.45bn 2019; this not a good sign for this state which disproportionately depends on federal revenue to fund its budget. Niger will need to bolster its IGR growth tangibly if the state ever hopes to achieve some of its 2020 fiscal projections.
In 2019, the state ’s total IGR contributed only 18.44% of all its total revenue, while in the previous year, IGR accounted for 15.35% of its total revenue.
Niger state ’s IGR growth has fluctuated over the years; between 2014 and 2015, it saw a 4.15% increase but lived through a -1.57% drop from 2015 to 2016. Fiscal year 2017 saw a 10.82% growth, while 2018 IGR of N10.43bn saw the highest upward surge of 60.05% from N6.52bn in 2017.
Overall, its internally generated revenue has grown by 122.50% from N5.74bn in 2014 to N12.77bn in 2019. Notwithstanding, this state still needs to do more as it currently ranks 25th by size of its internally generated revenue in the country as a t December 2019.
In 2019, its capital expenditure per capita amounted to N5,261 per citizen, well below the country average of N8,993 per citizen.
Recurrent expenditure is also clearly prioritised by this state as it gulped N 6 7.7 2 b n , o r 6 7. 6 6 % , o f i t s N100.09bn total expenditure, leaving a p a l t r y 3 2 . 3 4 % f o r c a p i t a l expenditures. The Power State� needs to understand that there is power in investing in its people and it has to show in how it spends its money.
The Power State
Niger state�s IGR growth has fluctuated over the years; between 2014 and 2015, it saw a 4.15% increase but lived through a -1.57% drop from 2015 to 2016.
Niger
State
19Sustainability
Ranking
87
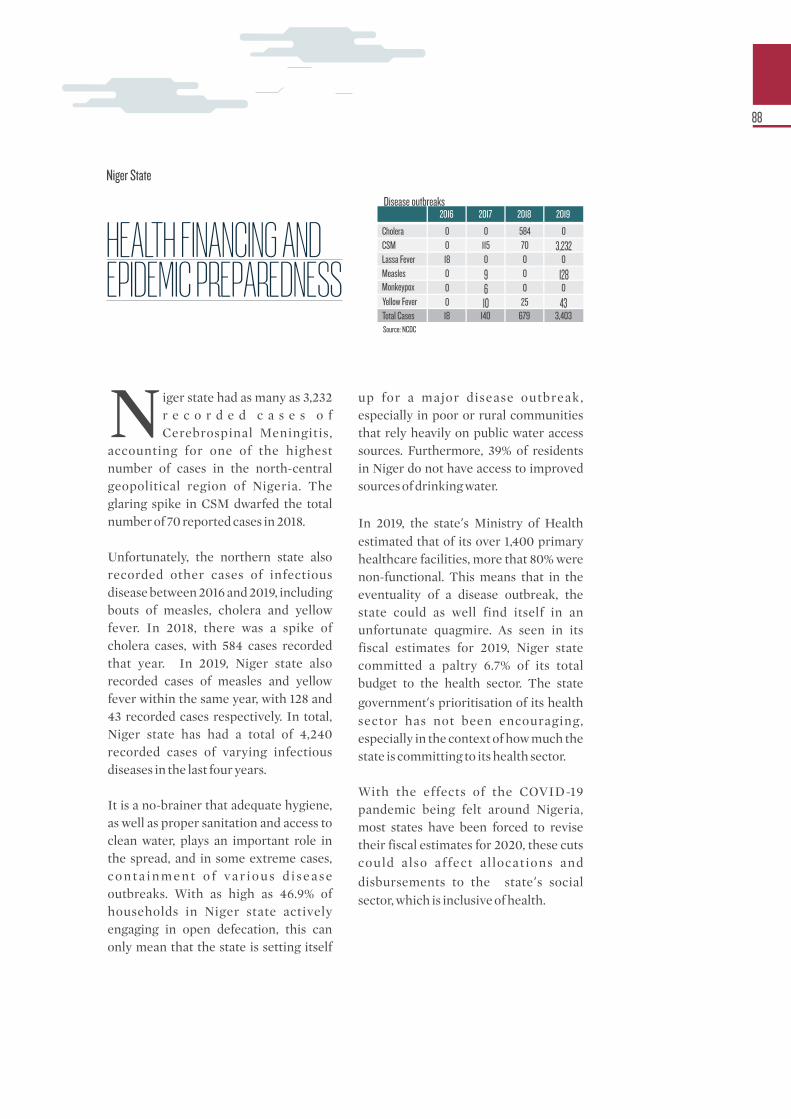
iger state had as many as 3,232 Nr e c o r d e d c a s e s o f Cerebrospinal Meningitis,
accounting for one of the highest number of cases in the north-central geopolitical region of Nigeria. The glaring spike in CSM dwarfed the total number of 70 reported cases in 2018.
Unfortunately, the northern state also recorded other cases of infectious disease between 2016 and 2019, including bouts of measles, cholera and yellow fever. In 2018, there was a spike of cholera cases, with 584 cases recorded that year. In 2019, Niger state also recorded cases of measles and yellow fever within the same year, with 128 and 43 recorded cases respectively. In total, Niger state has had a total of 4,240 recorded cases of varying infectious diseases in the last four years.
It is a no-brainer that adequate hygiene, as well as proper sanitation and access to clean water, plays an important role in the spread, and in some extreme cases, c o n t a i n m e n t o f va r i o u s d i s e a s e outbreaks. With as high as 46.9% of households in Niger state actively engaging in open defecation, this can only mean that the state is setting itself
up for a major disease outbreak, especially in poor or rural communities that rely heavily on public water access sources. Furthermore, 39% of residents in Niger do not have access to improved sources of drinking water.
In 2019, the state’s Ministry of Health estimated that of its over 1,400 primary healthcare facilities, more that 80% were non-functional. This means that in the eventuality of a disease outbreak, the state could as well find itself in an unfortunate quagmire. As seen in its fiscal estimates for 2019, Niger state committed a paltry 6.7% of its total budget to the health sector. The state
government’s prioritisation of its health sector has not been encouraging, especially in the context of how much the state is committing to its health sector.
With the effects of the COVID-19 pandemic being felt around Nigeria, most states have been forced to revise their fiscal estimates for 2020, these cuts could also affect al locations and
disbursements to the state’s social sector, which is inclusive of health.
Niger State
2016
Cholera 0CSM 0Lassa Fever 18Measles 0Monkeypox 0Yellow Fever 0Total Cases 18
2017 2018 2019
0 584 0115 70 3,2320 0 0
9 0 1286 0 0
10 25 43140 679 3,403
HEALTH FINANCING AND EPIDEMIC PREPAREDNESS
Disease outbreaks
Source: NCDC
88

Ogun State
2014 2015 2016 2017 2018 2019
48.95bn
39.64bn
6-Year Growth Analyis (2014 - 2019)
-20.92%
Net FAAC
IGR
305.33%
From N48.94bn - N38.71bn
107.79bn
124.79bn
87.22bn
95.82bn
102.01bn
139.28bn
130.22bn
173.07bn
2014
2015
2017
2019
2016
2018
Debt Growth
(2014 - 2019)
98.43%
Debt Size
most indebted in the country
9th
Total Debt Trend (2014 - 2019)
N142.29bn $100.61mDomestic
DebtExternal
Debt
Per Capita Analysis
N6,148N3,913 N30,042
Capital Expenditure
Recurrent Expenditure
107.79bn35.42bn
N
Net FAAC Proportion 35.31%
IGR Proportion 64.69%
Excess
17.00bn
Debt
2014 2015 2016 2017 2018 2019
Net FAAC17.50bn
N
34.60bn
72.98bn 74.84bn 70.92bn
34.33bn
26.19bn
38.71bn
Gateway State
IGR
84.55bn
20.07bn
Revenue Analysis (NGN’bn)
Debt Stock 2019
Per Capita Per Capita Per Capita
Health BudgetActual Expenditure 2019 (NGN)
Actual Capital Expenditure Total Debt
(NGN)
89
Total Revenue*
Recurrent Expenditure**
Structure of State Available Revenue (2019) 2019 Ability to meet Recurrent Expenditure (NGN’bn)
*Total Revenue here is defined as the sum of the State's Gross FAAC allocation and Internally Generated Revenue (IGR) using data obtained from NBS. In some states, this may differ from a State's available revenue which is the sum of its net FAAC and Internally Generated Revenue (IGR).�
** Includes loan repayments
Note:
Ogun state had the third highest internally generated revenue in Nigeria—coming
behind Lagos� N398.73bn and R i v e r s � N 14 0.4 0 b n—w i t h i t s N70.92bn earnings in 2019.
Indices also show that the �Gateway State has grown its IGR with 305.33%, from N17.50bn in 2014 to N70.92bn in 2019. Notwithstanding, Ogun saw its IGR drop by -16.12%, from N84.55bn in 2018 to N70.92bn in 2019.
Analysis indicates that, out of the total combined revenue of statutory allocation and IGR in 2019, the state generated about N70.92bn, or 64.69%, of its total N109.63bn available revenue internally with just 35.31% or N38.71bn coming from federal allocation.
The state�s net FAAC allocation has been witnessing a significant reduction in a period of six years. Analysis shows that the state receipts f rom the federal government shrinked by 20.92%, from N48.95bn in 2014 to N38.71bn in 2019. The state should continue strengthening its IGR drive in order to meet its expenditure obligations.
The state’s 2019 debt records also show it has a total debt stock of N173.06bn, making it the 9th heavily indebted state in Nigeria. The 2019 debt stock reveals it has $100.61m as external debt stock and domestic debt stock of N142.2bn.
The trend of the state debt stock profile also shows that it grew its domestic debt with 102.71%, from N70.19bn in 2014 to N142.29bn in 2019.
The state ’s 2019 audit report indicates that it spent N107.79bn on re c u r re n t ex p e n d i t u re w h i c h represents 75.27% of i ts total e x p e n d i t u r e o f N 1 4 3 . 2 1 b n . B r e a k d o w n o f t h e r e c u r r e n t expenditure includes debt charges and repayment of loans of N20.41bn, while its personnel and overhead costs arrived at N50.41bn and N20.50bn respectively.
Its capital expenditure obligations received N35.42bn, representing 24.73% of the total budget for infrastructural development across the states. This shows that the state is committing more of its spending on recurrent items than infrastructure that will meet the aspirations of its people.
Further breakdown of its capital ex p e n d i t u r e a l s o s h o w s t h a t economic affairs got N19.26bn, education N2.58bn, health with N3.94bn and N2.90bn on housing projects across the state. Ogun state needs to grow its IGR to enable it to spend more on health and education, especially as revenue from federally collected revenue via net FAAC is currently dwindling.
Gateway State
Analysis indicates that, out of the total combined revenue of statutory allocation and IGR in 2019, the state generated about N70.92bn, or 64.69%, of its total N109.63bn revenue internally with just 35.31% or N38.71bn coming from federal allocation.
Ogun
State
3Sustainability
Ranking
90

gun state had one of the lowest Odisease outbreaks in the South-West, recording only 486 cases
across 6 diseases (cholera, CSM, lassa fever, measles, monkeypox and yellow fever). It had the second smallest number of measles (452 cases), after Ondo state (330 cases), in the South-West. The burden of measles has remained a major public health crisis across the country with 36,932 total cases registered across Nigeria in 2019.
S A R S - C O V - 2 C o r o n a v i r u s h a s crystallised for this state government the negative impact diseases could have on economic activities if left unchecked. In the wake of the COVID-19 pandemic, the
24state government earmarked 20% of its total 2020 expenditure to the health sector, a significant improvement from only 6% of its total expenditure in 2019. Ogun state establ i shed a heal th insurance scheme in 2019; this will help
mobilise additional resources for health financing and reduce high out-of-pocket health expenses for its citizens. However, the devil is in the implementation.
The government also needs to pay attention to the Water Health and Sanitation situation in the state, 26% of the state�s population do not have access to improved sources of water and 23% of households s t i l l defecate in the
open—two situations that place the state
at risk of increasing communicable diseases.
On February 27, 2020, the index Covid-19 zcase in Nigeria was recorded in Ogun
state. The first significant response by t h e s t a t e g o v e r n m e n t w a s t h e establishment of a drive in facility to determine the spread and contact tracing of the index case. As at September 1,
2020, the state’s total confirmed cases arrived at 1,646 and 26 deaths.
Ogun State
²⁴https://www.ncbi.nlm.nih.gov/pmc/articles/PMC7123743/ ²⁵https://guardian.ng/news/ogun-state-plans-drive-through-testing-facilities-to-curb-covid-¹⁹/
2016
Cholera 0CSM 0Lassa Fever 2Measles 0Monkeypox 0Yellow Fever 0Total Cases 2
2017 2018 2019
0 0 140 0 00 0 1
0 0 4520 0 0
11 35 1911 35 486
HEALTH FINANCING AND EPIDEMIC PREPAREDNESS
Disease outbreaks
Source: NCDC
91

Ondo State
2014 2015 2016 2017 2018 2019
66.48bn 64.69bn6-Year Growth Analyis (2014 - 2019)
-12.87%
Net FAAC
IGR
157.16%
N66.48bn - N57.92bn
87.27bn
97.25bn
27.48bn
36.68bn
65.65bn
73.87bn
73.49bn
92.83bn
2014
2015
2017
2019
2016
2018
Debt Growth
(2014 - 2019)
237.77%
Debt Size
most indebted in the country
23rd
Total Debt Trend (2014 - 2019)
N67.50bn $82.81mDomestic
DebtExternal
Debt
Per Capita Analysis
N5,856N2,959 N18,161
Capital Expenditure
Recurrent Expenditure
87.27bn29.93bn
N
Net FAAC Proportion 65.78%
IGR Proportion 34.22%
Excess
9.98bn
Debt
2014 2015 2016 2017 2018 2019
Net FAAC11.72bn
N
10.10bn8.68bn
10.93bn
30.14bn
41.61bn45.90bn
57.93bn
Sunshine State
IGR
24.79bn
34.55bn
Revenue Analysis (NGN’bn)
Debt Stock 2019
Per Capita Per Capita Per Capita
Health Budget
Actual Expenditure 2019 (NGN)
Actual Capital Expenditure Total Debt
(NGN)
92
Total Revenue*
Recurrent Expenditure**
Structure of State Available Revenue (2019) 2019 Ability to meet Recurrent Expenditure (NGN’bn)
*Total Revenue here is defined as the sum of the State's Gross FAAC allocation and Internally Generated Revenue (IGR) using data obtained from NBS. In some states, this may differ from a State's available revenue which is the sum of its net FAAC and Internally Generated Revenue (IGR).�
** Includes loan repayments
Note:
The global downturn caused by the drastic fall in the crude oi l prices in the
international market has affected the Ondo state share of the FAAC allocation as an oil-producing state.
A two-year analysis of the state’s net FAAC allocation shows that its share suffered a -10.45% setback, sliding from from N64.69bn in 2018 to N57.93bn as of December 2019.
The fall in federal revenue has made the state look internally to generate more funds to meet its expenditure o b l i g a t i o n s . T h e s t a t e ’ s I G R increased significantly by 175.77%, from N10.92bn in 2017 to N30.14bn at the end of 2019. This increment has pushed the state’s ranking by IGR size from the 20th position in 2017 to the 10th position in 2019. It is important to note that the state now has the third largest IGR in South-West Nigeria, ahead of Oyo state.
Even though the state is recording an improvement in its IGR growth, evidence shows that it still relies on federal allocation which accounts for N57.93bn, or 65.78%, while IGR only accounts for N30.14bn, or 34.22%, of its total N88.06bn available revenue.
The state’s debt stock showed a continuous rise in the last two years, increasing from N73.49bn in 2018 to N92.83bn in 2019.
The 2019 breakdown of the state’s debt profiles reveals that its domestic debt stock presently stands at N67.50bn, increasing with 37.41% from the N49.12bn of the previous year while its foreign debt also stood at $82.81m, up by 3.70% from $79.85m in 2018.
The state’s 2019 financial statements show that the state spent a total of N87.27bn, representing 74.46% of its total expenditure of N117.21bn on recurrent obligations, with N44.38bn on personnel cost and N26.26bn on overheads which is almost same estimate with its actual capital expense of N29.93bn, or 24.54%, of its total expenditure.
The state could be applauded for reducing its debt servicing costs as its 2019 audit report shows that the sum for its debt charges reduced from N21.01bn in 2018 to N10.23bn in the 2019 fiscal year. However, the sustainable way to grow would be to increase its internal revenues through the expansion of economic opportuni t ies , only then wi l l the�Sunshine State� shine beyond the South-West, its impact felt beyond the country.
Sunshine State
The sustainable way to grow would be to increase its internal revenues through the expansion of economic opportunities, only then will the �Sunshine State� shine beyond the South-West, its impact felt beyond the country.
Ondo
State
24Sustainability
Ranking
93
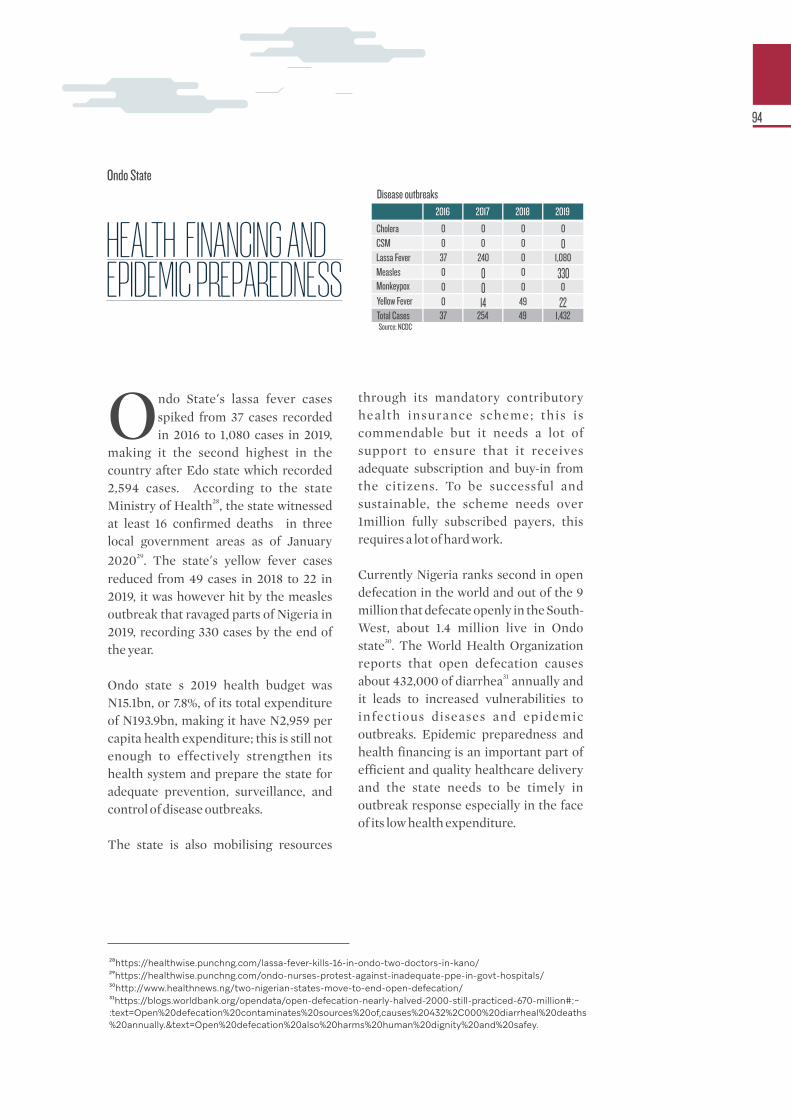
ndo State’s lassa fever cases Ospiked from 37 cases recorded in 2016 to 1,080 cases in 2019,
making it the second highest in the country after Edo state which recorded 2,594 cases. According to the state
28Ministry of Health , the state witnessed at least 16 confirmed deaths in three local government areas as of January
292020 . The state’s yellow fever cases reduced from 49 cases in 2018 to 22 in 2019, it was however hit by the measles outbreak that ravaged parts of Nigeria in 2019, recording 330 cases by the end of the year.
Ondo state�s 2019 health budget was N15.1bn, or 7.8%, of its total expenditure of N193.9bn, making it have N2,959 per capita health expenditure; this is still not enough to effectively strengthen its health system and prepare the state for adequate prevention, surveillance, and control of disease outbreaks.
The state is also mobilising resources
through its mandatory contributory health insurance scheme; this is commendable but it needs a lot of support to ensure that it receives adequate subscription and buy-in from the citizens. To be successful and sustainable, the scheme needs over 1million fully subscribed payers, this requires a lot of hard work.
Currently Nigeria ranks second in open defecation in the world and out of the 9 million that defecate openly in the South-West, about 1.4 million live in Ondo
30state . The World Health Organization reports that open defecation causes
31about 432,000 of diarrhea annually and it leads to increased vulnerabilities to infectious diseases and epidemic outbreaks. Epidemic preparedness and health financing is an important part of efficient and quality healthcare delivery and the state needs to be timely in outbreak response especially in the face of its low health expenditure.
Ondo State
²⁸https://healthwise.punchng.com/lassa-fever-kills-16-in-ondo-two-doctors-in-kano/ ²⁹https://healthwise.punchng.com/ondo-nurses-protest-against-inadequate-ppe-in-govt-hospitals/ ³⁰http://www.healthnews.ng/two-nigerian-states-move-to-end-open-defecation/³¹https://blogs.worldbank.org/opendata/open-defecation-nearly-halved-2000-still-practiced-670-million#:~:text=Open%20defecation%20contaminates%20sources%20of,causes%20432%2C000%20diarrheal%20deaths%20annually.&text=Open%20defecation%20also%20harms%20human%20dignity%20and%20safey.
2016
Cholera 0CSM 0Lassa Fever 37Measles 0Monkeypox 0Yellow Fever 0Total Cases 37
2017 2018 2019
0 0 00 0 0
240 0 1,080
0 0 3300 0 0
14 49 22254 49 1,432
HEALTH FINANCING AND EPIDEMIC PREPAREDNESS
Disease outbreaks
Source: NCDC
94
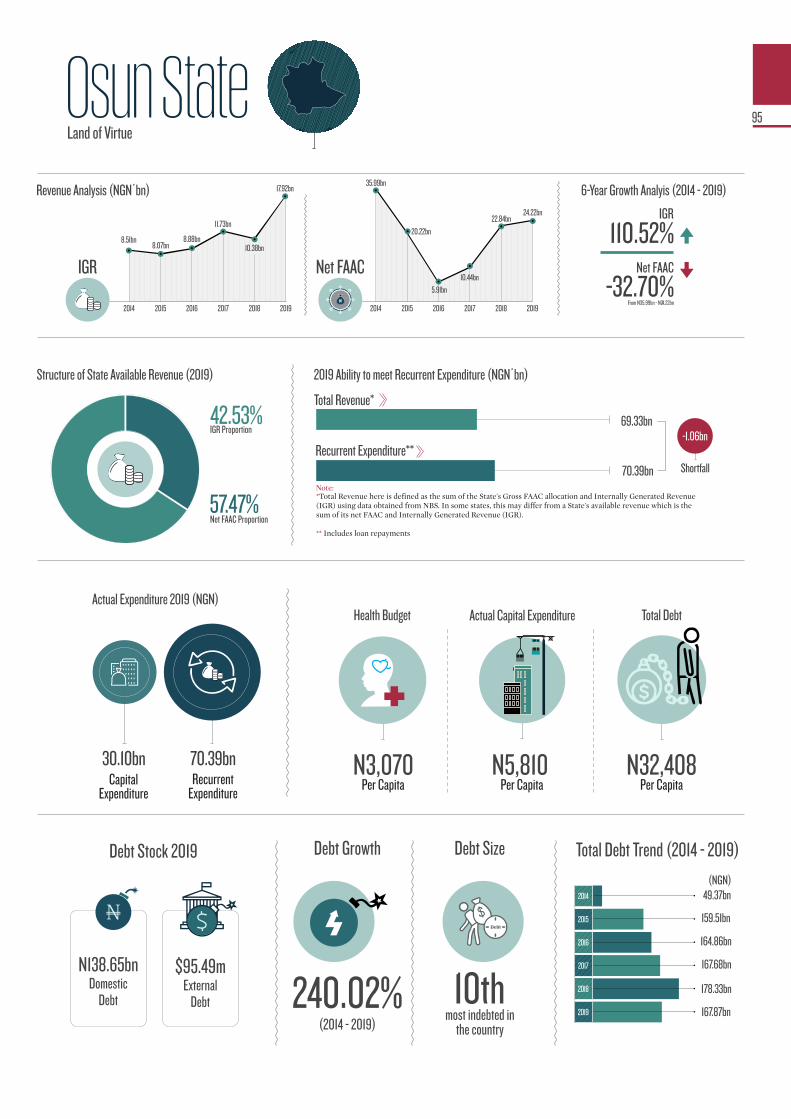
Osun State
2014 2015 2016 2017 2018 2019
35.99bn
22.84bn
6-Year Growth Analyis (2014 - 2019)
-32.70%
Net FAAC
IGR
110.52%
From N35.99bn - N24.22bn
49.37bn
159.51bn
164.86bn
167.68bn
178.33bn
167.87bn
2014
2015
2017
2019
2016
2018
Debt Growth
(2014 - 2019)
240.02%
Debt Size
most indebted in the country
10th
Total Debt Trend (2014 - 2019)
N138.65bn $95.49mDomestic
DebtExternal
Debt
Per Capita Analysis
N5,810N3,070 N32,408
Capital Expenditure
Recurrent Expenditure
70.39bn30.10bn
N
Net FAAC Proportion 57.47%
IGR Proportion 42.53%
70.39bn
69.33bn
Shortfall
-1.06bn
Debt
2014 2015 2016 2017 2018 2019
Net FAAC
8.51bn
N
8.07bn8.88bn
11.73bn
17.92bn
20.22bn
10.44bn
24.22bn
Land of Virtue
IGR10.38bn
5.91bn
Revenue Analysis (NGN’bn)
Debt Stock 2019
Per Capita Per Capita Per Capita
Health BudgetActual Expenditure 2019 (NGN)
Actual Capital Expenditure Total Debt
(NGN)
95
Total Revenue*
Recurrent Expenditure**
Structure of State Available Revenue (2019) 2019 Ability to meet Recurrent Expenditure (NGN’bn)
*Total Revenue here is defined as the sum of the State's Gross FAAC allocation and Internally Generated Revenue (IGR) using data obtained from NBS. In some states, this may differ from a State's available revenue which is the sum of its net FAAC and Internally Generated Revenue (IGR).�
** Includes loan repayments
Note:
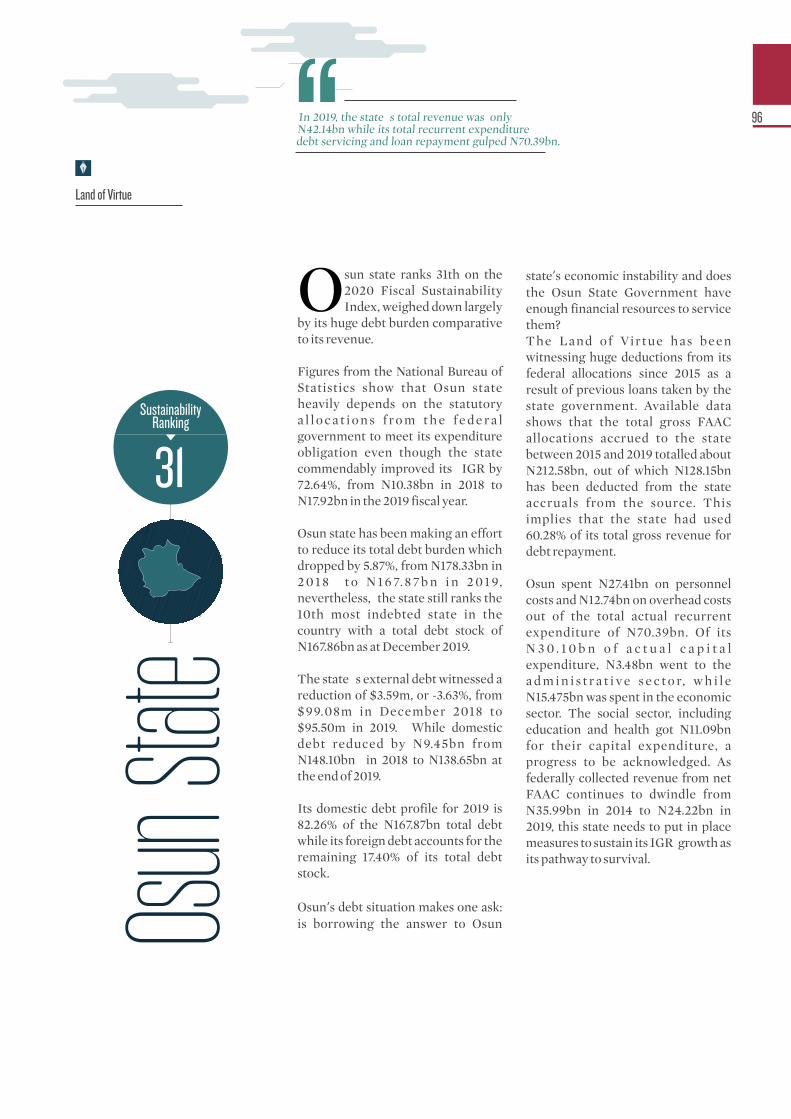
Osun state ranks 31th on the 2020 Fiscal Sustainability Index, weighed down largely
by its huge debt burden comparative to its revenue.
Figures from the National Bureau of Statistics show that Osun state heavily depends on the statutory a l l o c a t i o n s f r o m t h e f e d e r a l government to meet its expenditure obligation even though the state commendably improved its IGR by 72.64%, from N10.38bn in 2018 to N17.92bn in the 2019 fiscal year.
Osun state has been making an effort to reduce its total debt burden which dropped by 5.87%, from N178.33bn in 2 0 1 8 t o N 1 6 7. 8 7 b n i n 2 0 1 9, nevertheless, the state still ranks the 10th most indebted state in the country with a total debt stock of N167.86bn as at December 2019.
The state�s external debt witnessed a reduction of $3.59m, or -3.63%, from $99.08m in December 2018 to $95.50m in 2019. While domestic debt reduced by N9.45bn from N148.10bn in 2018 to N138.65bn at the end of 2019.
Its domestic debt profile for 2019 is 82.26% of the N167.87bn total debt while its foreign debt accounts for the remaining 17.40% of its total debt stock.
Osun’s debt situation makes one ask: is borrowing the answer to Osun
state’s economic instability and does the Osun State Government have enough financial resources to service them?The Land of Virtue has been witnessing huge deductions from its federal allocations since 2015 as a result of previous loans taken by the state government. Available data shows that the total gross FAAC allocations accrued to the state between 2015 and 2019 totalled about N212.58bn, out of which N128.15bn has been deducted from the state accruals from the source. This implies that the state had used 60.28% of its total gross revenue for debt repayment.
Osun spent N27.41bn on personnel costs and N12.74bn on overhead costs out of the total actual recurrent expenditure of N70.39bn. Of its N 3 0 . 1 0 b n o f a c t u a l c a p i t a l expenditure, N3.48bn went to the a d m i n i s t r a t i v e s e c t o r, w h i l e N15.475bn was spent in the economic sector. The social sector, including education and health got N11.09bn for their capital expenditure, a progress to be acknowledged. As federally collected revenue from net FAAC continues to dwindle from N35.99bn in 2014 to N24.22bn in 2019, this state needs to put in place measures to sustain its IGR growth as its pathway to survival.
Land of Virtue
In 2019, the state�s total revenue was only N42.14bn while its total recurrent expenditure debt servicing and loan repayment gulped N70.39bn.
Osun
State
31Sustainability
Ranking
96
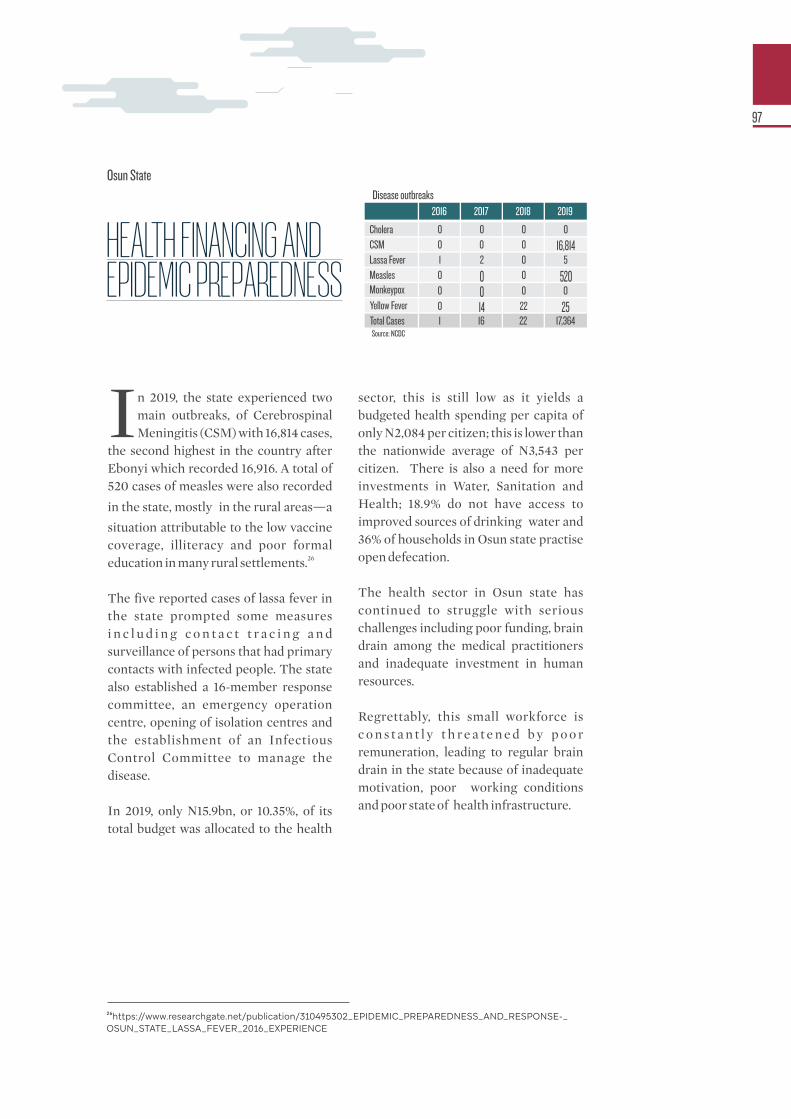
n 2019, the state experienced two Imain outbreaks, of Cerebrospinal Meningitis (CSM) with 16,814 cases,
the second highest in the country after Ebonyi which recorded 16,916. A total of 520 cases of measles were also recorded
in the state, mostly in the rural areas—a
situation attributable to the low vaccine coverage, illiteracy and poor formal
26education in many rural settlements.
The five reported cases of lassa fever in the state prompted some measures i n c l u d i n g c o n t a c t t r a c i n g a n d surveillance of persons that had primary contacts with infected people. The state also established a 16-member response committee, an emergency operation centre, opening of isolation centres and the establishment of an Infectious Control Committee to manage the disease.
In 2019, only N15.9bn, or 10.35%, of its total budget was allocated to the health
sector, this is still low as it yields a budgeted health spending per capita of only N2,084 per citizen; this is lower than the nationwide average of N3,543 per citizen. There is also a need for more investments in Water, Sanitation and Health; 18.9% do not have access to improved sources of drinking water and 36% of households in Osun state practise open defecation.
The health sector in Osun state has continued to struggle with serious challenges including poor funding, brain drain among the medical practitioners and inadequate investment in human resources.
Regrettably, this small workforce is c o n s t a n t l y t h r e a t e n e d b y p o o r remuneration, leading to regular brain drain in the state because of inadequate motivation, poor working conditions and poor state of health infrastructure.
Osun State
²⁶https://www.researchgate.net/publication/310495302_EPIDEMIC_PREPAREDNESS_AND_RESPONSE-_OSUN_STATE_LASSA_FEVER_2016_EXPERIENCE
2016
Cholera 0CSM 0Lassa Fever 1Measles 0Monkeypox 0Yellow Fever 0Total Cases 1
2017 2018 2019
0 0 00 0 16,8142 0 5
0 0 5200 0 0
14 22 2516 22 17,364
HEALTH FINANCING AND EPIDEMIC PREPAREDNESS
Disease outbreaks
Source: NCDC
97

Recurrent Expenditure
120.34bn
2014 2015 2016 2017 2018 2019
Net FAAC
57.42bn
N
42.99bn
33.54bn
44.47bn
59.29bn55.80bn
2014 2015 2016 2017 2018 2019
IGR
16.31bn
24.64bn
15.66bn
18.88bn
22.45bn
26.75bn
Pace Setter
Capital Expenditure
28.97bn
24.20bn
60.29bn
134.03bn
157.63bn
123.55bn
122.22bn
Oyo State6-Year Growth Analyis (2014 - 2019)
-2.82%
Net FAAC
IGR
64.02%
From N57.42bn - N55.80bn
120.34bn
93.93bn
2014
2015
2017
2019
2016
2018
Debt Growth
(2014 - 2019)
405.12%
Debt Size
most indebted in the country
17th
Total Debt Trend (2014 - 2019)
N91.57bn $100.20mDomestic
DebtExternal
Debt
Per Capita Analysis
�N3,337
�N2,084 N14,076
N
Net FAAC Proportion 67.60%
IGR Proportion 32.40%
Shortfall
-26.41bn
Debt
Revenue Analysis (NGN’bn)
Debt Stock 2019
Per Capita Per Capita Per Capita
Health Budget
Actual Expenditure 2019 (NGN)
Actual Capital Expenditure Total Debt
(NGN)
98
Total Revenue*
Recurrent Expenditure**
Structure of State Available Revenue (2019) 2019 Ability to meet Recurrent Expenditure (NGN’bn)
*Total Revenue here is defined as the sum of the State's Gross FAAC allocation and Internally Generated Revenue (IGR) using data obtained from NBS. In some states, this may differ from a State's available revenue which is the sum of its net FAAC and Internally Generated Revenue (IGR).�
** Includes loan repayments
Note:
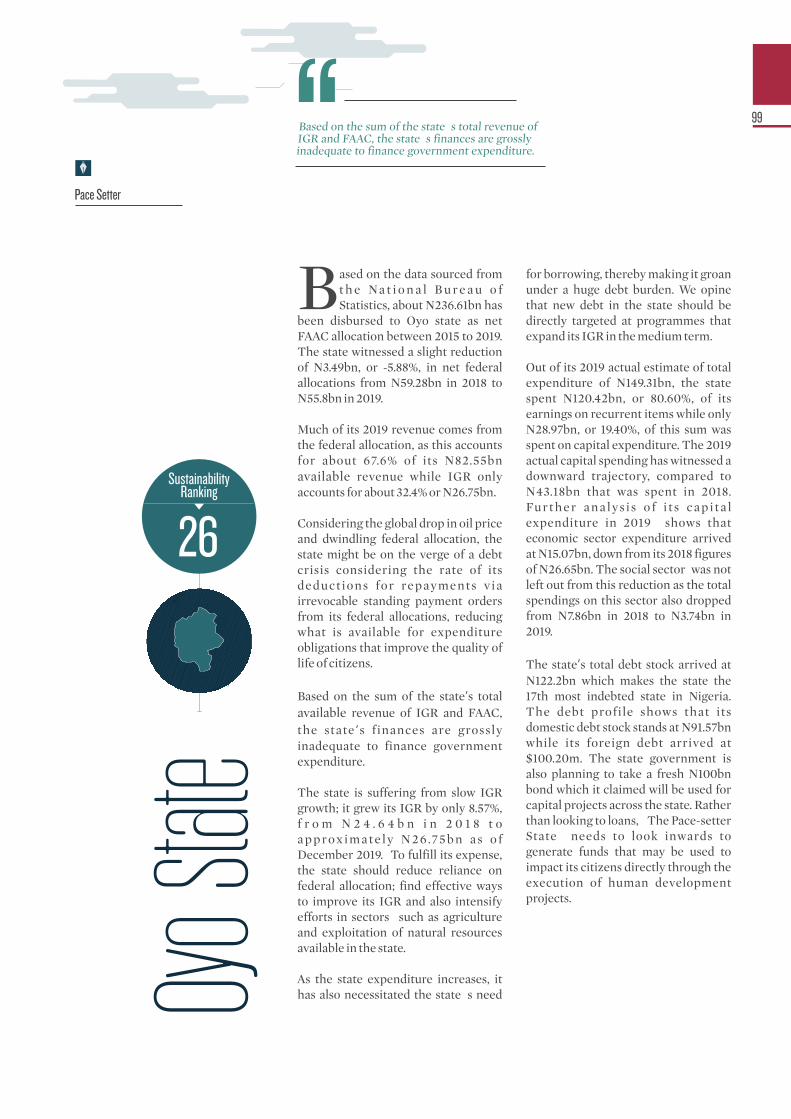
ased on the data sourced from Bt h e Na t i o n a l B u r e a u o f Statistics, about N236.61bn has
been disbursed to Oyo state as net FAAC allocation between 2015 to 2019. The state witnessed a slight reduction of N3.49bn, or -5.88%, in net federal allocations from N59.28bn in 2018 to N55.8bn in 2019.
Much of its 2019 revenue comes from the federal allocation, as this accounts for about 67.6% of its N82.55bn available revenue while IGR only accounts for about 32.4% or N26.75bn.
Considering the global drop in oil price and dwindling federal allocation, the state might be on the verge of a debt crisis considering the rate of its deductions for repayments via irrevocable standing payment orders from its federal allocations, reducing what is available for expenditure obligations that improve the quality of life of citizens.
Based on the sum of the state’s total available revenue of IGR and FAAC, the state ’s finances are grossly inadequate to finance government expenditure.
The state is suffering from slow IGR growth; it grew its IGR by only 8.57%, f r o m N 2 4 . 6 4 b n i n 2 0 1 8 t o a p p rox i m a t e l y N 2 6.7 5 b n a s o f December 2019. To fulfill its expense, the state should reduce reliance on federal allocation; find effective ways to improve its IGR and also intensify efforts in sectors such as agriculture and exploitation of natural resources available in the state.
As the state expenditure increases, it has also necessitated the state�s need
for borrowing, thereby making it groan under a huge debt burden. We opine that new debt in the state should be directly targeted at programmes that expand its IGR in the medium term.
Out of its 2019 actual estimate of total expenditure of N149.31bn, the state spent N120.42bn, or 80.60%, of its earnings on recurrent items while only N28.97bn, or 19.40%, of this sum was spent on capital expenditure. The 2019 actual capital spending has witnessed a downward trajectory, compared to N43.18bn that was spent in 2018. Further ana lys i s o f i t s capi ta l expenditure in 2019 shows that economic sector expenditure arrived at N15.07bn, down from its 2018 figures of N26.65bn. The social sector was not left out from this reduction as the total spendings on this sector also dropped from N7.86bn in 2018 to N3.74bn in 2019.
The state’s total debt stock arrived at N122.2bn which makes the state the 17th most indebted state in Nigeria. The debt profile shows that its domestic debt stock stands at N91.57bn while its foreign debt arrived at $100.20m. The state government is also planning to take a fresh N100bn bond which it claimed will be used for capital projects across the state. Rather than looking to loans, �The Pace-setter State� needs to look inwards to generate funds that may be used to impact its citizens directly through the execution of human development projects.
Pace Setter
Oyo S
tate
26Sustainability
Ranking
Based on the sum of the state�s total revenue of IGR and FAAC, the state�s finances are grossly inadequate to finance government expenditure.
99
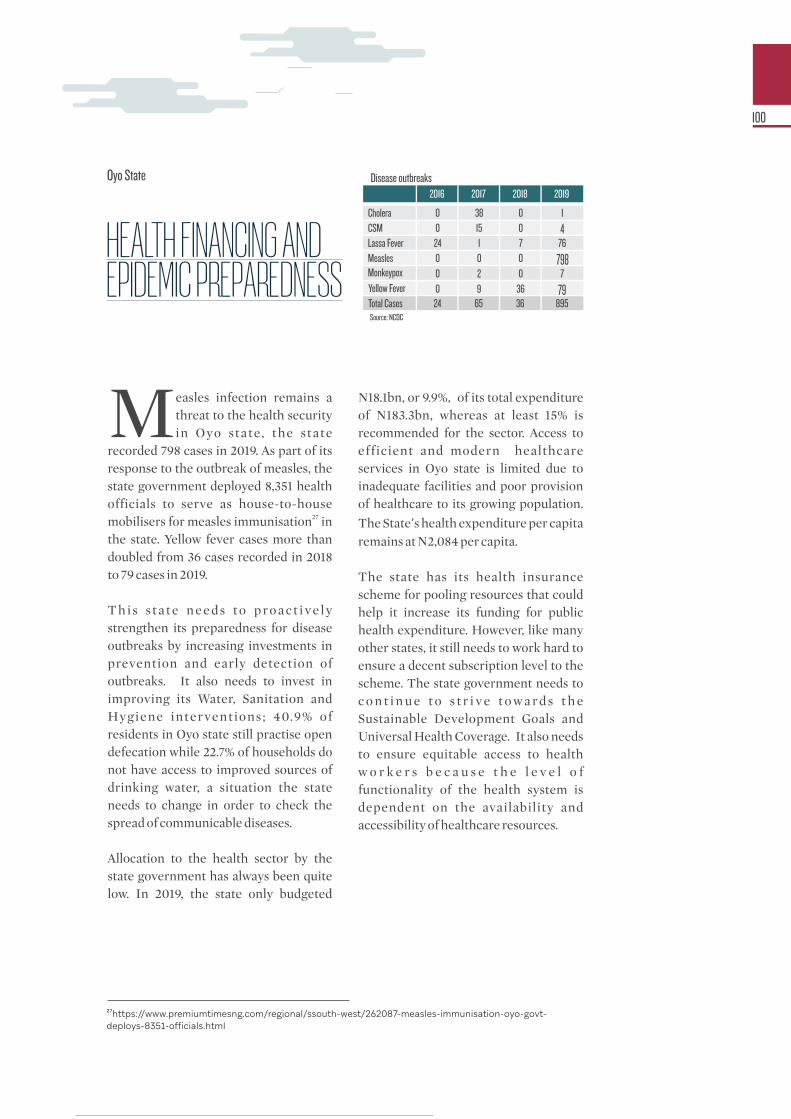
easles infection remains a Mthreat to the health security in Oyo state, the state
recorded 798 cases in 2019. As part of its response to the outbreak of measles, the state government deployed 8,351 health officials to serve as house-to-house
27mobilisers for measles immunisation in the state. Yellow fever cases more than doubled from 36 cases recorded in 2018 to 79 cases in 2019.
T h i s s t a t e n e e d s t o p ro a c t i ve l y strengthen its preparedness for disease outbreaks by increasing investments in prevention and early detection of outbreaks. It also needs to invest in improving its Water, Sanitation and Hygiene interventions; 40.9% of residents in Oyo state still practise open defecation while 22.7% of households do not have access to improved sources of drinking water, a situation the state needs to change in order to check the spread of communicable diseases.
Allocation to the health sector by the state government has always been quite low. In 2019, the state only budgeted
N18.1bn, or 9.9%, of its total expenditure of N183.3bn, whereas at least 15% is recommended for the sector. Access to efficient and modern healthcare services in Oyo state is limited due to inadequate facilities and poor provision of healthcare to its growing population.
The State’s health expenditure per capita remains at N2,084 per capita.
The state has its health insurance scheme for pooling resources that could help it increase its funding for public health expenditure. However, like many other states, it still needs to work hard to ensure a decent subscription level to the scheme. The state government needs to c o n t i n u e t o s t r i v e t o w a r d s t h e Sustainable Development Goals and Universal Health Coverage. It also needs to ensure equitable access to health w o r k e r s b e c a u s e t h e l e v e l o f functionality of the health system is dependent on the availability and accessibility of healthcare resources.
Oyo State 2016
Cholera 0CSM 0Lassa Fever 24Measles 0Monkeypox 0Yellow Fever 0Total Cases 24
2017 2018 2019
38 0 115 0 41 7 760 0 7982 0 79 36 79
65 36 895
²⁷https://www.premiumtimesng.com/regional/ssouth-west/262087-measles-immunisation-oyo-govt-deploys-8351-officials.html
HEALTH FINANCING AND EPIDEMIC PREPAREDNESS
Disease outbreaks
Source: NCDC
100
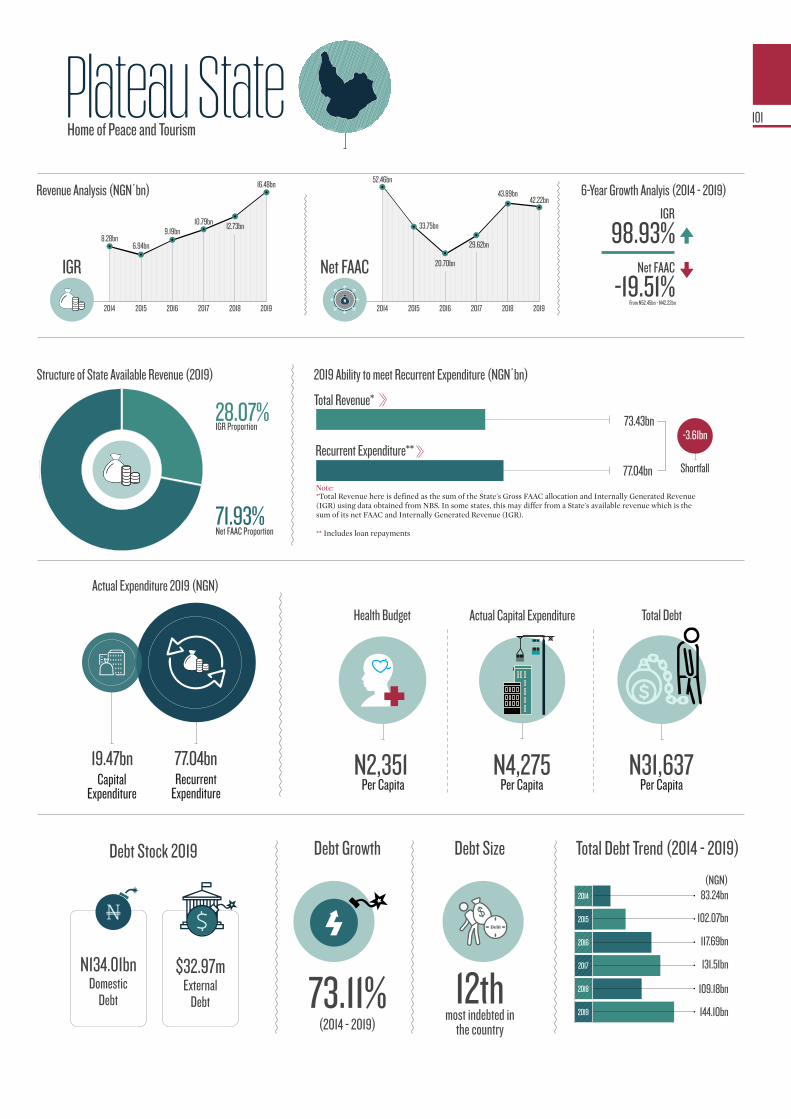
Recurrent Expenditure
77.04bn
2014 2015 2016 2017 2018 2019
Net FAAC
52.46bn
N
33.75bn
20.70bn
29.62bn
43.89bn42.22bn
2014 2015 2016 2017 2018 2019
IGR
8.28bn
12.73bn
6.94bn
9.19bn10.79bn
16.48bn
Capital Expenditure
19.47bn
83.24bn
102.07bn
117.69bn
131.51bn
109.18bn
144.10bn
Plateau State6-Year Growth Analyis (2014 - 2019)
-19.51%
Net FAAC
IGR
98.93%
From N52.45bn - N42.22bn
77.04bn
73.43bn
2014
2015
2017
2019
2016
2018
Debt Growth
(2014 - 2019)
73.11%
Debt Size
most indebted in the country
12th
Total Debt Trend (2014 - 2019)
Revenue Analysis (NGN’bn)
N134.01bn $32.97mDomestic
DebtExternal
Debt
Per Capita Analysis
�N4,275
N2,351 N31,637
N
Net FAAC Proportion 71.93%
IGR Proportion 28.07%
Shortfall
-3.61bn
Debt
Home of Peace and Tourism
Debt Stock 2019
Per Capita Per Capita Per Capita
Health Budget
Actual Expenditure 2019 (NGN)
Actual Capital Expenditure Total Debt
(NGN)
101
Total Revenue*
Recurrent Expenditure**
Structure of State Available Revenue (2019) 2019 Ability to meet Recurrent Expenditure (NGN’bn)
*Total Revenue here is defined as the sum of the State's Gross FAAC allocation and Internally Generated Revenue (IGR) using data obtained from NBS. In some states, this may differ from a State's available revenue which is the sum of its net FAAC and Internally Generated Revenue (IGR).�
** Includes loan repayments
Note:
It is important to note that Plateau state�s total debt stock rose by more than 31.99%, from
N109.18bn in 2018 to N144.10bn as at December 2019, according to the Debt Management Office of the federation.
The state’s domestic debt component experienced a faster surge with an u p wa rd t i c k o f 3 3. 5 2 % , f ro m N100.37bn in 2018 to N134.01bn in 2019; while its foreign debt grew by 14.19%, from $28.87m in 2018, to $32.97m in 2019. Plateau�s total debt stock rose significantly between 2014 and 2017 before witnessing a drop in 2018.
Unsurprisingly, the state’s internally generated revenue contributed a paltry N16.48bn, which comes to 28.07%, to its total revenue pool while statutory handouts from the federal government via FAAC allocations raked in 71.93% of its total revenue purse which was a total of N42.22bn.
Just like 2019, a look into 2018 shows that Plateau amassed a total of N12.73bn, or 22.48%, of its total N56.61bn revenue pool as its IGR, while FAAC allocation brought in N43.88bn, or 77.52%, of the total pool.
Plateau’s dream to bolster its IGR with an ambitious N2.5bn monthly and at least N50bn per annum may
have unfortunately died a natural death. Notwithstanding, the state can still return to the drawing board and revamp its IGR strategies.
The state already seems to be struggling to meet all its expenditure obligations; in 2019, its total revenue of N58.70bn could not meet up its recurrent expenditure of N77.04bn, placing the state at risk of sinking deeper into debt. Plateau state is one of the states in Nigeria running a recurrent deficit, which requires it to either reduce its recurrent burden or actively seek to expand its IGR.
With the COVID -19 pandemic ravaging federal government�s revenue, this state needs to treat rapidly growing its IGR as an emergency especially as its revenue from FG declined by -19.51% in pre-COVID-19 era, from N43.89bn in 2018 to N42.22bn in 2019.
Plateau state’s unique climate can provide export opportunities for e x o t i c f r u i t s a n d f l o w e r s . Consequently, this will show that �The Home of Peace and Tourism� is serious about a functional strategy to boost its homegrown revenue by attracting business investments.
Home of Peace and Tourism
The state�s domestic debt component experienced a faster surge with an upward tick of 33.52%, from N100.37bn in 2018 to N134.01bn in 2019; while its foreign debt grew by 14.19%, from $28.87m in 2018, to $32.97m in 2019.
Platea
u Stat
e
34Sustainability
Ranking
102
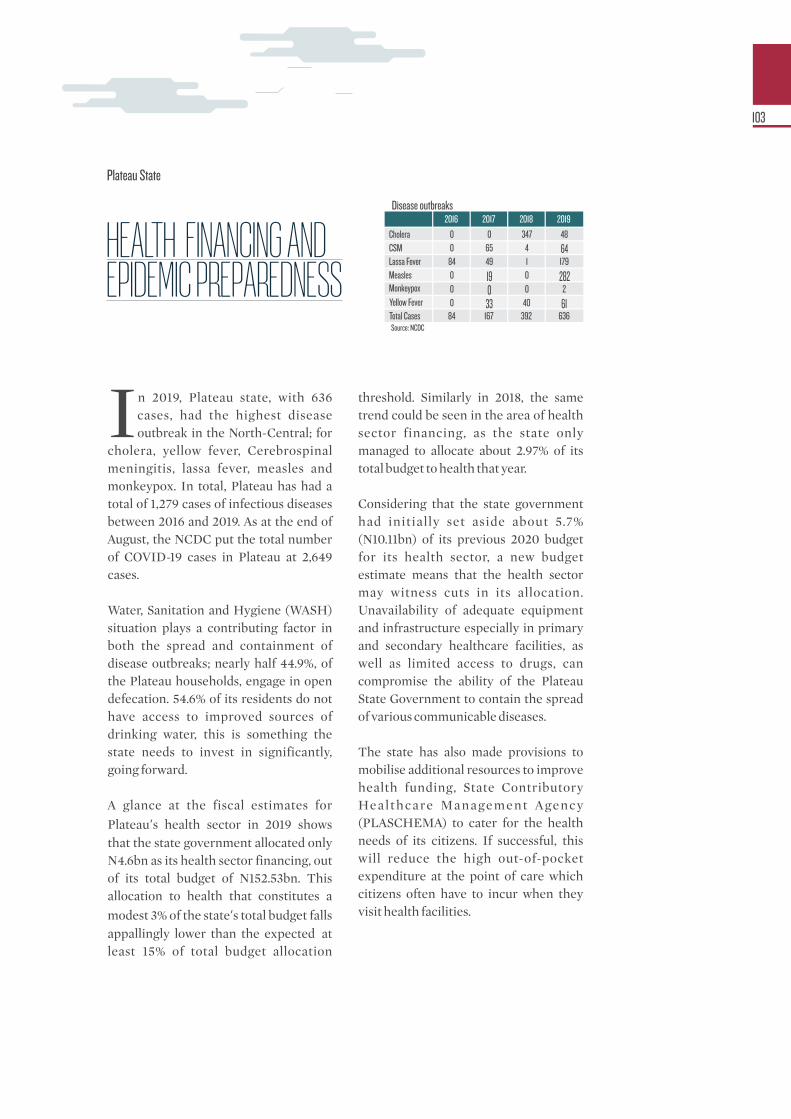
n 2019, Plateau state, with 636 Icases, had the highest disease outbreak in the North-Central; for
cholera, yellow fever, Cerebrospinal meningitis, lassa fever, measles and monkeypox. In total, Plateau has had a total of 1,279 cases of infectious diseases between 2016 and 2019. As at the end of August, the NCDC put the total number of COVID-19 cases in Plateau at 2,649 cases.
Water, Sanitation and Hygiene (WASH) situation plays a contributing factor in both the spread and containment of disease outbreaks; nearly half 44.9%, of the Plateau households, engage in open defecation. 54.6% of its residents do not have access to improved sources of drinking water, this is something the state needs to invest in significantly, going forward.
A glance at the fiscal estimates for
Plateau’s health sector in 2019 shows that the state government allocated only N4.6bn as its health sector financing, out of its total budget of N152.53bn. This allocation to health that constitutes a
modest 3% of the state’s total budget falls appallingly lower than the expected�at least�15% of total budget allocation
threshold. Similarly in 2018, the same trend could be seen in the area of health sector financing, as the state only managed to allocate about 2.97% of its total budget to health that year.
Considering that the state government had initially set aside about 5.7% (N10.11bn) of its previous 2020 budget for its health sector, a new budget estimate means that the health sector may witness cuts in its allocation. Unavailability of adequate equipment and infrastructure especially in primary and secondary healthcare facilities, as well as limited access to drugs, can compromise the ability of the Plateau State Government to contain the spread of various communicable diseases.
The state has also made provisions to mobilise additional resources to improve health funding, State Contributory Healthcare Management Agency (PLASCHEMA) to cater for the health needs of its citizens. If successful, this will reduce the high out-of-pocket expenditure at the point of care which citizens often have to incur when they visit health facilities.
Plateau State
2016
Cholera 0CSM 0Lassa Fever 84Measles 0Monkeypox 0Yellow Fever 0Total Cases 84
2017 2018 2019
0 347 4865 4 6449 1 179
19 0 2820 0 2
33 40 61167 392 636
HEALTH FINANCING AND EPIDEMIC PREPAREDNESS
Disease outbreaks
Source: NCDC
103

Recurrent Expenditure
113.93bn
2014 2015 2016 2017 2018 2019
Net FAAC
184.18bn
N
105.18bn
81.87bn
119.63bn
172.63bn158.45bn
2014 2015 2016 2017 2018 2019
IGR
89.11bn 112.78bn82.10bn 85.29bn89.48bn
140.40bn
Capital Expenditure
221.94bn
98.73bn
144.00bn
154.60bn
211.51bn
249.47bn
290.93bn
Rivers State6-Year Growth Analyis (2014 - 2019)
-13.97%
Net FAAC
IGR
57.55%
From N184.17bn - N158.44bn
113.93bn
309.53bn
2014
2015
2017
2019
2016
2018
Debt Growth
(2014 - 2019)
194.66%
Debt Size
most indebted in the country
2nd
Total Debt Trend (2014 - 2019)
N266.94bn $78.43mDomestic
DebtExternal
Debt
Per Capita Analysis
�N27,440
N3,128 N35,969
N
Net FAAC Proportion 53.02%
IGR Proportion 46.98%
Excess
195.60bn
Debt
Treasure Base of the Nation
Revenue Analysis (NGN’bn)
Debt Stock 2019
Per Capita Per Capita Per Capita
Health BudgetActual Expenditure 2019 (NGN)
Actual Capital Expenditure Total Debt
(NGN)
104
Total Revenue*
Recurrent Expenditure**
Structure of State Available Revenue (2019) 2019 Ability to meet Recurrent Expenditure (NGN’bn)
*Total Revenue here is defined as the sum of the State's Gross FAAC allocation and Internally Generated Revenue (IGR) using data obtained from NBS. In some states, this may differ from a State's available revenue which is the sum of its net FAAC and Internally Generated Revenue (IGR).�
** Includes loan repayments
Note:
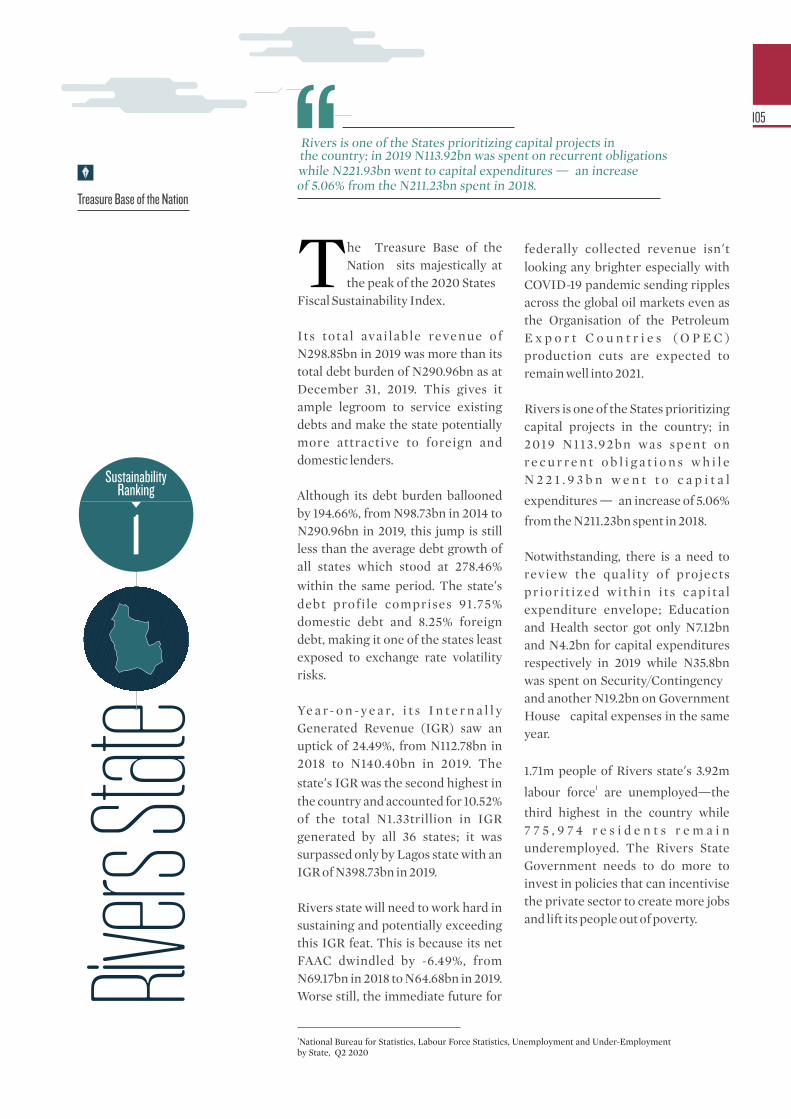
Rivers
State
The �Treasure Base of the Nation� sits majestically at the peak of the 2020 States�
Fiscal Sustainability Index.
Its total avai lable revenue of N298.85bn in 2019 was more than its total debt burden of N290.96bn as at December 31, 2019. This gives it ample legroom to service existing debts and make the state potentially more attractive to foreign and domestic lenders.
Although its debt burden ballooned by 194.66%, from N98.73bn in 2014 to N290.96bn in 2019, this jump is still less than the average debt growth of all states which stood at 278.46%
within the same period. The state’s debt profile comprises 91.75% domestic debt and 8.25% foreign debt, making it one of the states least exposed to exchange rate volatility risks.
Ye a r- o n - y e a r, i t s I n t e r n a l l y Generated Revenue (IGR) saw an uptick of 24.49%, from N112.78bn in 2018 to N140.40bn in 2019. The
state’s IGR was the second highest in the country and accounted for 10.52% of the total N1.33trillion in IGR generated by all 36 states; it was surpassed only by Lagos state with an IGR of N398.73bn in 2019.
Rivers state will need to work hard in sustaining and potentially exceeding this IGR feat. This is because its net FAAC dwindled by -6.49%, from N69.17bn in 2018 to N64.68bn in 2019. Worse still, the immediate future for
federally collected revenue isn’t looking any brighter especially with COVID-19 pandemic sending ripples across the global oil markets even as the Organisation of the Petroleum E x p o r t C o u n t r i e s � ( O P E C ) production cuts are expected to remain well into 2021.
Rivers is one of the States prioritizing capital projects in the country; in 2019 N113.92bn was spent on r e c u r r e n t o b l i g a t i o n s w h i l e N 2 2 1 . 9 3 b n w e n t t o c a p i t a l
expenditures — an increase of 5.06%
from the N211.23bn spent in 2018.
Notwithstanding, there is a need to review the quality of projects pr ior i t ized wi th in i t s capi ta l expenditure envelope; Education and Health sector got only N7.12bn and N4.2bn for capital expenditures respectively in 2019 while N35.8bn was spent on Security/Contingency� and another N19.2bn on Government House� capital expenses in the same year.
1.71m people of Rivers state’s 3.92m 1labour force are unemployed—the
third highest in the country while 7 7 5 , 9 7 4 r e s i d e n t s r e m a i n underemployed. The Rivers State Government needs to do more to invest in policies that can incentivise the private sector to create more jobs and lift its people out of poverty.
Treasure Base of the Nation
1Sustainability
Ranking
Rivers is one of the States prioritizing capital projects in the country; in 2019 N113.92bn was spent on recurrent obligations while N221.93bn went to capital expenditures — an increase of 5.06% from the N211.23bn spent in 2018.
1National Bureau for Statistics, Labour Force Statistics, Unemployment and Under-Employment by State, Q2 2020
105
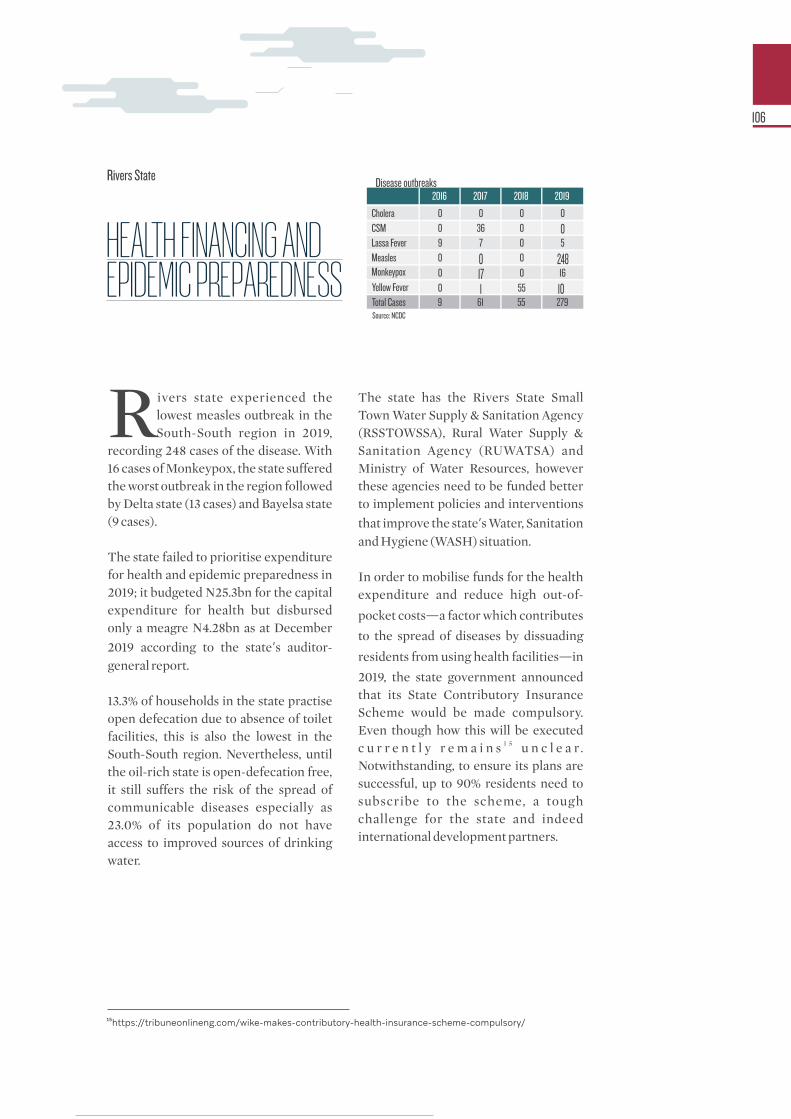
ivers state experienced the Rlowest measles outbreak in the South-South region in 2019,
recording 248 cases of the disease. With 16 cases of Monkeypox, the state suffered the worst outbreak in the region followed by Delta state (13 cases) and Bayelsa state (9 cases).
The state failed to prioritise expenditure for health and epidemic preparedness in 2019; it budgeted N25.3bn for the capital expenditure for health but disbursed only a meagre N4.28bn as at December
2019 according to the state’s auditor-general report.
13.3% of households in the state practise open defecation due to absence of toilet facilities, this is also the lowest in the South-South region. Nevertheless, until the oil-rich state is open-defecation free, it still suffers the risk of the spread of communicable diseases especially as 23.0% of its population do not have access to improved sources of drinking water.
The state has the Rivers State Small Town Water Supply & Sanitation Agency (RSSTOWSSA), Rural Water Supply & Sanitation Agency (RUWATSA) and Ministry of Water Resources, however these agencies need to be funded better to implement policies and interventions
that improve the state’s Water, Sanitation and Hygiene (WASH) situation.
In order to mobilise funds for the health expenditure and reduce high out-of-
pocket costs—a factor which contributes
to the spread of diseases by dissuading
residents from using health facilities—in
2019, the state government announced that its State Contributory Insurance Scheme would be made compulsory. Even though how this will be executed
1 5c u r r e n t l y r e m a i n s u n c l e a r . Notwithstanding, to ensure its plans are successful, up to 90% residents need to subscribe to the scheme, a tough challenge for the state and indeed international development partners.
Rivers State
¹⁵https://tribuneonlineng.com/wike-makes-contributory-health-insurance-scheme-compulsory/
2016
Cholera 0CSM 0Lassa Fever 9Measles 0Monkeypox 0Yellow Fever 0Total Cases 9
2017 2018 2019
0 0 036 0 07 0 5
0 0 24817 0 16
1 55 1061 55 279
HEALTH FINANCING AND EPIDEMIC PREPAREDNESS
Source: NCDC
Disease outbreaks
106

Recurrent Expenditure
42.57bn
2014 2015 2016 2017 2018 2019
Net FAAC
56.14bn
N
43.17bn
34.30bn
41.24bn
54.46bn55.48bn
2014 2015 2016 2017 2018 2019
IGR 5.62bn
18.76bn
6.22bn
4.55bn
9.02bn
19.01bn
Capital Expenditure
37.71bn
14.65bn
19.74bn
32.49bn
38.57bn
50.57bn
59.28bn
Sokoto State6-Year Growth Analyis (2014 - 2019)
-1.18%
Net FAAC
IGR
238.30%
From N56.14bn - N155.47bn
42.57bn
78.92bn
2014
2015
2017
2019
2016
2018
Debt Growth
(2014 - 2019)
304.70%
Debt Size
most indebted in the country
34th
Total Debt Trend (2014 - 2019)
N47.71bn $37.81mDomestic
DebtExternal
Debt
Per Capita Analysis
�N6,896
N4,005 N10,839
N
Net FAAC Proportion 74.48%
IGR Proportion 25.52%
Excess
36.35bn
Debt
Seat of the Caliphate
Revenue Analysis (NGN’bn)
Debt Stock 2019
Per Capita Per Capita Per Capita
Health BudgetActual Expenditure 2019 (NGN)
Actual Capital Expenditure Total Debt
(NGN)
107
Total Revenue*
Recurrent Expenditure**
Structure of State Available Revenue (2019) 2019 Ability to meet Recurrent Expenditure (NGN’bn)
*Total Revenue here is defined as the sum of the State's Gross FAAC allocation and Internally Generated Revenue (IGR) using data obtained from NBS. In some states, this may differ from a State's available revenue which is the sum of its net FAAC and Internally Generated Revenue (IGR).�
** Includes loan repayments
Note:
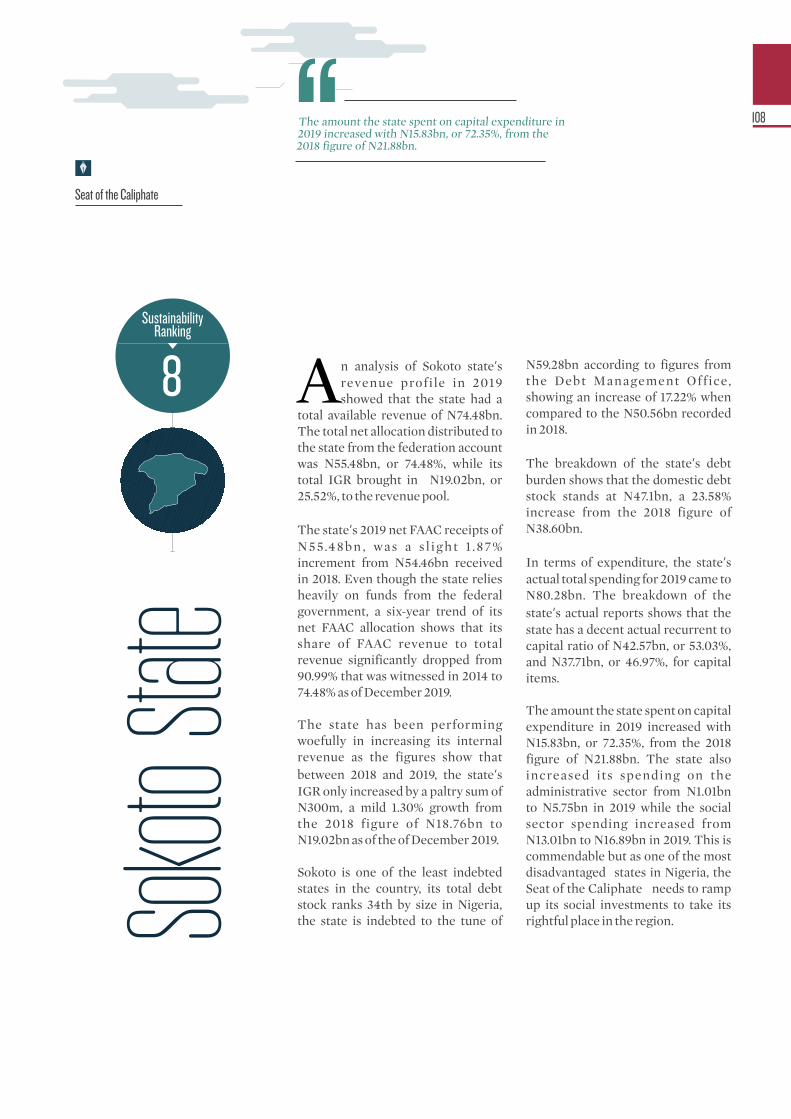
An analysis of Sokoto state’s revenue profile in 2019 showed that the state had a
total available revenue of N74.48bn. The total net allocation distributed to the state from the federation account was N55.48bn, or 74.48%, while its total IGR brought in N19.02bn, or 25.52%, to the revenue pool.
The state’s 2019 net FAAC receipts of N55.48bn, was a s l ight 1 .87% increment from N54.46bn received in 2018. Even though the state relies heavily on funds from the federal government, a six-year trend of its net FAAC allocation shows that its share of FAAC revenue to total revenue significantly dropped from 90.99% that was witnessed in 2014 to 74.48% as of December 2019.
The state has been performing woefully in increasing its internal revenue as the figures show that between 2018 and 2019, the state’s IGR only increased by a paltry sum of N300m, a mild 1.30% growth from the 2018 figure of N18.76bn to N19.02bn as of the of December 2019.
Sokoto is one of the least indebted states in the country, its total debt stock ranks 34th by size in Nigeria, the state is indebted to the tune of
N59.28bn according to figures from the Debt Management Office, showing an increase of 17.22% when compared to the N50.56bn recorded in 2018.
The breakdown of the state’s debt burden shows that the domestic debt stock stands at N47.1bn, a 23.58% increase from the 2018 figure of N38.60bn.
In terms of expenditure, the state’s actual total spending for 2019 came to N80.28bn. The breakdown of the state’s actual reports shows that the state has a decent actual recurrent to capital ratio of N42.57bn, or 53.03%, and N37.71bn, or 46.97%, for capital items.
The amount the state spent on capital expenditure in 2019 increased with N15.83bn, or 72.35%, from the 2018 figure of N21.88bn. The state also increased its spending on the administrative sector from N1.01bn to N5.75bn in 2019 while the social sector spending increased from N13.01bn to N16.89bn in 2019. This is commendable but as one of the most disadvantaged states in Nigeria, the Seat of the Caliphate� needs to ramp up its social investments to take its rightful place in the region.
Seat of the Caliphate
The amount the state spent on capital expenditure in 2019 increased with N15.83bn, or 72.35%, from the 2018 figure of N21.88bn.
Sokot
o Stat
e
8Sustainability
Ranking
108

okoto state has seen a decline in Sthe number of Cerebrospinal Meningitis (CSM) cases from
4,737 in 2017 to 168 cases in 2019. It also recorded no new case of cholera, down from 1,577 cases in 2018. Lack of sustainable water, proper sanitation and unhygienic act iv i t ies have been identified as key factors responsible for its previous cholera outbreak in 2018 when the Nigeria Centre for Disease Control identified Sokoto as one of the 16 states prone to cholera.
65.6%, the majority of citizens of Sokoto do not have access to improved sources of drinking water, the worst in the country while 15.5% of the households in the state still practise open defecation. The state government in collaboration with USAID made provision of safe drinking water for over 30 formal and non-formal primary schools and learning centres in the s ta te and i s a l so
implementing interventions to improve the WASH situation in the state.
Sokoto budgeted N21.9bn, or 12.91%, of its N169.65bn total budget to the health sector. Inorder to provide quality and effective healthcare system for its citizens, the government would need to invest more in the recruitment of m e d i c a l p e r s o n n e l a n d t h e i n c e n t i v i s a t i o n o f t h e m e d i c a l manpower.
Sokoto has an estimated population of 5.3 million people with about 4.5 million without health insurance. To mobilise additional resources for funding the health sector, the state set up its own health insurance scheme managed by Sokoto State Contributory Healthcare Management Agency (SOCHEMA). To achieve long-term sustainability, the state needs to ensure there is citizen buy-in.
Sokoto State
³²https://www.wofan-ng.org/index.php?option=com_content&view=article&id=13:usaidwofan-wash-project-sokoto-schools-get-safe-drinking-water&catid=1:latest-news
2016
Cholera 0CSM 0Lassa Fever 0Measles 15Monkeypox 0Yellow Fever 0Total Cases 15
2017 2018 2019
0 1,577 04,737 345 168
0 0 4
6 0 3600 0 0
24 33 454,767 1,955 577
HEALTH FINANCING AND EPIDEMIC PREPAREDNESS
Disease outbreaks
Source: NCDC
109
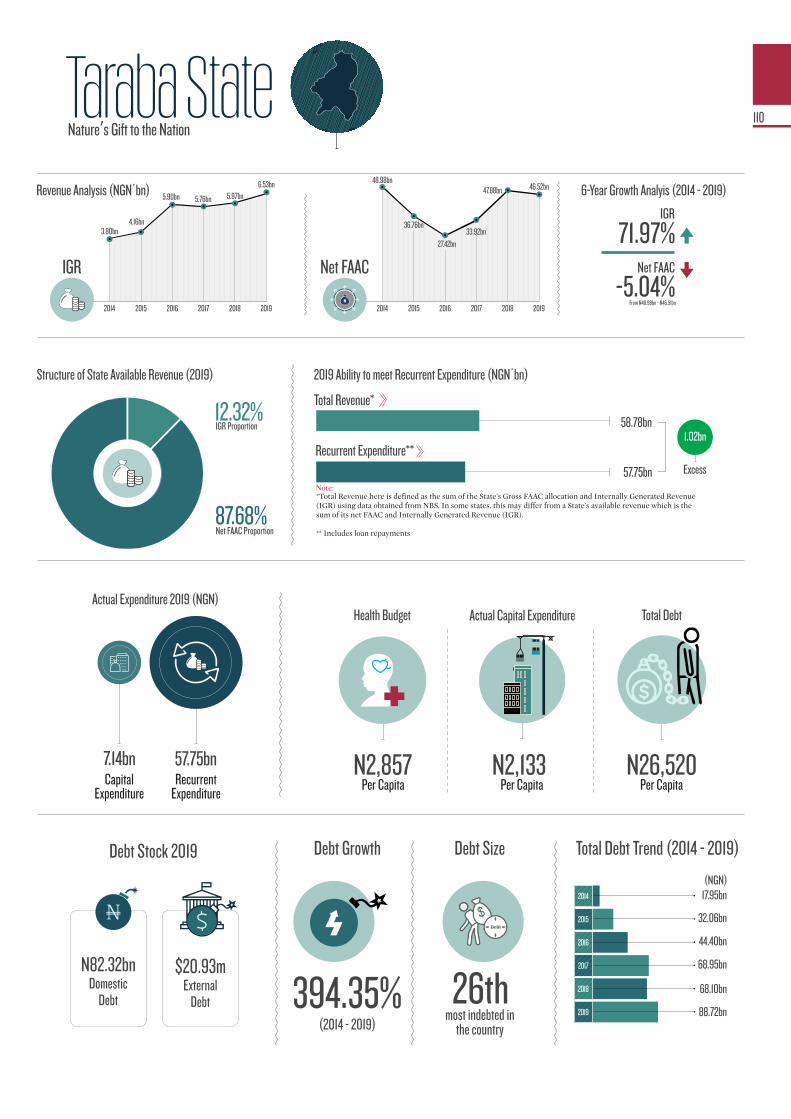
Recurrent Expenditure
57.75bn
2014 2015 2016 2017 2018 2019
Net FAAC
48.98bn
N
36.76bn
27.42bn
33.92bn
47.88bn 46.52bn
2014 2015 2016 2017 2018 2019
IGR
3.80bn
5.97bn
4.16bn
5.90bn 5.76bn
6.53bn
Capital Expenditure
7.14bn
17.95bn
32.06bn
44.40bn
68.95bn
68.10bn
88.72bn
Taraba State6-Year Growth Analyis (2014 - 2019)
-5.04%
Net FAAC
IGR
71.97%
From N48.98bn - N46.51bn
57.75bn
58.78bn
2014
2015
2017
2019
2016
2018
Debt Growth
(2014 - 2019)
394.35%
Debt Size
most indebted in the country
26th
Total Debt Trend (2014 - 2019)
N82.32bn $20.93mDomestic
DebtExternal
Debt
Per Capita Analysis
�N2,133
N2,857 N26,520
N
Net FAAC Proportion 87.68%
IGR Proportion 12.32%
Excess
1.02bn
Debt
Natureʼs Gift to the Nation
Revenue Analysis (NGN’bn)
Debt Stock 2019
Per Capita Per Capita Per Capita
Health BudgetActual Expenditure 2019 (NGN)
Actual Capital Expenditure Total Debt
(NGN)
110
Total Revenue*
Recurrent Expenditure**
Structure of State Available Revenue (2019) 2019 Ability to meet Recurrent Expenditure (NGN’bn)
*Total Revenue here is defined as the sum of the State's Gross FAAC allocation and Internally Generated Revenue (IGR) using data obtained from NBS. In some states, this may differ from a State's available revenue which is the sum of its net FAAC and Internally Generated Revenue (IGR).�
** Includes loan repayments
Note:
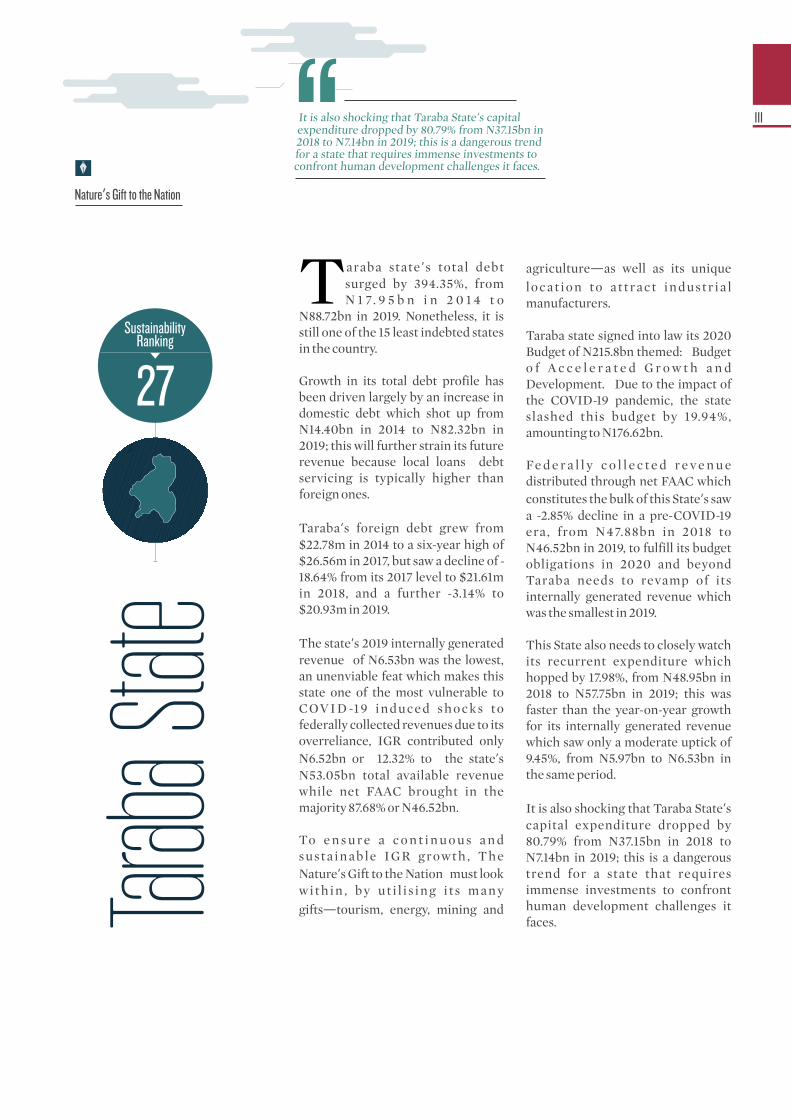
Taraba state ’s total debt surged by 394.35%, from N 1 7. 9 5 b n i n 2 0 1 4 t o
N88.72bn in 2019. Nonetheless, it is still one of the 15 least indebted states in the country.
Growth in its total debt profile has been driven largely by an increase in domestic debt which shot up from N14.40bn in 2014 to N82.32bn in 2019; this will further strain its future revenue because local loans� debt servicing is typically higher than foreign ones.
Taraba’s foreign debt grew from $22.78m in 2014 to a six-year high of $26.56m in 2017, but saw a decline of -18.64% from its 2017 level to $21.61m in 2018, and a further -3.14% to $20.93m in 2019.
The state’s 2019 internally generated revenue of N6.53bn was the lowest, an unenviable feat which makes this state one of the most vulnerable to C OV I D -1 9 i n d u c e d s h o c k s t o federally collected revenues due to its overreliance, IGR contributed only N6.52bn or 12.32% to the state’s N53.05bn total available revenue while net FAAC brought in the majority 87.68% or N46.52bn.
To e n s u r e a c o n t i n u o u s a n d susta inable IGR growth , The Nature’s Gift to the Nation�must look wi th in , by ut i l i s ing i t s many gifts—tourism, energy, mining and
agriculture—as well as its unique locat ion to a t t ract industr ia l manufacturers.
Taraba state signed into law its 2020 Budget of N215.8bn themed: �Budget o f A c c e l e r a t e d G r o w t h a n d Development.� Due to the impact of the COVID-19 pandemic, the state slashed this budget by 19.94%, amounting to N176.62bn.
Fe d e r a l l y c o l l e c t e d r e v e n u e distributed through net FAAC which constitutes the bulk of this State’s saw a -2.85% decline in a pre-COVID-19 era, from N47.88bn in 2018 to N46.52bn in 2019, to fulfill its budget obligations in 2020 and beyond Taraba needs to revamp of its internally generated revenue which was the smallest in 2019.
This State also needs to closely watch its recurrent expenditure which hopped by 17.98%, from N48.95bn in 2018 to N57.75bn in 2019; this was faster than the year-on-year growth for its internally generated revenue which saw only a moderate uptick of 9.45%, from N5.97bn to N6.53bn in the same period.
It is also shocking that Taraba State’s capital expenditure dropped by 80.79% from N37.15bn in 2018 to N7.14bn in 2019; this is a dangerous trend for a state that requires immense investments to confront human development challenges it faces.
Nature’s Gift to the Nation
It is also shocking that Taraba State’s capital expenditure dropped by 80.79% from N37.15bn in 2018 to N7.14bn in 2019; this is a dangerous trend for a state that requires immense investments to confront human development challenges it faces.
Tarab
a Stat
e
27Sustainability
Ranking
111
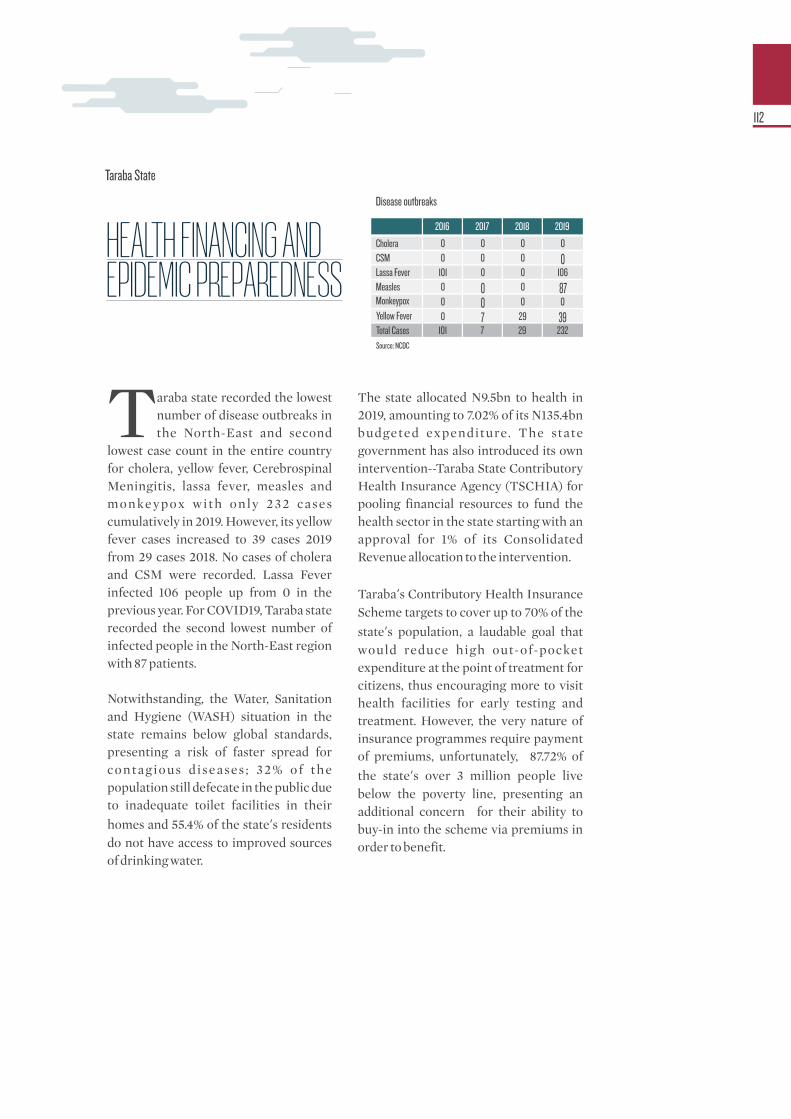
araba state recorded the lowest Tnumber of disease outbreaks in the North-East and second
lowest case count in the entire country for cholera, yellow fever, Cerebrospinal Meningitis, lassa fever, measles and monkeypox with only 232 cases cumulatively in 2019. However, its yellow fever cases increased to 39 cases 2019 from 29 cases 2018. No cases of cholera and CSM were recorded. Lassa Fever infected 106 people up from 0 in the previous year. For COVID19, Taraba state recorded the second lowest number of infected people in the North-East region with 87 patients.
Notwithstanding, the Water, Sanitation and Hygiene (WASH) situation in the state remains below global standards, presenting a risk of faster spread for contagious d iseases ; 32% of the population still defecate in the public due to inadequate toilet facilities in their
homes and 55.4% of the state’s residents do not have access to improved sources of drinking water.
The state allocated N9.5bn to health in 2019, amounting to 7.02% of its N135.4bn budgeted expenditure. The state government has also introduced its own intervention--Taraba State Contributory Health Insurance Agency (TSCHIA) for pooling financial resources to fund the health sector in the state starting with an approval for 1% of its Consolidated Revenue allocation to the intervention.
Taraba’s Contributory Health Insurance Scheme targets to cover up to 70% of the
state’s population, a laudable goal that would reduce high out-of-pocket expenditure at the point of treatment for citizens, thus encouraging more to visit health facilities for early testing and treatment. However, the very nature of insurance programmes require payment of premiums, unfortunately, 87.72% of
the state’s over 3 million people live below the poverty line, presenting an additional concern for their ability to buy-in into the scheme via premiums in order to benefit.
Taraba State
2016
Cholera 0CSM 0Lassa Fever 101Measles 0Monkeypox 0Yellow Fever 0Total Cases 101
2017 2018 2019
0 0 00 0 00 0 106
0 0 870 0 0
7 29 397 29 232
HEALTH FINANCING AND EPIDEMIC PREPAREDNESS
Disease outbreaks
Source: NCDC
112
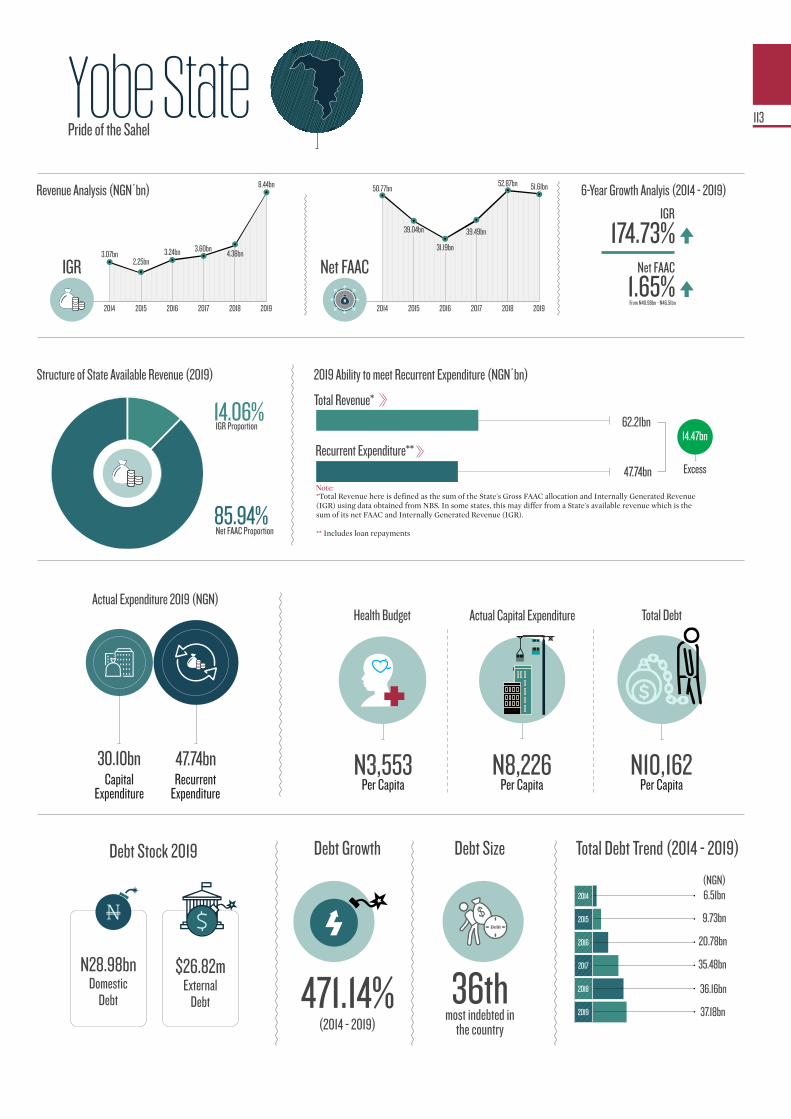
Recurrent Expenditure
47.74bn
2014 2015 2016 2017 2018 2019
Net FAAC
50.77bn
N
39.04bn
31.19bn
39.49bn
52.87bn 51.61bn
2014 2015 2016 2017 2018 2019
IGR3.07bn 4.38bn
2.25bn3.24bn 3.60bn
8.44bn
Capital Expenditure
30.10bn
6.51bn
9.73bn
20.78bn
35.48bn
36.16bn
37.18bn
Yobe State6-Year Growth Analyis (2014 - 2019)
1.65%
Net FAAC
IGR
174.73%
From N48.98bn - N46.51bn
47.74bn
62.21bn
2014
2015
2017
2019
2016
2018
Debt Growth
(2014 - 2019)
471.14%
Debt Size
most indebted in the country
36th
Total Debt Trend (2014 - 2019)
N28.98bn $26.82mDomestic
DebtExternal
Debt
Per Capita Analysis
�N8,226
N3,553 N10,162
N
Net FAAC Proportion 85.94%
IGR Proportion 14.06%
Excess
14.47bn
Debt
Pride of the Sahel
Revenue Analysis (NGN’bn)
Debt Stock 2019
Per Capita Per Capita Per Capita
Health BudgetActual Expenditure 2019 (NGN)
Actual Capital Expenditure Total Debt
(NGN)
113
Total Revenue*
Recurrent Expenditure**
Structure of State Available Revenue (2019) 2019 Ability to meet Recurrent Expenditure (NGN’bn)
*Total Revenue here is defined as the sum of the State's Gross FAAC allocation and Internally Generated Revenue (IGR) using data obtained from NBS. In some states, this may differ from a State's available revenue which is the sum of its net FAAC and Internally Generated Revenue (IGR).�
** Includes loan repayments
Note:

Yobe state is the least indebted state in the country with a total debt burden of N37.18bn
as at December 2019.
In 2016 and 2017, Yobe’s domestic debt stock stood at N13.58bn and N26.47bn respectively; it saw a moderate increase of 4.34%, from N27.77bn in 2018 to N28.98bn in 2019, while its foreign debt saw a decline of -2.43% from $27.49m to $26.82m within the same period.
However, the state needs to work hard to wean itself off the teats of federally distributed revenue, N51.61bn, or 85.94%, of its total 2019 available revenue came from the federal government through net FAAC while N8.44bn, or 14.06%, was derived from internally generated revenue.
Overall, its IGR has improved by 174.73%, from N3.07bn in 2014 to N8.44bn in 2019. Notwithstanding, so much more is possible for this state in terms of internally generated revenue as it currently has one of the smallest IGR in the country, ranking 31st by size.
To grow its IGR, Yobe can tap into its status of having one of the largest cattle markets in West Africa, situated in Potiskum, and build its local economy around the beef and d a i r y i n d u s t r y w h i c h i s t h e cornerstone of some developed economies. A barrel of milk is competitively priced with a barrel of
crude oil, strengthening its local dairy and processed beef industries could certainly lift it into prosperity and earn the state its place as �The Pride of the Sahel�.Accelerating its IGR growth should be a key priority for this state as its revenue from the federal government already suffered a decline in 2019, sliding by -2.40% from N52.87bn in 2018 to N51.61bn in 2019. This downward slide will likely continue in the light of COVID-19 induced shocks to crude oil prices which is a key source of the federally collected revenue.
L i k e o t h e r s t a t e s , r e c u r r e n t expenditure takes precedence in Yobe; N47.74bn, or 61.34%, of the state�s total expenditure of N77.84bn w a s c o m m i t t e d t o r e c u r r e n t e x p e n d i t u r e w h i l e c a p i t a l expenditure got N30.10bn or 38.66%. Yobe needs to do more to show that it is concerned about its development in how it prioritises its expenditure; its capital expenditure per capita stood at N8,226 per citizen, slightly below the country average of �8,993 per citizen. Yobe State can do more for its social sector that received N6.68bn out of its total capital e x p e n d i t u r e o f N 3 0 . 1 0 b n . A significant portion of its capex was spent on the economic sector at N 1 9. 8 8 b n , w i t h e m p h a s i s o n reconstruction efforts. Yobe needs to seek more international relief after significant losses due to the terrorist activities of Boko Haram.
Pride of the Sahel
Yobe needs to do more to show that it is concerned about its development in how it prioritises its expenditure; its capital expenditure per capita stood at N8,226 per citizen, slightly below the country average of �8,993 per citizen.
Yobe
State
18Sustainability
Ranking
114
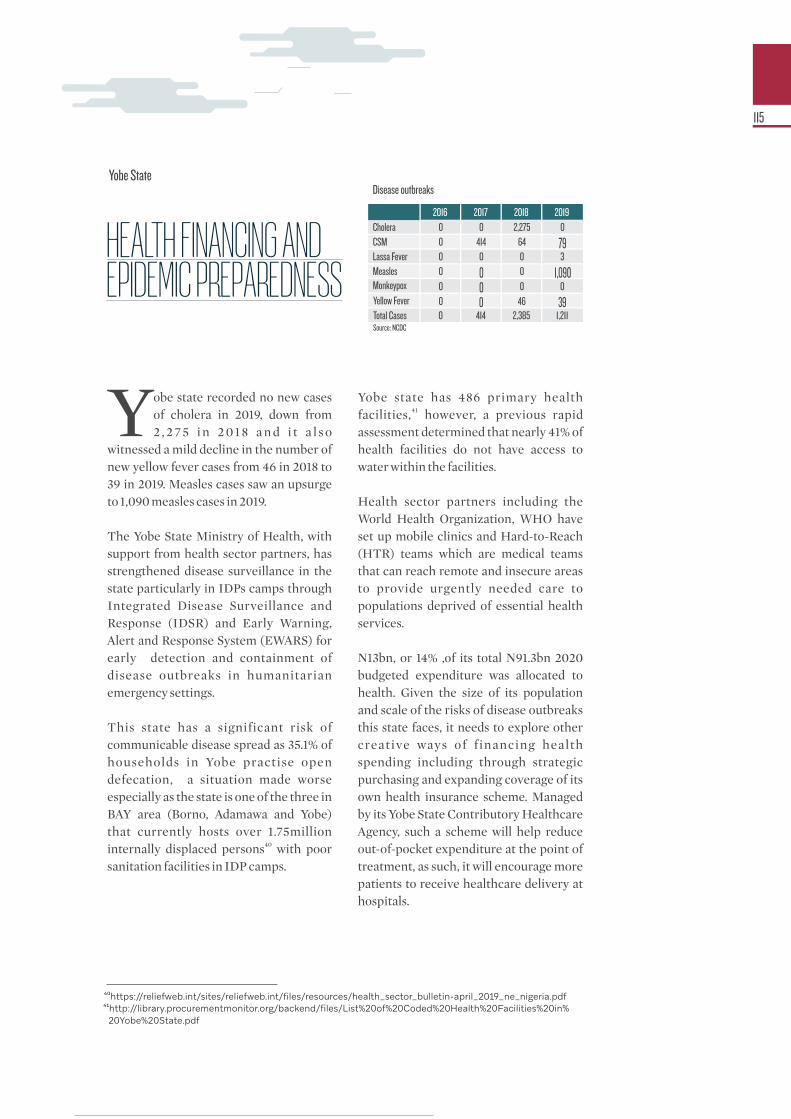
⁴¹http://library.procurementmonitor.org/backend/files/List%20of%20Coded%20Health%20Facilities%20in% 20Yobe%20State.pdf
obe state recorded no new cases Yof cholera in 2019, down from 2 , 2 7 5 i n 2 0 1 8 a n d i t a l s o
witnessed a mild decline in the number of new yellow fever cases from 46 in 2018 to 39 in 2019. Measles cases saw an upsurge to 1,090 measles cases in 2019.
The Yobe State Ministry of Health, with support from health sector partners, has strengthened disease surveillance in the state particularly in IDPs camps through Integrated Disease Surveillance and Response (IDSR) and Early Warning, Alert and Response System (EWARS) for early detection and containment of disease outbreaks in humanitarian emergency settings.
This state has a significant risk of communicable disease spread as 35.1% of households in Yobe practise open defecation, a situation made worse especially as the state is one of the three in BAY area (Borno, Adamawa and Yobe) that currently hosts over 1.75million
40internally displaced persons with poor sanitation facilities in IDP camps.
Yobe state has 486 primary health 41facilities, however, a previous rapid
assessment determined that nearly 41% of health facilities do not have access to water within the facilities.
Health sector partners including the World Health Organization, WHO have set up mobile clinics and Hard-to-Reach (HTR) teams which are medical teams that can reach remote and insecure areas to provide urgently needed care to populations deprived of essential health services.
N13bn, or 14% ,of its total N91.3bn 2020 budgeted expenditure was allocated to health. Given the size of its population and scale of the risks of disease outbreaks this state faces, it needs to explore other creative ways of financing health spending including through strategic purchasing and expanding coverage of its own health insurance scheme. Managed by its Yobe State Contributory Healthcare Agency, such a scheme will help reduce out-of-pocket expenditure at the point of treatment, as such, it will encourage more patients to receive healthcare delivery at hospitals.
Yobe State
⁴⁰https://reliefweb.int/sites/reliefweb.int/files/resources/health_sector_bulletin-april_2019_ne_nigeria.pdf
2016Cholera 0CSM 0Lassa Fever 0Measles 0Monkeypox 0Yellow Fever 0Total Cases 0
2017 2018 20190 2,275 0
414 64 790 0 3
0 0 1,0900 0 0
0 46 39414 2,385 1,211
HEALTH FINANCING AND EPIDEMIC PREPAREDNESS
Disease outbreaks
Source: NCDC
115
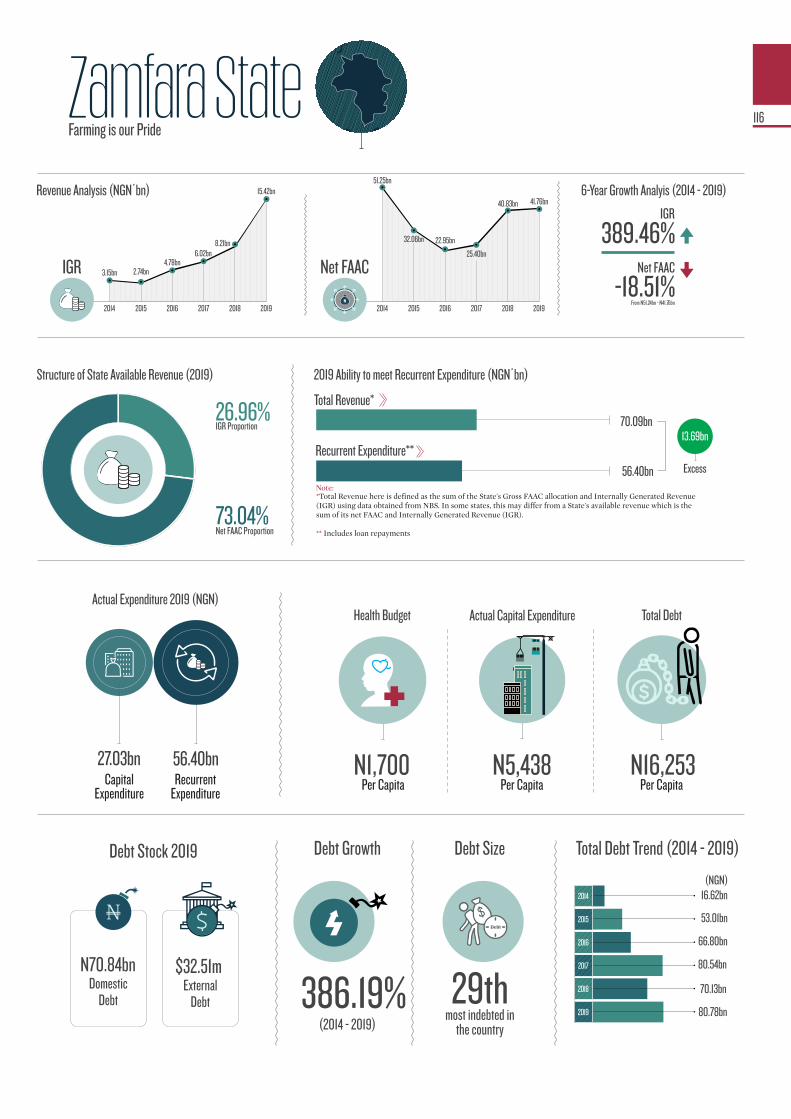
Recurrent Expenditure
56.40bn
2014 2015 2016 2017 2018 2019
Net FAAC
51.25bn
N
32.06bn 22.95bn
25.40bn
40.83bn 41.76bn
2014 2015 2016 2017 2018 2019
IGR 3.15bn
8.21bn
2.74bn4.78bn
6.02bn
15.42bn
Capital Expenditure
27.03bn
16.62bn
53.01bn
66.80bn
80.54bn
70.13bn
80.78bn
Zamfara State6-Year Growth Analyis (2014 - 2019)
-18.51%
Net FAAC
IGR
389.46%
From N51.24bn - N41.76bn
56.40bn
70.09bn
2014
2015
2017
2019
2016
2018
Debt Growth
(2014 - 2019)
386.19%
Debt Size
most indebted in the country
29th
Total Debt Trend (2014 - 2019)
N70.84bn $32.51mDomestic
DebtExternal
Debt
Per Capita Analysis
�N5,438
N1,700 N16,253
N
Net FAAC Proportion 73.04%
IGR Proportion 26.96%
Excess
13.69bn
Debt
Farming is our Pride
(NGN)
Revenue Analysis (NGN’bn)
Debt Stock 2019
Per Capita Per Capita Per Capita
Health BudgetActual Expenditure 2019 (NGN)
Actual Capital Expenditure Total Debt
116
Total Revenue*
Recurrent Expenditure**
Structure of State Available Revenue (2019) 2019 Ability to meet Recurrent Expenditure (NGN’bn)
*Total Revenue here is defined as the sum of the State's Gross FAAC allocation and Internally Generated Revenue (IGR) using data obtained from NBS. In some states, this may differ from a State's available revenue which is the sum of its net FAAC and Internally Generated Revenue (IGR).�
** Includes loan repayments
Note:

Despite a s l ight r ise in revenue, Zamfara state still faces further f inancial
constraints as its internal revenue and FAAC receipts cannot meet its expenditure obligations. The state's actual total available revenue in 2019 came to N57.18bn while it spent about N56.40bn on recurrent expenditure, which means it spent almost all its total available revenue for personnel, overheads and other recurrent obligations.
The state’s total available revenue witnessed a 16.59% increase, from N49.04bn in 2018 to N57.18bn in 2019. Zamfara’s IGR grew by 87.85% from N8.21bn in 2018 to N15.41bn in 2019. However, this IGR growth still a c c o u n t s f o r o n l y a s m a l l portion—26.96% of its total N57.18bn
available revenue—while federal allocation accounts for the remaining 73.04%.
However, it is worth noting that the state’s 73.04% dependence on FG a l l o c a t i o n i n 2 0 1 9 i s m i l d improvement, in 2014, Zamfara was 94.21% dependent on net FAAC which accounted for N51.25bn of its total N54.40bn revenue in that fiscal year while IGR brought in 5.79% or N3.15bn of the total revenue pool.
Arising from this, it becomes very clear that the state stil l faces challenges in terms of struggling to be less dependent on federal al locations and susceptible to financial crises due to its limited capacity to harness its internal revenue sources. To avoid this, the state whose nickname states Farming
is Our Pride� needs to get innovative to wean itself off federal allocations. Zamfara’s net FAAC allocation of N41.76bn in 2019 was a slight 2.28% increase from N40.83bn in 2018. Nevertheless, over a six-year period, it seemed to have decreased by -18.51% from N51.25bn in 2014 to N41.76bn in 2019. The state has to be cautious, considering the altering ef fects of COVID -19 on FG�s earnings, putting the state at risk.
Among the states with the lowest federal receipts in Nigeria, the state still experiences deductions from the source as a result of debt repayment of its external loans. Between 2015 and 2019, over N61bn has been deducted from the state’s N226bn gross FAAC allocation accruals.
Data sourced from the DMO shows that the state owed N80.78bn as total debt in 2019, a N10bn increase from the 2018 figure N70.13bn. The state’s total debt structure comprises N 7 0 . 8 4 b n a s d o m e s t i c d e b t accounting for 86.35% of its total debt stock, while its foreign debt stock stands at $32.51m as of December 2019.
According to its 2019 financial report, out of a tota l expenditure of N83.42bn, the state spent about N56.40bn, or 67.60%, on recurrent expenditure, including N19.86bn on personnel costs and N26.11bn on overheads. It is important to note that the amount the state spent on overheads was almost equal to what it spent on capital items of N27.03bn.
Farming is our Pride
Zamf
ara St
ate
16Sustainability
Ranking
Data sourced from the DMO shows that the state owed N80.78bn as total debt in 2019, a N10bn increase from the 2018 figure N70.13bn.
117

he state has the second largest Tnumber of people infected with cholera in Nigeria with 8,329
cases in 2018, only next to Bauchi state. However, this reduced to 0 cases in 2019. There was also a reduction in the number of reported cases of Cerebrospinal Meningitis which stood at 386 new cases from 7,317 new cases reported in 2017. The state also witnessed rising cases of yellow fever infections, up from the 2018 figure of 40 to 54 in 2019.
High out-of-pocket expenditure, low vaccination rates, health infrastructural decay, lack of knowledge on disease prevention and low per capita spending on health are some of the factors associated with high rates of disease outbreaks in Zamfara. Child vaccination rate in the state also remains extremely low with just 5%, way below the national average of 23%.
The state’s health budget for 2019 was in the region of N8.45bn which is only 6.2%
of the total expenditure of N135.4bn, with its health per capita arriving at N1,700 per citizen. This state needs to do more to invest in health systems that help prevent, detect and control disease outbreaks. To protect people from unpredictable expenditure on health, the state has also set up its own health insurance scheme managed by its Contributory Healthcare Management Agency. However, the government needs to work hard at ensuring public support for the scheme.
43.8% of citizens in Zamfara do not have access to improved sources of water, 2.2% of households practise open defecation, 27.6% of households use open pit latrines while 68.9% use pit latrines with slabs. Zamfara needs to invest more in improving its Water, Sanitation and Hygiene situation as this is a critical risk that could accelerate the spread of communicable diseases.
Zamfara State
2016
Cholera 0CSM 17Lassa Fever 0Measles 0Monkeypox 0Yellow Fever 0Total Cases 17
2017 2018 2019
570 8,329 07,317 928 386
0 0 8
0 0 2540 0 1
119 40 548,006 9,297 703
HEALTH FINANCING AND EPIDEMIC PREPAREDNESS
Disease outbreaks
Source: NCDC
118
Rankings
119
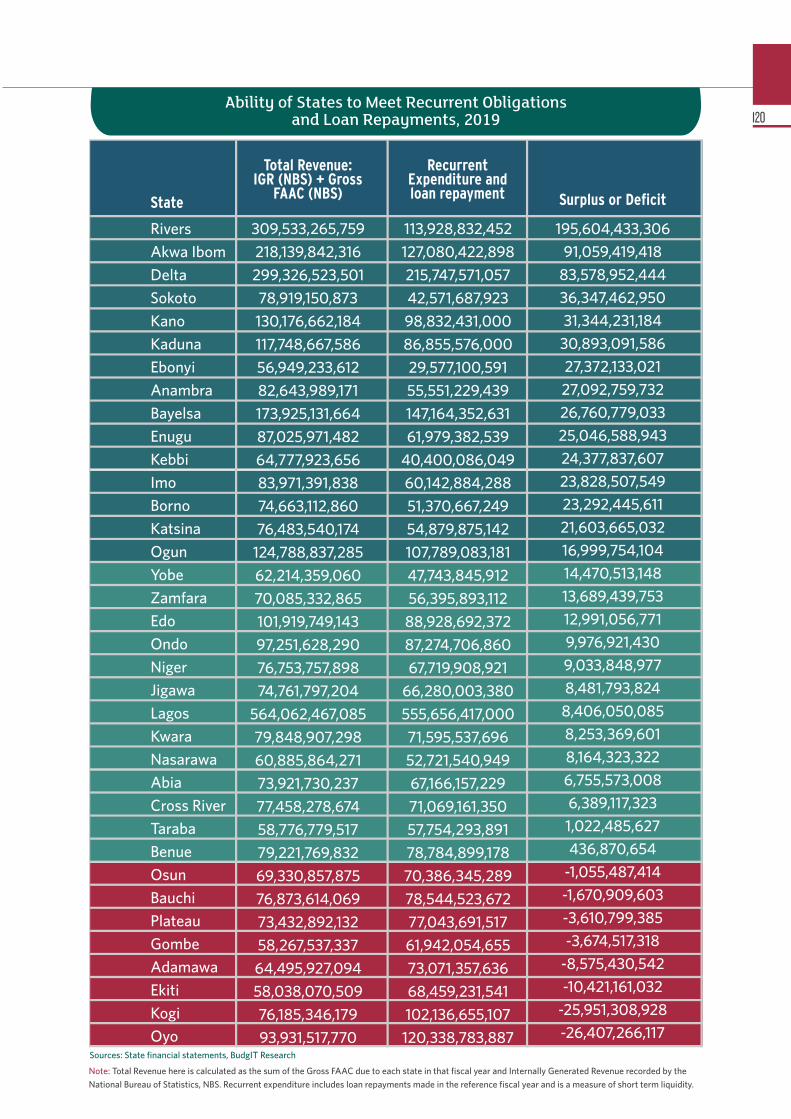
Ability of States to Meet Recurrent Obligations and Loan Repayments, 2019
State
Rivers
Akwa Ibom
Delta
Sokoto
Kano
Kaduna
Ebonyi
Anambra
Bayelsa
Enugu
Kebbi
Imo
Borno
Katsina
Ogun
Yobe
Zamfara
Edo
Ondo
Niger
Jigawa
Lagos
Kwara
Nasarawa
Abia
Cross River
Taraba
Benue
Osun
Bauchi
Plateau
Gombe
Adamawa
Ekiti
Kogi
Oyo
Total Revenue: IGR (NBS) + Gross
FAAC (NBS)
Recurrent Expenditure and loan repayment Surplus or Deficit
309,533,265,759
218,139,842,316
299,326,523,501
78,919,150,873
130,176,662,184
117,748,667,586
56,949,233,612
82,643,989,171
173,925,131,664
87,025,971,482
64,777,923,656
83,971,391,838
74,663,112,860
76,483,540,174
124,788,837,285
62,214,359,060
70,085,332,865
101,919,749,143
97,251,628,290
76,753,757,898
74,761,797,204
564,062,467,085
79,848,907,298
60,885,864,271
73,921,730,237
77,458,278,674
58,776,779,517
79,221,769,832
69,330,857,875
76,873,614,069
73,432,892,132
58,267,537,337
64,495,927,094
58,038,070,509
76,185,346,179
93,931,517,770
113,928,832,452
127,080,422,898
215,747,571,057
42,571,687,923
98,832,431,000
86,855,576,000
29,577,100,591
55,551,229,439
147,164,352,631
61,979,382,539
40,400,086,049
60,142,884,288
51,370,667,249
54,879,875,142
107,789,083,181
47,743,845,912
56,395,893,112
88,928,692,372
87,274,706,860
67,719,908,921
66,280,003,380
555,656,417,000
71,595,537,696
52,721,540,949
67,166,157,229
71,069,161,350
57,754,293,891
78,784,899,178
70,386,345,289
78,544,523,672
77,043,691,517
61,942,054,655
73,071,357,636
68,459,231,541
102,136,655,107
120,338,783,887
195,604,433,306
91,059,419,418
83,578,952,444
36,347,462,950
31,344,231,184
30,893,091,586
27,372,133,021
27,092,759,732
26,760,779,033
25,046,588,943
24,377,837,607
23,828,507,549
23,292,445,611
21,603,665,032
16,999,754,104
14,470,513,148
13,689,439,753
12,991,056,771
9,976,921,430
9,033,848,977
8,481,793,824
8,406,050,085
8,253,369,601
8,164,323,322
6,755,573,008
6,389,117,323
1,022,485,627
436,870,654
-1,055,487,414
-1,670,909,603
-3,610,799,385
-3,674,517,318
-8,575,430,542
-10,421,161,032
-25,951,308,928
-26,407,266,117Sources: State financial statements, BudgIT Research
120
Note: Total Revenue here is calculated as the sum of the Gross FAAC due to each state in that fiscal year and Internally Generated Revenue recorded by the
National Bureau of Statistics, NBS. Recurrent expenditure includes loan repayments made in the reference fiscal year and is a measure of short term liquidity.
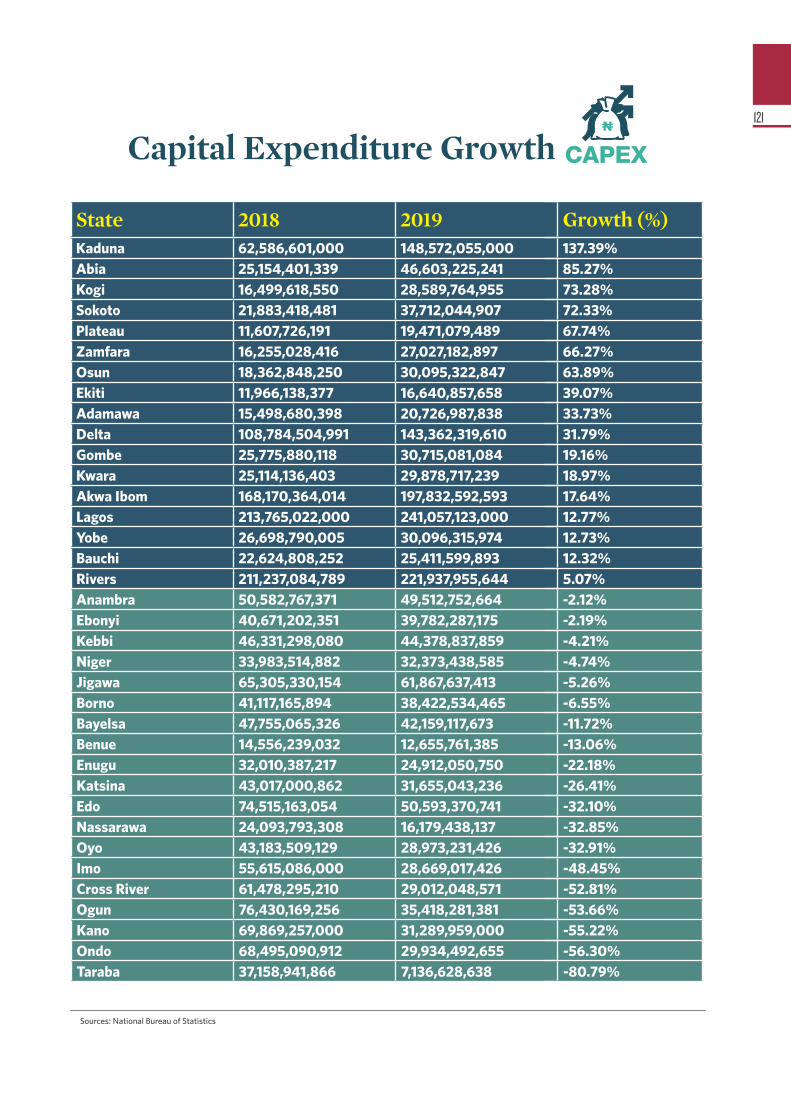
Sources: National Bureau of Statistics
121
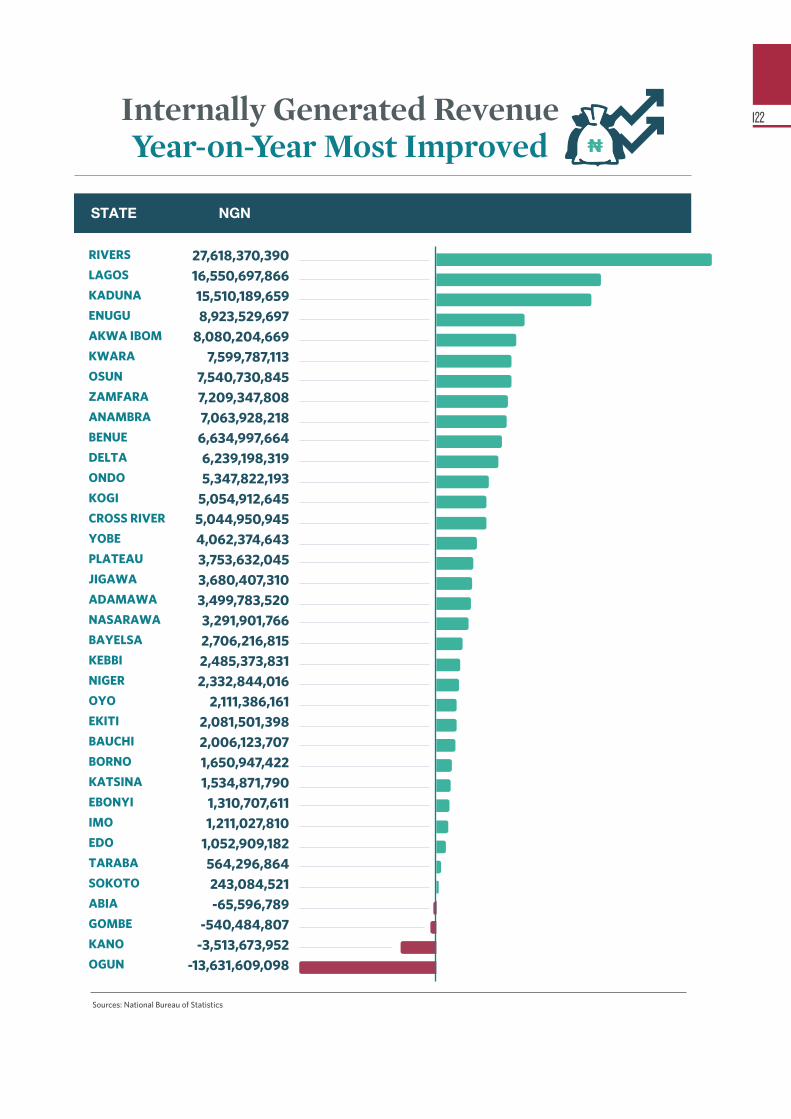
Sources: National Bureau of Statistics
122
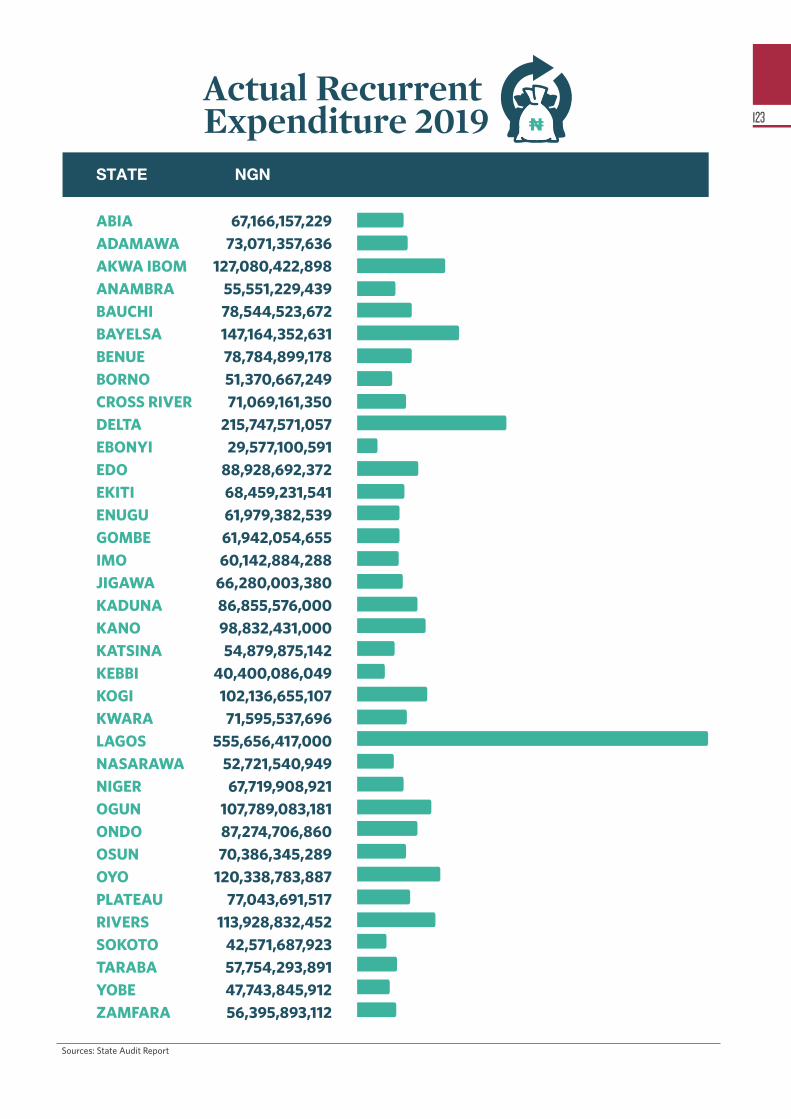
Sources: State Audit Report
123
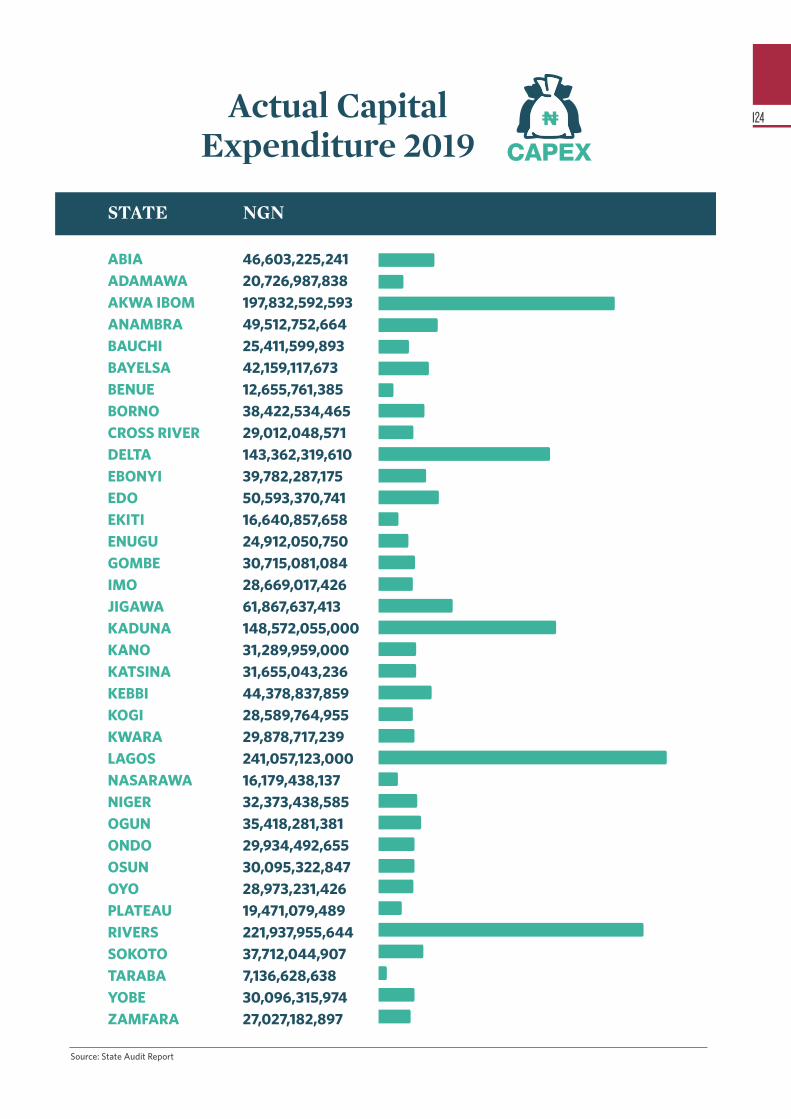
Source: State Audit Report
124
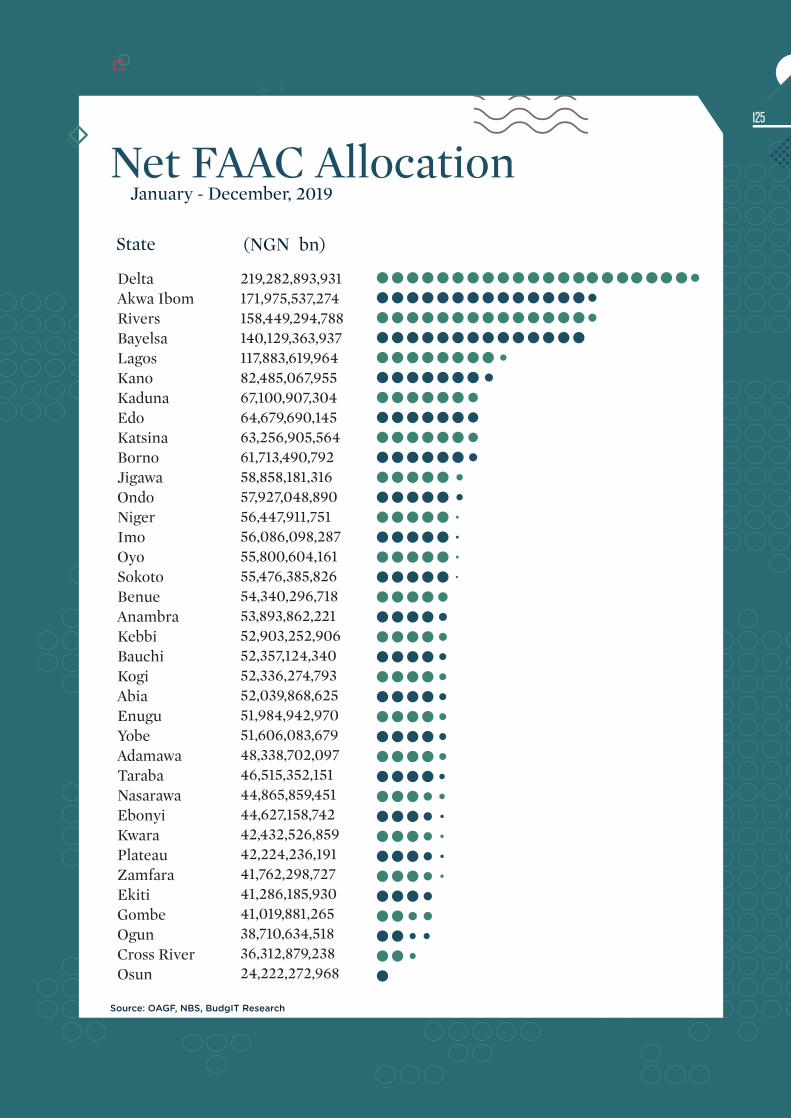
State (NGN�bn)
RANKING Net FAAC Allocation
DeltaAkwa IbomRiversBayelsaLagosKanoKadunaEdoKatsinaBornoJigawaOndoNigerImoOyoSokotoBenueAnambraKebbiBauchiKogiAbiaEnuguYobeAdamawaTarabaNasarawaEbonyiKwaraPlateauZamfaraEkitiGombeOgunCross RiverOsun
219,282,893,931171,975,537,274158,449,294,788140,129,363,937117,883,619,96482,485,067,95567,100,907,30464,679,690,14563,256,905,56461,713,490,79258,858,181,31657,927,048,89056,447,911,75156,086,098,28755,800,604,16155,476,385,82654,340,296,71853,893,862,22152,903,252,90652,357,124,34052,336,274,79352,039,868,62551,984,942,97051,606,083,67948,338,702,09746,515,352,15144,865,859,45144,627,158,74242,432,526,85942,224,236,19141,762,298,72741,286,185,93041,019,881,26538,710,634,51836,312,879,23824,222,272,968
January - December, 2019
Source: OAGF, NBS, BudgIT Research
125
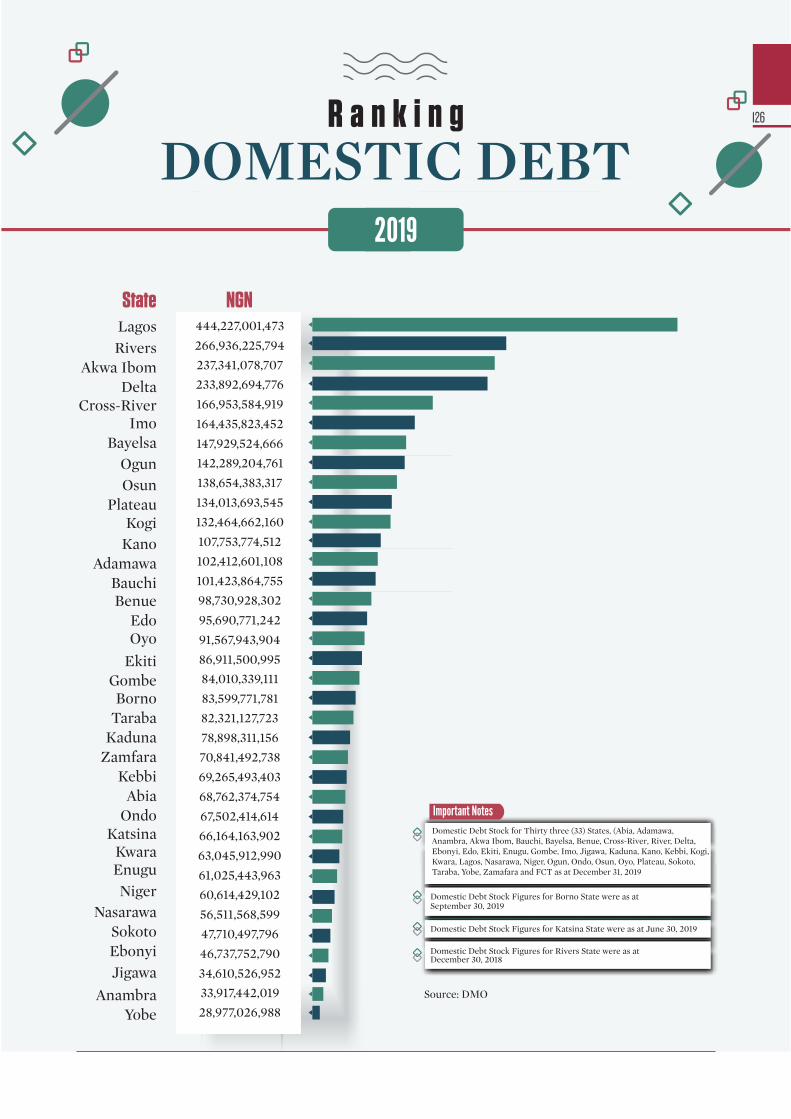
2019
R a n k i n g
DOMESTIC DEBT
StateLagosRivers
Akwa IbomDelta
Cross-RiverImo
BayelsaOgunOsun
PlateauKogi
KanoAdamawa
BauchiBenue
EdoOyo
EkitiGombeBorno
TarabaKaduna
ZamfaraKebbi
AbiaOndo
KatsinaKwaraEnuguNiger
NasarawaSokotoEbonyiJigawa
AnambraYobe
444,227,001,473
266,936,225,794
237,341,078,707
233,892,694,776
166,953,584,919
164,435,823,452
147,929,524,666
142,289,204,761
138,654,383,317
134,013,693,545
132,464,662,160
107,753,774,512
102,412,601,108
101,423,864,755
98,730,928,302
95,690,771,242
91,567,943,904
86,911,500,99584,010,339,111
83,599,771,781
82,321,127,723
78,898,311,156
70,841,492,738
69,265,493,403
68,762,374,754
67,502,414,614
66,164,163,902
63,045,912,990
61,025,443,963
60,614,429,102
56,511,568,599
47,710,497,796
46,737,752,790
34,610,526,952
33,917,442,019
28,977,026,988
Domestic Debt Stock for Thirty three (33) States, (Abia, Adamawa, Anambra, Akwa Ibom, Bauchi, Bayelsa, Benue, Cross-River , River, Delta, Ebonyi, Edo, Ekiti, Enugu, Gombe, Imo, Jigawa, Kaduna, Kano, Kebbi, Kogi, Kwara, Lagos, Nasarawa, Niger, Ogun, Ondo, Osun, Oyo, Plateau, Sokoto, Taraba, Yobe, Zamafara and FCT as at December 31, 2019
Important Notes
Domestic Debt Stock Figures for Borno State were as at September 30, 2019
Domestic Debt Stock Figures for Katsina State were as at June 30, 2019
Domestic Debt Stock Figures for Rivers State were as at December 30, 2018
Source: DMO
NGN
126
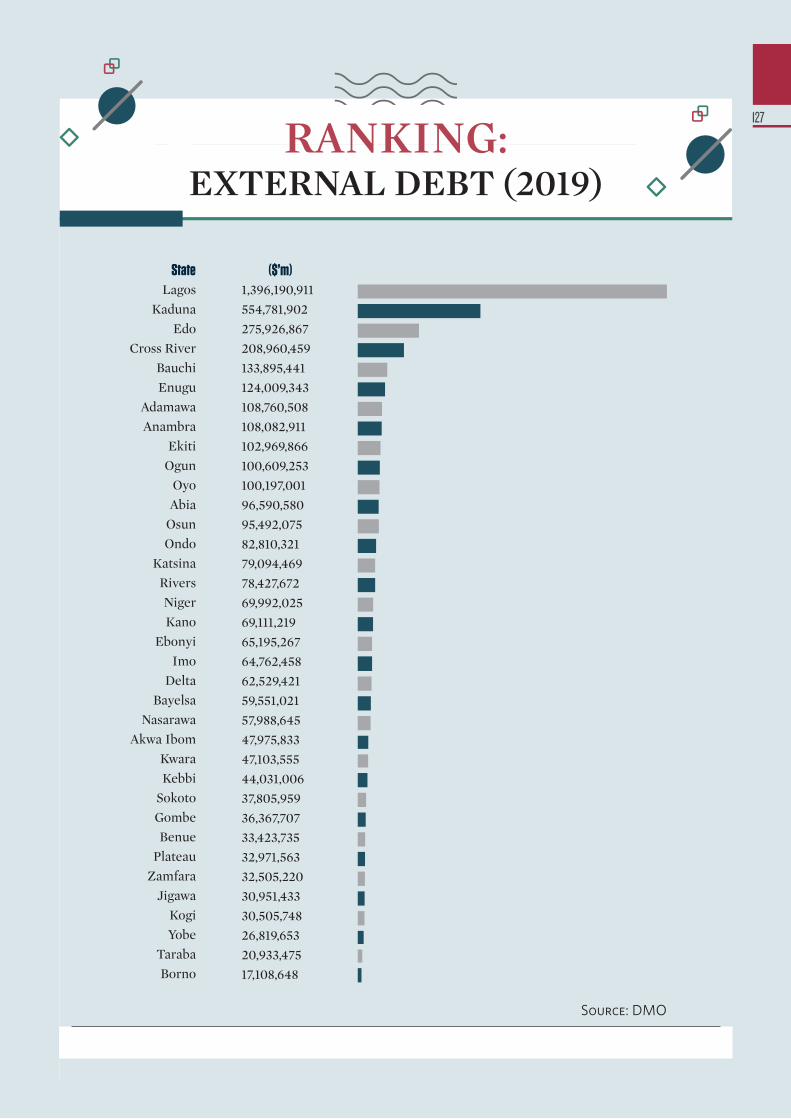
RANKING: EXTERNAL DEBT (2019)
LagosKaduna
EdoCross River
BauchiEnugu
AdamawaAnambra
EkitiOgun
OyoAbia
OsunOndo
KatsinaRiversNigerKano
EbonyiImo
DeltaBayelsa
NasarawaAkwa Ibom
KwaraKebbi
SokotoGombeBenue
PlateauZamfara
JigawaKogiYobe
TarabaBorno
1,396,190,911554,781,902275,926,867208,960,459133,895,441124,009,343108,760,508108,082,911102,969,866100,609,253100,197,00196,590,58095,492,07582,810,32179,094,46978,427,67269,992,02569,111,21965,195,26764,762,45862,529,42159,551,02157,988,64547,975,83347,103,55544,031,00637,805,95936,367,70733,423,73532,971,56332,505,22030,951,43330,505,74826,819,65320,933,47517,108,648
State ($’m)
Source: DMO
127
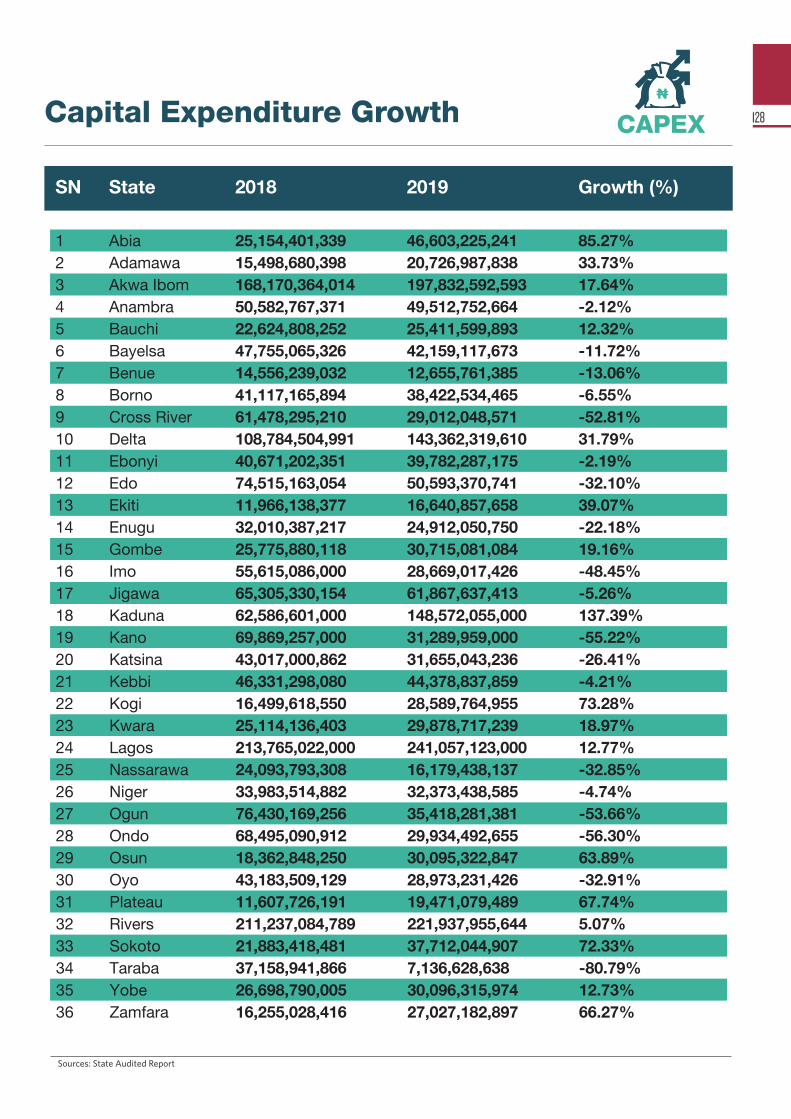
Sources: State Audited Report
128
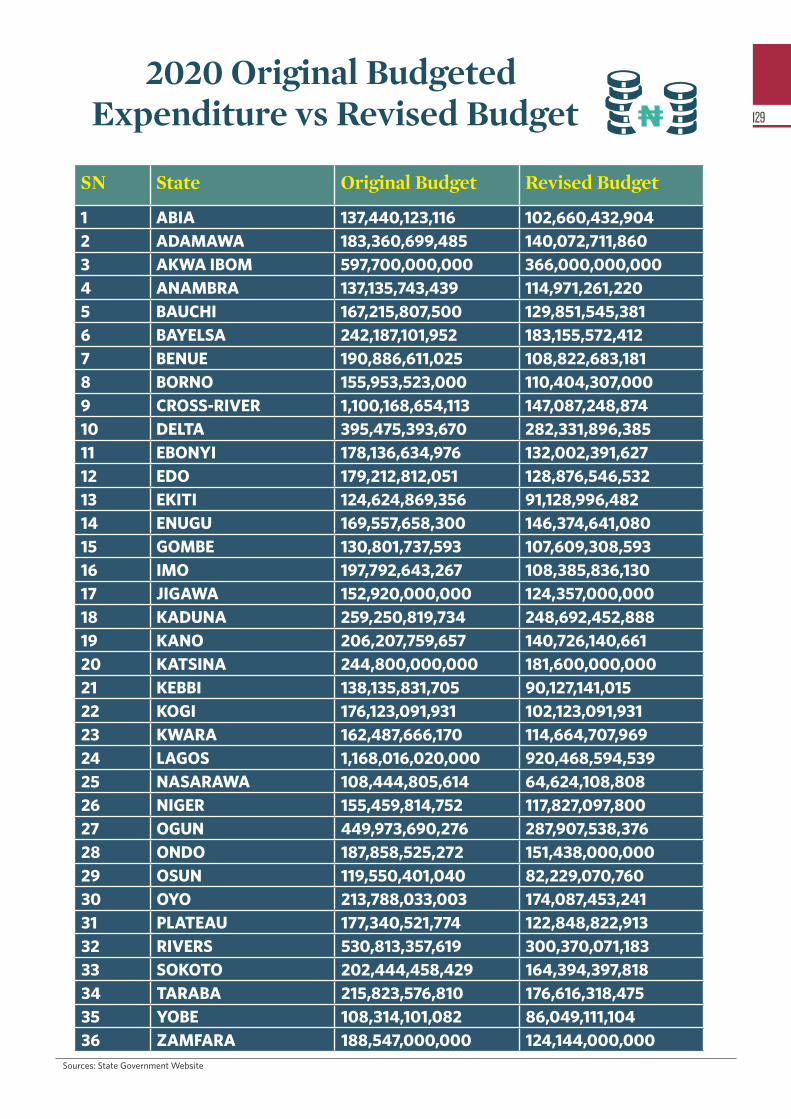
Sources: State Government Website
129
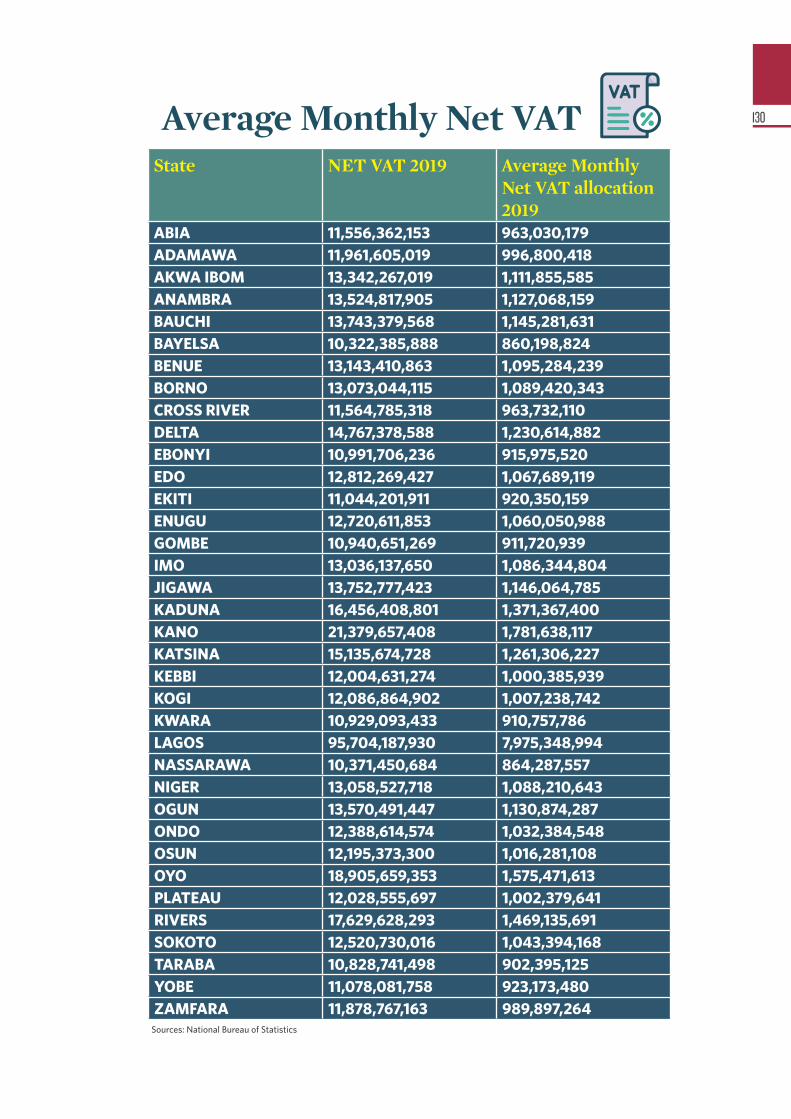
Sources: National Bureau of Statistics
130

Source: BudgIT Research
131
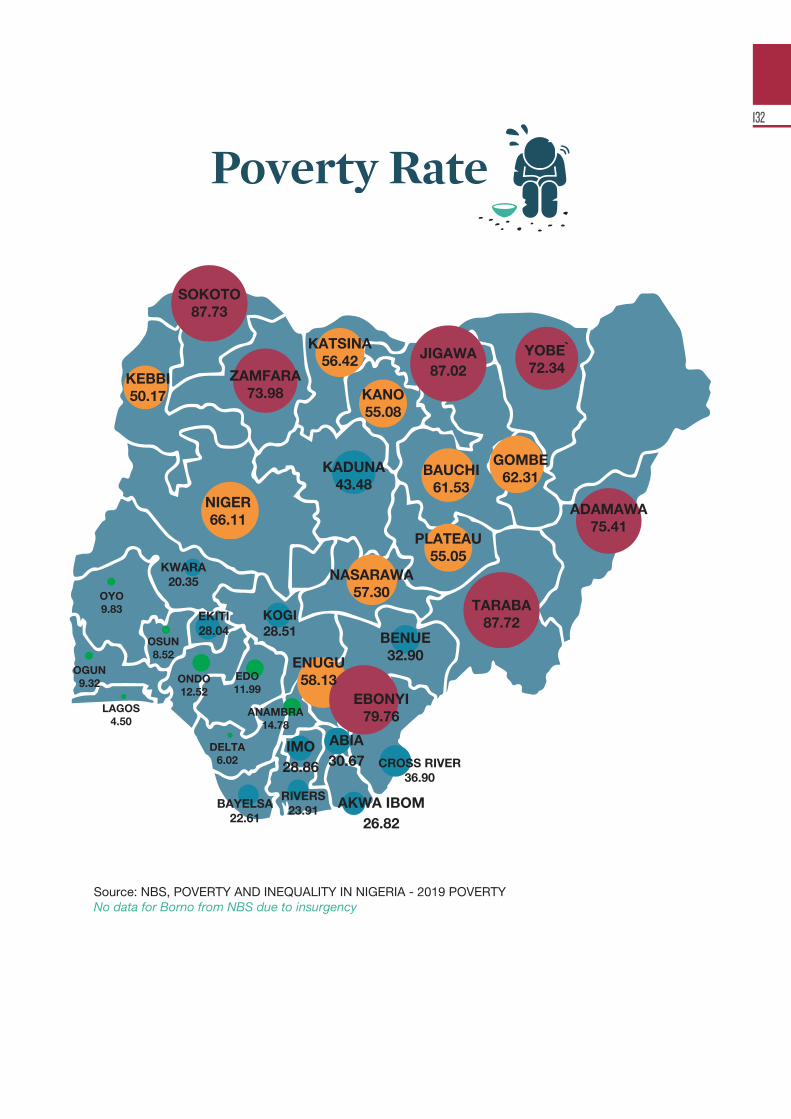
132
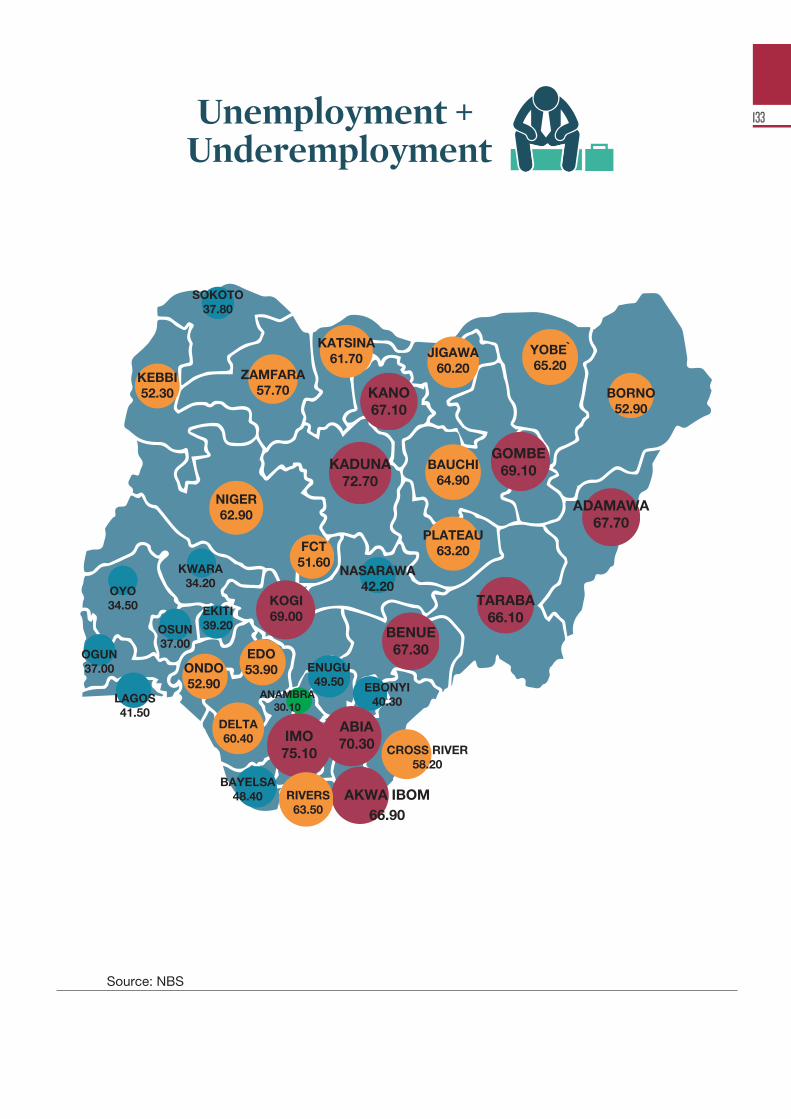
133
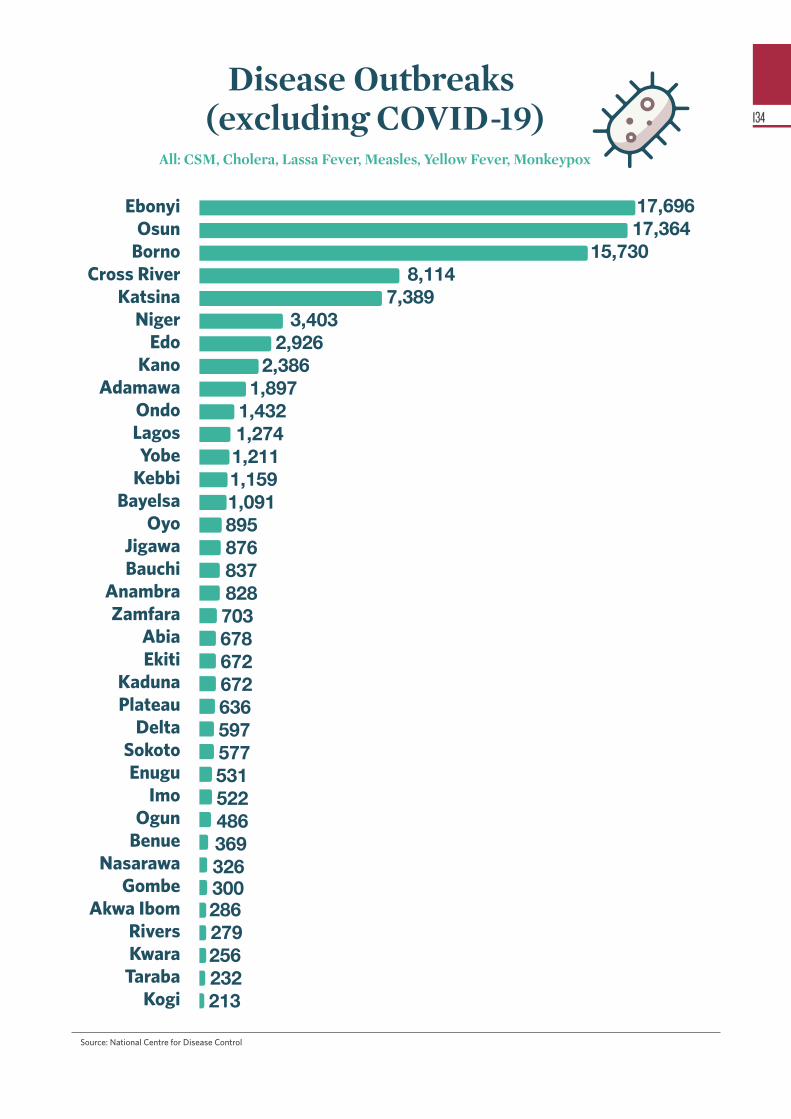
Source: National Centre for Disease Control
134
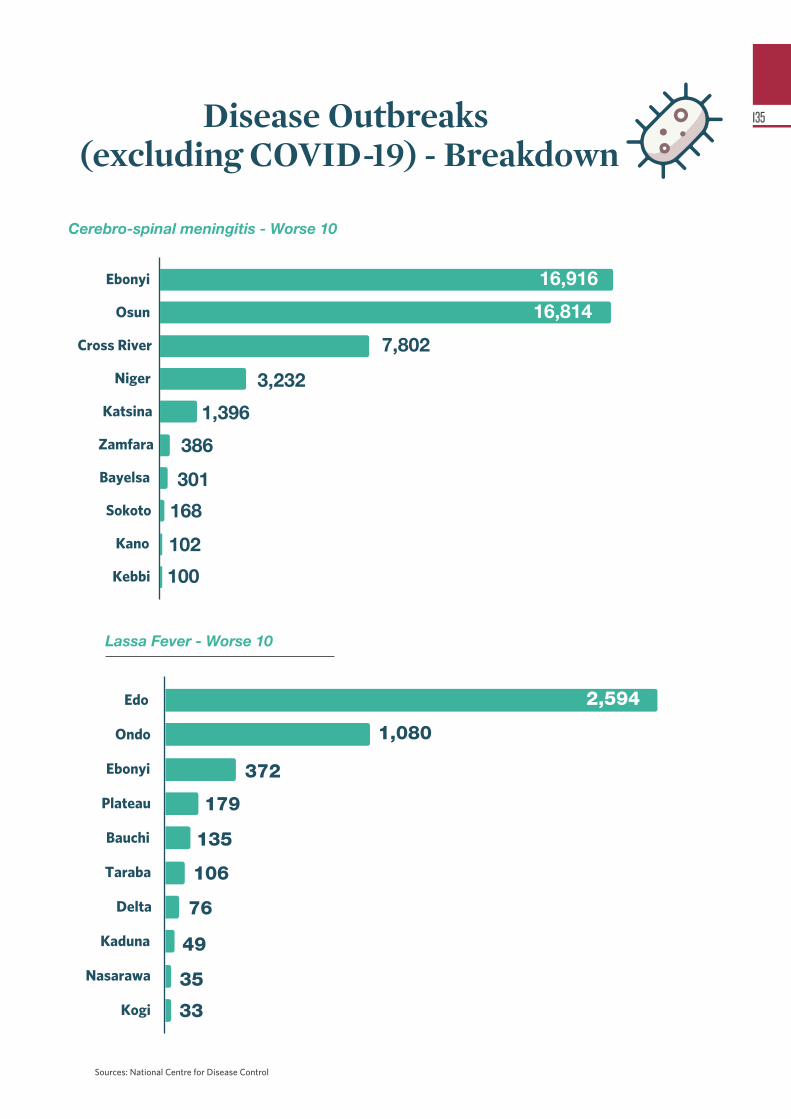
Sources: National Centre for Disease Control
135
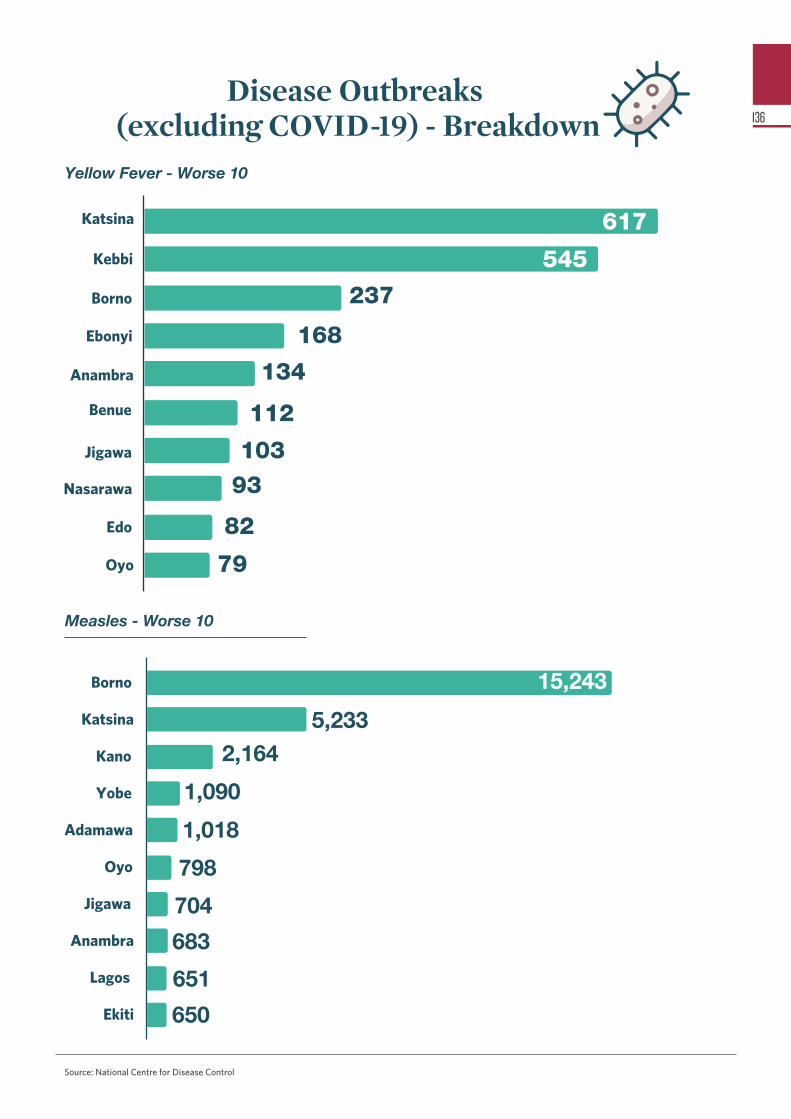
Source: National Centre for Disease Control
136
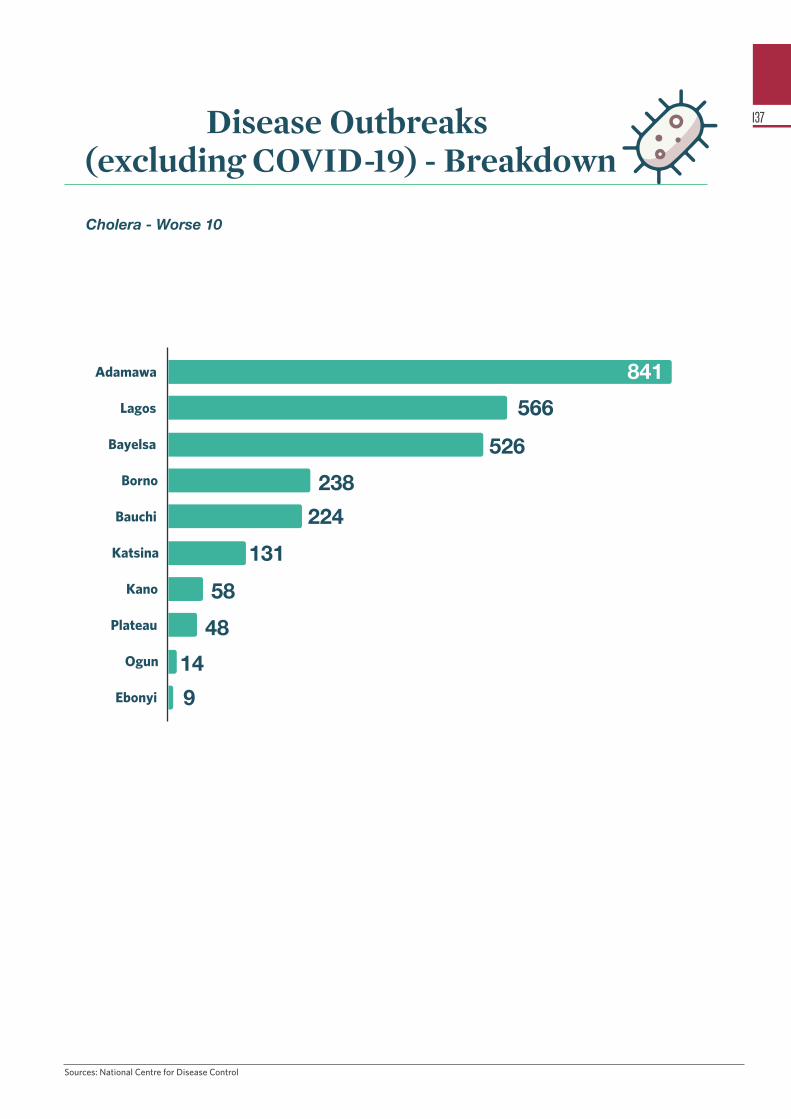
Sources: National Centre for Disease Control
137
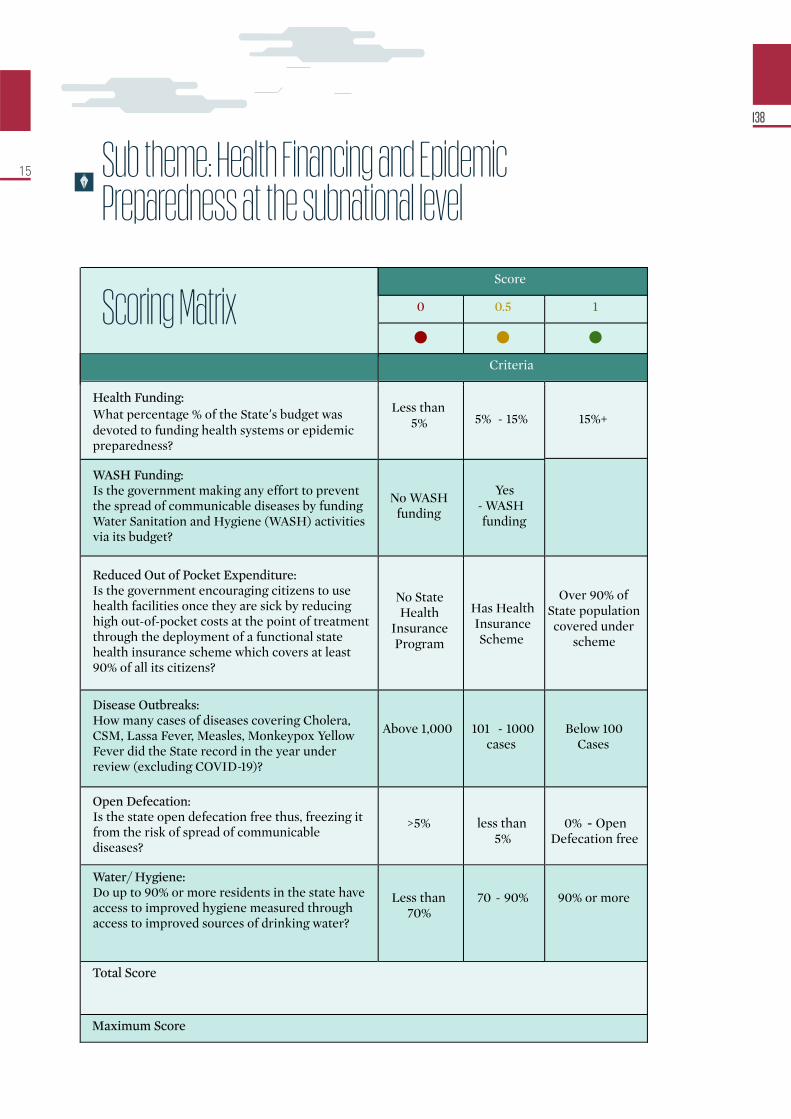
Less than 5%
5% - 15% 15%+
No WASH funding
Yes - WASH funding
No State Health
Insurance Program
Has Health Insurance Scheme
Over 90% of State population covered under
scheme
Above 1,000 101 - 1000 cases
Below 100 Cases
>5% less than 5%
0% - Open Defecation free
Less than 70%
70 -
90%
90% or more
Total Score
Maximum Score
15
Scoring Matrix
Health Funding:What percentage % of the State’s budget was devoted to funding health systems or epidemic preparedness?
WASH Funding:Is the government making any effort to prevent the spread of communicable diseases by funding Water Sanitation and Hygiene (WASH) activities via its budget?
Reduced Out of Pocket Expenditure:Is the government encouraging citizens to use health facilities once they are sick by reducing high out-of-pocket costs at the point of treatment through the deployment of a functional state health insurance scheme which covers at least 90% of all its citizens?
Disease Outbreaks:How many cases of diseases covering Cholera, CSM, Lassa Fever, Measles, Monkeypox Yellow Fever did the State record in the year under review (excluding COVID-19)?
Open Defecation:Is the state open defecation free thus, freezing it from the risk of spread of communicable diseases?
Water/ Hygiene:Do up to 90% or more residents in the state have access to improved hygiene measured through access to improved sources of drinking water?
Score
0 0.5 1
Criteria
Sub theme: Health Financing and Epidemic Preparedness at the subnational level
138
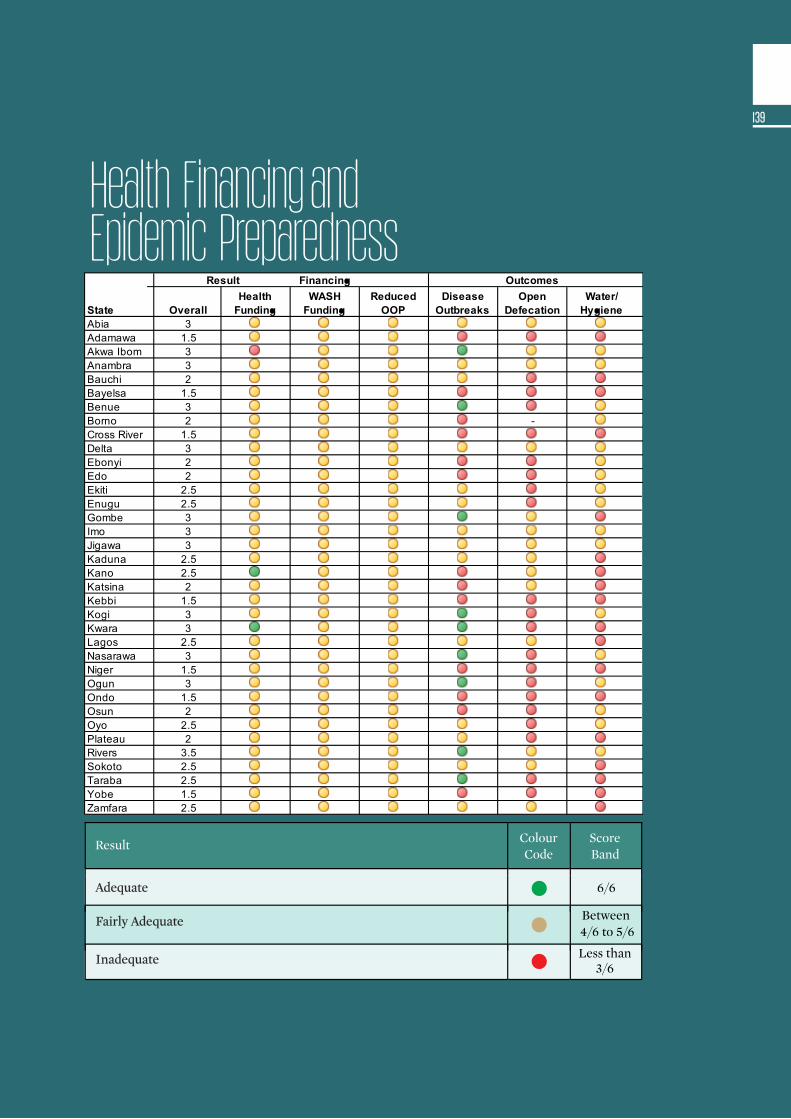
Health Financing and Epidemic Preparedness
Result
Colour Code
Score Band
6/6
Between 4/6 to 5/6
Less than3/6
Adequate
Fairly Adequate
Inadequate
139
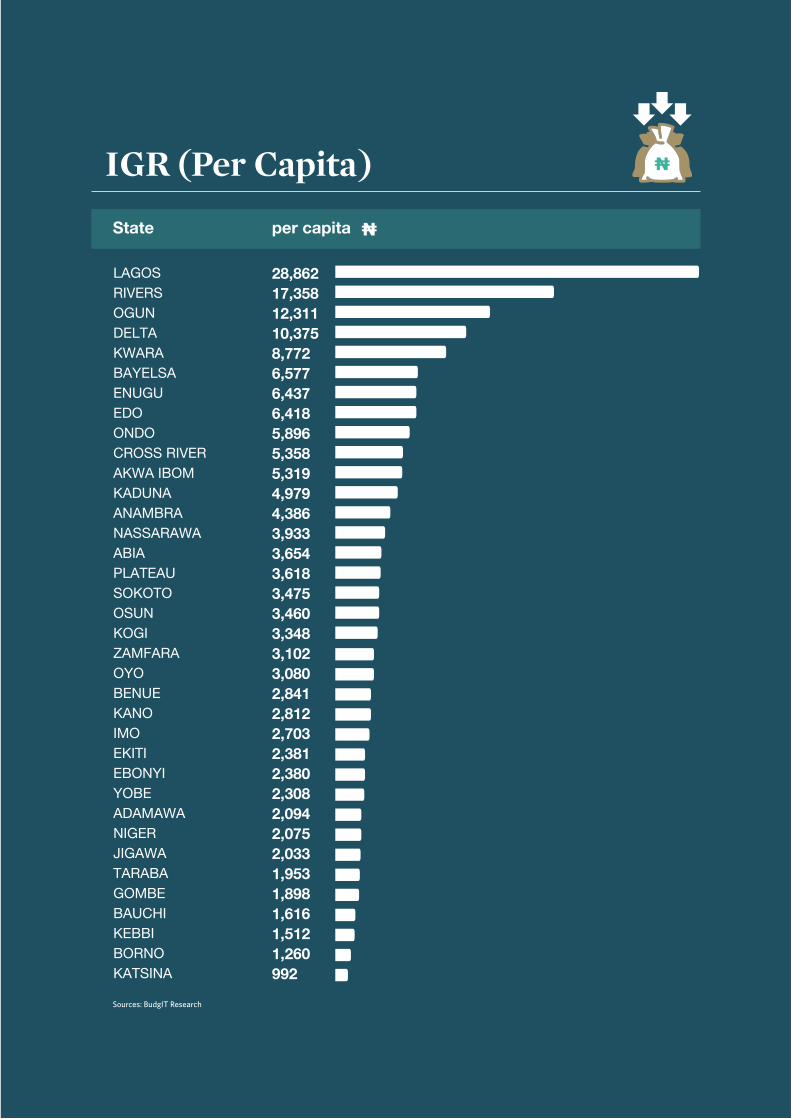
Sources: BudgIT Research
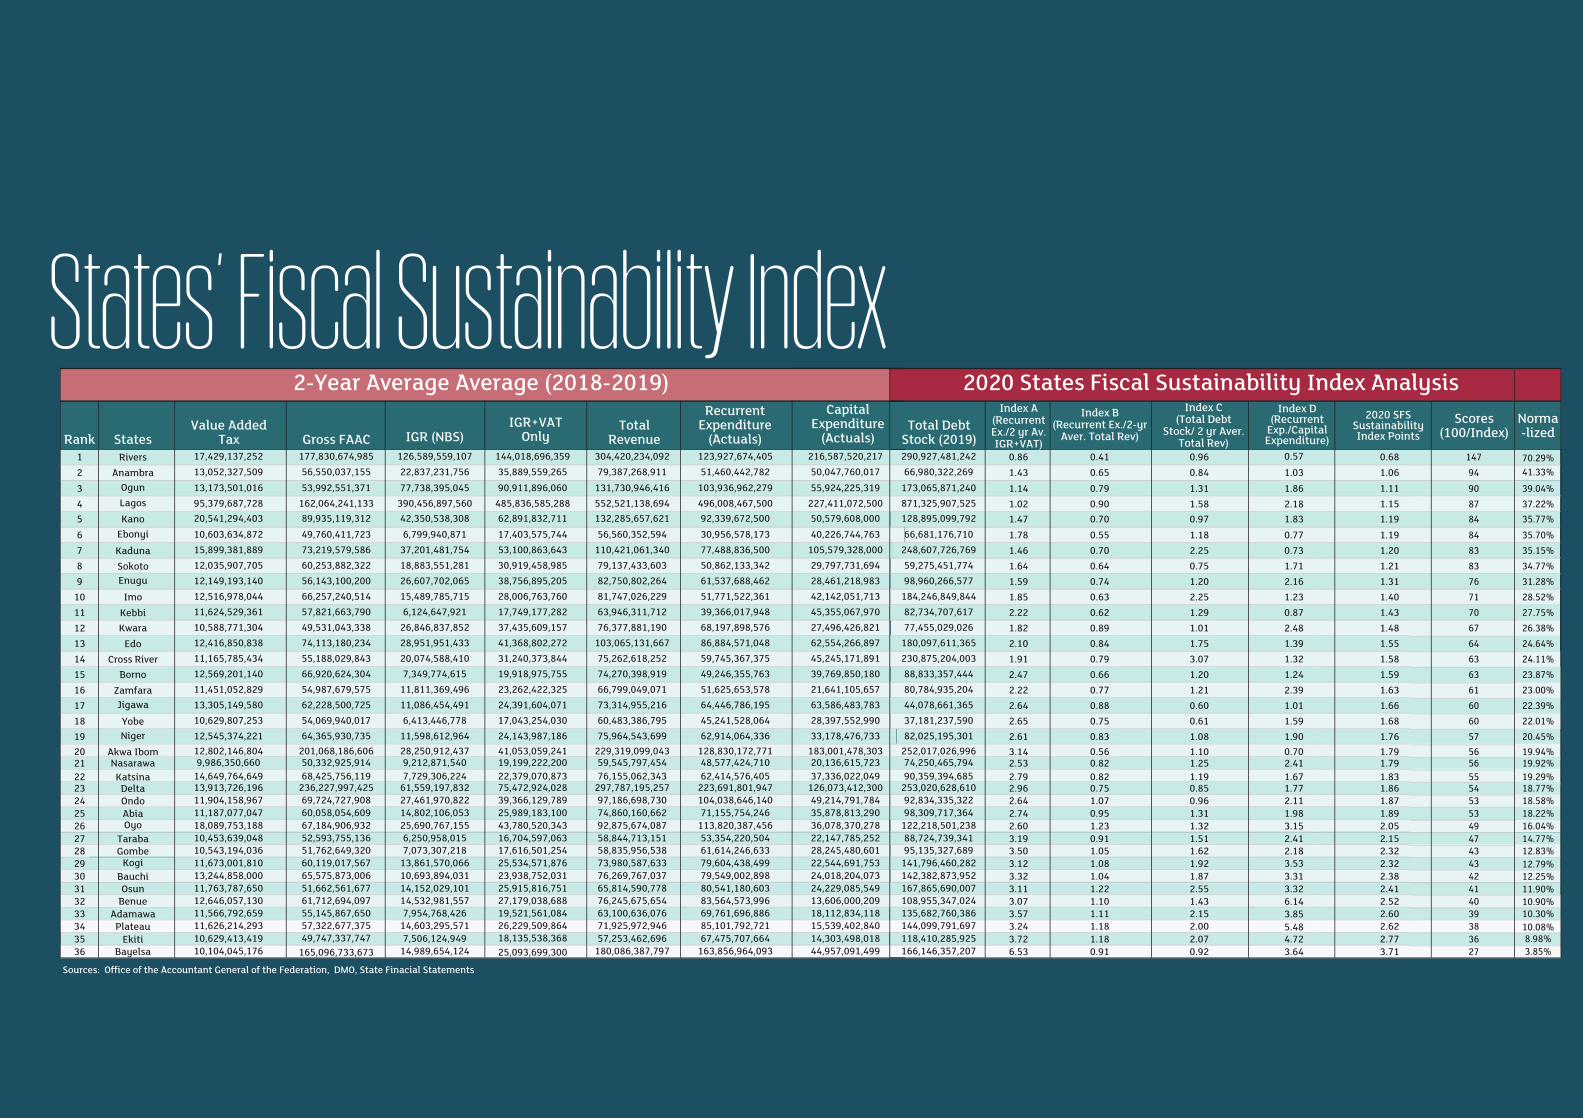
States’ Fiscal Sustainability Index Total Debt
Stock (2019)
Index A (Recurrent Ex./2 yr Av. IGR+VAT)
Index B (Recurrent Ex./2-yr
Aver. Total Rev)
Scores (100/Index)
290,927,481,242
66,980,322,269
173,065,871,240
871,325,907,525
128,895,099,792
66,681,176,710
248,607,726,769
59,275,451,774
98,960,266,577
184,246,849,844
82,734,707,617
77,455,029,026
180,097,611,365
230,875,204,003
88,833,357,444
80,784,935,204
44,078,661,365
37,181,237,590
82,025,195,301
252,017,026,99674,250,465,794
90,359,394,685253,020,628,61092,834,335,32298,309,717,364
122,218,501,23888,724,739,34195,135,327,689
141,796,460,282142,382,873,952167,865,690,007108,955,347,024135,682,760,386144,099,791,697118,410,285,925166,146,357,207
0.86
1.43
1.14
1.02
1.47
1.78
1.46
1.64
1.59
1.85
2.22
1.82
2.10
1.91
2.47
2.22
2.64
2.65
2.61
3.142.53
2.792.962.642.742.603.193.503.123.323.113.073.573.243.726.53
0.41
0.65
0.79
0.90
0.70
0.55
0.70
0.64
0.74
0.63
0.62
0.89
0.84
0.79
0.66
0.77
0.88
0.75
0.83
0.560.82
0.820.751.070.951.230.911.051.081.041.221.101.111.181.180.91
0.57
1.03
1.86
2.18
1.83
0.77
0.73
1.71
2.16
1.23
0.87
2.48
1.39
1.32
1.24
2.39
1.01
1.59
1.90
0.702.41
1.671.772.111.983.152.41
3.533.31
6.143.85
4.723.64
0.96
0.84
1.31
1.58
0.97
1.18
2.25
0.75
1.20
2.25
1.29
1.01
1.75
3.07
1.20
1.21
0.60
0.61
1.08
1.101.25
1.190.850.961.311.321.511.621.921.872.551.432.152.002.070.92
0.68
1.06
1.11
1.15
1.19
1.19
1.20
1.21
1.31
1.40
1.43
1.48
1.55
1.58
1.59
1.63
1.66
1.68
1.76
1.791.79
1.831.861.871.892.052.152.322.322.382.412.522.602.622.773.71
147 70.29%
41.33%
39.04%
37.22%
35.77%
35.70%
35.15%
34.77%
31.28%
28.52%
27.75%
26.38%
24.64%
24.11%
23.87%
23.00%
22.39%
22.01%
20.45%
19.94%19.92%
19.29%18.77%18.58%18.22%16.04%14.77%12.83%12.79%12.25%11.90%10.90%10.30%10.08%8.98%3.85%
94
90
87
84
84
83
83
76
71
70
67
64
63
63
61
60
60
57
5656
555453534947434342414039383627
2020 States Fiscal Sustainability Index Analysis Index C
(Total Debt Stock/ 2 yr Aver.
Total Rev)
Index D (Recurrent
Exp./Capital Expenditure)
2020 SFS Sustainability Index Points
Value Added TaxStatesRank Gross FAAC IGR (NBS)
IGR+VAT Only
Total Revenue
Recurrent Expenditure
(Actuals)
Capital Expenditure
(Actuals)
1 Rivers
Anambra
Ogun
Lagos
Kano
Ebonyi
Kaduna
Sokoto
Enugu
Imo
Kebbi
Kwara
Edo
Cross River
Borno
Zamfara
Jigawa
Yobe
Niger
Akwa IbomNasarawa
KatsinaDeltaOndoAbiaOyo
TarabaGombe
Kogi
BauchiOsun
BenueAdamawa
PlateauEkiti
Bayelsa
2
3
4
5
6
7
8
9
10
11
12
13
14
15
16
17
18
19
2021
222324252627282930313233343536
17,429,137,252 177,830,674,985
56,550,037,155
53,992,551,371
162,064,241,133
89,935,119,312
49,760,411,723
73,219,579,586
60,253,882,322
56,143,100,200
66,257,240,514
57,821,663,790
49,531,043,338
74,113,180,234
55,188,029,843
66,920,624,304
54,987,679,575
62,228,500,725
54,069,940,017
64,365,930,735
201,068,186,60650,332,925,914
68,425,756,119236,227,997,42569,724,727,90860,058,054,60967,184,906,93252,593,755,13651,762,649,32060,119,017,56765,575,873,00651,662,561,67761,712,694,09755,145,867,65057,322,677,37549,747,337,747
165,096,733,673
13,052,327,509
13,173,501,016
95,379,687,728
20,541,294,403
10,603,634,872
15,899,381,889
12,035,907,705
12,149,193,140
12,516,978,044
11,624,529,361
10,588,771,304
12,416,850,838
11,165,785,434
12,569,201,140
11,451,052,829
13,305,149,580
10,629,807,253
12,545,374,221
12,802,146,8049,986,350,660
14,649,764,64913,913,726,19611,904,158,96711,187,077,04718,089,753,18810,453,639,04810,543,194,03611,673,001,81013,244,858,00011,763,787,65012,646,057,13011,566,792,65911,626,214,29310,629,413,41910,104,045,176
126,589,559,107
22,837,231,756
77,738,395,045
390,456,897,560
42,350,538,308
6,799,940,871
37,201,481,754
18,883,551,281
26,607,702,065
15,489,785,715
6,124,647,921
26,846,837,852
28,951,951,433
20,074,588,410
7,349,774,615
11,811,369,496
11,086,454,491
6,413,446,778
11,598,612,964
28,250,912,4379,212,871,540
7,729,306,22461,559,197,83227,461,970,82214,802,106,05325,690,767,1556,250,958,0157,073,307,218
13,861,570,06610,693,894,03114,152,029,10114,532,981,5577,954,768,426
14,603,295,5717,506,124,949
14,989,654,124
304,420,234,092
79,387,268,911
131,730,946,416
552,521,138,694
132,285,657,621
56,560,352,594
110,421,061,340
79,137,433,603
82,750,802,264
81,747,026,229
63,946,311,712
76,377,881,190
103,065,131,667
75,262,618,252
74,270,398,919
66,799,049,071
73,314,955,216
60,483,386,795
75,964,543,699
229,319,099,04359,545,797,454
76,155,062,343297,787,195,25797,186,698,73074,860,160,66292,875,674,08758,844,713,15158,835,956,53873,980,587,63376,269,767,03765,814,590,77876,245,675,65463,100,636,07671,925,972,94657,253,462,696
180,086,387,797
144,018,696,359
35,889,559,265
90,911,896,060
485,836,585,288
62,891,832,711
17,403,575,744
53,100,863,643
30,919,458,985
38,756,895,205
28,006,763,760
17,749,177,282
37,435,609,157
41,368,802,272
31,240,373,844
19,918,975,755
23,262,422,325
24,391,604,071
17,043,254,030
24,143,987,186
41,053,059,24119,199,222,200
22,379,070,87375,472,924,02839,366,129,78925,989,183,10043,780,520,34316,704,597,06317,616,501,25425,534,571,87623,938,752,03125,915,816,75127,179,038,68819,521,561,08426,229,509,86418,135,538,368
25,093,699,300
123,927,674,405
51,460,442,782
103,936,962,279
496,008,467,500
92,339,672,500
30,956,578,173
77,488,836,500
50,862,133,342
61,537,688,462
51,771,522,361
39,366,017,948
68,197,898,576
86,884,571,048
59,745,367,375
49,246,355,763
51,625,653,578
64,446,786,195
45,241,528,064
62,914,064,336
128,830,172,77148,577,424,710
62,414,576,405223,691,801,947104,038,646,14071,155,754,246
113,820,387,45653,354,220,50461,614,246,63379,604,438,49979,549,002,89880,541,180,60383,564,573,99669,761,696,88685,101,792,72167,475,707,664
163,856,964,093
216,587,520,217
50,047,760,017
55,924,225,319
227,411,072,500
50,579,608,000
40,226,744,763
105,579,328,000
29,797,731,694
28,461,218,983
42,142,051,713
45,355,067,970
27,496,426,821
62,554,266,897
45,245,171,891
39,769,850,180
21,641,105,657
63,586,483,783
28,397,552,990
33,178,476,733
183,001,478,30320,136,615,723
37,336,022,049126,073,412,30049,214,791,78435,878,813,29036,078,370,27822,147,785,25228,245,480,60122,544,691,75324,018,204,07324,229,085,54913,606,000,20918,112,834,11815,539,402,84014,303,498,01844,957,091,499
2-Year Average Average (2018-2019)
Sources: Office of the Accountant General of the Federation, DMO, State Finacial Statements
Norma-lized
5.48
3.32
2.18