
Labour segregation and immigrant and native-born wage distributions in Spain: an analysis using...
34
Span Econ Rev (2008) 10:135–168 DOI 10.1007/s10108-007-9035-1 REGULAR ARTICLE Labour segregation and immigrant and native-born wage distributions in Spain: an analysis using matched employer–employee data Hipólito Simón · Esteban Sanromá · Raúl Ramos Published online: 14 September 2007 © Springer-Verlag 2007 Abstract This article carries out an empirical examination of the origin of the dif- ferences between immigrant and native-born wage structures in the Spanish labour market. Special attention is given in the analysis to the role played by occupational and workplace segregation of immigrants. Legal immigrants from developing coun- tries exhibit lower mean wages and a more compressed wage structure than native-born workers. By contrast, immigrants from developed countries display higher mean wages and a more dispersed wage structure. The main empirical finding is that the disparities in the wage distributions for the native-born and both groups of immigrants are largely explained by their different observed characteristics, with a particularly important influence in this context of workplace and, specially, occupational segregation. Keywords Wage differentials between native-born and immigrant workers · Labour market segregation · Immigrant workers Hipólito Simón, Esteban Sanromá and Raúl Ramos wish to thank the support received from the Ministerio de Fomento and the Ministerio de Educación y Ciencia through the projects T 75/2006 (Plan Nacional de Investigación, Desarrollo e Innovación Científica), SEJ2004-05860/ECON and SEJ2005-04348/ECON, respectively. A previous version of this paper was published as an IVIE Working Paper (WP-EC 2007-03). H. Simón (B ) Instituto de Economía Internacional, Universidad de Alicante, Campus de San Vicente del Raspeig, Alicante, Spain e-mail: [email protected] E. Sanromá IEB, Universidad de Barcelona, Barcelona, Spain e-mail: [email protected] R. Ramos AQR-IREA, Universidad de Barcelona, Barcelona, Spain e-mail: [email protected] 123
-
Upload
independent -
Category
Documents
-
view
2 -
download
0
Transcript of Labour segregation and immigrant and native-born wage distributions in Spain: an analysis using...
Span Econ Rev (2008) 10:135–168DOI 10.1007/s10108-007-9035-1
REGULAR ARTICLE
Labour segregation and immigrant and native-bornwage distributions in Spain: an analysis using matchedemployer–employee data
Hipólito Simón · Esteban Sanromá · Raúl Ramos
Published online: 14 September 2007© Springer-Verlag 2007
Abstract This article carries out an empirical examination of the origin of the dif-ferences between immigrant and native-born wage structures in the Spanish labourmarket. Special attention is given in the analysis to the role played by occupationaland workplace segregation of immigrants. Legal immigrants from developing coun-tries exhibit lower mean wages and a more compressed wage structure than native-bornworkers. By contrast, immigrants from developed countries display higher mean wagesand a more dispersed wage structure. The main empirical finding is that the disparitiesin the wage distributions for the native-born and both groups of immigrants are largelyexplained by their different observed characteristics, with a particularly importantinfluence in this context of workplace and, specially, occupational segregation.
Keywords Wage differentials between native-born and immigrant workers · Labourmarket segregation · Immigrant workers
Hipólito Simón, Esteban Sanromá and Raúl Ramos wish to thank the support received from the Ministeriode Fomento and the Ministerio de Educación y Ciencia through the projects T 75/2006 (Plan Nacional deInvestigación, Desarrollo e Innovación Científica), SEJ2004-05860/ECON and SEJ2005-04348/ECON,respectively. A previous version of this paper was published as an IVIE Working Paper (WP-EC 2007-03).
H. Simón (B)Instituto de Economía Internacional, Universidad de Alicante,Campus de San Vicente del Raspeig, Alicante, Spaine-mail: [email protected]
E. SanromáIEB, Universidad de Barcelona, Barcelona, Spaine-mail: [email protected]
R. RamosAQR-IREA, Universidad de Barcelona, Barcelona, Spaine-mail: [email protected]
123
136 H. Simón et al.
JEL Classification J15 · J24 · J30 · J61
Introduction
The relative situation of immigrants in the labour market of the host country hasplayed a central role in the numerous studies carried out in recent decades on thesubject of international migration and its consequences (Borjas 1999; Lalonde andTopel 1997; Card 2005). This literature has placed special attention on the wages ofimmigrants relative to native-born workers and its key empirical findings are, firstly,that immigrants typically face a significant wage gap and, secondly, that the gaptends to diminish the longer they remain in their host country (Chiswick 1978 andBorjas 1994, 1999 for the US; Chiswick et al. 2005a for Australia; Friedberg 2000for Israel; Lam and Liu 2002 for Hong Kong and Baker and Benjamin 1994 forCanada).
Building on these studies, this article aims to examine differences between the wagestructures of legal immigrants and the native-born in the Spanish labour market andtheir origin. A growing number of studies in recent years have addressed the phenom-enon of immigration in Spain and promoted greater understanding of it and its impact(for a general view, see Izquierdo and Jimeno 2005). These studies, however, have notaddressed the relative wages of immigrants. Nonetheless, an empirical examination ofthe magnitude and the causes of the differences between native-born and immigrantwage distributions is undoubtedly of great interest, as it allows for a more completeunderstanding of the relative situation of immigrants in the Spanish labour marketand provides useful evidence from an economic policy standpoint on the factors thatmay influence in the reduction on the wage gap between native-born and immigrantworkers.
Our empirical analysis takes special interest in the extent to which wage struc-ture differences arise between native-born and immigrant workers due to the segre-gation of immigrants into low-wage occupations and workplaces. Such segregationmay stem from discriminatory practices, as predicted by standard statistical discrim-ination models (Phelps 1972) or taste-based discrimination models à la Becker (1957).In addition, given the robust evidence that supports the existence of significantinterracial wage differentials (Altonji and Blank 1999), this is a more plausiblephenomenon when the ethnicities of immigrants actually differ from those of native-born workers. However, it must be considered that immigrant segregation may bealso a function of other factors, as imperfect transferability of human capital acquiredby immigrants in their home countries (Friedberg 2000) or, in the particular caseof workplace segregation, segregation along skill lines because of complementar-ities among workers, residential segregation coupled with constraints in commut-ing to work (spatial mismatch) or labour market networks (Hellerstein and Neumark2005).
Addressing occupational segregation, international empirical evidence shows thatimmigrants are typically segregated in every economy into occupations with termsand conditions that are worse relative to native-born workers (Chiswick et al. 2005b;
123
Labour segregation and immigrant and native-born wage distributions in Spain 137
Jasso and Rosenzweig 1988; Weiss et al. 2003; Constant and Massey 2005). ForSpain in particular, the findings of Amuedo-Dorantes and De la Rica (2007) confirmthat immigrants are segregated into low-wage occupations (with the only exceptionof immigrants from the EU-15 countries). Yet, given the scarcity of internationalempirical studies which quantify the relative importance that occupational segregationplays in the explanation of wage gaps between native-born and immigrant workers, ourempirical knowledge of the phenomenon is rather imperfect. The main exception in thiscontext is Liu et al. (2004), whose findings interestingly suggest that segregation intolow-wage occupations is an outstanding factor in explaining native-born/immigrantaverage wage gaps.
The use of matched employer–employee microdata in our empirical analysis per-mits us to examine the influence of both occupational and workplace segregation onthe relative wages of immigrants. Segregation into workplaces that pay lower wagesto individuals with otherwise similar observed characteristics is actually an importantreason of the lower wages earned in practice by women (see, for example, Amuedo–Dorantes and De la Rica 2006; Palacio and Simón 2006 for Spain) and certain ethnicminorities, such as African Americans and Hispanics (Bayard et al. 1999; Hellersteinand Neumark 2005 for the US). Nevertheless, as far as we know, there is no exist-ing evidence regarding the impact of firm segregation on immigrant wages. Hence,the purpose of this research is to contribute toward filling this gap in the literature.Yet, not only the extent of workplace segregation of immigrants, but also which arethe specific attributes of the firms where immigrant segregation occurs are relevantconcerns in this context. This research therefore looks at the impact on immigrantwages of those firm characteristics more extensively addressed in the literature but, inparticular, at that of two attributes related to a firm’s workforce composition, namelythe proportion of immigrants and the average level of qualifications. As regards thefirst attribute, the evidence that a relatively high proportion of either women or racialminorities in a firm depresses the relative wages of all workers in that firm (Bayardet al. 2003; Hirsch and Macpherson 2004) leads to the question: is the same effectalso to be found in Spain in the case of immigrant workers? Concerning the secondattribute, an additional question builds on the fact that the average human capital en-dowment of a firm’s workforce affects the individual wages of all its workers, dueto human capital externalities, such as productive complementarities and knowledgediffusion (Battu et al. 2003; Alcalá and Hernández 2006), namely if the relative wagesof immigrants are affected by a greater presence in firms typified by poorly qualifiedworkforces.
The empirical strategy is based on the use of two different methodologies in orderto decompose differences between native-born and immigrant workers in both averagewage gaps and the entire wage distributions. On that account, the first part of the analy-sis carries out an examination of the origin of the differences in average wages, drawingon the use of an extension of the Oaxaca–Blinder technique, which has been adaptedfor its use with matched microdata. This initial enquiry is of interest as it focuses onrepresentative individuals and is, thus, based on a moment of the distribution which isrepresentative of the aggregated behaviour of each of the groups in question. However,the results obtained from comparing the relative wages of native-born and immigrant
123
138 H. Simón et al.
workers may depend significantly on methodological choices, such as which spe-cific point of the wage structure is used in the comparison (Yuengert 1994). For thisreason, the second part of the empirical analysis consists of a distributional approach.In particular, the methodology put forward by Juhn et al. (1993) is employed in orderto analyse the explanatory factors for the overall differences in the wage distributionsfor native-born and immigrant workers. This technique is based on the estimation ofhypothetical wage distributions and its use permits to obtain complementary evidenceregarding, inter alia, the extent to which the native-born/immigrant wage gap and itsdeterminants vary throughout the wage distribution and if there are significant differ-ences in these groups’ wage dispersion and the causes for that. It is also important tonote that, except for some notable exceptions such as Butcher and DiNardo (2002)and Wilkins (2003), this sort of distributional analysis of the differences in the wagestructures of immigrants and the native-born is relatively uncommon in the economicliterature.
An additional noteworthy point to be stressed is that the empirical analysis hasbeen undertaken disaggregately by gender and by place of origin of immigrants,distinguishing whether the home country is developed or developing. The potentialinfluence of geographic factors on immigrant wages stems from the fact that thedegree of human capital transferability depends not only on individual qualificationsbut also on cultural, institutional and labour market similarities between home andhost countries (Chiswick 1978). Another potential source of this influence lies in theheterogeneity of the self-selection process undergone by immigrants, as they may orig-inate in differing segments of the ability distribution across countries (Borjas 1987). Inturn, there is abundant empirical evidence that corroborates that immigrants’ relativewage levels vary significantly as a function of gender and place of origin (Borjas 1987,1994; Adsera and Chiswick 2007) and, in particular, that immigrants from developingcountries experience higher wage gaps and less wage convergence than those fromdeveloped countries (Borjas 1987). This overall evidence supports our methodologi-cal decision to differentiate between different types of immigrants. A specific focusin this study, therefore, is to determine the extent to which wage structures for legalimmigrants in the Spanish labour market differ depending on their gender and place oforigin, as well as the potential effect of the relative extent of labour market segregationon this phenomenon.
Following this “Introduction”, “Data and descriptive evidence” describes the datasetused and presents descriptive evidence concerning average wages and the main fea-tures of the wage structures for native-born and legal immigrant workers. “Method-ology”sets out in detail the methodology that has been employed. “Empirical results”then develops the empirical analysis in two stages. Firstly, the explanatory factorsfor the gaps in average wage levels are examined, adapting the traditional Oaxaca–Blinder wage decomposition methodology for its use with the matched employer–employee microdata from the Encuesta de Estructura Salarial. Secondly, thecomparative analysis is extended to the entire wage distribution drawing onthe use of the Juhn et al. (1993) technique. Finally, “Conclusions” states ourconclusions.
123
Labour segregation and immigrant and native-born wage distributions in Spain 139
Data and descriptive evidence
The Encuesta de Estructura Salarial 2002
The microdata used in the study are drawn from the Spanish Encuesta de Estruc-tura Salarial for 2002 (hereafter EES). This survey was carried out by the SpanishNational Statistics Office (Instituto Nacional de Estadística) and constitutes theSpanish sample of the European Structure of Earnings Survey (SES), a 4-yearly surveyconducted in member states of the European Union according to a standard method-ology. The Spanish EES is a national representative survey directed at firms andcovers establishments employing at least ten workers and whose economic activitiesfall within divisions 10–93 of the detailed Nomenclature of Economic Activities inthe European Union, NACE. Therefore, non-covered sectors include agriculture andfisheries, domestic service, and public administration.
The EES sample is implemented in two stages. Firstly, establishments are sampledat random from the Social Security General Register of Payments records, which arestratified by economic activity, the size of local unit and region. Secondly, employ-ees within these establishments are randomly selected. The number of observationsper establishment depends on its size, from an average of five workers interviewedin establishments with 10–20 employees, up to 25 workers in establishments withmore than 200 employees. A prominent feature of the ESES is, therefore, that itconsists of matched employer–employee data with several observations at eachestablishment.
The EES collects comprehensive information, provided by the management of theestablishments, on the level and structure of remuneration of employees; workers’demographic and job characteristics (in particular, nationality, sex, age, level of edu-cation, tenure in the firm, occupation, type of contract, supervision tasks indicators andfull-time/part-time indicators) along with detailed information for each respondent’sestablishment (industry, size, region and type of collective agreement) (see Table 6 ofAppendix). Additional features of firm’s labour force composition have been derivedfrom the observations of each establishment in the sample (namely, the female andimmigrant share and the average years of education, seniority and experience in thefirm’s workforce) as is quite usual in empirical analysis (see, for instance, Amuedo–Dorantes and De la Rica 2006; Alcalá and Hernández 2006). Yet, given the nature ofthe sampling of the EES, these are rough measures of the corresponding counterpartsin the stock of workers of each firm. This room for measurement error in firm attributescomputed from the information in the sample must be taken into account in order tointerpret the results and the conclusions.
The wage measure is the logarithm of the gross hourly wage, computed as theannual gross earnings in euros divided by the number of hours worked in the year.Gross earnings cover all payments different from overtime pay paid by the employerbefore deductions for tax and employee social security contributions.
Firms with less than two observations have been excluded of the sample so as topermit an accurate identification of fixed effects by firm in the econometric estima-tions. Also excluded are those observations lacking information for the main variablesof interest or corresponding to workers under 16 or over 65 years of age. The final
123

140 H. Simón et al.
sample contains 126,367 observations in 14,177 establishments (that is, there are onaverage 8.91 workers per firm in the dataset). In accordance with the literature, thisinvestigation defines immigrant as a worker whose nationality is not Spanish. Thisrequirement is met by 4,237 individuals, or 3.35% of the total sample. Of these, 996come from developed countries (EU-15, North America and Oceania) and 3,241 comefrom developing countries (the remaining geographic areas).
Table 6 in Appendix reports descriptive statistics of native-born employees andlegal immigrants by sex and origin. By and large, significant differences in the rela-tive qualifications and other observed characteristics of these groups are to be found.For instance, a greater portion of immigrants from developing countries are male(73.1%) than are Spanish workers (63.8%). They also have lower educational levels(2.5 schooling years less than natives on average) and less actual potential experi-ence (1.7 years less) and seniority (6.4 years less).1 They also engage in higher lev-els of temporary (60.9 vs. 26.4% for natives) and part-time work (12.2 and 10.5%)and carry out supervisory tasks to a lesser extent (11.6% for immigrants fromdeveloping countries and 25.9% for natives). Moreover, they are specially concen-trated in regions characterised by higher employment and wages (Madrid andCatalonia), but working in smaller firms (27.3% in firms with less than 20employees and 20.2% for natives). Likewise, immigrants from developed countriesalso exhibit relatively smaller endowments of seniority (4.1 years less) and potentialexperience (2.5 years), and higher levels of temporary and part-time work. However,unlike the first group, these immigrants have higher educational levels (0.9 moreyears of schooling) and carry out supervisory tasks to a greater extent than native-born workers (34 and 25.9% for natives). Turning back to immigrants from devel-oping countries, it can be seen from analysing the attributes of firms that they tendto work in firms whose workforces exhibit lower levels of education, seniority andexperience. At the same time, and relative to native-born workers, all immigrants,irrespective of origin, tend to work in firms with a higher presence of immigrants.Overall, this evidence reveals that there are major differences in characteristics be-tween immigrants and native-born workers, but also between immigrants from de-veloping countries and from developed countries. Hence, this preliminary analysisof the data confirms the interest of analysing in a separate way these two groups ofimmigrants.
It must be stressed that there are some noteworthy shortcomings of the EES thatcould potentially affect our analysis. First, as the survey is addressed to firms, it doesnot include information about workers in the black economy and, as a result, theanalysis will be limited to workers in a legal situation. Second, the EES does not coverthe whole economy, as firms with fewer than ten workers are not considered in thesurvey, and neither it includes certain segments of the labour market (in particularprimary sector, domestic service, and public administration). This circumstance givesrise to a slight underrepresentation of immigrants in the sample (and also of womenand young workers in both groups).2 However, some additional evidence suggests
1 Potential experience is measured as current age minus age on first entering the labour market after leavingfull-time schooling.2 Further details can be found in Simón et al. (2007).
123

Labour segregation and immigrant and native-born wage distributions in Spain 141
that the wage gap between native-born workers and immigrants is not substantiallygreater in the segments of the labour market not covered by the EES. Thus, accord-ing to the data of the Conditions of Life Survey (Encuesta de Condiciones de Vida)of 2005, a survey to families with a complete coverage of the economy, immigrantsfrom European countries outside the European Union earn higher wages relative toSpaniards, with a gap of 3.3% (this percentage is 4.4% in the EES), whereas thosecoming from countries outside Europe earn lower wages, with a gap of 29.9% (26.7%in the EES). This evidence suggests that the EES tends in general to underestimate,but not in a severe manner, the wage gap between native-born workers and immi-grants, which must be considered in order to interpret the results of the empiricalanalysis.
Nevertheless, in spite of these shortcomings, the use of the EES to analyse theorigin of the differences between immigrant and native-born wage structures in theSpanish labour market is highly recommended. First, it contains a higher number ofobservations and richer information on workers’ demographic and job characteristics,and more information about firm characteristics than other databases (such as theEuropean Community Household Panel or the Encuesta de Condiciones de Vida).Second, it provides matched employer–employee data with several observations ateach establishment for the Spanish labour market. Such matched data uniquely affordthe possibility of appropriately weighing up the influence of factors related to labourdemand when analysing the wage-setting process (about the role of matched employer–employee datasets in advancing understanding of labour markets see Abowd andKramarz 1999 and Haltiwanger et al. 1999). Therefore, these kind of data have amain advantage for the purpose of decomposing wage differentials, namely that theypermit to examine the relative contribution of within- and between-workplace wagedifferentials, so that the effect of firm-level segregation can be taken into account as anadditional source of wage differentiation between groups of workers. For that reason,they have been extensively used in the recent past in order to examine the origin inthe Spanish labour market of the wage gaps by sex (Amuedo-Dorantes and De laRica 2006 and Palacio and Simón 2006) and type of contract (De la Rica 2004 andDavia and Hernanz 2004). Thus, in the context of this research these data allow toanalyse if wage differences between native-born and immigrant workers are related tothe segregation of immigrants in different types of firms. This is a subject where, aspointed in the introduction, no previous empirical international evidence is availableat present.
Descriptive evidence
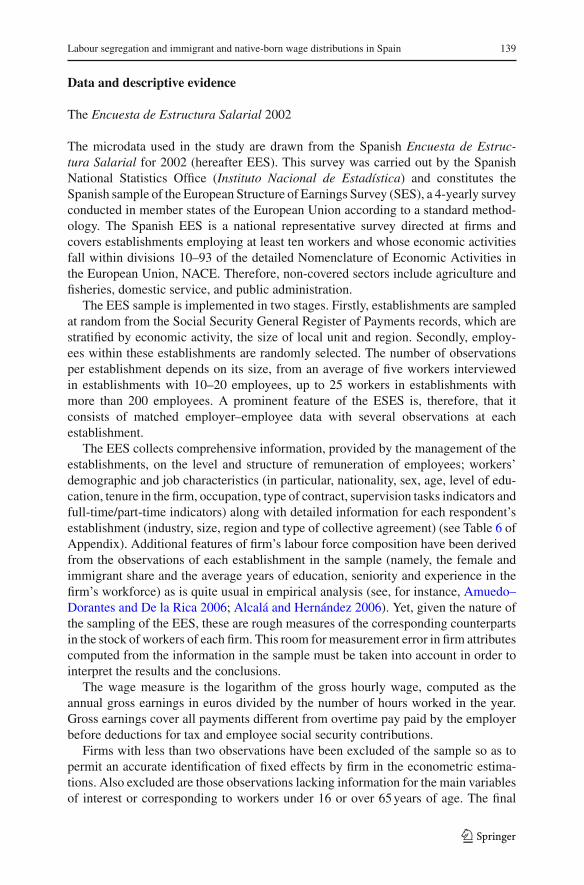
In this section, descriptive evidence about wage differentials between native-born andlegal immigrant workers is shown. Figure 1 displays separate estimations of the kerneldensity functions of the hourly wage for these two groups. The left-hand panel displaysdensity functions estimated for men and women jointly, and the central and right-handpanels break out the density functions for these two groups separately. Firstly, thejoint analysis for men and women attests to significant differences between native-born and immigrant wage structures. It also highlights substantial differences between
123
142 H. Simón et al.
Men and women Men
Women
0.5
11.
5
kden
sity
lnsa
lhor
a
-2 0 2 4 6
x
Native-born Immigrants from developed countries Immigrants from developing countries
0.5
11.
52
kden
sity
lnsa
lhor
a
0 2 4 6
x
0.5
11.
52
kden
sity
lnsa
lhor
a
-2 0 2 4 6
x
Native-born Immigrants from developed countries Immigrants from developing countries
Native-born Immigrants from developed countries Immigrants from developing countries
c)
b)a)
Fig. 1 Kernel density functions of the logarithm of hourly wages of natives and immigrants
the two groups of immigrants themselves. (The Kolmogorov–Smirnov test valuesformally confirm statistically significant differences when comparing any two of thethree distributions in question.) More specifically, the wage distribution of immigrantsfrom developed countries is shifted farther to the right and shows a greater degree ofdispersion, whereas the wage distribution of immigrants from developing countries isshifted relatively farther to the left and shows less dispersion. The same comparativepattern is repeated for both men and women. However, the density function estimationsseem to suggest that native-born/immigrant wage structure differences do not coincidesystematically for both sexes.
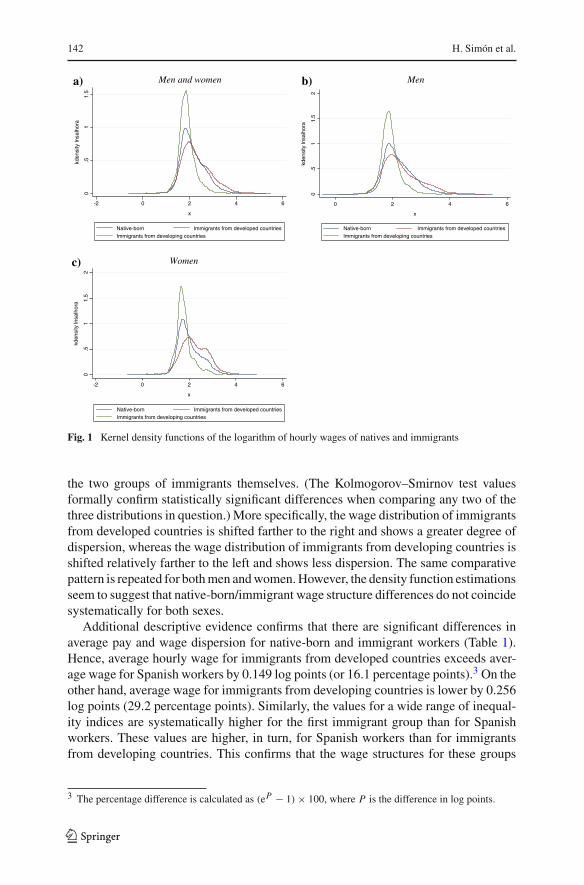
Additional descriptive evidence confirms that there are significant differences inaverage pay and wage dispersion for native-born and immigrant workers (Table 1).Hence, average hourly wage for immigrants from developed countries exceeds aver-age wage for Spanish workers by 0.149 log points (or 16.1 percentage points).3 On theother hand, average wage for immigrants from developing countries is lower by 0.256log points (29.2 percentage points). Similarly, the values for a wide range of inequal-ity indices are systematically higher for the first immigrant group than for Spanishworkers. These values are higher, in turn, for Spanish workers than for immigrantsfrom developing countries. This confirms that the wage structures for these groups
3 The percentage difference is calculated as (eP − 1) × 100, where P is the difference in log points.
123
Labour segregation and immigrant and native-born wage distributions in Spain 143
Table 1 Average wages and wage dispersion of natives and immigrants
Natives Immigrants Developed Developingcountries’ countries’immigrants immigrants
Men and women
Average wage
Hourly wage (euros) 9.93 8.39 12.44 7.16
Logarithm of the hourly wage 2.145 1.985 2.294 1.889
Hourly wage dispersion
Variance of the logarithm 0.263 0.216 0.374 0.130
Coefficient of variation 0.694 0.850 0.970 0.546
Gini index 0.306 0.288 0.376 0.209
Theil index 0.171 0.191 0.275 0.096
Men
Average wage
Hourly wage (euros) 10.65 8.63 13.23 7.411
Logarithm of the hourly wage 2.217 2.012 2.322 1.930
Hourly wage dispersion
Variance of the logarithm 0.257 0.208 0.414 0.120
Coefficient of variation 0.701 0.896 1.064 0.540
Gini index 0.305 0.284 0.402 0.201
Theil index 0.172 0.199 0.320 0.092
Women
Average wage
Hourly wage (euros) 8.66 7.84 11.11 6.46
Logarithm of the hourly wage 2.020 1.919 2.246 1.781
Hourly wage dispersion
Variance of the logarithm 0.248 0.233 0.301 0.142
Coefficient of variation 0.637 0.691 0.661 0.550
Gini index 0.296 0.292 0.317 0.217
Theil index 0.155 0.166 0.172 0.103
show rather different degrees of dispersion.4 Elaborating on this question, the Lorenzcurves for the three groups’ wages (available from the authors upon request) confirmthat the wages of immigrants from developed countries Lorenz-dominate the wages ofSpanish workers and theirs, in turn, Lorenz-dominate the wages of immigrants fromdeveloping countries.
4 The calculation of wage dispersion indices assumes that the observations in the sample are independentand identically distributed. When the calculation of the indices is corrected by the inclusion probabilityof each observation in the sample, the results are very similar. It should be pointed that although the EESuses a complex design, involving two-stage stratified sampling, this does not affect the estimation of thedispersion values.
123

144 H. Simón et al.
The descriptive evidence in Table 1 shows as well that average hourly wage is higherfor immigrants from developed countries than it is for Spanish workers both for menand for women (although the gap is notably smaller for men). It is also observedthat wage dispersion is comparatively more pronounced in this immigrant group bothfor men and women than it is for Spanish workers. In contrast, immigrants fromdeveloping countries show relatively lower average wages and less wage dispersionfor both sexes. Yet, interestingly, this third group is the only one that exhibits largerwage disparities among women than among men.
Summing up, the descriptive evidence conclusively shows that native-born andimmigrant wage structures are far from homogeneous in the Spanish labour market.Significant differences appear both in average wage levels and in the degree of wagedifferentiation between the two groups. In addition, significant disparities can be seenbetween immigrants from developing and developed countries and, within the twoimmigrant groups, between men and women. This underlines the value of carryingout an analysis differentiated according to these characteristics. Consequently, therest of the article examines the source of these wage structure differences betweennative-born and legal immigrants, starting with the decomposition of average wagedifferentials, followed by a distributional analysis. First, however, the methodologyused in the empirical analysis is described in “Methodology”.
Methodology
Decomposition of average wage differentials: the Oaxaca–Blinder methodology withmatched microdata
The methodology used in the empirical analysis to decompose native-born/immigrantaverage wage differentials is an extension of the standard Oaxaca–Blinder approach(Oaxaca 1973; Blinder 1973). It departs from the estimation of a wage function asfollows:5
wi j = Xiβ + λ j + εi j (1)
where wi j corresponds to the gross hourly wage for worker i in firm j; Xi is a vectorcapturing observed individual and job characteristics, along with a constant term; β isa parameter vector; λ j is an invariant error term for all individuals within firm j ; andεi j is a random error term.
The vector Xi includes individual characteristics—some of which proxy humancapital and, consequently, worker productivity—along with job features. Specifically,the controls include an individual’s gender indicator; the level of educational attain-ment (broken into ten different degrees and diplomas); years of potential experiencein the labour market and its quadratic form; seniority and its quadratic form; contract
5 The technique used coincides with the methodology proposed by Gartner and Stephan (2004) as anextension of the technique used by Blau and Kahn (1997).
123
Labour segregation and immigrant and native-born wage distributions in Spain 145
type (distinguishing between permanent or fixed-term) and whether the working dayis full-time or part-time. Furthermore, in order to capture the effects of horizontaland vertical job segregation on wages, a set of dummies for occupation (57) and adummy reflecting whether an individual performs supervisory tasks have in turn beenincluded.
As pointed earlier, the effects λ j are common to all individuals in a given firm andthey can be identified due to the availability in the microdata of several observationsin each firm. The Hausman test indicates that these effects are significantly correlatedin the EES sample with the individual and job characteristics in vector Xi . As a resultthey have been estimated as fixed effects.
The estimation by fixed effects of Eq. (1) is equivalent to the use of ordinary leastsquares with the inclusion of a set of firm dummies.6 According to the properties of theordinary least squares estimator, the average wage of a given group can be expressedafter the estimation of Eq. (1) as follows:
w̄A = X̄ Aβ̂ + ηγ̄A + σ θ̄A (2)
where w̄A is the average wage of group A (i.e., native-born or immigrant workers);X̄ A are the respective group’s average characteristics; β̂ is the vector of the parametersestimated from Eq. (1); η is the sample-wide standard deviation for fixed effects byfirm; γ̄A is the group’s standardised average fixed effect by firm; σ is the standarddeviation for the sample’s wage residuals; and θ̄A is the group’s standardised averagewage residual.
When carrying out wage decompositions, it is a quite common methodologicaldecision in the economic literature using as a reference the wage structure estimatedseparately for the majority group (for example, when addressing the gender wagegap, using men as the reference group). This choice rests on the assumption that ina non-discriminatory context this wage structure would correspond to the minoritygroup as well. Alternatively, pooling the wage structures for both groups allows useof all the available information to estimate wage returns. The joint wage structure alsoconstitutes a more natural approximation to the labour market’s non-discriminatorywage structure than just adopting the structure of the main group or using other alter-natives such as the wage structure of the minority group or a linear combination ofthe structures of both groups (Oaxaca and Ransom 1994; Neumark 1988). Therefore,Eq. (1) has been estimated for the pool of native-born and immigrant workers.
6 Wage decomposition methodologies, when carried out in detail, give rise to problems of identification.Such problems occur because the choice of a specific reference in each group of dummies included in theexplanatory variables, so as to avoid the effects of perfect multicollinearity, affects the detailed decompo-sition findings (Oaxaca and Ransom 1999). With the aim of accurately estimating the real contribution ofeach variable, the problems of identification have been corrected and normalised adopting the approachtaken by Gardeazábal and Ugidos (2004). Therefore, restricted least squares under the constraint that thesum of the coefficients of each set of dummies equals zero have been employed in the estimation of wagefunction (1).
123
146 H. Simón et al.
Using the pooled wage structure as a reference for decomposition, the averagehourly wage gap between the two groups can be then expressed as follows:
w̄nat − w̄im = (X̄nat − X̄ im)β̂ + (γ̄ nat − γ̄ im)η + (θ̄nat − θ̄ im)σ (3)
where superscripts nat and im correspond to native-born and immigrant workers,respectively.
Equation (3) quantifies the extent to which native-born/immigrant average wagedifferences are related to (a) differences in individual and job characteristics, (b) theinfluence of firm-related factors and (c) the influence of unobserved factors. Morespecifically, the first term on the right side of the equation corresponds to the portionof the wage differential attributable to the differences between the observed charac-teristics of the two groups (X̄nat − X̄ im), valued at market prices (β̂). That is, thisterm of the decomposition coincides with the “explained” component of the standardOaxaca–Blinder decomposition.7
The second term approximates the firm’s influence on the wage differential. Thisterm is taken as a product of the difference in the average standardised native-born/immigrant effect by firm (γ̄ nat − γ̄ im) and the dispersion of the sample-wide fixed-effects distribution (η). According to it, the influence of firms on native-born/immigrantwage gaps depends on two factors. The first is to what extent native-born and immi-grant workers work in firms where different wages are paid to observationally similarworker (i.e., if one group is segregated into low-wage firms). The significance of thisphenomenon is captured by the difference in the two groups’ average standardisedeffects by firm. The second is the magnitude of the wage dispersion across firms,which determines the extent of the wage penalty of the group which is relatively moresegregated into low-wage firms.
The third term measures the influence of unobserved factors (as unobserved ability,motivation and discrimination) on the relative wages of native-born and immigrantworkers. As can be seen, this component is the product of, firstly, the difference innative-born/immigrant average wage residuals (θ̄nat − θ̄ im) and, secondly, the disper-sion of the sample-wide distribution of the wage residuals (σ ), which determines thespecific wage penalty suffered by the group which is left comparatively disadvantagedby the unobserved factors.
As noted previously, the decomposition is based on the use of a pooled native-born/immigrant wage structure. Therefore, the third term in the decompositionimplicitly captures the potential differences between the two groups’ returns to theircharacteristics. Yet, it should be noted that although a usual interpretation in the liter-ature of different wage returns to the observed characteristics between two groups is
7 The widest possible range of observed characteristics has been chosen for use in the analysis. Thesecomprise occupation, for which the different levels of endowments/distributions for native-born and immi-grant workers may be affected by discriminatory practices and, as a result, they would not simply reflectcompetitive wage differentials. For that reason, the first term of the decomposition cannot be labelled‘non-discriminatory’, as it frequently is in the literature.
123
Labour segregation and immigrant and native-born wage distributions in Spain 147
that they are indicative of discrimination, this interpretation is blurred in the context ofthis research, given that differences in immigrant wage returns relative to native-bornworkers can also be explained by the fact that the human capital acquired by immi-grants in their home countries is not directly transferable to the Spanish labour market.For that reason, we consider that although the methodology used is not informativeabout whether differences exist between the returns to the two groups’ characteris-tics this does not imply a major loss of information in the context of the empiricalanalysis.8
Decomposition of wage distribution differences: the Juhn et al. (1993) methodology
As stated earlier, the second part of the empirical analysis draws on a distributionalapproach in order to decompose differences in the entire wage distributions of immi-grant and native-born workers. To do so, the technique put forward by Juhn et al. (1993)is used. This involves building hypothetical wages for each individual, then using thehypothetical wage distribution thus obtained to calculate distributional statistics, andfinally decomposing the wage distribution differentials for the two groups accordingto the observed characteristics, the returns to the characteristics and the unobservedfactors. Specifically, this technique begins with the separate estimation for native-bornand immigrant workers of a wage function as follows:
wnati = Xnat
i βnat + εnati (4)
wimi = Xim
i β im + εimi (5)
where, as before, superscripts nat and im correspond to native-born and immigrantworkers, respectively. Thus, for example, wnat
i is the gross hourly wage for native-bornworker i ; Xnat
i is a vector of the observed characteristics for the native-born groupplus a constant term; βnat is the parameter vector estimated for that group; and εnat
iis an individual random error term.
Following Juhn et al. (1993), the error term for an individual corresponds to theindividual’s position in the distribution of residuals. Thus, if θi = F(εi |Xi ) is the per-centile of the residual for worker i with observed characteristics Xi , then by definitionit can be expressed as εi = F−1(θi |Xi ), where F−1 is the inverse of the cumula-tive distribution function. This means a residual in a different residual distribution,corresponding to percentile θi , can be assigned to individual i .
Let us take as references a residual distribution F̄−1 (in our case, the average dis-tribution for native-born and immigrant samples) and a wage structure β̄ (the pooledwage structure estimated from the entire sample of native-born and immigrant work-ers). The hypothetical density functions for the two groups using fixed coefficients
8 On the other hand, estimating each group’s wage returns separately would, in practice, make it impos-sible to quantify the effect of firm-specific segregation on immigrants’ relative wages. This is because theestimation of fixed effects requires of each sampled company at least two observations for each group underconsideration. In contrast, the EES sample does not include a very high number of observations for thedifferent groups of immigrants.
123
148 H. Simón et al.
and a common residual distribution (thus restricting the wage distributions to varyamong them only as a function of their characteristics) would then be expressed in thefollowing way:
wnat1i = Xnat
i β̄ + F̄−1(θi |Xnati ) (6)
wim1i = Xim
i β̄ + F̄−1(θi |Ximi ). (7)
An alternative hypothetical distribution may, in turn, be simulated by maintainingonly the effect of the unobserved factors fixed (thus restricting the wage distributionsto vary among them as a function of both the coefficients and their characteristics). Itcan be expressed as follows:
wnat2i = Xnat
i βnat + F̄−1(θi |Xnati ) (8)
wim2i = Xim
i β im + F̄−1(θi |Ximi ). (9)
By using both hypothetical wage distributions, the differences in the native-born/immigrant actual wage distributions can be finally be decomposed into the contri-butions that stem from observed characteristics and prices, and unobserved factors.Thus, if �Y n is the native-born/immigrant differential at a given point of the wagedistribution (for example, at the mean, the median or a given percentile) or in a measureof disparity in the distribution (such as the standard deviation or the ratio between the90th and 10th percentiles) in scenario n (where 1 corresponds to both fixed coefficientsand unobserved factors; 2 to fixed unobserved factors and the absence of superscriptto the actual wage structures), the differential can be expressed as follows:
�Y = �Y 1 + (�Y 2 − �Y 1) + (�Y − �Y 2). (10)
The first term on the right side of Eq. (10) measures the portion of the differentialfor characteristic Y between native-born and immigrant actual wage distributionswhich can be attributed to the differences in the two groups’ observed characteristics.The second term captures the portion explained by the differences in the returns to thecharacteristics. Finally, the third term corresponds to the disparities in the effect of theunobserved factors.9
Empirical results
Decomposition of the average wage differential
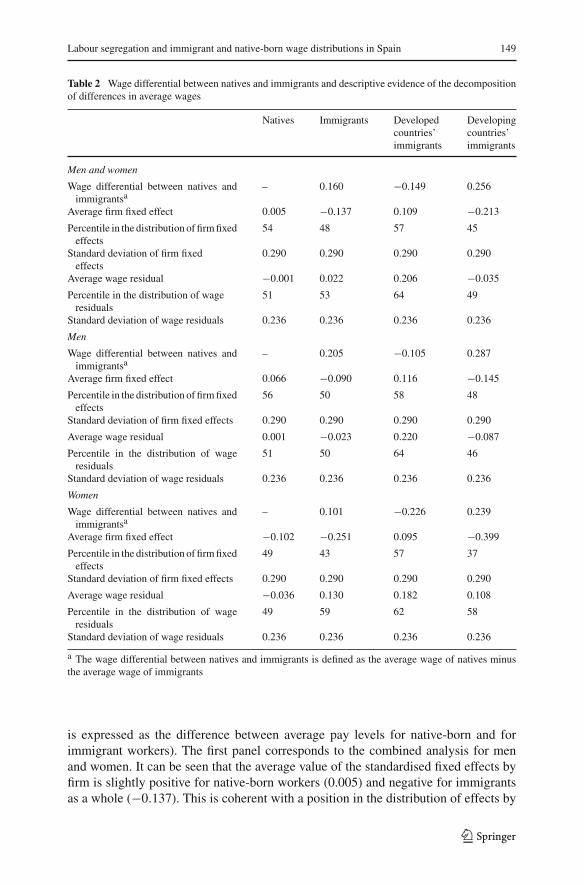
Table 2 sets out descriptive information, obtained by estimating Eq. (1), regardingthe decomposition results for the native-born/immigrant average wage gap (the gap
9 Note that returns are assumed homogeneous in the extension of the Oaxaca–Blinder methodology, whiledifferences in returns also account for a part of the wage differentials with the Juhn–Murphy–Piercemethodology, and that this can cause significant differences in the empirical results obtained with bothtechniques.
123
Labour segregation and immigrant and native-born wage distributions in Spain 149
Table 2 Wage differential between natives and immigrants and descriptive evidence of the decompositionof differences in average wages
Natives Immigrants Developed Developingcountries’ countries’immigrants immigrants
Men and women
Wage differential between natives andimmigrantsa
– 0.160 −0.149 0.256
Average firm fixed effect 0.005 −0.137 0.109 −0.213
Percentile in the distribution of firm fixedeffects
54 48 57 45
Standard deviation of firm fixedeffects
0.290 0.290 0.290 0.290
Average wage residual −0.001 0.022 0.206 −0.035
Percentile in the distribution of wageresiduals
51 53 64 49
Standard deviation of wage residuals 0.236 0.236 0.236 0.236
Men
Wage differential between natives andimmigrantsa
– 0.205 −0.105 0.287
Average firm fixed effect 0.066 −0.090 0.116 −0.145
Percentile in the distribution of firm fixedeffects
56 50 58 48
Standard deviation of firm fixed effects 0.290 0.290 0.290 0.290
Average wage residual 0.001 −0.023 0.220 −0.087
Percentile in the distribution of wageresiduals
51 50 64 46
Standard deviation of wage residuals 0.236 0.236 0.236 0.236
Women
Wage differential between natives andimmigrantsa
– 0.101 −0.226 0.239
Average firm fixed effect −0.102 −0.251 0.095 −0.399
Percentile in the distribution of firm fixedeffects
49 43 57 37
Standard deviation of firm fixed effects 0.290 0.290 0.290 0.290
Average wage residual −0.036 0.130 0.182 0.108
Percentile in the distribution of wageresiduals
49 59 62 58
Standard deviation of wage residuals 0.236 0.236 0.236 0.236
a The wage differential between natives and immigrants is defined as the average wage of natives minusthe average wage of immigrants
is expressed as the difference between average pay levels for native-born and forimmigrant workers). The first panel corresponds to the combined analysis for menand women. It can be seen that the average value of the standardised fixed effects byfirm is slightly positive for native-born workers (0.005) and negative for immigrantsas a whole (−0.137). This is coherent with a position in the distribution of effects by
123
150 H. Simón et al.
firm that is above the median for native-born workers (at the 54th percentile)10 andbelow for immigrants (at the 48th percentile). The result conclusively confirms thatimmigrants are, in general, segregated into low-wage firms. However, this is only thecase for those immigrants from developing countries. On the whole, immigrants fromdeveloped countries work in firms that pay higher wages than those of native-bornworkers (the average effect by firm is 0.109 for this immigrant group and the corre-sponding percentile is the 57th). In general, the described relative pattern is observedfor both men and women in the disaggregated analysis by gender. Furthermore, keep-ing with the previous findings of Amuedo-Dorantes and De la Rica (2006) and Palacioand Simón (2006) for the Spanish labour market, women are seen to be systematicallymore segregated into low-wage firms relative to men in the same group. Nevertheless,whereas women from developed countries are relatively closer to men in the samegroup in terms of the distribution of fixed effects by firm (at the 57th and 58th per-centiles, respectively), women from developing countries experience notably deepersegregation into low-wage firms (the average effect by firm is −0.399 for this groupand the distribution percentile is the 37th).
The fixed effects by firm have a standard deviation of 0.29. This result revealsthat the extent of wage differentiation between firms in the Spanish labour market ishigh from an international perspective (see Simón 2005). It also implies the existenceof a relatively severe penalty on the average wages of those groups segregated intolow-wage firms.
The average wage residuals are slightly negative for native-born workers (−0.001)and positive for legal immigrants as a whole (0.022). However, this arises from thespecially positive influence of the unobserved factors for immigrants from developedcountries (whose average wage residual is located at the 64th percentile of the pooleddistribution). By contrast, the legal immigrants from developing countries show anegative standardised residual (−0.035), which is nevertheless not much differentfrom that of native-born workers. While the separate results for men largely coincidewith the general case, a notable difference can be seen in the women’s results. Morespecifically, the unobserved factors have a much greater beneficial effect on womenwho are legal immigrants from developing countries than on native-born women (or,moreover, on men from the same immigrant group). These disparities by gender andplace of origin may be due to differences in unobserved abilities. In turn, they may berelated to self-selection processes that could vary by immigrant group, specially whenaccount is taken that the microdata do not cover all segments of the labour market.
Panel A of Table 3 shows the results of the decomposition of the average wagedifferential for native-born and legal immigrant workers according to the threecomponents on the right-hand side of Eq. (3).11 The average wage gap for legal
10 As can be observed from these data, the median of the firm effects is lower than the mean, which suggeststhat the distribution of firm effects is right-skewed.11 Detailed results of the estimated wage equations used when calculating the decomposition are shown inthe last columns of Table 6 in the appendix.
123

Labour segregation and immigrant and native-born wage distributions in Spain 151
Table 3 Decomposition of the differential of average wages between natives and immigrants
Men and women Men Women
Developed Developing Developed Developing Developed Developingcountries’ countries’ countries’ countries’ countries’ countries’immigrants immigrants immigrants immigrants immigrants immigrants
Wage differential among −0.149 0.256 −0.105 0.287 −0.226 0.239
natives and immigrantsa
A
Characteristics (1)b −0.069 0.184 −0.039 0.205 −0.124 0.178
(46.3) (71.9) (37.1) (71.4) (54.9) (74.5)
Gender 0.001 −0.011 0.000 0.000 0.000 0.000
Educational attainment −0.029 0.034 −0.022 0.032 −0.041 0.033
Experience 0.010 −0.003 0.009 0.000 0.011 −0.006
Seniority 0.035 0.059 0.042 0.064 0.025 0.050
Type of contract/full-time 0.004 0.012 0.004 0.014 0.003 0.006
or part-time
Occupation −0.079 0.073 −0.061 0.071 −0.110 0.081
Supervision tasks −0.011 0.020 −0.011 0.024 −0.012 0.014
Wage residuals (2) −0.049 0.008 −0.052 0.021 −0.044 −0.026
(32.9) (3.1) (49.6) (7.3) (19.5) (10.9)
Firm fixed effects (3) −0.031 0.063 −0.015 0.061 −0.058 0.087
(20.8) (24.6) (14.3) (21.3) (25.6) (36.4)
B
Characteristics (1) −0.084 0.238 −0.039 0.259 −0.163 0.248
(56.4) (93.0) (37.1) (90.2) (72.1) (103.8)
Gender 0.001 −0.011 0.000 0.000 0.000 0.000
Educational attainment −0.030 0.022 −0.024 0.019 −0.040 0.023
Experience 0.010 −0.004 0.008 −0.002 0.011 −0.007
Seniority 0.035 0.058 0.041 0.063 0.025 0.050
Type of contract/full-time 0.003 0.012 0.004 0.013 0.003 0.006
or part-time
Occupation −0.082 0.092 −0.063 0.092 −0.116 0.098
Supervision tasks −0.009 0.016 −0.009 0.018 −0.009 0.011
Region −0.010 −0.015 −0.013 −0.015 −0.006 −0.014
Activity sector −0.008 −0.006 −0.004 −0.002 −0.015 −0.004
Collective agreement 0.005 0.009 0.006 0.008 0.004 0.010
Firm size 0.005 0.017 0.002 0.014 0.010 0.019
Women’s proportion 0.004 −0.007 0.008 −0.005 −0.003 0.003
in the firm
Immigrant’s proportion 0.006 0.006 0.006 0.006 0.006 0.005
in the firm
Average education years −0.022 0.045 −0.012 0.042 −0.040 0.046
in the firm’s workforce
123
152 H. Simón et al.
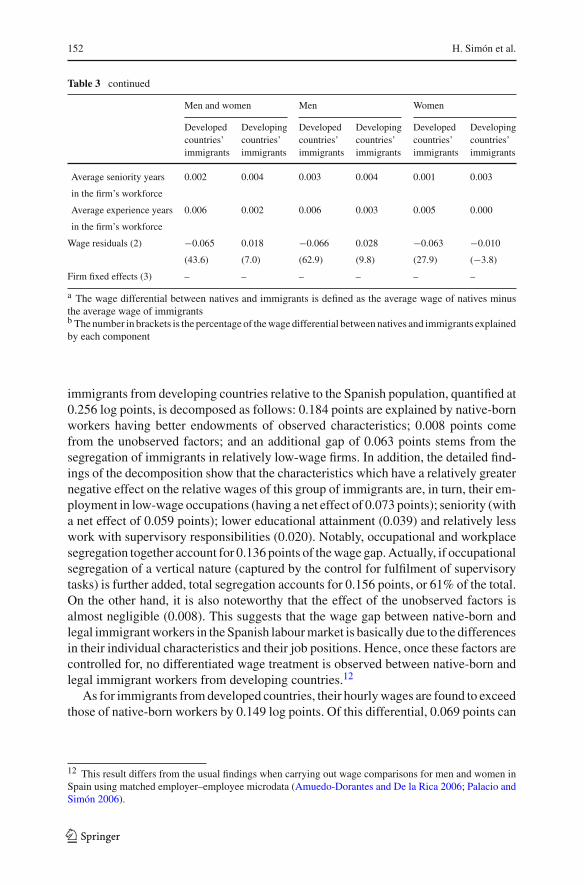
Table 3 continued
Men and women Men Women
Developed Developing Developed Developing Developed Developingcountries’ countries’ countries’ countries’ countries’ countries’immigrants immigrants immigrants immigrants immigrants immigrants
Average seniority years 0.002 0.004 0.003 0.004 0.001 0.003
in the firm’s workforce
Average experience years 0.006 0.002 0.006 0.003 0.005 0.000
in the firm’s workforce
Wage residuals (2) −0.065 0.018 −0.066 0.028 −0.063 −0.010
(43.6) (7.0) (62.9) (9.8) (27.9) (−3.8)
Firm fixed effects (3) – – – – – –
a The wage differential between natives and immigrants is defined as the average wage of natives minusthe average wage of immigrantsb The number in brackets is the percentage of the wage differential between natives and immigrants explainedby each component
immigrants from developing countries relative to the Spanish population, quantified at0.256 log points, is decomposed as follows: 0.184 points are explained by native-bornworkers having better endowments of observed characteristics; 0.008 points comefrom the unobserved factors; and an additional gap of 0.063 points stems from thesegregation of immigrants in relatively low-wage firms. In addition, the detailed find-ings of the decomposition show that the characteristics which have a relatively greaternegative effect on the relative wages of this group of immigrants are, in turn, their em-ployment in low-wage occupations (having a net effect of 0.073 points); seniority (witha net effect of 0.059 points); lower educational attainment (0.039) and relatively lesswork with supervisory responsibilities (0.020). Notably, occupational and workplacesegregation together account for 0.136 points of the wage gap. Actually, if occupationalsegregation of a vertical nature (captured by the control for fulfilment of supervisorytasks) is further added, total segregation accounts for 0.156 points, or 61% of the total.On the other hand, it is also noteworthy that the effect of the unobserved factors isalmost negligible (0.008). This suggests that the wage gap between native-born andlegal immigrant workers in the Spanish labour market is basically due to the differencesin their individual characteristics and their job positions. Hence, once these factors arecontrolled for, no differentiated wage treatment is observed between native-born andlegal immigrant workers from developing countries.12
As for immigrants from developed countries, their hourly wages are found to exceedthose of native-born workers by 0.149 log points. Of this differential, 0.069 points can
12 This result differs from the usual findings when carrying out wage comparisons for men and women inSpain using matched employer–employee microdata (Amuedo-Dorantes and De la Rica 2006; Palacio andSimón 2006).
123
Labour segregation and immigrant and native-born wage distributions in Spain 153
be explained by better endowments of characteristics (despite having less seniorityand potential experience); 0.049 come from the relatively positive influence of theunobserved factors and 0.031 stem from their higher presence in high-wage firms. Ingeneral, this group clearly tends to be employed in segments of the labour marketthat are relatively well-paid: firm and occupational segregation (both vertically andhorizontally) together account for 81% (0.121 in relation to 0.149 points) of its higherwage levels when compared to the native-born population.
The disaggregated results by gender show that male immigrants from developedcountries benefit somewhat less from the effect of occupational and workplace seg-regation, while men from developing countries notably experience the most negativequantitative effect from the unobserved factors. In spite of this, the most marked dif-ferences with respect to the general case are found in the case of the women. Whencompared to the relevant native group, women from developed countries show a wagedifferential that is much greater than it is for men (the relative differential is 0.121 logpoints greater). This is explained by their greater relative advantage in average educa-tional attainment; their slighter relative disadvantage in average seniority and, aboveall, their greater presence in well-paying occupations and companies. On the otherhand, women from developing countries show a lower wage differential than men intheir group. This occurs in spite of their greater segregation in low-wage occupationsand firms and can be explained largely by the surprisingly favourable effect of theunobserved factors.
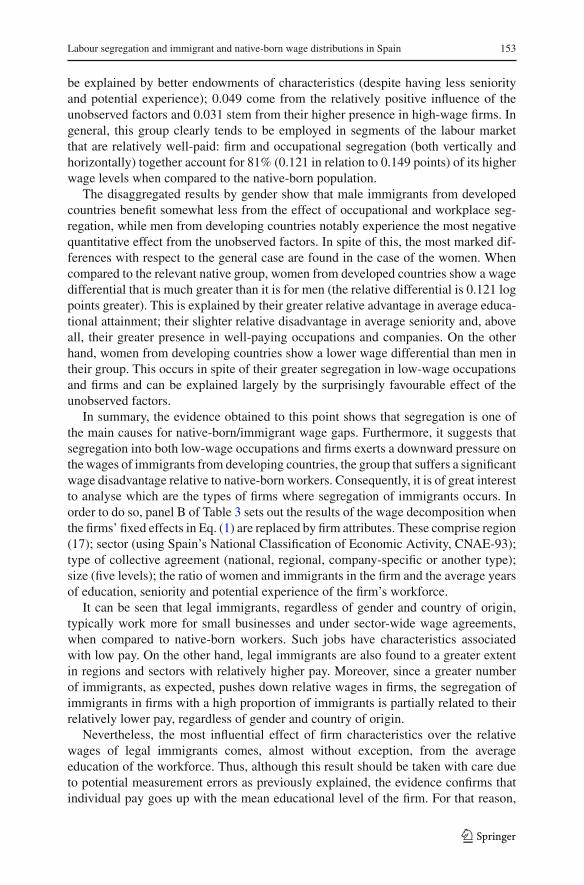
In summary, the evidence obtained to this point shows that segregation is one ofthe main causes for native-born/immigrant wage gaps. Furthermore, it suggests thatsegregation into both low-wage occupations and firms exerts a downward pressure onthe wages of immigrants from developing countries, the group that suffers a significantwage disadvantage relative to native-born workers. Consequently, it is of great interestto analyse which are the types of firms where segregation of immigrants occurs. Inorder to do so, panel B of Table 3 sets out the results of the wage decomposition whenthe firms’ fixed effects in Eq. (1) are replaced by firm attributes. These comprise region(17); sector (using Spain’s National Classification of Economic Activity, CNAE-93);type of collective agreement (national, regional, company-specific or another type);size (five levels); the ratio of women and immigrants in the firm and the average yearsof education, seniority and potential experience of the firm’s workforce.
It can be seen that legal immigrants, regardless of gender and country of origin,typically work more for small businesses and under sector-wide wage agreements,when compared to native-born workers. Such jobs have characteristics associatedwith low pay. On the other hand, legal immigrants are also found to a greater extentin regions and sectors with relatively higher pay. Moreover, since a greater numberof immigrants, as expected, pushes down relative wages in firms, the segregation ofimmigrants in firms with a high proportion of immigrants is partially related to theirrelatively lower pay, regardless of gender and country of origin.
Nevertheless, the most influential effect of firm characteristics over the relativewages of legal immigrants comes, almost without exception, from the averageeducation of the workforce. Thus, although this result should be taken with care dueto potential measurement errors as previously explained, the evidence confirms thatindividual pay goes up with the mean educational level of the firm. For that reason,
123
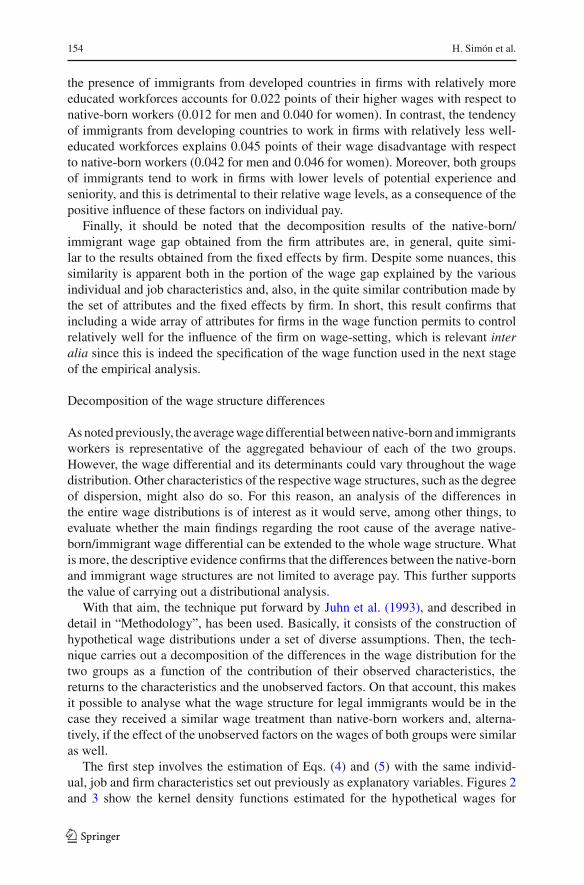
154 H. Simón et al.
the presence of immigrants from developed countries in firms with relatively moreeducated workforces accounts for 0.022 points of their higher wages with respect tonative-born workers (0.012 for men and 0.040 for women). In contrast, the tendencyof immigrants from developing countries to work in firms with relatively less well-educated workforces explains 0.045 points of their wage disadvantage with respectto native-born workers (0.042 for men and 0.046 for women). Moreover, both groupsof immigrants tend to work in firms with lower levels of potential experience andseniority, and this is detrimental to their relative wage levels, as a consequence of thepositive influence of these factors on individual pay.
Finally, it should be noted that the decomposition results of the native-born/immigrant wage gap obtained from the firm attributes are, in general, quite simi-lar to the results obtained from the fixed effects by firm. Despite some nuances, thissimilarity is apparent both in the portion of the wage gap explained by the variousindividual and job characteristics and, also, in the quite similar contribution made bythe set of attributes and the fixed effects by firm. In short, this result confirms thatincluding a wide array of attributes for firms in the wage function permits to controlrelatively well for the influence of the firm on wage-setting, which is relevant interalia since this is indeed the specification of the wage function used in the next stageof the empirical analysis.
Decomposition of the wage structure differences
As noted previously, the average wage differential between native-born and immigrantsworkers is representative of the aggregated behaviour of each of the two groups.However, the wage differential and its determinants could vary throughout the wagedistribution. Other characteristics of the respective wage structures, such as the degreeof dispersion, might also do so. For this reason, an analysis of the differences inthe entire wage distributions is of interest as it would serve, among other things, toevaluate whether the main findings regarding the root cause of the average native-born/immigrant wage differential can be extended to the whole wage structure. Whatis more, the descriptive evidence confirms that the differences between the native-bornand immigrant wage structures are not limited to average pay. This further supportsthe value of carrying out a distributional analysis.
With that aim, the technique put forward by Juhn et al. (1993), and described indetail in “Methodology”, has been used. Basically, it consists of the construction ofhypothetical wage distributions under a set of diverse assumptions. Then, the tech-nique carries out a decomposition of the differences in the wage distribution for thetwo groups as a function of the contribution of their observed characteristics, thereturns to the characteristics and the unobserved factors. On that account, this makesit possible to analyse what the wage structure for legal immigrants would be in thecase they received a similar wage treatment than native-born workers and, alterna-tively, if the effect of the unobserved factors on the wages of both groups were similaras well.
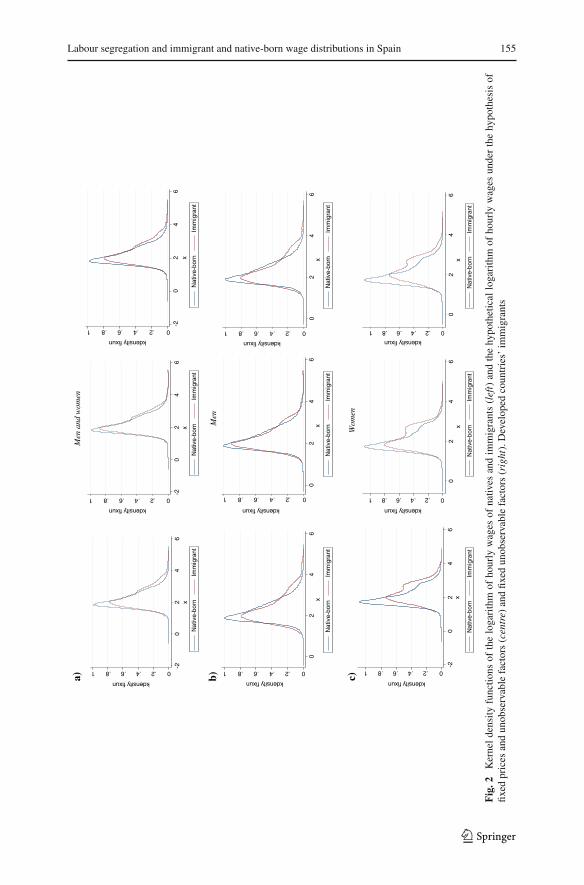
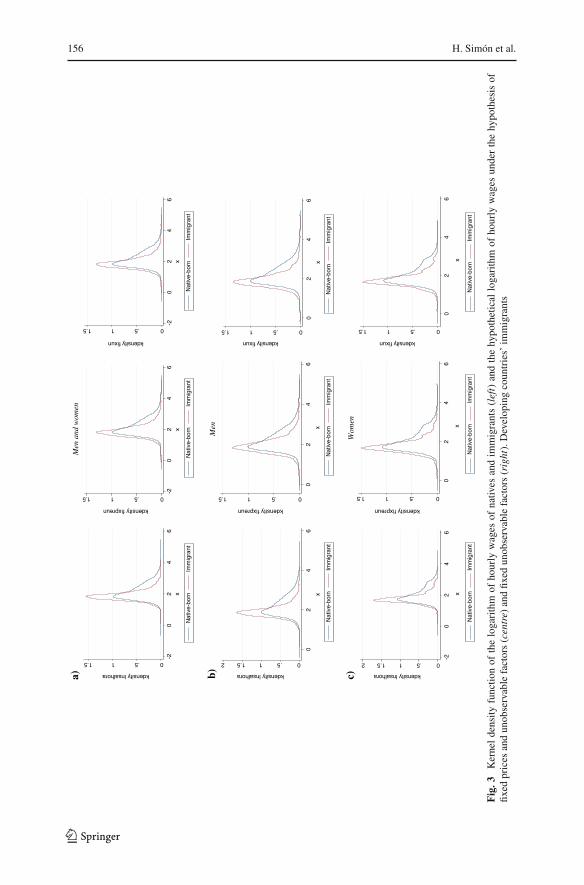
The first step involves the estimation of Eqs. (4) and (5) with the same individ-ual, job and firm characteristics set out previously as explanatory variables. Figures 2and 3 show the kernel density functions estimated for the hypothetical wages for
123
Labour segregation and immigrant and native-born wage distributions in Spain 155
Men
and
wom
en
0.2.4.6.81
kdensity fixun
-20
24
6x
Nat
ive-
born
Im
mig
rant
0.2.4.6.81
kdensity fixun
0.2.4.6.81
kdensity fixun
-20
24
6x
Nat
ive-
born
Im
mig
rant
0.2.4.6.81
kdensity fixun
kdensity fixun
kdensity fixun
kdensity fixun
kdensity fixun
kdensity fixun
-20
24
6x
Nat
ive-
born
Im
mig
rant
Nat
ive-
born
Im
mig
rant
Nat
ive-
born
Im
mig
rant
Nat
ive-
born
Im
mig
rant
Nat
ive-
born
Im
mig
rant
Nat
ive-
born
Im
mig
rant
Nat
ive-
born
Im
mig
rant
Men
02
46
x
0.2.4.6.81
02
46
x
0.2.4.6.81
02
46
x
Wom
en
a) b) c)
0.2.4.6.81
-20
24
6x
0.2.4.6.81
02
46
x
0.2.4.6.81
02
46
x
Fig
.2K
erne
lde
nsity
func
tions
ofth
elo
gari
thm
ofho
urly
wag
esof
nativ
esan
dim
mig
rant
s(l
eft)
and
the
hypo
thet
ical
loga
rith
mof
hour
lyw
ages
unde
rth
ehy
poth
esis
offix
edpr
ices
and
unob
serv
able
fact
ors
(cen
tre)
and
fixed
unob
serv
able
fact
ors
(rig
ht).
Dev
elop
edco
untr
ies’
imm
igra
nts
123
156 H. Simón et al.
Men
and
wom
en
0.511.5
kdensity lnsalhora
-20
24
6x
0.511.5
kdensity fixpreun
-20
24
6x
0.511.5
kdensity fixun
kdensity lnsalhora
kdensity fixpreun
kdensity fixun
kdensity lnsalhora
kdensity fixpreun
kdensity fixun
-20
24
6x
Nat
ive-
born
Im
mig
rant
Nat
ive-
born
Im
mig
rant
Nat
ive-
born
Im
mig
rant
Nat
ive-
born
Im
mig
rant
Nat
ive-
born
Im
mig
rant
Nat
ive-
born
Im
mig
rant
Nat
ive-
born
Im
mig
rant
Nat
ive-
born
Im
mig
rant
Nat
ive-
born
Im
mig
rant
Men
0.511.52
02
46
x
0.511.5
02
46
x
0.511.5
02
46
x
Wom
en
a)
b) c)
0.511.52
-20
24
6
x
0.511.5
02
46
x
0.511.5
02
46
x
Fig
.3K
erne
lde
nsity
func
tion
ofth
elo
gari
thm
ofho
urly
wag
esof
nativ
esan
dim
mig
rant
s(l
eft)
and
the
hypo
thet
ical
loga
rith
mof
hour
lyw
ages
unde
rth
ehy
poth
esis
offix
edpr
ices
and
unob
serv
able
fact
ors
(cen
tre)
and
fixed
unob
serv
able
fact
ors
(rig
ht).
Dev
elop
ing
coun
trie
s’im
mig
rant
s
123

Labour segregation and immigrant and native-born wage distributions in Spain 157
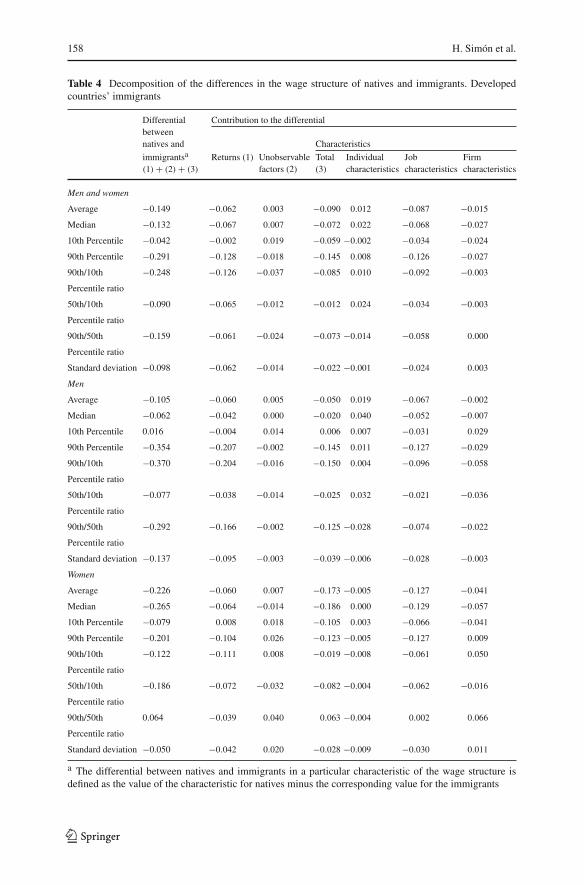
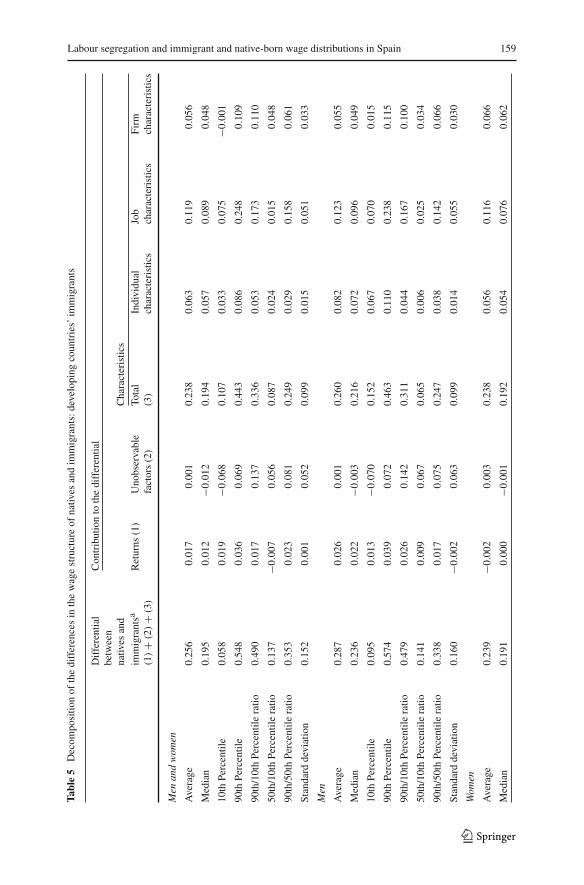
native-born and legal immigrant workers obtained from Eqs. (6)–(9), based on thehypothesis that prices and unobserved factors are fixed (central panel) or that onlyunobserved factors are fixed (right-hand panel). For comparison purposes, the kerneldensity functions for the original wages are also shown (left-hand panel). In turn,Tables 4 and 5 show the decomposition findings for the relative contribution of theobserved characteristics, the returns to the characteristics and the unobserved factorsfor native-born/immigrant differences at some representative points of their respec-tive wage distributions (specifically, at the mean, the median and the 10th and 90thpercentiles) and in the degree of dispersion (measured by standard deviation andthe 90th/10th, 50th/10th and 90th/50th percentile ratios). The relative contribution ofthe observed characteristics is further broken down into the relative contributions ofindividual, job and firm characteristics. The purpose for this is to approximate theinfluence of occupational and firm segregation on the generation of differences in thewage distributions.
The direction of the native-born/immigrant wage differentials holds (with slightexceptions) throughout the wage distribution. However, as the distribution proceeds,they tend to widen significantly. Thus, the wage advantage systematically held byimmigrants from developed countries relative to native-born workers is much lessmarked in the left tail of the distribution (0.042 points at the 10th percentile) than inthe right tail (0.291 points at the 90th percentile). Similarly, the wage disadvantagefaced by immigrants from developing countries is also much less marked in the lowersegment of the distribution (0.058 points at the 10th percentile) than in the higherpart (0.548 at the 90th percentile). In the same vein, there are significant disparitiesin the degree of dispersion of the wage distributions for immigrant and native-bornworkers and, in turn, in the dispersion in the two tails of the respective distributions.Thus, the main reason for the relatively greater dispersion of the wage distributionfor immigrants from developed countries lies in the higher degree of dispersion in theright tail of the distribution for men and in its left tail for women. By contrast, forimmigrants from developing countries the wage structure is, irrespective of gender,comparatively less dispersed, primarily because of the more intense compression ofwages in the left tail of the distribution.
Comparing real and hypothetical wage structures for immigrants from developedcountries and for native-born workers (Fig. 2) shows that if wages for these two groupswere equally affected by returns to the characteristics and by the unobserved factors(central panel), then their wage distributions would be more alike than they actu-ally are (left-hand panel). Therefore, some portion of the difference in their wagestructures must be due to the differentiated effect of the two sets of factors. Thisapproximation is, in turn, more significant under the assumption of fixed returns andunobserved factors than it is under the alternative assumption of fixed unobservedfactors alone (right-hand panel), pointing to the greater relative influence of returnson the disparity. In any case, even if the groups had equal returns to the characteristicsand the same unobserved factors, their wage structures would not coincide. Rather,the relative differences in their characteristics would lead immigrants from developedcountries to receive significantly higher relative average wages. To a lesser extent,they would also show a more dispersed wage distribution than native-born workers.
123
158 H. Simón et al.
Table 4 Decomposition of the differences in the wage structure of natives and immigrants. Developedcountries’ immigrants
Differential Contribution to the differentialbetweennatives and Characteristics
immigrantsa Returns (1) Unobservable Total Individual Job Firm(1) + (2) + (3) factors (2) (3) characteristics characteristics characteristics
Men and women
Average −0.149 −0.062 0.003 −0.090 0.012 −0.087 −0.015
Median −0.132 −0.067 0.007 −0.072 0.022 −0.068 −0.027
10th Percentile −0.042 −0.002 0.019 −0.059 −0.002 −0.034 −0.024
90th Percentile −0.291 −0.128 −0.018 −0.145 0.008 −0.126 −0.027
90th/10th −0.248 −0.126 −0.037 −0.085 0.010 −0.092 −0.003
Percentile ratio
50th/10th −0.090 −0.065 −0.012 −0.012 0.024 −0.034 −0.003
Percentile ratio
90th/50th −0.159 −0.061 −0.024 −0.073 −0.014 −0.058 0.000
Percentile ratio
Standard deviation −0.098 −0.062 −0.014 −0.022 −0.001 −0.024 0.003
Men
Average −0.105 −0.060 0.005 −0.050 0.019 −0.067 −0.002
Median −0.062 −0.042 0.000 −0.020 0.040 −0.052 −0.007
10th Percentile 0.016 −0.004 0.014 0.006 0.007 −0.031 0.029
90th Percentile −0.354 −0.207 −0.002 −0.145 0.011 −0.127 −0.029
90th/10th −0.370 −0.204 −0.016 −0.150 0.004 −0.096 −0.058
Percentile ratio
50th/10th −0.077 −0.038 −0.014 −0.025 0.032 −0.021 −0.036
Percentile ratio
90th/50th −0.292 −0.166 −0.002 −0.125 −0.028 −0.074 −0.022
Percentile ratio
Standard deviation −0.137 −0.095 −0.003 −0.039 −0.006 −0.028 −0.003
Women
Average −0.226 −0.060 0.007 −0.173 −0.005 −0.127 −0.041
Median −0.265 −0.064 −0.014 −0.186 0.000 −0.129 −0.057
10th Percentile −0.079 0.008 0.018 −0.105 0.003 −0.066 −0.041
90th Percentile −0.201 −0.104 0.026 −0.123 −0.005 −0.127 0.009
90th/10th −0.122 −0.111 0.008 −0.019 −0.008 −0.061 0.050
Percentile ratio
50th/10th −0.186 −0.072 −0.032 −0.082 −0.004 −0.062 −0.016
Percentile ratio
90th/50th 0.064 −0.039 0.040 0.063 −0.004 0.002 0.066
Percentile ratio
Standard deviation −0.050 −0.042 0.020 −0.028 −0.009 −0.030 0.011
a The differential between natives and immigrants in a particular characteristic of the wage structure isdefined as the value of the characteristic for natives minus the corresponding value for the immigrants
123
Labour segregation and immigrant and native-born wage distributions in Spain 159
Tabl
e5
Dec
ompo
sitio
nof
the
diff
eren
ces
inth
ew
age
stru
ctur
eof
nativ
esan
dim
mig
rant
s:de
velo
ping
coun
trie
s’im
mig
rant
s
Dif
fere
ntia
lC
ontr
ibut
ion
toth
edi
ffer
entia
lbe
twee
nna
tives
and
Cha
ract
eris
tics
imm
igra
ntsa
Ret
urns
(1)
Uno
bser
vabl
eTo
tal
Indi
vidu
alJo
bFi
rm(1
)+
(2)+
(3)
fact
ors
(2)
(3)
char
acte
rist
ics
char
acte
rist
ics
char
acte
rist
ics
Men
and
wom
en
Ave
rage
0.25
60.
017
0.00
10.
238
0.06
30.
119
0.05
6
Med
ian
0.19
50.
012
−0.0
120.
194
0.05
70.
089
0.04
8
10th
Perc
entil
e0.
058
0.01
9−0
.068
0.10
70.
033
0.07
5−0
.001
90th
Perc
entil
e0.
548
0.03
60.
069
0.44
30.
086
0.24
80.
109
90th
/10t
hPe
rcen
tile
ratio
0.49
00.
017
0.13
70.
336
0.05
30.
173
0.11
0
50th
/10t
hPe
rcen
tile
ratio
0.13
7−0
.007
0.05
60.
087
0.02
40.
015
0.04
8
90th
/50t
hPe
rcen
tile
ratio
0.35
30.
023
0.08
10.
249
0.02
90.
158
0.06
1
Stan
dard
devi
atio
n0.
152
0.00
10.
052
0.09
90.
015
0.05
10.
033
Men
Ave
rage
0.28
70.
026
0.00
10.
260
0.08
20.
123
0.05
5
Med
ian
0.23
60.
022
−0.0
030.
216
0.07
20.
096
0.04
9
10th
Perc
entil
e0.
095
0.01
3−0
.070
0.15
20.
067
0.07
00.
015
90th
Perc
entil
e0.
574
0.03
90.
072
0.46
30.
110
0.23
80.
115
90th
/10t
hPe
rcen
tile
ratio
0.47
90.
026
0 .14
20.
311
0.04
40.
167
0.10
0
50th
/10t
hPe
rcen
tile
ratio
0.14
10.
009
0.06
70.
065
0.00
60.
025
0.03
4
90th
/50t
hPe
rcen
tile
ratio
0.33
80.
017
0.07
50.
247
0.03
80.
142
0.06
6
Stan
dard
devi
atio
n0.
160
−0.0
020.
063
0.09
90.
014
0.05
50.
030
Wom
en
Ave
rage
0.23
9−0
.002
0.00
30.
238
0.05
60.
116
0.06
6
Med
ian
0.19
10.
000
−0.0
010.
192
0.05
40.
076
0.06
2
123
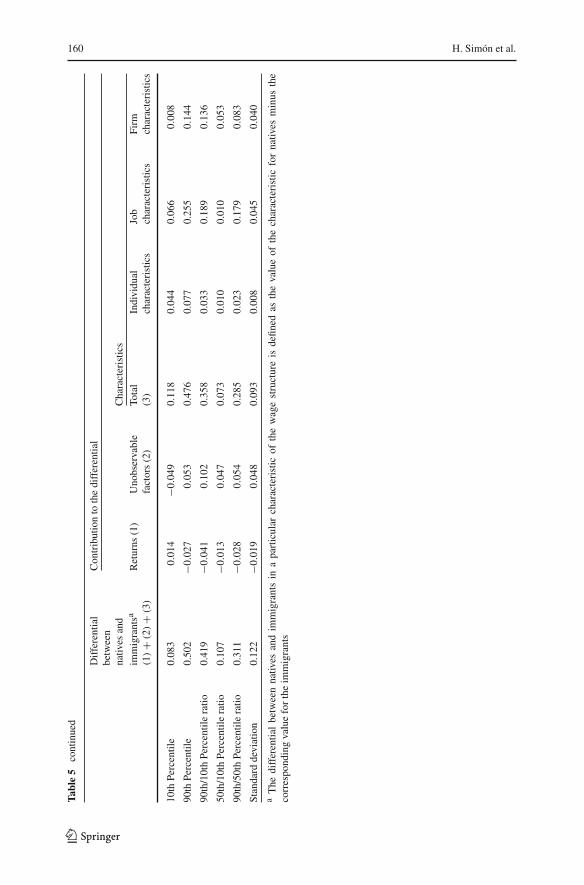
160 H. Simón et al.
Tabl
e5
cont
inue
d
Dif
fere
ntia
lC
ontr
ibut
ion
toth
edi
ffer
entia
lbe
twee
nna
tives
and
Cha
ract
eris
tics
imm
igra
ntsa
Ret
urns
(1)
Uno
bser
vabl
eTo
tal
Indi
vidu
alJo
bFi
rm(1
)+
(2)+
(3)
fact
ors
(2)
(3)
char
acte
rist
ics
char
acte
rist
ics
char
acte
rist
ics
10th
Perc
entil
e0.
083
0.01
4−0
.049
0.11
80.
044
0.06
60.
008
90th
Perc
entil
e0.
502
−0.0
270.
053
0.47
60.
077
0.25
50.
144
90th
/10t
hPe
rcen
tile
ratio
0.41
9−0
.041
0.10
20.
358
0.03
30.
189
0.13
6
50th
/10t
hPe
rcen
tile
ratio
0.10
7−0
.013
0.04
70.
073
0.01
00.
010
0.05
3
90th
/50t
hPe
rcen
tile
ratio
0.31
1−0
.028
0.05
40.
285
0.02
30.
179
0.08
3
Stan
dard
devi
atio
n0.
122
−0.0
190.
048
0.09
30.
008
0.04
50.
040
aT
hedi
ffer
entia
lbe
twee
nna
tives
and
imm
igra
nts
ina
part
icul
arch
arac
teri
stic
ofth
ew
age
stru
ctur
eis
defin
edas
the
valu
eof
the
char
acte
rist
icfo
rna
tives
min
usth
eco
rres
pond
ing
valu
efo
rth
eim
mig
rant
s
123
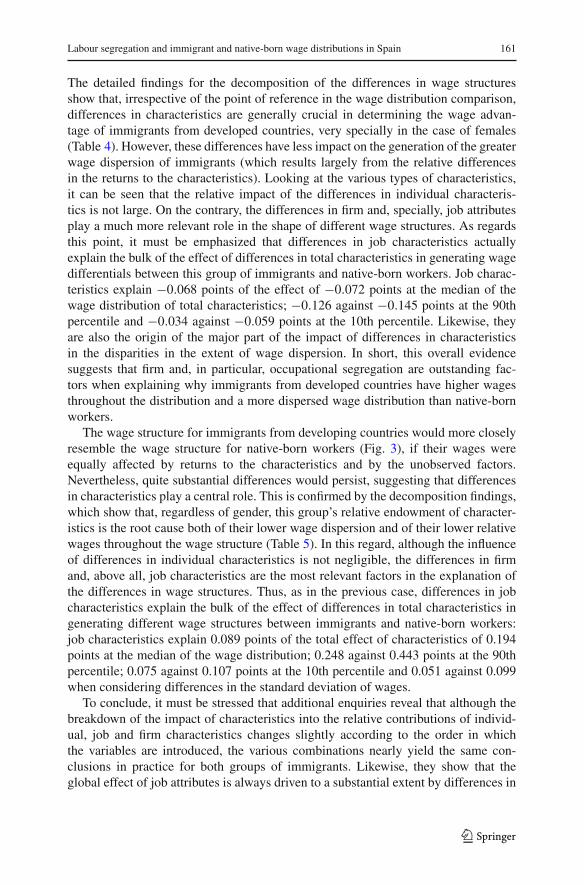
Labour segregation and immigrant and native-born wage distributions in Spain 161
The detailed findings for the decomposition of the differences in wage structuresshow that, irrespective of the point of reference in the wage distribution comparison,differences in characteristics are generally crucial in determining the wage advan-tage of immigrants from developed countries, very specially in the case of females(Table 4). However, these differences have less impact on the generation of the greaterwage dispersion of immigrants (which results largely from the relative differencesin the returns to the characteristics). Looking at the various types of characteristics,it can be seen that the relative impact of the differences in individual characteris-tics is not large. On the contrary, the differences in firm and, specially, job attributesplay a much more relevant role in the shape of different wage structures. As regardsthis point, it must be emphasized that differences in job characteristics actuallyexplain the bulk of the effect of differences in total characteristics in generating wagedifferentials between this group of immigrants and native-born workers. Job charac-teristics explain −0.068 points of the effect of −0.072 points at the median of thewage distribution of total characteristics; −0.126 against −0.145 points at the 90thpercentile and −0.034 against −0.059 points at the 10th percentile. Likewise, theyare also the origin of the major part of the impact of differences in characteristicsin the disparities in the extent of wage dispersion. In short, this overall evidencesuggests that firm and, in particular, occupational segregation are outstanding fac-tors when explaining why immigrants from developed countries have higher wagesthroughout the distribution and a more dispersed wage distribution than native-bornworkers.
The wage structure for immigrants from developing countries would more closelyresemble the wage structure for native-born workers (Fig. 3), if their wages wereequally affected by returns to the characteristics and by the unobserved factors.Nevertheless, quite substantial differences would persist, suggesting that differencesin characteristics play a central role. This is confirmed by the decomposition findings,which show that, regardless of gender, this group’s relative endowment of character-istics is the root cause both of their lower wage dispersion and of their lower relativewages throughout the wage structure (Table 5). In this regard, although the influenceof differences in individual characteristics is not negligible, the differences in firmand, above all, job characteristics are the most relevant factors in the explanation ofthe differences in wage structures. Thus, as in the previous case, differences in jobcharacteristics explain the bulk of the effect of differences in total characteristics ingenerating different wage structures between immigrants and native-born workers:job characteristics explain 0.089 points of the total effect of characteristics of 0.194points at the median of the wage distribution; 0.248 against 0.443 points at the 90thpercentile; 0.075 against 0.107 points at the 10th percentile and 0.051 against 0.099when considering differences in the standard deviation of wages.
To conclude, it must be stressed that additional enquiries reveal that although thebreakdown of the impact of characteristics into the relative contributions of individ-ual, job and firm characteristics changes slightly according to the order in whichthe variables are introduced, the various combinations nearly yield the same con-clusions in practice for both groups of immigrants. Likewise, they show that theglobal effect of job attributes is always driven to a substantial extent by differences in
123
162 H. Simón et al.
occupational sorting (these overall results are available from the authors on request).Hence, the obtained empirical evidence conclusively confirms the key role playedby firm and, particularly, occupational segregation in generating differences in theSpanish labour market between the wage distributions of native-born and legal immi-grant workers.
Conclusions
This article has examined differences in the wage distributions between native-bornand legal immigrants in the Spanish labour market, as well as the root cause of thesedifferences. The analysis has been carried out on matched employer–employee micro-data, and it has placed special attention on the effects of immigrant segregation intolow-wage occupations and firms. In doing so, it has drawn on the extensive literaturethat has analysed the part played by labour market segregation in the generation ofracial and gender wage gaps. This literature, however, had not previously explored theimpact on the relative wages of immigrants caused by workplace segregation.
In keeping with the general findings in the international migration literature, theSpanish case is characterised by wage distribution patterns for native-born andimmigrant workers that differ quite significantly by place of origin: immigrants fromdeveloped countries, when compared with native-born workers, have higher averagewages and show a wage distribution that is more dispersed, while immigrants fromdeveloping countries have lower average wages and show a relatively more com-pressed wage distribution. The use of several decomposition methodologies in orderto decompose differences for native-born and immigrant workers in average wages andin the entire wage distribution has permitted to obtain extensive empirical evidenceon the source of this phenomenon and, subsequently, analyse it thoroughly.
A major finding of the study is that the differences in the wage structures fornative-born and legal immigrant workers are, to a great extent, accounted for by thedifferences in their observed characteristics. In this regard, of special note is the impactof the segregation of immigrants in labour structures that are distinct from thoseof native-born workers. Although this segregation partially takes place through thesorting of immigrants across different firms than native-born workers, occupationalsegregation of immigrants seems to play a central role in generating differences inwage distributions.
The evidence obtained also suggests that those legal immigrants facing a con-siderable wage disadvantage relative to native-born workers (namely, those comingfrom developing countries) do not face a significantly different wage treatment whenworking in comparable jobs. From this result, it follows that any reduction in native-born/immigrant wage differences must be based on promotion and access to betterjobs, given that anti-discrimination legislation may not be enough in this respect. Atthis point, it should be considered that labour market segregation of immigrants maywell be arising from factors like imperfect transferability of human capital acquiredbefore immigrating to Spain, but also be the result of discriminatory practices in thehiring process itself. While the analysis of the specific cause of this phenomenon liesbeyond the scope of this study, it ought to be studied in future research.
123
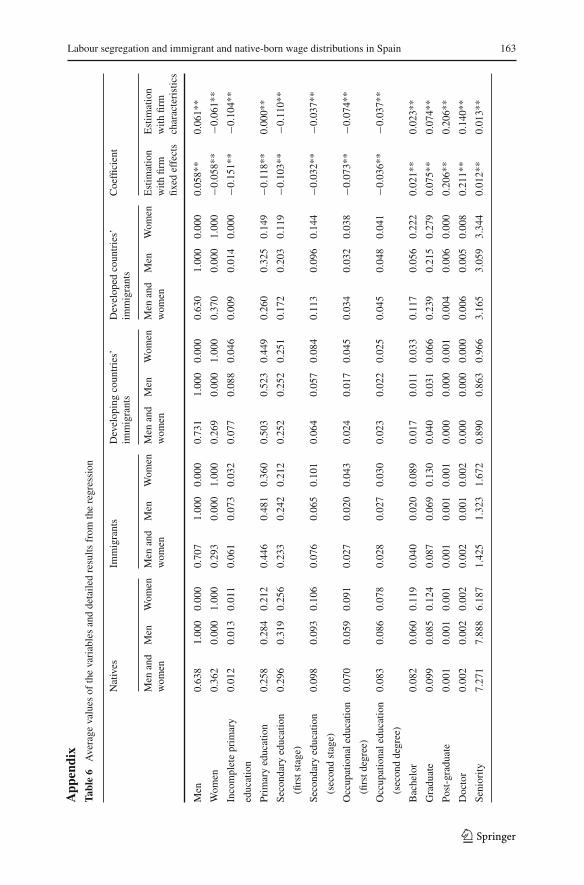
Labour segregation and immigrant and native-born wage distributions in Spain 163
App
endi
xTa
ble
6A
vera
geva
lues
ofth
eva
riab
les
and
deta
iled
resu
ltsfr
omth
ere
gres
sion
Nat
ives
Imm
igra
nts
Dev
elop
ing
coun
trie
s’D
evel
oped
coun
trie
s’C
oeffi
cien
tim
mig
rant
sim
mig
rant
s
Men
and
Men
Wom
enM
enan
dM
enW
omen
Men
and
Men
Wom
enM
enan
dM
enW
omen
Est
imat
ion
Est
imat
ion
wom
enw
omen
wom
enw
omen
with
firm
with
firm
fixed
effe
cts
char
acte
rist
ics
Men
0.63
81.
000
0.00
00.
707
1.00
00.
000
0.73
11.
000
0.00
00.
630
1.00
00.
000
0.05
8**
0.06
1**
Wom
en0.
362
0.00
01.
000
0.29
30.
000
1.00
00.
269
0.00
01.
000
0.37
00.
000
1.00
0−0
.058
**−0
.061
**
Inco
mpl
ete
prim
ary
0.01
20.
013
0.01
10.
061
0.07
30.
032
0.07
70.
088
0.04
60.
009
0.01
40.
000
−0.1
51**
−0.1
04**
educ
atio
n
Prim
ary
educ
atio
n0.
258
0.28
40.
212
0.44
60.
481
0.36
00.
503
0.52
30.
449
0.26
00.
325
0.14
9−0
.118
**0.
000*
*
Seco
ndar
yed
ucat
ion
0.29
60.
319
0.25
60.
233
0.24
20.
212
0.25
20.
252
0.25
10.
172
0.20
30.
119
−0.1
03**
−0.1
10**
(firs
tsta
ge)
Seco
ndar
yed
ucat
ion
0.09
80.
093
0.10
60.
076
0.06
50.
101
0.06
40.
057
0.08
40.
113
0.09
60.
144
−0.0
32**
−0.0
37**
(sec
ond
stag
e)
Occ
upat
iona
ledu
catio
n0.
070
0.05
90.
091
0.02
70.
020
0.04
30.
024
0.01
70.
045
0.03
40.
032
0.03
8−0
.073
**−0
.074
**
(firs
tdeg
ree)
Occ
upat
iona
ledu
catio
n0.
083
0.08
60.
078
0.02
80.
027
0.03
00.
023
0.02
20.
025
0.04
50.
048
0.04
1−0
.036
**−0
.037
**
(sec
ond
degr
ee)
Bac
helo
r0.
082
0.06
00.
119
0.04
00.
020
0.08
90.
017
0.01
10.
033
0.11
70.
056
0.22
20.
021*
*0.
023*
*
Gra
duat
e0.
099
0.08
50.
124
0.08
70.
069
0.13
00.
040
0.03
10.
066
0.23
90.
215
0.27
90.
075*
*0.
074*
*
Post
-gra
duat
e0.
001
0.00
10.
001
0.00
10.
001
0.00
10.
000
0.00
00.
001
0.00
40.
006
0.00
00.
206*
*0.
206*
*
Doc
tor
0.00
20.
002
0.00
20.
002
0.00
10.
002
0.00
00.
000
0.00
00.
006
0.00
50.
008
0.21
1**
0.14
0**
Seni
ority
7.27
17.
888
6.18
71.
425
1.32
31.
672
0.89
00.
863
0.96
63.
165
3.05
93.
344
0.01
2**
0.01
3**
123
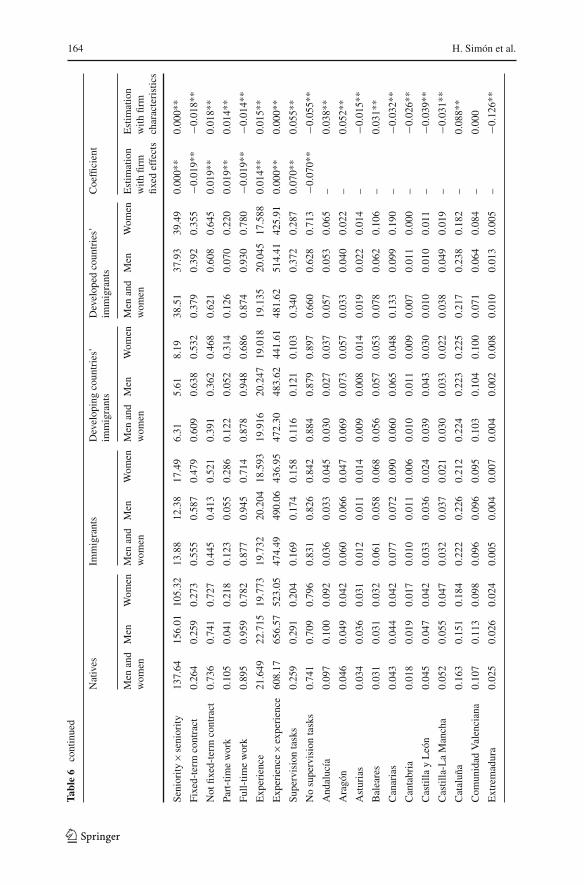
164 H. Simón et al.
Tabl
e6
cont
inue
d
Nat
ives
Imm
igra
nts
Dev
elop
ing
coun
trie
s’D
evel
oped
coun
trie
s’C
oeffi
cien
tim
mig
rant
sim
mig
rant
s
Men
and
Men
Wom
enM
enan
dM
enW
omen
Men
and
Men
Wom
enM
enan
dM
enW
omen
Est
imat
ion
Est
imat
ion
wom
enw
omen
wom
enw
omen
with
firm
with
firm
fixed
effe
cts
char
acte
rist
ics
Seni
ority
×sen
iori
ty13
7.64
156.
0110
5.32
13.8
812
.38
17.4
96.
315.
618.
1938
.51
37.9
339
.49
0.00
0**
0.00
0**
Fixe
d-te
rmco
ntra
ct0.
264
0.25
90.
273
0.55
50.
587
0.47
90.
609
0.63
80.
532
0.37
90.
392
0.35
5−0
.019
**−0
.018
**
Not
fixed
-ter
mco
ntra
ct0.
736
0.74
10.
727
0.44
50.
413
0.52
10.
391
0.36
20.
468
0.62
10.
608
0.64
50.
019*
*0.
018*
*
Part
-tim
ew
ork
0.10
50.
041
0.21
80.
123
0.05
50.
286
0.12
20.
052
0.31
40.
126
0.07
00.
220
0.01
9**
0.01
4**
Full-
time
wor
k0.
895
0.95
90.
782
0.87
70.
945
0.71
40.
878
0.94
80.
686
0.87
40.
930
0.78
0−0
.019
**−0
.014
**
Exp
erie
nce
21.6
4922
.715
19.7
7319
.732
20.2
0418
.593
19.9
1620
.247
19.0
1819
.135
20.0
4517
.588
0.01
4**
0.01
5**
Exp
erie
nce×e
xper
ienc
e60
8.17
656.
5752
3.05
474.
4949
0.06
436.
9547
2.30
483.
6244
1.61
481.
6251
4.41
425.
910.
000*
*0.
000*
*
Supe
rvis
ion
task
s0.
259
0.29
10.
204
0.16
90.
174
0.15
80.
116
0.12
10.
103
0.34
00.
372
0.28
70.
070*
*0.
055*
*
No
supe
rvis
ion
task
s0.
741
0.70
90.
796
0.83
10.
826
0.84
20.
884
0.87
90.
897
0.66
00.
628
0.71
3−0
.070
**−0
.055
**
And
aluc
ía0.
097
0.10
00.
092
0.03
60.
033
0.04
50.
030
0.02
70.
037
0.05
70.
053
0.06
5–
0.03
8**
Ara
gón
0.04
60.
049
0.04
20.
060
0.06
60.
047
0.06
90.
073
0.05
70.
033
0.04
00.
022
–0.
052*
*
Ast
uria
s0.
034
0.03
60.
031
0.01
20.
011
0.01
40.
009
0.00
80.
014
0.01
90.
022
0.01
4–
−0.0
15**
Bal
eare
s0.
031
0.03
10.
032
0.06
10.
058
0.06
80.
056
0.05
70.
053
0.07
80.
062
0.10
6–
0.03
1**
Can
aria
s0.
043
0.04
40.
042
0.07
70.
072
0.09
00.
060
0.06
50.
048
0.13
30.
099
0.19
0–
−0.0
32**
Can
tabr
ia0.
018
0.01
90.
017
0.01
00.
011
0.00
60.
010
0.01
10.
009
0.00
70.
011
0.00
0–
−0.0
26**
Cas
tilla
yL
eón
0.04
50.
047
0.04
20.
033
0.03
60.
024
0.03
90.
043
0.03
00.
010
0.01
00.
011
–−0
.039
**
Cas
tilla
-La
Man
cha
0.05
20.
055
0.04
70.
032
0.03
70.
021
0.03
00.
033
0.02
20.
038
0.04
90.
019
–−0
.031
**
Cat
aluñ
a0.
163
0.15
10.
184
0.22
20.
226
0.21
20.
224
0.22
30.
225
0.21
70.
238
0.18
2–
0.08
8**
Com
unid
adV
alen
cian
a0.
107
0.11
30.
098
0.09
60.
096
0.09
50.
103
0.10
40.
100
0.07
10.
064
0.08
4–
0.00
0
Ext
rem
adur
a0.
025
0.02
60.
024
0.00
50.
004
0.00
70.
004
0.00
20.
008
0.01
00.
013
0.00
5–
−0.1
26**
123
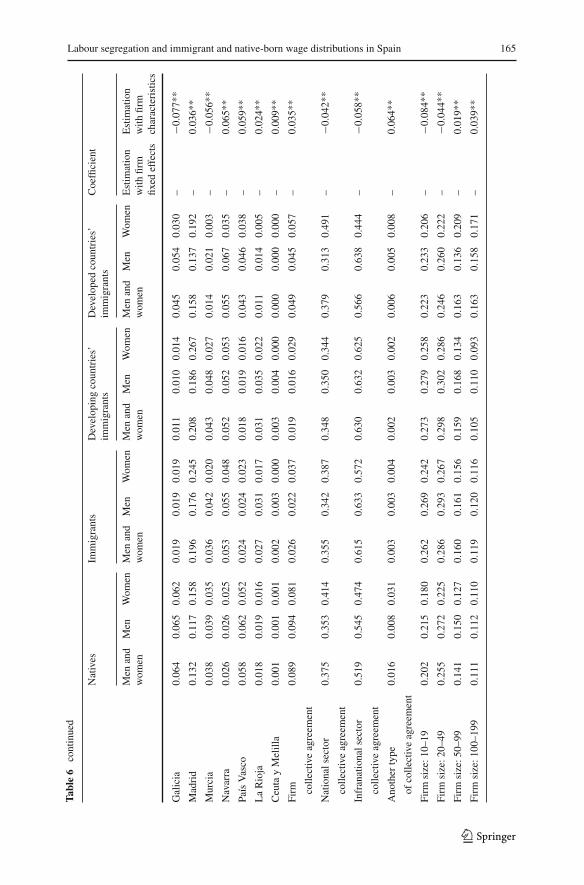
Labour segregation and immigrant and native-born wage distributions in Spain 165
Tabl
e6
cont
inue
d
Nat
ives
Imm
igra
nts
Dev
elop
ing
coun
trie
s’D
evel
oped
coun
trie
s’C
oeffi
cien
tim
mig
rant
sim
mig
rant
s
Men
and
Men
Wom
enM
enan
dM
enW
omen
Men
and
Men
Wom
enM
enan
dM
enW
omen
Est
imat
ion
Est
imat
ion
wom
enw
omen
wom
enw
omen
with
firm
with
firm
fixed
effe
cts
char
acte
rist
ics
Gal
icia
0.06
40.
065
0.06
20.
019
0.01
90.
019
0.01
10.
010
0.01
40.
045
0.05
40.
030
–−0
.077
**
Mad
rid
0.13
20.
117
0.15
80.
196
0.17
60.
245
0.20
80.
186
0.26
70.
158
0.13
70.
192
–0.
036*
*
Mur
cia
0.03
80.
039
0.03
50.
036
0.04
20.
020
0.04
30.
048
0.02
70.
014
0.02
10.
003
–−0
.056
**
Nav
arra
0.02
60.
026
0.02
50.
053
0.05
50.
048
0.05
20.
052
0.05
30.
055
0.06
70.
035
–0.
065*
*
País
Vas
co0.
058
0.06
20.
052
0.02
40.
024
0.02
30.
018
0.01
90.
016
0.04
30.
046
0.03
8–
0.05
9**
La
Rio
ja0.
018
0.01
90.
016
0.02
70.
031
0.01
70.
031
0.03
50.
022
0.01
10.
014
0.00
5–
0.02
4**
Ceu
tay
Mel
illa
0.00
10.
001
0.00
10.
002
0.00
30.
000
0.00
30.
004
0.00
00.
000
0.00
00.
000
–0.
009*
*
Firm
0.08
90.
094
0.08
10.
026
0.02
20.
037
0.01
90.
016
0.02
90.
049
0.04
50.
057
–0.
035*
*
colle
ctiv
eag
reem
ent
Nat
iona
lsec
tor
0.37
50.
353
0.41
40.
355
0.34
20.
387
0.34
80.
350
0.34
40.
379
0.31
30.
491
–−0
.042
**
colle
ctiv
eag
reem
ent
Infr
anat
iona
lsec
tor
0.51
90.
545
0.47
40.
615
0.63
30.
572
0.63
00.
632
0.62
50.
566
0.63
80.
444
–−0
.058
**
colle
ctiv
eag
reem
ent
Ano
ther
type
0.01
60.
008
0.03
10.
003
0.00
30.
004
0.00
20.
003
0.00
20.
006
0.00
50.
008
–0.
064*
*
ofco
llect
ive
agre
emen
t
Firm
size
:10–
190.
202
0.21
50.
180
0.26
20.
269
0.24
20.
273
0.27
90.
258
0.22
30.
233
0.20
6–
−0.0
84**
Firm
size
:20–
490.
255
0.27
20.
225
0.28
60.
293
0.26
70.
298
0.30
20.
286
0.24
60.
260
0.22
2–
−0.0
44**
Firm
size
:50–
990.
141
0.15
00.
127
0.16
00.
161
0.15
60.
159
0.16
80.
134
0.16
30.
136
0.20
9–
0.01
9**
Firm
size
:100
–199
0.11
10.
112
0.11
00.
119
0.12
00.
116
0.10
50.
110
0.09
30.
163
0.15
80.
171
–0.
039*
*
123

166 H. Simón et al.
Tabl
e6
cont
inue
d
Nat
ives
Imm
igra
nts
Dev
elop
ing
coun
trie
s’D
evel
oped
coun
trie
s’C
oeffi
cien
tim
mig
rant
sim
mig
rant
s
Men
and
Men
Wom
enM
enan
dM
enW
omen
Men
and
Men
Wom
enM
enan
dM
enW
omen
Est
imat
ion
Est
imat
ion
wom
enw
omen
wom
enw
omen
with
firm
with
firm
fixed
effe
cts
char
acte
rist
ics
Firm
size
:0.
291
0.25
20.
359
0.17
40.
156
0.21
80.
164
0.14
10.
229
0.20
60.
214
0.19
2–
0.07
0**
high
erth
an20
0
Wom
en’s
prop
ortio
n0.
361
0.21
50.
618
0.32
40.
198
0.62
90.
302
0.17
50.
645
0.39
80.
283
0.59
2–
−0.1
19**
inth
efir
m
Imm
igra
nt’s
prop
ortio
n0.
024
0.02
40.
023
0.31
10.
321
0.28
70.
310
0.32
30.
274
0.31
50.
313
0.31
9–
−0.0
20*
inth
efir
m
Ave
rage
educ
atio
n9.
769
9.49
910
.245
8.68
58.
350
9.49
58.
100
7.93
28.
555
10.5
909.
927
11.7
17–
0.02
7**
year
sin
the
firm
Seni
ority
aver
age
7.20
77.
508
6.67
73.
390
3.26
33.
695
2.96
82.
948
3.02
44.
762
4.45
45.
284
–0.
001*
*
year
sin
the
firm
Exp
erie
nce
aver
age
21.6
3522
.094
20.8
2720
.842
21.0
5620
.327
21.1
3021
.278
20.7
2919
.908
20.2
1919
.378
–0.
003*
*
year
sin
the
firm
Num
ber
ofob
serv
atio
ns12
2,13
077
,864
44,2
664,
237
2,29
51,
242
996
627
369
3,24
12,
368
873
126,
367
Num
ber
offir
ms
––
––
––
––
––
––
14,1
77
Adj
uste
dR
2–
––
––
––
––
––
–0.
761
0.57
1
The
spec
ifica
tion
ofth
ew
age
equa
tion
has
also
incl
uded
job
cont
rols
and,
inth
em
odel
with
firm
char
acte
rist
ics,
activ
ityse
ctor
cont
rols
**,*
the
estim
ated
coef
ficie
ntis
sign
ifica
ntly
diff
eren
tfro
mze
roat
the
1,5%
leve
ls,r
espe
ctiv
ely
123
Labour segregation and immigrant and native-born wage distributions in Spain 167
References
Abowd JM, Kramarz F (1999) The analysis of labor markets using matched employer–employee data. In:Ashenfelter O, Card D (eds) Handbook of labor economics. North-Holland, Amsterdam
Adsera A, Chiswick BR (2007) Are there gender and country of origin differences in immigrant labormarket outcomes across European destinations? J Popul Econ 20:495–526
Alcalá F, Hernández PJ (2006) Las externalidades del capital humano en la empresa española. Rev EconApl 41:61–83
Altonji JG, Blank RM (1999) Race and gender in the labor market. In: Ashenfelter O, Card D (eds)Handbook of labor economics, vol 3C. North-Holland, Amsterdam
Amuedo-Dorantes C, De la Rica S (2006) The Role of Segregation and Pay Structure on the GenderWage Gap: Evidence from Matched Employer–Employee Data for Spain. Contributions to EconomicAnalysis& Policy, 5(1)
Amuedo-Dorantes C, De la Rica S (2007) Labor market assimilation of recents immigrants in Spain. Br JInd Relat 45:257–284
Baker M, Benjamin D (1994) The performance of immigrants in the Canadian labor market. J Labor Econ12:369–405
Battu H, Belfield CR, Sloane PJ (2003) Human capital spill-overs within the workplace. Oxford Bull EconStat 65:575–594
Bayard K, Hellerstein J, Neumark D, Troske K (1999) Why are racial and ethnic wage gaps larger for menthan for women? Exploring the role of segregation using the new worker-establishment characteristicsdatabase. In: Haltiwanger JC et al (eds) The creation and analysis of employer–employee matcheddata. Elsevier, Amsterdam
Bayard K, Hellerstein J, Neumark D, Troske K (2003) New evidence on sex segregation and sex differencesin wages from matched employee–employer data. J Labor Econ 21:887–922
Becker G (1957) The economics of discrimination. University of Chicago Press, ChicagoBlau FD, Kahn LM (1997) Swimming upstream trends in the gender wage differential in the 1980s. J Labor
Econ 15:1–42Blinder AS (1973) Wage discrimination reduced form and structural estimates. J Human Resour 8:436–455Borjas GJ (1987) Self-selection and earnings of immigrants. Am Econ Rev 77:531–553Borjas GJ (1994) The economics of immigration. J Econ Lit 32:1667–1717Borjas GJ (1999) The economic analysis of immigration. In: Ashenfelter O, Card D (eds) Handbook of
labor economics, vol. 3A. North-Holland, AmsterdamButcher K, DiNardo J (2002) The immigrant and native-born wage distributions: evidence from United
States censuses. Ind Labor Relat Rev 56:96–121Card D (2005) Is the new immigration really so bad?. Econ J 115:F300–F323Chiswick RB (1978) The effect of Americanization on the earnings of foreign-born men. J Polit Econ
86:81–87Chiswick RB, Lee Y, Miller P (2005a) Immigrant earnings: a longitudinal analysis. Rev Income Wealth
51:485–503Chiswick RB, Lee Y, Miller P (2005b) Longitudinal analysis of immigrant occupational mobility: a test of
the immigrant assimilation hypothesis. Int Migr Rev 39:332–353Constant A, Massey D (2005) Labor market segmentation and the earnings of german guestworkers. Popul
Res Policy Rev 24:489–512Davia MA, Hernanz V (2004) Temporary work and segmentation in the Spanish labour market: an empirical
analysis through the study of wage differentials. Span Econ Rev 6:291–318De la Rica S (2004) Wage gaps between workers with indefinite and fixed-term contracts: the impact of
firm and occupational segregation. Moneda y Crédito 219:43–69Friedberg RM (2000) You can’t take it with you? Immigrant assimilation and the portability of human
capital. J Labour Econ 18:221–251Gardeazábal J, Ugidos A (2004) More on identification in detailed wage decompositions. Rev Econ Stat
86:1034–1036Gartner H, Stephan G (2004) How collective contracts and works councils reduce the gender wage gap.
IAB Discussion paper 7/2004Haltiwanger JC, Lane J, Spletzer JR, Theeuwes JJ, Troske K (1999) The creation and analysis of employer–
employee matched data. Elsevier, Amsterdam
123
168 H. Simón et al.
Hellerstein J, Neumark D (2005) Workplace segregation in the United States: race, ethnicity and skill.NBER working paper 11599
Hirsch B, Macpherson D (2004) Wages, sorting on skill, and the racial composition of jobs. J Labor Econ22:189–210
Izquierdo M, Jimeno JF (2005) Inmigración: desarrollos recientes y consecuencias económicas. BoletínEconómico del Banco de España febrero, pp 41–49
Jasso G, Rosenzweig MR (1988) How well do U.S. immigrants do? vintage effects, emigration selectivity,and occupational mobility. In: Schultz P (ed) Research in population economics, vol 6. JAI Press,Greenwich
Juhn C, Murphy K, Pierce B (1993) Wage inequality and the rise in returns to skill. J Polit Econ 101:410–442Lalonde RJ, Topel RH (1997) The economic impact of international migration and the economic perfor-
mance of migrants. In: Rosenzweig MR, Stark O (eds) Handbook in population and family economics.Elsevier, Amsterdam
Lam KC, Liu PW (2002) Earnings divergence of immigrants. J Labor Econ 20:86–101Liu PW, Zhang J, Chong S (2004) Occupational segregation and wage differentials between natives and
immigrants: evidence from Hong Kong. J Dev Econ 73:395–413Neumark D (1988) Employer’s discriminatory behaviour and the estimation of wage discrimination.
J Human Resour 23:279–295Oaxaca R (1973) Male–Female wage differentials in urban labor markets. Int Econ Rev 14:139–148Oaxaca R, Ramson M (1994) On discrimination and the decomposition of wage differentials. J Econom
61:5–22Oaxaca R, Ramson M (1999) Identification in detailed wage decompositions. Rev Econ Stat 81:154–157Palacio JI, Simón H (2006) Segregación laboral y diferencias salariales por razón de sexo en España. Estad
Esp 48:493–524Phelps E (1972) The statistical theory of racism and sexism. Am Econ Rev 62:659–661Simón H (2005) Employer wage differentials from an international perspective. Econ Lett 88:284–288Simón H, Ramos R, Sanromá E (2007) Segregación laboral y estructuras salariales de nativos e inmigrantes
en España. Un análisis con datos emparejados empresa-trabajador. Documento de Trabajo IVIE, WP-EC 2007-03
Weiss Y, Sauer RM, Gotlibovski M (2003) Immigration, search and loss of skill. J Labor Econ 21:557–591Wilkins R (2003) Immigrant and native-born earnings distributions in Australia 1982–1996. Aust J Labour
Econ 6:83–115Yuengert AM (1994) Immigrant earnings, relative to what? The importance of earnings function specifica-
tion and comparison points. J Appl Econom 9:71–90
123