Korea's Development in a Global Context
260
Report No. 5102-KO Korea's Development in a GlobalContext June 1984 'Cast Asia & Pacitic Region FOR OFFICIAL USEONLY Document of the WorldBank Thisdocument hasa restricteddistribution and may be usedby recipients only in the performance of their official duties. Its contentsmay not otherwdse be disclosed without World Bankauthorization. Public Disclosure Authorized Public Disclosure Authorized Public Disclosure Authorized Public Disclosure Authorized
-
Upload
khangminh22 -
Category
Documents
-
view
0 -
download
0
Transcript of Korea's Development in a Global Context
Report No. 5102-KO
Korea's Development in a Global Context
June 1984
'Cast Asia & Pacitic Region
FOR OFFICIAL USE ONLY
Document of the World Bank
This document has a restricted distribution and may be used by recipientsonly in the performance of their official duties. Its contents may not otherwdsebe disclosed without World Bank authorization.
Pub
lic D
iscl
osur
e A
utho
rized
Pub
lic D
iscl
osur
e A
utho
rized
Pub
lic D
iscl
osur
e A
utho
rized
Pub
lic D
iscl
osur
e A
utho
rized
CURRENCY EQUTVALENTS
Curreney Unit - Won (W)
Calendar 1983 June 1984
US$ 1.00 = W 775.75 W 795.0Won 1,000 = USS 1.29 USS 1.26
ABBREVIATIONS
BIS - Bank for International SettlementsBOK - Bank of KoreaDMB - Deposit Money BanksEPB - Economic Planning BoardFF - Fertilizer FundGMF - Grain Management FundICOR - Incremental Capital Output RatioKEXNM - Korea Export-Import BankKIET - Korea Institute for Industrial Economics and TechnologyMTTI - Ministry of Trade and Industry (Japan)NIC - Newly industrialized CountriesNIF - National Investment FundONA - Orderly Marketing ArrangementsSTFC - Short Term Finance Companies
FISCAL YEAR
January 1 - December 1
Note: $ denotes US dollars
FOR OFFMCIAL USE ONLY
Title: Korea's Development in a Global Context
Country: Korea
Region: East Asia and Pacific
Sector: Country Economic
Report Type Classification NM/YY Languages5102-KO CEM Official Use 06/84 English
Pub. date: June 1984
Abstract: The Korean economy took three years to adjust to the second oilshock, but by 1983 the most serious difficulties were past;inflation had been contained, the balance of payments gap hadbeen significantly reduced and the growth momentum restored.After reviewing, briefly, the experience of the early eighties,this report assesses Korea's development prospects, as outlinedin the revised Fifth Plan, from the perspective of changesoccurring in the world trading environment. The reportconcentrates on (i) the scope for domestic resource mobilizationthrough financial and fiscal reforms; (ii) trends in Korea'sexports and the likely evolution of international demand forKorean goods; and (iii) opportunities and problems faced by theseven manufacturing subsectors that currently and prospectivelyprovide the bulk of the country's exports. The revised FifthPlan projects a growth rate averaging 7.5% over the period 1984-86 and a balance of payments equilibrium by 1986. While theseare ambitious objectives, the analysis in this report suggeststhat given international trade and financing opportunitiescombined with supportive macroeconomic and industrial policies,the Government's objectives can be realized.
6-~~~~
This docmmet has a nwsricted distributk and niay be used by recipients only in the Performnce ofItheir of S1 dotim Its contents may not otherwise be dissbsed without World Bank authorizatin

KOREA
KOREA'S DEVELOPMENT IN A GLOBAL CONTEXT
Table of Contents
Page No.
SUMHARY AND CONCLUSIONS .......................................... i
I. INTERNATIONAL TRADING OPPORTUNITIES AND CAPITAL MARKETS..1A. Trade ........................................... . .... . 2
1. United States . .... ............... 22. Japan . ...... *. 53. Europe ........................................... . 54. Non-Oil LDC's ............ 65. OPEC ........................................................... 6
B. Capital Flows ..... 6
II. THE MACROECONOMIC PATH TO 1986A. Adjustments In the Eighties .......... ................. 8B. Revising the Fifth Plan ............................... 13
III. SAVINGS, INVESTMENT AND FINANCIAL INTERMEDIATIONA. Introduction ......................................... 16B. The Public Sector: Structure, Constraints and
S-trategy ....................................... 18
C. Investment ............................................ 21D. Prospects for Foreign Borrowing ....................... 29E. Financial Intermediation, Savings and Allocative
Efficiency .................................... ...... 30F. Financial Instruments, Interest Rates and Savings..... 31G. Financial Instruments and Intersectoral Resource
Transfer ............................................ 34H. Resource Allocation By Banks ........... .......... ...... 38
IV. KOREAN EXPORTS IN THE GLOBAL CONTEXTA. Introduction ................................... ..... . 40B. Growth and Structure of Exports ................ . ...... 42C. Korea's Exports Prospects: Theory and Practise ....... 52D. Future Market Conditions ........................ ..... . 54
1. Growth in OECD Countries . ...................... 552. Import Elasticities ............................ 55
The Report was prepared by a mission that visited Seoul during
November-December 1983. The mission was comprised of S. Yusuf (MissionChief), L. Ahamed, F. Byamugisha, '.R. Kincaid (IMF), E.Y. Park (Consultant),R.K. Peters and A. Virmani. Assistance in the preparation of the report wasalso provided in yashington by Y. Hirao and 14. Laurent.
-2-
Page No.
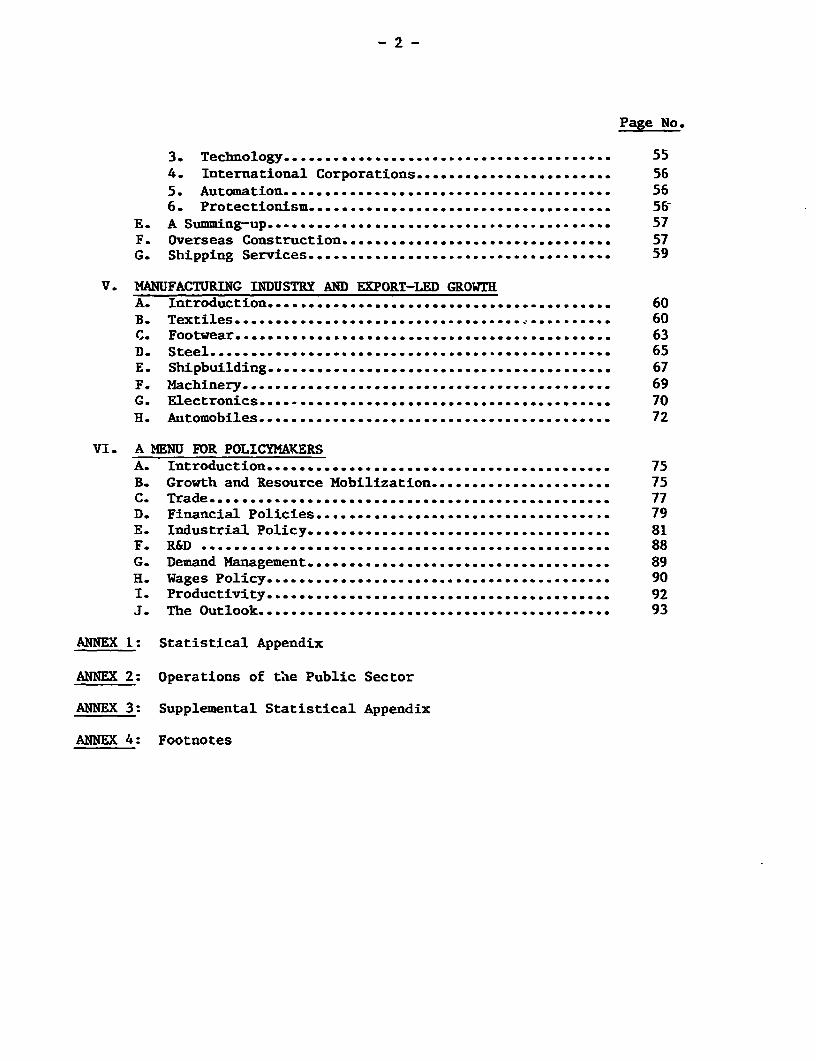
3. Technology . .................................. . 554. International Corporations . ....................... 565. Automation .... ............ . ..... 566. Protectionism ................. ., 56-
E. A Summingup ............. ........................ . . . . 57F. Overseas Construction ............................... . . 57G. Shipping Services .................................... . 59
V. MANUFACTURING INDUSTRY AND EXPORT-LED GROWTHA. Introduction ......... .......... ...................... 60B. Textiles . ...... 60C. Footwear ...................a....................................... 63D. Steel ................................................. 65E. Shipbuilding ................................. ......... 67F. Machinery ... 69G. Electronics . ...................................... 70H. Automobiles ........................................... 72
VI. A MENU FOR POLICYMAKERSA. Introduction ..................................... ..... 75B. Growth and Resource Mobilization ..................... . 75C. Trade ............ ..................................... 77D. Financial Policies .................................. . . 79E. Industrial Policy .................................... . 81Fe. R&D .................................................. 88G. Demand Management .... ............ ..................... 89H. Wages Policy ......................................... . 90I. Productivity.... .. . .. . ......... 92J. The Outlook ....................................... . . . . 93
ANNEX 1: Statistical Appendix
ANNEX 2: Operations of thLe Public Sector
ANNEX 3: Supplemental Statistical Appendix
ANNEX 4: Footnotes
-3-
TEXT TABLES AND CHARTS
Page No.
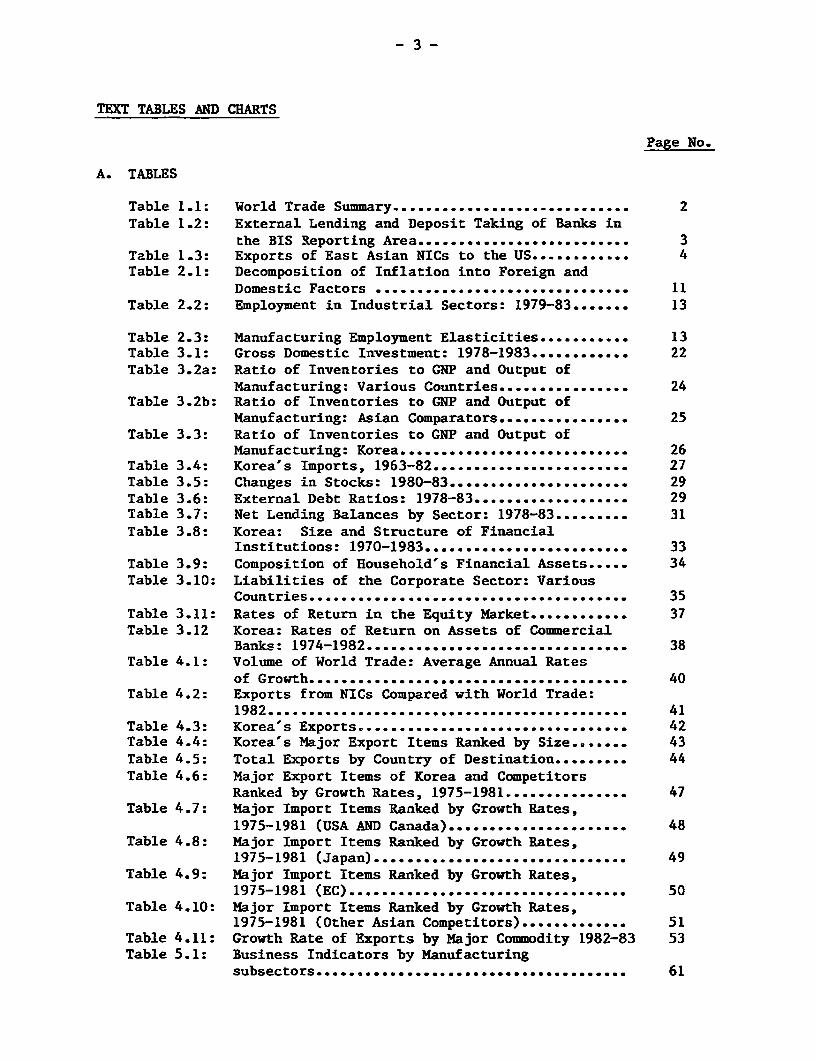
A. TABLES
Table 1.1: World Trade S umam a r y ............................. 2Table 1.2: External Lending and Deposit Taking of Banks in
the BIS Reporting Area .......................... 3Table 1.3: Exports of East Asian NICs to the US ............ 4Table 2.1: Decomposition of Inflation into Foreign and
Domestic Factors ..... .......................... 11Table 2.2: Employment in Industrial Sectors: 1979-83 ....... 13
Table 2.3: Manufacturing Employment Elasticities ........... 13Table 3.1: Gross Domestic Investment: 1978-1983 ............ 22Table 3.2a: Ratio of Inventories to GNP and Output of
Manufacturing: Various Countries ................ 24Table 3.2b: Ratio of Inventories to GNP and Output of
Manufacturing: Asian Comparators ................ 25Table 3.3: Ratio of Inventories to GNP and Output of
Manufacturing: K o r e a ............................ 26Table 3.4: Korea's Imports, 1963-82 . .. 27Table 3.5: Changes in Stocks: 1980-83 29Table 3.6: External Debt Ratios: 1978-83 . .. 29Table 3.7: Net Lending Balances by Sector: 1978-83 31Table 3.8: Korea: Size and Structure of Financial
Institutions: 1970-1983 33Table 3.9: Composition of Household's Financial Assets..... 34Table 3.10: Liabilities of the Corporate Sector: Various
Countries ....................................... 35Table 3.11: Rates of Return in the Equity Market ............ 37Table 3.12 Korea: Rates of Return on Assets of Commercial
Banks: 1974-1982 ............... . . 38Table 4.1: Volume of World Trade: Average Annual Rates
of Growth ............... *so .................................. 40Table 4.2: Exports from NICs Compared with World Trade:
1982 ... ................................... 41Table 4.3: Korea's Exports ................................. 42Table 4.4: Korea's Major Export Items Ranked by Size ....... 43Table 4.5: Total Exports by Country of Destination ......... 44Table 4.6: Major Export Items of Korea and Competitors
Ranked by Growth Rates, 1975-1981 ..... .......... 47Table 4.7: Major Import Items Ranked by Growth Rates,
1975-1981 (USA AND Canada) ...................... 48Table 4.8: Major Import Items Ranked by Growth Rates,
1975-1981 (Japan) . ..................... . 49Table 4.9: Major Import Items Ranked by Growth Rates,
1975-1981 (EC) ......... . 50Table 4.10: Major Import Items Ranked by Growth Rates,
1975-1981 (Other Asian Competitors) ............. 51Table 4.11: Growth Rate of Exports by Major Commodity 1982-83 53Table 5.1: Business Indicators by Manufacturing
subsectors .......... 0.....0.. ..... 61
-4-
Table 6.1 Macroeconomic Projections under AlternativeScenarios: 1984-1986 ............................ 76
Table 6.2: Share of Manufactures In Total Imports:Various Countries ............................... 79
Table 6.3: Total Debt/Net worth ............................ 82Table 6.4: Value Added Generation Coefficient by Industry.. 84Table 6.5: Foreign Exchange Earning Rate by Sector ......... 85Table 6.6: Operating Cash Flow as a Ratio of Net Sales ..... 85Table 6.7: Growth by Industrial Groups in Japan ............ 87Table 6.8: Earnings, Price and Productivity Trends in
Manufacturing ........................... .. ..... . 91Table 6.9: Monthly Real Earnings by Industrial Sector ...... 92
B. BOXESBox 3.1: Determinants and Projections of National Savings 18
C. CHARTSChart 2.1: Stock of External Debt .......................... 10Chart 3.1: National Savings: Actual vs Predicted ........... 19Chart 3.2: Composition of Merchandise Imports .............. 28Chart 4.1: Composition of Merchandise Exports .............. 45
KOREA
KOREA'S DEVELOPMENT IN A GLOBAL CONTEXT
Summary and Conclusions
1. There has been a strong revival of business confidence and economicactivity in Korea during the last eighteen months. This is in marked contrastto the early 1980s, when the international recession and excess manufacturingcapacity, a legacy of the heavy industry development program pursued through-out the second half of the 1970s, resulted in stagnation and pessimism.
2. With the Government's investment policies leading the way, theeconomy gathered speed early in 1983. By the middle of the year, the pullexerted by construction activities T.as supplemented by export growth intransport equipment, machinery, footwear, iron and steel products, andapparel, arising out of the strong recovery in the US. Korean merchandiseexports rose by 17% in terms of volume. Taken together with the increase indomestic consumption and investment spending it was sufficient to raise thenational product by 9.3%.
3. Comparable growth rates were last experienced in the late seventies,a time of rising prices and widening deficits in the balance of payments.What was so unusual about the economic resurgence in 1983 was the negligibleinflation (3.4% compared to 18% in 1979) and the small current account deficit($1.6 billion or 2.1% of GNP compared to $ 4.2 billion, or 6.4% of GNP in1979). Declining oil and raw material prices certainly helped to stabiliseprices and to reduce the import bill but they alone could not have carried theday. Tighter financial and wage policies were effective in moderatingdomestic core inflation. The steady ascent of household savings out of the1980 trough and the recent success of the government's own campaign atincreasing public savings by enforcing checks on its expenditures, supportedthe growth of exports. At the same time energy coaservation measures, after ahesitant start in 1981 were beginning to have a noticeable effect on purchasesof fuel, that account for nearly a quarter of Korea's total import bill.
4. It was with this considerable macroeconomic achievement as a back-drop, that the Government unveiled the revised Fifth Plan which describes thegoals for the next three years. The revised Plan does not depart signif-icantly from its predecessor issued two years ago although the improvementsought in the balance of payments is greater than what was desired earlier.It updates policies and projections using the experience of 1982-83 and therecent trends in the world economy as a guide. Economic growth of 7.5%,primed by a 10% average increase in export volume, remains the macroeconomiccenterpiece of the Plan. Most of the gains in exports are sought in thesteady maturing of heavy industries such as steel, machinery and transportequipment, and the ability of subsectors like electronics to achieve a degreeof technological competence sufficient to deepen their penetration of marketsin the OECD countries. Industrial policies aimed at modernizing facilities,
- ii -
promoting innovation and enhancing competitiveness by way of refinements inquality and a continuing growth in labor productivity, will be buttressed bymeasures assuring price stability and an adequate volume of domestic saving.
5. Price stability, according to the Plan is critical not only becauseit is a necessary ingredient of successful exporting but also by virtue of itspositive consequences for financial deepening, resource allocation, andsavings. The latter is the key which reconciles the projected growth rate ofthe economy with a current account equilibrium by 1986. External balance hasassumed proni.nence, due to the current international borrowing environment andKorea's large outstanding external debt. Korean policymakers feel that theyshould and can limit their net borrowing and move as quickly as possible to aneventual reduction in total debt outstanding.
6. The current account deficit, which mirrors the demand for foreignsavings, is equal to the gap between gross investment that regulates growthand the supply of national savings. Balance of payments equilibrium rests,therefore, on the manipulation of savings and investments so as to arrive at amatching. Reducing investment is always the easier of the two, but itpenalises growth unless the productivity of capital can concomitantly beraised, by adjusting the composition of investment so that short gestation,high return projects receive more prominence. Spending on electricitygenerating facilities is being cut because of a slower projected growth indemand, but given that the development of infrastructure is in a very intensephase, with many lumpy, power, transport, energy and housing investmentsunderway, there may be relatively small room for altering the investmentmix. Some gains in the productivity of capital can come from increasedcapacity utilization although the scope for this, after eighteen months ofrising demand, is rather restricted. Modernization of facilities andinnovation also promise high returns from a limited outlay of resources. Buteven allowing for the additional output which can, in the short term besqueezed out of the manufacturing sector, fixed investment necessary tosupport a growth of 7.5-8% might not-fall much belnw 31% of GNP over the 1984-86 period. It was 31.8% in 1983.
7. The national accounts indicate that gross investment was scaled downto 27-28% in 1982 and 1983 by depleting inventories of raw materials andfinished goods. The future behavior of inventories is not so easilyplumbed. Cuts in stockholdings of the magnitude experienced in recent yearssimply cannot continue. Eventually inventories will have to be replenishedand if instead of the decline in stocks being assumed, producers were to startadding to their holdings of intermediate products, there could be a delay inreaching balance of payments equilibrium. It is possible that the procedureused to estimate inventories in the national accounts is exaggerating theswings and perhaps, underestimating domestic savings. If so the Government'sbalance of payments projections through 1986, which rely on the assumption oflower inventories would be within reach.
8. National savings declined from 28.1 % of GNP in 1979 to 21.9 % in1980 but thereafter, rebounded to 22.4 % in 1982. They rose a further 2% ofGNP in 1983 in equal measure because of the behaviour of households and thebudgetary policies of the government. The Plan projects a savings rate equi-
- iii -
valent to 29.3% of GNP in 1986 based on a continuing upward trend in privatesavings and a widening of the spread between the current revenues and expendi-tures of the public sector which would push government savings to 8.3 % of GNP(from 7.1 % in 1983). A savings rate slightly above 29% of GNP and a level offixed investment around 31% (both premised on GNP growth averaging 7.5-8%),would translate into a small current account deficit by 1986 unless inven-tories can be adjusted downwards for three successive years. Alternatively,similar results might be attained if investment were reduced but itsefficiency increased, especially through improvement in the managementstructure of public sector corporations, currently being introduced.
9. On the basis of past aggregate savings performance and theanticipated movements in GNP, the trajectory for savings presented in the Planappears realistic although household saving propensities will be influenced bypolicies towards real interest rates, continued price stability and the demandfor consumer durables. Further, the public sector's ability to raise savingsfrom 7% in 1983 to 8.3% of GNP by 1986 through the freezing of certain projectrelated expenditures and enforcing economies in the administrative sphere,will be an important ingredient of the overall effort in mobilizing resources.
10. Taken together, the scenario delineated In the revised Fifth Plan isa plausible one. Of course a great deal hinges on the evolution of the inter-national economic environment and Korea's trade strategy; financial reformsthat could stimulate private savings as well as productivity enhancingallocative efficiency; success at overcoming industrial problems likely tointerfere with the supply and competitiveness of exports; domestic demandmanagement, which by buffering the economy to an extent against oscillatingforeign demand, could reduce the uncertainty for businessmen; and finally, theresults of the recent push for an enlargement of domestic R&D, calculated toease Korea's entry into new fields, while sharpening its edge in the marketfor some of its current exports.
Trade Strategy and the International Environment
11. For a country that now occupies fourteenth place among the World'strading nations export-led growth on the scale of the 1970s is problematicalfor two interrelated reasons: (i) there is the likelihood that the OECDcountries, Korea's principal trading partners will grow more slowly than inthe seventies, which would weaken their demand for imports; (ii) slowergrowth, widespread unemployment and the inability of the leading hightechnology subsectors in the advanced economies to abzorb the structurallyunemployed, not to mention workers now employed in some of the decliningindustries, have posed a serious dilemma for Governme-its in the OECD. Freetrade and allocation of resources mediated by market forces is supposed toassure efficient use of resources, tends to maximise weifare and lead to fullemployment. However, this reallocation of resources is not proceedingsmoothly. The birth of vibrant new industries is not keeping pace with thedecay of the old and the overhang of the unemployed is growing steadilylarger. With imports from LDC's threatening to make the existence of manytraditional industries, which are important sources of employment, even moreprecarious, the attraction of free-trade is being overshadowed by politicaland economic concerns supporting protectionism. The orderly marketing
- iv -
arrangements, quota restrictions and voluntary restraints that have become soobtrusive in trade relations, may be here for some time and these coulddepress the high import elasticities for particular products. The verymagnitude of Korea's exports and the importance of a small number of itemssuch as clothing, footwear, consumer appliances, steel products and transportequipment also now militate against high export growth in the future. Takenindividually or as a group the newly industrialized economies of East Asiasignificantly affect the industrial health of a handful of OECD countrieswhich are their main trading partners. Since the bulk of their trade is inthe items produced by the declining, traditional subsectors of the developedcountries, great dislocation is caused in certain industries whose employmentis so large that political reverberations are inevitable. Major inroads onnarrow, vulnerable fronts, at a time of high unemployment are leading toprotectionist resistance which, if it persists, would make losers of allcountries but especially nations heavily reliant on trade.
12. The state of the world economic environment and prevailinglimitations on trade by the advanced countries argue in favor of a trading andindustrial strategy supporting a balanced and gradual expansion of exportsfrom a broad array of manufacturing subsectors instead of major spurts in theoverseas sales of a small number of industries, which would have to involvethe deep penetration of a few products into slowly growing OECD markets.Sectoral diversification of exports could ideally proceed hand in hand with asubstantial increase in intra-industry trade, with Korea, for instancespecializing in certain kinds of machinery and importing others, producingparticular varieties of clothing and looking towards other countries to supplydifferent parts of the domestic market.
13. Such a strategy would allow Korea's planned increase in exportvolume, without arousing resentment among its trading partners who would seetheir own trade opportunities growing. Korea is now at a stage when there isroom for dismantling import restrictions and trimming tariffs withoutjeopardizing a number of mature industries. In fact, for several years thegovernment has been steadily expanding the list of importables subject toautomatic approval (expected to reach 85% in 1984 and exceed 90% by 1986) andis moving towards a reduction of tariff barriers.
14. Again, given that its resources of capital and skilled manpower arelimited, it would be good economics as well as trade policy if the countrywere selective in the backward and forward linkages that are exploited.Through specializing in some areas within particular industries and allowingother linkages to leak abroad, industrial efficiency would be strengthened andgrowing intra-industry trade with other economies would defuse the tensionswhich spring up when trade is one-sided. These initiatives might mean thatthe balance of payments deficit closes at a rate slower than is anticipated,but international financial markets permitting, this might be in the country'slonger run interests, seeing that returns on capital are still high and henceforeign savings could be economically utilized.
Foreign Borrowlng
15. Balance oi payments objectives must be attuned to the internationalborrowing climate. There is no doubt that with the international capitalmarkets still reeling from a series of debt crises and banks having grownsensitive to their country exposures, Korea, the fourth largest debtor amongthe LDCs, must be cautious in assuming that its additional demands will beeasily met. In the near term, foreign markets might remain fairly tight inspite of the improvements that have occurred in Korea's debt ratios (e.g. theratio of total debt outstanding to CNP was 54% in 1983 and the debt serviceratio, including interest on short term, was 19.9%). But gross borrowing inthe region of $7 billion per annum may be feasible over the next two to threeyears. This i3 somewhat beyond the requirements envisaged in the revisedPlan, and hence provides some cushion against the uncertainties inherent ineconomic forecasting. In particular, a modest shortfall in national savings,or a reversal in the trend in inventories could be accomodated throughsomewhat greater external borrowing rather than an adjustment of the growthtrajectory. Thus unless the loan rates are distinctly unattractive thisshould allow Korea the latitude to manage its economy with reference more tolonger term growth, trade and industrial concerns, than to the balance ofpayments.
Resource Mobilization and the Financial Sector
16. In the Korean growth calculus, exports are one side of the coin,domestic savings another. As stated above, a change in budgetary dynamicscould add 1-2% of GNP to national savings. But the financial sector couldalso make a contribution to a more efficient use of savings. A decade longeffort by the Government has led to a considerable broadening of the financialsystem. A host of nonfinancial intermediaries now compete against thecommercial banks and market participants can raise money through fairly activecommercial paper, bond and stock markets. However, past government attemptsat providing subsidised credit through the banks to the industrial sector andsupporting the development of other financial institutions, meant imposing lowdeposit and loan rate ceilings on the commercial banks. This weakened theirability to bid for deposits and extensive reliance on directed creditcircumscribed their allocative capabilities.
17. In one sense the expansion of other segments of the market at theexpense of the banks can be read as a sign of financial broadening and a mul-tiplication of choices for savers and investors alike. But, this process wasnot an unmitigated blessing. At early stages of development, banks haveadvantages in terms of accessibility and low transaction costs which make themattractive to relatively unsophisticated savers. On the side of allocationthe scope of their operations gives them unique advantages in accumulatinginformation and pooling risks. This is borne out by the experience of Japan,France and Germany, where banks remain the principal source of financing forcompanies and the preferred repositories of private savings.
18. Hobbling the banks lowered their effectiveness and deflected finan-cial activities towards other wings of the market and encouraged a measure ofinnovation. But closer analysis suggests that the new instruments may not
- vi -
have contributed very significantly to the objectives of financial diversi-fica ion, resource mobilization and efficient allocation. As described inChapters 3 and 6, the bond market is dominated by corporate bonds, almost allof which are guaranteed by the banks and in an indirect manner, serve as bankloans. Most transactions in the secondary market for bonds are predicated onrepurchase agreements varying between one and tnree months. The nature ofthese transactions is very similar to that of short-term loans against thecollateral of bonds and does not approximate the outright sale typical ofmarkets in developed countries.
19. Although 326 companies are listed on the stock market, trading isdominated by the shares of the 40 major conglomerates. The thinness and vola-tility of the market as far as shares of other companies are concerned, makesinsider trading the rule and discourages small investors from entering thefray. Investors other than majority shareholders are also discouraged by thelow level of share prices and the large variance in yields. While the averagereturn on equity over the period 1976-82 was 22.8% as compared to 21% forbonds, the variance of the former was 67.4%, that of the latter, 22%. Thedifference in returns did not compensate for the risk, with the result thatthe number of stock holders declined by almost a third between 1978 and 1982.
20. Some weaknesses are also apparent in the operations of the short-term investment finance companies whose higher deposit ceilings have enabledthem to bid funds away from the banks. These companies are owned by the majorindustrial groups and more frequently than not their operations are orientedtowards firms associated with the owning group and their satellites. From theperspective of economy-wide resource allocation, this has its drawbacks.Money circulates between individuals and firms drawn together by the forcefield of common business interests, but it rarely spills over the boundariesin search of fresh opportunities.
21. The Government is continuing with its attempts to strengthen thebond and the stock market, and has sharpened competition among the FinanceCompanies by permitting new entrants. Over the mediumrterm these shouldproduce welcome dividends. But since the immediate concerns are resourcemobilization and efficiency in allocation, commercial banks merit the closestattention. Given the sophistication of most savers, raising the interest rateceilings on bank deposits may do more for the financialization of savings thanthe propagation of new financial instruments. The permission to issue CDs at11% interest that was granted in June 1984 will allow the commercial banks toattract more funds. A larger deposit base together with the latitude to dif-ferentiate lending terms by risk and maturity could enlarge the role of thebanks in the allocation of capital. As indicated earlier, the seven commer-cial banks with their extensive branch -.etworks and close contacts with arange of businesses, are strategically placed to channel funds efficiently.Widening their spreads would enable them to improve their capital ratios thatbear the marks of years of low profits. Larger capital bases would betterenable the oanks to accommodate risk at- give them incentives to develop newbusiness. Wider spreads would also provide banks with the cash flow needed toraise the calibre of their staff and expand the range of services they canoffer.

- vii -
Directions of Industrial Development
22. The financial sector can coatribute towards the efficiency withwhich resources are used, but there are also gains to be realized by tacklingindustrial problems at the source. Compared with the seventies, whenGovernment emphasized industry specific support, the rapid deepening andgreater complexity of the industrial sector have necessitated a change inapproach. The government's current approach favors functional support in suchareas as improved technology transfer, tax policy, foreign investment,efficiency of labor markets, and enhanced productivity to encourage greaterefficiency across a broad spectrum of highly linked subsectors. Sevenindustries-textiles, footwear, machinery, automobiles, shipbuilding, steel andelectronics - together account for 46% of manufacturing output. Some of theseare confronting the traumas of middle age, while others are still trying tocope with the teething problems to which infant industries are prone. Afunctional approach offers the best prospect for an efficient path throughthese diverse problems. The problems are seven main subsectors and theirexport prospects, which are discussed fully in Chapter 5, are sketeched below.This is followed by a smmnary of the main approaches for achieving growth andproductivity gains in the industrial sector.
Textiles
23. Still the largest manufacturing industry and the first rankedexporter, textiles are faced with competition from other developing countriesand protectionism in its major markets abroad, while their diminishedprospects have hampered essential modernization. Textiles is a subsectorwhich by virtue of its economic weight cannot be treated with benign neglect.Since the advanced countries are increasing their competitiveness in yarn andfabrics, development efforts might perhaps be concentrated in apparel with theemphasis being on design of products and automation of production methods.
Footwear
24. Although Korea is the world's second largest exporter and its pros-pects for the medium-term look secure, it remains relatively weak in the areaof design and marketing, and the industry's geographica'l concentration ofexports renders it vulnerable to quota barriers that are springing up in theU.S., the principal market. Another potential threat stems from the labourintensive and unsophisticated nature of the manufacturing process, whichincreases the possibility of new entrants, that could challenge Korea's:position in the footwear trade.
Steel
25. Korea has emerged as an efficient producer of carbon steel and hasbegun making inroads into the U.S. and Japanese markets. As there is littlequestion that the country enjoys a comparative advantage in producing steel,the problem is largely an external one. How much headway Korea is able tomake depends on the willingness of the industrialised countries to provide itwith (i) the necessary technology and capital; and (ii) markets for Koreanexports by closing inefficient plants and dropping protectionist barriers.
- viii -
Shipbuilding
26. This industry is an offshoot of steel production in Korea. Byvirtue of its capacity, modern facilities and low costs, it has captured afourth of the world market for new ships. This could increase further asdemand for vessels recovers from the current slump, but Korean shipbuildersmust develop the indigenous research capabilities necessary for the construc-tion of sophisticated ships if they are to broaden their market share. Theyalso need to raise the industry's profitability, through productivity improve-ments, so as to acquire the financial resources necessary to consolidate theirposition.
Machinery
27. The program to create a base of heavy industry launched in the early1970s brought into existence facilities capable of producing a wide spectrumof machines. But given Korea's technological capabilities the most sub-stantial gains, in the medium term, appear to be in general machinery. As thissubsector is crowded with many small, undercapitalised producers, with limitedexperience, mergers between firms, training of workers, greater special-ization, more attention to R&D investment in new equipment and the paralleldevelopment of subsectors such as metallurgy and electronics, are allnecessary to fully realise the industry's apparent export potential.
Automobiles
28. An efficient and successful automobile industry requires a marketlarger than what Korea has been able to provide. The future lies in raisingdomestic sales - which carries with it the penalty of growing congestion andenergy costs - and also establishing a sizable presence in the OECD countries.The prohibitively high costs of developing the requisite technologicalsophistication as well as problems in surmounting entry barriers thrown up bythe western countries, renders collaboration *rith the major i;.ternational autocompanies a necessity. Considerable progress has been made in producing carsdomestically but the supporting infrastructure of subcontractors remainsweak. Arrangements negotiated with G.M. and Mitsubishi hold out the promiseof a take-off by the domestic motor car industry later in the 1980s. Thesecompanies may also be able to provide the know how and incentives for streng-thening the subcontracting network.
Electronics
29. While Korea is a major exporter of consumer durables such as TVsets, radios, calculators and watches, with high hopes of entering the marketsfor VCRs, semi-conductors, and mini-computers, this industry faces an uphillbattle. First, the research base is weak and the rapidly changing technologymakes this a serious competitive handicap. Second, the advantage seems to beshifting towards large vertically integrated firms selling a range of productsand relying on lavish research expenditures to custom design key inputs. Asthere are 900 mostly very small firms in the subsector, the Korean electronicsindustry is critically in need of rationalization, grouping efficient pro-ducers of parts around a few large firms. Third, consumer durables, the most
- ix -
attractive product category from the viewpoint of comparative advantage, mustnow run the gamut of increasingly stringent import restrictions in the U.S.and Europe and in the medium term, Korea may have to seek markets in East Asiaand some of the LDCs.
Other Engines of Growth
30. In a world where competitors are proliferating and the principalmarkets are becoming harder to penetrate, achieving growth targets will callfor considerable ingenuity, and skill in choosing among, a menu of policies.The state of Korea's industries and international trading circumstancessuggest that the highest pay-off might be obtained from:
(i) demand management which magnifies the part played by the domesticmarket with the smallest balance of payments penalty;
(ii) measures which raise industrial productivity;
Demand Management
31. Domestic demand yielded a substantial pay-off in early 1983 by rais-ing economic activity in advance of the world business recovery. Becausedemand vas directed towards industries with plentiful excess capacity, pro-duction could expand without there being a prior need for an increase incapacity. Demand management along these lines could become an even morepotent force behind macroeconomic stability in the future. Should exportsgrow less rapidly than is projected, or international business activity becomesusceptible to erratic fluctuations, demand switching could sustain thedomestic economy and by stabilising expectations encourage businessmen toembark upon capital intensive projects, which depend on stable markets andwhere returns are distributed over a long period of time. Demand switchingtowards goods produced by the manufacturing sector, by accelerating itsexpansion, can also raise average productivity.
Productivity
32. There are many avenues leading to higher productivity though nocertainty of arriving at the goal. Structural change which increases theshare of the manufacturing sector can raise average productivity. So caninvestment in mechanization, better management, heightened motivation of thework force and many others. All of these can make a contribution in theKorean context but two that might be singled out for special attention arelabour-management relations and research on technology. As industry has movedup the ladder of sophistication, human skills and experience have gained inimportance. In machinery, for instance, where learning is one of the mainfactors influencing productivity, an experienced labour force is mostvaluable. Hence it is a matter of concern when turnover rates, even inindustries where skilled labour has a large share of the labour force, are sosignificant - ranging from 4 to 12% per month. These are much in excess ofthose in Japan and even higher than in the U.S.. While it is difficult toexplain precisely why workers display so little loyalty towards theircompanies, the nature of employment contracts, shop-floor working arrangements
and relations with management could be among the factors determining theirbehaviour. A greater awareness of this problem on the part of corporations,changes in the organization of work and the system of remuneration wouldadvance the cause of productivity.
33. The Government's target is to increase spending on R&D to 2% of GNPby the end of the plan period and it has hopes that such investment willsecure Korea a place among the exporters of high technology products.Certainly, research has much to offer and there is no substitute for indi-genous technological mastery when it comes to assimilating and building uponresearch done abroad. A minimum amount of R&D can serve a "listening post"function in all major subsectors and it can be a conduit for productivityenhancing innovations. But before vast sums are expended on more advancedinvestigations, it is useful to explore fully the opportunities provided byoverseas training, licensing and joint ventures. A latecomer can take shortcuts in technologically stable industries such as steel, machinery, ship-building and textiles. In electronics and bio-technology, however, theinternational firms that generate many of the new discoveries are reluctant toshare them until they have exhausted the lion's share of the rents. Hereindependent research is unavoidable and Korea has made a start. Moreresources could usefully be channelled into these fields. But the wise coursein these subsectors would be to proceed gradually, accumulating knowledge,experience and scientific manpower before embarking upon any expensive, highrisk ventures.

CHAPTER I
INTERNATIONAL TRADING OPPORTUNITIES AND CAPITAL MARKETS
1.01 By effectively harnessing its abun4ant supply of skilled labor forthe production of manufactured exports, Korea, in the 1960s, overcame itsacute scarcity of natural resources and through successful trading, sweptaside the constraints which a small domestic market can impose on growth. Thenational product doubled between 1963 and 1971. It expanded a further 112Z inthe following 8 years, so that by 1979, the ccuntry had attained a per capitaincome of $1,662, putting it a long and prosperous distance from the $80income level of 1963. Because of the second oil shock, a serious harvestfailure in 1980 and the necessity of adjusting to the industrial capacitycreated by a highly ambitious investment program, the economy paused duringthe early 1980s. Exports and the government's efforts to modernize the infra-structure provided a degree of stimulus, but economic activity was relativelysluggish all through 1982, the average growth for the three year period beingunder 2%.
1.02 In 1983, with the public sector's spending on construction as a spurand businessmen's hopes once again revived by the prospects of buoyant exportmarkers, Korean growth rose to the levels that had been normal in the previousdecade. The GNP, drawn by a 17% increase in exports and the brisk pace ofdomestic investment, grew by over 9Z, raising per capita income to US$1,850,and with merchandise exports in excess of $23 billion - 1.27% of the worldtotal - Korea became the 14th largest trading nation.
1.03 Such a performance during a time when the rest of the world wasbarely recovering from a prolonged recession, certainly lends credence to thebelief that Korea's economic prospects through the middle of the decade arequite assured. The 7-8Z annual growth in GNP projected in the revised FifthPlan (1982-86) coupled with a 10% average annual increase in export volume,appears almost modest seei that growth in the OECD countries is expected toaverage 3.3% through 1986 - - compared to 2.3% in 1983 - and internationaltrade could expand as much as 5% per annum as against 1.0 in the past year.(See Table 1.1 for data on recent trends in growth and trade). However, theconditions under which the current cyclical upswing in world business activityis occurring does temper some of the optimism regarding Korea's medium termprospects. For a country that is so heavily dependent on trade, the strengthof export demand emanating from its major trading partners is of vital impor-tance. In this case, five countries, the US, Japan, Germany, France andBritain absorb well over half of Korea's merchandise exports, hence the vigorof industrial expansion in these economies exerts a pull whose significance isno less than the stimulus from Korean domestic demand. The level of unemploy-ment i-n the major OECD countrie I/ (9%), the difficulties being encountered bysome of their major industries,- and market saturation for certain tradedgoods, have not only clouded the future growth prospects of the major indus-trial nations but have also engendered protectionist pressures which couldcrimp the increase in world trade.
1/ Notes to the text are given in Annex 4.
-2-
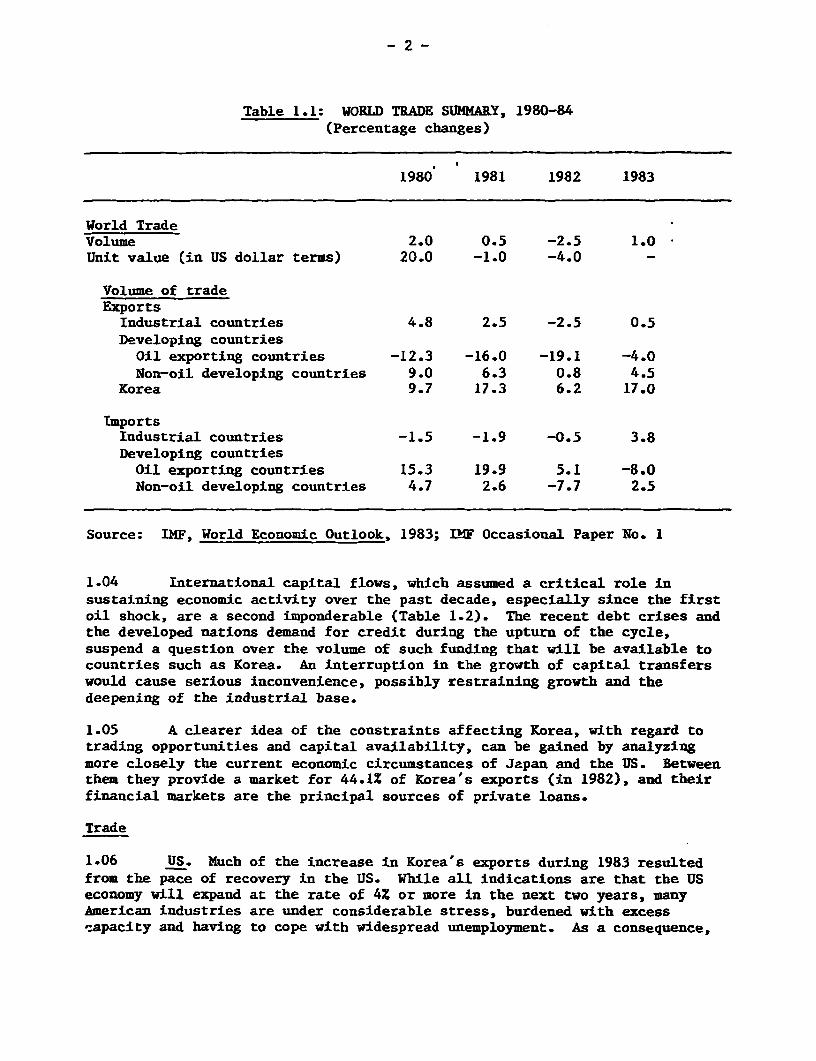
Table 1.1: WORLD TRADE SUMMARY, 1980-84(Percentage changes)
1980 1981 1982 1983
World TradeVolume 2.0 0.5 -2.5 1.0Unit value (in US dollar terms) 20.0 -1.0 -4.0 -
Volume of tradeExportsIndustrial countries 4.8 2.5 -2.5 0.5Developing countriesOil exporting countries -12.3 -16.0 -19.1 -4.0Non-oil developing countries 9.0 6.3 0.8 4.5
Korea 9.7 17.3 6.2 17.0
ImportsIndustrial countries -1.5 -1.9 -0.5 3.8Developing countriesOil exporting countries 15.3 19.9 5.1 -8.0Non-oil developing countries 4.7 2.6 -7.7 2.5
Source: IMF, World Economic Outlook, 1983; LIF Occasional Paper No. 1
1.04 International capital flows, which assumed a critical role insustaining economic activity over the past decade, especially since the firstoil shock, are a second imponderable (Table 1.2). The recent debt crises andthe developed nations demand for credit during the upturn of the cycle,suspend a question over the volume of such funding that will be available tocountries such as Korea. An interruption in the growth of capital transferswould cause serious inconvenience, possibly restraining growth and thedeepening of the industrial base.
1.05 A clearer idea of the constraints affecting Korea, with regard totrading opportunities and capital availability, can be gained by analyzingmore closely the current economic circumstances of Japan and the US. Betweenthem they provide a market for 44.1% of Korea's exports (in 1982), and theirfinancial markets are the principal sources of private loans.
Trade
1.06 US. Much of the increase in Korea's exports during 1983 resultedfrom the pace of recovery in the US. While all indications are that the USeconomy will expand at the rate of 4% or more in the next two years, manyAmerican industries are under considerable stress, burdened with excesscapacity and having to cope with widespread unemployment. As a consequence,

- 3 -
Table 1.2: EXTERNAL LENDING AND DEPOSIT TAKING /a OF BANKSIN THE BIS REPORTING AREA /b 1978-82
(US$ billions)
1979 1980 1981 1982
Destination of Lending .'c 125 160 165 95Industrial countries 69 96 99 57Oil exporting developing countries 7 6 2 8Non-oil developing countries 41 49 51 25Centrally planned economies /d 5 5 5 -4International organizations and unallocated 3 4 8 9
Sources of funds /c 125 160 165 95Industrial countries 66 103 141 102Oil exporting developing countries 37 41 5 -19Non-oil de-eloping countries 13 8 9 5Centrally planned economies /d 5 1 - 2International organizations and unallocated 4 7 10 5
Change in net claims /e - - - -On industrial countries 3 -7 -42 -45On oil exporting developing countries -30 -35 -3 27On non-oil developing countries 28 41 42 20On centrally planned economies /d - 4 5 -6International organizations and unallocated -1 -3 -2 4
Sources: Bank for International Settlements (BIS); and IMF staff estimates;INF Occasional Paper #23.
/a The data on lending and deposit taking are derived from stock data onbanks' claims and liabilities (net of redepositing among banks in the BISreporting area) including an adjustment for valuation changes due toexchange rate movements. Data on adjusted flows are provided by the BIS,but the distribution of those adjusted flows among the major groups ofcountries according to Fund classifications is a staff estimate.
/b The BIS reporting area includes all banks in the Group of Ten countries,Austria, Denmark, Ireland, and Switzerland, and the branches of U.S. banksin the Bahamas, the Cayman Islands, Hong Kong, Panama, and Singapore.
/c The classification by major groups of borrowers (depositors) was derivedfrom BIS data in the following manner. For industrial countries, grossclaims (liabilities) were reduced by redepositing among banks in thereporting area but increased by claims on (liabilities to) offshorecenters. The latter thus were assumed, in the absence of the availabilityof a country classification of the on-lending from (deposit taking by)offshore centers, to represent lending to (deposit taking from) industrialcountries. For the other groups of borrowers and depositors, net claims(liabilities) were taken to be equivalent to gross claims (liabilities).
/d Excluding Fund member countries./e Lending minus sources of funds.
-4-
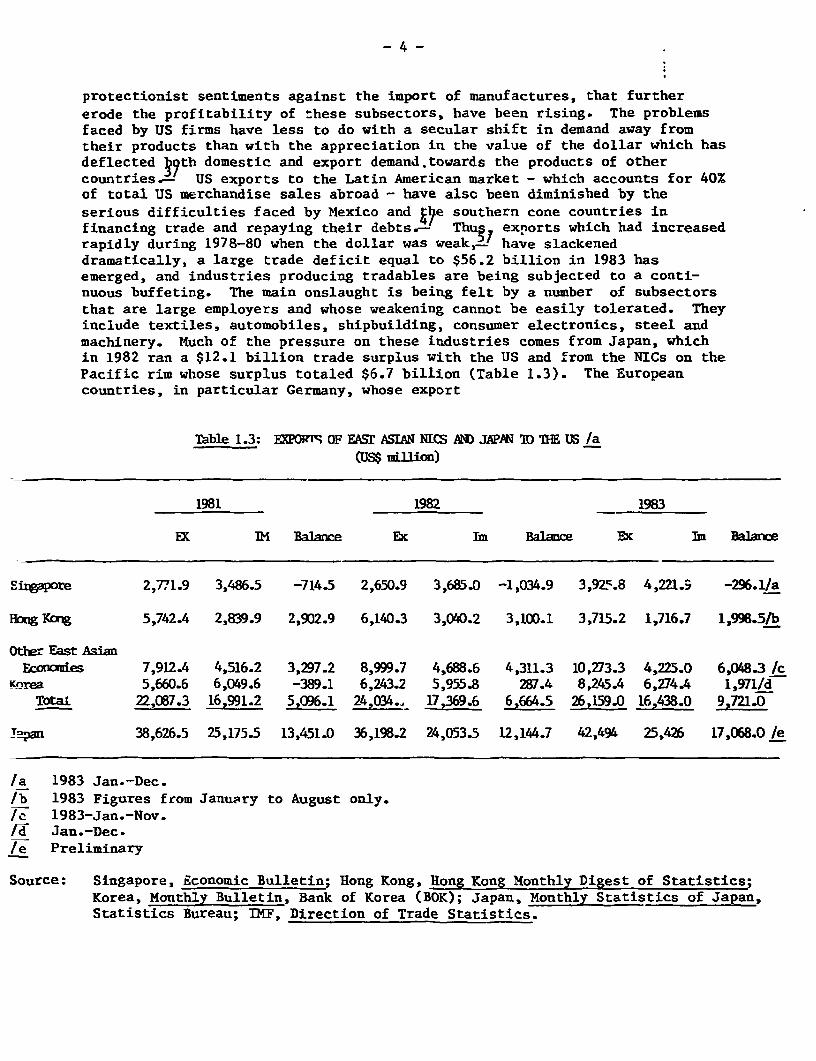
protectionist sentiments against the import of manufactures, that furthererode the profitability of these subsectors, have been rising. The problemsfaced by US firms have less to do with a secular shift in demand away fromtheir products than with the appreciation in the value of the dollar which hasdeflected 87 th domestic and export demand.towards the products of othercountries., US exports to the Latin American market - which accounts for 40%of total US merchandise sales abroad - have also been diminished by theserious difficulties faced by Mexico and k1e southern cone countries infinancing trade and repaying their debts.- Thug exnorts which had increasedrapidly during 1978-80 when the dollar was weak,- have slackeneddramatically, a large trade deficit equal to $56.2 billion in 1983 hasemerged, and industries producing tradables are being subjected to a conti-nuous buffeting. The main onslaught is being felt by a number of subsectorsthat are large employers and whose weakening cannot be easily tolerated. Theyinclude textiles, automobiles, shipbuilding, consumer electronics, steel andmachinery. Much of the pressure on these industries comes from Japan, whichin 1982 ran a $12.1 billion trade surplus with the US and from the NICs on thePacific rim wlhose surplus totaled $6.7 billion (Table 1.3). The Europeancountries, in particular Germany, whose export
Table 1.3: EXPRTr OF EASM ASIAN NICS AND JAPAN ID THE US /a(US$ mllion)
1981 1982 1983
EK IM Balance Ex ii Balance EXc Im Balarce
Sirigapore 2,771.9 3,486.5 -714.5 2,650.9 3,685.0 -1,034.9 3,925.8 4,221.9 -296.1/a
HongKong 5,742.4 2,839.9 2,902.9 6,140.3 3,040.2 3,100.1 3,715.2 1,716.7 1,998.5/b
Othe- East AsianEAoxcies 7,912.4 4,516.2 3,297.2 8,999.7 4,688.6 4,311.3 10,273.3 4,225.0 6,048.3 Ic
Korea 5,660.6 6,049.6 -389.1 6,243.2 5,955.8 287.4 8,245.4 6,274.4 1,971/dTotal 22,087.3 16,991.2 5,096.1 24,034., 17,369.6 6,664.5 26,159.0 16,438.0 9,721.0
TYPan 38,626.5 25,175.5 13,451.0 36,198.2 24,053.5 12,144.7 42,494 25,426 17,068.0 /e
/a 1983 Jan.-Dec.lb 1983 Figures from January to August only./c 1983-Jan.-Nov.M& Jan.-Dec./e Preliminary
Source: Singapore, Economic Bulletin; Hong Kong, Hong Kong Monthly Digest of Statistics;Korea, Monthly Bulletin, Bank of Korea (BOK); Japan, Monthly Statistics of Japan,Statistics Bureau; IMF, Direction of Trade Statistics.
trade is bigger than Lhat of Japan are less troublesome (except possibly insteel) for a number of reasons: their exports to the US are quite diversi- 6,fied, whereas the East Asian producers have a much more concentrated thrust;-this two-way trade in manufactures with the European countries is relativelybalanced, while the US exports a very limited volume of manufactured goods toJapan; a substantial amount of the European exports to the US are made bysubsidiaries of American firms; and finally, the East Asian sellers frequentlyengage in price competition which US manufacturers with fheir high cost andfairly modest profit margins have difficulty combattir.g.-
1.07 An upshot of all this is the multiplication of quota restrictions,orderly marketing arrangements, voluntary export restraints, and anti-dumpingactions aimed primarily at imports of textiles, automobiles, steel, consumerelectronics and footwear. Almost 40% of Japanese exports are affected and asKorean trade in similar goods has risen, a growing proportion of Korea'sexports to the US are subject to restrictions ngy easily sidestepped throughupgrading or by re-export from third countries.- Further, Korean goods thatare admitted into the U.S. market free of tariffs - about a fifth of the total- under the Generalized System of Preferences (GSP) might not enjoy thisprivilege for very long. A realignment of the dollar parity and vigorousdomestic expansion could ease the pressures for import control but withunemployment still above 8%, the likelihood of Korean exports increasing theirpenetration of US markets in areas such as yarn, garments, footwear, consumerelectronics and steel, in the medium term, are somewhat less certain.
1.08 Japan The share of Korea's exports to Japan has been fallingsteadily for a number of years. In 1983 most items registered a decline innominal terms, one exception being steel plate, a commodity for which Koreahas captured 70% (1.4 million tons) of Japanese imports. There are severalreasons behind this downward trend. One is, of course, the slow growth of theJapanese economy over the past three years. Second, Korean exports,especially of textiles and clothing, are being displaced by those from thePRC, Philippines and South Asian countries, all of which have large reservesof cheap labor and are widening their competitive margin over Koreanproducts. A third fa^tor is the continuing resilience of even the traditionallight industries in Japan at a time when the opportunities for profitableexpansion into gw sectors are very limited and energy intensive industriesare in retreat.- The infusion of new technology and capital into textiles,for instance, has permitted many Japanese firms to neutralize the challengefrom overseas, while the rapidity of technological advance and a shortening ofproduct cycles, has enabled producers of consumer electronics to minimize thethreat to their markets, at home as well as abroad. Rising wages continue tothreaten some Japanese industries with obsolescence, opening beachheads forexports from her neighbors, but the effectiveness with which Japanese fi mhave contained labor costs, the low propensity to import manufactures - andthe slow increase in domestic consumption, limit the scope for marketpenetration by Korean products.
1.09 Europe Much the same applies to the major European countries. Theytoo are scrambling to buttress their traditional industries through moderniza-tion supported by trade controls, while attempting at the same time to framepolicies that will secure the future of their new industries, such as elec-tronics. The 3% growth rate being projected for these economies through1985-86 - will reduce the numbers of the unemployed, but joblessness will
- 6 -
remain a problem for some time and it will interfere with the dismantling ofimport controls.
1.10 Non-oil LDC's Although growth rates close to 5% are forecast forthe non-oil developing countries, their potential for absorbing Korean goodsis bound to be circumscribed by the difficulty of financing imports and theneed to restrict their foreign exchange outlay in order to reduce their debtobligations. In fact there is a real possibility that instead of providingexport outlets for Korean producers, some of the developing countries willcompete more aggres 'vely against Korean goods in the world market and curtailtheir domestic consumption of foreign guods.
1.11 OPEC Almost 13% of Korean export trade is with the Middle Easternoil producers and this was the only area, other than the US, to which salesincreased in 1983. While their commitment to industrialization makes the oilproducing nations a potentially buoyant source of demand, their absorptivecapacity is limited and there is a danger, that for many goods, their marketswill soon be saturated. If oil prices remain fairly stable, the financing ofdevelopment programs, currently being sustained by borrowing or the drawingdown of reserves, will become more difficult.
1.12 Even though economic activity in areas with which Korea has tradinglinks, is quickening, the growth o¶2jts exports will hinge very much on thesuccess of the advanced economies - at shifting resources from decliningindustries to new sectors, and diminishing unemployment.
Capital Flows
1.13 Following the second oil shock, Korean borrowing rose to $8.4 bil-lion in 1980 with th; country having to finance a domestic savings gap of10.2%. Since then, increased mobilization of domestic resources and effectiveadjustment policies have lowered foreign capital inflows. In 1983, Koreaborrowed $5.7 billion but the likely persistence of a small savings gap, amor-tization payments, reserve accumulation and the financing of exports oncredit, are expected to generate gross ET borrowing needs of about $6.0billion annually between 1984 and 1986.- Korea's prospective exportperformance, high rate of domestic savings and moderate debt service ratios(21% for total debt, 15% for MLT debt service) could make the country aneminently attractive borrower. But the recent spate of debt reschedulingshave soured the lending climate. Commercial banks, their portfolios weigheddown by loans to financially precarious ec'onomies in Latin America and EasternEurope, are reluctant to increase their exposure in the developing world, whenthe recoymyy of business in the OECD countries lengthens the list of saferoptions_- While some redirection of ca'uital flows towar15 yhe center andaway from the periphery is normal in a period of recovery,- the situation isrendered more complex during this cycle by a number of developments. First,the OPEC countries, which for several years were major net lenders, have beentransformed by the weakening demand for oil into large borrowers (Table 1.2).Second, borrowing by the US has attracted a significant share of internait?nalnet savings which finances a substantial part of current net investment,-Although the US is by far the largest borrower, France and some of theScandinavian countries have also been drawing upon the international capitalmarket, with their greater creditworthiness allowing them to nudge aside lessaffluent borrowers. Third, "non-voluntary lending" by commercial banks to
- 7 -
countr'es faced with debt crises precipfilted by high interest costs',17' hasfurther depleted the supply of eapital.- Fourth, the handful of countrieswith net savings that others can draw upon - Japan, Germany, Switzerland,Kuwait and the UAE - closely monitor access to their capital markets whereinterest rates are regulated. Fifth, having suffered through the variousLatin American crises, neither Japanese banks nor the Ministry of Finance,which supervises their lending opefftions, are inclined to repeat theexperience elsewhere in the world. Hence, rxposure limits are more conser-vative and are adhered to closely.
1.14 While this does not constrain East Asian countries such as Malaysiaand Thailand that have borrowed frugally and have relatively small debtburdens, Korea, which with $40.1 billion in debt outstanding (DOD) was thefourth largest debtor nation in 1983, is in a more delicate position.Economic criteria and the geopolitical situation support lending to Korea;prudent banking principles weigh the scales in the other direction, possiblylimiting the increase in lending to Korea to the rate at which the major banksenlarge their capital base, i.e., about 6-7% per annum. Finally, and this iswhere capital and trade issues are completely intermeshed, the surplus savingsof Japanese households which directly and indirectly finance26yvestment in theUS, also cause Japan to run a large current account surplus. - Almost 30% ofJapan's exports are to the US (1983) whereas she T orts only modest amountsof either American manufactures or raw materials.- This puts large segmentsof key US industries that compete against Japanese exports on the defensive,and there is pressure on Japan to curtail the trade surplus and byimplication, the gap between domestic savings and investment. To the extentthat Japan is able to W 'ttle away at the gap, the volume of international netlending will diminish.- While the dollar remains the principal reservecurrency and a magnet for capital seeking a "safe haven", the US (and theEuropean countries) will continue to obtain the resources they require.However, less favored economies, such as Korea might have to be satisfied witha smaller increase in their share.
1.15 As the OECD economies have recovered from the ravages of the SecondWorld War, as they have depleted the technological backlog to rebuild andmodernize their industries, as the consumption of material goods has ifmbedto unimagined heights, and as natural resources, particularly energy,- havebecome more costly, their potential for continuing high growth has diminished.Since economic relations between the advanced nations and the NICs are closelyinterLwined, this makes the scope for very rapid, export-led growth by mediumsized economies, much smaller. As a trading nation, Korea is a long distancefrom Japan and while the world economy might hav 4 ifficulty accommodatinganother country exporting as much as Japan does,- there remains room forKorea to grow, albeit at more moderate rates as long as its trade and indus-trial strategy is judiciously devised. But whether Korea's ambitions can bereconciled with those of the other newly industrialized economies of EastAsia, whose combined merchandise exports total $78.5 billion in 1982 (or 57%of Japan's) is a very different matter. What seems feasible when viewed fromthe perspective of a single, dynamic East Asian country, becomes more ques-tionable when the field of vision is widened to embrace the other nations inthe Pacific region. It is from this perspective as much as the one drawn frompast trends that Korea's growth, trade and industrial strategies must beanalyzed.
- 8 -
CHAPTER II
THE MACROECONOMIC PATH TO 1986
Adjustment in the Eighties
2.01 In terms of growth, the Jdte 1970s were a high water mark for theKorean economy. Between 1976 and 1978, the GNP expanded at an average rate of11%. Much of the impetus during 1976-77 came from export demand and in factKorea registered a current account surplus of $12 million in 1977. Thefollowing two years saw a tapering of export growth because a downward driftin the real effective exchange rate rendered Korean goods somewhat lesscompetitive in overseas markets. It was the extraordinary surge in investmentspending that propelled the economy during 1978-79, an investment boom thatbrought into existence much new capacity in the heavy and chemical industries.Fixed investment, which was 31Z of GNP in 1978, rose to 33% in 1979 and withoverseas demand being scarce and a devaluation imminent, producers accumulatedlarge inventories. At the time of the second oil shock, gross domesticinvestment was at a peak, close to 36% of GNP, some 8% in excess of domesticsavings, with the result that the current account deficit was $4.2 billion.
2.02 The 136% increase in oil prices during 1979-80, plunged the Koreaneconomy into the worst recession it had experienced in seventeen years. Thiswas partly because of the resource transfer equal to 6% of GDP arising fromthe deterioration in the terms of trade. But a failure of the rice harvest in1980, the enormous overcapacity in industry, which precipitated a collapse ofprivate investment, and the contraction in real money balances stemming from atight monetary policy must also share responsibility. For the overheatedeconomy, the steep ascent of oil and raw material prices was the last straw.Inflation, as measured by the WPI, rose from 18.8% in 1979 to 38.9% in 1980 inspite of a reduction in the growth of M2, which together with the abovementioned cut in real money balances, created a monetary environment unusualfor an economy accustomed to abundant supplies of credit.
2.03 Adjustment to the second oil shock was a gradual process. Althoughmanufacturing investment by the private sector declined (and there was aslight rundown of inventories in 1980) in both 1980 and 1981 under the weightof low capacity utilization, indifferent market prospects and profitabilityratios seriously undermined by the sharp increase in foreign debts and thelocal currency costs of debt servicing, investment in infrastructure was main-tained. Fixed investment was 32% of GNP in 1980 and close to 29% in the fol-lowing year. Meanwhile, domestic savings decreased by 1 ver 5% of GNP asKorean households, unlike their Japanese counterparts,- remained faithful tothe "ratc§et" theories of consumption behavior and maintained .heirspending.- The government resisted taking stronger measures to restraindomestic investment, because OPEC's decision once again generated an abundanceof capital in the international market, needing to be recycled. Inflationaryconditions also pushed the interest costs of foreign borrowing to attractivelynegative rates. Thus, in 1980, the current balance widened to $5.3 billion,equivalent to 10Z of GNP.
- 9 -
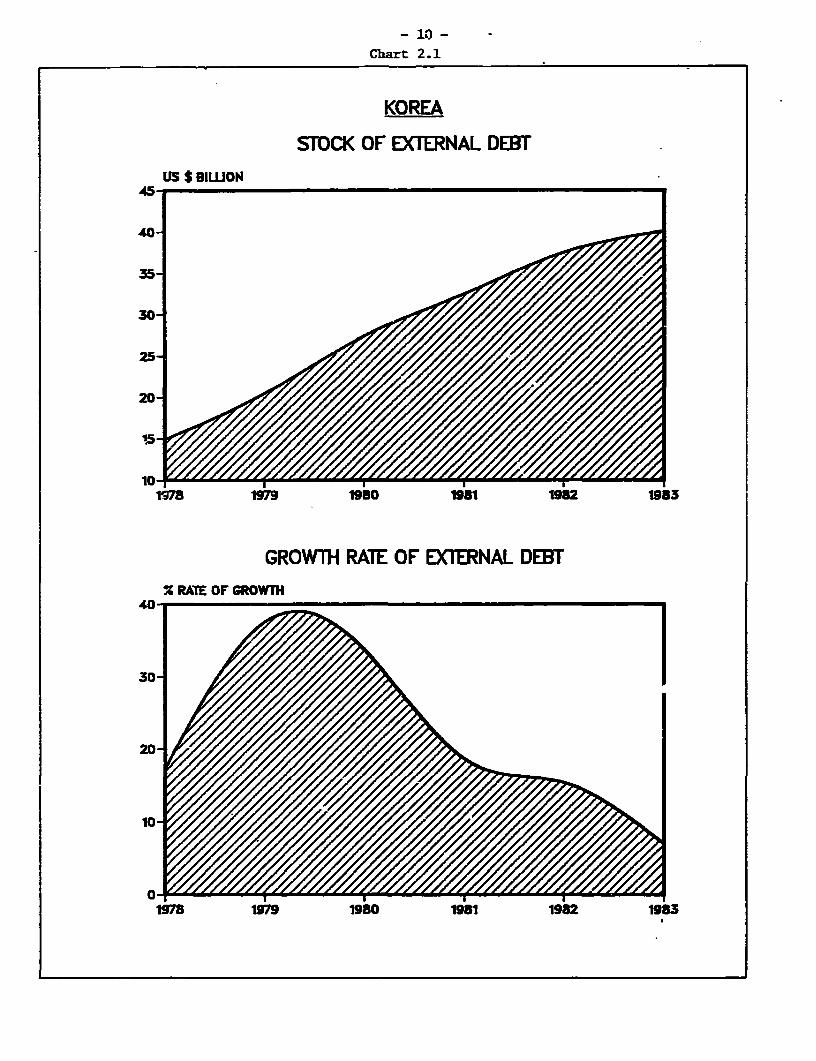
2.04 As economic activity remained at a low ebb in 1981 and businessmencontinued to worry about the country's future, private investment slidfurther. Once again, by borrowing heavily abroad, the government sustainedpublic sector investment. By avoiding the adjustment in public investment fortwo years, the government averted an even worse deterioration of the businessclimate; but the heavy reliance on foreign savings caused Korea's totalexternal debt to grow by 59% from $20.5 billion in 1979 to $32.5 billion in1981. (Chart 2-1).
2.05 By 1982, with the hopes of world economic recovery in the air,private spending on housing and office buildings revived, followed by a modestincrease in manufacturing investment. This served to reinforce the refla-tionary influence of public investment and enabled the economy to grow 5.6%even though real exports, which expanded by less than 5.8%, provided minimalsupport for the recovery. A significant narrowing of the current accountdeficit in 1982 to $2.6 billion (nearly billion if errors and omissionsamounting to $1.4 billion are included) - suggested a redoubling of thegovernment's efforts to bring about external adjustment in the face of sharplyrising real interest rates on foreign debt. But whereas private savings werehigher, they only served to accommodate the increased investment spending.Almost the entire gain in the external balance apparently came from therunning down of inventories. These fell by an amount equivalent to 3.3% ofGNP, bringing gross domestic investment to 27%. Two forces could have been atwork. First the high real interest costs and the scarcity of domestic creditdiscouraged firms from holding large inventories. Second, producers who hadaccumulated stocks of finished goods by utilizing their newly installedcapacity in the two previous years, preferred to draw down inventories insteadof increasing the output from their plants. Capacity utilization dropped toits lowest point - 69.5% - in 1982 even though economic conditions weresomewhat more propitious than they had been for some time.
2.06 Domestic construction gathered additional momentum in the early partof 1983, raising the economy's growth rate over 9% and drawing manufacturing-nvestment in its wake. Initially this was concentrated in industries thatsupported building activities, but an upward shift in export demand, from themiddle of the year, encouraged producers of electronics, machinery and tex-tiles to raise their capital spending. Higher fixed investment, about 32% ofGNP, was supported by a growth in the savings of the government as well ashouseholds, but the national accour.ts show that a depletion of inventories wasequally important in reducing the current account deficit to $1.6 billion($2.6 billion with the addition of errors and omissions) or 2.1% of the GNP.
2.07 To have halved the current accounc deficit in three years Is a con-siderable achievement and government stabilization policies which promoted therecovery of savings, while holding investment at levels sufficient to ensure amodicum of growth, deserve much of the credit. But the adjustment process wasalso influenced by some tightening of credit and interest rate policies whichdiscouraged companies from holding large volumes of raw materials and finishedgoods. The increased efficiency in the use of energy is another noteworthyfactor. Korea's imports of crude oil rose from $2.2 billion (15% of totalimports) on the eve of the second oil shock to $5.6 billion in 1980 (23% oftotal imports) and $6.5 billion in 1981. But by instituting a wide range of
- 10 -
Chart 2.1
KOREA
STOCK OF EXTERNAL DEBTUS $ IWON
40-_
35-
:m _~~~~"o Sal 198 198
GROWTH RATE OF EXTERNAL DEBT
X RATE OF GROWTH
401 9
1978 196 1980 1981 1962 19X13
- 11 -
measures to encourage energy conservation, the government has been able tolower the energy intensity of GDP. The index of the energy/GDP ratio fallingfrom 114.6 in 1980 to 106.0 in 1982. Imports of oil which increased in realterms by 0.3% during 1981, fell by just under 1% in 1982. In 1983, oil usagerose by 8% but the fall in oil prices held expenditures on imported crude to$5.6 (P) billion. Three years is too short a time to cure the many ineffi-cient practices that result in a waste of energy. Much more needs to be doneand the gains from conserving energy could be a source of major savings offoreign exchange in the years ahead.
2.08 While policies affecting savings, investment and trade were centralto the effort of correcting the external imbalance, the government's attemptsat quenching inflation, aside from their significance for financial develop-ment, enhanced export competitiveness and might even have had a part In therecovery of household savings. Money supply was first tightened in 1979 aspolicymakers shifted their attention from the goal of maximizing growth tocontrolling the inflationary spiral which had arisen in the rapidly expandingeconomy. The increase in M2, that averaged 38% during 1977-78 was broughtdown to 27% in 1979 and maintained at close to that level for the next threeyears, finally being reduced to 16% ir i983, a year in which prices rose by3.4% (CPI).
2.09 During the seventies both cost push and demand pull pressures wereinstrumental in raising prices and it is difficult to decide whether monetarypolicy played an active or an accommodative role. Price equations that wereestimated do not gypport the hypothesis that inflation was being propelled bythe money supply.- But this may be because throughout the period for whichtests were conducted - 1966-83 - money supply was more or less in balance withde.aand. The existence of a stable demand for money function suggests that thegro-th of the money supply, if it had a small part in actually gen yatinginflationary pressures, may have been decisive in validating them From theattempt to decomnese inflation into dom^sric and imported components, itappears that two thirds of the increase in prices during 1974-78 was of domes-tic origin (Table 2.1). It fell to 40% in 1979-81, buc domestic coreinflation arising primarily from wages has re-emerged as the main cause ofrising prices during 1982-83 (67%). This may reflect the substantial gains inreal wages during 1982-83. After declining by 6% in 1980 and another 1X in1981, real wages in the formal sector climbed by 7% in the course of 1982 andnearly 13% during 1983. As productivity rose 4.5% in the manufacturing sectorand by a fraction of that amount in services, this undoubtedly worsenedcompany profits in 1982. Although the growth in productivity was larger lastyear, companies still needed to accommodate higher labor costs in somefashion. In this they were helped by the 6% depreciation of the Won againstthe dollar in 1983. But some of the increase in costs has found its way intoselling prices.

- 12 -
Table 2.1: DECOMPOSITION OF INFLATION INTO FOREIGN AND DOMESTIC FACTORS
Domestic ForeignInflation /a Inflation InflationRate Component Component(Z) (X) (%)
1974 42.1 22.9 19.21975 26.3 16.6 9.71976 12.1 11.7 0.41977 9.0 7.5 1.51978 11.7 7.8 3.91979 18.7 11.4 7.31980 38.5 13.6 24.91981 20.7 8.2 12.51982 4.7 3.8 0.91983 0.8 -0.2 1.0
/a Inflation as measured by the WPI.
2.10 To summarize: stable or declining raw material and fuel prices havecontributed substantially to the easing of the price spiral. At the same timedomestic core inflation has been curbed by a weak demand during 1980-82, atighter money supply and the wages policy, but inflationary expectations havenot been suppressed altogether. And the possibility remains that a furtherstrengthening of the economy in 1984, by adding fuel to wage demands inmanufacturing, could spark a round of price increases in the service sector.The latter usually matches the wage increases negotiated by manufacturingworkers but cannot easily absorb the growth in costs since the annualproductivity increments in services are relatively small.i/
2.11 Unemployment has not been a central concern of Koreanpolicymakers. The economic problems of the early 80s certainly pushedrecorded nationwide unemployment to levels not seen for over a decade, but the5.2% rate of 1980 did not persist for long. By 1981, unemployment was down to4.4% and it was 3.8% in 1983, an extraordinarily low rate by internationalstandards.
2.12 These statistics are an average of the extremely low rates of openunemployment prevailing in the rural areas and the higher levels of joblgss-ness - particularly among school graduates - encountered in the cities.-They also suffer from problems of definition and reporting but these arehardly unique to Korea. What is noteworthy, however, is the distribution ofjob openings, the imp'ications they hold regarding the nature of future workopportunities and the trend in average productivity. While the economicallyactive population has grown at an average rate of 2.3% p.a. since 1979, asmall proportion of the new entrants have been absorbed by the manufacturingsector. The vast majority, including the migrants from the farming sector
- 13 -
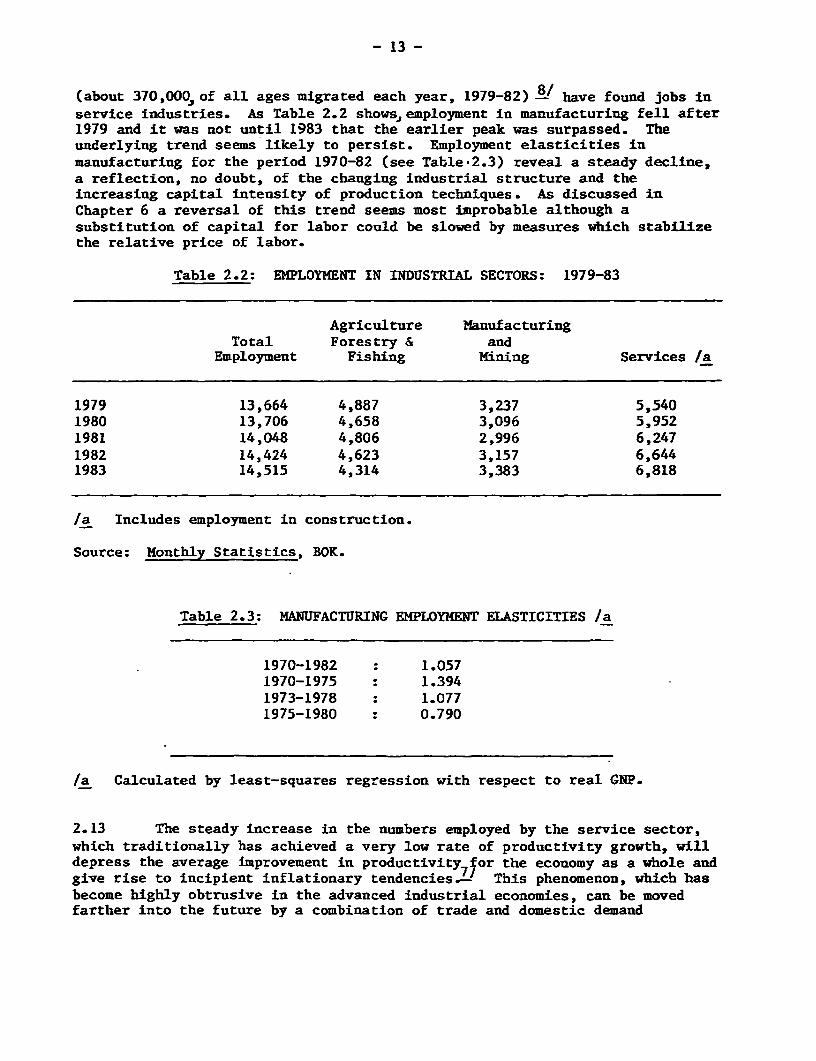
(about 370,000, of all ages migrated each year, 1979-82)I8 have found jobs inservice industries. As Table 2.2 showseiemployment in manufacturing fell after1979 and it was not until 1983 that the earlier peak was surpassed. Theunderlying trend seems likely to persist. Employment elasticities inmanufacturing for the period 1970-82 (see Table.2.3) reveal a steady decline,a reflection, no doubt, of the changing industrial structure and theincreasing capital intensity of production techniques. As discussed inChapter 6 a reversal of this trend seems most improbable although asubstitution of capital for labor could be slowed by measures which stabilizethe relative price of labor.
Table 2.2: EMPLOYMENT IN INDUSTRIAL SECTORS: 1979-83
Agriculture ManufacturingTotal Forestry & and
Employment Fishing Mining Services /a
1979 13,664 4,887 3,237 5,5401980 13,706 4,658 3,096 5,9521981 14,048 4,806 2,996 6,2471982 14,424 4,623 3,157 6,6441983 14,515 4,314 3,383 6,818
/a Includes employment in construction.
Source: Monthly Statistics, BOK.
Table 2.3: MANUFACTURING EMPLOYMENT ELASTICITIES /a
1970-1982 : 1.0571970-1975 : 1.3941973-1978 : 1.0771975-1980 : 0.790
/a Calculated by least-squares regression with respect to real GNP.
2.13 The steady increase in the numbers employed by the service sector,which traditionally has achieved a very low rate of productivity growth, willdepress the average improvement in productivity7for the economy as a whole andgive rise to incipient inflationary tendencies._ This phenomenon, which hasbecome highly obtrusive in the advanced industrial economies, can be movedfarther into the future by a combination of trade and domestic demand
- 14 -
management pol.cies ensuring a rapid growth of the manufacturing sector. Theform such policies might take is described later in the report.
Revising the Fifth Plan
2.14 At the early stage of a business recovery the impression gathered byreviewing the principal economic indicators often tends to be mixed, evidenceof a marked improvement in some areas being countered by persistent weaknessin others. By the conventional criteria, Korea has recovered with remarkablyfew scars from the recession of the early 80s. The government clearly is ofthe view that sustained export-led growth, with a balance of payments surplusby 1986, can be confidently projected. In revising the Fifth Five Year Planit has not only reaffirmed its faith in the country's future economic prowess,but learning from the recent exDerience, attempted also to clarify the objec-tives that will serve to guide planners and businessmen alike through themiddle of this decade.
2.15 Keenly aware both of Korea's potential as an exporter of manufac-tures and its vulnerability to the tensions besetting the internationalcapital market, Korean planners have attempted to reconci'le growth with pricestability and external adjustment. An annual gain of 7.5% in- the GNP servesas a point of departure for the planning exercise. This is considered to bethe minimum rate of expansion consistent with stable levels of unemployment asthe urban labor force will be growing by close to 3% per annum for the nextseveral years. A growth rate of this order cannot be sustained for any lengthof time mainly on the strength of domestic demand without sizeable externaldeficits. And since a second priority of the government is to attain a modestBOP surplus by 1986 in order to contain the size of the external debt, thegrowth and payments objectives can only be squared if the volume of exportsincreases annually by 10-11% while imports grow no faster tnan GNP, terms oftrade remaining unchanged.
2.16 Balance of payments equilibrium calls for a matching of domesticsavings with domestic investment. It also assumes that the country will adopta combination of exchange rate and industrial policies such that it canproduce goods in demand overseas and can market them at competitive prices.On the side of resource balances, the government has pruned the vast publicinvestnent program by shelving its plans to construct two nuclear powerstations, delaying the commencement of work on the 11th and 12th units andstretching out the construction schedules of four out of the six plants nowbeing built as the pro yted demand for electricity is lower than what wasbeing assumed earlier,- But this still leaves a very considerable volume ofcapital spending on transport urban infrastructure, power and water supplyprojects which is not easily pushed into the future. In addition, thegovernment intends adding nearly a half million new housing units - a lireless than 50% of the number to be constructed - to the stock of housing.--When taken together with the projected increase of industrial capacity, grossfixed investment should remain very close to the level reached during the pasttwo years.
2.17 A little under one quarter of the GNP was saved last year (24.4%)and the Plan sees savings climb to 29.3% by 1986. For a current account
- 15 -
surplus to be realized, therefore, gross domestic investment must fall some-what below that figure. Higher savings require the mediation from suitableindustrial and macroeconomic policies for them to be able to raise exports.The emphasis of the government's industrial initiatives is on technology.Encouraging local R&D, licensing new technolqgy.from abroad and modernizingequipment are expected to consolidate Korea's position as a trading nation inpromising fields such as consumer electronics, basic metals, machinery andtransport industries, as well as raising productivity (see chapters 5 and 6).Progress in technology is one prong of the trade strategy. A second is pricecompetitiveness. By limiting monetary growth (M2) to 12X p.a. between 1984-86, bringing the public sector budget into balance within three years, usingmoral suasion to check wage demands-and barring external price shocks-thegovernment will attempt to keep inflation close to the level reached in 1983.
2.18 Past experience has shown that Korea has almost invariably been ableto go beyond the often very high standards of performance set down in the FiveYear planning documents. The revised Fifth Plan is no less taut and ambitiousthan its predecessors. But the international milieu has changed and there isnow greater uncertainty over the extent to which Korean determination canregulate with extreme precision, a complex, open economy and at the same timeprevail over the political sediment settling into the channels of trade.Beyond matters of consistency, there loom questions of the feasibility, andeven possibly, the desirability of the goals presented in the Plan, some ofwhich are elaborated and analyzed in the following chapters.
- 16 -
CHAPTER III
SAVINGS, INVESTMENT AND FINANCIAL INTERMEDIATION
3.01 To keep the economy growing by 7.5% per annum while simultaneouslymoving towards a current account equilibrium calls for a sizable increase indomestic savings and improvement in the efficiency of investment. Given thenature of the investment program the first might be more readily attained thanthe second.
3.02 As a proportion of GNP, domestic savings doubled between 1964 andthe late seventies reaching a level of 28.5% in 1978. Although the contribu-tion of the corporate sector was far from negligible- and the maintenance ofgovernment savings at about 6% certainly helped, much of the growth resultedfrom the heightened saving propensities of households. The increase in house-hold savings to 10% of GNP in 1979 drew its momentum principally from the veryrapidly rising incomes, but several other factors also influenced householdsavings behavior. The development of financial markets, offering individualsconvenient financial instruments in which to hold their savings at attractivereal interest rates, certainly encouraged the financialization of savings andmight also have enlarged the quantum of real savings. Aside from this, a hostof institutional circumstances had a hand in modulating the habit of savings.A very strong desire to educate children, the absence of consumer credit, theunavailability of mortgage financing and the non-existence of a socialsecurity system, provided powerful incentives for household savings. Payingworkers a significant percentage of their annual salary in the form ofbonuses, given twice a year, sharpened the inclination to accumulate. Allthese determinants of savings, which are often difficult to isolate quantita-tively have been useful in illuminating the trend in Japanese savings as wellas those of some othey East Asian societies with institutions similar to theones found in Korea,_
3.03 The cut in real incomes resulting from the oil shock reducedhousehold savings to 4.6Z of GNP by 1981, as families ate into their savingsso as to preserve their consumption standards. This was reversed in 1982 withthe onset of a more favorable economic climate so that by 1983, householdsavings had risen to 7% of GNP - although they remained some distance from thepre-1980 levels (about 10%).
3.04 Profits and the existence of lucrative invesJVent opportunities areamong the variables known to affect corporate savings. There was certainlyno dearth of projects for companies to pursue during the sixties and theseventies. With returns rising steadily in the seventies, corporate savingshad grown to a healthy 10% of GNP by 1979. Subsequently, anaemic profits inthe years of recession, lowered corporate savings to 8.5% in 1981. The fastereconomic pace during 1983, helped spur accumulation but corporate savingsremained below the level reached in 1979.
3.05 Government savings have remained more stable over the past fiveyears than private savings. Inflation, which in the past had buoyed govern-ment 5evenues through bracket creep, and in combination with the "inflationtax" - had served to raise savings, declined steeply in 1981. By compressing

-17-
revenues, this tended to reduce savings. In 1983, the much higher than anti-cipated growth of the economy more than offset an even lower rate of inflationas well as a cut in taxes. With expenditure calibrated to a smaller increasein GNP, government's savings increased to over 7%.
3.06 On the basis of past experience the government's goal of a nationalsavings rate of 29.3% by 1986 would seem to be within reach since it requiresthe economy to go only a little beyond what was achieved in 1979. As thegrowth in household incomes (which strongly influences how much people save)during the next three years is likely to be less than the average for the1976-79 period, such a line of reasoning assumes that saving propensity isstronger now than it was earlier. This is difficult to establish. In fact,the growth in demand for consumer durables in 1983-84 would if anything, pointtowards a shift in the household consumption function. Higher spending byindividuals could be balanced by greater corporate and government savings andas described below, the latter is projected to be 1.2% of GNP larger by1986. The former should also regain the ground lost in the early eighties ifthe upward trend in corporate earnings persists. Thus, casual empiricismwould tend to support the Government's estimates. To see if it could bebolstered by more formal methods some econometric tests were conducted.
3.07 Attempts at projecting savings in the future are rendered hazardousihy the need to forecast a number of key macro-variables that propel nationalsavings and by having to assume that behavioral parameters will not drift fromthe estimates squeezed out of historical time series. An analysis of pasttrends indicates that domestic savings are sensitive to the level and growthof GNP the real time deposit rate and the rate of inflation (Box 3.1). Theequation derived very closely tracks past movements in savings (see Chart3.1). When this function is used to project savings over the period 1983-86the predicted outcome for 1983 is 23.9%, slightly less than the preliminaryestimate, which is 24.4%. Savings increase by 0.7% of GNP in 1984, as against2.3% estimated by the government. By 1986, the equation forecasts savingsequal to 26.6% of GNP. The results obtained fall below the estimates in therevised plan, primarily because the government expects that the recent changesin the budget will yield higher savings than those generated by a model fedupon time series data.
3.08 Empirical analysis is unable to uncover anything other than a stablelog linear relationship between the level of GNP and government savings.Neither the rate of inflation, interest or the growth in GNP has any signifi-cance. Using the savings elasticity derived in this fashion, produces fore-casts of government savings in the region of 5%, w;.ereas the Plan offers afigure that is more than 2% higher. The government's calculations aregrounded in a drastic revision of its budgetary strategy that draws upon theconcept of zero-basing and assumes that the growth of expenditures will becarefully controlled. Since the government's ability to enlarge its savingswill be critical for the fulfillment of the Plan's objectives, it is necessaryto sketch the public sector's budgetary dynamics. A more detailed discussionis presented in Annex 2.
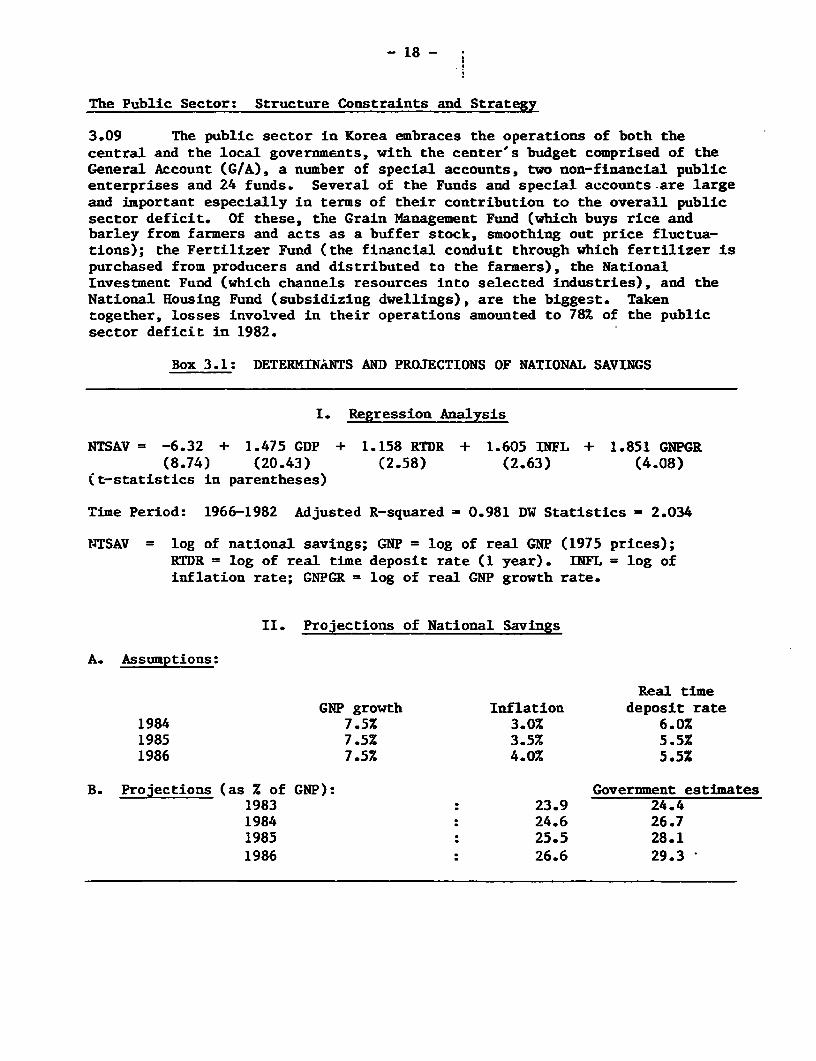
- 18 -
The Public Sector: Structure Constraints and Strategy
3.09 The public sector in Korea embraces the operations of both thecentral and the local governments, with the center's budget comprised of theGeneral Account (G/A), a number of special accounts, two non-financial publicenterprises and 24 funds. Several of the Funds and special accounts are largeand important especially in terms of their contribution to the overall publicsector deficit. Of these, the Grain Management Fund (which buys rice andbarley from farmers and acts as a buffer stock, smoothing out price fluctua-tions); the Fertilizer Fund (the financial conduit through which fertilizer ispurchased from producers and distributed to the farmers), the NationalInvestment Fund (which channels resources into selected industries), and theNational Housing Fund (subsidizing dwellings), are the biggest. Takentogether, losses involved in their operations amounted to 78X of the publicsector deficit in 1982.
Box 3.1: DETERMINANTS AND PROJECTIONS OF NATIONAL SAVINGS
I. Regression Analysis
NTSAV = -6.32 + 1.475 GDP + 1.158 RTDR + 1.605 INFL + 1.851 GNPGR(8.74) (20.43) (2.58) (2.63) (4.08)
Ct-statistics in parentheses)
Time Period: 1966-1982 Adjusted R-squared = 0.981 DW Statistics = 2.034
NTSAV = log of national savings; GNP = log of real GNP (1975 prices);RTDR = log of real time deposit rate (1 year). INFL = log ofinflation rate; GNPGR = log of real GNP growth rate.
II. Projections of National Savings
A. Assumptions:
Real timeGNP growth Inflation deposit rate
1984 7.5% 3.0% 6.0%1985 7.5% 3.5% 5.5%1986 7.5% 4.0% 5.5%
B. Projections (as % of GNP): Government estimates1983 : 23.9 24.41984 24.6 26.71985 : 25.5 28.11986 26.6 29.3

-19 -
Chart 3.1
NATIONAL SAVINGS ACTUAL VS PEDICTED
ACTUAL
.41 1 5.4
7.5. / 7.5
1 / F~~~~~~~~~~~~~~~~~~~~~~~~~
S. 1I, S.C7.1 - 7.6
7.6- .- 7.4
7. - 7.U --
7. 5 - 7.4
7.2 r~~~~~~~~~~~~~~~~~~~~~~5
7. 7 3 7.0' e. ') ~7~7 ~7 7 CS

- 20-
3.10 According to the 1984 Budget, the public sector deficit will shrinkto 0.6% of GNP from 2.7% in 1982 as a consequence of (i) an 83% decline in thedeficit of the Loan Management Special Account; (ii) an 82% fall in the lossesregistered by the GMF; (iii) a 67% drop in the deficit of the NIF since 1982;and (iv) 375% increase in the surplus of the G/A over a two year period.Besides the savings accruing from changes introduced into the operations ofthe various funds, the government also intends limiting its GIAexpenditures. It has set a ceiling on its outlay during 1984 which permits noincrease over the level of 1983. This ceiling will be raised over the nexttwo years at a rate equal to the growth in GNP. Administrative costs are alsobeing controlled through a freeze on public sector employment in 1984 and nomore than a 3% rise in salaries for all public sector employees.
3.11 The tax reductions enacted during 1982 have had the effect oflowering the elasticity of government revenues. In addition, a cut in importtariffs will drain W 60.3 billion from customs duties in 1984, W 16.0 billionin 1985 and W 6.3 billion in 1986. But, in order to preve-* further erosion,the defense surtax, expected to expire in 1985, will most probably be renewedfor another five years, and customs duties on petroleum imposed in 1983 willfunnel W 201 billion into the budget in the course of 1984.
3.12 Measures taken by the government in 1983 narrowed the public sectordeficit by 2% of GNP from the year before. This was a major achievement.Reducing it further will be increasingly difficult because certain items ofexpenditure cannot easily be changed, and this could danpen the growth ofgovernment savings that had reached 7% in 1983 (Table 3.7). For instance, byvirtue of statute:
(a) defense expenditure must equal 6% of GNP;
(b) grants-in-aid to the local government are to remain at 13.27% ofdomestic tax revenue although supplementary assistance will beeliminated;
(c) education grants will absorb 11.8% of domestic tax revenue; and
(d) receipts from the education surtax will be entirely devoted toeducation expenses.
3.13 With perhaps 70% of total expenditures more or less fixed in theshort-term, project expenditures and administrative costs must bear the fullforce of the economy drive. For 1984, it is planned to scale down the so-called flexible expenditures by 5.6% in nominal terms. This translates into a15.5% fall in administrative expenses and only a 1.2% growtl' in projectoutlay.
3.14 When a budgetary restructuring as far-reaching as this one isembarked upon, calculations, of a necessity, tend to be finely balanced andeasily upset by unforeseen movements in certain key parameters. The abilityto control public sector wages that have tended to lag behind those in theprivate sector, will, of course, be crucial. To succeed, the government mustnot only prevent a widening of the wage gap and the discontent which this
- 21 -
would generate, it must also prevent inflation from exceeding the rate of 1983at a time when international prices will be increasing by 4-6%.
3.15 The very slow growth in project expenditure planned for 1984 andpossibly beyond, may help in balancing the budget, but its macro-economic andindustrial ramifications should not be lightly glossed over. To grow, theKorean economy requires savings. It also needs the pull of demand. Duringthe last four years, public spending allied with export growth has providedthe demand impetus. A sudden fall in the growth rate of government spendingon projects could, aside from its effect on aggregate demand, cause disruptionin certain industries heavily dependent on the linkage effects produced bythese expenditures. In the event that exports do not take up the slack, growthcould be constrained by a lack of demand.
3.16 Lastly, to the extent that the budget is brought into equilibrium bypassing on some of the costs currently being absorbed in the deficits of themajor funds, on to consumers and industrialists, higher government savings,could be counter-balanced by a decline in those of households and corpora-tions. This phenomengy, labelled as Denison's Law has been encountered in theindustrial economies.- That it might migrate to Korea is not beyond therealm of possibility.
3.17 Certain assumptions regarding growth rates, the pace of inflationthrough the mid eighties, the persistence of moderately high real depositrates and the government's ability to raise its savings from 7.1% to 8.3% areneeded to arrive at domestic saving rates of more than 28% in 1986. Whetherthey are adequate to fully cover gross domestic investment depends very muchon the sectoral movements in fixed investment and the factors liable todetermine the size of inventories.
Investment
3.18 Fixed investment has moved in a narrow range since 1980 (Table 3.1)but the trend after 1981 has been upward, as confidence has seeped back intothe manufacturing sector with the upturn in profits and rates of capacity uti-lization. However, the pattern of investment in the eighties is quite diffe-rent from the one observed in the second half of the seventies, a periodduring which Korea was racing to develop a base of heavy and chemical indus-tries, the leading sectors of the current decade. In those years, a fifth ofall fixed investment was in manufacturing. By 1982 the sector accounted forless than 14%. It was investment in dwellings, office buildings and infra-structure which took the lion's share in the lean recessionary years - over62% in 1982 - but after nearly three years when capacity has remained stablein most major industries, an expansion of plant is very much in the cards.This is unlikely to take the form of a major surge as occurred in theseventies, when at the government's instigation and supported by an elasticsupply of cheap credit, businessmen exploited scale economies to the full andbuilt up an enormous volume of excess production capacity. The government'sdisengagement from a direct involvement in the planning of industrial ven-tures, limited credit availability, narrower profit margins and less exuberantexpectations concerning export demand, have all tempered the desire to invest.
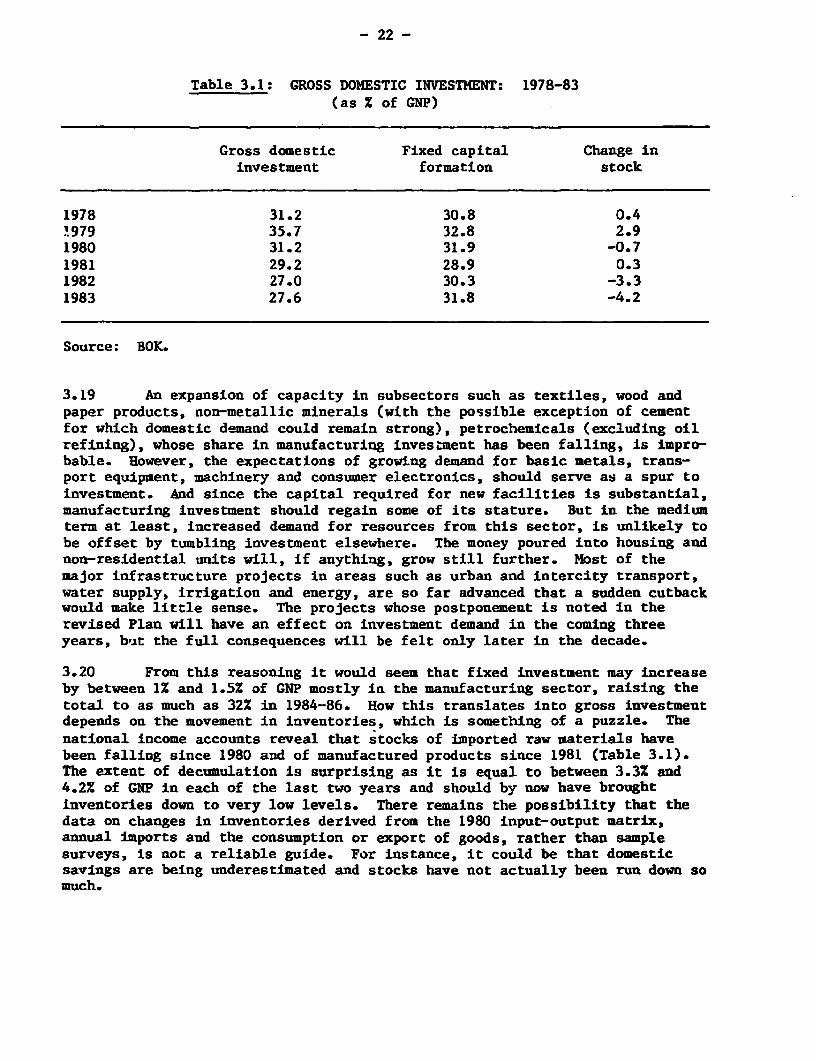
- 22 -
Table 3.1: GROSS DOMESTIC INVESTMENT: 1978-83(as Z of GNP)
Gross domestic Fixed capital Change ininvestment formation stock
1978 31.2 30.8 0.4'979 35.7 32.8 2.91980 31.2 31.9 -0.71981 29.2 28.9 0.31982 27.0 30.3 -3.31983 27.6 31.8 -4.2
Source: BOK.
3.19 An expansion of capacity in subsectors such as textiles, wood andpaper products, non-metallic minerals (with the possible exception of cementfor which domestic demand could remain strong), petrochemicals (excluding oilrefining), whose share in manufacturing investment has been falling, is impro-bable. However, the expectations of growing demand for basic metals, trans-port equipment, machinery and consumer electronics, should serve as a spur toinvestment. And since the capital required for new facilities is substantial,manufacturing investment should regain some of its stature. But in the mediumterm at least, increased demand for resources from this sector, is unlikely tobe offset by tumbling investment elsewhere. The money poured into housing andnon-residential units will, if anything, grow still further. Most of themajor infrastructure projects in areas such as urban and intercity transport,water supply, irrigation and energy, are so far advanced that a sudden cutbackwould make little sense. The projects whose postponement is noted in therevised Plan will have an effect on investment demand in the coming threeyears, bu.t the full consequences will be felt only later in the decade.
3.20 From this reasoning it would seem that fixed investment may increaseby between 1% and 1.5% of GNP mostly in the manufacturing sector, raising thetotal to as much as 32% in 1984-86. How this translates into gross investmentdepends on the movement in inventories, which is something of a puzzle. Thenational income accounts reveal that stocks of imported raw materials havebeen falling since 1980 and of manufactured products since 1981 (Table 3.1).The extent of decumulation is surprising as it is equal to between 3.3% and4.2% of GNP in each of the last two years and should by now have broughtinventories down to very low levels. There remains the possibility that thedata on changes in inventories derived from the 1980 input-output matrix,annual imports and the consumption or export of goods, rather than samplesurveys, is not a reliable guide. For instance, it could be that domesticsavings are being underestimated and stocks have not actually been run down somuch.
- 23 -
3.21 Since the magnitudes involved are very large and critical for arriv-ing at a realistic estimate of the need for foreign savings, Korean inventoryratios based on stocks in the manufacturing sector, aze compared with those ofseveral other countries (Tables 3.2a and 3.2b). Unlike the inventory statis-tics in the national accounts, data for the manufacturing sector are reason-ably reliable being drawn from extensive sample surveys conducted annually.What Table 3.3 shows is that the ratio of inventories to GNP during 1980 and1981 (more recent information is unavailable) was not very different from thatin other economies although well above the levels of Japan. However, theratio with respect to manufacturing output was considerably below that of theother countries in the sample (Japan again being the exception). These compa-risons suggest that although inventories were not excessive at the start ofthe eighties, there was room for economising. The statistics on Imports sheda little more light (Table 3.4). Raw material imports rose substantially in1981 but they declined in 1982 and registered a very small increase in 1983.They increased significantly in the first half of 1984. In real terms (Chart3.2) imports of raw materials for domestic use increased very little over thelevel of 1980, a year during which the local economy was in the grip of arecession. Intermediate goods used in producing exports were a little higherin 1982 as compared with 1980 or 1978, but the growth was less than what mightbe expected given the rising volume of exports between 1980 and 1982 (11%p.a.).
3.22 Neither the intercountrv comparison nor the import statistics canconclusively establish the validity of the inventory data in the nationalaccounts, but the possibility that stocks fell considerably over the past twoyears cannot be excluded. At least two alternatives can be defined dependingon whether or not the inventory data are treated as statistical anomalies.For the government's projected current account deficit of $0.6 billion to $1.0billion to be realized with GNP growing 7.5-8.0%, either savings must rise by6.5% of GNP (over 1983) by 1986; or inventories must be lowered at least 1.7%of GNP if savings increase by the projected 5%; or fixed investment must beCut by about 2%; or the efficiency of investment dramatically improved. A 2%(of GNP) increase in savings, a lowering of the ICOR and possibly a 3% cut instocks could produce the same results.
3.23 The alternative possibility is to assume that stock decumulationactually occurred over the past three years and inventories can be reduced byno more than 0.5% of GNP in 1984. With fixed investment eqL;l to 32Z of GNPand domestic savings of 25.5%, foreign capital transfers amounting to 5.5% ofGNP or about $2.7 billion would be required to bridge the savings investmentgap if a growth of 7.5-8.0% were sought.
3.24 In the government's version adjustment of inventor.es and increaseddomestic savings are decisive. The feasibility of the other Drojections restspartly on changes in domestic savings and stocks, but also ox the availabilityof foreign capital and greater investment efficiency internally. There isundoubtedly some scope for mobilizing additional savings from foreign anddomestic sources, enhancing allocative as well as technical efficiency,especially through a reform of the management system in public corporations,now being vigorously implemented, and raising the returns from the availablecapital stock by shifting demand towards the manufacturing sector, which has
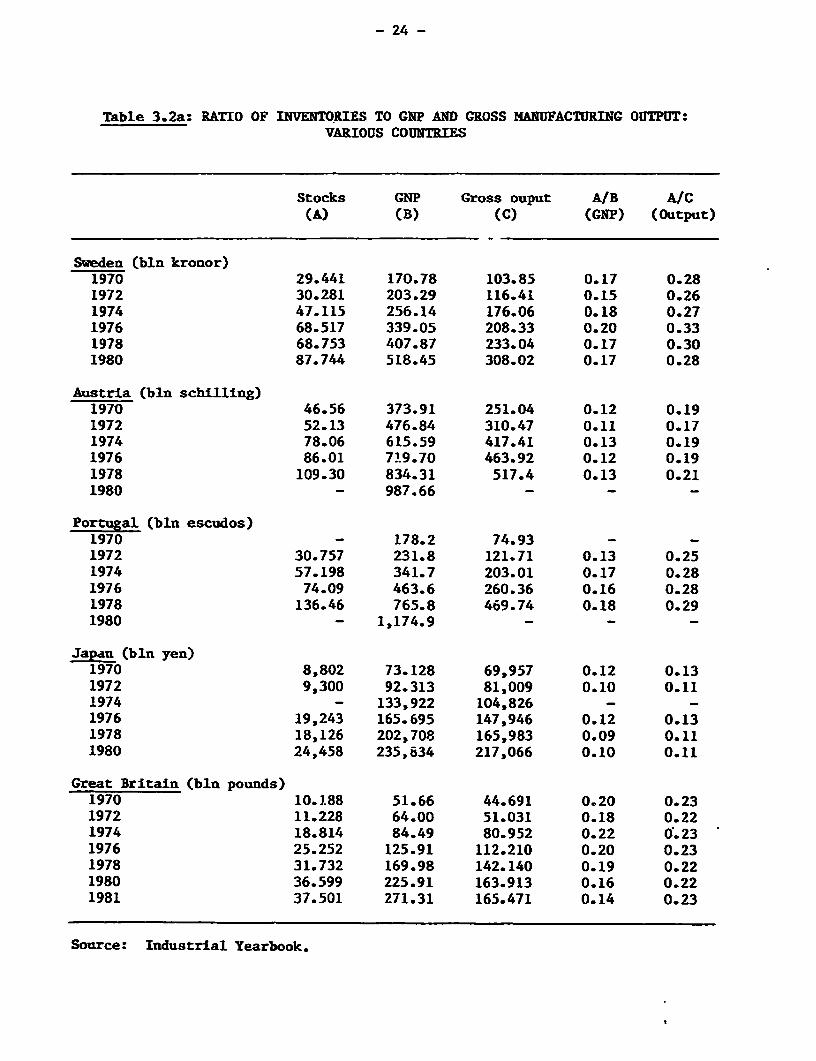
- 24 -
Table 3.2a: RATIO OF INVENTORIES TO GNP AND GROSS MANUFACTURING OUTPUT:VARIOUS COUNTRIES
Stocks GNP Gross ouput A/B A/C(A) (B) (C) (GNP) (Output)
Sweden (bln kronor)1970 29.441 170.78 103.85 0.17 0.281972 30.281 203.29 116.41 0.15 0.261974 47.115 256.14 176.06 0.18 0.271976 68.517 339.05 208.33 0.20 0.331978 68.753 407.87 233.04 0.17 0.301980 87.744 518.45 308.02 0.17 0.28
Austria (bln schilling)1970 46.56 373.91 251.04 0.12 0.191972 52.13 476.84 310.47 0.11 0.171974 78.06 615.59 417.41 0.13 0.191976 86.01 719.70 463.92 0.12 0.191978 109.30 834.31 517.4 0.13 0.211980 - 987.66 - - -
Portugal (bln escudos)1970 - 178.2 74.93 - -
1972 30.757 231.8 121.71 0.13 0.251974 57.198 341.7 203.01 0.17 0.281976 74.09 463.6 260.36 0.16 0.281978 136.46 765.8 469.74 0.18 0.291980 - 1,174.9 - - -
Japan (bln yen)1970 8,802 73.128 69,957 0.12 0.131972 9,300 92.313 81,009 0.10 0.111974 - 133,922 104,826 - -1976 19,243 165.695 147,946 0.12 0.131978 18,126 202,708 165,983 0.09 0.111980 24,458 235,834 217,066 0.10 0.11
Great Britain (bln pounds)1970 10.188 51.66 44.691 0.20 0.231972 11.228 64.00 51.031 0.18 0.221974 18.814 84.49 80.952 0.22 0.231976 25.252 125.91 112.210 0.20 0.231978 31.732 169.98 142.140 0.19 0.221980 36.599 225.91 163.913 0.16 0.221981 37.501 271.31 165.471 0.14 0.23
Source: Industrial Yearbook.
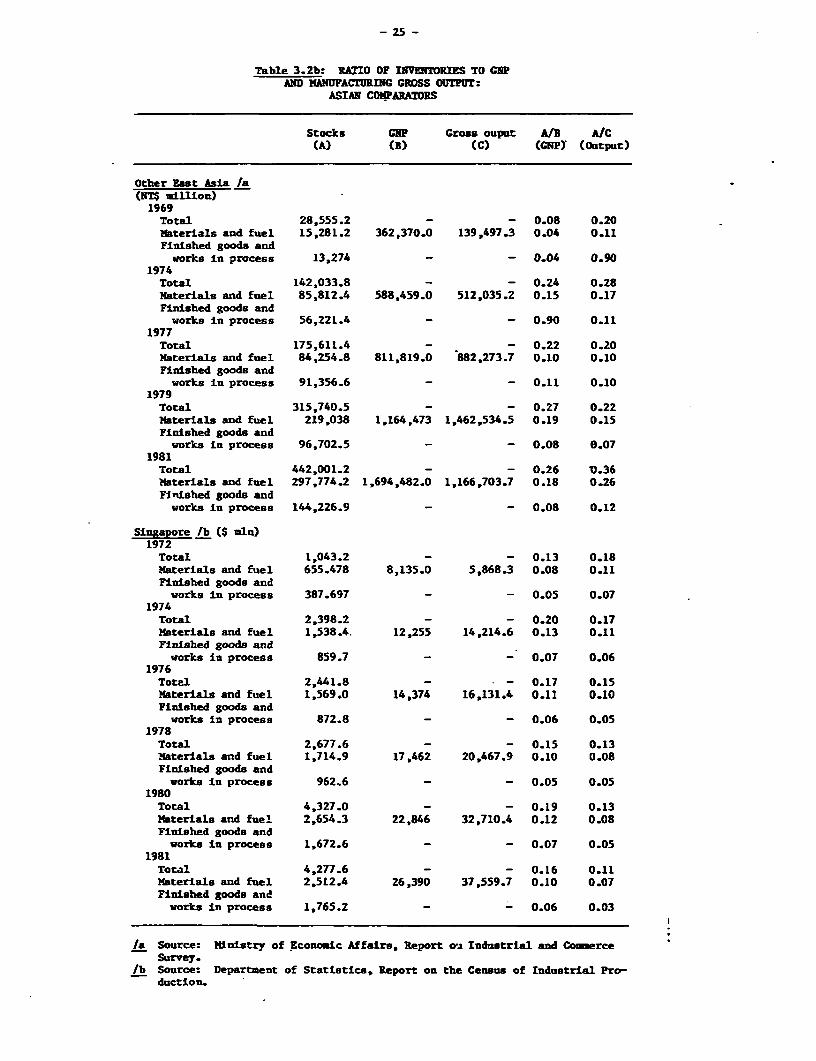
- 25-
Table 3.2b: RATIO OF INVENTORIES TO CUPAND MANUFACTURING GROSS OUTPUT:
ASIAN COIMPARATORS
Stocks GNP Gross ouput A/U A/C(A) (B) (C) (GNPY (Output)
Other East Asia /a(NT$ million) -
1969Total 28,555.2 - - 0.08 0.20Materials and fuel 15,281.2 362,370.0 139,497.3 0.04 0.11Finished goods and
works In process 13,274 - - 0.04 0.901974
Total 142,033.8 - - 0.24 0.28Materials and fuel 85,812.4 588,459.0 512,035.2 0.15 0.17FinIshed goods andworks In process 56,221.4 - - 0.90 0.11
1977Total 175,611.4 - - 0.22 0.20Materials and fuel 84,254.8 811,819.0 882,273.7 0.10 0.10Finished goods andworks in process 91,356.6 - - 0.11 0.10
1979Total 315,740.5 - - 0.27 0.22Materials and fuel 219,038 1.164,473 1,462,534.5 0.19 0.15Finished goods and
works in process 96,702.5 - - 0.08 0.071981Total 442,001.2 - - 0.26 1.36Materials and fuel 297,774.2 1,694,482.0 1,166,703.7 0.18 0.26Finished goods andworks in process 144,226.9 - - 0.08 0.12
Singapore /b ($ nln)1972Total 1,043.2 - - 0.13 0.18Materials and fuel 655.478 8,135.0 5,868.3 0.08 0.11Finished goods and
works in process 387.697 - - 0.05 0.071974
Total 2,398.2 - - 0.20 0.17Materials and fuel 1,538.4. 12,255 14,214.6 0.13 0.11Finished goods and
works in process 859.7 - - 0.07 0.061976Total 2,441.8 - - - 0.17 0.15Materials and fuel 1,569.0 14,374 16,131.4 0.11 0.10Finished goods and
works in process 872.8 - - 0.06 0.051978Total 2,677.6 - - 0.15 0.13Materials and fuel 1,714.9 17,462 20,467.9 0.10 0.08Finished goods andworks in process 962.6 - - 0.05 0.05
1980Total 4,327.0 - - 0.19 0.13Materials and fuel 2,654.3 22,846 32,710.4 0.12 0.08Finished goods and
works in process 1,672.6 - - 0.07 0.051981
Total 4,277.6 - - 0.16 0.11Materials and fuel 2,512.4 26,390 37,559.7 0.10 0.07Fluished goods andworks in process 1.765.2 - - 0.06 0.03
/a Source: Nlnistry of Economic Affairs, Report ou Industril- and CoumerceSurvey.
lb Source: Department of Statistics, Report on the Census of Industrial Pro-ductlon.
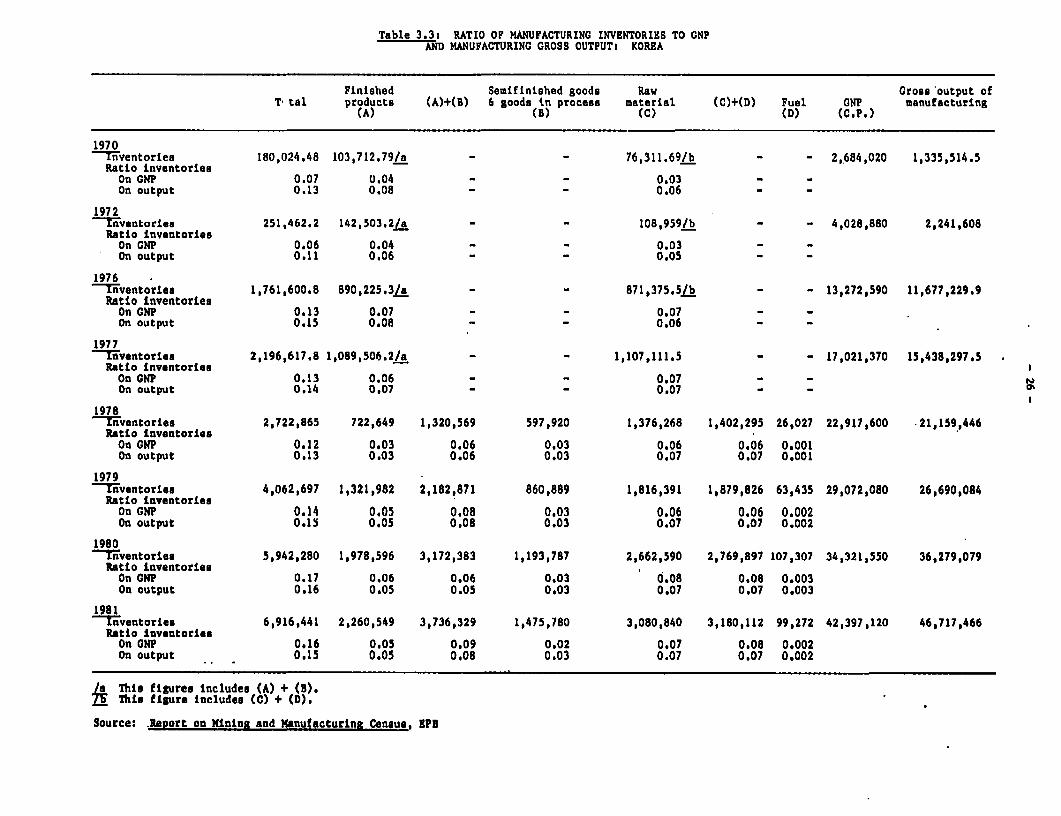
Table 3.3a RATIO OF MANUFACTURING INVENTORIES TO GNPAND MANUFACTURING GROSS OUTPUT: KOREA
Finished Semifinished goods Raw Gross output ofT tal products (A)+(B) 6 goods in process material (C)+(D) Fuel GNP manufacturing
(A) (B) (C) (D) (C.P.)
1970=iventoriea 180,024.48 103,712.79/a - - 76,311.69/b - - 2,684,020 1,335,514.5Ratio inventoriesOn GNP 0.07 0.04 0.03 - -On output 0.13 0,08 - - 0.06 - -
1972=hventories 251,462.2 142,503.2 - - 108,959/b - - 4,028,880 2,241,608Ratio inventoriesOn GNP 0.06 0.04 - - 0.03 - -On output 0.11 0.06 - - 0.05 - -
1976=nventories 1,761,600.8 890,225.3/a - - 871,375.5/b - - 13,272,590 11,677,229.9Ratio InventoriesOn GNP 0.13 0.07 - - 0.07On output 0.15 0.08 - - 0.06
1977=nventories 2,196,617.8 1,089,506.2/a - - 1,107,111.5 - - 17,021,370 15,438,297.5Ratio Inventories _
On GNP 0.13 0.06 - - 0.07 - -On output 0.14 0.07 - - 0.07 _ _
1978=nventories 2,722,865 722,649 1,320,569 597,920 1,376,268 1,402,295 26,027 22,917,600 .21,159,446Ratio inventoriesOn GNP 0.12 0.03 0.06 0.03 0.06 0.06 0.001On output 0.13 0.03 0.06 0.03 0.07 0.07 0.001
1979liventorles 4,062,697 1,321,982 2,182,871 860,889 1,816,391 1,879,826 63,435 29,072,080 26,690,084Ratio inventoriesOn GNP 0.14 0.05 0.08 0.03 0.06 0.06 0.002On output 0.15 0.05 0.08 0.03 0.07 0.07 0.002
1980=nventories 5,942,280 1,978,596 3,172,383 1,193,787 2,662,590 2,769,897 107,307 34,321,550 36,279,079Ratio inventoriesOn GNP 0.17 0.06 0.06 0.03 0,08 0.08 0.003On output 0.16 0.05 0.05 0.03 0.07 0.07 0.003
1981=nventories 6,916,441 2,260,549 3,736,329 1,475,780 3,080,840 3,180,112 99,272 42,397,120 46,717,466Ratio inventoriesOn GNP 0.16 0.05 0.09 0.02 0,07 0.08 0.002On output 0.15 0.05 0.08 0.03 0,07 0.07 0,002
/a This figures includes (A) + (B).7 T mis figure includes (C) + (D).
Source: Report on Mining and Manufacturing Census, EPs
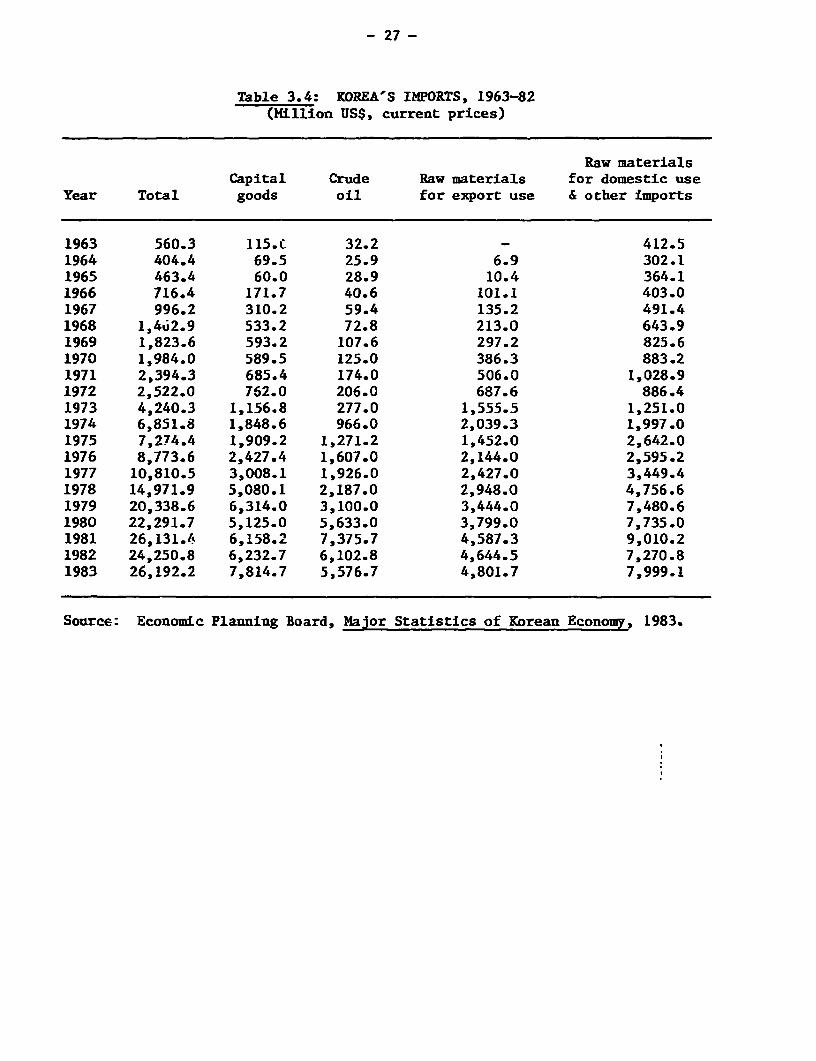
- 27 -
Table 3.4: KOREA'S IMPORTS, 1963-82(Million US$, current prices)
Raw materialsCapital Crude Raw materials for domestic use
Year Total goods oil for export use & other imports
1963 560.3 115.C 32.2 - 412.51964 404.4 69.5 25.9 6.9 302.11965 463.4 60.0 28.9 10.4 364.11966 716.4 171.7 40.6 101.1 403.01967 996.2 310.2 59.4 135.2 491.41968 1,4u2.9 533.2 72.8 213.0 643.91969 1,823.6 593.2 107.6 297.2 825.61970 1,984.0 589.5 125.0 386.3 883.21971 2,394.3 685.4 174.0 506.0 1,028.91972 2,522.0 762.0 206.0 687.6 886.41973 4,240.3 1,156.8 277.0 1,555.5 1,251.01974 6,851.8 1,848.6 966.0 2,039.3 1,997.01975 7,274.4 1,909.2 1,271.2 1,452.0 2,642.01976 8,773.6 2,427.4 1,607.0 2,144.0 2,595.21977 10,810.5 3,008.1 1,926.0 2,427.0 3,449.41978 14,971.9 5,080.1 2,187.0 2,948.0 4,756.61979 20,338.6 6,314.0 3,100.0 3,444.0 7,480.61980 22,291.7 5,125.0 5,633.0 3,799.0 7,735.01981 26,131.4 6,158.2 7,375.7 4,587.3 9,010.21982 24,250.8 6,232.7 6,102.8 4,644.5 7,270.81983 26,192.2 7,814.7 5,576.7 4,801.7 7,999.1
Source: Economic Planning Board, Major Statistics of Korean Economy 1983.
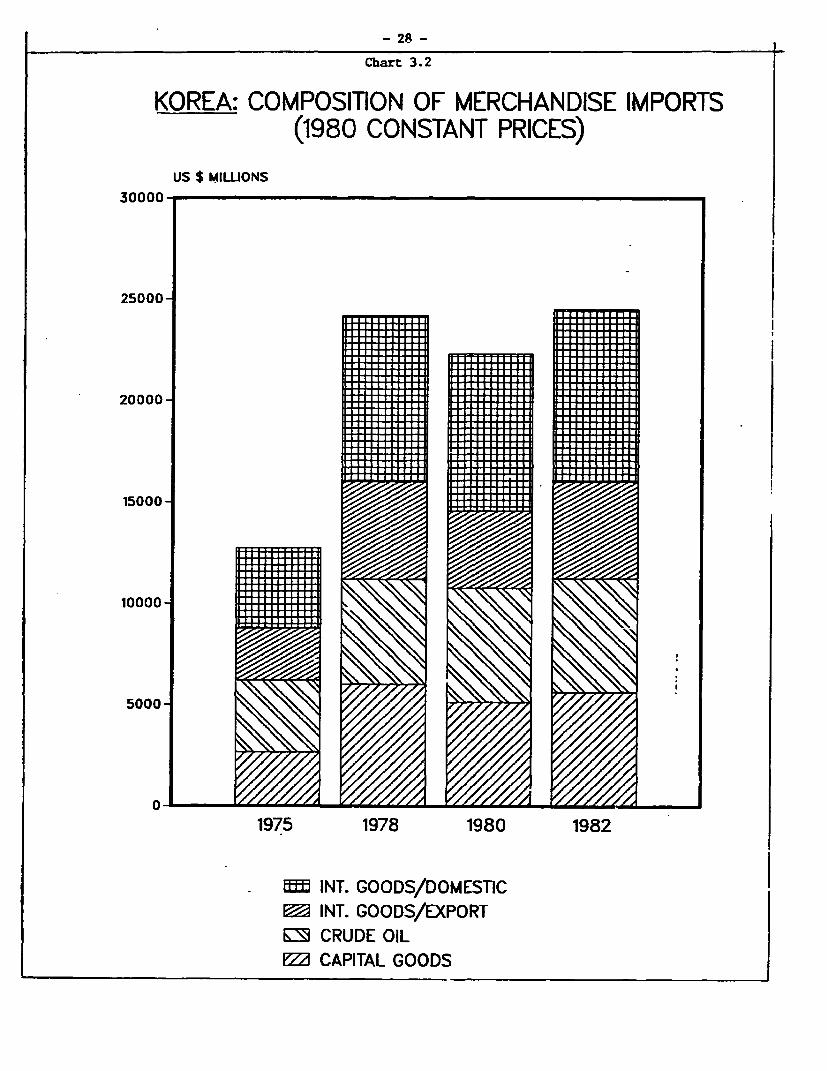
- 28 -
Chart 3.2
KOREA: COMPOSITION OF MERCHANDISE IMPORTS(1980 CONSTANT PRICES)
US $ MILWONS30000
25000-
I II I I I I I I III I 11 .1 .1
20000- II[ T Li II
15000-
10000-
5000-
0-1975 1978 1980 1982
INT. GOODS/DOMESTIC1E INT. GOODS/EXPORTE;i CRUDE OILEZ CAPITAL GOODS
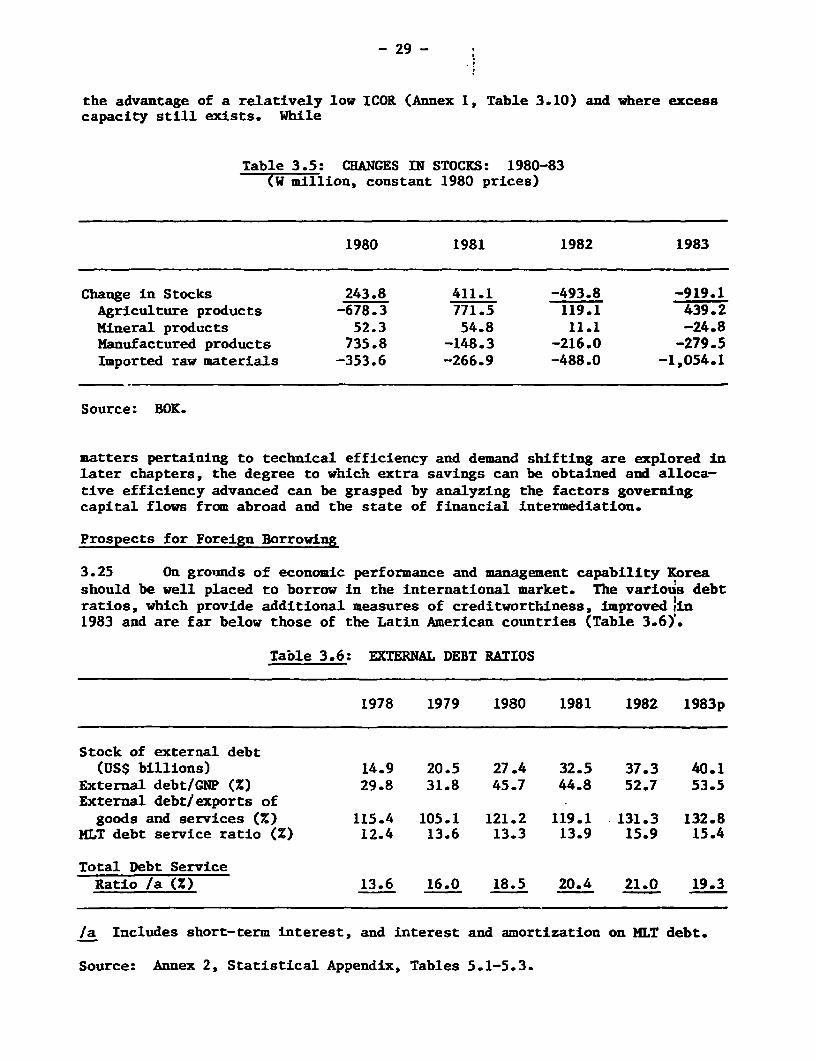
- 29-
the advantage of a relatively low ICOR (Annex 1, Table 3.10) and where excesscapacity still exists. While
Table 3.5: CHANGES IN STOCKS: 1980-83(W million, constant 1980 prices)
1980 1981 1982 1983
Change in Stocks 243.8 411.1 -493.8 -919.1Agriculture products -678.3 771.5 119.1 439.2Mineral products 52.3 54.8 11.1 -24.8Manufactured products 735.8 -148.3 -216.0 -279.5Imported raw materials -353.6 -266.9 -488.0 -1,054.1
Source: BOK.
matters pertaining to technical efficiency and demand shifting are explored inlater chapters, the degree to which extra savings can be obtained and alloca-tive efficiency advanced can be grasped by analyzing the factors governingcapital flows from abroad and the state of financial intermediation.
Prospects for Foreign Borrowing
3.25 On gromnds of economic performance and management capability Koreashould be well placed to borrow in the international market. The various debtratios, which provide additional measures of creditworthiness, improvedlin1983 and are far below those of the Latin American countries (Table 3.6).
Table 3.6: EXTERNAL DEBT RATIOS
1978 1979 1980 1981 1982 1983p
Stock of external debt(US$ billions) 14.9 20.5 27.4 32.5 37.3 40.1
External debt/GNP (Z) 29.8 31.8 45.7 44.8 52.7 53.5External debt/exports of
goods and services (%) 115.4 105.1 121.2 119.1 131.3 132.8MLT debt service ratio (%) 12.4 13.6 13.3 13.9 15.9 15.4
Total Debt ServiceRatio /a (Z) 13.6 16.0 18.5 20.4 21.0 19.3
/a Includes short-term interest, and interest and amortization on MfLT debt.
Source: Annex 2, Statistical Appendix, Tables 5.1-5.3.
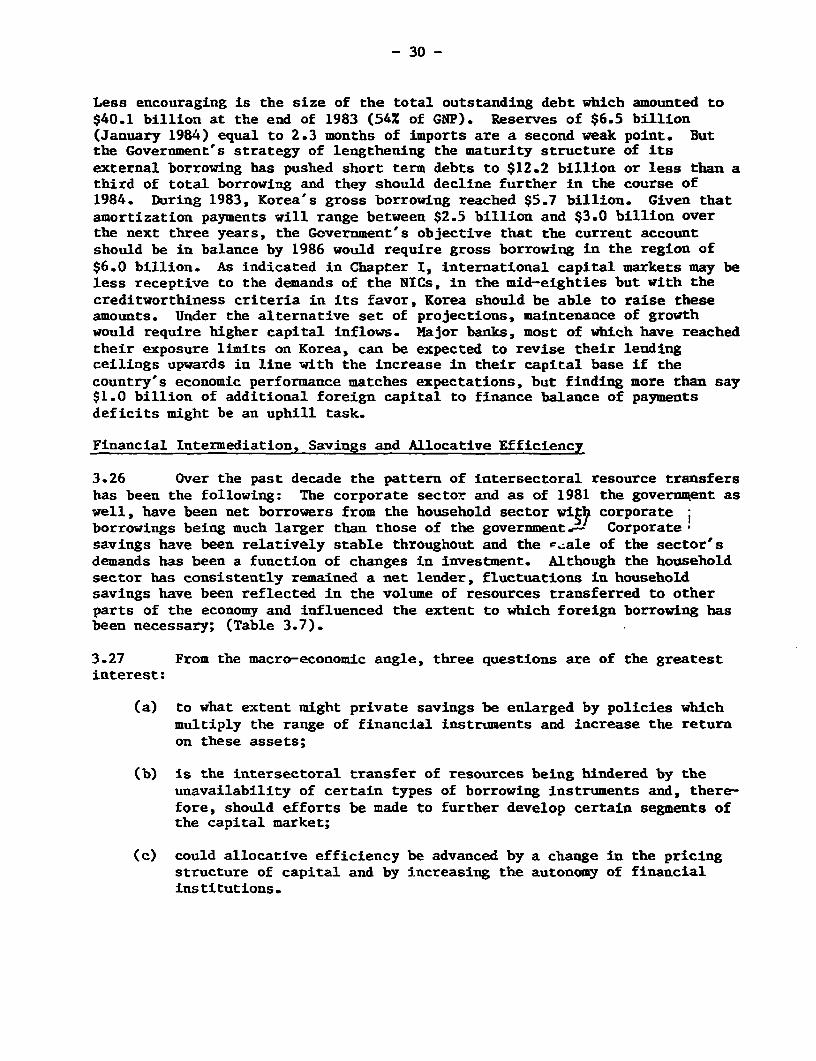
- 30 -
Less encouraging is the size of the total outstanding debt which amounted to$40.1 billion at the end of 1983 (54% of GNP). Reserves of $6.5 billion(January 1984) equal to 2.3 months of imports are a second weak point. Butthe Government's strategy of lengthening the maturity structure of itsexternal borrowing has pushed short term debts to $12.2 billion or less than athird of total borrowing and they should decline further in the course of1984. During 1983, Korea's gross borrowing reached $5.7 billion. Given thatamortization payments will range between $2.5 billion and $3.0 billion overthe next three years, the Government's objective that the current accountshould be in balance by 1986 would require gross borrowing in the region of$6.0 billion. As indicated in Chapter I, international capital markets may beless receptive to the demands of the NICs, in the mid-eighties but with thecreditworthiness criteria in its favor, Korea should be able to raise theseamounts. Under the alternative set of projections, maintenance of growthwould require higher capital inflows. Major banks, most of which have reachedtheir exposure limits on Korea, can be expected to revise their lendingceilings upwards in line with the increase in their capital base if thecountry's economic performance matches expectations, but finding more than say$1.0 billion of additional foreign capital to finance balance of paymentsdeficits might be an uphill task.
Financial Intermediation, Savings and Allocative Efficiency
3.26 Over the past decade the pattern of intersectoral resource transfershas been the following: The corporate sector and as of 1981 the governmqent aswell, have been net borrowers from the household sector wie corporateborrowings being much larger than those of the government.- Corporate-savings have been relatively stable throughout and the r_ale of the sector'sdemands has been a function of changes in investment. Although the householdsector has consistently remained a net lender, fluctuations in householdsavings have been reflected in the volume of resources transferred to otherparts of the economy and influenced the extent to which foreign borrowing hasbeen necessary; (Table 3.7).
3.27 From the macro-economic angle, three questions are of the greatestinterest:
(a) to what extent might private savings be enlarged by policies whichmultiply the range of financial instruments and increase the returnon these assets;
(b) is the intersectoral transfer of resources being hindered by theunavailability of certain types of borrowing instruments and, there-fore, should efforts be made to further develop certain segments ofthe capital market;
(c) could allocative efficiency be advanced by a change in the pricingstructure of capital and by increasing the autonomy of financialinstitutions.
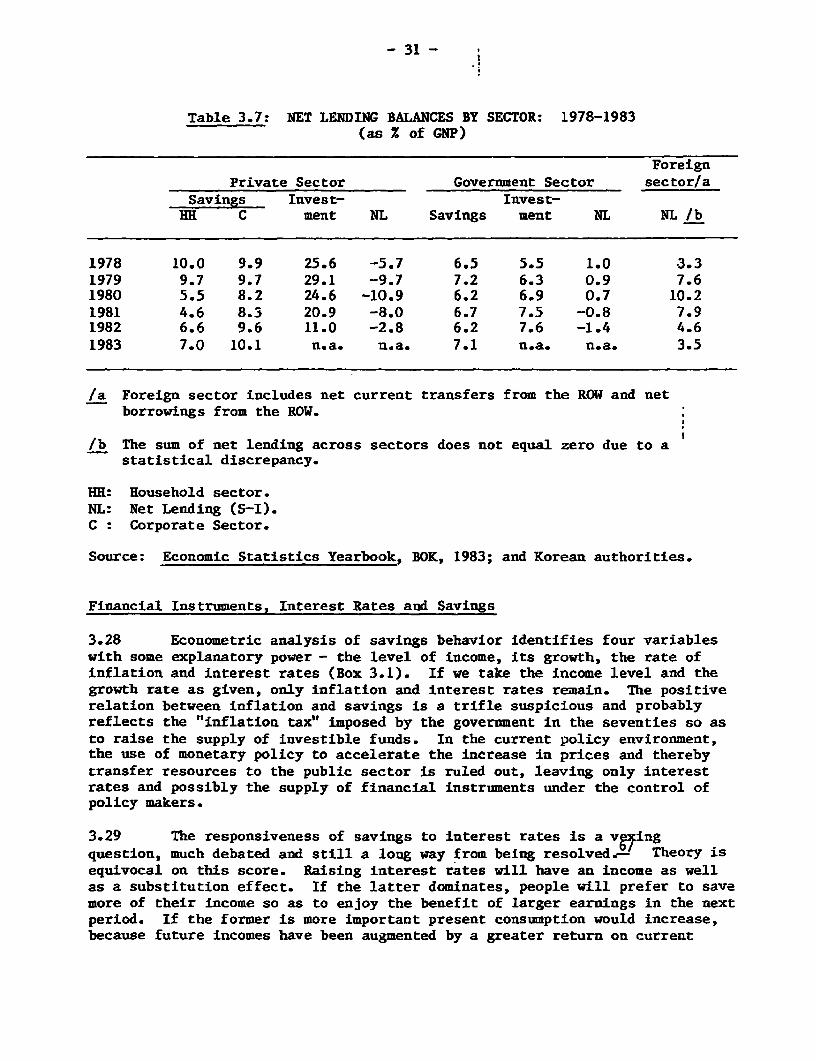
- 31-
Table 3.7: NET LENDING BALANCES BY SECTOR: 1978-1983(as Z of GNP)
ForeignPrivate Sector Government Sector sector/a
Savings Invest- Invest-HH C ment NL Savings ment NL NL /b
1978 10.0 9.9 25.6 -5.7 6.5 5.5 1.0 3.31979 9.7 9.7 29.1 -9.7 7.2 6.3 0.9 7.61980 5.5 8.2 24.6 -10.9 6.2 6.9 0.7 10.21981 4.6 8.3 20.9 -8.0 6.7 7.5 -0.8 7.91982 6.6 9.6 11.0 -2.8 6.2 7.6 -1.4 4.61983 7.0 10.1 n.a. n.a. 7.1 n.a. n.a. 3.5
la Foreign sector includes net current transfers from the ROW and netborrowings from the ROW.
lb The sum of net lending across sectors does not equal zero due to astatistical discrepancy.
RH: Household sector.NL: Net Lending (S-I).C : Corporate Sector.
Source: Economic Statistics Yearbook, BOK, 1983; and Korean authorities.
Financial Instruments, Interest Rates and Savings
3.28 Econometric analysis of savings behavior identifies four variableswith some explanatory power - the level of income, its growth, the rate ofinflation and interest rates (Box 3.1). If we take the income level and thegrowth rate as given, only inflation and interest rates remain. The positiverelation between inflation and savings is a trifle suspicious and probablyreflects the "inflation tax" imposed by the government in the seventies so asto raise the supply of investible funds. In the current policy environment,the use of monetary policy to accelerate the increase in prices and therebytransfer resources to the public sector is ruled out, leaving only interestrates and possibly the supply of financial instruments under the control ofpolicy makers.
3.29 The responsiveness of savings to interest rates is a vg9 ingquestion, much debated and still a long way from being resolved.- Theory isequivocal on this score. Raising interest rates will have an income as wellas a substitution effect. If the latter dominates, people will prefer to savemore of their income so as to enjoy the benefit of larger earnings in the nextperiod. If the former is more important present consumption would increase,because future incomes have been augmented by a greater return on current
- 32 -
savings. Even if savings are increased, following a change in interest rates,this need not imply an irreversible upward shift in savings behavior. As longas household patterns of savings, decumulation in later years and bequests forchildren, remain unaltered, fluctuations in rates can only lead co transitoryeffects. The relationship between savings and one year time deposit rates(used as a proxy for interest) is statistically significant over the period1965-82, and quite sizeable, but an increase in the average real deposit ratesof 2 percentage points will only raise savings an extra 0.6X of GNP.
3.30 This is one avenue through which the domestic resource base might beenlarged. Another, which promises a gain in financial if not real savings,suggests that higher interest rates can stimulate the demand for financialassets and through this means, enlarge the total resources to which companiescan gain access. A recent cross-section study shows that high real interestrates are correlated with a faster increase in financial assets (time andsaviyms deposits) which in turn is associated with a more rapid growth ofGDP.- The argument for financial savings assumes that in the absence ofintermediation, through a formal financial system, some percentage of savingscould be funnelled into unproductive assets. To optimally utilize the supplyof savings, the mobilizing and allocative functions of financial markets mustbe employed to the fullest extent.
3.31 Unlike the South Asian countries where a portion of savings might beinvested in jewelry and precious metals, there is scant evidence that Korea'seconomically very aware populace is not deriving the maximum benefit from itssavings. A priori, therefore, the possibility of engineering a significantgrowth in financial savings by way of interest rate policy would appear to belimited. At the same time it must be noted that Korean domestic savings areappreciably lower than those of Japan in the sixties and some of its Asiancompetitors with broadly similar economic characteristics and a comparablehistory of development. The difference in the ratio of M2 to GNP betweenKorea and some of these countries is also notable. It has been argued thattruncating the size o°,M2 in relation to GNP can reduce the flow of loanablefunds in the economy.- The ratio for Korea rose from 0.33 in 1971 to 0.38 in1982, wnereas for Japan it was 0.74 in 1970 and while Singapore had reached0.86 by 1982. Against this it can be claimed that the M2/GNP does not reflectthe expansion of Korean non bank financial intermediaries, where growth inrecent years has far outstripped the commercial banks. As shown in Table 3.8the ratio of financial sector liabilities to nominal GNP increased from 34Z in1975 to 60% in 1983. Thus interest rate controls, somewhat more stringent inKorea as compared to the other industrial nations, diverted savings towardsother financial intermediaries. 5 the informal sector which encompasses alarge market for promissory notes- - variously estimated at being 20-25% ofM1 is included, Korean financial ratios do not lag so very far behind those ofits competitors.
3.32 Nonetheless, there lingers the possibility that commercial banks,which are uniquely placed in a country such as Korea both in mobilizingsavings and to a degree, evaluating alternative investment possibilities havebeen at a disadvantage because of ceilings on deposits and lending. In thepast two years, their growth has also been affected by the tight monetarypolicy which is one of the instruments used by the Government to check
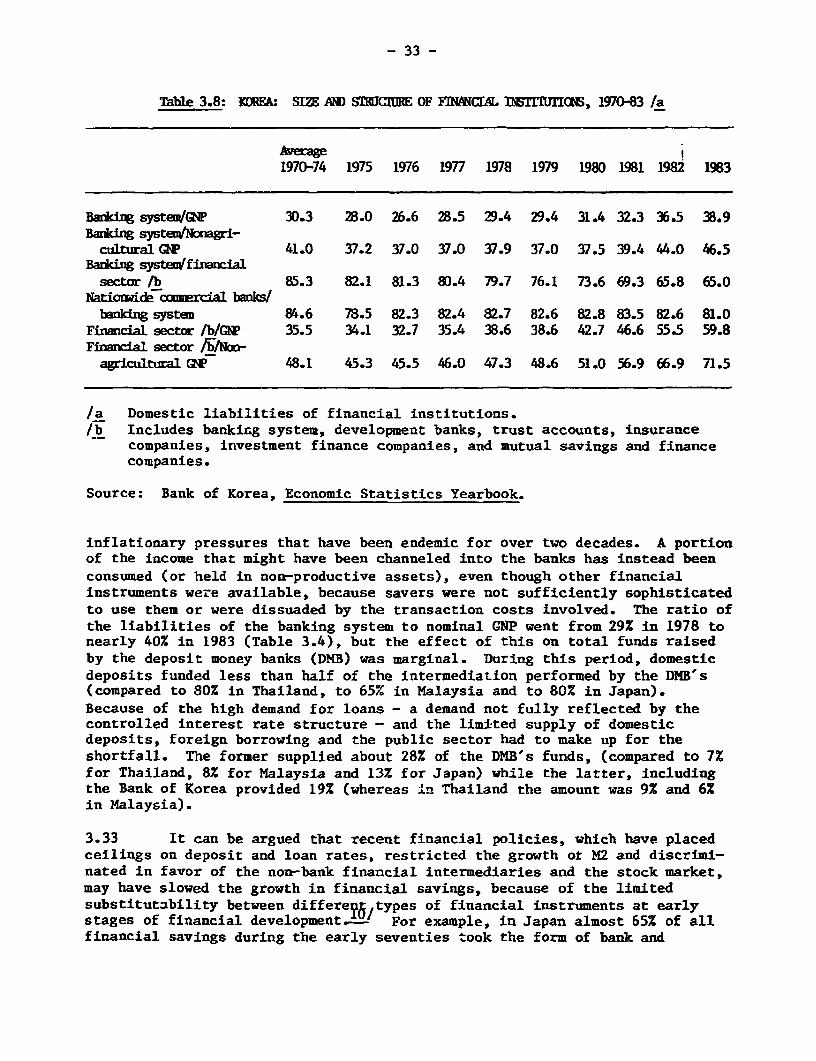
- 33 -
Table 3.8: 1WEWA SIM AND ST]C1RE OF F1NPCIAL IT1MUIlONS, 1970-83 /a
Average1970-74 1975 1976 1977 1978 1979 1980 1981 1982 1983
Baking systei/GNP 30.3 28.0 26.6 28.5 29.4 29.4 31.4 32.3 36.5 38.9Baiddng systefntagri-cultural GNP 41.0 37.2 37.0 37.0 37.9 37.0 37.5 39.4 44.0 46.5
Baridng systemfinaincialsector /b 85.3 82.1 81.3 80.4 79.7 76.1 73.6 69.3 65.8 65.0
Nationwide comlercial banks/bankdng system 84.6 78.5 82.3 82.4 82.7 82.6 82.8 83.5 82.6 81.0
Financial sector /b/Gte 35.5 34.1 32.7 35.4 38.6 38.6 42.7 46.6 55.5 59.8Financial sector /bINx-agricultual GGNP 48.1 45.3 45.5 46.0 47.3 48.6 51.0 56.9 66.9 71.5
/a Domestic liabilities of financial institutions.lb Includes banking system, development banks, trust accounts, insurance
companies, irivestment finance companies, and mutual savings and financecompanies.
Source: Bank of Korea, Economic Statistics Yearbook.
inflationary pressures that have been endemic for over two decades. A portionof the income that might have been channeled into the banks has instead beenconsumed (or held in nonm-productive assets), even though other financialinstruments were available, because savers were not sufficiently sophisticatedto use them or were dissuaded by the transaction costs involved. The ratio ofthe liabilities of the banking system to nominal GNP went from 29% in 1978 tonearly 40% in 1983 (Table 3.4), but the effect of this on total funds raisedby the deposit money banks (DMB) was marginal. During this period, domesticdeposits funded less than half of the intermediation performed by the DMB's(compared to 80% in Thailand, to 65% in Malaysia and to 80% in Japan).Because of the high demand for loans - a demand not fully reflected by thecontrolled interest rate structure - and the limited supply of domesticdeposits, foreign borrowing and the public sector had to make up for theshortfall. The former supplied about 28% of the DMB's funds, (compared to 7%for Thailand, 8% for Malaysia and 13% for Japan) while the latter, includingthe Bank of Korea provided 19% (whereas -L'n Thailand the amount was 9% and 6%in Malaysia).
3.33 It can be argued that recent financial policies, which have placedceilings on deposit and loan rates, restricted the growth ot N2 and discrimi-nated in favor of the non-bank financial intermediaries and the stock market,may have slowed the growth in financial savings, because of the limitedsubstitutability between differe?6/types of financial instruments at earlystages of financial development- For example, in Japan almost 65% of allfinancial savings during the early seventies took the form of bank and
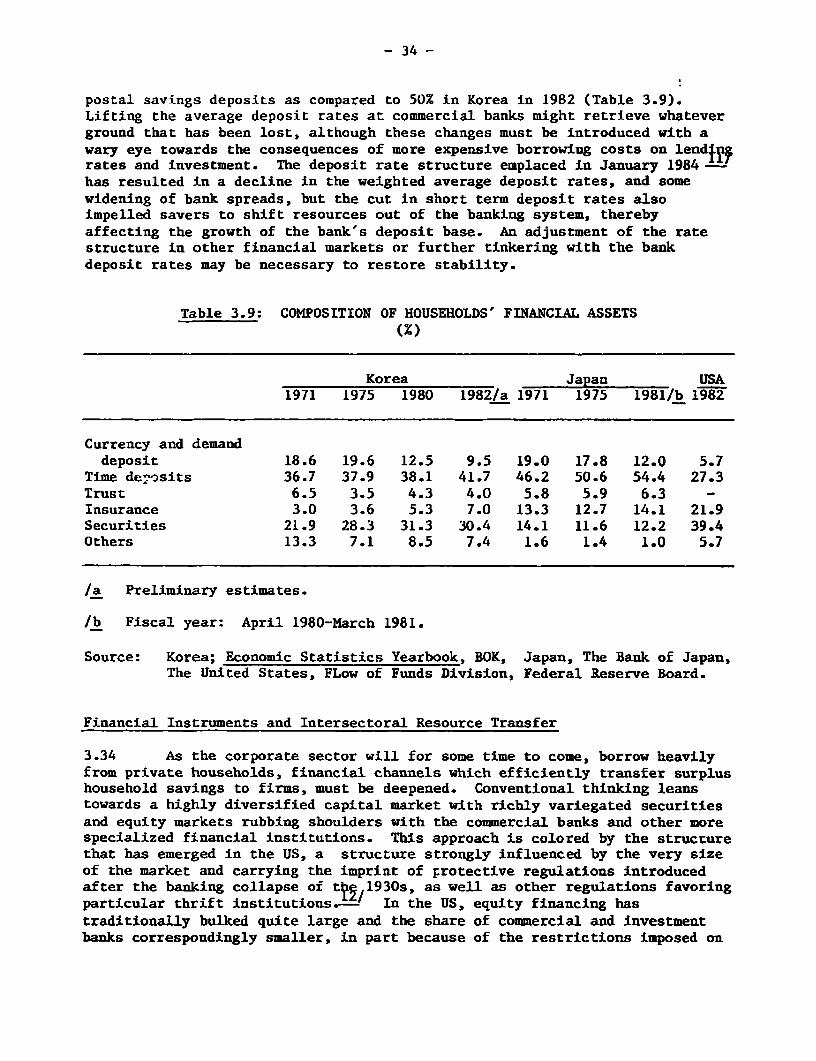
- 34 -
postal savings deposits as compared to 50% in Korea in 1982 (Table 3.9).Lifting the average deposit rates at commercial banks might retrieve whateverground that has been lost, although these changes must be introduced with awary eye towards the consequences of more expensive borrowing costs on lendfjfrates and investment. The deposit rate structure emplaced in January 1984has resulted in a decline in the weighted average deposit rates, and somewidening of bank spreads, but the cut in short term deposit rates alsoimpelled savers to shift resources out of the banking system, therebyaffecting the growth of the bank's deposit base. An adjustment of the ratestructure in other financial markets or further tinkering with the bankdeposit rates may be necessary to restore stability.
Table 3.9: COMPOSITION OF HOUSEHOLDS' FINANCIAL ASSETS(X)
Korea Japan USA1971 1975 1980 1982/a 1971 1975 1981/b 1982
Currency and demanddeposit 18.6 19.6 12.5 9.5 19.0 17.8 12.0 5.7
Time de-zsits 36.7 37.9 38.1 41.7 46.2 50.6 54.4 27.3Trust 6.5 3.5 4.3 4.0 5.8 5.9 6.3 -Insurance 3.0 3.6 5.3 7.0 13.3 12.7 14.1 21.9Securities 21.9 28.3 31.3 30.4 14.1 11.6 12.2 39.4Others 13.3 7.1 8.5 7.4 1.6 1.4 1.0 5.7
/a Preliminary estimates.
/b Fiscal year: April 1980-March 1981.
Source: Korea; Economic Statistics Yearbook, BOK, Japan, The Bank of Japan,The United States, FLow of Funds Division, Federal Reserve Board.
Financial Instruments and Intersectoral Resource Transfer
3.34 As the corporate sector will for some time to come, borrow heavilyfrom private households, financial channels which efficiently transfer surplushousehold savings to firms, must be deepened. Conventional thinking leanstowards a highly diversified capital market with richly variegated securitiesand equity markets rubbing shoulders with the commercial banks and other morespecialized financial institutions. This approach is colored by the structurethat has emerged in the US, a structure strongly influenced by the very sizeof the market and carrying the imprint of protective regulations introducedafter the banking collapse of tt M1930s, as well as other regulations favoringparticular thrift institutions.- In the US, equity financing hastraditionally bulked quite large and the share of commercial and investmentbanks correspondingly smaller, in part because of the restrictions imposed on
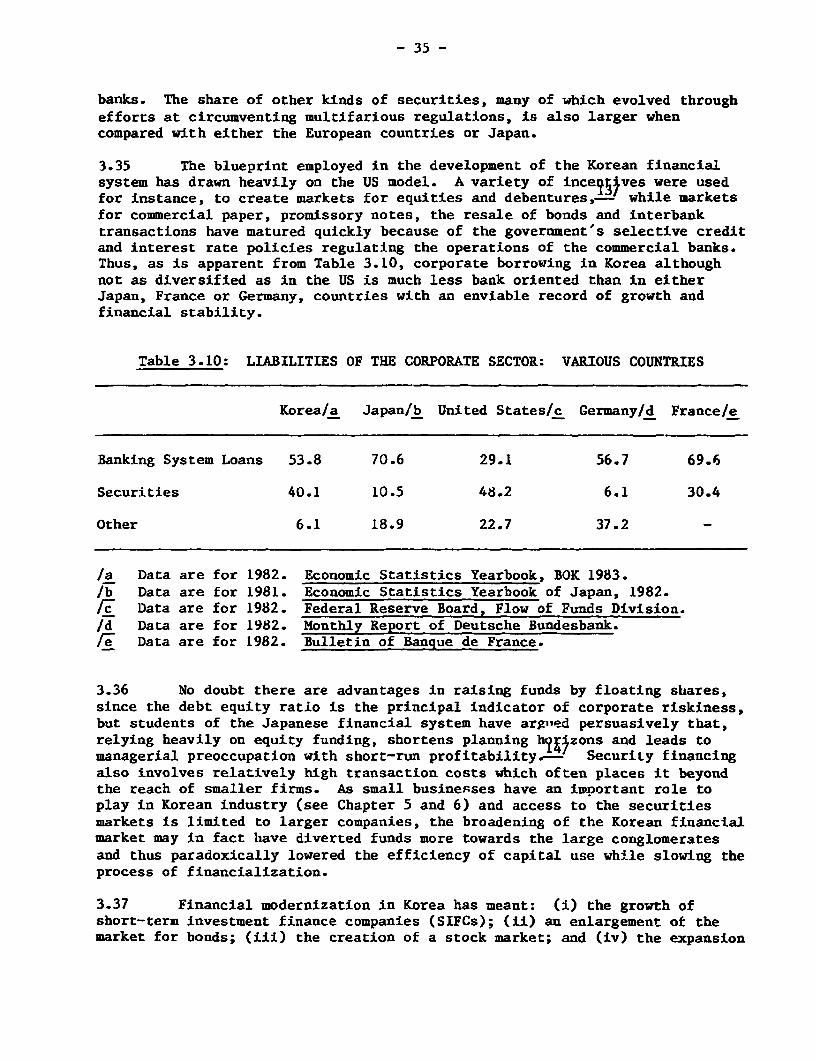
- 35 -
banks. The share of other kinds of securities, many of which evolved throughefforts at circumventing multifarious regulations, is also larger whencompared with either the European countries or Japan.
3.35 The blueprint employed in the development of the Korean financialsystem has drawn heavily on the US model. A variety of ince M ves were usedfor instance, to create markets for equities and debentures,- while marketsfor commercial paper, promissory notes, the resale of bonds and interbanktransactions have matured quickly because of the government's selective creditand interest rate policies regulating the operations of the commercial banks.Thus, as is apparent from Table 3.10, corporate borrowing in Korea althoughnot as diversified as in the US is much less bank oriented than in eitherJapan, France or Germany, countries with an enviable record of growth andfinancial stability.
Table 3.10: LIABILITIES OF THE CORPORATE SECTOR: VARIOUS COUNTRIES
Korea/a Japan/b United States/c Germany/d France/e
Banking System Loans 53.8 70.6 29.1 56.7 69.6
Securities 40.1 10.5 48.2 6.1 30.4
Other 6.1 18.9 22.7 37.2
/a Data are for 1982. Economic Statistics Yearbook, BOK 1983./b Data are for 1981. Economic Statistics Yearbook of Japan, 1982./c Data are for 1982. Federal Reserve Board, Flow of Funds Division./d Data are for 1982. Monthly Report of Deutsche Bundesbank./e Data are for 1982. Bulletin of Banque de France.
3.36 No doubt there are advantages in raising funds by floating shares,since the debt equity ratio is the principal indicator of corporate riskiness,but students of the Japanese financial system have argled persuasively that,relying heavily on equity funding, shortens planning hyf$zons and leads tomanagerial preoccupation with short-run profitability.- Security financingalso involves relatively high transaction costs which often places it beyondthe reach of smaller firms. As small businesses have an imoortant role toplay in Korean industry (see Chapter 5 and 6) and access to the securitiesmarkets is limited to larger companies, the broadening of the Korean financialmarket may in fact have diverted funds more towards the large conglomeratesand thus paradoxically lowered the efficiency of capital use whi1e slowing theprocess of financialization.
3.37 Financial modernization in Korea has meant: (i) the growth ofshort-term investment finance companies (SIFCs); (ii) an enlargement of themarket for bonds; (iii) the creation of a stock market; and (iv) the expansion
- 36 -
of trade credit. The SIFCs, which were established in 1972 to provide alter-native channels for funds that tended to gravitate towards the informal moneymarket, have dramatically increased their share of the total assets offinancial intermediaries, from 4.3% in 1975 to 10.7% in 1982. By offeringdeposit rates higher than those of the commercial banks they have untilrecently been more effective in attracting savings. Further, the SIFCs havebenefited from the growth of the market for commercial paper, bills andpromissory notes, which was off-limits to the banks until 1982. Unlike thebanks, however, the SIFCs orient their activities towards a selected group ofcustomers, especially those that do business with the corporation(s) control-ling the finance company.
3.38 The most significant development in the bond market _ver the pastdecade has been the growing popularity of primary corporate bonds. The amountoutstanding grew at an annual compound rate of 77% between 1975 and 1982,raising their share to 85% of the bond market. By 1982 almost 97% ofcorpurate bonds carried bank guarantees and served as substitutes for loanswhich banks were unable to extend to their favored customers because of theslow growth in their deposits. Rather than being financial instrumentsdistinct from the rest, corporate bonds serve as an indirect form of bankfinancing for a certain class of borrowers.
3.39 The secondary bond market is also quite different from itscounterparts in the advanced countries. Bonds worth Won 6,247 billion, whichis almost three times the amount of corporate bonds issued in that year, weretraded in this market in 1982, but the entire secondary market consists ofsales and purchase of bonds under repurchase agreements, and not of outrights..le as is typical elsewhere. The nature of this transaction is thereforebasically like a loan against the collateral of bonds (Annex 3, Tables 1.7-1.9). The period of this "loan", or the period between the initial and thereverse transaction was approximately one month during 1977-80 and varyingbetween one and three months in later periods. Similarly, the period of the"loan" repo transactions averaged four months in 1982-83. In other words,these were fairly short term "loans" (Annex 3, Table 1.11).
3.40 The stock market flourished briefly in the late 70s, but stocks haveattracted fewer investors since. As a proportion of total securities theirshare plummetted from 76.5% in 1975 to 40% in 1982. As the composite stockprice index in 1982 was 127.3 compared to 89.7 in 1975, the fall in proportionreflects a relative decline in the importance of the stock market. Smallinvestors have been discouraged by a number of factors. Transaction costs arehigh. The thinness of the market for particular equities or subgroups ofequities means that the quantity bought or sold is as important as theprice. So is the speed with which a sale is made. Since share prices arehighly variable, the value of stockholdings is too uncertain for them to serveas a convenient financial vehicle for most savers. An examination of Table3.11 shows that the average rate of return of equity for the period 1976 to1982 was 22.8% while that of corporate bonds was 20.9%. On the other hand,the variance in stock yields was 67.4% as against 21.7% for bcnds. A rate ofreturn premium of 1.9% seems totally inadequate to compensate for the muchhigher variance and may explain the decline in the totaj5yumber of share-holders from 1 million in 1978 to 680 thousand in 1982.- As minority

- 37 -
shareholders have withdrawn from the market share ownership is beingconcentrated in the hands of those with over 100,000 shares, since thethinness and volatility of the stock market makes tgie control over thefinancial decisions of firms a critical factor. While the demand for shares(also the size of public offerings is very small) comes increasingly fromeither institutional investors or individuals in a position to direct theactivities of firms, the companies successful in raising funds and whoseshares are most actively traded, comprise some 40 of the large diversifiedconglomerates. In 1982, the shares of these firms were responsible for 71% oftotal sales even though 327 companies were listed on the stock exchange.
Table 3.11: RATES OF RETURN IN THE EQUITY MARKET
Equity Market CorporatePE/PEI Yield Rate of Return Bank Yields
19741975 - 15.01976 1.16 14.0 30.0 20.41977 1.32 14.4 46.0 20.11978 1.06 19.8 26.0 21.11979 0.82 15.7 -23.0 26.71980 0.90 23.9 13.9 30.11981 0.97 24.5 21.5 24.41982 0.95 16.3 11.3 16.81983 - - - 14.2Mean 22.8 20.9Standard Deviation 15.38 4.53Variance 67.4 21.7
Source: Securities Statistics Year Book, Korea Stock Exchange.
3.41 An important counterpart of the decline in the relative importanceof bank loans is the growth in the relative size of trade credits. As aproportion of total loans this rose, from 15% in 1975 to 21% in 1982 (Annex 3,Table 1.6). An examination of the corporate sectors's asset portfolioindicates that as a proportion of total liabilities, trade credit shows noclear trend. As a share of total assets, it virtually doubled form 21% in1975 to 40% in 1982. Meanwhile the asset portfolios of households (includingfirms) reveal an inverse trend: Trade credit as a proportion of liabilitiesincreased from 2% in 1975 to 17% in 1982.
3.42 What the above suggests is that, by circumscribing the role of thebanks and by attempting to multiply the channels for transferring resourcesbetween sectors, the government might hfg7 inadvertently reduced the volume offinancial savings (discussed earlier), biased capital transfers in favorof large enterprises that are not always the most efficient users of these
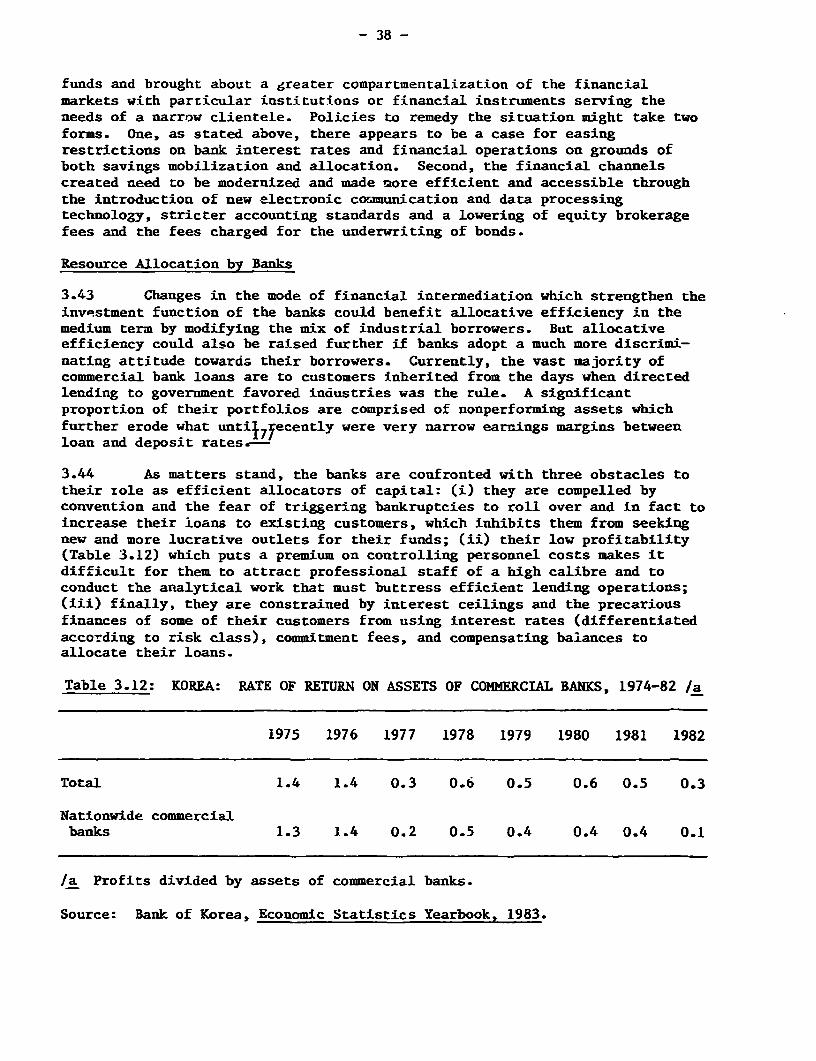
- 38 -
funds and brought about a greater compartmentalization of the financialmarkets with particular institutions or financial instruments serving theneeds of a narrow clientele. Policies to remedy the situation might take twoforms. One, as stated above, there appears to be a case for easingrestrictions on bank interest rates and financial operations on grounds ofboth savings mobilization and allocation. Second, the financial channelscreated need to be modernized and made more efficient and accessible throughthe introduction of new electronic communication and data processingtechnology, stricter accounting standards and a lowering of equity brokeragefees and the fees charged for the underwriting of bonds.
Resource Allocation by Banks
3.43 Changes in the mode of financial intermediation which strengthen theinvestment function of the banks could benefit allocative efficiency in themedium term by modifying the mix of industrial borrowers. But allocativeefficiency could also be raised further if banks adopt a much more discrimi-nating attitude towards their borrowers. Currently, the vast majority ofcommercial bank loans are to customers inherited from the days when directedlending to government favored industries was the rule. A significantproportion of their portfolios are comprised of nonperforming assets whichfurther erode what unti} 7 yecently were very narrow earnings margins betweenloan and deposit rates.--
3.44 As matters stand, the banks are confronted with three obstacles totheir role as efficient allocators of capital: (i) they are compelled byconvention and the fear of triggering bankruptcies to roll over and in fact toincrease their ioans to existing customers, which inhibits them from seekingnew and more lucrative outlets for their funds; (ii) their low profitability(Table 3.12) which puts a premium on controlling personnel costs makes itdifficult for them to attract professional staff of a high calibre and toconduct the analytical work that must buttress efficient lending operations;(iii) finally, they are constrained by interest ceilings and the precariousfinances of some of their customers from using interest rates (differentiatedaccording to risk class), commitment fees, and compensating balances toallocate their loans.
Table 3.12: KOREA: RATE OF RETURN ON ASSETS OF COMMERCIAL BANKS, 1974-82 /a
1975 1976 1977 1978 1979 1980 1981 1982
Total 1.4 1.4 0.3 0.6 0.5 0.6 0.5 0.3
Nationwide commercialbanks 1.3 1.4 0.2 0.5 0.4 0.4 0.4 0.1
/a Profits divided by assets of commercial banks.
Source: Bank of Korea, Economic Statistics Yearbook, 1983.
- 39 -
3.45 The answer of course, does not lie in wholesale abandonment ofcontrols and the severing of long standing customer relationships. Any set ofactions taken must be guided by the overarching macro-economic considerationsand industrial policies and not just by the exigencies of the savings-invest-ment gap, particularly when the modest gains in allocative efficiency that arepossible will have only marginal effects on short-term ICORs. These financialreforms are discussed in Chapter 6 after trade and industrial conceris havebeen brought into the picture.
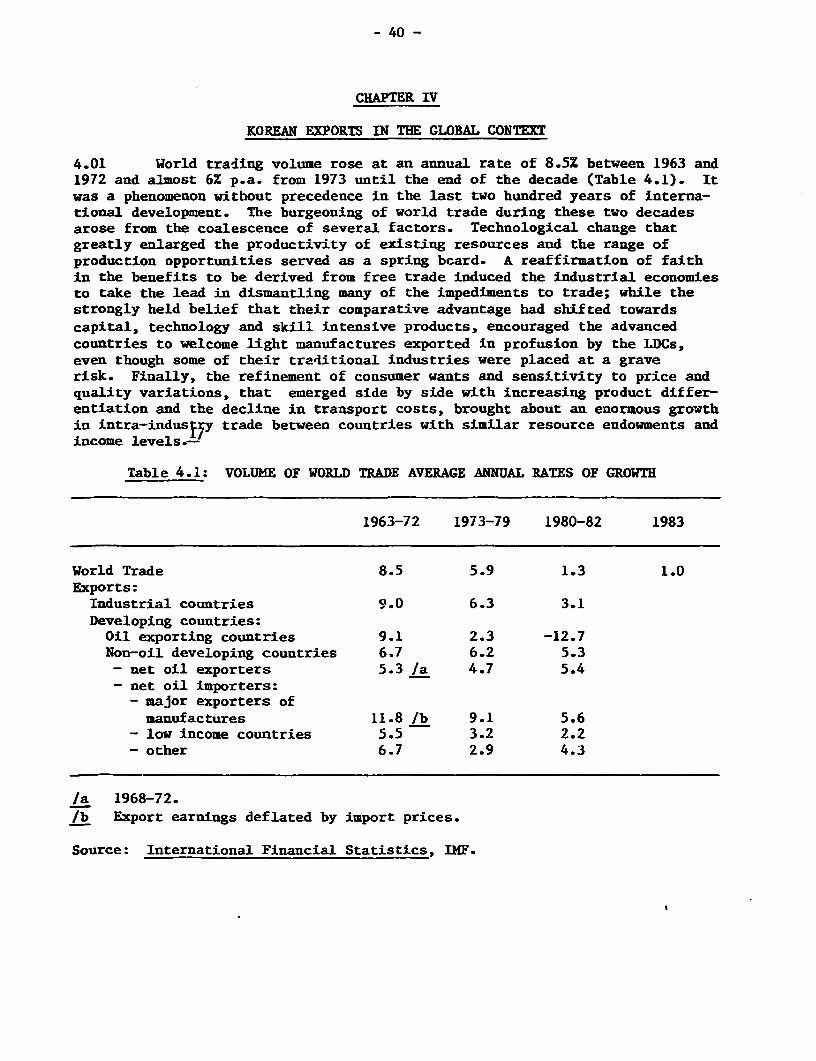
- 40 -
CHAPTER IV
KOREAN EXPORTS IN THE GLOBAL CONTEXT
4.01 World trading volume rose at an annual rate of 8.5Z between 1963 and1972 and almost 6Z p.a. from 1973 until the end of the decade (Table 4.1). Itwas a phenomenon without precedence in the last two hundred years of interna-tional development. The burgeoning of world trade during these two decadesarose from the coalescence of several factors. Technological change thatgreatly enlarged the productivity of existing resources and the range ofproduction opportunities served as a spring board. A reaffirmation of faithin the benefits to be derived from free trade induced the industrial economiesto take the lead in dismantling many of the impediments to trade; while thestrongly held belief that their comparative advantage had shifted towardscapital, technology and skill intensive products, encouraged the advancedcountries to welcome light manufactures exported in profusion by the LDCs,even though some of their traditional industries were placed at a graverisk. Finally, the refinement of consumer wants and sensitivity to price andquality variations, that emerged side by side with increasing product differ-entiation and the decline in transport costs, brought about an enormous growthin intra-indusjyy trade between countries with similar resource endowments andincome levels.-
Table 4.1: VOLUME OF WORLD TRADE AVERAGE ANNUAL RATES OF GROWTH
1963-72 1973-79 1980-82 1983
World Trade 8.5 5.9 1.3 1.0Exports:Industrial countries 9.0 6.3 3.1Developing countries:Oil exporting countries 9.1 2.3 -12.7Non-oil developing countries 6.7 6.2 5.3
- net oil exporters 5.3 /a 4.7 5.4- net oil importers:
- major exporters ofmanufactures 11.8 /b 9.1 5.6
- low income countries 5.5 3.2 2.2- other 6.7 2.9 4.3
/a 1968-72./b Export earnings deflated by import prices.
Source: International Financial Statistics, IMF.
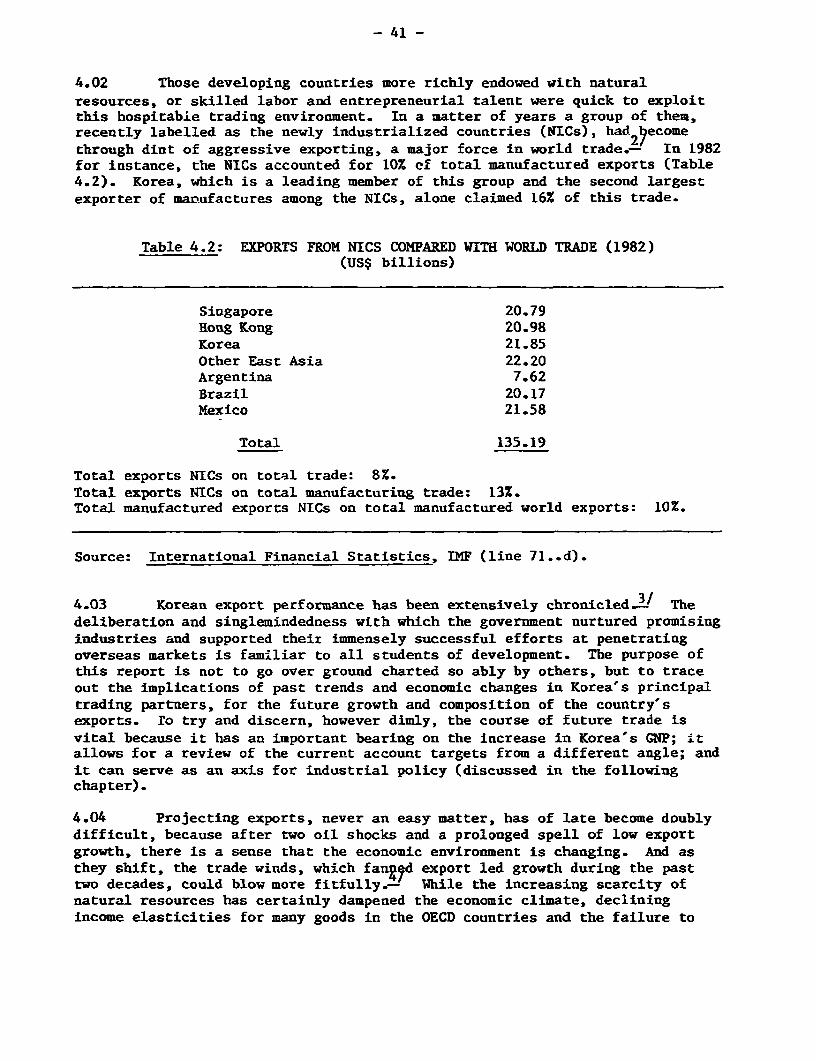
- 41 -
4.02 Those developing countries more richly endowed with naturalresources, or skilled labor and entrepreneurial talent were quick to exploitthis hospitabie trading environment. In a matter of years a group of them,recently labelled as the newly industrialized countries (NICs), had2yecomethrough dint of aggressive exporting, a major force in world trade.- In 1982for instance, the NICs accounted for 10% cf total manufactured exports (Table4.2). Korea, which is a leading member of this group and the second largestexporter of manufactures among the NICs, alone claimed 16% of this trade.
Table 4.2: EXPORTS FROM NICS COMPARED WITH WORLD TRADE (1982)(US$ billions)
Singapore 20.79Hong Kong 20.98Korea 21.85Other East Asia 22.20Argentina 7.62Brazil 20.17Mexico 21.58
Total 135.19
Total exports NICs on total trade: 8%.Total exports NICs on total manufacturing trade: 13%.Total manufactured exports NICs on total manufactured world exports: 10%.
Source: International Financial Statistics, IMF (line 71..d).
4.03 Korean export performance has been extensively chronicled ./ Thedeliberation and singlemindedness with which the government nurtured promisingindustries and supported their immensely successful efforts at penetratingoverseas markets is familiar to all students of development. The purpose ofthis report is not to go over ground charted so ably by others, but to traceout the implications of past trends and economic changes in Korea's principaltrading partners, for the future growth and composition of the country'sexports. ro try and discern, however dimly, the course of future trade isvital because it has an important bearing on the increase in Korea's GNP; itallows for a review of the current account targets from a different angle; andit can serve as an axis for industrial policy (discussed in the followingchapter).
4.04 Projecting exports, never an easy matter, has of late become doublydifficult, because after two oil shocks and a prolonged spell of low exportgrowth, there is a sense that the economic environment is changing. And asthey shift, the trade winds, which fang?d export led growth during the pasttwo decades, could blow more fitfully.- While the increasing scarcity ofnatural resources has certainly dampened the economic climate, decliningincome elasticities for many goods in the OECD countries and the failure to
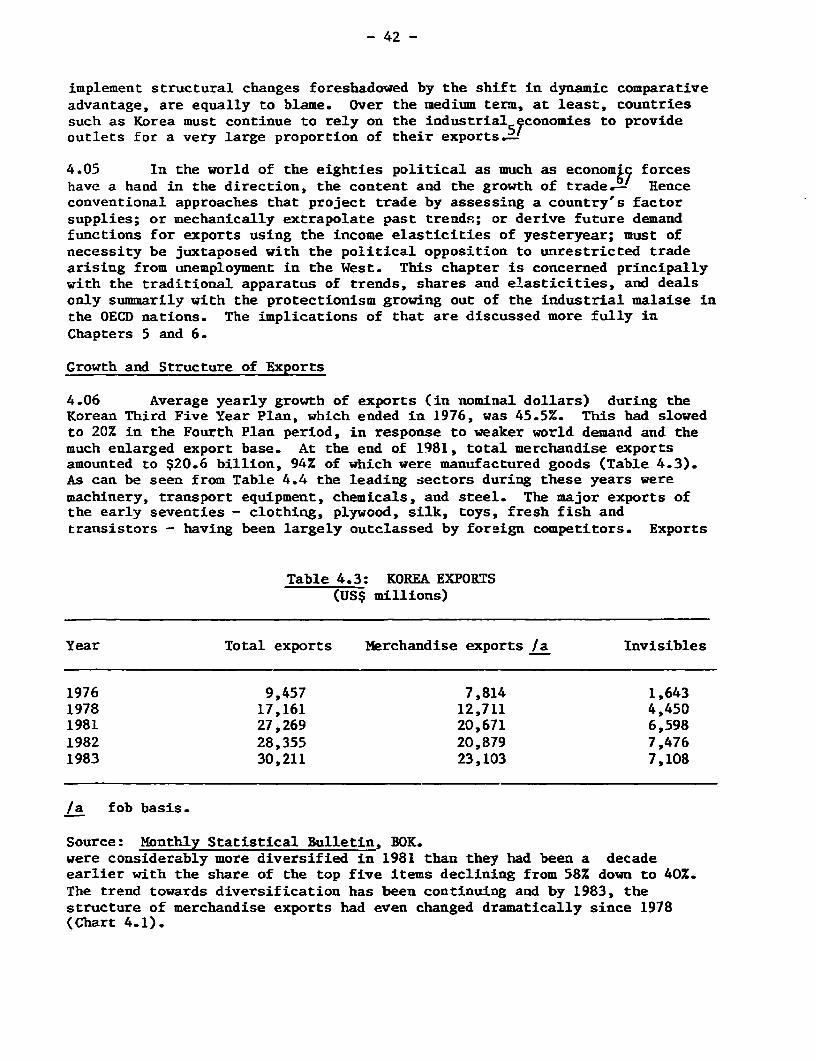
- 42 -
implement structural changes foreshadowed by the shift in dynamic comparativeadvantage, are equally to blame. Over the medium term, at least, countriessuch as Korea must continue to rely on the industrial 5 conomies to provideoutlets for a very large proportion of their exports-
4.05 In the world of the eighties political as much as economby forceshave a haad in the direction, the content and the growth of trade.- Henceconventional approaches that project trade by assessing a country's factorsupplies; or mechanically extrapolate past trends; or derive future demandfunctions for exports using the income elasticities of yesteryear; must ofnecessity be juxtaposed with the political opposition to unrestricted tradearising from unemployment in the West. This chapter is concerned principallywith the traditional apparatus of trends, shares and elasticities, and dealsonly summarily with the protectionism growing out of the industrial malaise inthe OECD nations. The implications of that are discussed more fully inChapters 5 and 6.
Growth and Structure of Exports
4.06 Average yearly growth of exports (in nominal dollars) during theKorean Third Five Year Plan, which ended in 1976, was 45.5%. This had slowedto 20% in the Fourth Plan period, in response to weaker world demand and themuch enlarged export base. At the end of 1981, total merchandise exportsamounted to $20.6 billion, 94% of which were manufactured goods (Table 4.3).As can be seen from Table 4.4 the leading sectors during these years weremachinery, transport equipment, chemicals, and steel. The major exports ofthe early seventies - clothing, plywood, silk, toys, fresh fish andtransistors - having been largely outclassed by foreign competitors. Exports
Table 4.3: KOREA EXPORTS(US$ millions)
Year Total exports Merchandise exports /a Invisibles
1976 9,457 7,814 1,6431978 17,161 12,711 4,4501981 27,269 20,671 6,5981982 28,355 20,879 7,4761983 30,211 23,103 7,108
/a fob basis.
Source: Monthly Statistical Bulletin, BOK.were considerably more diversified in 1981 than they had been a decadeearlier with the share of the top five items declining from 58% down to 40%.The trend towards diversification has been continuing and by 1983, thestructure of merchandise exports had even changed dramatically since 1978(Chart 4.1).
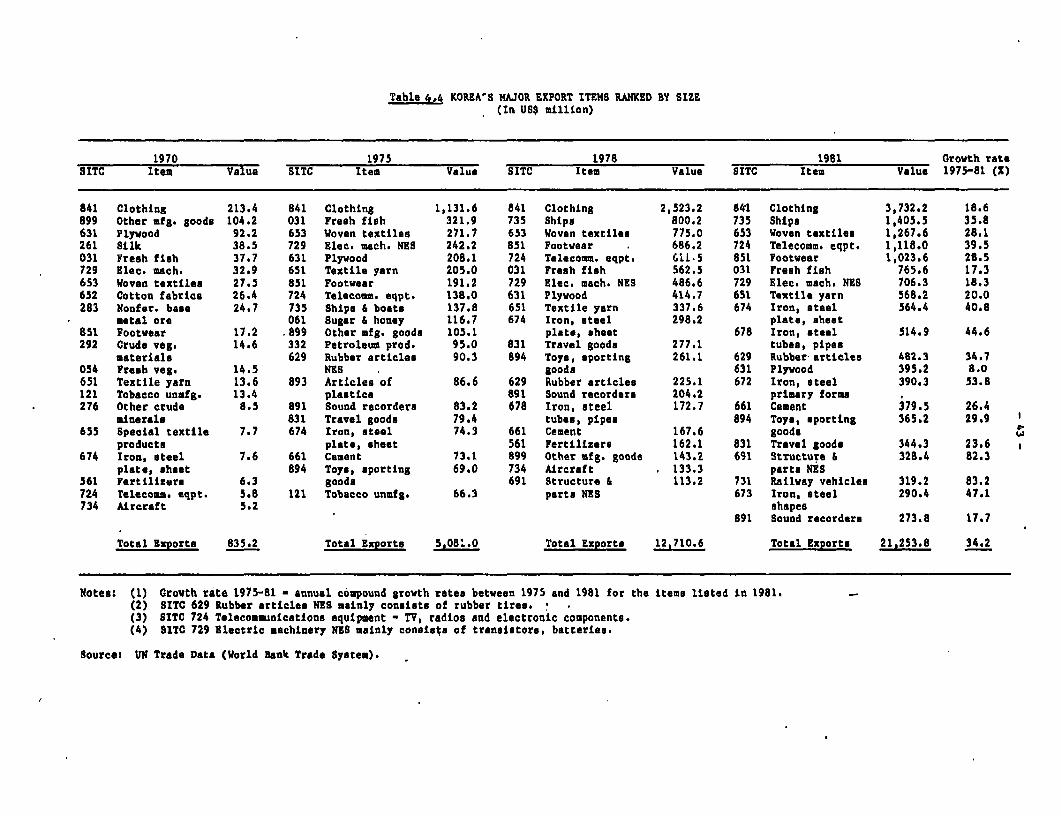
Table 4,4 KOREA'S MAJOR EXPORT ITEMS RANKED BY SIZE(In US$ million)
1970 1975 1978 1981 Growth rateSITC Item Value SITC Item Value SITC Item Value SITC Item Value 1975-81 (1)
841 Clothing 213.4 841 Clothing 1,131.6 841 Clothing 2,523.2 841 Clothing 3,732.2 18.6899 Other mfg. goods 104.2 031 Fresh fish 321.9 735 Ships 800.2 735 Ships 1,405.5 35.8631 Plywood 92.2 653 Woven textiles 271.7 653 Woven textiles 775.0 653 Woven textiles 1,267.6 28.1261 Silk 38.5 729 Elec. mach. NES 242.2 851 Footwear 686.2 724 Telecomm. eqpt. 1,118.0 39.5031 Fresh fimh 37.7 631 Plywood 208.1 724 Telecowm. eqpt. 6;1.5 851 Footwear 1,023.6 28.5729 Elec. mach. 32.9 651 Textile yarn 205.0 031 Fresh fish 562.5 031 Fresh fish 765.6 17.3653 Woven textiles 27.5 851 Footwear 191.2 729 Elec. mach. NES 486.6 729 Elec. mach. NES 706.3 18.3652 Cotton fabrics 26.4 724 Telecomm. eqpt. 138.0 631 Plywood 414.7 651 Textile yarn 568.2 20.0283 Nonfer. base 24.7 735 Ships & boats 137.8 651 Textile yarn 337.6 674 Iron, steel 564.4 40.8
metal ore 061 Sugar & honey 116.7 674 Iron, steel 298.2 plate, sheet851 Footwear 17.2 .899 Other mfg. goods 105.1 plate, sheet 678 Iron, steel 514.9 44.6292 Crude veg. 14.6 332 Petroleum prod. 95.0 831 Travel goods 277.1 tubes, pipes
materials 629 Rubber articles 90.3 894 Toys, sporting 261.1 629 Rubber articles 482.3 34.7054 Fresh veg. 14.5 NES goods 631 Plywood 395.2 8.0651 Textile yarn 13.6 893 Articles of 86.6 629 Rubber articles 225.1 672 Iron, steel 390.3 53.8121 Tobacco unmfg. 13.4 plastics 891 Sound recorders 204.2 primary forms276 Other crude 8.5 891 Sound recorders 83.2 678 Iron, steel 172.7 661 Cement 379.5 26.4
minerals 831 Travel goods 79.4 tubeso, pipes 894 Toys, sporting 365.2 29.9655 Special textile 7.7 674 Iron, steel 74.3 661 Cement 167.6 goods
products plate, sheet 561 Fertilizers 162.1 831 Travel goods 344.3 23.6674 Iron, steel 7.6 661 Cement 73.1 899 Other ufg. goods 143.2 691 Structure & 328.4 82.3
plate, sheet 894 Toys, sporting 69.0 734 Aircraft 133.3 parts NES561 Fertilizers 6.3 goods 691 Structure 6 113.2 731 Railway vehicles 319.2 83.2724 Telecom.. eqpt. 5.8 121 Tobacco unmfg. 66.3 parts NES 673 Iron, steel 290.4 47.1734 Aircraft 5.2 shapes
891 Sound recorders 273.8 17.7
Total Exports 835.2 Total ixports 5,08:.0 Total Exports 12,710.6 Total Exports 21,253.8 34.2
Notes: (1) Growth rate 1975-81 - annual compound growth rates between 1975 and 1981 for the items listed in 1981.(2) SITC 629 Rubber articles NES mainly consists of rubber tires.(3) SITC 724 Telecommunications equipment - TV, radios and electronic components.(4) SITC 729 Electric machinery NIS mainly consists of transistors, batteries.
Source: UN Trade Data (World Bank Trade System).
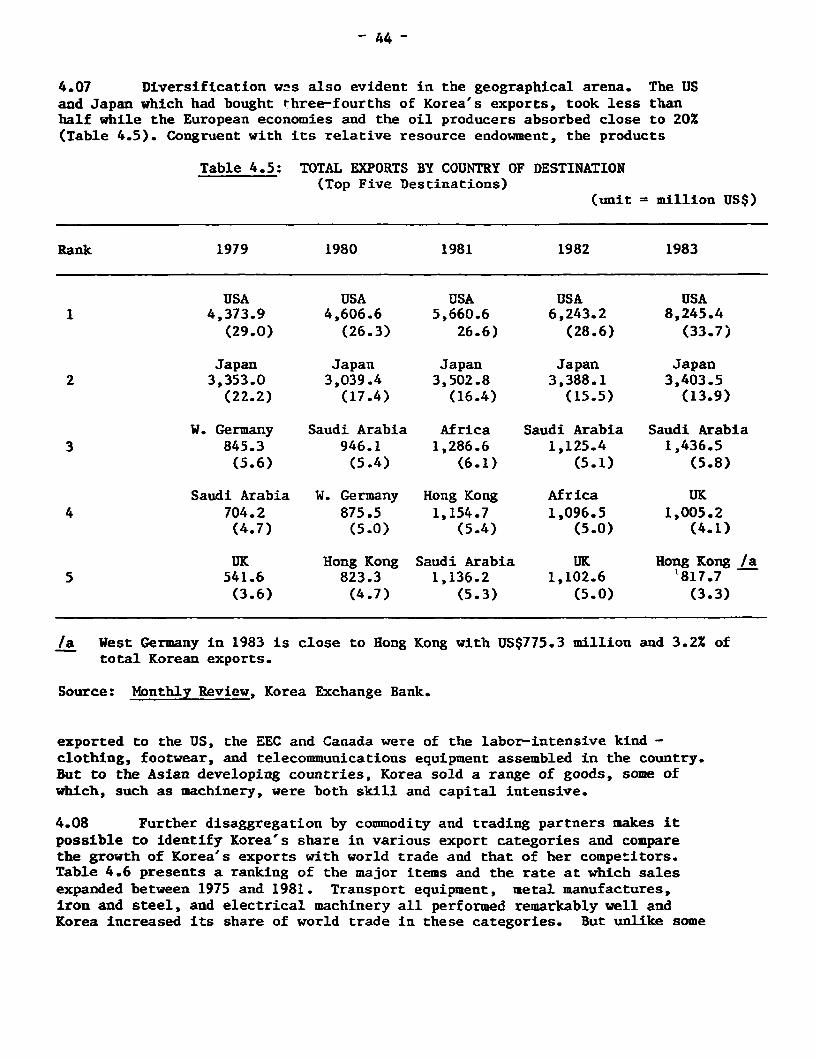
- 44 -
4.07 Diversification w2s also evident in the geographical arena. The USand Japan which had bought three-fourths of Korea's exports, took less thanhalf while the European economies and the oil producers absorbed close to 20X(Table 4.5). Congruent with its relative resource endowment, the products
Table 4.5: TOTAL EXPORTS BY COUNTRY OF DESTINATION(Top Five Destinations)
(unit = million US$)
Rank 1979 1980 1981 1982 1983
USA USA USA USA USA1 4,373.9 4,606.6 5,660.6 6,243.2 8,245.4
(29.0) (26.3) 26.6) (28.6) (33.7)
Japan Japan Japan Japan Japan2 3,353.0 3,039.4 3,502.8 3,388.1 3,403.5
(22.2) (17.4) (16.4) (15.5) (13.9)
W. Germany Saudi Arabia Africa Saudi Arabia Saudi Arabia3 845.3 946.1 1,286.6 1,125.4 1,436.5
(5.6) (5.4) (6.1) (5.1) (5.8)
Saudi Arabia W. Germany Hong Kong Africa UK4 704.2 875.5 1,154.7 1,096.5 1,005.2
(4.7) (5.0) (5.4) (5.0) (4.1)
UK Hong Kong Saudi Arabia UK Hong Kong /a5 541.6 823.3 1,136.2 1,102.6 '817.7
(3.6) (4.7) (5.3) (5.0) (3.3)
/a West Germany in 1983 is close to Hong Kong with US$775.3 million and 3.2Z oftotal Korean exports.
Source: Monthly Review, Korea Exchange Bank.
exported to the US, the EEC and Canada were of the labor-intensive kind -clothing, footwear, and telecommunications equipment assembled in the country.But to the Asian developing countries, Korea sold a range of goods, some ofwhich, such as machinery, were both skill and capital intensive.
4.08 Further disaggregation by commodity and trading partners makes itpossible to identify Korea's share in various export categories and comparethe growth of Korea's exports with world trade and that of her competitors.Table 4.6 presents a ranking of the major items and the rate at which salesexpanded between 1975 and 1981. Transport equipment, metal manufactures,iron and steel, and electrical machinery all performed remarkably well andKorea increased its share of world trade in these categories. But unlike some
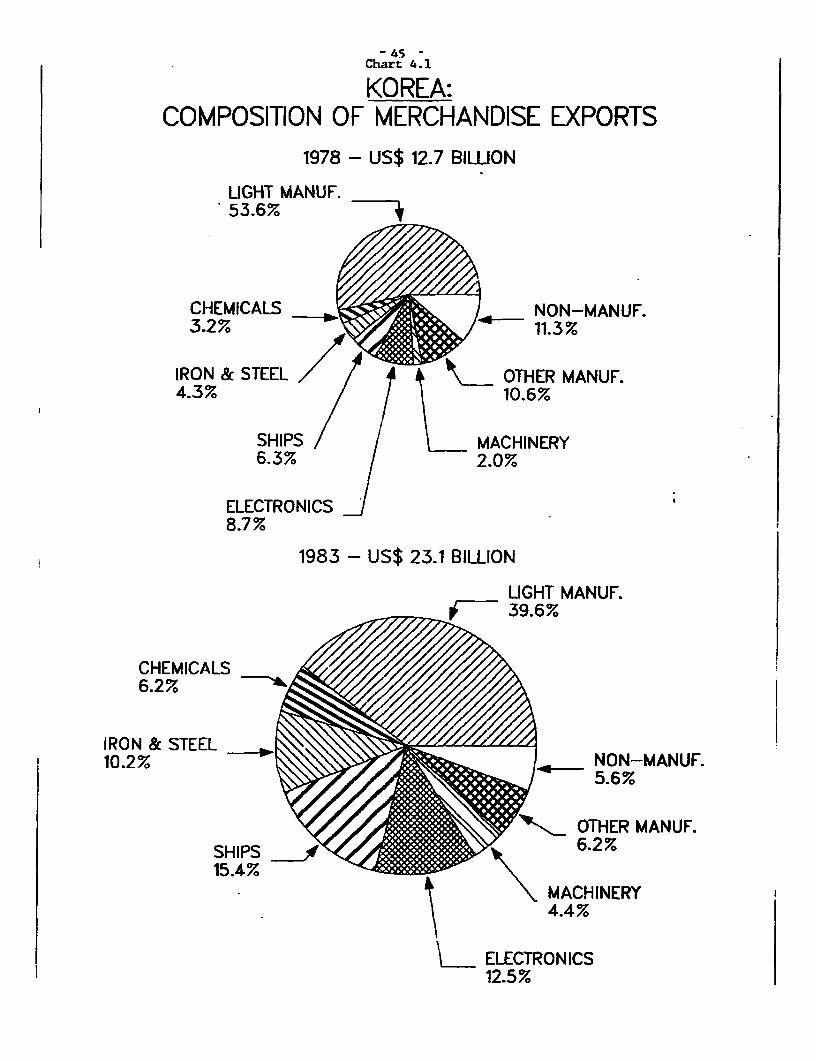
- 45-Chart 4.1
KOREA:COMPOSITION OF MERCHANDISE EXPORTS
1978 -US$ 12.7 BILLION
LIGHT MANUF.53.6%
CHEMICALS NON-MANUF.3.2% 11.3%
IRON & STEEL OTHER MANUF.4.3% 10.6%
SHIPS MACHINERY6.3% 2.0%
ELECTRONICS8.7%
1983- US$ 23.1 BILLION
LIGHT MANUF._,77,V< 39.670
CHEMICALS6.2%
IRON & STEEL10.2% NON-MANUF.
5.6%
~N.OTHER MANUF.SHIPS .%6.2%
15.4%MACHINERY4.4%
ELECTRONICS12.5%
- 46 -
of its East Asian competitors, the country's export mix was not such that itderived full advantage from the differential growth rates registered by indi-vidual commodities in world trade. This can be seen from Table 4.6. Forinstance, Korea lagged behind in products such as office machines and soundrecorders. Its competitors also did much better with machines for specialindustries, non-electric power machines, and plumbing and heating equipment.
4.09 Another way of evaluating the recent history of Korea's exportactivities is to list the fastest growing imports among Korea's major tradingpartners and compare them with its own major exports to these countries. Tokeep the list to a manageable length, only those commodities in which thetraded value exceeded $10 million were included in sales to the US and Canada,$5 million was used as a cut-off point for Japan and the EEC and $3 millionfor the East Aa4 an nations. From Table 4.7 it is apparent that Korea'sexports to North America roughly covered the high growth areas and that thecountry is industrially well-placed to increase its market share in otherrapidly growing fields such as iron and steel forms, general machinery(especially metal working machinery, electric and nonelectric poweredmachines), switch gear, and railway vehicles.
4.10 The very high proportion of raw materials and intermediate goodsrelative to manufactured products in total Japanese imports, has limited thepossibilities for increasing trade. Nevertheless, Korean producers were ableto exploit market possibilities in iron and steel products, petroleum,chemicals and cement, now accounting for a large part of Japanese imports inthese categories. But the lack of price competitiveness and low productquality have prevented Korean exporters from capitalizing on the demand fortravel goods and fur clothing, among the few items where greater marketpenetration by Korean goods was possible (Table 4.8).
4.11 So far, exports to the EEC have comprised such traditional commodi-ties as pottery, travel goods, fur clothing, footwear, toys and sporting goods(Table 4.9). But exports of machinery and transport equipment have picked upand they along with office machines are some of the items on which a futuregrowth in sales to the EEC will rest, as markets for light manufactures arenibbled away by countries with wages much lower than what Korean workers earn.Machinery and steel are also the products with the brightest future prospectsin the East Asian economies even though currently the most rapidly growingimports into these countries are consumer durables, footwear, clothing, soundrecorders, travel goods, furniture and sporting goods. While Korea manufac-tures all these items, the high quality products being purchased by the EastAsian countries are not especially sensitive to price competition and cannotbe outclassed by Korean exports in non-price areas (Table 4.10).
4.12 This brief review of import trends in Korea's major markets through1981, trends that might not persist further into the 1980s, indicates that interms of products the best opportunities might be in iron and steel products,transport equipment and machinery while the severity of competition againstthe exports of light manufactures will continue to mount. What the abovestatistics further suggest is that the EEC, Japan; the East Asian countriesand the Middle East, which between them take over two-thirds of Korea's salesabroad, may be less easily penetrated by exports in the medium term than North

Table 4.6 HAJOR EXPORT ITEMS OF KOREA AND COMPETITORS RANKED BY GROWTH PATES, 1975-81
Fastest-graving item. in Korea Fastest-growing items In other Asian CompetitorsValue Korea'. share Growth rate Value Growth ratein 1981 in the world Growth rate of world in 1981 Growth rats of world
SITC Item ($ min) exports (2) 1975-81 (2) trade (2) SITC ttem ( mln) 1975-81 (%) trade (2)
561 Fertilizer 188.4 2.5 238.71 14.20 521 Coal, petro- 984.7 119.06 34.26chemicals
842 Fur, etc. 130.4 11.7 125.60 26.72 687 Tin 257.8 98.42 11.39732 Road motor 150.8 0.1 88.64 15.22 431 Processed ani- 105.5 74.72 16.82
vehicle mal, ves. oil731 Railway 319.2 7.8 83.15 14.5 931 Special trans. 1,610.4 72.77 19.86691 Structures & 328.4 3.8 82.33 15.27 734 Aircraft 154.7 52.47 23.06
parts, NES725 Domestic 103.5 1.3 73.84 13.85 842 Fur, etc. 195.2 43.87 26.72
alec. eqpt.581 Plastic 149.9 0.6 66.49 18.27 725 Domestic 688.4 43.69 13.85
elec. eqpt.719 Nonelectrical 174.1 0.2 55.88 13.30 599 Chemicals, ifiS 110.6 37.24 20.27
machinery, NES672 Iron, steel 390.3 6.0 53.80. 12.51 722 Electric power 573.3 36.93 17.35
primary forms machinery697 Base metal 201.0 7.0 50.63 18.85 864 Watches, clocks 1,382.9 36.02 18.09
household eqpt.734 Aircraft 152.8 0.6 49.06 23.06 719 Nonelectrical 668.3 29.55 13.30
machinery673 Iron, steel 290.4 2.4 47.11 12.07 891 Sound recorders 432.3 28.36 24.86
shapes678 Iron, steel 514.9 2.7 44.57 10.45 422 Fixed veg. oil 267.3 27.77 4.89
tubes, pipes nonsoft674 Iron, stoel 564.4 3.1 40.84 11.46 581 Plastic 144.3 25.90 18.27
plate, sheet698 Metal mfg., NES 128.5 1.4 40.27 14.84 512 Organic chemi- 129.1 25.62 18.06
cals724 Telecomm. eqpt. 1,118.0 3.9 39.48 13.90 718 Machinery for 359.9 24.60 15.69
special industry641 Paper, paper- 102.9 0.5 36.33 14.92 714 Office machinery 643.8 23.95 21.38
board735 Ships, boats 1,405.5 7.4 35.80 -0.23 894 Toys, sporting 1,422.5 22.22 18.21
goods723 Elec. distrLbu- 100.1 1.8 35.26 15.70 332 Petroleum prod. 5,621.2 21.81 14.14
ting machinery512 Organic chemi- 176.4 0.6 33.79 18.06 292 Crude veg. 115.7 21.58 12.92
cals materials693 Wire products 138.0 6.6 33.66 9.80 892 Printed matter 200.9 21.31 15.10694 Steel, copper 102.7 3.9 32.96 12.70 698 Metal mfg., NES 213.5 21.09 14.84
nails, nuts656 Textile pro- 160.0 5.4 31.46 13.61 711 Nonelectrical 180.8 20.16 15.52
ducts, NES power machinery894 Toys, sporting 365.2 5.2 29.93 18.21 812 Plumbing, heat- 151.8 20.13 16.32
goods ing equipment851 Footwear 1,023.6 10.5 28.49 16.26 861 Instruments' 362.3 20.06 17.17
Note: Only those items whose export valuea exceeded $100 million in 1981 are included.
Source: UN Trade Data (World Bank Trade System).
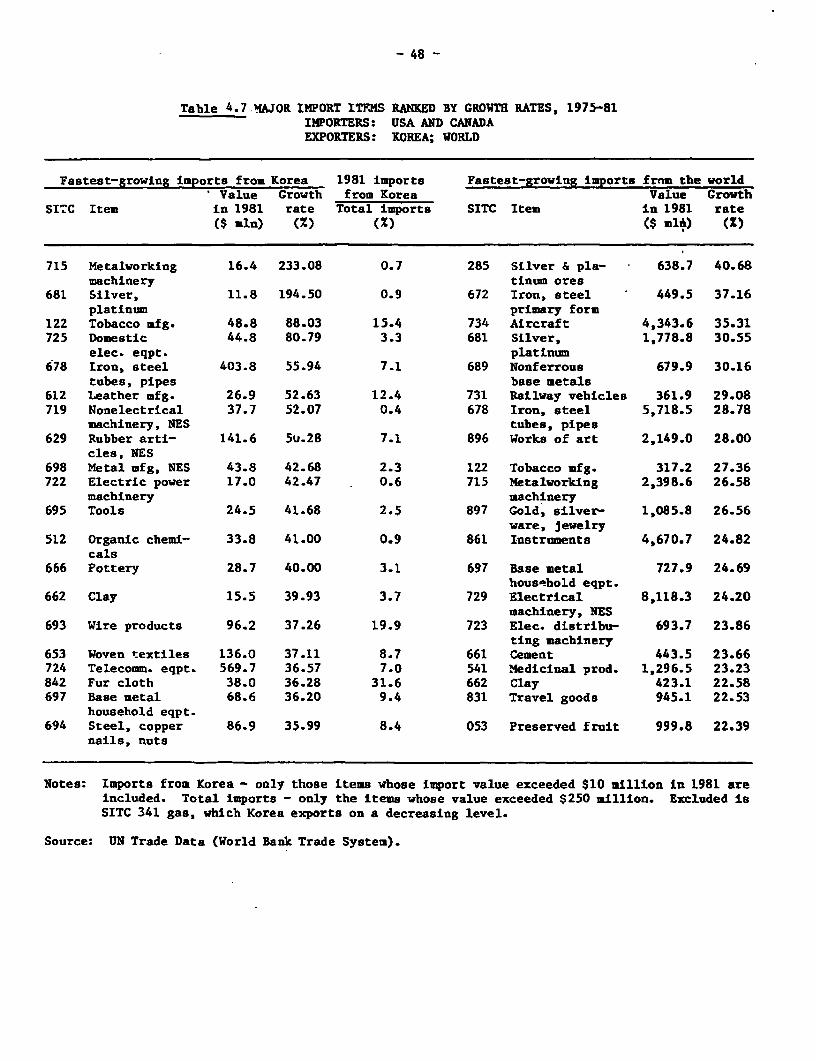
- 48 -
Table 4.7.MAJOR IMPORT ITFMS RANKED BY GROWTH RATES, 1975-81IMPORTERS: USA AND CANADAEXPORTERS: KOREA; WORLD
Fastest-growing imports from Korea 1981 imports Fastest-growing imports frmm the worldValue Growth from Korea Value Growth
SI.C Item in 1981 rate Total imports SITC Item in 1981 rate($ mln) (%) (Z) ($ mli) (2)
715 Metalworking 16.4 233.08 0.7 285 Silver & pla- 638.7 40.68machinery tinum ores
681 Silver, 11.8 194.50 0.9 672 Iron, steel 449.5 37.16platinum primary form
122 Tobacco mfg. 48.8 88.03 15.4 734 Aircraft 4,343.6 35.31725 Domestic 44.8 80.79 3.3 681 Silver, 1,778.8 30.55
elec. eqpt. platinum678 Iron, steel 403.8 55.94 7.1 689 Nonferrous 679.9 30.16
tubes, pipes base metals612 Leather mfg. 26.9 52.63 12.4 731 Railway vehicles 361.9 29.08719 Nonelectrical 37.7 52.07 0.4 678 Iron, steel 5,718.5 28.78
machinery, NES tubes, pipes629 Rubber arti- 141.6 5u.28 7.1 896 Works of art 2,149.0 28.00
cles, NES698 Metal mfg, NES 43.8 42.68 2.3 122 Tobacco mfg. 317.2 27.36722 Electric power 17.0 42.47 0.6 715 Metalworking 2,398.6 26.58
machinery machinery695 Tools 24.5 41.68 2.5 897 Gold, silver- 1,085.8 26.56
ware, jewelry512 Organic chemi- 33.8 41.00 0.9 861 Instruments 4,670.7 24.82
cals666 Pottery 28.7 40.00 3.1 697 Base metal 727.9 24.69
household eqpt.662 Clay 15.5 39.93 3.7 729 Electrical 8,118.3 24.20
machinery, NES693 Wire products 96.2 37.26 19.9 723 Elec. distribu- 693.7 23.86
ting machinery653 Woven textiles 136.0 37.11 8.7 661 Cement 443.5 23.66724 Telecomm. eqpt. 569.7 36.57 7.0 541 Medicinal prod. 1,296.5 23.23842 Fur cloth 38.0 36.28 31.6 662 Clay 423.1 22.58697 Base metal 68.6 36.20 9.4 831 Travel goods 945.1 22.53
household eqpt.694 Steel, copper 86.9 35.99 8.4 053 Preserved fruit 999.8 22.39
nails, nuts
Notes: Imports from Korea - only those items whose import value exceeded $10 million In 1981 areincluded. Total imports - only the items whose value exceeded $250 million. Excluded isSITC 341 gas, which Korea exports on a decreasing level.
Source: UN Trade Data (World Bank Trade System).
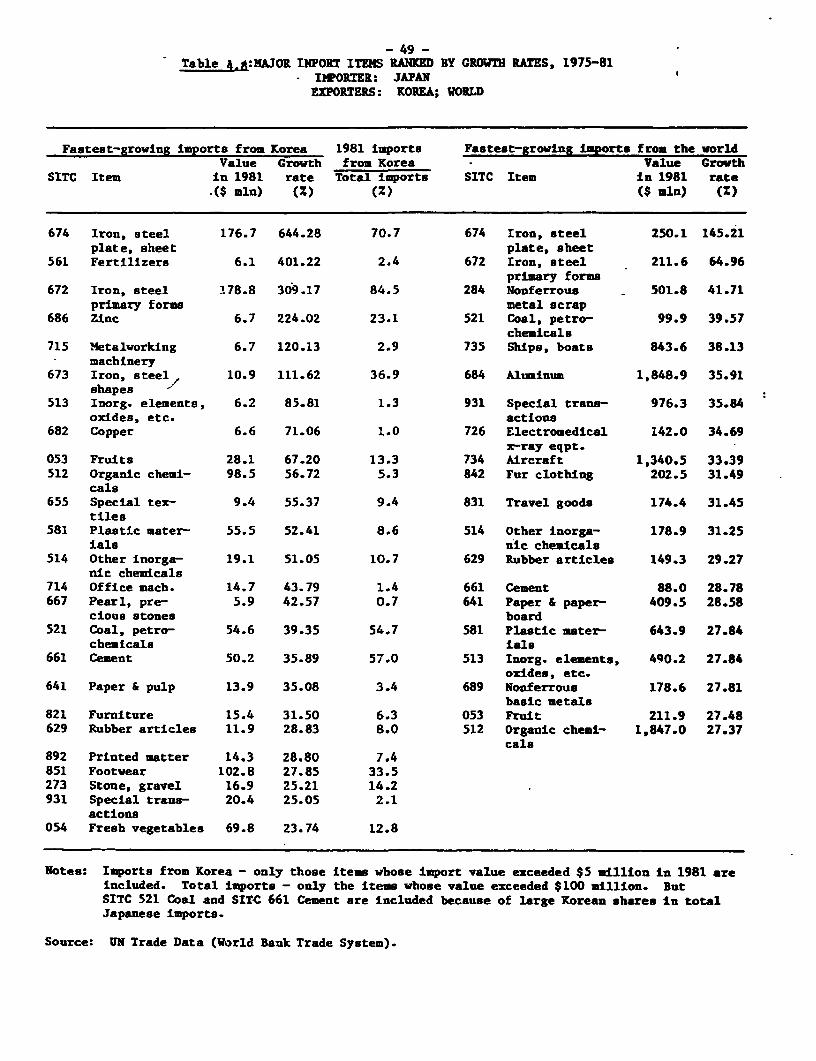
- 49 -Table 4 A:MAJOR INPORT ITEMS RANKED BY GROUTH RkTES, 1975-81
IMPORTER: JAPANEXPORTERS: KOREA; WORLD
Fastest-growing imports from Korea 1981 Imports Fastest-groving imports from the worldValue Growth fron Korea Value Growth
SITC Item In 1981 rate Total imports SITC Item in 1981 rateU$ *ln) (Z) (Z) ($ mn) (Z)
674 Iron, steel 176.7 644.28 70.7 674 Iron, steel 250.1 145.21plate, sheet plate, sheet
561 Fertilizers 6.1 401.22 2.4 672 Iron, steel 211.6 64.96primary forms
672 Iron, steel 178.8 309.17 84.5 284 Nonferrous 501.8 41.71primary forms metal scrap
686 Zinc 6.7 224.02 23.1 521 Coal, petro- 99.9 39.57chemicals
715 Metalworking 6.7 120.13 2.9 735 Ships, boats 843.6 38.13machinery
673 Iron, steel 10.9 111.62 36.9 684 Aluminum 1,848.9 35.91shapes I
513 Inorg. elements, 6.2 85.81 1.3 931 Special trans- 976.3 35.84oxides. etc. actions
682 Copper 6.6 71.06 1.0 726 Electromedical 142.0 34.69x-ray eqpt.
053 Fruits 28.1 67.20 13.3 734 Aircraft 1,340.5 33.39512 Organic chemi- 98.5 56.72 5.3 842 Fur clothing 202.5 31.49
cals655 Special tes- 9.4 55.37 9.4 831 Travel goods 174.4 31.45
tiles581 Plastic mater- 55.5 52.41 8.6 514 Other inorga- 178.9 31.25
ials nic chemicals514 Other inorga- 19.1 51.05 10.7 629 Rubber articles 149.3 29.27
nic chemicals714 Office mach. 14.7 43.79 1.4 661 Cement 88.0 28.78667 Pearl, pre- 5.9 42.57 0.7 641 Paper & paper- 409.5 28.58
cious stones board521 Coal, petro- 54.6 39.35 54.7 581 Plastic mater- 643.9 27.84
chemicals ials661 Cement 50.2 35.89 57.0 513 Inorg. elements, 490.2 27.84
oxides, etc.641 Paper & pulp 13.9 35.08 3.4 689 Nonferrous 178.6 27.81
basic metals821 Furniture 15.4 31.50 6.3 053 Fruit 211.9 27.48629 Rubber articles 11.9 28.83 8.0 512 Organic cheml- 1,847.0 27.37
cals892 Printed matter 14.3 28.80 7.4851 Footwear 102.8 27.85 33.5273 Stone, gravel 16.9 25.21 14.2931 Special trans- 20.4 25.05 2.1
actions054 Fresh vegetables 69.8 23.74 12.8
Notes: Imports from Korea - only those items whose import value exceeded $5 million ln 1981 areincluded. Total imports - only the items whose value exceeded $100 million. ButSITC 521 Coal and SITC 661 Cement are included because of large Korean shares in totalJapanese imports.
Source: UN Trade Data (World Bank Trade System).
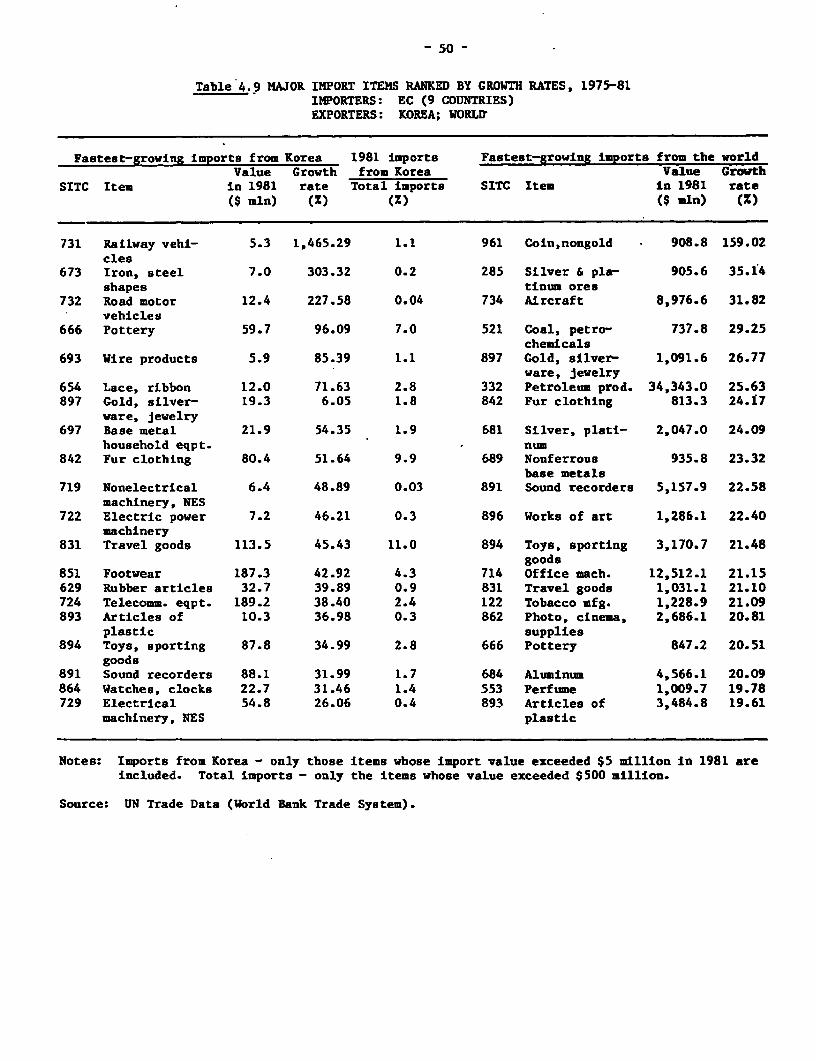
50 -
Table 4.9 MAJOR IMPORT ITEMS RANKED BY GROWTH RATES, 1975-81IMPORTERS: EC (9 COUNTRIES)EXPORTERS: KOREA; WORLWf
Fastest-growing imports from Korea 1981 imports Fastest-growing imports from the worldValue Growth from Korea Value Growth
SITC Item in 1981 rate Total imports SITC Item in 1981 rate($ mln) (Z) (1) ( *ln) (Z)
731 Railway vehi- 5.3 1,465.29 1.1 961 Coin,nongold 908.8 159.02cles
673 Iron, steel 7.0 303.32 0.2 285 Silver & pla- 905.6 35.14shapes tinum ores
732 Road motor 12.4 227.58 0.04 734 Aircraft 8,976.6 31.82vehicles
666 Pottery 59.7 96.09 7.0 521 Coal, petro- 737.8 29.25chemicals
693 Wire products 5.9 85.39 1.1 897 Gold, silver- 1,091.6 26.77ware, jewelry
654 Lace, ribbon 12.0 71.63 2.8 332 Petroleum prod. 34,343.0 25.63897 Gold, silver- 19.3 6.05 1.8 842 Fur clothing 813.3 24.17
ware, jewelry697 Base metal 21.9 54.35 1.9 681 Silver, plati- 2,047.0 24.09
household eqpt. num842 Fur clothing 80.4 51.64 9.9 689 Nonferrous 935.8 23.32
base metals719 Nonelectrical 6.4 48.89 0.03 891 Sound recorders 5,157.9 22.58
machinery, NES722 Electric power 7.2 46.21 0.3 896 Works of art 1,286.1 22.40
machinery831 Travel goods 113.5 45.43 11.0 894 Toys, sporting 3,170.7 21.48
goods851 Footwear 187.3 42.92 4.3 714 Office mach. 12,512.1 21.15629 Rubber articles 32.7 39.89 0.9 831 Travel goods 1,031.1 21.10724 Telecoma. eqpt. 189.2 38.40 2.4 122 Tobacco mfg. 1,228.9 21.09893 Articles of 10.3 36.98 0.3 862 Photo, cinema, 2,686.1 20.81
plastic supplies894 Toys, sporting 87.8 34.99 2.8 666 Pottery 847.2 20.51
goods891 Sound recorders 88.1 31.99 1.7 684 Aluminum 4,566.1 20.09864 Watches, clocks 22.7 31.46 1.4 553 Perfume 1,009.7 19.78729 Electrical 54.8 26.06 0.4 893 Articles of 3,484.8 19.61
machinery. NES plastic
Notes: Imports from Korea - only those items whose import value exceeded $5 million in 1981 areincluded. Total imports - only the items whose value exceeded $500 million.
Source: UN Trade Data (World Bank Trade System).
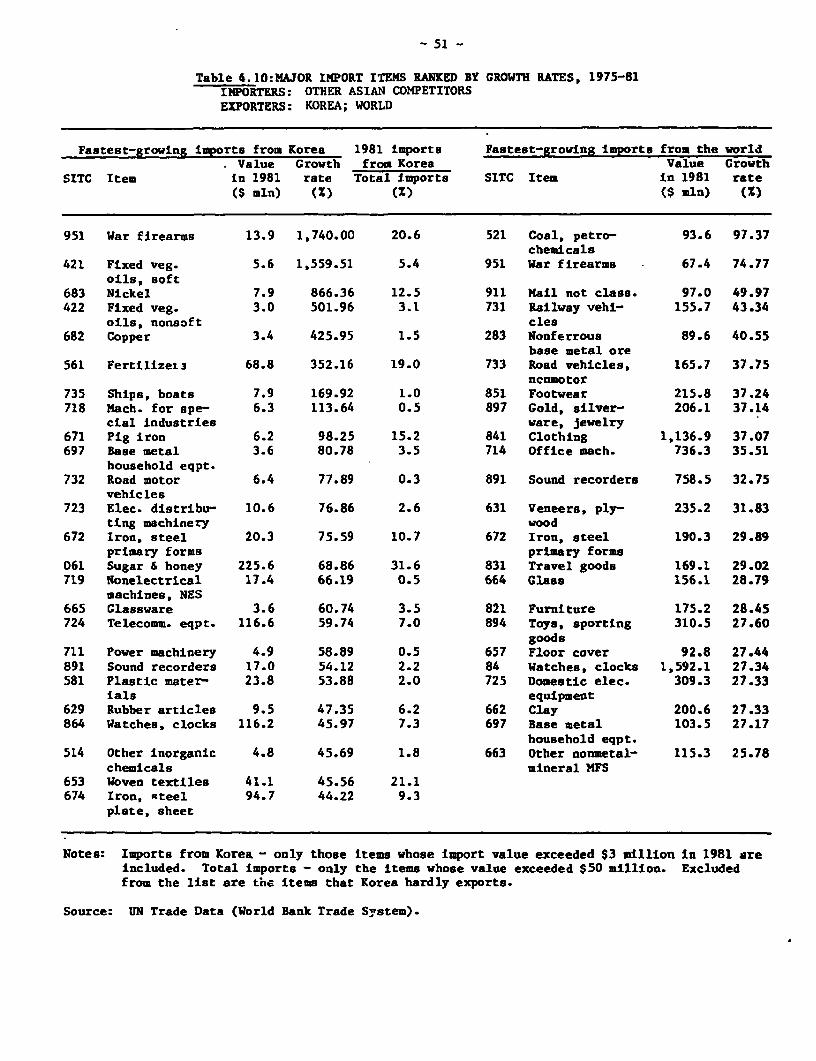
- 51 -
Table 4.10:MAJOR IMPORT ITEMS RANKED BY GROWTH RATES, 1975-81IMPORTERS: OTHER ASIAN COMPETITORSEXPORTERS: KOREA; WORLD
Fastest-growing imports from Korea 1981 imports Fastest-groving imports from the worldValue Growth from Korea Value Growth
SITC Item In 1981 rate Total imports SITC Item in 1981 rate($ mln) (Z) (Z) ($ mln) (%)
951 War firearms 13.9 1.740.00 20.6 521 Coal, petro- 93.6 97.37chemicals
421 Fixed veg. 5.6 1,559.51 5.4 951 War firearms 67.4 74.77oils, soft
683 Nickel 7.9 866.36 12.5 911 Mail not class. 97.0 49.97422 Fixed veg. 3.0 501.96 3.1 731 Railway vehi- 155.7 43.34
oils, nonsoft cles682 Copper 3.4 425.95 1.5 283 Nonferrous 89.6 40.55
base metal ore561 FertilizeL3 68.8 352.16 19.0 733 Road vehicles, 165.7 37.75
nenmotor735 Ships, boats 7.9 169.92 1.0 851 Footwear 215.8 37.24718 Mach. for spe- 6.3 113.64 0.5 897 Gold, silver- 206.1 37.14
cial industries ware, jewelry671 Pig iron 6.2 98.25 15.2 841 Clothing 1,136.9 37.07697 Base metal 3.6 80.78 3.5 714 Office mach. 736.3 35.51
household eqpt.732 Road motor 6.4 77.89 0.3 891 Sound recorders 758.5 32.75
vehicles723 Elec. distribu- 10.6 76.86 2.6 631 Veneers, ply- 235.2 31.83
ting machinery wood672 Iron, steel 20.3 75.59 10.7 672 Iron, steel 190.3 29.89
primary forms primary forms061 Sugar & honey 225.6 68.86 31.6 831 Travel goods 169.1 29.02719 Nonelectrical 17.4 66.19 0.5 664 Glass 156.1 28.79
machines, NES665 Glassware 3.6 60.74 3.5 821 Furniture 175.2 28.45724 Telecomm. eqpt. 116.6 59.74 7.0 894 Toys, sporting 310.5 27.60
goods711 Power machinery 4.9 58.89 0.5 657 Floor cover 92.8 27.44891 Sound recorders 17.0 54.12 2.2 84 Watches, clocks 1,592.1 27.34581 Plastic mater- 23.8 53.88 2.0 725 Domestic elec. 309.3 27.33
lals equipment629 Rubber articles 9.5 47.35 6.2 662 Clay 200.6 27.33864 Watches, clocks 116.2 45.97 7.3 697 Base metal 103.5 27.17
household eqpt.514 Other inorganic 4.8 45.69 1.8 663 Other nonmetal- 115.3 25.78
chemicals mineral MFS653 Woven textiles 41.1 45.56 21.1674 Iron, ateel 94.7 44.22 9.3
plate, sheet
Notes: Imports from Korea - only those items whose import value exceeded $3 million in 1981 areincluded. Total imports - only the Items whose value exceeded $50 million. Excludedfrom the list are the items that Korea hardly exports.
Source: UN Trade Data (World Bank Trade System).
-52 -
America. In fact this has been borne out by the experience of the past twoyears.
4.13 During 1982 the volume of exports grew a mere 5.8Z. In terms ofvalue, they increased less than 4%. Much of the expansion resulted from thesudden surge in demand for ships, as shipping companies attempted to takeadvantage of very low prices to replace the less efficient vessels in theirfleets. Exports of iron and steel products, machinery and footwear also rosebut in lesser amounts, while sales of a whole range of other goods, includingfoodstuffs, textiles, leather products and plywood lumber declined. Traderevived smartly in 1983, with export volume growing 17% and the value ofmerchandise trade by 11%, to $23.1 billion. But again, three categories ofgoods - ships, electronic goods, and footwear - were largely responsible forthis striking performance. In terms of value, sales to each major tradingregion declined excep5,North America, where the demand for Korean productsexpauaded by over 30%.- (Table 4.11).
4.14 For aggregate export volume to expand during two years when worldtrade decreased by an average of 1Z p.a. is extraordinary, but it does notnecessarily warrant revising current projections upwards. The unit priceindex for exports fell quite significantly during 1982-83 alongside the realeffective exchange rate (the won depreciated 6% against the dollar in 1983).The index for the latter declined from 103.1 in the fourth quarter of 1982 to93.4 at the end of 19f3 (Statistical Annex Table A4.3). Demand in the U'.being sensitive to the relative movements in import and domestic prices,- the-sharp improvement in the competitiveness of Korean products enabled them todisplace domestic goods and other imports. As export price adjustments tendto be matched very quickly by Korea's East Asian competitors, future exportgrowth cannot be linked to past trends but instead must be gauged through thestrengths and weaknesses of Korea's export drive and similar changes occurringin the economies of its traling partners.
Korea's Export Prospects: Tisory and Practice
4.15 An analysis of past trmding patterns suggests that as labor rich,export oriented countries progress towards industrial maturity, exports of rawmaterials and light manufactures give way to exports of standardized intermed-iate goods wh0h in turn are later joined by exports of differentiatedmanufactures- Some of the NICs, Ko-ea among them, have attempted to tele-scope the process, moving in the space of a few years from Stage I to StageIII and preparing, in fact, to challenge the advanced countries in productssuch as consumer electronics, where the technology is still evolving. Behindthis strategy was the realization that rising unit labor costs in the lightindustries were placing Korean producers at a disadvantage in internationalmarkets. A continuation of high export growth called for a change in the mixof manufactures, as did the desire to deepen the industrial base and raisedomestic value added.
4.16 In its efforts to expand the exports of standardized commoditiessuch as steel, chemicals, transport equipment, machinery, consumer durablesand electronics, Korean firms have been aided by a number of factors.Government support, which included subsidized credit, reduced some of the
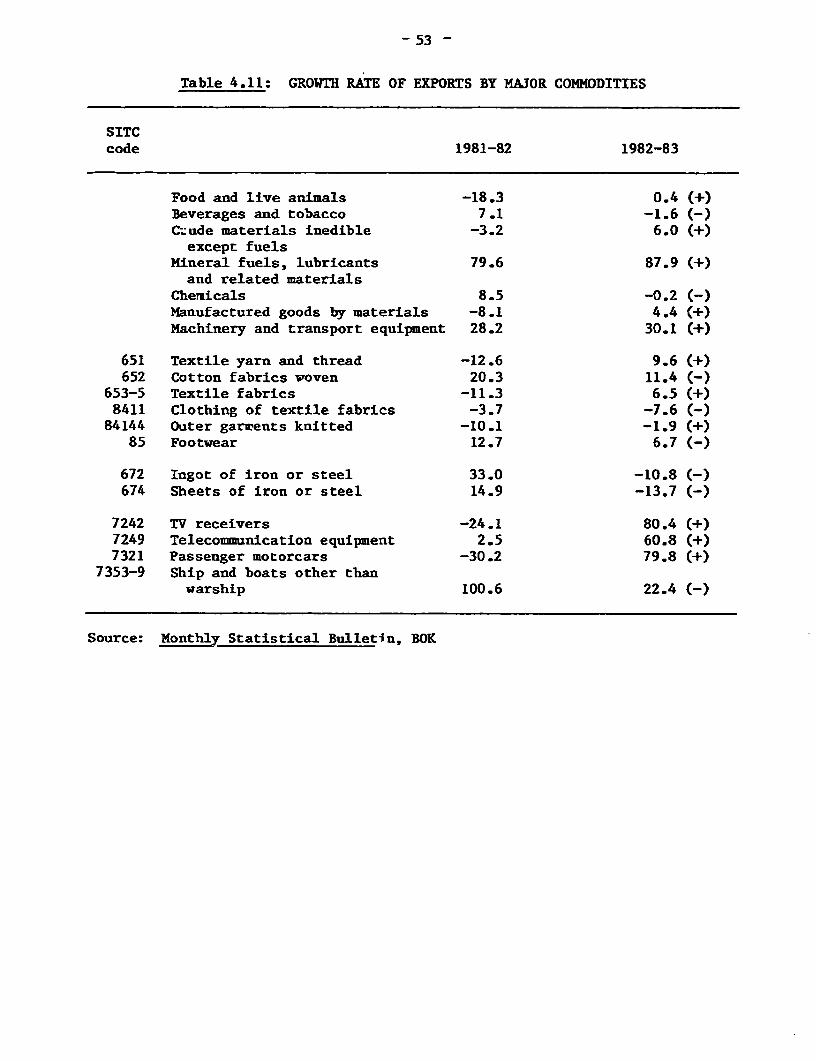
- 53 -
Table 4.11: GROWTH RATE OF EXPORTS BY MAJOR COMMODITIES
SITCcode 1981-82 1982-83
Food and live animals -18.3 0.4 (+)Beverages and tobacco 7.1 -1.6 ()C-;ude materials inedible -3.2 6.0 (+)except fuels
Mineral fuels, lubricants 79.6 87.9 (+)and related materials
Chemicals 8.5 -0.2 (-)Manufactured goods by materials -8.1 4.4 (+)Machinery and transport equipment 28.2 30.1 (+)
651 Textile yarn and thread -12.6 9.6 (+)652 Cotton fabrics woven 20.3 11.4 (-)
653-5 Textile fabrics -11.3 6.5 (+)8411 Clothing of textile fabrics -3.7 -7.6 (-)
84144 Outer garwents knitted -10.1 -1.9 (+)85 Footwear 12.7 6.7 C-)
672 Ingot of iron or steel 33.0 -10.8 (-)674 Sheets of iron or steel 14.9 -13.7 C-)
7242 TV receivers -24.1 80.4 (+)7249 Telecommunication equipment 2.5 60.8 (+)7321 Passenger motorcars -30.2 79.8 (+)
7353-9 Ship and boats other thanwarship 100.6 22.4 C-)
Source: Monthly Statistical Bulletin, BOK
54 -
risks of establishing large capital intensive production units in the absenceof assured markets. A labor force well endowed with the necessary industrialskills shortened the learning period. And fifteen years of intensive tradingin light manufacLures had created links with foreign markets, established thereputations of Korean firms and concentrated within large trading corporatf8?sa fund of experience which could be harnessed to the sale of new products.--
4.17 There were disadvantages, as well, in such an abrupt departure fromtraditional trading and industrial patterns. First the smallness of theeconomy militated against the reali: ation of scale economies. If optimallysized plants were constructed, they had from the outset to depend upon theirability to sell abroad. Second, the l1'uited sophistication of the domesticmarket has not allowed producers the latitude to launch, test and refinedifferentiated manufactures, in a protected environment, before venturingoverseas. Third, Korea is only now beginning to accumulate sufficientreserves of scientific manpower to develop the research infrastructure neededto sustain competitiveness in quality and technology conscious, differentiatedprodtLct markets. Lastly, whereas exports of light manufactures moved rela-tively unhindered into niches created by the decline of such production in theWest, the sale of machinery, durables and electronics must compete head onwith the still vigorous industries of the importing nations.
Future Market Conditions
4.18 Will the advantages Korea enjoys enable it to surmount the varioushurdles? This will depend on the following.
(a) the speed of growth in OECD countries and the length of businesscycies;
(b) import elasticities fzr advanced manufactures;
Cc) the volatility of product and process technologies in majorindustrial fields;
(d) the future strategy of international corporations that have come todominate production and technology of numerous important products;
(e) the effects of autom_-ion on the future prospects of majorsubsectors in the industrial economies;
(f) the direction of protectionist sentiments and the manner in whichthey influence imports into OECD countries from the small, EastAsian economies.
4.19 Each of these comprises a large topic justifying an extendedtreatment. Space limitations allow only the salient features to be outlinedhere. Some additional points pertaining to individual subsectors arediscussed in Chapters 5 and 6.
- 55 -
Growth in the OECD Countries:
4.20 As stated in Chapter I, OECD growth rates, that have been on adownward trend should average about 3.0-3.5% per annum, with world tradeexpanding at between 4 and 5%. While absolute growth rates are important fromthe perspective of Korean exporters even more important is the length of thesecycles. Recent experience suggests that business oscillations have becomeshorter and choppier, an unfortunate development when the production ofmachinery and basic metals is highly capital intensive, and producers areforced to commit large amounts of capital on the expectation of sustainedfuture demand. With Korean firms so heavily reliant on foreign markets,forecasts of the duration of trade cycles will critically determine the volumeof capacity installed. If the risks are too high, investment is likely to beat levels just sufficient for immediate requirements, leaving scant room forexploiting the sudden emergence of market opportunities.
4.21 Such supply constraints, avoided thus far thanks to the "buildingahead of demand" program in the seventies, loom in the future as excesscapacity is being exhausted in several sectors - notably iron and steelproducts, and non-ferrous metals - and investment in new plant continues to beinhibited by low profits and uncertain expectations in all but the transportand electronics subsectors.
Import elasticities:
4.22 Korean exports were aided by the high import elasticities prevailingthrough the seventies. Projections in the revised Fifth Plan assume thatthese have remained substantially unchanged. This may be a doubtfulpresupposition. The stiffening of import restrictions in the OECD countriesduring :he eighties is bound to depress market growth for exports fromKorea. Declining income elasticities for such items as clothiag and footwear,about a third of merchandise exports in 1983, will also take a toll. In thepast, very high growth rates could be achieved through increased marketpenetration at the COSt of domestic suppliers. Penetration at the rates ofthe seventies might no longer be a possibility both because of the defensivemeasures being taken by the importing countries as well as the fierceness ofcompetition among exporters.
Technology:
4.23 Where a country is selling a standardized product based on stabletechnologies, the competition revolves mainly around price, with wage costs,managerial efficiency and newness of plant, often being the decisivefactors. But consumer durables, electronics and the more advanced segments ofthe machinery industry ave constantly being swept by technological change,which by shortening product cycles, makes innovativeness the key to exportsuccess. Korea, with its embryonic research capabilities, will for some timeto come be poorly placed to challenge the leaders in the field. The bulk ofits exports will, therefore, be in the relatively unsophisticated ends of themarkets for TVs, other consumer electronics and machinery, where the OECDmarkets are fairly saturated and Korea does not enjoy a decisive edge over itsmany competitors among the NICs.
- 56 -
International Corporations
4.24 The cost and complexity of new production methods and technologieshas increasingly begun to favor large vertically integrated corporations withworldwide operations. Not only do these companies control certain kinds oftechnology, but also the access to OECD markets as a result of special tariffregulations, their marketing networks and established clientele. Automobiles,consumer electronics and computers are some of the industries dominated by afew international concerns. For Korea to become a significant exporter ofthese goods, a development that would certainly secure its export prospectsduring the eighties, a strategy allowing Korean firms to collaborate with andparticipate in the global trading networks created by internationalcorporations will have to be devised. The first such joint arrangement ofsignificance is likely to be in automobiles, but even if-it is consummated inthe near future, 3-4 years could elapse before it has a sizeable influence onexports.
Automation
4.25 Advances in electronic technology have begun transforming the coststructure of manufacturing production. Many labor intensive assembly opera-tions have been automated and computer assisted manufacturing (CAM) holds outthe possibility of restoring the competiveness of several important industriesin thy,7dvanced economies that have been buffeted by exports from theNICs.- Textiles and garments, machine tools, consumer durables could be onthe threshold of a new rennaisance. Further, some assembly operations thathave migrated to the East Asian countries may find their way back to-ryeindustrial economies as investment in the new technologies picks up. - Infact the negative effect of these production methods on the exports of theNICs could be twofold in character. TkL.ir assembly and processing industriescould be curtailed. And the sophisticated nature of the new technologiesmight also limit their participation in the rapidly growing trade in elec-tronic processors, machine tools and automated production machinery. Thus thetechnological changes brewing in the industrial sectors of the West, could, ifreinforced by political fears of deindustrialization and the opportunitiespresented by ample reserves of unemployed labor, significantly alter tradepatterns at considerable cost to countries such as Korea.
Protectionism
4.26 Earlier this was touched upon in the general context of importelasticities. It also poses a specific problem for Korea. The country is nowa large exporter of goods such as textiles and footwear, which hurt certainpolitically well entrenched industries in the West. In other items, where itsmarket share is small, the share of all the East Asian NICs which export abroadly similar mix of goods, taken together, is often not insignificant. Asa consequence, attempts at stemming the tide of exports from East Asian NICs,viewed as a bloc, could also affect Korea's export performance in many of thelesser commodities in its trade basket.
57-
A Summing-up
4.27 The above is a sobering catalog of reasons arguing against an excessof export optimism. At the very least it raises questions as to whether anexport elasticity of 2.0 (with respect to growth of world trade) should remainthe rule of thumb for projecting Korea's exports. There is a good chance thatwith Korea now firmly ensconced in the ranks of the major exporters, thelonger term rate of growth may be in the region of 7-8%, a point to which wereturn in Chapter 6.
4.28 When Korea's export led growth is analyzed, attention is focussedprimarily on merchandise trade. However, invisible earnings have grown from$4.8 million in 1979 to $7.3 billion in 1983, about 30% of merchandiseexports, and are making a very substantial contribution to the total inflow offoreign exchange. More than two thirds are derived from overseas constructionactivities and shipping services, with lesser amounts from insurance andinvestment income.
Overseas Construction
4.29 Korean firms' experience with construction projects abroad, datesback to the time of the Vietnam war, but the extent of their involvement andthe volume of earnings climbed to significant levels only after the first oilshock unleashed a construction boom in the Middle East. As of 1983, therewere 59 firms engaged in overseas work (out of 509 registered companies) with85% of the outstanding contracts, valued at $20 billion (from a cumulativetotal of $61.2 billion), concentrated in the Middle-East (Annex 1, Table A4.15).
4.30 From the heady days of the late 70s when Korean firms were winningnew contracts worth close to $14 billion (1979) per year, constructionactivity has begun to slacken, with new business of under $10 billion beingobtained in 1983 (Annex 3, Tables 7.2-7.3). In addition, net earnings fromoverseas construction have also been declining. There are several reasons forthis with important implications for the mediumr-term. The decline in oilprices by plunging many countries of the Middle East into current accountdeficits, has weakened their appetites for construction activity, especiallycivil works such as roads and buildings. This has diminished the flow ofcontracts to Korean firms, whose speciality lay in the execution of suchprojects. The entry of Turkish, Thai and Filipino firms, with labour costslower than those of Korean companies and the preference often given by ArabGovernments to their own construction enterprises, means that business is nowdistributed over many more contenders. As competition has stiffened, Koreanfirms have seen their average rate of profit slip from 10 in 1978-79 to 5% in1982, with gross profit to sales falling from 9.2% to 5.2%. Many companiesare faced with serious cash flow pr?Mems, with the delay in obtainingpaymerts only adding to their woes_-
4.31 The decreasing attractiveness of civil works and the diminishedvolume of business in that area, has induced companies to bid more activelyfor the construction of manufacturing plants requiring an appreciably higherlevel of engineering skills and technical competence, something that Koreanfirms are deficient in- Having in the past executed projects in collaboration
58 -
with foreign companies that provided all of the design and engineeringservices, the Koreans had limited oppportunity to develop their own expertisein this area. The changing nature of contracts has made this into a signifi-cant handicap. Aside from interfering with their ability to obtain newbusiness, the heightened complexity of construction activity also means thatthe companies can rely less on Korean suppliers of equipment and materials.Consequently induced commodity exports fell from 9.2% of contract value in1979 to 5.2% in 1982.
4.32 If hostilities between Iran and Iraq cease and a peace can benegotiated between the warring Lebanese sects, construction demand whichKorean firms are most suited to fulfill, could once again grow. Should thesedevelopments be long delayed, the Mid-East market will continue tightening.One way of maintaining earnings would be through geographical diversificationinto Africa and Southeast Asia. This is definitely rich with possibilities,but to make headway against Japanese and other foreign firms competing forwhat are very often quite sophisticated ventures, Korean companies will haveto remedy five important shortcomings:
(a) Although the capacity to do detailed engineering has increased,design and basic engineering skills remain primitive;
(b) Increasingly governments are requiring firms to provide a portion ofthe financing, something that only the largest companies canoffer. The many medium sized Korean operations are, therefore, at adisadvantage unless they are prepared to merge or to collaboratewith each other;
sc) Because of high turnover, companies have made little attempt totrain their workers, unlike the Japanese, who consequently outclassthem in this field;
(d) Construction companies need to strengthen their backward linkageswith suppliers of materials and equipment so as to improve qualityand reliability, both of which are low and a major liability inimplementing technologically advanced projects;
(e) As Korean labor becomes more expensive firms have to depend onworkers from the host country as well as from the Philippines, SriLanka and elsewhere. Managing these workers is a knack that theJapanese have perfected but Korean middle managers and foremen havestill to learn.
4.33 Even though it recognises the scale of the problems, the governmentis projecting $10 billion (at current prices) in new business in each of thenext three years. It also sees net foreign exchange earnings rising to$2.7 billion by 1986. This is within the bounds of possibility assuming animprovement in the Mid-East situation, but a lower estimate would seem morerealistic. Net earnings will certainly benefit from the higher value added inprojects recently contracted for, but the declining number of Korean workersengaged overseas (whose wages constitute 15% of the value of contracts) willtend to offset gains elsewhere. Instead of increasing, net earnings might
- 59 -
instead remain stable or even decline slightly over the coming years. To theextent that stock prices mirror the prospects of the construction companies,the drop in average share prices from W 7000 - W 8000 in 1978-79 to around thepar value of W 600 - W 700 in 1983 - although paid-in capital rose 5-10 fold -is perhaps indicative of future business and profitability.
Shipping Services
4.34 Korean shipping lines owned 7 million Gross Registered Tons (GRT) in1982, a fourfold increase over the 1975 level. Receipts from shippingservices grew from $317 million in 1975 to $2.4 billion in 1982. Since Koreahas a large supply of relatively low cost and well trained crews, with capablecaptains, plus an edge in maintenance and repair costs provided by T9ellent,local repair yards, earnings can be expected to rise in the future.-- The3.4 million GRT expansion in tonnage projected through 1986, should providesufficient capacity to service the increase in domestic exports as well asforeign demand. How rapidly, earnings can be enlarged will depend on arestructuring of the industry and a revival of the world shipping market, thathas been in a slump since 1980.
4.35 There are about 70 ocean going carriers operating 560 vessels underincreasingly adverse circumstances. Although the tonnage transported rose 20%in 1982, export receipts were 0.2% lower, as the Maritime Index of freightrates declined to 195 (300 being the break even point for Korean companies).Losses of $38 million in 1981 increased to $140 million in 1982, with 50companies pusp9 into the red by depressed rates and the excessive size oftheir fleets.-
4.36 The same medicine suggested for the overseas construction companiesmight also be effective in the shipping industry. Mergers between whatiarepotentially the more viable compayk?s would lessen cut-throat competition andeventually improve profitability. Capital costs might also be held incheck if Korean companies could, at least in the near term, continue buyingsecond hand ships abroad on the generous terms offered, rather than having topurchase more newly built vessel-- from local yards.
4.37 It is expected that the world shipping glut should have passed by1985-86 and a recovery of rates is being forecast. Hence, the upward trend inreceipts from shipping might resume within a year or two, unless the ordersnow being placed by foreign as well as if rean ship owners, result in aprolongation of the capacity overhang_-
- 60 -
CHAPTER V
HANUFACTURING INDUSTRY AND EXPORT-LED GROWTH
5.01 The fortunes of exports and those of industry have been linked in-extricably throughout Korean development. Exports provided a source of demandand loosened foreign exchange constraints on domestic growth, but it was thedynamism of the manufacturing sector, its ability to produce goods cf the typedemanded overseas at a reasonable price, which made them salable in foreignmarkets. The first phase of Korean industrialization was typical for acountry in its circumstances. Poorly endowed with natural resources andcapital, the economy's hopes rested on a labor force unusually well-educatedfor what was then a backwa- country. Some of the industries that flourishedin the early period-textiles, plywood, toys, wigs and other lightmanufactures-remain a force in the economy. Others have gone into eclipse,priced out of the international arena by the upward drift of Korean wages.
5.02 Worried by the impending obsolescence of many labor intensiveproducts, the Government, taking its cue from the Japanese strategy of thefifties and sixties, launched a second wave of heavy and chemicalindustries. By the late seventies, exports from the new subsectors had morethan compensated for losses in other industries and carved out a leading rolefor themselves. In the early seventies, light manufactures yielded theirexport dominance to heavy industry (Chart 4.1). Korea now stands poise4 tomake the transiLion from an economy drawing its strength from ample supoliesof labour, to one whose industrial strength rests on such capital and skillintensive industries as machinery, durables, electronics and basic metals.But until well into the eighties both trading success and the vigour of thedomestic economy will depend as much on the ability of textiles and footwearproducers to retain their overseas markets as on the effectiveness with whichmachinery and electronics firms enlarge their share of world trade.
5.03 Currently seven manufacturing subsectors - textiles, footwear,steel, machinery, automobiles, shipbuilding and electronics, are responsiblefor 73% of total exports, 53% of employment in manufacturing (Table 5.1).Since they comprise Korea's industrial core, their current problems and exportprospects will be analyzed in this chapter supplementing the more generald:.scussion in Chapter 4.
Textiles
5.04 Exports of textiles in 1983 were close to $6 billion making Koreathe second largest net exporter, after Italy. The industry also retained itspreeminence among the various manufacturing subsectors in its share of trade(27% of total merchandise exports), employment (26% of the industrial work-force in 1982) and value added (almost 16% in 1982). But recent years havebeen troubled ones with the brief spurt in 1981 doing nothing to dispel thefeeling of incipient crisis. Where textiles were once the driving forcebehind Koreas industrialization, absorbing a large proportion of the invest-ment and growing at an annual rate of nearly 20% (real value added) between1970 and 1978, it expanded a mere 4.5% p.a. during 1979-82. There was some
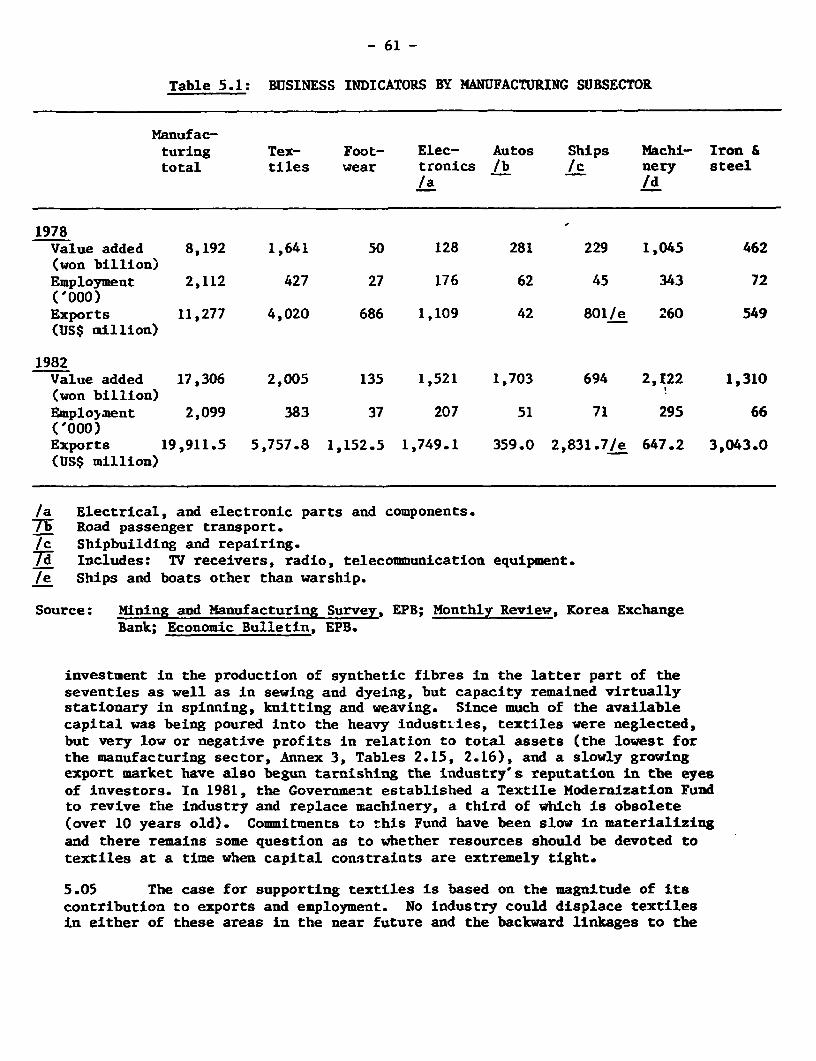
- 61 -
Table 5.1: BUSINESS INDICATORS BY MANUFACTURING SUBSECTOR
Manufac-turing Tex- Foot- Elec- Autos Ships Machi- Iron &total tiles wear tronics /b /c nery steel
/a /d
1978Value added 8,192 1,641 50 128 281 229 1,045 462(won billion)Employment 2,112 427 27 176 62 45 343 72('000)Exports 11,277 4,020 686 1,109 42 801/e 260 549(US$ million)
1982Value added 17,306 2,005 135 1,521 1,703 694 2,122 1,310(won billion)Emplo3raent 2,099 383 37 207 51 71 295 66('000)Exports 19,911.5 5,757.8 1,152.5 1,749.1 359.0 2,831.7/e 647.2 3,043.0(US$ million)
/a Electrical, and electronic parts and components.7b- Road passenger transport.Ic Shipbuilding and repairing.,d Includes: TV receivers, radio, telecommunication equipment./e Ships and boats other than warship.
Source: Mining and Manufacturing Survey, EPB; Monthly Review, Korea ExchangeBank; Economic Bulletin, EPB.
investment in the production of synthetic fibres in the latter part of theseventies as well as in sewing and dyeing, but capacity remained virtuallystationary in spinning, knitting and weaving. Since much of the availablecapital was being poured into the heavy industL-ies, textiles were neglected,but very low or negative profits in relation to total assets (the lowest forthe manufacturing sector, Annex 3, Tables 2.15, 2.16), and a slowly growingexport market have also begun tarnishing the industry's reputation in the eyesof investors. In 1981, the Government established a Textile Modernization Fundto revive the industry and replace machinery, a third of which is obsolete(over 10 years old). Commitments to this Fund have been slow in materializingand there remains some question as to whether resources should be devoted totextiles at a time when capital constraints are extremely tight.
5.05 The case for supporting textiles is based on the magnitude of itscontribution to exports and employment. No industry could displace textilesin either of these areas in the near future and the backward linkages to the
- 62 -
machinery and chemicals subsectors (42% of the machinery used was of domesticorigin in 1980 as against 17% in 1971), are extremely valuable. Nevertheless,the longer term viability of the industry, particularly its exportcompetitiveness, is debatable and a larger dose of capital alone may notrestore its fortunes.
5.06 There are two kinds of problems: internal ones which might possiblyrespond to policy initiatives and external ones associated with economicconditions abroad. Not only is textile machinery often old and labourintensive, but also Korean wages rose very steeply in the seventies - at 25%p.a. - much in excess of Korea's competitors, jeopardizing exports of lowpriced garments and textiles. The accumulated cost disadvantage has remainedin spite of a slower increase in wages during the early eighties and a qteadydepreciation of the Won (Annex 3, Table 2.5). Manufacturers of synthetictextiles find their earnings pinched further by the requirement that theypurchase a percentage of their raw materials from high priced localproducers. These difficulties could be minimized if manufacturers were ableto upgrade their produc; mix, but a number of obstacles stand in the way.
5.07 Inadequate techrology and antiquated equipment have hinderedprogress in the bleaching and dyeing areas and there is room for progress indesign and marketing. As long as Korea was a supplier of low quality fabricand garments, firms could depend upon foreign buyers to supply designs andspecifications, monitor quality and manage the marketing. Korean clothing wassold under foreign brand names, few salesmen were stationed abroad andadvertising could be neglected. Fashion garments and fabric of high qualityrequire an entirely different approach. Consumers in the developed countrieshave a more than adequate stock of apparel, when they buy, their deci7ions areguided not so much by price as by the newness of design and fashion.1Success at producing fashionable textiles requires proximity to the market,great speed in responding to shifts in preferences, ability to produce insmall lots and deliver items on2yery tight schedules, precise quality controlsand close links with retailers. Even if deficiencies in equipment can bemade good through special funds or the initiative of General Trading Companieswith strong interests in textiles, designing and marketing fashion garments isan uphill task, which only Hong Kong among the NIC's, may have partiallymastered.
5.08 Still, such obstacles are not insurmountable. More daunting arethose beyond the control of Korean producers. Textiles remain a sizableindustry in the advanced countries, employing between 10 and 17% of the manu-facturing labor force (14% in tVe U.S. as of 1982) or almost as much as auto-mobiles and chemicals together, This industry, which has taken a batteringat the hands of East Asian exporters, has been retaliating with increasingeffectiveness using political as well as economic weapons.
5.09 The textile industry's political power arises from the numbersinvolved and because the majority of workers - middle aged women living intowns with few alternative job possibilities - are geographically and occupa-tionally immobile.- Closure of textile factories results in lost jobs notreadily replaced in the current economic environment. Thus the industry'spolitical leverage has launched a succession of Multi Fibre Agreements
-63 -
(starting in 1974) between the indtistrial economies and the principal textileexporters, each mo 5e restrictive than the one before, with no relaxation ofcontrols in sight.- At a time when a number of important new exporters areentering the field, e.g. the PRC, Philippines and Sri Lanka, the likelihoodthat Korea could greatly enlarge its sales, appears remote.
5.10 Producers in the industrial economies have also been actively mar-shalling their technological defenses. They have always enjoyed the immeasur-able advantage flowing from closeness to what are increasingly trendy, smartand fashion conscious markets, but now, in addition tk7y are whittling away atthe price gap resulting from their higher wage costs.- The reaction hastaken two forms. Certain articles that can be produced in parts and thenassembled elsewhere are being produced in two stages. The first is within theindustrial economies. The second has been Foved to countries in CentralAmerica and South Asia where wages are low _L
5.11 Mechanization and automation has been another line of defense. Newopen ended rotor spindles offer a 40. saving in manpower over traditional ringspindles. Weaving has been automated by the advent of shuttleless and multi-phase looms that operate at higher speeds and can cope effectively withfashion changes when married with electronic monitoring systems. Knitting hasbeen transformed by the combining of fabric and garment stages into one,increasing enormously the flexibijty, through computer control of handlingthe design of high fashion items- In clothing manufacture, automation andthe acceleration of sewing operations have been assisted by computer control-led designing, laser beam cutting, high speed sewing machines and special pur-pose equipment for such previously labor intensive operations as buttonholing, patch pocket hemming and decorative stitching. With the advent ofcomputer controlled designing, cutting, pa'tterning and sewing, labor costswill be further redoed and manufacturers will be able to respond more quicklyto fashion changes,
5.12 Textiles is too important an industry to be easily abandoned byKorea, but with export/output ratios rising in the major industrial countriesand import/consumption ratios declining, it may not merit a major infusion ofcapital (Annex 3 Table 2.4). But certain segments of the industry, possiblyin the clothing sector currently providing 60% of textile exports, could bemodernised, by way of collaboration between the General Trading Companies andthe many small producers, and assured a place in the world trading system assecure as that of Hong Kong.
Footwear
5.13 The footwear industry has weathered the storms unleashed by theglobal recession with far fewer scars than textiles. Although growth ofoutput and exports was brought to a halt between 1978-80 by the introductionof Orderly Marketing Arrangements (OMAs) in the US, the destination for twothirds of overseas sales, their termination in 1981, permitted export volumeto increase by close to 10% in each of the past three years (Annex 3, Table3.1). In 1982, the footwear subsector employed 4% of the manufacturingsector's labour force and accounted for 0.6% of value added. Exports of$1 billion, made it the fifth largest trader and it remains one of the few
64 -
light industries whose cost structure is highly competitive in comparison withother East Asian producers, not to mention Italy, Spain and Brazil.
5.14 This competitiveness has been hard earned, because footwear is stilla very labor intensive subsector (in the U.S. wage costs were one third of thetotal) with between 50 and 250 separate operations that havemsistedautomation and benefit only moderately from scale economies__ Nominalwages, which were rising annually by over 50% in the mid seventies created aserious problem (Annex 3, Table 3.3). The weakening of sales during 1979-81provided firms with a strong incentive to curb the increase in labour costsand the depreciation of the Won in the early eighties also gave them welcomerelief. But company profitability strengthened only marginally, as the gainsin the cost structure were sacrificed in cutthroat competition for marketshares. The fierceness of the price war reflected the modest scale of exportopportunities, but excess production capacity, built up in anticipation of theend to U.S. trade controls, gave it an additional edge. While the price warcertainly aided exports, it forced several firms into bankruptcy and the 10%(1982-83) drop in prices induced U.S. firms to file charges of dumping againstKorean suppliers. Threatened by a renewal of the OMAs, the Korean footwearproducers association, under the government's prompting, formed a committee tovoluntarily limit exports to the U.S. market.
5.15 On the face of it, Korea may have some difficulties remaining amajor exporter of footwear in the longer term. The country imports all itsleather and rubber; backward linkages are few, though some cutting and sewingmachines are now being made domestically; and production is labour intensivewith the required skills learnt quite easily by the young women dominating theworkforce. Thus footwear has all the makings of an industry likely togravitate readily towards economies with the cheapest labor, the more so sincedesigning , quality control and marketing is done largely by foreign buyers.
5.16 Perhaps the strongest point in Korea's favor comes from being anestablished, reliable producer in whom buyers have acquired confidence throughlong association. Other countries might have the advantage of lower costlabor, but these intangibles might be missing. The structure of the footwearindustry has also strengthened the advantages derived from long experience andclose ties with markets abroad. Sixty firms, 12% of the industry's total,produce 87% of the output and employ 84% of the work force (1982). Concentra-tion reinforces the scale economies that do exist in the production of rubberfootwear, comprising 60% of Korea's total production, and the big firms canafford to spend more on research and quality control. Large companies arealso better placed to obtain patents for internationally ky?ry brands such asNike and Puma - and to market under their own brand names.- In an inter-national market increasingly riven by complex trade restrictions 2targe Lorpo-rations are also more adept at navigating around these barriers._
5.17 In the future, new producers of plastic and rubber shoes will emergeto challenge Korean supremacy and since the wages paid by the footwear indus-try are close to the average for manufacturing, it is only a matter of timebefore rising labor costs and the slow increase in productivity pushes Koreancompanies towards leather shoes with higher value added. Here they will becompeting against exports from Italy, Brazil and Spain, produced mainly by
- 65 -
quite small firms, whose strength lies in quality and design. The market formedium and high priced shoes is extremely style conscious and as in clothing,new fashions are subject to shorter and shorter cycles. Thus, innovativeness,the ability to anticipate fashion trends, close contacts with retailers bothlarge and small, flexibility in production and quickness in responding to achange in buyers' preferences are the determinants of success.
5.18 Local producers are better situated to take the market's pulse andsmaller firms generally react with greater speed. The Italians and theSpanish have a strong presence in the market for quality leather footwearbecause they have traditionally been the leaders in style. For Koreancompanies to enlarge their niche will call for a considerable departure fromtheir past strategy, much closer attention to trends in fashion and thesoldering of links with retail networks.
5.19 Equally important for export growth will be geographicaldiversification. After making some headway in selling to Euirope, Africa, theMid-East and Latin America, during 1978-81, the U.S. market which took threequarters of Korean footwear in the mid 70s, but only one half in 1980, onceagain absorbed 70% of overseas sales in 1983. The onslaught from exports inthe last two decades has decimated the U.S. shoe industry. The number offirms has been reduced by half (350) and production by almost as much. Butthe industry still provides employment to 150,000, semi-skilled workers and itis capaMi of mounting a rearguard action by way of OMAs to protect its localmarket_- Too rapid an expansion into the U.S. would, therefore, be counter-productive, ending in friction over trade and more vigilantly supervisedquotas.
5.20 No dramatic gains can be forecast for the shoe industry through themid eighties. But in spite of its low profitability this is a sector withsome residual growth potential. It is more likely to retain its position asan exporter, than parts of the textile industry, if only because the shoeindustry in some of the maior importing nations may not be able to put up asstrong a resistance as some of the other subsectors by virtue of its decliningimportance.
Steel
5.21 The longer term comparative advantage in producing and exportingcarbon 10eel seems to lie with modern steel plants built in NICs such asKorea.-- However, to realize this potential, the NICs wi±l require theactive support of the mature industrial economies in obtaining capital,technical assistance and eventually, export markets. Trade in steel and steelproducts is brisk, yet so far, the developing countries, in spite of their lowproduction costs have made very limited inroads into the marke g,of theadvanced countries, most of whose imports are from each other.-- It is atrade which has engendered much international tension and bitterness.
5.22 The production of steel has long been equated with industrialstrength and 'ts waning health has sparked public concern far in excess of itscontribution to economic well-being at a time when aluminium, plastics,composites and glass have superceded steel in many uses. Steel is also a

- 66 -
major employer and has linkages criss-crossing the industrial sector. Sinceclosing steel plants causes considerable local distress, Western governmentshave preferred to protect and subsidise inefficient steel plants that forreasons of technological backwardness and high labor costs could be driven outof business. Such policies have saddled several of the indust f0l countrieswith steel capacity beyond their needs and encouraged exports.- This hasprevented a rationalization of steel producrion o .7 worldwide basis. Cheapand efficiently produced carbon steel from Japan - competes against highlysubsidized exports from the European countries in the U.S. market. BeleaguredAmerican producers prevented by low profitability, escalating wage costs andthe uncertain future of the industry, from building the 'green fields' plantstxat would place them in a firmer competitive position, seek shelter behindvoluntary export controls, anti-dumping restrictions and import barriersprimed by trigger price clauses. Such actions gain a temporary reprieve forthe industry and protect jobs without getting at the excess capacity,technological obsolescence, low prodywivity and untipportable wage levels,that are at the root of the malaise
5.23 Recession has compounded the problem for the mature economies bylimiting alternative job outlets for steelworkers and making it harder fsteel firms to move downstream into engineering activities, for example.-Nonetheless changes are in the offing. In the U.S., ratioialization is takingplace bit by bit through mergers, closures of old plant and the gradualconcentration of new output, particularly of special steels in very efficientmini-mills. By 1985, experts see raw steel capacity in the U.S. dropping to105 million tons, from 138 million in 1 R9, and to 91 million tons in 1990. Asimilar cut back is probabljl'n Europe.- And with capacity being drawn downgradually in Japan as well,- the NICs should begin gaining more prominencein steel trade.
5.24 Currently Korea has 13 million tons of installed capacity, 8.4 mil-lion of which is in the modern Pohang steel complex, capable of producingsteel at prices lower than even the most efficient Japanese ?lants, by virtueof low2,capital costs and wages one fourth of those paid in Japan ($3 perhour).- In 1983, over 12 million tons of steel were produced of which 5.7million tons were sold abroad. Exports to Japan amounted to 1.4m, the U.S.1.7 m, and East Asian markets 1.02 m. Unfortunately, Korea's superiorproduction economics cannot readily be translated into growing exports and notjust. for the reasons referred to above. Domestic demand for steel from theshipbuilding, automobile, construction and machinery industries has beenea:panding steadily, reducing the surplus that can be sold abroad. A newintegrated steel mill, under constuction at Kwangyang will augment productioncapacity by 2.7 m tons in 1988. Until that facility becomes operational steelexports can grow at only a moderait/ pace, which, in fact, might be all thatKorea's main markets will absorb_-
5.25 The opposition on the part of Japanese and American producers,worried by the presence of over capacity and visions of rising imports - tothe erection of this new complex does generate some uncertainty. But it wouldbe unfortunate if sentiments aroused by the market conditions prevailing todayshould deflect Korea from developing a standardised tradeable item with highvalue added, it is suited for producing.
67
Shipbuilding
5.26 At the time when the Korean government was making plans to developbasic metals and machineTy industries, demand for ships was at a peak, theclosing of the Suez Canal having created the need for large tankers, capableof carrying crude at reasonable costs, via the Cape route. It was logical interms of forward integration, therefore, to include in the program, shipyardsthat would utilise the ste l plate and equipment manufactured by thie heavytndustries, in constructing the giant vessels being bought by the world'sshipping fleets. Financial support from the government persuaded four ofKorea's major corporations, Hyundai, Samsung, Daewoo and Korea Shipbuilding,to build in less than a decade, modern faciliti 59 capable of producing4 million Gross Tons (GT) (Annex 3, Table 4.2). - Production of new shipsrose from 12,000 GTs in 1973 to 1.4 million GTs in 1982, 85% of which wasexported with the217vernment's EXIM bank providing 50% of the financing atattractive rates.- By 1982, the industry employed 2% of the manufacturinglabor force, accounted for 3% of industrial value added, and exports of newships, offshore structures and ship repairs earned $2.2 billion.
5.27 Now the third ranked export subsector (15.4% of merchandise exports)with backward linkages to some 50 other industries, including machinery, basicmetals, electronics and chemicals, shipbuilding is a major force in theeconomy. If Korea's share of total world orders for new ships, which was 10Xin 1982 and 15% in 1983, rises to one third by 1986, its importance for theeconomy promises to become even more significant. But, having gained secondplace in the world market (Annex 3, Table 4.6), after Japan (with 40% of themarket), Korea must continue its efforts at strengthening the industry'sfoundations so as to secure its position internationally and to derive themaximum economic benefit from the industry's success.
5.28 With their eyes on market share and capacity utilization rates,Korea's shipbuilders have been willing to sacrifice profits for the sake ofgrowth. Until 1980, profits were negative. Then in 1981 and 1982, theindustry edged into the black, but the ratio of net profits to net sales was ameagre 2.7%. Last year, as shipbuilders slashed prices to attract new ordersat a time of acute recessly7 in the shipping industry, profits may haveslipped below that level.- Since little capital has been ploughed backinternally, the debt-equity ratio of the shipbuilding industry is close to2:1, which aside from posing financial risks, makes it difficult to obtainfunding from international banks, funding whose importance wiligrow if theKEXIM increases its rates and diversifies its lending policy. - Prices fornew ships have become firmer in the past few months as both Japanese andKorean yards are booked to capac-ty through mid-1985, but the 100 million tonglut in the shipping trade holds out scant prospect of a real upswing indemand before 1985/86. Profits in the intervening years will depend uponimprovement in productivity.
5.29 The level of productivity is largely a function of experience, theaverage size of vessels constructed in relation to what is optimal given theyard size, and process technology. Korean builders still lag behind theJapanese on the learning curve. There is some evidence that productivity in.certain shipbuilding operations is well below the level attained by Japanese
-68 -
yards 29/ This is compensated for by wages about two thirds lower than inJapan. Thus, there remains considerable scope for catching up, which wouldhelp fatten profit margins.
5.30 Since the construction of Korean yards commenced during the greattanker boom of the seventies it is for the building of VLCCs that they arebest suited. Unfortunately, few such vessels are being ordered today. Theaverage tonnage of ships being assembled is 17,000 GTs and the profit on suchcontracts is very slender. Marginal profitability, the young age of Koreanshipbuilding concerns and limited available stock of experienced designers,engineers and scientists, have constrained spending on local R & D inpreference to imported technology. Some 54 (Annex 3, Table 4.4) technologyagreements were secured in the seventies for ship design and hull construc-tion. More recently, Japanese builders, the main source of technology onproduction processes as well as design, have become cautg3ys about sharinginformation with what is now their principal competitor.- While des4gntechnology is still available from the European countries, the latest techni-ques concerning automation and management are more a preserve of the Japanese.Even in design the Japanese may be pulling ahead as the decay of Europeanshipbuilding has curtailed the interest of European builders in new techno-logy. Orders for more sophisticated vesse'ls, such as LNG carriers, forexample, would certainly boost the profitability of Korean yards, and toobtain such contracts, more R&D is required.
5.31 There are two other areas in which progress seems desirable: thelocal content ratio is one; a second is the development bf smaller yards.Although Korean firms with support from the government have been active insetting up ancillary industries supplying inputs to shipbuilding, the base ofsubcontractors feeding the subsector remains relatively shallow. In 1983, thelocal content ratio was 60% for exported vessels, 75% for the ones purchasedby domestic shippers. However, these statistics are misleading as they onlyinclude direct imports. For example, if a ship turbine is assembled in Koreawith some domestic components, the entire engine is recorded as being ofdomestic origin. Therefore, the actual ratios are much lower. Vigorouscollaboration, as found in Japan, is needed between the yards and potentialsubcontractors, with the builders supplying technical advice and specializedequipment, if necessary, to create an infrastructure of efficient and qualityconscious suppliers.
5.32 Since the heyday of the supertankers may have passed, the majorityof future orders will continue to be for vessels of a moderate size. Moder-nizing and expanding the smaller yards should be one objective. A secondwould be for shipbuilders, who now compete fiercely among themselves fobusiness, to share new orders in accordance with comparative advantage.-Major yards, for instance, could construct large bulk carriers, tankers, LNGcarriers and offshore structures, with smaller yards concentrating on therest.
Machinery
5.33 Korea followed the Japanese example of the thirties and earlyforties in attempting to establist? a broad based machinery industry through
- 69 -
one Big Push, in the decade of the seventies. Subsidized credit, tax exemp-tions, accelerated depreciation privileges, import controls and governmentinvestment in industrial estates, all helped strengthen entreprenurialresolve, so that by the early eighties, Korea had assembled the capacity toproduce not only all kinds of general machinery, but also electrical andnonelectrical machinery - including turbines and generators - earth movingequipment, numerically controlled machinery centers, nuclear steam supply sys-tems and various kinds of industrial plants. Even if shipbuilding is exclu-ded, employment in this sector had risen, by 1982, to half million (15% of themanufacturing labor force), the sector exported $1.6 billion worth of equip-ment and it contributed 21.6% of the value added in manufacturing (Annex 3,Table 6.2).
5.34 By these simple criteria, the program has been an enormoussuccess. But from other angles weaknesses are evident which suggest that itmay be many years before the industry overcomes its teething troubles and canstake out a strong competitive position internationally. Unlike processindustries such as steel and chemicals, where the production is machine pacedand the technology embodied mainly in the equipment, machinery is skill andcraft intensive, much more of the technology being embodied in the engineersand technicians comprising the work force. As a consequence, the gestationand payback period are long and geared to the slow accretion of intangibleknowledge, skills and experience. A crash program can and did bring physicalfacilities into existence, but it cannot force the pace along the learningcurve, nor can it readily induce users to switch from tried and familiarsources, even by quoting somewhat lower prices. The machinery sector, thexe-fore, finds itself with plenty of productive capacity, having fully exploitedscale economies where possible, but without the demand to utilize more than afraction of it (Annex 3, Table 6.1). This has meant low or negative profitsand very little internal generation of technology. Most seriously affectedhave been the longer run prospects of general machinery, the subsector poten-tially best suited to Korea's resource endowment.
5.35 There are over 2,000 firms in the field of general machinery, 96%rather small operations, with half of the total employees in the industry andproducing 35% of the output. These firms, whose vitality will determiae theindustry's future performance, suffer from a multitude of handicaps. Becausethe system of subcontracting is poorly developed most firms produce a widespectrum of products instead of concentrating on a few parts and components.Since division of labor cannot be exploited fully and specialized machines areunavailable, quality and productivity are poor. Productivity has also beenhampered by a high turnover of labor (6-7% per month in the seventies, 4% in1982) which has detracted from the accumulation of skills and experience.
5.36 In the early stages of the program, small firms, whose significancewas not appreciated by the zovernment, received only a tiny percentage of thecapital assigned to the industry. Most of the funds were monopolized by thelarge corporations who used them to set-up vertically integrated operations,poorly suited for the efficient production of machinery. By manufacturing 4U%of the parts and components themselves, the big companies acquired a greatdeal of equipment that stays idle much of the time and inflates corporateoverheads. This production structure discouraged the industry's giants from
- 70 -
taking the lead in deepening the infrastructure of subcontractors, collabora-ting with small firms in improving product quality and laying the channels fora two-way flow of information relating to production and future demands. Theforced growth of the machinery subsector also made it difficult for otherindustries that supply key inputs from keeping pace. Thus supplies of mate-
rials such as special steels, ceramics and silicon, still lag behind, as doelectronics responsible for key components in modern machines. Even in thecase of process technology, and know how related to heat treatment of metal,surface finishing, precision forging and casting, and precision moulding,
special effort is needed to move abreast of the industrial countries.
5.37 Recovery during 1983, by increasing domestic and export demand for
machinery, has fattened profits, led to a rise in investment and stimulatedgreater interest in licensing foreign technology. Small firms have beenhelped by credit from a newly created fund, lending exclusively to machinerycompanies. But the deficiencies remain. The import of technology in no wayobviates the need to accumulate uncodified knowledge in the firms themselves;to refine managerial skills; to make arrangements for financing sales, 95% of
machinery produced by small companies is currently being sold without credit;and to provide buyers the after-sales service they expect. During 1977-81,60% of all general machinery used was imported. Rence, apart from the over-seas market which takes a quarter of the industry's output, there is consider-able room for expanding sales and plenty of excess capacity to do that with.
As indicated in Chapter 4, machinery is one of the areas in which Korea couldexpand its trade. But a strategy emphasizing the growth of general machinery
might have a higher pay-off in the mediumr-term than one that concentrates onheavy engineering, where the gap between Korea and the Western countries isfar wider.
Electronics
5.38 The electronics industry is divided into three segments namely:(a) consumer products; (b) industrial equipment; (c) parts and components; and(d) sofrware. It is the industry most tightly ruled by technological change
and the one where the dependence on R&D is the greatest. From the earlieststages, the growth of the electronics sector in LDCs has been affected more bythe production strategies of large Western based companies than by the actionsof governments and local entrepreneurs. Now with the pace of technicaladvance accelerating and important new developments being concentrated in a
relatively small number of firms with the resources to expend on long dura-tion, expensive, research projects, the influence exerted by major interna-tional corporations has, if anything, grown.
5.39 The manufacture of electronics products in Korea began in the earlyseventies when, attracted by the availability of cheap labor, foreigncompanies established plants for assembling parts and components and home
appliances from imported components. A rapid increase in Korean wages duringthe 1970s induced a shift of foreign investment to other S.E. Asian countries,but domestic firms continued to invest and grow. By 1980, a tenth of manufac-turing output originated in the electronics subsector. Recession slowedgrowth to 7% during 1979-82 (nominal terms), exports increased at just % p.a.and employment of semi-skilled workers fell from 90,000 to 83,000 in 1982
- 71 -
(Annex 3, Table 5.6). Anticipating a business revival and concerned by theirflagging competitiveness, the large domestic companies raised their investmentin automation and new product development from 1981 onwards. Expenditure onR&D also increased from 1.5% of sales in 1980 to 1.9% in 1982.
5.40 The substantial growth in sales during 1983 showed that the effortwhich went into reducing product defects, introducing new quality controlprocedures, controlling wage costs and enlarging the share of items such assemi-conductors, ICs, electronic switching and VTRs had begun yielding divi-dends. Since electronics is widely recognized as the major growth industry ofthe eighties with its influence permeating all manner of industrial acti-vities, the government is anxious to groom it into a leading expc t sector.What is not clear, though, is whether the industry can compete with theleaders in this field and move from producing low priced consumer appliancesand simple components, in which it has considerable experience, to becoming anexporter of state-of-the-art products in areas such as semiconductors andmicroprocessors. For that to be possible, extensive access to foreign techno-logy would be necessary which might be difficult to achieve.
5.41 There are currently almost 900 firms in the electronics industry,more than half of which employ less than fifty workers, and lack the researchbase necessary to stay abreast of new innovations. The average size of theKorean electronics firms is one tenth of that in Japan and given the technolo-gical curreats; some of the smaller producers may not survive unless theyenter into close subcontracting arrangements with the major corporations inthe subsector.
5.42 Production and exports are heavily weighted by appliances (Annex 3,Table 5.1) and parts and components (89% of exports in 1983), but the growthof their markets is threatened by import barriers and the breakneck speed oftechnological advance in the U.S., Japan and Germany. Industrial equipment,where the highest growth is being projected in world trade, accounts for aseventh of the total output.
5.43 Meanwhile, a sea change may be imminent in the international elec-tronics industry and the manner in which its production is allocated. It isindicative, for instance that the share of wholly-owned subsidiaries and jointventures in exports has fallen from three fourths in 1971 to less than half in1983. Labor costs have discouraged foreign investment in recent years butother factors are also at work. First, high development costs, short productlife cycles, the need to finance costly research through stable sales and theadvantages of producing custom made electronic components for particular kindsof equipment, have begun t92favor large, vertically integrated firms withdiversified product lines, Second, the au5iqation of assembly and testingoperations is steadily reducing labor inputs. International corporations,who until recently located their assembly facilities in East Asia, arebecoming reluctant to install capital intensive equipment abroad, especiallywith technology changing as rapidly as it now is. The only remaining attrac-tion stems from the tax and other benefits that are offered. Third, theimportance of a large and stable home market on which to launch new productsis greater than ever, now that development costs have grown manifold. Fourth,major international corporations are far less eager to license the technolo-
- 72 -
gies emerging from the laboratories, for fear of competition and uncertaintiesregarding the speed of technical progress.
5.44 As their traditional industries have decayed and grown smaller, themature industrial economies have redistributed their resources and supportedthe expansion of other sectors. One of the most important of these is elec-tronics. The large inputs of capital and research skills that it requires isvery much ic line with resource availabilities in th2se economies. Korea isstill very much in the business of assembling equipment and components frominputs, two thirds of which are imported. It does not as yet have a clearadvantage in either industrial equipment or parts and components. Inappliances, its position is stronger, but even here the high technologyelements must be impori4e. No doubt extraordinary efforts could yield sometrade related rewards.- But a heavy investment of scarce capital and evenscarcer skills in an industry where the advanced economies are locked inbattle, will detract from the development of sectors in which gains could beachieved at far less cost (e.g. machinery).
Automobiles
5.45 The recent history of the automobile industry has been a stornLyone. Major western producers especially American ones, safe behind high entrybarriers and accustomed to a steady growth in demand have been deeply suiaken:by an increasingly sophisticated buying public's demand for smaller cars ofhigh quality; by the encroachment of Japanese imports superbly tailored to theconsumers mood; and by signs of market saturation. These developments haveinduced automobile manufacturers in the U.S. - the largest single market - totake a variety of steps that have 3glarpened defensive competition, quickenedthe pace of technological change - and mobilized political sentimentsagainst the unbridled import of cars.
5.46 Defensive measures include the down-sizing of cars, to match therequirements of buyers, and extensive retooling of plants to produce the newmachines and produce them more efficiently than in the past. As the shape ofcars has changed so have the methods of designing and assemblin 6Whem, withcomputer assisted and modular techniques very much in the fore.- The exten-sive use of electronics and new materials has enhanced engine performance,while it has reduced weight at virtually no sacrifice in strength and durabi-lity. Finally, the U.S. auto industry, which directly and indirectly employsllZ of the labor force, has been able to orchestrate the political pressureneeded to force Japanese manufacturers to adopt voluntary restraints onexports to the US.
5.47 As a result, automobile production is on the way to becoming evenmore the preserve of a few companies with the capital, the research capabili-ties and the international marketing apparatus to build and sell cars. Thefuture of trade, now more than ever, is in the hands of political lobbies inthe advanced countries and the companies who manage worldwide networks ofparts productior,, assembly, and distribution. The barriers have risen so highthat it may be almost Impossible for major new producers to enter OE9 7 marketsunless it is through collaboration with the established corporations.-
- 73 -
5.48 Korea began assembling automobiles in 1962, graduating to the fullfledged manufacture of an indigenously des-oned car, the ilyundai Pony, in1976. Production capacity for cars is currently about 176,000 (a new Hyundaiplant which should reach full capacity by 1985-86 will add 300,000 to this),and in 1983, after many years of low capacity utilization, 121,0 gocars wereproduced, 35,000 being exported, mainly to developing countries_-_ Koreanautomobile manufacturers have confronted a number of difficult impediments.Even though 80% of the parts or components used for the principal domesticmodels such as the Pony and the Daewoo Maepsy are of local arigin, the countrydoes not possess the technological base for designing and producing a car thatcan compete in Western markets. Automotive design is one botcleneck, thebackwardness of electronics, metallurgical and chemicals industries is anequally serious one. Automobile companies have also yet to perfect thecrucial support system, comprised of reliable and quality conscioussubcontractors, which Japanese experience has shown to be so important.
5.49 Although the ratio of cars to the population was as low as 8.5 perthousand in 1982, a sizeable internal market, almost essential for a healthyautomobille industry has been slow in emerging, because of the high cost ofbuying and maintaining cars. It has slowly become apparent that neither ofthe two major producers is capable of penetrating western markets with a largevolume of exports through their unaided efforts. Even the export of autoparts, a modest $73 million in 1983, can grow into a major business only bydovetailing expansion and modernization of the parts industry with the globalrequirements of international automobile producers and through improvements inquality, virtually none of the parts being exported cur4yntly being of thestandard where they can be used as original equipment.-i
5.50 The auto industry's chances of becoming a leading sector in thelatter part of the eighties have been assisted by a series of events over thepast eighteen months. First, the governmnCLt which till now had resisted thespread of automobile use because of the congestion and energy costs, isprepared to support the enlargFraent of the domestic market through a suitabloadjustment of indirect taxes on cars and gasoJ67e, some reduction in ownershipfees and a scaling down of insurance charges.-- It is anticipated that thesemeasures together with rising income, will result in domestic sales of over200,000 by 1986 as compared to 105,000 in 1983, a projection that appears tobe based on rather high demand elasticities with respect to income and runningcosts.
5.51 The possibility of gaining a foothold in the US market also nowseems assured following joint production deals between Hyundai and Mitsubishiand between Daewoo and GM. Both stem from the international companies desireto shave their production costs by siting certain kinds of faciljj-es incountries with adequate supplies of skilled labor but low wages.-- They alsoreflect the major's belief that the only way to compensat-i for flatteningsales in the OECD countries will be to sell cars in the grewing markets of theNICs. T ,agreement between GM and Daewoo, however, is part'cularly advan-tageous,- Not only will GM offer 60,000-100,000 of the subcompacts producedthrough its dealer networks to US customers, but also the company is no longerlikely to be very vE ferous in its attempts to contain the flow of automobileimports from Korea.-

74
5.52 These projects will be maturing in the second half of theeighties. At that time Korea will certainly benefit from increased exportsand the technology transfer arising out of the joint ventures. But a signifi-cant surge in exports cannot be expected in the three years remaining in theFifth plan.
-75 -
CHAPTER VI
A MENU FOR POLICYMAKERS
6.01 The fragile state of the international trading environment andreverberations from the debt crises of the past two years are the two externalfactors that must enter the calculations of Korean policymakers. But inaddition, there may be a need to align the growth and trade objectives moreclosely with (i) Korea's emerging industrial capabilities; and (ii) the scopefor mobilizing domestic resources in the context of overall demand management.The delicate situation resulting from the unusual concatenation of an over-valued dollar and large US deficits, above normal unemployment in OECD coun-tries aad extensive Japanese export penetration in key industrial markets wasdiscussed in Chapter I. Also touched upon was the emerging bias in thecapital markets of net lenders against the NICs with large outstanding debtobligations. These parameters are freighted with certain implications forKorean strategy in the near term.
Growth and Resource Mobilization
6.02 Diminishing employment elasticity in the manufacturing sector (seeChapter 2), disguised unemployment in services and the high projected growthof the work force have all pushed policymakers towards growth rates of 7-8%p.a. But at the current stage of Korea's development capital output ratiosare inflated by the expenditure on lumpy social overhead capital (StatisticalAnnex, Table A3.10). Hence high growth must be purchased through highsavings. In Lnis instance, a 7.5-8% increase in GNP will require a fixedinvestment/GNP ratio of between 30-32%. As was discussed at length in Chapter2, the implications of this projected rate of growth for the balance of pay-ments and foreign borrowing, depend very much on the behavior of inventories.It is possible, as shown in Table 6.1, for GNP to expand by 7.5% annually anda small current account surplus to be achieved in 1986 if exports increase byan average of 10% per annum and it is assumed that stocks can be compressedeach year by between 1.5% and 2.8% of GNP.
6.03 If we assume that the Government's policy of import liberalizationand attempts by producers to replenish inventories raises the import elasti-city from 1.0 to 1.2 in 1985-86, a growth rate of 7.5% would result in a BOPdeficit of about one and a half billion dollars by 1986. To achieve a surpluswith the import elasticity in this range would require that the GNP growth bereduced to 5.0%- 6.0%, assuming inventories are held constant. The worJc casescenario is one where we assume that the import elasticity is 1.2 and exportsaverage a growth of 7.5% p.a. (instead of 10%). In the event of such aweakening in external demand, the desired increase in GNP would be dearlypurchased in terms of foreign borrowing with the current account deficitreaching $3 to $4 billion by 1986.
6.04 Although the Government's projections might be the most plausible,the alternative scenarios presented in para. 6.03 cannot be ruled outaltogether and the question arises whether it would be preferable under thecircumstances to draw upon the international capit'1 market instead ofrestraining growth by 1% or more. A3 indicated above (Chapter 3), the foreign
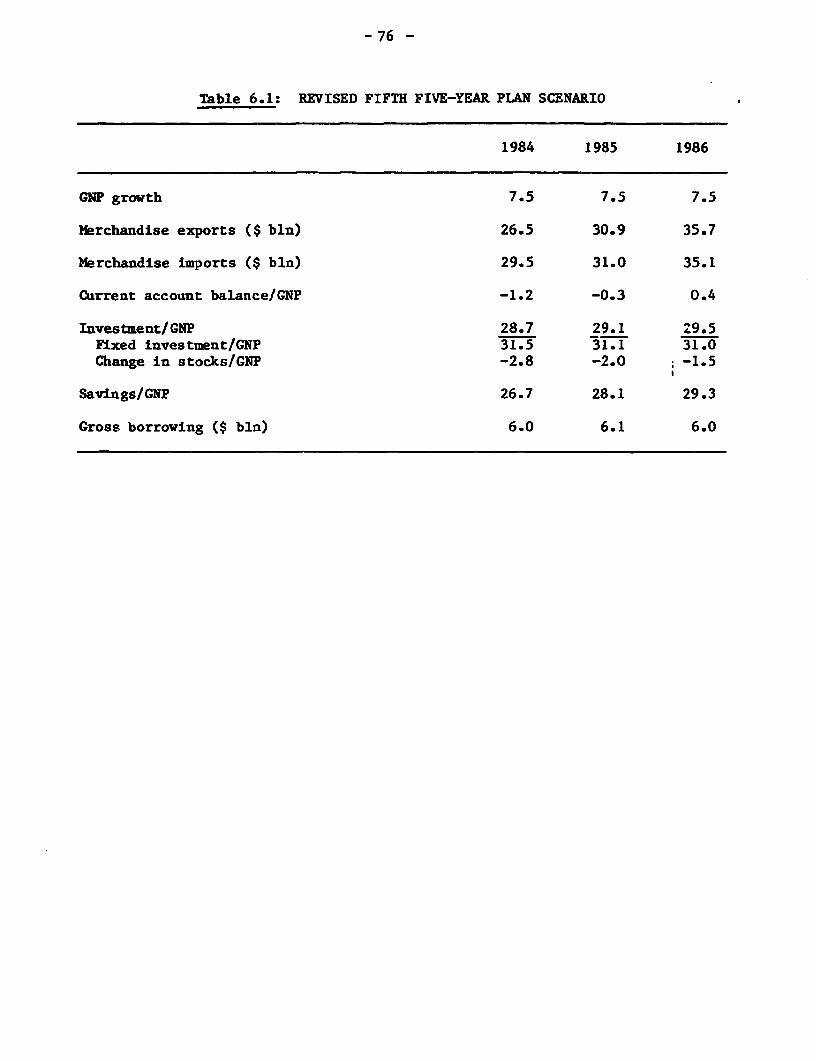
- 76 -
Table 6.1: REVISED FIFTH FIVE-YEAR PLAN SCENARIO
1984 1985 1986
GNP growth 7.5 7.5 7.5
Merchandise exports ($ bln) 26.5 30.9 35.7
Merchandise imports ($ bln) 29.5 31.0 35.1
Current account balance/GNP -1.2 -0.3 0.4
Investment/GNP 28.7 29.1 29.5Fixed investment/GNP 31.5 31.1 31.0Change in stocks/GNP -2.8 -2.0 -1.5
Savings/GNP 26.7 28.1 29.3
Gross borrowing ($ bln) 6.0 6.1 6.0
- 77 -
borrowing situation is far from easy and interest rates are still fairly high,but gross borrowing of up to $7 billion p.a. might not be infeasible whichcould finance a small current account deficit. When the trade-off is betweenborrowing at 7-9% real interest rates and slower growth, Korea is still at thestage where the economic benefits should more than defray the costs of longterm capital.
6.05 Aside from revealing the sensitivity of the balance of payments toassumptions concerning growth and import elasticities, these scenarios alsohighlight the importance of export growth and the saving ratio and to these wenow turn.
Trade
6.06 Korea's longer term trade strategy has of late receivef,an addedtwist from the difficulties encountered in raising funds abroad.- Exportsare seen not only as the engine of growth but also the means for closing anonerous current account deficit. Thus, the 10-11% rate for enlarging realexports is associated with the 7.5-8% increase in GNP and current accountequilibrium by 1986. Several points must be noted:
Ca) the increase in exports and imports cannot be divorced from the rateof change in domestic savings. For the sake of consistency, it isimportant to match t.he savings being projected with the anticipatedexport gains;
(b) even if the two happen to agree, the implications of such asubstantial growth in export volume must be traced out withreference to the commodity composition of exports and theirgeographical distribution to ensure that trading relationships withmajor OECD countries are not placed under strain; and
Cc) a closing of the trade gap could also occur from a progressivereduction in import elasticities through energy and raw materialconservation as well as the extension of backward and forwardlinkages that raise domestic value added.
6.07 Although a geographical diversification of exports to faster growingLDCs might seem desirable, until their foreign exchange supplies are morecomfortable they are likely to remain undependable trading partners. Thus, theOECD economies will continue to provide the NICs with most of its exportmarkets. For the NICs, with total manufactured exports of $95 billion to tryand enlarge their trade by 9-11% p.a. would put international trade relationsto a severe test unless it is accompanied by a diversification of exports andimport liberalization which increases the accessibility of their markets toproducers in the OECD countries.
6.08 As observed earlier, what has been most injurious to traderelations, is a sudden large spurt in the export of a few items. These spurtshave caused great industrial dislocation in the importing countries. Amoderate expansion in the sales of a multitude of goods is more easilyaccommodated. Such an approach calls for a broadly conceived trade and

- 78 -
investment program which breathes new life into the most promising segments ofeven the lagging sectors.
6.09 In textiles, for instance, some redirection of resources towardsmedium quality clothing and away from yarn or fabric, could stimulate exportgrowth in an area where competition is milder and Korea's lower wage ratesgive it a comparative advantage. More reliance on imported yarn and fabricwould help defuse criticism among trading partners.
6.10 Much the same applies to machinery. By consoliaating its positionin the field of general machinery, instead of covering the entire sector,resources of capital and manpower would be used most efficiently and exportgains maximized; while the continuation of a vigorous intra-industry tradewith both OECD and East Asian countries would eliminate friction in traderelations. In electronics, as already stated, the optimal strategy might beto concentrate on consumer appliances based on certaie,key custom built comrponents, supplied initially by foreign collaborators.- Finally, in overseasconstruction, a policy encouraging mergers among the many medium sizedcompanies, might make possible a concentration of capital and skills suffi-cient to undertake the risk minimizing strategy of pursuing sophisticatedprojects in several different geographical areas. If construction business isdifficult to obtain even with the promise of financing, service and trainingcontracts might be a more lucrative source of revenues in the longer term andless vulnerable to rising wage costs.
6.11 For several years the Korean Government has pursued a systematicpolicy of liberalizing imports by adding to the list of items for whichapproval is automatic and gradually scaling down tariffs on selected itams.By 1983, the liberalization ratio had climbed above 80% (in 1978 it was 58%)and it is proposed to raise this to 90% by 1986. Meanwhile, average importduties will be lowered from 30%, closer to 20%. These major steps shouldimprove the trading climate, enhancing the openness of the Korean economy,while retaining for certain key infant industries the protection theyrequire. They could be supplemented by further initiatives in the murky areaof non-tariff barriers, which in some instansys can constitute impediments noless difficult than import duties or quotas.-
6.12 The trade strategy being proposed here is only a refinement of thecourse being taken by Korea but an important one nonetheless. Selectivity inthe choice of products developed within subsectors, emphasis on intra-industrytrade through increased import liberalization and a gradual expansion ofexports on a broad front might be just as expeditious a strategy. It wouldserve to maintain the share of manufactured goods in total imports, that hasbeen declining of late (Table 6.2), and by mollifying Korea's tradingpartners, strengthen the country's bargaining position.
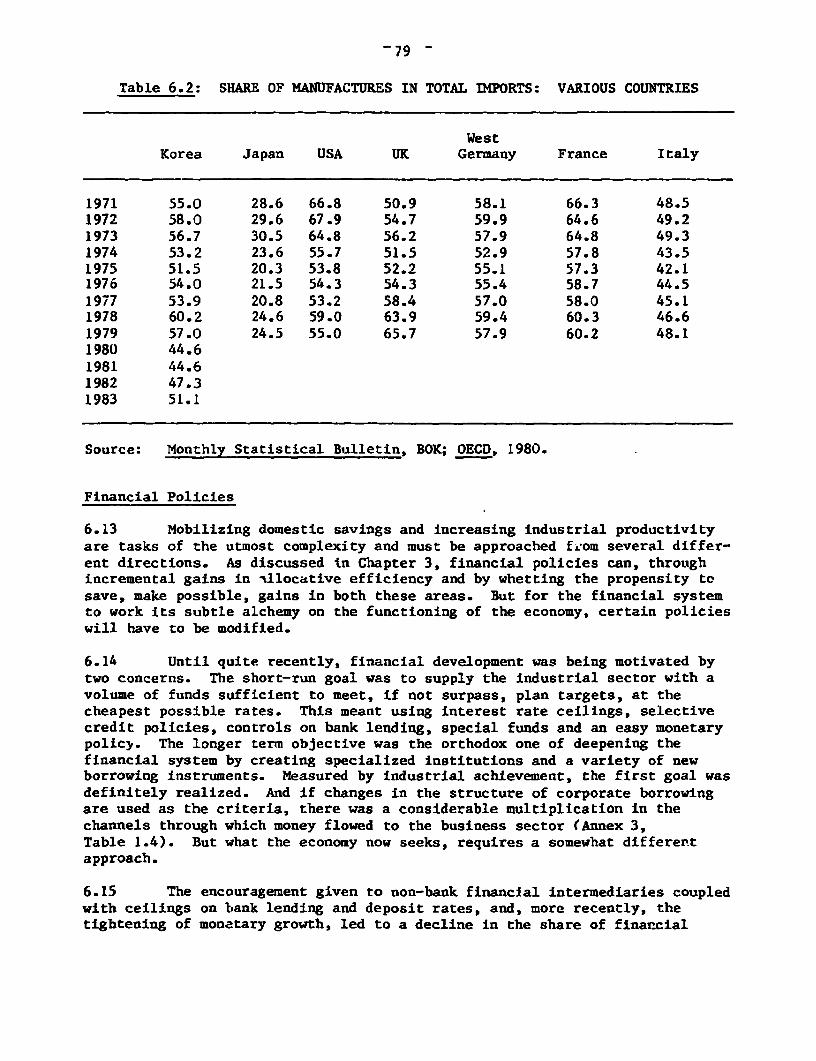
-79 -
Table 6.2: SHARE OF MANUFACTURES IN TOTAL IMPORTS: VARIOUS COUNTRIES
WestKorea Japan USA UK Germany France Italy
1971 55.0 28.6 66.8 50.9 58.1 66.3 48.51972 58.0 29.6 67.9 54.7 59.9 64.6 49.21973 56.7 30.5 64.8 56.2 57.9 64.8 49.31974 53.2 23.6 55.7 51.5 52.9 57.8 43.51975 51.5 20.3 53.8 52.2 55.1 57.3 42.11976 54.0 21.5 54.3 54.3 55.4 58.7 44.51977 53.9 20.8 53.2 58.4 57.0 58.0 45.11978 60.2 24.6 59.0 63.9 59.4 60.3 46.61979 57.0 24.5 55.0 65.7 57.9 60.2 48.11980 44.61981 44.61982 47.31983 51.1
Source: Monthly Statistical Bulletin, BOX; OECD, 1980.
Financial Policies
6.13 Mobilizing domestic savings and increasing industrial productivityare tasks of the utmost complexity and must be approached feom several differ-ent directions. As discussed in Chapter 3, financial policies can, throughincremental gains in illocative efficiency and by whetting the propensity tosave, make possible, gains in both these areas. But for the financial systemto work its subtle alchemy on the functioning of the economy, certain policieswill have to be modified.
6.14 Until quite recently, financial development was being motivated bytwo concerns. The short-run goal was to supply the industrial sector with avolume of funds sufficient to meet, if not surpass, plan targets, at thecheapest possible rates. This meant using interest rate ceilings, selectivecredit policies, controls on bank lending, special funds and an easy monetarypolic). The longer term objective was the orthodox one of deepening thefinancial system by creating specialized institutions and a variety of newborrowing instruments. Measured by industrial achievement, the first goal wasdefinitely realized. And if changes in the structure of corporate borrowingare used as the criteria, there was a considerable multiplication in thechannels through which money flowed to the business sector (Annex 3,Table 1.4). But what the economy now seeks, requires a somewhat differer-tapproach.
6.15 The encouragement given to non-bank financial intermediaries coupledwith ceilings on bank lending and deposit rates, and, more recently, thetightening of monetary growth, led to a decline in the share of financial
-80 -
assets held by the deposit money banks (DMB) from 49% in 1975 to 37Z in1982. Loans by DMHB as a proportion of the total fell from 56% to 44%. Thus,the institutions with potentially the most decisive role to play at Korea'scurrent stage of development, as evidenced by the experience of Germany,France and Japan, could neither bid aggressively for savings nor compete onequal terms with short term finance companies and mutual savings banks. Adiversion of funds to intermediaries with a limited perspective on the economyand a small base of information was one outcome of the controls enforced.Another was the bias that emerged against the smaller companies that dependedon the banks for funding. Hemmed in by ceilings and credit guidelines, banksreacted by increasing collateral requirements and lowering the size of loansto their riskier borrowers. After 1979, restraints on tate growth of M2 madeit even harder for the DMBs to hold on to their share of the markets, asindividuals and corporations substituted other assets for bank deposits.
6.16 As the DMBs fell back, other financial intermediaries, the bond andthe stock markets, rose in4Vrominence, helped along by a series of incentivesoffered by the government.- To a degree they compensated for the decline inthe banks' ability to mobilize resources, but it can be argued, that at thisjuncture, they weakened the beneficial effect of the financ 1 al system on thefunctioning of the economy. For smaller savers they offered less convenientassets involving higher transaction costs. From the standpoint of allocation,they probably reduced the accessibility and increased the cost of capital to awide class of borrowers and did not represent an effective marshalling ofmarket knowledge for the purposes of efficient allocation. The short termfinance companies, which are owned by large corporations, cater to a fairlylimited clientele of companies, linked together through business dealings.Circulation of capital is, therefore, within narrow pools that have fewinterconnections.
6.17 The growth of the corporate bond market as an independent phenomena,is also a trifle deceptive. In recent years, commercial banks that must turnaway valued customers because of a shortage of credit, have been willing tohelp in other ways. By guaranteeing corporate bonds for a fee, the banks haveadded an important source of income and provided business with another avenuefor raising capital. Except that very little financial or "borrower" diversi-fication has resulted since the bonds are virtually like loans as far as theDMBs are concerned and they can only be issued by very select customers.While the fees earned are attractive at a time when spreads on bank operationsare still very slim, guaranteeing bonds is much riskier for the banks as theydo not take any collateral for what is an "implicit loan".
6.18 The stock market, analysed in Chapter 3, remains in the doldrums.Costs of raising funds are steep. They would be higher still were it not forthe presence of institutional investors and the support given by the Ministryof Finance which have averted a further slide in share prices. Wi: manycompanies showing alarmingly low returns on capital and there bein& Lio expec-tation of a speedy revival in earnings, non-institutional investgys concernedwith income rather than capital gains, find shares unattractive,-
- 81 -
6.19 Recent measures taken bw the Government will work towards a streng-thening of the stock market and gyll facilitate the raising of equity capitalby companies in the longer-term.-- But there seems little point to pushingits development ahead of investor and corporate preferences and businessprofitability. The very high corporate debt-net worth ratios (Table 6.3)which have of late spurred reforms in the equity markets may in fact be farless of a problem than they appear on the surface once the effects ofacceler7ed depreciation rules are factored into the calcuLation of corporateassets.- The debt-equity ratio has also been biased upward by the tendencyof Korean companies not to revalue their assets, in spite of rgyidly risingprices, to avoid paying the 3% tax such a revaluation entails.-
6.20 Thus the emphasis of financial reform should be on the bankingsystem which is best situated to attract savings. In an economy that ismoving towards structural stability, the banking system, has advantages as aninstrument for allocating capital because of its broad information base andthe wide scope of its lending activities. Greater freedom in setting depositrates, and the removal of discriminatory interest rate regulations favouringother segments of the market would enhance the banking systems ability toattract savings. As the fiscal deficit is on the way to being eliminated, themonetary base is much more secure and it may even be possible to think interms of monetary expansion somewhat larger than what is currently planned.Flexibility in adjusting lending rates to the term and riskiness of loanst-hrough a lifting of the ceilings on lendiqf rates, would stimulate banks toaccommodate a wider spectrum of borrowers. It might also encourage them toenlarge the volume of term lending and curtail the long-term finance theyprovide indirectly by guaranteeing bonds. Direct term lending could helpaccelerate certain desirable institutional changes. For instance creditwor-thiness analysis (currently conducted for 5% of loans) would become a seriousenterprise and might lessen the reliance on collateral for loans. Banks wouldbe induced to raise the calibre of their staff and in doing so will find iteasier to increase the efficiency and profitability of their operations. Anattempt at determining the costs and returns from various activities couldprovide bank mangements with other ways of raising profitability. So would awidening of the services offered to customers especially tne bigger ones.
6.21 Finally, a measure that in part has already been taken, the experi-ence of the baaks and their need for a broader earnings base argues in favorof a considerable enlargment of their activities to include commercial naper,leasing and trust business. in June 1984, banks were permitted to issue largedenomination CDs at an interest rate of 11% and to lend the funds so obtainedto their corporate customers at 12%. While this move well result in someswitching out of time deposits and into the new instruments, the banks shouldalso be able to bid more successfully for funds from the commercial paper andbond markets, augmenting the volume of resources at their disposal.Undoubtedly, such changes and the competition they induce will furce othersegments of the market to contract in size, but the cost imposed by thesetransitory difficulties should be outweighed by the gains from aninstitutionally more compact system with a firmer grasp on the flow ofrevenues.
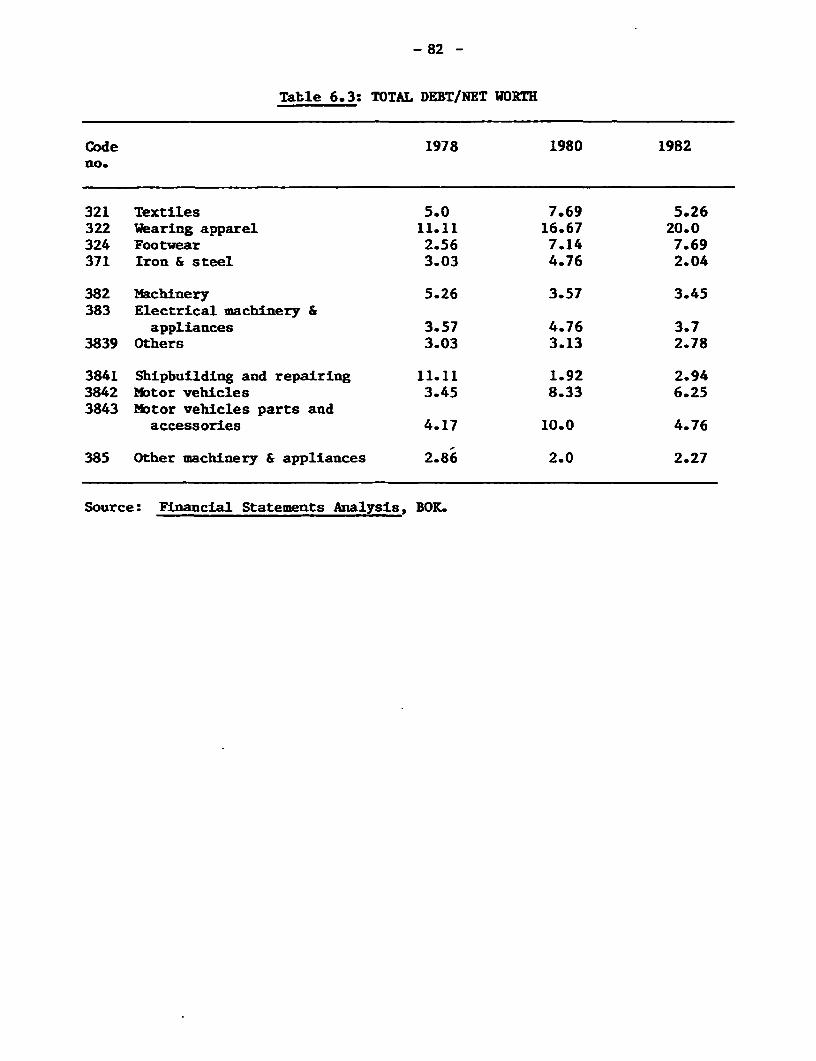
- 82 -
Table 6.3: TOTAL DEBT/NET WORTH
Code 1978 1980 1982no.
321 Textiles 5.0 7.69 5.26322 Wearing apparel 11.11 16.67 20.0324 Footwear 2.56 7.14 7.69371 Iron & steel 3.03 4.76 2.04
382 Machinery 5.26 3.57 3.45383 Electrical machinery &
appliances 3.57 4.76 3.73839 Others 3.03 3.13 2.78
3841 Shipbuilding and repairing 11.11 1.92 2.943842 Motor vehicles 3.45 8.33 6.253843 Motor vehicles parts and
accessories 4.17 10.0 4.76
385 Other machinery & appliances 2.86 2.0 2.27
Source: Financial Statements Analysis, BOK.
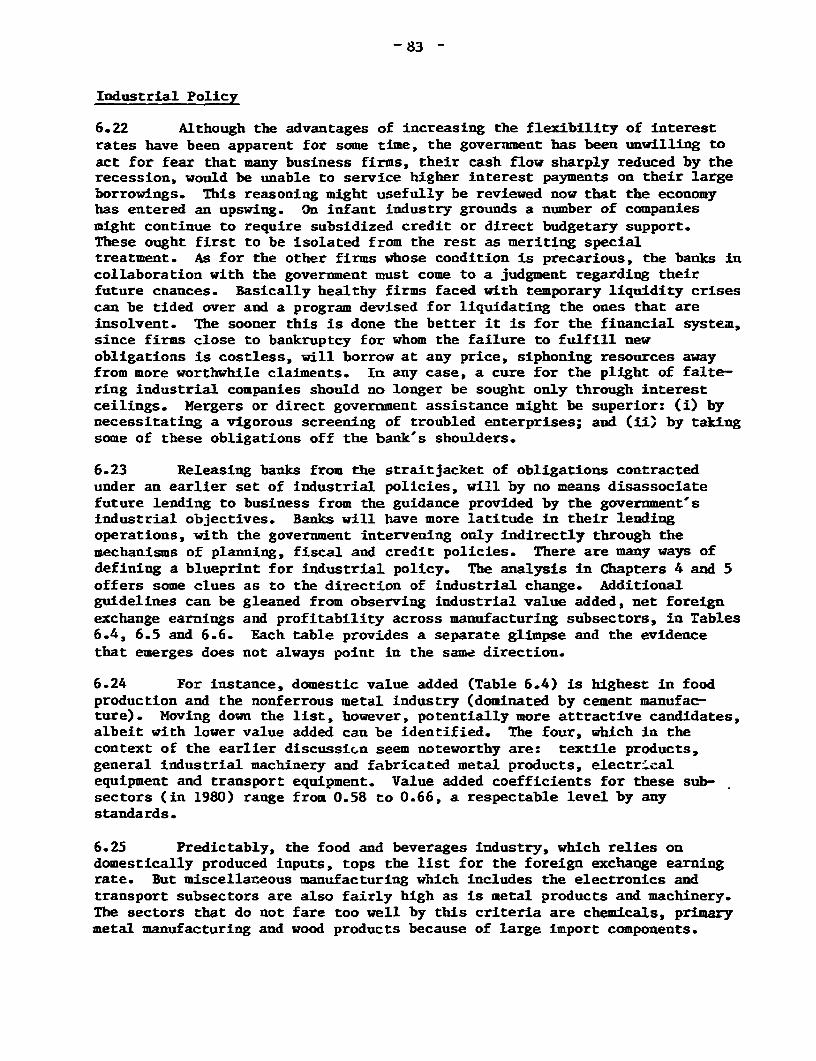
83
Industrial Policy
6.22 Although the advantages of increasing the flexibility of interestrates have been apparent for some time, the government has been unwilling toact for fear that many business firms, their cash flow sharply reduced by therecession, would be unable to service higher interest payments on their largeborrowings. This reasoning might usefully be reviewed now that the economyhas entered an upswing. On infant industry grounds a number of companiesmight continue to require subsidized credit or direct budgetary support.These ought first to be isolated from the rest as meriting specialtreatment. As for the other firms whose condition is precarious, the banks incollaboration with the government must come to a judgment regarding theirfuture cnances. Basically healthy firms faced with temporary liquidity crisescan be tided over and a program devised for liquidating the ones that areinsolvent. The sooner this is done the better it is for the financial system,since firms close to bankruptcy for whom the failure to fulfill newobligations is costless, will borrow at any price, siphoning resources awayfrom more worthwhile claiments. In any case, a cure for the plight of falte-ring industrial companies should no longer be sought only through interestceilings. Mergers or direct government assistance might be superior: (i) bynecessitating a vigorous screening of troubled enterprises; and (ii, by takingsome of these obligations off the bank's shoulders.
6.23 Releasing banks from the straitjacket of obligations contractedunder an earlier set of industrial policies, will by no means disassociatefuture lending to business from the guidance provided by the government'sindustrial objectives. Banks will have more latitude in their lendingoperations, with the government intervening only indirectly through themechanisms of planning, fiscal and credit policies. There are many ways ofdefining a blueprint for industrial policy. The analysis in Chapters 4 and 5offers some clues as to the direction of industrial change. Additionalguidelines can be gleaned from observing industrial value added, net foreignexchange earnings and profitability across manufacturing subsectors, in Tables6.4, 6.5 and 6.6. Each table provides a separate glimpse and the evidencethat emerges does not always point in the same direction.
6.24 For instance, domestic value added (Table 6.4) is highest in foodproduction and the nonferrous metal industry (dominated by cement manufac-ture). Moving down the list, however, potentially more attractive candidates,albeit with lower value added can be identified. The four, which in thecontext of the earlier discussicn seem noteworthy are: textile products,general industrial machinery and fabricated metal products, electr.calequipment and transport equipment. Value added coefficients for these sub-sectors (in 1980) range from 0.58 to 0.66, a respectable level by anystandards.
6.25 Predictably, the food and beverages industry, which relies ondomestically produced inputs, tops the list for the foreign exchange earningrate. But miscellaneous manufacturing which includes the electronics andtransport subsectors are also fairly high as is metal products and machinery.The sectors that do not fare too well by this criteria are chemicals, primarymetal manufacturing and wood products because of large import components.
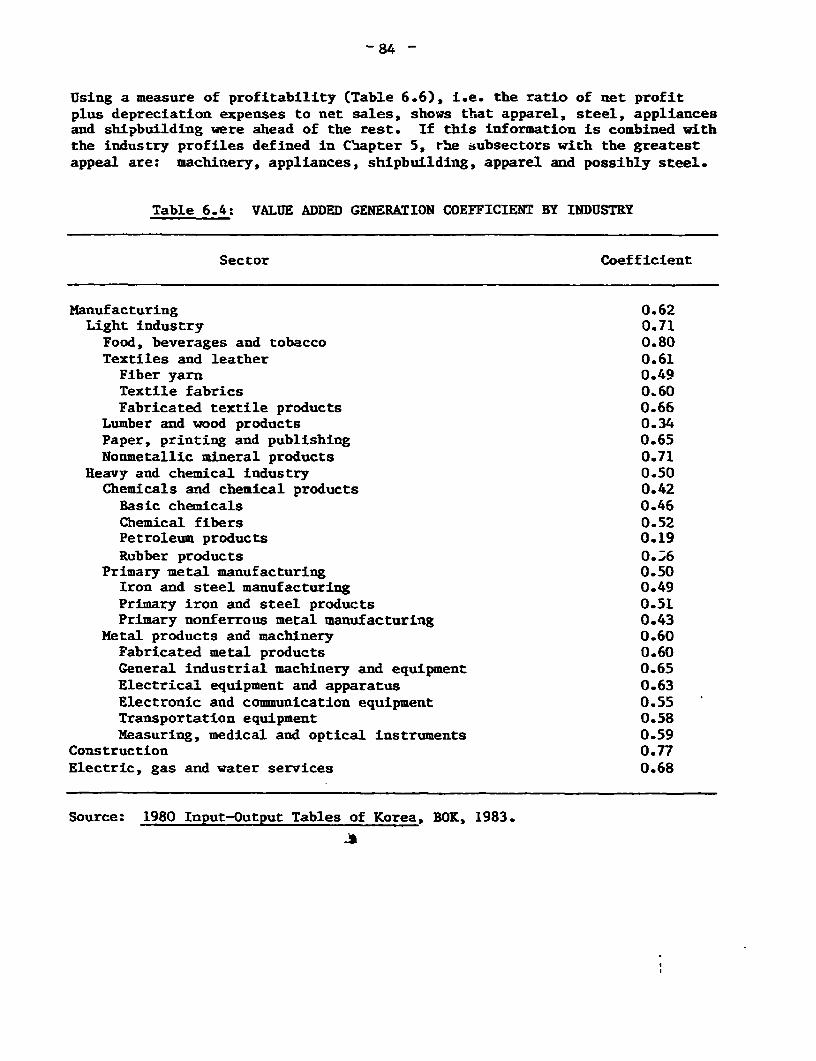
84 -
Using a measure of profitability (Table 6.6), i.e. the ratio of net profitplus depreciation expenses to net sales, shows that apparel, steel, appliancesand shipbuilding were ahead of the rest. If this information is combined withthe industry profiles defined in Chapter 5, the subsectors with the greatestappeal are: machinery, appliances, shipbuilding, apparel and possibly steel.
Table 6.4: VALUE ADDED GENERATION COEFFICIENT BY INDUSTRY
Sector Coefficient
Manufacturing 0.62Light industry 0.71
Food, beverages and tobacco 0.80Textiles and leather 0.61
Fiber yarn 0*49Textile fabrics 0.60Fabricated textile products 0.66
Lumber and wood products 0.34Paper, printing and publishing 0.65Nonmetallic mineral products 0.71
Heavy and chemical industry 0.50Chemicals and chemical products 0.42
Basic chemicals 0.46Chemical fibers 0.52Petroleum products 0.19Rubber products O.J6
Primary metal manufacturing 0.50Iron and steel manufacturing 0.49Primary iron and steel products 0.51Primary nonferrous metal manufacturing 0.43
Metal products and machinery 0.60Fabricated metal products 0.60General industrial machinery and equipment 0.65Electrical equipment and apparatus 0.63Electronic and communication equipment 0.55Transportation equipment 0.58Measuring, medical and optical instruments 0.59
Construction 0.77Electric, gas and water services 0.68
Source: 1980 Input-Output Tables of Korea, BOK, 1983.
- 85 -
Table 6.5: FOREIGN EXCHANGE EARNING RATE BY SECTOR
Sector Percent
Manufacturing 62.3Light industry 71.3Food, beverages and tobacco 79.7Textiles and leather 60.8Lumber and wood products 34.3Paper, printing and publishing 64.5Nonmetallic mineral products 70.5Miscellaneous manufacturing 69.0
Heavy and chemical industry 50.4Chemicals and chemical products 42.4Primary metal manufacturing 49.5Metal products and machinery 59.7
Construction 76.8Electric, gas and water services 78.1
Source: 1980 Input-Output Tables of Korea, BOK, 1983.
Table 6.6: OPERATING CASH FLOW (NET PROFIT PLUS DEPRECIATION EXPENSES)AS A RATIO OF NET SALES
Code no. 1978 1980 1982
321 Textiles 0.02 -0.01 -0.01
322 Wearing apparel -0.004 -0.002 0.01
324 Footwear 0.02 -0.004 0.003
371 Iron & steel 0.04 -0.02 0.01
382 Machine:y 0.04 -0.20 -0.03
383 Electrical machinery & appliances 0.02 -0.02 0.01
3841 Shipbuilding & repairing -0.09 0.03 0.02
3842 Motor vehicles 0.03 -0.10 0-004
3843 Motor vehicles parts & accessories 0.03 -0.14 O.002
385 Other machinery & appliances 0.03 0.04 0.02
Source: Financial Statements Analysis, BOK.
- 86 -
All of them derive their competitive edge from Korea's relatively low wagecosts, but they also possess certain other attractive characteristics. Inmachinery, steel and shipbuilding, both product and process technologies arestable; price and quality are important determinants of the ability to sell,and the steel industry produces relatively standardized products. Success atselling higher quality garments depends on skill at design, flexibility atadapting products and low labor costs. The market for appliances covers awide spectrum. There is a very large market for low priced, mass produceditems of only moderate sophistication that can be captured once producers havemastered the technique of running efficient assembly line operations,practising strict quality control and creating an arparatus to market andservice the products.
6.25 It is interesting to compare the findings from Table 6.4-6.6 withviews concerning Japan's growth industries (Table 6.7). There is some overlapin the area of appliances, but Japan is clearly setting its sights ontechnology intensive products in the electronics and machinery subsectorswhere its comparative advantage now lies.
6.27 The industrial reshuffling, now occurring, also has a bearing onfirm size. Currently some 30 companies account for 31% of value added in themanufacturing sector and 17% of total value added. They own 37Z of all fixedassets in the manufacturing industry and employ 24% of the labor force. Moresignificantly, the 10 largest conglomerates absorb nearly 50% of the totalcredit available. This high degree of concentration has resulted from thefinancial and marketf" advantages enjoyed by large general trading companiesiu selling overseas;- from attempts by the conglomerates at minimizing risksand promuting earnings stability through ever widening diversification acrossmanufacturing subsectors; from the improved access to financing that largesize and diversified activities make possible; from the potential which aconglomerate firm enjoys for deriving larger benefits from its R&D activities;and from tW/ scale economies which are within reach of only the biggercompanies-
6.28 An attempt to increase international competitiveness by buildingplants that fully exploited scale economies, favored the emergence of largecorporations during the industrial big push of the seventies. But the govern-ment also discovered that it was easier to coordinate industrial strategy witha few major producers, than a multitude of small ones. With the governmentwilling to eschew its former interventionist role in industrial planning, andconcern for the economic weight of the conglomerates in decision makingbeginning to mount, the advantages of bigness need to be appraised against thebackdrop of future industrial trends.
6.29 There is no question that in sectors such as electronics,automobiles and basic metals, capital costs, technology intensity and thescale of marketing efforts all weigh in favor of large companies. Yet even inthese industries, particularly automobiles, vertical integration c 12betempered by an appreciation for the economies from subcontracting.- Infields such as garments, leather footwear, general machinery and to an extent,shipbuilding, the markets of tomorrow, will test the flexibility of producers;the speed with which they can design and manufacture items of the requisite
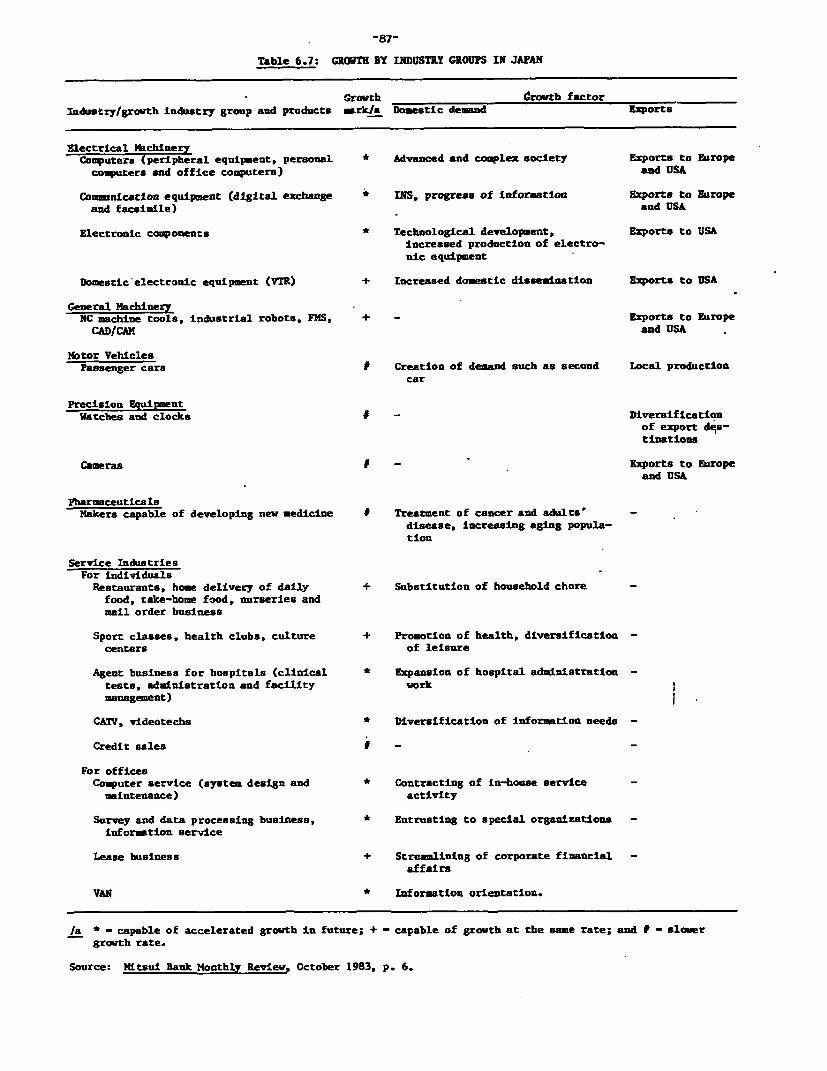
-87-
Table 6.7: GROWTH BY INDUSTRY GROUPS IN JAPAN
Growth Crowth factorIndustryfgrowth industry group and products mark/a Domestic demand Exports
Electrical MachineryComputers (peripheral equipment. personal * Advanced and complex society Exports to Europe
coWputers and office computers) and USA
Coomnication equipment (digital exchange * INS, progress of Infor stion Exports to Europeand facsimile) and USA
Electronic components * Technological development, Exports to USAincreased production of electro-nic equipment
Domestic-electronic equipment (VTR) + Increased domestic disaemination Exports to USA
General MachineryNC machine tools, industrial robots, FMS, + - Exports to Europe
CAD/CAM and USA
Motor VehiclesPassenger cars I Creation of demand such as second Local production
car
Precision EquipmentWatches and clocks I - Diversification
of export des-tinations
Cameras I - Exports to Europeand USA
PharcsceuticalsMakers capable of developing new medicine I Treatment of cancer and adults' -
disease, increasing aging popula-tion
Service IndustriesFor individuals _
Restaurants, home delivery of daily + Substitution of household chore -food, take-home food, nurseries andmail order buslness
Sport classes, health clubs, culture + Promotion of health, diversification -centers of leisure
Agent business for hospitals (cllnical * Expansion of hospital administration -tests, administration and facility workmanagement)
CATV, videotechs * Diversification of information needs -
Credit sales I -
For officesComputer service (system design and * Contracting of in-house service -
maintenance) activity
Survey and data processing business, * Entrusting to speclal organizations -information service
Lease business + Streamlining of corporate financial -affairs
VAN * Information orientation.
/a * - capable of accelerated growth in future; + - capable of growth at the same rate; and F - slowergrowth rate.
Source: Mitsui Bank Monthly Review, October 1983, p. 6.
- 88 -
quality; and their ability to carve niches for their differentiated goodsunder their own brand names. While very small firms, distant from theirmarkets can rarely sustain the information, financing and selling costsattendant upon long distance trading, medium sized firms should be able toflourish in all of these industries. In fact such companies might well bebetter placed than the conglomerates currently dominating industry, not onlyin responding nimbly to volatile foreign demand but also in controlling laborcosts.
R&D
6.30 The revised Fifth Plan sees technology as the touchstone of indus-trial maturity and fundamental to the continuing of export-led growth. TheGovernment's objective is to raise R&D spending, currently about 1.2% of GNPto 2% of GNP bringing Korea almost abreast of Japm,which invests 2.2Z in R&Dand the US which devotes 2.3% of GNP to research.- While the process cancommence through technology transfers from abroad, it must be supplemented byindigenous efforts both in assimilating foreign technology and innovating.
6.31 But R&D should not be seen as a way of vaulting over hard industrialtruths. It is not costless and resources can be wasted on research just as onany other activities. As Japan's experience shows, industrial success storiesare just as often based on superb design, accurately anticipating users needs,efficien 4hnd imaginative production engineering and careful qualitycontrol,- than on major technological breakthroughs.
6.32 Each industry should have a minimal R&D capability to serve a'listening post' function, assimilate technical advances being mad e5 .broad andwhere necessary, adapt foreign technology to Korea's requirements.- In manysectors a research base with these modest objectives should not involve alarge outlay. Before firms raise the stakes, substantially increase theirexpenditure and attempt to acquire the capacity to conduct R&D geared to stateof the art technology, other options such as licensing, overseas trainidg,etc., could first be explored.
6.33 The market for technology is highly imperfect. If the rate at whichnew innovations are produced slows, or the costs of R&D continue to increase,which results in these activities being concentrated in few companies, termsand availability could both deteriorate. However, in certain areas, thereadiness to license technologies is clygyly still there with process techno-logy more easily procured than product. In addition, smaller companiesexposed to stiffer competition in the sphere of technology and often in noposition to set up production facilities overseas, show a greater willingnessto license outright in an effort to extract what rent they can, or enter intojoint ventures on terms favorable to the local partner.
6.34 For industries characterised by relatively stable technologies, suchas basic metals, textiles, footwear, wood products, new technology is embodiedin equipment or can be licensed without too much difficulty. The same appliesto general machinery, although many of the latest machine tools and computeraided production facilities are based on advances in metallurgy and electro-nics, whose secrets their owners will not easily part with. Shipbuilding
- 89 -
occupies an intermediate position. This is not an industry in the throes of atechnological revolutior. No recent breakthroughs have been reported whichgive some shipbuilders a decisive edge over others and much of the productiontechnology can be obtained through the world market. Unfortunately for newentrants into the shipbuilding industry, technological progress in the designand construction of sophisticated commercial vessels is becoming the provinceof a handful of shipbuilders in one or two countries. This could interferewith the ease of licensing i- the future, as Korea attempts to automate theconstruction process and enlarges its share of the business in specializedtypes of ships. An expansion of R&D in ship design would therefore, seen onlyprudent.
6.35 A strong domestic R&D base is most important in fields such aschemicals, consumer appliances, computers, electronic components, andautomobiles. A competitive position cannot easily be established in theexport markets for such goods on the basis of licensing alone, not onlybecause of the nature and cost of technological changes that are occuring, butalso because major international companies, with a tendency to be wary aboutsharing technology, dominate these industries.
6.36 In automobiles, joint ventures involving Mitsubishi and GM willbring a welcome infusion of technology. Such arrangements or even whollyowned subsidiaries of foreign companies might reduce the necessity of crashR&D programs. But Korea cannot really avoid gradually widening the scale ofR&D as joint ventures and wholly owned subsidiaries rarely lead to thetransfer of the latest technology, or the genuine training of local labor.Freque>ly the products manufactured are those developed some time in tIepast.4
6.37 Local R&D holds out the promise of technological independence andthe ability to compete on equal terms with the advanced countries, and therecent initiatives in areas such as electronics and biotechnology need to beencouraged. But since R&D conducted on an effective sale is highly expensiveand Korean companies could face difficulties in financing major researchprograms out of their limited profits or in finding experienced researchscientists to manage them, initially at least, joint ventures and licensingcould be more important. Their drawbacks could be lessened throug118 loseGovernment screening and support as was provided by MITI in Japan.- Forexample, licensing could be a costly affair since the terms negotiated dependon the relative bargaining power of the companies involved. In the mediumterm, at least, Korean firms could be at a disadvantage when dealing withlarge international corporations. The price paid to attract major interna-tional producers to enter into joint ventures or establish subsidiaries iseven higher and the sum total of technological gains not overly large. Asmany countries are in the race to draw foreign investors, the latter can shoparound for credit, fiscal and marketing incentives, which now greatly outweighthe benefi of labor cost differentials between developing and advancedeconomies _ / All this calls for hard headedness in negotiations andpragmatism in devising a national R&D program.

-90 -
Demand Management
6.38 To sqeeze the maximum growth rate out of the economy given internalresource constraints and the problems afflicting the trading environment,descibed above, demand management, with a very sure touch is the only answer.Over the past two years, the government has shown considerable adroitness incushioning the swings in trade by stoking domestic construction activity andconsumer demand. In 1983, for example, it was the construction sector, joinedin the second quarter by producers of consumer durables, which provided muchof the economic momentum in the first half, with exports taking over later inthe year. By drawing upon the excess capacity in the ferrous and non-ferrousmetal industry and subsectors produc4ng transport equipment, consumer durablesand electronic components, a growth oi over 9% was achieved with fixedinvestment that was 31.5% of GNP.
6.39 Since capacity utilization is now approaching 78% (first half of1984) such a striking performance will be harder to obtain on the b-sis ofprojected investment (average of 31% in 1984-86), but demand management canstill make an appreciable difference. The persistence of excess capacity incertain subsectors, paticularly machinery and automobiles means that measureswhich stimulate internal and export demand for these items will raise growthand employment with the least amount of strain on the savings-investmendgap. For the medium-term, a strategy that nudges the incre_se in domiesticdemand to dyds manufactures, consumed directly or indirectly as inputs intoservices,- will lead to the largest expansion of the GNP. The manufacturingsector, as several studies have revealed, has experienced the most rapidgrowth in pRI uctivity and has an ICOR far lower than in many serviceindustries.- (Table A3.10, Statistical Annex).
6.40 The goverment's willingness to stabilize domestic deamnd at a levelclose to full employment, by way of flexible tax, spending and monetarypolicies could have other positive effects as well. First, it will encouragemanufacturing investment by dimfy.shing the risks from wide and frequentfluctuations in foreign demand.- Second, it might also induce some degreeof anti-cyclical behavior on the part of local investors. By shifting a partof their capital expenditures from the peak of a cycle, when expandingcapacity is most costly, to a period of greater slack, businessmen couldreinforce the actions of the government and pull up the average rate of growthover a cycle.
Wages Policy
6.41 Trade and industrial programs and the stabilization of demand atlevels which will ensure a respectable growth rate, could unravel if infla-tionary pressures are not held in check. Wages have frequently been impli-cated (see Chapter 2) in the cost-push process which worsened inflation in theseventies and eroded Korea's competitiveness in light manufactures andelectronic parts. As Korea broadens its industrial base and attempts topreserve a diversified export mix, containing wage costs in manufacturing andeven more stringently in services, will be an important in,&edient of theoverall development strategy.
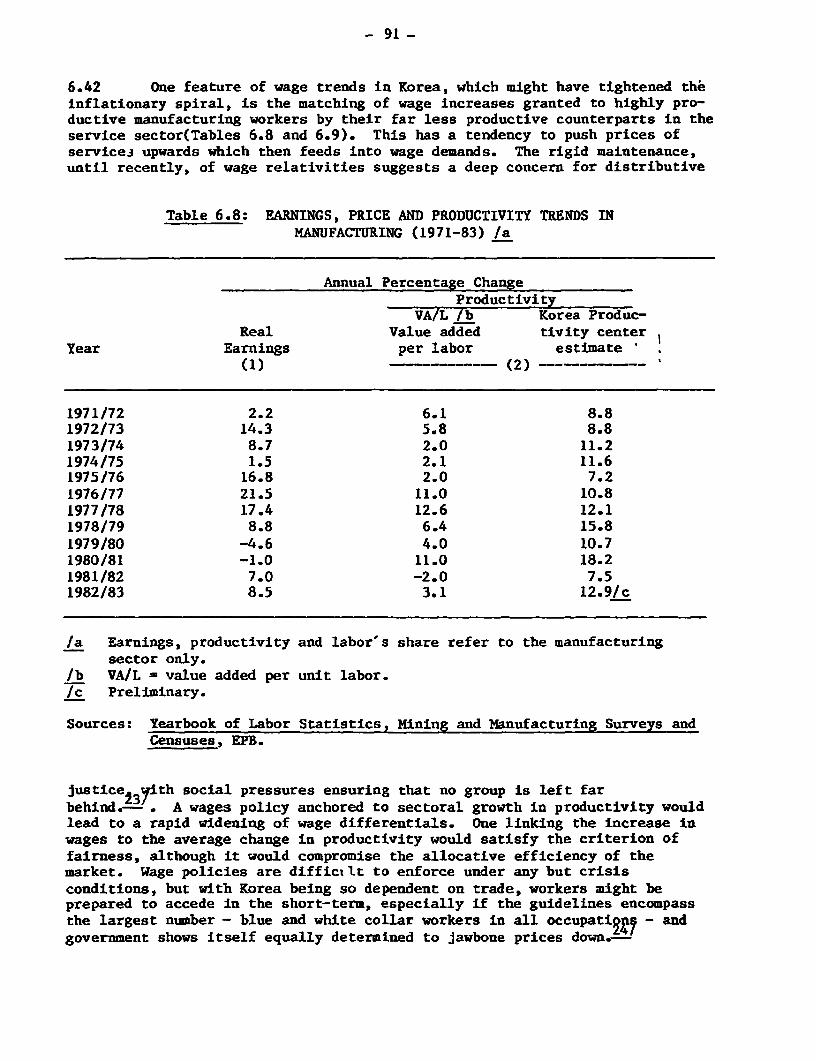
- 91 -
6.42 One feature of wage trends in Korea, which might have tightened theinflationary spiral, is the matching of wage increases granted to highly pro-ductive manufacturing workers by their far less productive counterparts in theservice sector(Tables 6.8 and 6.9). This has a tendency to push prices ofservices upwards which then feeds into wage demands. The rigid maintenance,until recently, of wage relativities suggests a deep concern for distributive
Table 6.8: EARNINGS, PRICE AND PRODUCTIVITY TRENDS INMANUFACTURING (1971-83) /a
Annual Percentage ChangeProductivity
VA/L /b Korea Produc-Real Value added tivity center
Year Earnings per labor estimate(1) -- --- (2) __
1971/72 2.2 6.1 8.81972/73 14.3 5.8 8.81973/74 8.7 2.0 11.21974/75 1.5 2.1 11.61975/76 16.8 2.0 7.21976/77 21.5 11.0 10.81977/78 17.4 12.6 12.11978/79 8.8 6.4 15.81979/80 -4.6 4.0 10.71980/81 -1.0 11.0 18.21981/82 7.0 -2.0 7.51982/83 8.5 3.1 12.9/c
/a Earnings, productivity and labor's share refer to the manufacturingsector only.
/b VA/L - value added per unit labor./c Preliminary.
Sources: Yearbook of Labor Statistics, Mining and Manufacturing Surveys andCensuses, EPB.
justice 3yith social pressures ensuring that no group is left farbehind,-- . A wages policy anchored to sectoral growth in productivity wouldlead to a rapid widening of wage differentials. One linking the increase inwages to the average change in productivity would satisfy the criterion offairness, although it would compromise the allocative efficiency of themarket. Wage policies are diffictilt to enforce under any but crisisconditions, but with Korea being so dependent on trade, workers might beprepared to accede in the short-term, especially if the guidelines encompassthe largest number - blue and white collar workers in all occupatif7 - andgovernment shows itself equally determined to jawbone prices down.-
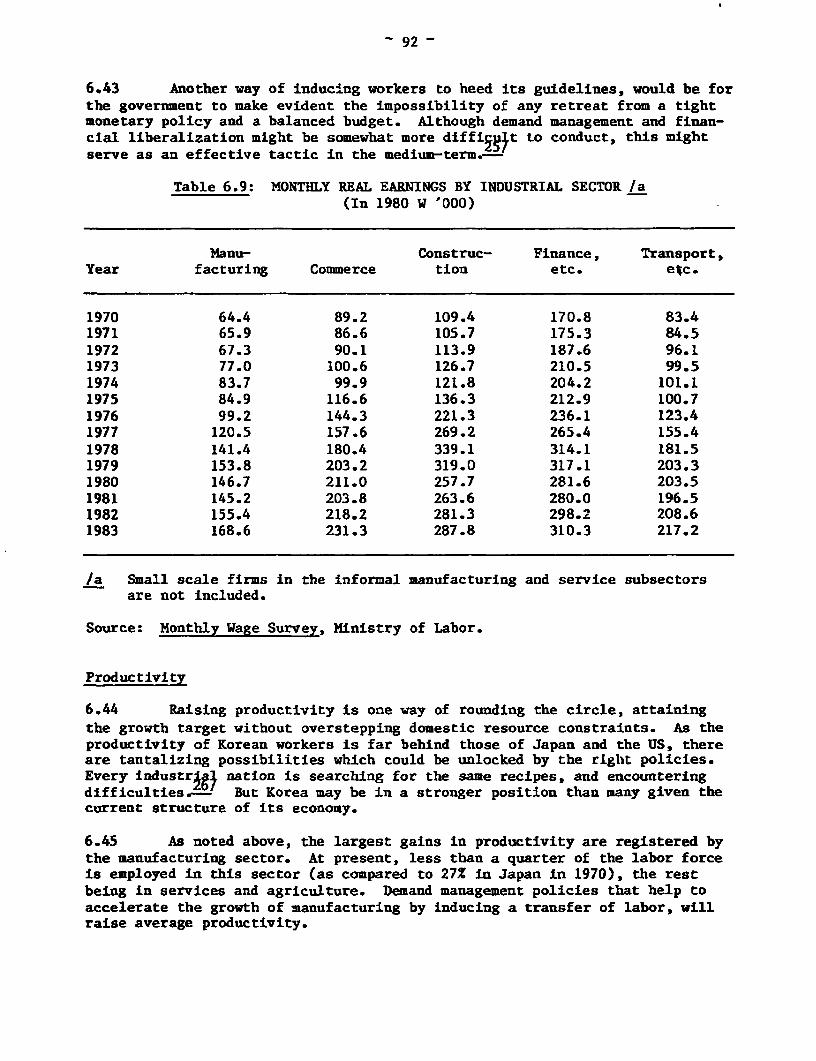
92 -
6.43 Another way of inducing workers to heed its guidelines, would be forthe government to make evident the impossibility of any retreat from a tightmonetary policy and a balanced budget. Although demand management and finan-cial liberalization might be somewhat more diffig3 t to conduct, this mightserve as an effective tactic in the medium-term.-
Table 6.9: MONTHLY REAL EARNINGS BY INDUSTRIAL SECTOR /a(In 1980 W '000)
Manu- Construc- Finance, Transport,Year facturing Commerce tion etc. etc.
1970 64.4 89.2 109.4 170.8 83.41971 65.9 86.6 105.7 175.3 84.51972 67.3 90.1 113.9 187.6 96.11973 77.0 100.6 126.7 210.5 99.51974 83.7 99.9 121.8 204.2 101.11975 84.9 116.6 136.3 212.9 100.71976 99.2 144.3 221.3 236.1 123.41977 120.5 157.6 269.2 265.4 155.41978 141.4 180.4 339.1 314.1 181.51979 153.8 203.2 319.0 317.1 203.31980 146.7 211.0 257.7 281.6 203.51981 145.2 203.8 263.6 280.0 196.51982 155.4 218.2 281.3 298.2 208.61983 168.6 231.3 287.8 310.3 217.2
/a Small scale firms in the informal manufacturing and service subsectorsare not included.
Source: Monthly Wage Survey, Ministry of Labor.
Productivity
6.44 Raising productivity is one way of rounding the circle, attainingthe growth target without overstepping domestic resource constraints. As theproductivity of Korean workers is far behind those of Japan and the US, thereare tantalizing possibilities which could be unlocked by the riglht policies.Every industr X 3 nation is searching for the same recipes, and encounteringdifficulties.- But Korea may be in a stronger position than many given thecurrent structure of its economy.
6.45 As noted above, the largest gains in productivity are registered bythe manufacturing sector. At present, less than a quarter of the labor forceis employed in this sector (as compared to 272 in Japan in 1970), the restbeing in services and agriculture. Demand management policies that help toaccelerate the growth of manufacturing by inducing a transfer of labor, willraise average productivity.
93
6.46 At the macroeconomic level, this would be the most noteworthy devel-opment. It would be reinforced at the industry level by modernization ofequipment, automation and by management's efforts at improving the organiza-tion and layout of shop floor activities. In assembly line work, the latteris of the highest importance, in a capital scarce country. The textileindustry badly needs to replace ageing machinery. Jobs will be reduced, butthe potential production gains are very large. Perhaps the greatest adtaff7scould be in the service sector, again with certain jobs being threatened-Office work, retailing, wholesaling and warehousing are being transformed byelectronic technology. Korea lags farther behind in this area than in othersand as the capital needs of infrastructure begin to taper, investment inservices could yield a large productivity bonus.
The Outlook
6.47 The Korean economy turned in a performance second to none during1983 at a time when the world economy was struggling out of a recession,growth in world trade was at a near standstill and net international lendingwas almost nil. Many problems remain but clearly, the economy seems littlethe worse from the three difficult years it endured at the start of thedecade. If anything, the policymakers have honed their skills at managing theeconomy further and entrepreneurial enthusiasm is undiminished in spite ofprofit worries and the bleakly protectionist slant to the many trade negotia-tions now in progress among the OECD countries.
6.48 The determined mood in which Korea is entering the mid eighties isfully captured by the forceful language and optimistic goals with which therevised Fifth Plan is clothed. Many of them seem within reach; some will testthe planners mettle. Small open industrializing economies must these dayswalk a tight rope. Their vulnerability to external and internal crises isvery great. Their manufactured exports do not enjoy the assured long termmarkets some minerals do. They cannot tolerate an interruption of vitalimports. But whzen a country performs so resoundingly well as Korea has done,offers high returns to capital and gives every evidence of being efficientlymanaged, there is reason to believe that the remaining macroeconomic andindustrial problems can in time be overcome.
- 94 -
ANN 1
KOREA
COUNTRY ECONOMIC MEMORANDUM
STATISTICAL APPENDIX
Table of Contents
Table No.
SECTION I - STANDARD TABLES
A1.1 National Accounts Summary, Current PricesA1.2 National Accounts Summary, Constant PricesA1.3 Balance of Payments, Current PricesA1.4 Social Indicators
SECTION II - POPULATION AND EMPLOYMENT
A2.1 Population and EmploymentA2.2 Sectoral Employment
SECTION III - NATIONAL ACCOUNTS
A3.1 GNP by Expenditbre Category, Current Prices, 1970-83A3.2 GNP by Expenditure Category, Constant Prices, 1970-83A3.3 GNP (at market prices) by Industrial Origin, Current Prices
1970-83A3.4 GNP (at market Prices) by Industrial Origin, Constant Prices,
1970-83A3.5 GDP (at factor cost) by Industrial Origin, Current Prices
1970-82A3.6 GDP (at factor cost) by Industrial Origirn, Constant Prices
1970-82A3.7 Composition and Growth of Domestic Capital Formation by
TyDe of Capital GoodsA3.8 Composition and Growth of Domestic Capital Formation by
Type of PurchaserA3.9 Composition and Growth of Domestic Capital Formation by
Industrial Use, 1976-83A3.10 Average Incremental Capital Output Ratios, 1970-81
- 95 -
SECTION IV - TRADE AND BALANCE OF PAYMENTS
A4.1 Balance of Payments Summnry, 1976-83A4.2 Indices of Foreign Trade and Terms of Trade, 1970-83A4.3 Indices of External CompetitivenessA4.4 Exports and Export Orders, 1978-83A4.5 Merchandise Exports by Commodity Group, 1976-83A4.6 Exports by Major Commodity, 1976-83A4.7 Merchandise Exports by Principal Countries, 1976-83A4.8 Merchandise Imports by Commodity Group, 1976-83A4.9 Imports by Major Commodity, 1976-83A4.10 Merchandise Imports by Principal Countries 1976-83A4.11 Invisible Trade by Type, 1976-83A4.12 Investment IncomeA4.13 Long-term Capital Balance, 1976-83A4.14 International Reserves, 1977-83A4.15 Construction Contracts Overseas
SECTION V - EXTERNAL DEBT
A5.1 Outstanding External Debt by Maturity and Borrower, 1977-83A5.2 External Debt Indicators, 1977-83A5.3 Debt Service, 1977-83
SECTION VI - PUBLIC FINANCE
A6.1 Public Sector Resource BalanceA6.2 Summary of Public Sector Revenues and ExpendituresA6.3 Tax Revenue Projections, 1982-86A6.4 1984 Revenue Impact of 1982 Tax Law Revisions
SECTION VII -MONEY ADTD PRICES
A7.1 Monetary Survey, 1978-83A7.2 Selected Interest Rates, Deposit Money Banks, 1979-83A7.3 Movement of Wholesale and Consumer Prices, 1978-83
SECTION VII - AGRICULTURE
A8.1 Production and Yield of Agricultural CropsA8.2 Utilization of Arable i-ndA8.3 Rice PricesA8.4 Fertilizer Prices
SECTION IX - OTHER SECTORS
A9.1 Industrial Production, 1970-83A9.2 Manufacturing Capacity UtilizationA9.3 Energy Consumption by SectorsA9.4 Energy Demand and Imports by FuelA9.5 Principal Energy Prices to Consumers
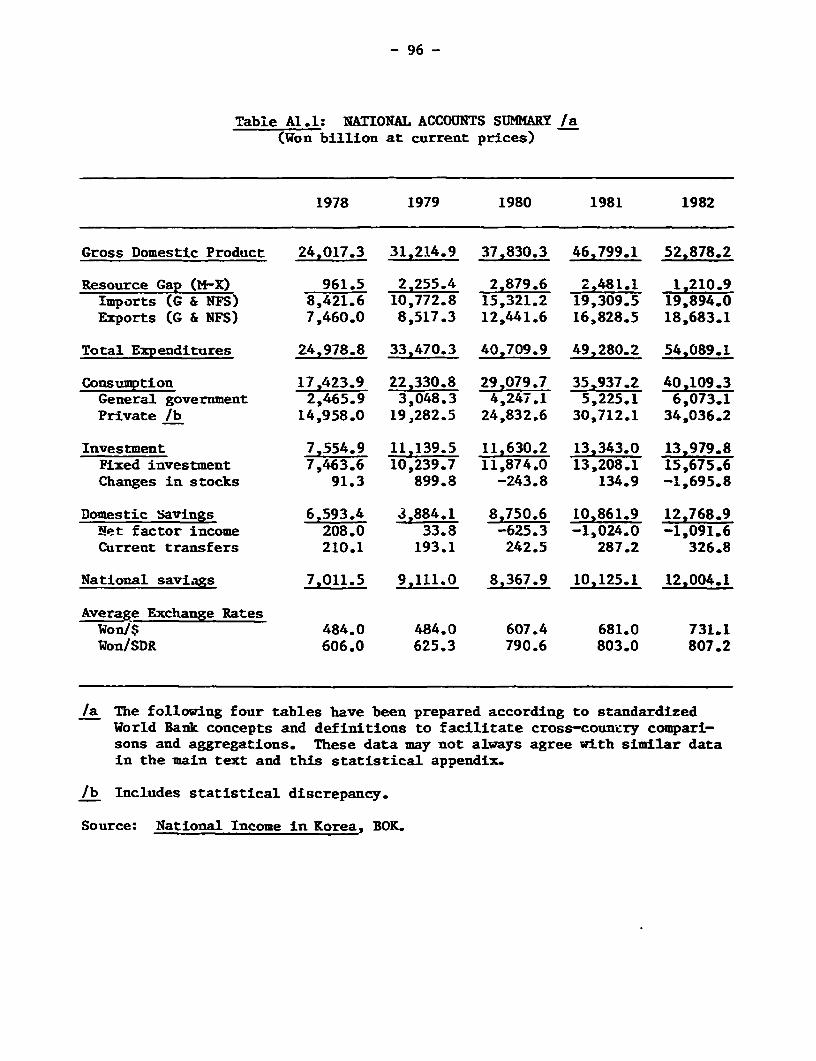
- 96 -
Table Al.1: NATIONAL ACCOUNTS SUMMARY /a(Won billion at current prices)
1978 1979 1980 1981 1982
Gross Domestic Product 24,017.3 31,214.9 37,830.3 46,799.1 52.878.2
Resource Gap (M+X) 961.5 2,255.4 2,879.6 2,481.1 1,210.9Imports (G & NFS) 8,421.6 10,772.8 15,321.2 19,309.5 19,894.0Exports (G & NFS) 7,460.0 8,517.3 12,441.6 16,828.5 18,683.1
Total Expenditures 24,978.8 33,470.3 40,709.9 49,280.2 54,089.1
Consumption 17,423.9 22,330.8 29,079.7 35,937.2 40,109.3General government 2,465.9 3,048.3 4,247.1 5,225.1 6,073.1Private /b 14,958.0 19,282.5 24,832.6 30,712.1 34,036.2
Investment 7,554.9 11,139.5 11,630.2 13,343.0 13,979.8Fixed investment 7,463.6 10,239.7 11,874.0 13,208.1 15,675.6Changes in stocks 91.3 899.8 -243.8 134.9 -1,695.8
Domestic savings 6,593.4 3,884.1 8,750.6 10,861.9 12,768.9Net factor income 208.0 33.8 -625.3 -1,024.0 -1,091.6Current transfers 210.1 193.1 242.5 287.2 326.8
National saviags 7,011.5 9,111.0 8,367.9 10,125.1 12,004.1
Average Exchange RatesWon/$ 484.0 484.0 607.4 681.0 731.1Won/SDR 606.0 625.3 790.6 803.0 807.2
/a The following four tables have been prepared according to standardizedWorld Bank concepts and definitions to facilitate cross-counLry compari-sons and aggregations. These data may not always agree with similar datain the main text and this statistical appendix.
/b Includes statistical discrepancy.
Source: National Income in Korea, BOKL
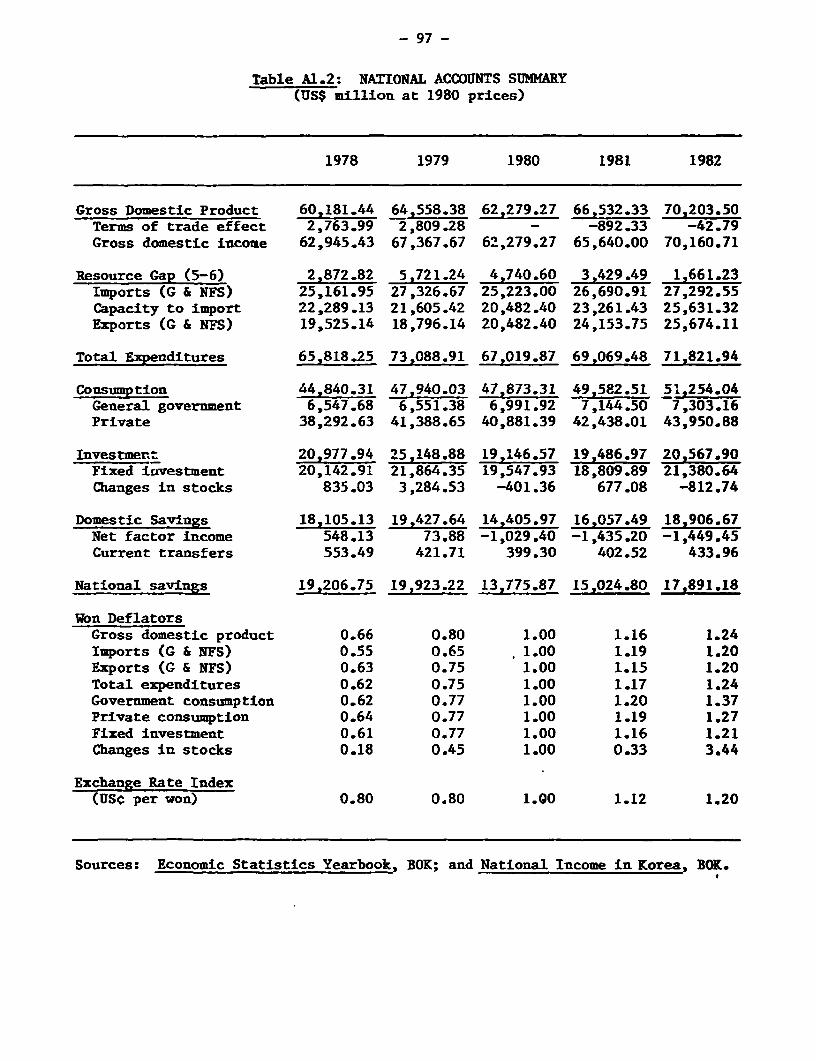
- 97 -
Table A1.2: NATIONAL ACCOUNTS SUMMARY(US$ million at 1980 prices)
1978 1979 1980 1981 1982
Gross Domestic Product 60,181.44 64,558.38 62,279.27 66,532.33 70,203.50Terms of trade effect 2,763.99 2,809.28 - -892.33 -42.79Gross domestic income 62,945.43 67,367.67 62,279.27 65,640.00 70,160.71
Resource Gap (5-6) 2,872.82 5,721.24 4,740.60 3,429.49 1,661.23Imports (G & NFS) 25,161.95 27,326.67 25,223.00 26,690.91 27,292.55Capacity to import 22,289.13 21,605.42 20,482.40 23,261.43 25,631.32Exports (G & NFS) 19,525.14 18,796.14 20,482.40 24,153.75 25,674.11
Total Expenditures 65,818.25 73,088.91 67,019.87 69,069.48 71,821.94
Consumption 44,840.31 47,940.03 47,873.31 49,582.51 51,254.04General government 6,547.68 6,551.38 6,991.92 7,144.50 7,303.16Private 38,292.63 41,388.65 40,881.39 42,438.01 43,950.88
Investmer.: 20,977.94 25,148.88 19,146.57 19,486.97 20,567.90Fixed investment 20,142.91 21,864.35 19,547.93 18,809.89 21,380.64Chagnes in stocks 835.03 3,284.53 -401.36 677.08 -812.74
Domestic Savings 18,105.13 19,427.64 14,405.97 16,057.49 18,906.67Net factor income 548.13 73.88 -1,029.40 -1,435.20 -1,449.45Current transfers 553.49 421.71 399.30 402.52 433.96
National savings 19,206.75 19,923.22 13,775.87 15,024.80 17,891.18
Won DeflatorsGross domestic product 0.66 0.80 1.00 1.16 1.24Imports (G & NFS) 0.55 0.65 1.00 1.19 1.20Exports (G & NFS) 0.63 0.75 1.00 1.15 1.20Total expenditures 0.62 0.75 1.00 1.17 1.24Government consumption 0.62 0.77 1.00 1.20 1.37Private consumption 0.64 0.77 1.00 1.19 1.27Fixed investment 0.61 0.77 1.00 1.16 1.21Changes in stocks 0.18 0.45 1.00 0.33 3.44
Exchange Rate Index(USc per won) 0.80 0.80 1.00 1.12 1.20
Sources: Economic Statistics Yearbook, BOK; and National Income in Korea, BOK.

- 98 -
Table A1.3: BALANCE OF PAYMENTS(US$ million at current prices)
1978 1979 1980 1981 1982
Exports (G & NFS) 15,413.3 17,597.8 20,482.4 24,710.3 25,553.7Merchandise (FOB) 12,710.6 14,704.5 17,214.0 20,670.8 20,879.0Nonfactor services 2,702.7 2,893.3 3,268.4 4,039.5 4,674.7
Imports (G & NFS) 17,399.9 22,257.8 25,223.0 28,353.4 27,209.9Merchandise (FOB) 14,491.4 19,100.0 21,598.1 24,299.1 23,474.0Nonfactor services 2,908.5 3,157.8 3,624.9 4,054.3 3,735.9
Resource Balance -12986.6 -4,660.0 -4,740.6 -3,643.1 -1,656.2
Net Factor Income 429.8 69.9 -1,029.4 -1,503.6 -1,493.0Factor receipts 1,747.4 1,932.9 2,094.9 2,558.6 2,801.6Factor payments 1,317.6 1,863.0 3,124.3 4,062.2 4,294.6(MLT interest paid) 693.8 932.1 1,353.8 1,757.6 2,065.1
Net Current Transfers 434.0 399.0 399.3 421.7 447.0Transfer receipts N/A N/A N/A N/A NIA7Transfer payments N/A N/A N/A N/A N/A
Current Account Balance -1.122.8 -4,191.1 -5,370.7 -4,725.0 -2,702.2
Direct investment 100.5 126.0 96.2 105.4 100.6Official grant aid 37.0 40.0 50.0 79.0 52.0
Net NLT Loans (DRS) /a 2,155.9 2,936.8 2,140.3 3,379.8 2,354.5Disbursements 3,392.8 4,669.7 3,643.7 5,286.2 4,346.0Repayments 1,236.9 1,732.9 1;503.4 1,906.4 1,991.5Other MLT (net) - - - - -
Net Credit from IMF -776. -125.4 545.4 563.3 13.2Disbursements N/A N/A N/A N/A N/ARepayments N/A N/A N/A N/A N/A
Net short-term capital -1,171.0 843.6 1,944.5 -82.3 3.6Capital flows NEI 1,020.7 1,469.8 1,839.2 1,911.4 1,946.8Errors and omissions -312.0 -328.7 -369.9 -410.6 -1,295.5
Change in Net Reserves -630.7 -771.0 -875.0 -821.0 -473.0
/a Includes private nonguaranteed debt.
Source: Economic Statistics Yearbook, BOK.
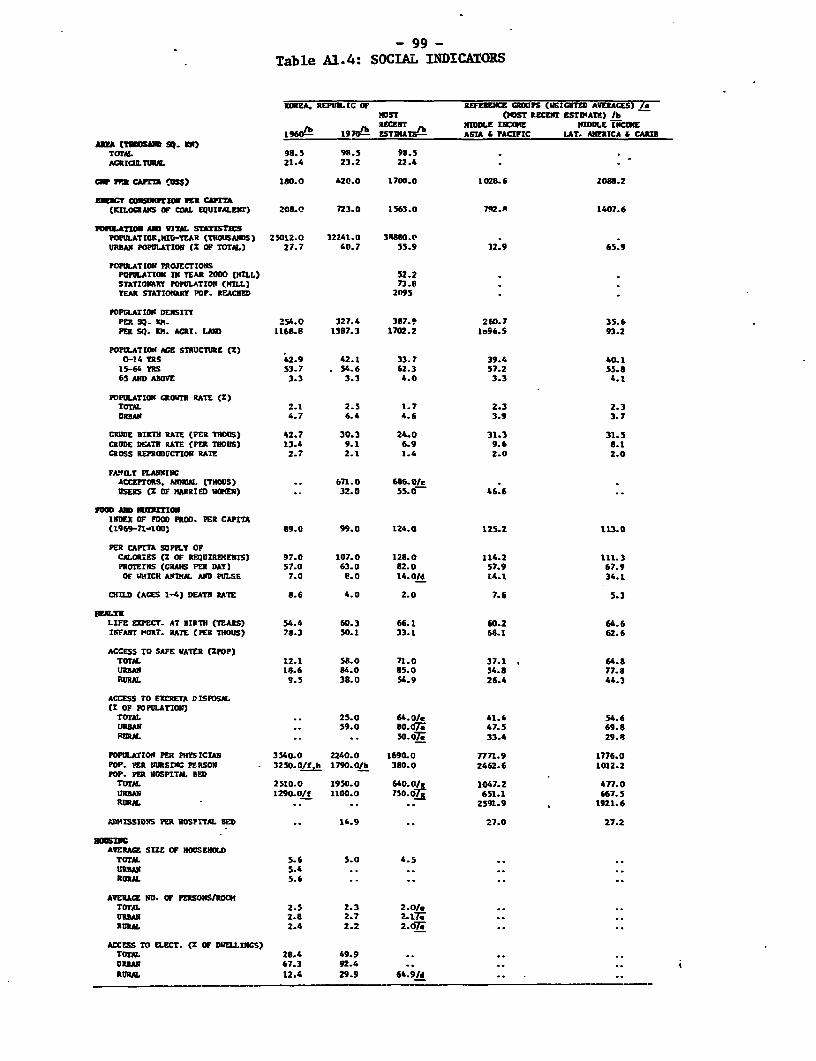
- 99 -
Table A1.4: SOCIAL INDICATORS
KOREA. REPUL IC OF REEE E OUr tPS (WCIGHTED AVRAGES) ToOST (MOST RECET ESYDIATE) /b
lb011 19 70 RECENT MIDDLE rCOE MDDLE TNCaIE1960- 1970- ESTINATL ASTA 4 PACIFIC LAT. AIERICA £ CARIB
TOTAL 98.5 98.5 98.5AGRIaILTRIUL 21.4 23.2 22.4
GNr M CArI CMss) 180.0 420.0 1700.0 1028.6 2088.2
CYr OfhIOw R CAPT(KILOCRAMS aF COAL EQUIVALENT) 208.0 723.0 1563.o 792.a 1407.6
PDNLATIOU S VITAL STATISTICSPOPULATION.HID-TEAR (THOUSANDS) 25012.0 32241.0 3R88. oURBAN POPULATION (Z OF TOTAL) 27.7 40.7 55.9 32.9 65.9
POPULATION PROJECTIONSPOPULATION IN YEAR 2000 (HLL) 52.2STATIONAR POPULATION (CILL) 73.8YEAR STATIONART POP. REACHlD 2095
POPULATION DENSITYPER sq- th. 254.0 327.4 387.9 260.7 35.6PER SQ. IU. ACRI. LAND 1168.8 1387.3 1702.2 1096.5 93.2
POPULATIOS AGE STRUCTURE (2)0-14 YRS 42.9 42.1 33.7 39.4 40.1
15-64 YRS 53.7 54.6 62.3 57.2 55.865 AND ABOVE 3.3 3.3 4.0 3.3 4.1
POPULATION GROWrU RATE (K)TOrAL 2.1 2.5 1.7 2.3 2.3URBAN 4.7 6.4 4.6 3.9 3.7
CRUDE BIRTH RATE (PER TROUS) 42.7 30.3 24.0 31.3 31.5CRUDE DEATH RATE (PER 7wTNO) 13.4 9.1 6.9 9.6 8.1CROSS REPBODUCTION RATE 2.7 2.1 1.4 2.0 2.0
FAYI LY PLANNINCACCETORS. ANNAL (nHS) . 6.0 6E6.0/cUSERS (E OF MARRIED liHN) . 32.0 55.60 46.6
FMD AND wmUrRM
INDEX OF FOO PROD. PER CAPITA(1969-71-100) 89.0 9.0 124.0 125.2 I13.0
PER CAPITA SUPFLY OFCALORIES t: OF RtEUIRENENTS) 97.0 107.0 128.0 114.2 111.3PROTEINS (GRAMS PER DAY) 57.0 63.0 82.0 57.9 67.9OF WHICH A2I4DL AND PULSE 7.0 e.0 14. Old 14.1 34.1
CHILD (AGES 1-4) DEATH RATE 8.6 4.0 2.0 7.6 5.3
LTRLIFE EXECT. AT BIRTH (YEARS) 54.4 60.3 66.1 60.2 64.6INFANT NORT. RATE (PER THOUS) 78.3 50.1 33.1 68.1 62.6
ACCESS TO SAFE WATER (20op)TorAL 12.1 58.0 71.0 37.1 64.8URBAN 16.6 84.0 85.0 54.8 77.8RURAL 9.5 38.0 54.9 26.4 44.3
ACCESS TO EXCRETA DISPOSAL(C OF POPLATION)
TOTAL .. 25.0 6M.D/e 41.4 54.6URBAN .. 59.0 80.07; 47.5 69.8RURAL .. .. so.6fl 33.4 29.6
POPULATION PER PHYSIcIAN 3540.0 2240.0 1690.0 7771.9 1776.0POP. PER NURSING PERSON 3250./f.0fh 17M.O/h 380.0 2462.6 1012.2POP PER HOSPITAL BED
ToTAL 2510.0 1950.0 6
40O./ 1047.2 477.0URBAN 1290.0/f 1100.0 750.0: 651.1 667.5RuRAL *- .. *- 2591.9 1921.6
AMISSIONS PER HOSPITAL BED .. 14.9 .. 27.0 27.2
AVERAGE SIZE OF NOUSENULDTOTAL 5.6 5.0 4.5URa 5.4 ..RURAL 5.6 ..
AVERACE No. OF PERSO NS/RockTOTAL 2.5 2.3 2.0e*URBAN 2.6 2.7 2.17 .RURAL 2.4 2.2 2.07;.
ACCESS TO ELECT. (Z OF DUELLInCS)TorAL 28.4 49.9URAN 67.3 92.4 ..
RURAL 12.4 29.9 64.91d
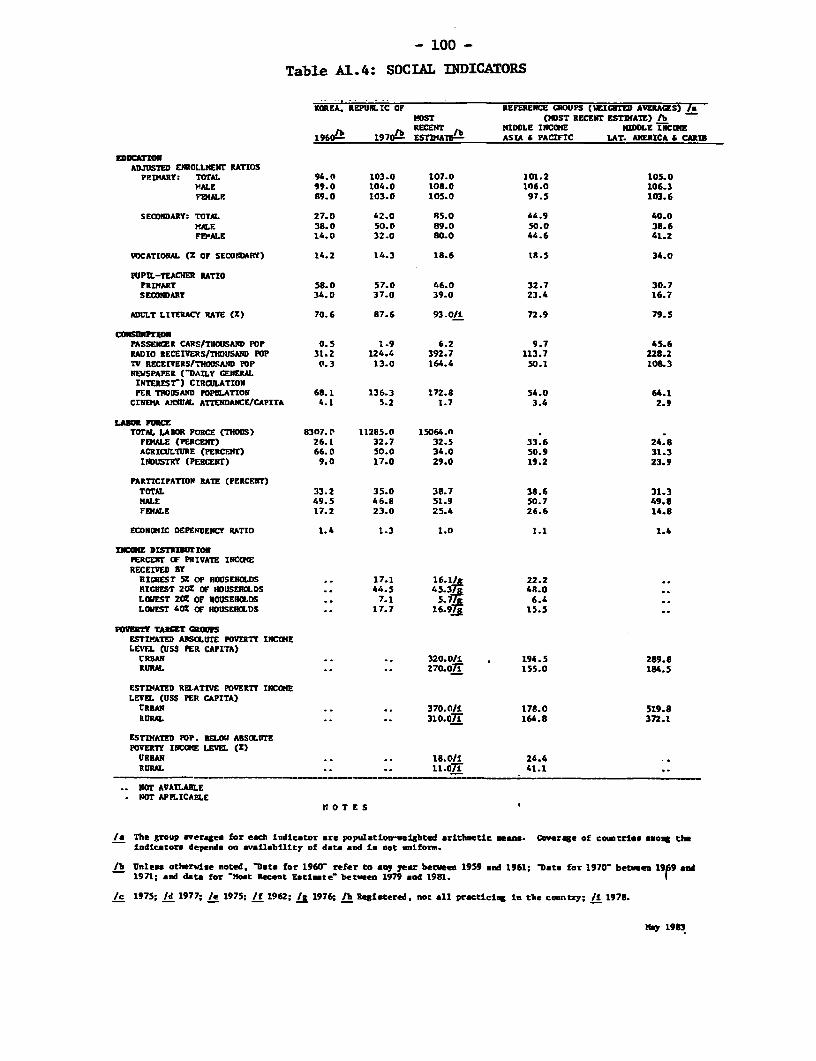
- 100 -
Table A1.4: SOCIAL INDICATORS
KOREA, REPUBLIC OF REFERENCE GROUPS C UEICIITED AVERAGES) /aMosT (MOST RECENT ESTltATE) /bRECENT MIDDLE INCOIE MIDDLE NCloE
1960b 1920JL ESTIMAT- ASIA 6 PACIFIC LAT. AIERICA 6 CARIB
EDCATIOADJUSTED EMROLLMENr RATIOS
PRDMARY: TOTAL 94.0 103.0 107.0 101.2 105.0MALE 99.0 104.0 108.0 106.0 106.3FELE 89.0 103.0 105.0 97.5 103.6
SECONDARY: TOTAL 27.0 42.0 85.0 44.9 40.0MALE 38.0 50.0 89.0 50.0 38.6FEYALE 14.0 32.0 80.0 44.6 41.2
VOCATIONAL (S OF SECONDARY) 146Z 14.3 18.6 18.5 34.0
PUPIL-TEACHER RArTOPRIMARY 58.0 57.0 46.0 32.7 30.7SECONDARY 34.0 37.0 39.0 23.4 16.7
ADULT LITERACY RATE (X) 70.6 87.6 93.0/i 72.9 79.5
coIREmrIOUPASSENER CARS/TIIOUSAND POP 0.5 1.9 6.2 9.7 45.6RADIO RECEIVERS/THOUSAND POP 31.2 124.4 392.7 113.7 228.2TV RECEIVERSITNOUSAND POP 0.3 13.0 164.4 50.1 108.3NEWSPAPER (-DAILY GENERAL
INTERESrT) CIRCULATIONPER THOUSAND POPULATION 68.1 136.3 172.8 54.0 64.1
CINDIA ABIUIAL ATTENDANCE/CAPITA 4.1 5.2 1.7 3.4 2.9
LA'= FORCTurAL LABOR FORCE (THOUS) 8307.r 11285.0 15064.n
F-IALE (PERCENT) 26.1 32.7 32.5 33.6 24.8ACRICULTURE (PERCENT) 66.0 50.0 34.0 50.9 31.3INDUSTRY (PERCENT) 9.0 17.0 29.0 19.2 23.9
PARTICIPATION RATE (PERCENT)TOTAL 33.2 35.0 38.7 38.6 31.3MALE 49.5 46.8 51.9 50.7 49.8FEMALE 17.2 23.0 25.4 26.6 14.8
EONDOMIC DEPENDENCY RATIO 1.4 1.3 1.0 1.1 1.4
INUE DISTRIIONPERCENT OF PRIVATE INCGIERECEIVED BY
RICHEST 5T OF NOUSEHOLDS 17.1 16 l/l 22.2EICHEST 20X OF NOUSENHLDS 44.5 45 37j 48.0LOYEST 202 OF HOUSEHOLW 7.1 5 77it 6.4LOWEST 402 OF HOUSEHOLDS 17.7 16.97j: 15.5
POnER TAmIT OUtOUSESTIMATED AJSOLUTE POVERTY INCOMELEVEL (US5 PER CAPITA)
URBAN 320.0/i 194.5 289.8RURAL 270.07T 155.0 184.5
ESTDIATED REL.ATIVE POVERTT INCOMELEVEL (USS PER CAPITA)
URBAN 370.0/i 178.0 519.8RURAL 310.07r 1648 372.1
ESTWKATED POP. IU.OU ABSOLUTEPOVERTY INCOME LEVEL (2)
URBAN .o18.0/I 24.4RURAL 11 07 41.1
NOT AVAILABLENOT APPLICABLE
17 O T E S
/a The group averages for eacb indicator are population-v.igbted aritduetae nee,n. Coverge of countries among tbnIndicators depends on availability of data and is not uniform.
/b Unlles. otherwise noted, 'Data for 1960- refer to any year between 1959 *nd 1961; 'Data for 1970- betmen 199 A1971; and data for 'Moat Recent Eatimte' between 1979 and 1981. 1
lc 1975; /d 1977; /e 1975; /f 1962; /g 1976; lb Registered. not all practicing in the cluntry; /i 1978.
May 1983
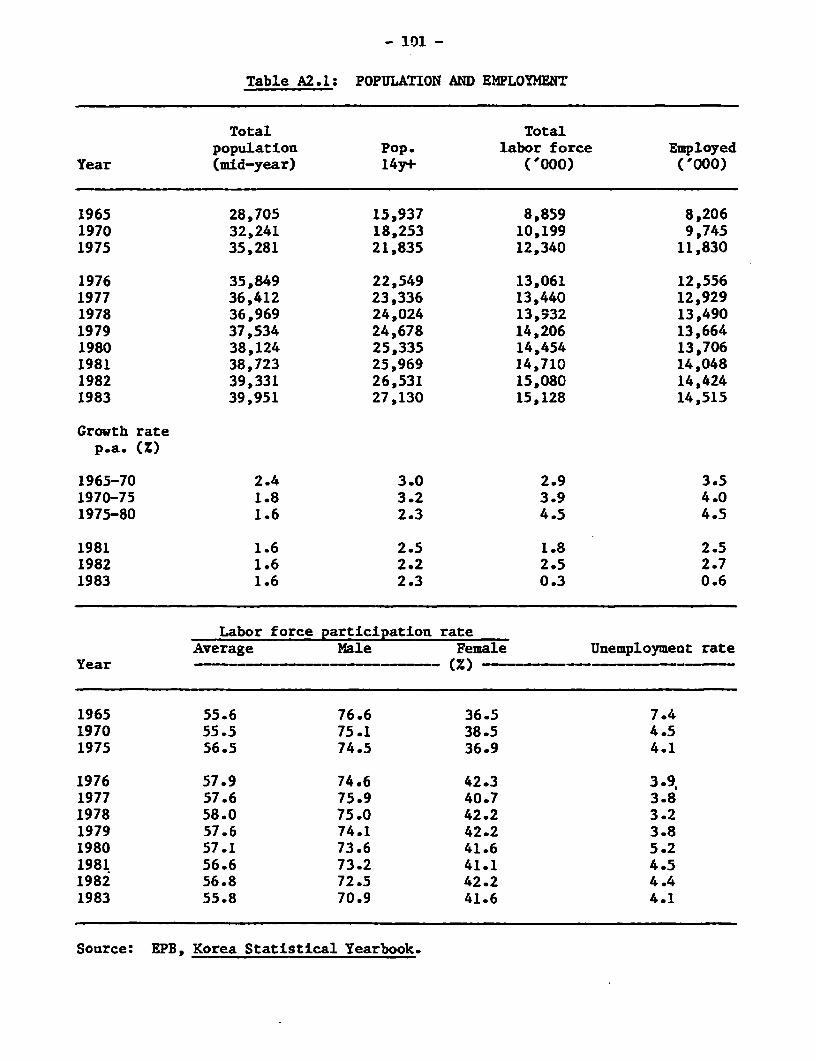
- 101 -
Table A2.1: POPULATION AND EMPLOYMENT
Total Totalpopulation Pop. labor force Employed
Year (mid-year) 14y+ ('000) ('000)
1965 28,705 15,937 8,859 8,2061970 32,241 18,253 10,199 9,7451975 35,281 21,835 12,340 11,830
1976 35,849 22,549 13,061 12,5561977 36,412 23,336 13,440 12,9291978 36,969 24,024 13,932 13,4901979 37,534 24,678 14,206 13,6641980 38,124 25,335 14,454 13,7061981 38,723 25,969 14,710 14,0481982 39,331 26,531 15,080 14,4241983 39,951 27,130 15,128 14,515
Growth ratep.a. (Z)
1965-70 2.4 3.0 2.9 3.51970-75 1.8 3.2 3.9 4.01975-80 1.6 2.3 4.5 4.5
1981 1.6 2.5 1.8 2.51982 1.6 2.2 2.5 2.71983 1.6 2.3 0.3 0.6
Labor force participation rateAverage Male Female Unemployment rate
Year --- - (X)
1965 55.6 76.6 36.5 7.41970 55.5 75.1 38.5 4.51975 56.5 74.5 36.9 4.1
1976 57.9 74.6 42.3 3.9,1977 57.6 75.9 40.7 3.81978 58.0 75.0 42.2 3.21979 57.6 74.1 42.2 3.81980 57.1 73.6 41.6 5.21981 56.6 73.2 41.1 4.51982 56.8 72.5 42.2 4.41983 55.8 70.9 41.6 4.1
Source: EPB, Korea Statistical Yearbook.

- 102 -
Table A2.2: SECTORAL ENPLOYMENT
Total Mining andemployment Agriculture manufacturing Other
Year ('000) '000 Z '000 Z '000 Z
1965 8,206 4,810 58.6 849 10.3 2,547 31.01970 9,745 4,916 50.4 1,395 14.4 3,434 35.21975 11,830 5,425 45.9 2,265 19.1 4,140 35.0
1976 12,556 5,601 44.6 2,743 21.9 4,212 33.51977 12,929 5,405 41.8 2,901 22.4 4,623 35.81978 13,490 5,181 38.4 3,123 23.2 5,186 38.41979 13,664 4,887 35.8 3,237 23.7 5,540 40.51980 13,706 4,658 34.0 3,095 22.6 5,952 43.41981 14,048 4,806 34.2 2,996 21.3 6,247 44.51982 14,424 4,623 32.1 3,157 21.9 6,644 46.11983 14,515 4,314 29.7 3,383 23.3 6,818 47.0
Growth ratep.a. (Z)
1965-70 3.5 0.4 10.4 6.21970-75 4.0 2.0 10.2 3.81975-80 3.0 -3.0 6.4 7.5
1976 6.1 3.2 21.1 1.71977 3.0 -3.5 5.8 9.81978 4.3 -4.1 7.7 12.21979 1.3 -5.7 3.7 6.81980 0.3 -4.7 -4.4 7.41981 2.5 3.2 -3.2 5.01982 2.7 9.6 5.4 6.41983 0.6 -6.7 7.2 2.6
Source: EPB, Korea Statistical Yearbook.
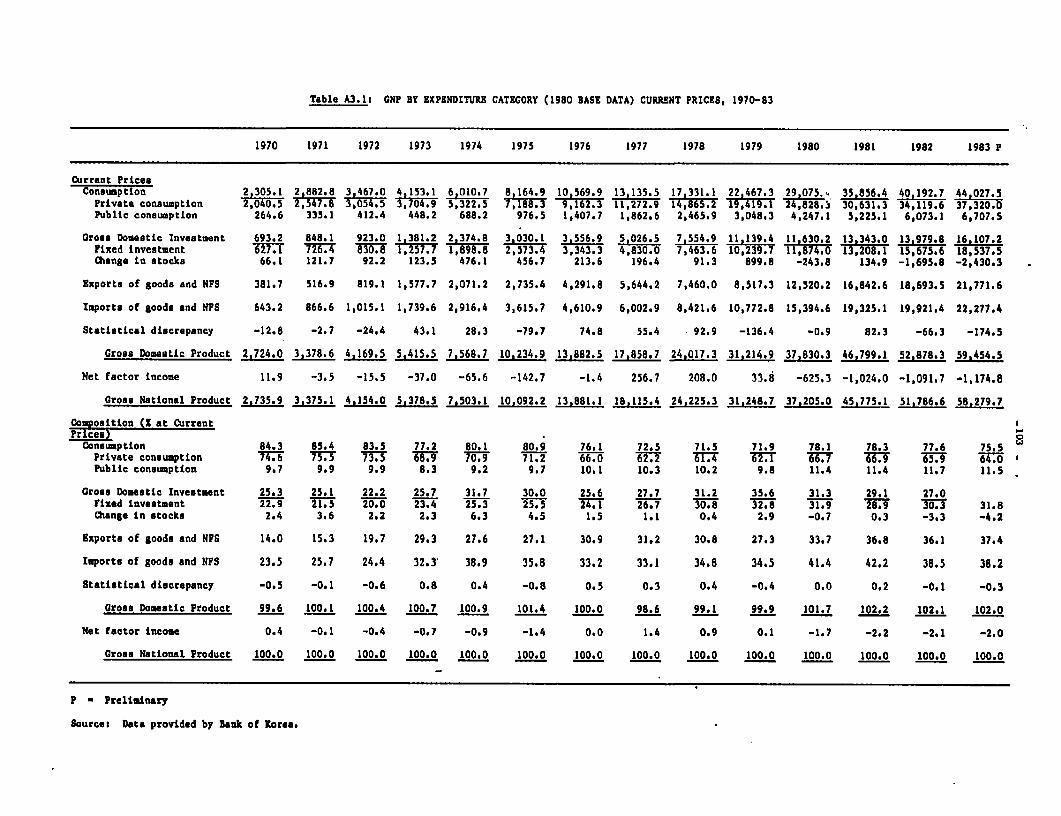
Table A3.1: GNP BY EXPENDITURE CATEGORY (1980 BASE DATA) CURRSNT PRICES, 1970-83
1970 1971 1972 1973 1974 1975 1976 1977 1978 1979 1980 1981 1982 1983 P
Current PricesConsumption 2 305.1 2 882.8 3 467.0 4 153.1 6,010.7 B 164.9 10 569.9 13,135.5 17,331.1 22,467.3 29 075 . 35,856.4 40,192.7 44 027.5Private consumption 2,040.5 2,547.8 3,054.5 3,704.9 5,322.5 7,188.3 9,162.3 11,272.9 14,865.2 19,419.1 24 828,i 30,631.3 34,119.6 37,320.0Public consumption 264.6 335.1 412.4 448.2 688.2 976.5 1,407.7 1,862.6 2,465.9 3,048.3 4,247.1 5,225.1 6,073.1 6,707.5
Gross Domestic Investment 693.2 848.1 923.0 1,381.2 2,374.8 3 030.1 3,556.9 5,026.5 7,554.9 11,139.4 11,630.2 13,343.0 13,979.8 16,107,2Fixed investment 627.1 726.4 830.8 1,257.7 1,898.8 2,573.4 3,343.3 4,830.0 7,463.6 10,239.7 11,874.0 13,208.1 15,675.6 18,537.5Change in stocks 66.1 121.7 92.2 123.5 476.1 456.7 213.6 196.4 91.3 899.8 -243.8 134.9 -1,695.8 -2,430.3
Exports of goods and NFS 381.7 516.9 819.1 1,577.7 2,071.2 2,735.4 4,291.8 5,644.2 7,460.0 8,517.3 12,520.2 16,842.6 18,693.5 21,771.6
Imports of goods and NFS 643.2 866.6 1,015.1 1,739.6 2,916.4 3,615.7 4,610.9 6,002.9 8,421.6 10,772.8 15,394.6 19,325.1 19,921.4 22,277.4
Statintical discrepancy -12.8 -2.7 -24.4 43.1 28.3 -79.7 74.8 55.4 92.9 -136.4 -0.9 82.3 -66.3 -174.5
Groas Domeatic Product 2,724.0 3,378.6 4,169.5 5,415.5 7,568.7 10,234.9 13,882.5 17,858.7 24,017.3 31,214.9 37,830.3 46,799.1 52,878.3 59,454.5
Net factor income 11.9 -3.5 -15.5 -37.0 -65.6 -142.7 -1.4 256.7 208.0 33.8 -625.3 -1,024.0 -1,091.7 -1,174.8
Gross National Product 2,735.9 3,375.1 4,154.0 5,378.5 7,503.1 10,092.2 13,881.1 18.115.4 24.225.3 31,248.7 37,205.0 45,775.1 51 786.6 58,279.7
Couosition (X at CurrentPFr ces)Consumption 84.3 85.4 83.5 77.2 80.1 80.9 76.1 72.5 71.5 71.9 78.1 78.3 77.6 755wPrivate consumption 74.6 75.5 73.5 7 70.9 71.2 66.0 XI7Y 4 62.1 TI7. TT 7IT I 65.9 64.0Public consumption 9.7 9.9 9.9 8.3 9.2 9.7 10.1 10.3 10.2 9.8 11.4 11.4 11.7 11.5
Gross Domestic Investment 25.3 25,1 22.2 25,7 31.7 30.0 25.6 27.7 31.2 35.6 31.3 29.1 27.0Fixed investment 22.9 21.5 20.0 23.4 25.3 25.-5 24,1 26.7 30.8 32.8 31. 28.9 30.3 31.8Change in stocks 2.4 3.6 2.2 2.3 6.3 4.5 1.5 1.1 0.4 2.9 -0.7 0.3 -3.3 -4.2
Exports of goods and NFS 14.0 15.3 19.7 29.3 27.6 27.1 30.9 31.2 30.8 27.3 33.7 36,8 36.1 37.4
Imports of goods and NFS 23.5 25.7 24.4 32.3 38.9 35.8 33.2 33.1 34.8 34.5 41.4 42,2 38.5 38.2
Statistlcal discrepancy -0.5 -0.1 -0.6 0.8 0.4 -0.8 0.5 0.3 0.4 -0.4 0.0 0,2 -0.1 -0.3
Gross Domestic Product 99.6 100.1 100.4 100.7 100.9 101.4 100.0 98.6 99.1 99.9 101.7 102.2 102.1 102.0
Net factor income 0.4 -0.1 -0.4 -0.7 -0.9 -1.4 0.0 1.4 0.9 0.1 -1.7 -2.2 -2.1 -2.0
Gross National Product 100.0 100.0 100.0 100.0 100.0 100.0 100.0 100.0 100.0 100.0 100.0 100.0 100.0 100.0
P a Preliminary
Sourceg Data provided by Bank of Korea.
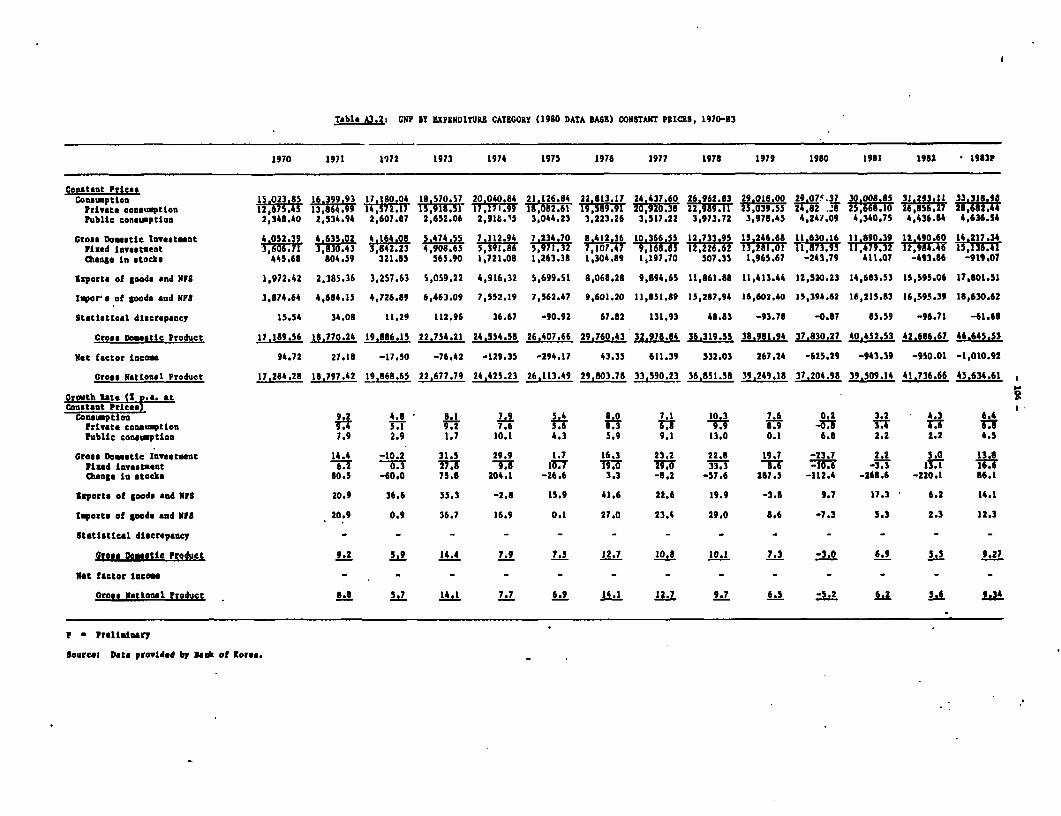
Table A3.2: CNP BY EXPENDITUIE CATEGORY (1980 DATA BASS) CONSTANT PRICKS. 1970-83
1970 1971 1072 1973 1974 1975 1976 1977 1978 1979 1980 1981 1982 * 1983W
Constent PricesConsumption 15 023.85 16 399.93 17 180.04 18,570.57 20,040.84 21.126.84 22 813.17 24,437,60 26 962.83 29 018 00 29 07' 37 30,008.85 31.293.11 33 318 98
Private consumption 12;675.45 13;i64.99 14!572.17 15,918.31 17,171.99 18,082.61 I19,59.91 20,920.38 22,9811i 25:039:55 2,82 _8 25,668.10 26,856.27 18,7Public conesuption 2,348.40 2,534.94 2,607.87 2,652.06 2,91t.'5 3,044.23 3,223.26 3,517.22 3,973.72 3,978.45 4,241.09 4,340.75 4,436.84 4,636.54
Gross Doestic Invteesnt 4.052.39 4 635.02 4.164.08 5.474.55 7.112.94 7.234,70 8,412.36 10 366,55 12 733,95 15,246.68 11 630.16 11,890.39 12 490.60 14.217.34Fized investment 3,606.71 3,630.43 3,642.23 4,908.65 5,391.86 5,971.32 7;107.47 9,168.85 12,226.62 13,281.01 11,873.95 11,479.32 12,984.46 15,136.41Change in stocks 445.68 804.59 321.85 565.90 1,721.08 1,263.38 1,304.89 1,197.70 507.33 1,965.67 -243.79 411.07 -493.86 -919.07
zxports of godas nd NFS 1,972.42 2,385.36 3,257.63 5,059.22 4,916.32 5,699.51 8,068.28 9,894.65 11,861.88 11,413.44 12,520.23 14,683.53 15,595.06 17,801.51
Ispor's of goods and NFS 3,874.64 4,684.15 4,726.89 6,463.09 7,552.19 7,562.47 9,601.20 11,851.89 15,287.94 16,602.40 15,394.62 16,215.83 16,595.39 18,630.62
Stetistical discrepaney 15.54 34.08 11.29 112.96 36.67 -90.92 67.82 131.93 48.83 -93.78 -0.87 85.59 -96.71 -61.68
Grose Douetic Product 17,189.56 18,770.24 19,886.15 22,754.21 24,554.58 26,407.66 29,760.43 32,978.84 36.319.55 38.981.94 37,830,27 40.452.53 42.686,67 46.645.53
Nst fector incom 94.72 27.18 -17.50 -76.42 -129.35 -294.17 43.35 611.39 532.03 267.24 -625.29 -943.39 -950.01 -1,010.92
Gross National Product 17,284.28 18,797.42 19,868.65 22,677.79 24,425.23 26,113.49 29,803.78 33,590.23 36,851.58 39,249.18 37.204.98 39,509.14 41,736.66 43.634.61
Oxwth Rt3.. Z. a. atConstant Prices .36.
Consomption 9 2 4.8 8.1 7.9 5.4 8.0 7.1 10.3 7.6 0.2 3.2 4.3 6.4PFrivte coneuption ft. T 7.6 5.6 T I 9,9 H - T ;[ TJPublic consuaption 7.9 2.9 1.7 10.1 4.3 5.9 9.1 13.0 0.1 6.8 2.2 2.2 4.5
Gross Domestic Investmnt 14.4 -10.2 31.5 29.9 1.7 16.3 23,2 22.8 19.7 -23.7 2.2 5.0 13.6Find investment 6.2 0.3 27,8 9 .8 T IT T9 IT 5.6 .-10.6 -3.3 1:T i6.Cange in stocks 80.5 -60.0 75.8 204.1 -26.6 3.3 -8.2 -57.6 287.5 -112.4 -268.6 -220.1 86.1
Exports of goodes nd Nlr 20.9 36.6 55.3 -2.8 15.9 41.6 22.6 19.9 -3.8 9.7 17.3 6.2 14.1
Itports of goods end UIPS 20.9 0.9 36.7 16.9 0.1 27.0 23.4 29.0 8.6 -7.3 5.3 2.3 12.3
Statistical discrepancy
Gross DoSmstic Froduct 9.2 5.9 14.4 7.9 7.5 12.7 10,8 10.1 7.3 -3.0 6.9 5.5 9.27
Net factor income - - - - - - - - - - - -
Gross lationel Product 8.8 5,7 144 7.7 6.9 14.1 12.7 9.7 6.5 2 6.2 5.6 9.34
r* relimina
Sources Date provided by Bank of Korea,
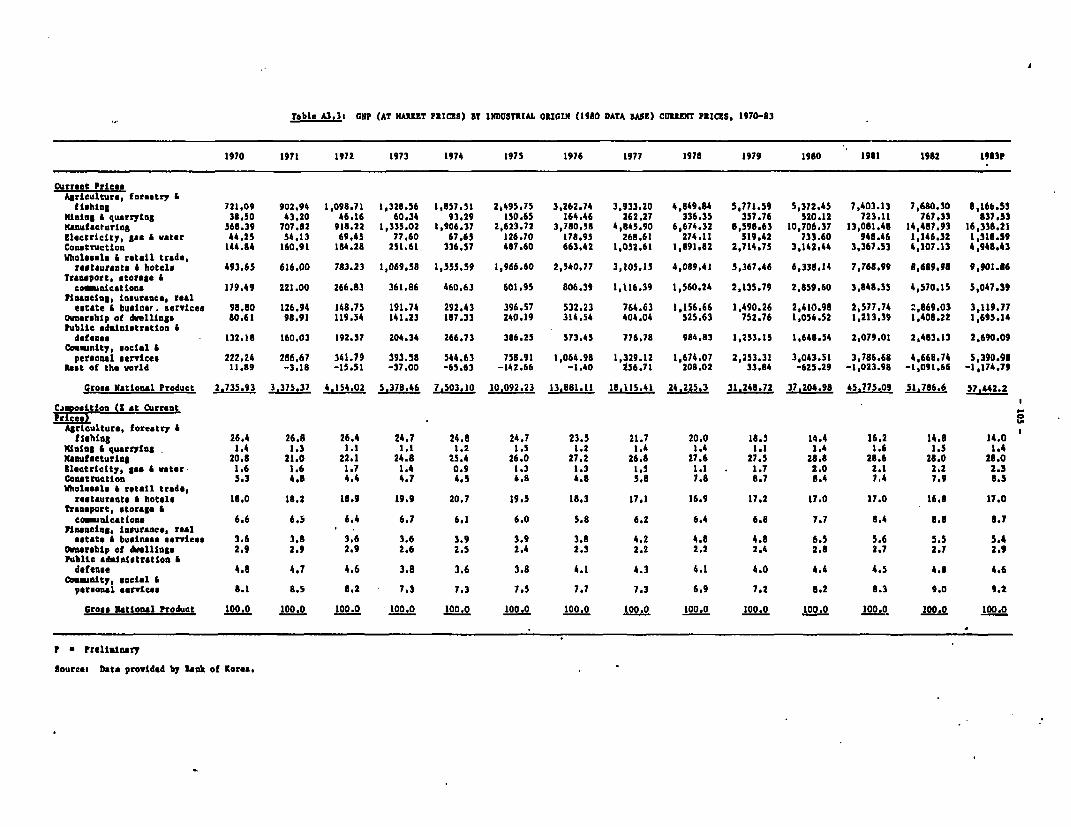
Table A3.3. GNP (AT MARKUT PIICES) By INDUSTRIAL ORIGIN (1980 DATA BASE) CURUZNT PRICES, 1970-83
1970 1971 1972 1973 1974 1975 1976 1977 1978 1979 1980 1981 1982 1983P
Current PricesAgriculture, forestry 6fishing 721.09 902.94 1,098.71 1,328.56 1,857.51 2,495.75 3,262.74 3,933.20 4,849.84 5,771.59 5,372.45 7,403.13 7,680.30 8,166.53Kining 4 quarrying 38.50 43.20 46.16 60.34 93.29 150.65 164.46 262.27 336.35 357.76 520.12 723.11 767.33 837.53Kanulacturing 568.39 707.82 918.22 1,335.02 1,906.37 2,623,72 3,780.58 4,8645.90 6,674,32 8,598.63 10,706.37 13,081,48 14,487.93 16,338.21Electricity, gas A vater 44.25 54.13 69.45 77.60 67.65 126.70 178.95 268.61 274.11 519.42 733.60 948.46 1,146.32 1,318.59ConatructLon 144.84 160.91 184.28 251,61 336.57 487.60 663.42 1,052.61 1,691,62 2,714.75 3,142.44 3,367.53 4,107.13 4,948.43Wholesale 4 retail trade,restaurants £ hotels 493.65 616.00 783.23 1,069.58 1,555,59 1,966.60 2,540.77 3,105,15 4,089.41 3,367.46 6,338.14 7,768.99 8,689.98 9,901.86Transport, storage 6co_unieetions 179.49 221.00 266.83 361,86 460.63 601.95 806.39 1,116.39 1,560.24 2,135.79 2,859.60 3,848.55 4,570.15 5,047.39"InBeting, rnsurance, tealestate * builner. servlces 98.80 126.94 148.75 191.74 292.43 396.57 532.23 764.63 1,156.66 1,490.26 2,410.98 2,577.74 2,869.03 3,119.77OunXrship of dvellings 80.61 98.91 119.54 141.23 187.33 240.19 314.54 404.04 525.63 752.76 1,054.52 1,213.39 1,408.22 1,695.14Public aduinlntration &defense 132.18 160.03 192.57 204.34 266.73 386.25 573.45 776.78 984.83 1,253.15 1,648.54 2,079.01 2,483.13 2.690.09Coamunity, social 4personal services 222.24 286.67 341.79 393.58 544.63 758.91 1,064.98 1,329.12 1,674.07 2,253.31 3,043.51 3,786.68 4.668.74 5,390.98Rest of the world 11.89 -3.18 -15.51 -37.00 -65.63 -142.66 -1.40 256.71 208.02 33.84 -625.29 -1,023.98 -1,091.66 -1,174.79
Gross National Product 2,735.93 3,375,37 4.154,02 5,378.46 7.503.10 10,092.23 13,851.11 18,115,41 24.225.3 31.248.72 37.204.98 45,775.09 51.786.6 57,442.2
Coositton ( at Current ,Pricesn).
Agriculture, forestry 6fishing 26.4 26.8 26.4 24.7 24.8 24.7 23.5 21.7 20.0 18.5 14.4 16.2 14.8 14,0Kining 4 quarrying 1.4 1.3 1.1 1.1 1.2 1.5 1.2 1.4 1.4 1.1 1.4 1.6 1.5 1.4Nanufacturins 20.8 21.0 22.1 24.8 25.4 26.0 27.2 26.8 27.6 27.5 28,8 28.6 28.0 28.0Electricity, gas 6 water 1.6 1.6 1.7 1.4 0.9 1.3 1.3 1.5 1.1 1.7 2.0 2.1 2.2 2.3Construction 5.3 4.8 4.4 4.7 4.5 4.8 4.8 5.8 7.8 8.7 8.4 7.4 7.9 8.5Wholesale 4 retall trade,restaurants 6 hotels 18.0 18.2 18.9 19.9 20.7 19.5 18.3 17.1 16.9 17.2 17.0 17.0 16.8 17.0Traneport, storage 5co1unications 6.6 6.5 6.4 6.7 6.1 6.0 5.8 6.2 6.4 6.8 7.7 8.4 8.8 8.7Financing, Insurance, realestate * business services 3.6 3.8 3.6 3.6 3.9 3.9 3.8 4.2 4.8 4.8 6.5 5.6 5.5 5.4Ownership of dwellings 2.9 2.9 2.9 2.6 2.5 2.4 2.3 2.2 2.2 2.4 2.8 2.7 2.7 2.9Public administration 6defense 4.8 4.7 4.6 3.8 3.6 3.8 4.1 4.3 4.1 4.0 4.4 4.S 4.8 4.6Comnity, social 4pernonal services 8.1 8.5 8.2 7.3 7.3 7.5 7.7 7.3 6.9 7.2 8.2 8.3 9.0 9.1
Grose National Product 100.0 100.0 100.0 100.0 100.0 100.0 100.0 100.0 100-0 100.0 100.0 100.0 100.0 100.0
P a Prellalnary
Sources Data provided by ank of Korea.

Table A3.4t GNP (AT MARKET PRICES) BY INDUSTRIAL ORIGIN (1980 DATA BASE) CONSTANT PRICES, 1970-83
1970 1971 1972 1973 1974 1975 1976 1977 1978 1979 1980 1981 1982 1983P
Constant PricesAgriculture, forestry &
fishing 4,966.49 5,121.98 5,271.60 5,598.74 6,013.18 6,307.99 6,900.31 7,077.32 6,429.42 6,662.06 5,372.45 6,687.74 6,962.48 7,441.15MinLng & quarrying 364.23 370.54 362.30 424.93 444.02 514,77 518.93 580.75 611.06 568.22 520.12 603.94 580.81 617.37Manufacturing 2,458.50 2,918.30 3,349.48 4,351.16 5.032.36 5,628.98 6,974.30 8,090.19 9,815.18 10,825.45 10,706.37 11,479.33 11,933.31 13,227.49Electricity, gas & vater 164.27 197.57 220.44 270.56 303.57 361.73 421.38 496.42 582,08 682.44 733.60 804.47 872.31 979.54Construction 1,209.00 1,198.50 1,209.16 1,540.49 1,582.09 1,800.99 1,988.33 2,513.78 3,094.95 3,186.67 3,142.44 2,972.62 3,565.89 4,295.29Wholesele 6 retail trade,
restaurants * hotels 2,679.58 3,174.16 3,488.39 4,095.05 4,357.16 4,651.06 5,228.24 5,665.07 6,321.52 6,575.59 6,338.14 6,740.80 7,043.04 7,765.15Traensport, storage 6counicattoons 777.86 889,81 969.92 1,217.66 1,306.39 1,446.75 1,670.92 2,030.11 2,381.93 2,789.52 2,859.60 3,100.04 3,274.99 3,533.28
finaneing, Insurance, realeetate 4 busines ssrvices 692.90 766.77 773.24 849.85 978.10 1,038.51 1,215.79 1,481.34 1,798.62 1,951.85 2,410.98 2,142.30 2,255.18 2,362.48
Ownership of dvellinge 732.84 760.84 786.46 811.66 640.04 861.64 897.69 927.55 968.88 1,017.90 1,054.52 1,076.40 1,141.22 1,199.28Public adinistration &
defense 1,344.60 1,391.78 1,376.51 1,377.37 1,396.82 1,423.76 1,460.72 1,502.02 1,541.65 1,590,04 1,64B.54 1,675.65 1,715.92 1,736.84Comalnity, social &
personal services 1,799.29 1,979.99 2,078.65 2,216.74 2,300.85 2,371.48 2,483.82 2,614,29 2,774.26 2,932.20 3,043.51 3,169.24 3,341.52 3,487.66Rest of the world 94.72 27.18 -17.50 -76.42 -129.35 -294.17 43.35 . 611.39 532.03 267.24 -625.29 -943.39 -950.01 -1,010.92
Gronr 0ctLonal Product 17,284.28 18,797.42 19,868.65 22L677.79 24,425.23 26.113.49 29,803.78 33,590.23 36,851.58 39,249.18 37,204.98 39,509,14 41,736.66 45,634.61
Growth Rate (S P.*. atConeteta rrce)
Agriculture,cfarestry &fishing 3.1 2.9 6.2 7.4 4.9 9.4 2.6 -9.2 6.7 -21.7 24.5 4.1 6.8
Nining A quarrying 1.7 -2.2 17.3 4.5 15.9 0.8 11.9 5.2 -7.0 -8.5 16.1 -3.8 6.7Manufacturing 18.7 14.8 29.9 15.7 11.9 23.9 16.0 21.3 10.3 -1I1 7,2 4.0 10.8Electricity, gas & water 20.3 11.6 22.7 12.2 19.2 16.5 17.8 17.3 17.2 7.5 9.7 864 12.3Construction -0.9 0.9 27.4 2.7 13.8 10.4 26.4 23.1 3.0 -1.4 -5.4 20,0 20.3Wholesale & retail trade,
restaurants A hotels 18.5 9.9 17.4 6.4 6.7 12.4 8.4 11.6 4.0 -3.6 6.4 4.5 10.3Transport, storage A
co_unicatioas 14.4 9.0 25.5 7,3 10.7 15.5 21.5 17.3 17.1 2.5 8.4 5.6 7,9Financing, insurance, real
estate 6 business serviesa 10.7 0.8 9.9 15.1 6.2 17.1 21.8 21.4 8.5 23.5 -11.1 5.3 4.8Ownership of dvellings 3.8 3.4 3.2 3.5 2.6 4.2 3.3 4.5 5.1 3.6 2.1 6.0 5.1Public administration 6
defense 3.5 -1.1 0.1 1.4 1,9 2.6 2.8 2.6 3.1 3.7 1.6 2.4 1.2Comunity, social &personal services 10.0 5.0 6.6 3.8 3,1 4.7 5.3 6.1 5.7 3.8 4.1 5.4 4.4
Gross National Product 8. 5.7 14.1 7.7 6.9 14.1 12,7 9.7 6.5 -5.2 6,2 5.6 9.34
P - Prelilinary
Sourcet Data provided by Bank of Korea.
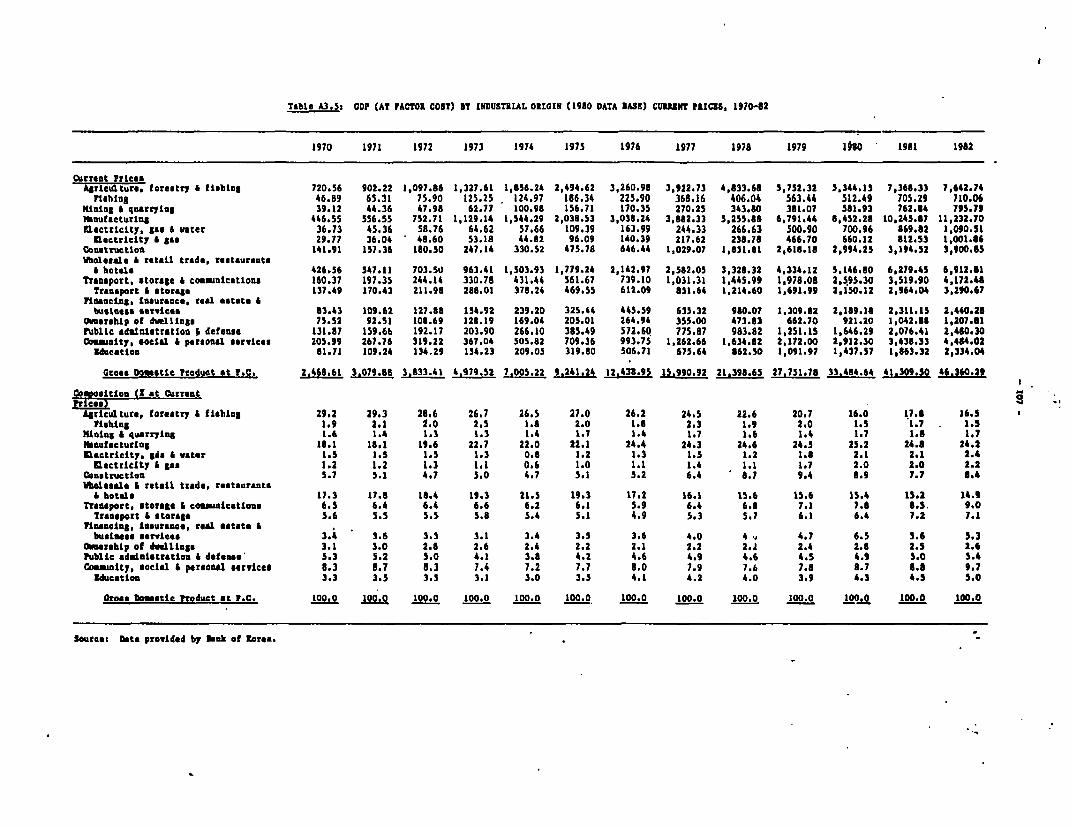
Table A3.5s GDP (AT PACTOR COST) BY INDUSTRIAL ORIGIN (1980 DATA BASE) CURUNT PRICES, 1970-82
1970 1971 1972 1973 1974 1915 1976 1977 1978 1979 1980 1981 1982
COrreet FricesAgrlculture, forestry * flObing 720.56 902.22 1,097.86 1,327.61 1,856.24 2,494.62 3,260.98 3,922.73 4,833.68 5,752.32 5,344.15 7,368.33 7,642.74
fisbing 46.89 65.31 75.90 125.25 124.97 166.34 225.90 368.16 406.04 563.44 512.49 705.29 710.06KinLng 6 quarrying 39.12 44.36 47.98 62.77 100.98 156.71 170.35 270.25 343.60 381.07 581.93 762.84 795.79lhautacturlng 446.55 556.55 752.71 1,129.14 1,544.29 2,038.53 3,038.24 3,882.33 5,255.88 6,791.44 8,452.28 10,245.37 11,232.70nectr±city, gas & water 36.73 45.36 58.76 64.62 57.66 109.39 163.99 244.33 266.63 500.90 700.96 669.62 1,090.51
Emctrieity * Sao 29.77 36.04 48.60 53.18 44.82 96.09 140.39 217.62 238.78 466.70 660.12 812.53 1,001.86Constructlon 141.91 157.36 180.50 247.14 330.52 475.78 646.44 1,029.07 1,851.81 2,618.18 2,994.25 3,194.52 3,900.65Wnolesale A retaLl trade, restaurants
& hotels 426.56 547.11 703.51) 963.41 1,503.93 1,779.24 2,142.97 2,582.05 3,328.32 4,334.12 5,146.80 6,279.45 6,912.81Transport, storage & com-unlcations 160.37 197.35 244.14 330.78 431.44 561.67 739.10 1,031.31 1,445.99 1,978.08 2,595.30 3,519.90 4,172.48
Transport A storage 137.49 170.43 211.98 288,01 378.24 469.55 612.09 851.64 1,214.60 1,691.99 2,150.12 2,964.04 3,290.67inaneiS, Insurance, real estate Abusteess setvicea 83.43 109.62 127.88 154,92 239.20 325.44 445.59 635.32 980.07 1,309.82 2,189.16 2,311.15 2,440,26
onership of dwellings 75.52 92.51 108.69 128.19 169.04 205,01 264.94 355.00 473.83 662.70 921.20 1,042.68 1,207-.1Public adalnstratlon * defense 131.87 159.6b 192.17 203.90 266.10 385.49 572.60 775.87 983.82 1,2SI.15 1,646.29 2,076.41 2,480.30Comumanty, social & personal servlces 205.99 267.76 319.22 367.04 505.82 709.36 993.75 1,262.66 1,634.82 2,172.00 2,912.30 3,638.33 4,464.02
Education 81.71 109.24 134.29 154.23 209.05 319.80 506.71 675.64 862.50 1,091.97 1,437.37 1,663.32 2,334.04
Greos Domette Product at P.C. 2,468.61 3,079.88 3,833.41 4,979.52 7,005.22 9,241.24 12.438.95 15.990.92 21,398.65 27,751.78 33,484.64 41.309.30 46.360-29
C0. stion (o at Curreetprlees)
Agriculture, forestry 4 filsing 29.2 29.3 28.6 26.7 26.5 27.0 26.2 24.5 22.6 20.7 16.0 17.8 16.5Flbhing 1.9 2.1 2.0 2.5 1.6 2.0 1.e 2.3 1.9 2.0 1.5 1.7 1.5
Mining 6 quarrying 1.6 1.4 1.3 1.3 1.4 1.7 1.4 1.7 1.6 1.4 1.7 1.6 1.7Ibnufacturtig 18.1 18.1 19.6 22.7 22,0 22.1 24.4 24.3 24.6 24.5 25.2 24.8 24.2Electricity, gis A vater 1.5 1.5 1.5 1.3 0.6 1.2 1.3 1.5 1.2 1.8 2.1 2.1 2.4
Ietrieity & as 1.2 1.2 1.3 1.1 0.6 1.0 1.1 1.4 1.1 1.7 2.0 2.0 2.2Construction 5.7 5.1 4.7 5.0 4.7 5.1 5.2 6.4 8.7 9.4 8.9 7.7 8.4Wholesale & retail trade, restaurants
A hotels 17.3 17.8 18.4 19.3 21.5 19.3 17.2 16.1 15.6 15.6 15.4 15.2 14.9Transport, storage 6 coamaications 6.5 6.4 6.4 6.6 6.2 6.1 5.9 6.4 6.8 7.1 7.8 8.3. 9.0Transport * storage 5.6 5.5 5.5 5.8 5.4 5.1 4.9 5.3 5.7 6.1 6.4 7.2 7.1
fle eetes, Insurance, real estate Abunin,es servne,s 3.4 3.6 3.3 3.1 3.4 3.5 3.6 4.0 4 4.7 6.5 5.6 5.3
0erebip of dillings 3.1 3.0 2.8 2.6 2.4 2.2 2.1 2.2 2.2 2.4 2.8 2.5 2.6Public admLiistration 4 defunae 5.3 5.2 5.0 4.1 3.8 4.2 4.6 4.9 4.6 4.5 4.9 5.0 5.4CoQaiuty, social 6 personl servLceg 8.3 8.7 8.3 7.4 7.2 7.7 6.0 7.9 7.6 7.8 3.7 8.8 9.78dueation 3.3 3.5 3.5 3.1 3.0 3.5 4.1 4.2 4.0 3.9 4.3 4.5 5.0
Gross Donestie Prvduct at ?.C. 100.0 100.0 100.0 100.0 100.0 100.0 100.0 100.0 100.0 100.0 100.0 100.0 100.0
Soure,e Deta provided by lank of Korea.
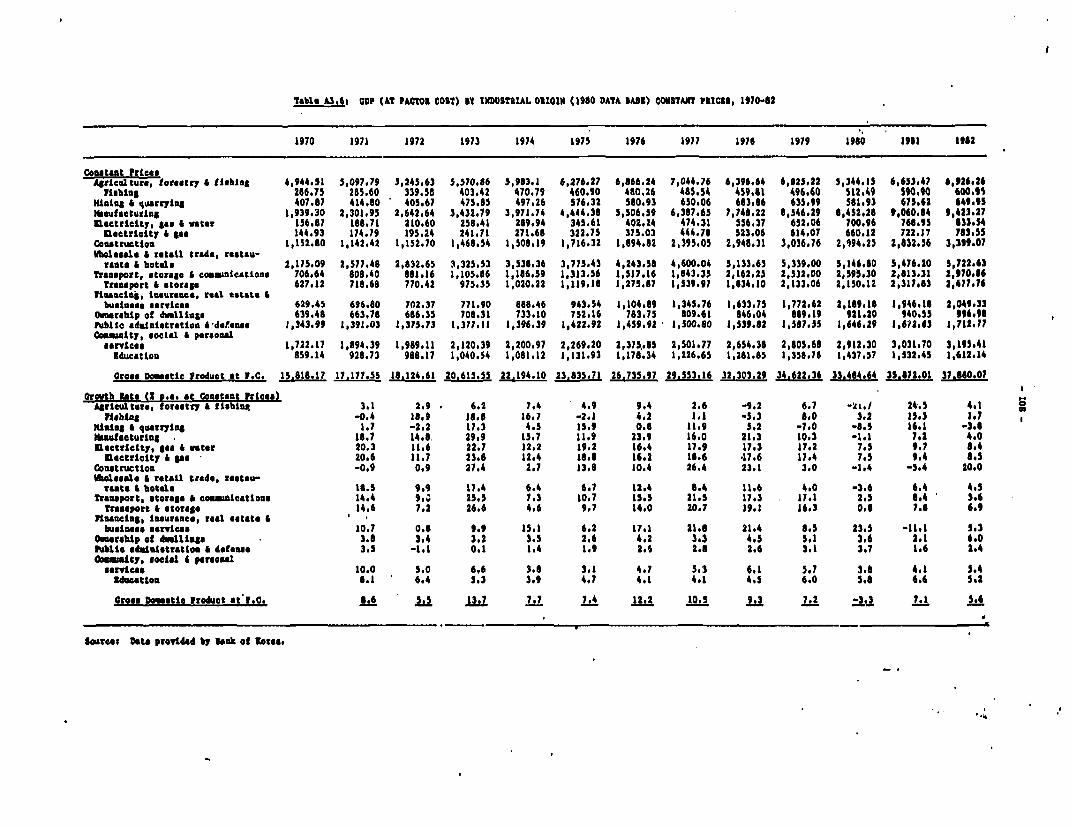
Table A3.6: CDP (AT 0ACTO1 COST) 9Y INDUSTRIAL 010IN (1980 DATA SABd) CONSTANT PIUCS, 1970-62
1970 1971 1972 1973 1974 1975 1976 1977 1975 1979 1960 1951 1962
Conetact 7rleccACrculture, fetrct-7 6 Lishing 4,944.51 5,097.79 3,245.63 5,570.86 5,963.1 6,276.27 6,866.24 7,044.76 6,396.64 6,825.22 5,344.15 6,653.47 6,926.26Fishing 266.75 265.60 339.58 403,42 470.79 460.90 480.26 465.54 459,81 496,60 512,49 590,90 600.99
H1imin 6 quarrling 407.87 414#80 405.67 475,55 497.26 576.32 580,93 650.06 663.66 635.99 561,93 675.62 649.95Manufacturing 1,939.30 2,301,95 2,642.64 3,432.19 3,971.74 4,444,38 5,506.59 6,387.65 7,746.22 6,546.29 6,452.26 9,060.84 9,423.27nectricity, gas 6 wator 156.87 188.71 210.60 258.41 289.94 345.61 402.24 474.31 556.37 652.06 700,96 766.95 633.54lloctricity 6 gas 144.93 174.79 195.24 241.11 271.68 322.75 375,03 444.78 523.06 614.07 660.12 722,17 763.55
Constructioe 1,152.80 1,142.42 1,152.70 1,466.54 1,508.19 1,716.32 1,894.62 2,395.05 2,946.31 3,036.76 2,i94.25 2,532.56 3,399.07Wbolesale 6 cetail trada, rastau-
coste 6 hotels 2,175.09 2,577.48 2,832.65 3,325.53 3,538.36 3,775.43 4,243.58 4,600.04 5,133.65 5,339,00 5,146.60 5,476.20 5,722.63Transport, storage 6 coA unicatione 706.64 808.40 881.16 1,105.86 1,166.59 1,313.56 1,517.16 1,843.35 2,162,25 ;,532,00 2,595.30 2,613.31 2,970.36
Transport 6 storage 627.12 718.68 770.42 975,35 1,020.22 1,119.18 1,275.57 1,539.97 1,834,10 2,133.06 2,150.12 2,317.83 2,477.76Fimncink, insurance, real estate 6busluns. services 629.45 696.60 702.37 771.90 888.46 943.54 1,104.89 1,345.76 1,633.75 11772,62 2,169.18 1,946:15 2,049.33
Owncerhip of dwallioge 639*48 663.76 666,35 708.31 733,10 752,16 753.75 809.61 546,04 589.19 921,20 940.55 996.96Publc ad*duaetratlon 6Udefense 1,343.99 1,391.03 1,375.73 1,377.11 1,396.39 1,422.92 1,459.92 1,500-40 1,539.62 1,547,55 1,646.29 1,672,63 1,712.77Community, social A personal
services 1,722.17 1,894.39 1,989.11 2,120.39 2,200.97 2,269,20 2,375.85 2,501.77 2,654.38 2,805.65 2,912.30 3,031,70 3,195.41Education 859.14 928.73 988.17 1,040.54 1,081.12 1,131.93 1,178.34 1,226.65 1,281.85 1,356,76 1,437,57 1,532,45 1,612.14
Oross Domestic Product at F.C. 15.818.17 17.177.55 18,124,61 20,615,55 22.194.10 23.635.71 26.735,97 29.553.16 32,303,29 34.622,36 33,454.64 35.L72,01 37.,6J.07
Growth 1 te (Z s.a. at Conctcat Prices)arleulture, forestry 6 flabln9 3.1 2.9 . 6.2 7.4 4,9 9.4 2.6 -9.2 6.7 -k1,/ 24.5 4.1 £7iehale -0.4 18.9 1i.8 16.7 -2.1 4.2 1.1 -5.3 4.0 3.2 153 1.7
Mining A quarrying 1.7 -2.2 17.3 4.5 15.9 0.6 11,9 5.2 -7.0 -6.5 16.1 -3.6kaufacturing 18.7 14.8. 29, 15.7 11.9 23.9 16.0 21.3 10.3 -1.1 7,2 C,0
a etrtctty, gso & water 20.3 11.6 22.7 12.2 19.2 16.4 17.9 1793 17.2 7.5 9.7 6.4*1ectrietty A Pe 20*6 11.7 23*6 12.4 16S6 16.2 18.6 17.6 17,4 7.5 9.4 6e5
Ooutructlon -0.9 0.9 27,4 2.7 13.6 10.4 26.4 23.1 30O -1.4 -5.4 20.0Wbaoleale 6 retail trade, restau-
raate * botels 18.5 9.9 17,4 6,4 6.7 12.4 8.4 11.6 4,0 -3.6 6,4 4C5Transport, storage 6 ctO.aications 14.4 90. 25.5 7,3 10.7 15,5 21.5 17.3 17,1 2.5 644 5,6
Transport 6 storage 14.6 7.2 26.6 4.6 9g7 14.0 20.7 19.1 1603 0.8 7.8 609Financiga, inaurance, real estate 6
buosines seryicee 10.7 0.5 9.9 15.1 602 17,1 21.6 21*4 805 23.5 -11.1 5.3Oarebip of dwlliogs 3.5 3.4 3,2 3.5 2,6 4*2 3.3 4,5 501 3.6 2,1 6.0Public admiliatratlon 6 doleves 3.5 -1.1 0.1 1.4 109 2.6 2.8 2.6 3.1 3.7 1,6 2,4Onamity, social 6 persoelservices 10.0 5.0 6.6 3.6 3,1 4,7 5.3 6,1 5,7 3.6 4.1 5.43dbat1on *.1 6.4 5.3 3.9 4,7 461 4.1 4.5 6.0 5.6 6.6 5,2
Creee Doatic Product at-F.c. 6.6 5.5 13.7 7.7 7,4 12,2 10.5 9.3 7.2 -3.3 7,1 5.6
S.reus Data provided by lnk of Korea.
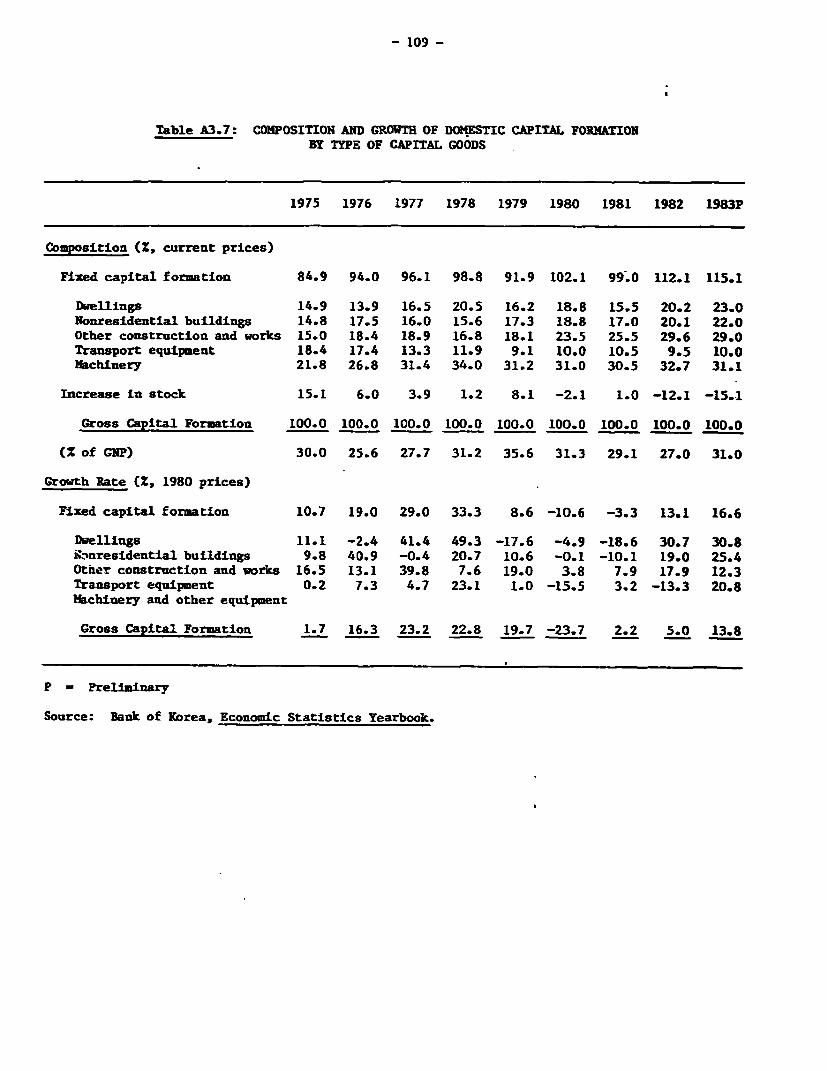
- 109 -
Table A3.7: COHPOSITION AND GROWTH OF DOMESTIC CAPITAL FORMATIONBY TYPE OF CAPITAL GOODS
1975 1976 1977 1978 1979 1980 1981 1982 1983P
Composition (X, current prices)
Fixed capital formation 84.9 94.0 96.1 98.8 91.9 102.1 99.0 112.1 115.1
Dwelliugs 14.9 13.9 16.5 20.5 16.2 18.8 15.5 20.2 23.0Nonresidential buildings 14.8 17.5 16.0 15.6 17.3 18.8 17.0 20.1 22.0Other construction and works 15.0 18.4 18.9 16.8 18.1 23.5 25.5 29.6 29.0Transport equipment 18.4 17.4 13.3 11.9 9.1 10.0 10.5 9.5 10.0Nachinery 21.8 26.8 31.4 34.0 31.2 31.0 30.5 32.7 31.1
Increase in stock 15.1 6.0 3.9 1.2 8.1 -2.1 1.0 -12.1 -15.1
Gross Capital Formation 100.0 100.0 100.0 100.0 100.0 100.0 100.0 100.0 100.0
(Z of GNP) 30.0 25.6 27.7 31.2 35.6 31.3 29.1 27.0 31.0
Growth Rate (Z, 1980 prices)
Fixed capital formation 10.7 19.0 29.0 33.3 8.6 -10.6 -3.3 13.1 16.6
Dwellings 11.1 -2.4 41.4 49.3 -17.6 -4.9 -18.6 30.7 30.89nnresidential buildings 9.8 40.9 -0.4 20.7 10.6 -0.1 -10.1 19.0 25.4Otner construction and works 16.5 13.1 39.8 7.6 19.0 3.8 7.9 17.9 12.3Transport equipment 0.2 7.3 4.7 23.1 1.0 -15.5 3.2 -13.3 20.8Machinery and other equipment
Gross Capital Formation 1.7 16.3 23.2 22.8 19.7 -23.7 2.2 5.0 13.8
P - Preliminary
Source: Bank of Korea, Economic Statistics Yearbook.
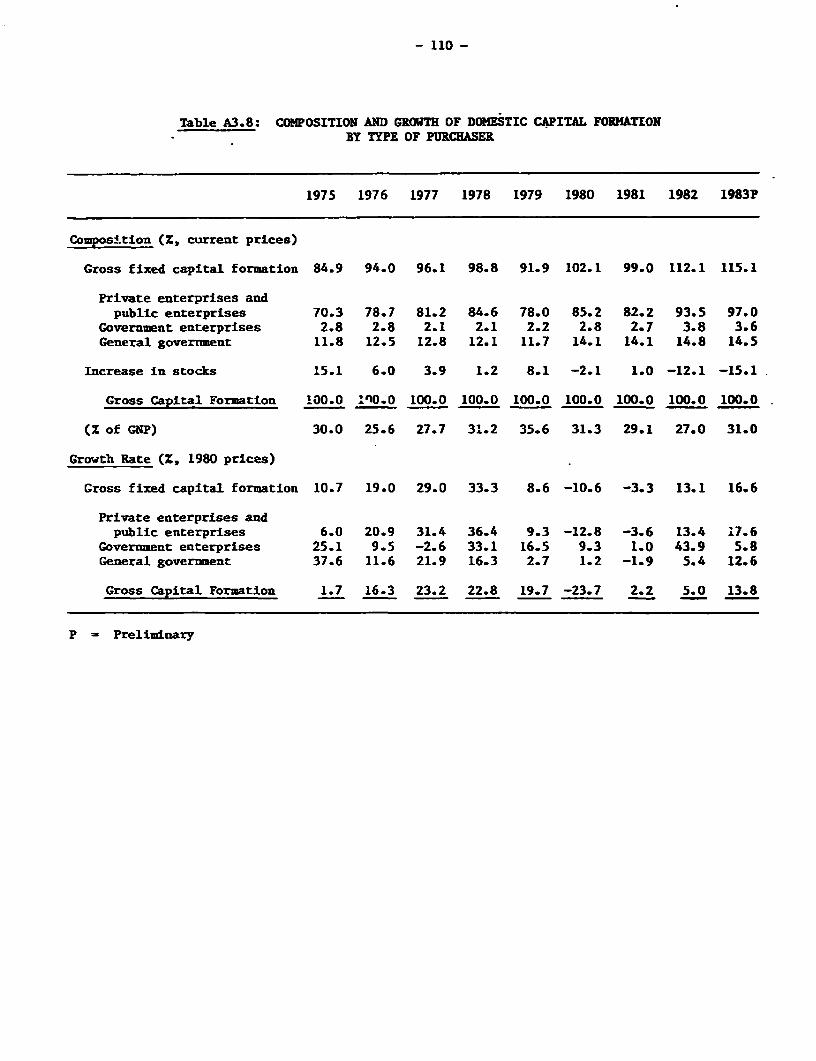
- 110 -
Table A3.8: COMPOSITION AND GROWTH OF DOMESTIC CAPITAL FORMATIONBY TYPE OF PURCHASER
1975 1976 1977 1978 1979 1980 1981 1982 1983P
Composition tZ. current prices)
Gross fixed capital formation 84.9 94.0 96.1 98.8 91.9 102.1 99.0 112.1 115.1
Private enterprises andpublic enterprises 70.3 78.7 81.2 84.6 78.0 85.2 82.2 93.5 97.0
Government enterprises 2.8 2.8 2.1 2.1 2.2 2.8 2.7 3.8 3.6General government 11.8 12.5 12.8 12.1 11.7 14.1 14.1 14.8 14.5
Increase in stocks 15.1 6.0 3.9 1.2 8.1 -2.1 1.0 -12.1 -15.1
Gross Capital Formation 100.0 In0.0 100.0 100.0 100.0 100.0 100.0 100.0 100.0
(% of GNP) 30.0 25.6 27.7 31.2 35.6 31.3 29.1 27.0 31.0
Growth Rate (Z, 1980 prices)
Gross fixed capital formation 10.7 19.0 29.0 33.3 8.6 -10.6 -3.3 13.1 16.6
Private enterprises andpublic enterprises 6.0 20.9 31.4 36.4 9.3 -12.8 -3.6 13.4 ;7.6
Government enterprises 25.1 9.5 -2.6 33.1 16.5 9.3 1.0 43.9 5.8General goverrment 37.6 11.6 21.9 16.3 2.7 1.2 -1.9 5.4 12.6
Gross Capital Formation 1.7 16.3 23.2 22.8 19.7 -23.7 2.2 5.0 13.8
P - Preliminary
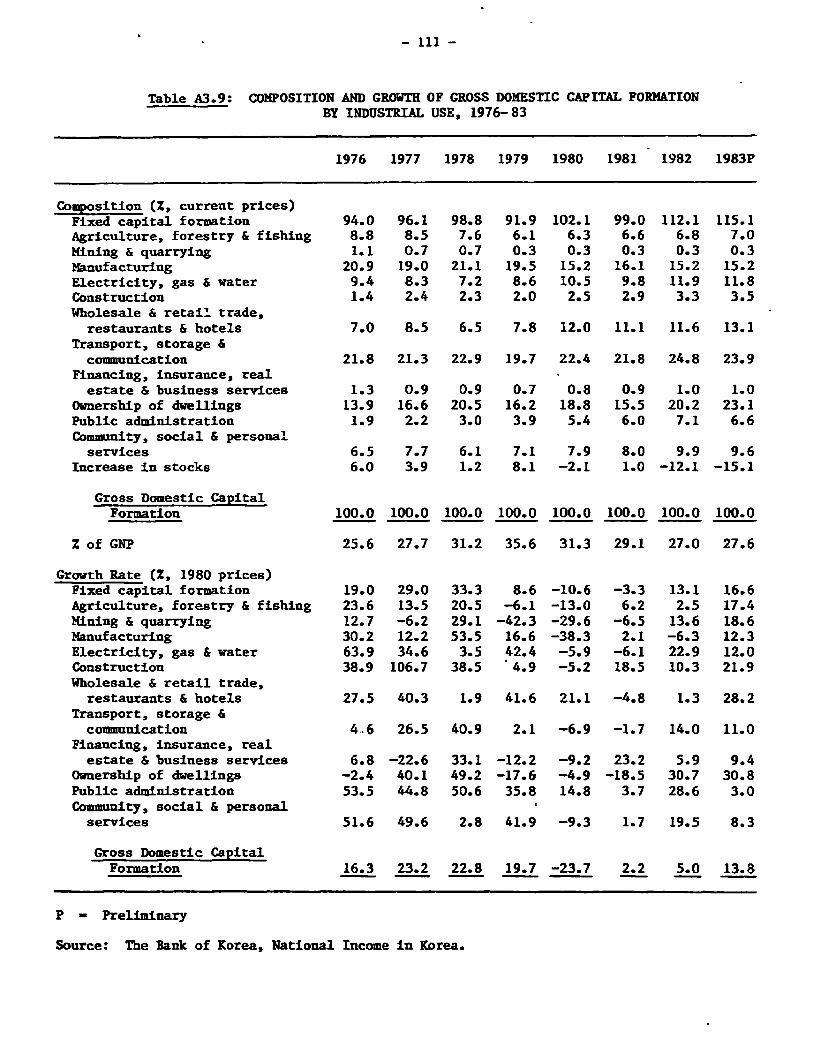
- 111 -
Table A3.9: COMPOSITION AND GROWTH OF GROSS DOMESTIC CAPITAL FORMATIONBY INDUSTRIAL USE, 1976-83
1976 1977 1978 1979 1980 1981 1982 1983P
Composition (%, current prices)Fixed capital formation 94.0 96.1 98.8 91.9 102.1 99.0 112.1 115.1Agriculture, forestry & fishing 8.8 8.5 7.6 6.1 6.3 6.6 6.8 7.0Mining & quarrying 1.1 0.7 0.7 0.3 0.3 0.3 0.3 0.3Manufacturing 20.9 19.0 21.1 19.5 15.2 16.1 15.2 15.2Electricity, gas & water 9.4 8.3 7.2 8.6 10.5 9.8 11.9 11.8Construction 1.4 2.4 2.3 2.0 2.5 2.9 3.3 3.5Wholesale & retail trade,restaurants & hotels 7.0 8.5 6.5 7.8 12.0 11.1 11.6 13.1
Transport, storage &communication 21.8 21.3 22.9 19.7 22.4 21.8 24.8 23.9
Financing, insurance, realestate & business services 1.3 0.9 0.9 0.7 0.8 0.9 1.0 1.0
Ownership of dwellings 13.9 16.6 20.5 16.2 18.8 15.5 20.2 23.1Public administration 1.9 2.2 3.0 3.9 5.4 6.0 7.1 6.6Cominity, social & personalservices 6.5 7.7 6.1 7.1 7.9 8.0 9.9 9.6
Increase in stocks 6.0 3.9 1.2 8.1 -2.1 1.0 -12.1 -15.1
Gross Domestic CapitalFormation 100.0 100.0 100.0 100.0 100.0 100.0 100.0 100.0
Z of GNP 25.6 27.7 31.2 35.6 31.3 29.1 27.0 27.6
Growth Rate (Z, 1980 prices)Fixed capital formation 19.0 29.0 33.3 8.6 -10.6 -3.3 13.1 16.6Agriculture, forestry & fishing 23.6 13.5 20.5 -6.1 -13.0 6.2 2.5 17.4Mining & quarrying 12.7 -6.2 29.1 -42.3 -29.6 -6.5 13.6 18.6Manufacturing 30.2 12.2 53.5 16.6 -38.3 2.1 -6.3 12.3Electricity, gas & water 63.9 34.6 3.5 42.4 -5.9 -6.1 22.9 12.0Construction 38.9 106.7 38.5 4.9 -5.2 18.5 10.3 21.9Wholesale & retail trade,restaurants & hotels 27.5 40.3 1.9 41.6 21.1 -4.8 1.3 28.2
Transport, storage &communication 4.6 26.5 40.9 2.1 -6.9 -1.7 14.0 11.0
Financing, insurance, realestate & business services 6.8 -22.6 33.1 -12.2 -9.2 23.2 5.9 9.4
Ownership of dwellings -2.4 40.1 49.2 -17.6 -4.9 -18.5 30.7 30.8Public administration 53.5 44.8 50.6 35.8 14.8 3.7 28.6 3.0Community, social & personalservices 51.6 49.6 2.8 41.9 -9.3 1.7 19.5 8.3
Gross Domestic CapitalFormation 16.3 23.2 22.8 19.7 -23.7 2.2 5.0 13.8
P - Preliminary
Source: The Bank of Korea, National Income in Korea.
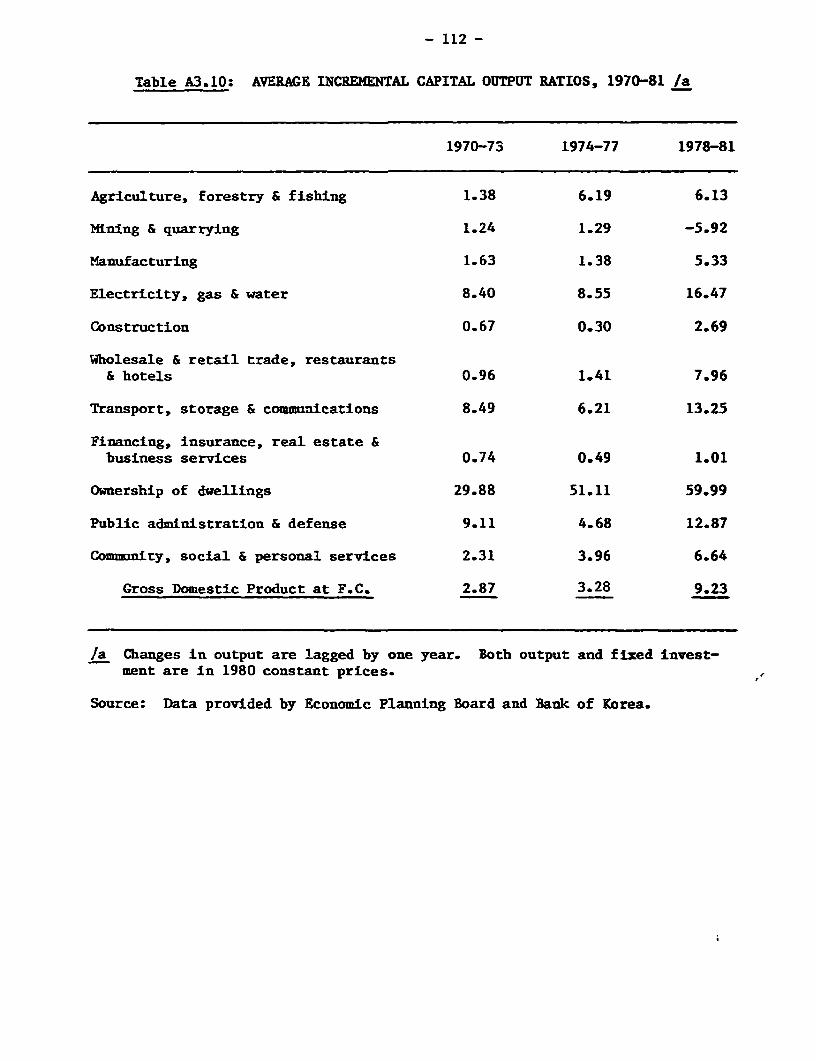
- 112 -
Table A3.10: AVERAGE INCREMENTAL CAPITAL OUTPUT RATIOS, 1970-81 /a
1970-73 1974-77 1978-81
Agriculture, forestry & fishing 1.38 6.19 6.13
Mining & quarrying 1.24 1.29 -5.92
Manufacturing 1.63 1.38 5.33
Electricity, gas & water 8.40 8.55 16.47
Construction 0.67 0.30 2.69
Wholesale & retail trade, restaurants& hotels 0.96 1.41 7.96
Transport, storage & communications 8.49 6.21 13.25
Financing, insurance, real estate &business services 0.74 0.49 1.01
Ownership of dwellings 29.88 51.11 59.99
Public administration & defense 9.11 4.68 12.87
Community, social & personal services 2.31 3.96 6.64
Gross Domestic Product at F.C. 2.87 3.28 9.23
la Changes in output are lagged by one year. Both output and fixed invest-ment are in 1980 constant prices.
Source: Data provided by Economic Planning Board and Bank of Korea.
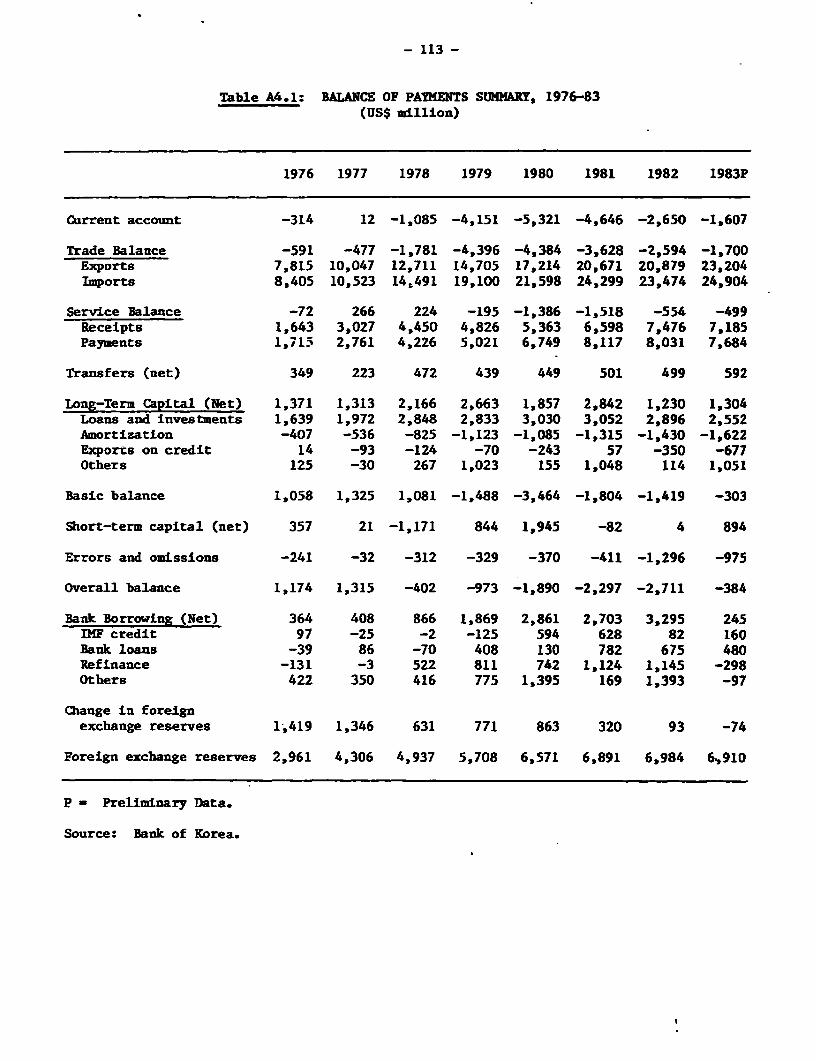
- 113 -
Table A4.1: BALANCE OF PAYMENTS SUMMARY, 1976-83(US$ million)
1976 1977 1978 1979 1980 1981 1982 1983P
Current account -314 12 -1,085 -4,151 -5,321 -4,646 -2,650 -1,607
Trade Balance -591 -477 -1,781 -4,396 -4,384 -3,628 -2,594 -1,700Exports 7,815 10,047 12,711 14,705 17,214 20,671 20,879 23,204Imports 8,405 10,523 14,491 19,100 21,598 24,299 23,474 24,904
Service Balance -72 266 224 -195 -1,386 -1,518 -554 -499Receipts 1,643 3,027 4,450 4,826 5,363 6,598 7,476 7,185Payments 1,715 2,761 4,226 5,021 6,749 8,117 8,031 7,684
Transfers (net) 349 223 472 439 449 501 499 592
Long-Term Capital (Net) 1,371 1,313 2,166 2,663 1,857 2,842 1,230 1,304Loans and investments 1,639 1,972 2,848 2,833 3,030 3,052 2,896 2,552Amortization -407 -536 -825 -1,123 -1,085 -1,315 -1,430 -1,622Exports on credit 14 -93 -124 -70 -243 57 -350 -677Others 125 -30 267 1,023 155 1,048 114 1,051
Basic balance 1,058 1,325 1,081 -1,488 -3,464 -1,804 -1,419 -303
Short-term capital (net) 357 21 -1,171 844 1,945 -82 4 894
Errors and omissions -241 -32 -312 -329 -370 -411 -1,296 -975
Overall balance 1,174 1,315 -402 -973 -1,890 -2,297 -2,711 -384
Bank Borrowing (Net) 364 408 866 1,869 2,861 2,703 3,295 245IMF credit 97 -25 -2 -125 594 628 82 160Bank loans -39 86 -70 408 130 782 675 480Refinance -131 -3 522 811 742 1,124 1,145 -298Others 422 350 416 775 1,395 169 1,393 -97
Change in foreignexchange reserves 1,419 1,346 631 771 863 320 93 -74
Foreign exchange reserves 2,961 4,306 4,937 5,708 6,571 6,891 6,984 6,910
P - Preliminary Data.
Source: Bank of Korea.
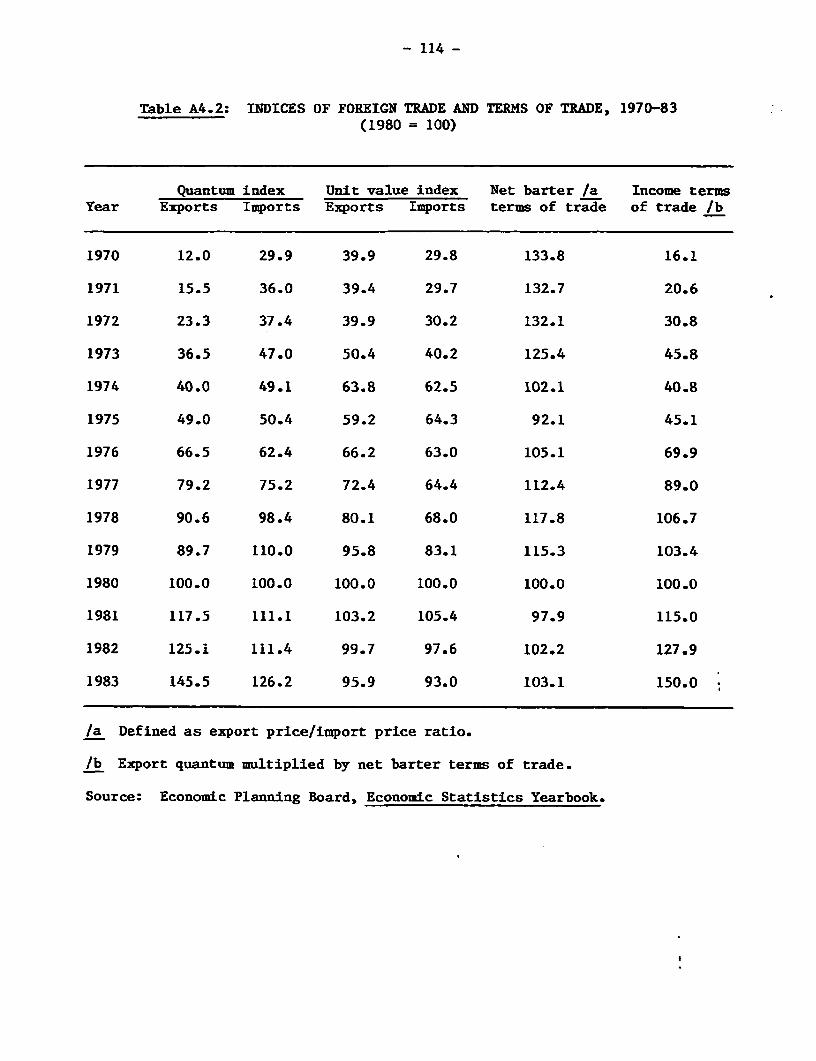
- 114 -
Table A4.2: INDICES OF FOREIGN TRADE AND TERMS OF TRADE, 1970-83(1980 = 100)
Quantum index Unit value index Net barter /a Income termsYear Exports Imports Exports Imports terms of trade of trade /b
1970 12.0 29.9 39.9 29.8 133.8 16.1
1971 15.5 36.0 39.4 29.7 132.7 20.6
1972 23.3 37.4 39.9 30.2 132.1 30.8
1973 36.5 47.0 50.4 40.2 125.4 45.8
1974 40.0 49.1 63.8 62.5 102.1 40.8
1975 49.0 50.4 59.2 64.3 92.1 45.1
1976 66.5 62.4 66.2 63.0 105.1 69.9
1977 79.2 75.2 72.4 64.4 112.4 89.0
1978 90.6 98.4 80.1 68.0 117.8 106.7
1979 89.7 110.0 95.8 83.1 115.3 103.4
1980 100.0 100.0 100.0 100.0 100.0 100.0
1981 117.5 111.1 103.2 105.4 97.9 115.0
1982 125.1 111.4 99.7 97.6 102.2 127.9
1983 145.5 126.2 95.9 93.0 103.1 150.0
/a Defined as export price/import price ratio.
/b Export quantum multiplied by net barter terms of trade.
Source: Economic Planning Board, Economic Statistics Yearbook.
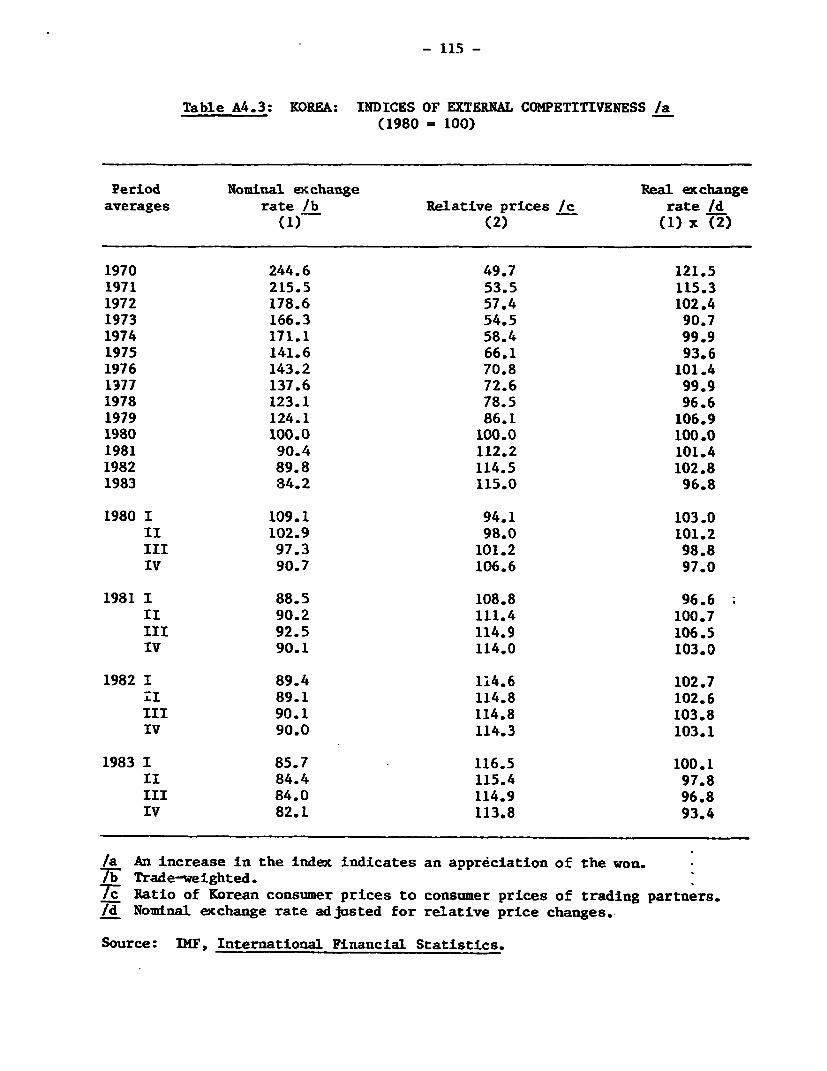
- 115 -
Table A4.3: KOREA: INDICES OF EXTERNAL COMPETITIVENESS /a(1980 = 100)
Period Nominal exchange Real exchangeaverages rate lb Relative prices /c rate /d
(1) (2) (1) x (2)
1970 244.6 49.7 121.51971 215.5 53.5 115.31972 178.6 57.4 102.41973 166.3 54.5 90.71974 171.1 58.4 99.91975 141.6 66.1 93.61976 143.2 70.8 101.41377 137.6 72.6 99.91978 123.1 78.5 96.61979 124.1 86.1 106.91980 100.0 100.0 100.01981 90.4 112.2 101.41982 89.8 114.5 102.81983 84.2 115.0 96.8
1980 I 109.1 94.1 103.0II 102.9 98.0 101.2III 97.3 101.2 98.8IV 90.7 106.6 97.0
1981 I 88.5 108.8 96.6II 90.2 111.4 100.7III 92.5 114.9 106.5IV 90.1 114.0 103.0
1982 I 89.4 114.6 102.71I 89.1 114.8 102.6III 90.1 114.8 103.8IV 90.0 114.3 103.1
1983 I 85.7 116.5 100.1II 84.4 115.4 97.8III 84.0 114.9 96.8IV 82.1 113.8 93.4
/a An increase in the index indicates an appreciation of the won.T7 Trade-weighted.T7 Ratio of Korean consumer prices to consumer prices of trading partners./d Nominal exchange rate adjusted for relative price changes.
Source: INF, International Financial Statistics.
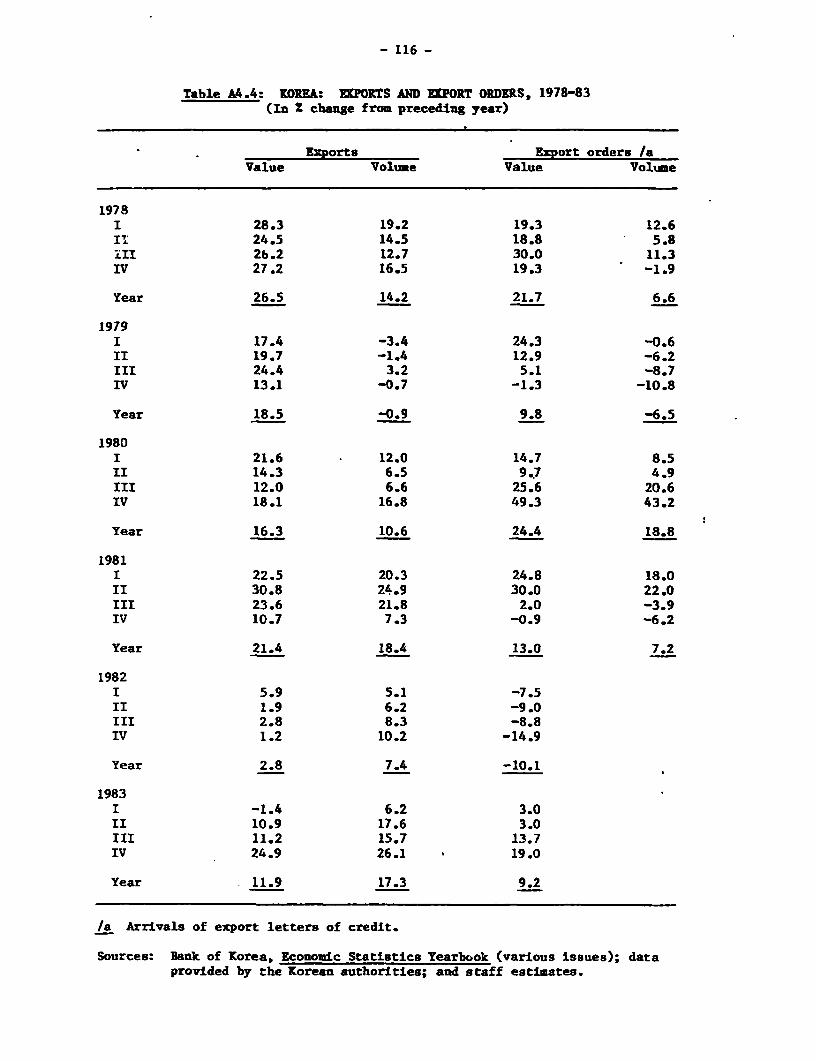
- 116 -
Table AM.4: KOREk: EXPORTS AND EXPORT ORDERS, 1978-83(In X change from preceding year)
Exports Export orders laValue Volume Value Volume
1978I 28.3 19.2 19.3 12.6I' 24.5 14.5 18.8 5.8III 2b.2 12.7 30.0 11.3IV 27.2 16.5 19.3 -1.9
Year 26.5 14.2 21.7 6.6
1979I 17.4 -3.4 24.3 -0.6II 19.7 -1.4 12.9 -6.2III 24.4 3.2 5.1 -8.7IV 13.1 -0.7 -1.3 -10.8
Year 18.5 -0.9 9.8 -6.5
1980I 21.6 12.0 14.7 8.5II 14.3 6.5 9.7 4.9III 12.0 6.6 25.6 20.6IV 18.1 16.8 49.3 43.2
Year 16.3 10.6 24.4 18.8
1981I 22.5 20.3 24.8 18.0II 30.8 2&.9 30.0 22.0III 23.6 21.8 2.0 -3.9IV 10.7 7.3 -0.9 -6.2
Year 21.4 18.4 13.0 7.2
1982I 5.9 5.1 -7.5II 1.9 6.2 -9.0III 2.8 8.3 -8.8IV 1.2 10.2 -14.9
Year 2.8 7.4 -10.1
1983I -1.4 6.2 3.0II 10.9 17.6 3.0III 11.2 15.7 13.7IV 24.9 26.1 19.0
Year 11.9 17.3 9.2
/a Arrivals of export letters of credit.
Sources: Bank of Korea, Economic Statistics Yearbook (various issues); dataprovided by the Korean authorities; and staff estimates.
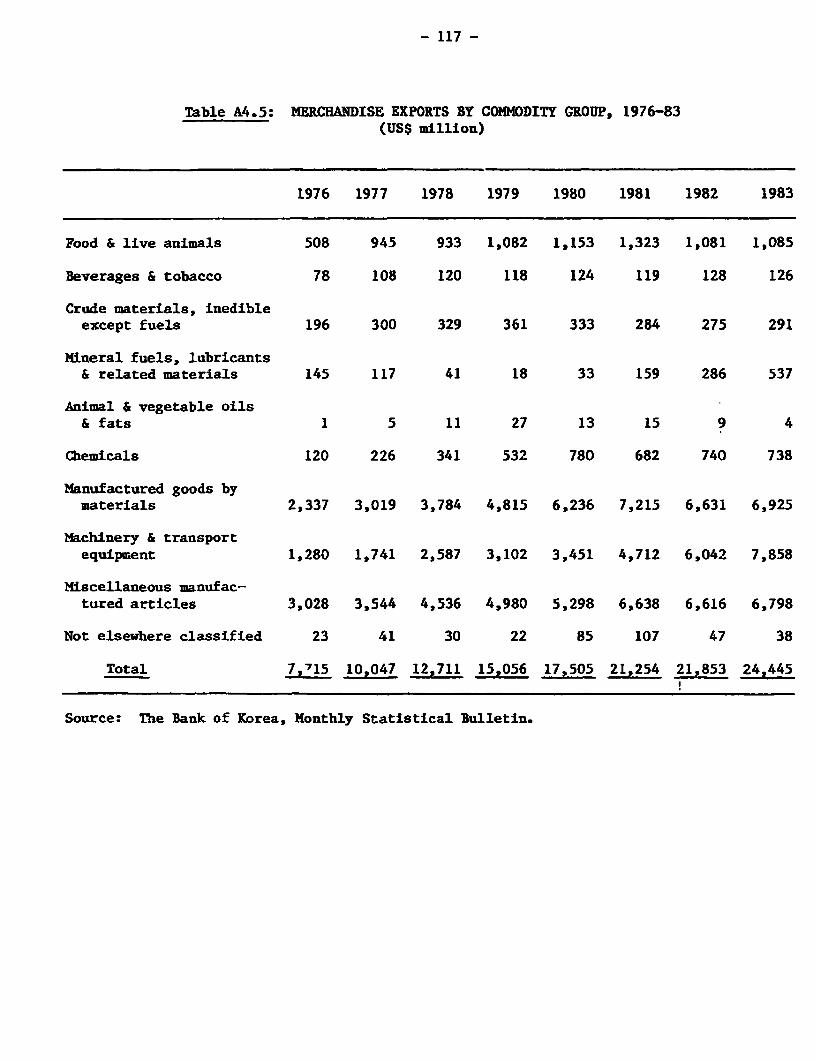
- 117 -
Table A4.5: MERCHANDISE EXPORTS BY COMMODITY GROUP, 1976-83(US$ million)
1976 1977 1978 1979 1980 1981 1982 1983
Food & live animals 508 945 933 1,082 1,153 1,323 1,081 1,085
Beverages & tobacco 78 108 120 118 124 119 128 126
Crude materials, inedibleexcept fuels 196 300 329 361 333 284 275 291
Mineral fuels, lubricants& related materials 145 117 41 18 33 159 286 537
Animal & vegetable oils& fats 1 5 11 27 13 15 9 4
Chemicals 120 226 341 532 780 682 740 738
Manufactured goods bymaterials 2,337 3,019 3,784 4,815 6,236 7,215 6,631 6,925
Machinery & transportequipment 1,280 1,741 2,587 3,102 3,451 4,712 6,042 7,858
Miscellaneous manufac-tured articles 3,028 3,544 4,536 4,980 5,298 6,638 6,616 6,798
Not elsewhere classified 23 41 30 22 85 107 47 38
Total 7,715 10,047 12,711 15,056 17,505 21,254 21,853 24,445
Source: The Bank of Korea, Monthly Statistical Bulletin.
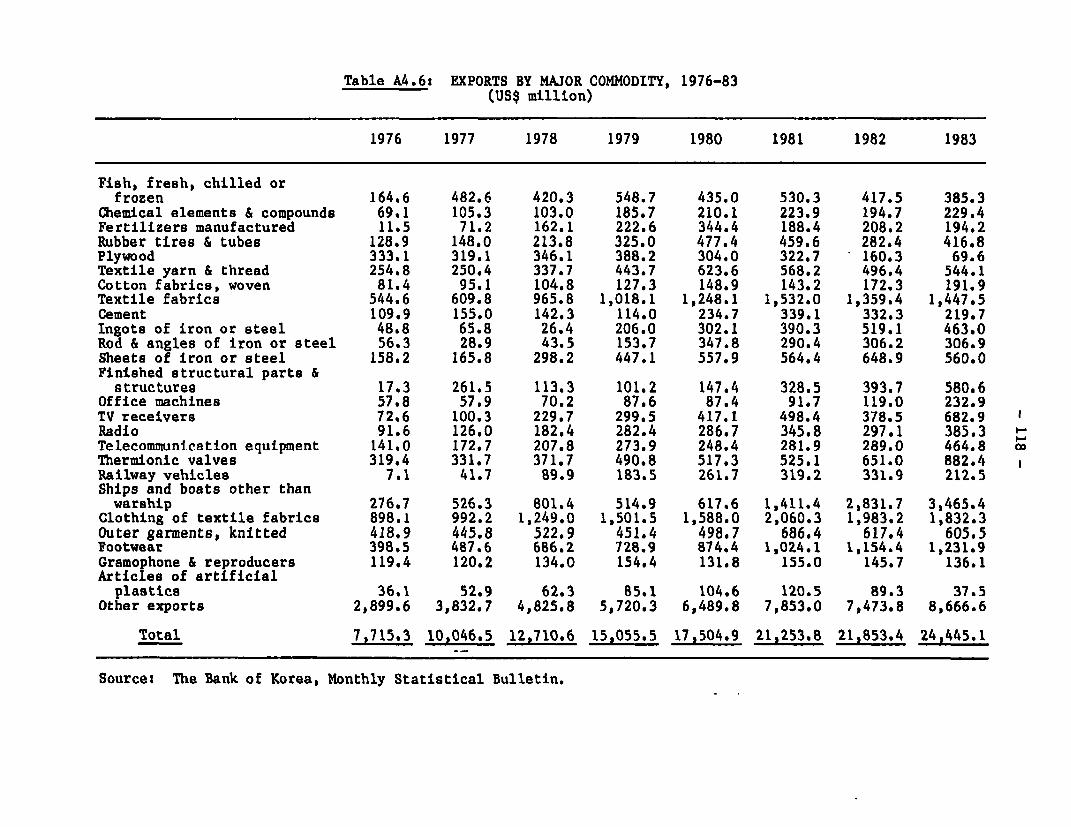
Table A4.6: EXPORTS BY MAJOR COMMODITY, 1976-83(US$ million)
1976 1977 1978 1979 1980 1981 1982 1983
Fish, fresh, chilled orfrozen 164.6 482.6 420.3 548.7 435.0 530.3 417.5 385.3
Chemical elements & compounds 69.1 105.3 103.0 185.7 210.1 223.9 194.7 229.4Fertilizers manufactured 11.5 71.2 162.1 222.6 344.4 188.4 208.2 194.2Rubber tires & tubes 128.9 148.0 213.8 325.0 477.4 459.6 282.4 416.8Plywood 333.1 319.1 346.1 388.2 304.0 322.7 160.3 69.6Textile yarn & thread 254.8 250.4 337.7 443.7 623.6 568.2 496.4 544.1Cotton fabrics, woven 81.4 95.1 104.8 127.3 148.9 143.2 172.3 191.9Textile fabrics 544.6 609.8 965.8 1,018.1 1,248.1 1,532.0 1,359.4 1,447.5Cement 109.9 155.0 142.3 114.0 234.7 339.1 332.3 219.7Ingots of iron or steel 48.8 65.8 26.4 206.0 302.1 390.3 519.1 463.0Rod & angles of iron or steel 56.3 28.9 43.5 153.7 347.8 290.4 306.2 306.9Sheets of iron or steel 158.2 165.8 298.2 447.1 557.9 564.4 648.9 560.0Finished structural parts &structures 17.3 261.5 113.3 101.2 147.4 328.5 393.7 580.6
Office machines 57.8 57.9 70.2 87.6 87.4 91.7 119.0 232.9TV receivers 72.6 100.3 229.7 299.5 417.1 498.4 378.5 682.9 1Radio 91.6 126.0 182.4 282.4 286.7 345.8 297.1 385.3 3Telecommunieation equipment 141.0 172.7 207.8 273.9 248.4 281.9 289.0 464.8 coThermionic valves 319.4 331.7 371.7 490.8 517.3 525.1 651.0 882.4Railway vehicles 7.1 41.7 89.9 183.5 261.7 319.2 331.9 212.5Ships and boats other thanwarship 276.7 526.3 801.4 514.9 617.6 1,411.4 2,831.7 3,465.4
Clothing of textile fabrics 898.1 992.2 1,249.0 1,501.5 1,588.0 2,060.3 1,983.2 1,832.3Outer garments, knitted 418.9 445.8 522.9 451.4 498.7 686.4 617.4 605.5Footwear 398.5 487.6 686.2 728.9 874.4 1,024.1 1,154.4 1,231.9Gramophone & reproducers 119.4 120.2 134.0 154.4 131.8 155.0 145.7 136.1Articles of artificialplastics 36.1 52.9 62.3 85.1 104.6 120.5 89.3 37.5
Other exports 2,899.6 3,832.7 4,825.8 5,720.3 6,489.8 7,853.0 7,473.8 8,666.6
Total 7,715.3 10,046.5 12,710.6 15,055.5 17,504.9 21,253.8 21,853.4 24,445.1
Source: The Bank of Korea$ Monthly Statistical Bulletin.
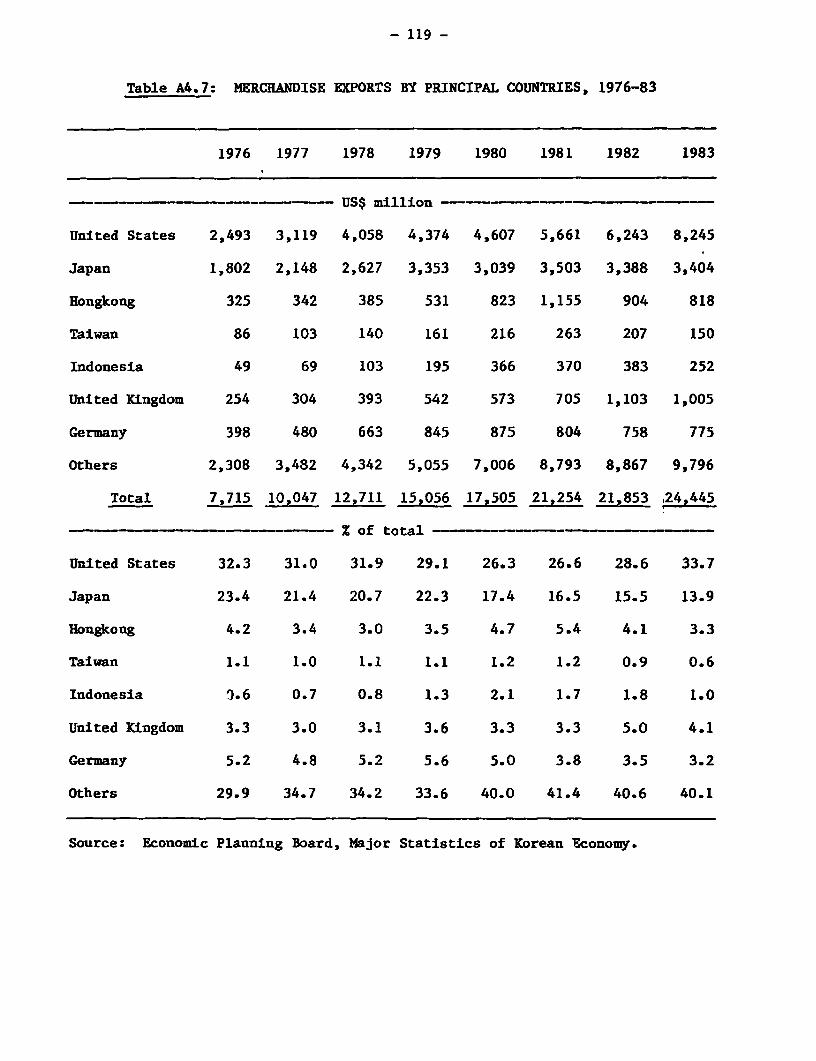
- 119 -
Table A4.7: MERCHANDISE EXPORTS BY PRINCIPAL COUNTRIES, 1976-83
1976 1977 1978 1979 1980 1981 1982 1983
US$ million ---
United States 2,493 3,119 4,058 4,374 4,607 5,661 6,243 8,245
Japan 1,802 2,148 2,627 3,353 3,039 3,503 3,388 3,404
Hongkong 325 342 385 531 823 1,155 904 818
Taiwan 86 103 140 161 216 263 207 150
Indonesia 49 69 103 195 366 370 383 252
United Kingdom 254 304 393 542 573 705 1,103 1,005
Germany 398 480 663 845 875 804 758 775
Others 2,308 3,482 4,342 5,055 7,006 8,793 8,867 9,796
Total 7,715 10,047 12,711 15,056 17,505 21,254 21,853 .24,445
= =Z--v of total -
United States 32.3 31.0 31.9 29.1 26.3 26.6 28.6 33.7
Japan 23.4 21.4 20.7 22.3 17.4 16.5 15.5 13.9
Hongkong 4.2 3.4 3.0 3.5 4.7 5.4 4.1 3.3
Taiwan 1.1 1.0 1.1 1.1 1.2 1.2 0.9 0.6
Indonesia 0.6 0.7 0.8 1.3 2.1 1.7 1.8 1.0
United Kingdom 3.3 3.0 3.1 3.6 3.3 3.3 5.0 4.1
Germany 5.2 4.8 5.2 5.6 5.0 3.8 3.5 3.2
Others 29.9 34.7 34.2 33.6 40.0 41.4 40.6 40.1
Source: Economic Planning Board, Major Statistics of Korean Economy.
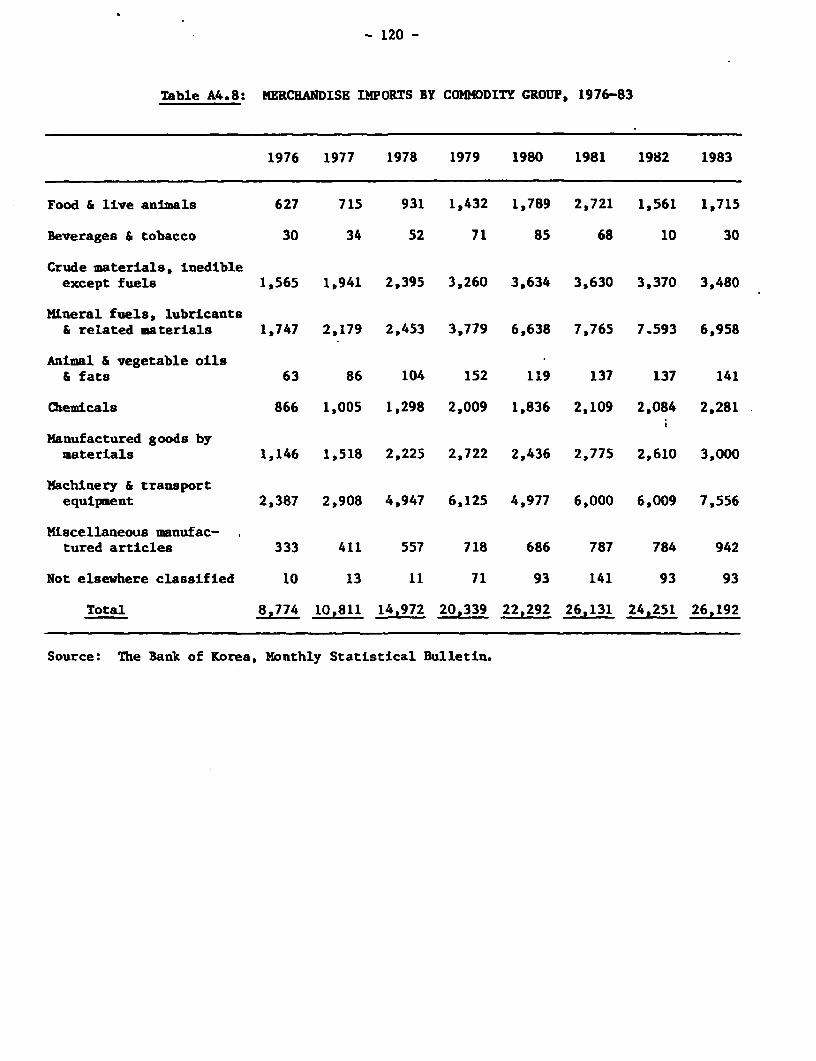
- 120 -
Table A4.8: MERCHANDISE IMPORTS BY COMMODITY GROUP, 1976-83
1976 1977 1978 1979 1980 1981 1982 1983
Food & live animals 627 715 931 1,432 1,789 2,721 1,561 1,715
Beverages & tobacco 30 34 52 71 85 68 10 30
Crude materials, inedibleexcept fuels 1,565 1,941 2,395 3,260 3,634 3,630 3,370 3,480
Mineral fuels, lubricants& related materials 1,747 2,179 2,453 3,779 6,638 7,765 7.593 6,958
Animal & vegetable oils& fats 63 86 104 152 119 137 137 141
Chemicals 866 1,005 1,298 2,009 1,836 2,109 2,084 2,281
Manufactured goods bymaterials 1,146 1,518 2,225 2,722 2,436 2,775 2,610 3,000
M-achinery & transportequipment 2,387 2,908 4,947 6,125 4,977 6,000 6,009 7,556
Miscellaneous manufac-tured articles 333 411 557 718 686 787 784 942
Not elsewhere classified 10 13 11 71 93 141 93 93
Total 8,774 10,811 14,972 20,339 22,292 26,131 24,251 26,192
Source: The Bank of Korea, Monthly Statistical Bulletin.
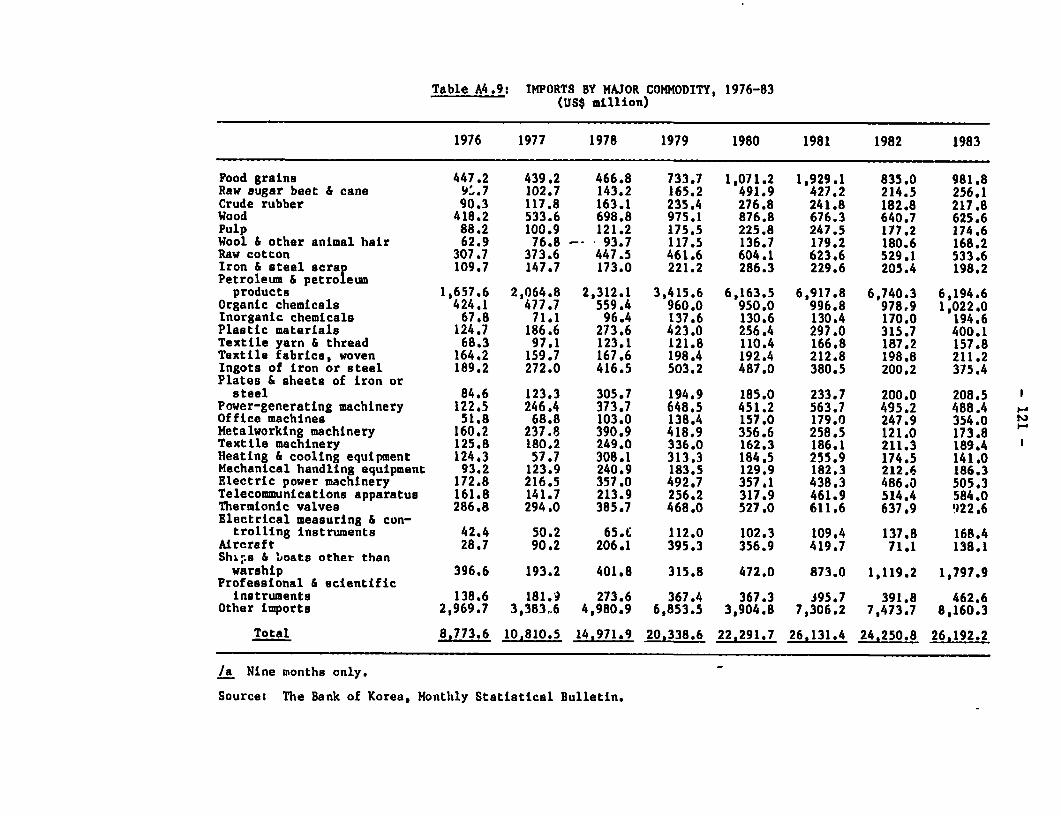
Table A4,9: IMPORTS BY MAJOR COMMODITY, 1976-83(US$ million)
1976 1977 1978 1979 1980 1981 1982 1983
Food grains 447.2 439.2 466.8 733.7 1,071.2 1,929.1 835.0 981.8Raw sugar beet & cane 9J.7 102.7 143.2 165.2 491.9 427.2 214.5 256.1Crude rubber 90.3 117.8 163.1 235.4 276.8 241.8 182.8 217.8Wood 418.2 533.6 698.8 975.1 876,8 676.3 640.7 625.6Pulp 88.2 100.9 121.2 175.5 225.8 247.5 177.2 174.6Wool & other animal hair 62.9 76.8 -- 93.7 117.5 136.7 179.2 180.6 168.2Raw cotton 307.7 373.6 447.5 461.6 604.1 623,6 529.1 533.6Iron & steel scrap 109.7 147.7 173.0 221.2 286.3 229.6 205.4 198.2Petroleum & petroleumproducts 1,657.6 2,064.8 2,312.1 3,415.6 6,163.5 6,917.8 6,740.3 6,194.6
Organic chemicals 424.1 477.7 559.4 960.0 950.0 996.8 978.9 1,022.0Inorganic chemicals 67,8 71.1 96.4 137.6 130.6 130.4 170.0 194.6Plastic materials 124.7 186.6 273.6 423.0 256.4 297.0 315.7 400.1Textile yarn & thread 68.3 97.1 123.1 121.8 110.4 166.8 187.2 157.8Textile fabrics, woven 164.2 159.7 167.6 198.4 192.4 212.8 198.8 211.2Ingots of iron or steel 189.2 272.0 416.5 503.2 487.0 380.5 200,2 375.4Plates & sheets of iron orsteel 84.6 123.3 305.7 194.9 185.0 233.7 200.0 208.5
Power-generating machinery 122.5 246.4 373.7 648.5 451.2 563.7 495.2 488.4 -Office machines 51.8 68.8 103.0 138.4 157.0 179.0 247.9 354.0 0Metalworking machinery 160.2 237.8 390.9 418.9 356.6 258.5 121.0 173.8Textile machinery 125.8 180.2 249.0 336.0 162.3 186.1 211.3 189.4Heating & cooling equipment 124.3 57.7 308.1 313.3 184.5 255.9 174.5 141.0Mechanical handling equipment 93.2 123.9 240.9 183.5 129.9 182.3 212.6 186.3Electric power machinery 172.8 216.5 357.0 492.7 357.1 438.3 486.0 505,3Telecommunications apparatus 161.8 141.7 213.9 256.2 317.9 461.9 514.4 584.0Thermionic valves 286.8 294.0 385.7 468.0 527.0 611,6 637.9 922.6Electrical measuring & con-trolling instruments 42.4 50.2 65.6 112.0 102.3 109.4 137.8 168.4
Aircraft 28,7 90.2 206.1 395.3 356.9 419.7 71.1 138.1Shx,a & boats other thanwarship 396.6 193.2 401.8 315.8 472.0 873.0 1,119.2 1,797.9
Professional & scientificinstruments 138.6 181.9 273.6 367.4 367.3 395,7 391.8 462.6
Other imports 2,969.7 3,383.6 4,980.9 6,853.5 3,904.8 7,306.2 7,473.7 8,160.3
Total 8,773.6 10,810,S 14,971.9 20,338.6 22,291.7 26,131.4 24.250.8 26,192.2
/a Nine months only.
Source: The Bank of Korea, Monthly Statistical Bulletin.
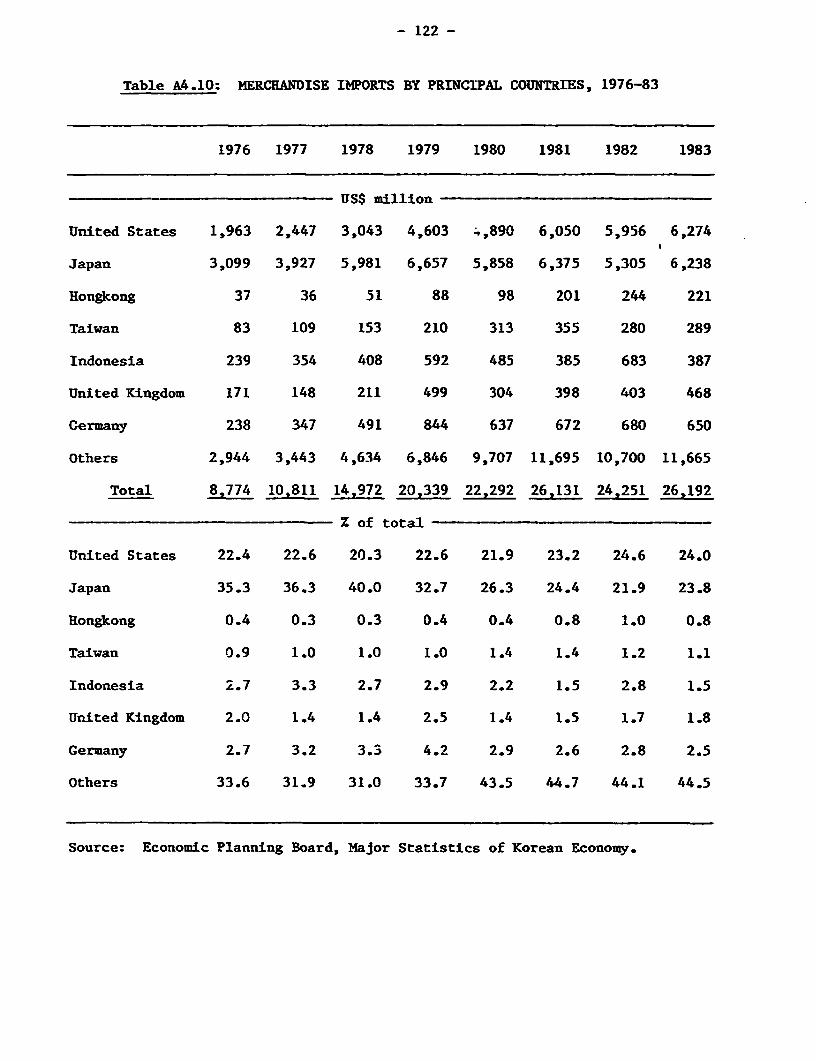
- 122 -
Table A4.10: MERCHANDISE IMPORTS BY PRINCIPAL COUNTRIES, 1976-83
1976 1977 1978 1979 1980 1981 1982 1983
US$ million
United States 1,963 2,447 3,043 4,603 .,890 6,050 5,956 6,274
Japan 3,099 3,927 5,981 6,657 5,858 6,375 5,305 6,238
Hongkong 37 36 51 88 98 201 244 221
Taiwan 83 109 153 210 313 355 280 289
Indonesia 239 354 408 592 485 385 683 387
United Kingdom 171 148 211 499 304 398 403 468
Germany 238 347 491 844 637 672 680 650
Others 2,944 3,443 4,634 6,846 9,707 11,695 10,700 11,665
Total 8,774 10.811 14,972 20.339 22,292 26,131 24,251 26,192
Z of total
United States 22.4 22.6 20.3 22.6 21.9 23.2 24.6 24.0
Japan 35.3 36.3 40.0 32.7 26.3 24.4 21.9 23.8
Hongkong 0.4 0.3 0.3 0.4 0.4 0.8 1.0 0.8
Taiwan 0.9 1.0 1.0 1.0 1.4 1.4 1.2 1.1
Indonesia 2.7 3.3 2.7 2.9 2.2 1.5 2.8 1.5
United Kingdom 2.0 1.4 1.4 2.5 1.4 1.5 1.7 1.8
Germany 2.7 3.2 3.3 4.2 2.9 2.6 2.8 2.5
Others 33.6 31.9 31.0 33.7 43.5 44.7 44.1 44.5
Source: Economic Planning Board, Major Statistics of Korean Economy.
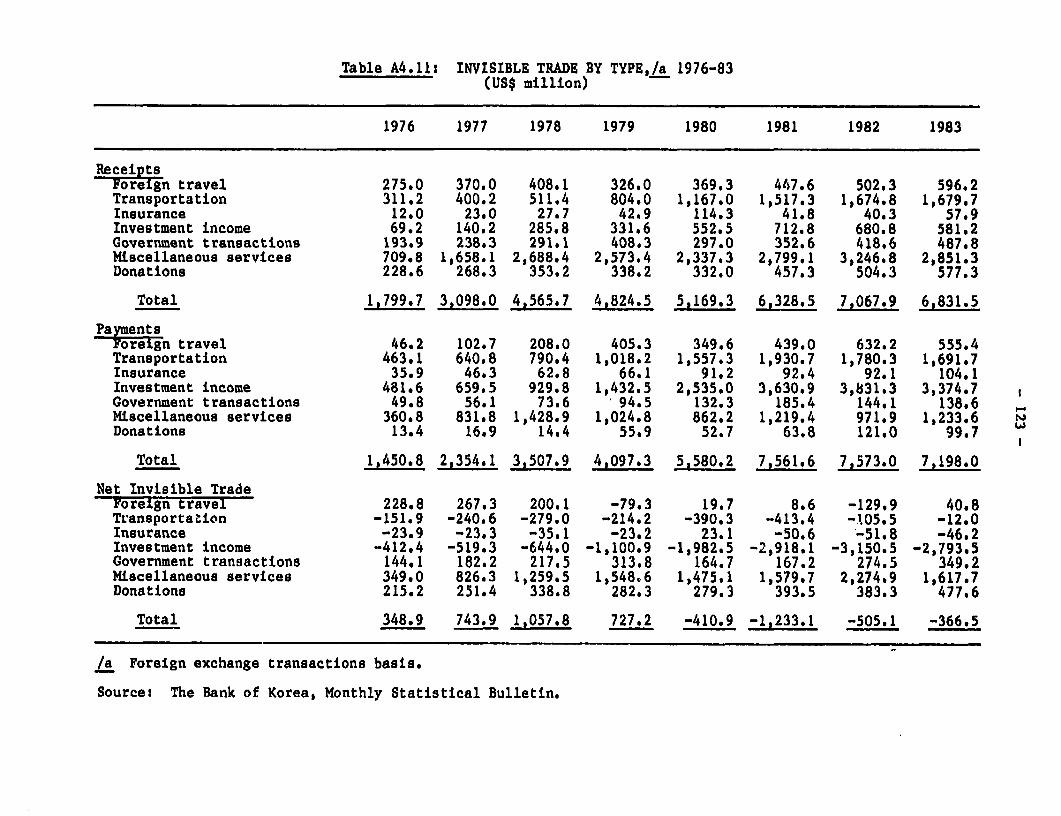
Table A4.11: INVISIBLE TRADE BY TYPE,/a 1976-83(US$ million)
1976 1977 1978 1979 1980 1981 1982 1983
ReceiptsForeghn travel 275.0 370.0 408.1 326.0 369.3 447.6 502.3 596.2Transportation 311.2 400.2 511.4 804.0 1,167.0 1,517.3 1,674.8 1,679.7Insurance 12.0 23.0 27.7 42.9 114.3 41.8 40.3 57.9Investment income 69.2 140.2 285.8 331.6 552.5 712.8 680.8 581.2Government transactions 193.9 238.3 291.1 408.3 297.0 352.6 418.6 487.8Miscellaneous services 709.8 1,658.1 2,688.4 2,573.4 2,337.3 2,799.1 3,246.8 2,851.3Donations 228.6 268.3 353.2 338.2 332.0 457.3 504.3 577.3
Total 19799.7 3,098.0 4,565.7 4,824.5 5,169.3 69328.5 7067.9 6,831.5
PaymentsForeign travel 46.2 102.7 208.0 405.3 349.6 439.0 632.2 555.4Transportation 463.1 640.8 790.4 1,018.2 1,557.3 1,930.7 1,780.3 1,691.7Insurance 35.9 46.3 62.8 66.1 91.2 92.4 92.1 104.1Investment income 481.6 659.5 929.8 1,432.5 2,535.0 3,630.9 3,831.3 3,374.7Government transactions 49.8 56.1 73.6 94.5 132.3 185.4 144.1 138.6Miscellaneous services 360.8 831.8 1,428.9 1,024.8 862.2 1,219.4 971.9 1,233.6Donations 13.4 16.9 14.4 55.9 52.7 63.8 121.0 99.7
Total 1,450.8 2,354.1 3,507.9 4,097.3 5,580.2 7,561.6 7,573.0 7,198.0
Net Invisible TradeForeign travel 228.8 267.3 200.1 -79.3 19.7 8.6 -129.9 40.8Transportation -151.9 -240.6 -279.0 -214.2 -390.3 -413.4 -105.5 -12.0Insurance -23.9 -23.3 -35.1 -23.2 23.1 -50.6 -51.8 -46.2Investment income -412.4 -519.3 -644.0 -1,100.9 -1,982.5 -2,918.1 -3,150.5 -2,793.5Government transactions 144.1 182.2 217.5 313.8 164.7 167.2 274.5 349.2Miscellaneous services 349.0 826.3 1,259.5 1,548.6 1,475.1 1,579.7 2,274.9 1,617.7Donations 215.2 251.4 338.8 282.3 279.3 393.5 383.3 477.6
Total 348.9 743.9 1,057.8 727.2 -410.9 -1,233.1 -505.1 -366.5
/a Foreign exchange transactions basis.
Source: The Bank of Korea, Monthly Statistical Bulletin.

- 124 -
Table A4.12: INVESTMENT INCOOECUS$ million)
1976 1977 1978 1979 1980 1981 1982 1983p
Receipts-Private sector 69.2 140.2 285.8 331.6 552.5 712.8 680.8 581.2Interest /a 67.6 127.3 256.5 280.2 459.9 653.6 599.2 509.4Profits of branches 0.2 4.6 4.5 12.1 21.7 22.5 45.8 33.6Other 1.4 8.3 24.8 39.3 70.9 36.7 35.8 38.2
PaymentsPrivate sector 405.6 540.2 754.2 1,190.1 2,214.6 3,247.2 3,417.7 2,907.1Interest /b 356.7 480.7 682.9 1,111.0 2,101.3 3,079.0 3,276.8 2,809.8Profits of branches 3.7 5.3 3.9 8.5 18.0 30.1 13.7 37.5Dividends 32.8 51.6 52.5 39.7 46.0 49.1 33.4 59.8
Public sectorInterest 75.9 119.3 175.6 242.4 320.5 383.7 413.6 513.8/c
Subtotal 481.8 659.5 929.8 1,432.5 2,535.1 3,630.9 3,831.3 3,420.9
Net InvestmentI-come -412.3 -519.3 -644.0 -1.100.9 -1,982.6 -2,918.1 -3,150.5 -2,839.7
Private sector -336.4 -400.0 -468.4 -858.5 -1,662.1 -2,534.4 -2,736.9 -2,325.9Public sector -75.9 -119.3 -175.6 -242.4 -320.5 -383.7 -413.6 -513.8
la Includes interest receipts on foreign bonds, buyers' credits and intrabank loans.
lb Includes interest payments on commercial loars, intrabank loans and other short-term loans.
/c Interest payments on public loans.
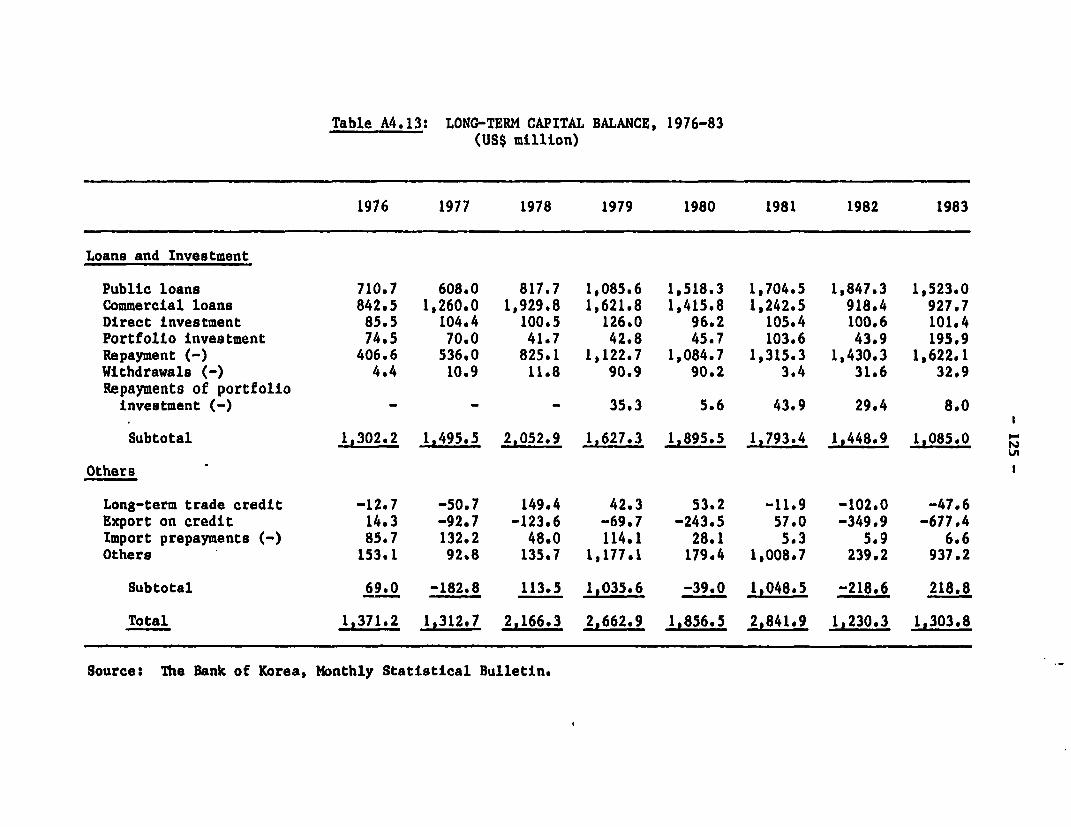
Table A4.13: LONG-TERM CAPITAL BALANCE, 1976-83(US$ million)
1916 1977 1978 1979 1980 1981 1982 1983
Loans and Investment
Public loans 710.7 608.0 817.7 1,085.6 1,518.3 1,704.5 1,847.3 1,523.0Commercial loans 842.5 1,260.0 1,929.8 1,621.8 1,415.8 1,242.5 918.4 927.7Direct investment 85.5 104.4 100.5 126.0 96.2 105.4 100.6 101.4Portfolio investment 74.5 70.0 41.7 42.8 45.7 103.6 43.9 195.9Repayment (-) 406.6 536.0 825.1 1,122.7 1,084.7 1,315.3 1,430.3 1,622.1Withdrawals (-) 4.4 10.9 11.8 90.9 90.2 3.4 31.6 32.9Repayments of portfolioinvestment (-) - - - 35.3 5.6 43.9 29.4 8.0
Subtotal 1302.2 ,495.5 2,052.9 1 627.3 1,895.5 1,793.4 1,448.9 1,085, 0
Others
Long-term trade credit -12.7 -50.7 149.4 42.3 53.2 -11.9 -102.0 -47.6Export on credit 14.3 -92.7 -123.6 -69.7 -243.5 57.0 -349.9 -677.4Import prepayments (-) 85.7 132.2 48.0 114.1 28.1 5.3 5.9 6.6Others 153.1 92.8 135.7 1,177.1 179.4 1,008.7 239.2 937.2
Subtotal 69.0 -182.8 113.5 1,035.6 -39.0 1,048.5 -218.6 218.8
Total 1,371.2 1,312.7 2,166.3 2,662.9 1,856.5 2,841.9 1,230.3 1,303.8
Source: The Bank of Korea, Monthly Statistical Bulletin.

- 126 -
Table A4.14: INTERNATIONAL RESERVES, 1977-83(US$ million)
End of period: 1977 1978 1979 1980 1981 1982 1983
Monetary Authorities
Cold 6 30 31 31 32 31 31
SDRs 12 15 25 13 64 62 64
Reserve position in the Fund
Foreign exchange 2,955 2,734 2,909 2,912 2,619 2,744 2,283
Subtotal 2,973 2,973 2,990 2,956 2,715 2,837 2,378
Commercial banks 1,333 2,144 2,718 3,615 4,176 4,147 4,532
Gross International Reserves 4,306 4,937 5,708 6,571 6,891 6,984 6,910
Gross international reserves inmillions of SDRs /a 3,545 3,790 4,333 5,152 5,920 6,331 6,612
Gross international reserves inmonths of imports of goods andservices 3.9 3.2 2.8 2.8 2.6 2.7
/a Converted with end-of-period exchange rate.
Sources: Bank of Korea; INF, International Financial Statistics.
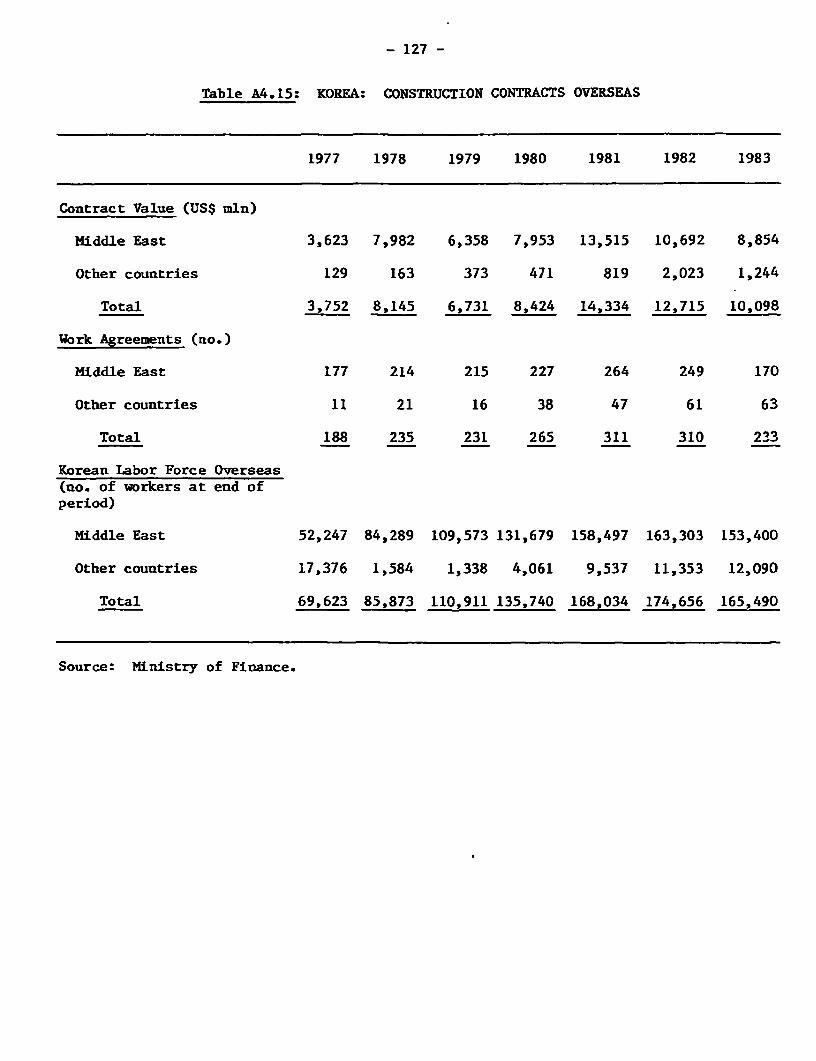
- 127 -
Table A4.15: KOREA: CONSTRUCTION CONTRACTS OVERSEAS
1977 1978 1979 1980 1981 1982 1983
Contract Value (USS mln)
Middle East 3,623 7,982 6,358 7,953 13,515 10,692 8,854
Other countries 129 163 373 471 819 2,023 1,244
Total 3,752 8,145 6,731 8,424 14,334 12,715 10,098
Work Agreements (no.)
Middle East 177 214 215 227 264 249 170
Other countries 11 21 16 38 47 61 63
Total 188 235 231 265 311 310 233
Korean Labor Force Overseas(no. of workers at end ofperiod)
Middle East 52,247 84,289 109,573 131,679 158,497 163,303 153,400
Other countries 17,376 1,584 1,338 4,061 9,537 11,353 12,090
Total 69,623 85,873 110,911 135,740 168,034 174,656 165,490
Source: Ministry of Finance.

- 126 -
Table A5.1: OUTSTANDING EXTERNAL DEBT BY MATURITYAND BORROWER, 1977-83 /a
1977 1978 1979 1980 1981 1982 1983P
Debt with maturity of more than 8,242 10,270 13,199 15,424 18,881 21,352 23,604three yearsFinancial institutions 3,299 4,057 5,132 5,818 6,653 8,115 9,049Public sector 3,837 5,079 5,707 6,269 6,536 6,401 6,266Private sector 1,106 1,134 2,360 3,337 5,692 6,836 8,289
Debt with maturities of one to 350 483 561 617 602 488 1,078three years
Short-term debt of the private 1,828 1,041 2,251 4,158 4,110 4,001 4,947sector /bTrade credits 1,492 840 1,811 3,436 3,454 3,339 4,114Borrowing for oil bill - - - 367 371 447 584Others 336 201 440 355 285 215 249
Subtotal 10,420 11,794 16,011 20,199 23,593 25,841 29,629
Short-term debt of financial 1,095 1,552 2,400 3,417 4,376 6,287 5,639sector
Refinanced 695 1,216 2,028 2,770 3,892 5,038 4,740Deposits 326 128 143 200 252 245 263Others 74 208 229 447 232 1,004 636Interoffice "A" account of 792 1,262 1,951 3,036 3,275 3,908 3,489foreign bank branches
Use of fund credit 341 263 138 713 1,246 1,259 1,354
Total 12,648 14,871 20,500 27,365 32,490 37,295 40,111
Memorandum item
Undisbursed loans with maturity 2,098 3,020 4,191 3,332 5,025 4.252 4,298of more than three years /a
P - Preliminary
/a Public and commercial loan and Bank loan.
Source: Ministry of Finance.
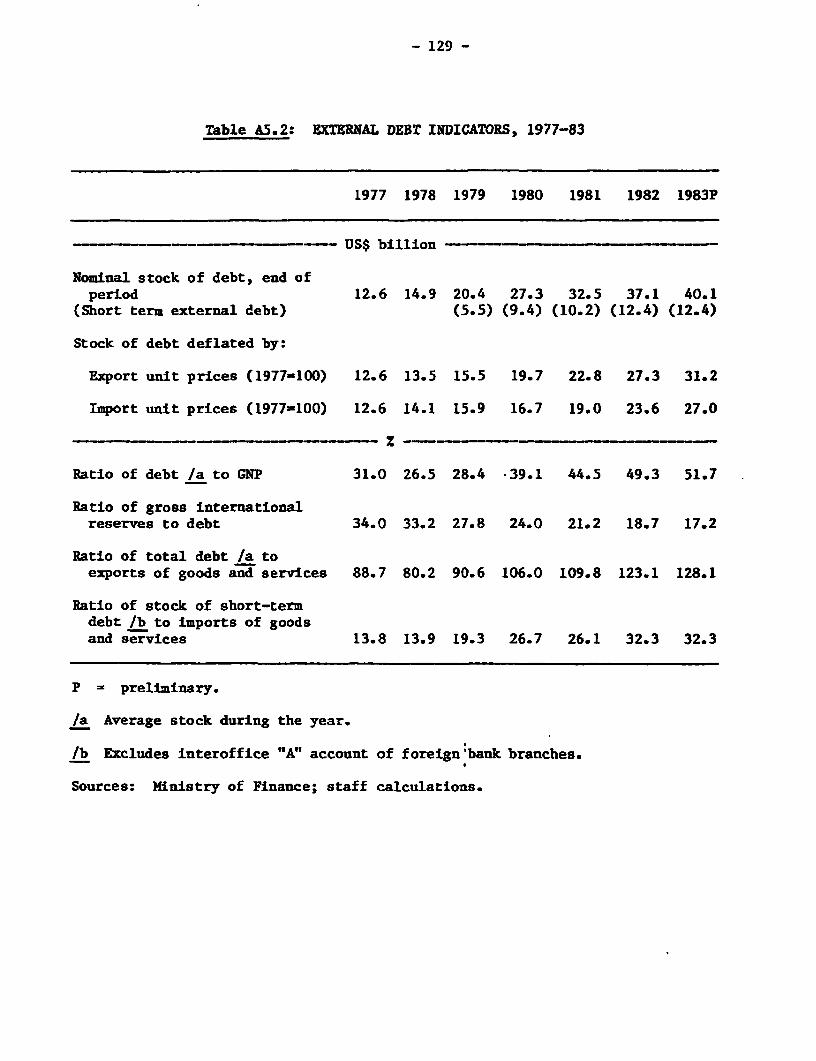
- 129 -
Table A5.2: EXTERNAL DEBT INDICATORS, 1977-83
1977 1978 1979 1980 1981 1982 1983P
US$ billion
Nominal stock of debt, end ofperiod 12.6 14.9 20.4 27.3 32.5 37.1 40.1
(Short term external debt) (5.5) (9.4) (10.2) (12.4) (12.4)
Stock of debt deflated by:
Export unit prices (1977-100) 12.6 13.5 15.5 19.7 22.8 27.3 31.2
Import unit prices (1977-100) 12.6 14.1 15.9 16.7 19.0 23.6 27.0
Ratio of debt /a to GNP 31.0 26.5 28.4 39.1 44.5 49.3 51.7
Ratio of gross internationalreserves to debt 34.0 33.2 27.8 24.0 21.2 18.7 17.2
Ratio of total debt /a toexports of goods and services 88.7 80.2 90.6 106.0 109.8 123.1 128.1
Ratio of stock of short-termdebt /b to imports of goodsand services 13.8 13.9 19.3 26.7 26.1 32.3 32.3
P = preliminary.
/a Average stock during the year.
/b Excludes interoffice "A" account of foreign'bank branches.
Sources: Ministry of Finance; staff calculations.
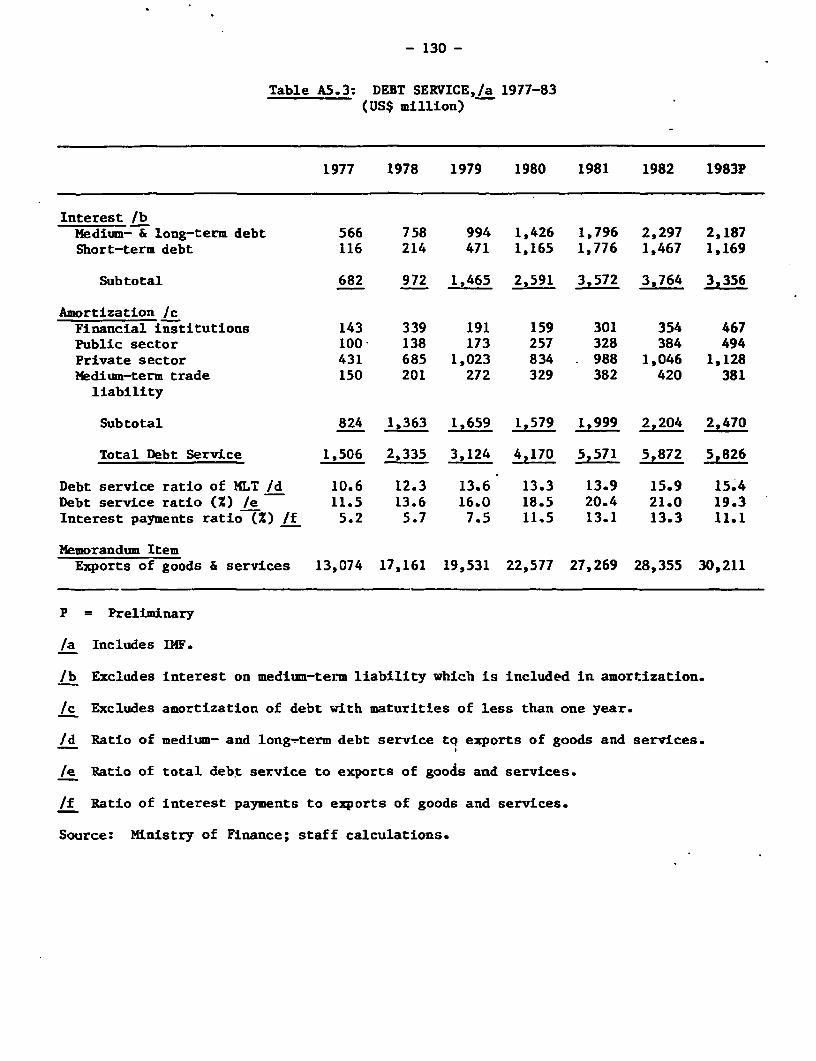
- 130 -
Table A5.3: DEBT SERVICE,/a 1977-83(US$ million)
1977 1978 1979 1980 1981 1982 1983P
Interest /bMedium- & long-term debt 566 758 994 1,426 1,796 2,297 2,187Short-term debt 116 214 471 1,165 1,776 1,467 1,169
Subtotal 682 972 1,465 2,591 3,572 3,764 3,356
Amortization /cFinancial institutions 143 339 191 159 301 354 467Public sector 100 138 173 257 328 384 494Private sector 431 685 1,023 834 988 1,046 1,128Medium-term trade 150 201 272 329 382 420 381liability
Subtotal 824 1,363 1,659 1,579 1,999 2,204 2,470
Total Debt Service 1,506 2,335 3,124 4,170 5,571 5,872 5,826
Debt service ratio of MLT /d 10.6 12.3 13.6 13.3 13.9 15.9 15.4Debt service ratio (X) /e 11.5 13.6 16.0 18.5 20.4 21.0 19.3Interest payments ratio (%) /f 5.2 5.7 7.5 11.5 13.1 13.3 11.1
Memorandum ItemExports of goods & services 13,074 17,161 19,531 22,577 27,269 28,355 30,211
P = Preliminary
/a Includes IMF.
/b Excludes interest on medium-term liability which is included in amortization.
/c Excludes amortization of debt with maturities of less than one year.
/d Ratio of medium- and long-term debt service tQ exports of goods and services.
/e Ratio of total debt service to exports of goods and services.
/f Ratio of interest payments to exports of goods and services.
Source: Ministry of Finance; staff calculations.
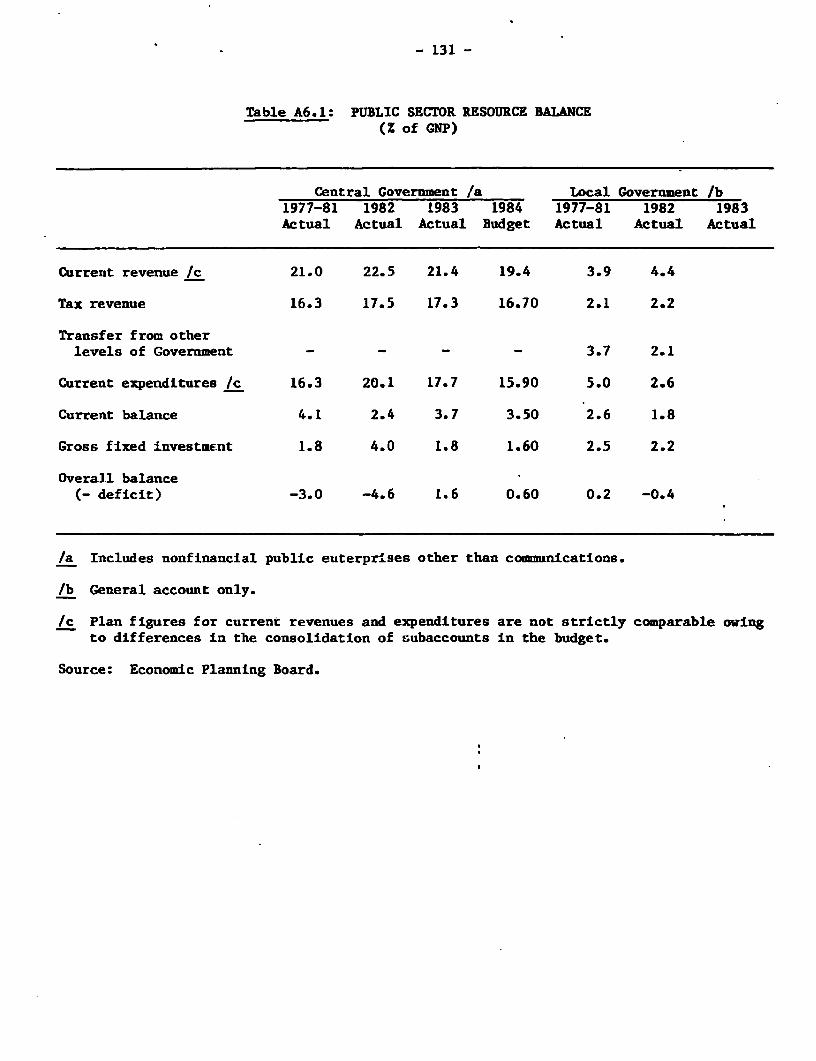
- 131 -
Table A6.1: PUBLIC SECTOR RESOURCE BALANCE(Z of GNP)
Central Government /a Local Government /b1977-81 1982 1983 1984 1977-81 1982 1983Actual Actual Actual Budget Actual Actual Actual
Current revenue /c 21.0 22.5 21.4 19.4 3.9 4.4
Tax revenue 16.3 17.5 17.3 16.70 2.1 2.2
Transfer from otherlevels of Government - - - - 3.7 2.1
Current expenditures /c 16.3 20.1 17.7 15.90 5.0 2.6
Current balance 4.1 2.4 3.7 3.50 2.6 1.8
Gross fixed investment 1.8 4.0 1.8 1.60 2.5 2.2
OveralI balanced- eficit) -3.0 -4.6 1.6 0.60 0.2 -0.4
/a Includes nonfinancial public euterprises other than communications.
/b General account only.
Ic Plan figures for current revenues and expenditures are not strictly comparable owingto differences in the consolidation of subaccounts in the budget.
Source: Economic Planning Board.
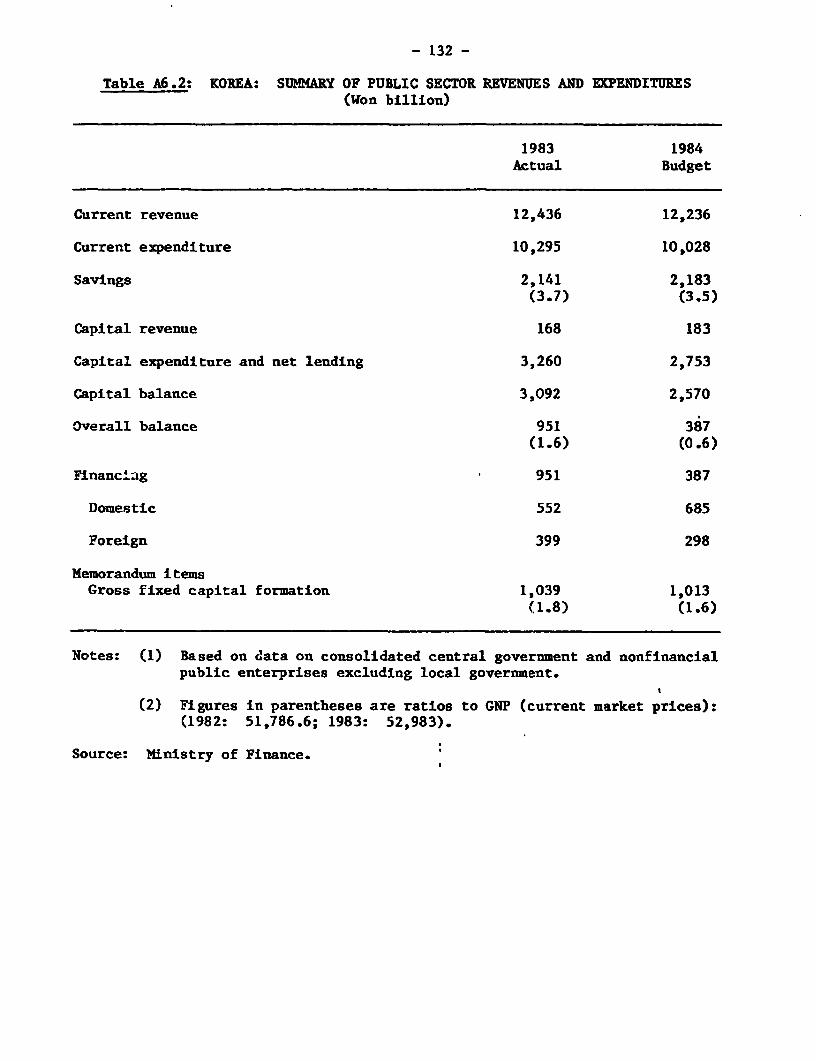
- 132 -
Table A6.2: KOREA: SUMMARY OF PUBLIC SECTOR REVENUES AND EXPENDITURES(Won billion)
1983 1984Actual Budget
Current revenue 12,436 12,236
Current expenditure 10,295 10,028
Savings 2,141 2,183(3.7) (3.5)
Capital revenue 168 183
Capital expenditure and net lending 3,260 2,753
Capital balance 3,092 2,570
Overall balance 951 387(1.6) (0.6)
Financ4ag 951 387
Domestic 552 685
Foreign 399 298
Memorandum itemsGross fixed capital formation 1,039 1,013
(1.8) (1.6)
Notes: (1) Based on data on consolidated central government and nonfinancialpublic enterprises excluding local government.
(2) Figures in parentheses are ratios to GNP (current market prices):(1982: 51,786.6; 1983: 52,983).
Source: Ministry of Finance.
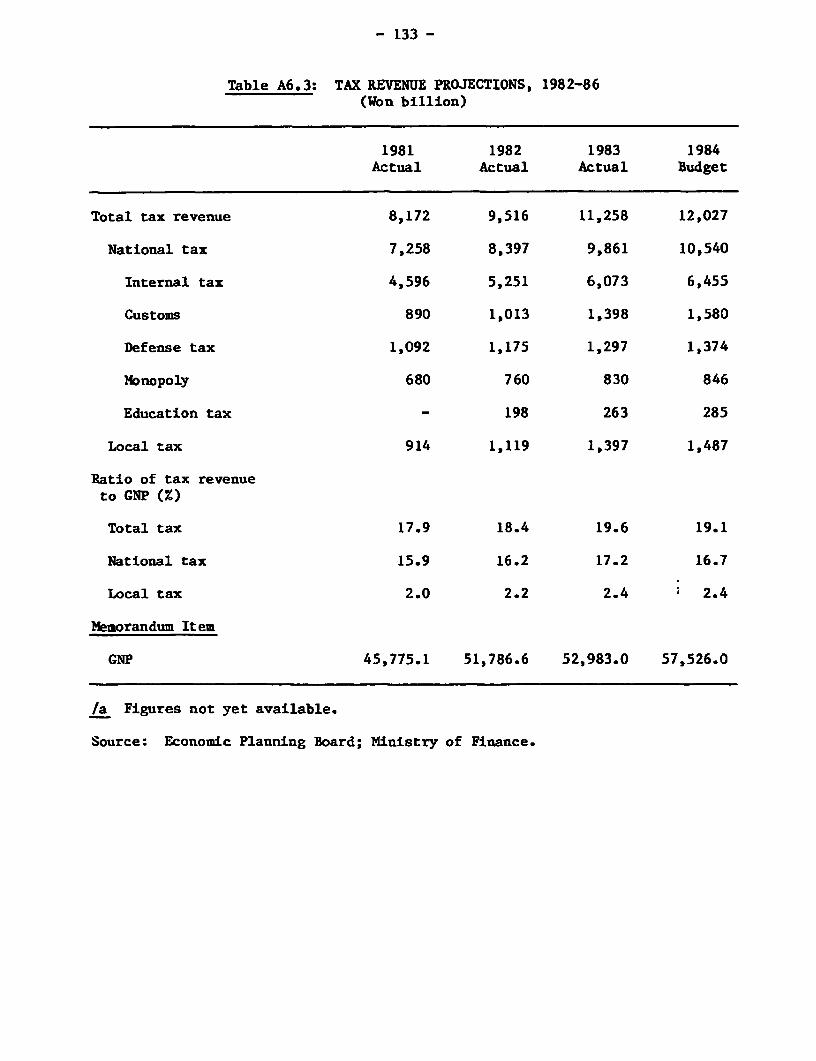
- 133 -
Table A6.3: TAX REVENUE PROJECTIONS, 1982-86(Won billion)
1981 1982 1983 1984Actual Actual Actual Budget
Total tax revenue 8,172 9,516 11,258 12,027
National tax 7,258 8,397 9,861 10,540
Internal tax 4,596 5,251 6,073 6,455
Customs 890 1,013 1,398 1,580
Defense tax 1,092 1,175 1,297 1,374
Monopoly 680 760 830 846
Education tax - 198 263 285
Local tax 914 1,119 1,397 1,487
Ratio of tax revenueto GNP (M)
Total tax 17.9 18.4 19.6 19.1
National tax 15.9 16.2 17.2 16.7
Local tax 2.0 2.2 2.4 2.4
Memorandum Item
GNP 45,775.1 51,786.6 52,983.0 57,526.0
/a Figures not yet available.
Source: Economic Planning Board; Ministry of Finance.
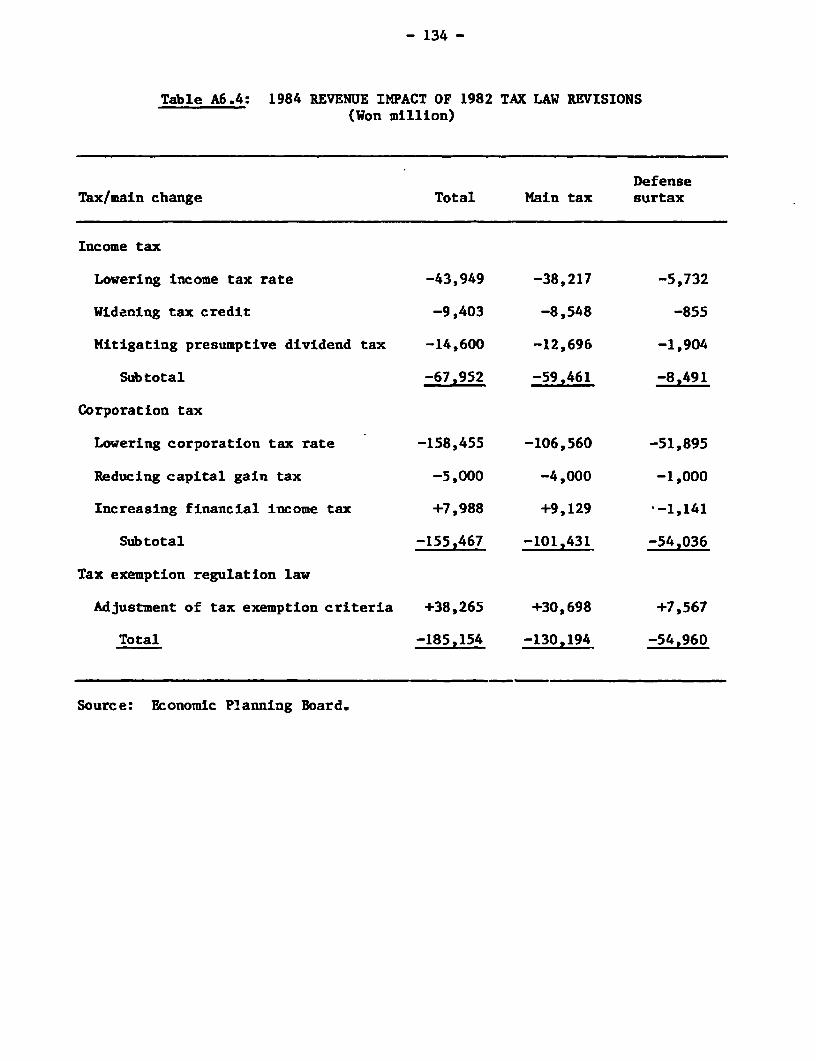
- 134 -
Table A6.4: 1984 REVENUE IMPACT OF 1982 TAX LAW REVISIONS(Won million)
DefenseTax/main change Total Main tax surtax
Income tax
Lowering income tax rate -43,949 -38,217 -5,732
Widening tax credit -9,403 -8,548 -855
Mitigating presumptive dividend tax -14,600 -12,696 -1,904
Subtotal -67,952 -59,461 -8,491
Corporation tax
Lowering corporation tax rate -158,455 -106,560 -51,895
Reducing capital gain tax -5,000 -4,000 -1,000
Increasing financial income tax +7,988 +9,129 -1,141
Sub total -155,467 -101,431 -54,036
Tax exemption regulation law
Adjustment of tax exemption criteria +38,265 +30,698 +7,567
Total -185,154 -130,194 -54,960
Source: Economic Planning Board.
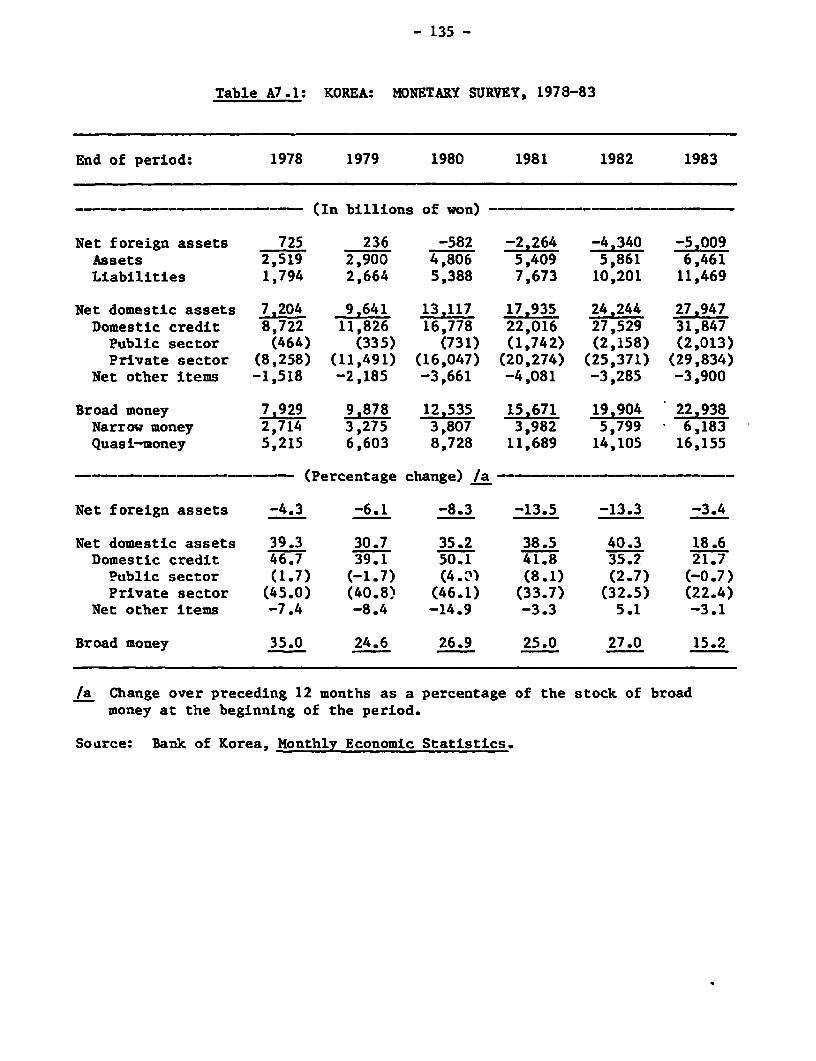
- 135 -
Table A7.1: KOREA: MONETARY SURVEY, 1978-83
End of period: 1978 1979 1980 1981 1982 1983
-- (In billions of won)
Net foreign assets 725 236 -582 -2.264 -4.340 -5,009Assets 2,519 2,900 4,806 5,409 5,861 6,461Liabilities 1,794 2,664 5,388 7,673 10,201 11,469
Net domestic assets 7,204 9,641 13,117 17,935 24,244 27,947Domestic credit 8,722 11,826 16,778 22,016 27,529 31,847Public sector (464) (335) (731) (1,742) (2,158) (2,013)Private sector (8,258) (11,491) (16,047) (20,274) (25,371) (29,834)
Net other items -1,518 -2,185 -3,661 -4,081 -3,285 -3,900
Broad money 7,929 9,878 12,535 15,671 19,904 22,938Narrow money 2,714 3,275 3,807 3,982 5,799 6,183Quasi-money 5,215 6,603 8,728 11,689 14,105 16,155
-…- - --- (Percentage change) /a
Net foreign assets -4.3 -6.1 -8.3 -13.5 -13.3 -3.4
Net domestic assets 39.3 30.7 35.2 38.5 40.3 18.6Domestic credit 46.7 39.1 50.1 41.8 35.2 21.7Public sector (1.7) (-1.7) (4.3) (8.1) (2.7) (-0.7)Private sector (45.0) (40.8) (46.1) (33.7) (32.5) (22.4)
Net other items -7.4 -8.4 -14.9 -3.3 5.1 -3.1
Broad money 35.0 24.6 26.9 25.0 27.0 15.2
/a Change over preceding 12 months as a percentage of the stock of broadmoney at the beginning of the period.
Souirce: Bank of Korea, Monthly Economic Statistics.

- 136 -
Table A7.2: SELECTED INTEREST RATES, DEPOSIT MONEY BANKS, 1979-83(% p.a.)
1979 1980 1981 1982 1983 1983Effective from: Sep Nov Nov Nov Apr Nov
Household checking deposits -/a - 14.4/b 8.0 8.0 8.0
Notice deposits (more than 30 days) 10.0 10.5 8.3 -/c - -
Time depositsOver 3 months 15.0 14.8 14.8 7.6 7.6 7.6Over 6 months 17.1 16.9 15.2 7.6 7.6 7.6Over 1 year 18.6 19.5 17.4 8.0 8.0 8.0
Savings depositsLess than 30 days 5.5 5.5 14.4 8.0 8.0 8.0More than 30 days 12.6 12.3 14.4
Installment savings deposits, 3 years 18.2 19.5 17.3 8.0 8.0 8.0(22.5)/d (20.3)/c
Workmen's wealth acclmilationdeposits /e
2 years 25.7 28.4 28.4 19.5 19.5 19.55 years 30.2 33.6 33.6 21.0 21.0 21.0
Memorandum ItemsSelected interest rates on depositsof nonbank financial institutionsInvestment and financial companiesBLlls resold: 1-29 days 20.6 19.2 18.1 9.0 8.5 8.5
60-90 days 24.6 23.1 20.0 11.0 10.5 10.5Mutual credit cooperatives - timedeposits, 1 year 19.8 22.5 19.5 9.0 9.0 9.0
/a Interest rate of 6.0X between April 1977 and April 1979.7F Established in June 1982.T Abolished from June 1982.7d7 Special interest rate on household deposits.T These rates include only the interest paid by banks and the government sub-
sidy. In addition, employees are encouraged to contribute to the yield on theseassets.
Sources: Bank of Korea, Monthly Statistical Bulletin; and data provided by theKorean authorities.
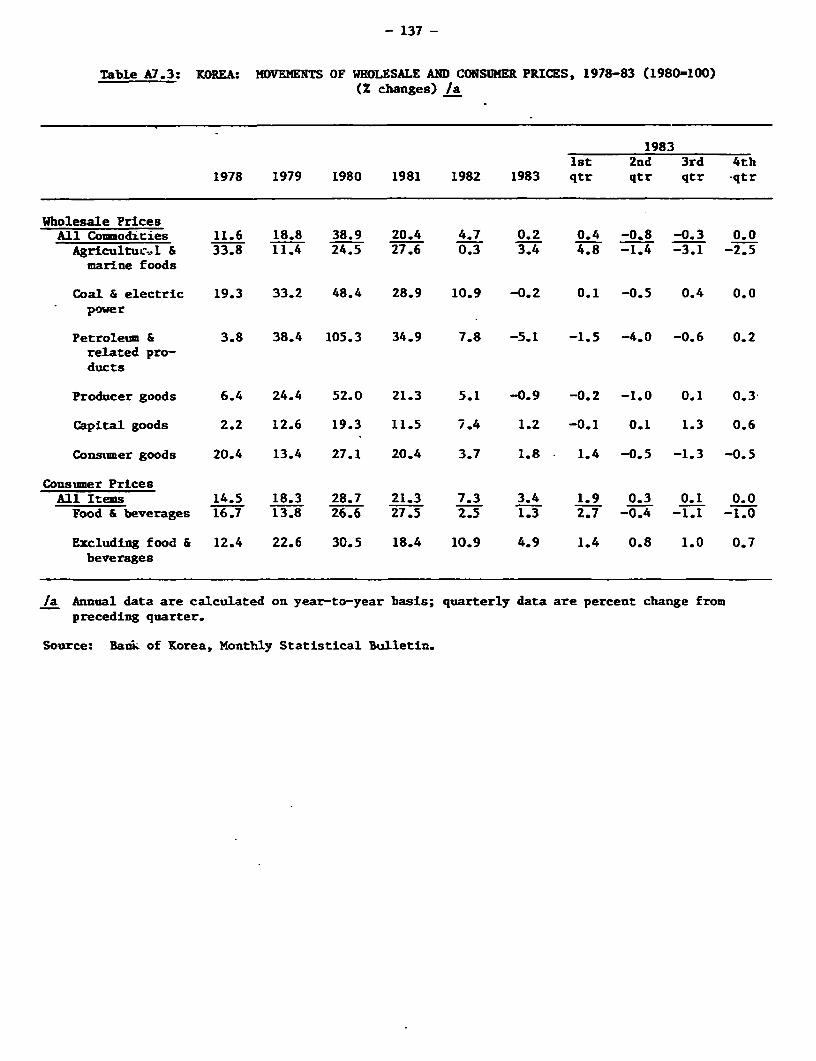
- 137 -
Table A7.3: KOREA: MOVEMENTS OF WHOLESALE AND CONSUMER PRICES, 1978-83 (1980-100)(Z changes) /a
19831st 2nd 3rd 4th
1978 1979 1980 1981 1982 1983 qtr qtr qtr -qtr
Wholesale PricesAll Comodities 11.6 18.8 38.9 20.4 4.7 0.2 0.4 -0.8 -0.3 0.0Agricultucil & 33.8 11.4 24.5 27.6 0.3 3.4 4.8 -1.4 -3.1 -2.5
marine foods
Coal & electric 19.3 33.2 48.4 28.9 10.9 -0.2 0.1 -0.5 0.4 0.0power
Petroleum & 3.8 38.4 105.3 34.9 7.8 -5.1 -1.5 -4.0 -0.6 0.2related pro-ducts
Producer goods 6.4 24.4 52.0 21.3 5.1 -0.9 -0.2 -1.0 0.1 0.3
Capital goods 2.2 12.6 19.3 11.5 7.4 1.2 -0.1 0.1 1.3 0.6
Consumer goods 20.4 13.4 27.1 20.4 3.7 1.8 - 1.4 -0.5 -1.3 -0.5
Consimer PricesAll Items 14.5 18.3 28.7 21.3 7.3 3.4 1.9 0.3 0.1 0.0Food & beverages 16.7 13.8 26.6 27.5 2.5 1.3 2.7 -0.4 -1.1 -1.0
Excluding food & 12.4 22.6 30.5 18.4 10.9 4.9 1.4 0.8 1.0 0.7beverages
/a Annual data are calculated on year-to-year basis; quarterly data are percent change frompreceding quarter.
Source: Bank of Korea, Monthly Statistical Bulletin.
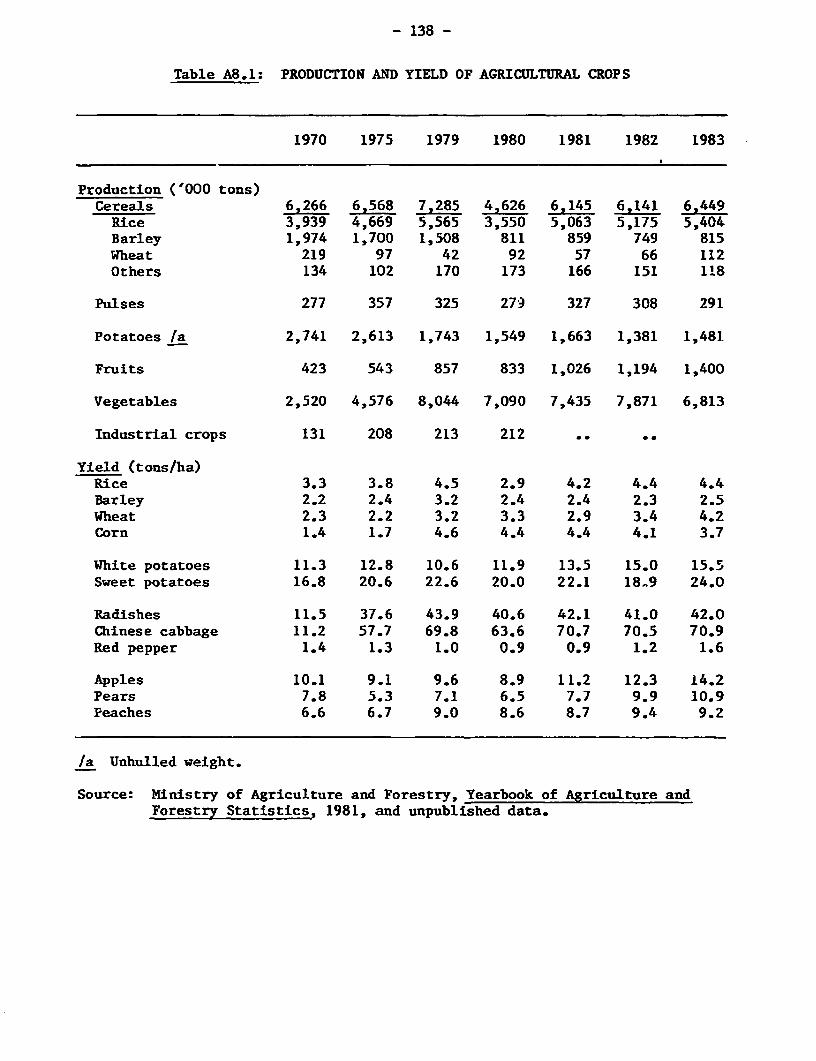
- 138 -
Table A8.1: PRODUCTION AND YIELD OF AGRICULTURAL CROPS
1970 1975 1979 1980 1981 1982 1983
Production ('000 tons)Cereals 6,266 6,568 7,285 4,626 6,145 6,141 6,449Rice 3,939 4,669 5,565 3,550 5,063 5,175 5,404Barley 1,974 1,700 1,508 811 859 749 815Wheat 219 97 42 92 57 66 112Others 134 102 170 173 166 151 118
Pulses 277 357 325 279 327 308 291
Potatoes /a 2,741 2,613 1,743 1,549 1,663 1,381 1,481
Fruits 423 543 857 833 1,026 1,194 1,400
Vegetables 2,520 4,576 8,044 7,090 7,435 7,871 6,813
Industrial crops 131 208 213 212 .
Yield (tons/ha)Rice 3.3 3.8 4.5 2.9 4.2 4.4 4.4Barley 2.2 2.4 3.2 2.4 2.4 2.3 2.5Wheat 2.3 2.2 3.2 3.3 2.9 3.4 4.2Corn 1.4 1.7 4.6 4.4 4.4 4.1 3.7
White potatoes 11.3 12.8 10.6 11.9 13.5 15.0 15.5Sweet potatoes 16.8 20.6 22.6 20.0 22.1 18-9 24.0
Radishes 11.5 37.6 43.9 40.6 42.1 41.0 42.0Chinese cabbage 11.2 57.7 69.8 63.6 70.7 70.5 70.9Red pepper 1.4 1.3 1.0 0.9 0.9 1.2 1.6
Apples 10.1 9.1 9.6 8.9 11.2 12.3 14.2Pears 7.8 5.3 7.1 6.5 7.7 9.9 10.9Peaches 6.6 6.7 9.0 8.6 8.7 9.4 9.2
/a Unhulled weight.
Source: Ministry of Agriculture and Forestry, Yearbook of Agriculture andForestry Statistics, 1981, and unpublished data.
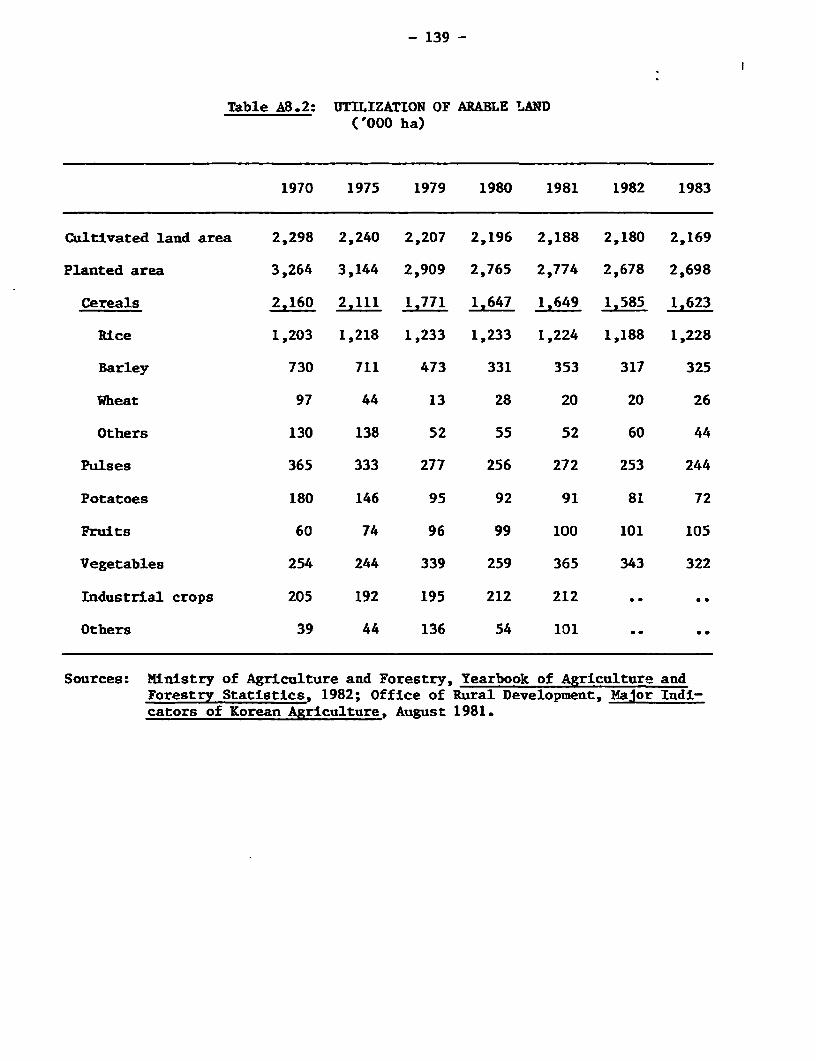
- 139 -
Table A8.2: UTILIZATION OF ARABLE !1AND('000 ha)
1970 1975 1979 1980 1981 1982 1983
Cultivated land area 2,298 2,240 2,207 2,196 2,188 2,180 2,169
Planted area 3,264 3,144 2,909 2,765 2,774 2,678 2,698
Cereals 2,160 2,111 1,771 1,647 1,649 1,585 1,623
Rice 1,203 1,218 1,233 1,233 1,224 1,188 1,228
Barley 730 711 473 331 353 317 325
Wheat 97 44 13 28 20 20 26
Others 130 138 52 55 52 60 44
Pulses 365 333 277 256 272 253 244
Potatoes 180 146 95 92 91 81 72
Fruits 60 74 96 99 100 101 105
Vegetables 254 244 339 259 365 343 322
Industrial crops 205 192 195 212 212
Others 39 44 136 54 101
Sources: Ministry of Agriculture and Forestry, Yearbook of Agriculture andForestry Statistics, 1982; Office of Rural Development, Major Indi-cators of Korean Agriculture, August 1981.
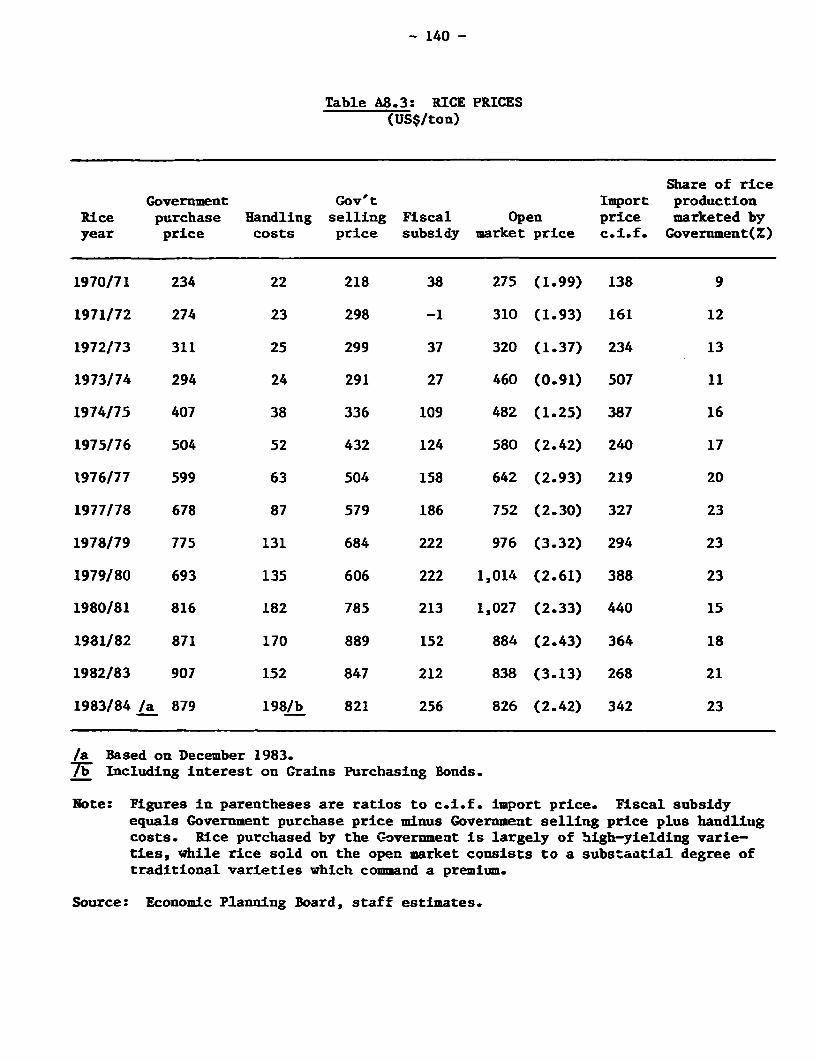
- 140 -
Table A8.3: RICE PRICES(US$/ton)
Share of riceGovernment Gov't Import production
Rice purchase Handling selling Fiscal Open price marketed byyear price costs price subsidy market price c.i.f. Government(%)
1970/71 234 22 218 38 275 (1.99) 138 9
1971/72 274 23 298 -1 310 (1.93) 161 12
1972/73 311 25 299 37 320 (1.37) 234 13
1973/74 294 24 291 27 460 (0.91) 507 11
1974/75 407 38 336 109 482 (1.25) 387 16
1975/76 504 52 432 124 580 (2.42) 240 17
1976177 599 63 504 158 642 (2.93) 219 20
1977/78 678 87 579 186 752 (2.30) 327 23
1978/79 775 131 684 222 976 (3.32) 294 23
1979/80 693 135 606 222 1,014 (2.61) 388 23
1980/81 816 182 785 213 1,027 (2.33) 440 15
1981/82 871 170 889 152 884 (2.43) 364 18
1982/83 907 152 847 212 838 (3.13) 268 21
1983/84 /a 879 198/b 821 256 826 (2.42) 342 23
/a Based on December 1983.7T7 Including interest on Grains Purchasing Bonds.
Note: Figures in parentheses are ratios to c.i.f. import price. Fiscal subsidyequals Government purchase price minus Government selling price plus handlingcosts. Rice purchased by the Government is largely of high-yielding varie-ties, while rice sold on the open market consists to a substantial degree oftraditional varieties which command a premium.
Source: Economic Planning Board, staff estimates.
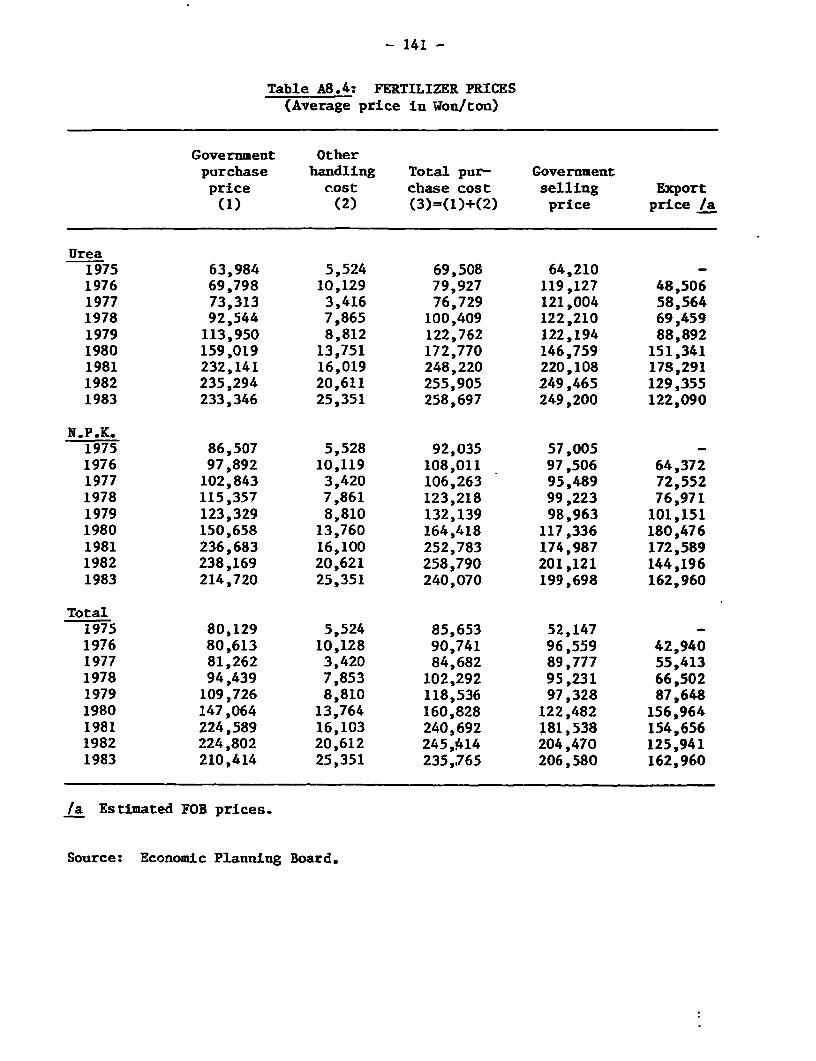
- 141 -
Table A8.4: FERTILIZER PRICES(Average price in Won/ton)
Government Otherpurchase handling Total pur- Governmentprice cost chase cost selling Export(1) (2) (3)=(1)+(2) price price /a
Urea1975 63,984 5,524 69,508 64,210 -1976 69,798 10,129 79,927 119,127 48,5061977 73,313 3,416 76,729 121,004 58,5641978 92,544 7,865 100,409 122,210 69,4591979 113,950 8,812 122,762 122,194 88,8921980 159,019 13,751 172,770 146,759 151,3411981 232,141 16,019 248,220 220,108 178,2911982 235,294 20,611 255,905 249,465 129,3551983 233,346 25,351 258,697 249,200 122,090
N.P.K.1975 86,507 5,528 92,035 57,005 -1976 97,892 10,119 108,011 97,506 64,3721977 102,843 3,420 106,263 95,489 72,5521978 115,357 7,861 123,218 99,223 76,9711979 123,329 8,810 132,139 98,963 101,1511980 150,658 13,760 164,418 117,336 180,4761981 236,683 16,100 252,783 174,987 172,5891982 238,169 20,621 258,790 201,121 144,1961983 214,720 25,351 240,070 199,698 162,960
Total1975 80,129 5,524 85,653 52,147 -1976 80,613 10,128 90,741 96,559 42,9401977 81,262 3,420 84,682 89,777 55,4131978 94,439 7,853 102,292 95,231 66,5021979 109,726 8,810 118,536 97,328 87,6481980 147,064 13,764 160,828 122,482 156,9641981 224,589 16,103 240,692 181,538 154,6561982 224,802 20,612 245,414 204,470 125,9411983 210,414 25,351 235,765 206,580 162,960
/a Estimated FOB prices.
Source: Economic Planning Board.

- 142 -
Table A9.1: INDUSTRIAL PRODUCTION, 1970-83(1980 = 100)
All items Mining Manufacturing ElectricityGrowth Growth Growth Growth
Index rate (X) Index rate (X) Index rate (%) Index rate (Z)
1970 17.8 11.9 64.1 11.7 16.3 11.6 24.6 19.4
1971 20.5 15.2 66.2 3.3 19.0 16.6 28.3 15.0
1972 23.5 14.6 63.1 -4.7 22.1 16.3 31.8 12.4
1973 31.4 33.6 73.4 16.3 30.0 35.7 39.8 25.2
1974 40.0 27.4 80.2 9.3 38.7 29.0 45.2 13.6
1975 47.6 19.0 89.9 12.1 46.3 19.6 53.2 17.7
1976 61.9 30.0 90.6 0.8 61.0 31.7 62.0 16.5
1977 74.1 19.7 98.8 9.1 73.4 20.3 71.3 15.0
1978 91.1 22.9 101.1 2.3 90.9 23.8 84.6 18.7
1979 101.8 11.7 101.1 0.0 101.9 12.1 95.6 13.0
1980 100.0 -1.8 100.0 -1.1 100.0 -1.9 100.0 4.6
1981 112.7 12.7 102.7 2.7 113.4 13.4 108.0 8.0
1982 117.7 4.4 96.9 -5.6 118.7 4.7 115.8 7.2
1983 135.6 15.2 97.6 0.7 137.6 15.9 131.2 13.3
Source: Economic Planning Board.

- 143 -
Table A9.2: MANUFACTURING CAPACITY UTILIZATION(X)
1976 1977 1978 1979 1980 1981 1982 1983
Manufacturing sector 78.9 81.5 88.1 81.9 69.5 70.3 69.8 76.7
Textiles and footwear 87.7 86.0 84.8 82.9 81.8 81.4 80.7 80.4
Automobiles 48.2 62.2 83.9 56.0 31.1 39.0 53.0 82.4
Shipbuilding 36.1 23.2 26.4 25.7 40.9 65.0 65.3 64.9
Machinery 69.3 66.9 69.1 75.1 46.8 51.4 52.4 69.1
Electronics 75.3 72.0 71.2 74.8 65.3 69.0 65.2 76.3
Source: Economic Planning Board.

- 144 -
Table A9.3: ENERGY CONSUMPTION BY SECTORS('000 tons of oil equivalent)
Sectors 1970 1975 1980 1981 1982 1983/a
IndustryPetroleum products 3,370 7,176 10,758 9,927 8,382 8,715Coal 840 830 3,653 5,275 5,842 6,141Electricity 1,349 1,018 1,971 2,087 2,188 2,424Firewood and charcoal 245 - - - - -
Total 5,804 9,024 16,382 17,291 16,412 17,280
TransportationPetroleum products 2,254 2,275 5,073 5,677 5,908 6,684Coal 30 20 2 2 2 -Electricity 17 22 34 40 40 47
Total 2,301 2,317 5,109 5,719 5,950 6,731
Residential and CommercialPetroleum products 447 354 2,221 2,224 2,231 2,546Coal 4,369 6,572 8,670 9,105 8,630 8,909Electricity 649 317 710 804 912 1,052Noncommercial fuels 3,985 3,420 2,517 2,492 2,417 2,364
Total 9,450 10,663 14,118 14,625 14,190 14,871
Public and OthersPetroleum products 1,188 1,295 1,994 1480 2,332 2,379Coal 477 144 101 95 74 75Electricity 277 73 100 113 118 132Noncommercial fuels 21 - - - -
Total 1,963 1,512 2,195 1,688 2,524 2,586
ElectricityPetroleum products 1,916 4,629 6,988 7,608 7,809 7,526Coal 279 509 773 766 902 1,427Hydro /b 339 421 496 677 501 644Nuclear /b - - 869 724 944 1,929Gas - - - - - -
Total 2,534 5,559 9,126 9,775 10,156 11,522
Total Internal Demand 22,052 27,644 44,115 46,052 45,974 49,335
/a Estimate./b TOE required for some output using fuel output ratios appropriate for each
year.
Source: Ministry of Energy and Resources, 1983 Yearbook of Energy Statistics.
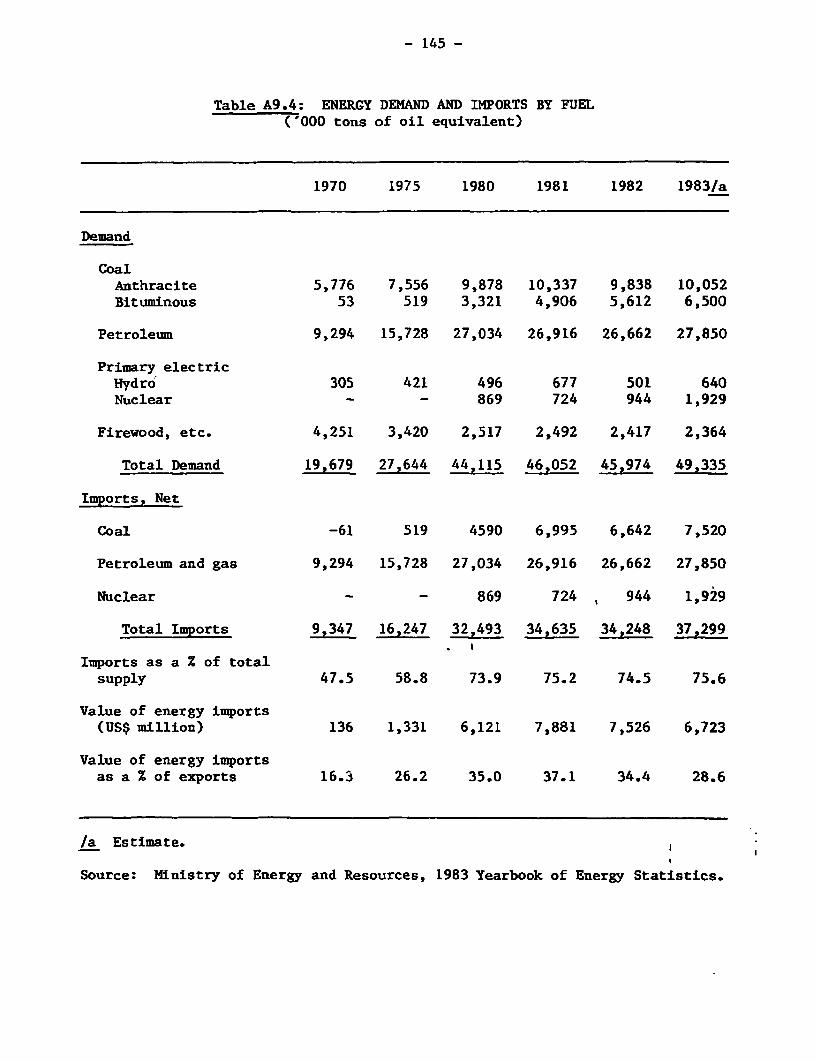
- 145 -
Table A9.4: ENERGY DEMAND AND IMPORTS BY FUEL('000 tons of oil equivalent)
1970 1975 1980 1981 1982 1983/a
Demand
CoalAnthracite 5,776 7,556 9,878 10,337 9,838 10,052Bituminous 53 519 3,321 4,906 5,612 6,500
Petroleum 9,294 15,728 27,034 26,916 26,662 27,850
Primary electricHydro 305 421 496 677 501 640Nuclear - - 869 724 944 1,929
Firewood, etc. 4,251 3,420 2,517 2,492 2,417 2,364
Total Demand 19,679 27,644 44,115 46,052 45,974 49,335
Imports, Net
Coal -61 519 4590 6,995 6,642 7,520
Petroleum and gas 9,294 15,728 27,034 26,916 26,662 27,850
Nuclear - - 869 724 944 1,929
Total Imports 9,347 16,247 32,493 34,635 34,248 37,299
Imports as a X of totalsupply 47.5 58.8 73.9 75.2 74.5 75.6
Value of energy imports(US$ million) 136 1,331 6,121 7,881 7,526 6,723
Value of energy importsas a Z of exports 16.3 26.2 35.0 37.1 34.4 28.6
/a Estimate.
Source: Ministry of Energy and Resources, 1983 Yearbook of Energy Statistics.
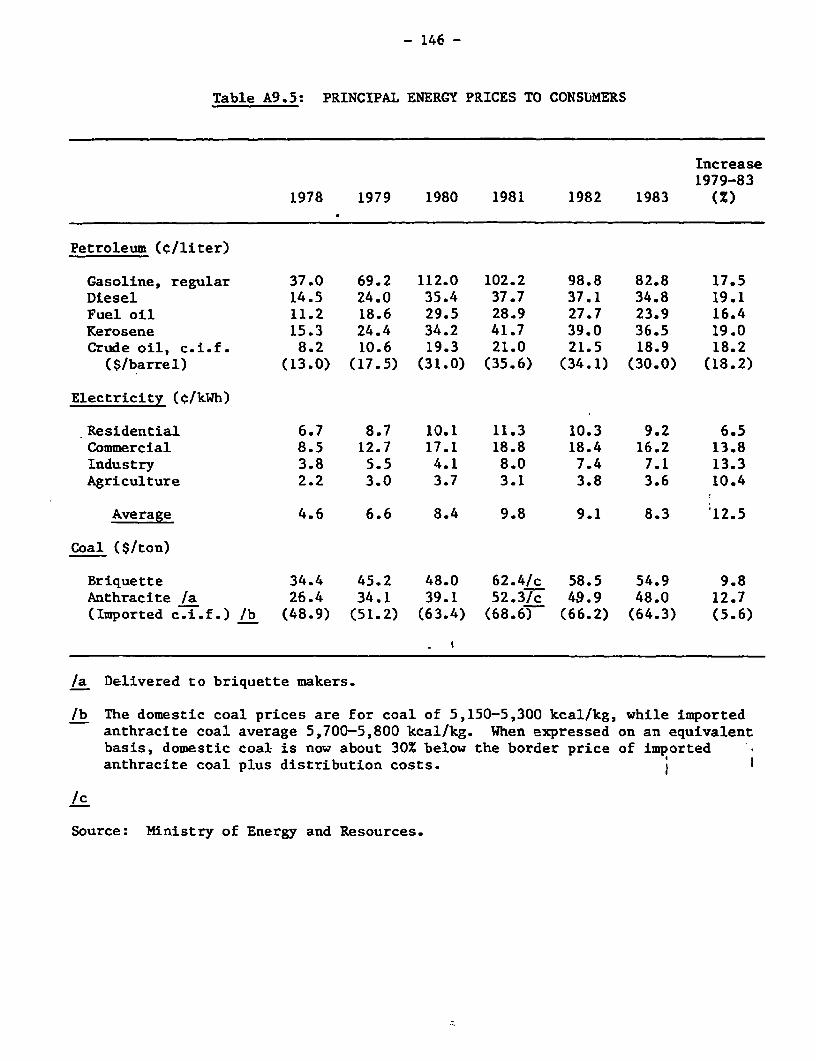
- 146 -
Table A9.5: PRINCIPAL ENERGY PRICES TO CONSbMERS
Increase1979-83
1978 1979 1980 1981 1982 1983 (%)
Petroleum (¢/liter)
Gasoline, regular 37.0 69.2 112.0 102.2 98.8 82.8 17.5Diesel 14.5 24.0 35.4 37.7 37.1 34.8 19.1Fuel oil 11.2 18.6 29.5 28.9 27.7 23.9 16.4Kerosene 15.3 24.4 34.2 41.7 39.0 36.5 19.0Crude oil, c.i.f. 8.2 10.6 19.3 21.0 21.5 18.9 18.2($/barrel) (13.0) (17.5) (31.0) (35.6) (34.1) (30.0) (18.2)
Electricity (C/kWh)
Residential 6.7 8.7 10.1 11.3 10.3 9.2 6.5Commercial 8.5 12.7 17.1 18.8 18.4 16.2 13.8Industry 3.8 5.5 4.1 8.0 7.4 7.1 13.3Agriculture 2.2 3.0 3.7 3.1 3.8 3.6 10.4
Average 4.6 6.6 8.4 9.8 9.1 8.3 12.5
Coal ($/ton)
Briquette 34.4 45.2 48.0 62.4/c 58.5 54.9 9.8Anthracite /a 26.4 34.1 39.1 52.3/c 49.9 48.0 12.7(Imported c.i.f.) /b (48.9) (51.2) (63.4) (68.6) (66.2) (64.3) (5.6)
/a Delivered to briquette makers.
/b The domestic coal prices are for coal of 5,150-5,300 kcal/kg, while importedanthracite coal average 5,700-5,800 kcal/kg. When expressed on an equivalentbasis, domestic coal is now about 30% below the border price of importedanthracite coal plus distribution costs.
/c
Source: Ministry of Energy and Resources.
-147 - ANNEX 2Page 1
KOREA
OPERATIONS OF THE PUBLIC SECTOR 1/
1. During the past several years, the public sector has been a netborrower of funds from private households (Table 3.3 - main report). Suchborrowing reached a peak in 1982 of 1.4% of GNP, but, since public sectorsavings increased by 1% of GNP in 1983, this deficit has almost been elimi-nated. In the revised Fifth FYP, public sector savings are projected to risefrom the current level of 7% of GNP to 8.3% by 1986. Fiscal austerity in thepublic sector is a cornerstone of the government's overall macro-strategy tosubstantially lower the rate of inflation and to eliminate the current accountdeficit by 1986.
The Structure of the Public Sector
2. The public sector in Korea is comprised of the operations of theconsolidated Central government and all local governments. As shown inChart 1, the consolidated central government includes: the General Account(G/A); 5 enterprise special accounts; 12 special accounts (S/A); 2 nonfinan-cial public enterprises (NFPE); and, 23 funds. The G/A executes all of theadministrative functions of the government, including the revenue raisingactivities, the operation of the various ministries, and the majority of theeconomic and social development activities of the government. The funds andspecial accounts cover all public enterprises which are financially integratedwith the general account and which do not keep their own reserves except forworking balances. The twenty-six public corporations, in which the governmenthas an equity share, are not included in the public sector accounts, sincetheir operations are financially independent of the central gdvernment, apartfrom receiving net lending.
3. Four of the Funds and special accounts are large and important interms of their contribution to the overall public sector deficit. The GrainManagement Fund (GMF) (the Grain Management special account is used to channelthe administrative costs of the operation of the fund) buys rice and barleyfrom the farmers, selling the rice and barley to the public, primarilysmoothing out price fluctuations. In addition, the GMF administers the importof all grains, now averaging about 6 million metric tons per annum. TheSupply Fund (or the Fertilizer Fund) buys fertilizer from producers and thendistributes it to the farmers. The National investment Fund (NIF), created in1974, provides resources drawn from the budget, as well as the banking sector,for the development of the heavy industry and chemical sector. Loansadministered by the NIF, which are filtered through the banking system, were,
1/ The public sector includes all operations of the Central Government andall local governments. It is identical to the term "government sector,"which is used in the main body of the report.
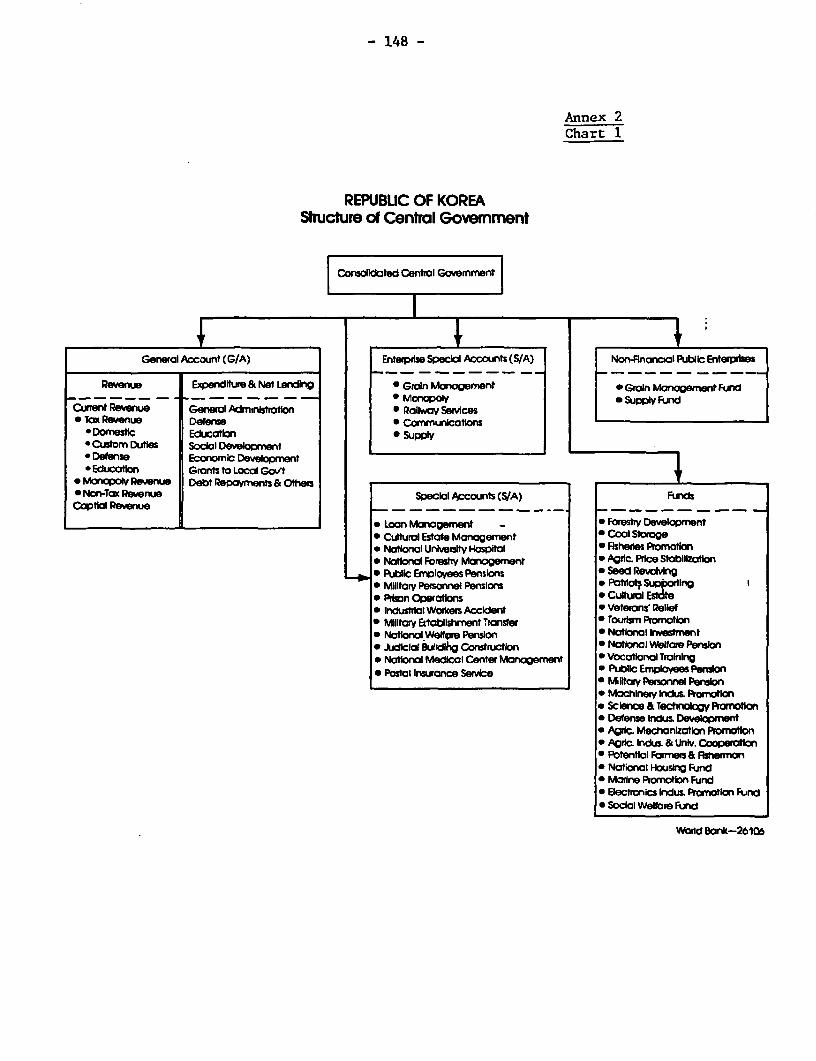
- 148 -
Annex 2Chart 1
REPUBUC OF KOREAStructure of Central Government
ConaoIdated Central Government
General Account (G/A) Enterprise Special Accounts (S/A) Non-Rnoncial Public Enterpimes
Revenue Expendituxe & Net Lending * Grin Management L Groln Marnament Fund_ _ _ _ _ _ _ _ _ _ _ _ _ _ _ _ *~~~ MonopOty o Stupply d
Curent Revenue General Administratoin * Railwa Semces* Tax Revenue Defense *Communkcatlons
* Domestic Ecucatrin * SUpPI; Custom Duties Social Development* Defense Economic Development* Eduction | Grants to Local Govt
*Manopoly Revenue Debt Repayments & Others* Non-Tax Revenue Special Accounts (S/A) FundsCaptial Revenue
I__ _ _ _ _ 9* Loan Management ForestIry Development* Culturl Estate Monagement * Cool Storge* National University Hospital * Rsheries Promotion* Natlonal Forestry Management * Agric. Pice StobilIztion* PLblic Effplovess Pensions * Seed RevoMng_ Miltary Personel Pensions * Prols SuppotIng* Pion Operatl' * Cultural E5tdte* lndustdlt Workers Accldent * Veterans Relief* Miltary ELhablishment-Iranser * Touris Promtihn* NatlnaloWelfte Pension ' Natinal lrwestrent* Judicial euirdlg Construction ' Natonal efUbare Penson* Nationol Medical Center Manaogemnt ' Vocational Training
Postal nsrance Service aPlic Emplyees Penson__________ _________ ________ M ilitay Personnel Pension
* Machinery lndus Prormotion* Scince & Technology Promotion' Deferse hndu& Develpment' Agric. Mechanization Promotion' Agrlc Indus & Univ. Coopeation' Potential Farers & Psherman* National Housing Fjnd* Marine Promotion Fund* Electronics Indus. Promiotion Fund' Social Welfare Fund
Word Bank-26106
- 149 - ANNEX 2Page 3
until recently, given at concessional rates to infant industries for building,increasing, and modernizing industrial capacity. Finally, the NationalHousing Fund subsidizes low-income and low-cost housing.
Integrated Accounts of the Consolidated Central Government
4. The course of consolidated central government operations is set outin Table 1. These figures are arranged into three sectors: (i) the generalaccount; (ii) all special accounts, including the enterprise special accounts;and, (iii) all funds, including the two NFPEs. The program of fiscal auste-rity being pursued by the goverrnment under the Fifth Plan is strikinglyevident. The actual 1983 deficit represents a substantial improvement overboth the 1982 outcome and the 1983 budget. This is because expenditures wereincreased very little, while the unexpected growth in GNP increased taxrevenues by 4% over the original plan. The majority of this improvementoccurred .n the G/A, where the surplus increased almost fourfold; in the 1984budget, a small reduction in the surplus is planned. The 1984 budget for thespecial accounts implies a slight decline from the 1983 outcome; however, thedeficit in 1984 is still 20% higher than in 1982. The government's commitmentto reducing the activities of the various funds is evidenced by the decline intheir overall deficit - a decline of 37% from the W 1,466.3 billion deficit of1982 to a W 922 billion deficit in 1983 and a further 22% decline in 1984.The deficit of the consolidated central government, the consolidated budgetdeficit (CBD), was W 1,582 billion in 1982; in 1983, it had dropped substanr-tially to W 400 billion and is projected to remain at this level in *19814.
5. Individual components of the CBD are shown in Table 2. As indicatedat the top of this table, there is a difference between the MOF's definitionof this deficit, which is consistent with IMF accounting procedures and thatused by the Economic Planning Board, due to the exclusion from the EPB statis-tics of three items; (i) foreign borrowing on-lent to the private sector;(ii) Foreign Military Sales' Credits (FMS); and (iii) reimbursements forrequisitioned property. Therefore, the CBD on the MOF/IMF criteria is larger.For the sake of consistency, the EPB's presentation is used throughout.
6. The CBD reached a peak of 4.2% of GNP in 1981, declining by about 1%in 1982 and by over 2% in 1983; it is projected to remain stable in 1984.This dramatic reduction in the CBD is primarily the result of four factors:(i) an 83% decline in the deficit of the Loan Management special account since1983; (ii) an 82% decline in the deficit of the GMF since 1982; and (iv) a375% increase in the surplus of the G/A since 1982.
The Loan Management Special Account
7. The reduction in the deficit of the Loan Management special account,which finances government projects outside the budget, will be attained byrephasing and curtailing major investment projects. The government will givepriority to supporting projects directly related to economic and socialdevelopment, and projects which increase productivity in the agriculture andfishery sectors, while infrastructure projects, especially electricity andrailroads, will be postponed. These reductions in several public sectorinvestment projects would enable the government to reduce the deficit in thisspecial account.
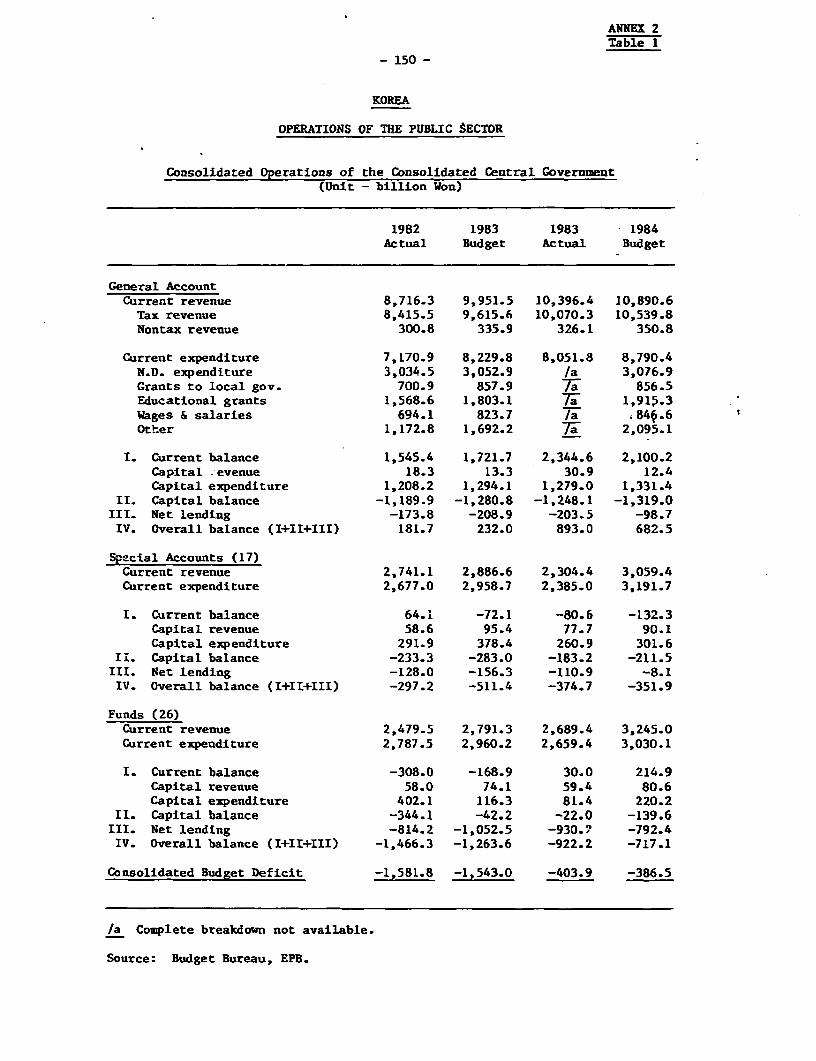
ANNEX 2Ta ble I
- 150 -
KOREA
OPERATIONS OF THE PUBLIC tECTOR
Consolidated Operations of the Consolidated Central Government(Unit - billion Won)
1982 1983 1983 1984Actual Budget Actual Budget
General AccountCurrent revenue 8,716.3 9,951.5 10,396.4 10,890.6Tax revenue 8,415.5 9,615.6 10,070.3 10,539.8Nontax revenue 300.8 335.9 326.1 350.8
Current expenditure 7,170.9 8,229.8 8,051.8 8,790.4N.D. expenditure 3,034.5 3,052.9 /a 3,076.9Grants to local gov. 700.9 857.9 7aT 856.5Educational grants 1,568.6 1,803.1 7a 1,915.3Wages & salaries 694.1 823.7 /a 084v.6Other 1,172.8 1,692.2 Ta 2,095.1
1. Current balance 1,545.4 1,721.7 2,344.6 2,100.2Capital evenue 18.3 13.3 30.9 12.4Capital expenditure 1,208.2 1,294.1 1,279.0 1,331.4
II. Capital balance -1,189.9 -1,280.8 -1,248.1 -1,319.0III. Net lending -173.8 -208.9 -203.5 -98.7IV. Overall balance (I+II+III) 181.7 232.0 893.0 682.5
Special Accounts (17)Current revenue 2,741.1 2,886.6 2,304.4 3,059.4Current expenditure 2,677.0 2,958.7 2,385.0 3,191.7
I. Current balance 64.1 -72.1 -80.6 -132.3Capital revenue 58.6 95.4 77.7 90.1Capital expenditure 291.9 378.4 260.9 301.6
II. Capital balance -233.3 -283.0 -183.2 -211.5III. Net lending -128.0 -156.3 -110.9 -8.1IV. Overall balance (I+II+III) -297.2 -511.4 -374.7 -351.9
Funds (26)Current revenue 2,479.5 2,791.3 2,689.4 3,245.0Current expenditure 2,787.5 2,960.2 2,659.4 3,030.1
I. Current balance -308.0 -168.9 30.0 214.9Capital revenue 58.0 74.1 59.4 80.6Capital expenditure 402.1 116.3 81.4 220.2
II. Capital balance -344.1 -42.2 -22.0 -139.6III. Net lending -814.2 -1.052.5 -930.) -792.4IV. Overall balance (I+I1+III) -1,466.3 -1,263.6 -922.2 -717.1
Consolidated Budget Deficit -1,581.8 -1,543.0 -403.9 -386.5
/a Complete breakdown not available.
Source: Budget Bureau, EPB.
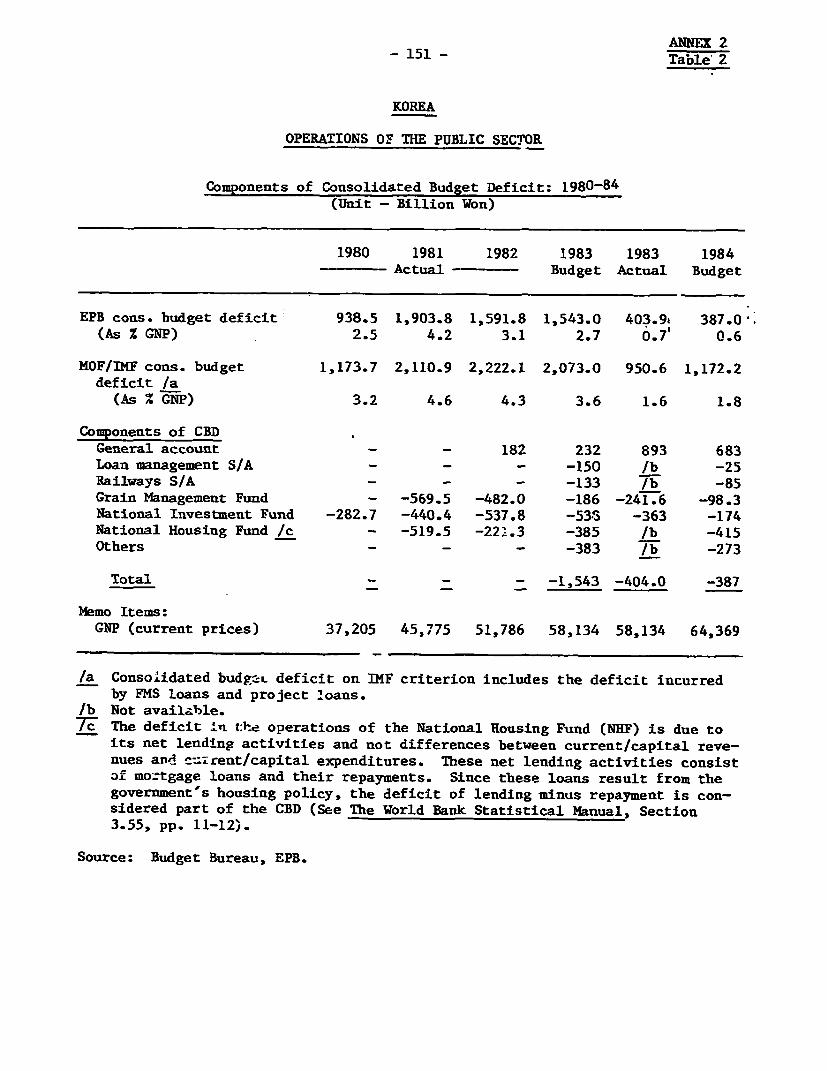
ANNEX 2- 151 - Table 2
KOREA
OPERATIONS OF THE PUBLIC SECTOR
Components of Consolidated Budget Deficit: 1980-84(Unit - Billion Won)
1980 1981 1982 1983 1983 1984- Actual - Budget Actual Budget
EPB cons. budget deficit 938.5 1,903.8 1,591.8 1,543.0 403.9a 387.0'.(As Z GNP) 2.5 4.2 3.1 2.7 0.7 0.6
MOF/IMF cons. budget 1,173.7 2,110.9 2,222.1 2,073.0 950.6 1,172.2deficit /a
(As % GNP) 3.2 4.6 4.3 3.6 1.6 1.8
Components of CBDGeneral account - - 182 232 893 683Loan management S/A - - -150 /b -25
Railways S/A - - - -133 /b -85
Grain Management Fund - -569.5 -482.0 -186 -241.6 -98.3National Investment Fund -282.7 -440.4 -537.8 -533 -363 -174National Housing Fund /c - -519.5 -22'.3 -385 /b -415Others - - - -383 /b -273
Total - -- -1,543 -404.0 -387
Memo Items:GNP (current prices) 37,205 45,775 51,786 58,134 58,134 64,369
/a ConsoLidated budgL: deficit on IMF criterion includes the deficit incurredby FMS loans and project loans.
/b Not available.7-c The deficit In the operations of the National Housing Fund (NHF) is due to
its net lending activities and not differences between current/capital reve-nues and =:zrent/capital expenditures. These net lending activities consistof mo:tgage loans and their repayments. Since these loans result from thegovernment's housing policy, the deficit of lending minus repayment is con-sidered part of the CBD (See The World Bank Statistical Manual, Section3.55, pp. 11-12).
Source: Budget Bureau, EPB.
- 152 - ~ANEX 2Page 6
The Grain Management Fund
8. A substantial reduction in the GMF deficit has been achieved in thepast several years. As shown by Table 3, the GMF deficit peaked atW 570 billion in 1981, about 30X of the CBD in that year; in 1982, it declinedto W 482 billion, remaining about 30% of the CBD. In 1983, a 50% reduction iLthe size of the deficit was achieved, to only W 242 billion. Improvements inthe level of theG deficits have resulted from a narrowing of the gapbetween the gover njent's selling and purchase price (plus management cqsts)for rice and barley (Table 4). For rice, the ratio of the sales price to thebuying cost has increased from 73.2Z in 1980 to 80.0% in 1983; for barley,from 32% to 64.7%. Recent deficits have resulted largely from the trading ofbarley - the barley deficit totalled W 178 billion in 1983 - for whichdomestic demand is falling and which has virtually no export potential.
9. The decrease in the GMF deficit shown in Table 3 for the 1984 budgetis partly the result of an accounting convention, since a W 300 billion trans-fer from the G/A to finance the deficit is considered a revenue item by IMFaccounting procedures, not a financing item, and therefore is netted out ofthe deficit. Changing sne method of financing the GMF deficit is signifi_antfor two reasons: (i) expenditures on the G/A are more closely scrutinized bythe National Assembly, wnereas the previous method of financing GMF deficitsby BOK borrowings were not and a fuller public debate, in which both the costsand the benefits of the GMF are explicitly discussed has been promoted; and,(ii) the monetary expansion which resulted from the financing of the past GMFdeficits, is being eliminated allowing the government greater control over themonetary base. There continue to be operating deficits in the GMF, whichrequire continuing transfers from the GIA, and in 1984 the fund's operatingshortfall will be equivalent to the levels of previous years. Moreover, theGovernment has committed itself to phasing out the operating subsidies by theend of 1987.
The National Investment Fund
10. The operations of the NIF are shown in Table 5. The deficit of theNIF was W 540 billion in 1982 (34% of CBD); and in 1983, W 370 billion. The1984 budget projects a deficit of W 176 billion, a reduction of about 50% from1983. This reduction in the budgeted deficit of the NIF for 1984, which isconsistent with the stratcev embodied in the revised Fifth FYP, reflects thegovernment's desire to become less active in directing the country's invest-ment activities, thereby allowing the private sector more latitude for initia-tive and risk-taking.
The General Account.
11. The G/A for 1984 involves a substantial departure from precedingyears in that the overall level of expenditures will be frozen at the 1983level. A key ingredient to this is the control of administrative costs by afreeze on public sector salaries and employment, including the military, theeducation sector, and all public enterprises. The increased revenues,resulting from the economy's growth, will be used to replace the BOKborrowings for the GMF and the Supply Fund, as well as the foreign loan
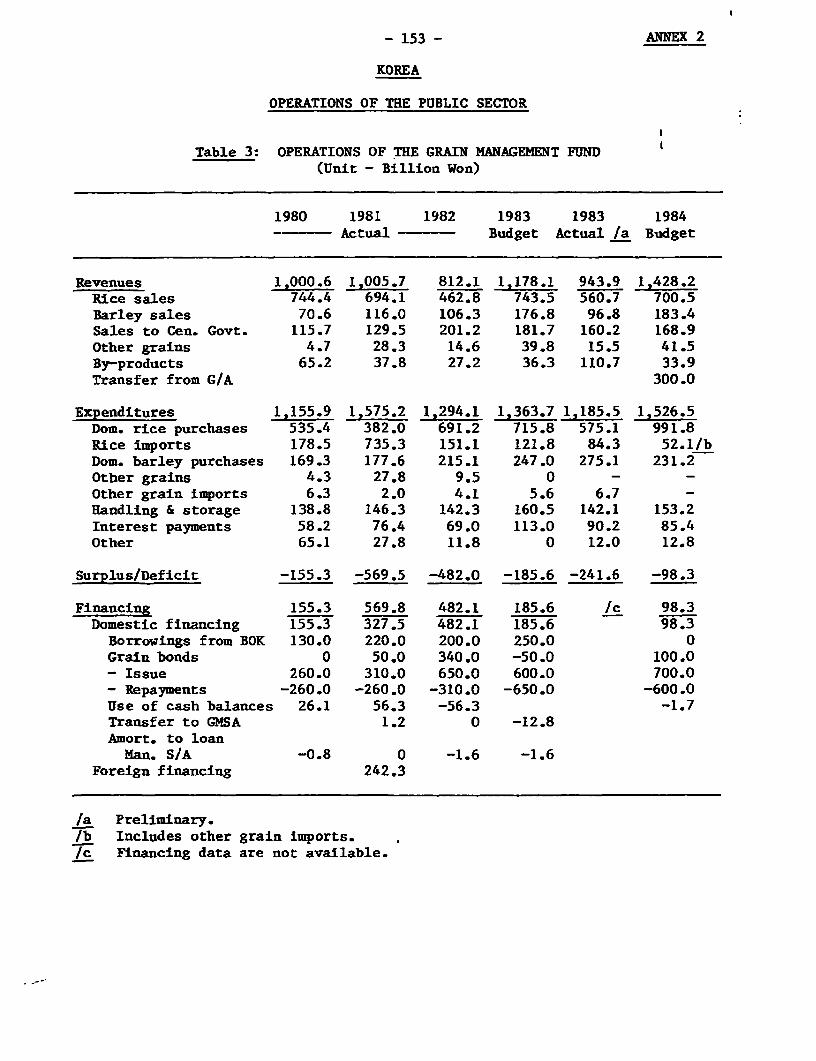
- 153- ANNEX 2
KOREA
OPERATIONS OF THE PUBLIC SECTOR
Table 3: OPERATIONS OF THE GRAIN MANAGEMENT FUND(Unit - Billion Won)
1980 1981 1982 1983 1983 1984Actual - Budget Actual /a Budget
Revenues 1,000.6 1,005.7 812.1 1,178.1 943.9 1,428.2Rice sales 744.4 694.1 462.8 743.5 560.7 700.5Barley sales 70.6 116.0 106.3 176.8 96.8 183.4Sales to Cen. Govt. 115.7 129.5 201.2 181.7 160.2 168.9Other grains 4.7 28.3 14.6 39.8 15.5 41.5By-products 65.2 37.8 27.2 36.3 110.7 33.9Transfer from G/A 300.0
Expenditures 1,155.9 1,575.2 1,294.1 1,363.7 1,185.5 1,526.5Dom. rice purchases 535.4 382.0 691.2 715.8 575.1 991.8Rice imports 178.5 735.3 151.1 121.8 84.3 52.1/bDom. barley purchases 169.3 177.6 215.1 247.0 275.1 231.2Other grains 4.3 27.8 9.5 0 - -Other grain imports 6.3 2.0 4.1 5.6 6.7 -Handling & storage 138.8 146.3 142.3 160.5 142.1 153.2Interest payments 58.2 76.4 69.0 113.0 90.2 85.4Other 65.1 27.8 11.8 0 12.0 12.8
Surplus/Deficit -155.3 -569.5 -482.0 -185.6 -241.6 -98.3
Financing 155.3 569.8 482.1 185.6 /c 98.3Domestic financing 155.3 327.5 482.1 185.6 98.3Borrowings from BOK 130.0 220.0 200.0 250.0 0Grain bonds 0 50.0 340.0 -50.0 100.0- Issue 260.0 310.0 650.0 600.0 700.0- Repayments -260.0 -260.0 -310.0 -650.0 -600.0Use of cash balances 26.1 56.3 -56.3 -1.7Transfer to GMSA 1.2 0 -12.8Amort. to loanMan. S/A -0.8 0 -1.6 -1.6
Foreign financing 242.3
/a Preliminary./b Includes other grain imports./c Financing data are not available.
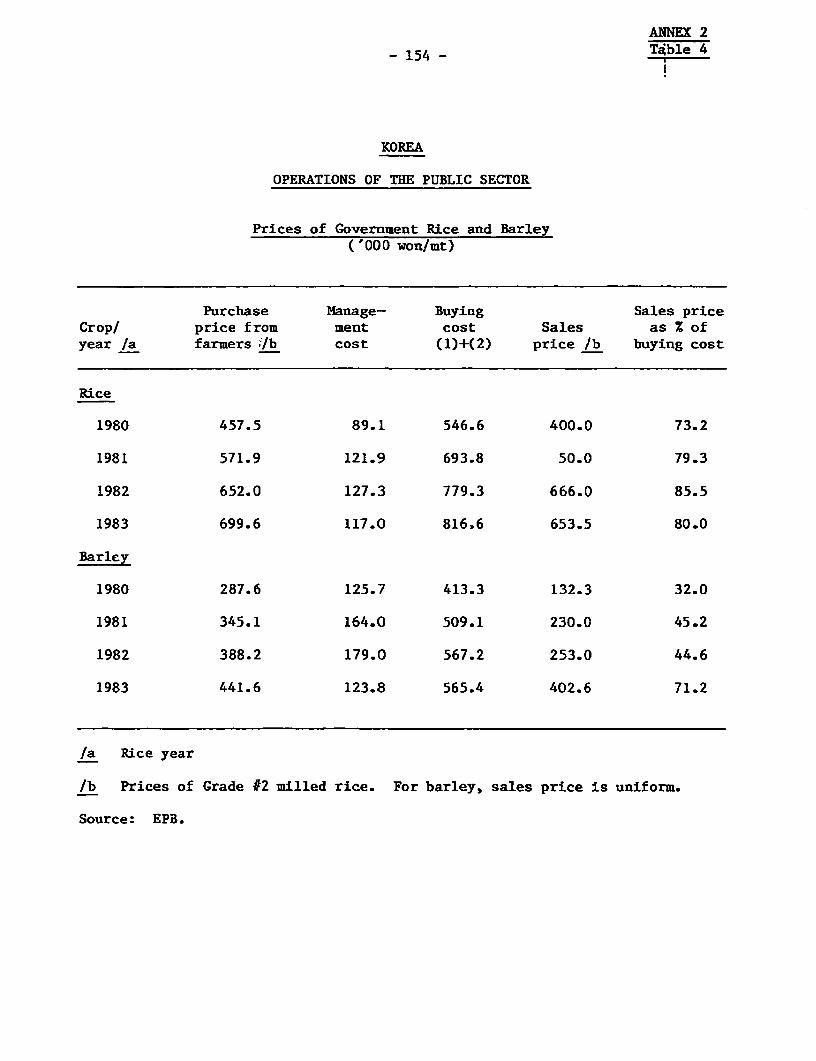
ANNEX 2
- 154 - Tib1e4
KOREA
OPERATIONS OF THE PUBLIC SECTOR
Prices of Government Rice and Barley('000 won/mt)
Purchase Manage- Buying Sales priceCrop/ price from ment cost Sales as x ofyear /a farmers lb cost (1)+(2) price lb buying cost
Rice
1980 457.5 89.1 546.6 400.0 73.2
1981 571.9 121.9 693.8 50.0 79.3
1982 652.0 127.3 779.3 666.0 85.5
1983 699.6 117.0 816.6 653.5 80.0
Barley
1980 287.6 125.7 413.3 132.3 32.0
1981 345.1 164.0 509.1 230.0 45.2
1982 388.2 179.0 567.2 253.0 44.6
1983 441.6 123.8 565.4 402.6 71.2
/a Rice year
/b Prices of Grade #2 milled rice. For barley, sales price is uniform.
Source: EFB.
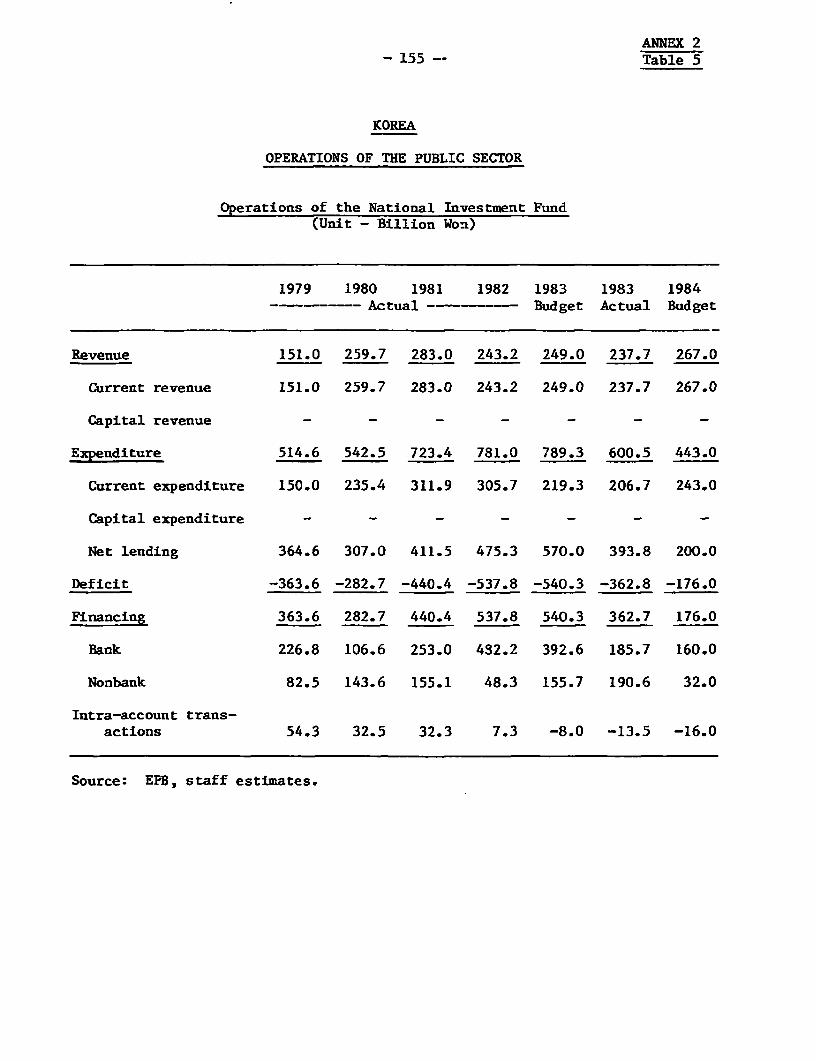
ANNEX 2- 155 -- Table 5
KOREA
OPERATIONS OF THE PUBLIC SECTOR
Operations of the National Investment Fund(Unit - Billion Won)
1979 1980 1981 1982 1983 1983 1984---- Actual ---- Budget Actual Budget
Revenue 151.0 259.7 283.0 243.2 249.0 237.7 267.0
Current revenue 151.0 259.7 283.0 243.2 249.0 237.7 267.0
Capital revenue - - - - - -
Expenditure 514.6 542.5 723.4 781.0 789.3 600.5 443.0
Current expenditure 150.0 235.4 311.9 305.7 219.3 206.7 243.0
Capital expenditure - - - - - - -
Net lending 364.6 307.0 411.5 475.3 570.0 393.8 200.0
Deficit -363.6 -282.7 -440.4 -537.8 -540.3 -362.8 -176.0
Financing 363.6 282.7 440.4 537.8 540.3 362.7 176.0
Bank 226.8 106.6 253.0 432.2 392.6 185.7 160.0
Nonbank 82.5 143.6 155.1 48.3 155.7 190.6 32.0
Intra-account trans-actions 54.3 32.5 32.3 7.3 -8.0 -13.5 -16.0
Source: EPB, staff estimates.
ANNEX 2- 156 - Page 10
requirements of the Loan Management Special Account. In the public investmentprogram, the Government will continue to emphasize basic needs, such as watersupply and sewage, health, insurance, the subway system, and education. Amedium-term financial plan was also prepared for the G/A projecting revenueand expenditure trends through 1986.
12. The revenue side of the G/A is composed of six items: domestictaxes; custom duties; defense tax; education tax; monopoly revenues; and,other nontax revenues (Table 6). Domestic taxes, which constitute 60% oftotal revenues include direct taxes, such as the personal income tax and thecorporate tax, and indirect taxes, such as the Value-Added Tax (VAT), liquortax, and other special excise taxes. The VAT, which was introduced in 1977,replaced eight other indirect taxes, and is the largest component of domestictaxes (40%). The personal income tax, the corporate tax, and other specialexcise taxes comprise about 45% of domestic tax revenue.
13. Custom duties, currently about 14% of total tax revenue, increasedby 45% in 1983, as a result of the duty imposed on imported petroleum.Revenues from this duty amounted to an additional W 130 billion in 1983, andare projected to increase W 200.9 billion in 1984, W 1219.6 billion in 1985,and W 242.3 billion in 1986. But, due to the government's program of importliberalization, other custom duties will decline during 1984-86 - byW 0.6 billion in 1984, W 15.8 billion in 1985, and W 60.3 billion in 1986.
14. The third largest component of revenues is the defense tax, which islevied as a surcharge on most national and local taxes. Currently, thesesurcharges constitute about 12.5% of total tax revenues. The defense tax wasestablished for a five-year period in 1975, renewed for an additional five-year period in 1980, and in the Fifth FYP, it is projected to be renewed foranother five-year period.
15. The education tax, which contains both tax and surtax elements, wasintroduced in 1982 for a period of five years. Currently, it constitutes only2.5% of tax revenue and draws its revenues from a tax on interest and dividendincome, a surtax on the liquor tax, a tax on tobacco sales, and a tax onbanking and insurance (as well as the unorganized money market) grossreceipts. Monopoly revenues constitute slightly under 8% of total revenue,and are derived almost entirely from the sale of tobacco. Other Non-taxrevenues arise from the surpluses of government enterprises, public employeepension funds, school fees, and government bond issues.
16. By 1982, total revenues had risen to W 9,340.8 billion -W 7,636.5 billion of tax revenues and W 1,704.3 billion in nontax revenues.The national tax burden as a percentage of GNP was 14.8%; the total revenueburden 18%. The budget for 1983 projected tax revenues of W 10,416.6 billion,including bond issues of W 346.7 billion in non-tax revenue. Due to theunexpected growth in nominal GNP and the imposition of a custom duty onimported petroleum, tax revenues were 4.6% higher than the budgeted level,W 9,232 billion compared to W 8,615.1 billion, and the majority of the Bondissues were cancelled. The tax burden increased to 15.9% of GNP; the revenueburden to 18.1%.
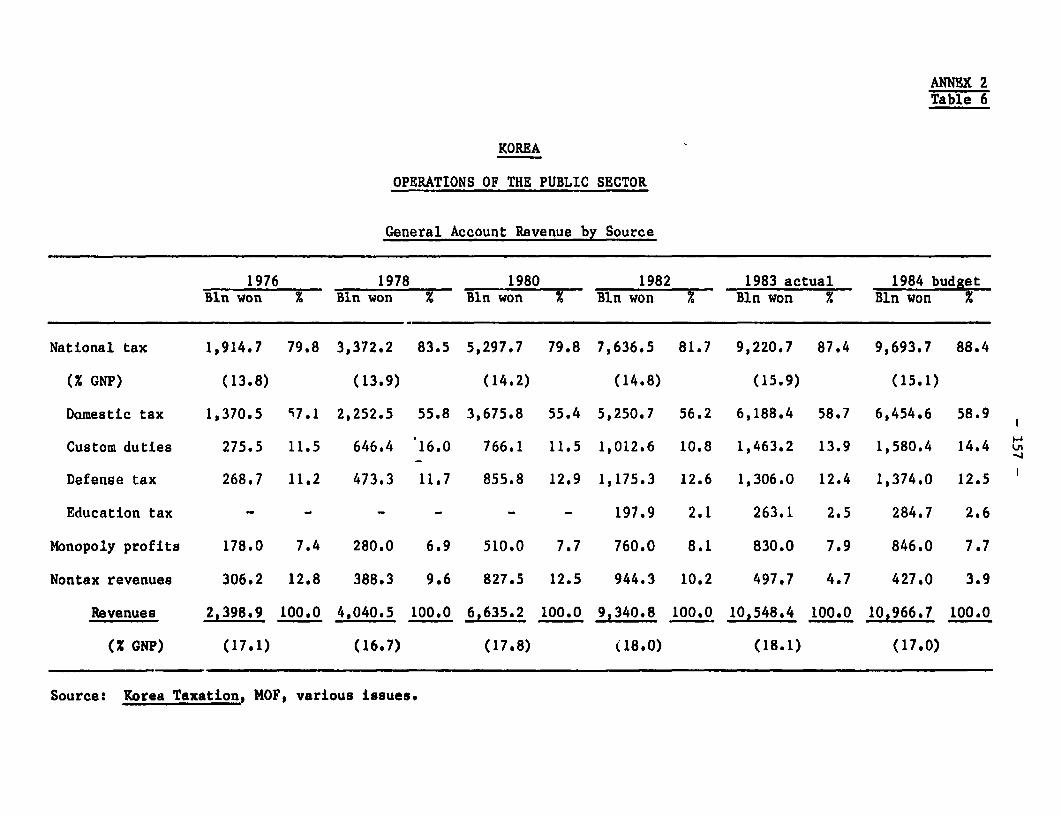
ANNEX 2Table 6
KOREA
OPERATIONS OF THE PUBLIC SECTOR
General Account Revenue by Source
1976 1978 1980 1982 1983 actual 1984 budgetBln won % Bln won % Bln won % Bln won % Bln won % Bln won %
National tax 1,914.7 79.8 3,372.2 83.5 5,297.7 79.8 7,636.5 81.7 9,220.7 87.4 9,693.7 88.4
(% GNP) (13.8) (13.9) (14.2) (14.8) (15.9) (15.1)
Domestic tax 1,370.5 57.1 2,252.5 55.8 3,675.8 55.4 5,250.7 56.2 6,188.4 58.7 6,454.6 58.9
Custom duties 275.5 11.5 646.4 16.0 766.1 11.5 1,012.6 10.8 1,463.2 13.9 1,580.4 14.4 t-n
Defense tax 268.7 11.2 473.3 11.7 855.8 12.9 1,175.3 12.6 1,306.0 12.4 1,374.0 12.5
Education tax - - - - - - 197.9 2.1 263.1 2.5 284.7 2.6
Monopoly profits 178.0 7.4 280.0 6.9 510.0 7.7 760.0 8.1 830.0 7.9 846.0 7.7
Nontax revenues 306.2 12.8 388.3 9.6 827.5 12.5 944.3 10.2 497.7 4.7 427.0 3.9
Revenues 2,398.9 100.0 4,040.5 100.0 6,635.2 100.0 9,340.8 100.0 10,548.4 100.0 10,966.7 100.0
(Z GNP) (17.1) (16.7) (17.8) (18.0) (18.1) (17.0)
Source: Korea Taxation, MOF, various issues.
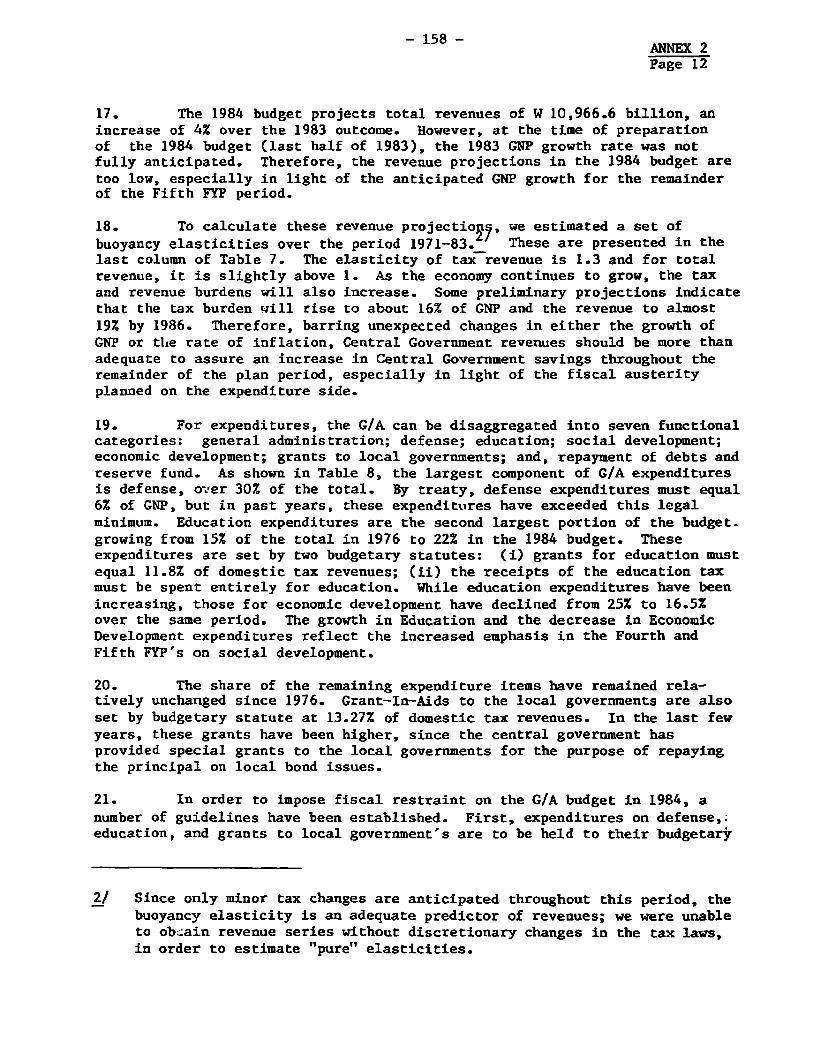
- 158- ANNEX2
Page 12
17. The 1984 budget projects total revenues of W 10,966.6 billion, anincrease of 4% over the 1983 outcome. However, at the time of preparationof the 1984 budget (last half of 1983), the 1983 GNP growth rate was notfully anticipated. Therefore, the revenue projections in the 1984 budget aretoo low, especially in light of the anticipated GNP growth for the remainderof the Fifth FYP period.
18. To calculate these revenue projectioTy, we estimated a set ofbuoyancy elasticities over the period 1971-83. These are presented in thelast column of Table 7. The elasticity of tax revenue is 1.3 and for totalrevenue, it is slightly above 1. As the economy continues to grow, the taxand revenue burdens will also increase. Some preliminary projections indicatethat the tax burden will rise to about 16% of GNP and the revenue to almost19% by 1986. Therefore, barring unexpected changes in either the growth ofGNP or the rate of inflation, Central Government revenues should be more thanadequate to assure an increase in Central Government savings throughout theremainder of the plan period, especially in light of the fiscal austerityplanned on the expenditure side.
19. For expenditures, the G/A can be disaggregated into seven functionalcategories: general administration; defense; education; social development;economic development; grants to local governments; and, repayment of debts andreserve fund. As shown in Table 8, the largest component of G/A expendituresis defense, over 30% of the total. By treaty, defense expenditures must equal6% of GNP, but in past years, these expenditures have exceeded this legalminimum. Education expenditures are the second largest portion of the budget.growing from 15% of the total in 1976 to 22% in the 1984 budget. Theseexpenditures are set by two budgetary statutes: (i) grants for education mustequal 11.8% of domestic tax revenues; (ii) the receipts of the education taxmust be spent entirely for education. While education expenditures have beenincreasing, those for economic development have declined from 25% to 16.5%over the same period. The growth in Education and the decrease in EconomicDevelopment expenditures reflect the increased emphasis in the Fourth andFifth FYP's on social development.
20. The share of the remaining expenditure items have remained rela-tively unchanged since 1976. Grant-ln-Aids to the local governments are alsoset by budgetary statute at 13.27% of domestic tax revenues. In the last fewyears, these grants have been higher, since the central government hasprovided special grants to the local governments for the purpose of repayingthe principal on local bond issues.
21. In order to impose fiscal restraint on the G/A budget in 1984, anumber of guidelines have been established. First, expenditures on defense,;education, and grants to local government's are to be held to their budgetary
2/ Since only minor tax changes are anticipated throughout this period, thebuoyancy elasticity is an adequate predictor of revenues; we were unableto ob.ain revenue series without discretionary changes in the tax laws,in order to estimate "pure" elasticities.

ANNEX 2- 159 - Table 7
KOREA
OPERATIONS OF THE PUBLIC SECTOR
General Account Revenue Projections: 1984(Unit - Billion Won)
1984 1984 ElasticityBudget /a Projected /b 1971-83
Actual RevenueTax revenue 9,693.7 9,984.5 1.3(Sum of elas proj) 10,022.7Domestic tax 6,454.6 6,495.4 1.030Custom duties 1,580.4 1,712.9 1.146Defense tax 1,374.0 1,529.7 1.160/cEducation tax 284.7 284.7 /d
Monopoly revenue 846.0 901.5 1.090Nontax revenue 427.0 1,072.8 0.773/e
Total Revenue 10,966.7 11,578.6 1.055/e(Sum of elas proj) 11,997.0
Revenue Burden (Z)Tax revenue 15.1 15.5
(Sum of elas proj) 15.6Domestic tax 10.0 10.1Custom duties 2.1 2.4Defense tax 2.1 2.4Education tax 0.4 0.4
Monopoly profits 1.3 1.4Nontax revenue 0.7 1.7
Total Revenue 17.0 18.0(Sum of elas proj) 18.6
Memo ItemGNP (current prices) 64,369 64,369
/a Budget data.T7 Projected data based on elasticities in the last column of table and GNP
projections./c Defense tax elasticity was calculated over the period 1976-83./d Education tax data are available for 1981-83 only.
/e Elasticity for period 1971-82.
Source: Budget Bureau, EPB.
ANNEX 2Table 8
KOREA
OPERATIONS OF THE PUBLIC SECTOR
General Account Expenditures by Function
1976 1978 1980 1982 1983 estimate 1984 budgetBin won Z Bin won % Bln won % Biln won X Bln won X Bln won 2
General administration 221.9 10.4 359.2 10.2 629.2 9.7 1,004.9 11.0 1,101.6 10.8 1,100.9 10.6
Defense 703.8 32.8 1,307.6 37.0 2,308.4 35.6 3,171.2 34.5 3,357.5 33.0 3,451.6 33.1
Education 317.0 14.8 615.7 17.4 1,122.1 17.3 1,909.1 20.8 2,150.0 21.1 2,275.2 21.9
Social development 132.7 6.2 175.8 5.0 442.4 6.8 569.8 6.2 663.6 6.5 737.1 7.1
Economic development 535.6 25.0 725.1 20.5 1,397.4 21.6 1,607.8 17.5 1,752.6 17.2 1,722.7 16.5
Grants to localgovernments 151.4 7.1 246.9 6.9 410.0 6.3 700.9 7.6 858.8 8.5 856.5 8.2
Repayment of debts &reserve fund 79.9 3.7 108.3 3.0 176.5 2.7 215.2 2.4 296.6 2.9 272.7 2.6
Total. 2,142.3 100.0 3,538.6 100.0 6,486.0 100.0 9,178.9 100.0 10,180.7 100.0 10,416.7 100.0
Source: Korea Taxation, MOF, various issues.
- 161 - ANNEX 2Page 14
minimums. Second, wages and salaries in the public sector will increase byonly 3%, allowing for no employment or general wage increases, only wageincreases resulting from changes in grades. Finally, administrative costswill increase by no more than 3%.
22. Table 9 shows Central Government Expenditures, for 1983-84, brokendown into two expenditure categories: inflexible expenditures, i.e. expendi-ture items which are governed by budgetary statutes; repayment of debts; andwages and salaries, where the 3% increase can be considered an absoluteminimum; and flexible expenditures. In the 1983 budget, expenditures ondefense, grants to local governments, and education grants were above thestatutory minimums. By holding expenditures in these categories to theminimum in 1984, inflexible expenditures in 1984 will increase by just 1.5%; adecline in real terms, given current inflation projections. The government'scommitment to fiscal austerity is also evident in the 1984 budget for flexibleexpenditures, which fall in nominal terms by 4.2%; nonproject expendituresdecreasing by 14.1% and project expenditure increasing by only 1.2%.
23. To examine the impact of the higher level of the GNP projected in1984, while retaining the budgetary statutes as outlined above, we have simu-lated the effects of our revenue projections (Table 7) for 1984 in the lasttwo columns of Table 8. These projections show an increase of 7.3% in inflex-ible expenditures for 1984; total expenditures increase by about W 400 bil-lion. However, this increase in expenditures is slight in comparison to the;W 600 billion increase in Central Government rlvenues, that we projected(Table 7). Given the tremendous compression in G/A expenditures that occurredin 1983 (Table 1) - about W 200 billion lower than budget - there seems to belittle room for improvement in the short term. But, with the anticipatedincreases in 1984 revenues, and an adherence to the expenditure guidelinesoutlined above, the G/A surplus of W 700 billion is achievable. However,increased compression of expenditures in order to achieve a higher level ofgovernment savings would be difficult.
Local Governments
24. Currently, there is no information on actual 1983 revenues or expen-ditures through 1982. We were able to project, via expenditure and revenueelasticities, a probably trend for local government operations during1983-86. However, this analysis is premised upon future behavior being iden-tical to past behavior. The results of our projections indicate little changein the surplus in the operations of local governments (about 1% of GNP).Therefore, the net savings of local governments are likely to remain between2-2.5% of GNP (the current level) for the remainder of the Fifth FYP period.
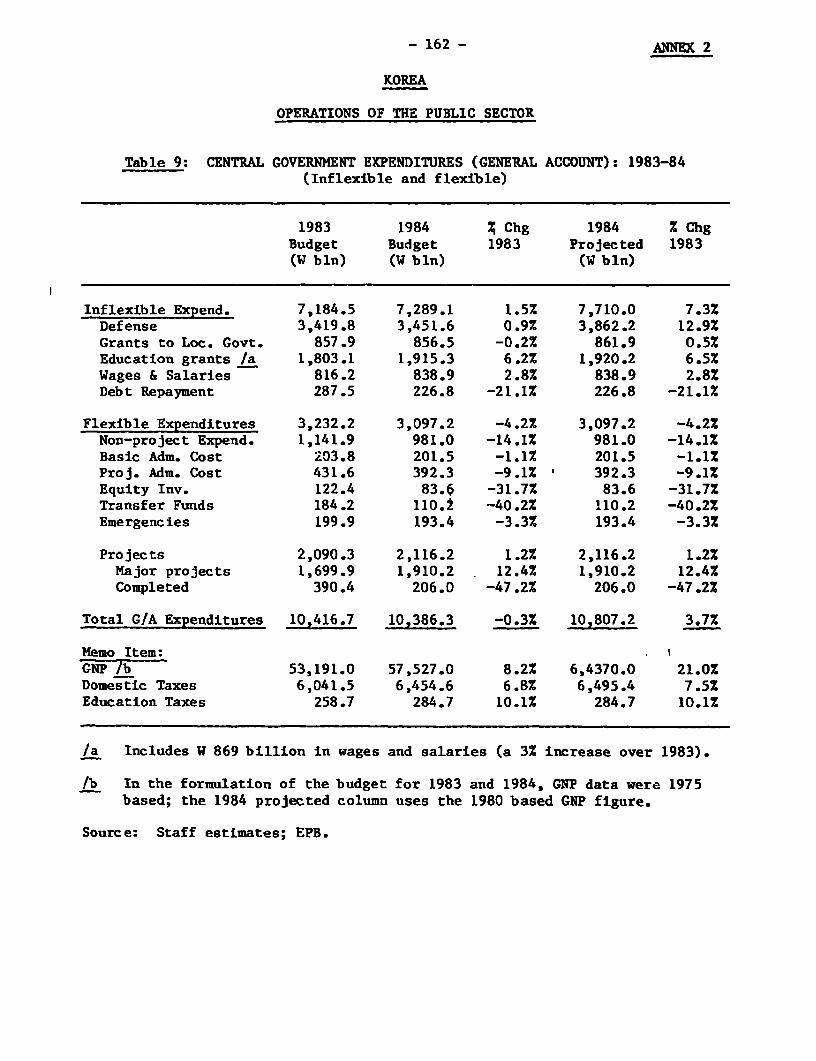
- 162 - ANNMX 2
KOREA
OPERATIONS OF THE PUBLIC SECTOR
Table 9: CENTRAL GOVERNMENT EXPENDITURES (GENERAL ACCOUNT): 1983-84(Inflexible and flexible)
1983 1984 ; Chg 1984 X ChgBudget Budget 1983 Projected 1983(W bln) (W bln) (W bln)
Inflexible Expend. 7,184.5 7,289.1 1.5% 7,710.0 7.3%Defense 3,419.8 3,451.6 0.9% 3,862.2 12.9%Grants to Loc. Govt. 857.9 856.5 -0.2% 861.9 0.5%Education grants /a 1,803.1 1,915.3 6.2% 1,920.2 6.5%Wages & Salaries 816.2 838.9 2.8% 838.9 2.8%Debt Repayment 287.5 226.8 -21.1% 226.8 -21.1%
Flexible Expenditures 3,232.2 3,097.2 -4.2% 3,097.2 -4.2%Non-project Expend. 1,141.9 981.0 -14.1% 981.0 -14.1%Basic Adm. Cost 203.8 201.5 -1.1% 201.5 -1.1%Proj. Adm. Cost 431.6 392.3 -9.1% ' 392.3 -9.1%Equity Inv. 122.4 83.6 -31.7% 83.6 -31.7%Transfer Funds 184.2 110. -40.2% 110.2 -40.2%Emergencies 199.9 193.4 -3.3% 193.4 -3.3%
Projects 2,090.3 2,116.2 1.2% 2,116.2 1.2%Major projects 1,699.9 1,910.2 12.4% 1,910.2 12.4%Completed 390.4 206.0 -47.2% 206.0 -47.2%
Total G/A Expenditures 10,416.7 10,386.3 -0.3% 10,807.2 3.7%
Memo Item: IGNP / 53,191.0 57,527.0 8.2% 6,4370.0 21.0%Domestic Taxes 6,041.5 6,454.6 6.8% 6,495.4 7.5%Education Taxes 258.7 284.7 10.1% 284.7 10.1%
/a Includes W 869 billion in wages and salaries (a 3% increase over 1983).
/b In the formulation of the budget for 1983 and 1984, GNP data were 1975based; the 1984 projected column uses the 1980 based GNP figure.
Source: Staff estimates; EPB.
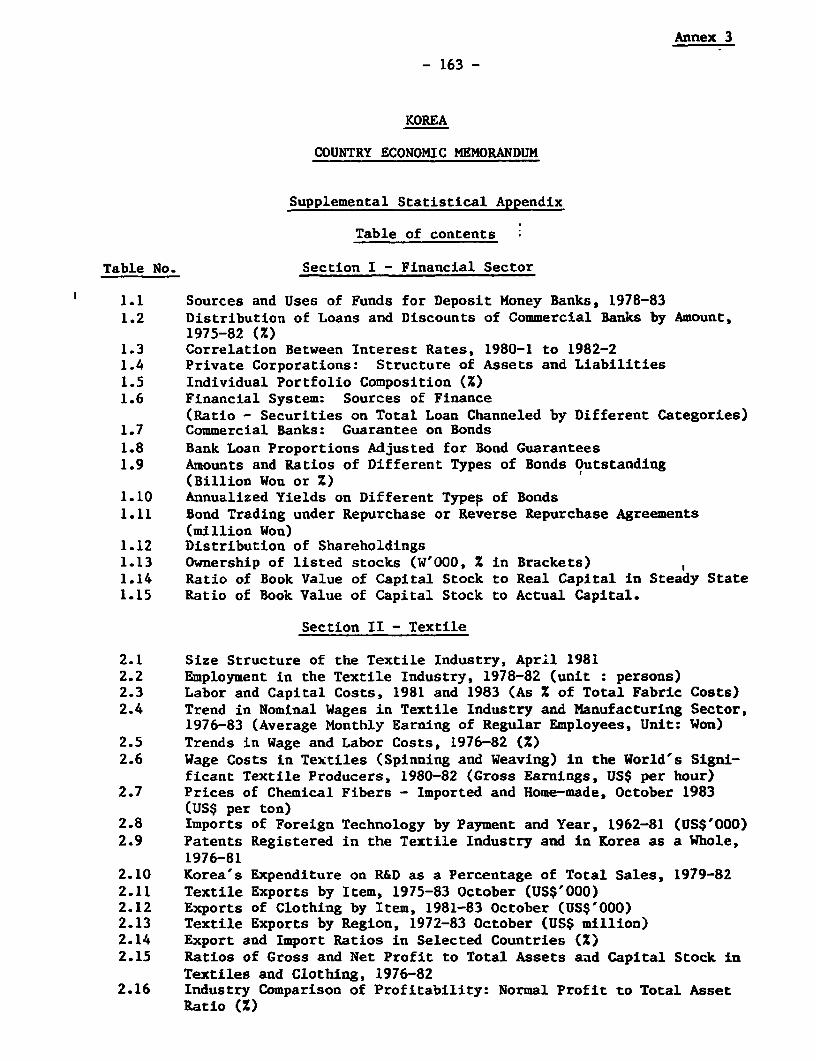
Annex 3
- 163 -
KOREA
COUNTRY ECONOMIC MEMORANDUM
Supplemental Statistical Appendix
Table of contents
Table No. Section I - Financial Sector
1.1 Sources and Uses of Funds for Deposit Money Banks, 1978-831.2 Distribution of Loans and Discounts of Commercial Banks by Amount,
1975-82 (%)1.3 Correlation Between Interest Rates, 1980-1 to 1982-21.4 Private Corporations: Structure of Assets and Liabilities1.5 Individual Portfolio Composition (%)1.6 Financial System: Sources of Finance
(Ratio - Securities on Total Loan Channeled by Different Categories)1.7 Commercial Banks: Guarantee on Bonds1.8 Bank Loan Proportions Adjusted for Bond Guarantees1.9 Amounts and Ratios of Different Types of Bonds Outstanding
(Billion Won or Z)1.10 Annualized Yields on Different Typep of Bonds1.11 Bond Trading under Repurchase or Reverse Repurchase Agreements
(million Won)1.12 Distribution of Shareholdings1.13 Ownership of listed stocks (W'OOO, X in Brackets)1.14 Ratio of Book Value of Capital Stock to Real Capital in Steady State1.15 Ratio of Book Value of Capital Stock to Actual Capital.
Section II - Textile
2.1 Size Structure of the Textile Industry, April 19812.2 Employment in the Textile Industry, 1978-82 (unit : persons)2.3 Labor and Capital Costs, 1981 and 1983 (As X of Total Fabric Costs)2.4 Trend in Nominal Wages in Textile Industry and Manufacturing Sector,
1976-83 (Average Monthly Earning of Regular Employees, Unit: Won)2.5 Trends in Wage and Labor Costs, 1976-82 (%)2.6 Wage Costs in Textiles (Spinning and Weaving) in the World's Signi-
ficant Textile Producers, 1980-82 (Gross Earnings, US$ per hour)2.7 Prices of Chemical Fibers - Imported and Home-made, October 1983
(US$ per ton)2.8 Imports of Foreign Technology by Payment and Year, 1962-81 (US$'000)2.9 Patents Registered in the Textile Industry and in Korea as a Whole,
1976-812.10 Korea's Expenditure on R&D as a Percentage of Total Sales, 1979-822.11 Textile Exports by Item, 1975-83 October (US$'000)2.12 Exports of Clothing by Item, 1981-83 October (US$'000)2.13 Textile Exports by Region, 1972-83 October (US$ million)2.14 Export and Import Ratios in Selected Countries (X)2.15 Ratios of Gross and Net Profit to Total Assets and Capital Stock in
Textiles and Clothing, 1976-822.16 Industry Comparison of Profitability: Normal Profit to Total Asset
Ratio (Z)
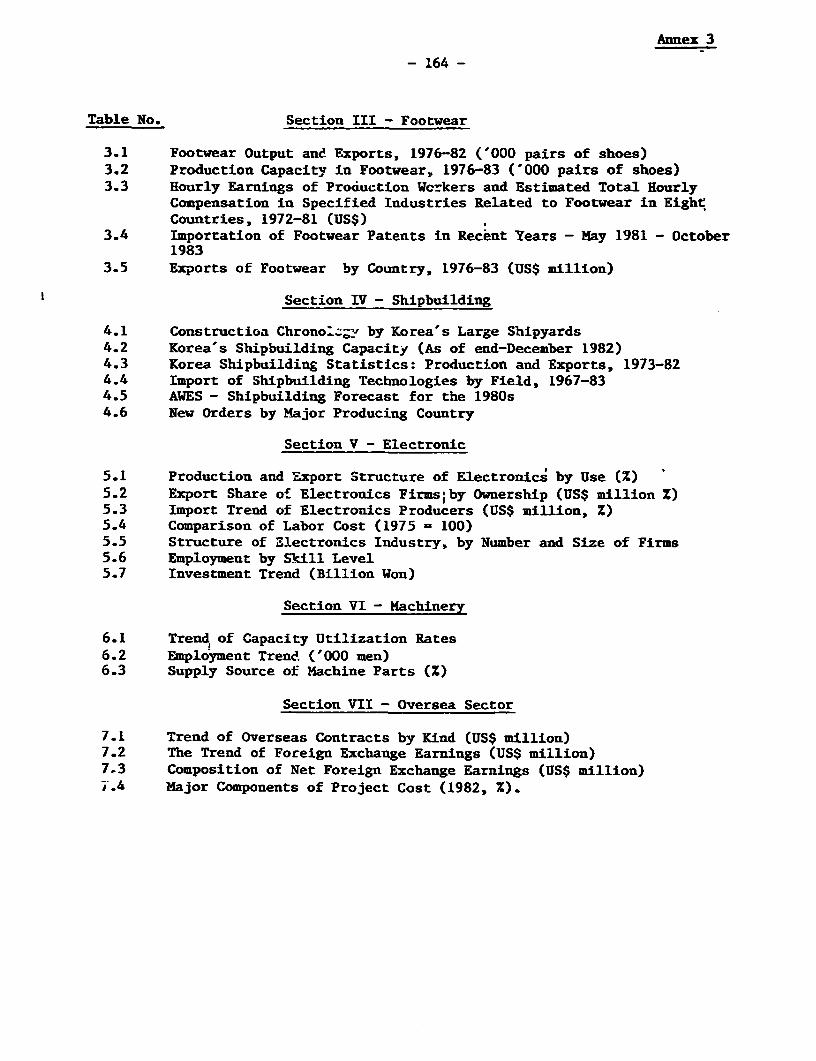
Annex 3
- 164 -
Table No. Section III - Footwear
3.1 Footwear Output ane Exports, 1976-82 ('000 pairs of shoes)3.2 Production Capacity in Footwear, 1976-83 ('000 pairs of shoes)3.3 Hourly Earnings of Proauction Wcr-kers and Estimated Total Hourly
Compensation in Specified Industries Related to Footwear in Eight;Countries, 1972-81 (US$)
3.4 Importation of Footwear Patents in Recent Years - May 1981 - October1983
3.5 Exports of Footwear by Country, 1976-83 (US$ million)
Section IV - Shipbuilding
4.1 Constructioa Chronolz- by Korea's Large Shipyards4.2 Korea's Shipbuilding Capacity (As of end-December 1982)4.3 Korea Shipbuilding Statistics: Production and Exports, 1973-824.4 Import of Shipbuilding Technologies by Field, 1967-834.5 AWES - Shipbuilding Forecast for the 1980s4.6 New Orders by Major Producing Country
Section V - Electronic
5.1 Production and Export Structure of Electronics by Use (Z)5.2 Export Share of Electronics Firms;by Ownership (US$ million Z)5.3 Import Trend of Electronics Producers (US$ million, X)5.4 Comparison of Labor Cost (1975 = 100)5.5 Structure of Electronics Industry, by Number and Size of Firms5.6 Employment by Skill Level5.7 Investment Trend (Billion Won)
Section VI - Machinery
6.1 Trend of Capacity Utilization Rates6.2 Employment Trend. ('000 men)6.3 Supply Source of Machine Parts (Z)
Section VII - Oversea Sector
7.1 Trend of Overseas Contracts by Kind (US$ million)7.2 The Trend of Foreign Exchange Earnings (US$ million)7.3 Composition of Net Foreign Exchange Earnings (US$ million)7.4 Major Components of Project Cost (1982, X).

ANNEX 3
- 165 - Table 1.1
KOREA
COUNTRY ECONOMIC MEMORANDUM
Sources and Uses of Funds for Deposit Money Banks, 1978-83 /a
1978-80 1981-83 /aAmount Share Amount Share(Won bln) (Z) (Won bin) (z)
Sources
Deposits /b 6,199 46.0 8,306 47.6
Foreign liabilities 3,605 26.8 5,007 28.7
Credit from Bank of Korea 2,069 15.4 1,917 11.0
Public sector deposits 511 3.8 1,298 7.4
Capital accounts 854 6.4 936 5.3
Net other items 218 1.6
Total 13,461 100.0 17,464 100.0
Uses
Credit to private sector 10,405 77.3 12,750 73.0
Foreign assets 1,819 13.5 1,002 5.7
Deposits at Bank of Korea 578 4.3 1,295 7.4
Credit to public sector 659 4.9 1,303 7.5
Net other items - - 1,114 6.4
Total 13,461 100.0 17,464 100.0
/a September 1983.
/b Incluides demand deposits, savings deposits, bonds and import deposits.
Source: IMF, International Financial Statistics.
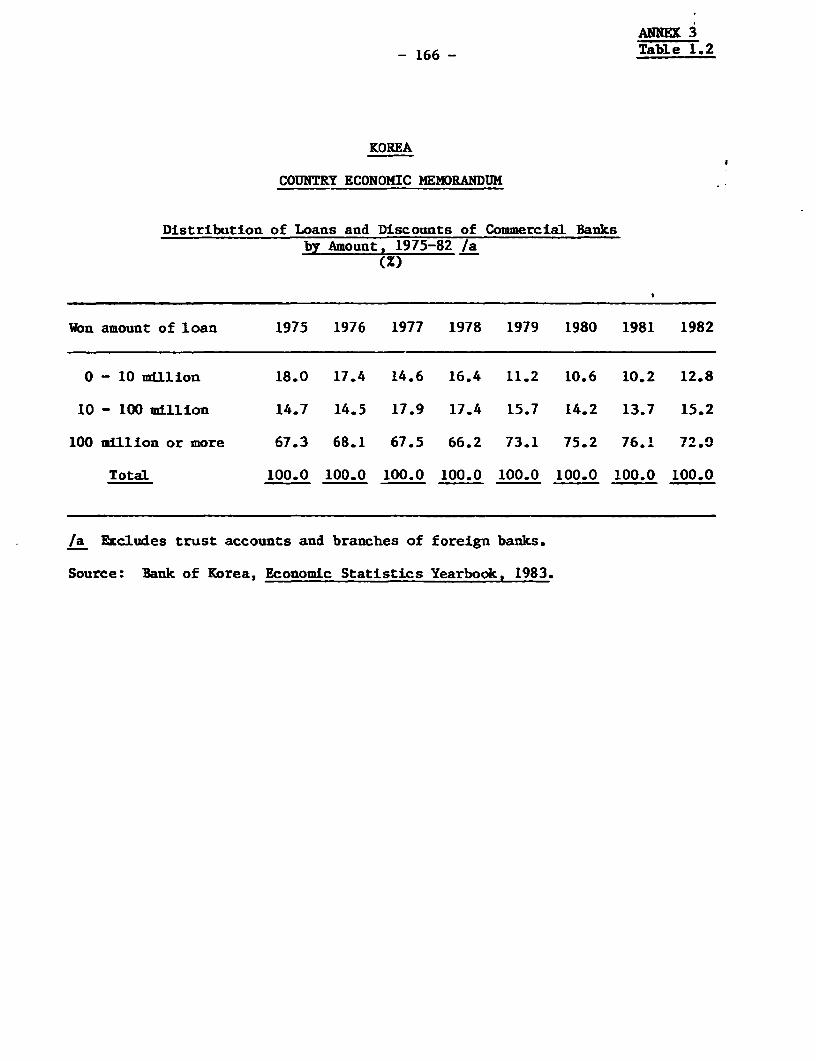
ANNEX 3
- 166 - Table 1.2
KOREA
COUNTRY ECONOMIC MEMORANDUM
Distribution of Loans and Discounts of Commercial Banksby Amount, 1975-82 /a
(%)
Won amount of loan 1975 1976 1977 1978 1979 1980 1981 1982
0 - 10 million 18.0 17.4 14.6 16.4 11.2 10.6 10.2 12.8
10 - 100 million 14.7 14.5 17.9 17.4 15.7 14.2 13.7 15.2
100 million or more 67.3 68.1 67.5 66.2 73.1 75.2 76.1 72.0
Total 100.0 100.0 100.0 100.0 100.0 100.0 100.0 100.0
/a Excludes trust accounts and branches of foreign banks.
Source: Bank of Korea, Economic Statistics Yearbook, 1983.
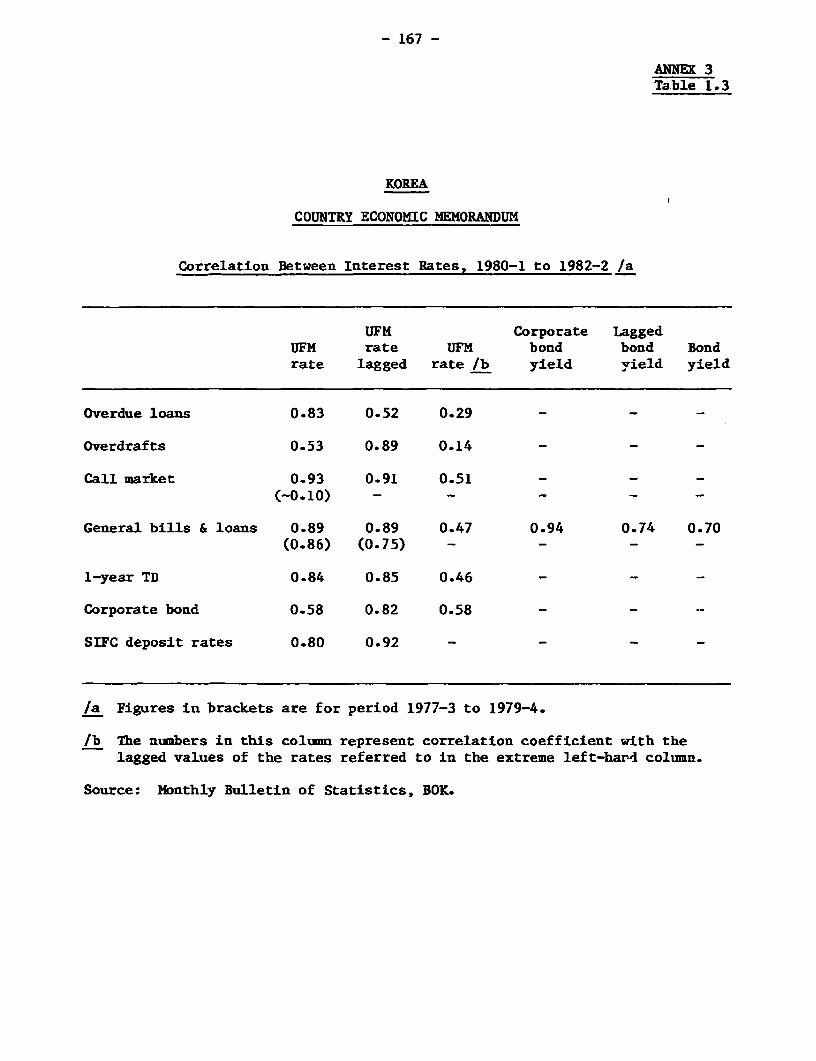
- 167 -
ANNEX 3Table 1.3
KOREA
COUNTRY ECONOMIC MEMORANDUM
Correlation Between Interest Rates, 1980-1 to 1982-2 /a
UFM Corporate LaggedUFM rate UFM bond bond Bondrate lagged rate /b yield yield yield
Overdue loans 0.83 0.52 0.29 -
Overdrafts 0.53 0.89 0.14 -
Call market 0.93 0.91 0.51 -
(-0.10) - - _
General bills & loans 0.89 0.89 0.47 0.94 0.74 0.70(0.86) (0.75) - - - -
1-year TD 0.84 0.85 0.46 -
Corporate bond 0.58 0.82 0.58 -
SIFC deposit rates 0.80 0.92 - -
/a Figures in brackets are for period 1977-3 to 1979-4.
/b The numbers in this column represent correlation coefficient with thelagged values of the rates referred to in the extreme left-hard column.
Source: Monthly Bulletin of Statistics, BOK.
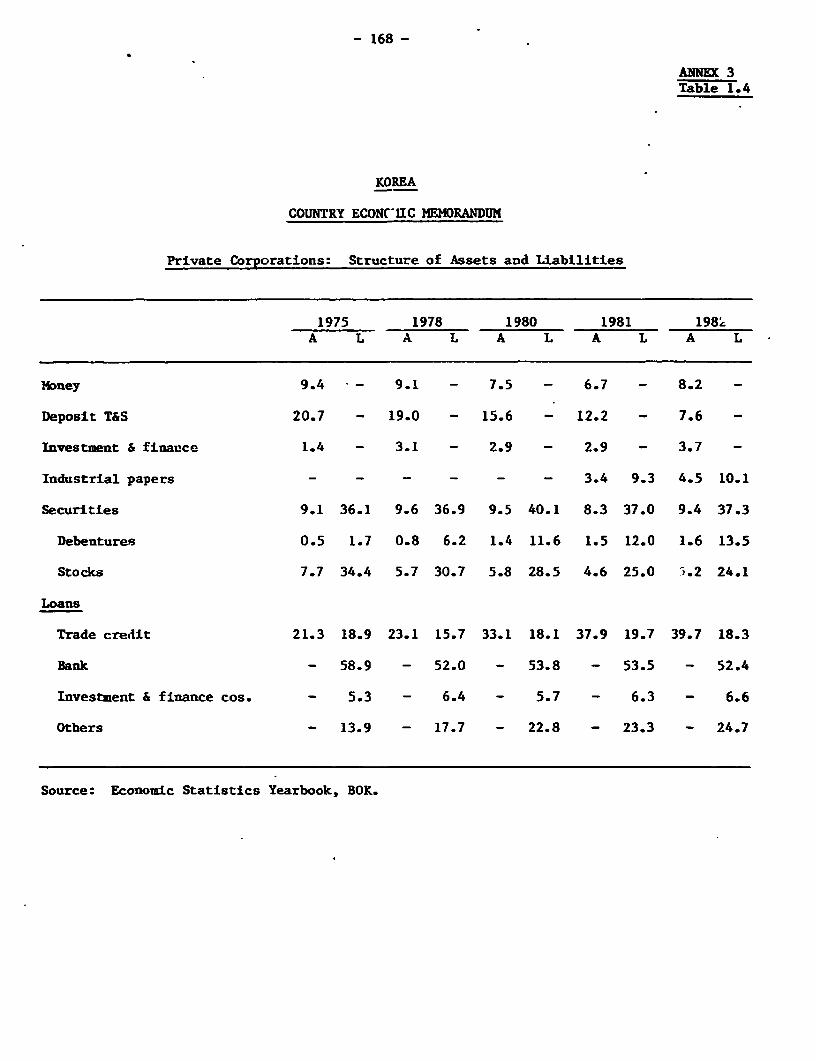
- 168 -
ANNEX 3Table 1.4
KOREA
COUNTRY ECONCIIC MEMORANDUM
Private Corporations: Structure of Assets and Liabilities
1975 1978 1980 1981 198KA L A L A L A L A L
14ney 9.4 - 9.1 - 7.5 - 6.7 - 8.2 -
Deposit T&S 20.7 - 19.0 - 15.6 - 12.2 - 7.6 -
Investment & finance 1.4 - 3.1 - 2.9 - 2.9 - 3.7 -
Industrial papers - - - - - - 3.4 9.3 4.5 10.1
Securities 9.1 36.1 9.6 36.9 9.5 40.1 8.3 37.0 9.4 37.3
Debentures 0.5 1.7 0.8 6.2 1.4 11.6 1.5 12.0 1.6 13.5
Stocks 7.7 34.4 5.7 30.7 5.8 28.5 4.6 25.0 ;.2 24.1
Loans
Trade crelit 21.3 18.9 23.1 15.7 33.1 18.1 37.9 19.7 39.7 18.3
Bank - 58.9 - 52.0 - 53.8 - 53.5 - 52.4
Investment & finance cos. - 5.3 - 6.4 - 5.7 - 6.3 - 6.6
Others - 13.9 - 17.7 - 22.8 - 23.3 - 24.7
Source: Economic Statistics Yearbook, BOK.
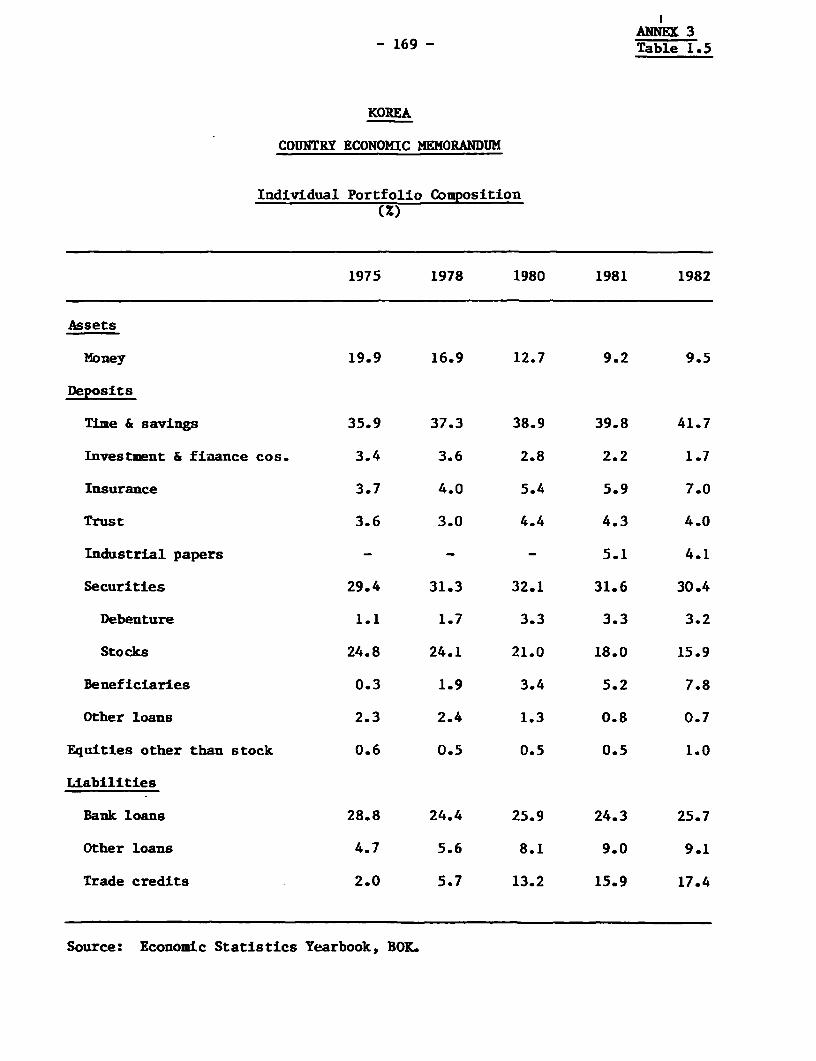
ANNEX 3- 169 - Table 1.5
KOREA
COUNTRY ECONOMIC MEMORANDUM
Individual Portfolio Composition(Z)
1975 1978 1980 1981 1982
Assets
Money 19.9 16.9 12.7 9.2 9.5
Deposits
Time & savings 35.9 37.3 38.9 39.8 41.7
Investment & finance cos. 3.4 3.6 2.8 2.2 1.7
Insurance 3.7 4.0 5.4 5.9 7.0
Trust 3.6 3.0 4.4 4.3 4.0
Industrial papers - - - 5.1 4.1
Securities 29.4 31.3 32.1 31.6 30.4
Debenture 1.1 1.7 3.3 3.3 3.2
Stocks 24.8 24.1 21.0 18.0 15.9
Beneficiaries 0.3 1.9 3.4 5.2 7.8
Other loans 2.3 2.4 1.3 0.8 0.7
Equities other than stock 0.6 0.5 0.5 0.5 1.0
Liabilities
Bank loans 28.8 24.4 25.9 24.3 25.7
Other loans 4.7 5.6 8.1 9.0 9.1
Trade credits 2.0 5.7 13.2 15.9 17.4
Source: Economic Statistics Yearbook, BOKL
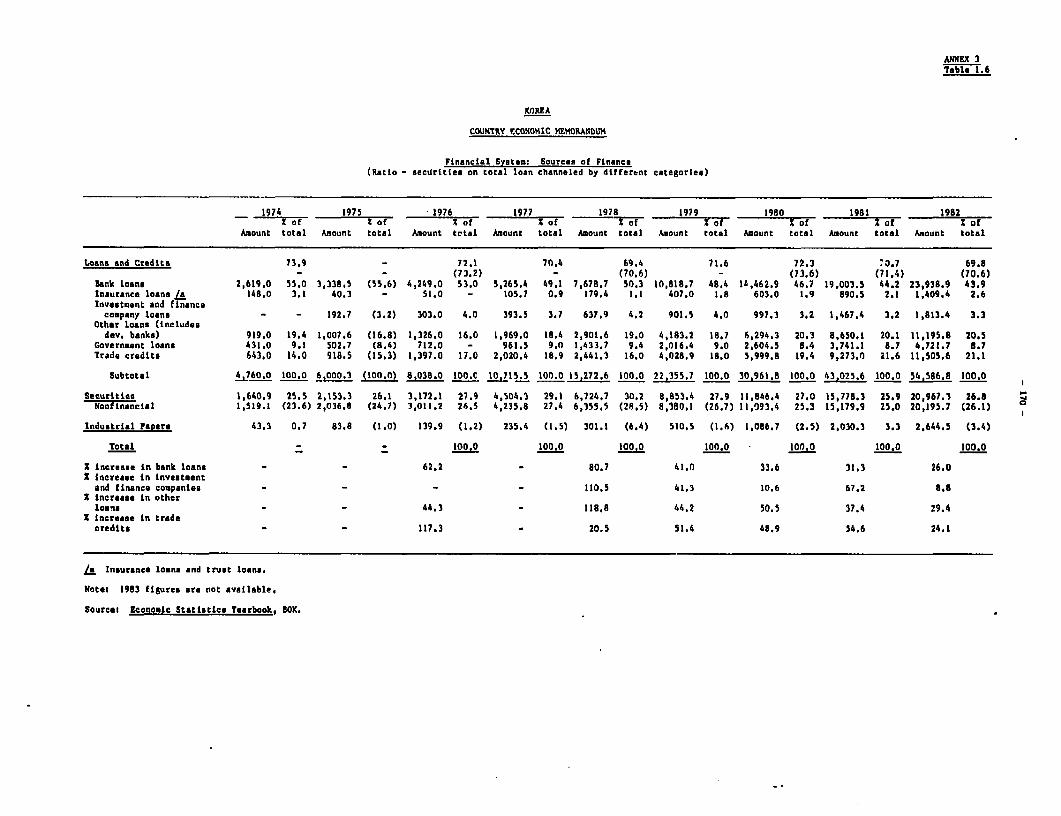
ANNEX 3Table 1.6
KOREA
COUNTRY_ ECONOMIC MEMORANDUM
Financial System: Sources of Finance(Ratio - securities on total loan channeled by different categories)
1974 1975 1976 1977 1978 1979 1980 1981 1982Z of X of X ot of S S of X of S o of
Amount total Amount total Amount total Amount total Amount total mount total Amount total Amount total Amount total
Loans and Ctedita 73.9 - 72.1 7n.4 69.4 71.6 72.3 .0 7 69.8- - (73.2) - (70.6) - (73.6) (71.4) (70.6)
Bank loans 2,619.0 55.0 3,338.5 (55.6) 4,249.0 53.0 5,265.4 49.1 7,678.7 50.3 10,818.7 48.4 14,462,9 46.7 19,003.5 44.2 23,938.9 43.9Inaurance loans a 148.0 3.1 40.3 - 51.0 - 105.7 0.9 179.4 1.1 407.0 1.8 603.0 1.9 890.5 2.1 1,409.4 2.6Investment and finance
company loans - - 192.7 (3.2) 303.0 4.0 393.5 3.7 637.9 4.2 901.5 4.0 997.3 3.2 1,467.4 3.2 1,813.4 3.3Other loans (includes
dev, banks) 919.0 19.4 1,007.6 (16.8) 1,326.0 16.0 1,969.0 18.4 2,901.6 19.0 4,183.2 18.7 6,294.3 20.3 8,650.1 20.1 11,195.8 20.5Government loans 431.0 9.1 502.7 (8.4) 712.0 - 961.5 9.0 1,433.7 9.4 2,016.4 9.0 2,604.5 8.4 3,741.1 8.7 4,721.7 8.7Trade credits 643.0 14,0 918.5 (15.3) 1,397.0 17.0 2,020.4 18.9 2,441.3 16,0 4,028,9 18,0 5,999.8 19.4 9,273.0 21.6 11,505,6 21.1
Subtotal 4,760.0 100.0 6,000,3 (100.0) 8,038,0 100. 10,715.5 100.0 15,272.6 100.0 22,355.7 100.0 30,961,8 100.0 43,025.6 100.0 54,586,8 100.0
SecuTities 1,640,9 25.5 2,153.3 26.1 3,172.1 27.9 4,504.3 29.1 6,724.7 30,2 8,853.4 27.9 11,846.4 27.0 15,778.3 25.9 20,967.1 26.8Nonfinancial 1,519.1 (23.6) 2,036.8 (24.7) 3,011.2 26.5 4,235,8 27.4 6,355.5 (28.5) 8,380.1 (26.7) 11,093.4 25.3 15,179.9 25.0 20,195.7 (26.1)
Industrlal Papers 43.3 0.7 83.8 (1.0) 139.9 (1.2) 235.4 (1.5) 301.1 (6.4) 510.5 (1.6) 1,086.7 (2,5) 2,030.3 3.3 2,644.5 (3.4)
Total - 100,0 100.0 100,0 100,0 100.0 100.0 100.0
X Increase In bank loans - - 62.2 - 80.7 41,0 33.6 31,3 26.02Increase in Investment
and finance companiee - - - - 110,5 41,3 10.6 67,2 8.8X increase ln otherloans - - 44.3 - 118.8 44.2 50.5 37.4 29.4
XIncrease in tradecredits - - 117,3 - 20.5 51.4 48,9 54.6 24,1
/a Insurance loana and trust loans.
Notei 1983 figures are not available,
Sourcat Economic Statistics Yearbook, B0K.
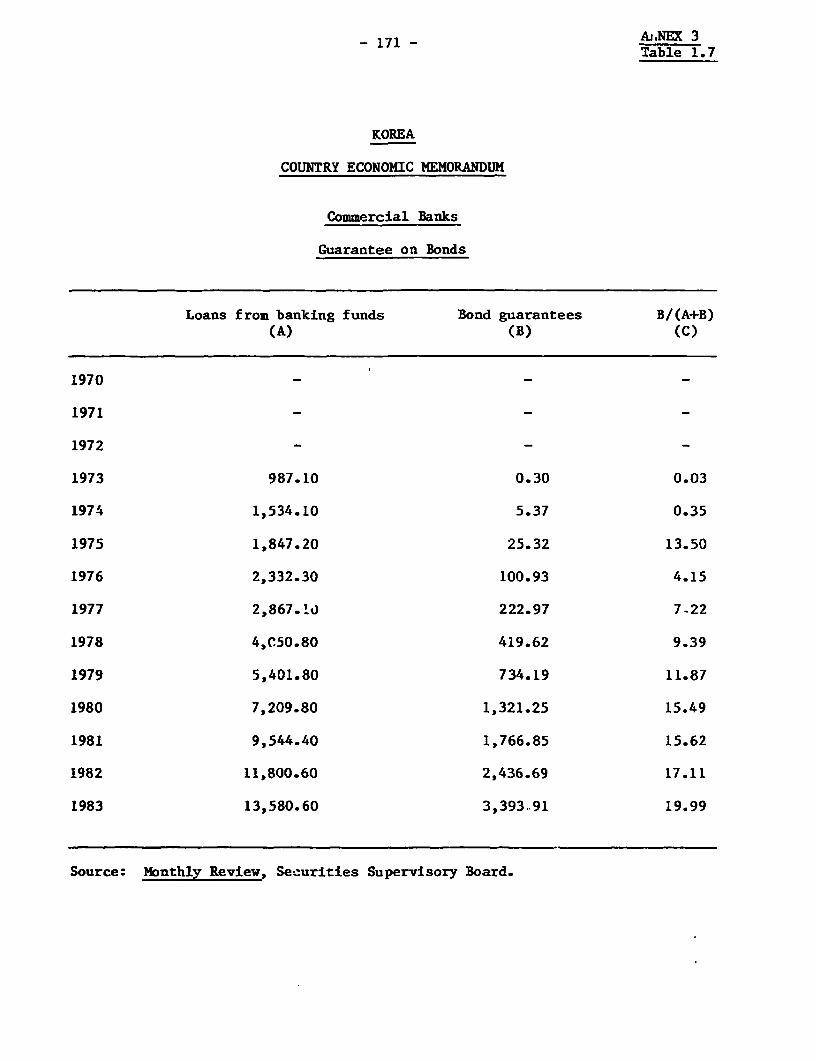
- 171 - ~~~~~~Aj.NEX 3- 171 - Table 1.7
KOREA
COUNTRY ECONOMIC MEMORANDUM
Commercial Banks
Guarantee on Bonds
Loans from banking funds Bond guarantees B/(A+B)(A) (B) (C)
1970
1971
1972
1973 987.10 0.30 0.03
1974 1,534.10 5.37 0.35
1975 1,847.20 25.32 13.50
1976 2,332.30 100.93 4.15
1977 2,867.10 222.97 7-22
1978 4,C50.80 419.62 9.39
1979 5,401.80 734.19 11.87
1980 7,209.80 1,321.25 15.49
1981 9,544.40 1,766.85 15.62
1982 11,800.60 2,436.69 17.11
1983 13,580.60 3,393.91 19.99
Source: Monthly Review, Securities Supervisory Board.
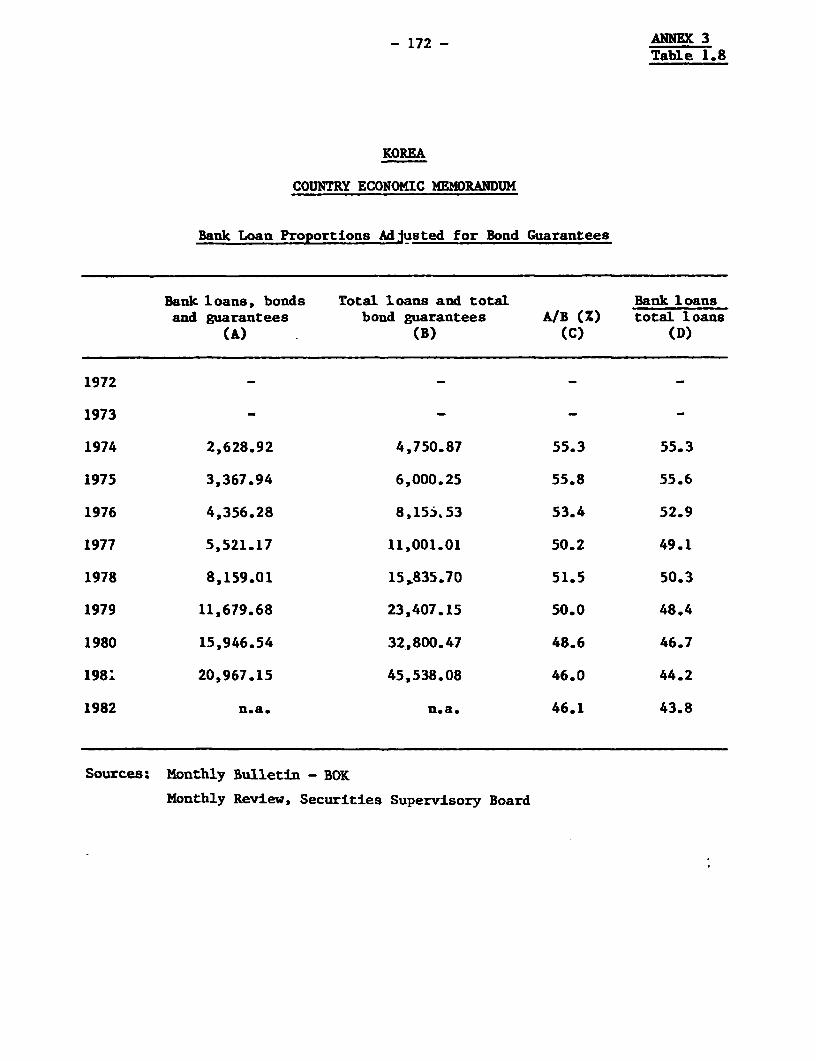
- 172 - ANNEX 3Table 1.8
KOREA
COUNTRY ECONOMIC NEMORANDUMI
Bank Loan Proportions Adjusted for Bond Guarantees
Bank loans, bonds Total loans and total Bank loansand guarantees bond guarantees A/B (Z) total loans
(A) (B) (C) (D)
1972
1973
1974 2,628.92 4,750.87 55.3 55.3
1975 3,367.94 6,000.25 55.8 55.6
1976 4,356.28 8,155.53 53.4 52.9
1977 5,521.17 11,001.01 50.2 49.1
1978 8,159.01 15,835.70 51.5 50.3
1979 11,679.68 23,407.15 50.0 48.4
1980 15,946.54 32,800.47 48.6 46.7
198; 20,967.15 45,538.08 46.0 44.2
1982 n.a. n.a. 46.1 43.8
Sources: Monthly Bulletin - BOK
Monthly Review, Securities Supervisory Board
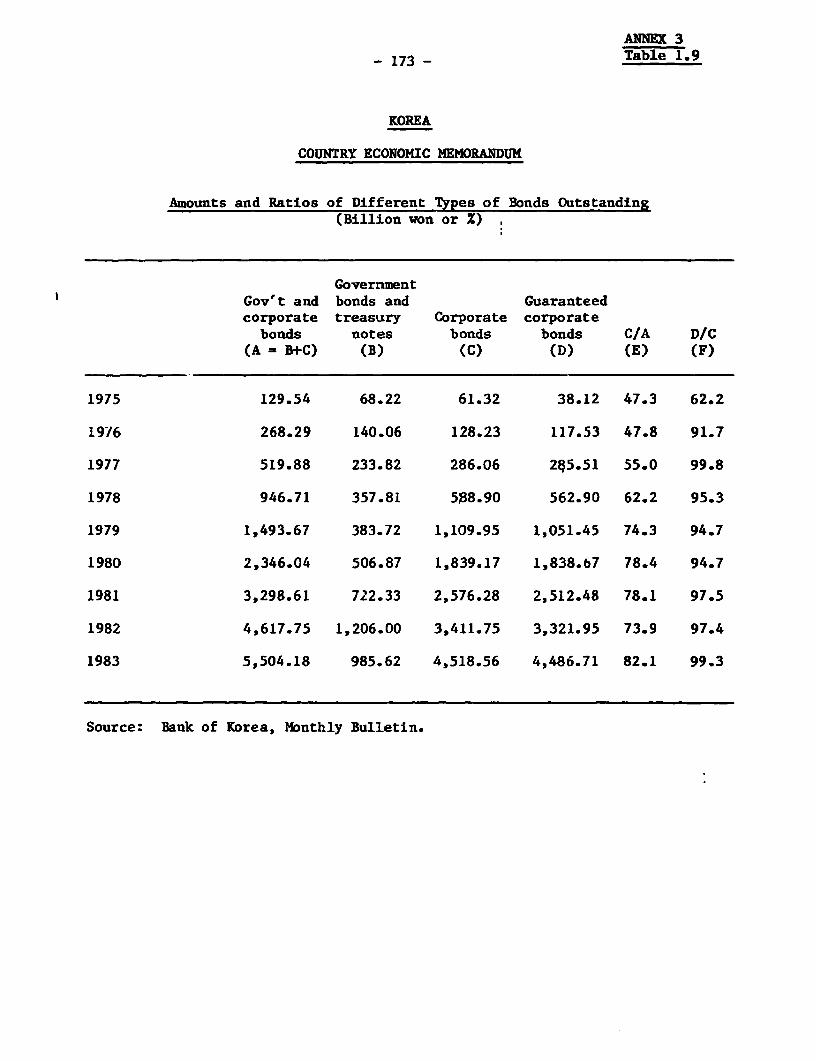
ANNEX 3
- 173 - Table 1.9
KOREA
COUNTRY ECONOMIC MEMORANDUM
Amounts and Ratios of Different Types of Bonds Outstanding(Billion won or X)
GovernmentGov't and bonds and Guaranteedcorporate treasury Corporate corporatebonds notes bonds bonds C/A D/C
(A = B+C) (B) (C) (D) (E) (F)
1975 129.54 68.22 61.32 38.12 47.3 62.2
1976 268.29 140.06 128.23 117.53 47.8 91.7
1977 519.88 233.82 286.06 2§5.51 55.0 99.8
1978 946.71 357.81 5a8.90 562.90 62.2 95.3
1979 1,493.67 383.72 1,109.95 1,051.45 74.3 94.7
1980 2,346.04 506.87 1,839.17 1,838.67 78.4 94.7
1981 3,298.61 722.33 2,576.28 2,512.48 78.1 97.5
1982 4,617.75 1,206.00 3,411.75 3,321.95 73.9 97.4
1983 5,504.18 985.62 4,518.56 4,486.71 82.1 99.3
Source: Bank of Korea, Monthly Bulletin.
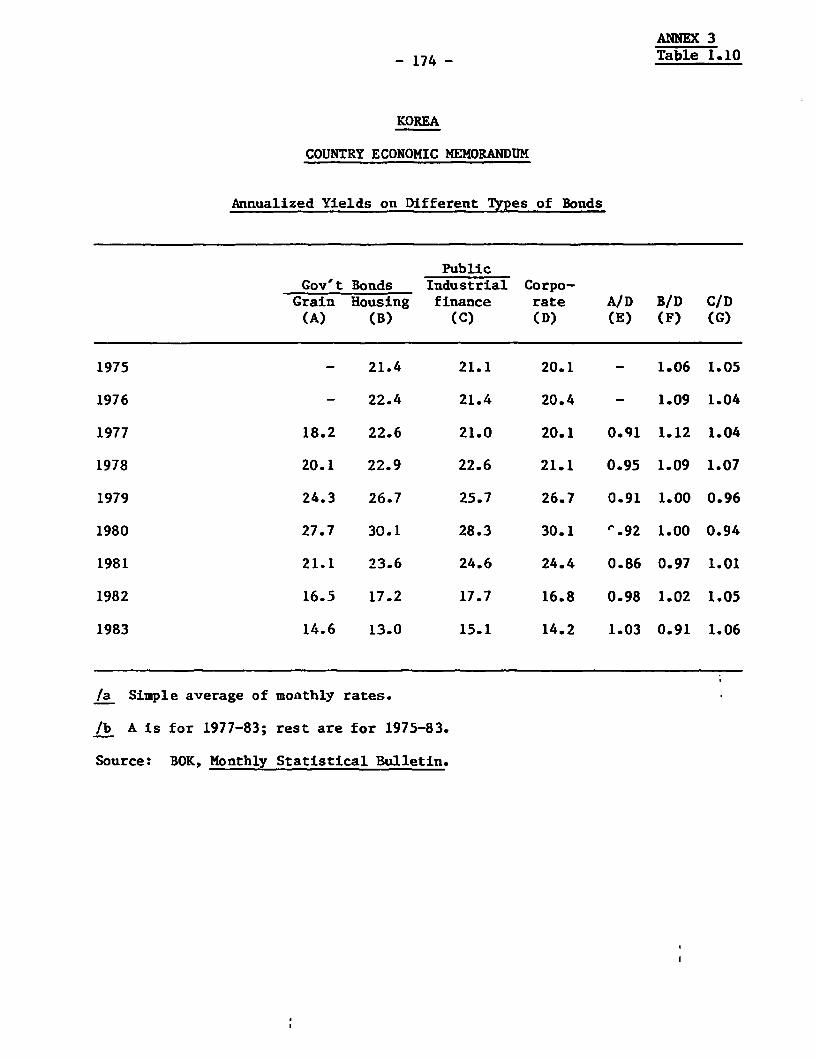
ANNEX 3
- 174 - Table 1.10
KOREA
COUNTRY ECONOMIC MEMORANDUM
Annualized Yields on Different Types of Bonds
PublicGov't Bonds Industrial Corpo-Grain Housing finance rate A/D B/D C/D(A) (B) (C) (D) (E) (F) (G)
1975 - 21.4 21.1 20.1 - 1.06 1.05
1976 - 22.4 21.4 20.4 - 1.09 1.04
1977 18.2 22.6 21.0 20.1 0.91 1.12 1.04
1978 20.1 22.9 22.6 21.1 0.95 1.09 1.07
1979 24.3 26.7 25.7 26.7 0.91 1.00 0.96
1980 27.7 30.1 28.3 30.1 '.92 1.00 0.94
1981 21.1 23.6 24.6 24.4 0.86 0.97 1.01
1982 16.5 17.2 17.7 16.8 0.98 1.02 1.05
1983 14.6 13.0 15.1 14.2 1.03 0.91 1.06
/a Simple average of moathly rates.
/b A is for 1977-83; rest are for 1975-83.
Source: BOK, Monthly Statistical Bulletin.

ANNEX 3Table 1.11
KOREA
COUNTRY ECONOMIC MEHORANDUH
Bond Trading Under Repurchase or Reverse Repurchase Agreements(Million won)
Under reverse Secondaryrepurchase Outstanding Under repurchase Oustanding market Tertiary
Year a8reement at year or agreement at year or Total activity activity Rep outstandinaor month Purchase Sales month end- Ssles Repurchase month end outstanding (1+4) (2+5) Balance listed of bonds {x)
(1) (2) (3) (4) (5) (6) (7) (8) (9) (10) (11)
1977 15,418 13,500 1,818 500 - 500 2,318 15,918 13,500 15,283 0.68
1978 201,759 178,848 24,729 861 990 372 25,101 302,620 382,458 22,911 5.84
1979 324,906 337,079 12,556 1,021 1,392 - 12,566 325,927 664,398 -12,173 2.33
1980 284,758 278,402 18,912 500 500 - 18,912 285,258 564,160 6,358 2.11
1981 313,365 306,981 25,295 5,105 5,105 - 25,295 318,470 630,556 6,384 1.65
1982 Jan 34,812 46,347 13,760 - -Feb 36,099 30,281 19,577 - - -Mar 54,787 62,546 11,818 - - -Apr 56,867 40,571 28,114 - - -Hay 26,751 46,129 8,736 - - -Jun 32,618 19,995 21,358 - - -
1982 1-6 241,934 245,869 21,358 - - - 21,358 241,934 - -
Source: Introduction to the Korean Securities Harket, 1982.
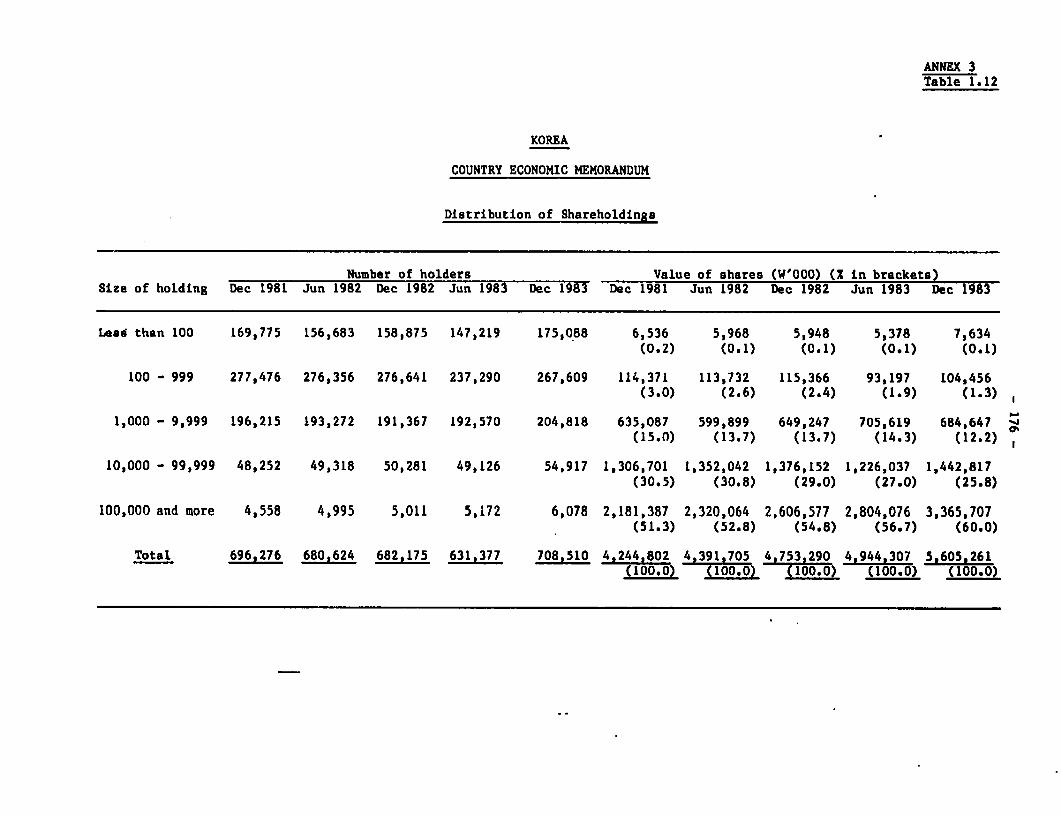
ANNEX 3Table 1.12
KOREA
COUNTRY ECONOMIC MEMORANDUM
Distribution of Shareholdings
Number of holders Value of shares (W'000) (% in brackets)Size of holding Dec 1981 Jun 1982 Dee 1982 Jun 1983 Dec 1983 Dec 1981 Jun 1982 Dec 1982 Jun 1983 Dec 1983
Lead than 100 169,775 156,683 158,875 147,219 175,088 6,536 5,968 5,948 5,378 7,634(0.2) (0.1) (0.1) (0.1) (0.1)
100 - 999 277,476 276,356 276,641 237,290 267,609 114,371 113,732 115,366 93,197 104,456(3.0) (2.6) (2.4) (1.9) (1.3)
1,000 - 9,999 196,215 193,272 191,367 192,570 204,818 635,087 599,899 649,247 705,619 684,647 >(15.0) (13.7) (13.7) (14.3) (12.2)
10,000 - 99,999 48,252 49,318 50,281 49,126 54,917 1,306,701 1,352,042 1,376,152 1,226,037 1,442,817(30.5) (30.8) (29.0) (27.0) (25.8)
100,000 and more 4,558 4,995 5,011 5,172 6,078 2,181,387 2,320,064 2,606,577 2,804,076 3,365,707(51.3) (52.8) (54.8) (56.7) (60.0)
Total 696,276 680,624 682,175 631,377 708,510 4,244,802 4,391,705 4,753,290 4 944 307 5,605,261(100.0) (100.0) (100.0) (100).0 (100.0)
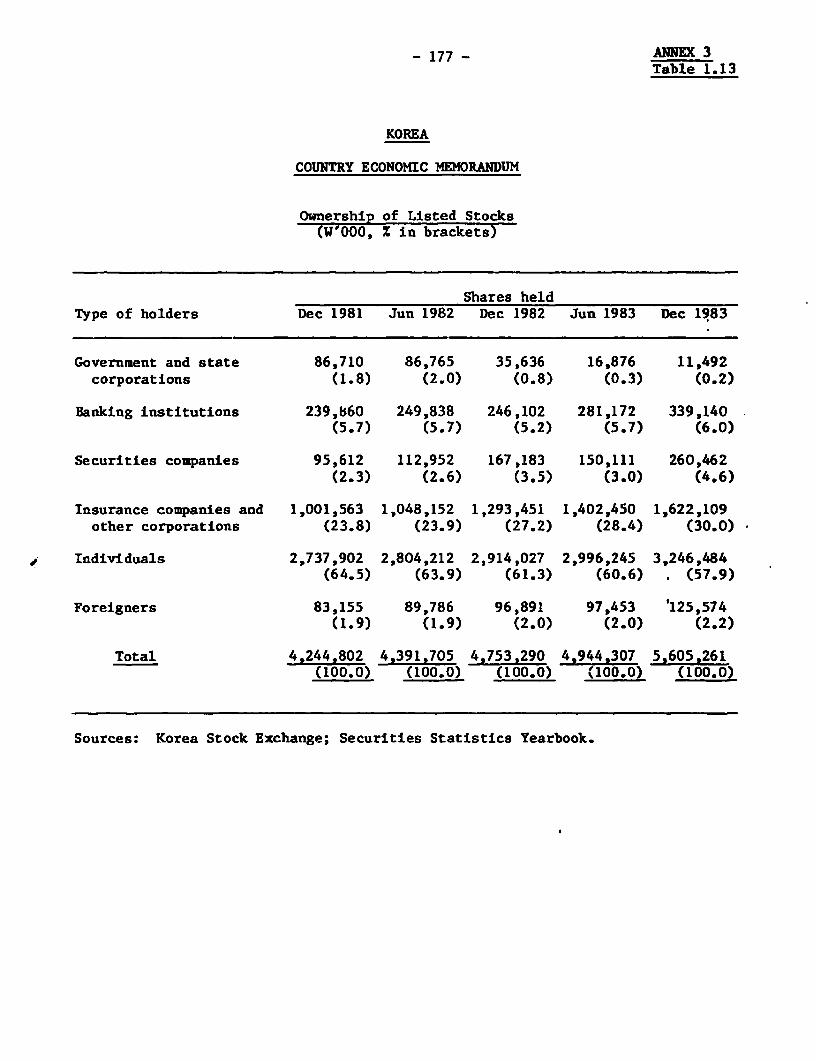
- 177- ANNEX 3Table 1.13
KOREA
COUNTRY ECONOMIC MEMORANDUM
Ownership of Listed Stocks(W'000, % in brackets)
Shares heldType of holders Dec 1981 Jun 1982 Dec 1982 Jun 1983 Dec 1983
Government and state 86,710 86,765 35,636 16,876 11,492corporations (1.8) (2.0) (0.8) (0.3) (0.2)
Banking institutions 239,860 249,838 246,102 281,172 339,140(5.7) (5.7) (5.2) (5.7) (6.0)
Securities companies 95,612 112,952 167,183 150,111 260,462(2.3) (2.6) (3.5) (3.0) (4.6)
Insurance companies and 1,001,563 1,048,152 1,293,451 1,402,450 1,622,109other corporations (23.8) (23.9) (27.2) (28.4) (30.0)
Individuals 2,737,902 2,804,212 2,914,027 2,996,245 3,246,484(64.5) (63.9) (61.3) (60.6) (57.9)
Foreigners 83,155 89,786 96,891 97,453 '125,574(1.9) (1.9) (2.0) (2.0) (2.2)
Total 4,244,802 4,391,705 4,753,290 4,944,307 5,605,261(100.0) (100.0) (100.0) (100.0) (100.0)
Sources: Korea Stock Exchange; Securities Statistics Yearbook.
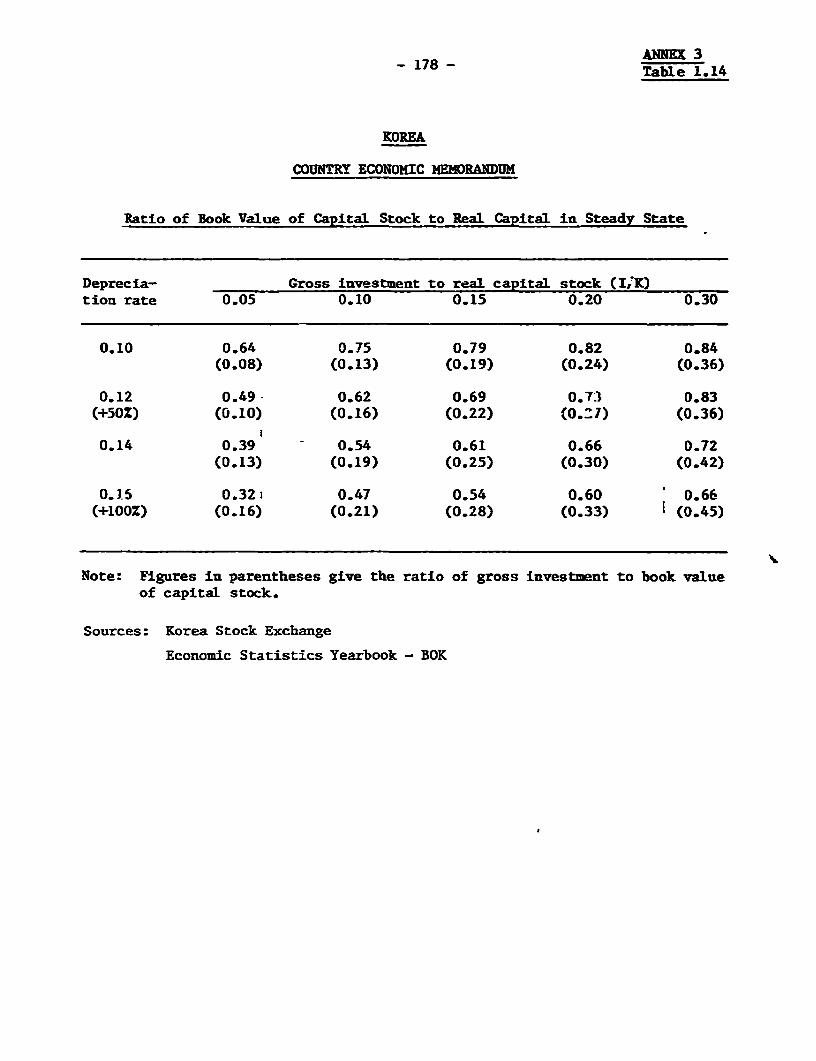
ANNEX 3- 178 - Table 1.14
KOREA
COUNTRY ECONOMIC MEMORANDUM
Ratio of Book Value of Capital Stock to Real Capital in Steady State
Deprecia- Gross investment to real capital stock (IRK)tion rate 0.05 0.10 0.15 0.20 0.30
0.10 0.64 0.75 0.79 0.82 0.84(0.08) (0.13) (0.19) (0.24) (0.36)
0.12 0.49- 0.62 0.69 0.73 0.83(+50Z) (0.10) (0.16) (0.22) (0.7) (0.36)
I0.14 0.39 - 0.54 0.61 0.66 0.72
(0.13) (0.19) (0.25) (0.30) (0.42)
0.15 0.32i 0.47 0.54 0.60 0.66(+100Z) (0.16) (0.21) (0.28) (0.33) (0.45)
Note: Figures in parentheses give the ratio of gross investment to book valueof capital stock.
Sources: Korea Stock Exchange
Economic Statistics Yearbook - BOK
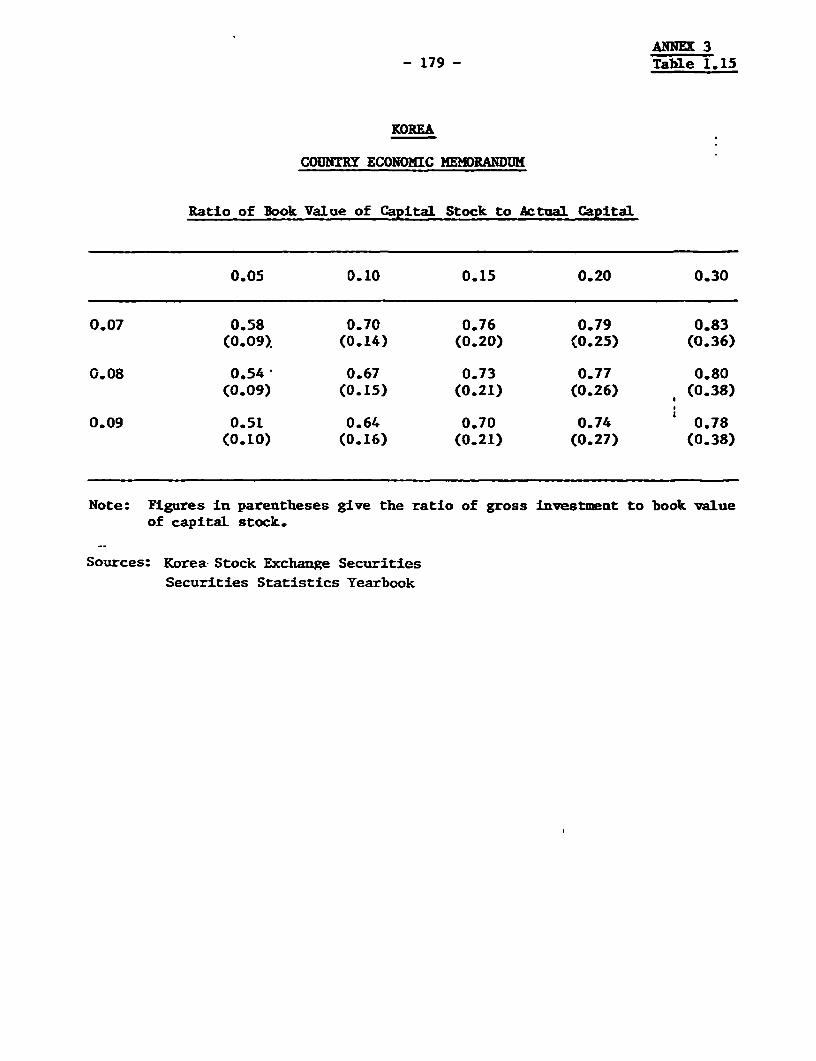
ANNEX 3- 179 - Table 1.15
KOREA
COUNTRY ECONOMIC MEMORANDUM
Ratio of Book Value of Capital Stock to Actual Capital
0.05 0.10 0.15 0.20 0.30
0.07 0.58 0.70 0.76 0.79 0.83(0.09). (0.14) (0.20) (0.25) (0.36)
0.08 0.54' 0.67 0.73 0.77 0.80(0.09) (0.15) (0.21) (0.26) (0.38)
0.09 0.51 0.64 0.70 0.74 0.78(0.10) (0.16) (0.21) (0.27) (0.38)
Note: Figures in parentheses give the ratio of gross investment to book valueof capital stock.
Sources: Korea Stock Exchange Securities
Securities Statistics Yearbook
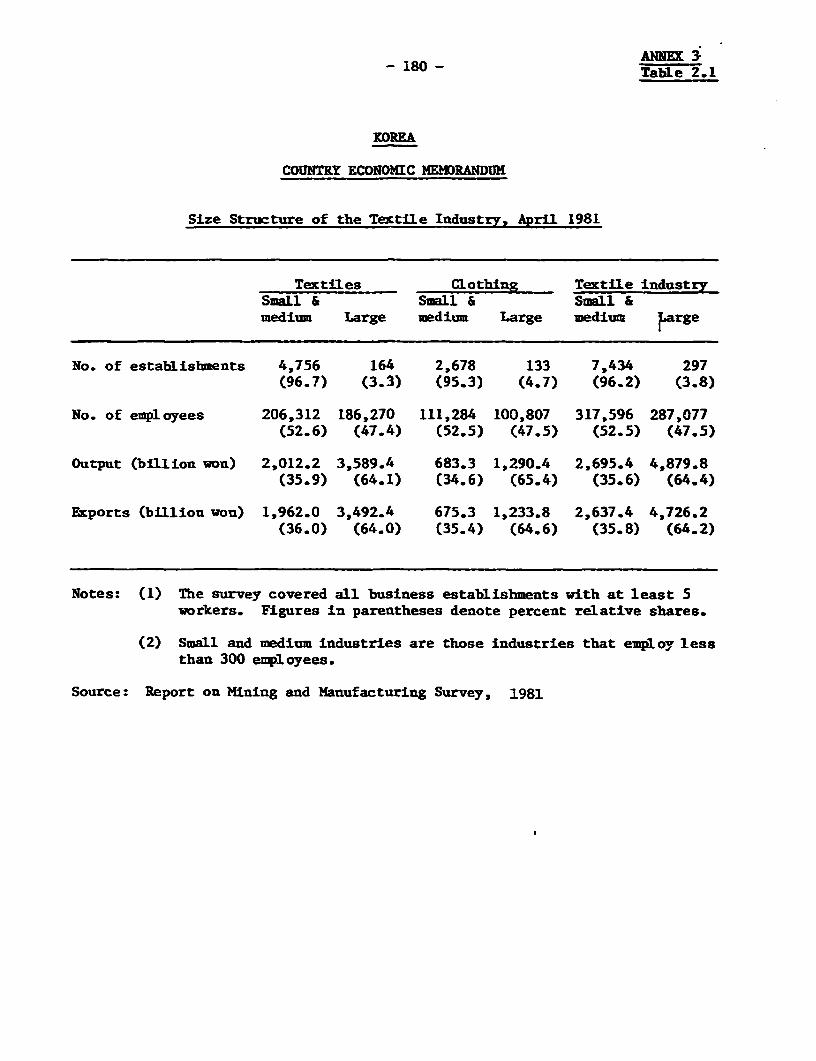
ANNEX 3- 180 - Table 2.1
KOREA
COUNTRY ECONOMIC 1EMERANDUK
Size Structure of the Textile Industry, April 1981
Textiles Clothing Textile industrySmall & Small & Small &medium Large medium Large medium Large
No. of establishments 4,756 164 2,678 133 7,434 297(96.7) (3.3) (95.3) (4.7) (96.2) (3.8)
No. of employees 206,312 186,270 111,284 100,807 317,596 287,077(52.6) (47.4) (52.5) (47.5) (52.5) (47.5)
Output (billion won) 2,012.2 3,589.4 683.3 1,290.4 2,695.4 4,879.8(35.9) (64.1) (34.6) (65.4) (35.6) (64.4)
Exports (billion won) 1,962.0 3,492.4 675.3 1,233.8 2,637.4 4,726.2(36.0) (64.0) (35.4) (64.6) (35.8) (64.2)
Notes: (1) The survey covered all business establishments with at least 5workers. Figures in parentheses denote percent relative shares.
(2) Small and medium industries are those industries that employ lessthan 300 employees.
Source: Report on Mining and Manufacturing Survey, 1981
I
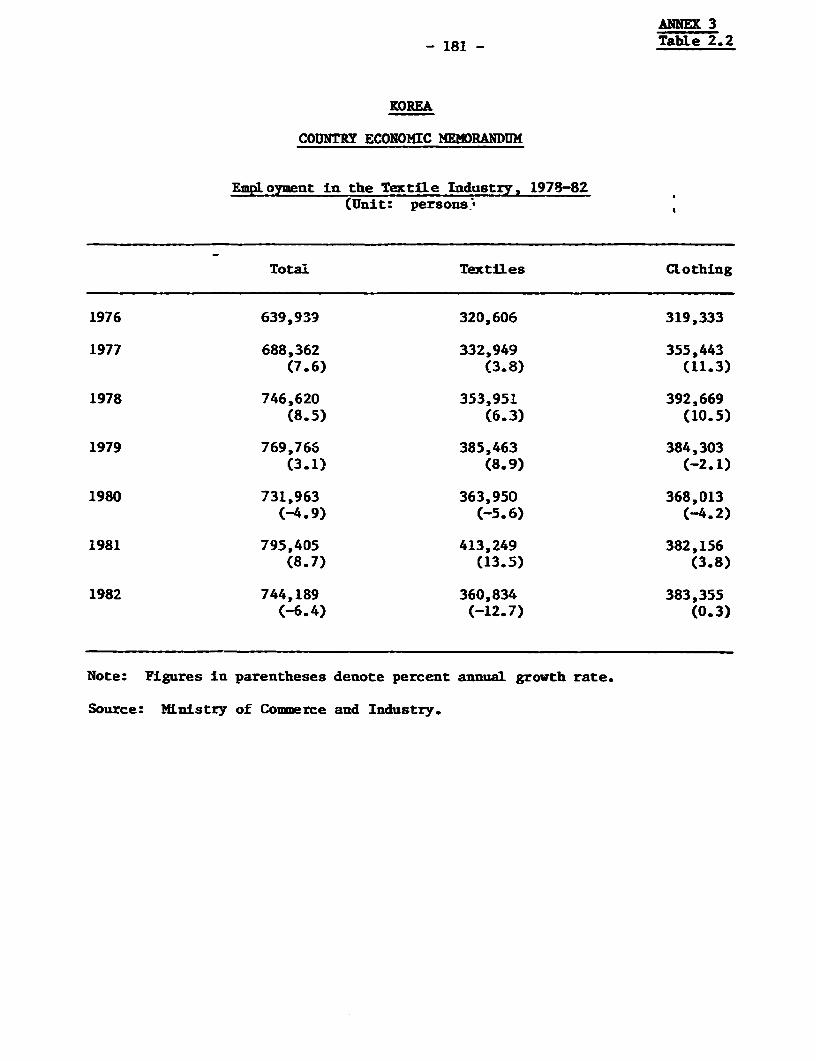
ANNEX 3- 181 - Table 2.2
KOREA
COUNTRY ECONOMIC MEMORANDUM
Emtployment in the Textile Industry, 1978-82(Unit: persons '
Total Textiles CLothing
1976 639,939 320,606 319,333
1977 688,362 332,949 355,443(7.6) (3.8) (11.3)
1978 746,620 353,951 392,669(8.5) (6.3) (10.5)
1979 769,766 385,463 384,303(3.1) (8.9) (-2.1)
1980 731,963 363,950 368,013(-4.9) (-5.6) (-4.2)
1981 795,405 413,249 382,156(8.7) (13.5) (3.8)
1982 744,189 360,834 383,355(-6.4) (-12.7) (0.3)
Note: Figures in parentheses denote percent annual growth rate.
Source: Ministry of Commerce and Industry.
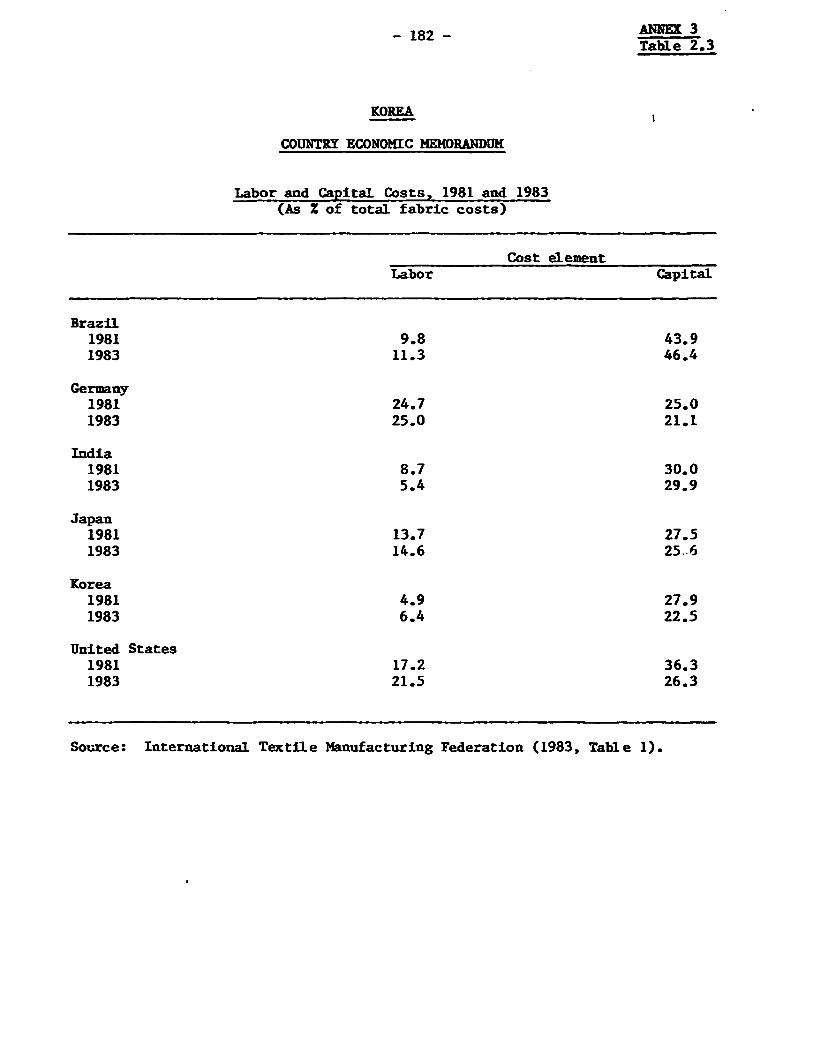
- 182 - ANNEX 3Table 2.3
KOREA
COUNTRY ECONOMIC MEMORANDUM
Labor and Capital Costs, 1981 and 1983(As Z of total fabric costs)
Cost elementLabor Capital
Brazil1981 9.8 43.91983 11.3 46.4
Germany1981 24.7 25.01983 25.0 21.1
India1981 8.7 30.01983 5.4 29.9
Japan1981 13.7 27.51983 14.6 25.6
Korea1981 4.9 27.91983 6.4 22.5
United States1981 17.2 36.31983 21.5 26.3
Source: International Textile Manufacturing Federation (1983, Table 1).
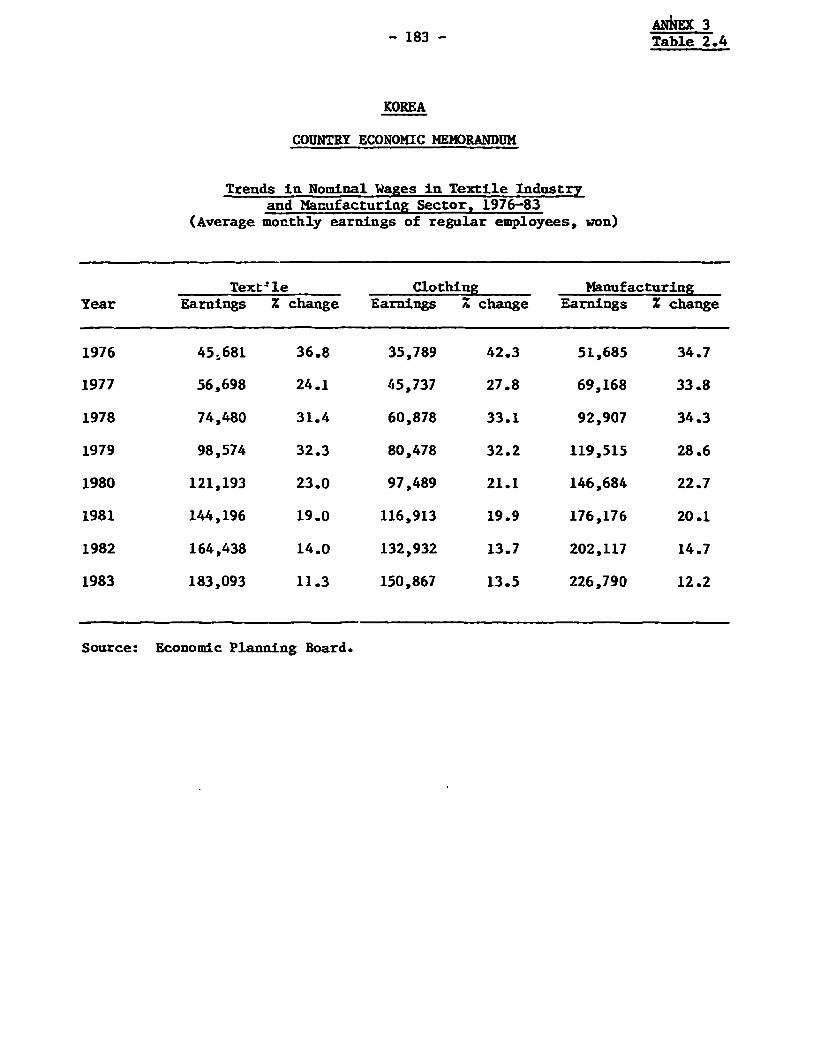
ANEX 3- 183 - Table 2.4
KOREA
COUNTRY ECONOMIC MEMORANDUM
Trends in Nominal Wages in Textile Industryand Manufacturing Sector, 1976-83
(Average monthly earnings of regular employees, won)
Text'le Clothing ManufacturingYear Earnings Z change Earnings % change Earnings Z change
1976 45 681 36.8 35,789 42.3 51,685 34.7
1977 56,698 24.1 45,737 27.8 69,168 33.8
1978 74,480 31.4 60,878 33.1 92,907 34.3
1979 98,574 32.3 80,478 32.2 119,515 28.6
1980 121,193 23.0 97,489 21.1 146,684 22.7
1981 144,196 19.0 116,913 19.9 176,176 20.1
1982 164,438 14.0 132,932 13.7 202,117 14.7
1983 183,093 11.3 150,867 13.5 226,790 12.2
Source: Economic Planning Board.
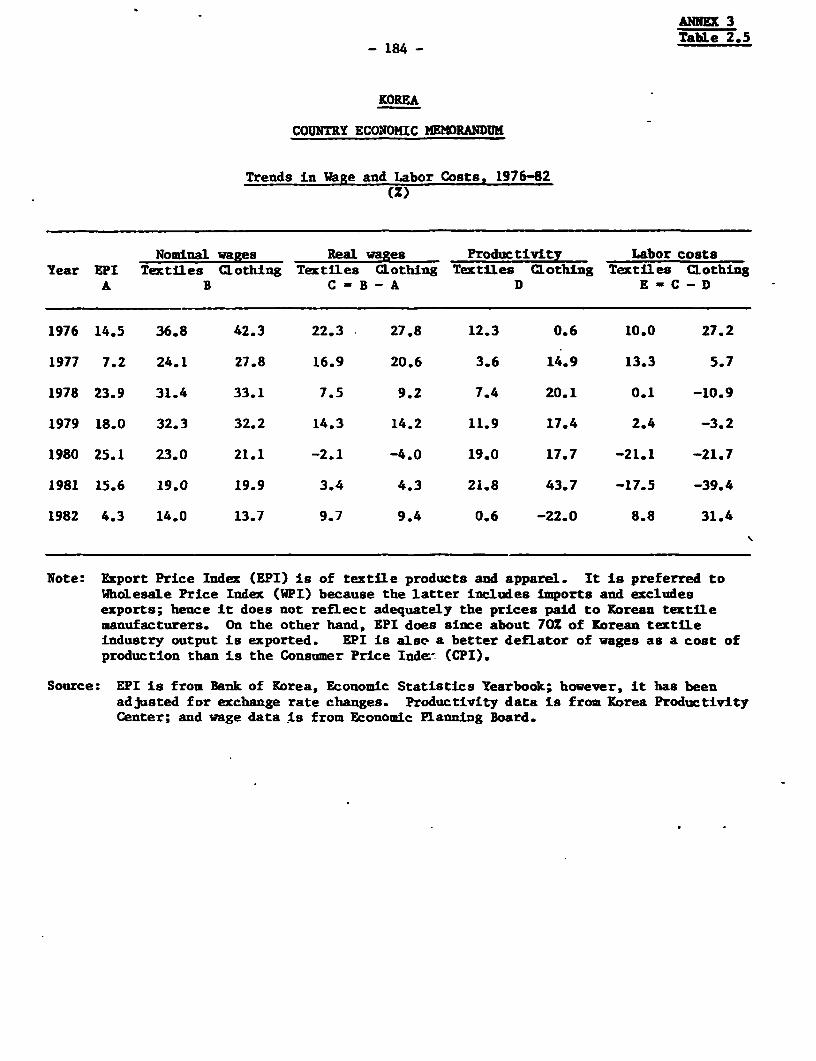
ANNEX 3TabLe 2.5
-184 -
KOREA
COUNTRY ECONOMIC MEMORANDUM
Trends in Wage and Labor Costs, 1976-82(Z)
Nominal wages Real wages Productivity Labor costsYear EPI Textiles CLothing Textiles Clothing Textiles Clothing Textiles Clothing
A B C B - A D E - C - D
1976 14.5 36.8 42.3 22.3 27.8 12.3 0.6 10.0 27.2
1977 7.2 24.1 27.8 16.9 20.6 3.6 14.9 13.3 5.7
1978 23.9 31.4 33.1 7.5 9.2 7.4 20.1 0.1 -10.9
1979 18.0 32.3 32.2 14.3 14.2 11.9 17.4 2.4 -3.2
1980 25.1 23.0 21.1 -2.1 -4.0 19.0 17.7 -21.1 -21.7
1981 15.6 19.0 19.9 3.4 4.3 21.8 43.7 -17.5 -39.4
1982 4.3 14.0 13.7 9.7 9.4 0.6 -22.0 8.8 31.4
Note: Export Price Index (EPI) is of textile products and apparel. It is preferred toWholesale Price Index (WPI) because the latter includes Imports and excludesexports; hence it does not refLect adequately the prices paid to Korean textilemanufacturers. On the other hand, EPI does since about 70% of Korean textileindustry output is exported. EPI is also a better deflator of wages as a cost ofproduction than is the Consumer Price Inde- (CPI).
Source: EPI is from Bank of Korea, Economic Statistics Yearbook; however, it has beenadjusted for exchange rate changes. Productivity data is from Korea ProductivityCenter; and wage data is from Economic Planning Board.
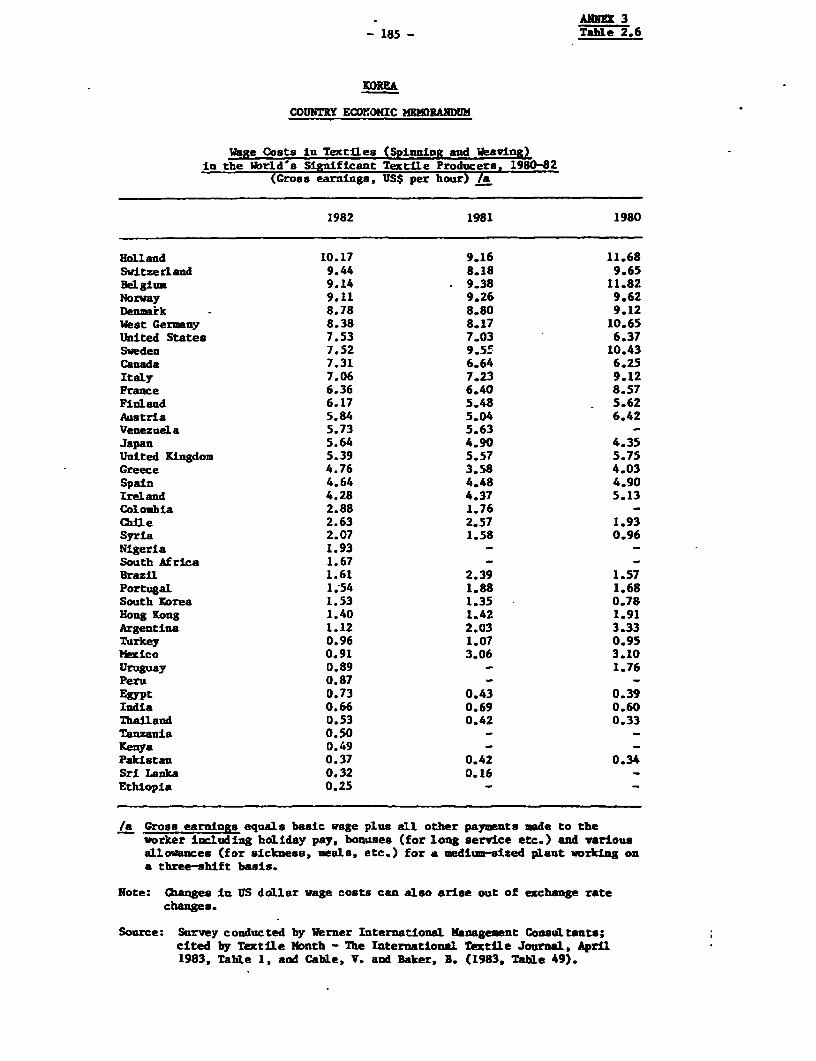
ANNEX 3- 185 - Table 2.6
KOREA
COUNTRY ECOrOMIC EMORANDUM
Wage Costs in Textiles (Spinning and Weaving)in the World's Significant Textile Producers, 1980-82
(Gross earnings, US$ per hour) /a
1982 1981 1980
Holland 10.17 9.16 11.68Switzerland 9.44 8.18 9.65Belgium 9.14 9.38 11.82Norway 9.11 9.26 9.62Denaik - 8.78 8.80 9.12West Germany 8.38 8.17 10.65United States 7.53 7.03 6.37Sweden 7.52 9.5' 10.43Canada 7.31 6.64 6.25Italy 7.06 7.23 9.12France 6.36 6.40 8.57Finland 6.17 5.48 5.62Austria 5.84 5.04 6.42Venezuela 5.73 5.63 -Japan 5.64 4.90 4.35United Kingdom 5.39 5.57 5.75Greece 4.76 3.58 4.03Spain 4.64 4.48 4.90Ireland 4.28 4.37 5.13Colombia 2.88 1.76 -Chile 2.63 2.57 1.93Syria 2.07 1.58 0.96NLgeria 1.93 - -South Africa 1.67 - -Brazil 1.61 2.39 1.57Portugal 1.54 1.88 1.68South Xorea 1.53 1.35 0.78Hong Kong 1.40 1.42 1.91Argentina 1.12 2.03 3.33Turkey 0.96 1.07 0.95Mexico 0.91 3.06 3.10Uruguay 0.89 - 1.76Peru 0.87 - -Egypt 0.73 0.43 0.39India 0.66 0.69 0.60Thailand 0.53 0.42 0.33Tanzania 0.50 - -Kenya 0.49 - -Pakistan 0.37 0.42 0.34Srl Lanka 0.32 0.16Ethiopia 0.25
/a Gross earnings equals basic wage plus all other payments made to theworker including holiday pay, bonuses (for long service etc.) and variousallournces (for sickness, meals, etc.) for a medium-sized plant working ona three-shift basis.
Note: Changes in US dollar wage costs can also arise out of exchange ratechanges.
Source: Survey conduc ted by Werner International Management Consultants;cited by Textile Month - The International Textile Journal, April1983, Table 1, and Cable, V. and Baker, D. (1983, Table 49).
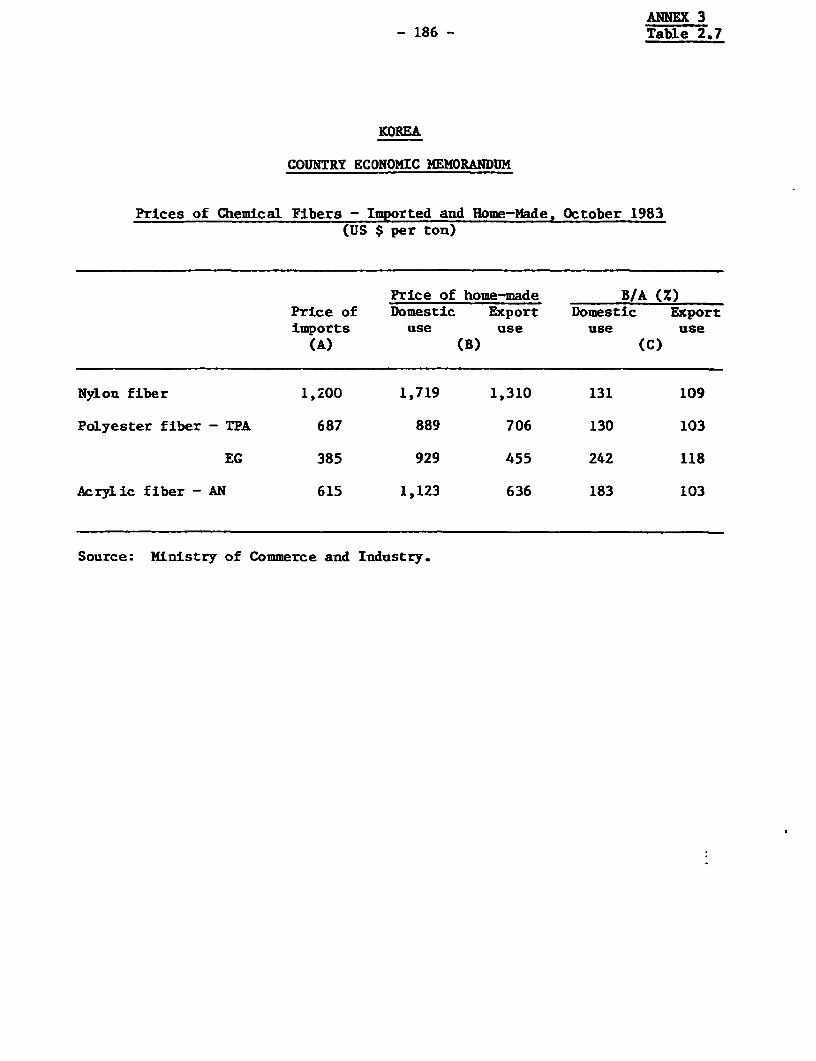
ANNEX 3- 186 - Table 2.7
KOREA
COUNTRY ECONOMIC MEMORANDUM
Prices of Chemical Fibers - Imported and Home-Nade, October 1983(US $ per ton)
Price of home-made B/A (Z)Price of Domestic Export Domestic Exportimports use use use use
(A) (B) (C)
Nylon fiber 1,200 1,719 1,310 131 109
Polyester fiber - TPA 687 889 706 130 103
EG 385 929 455 242 118
Acrylic fiber - AN 615 1,123 636 183 103
Source: Ministry of Commerce and Industry.
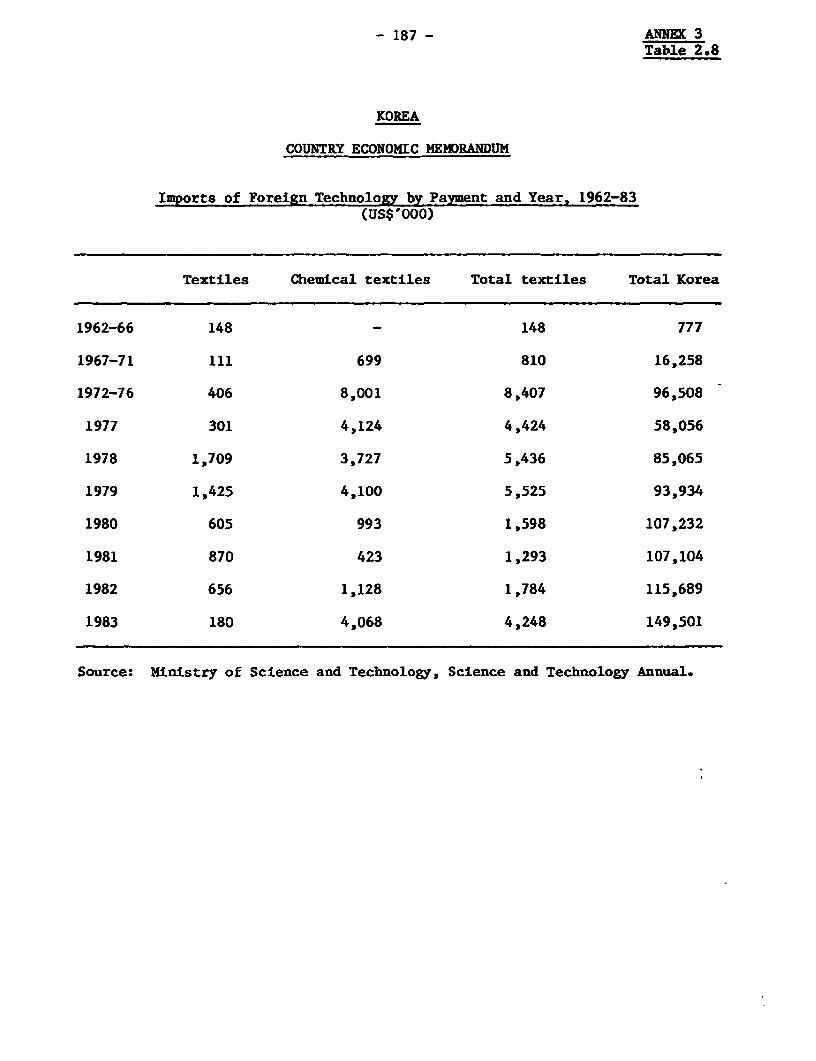
-187- ANNE 3Table 2.8
KOREA
COUNTRY ECONOMIC MEMORANDUM
Imports of Foreign Technology by Payment and Year, 1962-83(US$'000)
Textiles Chemical textiles Total textiles Total Korea
1962-66 148 - 148 777
1967-71 111 699 810 16,258
1972-76 406 8,001 8,407 96,508
1977 301 4,124 4,424 58,056
1978 1,709 3,727 5,436 85,065
1979 1,425 4,100 5,525 93,934
1980 605 993 1,598 107,232
1981 870 423 1,293 107,104
1982 656 1,128 1,784 115,689
1983 180 4,068 4,248 149,501
Source: Ministry of Science and Technology, Science and Technology Annual.
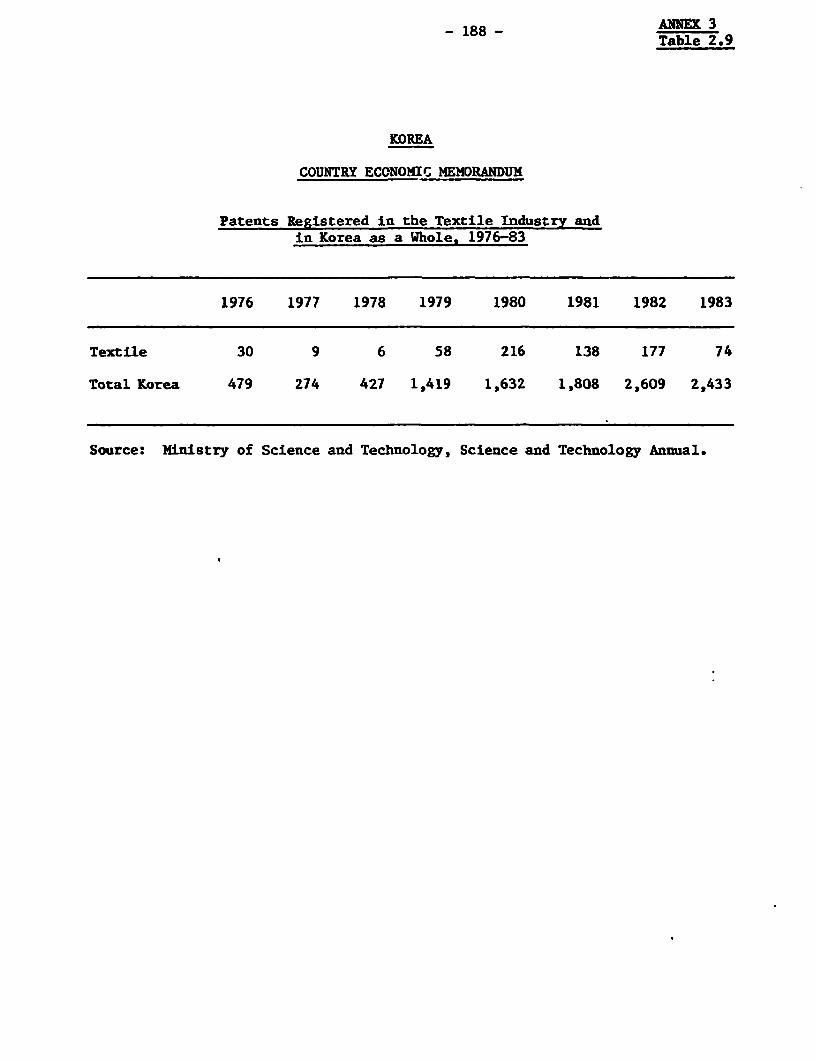
- 188 - ANNEX 3Table 2.9
KOREA
COUNTRY ECONOMIC MEMORANDUM
Patents Registered in the Textile Industry andin Korea as a Whole, 1976-83
1976 1977 1978 1979 1980 1981 1982 1983
Textile 30 9 6 58 216 138 177 74
Total Korea 479 274 427 1,419 1,632 1,808 2,609 2,433
Source: Ministry of Science and Technology, Science and Technology Annual.
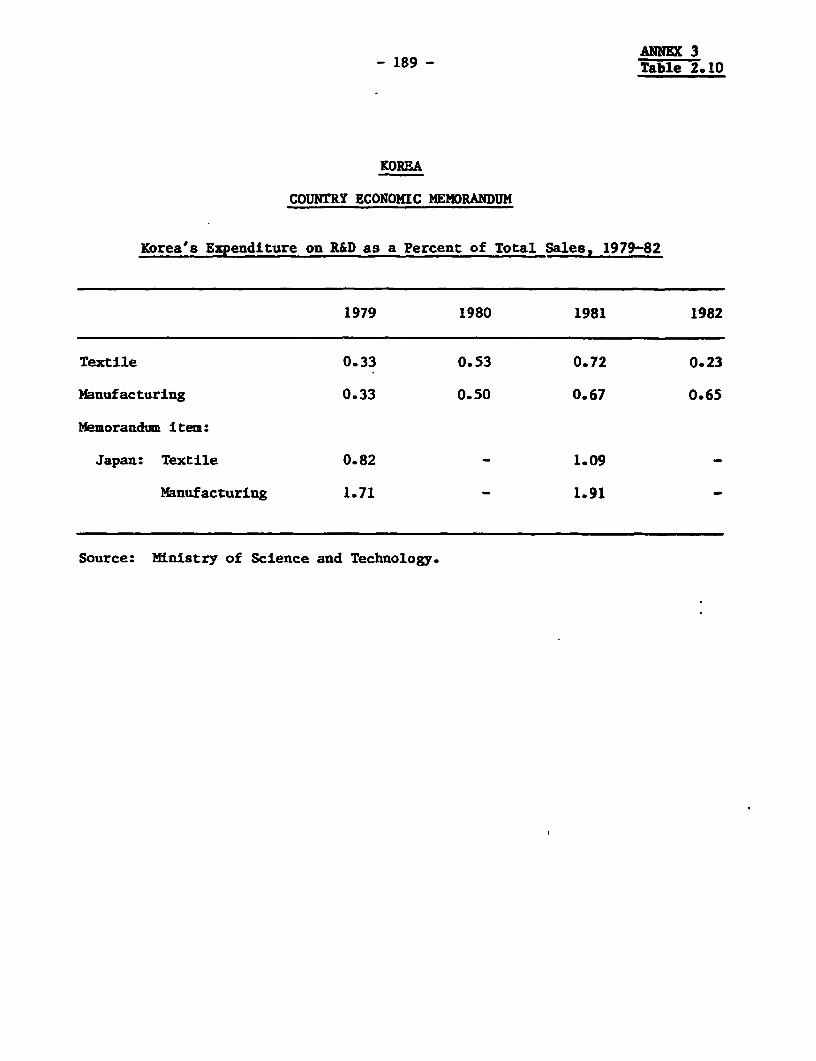
ANNEX 3- 189 - Table 2.10
KOREA
COUNTRY ECONOMIC MEMORANDUM
Korea's Expenditure on R&D as a Percent of Total Sales, 1979-82
1979 1980 1981 1982
Textile 0.33 0.53 0.72 0.23
Manufacturing 0.33 0.50 0.67 0.65
Memorandum item:
Japan: Textile 0.82 - 1.09
Manufacturing 1.71 1.91 -
Source: Ministry of Science and Technology.
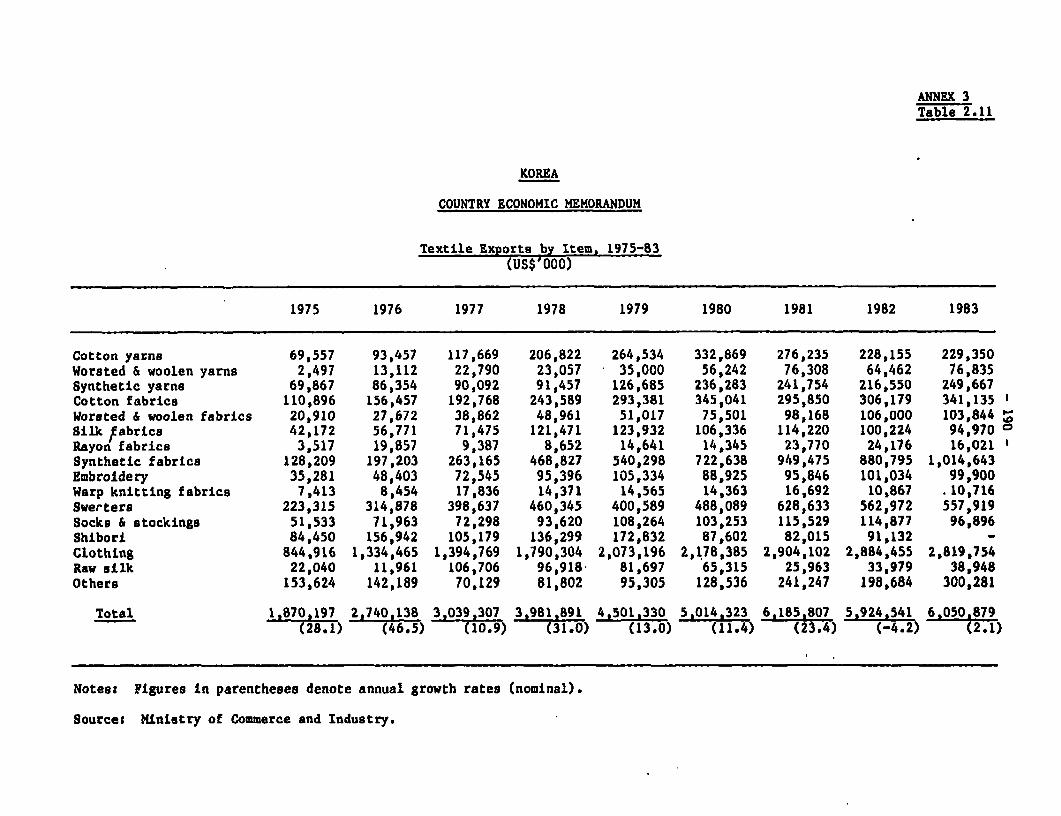
ANNEX 3Table 2.11
KOREA
COUNTRY ECONOMIC MEMORANDUM
Textile Exports by Item. 1975-83(US$'000)
1975 1976 1977 1978 1979 1980 1981 1982 1983
Cotton yarns 69,557 93,457 117,669 206,822 264,534 332,869 276,235 228,155 229,350Worsted & woolen yarns 2,497 13,112 22,790 23,057 35,000 56,242 76,308 64,462 76,835Synthetic yarns 69,867 86,354 90,092 91,457 126,685 236,283 241,754 216,550 249,667Cotton fabrics 110,896 156,457 192,768 243,589 293,381 345,041 295,850 306,179 341,135Worsted & woolen fabrics 20,910 27,672 38,862 48,961 51,017 75,501 98,168 106,000 103,844Silk fabrics 42,172 56,771 71,475 121,471 123,932 106,336 114,220 100,224 94,970 0Rayon fabrics 3,517 19,857 9,387 8,652 14,641 14,345 23,770 24,176 16,021Synthetic fabrics 128,209 197,203 263,165 468,827 540,298 722,638 949,475 880,795 1,014,643Embroidery 35,281 48,403 72,545 95,396 105,334 88,925 95,846 101,034 99,900Warp knitting fabrics 7,413 8,454 17,836 14,371 14,565 14,363 16,692 10,867 .10,716Swerters 223,315 314,878 398,637 460,345 400,589 488,089 628,633 562,972 557,919Socks & stockings 51,533 71,963 72,298 93,620 108,264 103,253 115,529 114,877 96,896Shibori 84,450 156,942 105,179 136,299 172,832 87,602 82,015 91,132 -Clothing 844,916 1,334,465 1,394,769 1,790,304 2,073,196 2,178,385 2,904,102 2,884,455 2,819,754Raw silk 22,040 11,961 106,706 96,918 81,697 65,315 25,963 33,979 38,948Others 153,624 142,189 70,129 81,802 95,305 128,536 241,247 198,684 300,281
Total 1,870,197 2,740,138 3,039,307 3,981,891 4,501,330 5,014,323 6,185,807 5,924,541 6 050 879-~ (28.1) (46.5) (10.9) (31.0) (13.0) (11.4) (23.4) (-4.2)
Notes; Figures in parentheses denote annual growth rates (nominal).
Source: Mlnistry of Commerce and Industry.
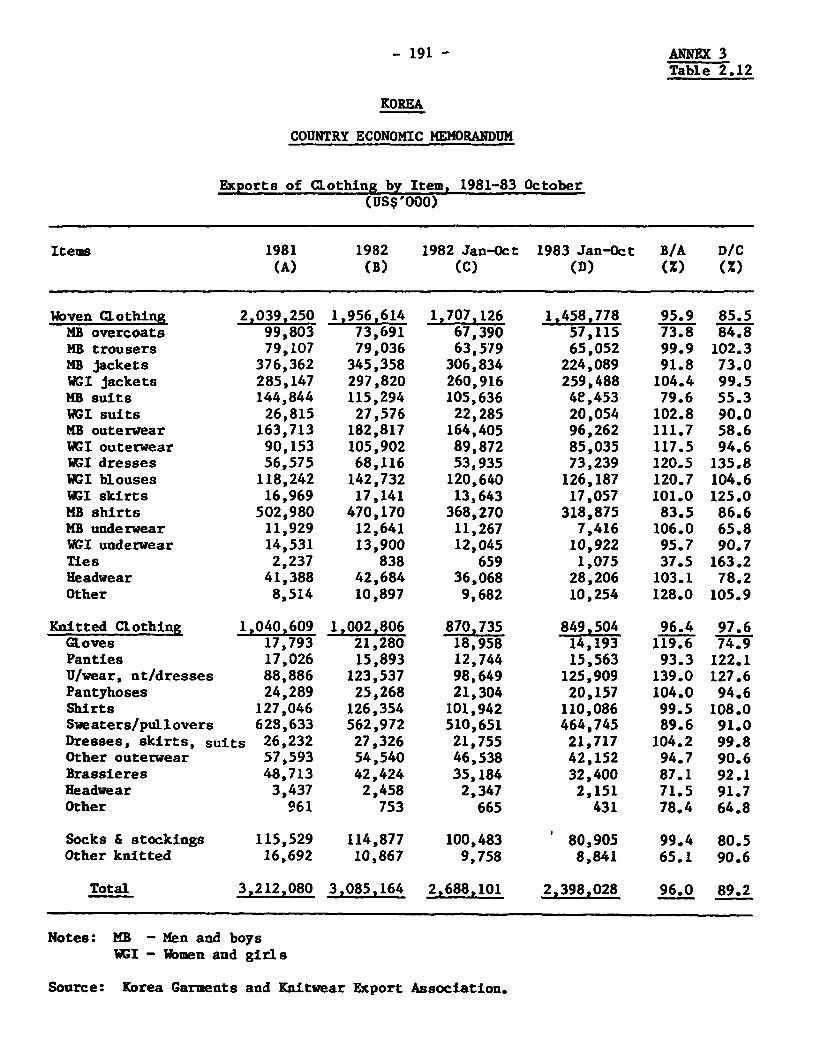
- 191 - ANNEX 3Table 2.12
KOREA
COUNTRY ECONOMIC MEMORANDUM
Exports of Clothing by Item, 1981-83 October(US$'000)
Items 1981 1982 1982 Jan-Oct 1983 Jan-Oct B/A D/C(A) (B) (C) (D) (Z) (Z)
Woven Clothing 2,039,250 1,956,614 1,707,126 1,458,778 95.9 85.5MB overcoats 99,803 73,691 67,390 57,115 73.8 84.8MB trousers 79,107 79,036 63,579 65,052 99.9 102.3MB jackets 376,362 345,358 306,834 224,089 91.8 73.0WGI jackets 285,147 297,820 260,916 259,488 104.4 99.5MB suits 144,844 115,294 105,636 4e,453 79.6 55.3WGI suits 26,815 27,576 22,285 20,054 102.8 90.0MB outerwear 163,713 182,817 164,405 96,262 111.7 58.6WGI outerwear 90,153 105,902 89,872 85,035 117.5 94.6WGI dresses 56,575 68,116 53,935 73,239 120.5 135.8WGI blouses 118,242 142,732 120,640 126,187 120.7 104.6WGI skirts 16,969 17,141 13,643 17,057 101.0 125.0MB shirts 502,980 470,170 368,270 318,875 83.5 86.6MB underwear 11,929 12,641 11,267 7,416 106.0 65.8GI underwear 14,531 13,900 12,045 10,922 95.7 90.7Ties 2,237 838 659 1,075 37.5 163.2Headwear 41,388 42,684 36,068 28,206 103.1 78.2Other 8,514 10,897 9,682 10,254 128.0 105.9
Knitted Clothing 1,040,609 1,002,806 870,735 849,504 96.4 97.6GLoves 17,793 21,280 18,958 14,193 119.6 74.9Panties 17,026 15,893 12,744 15,563 93.3 122.1U/wear, nt/dresses 88,886 123,537 98,649 125,909 139.0 127.6Pantyhoses 24,289 25,268 21,304 20,157 104.0 94.6Shirts 127,046 126,354 101,942 110,086 99.5 108.0Sweaters/pullovers 628,633 562,972 510,651 464,745 89.6 91.0Dresses, skirts, suits 26,232 27,326 21,755 21,717 104.2 99.8Other outerwear 57,593 54,540 46,538 42,152 94.7 90.6Brassieres 48,713 42,424 35,184 32,400 87.1 92.1Headwear 3,437 2,458 2,347 2,151 71.5 91.7Other 961 753 665 431 78.4 64.8
Socks & stockings 115,529 114,877 100,483 80,905 99.4 80.5Other knitted 16,692 10,867 9,758 8,841 65.1 90.6
Total 3,212,080 3,085,164 2,688,101 2,398,028 96.0 89.2
Notes: MB - Men and boysWGI - Women and girls
Source: Korea Garments and Knitwear Export Association.

ANNEX 3Table 2.13
KOREA
COUNTRY ECONOMIC MEMORANDUH
Textile Exports by Region. 1972-83(US$ million)
1972 1974 1976 1978 1979 1980 1981 1982 1983
Quota areas 385.6 708,1 1,437.0 1,853.1 2,051.9 2,335.4 2,906.5 2,985.4 3,276.4(54.6) (48.5) (52,4) (46,5) (55.1) (46.6) (47.0) (50.4) (54.2)
USA 282.0 336.5 754.7 987.2 980.3 1,113.5 1,468.2 1,619.0 1,981.1(39.9) (23.1) (27,5) (24.8) (21.8) (22.2) (23.7) (27.3) (32.7)
EEC 61.4 287.7 489.0 702.2 889.9 1,040.9 1,146.9 1,045.6 949.8(8.7) (19.7) (17.8) (17.7) (19.8) (20.6) (18.5) (17.6) (15,7)
Canada 33.7 92.0 127.7 114.2 128,1 117.4 170.4 188.5 223,7(4.8) (4.2) (4.7) (2,9) (2.8) (2.3) (2.8) (3.2) (3.7)
Sweden 8.5 21.9 65.6 49.5 53.6 63.6 65.4 67.3 51.1(1.2) (1.5) (2.4) (1.3) (1.2) (1.3) (1.1) (1.1) (0.8)
Nonquota areas 321.5 751.9 1,303.1 2,128.8 2,451.0 2,678.9 3,279.3 2,939.2 2,774.4(45.4) (51,5) (47,6) (53,5) (54.4) (53,4) (53.0) (49.6) (45.8)
Japan 182.6 521.2 669.0 1,097.8 1,266.9 885.0 1,018.5 974,1 721.6(25.8) (35.7) (24,4) (27.6) (28.1) (17.6) (16.5) (16.4) (11,9)
Hong Kong 51.7 47.9 123.1 163,1 205.0 336.5 436.5 262,2 259.0(7.3) (3.3) (4.5) (4.1) (4.6) (6.7) (7.1) (4.4) (4.3)
Mlddle East 11.1 22.7 189.0 228.9 219.9 230.2 286.7 341,2 563.5(1.5) (1.5) (6.9) (5.8) (4.8) (4.6) (4.6) (5.8) (9,3)
SLngapore 5.3 19.1 25,9 69,3 85.1 95,0 107,9 132,2 146,6(0.8) (1.3) (1.0) (1.8) (1.9) (1.9) (1.7) (2.2) (2,4)
Other 70.8 141.0 296.0 569.7 674.1 1,132.2 1,429.7 1,229.5 1,083.7(10.0) (9.7) (10.8) (14,2) (15.0) (22.6) (23.1) (20.8) (17.9)
Total 707.1 1 460.0 2 740.1 3,981.9 4 602,9 5 014.3 6 185,8 5 924.5 6 050,8(100.0) (100.0) (100.0) (10.0) (100.0) (100.0) (10.0) (100.0) (100.0)
Note: Figures in parentheses denote percent ratio to the total.
Source: Ministry of Commerce and Industry.
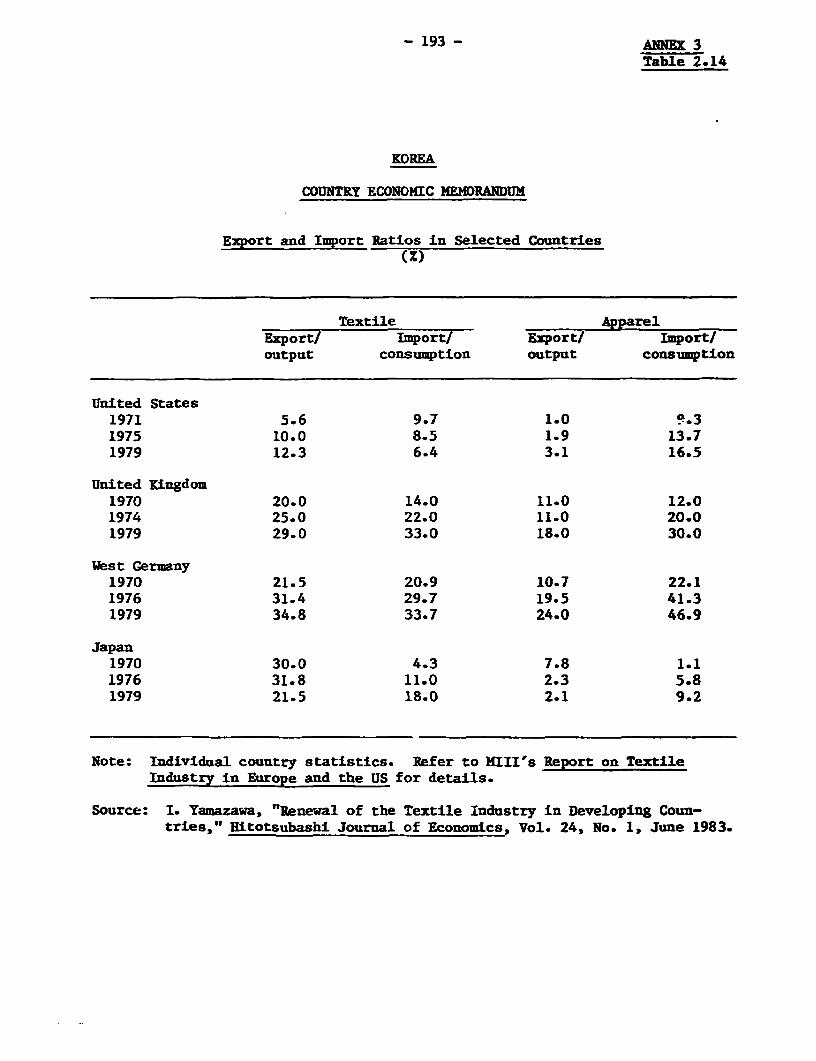
- 193 - ANNEX 3Table 2.14
KOREA
COUNTRY ECONOMIC MEMDRANDUM
Export and Import Ratios in Selected Countries
Textile ApparelExport/ Import/ Export/ Import/output consumption output consumption
United States1971 5.6 9.7 1.0 !.31975 10.0 8.5 1.9 13.71979 12.3 6.4 3.1 16.5
United Kingdom1970 20.0 14.0 11.0 12.01974 25.0 22.0 11.0 20.01979 29.0 33.0 18.0 30.0
West Germany1970 21.5 20.9 10.7 22.11976 31.4 29.7 19.5 41.31979 34.8 33.7 24.0 46.9
Japan1970 30.0 4.3 7.8 1.11976 31.8 11.0 2.3 5.81979 21.5 18.0 2.1 9.2
Note: Individual country statistics. Refer to MIII's Report on TextileIndustry in Europe and the US for details.
Source: I. Yamazawa, "Renewal of the Textile Industry in Developing Coun-tries," Hitotsubashi Journal of Economics, Vol. 24, No. 1, June 1983.
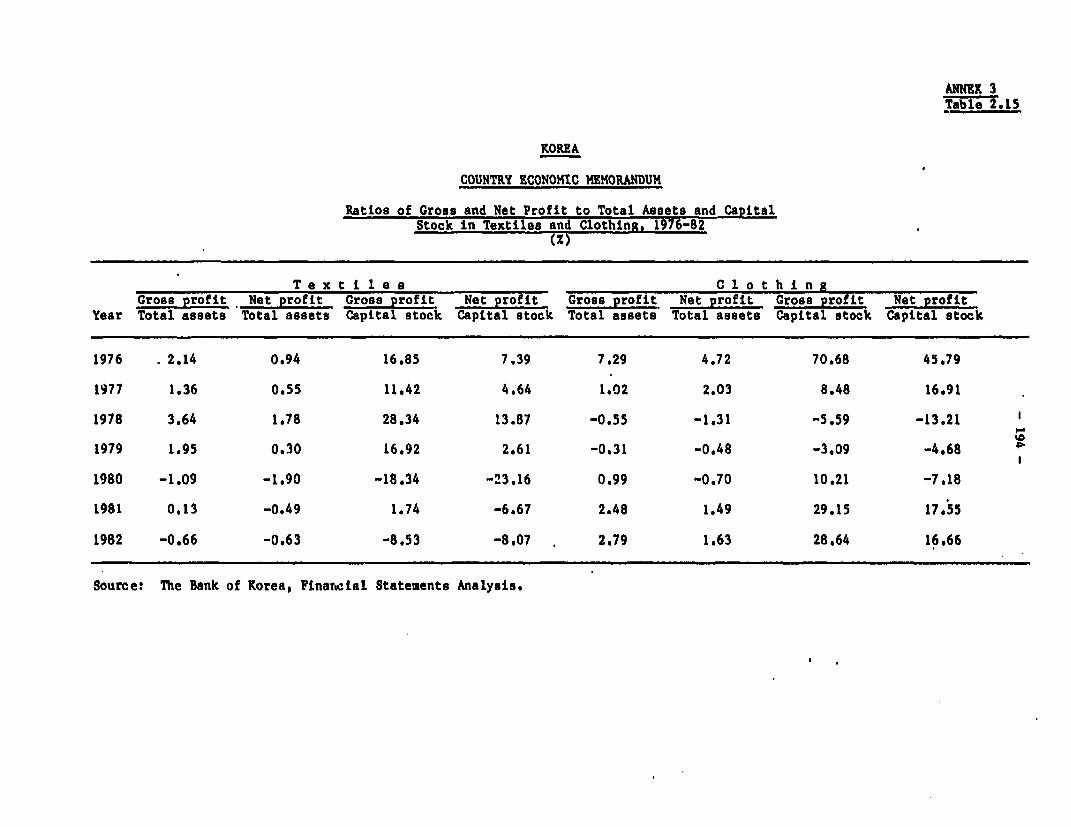
ANNEX 3Table 2.15
KOREA
COUNTRY ECONOMIC MEMORANDUM
Ratios of Gross and Net Profit to Total Asaets and CapitalStock in Textiles and Clothing. 1976-82
(Z)
T e x t i 1 e s C 1 o t h I ngGross profit Net profit Gross profit Net profit Gross profit Net profit Gross profit Net profit
Year Total assets Total assets Capital stock Capital stock Total assets Total assets Capital stock Capital stock
1976 2.14 0.94 16.85 7.39 7.29 4.72 70.68 45.79
1977 1.36 0.55 11.42 4.64 1.02 2.03 8.48 16.91
1978 3.64 1.78 28.34 13.87 -0.55 -1.31 -5.59 -13,21
1979 1.95 0.30 16,92 2,61 -0.31 -0.48 -3.09 -4.68
1980 -1.09 -1.90 -18.34 -23.16 0.99 -0.70 10.21 -7.18
1981 0.13 -0.49 1.74 -6.67 2.48 1.49 29.15 17.55
1982 -0.66 -0.63 -8.53 -8.07 2,79 1.63 28.64 16.66
Source: The Bank of Korea, Finanial Statements Analysis.
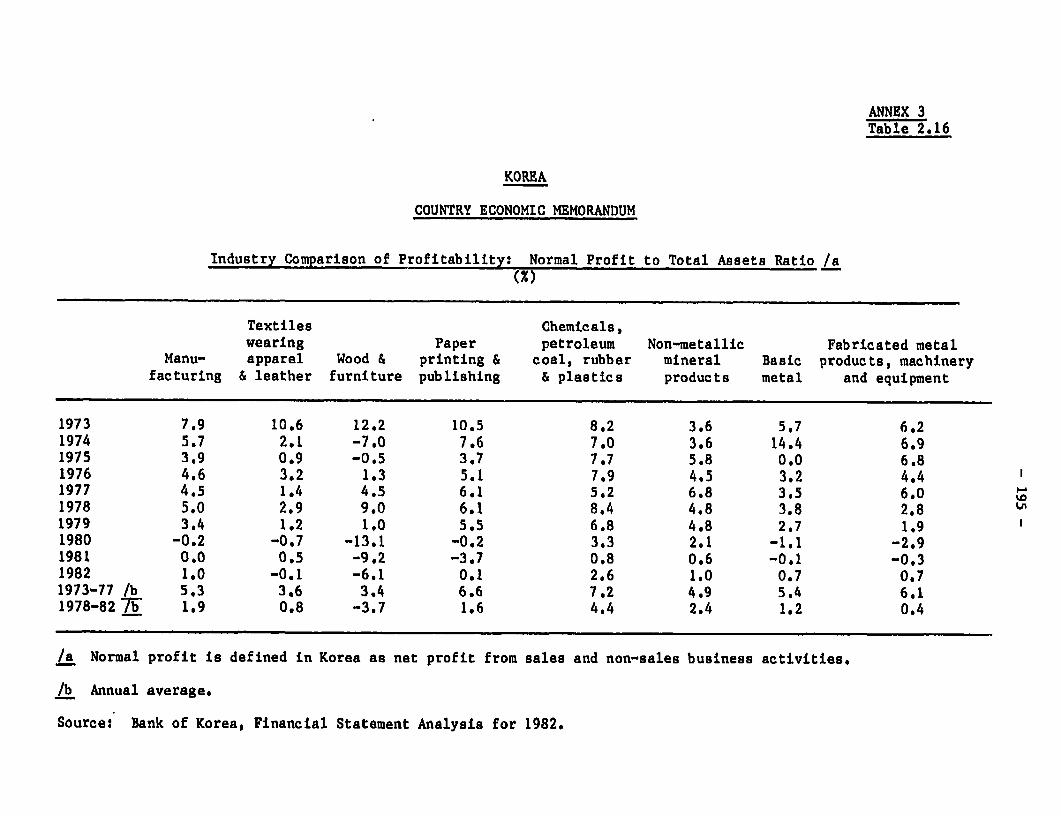
ANNEX 3Table 2.16
KOREA
COUNTRY ECONOMIC MEMORANDUM
Industry Comparison of Profitability: Normal Profit to Total Assets Ratio /a
Textiles Chemicals,wearing Paper petroleum Non-metallic Fabricated metal
Manu- apparel Wood & printing & coal, rubber mineral Basic products, machineryfacturing & leather furniture publishing & plastics products metal and equipment
1973 7.9 10.6 12.2 10.5 8.2 3.6 5,7 6.21974 5.7 2.1 -7.0 7.6 7.0 3.6 14.4 6.91975 3.9 0.9 -0.5 3.7 7.7 5.8 0.0 6.81976 4.6 3.2 1.3 5.1 7.9 4.5 3.2 4.41977 4.5 1.4 4.5 6.1 5,2 6,8 3,5 6.01978 5.0 2.9 9.0 6.1 8.4 4.8 3.8 2.81979 3.4 1.2 1.0 5.5 6.8 4.8 2,7 1.91980 -0.2 -0.7 -13.1 -0.2 3.3 2.1 -1.1 -2.91981 0.0 0,5 -9,2 -3.7 0.8 0.6 -0,1 -0.31982 1.0 -0.1 -6.1 0.1 2.6 1.0 0.7 0.71973-77 /b 5.3 3.6 3.4 6.6 7.2 4.9 5.4 6,11978-82 T 1.9 0.8 -3.7 1.6 4.4 2.4 1.2 0.4
/a Normal profit is defined in Korea as net profit from sales and non-sales business activities.
/b Annual average.
Source: Bank of Korea, Financial Statement Analysis for 1982.
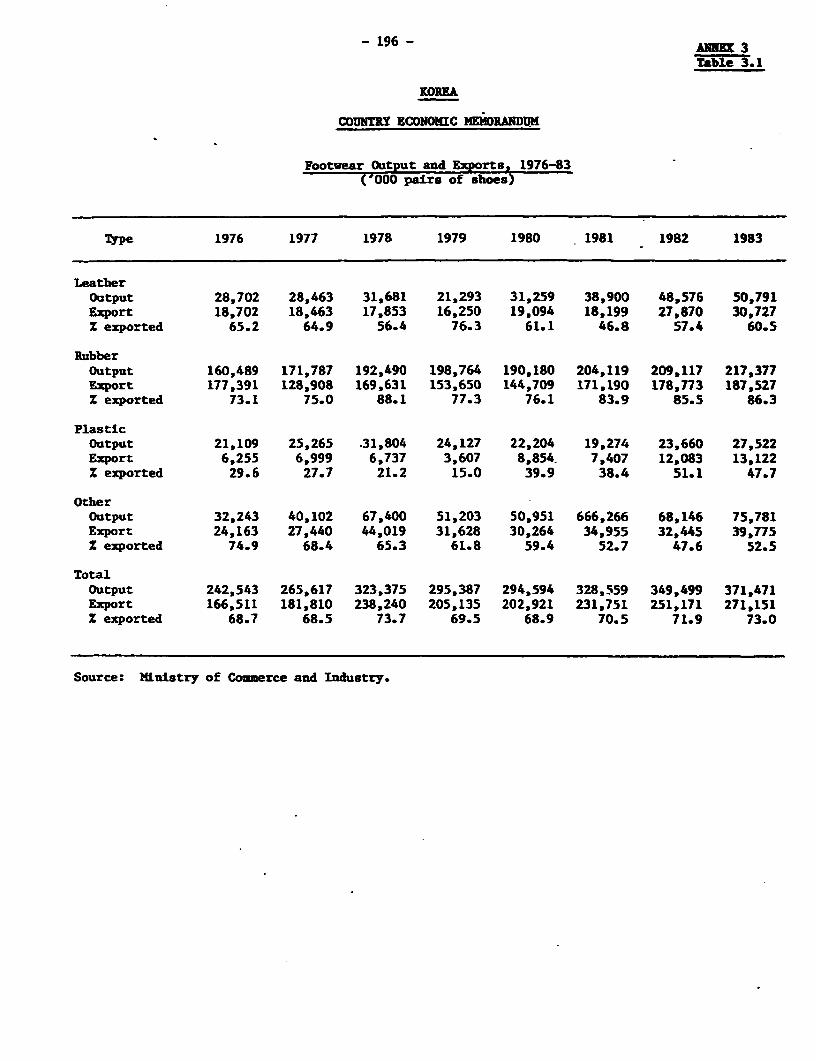
-196 - ASKER 3
Table 3.1
KOREA
COUNTRY ECONOMIC MEMORANDUM
Footwear Output and Exports, 1976-83('000 pairs of shoes)
Type 1976 1977 1978 1979 1980 1981 1982 1983
LeatherOutput 28,702 28,463 31,681 21,293 31,259 38,900 48,576 50,791Export 18,702 18,463 17,853 16,250 19,094 18,199 27,870 30,727Z exported 65.2 64.9 56.4 76.3 61.1 46.8 57.4 60.5
RubberOutput 160,489 171,787 192,490 198,764 190,180 204,119 209,117 217,377Export 177,391 128,908 169,631 153,650 144,709 171,190 178,773 187,527Z exported 73.1 75.0 88.1 77.3 76.1 83.9 85.5 86.3
Plasticoutput 21,109 25,265 .31,804 24,127 22,204 19,274 23,660 27,522Export 6,255 6,999 6,737 3,607 8,854. 7,407 12,083 13,122Z exported 29.6 27.7 21.2 15.0 39.9 38.4 51.1 47.7
OtherOutput 32,243 40,102 67,400 51,203 50,951 666,266 68,146 75,781Export 24,163 27,440 44,019 31,628 30,264 34,955 32,445 39,775Z exported 74.9 68.4 65.3 61.8 59.4 52.7 47.6 52.5
Totaloutput 242,543 265,617 323,375 295,387 294,594 328,559 349,499 371,471Export 166,511 181,810 238,240 205,135 202,921 231,751 251,171 271,151Z exported 68.7 68.5 73.7 69.5 68.9 70.5 71.9 73.0
Source: Ministry of Commerce and Industry.
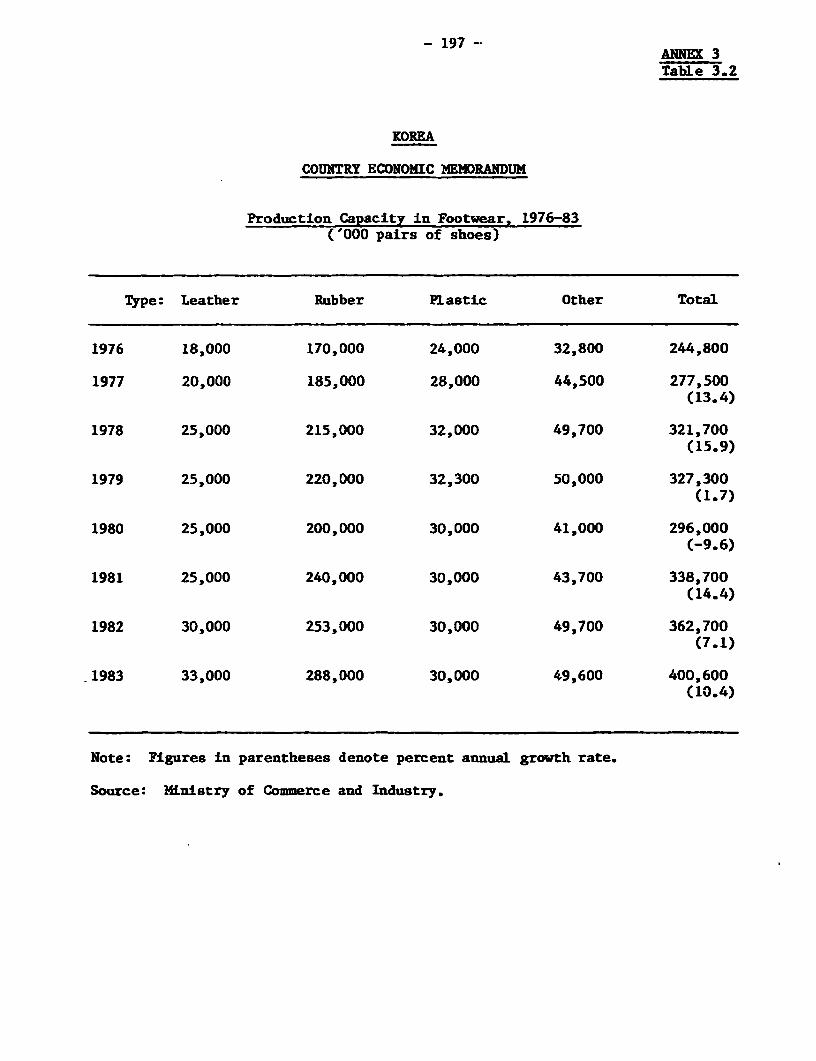
- 197 -ANNEX 3Table 3.2
KOREA
COUNTRY ECONOMIC MENDRANDUM
Production Capacity in Footwear, 1976-83('000 pairs of shoes)
Type: Leather Rubber Plastic Other Total
1976 18,000 170,000 24,000 32,800 244,800
1977 20,000 185,000 28,000 44,500 277,500(13.4)
1978 25,000 215,000 32,000 49,700 321,700(15.9)
1979 25,000 220,000 32,300 50,000 327,300(1.7)
1980 25,000 200,000 30,000 41,000 296,000(-9.6)
1981 25,000 240,000 30,000 43,700 338,700(14.4)
1982 30,000 253,000 30,000 49,700 362,700(7.1)
1983 33,000 288,000 30,000 49,600 400,600(10.4)
Note: Figures in parentheses denote percent annual growth rate.
Source: Ministry of Commerce and Industry.
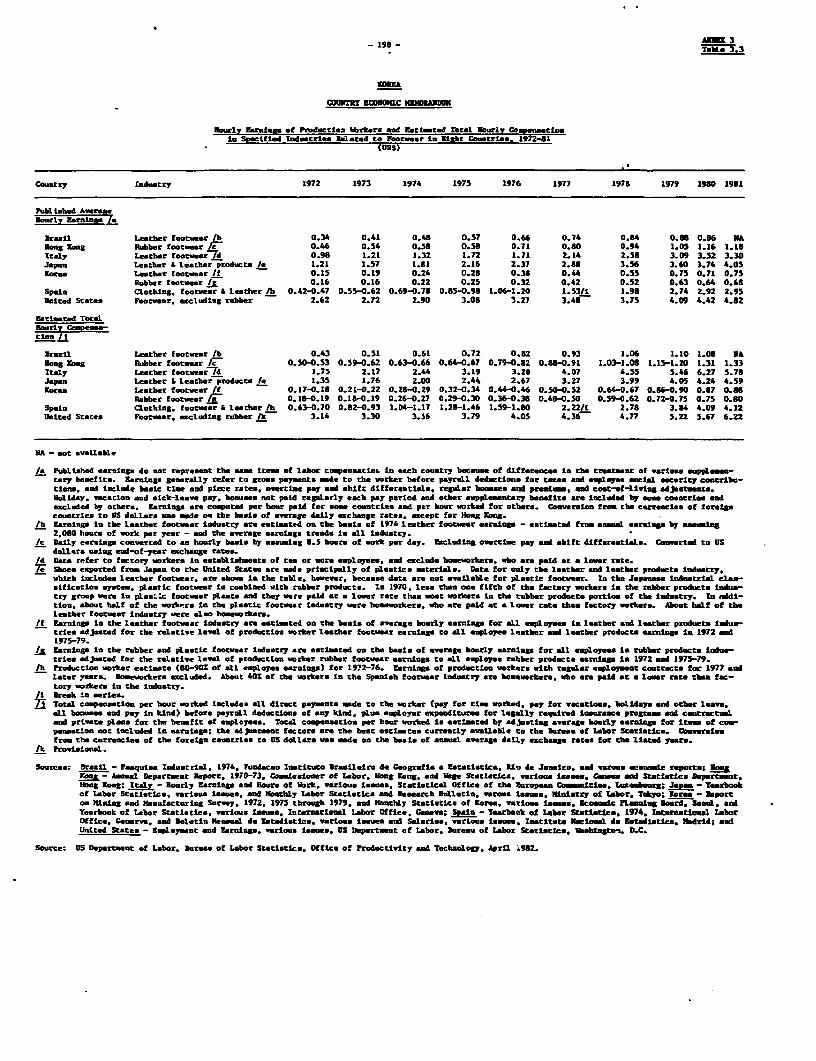
19- SUMM 3Take 3.3
COUNTRY EIIOIIC KBIBANDU
tourwly llarnls of Production WHrkers aud REctufted Total Hourly Co aonin Specif ld Induetries -lated to Footwear In Eight Countries. 1972-SI
Country Industry 1972 1973 1974 1975 1976 1977 1975 1979 1980 1931
Publ bd Awar ilirlsv Irain- la
8ra11 Leather footwear lb 0.34 0.41 0.48 0.7 0.66 0.74 0.34 G.M 0.86 EaHong tong Rubber footwer i. 0.46 0.54 0.58 0.53 0.71 0.80 0.94 1.05 1.16 1.13Italy lther footwear7d 0.98 1.21 1.32 1.72 1.71 2.14 2.58 3.09 3.52 3.30Japan Leather * leather producto la 1:.2 1.57 1.31 2.16 2.37 2.88 3.56 3.60 3.74 4.05Korea Leather footwear If 0.IS 0.19 0.24 0.23 0.38 0.44 0.55 0.75 0.71 0.75
Rubber footwear La 0.16 0.16 0.22 0.25 0.32 0.42 0.52 0.63 G.M 0.68Spain Clothing, footwear * lesther lb 0.42-0.47 0.55-0.62 0.69-0.78 0.33-0.98 1.06-1.20 1.5311 I.98 2.74 2.92 2.95United States Footwear. ecuding rubber 2.62 2.72 2.90 3.08 3.27 3.48 3.75 4.09 4.42 4.82
ratlited Total
rail Leather footwear lb 0.43 0.51 0.61 0.72 0.82 0.93 1.06 1.10 1.08 NKong ong Rubber footusar Ic 0.50.33 0.59-0.62 0.63-0.66 0.64-0.67 0.79-0.82 0.88-0.91 1.03-1.08 1.15-1.20 1.31 1.33
ICtly Leather footwear t 1.75 2.17 2.44 3.19 3.28 4.07 4.55 3.46 6.27 3.73Japan Lether A leatber products Ie 1.35 1.76 2.00 2.44 2.67 3.27 3.99 4.05 4.24 4.59Korea Leather footwear If 0.17-0.18 0.21-0.22 0.28-0.29 0.32-0.34 0.44-0.6 0.50-0.52 0.64-0.67 0.36-0.90 0.87 O.ee
Rubber footwear Jrg 0.18-0.19 0.18-0.19 0.26-0.27 0.29-0.30 0.36-0.38 0.48-0.50 0.59-0.62 0.72-0.75 0.75 0.80Spain Qotting. footwear A leatbhr fb 0.63-0.70 0.82-0.93 I.04-1.17 1.28-1.46 1.59-1.80 2.22/1 2.78 3.34 4.09 4.12United Statea Footwear. excluding rubber n 3.14 3.30 3.56 3.79 4.05 4.36 4.77 5.22 5.67 6.22
MA - aot available
la Publiahed earninga do not represent the e Items of labor cOMpensatior in eacb country beeus of differences in the tre-atat of vartons supplemen-Cery benefits. Earninge generally refer to gras pay_ets mAde to the worker before payroll deductions for tees and mloy escal security contribu-tions and Include bseac tle snd piece rates overtime pay and shift differentials, reglar bouses and premise mad cont-of-lving adjustments.Holiday. vacation and eick-leave pay. bonuse not paid regularly each pay perlod and other eupplesentary benefits Are included by o_m countries adsecluded by others. EarninW anr computed par bhr paid for eom coutrits and per bour worked for others. Converio from the curreies of fore4ncountriea to US dollars was made on the basia of average daily exchange rates, wcept for Hong Kong.
/b EZrnings In the leather footwear induatry are estiated on the beats of 1974 leather footwear earning - eatiated from a*mul earnieng by e-asming2.080 hours of work per year - and the average earnings trends In all iuduatry.
/c Daily earnings converted to an hourly basis by asasing 835 bourn of work par day. Eacleding overtime pay and sbift differentials. Converted to USdoll%rs using end-of-year exchenge rates.
Id Dat refer to factory workers in estsbtishbents of ten or more employee, and eclude bomeworkers. wbo are pald at a lmer rate.7; Since exported from Japan to the United States are ma* principally of plastic materials. Data for only the leatbhr and leatbhr products indstry,
wbteb includes leatber footwear. are abown In the table. hwever. because data are aot available for plastic footwear. In the Japanese industrial elac-sification system, platTiC footwear is combined wLch rubber products. In 1970, lesa tbhe one fiftb of the factory workers in the rubber products indus-tey group were In plasA:c footwear plants and they were paid at a lo_r rate than mat workers li the rubber products portion of the industry. In addi-tion, about half of the work-re in the ptastic footwer Industry were hbomerkers. who are paid at a lowr rats than factory workers. About half of theletber footwear industry were also hma rkers.
tf Earnings In the leather footwear tndustry are satiated on the beets of averge hourly earning for All empoyees in leather sad leatbr product indus-tries adjusted for the relative level of production worker leather footwar earning to all employee lssther and lether products earntnV in 1972 and1975-79.
/A Earning in the rubber and plastic footwear industry are esatiated oan the basls of average bourly earningu for all employee in rubber products indus-tries adjeated for the relative level of production worker rubber footwear earnings to all employee rubber products earnqns in 1972 and 1975-79.
lh Prduction worker setiate (80-901 of all eploye earninlg) for 1972-76. Earnings of production workers witb regular employmet contrcts for 1977 andlater years. _meworkera excluded. About 401 of the workers In the Spanish footwear Industry are bomeorkers* who are pad at a laer rate then fac-tory workers in the Industry.B Break in eries.Totai compexntion per hour worked Includes all direct payments made to tbe worker (pay for tlm worked. pay for vacations. bolidays and other leav.all bosnes and pay In kind) before payroll deductions of any kind. plus employer expenditures for leally requtred Insurane programsan c_tractumLand private plane for the benefit of employees. Total compensatlon per hour worked I estited by adjusting averag hourly earnine for Itema of com-pensation not Included in earnings; the adjstsnt factors re the best estimtes currently available to the Bureu of labor Statltics. Conversionfrom the curretciea of the foreign countrles to US dollars was made on the ba is of annual average daily exc_ag crate for the listed year.
/k Provisional.
Sources: lr tal - Pasquie Industrial, 1974, hundeco Inatituto Bra-ileiro de Ceografia a Eatatistca-. Bin de Janelro. and verwus escomie reports; !esa- Anual Departenat BAport. 1970-73. Comtmisioner of Labor. onmg oang. and Us" Statisetcs. various laemu. Cnm and Stettitics Dapartant.
Hong Kong; Italy - Hourly srnlngs and Sours of Work. various issues, Statiatical Office of the European Committee. Luxembourg; Jea - Terbonkof Labor Statistics, various lsues, and ronthly labor Statistics ed ae_march Bulletin. vooa iess Mnistry of Labor. Tokyo; Korea - Importon Mining and Mauofacturing Survey. 1972, 1975 through 1979. and Monthly Statistics of Kore. ivos Issues. Bcooamic Plening board. Seoul. andYearbook of Labor Statistics. various isdues. Iuternationl labor Office, Ceava; Spain - Yearbook of labor Statistics, 1974. International laborOffice. Cenrva. and Boleti leelan de Estadiatics, various Issues and Salarlos various ssue,. Inattelto lIclomal de e-tadiatlea. Madrid; andUnited States - Employmet and Earnlngs, varlous issua, US Departmnt of labor. Bureau of labor Statistics. lhsbingto. D.C.
Source: US Departmet of labor. Bureau of labor Statistics. Office of Productivity and Technolog. April i9S2.
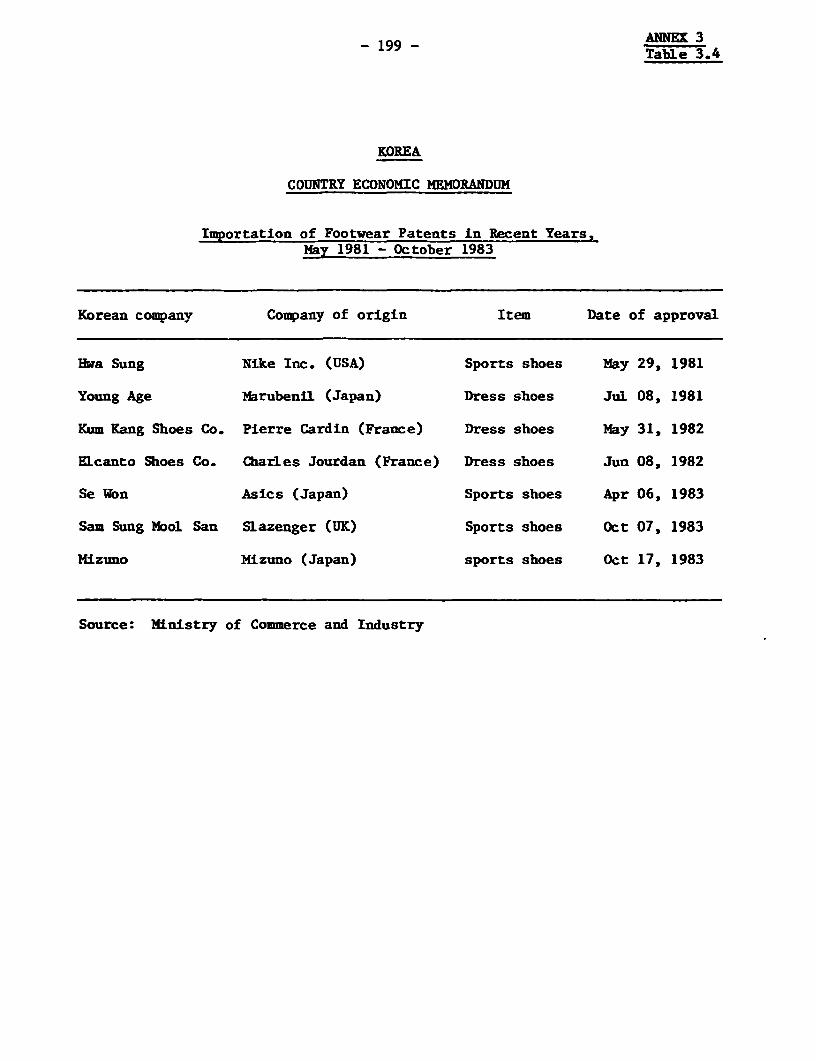
- 199 - Table 3.4
KOREA
COUNTRY ECONOMIC MEMORANDUM
Importation of Footwear Patents in Recent Years,May 1981 - October 1983
Korean company Company of origin Item Date of approval
Hwa Sung Nike Inc. (USA) Sports shoes May 29, 1981
Young Age Marubenil (Japan) Dress shoes Jul 08, 1981
Kum Kang Shoes Co. Pierre Cardin (France) Dress shoes May 31, 1982
Elcanto Shoes Co. Charles Jourdan (France) Dress shoes Jun 08, 1982
Se Won Asics (Japan) Sports shoes Apr 06, 1983
Sam Sung Mool San Slazenger (UK) Sports shoes Oct 07, 1983
Mizuno Mizuno (Japan) sports shoes Oct 17, 1983
Source: Ministry of Commerce and Industry

ANNEX 3- 200 - Table 3.5
KOREA
COUNTRY ECONOMIC MEMORANDUM
Exports of Footwear by Country, 1976-83(US$ million)
1976 1977 1978 1979 1980 1981 1982 1983/a
USA 287 304 420 373 497 575 800 658(69) (59) (58) (49) (55) (55) (68) (71)
Japan 42 64 97 127 83 86 78 43
UK 12 19 36 47 37 52 33 23
Canada 27 24 27 33 38 53 34 36
France 12 7 21 39 45 33 29 19
Italy 2 4 6 11 20 17 22 32
Others 35 93 119 135 184 233 186 117
Total 417 515 726 765 904 1,049 1,182 928
/a Only nine months.
Note: Figures in parentheses denote percent share in total.
Source: Ministry of Commerce and Industry.
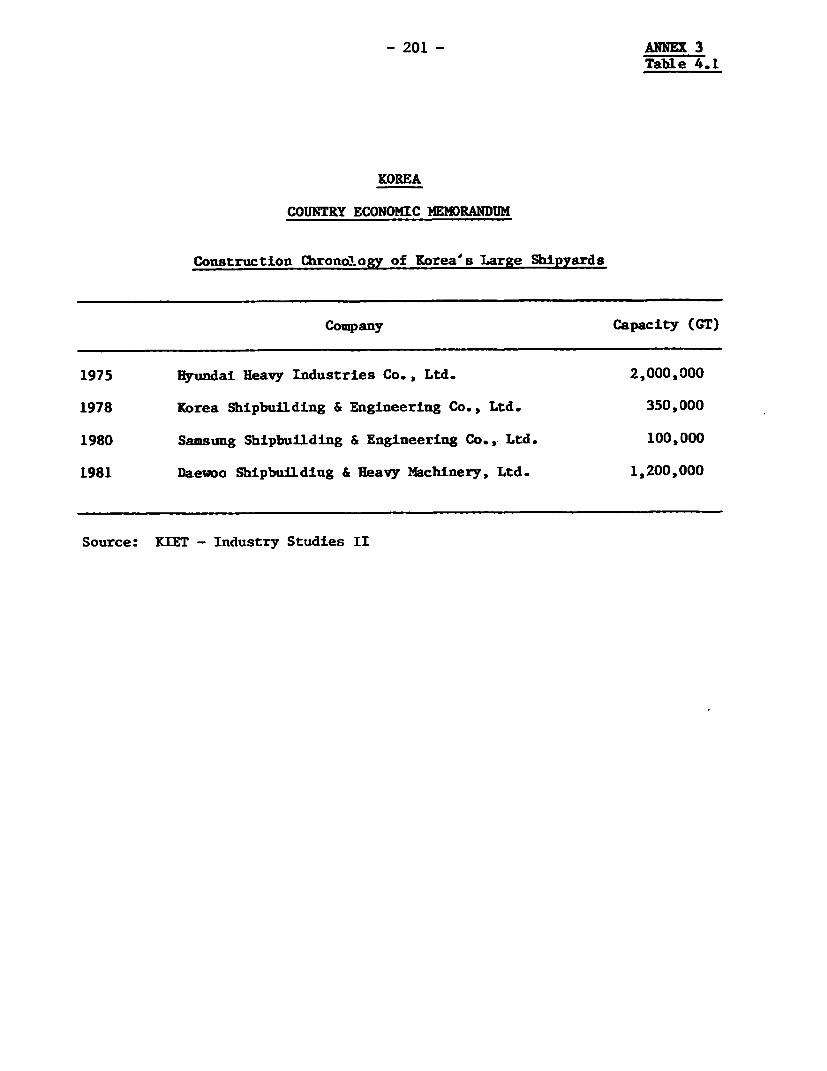
- 201 - ANNEX 3Table 4.1
KOREA
COUNTRY ECONOMIC MEMORANDUM
Construction Chronology of Korea's Large Shipyards
Company Capacity (GT)
1975 Hyundai Heavy Industries Co., Ltd. 2,000,000
1978 Korea Shipbuilding & Engineering Co., Ltd. 350,000
1980 Samsung Shipbuilding & Engineering Co.,- Ltd. 100,000
1981 Daewoo Shipbuilding & Heavy Machinery, Ltd. 1,200,000
Source: KIET - Industry Studies II
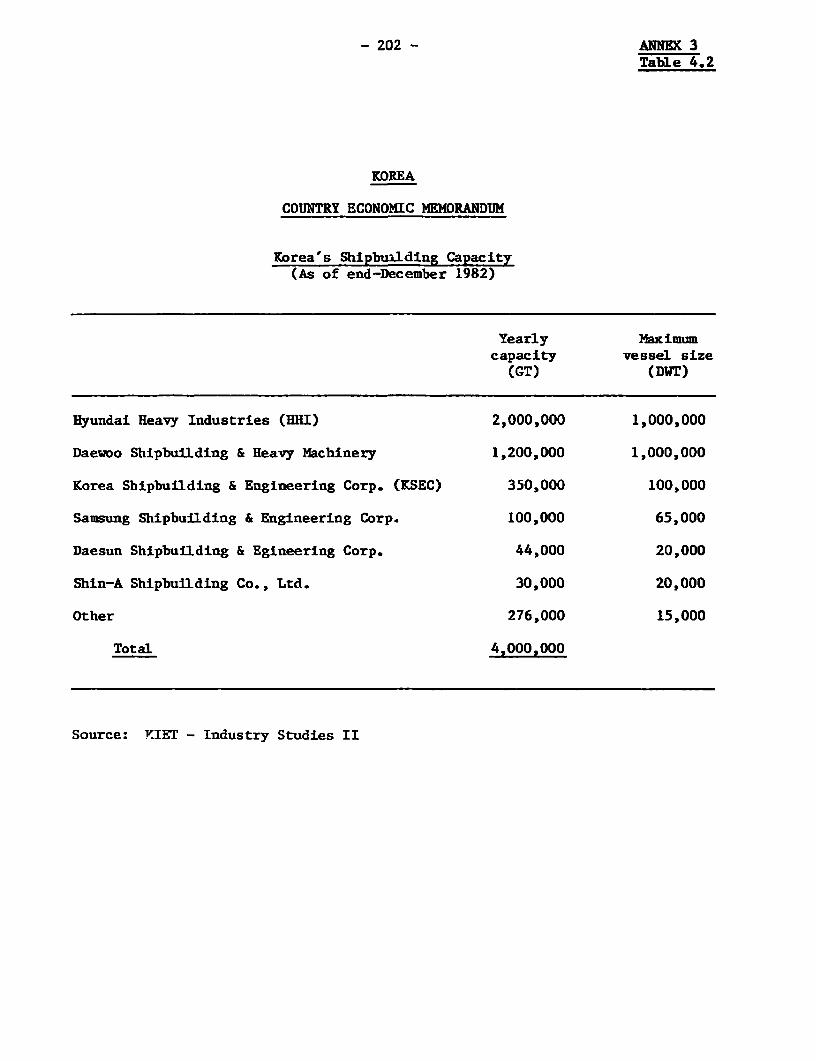
- 202 - ANNEX 3Table 4.2
KOREA
COUNTRY ECONOMIC MEMORANDUM
Korea's Shipbuilding Capacity(As of end-December 1982)
Yearly Maximumcapacity vessel size
(GT) (DWT)
Hyundai Heavy Industries (HHI) 2,000,000 1,000,000
Daewoo ShipbuiLding & Heavy Machinery 1,200,000 1,000,000
Korea Shipbuilding & Engineering Corp. (KSEC) 350,000 100,000
Samsung Shipbuilding & Engineering Corp. 100,000 65,000
Daesun Shipbuilding & Egineering Corp. 44,000 20,000
Shin-A Shipbuilding Co., Ltd. 30,000 20,000
Other 276,000 15,000
Total 4,000,000
Source: KIET - Industry Studies II
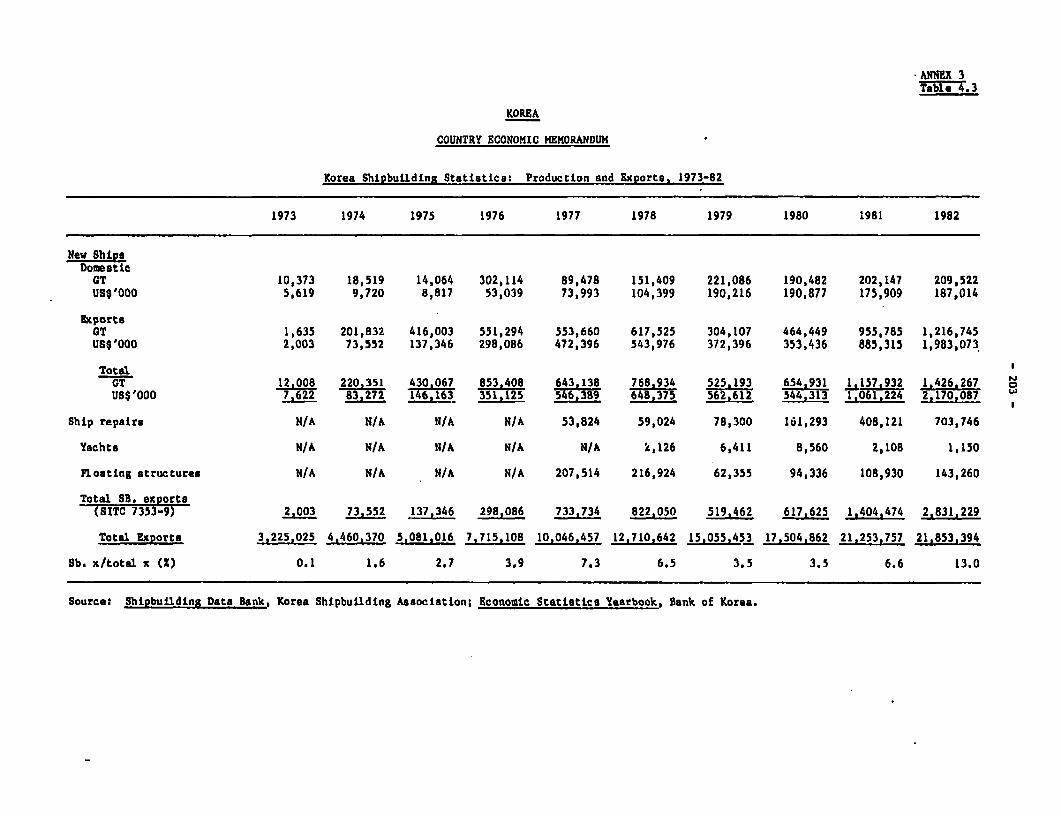
.ANNEX 3Table 4.3
KOREA
COUNTRY ECONOMIC MEMORANDUM
Korea Shipbuilding Statistics: Production and Exports, 1973-82
1973 1974 1975 1976 1977 1978 1979 1980 1981 1982
New ShipgDomestic
GT 10,373 18,519 14,064 302,114 89,478 151,409 221,086 190,482 202,147 209,522US$'OO0 5,619 9,720 8,817 53,039 73,993 104,399 190,216 190,877 175,909 187,014
ExportesGT 1,635 201,832 416,003 551,294 553,660 617,525 304,107 464,449 955,785 1,216,745US$'000 2,003 73,552 137,346 298,086 472,396 543,976 372,396 353,436 885,315 1,983,073
TotalGT 12,008 220,351 430 067 853 408 643 138 768 934 525.193 654 931 1 157 93 2 1,426,267 oUS$'O00 7,622 83,272 146163 351,125 546a3§9 648e375 562,612 544,313 1,061,224 2,170,087 W
Ship repairs N/A N/A N/A N/A 53,824 59,024 78,300 161,293 408,121 703,746
Yachts N/A N/A N/A N/A N/A 2,126 6,411 8,560 2,108 1,150
Floating structures N/A N/A N/A N/A 207,514 216,924 62,355 94,336 108,930 143,260
Total SB. exports-(SITC 7353-9) 2003 73,552 137,346 298,086 733,734 822,050 519,462 617,625 1,404,474 2,831,229
Total Exports 3,225,025 4,460,370 5,081,016 7,715,108 10,046,457 12,710,642 15,055,453 17,504,862 21,253,757 21,853,394
Sb. x/total x (2) 0.1 1,6 2.7 3.9 7.3 6.5 3.5 3.5 6.6 13.0
Source: Shipbuilding Data Bank, Korea Shipbuilding Association; Economic Statistics Yearbook, Bank of Korea.
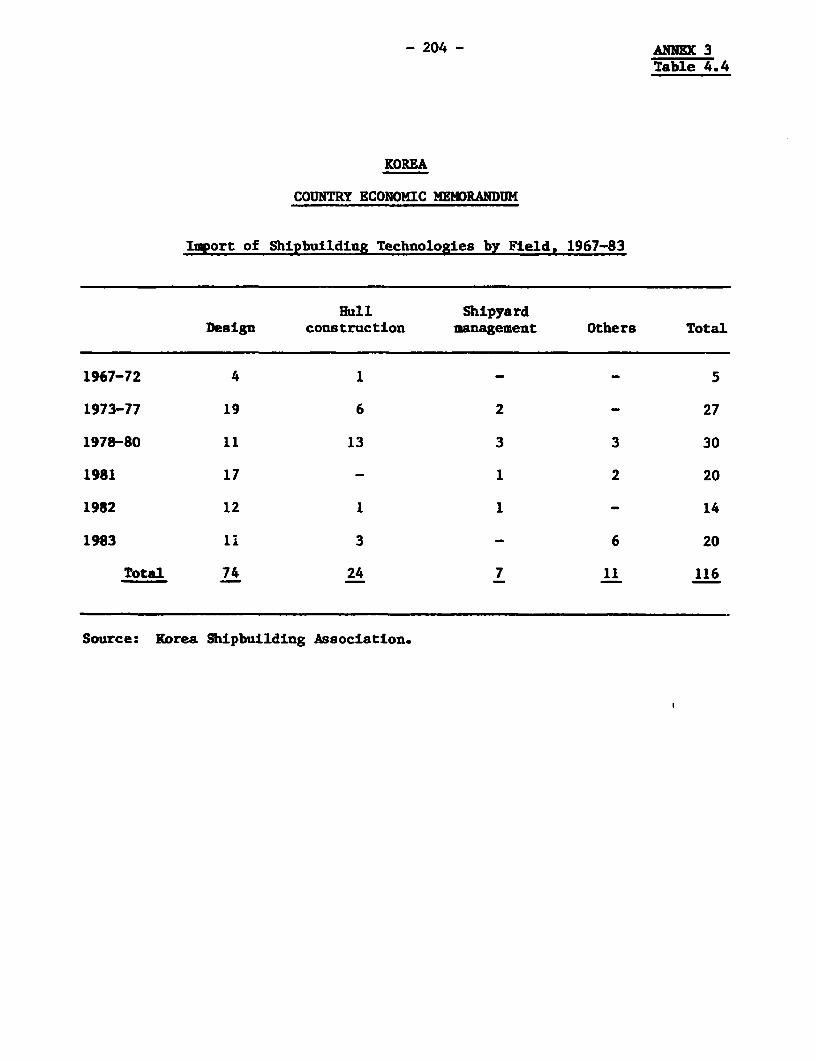
- 204 - ANNEX 3Table 4.4
KOREA
COUNTRY ECONOMIC MEMORANDUM
Import of Shipbuilding Technologies by Field, 1967-83
Hull ShipyardDesign construction management Others Total
1967-72 4 1 - 5
1973-77 19 6 2 - 27
1978-80 11 13 3 3 30
1981 17 - 1 2 20
1982 12 1 1 - 14
1983 1. 3 - 6 20
Total 74 24 7 11 116
Source: Korea Shipbuilding Association.
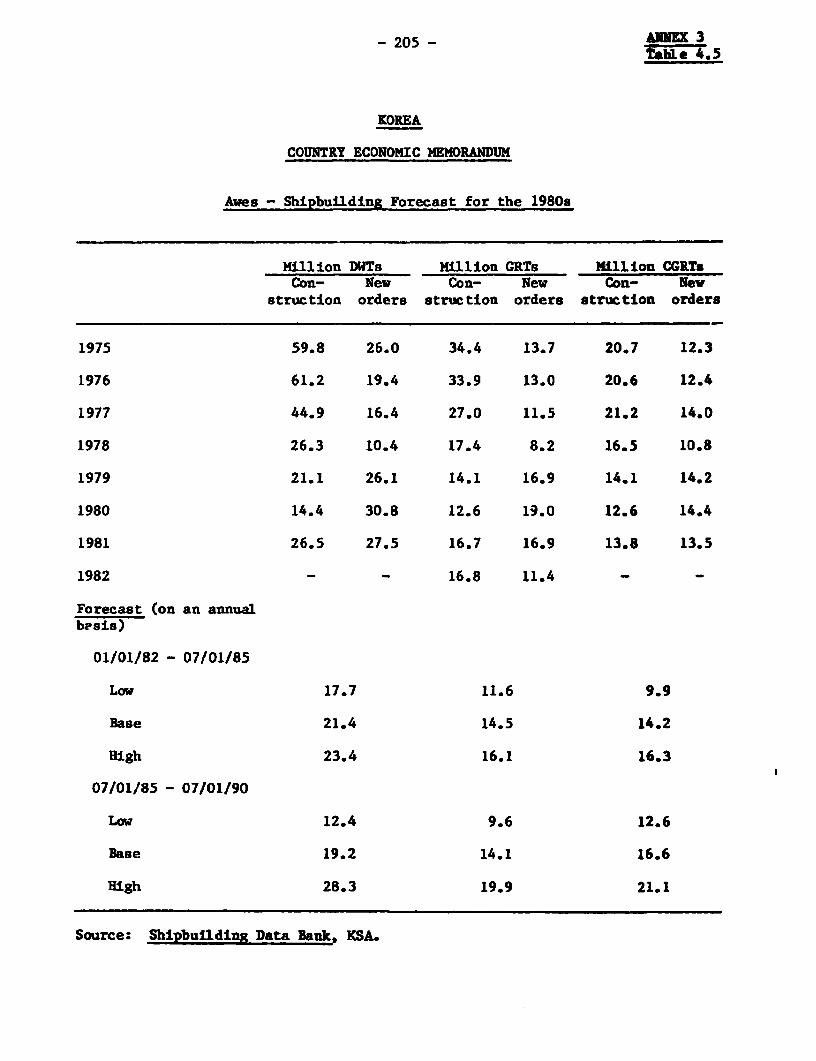
- 205 - ANE 3tai. e4. 5
KOREA
COUNTRY ECONOMIC MEMORANDUN
Awes - Shipbuilding Forecast for the 19809
Million DWTs Million GRTs Million CGRTsCon- New Con- New Con- New
struction orders struction orders struction orders
1975 59.8 26.0 34.4 13.7 20.7 12.3
1976 61.2 19.4 33.9 13.0 20.6 12.4
1977 44.9 16.4 27.0 11.5 21.2 14.0
1978 26.3 10.4 17.4 8.2 16.5 10.8
1979 21.1 26.1 14.1 16.9 14.1 14.2
1980 14.4 30.8 12.6 19.0 12.6 14.4
1981 26.5 27.5 16.7 16.9 13.8 13.5
1982 - - 16.8 11.4 - -
Forecast (on an annualbesis)
01/01/82 - 07/01/85
Low 17.7 11.6 9.9
Base 21.4 14.5 14.2
High 23.4 16.1 16.3
07/01/85 - 07/01/90
Low 12.4 9.6 12.6
Base 19.2 14.1 16.6
High 28.3 19.9 21.1
Source: Shipbuilding Data Bank, KSA.
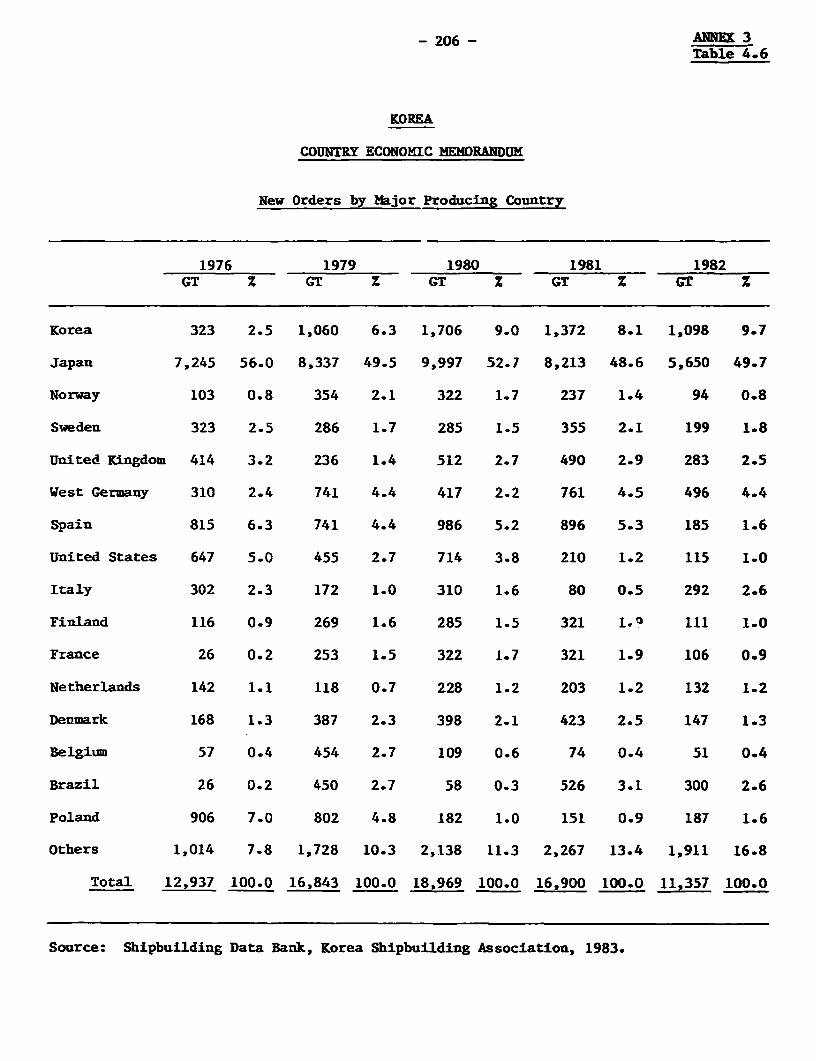
- 206 - ANNEX 3Table 4.6
KOREA
COUNTRY ECONOMIC MEMORANDUM
New Orders by Major Producing Country
1976 1979 1980 1981 1982GT Z GT Z GT z GT Z GT Z
Korea 323 2.5 1,060 6.3 1,706 9.0 1,372 8.1 1,098 9.7
Japan 7,245 56.0 8,337 49.5 9,997 52.7 8,213 48.6 5,650 49.7
Norway 103 0.8 354 2.1 322 1.7 237 1.4 94 0.8
Sweden 323 2.5 286 1.7 285 1.5 355 2.1 199 1.8
United Kingdom 414 3.2 236 1.4 512 2.7 490 2.9 283 2.5
West Germany 310 2.4 741 4.4 417 2.2 761 4.5 496 4.4
Spain 815 6.3 741 4.4 986 5.2 896 5.3 185 1.6
United States 647 5.0 455 2.7 714 3.8 210 1.2 115 1.0
Italy 302 2.3 172 1.0 310 1.6 80 0.5 292 2.6
Finland 116 0.9 269 1.6 285 1.5 321 1.? 111 1.0
France 26 0.2 253 1.5 322 1.7 321 1.9 106 0.9
Netherlands 142 1.1 118 0.7 228 1.2 203 1.2 132 1.2
Denmark 168 1.3 387 2.3 398 2.1 423 2.5 147 1.3
Belgium 57 0.4 454 2.7 109 0.6 74 0.4 51 0.4
Brazil 26 0.2 450 2.7 58 0.3 526 3.1 300 2.6
Poland 906 7.0 802 4.8 182 1.0 151 0.9 187 1.6
others 1,014 7.8 1,728 10.3 2,138 11.3 2,267 13.4 1,911 16.8
Total 12,937 100.0 16,843 100.0 18,969 100.0 16,900 100.0 11,357 100.0
Source: Shipbuilding Data Bank, Korea Shipbuilding Association, 1983.
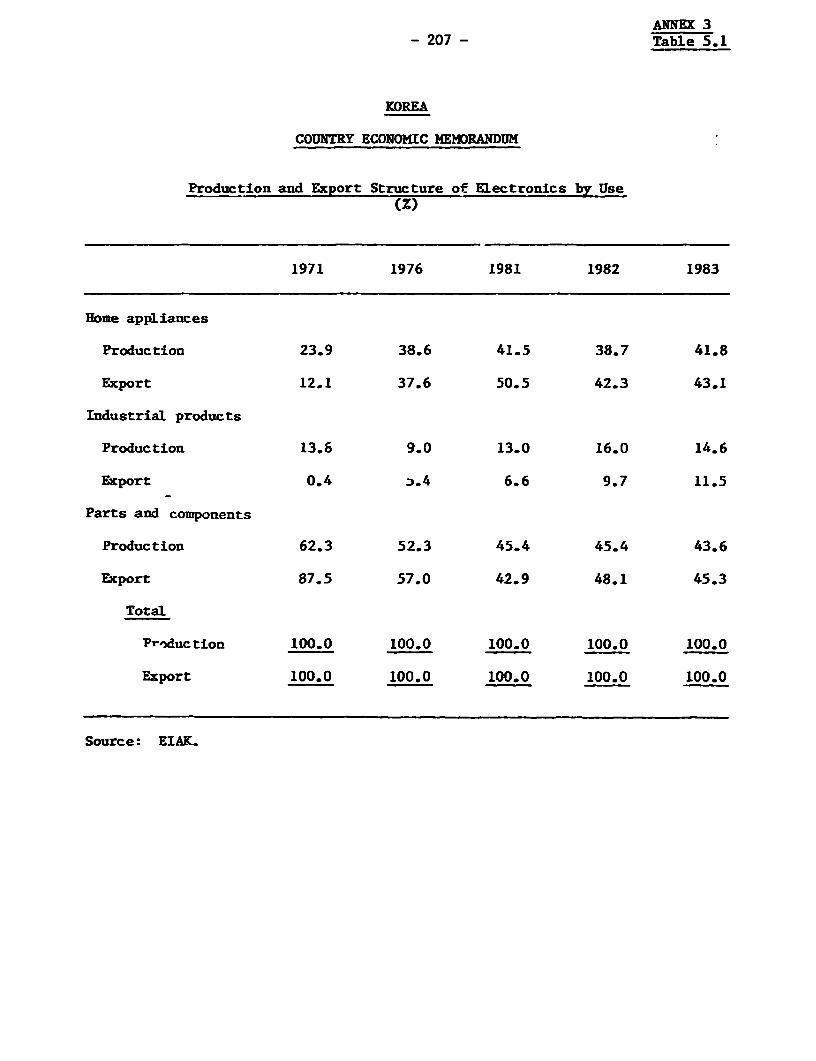
ANNE[ 3- 207 - Table 5.1
KOREA
COUNTRY ECONOMIC MEMORANDUM
Production and Export Structure of Electronics by Use
1971 1976 1981 1982 1983
Home appliances
Production 23.9 38.6 41.5 38.7 41.8
Export 12.1 37.6 50.5 42.3 43.1
Industrial products
Production 13.& 9.0 13.0 16.0 14.6
Export 0.4 i.4 6.6 9.7 11.5
Parts and components
Production 62.3 52.3 45.4 45.4 43.6
Export 87.5 57.0 42.9 48.1 45.3
Total
Pr')duction 100.0 100.0 100.0 100.0 100.0
Export 100.0 100.0 100.0 100.0 100.0
Source: EIAK.
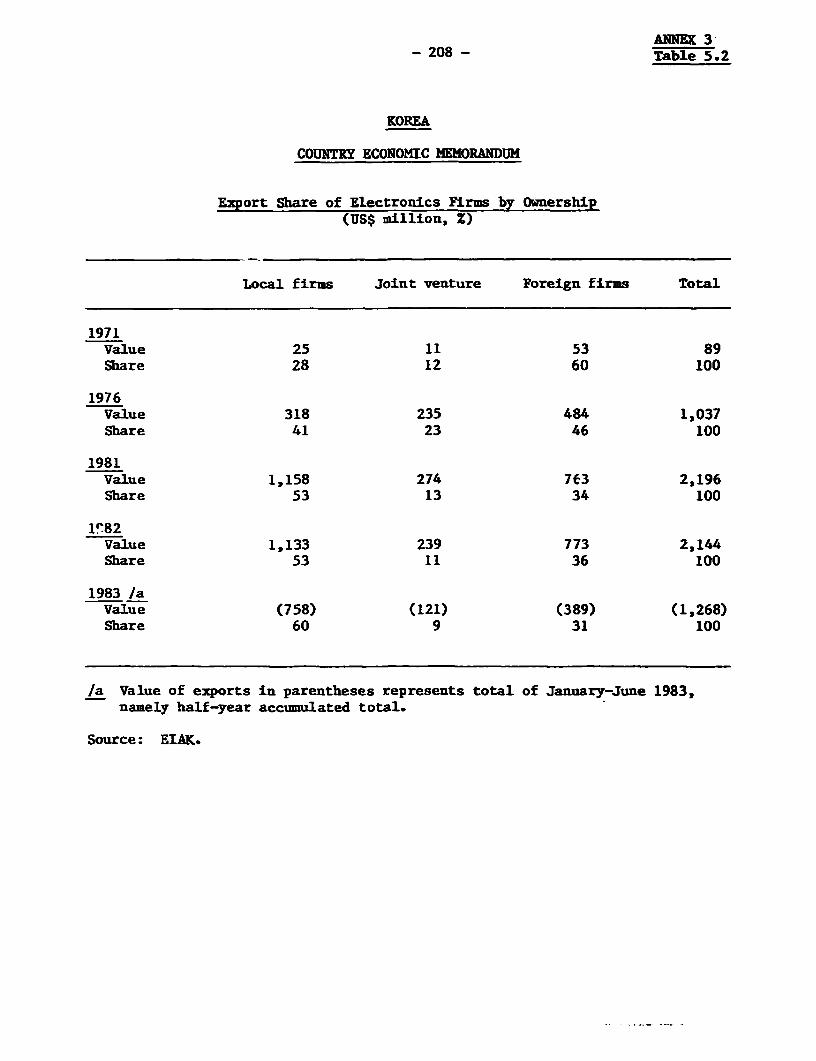
ANNEX 3- 208 - Table 5.2
KOREA
COUNTRY ECONOMIC MEMORANDUK
Export Share of Electronics Firms by Ownership(US$ million, X)
Local firms Joint venture Foreign firms Total
1971Value 25 11 53 89Share 28 12 60 100
1976Value 318 235 484 1,037Share 41 23 46 100
1981Value 1,158 274 763 2,196Share 53 13 34 100
1"82Value 1,133 239 773 2,144Share 53 11 36 100
1983 IaValue (758) (121) (389) (1,268)Share 60 9 31 100
/a Value of exports in parentheses represents total of January-June 1983,namely half-year accumulated total.
Source: EIAK.
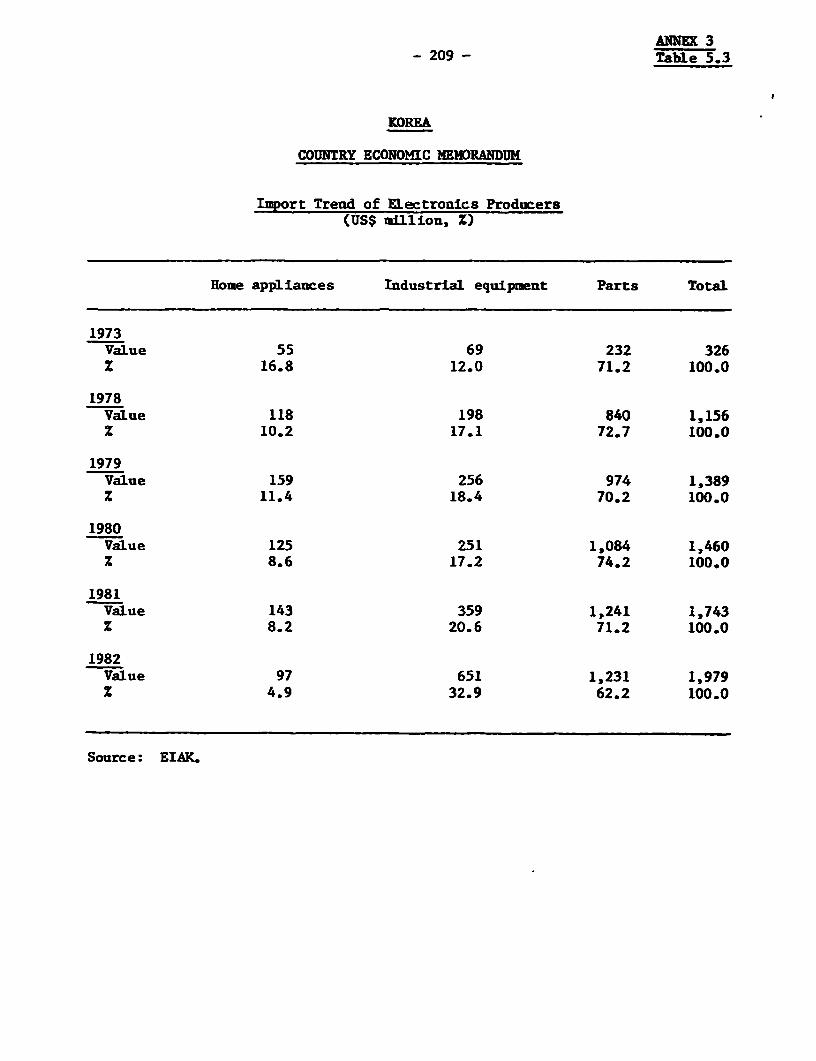
AMNEX 3- 209 - Table 5.3
KOREA
COUNTRY ECONOMIC MEMORANDUM
Import Trend of Electronics Producers(US$ million, Z)
Home appliances Industrial equipment Parts Total
1973Value 55 69 232 326Z 16.8 12.0 71.2 100.0
1978Value 118 198 840 1,156z 10.2 17.1 72.7 100.0
1979Value 159 256 974 1,389z 11.4 18.4 70.2 100.0
1980Value 125 251 1,084 1,460% 8.6 17.2 74.2 100.0
1981Value 143 359 1,241 1,743Z 8.2 20.6 71.2 100.0
1982Value 97 651 1,231 1,979Z 4.9 32.9 62.2 100.0
Source: EIAK.
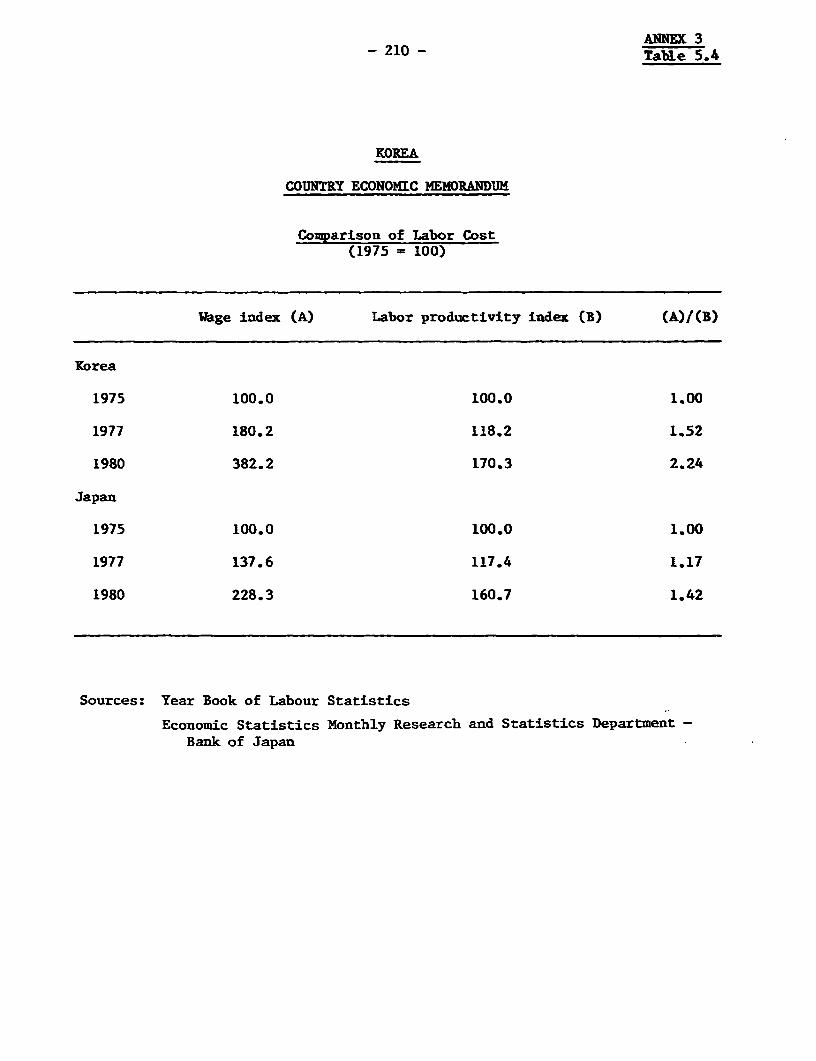
ANNEX 3- 210 - Table 5.4
KOREA
COUNTRY ECONOMIC MEMORANDUM
Comparison of Labor Cost(1975 = 100)
Wage index (A) Labor productivity index (B) (A)/(B)
Korea
1975 100.0 100.0 1.00
1977 180.2 118.2 1.52
1980 382.2 170.3 2.24
Japan
1975 100.0 100.0 1.00
1977 137.6 117.4 1.17
1980 228.3 160.7 1.42
Sources: Year Book of Labour Statistics
Economic Statistics Monthly Research and Statistics Department -Bank of Japan
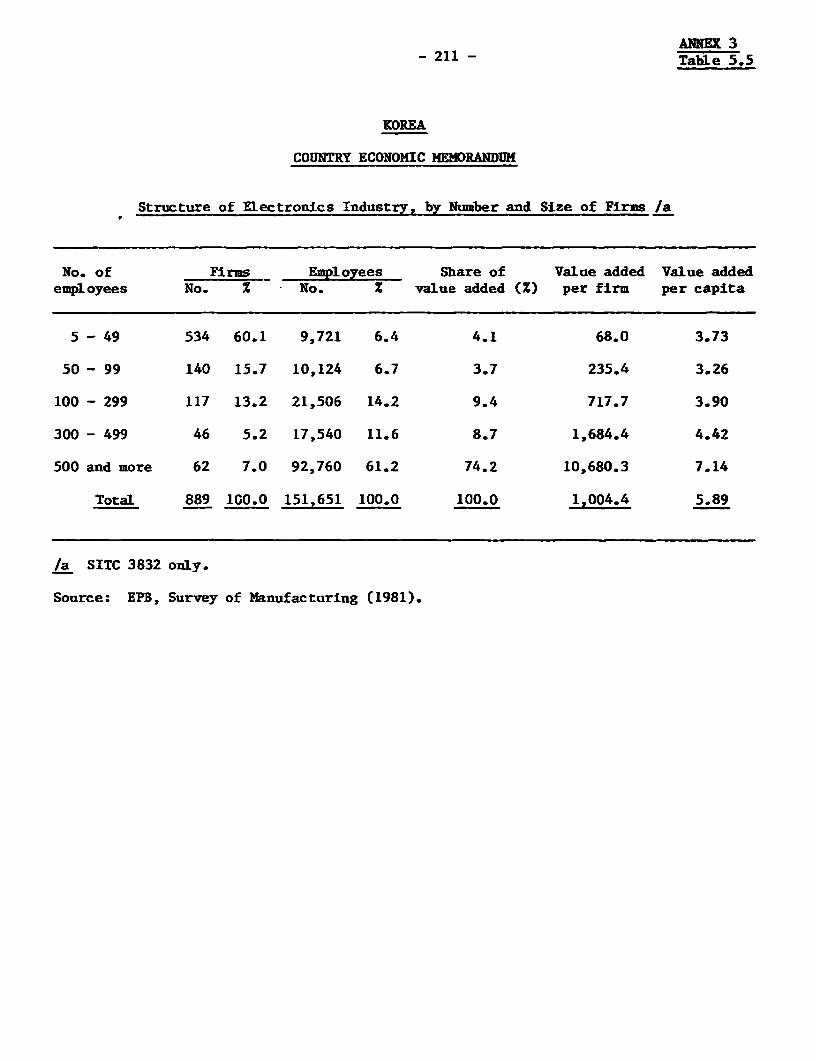
ANNEX 3- 211 - TabLe 5.5
KOREA
COUNTRY ECONOMIC MEMORANDUM
Structure of Electronics Industry, by Number and Size of Firms /a
No. of Firms Employees Share of Value added Value addedemployees No. Z No. Z value added (Z) per firm per capita
5 - 49 534 60.1 9,721 6.4 4.1 68.0 3.73
50 - 99 140 15.7 10,124 6.7 3.7 235.4 3.26
100 - 299 117 13.2 21,506 14.2 9.4 717.7 3.90
300 - 499 46 5.2 17,540 11.6 8.7 1,684.4 4.42
500 and more 62 7.0 92,760 61.2 74.2 10,680.3 7.14
Total 889 100.0 151,651 100.0 100.0 1,004.4 5.89
/a SITC 3832 only.
Source: EPB. Survey of Manufacturing (1981).
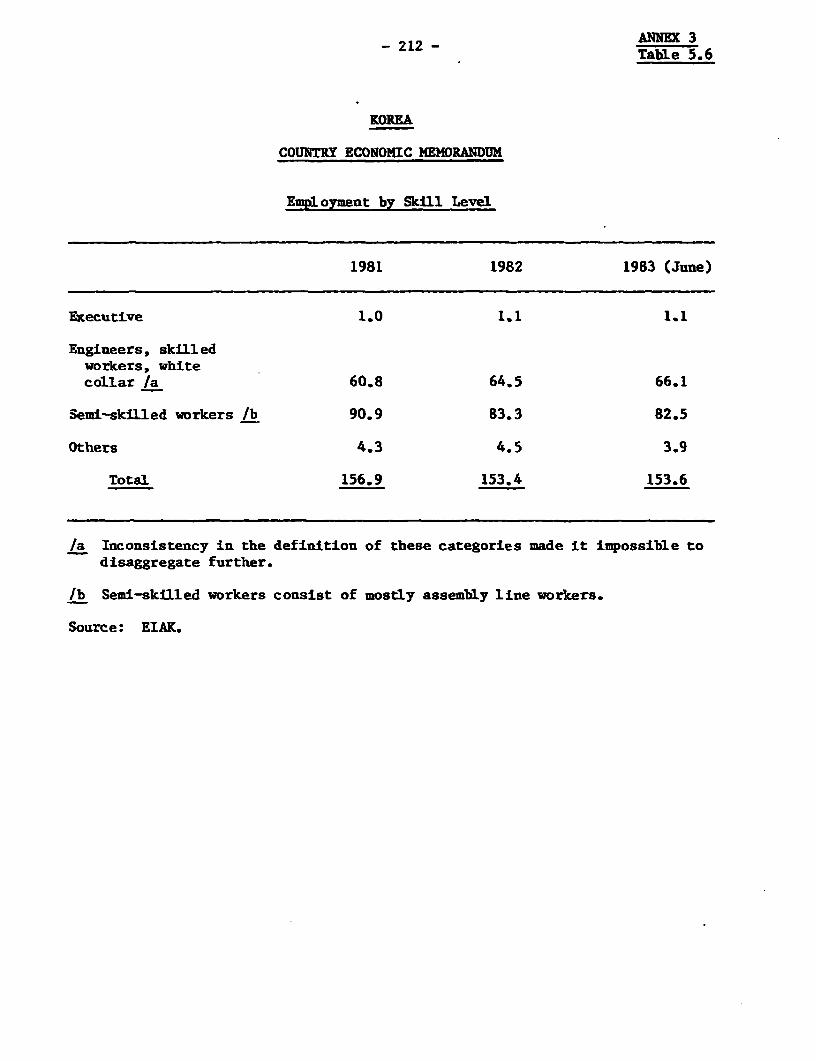
212 ~~~~~ANNE 3- 212 - Table 5.6
KOREA
COUNTRY ECONOMIC MEMORANDUM
Employment by Skill Level
1981 1982 1983 (June)
Executive 1.0 1.1 1.1
Engineers, skilledworkers, whitecollar /a 60.8 64.5 66.1
Semi-skilled workers /b 90.9 83.3 82.5
Others 4.3 4.5 3.9
Total 156.9 153.4 153.6
/a Inconsistency in the definition of these categories made it impossible todisaggregate further.
lb Semi-skilled workers consist of mostly assembly line workers.
Source: EIAK.
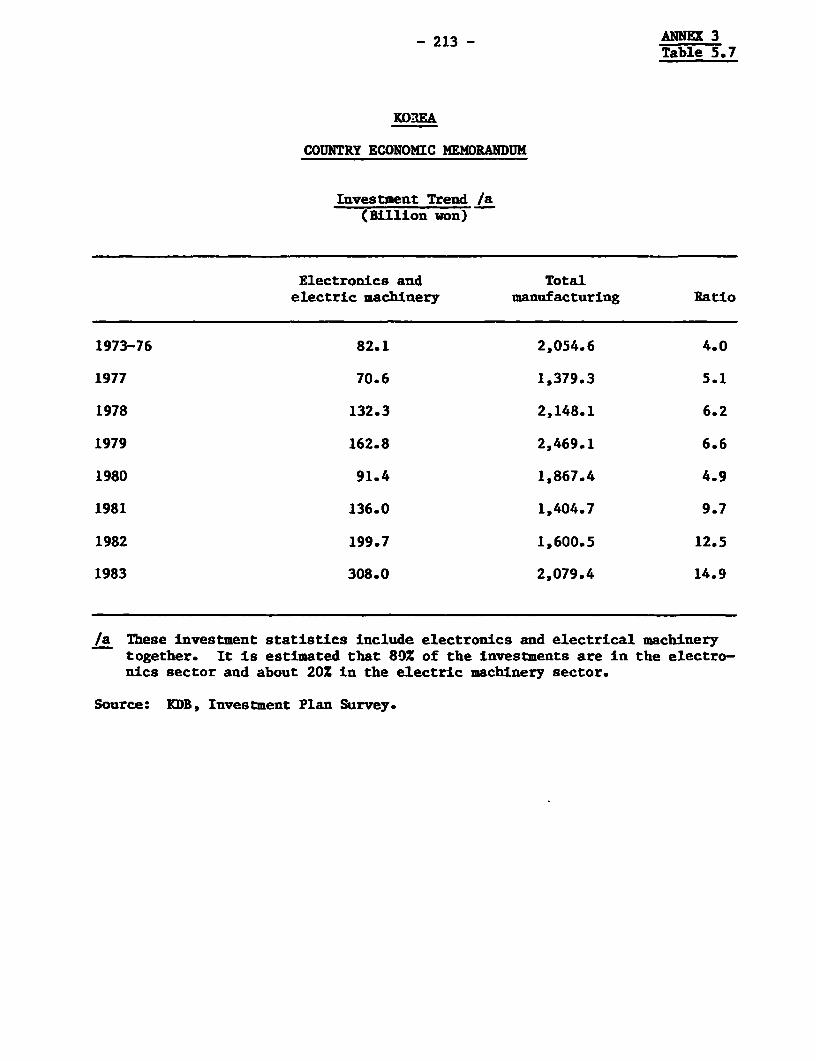
- 213 - ANNEX 3Table 5.7
KOREA
COUNTRY ECONOMIC MEMORANDUM
Investment Trend /a(Billion won)
Electronics and Totalelectric machinery manufacturing Ratio
1973-76 82.1 2,054.6 4.0
1977 70.6 1,379.3 5.1
1978 132.3 2,148.1 6.2
1979 162.8 2,469.1 6.6
1980 91.4 1,867.4 4.9
1981 136.0 1,404.7 9.7
1982 199.7 1,600.5 12.5
1983 308.0 2,079.4 14.9
/a These investment statistics include electronics and electrical machinerytogether. It is estimated that 80% of the investments are in the electro-nics sector and about 20% in the electric machinery sector.
Source: KDB, Investment Plan Survey.
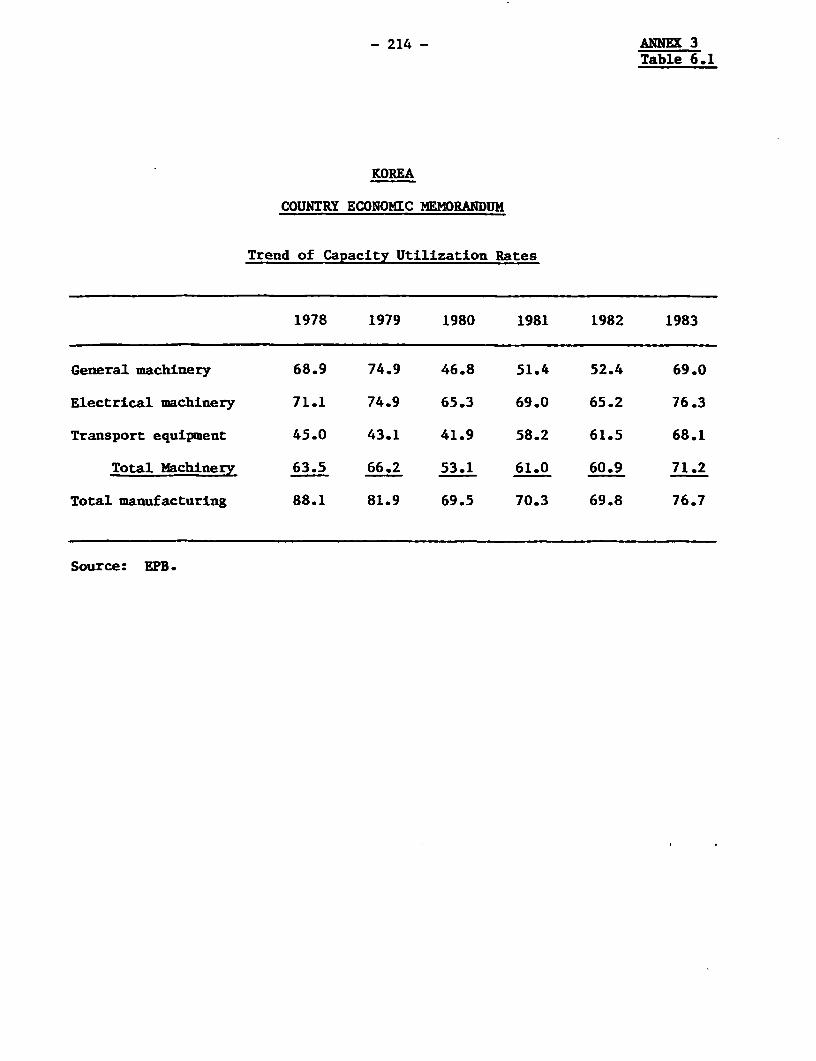
- 214- ANNEX 3Table 6.1
KOREA
COUNTRY ECONOMIC MEMORANDUM
Trend of Capacity Utilization Rates
1978 1979 1980 1981 1982 1983
General machinery 68.9 74.9 46.8 51.4 52.4 69.0
Electrical machinery 71.1 74.9 65.3 69.0 65.2 76.3
Transport equipment 45.0 43.1 41.9 58.2 61.5 68.1
Total Machinery 63.5 66.2 53.1 61.0 60.9 71.2
Total manufacturing 88.1 81.9 69.5 70.3 69.8 76.7
Source: EPB.
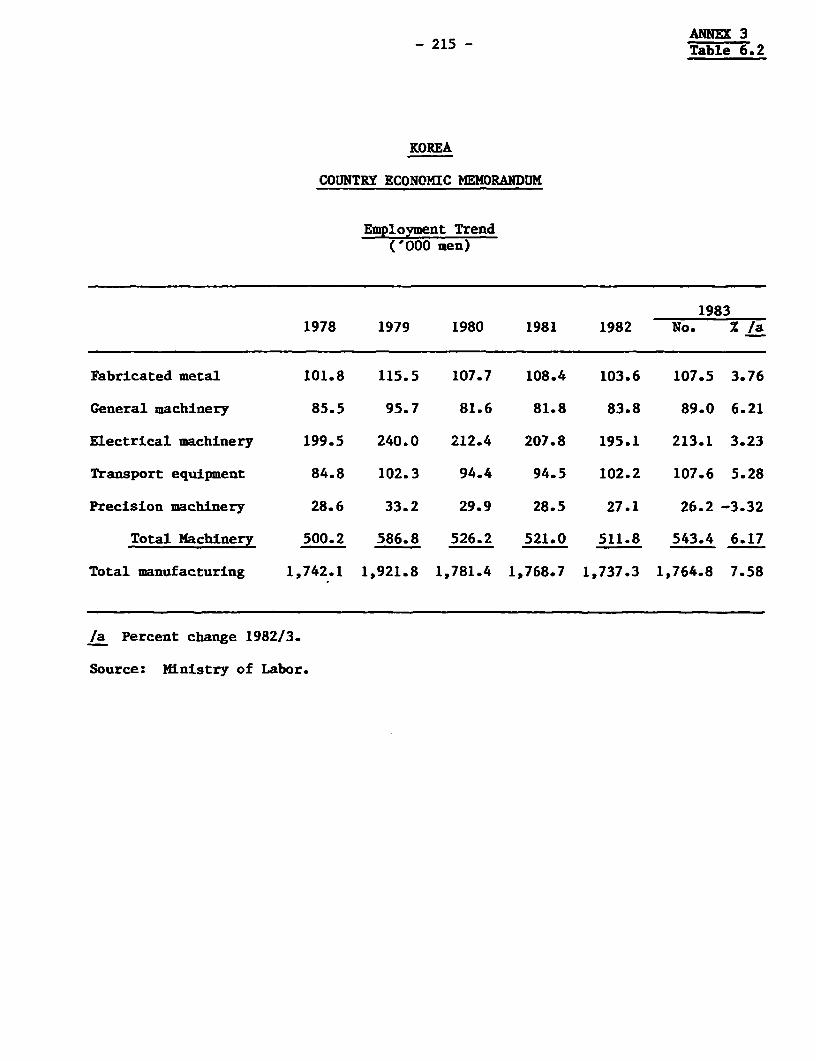
- 215 - ANNEX 3Table 6.2
KOREA
COUNTRY ECONOMIC MEMORANDUM
Employment Trend('000 men)
19831978 1979 1980 1981 1982 No. Z /a
Fabricated metal 101.8 115.5 107.7 108.4 103.6 107.5 3.76
General machinery 85.5 95.7 81.6 81.8 83.8 89.0 6.21
Electrical machinery 199.5 240.0 212.4 207.8 195.1 213.1 3.23
Transport equipment 84.8 102.3 94.4 94.5 102.2 107.6 5.28
Precision machinery 28.6 33.2 29.9 28.5 27.1 26.2 -3.32
Total Machinery 500.2 586.8 526.2 521.0 511.8 543.4 6.17
Total manufacturing 1,742.1 1,921.8 1,781.4 1,768.7 1,737.3 1,764.8 7.58
/a Percent change 1982/3.
Source: Ministry of Labor.
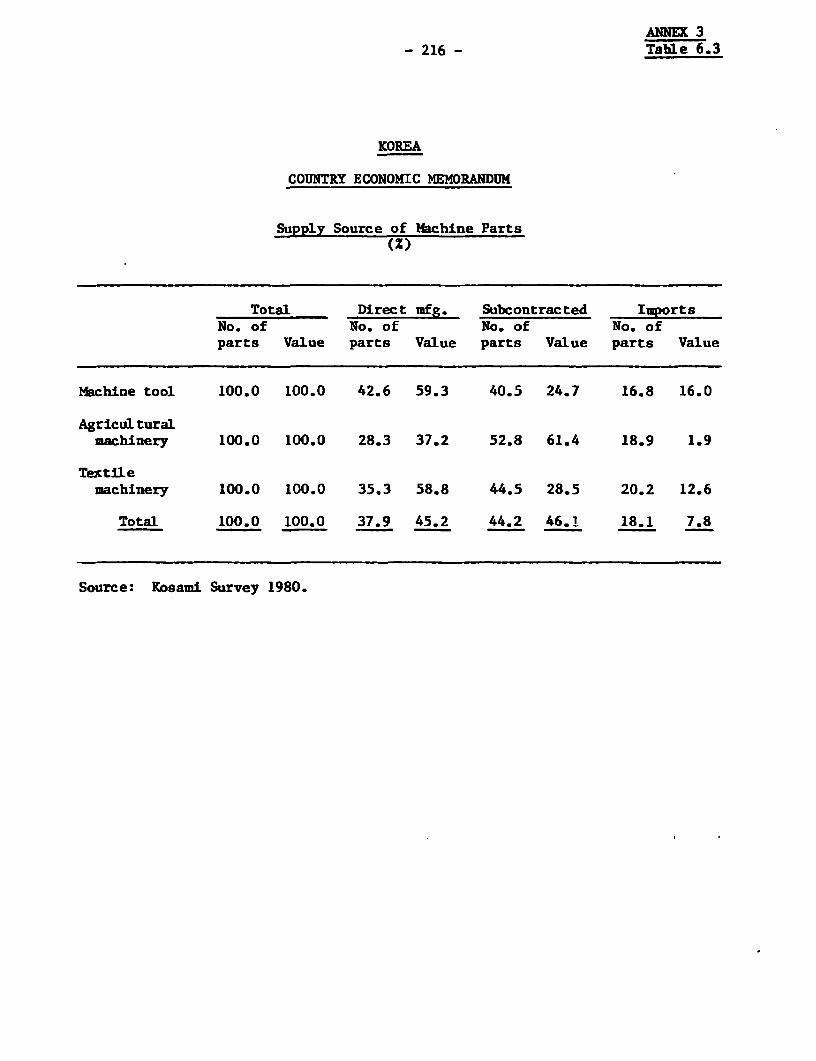
ANNEX 3- 216 - Table 6.3
KOREA
COUNTRY ECONOMIC MEMORANDUM
Supply Source of Machine Parts(Z)
Total Direct mfg. Subcontracted ImportsNo. of No. of No. of No. ofparts Value parts Value parts Value parts Value
Machine tool 100.0 100.0 42.6 59.3 40.5 24.7 16.8 16.0
Agriculturalmachinery 100.0 100.0 28.3 37.2 52.8 61.4 18.9 1.9
Textilemachinery 100.0 100.0 35.3 58.8 44.5 28.5 20.2 12.6
Total 100.0 100.0 37.9 45.2 44.2 46.1. 18.1 7.8
Source: Kosami Survey 1980.
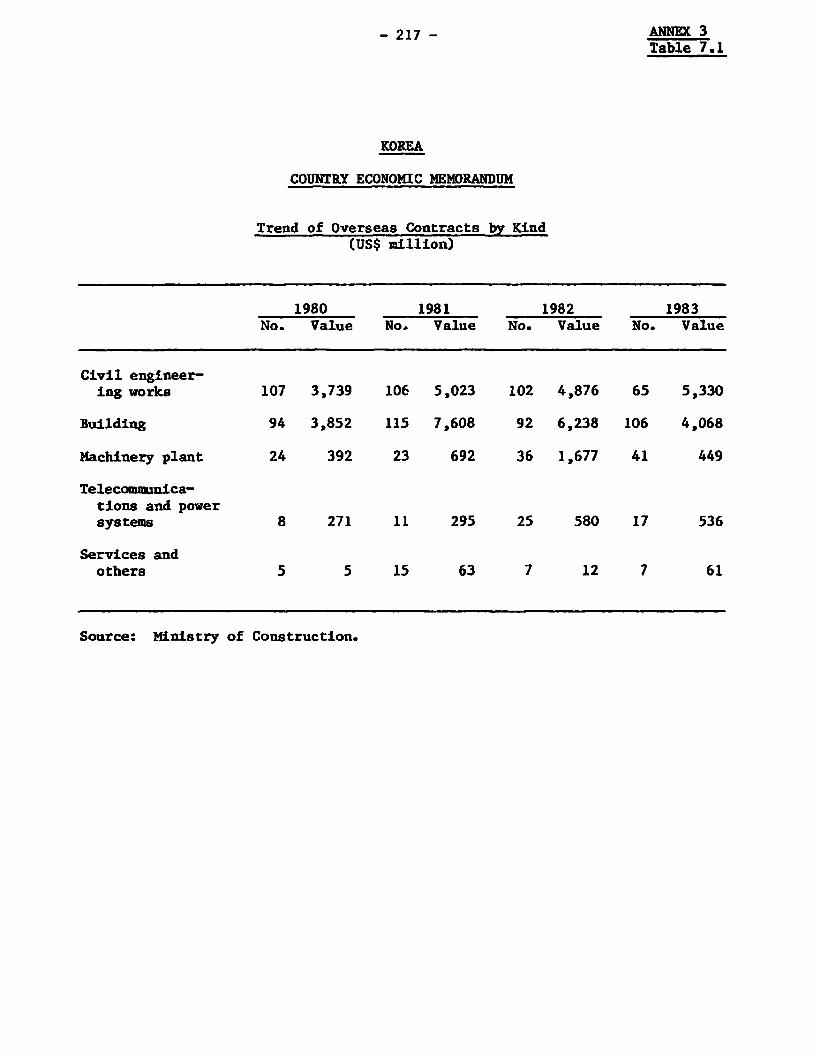
- 217 - ANNEX 3Table 7.1
KOREA
COUNTRY ECONOMIC MEMORANDUM
Trend of Overseas Contracts by Kind(US$ million)
1980 1981 1982 1983No. Value No. Value No. Value No. Value
Civil engineer-ing works 107 3,739 106 5,023 102 4,876 65 5,330
Building 94 3,852 115 7,608 92 6,238 106 4,068
Machinery plant 24 392 23 692 36 1,677 41 449
Telecommutnica-tions and powersystems 8 271 11 295 25 580 17 536
Services andothers 5 5 15 63 7 12 7 61
Source: Ministry of Construction.
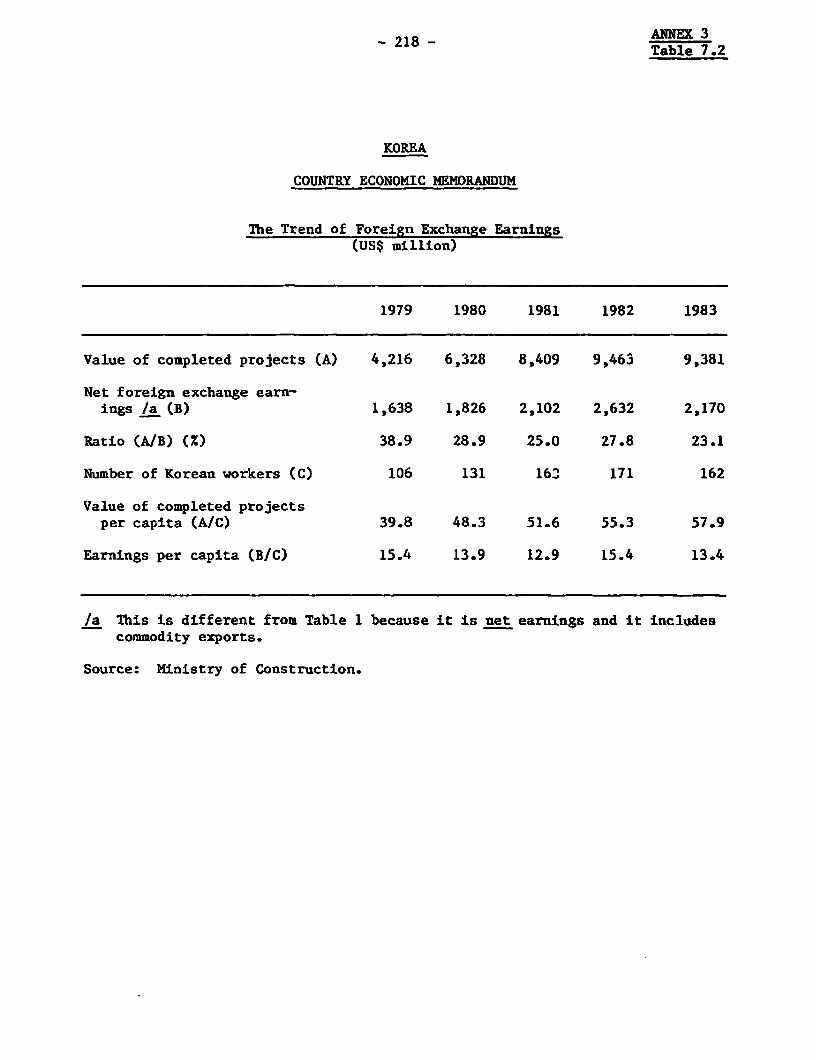
- 218 - ANNEX 3Table 7.2
KOREA
COUNTRY ECONOMIC NEMORANDUM
The Trend of Foreign Exchange Earnings(US$ million)
1979 1980 1981 1982 1983
Value of completed projects (A) 4,216 6,328 8,409 9,463 9,381
Net foreign exchange earn-ings /a (B) 1,638 1,826 2,102 2,632 2,170
Ratio (A/B) (Z) 38.9 28.9 25.0 27.8 23.1
Number of Korean workers (C) 106 131 16j 171 162
Value of completed projectsper capita (A/C) 39.8 48.3 51.6 55.3 57.9
Earnings per capita (B/C) 15.4 13.9 12.9 15.4 13.4
/a This is different from Table 1 because it is net earnings and it includescommodity exports.
Source: Ministry of Construction.
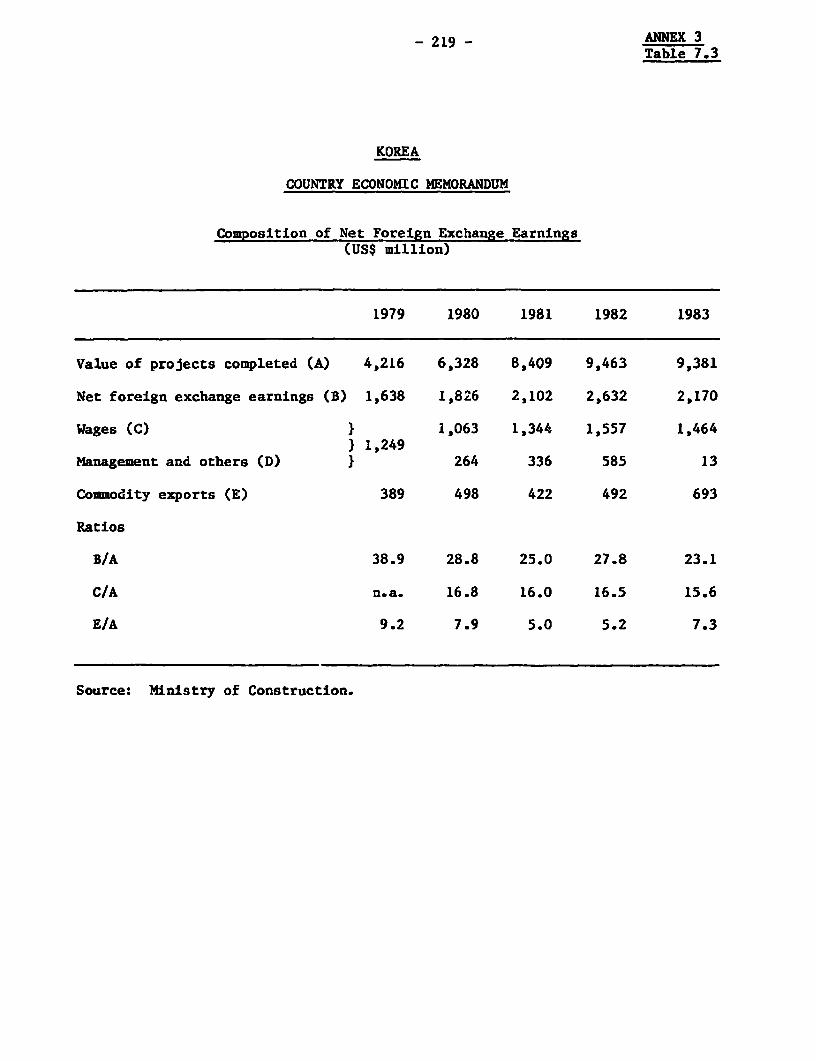
- 219 - ANNEX 3Table 7.3
KOREA
COUNTRY ECONOMIC MEMORANDUM
Composition of Net Foreign Exchange Earnings(US$ million)
1979 1980 1981 1982 1983
Value of projects completed (A) 4,216 6,328 8,409 9,463 9,381
Net foreign exchange earnings (B) 1,638 1,826 2,102 2,632 2,170
Wages (C) } 1,063 1,344 1,557 1,464} 1,249
Management and others (D) } 264 336 585 13
Commodity exports (E) 389 498 422 492 693
Ratios
B/A 38.9 28.8 25.0 27.8 23.1
C/A n.a. 16.8 16.0 16.5 15.6
E/A 9.2 7.9 5.0 5.2 7.3
Source: Ministry of Construction.
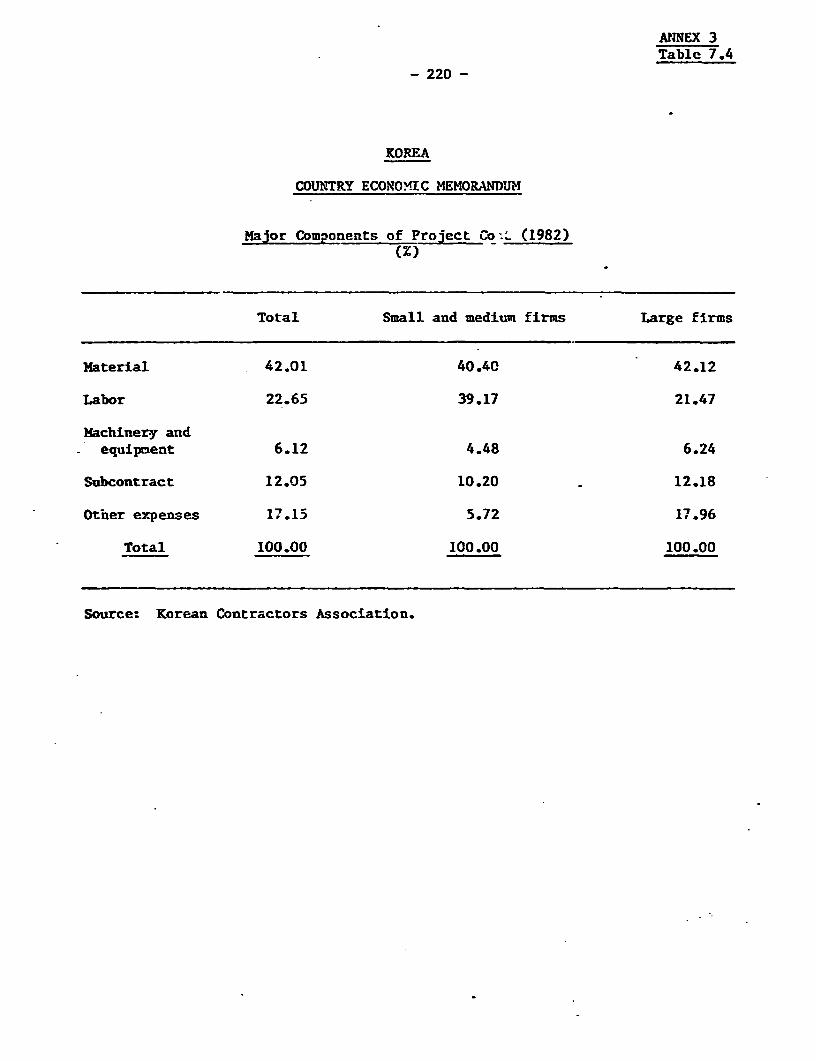
ANNEX 3Table 7.4
-220-
KOREA
COUNTRY ECONOMIC MEMORANDUH
Major Components of Project -o-L (1982)
Total Small and medium firms Large firms
Material 42.01 40.40 42.12
Labor 22.65 39.17 21.47
Machinerjy andequipment 6.12 4.48 6.24
Subcontract 12.05 10.20 12.18
Other expenses 17.15 5.72 17.96
Total 100.00 100.00 100.00
Source: Korean Contractors Association.
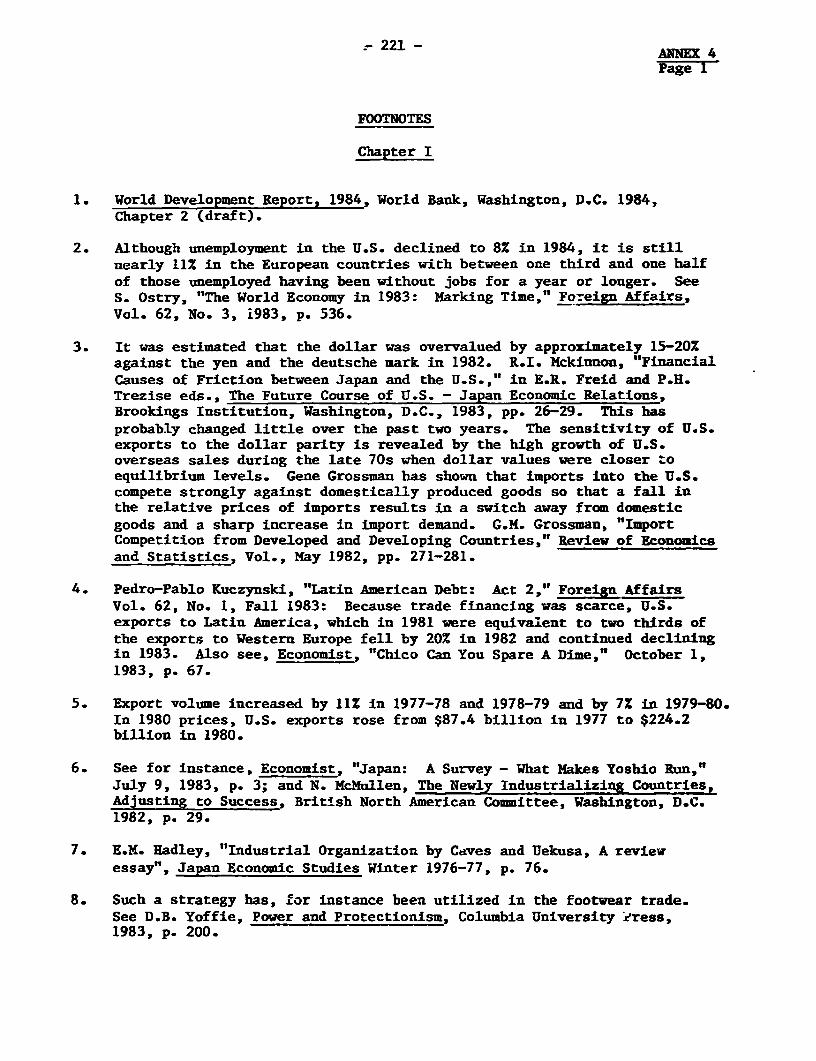
- 221 - ANNEX 4
Page 1
FOOTNOTES
Chapter I
1. World Development Report, 1984, World Bank, Washington, D.C. 1984,Chapter 2 (draft).
2. Although unemployment in the U.S. declined to 8% in 1984, it is stillnearly 11% in the European countries with between one third and one halfof those unemployed having been without jobs for a year or longer. SeeS. Ostry, "The World Economy in 1983: Marking Time," Foreign Affairs,Vol. 62, No. 3, i983, p. 536.
3. It was estimated that the dollar was overvalued by approximately 15-20%against the yen and the deutsche mark in 1982. R.I. Mckinnon, "FinancialCauses of Friction between Japan and the U.S.," in E.R. Freid and P.H.Trezise eds., The Future Course of U.S. - Japan Economic Relations,Brookings Institution, Washington, D.C., 1983, pp. 26-29. This hasprobably changed little over the past two years. The sensitivity of U.S.exports to the dollar parity is revealed by the high growth of U.S.overseas sales during the late 70s when dollar values were closer toequilibrium levels. Gene Grossman has shown that imports into the U.S.compete strongly against domestically produced goods so that a fall inthe relative prices of imports results in a switch away from domesticgoods and a sharp increase in import demand. G.M. Grossman, "ImportCompetition from Developed and Developing Countries," Review of Economicsand Statistics, Vol., May 1982, pp. 271-281.
4. Pedro-Pablo Kuczynski, "Latin American Debt: Act 2," Foreign AffairsVol. 62, No. 1, Fall 1983: Because trade financing was scarce, U.S.exports to Latin America, which in 1981 were equivalent to two thirds ofthe exports to Western Europe fell by 20% in 1982 and continued decliningin 1983. Also see, Economist, "Chico Can You Spare A Dime," October 1,1983, p. 67.
5. Export volume increased by 11% in 1977-78 and 1978-79 and by 7% in 1979-80.In 1980 prices, U.S. exports rose from $87.4 billion in 1977 to $224.2billion in 1980.
6. See for instance, Economist, "Japan: A Survey - What Makes Yoshio Run,"July 9, 1983, p. 3; and N. McMullen, The Newly Industrializing Countries,Adjusting to Success, British North American Committee, Washington, D.C.1982, p. 29.
7. E.M. Hadley, "Industrial Organization by Caves and Uekusa, A reviewessay", Japan Economic Studies Winter 1976-77, p. 76.
8. Such a strategy has, for instance been utilized in the footwear trade.See D.B. Yoffie, Power and Protectionism, Columbia University .Iress,1983, p. 200.
- 222 - ANNEX 4Page 2
9. The petrochemical and non-ferrous metal refining industries (e.g.aluminum smelting) have been particularly hard hit by higher energy costsand have begun contracting. R.J. Samuels, "The Industrial Destructuringof the Japanese Aluminum Industry," Pacific Affairs, Vol. 50, No. 3, Fall1983; S. Sekiguchi, "Industrial Adjustment in East Asia's Resource - PoorEconomics," World Economy, Vol. 6, No. 2, June 1983.
10. The small relative share of manufactures in Japanese imports hasfrequently been commented upon. See G. Saxonhouse, "Evolving ComparativeAdvantage and Japan's Imports Of Manufactures," in K. Yamamura, Policyand Trade Issues of the Japanese Economy, University of Washington Press,1982; and G. Saxonhouse, "The Micro and Macro-economics of Foreign Salesto Japan," in W.R. Cline ed. Trade Policy in the 1980s, Institute forInternational Economics, MIT Press, 1983, esp. p. 266. See also Table6.2 *n Chauter 6.
11. World Development Report, 1984 (draft) Chapter 2. World Bank, WashingtonD.C. 1984. The effects of Japanese exports in the SITC 7 category(including cars and machinery) on European industries are described by G.Shepherd, "The Japanese Challenge to Western Europe's New Crisis Indus-tries", The World Economy, Vol. 4, No. 4, December 1981, pp. 375-390.
12. Since most exports of the NIC's to the OECD countries compete against theproducts of domestic firms in the traditional sectors, the contraction ofthese sectors will be the key to future market penetration. But, tradi-tional industries can only be allowed to decline if alternative jobopportunities become available in other sectors.
13. The estimate for 1984 is based on (i) amortization payments of $2.8 bil-lion - $3.0 billion, (ii) additions to reserves of $0.7 billion; (iii)borrowing to finance exports equal to $0.5 billion; (iv) current accountdeficit of $1.0 billion; (v) errors and omissions of $0.5 billion; and(vi) reduction in short-term debt of $0.75 billion.
14. Information obtained from discussions with bankers. See also, WashingtonPost, "Japanese Lenders Bank on U.S.," March 2, 1984, p. D.9.
15. A historical analysis of this tendency - with some qualifications - isgiven in C.P. Kindelberger, "The Cyclical Pattern of Long-Term Lending,"in M. Gersovitz et. al. eds. The Theory and Experience of EconomicDevelopment, Allen and Unwin, 1982, pp. 300-308.
16. Net US investment financed through foreign savings may now exceed 40%(1983).
17. The importance of high interest costs has been convincingly argued bySjaastad. See L.A. Sjaastad, "International Debt Quagmire - To Whom DoWe Owe It," World Economy, Vol. 6, No. 3, September 1983, pp. 306-310.
18. The term non-voluntary lending has been coined by the BIS. On the extentof reschedulings see IMF, Occasional Paper No. 23, International CapitalMarkets: Developments and Prospects, Washington, D.C. 1983
- 223 - ANNEX 4Page 3
19. The relations between the Japanese authorities and commercial banks aredescribed by J. Andrew Spindler, The Politics of International Credit,Brookings Institution, 1984, Chs. 5 and 6. For the reaction of Japanesebanks to the recent debt crises and their proposed future lendingstrategy, see "The Singed Samurai," Far Eastern Economic Review, May 3,1984.
20. M. Yoshitomi, "An Analysis of Current Account Surpluses in the JapaneseEconomy," in E.R. Fried and P.H. Trezise ed. op. cit. pp. 12-14. Thehigh savings of Japanese households have sparked much empiricalanalysis. A useful source of information is the Economic Survey of Japan1981-82, Economic Planning Agency, Japanese Gov2rnment, Tokyo 1982, pp.177-193.
21. See R. S. Ozaki, "U.S. - Japanese Economic Relations," Current History,November, 1983, pp. 358-9.
22. Investment in infrastructure has reduced the savings-investment gap andcould lower it still further. See N. Gall, "The Rise and Decline ofIndustrial Japan," Commentary, October 1983, pp. 30-33.
23. Some of the factors explaining the decline in the marginal efficiency ofcapital and labour productivity are reviewed in R.C.O. Matthews,Introduction: A Summary View, in R.C.O. Matthew, ed. Slower Growth inthe Western World, National Institute of Economic and Social Research,London, 1982, pp. 1-15.
24. N. McMullen, op cit, note 6, p. 97.
- 224 - ANNME 4Page 4
Chapter 2
1. An increase in the Japanese savings ratio during 1973-74 eased theadjustment to the oil shock. See Economic Survey of Japan 1981-82, op.cit. Note 22, Chapter 1, p. 177.
2. According to the ratchet theories of consumption behavior, patterns ofspending respond with a lag to changes in income as people tend to main-tain living standards. Hence a fall in incomes is likely to resultinitially in a decrease in savings. For a brief review &-ee S. Yusuf andR. Kyle Peters, "Savings Behavior and Its Implications for DomesticResource Mobilization: The Case of the Republic of Korea," World BankStaff Working Paper No. 628, Washington, D.C. 1984.
3. The current account has contained a large negative errors and omissionscomponent for the past 4 years. It was $1.4 billion in 1982 and $1.0billion in 1983. So far it has been impossible to decompose it intocapital and current balance components. It is possible however, thatmuch of this may belong to the current balance.
4. Determinnts of Inflation.
WPI = -0.465 + 0.281 NP + 0.236 NP(-1) + 0.083 MP(-2) + 0.184 XR+ 0.303 XR(-1) + 0.130 XR(-2)(2.01) (4.55) (3.96) (1.37) (2.36) (3.88) (1.63)
+ 0.146 IG(-1) + 0.099 1C(-2)(2.24) (1.56)
(t-statistics in paentheses)Time period: Ql 1966 - Q3 1983 Adjusted R-squared - 0.492 DN Statistic - 1.911
WPI: inflatin as masured by iiblesale price index; MP grwth In Imqort prir inde;ML chawge in exwange rate; WG: growth In IKinal wage inxex; (-N): n period lag.
5. Determinants of Real Money Demand
MS = 0.041 + J.054 GDP - 0.186 INFL-0.002 UMR. + 0.003 TDR + 0.914 MS (-1)(0.28) (2.86) (2.95) (2.27) (1.20) (54.89)
(t-statistic in parentheses)Time Period: Q1 1966-Q4 1983; Adjusted R-squared 0.997;
Durbin-Watson (D.W.) statistics - 1.561
MS: log of money supply deflated by the WPI; GDP: log of real GDP;INFL: log of annual inflation as measured by the WPI; UMR: interestrate in unofficial money markets; TDR: interest rates on 1 year timedeposit rates; (-1) one period lag.
- 225 - ANNEX 4
Analysis of Real Money Demand
A. Elasticities of money demand:(i) Income elasticity = 0.63
(ii) Inflation elasticity -2.16(iii) UMR elasticity = 0.02(iv) TDR elasticity = 0.04
B. Summary: The demand for real money balances, as indicated by ourresults, is stable. Therefore, an increase in money supply in excessof demand may spill over into prices. The income elasticity of realmoney demand is significantly lower than one. This result isconsistent with scale economies and the availability of alternativefinancial assets in the Korean economy. See Goldfield, S.M., "TheDemand for Money Revisited", Brooking Papers on Economic Activity,No. 3: 1973, p. 583. The inflation elasticity is greater than one,suggesting the economy's susceptability to self-generatinginflationary spirals. The coefficient of adjustment is very low,0.086; this is consistent with the observation that expectationsadjust very slowly. OLS estimation has been used in this "Goldfeld-type" money demand equation. While the rate of inflation, theinterest rate, and real income are not exogenous, "OLS remains auseful way of organizing an overview of the data pertinent to thequestion of whether the public's money demand function is stable."See Robert L. Hetzel, "Estimating Money Demand Functions, "The Journalof Money, Credit, and Banking, Vol. 16, No. 2 (May 1984).
6. A review of the literature on productivity in service industries world-wide, which highlights the problems of measurement was recently conductedby Colin Clark. Although growth rates are now much lower, they onceranged as high as 2-3Z p.a. C. Clark, "Productivity in the ServiceIndustries," in H. Rao and P.C. Joshi eds. Reflections on EconomicDevelopment and Social Change, Allied Publishers, New Delhi, 1979. Dataon the very low trend rates of increase in productivity of the Koreanservice industry can be found in Labor and Export-Led Industrialization:The Case of Korea, World Bank Report No. 4485-KO, Washington, D.C.September 1983, pp. 18-22.
7. Labor and Export-Led Development, op. cit, pp. 23-25.
8. Obtained from Yearbook of Migration Statistics, 1982, National Bureau ofStatistics, EPB. The figures are based on registration data.
9. This phenomenon has been widely noted. See W. H. Banson and J. Myhrman,"Inflation in Open Economies," European Economic Review, Vol. 7, No. 1,1976; A. Lindbeck, Inflation, Leauven University Press, 1980, p..40;T. Nakamura, The Postwar Japanese Economy: Its Development and Structure,University of Tokyo Press 1981, pp. 117-121; and Y. Suzuki, "The InflationDebate in Japan: A Historical Survey," Japanese Economic Studies, Fall1982, p. 21.
- 226 - ANNEX 4Page 6
10. "Five-Year Plan Revised to Spur Progress", Business Korea, February 1984,p. 28.
11. "Economics of Korea's Ambitions Nuclear Program Reassessed," BusinessKorea, April, 1984, p. 19.
- 227- ANNEX 4
Page 7
Chapter 3
1. See T. Mizoguchi, Personal Savings and Consumption in Postwar Japan, Kino-Kuniya Bookstore Co., Tokyo 1970; T. Blumenthal, Saving in Postwar Japan,Harvard East Asian Monographs, Cambridge, Mass, 1970; T. Ishikawa and K.Ueda, "The Bonus Payment System and Japanese Personal Savings," in M.Aoki, The Economic Analysis of the Japanese Firm, North Holland,Amsterdam, 1984; and Yusuf and Peters, op. cit, Note 2, Chapter 2.
2. A. V. Que, "Financial System, "in P. Hasan and D. C. Rao, eds. Korea.Johns Hopkins Press, 1979, pp. 383-4.
3. Individual's willingness to hold money balances during inflationary timessubjects them to an "inflation tax" which approximates the decline in thereal purchasing power of their money holdings. A part of this inflationtax accrues to the government since it is in a position to bid forresources by printing money - at zero cost - and thereby raising prices.There is a large literature on this topic and the measurement of the taxhas been much refined. Two early articles remain the most accessible,however. See M. J. Bailey "The Welfare Cost of Inflationary Finance,"Journal of Political Economy, Vol. 64, 1956, pp. 93-110; and R. A.Mundell, "Growth, Stability and Inflationary Finance," Journal ofPolitical Economy, Vol. 73, April 1965.
4. Several theoretical and empirical studies have discussed the substi-tutability of household savings with those of other sectors. See P.A.David and J. Scadding, "Private Savings: Ultra-nationality, Aggregationand Denisons Law," Journal of Political Economy, Vol. 82, March/April,1974, pp. 225-49.
5. The size of intersectoral resource transfers is an important indicator ofa country's financial superstructure. The larger the sectoral financialsurpluses and deficits, that is, the excess of savings over investment ineach individual sector, the larger the financial superstructure is incomparison to the infrastructure of national product. The absolute sum ofthese surpluses and deficits as a ratio to GNP, the net financial flowratio, can be used as indicator of financial sector maturity. SeeRaymond Goldsmith, The Financial Development of India, Japan, and theUnited States, Yale University Press, 1983, pp. 32-33.
6. A positive relationship between interest rates and savings has beendetected by R. McKinnon, Money and Capital in Economic Development,Brookings Institution, Washington, D.C., 1973; M. Fry, "Money and Capitalor Financial Deepening in Economic Development," Journal of Money, Creditand Banking, Vol. 10, November 1978; C. Wright, "Saving and the Rate ofInterest," in A.C. Harberger and M J. Bailey, The Taxation of Income fromCapital, Brookings Institution Washington, D.C. 1969; and Yusuf andPeters, op. cit. Note 2, Chapter 2. No such effect could be found in arecent cross-section study by Alberto Giovannini, "The Interest Elasticityof Savings in Developing Countries: The Existing Evidence," WorldDevelopment, Vol. 11, No. 7, 1983. E. Sakakibara and R. A. Fielduan also
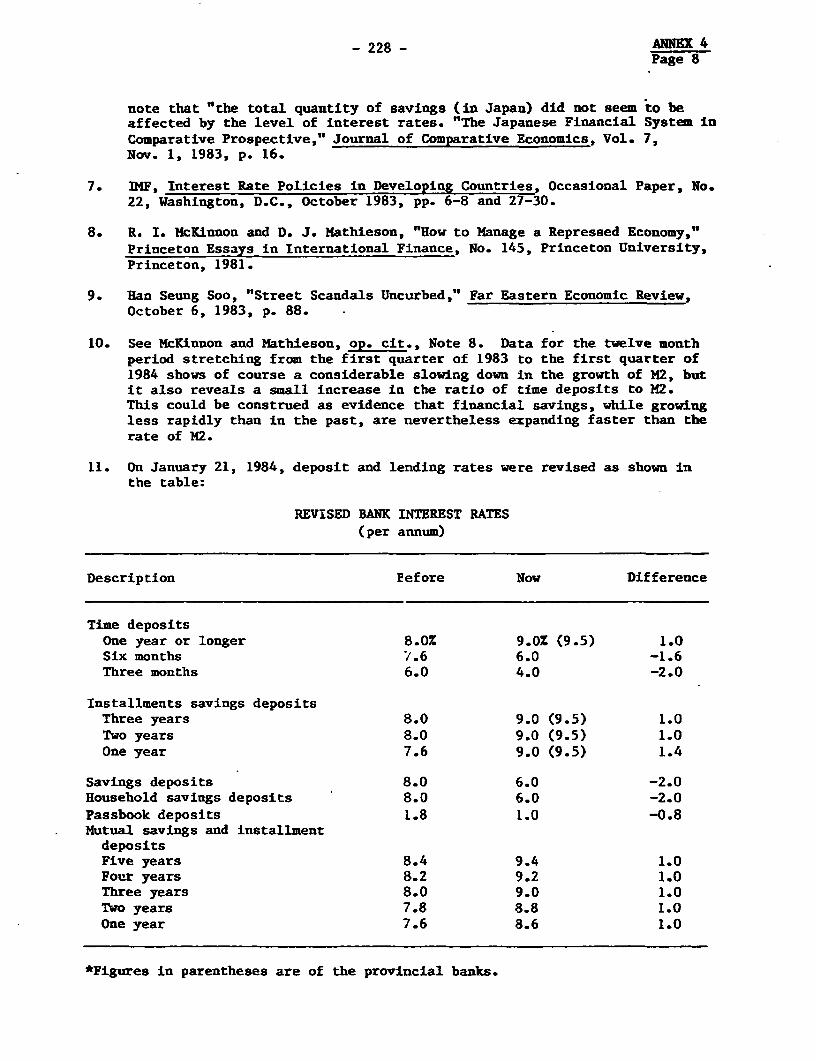
228 ANNEX 4Page 8
note that "the total quantity of savings (in Japan) did not seem to beaffected by the level of interest rates. "The Japanese Financial System inComparative Prospective," Journal of Comparative Economics, Vol. 7,Nov. 1, 1983, p. 16.
7. IMF, Interest Rate Policies in Developing Countries, Occasional Paper, No.22, Washington, D.C., October 1983, pp. 6-8 and 27-30.
8. R. I. McKinnoa and D. J. Mathieson, "How to Manage a Repressed Economy,"Princeton Essays in International Finance, No. 145, Princeton University,Princeton, 1981.
9. Han Seung Soo, "Street Scandals Uncurbed," Far Eastern Economic Review,October 6, 1983, p. 88.
10. See McKinnon and Mathieson, op. cit., Note 8. Data for the twelve monthperiod stretching from the first quarter of 1983 to the first quarter of1984 shows of course a considerable slowing down in the growth of M2, butit also reveals a small increase in the ratio of time deposits to M2.This could be construed as evidence that financial savings, while growingless rapidly than in the past, are nevertheless expanding faster than therate of M2.
11. On January 21, 1984, deposit and lending rates were revised as shown inthe table:
REVISED BANK INTEREST RATES
(per annum)
Description Pefore Now Difference
Time depositsOne year or longer 8.0% 9.0X (9.5) 1.0Six months l.6 6.0 -1.6Three months 6.0 4.0 -2.0
Installments savings depositsThree years 8.0 9.0 (9.5) 1.0Two years 8.0 9.0 (9.5) 1.0One year 7.6 9.0 (9.5) 1.4
Savings deposits 8.0 6.0 -2.0Household savings deposits 8.0 6.0 -2.0
Passbook deposits 1.8 1.0 -0.8Mutual savings and installment
depositsFive years 8.4 9.4 1.0Four years 8.2 9.2 1.0Three years 8.0 9.0 1.0Two years 7.8 8.8 1.0One year 7.6 8.6 1.0
*Figures in parentheses are of the provincial banks.
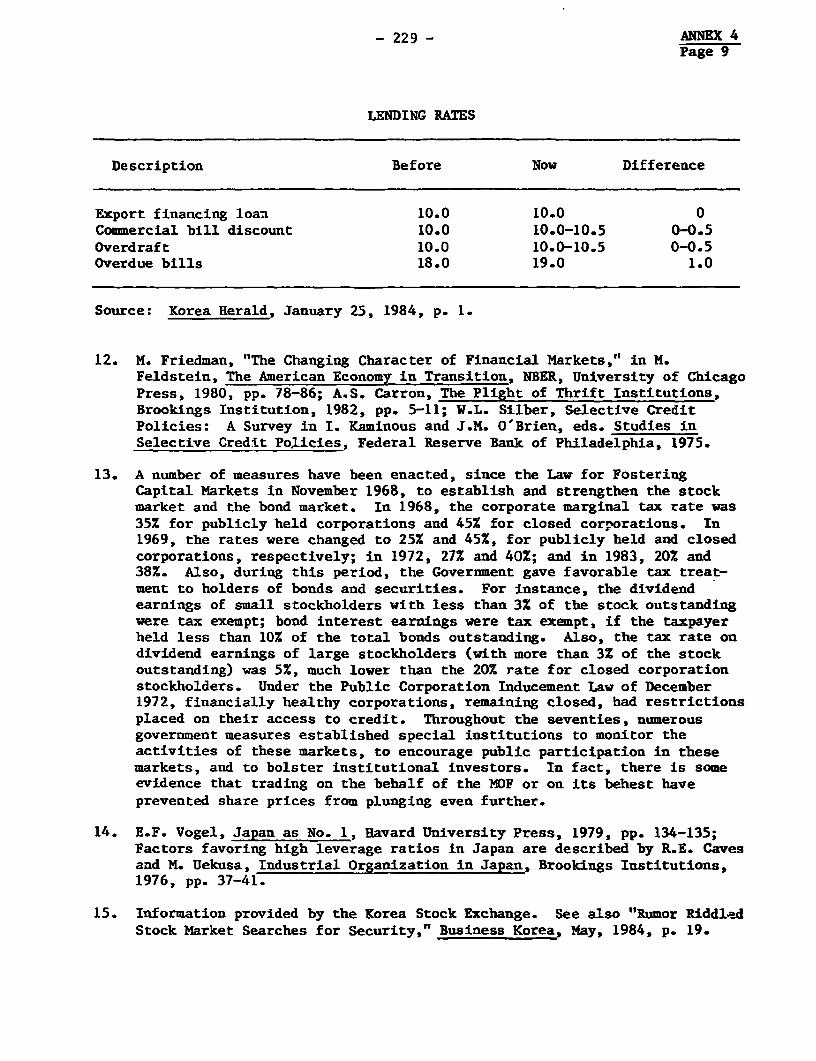
- 229- ANNEX 4Page 9
LENDING RATES
Description Before Now Difference
Export financing loan 10.0 10.0 0Commercial bill discount 10.0 10.0-10.5 0-0.5Overdraft 10.0 10.0-10.5 0-0.5Overdue bills 18.0 19.0 1.0
Source: Korea Herald, January 25, 1984, p. 1.
12. M. Friedman, "The Changing Character of Financial Markets," in M.Feldstein, The American Economy in Transition, NBER, University of ChicagoPress, 1980, pp. 78-86; A.S. Carron, The Plight of Thrift Institutions,Brookings Institution, 1982, pp. 5-11; W.L. Silber, Selective CreditPolicies: A Survey in I. Kaminous and J.M. O'Brien, eds. Studies inSelective Credit Policies, Federal Reserve Bank of Philadelphia, 1975.
13. A number of measures have been enacted, since the Law for FosteringCapital Markets in November 1968, to establish and strengthen the stockmarket and the bond market. In 1968, the corporate marginal tax rate was35% for publicly held corporations and 45% for closed corporations. In1969, the rates were changed to 25% and 45%, for publicly held and closedcorporations, respectively; in 1972, 27% and 40%; and in 1983, 20% and38Z. Also, during this period, the Government gave favorable tax treat-ment to holders of bonds and securities. For instance, the dividendearnings of small stockholders with less than 3% of the stock outstandingwere tax exempt; bond interest earnings were tax exempt, if the taxpayerheld less than 10% of the total bonds outstanding. Also, the tax rate ondividend earnings of large stockholders (with more than 3X of the stockoutstanding) was 5%, much lower than the 20% rate for closed corporationstockholders. Under the Public Corporation Inducement Law of December1972, financially healthy corporations, remaining closed, had restrictionsplaced on their access to credit. Throughout the seventies, numerousgovernment measures established special institutions to monitor theactivities of these markets, to encourage public participation in thesemarkets, and to bolster institutional investors. In fact, there is someevidence that trading on the behalf of the MOF or on its behest haveprevented share prices from plunging even further.
14. E.F. Vogel, Japan as No. 1, Havard University Press, 1979, pp. 134-135;Factors favoring high leverage ratios in Japan are described by R.E. Cavesand M. Uekusa, Industrial Organization in Japan, Brookings Institutions,1976, pp. 37-41.
15. Information provided by the Korea Stock Exchange. See also "Rumor RiddlsdStock Market Searches for Security," Business Korea, May, 1984, p. 19.
ANNEX 4- 230 - Page 10
16. Sakakibara and Feldman, Note 6, op. cit. suggest that the structure offinancial intermediation in Japan may be partly responsible for the highsaving rates.
17. It has been reported that non-performing assets average 147 of commercial
bank portfolios. Korea Herald, 1984.
- 231 - ANNEX 4Page 11
CHAPTER 4
1. On the theory of intra-industry trade see P.Krugman, "Intra-industrySpecialization and the gains from Trade," Journal of Political Economy,Vol. 89, October 1981, pp. 959-973; P. Krugman, "New Theories of TradeAmong Industrial Countries," American Economic Review, Vol. 73, May 1983,pp. 343-347; some empirical information on trading magnitudes is given inJ. H. Bergstrand, "The Scope, Growth and Causes of Intra-industryInternational Trade, Challenge, September 1982, pp. 45-61.
2. The emergence of the East Asian NICs as a force in international trade isdescribed by R. Hofheinz and K. E. Calder, The Eastasia Edge, Basic Books,1982.
3. J. Datta-Mitra, "Structure of Exports and Imports," in P. Hasan and D. C.Rao, eds. Korea, Johns Hopkins Press, Baltimore 1979; D.C. Rao, "ThePattern of Economic Growth 1961-76," in P. Hasan and D.C. Rao, op. cit.;and A. 0. Krueger, The Developmental Role of the Foreign Sector and Aid,Council on East Asian Studies, Harvard University Press, Cambridge, Mass.1979, Chapters 3-5.
4. W. Arthur Lewis, "The Slowing Down of the Engine of Growth," AmericanEconomic Review, Vol. 70, No. 4, September 1980.
5. Although geographical diversification of exports has been given priorityby the NICs, the new markets are far less reliable than those of the OECDcountries. As Diaz-Alejandro shows for Brazil, the loss of exports inrecent years was in the new markets, exports to some of the industrialeconomies actually expanded in nominal terms. C. Diaz-Alejandro, "SomeAspects of 1982-83 Brazilian Payments Crisis," Brookings Papers onEconomic Activity, No. 2, 1983, pp. 521-522.
6. Ingo Walter has noted in a review of the steel industry, that "politicsthreatens to replace economics as the main determinant of the structure ofglobal production in the industry." I. Walter, "Structural Adjustment andTrade Policy in the International Steel Industry," in W.R. Cline, TradePolicy in the 1980s, op cit, Chapter 1, Note 12 p. 513, the politicaleconomy of trade patterns is also discussed by R. Ballance and S.Sinclair, Collapse and Survival: Industry Strategies in a Changing World,Allen and Unwin, 1983 Chapter 8.
7. Much of this can be explained by the speed and extent of the US recoveryvis-a-vis that of other OECD countries.
8. Grossman, op. cit. Chapter 1, Note. 3.
9. L. T. Wells,Jr., "International Trade; The Product Life Cycle Approach,"in L.T. Wells, ed. The Product Life Cycle and International Trade,Graduate School of Business Administration, Harvard University, Boston,pp. 3-33; Trade in standardized, as against differentiated products, isanalyzed by J. Dreze in the context of Belgium, see p. 23 in Wells. Alsosee S. Linder, An Essay on Trade and Transformation, Wiley, New York,1961.
- 232 - ANNEX 4Page 12
10. Nine Korean General Trading Companies, that are modelled after theJapanese SogoShosha, account for 521 of manufactured exports ani haveplayed an important role in the growth of trade. The strengths and weak-nesses of these trading companies, both Japanese and Korean are describedby Y. Tsurumi and R. R. Tsurumi, Sogoshosha, Institute for Research onPublic Policy, Quebec, 1980; A.K. Young, The Sogoshosha: Japan'sMultinational Trading Companies, Western Boulder, 1979; "Growing Role ofGeneral Trading Companies in Korea," Monthly Review, Korea Exchange Bank,September 1983, No. 9; "Merchandise Exports by GTC,"' Business Korea,Vol. 1, No. 6, December 1983, pp. 56-61.
11. R. Ballance and S. Sinclair, op. cit Note 6, pp. 149-150; R. U. Ayres andS.M. Miller, "Robotic Realities: Near Term Prospects and Pr-blems,"Annals, Vol. 470, November 1983, pp. 28-55; J. Lawson, et. al, "Technologyfor the Factory of the Future," Annals, Vol. 470, November 1983, pp. 56-67; M. Eugene Merchant, "Flexible Manufacturing Systems: Robotics andComputer-Used Automation," Annals, Vol. 470, November 1983, pp. 123-135;"U.S. Factories Reach into the Future," New York Times, March 13, 1984, p.C.1.
12. W. Leontief, "Technological Advance Economic Growth and the Distributionof Income," Population and Development Review, Vol. 9, No. 3, September1983.
13. "Government Steps in as Construction Crisis Looms," Business Korea, April1984, pp. 31-32.
14. Korea: Shipping Projects, IFC, mimeo, p. 4.
15. "Tossing on A Sea of Red Ink," Business Korea, September 1983, p. 50.
16. The rationalization of shipping firms, as one step in alleviating pressureon the industry, has been recommended by the Korea Maritime and PortAdministration, see "Rationalization is Under Discussion AmongShipowners," Korean Maritime News, No. 62, November 1, 1983, p. 2.
17. "World Shipping Industry Hit by Worst Slump in 50 Years," The KoreanTimes, December 6, 1983, p. 9.
- 233 - ANNEX 4Page 13
CHAPTER 5
1. I. Yamazawa, "Renewal of the Textile Industry in Developed Countries andWorld Textile Trade," Hitotsubashi Journal of Economics, Vol. 24, No. 1.June 1983, p. 26; Economist (London) February 4, 1984.
2. D. Morawetz, "Why the Emperors New Clothes Are Not Made in Colombia,"World Bank Staff Working Paper, No. 368, Washington, D.C. 1980, pp. 192,205. M. J. Piore and C.F. Sabel, "Italian Small Business Development:Lessons for U.S. Industrial Policy," in J. Zysman and L. Tyson, AmericanIndustry in International Competition, Cornell University Press, 1983, pp.415-416.
3. McMullen, op. cit. The Newly Industrializing Countries, p. 30.
4. S. Nehmer, "Comment on Wolf," in W.R. Cline ed. Trade Policy in the 1980s,op. cit. Chapter 1, Note 12, pp. 570-72.
5. On MFAs, M. Wolf, "Managed Trade in Practice: Implications of the TextileAgreements," in W. R. Cline ed. op. cit. Chapter 1, Note 12, pp. 455-482. In his comment on Wolf's paper Stanley Nehmer remarks even if the1-FAs were somehow terminated "the alternative is not a free market. Thealternative to the MFA is unilateral action by the importing countries."
6. See Yamazawa, op. cit. Note 1, p. 31.
7. McMullen; The Newly Industrializing Countries, op. cit., p. 33.
8. V. Cable and B. Baker, World Textile Trade and Production Trends, SpecialReport No. 152, Economist Intelligence Unit, Ljndon, 1983.
9. Yamazawa, op. cit., Note 1, p. 27; V. Cable and B. Baker, World TextileTrade and Production Trends, Special Report No. 152, Economist Intelli-gence Unit, London, 1983, pp- 29-33; B. Toyne et. al. The Global TextileIndustry, Allen and Unwin, 1984, Ch. 3; F. Clairmonte and J. Cavanagh, TheWorld in their webs; the dynamics of textile multinationals, ZED Press,London, 1981, pp. 223-241.
10. D. B. Yoffie, "Adjustment in the Footwear Industry, The Consequences ofOrderly Marketing Agreements," in J. Zysman and L. Tyson eds. op. cit.,Note 2, p. 325; C. Pratten and R. M. Dean, The Economics Of Large ScaleProduction in British Industry, Cambridge University Press, 1965, pp. 43-44; some of the technological advances that have occurred are described inChu Peng Lim, "Manufacture of Leather Shoes and Bricks in Malaysia," inA.S. Bhalla ed. Technology and Employment in Industry, ILO, 1981, pp. 249-258. It now seems that the cutting and sewing of shoes may gradually becomputerized, see "Can Computerization Save U.S. Shoemakers," TechnologyReview, April 1984, p. 79.
11. "Local Footwear Manufacturers On Warpath," Korea Herald, March 15, 1984,p. 5.
AMNEX 4- 234 - Page 14
12. For instance, the US OMAs of the late seventies excluded rubber footwearand thereby created an important loophole. By adding rubber to the soleor making other minor alterations, Korean exporters were able to reclas-sify non-rubber footwear as rubber and maintain their sales. See D.B.Yoffie, Power and Protectionism, op. cit., Chapter 1, Note 8, p. 196.
13. The increase in footwear imports into the U.S. during 1983 has sparkeddemands for stronger measures to keep out footwear from abroad. A renewalof OMAs or the introduction of more stringent restrictions could result.
14. Walter, op. cit., Chapter 4, Note 5, pp. 509-510; New York Tires,"Critical Shift for Japan's Steel", March 20, 1984, p. D.1.
15. In 1980, the import shares of the LDCs for the industry as a whole were5.7%. See McMullen, op. cit., Chapter 1, Note 6, p. 37; on futureprospects, Ballance and Sinclair make some interesting observations, op.cit., Chapter 4. Note 6, pp. 120-128.
'6. Walter, op. cit., Chapter 4, Note 6, p. 497, and J. Aylen, Prospects forSteel, Lloyds Bank Review, April 1984, No. 152, pp. 13-30.
17. Walter, op. cit., p. 500; D.F. Barnet and Louis Schorsch, Steel: Upheavalin a Basic Industry, Ballinger, 1983, provide a detailed comparison of USand Japanese production costs.
18. M. Borrus, "The Politics of Competitive Erosion in the US Steel Industry,"in J. Zysman and L. Tyson eds. op. cit., Note 2, pp. 64-76; Walter, op.cit., pp. 484-490.
19. Ballance and Sirclair, op. cit., p. 120.
20. Current-Ly the 50 minimills operating in the U.S. account for between 15-18% of the output. J.R. Miller "Steel Minimills," Scientific American,May 1984, No. 5, pp. 33-39.
21. New York Times, "A Restructured Steel Industry," February 2, 1984, p. D.1.
22. New York rimes, "Critical Shift for Japan's Steel," March 20, 1984,p. D.1.
23. New York Times, ibid, Note 21; and Financial World', October 31, 1983, p.12.
24. Even Japan's steelmakers have begun petitioning the government to imposerestraints on steel imports from Korea; New York Times, op. cit., Note 21.
25. "South Korea: Shipbuilding - The Basis for Economic Growth," Lloyd'sShipping Economist, April 1981, p. 11.
26. Quarterly EXIM Bulletin, The Export-Import Bank of Korea, Vol. 7, No. 2,p. 10.
- 25- ANNEX 4Page 15
27. "Japan, No. 1 Shipbuilder, Losing Ground Despite Rise in Orders Earlierthis Year," The Wall Street Journal, Tuesday, November 1, 1983, p. 34.
28. "Korean Shipbuilding Sink or Sail," Business Korea, April, 1984, p. 30.
29. The only measure of productivity is an estimate by the Korea Institute ofIndustrial Economics and Technology (KIIET) which indicates thatproductivity in Korean heavy industry is 40% of that in Japan. See also,"Buzzing with Soaring Orders," Business Korea, June 1',83, p. 28.
30. "Technology Flow from Japan: Breaking the Bottleneck," Business Korea,December 1983, p. 75.
31. An arrangement to set up an "information - exchange system" has been underdiscussions between Hyundai Heavy Industries and Daewoo Shipbuilding andEngineering Corporation." See Buzzing with Soaring," op. cit., p. 27.
32. M. Borrus, J.E. Millstein and J. Zysman, "Trade and Development in theSemi-conductor Industry," in Zysman and Tyson eds. op. cit., Note 2,pp. 188-199; C.H. Ferguson, "The Micro Electronics Industry in Distress,"Technology Review, September 1983, pp. 24-37; "Another Leap into the1980," Far Eastern Economic Review, Industrial Japan, December 5, 1980,pp. 72-74
33. Ballance and Sinclair, op. cit., Chapter 4, Note 6, pp. 131-132.
34. Recent research initiatives, by Korean firms are reviewed in "KoreansEstablish a Toehold in Silicon Valley," Business Korea, March 1984,pp. 10-16. The problems which Korean companies might encounter arediscussed by J.F. Roda, The Impact of Micro-electronics and InformationTechnology, UNESCO, 1982, pp. 40-44, 58-59.
35. D.E. Cole and L.T. Harbeck, "Evolving Automotive Technology, Joint - JapanAutomotive Study," Working Paper Series No. 4, March 1982, University ofMichigan.
36. "Detroit Innovation," New York Times, February 8, 1983, p. Cl; "The AllAmerican Small Car is Fading", Business Week, March 12, 1984, p. 91.
37. Aside from the trade barriers, the costs of producing a new small car fromscratch have began extremely high - as much as $26 billion. See BusinessWeek, op. cit, p. 88; S.W. Sinclair, Motorizing the Third World,Prospects to 1990, Economist Intelligence Unit, Special Report No. 131,1982, London, p. 6.
38. "The New World Carmakers," Far Eastern Economic Review, April 5, 1984,p. 68.
39. "The New World Carmakers," op. cit. p. 72
- 236 -Page 16
40. The total costs of owning a car are a very important determinant ofpurchasing decisions. G. Bittlingmayer, The Market for Automobiles andthe Future of the Auto Industry, Joint US-Japan Automotice Study, WorkingPaper Series 2, Univ. of Michigan, 1983.
41. See Note 37.
42. With GM support, Daewoo will construct a plant that has a capacity of160,000-200,000, about half of which will be sold in the U.S.
43. This does not mean that the trade barriers will come down. Recently theEL/Honda jointly produced Acclaim has encountered difficulties in enteringthe Italian market, as it is being claimed that the car contains asufficiently large number of Japanese parts for it to be subject to thequota regulating the import of Japanese cars. S. Sinclair, op. cit., Note32, p. 8.
ANEX 4- 237 - Page 17
CHAPTER 6
1. On the Korean export strategy see, L.E. Westphal, "Review of E.S. Mason etat., The Economic and Social Modernization of the ROK", EconomicDevelopment and Cultural Change, Vol. 32, No. 1, October 1983, pp. 205-206.
2. Okimoto et. al. conclude that the electronics industry of the future willsee a "proliferating network of cross-licensing arrangements, secondsourcing, joint production technological cooperation, inter firm transfer-ability of certain technologies . . . etc." See D.I. Okimoto, T. Sugano,and F.B. Weinstein, Competitive Edge, Stanford University Press 1983,p. 231.
3. "Striving for TWo-Way Market Expansion, Business Korea, April 1983, pp.53-55; "An Emotional Divide," Far Eastern Economic Review, April 19, 1984,pp. 58-61.
4. On the factors determining share prices, see R.A. Brealey, An Introductionto Risk and Return from Common Stocks, MIT Press, Second ed. 1983, pp. 69-73; and W.E. Fruhan, Jr., "How Fast Should Your Company Grow," harvardBusiness Review, January 1984, No. 1, pp. 184-93.
5. This is what one can infer from the behavior of stock prices in recentyears. See R.A. Brealey, An Introduction to Risk and Return from CommonStocks, 2nd ed. MIT, Press, 1983, Ch 4.
6. The Ministry of Finance, in order to expand the "equity issuing" marketand to grant access to this market for medium-sized companies, has enactedthe following set of policies:
(i) to urge corporations in good standing to go public;
(ii) to ease listing requirements, by lowering the capital require-ment from W 2.5 billion to W 500 million and by lowering therequirement on the amount of total shares outstanding from 40%to 20%;
(iii) to facilitate the ability of unlisted corporation to raisecapital by issuing OTC stocks and convertible bonds;
(iv) to introduce an issues-at-market price policy rather than at parvalue;
(v) to change the dividend-to-capital policy to a dividend-to-netincome policy.
See, "Functional Expansion of the Capital Market," MOF, July 18, 1983.
7. Debt-Equity Ratios: Many observers have noted the apparently highdebt-equity (net-worth) ratios in Korea. It is, of course, well known
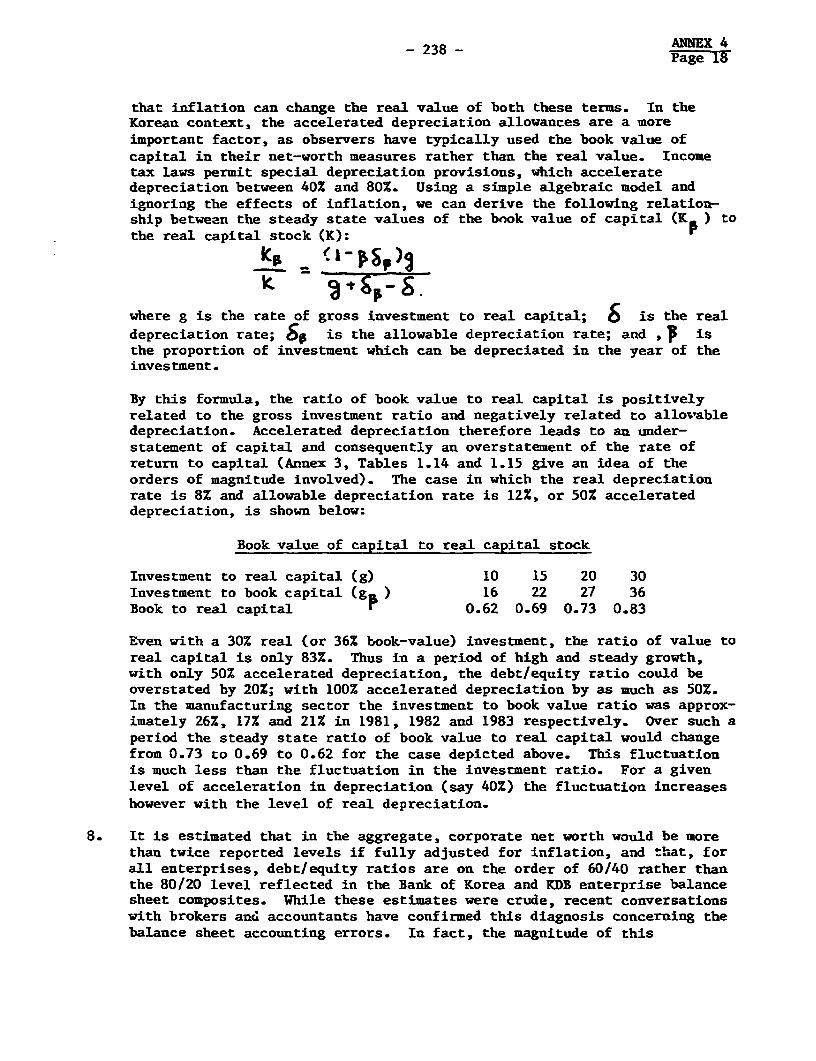
- 238 - ANNEX 4-Page 18
that inflation can change the real value of both these terms. In theKorean context, the accelerated depreciation allowances are a moreimportant factor, as observers have typically used the book value ofcapital in their net-worth measures rather than the real value. Incometax laws permit special depreciation provisions, which acceleratedepreciation between 40% and 80%. Using a simple algebraic model andignoring the effects of inflation, we can derive the following relation-ship between the steady state values of the book value of capital (K ) tothe real capital stock (K):
where g is the rate of gross investment to real capital; 6 is the realdepreciation rate; 4 is the allowable depreciation rate; and , f isthe proportion of investment which can be depreciated in the year of theinvestment.
By this formula, the ratio of book value to real capital is positivelyrelated to the gross investment ratio and negatively related to allo,abledepreciation. Accelerated depreciation therefore leads to an under-statement of capital and consequently an overstatement of the rate ofreturn to capital (Annex 3, Tables 1.14 and 1.15 give an idea of theorders of magnitude involved). The case in which the real depreciationrate is 8% and allowable depreciation rate is 12%, or 50% accelerateddepreciation, is shown below:
Book value of capital to real capital stock
Investment to real capital (g) 10 15 20 30Investment to book capital (ge) 16 22 27 36Book to real capital r 0.62 0.69 0.73 0.83
Even with a 30% real (or 36% book-value) investment, the ratio of value toreal capital is only 83%. Thus in a period of high and steady growth,with only 50% accelerated depreciation, the debt/equity ratio could beoverstated by 20%; with 100% accelerated depreciation by as much as 50%.In the manufacturing sector the investment to book value ratio was approx-imately 26%, 17% and 21% in 1981, 1982 and 1983 respectively. Over such aperiod the steady state ratio of book value to real capital would changefrom 0.73 to 0.69 to 0.62 for the case depicted above. This fluctuationis much less than the fluctuation in the investment ratio. For a givenlevel of acceleration in depreciation (say 40%) the fluctuation increaseshowever with the level of real depreciation.
8. It is estimated that in the aggregate, corporate net worth would be morethan twice reported levels if fully adjusted for inflation, and that, forall enterprises, debt/equity ratios are on the order of 60/40 rather thanthe 80/20 level reflected in the Bank of Korea and KDB enterprise balancesheet composites. While these estimates were crude, recent conversationswith brokers and accountants have confirmed this diagnosis concerning thebalance sheet accounting errors. In fact, the magnitude of this

ANNEX 4
- 239 - Page 19
accounting distortion may be understated; it would not be surprising ifthe true debt to equity ratio was 55/45 or even 50/50. In sum, I do notbelieve that Korean corporations in the aggregate are gravely overin-debted. They are fairly heavily indebted, but, except for a few leveragedconglomerates, the problem is not so serious as to call for strongremedial measures.
Adjusting the income statement for comparable distortions is morecomplex. Partial revaluation of assets raises depreciation charges, butnot as much as they should be raised, thus tending to overstate profits.On the other hand, Korean firms do not add to profits gains received fromthe devaluation of their debt in real terms due to inflation. Thisadjustment is important, since under high inflation, there is a largeinflation premium in the nominal interest rate, which under Koreanaccounting principles, is expensed. In economic terms, this is not a realcost: it is a means whereby creditors are compensated for the devaluationof the real principal of their financial claims due to inflation. Thefirm must pay such high nomirLal interest, but benefits from inflation'sdepreciation of the real value of its debt. To reflect the real impact ofinflation and nominal interest payments on corporate profits one must addthe gain on the devaluation of a firm's debt to the income statement ifone expenses the entire nominal interest payment. To be more precise, thefirm earns nominal interest on its financial assets, which is recorded,and experiences a loss due to inflation on the real value of the principalof these assets. One must make comparable adjustments to the firm'sfinancial assets, or, taken together, to the firm's "net monetaryliabilities."
When inflation and nominal interest rates are high, this accountingdeficiency results in large distortions; real economic profits areseriously undervalued due to high nominal interest charges. In factcompanies which in reality are quite profitable may appear to be runninglosses. Furthermore, under highly inflationary conditions this distor-tion, which tends to depress profits, would be far greater than theoverstatement of profits that results from underdepreciating due to afailure to fully revalue assets. For Korean companies, these severaldistortions could tend to understate profits in periods of high inflation- 20% or more - and overstate profits in periods of low inflation - lessthan 1OZ. Contrary to reported corporate income statistics, profits wereprobably quite substantial in the period 1979-81; on the other hand, theymay have been overs ated in 1982.
In F. Veneroso, Korea Financial Structure, World Bank, mimeo, October1983. Japanese firms also have fairly high debt equity for similarreasons. Aoki lists four: (1) the high proportion of accounts payable;(2) absence of inflation accounting; (3) the practice of compensatingbalances; and (4) the accumulation of nontaxable reserves by firms andtheir inclusion in the long-term debt. M. Aoki, Aspects of the JapaneseFirm in M. Aoki ed. The Economic Analysis of the Japanese Firm, NorthHolland, 1984, pp. 16-21. See also R. Clark, The Japanese Company, YaleUniversity Press, 1979, pp. 77-80. While the above factors would resultin the debt equity ratio being overstated, over the past year some
ANNEX 4- 240 - Page 20
countervailing forces have also been at work that might encourage KoreancouLpanies to exaggerate their equity base: first a lower d/e ratio has apositive effect on share prices; and second, the Government restrictscorporate borrowing from commercial banks unless the companies can satisfycertain debt/equity criteria.
9. The Government's proposal is to liberalize rates once the gap betweencontrolled and market rates is eliminated as market rates decline with thedampening of inflationary expectations and banks are allowed to chargelarger risk differentials on their lending rates. This closure, whilepossible in the longer run, is not imminent as the Government's tightmonetary policy will maintain upward pressure on market rates, possiblyfor the balance of 1984.
10. See Chapter 4, footnote 10.
11. R.E. Caves, et. al. Competition in the Open Economy, Harvard UniversityPress, Cambridge, Massachussetts, 1980, p. 381.
12. The advantages of subcontracting as apparent from the Japanese experienceare spelled out by D. Friedman, Beyond the Age of Ford; The StrategicBasis of the Japanese Success in Automobiles," in J. Zysman and L. Tysoneds. American Industry in International Competition, op. cit., pp. 371-375; R.E. Caves and M. Uekusa, Industrial Organization in Japan, BrookingsInstitution, 1976, pp. 112-114.
13. "Science in Japan," Nature, Vol. 305, September 29, 1983, p. 361.
14. op. cit., p. 356.
15. Competition in the Open Economy, op. cit.. Note 11, p. 172.
16. R.E. Caves, H. Crookel and J. Peter Killing, The Imperfect Market forTechnology Licenses, Oxford Bulletin of Economics and Statistics, Vol. 45,No. 3, Augrst, 1983, pp. 249-267; C.C. Coughlin, The Relationship betweenForeign Ownership and Technology Transfer, Journal of ComparativeEconomics, Vol. 7, No. 4, December, 1983, p. 407.
17. Admittedly this cannot be generalized too far. See, however, P.B. Tigre,Technology and Competition in tha Brazilian Computer Industry, FrancesPinter, 1983, Ch. 11.
18. D.W. Layton, "Japan and the Introduction of Foreign Technology: ABlueprint for Less Developed Countries?", Stanford Journal ofInternational Law, Vol. 18, Spring 1982, pp. 171-214.
19. R. B. Cohen, The Prospects for Trade and Protectionism in the AutoIndustry, in W. R. Cline, ed. Trade Policy in the 1980s, MIT Press, 1983,p. 547.
20. Many final services involve substantial inputs of manufactured goods. SeeJ. Kravis, A.W. Heston and R. Summers, The Share of Services in Economic
ANNEX 4- 241 - -Page 21
Growth, in F. Gerard Adams and B.G. Hickman eds. Global Econometrics, HITPress, 1983, pp. 197-98.
21. See for instance, A.P. Thirlwall, "A Plain Man's Guide to Kaldor's GrowthLaws," Journal of Post-Keynesian Economics, Vol. V, No. 3, Spring 1983,pp. 345-358.
22. The relationship between business fluctuations and in-3estment is discussedby B.G. Malkiel, The Capital Formation Problem in the U.S. Journal ofFinance, Vol. 34, May 1979, No. 2., pp. 296-298.
23. An interesting analysis of this phenomenon is provided by T.J. Courchene,Towards a Protected Society: the Politicisation of Economic Life,Canadian Journal of Economics, Vol. 13, No. 4, November 1980.
24. M. Olson, The Political Economy of Comparative Growth Rates, in D.C.Mueller, The Political Economy of Growth, Yale University Press, 1983, pp.7-52. The relativities appear to have loosened in the past two yearsunder the Government's encouragement. In 1983 for instance, manufacturingwages rose an average of 12.2%, while those in service industriesincreased by about 8%. The trend has been maintained in the base payadjustment negotiated in the first quarter of 1984. Manufacturing wagesincreased 6%, those of service industries by 2.3%
25. L. Johansen, The Bargaining Society and the Inefficiency of Bargaining,Kyklos, Vol. 32, Fasc. 3, 1979, pp. 497-522.
26. The air is thick with explanations and counter explanations about what ishappening to productivity in the West. For a sample of the views, see thepapers by A. Lindbeck, H. Giersch and F. Wolter and E.F. Denison inEconomic Journal, Vol. 93, March 1983, pp. 13-77; "Thurow's Third Way,"'Economist (London), January 23, 1982, pp. 23-26; "Productivity ProblemsTrouble Economy," Science, Vol. 206, October 19, 1979, pp. 310-11;"Productivity Study Implies Dim Future," New York Times, Hay 31, 1983, pp.D1-D4. 0
27. K. Newland, Productivity: The New Economic Context, Worldwatch Paper, No.49, June, 1982, pp. 28-34. The microelectronic revolution is likely tolead to a loss of jobs in wholesaling, retailing and secretarial services.

IBR)D 12351
k USSR N:!. 12r MAY m
f __ DEMOCRATIC PEOPLE'S REPUBLICI
CHINA I . OF KOREA -
N'~~~~~~~~~~~~~~~~~~~~~~~~~~~~~~4
Japan Sea - !!achornnols >,.JL' , pK f East Sea
- REPOF
KOREA JAPAr'. u
S .3 WEONa
E > ;$\:m mq t r- >|\venns S .12 ~~~onqmInqf Pa C, f.
East Oc .CA.na Sea
37-
SeRI'Y/~~~~~~~~~~~~~~<sS>t ~ ~ ~ ~ ,n., road,,,,sJ X ,
N ~~~~~~~~~~G YB U N
| Yellow SeaoPohor
'%\zy>t;tiwAN~~~ A M-5 - Pro,,ncgal bounormo3
: - - REPUBLIC OF KOREA, - . PllnBcty roards
O Ro0 0 0Ra s ,,de co1stmc0o. IF
3^ _ v~~~~~~~~~~~~~~~~~~~~~~~~~~~~ A.,ports
Pro..ncgrJl bou.dorles_ |- _ _ _ Ini~~ernot,na I boundcores
(ILO'tt#S
75' I2i- 127- ?' I>Qaoi-
0 2 0 40 .0 ,O ,0