Kinematic significance of morphological structures generated by mixing of magmas: a case study from...
16
Kinematic significance of morphological structures generated by mixing of magmas: a case study from Salina Island (southern Italy) D. Perugini a, * , G. Ventura b , M. Petrelli a , G. Poli a a Department of Earth Sciences, University of Perugia, Piazza Universita `, I-06100 Perugia, Italy b Osservatorio Vesuviano, Istituto Nazionale di Geofisica e Vulcanologia (INGV), Via Diocleziano, 328, I-80124 Napoli, Italy Received 7 November 2003; received in revised form 26 February 2004; accepted 24 March 2004 Abstract Morphological features of mixing/mingling structures of heterogeneous juveniles from the 13-ka-old Upper Pollara eruption (Salina Island, southern Italy) are studied. These heterogeneous rocks result from the mixing between an andesitic and a rhyolitic magma. Concentration patterns generated by magma mixing are analyzed on digital images and results have been compared with those obtained from numerical simulations of mixing processes coupling chaotic advection and chemical diffusion. Results show that the Upper Pollara rocks were produced by mixing 24 – 49% of andesite and 76 – 51% of rhyolite. Multifractal analysis of the mixing structures is performed and the mixing intensity, i.e. the degree of interaction between the two end-member magmas, has been deduced from the analysis of the singularity spectrum. Results show that narrower is the multifractal spectrum, the higher is the degree of homogenization of magmas. Reynolds number (Re) during mixing has been estimated from the geometrical analysis of mixing structures by using experimentally defined relationships between shape parameters and Re. Results show that Re is between ca. 500 and 7000. There is a positive correlation between the estimated initial percentage of mafic magma in the different analyzed samples and Re, in agreement with the observation that the higher is the percentage of the mafic, lower viscosity magma, the higher is the turbulence of the mixing system. In addition, our analysis reveals an unexpected inverse relationship between the calculated Re and the degree of magma homogeneity suggesting that energy dissipation may have had a major role in the controlling mixing process because dissipation is inversely proportional to the mixing efficiency. Results suggest that mixing processes between the andesitic and rhyolitic magmas mainly developed in the conduit. It is also suggested that mixing occurred in a shear layer-type or pipe-type flow. D 2004 Elsevier B.V. All rights reserved. Keywords: magma mixing; morphological structures; concentration patterns; image analysis; multifractals; fluid dynamic regime 1. Introduction Textural heterogeneity due to magma mixing/ mingling is a common feature of volcanic rocks (e.g. Refs. [1–5]), and the processes responsible for them have been discussed extensively [5–10]. This heterogeneity includes enclaves, banding, and ‘streaky’ structures [4,11–13]. Although studies on the mineralogical and geochemical features of mixed rocks are abundant (e.g. Refs. [12,14 – 17]), only few studies focus on quantitative analyses of morpholo- gies related to textural heterogeneity [18–24]. These 0012-821X/$ - see front matter D 2004 Elsevier B.V. All rights reserved. doi:10.1016/j.epsl.2004.03.038 * Corresponding author. Tel.: +39-75-585-2652; fax: +39-75- 585-2603. E-mail address: [email protected] (D. Perugini). www.elsevier.com/locate/epsl Earth and Planetary Science Letters 222 (2004) 1051 – 1066
Transcript of Kinematic significance of morphological structures generated by mixing of magmas: a case study from...
www.elsevier.com/locate/epsl
ters 222 (2004) 1051–1066
Earth and Planetary Science LetKinematic significance of morphological structures generated by
mixing of magmas: a case study from Salina Island (southern Italy)
D. Peruginia,*, G. Venturab, M. Petrellia, G. Polia
aDepartment of Earth Sciences, University of Perugia, Piazza Universita, I-06100 Perugia, ItalybOsservatorio Vesuviano, Istituto Nazionale di Geofisica e Vulcanologia (INGV), Via Diocleziano, 328, I-80124 Napoli, Italy
Received 7 November 2003; received in revised form 26 February 2004; accepted 24 March 2004
Abstract
Morphological features of mixing/mingling structures of heterogeneous juveniles from the 13-ka-old Upper Pollara eruption
(Salina Island, southern Italy) are studied. These heterogeneous rocks result from the mixing between an andesitic and a
rhyolitic magma. Concentration patterns generated by magma mixing are analyzed on digital images and results have been
compared with those obtained from numerical simulations of mixing processes coupling chaotic advection and chemical
diffusion. Results show that the Upper Pollara rocks were produced by mixing 24–49% of andesite and 76–51% of rhyolite.
Multifractal analysis of the mixing structures is performed and the mixing intensity, i.e. the degree of interaction between the
two end-member magmas, has been deduced from the analysis of the singularity spectrum. Results show that narrower is the
multifractal spectrum, the higher is the degree of homogenization of magmas. Reynolds number (Re) during mixing has been
estimated from the geometrical analysis of mixing structures by using experimentally defined relationships between shape
parameters and Re. Results show that Re is between ca. 500 and 7000. There is a positive correlation between the estimated
initial percentage of mafic magma in the different analyzed samples and Re, in agreement with the observation that the higher is
the percentage of the mafic, lower viscosity magma, the higher is the turbulence of the mixing system. In addition, our analysis
reveals an unexpected inverse relationship between the calculated Re and the degree of magma homogeneity suggesting that
energy dissipation may have had a major role in the controlling mixing process because dissipation is inversely proportional to
the mixing efficiency. Results suggest that mixing processes between the andesitic and rhyolitic magmas mainly developed in
the conduit. It is also suggested that mixing occurred in a shear layer-type or pipe-type flow.
D 2004 Elsevier B.V. All rights reserved.
Keywords: magma mixing; morphological structures; concentration patterns; image analysis; multifractals; fluid dynamic regime
1. Introduction
Textural heterogeneity due to magma mixing/
mingling is a common feature of volcanic rocks
0012-821X/$ - see front matter D 2004 Elsevier B.V. All rights reserved.
doi:10.1016/j.epsl.2004.03.038
* Corresponding author. Tel.: +39-75-585-2652; fax: +39-75-
585-2603.
E-mail address: [email protected] (D. Perugini).
(e.g. Refs. [1–5]), and the processes responsible
for them have been discussed extensively [5–10].
This heterogeneity includes enclaves, banding, and
‘streaky’ structures [4,11–13]. Although studies on
the mineralogical and geochemical features of mixed
rocks are abundant (e.g. Refs. [12,14–17]), only few
studies focus on quantitative analyses of morpholo-
gies related to textural heterogeneity [18–24]. These

D. Perugini et al. / Earth and Planetary Science Letters 222 (2004) 1051–10661052
studies mainly focus on (1) the deformation of the
interface between the two interacting magmas in
laminar flows (e.g. Refs. [20,21]) and turbulent flows
[18]; (2) the effects of the vesiculation on the
deformation of enclaves [23]; and (3) the relation-
ships between the morphology of the mingling/mix-
ing structures and the degree of magma interaction
[22,24].
Studies on the fluid-dynamics of interacting
liquids (e.g. Refs. [25–30]), as well as analogue
models on magma mixing (e.g. Refs. [31–33]), have
shown that different morphological structures (e.g.
folds, blobs, filaments, vortexes) give useful infor-
mation about the flow regime and the dynamics of
mixing.
In this study, we analyze mixing morphological
structures of heterogeneous juvenile fragments from a
13-ka-old flow deposit of the Upper Pollara eruption
(Salina Island, southern Italy). In a first step, we
show that different colours of the glass correspond to
different magma compositions. In a second step, we
perform image and multifractal analysis of the mix-
ing structures in order to determine (a) the initial
percentages of the end-member magmas, (b) the
mixing intensity and (c) the flow regime acting
during the mixing process. In a third step, we discuss
the relationships between (a), (b) and (c), and pro-
pose a kinematic model for magma interaction. We
show that the analytical approach proposed here can
be used to extract petrological and physical informa-
tion from the analysis of the concentration patterns of
mixed rocks.
2. Geological setting and the Upper Pollara
eruption
The Pollara depression is located in the north-
western sector of Salina Island (Aeolian Archipela-
go, Southern Tyrrhenian Sea), which consists of five
main volcanoes (Corvo, Rivi-Capo, Fossa delle
Felci, Porri and Pollara) formed between 170 and
13 ka (Fig. 1A; Ref. [34]). Volcanism within the
Pollara depression started with the emission of the
Punta Perciato lava flow (30 ka [35]) and ended
with two explosive eruptions known as Lower
Pollara (24 ka [12]) and Upper Pollara (13 ka
[36]). The Lower Pollara deposits consist of three
main fall units. Magma compositions are andesitic
(lowermost fall unit), andesitic and dacitic (interme-
diate unit) and rhyolitic (uppermost unit). Such
variability has been interpreted as the result of the
syn-eruptive turbulent mixing between an aphyric
rhyolitic magma and an andesitic, partly crystal-
lized, magma [12].
The Upper Pollara deposits (Fig. 1C) consist of a
70-m-thick sequence of fall beds (lithofacies A1 in
Fig. 1C) followed by a rhythmic alternation of
massive (lithofacies B) to crudely stratified (lithofa-
cies A) coarse ash and lapilli layers. In the upper part
of the sequence, thick, inversely graded beds of
medium-coarse ash and lapilli (lithofacies C) occur
[37,38]. The sequence ends with a massive bed of
fine to medium ash (lithofacies D). According to Ref.
[39], the Upper Pollara sequence mainly resulted
from the emplacement of highly concentrated pyro-
clastic flows.
3. The Upper Pollara juvenile component:
evidence of magma mixing processes
On the basis of petrographic investigations on the
coarse (2 mm) to medium (1/16 mm) ash fraction of
the deposits, the juvenile glass population consists of
four main classes [38] (Fig. 1C): (i) dark glass, (ii)
colorless glass, (iii) heterogeneous glass and (iv)
gray glass with microlites. Both (i) and (iv) glasses
are less than 20 vol.% in the sequence. Glass (ii)
decreases with increasing stratigraphic height, where-
as glass (iii) increases. Detailed observations (Fig.
2A–C) show that glass (iii) consists of micrometer-
to centimeter-sized filament-like structures, plane-
parallel and poorly folded bands to vortex- and
strongly folded-like structures. In detail, inside the
same mixing system, it is possible to observe the
contemporaneous occurrence of (i) filament-like
regions in which magmas are in contact along wide
interfaces and (ii) coherent regions, showing a glob-
ular shape, and occurring between filament-like
regions (Fig. 2A–C). It is noteworthy that the
occurrence of such structures has been widely docu-
mented in mixed volcanic rocks and it is interpreted
as the result of chaotic dynamics of the magma
mixing process [22,24]. As shown by Ref. [34],
glass compositions range from high-potassium

Fig. 1. (A) Structural scheme of the Aeolian Islands. (B) Simplified geological map of Salina Island (from Ref. [37]) with the distribution of the
Pollara pyroclastics. (C) Stratigraphic column of the Upper Pollara deposits (from Ref. [38]). The vol.% variation of the different types of
juvenile fragments with stratigraphy is also reported (data from Ref. [38]).
D. Perugini et al. / Earth and Planetary Science Letters 222 (2004) 1051–1066 1053

Fig. 2. (A–C) Pictures of representative magma mixing structures occurring in the Upper Pollara sequence; (D) SiO2 vs. grey level plot for the
Upper Pollara juveniles (data from Ref. [22]). The best fit line among the data and the 0.95 confidence is also reported.
D. Perugini et al. / Earth and Planetary Science Letters 222 (2004) 1051–10661054
(HK) andesites (SiO2f 63%) to high-silica rhyolites
(SiO2f 76 wt.%). According to Refs. [22,39], the
geochemical data indicate, together with the macro-
scopic and petrographic features of the juvenile
component, that the Upper Pollara magmas are the
product of the mixing of a HK andesitic magma with
a high-silica rhyolite before the magma fragmenta-
tion in the conduit. The whole eruptive sequence has
been interpreted as the result of the emptying of a
normally zoned magmatic reservoir.
4. Analysis of the concentration patterns of
heterogeneous juveniles
Digital images of heterogeneous juveniles show
that the dispersion of the mafic magma into the felsic
one generated complex morphological structures
whose gray value is highly variable (Fig. 2A–C).
[22] selected poorly vesiculated (vesicles < 5 vol.%)
and subaphyric (crystalsV 5 vol.%) heterogeneous
juvenile clasts from the Upper Pollara sequence in

D. Perugini et al. / Earth and Planetary Science Letters 222 (2004) 1051–1066 1055
order to calibrate the gray value of digital images with
the glass composition. Glass composition has been
determined by electron microprobe on homogeneous
glass portions with variable gray intensity. Details
about the analytical methods can be found in Ref.
[22]. Results of the coupled image/chemical analysis
of the selected Upper Pollara clasts are reported in
Fig. 2D, where a positive correlation between gray
values and chemical composition (SiO2 wt.%) of
glasses is observed. The best fitting curve is the
polynomial curve reported in the graph [22]. This
result indicates that differences in the gray value of
images reflect different chemical compositions. It
should be noted that the gray value equal to 20
(SiO2f 63 wt.%) corresponds to the most mafic
magma and that gray values below 20 are associated
to the few vesicles occurring in the samples. Since the
focus here is on the analysis of concentration patterns
of samples, gray values below 20 will be not consid-
ered. Gray values above 250 (SiO2f 76 wt.%) are
not detected in the analyzed samples meaning that this
gray value corresponds to the most felsic magma.
Hereafter, results based on analysis of digital images
of samples will be presented considering the SiO2
Fig. 3. Frequency histograms of concentration for the three representative m
level (GL) and corresponding SiO2 values are reported. Light gray areas o
vesicles (GL < 20) and not detected (GL>250) in the mixing structures, re
composition of glasses calculated by using the equa-
tion reported in Fig. 2D.
5. Determination of initial percentages of magmas
We selected 10 heterogeneous clasts from the Upper
Pollara sequence. These samples have been collected
within two inversely graded beds (lithofacies B) at 25–
30 m from the base of the stratigraphic column, where
the heterogeneous clasts represent over 70 vol.% of the
total juvenile component. All samples have vesicles
< 5 vol.% and a crystal content V 5 vol.%. Polished
thick slices from these samples have been acquired in
gray scale by means of a high-resolution optical
scanner with resolution 1 pixel = 0.075 mm (1 mm=
13.35 pixels) and gray values have been extracted from
digital images using the National Institute of Health
(NIH) image analysis software.
Fig. 3 reports frequency histograms for SiO2 calcu-
lated from digital images of some representative sam-
ples (Fig. 2A–C). Histograms are bell-shaped and
encompass all compositions between SiO2 = 63%
(mafic magma) and SiO2 = 76% (felsic magma) with
agma mixing structures shown in Fig. 2. Along the x-axis both gray
n the left and right side of the graph represent gray levels related to
spectively.

D. Perugini et al. / Earth and Planetary Science Letters 222 (2004) 1051–10661056
intermediate compositions having the highest frequen-
cy. The histograms for the different images are different
because the maximum frequency of composition for
each image is placed at different SiO2 values (Fig. 3).
The presence of all the intermediate compositions
between the mafic and felsic end-member, as also
shown by the continuous variation of SiO2 vs. grey
level in Fig. 2D, indicates the occurrence of chemical
diffusion processes. In fact, if diffusion processes
between the end-member magmas were not operating,
only two popula t ions of composi t ion, one
corresponding to the mafic (SiO2 = 63%) and the other
to the felsic (SiO2 = 76%) magma, should be observed
in the histograms and in Fig. 2D.
As introduce above, the morphological structures
of the Upper Pollara juvenile fragments are similar to
those generated by numerical and analogue models
of chaotic mixing of fluids (Ref. [30] and references
therein). Chaotic mixing results from the dispersion
of one fluid in the other fluid by stretching and
folding processes coupled with chemical diffusion.
The process of stretching and folding can occur in
both laminar and turbulent flow regimes and has
been observed in a large variety of flow types (pipe-
flows, shear flows, convective flows). In other
words, chaotic mixing describes a set of processes
(stretching–folding–fragmentation–diffusion) that
occur in a variety of flow regimes and flow types
[30,40]. It is to note that numerical models of chaotic
mixing have been successfully applied to reproduce
morphological structures generated by mixing of
magmas [24,41]. Taking into account that the mor-
phological structures of the Upper Pollara pumices
are analogous to those produced by chaotic advec-
tion [30], a numerical model of chaotic mixing
involving both advection (i.e. stretching and folding)
and chemical diffusion is here used.
The system we consider for advection is the ‘‘sine
flow’’ map (hereafter map [42–44]). The flow is
defined by two motions:
xnþ1 ¼ xn þk
2� sinð2p � ynÞ ½mod1�
ynþ1 ¼ yn þk
2� sinð2p � xnþ1Þ ½mod1� ð1Þ
It forms a two-dimensional system where the
[mod1] statement means that the domain of the system
is periodic between zero and one [i.e. 0V (x, y)V 1].
(xn, yn) and (xn + 1, yn + 1) are the coordinate of each
fluid particle at the dimensionless time t = n and
t = n + 1, respectively, and k is the parameter of the
map. The flow is defined on the 2D torus meaning
that whenever a particle exits the unit square, it re-
enters the box through the opposite side. As pointed
out by several authors (e.g. Refs. [24,42,43,45]), this
flow scheme is useful for simulating advection during
chaotic fluid mixing and, in particular, during mixing
of magmas because a variety of flow behaviors can be
obtained by varying parameter k. As indicated by
several authors (e.g. Refs. [24,42,43]) mixing induced
by this map generates, within the same system,
filament-like regions and coherent regions analogous
to those observed in the Upper Pollara structures (Fig.
2A–C). The parameter k regulates the relative pro-
portions of filament-like regions and coherent regions
in the mixing system. In particular, increasing k values
correspond to increasing amount of filament-like
regions and, hence, to increasing efficiency of stretch-
ing and folding processes (e.g. Refs. [24,42,43]).
Details on the applicability of this system to magma
mixing processes, as well as on the detailed meaning
of parameter k can be found in Refs. [24,45] and here
are not repeated. Note that changing velocity profile,
i.e. using another map consisting of stretching and
folding processes, does not influence the structure of
the results.
Diffusion is simulated by defining a continuous
concentration field c(x,y) on the plane, and spatially
discretizing it to a regular grid cij = c(xi, yj) (e.g.
Refs. [24,26,45]). For the initial configuration, we
consider the mafic magma as represented by dark
colored blobs with composition, in gray value, equal
to 20 (i.e. the gray intensity of the Upper Pollara
mafic magma) dispersed within a light colored felsic
magma with a composition equal to 250 (i.e. the
gray intensity of the felsic magma) (Fig. 4A). The
‘‘sine flow’’ map was first used to rearrange c(x,y)
through mapping (x,y) and re-interpolating to the
grid. This iteration was followed by the diffusion
step:
cij ¼ ð1� AÞ � cij þ1
4� A � ½cðiþ1Þj þ ciðjþ1Þ
þ cði�1Þj þ ciðj�1Þ� ð2Þ
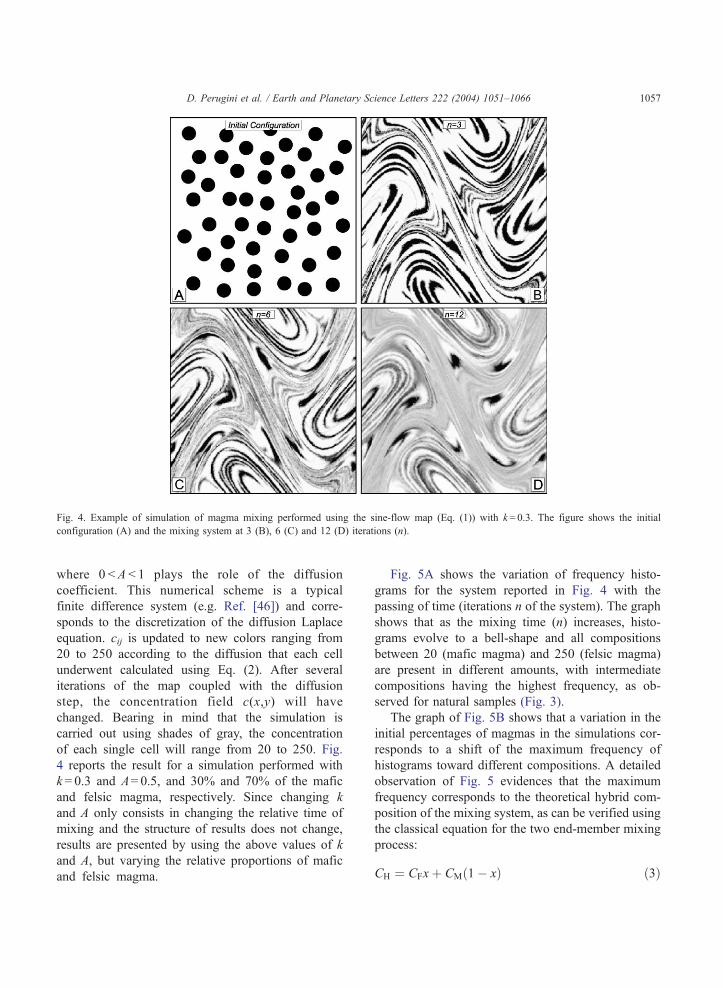
Fig. 4. Example of simulation of magma mixing performed using the sine-flow map (Eq. (1)) with k= 0.3. The figure shows the initial
configuration (A) and the mixing system at 3 (B), 6 (C) and 12 (D) iterations (n).
D. Perugini et al. / Earth and Planetary Science Letters 222 (2004) 1051–1066 1057
where 0 < A < 1 plays the role of the diffusion
coefficient. This numerical scheme is a typical
finite difference system (e.g. Ref. [46]) and corre-
sponds to the discretization of the diffusion Laplace
equation. cij is updated to new colors ranging from
20 to 250 according to the diffusion that each cell
underwent calculated using Eq. (2). After several
iterations of the map coupled with the diffusion
step, the concentration field c(x,y) will have
changed. Bearing in mind that the simulation is
carried out using shades of gray, the concentration
of each single cell will range from 20 to 250. Fig.
4 reports the result for a simulation performed with
k = 0.3 and A= 0.5, and 30% and 70% of the mafic
and felsic magma, respectively. Since changing k
and A only consists in changing the relative time of
mixing and the structure of results does not change,
results are presented by using the above values of k
and A, but varying the relative proportions of mafic
and felsic magma.
Fig. 5A shows the variation of frequency histo-
grams for the system reported in Fig. 4 with the
passing of time (iterations n of the system). The graph
shows that as the mixing time (n) increases, histo-
grams evolve to a bell-shape and all compositions
between 20 (mafic magma) and 250 (felsic magma)
are present in different amounts, with intermediate
compositions having the highest frequency, as ob-
served for natural samples (Fig. 3).
The graph of Fig. 5B shows that a variation in the
initial percentages of magmas in the simulations cor-
responds to a shift of the maximum frequency of
histograms toward different compositions. A detailed
observation of Fig. 5 evidences that the maximum
frequency corresponds to the theoretical hybrid com-
position of the mixing system, as can be verified using
the classical equation for the two end-member mixing
process:
CH ¼ CFxþ CMð1� xÞ ð3Þ

Fig. 5. Frequency histograms of concentration (in gray levels) of the mixing systems resulting from the numerical simulation of magma
mixing (Eq. (1)) with k = 0.3. (A) Mafic magma= 30%, felsic magma = 70%, at different iterations (n) of the mixing process; (B)
frequency histograms for mixing systems with different initial amounts of mafic and felsic magma at the same number of iterations
(n= 12).
D. Perugini et al. / Earth and Planetary Science Letters 222 (2004) 1051–10661058
where CH, CF and CM are the composition of
the hybrid, felsic and mafic magma, respectively,
and x is the proportion of felsic magma in the
mixture. For instance, the theoretical hybrid for a
system constituted by 70% of felsic magma is ca.
181 [i.e. CH = 2500.70 + 20 (1� 0.70)], which
exactly corresponds to the maximum value of the
histogram in Fig. 5A. Therefore, the maximum
frequency of compositional histograms corresponds
to the theoretical hybrid composition of the mixing
system.
These results can be utilized to estimate the
initial percentages of end-member magmas occur-
ring in the analyzed natural samples. Indeed, know-

Table 1
Parameters estimated and calculated from the analyzed digital
images of magma mixing
Sample % of
acid
magma
% of
mafic
magma
Intensity
of mixing
(Da)
Log
(Re)
Re
Poll-1 55 45 0.258 3.66 4600
Poll-2b 76 24 0.119 2.74 550
Poll-3 68 32 0.177 3.19 1550
Poll-2-4a-bis 57 43 0.221 3.56 3650
Poll-2-4a 54 46 0.158 3.65 4500
Poll-2-6a 58 42 0.104 3.20 1600
Poll-2-2d 57 43 0.240 3.86 7200
Poll-2-6a-bis 48 52 0.242 3.80 6300
Poll-2-6a-ter 51 49 0.205 3.65 4500
Poll-2-2b-2 64 36 0.064 2.81 650
D. Perugini et al. / Earth and Planetary Science Letters 222 (2004) 1051–1066 1059
ing the composition of the hybrid magma, i.e. the
maximum frequency of the histograms (e.g. Fig. 3),
and the compositions of the end-member mafic and
felsic magmas (SiO2 = 63 and 76 wt.%, respective-
ly), the percentages of magmas can be calculated
using Eq. (3). As an example, the sample Poll-2b
has a maximum frequency at SiO2 = 72.63 wt.%
(Fig. 3) and, therefore, the calculated initial percent-
age of the felsic magma is about 76% and, conse-
quently, that of the mafic magma is 24% (Table 1).
We calculated the initial percentages of end-member
magmas for all the analyzed samples. Results are
reported in Table 1 and indicate that the heteroge-
neous Upper Pollara samples resulted from the
mixing of different amounts of the mafic and felsic
magma in proportions of 24–49% and 76–51%,
respectively.
6. Multifractal analysis and determination of
mixing intensity
Several studies (e.g. Refs. [47,48]) have shown
that morphological structures generated by mixing
of fluids are multifractals. This means that they are
described by a spectrum of fractal dimensions
(singularities) at the different scales (e.g. Ref.
[49]). The singularity spectrum formalism is defined
by two indices: the singularity strength a and the
singularity spectrum f(a). These parameters can be
estimated from digital images using the Box Count-
ing Method (BCM). The method consists in cover-
ing the image with boxes of size l and defining
Pi(l ) as
PiðlÞ ¼Gi
Gtot
ð4Þ
where Gi the sum of gray values of pixels within
the cell i and Gtot is the total sum of gray values
of the whole image (Fig. 6). Pi is calculated for
the different scales using different values of l. A
family of normalized measures, l(q,l ) can be
obtained as
lðq; lÞ ¼ ½piðlÞ�q
XNl
j¼1
½piðlÞ�qð5Þ
where Nl is the total number of cells for each box
size (l) utilized in the BCM and q is a parameter
that varies from �l to +l (Fig. 6). The f(a) anda are calculated by linear regression analysis using
the following relations:
f ðaÞ ¼ liml!o
XNi¼1
lðq; lÞlog½lðq; lÞ�
logðlÞ ð6Þ
a ¼ liml!o
XNi¼1
lðq; lÞlog½pðq; lÞ�
logðlÞ ð7Þ
In practice, f(a) and a are estimated for each value of q
calculating the slope of the straight line by linear
regression analysis in aPN
i¼1 lðq; 1Þlog½lðq; 1Þ� vs.
log(l) and aPN
i¼1 lðq; 1Þlog½ pðq; 1Þ� vs. log(l) graph,respectively.
As reported by Ref. [50], the multifractals tech-
nique is suitable to determine the degree of homoge-
neity of samples and, therefore, in our case, is suitable
to estimate the degree of mixing of studied natural
samples.
The technique has been first applied on the
images obtained by the simulation of magma mixing

Fig. 6. Schematic representation of the BCM used to calculate the multifractal spectra of mixing structures: (A) the image is covered with a grid
having different cell size (l1, l2, l3, etc.); for simplicity, the procedure is shown only on one quadrant; (B) enlargement of the portion of image in
(A) evidenced by the bold square; (C) enlargement of the portion of image in (B) evidenced by the bold square. For each pixel, the gray level gj,
rescaled to the silica content (Fig. 2D), is detected; (D) equations used to estimate Gi and Gtot: Gi is the sum of all concentration values gj present
within each box (e.g. C) and Gtot is the sum of all concentration values gi present within the entire image. N = number of pixels in the entire
image. M = number of pixels in each box.
D. Perugini et al. / Earth and Planetary Science Letters 222 (2004) 1051–10661060
(Fig. 4). Results show that as the mixing time (n)
increases, the width of the f(a) spectrum decreases
(Fig. 7A). The narrower is the f(a) curve width (i.e.
smaller Da), the higher the degree of mixing (ho-
mogeneity). Note that, in the limit case of perfect
mixing (i.e. complete chemical homogenization), the
f(a) spectrum collapses to a single point [50]. Then,
the width of the multifractal spectrum, calculated as
the difference between the maximum (amax) and
minimum (amin) value of a (Da = amax� amin), can
be utilized to estimate the mixing intensity for the
natural samples.
Representative multifractal spectra measured for
natural structures whose gray intensity has been
converted to the silica content (Fig. 2D) are reported
in Fig. 7B. The graph shows that the analyzed
samples display f(a) spectra with different width
(Da). Da values have been calculated for the natural
samples and the results are reported in Table 1. The
analyzed samples show Da values between 0.064
and 0.258 indicating that they experienced different
mixing intensities.
7. Estimate of Reynolds number
Ref. [27] demonstrates, using experiments of
turbulent jet mixing between water and water dyed
with disodium fluoscein (viscosity ratio f 1.0), that
there is a strict relationship between concentration
patterns of mixing structures and associated Rey-
nolds numbers (Re). In particular, there is a linear

Fig. 7. (A) Multifractal spectra for the systems resulting from the numerical simulation of magma mixing (Fig. 4) at different iterations (n); (B)
representative multifractal spectra calculated for the natural structures of Fig. 2A–C.
D. Perugini et al. / Earth and Planetary Science Letters 222 (2004) 1051–1066 1061
relationship between Log(Re) and Log( Ptot/yb),where Ptot is the perimeter of contours traced con-
sidering the modal concentration value of the prob-
ability density function (PDF) of mixed structures
normalized by the bounding box (yb) in which the
structure is embedded. Ptot is rescaled by yb in order
to obtain a parameter that is independent on the scale
[27].
Fig. 8 shows how the calculation of (Ptot/yb) is
performed. Fig. 8A and B shows the digital image of a
sample and the corresponding concentration (SiO2)
histogram, respectively. The modal value (i.e. the
maximum frequency of the histogram) corresponds
to SiO2 = 72.63 wt.%. Fig. 8C shows the concentra-
tion contours traced considering this modal value; the
bounding box (yb = 3.3 4 = 13.2 cm) used to nor-

Fig. 8. Schematic illustration of the steps required to measure Ptot and yb. (A) Reference sample; (B) concentration frequency histogram (in both
gray levels, GL and SiO2); (C) concentration contours traced from the image presented in (A) considering the modal value of the histogram
reported in (B). In (C), the measured values of Ptot and yb are also shown.
D. Perugini et al. / Earth and Planetary Science Letters 222 (2004) 1051–10661062
malize the perimeter (Ptot) of contours is also shown
in Fig. 8C. Perimeter of contours has been measured
by image analysis using the NIH software.
Using experimental data from Ref. [27], the equa-
tion relating Log(Re) and Log(Ptot/yb) is
LogPtot
yb
� �¼ �0:33LogðReÞ þ 1:90 ð8aÞ
Log (Re) can be derived as
LogðReÞ ¼1:90� Log
Ptot
yb
� �
0:33ð8bÞ
Eqs. (8a) and (8b) holds for 103 <Re < 104 and length
scales 10� 2–10� 3 m in liquid and gas jets and shear

D. Perugini et al. / Earth and Planetary Science Letters 222 (2004) 1051–1066 1063
layers [27,51]. Re for all analyzed natural structures
has been calculated (Table 1) and results show that Re
ranges from ca. 500 to 7000. Note that the values of
Ptot/yb measured on the natural structures are of the
same order of magnitude of those measured by Ref.
[27], except two samples (Poll-2b and Poll-2-2b-2)
that, however, show Ptot/yb not far from those esti-
mated by Ref. [27]. Note also that the length scale of
the experiments is 10� 2–10� 3 m, which is also the
length scale of the images of the Upper Pollara
pumices. This indicates that, in our case, Eqs. (8a)
and (8b) can be utilized to estimate Re for natural
structures. It is to note that extrapolation of Eqs. (8a)
and (8b) to higher (Re>104) or lower (Re < 103) values
of Re than those investigated by Ref. [27] should
require caution because of the possible non-linearity
of the Re vs. Ptot/yb relationship outside the experi-
mentally investigated Re values. Therefore, although
additional experimental efforts should be done to
define the limits of applicability of the results from
Ref. [27] to a wider range of Re, the use of Eqs. (8a,b)
can be considered, in our case, a useful tool to
estimate Re values during the magma interaction
process.
Fig. 9. (A) Binary graph showing the positive correlation between
the percentage of mafic magma and Log(Re); (B) binary graph
showing the positive correlation between Da and Log(Re). The lines
on the graphs are drawn to guide the eye.
8. Discussion
The morphological structures observed in the
Upper Pollara juvenile fragments, which include
plane-parallel to poorly folded structures, strongly
folded-like, vortex-like structures, result from the
mixing between a HK andesitic and a rhyolitic
magma. The values of Re estimated for the studied
structures (500 <Re < 7000) suggest that the flow
regime during the interaction between the andesitic
and rhyolitic magmas was heterogeneous, from sub-
turbulent (Re below of order 103, i.e. below the
mixing transition) to fully turbulent (Re above of
order 103). Such flow heterogeneity is inherent to
turbulence and is commonly due to the local fluctu-
ations of the velocity in the system at the different
scales (e.g. Ref. [25]).
Fig. 9A shows that there is a direct relationship
between the percentage of initial mafic magma esti-
mated in the different analyzed samples and Log(Re).
This result is in agreement with the observation that,
having the mafic magma a lower viscosity (andesite
viscosity f 103.5–4.2 Pa s) than the felsic magma
(rhyolite viscosity f 104.8–6 Pa s [12]), the higher
is the percentage of the mafic magma, the lower is the
viscosity of the whole system and, therefore, the
higher is the turbulence, since turbulence is inversely
related to viscosity by:
Returb ¼ffiffiffiffiffiq2
pL
m>> 1 ð9Þ
whereffiffiffiffiffiq2
pis the characteristic velocity in the turbu-
lent flow associated with the velocity fluctuations,
Returb is the Reynolds number, L is the characteristic
length of the system and m is the kinematic viscosity
(e.g. Ref. [52]). The results of Fig. 9A are also
consistent with those from fluid dynamic experiments

D. Perugini et al. / Earth and Planetary Science Letters 222 (2004) 1051–10661064
on magma mixing (e.g. Refs. [53,54]), which show
that increasing amounts of initial mafic magma pro-
voke increasing turbulence in the magma mixing
system.
Fig. 9B shows a direct relationship between Log(Re)
and Da. Recalling that Da increases as the mixing
intensity decreases, the graph shows that the higher
is the turbulence, the lower is the mixing experi-
enced by magmas. This conclusion contradicts
results from experimental and numerical models on
convective and fountain mixing in magma chambers
[53,55–57]. However, it is worth noting that increas-
ing turbulence does not necessarily imply increasing
mixing efficiency. [52], using dimensional analysis,
define a parameter (I) inversely related to the mixing
efficiency as
IflRe 1þ lnffiffiffiffiffiSc
p� 1ffiffiffiffiffiffi
Rep
� �2
ð10Þ
where Sc is the Schmidt number, which is the ratio
between m and the chemical diffusivity D, and l is the
fluid viscosity. Eq. (10) is valid for Sc larger than about
104, a value well below typical Sc values for magmas
(Sc larger than about 1015). Eq. (10) shows that the
higher is I, the higher is the turbulence (increasing Re)
and, hence, the lower is the mixing efficiency. This
result depends on the fact that higher Re values
correspond to higher energy dissipation of the mixing
system for highly viscous fluids and this provokes a
strong decrease of mixing efficiency toward higher Re
[52]. Experimental models in shear layers and pipe
flows also corroborate this result (e.g. Refs. [28,58]).
In addition, Ref. [32] shows that, in laminar and sub-
turbulent regimes, mixing in a rising magma batch in a
conduit occurs and increases when the dimensionless
number Imix is larger than ca. 10� 1. In the sub-
turbulent–turbulent regime, Imix is defined as:
Imix ¼4ðqr � qmÞql
kDqqm
Re�1l ð11Þ
where qr is the density of the country rock, qm is the
density of the bulk magma, ql is the density of the
upper magma, Dq is the density difference between
magmas, k is a friction factor. Eq. (11) refers to a
system in which a more viscous magma overlays a
less viscous magma within a conduit and it is valid (a)
for fluids with viscosity ratio between 1 and 103, a
range of values within that estimated for the Upper
Pollara magmas (viscosity rhyolite/viscosity andesite
f 1–103 [12]); and (b) 102<Re< 106. Length scales
investigated by Ref. [32] are of the order of 10� 2 m,
which is also consistent with the length scale of
Upper Pollara structures. This equation demonstrates
that, when Imix, and then mixing efficiency, increases,
Re decreases. As reported by Ref. [32], this model of
mixing in a conduit ‘‘contrasts with fountains [7] and
plumes [59]’’, which refer to mixing in magma
chambers. The positive correlation between Re and
Da revealed by our analysis is in agreement with
results of the mixing model of Ref. [32]. This
suggests that the mixing/mingling processes in the
Upper Pollara eruption mainly developed in the
conduit and not within the chamber. This conclusion
is also supported by the relatively high estimates of
Re-values (Ref 103), which are poorly consistent
with a high viscosity magma, like the Upper Pollara
rhyolite, flowing within a chamber [32]. In addition,
on the basis of our results and those from experimen-
tal models [58], we conclude that the mixing between
the rhyolite and andesite developed in a shear layer-
type or pipe-type flow rather than in a fountain-like
flow in a magma chamber.
9. Concluding remarks
Results presented in this study indicate that it is
possible to estimate (i) the initial percentages of mag-
mas that took part in the mixing process, (ii) the mixing
intensity and (iii) the Reynolds number, from the
analyses of the concentration patterns of heterogeneous
juvenile samples. These estimates can give useful
information on the kinematics of the mixing processes
and may be used to better constraint petrological/
volcanological models of eruptions. The possibility
to estimate the initial percentages of magmas that are
involved in a mixing process cannot be easily deduced
using classical geochemical modeling (e.g. Ref. [15])
and the approach proposed here, when applicable, can
give additional information to constraint such models.
In addition, the possibility to estimate the intensity of
mixing using multifractal analysis can be an indepen-
dent method to test the reliability of whole rock
geochemical modeling (e.g. Refs. [12,60]). Moreover,

D. Perugini et al. / Earth and Planetary Science Letters 222 (2004) 1051–1066 1065
we have shown that it is possible to deduce the flow
regime associated to mixing structures.
Results obtained in this study are promising and
future researches need to be carried out in order to test
the general validity of the proposed analytical ap-
proach by using both numerical and analogue experi-
ments, as well as by studying other volcanic eruptions
characterized by magma mixing processes. This kind
of studies may provide the basis for better constrain-
ing time scales of magma mixing processes.
Acknowledgements
We thank Paola Donato and Rosanna De Rosa for
having kindly provided some of the studied samples
and for discussions on the Upper Pollara eruption. We
also thank Francois Holtz for discussions on magma
mixing and Paul Dimotakis for his help on turbulent
mixing. Antonio Costa is gratefully acknowledged for
the revision of an early version of the manuscript. We
are grateful to R.C. Kerr and H. Gonnerman for
helpful suggestions and criticisms in reviewing the
manuscript. The editorial handling of S.D. Scott is
gratefully acknowledged. This work has been sup-
ported by the Italy–Germany ‘Vigoni’ Project and by
MIUR grants. [SK]
References
[1] J.C. Eichelberger, Origin of andesite and dacite: evidence of
mixing at Glass Mountain in California and other circum-Pa-
cific volcanoes, Geol. Soc. Amer. Bull. 86 (1975) 1381–1391.
[2] J.C. Eichelberger, Andesitic volcanism and crustal evolution,
Nature 275 (1978) 21–27.
[3] A.T. Anderson, Magma mixing: petrological process and vol-
canological tool, J. Volcanol. Geotherm. Res. 1 (1976) 3–33.
[4] C.R. Bacon, Magmatic inclusions in silicic and intermediate
volcanic rocks, J. Geophys. Res. 91 (1986) 6091–6112.
[5] D. Snyder, Thermal effects of the intrusion of basaltic magma
into a more silicic magma chamber and implications for erup-
tion triggering, Earth Planet. Sci. Lett. 175 (2000) 257–273.
[6] R.S.J. Sparks, L.A. Marshall, Thermal and mechanical con-
straints on mixing between mafic and silicic magmas, J. Vol-
canol. Geotherm. Res. 29 (1986) 99–124.
[7] I.H. Campbell, J.S. Turner, Fountains in magma chambers,
J. Petrol. 30 (1989) 885–923.
[8] J.C. Eichelberger, Vesiculation of mafic magma during re-
plenishment of silicic magma reservoir, Nature 288 (1980)
446–450.
[9] H.E. Huppert, R.S.J. Sparks, J.S. Turner, Effects of volatiles
on mixing in calc-alkaline magma systems, Nature 297 (1982)
554–557.
[10] T. Koyaguchi, Magma mixing in a conduit, J. Volcanol. Geo-
therm. Res. 25 (1985) 365–369.
[11] T. Koyaguchi, Evidence for two-stage mixing in magmatic
inclusions and rhyolitic lava domes on Nijima Island, Japan,
J. Volcanol. Geotherm. Res. 29 (1986) 71–98.
[12] N. Calanchi, R. De Rosa, R. Mazzuoli, L. Rossi, R. Santa-
croce, G. Ventura, Silicic magma entering a basaltic magma
chamber: eruptive dynamics and magma mixing—an example
from Salina (Aeolian Islands, Southern Tyrrhenian Sea), Bull.
Volcanol. 55 (1993) 504–522.
[13] N. Thomas, S.R. Tait, The dimensions of magmatic inclusions
as a constraint on the physical mechanism of mixing, J. Vol-
canol. Geotherm. Res. 75 (1997) 167–178.
[14] D.Y. Venezky, M.J. Rutherford, Preeruption conditions and
timimg of dacite-andesite magma mixing in the 2.2 ka eruption
at Mount Rainier, J. Geophys. Res. 102 (1997) 20069–20086.
[15] S. Takeuchi, M. Nakamura, Role of precursory less-viscous
mixed magma in the eruption of phenocryst-rich magma: ev-
idence from the Hokkaido-Komagatake 1929 eruption, Bull.
Volcanol. 63 (2001) 365–376.
[16] S.E. Bryan, J. Marti, M. Leosson, Petrology and geochemistry
of the Bandas del Sur Formation, Las Canadas Edifice, Ten-
erife (Canary Islands), J. Petrol. 43 (2002) 1815–1856.
[17] G.S. Leonard, J.W. Cole, I.A. Nairn, Self S. Basalt triggering
of the c. AD 1305 Kaharoa rhyolite eruption, Tarawera Vol-
canic Complex, New Zealand, J. Volcanol. Geotherm. Res.
115 (2002) 461–486.
[18] K. Wada, Fractal structure of heterogeneous ejecta from the
Me-akan volcano, eastern Hokkaido, Japan: implications for
mixing mechanism in a volcanic conduit, J. Volcanol. Geo-
therm. Res. 66 (1995) 69–79.
[19] R. De Rosa, R. Mazzuoli, G. Ventura, Relationships between
deformation and mixing processes in lava flows: a case study
from Salina (Aeolian Islands, Tyrrhenian Sea), Bull. Volcanol.
58 (1996) 286–297.
[20] G. Ventura, Kinematic significance of mingling-rolling struc-
tures in lava flows: a case study from Porri volcano (Salina
Southern Tyrrhenian Sea), Bull. Volcanol. 59 (1998) 394–403.
[21] J.V. Smith, Structures on interfaces of mingled magmas, Stew-
art Island, New Zealand, J. Struct. Geol. 22 (2000) 123–133.
[22] R. De Rosa, P. Donato, G. Ventura, Fractal analysis of min-
gled/mixed magmas: an example from the Upper Pollara erup-
tion (Salina Island, Southern Tyrrhenian Sea, Italy), Lithos 65
(2002) 299–311.
[23] D. Perugini, G. Poli, N. Prosperini, Morphometric analysis of
magmatic enclaves: a tool for understanding magma vesicula-
tion and ascent, Lithos 61 (2002) 225–235.
[24] D. Perugini, G. Poli, R. Mazzuoli, Chaotic advection, fractals
and diffusion during mixing of magmas: evidence from lava
flows, J. Volcanol. Geotherm. Res. 124 (2003) 255–279.
[25] C. Meneveau, K.R. Sreenivasan, Interface dimension in inter-
mittent turbulence, Phys. Rev., A 41 (1990) 2246–2248.
[26] R.T. Pierrehumbert, Tracer microstructures in the large-eddy
dominated regime, in: H. Aref, M.S. El Naschie (Eds.), Chaos
AppliedtoFluidMixing,Pergamon,Oxford,U.K.,1995,380pp.
D. Perugini et al. / Earth and Planetary Science Letters 222 (2004) 1051–10661066
[27] H.J. Catrakis, P.E. Dimotakis, Shape complexity in turbulence,
Phys. Rev. Lett. 80 (1998) 968–971.
[28] P. Dimotakis, The mixing transition in turbulent flows, J. Fluid
Mech. 409 (2000) 69–98.
[29] J.M. Ottino, Mixing, chaotic advection and turbulence, Annu.
Rev. Fluid Mech. 22 (1990) 207–254.
[30] J.M. Ottino, P. DeRoussel, S. Hansen, D.V. Khakhar, Mixing
and dispersion of viscous liquids and powdered solids, Adv.
Chem. Eng. 25 (2000) 105–204.
[31] A. Kouchi, I. Sunagawa, A model for mixing basaltic and
dacitic magmas as deduced from experimental data, Contrib.
Mineral. Petrol. 89 (1985) 17–23.
[32] T. Koyaguchi, S. Blake, The dynamics of magma mixing in a
rising magma batch, Bull. Volcanol. 52 (1989) 127–137.
[33] M.A. Jellinek, R.C. Kerr, Mixing and compositional layering
produced by natural convection: Part 2. Applications to the
differentiation of basaltic and silicic magma chambers, and
komatiite lava flows, J. Geophys. Res. 104 (1999) 7203–7218.
[34] R. De Rosa, H. Guillou, R. Mazzuoli, G. Ventura, New
unspiked K–Ar ages of volcanic rocks of the central and
western sector of the Aeolian Islands: reconstruction of the
volcanic stages, J. Volcanol. Geotherm. Res. 120 (2003)
161–178.
[35] P.Y. Gillot, Histoire volcanique des Iles Eoliennes: arc insu-
laire or complexe orogenique anulaire? D.T. IGAL 11 (1987)
35–42.
[36] J. Keller, The Island of Salina, Rend. Soc. Ital. Mineral. Petrol.
36 (1980) 489–524.
[37] R. De Rosa, R. Mazzuoli, P.L. Rossi, R. Santacroce, G. Ven-
tura, Nuovi dati ed ipotesi per la ricostruzione della storia
eruttiva dell’Isola di Salina (Isole Eolie), Boll. GNV-CNR 2
(1989) 791–809.
[38] R. De Rosa, Compositional modes in the ash fraction of some
modern pyroclastic deposits: their determination and signifi-
cance, Bull. Volcanol. 3 (1999) 162–173.
[39] N. Calanchi, R. De Rosa, R. Mazzuoli, F. Ricci Lucchi, P.L.
Rossi, R. Santacroce, L’attivita’ del centro di Pollara (Salina
Isole Eolie), Boll. GNV (1987) 187–213.
[40] G.A. Voth, G. Haller, J. Gollub, Experimental measurements
of stretching fields in fluid mixing, Phys. Rev. Lett. 88 (2002)
254501.
[41] D. Perugini, G. Poli, G. Gatta, Analysis and simulation of
magma mixing processes in 3D, Lithos 65 (2002) 313–330.
[42] M. Liu, F.J. Muzzio, R.L. Peskin, Quantification of mixing in
aperiodic chaotic flows, Chaos, Solitons Fractals 4 (1994)
869–893.
[43] M.J. Clifford, S.M. Cox, E.P.L. Robert, Lamellar modelling of
reaction, diffusion and mixing in a two-dimensional flow,
Chem. Eng. J. 71 (1998) 49–56.
[44] M.J. Clifford, S.M. Cox, E.P.L. Robert, Reaction and diffusion
in a lamellar structure: the effect of the lamellar arrangement
upon yield, Physica, A 262 (1999) 294–306.
[45] D. Perugini, T. Busa, G. Poli, S. Nazzareni, The role of
chaotic dynamics and flow fields in the development of
disequilibrium textures in volcanic rocks, J. Petrol. 44
(2003) 733–756.
[46] J. Crank, The Mathematics of Diffusion, Clarendon Press,
Oxford, 1975, 414 pp.
[47] C. Meneveau, K.R. Sreenivasan, Simple multifractal cascade
model for fully developed turbulence, Phys. Rev. Lett. 59
(1987) 1424–1427.
[48] J. Kalda, Simple model of intermittent passive scalar turbu-
lence, Phys. Rev. Lett. 84 (2000) 471–474.
[49] J. Feder, Fractals, Plenum, New York, NY, 1988, 283 pp.
[50] S.L. Mills, G.C. Lees, C.M. Liauw, S. Lynch, Dispersion as-
sessment of flame retardant filler/polymer systems using a
combination of X-ray mapping and multifractal analysis,
Polym. Test. 21 (2002) 941–948.
[51] P. Dimotakis, H. Catrakis, A.W. Cook, J.M. Patton, On the
geometry of two-dimensional slices of irregular level sets in
turbulent flows, Trends in Mathematics, Birkhauser, Basel,
1999, pp. 406–418.
[52] F. Raynal, J.N. Gence, Energy saving in chaotic laminar mix-
ing, Int. J. Heat Mass Transfer 40 (1997) 3267–3273.
[53] J.S. Turner, I.H. Campbell, Convection and mixing in magma
chambers, Earth Sci. Rev. 23 (1986) 255–352.
[54] S. Blake, H. Campbell, The dynamics of magma mixing dur-
ing flow in volcanic conduits, Contrib. Mineral. Petrol. 94
(1986) 72–81.
[55] H.E. Huppert, R.S.J. Sparks, The fluid dynamics of a basalt
magma chamber replenished by influx of hot, dense ultrabasic
magma, Contrib. Mineral. Petrol. 75 (1980) 279–289.
[56] I.H. Campbell, J.S. Turner, Turbulent mixing between fluids
with different viscosities, Nature 313 (1985) 39–42.
[57] S.S.S. Cardoso, A.W. Woods, Interfacial turbulent mixing in
stratified magma reservoirs, J. Volcanol. Geotherm. Res. 73
(1996) 157–175.
[58] P. Dimotakis, Some issues on turbulent mixing and turbu-
lence, Turbulence Symposium in honour of W.C. Reynolds,
GALCIT Report FM 93-1 (1993) 1–34.
[59] H.E. Huppert, R.S.J. Sparks, J. Whitehead, M.A. Hallworth,
Replenishment of magma chambers by light inputs, J. Geo-
phys. Res. 203 (1986) 6113–6122.
[60] R. Cioni, L. Civetta, P. Marianelli, N. Metrich, R. Santacroce,
A. Sbrana, Compositional layering and syneruptive mixing
of a periodically refilled shallow magma chamber: the AD
79 Plinian eruption of Vesuvius, J. Petrol. 36 (1995)
739–750.