Keynote at European Liberal Forum – Ralf Dahrendorf Roundtable Freedom Of Movement Under Threat?
10
1 European Liberal Forum – Ralf Dahrendorf Roundtable: Freedom Of Movement Under Threat? May 2, 2014 Vienna, Austria Evelyn Ersanilli International Migration Institute University of Oxford I would like to start by thanking the European Liberal Forum for inviting me to this roundtable. For me this is a wonderful occasion to think about the future of intra-EU mobility and I look forward to hearing the thoughts of the other speakers and audience members on this topic. But before discussing the future of free movement in the European Union, I feel it’s important to review its history. Free movement of ‘persons, services and capital’ 1 was part of the Treaty of Rome that in 1957 established the European Economic Community (EEC). The free movement of persons was presented as a way of creating a more efficient labour market by increasing options available to both employers and workers 2 . Gradually the freedom of movement within the EEC was extended to other groups. A 1990 directive granted freedom of movement to retirees 3 and a 1993 directive to students 4 . When Greece, Spain and Portugal joined the EEC in 1981 and 1986, six year transitional restrictions on free movement were put in place. All three countries had seen large scale migration to North-Western Europe in the 1960s and there were concerns that immediate freedom would lead to mass emigration. However, both during these restrictions and after they were lifted, migration from Greece, Spain and Portugal to other member states remained low. Some scholars have argued that this low migration rate was due to the economic optimism in the southern countries that followed their EU membership: hope of a better future at home, decreased the need to look for better opportunities elsewhere 5 . Similarly freedom of movement allowed those who had already migrated to return, knowing that if things at home did not work out they could easily move again. Despite low overall levels of intra-EU migration, worries about ‘social dumping’, that is hiring workers or using subcontractors from other member states to carry out work for lower wages led to establishment of the Posted Workers Directive in 1996 6 . This directive states that workers posted in another member state should receive the same wage as local workers from the start of their employment. 1 Part one, Article 3, sub c 2 Boswell, Christina & Andrew Geddes (2011) Migration and mobility in the European Union. Houndsmills, Basingstoke: Palgrave Macmillan 3 Directive 90/365/EEC 4 Directive 93/96/EEC 5 Boswell & Geddes (2011) 6 Directive 96/71/EC
Transcript of Keynote at European Liberal Forum – Ralf Dahrendorf Roundtable Freedom Of Movement Under Threat?

1
European Liberal Forum – Ralf Dahrendorf Roundtable: Freedom Of Movement Under Threat? May 2, 2014 Vienna, Austria Evelyn Ersanilli International Migration Institute University of Oxford
I would like to start by thanking the European Liberal Forum for inviting me to this roundtable.
For me this is a wonderful occasion to think about the future of intra-EU mobility and I look
forward to hearing the thoughts of the other speakers and audience members on this topic. But
before discussing the future of free movement in the European Union, I feel it’s important to
review its history.
Free movement of ‘persons, services and capital’1 was part of the Treaty of Rome that in 1957
established the European Economic Community (EEC). The free movement of persons was
presented as a way of creating a more efficient labour market by increasing options available to
both employers and workers2. Gradually the freedom of movement within the EEC was
extended to other groups. A 1990 directive granted freedom of movement to retirees3 and a
1993 directive to students4.
When Greece, Spain and Portugal joined the EEC in 1981 and 1986, six year transitional
restrictions on free movement were put in place. All three countries had seen large scale
migration to North-Western Europe in the 1960s and there were concerns that immediate
freedom would lead to mass emigration. However, both during these restrictions and after they
were lifted, migration from Greece, Spain and Portugal to other member states remained low.
Some scholars have argued that this low migration rate was due to the economic optimism in
the southern countries that followed their EU membership: hope of a better future at home,
decreased the need to look for better opportunities elsewhere5. Similarly freedom of movement
allowed those who had already migrated to return, knowing that if things at home did not work
out they could easily move again.
Despite low overall levels of intra-EU migration, worries about ‘social dumping’, that is hiring
workers or using subcontractors from other member states to carry out work for lower wages
led to establishment of the Posted Workers Directive in 19966. This directive states that
workers posted in another member state should receive the same wage as local workers from
the start of their employment.
1 Part one, Article 3, sub c 2 Boswell, Christina & Andrew Geddes (2011) Migration and mobility in the European Union. Houndsmills, Basingstoke: Palgrave Macmillan 3 Directive 90/365/EEC 4 Directive 93/96/EEC 5 Boswell & Geddes (2011) 6 Directive 96/71/EC

2
The Maastricht Treaty that came into effect in 1993 made freedom of movement a fundamental
right of all citizens of EU member states. Scholars have pointed out that this codification of the
freedom of movement indicates a tension between the EU’s economic and political-cultural
aspirations7. Though initially put in place for economic reasons, the Maastricht Treaty and the
2004 “Directive on the right of citizens of the Union and their family members to move and
reside freely within the territory of the Member States”8 emphasised the role of freedom of
movement in the political integration of EU member states. In addition to stressing the role of
freedom of movement for the internal market, the 2004 directive argues that it is important that
union citizens residing in other member states can receive permanent residence after a certain
time because this “would strengthen the feeling of Union citizenship and is a key element in
promoting social cohesion, which is one of the fundamental objectives of the Union.”9
By 2004 about 1.6%10 of Europeans lived in member states other than that of their nationality.
Rates varied strongly across countries, with less than 1% of Germans and French living in other
EU member states and more than 5% of Portuguese and Irish citizens. However these latter two
migration streams have little to do with freedom of movement and more with prior labour
migration. The main recipients of EU migrants were Germany and France, though in relative
terms Luxembourg stands out with about a third of the population having a nationality of
another EU member state.
As you are all well-aware, in that same year, 2004, ten countries, mainly in Central and Eastern
Europe joined the EU. As at the time of accession of Greece, Portugal and Spain, there were
concerns about how much migration would come from the new member states, and therefore
members were allowed to apply transitional restrictions on the movements from the new
member states. A by now infamous study for the UK Home Office11 estimated that the net-
migration of workers from Central and Eastern European countries to the United Kingdom
would be in the range of 5,000 -13,000 a year. The UK decided not to implement any transitional
restrictions. Ireland and Sweden did the same. The migration from the new member states
exceeded all expectations. By 2011 more than 1.1 million people from Central and Eastern
Europe settled in the UK12 – more than ten times as many as had been predicted.
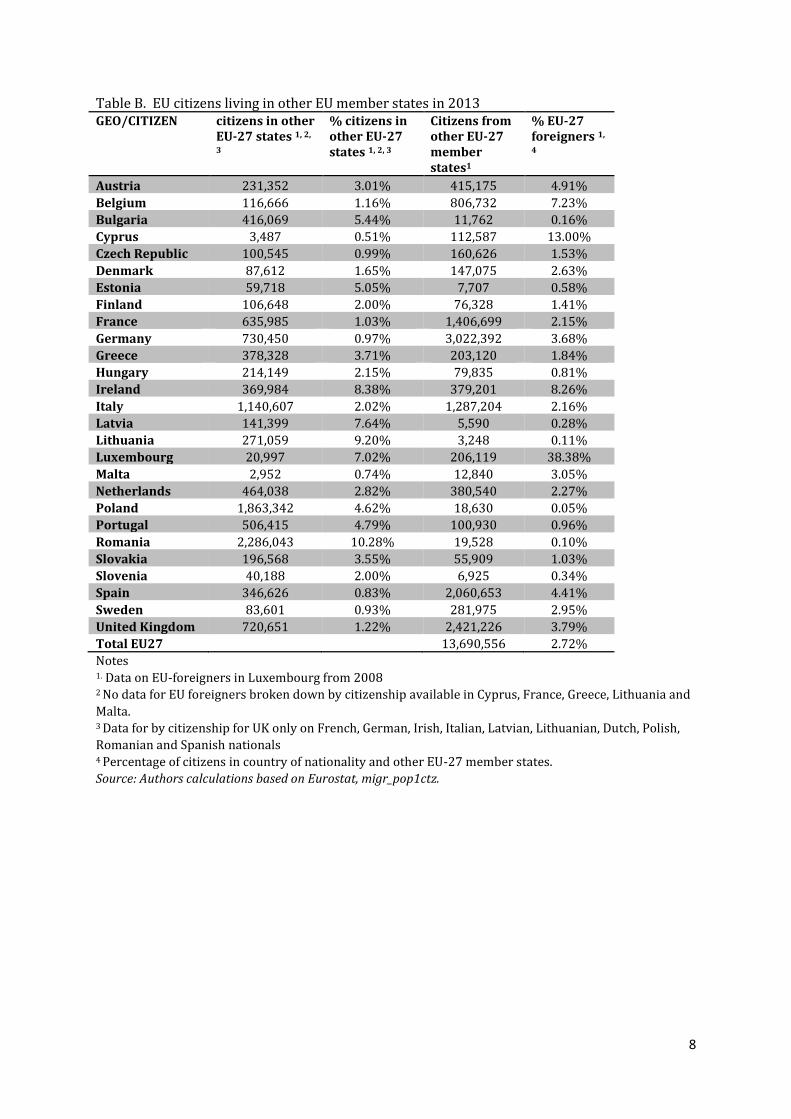
By 2013 roughly 2.5-3% of EU citizens13 lived in a member state other than that of their
nationality; this is an increase in mobility of 75-100% in 10 years’ time. I emphasise ‘roughly’ as
most of the data come from national censuses that are not held every year, or population
7 Shaw, Jo (2007) The Transformation of Citizenship in the European Union: Electoral Rights and the Restructuring of Political Space. Cambridge University Press 8 Directive 2004/38/EC 9 Sub 17 of the preamble 10 Calculations based on nationality, Eurostat table migr_pop1ctz. Where no 2004 data were available the closest year was used as substitute: for Belgium data for 2003, for Greece 2001, for France 2005, for Portugal 2003. Data for Ireland is missing. Full table can be found below. Table A. 11 Dustmann, C., Casanova, M., Fertig, M., Preston, I., & Schmidt, C. M. (2003)The impact of EU enlargement on migration flows (No. 25/03). Research Development and Statistics Directorate, Home Office. http://discovery-dev.ucl.ac.uk/14332/1/14332.pdf 12 Vargas-Silva, Carlos (2014) “Migration Flows of A8 and other EU Migrants to and from the UK”, Migration Observatory Briefing, COMPAS, University of Oxford, UK, April 2014. 13 Calculations based on nationality, Eurostat table migr_pop1ctz. Where no 2013 data were available. Full table can be found below (Table B).

3
registers that are likely to not contain most recent and more mobile migrants14. The United
Kingdom and Spain are the most popular destinations, with more than a million of post-2004
intra-EU migrants settling in each country, followed by Italy with little under a million. The next
largest recipient, Germany, has received around half a million intra-EU migrants since 2004.
The rates of intra-EU migration vary widely across the new member states. From Poland, the
most populous new member state, almost 1.3 million people – about 3.5% of the population -
moved to other member states after 2004, mainly the UK, Germany and Ireland. With almost 1.7
million, which is 10% of the population (up from 2.5% in 2004) Romania has the highest share
of intra-EU movers. Most Romanians went to Spain and Italy. Interestingly, this migration
started before Romania joined the EU in 2007, which raises the question what role EU freedom
of movement has played in this migration. It also suggests that worries about mass-migration
from Romanians, who since January of this year enjoy full freedom of movement, may be
unfounded; many of those who would like to migrate have already done so.
Why is intra-EU mobility of A8 and A215 country nationals so much higher than that of citizens
of the older member states? We don’t know exactly, but the larger income differences are likely
to play a role. While the GDP per capita in Greece and Portugal – currently the poorest of the old
member states - is about two-thirds of that in Germany and the UK, the GDP in Poland is only
half (up from 40% in 2005) and in Romania even less than a third16.
Whereas language barriers are often cited as a reason for low levels of intra-EU migration, the
mass intra-EU migration of Romanians has been facilitated by the linguistic similarities of
Romanian with Spanish and Italian.
The large flows of post-2004 intra-EU migration have led to heated debates and calls to limit
intra-EU migration have become common place. An issue currently at the top of the agenda in
my EU country of residence, the United Kingdom, is ‘welfare tourism’. The tabloids have already
located several ‘Romanian’ or ‘Roma’ (the distinction seems to be irrelevant to the editors)
families who have come to the UK to claim social benefits.
Two separate issues are at play in the debates on welfare tourism; firstly the fear that people
from A8 and A2 countries will migrate for no other reason than to collect benefits, and secondly
the fear that, like some non-European migrant groups who came to Europe to work, the new
intra-EU migrants may start off by working, but stay on even after they lose their employment
and start collecting benefits rather than return home.
Let me first address the issue of migration with no other purpose than to collect welfare.
Already before the EU accession of the A8 and A2 countries, there were significant differences in
welfare systems across EU member states. To prevent abuse, the right to freedom of movement
in the EU is not unconditional. For the right to reside in another member state for more than
14 Data are drawn from national censuses and population register data. Population register data are likely to underestimate EU mobility because intra-EU movers not always deregister in their place of origin or register in their place of arrival. These data also do not capture people whose main residence is in their country of nationality but who work in another member state. Census data are more likely to capture all intra-EU movers at the time of the census but are held at a low frequency due to the very high costs involved. 15 A8: Czech Republic, Estonia, Hungary, Latvia, Lithuania, Poland, Slovakia and Slovenia. A2: Bulgaria and Romania 16 Data for 2011. Source: HDI http://hdr.undp.org/en/data. Full table can be found below (Table C)

4
three months, EU citizens need to either be employed, studying, or have sufficient resources for
themselves and their family members not to become a burden on the social assistance system of
the host member state. And have a ‘comprehensive sickness insurance cover’17.
Where newly arrived intra-EU migrants are able to collect welfare without much or even any
work experience, this is often in part a consequence of national systems of welfare entitlements
that do not require people to pay in before taking out. Part of the solution here can therefore lie
in reforming national welfare systems to make it less attractive to live of benefits rather than
employment.
The fact that a lot of A8 and A2 migrants went to Italy and Spain, not exactly the most generous
welfare states in the EU, and very few went to Sweden, one of the more generous welfare state
and a country that did not implement any transitional restrictions, suggests that migration with
the only aim to collect welfare is not as common as many seem to believe.
As for the welfare use of intra-EU migrants who have been working in another member state, it
is currently still a bit too early to tell. A study of A8 migrants in the UK in 201018 (so after start
of the crisis) showed that this group uses welfare much less than the native population, even
after taking into account the young age and high education of this group. The fear of welfare use
by migrants is probably influenced by the experience with guest-workers from the 1960s and
1970s. However the A8 and A2 migrants have a much higher education, and free movement
should facilitate circular migration of those who do lose their jobs, both factors lowering the
chance of prolonged welfare use.
Experiences with guest-workers have not only influenced worries about welfare dependence,
but also about integration. Studies on immigrant integration in North-America and Europe have
shown that immigrant characteristics are an important determinant of integration, and these
are quite positive for intra-EU migrants including those from A8 and A2 countries. On average
Romanian and Bulgarian citizens have had a bit more than 10 years of education, this is about
the same as people in Spain, Finland and Italy (Austria 10.8, Germany 12.2, UK 9.4) and 4 years
more than the current level in Turkey, and even more than the level in Turkey at the time that
guest-workers were recruited19. In schools in Ireland, the children of Polish migrants are known
to outperform native children.
Another issue raised about recent intra-EU migration – though more so by left-wing than liberal
parties – is the problem of wages being undercut. The posted worker directive has only been
limited in its success to combat this problem, partly because employers use subsidiaries based
in other countries or hire workers as self-employed rather than employees. Casualisation of
work is also increasingly common for people who do not move, even for those with a good
education. Too many of my linkedin connections have new jobs as “director/owner @ self-
employed”. I tend to decline linkedin’s suggestion to congratulate them, as these people
frequently have ended up in a rather precarious labour situation. Like with use of welfare, the
issues raised by intra-EU mobility are not simply a consequence of this mobility but point to
wider structural issues.
17 Directive 2004/38/EC, article 7 18 Dustmann, C., Frattini, T., & Halls, C. (2010) ‘Assessing the Fiscal Costs and Benefits of A8 Migration to the UK’. Fiscal Studies, 31(1), 1-41. 19 Data for 2012 from http://hdr.undp.org/en/data. Full table can be found below (Table D)

5
So maybe intra-EU mobility is ‘not so bad’ as some might think. Is it maybe even good? Does it
have benefits?
As I mentioned at the start, the hope of the authors of the Treaty of Rome was that free
movement of people in the EU – or at that time the ECC – would help economic growth.
A lot of migrants from the new member states have filled demands for low skilled work,
especially in agriculture, construction and the service industry. It is unlikely that this will
continue in the future. As incomes in the new member states increase, fewer Bulgarian doctors
will come to the UK to pick raspberries as they will no longer earn a multi-fold of their income in
Bulgaria. Agricultural and other employers will need to look for workers elsewhere, make more
use technology to replace manual labour or move to other countries.
The Lisbon Strategy adopted in 2000 looked to intra-EU migration as an important stimulus for
making the EU a ‘dynamic and competitive knowledge-based economy’20.
I have not been able to find any studies that have looked at the effects of EU mobility on
innovation, but it is generally thought that one of the drivers behind innovation clusters such as
Silicon Valley is the inflow of skilled migrants.
In my own field of work, academia, migration is very important. Most academics of my
generation have worked in two or more countries, often within the EU. This movement exposes
researchers to new ideas and methods that we can use to improve our work.
This suggests that intra-EU mobility might indeed contribute to innovation and thus to
economic growth. What about the political consequences of intra-EU mobility?
Glancing over some of the election manifestos of ALDE member parties for the European
Parliamentary elections later this month, two different views stand out; those who see freedom
of movement as an essential part of the European project (for example the Lib-Dems, NEOS),
and those who focus on the perceived costs of this freedom, most notably ‘welfare tourism’ (for
example, the VVD). Views on free movement seem to roughly coincide with views on the future
of Europe, with integrationists favouring free movement and sceptics stressing the downsides
and calling for restrictions. A cynic might argue that at least for some parties, arguments about
welfare state costs are an economic cover for the political preference to limit EU integration.
It is time to accept that on a global scale, among world powers like the US, Russia, China and in
the future maybe Brazil, most countries in the EU are fairly insignificant. The only way to assert
influence is to act as a union. It seems unlikely that the EU can be a force of international
importance, economically, but even more so politically, without the freedom of movement. This
freedom is a vital element in connecting people of the different member states and provides an
important push for further integration across policy domains.
Over 50 years after the start of free movement, intra-EU mobility is still low. There are many
barriers blocking movement. Aside from linguistic barriers, the most important ones are
20
cited in Boswell & Geddes (2011)

6
portability of pensions and problems with acceptance of qualifications21. The Bologna
agreement has made European education systems more similar. More and more students are
choosing to study in another member state. This allows them to pursue the degree of their
choice, in some cases such as the UK avoid high fees, and also is a vital platform for exchange
between European citizens. As it becomes increasingly common to study in another member
state, EU mobility is likely to increase: these students more often speak multiple European
languages and their experience of mobility is likely to lead to more mobility.
What is required both to respond to existing EU movements and to pave the way for more
movement is a step-by-step reform and integration of European welfare systems, both to
prevent abuse but more importantly to encourage mobility.
The past five years I paid into three different EU welfare states and I am concerned about the
implications for my future pension. I do occasional work in other EU member states; the
complex tax procedures I am confronted with as a consequence are disheartening.
Rather than restricting or even abandoning freedom of movement in the EU because of the
problems with welfare state entitlements, freedom of movement should be used as a driver for
reform.
I would like to close by reiterating the words of ALDE Group President Guy Verhofstadt without
the right to free movement in the EU “there is no Europe. Capping the number of migrants of EU
citizens does not only mean undermining one of the greatest achievements of EU integration and
one of the main EU fundamental values, but it also means blocking European growth and wealth
creation". 22
Thank you.
21
A recent revision of the legislation on 'Mutual recognition of professional qualifications' should encourage this by lifting some of the barriers to movement. 22
http://politicalpress.eu/category/euinstitutions/europeanparliament/newsletter/

7
Appendix – full tables Table A. EU citizens living in other EU member states in 2004
GEO/CITIZEN citizens in other EU-15 states 1, 2
% citizens in other EU-15 states 1, 2, 3
Citizens from other EU-15 member states2
% EU-15 foreigners 2
Belgium 188,662 1.95% 566,681 5.45% Denmark 93,836 1.80% 56,363 1.04% Germany 575,064 0.76% 1,849,986 2.24% Ireland 412,970 9.13% Greece 430,846 4.06% 46,897 0.43% Spain 401,709 1.00% 538,213 1.27% France 468,658 0.78% 1,186,893 1.89% Italy 1,210,511 2.12% 133,545 0.23% Luxembourg 18,377 6.21% 148,590 32.66% Netherlands 353,359 2.22% 211,009 1.30% Austria 236,597 3.10% 122,394 1.50% Portugal 864,098 7.83% 66,013 0.63% Finland 141,217 2.69% 18,682 0.36% Sweden 98,092 1.14% 185,691 2.07% United Kingdom 683,190 1.21% 930,698 1.59% Total EU-15 1.61%
Notes 1 Excludes other EU15 citizens living in Ireland (no data available). 2 Data for Belgium from 2003, for Greece 2001, for France 2005, for Portugal 2003. 3 Percentage of citizens in country of nationality and other EU15 member states.
Source: Authors calculations based on Eurostat, migr_pop1ctz.
8
Table B. EU citizens living in other EU member states in 2013 GEO/CITIZEN citizens in other
EU-27 states 1, 2,
3
% citizens in other EU-27 states 1, 2, 3
Citizens from other EU-27 member states1
% EU-27 foreigners 1,
4
Austria 231,352 3.01% 415,175 4.91%
Belgium 116,666 1.16% 806,732 7.23%
Bulgaria 416,069 5.44% 11,762 0.16%
Cyprus 3,487 0.51% 112,587 13.00%
Czech Republic 100,545 0.99% 160,626 1.53%
Denmark 87,612 1.65% 147,075 2.63%
Estonia 59,718 5.05% 7,707 0.58%
Finland 106,648 2.00% 76,328 1.41%
France 635,985 1.03% 1,406,699 2.15%
Germany 730,450 0.97% 3,022,392 3.68%
Greece 378,328 3.71% 203,120 1.84%
Hungary 214,149 2.15% 79,835 0.81%
Ireland 369,984 8.38% 379,201 8.26%
Italy 1,140,607 2.02% 1,287,204 2.16%
Latvia 141,399 7.64% 5,590 0.28%
Lithuania 271,059 9.20% 3,248 0.11%
Luxembourg 20,997 7.02% 206,119 38.38%
Malta 2,952 0.74% 12,840 3.05%
Netherlands 464,038 2.82% 380,540 2.27%
Poland 1,863,342 4.62% 18,630 0.05%
Portugal 506,415 4.79% 100,930 0.96%
Romania 2,286,043 10.28% 19,528 0.10%
Slovakia 196,568 3.55% 55,909 1.03%
Slovenia 40,188 2.00% 6,925 0.34%
Spain 346,626 0.83% 2,060,653 4.41%
Sweden 83,601 0.93% 281,975 2.95%
United Kingdom 720,651 1.22% 2,421,226 3.79%
Total EU27 13,690,556 2.72%
Notes 1. Data on EU-foreigners in Luxembourg from 2008 2 No data for EU foreigners broken down by citizenship available in Cyprus, France, Greece, Lithuania and
Malta. 3 Data for by citizenship for UK only on French, German, Irish, Italian, Latvian, Lithuanian, Dutch, Polish,
Romanian and Spanish nationals 4 Percentage of citizens in country of nationality and other EU-27 member states.
Source: Authors calculations based on Eurostat, migr_pop1ctz.

9
Table C. GDP per capita in $, 2005 PPP EU membership status Country 2005
%of German
GDP 2011
%of German
GDP
EU12 Luxembourg 68,320 219.57% 68,459 198.79%
EEA Norway 47,626 153.06% 46,982 136.43%
EEA Switzerland 35,784 115.01% 37,979 110.29%
EU12 Netherlands 35,104 112.82% 37,251 108.17%
EU15 Austria 33,626 108.07% 36,353 105.56%
EU12 Ireland 38,896 125.01% 35,640 103.49%
EU15 Sweden 32,703 105.10% 35,048 101.77%
EU12 Germany 31,115 100.00% 34,437 100.00%
EU12 Belgium 32,189 103.45% 33,127 96.20%
EU12 United Kingdom 32,738 105.22% 32,474 94.30%
EU12 Denmark 33,193 106.68% 32,399 94.08%
EU15 Finland 30,708 98.69% 32,254 93.66%
EU12 France 29,453 94.66% 29,819 86.59%
EU12 Italy 28,280 90.89% 27,069 78.60%
EU12 Spain 27,392 88.03% 27,063 78.59%
EU25 Cyprus 24,408 78.44% 26,045 75.63%
A8 Slovenia 23,476 75.45% 24,967 72.50%
A8 Czech Republic 21,264 68.34% 23,967 69.60%
EU25 Malta 21,018 67.55% 23,007 66.81%
EU12 Greece 24,348 78.25% 22,558 65.51%
EU12 Portugal 21,369 68.68% 21,317 61.90%
A8 Slovakia 16,175 51.98% 20,757 60.28%
A8 Poland 13,784 44.30% 18,087 52.52%
A8 Estonia 16,548 53.18% 17,885 51.94%
A8 Hungary 16,975 54.56% 17,295 50.22%
A8 Lithuania 14,197 45.63% 16,877 49.01%
EU28 Croatia 15,332 49.28% 16,162 46.93%
A8 Latvia 13,040 41.91% 13,773 39.99%
Turkey Turkey 11,465 36.85% 13,466 39.10%
A2 Bulgaria 9,809 31.52% 11,799 34.26%
A2 Romania 9,361 30.09% 10,905 31.67%
Source: Human Development Index, http://hdr.undp.org/en/data

10
Table D. Mean years of education EU membership status Country 1980 2012
EEA Norway 9.1 12.6
A8 Czech Republic 10.3 12.3
EU12 Germany 5.7 12.2
A8 Estonia 8.4 12
A8 Slovenia 9 11.7
A8 Hungary 8.7 11.7
EU15 Sweden 9.1 11.7
A8 Slovakia 10.1 11.6
EU12 Netherlands 9.3 11.6
EU12 Ireland 9.5 11.6
A8 Latvia 6.3 11.5
EU12 Denmark 9 11.4
EEA Switzerland 10 11
A8 Lithuania 6.8 10.9
EU12 Belgium 8 10.9
EU15 Austria 7.4 10.8
A2 Bulgaria 8 10.6
EU12 France 6 10.6
A2 Romania 7.9 10.4
EU12 Spain 5 10.4
EU15 Finland 8.3 10.3
EU12 Italy 6.1 10.1
EU12 Luxembourg 8.3 10.1
EU12 Greece 6.6 10.1
A8 Poland 7.7 10
EU25 Malta 7 9.9
EU25 Cyprus 6.7 9.8
EU28 Croatia 6.9 9.8
EU12 United Kingdom 7.5 9.4
EU12 Portugal 4.8 7.7
Turkey Turkey 2.9 6.5
Source: Human Development Index, http://hdr.undp.org/en/data