KENYA FISHERIES SUB-SECTOR DIAGNOSTIC REPORT - RICHARD O. ABILA
83
1 Supply Capacity, Firm Level Performance, Markets, Policy Environment and Constraints CONSULTANTS Dr. ENOCK WAKWABI Kenya Marine and Fisheries Research Institute Dr RICHARD O. ABILA Kenya Marine and Fisheries Research Institute Dr. LUCY M. MBITHI Department of Economics, University of Nairobi December, 2002 Sectoral Diagnostic Report for the Kenya Fish Sub-Sector
-
Upload
independent -
Category
Documents
-
view
3 -
download
0
Transcript of KENYA FISHERIES SUB-SECTOR DIAGNOSTIC REPORT - RICHARD O. ABILA

1
Supply Capacity, Firm Level Performance, Markets,
Policy Environment and Constraints
CONSULTANTS
Dr. ENOCK WAKWABI Kenya Marine and Fisheries Research Institute Dr RICHARD O. ABILA Kenya Marine and Fisheries Research Institute Dr. LUCY M. MBITHI Department of Economics, University of Nairobi
December, 2002
Sectoral Diagnostic Report for the
Kenya Fish Sub-Sector

2
Chapter One THE STATUS OF FISHERIES SECTOR IN KENYA Introduction
The Fisheries sector in Kenya plays an important role in the economy by providing employment
and income to over 500,000 Kenyans engaged in fish production and related enterprises, fish trade
and industrial fish processing. Fish is also a rich source of animal proteins for human consumption
and provides raw material for the manufacture of animal feeds. Over the last 10 years, the fish
industry role in foreign exchange earning for the country has continued to increase and its full
potential is yet to be realized.
The Kenya Fish sector is characterized by a mainly artisanal fishery at the production level, an array
of middlemen traders who move the product from production areas to processing units or local
consumers mainly in the urban areas and processors/exporters. The industry is organized around
community-based fishermen; Government support institutions, urban merchandising centres, some
small scale processing activities such as drying and large scale export oriented factories (see fig 1).
The post-catch marketing channels of fishery products destined for export markets differ
significantly from those meant for local consumption. The tonnage of fishery products consumed
locally is currently about par with that which is exported.
Fish Production in Kenya
The annual average total production of fish in Kenya is estimated at 180,000 Metric tonnes (MT)
valued at Ksh. 6.667 million to the fishermen with a retail value of Ksh. 25,004 million. The bulk of
the total annual catch (92.5 %) is landed along the shores Lake Victoria by some 30,000 fishermen,
who are mainly artisanal, operating 8,000 fishing boats. Marine fish, crustaceans and molluscs
accounts for 3.9 % of the total catches while fish harvested from other inland lakes such as lakes
Turkana, Baringo, Naivasha and Tana river dams constitutes 3.1 %. Aquaculture accounts for about
0.5 % of the total production with tilapia and trout forming the bulk of farmed fish in Kenya. The
fisher-folk usually operate in loosely organised cooperatives, as contract fishermen under some
fishing agents or as individuals.
The main challenges facing fishermen are acquisition of efficient fishing gears such as motorised
boats, and ice for their catch. Poor infrastructure such as roads, communication and electricity to the
landing sites remains the biggest challenge to improvement of the fish production sector in Kenya.

3
Lake Victoria production L. Victoria is the second largest lake in the world and is shared between Kenya (6 %), Uganda (45
%) and Tanzania (49 %). The surface area is some 68,000 Km 2 and the shoreline length is 3400
km. The commercially important fish species of lake Victoria are Lates niloticus (Nile perch),
Rastrineobola argentea (Dagaa) and Oreochromis species (Tilapia). These species account for
57.95 %, 29.84 % and 9.54 % respectively of the total weight of fish landed from Kenya’s portion
of the lake. All the other species such as Alestes, Barbus, Labeo, Synodontis, Schilbe, Protopterus,
Clarius, Mormyrus and the once abundant Haplochromis contribute the remaining 2.67 %.
Marine Fish Production
An average of 6,296 MT of marine fish, crustaceans and molluscs valued at 348.2 million Kenya
shillings to the fishermen are landed annually. This amount is harvested mostly by artisanal
fishermen who restrict their operations within the continental shelf (national waters), as they are not
sufficiently equipped to venture into the deep sea. However, there are several commercial fishermen
operating eight modern fishing vessels that trawl prawns along the Kenyan coast.
Dermasal fish species such as scavengers, rabbit fish, snappers and parrot fish dominate the marine
catch, constituting 36.5 % of the total marine landings. Pelagic fish species (mullets, bonito, cavalla
jacks, mackerel, king fish and sail fish) accounted for 16 %, crustaceans for 12 %, molluscs for 12
% while other marine fish contributed the remaining 23%.
Domestic Fish Market
The domestic fish market in Kenya is varied, from fish selling to the communities neighbouring the
landing sites to merchants who transport it to urban centres such as Nairobi. Tilapia constitutes the
bulk of the fish marketed in Kenya thereby contributing much of the fish based proteins in the diet
of consumers. Nile perch is mainly exported, as is crustaceans and cephalopods, except for limited
quantities sold to high-class tourist hotels, especially in Nairobi and Mombasa. Fish in Kenyan
markets is mainly sold whole and fresh, though there are significant amounts that are dried, smoked
or filleted. The marketing channels also vary greatly, from the high-class hotels to merchant
markets in urban centres. It should also be noted that the domestic market is characterized by many
middlemen at each level of distribution.

4
Fig. 1: Kenya Fish Distribution Channel (Industry Structure)
Kenya’s Fish Export Market Traditionally, communities living around the fish harvesting areas consumed much of the fish
landed in Kenya. However, in the last two decades, commercialisation of fishery activities at all
levels has resulted in development of a vibrant, export oriented industry in Kenya. The export
industry constitutes the largest part of the formal fish industry in the country.
FISHERMEN (Mainly catch, land and sell the fish on the beach)
Factory Buying Agents
Buying Agents
PROCESSING FACTORIES
LOCAL CONSUMER MARKET
(Mainly Tilapia & Rastrineobola argentea (Omena), Nile perch small quantities)
EXPORT MARKET (Mainly Nile Perch: fillet, fresh chilled or frozen; prawns lobsters, octopus, and squids
By-Products Processors (Mainly maws, scales,
Animal feeds, etc
Significant spoilage at the beach

5
The fish industry comprises of 18 processing plants located around lake Victoria, Nairobi and
Mombasa. Since the countries legislation on processed fish is very similar to the EU legislation on
fish and fishery products, these factories have all instituted stringent quality control procedures such
as HACCP and have been issue with EU factory Numbers. Processing/exporting companies are
members of the Kenya Fish Processors and Exporters Association (AFIPEK) whose main
responsibility is to lobby on behalf of the industry. The secretariat of this association is charged
with in-house training on quality control of members, self-enforcement of an industry code-of-
practise and liaison activities with Government and international markets.
The export of fresh, frozen and other processed fishery products from Kenya has a crucial
importance in terms of economic returns and employment for many Kenyans. Currently, 80-90 %
of Nile perch landed in Kenya is used to produce fillets for export. Prior to European Union
Commission Decision 1999/253/EC (suspending fish products, fresh, frozen or processed, caught in
Lake Victoria), 1,892 MT of fish and fishery products were exported annually from Kenya earning
the country Ksh. 3.426 billion in foreign exchange. Bulk of the exports was Lates niloticus fillets
and contributed 16,477 MT (or 87.2 %) worth Ksh. 2.881 billion. The major export markets for
Lates niloticus fillets included European Union (Netherlands, Belgium, Germany, Germany, Greece
and Spain), Israel, Singapore, Australia, Hong Kong, Japan and United Arab Emirates (U.A.E).
The other fish and fishery products which contributed to export earnings are Nile perch swim
bladders, Headless and gutted (H and G) Nile perch, Molluscs (mainly octopus and Squid),
Crustaceans (lobsters, prawns, crabs and freshwater crayfish), live fish mainly ornamental fish, dry
shark fins, fish meals, Marine shells, dried salted fish, Bonitos and Beche-der-mers which are
mainly exported to Singapore.
The European Union is still the market of choice for fishery products from Kenya. This is because
of its proximity to the country, when compared with other markets such as USA and Japan and
therefore the relatively better profit margins. The main export product, Nile perch fillets, is popular
in mainland Europe, where they supplement the dwindling white fish stocks of cod and halibut.
Factors Affecting Fish Exports in Kenya
a) The First Ban Imposed on Kenya's Fish Exports

6
The lake Victorian Nile perch fishery has suffered three EU bans in the recent past. In November
1997, Spain and Italy, both of who are members of the E.U, imposed a ban on Kenyan fish exports
claiming the presence of Salmonellae in fish. Other EU member States, were however, not
influenced by the ban and, therefore, continued to import fish from Kenya on bilateral agreements.
As a result of this ban, both production and export of fish dropped by 13.1% in 1997 in the forex
earnings occasioned by a 33% drop in quantity of fish exported to the EU as compared to 1996. The
quantity of Kenyan fish exports to Spain declined by 86% in 1997 compared to 1996 exports. To
date, fish exports to Spain have never attained the level at which they were in 1996.
b) Second Ban on chilled fish exports
In January 1998, the EU banned chilled fish imports from East Africa and Mozambique because of
a cholera epidemic in these countries. This decision by the EU Sanitary Authorities was
unfortunate, because curative and preventive measures had already been put in place to curb the
spread in Kenya, even before the ban was imposed. Cholera outbreak is indicative of the poor
hygiene standards of a community. The WHO gave a reassurance that Cholera cannot be
transmitted to human through fish that has undergone hygienic processing, an argument which most
of the importing countries in the EU accepted.
The cholera ban greatly affected Nile perch exports to the EU, causing a 24% drop in total quantity
of fish exports, accompanied by a 32% drop in value of foreign exchange. The ban was lifted on
30th June 1998. The decision that lifted the ban demanded an amendment be made on the Fish and
Fishery products health certificates to indicate that 'any person working on and /or handling the
fishery products must have satisfactorily undergone the medical supervision laid down in Chapter
III, point II (B) of Annex to Directive 91/ 493/EEC'.
c) Third Ban on fish originating from L. Victoria
The EU imposed a third ban on fish exports from the three East African States in April 1999, due to
reported purported use of chemicals for harvesting fish in Lake Victoria by a neighbouring country.
The ban resulted in a 68% drop in export quantities in 1999 as compared to 1998. The ban was
finally lifted November 2000 following recommendations of the Veterinary Committee of the EU
after an elaborate demonstration of implementation of a stringent control, monitoring and
evaluation plan for safety and quality controls by the three E. African states.

7
Chapter Two Fisheries demand Analysis
Introduction The export of fresh, frozen and other processed fishery products from Kenya is of crucial importance in terms of economic returns and employment for many Kenyans. Prior to the 1999 EU ban of fish from lake Victoria, 1,892 MT of fish and fishery products were exported annually from Kenya, earning the country Ksh. 3,426 million in foreign exchange. Bulk of the exports was Nile Perch (Lates niloticus) fillets, which contributed 16,477 MT (or 87.2 %) worth Ksh. 2,881 million. Kenya’s export of fish and fishery products currently (2001) stands at about US$ 50 million (Ksh. 3.86 billion) and at same time, the fish industry was the fourth most important foreign exchange earner in the agricultural sector. The major export markets for Lates niloticus fillets include European Union (Netherlands, Belgium, Germany, Germany, Greece and Spain), Israel, Singapore, Australia, Hong Kong, Japan and United Arab Emirates (U.A.E). The other fish and fishery products that contribute to export earnings are Nile perch swim bladders, headless and gutted (H and G) Nile perch, tuna, molluscs (mainly octopus and squid), crustaceans (lobsters, prawns, crabs and freshwater crayfish), live (mainly ornamental) fish, dry shark fins, fish meals, marine shells, dried salted fish, bonitos and beche-der-mers. Types of Fish and Fishery Products Exported from Kenya The types of fishery products exported from Kenya are as follows; Species Nile perch Silver cyprinid Tilapias nei Nile tilapia Freshwater fishes nei Nile crocodile Mouth brooding cichlids African lungfishes Torpedo-shaped catfishes nei Upside-down catfishes Rhino fishes nei Naked catfishes Common carp North African catfish Rainbow trout Salmonoids nei Red swamp crawfish Cyprinids nei Trouts nei Marine fishes nei Demersal percomorphs nei
Pelagic percomorphs nei Natantian decapods nei Emperors(=Scavengers) nei Spine feet (=Rabbit fishes) nei Marine shells nei Octopuses, etc. nei Clupeoids nei Snappers, jobfishes nei Mullets nei Marine crabs nei Sharks, rays, skates, etc. nei Narrow-barred Spanish mackerel Skipjack tuna Barracudas nei Marine crustaceans nei Carangids nei Marlins, sailfishes, etc. nei Amberjacks nei Grunts, sweetlips nei Tropical spiny lobsters nei Various squids nei
8
Sea cucumbers nei Cupped oysters nei ANALYSIS OF CURRENT AND POTENTIAL MARKETS Kenya’s Fish Export Performance
Fig 2 Kenya: Fish exports by Value
0
1
2
3
4
5
1994 1995 1996 1997 1998 1999 2000 2001
Year
Val
ue (b
illio
n K
sh)
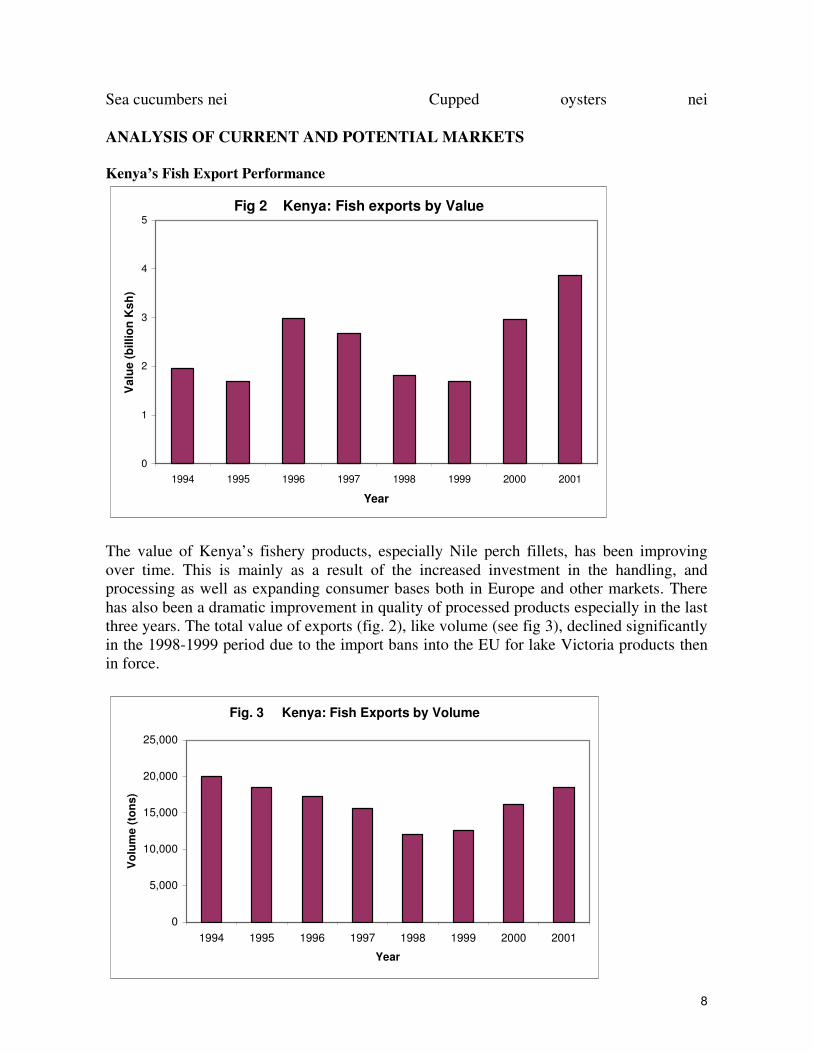
The value of Kenya’s fishery products, especially Nile perch fillets, has been improving over time. This is mainly as a result of the increased investment in the handling, and processing as well as expanding consumer bases both in Europe and other markets. There has also been a dramatic improvement in quality of processed products especially in the last three years. The total value of exports (fig. 2), like volume (see fig 3), declined significantly in the 1998-1999 period due to the import bans into the EU for lake Victoria products then in force.
Fig. 3 Kenya: Fish Exports by Volume
0
5,000
10,000
15,000
20,000
25,000
1994 1995 1996 1997 1998 1999 2000 2001
Year
Vol
ume
(ton
s)

9
The 1997, 1998 and 1999 successive market bans of fish and fishery products from lake Victoria caused a steady decline in Kenya’s’ fish export both in value and volume terms. In 2000 however, there was a marked increase in exports despite the EU ban, which was later lifted, late in the same year (November). This was as a result of market diversification and new markets development efforts by the industry players. The markets that were developed during this period of the ban include Far East countries (Japan, Australia, China, Hong Kong, etc.), Americas (US and Canada), Middle East, Regional Countries (Democratic Republic of Congo) and North Africa (see fig 5).
Fig 4 Kenya: Value of Nile Perch Exports to Various Regions
0200400600800
1,0001,2001,4001,6001,8002,000
1996 1997 1998 1999
Year
KS
h (M
illio
ns)
EU Far East ISRAEL Mid. East OTHERS
Fig 5 Kenya: Volume of Nile Perch exports to Various Regions
0
2000
4000
6000
8000
10000
12000
1996 1997 1998 1999
Year
Vol
ume
(Ton
s)
EU Far East ISRAEL Mid. East OTHERS

10
As can be seen from figures 4 and 5 the importance of the EU market for Kenya fish and fishery products cannot be overemphasised. The EU market used to consume about 87% of total fish exports from Kenya prior to the bans, however, this share declined to the lowest in the year 2000. This can be concluded that any negative developments in the EU adversely affect both the value and volume of exports. T should be noted that the EU market offer premium prices for fish products. Thus despite the observed increase in exports in terms of volume to emerging markets during the bans, the earnings from exports were low as compared to the earnings before the ban. Table 1: List of Products (tons) Exported by Kenya in 2000 HS rev.0
Product Value 2000 in US$ (000)
Quantity 2000
Annual Growth in Value between 1996-2000.%
Annual Growth in Quantity between 1996-2000.%
Annual Growth in Value between 1999-2000.%
Ranking in world market
Annual growth in value of world imports between 1996-2000.%
030199 Fish live, nes 352 129 -6 -15 50 28 2 030379 Fish nes,
excluding heading, livers or roes
754 398 13 13 -51 82 3
030410 Fish fillets and other meats, fresh or chilled
219 51 -56 -59 -45 59 11
030420 Fish fillets frozen 34,255 15,479 -4 7 30 24 4 030490 Fish meat nes,
minced or not, frozen
374 35 -42 -65 160 54 -6
030559 Fish nes dried, whether or not salted but not smoked
523 79 -2 51 571 59 3
030569 Fish nes, salted and in brine, but not smoked
310 57 32 10
030612 Lobsters nes, frozen in shell or not, including boiled in shell
52 4 -57 -64 -91 42 14
030613 Shrimps and prawns, frozen, in shell or not, including boiled in shell
250 55 -24 -19 -27 97 2
030623 Shrimps and prawns, not
857 298 -5 7 -25 38 2

11
frozen, in shell or not, including boiled in shell
030751 Octopus, live, fresh or chilled
73 45 -57 -46 -88 18 6
030759 Octopus, frozen, dried, salted or in brine
591 160 -26 -28 17 30 -7
Source: ITC (International Trade Centre, Geneva) Trade Maps It is important to note that the data in this table is drawn from the period 1996-2000 during which time the Kenyan fish sector experienced 3 EU bans, which caused massive fluctuations in the volume and value of fish exported. Exports of fresh/chilled fillets decreased significantly, since it is difficult to divert to new markets once the exports to traditional markets are banned. Products that were normally being sold fresh were now being sold frozen, and this caused a significant increase of this segment. Due to the glut in the supply situation as a result of the ban, some fish was dried and exported mainly to regional markets. This led to the significant growth in exports of dried fish as recorded in table 1. The EU ban affected mainly fishery products from lake Victoria, however there was a general decline in growth of exports of marine fishery products, which was due to a different phenomenon. Marine catch is usually periodic, with cycles of scarcity lasting even 3 years before the quantities improve. As a result of this phenomenon, the marine catch in Kenya has been low for the last several years and only stared to pick up in October 2002. When the season is down in our region, coincidentally the catch in other oceans and seas of the world might be high. A case in point is the octopus market. Morocco, the world’s main producer of octopus, produces the soft white variety of octopus, which is preferred in the market as compared to the relatively hard and dark variety from our region. These, combined with the fact that Morocco is in close proximity with the Mediterranean countries such as Spain and Portugal, which are the main consumers of octopus, serve to ensure that Morocco sets the world price for octopus. A similar case is that of lobsters where Cuba is the largest producer and therefore a price setter in the world. It is estimated that Cuba produces about 100 tonnes per day in some seasons which when compared to Kenya’s low production further emphasises the point that marine exports from Kenya is grossly affected by what happens in these major producers. EU Market Orientation Tour As part of the sector strategy development, a team of fish sector participants undertook a two week tour of Europe, our traditional market and the world setter of trends in the fish market. The participants were drawn from; the Department of Fisheries, Ministry of Agriculture and Rural Development (CA); the AFIPEK; the EPC; Fish processing factories and the KEMFRI. The countries visited were Netherlands, Switzerland, Germany, England and Belgium. These tours are intended to enable the participants understand the mindset of the buyers in the target markets and to build their collective knowledge bases to help export oriented enterprises, and the institutions

12
that support them, in formulating sector development strategies. They were also expected to help the selected enterprises in the sectors concerned to come up with appropriate business plans that would lead to success in markets of interest to them. The core objectives of the Market Orientation Tour were;
• To build on and diversify existing export business, • To focus on business in northern European country markets, and • To concentrate primarily on developing greater familiarity with all elements of the product
supply chain, and through this identify constraints to business, and development opportunities.
Main Findings Quality Guarantees It was observed that consumers in Europe critically sought for guarantees as regards product safety, quality, reputable source and sound ecological credentials from exporters. Most suppliers in third countries especially developing countries could not provide such guarantees mainly for tuna. Product Form Low value frozen produce: It was established that frozen products, especially whole fishery products fetched lower prices than the fresh chilled and semi processed (filleted, breaded, marinated etc) products. These products commanded low prices and served consumers (often immigrant or visiting populations) who were not looking for high quality standards or characteristics. In this context it was evident that there was substantial unsatisfied demand for fresh tuna, primarily tuna loins, in northern European markets, created primarily by consumer preferences for fresh tuna in a convenient read-to-use form. Matching product form, supply routes and demand: Nile perch, despite the higher profile and branding of exports of fresh skinless fillets to northern European markets from Lake Victoria, the major part of the trade was in fact in frozen product. Here there were no overt concerns about low quality, or suggestions of pandering to the bottom strata of the market. Nile perch fillets have in the recent past been exported increasingly in fresh/chilled form. This has been possible because of the well developed horticultural export sector hence the linkages to the establishment of an efficient airfreight and logistical system in Kenya. It should be noted that it is practical to have fresh fillets landed in the market within 48 hours of the catch. However the need for tight management, extra effort, and higher costs associated with this trade are reflected in the prices paid for such product. But only the top-end of the market is capable of supporting such prices. In developing marketing strategies companies and industries should aspire to supply to the top end of the market, but should also recognise that some of the products, may not meet the exacting standards of this market segment and must actively diversify to other more appropriate market segments. Entry Requirements Export Documentation: It was reported by the Veterinary Inspectorate responsible for sanitary inspections at EU entry points is required to undertake a range of tasks as a matter of law. These tasks are not subject to interpretation and in undertaking these tasks; the Inspectorate applied the rules impartially irrespective countries of origin or different importers. They apply rules on the
13
basis of an assessment of the risks to animal and human health that production practices in the country of origin or by that exporter pose. All shipments, whether samples or commercial shipments, need to be accompanied by a valid health certificate so as to satisfy the authorities that it is safe to recognise it on the face value. It is not valid if it is not fully filled in, or if there is any confusion as to the validity of the authorising signature. Where this is the case, product will be impounded until a valid health certificate specific to the shipment is provided, with costs billed to the shipper. This therefore requires that exporters use a shipping and clearing agent who are fully aware of the requirements, and are sensitive to the time critical nature of such shipments, and are prepared to do whatever is necessary to expedite onward transfer of the shipment to the customer. In most cases of a missing health certificate it will be necessary to send a duplicate certificate from the exporting country on the next available flight. Making sure that you the exporter are made aware of such a situation in a timely fashion is critical to the trade in fresh produce, Using inexperienced and low cost shipment and forwarding agents can be a false economy. Product sampling: It was established that the Inspectorate is required by law to sample shipments according to a fixed protocol and to follow-up with further specified procedures should the specific results of inspection and tests dictate. Thus developing a clear and positive track record with the Inspectorate so that the inspectors recognise your name as a credible exporter and trusted to meet sanitary and documentary standards, by keeping a clean track record of shipment. Part of an Inspector’s decision-making is based on the assessment of past shipping record, if there have been no previous problems with ones shipments, then lesser risk is posed than when there have been several instances where shipping documents have not tallied with product shipped, or where sampling showed irregularities or serious sanitary problems. Product development One of the major revelations for team members was the extent to which western European consumers, especially in UK, preferred near to fully prepared products ready for presentation on the plate for consumption. Consumers are characterised by high incomes and time constraints ("income rich, time poor"). This has major consequences for Kenyan fish processors and exporters. Except for specific niche markets, almost no consumers will see their product in the form that it is exported, and few have any interest in seeing whole fish. Whole fresh or frozen fish presents the household consumer with real problems in deciding how to prepare the fish, how to cook the fish, and how to dispose of any waste from such preparation. To a slightly lesser extent caterers present similar characteristics, and would also like to access product that is ready for use. Only in exceptional circumstances, at the top end of the catering market, would chefs wish to see the whole animal - primarily so that they can confirm that it is actually as fresh as they require (before having the fish cut into the form that they finally wish to use in), or because it is a form of the whole fish that will eventually be presented to the consumer (as in portion or plate sized tilapia or bass or coral cod). Importer preferences Traditionally European importers purchase bulk raw material for onward processing within Europe. Therefore being able to exert considerable control over the specification and sanitary quality of the raw material supply before it is subjected to often costly secondary processing and packing. Part of this behaviour is borne out of an interest in binding as much of the value added opportunities to the importing company, and part because quality control systems in the exporting countries have not been sufficiently consistent to limit the risk of sanitary problems to an acceptable level. These characteristics still apply today, but as a generality the sanitary risks attaching to exports from tropical and developing country sources have been substantially reduced.
14
At the industry level in the exporting country, and at the individual exporter level, little has been done to convince importers that they can and should consider purchasing part or fully processed product from source. Some importers had no immediate plans of buying processed product from the tropics, while others specifically sought to identify exporters who could supply to their processed specification, since the last thing they wanted to be doing was reprocessing and packing in Europe. Combining Labour Cost Advantages With Quality Assurances: It was reported that labour rates throughout the EU were generally higher than in Kenya. In a highly competitive industrial sector such as seafood, the last thing importers need to be doing is sub-contracting local processors to handle product that could easily have been processed to the required specification at source. Typically this refers to the production of fresh and frozen skinless fillets, tuna loins, and cleaned cephalopods, etc., but is also relevant to the packing of fresh and frozen gilled and gutted fresh and frozen product. It was established that, once an importer can be convinced that the necessary basic quality control systems are in place and functioning appropriately, this sort of secondary processing presents little problem, however, more challenges are experienced in the complex processing and requires more testing. It was reported that it take a long time to establish trust with importers before value added products can be exported from developing countries, however with building of relationships, this would reduce the period of building credibility. Entering the value added business To progress from the provision of generic raw material to fillets and then to more value added products has to be based on the development of industry-wide credibility, and the establishment of exporter / importer trust. Industry-wide credibility has everything to do with joint action, and recognition that the reputation of the national industry as a whole is important. This is where promotion of the industry, establishment of accepted and implemented codes of practice across the industry, and demonstration of effective standards monitoring is essential. It should be noted that Kenya fish processors have a code of practice, which is being implemented. At the company level, it has to be recognised that the establishment of credibility in these areas takes some time to achieve, and that it is easier to develop such credibility in the eyes of a small number of importing partners, than with the European market as a whole. So in developing the credibility and then seeking to develop a business in value added processing the strategy should be to do so with one or two European partners with whom the company works particularly closely. Finding the right partners A number of companies met during the tour indicated that establishing long-term relations with importers was by far the most productive course of action. Changing preferred importers, or constantly trying to identify yet another importer to trade with, did not transmit signals of confidence to importers and their onward distribution networks. Better to make informed strategic alliances and work with these alliances over many years. To do this therefore requires the exporter to develop a marketing and development strategy with respect to Europe (and within the context of its business interests in other parts of the world). This requires that an exporting company undertake background research, market research, and market orientation in order to be informed of its strategic opportunities. It is unlikely that the European leader in a particular product line will readily take on a new supplier, and particularly not a supplier that he has not previously been aware of.

15
Accessing the Catering Distribution System Throughout the market orientation tour team members became more and more aware of the complex linkages within the distribution system, the existence of differences between country markets, and between different components of the markets, and recognition that this information was likely to be important in the choice of trading partner. Thus in Germany it was apparent that there existed a number of catering distributor chains that formed a key link in the supply of fresh, frozen and processed product to restaurants and caterers. The chain that was visited had retail and wholesale units located in the main conurbations of Germany, supplying a comprehensive range of drinks and foodstuffs to visiting buyers (housewives, chefs, restaurateurs), and a delivery service to restaurants, retailers, etc. Whilst this chain did some importing business in its own right, it tended to rely on the services of importers in other parts of Europe – for example the Rungis market in Paris, Boulogne on the French coast, Hamburg and Bremerhaven in Germany, and Genoa and Milan in Italy. Thus it is crucial for exporters targeting this segment to identify agents/importers used by caterers network. Accessing Multiple Retailers By contrast, the retail markets in most northern European countries are dominated by multiple retailers – the supermarket chains. This dominance is greatest in the UK (up to 80 per cent of all household food purchases are from supermarkets), but is also very significant in the German, Swiss, Dutch and Belgian markets visited. Here a very small number of key fresh fish processors and distributors are responsible for the bulk of fresh supplies to these supermarket chains. These companies also import on their own behalf, but also rely on a few intermediary importers to supply particular species categories or source from particular geographic areas where they have particularly good connections. Here the processor / distributor focuses on the business of the daily distribution (sometimes delivering two or three times a day) of fresh product to a various supermarket chains, leaving importers to focus on the logistics of accessing product from a range of distant suppliers. In these connections, quality and trust are arguably more important than price. Prices are not usually discussed until the other qualities can be established. Logistical Dimensions of Distributing Product Across Europe Despite the large number of countries that go to make up the European Union, the combination of common commercial structures across the European Union, geographical proximity and excellent transport infrastructure means that increasingly the European Union can be viewed as a single market with regional differences. To service demand in Germany it is no longer necessary to deal with a German importer, or to have product distributed from a German logistical centre. For some years this characteristic has been exploited by traders in Holland (and to a lesser extent Belgium), but it is now possible to distribute to most European markets on a cost-effective basis from many more locations around Europe – for example Antwerp, Boulogne, Hamburg, Lyons, Genoa, Bilbao, Humberside. For frozen imports the ports of Rotterdam, Antwerp and Hamburg / Bremerhaven are dominant entrepôts, with the ports of Genoa, Vigo and Bilbao servicing some of the southern European trade. The European Logistics of Air Freight Similarly, for fresh produce, it is possible to transport fresh fish from almost any reasonably sized European airport to most parts of Europe within 12 to 24 hrs. To facilitate such business, important large-scale logistical centres have been established for air shipment through such centres as Heathrow, Amsterdam and Frankfurt, but most regional airports are now able to handle such perishable cargoes as a matter of course. Nonetheless it is evident that different importers have their preferred airport of entry based on their particular experiences with getting shipments through inspection and customs. Having fresh perishable produce unduly held up at point of entry is a problem that all importers experience. Having the right shipping agent, and building up a good working relationship with both customs and inspection services, are crucial pre-requisites to

16
expediting transit through these airports. But the biggest hold-up in clearing produce through these airports is inevitably where there is a mismatch between product and documents. Getting this right is a pre-requisite to good business. Understanding National / Regional Differences Whilst it was evident during the trip that there were discernible regional differences in industry structure, shopping behaviour and consumer preferences, in general these were rather less than might be expected. The preference in the UK for coated fish products and chilled and frozen “ready-meals”, contrasted with Continental tastes which seemed to favour fillets and steaks, new and traditional smoked and cured products, and consumer packs of marinades and shellfish in various forms of mayonnaise. A general preference on the continent, compared to the UK, for fresh produce, and less reluctance to handle whole fish, was apparent. This was evident in the wide range of whole, head-on fish available in continental supermarkets and retail outlets, and to some extent the successful introduction of fresh and frozen skin-off Nile perch fillets in Germany, Holland and Belgium, but its complete absence from the UK. Food Quality Concerns It was evident that UK traders somewhat expressed greater concern in matters to do with clear indication as to where fish had come from, how they had been caught, and whether the systems of production conformed to environmental and sustainability best practice. On the continental markets, more effort was focussed on the inherent quality of the product (though issues relating to Nile perch and tuna were an issue), whereas this was considered a basic requirement by the upper margins of the UK trade. Given the recent constraints to trade in Nile perch from Lake Victoria associated with the recent EU bans, food quality issues are of considerable concern. Discussions on sustainability and eco-labelling issues held with the Marine Stewardship Council, a representative from the Commonwealth Secretariat and a fresh fish importer supplying certified product to supermarkets in the UK, in London proved particularly interesting in this regard. Arising from the meeting it was apparent that these matters should be taken further in respect of sustainable fishing of tuna, and the harvesting of Nile perch in Lake Victoria. Obtaining Certification of Quality Systems in Supplying Factories: As with supplies to the US (where the production systems and processes need to be certified as applying HACCP, quality control systems), the EU requires that the premises and systems used in supplying fish from exporting countries (as with the supply of fish by producers and processors within the European Union) need to be certified as complying with a basic set of EU health directives. Imports that do not hail from a certified plant are not allowed into the EU. Inspection and quality systems should be made more of in establishing the credibility of exporting industries, and in promoting seafood exports from Kenya. This is not currently evident in the promotional efforts made by the Kenyan industries, which expects to obtain EU approval for their inspection system shortly. PROMOTING THE KENYAN FISHERIES INDUSTRY It was apparent that many importers and fishery trade members associated Kenya with Nile perch exports, but however there was little product recognition with respect to Kenyan seafood industries. This may not be too surprising given the relatively small scale of the export industries, which represents a major barrier to trade and development for the industry. Rather more needs to be done to promote the expertise, products and credibility of the Kenyan industry. To date, most of the running has been left to individual companies, with varying success. Much of the promotion has been more opportunistic than strategic, and in some cases the exporting companies may have been promoting systems, volumes and qualities of production that they have not been able to realistically support. Since reputation and credibility are now clearly increasingly important to establishing and

17
maintaining comparative advantage in a highly competitive market place, greater co-operative effort needs to be expended in developing and promulgating these characteristics. In the instances of Kenya it is clear that the industry has much to be proud of, and that whilst further development is undoubtedly necessary, more should be made of what is there now. Superiority of Kenyan distribution systems over those of Europe: In this context, it was of note that whilst on the one hand the facilities and materials associated with fresh and frozen fish handling in Europe were often substantially better than those available in Kenya, the quality of the fish being handled was in many respects below that considered as standard in Kenya. It was, therefore, something of a revelation that marine fish harvested in European waters could be easily five to ten days old before it even reached first-hand sale, meaning that the product that reached the consumer could be substantially older than this. Given that the Kenyan Nile perch industry seeks to get its best fresh fillets to destination market within 48 hours of capture, the contrast is striking. Much more needs to be made of this advantage whether associated with a fresh distribution chain or a frozen one. Preparing a promotional package for importing industries: The Kenya Fishery sector, both at the support institutions and industry level, had not developed promotional materials. Given the poor product and country recognition evident amongst importers and other further down the supply chain, it is essential that more efforts be made to help them buy Kenyan. As a matter of urgency, once a seafood strategy has been developed for Kenya, some national material needs to be developed in printed and web-based form. In addition, some effort should be made to place appropriate editorial material in the international trade press, and to consider encouraging the making of documentaries and radio programmes on the respective production systems for showing in Europe (TV and radio programmers throughout Europe are particularly interested in food, environmental, marine and rural development stories, and there are many production companies and special interest groups interested in putting together such stories). International trade shows: Further, such material can be used to advantage at appropriate international trade shows. There is some evidence of declining interest in such shows on the part of the trade and economic development agencies, meaning that co-funding of attendance at such shows may be more difficult to raise. But in part this is due to poor past experience, and less than impressive representation. In this regard, at least some consideration should be given to supporting companies in making representation through their preferred European trading partners, as well as using well-thought out national stands. This requires that national bodies and individual companies take a much more professional and pro-active stance to building up the reputation of their home industries as a whole, and making life much easier for importer, catering distributor, retail multiple and consumer to recognise and act upon the high reputation of Kenyan exporters. Inward missions: By the same token, when potential importers visit Kenya, they must feel able to contact the industry easily (email and fax access is now a must), and should be able to undertake much of their background research on the Internet, through national embassies, and through trade profiles. During the mission there were at least two instances where businessmen described how difficult and off-putting it was to try and establish contact with bona fide exporters in some countries. Indeed it seemed to be that only by the shear determination and spirit of the importer to find a source of supplies, rather than any effort on the exporting country or industry, was any trade likely to result from such visits. This is a very poor reflection on exporting industry. And not just the national export promotions board. There is a real requirement for exporting companies to buy-in to a strategic and co-ordinated approach to long-term seafood exports, supported by individual company

18
efforts. It is not enough to consider this a job of government or its agencies, and it is not enough to consider it the job of exporter associations if they are also under-supported and under-funded. Value added processing: There was considerable interest on the part of tour members in value added processing. Interest ranged from identifying new high value outlets for brine frozen tuna to developing trade in hot smoked products; from exploring opportunities for producing portion controlled Nile perch retail packs at source to stepping up the sale of fresh and frozen reef fish produced using sustainable small-scale fishing practices. Whilst a number of importers indicated that there was certainly a market for some value added products, stepping up the chain from supplying primary processed product required a secure partnership with an informed importer, processor or distributor (or all three). It was made quite clear that there was no purpose to an exporting country deciding that it wanted to sell a particular value added product without undertaking considerable market investigation and product development work – in the destination market. At a time when everyone was going on about the development merits of “value added processing”, this was a salutary lesson that it was not just a matter of electing to undertake value added processing, but that once again it had to form a coherent part of a long-term strategic development plan. Smoked fish: There was some interest in developing exports in traditional hot-smoked marine and freshwater product. By capturing slightly larger improved smoking systems that could generate the improved economics of production it was thought possible to provide at least some skilled producers with secure long-term business opportunities. Indeed it was identified in each of the markets visited that there was a consumer market for hot-smoked product (herring kippers, mackerel, Arbroath haddock smokies, sprats, etc.) but that these markets were in decline. Further, it was identified that there were growing concerns about the tar content of such smoked products and that this was particularly pertinent to high temperature and intense smoked product. On balance it was identified that it would be unrealistic to seek to export traditional smoked product to Europe except to supply a small, low priced expatriate market. Instead, there was a growing market for light cold smoked products – such as for halibut, sail fish, tuna, Nile perch, etc., but that any ambitions in this direction could not realistically be undertaken at an artisanal scale. They required the use of sophisticated electrically controlled kilns within a tight quality controlled environment. Tuna: For tuna, it became quickly apparent that the northern markets of western Europe are crying out for ever increasing quantities of fresh and frozen tuna from guaranteed sources – in terms of location of capture, method of capture, and nature of handling from line to table. The problem being faced by importers, distributors, caterers and retailers was that so few suppliers could actually provide the necessary level of information about their product, let alone to guarantee that the product being delivered was indeed the fish that actually met that specification, rather than fish from another fishery altogether. In this area of the market it was clearly evident that brine-frozen fish was quite low priced. One of the outcomes of a number of meetings was that there could be particular interest if producers were to consider switching from the use of freeze-at-sea tuna pole and line vessels to a fleet fishing fresh product closer to shore on a daily delivery basis. Supported by high standards of traceability, such production could constitute a very lucrative value added development route (the value added occurring less from the processing and more from the addition of specific product quality and traceability guarantees). Reef fish / tilapia: It was also evident from a number of meetings that there was considerable interest in a range of small fresh (and frozen) tropical reef fish, offering “exotic” table sized fish for consumption in restaurants and in the home. Considerable headway had been made in the production, distribution and marketing of farmed tilapia (Jamaica and Zimbabwe) and sea bream (Greece, Turkey, Italy),

19
but that a wild product could be sold with a caché over farmed produce, and that there was considerable room in the market-place for a wider range of species. Adom Seafoods was already exploiting this possibility in the UK market, but was well aware that his production capacity came no-where near to meeting demand KEY STRATEGIC INDICATORS FOR KENYA Below are listed some of the main strategic indicators for Kenya arising from discussions and visits associated with the market orientation tour
• Approach the objective of moving up the value added chain in the processing and export of Nile perch through a strategic approach at national and company levels involving the strengthening of national seafood identity through information and PR initiatives, and the formation of strategic partnerships with European importers and processors.
• Substantially improve outside accessibility to information on the Kenyan seafood trade
through the publication of overview material, the preparation of an appropriate seafood Internet portal, and the placement of editorial material in the international trade press and Internet magazines and information sites.
• Make much more of the inspection and quality control infrastructures already in place in
Kenya.
• Be ready to use much more adventurous PR channels (film and TV, inward missions) to influence public opinion as to the probity of the Lake Victoria Nile perch fishery, and to challenge and correct attacks on its environmental, biodiversity, socio-economic and economic dimensions.
• Not to forget that there are many more seafood species and products that could find a
valuable place in the European and other markets; strengthening the national branding of seafood in support of the Nile perch trade would also support trade in other products, which could provide valuable additional volume in the use of expensive air and sea freight distribution.
• Give serious consideration to securing sustainability, quality and eco-labelling certification
for various elements of the Nile perch supply chain, for example through Marine Stewardship Council certification.
• Provide some strategic focus to the future development of the sector through establishment
of a long-term strategic plan - focusing on quality systems, freshness and sustainability. • Slowly step-up the development of small fleets of artisanal vessels capable of supplying
fresh iced fish and shellfish to a high value export markets based on the increased use of air freight.
• Explore the possibilities of developing reasonably large-scale tilapia farming enterprises.
• Explore the possibility (initially through exploration of technical and economic feasibility)
of developing and supporting a small number of sophisticated fish smoking operations focused on precision process control employing electronic kilns capable of producing hot and cold smoked product.

20
Implications of International Trade Reform It is easier to conceptualise international trade reform by looking at effects of globalisation. Globalisation entails processes of international economic integration, whose key features are the global opening up of financial markets and the increased mobility of foreign direct investments. Finance for investments is no longer being limited to available domestic credit, but to efficiency in order to maintain market presence. In addition, domestic markets will be infiltrated with more foreign products, leading to closure of inefficient inward-looking production structures and possibly unemployment.
Nile perch, the principle fishery product export from Kenya is native to the region. As such, the region still enjoys a monopoly supply of the product to the world market. The region has never to date met market demands for the product. Other fishery products, especially marine, do not enjoy such a monopoly but have to compete with major world producers for market share. Kenya is signatory to various pacts impacting on trade, the most relevant for the fish sector being the World Trade Organization (WTO), the Cotonou Partnership Arrangement (CPA) which was preceded by the Lome Convention, reforms on EU Common Agricultural Policy (CAP), EU Directive 91/ 493/EEC which lays down the requirements for handling and placement into the market of fish and fish products and the Codex Alimentarius. WTO Trade Reforms GATT, especially during the Uruguay Round of 1986 to 1993, formed the basis of the majority of trade agreements currently under the WTO. The major aims of the Round were to deepen liberalization of trade expected to lead to expansion of traded volumes, improvement of market access for goods originating from developing countries, and to bring in more of traded goods, previously governed by separate protocols, under the discipline of multilateral trading system. The WTO, starting in January 1995, therefore found itself already on a firm base to implement the agreements. It is under such agreements that Kenya was able to launch and sustain fish exports to EU from the late eighties to the nineties. Agricultural agreements under WTO concentrate on three areas: Market Access; Domestic Support and Export Subsidies. In Market Access, the Agreement aims to streamline rules like tariffication of protective measures, and then reduce protective tariffs in agreed schedule. The Agreement also aims to reduce (or possibly eliminate) the negative effects of support and subsidies, each of which has the effect of encouraging inefficient producers to remain in business at the expense of more efficient but unsupported foreign exporters. Markets are therefore distorted since prices do not reflect the actual cost of production. The Agreement on Agriculture provides for systematic reductions on farm support based on a base period. The effect will be that some elements of market distortion will be eliminated, paving the way for rewards to comparative advantage and efficiency. To date, domestic farm support and export subsidies in developed countries remain some of the toughest challenges to competitiveness of agricultural exports from developing world. Of specific interest to the Kenyan Fish industry is the subsidised sustenance of uneconomic fishing fleets of competing species such ad cod and haddock. The implementation of Sanitary and Phyto-sanitary (SPS) measures has a double-edged role; they lead to improvement in industry standards, such that they can compete at world level, but also are expensive to implement, and therefore stifle upcoming enterprises. Technical Barriers to Trade (TBT) agreements have also been challenged as discriminatory trade practices. The legal process for challenging implementation of SPS and TBT measures by large economies is costly to small (and especially developing) economies. Even with the assistance of the WTO under its mandate,
21
the disruption of production processes in affected economies could take long to revive after disputes settlement. Implementation of these measures in Kenya led to closure of nearly half of all fish processing factories, and costly upgrading of the remaining ones. One of the probable impediments of implementation of TBTs to the Kenyan fish industry is the combined effect of the fact that current world demand of most fishery products outweighs supply, and lake Victoria is the only source of Nile perch. Kenya is signatory to various ILO conventions on utilization of labour. Some of the challenges of such international labour regulations/standards could be explained by income levels, and also by the nature of production processes for particular products in developing countries. In terms of working conditions, again issues centre on unemployment and the ability on the part of employer to afford better packages. Trade-offs have to be brought to play. Unfortunately, there are indications that lobby groups have continued to use these loopholes to campaign against imports from developing countries like Kenya. The Trade-Related aspects of Intellectual Property Rights (TRIPS) Agreement also posses another challenge; those in the know will rush to patent new technologies in order to benefit from royalties arising from use of these. The TRIPS Agreement provides that “patents shall be available for any inventions, whether products or processes, in all fields of technology, provided that they are new, involve an inventive step and are capable of industrial application”. This implies that even in agriculture, technology, especially at breeding stage, will become increasingly a trade issue and that the benefits of trade may not so much go to the farmer but owners of technology. Recently, countries such as China have expressed strong interest to farm Nile perch, with official requests for fingerlings being made to the regions Governments. Even though the fish is still inherently difficult to farm economically owing to its carnivorous eating habits, countries in the Far East could farm it efficiently, threatening east Africa’s current market share. The industry and Governments of the region are currently exploring patenting the processing of Nile perch products, and trade marking the fish from lake Victoria. Regional Economic Integrations There have been strong moves towards easing trade barriers amongst participating countries of a regional integration initiative. These steps could include reduction or elimination of trade tariffs, easing intra-regional trade regulations including documentation and harmonization/unification of extra-regional tariffs and regulations, among other measures. The particular measures implemented depend on level of integration. Although the various trade arrangements are sometimes achieved amongst countries that are geographically detached or distant, there is widespread occurrence of economic blocs of countries sharing common borders. Advantages of this are several, from culture to pure economic calculations. Whatever the degree of integration, whatever the geographical spread, trade protocol has been assuming a central role in economic blocs. Inevitably, members of the bloc are given preference in terms of intra-bloc trade preferences. Since preferential treatment amongst integrated states is provided for under WTO as one of the exceptions to the Most Favoured Nation (MFN) treatment, exports external to the bloc meet stiff price competition from “domestic” producers. Traditional fishery products such as smoked and dried fish, mainly sold to countries such as Congo and other central African states, are expected to benefit from such integrations. High quality fishery products destined for high-end consumers in COMESA countries could fetch prices comparable to those in Europe. These regional integrations could therefore contribute to diversification of the market base for Kenyan fish.

22
Effect of Cotonou Agreement on Fish Sector The Lome Convention successor, the Cotonou Agreement, is perhaps the most important (for Kenya’s fish sector) of all the trade reforms being undertaken worldwide. This Convention provided market access to former colonies of the EEC member states. The former colonies were spread across African, the Caribbean and Pacific states, thus the ACP. Market access was limited to unprocessed agricultural products and minerals in terms of duty free entry, and some commodity protocols that accorded target countries some guaranteed market quotas. Some other financial assistance envelopes were extended to address supply-side constraints. It is significant to note that Lome provisions were preference types – there was no negotiation. Under Cotonou, market access provisions are negotiated. For developing countries like Kenya, the preference will be on reciprocal basis after year 2007. A look at tariff trends predicts the future competitiveness of Kenya’s fish exports:
i. The general trend under the WTO regimes is that tariff levels will decline and be more simplified. This means that concessions that are built on tariffs will relatively lose appeal. This further implies that even blocs where tariffs are cornerstones of integration, the justification of intra-bloc trade will be weakened;
ii. Due to reductions of tariffs under WTO, the significance of benefits of the Generalised
System of Preferences (GSP) scheme between the OECD and developing countries will also go down;
iii. Under the Cotonou Agreement, developing countries like Kenya have to brace for
reciprocal with EU Member States after 2007. This implies opening local markets for competing EU products if Kenya wants that kind of preference to access the EU markets.
iv. The other implication is a greater challenge to developing country exports in the EU when
the Least Developed ACP Member States continue enjoying non-reciprocal trade preferences after year 2007. It becomes more vivid when one considers that under the current equal treatment, some Least Developed ACP States are already posing great challenge to their developing counterparts in ACP. Should the preferences in LDCs be attractive enough, it would be expected that investments in export oriented areas targeting the EU markets would move from the ACP Developing to the ACP LDC States. A case in point will be the effect on Nile perch exports, given that Kenya is not an LDC, while Tanzania and Uganda, who export the same product from the same source, are LDC.
v. One lesson learnt from Lome phases is that if supply constraints in ACP member states are
not appropriately addressed, the expected positive impact of market access provisions to ACP exporters will not be felt. It is of greater concern that development assistance pledged under the Cotonou and broadly under WTO is properly utilised if these trade-oriented pacts are to be of any use. Developing and Least Developed countries should also use these short-term provisions to built capacities that would in the long-term make them competitive with or without preferential treatment.
The EU Common Agriculture Policy (EU-CAP) The Common Agricultural Policy (CAP) of the EU is a domestically oriented farm policy whose main objective is to support farm incomes, increase agricultural production, ensure a fair standard of living for the EU farmers, stabilise agricultural markets, guarantee regular supplies of agricultural products and ensure reasonable prices to consumers. Since CAP was developed and

23
implemented in 1962, it has largely depended on price management system to achieve its multiple objectives. The CAP aims at supporting the incomes of the EU farmers through;
• Purchase of surplus supply of produce especially when prices fall below agreed minimum prices
• Application tariffs at the entry borders of the EU so as to ensure that imports into the EU are
not sold below the desired set internal market prices. Methods used in managing prices of agricultural products include target prices, intervention prices and export subsidies. All these tools serve to distort the markets by raising prices higher that the world prices and encourage inefficient production in the EU. Again these tools are incompatible with the WTO rules and are being contested by WTO members. Thus to be WTO compatible the EU has instituted reforms called the EU Agenda 2000 whose objectives include;
• Improve the competitiveness of the EU agricultural produce on both domestic and external markets,
• Ensure the highest possible food safety and to promote food quality,
• Ensure a fair standard of living for farming (rural) community and to contribute to the
stability of farm incomes,
• Integrate environmental goals into CAP and to develop the role of farmers in the management of the natural resources and landscape conservation,
• Promote the creation of complement or alternative income and employment opportunities to
farmers and their families on farm and off farm. The CAP reforms are geared towards removing direct price support system to farmers and replacing it with direct aid (payments) coupled with measures aimed at protecting the environment. The impact of the CAP review will include reduction of internal price of EU agricultural products (close to world market prices) without undermining farm incomes, making EU WTO compatible, enhance EU’s competitiveness in the world market. These EU CAP reforms will result in;
• The reduction of the value and margins of preferences obtained under the Lome and GSP arrangements since market distortion as a result of price support system will have been eliminated,
• Increased use of TBTs, SPS and other legal instruments to bar imports from third countries
including Kenya,
• Lower prices for imports into the EU hence less earnings to exporters since target price will be the same as the world price.
As a result of the change in policy and over fishing in the North Sea, the EU is currently paying fishermen not to fish so as sustain and conserve fish. Measures have also been instituted to increase

24
mesh size, impose catch quotas and seasonal fishing. This will have the impact of increasing imports of fish products from third countries including Kenya. FISH QUALITY STANDARDS There has been enormous development in the past decade in fish production and processing industry in Kenya in response to expanding markets. However, trade in this sector (retention, market share gain and growth) has been plagued by an array of fluctuating hygiene and quality control standards, relating not only to the fish products themselves but also to the processes by which they are produced and handled. The proliferation of standards has been occurring and affecting the industry directly at the public level (CODEX, regional blocks and local country) and indirectly at the private level (through the supply chain management, consumer demands and other civil rights organizations). The changing standards however, have resulted in significant overall improvement in quality control practices in factory operation. In spite of the improvements achieved, the industry itself has not been left unscathed by the fluctuating hygiene standards. This has been due to contradictory audit reports and a lack of an internationally agreed fish processing factory model internationally approved, down to all the equipments, where a manual can easily guide an investor. The fish industry in Kenya is governed directly by six sets of standards operated through three organizations:
- Fisheries department � Fisheries act cap 378 laws of Kenya and � the Fish Quality Assurance Regulation 2000.
These standards are implemented and enforced through the fisheries department (the Competent Authority). The Competent Authority structure had to be developed and operationalised to ensure efficiency in assuring fish safety and quality.
- Kenya Bureau of Standards –
� Kenya Fish handling standards KS05-1516 and � Specification for drinking water KS05-459.
These set of standards are implemented and enforced through the Kenya Bureau of Standards
- European Union –
� EU directive 91/473/EEC and � the EU directive 98/83/EC.
These standards are implemented by the EU and enforced through the competent authority with periodic audits by the EU inspectors
The Fish industry, specifically the Export sector, is also organised into a professional industry association, the Kenya Fish Processors and Exporters Association (AFIPEK). The secretariat of the association has three main mandates;
� Liaison with Government, and International bodies on matters of fish quality � Enforcement of an industry-wide international code of practise for processing of fish

25
� Promotion of fish and fishery products from Kenya.
- The Fisheries Department – fisheries Act cap 378 laws of Kenya and the Fish Quality Assurance Regulation 2000.
The Fisheries Department is the technical implementing body of the Competent Authority for purposes of quality assurance of Fish and Fishery products in Kenya. The Fisheries Department since the year 1999 was moved to the Ministry of Agriculture and Rural Development. On 11th August 2000 the Minister invoked section 23(2) of the Fisheries Act to set out “The Fisheries (Fish Quality Assurance) Regulations 2000”. These regulations address the gaps that had been observed in the Act with particular reference to assurance of fish quality and safety. The Fisheries (Fish Quality Assurance) Regulation 2000 created a single Competent Authority, the Ministry of Agriculture and Rural Development responsible for Fisheries Department. The publication and official launching of the regulations led to the achievement of a one stop Competent Authority mandated to assure quality and safety of fish and to regulate fishing activities nationwide. The Management of the Competent Authority in matters related to fish quality assurance is guided by the Fisheries (Fish Quality Assurance) regulations 2000, which states that the Competent authority shall be directed by a standing committee, which comprises Permanent Secretary to the Ministry who is the chairman, Director of Fisheries and the Director of Veterinary Services and Agriculture as members. The Standing Committee handles major decisions and interventions e.g. new establishments, and vessels, quota systems, awarding establishments and vessels with Certificates of Compliance and Permanent Reference numbers for export among other functions. The regulation 2000 also states that the department shall work in collaboration with the Bureau in the establishment of Kenya Standards for fish handling and processing. In circumstances where some standards are not covered in the aforementioned Act, the fisheries department invokes the Standards that are provided by the Kenya Bureau of Standards, which is the Kenyan standards body. The fish quality standards of Kenya are fashioned around the EU regulations, which was adopted by the fisheries department and incorporated in the Fisheries Act Cap 378, the Fisheries (Fish Quality Assurance) regulations 2000. The standards cover the sector across board from the fishing grounds, aquaculture to marketing of the fish and fishery products. The key feature of this Regulation is that it aims to achieve a health attestation of wholesomeness of all fishery products (whether fresh, chilled, or frozen) and all support materials that come in the preparation, processing, packaging, storage and transportation of the product. The regulation imposes strict recommendations on the fishing grounds for any pollutants; controlling of fish landing, handling and transportation; approving new fish processing establishments on building, construction, equipment, water purification and operation of Fish processing plants and factory vessels. The regulation also gives recommendations to the competent authority on inspection of operational fish processing plants to ascertain compliance with the Kenya standards for handling and processing; services of laboratories for microbiological, physico-chemical, pesticide and heavy metal analysis of fish products are used with a provision of a health certification of fish and fishery products on the basis of HACCP. The regulation also lays down all the procedures to be followed for compliance with these regulations. It also gives guidelines on approving of establishments of fish markets; specifies conditions for placing on the market of fish and fishery products and maintaining a register of approved fish processing plants, auctions and wholesale markets and landing sites.
26
2. Kenya Bureau of Standards - Kenya Fish handling standards KS05-1516 and Specification for drinking water KS05-459 This code applies to fish for human consumption and sets out the treatment that shall be applied to fish from the time it is taken from the source through all the stages in order that it reaches the consumer whether on the home market or export market in top quality condition. The document is also an adoption of the EU directive 91/493/EEC with modifications to meet Kenyan export and import requirements. The Food Standards organisation role mainly include:
• Advice to traders on food labelling requirements
• Sampling of foods to ensure compliance with compositional standards
• Monitor use by dates on food
• Carry out food surveys for national and regional clients
• Visit retailers and manufacturers to ensure they comply with food legislation 3. European Union - EU directive 91/473/EEC and the EU directive 98/83/EC. The EU directive 91/473/EEC - laying down the health conditions for the production and placing on the market of fishery products and potable water directive 98/83/EC are the guiding principles in which the local fish standards are fashioned. The directive states that:
• It is the responsibility primarily, of the fisheries industry to ensure that fishery products meet the health requirements laid down in this Directive. This allows for investigation to be carried out during the production phase and recording of the data.
• That fishery products from third countries intended to be placed on the market of the
Community must not qualify for more favourable arrangements than those applied in the Community.
• A provision for a Community procedure for the inspection in third countries of the
conditions of production and placing on the market in order to permit the application of a common import system based on conditions of equivalence must be in place
• It also mandates the competent authorities to carry out checks and inspections, ensure that
producers and manufacturers comply with its’ requirements. The competent Authorities are held solely responsible for the monitoring of the plants. They are then expected to submit a list of factories complying with the directives who then are issued with the official EU number authorising them to export to the EU.
Directive 91/492/EEC is based on the HACCP principles whose main purpose is to avoid systemic detention, heavy sampling and laboratory checks at the points of entry in the EU. The directives scope is broad based and instructs that the essential requirements should be laid down for the correct hygienic handling of fresh and processed fishery products at all stages of production and during storage and transport.

27
Directive 91/493/EEC imposes strict recommendations on the building, construction, equipment, purification tanks and storage tanks. The premises are expected to have laboratories. Record keeping is paramount and there are clear guidelines on labelling of packaging material. The cost of compliance to the directives has been very high on the industry. At the regulatory level the implication of these directives in Kenya resulted in the updating of cap 378 fisheries regulations and adopting of the current fisheries regulation 2000. Inspection services have had to be re-organised and the production units have needed to improve on facilities and equipments, handling and processing. The Kenya Fish processors and exporters association (AFIPEK) The Formation of this professional industry association was one of the conditions, together with establishment of a Competent Authority and enactment of the necessary legislation, which were demanded by the EU as a pre-condition to harmonization of the country with EU. One of the first tasks of the industry association was to draw up an industry code of practice, based on Fishery regulations in the country, and international standards, which was achieved in 2000. The secretariat, since it is manned by personnel competent in fish industry quality control matters, conducts in house inspections of member companies to ensure compliance. Other benefits of the establishment of the association has been facilitation of liaison of the Competent Authority with industry, organizing promotional (buyer-seller) activities for members and discussions with EU and other international bodies on matters of industry-wide importance. Other activities being undertaken by the association are training on hygiene and quality control for members and participation in infrastructural improvements of the fishery sector. Fish Sector Issues Associated with Quality Control From 1996 to 2000 the industry has been beset by numerous EU market bans. The first ban in 1997 resulted in a drop of 13.1% in foreign exchange earning with a drop in 33% in quantity of fish exported to the EU. In 1998 following the second ban, foreign exchange earnings dropped by 32% with a 24% drop in quantity. The third ban in 1999, which was subsequently lifted in the year 2000, resulted in a drop of 68% of fish exports to the EU. The net result of all these problems has seen the closing down of some of the major fish processing factories with thousands of jobs lost. This has escalated the level of poverty amongst the fishing communities. These issues have put lake Victoria on world focus resulting in fish from this lake being among the most scrutinized food item on international market. Even though the recent EU ban on fish from lake Victoria was occasioned by use of pesticides for fishing in a neighbouring country, it was not immediately lifted in the 3 East African states even when the problem had been contained. This is because the EU used this occasion to reorganize the entire industry to comply with the international standards. The lifting of the ban was made subject to a country meeting four principle requirements: • Establishment of a Competent Authority • Professional reorganization of the industry • Adherence to hygiene and quality standards • Enforcement of appropriate legislation

28
It should be noted that to date Kenya, has not yet been harmonised with the EU in terms of fishery products. It is still on list II, as opposed to list I (fully harmonised). Currently the country is still exporting fish to the EU on bilateral agreement with individual EU member states and, therefore, has to fulfil their individual conditions. When fully harmonised, Kenya will be able to export to any EU member state without additional conditions other than those set in the EU regulations and EU Commission Decisions. In line with the Country’s legislation on fish and fishery products, the Competent Authority has put into place several measures to ensure compliance with the standards. The competent authority has designated 10 landing beaches for landing of fish, down from over 200 beaches where fish for export used to be landed. These sites have a banda and some other basic facilities for handling fish. Other facilities such as ice making equipment still lack in these beaches. Due to the high demand for fish for export in Kenya (the supply has never been able to meet demand), incoming fish from boats is soon loaded into trucks, which have ice for onward transportation to the processing factories. This minimises quality losses at the fish landing sites. Infrastructural problems, especially condition of roads leading to fish landing beaches continue to hinder quick flow of raw materials to the factories, and this increases the cost of doing business. The quality of the transported fish is however guaranteed by the 1:1 ratio of ice to fish enforced by the CA, through their officers who are located on the landing points. The country now has an internationally accredited Laboratory, the Kenya Bureau of Standards (KeBS). KeBS is accredited with United Kingdom Accreditation Services (UKAS), and the fish industry relies heavily on their microbiological laboratory for analysis. The Kenya Plant health Inspection Services (KEPHIS) laboratory has been inspected severally by official EU inspectors and found competent to handle analysis of pesticide residues in fish. The industry therefore solely uses this lab for the monitoring of pesticide residues in both water and fish in Kenya.
29
Chapter three
3.00 THE POLICY ENVIRONMENT
The fisheries sector has both backward and forward linkages to the rest of Kenyan economy, and its
importance cannot be underscored in provision of food, employment and income, which are core
factors in Kenya’s growth and development. The fisheries sector therefore, just as is the case with
the whole of the Kenyan agricultural sector has an important role to play in poverty eradication
and in the overall development.
With the wake of globalisation and market liberalization, governments world over are increasingly
expected to play a lesser role in markets instead leaving the markets to be controlled by the
‘invisible’ hand of free markets. However, governments even in the so-called free market states get
involved in their economies through the formulation and implementation of public policies.
Reasons why government get involved in their economies are many and varied but all stem up from
the failure of free markets to deliver the ingredients of development. Government policies (which
are basically the deliberate courses of action undertaken by the government) are therefore expected
to correct these market failures.
The policy process (i.e. formulation and implementation) is an interplay of different agencies and
supporting institutions play a great role towards attaining these policies. However, the attainment of
the specific policies is always limited by the constraints that face the different relevant institutions.
This section analyses Kenyan policies relevant to the fisheries sector and the institutions involved in
the sector.
The Policy environment The fisheries act, (cap 378, Republic of Kenya, 1991) and its additional legislative
supplement, the fish quality assurance regulations 2000 are the main legal documents
providing for the development, management, exploitation, utilization and conservation of
fisheries and for connected purposes in Kenya.
Relevant policies for the Kenyan fisheries sector in this study will be classified and
discussed under four main categories: Production development policies, conservation
policies, Industrial development policies and land policies.

30
4. 1.3.1 Macro economic policy
This is crucial for success of any industrialization strategy. A stable macro economic
environment with sound monetary and fiscal policies leads to reduced budget deficits and
therefore reduce undesirable effects of budget deficits on inflations, more specifically on
prices and interest rates. Monetary policy among other things should seek to achieve price
stabilization, lower interest rates, and achieve a desirable exchange rate.
The current policy on economic liberalization has lead to liberalization of the exchange rate.
However interest rates continue to be high in Kenya, a factor that discourages borrowing
and therefore may constraint small and infant industries.
4. 1.3.2 Trade policy
Trade policy is an important component of any country’s development strategy. In Kenya in
particular, trade policy has been a crucial instrument used by the government as a part of its
overall policy tools to achieve development in line with poverty reduction and industrial
development. Over the years, Kenya’s trade policy has evolved over two main regimes:
• Period before 1985:
Trade policy was characterized by protectionist type of policies aiming at import
substitution. This kind of trade regimes was also characterised by government trade
controls, which in addition to protecting the domestic industry also aimed at reducing the
loss of foreign exchange reserves. The impact of these policies was a massive anti-exports
bias.
Protectionist type of trade policy should only be applied for a limited period to enable the
infant industry to grow after which period the policies should move towards a free market
situation, therefore leaving the industries to compete freely for their survival.
• The period after 1985 (the current trade policy):
The strategies that have shaped the current Kenyan trade policy were first presented in
sessional paper No. 1 of 1986 on economic management for renewed growth (Republic
31
of Kenya 1986). In particular, strategies in this document encouraged moving towards a
more outward looking trade regime, strengthening and increasing overseas market
access for Kenyan products and further integration into the world economy. The current
poverty reduction strategy paper (PRSP) describes the objectives of trade, tourism and
industry sector as to promote product and market development and competitiveness.
• Market development objective Enhancing market access is pursued mainly through Regional and bilateral trade negotiations within
the African region as well as through multilateral trading arrangements such as inn EAC,
COMESA, AGOA, EU-ACP).
Of special reference here is the ACP-EU trading arrangement, which gives the African,
Caribbean and Pacific countries with preferential market access to the EU markets. This
agreement through its successive agreements has encouraged trade between Kenya
European Union member states. Of critical note is that preferential trading arrangements are
increasingly being challenged and are being pressurized to become WTO compatible, which
calls for elimination of the preferential market access and movement towards trade
liberalization. A critical implication of this to the Kenyan industries exporting to EU under
this arrangement is that there is a need to increase their production efficiency and
competitiveness to give them a competitive edge internationally in the absence of the
preferential market access provisions.
In general production and transaction costs in Kenya are high and there is a need for a
strategy to reduce them, as this will contribute towards an increased competitiveness.
Production development policy Production policies aim at enhancing productivity or total production. The necessity to increase
fisheries production stems from the need to increase production for both domestic consumption and
for export. Fish is an important source of protein especially to the communities living around the
lake Victoria. Indeed, the national food policy (Republic of Kenya, 1981) has stressed the
importance of fish in achieving food security. By 1998, more than 100 000 people had been
employed directly or indirectly in the Kenyan fishing industry. Foreign exchange earnings from the
fisheries exports have also been increasing. It is from this multi-dimensional contribution towards
development that increasing fisheries production is deemed necessary in the current Kenya rural
development strategy (Republic of Kenya, 2002).
32
The instrument for attaining increased production is through developing aquaculture.
This is an option to enhancing the current fisheries production to supplement capture fisheries.
Strategies to be used include: enhancing provision of extension services through training,
rehabilitation, improvement and expansion of the hatcheries; and development and promotion of
fish farming research and demonstration centres (Development plan 2002-2008, Republic of Kenya,
2002).
Current constraints in Kenya to this type of farming include inadequate facilities such as: reduction
in water volume due to abstraction and diversion for agriculture, inadequate hatcheries, inadequate
fish seed and feed, lack of developed farms for shrimps, seaweed and oysters and poor access to the
potential farm areas, among others.
These government strategies will undoubtedly contribute towards development of aquaculture but
their implementation calls for increased budget expenditure on the side of the government.
Likewise, the farmers require large investments to develop the farms and this necessitates
development of a credit policy geared towards achieving this objective.
Reduction of post harvest loses will contribute towards increased production. Currently, the
government strategy towards reducing post harvest loses include repairing of the roads leading to
the landing beaches especially after a period of heavy rains to make the beaches easily accessible.
The rural development strategy document (Republic of Kenya, 2002) emphasis the need for
reducing post harvest loses.
4.1.2 Conservation Policy Starting with the government paper on African socialism and its application to planning in
Kenya (Republic of Kenya (1965), the government of Kenya has always expressed the need
for conservation, both for the biodiversity and the environment. Republic of Kenya, (1997),
further stresses the need of a conservation policy for improving environmental sustainability
for agriculture in general. Further, PRSP (Republic of Kenya, 2001) has an objective of
integrating biodiversity management principles in development planning through
conservation, sustainable utilization and natural resource management. Particularly to the
fisheries sector, the document is specific on controlling hyacinth and other invasive weeds
on the Kenyan lakes as a way of enhancing conservation of biodiversity and environment.
33
The different instruments used to achieve conservation in Kenya include:
• Conservation measures Conservation measures are to be taken by the fisheries department. These measures include
protection of breeding sites, marine mammals and turtles. Other measures include
prohibited fishing methods and gear in designated areas, limitation on the sizes of seining
nets and prohibition of landing fish of specified sizes from designated Kenya fishery waters,
as well prohibition of harvesting or fishing specified fishery species from designated areas.
This includes also inspecting any live fish coming into the country to ensure that it is
disease free.
The need for species conservation cannot be underscored if production of different fisheries
has to remain sustainable.
• Management measures This include the imposition of proper management of fisheries which include: regulations
on the fishing of inland waters, prohibited fishing areas or fishing methods which include
fishing using explosives, poisonous or noxious substances or electric shock device with aim
of killing, stunning or disabling the fish to render them easy to catch; limitation on methods
of gear and net mesh sizes that may be used in fishing, limitations on the amount, size age
and species of fish or their composition that may be caught, landed or traded, regulation of
the landing of fish and management of landing sites and control of introduction into, or
harvesting or removal from, of any Kenyan aquatic plant from any Kenya fishery waters.
Other measures include protection of breeding sites.
In addition, the department of fisheries issues a certificate of registration for any vessels for
fishing in Kenyan fishery waters, for both local and foreign fishing vessels. The fisheries
also has the responsibility of ensuring that the vessels going on a fishing journey are
seaworthy and if they deem the vessels unsea-worthy, they may detain the vessels until it
has been issued with a certificate of sea worthiness.
Vessel registration however seeks to ensure that only seaworthy boats are used and that
ownership of the boats is easily determined. This function has much to do with ensuring
safety of the fishermen.
34
At the regional level, the Lake Victoria fisheries Organization (LVFO) has a great potential
of achieving an improved resource management in Lake Victoria through implementation
and enforcement of common management strategies for Kenya Uganda and Tanzania.
Recent common regulations passed by the organization have led to a ban in beach seining in
Kenya, enforcement of mesh sizes and trawling ban reinforcement.
• Issuance of Licenses
The fisheries department regulates the various fisheries activities through issuance of
licences. Licenses are issued to the general fishermen, aquarium fishermen, Oysters
collectors, sport fishermen and trout fishers as well as registration of sport fishing clubs.
Licensing is a policy instrument used to control or restrict the number of firms involved in an
activity. Indeed, in Kenya, the fisheries act provides the licensing process with the possibility to
limit the number of license holders. Licensing leads to better monitoring of the firms engaging in an
activity and the various fees collected also provide revenue. The license fees paid in Kenya are
relatively low. Given the large number and the spatial dispersion of the artisan fishermen in the
country, there is a substantial non-compliance.
Although various measures have been legislated towards fisheries biodiversity conservation, their
enforcement, just like in any other sector of the economy still remains an issue.
purpose of fish quality assurance is to ensure that fishing grounds are monitored for any
pollutants, fish landing, handling and transportation is controlled, there is collaboration with
the Kenya Bureau of Standards to establish Kenyan fish standards for fish handling and
processing, to approve the establishment and operation of fish processing plants and factory
vessels, to carry out inspection of operational fish processing to ascertain compliance with
the Kenya Standards for handling and processing, to specify the conditions for export and
issue a health certificate to those exporting fish or fishery products, to provide health
certification of fish and fishery products, to lay down all the procedures to be followed for
compliance with the regulations and to specify conditions for the placing on the market of
fish and fishery products, among other functions.

35
To achieve these objectives, the fisheries department appoints qualified fisheries officers to
act as fish inspectors, give authority for establishment of fish processing plant, and issue a
certificate of compliance before commencement of the plant operations, establish whether
the requirements put in regulations are complied with as well as any other functions all
contributing towards attaining the objectives.
Quality assurance is crucial not only for the general health concerns but also in ensuring that
Kenyan fish is produced within the international standards requirements and SPS measures,
especially if the products have to traded in the international markets. Occasionally, failure to
meet the international standards has led to fish export bans especially to the European
markets.
4. 1.3: The industrialization policies Industrial policies are directed at developing and encouraging certain industries. Like any
other public policy, they are justified by the existence of market failure. The policy
document that outlines the current industrialization policy is the sessional paper no. 2 of
1996 (Republic of Kenya, 1996). The objective of the industrialization policy is to
transform Kenyan economy to newly industrializing status by the year 2020. In addition to
this objective, industrialization has been embraced as a key policy strategy towards attaining
Kenya’s economic development goal of increasing the nations welfare as expressed by
consecutive development plans and poverty strategy reduction papers.
Central to Kenya’s industrialization policy is the need to encourage export industries, with
the main initiatives being to encourage and enhance the efficiency of the existing ones
including promotion of export industries, privatising and restructuring parastatals,
promoting small scale and medium scale enterprises (SMEs) especially in rural areas, and
government efforts to attract foreign direct investment.
Other objectives of the trade, tourism and industrial sector as stated by the current PRSP
include to promote product and market development and competitiveness, with the specific
activities including private sector development, technology development, reviewing the
industrial bill and introducing review of current legislation among others.
36
The objectives of the current industrialization policy can be achieved through various policy
instruments:
• Enhancing Kenya’s products competitive This objective is pursued through reduction in raw material import tariffs. Trade
liberalization has lead to reduction in tariffs with import duty rates in most capital
equipment reducing to 5% for most raw materials. This is an incentive to processing
industries and as a result there has been an increase in imports of raw materials in Kenya
general. Reduction in raw material import tariffs contributes to lowering the overall costs of
production, which increases the competitiveness of Kenyan products.
• Enhancing Kenya’s ability to meet market entry conditions This is of particular importance because products meeting international market entry conditions are
an assurance to the consumers in the importing countries that Kenyan products are of good quality.
This objective is mainly pursued through regulation through issuance of licences.
The purpose of issuing licences to various fisheries product traders is to monitor and ensure
quality. Licences are issued to various fisheries dealers including fish processors, fish
traders, crustacean dealers, shell collectors and dealers. Licences are also issued to persons
culturing, keeping, exporting or disposing aquarium fish. It also includes provision of
permits to people moving fish from one water catchment to another as well as to those
importing or exporting fish and fish products. Table 4.1 shows the types of the licences
issued to different fish dealers by the department of fisheries.
Table 4.1: Types of licence issued and the amount of fees paid.
Type of dealers Type of licence
issued
Amount of fees
paid
Ksh /year
Rural fish trader Fish traders licence 100
Urban fish trader Fish traders licence 300
Transporters of fish for
purposes of trade
Fish movement
permit
500 for vehicles

37
Fish exporters
Fish importers
Export permit fees
Fish import fee
≤3T,
1000 for vehicles >
3
1000 for boats ≤ 10
T
5000 for boats >10 T
0.5% market price
5% ad valorem
market price
Source: compiled from SMEC (2002).
These fee paid to the department of fisheries can be considered as a commodity tax because
there are no services provided or management rationale implied. In addition to the
Department of Fisheries issuing licences to fish traders, the local government authorities
license traders too (including fish traders). This therefore leads to double payment of traders
licence. No services or management rationale are implied from such fees, but the fees may
be justified as means of collecting the government revenue.
The total impact of such fees is to increase production costs in the fish industry, which
further reduces the competitiveness of the Kenyan fisheries products.
Other strategies include developing an elaborate trade policy, improving training of
commercial representation abroad, mounting workshops on dissemination of opportunities
in AGOA, ACP-EU, undertaking export development and promotion and promoting
consumer protection.
These strategies will play a great role in promotion of the general industrial sector,
especially by providing increased markets for the industry’s products. However for the
Kenyan fisheries sector, currently, market development is not an issue, because the
challenge with the industry is more to meeting the already existing demand. A more precise
strategy should seek to eliminate the existing supply constraints, which make the Kenyan

38
fishery products not to meet the demand in the EU market. Elimination of such constraints
will further pave way for the fisheries sector to expand its exports and take advantage of
other trade arrangements such as those provided by AGOA.
Another critical missing strategy is promotion and encouragement of value adding through
improved and increased processing and packaging, which will improve a great deal the
value, earned from the fisheries trade.
There is also a need to harmonise domestic policies in light of liberalization, as the policies
themselves are a source of conflicts and inconsistencies. A big challenge with the industry is
to assure consumers in the market of its ability to meet market quality requirements and
other sanitary entry conditions.
In most developing countries there is a lack of a clear policy on intellectual property rights.
In the Kenyan fisheries sector in particular, there is a need for a policy to facilitate patenting
of traded Kenyan fisheries products clearly indicating that they are native to the region.
• Technology development policy
There are constraints in Kenya that hamper development of local research and
development capacity. These include inadequate public funding for industrial research
and development, inadequate private sector participation in research and development,
poor staff retention in local research and development institutions, inadequate links
between industrial sector and public research and development institutions as well as
poor technological infrastructure. The government has proposed strategies for dealing
with these constraints among others which include: offering incentives to the private
sector to increase its funding and support for research and development activities,
increasing the proportion of total public research expenditure allocations to industrial
research and development, etc.
In addition to the above strategies, to overcome the constraints facing the research and
technology development sub-sector, it is imperative that the government together with
the private sector and the development partners step up expenditures in research in
technology development and its dissemination to various.

39
• Infrastructure development policy
The current policy framework aims at improving quality and efficiency of operation of
existing infrastructure facilities. Key infrastructure facilities for industrial development
include transport, energy, communications, water sanitation and land.
The poor state of infrastructure has been attributed to rapid population growth, limited
financial resources for repair and maintenance, poor management capacity and corruption in
awarding and supervising infrastructure projects.
Poor and deteriorating state of infrastructure in the country has contributed to high costs of
production, which greatly reduces competitiveness of the domestic firms and industries.
Improvement and creation of new infrastructure facilities is critical in improving industries
efficiency and competitiveness.
Strategies for developing this sub-sector include both legislative and budgetary and aim to
improve on transport, revitalize the energy sector, improve communications, water and
sanitation and land.
• Industries location policy
The government recognizes the need to disperse industries through out the country. To
achieve these, strategies to achieve this include: providing infrastructure in major urban
centres, with a long-term plan to include poor served areas. The government further
proposes to strengthen the local authorities to provide basic infrastructure and set a side land
for industrial use as well as for the construction of industrial parks. Improved transport will
act as a catalyst for development of industries in local urban centres.
• Human resource development policies:
The objectives of the current human development policies aim at promoting human
resources through education, training employment creation, population and provision of
health. All these are necessary to enhancing and utilizing the productive capacity of the
Kenya’s manpower.

40
Of critical importance to the Kenyan industrial sector as a whole currently is the challenge posed by
the HIV/Aids, which has mainly affected the economically active population group. Particularly in
the fishing industry, the HIV/AID has impacted negatively on the fishing community as well as
workers in the fish processing plants.
• Institutional development policy
World over, there is an increased effort to enhance the participation of the private sector in
development policy process. To increases the partnership between the private and public
sectors, the government of Kenya proposes a support framework for market development,
investment promotion, establishment of a national industrial development council and
improving the socio-political environment.
Currently there have been increased efforts by the government, civil organizations and other
development partners to increase the private sector participation in policy process. The
government has in particular promoted formation of associations, which in addition to
increasing the bargaining power of different firms, have also gone along way towards
increasing the private sector involvement in policy process. The government has also
encouraged industry self-regulation through use of codes of practice such as the AFIPEK’s
code of conduct.
Other industrial strategies for market development proposed by the government include
investment promotion, establishing a national industrial development council through the
industrial development act and enhancing a socio-political environment for investment.
4. 2 Land tenure systems in Kenya Property rights and collective action play an important role in application of technologies
for natural resources management. Technologies with long-term frames such as those of
crops require tenure security to provide incentives for adoption. On the contrary,
technologies operating on a large spatial scale (such as is the case with natural resource
management) require collective action to co-ordinate.

41
Kenya has experienced an evolution of land policies and legislation over time. The
evolution has led to three distinct land tenure systems:
4.2.1 Customary tenure Areas classified as under customary tenure system are those designated as trust land. This is
the tenure characteristic of land, which has not yet been adjudicated, consolidated or
registered. Under this tenure system, land belongs to the clan, ethnic group or the
community as a whole. Each individual in the community has access rights to the land, but
rights of control of the land are vested on community heads.
4..2 Private tenure This type of tenure gives an individual or corporate entity an indefeasible and exclusive title
to a specific land or estate. Land in this category include all land held on freehold or
leasehold by individuals, companies, cooperative societies, religious organizations, public
bodies and legal bodies. Most of the Kenyan agricultural land falls under this category of
tenure system.
4.2.3 Public tenure 20% of Kenyan land falls under this category. This tenure system establishes control over
forests, national parks, open waters, townships and other urban centres as well as alienated
and un-alienated government land. Under this tenureship system, the government is the
private landowner. The land is supposed to be preserved by the government for public
purpose until it has been designated as freehold or leasehold. The government has two types
of powers in relation to such land:
• The eminent domain which gives the government rights to compulsorily acquire land
for public purpose, in most of the times through the county councils;
• Policy powers which relate to regulation of property rights in the land.
The Kenyan beaches and the fish landing sites belong to this tenure system. With the
declining role of the government in the whole economy and the large spatial dimensions on
which fisheries activities operate, management of fishing itself, conservation of the beaches
and the landing sites entails collective action. The main issue with the public rights of
ownership is that it leads to lack of individual responsibility in fisheries resource
42
management, improvement, management and regulation of fish handling facilities at the
landing beaches.
However, collective action may poster empowerment and therefore increases the
bargaining power of disadvantaged community interest group. Collective action has also
been found to prevent use of certain technologies such as use of seine nets, dynamite and
strong poisons for fishing in Philippines. However, for the collective action to produce these
positive effects, there is need for coordination of the users (fishermen). The current Beach
Management Unites (BMUs) provide potential to collection action and if promoted, will
contribute towards well maintained beaches and landing sites.
4. 3 Supporting institutions There are several supporting institutions both at the national and international levels to the Kenyan
fisheries. At the national level, these institutions include: The Department of Fisheries, The Kenya
Marine Fisheries and Research Institute (KMFRI), The Kenya Bureau of standards (KBS), The
Association of Fish processors and exporters of Kenya (AFIPEK), EPC, Department of trade and
industry and other community based organizations. At the regional level, the institutions include the
Lake Victoria Fisheries Organization (LVFO) among others. At the international levels, the main
institutions providing support to the fisheries sector in the country include the FAO and the IUCN.
4.3.1 The Department of Fisheries:
At the national level, the department of fisheries is the main institution that is responsible for the
fisheries sub-sector. The Department of Fisheries, which falls under the ministry of agriculture and
rural development, is the main government arm mandated to carry out the government activities in
the fisheries sector. In deed, it is the government implementing policy agent in this sector. ‘It is the
competent authority’ in all Kenyan fisheries matters. The department of fisheries headquarters is
located in Nairobi and has a network of staff next to all Kenyan waters with commercially
significant amounts of fisheries. It has its staff deployed at seven Provincial Fisheries Offices, as
well as in 49 District Fisheries Offices.
The presidential circular 1/98 defines the mandate of the fisheries department as ‘fisheries
development and management’. The main functions of the department include: management and
conservation of fishery resources, promotion of aquaculture development, fish quality control and

43
fish marketing regulations. Other minor functions include: promotion of creational fisheries, ice
production and cold storage, operation of fishermen’s loan scheme and boat building.
The specific activities carried out by the department include: Issuance of fishing, processing
and fish trade licensing, maintenance of quality standards, stock control and statistical
recording of the entire industry, inspection of fishing and fish processing facilities,
enforcing the fisheries legislation and running aquaculture promoting projects in the
country.
Among the constraints experienced by the fisheries department include: lack of adequate
training funds and facilities, inadequate appropriate transport on land and water fitted
communication facilities and lack of motivation among the staff due to poor remuneration.
4.3.2 The Kenya Marine Fisheries and Research Institute (KMFRI) On the national level, the Kenya Marine Fisheries and Research Institute (KMFRI) is the
research body charged with conducting research on fishery matters. Such research includes
stock assessment, control of pollution and other environmental concerns, and investigation
of other issues of concern to the fishery industry.
4.3.3 The Kenya fish processors and exporters association (AFIPEK) This is the professional association of the fisheries industry. It was established in the year
2000. It is composed of processors and exporters of fisheries products from Kenya. It is
coordinated through a secretariat based in Nairobi who serves the various members located
in Kisumu, Nairobi and Mombasa.
The secretariat role include: promoting marketing fisheries products in Kenya, Liasing with
government and other relevant organizations, formulating and facilitating implementation of
fisheries’ industry code of practice and ensuring quality standards across the country,
training of member companies on quality standards and implementing projects which
promote the fisheries sector, either as an institution or jointly with other development
partners.
44
4.3.3 Export Promotion council (EPC) Established in 1992, EPC is the main governments arm with the purpose of promoting
Kenya exports in order to increase the level of performance of the sector. Its responsibility
is to co-ordinate and harmonise Kenya’s export development and promotion activities and
therefore provide leadership to all other national export programmes.
Its mandate include: formulation of Kenya’s export market strategy, identification of export
opportunities and assisting exporters seize the identified opportunities. Its strategies include:
Policy & facilitation export market development, product development & adaptation, and
development of exporting skills.
4.3.4 Kenya Bureau of standards (KeBS)
Established under the standards act, KeBS is the official government institution with the
mandate of formulating and foreseeing implementing of quality standards in Kenya.
KeBS is responsible for metrology, standardization, and testing and quality management
issues in Kenya. The aims and objectives if KeBS include preparation of standards relating
to products, measurements, materials, processes, etc.; their promotion; certification;
assistance in the production of quality products; improvement of measurements accuracies
and dissemination of information relating to standards. As regards fish, the KeBS
undertakes microbiological laboratory testing for fish and fishery products
4.3.5 IUCN At the regional level, IUCN is one of the organizations contributing towards the fisheries
sector in the country. IUCN contributes to Kenyan fisheries mainly through its programme
on socio-economics of lake Victoria, which is implemented in collaboration with
government research institutions and local NGOs in Kenya, Uganda and Tanzania. The
programme recognizes involvement of the local community as the basis for the project. The
objectives of the project include: understanding the socio-economic conditions of various
stakeholders; and building capacity to manage the fisheries in a sustainable manner.
4.3.6 The Lake Victoria Fisheries Organization (LVFO) Established in 1994, LVFO is a regional organization whose objectives are three fold: To
foster co-operation among the supporting parties (Republics of Kenya, Uganda and

45
Tanzania), harmonise national measures for the sustainable utilization of the living
resources of the lake Victoria, and to develop and adopt conservation and management
measures to assure the lake’s ecosystem health and sustainability of the living resources. Its
secretariat is based in Jinja –Uganda. It’s responsibilities include: Promoting the proper
management and optimum utilization of the fisheries resources of the lake, enhancing
capacity building of existing institutions and develop new ones, and provide a forum for
discussions of the impacts of initiatives dealing with the environment and water quality in
the lake basin and maintain liaison with existing bodies and programmes among others.
At the regional level, this is the most powerful organization with regards to the Lake
Victoria fisheries management. It is headed by the council of ministers consisting of
ministers responsible for the fisheries in Kenya, Uganda and Tanzania, or their
representatives. Below the council of ministers, the organization also has various
committees consisting of heads of the fisheries departments in the three countries, as well as
other organizations involved in fisheries. The organization has a great potential of achieving
an improved resource management in Lake Victoria through implementation and
enforcement of common management strategies. Recent common regulations passed by the
organization have led to a ban in beach seining in Kenya, enforcement of mesh sizes and
trawling ban reinforcement.
4.3.6 Community Based Organizations (CBO) Many community-based organizations dealing with fisheries exist especially at the lake Victoria
region. Two of such organizations are discussed here:
• Beach Management Units (BMUs)
Currently, these are the most active and effective of the Community Based Organizations. They are
present at all designated landing sites. They are made up of each of 5 to 9 persons, are independent
of government and have no legal authority. The local fishing communities determine the BMU’s
memberships. Their maintenance is through a levy of 1 Kshs/Kg imposed on all the fish landings.
They have been found to be highly accountable to their communities and to be effective (Republic
of Kenya, 2002).

46
The functions of the BMUs include resolving conflict, establishing beach hygiene and sanitation
facilities, facilitating search and rescue, and the establishment and maintenance of beach
infrastructure.
This is an effective way of maintaining the landing bays given that they fall under public land
tenure system. Since the members of these units come from the community, it can be easily
recognized when the BMU’s have failed to deliver according to the community’s expectations.
• Fishermen’s cooperative societies
There are about 46 fishermen’s cooperative societies around the lake Victoria districts alone. They
operate under the authority of the cooperative societies act. Their functions include providing
fishing gears, material for boat maintenance, fuel, fish transport, fish preservation facilities and
organised marketing. Just like all the cooperative circles in Kenya, most of these cooperatives have
not been doing well and to survive, some of them are edging in providing banking services.

47
Chapter Four
4.0 FISH SUPPLY CAPACITY AND CONSTRAINTS
2.1 FISH SOURCES Kenya’s annual national fish output reached a peak of 203,590 tonnes in 1994, and has since then
declined to about 167,601 tonnes (See Table 1). Lake Victoria contributes about 93% of this fish,
hence, has a big influence on the catch trends. Besides Lake Victoria, the other sources of fish in
Kenya are the fresh-water lakes, most of which are located in the Rift Valley, including Turkana,
Baringo, Naivasha, and Jipe. Additional fish is landed in the dams and rivers located in various
parts of the country. Marine fisheries and aquaculture produce the remaining bulk of fish landed in
the country.
Table 2.1 Quantity of fish landed 1995 - 2000 (tonnes)
Year L. Victoria Other inland
lakes and
rivers
Fish
farming
Marine fish
and products
Total
1992 151,216 2,295 1,017 7,194 163,758
1993 174,829 3,552 1,014 4,336 183,731
1994 193,652 3,915 1,119 4,904 203,590
1995 181,888 4,923 1,083 5,994 193,888
1996 166,460 7,522 1,089 6,263 181,334
1997 164,174 7,524 1,086 6,129 178,913
1998 158,876 7,977 994 4,998 172,845
1999 155,084 7,391 984 5,806 169,265
2000* 192,738 7,297 904 5,806 206,745
* provisional data
Source: Kenya Government (2000)

48
2.2 FISH VARIETY AVAILABLE
Fish is a highly specific organism with respect to the ecological niches it occupies. Most
fish species will only occupy particular ecological zones determined by certain
environmental conditions such as food availability, water temperature, pH and organic and
inorganic nutrient concentration. Thus, Nile perch is found only in lakes Victoria and
Turkana, while, ‘dagaa’ is endemic to Lake Victoria. Various tilapine species are able to
withstand a much wider band of environmental conditions, hence, they are found in nearly
all the fresh-water systems in the country. They are also the main species produced in
aquaculture.
The riverine fish species also have an appreciable tolerance to varying environmental
conditions, therefore, can spend part of their lives in the lake systems and later return to the
rivers for the purposes of breeding. Marine fish species are generally specific to the saline-
water conditions of the Indian Ocean, and are hardly found elsewhere in the country.
It is, therefore, a fact that the wide range of ecological conditions in the different lakes,
rivers, dams, ocean and fish farms, have helped to sustain a variety of fish species in the
country. As a result Kenya is endowed with multi-species fisheries, most of which,
unfortunately, have very little commercial value. The species found in each of these water
systems are discussed below.
2.2.1 Lake Victoria fisheries Lake Victoria is known to have probably the highest level of fish species diversity,
although, there are conflicting estimates of the actual number of species. Some reports put
the number of species at 170 while Greenwood (1981) estimated that up to 350 fish species
may be present in the lake. However, only three species – Nile perch, ‘dagaa’ and tilapia -
are of commercial importance. These three constitute about 58%, 30% and 10%
respectively of the total fish landed on Lake Victoria. Haplochromines, Clarias spp,
Synodontis spp, Schilbe spp and mormyrus spp, are often captured in the catch assessment
statistics for Lake Victoria, although they jointly make up less than 2% of the overall
49
output. Other rare species of Lake Victoria include Alestes spp, Bagrus spp, Barbus spp and
Labeo spp.
Since the early 1990s, the quantity of fish landed from Lake Victoria (and from nearly each
of the other inland lakes and rivers in Kenya) has been on a generally declining trend. For
instance, between 1995 and 1999, the total annual fish production from the lake went down
by about 15% from 181, 888 tons to 155,084 tons (Table 2.1).
The catch decline is one indicator of over-exploitation, and has been a cause of concern
especially for Nile perch, whose catch has gradually decreased since 1991. This is largely
attributed to the use of small mesh nets, indiscriminate gears and mass-target fishing
methods, which have been prevalent in Lake Victoria. In particular, there has been a gradual
reduction in mean mesh sizes of gillnets used in the lake in the last decade. For example, the
average mesh size of gill net used in the lake to target Nile perch reduced from 12 inches in
1981 to 6 inches in 1996 (O'Riordan, 1997; Othina and Osewe-Odera, 1996). In addition,
trawlers and beach seines operated in the lake for much of the last decade, with serious
environmental consequences. Fortunately, trawling has now been eradicated but beach
seining still persists in parts of the lake.
Besides the annual catches, the other two commonly applied stock assessment indicators –
mean catch sizes and catch per unit effort – have also generally declined in the past decade.
For example, in 1981, the mean weight of Nile perch caught in Lake Victoria ranged from
50-100 Kg. In 1996, this had reduced to around 5-10 Kg (O'Riordan, 1997). Similarly, the
catch per unit effort dropped from about 180 Kg per boat per day in 1989 to about 80 Kg
per boat per day in 1999 (Othina, 1999).
There are no reliable figures for the maximum sustainable yield. It has been estimated that
the maximum sustainable yield for Nile perch in the Kenyan part of the lake is about 39,200
tonnes (Bwathondi et al, 2001). Even though this figure is still contentious, the current
exploitation rates of Nile perch (about 90,000 tonnes in 1999) are much above the
sustainable exploitation levels. Othina (1999) has also estimated the maximum sustainable
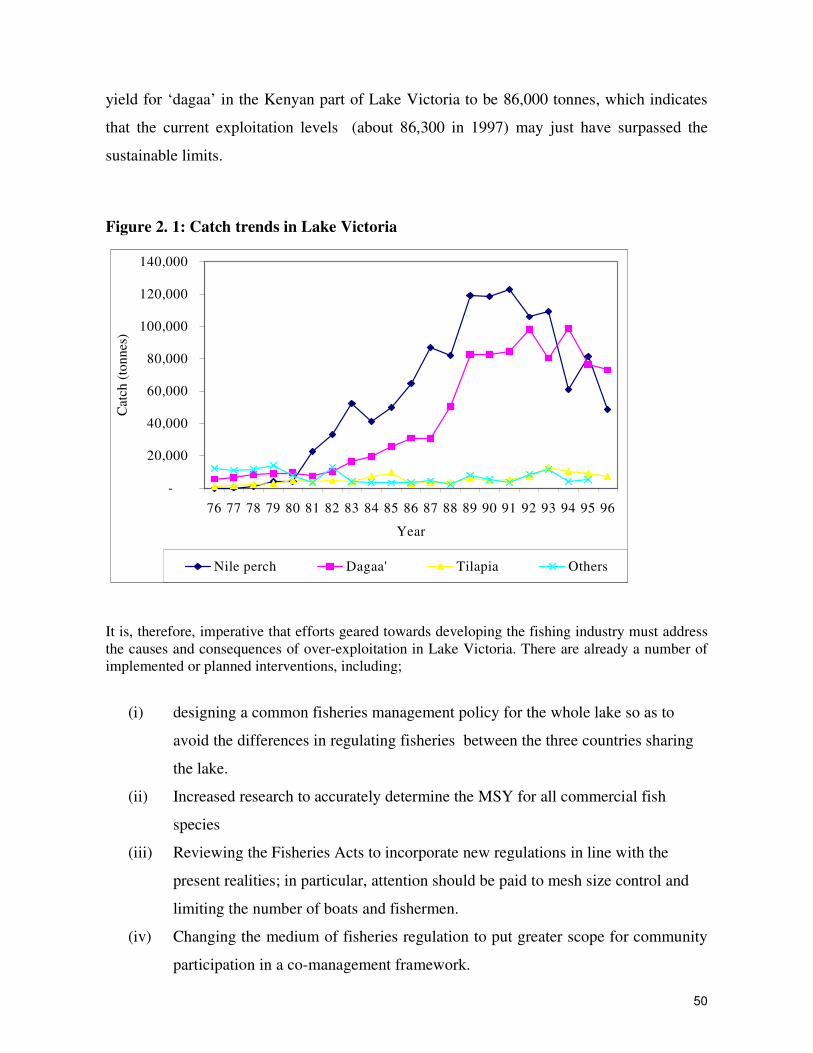
50
yield for ‘dagaa’ in the Kenyan part of Lake Victoria to be 86,000 tonnes, which indicates
that the current exploitation levels (about 86,300 in 1997) may just have surpassed the
sustainable limits.
Figure 2. 1: Catch trends in Lake Victoria
-
20,000
40,000
60,000
80,000
100,000
120,000
140,000
76 77 78 79 80 81 82 83 84 85 86 87 88 89 90 91 92 93 94 95 96
Year
Cat
ch (t
onne
s)
Nile perch Dagaa' Tilapia Others
It is, therefore, imperative that efforts geared towards developing the fishing industry must address the causes and consequences of over-exploitation in Lake Victoria. There are already a number of implemented or planned interventions, including;
(i) designing a common fisheries management policy for the whole lake so as to
avoid the differences in regulating fisheries between the three countries sharing
the lake.
(ii) Increased research to accurately determine the MSY for all commercial fish
species
(iii) Reviewing the Fisheries Acts to incorporate new regulations in line with the
present realities; in particular, attention should be paid to mesh size control and
limiting the number of boats and fishermen.
(iv) Changing the medium of fisheries regulation to put greater scope for community
participation in a co-management framework.

51
(v) Instituting a fish levy trust to sustain a source of funding for fisheries research
and management
Hopefully, these efforts will pay dividend, and turn around the catch trends or, at least, halt
the decline in catches.
2.2.2 Fisheries of the other inland lakes
The Fisheries Department’s (1995) reveals that a number of fish species live in the inland
lakes Turkana, Baringo, Naivasha and Jipe. The species variety are, though, significantly
less than in Lake Victoria. In Lake Turkana the main fishes are Nile perch (6%), various
species of tilapia (24%), Labeo spp (28%), Bagrus spp (6%) and Barbus spp (11%). There
are also insignificant quantities of Clarias spp and Alestes spp, while the rest comprise of a
large number of unidentified species.
In Lake Baringo the main fisheries are tilapia spp (17%), Barbus spp,(8%), Clarius spp
(25%) and Protopterus spp. (51%). Lake Naivasha has mainly tilapine species (65%), black
bass (11%) and cray fish (24%), while in Lake Jipe there are mainly Tilapines constituting
more than 90% of total catch and some amounts of clarias spp and sardines.
In the past the fisheries in the inland lakes had been seen as under-exploited. In particular, Lake
Turkana remained under-exploited due to its remote location and lack of reliable marketing
arrangement. The situation has rapidly changed as much of the produced fish is now transported to
towns in Western Kenya where it has a ready market.
For Lake Naivasha, the threat of over-exploitation has been realised by the Fisheries Department,
leading to the implementation of a fishing ban on the lake in 2001 – 2002, followed by attempt to
control the number of boats and fishermen. Similarly, Lake Baringo was closed for fishing between
1993 and 1994 but, according to the Fisheries Department’s (1995) report, this did not result in
significant stock recovery.
It is evident that the inland lakes now require similar management strategies being adopted in Lake
Victoria. Periodic closed seasons lasting 2-3 years may help to recover some of the stocks, but this

52
does not offer long-term solutions. More effective action should be taken in the direction of
controlling mesh sizes, number of boats and gears so as to limit overall fishing effort.
For Lake Jipe the main problem is related to siltation and encroachment by water weeds
which reduce navigation and total fishing space. A similar problem is faced by Lake
Baringo, which is becoming shallower due to siltation from inflowing rivers. Perhaps these
lakes need to be re-opened up through controlled excavation.
2.2.3 River-based fishes A large variety of riverine fish species have been identified in Kenya’s rivers, particularly
those entering Lake Victoria. Owing to their low abundance and due to the undeveloped
markets beyond the Lake region, these species have remained more valuable for their
contribution to biodiversity rather than for commercial importance. Table 2 Shows the 28
most important riverine fish species that have been identified in different rivers in Western
Kenya. Most of those fish are anadromous – they spend the greater part of their time in the
lake, but travel up a river to spawn and then return to the lake with the young ones.
Early surveys, for example by Whitehead (1959) indicated that Kenyan rivers had high
potential to contribute to the national fish production. However, subsequent studies have
shown that river systems are quite vulnerable to over-exploitation and the adverse effects of
environmental degradation. According to Kibaara (1981), fish catches in the rivers have
been reducing since the 1940s. Studies conducted by Ochumba and Manyala (1992), Muli
and Ojwang (1998) and Gichuki et al (2001) in Lake Victoria rivers produced further
evidence of declining species diversity and total yields. In fact, the total annual output from
some of the rivers surveyed (e.g. Sondu-Miriu) show that there has been a decline by up to
90%, compared to the catch levels in the 1950s and 1960s.
Table 2. 2: Fish species in rivers flowing into Lake Victoria
Biological/ Latin names Local/ common names
Schilbe mystus Sire
Schilbe intermedius Sire Synodontis victoriae Okoko rachar Synodontis afrofischeri Okoko rateng

53
Lates niloticus Mbuta
Labeo victorianus Ningu
Barbus altianalis Fuani Barbus neglectus Adel Barbus cercops Adel Barbus yongei Adel Barbus nyanzae Adel Tilapia zilli Silli Oreochromis niloticus Nyamami Oreochromis leucosticus Opat Mormyrus Kannume Suma Clarias gariepinus Mumi Clarias mossambicus Mumi Alestes sadleri Osoga Bagrus dogmac Seu Oreochromis variabilis Mbiru
Barbus jacksonii Fuani Barbus Kerstenii Fuani Xenoclarias spp. Ndhira Mastacembalus frenatus Okunga Haplochromis spp. Fulu Aplocheilichthys eduardis Micropterus salmoides Protopterus aethiopicus Kamongo Petrecephalus cutostoma Obu Gnathonemus longiberbis Odhore
Marcusenius grahami Alestes nurse Brycinus jacksonii Brycinus solderi Clenopoma muriei
[Adapted from Whitehead (1959), Kibaara (1981), Ochumba and Manyala (1992)’ Muli and
Ojwang (1998) and Gichuki et al (2001)]
The main causes of the decline in the catches of riverine species include overfishing by destructive
fishing methods, papyrus encroachment, habitat destruction, predation by Nile perch, poor
management and pollution (Whitehead, 1959; Ochumba and Manyala, 1992). However, Kenyan
river fisheries are also prone to the effects of pollution, irrigation and hydropower development, for
example, on rivers Kuja and Sondu-Miriu.
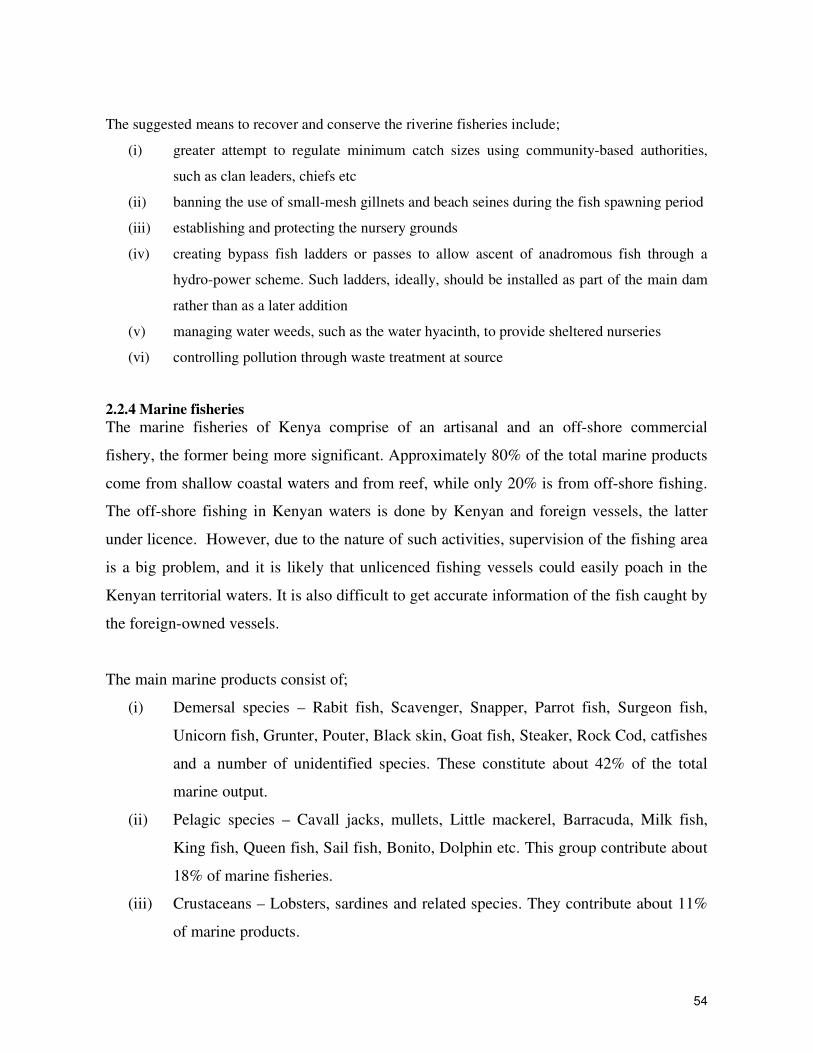
54
The suggested means to recover and conserve the riverine fisheries include;
(i) greater attempt to regulate minimum catch sizes using community-based authorities,
such as clan leaders, chiefs etc
(ii) banning the use of small-mesh gillnets and beach seines during the fish spawning period
(iii) establishing and protecting the nursery grounds
(iv) creating bypass fish ladders or passes to allow ascent of anadromous fish through a
hydro-power scheme. Such ladders, ideally, should be installed as part of the main dam
rather than as a later addition
(v) managing water weeds, such as the water hyacinth, to provide sheltered nurseries
(vi) controlling pollution through waste treatment at source
2.2.4 Marine fisheries The marine fisheries of Kenya comprise of an artisanal and an off-shore commercial
fishery, the former being more significant. Approximately 80% of the total marine products
come from shallow coastal waters and from reef, while only 20% is from off-shore fishing.
The off-shore fishing in Kenyan waters is done by Kenyan and foreign vessels, the latter
under licence. However, due to the nature of such activities, supervision of the fishing area
is a big problem, and it is likely that unlicenced fishing vessels could easily poach in the
Kenyan territorial waters. It is also difficult to get accurate information of the fish caught by
the foreign-owned vessels.
The main marine products consist of;
(i) Demersal species – Rabit fish, Scavenger, Snapper, Parrot fish, Surgeon fish,
Unicorn fish, Grunter, Pouter, Black skin, Goat fish, Steaker, Rock Cod, catfishes
and a number of unidentified species. These constitute about 42% of the total
marine output.
(ii) Pelagic species – Cavall jacks, mullets, Little mackerel, Barracuda, Milk fish,
King fish, Queen fish, Sail fish, Bonito, Dolphin etc. This group contribute about
18% of marine fisheries.
(iii) Crustaceans – Lobsters, sardines and related species. They contribute about 11%
of marine products.

55
(iv) Shark and rays, sardines and similar species, which constitute about 18% of
marine products.
(v) Oysters, beche-de-mer, octopus, squids and related species which constitute about
4%.
(vi) Deep sea and game fish which contribute about 6% of marine products.
The inshore fishery is thought to be over-exploited while it is evident that the off-shore
fishery is still below the maximum sustainable yield. Hence, there exists a large potential to
increase the fishing capacity in off-shore marine waters, while there should be attempt to
reduce fishing effort in the inshore coast.
2.3 SEASONALITY IN FISH PRODUCTION There is evidence of high seasonality in the supply of most fish species. This seasonality is marked
for the different fish species and the different lakes, and is likely determined by the rainfall pattern.
Rainfall has effect on food availability, water quality (e.g. nutrient concentration), water
temperature, macrophyte growth etc, hence will determine the natural production cycle for some of
the fish species. It should, therefore, be expected that the supply pattern may vary from one year to
another if, for example, there is significant change in the rainfall pattern.
Data collected by the Kenya Marine and Fisheries Research Institute (KMFRI) from January to
December 2001 for Nile perch landed on four beaches of Lake Victoria show that the fish has a
peak supply season between March and May, during the long rainy season (Figure 2.2). This,
unfortunately, is the period when most roads around the lake are in their worst state, leading to high
fish spoilage. Inevitably, fishermen get the lowest prices during that period due to high supply and
poorer distribution. The fish catches are more evenly distributed for the rest of the year.
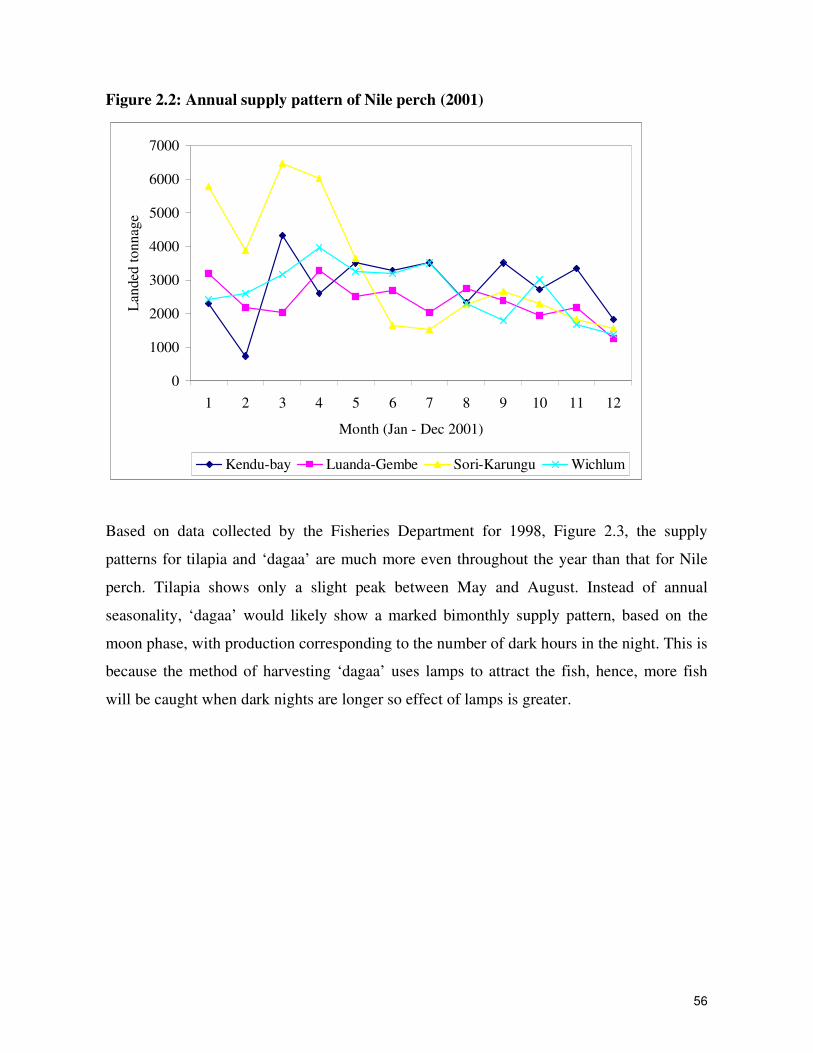
56
Figure 2.2: Annual supply pattern of Nile perch (2001)
0
1000
2000
3000
4000
5000
6000
7000
1 2 3 4 5 6 7 8 9 10 11 12
Month (Jan - Dec 2001)
Lan
ded
tonn
age
Kendu-bay Luanda-Gembe Sori-Karungu Wichlum
Based on data collected by the Fisheries Department for 1998, Figure 2.3, the supply
patterns for tilapia and ‘dagaa’ are much more even throughout the year than that for Nile
perch. Tilapia shows only a slight peak between May and August. Instead of annual
seasonality, ‘dagaa’ would likely show a marked bimonthly supply pattern, based on the
moon phase, with production corresponding to the number of dark hours in the night. This is
because the method of harvesting ‘dagaa’ uses lamps to attract the fish, hence, more fish
will be caught when dark nights are longer so effect of lamps is greater.
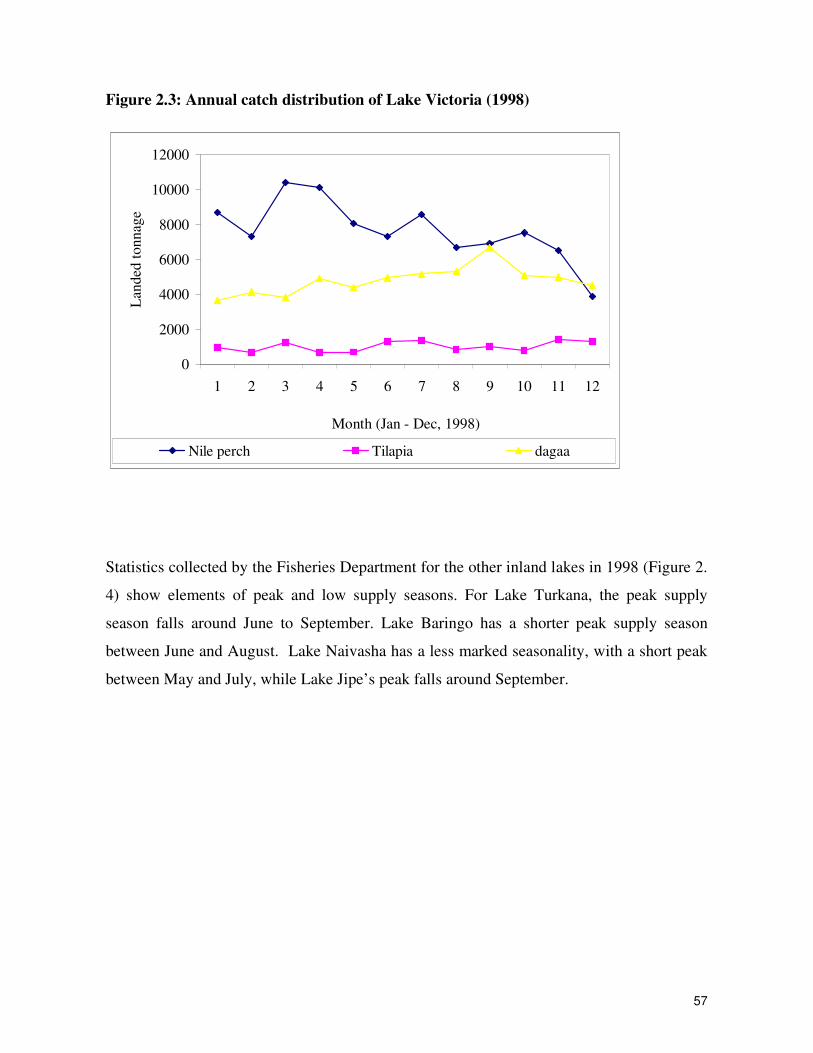
57
Figure 2.3: Annual catch distribution of Lake Victoria (1998)
0
2000
4000
6000
8000
10000
12000
1 2 3 4 5 6 7 8 9 10 11 12
Month (Jan - Dec, 1998)
Lan
ded
tonn
age
Nile perch Tilapia dagaa
Statistics collected by the Fisheries Department for the other inland lakes in 1998 (Figure 2.
4) show elements of peak and low supply seasons. For Lake Turkana, the peak supply
season falls around June to September. Lake Baringo has a shorter peak supply season
between June and August. Lake Naivasha has a less marked seasonality, with a short peak
between May and July, while Lake Jipe’s peak falls around September.

58
Figure 2.4: Total catch distribution in inland lakes (1998)
0
10
20
30
40
50
60
70
1 2 3 4 5 6 7 8 9 10 11 12
Month Jan - Dec, 1998)
Lan
ding
(ton
nes)
L. Baringo L. Naivasha L. Jipe L. Turkana x 5 ton
2.4 THE FISHERMEN
The number of fishermen in Kenya has consistently increased since the 1960s. In 1995 the
Fisheries Department revealed that there were then 30,000 fishermen on Lake Victoria and
8,000 fishing vessels (Table 2.3). Marine fisheries had the second highest population of
fishermen and fishing vessels, followed by Lake Turkana, Tana River dams and Lake
Naivasha. There was no estimate for the number of fish farmers.
The there are no reliable estimates for the number of fishermen in 2000, except for Lake
Victoria, where a frame survey was conducted in that year. In Lake Victoria, the number of
fishermen grew by about 10% while the number of vessels increased by 25% between 1995
and 2000. Assuming that the number of fishermen and vessels in the other lakes increased
by half this margin, then the statistics for fishermen and vessels in Kenya in 2000 would be
as in Table 2.3

59
Table 2.3. Number and distribution of fishermen in Kenya (1995 and 2000)
1995 2000
Number
of
fishermen
Number of
fishing
vessels
Number of
fishermen
Number of
fishing
vessels
Lake Victoria 30,000 8,000 33,037 9985 Marine fisheries 7,640 2,388 8,022 2,687 Lake Turkana 387 97 406 109 Lake Baringo 45 11 47 12 Lake Naivasha 78 29 82 33 Lake Jipe and dams 62 43 65 48 Tana River dams 503 225 528 253 Fish farmers - -
Total* 38,715 10,793 42,187 13,127
* Excludes figures for fish farmers
Source: Fisheries Department (1995)
More recent data was collected by the Fisheries Department, KMFRI and the Lake Victoria
Fisheries Research Project in a frame survey for Lake Victoria conducted in 2000. It
revealed that there were 33,037 fishermen and 9,985 fishing crafts operating on the Kenyan
part of Lake Victoria. These were distributed in 297 fish landing beaches in the 8 fishing
districts as in Table 2. 3.
Fishermen face a number of critical limitations in their occupation. There are already
numerous recommendations from various studies on how to improve the living standards of
fishermen and, consequently, reduce the pressure on fish resources. Among the problems
facing fishermen that, if addressed, would contribute to better resource utilization are;

60
Table 2.3 Distribution of fishermen, beaches and fishing crafts (2000)
District No. of
Fishermen
No. of beaches in
district
No. of Active Fishing
Crafts (All types)
Busia 2,748 23 770
Bondo 8,395 67 2,611
Kisumu 2,540 32 1,189
Nyando 512 6 185
Rachuonyo 4,438 38 1,133
Homa Bay 568 7 181
Suba 10,239 97 2,833
Migori 3,597 27 1,083
Total 33,037 297 9,985
Source: Adapted from Asila (2001)
(i) irregular and, often low, incomes
(ii) lack of access to credit
(iii) poor infrastructure
(iv) lack of cold storage facilities for their fish
(v) inability to organize themselves and improve their bargaining power
(vi) lack of information on savings options
(vii) inadequate savings facilities
(viii) lack of skills for alternative livelihood
(ix) Post harvest handling facilities
(x) Business Management skills
(xi) Use of traditional boats whose carrying capacity and efficiency is low
2.5 FISHING GEARS Fishing gears in Kenya fall into four broad types:
(i) Traditional gears: These are mainly used in river systems or areas of the lake
close to river openings, and they catch mostly anadromous riverine fish species.

61
Most of the traditional gears (e.g. weirs, barricades, baskets, traps) are no longer
used in the lake, a part from near river mouths.
(ii) Gill nets: Of various mesh sizes, although the legal standard for tilapia in Lake
Victoria is 5” mesh stretched across the diagonal. The other lakes have lower
accepted mesh limits for their fisheries. Similarly, the riverine fisheries require
lower mesh sized nets. In the last 5 years, drifting gillnets (locally called
‘tembea’) became popular in some areas, though they damaged stationery gear set
by other fishermen.
(iii) Seine nets: The seine net, though presently banned on Lake Victoria, still persists.
It is indiscriminate, and targets mainly Nile perch and tilapines, but ends up with
various other species of all sizes. Seine nets are particularly destructive when
used around river mouths, where it catches anadromous fish on their way to
spawn. Mosquito seine is a special kind of seine used to target ‘dagaa’, and which
is the only kind of seine legally permitted on Lake Victoria.
(iv) Line gears: These use baited hooks placed at regular intervals along a nylon rope
to catch mainly Nile perch, although simple angle-line is a cheap way to catch
tilapia.
2.5.1 Costs of various gears
For some gears, the cost component includes the elements of purchase (investment) costs
and operational or maintenance costs. The investment cost would include the cost of gear
as well as that of the boat carrying it. An attempt has been made below to determine the real
costs of constructing a standard boat (25 ft long) and making/ purchasing the mosquito seine
to equip it. This example is applicable in the ‘dagaa’ fishery. For this kind of fishing outfit,
the total investment cost could be about Ksh 46,960.
The operational costs for the boat, if operating in the ‘dagaa’ fishery, include wages for
fishing crew, boat owners’ daily remuneration, cost of paraffin for attraction lamps, cost of

62
boat rental or provision for boat depreciation, cost of food provided to crew, provision for
gear repair and other miscellaneous costs. These are listed in Tables 2.4 and 2.5.
Table 2.4: Costs of making a boat of length (25ft long, prices as at November 2002] Item (some in local dialect) Quantity Price (Ksh) Total amount
(Ksh) Timber 14x1 x 15 ft x 14
pieces 1,200 16,800
Keel (‘mgongo’) 30 ft 2,200 Paddles (‘manga’) 6 200 1,200 Keel cover (‘raum’) 2 250 500 Achor (‘sambago’) 1 150 150 Plain iron sheet (‘mabati’) 2 600 1,200 Nails 3.5 kg 60 210 8 kg 60 480 Bottom sheath (‘Capera’) 3 m 60 180 Putty 4 kg 25 100 Cotton 4 kg 60 240 Paints 2,500 Construction labour 6,500 Painting labour 1,800 Total 34,060 Table 2.5: Cost of ‘Dagaa’ mosquito net (‘Ambega’) of 3 rolls (‘jora’) Item (some items in local dialect)
Quantity Price (Ksh) Total amount (Ksh)
Floats (‘opira’) 250
Main rope (‘Funo’) 22 x 2 20 880
Cloth pieces (‘Nanga’) 32 20 640
Corner material (‘Ogwom’) 10 20 200
Thread (‘Lana’) 20 20 400
Float holder (‘Kengle’) 150 5 750
Marker (‘olango’) 20
Fishing lamps 5 1,300 6,500
Adjoining rope (‘Ngozi’) 32 5 160
Sail 2,000
Oars/ paddles 4 275 1,100
Total 12,900

63
2.6 FISH PRICES
Fish price data obtained from the Fisheries Department and the Central Bureau of Statistics,
and adjusted for inflation, show that there has been a gradual increase in the prices of the
three commercial species in the last decade. There is no consistent record of the market
prices of the non-commercial species; hence, it is difficult to know how their prices have
changed during the same period. Table 2.6 displays the adjusted prices for the three
commercial species of Lake Victoria.
Table 2.6. Lake Victoria fish prices Year Fish prices (Ksh/ kg)
Nile perch Nile tilapia ‘dagaa’
1991 12.00 8.46 5.90
1992 24.73 22.38 12.12
1993 26.21 25.00 4.95
1994 26.40 25.75 5.25
1995 31.02 31.67 12.83
1996 49.56 36.49 14.37
1997 37.19 35.93 13.17
1998 47.72 51.66 18.94
1999 47.72 27.16 17.59
2000 51.62 24.42 18.13
Source: Adapted from SMEC (2002)
2.7 AQUACULTURE PRODUCTION
Despite the growth of aquaculture production in Kenya in the last two decades, shown in
Figure 2.5, it still contributes just about 1% of the total fish landed in Kenya. Aquaculture,
therefore, remains with huge potential for expansion. Considering that the natural sources of
fish in Kenya are already showing signs of over-exploitation, it would be justified to invest
resources towards expanding and modernising aquaculture production systems. The main

64
fish species presently produced in aquaculture in Kenya are Oreochromis niloticus, Tilapia
zillii, Clarias gariepinus and Cyprinus carpio.
Figure 2.5:Aquaculture production in Kenya (1980-98)
0
200
400
600
800
1000
1200
1400
Years (1980 - 98)
Qua
ntity
of f
ish
(ton
s)
quantity (tons)
At present aquaculture in Kenya is characteristically for subsistence, adopting low
investment and, in return, getting low pond production. The ponds are small in size, with a
production output hardly exceeding 0.15 Kg/m2/year. Most of these ponds are for extensive
fish production. There are also a few semi-intensive systems producing 0.5 – 1.5
Kg/m2/year. Intensive systems of production are even fewer, the most notable example
being the Baobab farm, which can produce 5 – 45 Kg/m2/year.
According to Mbugua (2002), fish-farming system in Kenya is relatively under developed,
mainly using earthen ponds. It is practised at varying degrees of intensification using the
following holding units;
(i) Pond culture: These mainly use earthen ponds for extensive or semi-intensive
aquaculture. Most of Tilapines, catfish and common carp are cultured in such ponds

65
(ii) Raceway culture: These are rectangular ponds through which water flow
continuously. They are either concrete or earthen, although the latter are more
common in Kenya. This unit allows for high stocking densities because of the high
water exchange rate and provision of a complete diet for the fish. Raceway culture is
used in most trout farms. Examples include Kiganjo Trout Hatchery, Ndaragwa
Trout Farm and Baobab Fish Farm. The production rate in trout raceway ranges from
5 to 45 Kg/m2/year depending on the management level.
(iii) Tank culture: Tanks are usually circular concrete structures with a central outlet. This
system deploys continuous water flow and complete feeding with formulated feeds.
Aquaculture production in Kenya varies in the different provinces, the leading acreage
under aquaculture being in Western Province, followed by Central and Nyanza provinces.
These regional differences are largely attributable to physical suitability of soils and land
topography, availability of sufficient water supply, attitude of residents towards fish
farming, a tradition of fishing or fish farming and availability of extension and other support
services. Table 2. 7 display the statistics of aquaculture by Kenyan regions for 2000.
Table 2.7: Aquaculture Production by Kenyan regions (2000)
Province No. of
farmers
No. of
active
ponds
Area (m2)
of active
ponds
Quantity (Kg) harvested for each
species
Tilapia Catfish Common
carp Trout
Central 953 1269 419498 4257 732 675 3023
Coast 0 0 0 39000 0 0 0
N/Eastern 187 166 66732 742 24 13 0
Nyanza 2040 7276 395984 8956 80 0 0
R/Valley 1619 2087 281071 10742 2 0 730
Western 2879 3803 693780 8190 330 0 0
Total 7688 14601 1857065 71887 11,678 688 3753
Source: Adapted from Mbugua (2002)

66
These issues, among other factors, must be addressed if aquaculture is to be developed and
contribute more towards fish production in Kenya. However, the potential for aquaculture
cannot be overstated.
Table 1. SWOT analysis of Kenya’s fisheries supply side Strengths Weaknesses Opportunities Threats
1. Fish production
• Abundant natural supply of fish
• Predictable annual fish output
• Well skilled and reliable fishermen
• Over-reliance on one major species, Nile perch, for export
• Over 90% of fish from one source, Lake Victoria
• Seasonality of fish supply
• Fishermen lack efficient gears e.g. motorised boats
• Increased exploitation of inland lakes’ fisheries
• Greater production from aquaculture
• Diversification to non-traditional fisheries
• Increased output of marine fisheries, especially located off-shore
• Increased fish imports from the neighbouring countries
• Improved waste management
• Control of aquatic weeds
• Poor management of fisheries sources
• Over-fishing using destructive gears and methods
• Unsustainable catch levels
• Official attitude and policies of neighbouring countries against fish exports to Kenya
• Siltation of rivers and dams
• Pollution of fish supply sources
• Uncontrolled aquatic weeds e.g. water hyacinth
• Increased cross-border conflicts in the use of fishery products
2. Fish supply networks
• Well developed local supply network
• Sufficient numbers of refrigerated fish transport trucks
• Support services e.g. supply of ice to fish trucks
• Exploitation of fishermen by middlemen
• Poor roads to fish landing beaches
• Ice insufficient to serve fishing and fish transport boats
• Concentrating fish landing beaches to reduce travel time and costs for fish buyers
• A leaner marketing channel avoiding agents
• Ice production units close to fish landing beaches
• Formalisation
• Concentrating beaches have social and financial implications to fishermen e.g. increased average transport costs
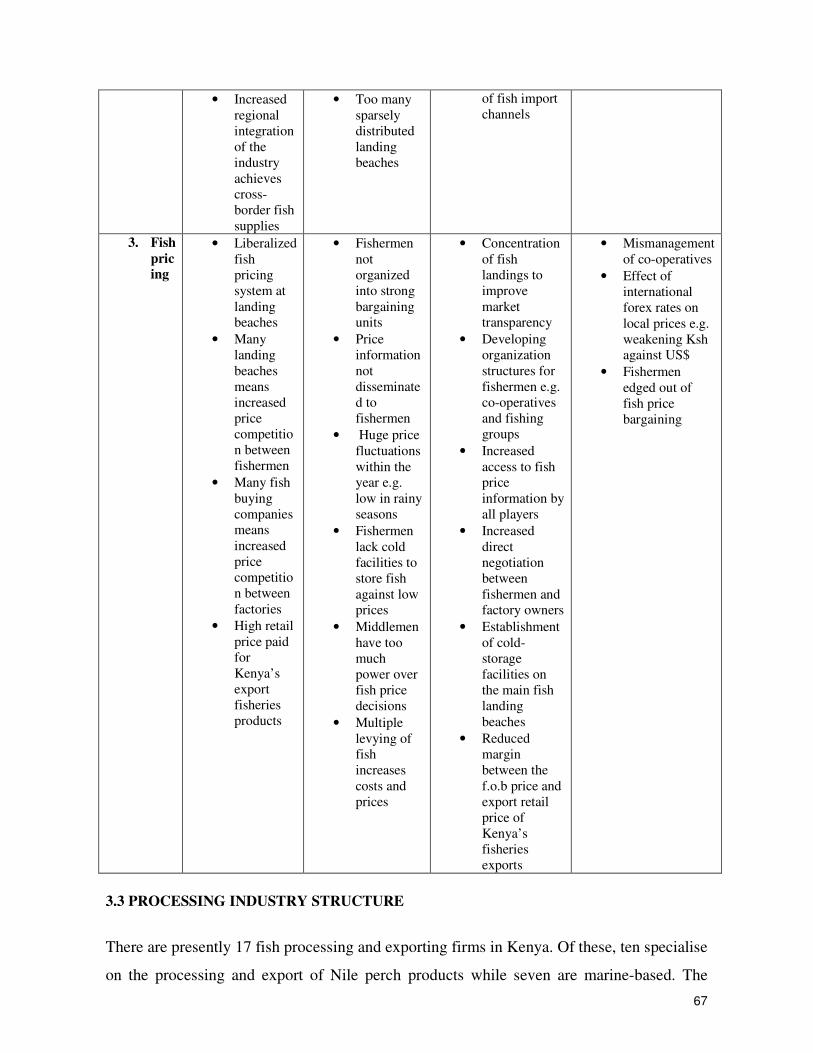
67
• Increased regional integration of the industry achieves cross-border fish supplies
• Too many sparsely distributed landing beaches
of fish import channels
3. Fish pricing
• Liberalized fish pricing system at landing beaches
• Many landing beaches means increased price competition between fishermen
• Many fish buying companies means increased price competition between factories
• High retail price paid for Kenya’s export fisheries products
• Fishermen not organized into strong bargaining units
• Price information not disseminated to fishermen
• Huge price fluctuations within the year e.g. low in rainy seasons
• Fishermen lack cold facilities to store fish against low prices
• Middlemen have too much power over fish price decisions
• Multiple levying of fish increases costs and prices
• Concentration of fish landings to improve market transparency
• Developing organization structures for fishermen e.g. co-operatives and fishing groups
• Increased access to fish price information by all players
• Increased direct negotiation between fishermen and factory owners
• Establishment of cold-storage facilities on the main fish landing beaches
• Reduced margin between the f.o.b price and export retail price of Kenya’s fisheries exports
• Mismanagement of co-operatives
• Effect of international forex rates on local prices e.g. weakening Ksh against US$
• Fishermen edged out of fish price bargaining
3.3 PROCESSING INDUSTRY STRUCTURE
There are presently 17 fish processing and exporting firms in Kenya. Of these, ten specialise
on the processing and export of Nile perch products while seven are marine-based. The
68
latter include four shrimp processors, two firms exporting various crustaceans, such as
octopus, squids and lobsters, and the remaining one processing tuna. The Nile perch
factories all produce fillet, skin on, headless and gutted products.
The Nile perch factories are East African Sea Foods Ltd, Kendag Ltd, Prinsal Ltd, Food
Processors 2000 K Ltd, Samaki Industries (2000) Ltd, Peche Foods Ltd, Afromeat Ltd,
W.E. Tilley Ltd, Capital Fish Ltd and Plantex Ltd.
The marine based processing firms are Alpha Serengeti, Alpha Manyana, Alpha Amboseli,
Wananchi Marine Products Ltd, Trans Africa Fisheries Ltd, Seaharvest Ltd and Basta and
Sons Ltd.
A study conducted in 1997 by Abila and Jansen (1997), in which all Nile perch factories
participated, revealed that there is high degree of vertical and horizontal integration in this
industry. Vertical integration arises because a factory owns or controls other enterprises
relating to fish supply acquisition, transporting fish, product distribution and export
marketing. Horizontal integration arises because factories own or control other factories
operating at the same level i.e. different ‘branches’ of the same factories. Horizontal
integration now extends beyond Kenya’s borders as some factories here own similar
factories in Uganda and Tanzania.
The typical fish supply arrangement involves the use of middlemen or ‘fish agents’, who
operate between the factory and the fishermen. Agents may either be:
(i) Company agents – these are contracted by the fish factory to supply it with fish.
The factory will normally provide the agent with an insulated fish truck equipped
with ice. Such an agent may not supply another firm with fish in the duration of
the contract.
(ii) Independent agent – These sell fish to any factory of their choice without a
binding contract. Often they use their own fish transportation facility, or, they
may hire an insulated truck from a factory to which it intends to supply fish.

69
The factory will agree on a price with an agent in advance of supplying fish. Once this is
done, the agents negotiate their own price with fishermen, leaving as high a margin as they
are able to take. Commonly agents will pay to fishermen a price in the range of 50 – 75% of
the price they get at the factory gate. Repeated complaint is that agents are quite exploitative
against fishermen.
Some factories exert their influence beyond agents and provide outboard engines, nets and
other fishing gear to fishermen under an agreement that the fishermen will supply fish to
offset the credit. This is not a popular arrangement as fishermen are bound to cheat
regarding their fish catches while they may also be unnecessarily tied down to a factory
paying uncompetitive prices.
Some factories also sign agreement with fishermen co-operatives to supply fish. This would
be the ideal situation as co-operatives may improve the level of bargaining and some degree
of quality control. The problem is that most fishermen co-operatives have not been
performing well. However, as it becomes more difficult to get fish, factories have to adopt
new ways, using all available options, to acquire it.
It is noteworthy that this is a very dynamic industry with frequent closures, take-overs and
ownership changes. But certainly the industry has been operating way below the established
capacities of most of its factories, more so in the face of diminishing Nile perch catches.
3.4 NILE PERCH PROCESSING INDUSTRY
Nile perch accounts for about 90% of all fish and fish product exports. Kenya’s Nile perch
exporting sector is a relatively new introduction to the fishing industry, having been in existence for
just about two decades. The first Nile perch filleting and exporting plants were set up in Kenya in
early 1980s, to satisfy an existing demand for white-flesh fish in parts of Europe and other
developed countries. The Kenyan firms were pioneers in Nile perch processing in the East African
region at a time of the initial Nile perch boom, with little else competing for the fish. Here was a
strange new fish facing almost hostile rejection from the traditional fish consumers in the country,
who saw it as a fatty and oily, smelly cannibal fish, associated with very distasteful stories. For
70
instance, it was then common to hear unsubstantiated stories about someone’s hand, watch etc.
having been found in the stomach of the ‘mbuta’; thus, many potential consumers kept off the fish.
With the fish going almost for free, those early filleting firms seemingly made huge profits, and
were so successful, that the industry expanded very rapidly in Kenya and also established itself in
Uganda and Tanzania. By 1987, there were already 10 factories processing Nile perch in Kenya
(Reynolds and Greboval, 1988). The profits in this new industry were still so high that further
expansion was justified; some of the initial factories closed down, while new modern ones were
established. Even though the quantity of processed and exported Nile perch has increased in the last
decade, the actual number of factories has remained nearly the same. In 2000, there were 12 Nile perch
processing factories operating in Kenya, which compared well with the number in 1990. Thus, it
seems that one strategy of the fish processing industry in the last decade has been to replace the old
smaller processing units with modern factories having much larger processing capacity. It also
suggests increasing horizontal integration in the fish processing industry, as old established firms
expand their activities to the other two countries.
The expansion in capacity of the factories has been so rapid that from mid 1990s there has
been excess capacity in the processing industry. After 1997 the Nile perch processing industry
was able to operate at only about half of the available processing capacity (Abila and Jansen,
1997; SEDAWOG I, 1999). The main reason for under-capacity utilization has been fish
supply problems, but for some factories, insufficient operating capital has also been a limiting
factor. One of the strategies taken by the factories to overcome fish supply problems has been
to seek their fish supplies from beyond Kenya’s boundaries, an event that has introduced a new line of
conflict in this industry (Gibbon, 1997).
As the Lake Victoria fish marketing system became more integrated in the global economy, so the
industry increasingly became subjected to international quality requirements. From the mid-1990s,
the fishery has directly been subjugated particularly to the European Union (EU) import
regulations. This resulted in two suspensions of Nile perch exports to the EU between 1997 and
2000, the reason being that Nile perch did not meet EU’s quality standards. Since the EU was the
premium Nile perch export market, the export suspensions have had a significant impact on the
entire fishing industry. Most factories have had to adopt new quality monitoring procedures, some
which involved major capital re-investment, for example redesigning the fish processing lines.
Some other factories could not cope with the new quality expectations, leading to their closure.

71
SWOT analysis for the Processing
Strengths Weaknesses Opportunities Threats 4. Fish
processing
• Well developed fish processing facilities
• Integration in factory ownership across borders ensures shared information and resources
• High labour costs of processing fish in Kenya compared to Tanzania and Uganda
• Developing units of producing higher valued products
• Importing raw fillets and adding value for export
• Excess capacity indicating insufficient supply of raw material
5. Fish packaging
• Well developed wax packaging manufacturing industry able to export to the region
•
• Little investment in packaging by fish industry
• Styrofoam packaging material has to be imported
• Development of credibility and importer-exporter trust
•
3.5 EXPORT MARKETS
The major export market for Nile perch are the European Union (Netherlands, Germany, Belgium,
Greece, Spain, Portugal, UK, France), Israel, Singapore, Australia, Hongkong, Japan, United Arab
Emirates, USA and Egypt.
Table 3.3 indicates that the European Union was, by far, the leading importer of Kenya’s Nile perch
up to 1997. But due to import bans and other quality restrictions, the volume of Nile perch entering
the EU sharply dropped by 66% in 1997-1998, and by a further 68% in 1998-1999 to reach a very
low figure of 742 tonnes. Following the problems with the EU market, Israel remained the leading
importer of Nile perch followed by countries in the Far East, principally Singapore and Japan.
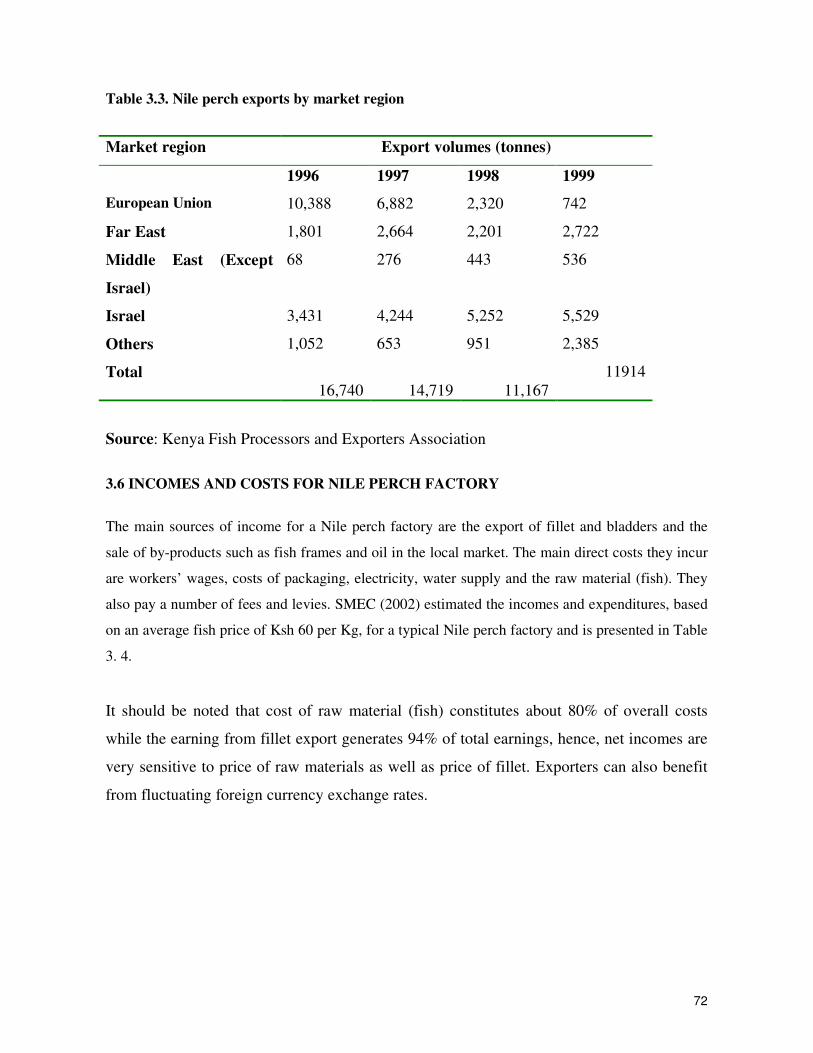
72
Table 3.3. Nile perch exports by market region
Market region Export volumes (tonnes)
1996 1997 1998 1999
European Union 10,388 6,882 2,320 742
Far East 1,801 2,664 2,201 2,722
Middle East (Except
Israel)
68 276 443 536
Israel 3,431 4,244 5,252 5,529
Others 1,052 653 951 2,385
Total 16,740 14,719 11,167
11914
Source: Kenya Fish Processors and Exporters Association
3.6 INCOMES AND COSTS FOR NILE PERCH FACTORY
The main sources of income for a Nile perch factory are the export of fillet and bladders and the
sale of by-products such as fish frames and oil in the local market. The main direct costs they incur
are workers’ wages, costs of packaging, electricity, water supply and the raw material (fish). They
also pay a number of fees and levies. SMEC (2002) estimated the incomes and expenditures, based
on an average fish price of Ksh 60 per Kg, for a typical Nile perch factory and is presented in Table
3. 4.
It should be noted that cost of raw material (fish) constitutes about 80% of overall costs
while the earning from fillet export generates 94% of total earnings, hence, net incomes are
very sensitive to price of raw materials as well as price of fillet. Exporters can also benefit
from fluctuating foreign currency exchange rates.

73
Table 3.4. Income and cost estimates for a Nile perch factory (2002)
Item Estimated income
(million Ksh)
Estimated costs
(million Ksh)
Fish fillet export 380.25 (94%)
Sale of by-products (maws, frames
etc)
22.82 (6%)
Workers’ wages 24.00 (71%)
Packaging costs 10.14 (3%)
Cost of electricity 24.00 (7%)
Cost of water and sewerage fees 1.20 (0.4%)
Cost of raw product (fish) 276.25 (81%)
Fish export fee 1.9 (0.6%)
Export certificates 0.12 (.04)
Local authority charges 0.09 (.03)
403.07 337.71
Net income (pre-tax) 65.36
Kenya’s fish export industry
Being a country experiencing a trade deficit, it is in the interest of the Kenyan Government to raise
substantially the volume of exports, especially non-traditional exports, such as fish. Fisheries
products, especially from marine fisheries, have been exported from Kenya from as early as the
1960s, but these were limited in volumes and returns were low due to competition from other lower
cost producing countries. To be able to process marine fisheries products for export, a few factories
were established in the Kenyan coast from as early as the mid-1960s.
But it was after 1980, with the coming of Nile perch, that fish exports started contributing
meaningfully to Kenya’s economy. Between 1980 and 1996, foreign exchange earnings from
Kenya’s fishery increased tremendously, from Ksh. 18 million to Ksh. 1.5 billion in 1998, in real
terms, largely attributed to Nile perch (Bokea and Ikiara, 2000). Table 3. 1 shows the increase in
volume and value (adjusted for inflation) of fish exports from Kenya as from 1980.
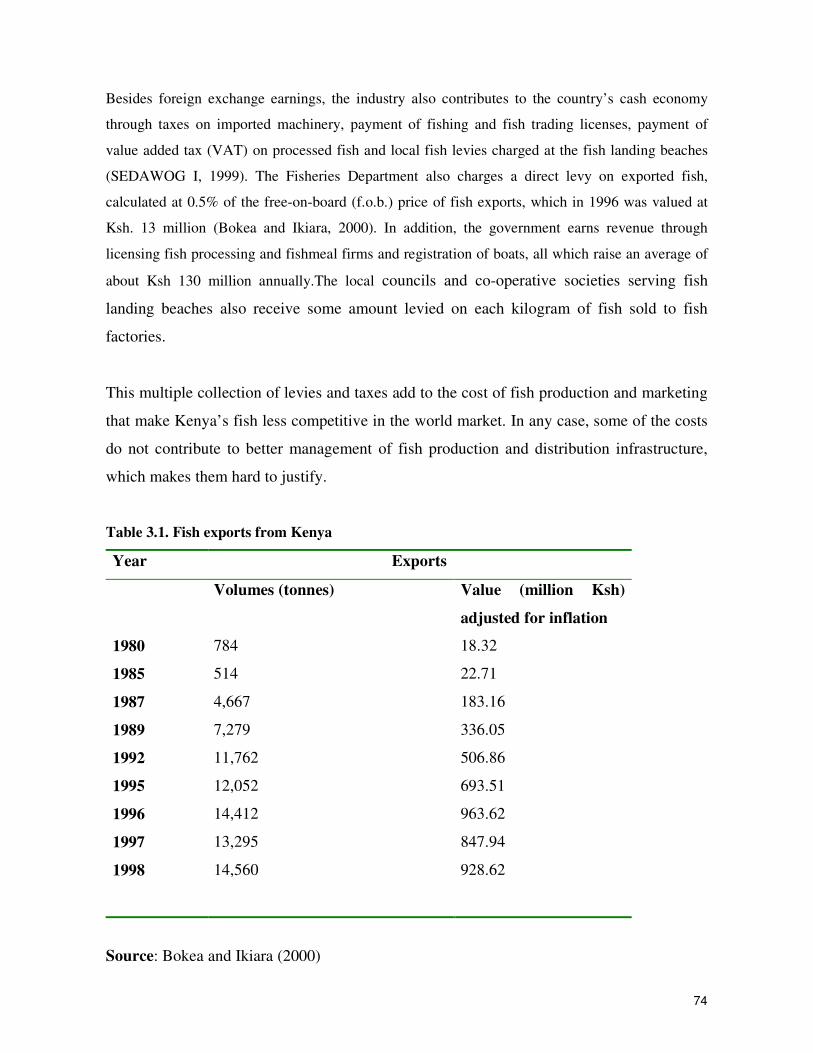
74
Besides foreign exchange earnings, the industry also contributes to the country’s cash economy
through taxes on imported machinery, payment of fishing and fish trading licenses, payment of
value added tax (VAT) on processed fish and local fish levies charged at the fish landing beaches
(SEDAWOG I, 1999). The Fisheries Department also charges a direct levy on exported fish,
calculated at 0.5% of the free-on-board (f.o.b.) price of fish exports, which in 1996 was valued at
Ksh. 13 million (Bokea and Ikiara, 2000). In addition, the government earns revenue through
licensing fish processing and fishmeal firms and registration of boats, all which raise an average of
about Ksh 130 million annually.The local councils and co-operative societies serving fish
landing beaches also receive some amount levied on each kilogram of fish sold to fish
factories.
This multiple collection of levies and taxes add to the cost of fish production and marketing
that make Kenya’s fish less competitive in the world market. In any case, some of the costs
do not contribute to better management of fish production and distribution infrastructure,
which makes them hard to justify.
Table 3.1. Fish exports from Kenya
Year Exports
Volumes (tonnes) Value (million Ksh)
adjusted for inflation
1980 784 18.32
1985 514 22.71
1987 4,667 183.16
1989 7,279 336.05
1992 11,762 506.86
1995 12,052 693.51
1996 14,412 963.62
1997 13,295 847.94
1998 14,560 928.62
Source: Bokea and Ikiara (2000)

75
3.2 FISH AND FISHERY PRODUCTS EXPORTED
Nile perch is the dominant fish species in the export trade, accounting for about 90% in
volume and value of Kenya’s total fish exports. The exported products of Nile perch include
the fillet, whole body (gutted, headless), fish maws and Nile perch bladder. Other fish
products exported from Kenya are mainly marine products, such as crustaceans lobsters,
prawns, crabs and fresh-water cray fish), molluscs (octopus and squid), rock cod, livers and
roes, Bonitos, Beche-de-mer, marine shells, dry shark fins, other marine fish and small
quantities of live fish. In the early 1990s, a few firms attempted to export tilapia, but this
failed to pick up due to the limited supplies of the fish and high competition from low-cost
tilapia exporters. In any case the Fisheries Department did not encourage the export of
tilapia for food security reasons. Table 3.2 shows the quantities and values (unadjusted) for
various fish and fishery products exported from Kenya in 1997 and 1998.
Table 3.2. Exports of fish and fishery products (1997 – 98)
Product 1997 1998
Volume
exported
(tonnes)
Unadjusted
value (‘000
Ksh)
Volume
exported
(tonnes)
Unadjusted
value (‘000
Ksh)
Fish fillets 14,719 2,554,525 11,698 1,838,242
Crustaceans 413 128,628 754 229,338
Molluscs 767 144,512 734 116,802
Marine shells 214 15,675 171 12,478
Live fish 194 21,960 166 20,665
Fish maws 123 57,961 53 16,201
Rock cod 71 11,916 41 6,298
Livers and roes - - 37 12,376
Bech-der-mer 13 5,419 8 1,892
Dry shark fins 7 8,075 6 7,970
Other marine fish 511 57,968 892 138,715
Total 17,032 3,006,639 14,560 2,400,977
Source: Kenya Fish Processors and Exporters Association
76
Chapter 5. Constraints and the way forward
Like the agricultural sector itself, the Kenyan fisheries sector has experienced several
constraints. Constraints experienced in the industry can be divided into fish production
constraints, processing and export constraints.
Fish production constraints
These are the constraints related to the fisheries sources and the fisherman. They include:
(xii) poor infrastructure
(xiii) lack of access to credit
(xiv) lack of cold storage facilities for fish
(xv) inability of fishermen to organize themselves and improve their bargaining
power
(xvi) lack of information on savings options
(xvii) inadequate savings facilities
(xviii) lack of skills for alternative livelihood
(xix) Over 90% of fish from one source, Lake Victoria
(xx) Seasonality of fish supply
(xxi) Fishermen lack efficient gears e.g. motorised boats
(xxii) Poor roads to fish landing beaches
(xxiii) Ice insufficient to serve fishing and fish transport boats
(xxiv) Fishermen lack cold facilities to store fish against low prices
Aquaculture is constrained by a number of factors; including, technology, feeds availability,
trained staff and the failure of fish farmers to perceive it as a commercial, rather than
subsistence, venture. Specifically, the constraints facing aquaculture development in Kenya;
(i) Limited government budget for aquaculture development
(ii) Lack of adequate and quality fish feeds and seeds
(iii) In effective extension services
(iv) lack of co-ordinated approach to aquaculture research and extension

77
(v) Lack of farm-based research results for small-scale aquaculture development
(vi) decreasing interest in fish farming due to low returns and uncertainties
(vii) No clear policy on fish farming
(viii) Competition by cheaper fish from capture fisheries, especially around\Lake
Victoria
(ix) Poor book keeping and farm management
(x) The subsistence, rather than commercial orientation of fish farming
(xi) Lack of access to credit facilities
(xii) Poor marketing arrangements
Aquaculture development should aim at the following goals;
(i) development of quality seeds and fingerling production
(ii) commercialisation of the aquaculture sector
(iii) improving the farm management skills of fish farmers
(iv) improved co-ordination of aquaculture extension services
(v) increased research in to suitable aquaculture species
(vi) Market research for potential aquaculture products
3.7 CONSTRAINTS FACING THE EXPORT INDUSTRY
A number of problems face the development of the Nile perch processing industry. These may be
looked at in terms of the production and marketing constraints.
(a) Production constraints
(i) Diminishing Nile perch stocks
(ii) Destructive fishing methods
(iii) Fish spoilage during some months
(iv) Poor infrastructure to the landing beaches
(v) Lack of cold storage facilities in the landing beaches
(vi) Undeveloped fish landing facilities
(vii) Inadequate sanitary conditions at fish landing sites.

78
(b) Marketing constraints
(i) Ban imposed on Kenya’s fish to EU markets
(ii) High prices on fish landing beaches
(iii) Lack of HACCP systems auditors
(iv) Improper fish handling practices from harvesting to packaging
(v) Lack of a national fish quality control laboratory
Constraints associated with the Policy environment
Constraints associated to the policy environment include: multiple levies, disharmony of
regulations, lack of coordination between different institutions dealing with fisheries, and
the issues of multiple licences e.g. fish traders being licensed by the department of fisheries
as well as by the local authority.
79
REFERENCES
Abila R.O. and E.G. Jansen (1997). The fish exporting and fishmeal industries of Lake Victoria:
Structure, strategies and socio-economic impacts in Kenya. IUCN Socio-economics of Lake
Victoria fisheries report no. 1. IUCN-EARO. Nairobi.
Bwathondi P.O.J, R. Ogutu-Ohwayo and J. Ogari (2001). Lake Victoria Fisheries Management
Plan. Document prepared for the Lake Victoria Fisheries Organization. LVFRP Technical
Document no. 16. LVFRP/TECH/01/16. Jinja, Uganda.
Fisheries Department, (1995) Fisheries Annual Report 1995. Fisheries Department, Nairobi.
Gichuki, J., F.D. Guebas, J. Mugo, C.O. Rabuor, L. Triest, F. Dehairs (2001). Species Inventory
and the Local Uses of the Plants and Fishes of the Lower Sondu-Miriu Wetland of Lake Victoria,
Kenya. Hydrobiologia 458:99106. pp 99.
Greenwood, P. H. (1981) The Haplochromine Fishes of the East African Lakes: Collected Papers
on their Taxonomy, Biology and Evolution. Kraus International Publications, Munchen.
Kenya Government, (2000) Economic Survey 2000. Central Bureau of Statistics.
Ministry of Finance and Planning. Nairobi, Kenya.
Kibaara, D. (1981). Endangered Fish Species of Kenya’s Inland Waters with Emphasis on Labeo
spp. In: Proceedings of the Workshop of the Kenya Marine and Fisheries Research Institute on
Aquatic Resources of Kenya, 1981, Mombasa. Pp 157-164.
Mbugua H. M. (2002). The Role of Fisheries Department in Aquaculture Development in Kenya.
Samaki News. Department of Fisheries Kenya. Nairobi Vol 1 no. 1 June 2002.
Ministry of Agriculture and Livestock Development (1997). Agricultural sector
development strategy. Kenya: Agricultural sector investment Programme (ASIP). Draft.

80
Muli, J. and W. Ojwang (1998). Growth and Mortality Rates of an Endangered Species, Synodontis
Victoriae, in Sondu/ Miriu River, Kenya. In: Cowx, I.G. (1998). (ed). Stock Assessment in Inland
Fisheries. Fishing News Books. Pp 409-415
O’Riordan, B. (1997) ‘Fisheries, Farming and Food Security in Nyanza: Caught Between
the Devil and the Deep Blue Sea?’ ITDG, Nairobi.
Ochumba, P.B.O. and J.O. Manyala (1992). Distribution of Fishes along the Sondu-Miriu River of
Lake Victoria, Kenya, with Special Reference to Upstream Migration, Biology and Yield.
Aquaculture and Fisheries Management 23, 709-719.
Othina, A. N and S. Osewe-Odera (1996) ‘Catch and Effort Assessment Survey for
Artisanal Fisheries of Lake Victoria (Kenya Waters)’, Kenya Marine and Fisheries
Research Institute, Kisumu.
Othina, A. N. (1999) ‘The Status of the Artisanal Fishery of Lake Victoria, Kenya’. In:
FIDAWOG, (1999). Report on the Third FIDAWOG Workshop held at the Triangle Hotel, Jinja,.
LVFRP Technical Document no. 6. LVFRP/TECH/99/06. The Lake Victoria Fisheries Research
Project, Jinja, Uganda: 6: 73-78.
Republic of Kenya (1965). African socialism and its application to planning in Kenya.
Government Printer.
Republic of Kenya (1981). Sessional paper no. 4 of 1981 on national food policy. Government Printer, Nairobi. Republic of Kenya (1991). The fisheries Act. Chapter 378, Laws of Kenya. Revised edition.
Government printer, Nairobi.
Republic of Kenya (2000). The fisheries (Fish quality assurance regulations, 2000). Kenya
Gazette supplement No. 55, Legislative supplement No. 36, The fisheries act (Cap 378).
Government printer, Nairobi.
Republic of Kenya (2002). Kenya rural development strategy, 2002-2017. Final draft.

81
Republic of Kenya (2002). National development plan, 2002-2008. Government Printer, Nairobi. Republic of Kenya, 1986. Economic management for renewed growth. Sessional paper no.1
Nairobi. Government printer.
Republic of Kenya, 1996. Industrial transformation to the year 2020. Sessional paper No. 2.
Nairobi. Government printer.
SMEC (2002). A study leading to the establishment of fish levy trust for Lake Victoria fisheries.
SMEC international. Drafts Report No. 58302. SMEC/ LVEMP
Whitehead, P.J.R (1958). The Anadromous Fishes of Lake Victoria. The East African Agricultural
Journal.

82
Annex1: Tabulation of visits made, listed in the context of fresh and frozen supply chains Frozen supply chain Entry point • Billingsgate
• Port of Antwerp
Inspection • Port of Antwerp
Importer • Billingsgate
• Anova Foods
• Nederlof
• Youngs Bluecrest
• New England Fish Traders
• Hottlet
Processor • Youngs Bluecrest
Catering distributor • Hottlet
• Billingsgate
• Frisch Edelfisch
Multiple retailer • Migros
• Karstadt
• Kaufhof
• Waitrose
• Sainsbury
• Safeway
• Aldi
• Markt Plus
• Prinz
• Delhaize
• Coruyt
Chilled supply chain Entry point • Perishable Centre, Frankfurt
Inspection • Perishable Centre, Frankfurt
Importer • Seachill
• Gadus
• Nederlof
• Anova Foods
• New England Fish Traders
Processor • Seachill, Grimsby
• Gadus, Nieupoort
Catering distributor • Frisch Edelfisch
Multiple retailer • Migros
• Karstadt
• Kaufhof
• Waitrose
• Sainsbury
• Safeway
• Aldi
• Markt Plus
• Prinz
• Delhaize
Other Certification • Marine Stewardship Council
Trade development organisations
Facilities management • Grimsby Fish Auction
• Scheveningen Fish Auction and

83
• ITC
• CBI, Rotterdam
• Commonwealth Secretariat
• Ghanaian High Commission
market
• Hottlet
• Perishable Centre, Frankfurt
Quality control • Youngs Bluecrest
• Seachill