Keeping Track of Garment Production Process and Process ...
16
Periodicals of Engineering and Natural Sciences ISSN 2303-4521 Vol. 6, No. 1, March 2018, pp. 11‒26 Available online at: http://pen.ius.edu.ba DOI: 10.21533/pen.v6i1.162 11 Keeping Track of Garment Production Process and Process Improvement using Quality Control Techniques Safa Tuna 1 Department of Industrial Engineering, International University of Sarajevo Article Info ABSTRACT Article history: Received Jan 7 th , 2018 Revised Feb 10 th , 2018 Accepted Feb 27 th , 2018 In serial mass production, very small changes and factors may cause huge effects and results. Companies can ignore the small changes and struggle with the problems and wonder why or develop their systems and get improvements and benefits out of detection of small factors. In this paper tracking the process and analyzing with certain quality improvement tools has been examined, analyzed and problems are detected. Pareto analysis, flowcharting, fishbone analysis and SPC methods are used to get results. The results say a lot about company’s problems such as out of nearly 20% of the company’s production faults cause nearly 80% of their problems and statistically it is proven that those mistakes carry the process out of control. By the side, instability and great variations are detected in the process which is not wanted in any kind of mass production. Keywords: Garment Industry Statistical Process Control Six Sigma Process Improvement Quality Corresponding Author: Safa Tuna International University of Sarajevo, Hrasnicka cesta 15, 71210 Sarajevo, Bosnia and Herzegovina Email: [email protected] 1. Introduction Sample Co. Company started without a name as a workshop in a basement of the apartment in 1995 in Istanbul, Turkey. The current company is a contractor company and more of an atelier which produces for the big brands such as Lacoste, Armani, Network and etc. There are 30 and more employees when needed in specific departments of the production of the company. Comparing to other textile companies, Sample Co. is a middle-sized company in the market. Lately, the company focused on producing only warm and winter clothes for the men, women and children segments with the order of famous brands There are cutting, sewing, ironing, accessories, finishing and packing departments in the company. The company runs all processes except embroidering, printing Company’s mechanism usually goes as follows; meetings being held with clients and in these meetings, there are mostly owners, designers, and productions manager are taking the role. Usually, clients come with their own models and orders but sometimes they may pick from companies collections. Productions manager is taking notes for the sampling and add in the orders folder. In some cases, samples are given to the company by the clients. Either the sample is given or the measures of the sample is being determined by the designers and productions manager, in both cases, related measures of the sample are being distributed to all departments. After orders are being received it is the time for production planning. Planning of production units is done in the production planning step. Owners, designers, productions manager and head of the departments are estimating the amount of labors, materials, and machines will be needed for the current order.
-
Upload
khangminh22 -
Category
Documents
-
view
0 -
download
0
Transcript of Keeping Track of Garment Production Process and Process ...

Periodicals of Engineering and Natural Sciences ISSN 2303-4521
Vol. 6, No. 1, March 2018, pp. 11‒26
Available online at: http://pen.ius.edu.ba
DOI: 10.21533/pen.v6i1.162 11
Keeping Track of Garment Production Process and Process
Improvement using Quality Control Techniques
Safa Tuna 1Department of Industrial Engineering, International University of Sarajevo
Article Info ABSTRACT
Article history:
Received Jan 7th, 2018
Revised Feb 10th, 2018
Accepted Feb 27th, 2018
In serial mass production, very small changes and factors may cause huge
effects and results. Companies can ignore the small changes and struggle with
the problems and wonder why or develop their systems and get improvements
and benefits out of detection of small factors. In this paper tracking the
process and analyzing with certain quality improvement tools has been
examined, analyzed and problems are detected. Pareto analysis, flowcharting,
fishbone analysis and SPC methods are used to get results. The results say a
lot about company’s problems such as out of nearly 20% of the company’s
production faults cause nearly 80% of their problems and statistically it is
proven that those mistakes carry the process out of control. By the side,
instability and great variations are detected in the process which is not wanted
in any kind of mass production.
Keywords:
Garment Industry
Statistical Process Control
Six Sigma
Process Improvement
Quality
Corresponding Author:
Safa Tuna
International University of Sarajevo,
Hrasnicka cesta 15, 71210 Sarajevo, Bosnia and Herzegovina
Email: [email protected]
1. Introduction
Sample Co. Company started without a name as a workshop in a basement of the apartment in 1995 in
Istanbul, Turkey. The current company is a contractor company and more of an atelier which produces for the
big brands such as Lacoste, Armani, Network and etc. There are 30 and more employees when needed in
specific departments of the production of the company. Comparing to other textile companies, Sample Co. is a
middle-sized company in the market.
Lately, the company focused on producing only warm and winter clothes for the men, women and children
segments with the order of famous brands
There are cutting, sewing, ironing, accessories, finishing and packing departments in the company. The
company runs all processes except embroidering, printing
Company’s mechanism usually goes as follows; meetings being held with clients and in these meetings, there
are mostly owners, designers, and productions manager are taking the role. Usually, clients come with their
own models and orders but sometimes they may pick from companies collections. Productions manager is
taking notes for the sampling and add in the orders folder. In some cases, samples are given to the company
by the clients. Either the sample is given or the measures of the sample is being determined by the designers
and productions manager, in both cases, related measures of the sample are being distributed to all
departments. After orders are being received it is the time for production planning. Planning of production
units is done in the production planning step. Owners, designers, productions manager and head of the
departments are estimating the amount of labors, materials, and machines will be needed for the current order.

Safa Tuna PEN Vol. 6, No. 1, March 2018, pp. 11 – 26
12
In case there is a larger amount of order than the capacity company will go to way of hiring extra labor and
renting extra machines or they will go to way of subcontracting with another atelier. Usually, thesecond way
is being chosen. Then it is time for sampling. For eachmodel, they produce few samples and send it to clients
for approval. The clients check the samples and approve or demand some corrections. Corrections and
adjustments are getting done and approval is getting verified after all. Now it is time for pre-production
meeting where owners, designers, and heads of departments are developing their estimations and making sure
how many labors, material, and machines are needed. In this meeting also material sourcing and
merchandising raw materials and semi-finished products are being determined. Departments are checking the
raw materials and accessories which are purchased for producing. Mostly fabric is being checked for color
differences, size, color and other defects. When everything is ready for production the next step is starting the
processes. There is one outsource person who checks each step during the production. And also during and
after finishing the processes finished garments are being inspected by the client's own inspectors. Because all
of the clients are very famous and important brands, they want to keep their reputation in the market and
customers good. To keep it good the clients send their quality control team during the process, after finishing
and they inspect finished garments when they receive the finished garments in their inventory. If there are
defected garments of nonconforming parts on the garments they are sent to the company for rework, or for
return if it is not possible to fix.
In garment industry depending on the type and organism of the company, there might be multiple problems.
Those problems are the situations which affect the performance of the production, quality of the product and
agreed delivery time. There is no factory which has no problem and working with 100% efficiency. Detecting
problems are essential because after detection those problems may be solved and efficiency approximates to
higher rates. After solving a problem another may come out and it is very normal because each batch, each
different model of the garment is being prepared with different materials and accessories, techniques and
settings.
According to the observations which are done, detected problems of the company are the following;
Defected parts, usage of inefficient techniques, process control and stability, lack of automation, lost time
caused by the problems above. Detailed problems of the company are; returned garments from the customers
due to defects on the garments. Without exceptions in every group of garments delivered to the customers
there are returned garments in certain amounts. Even though there are inspections during the process and after
the process, still customers make a last inspection before selling the garments in the inventory. Occasionally
this case is easy to deal and does not cause any other problem but usually fixing or making new garments in
some cases take a lot of time, slow down the workstations and reduce the reputation.
Specifications determined by the customer is one of the most important tasks of the company and when the
company is unable to do that, its meaning is a failure. Because that is the only thing that customer demands
and wants to buy from the company. After receiving the defected garments which are returned the company
gets a report about what is done wrong or where are the nonconforming or faulty parts of the garment.
In almost every single different garment the design, the style and at the same time stitch technique and style is
different. When customers order a kind of garment from the company, they mention in the measurements. But
this process needs skills, motivation, convenient tools, and workers. So Sample Co. is having difficulties
about placing the right amount of stitches per cm in the garments.
Also after making patterns, the cutting process is the one of the most time consuming, hardworking, fine
workmanship requiring, and crucial step in the production process. Sample Co. has the insufficient cutting
capacity, thus the company usually goes the way of subcontracting another cutting atelier for Sample Co..
It is important to have one of the most important step’s workers, tools, and machines but the orders are
coming usually uneven. Therefore the company does not hire or invest in cutting department. When the order
is in small amounts the workers use hand scissors to cut the fabrics under the patterns when there are medium
and quite big amounts of orders; motor scissors are being used. If there is a big amount of order and strict
deadline; the company subcontracts other ateliers or does the cutting process outside of the company facilities
like subcontracting but with a laser cutter or does all of them together. This decision totally depends on how
many and what kind of orders the company has at that time. So this complexity causes many varieties in the
finished garments when they are being measured. Inattentive cut parts cause problems in the inspection phase
and resultin a return to the company.
Holes and defects on the garment related to various reasons such as pulled knife, holes because of overheated
needles, stretching of the fabric, defects on the fabric itself are other problems but when compared with the

Safa Tuna PEN Vol. 6, No. 1, March 2018, pp. 11 – 26
13
main problems, these problems can be tolerated, and these will not cause many other problems, will not cause
contract cancelling or affect the business in a very bad way.
One of the other problems of Sample Co. is lack of automation.
Lack of automation causes delays, change in the plan during the production, exceed the deadline and have a
penalty due to contracts with clients.
After all very amateurly, the main problem of the Sample Co. company is lack of keeping track of the
production processes, analyzing and interpreting the huge historical data and even lack of usage of prepared
data and reports in order to improve the processes even though constantly data and reports about the
production and process are provided by the customers when they make inspections in order to measure the
quality of the final products.
2. Methods and Tools
Here in this part methods and tools will be presented shortly and launched in order to analyze the problems
and try to make improvements.
Tools which are convenient and suitable to use for the certain problems will be subgroups Six Sigma and SPC
basicly.
Six Sigma is another gathering of techniques for improvement of the process and enhance the quality. This
philosophy is used for wiping out nonconformance subsequently another approach to enhance the process and
quality. In a similar discipline like Deming's cycle, there is DMAIC (define, measure, analyze, improve,
control) circle in Six Sigma change program.
By definition, Six Sigma is less than 3.4 Defect for every Million Opportunities (DPMO) or parts per million
(PPM). Eventually 99.99966% exactness, which is a definitive objective to enhance and decrease the costs of
low quality at 1÷2 %. Six Sigma is characterized as a set of techniques based on Statistical Process Control
(SPC) which can help companies to accomplish significant change in item quality and thusly increase
competitiveness [1].
Six Sigma provides a comprehensive arrangement, which helps companies to coordinate suitable statistical
tools and different techniques in a "comprehensive" apparatus, for process change. These tools can be
connected in singular phases of Define, Measure, Analyze, Improve and Control (DMAIC) approach keeping
in mind the end goal to establish a successful processes quality change system. This structured strategy is
based on Plan, Do, Check, Act (PDCA) cycle, yet Six Sigma specifies the tools and techniques to use inside
each step, which is interesting to Six Sigma. The six sigma accomplishment also depends on the generation
age [1].
In DMAIC the concept is defining the problem, measuring the problem, analyzing the problem, after
determining what causes the problem after accurate analysis this step is improving by developing solutions to
the problem and the last step is control which is making sure that problem is solved and the new system is
consistent and in control.
SPC is a statistical approach to measure and control the quality aspects of a process such as if the process is
stable or capable of using variety of specific statistical calculations. The advantage of SPC is that the SPC is
applicable to all jobs and a great way to improve continuously the quality of products. Numbers of defects in a
batch and number of defects on one unit can be detected, studied and analyzed using SPC "hard tools" [2].
Hence required adjustments and settings can be implemented in the process. In continuous productions like
garment industry, SPC is a key factor which brings the company to the success and improvement.
2.1.1. Pareto Analysis
The Pareto Principle expresses that for some wonders 80% of the yield or results are created by 20% of the
reasons or causes. It is frequently utilized as a part of administration, financial aspects and business to enhance
efficiency and settle on better choices, but at the same time is utilized as a part of software engineering and
human actions. It provides to understand that frequently the dominant part of results originates from a
minority of sources of causes. Here are a few cases of the Pareto Principle as it applies to different
circumstances: 80% of the income originates from 20% of the clients, 20% of items yield 80% of offers, 20%
of society hold 80% of its riches et cetera. The Pareto Principle is an improved adaptation of the science
behind the Pareto circulation. It is likewise not vital that the two numbers signify 100%. The numbers 20 and

Safa Tuna PEN Vol. 6, No. 1, March 2018, pp. 11 – 26
14
80 are not numerically settled, but rather are utilized as a dependable guideline. It could be 80-20, 90-10, or
even 90-20 [3].
2.1.2. Process Flowchart
A flowchart is a sort of chart that speaks to a measurement, work process or process, demonstrating the means
as boxes of different sorts, and their request by associating them with bolts. This diagrammatic portrayal
represents an answer model to a given issue. Flowcharts are utilized as a part of breaking down, investigating,
dissecting, planning, archiving or dealing with a procedure or program in different fields [4].
Flowcharts allow to look into the processes in a wide sense and understand the mechanism of the whole
process. By the side, flowcharts help in order to identify badly organized work packages or detect the
problems in the process.
2.1.3. Process Control Charts
Control charts, presented by W.A. Shewhart in 1924, is a successful method for the examination of the variety
of redundant procedures. They can distinguish conceivable wellsprings of process variety with a specific end
goal to control and in the long run dispose of them. In a usual process, two various types of varieties can be
recognized:
1. Common causes variations. They are the distortions of a process framework and are out of control varieties.
2. Assignable (or special) causes variations. They can be appropriately recognized and controlled. A few cases
are turnover in worker stack, breakdowns, machine or part wear out, and instrument change [5].
With UCL (upper control limit), LCL (lower control limit), USL (upper specification limit) and LSL (lower
specification level) process control charts allow to monitor and analyze the variations in the process and
intervent.
The Western Electric Handbook (1956) suggests a set of decision rules for detecting
Nonrandom patterns on control charts. Specifically, it suggests concluding that the process is out of control if
either:
1. One point plots outside the three-sigma control limits,
2. Two out of three consecutive points plot beyond the two-sigma warning limits,
3. Four out of five consecutive points plot at a distance of one-sigma or beyond from the center line, or
4. Eight consecutive points plot on one side of the center line [6].
2.1.3.1. The np‒Control Chart
NP charts are executed to screen the quantity of nonconforming units of a production in light of samples taken
from the procedure at given circumstances (hours, shifts, days, weeks, months, and so on.). Normally, an
underlying arrangement of samples is utilized to assess the normal number of nonconforming units per test.
The assessed normal is then used to create control limits for the quantity of nonconforming units. Amid this
underlying stage, the process ought to be in control. On the off chance that focuses are out of control amid the
underlying (estimation) stage, the assignable reason ought to be resolved and the example ought to be expelled
from estimation. Once as far as possible have been set up for the np‒chart, these breaking points might be
utilized to screen the number nonconforming going ahead. At the point when a point is outside these set up
control limits, it shows that the quantity of nonconforming units of the process is out of control. An assignable
reason is suspected at whatever point the control graph shows an off-control process.
The np‒chart is fundamentally the same as the p‒chart. Instead of concentrating on the extent of
nonconforming units, as does the p‒chart, the np‒chart centers around the normal number of non-
accommodating units. Thusly, the decision of the p or np chart is just an issue of inclination, as each is a
scaled variant of the other. One case in which the p‒chart might be suggested over the np‒chart is where the
example measure shifts crosswise over examples since the p‒chart is simpler to translate for this situation.
Formulas used for the np‒chart are:
Suppose we have k samples, each of size n. Let represent the number of nonconforming units in the
sample.
Each point on the chart is given by ,the number of noncomforming units in the sample.
Centerline = n , where =
The lower and upper control limits for the P chart are calculated using the formulas;

Safa Tuna PEN Vol. 6, No. 1, March 2018, pp. 11 – 26
15
LCL = n - m
UCL = n + m
where m is a multiplier (usually set to 3) chosen to control the likelihood of false alarms (out-of-control
signals when the process is in control)[7].
2.1.3.2. C Control Chart C charts are utilized to monitor the quantity of defects on a unit of a process in light of units taken from the
process at given times. Regularly, an underlying arrangement of units is utilized to evaluate the number of
defects in a process. The evaluated esteem is then used to create control limits for the quantity of defects.
Amid this underlying stage, the procedure ought to be in charge. On the off chance that focuses are crazy amid
the underlying (estimation) stage, the assignable reason ought to be resolved and the unit ought to be expelled
from estimation. Once as far as possible have been set up for the C chart, these breaking points might be
utilized to screen the quantity ofdissensions (defects) of the process going ahead. At the point when a point is
outside these built up control limits, it shows that the quantity of individualities for a unit of the procedure is
crazy. An assignable reason is suspected at whatever point the control diagram demonstrates an of-control
process.
Formulas for the c‒control chart are:
Suppose we have sampled k units, one at each time period. Let represent the number of nonconformities of
the unit.
Each point on the chart is given by , the number of nonconformities of the unit.
In the C Charts procedure, the center line (average number of nonconformities) may be input directly, or it
may be estimated from a series of units. If it is estimated from the units, the formula for the center line is;
=
The lower and upper control limits for the C chart are calculated using the formulas;
LCL = - m
UCL = + m where m is a multiplier (usually set to 3) chosen to control the likelihood of false alarms (out-of-control
signals when the process is in control) [8].
2.1.3.3. -R Control Chart
Control charts are utilized to examine variety inside processes. There is a wide range of kinds of control
charts, ordered relying on whether you are following factors specifically (e.g. tallness, weight, cost,
temperature, thickness) or properties of the whole process (e.g. a number of flawed parts delivered, the extent
of defectives). It's utilized for variable information when the information is promptly accessible. This is a
standout amongst the most usually experienced control chart variations, and use two unique perspectives:
The chart demonstrates the amount of the variations in the process in a certain time interval.
The Range (R) diagram presents the variety inside every factor (called "subgroups"). A process that is in
measurable control limits is foreseeable and portrayed by focuses that fall between the lower and upper
control limits. At the point when a -R diagram is in control, the normal incentive for every subgroup is
steady after some time, and the variety inside a subgroup is additionally reliable. Control limits are not the
same as particular specification limits, but rather both are critical when we are performing process
examination:
Control limits are outlines of the process. They mirror the real measure of variety which is watched and
recorded. It is expected that the variety can be portrayed by the normal distribution, which implies that
99.73% of the greater part of our perceptions will fall into a location close to three standard deviations
underneath the mean (-3) and three standard deviations over the mean (+3). To set the control limits these
guidelines are used.
SL grants an opinion of the voice of the client. SL mirrors the variety that the client will acknowledge the
procedure. It is used that the objective incentive for the variable and the client indicated tolerance around that
variable to decide SL. (There is no association between the tolerance that the client determines and the
observed standard deviation of the procedure.)

Safa Tuna PEN Vol. 6, No. 1, March 2018, pp. 11 – 26
16
To decide CL, it is applied that the accompanying formulas, where X with a double bar ( ) demonstrates the
normal of all the , and the constants A2, D3, and D4 are chosen from the appendix table in view of the
quantity of sample in every one of the subgroups [9].
Formulas of chart:
Range = ( - )
=
, k is the number of subgroups
=
, n is the number of observations
=
, k is the number of subgroups
= +
= -
=
=
2.1.4. Process Capability ( )
Process capability addresses to the consistency and ability of the process. Shortly means that what is the
process capable to do. Clearly, the changeability of essential-to-quality attributes in the process is a measure
of the consistency of the yield [10].
“It is frequently convenient to have a simple, quantitative way to express process capability. One way to do so
is through the process capability ratio (PCR) Cp. Recall that where USL and LSL are the upper and lower
specification limits, respectively. Cp and other process capability ratios are used extensively in the industry.
The formula of Cp is:
=
USL : Upper specification limit
LSL : Lower specification limit
: Standard deviation
A few organizations require that the base estimation of Cp value is 1.33. Some different organizations raise
this necessity up to 1.67 or Cp ≥ 2, what relates to the Six Sigma level. In the event that Cp<1, it implies that
procedure mean μ is outside of indicated range and creates a high level of imperfections however in the event
that the procedure is focused all things considered Cpk = Cp, and if Cp> 1 at that point procedure meets
specifications. Likewise, if the procedure is "under control" calculating the process capability index is not
necessary.
2.1.5. Scatter Diagram and Regression Line
The scatter diagram is a helpful graph for recognizing a potential connection between two factors. Information
is gathered in sets on the two factors —say, ( , )—for i= 1, 2, . . . ,n. At that point, is plotted against the
corresponding . The state of the scatter diagram frequently demonstrates what kind of relationship may exist
between the two factors. Scatter diagrams are significantly helpful and sort of the first step in order to create
regression models. Regression is an importantly valuable method in the examination in advance of DMAIC.
Usually, it is assumed that there is a dependent variable or reaction y that relies upon k independent or
repressor factors, for instance, the connection between these factors is described by a numerical model called
a regression model. The regression model is fit to an arrangement of test information. However, in general, the
functional relationship is obscure, and the experimenter picks a proper function to inexact the genuine model
[11].
The general formula for the linear regression line is:
= + + +… +
: Line, : i th observation of the j th independent variable
: intercept of the plane
and : partial regression coefficents
: Error

Safa Tuna PEN Vol. 6, No. 1, March 2018, pp. 11 – 26
17
2.1.6. ANOVA Single Factor
Analysis of variance, shortly called ANOVA is a statistical method used to examine test changes to acquire
data on looking at different population means. This method is comprised of a few essential statistical factual
ideas such as F-test and hypothesis testing.
ANOVA is usually used to examine the impact of a couple of factors on a reaction variable. Nevertheless,in
reality, it is more useful to examine multiple of elements on at least one reaction factors together and DOE is
utilized as a part of those intricate cases. In any case, the idea of ANOVA is utilized in DOE strategy for
information examination.
Under the Null Hypothesis ( ), the observed event from the greater part of the test information recorded on
RV is because of trial blunder as it were. This implies even the factor under investigation applies no impact on
the RV. The Alternate Hypothesis ( ) stipulates that the factor applies a critical impact on the RV. Any
conclusion is determined through the examination by the F-test. The F-test is set up such that the variety from
the factor is partitioned by the variety from mistake. Subsequently, if the computed is bigger than the
arranged F value, the factor under investigation is thought to be significant (dismiss the Null Hypothesis). In
the event that the computed is less than the organized F value, the factor under examination is thought to be
not significant (accept the Null Hypothesis) [11].
The formulas in order to do ANOVA analysis are:
= + : total sum of squares
=
=
=
=
=
2.1.7. Fishbone Diagram
Also Called: Cause–and–Effect Diagram, Ishikawa Diagram. The fishbone diagram distinguishes numerous
conceivable reasons for an impact or issue. It can be utilized to arrange a meeting to generate new ideas. It
promptly sorts thoughts into helpful classes.
When to Use a Fishbone Diagram:
When estimating and obtaining possible causes for an issue.
Particularly when a group's reasoning tends to fall into trenches.
Fishbone Diagram Procedure:
1. Determine the effect, in other words determining the main problem whose causes are trying to be estimated.
2. Generate the main categories of the causes.
3. Write them down as branches from the main arrow.
4. Forecast the subgroups of causes and obtain more specific causes.
When the brainstorming about causes are done, analyze the causes with certain tools and find the most
significant ones and fix them [12] [13].

Safa Tuna PEN Vol. 6, No. 1, March 2018, pp. 11 – 26
18
3. Results and Discussion
3.1. Process Flowchart
The improved flowchart
of the company’s activities
are shown below:
As visible above there is the
newly improved flowchart is
created. Here one of the
main problems of the
company will be solved
which is procurement
management and it is solved
by parallelizing the starting
activities. Back then the
company was doing almost
every activity one after
another and that was causing
so much waste of time and
delays. From interviews with
employees, one of the main
reason for the delay’s reason
was told as procurement.
With shifting the
procurement sourcing and
managing to the early stages
of the planning the time
management will relax and
will have more time to reach
the sources and procure on
time.
The measurement points on
the flowchart are highlighted
with yellow color. The data
which are used for analysis
are taken from cutting and
sewing inspection results.
From the other side there are
other data which are used in
analysis but not taken from
the process which is running
in the company, yet coming
from customers own
inspections in their own
facilities and sent to the
company as reports.
3.2. Pareto Analysis
Studying according to the data and reports that customers provided about defects of returned garments, a
Pareto chart have been created and analyzed. As a result, as expected %78 of the noncomfortings are caused
by around 20% problems in the production. Luckily those problems in the production can be monitored,
Flowchart
Figure 1Improved Process Flowchart Figure 2.Improved Process Flowchart

Safa Tuna PEN Vol. 6, No. 1, March 2018, pp. 11 – 26
19
tracked, recorded and analyzed by the SPC tools and can be improved by six sigma techniques and TQM
philosophy. The Pareto chart is represented below in the graph. According to Pareto analysis %78 of
the nonconformanceare consist of
garments out of tolerances and faulty
stitches. In the following part of the
analysis, the causes of the defects will
be analyzed and examined. After the
analysis, if the company can read the
reports successfully, they can fix and
improve almost 80% of their problems
by only focusing 20% of their
mistakes.
3.3. Process Control Charts
3.3.1. np‒Chart
A number of defective final garments are represented in the graph below.
Figure 4.NP Chart
This graph is created accordingly with the data in every 500 finished garment packs’ the customer's inspectors
and quality control departments reported.
By evaluating the np‒chart of shipped garments to the customer, the result is very clearly negative. This graph
tells to the company that their production is not in control whose specification limits are determined by the
customers and the process gives alerts about the future processes and productions. There are six points out of
control limits which can be interpreted as the process is extremely out of control and not stable. And 6 other
points which are out of 2 sigma limits which should be considered as alerts but the process already is
out of control.
3.3.2. c‒Chart
The returned garments with their report attached to them examined and the results are on the C chart above.
Here the data which is examined is the number of defects on each garment from each pack sent back from the
customers. The sequence has a time order and the first one is the one which sent to the customer first and so
on. The process is within control limits but it seems to have an increasing trend and if there is really an
increasing trend the process is not under control. The outcomes are shifting to upwards from downwards.
0
20
40
60
1 2 3 4 5 6 7 8 9 10 11 12 13 14 15 16 17 18 19 20 21 22 23 24 25
Nu
mb
er o
f d
efec
tive
ga
rmen
ts in
eve
ry 5
00
Sequence of shipped garments in amount of 500 in one pack
Di CL UCL LCL
1.σ(+) 1.σ(-) 2.σ(+) 2.σ(-)
66 21 13 8 4
63% 78%
89% 96% 100%
0% 20% 40% 60% 80% 100%
0 20 40 60 80
Garments out of
tolerances
Faulty Stitches
Holes on the
garment
Accessories Faults
Other
Nu
mb
er o
f d
efec
ts
Axis Title
Frequency Cumulative Percent
Figure 3.Pareto Chart

Safa Tuna PEN Vol. 6, No. 1, March 2018, pp. 11 – 26
20
There are 5 points out of one minus sigma limits almost until the middle then 4 points out of one plus sigma
shows an obvious shift and trend upwards.
Figure 5.C Chart
To understand if there is a trend, a linear regression graph has created. And as it can be seen below in the
graph there is an increasing trend on the defects as the time goes on and makes the process out of control.
Figure 6.Scatter Diagram and Regression Line
3.3.3. Chart
In the graph below there is the average performance of the stitch workstations over time. The task is making
3,5 stitches in per cm for a certain type of coat in the sewing workstations. The tolerance is ± 0,5 cm. From
the graph easily can be understood that process is not under control first of all due to visual interpretations
before examining the process capability. Here in the chart there are five consecutive points beyond the one
sigma and if six sigma is wider than USL and LSL process is not capable. There is also one point which is out
of UCL which means the process is out of control. By the way, there is one point which is touching to the LSL
and another one touching to LSL and two points located out of two sigma zone except for the one which is out
of USL which can be seen as warning points.
0
5
10
1 2 3 4 5 6 7 8 9 10 11 12 13 14 15 16 17 18 19 20
Nu
mb
er o
f d
efec
ts
Inspected garments' sequence
defects cbar UCL LCL1
1.σ(+) 1.σ(-) 2.σ(+) 2.σ(-)
0
2
4
6
8
0 5 10 15 20 25 Nu
mb
er o
f d
efec
ts
Inspected garments' sequence

Safa Tuna PEN Vol. 6, No. 1, March 2018, pp. 11 – 26
21
Figure 7. Chart
Other than visual interpretations of the chart the process capability has been calculated and analyzed
mathematically.
Table 1.Process Capability Ratio
From process capability ratio the result can be interpreted as the process is
not capable but also the process is relatively close to 1. Thus with certain and
specificadjustments, the process can be taken under control and a capable
process can be maintained.
To understand the causes of the effect which is the defect, in this case,
fishbone diagram has been created and with brainstorming the most common
causes related to sewing problems have been determined with employees.
In the fishbone diagram (cause and effect diagram) the main causes of the
sewing problems are examined and reflected in Table 1.
3.3.4. R‒Chart
Continuing with the same analysis of sewing process which investigates stitches per cm shows us the range
chart seems to be within the control limits. Yet to be able to say that the process is under control and it is
capable the both and R charts must be within the control limits. Although the R chart seems to be in control
the process is out of control. On the other hand, it is very clear that there is a high variability, thus the process
is also not stable. There is no increasing variation, increasing or decreasing trends. Variations kind of look
cyclic. This means there may be a chronical constant problem which can be discovered relatively easily and
can be improved.
Figure 8.R Chart
2.5
2.7
2.9
3.1
3.3
3.5
3.7
3.9
4.1
4.3
1 2 3 4 5 6 7 8 9 10 11 12 13 14 15 16 17 18 19 20
Stit
ches
per
cm
Number of samples
xbar LSL CL LCL UCL
USL 1.σ(+) 1.σ(-) 2.σ(+) 2.σ(-)
0
0.5
1
1.5
2
2.5
1 2 3 4 5 6 7 8 9 10 11 12 13 14 15 16 17 18 19 20
Ran
ge
Number of sample
R
R CL
R LCL
R UCL
1.σ(+)
1.σ(-)
2.σ(+)
2.σ(-)
σ = 0,192333
6σ = 1,154
USL 4
LSL 3
USL - LSL 1
Cp 0,866551
Cp< 1
Safa Tuna PEN Vol. 6, No. 1, March 2018, pp. 11 – 26
22
There are randomly six points out of one minus sigma limit and three points out of two plus sigma limit. So
clearly there is a huge variation in process and the variations should be decreased and theprocess should be
narrowed down for more accurate production.
This R chart analysis can be used in the future processes to identify and eliminate assignable variations in
order to provide more stable process and prevent defects on products
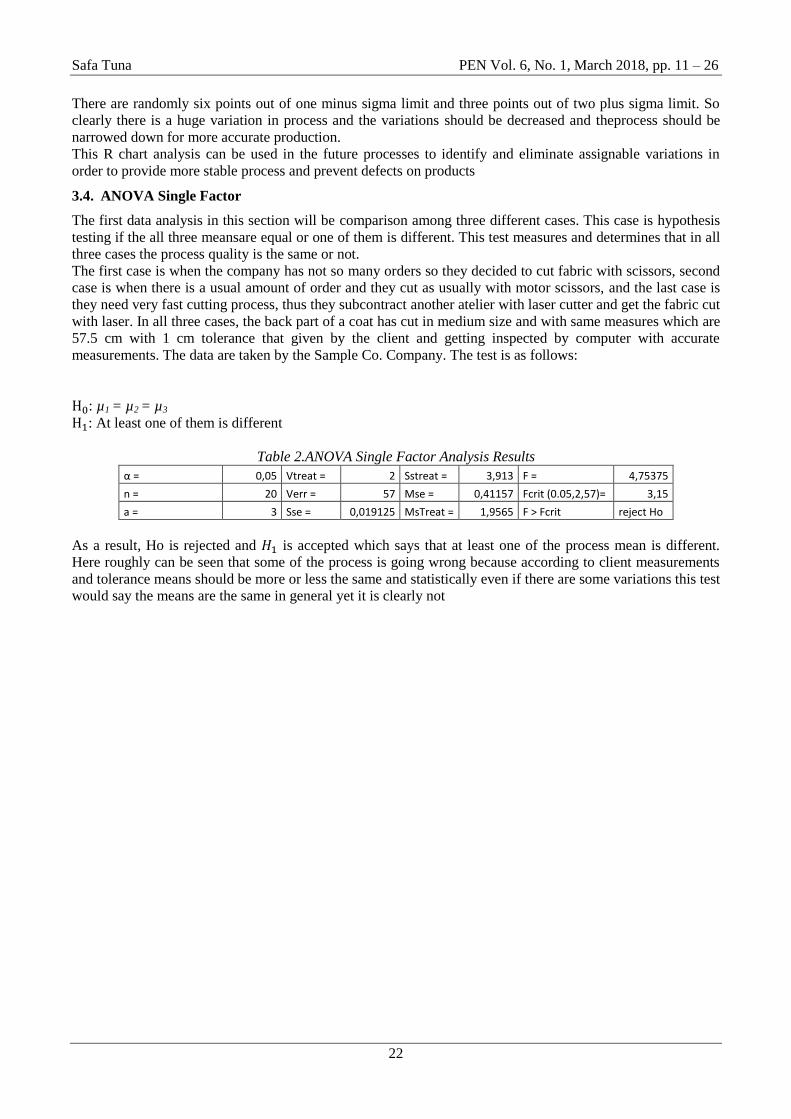
3.4. ANOVA Single Factor
The first data analysis in this section will be comparison among three different cases. This case is hypothesis
testing if the all three meansare equal or one of them is different. This test measures and determines that in all
three cases the process quality is the same or not.
The first case is when the company has not so many orders so they decided to cut fabric with scissors, second
case is when there is a usual amount of order and they cut as usually with motor scissors, and the last case is
they need very fast cutting process, thus they subcontract another atelier with laser cutter and get the fabric cut
with laser. In all three cases, the back part of a coat has cut in medium size and with same measures which are
57.5 cm with 1 cm tolerance that given by the client and getting inspected by computer with accurate
measurements. The data are taken by the Sample Co. Company. The test is as follows:
: µ1 = µ2 = µ3
: At least one of them is different
Table 2.ANOVA Single Factor Analysis Results
α = 0,05 Vtreat = 2 Sstreat = 3,913 F = 4,75375
n = 20 Verr = 57 Mse = 0,41157 Fcrit (0.05,2,57)= 3,15
a = 3 Sse = 0,019125 MsTreat = 1,9565 F > Fcrit reject Ho
As a result, Ho is rejected and is accepted which says that at least one of the process mean is different.
Here roughly can be seen that some of the process is going wrong because according to client measurements
and tolerance means should be more or less the same and statistically even if there are some variations this test
would say the means are the same in general yet it is clearly not

Safa Tuna PEN Vol. 6, No. 1, March 2018, pp. 11 – 26
23
3.5. Fishbone Diagram
Figure 9. Fishbone Diagram
In the fishbone diagram (cause and effect diagram) the main causes of the sewing problems are examined and
reflected in the figure above.
3.6. Regression and Correlation
After finding the possible reasons for the faulty stitches in the process with brainstorming, a regression and
correlation analysis are done. Daily defects in the sewing department analyzed whether they are related to
certain causes in the fishbone diagram. Only measurable causes are taken into consideration.
In order to understand the causes of the faulty stitches (more or fewer stitches per cm than specified with
limits) 15 days recorded data analyzed with multiple regression and examined if the effects (faulty stitches)
can be related and explained with the potential causes of the problem.
In the worker segment of potential causes under the unskilled title, daily new workers or the ones who shifted
to sewing department for that day are recorded in total. Under the lack of motivation title, there are the
numbers of fired, resigned or the workers who are shifted to other departments from sewing. Under the
laziness or speediness, there are the numbers of inspected garments which have other than exact 3.5 cm
stitches per cm (tolerance numbers included).
In the machines segment under the worn out tools, there is the daily number of parts of the machines has
changed due to long time usage. Under the title, feeder breaks off there are the daily numbers of the feeder
rope bobbins which are broken. And the last potential cause of the machine segment is broken needle which is
clearly counting the daily broken needles.
In the materials segment under the ripped off rope, there is the number of cases when the rope gets ripped off.
Under the bent needle, there are the daily amounts of records due to thick fabric low-quality needles get bend
which tends to get hot easily.
In the management, under the poor investigation title, there are the data of daily amounts of inspections in the
company. The defects are the final defect number of the day if there were more than one inspection in the

Safa Tuna PEN Vol. 6, No. 1, March 2018, pp. 11 – 26
24
company and some parts fixed which sent to the workstations after inspections. Because the customers have
their own inspectors and quality control departments, Sample Co.’s inspectors sometimes tend to lower the
frequency of the inspections and do some other tasks in the company. Summary statistics for ANOVA shown
in Table 3.
Table 3. ANOVA for factor causes
df SS MS F Significance
F
Regression 9 677,6781958 75,29757731 138,3229148 1,86636E-05*
Residual 5 2,721804173 0,544360835
Total 14 680,4
*Significant
As can be seen from the regression summary Fo = 138,32 which is much higher than its critical value (
1,86636E-05) thus, overall model is significant implying that at least one factor is significant. The values of
R2 and adjusted R
2 are over 0.98 implying a good fit of the model. Regression coefficients are calculated and
shown in Table 4.
Table 4. Factor significance of multiple linear regression models
Coefficients Standard Error t Stat P-value Lower 95% Upper 95%
Intercept 4,040156793 2,543039237 1,588711937 0,172992366 -2,496933677 10,57724726
Broken needles (x1)* 1,468399237 0,442118811 3,321277452 0,020978814 0,331896653 2,604901821
Ripped off rope (x2)* 1,05813882 0,21722947 4,871064778 0,004588606 0,49973269 1,61654495
Unskilled operator (x3)* -1,64622783 0,578136032 -2,847474882 0,035929951 -3,132373812 -0,160081847
Lack of motivation (x4) -0,894604137 0,493021773 -1,814532717 0,1293158 -2,16195695 0,372748676
Laziness or speediness (x5) -0,227547805 0,15921772 -1,429161313 0,212338766 -0,636829984 0,181734373
Worn out tools (x6) -0,082292086 0,146045923 -0,56346719 0,597448319 -0,457715083 0,293130911
Feeder breaks off (x7)* 1,283987638 0,176366181 7,28023723 0,000764823 0,830623936 1,73735134
Bent needle (x8)* 2,318473378 0,543579073 4,265199846 0,007975193 0,921158887 3,715787869
Poor inspection (x9) -0,509137312 0,576407291 -0,883294365 0,417517666 -1,990839423 0,972564799
*Significant variables
From regression table it is observed that defect caused such as broken needles, ripped off the rope, unskilled
operator, feeder breaks off, bent needle has P-values less than 0.05 and they are considered as significant
caused. Therefore, the predicted value of the regression model that includes only significant factors can be
written as:
Therefore these five causes of defects are critical to product quality and must be paid special attention to them
and to maintain process capable and under control.
Again surprisingly according to the data and its results worn-out tools are not significant to the defects. It may
be because the worn out parts are changed in time so they don't cause many problems in the process.
3.7. Design of Experiments
In the last few decades, DOE was an extremely helpful methodology that is generally utilized for the change
of item quality and reliability and providing improvements in the processes. The utilization of DOE has been
extended crosswise over numerous businesses and sectors as a component of the base of deciding process
either along another item advancement, producing procedure, development, and improvement.

Safa Tuna PEN Vol. 6, No. 1, March 2018, pp. 11 – 26
25
Engineering takes the second place where DOE is applied and its margin is bigger than all other fields where
DOE is applied except medicine.
And at this point, DOE's two main uses out of five are applied in here and other two can be applied and have
good results in the name of process improvement and a new system of work with new adjustments
accordingly to the results of the analysis. The two components which are applied here are variable screening
and comparison and the other two can be applied in order to have an improved process which is system
optimization and robust design [14].
4. Conclusion
Eventually in this project related problems determined and examined with convenient tools. After
implementing the techniques there is an improved flowchart which refers to a new way of functioning instead
of old chain work sequence which is very wrong decision in mass production and garment industry. Finding
out the biggest and most significant problems of the company with Pareto analysis, keeping track of the
current process and analyzing historical reports and data with SPC helped in order to understand the nature of
the mistakes during the production process.
According to Cp analysis, the process is not capable but when it is compared, the process is relatively close to
1 so that means that process can be improved and be capable with fixing the problems which are determined
and sorted accordingly to their significances.
Another issue that the company should deal with is choosing an effective and precise way to cut fabrics. The
company changes the cutting tools and techniques depending on the size of the order but the old-fashioned
and less automated methods are detected to be out of specification limits, thus the process is out of control and
causes the return of garments.
With the fishbone causes of the problems tried to gather and a map which shows the way of going to the
problem has generated. Related historical data is used to analyze and measure the significance of the problem
and create a regression model. According to the regression model the most significant problems which should
be fixed and improved as soon as possible are broken needles, bent needles, ripped off ropes, broken feeders,
and unskilled operators. These are the most significant problems and according to Pareto diagram if those
problems are solved the process can be improved almost 80% which is a big improvement and benefit for the
company.
Finally, it is expected from the company to study on the analysis has been made and prepare themselves for
the fixings, adjustments, and improvements. Having TQM philosophy and keep implementing process
improvement tools as professionals of garment industry is expected. Two of the DOE components which are
process improvements and robust design is needed to be done according to results of the analysis which are
made. The company should leave old timer tools and techniques in production (especially in the cutting
department) if they want to keep working with big brands. Also, thetransition to automation is needed. Hence
human factor in mistakes should be reduced as much as the company can do. Since the causes of the problems
have been determined categorized and analyzed with regression the significance and relation with defects
have been found and reported. Moreover improved and more efficient process, less defected garments, less
returned products, reduction in waste material and final waste and incrimination in profit is expected. If the
company takes the opportunity of using this analysis, take up seriously the engineering methods in production
and improvements and implements the six sigma and SPC techniques the mass production will be more
precise, reliable and higher quality.
5. References
[1] B. Duraković and H. Bašić, "Textile Cutting Process Optimization Model Based On Six Sigma
Methodology In A Medium-Sized Company," Journal of Trends in the Development of Machinery and
Associated Technology, vol. 16, no. 1, pp. 107-110, 2012.
[2] B. Durakovic, H. Basic and H. Muhic, "The Interrelationships between Quality Management Practices
and Their Effects on Innovation Performances," in Trends in The Development of Machinery and
Associated Technology TMT 2014, Budapest, 2014.

Safa Tuna PEN Vol. 6, No. 1, March 2018, pp. 11 – 26
26
[3] Q. S. E. T. a. A. W. Rosie Dunford, "The Pareto Principle," The Plymouth Student Scientist, vol. 7, no. 1,
pp. 140-148, 2014.
[4] Wikipedia, "https://en.wikipedia.org," Wikipedia, [Online]. Available:
https://en.wikipedia.org/wiki/Flowchart.
[5] R. Manzini, A. Regattieri, H. Pham and E. Ferrari, "Control Charts," in Quality Management Systems and
Statistical Quality Contro, Springer, 2010, pp. 17-51.
[6] D. C. Montgomery, Introduction to Statistical Quality Control, Sixth Edition, John Wiley & Sons, Inc.,
2009.
[7] N. S. Software, "NCSS.com," [Online]. Available: https://ncss-wpengine.netdna-ssl.com/wp-
content/themes/ncss/pdf/Procedures/NCSS/NP_Charts.pdf.
[8] N. S. Software, "NCSS.com," [Online]. Available: https://ncss-wpengine.netdna-ssl.com/wp-
content/themes/ncss/pdf/Procedures/NCSS/C_Charts.pdf.
[9] N. Radziwill, "http://qualityandinnovation.com," 2015. [Online]. Available:
https://qualityandinnovation.files.wordpress.com/2015/11/xbar-r-75-925_9.pdf.
[10] B. Durakovic and H. Basic, "Continuous Quality Improvement in Textile Processing by Statistical
Process Control Tools: A Case Study of Medium-Sized Company," Periodicals of Engineering and
Natural Sciences, vol. 1, no. 1, pp. 39-46, 2013.
[11] D. C. Montgomery, Introduction to Statistical Quality Control, Sixth Edition, John Wiley & Sons, Inc.,
2009.
[12] H. Bašić, B. Duraković and A. Softić, "Six Sigma Model Testing In Optimizing Medium-Sized Company
Production Process," Journal of Trends in the Development of Machinery and Associated Technology,
vol. 16, no. 1, pp. 103-106, 2012.
[13] N. R. Tague, The Quality Toolbox, ASQ Quality Press, 2005.
[14] B. Durakovic, "Design of Experiments Application, Concepts, Examples: State of the Art," Periodicals
of Engineering and Natural Scinces, vol. 5, no. 3, pp. 421-438, 2017.