
Journal of food Science Volume.38 No.5
190
5 July-August 1973 Volume 38 Number 5 Coden: JFDSAZ 38(5) 735-916 (1973) JOURNAL of FOOD SCIENCE SYMPOSIUM 735 Protein interactions in biosystems: Introduction— E. Karmas 736 Water in biosystems— E. Karmas 740 Protein structure and stability: Conventional wisdom and new perspectives— D.B. Wetlaufer 744 Some recent ideas about the nature of the interactions be- tween proteins and liquid water—/?. Lumry 756 Protein-lipid interactions— M. Karel BASIC SCIENCE 764 A standardized reversed passive hemagglutination technique for the determination of botulinum toxin—G./W . Evancho, D.H. Ashton, E.J. Briskey and E.J. Schantz 768 Contribution of adsorption to volatile retention in a freeze- dried food model containing PVP— J. Chirife and M. Karel 772 Pea lipids and their oxidation on carbohydrate and protein matrices— M. Haydar and D. Hadziyev 779 Calcium activation of soybean lipoxygenase—A Restrepo, H.E. Snyder and G.L. Zimmerman 783 Influence of ingredients upon edible protein-lipid film characteristics— L.C. Wu and R.P. Bates 788 Formation of a potato chip-like flavor from methionine under deep-fat frying conditions— S-C. Lee, B.R. Reddy and S.S. Chang 791 Distribution of dieldrin in milk fractions— C. Y. W. Ang and L.R. Dugan jr. 7% Acid production by Streptococcus lactis in low-lactose skim milk-/?./.. Richter, G.A. Reineccius and L.L. McKay 799 Polyphenol oxidase of Royal Ann cherries: Purification and characterization— N.D. Benjamin and M.W. Montgomery 807 Nonvolatile acids of strawberries— W.A. Sistrunk and J.N. Cash 810 Anthocyanins of Roselle (Hibiscus sabdariffa, L.)— C.T. Du and F. j. Francis 813 Oxidative changes in oxymyoglobin during interaction with arginine linoleate—C. Koizumi, /. Nonaka and W.D. Brown 816 Effect of altering ultimate pH on bovine muscle tender- ness— P.E. Bouton, F.D. Carroll, A.L. Fisher, P.V. Harris and W.R. Shorthose 821 Effect of feeding a protected safflower oil supplement on the composition and properties of the sarcoplasmic retic- ulum and on postmortem changes in bovine skeletal muscle— /?. P. Newbold, R.K. Tume and D .j. Horgan 824 Myofibril fragmentation in bovine longissimus dorsi as an index of tenderness— A .] . M<pller, T. Vestergaard and J. Wismer-Pedersen APPLIED SCIENCE AND ENGINEERING 826 An experimental study of the optimal feedback control of a freeze dryer— D. Meo ill and J.C. Friedly 831 Accelerated pork processing. Fresh-frozen pork chops— L.C. Hinnergardt, R. W. Mandigo and j.M. Tuomy 834 Accelerated pork processing. Freeze-dried pork chops— L.C. Hinnergardt, R. W. Mandigo and J.M. Tuomy 837 Feasibility of adding freeze-dried meat in the preparation of fermented dry sausage—/. Lu and W.E. Townsend -CONTENTS CONTINUED (on the inside of the front cover) . . . IFT\ A PUBLICATION OF THE INSTITUTE OF FOOD TECHNOLOGISTS
-
Upload
khangminh22 -
Category
Documents
-
view
0 -
download
0
Transcript of Journal of food Science Volume.38 No.5
5 July-August 1973 Volume 38 Number 5
Coden: JFDSAZ 38(5) 735-916 (1973)
JOURNAL of FOOD SCIENCESYMPOSIUM735 Protein interactions in biosystems: Introduction— E. K a rm a s
736 Water in biosystems—E. K a rm a s
740 Protein structure and stability: Conventional wisdom and new perspectives— D .B . W e tla u fe r
744 Some recent ideas about the nature of the interactions between proteins and liquid water—/?. L u m r y
756 Protein-lipid interactions—M . K a re l
BASIC SCIENCE764 A standardized reversed passive hemagglutination technique
for the determination of botulinum toxin—G./W. E v a n c h o , D .H . A s h t o n , E .J . B r i s k e y a n d E .J . S c h a n tz
768 Contribution of adsorption to volatile retention in a freeze- dried food model containing PVP—J . C h ir i fe a n d M . K a re l
772 Pea lipids and their oxidation on carbohydrate and protein matrices— M . H a y d a r a n d D . H a d z iy e v
779 Calcium activation of soybean lipoxygenase—A R e s tr e p o ,H .E . S n y d e r a n d G .L . Z im m e r m a n
783 Influence of ingredients upon edible protein-lipid film characteristics— L .C . W u a n d R .P . B a te s
788 Formation of a potato chip-like flavor from methionine under deep-fat frying conditions—S -C . L e e , B .R . R e d d y a n d S .S . C h a n g
791 Distribution of dieldrin in milk fractions— C. Y. W. A n g a n d L .R . D u g a n j r .
7% Acid production by Streptococcus lactis in low-lactose skim milk-/?./.. R ic h te r , G .A . R e in e c c iu s a n d L .L . M c K a y
799 Polyphenol oxidase of Royal Ann cherries: Purification and characterization—N .D . B e n ja m in a n d M .W . M o n tg o m e r y
807 Nonvolatile acids of strawberries— W .A . S i s t r u n k a n d J .N . C ash
810 Anthocyanins of Roselle (Hibiscus sabdariffa, L.)—C .T . D u a n d F. j . F ra n c is
813 Oxidative changes in oxymyoglobin during interaction with arginine linoleate—C. K o iz u m i , /. N o n a k a a n d W .D . B r o w n
816 Effect of altering ultimate pH on bovine muscle tenderness— P .E . B o u to n , F .D . C a rro ll, A .L . F is h e r , P .V . H arris a n d W .R . S h o r th o s e
821 Effect of feeding a protected safflower oil supplement on the composition and properties of the sarcoplasmic reticulum and on postmortem changes in bovine skeletal muscle— /?.P. N e w b o ld , R .K . T u m e a n d D . j . H o rg a n
824 Myofibril fragmentation in bovine longissimus dorsi as an index of tenderness—A .] . M<pller, T. V e s te rg a a r d a n d J. W ism e r-P e d e rse n
APPLIED SCIENCE AND ENGINEERING826 An experimental study of the optimal feedback control of a
freeze dryer—D. M e o i l l a n d J .C . F r ie d ly
831 Accelerated pork processing. Fresh-frozen pork chops— L .C . H in n e rg a rd t, R . W. M a n d ig o a n d j .M . T u o m y
834 Accelerated pork processing. Freeze-dried pork chops— L .C . H in n e rg a rd t, R . W. M a n d ig o a n d J .M . T u o m y
837 Feasibility of adding freeze-dried meat in the preparation of fermented dry sausage—/. L u a n d W .E . T o w n s e n d
- C O N T E N T S C O N T IN U E D (o n th e in s id e o f th e f r o n t c o v e r) . . .
IF T \ A P U B L IC A T IO N O F T H E IN S T I T U T E O F F O O D T E C H N O L O G IS T S
— C O N T E N T S ( C O N T I N U E D ) —
841 Freeze drying o f beef: Theory and experiment—H.J. Hoge and M.N. Pilsworth Jr.
849 Efficacy of protein additives as emulsion stabilizers in frankfurters—G.C. Smith, H. Juhn, Z .L . Carpenter, K .F. M atti/ and C.M. Cater
856 Batch dry rendering: An investigation o f heat transfer to boiling water/tallow emulsions—L.5. Herbert and H. Mamers
860 H ot water and microwave energy for precooking chicken parts: Effects on yield and organoleptic quality—J.T. Culotta and T.C. Chen
864 Autolysis as a factor in the production of protein isolates from whole fish— W. W. Meinke and K .F. M attil
867 Skim milk protein recovery and purification by ultrafiltration. Influence of temperature on permeation rate and re tention— C. Pompei, P. Resmini and C. Peri
871 Reduction o f chilling injury o f citrus fruits in cold storage by interm ittent warming—P.L. Davis and R.C. Hofmann
874 Changes in titratable acidity, °Brix, pH, potassium content, malate and tartrate during berry development of T h o m p s o n Seedless grapes— T. Philip and J.R. Kuykendall
877 Compaction behavior o f ground corn—M. Kumar
879 Hot air toasting and rolling whole wheat. Effect on organoleptic, physical and nutritional quality—A.P. Mossman, W.C. Rockwell and D.A. Fellers
885 Inhibition o f Staphylococcal enterotoxin production inconvenience foods—R.J. Heideibauer and P.R. Middaugh
889 Effect of roasting on aflatoxin content of artificially contaminated pecans— F.E. Escher, P.E. Koehler and J.C. Ayres
893 Comparative effects o f ethylene oxide, gamma irradiation and microwave treatments on selected spices— M. Vajdi and R. R. Pereira
RESEARCH NOTES
896 Reaction products of histidine with autoxidized methyl linoleate— R.B. Roy and M. Karel
898 Stability o f butylhydroxyanisole (BH A) in water under stresses o f sterilization— W.C. Monte and J.A. Maga
901 A comparison o f chilled-holding versus frozen storage on quality and wholesomeness o f some prepared foods—C. Kossovitsas, M. Navab, C.M. Chang and G.E. Livingston
903 Microbiological comparison o f steam- (at sub-atmospheric pressure) and immersion-scalded broilers— H.S. LiHard,A .A . Klose, R .l. Hegge and V. Chew
905 The rate o f coagulation of zein—E. Balmaceda and C.K. Rha
907 Chilling injury of green banana fruit: Kinetic anomolies o f IA A oxidase at chilling temperatures— N .F . Hoard
909 Anthocyanins of black grapes o f 10 clones o f V itis rotundi- folia, M ichx.—W.E. Ballinger, E.P. Ma ness, W.B. Nesbitt and D.E. Carroll Jr.
911 Spectrophotometric determination o f caffeine in Nigerian kola nuts— O. Somorin
913 Spectrophotometric analyses of orange juices and corresponding orange pulp washes— D.R . Petrus and M .H. Dougherty
915 Amylose content and puffed volume o f parboiled rice—A .A . Antonio and B.O. Juiiano
ii Call for Papers, I FT 1974 Annual Meetingiii Abstract Form and Instructions for 1974 I FT Annual Meeting Papers
REPRINTS of Articles from “Journal of Food Science”
□ S I N G L E reprin ts are N U T available fro m JOURNAL Ol- FOOD SCIENCE sen d req u ests d ire c tly to th e sen ior a u th or (address appears near title).
Q U A N T I T Y reprin ts can be o rd ered fro m IF T S u b scrip tion D ep a rtm en t m in im u m o f 100 copies. Price schedule available upon request.
NOTICE: Page Charges for Publicationof Research Papers
□ A T IT S M arch 1 9 6 9 m eetin g , th e E x ecu tive C o m m itte e o f IF T v o te d to increase the page charge fo r research a rtic les p u b lish ed in the JOURNAL OF FOOD SCIENCE. The page charge o f 55 0 p er p r in te d page w ill be e ffe c tiv e fo r research m an u scrip ts rece ived A F T E R A p ril l , 1969 . The page charge shall n o t c o n s t i tu te a bar to a c cep ta n ce o f research m a n u scrip ts b e cause the a u th o r is unable to p a y th e charge.
J u ly -A u g u s t 1 9 7 3 V o lu m e 3 8 : N u m b e r 5
\ J J
J O U R N A L
o f F O O D S C I E N C E
D ire c to r o f P u b lic a t io n sJ o h n B . K l is
M an ag in g E d it o rB e rn a rd S c h u k r a f t
A d v e rt is in g M an ag e rE d w a rd H . H o ffm a n
P u b lish e rC a lv e r t L . W ille y
S c ie n t if ic E d it o rB e rn a rd J . L is k a
A s s t , t o S c ie n t if ic E d it o rA n n a M a y S c h e n c k
B o a rd o f E d it o r sE . B r is k e y (7 4 )L . D u g a n (7 4 )F . F r a n c is (7 4 )J . L is t o n (7 4 )R . P a n g b o rn (7 4 ) J . P o w e rs (7 4 )W . S ta h l (7 4 )
R . C a ss e n s (7 5 ) A . D e n to n (7 5 ) D . G o l l (7 5 )H . H u lt in (7 5 ) T . L a b u z a (7 5 ) R . M a x c y (7 5 ) P . N e lso n (7 5 )
W . C la r k (7 6 )R . E is e r le (7 6 )G . G id d in g s (7 6 ) D . H e ld m a n (7 6 ) P . H o p p e r (7 6 )Y . P o m e ra n z (7 6 ) M . S o lb e rg (7 6 )
• MANUSCRIPTS (3 copies) should be submitted to:Dr. Bernard J. Liska 1FT Scientific EditorP. O. Box 3067 Lafayette, IN 47906 USA
NO RESPONSIBILITY is assumed by the Institute o f Food Technologists for statements and opinions expressed by the contributors to its publications.
MANUSCRIPTS should conform to the style used in Journal o f Food Science. Authors should request from the Director o f Publications the revised leaflet “Style Guide for Research Papers.” Journal o f Food Science reserves the privilege of editing manuscripts to make them conform with the adopted style o f the journal or returning them to authors for revision. Editing changes may be reviewed by authors before publication.
PAGE CHARGES for Publication. The IFT Executive Committee has established a page charge o f $50 per printed page for all papers published in Journal o f Food Science. The page charge shall not constitute a bar to acceptance of research manuscripts because the author is unable to pay the charge.
• SUBSCRIPTIONS: All communications related to handling o f subscriptions, including loss claims, change o f address, orders for back issues, and 100 or more reprints should be sent to:
Subscription Department Institute o f Food Technologists-Suite 2120221 N. LaSalle Street Chicago, IL 60601 USA
Member Subscriptions- $ 1 0 per year.Non-Member Subscriptions-A ccepted only on a calendar year basis-no refunds. Rates include postage. Payment must
accompany order. Domestic and Pan American U nion-$20; all other destinations-$25. Reduced rates for 2 - and 3-year subscriptions.
Change o f address notice, with old address label, is required 4 weeks before issue date.Claims fo r lost copies are allowed only if received within one month after publication (3 months for foreign subscribers). Single copies and available back issues. $5 each; remittance to accompany order.
• REPRINTS: Request single reprints from AUTHORS. Price Schedule for 100 or more reprints available upon request from Subscription Department.
© Copyright 1973 by Institute o f Food Technologists. All rights reserved. JOURNAL OF FOOD SCIENCE (formerly Food Research) is published 7 times a year (bimonthly except monthly during January and February) by Institute of Food Technologists, Suite 2120, 221 N. LaSalle Street, Chicago, Illinois 60601 USA. Printed in USA. Second class postage paid at Chicago, 111. and at additional mailing offices.
l

C a l l F o r C o n t r i b u t e d P a p e r s
I F T 3 4 t h A N N U A L M E E T I N G
M a y 1 2 - 1 6 . 1 9 7 4
T h e R i v e r g a t e , N e w O r l e a n s , L o u i s i a n a
ALL IFT MEMBERS ARE CORDIALLY INVITED to submit original research papers dealing with any aspect of food science or technology for consideration by the 1974 Program Committee.
Volunteered papers are a fundamentally important part of each Annual Meeting. Have you some interesting work to share with IFT’s membership? The Program Committee welcomes your contribution. To assist the Committee in its review and scheduling, please indicate on the Official Abstract Form the area of food science and technology under which your work falls. A number of areas are listed below. Indicate others if appropriate.
B io c h e m is t ry o f M eats B io c h e m is t ry o f P la n ts B io p h y s ic s C a rb o h y d ra te sC h e m ic a l P ro p e rt ie s & A n a ly s is C h e m is t r y , B a s ic F o o d C h e m is t r y , F la v o rE n g in e e r in g , P ro ce ss e s & E q u ip m e n t
E n z y m e s F o o d P ro ce ss in gF o o d S e rv ic e P ro d u c ts & S y s te m sL a w s & R e g u la t io n sL ip id sM ic ro b io lo g yN e w F o o d In g re d ie n ts & A d d it iv e s N e w F o o d P ro d u c ts
N u t r it io nP a c k a g in g M a te r ia ls & M e th o d s P h y s ic a l P ro p e rt ie s & M e a su re m e n t P o llu t io n C o n t ro l P ro te in sQ u a l i t y A s s u ra n c e R e fr ig e ra te d & F r o z e n F o o d s S e n s o r y P ro p e rt ie s & E v a lu a t io n
D E A D L IN E F O R T IT L E S A N D A B S T R A C T S IS J A N U A R Y 1 5 , 1 9 7 4
U S E O N L Y T H E O F F IC IA L A B S T R A C T F O R M
BEFORE WRITING YOUR ABSTRACT, please read the Rules Governing Papers Presented at IFT Annual Meetings and Publication Rights & Procedures, below; and the Instructions for Preparation of Abstracts, on the next page.
RULES GOVERNING PAPERS PRESENTED AT IFT ANNUAL MEETINGSN o su b m itted paper shall be presented at an A nnual M eeting un less at least o n e o f th e authors is a m em ber in good
standing o f the In stitu te o f F o o d T ech n o log ists or a ffilia te organ izations.N o paper shall be presented at an Annual M eeting w h ich has previously been given before oth er groups, or w h ich
has appeared in print prior to th e M eeting.C ontributed papers w ill N O T be accep ted w ith o u t abstracts su itab le for p u b lica tio n in the annual m eetin g program
b o o k le t.I
PUBLICATION RIGHTS & PROCEDURES
The In stitu te shall have first right to publish papers presented at an A nnual M eeting o f th e In stitu te . H ow ever, after a paper has b een accep ted for the M eeting program , th e author m ay, w ith supporting ev id en ce , request its release, e ither before or after oral presen ta tion . Under n o c ircu m stan ces shall release, if granted, perm it p u b lica tio n o f the paper before th e oral presen tation . W ithin few er than 6 0 days after receiving the co m p lete m anuscript and a request for release, th e In stitu te shall give th e author a d ec is io n to release th e paper or to accep t it for p u b lica tio n subject to the necessary ed itoria l revision . If accep ted , the au th or or authors shall assign all rights in th e paper to the In stitu te , and after p u b lica tion th e In stitu te shall, up on request, reassign all rights back to th e author or authors.
M anuscripts m ay be su b m itted as so o n as co m p leted to the In stitu te o f F o o d T ech n o lo g ists so that the papers m ay be review ed and cleared for p u b lica tion fo llo w in g th e m eeting.
All m anuscripts n o t su b m itted prior to the m eetin g M UST be turned over to the chairm an o f yo u r session at the Annual M eeting.
AL L M A N U S C R IP T S -w h eth er su b m itted prior to or during the Annual M e e tin g -m u st co n fo rm to the sty le used in Journal o f F o o d S c ien ce . T he “ S ty le G uide for Research Papers” is available from the D irector o f P u b lica tion s, In stitu te o f F ood T ech n o log ists, 221 N. LaSalle S t., C hicago, IL 6 0 6 0 1 U SA .
3 COM PLETE COPIES o f each m anuscript are required. O ne is an original ty p ed c o p y o n g o o d qu a lity w h ite bond. T he second and third co p ies m ay be clear and easily readable carbon cop ies.
h
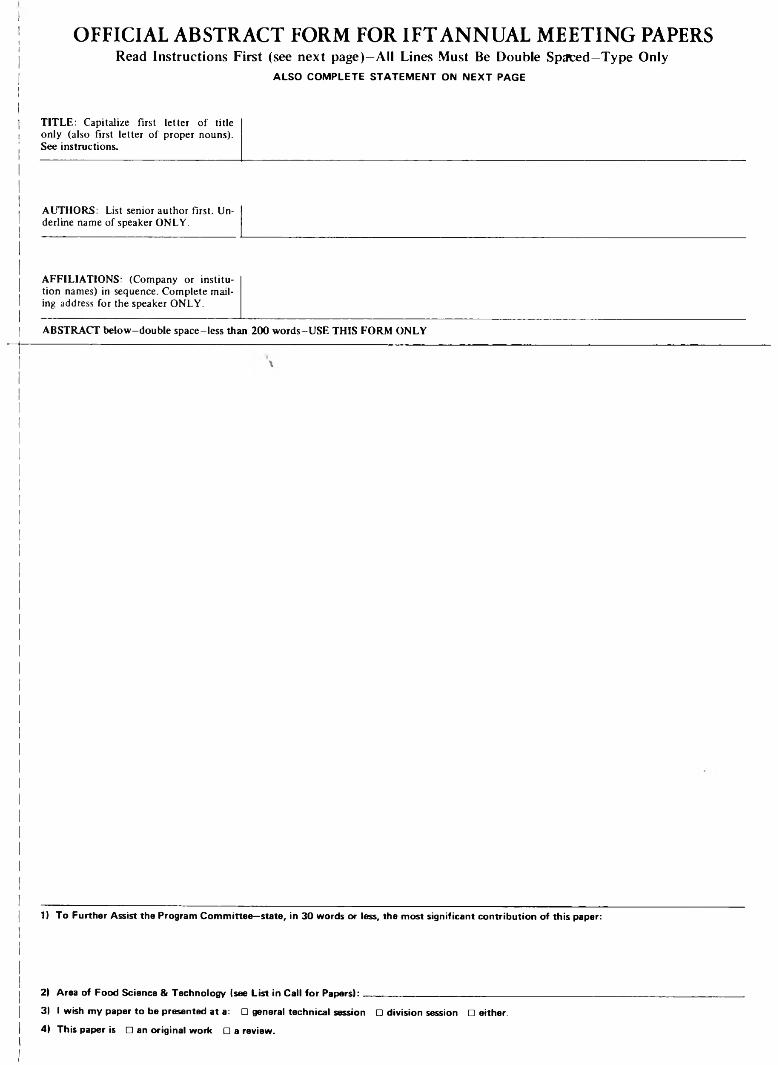
O F F I C I A L A B S T R A C T F O R M F O R I F T A N N U A L M E E T I N G P A P E R SR e a d I n s t r u c t io n s F i r s t (see n e x t p a g e )—A ll L in e s M u st B e D o u b le S p a c e d —T y p e O n ly
A L S O C O M P L E T E S T A T E M E N T O N N E X T P A G E
TITLE: Capitalize first letter o f title only (also first letter o f proper nouns). See instructions.
AUTHORS: List senior author first. Underline name of speaker ONLY.
AFFILIATIONS: (Company or institution names) in sequence. Complete mailing address for the speaker ONLY.
ABSTRACT below -double space-less than 200 words-USE THIS FORM ONLY
\
1) T o F u r th e r A s s is t th e P ro g ra m C o m m it t e e —sta te , in 3 0 w o rd s o r le ss , th e m o st s ig n if ic a n t c o n tr ib u t io n o f t h is p a p e r:
2 ) A re a o f F o o d S c ie n c e & T e c h n o lo g y (see L i s t in C a l l f o r P a p e r s ) : ________________________________________________
3 ) I w ish m y p a p e r to b e p re se n te d a t a : □ g e n e ra l te c h n ic a l se ss io n □ d iv is io n se ss io n □ e ith e r .
4 ) T h is p a p e r is □ an o r ig in a l w o rk □ a re v ie w .
IN S T IT U T E O F F O O D T E C H N O L O G IS T S — 1 9 7 4 A n n u a l M e e tin g
ABSTRACTS M UST BE R E C E IV E D BY JA N U A R Y 15, 1974
R E A D B E F O R E W R I T I N G A B S T R A C T
U s e O f f ic ia l A b s t r a c t F o r m —see o th e r s id e o f th is page
IN S T R U C T IO N S F O R P R E P A R A T IO N O F A B S T R A C T S
P ro c e d u re
Use a reasonably dark typewriter ribbon. TYPE abstracts (do NOT write) as directed on the Official Abstract Form. Use the printed form for the original and make three carbon or Xerox copies.
T i t le o f P a p e r
Capitalize first letter o f first word and o f proper nouns ONLY,as:
Quick-cooking large Lima and other dry beans. 3. Technology requirements pertinent to design
A u t h o r s a n d In s t it u t io n s
List senior author first. Underline name o f speaker ONLY. Capitalize first letters and initials only. List company or institution names in sequence. Show complete mailing address for company or institution of the speaker ONLY. Addresses usually can be abbreviated; use standard abbreviations. In case o f multiple authors and multiple affiliations, use asterisks to identify, as:
James Korling Jr.,** M. C. Sharrah,* G. J. Drazwood** and Paul P. Black.**Dept. o f Food Science and Technol., Univ. o f Calif., Davis, CA 95616; ** Hunt Foods Co.
C o n t e n t o f A b s t r a c t
An abstract should contain a concise statement of: (1) the problem under investigation; (2) the experimental method used; (3) the essential results obtained. The text should cite quantitative data from representative experiments, or summary data; (4) what findings are new over the known art; and (5) conclusions. Do not state, “The results will be discussed.” Let the abstract represent you to the Institute o f Food Technologists.
S e lf -A d d re s s e d P o st C a r d s
Enclose TWO standard sized, self-addressed and stamped postal cards for notification of the date your paper is scheduled for presentation, and for acknowledgement by the Program Committee of
receipt of your abstract. Include a separate set o f cards for each abstract submitted. For each set o f post cards, type paper title on back o f both return postal cards.
S u b m it O r ig in a l & 2 C o p ie s
Please submit completed original o f Official Abstract Form and two copies, together with the self-addressed postal cards and the coupon below. Retain one copy of the abstract form for your files.
M a il A b s t r a c t s T o :
Mr. Evan F. Binkerd, 1974 1FT Program Director Research Division-Armour and Company 801 W. 22nd Street Oak Brook, 1L 60521
Other communications concerning the program should be sent to the same address.
E x t r a A b s t r a c t F o r m s
Additional Official Abstract Forms, if needed, can be secured from the Institute o f Food Technologists, Suite 2120, 221 N. LaSalle Street, Chicago, IL 60601.
O ra l P re s e n ta t io n
The maximum time allowed for presentation of a paper is 15 minutes, including time for discussion. Autiiors should prepare the complete manuscript and be sure it can be presented easily within the allotted time, including time ftjr presentation of slides.
To eliminate visual aid problems and to upgrade paper presentations, IFT has standardized slide projection. Remote control Kodak Carousel projectors requiring 2" X 2" slides will be used. Therefore, all slides must be prepared on 2" X 2" (50mm x 50mm) slide mounts.
Authors whose papers are accepted for presentation will receive, prior to the Annual Meeting, a copy o f Kodak pamphlet #S22, Effective Lecture Slides, to assist them in preparing art work for their slides.
P L E A S E C O M P L E T E S T A T E M E N T B E L O W B E F O R E M A I L I N G A B S T R A C T .
O ' o
I have read the Rules Governing Papers Presented at IFT Annual Meetings and Publication Rights & Procedures, and agree to abide by these terms.
(signature)
(date)
ABSTRACTS :IN THIS ISSUE
WATER IN BIOSYSTEMS. E. KARMAS. J. Food Sci. 38, 7 3 6 -7 3 9(1973)—It has been widely accepted that the structural properties of water can serve as a key to understanding and explanation of biological phenomena and processes. A qualitative account in the form of a literature review is given on biological significance of water, biological activity as a function of temperature, the structure of water, solute effect on water structure and the state o f water in biological systems. The functional role o f water in biosystems is discussed.
PROTEIN STRUCTURE AND STABILITY: CONVENTIONAL WISDOM AND NEW PERSPECTIVES. D.B. WETLAUPER. J. Food Sci. 38, 740-743 (1973) -The conventional wisdom on protein structure and stability is reviewed. With occasional exceptions, the conventional wisdom works quite well. However, the thermodynamic basis o f the conventional wisdom fails to qualify it for addressing time-related questions such as: “ How rapidly can three-dimensional structures form, and how long can specific native structures persist in vivo, and under practical in vitro conditions?” A more inclusive, kinetic perspective is required for addressing such questions. Experimental approaches and some practical consequences of the broader kinetic perspective are outlined.
SOME RECENT IDEAS ABOUT THE NATURE OF THE INTERACTIONS BETWEEN PROTEINS AND LIQUID WATER. R. LUMRY. J. Food Sci. 38, 744 -755 (1 9 7 3 ) -The phenomenological pattern of thermodynamic behavior called “ linear enthalpy-entropy compensation” which has been found to characterize many small-solute processes in water solution has been found with protein reactions and provides an experimental pathway for studying the role o f water in determining the chemical, physical and specific functional properties o f proteins and other biological macromolecules. The pattern is closely related to the source of inhibitor, pH and species specificity in protein reactions. Attempts to determine whether the source is water, the protein or some combination using experimental values for structural parameters o f protein suggest that proteins have unique and remarkable properties which must be understood before direct questions about water participation can be studied with any promise of success.
PROTEIN-LIPID INTERACTIONS. M. KAREL. J. Food Sci. 38, 756-763 (1 9 7 3 )-A number of significant processes in food and biological systems involve interactions between proteins and lipids. Mechanisms by which proteins and lipids interact, the nature o f the forces involved and factors which affect the interactions are reviewed. Examples o f particularly important interactions in food and biosystems are presented, including biological membrane interactions, protein-oxidizing lipid interactions and coalescence and inversion o f emulsions.
A STANDARDIZED REVERSED PASSIVE HEMAGGLUTINATION TECHNIQUE FOR THE DETERMINATION OF BOTULINUM TOXIN.G.M. EVANCHO, D.H. ASHTON, E.J. BR1SKEY & E.J. SCHANTZ. J. Food Sci. 38, 764 -7 6 7 (1973)-T he use of reversed passive hemagglutination (RPHA) for the rapid detection of Gostridium botulinum type A toxin in foods and culture filtrates was investigated. Detection o f 0.0008 Mg of toxin per ml of sample (27 mouse LD50 per ml) was possible with cells sensitized with antitoxin globulin. Hemagglutination results compared well with those obtained by mouse assay but were available within ' * to 3 hr. No cross-reactions were observed between the A antiglobulin
sensitized cells and the other botulinum toxin types. Titers were identical using either crystalline toxin or toxoid prepared from the crystalline toxin, making standardization of the test possible, so that results from different laboratories can be made comparable.
CONTRIBUTION OF ADSORPTION TO VOLATILE RETENTION IN A FREEZE-DRIED FOOD MODEL CONTAINING PVP. J. CHIRIFE &M. K AREL./. Food Sci. 3 8 ,7 6 8 -7 7 1 (1973)-R eten tion of ' 4C-labeled n-propanol was studied in a freeze-dried system containing polyvinylpyrrolidone (PVP). The major fraction o f n-propanol retained after freeze drying o f aqueous solutions o f PVP and propanol is held by entrapment in microregions. Some n-propanol can also be entrapped by the polymeric aggregates o f PVP after sorption of the alcohol from the vapor phase, even in the absence o f plasticizing action of water, apparently because of the ability o f propanol to act as solvent for PVP. In addition to entrapment, there is a small but significant contribution of adsorption to n-propanol retention in freeze drying which could not be determined exactly. However, dry layer adsorption experiments on rapidly frozen PVP show readsorption amounting to approximately 10% of the total retention.
PEA LIPIDS AND THEIR OXIDATION ON CARBOHYDRATE AND PROTEIN MATRICES. M. HAYDAR & D. H A D Z IY E V ./ Food Sci. 38, 7 7 2 -7 7 8 ( 1973)-T he total lipids o f pea seeds were isolated and fractionated by column and two dimensional thin-layer chromatography, and their fatty acid composition determined. The polar lipid fraction revealed up to 10 individual components consisting o f phospho-, glyco- and sterol-lipids. The neutral lipid fraction consisted mainly o f triglycerides, small amounts o f diglycerides, free fatty acids and esterified sterols. Oxidation of lipids coated on pea carbohydrate and protein matrices depended on both the matrix used and the polar or neutral lipid classes being oxidized. The neutral lipids coated on cellulose were oxidized at a higher rate than lipids on cellulose precoated with amylose, amylopectin or pectin. The pectin matrix induced a 26% retardation. The amylopectin matrix induced the highest retardation of 36%. The oxidation rate of polar lipids was four times higher than that o f neutral lipids. All carbohydrate precoats promoted oxidation relative to cellulose, with pectin exerting the greatest effect. The effect o f pea albumins and globulins was low in promoting oxidation of neutral lipids but high for polar lipids. In the latter case, globulins were exerting a rate o f oxidation 2.8 times higher than that o f albumins after 20 hr, while after 40 hr the results were not comparable by direct manometric readings. From these results it was concluded that lipid polarity rather than degree of unsaturation has the primary influence on lipid oxidation.
CALCIUM ACTIVATION OF SOYBEAN LIPOXYGENASE. F.RESTREPO, H.E. SNYDER & G.L. ZIMMERMAN. J. Food Sci. 38, 7 7 9 -7 8 2 (1973)-L ipoxygenase is known to be activated by Ca2+ but only under special circumstances. This study confirms that Ca2+ activation depends on the addition o f Ca2+ to the reaction mixture before or concurrently with enzyme. We have found that two isozymes o f lipoxygenase differ in their response to added Ca2+, lipoxygenase 1 is inhibited while lipoxygenase 2 is activated. Also, Ca2+ activation of soybean extracts is eliminated by a procedure for phytate removal, but addition of phytate does not restore the activation. A study o f the Ca2+, lipoxygenase and linoleic acid concentrations on lipoxygenase activity showed that maximum Ca2+ activation varies with linoleic acid concentration but not with lipoxygenase concentration. The mechanism by which Ca2 + activates lipoxygenase is still obscure.
v
ABSTRACTS :IN THIS ISSUE
INFLUENCE OF INGREDIENTS UPON EDIBLE PROTEIN-LIPID FILM CHARACTERISTICS. L.C. WU & R.P. BATES. J. Food Sei. 38. 7 8 3 -7 8 7 (1973)-Pure and mixed systems o f aqueous slurries from soybean, peanut, cottonseed and milk have been used as substrates for protein-lipid film formation. Film strength, yield, formation rate and protein incorporation efficiency indicated that soymilk. soy protein isolate or cow’s milk formed ideal films. Full fat peanut and cottonseed milks required upward adjustment of the protein-lipid ratios for optimal film strength and quality. Whey protein concentrate demonstrated excellent film-forming ability whereas cottage cheese whey did not. Protein-lipid film formation represents a practical technique for both partially concentrating and texturizing protein from dilute solutions while controlling lipid composition and nutritive value.
FORMATION OF A POTATO CHIP-LIKE FLAVOR FROM METHIONINE UNDER DEEP-FAT FRYING CONDITIONS. S-C. LEE, B.R. REDDY & S.S. CHANG. J. Food Sci. 38, 7 8 8 -7 9 0 (1973)—A model system was developed for treating the various components o f potatoes under deep-fat frying conditions. The system involved the deep-fat frying of cotton balls moistened with an aqueous solution of either amino acids or sugars or their combinations. When methionine was treated under deep-fat frying conditions, its reaction products imparted an odor and flavor reminiscent o f that o f potato chips to the oil. By observing the aroma generated by different homologs and analogs o f methionine under deep-fat frying conditions, it was observed that a certain chemical structure is necessary for the production of the potato chip-like flavor.
DISTRIBUTION OF DIELDRIN IN MILK FRACTIONS. C.Y.W. ANG & L.R. DUGAN JR. J. Food Sci. 38, 7 9 1 -7 9 5 (1973)-D ieldrin was found to be distributed in a similar pattern in milk containing added pesticide and milk containing physiologically incorporated pesticide. The relative amounts o f dieldrin in various fractions closely resemble the relative amounts o f total lipids in these fractions. Comparable levels o f residue, on a fat basis, were found in whole milk, skim milk, cream, washed cream, butter and butteroil. Lower levels were observed in buttermilk and butter serum, and lowest values were found in refined buttermilk, refined butter serum and fat globule membrane pellets. An inverse relationship between the dieldrin concentration and the level o f phospholipid and/or high-melting glyceride content apparently exists. The slightly higher concentrations of dieldrin, on a fat basis, observed in refined skim milk might be due to slight solubility o f this pesticide in the milk serum. This study suggests that dieldrin has a tendency to be distributed more favorably with the neutral or free lipids in milk regardless o f whether it is the original deposition or is in an altered orientation as a consequence of separation.
ACID PRODUCTION BY Streptococcus lactis IN LOW-LACTOSE SKIM MILK. R.L. RICHTER, G.A. REINECCIUS & L.L. McKAY. J. Food Sci. 38, 7 9 6 -7 9 8 ( 1973)-Lim iting lactose content o f milk was examined as a means of controlling dairy fermentations. Low-lactose milk (< 0.2%) was prepared from 1 1 % reconstituted nonfat dry milk by cycling it several times through Sephadex G-25 in a basket centrifuge. Acid production by lactic streptococci was restricted in the low-lactose milk, and supplementation with lactose did not restore normal acid production. Supplementation with yeast extract, metals and lactose was required to regain acid production comparable to the untreated milk. Corresponding increases in acid production were observed when increasing amounts o f lactose were added to treated milk supplemented with yeast extract and metals.
POLYPHENOL OXIDASE OF ROYAL ANN CHERRIES: PURIFICATION AND CHARACTERIZATION. N.D. BENJAMIN & M.W. MONTGOMERY. J. Food Sci. 38, 7 9 9 -8 0 6 (1973)-Polyphenol oxidase (o-diphenol: 0 2 oxidoreductase, EC 1.10.3.1) was purified from freeze- dried Royal Ann cherries by extraction with polyethylene glycol and acetone. The acetone powder was extracted with 0.05M acetate (pH 5.6) and the polyphenol oxidase was precipitated with acetone. Chromatography on DEAE-cellulose and Sephadex G-100 partially separated the acetone precipitate into two and three fractions, respectively. This suggests that the polyphenol oxidases had different molecular sizes. The two fractions from DEAE-cellulose had similar sensitivities to inhibitors, pH optima, V max and Km , but differed in substrate specificity and heat stability. Polyacrylamide-gel electrophoresis separated the polyphenol oxidases into three groups containing five, three and one components. All three groups possessed similar substrate and inhibitor specificities. The polyphenol oxidase system o f Royal Ann cherries appears to be com posed of three enzymes. Two of these enzymes have isozymes.
NONVOLATILE ACIDS OF STRAWBERRIES. W.A. SISTRUNK & J.N. CASH. J. Food Sci. 38, 8 0 7 -8 0 9 (1973) — A study was initiated to determine nonvolatile acids in different maturities and varieties of strawberries. The only major difference between the two maturities (firm-ripe and full-ripe of the four varieties (Surecrop, Earlibelle, Sunrise and SIUS 253) was the higher total acidity in greener fruit. Malic and citric were responsible for most of the difference. Concludes that (1) the nonvolatile acids in these varieties did not vary qualitatively but there were quantitative differences between varieties and maturities; and (2) it is possible the ratio o f citric to malic acid in different genetic lines and maturities could affect color.
ANTHOCYANINS OF ROSELLE (Hibiscus sabdariffa, L.). C.T. DU &F.J. FRANCIS. J. Food Sci. 38, 8 1 0 -8 1 2 (1973) -The anthocyanin pigments o f Roselle were extracted with acidic methanol and purified by conventional chromatography. The major pigment which is primarily responsible for the reddish-violet color of Roselle was identified as delphi- nidin-3-sambubioside. Cyanidin-3-sambubioside was found to be the pigment present in second largest concentration. Two minor pigments, delphinidin-3-glucoside and cyanidin-3-glucoside, were also identified. Several other trace pigments were present in Roselle in too low a concentration for identification. Total pigment was approximately 1.5g/100g dry weight expressed as dclphinidin-3-glucoside.
OXIDATIVE CHANGES IN OXYMYOGLOBIN DURING INTERACTION WITH ARGININE LINOLEATE. C. KOIZUMI, J. NONAKA &W.D. BROWN. J. Food Sci. 38, 813 815 (1973) Interaction of M b02 with linoleatc was studied with regard to the oxidative changes of \ 1b0 2. When M b02 was added to give a final concentration of 0.07 mM in a buffer solution of linoleate o f concentration higher than 1.32 mM at pH 6.28. the M b02 was rapidly oxidized to the ferric form, accompanied by some degradation of the heme moiety o f Mb. Accompanying the oxidative changes of M b02. the linoleate also underwent catalytic oxidation. Addition o f 0.2% serum albumin to the reaction system effectively inhibited both rapid oxidation of M b02 and of linoleate.
EFFECT OF ALTERING ULTIMATE pH ON BOVINE MUSCLE TENDERNESS. P.E. BOUTON, F.D. CARROLL, A.L. FISHER, P.V. HARRIS & W.R. SHORTHOSE. J. Food Sci. 38 816 820 ( 1973(-Preslaughter injections of adrenaline have been used to produce bovine muscles with ultimate pH values ranging from 5.4 to about 7.0. Measurements o f water-holding capacity showed a highly significant relationship
vi
with pH. Shear force and taste panel measurements on the longissimus dorsi muscles from sides hung from the Achilles tendon showed maximum toughness at pH 5.8-6.0. Most objective and subjective measurements on other muscles indicated that tenderness increased linearly with increasing pH. Aging reduced fiber tensile strength until it was no longer dependent on pH. Adhesion values were related to pH when meat samples were cooked at 80°C but were independent of pH when cooked at 60°C.
EFFECT OF FEEDING A PROTECTED SAFFLOWER OIL SUPPLEMENT ON THE COMPOSITION AND PROPERTIES OF THE SARCOPLASMIC RETICULUM AND ON POSTMORTEM CHANGES IN BOVINE SKELETAL MUSCLE. R.P. NEWBOLD, R.K. TUME & D.J. HORGAN. J. Food Sci. 38, 821-823 1973)-Supplementing the diet of steers with safflower oil which had been protected from ruminal hydrogenation by formaldehyde-treated protein led to substantial changes in the fatty acid composition of the phospholipids of the sarcoplasmic reticulum. However, it did not affect the rate or extent of Ca2 + uptake, the rate or extent of Ca2 + release on cooling, or the basal or extra ATPase activities of the sarcoplasmic reticulum. Nor did it affect the rate and extent of pre-rigor changes such as cold shortening, thaw shortening and fall in pH. In addition the postmortem rates and patterns of change in the concentrations of adenine nucleotides, glycolytic products and intermediates were unaffected. Thus the meat from animals fed a protected polyunsaturated oil supplement does not appear to need different pre- rigor handling to that from unsupplemented animals.
MYOFIBRIL FRAGMENTATION IN BOVINE LONGISSIUMUS DORSI AS AN INDEX OF TENDERNESS. A.J. M0LLER, T. VESTERGAARD & J. WISMER-PEDERSEN. J. Food Sci. 38, 824-825 (1973)-Fragmen- tation of bovine longissimus dorsi myofibrils exposed to standard mechanical treatment was investigated as an index of tenderness. 20 young bulls were chosen at random from a group of Danish Black Pied cattle reared at a progeny testing station. The degree of fragmentation was measured in a phase contrast microscope as well as by emission spectrophotometry on myofibril suspension. Significant correlations were found between Warner Bratzler shear value and number of sarcomers per fibril as well as between Warner Bratzler and emission. The relationship between the nitrogen concentration in the suspension and the emission values was linear. However, the effect of nitrogen concentration on emission values differed and was related to the level of shear force. When the spectrophotometric values were corrected to the same nitrogen contents they accounted for about 60% of the variation in tenderness.
AN EXPERIMENTAL STUDY OF THE OPTIMAL FEEDBACK CONTROL OF A FREEZE DRYER. D. MEO III & J.C. FRIEDLY. J. Food Sci. 38, 826-830 (1973)-The optimal feedback control of a freeze dryer has been experimentally investigated using a 50-g sample of reconstituted instant nonfat milk as a food product. Constraints on the maximum temperatures of the product surface and the ice core are maintained to insure product quality. To decrease the drying time the radiator can be at full power until the maximum surface temperature is approached, after which the radiator can be controlled in a feedback fashion based on the surface temperature. This intuitive control strategy is used in a series of constant total pressure runs to establish the relationship between the drying chamber pressure and the time required to freeze dry the sample to a fixed moisture content. An analysis of the constant total pressure series is used to develop feedback control loops capable of automatically maintaining the experimentally indicated optimal drying chamber pressure during the entire freeze-drying cycle. It is expected that this policy constitutes a near optimal feedback control.
ACCELERATED PORK PROCESSING. Fresh-Frozen Pork Chops. L.C. HINNERGARDT, R.W. MANDIGO & J.M. TUOMY. J. Food Sci. 38, 831-833 ( 1973)—60 pork carcasses were split and alternate sides designated for accelerated and conventional processing under packing house conditions. The loins were used for this study. Accelerated is defined as fabricating to finished fresh primal pork loin prior to initial chilling of the
carcass. Ten 1.27-cm thick boneless pork chops from each loin were evaluated for tenderness with an Allo-Kramer shear press and an organoleptic panel. The organoleptic panel also evaluated the pork chops for color, aroma, flavor and appearance. Proximate analysis, percent cooking loss, water-holding capacity and pH were determined for each loin processing method. Accelerated processing of pork loins under packing house conditions failed to have any major effect on fresh-frozen boneless pork chops when compared to chops made from corresponding conventionally processed pork loins. Minor differences were found by the taste panels for tenderness in two of the three studies.
ACCELERATED PORK PROCESSING. Freeze-Dried Pork Chops. L.C. HINNERGARDT, R.W. MANDIGO & J.M. TUOMY. / Food Sci. 38, 834-836 (1973)-Ten 1.27-cm thick pork chops were removed from accelerated processed pork loins with their counterparts being removed from conventionally processed pork loins for freeze drying at 51.7°C plate temperature and a chamber pressure of 0.3-0.5 mm mercury. Accelerated is defined as fabricating to finished fresh primal pork loins prior to initial chilling of the carcass. The dry weights, rehydrated weights and rehydration ratio of freeze-dried pork chops were not affected by the accelerated processing method. A 10-member organoleptic panel noted no significant differences in flavor, aroma, color and appearance due to accelerated processing. Tenderness was acceptable for freeze-dried pork chops from accelerated processed pork loins.
FEASIBILITY OF ADDING FREEZE-DRIED MEAT IN THE PREPARATION OF FERMENTED DRY SAUSAGE. J. LU & W.E. TOWNSEND. J. Food Sci. 38, 837-840 (1973)-Fermented dry sausages were prepared by mixing freeze-dried meat with fresh pork at the ratio of 1:4, 1:5, 1:6, 1:9 and 0, respectively. Chemical and physical changes were recorded during the 35-day drying period. Results indicate a shorter drying period, less weight loss, slower rate of decrease in pH during the fermentation period, lower peroxide value, higher fatty acid value, softer consistency and the development of a brownish-red color with the increase in proportion of freeze-dried meat. Flavor was good in all sausages. Comparison of all of the quality attributes, indicates that the best ratio is between 1:6 and 1:9. The practical application of these findings is contingent on several economic factors.
FREEZE DRYING OF BEEF: THEORY AND EXPERIMENT. H.J. HOGE & M.N. PILSWORTH JR. J. Food Sci. 38, 841-848 (1973)-Six spherical specimens of raw beef were freeze dried under controlled conditions. A theory of freeze drying is developed and tested with the experimental data. Satisfactory agreement is obtained between theory and experiment. Values obtained for the thermal conductivity of freeze-dried beef are in reasonably good agreement with previously published work. Drying times of the specimens were measured and a convenient method of determining the drying time by extrapolating the curve of rate-of- change of mass is described. Heat transfer to the specimen is broken down into its radiative and conductive components and equations are given from which the surface temperature of the specimen can be calculated.
EFFICACY OF PROTEIN ADDITIVES AS EMULSION STABILIZERS IN FRANKFURTERS. G.C. SMITH, H. JUHN, Z.L. CARPENTER, K.F. MATTIL & C.M. CATER. J. Food Sci. 38, 849-855 (1973)-Frank- furters of four different fat contents were prepared using only meat (control) or meat plus 3.5% of 11 kinds of protein additives. Protein additives were of low (LNS) or high (HNS) nitrogen solubility and included: soy protein isolates (LNS and HNS), soy protein concentrates (LNS and HNS), soy flours (LNS and HNS), glandless cottonseed flours (LNS and HNS), cottonseed protein concentrate (LNS), nonfat dry milk (HNS) and fish protein concentrate (LNS). None of the functional properties or characteristics of the protein additives was closely related to their performance in stabilizing emulsions when utilized at the 3.5% level. Nitrogen solubility index was significantly correlated with water-holding capacity but was not related to other functional properties of protein additives. Higher emulsion stability was not always indicative of more desirable appearance in frankfurters. The protein additives had little or
vii
ABSTRACTS :IN THIS ISSUE
no effect on emulsion stability among frankfurters of low fat content (24-26% fat). When frankfurters were prepared to contain 34-35% fat, soy protein concentrate (LNS) and fish protein concentrate (LNS) increased emulsion stability and decreased fatting-out. Microscopic studies suggested that these latter two protein additives affected emulsion stability by their contribution in forming three-phase emulsions in which the protein additives, as solid particles, attached to oil droplets and lowered the interfacial contact between the internal and external phases.
BATCH DRY RENDERING: AN INVESTIGATION OF HEAT TRANSFER TO BOILING WATER/TALLOW EMULSIONS. L.S. HERBERT &H. MAMERS. J. Food Sci. 38, 856-859(1973)-Laboratory scale experiments have been performed to determine the changes in heat transfer coefficient which occur when water is evaporated from a boiling water/ tallow emulsion. The coefficients for a water-continuous emulsion were found to be higher than for a tallow-continuous emulsion. However, for a stabilized emulsion, the transition in coefficients from a water-continuous state to a tallow-continuous state was not abrupt and was preceded by a period of declining heat transfer rates to the water-continuous emulsion. The results have been used to interpret the heat transfer processes occurring in a batch dry rendering cooker.
HOT WATER AND MICROWAVE ENERGY FOR PRECOOKING CHICKEN PARTS: EFFECTS ON YIELD AND ORGANOLEPTIC QUALITY. J.T. CULOTTA & T.C. CHEN. J. Food Sci. 38, 860-863(1973)-Precooking chicken parts in hot water and by microwave energy were studied. Precooking times and temperatures, effects of microwave oven load, percentage yield and organoleptic quality were determined. All chicken parts precooked by water at 85.0, 87.8 and 90.6°C had significantly lower cooking losses than those precooked by the micro- wave oven. Volatile fraction accounted for the greatest amount of total cooking loss for parts precooked in the microwave oven. Precooking treatments significantly influenced taste panel rating for flavor, juiciness and tenderness of both dark and white meat. Microwave cooked white meat received lower acceptability scores (higher values), and dark meat for both precooking methods received the higher palatability ratings (lower values).
AUTOLYSIS AS A FACTOR IN THE PRODUCTION OF PROTEIN ISOLATES FROM WHOLE FISH. W.W. MEINKE & K.F. MATTIL. J. Food Sci. 38, 864-866 (1973)-An earlier paper cited data relative to the influence of some factors-species of fish, frozen vs. iced, pH temperature, salt concentrate-on the extraction of protein from whole fish and the ultimate recovery of a protein isolate from such extracts by the mean isoelectric pH precipitation method. Subsequent studies have indicated that the autolytic (proteolytic) enzymes of fish also may influence the yield of isolate obtainable from both whole and eviscerated fish by the mean isoelectric pH precipitation approach employed in this investigation. Proteolytic enzymes of both the viscera and flesh enhance the extraction of protein from whole fish at pH 3 and 10. The native autolytic enzyme activities increase crude isolate (curd) yield on whole fish basis by the mean isoelectric pH precipitation method. Curds produced from whole fish, as well as fillets of certain fish, are creamy rather than granular. Catheptic enzymes of flesh and viscera are more active during acidic extractions. Other enzymes (proteolytic) of the viscera are more active during alkaline extractions. Variations in enzyme activities between different fishes are indicated.
SKIM MILK PROTEIN RECOVERY AND PURIFICATION BY ULTRAFILTRATION. Influence o f Temperature on Permeation Rate and Retention. C. POMPEI, P. RESMINI & C. PERI. J. Food Sci. 38, 867-870 (1973)-Ultrafiltration experiments were carried out on pasteurized skim milk at 5 and 50°C, using a pilot plant with a tubular membrane configuration. The permeation rates and retentions are reported with particular reference to the behavior of nitrogen compounds of both the protein and nonprotein fractions. It is concluded that the operation is more economical and more effective on protein purification when carried out at 50°C. At this temperature permeation rates are four- to fivefold higher than at 5°C, retention of low molecular weight contaminants such as lactose and salts is nearly zero; and minor loss of whey proteins, especially a-lactalbu- min, takes place accounting for only about 1% of the total protein content. When operating at 5°C higher retentions were obtained for the soluble constituents and the loss of whey proteins was negligible. Disc electrophoresis showed no detectable qualitative changes or dénaturation of proteins at either temperature.
REDUCTION OF CHILLING INJURY OF CITRUS FRUITS IN COLD STORAGE BY INTERMITTENT WARMING. P.L. DAVIS & R.C. HOFMANN. J. Food Sci. 38, 871-873 (1973)-lntermittent warming of Marsh grapefruit in cold storage reduced the incidence of pitting and brown staining, two symptoms of chilling injury. 1-wk intervals of warming at 70°F for 1 day (8 hr) were more beneficial than warming at 2-wk intervals. Brown staining was eliminated in Temple oranges by intermittent warming. Valencia oranges developed less decay when warmed at weekly intervals which may indicate that the rind is weakened by chilling during continuous cold storage even though visible symptoms do not appear. Internal quality, as measured by analysis of juice for ethanol, acetaldehyde, solids, acid and pH, was not affected by intermittent warming.
CHANGES IN TITRATABLE ACIDITY, °BRIX, pH, POTASSIUM CONTENT, MALATE AND TARTRATE DURING BERRY DEVELOPMENT OF THOMPSON SEEDLESS GRAPES. T. PHILIP & J.R. KUYKENDALL. J. Food Sci. 38, 874-876 (1973)—Changes in titratable acidity, °Brix, pH, potassium content, malate and tartrate during berry development of Thompson Seedless grapes are reported. A positive relation between increasing pH and °Brix; a negative relation between increasing “Brix and log titratable acidity; and a negative relation between increasing log titratable acidity and pH are shown. The potassium content increases linearly with °Brix. The possible role of potassium in the control of pH is shown.
COMPACTION BEHAVIOR OF GROUND CORN. M. KUMAR. J. Food Sci. 38, 877-878 (1973)-The compaction behavior of ground whole corn and endosperm was described by an exponential expression containing two parameters namely: compressibility factor and packing factor. Packing factor could be related to densification during filling, densifica- tion due to individual particle movement and preloading of specimen. Compressibility factor was a measure of the ability of powder foods to density by plastic deformation. The compressibility factor increased with an increase in moisture content, indicating that deformation at higher moisture contents was plastic.
viii
HOT AIR TOASTING AND ROLLING WHOLE WHEAT. Effect on Organoleptic, Physical and Nutritional Quality. A.P. MOSSMAN, W.C. ROCKWELL & D.A. FELLERS. J. Food Sci. 38, 879-884 (1973) Whole wheat batches tempered to 10 and 20'/ moisture contents are treated at high temperature for short times in a continuous hot air grain popper and then rolled. The (lakes have an attractive toasted flavor when prepared with boiling water to make a hot breakfast cereal. The effect of processing conditions on color, flavor, flake integrity, thiamine, phytic acid, starch damage, water absorption index, soluble solids, digestibility and protein efficiency ratio are reported. The toasted whole wheat can also be reduced to a flour or grit suitable for use in formulating precooked high-protein porridge or beverage-type products. ,
INHIBITION OF STAPHYLOCOCCAL ENTEROTOXIN PRODUCTION IN CONVENIENCE FOODS. R.J. HEIDELBAUER & P.R. MIDDAUGH.J. Food Sci. 38, 885-888 (1973) -Presents data showing the effects of combinations of environmental conditions (temperature of incubation, initial pH, NaCI concentration and an atmosphere of C 03, N2 or air) on staphylococcal enterotoxin B production in cheese, ham and shrimp slurries. Enterotoxin production in cheese slurries was limited at 44°C and optimum at 37°C. A pH of 5.5 inhibited toxin production. Fluorescence preceded enterotoxin detection in the supernatant fluid by up to 4 hr. Growth conditions at pH 7 and 9 with 2% NaCI (37°C) gave best cell fluorescence, with fair fluorescence at pH 7 and 9-6% NaCI. Fluorescence was limited to 2% NaCI with « 50% added C 02.6% NaCI inhibited cell fluorescence and enterotoxin production in C 03 or N3. Results with shrimp slurries were similar except pH change was insignificant.
EFFECT OF ROASTING ON AFLATOXIN CONTENT OF ARTIFICIALLY CONTAMINATED PECANS. F.E. ESCHER, P.E. KOEHLER & J.C. AYRES. J. Food Sci. 38, 889-892 (1973) Dry roasting at 191°C for 15 min reduced the concentration of aflatoxin B, and G, in artificially contaminated seedling pecan halves (500 halves per lb) by 80%, in Stuart pecan halves (240 halves per lb) by 45%, and in pecan meal by 60%. Roasting of these nutmeats in coconut oil at 375°F for 6 min or in margarine at 107°C for 60 min lowered the concentration by 60%. 3% of the quantity of toxin initially introduced was found in the oil or margarine bath after roasting. No survival of mold was observed on halves after any of the three treatments.
COMPARATIVE EFFECTS OF ETHYLENE OXIDE, GAMMA IRRADIATION AND MICROWAVE TREATMENTS ON SELECTED SPICES.M. VAJD1 & R.R. PEREIRA. J. Food Sci. 38, 893-895 (1973)-This study involved microbiological, chemical and physical effects of gamma irradiation, ethylene oxide and microwaves on six ground spices (black pepper, paprika, oregano, allspice, celery seeds and garlic) and their effects on the quality of garlic sausage containing such spices. In general, gamma irradiation was most effective for the destruction of bacterial flora in spices. Ethylene oxide treatment affected oil content of the spices and color of paprika, while gamma irradiated spices indicated no change following radiation. With respect to garlic sausage, microbiological examinations indicated the highest increase in sausages made with untreated spices followed by the ethylene oxide treated and gamma irradiated spices during the storage at different conditions of incubation. Flavor analysis indicated no sigificant difference among the sausages. However, preference analysis indicated that the panel preferred sausages made with the gamma irradiated spices to ethylene oxide treated samples.
REACTION PRODUCTS OF HISTIDINE WITH AUTOXIDIZED METHYL LINOLEATE. R.B. ROY & M. KAREL. J. Food Sci. 38, 896-897 (1973) Histidine was reacted with autoxidizing methyl linole- ate: (a) in stirred anhydrous mixture; (b) dispersed on filter paper; and (c) in aqueous dispersion. Analysis of the reaction products led to the tentative identification of histamine, ethylamine and aspartic acid. An unidentified histidine-derived compound was also observed. Different reaction conditions resulted in different reaction products.
STABILITY OF BUTYLHYDROXYANISOLE (BHA) IN WATER UNDER STRESSES OF STERILIZATION. W.C. MONTE & J.A. MAGA. J. Food Sci. 38, 898-900 (1973)-Most antioxidants are incorporated into food systems at a concentration between 0.01-0.02% (based on lipid content of food moiety). Our study of the behavior of BHA under thermal processing conditions was at concentrations compatible with these systems. The most significant finding was the separation of two compounds representing dimer structures identical to those resulting from the photodegradation of BHA. Under normal circumstances of concentration and time and temperature of thermal processing, BHA undergoes extensive rearrangement and condensation. Further work is in progress to completely identify all reaction products and to investigate effects of pH and reactive food ingredients such as amino acids and reducing sugar.
A COMPARISON OF CHILLED-HOLDING VERSUS FROZEN STORAGE ON QUALITY AND WHOLESOMENESS OF SOME PREPARED FOODS. C. KOSSOVITSAS, M. NAVAB, C.M. CHANG & G.E. LIVINGSTON. J. Food Sci. 38, 901-902 (1973)-Experiments were conducted to determine, on a limited basis, whether the Swedish Nacka pasteurization treatment is adequate to destroy Salmonella or C. per- fringens if present in the food after preparation; how the retention of thiamine, riboflavin and ascorbic acid in chilled samples compares with frozen samples; and how palatability of stored chilled foods compares with frozen controls. Refrigerated samples gave negative bacteriological results indicating that the preparation, handling and pasteurization procedures prescribed by the Nacka system effectively destroyed the organisms with which they were inoculated. Retention of vitamins varied: retention of ascorbic acid in frozen samples was significantly greater than in the chilled samples; comparable thiamine and riboflavin values were found in both before storage, but slightly higher in refrigerated samples after storage. After 15 days’ storage, the panel detected no significant difference in appearance, flavor and consistency between frozen and refrigerated samples, but rated fresh controls superior to either. After 30 days’ storage, refrigerated samples were no longer deemed acceptable by the panel; frozen samples were acceptable but inferior to fresh.
MICROBIOLOGICAL COMPARISON OF STEAM- (AT SUB-ATMOSPHERIC PRESSURE) AND IMMERSION-SCALDED BROILERS. H.S. LILLARD, A.A. KLOSE, R.I. HEGGE & V. CHEW. J. Food Sci. 38, 903-904 (1973)-A microbiological comparison was made between broilers from the bleeding line, after water scalding, and after scalding with steam at sub-atmospheric pressure. Lung samples were used as indicators of the degree of contamination resulting from each treatment. Lung samples were analyzed for Clostridium perfringens, which is found in water from commercial scald tanks, and for total number of aerobic microorganisms. No significant difference was found between lungs of broilers from the bleeding line and lungs from sub-atmospheric steam- scalded broilers. Counts from lungs of broilers scalded by sub-atmospheric steam were significantly lower at the 0.1% level than counts from lungs of water-scalded broilers.
THE RATE OF COAGULATION OF ZEIN. E. BALMACEDA & C.K. RHA. J. Food Sci. 38, 905-906 (1973)-The rate of coagulation of protein dope (zein in 95% alcohol) in HC1 constant temperature coagulating bath (pH 3) was determined experimentally. Data were analyzed assuming diffusion controlled coagulation and values of a parameter called diffusion velocity, which adequately describes the boundary advancement, were obtained.
CHILLING INJURY OF GREEN BANANA FRUIT: KINETIC ANOMO- LIES OF IAA OXIDASE AT CHILLING TEMPERATURES. N.F. HAARD. J. Food Sci. 38, 907-908 (1973)-Indole-3-acetic acid oxidase was isolated from green banana pulp and assayed at temperatures ranging from 5-30°C. The velocity of IAA oxidation was hyperbolic in the substrate range of 0.05-1.00 mM when the assay temperature was above 15°C. At assay temperatures below 15°C the velocity was preferentially decreased at low substrate concentrations such that sigmoid-like kinetics were observed. At an assay temperature of 5°C the enzyme was inactive with 0.2 mM IAA. It is suggested that the temperature-induced anomo- lous kinetics relate to the failure of banana fruit to acclimate to chilling temperatures and ripen.
tx

ABSTRACTS :IN THIS ISSUE
ANTHOCYANINS OF BLACK GRAPES OF 10 CLONES OF Vitis rotundifolia, MICHX. W.E. BALLINGER, E.P. MANESS, W.B. NESBITT & D.E. CARROLL JR. /. Food Sci., 38, 909-910 (1973)-The antho- cyanins (Acy) of homogenized hulls of ripe berries were extracted with 1% HC1 in methanol, and separated and purified by paper chromatography using the solvents 1% HC1, BAW and 15% HAc in sequence. The purified Acy were identified using spectral analysis, partial- and complete-hydrolysis, and co-chromatography with known markers. Berries from each of the 10 clones, representing a wide range of genotypes, contained the same Acy, all 3,5-diglucosides of delphinidin, petunidin, cyanidin, malvidin and peonidin. None was acylated. These findings confirm and extend those of Ribereau-Gayon which were based on an unspecified number or type of clones.
SPECTROPHOTOMETRIC DETERMINATION OF CAFFEINE IN NIGERIAN KOLA NUTS. O. SOMORIN. /. Food Sci. 38, 911-912(1973)—The purpose of this investigation was to determine the caffeine contents of Nigerian kola nuts. By using gradient elution chromatography and by determining the caffeine spectrophotometrically, reliable quantitative results were obtained. Results show that Nigerian kola nuts have variable caffeine contents, for instance Cola acuminata has a caffeine content of 2.19% in contrast to Cola verticillata with a caffeine content of 1.04%. The variability in caffeine content also exists between varieties of the same species as exemplified by Cola nitida rubra with a caffeine content of 1.91% and Cola nitida alba with a caffeine content of 1.40%.
SPECTROPHOTOMETRIC ANALYSES OF ORANGE JUICES AND CORRESPONDING ORANGE PULP WASHES. D R PETRUS & M.H. DOUGHERTY. J. Food Sci. 38, 913-914 (1973) The combined visible and ultraviolet absorption was obtained of alcoholic solutions of five midseason (Pineapple) and seven late season (Valencia) orange juices and orange pulp washes. The spectra for all pulp washes were much lower in visible absorbance but higher in ultraviolet absorbance than their corresponding orange juices. From analyses of the spectra, the orange juice content of the pulp wash was estimated. The orange juice contents of the pulp washes were found to vary between processors.
AMYLOSE CONTENT AND PUFFED VOLUME OF PARBOILED RICE. A.A. ANTONIO & B.O. JULIANO. J. Food Sci. 38, 915-916(1973)-Resu!ts show equilibrium water content of steeped rice differed among varieties and lines tending to be highest in waxy rice followed by nonwaxy rice with low and intermediate amylose and then by those with moderately high and high amylose. Protein content was not related to equilibrium water content. Volume expansion during puffing differed among samples, being highest for waxy rice. Puffed volume was greater in steeped rices with water contents above 30%. at 28-30°C. Samples parboiled at different moisture contents but puffed under the same conditions showed the water content of the rice on parboiling determined the puffed volume. Data indicate in addition to parboiling conditions that amylose content of rice influences the puffed volume of the resulting milled parboiled rice by affecting the degree of parboiling of grains processed under identical conditions.
E r r a tu m N o tic e
J. Food Sci. 38(4): v (1973), K. Ostovar: “A study on survival of S taphy lo coccus aureus in dark and milk chocolate.” On page v, Abstract, line 3 and following, change to: Dark and milk chocolate bars were inoculated with Staphylococcus aureus to establish an initial population of approximately 103, 10s and 107 cells per gram. Samples were stored at room temperature and examined for the survival of staphylococci at 2-day intervals for the first 6 days and every 8 days thereafter. Counts of less than 100 cells per gram were obtained after: (a) 2 days in dark and 14 days of storage in milk chocolate when the samples were inoculated with 103 cells per gram; (b) 38 days in dark and 86 days in milk chocolate when the bars were inoculated with 10s cells per gram; and finally (c) 86 days in dark and 110 days of storage in milk chocolate when the samples were inoculated with 107 cells per gram.
R E P R IN TS
S in g le re p r in ts a re n o t a v a ila b le f ro m " J o u r n a l o f F o o d S c ie n c e " —se n d re q u e s ts d ir e c t ly to th e s e n io r a u t h o r (a d d re s s a p p e a rs n e a r t it le ) .
Q u a n t it y re p r in ts c a n b e o rd e re d fro m I F T R e p r in t D e p a r tm e n t —m in im u m o f 1 0 0 c o p ie s . P r ic e s c h e d u le a v a ila b le u p o n re q u e s t .
x
ENDEL KARMASDept, o f Food Science, Rutgers University, New Brunswick, NJ 08903
A SYMPOSIUM . . . complete in this issue
PROTEIN INTERACTIONS IN BIOSYSTEMS INTRODUCTION
FOODS are complex biosystems in which many constituent interactions can take place. Recent developments in food science have singled out protein as an important food constituent nutritionally as well as functionally. Proteins in foods undergo a multitude of interactions.
The constituents in food biosystems which can interact with proteins include water, lipids, carbohydrates, minerals, vitamins, pigments and others. It is, however, impossible to cover such a vast field of interactions. Therefore, the discussion is limited to the macroconstituents: water, lipids and carbohydrates.
In order to provide a better understanding of the protein interactions, the structure of water (Karmas, 1973) and protein (Wetlaufer, 1973) are also discussed to provide important background information. The protein interaction topics include protein-water (Lumry, 1973), protein-lipid (Karel, 1973) and protein- carbohydrate (Hodge, 1973) interactions. Unfortunately, the latter paper, discussing an extremely interesting and important field from the food science point of view, was not made available for publication by the author.
It should be noted that the interactions in biosystems mentioned above take place in aqueous medium and are thus intimately related to the water structures. The first paper of the symposium (Karmas, 1973) deals with the structural properties of water. It has been widely accepted that the structural properties of water can serve as a key to understanding and explanation of biological phenomena and processes. Biological significance of
water, biological activity as a function of temperature, the structure of water, solute effect on water structure and the state and functional role of water in biological systems are discussed in this paper.
The second paper (Wetlaufer, 1973) reviews the protein structure and stability in biosystems. Recent research has shown that protein structures are frequently not as archtypical as described in the classical literature. For example, the a-helical and pleated sheet structural modes are frequently irregular; or, many proteins have a substantial fraction of their nonpolar groups exposed to water and charged groups are occasionally found in the protein interior. These irregularities do not necessarily violate the conventional principles. On the contrary, protein structures may be considered as compromises on the simultaneous optimization of many structural principles. The author points out that protein nucleation or self-assembly mechanism, directed by the local free energy minimum, appears to be the only plausible way of reducing the number of statistically possible protein structures.
Lumry (1973) discusses some recent ideas about the nature of the interactions between proteins and liquid water emphasizing many puzzling problems. The paper points out that the understanding of proteins as chemical species has to be improved before the ideas about the protein reaction mechanisms can be verified. The linear enthalpy-entropy compensation pattern has been found to provide an experimental pathway for studying the role of water in determining the chemical, physical and specific functional proper
ties of proteins. Protein function may be linked to bulk water through volume change. Similarly changes in protein surface properties can be linked to bulk water.
Karel (1973) points out a number of significant processes in food and biosystems which involve interactions between proteins and lipids. Mechanisms by which proteins and lipids interact, the nature of the forces involved, and factors which affect the interactions are reviewed. Examples of particularly important interactions in food biosystems are presented, including biological membrane interactions, protein-oxidizing lipid interactions and coalescence and inversion of emulsions.
This symposium attempts to present some fundamental concepts on protein interactions which should contribute to the recognition of the complexities involved in food biosystems. Furthermore, it is hoped that this information will project potential applications in food science.
REFERENCESHodge, J.E. 1973. Protein-carbohydrate interac
tions and reactions. Paper No. 13 presented at the 32nd Annual Meeting of the Institute of Food Technologists, Minneapolis, Minn.
Karel, M. 1973. Protein-lipid interactions. J. Food Sci. 38: 756.
Karmas, E. 1973 . Water in biosystem s. J. Food Sci. 38: 736.
Lumry, R. 1973. Som e recent ideas about the nature o f the interactions betw een proteins and liquid water. J. Food Sci. 38: 744 .
Wetlaufer, D.B. 1973. Protein structure and stability: Conventional wisdom and new perspectives. J. Food Sci. 38: 740.
Ms received 5 /2 0 /7 3 ; accepted 5 /2 5 /7 3 .Presented during the Sym posium on Protein
Interactions in Biosystem s at the 32nd Annual Meeting of the Institute o f Food Technologists in Minneapolis.
Volume 38 (1973)-J0URNAL OF FOOD SCIENCE- 735
ENDEL KARMASDept, o f Food Science, Rutgers University, New Brunswick, NJ 08903
SYMPOSIUM: Protein Interactions in Biosystems WATER IN BIOSYSTEMS
Biological significance of waterSzent-Gyorgyi (1957) has stated that
“water is not only the m ater, mother, it is also the matrix of life.” It is reasonable to think that life originated in water and is thriving in water, since biological reactions do not take place unless aqueous medium is present. Water is not only an inert medium, but an all-important biochemical, a chemically active substance participating in such essential reactions as photosynthesis and terminal respiration. Water also seems to have molded the various forms of life according to its own structure. Hence, it is appropriate to say that in the evolutionary stream of life in water, the shapes were formed and the kinds were multiplied. On the molecular level, the proteins were structured and molded by the structure of water. Finally, the aquatic plants and animals adopted themselves to the conditions of existence on land. However, water was still retained as the most important constituent in all forms of life, from relatively simple single-celled to the exceedingly complex multicellular organisms, amounting sometimes to as much as 95%, but seldom less than 60%.
The origin of life lies in the unique power of water to interact with biochemical solutes. The existence of life depends on controlled movement of biochemical solutes. Water itself is unable to exercise that control. The creation of proteinaceous framework was a primary step in the evolution of life, and this creation took place in water. In general sense, the tension at both sides of the membrane, termed as osmotic pressure, may be called life. In biological systems this tension-life-is maintained by metabolic action within the biosystem.
In every phase of the evolutionary process, water with its remarkable properties has played a leading and perhaps a dominant role. Proteinaceous structures enter so closely into the structure of water that they may well be considered as an intimate part of the biological structure of water.
Biological activity as a function of temperature
In the universe, the temperature ranges from near absolute zero to millions of de
grees. However, biological activity is restricted to a narrow temperature interval. It is within the range in which water remains liquid at one atmosphere. For higher forms of life—man and other mammals—this range is extremely small being only some 1 5 C. For plants, the temperature range over which survival may occur is some 90°C.
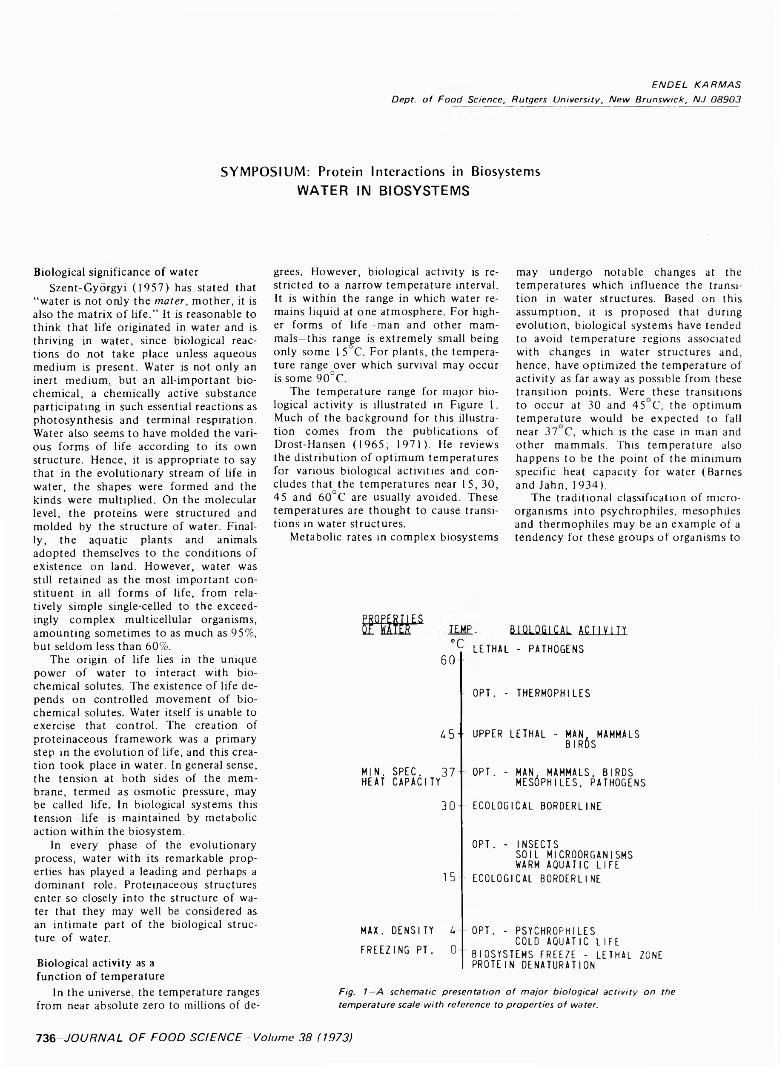
The temperature range for major biological activity is illustrated in Figure 1. Much of the background for this illustration comes from the publications of Drost-Hansen (1965; 1971). He reviews the distribution of optimum temperatures for various biological activities and concludes that the temperatures near 15, 30, 45 and 60°C are usually avoided. These temperatures are thought to cause transitions in water structures.
Metabolic rates in complex biosystems
may undergo notable changes at the temperatures which influence the transition in water structures. Based on this assumption, it is proposed that during evolution, biological systems have tended to avoid temperature regions associated with changes in water structures and, hence, have optimized the temperature of activity as far away as possible from these transition points. Were these transitions to occur at 30 and 45 C, the optimum temperature would be expected to fall near 37 C, which is the case in man and other mammals. This temperature also happens to be the point of the minimum specific heat capacity for water (Barnes and Jahn, 1934).
The traditional classification of microorganisms into psychrophiles, mesophiles and thermophiles may be an example of a tendency for these groups of organisms to
r a r TEMP. BiQLQSICAL ACTIVITY°C
60--
- OPT. - THERMOPHILES
A 5"
MIN. SPEC. 37 HEAT CAPACITY
30
15-
MAX. DENSITY U FREEZING PT. 0
LETHAL - PATHOGENS
UPPER LETHAL - MAN, MAMMALS BIRDS
OPT. - MAN, MAMMALS, BIRDSMESOPHILES, PATHOGENS
ECOLOGICAL BORDERLINE
OPT. - INSECTSSOIL MICROORGANISMS WARM AQUATIC LIFE
ECOLOGICAL BORDERLINE
OPT. - PSYCHROPHILESCOLD AQUATIC LIFE
BIOSYSTEMS FREEZE - LETHAL ZONE PROTEIN DENATURATION
Fig. 1—A schematic presentation o f m ajor biological activity on the temperature scale with reference to properties o f water.
136-JOURNAL OF FOOD SCIENCE-Volume 38 (1973)
Symposium— TER IN BIO SYSTEM S-737exhibit optimal growth between various consecutive ecological borderlines. For example, a majority of thermophilic microorganisms are known to possess optima around 53 C. On the other hand, it is well known that pasteurization temperature for human pathogens starts at 60 C.
There are thermophilic organisms which survive at temperatures higher than 60°C. A few organisms may even survive at above the boiling point of water. Such life processes suggest that some living systems have been able, through evolution, to select and enhance the mechanism which has the greatest ability to protect the native structures.
An obvious transitional temperature for water structure is the freezing point. Biological systems freeze a few degrees lower than pure water. This is a most detrimental temperature to aquatic life and microorganisms as well as to the native proteins. Microorganisms die rapidly when kept at freezing point temperatures, whereas they may survive when rapidly frozen to, say, -70°C (Frazier, 1967). Proteins denature extensively at the freezing point temperatures, whereas dénaturation may be negligible when the protein is kept at -20°C (Finn, 1932).
This discussion suggests a strong interaction between the structure of water and biological activity. Furthermore, it is meaningless to speak about water structures without reference to temperature. The properties of water are strongly related to the temperature. As the properties and the structures of the water change, the biological activity is influenced.Water structure
Water is a puzzling substance. This most abundant, but most anomalous liquid on earth has challenged scientists for centuries. A number of monographs (e.g., Eisenberg and Kauzmann, 1969; Kavanau, 1964) and articles e.g., Buswell and Rodebush, 1956; Frank, 1970) have been written about “ordinary” water.
To understand the behavior of water in biological systems, the structure of pure water must be understood. The unusual properties of water are directly traceable to the complex structure of this remarkable liquid. Although improved instrumentation is rapidly becoming available, understanding which presently prevails regarding the structure of water, in general, and that in biological systems, in particular, is fragmentary and incomplete. In fact, contradictory and mutually exclusive theories are currently discussed in the literature. Safford and Leung (1971) have given a detailed overview of current water structure theories.
All models of water structure invoke the occurrence of hydrogen bonding to a greater or lesser degree. The best models also agree that water is a mixture of monomeric and hydrogen-bonded polymeric
molecules. The models have been divided into three groups: continuum, cluster and specific structure models.
In continuum models, a hydrogen- bonded system penetrates throughout the water body without a definitive structure. One of such continuum models is proposed in the classic paper of Bernal and Fowler (1933). This was also the first time when hydrogen bonding, discovered by Latimer and Rodebush in 1920, was proposed as a basic framework of water structure.
Compared with liquid water, ice is 100% hydrogen-bonded and has a symmetrical, highly open hexagonal structure (Runnels, 1966). In the ice structure, each oxygen atom is tetrahedrally surrounded by four other oxygen atoms at a distance of 2.76A. This ice structure is possible because the tetrahedral angle of 109.5° approximates rather closely to the water dipole angle of 104.5°. The hydrogen atoms in ice, however, are distributed asymmetrically. Each oxygen atom has two hydrogen atoms covalently bonded and two farther away hydrogen-bonded. The distinctive structural features of liquid water generally have been ascribed to its partial retention of the tetrahedrallv- directed hydrogen bonding involved in the crystalline structure of ice.
Large more-or-less structureless ice-like polymers represent the idea of the cluster models. The most important cluster model was proposed by Frank and Wen(1957). The crystalline clusters are dispersed in a denser nonhydrogen-bonded monomeric water. The formation and collapse of hydrogen bonds is a cooperative phenomenon and short-lived or “flickering” ( 10 “ times per second) ice-like clusters of varying size are mixing and exchanging with monomeric molecules. No specific size is assigned to the clusters. Nemethy and Scheraga (1962) have done statistical-thermodynamic calculations for the flickering-cluster model. In their concept, the compact clusters are made up of four distinct species corresponding to molecules with one, two, three and four hydrogen bonds; a fifth species is the monomer which is in equilibrium with the clusters. Cluster size and monomeric fraction vary with the temperature.
Specific structure models are based on the notion that structurally identifiable ice-like units are present in liquid water. The most important representative of the structure models is the Pauling’s clathrate model (Pauling, 1959). In Pauling’s model, 20 water molecules lie at the corners of a pentagonal dodecahedron with an unbonded molecule at the center of the dodecahedron. The water is conceived to be a hydrate of itself with the formula of H20 • (H2O)20. The clathrate structures are similar to those of the gas hydrates (Stackelberg, 1949). The inside diameter of the clathrate cage is about 5 A . The
significance of the pentagonal dodecahedron to molecular architecture is in part a result of the close approximation of the angles of 108° between its edges to the tetrahedral angle of 109.5° in ice. The necessary fluidity is introduced into the model by “flickering” of the clathrate hydrogen bonds (Frank and Quist, 1961). The dodecahedra may be arranged relative to one another in a large number of ways, forming additional hydrogen bonds with each other or fusing together to share pentagonal faces; they also may be joined through hydrogen-bonded water molecule bridges. In addition, monomeric water molecules may be present. Such labile structures give rise to a variety of voids within the structures.
The concept of structured water is now being taken seriously. It is remarkable that it has not been possible to firmly prove or disprove any of the various theories proposed for water structure. If the ordered water is conceived as a part of the highly differentiated and ordered three-dimensional macromolecular proteins which constitute the fabric of living systems, it is natural to assume that structured water—from the crystalline clathrate structures to the numerous other possible frameworks-is an integral part of the macromolecular structures.Solute effect on water structure
Frank (1965) has classified the general effects of different types of solutes in terms of water “structure-making” and “structure-breaking.” Four types of solute action may be recognized and analyzed with respect to the water structure: ionic, nonionic polar, nonpolar and polyfunctional.
The electric field in the vicinity of an electrically charged ion strongly polarizes the water dipoles and they become oriented as a shell around the ion. This causes a breakdown of the latent intrinsic structures of pure water. Through the torque of the ionic electric field on water dipoles, the structure equilibrium is shifted in the direction of a smaller degree of ice-likeness (Frank and Wen, 1957). An electric charge, whether carried by a free ion in solution or an ionic side chain of a protein molecule, generally does not differ appreciably in magnitude. Beyond the immobilized monolayer, restricted motional freedom is induced in other adjacent water dipoles. According to Frank and Wen (1957), three concentric regions surround an ion: ( 1) an innermost region of polarized and immobilized, (2 ) an intermediate region of random organization and (3) an outer region of normal tetrahedrally oriented liquid water molecules.
Nonionic polar groups-such as hydroxyl, amide and peptide bond-either participate in the hydrogen bond formation or exert only negligible effect on the normal water structures and, hence, they
738-JOURNAL OF FOOD SCIENCE-Volume 38 (1973)
are more-or-less neutral. Molecules with a large polar moment, such as tyrosine side- chain, tend to interfere with the symmetry required for the formation and stabilization of the clathrate framework, such that may otherwise shelter a phenylalanine sidechain (Karmas and DiMarco,1970).
Nonpolar solutes have the structuremaking ability by forming water cla- thrates in the Pauling’s model sense. For example, the methane molecule is nonpolar, it does not ionize, nor does it accept hydrogen bonds; there is no obvious attraction between it and the water molecule. Methane, however is “soluble” in water, not in the classical sense, but through the formation of crystalline hydrate with water (Stackelberg, 1949). Pentagonal dodecahedral clathrate structures provide an array of voids that may be able to envelop smaller nonpolar side- chains. Drost-Hansen (1971) states that while methane, ethane, propane and isobutane form clathrate hydrates quite readily, pentane does not appear to form such compounds. This may be interpreted as due to the inability of the classically recognized clathrate cages to accommodate larger hydrocarbon chains. It is interesting to point out that the largest nonpolar aliphatic amino acid sidechain is isobutane. Karmas and DiMarco (1970) in a thermoanalytical study have demonstrated a strong interaction between water and nonpolar amino acids, particularly those of leucine and isoleucine.
The macrosolutes in biological systems are polyfunctional and the resulting interactions and water structures exceedingly complex. Szent-Gyorgyi (1957) stated that crystalline water structures can be built around dissolved molecules. These structures may be different according to the polar or nonpolar nature of the molecule and the mutual distance of these groups. It is believable that different spacing promotes different crystalline forms, possibilities being rich and relations complex.The physical state of water in biosystems
Historically Szent-Gyorgyi (1951) was the first scientist to state that ordered water structures are important elements in biological functioning. He proposed that muscle contraction and relaxation involves collapse and reformation of crystalline water structures. Klotz (1958) suggested that the nonpolar sidechains of proteins could induce crystalline clathrate structures of water around protein with the added cooperative effects due to the presence of many such sidechains bound to the frame of the protein molecule. Ling (1965) concluded that all the water in the living cell exists in cooperatively polarized multilayers oriented by the electric charges of cell proteins and ions.
Until recently these concepts were
only speculations. However, experimental evidence has now confirmed these predictions qualitatively. One of the most convincing pieces of evidence for ordered water in biological systems has come from the NMR studies by Hazlewood et al.(1969). They concluded that most of the skeletal muscle water has restricted motional freedom. At least two ordered phases of water have been observed. The major phase consists of water molecules that have lost considerable motional freedom relative to free water. The minor phase contains water molecules that have even less motional freedom than the major phase but more than solid ice. Heat denaturation of the muscle protein lessens the ordered phases significantly.
Similarly Cope (1969), employing NMR, indicated that the structure of biological water has a significantly greater degree of crystallinity than liquid water.
Szent-Gyorgyi (1951) stated that “heat can be expected to destroy water structures.” Karmas and DiMarco (1969) found that heat denaturation of skeletal muscle tissue and egg albumin takes place in two irreversible phases. The calculations strongly suggest that collapse of water structures is involved. The native structures, stable at low temperatures, are not reformed after denaturation when the temperature is lowered. The possibility exists that the symmetry and ordered matrices of the native structures are destroyed irreversibly by high temperatures and thus cannot be restored.Biological water activity and the functional role of water
There is plenty of evidence that the living cell is not simply a sac of biological solutes in ordinary water solution. Water, considering all its unusual properties, must necessarily accomplish a much more important and complicated role than that of an inactive solvent.
Water in biological systems is usually divided into two major phases: bound and free water. These terms seem to be inadequate. It would be more meaningful to use the term “b io log ica l w ater ac tiv i t y ” which ranges from b io log ica lly active w ater to s tru c tu ra l water. Biologically active water is needed by biosystems at the peak biological activity. The structural or protective water is vital for survival of the living organism and it cannot be frozen or evaporated.
Biological water activity is a function of the cellular water content, solute concentration and temperature. Thus, the biological water activity may be regulated by the nature in three ways: by changing the cellular water content, solute concentration and temperature. All these mechanisms are interrelated by a common denominator—change in biological water activity.
A grain of wheat at its peak growing period contains some 75% of water. When
the biologically active water is no longer needed, it is released readily and the cereal grain is dehydrated to about 13% water content which is the upper level of structural water essential for survival. This mechanism may be considered as cereal grain “ spore” formation. A grain of wheat at this water content may remain biologically dormant, its enzyme active sites “frozen” or protected by the structural water, for many years until the active water is replaced and a new biological cycle begins.
Similarly, the vegetative bacterial cells have a high biologically active water content. Bacterial spores, on the other hand, have given up their biologically active water and retained only the vital structural water necessary for survival and protection particularly at temperatures near, or even above, the boiling point of water. It has been found that the heat resistance of spores from six bacterial test species was at a maximum at water activity levels between 0.2 and 0.4 (Insalata, 1972) which may be correlated with a moisture content between about 7% to 10%.
The survival of woody plant cells at freezing temperatures is analogous to that of bacterial spores at high temperatures. The death of hardy plant cells invariably results when intracellular freezing of the intracellular water occurs due to rapid freezing rates (Weister, 1970). The winter acclimation of hardy plants has to take place slowly. First, the extracellular water freezes and rapid propagation of ice throughout the stem results. Due to the vapor pressure difference, the once active protoplasmic water migrates from the cell to the extracellular ice. The partial dehydration of protoplasm, or concentration of the protoplasmic solutes, prevents intracellular freezing and thus contributes to the survival of the plant. Farmers in the cold Nordic climates protect semihardy plants from freezing by supplying the plants, immediately before the cold season, with certain inorganic salts, such as potassium nitrate and phosphates, and plenty of water. This supposedly increases the intracellular solute content and helps the plant to survive the freezing weather.
However, not all phenomena of biological water activity need involve extreme conditions. It is known (Drost-Hansen, 1965; 1971) that in both man and many other mammals, 30°C is a temperature of considerable physiological importance. For example, in man there is a loss of consciousness at about 30°C combined with a loss of the ability to regulate body temperature. For mammalian hibernation, the critical temperature again is around 30 C. These phenomena are believed to be due to the transition in the water structures toward more ice-like states. Some water activity is “frozen” which, in turn, arrests the functional
Symposium—14(4 TER IN BIOSYSTEMS-739activity of the delicate brain cells. The same effect can be accomplished by the anesthetic solutes which are believed to form ice-like hydrates (Pauling, 1961).
It is reasonable to believe that the structural water has a complex molecular architecture. Perhaps Pauling’s pentagonal dodecahendron-like clathrates are surrounded by Nemethy-Scheraga’s ice-like clusters interwoven with Ling’s multilayer interaction?
Western scientists were skeptical when the Russian scientists Deryagin and Churayev (1968) claimed to have produced a mysterious new substance, a new form of water, the so-called po lyw a te r. Made in thin capillaries of 1 5 0 /am in diameter, this “new” water boiled above 250 C. It did not freeze, though at -4 0 C it hardened into a glass-like substance. It was soon reported by Davis et al. (1971) and Everett et al. (1971) that the anomalously behaving water contained high concentrations of sodium, potassium, sulfate, chloride, nitrate and other impurities, but relatively little water.
At this time, when the final chapters of the story of the anomalous water have been written, I would like to revive this controversial subject matter once more to take another look at the anomalous water but from a different point of view.
One is tempted to picture the so-called anomalous water as a part of the biosystems. The conditions described by Davis et al. (1971) and Everett et al. (1971) may be found in nature. Living cells, particularly at the time of survival, contain relatively high concentrations of various inorganic salts in the structural water. Furthermore, the cellular diameter is in the range of that of the capillaries in which the anomalous water has been reported to form. Therefore, there is a strong possibility of the formation and existence of anomalous water in nature. Any point of a small pore or capillary may be the deposition site of anomalous water. Perhaps the difference
in the height and cellular diameter between the Nordic and tropical plants, for example, is influenced by the difference in the biological water activity? Is it coincidental that temperatures around -40°C , the hardening temperatures of anomalous water, are particularly critical for plant survival in the cold climates?
The survival of bacterial spores when boiled at high temperatures could be explained if their structural water were a high-boiling substance such as the anomalous water. Animal cells, for example, do not have such a survival mechanism.
Is Deryagin water a combination of Pauling’s, Nemethy-Scheraga’s, and Ling’s concepts? Or may it be considered as a new concept of water in biosystems? These and many other questions remain to be answered regarding the state of water in biosystems.
REFERENCESBarnes, T .C . and Jah n , T .L . 1 9 3 4 . Properties o f
w ater o f b io lo g ica l in terest. Quart. Rev. B io l. 9: 2 9 2 .
Bernal, J .D . and F o w ler , R .H . 1 9 3 3 . A th eory o f w ater and ion ic so lu tio n , w ith particular referen ce to h yd rogen and h y d ro x y l ion s. J. C hem . P h ys. 1: 5 1 5 .
B u sw ell, A .M . and R o d eb u sh , W .H. 1 9 5 6 . Water. Sci. A m . 1 9 4 (4 ) : 77 .
C op e, F.W . 1 9 6 9 . N uclear m agn etic resonan ce ev id en ce using D 2 O for structured w ater in m u scle and brain. B iop h ys. J. 9: 3 0 3 .
D avis, R .E ., R ou sseau , D .L . and Board, R .D .1 9 7 1 . “ P o ly w a ter” : E vidence from e lectron sp e c tro sco p y for ch em ica l analysis (E SC A ) o f a co m p lex sa lt m ix tu re. Scien ce 171: 1 6 7 .
D eryagin , B .V . and C hurayev, N .V . 1 9 6 8 . P h en o m en o n o f an om alou s w ater described . N ature (M o sco w ) 4: 16 .
D rost-H ansen , W. 1 9 6 5 . The e ffe c ts o f b io lo g ical sy stem s o f higher-order phase transitio n s in w ater. A nn . N .Y . A cad. S ci. 125: 4 7 1 .
D rost-H ansen , W. 1 9 7 1 . S tructure and propertie s o f w ater at b io log ica l in terfaces. In “ C hem istry o f th e C ell In ter fa ce ,” Ed B row n , H .D . A cad em ic Press, Inc., N ew Y ork.
E isenb erg, D . and K auzm an n, W. 1 9 6 9 . “ The Stru cture and P rop erties o f W ater.” O xford U niversity Press, N ew Y ork.
E verett, D .H ., H ayn es, J.M. and M cE lroy, P.J.1 9 7 1 . T he story o f an om alou s w ater. Sci. Prog. O xf. 59: 2 7 9 .
F in n , D .B . 1 9 3 2 . D en atu ra tion o f proteins in
m u scle ju ice by freezin g . Proc. R o y . S oc ., Ser B - l l l : 3 9 6 .
Frank, H .S. 1 9 6 5 . T he structure o f w ater. F ed . P roc ., S u p p l. 1 5 , 2 4 , S - l .
Frank , H .S . 1 9 7 0 . The structure o f ordinary w ater. S c ien ce 1 69 : 6 3 5 .
Frank, H .S. and Q uist, A .S . 1 9 6 1 . Pau ling’s m o d el and th e th erm od yn am ic prop erties o f w ater. J. C hem . Ph ys. 34: 6 0 4 .
Frank, H .S. and W en, W .Y. 1 9 5 7 . Ion -so lven t in tera ctio n . 3 . S tru ctural asp ects o f io n -so lven t in tera ctio n in aq u eou s so lu tio n s: A suggested p ictu re o f w ater structure. D isc. Far. S o c . 24: 1 4 4 .
Frazier, W.C. 1 9 6 7 . “ F o o d M icro b io lo g y ,” 2nd ed. M cG raw-H ill B ook C o., N ew York.
H a ze lw o o d , C .F ., N ich o ls , B .L . and C ham ber- lain , N .F . 1 9 6 9 . E vidence for th e ex isten ce o f a m in im um o f tw o phases o f ordered w ater in sk e leta l m u scle . N ature 2 2 2 : 7 4 7 .
Insalata, N .F . 1 9 7 2 . T he tech n ica l m icro b io lo g ical p rob lem s in in term ed ia te m oistu re produ cts . 2 0 th A nnu al F o o d T ech n o lo g y C on fere n c e , U niversity o f M issouri, C olum bia , M o., M arch 2—4.
K avanau, J.L . 1 9 6 4 . “ W ater and Solu te-W ater In tera ctio n s .” H o ld en — D ay, In c ., San Franc isco .
K arm as, E. and D iM arco, G .R . 1 9 6 9 . W ater-prote in in tera ctio n and p rote in den atu ration . Su ppl. Bull, l ’ln s t. In t. du F ro id , 1 1 7 .
K arm as, E. and D iM arco, G .R . 1 9 7 0 . D eh yd rat io n th erm op rofile s o f am in o acids and p rote in s . J. F o o d S ci. 35: 6 1 5 .
K lo tz , I.M. 1 9 5 8 . P rotein hyd ration and b e havior. S c ien ce 128 : 8 1 5 .
Ling, G .N . 1 9 6 5 . T he p h ysica l sta te o f w ater in living cell and m o d el sy stem s. A nn. N .Y . A cad . S ci. 1 2 5 : 4 0 1 .
N d m eth y , G. and Scheraga, H .A . 1 9 6 2 . S tru cture o f w ater and h y d ro p h o b ic b on d in g in p rote in s. 1 . A m o d el for th e th erm od yn am ic p roperties o f liquid w ater. J. C hem . Phys. 36: 3 3 8 2 .
Pauling, L. 1 9 5 9 . The structure o f w ater. In “ H ydrogen B o n d in g ,” ed H adzi, D. and T h o m p so n , H.W . Pergam on Press, L on d on .
Pauling, L. 1 9 6 1 . A m olecu lar th eory o f anesth esia . S c ien ce 1 3 4 : 15 .
R u n n els, L .K . 1 9 6 6 . Ice. S ci. A m . 2 1 5 (6 ) : 1 1 8 .S a ffo rd , G .J. and L eu ng, P .S . 1 9 7 1 . S tu d ies o f
e le c tro ly tic so lu tio n s by X-ray d iffra ctio n and n eu tro n in e lastic scatterin g. In “ T ech n iq u es o f E lectro ch em istry ,” V o l 2 . John W iley & S on s, N ew Y ork.
S tack elb erg , M .V . 1 9 4 9 . F este G ashydrate. N atu rw issen sch aften 36: 3 2 7 .
S zen t-G yorgy i, A . 1 9 5 1 . “ C hem istry o f M uscular C o n tra ctio n ,” 2nd ed . A cadem ic Press, In c ., N ew Y ork .
S zen t-G yorgy i, A. 1 9 5 7 . “ B ioen ergetic s .” A cad em ic Press, Inc. N ew Y ork .
W eister, C.J. 1 9 7 0 . C old resistance and injury in w o o d y plants. S c ien ce 1 69 : 1 2 6 9 .
Ms received 5 /2 8 /7 2 ; accep ted 5 /2 5 /7 3 .
P resented during th e S y m p o siu m o n P roteinIn teraction s in B io sy stem s at th e 3 2 n d A nnualM eeting o f th e In stitu te o f F o o d T ech n o log istsin M inneapolis.
D. B. W E T L A U F E RDept, o f Biochem istry, 22 7 Millard Hall, University o f Minnesota Medical School, Minneapolis, M N 55455
SYMPOSIUM: Protein Interactions in BiosystemsP ro te in S t r u c tu r e a n d S ta b i l i ty : C o n v e n tio n a l W isd o m a n d N ew P e rsp e c tiv e s
ONE OF THE basic perspectives of the conventional wisdom is that native proteins contain certain characteristic structural modes of peptide chain arrangement which are probably familiar to most of you.Collagen structure
Since collagen is the most abundant protein in higher organisms, and surely is very important in determining the mechanical and textural properties of tissues, we will consider its structure first. The collagen twist is a three-stranded helix, with each strand a polypeptide chain. The three peptide chains are packed close together in a way that permits extensive interchain hydrogen bonding. (An up-to-date and readable refresher on this and other standard peptide chain structural modes can be found in the recent paperback by Dickerson and Geis, 1969.)
The second structural mode is the pleated sheet, which is formed from two to several lengths of extended peptide chain packed side by side in such a way as to produce a wavy (pleated) planar structure. There are two varieties of pleated sheet, depending on whether two adjacent peptide chains are pointing the same direction, looking from the N-terminal end of the chain segment (parallel), or pointing in opposite directions (antiparallel). In both parallel and antiparallel sheets, the adjacent segments of peptide chain are so closely packed that there is intersegment peptide-peptide H-bonding at every amino acid residue.
The third structural mode surely has the greatest fame of all—it is the a-helix. Its fame is so great, in fact, that I have been told by a few students that the a- helix is the characteristic structure of DNA. However, the conventional way of viewing the a-helix is that of a moderately pitched polypeptide chain wound round a cylinder so that one complete turn requires somewhat less than four amino acid residues with the residues in such a geometry that intrachain H-bonding occurs between the carbonyl oxygen of the nth peptide bond and the H-N of the (n+3)rd peptide bond.
In proteins whose three-dimensional structure has been determined, the above structural modes often account for no
more than half the molecule. The remainder of the peptide chain is arranged in structures which have no discernible structural pattern. Earlier workers often tended to call these structures “random”, or “random coil”, in analogy with the unordered structures of synthetic polypeptides in good solvents. However, since these structures in proteins are usually the same in all the molecules of a particular protein, “random” is clearly inappropriate. There is at present no accepted generic term for these structures. We have suggested “remainder” (Saxena and Wet- laufer, 1971) which can be recommended as operationally acceptable.Elastic proteins
Another protein structural mode is found in the elastic proteins elastin (Mammal), resilin (Insect) and abductin (Scallop). Various investigations support the interpretation that these proteins have the rubber-like elasticity associated with a highly crosslinked random coil. In these structures, which maintain their elasticity only when hydrated, the peptide chain segments continually undergo random thermal motions, within the constraints of the covalent bonds and customary steric factors.Protein structural principles
In addition to the structural modes sketched above, several structural principles have become part of the conventional wisdom about protein structure. We begin with the criteria for stable structures proposed by Pauling and Corey, (1951a—e; 1952; 1953a,b) and Pauling et al. (1951; 1952). From extensive X-ray crystallographic structural determinations on small peptides and peptide analogs, these investigators argued that stable protein structures should meet the following conditions: (A) the six atoms of peptide bond should be co-planar; and (B) the bond should have a trans conformation; (C) and (D) the bond angles and interatomic distances should be the same as in the low molecular weight model compounds; (E) all H-bond donor and acceptor potential is satisfied, mainly by pep- tide-peptide interactions; and (F) for maximum energy from H-bond interactions, co-linearity of peptide N-H-*- 0=C atoms should obtain.
The next group of structural principles
concerns the disposition of the hydrophilic and hydrophobic parts of the protein. It is assumed that the most stable structure will result when the nonpolar sidechains (leucine, valine, tryptophan, etc.) are packed inside the protein molecule away from aqueous solvent, while polar sidechains (formally charged groups, plus hydroxyl groups, amide groups, etc.) are exposed to aqueous solvent. The clear and compelling presentation of these principles is due to Kauz- mann (1959). In what appeared to be reasonable extension of these principles, globular proteins were thought to be compact, close-packed structures with no holes or channels.
CONVENTIONAL WISDOM VS EXPERIMENTAL DATA
WE WILL NOW briefly discuss how the conventional wisdom compares with experimental data.Bond angles and distances
Bond angles and distances are generally in good agreement with those of model compounds. However, refinement of the lysozyme data appears to show that a few peptide bonds are out-of-plane, perhaps by as much as 30° (Phillips, 1972).
In general peptide bonds are trans in proteins, but a cis bond has been found in ribonucléase S and another in carboxypeptidase A (Phillips, 1972).Structural modes
When the a-helical and pleated sheet structural modes are found in proteins, they are frequently distorted from the archtypical structure. Helices may be bent, and do not always show the H- bonding pattern of the a-helix. Pleated sheets are more frequently twisted or curved than planar, notable examples being found in chymotrypsin, carboxypeptidase A, and carbonic anhydrase.
Many proteins have a substantial fraction of their nonpolar groups exposed to water, although generally more than 2/3 are “buried.” Charged groups are occasionally found in the protein interior, as ion pairs. As to the “no holes” rule, myoglobin has an unfilled cavity large enough to accept a Xenon atom, (Schoenborn,1969), ribonucléase S has an empty channel (Lee and Richards, 1971), and chymotrypsin has 13 internal water mole-
740—JOURNAL OF FOOD SCIENCE-Volume 38 (1973)
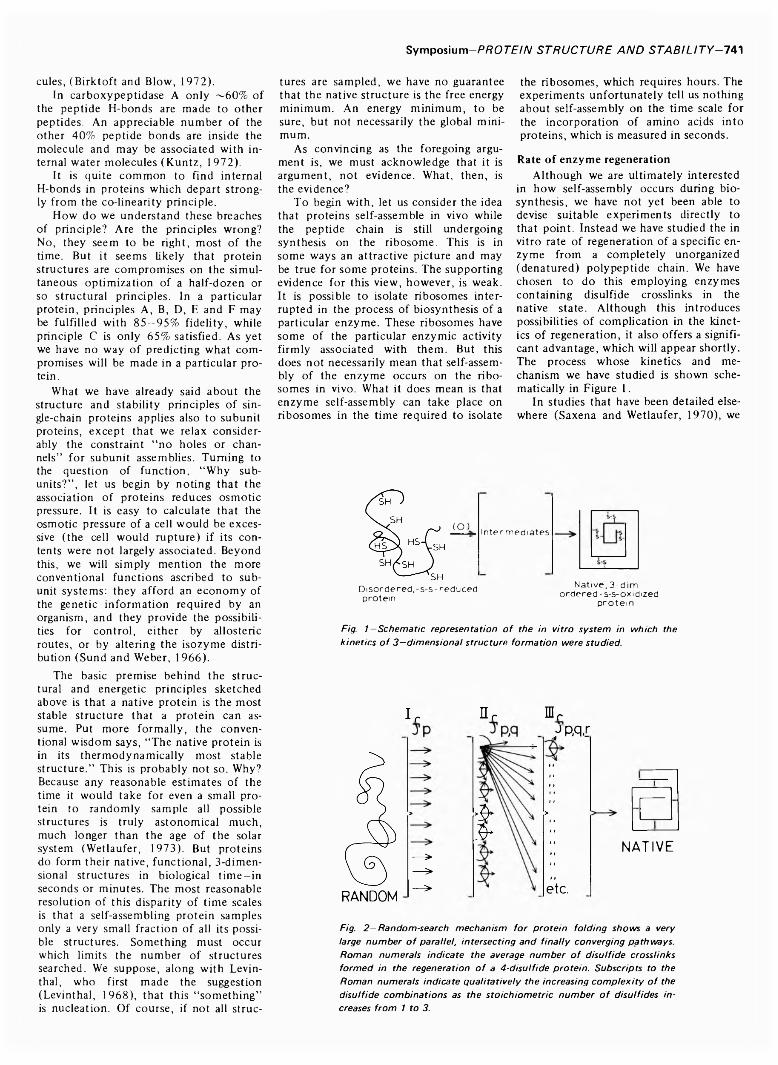
Symposium—PflOrF/ZV STRUCTURE AND STABILITY-741
cules, (Birktoft and Blow, 1972).In carboxypeptidase A only ~60% of
the peptide H-bonds are made to other peptides. An appreciable number of the other 40% peptide bonds are inside the molecule and may be associated with internal water molecules (Kuntz, 1972).
It is quite common to find internal H-bonds in proteins which depart strongly from the co-linearity principle.
How do we understand these breaches of principle? Are the principles wrong? No, they seem to be right, most of the time. But it seems likely that protein structures are compromises on the simultaneous optimization of a half-dozen or so structural principles. In a particular protein, principles A, B, D, E and F may be fulfilled with 85-95% fidelity, while principle C is only 65% satisfied. As yet we have no way of predicting what compromises will be made in a particular protein.
What we have already said about the structure and stability principles of single-chain proteins applies also to subunit proteins, except that we relax considerably the constraint “no holes or channels” for subunit assemblies. Turning to the question of function, “Why subunits?” , let us begin by noting that the association of proteins reduces osmotic pressure. It is easy to calculate that the osmotic pressure of a cell would be excessive (the cell would rupture) if its contents were not largely associated. Beyond this, we will simply mention the more conventional functions ascribed to subunit systems: they afford an economy of the genetic information required by an organism, and they provide the possibilities for control, either by allosteric routes, or by altering the isozyme distribution (Sund and Weber, 1966).
The basic premise behind the structural and energetic principles sketched above is that a native protein is the most stable structure that a protein can assume. Put more formally, the conventional wisdom says, “The native protein is in its thermodynamically most stable structure.” This is probably not so. Why? Because any reasonable estimates of the time it would take for even a small protein to randomly sample all possible structures is truly astonomical-much, much longer than the age of the solar system (Wetlaufer, 1973). But proteins do form their native, functional, 3-dimensional structures in biological tim e-in seconds or minutes. The most reasonable resolution of this disparity of time scales is that a self-assembling protein samples only a very small fraction of all its possible structures. Something must occur which limits the number of structures searched. We suppose, along with Levin- thal, who first made the suggestion (Levinthal, 1968), that this “something” is nucleation. Of course, if not all struc
tures are sampled, we have no guarantee that the native structure is the free energy minimum. An energy minimum, to be sure, but not necessarily the global minimum.
As convincing as the foregoing argument is, we must acknowledge that it is argument, not evidence. What, then, is the evidence?
To begin with, let us consider the idea that proteins self-assemble in vivo while the peptide chain is still undergoing synthesis on the ribosome. This is in some ways an attractive picture and may be true for some proteins. The supporting evidence for this view, however, is weak. It is possible to isolate ribosomes interrupted in the process of biosynthesis of a particular enzyme. These ribosomes have some of the particular enzymic activity firmly associated with them. But this does not necessarily mean that self-assembly of the enzyme occurs on the ribosomes in vivo. What it does mean is that enzyme self-assembly can take place on ribosomes in the time required to isolate
the ribosomes, which requires hours. The experiments unfortunately tell us nothing about self-assembly on the time scale for the incorporation of amino acids into proteins, which is measured in seconds.
Rate o f enzym e regenerationAlthough we are ultimately interested
in how self-assembly occurs during biosynthesis, we have not yet been able to devise suitable experiments directly to that point. Instead we have studied the in vitro rate of regeneration of a specific enzyme from a completely unorganized (denatured) polypeptide chain. We have chosen to do this employing enzymes containing disulfide crosslinks in the native state. Although this introduces possibilities of complication in the kinetics of regeneration, it also offers a significant advantage, which will appear shortly. The process whose kinetics and mechanism we have studied is shown schematically in Figure 1.
In studies that have been detailed elsewhere (Saxena and Wetlaufer, 1970), we
(O) Interm ediates
Disordered,-s-s- reduced protein
Native, 3-dim. ordered-s-s-oxidized
prote in
Fig. 1 —S c h e m a tic re p re s e n ta tio n o f th e in v itro s y s te m in w h ic h th e k in e t ic s o f 3 —d im e n s io n a l s tr u c tu r e fo r m a tio n w ere s tu d ie d .
RANDOM
I r n r n ip/ R q . r
* «11 • 1 11
>
t
>1 « 11
3• 1 i 1 I «
e tc .
NATIVE
Fig. 2 — R a n d o m -sea rch m e c h a n is m fo r p r o te in fo ld in g s h o w s a very large n u m b e r o f para lle l, in te r s e c tin g a n d f in a lly c o n v e rg in g p a th w a y s . R o m a n n u m e ra ls in d ic a te th e average n u m b e r o f d is u l f id e c ro ss lin k s fo r m e d in th e reg en era tio n o f a 4 -d isu lf id e p r o te in . S u b s c r ip ts to th e R o m a n n u m e ra ls in d ic a te q u a li ta tiv e ly th e in crea sin g c o m p le x i ty o f th e d is u lf id e c o m b in a t io n s as th e s to ic h io m e tr ic n u m b e r o f d isu lf id e s in creases fr o m 1 to 3.
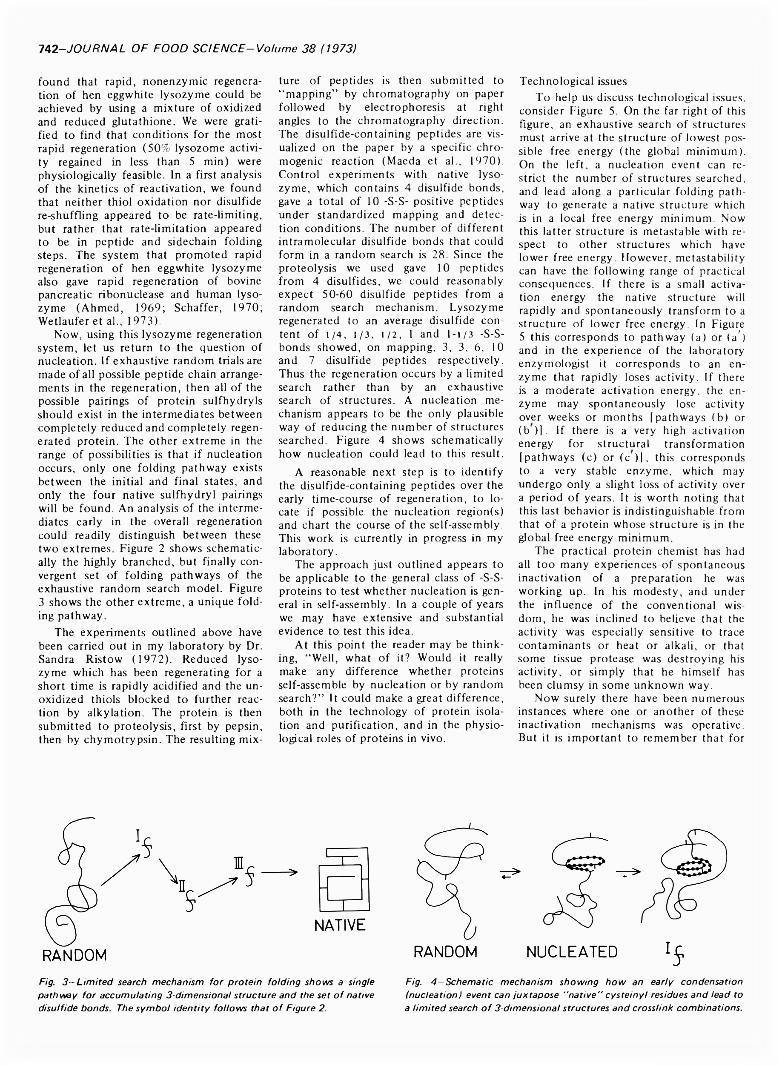
742—JOURNAL OF FOOD SCIENCE-Volume 38 (1973)
found that rapid, nonenzymic regeneration of hen eggwhite lysozyme could be achieved by using a mixture of oxidized and reduced glutathione. We were gratified to find that conditions for the most rapid regeneration (50% lysozome activity regained in less than 5 min) were physiologically feasible. In a first analysis of the kinetics of reactivation, we found that neither thiol oxidation nor disulfide re-shuffling appeared to be rate-limiting, but rather that rate-limitation appeared to be in peptide and sidechain folding steps. The system that promoted rapid regeneration of hen eggwhite lysozyme also gave rapid regeneration of bovine pancreatic ribonuclease and human lysozyme (Ahmed, 1969; Schaffer, 1970; Wetlaufer et al., 1973).
Now, using this lysozyme regeneration system, let us return to the question of nucleation. If exhaustive random trials are made of all possible peptide chain arrangements in the regeneration, then all of the possible pairings of protein sulfhydryls should exist in the intermediates between completely reduced and completely regenerated protein. The other extreme in the range of possibilities is that if nucleation occurs, only one folding pathway exists between the initial and final states, and only the four native sulfhydryl pairings will be found. An analysis of the intermediates early in the overall regeneration could readily distinguish between these two extremes. Figure 2 shows schematically the highly branched, but finally convergent set of folding pathways of the exhaustive random search model. Figure 3 shows the other extreme, a unique folding pathway.
The experiments outlined above have been carried out in my laboratory by Dr. Sandra Ristow (1972). Reduced lysozyme which has been regenerating for a short time is rapidly acidified and the unoxidized thiols blocked to further reaction by alkylation. The protein is then submitted to proteolysis, first by pepsin, then by chymotrypsin. The resulting mix
ture of peptides is then submitted to “mapping” by chromatography on paper followed by electrophoresis at right angles to the chromatography direction. The disulfide-containing peptides are visualized on the paper by a specific chro- mogenic reaction (Maeda et al., 1970). Control experiments with native lysozyme, which contains 4 disulfide bonds, gave a total of 10 -S-S- positive peptides under standardized mapping and detection conditions. The number of different intramolecular disulfide bonds that could form in a random search is 28. Since the proteolysis we used gave 10 peptides from 4 disulfides, we could reasonably expect 50-60 disulfide peptides from a random search mechanism. Lysozyme regenerated to an average disulfide content of 1/4 , 1/ 3 , 1/ 2 , 1 and 1-1/3 -S-S- bonds showed, on mapping, 3, 3, 6 , 10 and 7 disulfide peptides respectively. Thus the regeneration occurs by a limited search rather than by an exhaustive search of structures. A nucleation mechanism appears to be the only plausible way of reducing the number of structures searched. Figure 4 shows schematically how nucleation could lead to this result.
A reasonable next step is to identify the disulfide-containing peptides over the early time-course of regeneration, to locate if possible the nucleation region(s) and chart the course of the self-assembly. This work is currently in progress in my laboratory.
The approach just outlined appears to be applicable to the general class of -S-S- proteins to test whether nucleation is general in self-assembly. In a couple of years we may have extensive and substantial evidence to test this idea.
At this point the reader may be thinking, “Well, what of it? Would it really make any difference whether proteins self-assemble by nucleation or by random search?” It could make a great difference, both in the technology of protein isolation and purification, and in the physiological roles of proteins in vivo.
Technological issuesTo help us discuss technological issues,
consider Figure 5. On the far right of this figure, an exhaustive search of structures must arrive at the structure of lowest possible free energy (the global minimum). On the left, a nucleation event can restrict the number of structures searched, and lead along a particular folding pathway to generate a native structure which is in a local free energy minimum. Now this latter structure is metastable with respect to other structures which have lower free energy. However, metastability can have the following range of practical consequences. If there is a small activation energy the native structure will rapidly and spontaneously transform to a structure of lower free energy. In Figure 5 this corresponds to pathway (a) or (a') and in the experience of the laboratory enzymologist it corresponds to an enzyme that rapidly loses activity. If there is a moderate activation energy, the enzyme may spontaneously lose activity over weeks or months [pathways (b) or(b ) [ . If there is a very high activation energy for structural transformation [pathways (c) or (c ) 1, this corresponds to a very stable enzyme, which may undergo only a slight loss of activity over a period of years. It is worth noting that this last behavior is indistinguishable from that of a protein whose structure is in the global free energy minimum.
The practical protein chemist has had all too many experiences of spontaneous inactivation of a preparation he was working up. In his modesty, and under the influence of the conventional wisdom, he was inclined to believe that the activity was especially sensitive to trace contaminants or heat or alkali, or that some tissue protease was destroying his activity, or simply that he himself has been clumsy in some unknown way.
Now surely there have been numerous instances where one or another of these inactivation mechanisms was operative. But it is important to remember that for
Fig. 3 —Lim ited search mechanism for protein folding shows a single pathway for accumulating 3-dimensional structure and the set o f native disulfide bonds. The sym bol identity follows that o f Figure 2.
Fig. 4 —Schem atic mechanism showing how an early condensation (nucleation) event can juxtapose "native" cysteinyl residues and lead to a limited search o f 3-dimensional structures and crosslink combinations.
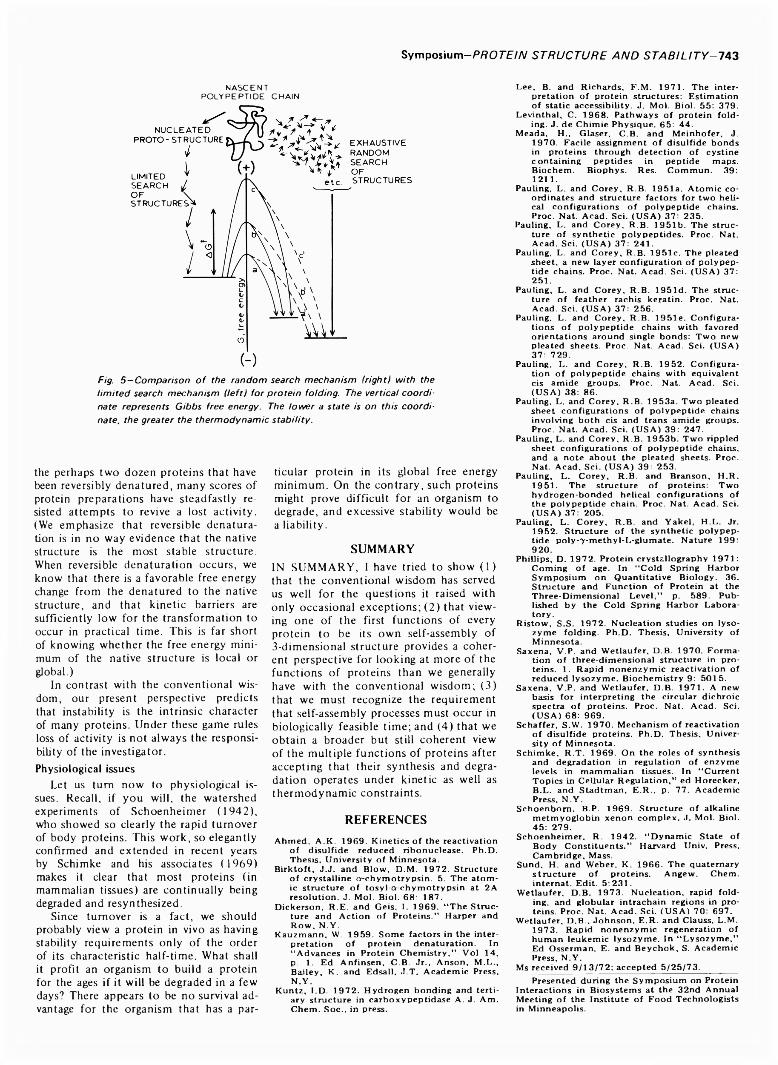
Symposium—PR OTE IN STRUCTURE AND STABILITY- 743
NASCENTPO L Y PEPTID E CHAIN
( - )Fig. 5 —Comparison o f the random search mechanism (right) with the limited search mechanism (left) for protein folding. The vertical coordinate represents Gibbs free energy. The lower a state is on this coordinate, the greater the therm odynam ic stability.
the perhaps two dozen proteins that have been reversibly denatured, many scores of protein preparations have steadfastly resisted attempts to revive a lost activity. (We emphasize that reversible dénaturation is in no way evidence that the native structure is the most stable structure. When reversible dénaturation occurs, we know that there is a favorable free energy change from the denatured to the native structure, and that kinetic barriers are sufficiently low for the transformation to occur in practical time. This is far short of knowing whether the free energy minimum of the native structure is local or global.)
In contrast with the conventional wisdom, our present perspective predicts that instability is the intrinsic character of many proteins. Under these game rules loss of activity is not always the responsibility of the investigator.Physiological issues
Let us turn now to physiological issues. Recall, if you will, the watershed experiments of Schoenheimer (1942), who showed so clearly the rapid turnover of body proteins. This work, so elegantly confirmed and extended in recent years by Schimke and his associates ( 1969) makes it clear that most proteins (in mammalian tissues) are continually being degraded and resynthesized.
Since turnover is a fact, we should probably view a protein in vivo as having stability requirements only of the order of its characteristic half-time. What shall it profit an organism to build a protein for the ages if it will be degraded in a few days? There appears to be no survival advantage for the organism that has a par
ticular protein in its global free energy minimum. On the contrary, such proteins might prove difficult for an organism to degrade, and excessive stability would be a liability.
SUMMARYIN SUMMARY, 1 have tried to show (1) that the conventional wisdom has served us well for the questions it raised with only occasional exceptions; (2 ) that viewing one of the first functions of every protein to be its own self-assembly of3-dimensional structure provides a coherent perspective for looking at more of the functions of proteins than we generally have with the conventional wisdom; (3) that we must recognize the requirement that self-assembly processes must occur in biologically feasible time; and (4) that we obtain a broader but still coherent view of the multiple functions of proteins after accepting that their synthesis and degradation operates under kinetic as well as thermodynamic constraints.
REFERENCESAhmed, A.K. 1969. K inetics o f the reactivation
o f disulfide reduced ribonuclease. Ph.D. Thesis, University of Minnesota.
Birktoft, J.J. and Blow, D.M. 1972. Structure of crystalline o-chym otrypsin. 5. The atom ic structure o f tosyl-a-chym otrypsin at 2A resolution. J. Mol. Biol. 6 8 : 187.
Dickerson, R.E. and Geis, I. 1969. “ The Structure and Action of Proteins.” Harper and R ow, N.Y.
Kauzmann, W. 1959 . Som e factors in the interpretation of protein denaturation. In “ Advances in Protein Chem istry,” V ol 14, p. 1. Ed Anfinsen, C.B. Jr., Anson, M.L., Bailey, K. and Edsall, J.T. Academic Press,N.Y.
Kuntz, I.D. 1972. Hydrogen bonding and tertiary structure in carboxypeptidase A. J. Am. Chem. Soc., in press.
Lee, B. and Richards, F.M. 1971. The interpretation o f protein structures: Estimation of static accessibility. J. Mol. Biol. 55: 379.
Levinthal, C. 1968. Pathways o f protein folding. J. de Chimie Physique. 65: 44.
Meada, H., Glaser, C.B. and M einhofer, J.1970. Facile assignment o f disulfide bonds in proteins through detection of cystine containing peptides in peptide maps. Biochem . Biophys. Res. Commun. 39: 1211.
Pauling, L. and Corey, R.B. 1951a. Atom ic coordinates and structure factors for two helical configurations o f polypeptide chains. Proc. Nat. Acad. Sci. (USA) 37: 235.
Pauling, L. and Corey, R.B. 1951b. The structure o f synthetic polypeptides. Proc. Nat. Acad. Sci. (USA) 37: 241.
Pauling, L. and Corey, R.B. 1951c. The pleated sheet, a new layer configuration of polypeptide chains. Proc. Nat. Acad. Sci. (USA) 37: 251.
Pauling, L. and Corey, R.B. 1951d. The structure o f feather rachis keratin. Proc. Nat. Acad. Sci. (USA) 37: 256.
Pauling, L. and Corey, R.B. 1951e. Configurations o f polypeptide chains with favored orientations around single bonds: Two new pleated sheets. Proc. Nat. Acad. Sci. (USA) 37: 729.
Pauling, L. and Corey, R.B. 1952. Configuration of polypeptide chains with equivalent cis amide groups. Proc. Nat. Acad. Sci. (USA) 38: 8 6 .
Pauling, L. and Corey, R.B. 1953a. Two pleated sheet configurations of polypeptide chains involving both cis and trans amide groups. Proc. Nat. Acad. Sci. (USA) 39: 247.
Pauling, L. and Corey, R.B. 1953b. Two rippled sheet configurations o f polypeptide chains, and a note about the pleated sheets. Proc. Nat. Acad, Sci. (USA) 39: 253.
Pauling, L. Corey, R.B. and Branson, H.R.1951. The structure o f proteins: Twohydrogen-bonded helical configurations of the polypeptide chain. Proc. Nat. Acad. Sci. (USA) 37: 205.
Pauling, L. Corey, R.B. and Yakel, H.L. Jr.1952. Structure o f the synthetic polypeptide poly-7 -methyl-L-glumate. Nature 199: 920.
Phillips, D. 1972. Protein crystallography 1971: Coming of age. In “Cold Spring Harbor Sym posium on Quantitative Biology. 36. Structure and Function of Protein at the Three-Dimensional Level,” p. 589. Published by the Cold Spring Harbor Laboratory.
R istow , S.S. 1972. Nucléation studies on lysozym e folding. Ph.D. Thesis, University of Minnesota.
Saxena, V.P. and Wetlaufer, D.B. 1970. Formation of three-dimensional structure in proteins. 1. Rapid nonenzym ic reactivation of reduced lysozym e. Biochem istry 9: 5015.
Saxena, V.P. and Wetlaufer, D.B. 1971. A new basis for interpreting the circular dichroic spectra of proteins. Proc. Nat. Acad. Sci. (USA) 6 8 : 969.
Schaffer, S.W. 1970. Mechanism of reactivation of disulfide proteins. Ph.D. Thesis, University o f Minnesota.
Schim ke, R.T. 1969. On the roles of synthesis and degradation in regulation of enzym e levels in mammalian tissues. In “Current Topics in Cellular Regulation,” ed Horecker, B.L. and Stadtman, E.R., p. 77. Academic Press, N.Y.
Schoenbom , B.P. 1969. Structure o f alkaline m etm yoglobin xenon com plex. J. Mol. Biol. 45: 279.
Schoenheim er, R. 1942. “ Dynamic State of Body C onstituents.” Harvard Univ. Press, Cambridge, Mass.
Sund, H. and Weber, K. 1966. The quaternary structure o f proteins. Angew. Chem. internat. Edit. 5 :231.
Wetlaufer, D.B. 1973 . Nucléation, rapid folding, and globular intrachain regions in proteins. Proc. Nat. Acad. Sci. (USA) 70: 697.
Wetlaufer, D.B., Johnson, E.R. and Clauss, L.M.1973. Rapid nonenzym ic regeneration of human leukem ic lysozym e. In “ Lysozym e,” Ed Osserman, E. and B eychok, S. Academic Press, N.Y.
Ms received 9 /1 3 /7 2 ; accepted 5 /2 5 /7 3 .Presented during the Symposium on Protein
Interactions in Biosystem s at the 32nd AnnualMeeting of the Institute o f Food Technologistsin Minneapolis.
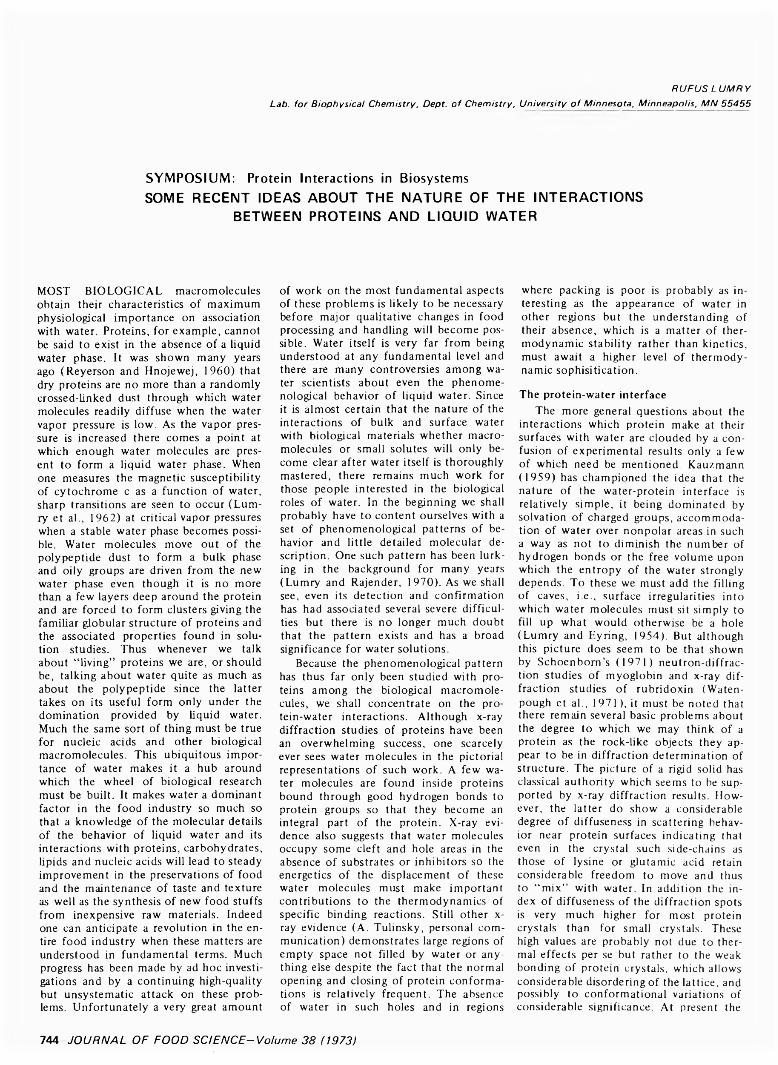
R U F U S L U M R Y
Lab. for Biophysical Chemistry, Dept, o f Chemistry, University o f Minnesota, Minneapolis, M N 55455
SYMPOSIUM: Protein Interactions in BiosystemsSOME RECENT IDEAS ABOUT THE NATURE OF THE INTERACTIONS
BETWEEN PROTEINS AND LIQ UID WATER
MOST BIOLOGICAL macromolecules obtain their characteristics of maximum physiological importance on association with water. Proteins, for example, cannot be said to exist in the absence of a liquid water phase. It was shown many years ago (Reyerson and Hnojewej, 1960) that dry proteins are no more than a randomly crossed-linked dust through which water molecules readily diffuse when the water vapor pressure is low. As the vapor pressure is increased there comes a point at which enough water molecules are present to form a liquid water phase. When one measures the magnetic susceptibility of cytochrome c as a function of water, sharp transitions are seen to occur (Lum- ry et al., 1962) at critical vapor pressures when a stable water phase becomes possible. Water molecules move out of the polypeptide dust to form a bulk phase and oily groups are driven from the new water phase even though it is no more than a few layers deep around the protein and are forced to form clusters giving the familiar globular structure of proteins and the associated properties found in solution studies. Thus whenever we talk about “living” proteins we are, or should be, talking about water quite as much as about the polypeptide since the latter takes on its useful form only under the domination provided by liquid water. Much the same sort of thing must be true for nucleic acids and other biological macromolecules. This ubiquitous importance of water makes it a hub around which the wheel of biological research must be built. It makes water a dominant factor in the food industry so much so that a knowledge of the molecular details of the behavior of liquid water and its interactions with proteins, carbohydrates, lipids and nucleic acids will lead to steady improvement in the preservations of food and the maintenance of taste and texture as well as the synthesis of new food stuffs from inexpensive raw materials. Indeed one can anticipate a revolution in the entire food industry when these matters are understood in fundamental terms. Much progress has been made by ad hoc investigations and by a continuing high-quality but unsystematic attack on these problems. Unfortunately a very great amount
of work on the most fundamental aspects of these problems is likely to be necessary before major qualitative changes in food processing and handling will become possible. Water itself is very far from being understood at any fundamental level and there are many controversies among water scientists about even the phenomenological behavior of liquid water. Since it is almost certain that the nature of the interactions of bulk and surface water with biological materials whether macromolecules or small solutes will only become clear after water itself is thoroughly mastered, there remains much work for those people interested in the biological roles of water. In the beginning we shall probably have to content ourselves with a set of phenomenological patterns of behavior and little detailed molecular description. One such pattern has been lurking in the background for many years (Lumry and Rajender, 1970). As we shall see, even its detection and confirmation has had associated several severe difficulties but there is no longer much doubt that the pattern exists and has a broad significance for water solutions.
Because the phenomenological pattern has thus far only been studied with proteins among the biological macromolecules, we shall concentrate on the protein-water interactions. Although x-ray diffraction studies of proteins have been an overwhelming success, one scarcely ever sees water molecules in the pictorial representations of such work. A few water molecules are found inside proteins bound through good hydrogen bonds to protein groups so that they become an integral part of the protein. X-ray evidence also suggests that water molecules occupy some cleft and hole areas in the absence of substrates or inhibitors so the energetics of the displacement of these water molecules must make important contributions to the thermodynamics of specific binding reactions. Still other x- ray evidence (A. Tulinsky, personal communication) demonstrates large regions of empty space not filled by water or anything else despite the fact that the normal opening and closing of protein conformations is relatively frequent. The absence of water in such holes and in regions
where packing is poor is probably as interesting as the appearance of water in other regions but the understanding of their absence, which is a matter of thermodynamic stability rather than kinetics, must await a higher level of thermodynamic sophisitication.
The protein -w ater in terfaceThe more general questions about the
interactions which protein make at their surfaces with water are clouded by a confusion of experimental results only a few of which need be mentioned. Kauzmann(1959) has championed the idea that the nature of the water-protein interface is relatively simple, it being dominated by solvation of charged groups, accommodation of water over nonpolar areas in such a way as not to diminish the number of hydrogen bonds or the free volume upon which the entropy of the water strongly depends. To these we must add the filling of caves, i.e., surface irregularities into which water molecules must sit simply to fill up what would otherwise be a hole (Lumry and Eyring, 1954). But although this picture does seem to be that shown by Schoenbom’s (1971) neutron-diffraction studies of myoglobin and x-ray diffraction studies of rubridoxin (Waten- pough et al., 1971), it must be noted that there remain several basic problems about the degree to which we may think of a protein as the rock-like objects they appear to be in diffraction determination of structure. The picture of a rigid solid has classical authority which seems to be supported by x-ray diffraction results. However, the latter do show a considerable degree of diffuseness in scattering behavior near protein surfaces indicating that even in the crystal such side-chains as those of lysine or glutamic acid retain considerable freedom to move and thus to “mix” with water. In addition the index of diffuseness of the diffraction spots is very much higher for most protein crystals than for small crystals. These high values are probably not due to thermal effects per se but rather to the weak bonding of protein crystals, which allows considerable disordering of the lattice, and possibly to conformational variations of considerable significance. At present the
744—70 URN A L OF FOOD SCIENCE- Volume 38 (1973)
Symposium-PROTEIN/LIQUID WATER INTERACTIONS- 745
large values of the index can be attributed primarily to the disordering in the crystal since such few studies of the interiors of globular proteins as are available from nmr work, fluorescence and light absorption by buried protein groups or inhibitors bound to proteins indicate that indeed proteins in folded parts are rocklike or at least they have the mechanical consistency and rigidity of a hard wax or even stronger solids ( vide in fra ). However, the possibility of considerable conformational variation from one molecule in the lattice to another cannot be eliminated.
Some protein structures like collagen fibers and muscle fibers may have a good bit of water actually built into the structure and as tightly packed as the polypeptide itself. The large interstitial hole in hemoglobin is too small to accommodate water in its normal liquid state. Water positions within this cavity must have been evolved in the same way that the remainder of the structure of hemoglobin was evolved. The rearrangements of this water accompanying function are thus likely to prove to be as important thermodynamically as the changes in the polypeptide so that the x-ray diffraction job will not be finished until this sequestered water and its changes during function have been described. Even then it is unlikely to be possible to attach numbers indicating the energetic importance of the changes for function any more than it is possible at current x-ray resolution to attach numbers for any type to change in the polypeptide.
Whether or not the conformational description of proteins provided by diffraction studies are adequate to the freely dissolved globular protein remains to be seen. Current opinion supported by some evidence suggests that the differences are slight. NMR relaxation studies, for example, show that most protein hydrogens and carbons are so firmly associated with neighboring groups that the rocklike character is retained as demonstrated by the existence of a slow tumbling time characteristic of a large firmly built molecule (Jardetzky and Wade-Jardetzky, 1971). Such studies on the other hand have yet to establish that there are no other folded conformations of about equal free energy. Proton-exchange studies not only provide some support for the latter, more complicated picture, but also show that unfolding and refolding are relatively frequent. Hence kinetic barriers to the interconversions among conformers are not usually restrictive (Woodward and Rosenberg, 1971a, b). Arguments based on similar reasoning were used long ago (Lumry and Eyring, 1954) to show that the folded conformations of proteins are the states of lowest free energy. Recent discussions of the need for nucléation and an ordered sequence of steps in folding do not seem to be required by the magni
tudes of the negative entropy changes observed in polypeptide folding processes (Lumry, 1971). We can admit that the inside of the protein probably folds before the outside which is quite reasonable considering that the protein is rough lattice of polar and nonpolar regions and that the internal nonpolar regions are likely to form rather stable but distorta- ble clusters which can undergo subsequent reorganization to satisfy hydrogenbonding and other details of folding.Water must be intimately involved in the folding process too. In fact, the major feature of the application of thermodynamic methods to proteins has been the revelation of a large heat capacity effect due to the interaction of oily side-chains and peptide groups with liquid water when the protein is unfolded (Brandts,1969). About the only classification we now have for conformation changes is based on the amount of heat capacity change in the process (Lumry and Bil- tonen, 1969). A large positive heat capacity change is a clear indication of an increase in unfolding. A small overall heat capacity change but a slow reaction usually indicates a refolding process with little net change in exposure of oily groups and peptide groups to bulk water; a fast reaction without heat capacity change indicates a rearrangement of atoms without unfolding-the so-called “subtle change” which is probably of the type associated with specific function. The large heat- capacity effect in unfolding has several consequences of which the most interesting from the point of view of the food industry is that cooling is quite as effective in unfolding proteins as heating and produces the same unfolded state (Brandts, 1969). Thus those people interested in the preservation of food by low- temperature storage must bear in mind that unfolding and aggregation, which is essentially irreversible, can occur in low- temperature solutions and may even occur in ice as shown by studies of Brandts et al. (1970a) and Massey (1966) and their coworkers.
Returning to the protein-water interface and taking into account the possibility that the unfolded regions of proteins near the surface may be greater in solution than x-ray pictures of crystals indicate, we can examine the alternative to the relatively simple picture proposed by Kauzmann. This is the picture which surrounds the protein with a layer of icelike water. This view is an old one but is still accepted by some workers (e.g., Likhten- shtein, 1969; Likhtenshtein & Sukhoru- kov, 1965). Klotz (1958) has been the major spokesman for a more moderate view in which it is proposed that the protein induces a general ordering effect on some shells of water molecules around proteins. The x-ray diffraction data give no evidence for any extended icelike
structures having any permanency but they do show in at least the case of car- boxypeptidase A that there are slightly preferred positions for water oxygen atoms throughout the crystal lattice of this protein (Lipscomb et al., 1968). Thus even in the largest interstitial regions of the crystal the influence of the protein on water is felt. Similar influences appear to be exerted by the surfaces of clays and zeolites out to distances as large as 30A (Berendsen, 1967) but in protein cases the thermodynamic consequences are probably minor since studies of the diffusion of small molecules and even polymers through the crystal (Low et al.,1956) demonstrate that diffusion is rapid. Such studies do not, however, exclude a few rigid layers of water next to the protein surface. The most interesting recent observations on the protein-water interaction due to Kuntz and coworkers (1969; 1970a, b) probably do provide information about these layers. Using nmr these investigators find that there is a considerable fraction of water about proteins and polypeptides which does not freeze at temperatures even below —50°C in the sense that the nmr band widths are very much smaller than those expected for water protons held in a rigid lattice. The amount of water thus influenced by the protein is roughly 30% of the dry weight of the protein but it decreases with temperature as more water molecules are trapped in the true ice phase about the protein. Thus the protein or polypeptide prevents normal freezing rather than favors the formation of an icelike shell at least at temperatures below 0 C. As indicated by band widths the amount of motion which remains at the low temperatures varies considerably with the hydrated solute but is always considerable relative to the motion in ice. Recently also Schachman and Edelstein (1967) studying the sedimentation behavior of hemoglobin as a function of salt produced data most easily interpreted to indicate a shell of water into which ions cannot penetrate so that the buoyant density of hemoglobin is less than would be predicted if the solvent composition in this shell were that of the true salt-containing solvent. However, such measurements like most indirect measurements of protein density and volume are complicated by the fact that changes in the density may be a result of changes in the populations of the two phenomenological species of water in the neighborhood of the protein. Most students of the behavior of water agree that for some strange reason water acts as though it exists in only two states, one of higher density than the other. This two-state picture of water (Davis and Jarzynski, 1972) is not quite thermodynamically sound but has nevertheless been verified repeatedly although each investigator appears to have
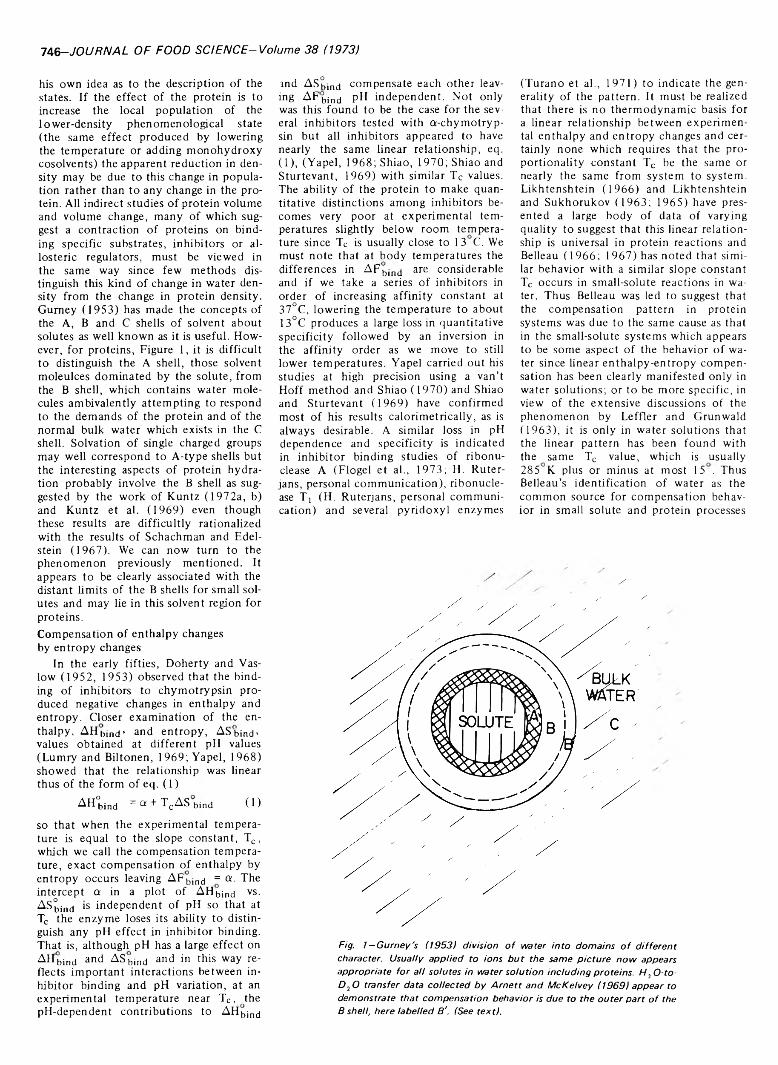
746-JOURNAL OF FOOD SCIENCE-Volume 38 (1973)
his own idea as to the description of the states. If the effect of the protein is to increase the local population of the lower-density phenomenological state (the same effect produced by lowering the temperature or adding monohydroxy cosolvents) the apparent reduction in density may be due to this change in population rather than to any change in the protein. All indirect studies of protein volume and volume change, many of which suggest a contraction of proteins on binding specific substrates, inhibitors or allosteric regulators, must be viewed in the same way since few methods distinguish this kind of change in water density from the change in protein density. Gurney (1953) has made the concepts of the A, B and C shells of solvent about solutes as well known as it is useful. However, for proteins, Figure 1, it is difficult to distinguish the A shell, those solvent moleulces dominated by the solute, from the B shell, which contains water molecules ambivalently attempting to respond to the demands of the protein and of the normal bulk water which exists in the C shell. Solvation of single charged groups may well correspond to A-type shells but the interesting aspects of protein hydration probably involve the B shell as suggested by the work of Kuntz (1972a, b) and Kuntz et al. (1969) even though these results are difficultly rationalized with the results of Schachman and Edel- stein (1967). We can now turn to the phenomenon previously mentioned. It appears to be clearly associated with the distant limits of the B shells for small solutes and may lie in this solvent region for proteins.Compensation of enthalpy changes by entropy changes
In the early fifties, Doherty and Vas- low (1952, 1953) observed that the binding of inhibitors to chymotrypsin produced negative changes in enthalpy and entropy. Closer examination of the enthalpy, AHbind> and entropy, ASbind’ values obtained at different pH values (Lumry and Biltonen, 1969; Yapel, 1968) showed that the relationship was linear thus of the form of eq. ( 1)
AH°bind = a + Tc ASwnd (Dso that when the experimental temperature is equal to the slope constant, Tc , which we call the compensation temperature, exact compensation of enthalpy by entropy occurs leaving AFbind = a. The intercept a in a plot of AHbind vs. ASbind *s independent of pH so that at Tc the enzyme loses its ability to distinguish any pH effect in inhibitor binding. That is, although pH has a large effect on AHbind and ASbind and in this way re- fleets important interactions between inhibitor binding and pH variation, at an experimental temperature near Tc , the pH-dependent contributions to AHbind
md ASbind compensate each other leaving AFbind pH independent. Not only was this found to be the case for the several inhibitors tested with a-chymotryp- sin but all inhibitors appeared to have nearly the same linear relationship, eq.(1), (Yapel, 1968; Shiao, 1970; Shiao and Sturtevant, 1969) with similar Tc values. The ability of the protein to make quantitative distinctions among inhibitors becomes very poor at experimental temperatures slightly below room temperature since Tc is usually close to 13 C. We must note that at body temperatures the differences in AFbjnd are considerable and if we take a series of inhibitors in order of increasing affinity constant at 37°C, lowering the temperature to about 13°C produces a large loss in quantitative specificity followed by an inversion in the affinity order as we move to still lower temperatures. Yapel carried out his studies at high precision using a van’t Hoff method and Shiao (1970) and Shiao and Sturtevant (1969) have confirmed most of his results calorimetrically, as is always desirable. A similar loss in pH dependence and specificity is indicated in inhibitor binding studies of ribonucléase A (Flogel et al., 1973; H. Ruter- jans, personal communication), ribonucléase T! (H. Ruterjans, personal communication) and several pyridoxyl enzymes
(Turano et al., 1971) to indicate the generality of the pattern. It must be realized that there is no thermodynamic basis for a linear relationship between experimental enthalpy and entropy changes and certainly none which requires that the proportionality constant Tc be the same or nearly the same from system to system. Likhtenshtein (1966) and Likhtenshtein and Sukhorukov (1963; 1965) have presented a large body of data of varying quality to suggest that this linear relationship is universal in protein reactions and Belleau (1966; 1967) has noted that similar behavior with a similar slope constant Tc occurs in small-solute reactions in water. Thus Belleau was led to suggest that the compensation pattern in protein systems was due to the same cause as that in the small-solute systems which appears to be some aspect of the behavior of water since linear enthalpy-entropy compensation has been clearly manifested only in water solutions; or to be more specific, in view of the extensive discussions of the phenomenon by Leffler and Grunwald(1963), it is only in water solutions that the linear pattern has been found with the same Tc value, which is usually 285 K plus or minus at most 15 . Thus Belleau’s identification of water as the common source for compensation behavior in small solute and protein processes
/
Fig. /—Gurney's (1953) division o f water into domains o f different character. Usually applied to ions b u t the same picture now appears appropriate for all solutes in water solution including proteins. H 2 O-to- D 20 transfer data collected b y A rn ett and M cK elvey (1969) appear to demonstrate that compensation behavior is due to the outer part o f the B shell, here labelled B \ (See text).
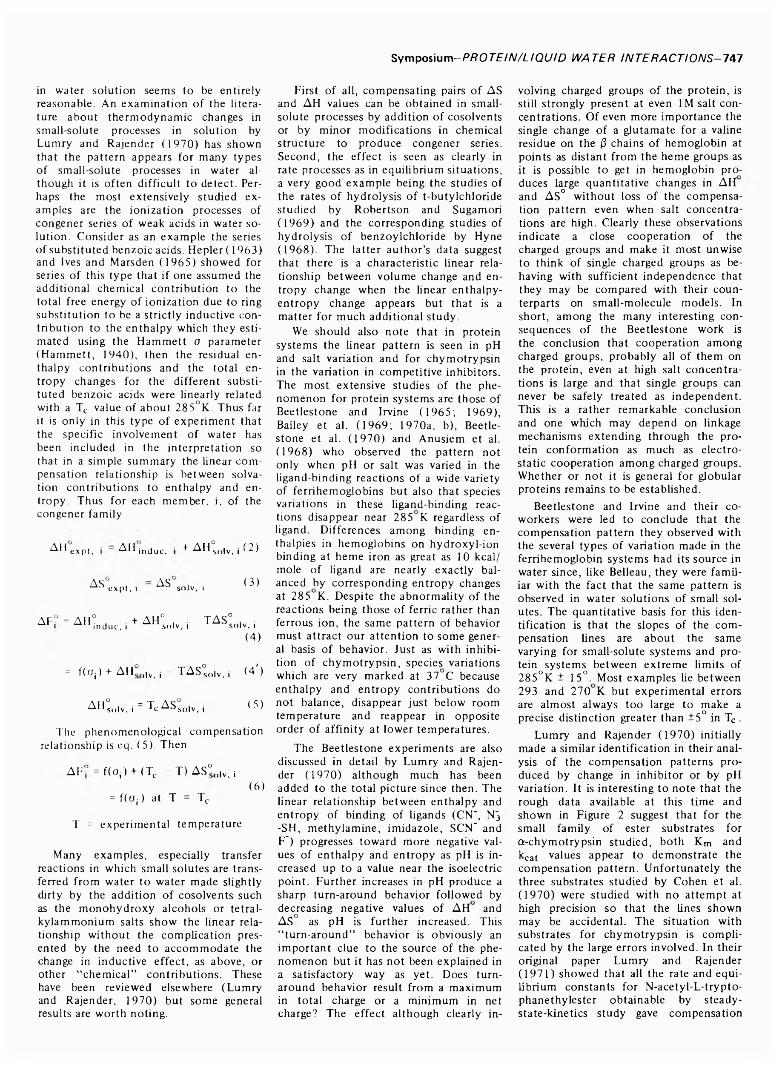
Symposium-PROTEIN/LIQUID WATER INTERACTIONS-7 4 7
in water solution seems to be entirely reasonable. An examination of the literature about thermodynamic changes in small-solute processes in solution by Lumry and Rajender (1970) has shown that the pattern appears for many types of small-solute processes in water although it is often difficult to detect. Perhaps the most extensively studied examples are the ionization processes of congener series of weak acids in water solution. Consider as an example the series of substituted benzoic acids. Hepler ( 1963) and Ives and Marsden (1965) showed for series of this type that if one assumed the additional chemical contribution to the total free energy of ionization due to ring substitution to be a strictly inductive contribution to the enthalpy which they estimated using the Hammett a parameter (Hammett, 1940), then the residual enthalpy contributions and the total entropy changes for the different substituted benzoic acids were linearly related with a Tt value of about 285°K. Thus far it is only in this type of experiment that the specific involvement of water has been included in the interpretation so that in a simple summary the linear compensation relationship is between solvation contributions to enthalpy and entropy. Thus for each member, i, of the congener family
AH expt. AH indue. + AH°solVil(2)
AS uxpt, i AS solV, i (3)
AF° = AHOindue, i + AHO
solv, i TASosolv, i
(4)
= f(a j) + AH°olv j TAS°so|v, i (4 ')
AH0s()1v,i = TcAS0solv,, (5)
The phenomenological compensation relationship is eq. (5). Then
AF° = f(Oj) + (Tc T) AS°()iv> j(6)
= f(fJj) at T = Tc
T = experimental temperature
Many examples, especially transfer reactions in which small solutes are transferred from water to water made slightly dirty by the addition of cosolvents such as the monohydroxy alcohols or tetral- kylammonium salts show the linear relationship without the complication presented by the need to accommodate the change in inductive effect, as above, or other “chemical” contributions. These have been reviewed elsewhere (Lumry and Rajender, 1970) but some general results are worth noting.
First of all, compensating pairs of AS and AH values can be obtained in small- solute processes by addition of cosolvents or by minor modifications in chemical structure to produce congener series. Second, the effect is seen as clearly in rate processes as in equilibrium situations, a very good example being the studies of the rates of hydrolysis of t-butylchloride studied by Robertson and Sugamori (1969) and the corresponding studies of hydrolysis of benzoylchloride by Hyne (1968). The latter author’s data suggest that there is a characteristic linear relationship between volume change and entropy change when the linear enthalpy- entropy change appears but that is a matter for much additional study.
We should also note that in protein systems the linear pattern is seen in pH and salt variation and for chymotrypsin in the variation in competitive inhibitors. The most extensive studies of the phenomenon for protein systems are those of Beetlestone and Irvine (1965; 1969), Bailey et al. (1969; 1970a, b), Beetle- stone et al. (1970) and Anusiem et al. (1968) who observed the pattern not only when pH or salt was varied in the ligand-binding reactions of a wide variety of ferrihemoglobins but also that species variations in these ligand-binding reactions disappear near 285 K regardless of ligand. Differences among binding enthalpies in hemoglobins on hydroxyl-ion binding at heme iron as great as 10 kcal/ mole of ligand are nearly exactly balanced by corresponding entropy changes at 285 K. Despite the abnormality of the reactions being those of ferric rather than ferrous ion, the same pattern of behavior must attract our attention to some general basis of behavior. Just as with inhibition of chymotrypsin, species variations which are very marked at 37 C because enthalpy and entropy contributions do not balance, disappear just below room temperature and reappear in opposite order of affinity at lower temperatures.
The Beetlestone experiments are also discussed in detail by Lumry and Rajender (1970) although much has been added to the total picture since then. The linear relationship between enthalpy and entropy of binding of ligands (CN~, N3 -SH, methylamine, imidazole, SCN~ and F") progresses toward more negative values of enthalpy and entropy as pH is increased up to a value near the isoelectric point. Further increases in pH produce a sharp turn-around behavior followed by decreasing negative values of AH and AS as pH is further increased. This “turn-around” behavior is obviously an important clue to the source of the phenomenon but it has not been explained in a satisfactory way as yet. Does turnaround behavior result from a maximum in total charge or a minimum in net charge? The effect although clearly in-
volving charged groups of the protein, is still strongly present at even 1M salt concentrations. Of even more importance the single change of a glutamate for a valine residue on the 0 chains of hemoglobin at points as distant from the heme groups as it is possible to get in hemoglobin produces large quantitative changes in AH and AS° without loss of the compensation pattern even when salt concentrations are high. Clearly these observations indicate a close cooperation of the charged groups and make it most unwise to think of single charged groups as behaving with sufficient independence that they may be compared with their counterparts on small-molecule models. In short, among the many interesting consequences of the Beetlestone work is the conclusion that cooperation among charged groups, probably all of them on the protein, even at high salt concentrations is large and that single groups can never be safely treated as independent. This is a rather remarkable conclusion and one which may depend on linkage mechanisms extending through the protein conformation as much as electrostatic cooperation among charged groups. Whether or not it is general for globular proteins remains to be established.
Beetlestone and Irvine and their coworkers were led to conclude that the compensation pattern they observed with the several types of variation made in the ferrihemoglobin systems had its source in water since, like Belleau, they were familiar with the fact that the same pattern is observed in water solutions of small solutes. The quantitative basis for this identification is that the slopes of the compensation lines are about the same varying for small-solute systems and protein systems between extreme limits of 285°K ± 15°. Most examples lie between 293 and 270 K but experimental errors are almost always too large to make a precise distinction greater than ±5° in Tc .
Lumry and Rajender (1970) initially made a similar identification in their analysis of the compensation patterns produced by change in inhibitor or by pH variation. It is interesting to note that the rough data available at this time and shown in Figure 2 suggest that for the small family of ester substrates for a-chymotrypsin studied, both Km and kcat values appear to demonstrate the compensation pattern. Unfortunately the three substrates studied by Cohen et al.(1970) were studied with no attempt at high precision so that the lines shown may be accidental. The situation with substrates for chymotrypsin is complicated by the large errors involved. In their original paper Lumry and Rajender(1971) showed that all the rate and equilibrium constants for N-acetyl-L-trypto- phanethylester obtainable by steady- state-kinetics study gave compensation
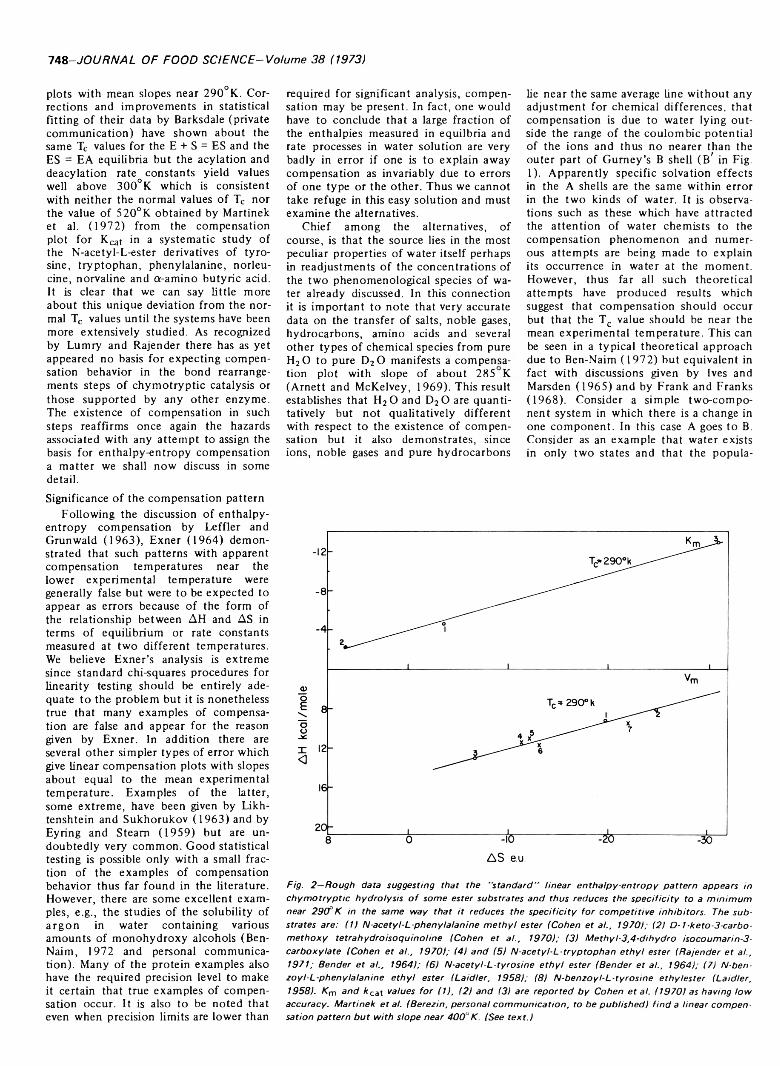
748-JOURNAL OF FOOD SCIENCE-Volume 38 (1973)
plots with mean slopes near 290°K. Corrections and improvements in statistical fitting of their data by Barksdale (private communication) have shown about the same Tc values for the E + S = ES and the ES = EA equilibria but the acylation and deacylation rate constants yield values well above 300°K which is consistent with neither the normal values of Tc nor the value of S20°K obtained by Martinek et al. (1972) from the compensation plot for Kcat in a systematic study of the N-acetyl-L-ester derivatives of tyrosine, tryptophan, phenylalanine, norleu- cine, norvaline and a-amino butyric acid. It is clear that we can say little more about this unique deviation from the normal Tc values until the systems have been more extensively studied. As recognized by Lumry and Rajender there has as yet appeared no basis for expecting compensation behavior in the bond rearrangements steps of chymotryptic catalysis or those supported by any other enzyme. The existence of compensation in such steps reaffirms once again the hazards associated with any attempt to assign the basis for enthalpy-entropy compensation a matter we shall now discuss in some detail.Significance of the compensation pattern
Following the discussion of enthalpy- entropy compensation by Leffler and Grunwald (1963), Exner (1964) demonstrated that such patterns with apparent compensation temperatures near the lower experimental temperature were generally false but were to be expected to appear as errors because of the form of the relationship between AH and AS in terms of equilibrium or rate constants measured at two different temperatures. We believe Exner’s analysis is extreme since standard chi-squares procedures for linearity testing should be entirely adequate to the problem but it is nonetheless true that many examples of compensation are false and appear for the reason given by Exner. In addition there are several other simpler types of error which give linear compensation plots with slopes about equal to the mean experimental temperature. Examples of the latter, some extreme, have been given by Likh- tenshtein and Sukhorukov (1963) and by Eyring and Steam (1959) but are undoubtedly very common. Good statistical testing is possible only with a small fraction of the examples of compensation behavior thus far found in the literature. However, there are some excellent examples, e.g., the studies of the solubility of argon in water containing various amounts of monohydroxy alcohols (Ben- Naim, 1972 and personal communication). Many of the protein examples also have the required precision level to make it certain that true examples of compensation occur. It is also to be noted that even when precision limits are lower than
required for significant analysis, compensation may be present. In fact, one would have to conclude that a large fraction of the enthalpies measured in equilbria and rate processes in water solution are very badly in error if one is to explain away compensation as invariably due to errors of one type or the other. Thus we cannot take refuge in this easy solution and must examine the alternatives.
Chief among the alternatives, of course, is that the source lies in the most peculiar properties of water itself perhaps in readjustments of the concentrations of the two phenomenological species of water already discussed. In this connection it is important to note that very accurate data on the transfer of salts, noble gases, hydrocarbons, amino acids and several other types of chemical species from pure H20 to pure D20 manifests a compensation plot with slope of about 285 K (Arnett and McKelvey, 1969). This result establishes that H20 and D20 are quantitatively but not qualitatively different with respect to the existence of compensation but it also demonstrates, since ions, noble gases and pure hydrocarbons
lie near the same average line without any adjustment for chemical differences, that compensation is due to water lying outside the range of the coulombic potential of the ions and thus no nearer than the outer part of Gurney’s B shell (B* in Fig.1). Apparently specific solvation effects in the A shells are the same within error in the two kinds of water. It is observations such as these which have attracted the attention of water chemists to the compensation phenomenon and numerous attempts are being made to explain its occurrence in water at the moment. However, thus far all such theoretical attempts have produced results which suggest that compensation should occur but that the Tc value should be near the mean experimental temperature. This can be seen in a typical theoretical approach due to Ben-Naim (1972) but equivalent in fact with discussions given by Ives and Marsden (1965) and by Frank and Franks(1968). Consider a simple two-component system in which there is a change in one component. In this case A goes to B. Consider as an example that water exists in only two states and that the popula-
Fig. 2 —Rough data suggesting that the "standard" linear enthalpy-entropy pattern appears in chym otryptic hydrolysis o f some ester substrates and thus reduces the specificity to a minimum near 2 9 (f K in the same way that it reduces the specificity for com petitive inhibitors. The substrates are: (1) N-acetyl-L-phenylalanine m ethyl ester (Cohen et al., 19701; (21 D-1-keto-3-carbo- m ethoxy tetrahydroisoquinoline (Cohen et a i , 1970); (3) M ethy 1-3,4-dihydro isocoumarin-3- carboxylate (Cohen et al., 1970); (4) and (5) N-acetyl-L-tryptophan ethyl ester (Rajender et a!., 1971 ; Bender et al., 1964); (6) N-acetyl-L-tyrosine ethyl ester (Bender et a!., 1964); (7) N-ben- zoyl-L-phenylalanine ethyl ester (Laidler, 1958); (8) N-benzoyl-L-tyrosine ethylester (Laidler, 1958). K m and ACat values for (1), (2) and (3) are reported by Cohen et al. (1970) as having low accuracy. Martinek et al. (Berezin, personal com m unication, to be published) find a linear com pensation pattern bu t with slope near 4 0 0 °K. (See text.)
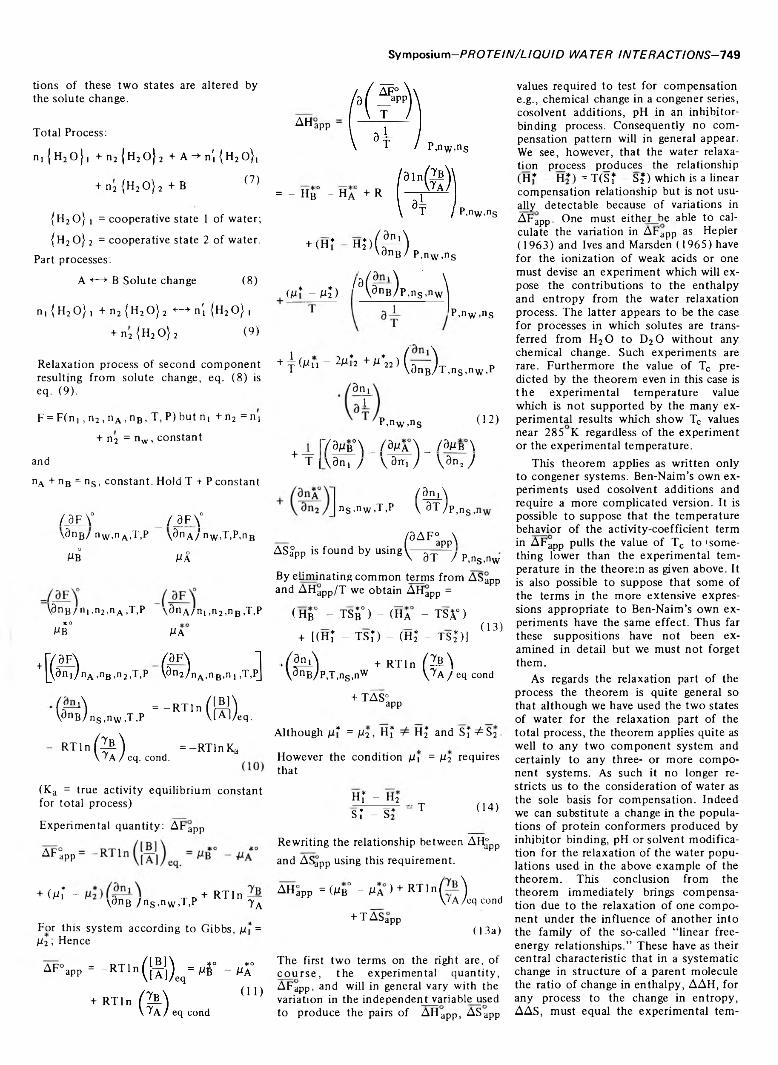
Symposium—PROTEIN/LIQUID WATER INTERACTIONS-7 4 9
tions of these two states are altered by the solute change.
Total Process:
n ,{H 20 } , + n 2 {H20 }2 + A -> n', {H2 o},
+ n2 {H20 } 2 + B (7)
{H20 } ] = cooperative state 1 of water;
{H20 } 2 = cooperative state 2 of water. Part processes:
A <—> B Solute change (8)
ni {H20} ! + n2 {H20 }2 +-+ n [ {H20} t
+ n2 {H2 O} 2 (9)
Relaxation process of second component resulting from solute change, eq. (8) is eq. (9).
F = F(n, ,n 2 ,n A,n B, T,P)but n! + n2 =ni + n2 = nw, constant
and
nA + n B = ns . constant. Hold T + P constant
/ M / j l \°\ 9 n B / nW’nA ’4 \p \ 9 n A / nw ,T,P,nB
Omb MÂ
\9 n B / nl >n2,nA ,T,P \ 9 n A /n i ,n2 ,nB ,T,p*0
mb MA°
+n A > n B>n 2 . T . P n A ’n B ’n 1
( j r ^ ) = - R T l n ( | - ^ T )\ 9nB /n s ,nw ,T,P \[A ] /eq.
R T l n f è ) , = —RTln Ka\ ' A / e q . c o n d .
(Ka = true activity equilibrium constant for total process)
Experimental quantity: AFapp
AF°app
+ ( ^ r - T p + RTln — \ 9 n B / n s ,nw ,T,P y A
For this system according to Gibbs, ¡u* = ju2; Hence
AF° app = -R T ln
+ RTln
AHapp
= - Hb° - Ha° + Rp>nw>ns
+ ( H * H î ) ( ^ )\d n B / P ,nw ,ns
(M* - MÎ) f H i r 1) \\ o nB /P ,n s ,n\y1 P,nw ,ns
+ i ( M u ~~ 2M*2 + M*22 ) (a 'i-r pT \d n B /T ,n s ,nw ,P
3n!r
+ T
P,nw ,ns (12)
) W7 ômb0\ _ /9 ma \ _ /9 mb° \\ 3 n , / \ 9iti / \ 9iG /
( ^ ) p , S.
/9AF° \( app)V 3T /
n S>n W >T ,p
AS|pp is found by usingP,ns,nw
By eliminating common terms from ASapp and AHapp/T we obtain AHapp =
(H b° - TSê°) - (Ha - TSX°)
+ [(Hî - TSÎ) - (H2* - T S 2*)](13)
' f e )+ RTln ( Q \
+ TÄS°
P,T,ns ,nw \ T a / eq cond
app
Although M* = M2 , Hi H | and S? ^=S2 .
However the condition Mi = M2 requires that
Hf - H2sT - s2TT - T (14)
Rewriting the relationship between AH£pp and AS.jpp using this requirement.
AHapp =(M b° - M a ) + R T1 n( ~ )V A /e q c+ TAS;app
co n d
(13a)
The first two terms on the right are, of course, the experimental quantity, AFapp, and will in general vary with the variation in the independent variable used to produce the pairs of AHapp, ASapp
values required to test for compensation e.g., chemical change in a congener series, cosolvent additions, pH in an inhibitorbinding process. Consequently no compensation pattern will in general appear. We see, however, that the water relaxation process produces the relationship (H* - H*) = T(Sf - S?) which is a linear compensation relationship but is not usually detectable because of variations in AFapp. One must either be able to calculate the variation in AFapp as Hepler (1963) and Ives and Marsden (1965) have for the ionization of weak acids or one must devise an experiment which will expose the contributions to the enthalpy and entropy from the water relaxation process. The latter appears to be the case for processes in which solutes are transferred from H20 to D20 without any chemical change. Such experiments are rare. Furthermore the value of Tc predicted by the theorem even in this case is the experimental temperature value which is not supported by the many experimental results which show Tc values near 285 K regardless of the experiment or the experimental temperature.
This theorem applies as written only to congener systems. Ben-Naim’s own experiments used cosolvent additions and require a more complicated version. It is possible to suppose that the temperature behavior of the activity-coefficient term in AFapp pulls the value of Tc to ] something lower than the experimental temperature in the theorem as given above. It is also possible to suppose that some of the terms in the more extensive expressions appropriate to Ben-Naim’s own experiments have the same effect. Thus far these suppositions have not been examined in detail but we must not forget them.
As regards the relaxation part of the process the theorem is quite general so that although we have used the two states of water for the relaxation part of the total process, the theorem applies quite as well to any two component system and certainly to any three- or more component systems. As such it no longer restricts us to the consideration of water as the sole basis for compensation. Indeed we can substitute a change in the populations of protein conformers produced by inhibitor binding, pH or solvent modification for the relaxation of the water populations used in the above example of the theorem. This conclusion from the theorem immediately brings compensation due to the relaxation of one component under the influence of another into the family of the so-called “linear free- energy relationships.” These have as their central characteristic that in a systematic change in structure of a parent molecule the ratio of change in enthalpy, AAH, for any process to the change in entropy, AAS, must equal the experimental tern-
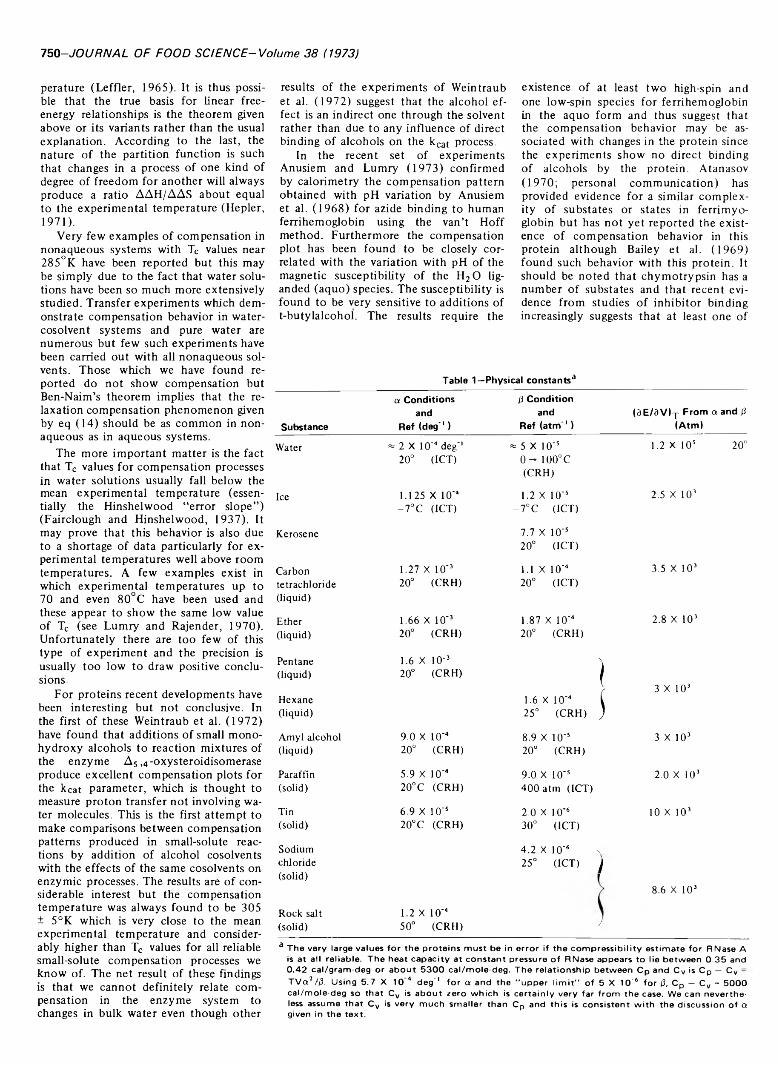
ISO-JOURNAL OF FOOD SCIENCE-Volume 38 (1973)
perature (Leffler, 1965). It is thus possible that the true basis for linear free- energy relationships is the theorem given above or its variants rather than the usual explanation. According to the last, the nature of the partition function is such that changes in a process of one kind of degree of freedom for another will always produce a ratio AAH/AAS about equal to the experimental temperature (Hepler,1971).
Very few examples of compensation in nonaqueous systems with Tc values near 285°K have been reported but this may be simply due to the fact that water solutions have been so much more extensively studied. Transfer experiments which demonstrate compensation behavior in water- cosolvent systems and pure water are numerous but few such experiments have been carried out with all nonaqueous solvents. Those which we have found reported do not show compensation but Ben-Naim’s theorem implies that the relaxation compensation phenomenon given by eq (14) should be as common in nonaqueous as in aqueous systems.
The more important matter is the fact that Tc values for compensation processes in water solutions usually fall below the mean experimental temperature (essentially the Hinshelwood “error slope”) (Fairclough and Hinshelwood, 1937). It may prove that this behavior is also due to a shortage of data particularly for experimental temperatures well above room temperatures. A few examples exist in which experimental temperatures up to 70 and even 80°C have been used and these appear to show the same low value of Tc (see Lumry and Rajender, 1970). Unfortunately there are too few of this type of experiment and the precision is usually too low to draw positive conclusions.
For proteins recent developments have been interesting but not conclusive. In the first of these Weintraub et al. (1972) have found that additions of small monohydroxy alcohols to reaction mixtures of the enzyme As ,4-oxysteroidisomerase produce excellent compensation plots for the kcat parameter, which is thought to measure proton transfer not involving water molecules. This is the first attempt to make comparisons between compensation patterns produced in small-solute reactions by addition of alcohol cosolvents with the effects of the same cosolvents on enzymic processes. The results are of considerable interest but the compensation temperature was always found to be 305 ± 5°K which is very close to the mean experimental temperature and considerably higher than Tc values for all reliable small-solute compensation processes we know of. The net result of these findings is that we cannot definitely relate compensation in the enzyme system to changes in bulk water even though other
results of the experiments of Weintraub et al. (1972) suggest that the alcohol effect is an indirect one through the solvent rather than due to any influence of direct binding of alcohols on the kcat process.
In the recent set of experiments Anusiem and Lumry (1973) confirmed by calorimetry the compensation pattern obtained with pH variation by Anusiem et al. (1968) for azide binding to human ferrihemoglobin using the van’t Hoff method. Furthermore the compensation plot has been found to be closely correlated with the variation with pH of the magnetic susceptibility of the H20 lig- anded (aquo) species. The susceptibility is found to be very sensitive to additions of t-butylalcohol. The results require the
existence of at least two high-spin and one low-spin species for ferrihemoglobin in the aquo form and thus suggest that the compensation behavior may be associated with changes in the protein since the experiments show no direct binding of alcohols by the protein. Atanasov (1970; personal communication) has provided evidence for a similar complexity of substates or states in ferrimyo- globin but has not yet reported the existence of compensation behavior in this protein although Bailey et al. (1969) found such behavior with this protein. It should be noted that chymotrypsin has a number of substates and that recent evidence from studies of inhibitor binding increasingly suggests that at least one of
T a b le 1 —P h y s ic a l c o n s t a n t s 3
a C o n d it io n s (3 C o n d it io na n d a n d (3E/3VI-J- F r o m a a n d (3
S u b s ta n c e R e f ( d e g '1 ) R e f ( a t m '1 ) (A t m )
Water « 2 X 10'4 deg'1 « 5 X 10'5 1.2 X 10s 20°20° (ICT) 0 ^ 100°C
(CRH)
Ice 1.125 X 10'4 1.2 X 10'5 2.5 X 10³-7°C (ICT) -7°C (ICT)
Kerosene 7.7 X 10'5 20° (ICT)
Carbon 1.27 X 10'3 1.1 X 10'4 3.5 X 10³tetrachloride(liquid)
20° (CRH) 20° (ICT)
Ether 1.66 X 10'3 1.87 X 10'4 2.8 X 10³(liquid) 20° (CRH) 20° (CRH)
Pentane 1.6 X 10'3 \(liquid) 20° (CRH)
( 3 X 10³Hexane 1.6 X 10 '4 C(liquid) 25° (CRH) )
Amyl alcohol 9.0 X 10'4 8.9 X 10's 3 X 10³(liquid) 20° (CRH) 20° (CRH)
Paraffin 5.9 X 10'4 9.0 X 10'5 2.0 X 10³(solid) 20°C (CRH) 400 atm (ICT)
Tin 6.9 X 10'5 2.0 X 10'6 10 X 103(solid) 20°C (CRH) 30° (ICT)
Sodium 4.2 X 10'6 schloride(solid)
25° (ICT) J
8.6 X 10³
Rock salt 1.2 X 10'4(solid) 50° (CRH) 'a T h e v e ry la rg e v a lu e s fo r th e p ro te in s m u s t b e In e r ro r If th e c o m p r e s s ib il it y e s t im a te fo r R N a s e A
is a t a ll re l ia b le . T h e h e a t c a p a c it y a t c o n s ta n t p re s su re o f R N a s e a p p e a rs to lie b e tw e e n 0 .3 5 and 0 .4 2 ca l/g ram -d e g o r a b o u t 5 3 0 0 ca l/m o le -d e g . T h e re la t io n s h ip b e tw e e n C p an d C v Is C p — Cv - T V a ! /|3. U s in g 5 .7 X 1 0 4 deg "1 f o r a an d th e " u p p e r l im it " o f 5 X 1 0 '6 fo r (3, C p — C v = 5 0 0 0 ca l/m o le -d e g so th a t C v Is a b o u t z e ro w h ic h is c e r ta in ly v e ry fa r fro m th e ca se . W e ca n n e v e r th e less a s su m e th a t C v Is v e ry m u c h s m a lle r th a n C p an d th is Is c o n s is te n t w ith th e d is c u s s io n o f a given In th e te x t .
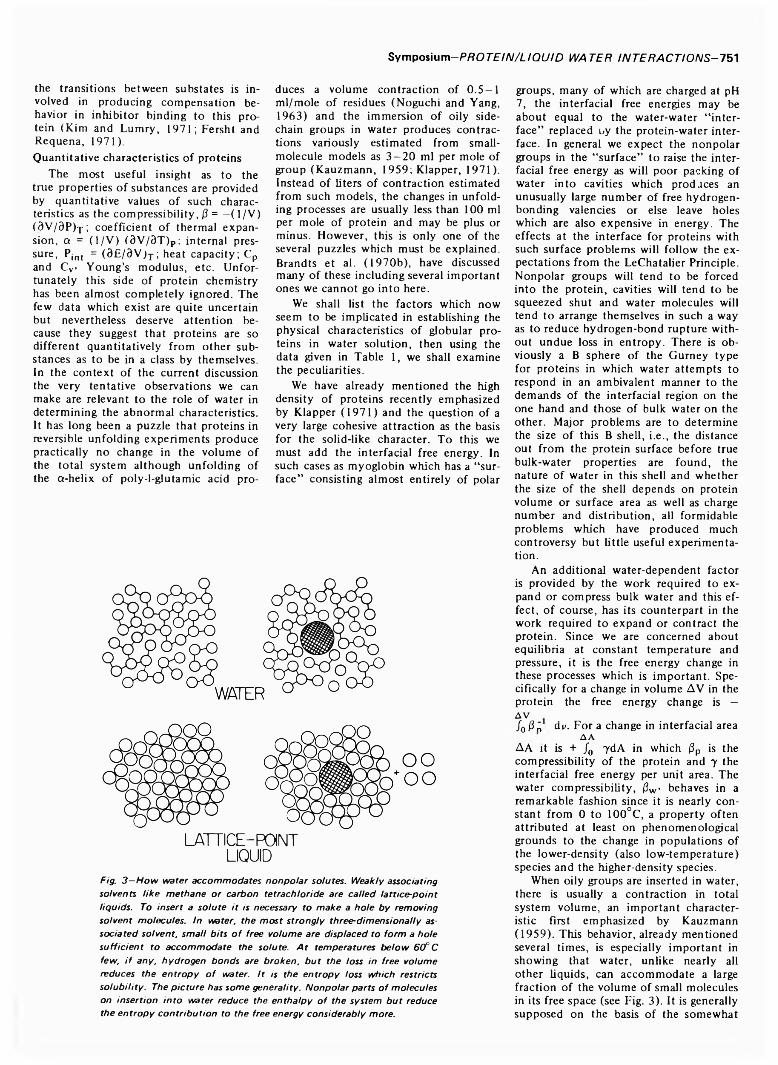
Symposium-PROTEIN/LIQUID WATER INTER ACT! O/VS-751
the transitions between substates is involved in producing compensation behavior in inhibitor binding to this protein (Kim and Lumry, 1971; Fersht and Requena, 1971).Quantitative characteristics of proteins
The most useful insight as to the true properties of substances are provided by quantitative values of such characteristics as the compressibility, j3 = —(1/V) (9V/9P)T ; coefficient of thermal expansion, a = (1/V) (9V/9T)P: internal pressure, Pint = (9£/9V )T; heat capacity; Cp and Cv- Young’s modulus, etc. Unfortunately this side of protein chemistry has been almost completely ignored. The few data which exist are quite uncertain but nevertheless deserve attention because they suggest that proteins are so different quantitatively from other substances as to be in a class by themselves. In the context of the current discussion the very tentative observations we can make are relevant to the role of water in determining the abnormal characteristics. It has long been a puzzle that proteins in reversible unfolding experiments produce practically no change in the volume of the total system although unfolding of the a-helix of poly-l-glutamic acid pro
duces a volume contraction of 0 .5 -1 ml/mole of residues (Noguchi and Yang,1963) and the immersion of oily side- chain groups in water produces contractions variously estimated from small- molecule models as 3—20 ml per mole of group (Kauzmann, 1959; Klapper, 1971). Instead of liters of contraction estimated from such models, the changes in unfolding processes are usually less than 100 ml per mole of protein and may be plus or minus. However, this is only one of the several puzzles which must be explained. Brandts et al. (1970b), have discussed many of these including several important ones we cannot go into here.
We shall list the factors which now seem to be implicated in establishing the physical characteristics of globular proteins in water solution, then using the data given in Table 1, we shall examine the peculiarities.
We have already mentioned the high density of proteins recently emphasized by Klapper (1971) and the question of a very large cohesive attraction as the basis for the solid-like character. To this we must add the interfacial free energy. In such cases as myoglobin which has a “surface” consisting almost entirely of polar
groups, many of which are charged at pH 7, the interfacial free energies may be about equal to the water-water “interface” replaced oy the protein-water interface. In general we expect the nonpolar groups in the “surface” to raise the interfacial free energy as will poor packing of water into cavities which produces an unusually large number of free hydrogenbonding valencies or else leave holes which are also expensive in energy. The effects at the interface for proteins with such surface problems will follow the expectations from the LeChatalier Principle. Nonpolar groups will tend to be forced into the protein, cavities will tend to be squeezed shut and water molecules will tend to arrange themselves in such a way as to reduce hydrogen-bond rupture without undue loss in entropy. There is obviously a B sphere of the Gurney type for proteins in which water attempts to respond in an ambivalent manner to the demands of the interfacial region on the one hand and those of bulk water on the other. Major problems are to determine the size of this B shell, i.e., the distance out from the protein surface before true bulk-water properties are found, the nature of water in this shell and whether the size of the shell depends on protein volume or surface area as well as charge number and distribution, all formidable problems which have produced much controversy but little useful experimentation.
An additional water-dependent factor is provided by the work required to expand or compress bulk water and this effect, of course, has its counterpart in the work required to expand or contract the protein. Since we are concerned about equilibria at constant temperature and pressure, it is the free energy change in these processes which is important. Specifically for a change in volume AV in the protein the free energy change is — Avf 0 Pn dv. For a change in interfacial area
A AAA it is + f 0 7 dA in which |3p is the compressibility of the protein and y the interfacial free energy per unit area. The water compressibility, |3W> behaves in a remarkable fashion since it is nearly constant from 0 to 100°C, a property often attributed at least on phenomenological grounds to the change in populations of the lower-density (also low-temperature) species and the higher-density species.
When oily groups are inserted in water, there is usually a contraction in total system volume, an important characteristic first emphasized by Kauzmann(1959). This behavior, already mentioned several times, is especially important in showing that water, unlike nearly all other liquids, can accommodate a large fraction of the volume of small molecules in its free space (see Fig. 3). It is generally supposed on the basis of the somewhat
LA TTIC E-PO IN TLIQUID
Fig. 3 —H ow water accomm odates nonpolar solutes. Weakly associating solvents like methane or carbon tetrachloride are called lattice-point liquids. To insert a solute it is necessary to make a hole by removing solvent molecules. In water, the m ost strongly three-dimensionally associated solvent, small bits o f free volume are displaced to form a hole sufficient to accom m odate the solute. A t temperatures below 60° C few, if any, hydrogen bonds are broken, but the loss in free volume reduces the entropy o f water. It is the entropy loss which restricts solubility. The picture has some generality. Nonpolar parts o f molecules on insertion into water reduce the enthalpy o f the system but reduce the entropy contribution to the free energy considerably more.
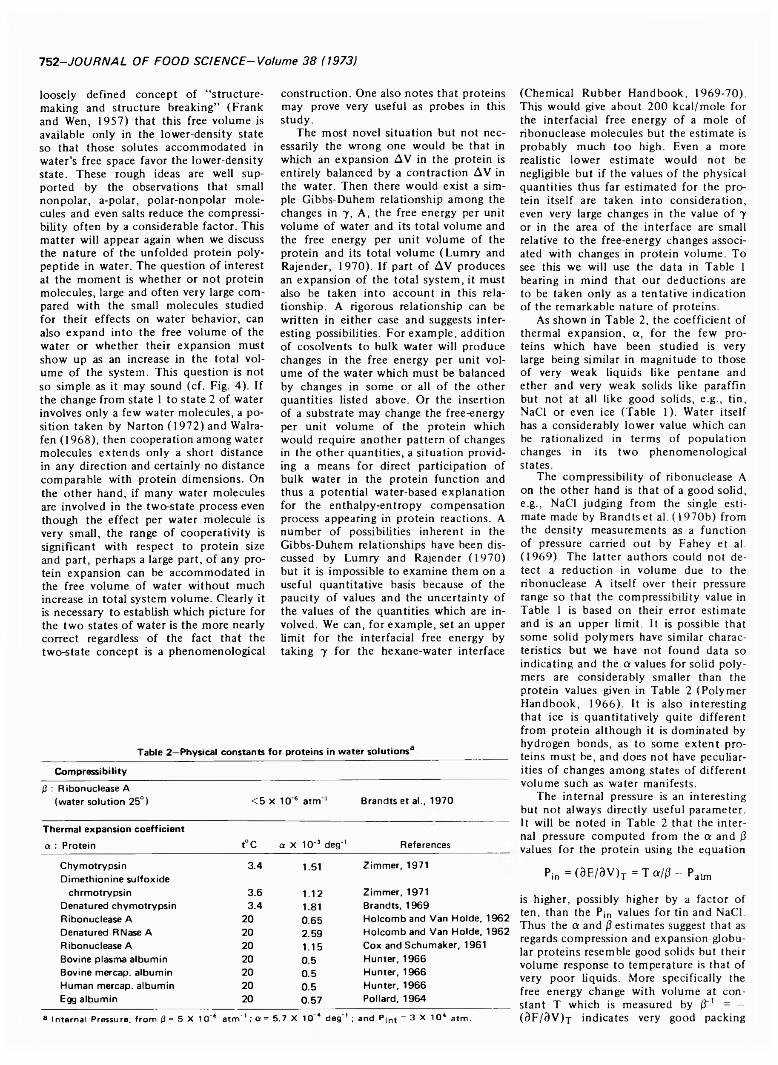
152-JOURNAL OF FOOD SCIENCE-Volume 38 (1973)
loosely defined concept of “structure- making and structure breaking” (Frank and Wen, 1957) that this free volume is available only in the lower-density state so that those solutes accommodated in water’s free space favor the lower-density state. These rough ideas are well supported by the observations that small nonpolar, a-polar, polar-nonpolar molecules and even salts reduce the compressibility often by a considerable factor. This matter will appear again when we discuss the nature of the unfolded protein polypeptide in water. The question of interest at the moment is whether or not protein molecules, large and often very large compared with the small molecules studied for their effects on water behavior, can also expand into the free volume of the water or whether their expansion must show up as an increase in the total volume of the system. This question is not so simple as it may sound (cf. Fig. 4). If the change from state 1 to state 2 of water involves only a few water molecules, a position taken by Narton (1972) and Walra- fen (1968), then cooperation among water molecules extends only a short distance in any direction and certainly no distance comparable with protein dimensions. On the other hand, if many water molecules are involved in the two-state process even though the effect per water molecule is very small, the range of cooperativity is significant with respect to protein size and part, perhaps a large part, of any protein expansion can be accommodated in the free volume of water without much increase in total system volume. Clearly it is necessary to establish which picture for the two states of water is the more nearly correct regardless of the fact that the two-state concept is a phenomenological
construction. One also notes that proteins may prove very useful as probes in this study.
The most novel situation but not necessarily the wrong one would be that in which an expansion AV in the protein is entirely balanced by a contraction AV in the water. Then there would exist a simple Gibbs-Duhem relationship among the changes in 7 , A, the free energy per unit volume of water and its total volume and the free energy per unit volume of the protein and its total volume (Lumry and Rajender, 1970). If part of AV produces an expansion of the total system, it must also be taken into account in this relationship. A rigorous relationship can be written in either case and suggests interesting possibilities. For example, addition of cosolvents to bulk water will produce changes in the free energy per unit volume of the water which must be balanced by changes in some or all of the other quantities listed above. Or the insertion of a substrate may change the free-energy per unit volume of the protein which would require another pattern of changes in the other quantities, a situation providing a means for direct participation of bulk water in the protein function and thus a potential water-based explanation for the enthalpy-entropy compensation process appearing in protein reactions. A number of possibilities inherent in the Gibbs-Duhem relationships have been discussed by Lumry and Rajender (1970) but it is impossible to examine them on a useful quantitative basis because of the paucity of values and the uncertainty of the values of the quantities which are involved. We can, for example, set an upper limit for the interfacial free energy by taking 7 for the hexane-water interface
T a b le 2 —P h y s ic a l c o n s ta n ts f o r p ro te in s in w a te r s o lu t io n s 3
C o m p re s s ib i l it y
ß : R ib o n u c lé a s e A(w a te r s o lu t io n 2 5 ° ) < 5 x 10"6 a t m '1 B ra n d ts e t a l., 1 9 7 0
T h e r m a l e x p a n s io n c o e f f ic ie n t
a : P ro te in t ° C a X 1 0 '3 d e g '1 R e fe re n c e s
C h y m o t r y p s in 3 .4 1 .51 Z im m e r , 1 9 7 1D im e th io n in e s u lfo x id e
c h r m o t ry p s in 3 .6 1 .1 2 Z im m e r , 1 9 7 1D e n a tu re d C h y m o try p s in 3 .4 1 .81 B ra n d ts , 1 9 6 9R ib o n u c lé a s e A 2 0 0 .6 5 H o lc o m b an d V a n H o ld e , 1 9 6 2D e n a tu re d R N a s e A 2 0 2 .5 9 H o lc o m b an d V a n H o ld e , 1 9 6 2R ib o n u c lé a s e A 2 0 1 .1 5 C o x a n d S c h u m a k e r , 1 9 6 1B o v in e p la sm a a lb u m in 2 0 0 .5 H u n te r , 1 9 6 6B o v in e m e rc a p . a lb u m in 2 0 0 .5 H u n te r , 1 9 6 6H u m a n m e rc a p . a lb u m in 2 0 0 .5 H u n te r , 1 9 6 6E g g a lb u m in 2 0 0 .5 7 P o lla rd , 1 9 6 4
a In te rn a l P re ssu re , f ro m ß = 5 X 1 0 ’ 6 a t m '1 -,a= 5 .7 X 1 0 4 d e g '1 ; an d P jn t = 3 X 1 0 4 a tm .
(Chemical Rubber Handbook, 1969-70). This would give about 200 kcal/mole for the interfacial free energy of a mole of ribonucléase molecules but the estimate is probably much too high. Even a more realistic lower estimate would not be negligible but if the values of the physical quantities thus far estimated for the protein itself are taken into consideration, even very large changes in the value of 7 or in the area of the interface are small relative to the free-energy changes associated with changes in protein volume. To see this we will use the data in Table 1 bearing in mind that our deductions are to be taken only as a tentative indication of the remarkable nature of proteins.
As shown in Table 2, the coefficient of thermal expansion, a, for the few proteins which have been studied is very large being similar in magnitude to those of very weak liquids like pentane and ether and very weak solids like paraffin but not at all like good solids, e.g., tin, NaCl or even ice (Table 1). Water itself has a considerably lower value which can be rationalized in terms of population changes in its two phenomenological states.
The compressibility of ribonucléase A on the other hand is that of a good solid, e.g., NaCl judging from the single estimate made by Brandts et al. ( 1970b) from the density measurements as a function of pressure carried out by Fahey et al.(1969). The latter authors could not detect a reduction in volume due to the ribonucléase A itself over their pressure range so that the compressibility value in Table 1 is based on their error estimate and is an upper limit. It is possible that some solid polymers have similar characteristics but we have not found data so indicating and the a values for solid polymers are considerably smaller than the protein values given in Table 2 (Polymer Handbook, 1966). It is also interesting that ice is quantitatively quite different from protein although it is dominated by hydrogen bonds, as to some extent proteins mast be, and does not have peculiarities of changes among states of different volume such as water manifests.
The internal pressure is an interesting but not always directly useful parameter. It will be noted in Table 2 that the internal pressure computed from the a and P values for the protein using the equation
Pin = OE/0V)T = T a/0 - Patm
is higher, possibly higher by a factor of ten, than the Pj„ values for tin and NaCl. Thus the a and P estimates suggest that as regards compression and expansion globular proteins resemble good solids but their volume response to temperature is that of very poor liquids. More specifically the free energy change with volume at constant T which is measured by (T1 = — (9F/9V)x indicates very good packing

Symposium-PROTEIN/LIQUID WATER IN TERACTIO NS-!^
with little free volume in the protein or at least with little ability to adjust to reduce any such free volume. The indication of tight packing is consistent with Klapper’s (1971) discussion on the high density, the finding by Brandts and Kaplan (1973) that buried chromophores have only weakly broadened spectra compared with the spectra in liquid solution, and with the ideas of solid-like binding (i.e., extreme loss of vibrational and librational freedom as well as rotation and translation freedom) of substrates and inhibitors to proteins as recently examined by Page and Jencks (1971). Nevertheless new experiments are necessary to establish the nature of the protein as a solid, the generality of the solid model and the variability in degree of solidity, which is probably considerable, from point to point in any given protein.
For the proteins the low values for the coefficient of thermal expansion, which is equal to —( l/V)(9S/9P)x, are also very intriguing since their source is also not at all obvious. Taken together with the low compressibility values the a values tend to suggest that some of the peculiarities may be due to water. An alternative explanation is that the internal pressure is so high that the usually weak force constants associated with van der Waal’s contacts, i.e., those of the vibrational modes due to the bonding produced by weak secondary interactions, are forced to high values. Then small decreases in pressure producing small expansions will produce great weakening in these force constants which in turn produce large increases in entropy since the weaker vibrational modes are responsible for most of the entropy of proteins. The latter alternative does not explain why the internal pressure is so great and is thus as puzzling as the alternative based on water.
The compressibility is the most relevant quantity since it is the only one of the three physical parameters simply related to free energy and the values thus far estimated for proteins suggest excellent packing, low free volume and apparently little change in protein volume in protein processes. There are increasing numbers of reports of protein expansion and contraction on binding of substrates, inhibitors or “allosteric effectors.” The actual volumes involved are invariably measured indirectly so that it is usually not possible to separate true changes in protein geometry from associated changes in nearby water volume. However, claims of actual change in protein volume are not readily consistent with the |3 value since if we make the poor but order-of- magnitude estimate that the compressibility of proteins is independent of volume for small enough volume changes, a value of (3 for RNase A of —5 x 10‘6 atm means a change of 5 kcal of free energy per ml of volume change near the equilib
rium volume and thus for a 3% change in volume of this protein the free-energy change would be 1500 kcal/mole. Even if the compressibility value is revised upward and the expansion of a protein found to fall off very rapidly with volume increase, some hundreds of kilocalories of free energy must be associated with changes in volume of only a few percent. As yet there has been no indication that such large free-energy changes are associated with specific or nonspecific binding processes of proteins. Nor, for that matter, is there any apparent way for other part processes of the total binding process to provide or utilize this much free energy.
Brandts et al. (1970b) have pointed out in their discussion of the effects of pressure on proteins that some factor of major importance is missing in our understanding. The high compressibility is the most direct manifestation of the missing factor. The high compressibility is also inconsistent with recent plotting of the internal spatial distribution of —CH2 — and CH3 - groups and polar groups, mostly backbone, for carboxypeptidase A by Kuntz (1972c) which show large “puddles” and layers of hydrophobic materials distributed among hydrogen-bonded structures of the main chain. The density he calculated for these regions from x-ray coordinates is about 0.9g/ml and thus consistent with the provisional value of (3 but less consistent with the values for
a given in Table 2. The a values suggest that the mechanical and thermal properties should be dominated by the soft hydrophobic regions of a protein. The small volume change on unfolding proteins in water, the very lowj3 value, which appears to be a sound upper limit, and the density discussion given by Klapper clearly convey a completely different picture. The two pictures might be made consistent if the polar groups form an unusually strong skeleton. It is true that the hydrogen bonds formed by these groups have considerably higher force constants in media of low dielectric constant and that the dielectric constant at points well removed from the surface of the protein must be quite low, but the associated lower free- energy of the hydrogen bonding is exactly balanced by a positive free-energy contribution which occurs in folding due to the replacement of water molecules around the hydrogen bonds by the nonpolar groups; that is, by the very process of reducing the dielectric constant at the hydrogen-bonds. Thus we can explain a strong skeleton and a somewhat higher overall density but we cannot explain the low value of j3 since jT1 is a measure of the free energy change with volume and the density gain in polar regions is unlikely to be sufficient to overbalance the density of the nonpolar regions which Kuntz computes.
We have already mentioned that unfolding to the hydrated polypeptide also
r - ' / 'SOLVENT INTERFACIAL INTERIOR
REGION
Fig. 4 —The balance o f forces o f a protein in water. Compression by bulk water is shown on the left. Compression due to an unfavorable interaction o f interfacial water and protein surface is shown in the middle. The cohesive and repulsive forces within the protein provide a balancing outward force shown on the right.
754-JOURNAL OF FOOD SCIENCE-Volume 38 (1973)
produces a rather remarkable situation. Brandts et al. (1970b) were able to obtain a reliable value for the increase in |3 in the reversible unfolding of RNase A and found it to be only +1.5 x 10'6 atm'1 so that the compressibility of the hydrated net of unfolded polypeptide is estimated to be less than +6.5 x 10'6 atm'1. Hawley (1971) estimated a change of +0.8 x 1 0 '6 atm"1 for the same process in reasonable agreement considering the assumptions and differences in conditions. For unfolding of chymotrypsinogen A, Hawley estimated +1.24 x 10'6 atm'1. The high value of the compressibility for unfolded proteins is psychologically, but only psychologically, easier to accept since, as already mentioned, the addition of polar and nonpolar small molecules as well as salts reduces the magnitude of the compressibility of water and we are accustomed to accept water as abnormal. The small changes in volume reported for unfolding processes have been rationalized on the basis that there are errors in the use of small hydrophobic models for the desolvation of oily side chains of proteins but we see that although there may be such errors, it is really the abnormally low compressibility of the protein and the equally abnormal low compressibility of the hydrated polypeptide which are resp on sib le . The small free-energy changes which appear in unfolding, e.g.,5 -2 5 kcal for many small proteins are consistent with this view.
CONCLUSIONSTHESE OBSERVATIONS bring us back to water and point up the confusion which exists. The relatively high constant compressibility of water when combined with its high and highly variable thermal expansion coefficient suggests that water plays a minor role in determining the properties of proteins. Water appears to be too easily compressed itself to act as an effective source of compression on the protein and it clearly plays such a secondary role in the free-energy changes associated with protein volume changes, if the protein f) and a estimates are roughly correct, as to be an almost negligible factor relative to the protein itself. In our RNase example the 3% expansion would produce only a 150 kcal/mole contribution to the free energy from the compression or expansion of the water if all the protein volume change is accommodated by change in water volume. However, this discussion has taken us rather far afield from the original problem which was the source of the compensation pattern. Even though we have had to assume that changes in protein volume involve large free energies and we cannot explain why this is so in terms of cohesive energy, compression by water or a high interfacial free energy, if volume changes do occur
in protein function, they can, under the condition that the cooperative regions in water are large, produce changes in water of the same kind produced by changes in small solutes in water solution and thus produce the compensation pattern in the same way. Thus protein function may be linked to bulk water through volume change. Similarly changes in protein surface properties can be linked to bulk water.
In conclusion we observe that this discussion has covered many puzzling problems. Almost none of the alternatives given for explanations of compensation behavior or to rationalize the abnormal values of a, (3 and Pjnt is even remotely consistent with first impressions based on familiar small-solute systems but familiarity does not necessarily imply accuracy and it is probable that many traditional views about the nature and behavior of small-solute solutions in water will undergo dramatic change when water becomes truly understood. We may then be able to establish just how water fits into the biological picture. Are proteins really so insensitive to water as our discussion would suggest? It hardly seems possible but perhaps we have fixed our attention too much on the real or apparent abnormality of the protein. Compressive and inter- facial effects of water, despite a relative unimportance in terms of thermodynamic changes as compared with the new picture of the protein which has developed, nevertheless could easily produce contributions to enthalpy, entropy and free energy of the size actually measured in protein experiments. We can suspect that this is the case and that the protein properties will turn out to produce less dramatic contributions than we have estimated. Even for such large structures as mitochondria, grana and lipid bilayer membranes with their associated surface material, there is much evidence to implicate water as a major determinant of properties and behavior. It seems quite possible that bulk and interfacial water determine the permeability, viscosity and density properties of these bodies but it is quite clear at present that we cannot casually assume this to be the case. In fact, one must work on a foundation of existing facts which suggests that these bodies like globular proteins may be so dominated by their cohesive forces as to make the role of water very secondary in importance. The purpose of this paper has been to show that water may play a direct role in the physical state and function of most biological macromolecules, a role revealed by the enthalpy-entropy compensation pattern. The message of the paper is obviously quite different. That message is that too many of the most important kinds of experiments have been put off too long. We can look at the x-ray diffraction pictures of pro
teins forever without improving our understanding of proteins as chemical species and we can never verify ideas about reaction mechanisms drawn from such pictures or from any other type of currently popular experimental approach until basic information on the physical properties and the quantitative characterization of the forces holding proteins in folded forms are determined in difficult experiments. Unfortunately such experiments still have very little popular appeal.
REFERENCESAnusiem, A.C., B eetlestone, J.G. and Irvine,
D.H. 1968 . J. Chem. Soc. (A ) 960 .Anusiem, A.C. and Lumry, R. 1972 . J. Amer.
Chem. Soc. 94: 904.Arnett, E.M. and M cKelvey, D.R. 1969 . In
“Solute-Solvent Interactions,” Ed. C oetzee, J.F. and R itchie, C .D ., p. 344 . Marcel Dek- ker. New York.
Atanasov, B.P. 1970 . Consultants Bureau, New York, p. 276 . [Translated from Molekulyar- naya Biologiya, 1970 . 4 (3): 348.]
Bailey, J.E., Beetlestone, J.G. and Irvine, D.H.1969 . J. Chem. Soc. (A ) 241.
Bailey, J.E., B eetlestone, J.G. and Irvine, D.H.1970(a). J. Chem. Soc. (A ) 756.
Bailey, J.E., B eetlestone, J.G ., Irvine, D.H. and Ogunmola, G.B. 1970(b ). J. Chem . Soc. (A) 749.
B eetlestone, J.G. and Irvine, D.H. 1965 . J. Chem. Soc. 3271 .
Beetlestone, J.G. and Irvine, D.H. 1969 . J. Chem. Soc. (A ) 735.
Beetlestone, J.G., Ige, R.O. and Irvine, D.H.1970 . J. Chem. Soc. (A ) 1368.
Belleau, B. 1966. Proc. Sym p. Physico-Chem ical Approaches to Drug-receptor Interactions, San Paolo, Ed. Ariens, E.J. Pergamon Press, London.
Belleau, B. 1967. Ann. N.Y . Acad. Sci. 144: 705.
Bender, M., K ezdy, F. and Gunter, C. 196 4 . J.Amer. Chem. Soc. 8 6 : 371 4 .
Ben-Naim, A. 1972 . In “ Water and A queous Solu tion s,” Ed. Horne, R., p. 42 5 . Wiley- Interscience, New York.
Berendsen, H.J.C. 1967. Theoret. Exptl. Biophys. 1 : 1 .
Brandts, J. 1969 . In “ Structure and Stability o f Biological M acrom olecules,” Ed. Tim asheff, S. and Fasman, G., p. 213 . Marcel Dekker, New York.
Brandts, J., Fu, J. and Nordin, J. 1970a. CIBA Found. Sym p. on Frozen Cell. J. & A. Churchill, L ondon, p. 189.
Brandts, J. and Kaplan, L.J. 197 3 . Biochem .12: 2011.
Brandts, J., Oliveira, R. and W estwort, C.1970b . Biochem . 9: 1038.
Cohen, S., Vaidya, V. and Schultz, R. 1970.Proc. Natl. Acad. Sci. (U .S .) 6 6 : 249.
Cox, D.J. and Schumaker, V .N . 1 961 . J. Am. Chem. Soc. 83: 2433 .
Davis, C. and Jarzynski, J. 1972 . In “ Water and A queous So lu tion s,” Ed. Horne, R., p. 377. Interscience Publishers, New York.
D oherty, D. and Vaslow , F. 1 952 . J. Amer. Chem. Soc. 74: 931 .
Exner, O. 1 964 . Coll. Czech. Chem . Commun. 29: 1094.
Eyring, H. and Stearn. A. 1 959 . Chem. Revs. 24: 253 .
Fahey, P., K upke, D. and Beams, J. 1969 . Proc.Natl. Acad. Sci. (U .S .) 63: 548.
Fairclough, R. and H inshelw ood, C. 1937 . J. Chem. Soc. 47.
Fersht, A. and Requena, Y. 1971 . J. Mol. Biol. 60: 279.
Flogel, M., Bolen, D.W. and Biltonen, R. 1973 . “Proc. 20th Annual Colloquium of the Pro- teids o f the Biological F luids,” Pergamon Press, N.Y.
Frank, H.S. and Franks, F. 1968 . J. Chem. Phys. 48: 474 6 .
Frank, H. and Wen, W.Y. 195 7 . Disc. Farad. Soc. 24: 133.
Gurney, R. 1953 . “ Ionic Processes in Solutio n .” McGraw Hill, New York.
H am m ett, L. 1940 . “ Physical Organic Chemistry .” McGraw Hill, New York.
Symposium—PROTE/N/L/QU/D WATER INTERACTIONS-ISS
Hawley, S. 1971. Biochem . 10: 2436.Hepler, L.G. 1963. J. Amer. Chem. Soc. 85:
3089.Hepler, L.G. 1971 . Can. J. Chem. 49: 2803. H olcom b, D.N . and Van H olde, K.E. 1962. J.
Phys. Chem. 66: 1999.Hunter, M.J. 1966 . J. Phys. Chem. 70: 3285 . Hyne, J.B. 1968. In “ Hydrogen-Bonded Solvent
System s,” Ed. Covington, A.K. and Jones,P., p. 99 . Taylor and Francis, London.
Ives, D. and Marsden, P. 1965 . J. Chem. Soc. 649.
Jardetzky, O. and Wade-Jprdetzky, M. 1971 .Ann. Rev. Biochem . 605 .
Kauzmann, W. 1959. Adv. Protein Chem. 14: 1. Kim, Y. and Lumry, R. 1971 . J. Amer. Chem.
Soc. 93: 5882.Klapper, M.H. 1971. Biochim . Biophys. Acta
229: 557.Klotz, I.M. 1958. Science 128: 815.Kuntz, I. 1972(a). J. Amer. Chem. Soc. 93:
514.Kuntz, I. 1972(b). J. Amer. Chem. Soc. 93:
516.Kuntz, I. 1 972(c). J. Amer. Chem. Soc., 94: 8568.Kuntz, 1., Brassfield, T.S., Law, G.D. and Pur
cell, G.V. 1969 . Science 163: 1329.Laidler, K.J. 1 958 . “ The Chemical Kinetics of
Enzym e A ction ,” p. 198. Oxford Univ. Press, London.
Leffler, J. and Grunwald, E. 1963 . “Rates and Equilibria o f Organic R eactions.” Wiley, New York.
Leffler, J. 1965. Nature 205: 1101. Likhtenshtein, G.I. and Sukhorukov, B.I. 1963.
Zh. Fiz. Khim. 38: 747.Likhtenshtein, G.I. and Sukhorokov, B.I. 1965.
Biofizika 10: 925.Likhtenshtein, G.I. 1969 . In “ Water in Biologi
cal System s,” Ed. Kayushin, L. Consultants
Bureau, New York.Likhtenshtein, G.I. 196 6 . Biofizika 11: 23. Lipscom b, W., Hartsuck, J., Reeke, G. Jr.,
Q uiocho, F ., Bethge, P., Ludwig, M., Steitz,T., Muirhead, H. and Coppola, J. 1968. Brookhaven Symp. Quant. Biol. 21: 24.
Low, B.W., Richards, F.M. and Berger, J.E.1956 . J. Amer. Chem. Soc. 78: 1107.
Lumry, R. 1971 . In “ Electron and Coupled Energy Transfer in Biological System s,” Ed. King, T. and Klingenberg, M., V ol. 1, Part A, p. 1. Marcel Dekker, New York.
Lumry, R. and Eyring, H. 1954. J. Phys. Chem. 58: 110.
Lumry, R ., Solbakken, A., Sullivan, J. and R eyerson, L. 1962 . J. Amer. Chem. Soc. 84: 142.
Lumry, R. and Biltonen, R. 1969. In “Structure and Stability o f Biological Macromolecu les,” Ed. Tim asheff, S. and Fasman, G., p. 65 . Marcel Dekker, New York.
Lumry, R. and Rajender, S. 1970. Biopolym ers 9: 1125.
Lumry, R. and Rajender, S. 1971. J. Phys. Chem. 75: 1387.
Massey, V. 1966 . J. Biol. Chem. 241: 2347. Narton, A. 1972 . J. Chem. Phys. 56: 5681. Noguchi, H. and Yang, J.T. 1963 . Biopolym ers
1: 359.Page, M. and Jencks, W. 1971 . Proc. Natl. Acad.
Sci. (U .S .) 68: 1678.Pollard, E. 1964. Adv. Chem. Phys. 7: 201. Martinek, K., Dorovska, V ., V arfolom eyev, S.
and Berezin, I. 1972 . Biochim . Biophys. Acta 271: 80.
Rajender, S., Lumry, R. and Han, M. 1971 . J. Phys. Chem. 75: 1375.
Reyerson, L. and Hnojewej, W. 1960. J. Phys. Chem. 64: 811.
R obertson, R. and Sugamori, S. 1969. J. Amer. Chem. Soc. 91: 26.
Schachman, H. and Edelstein, S. 1967 . J. Biol. Chem. 242: 306.
Schoenborn, B. 1971 . Cold Spring Harbor Symp. Quant. Biol. 36: 569.
Shiao, D .D .F. 1970 . Biochem . 9: 1083 .Shiao, D .D .F. and Sturtevant, J.M. 1969.
Biochem . 8: 4910.Turano, G., Borri V oltattorni, C., Orlacchio, A.
and Giartosio, A. 1971. Proc. First Europ. Biophysics Cong. 14—17 Sept. Baden, Austria, p. 45.
Vaslow, F. and D oherty, D. 1953. J. Amer. Chem. Soc. 75: 928 .
Walrafen, G.W. 196 8 . In “ Hydrogen-Bonded Solvent System s,” Ed. Covington, A. and Jones, P., p. 9. Taylor and Francis, London.
Watenpaugh, K., Sieker, L., Herriot, J. and Jensen, L. 197 1 . Cold Spring Harbor Symp. Quant. Biol. 36: 359.
Weintraub, H., Baulieu, E.E. and A lfsen, A.1972 . Biochim . Biophys. Acta 258: 655.
Woodward, C. and Rosenberg, A. 1971(a). J. Biol. Chem. 246: 4105 .
W oodward, C. and Rosenberg, A. 1971(b ). J. Biol. Chem. 246: 411 4 .
Yapel, A. 1968 . Ph.D. thesis. University o f M innesota, M inneapolis, Minn.
Zimmer, S. 1971 . Ph.D. thesis. The Johns H opkins University, Baltimore, Md.
Ms received 7 /3 1 /7 2 ; accepted 5 /2 5 /7 3 .Presented during the Sym posium on Protein
Interactions in Biosystem s at the 32nd Annual Meeting o f the Institute o f Food Technologists in Minneapolis.
Paper N o. 80 from the Laboratory for Biophysical Chemistry. Please request reprints by this number.
Supported by the National Institutes o f Health through grant numbers H L 13109 and AM 05853.

M. K A R E LD ep t, o f N u tr i t io n & F o o d S c ie n c e , M a ssa ch u se tts I n s t i tu te o f T e c h n o lo g y , C a m b rid g e , M A 0 2 1 3 9
SYMPOSIUM: Protein Interactions in Biosystems PROTEIN-LIPID INTERACTIONS
INTERACTION between proteins and lipids is a major field of biochemical research. Most of the work has concentrated on cellular and subcellular structures (especially membranes), on blood constituents, and on model system interactions in aqueous solution. The status of this research has been the subject of numerous conferences, reviews and books. A recent book edited by Tria and Scanu(1969) is particularly instructive.
This paper will present:(a)Current ideas about mechanisms of
lipid protein interactions in model systems, in tissues and in selected food systems;
IN TRO DU CTION (b) The role of protein lipid interactions in changes in food processes;
(c) The status of current research on interactions between oxidizing lipids and proteins.
NATURE OF LIPID PROTEIN INTERACTION
Types of bonding between protein and phospholipids
There is no single type of bonding by which lipids interact with proteins. In most isolated natural lipid protein complexes, the lipoproteins contained phospholipids in their lipid constituents; two types are shown in Figure 1. Phospholipid interactions with proteins may involve
electrostatic forces. Electrostatic binding can arise from attraction between the negatively charged phosphate group and a positively charged protein group such as lysyl or guanidyl residue. It may also involve a positively charged group in the phospholipid (for instance choline) and a negatively charged residue (for instance aspartyl). A related mode of binding is the formation of salt bridges via divalent metals such as calcium as shown in Figure1. Chapman (1969) suggested that simultaneous and cooperative occurrence of electrostatic binding and of salt bridges is operative in bacterial cell walls.
Characteristics of different types of intermolecular forces are shown in Figure2. Of these, covalent binding is the excep-
P O S S I B I U T I E S f o r P H O S P H O L I P I D - P R O T E I N b o n d s
TYPICAL BOND ENERGIES FOR DIFFERENT LIPID PROTEIN BONDS
BOND EN E RGY(kcal/mole) DEPENDENCE ONDISTANCE ( r )
oCOVALENT 30 - 100 MAX. ATTRACTION AT |-2 A
ELECTRO STA TIC 10 - 2 0 ENERGY o x HHYDROGEN BOND 1.5- 6 MAX. ATTRACTION AT 2~3AVAN DER WAALS 0 .5 - 2 EN ERG Y e x r -6
Fig. 2 — T y p ic a l b o n d en erg ies fo r d i f f e r e n t lip id -p r o te in b o n d s .
756-JOURNAL OF FOOD SCIENCE-Volume 38 (1973)
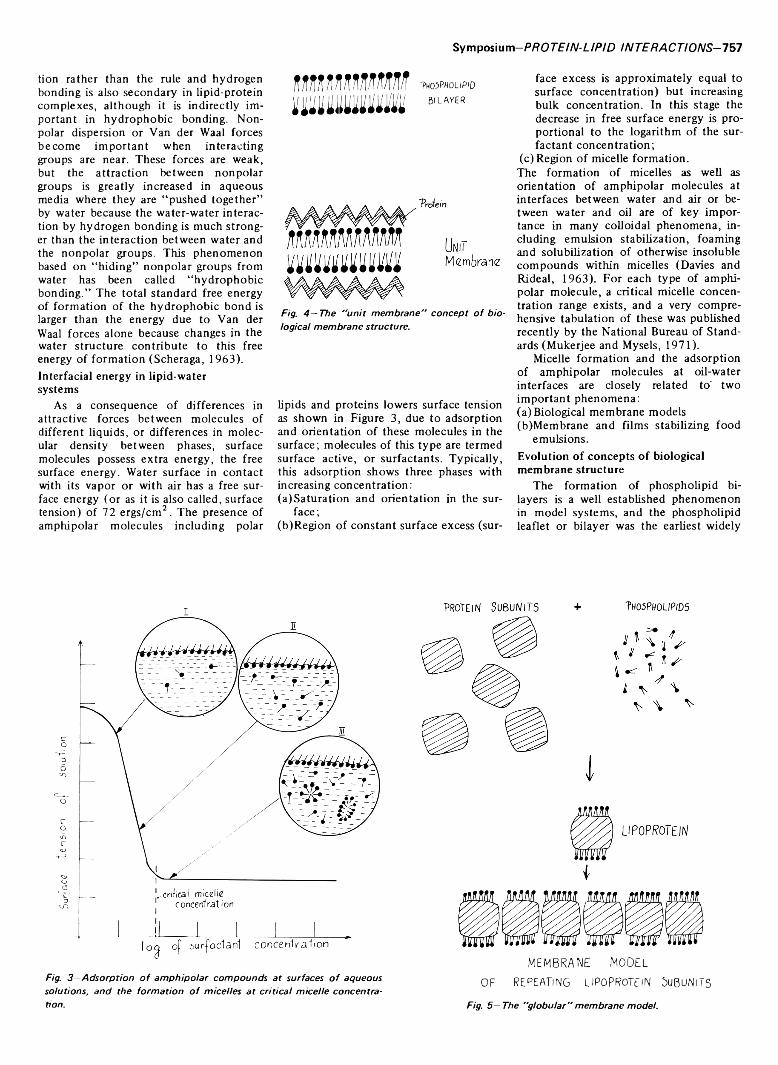
Symposium-PROTEIN-LIPID INTERACTIONS—IB I
tion rather than the rule and hydrogen bonding is also secondary in lipid-protein complexes, although it is indirectly important in hydrophobic bonding. Nonpolar dispersion or Van der Waal forces becom e important when interacting groups are near. These forces are weak, but the attraction between nonpolar groups is greatly increased in aqueous media where they are “pushed together” by water because the water-water interaction by hydrogen bonding is much stronger than the interaction between water and the nonpolar groups. This phenomenon based on “hiding” nonpolar groups from water has been called “hydrophobic bonding.” The total standard free energy of formation of the hydrophobic bond is larger than the energy due to Van der Waal forces alone because changes in the water structure contribute to this free energy of formation (Scheraga, 1963).Interfacial energy in lipid-water systems
As a consequence of differences in attractive forces between molecules of different liquids, or differences in molecular density between phases, surface molecules possess extra energy, the free surface energy. Water surface in contact with its vapor or with air has a free surface energy (or as it is also called, surface tension) of 72 ergs/cm2 . The presence of amphipolar molecules including polar
m m r t m m u THOiPHOLlPlDtmiuimm 61 LA YER
Fig. 4 — T h e " u n i t m e m b r a n e " c o n c e p t o f b io lo g ica l m e m b r a n e s tr u c tu re .
lipids and proteins lowers surface tension as shown in Figure 3, due to adsorption and orientation of these molecules in the surface; molecules of this type are termed surface active, or surfactants. Typically, this adsorption shows three phases with increasing concentration:(a) Saturation and orientation in the sur
face;(b) Region of constant surface excess (sur
face excess is approximately equal to surface concentration) but increasing bulk concentration. In this stage the decrease in free surface energy is proportional to the logarithm of the surfactant concentration;
(c) Region of micelle formation.The formation of micelles as well as orientation of amphipolar molecules at interfaces between water and air or between water and oil are of key importance in many colloidal phenomena, including emulsion stabilization, foaming and solubilization of otherwise insoluble compounds within micelles (Davies and Rideal, 1963). For each type of amphipolar molecule, a critical micelle concentration range exists, and a very comprehensive tabulation of these was published recently by the National Bureau of Standards (Mukerjee and Mysels, 1971).
Micelle formation and the adsorption of amphipolar molecules at oil-water interfaces are closely related to' two important phenomena:(a) Biological membrane models(b) Membrane and films stabilizing food
emulsions.Evolution of concepts of biological membrane structure
The formation of phospholipid bi- layers is a well established phenomenon in model systems, and the phospholipid leaflet or bilayer was the earliest widely
I
MEMBRANE MODELOF REPEATING LIPOPROTEIN 5ußuNlTSFig. 3 —A d s o r p t io n o f a m p h ip o la r c o m p o u n d s a t s u r fa c e s o f a q u e o u s
so lu tio n s , a n d th e fo r m a t io n o f m ic e lle s a t c r itic a l m ic e lle c o n c e n tr a tion . Fig. 5 — T h e " g lo b u la r " m e m b r a n e m o d e l.
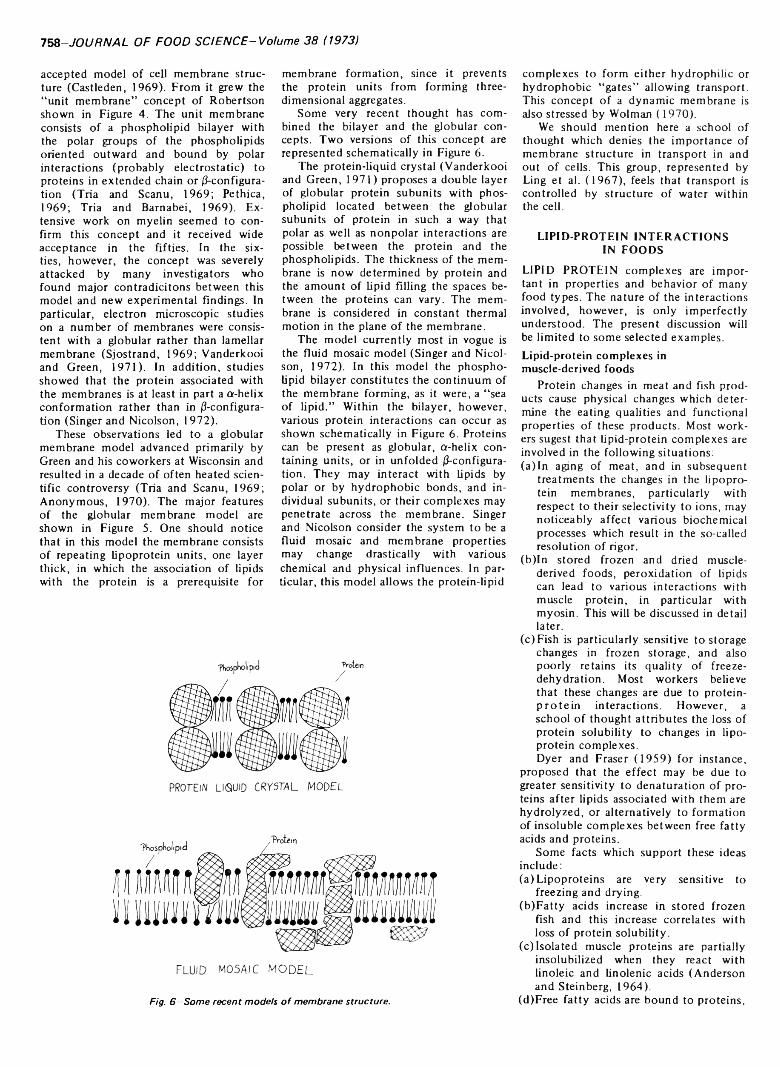
758-JOURNAL OF FOOD SCIENCE-Volume 38 (1973)
accepted model o f cell membrane structure (Castleden, 1969). From it grew the “unit membrane” concept of Robertson shown in Figure 4. The unit membrane consists of a phospholipid bilayer with the polar groups of the phospholipids oriented outward and bound by polar interactions (probably electrostatic) to proteins in extended chain or /^configuration (Tria and Scanu, 1969; Pethica, 1969; Tria and Barnabei, 1969). Extensive work on myelin seemed to confirm this concept and it received wide acceptance in the fifties. In the sixties, however, the concept was severely attacked by many investigators who found major contradicitons between this model and new experimental findings. In particular, electron microscopic studies on a number of membranes were consistent with a globular rather than lamellar membrane (Sjostrand, 1969; Vanderkooi and Green, 1971). In addition, studies showed that the protein associated with the membranes is at least in part a a-helix conformation rather than in ^-configuration (Singer and Nicolson, 1972).
These observations led to a globular membrane model advanced primarily by Green and his coworkers at Wisconsin and resulted in a decade of often heated scientific controversy (Tria and Scanu, 1969; Anonymous, 1970). The major features of the globular membrane model are shown in Figure 5. One should notice that in this model the membrane consists of repeating lipoprotein units, one layer thick, in which the association of lipids with the protein is a prerequisite for
membrane formation, since it prevents the protein units from forming three- dimensional aggregates.
Some very recent thought has combined the bilayer and the globular concepts. Two versions of this concept are represented schematically in Figure 6 .
The protein-liquid crystal (Vanderkooi and Green, 1971) proposes a double layer of globular protein subunits with phospholipid located between the globular subunits o f protein in such a way that polar as well as nonpolar interactions are possible between the protein and the phospholipids. The thickness of the membrane is now determined by protein and the amount of lipid filling the spaces between the proteins can vary. The membrane is considered in constant thermal motion in the plane of the membrane.
The model currently most in vogue is the fluid mosaic model (Singer and Nicolson, 1972). In this model the phospholipid bilayer constitutes the continuum of the membrane forming, as it were, a “sea of lipid.” Within the bilayer, however, various protein interactions can occur as shown schematically in Figure 6 . Proteins can be present as globular, a-helix containing units, or in unfolded 0-configura- tion. They may interact with lipids by polar or by hydrophobic bonds, and individual subunits, or their complexes may penetrate across the membrane. Singer and Nicolson consider the system to be a fluid mosaic and membrane properties may change drastically with various chemical and physical influences. In particular, this model allows the protein-lipid
complexes to form either hydrophilic or hydrophobic “gates” allowing transport. This concept of a dynamic membrane is also stressed by Wolman (1970).
We should mention here a school of thought which denies the importance of membrane structure in transport in and out of cells. This group, represented by Ling et al. (1967), feels that transport is controlled by structure of water within the cell.
LIPID-PROTEIN INTERACTIONS IN FOODS
LIPID PROTEIN complexes are important in properties and behavior of many food types. The nature of the interactions involved, however, is only imperfectly understood. The present discussion will be limited to some selected examples.Lipid-protein complexes in muscle-derived foods
Protein changes in meat and fish products cause physical changes which determine the eating qualities and functional properties o f these products. Most workers sugest that lipid-protein complexes are involved in the following situations:(a ) In aging of meat, and in subsequent
treatments the changes in the lipoprotein membranes, particularly with respect to their selectivity to ions, may noticeably affect various biochemical processes which result in the so-called resolution of rigor.
(b) In stored frozen and dried muscle- derived foods, peroxidation of lipids can lead to various interactions with muscle protein, in particular with myosin. This will be discussed in detail later.
(c ) Fish is particularly sensitive to storage changes in frozen storage, and also poorly retains its quality of freeze- dehydration. Most workers believe that these changes are due to protein- p rotein interactions. However, a school o f thought attributes the loss of protein solubility to changes in lipoprotein complexes.Dyer and Fraser (1959) for instance,
proposed that the effect may be due to greater sensitivity to denaturation of proteins after lipids associated with them are hydrolyzed, or alternatively to formation of insoluble complexes between free fatty acids and proteins.
Some facts which support these ideas include:(a) Lipoproteins are very sensitive to
freezing and drying.(b) Fatty acids increase in stored frozen
fish and this increase correlates with loss of protein solubility.
(c ) Isolated muscle proteins are partially insolubilized when they react with linoleic and linolenic acids (Anderson and Steinberg, 1964).
(d) Free fatty acids are bound to proteins,Fig. 6 —S o m e r e c e n t m o d e ls o f m e m b r a n e s tr u c tu re .
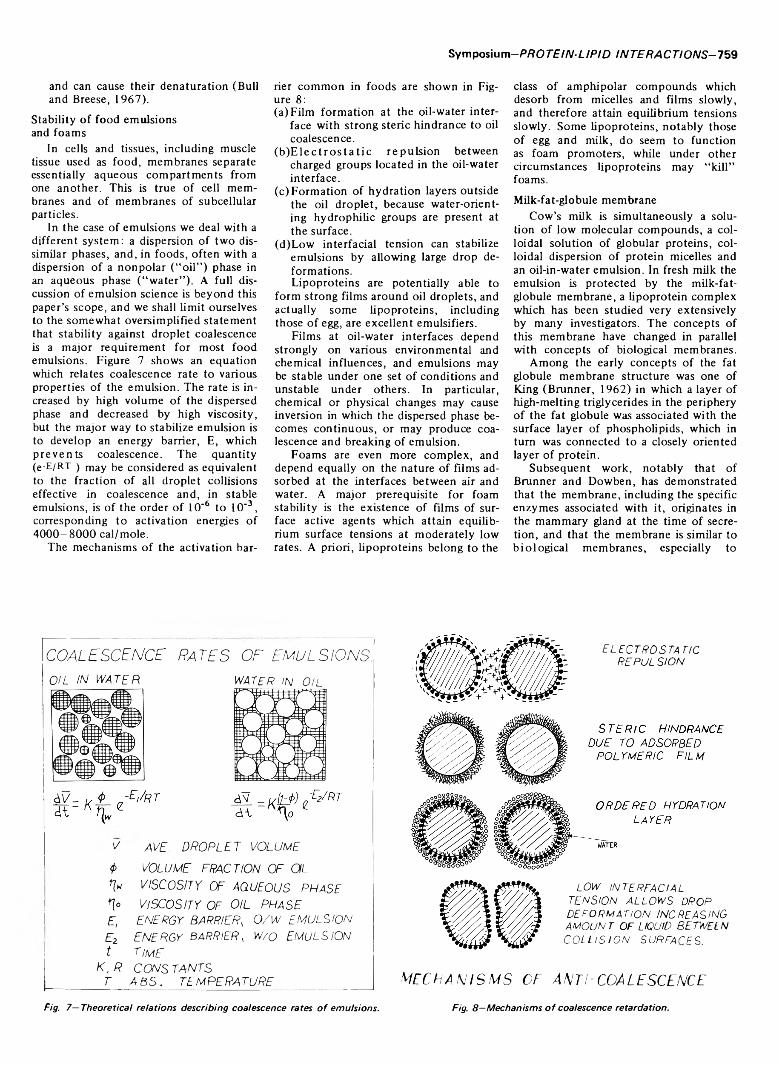
Sy m posi u m- P R OTE IN- LIPID IN TE R ACTIONS- 759
and can cause their denaturation (Bulland Breese, 1967).
Stability of food emulsions and foams
In cells and tissues, including muscle tissue used as food, membranes separate essentially aqueous compartments from one another. This is true of cell membranes and of membranes of subcellular particles.
In the case of emulsions we deal with a different system: a dispersion of two dissimilar phases, and, in foods, often with a dispersion of a nonpolar (“oil”) phase in an aqueous phase (“water”). A full discussion of emulsion science is beyond this paper’s scope, and we shall limit ourselves to the somewhat oversimplified statement that stability against droplet coalescence is a major requirement for most food emulsions. Figure 7 shows an equation which relates coalescence rate to various properties of the emulsion. The rate is increased by high volume of the dispersed phase and decreased by high viscosity, but the major way to stabilize emulsion is to develop an energy barrier, E, which prevents coalescence. The quantity (e-E/RT ) may 5e considered as equivalent to the fraction of all droplet collisions effective in coalescence and, in stable emulsions, is of the order of 10 ' 6 to 10 '3 , corresponding to activation energies of 4000—8000 cal/mole.
The mechanisms of the activation bar
rier common in foods are shown in Figure 8 :(a) Film formation at the oil-water inter
face with strong steric hindrance to oil coalescence.
(b) E le c tr o s ta t ic repulsion between charged groups located in the oil-water interface.
(c) Formation of hydration layers outside the oil droplet, because water-orienting hydrophilic groups are present at the surface.
(d) Low interfacial tension can stabilize emulsions by allowing large drop deformations.Lipoproteins are potentially able to
form strong films around oil droplets, and actually some lipoproteins, including those of egg, are excellent emulsifiers.
Films at oil-water interfaces depend strongly on various environmental and chemical influences, and emulsions may be stable under one set of conditions and unstable under others. In particular, chemical or physical changes may cause inversion in which the dispersed phase becomes continuous, or may produce coalescence and breaking of emulsion.
Foams are even more complex, and depend equally on the nature of films adsorbed at the interfaces between air and water. A major prerequisite for foam stability is the existence of films of surface active agents which attain equilibrium surface tensions at moderately low rates. A priori, lipoproteins belong to the
class o f amphipolar compounds which desorb from micelles and films slowly, and therefore attain equilibrium tensions slowly. Some lipoproteins, notably those of egg and milk, do seem to function as foam promoters, while under other circumstances lipoproteins may “kill” foams.
Milk-fat-globule membraneCow’s milk is simultaneously a solu
tion of low molecular compounds, a colloidal solution of globular proteins, colloidal dispersion of protein micelles and an oil-in-water emulsion. In fresh milk the emulsion is protected by the milk-fat- globule membrane, a lipoprotein complex which has been studied very extensively by many investigators. The concepts of this membrane have changed in parallel with concepts of biological membranes.
Among the early concepts of the fat globule membrane structure was one of King (Brunner, 1962) in which a layer of high-melting triglycerides in the periphery of the fat globule was associated with the surface layer of phospholipids, which in turn was connected to a closely oriented layer of protein.
Subsequent work, notably that of Brunner and Dowben, has demonstrated that the membrane, including the specific enzymes associated with it, originates in the mammary gland at the time of secretion, and that the membrane is similar to biological membranes, especially to
C O A L E S C E N C E R A T E S O F E M U L S I O N S
O I L I N W A T E R W A T E R i n O I L
V A V E D R O P L E T V O L U M E
<p V O L U M E F R A C T I O N O F O IL
*1" V I S C O S I T Y O F A Q U E O U S P H A S E
*1o V I S C O S I T Y O F O I L P H A S E
E , E N E R G Y B A R R I E R , O / W E M U L S I O N
E z E N E R G Y B A R R I E R , W / o E M U L S I O N
t T i m E
K , R C O N S T A N T S T A B S . T E M P E R A T U R E
E L E C T R O S T A T I C R E P U L S I O N
L O W I N T E R F A C I A L T E N S I O N A L L O W S D R O P D E F O R M A T I O N I N C R E A S I N G A M O U N T O F LIQUID B E T W E E N C O L L I S I O N S U R F A C E S .
m e c h a n i s m s o f a n t i - c o a l e s c e n c e
Fig. 7 — T h e o re tic a l r e la tio n s d e sc r ib in g c o a le s c e n c e ra te s o f e m u ls io n s . Fig. 8 —M e c h a n ism s o f c o a le sc e n c e re ta rd a tio n .
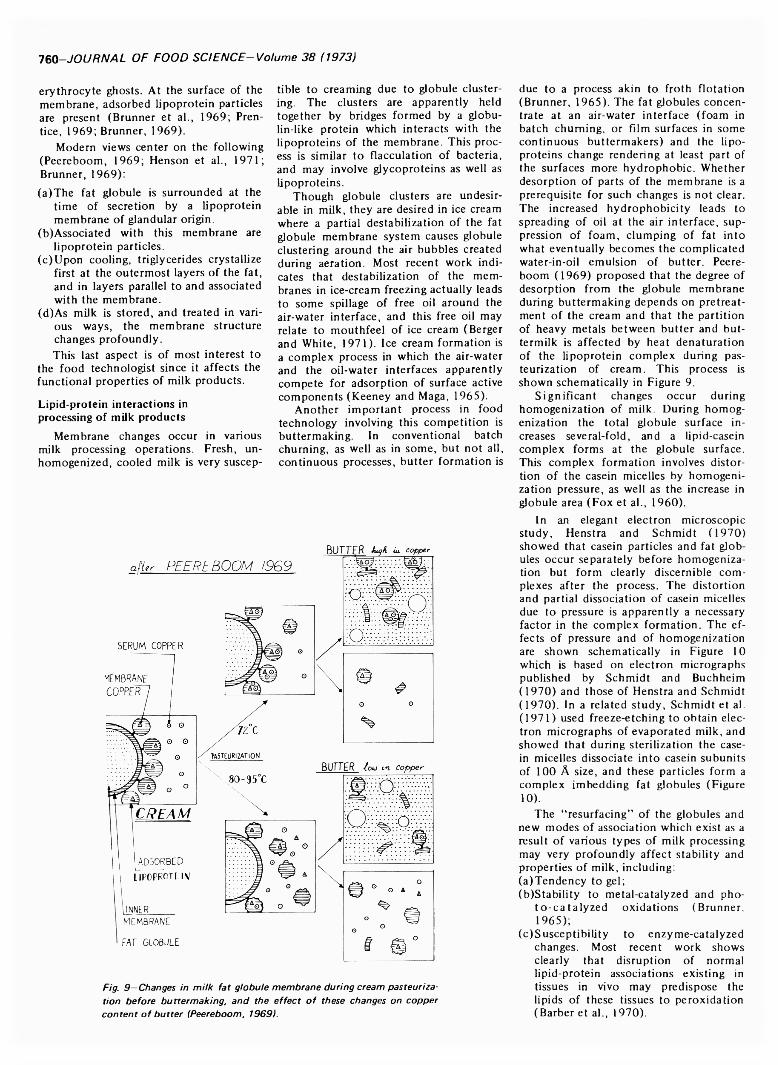
760-JOURNAL OF FOOD SCIENCF-Volume 38 (1973)
erythrocyte ghosts. At the surface of the membrane, adsorbed lipoprotein particles are present (Brunner et al., 1969; Prentice, 1969; Brunner, 1969).
Modern views center on the following (Peereboom, 1969; Henson et al., 1971; Brunner, 1969):(a) The fat globule is surrounded at the
time of secretion by a lipoprotein membrane of glandular origin.
(b) Associated with this membrane are lipoprotein particles.
(c ) Upon cooling, triglycerides crystallize first at the outermost layers of the fat, and in layers parallel to and associated with the membrane.
(d) As milk is stored, and treated in various ways, the membrane structure changes profoundly.This last aspect is o f most interest to
the food technologist since it affects the functional properties of milk products.
Lipid-protein interactions in processing of milk products
Membrane changes occur in various milk processing operations. Fresh, unhomogenized, cooled milk is very suscep
tible to creaming due to globule clustering. The clusters are apparently held together by bridges formed by a globulin-like protein which interacts with the lipoproteins of the membrane. This process is similar to flacculation of bacteria, and may involve glycoproteins as well as lipoproteins.
Though globule clusters are undesirable in milk, they are desired in ice cream where a partial destabilization of the fat globule membrane system causes globule clustering around the air bubbles created during aeration. Most recent work indicates that destabilization of the membranes in ice-cream freezing actually leads to some spillage of free oil around the air-water interface, and this free oil may relate to mouthfeel of ice cream (Berger and White, 1971). Ice cream formation is a complex process in which the air-water and the oil-water interfaces apparently compete for adsorption of surface active components (Keeney and Maga, 1965).
Another important process in food technology involving this competition is buttermaking. In conventional batch churning, as well as in some, but not all, continuous processes, butter formation is
due to a process akin to froth flotation (Brunner, 1965). The fat globules concentrate at an air-water interface (foam in batch churning, or film surfaces in some continuous buttermakers) and the lipoproteins change rendering at least part of the surfaces more hydrophobic. Whether desorption of parts of the membrane is a prerequisite for such changes is not clear. The increased hydrophobicity leads to spreading of oil at the air interface, suppression of foam, clumping of fat into what eventually becomes the complicated water-in-oil emulsion of butter. Peereboom (1969) proposed that the degree of desorption from the globule membrane during buttermaking depends on pretreatment of the cream and that the partition of heavy metals between butter and buttermilk is affected by heat denaturation of the lipoprotein complex during pasteurization of cream. This process is shown schematically in Figure 9.
Significant changes occur during homogenization of milk. During homogenization the total globule surface increases several-fold, and a lipid-casein complex forms at the globule surface. This complex formation involves distortion of the casein micelles by homogenization pressure, as well as the increase in globule area (Fox et al., 1960).
In an elegant electron microscopic study, Henstra and Schmidt (1970) showed that casein particles and fat globules occur separately before homogenization but form clearly discernible com plexes after the process. The distortion and partial dissociation of casein micelles due to pressure is apparently a necessary factor in the complex formation. The effects o f pressure and of homogenization are shown schematically in Figure 10 which is based on electron micrographs published by Schmidt and Buchheim(1970) and those of Henstra and Schmidt(1970 ) . In a related study, Schmidt et al.(1971) used freeze-etching to obtain electron micrographs of evaporated milk, and showed that during sterilization the casein micelles dissociate into casein subunits of 100 A size, and these particles form a complex imbedding fat globules (Figure 1 0 ).
The “resurfacing” of the globules and new modes of association which exist as a result o f various types of milk processing may very profoundly affect stability and properties of milk, including:(a ) Tendency to gel;(b) Stability to metal-catalyzed and pho
to -cata lyzed oxidations (Brunner.1965);
(c ) Susceptibility to enzyme-catalyzed changes. Most recent work shows clearly that disruption of normal lipid-protein associations existing in tissues in vivo may predispose the lipids of these tissues to peroxidation (Barber et al., 1970).
Fig. 9 - C h a n g e s in m i lk fa t g lo b u le m e m b r a n e d u r in g crea m p a s te u r iz a tio n b e fo r e b u tte r m a k in g , a n d th e e f f e c t o f th e s e ch a n g es o n c o p p e r c o n te n t o f b u t t e r IP eereb o o m , 1969).
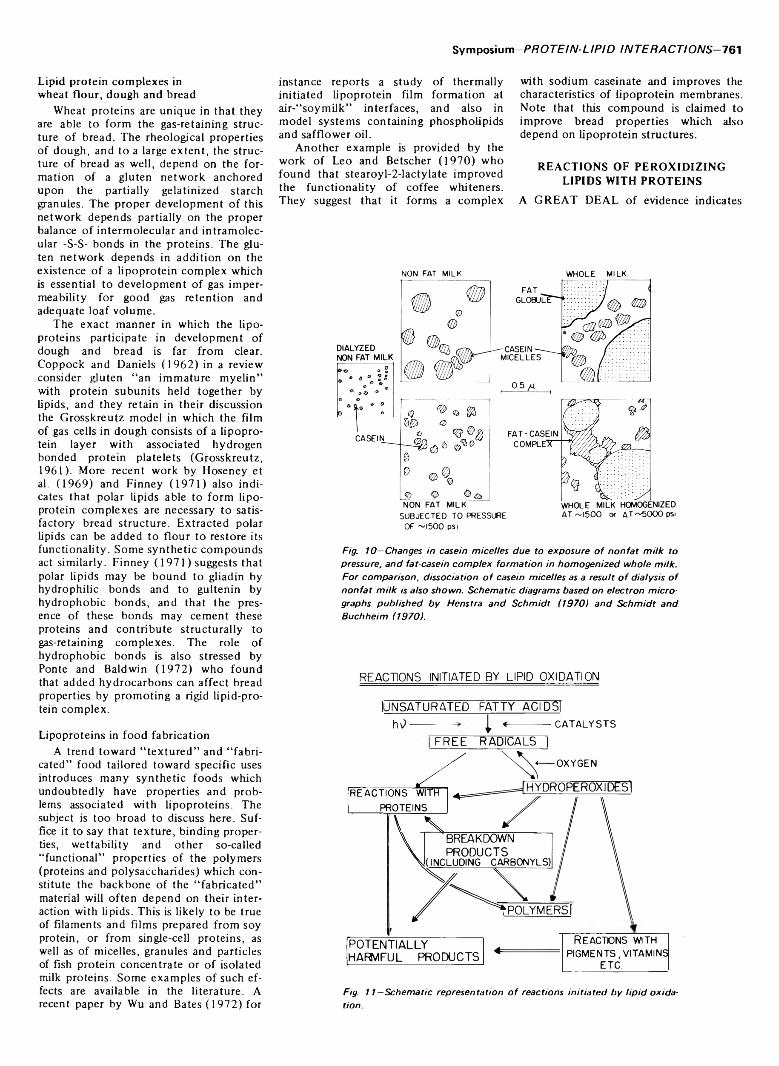
Sym posium —/>/?07'£7/V-Z_/P/D IN T E R A C T IO N S - 7 6 1
Lipid protein complexes in wheat flour, dough and bread
Wheat proteins are unique in that they are able to form the gas-retaining structure of bread. The rheological properties of dough, and to a large extent, the structure of bread as well, depend on the formation of a gluten network anchored upon the partially gelatinized starch granules. The proper development of this network depends partially on the proper balance of intermolecular and intramolecular -S-S- bonds in the proteins. The gluten network depends in addition on the existence of a lipoprotein complex which is essential to development of gas impermeability for good gas retention and adequate loaf volume.
The exact manner in which the lipoproteins participate in development of dough and bread is far from clear. Coppock and Daniels (1962) in a review consider gluten “an immature myelin” with protein subunits held together by lipids, and they retain in their discussion the Grosskreutz model in which the film of gas cells in dough consists of a lipoprotein layer with associated hydrogen bonded protein platelets (Grosskreutz,1961). More recent work by Hoseney et al. (1969) and Finney (1971) also indicates that polar lipids able to form lipoprotein complexes are necessary to satisfactory bread structure. Extracted polar lipids can be added to flour to restore its functionality. Some synthetic compounds act similarly. Finney ( 1971 ) suggests that polar lipids may be bound to gliadin by hydrophilic bonds and to gultenin by hydrophobic bonds, and that the presence of these bonds may cement these proteins and contribute structurally to gas-retaining complexes. The role of hydrophobic bonds is also stressed by Ponte and Baldwin (1972) who found that added hydrocarbons can affect bread properties by promoting a rigid lipid-protein complex.
Lipoproteins in food fabricationA trend toward “ textured” and “fabri
cated” food tailored toward specific uses introduces many synthetic foods which undoubtedly have properties and problems associated with lipoproteins. The subject is too broad to discuss here. Suffice it to say that texture, binding properties, wettability and other so-called “functional” properties of the polymers (proteins and polysaccharides) which constitute the backbone of the “ fabricated” material will often depend on their interaction with lipids. This is likely to be true of filaments and films prepared from soy protein, or from single-cell proteins, as well as of micelles, granules and particles of fish protein concentrate or of isolated milk proteins. Some examples of such effects are available in the literature. A recent paper by Wu and Bates (1972) for
instance reports a study of thermally initiated lipoprotein film formation at air-“soymilk” interfaces, and also in model systems containing phospholipids and safflower oil.
Another example is provided by the work of Leo and Betscher (1970) who found that stearoyl-2 -lactylate improved the functionality of coffee whiteners. They suggest that it forms a complex
with sodium caseinate and improves the characteristics of lipoprotein membranes. Note that this compound is claimed to improve bread properties which also depend on lipoprotein structures.
REACTIONS OF PEROXIDIZING LIPIDS WITH PROTEINS
A GREAT DEAL of evidence indicates
NON FAT MILK WHOLE MILK
SUBJECTED TO PRESSURE AT ~I500 or AT~5000psiOF ~I500 psi
Fig. 10 —C hanges in ca se in m ic e lle s d u e to e x p o s u r e o f n o n fa t m i lk to p re ssu re , a n d fa t-ca se in c o m p le x fo r m a tio n in h o m o g e n iz e d w h o le m ilk . F o r c o m p a r iso n , d is s o c ia tio n o f ca se in m ic e lle s as a re s u lt o f d ia ly s is o f n o n fa t m i lk is a lso s h o w n . S c h e m a tic d ia g ra m s b a s e d o n e le c tr o n m ic r o g raphs p u b l is h e d b y H en s tra a n d S c h m id t (1 9 7 0 ) a n d S c h m id t a n d B u c h h e im (1 9 7 0 ).
REACTIO N S INITIATED BY LIPID OXIDATION
IU N SA TU R A TED FA T T Y ACIDS1 h \)------- I «----------- CA TA LYSTS
F R E E R A D IC A L S |
REACTIONS WITH PROTEINS
OXYGEN
H Y D R 0 P E R 0 )0 D E s 1
BREAKDOWNP R O D U C T S
(INCLUDING CARBONYLS)
P o ly m ers I
' ’
P O T E N T IA L L Y R E ACTONS WITHH A RM FU L P R O D U C T S 4~ PIGMENTS, VITAMINS
ETC.
Fig. 1 1 —S c h e m a tic r e p re s e n ta tio n o f re a c tio n s in i t ia te d b y l ip id o x id a tio n .
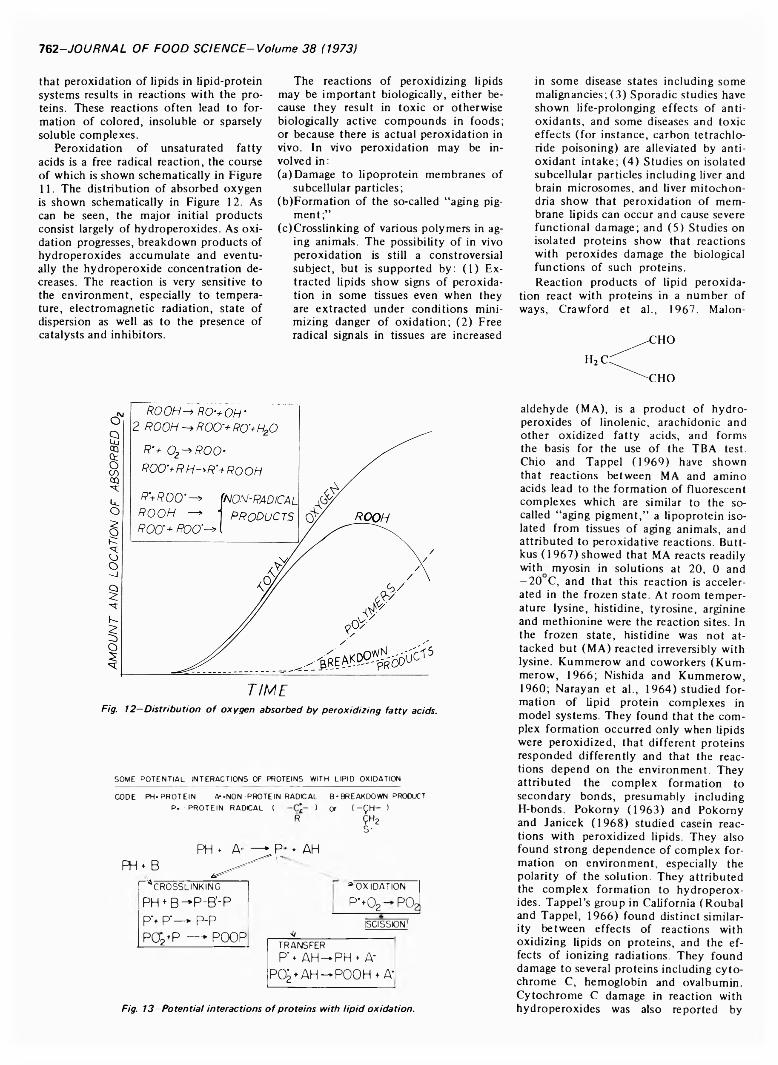
762-JOURNAL OF FOOD SCIENCE-Volume 38 (1973)
that peroxidation of lipids in lipid-protein systems results in reactions with the proteins. These reactions often lead to formation of colored, insoluble or sparsely soluble complexes.
Peroxidation of unsaturated fatty acids is a free radical reaction, the course of which is shown schematically in Figure11. The distribution of absorbed oxygen is shown schematically in Figure 12. As can be seen, the major initial products consist largely of hydroperoxides. As oxidation progresses, breakdown products of hydroperoxides accumulate and eventually the hydroperoxide concentration decreases. The reaction is very sensitive to the environment, especially to temperature, electromagnetic radiation, state of dispersion as well as to the presence of catalysts and inhibitors.
The reactions of peroxidizing lipids may be important biologically, either because they result in toxic or otherwise biologically active compounds in foods; or because there is actual peroxidation in vivo. In vivo peroxidation may be involved in:(a) Damage to lipoprotein membranes of
subcellular particles;(b) Formation of the so-called “aging pig
ment;”(c ) Crosslinking of various polymers in ag
ing animals. The possibility of in vivo peroxidation is still a constroversial subject, but is supported by: (1) Extracted lipids show signs of peroxidation in some tissues even when they are extracted under conditions minimizing danger of oxidation; (2) Free radical signals in tissues are increased
T I M E
Fig. 1 2 - D is t r ib u t io n o f o x y g e n a b s o r b e d b y p e r o x id iz in g fa t t y acids.
SOME POTENTIAL INTERACTIONS OF PROTEINS WITH LIPID OXIDATIONCODE PH-PROTEIN A--NON -PROTEIN RADICAL B - BREAKDOWN PROOUCT
P. ■ PROTEIN RADICAL (
PH * A'PH F B
r CROSSLINKINGPH + B-P-B'-P F+ p-_^ p-p POg+P —- POOP
»Ror (-ÇH- >
ÇH2s-* AH
* OXIDATIONP'+02 P02
4 SCISSION'TRANSFERP't AH—PH F A*
P(£ + AH —POOH + A-I
Fig. 1 3 —P o te n tia l in te r a c tio n s o f p r o te in s w ith l ip id o x id a tio n .
in some disease states including some malignancies; (3) Sporadic studies have shown life-prolonging effects of antioxidants, and some diseases and toxic effects (for instance, carbon tetrachloride poisoning) are alleviated by antioxidant intake; (4) Studies on isolated subcellular particles including liver and brain microsomes, and liver mitochondria show that peroxidation of membrane lipids can occur and cause severe functional damage; and (5) Studies on isolated proteins show that reactions with peroxides damage the biological functions of such proteins.Reaction products o f lipid peroxida
tion react with proteins in a number of ways, Crawford et al., 1967. Malon-
aldehyde (MA), is a product of hydroperoxides of linolenic, arachidonic and other oxidized fatty acids, and forms the basis for the use of the TBA test. Chio and Tappel (1969) have shown that reactions between MA and amino acids lead to the formation of fluorescent complexes which are similar to the so- called “aging pigment,” a lipoprotein isolated from tissues of aging animals, and attributed to peroxidative reactions. Butt- kus (1967) showed that MA reacts readily with myosin in solutions at 2 0 , 0 and — 20 C, and that this reaction is accelerated in the frozen state. At room temperature lysine, histidine, tyrosine, arginine and methionine were the reaction sites. In the frozen state, histidine was not attacked but (MA) reacted irreversibly with lysine. Kummerow and coworkers (Kum- merow, 1966; Nishida and Kummerow, 1960; Narayan et al., 1964) studied formation of lipid protein complexes in model systems. They found that the complex formation occurred only when lipids were peroxidized, that different proteins responded differently and that the reactions depend on the environment. They attributed the complex formation to secondary bonds, presumably including H-bonds. Pokorny (1963) and Pokomy and Janicek (1968) studied casein reactions with peroxidized lipids. They also found strong dependence of complex formation on environment, especially the polarity of the solution. They attributed the complex formation to hydroperoxides. Tappel’s group in California (Roubal and Tappel, 1966) found distinct similarity between effects of reactions with oxidizing lipids on proteins, and the effects o f ionizing radiations. They found damage to several proteins including cytochrome C, hemoglobin and ovalbumin. Cytochrome C damage in reaction with hydroperoxides was also reported by
Symposium—/V?O7T//V-Z.//>/0 INTERACTIONS- 763
O’Brien and Frazer (1966). The work of Roubal and Tappel led to their suggestion that protein insolubilization can result from protein-protein interactions initiated by lipid-free radicals as shown in Figure 13.
We studied gelatin-linoleate interactions in the dry state (Zirlin and Karel,1969). From our results, we concluded that reactions of gelatin with lipids can lead to scission of the protein as well as to crosslinking as shown in Figure 13.
In subsequent work we have shown a strong similarity between radiation effects and reactions of proteins with peroxides, and that apparently in both, free radicals may form on a-carbons of the proteins and cysteyl radicals may form in proteins containing cysteine or cystine. The sulfur-containing proteins are more likely to crosslink than gelatin or collagen which contain no sulfur.
We are presently attempting to obtain defininte proof that protein free radicals are actually formed during reactions with lipid peroxides. This is a difficult task, and some authors including Roubal(1970) in his most recent work consider that the ESR signal in proteins after exposure to oxidized lipids is caused by lipid peroxides complexed with proteins.
The role of free radical in lipoprotein formation, reactions and properties is a most challenging subject currently being studied at several institutions. Our group is concentrating on the following aspects of reactions of fatty ester peroxides with proteins in solutions and in the dry state:(a) Nature, origin and fate of free radicals;(b) Similarities between these reactions
and sensitized photooxidation and radiation effects;
(c ) Fate of individual amino acid residues;(d) Potential biological significance of
these reactions. This is an interdisciplinary effort, and in particular the biological aspects are studied in collaboration with our toxicology group under G. Wogan, our animal pathology laboratories under P. Newberne and with R. Wurtman, who, with his colleagues, has made great strides in the effects of light on hormones.
REFERENCES
Anderson, M .L . and S teinberg, M .A . 1 9 6 4 . E ffect o f lip id co n ten t on prote in -sodium linoleate in terac tion in fish muscle hom ogenates. J. Fo od Sci. 29: 3 27 .
Anonym ous. 1 9 7 0 . N ew m odel fo r lip id and protein in m em branes sparks strong debate. Chem . Eng. New s, M ay 25: 40 .
Barber, A .A ., T inberg , H .M . and V ic to r ia , E.J.1970 . The m echanism o f lip id p erox ida tio n in tissues. In “ N u tr it io n ,” Proceedings o f the 8th In te rn a tio n a l Congress, Prague, Septem ber 1 9 6 9 , p. 9 5 . E xcerp ta M ed. (A m s te rdam ).
Berger, K .G . and W h ite , G .W . 1 9 7 1 . A n electron m icroscopical investigation o f fa t de- stab ilization in ice cream . J. Fo od Techno l. 6: 285.
Brunner, J .R . 1 9 6 2 . P ro te in -lip id in teractions
and th e ir re la tio n to the physical-chem ical stab ility o f concentrated m ilk . A review . J. D airy Sci. 4 5 : 9 4 3 .
B runner, J .R . 1 9 6 5 . Physical e qu ilib ria in m ilk fa t. In “ Fundam entals o f D a iry C h e m is try ,” ed W ebb, B .H . and Johnson, A .H . A v i Publ. C o., W estport, Conn.
B runner, J .R . 1 9 6 9 . M ilk lipopro te ins . In “ S tru c tu ra l and F u n c tio n a l Aspects o f L ip o prote ins in L iv ing System s,” ed T r ia , E . and Scanu, A .M ., p. 5 46 . A cadem ic Press, N ew Y o rk and Lo ndo n .
B runner, J .R . and Sw ope, P .C . 1 9 6 9 . S tructure o f the fa t g lobule m em brane. J. D a iry Sci. 52: 1 09 2 .
B u ll, H .B . and Breese, K . 1 9 6 7 . D en atu ra tio n o f prote ins by fa tty acids. A rch . B iochem . B iophys. 1 20 : 3 0 9 . B uttkus , H . 1 9 6 7 . The reaction o f m yosin w ith m alona ldehyde. J. Fo od Sci. 32: 4 32 .
C astleden, J .A . 1 9 6 9 . Phospholip id cell-m em brane m odels. J. P harm acol. Sci. 58: 1 49 .
C hapm an, D . 1 9 6 9 . Th e physico-chem ical approach to the study o f lip o p ro te in in teractions. In “ S tru c tu ra l and F u n c tio n a l Aspects o f L ip o p ro te in s in L iv ing System s,” ed T r ia ,E . and Scanu, A .M ., p. 3. A cadem ic Press, N ew Y o rk and L o ndo n .
C hio , K .S . and T ap p el, A .L . 1 9 6 9 . Synthesis and characterization o f the fluorescent products derived from m alonaldehyde and am ino acids. B iochem istry 8: 2 82 7 .
C oppock, J .B .M . and D aniels, N .W .R . 1 9 6 2 . W heat flo u r lip ids, th e ir ro le in bread m ak ing and n u tritio n . In “ R ecent Advances in Processing Cereals,” S .C .I. M onograph 1 6 , p.1 1 3 . Soc. o f C hem . In d u s try , L o ndo n .
C ra w fo rd , D .L ., Y u , T .C . and S innhuber, R .O .1 9 6 7 . R eaction o f m alonaldehyde w ith pro te in . J. F o o d Sci. 3 2 : 332 .
Davies, J .T . and R idea l, E .K . 1 9 6 3 . “ In terfac ia l Phenom ena.” A cadem ic Press, N ew Y o rk .
D ye r, W .J. and Fraser, D . I . 1 9 5 9 . Proteins in fish muscle. 1 3 . L ip id hydrolysis . J. Fish Res. Board Can. 16: 43.
F in n e y , K .F . 1 9 7 1 . F ractiona tin g and reconstitu tin g techniques to relate fun ctiona l (b read m ak in g ) to b iochem ical properties o f w h eat flo u r com ponents. Cer. Sci. To day 16: 3 4 4 .
F o x , K .K ., H olsinger, V .H ., Caha, J. and Pal- lansch, M .J . 1 9 6 0 . F o rm a tio n o f a fa t p ro te in com plex in m ilk by ho m o geniza tio n . J. D airy Sci. 4 3 : 1 3 9 6 .
G rosskreutz, J .G . 1 9 6 1 . A lip o p ro te in m ode l o f w h eat gluten structure . Cereal C hem . 38:3 36 .
H enson, A .F . , H o ld sw o rth , G . and C handan,R .C . 1 9 7 1 . Physicochem ical analyses o f the bovine m ilk fa t g lobule m em brane. 2. E lectron m icroscopy. J. D a iry Sci. 54: 1 95 2 .
Henstra, S. and S chm id t, D .G . 1 9 7 0 . O n the structure o f the fa t-p ro te in com plex in hom ogenized c o w ’s m ilk . N e th . D a iry J. 24: 4 5 .
Hoseney, R .C ., F in n ey , K .F . , Pom eranz, Y . and Shogren, M .D . 1 9 6 9 . F u n c tio n a l (b read m aking) and b iochem ical p roperties o f w heat flo u r com ponents. 5. R o le o f to ta l extractab le lip ids. Cereal C hem . 4 6: 6 0 6 .
K eeney, P .G . and M aga, J .A . 1 9 6 5 . Factors a ffecting com position and y ie ld o f a foam frac tio n recovered from ice cream . J. D airy Sci. 48: 1 5 9 1 .
K u m m e ro w , F .A . 1 9 6 6 . F o rm a tio n o f lip id -p ro te in com plexes. N u tr . Rev. 2 4 (5 ) : 147 .
Leo , A . and Betscher, J.J. 1 9 7 0 . Use o f sodi- u m -stearoy l-2 -lac ty late to im prove the lip o p ro te in m em brane in nondairy coffee creamers. Fo od Prod. Dev. 4 (4 ): 70.
L ing, G .N ., O chsenfeld, M .N . and K arrem an, G .1 9 6 7 . Is the cell m em brane a universial ra te -lim itin g barrie r to the m ovem ent o f w ater betw een the living cell and its surrounding m edium ? J. G en. Physiol. 50: 1 80 7 .
M ukerjee , P. and Mysels, K .J . 1 9 7 1 . C ritica l m icelle concentrations o f aqueous surfa c ta n t systems. P ub lica tion N S R D S -N B S 3 6 , N a tio n a l Bureau o f Standards, Washingto n D .C .
N arayan , K .A ., Sugai, M . and K u m m e ro w , F .A .1 9 6 4 . C om plex fo rm atio n betw een ox id ized lip ids and egg a lbu m in . J. A m . O il C hem . Soc. 4 1 : 2 54 .
N ishida, T . and K u m m e ro w , F .A . 1 9 6 0 . In te r action o f serum lipop ro te ins w ith the h y d ro perox ide o f m e th y l lino leate . J. L ip id Res. 1: 4 50 .
O ’B rien , P.J. and F razer, A .C . 1 9 6 6 . The effect o f lip id peroxides on the b iochem ical constituents o f the cell. Proc. N u tr . Soc. 2 5 (1 ): 9.
Peereboom , J.W .C . 1 96 9 . M od ern views on the physical s tructure o f the m em brane o f the fa t globules in m ilk and cream and a possib le re la tio n w ith the m igra tion o f copper during b u tte r m anufactu re . F e tte Seifen A nstrich m . 7 1 : 3 14 .
Pethica, B .A . 1 9 6 9 . P hospholipid m onolayers. In “ S tru c tu ra l and F u n c tio n a l Aspects o f L ipop ro te ins in L iving System s,” ed T r ia , E . and Scanu, A .M ., p. 3 7 . A cadem ic Press, N ew Y o rk .
P o k o m y , J, 1 9 6 3 . Uber die B ildung von K om - plexverb indungen bei der R ea k tio n o xy - d ierte r L ip id e m it E iw eissto ffen . F e tte Seifen A nstrichm . 65: 278 .
P o ko rn y , J. and Janicek, G . 1 9 6 8 . R eak tio n o x y d ie rte r L ip id e m it E iw eissto ffen. 4. D ie Bindung o x y d ie rte r L ip id e an Casein. N ahrung 12: 81.
Ponte, J .G . and B aldw in , R .R . 1 9 7 2 . Studies on the lip id system o f flo u r and dough. B aker’s Digest 4 6 (2 ): 28.
Prentice, J .H . 1 96 9 . Th e m ilk fa t globule m em brane, 1 9 5 5 —1 96 8 . D airy Sci. A bstr. 31: 3 53 .
R oub al, W .T . and Tapp el, A .L . 1 9 6 6 . P o lym eriza tion o f prote ins induced by free-radical lip id p ero x id a tio n . A rch . B iochem . B iophys. 1 13 : 1 50 .
R oub al, W .T . 1 9 7 0 . Trapped radicals in dry lip id -p ro te in systems undergoing ox id ation . J. A m . O il C hem . Soc. 47: 1 41 .
Scheraga, H .A . 1 9 6 3 . In term o le c u la r bonds in proteins. 2 . N oncova lent bonds. In “ The P rote ins,” ed N eu ra th , H ., V o l. 1 , p. 4 78 . A cadem ic Press, N ew Y o rk .
S chm id t, D .G . and B uchheim , W . 1 9 7 0 . Elec- tronenm ikroskopische Untersuchung der F e in s tru k tu r von C aseinm icellen in K uh- m ilch. M ilchwiss. 25: 596 .
S chm id t, D .G ., B uchhein , W . and K oops, J.1 9 7 1 . A n electron-m icroscopic study o f the fa t-p ro te in com plexes in evaporated m ilk , using the freeze-etch ing technique. N eth . M ilk D a iry J. 25: 200 .
Singer, S.J. and N icolson , G .L . 1 9 7 2 . The flu id mosaic m odel o f the structu re o f cell m em -
Mbranes. Science 1 75 : 7 20 .Sjostrand, F .S . 1 9 6 9 . M orpholog ica l aspects o f
lip o p ro te in structures. In “ S truc tu ra l and F u n tio n a l Aspects o f L ipop ro te ins in Living Systems, ” ed T r ia , E . and Scanu, A .M ., p.7 3 . A cadem ic Press, N ew Y o rk and London.
T ria , E . and Scanu, A .M ., ed. 1 9 6 9 . “ S tructu ra l and F u n c tio n a l Aspects o f L ipop ro te ins in Living System s.” A cadem ic Press, N ew Y o rk and London.
T ria , E . and B am abei, O . 1 9 6 9 . L ipopro te ins and lipopeptides o f cell m em branes. In “ S truc tu ra l and Fu n c tio n a l Aspects o f L ip o proteins in L iving System s,” ed T ria , E . and Scanu, A .M ., p. 1 4 4 . A cadem ic Press, N ew Y o rk and Londo n .
V a n d e rk o o i, G . and Green, D .E . 1 9 7 1 . N ew in sights in to bio logical m em brane structure. B io l Science 21: 4 0 9 .
W ebb, B .H . and Johnson, A .H . 1 9 6 5 . “ Fu ndam entals o f D a iry C h em istry .” A v i Publishing C o., W estport, Conn.
W olm an , M . 1 9 7 0 . S tructure o f b io log ical m em branes: Th e lam ellar versus the globoid concept. In “ R ecent Progess in Surface Science,” ed D an ie lli, J .F ., R id d ifo rd , A .C . and Rosenberg, M .D ., V o l. 3 , p. 2 6 1 . A cadem ic Press, N ew Y o rk .
W u, L .C . and Bates, R .P . 1 9 7 2 . Soy pro te in - lip id film s. 2. O p tim iza tio n o f film fo rm a tio n . J. Fo od Sci. 37: 40.
Z ir lin , A . and K arel, M . 1 9 6 9 . O x id atio n effects in a freeze-dried ge la tin -m eth y l lino leate m odel system . J. Fo od Sci. 34: 160 .
Ms received 5 /1 2 /7 2 ; accepted 5 /2 5 /7 3 .Presented during the Sym posium on P rote in
In terac tions in Biosystem s at the 32n d A nnual M eeting o f the In s titu te o f Fo od Technologists in M inneapolis.
The paper is C o n tr ib u tio n N o . 1 9 7 4 fro m the D ep t, o f N u tr it io n & F o o d Science, Massachusetts In s titu te o f Techno log y, Cam bridge, M A 0 2 1 3 9 .
This w o rk was supported in part by PHS Research G ran t N o . F D -0 0 0 5 0 -0 9 fro m the Food & D rug A d m in is tra tio n .
% JLg B A S I C S C I E N C E■ ■ ii ■ ■
G. M. E V A N C H O , D. H. A S H T O N a n d E. J. B R I S K E Y
C a m p b e ll I n s t i tu te fo r F o o d R e se a rc h , C a m d e n , N J 0 8 1 0 1
a n d E. J. S C H A N T Z
F o o d R esea rch I n s t i tu te , U n iv e r s ity o f W isco n s in , M a d iso n , W l 5 3 7 0 6
A STANDARDIZED REVERSED PASSIVE HEMAGGLUTINATION TECHNIQUE FOR THE DETERMINATION OF BOTULINUM TOXIN
INTRODUCTION
RAPID DETECTION and identification of the toxins of C lo s t r i d iu m b o t u l i n u m are important for the proper treatment of those afflicted and the determination of the implicated food so that it may be removed from distribution as quickly as possible. The currently accepted method for detection and identification of these toxins in foods, stomach contents and blood is to inject the suspect material into mice, some o f which have been protected with specific antitoxins (Crisley,1964). Quantitation of the toxin is also done by mouse assay, involving the injection of 0.5 ml of a serial dilution of the suspect material intraperitoneally into white mice weighing approximately 20g. The fraction dead in each dilution is recorded over a 96 hr period and the dilution that will kill 50% of the mice (LDS0) determined. A variation of this technique is to inject 0.5 ml o f the undiluted extract intraperitoneally or 0.1 ml intravenously and measure the time from challenge to death. This latter technique is often referred to as the rapid assay because if high amounts of toxin are present, death will occur in about 0.5 hr if the dose is 10 6 LD50, 1 hr if the dose is 1 0 s LDS0 and 2 hr if the dose is 104 LDso- In our experience and in the experience of others (Dack, 1956; Segner and Schmidt, 1968) it is important that the mice die with typical symptoms of botulism or false interpretations may result. This necessitates that mice must be observed at frequent intervals throughout the test period, which could be as long as 96 hr if the toxin level is low. Another factor detracting from the use of the mouse test is that mice of the right age and weight
must be made available continually.Numerous techniques have been devel
oped in recent years attempting to overcome many of the disadvantages of the mouse assay. Any replacement technique, however, should approach the mouse test in sensitivity to be acceptable and should also possess the advantage of being more rapid. Few of the techniques offered as a replacement fulfill these requirements, and many have other disadvantages as well. The use of goldfish in place of mice has been suggested by Crisley (1960) but has never gained acceptance. The fluorescent antibody (FA) technique has been investigated by Kalitina (1960), Bulatova and Kabanova (1960), Boothroyd and Georgala (1964), Walker and Batty(1964), Midura et al. (1967), Lynt et al.(1971) and others with conflicting results and varying degrees of success. A distinct disadvantage of the FA technique is that it does not detect soluble toxin and therefore the mouse test is still required to demonstrate toxicity. Other techniques, such as immunodiffusion (Vermilyea et al., 1968; Anderson and Niedermeyer, 1970; Miller and Anderson, 1971) have limited value because they either lack the required sensitivity, are not extremely rapid or require elaborate procedures.
Rycaj (1956) demonstrated that the hemagglutination (HA) technique could be used to detect minute amounts of type A toxin in foods with greater sensitivity than that achieved with guinea pigs. Yafaev and Chepelev (1961), using indirect hemagglutination, claimed sensitivity equal to that achieved with animal assay but were unable to differentiate between types A and B toxin. Johnson et al. (1966) demonstrated cross-reactions between antisera and toxins of types A
and B but were able to eliminate those cross-reactions by titration of antitoxins with the heterologous antigens. Uemura and Sakaguchi (1971) using reversed passive hemagglutination (RPHA) for the detection of type E toxin showed a toxin detection level o f less than 10 LD50- They experienced cross-reaction between type E antitoxin and 500 LDS0 of type A toxin but not with 2,300 LDS0 o f type B toxin or with 7,500 LDS0 o f type F toxin.
The above RPHA techniques have formed a basis for the development of a practical test for the qualitative and quantitative determination o f the toxins in foods. This paper introduces a means for the standardization o f the test with toxoid prepared from crystalline toxin so that results from different laboratories can be made comparable.
EXPERIMENTALSheep erythrocytes
Formalin-preserved sheep erythrocytes (SRBC) (Difco) were washed once with 0.038M NaHS03 in 0.85% saline (Silverman et al.,1968) and then three times with saline. The washed cells were diluted to a concentration of 2.5% with saline and refrigerated until needed.Antisera
Antiserum against partially purified (alcohol precipitated) botulinum type A toxin was prepared by injection of rabbits with alum adsorbed toxoid (supplied by the Michigan State Department of Health). Antiserum against crystalline type A toxin was prepared by injection of rabbits with toxoid in Freund’s complete adjuvant.
Antitoxin globulin was prepared from rabbit antiserum by saturation with (NH^SC^ to 50%. The precipitate was dissolved in saline to the original volume and reprecipitated with
764- J O U R N A L O F F O O D S C I E N C E - V o l u m e 3 8 (1 9 7 3 )
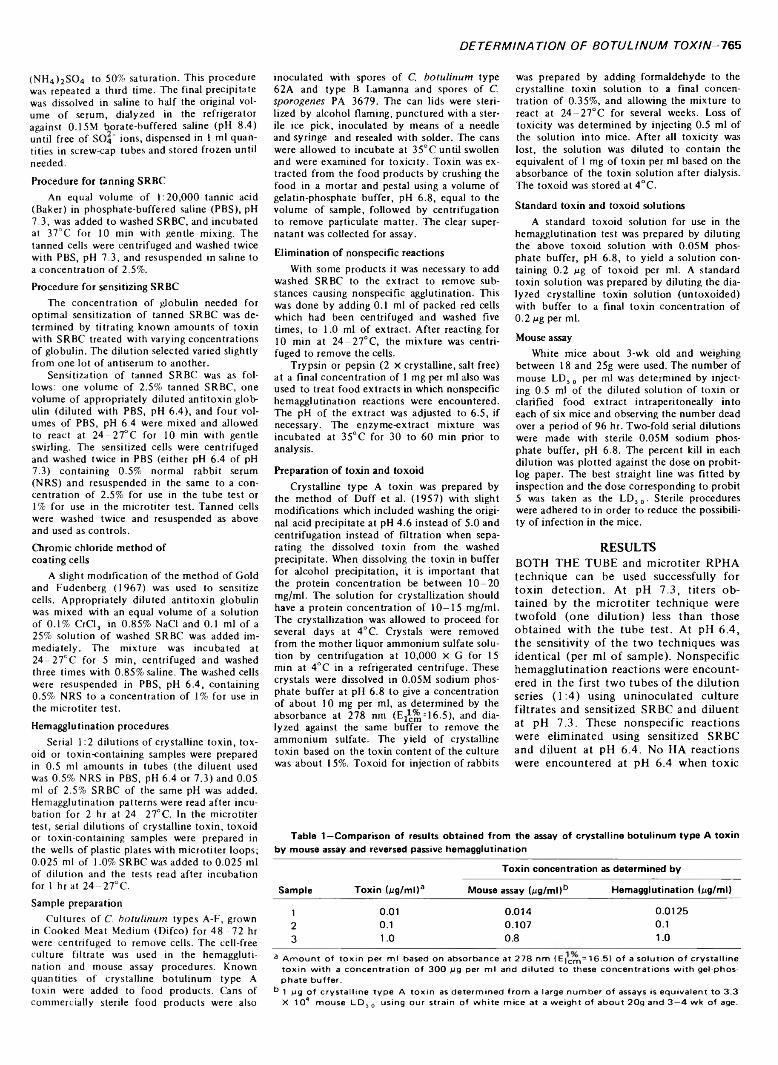
DETERMINATION OF BOTULINUM TOXIN-765
(NH4)2S04 to 50% saturation. This procedure was repeated a third time. The final precipitate was dissolved in saline to half the original volume of serum, dialyzed in the refrigerator against 0.15M borate-buffered saline (pH 8.4) until free of S04" ions, dispensed in 1 ml quantities in screw-cap tubes and stored frozen until needed.Procedure for tanning SRBC
An equal volume of 1:20,000 tannic acid (Baker) in phosphate-buffered saline (PBS), pH7.3, was added to washed SRBC, and incubated at 37°C for 10 min with gentle mixing. The tanned cells were centrifuged and washed twice with PBS, pH 7.3, and resuspended in saline to a concentration of 2.5%.Procedure for sensitizing SRBC
The concentration of globulin needed for optimal sensitization of tanned SRBC was determined by titrating known amounts of toxin with SRBC treated with varying concentrations of globulin. The dilution selected varied slightly from one lot of antiserum to another.
Sensitization of tanned SRBC was as follows: one volume of 2.5% tanned SRBC, one volume of appropriately diluted antitoxin globulin (diluted with PBS, pH 6.4), and four volumes of PBS, pH 6.4 were mixed and allowed to react at 24-27°C for 10 min with gentle swirling. The sensitized cells were centrifuged and washed twice in PBS (either pH 6.4 of pH7.3) containing 0.5% normal rabbit serum (NRS) and resuspended in the same to a concentration of 2.5% for use in the tube test or 1% for use in the microtiter test. Tanned cells were washed twice and resuspended as above and used as controls.Chromic chloride method of coating cells
A slight modification of the method of Gold and Fudenberg (1967) was used to sensitize cells. Appropriately diluted antitoxin globulin was mixed with an equal volume of a solution of 0.1% CrCl3 in 0.85% NaCl and 0.1 ml of a 25% solution of washed SRBC was added immediately. The mixture was incubated at 24-27°C for 5 min, centrifuged and washed three times with 0.85% saline. The washed cells were resuspended in PBS, pH 6.4, containing 0.5% NRS to a concentration of 1% for use in the microtiter test.Hemagglutination procedures
Serial 1:2 dilutions of crystalline toxin, toxoid or toxin-containing samples were prepared in 0.5 ml amounts in tubes (the diluent used was 0.5% NRS in PBS, pH 6.4 or 7.3) and 0.05 ml of 2.5% SRBC of the same pH was added. Hemagglutination patterns were read after incubation for 2 hr at 24-27°C. In the microtiter test, serial dilutions of crystalline toxin, toxoid or toxin-containing samples were prepared in the wells of plastic plates with microtiter loops; 0.025 ml of 1.0% SRBC was added to 0.025 ml of dilution and the tests read after incubation for 1 hr at 24-27°C.Sample preparation
Cultures of C. h o tu l in u m types A-F, grown in Cooked Meat Medium (Difco) for 48-72 hr were centrifuged to remove cells. The cell-free culture filtrate was used in the hemagglutination and mouse assay procedures. Known quantities of crystalline botulinum type A toxin were added to food products. Cans of commercially sterile food products were also
inoculated with spores of C. b o tu l in u m type 62A and type B Lamanna and spores of C. sp o r o g e n e s PA 3679. The can lids were sterilized by alcohol flaming, punctured with a sterile ice pick, inoculated by means of a needle and syringe and resealed with solder. The cans were allowed to incubate at 35°C until swollen and were examined for toxicity. Toxin was extracted from the food products by crushing the food in a mortar and pestai using a volume of gelatin-phosphate buffer, pH 6.8, equal to the volume of sample, followed by centrifugation to remove particulate matter. The clear supernatant was collected for assay.Elimination o f nonspecific reactions
With some products it was necessary to add washed SRBC to the extract to remove substances causing nonspecific agglutination. This was done by adding 0.1 ml of packed red cells which had been centrifuged and washed five times, to 1.0 ml of extract. After reacting for 10 min at 24-27°C, the mixture was centrifuged to remove the cells.
Trypsin or pepsin (2 x crystalline, salt free) at a final concentration of 1 mg per ml also was used to treat food extracts in which nonspecific hemagglutination reactions were encountered. The pH of the extract was adjusted to 6.5, if necessary. The enzyme-extract mixture was incubated at 35°C for 30 to 60 min prior to analysis.
Preparation o f toxin and toxoidCrystalline type A toxin was prepared by
the method of Duff et al. (1957) with slight modifications which included washing the original acid precipitate at pH 4.6 instead of 5.0 and centrifugation instead of filtration when separating the dissolved toxin from the washed precipitate. When dissolving the toxin in buffer for alcohol precipitation, it is important that the protein concentration be between 10-20 mg/ml. The solution for crystallization should have a protein concentration of 10-15 mg/ml. The crystallization was allowed to proceed for several days at 4°C. Crystals were removed from the mother liquor ammonium sulfate solution by centrifugation at 10,000 x G for 15 min at 4°C in a refrigerated centrifuge. These, crystals were dissolved in 0.05M sodium phosphate buffer at pH 6.8 to give a concentration of about 10 mg per ml, as determined by the absorbance at 278 nm (£¿^, = 16.5), and dialyzed against the same buffer to remove the ammonium sulfate. The yield of crystalline toxin based on the toxin content of the culture was about 15%. Toxoid for injection of rabbits
was prepared by adding formaldehyde to the crystalline toxin solution to a final concentration of 0.35%, and allowing the mixture to react at 24-27°C for several weeks. Loss of toxicity was determined by injecting 0.5 ml of the solution into mice. After all toxicity was lost, the solution was diluted to contain the equivalent of 1 mg of toxin per ml based on the absorbance of the toxin solution after dialysis. The toxoid was stored at 4°C.
Standard toxin and toxoid solutionsA standard toxoid solution for use in the
hemagglutination test was prepared by diluting the above toxoid solution with 0.05M phosphate buffer, pH 6.8, to yield a solution containing 0.2 Mg of toxoid per ml. A standard toxin solution was prepared by diluting the dialyzed crystalline toxin solution (untoxoided) with buffer to a final toxin concentration of 0.2 Mg per ml.Mouse assay
White mice about 3-wk old and weighing between 18 and 25g were used. The number of mouse LDS 0 per ml was determined by injecting 0.5 ml of the diluted solution of toxin or clarified food extract intraperitoneally into each of six mice and observing the number dead over a period of 96 hr. Two-fold serial dilutions were made with sterile 0.05M sodium phosphate buffer, pH 6.8. The percent kill in each dilution was plotted against the dose on probit- log paper. The best straight line was fitted by inspection and the dose corresponding to probit 5 was taken as the LDS 0. Sterile procedures were adhered to in order to reduce the possibility of infection in the mice.
RESULTSBOTH THE TUBE and microtiter RPHA technique can be used successfully for toxin detection. At pH 7.3, titers obtained by the microtiter technique were twofold (one dilution) less than those obtained with the tube test. At pH 6.4, the sensitivity of the two techniques was identical (per ml o f sample). Nonspecific hemagglutination reactions were encountered in the first two tubes of the dilution series (1:4) using uninoculated culture filtrates and sensitized SRBC and diluent at pH 7.3. These nonspecific reactions were eliminated using sensitized SRBC and diluent at pH 6.4. No HA reactions were encountered at pH 6.4 when toxic
Table 1—Comparison of results obtained from the assay of crystalline botulinum type A toxin by mouse assay and reversed passive hemagglutination
Sample Toxin <Mg/ml)a
Toxin concentration as determined by
Mouse assay (Mg/ml )b Hemagglutination (Mg/ml)
1 0.01 0.014 0.01252 0.1 0.107 0.13 1.0 0.8 1.0
a A m o u n t o f to x in p e r m l b ased o n a b s o rb a n c e a t 2 7 8 n m ( E | c m = 1 6 .5 ) o f a s o lu t io n o f c r y s ta ll in e to x in w ith a c o n c e n t ra t io n o f 3 0 0 M9 per m l an d d ilu te d to th e se c o n c e n t ra t io n s w ith g e l-p h o sp h a te b u ffe r .
b 1 M9 o f c r y s t a l l in e ty p e A to x in as d e te rm in e d fro m a la rg e n u m b e r o f a s sa y s is e q u iv a le n t to 3 .3 X 1 0 4 m o u se L D S0 u s in g o u r s t ra in o f w h ite m ic e a t a w e ig h t o f a b o u t 2 0 g an d 3 —4 w k o f age.
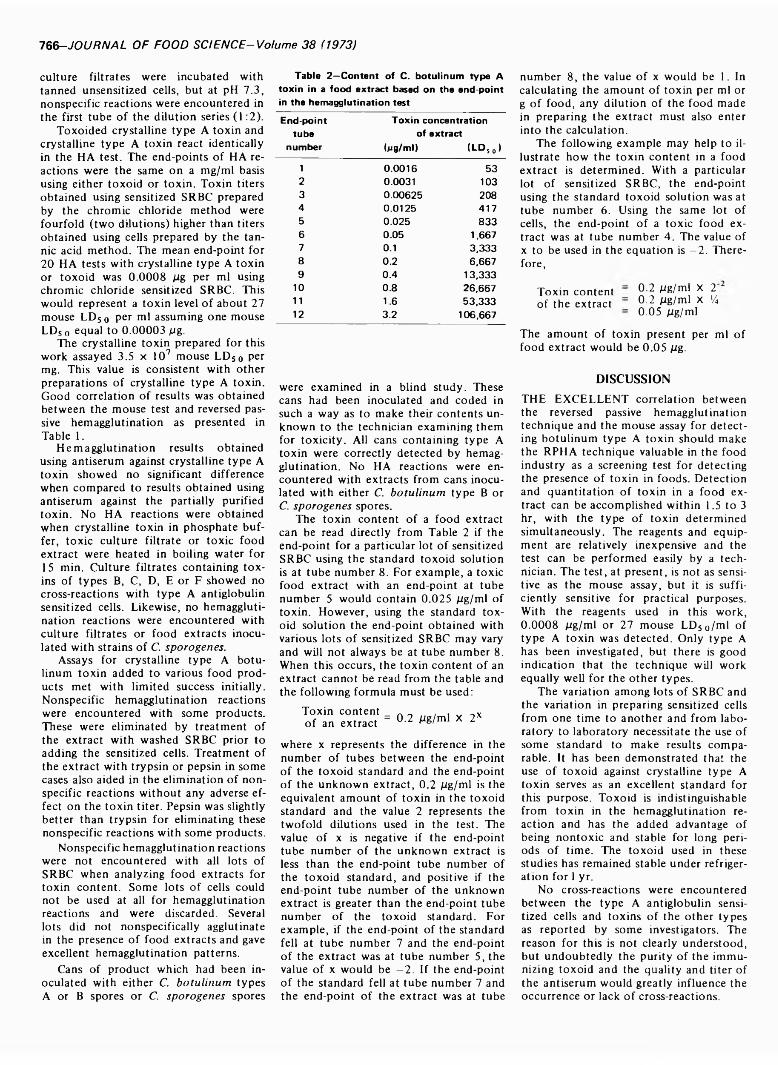
766-JOURNAL OF FOOD SCIENCE-Volume 38 (1973)
culture filtrates were incubated with tanned unsensitized cells, but at pH 7.3, nonspecific reactions were encountered in the first tube of the dilution series ( 1 :2 ).
Toxoided crystalline type A toxin and crystalline type A toxin react identically in the HA test. The end-points of HA reactions were the same on a mg/ml basis using either toxoid or toxin. Toxin titers obtained using sensitized SRBC prepared by the chromic chloride method were fourfold (two dilutions) higher than titers obtained using cells prepared by the tannic acid method. The mean end-point for 20 HA tests with crystalline type A toxin or toxoid was 0.0008 Mg per ml using chromic chloride sensitized SRBC. This would represent a toxin level o f about 27 mouse LD50 per ml assuming one mouse LDS0 equal to 0.00003 Mg-
The crystalline toxin prepared for this work assayed 3.5 x 1 0 7 mouse LDS0 per mg. This value is consistent with other preparations of crystalline type A toxin. Good correlation of results was obtained between the mouse test and reversed passive hemagglutination as presented in Table 1.
Hemagglutination results obtained using antiserum against crystalline type A toxin showed no significant difference when compared to results obtained using antiserum against the partially purified toxin. No HA reactions were obtained when crystalline toxin in phosphate buffer, toxic culture filtrate or toxic food extract were heated in boiling water for 15 min. Culture filtrates containing toxins of types B, C, D, E or F showed no cross-reactions with type A antiglobulin sensitized cells. Likewise, no hemagglutination reactions were encountered with culture filtrates or food extracts inoculated with strains of C. s p o r o g e n e s .
Assays for crystalline type A botu- linum toxin added to various food products met with limited success initially. Nonspecific hemagglutination reactions were encountered with some products. These were eliminated by treatment of the extract with washed SRBC prior to adding the sensitized cells. Treatment of the extract with trypsin or pepsin in some cases also aided in the elimination of nonspecific reactions without any adverse effect on the toxin titer. Pepsin was slightly better than trypsin for eliminating these nonspecific reactions with some products.
Nonspecific hemagglutination reactions were not encountered with all lots of SRBC when analyzing food extracts for toxin content. Some lots of cells could not be used at all for hemagglutination reactions and were discarded. Several lots did not nonspecifically agglutinate in the presence of food extracts and gave excellent hemagglutination patterns.
Cans of product which had been inoculated with either C. b o t u l i n u m types A or B spores or C. s p o r o g e n e s spores
Table 2—Content of C. botulinum type A toxin in a food extract based on the end-point in the hemagglutination testEnd-point Toxin concentration
tube of extractnumber (pg/ml) <l d50)
1 0.0016 532 0.0031 1033 0.00625 2084 0.0125 4175 0.025 8336 0.05 1.6677 0.1 3,3338 0.2 6,6679 0.4 13,333
10 0.8 26,66711 1.6 53,33312 3.2 106,667
were examined in a blind study. These cans had been inoculated and coded in such a way as to make their contents unknown to the technician examining them for toxicity. All cans containing type A toxin were correctly detected by hemagglutination. No HA reactions were encountered with extracts from cans inoculated with either C. b o t u l i n u m type B orC. s p o r o g e n e s spores.
The toxin content of a food extract can be read directly from Table 2 if the end-point for a particular lot o f sensitized SRBC using the standard toxoid solution is at tube number 8 . For example, a toxic food extract with an end-point at tube number 5 would contain 0.025 Mg/ml of toxin. However, using the standard toxoid solution the end-point obtained with various lots o f sensitized SRBC may vary and will not always be at tube number 8 . When this occurs, the toxin content of an extract cannot be read from the table and the following formula must be used:
Toxin content of an extract = 0.2 Mg/ml X 2X
where x represents the difference in the number of tubes between the end-point of the toxoid standard and the end-point of the unknown extract, 0.2 Mg/ml is the equivalent amount of toxin in the toxoid standard and the value 2 represents the twofold dilutions used in the test. The value of x is negative if the end-point tube number of the unknown extract is less than the end-point tube number of the toxoid standard, and positive if the end-point tube number of the unknown extract is greater than the end-point tube number of the toxoid standard. For example, if the end-point of the standard fell at tube number 7 and the end-point of the extract was at tube number 5, the value of x would be —2 . If the end-point of the standard fell at tube number 7 and the end-point o f the extract was at tube
number 8 , the value of x would be 1 . In calculating the amount of toxin per ml or g of food, any dilution of the food made in preparing the extract must also enter into the calculation.
The following example may help to illustrate how the toxin content in a food extract is determined. With a particular lot of sensitized SRBC, the end-point using the standard toxoid solution was at tube number 6 . Using the same lot of cells, the end-point o f a toxic food extract was at tube number 4. The value of x to be used in the equation is - 2 . Therefore,
Toxin content of the extract
0.2 Mg/ml X 2' 0.2 Mg/ml X 'A 0.05 Mg/ml
The amount of toxin present per ml of food extract would be 0.05 Mg-
DISCUSSIONTHE EXCELLENT correlation between the reversed passive hemagglutination technique and the mouse assay for detecting botulinum type A toxin should make the RPHA technique valuable in the food industry as a screening test for detecting the presence of toxin in foods. Detection and quantitation of toxin in a food extract can be accomplished within 1.5 to 3 hr, with the type of toxin determined simultaneously. The reagents and equipment are relatively inexpensive and the test can be performed easily by a technician. The test, at present, is not as sensitive as the mouse assay, but it is sufficiently sensitive for practical purposes. With the reagents used in this work, 0.0008 Mg/ml or 27 mouse LD50/ml of type A toxin was detected. Only type A has been investigated, but there is good indication that the technique will work equally well for the other types.
The variation among lots of SRBC and the variation in preparing sensitized cells from one time to another and from laboratory to laboratory necessitate the use of some standard to make results comparable. It has been demonstrated that the use of toxoid against crystalline type A toxin serves as an excellent standard for this purpose. Toxoid is indistinguishable from toxin in the hemagglutination reaction and has the added advantage of being nontoxic and stable for long periods of time. The toxoid used in these studies has remained stable under refrigeration for 1 yr.
No cross-reactions were encountered between the type A antiglobulin sensitized cells and toxins of the other types as reported by some investigators. The reason for this is not clearly understood, but undoubtedly the purity of the immunizing toxoid and the quality and titer of the antiserum would greatly influence the occurrence or lack of cross-reactions.
DETERMINATION OF BOTULINUM TOXIN-767
The method used for the sensitization of cells appears to influence the sensitivity of the hemagglutination technique. When using cells sensitized by the chromic chloride method, the sensitivity of the RPHA technique was invariably greater than when using cells sensitized by the tannic acid method. The chromic chloride method also has the advantage of being a one-step method and being considerably more rapid.
Differences in cell patterns and endpoints in the hemagglutination reaction were noted between various lots o f commercially available SRBC. Some cells formed tight, compact buttons to indicate a negative reaction whereas others formed more diffuse buttons. Some lots were not acceptable for use in hemagglutination tests because of the spontaneous agglutination encountered with some food extracts. The time required for hemagglutination patterns to develop also varied from lot to lot. It is advisable that when a good lot o f cells is encountered, a large quantity of these cells be acquired. Formalinized, unsensitized cells remain acceptable for over a year and when sensitized and stored at 4°C are satisfactory for at least 4 to 5 months.
Nonspecific hemagglutination reactions were not encountered with all products tested, but when encountered, were easily eliminated by one of several treatments. The method of choice would be influenced by the product and it is suggested that an assay technique be determined for each type of product to be examined.
Reversed passive hemagglutination is a rapid screening technique applicable to the detection of type A botulinum toxin
in culture filtrates or food extracts. With the reagents used in this work, 0.0008 Atg/ml of type A toxin was detected. Nonspecific reactions encountered with some food extracts were easily eliminated. The technique presented minimizes differences encountered between different laboratories, using different antisera and different lots o f cells by using a standardized toxoid solution. This standardized toxoid solution will be available upon request for research purposes and can be obtained through Dr. E.J. Schantz at the Food Research Institute, Madison, Wise.
REFERENCESA nderson , A .W . and N iederm eyer, G .J. 1 9 7 0 .
In v itro d e tectio n o f C lostrid ium b o tu lin u m . Proc. 1st U .S .—Japan C o n f. on T o x ic M ic ro organisms. U .S . D e p t, o f In te r io r. S up t. o f D ocum ents, U .S . G ovt. P rin ting O ffice , W ashington, D .C .
B o o th ro yd , M . and Georgala, D .L . 1 9 6 4 . Im - m uno fluo rescen t id en tific a tio n o f C los trid ium b o tu lin u m . N atu re 2 02 : 5 1 5 .
B ulatova, T . I . and K abanova, Y .A . 1 9 6 0 . Id e n tif ic a tio n o f the bo tu lism pathogen w ith lum inescent sera. J. M ic ro b io l. E p id e m . Im m u n o b io l. 3 1 : 4 0 3 .
C risley, F .D . 1 9 6 0 . R o u tin e m eth od fo r the goldfish assay o f to x in in crude culture centrifugates o f C los trid ium b o tu lin u m typeA . A p p l. M ic ro b io l. 8: 2 8 2 .
C risley, F .D . 1 9 6 4 . D em o n stra tio n o f bo tu linus tox in s and C los trid ium b o tu lin u m in foods. In “ E x a m in a tio n o f Foods fo r E n te ropa tho - genic and In d ic a to r B acteria .” Public H ea lth Service P ub lica tion N o . 1 1 4 2 . Public H ea lth Service, W ashington, D . C.
D ac k , G .M . 1 9 5 6 . “ F o o d Poisoning,” 3rd ed.Th e U n ivers ity o f Chicago Press, Chicago.
D u ff , J .T ., W rig h t, G .G ., K le re r, J ., M o o re , D .E . and B ib ler, R .H . 1 9 5 7 . Studies on im m u n ity to toxins o f C los trid ium b o tu lin u m . 1. A s im p lified procedure fo r iso lation o f type A to x in . J. B acterio l. 7 3 : 4 2 .
G o ld , E .R . and Fudenberg , H .H . 1 9 6 7 . C hrom ic ch lo ride: A coup ling reagent fo r passivehem agglu tination reactions. J. Im m u n o l. 9 9 : 8 5 9 .
Johnson, H .M ., B renner, K ., A n g e lo tti, R . and H a ll, H .E . 1 9 6 6 . Serological studies o f types A , B and E b o tu lin a l tox in s by passive
hem agglu tination and b en to n ite floccula tio n . J. B acterio l. 9 1 : 9 6 7 .
K a lit in a , T .A . 1 9 6 0 . The d e tection o f C lostrid iu m b o tu lin u m by means o f lum inescent antibodies. C om m u nica tion 1. The productio n o f specific luminescence in C lostrid ium b o tu lin u m by trea tm e n t w ith a lum inescent im m u n e serum . B u ll. B io l. M ed . E x p . 49: 8 1 .
L y n t, R .K ., S o lom on , H .M . and K a u tte r , D .A .1 9 7 1 . Im m unofluorescence am ong strains o f C lostrid ium b o tu lin u m and o ther c lostrid ia b y d irect and in d irect m ethods. J. F o o d Sci. 36: 5 9 4 .
M id u ra , T .F ., In o u y e , Y . and B o d ily , H .L .1 9 6 7 . Use o f im m unofluorescence to id en tify C los trid ium b o tu lin u m types A , B and E . Public H ea lth R ep orts . 8 2 :2 7 5 .
M ille r , C . and A nderson, A .W . 1 9 7 1 . R ap id detectio n and qu an tita tive estim ation o f ty p e A b o tu lin u m to x in by e lec tro im m u nod iffu s io n . A p p l. M ic ro b io l. 4 :1 2 6 .
R yc a j, T . 1 9 5 6 . Th e testing o f foo d fo r b o tu - lin ic typ e A to x in w ith the aid o f the spec ific hem agglu tination m eth od . Bull. Acad. P olon . Sci. Classe I I . 4: 3 1 7 .
Segner, W .P. and S chm id t, C .F . 1 9 6 8 . Nonspec ific tox ic ities in the mouse assay test for b o tu lin u m to x in . A p p l. M ic ro b io l. 16: 1 1 0 5 .
S ilverm an, S .J., K n o tt , A .R . and H o w a rd , M .1 9 6 8 . R ap id , sensitive assay fo r s taphy lo coccal e n te ro to x in and a com parison o f serological m ethods. A p p l. M ic ro b io l. 16: 1 0 1 9 .
U em u ra , T . and Sakaguchi, G . 1 9 7 1 . Reversed passive hem agglu tination o f C lostrid ium b o tu lin u m typ e E to x in . Jap. J. V e t. Sci. 33: 8 2 .
V e rm ily ea , B .L ., W alker, H .W . and Ayres, J.C.1 9 6 8 . D e te c tio n o f b o tu lin a l tox ins by im m u n o d iffu s io n . A p p l. M ic ro b io l. 16: 2 1 .
W alker, P .D . and B a tty , I . 1 9 6 4 . Fluorescent studies in the genus C lo s trid iu m . 2. A rap id m eth o d fo r d iffe re n tia tin g C lostrid ium b o tu lin u m types A , B and F , types C and D , and ty p e E . J . A p p l. B acterio l. 2 7 : 1 40 .
Y a fae v , R .K . and Chepelev, S .A . 1961. A p p lica tion o f in d irect hem agglu tination reaction fo r determ in ing b o tu lin in sausages. Z h . M ik ro b io l. E p id em io l. Im m u n o b io l. 32: 2 1 .
M s received 1 /2 8 /7 3 ; revised 3 /2 4 /7 3 ; accepted 3 /2 7 /7 3 . _____________
The authors g ra te fu lly acknowledge the generosity o f D r. E .M . Foster and D r. H . Sugi- yam a o f the Fo o d Research In s titu te , M adison, Wise, fo r provid ing labo ra to ry space and equipm en t so th a t th is w o rk could be successfully com pleted .
J O R G E C H I R I F E ' a n d M A R C U S K A R E L D ep t, o f N u tr i t io n & F o o d S c ie n c e , M a ssa ch u se tts I n s t i tu te o f T e c h n o lo g y , C a m b rid g e , M A 0 2 1 3 9
CONTRIBUTION OF ADSORPTION TO VO LATILE RETENTION IN A FREEZE-DRIED FOOD MODEL CONTAINING PVP
INTRODUCTIONIN A PREVIOUS paper we reported that in a freeze-dried system containing PVP (polyvinylpyrrolidone) and n-propanol the retention of most of the alcohol could be explained by entrapment of the alcohol in microregions formed by PVP (Chirife et al., 1973). There appeared to be a competition for water sorbing sites by the entrapped propanol, resulting in reduction of water sorbing capacity at levels below the BET monolayer value.
The ability of various polar sites in hydrophilic polymers to adsorb either water or alcohol has also been observed by Le Maguer (1972) and Fogiel and Heller(1966).
In the present study we show the extent to which adsorption is important in the retention of n-propanol in freeze- dried PVP solutions.
MATERIALS & METHODSModel system preparation
The model system consisted of a water- soluble polymer (PVP), 14C-labeled n-propanol and water.
The system was prepared by dissolving the desired amount of PVP in water and adding n-propanol. 5-ml aliquots of the solution were pipetted into 50-ml Erlenmeyer flasks, frozen as specified below and then freeze dried at room temperature and at a chamber pressure of less than 1 00/j for 48 hr in a Virtis freeze drier (Model 10-MRTR). Temperatures were not measured during freeze drying. The drying took place with limited heat transfer and unheated platens at low chamber pressures. No melting or collapse was observed in any of the samples during freeze drying. The conditions of freeze drying were identical to those previously found by us to give high volatile retentions in carbohydrate-volatile systems.
The volume of solution per flask and resultant sample thickness varied in some experiments, as noted under Results & Discussion.
The composition of the system was fixed as the following initial concentration expressed in weight percent: PVP 20%, n-propanol 1%, water 79%.
Samples were frozen by one of two methods: rapid freezing was accomplished by immersion of flasks in liquid nitrogen; slow freezing
1 Present address: D epartam ento de Industrias, Facu ltad de Ciencias Exactas y Naturales, Buenos A ires, A rgentina
by placing the stoppered flasks in still air at -40°C.PVP
Polyvinylpyrrolidone K-30 (molecular weight 40,000) was obtained from Matheson, Coleman and Bell (East Rutherford, N. J.).N-propanol
Reagent grade n-propanol was mixed with 14C-labeled n-propanol to give the desired specific radioactivity. The radioactive propanol was obtained from International & Nuclear Corp., Irving, Calif.
Hum idification experimentsin several experiments freeze-dried
PVP-n-propanol systems were humidified by placing tared and weighed flasks in vacuum
desiccators containing saturated salt solutions, which maintained the desired constant relative humidities.N-propanol analysis
The n-propanol content was determined by measuring the radioactivity of the samples with a liquid scintillation counter.
The dried samples of PVP were dissolved in water (to 10% solution); 1 ml of this solution was added to 10 ml of water-miscible scintillator (2,5-diphenyloxazole, lg; naphthalene, 100g; dioxane to 1,000 ml volume) in the counting vial, and the resulting solution was counted with a liquid scintillation counter (Nuclear Chicago Corp., 720 series).N-propanol adsorption
Some experiments on sorption of n-propa-
HEATEDBLOWER
Q n-PROPANOL @ SAMPLE© CONSTANT TEMPERATURE (?) THERMOMETER
BATH(?) THERMOMETER
Fig. 1 —A p p a r a tu s fo r s tu d y o f n -p ro p a n o l a d s o r p tio n o n PVP.
O->0.c*oo
I 2
zUJ0 6
0 4
0.2 .
0
o
kII % RH FROZEN SLOWLY
o
11% RH FROZEN RAPIDLY‘ - A ----- A --------
•52% RH FROZEN RAPim v
------- A ____
0 20 4 0 6 0 8 0 1 0 0 120TIM E (HOURS)
Fig. 2 —R e te n t io n o f n -p ro p a n o l in fr e e ze -d r ie d P V P h u m id i f i e d to 11% a n d 52% R H .
7 6 8 - J O U R N A L O F F O O D S C I E N C E - V o l u m e 3 8 ( 1 9 7 3 )
FREEZE-DRIED FOOD MODEL WITH PVP- 769
not in freeze-dried PVP were carried out as shown in Figure 1. The sample was maintained at 24°C by circulating heated air from a blower operated by a temperature control. The activity of the n-propanol vapor in the evacuated system shown in Figure 1 was regulated by controlling the temperature in the cold bath.
RESULTS & DISCUSSION
RETENTION of n-propanol after freeze
drying solutions of PVP and n-propanol depends on freezing rate, sample thickness, drying conditions and the concentration of PVP and propanol (Chirife et al., 1973). Under typical drying conditions for 25% PVP, 1% n-propanol solution, the retention was 0.49g n-propanol/ 100g PVP in rapidly frozen samples and 1.2g/100g in slowly frozen systems. Most of the retained alcohol was entrapped in
ternally in microregions, as evidenced by lack of desorption in the absence of structural disruption by water (Chirife et al.,1973).
There appeared to be indications, however, that part of the alcohol may be retained after freeze drying by strong adsorption. Relative contribution of adsorption is likely to be most pronounced in rapidly frozen systems in which the microregion development is less complete than in slow frozen systems, especially in the case of polymers which have a low mobility, and in which entrapment is more difficult.
Figure 2 shows the n-propanol content in freeze-dried PVP after humidificaiton to 11% and 52% RH. In the PVP system the BET monolayer value for water, at which microregion disruption begins to occur, corresponds to 30% RH (Chirife et al., 1972). The loss at 11% RH therefore may be due to desorption of the adsorbed fraction; relative contribution is greater in rapidly-frozen PVP than in slowly-frozen PVP, even though the absolute losses at 11% RH are comparable (0.1 lg/100g PVP for slow frozen and 0 .15g/l lOg for rapidly frozen).
Fast and slow frozen freeze-dried PVP-n-propanol systems were kept at very low humidity by placing samples in evacuated desiccators containing activated charcoal and calcium sulfate at 37°C and 50°C with the loss of n-propa- nol determined. Results are shown in Figure 3. In all cases there is a loss asymptotically approaching a value dependent on temperature. These losses are likely to correspond to the portion of total alcohol which is held by “adsorption irreversible by freeze drying” but reversible by desorption at a higher temperature. The remaining n-propanol is held in microregions which are impermeable until disrupted by treatment with water vapor or possibly other structure-disrupting treatments (polar solvents, very high temperature). The fractional contribution of adsorption is larger for rapidly frozen than for slowly frozen samples. However, the absolute losses do not differ much: at 50°C and 93 hr 0.20g n-propanol/lOOg PVP are lost in slowly frozen samples, and 0.19g/100g PVP in rapidly frozen samples.
In order to confirm that a portion of the total propanol retained after freeze drying of PVP is capable of being held by adsorption, we conducted adsorption-desorption experiments. Freeze-dried samples of PVP containing no propanol were placed in a vacuum oven at 95—100°C for 72 hr to remove the last traces of water. Adsorption of n-propanol was then carried out at room temperature (24°C) by exposing the samples to the alcohol vapor at propanol activities of 0.20 or 0.11. The samples were then transferred to a vacuum desiccator con-
Fig. 3 —R e te n t io n o f n -p r o p a n o l in fr e e ze -d r ie d P V P d u r in g d e s o r p tio n a t 3 7 ° C a n d 5 0 ° C: (A I S lo w ly fr o z e n , d e s o r p t io n a t 3 7 ° C; (B ) S lo w ly fr o z e n , d e s o r p t io n a t 5 0 ° C; (C) R a p id ly fr o z e n , d e s o r p t io n a t 3 7 ° C; ID ) R a p id ly f r o z e n , d e s o r p t io n a t 5 0 ° C. N -p ro p a n o l c o n te n t a f te r fre e ze d ry in g : (A ) a n d IB ): 1 .2 g /1 0 0 g P V P ; (C) a n d ID ): 0 .4 9 g /1 0 0 g PVP.
Fig. 4 —D e s o rp tio n o f w a te r a n d o f a lc o h o ls a f te r a d s o r p t io n o n freeze- d r ie d P V P : IA ) W ater, d e s o r p t io n a t 2 5 ° C; IB) N -p ro p a n o l Ia d so rp tio n a t p r o p a n o l a c t iv i ty o f 0 .2 ) d e s o r p tio n a t 25°C; (C) N -p ro p a n o l lad- s o r p t io n a t p r o p a n o l a c t iv i ty o f 0 .1 1 ) d e s o r p tio n a t 2 5 ° C; ID ) N p r o p a n o l Ia d so r p tio n a t p r o p a n o l a c t iv i ty o f 0 .1 1 ) d e s o r p tio n a t 3 7 ° C; IE) N -h e p ta n o l, d e s o r p t io n a t 2 5 ° C.
770-JOURNAL OF FOOD SCIENCE-Volume 38 (1973)
Fig. 5 —D e s o rp tio n o f n -p ro p a n o l a d s o r b e d b y d r y P V P b y e x p o s u r e to s a tu r a te d vapor.
taining activated charcoal and calcium sulfate; desorption of n-propanol was followed with time at either 25°C or 37°C.
Figure 4 shows the decrease of adsorbed amount with time. It can be seen that, following an initial rapid rate of desorption, the removal of n-propanol continues very slowly and appears to approach a constant retention level; this level decreases with increase in temperature (curves B and D).
The interpretation of this phenomenon could be simply made on the basis of the energies o f activation of desorption (Bliznakov and Polikarova, 1966). The removal o f each successive portion of alcohol is more difficult due to the increase of the energy barrier, until a value is reached of the energy of desorption at which the rate of the process becomes practically zero. This will determine the irreversible amount of adsorbed n-propanol.
However, that the situation is not so simple is clearly illustrated by curve C in Figure 4, which corresponds to a sample adsorbed initially at a lower vapor activity (0.11) than that for curve B (0.20) and even more dramatically in Figure 5 which shows desorption of n-propanol after exposure to saturated vapor of the alcohol up to the adsorption of about 12%. The amount of retained n-propanol depends on the initial amount adsorbed and on the activity of the sorbate. Even at the relatively low vapor activities in Figure 4 n-propanol is capable of penetration into the PVP structure and subsequent entrapment.
This fact makes difficult to assign the total retention observed in adsorption experiments to a true adsorption process. This is also confirmed by the results showed by curve E (Fig. 4) corresponding to the desorption of adsorbed n-heptanol: the retained amount is practically zero. Heptanol does not readily dissolve PVP, in contrast to n-propanol.
The retention of strongly adsorbed alcohol in the polar PVP in preference to water would be difficult to accept in view of the relative polarities of water and propanol. However, our experiments in the PVP system showed that there is water retention in addition to n-propanol retention: 20 samples of 20% PVP solutions (3.5 mm thickness) without volatile were freeze dried in standard conditions for 48 hr. The samples were analyzed gravimet- r ica lly (2 4 hr, vacuum oven at 95—100 C) for residual moisture content. No significant difference was found between slow and fast frozen samples. The “water retention” was found to be 0.66 ± 0.11 g water/1 OOg PVP.
For fast frozen samples the retention of n-propanol was 0.49g n-propanol/1 OOg PVP. On molar basis the retention of water alone is much higher than the total retention of the n-propanol, which also
included the alcohol entrapped in microregions. The values for water are: 14.7 moles/mole PVP; for n-propanol they are3.27 moles propanol/mole PVP.
Desorption of previously adsorbed water was studied in the following experiment: Samples of PVP freeze dried without n-propanol were placed in a vacuum oven at 95— 100°C for a period of 24 hr. The dry weight was recorded. The samples were placed in a vacuum desiccator over a constant humidity solution until they reached an equilibrium moisture content of 13.5g water/1 OOg PVP. The samples were then removed and desorbed by evacuation over a bed of calcium sulfate. Figure 4, curve A shows the decrease of the adsorbed amount (on molar basis) o f water with time. It can be seen that below about 0.039 moles water/1 OOg PVP (~0 .71g w ater/1 OOg PVP) there is almost no decrease with time. This amount of adsorbed water is close to the water content retained after freeze drying (0 .6 6 ± 0 .1 1 g water/1 OOg PVP). This strong semipermanent adsorption responsible for part of the retention is referred to as irreversible adsorption, which is defined as the situation occuring when there is adsorbed material which cannot be removed by evacuation at the temperature at which the adsorption was carried out (Clark-Monks et al., 1970).
Additional evidence for adsorption as a mechanism for part of retention in the PVP systems was obtained from experi
ments with layered systems. Samples were prepared by rapidly freezing alternate layers of a solution containing no volatile and layers of a solution containing the volatile. Each layer was completely frozen before the next layer was added. After the standard cycle of freeze drying (48 hr) the layers were separated for individual analysis. In some samples the layers were separated by thin brass mesh to avoid any “contamination” between layers. In other samples, an already freeze-dried layer of PVP with no n-pro- panol was placed on the frozen layer containing the volatile.
Good agreement was found among all the samples: it was observed that the amount of n-propanol adsorbed in the dry layers was about 1 0 % of the total retention found in the layers originally containing the volatile. The absolute amounts were 0 .0 4 7 -0 .0 6 lg n-propanol/ lOOg PVP.
We can now explain the observed results by the hypothesis that, in addition to the bulk of the retained alcohol which is entrapped in impermeable microregions, a portion of the retained alcohol and a portion of the water remaining after freeze drying are held by adsorption outside the impermeable microregions.
The situation in which two vapors are in competition for sites capable of adsorbing either vapor can be approximated by equations ( 1 ) and (2 ) derived from the Langmuir isotherm, provided that the as-
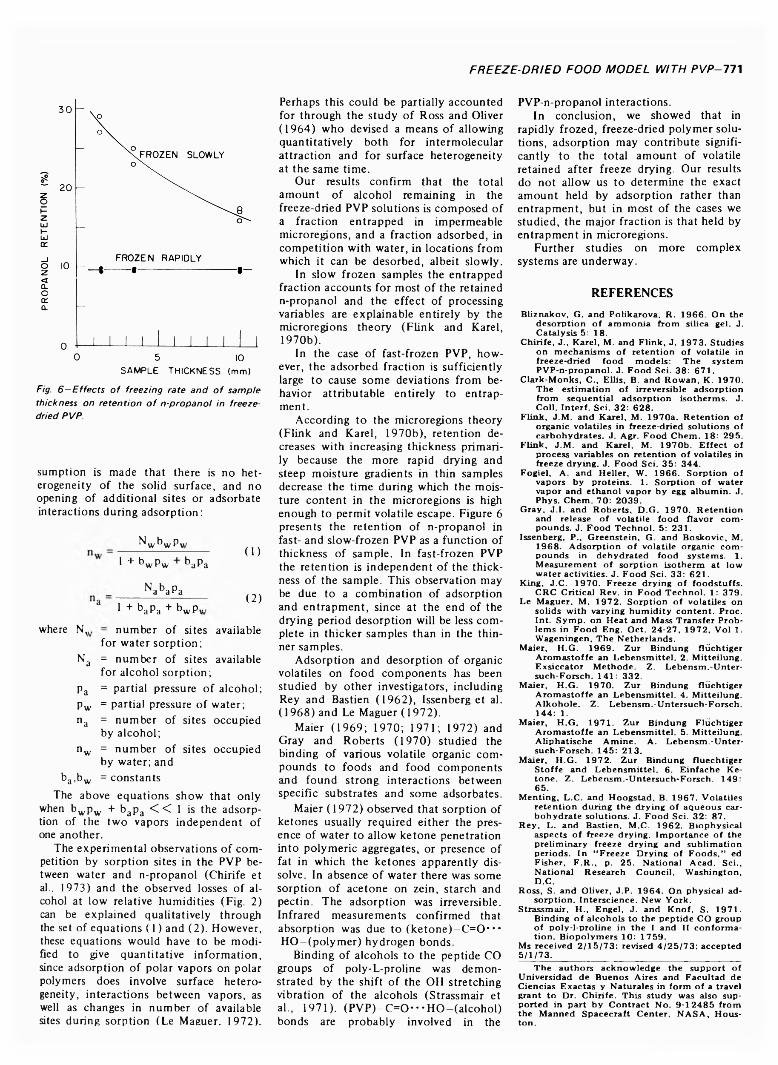
FREEZE-DRIED FOOD MODEL WITH PVP-Tl'i
SAM PLE TH ICKN ESS (mm)
Fig. 6 —E ffe c ts o f fr e e z in g ra te a n d o f sa m p le th ic k n e ss o n r e te n t io n o f n -p r o p a n o l in fre eze - dried PVP.
sumption is made that there is no heterogeneity of the solid surface, and no opening of additional sites or adsorbate interactions during adsorption:
NwbwPv
1 ■*" bwPw baPa(1)
NabaPa1 + b apa + bwpv
where N„
(2)
number of sites availablefor water sorption;
Na = number of sites available for alcohol sorption;
pa = partial pressure of alcohol; pw = partial pressure of water; na = number of sites occupied
by alcohol;nw = number of sites occupied
by water; and ba,bw = constants
The above equations show that only when bwpw + bapa < < 1 is the adsorption of the two vapors independent of one another.
The experimental observations of com petition by sorption sites in the PVP between water and n-propanol (Chirife et al., 1973) and the observed losses of alcohol at low relative humidities (Fig. 2) can be explained qualitatively through the set of equations (1) and (2). However, these equations would have to be modified to give quantitative information, since adsorption of polar vapors on polar polymers does involve surface heterogeneity, interactions between vapors, as well as changes in number of available sites during sorption (Le Maguer. 1972).
Perhaps this could be partially accounted for through the study of Ross and Oliver(1964) who devised a means of allowing quantitatively both for intermolecular attraction and for surface heterogeneity at the same time.
Our results confirm that the total amount of alcohol remaining in the freeze-dried PVP solutions is composed of a fraction entrapped in impermeable microregions, and a fraction adsorbed, in competition with water, in locations from which it can be desorbed, albeit slowly.
In slow frozen samples the entrapped fraction accounts for most o f the retained n-propanol and the effect of processing variables are explainable entirely by the microregions theory (Flink and Karel, 1970b).
In the case of fast-frozen PVP, however, the adsorbed fraction is sufficiently large to cause some deviations from behavior attributable entirely to entrapment.
According to the microregions theory (Flink and Karel, 1970b), retention decreases with increasing thickness primarily because the more rapid drying and steep moisture gradients in thin samples decrease the time during which the moisture content in the microregions is high enough to permit volatile escape. Figure 6 presents the retention of n-propanol in fast- and slow-frozen PVP as a function of thickness of sample. In fast-frozen PVP the retention is independent of the thickness of the sample. This observation may be due to a combination of adsorption and entrapment, since at the end of the drying period desorption will be less complete in thicker samples than in the thinner samples.
Adsorption and desorption of organic volatiles on food components has been studied by other investigators, including Rey and Bastien (1962), Issenberg et al.(1968) and Le Maguer (1972).
Maier (1969; 1970; 1971; 1972) and Gray and Roberts (1970) studied the binding of various volatile organic compounds to foods and food components and found strong interactions between specific substrates and some adsorbates.
Maier (1972) observed that sorption of ketones usually required either the presence of water to allow ketone penetration into polymeric aggregates, or presence of fat in which the ketones apparently dissolve. In absence of water there was some sorption of acetone on zein, starch and pectin. The adsorption was irreversible. Infrared measurements confirmed that absorption was due to (ketone)-C =0" • • HO-(polym er) hydrogen bonds.
Binding of alcohols to the peptide CO groups of poly-L-proline was demonstrated by the shift of the OI1 stretching vibration of the alcohols (Strassmair et al., 1971). (P V P )-C = 0- • • HO -(alcohol) bonds are probably involved in the
PVP-n-propanol interactions.In conclusion, we showed that in
rapidly frozed, freeze-dried polymer solutions, adsorption may contribute significantly to the total amount of volatile retained after freeze drying. Our results do not allow us to determine the exact amount held by adsorption rather than entrapment, but in most of the cases we studied, the major fraction is that held by entrapment in microregions.
Further studies on more complex systems are underway.
REFERENCES
B liznakov, G . and Polikarova, R . 1 9 6 6 . O n the desorption o f am m onia fro m silica gel. J. Catalysis 5: 18.
C h irife , J ., K are l, M . and F lin k , J. 1 9 7 3 . Studies on m echanisms o f re ten tio n o f vo latile in freeze-dried food models: Th e systemPV P -n-p ropanol. J. Food Sei. 38: 6 7 1 .
C lark -M onks, C ., E llis, B. and R ow an , K . 1 9 7 0 . The estim ation o f irreversible adsorption from sequential adsorption isotherm s. J. C oll. In te r f . Sei. 3 2 : 6 2 8 .
F lin k , J .M . and K are l, M . 1 97 0 a . R e te n tio n o f organic volatiles in freeze-dried solutions o f carbohydrates. J. Agr. Food C hem . 18: 2 95 .
F lin k , J .M . and K are l, M . 1 9 7 0 b . E ffe c t o f process variables on re ten tio n o f volatiles in freeze dry ing . J. Food Sei. 35: 344 .
Fogiel, A . and H e lle r, W . 1 9 6 6 . S orp tion o f vapors by proteins. 1. S orp tion o f w ater vapor and ethanol vapor by egg a lbu m in . J. Phys. C hem . 70: 2 03 9 .
G ray , J .I. and R oberts, D .G . 1 9 7 0 . R eten tio n and release o f vo latile food flavor com pounds. J. Fo od Techno l. 5: 2 31 .
Issenberg, P., G reenstein, G . and Boskovic, M .1 9 6 8 . A dsorption o f vo la tile organic com pounds in dehydrated food systems. 1. M easurem ent o f sorption isotherm at low w ater activ ities. J. Food Sei. 3 3 : 6 21 .
K ing , J.C . 1 9 7 0 . Freeze dry ing o f foodstuffs .C R C C ritica l Rev. in Fo od Techno l. 1: 379 .
Le M aguer, M . 1 9 7 2 . S orp tion o f volatiles on solids w ith varying h u m id ity c on ten t. Proc. In t . S ym p. on H ea t and Mass Transfer Problems in Food Eng. O ct. 2 4 -2 7 , 1 9 7 2 , V o l 1. Wageningen, Th e Netherlands.
M aier, H .G . 1 9 6 9 . Z u r B indung flüch tigerA ro m asto ffe an Lebensm itte l. 2. M itte ilu n g . E xsiccator M ethod e. Z . Lebensm .-U n tersuch-Forsch. 1 41 : 3 32 .
M aier, H .G . 1 9 7 0 . Z u r Bindung flüch tigerA ro m asto ffe an Lebensm itte l. 4. M itte ilu n g . A lk o h o le . Z . Lebensm .-U ntersuch-Forsch. 144 : 1.
M aier, H .G . 1 9 7 1 . Z u r B indung F lüchtiger A ro m asto ffe an Lebensm itte l. 5. M itte ilu n g . A liphatische A m ine . A . Lebensm .-U n tersuch-Forsch. 1 45 : 2 13 .
M aier, H .G . 1 9 7 2 . Z u r Bindung fluechtiger S to ffe and Lebensm itte l. 6 . E in fache K e ton e. Z . Lebensm .-U ntersuch-Forsch . 149 : 65 .
M entin g , L .C . and Hoogstad, B. 1 9 6 7 . V o latiles re te n tio n during the dry ing o f aqueous carb o hydrate solutions. J. Fo od Sei. 32: 87.
R ey , L . and Bastien, M .C . 1 9 6 2 . B iophysical aspects o f freeze drying . Im po rtance o f the pre lim in ary freeze d ry ing and sub lim ation periods. In “ Freeze D ry in g o f Fo ods ,” ed Fisher, F .R ., p. 2 5 . N ationa l A cad. Sei., N atio n a l Research C ouncil, W ashington,D .C .
Ross, S. and O liver, J.P. 1 9 6 4 . O n physical adsorption. In terscience. N ew Y o rk .
Strassm air, H ., Engel, J. and K n o f, S. 1 9 7 1 . B inding o f alcohols to the peptide C O group o f po ly -l-p ro line in the I and I I confo rm atio n . B iopolym ers 10: 1 7 5 9 .
Ms received 2 /1 5 /7 3 ; revised 4 /2 5 /7 3 ; accepted5 /1 /7 3 .___________________________________________
The authors acknowledge the support o f Universidad de Buenos Aires and Facultad de Ciencias Exactas y N aturales in fo rm o f a travel grant to D r. C h irife . This study was also supported in part by C ontract N o . 9 -1 2 4 8 5 from the M anned Spacecraft C enter, N A S A , H ouston .
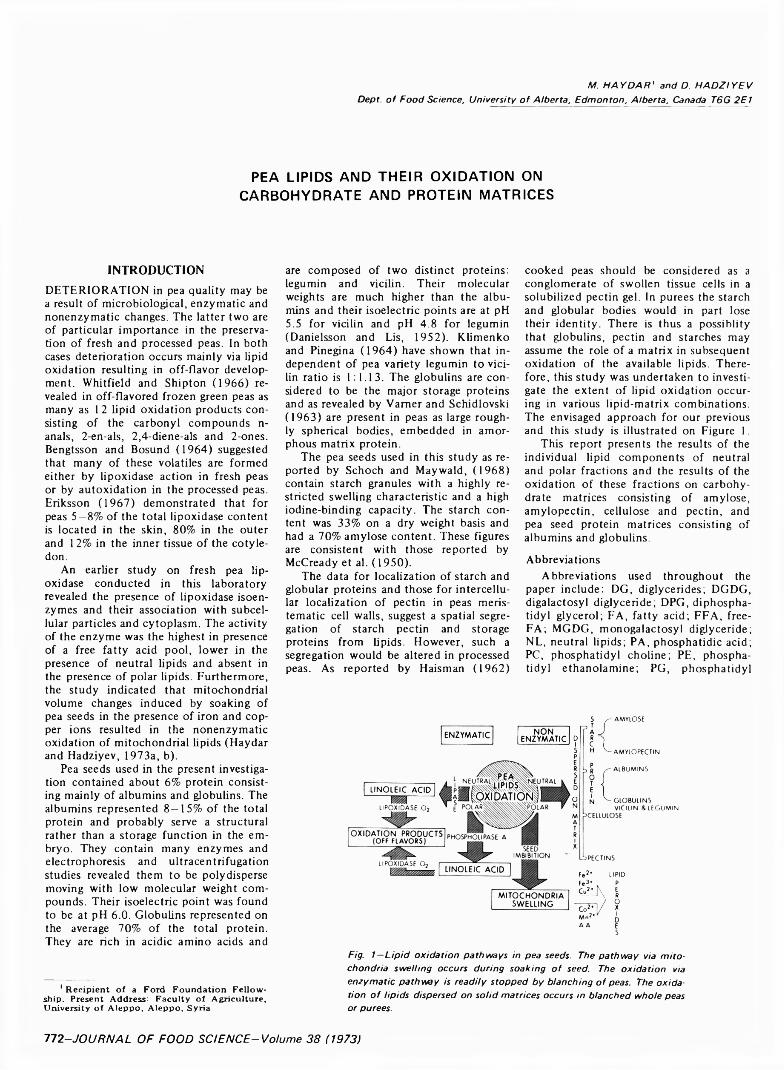
M. H A Y D A R ' a n d D. H A D Z I Y E V D ep t, o f F o o d S c ie n c e , U n iv e r s ity o f A lb e r ta , E d m o n to n , A lb e r ta , C anada T 6 G 2 E 1
PEA LIPIDS AND THEIR O XIDATION ON CARBOHYDRATE AND PROTEIN MATRICES
INTRODUCTION
DETERIORATION in pea quality may be a result of microbiological, enzymatic and nonenzymatic changes. The latter two are of particular importance in the preservation of fresh and processed peas. In both cases deterioration occurs mainly via lipid oxidation resulting in off-flavor development. Whitfield and Shipton (1966) revealed in off-flavored frozen green peas as many as 1 2 lipid oxidation products consisting of the carbonyl compounds n- anals, 2-en-als, 2,4-diene-als and 2-ones. Bengtsson and Bosund (1964) suggested that many of these volatiles are formed either by lipoxidase action in fresh peas or by autoxidation in the processed peas. Eriksson (1967) demonstrated that for peas 5—8% of the total lipoxidase content is located in the skin, 80% in the outer and 1 2 % in the inner tissue of the cotyledon.
An earlier study on fresh pea lipoxidase conducted in this laboratory revealed the presence of lipoxidase isoenzymes and their association with subcel- lular particles and cytoplasm. The activity of the enzyme was the highest in presence of a free fatty acid pool, lower in the presence of neutral lipids and absent in the presence of polar lipids. Furthermore, the study indicated that mitochondrial volume changes induced by soaking of pea seeds in the presence of iron and copper ions resulted in the nonenzymatic oxidation of mitochondrial lipids (Haydar and Hadziyev, 1973a, b).
Pea seeds used in the present investigation contained about 6% protein consisting mainly of albumins and globulins. The albumins represented 8-15% of the total protein and probably serve a structural rather than a storage function in the embryo. They contain many enzymes and electrophoresis and ultracentrifugation studies revealed them to be polydisperse moving with low molecular weight compounds. Their isoelectric point was found to be at pH 6.0. Globulins represented on the average 70% of the total protein. They are rich in acidic amino acids and
1 R ec ip ient o f a Ford Fo u n d atio n Fellow - ship. Present Address: F acu lty o f A gricu ltu re , U nivers ity o f A leppo , A leppo , Syria
are composed of two distinct proteins: legumin and vicilin. Their molecular weights are much higher than the albumins and their isoelectric points are at pH5.5 for vicilin and pH 4.8 for legumin (Danielsson and Lis, 1952). Klimenko and Pinegina (1964) have shown that independent of pea variety legumin to vicilin ratio is 1:1.13. The globulins are considered to be the major storage proteins and as revealed by Varner and Schidlovski (1963) are present in peas as large roughly spherical bodies, embedded in amorphous matrix protein.
The pea seeds used in this study as reported by Schoch and Maywald, (1968) contain starch granules with a highly restricted swelling characteristic and a high iodine-binding capacity. The starch content was 33% on a dry weight basis and had a 70% amylose content. These figures are consistent with those reported by McCready et al. (1950).
The data for localization of starch and globular proteins and those for intercellular localization of pectin in peas meris- tematic cell walls, suggest a spatial segregation of starch pectin and storage proteins from lipids. However, such a segregation would be altered in processed peas. As reported by Haisman (1962)
cooked peas should be considered as a conglomerate of swollen tissue cells in a solubilized pectin gel. In purees the starch and globular bodies would in part lose their identity. There is thus a possiblity that globulins, pectin and starches may assume the role of a matrix in subsequent oxidation of the available lipids. Therefore, this study was undertaken to investigate the extent of lipid oxidation occur- ing in various lipid-matrix combinations. The envisaged approach for our previous and this study is illustrated on Figure 1.
This report presents the results of the individual lipid components of neutral and polar fractions and the results of the oxidation of these fractions on carbohydrate matrices consisting of amylose, amylopectin, cellulose and pectin, and pea seed protein matrices consisting of albumins and globulins.
AbbreviationsAbbreviations used throughout the
paper include: DG, diglycerides; DGDG, digalactosyl diglyceride; DPG, diphosphatidyl glycerol; FA, fatty acid; FFA, free- FA; MGDG, monogalactosyl diglyceride; NL, neutral lipids; PA, phosphatidic acid; PC, phosphatidyl choline; PE, phosphatidyl ethanolamine; PG, phosphatidyl
Fig. 1—L ip id o x id a t io n p a th w a y s in p e a seed s. T h e p a th w a y via m i t o c h o n d r ia sw e llin g o ccu rs d u r in g s o a k in g o f se ed . T h e o x id a t io n via e m y m a t i c p a th w a y is r e a d ily s to p p e d b y b la n c h in g o f peas. T h e o x id a tio n o f l ip id s d isp e rse d o n s o l id m a tr ic e s o ccu rs in b la n c h e d w h o le p ea s or p u rees .
772-JOURNAL OF FOOD SCIENCF-Volume 38 (1973)
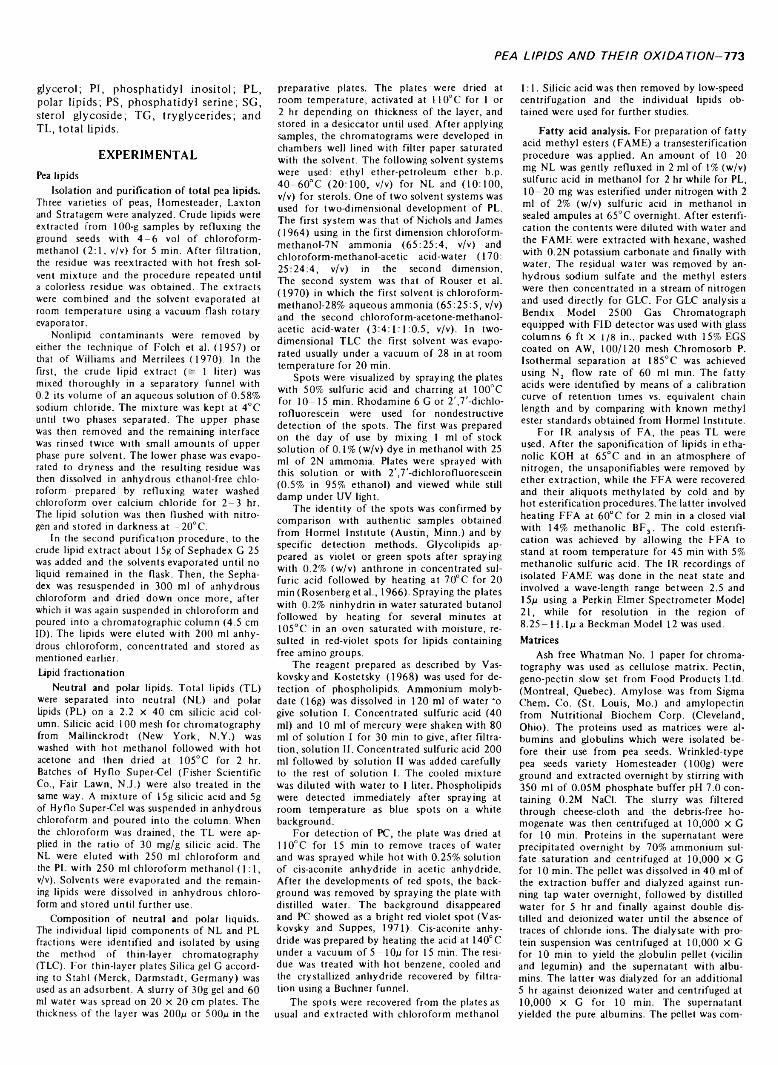
PEA LIPIDS AND THEIR OXIDATION-712
glycerol; PI, phosphatidyl inositol; PL, polar lipids; PS, phosphatidyl serine; SG, sterol glycoside; TG, tryglycerides; and TL, total lipids.
EXPERIMENTALPea lipids
Isolation and purification of total pea lipids.Three varieties of peas, Homesteader, Laxton and Stratagem were analyzed. Crude lipids were extracted from 100-g samples by refluxing the ground seeds with 4 -6 vol of chloroform- methanol (2:1, v/v) for 5 min. After filtration, the residue was reextracted with hot fresh solvent mixture and the procedure repeated until a colorless residue was obtained. The extracts were combined and the solvent evaporated at room temperature using a vacuum flash rotary evaporator.
Nonlipid contaminants were removed by either the technique of Folch et al. (1957) or that of Williams and Merrilees (1970). In the first, the crude lipid extract (~ 1 liter) was mixed thoroughly in a separatory funnel with 0.2 its volume of an aqueous solution of 0.58% sodium chloride. The mixture was kept at 4°C until two phases separated. The upper phase was then removed and the remaining interface was rinsed twice with small amounts of upper phase pure solvent. The lower phase was evaporated to dryness and the resulting residue was then dissolved in anhydrous ethanol-free chloroform prepared by refluxing water washed chloroform over calcium chloride for 2 -3 hr. The lipid solution was then flushed with nitrogen and stored in darkness at -20°C.
In the second purification procedure, to the crude lipid extract about 15g of Sephadex G 25 was added and the solvents evaporated until no liquid remained in the flask. Then, the Sephadex was resuspended in 300 ml of anhydrous chloroform and dried down once more, after which it was again suspended in chloroform and poured into a chromatographic column (4.5 cm ID). The lipids were eluted with 200 ml anhydrous chloroform, concentrated and stored as mentioned earlier, lipid fractionation
Neutral and polar lipids. Total lipids (TL) were separated into neutral (NL) and polar lipids (PL) on a 2.2 x 40 cm silicic acid column. Silicic acid 100 mesh for chromatography from Mallinckrodt (New York, N.Y.) was washed with hot methanol followed with hot acetone and then dried at 105°C for 2 hr. Batches of Hyflo Super-Cel (Fisher Scientific Co., Fair Lawn, N.J.) were also treated in the same way. A mixture of 15g silicic acid and 5g of Hyflo Super-Cel was suspended in anhydrous chloroform and poured into the column. When the chloroform was drained, the TL were applied in the ratio of 30 mg/g silicic acid. The NL were eluted with 250 ml chloroform and the PL with 250 ml chloroform methanol (1:1, v/v). Solvents were evaporated and the remaining lipids were dissolved in anhydrous chloroform and stored until further use.
Composition of neutral and polar liquids. The individual lipid components of NL and PL fractions were identified and isolated by using the method of thin-layer chromatography (TLC). For thin-layer plates Silica gel G according to Stahl (Merck, Darmstadt, Germany) was used as an adsorbent. A slurry of 30g gel and 60 ml water was spread on 20 x 20 cm plates. The thickness of the layer was 200m or 500m in the
preparative plates. The plates were dried at room temperature, activated at 110°C for 1 or 2 hr depending on thickness of the layer, and stored in a desiccator until used. After applying samples, the chromatograms were developed in chambers well lined with filter paper saturated with the solvent. The following solvent systems were used: ethyl ether-petroleum ether b.p. 40-60°C (20:100, v/v) for NL and (10:100, v/v) for sterols. One of two solvent systems was used for two-dimensional development of PL. The first system was that of Nichols and James(1964) using in the first dimension chloroform- methanol-7N ammonia (65:25:4, v/v) and chloroform-methanol-acetic acid-water (170: 25:24:4, v/v) in the second dimension, The second system was that of Rouser et al.(1970) in which the first solvent is chloroform- methanol-28% aqueous ammonia (65:25:5, v/v) and the second chloroform-acetone-methanol- acetic acid-water (3:4:1:1:0.5, v/v). In two- dimensional TLC the first solvent was evaporated usually under a vacuum of 28 in at room temperature for 20 min.
Spots were visualized by spraying the plates with 50% sulfuric acid and charring at 100°C for 10-15 min. Rhodamine 6 G or 2',7'-dichlo- rofluorescein were used for nondestructive detection of the spots. The first was prepared on the day of use by mixing 1 ml of stock solution of 0.1% (w/v) dye in methanol with 25 ml of 2N ammonia. Plates were sprayed with this solution or with 2’,7'-dichlorofluorescein (0.5% in 95% ethanol) and viewed while still damp under UV light.
The identity of the spots was confirmed by comparison with authentic samples obtained from Hormel Institute (Austin, Minn.) and by specific detection methods. Glycolipids appeared as violet or green spots after spraying with 0.2% (w/v) anthrone in concentrated sulfuric acid followed by heating at 70°C for 20 min (Rosenberg et al., 1966). Spraying the plates with 0.2% ninhydrin in water saturated butanol followed by heating for several minutes at 105°C in an oven saturated with moisture, resulted in red-violet spots for lipids containing free amino groups.
The reagent prepared as described by Vas- kovskyand Kostetsky (1968) was used for detection of phospholipids. Ammonium molybdate (16g) was dissolved in 120 ml of water ':o give solution I. Concentrated sulfuric acid (40 ml) and 10 ml of mercury were shaken with 80 ml of solution I for 30 min to give, after filtration, solution II. Concentrated sulfuric acid 200 ml followed by solution II was added carefully to the rest of solution I. The cooled mixture was diluted with water to 1 liter. Phospholipids were detected immediately after spraying at room temperature as blue spots on a white background.
For detection of PC, the plate was dried at 110°C for 15 min to remove traces of water and was sprayed while hot with 0.25% solution of cis-aconite anhydride in acetic anhydride. After the developments of red spots, the background was removed by spraying the plate with distilled water. The background disappeared and PC showed as a bright red violet spot (Vas- kovsky and Suppes, 1971). Cis-aconite anhydride was prepared by heating the acid at 140°C under a vacuum of 5—10m for 15 min. The residue was treated with hot benzene, cooled and the crystallized anhydride recovered by filtration using a Buchner funnel.
The spots were recovered from the plates as usual and extracted with chloroform methanol
1:1. Silicic acid was then removed by low-speed centrifugation and the individual lipids obtained were used for further studies.
Fa tty acid analysis. For preparation of fatty acid methyl esters (FAME) a transesterification procedure was applied. An amount of 10-20 mg NL was gently refluxed in 2 ml of 1% (w/v) sulfuric acid in methanol for 2 hr while for PL, 10-20 mg was esterified under nitrogen with 2 ml of 2% (w/v) sulfuric acid in methanol in sealed ampules at 65°C overnight. After esterification the contents were diluted with water and the FAME were extracted with hexane, washed with 0.2N potassium carbonate and finally with water. The residual water was removed by anhydrous sodium sulfate and the methyl esters were then concentrated in a stream of nitrogen and used directly for GLC. For GLC analysis a Bendix Model 2500 Gas Chromatograph equipped with FID detector was used with glass columns 6 ft x 1/8 in., packed with 15% EGS coated on AW, 100/120 mesh Chromosorb P. Isothermal separation at 185°C was achieved using N2 flow rate of 60 ml min. The fatty acids were identified by means of a calibration curve of retention times vs. equivalent chain length and by comparing with known methyl ester standards obtained from Hormel Institute.
For IR analysis of FA, the peas TL were used. After the saponification of lipids in etha- nolic KOH at 65°C and in an atmosphere of nitrogen, the unsaponifiables were removed by ether extraction, while the FFA were recovered and their aliquots methylated by cold and by hot esterification procedures. The latter involved heating FFA at 60°C for 2 min in a closed vial with 14% methanolic BF3. The cold esterification was achieved by allowing the FFA to stand at room temperature for 45 min with 5% methanolic sulfuric acid. The IR recordings of isolated FAME was done in the neat state and involved a wave-length range between 2.5 and 15m using a Perkin Elmer Spectrometer Model 21, while for resolution in the region of 8.25-1 1.1m a Beckman Model 12 was used.Matrices
Ash free Whatman No. 1 paper for chromatography was used as cellulose matrix. Pectin, geno-pectin slow set from Food Products Ltd. (Montreal, Quebec). Amylose was from Sigma Chem. Co. (St. Louis, Mo.) and amylopectin from Nutritional Biochem Corp. (Cleveland, Ohio). The proteins used as matrices were albumins and globulins which were isolated before their use from pea seeds. Wrinkled-type pea seeds variety Homesteader (lOOg) were ground and extracted overnight by stirring with 350 ml of 0.05M phosphate buffer pH 7.0 containing 0.2M NaCl. The slurry was filtered through cheese-cloth and the debris-free homogenate was then centrifuged at 10,000 X G for 10 min. Proteins in the supernatant were precipitated overnight by 70% ammonium sulfate saturation and centrifuged at 10,000 x G for 10 min. The pellet was dissolved in 40 ml of the extraction buffer and dialyzed against running tap water overnight, followed by distilled water for 5 hr and finally against double distilled and deionized water until the absence of traces of chloride ions. The dialysate with protein suspension was centrifuged at 10,000 X G for 10 min to yield the globulin pellet (vicilin and legumin) and the supernatant with albumins. The latter was dialyzed for an additional 5 hr against deionized water and centrifuged at10,000 x G for 10 min. The supernatant yielded the pure albumins. The pellet was com-
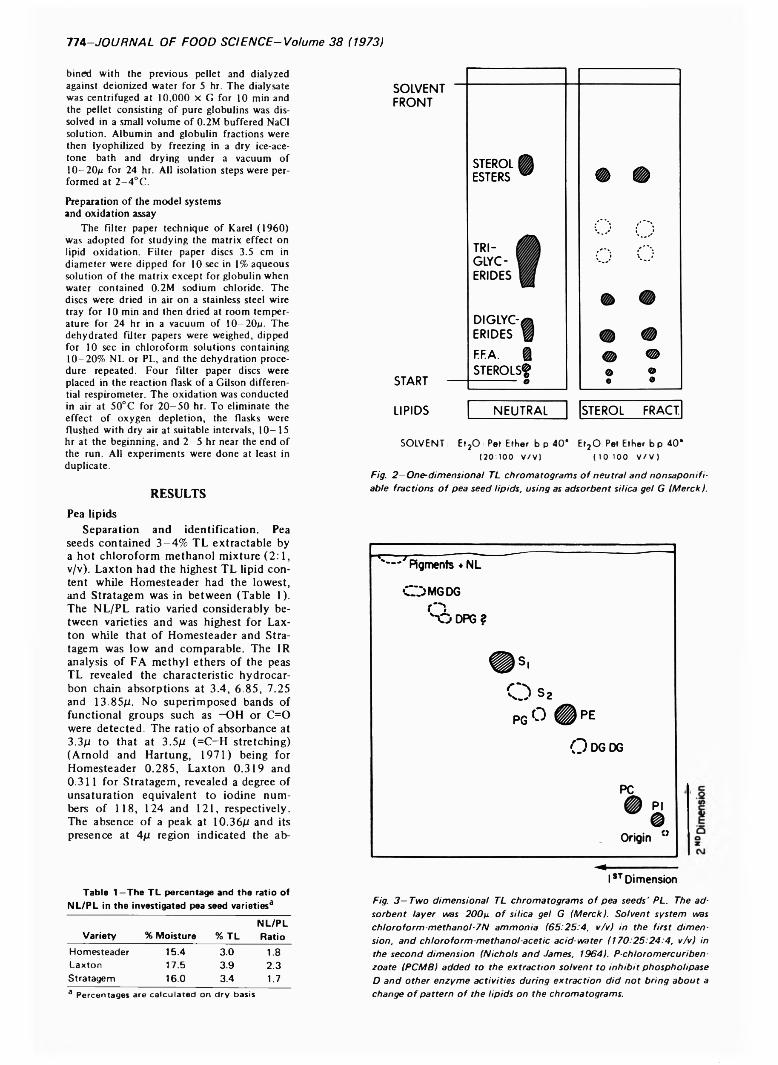
774- JOURNAL OF FOOD SCIENCE-Volume 38 (1973)
bined with the previous pellet and dialyzed against deionized water for 5 hr. The dialysate was centrifuged at 10.000 X G for 10 min and the pellet consisting o f pure globulins was dissolved in a small volume o f 0.2M buffered NaCl solution. Albumin and globulin fractions were then lyophilized by freezing in a dry ice-acetone bath and drying under a vacuum o f 1 0 -20m for 24 hr. A ll isolation steps were performed at 2 -4 °C .
Preparation of the model systems and oxidation assay
The filter paper technique o f Karel (1960) was adopted for studying the m atrix effect on lipid oxidation. F ilter paper discs 3.5 cm in diameter were dipped for 10 sec in 1% aqueous solution o f the m atrix except for globulin when water contained 0.2M sodium chloride. The discs were dried in air on a stainless steel wire tray for 10 min and then dried at room temperature for 24 hr in a vacuum o f 1 0 - 20m- The dehydrated filter papers were weighed, dipped for 10 sec in chloroform solutions containing 10-20% N L or P L , and the dehydration procedure repeated. Four filter paper discs were placed in the reaction flask o f a Gilson differential respirometer. The oxidation was conducted in air at 50°C for 2 0 -5 0 hr. To eliminate the effect o f oxygen depletion, the flasks were flushed with dry air at suitable intervals, 10-15 hr at the beginning, and 2 - 5 hr near the end of the run. A11 experiments were done at least in duplicate.
RESULTSPea lipids
Separation and identification. Peaseeds contained 3—4% TL extractable by a hot chloroform methanol mixture (2 : 1 , v/v). Laxton had the highest TL lipid content while Homesteader had the lowest, and Stratagem was in between (Table 1). The NL/PL ratio varied considerably between varieties and was highest for Lax- ton while that o f Homesteader and Stratagem was low and comparable. The 1R analysis of FA methyl ethers of the peas TL revealed the characteristic hydrocarbon chain absorptions at 3.4, 6.85, 7.25 and 13.85/i. No superimposed bands of functional groups such as —OH or C=0 were detected. The ratio of absorbance at 3.3/ct to that at 3 .5/1 (=C-H stretching) (Arnold and Hartung, 1971) being for Homesteader 0.285, Laxton 0.319 and 0.311 for Stratagem, revealed a degree of unsaturation equivalent to iodine numbers of 118, 124 and 121, respectively. The absence of a peak at 10.36/4 and its presence at 4/t region indicated the ab-
Table 1—The TL percentage and the ratio of NL/PL in the investigated pea seed varieties3
Variety % Moisture % TLNL/PLRatio
Homesteader 15.4 3.0 1.8Laxton 17.5 3.9 2.3Stratagem 16.0 3.4 1.73 Pe rcen tag es are ca lc u la te d on d ry basis
SOLVENT: Et20 : Pet Ether b p 40" Et20: Pet Ether b p 40"(20 100 v/v) (10 100 V/V )
Fig. 2 —O n e -d im e n s io n a l TL c h r o m a to g ra m s o f n e u tr a l a n d n o n sa p o n ifi- a b le fra c tio n s o f p e a s e e d lip id s , u s in g as a d s o r b e n t silica g e l G (M erck ).
Fig. 3 — T w o d im e n s io n a l TL c h r o m a to g ra m s o f p e a s e e d s ' P L. T h e a d s o r b e n t la y e r was 2 0 0 p o f silica g e l G (M erck). S o lv e n t s y s te m was c h lo r o fo r m -m e th a n o l-7 N a m m o n ia (6 5 :2 5 :4 , v /v ) in th e f ir s t d im e n s io n , a n d c h lo r o fo r m -m e th a n o l-a c e tic a c id -w a te r ( 1 7 0 :2 5 :2 4 :4 , v /v ) in th e s e c o n d d im e n s io n (N ich o ls a n d Ja m es , 19 6 4 ). P -ch lo ro m erc u rib en - z o a te (PC M B ) a d d e d to th e e x tr a c t io n s o lv e n t to in h ib i t p h o s p h o lip a s e D a n d o th e r e n z y m e a c tiv it ie s d u r in g e x tr a c t io n d id n o t b r in g a b o u t a ch a n g e o f p a t te r n o f th e lip id s o n th e ch ro m a to g ra m s .
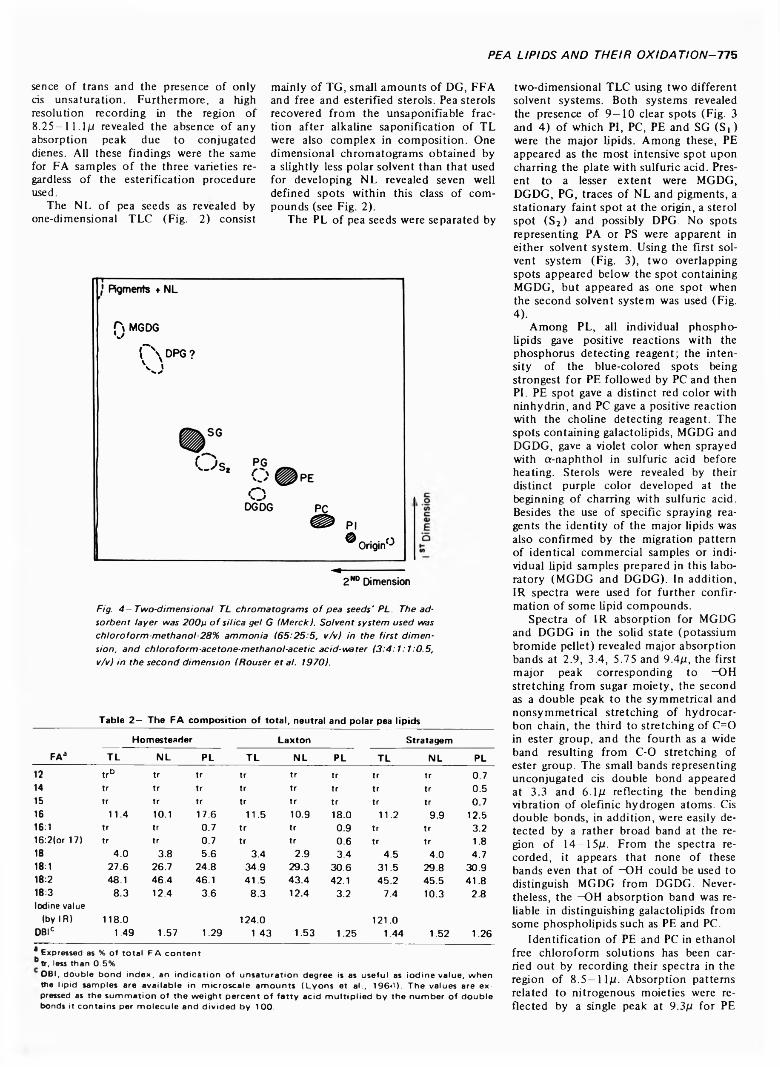
PEA LIPIDS AND THEIR OXIDATION-775
sence of trans and the presence of only cis unsaturation. Furthermore, a high resolution recording in the region of8 .2 5 -1 1.1/Lt revealed the absence of any absorption peak due to conjugated dienes. All these findings were the same for FA samples o f the three varieties regardless o f the esterification procedure used.
The NL of pea seeds as revealed by one-dimensional TLC (Fig. 2) consist
mainly of TG, small amounts of DG, FFA and free and esterified sterols. Pea sterols recovered from the unsaponifiable fraction after alkaline saponification of TL were also complex in composition. One dimensional chromatograms obtained by a slightly less polar solvent than that used for developing NL revealed seven well defined spots within this class of compounds (see Fig. 2).
The PL of pea seeds were separated by
Fig. 4 - T w o -d im e n s io n a l TL c h r o m a to g ra m s o f p e a s e e d s ' P L . T h e a d s o r b e n t la y e r was 2 0 0 p o f silica g e l G IM erckI. S o lv e n t s y s te m u se d was c h lo r o fo r m -m e th a n o l-2 8 % a m m o n ia 1 6 5 :2 5 :5 , v /v l in th e f ir s t d im e n s io n , a n d c h lo r o fo r m -a c e to n e -m e th a n o l-a c e t ic a c id -w a te r 1 3 :4 :1 :1 :0 .5 , v /v ) in th e s e c o n d d im e n s io n (F touser e t at. 197 0 ).
Table 2— The FA composition of total, neutral and polar pea lipidsIS<u.
Homesteader Laxton StratagemTL NL PL TL NL PL TL NL PL
12 trB tr tr tr tr tr tr tr 0.714 tr tr tr tr tr tr tr tr 0.515 tr tr tr tr tr tr tr tr 0.716 11.4 10.1 17.6 11.5 10.9 18.0 11.2 9.9 12.516:1 tr tr 0.7 tr tr 0.9 tr tr 3.216:2(or 17) tr tr 0.7 tr tr 0.6 tr tr 1.818 4.0 3.8 5.6 3.4 2.9 3.4 4.5 4.0 4.718:1 27.6 26.7 24.8 34.9 29.3 30.6 31.5 29.8 30.918:2 48.1 46.4 46.1 41.5 43.4 42.1 45.2 45.5 41.818:3 8.3 12.4 3.6 8.3 12.4 3.2 7.4 10.3 2.8Iodine value
(by IR) 118.0 124.0 121.0DBIC 1.49 1.57 1.29 1.43 1.53 1.25 1.44 1.52 1.26'E x p re s s e d as % o f to ta l F A c o n te n t B tr, less than 0 .5 %
O B I, double bond in d e x , an in d ic a t io n o f u n sa tu ra t io n degree is as u se fu l as io d in e v a lu e , w h en the lip id sam p les are a v a ila b le in m ic ro sc a le a m o u n ts ( L y o n s et a l . , 1 9 6 A ). T h e va lu es are e x pressed as the su m m a tio n o f th e w e ig h t p e rce n t o f fa t t y ac id m u lt ip lie d b y th e n u m b er o f d o u b le bonds it co n ta in s per m o le c u le and d iv id e d b y 1 00 .
two-dimensional TLC using two different solvent systems. Both systems revealed the presence of 9—10 clear spots (Fig. 3 and 4) o f which PI, PC, PE and SG ( S |) were the major lipids. Among these, PE appeared as the most intensive spot upon charring the plate with sulfuric acid. Present to a lesser extent were MGDG, DGDG, PG, traces of NL and pigments, a stationary faint spot at the origin, a sterol spot (S2) and possibly DPG. No spots representing PA or PS were apparent in either solvent system. Using the first solvent system (Fig. 3), two overlapping spots appeared below the spot containing MGDG, but appeared as one spot when the second solvent system was used (Fig.4).
Among PL, all individual phospholipids gave positive reactions with the phosphorus detecting reagent; the intensity of the blue-colored spots being strongest for PE followed by PC and then PL PE spot gave a distinct red color with ninhydrin, and PC gave a positive reaction with the choline detecting reagent. The spots containing galactolipids, MGDG and DGDG, gave a violet color when sprayed with a-naphthol in sulfuric acid before heating. Sterols were revealed by their distinct purple color developed at the beginning of charring with sulfuric acid. Besides the use of specific spraying reagents the identity of the major lipids was also confirmed by the migration pattern of identical commercial samples or individual lipid samples prepared in this laboratory (MGDG and DGDG). In addition, 1R spectra were used for further confirmation of some lipid compounds.
Spectra of IR absorption for MGDG and DGDG in the solid state (potassium bromide pellet) revealed major absorption bands at 2.9, 3.4, 5.75 and 9.4ju, the first major peak corresponding to -OH stretching from sugar moiety, the second as a double peak to the symmetrical and nonsymmetrical stretching of hydrocarbon chain, the third to stretching of C=0 in ester group, and the fourth as a wide band resulting from C-0 stretching of ester group. The small bands representing unconjugated cis double bond appeared at 3.3 and 6.1ft reflecting the bending vibration of olefinic hydrogen atoms. Cis double bonds, in addition, were easily detected by a rather broad band at the region of 14—15fi. From the spectra recorded, it appears that none of these bands even that of -OH could be used to distinguish MGDG from DGDG. Nevertheless, the -OH absorption band was reliable in distinguishing galactolipids from some phospholipids such as PE and PC.
Identification of PE and PC in ethanol free chloroform solutions has been carried out by recording their spectra in the region of 8 .5— lif t . Absorption patterns related to nitrogenous moieties were reflected by a single peak at 9.3fl for PE
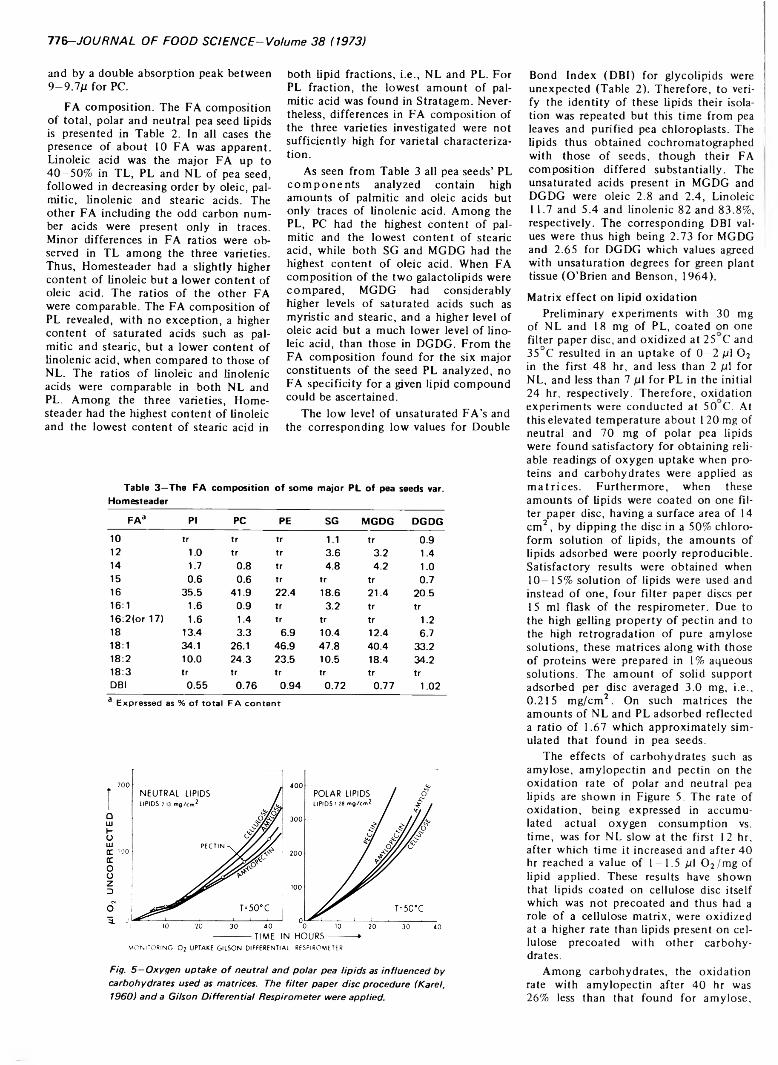
7 7 6 -JOURNAL OF FOOD SCIENCE-Volume 38 (1973)
and by a double absorption peak between 9 - 9 . l l ! for PC.
FA composition. The FA composition of total, polar and neutral pea seed lipids is presented in Table 2. In all cases the presence of about 10 FA was apparent. Linoleic acid was the major FA up to 40—50% in TL, PL and NL of pea seed, followed in decreasing order by oleic, palmitic, linolenic and stearic acids. The other FA including the odd carbon number acids were present only in traces. Minor differences in FA ratios were observed in TL among the three varieties. Thus, Homesteader had a slightly higher content of linoleic but a lower content of oleic acid. The ratios of the other FA were comparable. The FA composition of PL revealed, with no exception, a higher content of saturated acids such as palmitic and stearic, but a lower content of linolenic acid, when compared to those of NL. The ratios o f linoleic and linolenic acids were comparable in both NL and PL. Among the three varieties, Homesteader had the highest content of linoleic and the lowest content of stearic acid in
both lipid fractions, i.e., NL and PL. For PL fraction, the lowest amount of palmitic acid was found in Stratagem. Nevertheless, differences in FA composition of the three varieties investigated were not sufficiently high for varietal characterization.
As seen from Table 3 all pea seeds’ PL com p on en ts analyzed contain high amounts of palmitic and oleic acids but only traces of linolenic acid. Among the PL, PC had the highest content of palmitic and the lowest content of stearic acid, while both SG and MGDG had the highest content of oleic acid. When FA composition of the two galactolipids were compared, MGDG had considerably higher levels o f saturated acids such as myristic and stearic, and a higher level of oleic acid but a much lower level o f linoleic acid, than those in DGDG. From the FA composition found for the six major constituents o f the seed PL analyzed, no FA specificity for a given lipid compound could be ascertained.
The low level o f unsaturated FA’s and the corresponding low values for Double
Bond Index (DBI) for glycolipids were unexpected (Table 2). Therefore, to verify the identity of these lipids their isolation was repeated but this time from pea leaves and purified pea chloroplasts. The lipids thus obtained cochromatographed with those of seeds, though their FA composition differed substantially. The unsaturated acids present in MGDG and DGDG were oleic 2.8 and 2.4, Linoleic11.7 and 5.4 and linolenic 82 and 83.8%, respectively. The corresponding DBI values were thus high being 2.73 for MGDG and 2.65 for DGDG which values agreed with unsaturation degrees for green plant tissue (O’Brien and Benson, 1964).
Matrix effect on lipid oxidationPreliminary experiments with 30 mg
of NL and 18 mg of PL, coated on one filter paper disc, and oxidized at 25 C and 35°C resulted in an uptake of 0 - 2 /zl 0 2 in the first 48 hr, and less than 2 jal for NL, and less than 7 f! 1 for PL in the initial 24 hr, respectively. Therefore, oxidation experiments were conducted at 50 C. At this elevated temperature about 1 2 0 mg of neutral and 70 mg of polar pea lipids were found satisfactory for obtaining reliable readings of oxygen uptake when proteins and carbohydrates were applied as m atrices. Furthermore, when these amounts of lipids were coated on one filter paper disc, having a surface area of 14 cm2 , by dipping the disc in a 50% chloroform solution of lipids, the amounts of lipids adsorbed were poorly reproducible. Satisfactory results were obtained when 10—15% solution of lipids were used and instead of one, four filter paper discs per 15 ml flask of the respirometer. Due to the high gelling property of pectin and to the high rétrogradation of pure amylose solutions, these matrices along with those of proteins were prepared in 1 % aqueous solutions. The amount of solid support adsorbed per disc averaged 3.0 mg, i.e., 0.215 mg/cm2 . On such matrices the amounts of NL and PL adsorbed reflected a ratio of 1.67 which approximately simulated that found in pea seeds.
The effects of carbohydrates such as amylose, amylopectin and pectin on the oxidation rate of polar and neutral pea lipids are shown in Figure 5. The rate of oxidation, being expressed in accumulated actual oxygen consumption vs. time, was for NL slow at the first 12 hr, after which time it increased and after 40 hr reached a value of 1 -1 .5 jul 0 2/mg of lipid applied. These results have shown that lipids coated on cellulose disc itself which was not precoated and thus had a role of a cellulose matrix, were oxidized at a higher rate than lipids present on cellulose precoated with other carbohydrates.
Among carbohydrates, the oxidation rate with amylopectin after 40 hr was 26% less than that found for amylose.
Table 3—The FA composition of some major PL of pea seeds var. Homesteader
FAa PI PC PE SG MGDG DGDG10 tr tr tr 1.1 tr 0.912 1.0 tr tr 3.6 3.2 1.414 1.7 0.8 tr 4.8 4.2 1.015 0.6 0.6 tr tr tr 0.716 35.5 41.9 22.4 18.6 21.4 20.516:1 1.6 0.9 tr 3.2 tr tr16:2(or 17) 1.6 1.4 tr tr tr 1.218 13.4 3.3 6.9 10.4 12.4 6.718:1 34.1 26.1 46.9 47.8 40.4 33.218:2 10.0 24.3 23.5 10.5 18.4 34.218:3 tr tr tr tr tr trDBI 0.55 0.76 0.94 0.72 0.77 1.02
a Expressed as % o f to ta l F A con ten t
Fig. 5 —O x y g e n u p ta k e o f n e u tr a l a n d p o la r p e a l ip id s as in f lu e n c e d b y c a r b o h y d ra te s u s e d as m a tr ices . T h e f i l te r p a p e r d isc p r o c e d u r e (K arel, 1 9 6 0 ) a n d a G ilson D iffe r e n tia l R e s p ir o m e te r w ere a p p lied .
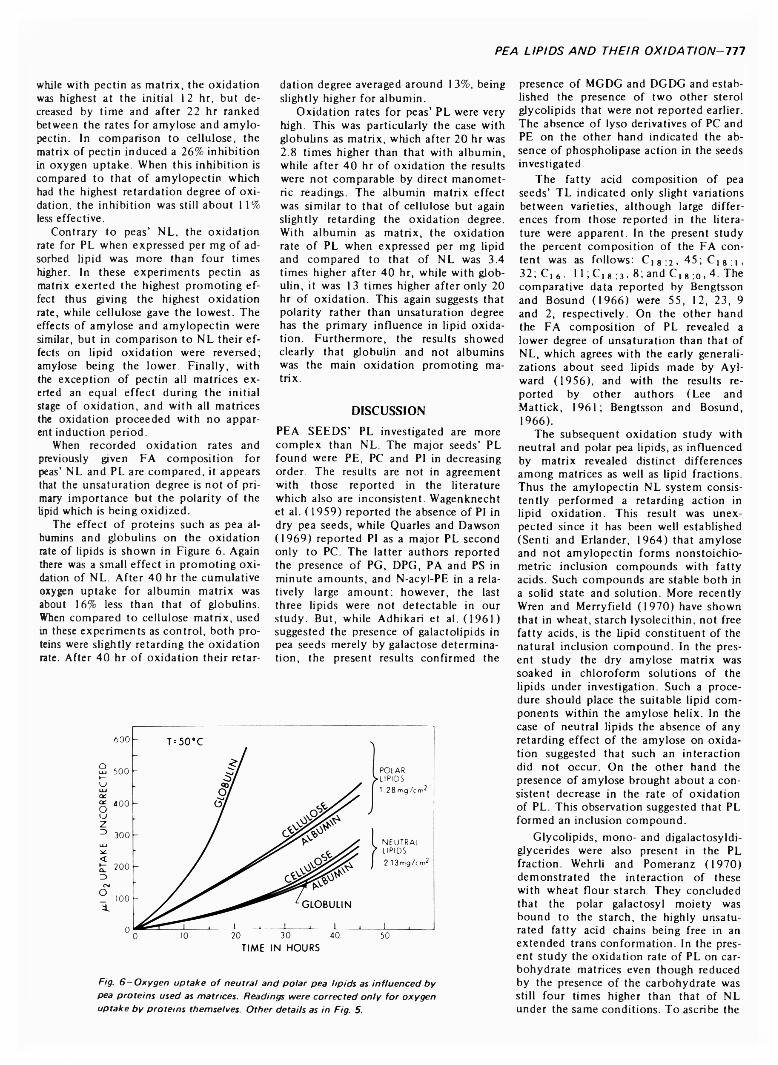
PEA LIPIDS AND THEIR OXIDATION-111
while with pectin as matrix, the oxidation was highest at the initial 1 2 hr, but decreased by time and after 22 hr ranked between the rates for amylose and amylo- pectin. In comparison to cellulose, the matrix of pectin induced a 26% inhibition in oxygen uptake. When this inhibition is compared to that o f amylopectin which had the highest retardation degree of oxidation, the inhibition was still about 1 1 % less effective.
Contrary to peas’ NL, the oxidation rate for PL when expressed per mg of adsorbed lipid was more than four times higher. In these experiments pectin as matrix exerted the highest promoting effect thus giving the highest oxidation rate, while cellulose gave the lowest. The effects of amylose and amylopectin were similar, but in comparison to NL their effects on lipid oxidation were reversed; amylose being the lower. Finally, with the exception of pectin all matrices exerted an equal effect during the initial stage of oxidation, and with all matrices the oxidation proceeded with no apparent induction period.
When recorded oxidation rates and previously given FA composition for peas’ NL and PL are compared, it appears that the unsaturation degree is not of primary importance but the polarity of the lipid which is being oxidized.
The effect of proteins such as pea albumins and globulins on the oxidation rate of lipids is shown in Figure 6 . Again there was a small effect in promoting oxidation of NL. After 40 hr the cumulative oxygen uptake for albumin matrix was about 16% less than that of globulins. When compared to cellulose matrix, used in these experiments as control, both proteins were slightly retarding the oxidation rate. After 40 hr of oxidation their retar
dation degree averaged around 13%, being slightly higher for albumin.
Oxidation rates for peas’ PL were very high. This was particularly the case with globulins as matrix, which after 20 hr was2.8 times higher than that with albumin, while after 40 hr of oxidation the results were not comparable by direct manomet- ric readings. The albumin matrix effect was similar to that of cellulose but again slightly retarding the oxidation degree. With albumin as matrix, the oxidation rate of PL when expressed per mg lipid and compared to that of NL was 3.4 times higher after 40 hr, while with globulin, it was 13 times higher after only 20 hr of oxidation. This again suggests that polarity rather than unsaturation degree has the primary influence in lipid oxidation. Furthermore, the results showed clearly that globulin and not albumins was the main oxidation promoting matrix.
DISCUSSION
PEA SEEDS’ PL investigated are more complex than NL. The major seeds’ PL found were PE, PC and PI in decreasing order. The results are not in agreement with those reported in the literature which also are inconsistent. Wagenknecht et al. (1959) reported the absence of PI in dry pea seeds, while Quarles and Dawson(1969) reported PI as a major PL second only to PC. The latter authors reported the presence of PG, DPG, PA and PS in minute amounts, and N-acyl-PE in a relatively large amount; however, the last three lipids were not detectable in our study. But, while Adhikari et al. (1961) suggested the presence of galactolipids in pea seeds merely by galactose determination, the present results confirmed the
presence of MGDG and DGDG and established the presence of two other sterol glycolipids that were not reported earlier. The absence of lyso derivatives of PC and PE on the other hand indicated the absence of phospholipase action in the seeds investigated.
The fatty acid composition of pea seeds’ TL indicated only slight variations between varieties, although large differences from those reported in the literature were apparent. In the present study the percent composition of the FA content was as follows: C18;2, 45; C1 8 :I , 32; Ci 6 . 1 1 ; Ci 8 :3 , 8 ; and C j 8 ;o > 4. The comparative data reported by Bengtsson and Bosund (1966) were 55, 12, 23, 9 and 2, respectively. On the other hand the FA composition of PL revealed a lower degree of unsaturation than that of NL, which agrees with the early generalizations about seed lipids made by Ayl- ward (1956), and with the results reported by other authors (Lee and Mattick, 1961; Bengtsson and Bosund,1966).
The subsequent oxidation study with neutral and polar pea lipids, as influenced by matrix revealed distinct differences among matrices as well as lipid fractions. Thus the amylopectin NL system consistently performed a retarding action in lipid oxidation. This result was unexpected since it has been well established (Senti and Erlander, 1964) that amylose and not amylopectin forms nonstoichio- metric inclusion compounds with fatty acids. Such compounds are stable both in a solid state and solution. More recently Wren and Merryfield (1970) have shown that in wheat, starch lysolecithin, not free fatty acids, is the lipid constituent of the natural inclusion compound. In the present study the dry amylose matrix was soaked in chloroform solutions of the lipids under investigation. Such a procedure should place the suitable lipid components within the amylose helix. In the case of neutral lipids the absence of any retarding effect o f the amylose on oxidation suggested that such an interaction did not occur. On the other hand the presence of amylose brought about a consistent decrease in the rate of oxidation of PL. This observation suggested that PL formed an inclusion compound.
Glycolipids, mono- and digalactosyldi- glycerides were also present in the PL fraction. Wehrli and Pomeranz (1970) demonstrated the interaction of these with wheat flour starch. They concluded that the polar galactosyl moiety was bound to the starch, the highly unsaturated fatty acid chains being free in an extended trans conformation. In the present study the oxidation rate of PL on carbohydrate matrices even though reduced by the presence of the carbohydrate was still four times higher than that of NL under the same conditions. To ascribe the
Fig. 6 —O x y g e n u p ta k e o f n e u tr a l a n d p o la r p e a lip id s as in f lu e n c e d b y p ea p r o te in s u s e d as m a tr ic e s . R ea d in g s w e re c o r r e c te d o n ly fo r o x y g e n u p ta k e b y p r o te in s th e m se lv e s . O th e r d e ta ils as in Fig. 5.
778-JOURNAL OF FOOD SCIENCE-Volume 38 (1973)
oxidation rate difference solely to the exposed glycolipid fatty acids would not be justified. Firstly, these are minor constituents of the PL fraction; secondly, they were found to be less unsaturated than the glycolipids of cereals reported by Graveland (1968) and even less so than those of pea leaves.
The pectin matrix effect on lipid oxidation appears to be two-fold. In oxidation of NL it retards whereas for PL it enhances the oxidation. Bishov and Henick (1961) indicated that pectin generally exhibits a protective action, which action correlates with the charge on the pectin molecules. The results of the present study have shown that retardation is exclusively confined to NL but not to PL. In the latter case an interaction between the negatively charged matrix and the zwitter-ion components of PL has to be assumed. If this assumption is valid then the basic electrophylic nitrogen of PC and PE would interact, while the nu- cleophylic centers released would orient the fatty acid chains to a sterically more exposed conformation, thus providing an increased rate of oxidation.
The protein matrix effect on lipid oxidation was relatively small with the NL and substantial with the PL fraction. Togashi et al. (1961) demonstrated that the higher the charge on the gelatin surface the lesser the rate of oxidation. If the measure of the charge is reflected by a numerical difference of the protein isoelectric points and pH, as suggested by these authors, then in the present study in which proteins were isolated in a buffer of pH 7.0, globulins should bring about a higher retardation than albumins. However, the results were consistently opposite: globulins promoted while albumins retarded the rate of lipid oxidation.
From the results discussed above it must be concluded that lipid polarity rather than its degree of unsaturation is the predominant factor controlling the rate of oxidation. In addition, it is evi
dent that physical and chemical interactions of lipids and matrices do influence the rate of oxidation. The role and mechanisms of these interactions are the subject of our current investigation.
REFERENCESA d h ika ri, S ., S horland, F .B . and W eenink, R .O .
1 9 6 1 . L ipids o f the com m on pea (Pisum sativum L .) w ith special reference to the occurrence o f galactolipids. N atu re (L o n d o n ) 191 : 1 3 0 1 .
A rn o ld , R .G . and H artun g , T .E . 1 9 7 1 . In fra red spectroscopic d e te rm in a tio n o f degree o f un satura tion o f fats and oils. J. F o o d Sci. 36: 1 66 .
A y lw a rd , F . 1 9 5 6 . Phospholipids in foods. Chem & In d : 1 36 0 .
Bengtsson, B. and Bosund, I . 1 9 6 4 . Gas chro m atographic evaluation o f the fo rm a tio n o f vo la tile substances in stored peas. Food Techno l. 1 8 : 7 73 .
Bengtsson, B. and Bosund, I . 1 9 6 6 . L ip id hydrolysis in unblanched frozen peas (Pisum sativum ). J. Fo od Sci. 31: 4 74 .
Bishov, S.J. and H en ic k , A .S . 1 9 6 1 . C ited in K och, R .B . D eh yd rated foods and m odel systems. In “ Sym posium on Foods: L ip ids and T h e ir O x id a tio n ,” ed S chu ltz , H .W ., D ay , E .A . and S innhuber, R .O . (1 9 6 2 ) p. 2 3 0 . Th e A v i Pub. C o ., In c ., W estport, Conn.
Danielsson, C .E . and Lis, H . 1 9 5 2 . D ifferences in the chem ical com position o f some pea proteins. A cta C hem . Scand. 6: 139 .
Eriksson, C .E . 1 9 6 7 . Pea lipoxidase, d is trib u tio n o f enzym e and substrate in green peas. J. Fo od Sci. 3 2 : 4 3 8 .
Fo lch , J ., Lees, M . and S tan ley , G .H .S . 1 9 5 7 . A sim ple m ethod fo r the iso lation and p u rif ication o f to ta l lip ids from an im al tissues. J. Biol. C hem . 226 : 4 97 .
G raveland, A . 1 9 6 8 . C o m b in atio n o f th in -layer chrom atography and gas chrom atography in the analysis on a m icrogram scale o f lipids from w heat flo u r and w h eat flo u r doughs. J. A m . O il C hem . Soc. 4 5 : 8 34 .
Haism an, D .R . 1 9 6 2 . Factors c on tro llin g the te x tu re o f peas. F irs t In te rn . C ongr. Food Sci. and Techno l. 1: 7 1 1 .
H aydar, M . and H ad ziyev, D . 1 97 3 a . A study o f lipoxidase in pea seeds and seedlings. J. Sci. Food Agr. ( in press).
H aydar, M . and H ad ziyev, D . 1 9 7 3 b . Pea m ito chondria l lip id o x id a tio n as affec ted by tran sition al m eta l ions and ascorbic acid. B iochem . J. ( in press).
K are l, M . 1 9 6 0 . E ffects o f w ater and o f oxygen on reactions o f food com ponents. P h .D . thesis, M .I .T . , C am bridge, Mass.
K lim e n k o , V .G . and Pinegina, R .I . 1 9 6 4 . V aria b ility o f the proteins o f pea seeds during ripening. B io kh im iya 2 9: 327 .
Lee, F .A . and M a ttic k , L .R . 1 9 6 1 . F a tty acids o f the lip ids o f vegetables. 1. Peas (Pisum sativum ). J. Fo od Sci. 26: 2 7 3 .
Lyons, J .M ., W heaton , T .A . and P ra tt, H .K .
1 9 6 4 . R elationsh ip betw een the physical nature o f m ito c h o n d ria l m em branes and chilling sensitiv ity in plants. PI. Physiol. 39: 2 62 .
M cC ready , R .M ., Guggolz, J ., S ilviera, V . and Owens, H .S . 1 9 5 0 . D e te rm in a tio n o f starch and am ylose in vegetables. A na l. C hem . 22: 1 1 5 6 .
N ichols, B.W . and James A .T . 1 9 6 4 . The lipids o f p lan t storage tissue. F e tte , S e ifen , An- s trich m itte l 66: 1 0 0 3 .
O ’B rien , J.S. and Benson, A .A . 1 9 6 4 . Iso lation and fa tty acid com position o f the p lan t sul- fo lip id and galactolip ids. J. L ip id Res. 5: 4 32 .
Quarles, R .H . and D aw son, R .M .C . 1 9 6 9 . The d is tr ib u tio n o f phospholipase D in developing and m ature plants. B iochem . J. 112: 7 87 .
Rosenberg, A ., G o uaux, J. and M ilch , P. 196 6 . M onogalactosyl and digalactosyl d ig lycerides fro m he te ro tro p h ic , he te ro au to troph ic and p h o to b io tic Euglena gracilis. J. L ip id Res. 7: 7 33 .
R ouser, G ., F leischer, S. and Y a m a m o to , A.1 9 7 0 . T w o dim ensional th in layer chrom atographic separation o f po lar lip ids and d ete rm in a tio n o f phospholip ids by phosphorus analysis o f spots. L ip ids 5: 4 9 4 .
Schoch, T .J . and M a yw a ld , E .C . 1 9 6 8 . Preparatio n and properties o f various legume starches. Cereal C hem . 4 5: 564 .
S enti, F .R . and E rlander, S .R . 1 9 6 4 . C arbo hydrates. In “ N o n sto ich io m etric C om pou nds,” ed M a n d e lc o m , L . , p. 5 68 . A cadem ic Press, N ew Y o rk , N .Y .
Togashi, H .J ., H en ic k , A .S . and K och, R .B . 1 9 6 1 . Th e o x id a tio n o f lip ids in th in film s. J. Fo od Sci. 26: 1 86 .
V a rn e r, J .E . and S chid lovsky, G . 1 9 6 3 . In tra cellu lar d is tr ib u tio n o f prote ins in pea c o ty ledons. P lant Physiol. 3 8 : 139 .
V askovsky, V .E . and K ostetsky , E .V . 1 9 6 8 . M o d ifie d spray fo r the de tectio n o f phospho lip ids on th in -la y er chrom atogram s. J. L ip id Res. 9: 3 96 .
Vaskovsky, V .E . and Suppes, Z .S . 1 9 7 1 . D etectio n o f cho line-conta in ing lipids on th in - layer chrom atogram s. J. C hrom ato gr. 63: 4 55 .
W agenknecht, A .C ., L e w in , L .M . and C arter,H .E . 1 9 5 9 . Th e phosphatid yl inos ito l o f peas. J. B io l. C hem . 2 34 : 2 2 6 5 .
W ehrli, H .P . and Pom eranz, Y . 1 9 7 0 . A no te on the in terac tio n betw een glycolip ids and w h eat flo u r m acrom olecules. Cereal C hem . 4 7: 160 .
W h itfie ld , F .B . and S h ip to n , L . 1 9 6 6 . V o la tile carbonyls in stored unblanched frozen peas. J. Fo od Sci. 31: 3 28 .
W illiam s, J.P. and M errilees, P .A . 1 9 7 0 . The rem oval o f w a te r and no n -lip id co n tam inants fro m lip id extracts. L ip ids 5: 3 67 .
W ren, J.J. and M e rry fie ld , D .S . 1 9 7 0 . “ F irm ly - b o u n d ” lyso lec ith in o f w h eat starch. J. Sci. Food Agr. 21: 2 54 .
Ms received 3 /3 /7 3 ; revised 4 /2 8 /7 3 ; accepted5 / 1 / 7 3 . ________
This study has been supported by grantsfrom Th e N a tio n a l Research C ouncil o f Canadaand The A lb e rta A g ric u ltu ra l Research Trust.
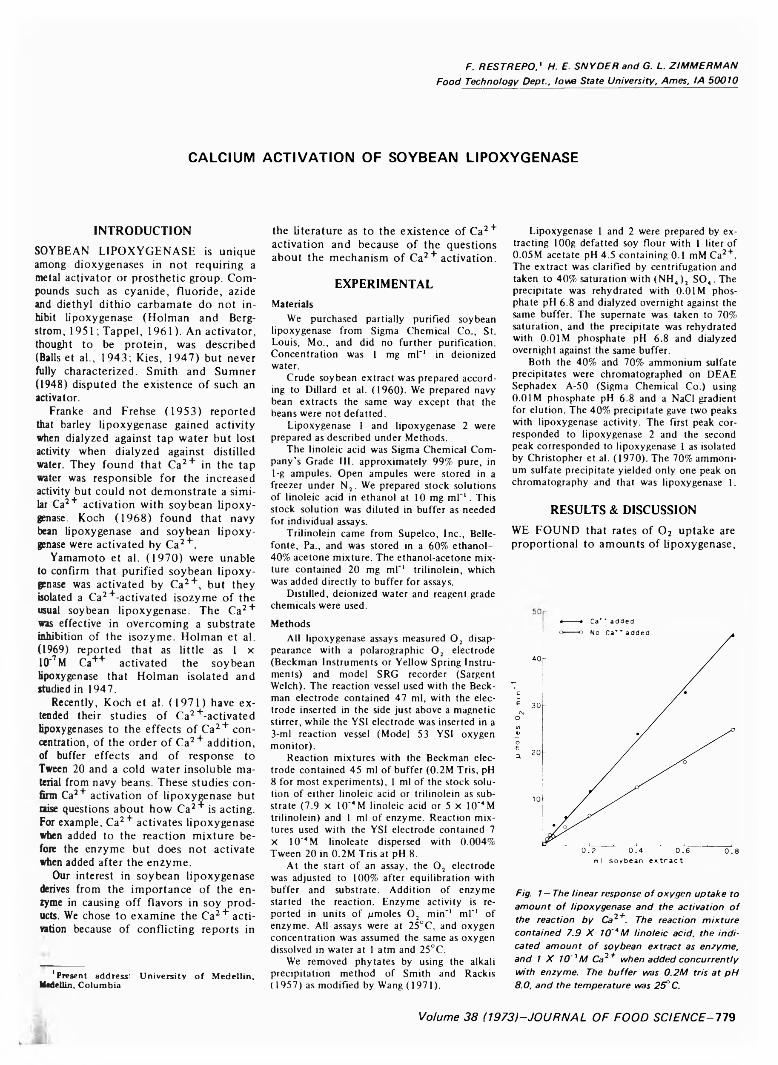
F. R E S T R E P O .' H. E. S N Y D E R a n d G. L . Z IM M E R M A N
F o o d T e c h n o lo g y D e p t., Io w a S ta te U n ive rs ity , A m e s , !A 5 0 0 1 0
CALCIUM ACTIVATIO N OF SOYBEAN LIPOXYGENASE
INTRODUCTIONSOYBEAN LIPOXYGENASE is unique among dioxygenases in not requiring a metal activator or prosthetic group. Compounds such as cyanide, fluoride, azide and diethyl dithio carbamate do not inhibit lipoxygenase (Holman and Bergstrom, 1951; Tappel, 1961). An activator, thought to be protein, was described (Balls et al., 1943; Kies, 1947) but never fully characterized. Smith and Sumner (1948) disputed the existence of such an activator.
Franke and Frehse (1953) reported that barley lipoxygenase gained activity when dialyzed against tap water but lost activity when dialyzed against distilled water. They found that Ca2+ in the tap water was responsible for the increased activity but could not demonstrate a similar Ca2 + activation with soybean lipoxygenase. Koch (1968) found that navy bean lipoxygenase and soybean lipoxygenase were activated by Ca2+.
Yamamoto et al. (1970) were unable to confirm that purified soybean lipoxygenase was activated by Ca2+, but they isolated a Ca2+-activated isozyme of the usual soybean lipoxygenase. The Ca2 + was effective in overcoming a substrate inhibition of the isozyme. Holman et al.(1969) reported that as little as 1 x 10'7M Ca++ activated the soybean lipoxygenase that Holman isolated and studied in 1947.
Recently, Koch et al. (1971) have extended their studies of Ca2+-activated lipoxygenases to the effects of Ca2+ concentration, of the order of Ca2+ addition, of buffer effects and of response to Tween 20 and a cold water insoluble material from navy beans. These studies confirm Ca2 + activation of lipoxygenase but raise questions about how Ca2+ is acting. For example, Ca2+ activates lipoxygenase when added to the reaction mixture before the enzyme but does not activate when added after the enzyme.
Our interest in soybean lipoxygenase derives from the importance of the enzyme in causing off flavors in soy products. We chose to examine the Ca2+ activation because of conflicting reports in
'Present address: U n ivers ity o f M edellin , Medellin, Colum bia
the literature as to the existence of Ca2 + activation and because of the questions about the mechanism of Ca2+ activation.
EXPERIMENTALMaterials
We purchased partially purified soybean lipoxygenase from Sigma Chemical Co., St. Louis, Mo., and did no further purification. Concentration was 1 mg ml"1 in deionized water.
Crude soybean extract was prepared according to Dillard et al. (1960). We prepared navy bean extracts the same way except that the beans were not defatted.
Lipoxygenase 1 and lipoxygenase 2 were prepared as described under Methods.
The linoleic acid was Sigma Chemical Company’s Grade 111, approximately 99% pure, in1-g ampules. Open ampules were stored in a freezer under N2. We prepared stock solutions of linoleic acid in ethanol at 10 mg ml'1. This stock solution was diluted in buffer as needed for individual assays.
Trilinolein came from Supelco, Inc., Belle- fonte, Pa., and was stored in a 60% ethanol- 40% acetone mixture. The ethanol-acetone mixture contained 20 mg ml"1 trilinolein, which was added directly to buffer for assays.
Distilled, deionized water and reagent grade chemicals were used.Methods
All lipoxygenase assays measured 0 2 disappearance with a polarographic 0 2 electrode (Beckman Instruments or Yellow Spring Instruments) and model SRG recorder (Sargent Welch). The reaction vessel used with the Beckman electrode contained 47 ml, with the electrode inserted in the side just above a magnetic stirrer, while the YSI electrode was inserted in a3-ml reaction vessel (Model 53 YSI oxygen monitor).
Reaction mixtures with the Beckman electrode contained 45 ml of buffer (0.2M Tris, pH 8 for most experiments), 1 ml of the stock solution of either linoleic acid or trilinolein as substrate (7.9 X 10"4M linoleic acid or 5 x 10'4M trilinolein) and 1 ml of enzyme. Reaction mixtures used with the YSI electrode contained 7 X 10"4M linoleate dispersed with 0.004% Tween 20 in 0.2M Tris at pH 8.
At the start of an assay, the 0 2 electrode was adjusted to 100% after equilibration with buffer and substrate. Addition of enzyme started the reaction. Enzyme activity is reported in units of pmoles 0 2 min'1 ml'1 of enzyme. All assays were at 25°C, and oxygen concentration was assumed the same as oxygen dissolved in water at 1 atm and 25°C.
We removed phytates by using the alkali precipitation method of Smith and Rackis(1957) as modified by Wang (1971).
Lipoxygenase 1 and 2 were prepared by extracting 100g defatted soy flour with 1 liter of 0.05M acetate pH 4.5 containing 0.1 mM Ca2+. The extract was clarified by centrifugation and taken to 40% saturation with (NH„)2 SO,. The precipitate was rehydrated with 0.01M phosphate pH 6.8 and dialyzed overnight against the same buffer. The supernate was taken to 70% saturation, and the precipitate was rehydrated with 0.01M phosphate pH 6.8 and dialyzed overnight against the same buffer.
Both the 40% and 70% ammonium sulfate precipitates were chromatographed on DEAE Sephadex A-50 (Sigma Chemical Co.) using 0.01M phosphate pH 6.8 and a NaCl gradient for elution. The 40% precipitate gave two peaks with lipoxygenase activity. The first peak corresponded to lipoxygenase 2 and the second peak corresponded to lipoxygenase 1 as isolated by Christopher et al. (1970). The 70% ammonium sulfate precipitate yielded only one peak on chromatography and that was lipoxygenase 1.
RESULTS & DISCUSSIONWE FOUND that rates of 0 2 uptake are proportional to amounts of lipoxygenase,
•----- • Ca** added
Fig. 1 — T h e lin ea r re sp o n s e o f o x y g e n u p ta k e to a m o u n t o f l ip o x y g e n a s e a n d th e a c tiv a tio n o f th e re a c tio n b y C a2+. T he re a c tio n m ix tu r e c o n ta in e d 7 .9 X 1 0 " ' M lin o le ic a c id , th e in d ic a te d a m o u n t o f s o y b e a n e x tr a c t a s e n z y m e , a n d 1 X 1 0 '3M C a2+ w h e n a d d e d c o n c u r r e n t ly w ith e n z y m e . T he b u f f e r was 0 .2 M tris a t p H 8 .0 , a n d th e te m p e r a tu r e was 2 5 0C.
V o l u m e 3 8 ( 1 9 7 3 ) - J O U R N A L O F F O O D S C I E N C E - 7 7 9
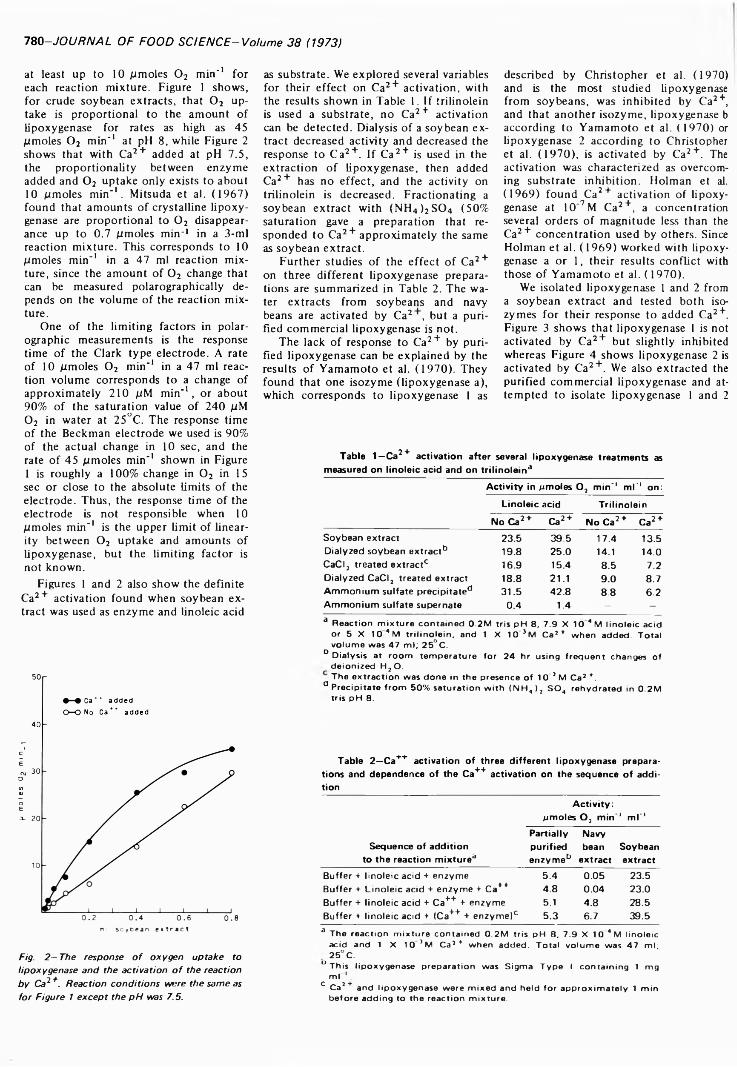
780-JOURNAL OF FOOD SCIENCE-Volume 38 (1973)
at least up to 10 mmoles 0 2 min' 1 for each reaction mixture. Figure 1 shows, for crude soybean extracts, that 0 2 uptake is proportional to the amount of lipoxygenase for rates as high as 45 Mmoles 0 2 min' 1 at pH 8 , while Figure 2 shows that with Ca2+ added at pH 7.5, the proportionality between enzyme added and 0 2 uptake only exists to about 10 Mmoles min'1. Mitsuda et al. (1967) found that amounts of crystalline lipoxygenase are proportional to 0 2 disappearance up to 0.7 Mmoles min-1 in a 3-ml reaction mixture. This corresponds to 10 Mmoles min' 1 in a 47 ml reaction mixture, since the amount of 0 2 change that can be measured polarographically depends on the volume of the reaction mixture.
One of the limiting factors in polar- ographic measurements is the response time of the Clark type electrode. A rate of 10 Mmoles 0 2 min' 1 in a 47 ml reaction volume corresponds to a change of approximately 2 1 0 mM min'1, or about 90% of the saturation value of 240 mM 0 2 in water at 25°C. The response time of the Beckman electrode we used is 90% of the actual change in 10 sec, and the rate of 45 Mmoles min' 1 shown in Figure 1 is roughly a 100% change in 0 2 in 15 sec or close to the absolute limits of the electrode. Thus, the response time of the electrode is not responsible when 10 Mmoles min' 1 is the upper limit of linearity between 0 2 uptake and amounts of lipoxygenase, but the limiting factor is not known.
Figures 1 and 2 also show the definite Ca2+ activation found when soybean extract was used as enzyme and linoleic acid
ml soybean extract
Fig. 2 — T h e re sp o n se o f o x y g e n u p ta k e to l ip o x y g e n a s e a n d th e a c tiv a tio n o f th e re a c tio n b y C ai+ . R e a c tio n c o n d it io n s w ere th e sa m e as fo r F igure 1 e x c e p t th e p H was 7 .5.
as substrate. We explored several variables for their effect on Ca2+ activation, with the results shown in Table 1. If trilinolein is used a substrate, no Ca2+ activation can be detected. Dialysis o f a soybean extract decreased activity and decreased the response to Ca2+. If Ca2+ is used in the extraction of lipoxygenase, then added Ca2+ has no effect, and the activity on trilinolein is decreased. Fractionating a soybean extract with (NH4 )2 S 0 4 (50% saturation gave a preparation that responded to Ca2 + approximately the same as soybean extract.
Further studies of the effect o f Ca2 + on three different lipoxygenase preparations are summarized in Table 2. The water extracts from soybeans and navy beans are activated by Ca2 , but a purified commercial lipoxygenase is not.
The lack of response to Ca2+ by purified lipoxygenase can be explained by the results of Yamamoto et al. (1970). They found that one isozyme (lipoxygenase a), which corresponds to lipoxygenase 1 as
described by Christopher et al. (1970) and is the most studied lipoxygenase from soybeans, was inhibited by Ca2+, and that another isozyme, lipoxygenase b according to Yamamoto et al. (1970) or lipoxygenase 2 according to Christopher et al. (1970), is activated by Ca2+. The activation was characterized as overcoming substrate inhibition. Holman et al.(1969) found Ca2+ activation of lipoxygenase at 10'7 M Ca2+, a concentration several orders of magnitude less than the Ca2+ concentration used by others. Since Holman et al. (1969) worked with lipoxygenase a or 1 , their results conflict with those of Yamamoto et al. ( 1970).
We isolated lipoxygenase 1 and 2 from a soybean extract and tested both isozymes for their response to added Ca2+. Figure 3 shows that lipoxygenase 1 is not activated by Ca2+ but slightly inhibited whereas Figure 4 shows lipoxygenase 2 is activated by Ca2+. We also extracted the purified commercial lipoxygenase and attempted to isolate lipoxygenase 1 and 2
Table 1—Ca2+ activation after several lipoxygenase treatments asmeasured on linoleic acid and on trilinolein“
Activity in pmoles O2 min'1 ml ■' on:Linoleic acid Trilinolein
No Ca2 + Ca2 + No Ca2 + Ca2 +Soybean extract 23.5 39.5 17.4 13.5Dialyzed soybean extract13 19.8 25.0 14.1 14.0CaCI2 treated extract13 16.9 15.4 8.5 7.2Dialyzed CaCI2 treated extract 18.8 21.1 9.0 8.7Ammonium sulfate precipitate11 31.5 42.8 8.8 6.2Ammonium sulfate supernate 0.4 1.4 - -
a R e a c t io n m ix tu r e c o n ta in e d 0 .2 M t r is p H 8 , 7 .9 X 1 0 4 M lin o le ic a c id o r 5 X 1 0 4 M t r i l in o le in , an d 1 X 1 0 3 M C a 3 + w h e n a d d e d . T o ta l v o lu m e w a s 4 7 m l; 2 5 ° C .
D D ia ly s is a t ro o m te m p e ra tu re fo r 2 4 h r u s in g f re q u e n t ch a n g e s o f d e io n iz e d H 2 0 .T h e e x t ra c t io n w a s d o n e in th e p re s e n c e o f 10 ’ 3 M C a 3 +.
a P re c ip ita te f ro m 5 0 % s a tu ra t io n w ith ( N H 4 ) 2 S 0 4 r e h y d ra te d in 0 .2 M t r is p H 8.
Table 2—Ca4"1' activation of three different lipoxygenase preparations and dependence of the Ca4"1' activation on the sequence of addition
Activity:pmoles 0 2 min'1 ml'1
Partially NavySequence of addition purified bean Soybean
to the reaction mixture“ enzyme13 extract extractBuffer + linoleic acid + enzyme 5.4 0.05 23.5Buffer + Linoleic acid + enzyme + Ca++ 4.8 0.04 23.0Buffer + linoleic acid + Ca++ + enzyme 5.1 4.8 28.5Buffer + linoleic acid + (Ca++ + enzyme)0 5.3 6.7 39.5
a T h e re a c t io n m ix tu re c o n ta in e d 0 .2 M t r is
I .
COIQ. 7 .9 X 1 0 4 M lin o le icac id an d 1 X 1 0 3 M C a 2+ w h e n a d d e d . T o ta l v o lu m e w as 4 7 m l;2 5 ° C .
D T h is lip o x y g e n a s e p re p a ra t io n w a s S ig m a T y p e I c o n ta in in g 1 m g m l 1 .
c C a 3 4 an d lip o x y g e n a s e w e re m ix e d an d h e ld fo r a p p ro x im a te ly 1 m in b e fo re a d d in g to th e re a c t io n m ix tu re .
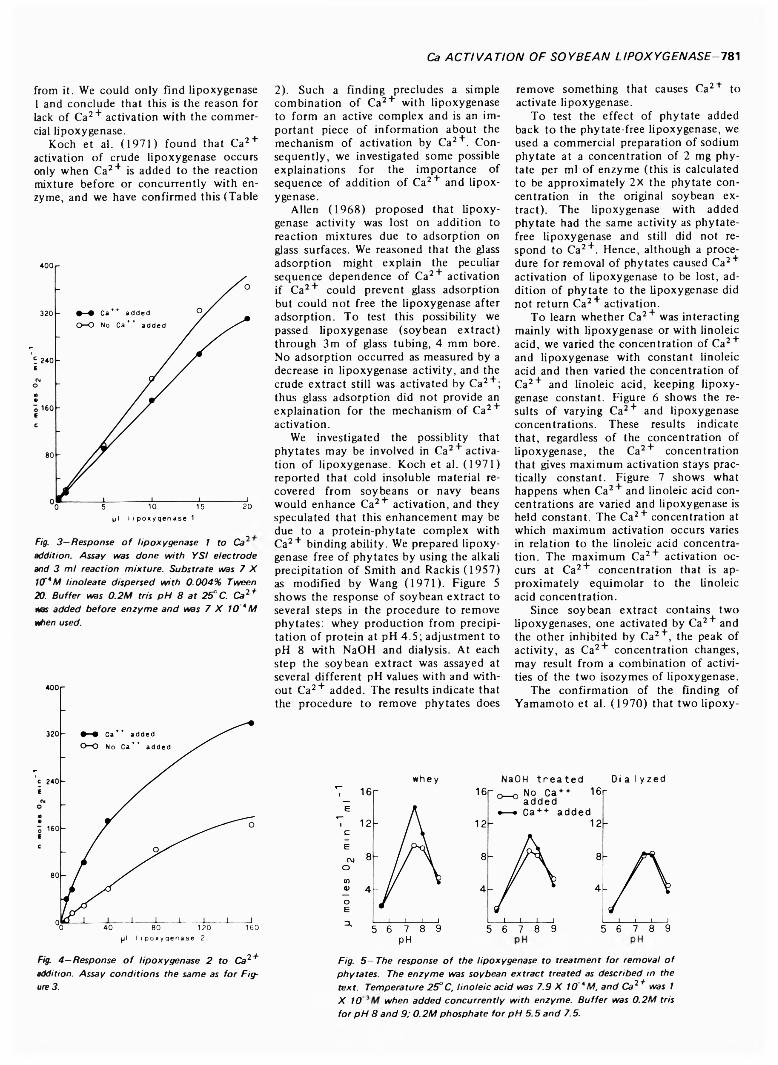
Ca ACTIVATION OF SOYBEAN LIPOXYGENASE-781
from it. We could only find lipoxygenase l and conclude that this is the reason for lack of Ca2+ activation with the commercial lipoxygenase.
Koch et al. (1971) found that Ca2 + activation of crude lipoxygenase occurs only when Ca2+ is added to the reaction mixture before or concurrently with enzyme, and we have confirmed this (Table
Fig. 3 —R e s p o n s e o f l ip o x y g e n a s e 1 to C a2 addition . A s s a y was d o n e w ith Y S I e le c tr o d e and 3 m l re a c tio n m ix tu r e . S u b s tr a te was 7 X K X 'M lin o le a te d isp e rse d w ith 0 .0 0 4 % T w ee n 20. B u ffe r w as 0 .2 M tris p H 8 a t 2 5 ° C. C a2 + was a d d e d b e fo r e e n z y m e a n d w as 7 X 10'* M when used .
addition. A ssa y c o n d i t io n s th e sa m e as fo r F igure 3.
2). Such a finding precludes a simple combination of Ca2+ with lipoxygenase to form an active complex and is an important piece of information about the mechanism of activation by Ca2+. Consequently, we investigated some possible explainations for the importance of sequence of addition of Ca2+ and lipoxygenase.
Allen (1968) proposed that lipoxygenase activity was lost on addition to reaction mixtures due to adsorption on glass surfaces. We reasoned that the glass adsorption might explain the peculiar sequence dependence of Ca2+ activation if Ca2+ could prevent glass adsorption but could not free the lipoxygenase after adsorption. To test this possibility we passed lipoxygenase (soybean extract) through 3m of glass tubing, 4 mm bore. No adsorption occurred as measured by a decrease in lipoxygenase activity, and the crude extract still was activated by Ca2+; thus glass adsorption did not provide an explaination for the mechanism of Ca2 + activation.
We investigated the possiblity that phytates may be involved in Ca2 + activation of lipoxygenase. Koch et al. (1971) reported that cold insoluble material recovered from soybeans or navy beans would enhance Ca2+ activation, and they speculated that this enhancement may be due to a protein-phytate complex with Ca2+ binding ability. We prepared lipoxygenase free of phytates by using the alkali precipitation of Smith and Rackis (1957) as modified by Wang (1971). Figure 5 shows the response of soybean extract to several steps in the procedure to remove phytates: whey production from precipitation of protein at pH 4.5; adjustment to pH 8 with NaOH and dialysis. At each step the soybean extract was assayed at several different pH values with and without Ca2+ added. The results indicate that the procedure to remove phytates does
remove something that causes Ca2+ to activate lipoxygenase.
To test the effect of phytate added back to the phytate-free lipoxygenase, we used a commercial preparation of sodium phytate at a concentration of 2 mg phytate per ml of enzyme (this is calculated to be approximately 2 X the phytate concentration in the original soybean extract). The lipoxygenase with added phytate had the same activity as phytate- free lipoxygenase and still did not respond to Ca2+. Hence, although a procedure for removal of phytates caused Ca2 + activation of lipoxygenase to be lost, addition of phytate to the lipoxygenase did not return Ca2+ activation.
To learn whether Ca2+ was interacting mainly with lipoxygenase or with linoleic acid, we varied the concentration of Ca2 + and lipoxygenase with constant linoleic acid and then varied the concentration of Ca2+ and linoleic acid, keeping lipoxygenase constant. Figure 6 shows the results o f varying Ca2+ and lipoxygenase concentrations. These results indicate that, regardless o f the concentration of lipoxygenase, the Ca2+ concentration that gives maximum activation stays practically constant. Figure 7 shows what happens when Ca2+ and linoleic acid concentrations are varied and lipoxygenase is held constant. The Ca2+ concentration at which maximum activation occurs varies in relation to the linoleic acid concentration. The maximum Ca2+ activation occurs at Ca2+ concentration that is approximately equimolar to the linoleic acid concentration.
Since soybean extract contains two lipoxygenases, one activated by Ca2+ and the other inhibited by Ca2+, the peak of activity, as Ca2+ concentration changes, may result from a combination of activities of the two isozymes of lipoxygenase.
The confirmation of the finding of Yamamoto et al. (1970) that two lipoxy-
whey NaOH t r e a t e d D i a l y z e d
Fig. 5 — T h e re sp o n s e o f th e l ip o x y g e n a s e to t r e a tm e n t fo r re m o v a l o f p h y ta te s . T h e e n z y m e was s o y b e a n e x t r a c t tr e a te d as d e s c r ib e d in th e te x t . T e m p e r a tu re 2 5 ° C, lin o le ic a c id was 7 .9 X 1 0 '* M , a n d C a2+ w as 1 X 10 ' w h e n a d d e d c o n c u r r e n t ly w ith e n z y m e . B u f fe r w as 0 .2 M tris fo r p H 8 a n d 9 ; 0 .2 M p h o s p h a te fo r p H 5 .5 a n d 7.5.
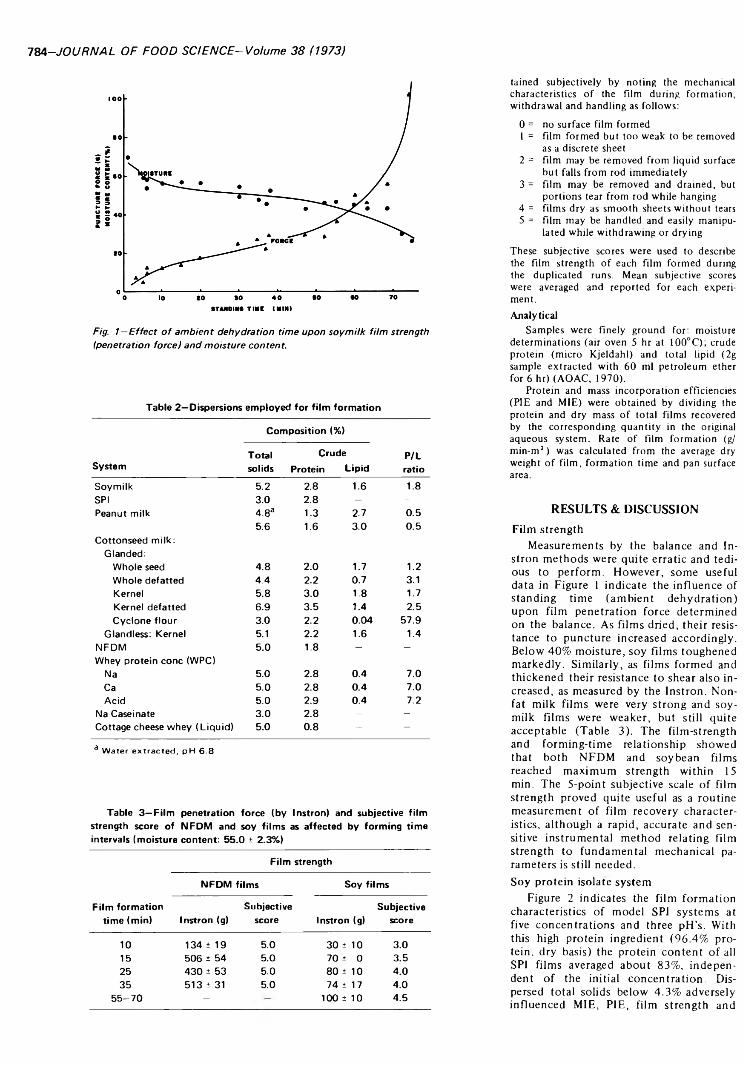
784-JOURNAL OF FOOD SCIENCE-Volume 38 (1973)
Fig. 1—E ff e c t o f a m b ie n t d e h y d r a t io n t im e u p o n s o y m i lk f i lm s tr e n g th Ip e n e tra tio n fo rc e ) a n d m o is tu r e c o n te n t .
Table 2—Dispersions employed for film formation
System
Composition (%)
Total Crude solids Protein Lipid
P/Lratio
Soymilk 5.2 2.8 1.6 1.8SPI 3.0 2.8 - -Peanut milk 4.8a 1.3 2.7 0.5
5.6 1.6 3.0 0.5Cottonseed milk:
Glanded:Whole seed 4.8 2.0 1.7 1.2Whole defatted 4.4 2.2 0.7 3.1Kernel 5.8 3.0 1.8 1.7Kernel defatted 6.9 3.5 1.4 2.5Cyclone flour 3.0 2.2 0.04 57.9
Glandless: Kernel 5.1 2.2 1.6 1.4NFDM 5.0 1.8 - -
Whey protein cone (WPC)Na 5.0 2.8 0.4 7.0Ca 5.0 2.8 0.4 7.0Acid 5.0 2.9 0.4 7.2
Na Caseinate 3.0 2.8 - -Cottage cheese whey (Liquid) 5.0 0.8 - -
3 Water extracted, pH 6.8
Table 3—Film penetration force (by Instron) and subjective film strength score of NFDM and soy films as affected by forming time intervals (moisture content: 55.0 ± 2.3%)
Film strength
NFDM films Soy films
Film formation Subjective Subjectivetime (min) Instron (g) score Instron (g) score
10 134 ±19 5.0 30 ± 10 3.015 506 ± 54 5.0 7 0 + 0 3.525 430 ± 53 5.0 80 ± 10 4.035 513 + 31 5.0 74 ± 17 4.0
55-70 - 100 ± 10 4.5
tained subjectively by noting the mechanical characteristics of the film during formation, withdrawal and handling as follows:
0 = no surface film formed1 = film formed but too weak to be removed
as a discrete sheet2 = film may be removed from liquid surface
but falls from rod immediately3 = film may be removed and drained, but
portions tear from rod while hanging4 = films dry as smooth sheets without tears5 = film may be handled and easily manipu
lated while withdrawing or dryingThese subjective scores were used to describe the film strength of each film formed during the duplicated runs. Mean subjective scores were averaged and reported for each experiment.Analytical
Samples were finely ground for: moisture determinations (air oven 5 hr at 100°C); crude protein (micro Kjeldahl) and total lipid (2g sample extracted with 60 ml petroleum ether for 6 hr) (AOAC, 1970).
Protein and mass incorporation efficiencies (PIE and MIE) were obtained by dividing the protein and dry mass of total films recovered by the corresponding quantity in the original aqueous system. Rate of film formation (g/ min-rrri) was calculated from the average dry weight of film, formation time and pan surface area.
RESULTS & DISCUSSION Film strength
Measurements by the balance and In- stron methods were quite erratic and tedious to perform. However, some useful data in Figure 1 indicate the influence of standing time (ambient dehydration) upon film penetration force determined on the balance. As films dried, their resistance to puncture increased accordingly. Below 40% moisture, soy films toughened markedly. Similarly, as films formed and thickened their resistance to shear also increased, as measured by the Instron. Nonfat milk films were very strong and soymilk films were weaker, but still quite acceptable (Table 3). The film-strength and forming-time relationship showed that both NFDM and soybean films reached maximum strength within 15 min. The 5-point subjective scale of film strength proved quite useful as a routine measurement of film recovery characteristics, although a rapid, accurate and sensitive instrumental method relating film strength to fundamental mechanical parameters is still needed.Soy protein isolate system
Figure 2 indicates the film formation characteristics of model SPi systems at five concentrations and three pH’s. With this high protein ingredient (96.4% protein, dry basis) the protein content of all SPI films averaged about 83%, independent of the initial concentration. Dispersed total solids below 4.3% adversely influenced MIE, PIE, film strength and
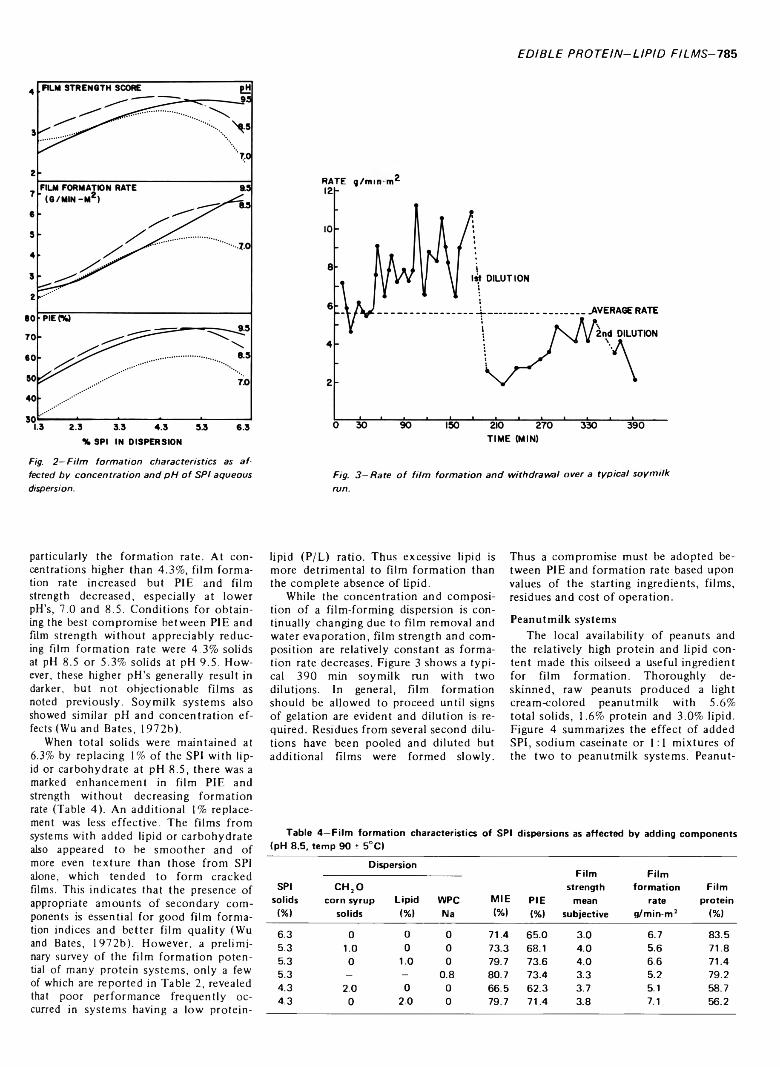
EDIBLE PROTEIN-LIPID FILMS- 785
Fig. 2 —F ilm fo r m a tio n c h a r a c te r is tic s as a f fe c te d b y c o n c e n tr a t io n a n d p H o f S P I a q u e o u s dispersion.
RATE g / m i n m ^
Fig. 3 —R a te o f f i lm fo r m a tio n a n d w ith d r a w a l o v e r a ty p ic a l s o y m i lk run.
particularly the formation rate. At concentrations higher than 4.3%, film formation rate increased but PIE and film strength decreased, especially at lower pH’s, 7.0 and 8.5. Conditions for obtaining the best compromise between PIE and film strength without appreciably reducing film formation rate were 4.3% solids at pH 8.5 or 5.3% solids at pH 9.5. However, these higher pH’s generally result in darker, but not objectionable films as noted previously. Soymilk systems also showed similar pH and concentration effects (Wu and Bates, 1972b).
When total solids were maintained at 6.3% by replacing 1% of the SPI with lipid or carbohydrate at pH 8.5, there was a marked enhancement in film PIE and strength without decreasing formation rate (Table 4). An additional 1% replacement was less effective. The films from systems with added lipid or carbohydrate also appeared to be smoother and of more even texture than those from SPI alone, which tended to form cracked films. This indicates that the presence of appropriate amounts of secondary com ponents is essential for good film formation indices and better film quality (Wu and Bates, 1972b). However, a preliminary survey of the film formation potential of many protein systems, only a few of which are reported in Table 2, revealed that poor performance frequently occurred in systems having a low protein-
lipid (P/L) ratio. Thus excessive lipid is more detrimental to film formation than the complete absence of lipid.
While the concentration and composition of a film-forming dispersion is continually changing due to film removal and water evaporation, film strength and composition are relatively constant as formation rate decreases. Figure 3 shows a typical 390 min soymilk run with two dilutions. In general, film formation should be allowed to proceed until signs of gelation are evident and dilution is required. Residues from several second dilutions have been pooled and diluted but additional films were formed slowly.
Thus a compromise must be adopted between PIE and formation rate based upon values of the starting ingredients, films, residues and cost o f operation.
Peanutmilk systemsThe local availability of peanuts and
the relatively high protein and lipid content made this oilseed a useful ingredient for film formation. Thoroughly de- skinned, raw peanuts produced a light cream-colored peanutmilk with 5.6% total solids, 1.6% protein and 3.0% lipid. Figure 4 summarizes the effect of added SPI, sodium caseinate or 1:1 mixtures of the two to peanutmilk systems. Peanut-
Table 4—Film formation characteristics of SPI dispersions as affected by adding components (pH 8.5, temp 90 ± 5°C>
SPIsolids(%)
Dispersion
M IE(%)
PIE<%)
Filmstrength
meansubjective
Filmformation
rateg/min-m2
Filmprotein
(%)
c h 2ocorn syrup
solidsLipid(%>
WPCNa
6.3 0 0 0 71.4 65.0 3.0 6.7 83.55.3 1.0 0 0 73.3 68.1 4.0 5.6 71.85.3 0 1.0 0 79.7 73.6 4.0 6.6 71.45.3 — - 0.8 80.7 73.4 3.3 5.2 79.24.3 2.0 0 0 66.5 62.3 3.7 5.1 58.74.3 0 2.0 0 79.7 71.4 3.8 7.1 56.2
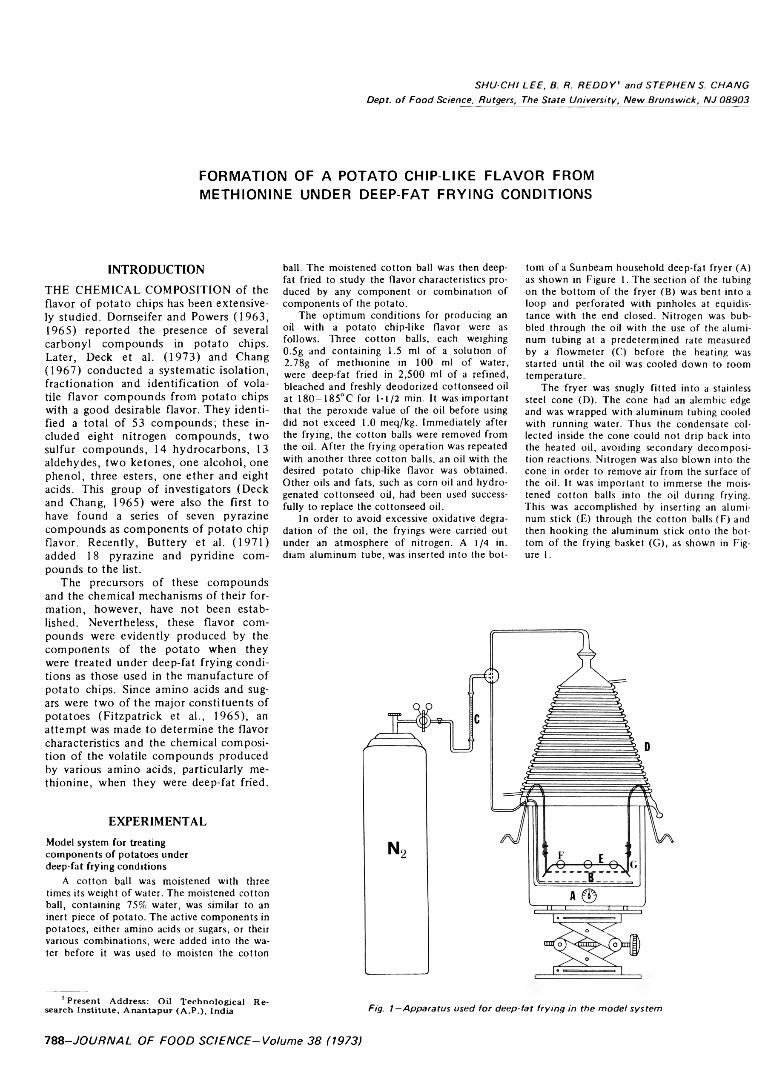
S H U -C H I L E E , B. R . R E D D Y ' a n d S T E P H E N S. C H A N G
D ep t, o f F o o d S c ie n c e , R u tg e rs , T h e S ta te U n iv e r s ity , N e w B ru n sw ic k , N J 0 8 9 0 3
FORMATION OF A POTATO CHIP-LIKE FLAVOR FROM METHIONINE UNDER DEEP-FAT FRYING CONDITIONS
INTRODUCTIONTHE CHEMICAL COMPOSITION of the flavor of potato chips has been extensively studied. Domseifer and Powers (1963,1965) reported the presence of several carbonyl compounds in potato chips. Later, Deck et al. (1973) and Chang(1967) conducted a systematic isolation, fractionation and identification of volatile flavor compounds from potato chips with a good desirable flavor. They identified a total of 53 compounds; these included eight nitrogen compounds, two sulfur compounds, 14 hydrocarbons, 13 aldehydes, two ketones, one alcohol, one phenol, three esters, one ether and eight acids. This group of investigators (Deck and Chang, 1965) were also the first to have found a series of seven pyrazine compounds as components of potato chip flavor. Recently, Buttery et al. (1971) added 18 pyrazine and pyridine compounds to the list.
The precursors of these compounds and the chemical mechanisms of their formation, however, have not been established. Nevertheless, these flavor compounds were evidently produced by the components of the potato when they were treated under deep-fat frying conditions as those used in the manufacture of potato chips. Since amino acids and sugars were two of the major constituents of potatoes (Fitzpatrick et aL, 1965), an attempt was made to determine the flavor characteristics and the chemical composition of the volatile compounds produced by various amino acids, particularly methionine, when they were deep-fat fried.
EXPERIMENTALModel system for treating components o f potatoes under deep-fat frying conditions
A cotton ball was moistened with three times its weight of water. The moistened cotton ball, containing 75% water, was similar to an inert piece of potato. The active components in potatoes, either amino acids or sugars, or their various combinations, were added into the water before it was used to moisten the cotton
1 Present Address: O il Technolog ical R esearch In s titu te , A n a n ta p u r (A .P .) , In d ia
ball. The moistened cotton ball was then deep- fat fried to study the flavor characteristics produced by any component or combination of components of the potato.
The optimum conditions for producing an oil with a potato chip-like flavor were as follows. Three cotton balls, each weighing 0.5g and containing 1.5 ml of a solution of 2.78g of methionine in 100 ml of water, were deep-fat fried in 2,500 ml of a refined, bleached and freshly deodorized cottonseed oil at 180-185°C for 1-1/2 min. It was important that the peroxide value of the oil before using did not exceed 1.0 meq/kg. Immediately after the frying, the cotton balls were removed from the oil. After the frying operation was repeated with another three cotton balls, an oil with the desired potato chip-like flavor was obtained. Other oils and fats, such as corn oil and hydrogenated cottonseed oil, had been used successfully to replace the cottonseed oil.
In order to avoid excessive ox id ative degradation o f the o il, the fry ings were carried out under an atm osphere o f n itrogen . A 1/4 in . diam a lum inum tube, was inserted in to the bo t
tom of a Sunbeam household deep-fat fryer (A) as shown in Figure 1. The section of the tubing on the bottom of the fryer (B) was bent into a loop and perforated with pinholes at equidistance with the end closed. Nitrogen was bubbled through the oil with the use of the aluminum tubing at a predetermined rate measured by a flowmeter (C) before the heating was started until the oil was cooled down to room temperature.
The fryer was snugly fitted into a stainless steel cone (D). The cone had an alembic edge and was wrapped with aluminum tubing cooled with running water. Thus the condensate collected inside the cone could not drip back into the heated oil, avoiding secondary decomposition reactions. Nitrogen was also blown into the cone in order to remove air from the surface of the oil. It was important to immerse the moistened cotton balls into the oil during frying. This was accomplished by inserting an aluminum stick (E) through the cotton balls (F) and then hooking the aluminum stick onto the bottom of the frying basket (G), as shown in Figure 1.
Fig. 1 —Apparatus used for deep-fat frying in the model system
788-JOURNAL OF FOOD SCIFNCE-Volume 38 (1973)

P O T A T O C H IP -L IK E F L A V O R F R O M M E T H IO N IN E - 789
Methionine usedDL-Methionine, M.A. (Mann Research Lab
oratories, New York, N.Y.) was used. It produced only one spot by two-dimensional paper chromatography.
RESULTS & DISCUSSION
Aroma generated by amino acid under deep-fat frying conditions
Five different amino acids were selected according to their chemical structures (Table 1). Each of them was treated under deep-fat frying conditions with the use of the model system. The aroma thus generated by each of the amino acids as judged by an experienced panel o f six persons is shown in Table 1. The strong pleasant potato chip-like aroma could be produced by either the D- or L-isomers of methionine or their mixtures. After the cottonseed oil was used for the deep-fat frying of moistened cotton balls containing methionine, it retained a strong potato chip-like flavor. The flavor o f the oil was evaluated by an experienced panel of six persons. The volatile flavor compounds in this oil can be isolated by subjecting the oil to 90 C under a vacuum of less than 0.01 mm Hg for 1-1/2 hr. The isolated volatile compounds had a strong potato chip-like aroma. When they were dropped on a perfumers’ paper stick, the aroma lingered on the stick for many hours, thus indicating that the com pounds responsible for the potato chiplike aroma were of relatively high boiling points.
Addition of glucose to methionine in the model system did not improve the characteristic o f the flavor produced. At weight ratios (methionine:glucose) o f 1:1 to 7.7:1, the cotton balls were dark brown in color after deep-fat frying and the odor was reminiscent of burnt brown potato chips. At weight ratios (methio- nine:glucose) of 16.6:1 to 33:1, the cotton balls were light brown to yellow in color after deep fat frying and the odor was reminiscent of that of ordinary potato chips. Since a potato chip-like flavor could be produced by methionine alone without glucose and without the development of a dark brown color, it appeared
Table 1—Aroma generated by different amino acids
Amino acidAroma generated under deep-
fat frying conditionsThreonine Wet hair, earthyProline Stale popcorn, bitterHistidine Stale popcornCystine Slightly meatyMethionine Strong potato chip-like
that potato chip flavor might not entirely be due to browning reactions. It probably could also be produced by simple thermal decomposition of some amino acids, such as methionine.
Since it was noted that the compounds responsible for the potato chip-like aroma were of relatively high boiling points, they probably could not be formed by direct degradation of methionine which had a rather low molecular weight itself. It was suspected that the potato chip-like aroma was produced by interactions between the thermal oxidative decomposition products o f the oil and the thermal degradation products o f methionine. For example, Rizzi (1972) reported that a variety of pyrazine compounds could be formed by the reaction of alpha-dicarbonyls with alpha-amino acids.
The production of a potato aroma by methionine has been reported previously by Herz and Shallenberger (1960). They claimed that heating methionine and glucose in water at 100 C and heating the said reactants with mineral oil to 180 C could both yield a potato aroma. In the present investigation, only a weak aroma was detected when either methionine or methionine and glucose were heated to 100 C in water. When methionine or a mixture of methionine and glucose were heated in an oil, a pleasant potato and tomato-like aroma was generated, starting at 50°C and reaching a maximum of 110°C. When heated over 130°C, the characteristic of the aroma began to deteriorate. At 180°C, the aroma was obnoxious (Chang and Reddy, 1971). Elode et al. (1966) also claimed that heating an aqueous methionine solution with sugars to 100° and 180°C yielded a cabbage-like odor. The potato chip-like aroma was noticed only when methionine was treated under deep-fat frying conditions.
It was known that methional was a Strecker degradation product of methio
nine (Ballance, 1961). However, the flavor produced by treating methionine under deep-fat frying conditions was found to be more pleasant and more reminiscent of that o f potato chips than a solution of methional in oil. Furthermore, deep-fat frying of moistened cotton balls containing methional did not yield the same flavor as heating methionine under the same conditions.
Quantitative estimation of volatile flavor compounds
In the model system, a total of approximately 125 ppm of methionine by weight of oil was deep fat fried in moistened cotton balls to produce an oil with a potato chip-like flavor. However, the amount of methionine actually reacted to produce the desired flavor was much less than the total amount used. The amount of methionine in the moistened cotton balls before and after frying was analyzed by paper chromatography. The methionine spot was developed with the use of ninhydrin and its quantity was measured by absorption at 570 m fi. It was found that only 24 ppm of methionine by weight of the oil was reacted to produce the desired flavor.
The amount of volatile flavor compounds in the oil with the potato chiplike flavor was extremely small. By maintaining the flavored oil at 90°C for 1-1/2 hr under 0.01 mm Hg, only 3 ppm of volatile compounds by weight of the oil could be isolated. However, these 3 ppm of volatile compounds must be responsible for the potato chip-like flavor, because after they were removed, the oil was practically bland in odor and flavor.
Effect of the chemical structure of-methionine upon its ability to produce a potato chip-like flavor
The chemical structure required for the generation of the potato chip-like fla-
Table 2—Effect of chemical structure upon the production of a potato chip-like flavor by methionine under deep-fat frying conditions
Compound Structures
Characteristic of flavor produced under deep-fat
frying conditions
D-MethionineL-MethionineDL-Methionine
CH3-S-CH2-CH2-CH(NH2) cooh Good potato chip-like
S-Methyl-L-cysteine CH3-S-CH2-CH(NH2) cooh Good potato chip-likeDL-Ethionine CH3-CH2-S-CH2-CH2-CH(NH2) cooh Good potato chip-likeS-Ethyl-L-cysteine CH3-CH2-S-CH2-CH(NH2) COOH Obnoxious (cooked turnip)Methionine hydroxy
analogCH3-S-CH2-CH2-CH(OH) COOH Obnoxious (cooked turnip)
S-Carboxy methyl- L- cysteine
HOOC-CH2-S-CH2-CH(NH2) COOH Obnoxious (cooked turnip)
790-JOURNAL OF FOOD SCIENCE-Volume 38 (1973)
vor during the deep-fat frying of methionine was quite specific (Table 2). Methionine, either D- or L- or DL-, generated a good potato chip-like flavor. Elimination of a carbon in the carbon chain of methionine did not affect its ability to produce a good flavor. Lengthening the methyl group at the end by one carbon atom could still produce good potato chip-like flavor. However, when both happened at the same time, that was, when the terminal methyl group was lengthened, and the carbon chain was shortened, an obnoxious flavor, instead of a potato chip-like flavor, was produced. The amino group was also important to the production of potato chip-like flavor. Replacement of this group with a hydroxyl group resulted in the production of an obnoxious flavor. The terminal methyl group was also important to the potato chip-like flavor production. Replacement of one hydrogen atom by a
carboxyl group also resulted in the generation of an obnoxious flavor.
REFERENCESB allance, P .E . 1 9 6 1 . P rodu ction o f vo la tile
com pounds related to the flavor o f foods from the S trecker degradation o f D L -m e- th io n in e . J. Sci. F o o d A gr. 1 2 : 532 .
B u tte ry , R .G ., S e ife rt, R .M ., G uadagni, D .G . and L ing, L .C . 1 9 7 1 . C haracterization o f volatile pyrazine and p yrid in e com ponents o f p o ta to chips. J. Agr. Fo od C hem . 19: 9 6 9 .
Chang, S.S. 1 9 6 7 . Iso la tion and id en tific a tio n o f vo la tile flavor com pounds in p o ta to chips. Proceedings o f the P rodu ction and Technical D iv is ion M eeting o f the P ota to C hip In s titu te In te rn a tio n a l, p. 7.
Chang, S.S. and R ed d y , B .R . 1 9 7 1 . P o ta to and p o ta to chip flavor and arom a. U .S . Patent 3 ,6 1 9 ,2 1 1 .
D eck, R .E . and Chang, S.S. 1 9 6 5 . Id e n tific a tio n o f 2 ,5 -d im e th y l-p y ra z in e in the vo la tile fla vor com pounds o f p o tato chips. C hem . & In d . (L o n d o n ): 1 34 3 .
D eck, R .E ., P o ko rn y , J. and Chang, S.S. 1 9 7 3 . Iso la tion and id en tific a tio n o f vo la tile flavor com pounds from p o ta to chips. J. Fo od Sci. 3 8: 3 45 .
D ornseifer, T .P . and Powers, J.J. 1 9 6 3 . Changes
in the vo la tile carbonyls o f p o ta to chips during storage. F o o d Techno l. 17: 1 18 .
D ornseifer, T .P . and Powers, J.J. 1 9 6 5 . V o la tile constituen ts o f p o ta to chips and changes during storage. Fo od T ech n o l. 19: 8 77 .
E lode, K .E ., D ornseifer, T .P ., K e ith , E .S . and Powers, J.J. 1 9 6 6 . E ffe c t o f p H and tem pera ture on the carbonyls and arom as produced in heated am ino acid-sugar m ix tu res . J. Fo o d Sci. 3 1 : 3 51 .
F itz p a tric k , T .J ., T a lle y , E .A . and P o rte r, W .L .1 9 6 5 . P re lim in ary studies on the fate o f sugars and am ino acids in chips m ade from fresh and stored potatoes. J. A gr. Food C hem . 13: 10.
H erz , W .J. and Shallenberger, R .S . 1 9 6 0 . Some aromas produced by sim ple am ino acid, sugar reactions. F o o d Res. 25: 4 9 1 .
R iz z i, G .P . 1 9 7 2 . A m echanistic study o f a lky l pyrazine fo rm a tio n in m odel systems. J. A gr. Fo od C hem . 20: 1 0 8 1 .
Ms received 1 /2 /7 3 ; revised 3 /3 /7 3 ; accepted 3 / 5 /7 3 ._________________________________________
Presented a t the 32n d A n n u a l M eeting of the In s titu te o f F o o d Technolog ists in M in neapolis.
Paper o f the Journa l Series, N ew Jersey A gric u ltu ra l E x p e rim en t S ta tio n , R utgers, T h e State U nivers ity o f N ew Jersey.
Th is investigation was supported by a research grant fro m the P o ta to C h ip In s titu te In te rn atio n a l.
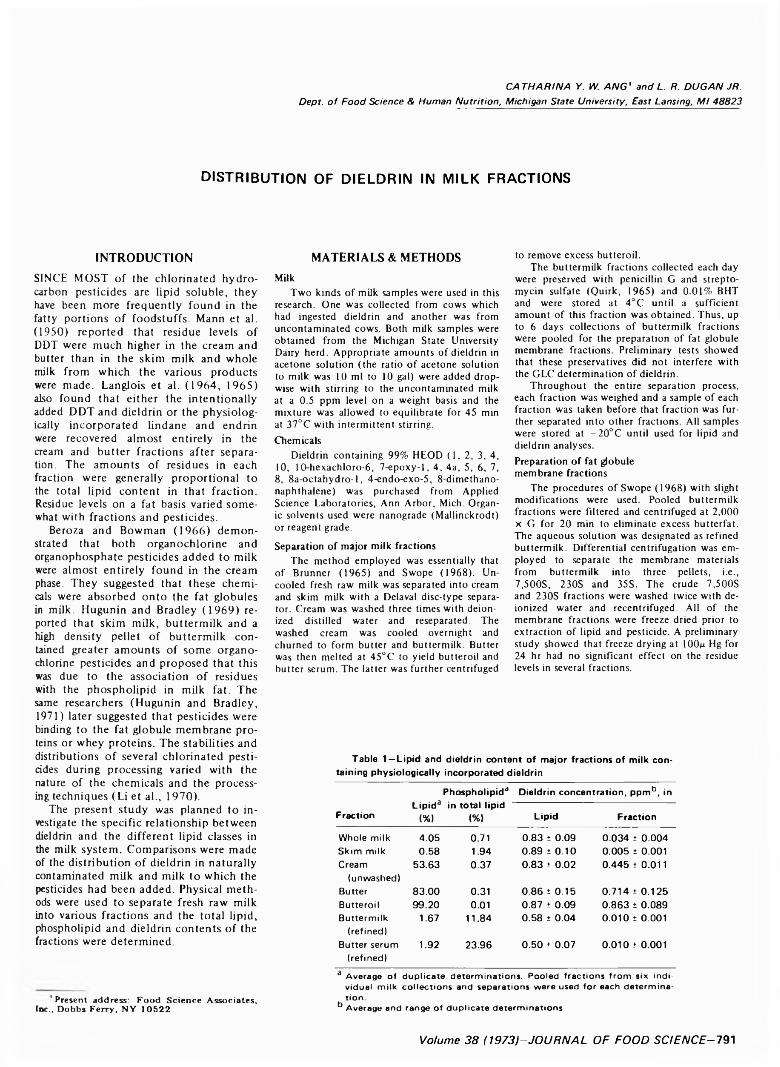
C A T H A R I N A Y. W. A N G ' a n d L. R . D U G A N JR .
D ep t, o f F o o d S c ie n c e & H u m a n N u tr i t io n , M ich igan S ta te U n iv e rs ity , E a s t L an sin g , M l 4 8 8 2 3
d is t r ib u t io n o f d ie l d r in in m il k f r a c t io n s
i n t r o d u c t i o n
SINCE MOST of the chlorinated hydrocarbon pesticides are lipid soluble, they have been more frequently found in the fatty portions of foodstuffs. Mann et al.(1950) reported that residue levels of DDT were much higher in the cream and butter than in the skim milk and whole milk from which the various products were made. Langlois et al. (1964, 1965) also found that either the intentionally added DDT and dieldrin or the physiologically incorporated lindane and endrin were recovered almost entirely in the cream and butter fractions after separation. The amounts of residues in each fraction were generally proportional to the total lipid content in that fraction. Residue levels on a fat basis varied som ewhat with fractions and pesticides.
Beroza and Bowman (1966) demonstrated that both organochlorine and organophosphate pesticides added to milk were almost entirely found in the cream phase. They suggested that these chemicals were absorbed onto the fat globules in milk. Hugunin and Bradley (1969) reported that skim milk, buttermilk and a high density pellet of buttermilk contained greater amounts of some organochlorine pesticides and proposed that this was due to the association of residues with the phospholipid in milk fat. The same researchers (Hugunin and Bradley,1971) later suggested that pesticides were binding to the fat globule membrane proteins or whey proteins. The stabilities and distributions of several chlorinated pesticides during processing varied with the nature of the chemicals and the processing techniques (Li et al., 1970).
The present study was planned to investigate the specific relationship between dieldrin and the different lipid classes in the milk system. Comparisons were made of the distribution of dieldrin in naturally contaminated milk and milk to which the pesticides had been added. Physical methods were used to separate fresh raw milk into various fractions and the total lipid, phospholipid and dieldrin contents o f the fractions were determined.
1 Present address: Fo od Science Associates, Inc., Dobbs F e rry , N Y 1 0 5 2 2
MATERIALS & METHODSMilk
Two kinds of milk samples were used in this research. One was collected from cows which had ingested dieldrin and another was from uncontaminated cows. Both milk samples were obtained from the Michigan State University Dairy herd. Appropriate amounts of dieldrin in acetone solution (the ratio of acetone solution to milk was 10 ml to 10 gal) were added drop- wise with stirring to the uncontaminated milk at a 0.5 ppm level on a weight basis and the mixture was allowed to equilibrate for 45 min at 37°C with intermittent stirring.Chemicals
Dieldrin containing 99% HEOD (1, 2, 3, 4, 10, 10-hexachloro-6, 7-epoxy-l, 4, 4a, 5, 6, 7, 8, 8a-octahydro-l, 4-endo-exo-5, 8-dimethano- naphthalene) was purchased from Applied Science Laboratories, Ann Arbor, Mich. Organic solvents used were nanograde (Mallinckrodt) or reagent grade.Separation of major milk fractions
The method employed was essentially that of Brunner (1965) and Swope (1968). Uncooled fresh raw milk was separated into cream and skim milk with a Delaval disc-type separator. Cream was washed three times with deionized distilled water and reseparated. The washed cream was cooled overnight and churned to form butter and buttermilk. Butter was then melted at 45°C to yield butteroil and butter serum. The latter was further centrifuged
to remove excess butteroil.The buttermilk fractions collected each day
were preserved with penicillin G and streptomycin sulfate (Quirk, 1965) and 0.01% BHT and were stored at 4°C until a sufficient amount of this fraction was obtained. Thus, up to 6 days collections of buttermilk fractions were pooled for the preparation of fat globule membrane fractions. Preliminary tests showed that these preservatives did not interfere with the GLC determination of dieldrin.
Throughout the entire separation process, each fraction was weighed and a sample of each fraction was taken before that fraction was further separated into other fractions. All samples were stored at -20°C until used for lipid and dieldrin analyses.Preparation o f fat globule membrane fractions
The procedures of Swope (1968) with slight modifications were used. Pooled buttermilk fractions were filtered and centrifuged at 2,000 x G for 20 min to eliminate excess butterfat. The aqueous solution was designated as refined buttermilk. Differential centrifugation was employed to separate the membrane materials from buttermilk into three pellets, i.e., 7,500S, 230S and 35S. The crude 7,500S and 230S fractions were washed twice with deionized water and recentrifuged. All of the membrane fractions were freeze dried prior to extraction of lipid and pesticide. A preliminary study showed that freeze drying at 100m Hg for 24 hr had no significant effect on the residue levels in several fractions.
Table 1—Lipid and dieldrin content of major fractions of milk containing physiologically incorporated dieldrin
Phospholipid3 in total lipid
<%)
Dieldrin concentration, ppm*3, in
FractionLipid3
<%) Lipid Fraction
Whole m ilk 4.05 0.71 0.83 ± 0.09 0.034 ± 0.004S k im m ilk 0.58 1.94 0.89 ± 0.10 0.005 ± 0.001Cream 53.63 0.37 0.83 t 0.02 0.445 ± 0.011
(unwashed)Butter 83.00 0.31 0.86 ± 0.15 0.714 ± 0.125Buttero il 99.20 0.01 0.87 ± 0.09 0.863 ± 0.089Butte rm ilk 1.67 11.84 0.58 ± 0.04 0.010 ± 0.001
(refined )Butter serum 1.92 23.96 0.50 ± 0.07 0.010 ± 0.001
(re fined )
3 A v e ra g e o f d u p lic a te d e te rm in a t io n s . P o o le d f ra c t io n s fro m s ix in d iv id u a l m ilk c o lle c t io n s an d se p a ra t io n s w e re u sed fo r e ach d e te rm in a -t io n .
b A v e ra g e an d ran g e o f d u p lic a te d e te rm in a t io n s
V o l u m e 3 8 ( 1 9 7 3 ) - J O U R N A L O F F O O D S C I E N C E -7 9 1

122-JOURNAL OF FOOD SCIENCE-Volume 38 (1973)
Extraction and determinationLipid and dieldrin in the major fractions
were extracted with ethanol, ethyl ether and petroleum ether, and the extracted lipid was subjected to acetonitrile-petroleum ether cleanup using the procedures described by the Food and Drug Administration (1968). Further cleanup with a Florisil-celite column was accomplished according to recommendations by the Shell Chemical Company (1964).
Slightly modified extraction procedures were adopted for buttermilk and butter serum to facilitate a better separation between the solvent phase and the aqueous phase and to recover the lipids completely. 3.5 voi of ethanol, 1 voi o f ethyl ether and 2.5 voi o f petroleum ether were used in the first extraction, whereas, 1 voi o f petroleum ether was used in each of the second and third extractions. The residual phase was diluted with 2.5 voi of distilled water and then extracted with ethyl ether and petroleum ether following the original procedure.
Free lipids o f the membrane material were extracted with petroleum ether (Cerbulis,1967). The residue portion was rehydrated with 10 voi o f water and then the bound lipids were extracted with ethanol, petroleum ether and ethyl ether following the same procedures as used for buttermilk.
Quantitative determinations of dieldrin were carried out on a F and M Hewlett-Packard Model 5750B research gas chromatograph equipped with a tritium electron capture detec
tor. The operating conditions were 4' x 1 /4" OD coiled glass column prepacked with 3.8% SE-30 on 80/100 mesh Diatoport S; injection port temperature 240°C; column oven 200°C; detector 210°C; flow rate o f carrier gas (helium) 4 5 - 5 0 ml/min; and purge gas (90% argon- 10% methane) 50 ml/min. Sample size was 1-4 jul. The peak heights o f dieldrin in the samples were compared with those provided by standard concentrations to give quantitative data.
A portion of the extracted lipid was used for phosphorus determination employing the method of Morrison (1964). Phospholipid content was estimated by multiplying the phosphorus values by 25.
RESULTS & DISCUSSION Physiologically incorporated dieldrin
The total lipid, phospholipid and dieldrin content of various major fractions of milk containing physiologically incorporated pesticide are shown in Table 1. Lipid content ranged from 0.01 to 23.06% with the butter serum containing the greater amount of phospholipid. The dieldrin concentration of each fraction on a weight basis was closely related to the lipid content of that fraction. On a lipid basis, whole milk, cream, skim milk, butter and butteroil contained compara
Table 2—Relative distribution of lipids and dieldrin in major fractions of milk containing physiologically incorporated dieldrin
FractionFraction wta
(%)
% Distribution in fraction
Lipid13 Dieldrin13Whole milk 100.00 100.00 100.00Skim milk 93.60° 13.40 14.49Cream (unwashed) 6.40 84.74 84.78Cream (washed) 3.74 - -Butter 2.43 49.80 51.60Butteroil 2.00 48.98 50.76Buttermilk (refined) 1.31 0.54 0.40Butter serum (refined) 0.27 0.13 0.08
3 A verag e o f d u p lic a te p re p a ra t io n s . E a ch rep rese n ts th e average o f s ix in d iv id u a l m ilk c o lle c t io n s and se p a ra t io n s
13 A ve rag e o f d u p lic a te d e te rm in a t io n s . P o o led f ra c t io n s o f s ix in d iv idual m ilk c o lle c t io n s and se p a ra t io n s w ere used fo r each d e te rm in a t io n .
° E s t im a te d b y th e d iffe re n c e b etw een w h o le m ilk and u n w ash e d cream
Table 3—Lipid and dieldrin content of freeze-dried fat globule membrane pellets prepared from milk containing physiologically incorporated dieldrin
% Lipid in Pellet13 % Phospholipid in Dieldrin concentration, ppmc, inPellet3 (%) FL BL TL FL BL TL TL Pellet7500S 2.92 9.56 8.62 18.18 — — _ — —
230S 43.05 26.00 7.65 33.65 12.22 57.33 22.96 0.28 ± 0.02 0.088 ± 0.000635S 54.03 39.77 8.38 48.15 19.34 37.70 71.87 0.27 ± 0.03 0.129 ± 0.016
a Ea ch va lu e is th e average o f d u p lic a te p re p a ra t io n s o f p e lle ts f ro m p o o led b u t te rm ilk . Ea ch p o o led b u t te rm ilk re su lts f ro m s ix in d iv id u a l m ilk c o lle c t io n s and se p a ra tio n s
13 F L = F re e lip id s , e x tra c te d w ith p e tro le u m e th e r ; B L = B o u n d lip id s , e x tra c te d w ith e th a n o l, e th y l e th e r and p e tro le u m e th e r ; T L = T o ta l l ip id s = F L + B L .
c A verag e and range o f d u p lic a te d e te rm in a t io n s
ble concentrations of dieldrin, whereas refined buttermilk and butter serum containing higher levels of phospholipid contained lower levels of dieldrin. The distribution of phospholipid among these fractions is similar to that reported by Privett et al. (1968) except that the skim milk obtained in the present study contained lesser amounts of phospholipid.
The percentage yield of major fractions from whole milk and the relative distribution of dieldrin and lipid in each fraction are shown in Table 2. Although the skim milk contained very little dieldrin on a weight basis (Table 1), it comprised more than 90% of the total weight of milk. Therefore, it accounted for a significant quantity of dieldrin and lipid in milk. On the other hand, unwashed cream accounted for about 6% of the total weight of milk, but contributed almost 85% of both the total lipid and dieldrin in the milk system. Similarly, butter and butteroil accounted for only a small fraction of the milk, but contributed a relatively large amount of lipid and dieldrin. From these data, it is again observed that the distribution of dieldrin is proportional to the lipid distribution in milk.
In order to learn more about the nature of the relationship between dieldrin and various types of lipids, the free lipid and bound lipid phases were extracted from the membrane pellets. Phospholipid content of these two lipid phases was also determined. Since the fat soluble pesticides tend to be extracted with the nonpolar solvent along with the free lipid phase even if these residues are originally associated with the bound lipid, any individual analysis of residue in either of these two types of lipids may not reflect completely the actual original pesticide distribution. Correlations of residue with different types of lipids, however, still can be made by comparing the free and bound lipid levels with the residue levels on a lipid basis in different pellet fractions. The analytical data of this phase of the study are shown in Table 3.
The 230S and 35S pellets were the major fractions of membrane materials, and the total lipids extracted from these two pellets were used for residue analysis. The amount of 7,500S pellet was too small for accurate residue analysis, especially at the low residue levels encountered. Results in Table 3 show that although 230S and 35S pellets contained different levels of phospholipid, and free and bound lipid, the concentrations of dieldrin in the total lipid were comparable with each other. It appears that at the membrane levels of the milk system and/ or at these low levels of residue, the deposition of pesticide is not affected by the various types of lipids.
As comparisons were made between Table 1 and 3, it was observed that the phospholipid content was much higher
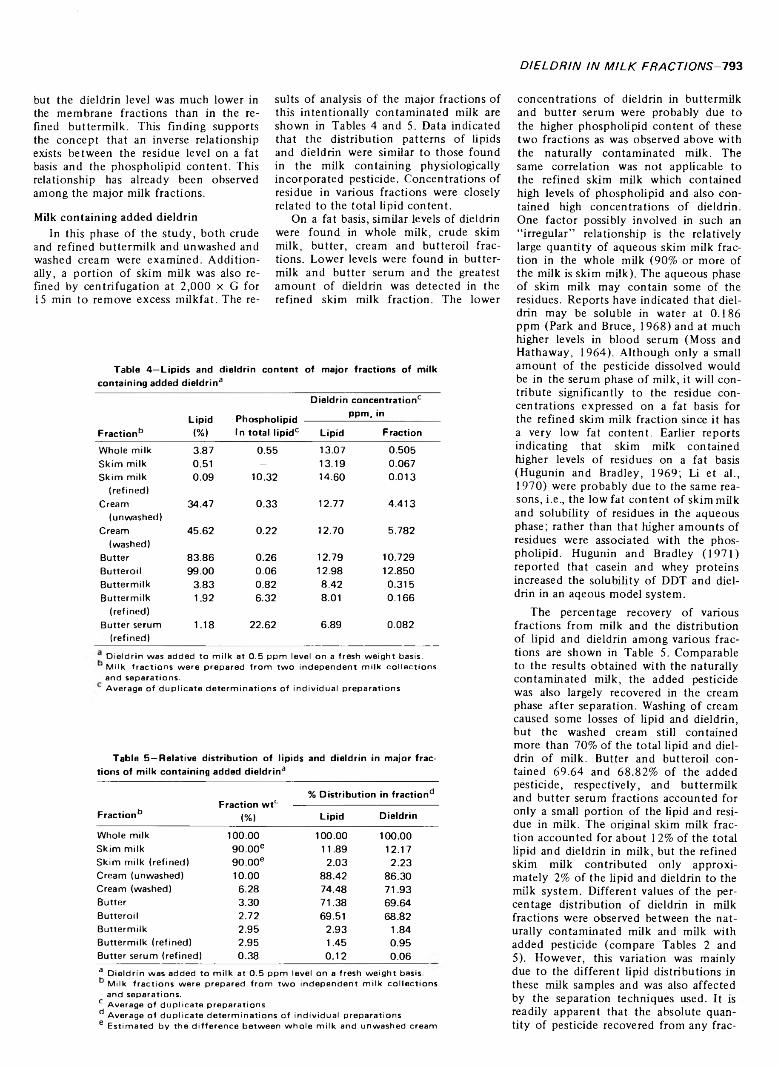
DIELDRIN IN M ILK FRACTIONS- 793
but the dieldrin level was much lower in the membrane fractions than in the refined buttermilk. This finding supports the concept that an inverse relationship exists between the residue level on a fat basis and the phospholipid content. This relationship has already been observed among the major milk fractions.
Milk containing added dieldrinIn this phase of the study, both crude
and refined buttermilk and unwashed and washed cream were examined. Additionally, a portion of skim milk was also refined by centrifugation at 2,000 x G for 15 min to remove excess milkfat. The re
sults of analysis of the major fractions of this intentionally contaminated milk are shown in Tables 4 and 5. Data indicated that the distribution patterns of lipids and dieldrin were similar to those found in the milk containing physiologically incorporated pesticide. Concentrations of residue in various fractions were closely related to the total lipid content.
On a fat basis, similar levels of dieldrin were found in whole milk, crude skim milk, butter, cream and butteroil fractions. Lower levels were found in buttermilk and butter serum and the greatest amount of dieldrin was detected in the refined skim milk fraction. The lower
concentrations of dieldrin in buttermilk and butter serum were probably due to the higher phospholipid content of these two fractions as was observed above with the naturally contaminated milk. The same correlation was not applicable to the refined skim milk which contained high levels of phospholipid and also contained high concentrations of dieldrin. One factor possibly involved in such an “irregular” relationship is the relatively large quantity of aqueous skim milk fraction in the whole milk (90% or more of the milk is skim milk). The aqueous phase of skim milk may contain some of the residues. Reports have indicated that dieldrin may be soluble in water at 0.186 ppm (Park and Bruce, 1968) and at much higher levels in blood serum (Moss and Hathaway, 1964). Although only a small amount of the pesticide dissolved would be in the serum phase of milk, it will contribute significantly to the residue concentrations expressed on a fat basis for the refined skim milk fraction since it has a very low fat content. Earlier reports indicating that skim milk contained higher levels of residues on a fat basis (Hugunin and Bradley, 1969; Li et al.,1970) were probably due to the same reasons, i.e., the low fat content of skim milk and solubility of residues in the aqueous phase; rather than that higher amounts of residues were associated with the phospholipid. Hugunin and Bradley (1971) reported that casein and whey proteins increased the solubility of DDT and dieldrin in an aqeous model system.
The percentage recovery of various fractions from milk and the distribution of lipid and dieldrin among various fractions are shown in Table 5. Comparable to the results obtained with the naturally contaminated milk, the added pesticide was also largely recovered in the cream phase after separation. Washing of cream caused some losses of lipid and dieldrin, but the washed cream still contained more than 70% of the total lipid and dieldrin of milk. Butter and butteroil contained 69.64 and 68.82% of the added pesticide, respectively, and buttermilk and butter serum fractions accounted for only a small portion of the lipid and residue in milk. The original skim milk fraction accounted for about 12% of the total lipid and dieldrin in milk, but the refined skim milk contributed only approximately 2% of the lipid and dieldrin to the milk system. Different values of the percentage distribution of dieldrin in milk fractions were observed between the naturally contaminated milk and milk with added pesticide (compare Tables 2 and5). However, this variation was mainly due to the different lipid distributions in these milk samples and was also affected by the separation techniques used. It is readily apparent that the absolute quantity of pesticide recovered from any frac-
Table 4—Lipids and containing added dieldrin
dieldrin contenta
of major fractions of milk
Lipid(%)
Phospholipid In total lipidc
Dieldrin concentration0 ppm, in
Fraction0 Lipid FractionWhole milk 3.87 0.55 13.07 0.505Skim milk 0.51 - 13.19 0.067Skim milk 0.09 10.32 14.60 0.013
(refined)Cream 34.47 0.33 12.77 4.413
(unwashed)Cream 45.62 0.22 12.70 5.782
(washed)Butter 83.86 0.26 12.79 10.729Butteroil 99.00 0.06 12.98 12.850Buttermilk 3.83 0.82 8.42 0.315Buttermilk 1.92 6.32 8.01 0.166
(refined)Butter serum 1.18 22.62 6.89 0.082
(refined)D ie ld r in w as added to m ilk a t 0 .5 p pm leve l on a fre sh w e ig h t basis .
* M ilk f ra c t io n s w e re p re p a re d f ro m tw o in d e p e n d e n t m ilk c o lle c t io n s and se p a ra t io n s .
' A v e ra g e o f d u p lic a te d e te rm in a t io n s o f in d iv id u a l p re p a ra t io n s
Table 5—Relative distribution of lipids and dieldrin in major fractions of milk containing added dieldrin3
% Distribution in fractiondFraction wtc
Fractionb (%) Lipid Dieldrin
Whole milk 100.00 100.00 100.00Skim milk 90.00e 11.89 12.17Skim milk (refined) 90.00e 2.03 2.23Cream (unwashed) 10.00 88.42 86.30Cream (washed) 6.28 74.48 71.93Butter 3.30 71.38 69.64Butteroil 2.72 69.51 68.82Buttermilk 2.95 2.93 1.84Buttermilk (refined) 2.95 1.45 0.95Butter serum (refined) 0.38 0.12 0.063 D ie ld r in w a s added to m ilk a t 0 .5 p p m leve l on a fre sh w e ig h t basis . d M ilk f ra c t io n s w e re p rep ared f ro m tw o in d e p e n d e n t m ilk c o lle c t io n s
and se p a ra t io n s .c A ve rag e o f d u p lic a te p re p a ra t io n sd A v e ra g e o f d u p lic a te d e te rm in a t io n s o f in d iv id u a l p re p a ra t io n s e E s t im a te d b y th e d iffe re n c e b e tw ee n w h o le m ilk and u n w ash e d cream
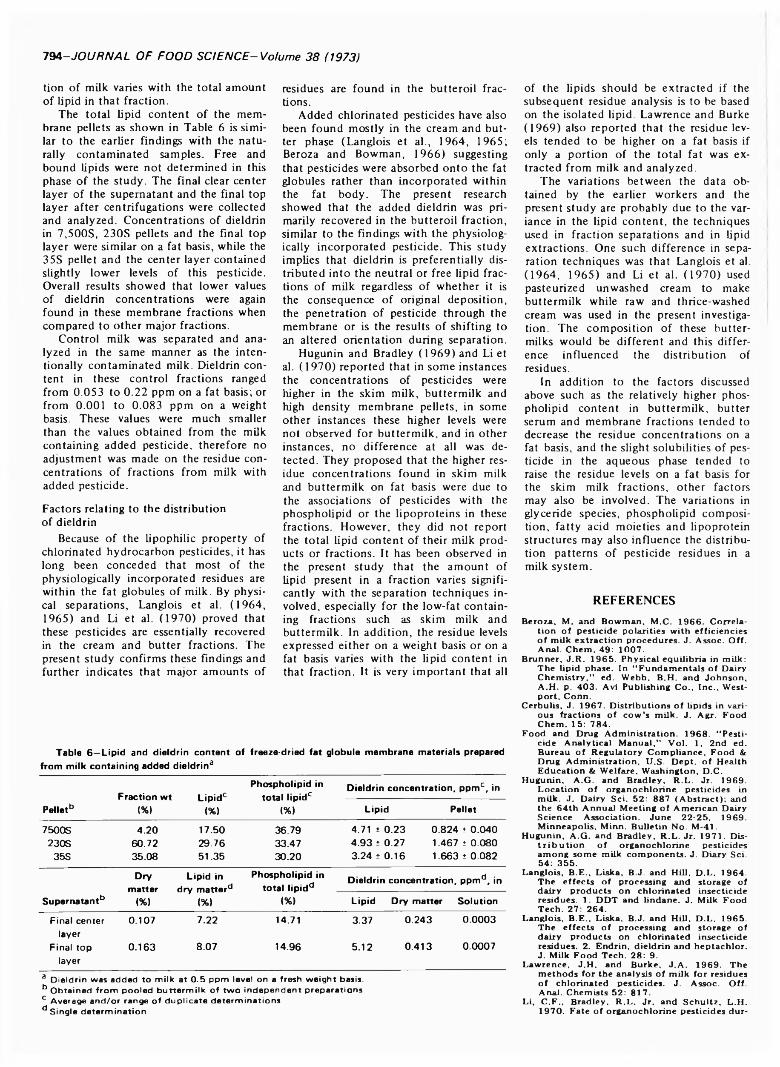
794-JOURNAL OF FOOD SCIENCE-Volume 38 (1973)
tion of milk varies with the total amount of lipid in that fraction.
The total lipid content of the membrane pellets as shown in Table 6 is similar to the earlier findings with the naturally contaminated samples. Free and bound lipids were not determined in this phase of the study. The final clear center layer of the supernatant and the final top layer after centrifugations were collected and analyzed. Concentrations of dieldrin in 7,500S, 230S pellets and the final top layer were similar on a fat basis, while the 35S pellet and the center layer contained slightly lower levels of this pesticide. Overall results showed that lower values of dieldrin concentrations were again found in these membrane fractions when compared to other major fractions.
Control milk was separated and analyzed in the same manner as the intentionally contaminated milk. Dieldrin content in these control fractions ranged from 0.053 to 0.22 ppm on a fat basis; or from 0.001 to 0.083 ppm on a weight basis. These values were much smaller than the values obtained from the milk containing added pesticide, therefore no adjustment was made on the residue concentrations of fractions from milk with added pesticide.
Factors relating to the distribution of dieldrin
Because of the lipophilic property of chlorinated hydrocarbon pesticides, it has long been conceded that most of the physiologically incorporated residues are within the fat globules of milk. By physical separations, Langlois et al. (1964,1965) and Li et al. (1970) proved that these pesticides are essentially recovered in the cream and butter fractions. The present study confirms these findings and further indicates that major amounts of
residues are found in the butteroil fractions.
Added chlorinated pesticides have also been found mostly in the cream and butter phase (Langlois et al., 1964, 1965; Beroza and Bowman, 1966) suggesting that pesticides were absorbed onto the fat globules rather than incorporated within the fat body. The present research showed that the added dieldrin was primarily recovered in the butteroil fraction, similar to the findings with the physiologically incorporated pesticide. This study implies that dieldrin is preferentially distributed into the neutral or free lipid fractions of milk regardless of whether it is the consequence of original deposition, the penetration of pesticide through the membrane or is the results of shifting to an altered orientation during separation.
Hugunin and Bradley (1969) and Li et al. (1970) reported that in some instances the concentrations of pesticides were higher in the skim milk, buttermilk and high density membrane pellets, in some other instances these higher levels were not observed for buttermilk, and in other instances, no difference at all was detected. They proposed that the higher residue concentrations found in skim milk and buttermilk on fat basis were due to the associations of pesticides with the phospholipid or the lipoproteins in these fractions. However, they did not report the total lipid content of their milk products or fractions. It has been observed in the present study that the amount of lipid present in a fraction varies significantly with the separation techniques involved, especially for the low-fat containing fractions such as skim milk and buttermilk. In addition, the residue levels expressed either on a weight basis or on a fat basis varies with the lipid content in that fraction. It is very important that all
of the lipids should be extracted if the subsequent residue analysis is to be based on the isolated lipid. Lawrence and Burke(1969) also reported that the residue levels tended to be higher on a fat basis if only a portion of the total fat was extracted from milk and analyzed.
The variations between the data obtained by the earlier workers and the present study are probably due to the variance in the lipid content, the techniques used in fraction separations and in lipid extractions. One such difference in separation techniques was that Langlois et al. (1964, 1965) and Li et al. (1970) used pasteurized unwashed cream to make buttermilk while raw and thrice-washed cream was used in the present investigation. The composition of these buttermilks would be different and this difference influenced the distribution of residues.
In addition to the factors discussed above such as the relatively higher phospholipid content in buttermilk, butter serum and membrane fractions tended to decrease the residue concentrations on a fat basis, and the slight solubilities of pesticide in the aqueous phase tended to raise the residue levels on a fat basis for the skim milk fractions, other factors may also be involved. The variations in glyceride species, phospholipid composition, fatty acid moieties and lipoprotein structures may also influence the distribution patterns of pesticide residues in a milk system.
REFERENCESB eroza , M. and B ow m an , M .C. 1 9 6 6 . C orrela
tio n o f p estic id e p o lar ities w ith e ffic ie n c ie s o f m ilk e x tra c tio n p roced u res. J. A ssoc . O ff. A nal. C hem . 49 : 1 0 0 7 .
Brunner, J .R . 1 9 6 5 . P h ysica l equ ilibria in m ilk: T he lip id phase. In “ F u n d am en ta ls o f Dairy C h em istry ,’’ ed . W ebb, B .H . and Jo h n so n ,A .H . p . 4 0 3 . A vi Pu blish in g C o ., In c ., W est- p ort, C onn.
C erbulis, J. 1 9 6 7 . D istr ib u tio n s o f lip ids in variou s fraction s o f c o w ’s m ilk . J. Agr. F ood C hem . 15: 7 8 4 .
F o o d and Drug A d m in istra tion . 1 9 6 8 . “ P estic id e A n a ly tica l M anual,” V o l. 1 , 2nd ed . Bureau o f R egu latory C o m p lia n ce, F o o d & Drug A d m in istra tion , U .S . D ep t, o f H ealth E d u cation & W elfare, W ashington, D .C .
H ugunin , A .G . and B rad ley , R .L . Jr. 1 9 6 9 . L o ca tio n o f organ och lor in e p estic id es in m ilk . J. D airy S c i. 52: 8 8 7 (A b strac t); and th e 6 4 th A nnu al M eeting o f A m erican Dairy S c ien ce A sso c ia tio n . June 2 2 -2 5 , 1 9 6 9 .M inneapolis, M inn. B u lle tin N o . M -41.
H ugu nin , A .G . and B rad ley , R .L . Jr. 1 9 7 1 . D ist r ib u t io n o f organ och lor in e p estic id es am on g so m e m ilk c o m p o n en ts . J. Diary Sci. 54: 3 5 5 .
L anglois, B .E ., L iska, B .J. and H ill, D .L . 1 9 6 4 . T he e ffe c ts o f processing and storage o f dairy p ro d u cts o n ch lor in a ted in sectic id e residu es. 1 . D D T and lin dane. J. M ilk F o o d T ech . 27: 2 6 4 .
L anglo is, B .E ., Liska, B.J. and H ill, D .L . 1 9 6 5 . T he e ffe c ts o f processing and storage o f dairy p rod u cts on ch lor in a ted in sectic id e residu es. 2. Endrin, d ie ld rin and h ep tach lor. J. Milk F o o d T ech . 28: 9.
L aw rence, J.H . and B urke, J .A . 1 9 6 9 . T he m eth o d s for th e analysis o f m ilk for residu es o f ch lor in a ted p estic id es. J. A sso c . O ff. A nal. C hem ists 52: 8 1 7 .
Li, C .F ., B rad ley, R .L . Jr. and S c h u ltz , L .H .1 9 7 0 . F ate o f o rg an och lor in e p estic id es dur
Table 6—Lipid and dieldrin content of freeze-dried fat globule membrane materials prepared from milk containing added dieldrin3
Fraction wt <%>
Lipidc(%)
Phospholipid in total lipid0
(%)
Dieldrin concentration, ppmc, in
Pellet6 Lipid Pellet
7500S 4.20 17.50 36.79 4.71 i 0.23 0.824 t 0.040230S 60.72 29.76 33.47 4.93 ± 0.27 1.467 t 0.080
35S 35.08 51.35 30.20 3.24 ± 0.16 1.663 i 0.082
Supernatant6
Drymatter
(%)
Lipid in dry matter6
(%)
Phospholipid in total lipid6
(%)
Dieldrin concentration, ppm6, in
Lipid Dry matter Solution
Final center 0.107 7.22 14.71 3.37 0.243 0.0003layer
Final top 0.163 8.07 14.96 5.12 0.413 0.0007layer
3 D ie ld r in w a s added to m ilk a t 0 .5 p pm leve l on a fre sh w e ig h t basis . b O b ta in ed f ro m p o o led b u t te rm ilk o f tw o in d e p e n d e n t p re p a ra t io n s c A ve rag e a n d /o r range o f d u p lic a te d e te rm in a t io n s ^ S in g le d e te rm in a t io n

DIELDRIN IN M ILK FRACTIONS- 795
ing processin g o f m ilk in to dairy p rod u cts. J. A sso c . O ff. A nal. C hem . 53: 1 2 7 .
M ann, H .D ., C arter, R .H . and E ly , R .E . 1 9 5 0 . T he D D T c o n te n t o f m ilk p rod u ts. J. Milk F o o d T ech . 13: 3 4 0 .
M orrison, W .R. 1 9 6 4 . A fa st, s im p le and reliab le m eth o d for th e m icro -d eterm in a tio n o f p h osp h oru s in b io lo g ica l m aterials. A nal. B io ch em . 7: 2 1 8 .
M oss, J .A . and H ath aw ay, D .E . 1 9 6 4 . T ransport o f organic c o m p o u n d s in th e m am m al. B io ch em . J. 91 : 3 8 4 .
Park, K .S . and B ruce, W .N. 1 9 6 8 . T h e d e term in ation o f th e w ater so lu b ility o f aldrin , d ie l-
drin , h ep ta ch lo r and h ep tach lor ep o x id e . J. E con . E n to m o l. 61 : 7 7 0 .
P rivett, O .S ., N u tter , L .J. and G ross, R .A .1 9 6 8 . A n alysis o f m ilk lip id s (1 9 6 7 ) . In “ S y m p o siu m : D airy L ip id s and L ipid M eta b o lism ,** ed . B rink, M .F . and K ritchevsky ,K ., p . 9 9 . A vi Pu blish in g C o., Inc. W estport, C onn.
Q uirk, L.W. 1 9 6 5 . L ip id s in frac tion s o f th e fat glob u le m em b ran e o f c o w ’s m ilk . M .S. T h esis , M ichigan S ta te U n iversity .
S h ell C hem ical C o. 1 9 6 4 . “ M anual o f M ethods for th e D eterm in ation o f R esid u es o f Sh ell P estic id es .” A gricultural C hem ical D iv .,
S h ell C hem ical C o., N ew Y ork , N .Y .S w o p e , F .C . 1 9 6 8 . C haracteristics o f M em brane
l ip o p ro te in frac tion s from c o w ’s m ilk . Ph .D . T hesis. M ichigan S ta te U niversity .
Ms rece ived 9 /2 /7 2 ; revised 3 /3 0 /7 3 ; accep ted4 /2 /7 3 .____________________________________________
M ichigan A gricu ltural E xp erim en t S ta tio n Journal A rtic le N o . 6 0 6 8 .
T h e authors are in d eb ted to Dr. J .R . Brunner, for h e lp fu l d iscu ssion s and assistance and to K .A . W ilson for provid ing m ilk sam ples. A p p rec ia tion is a lso exp ressed to Dr. L.G . Harm on and Dr. R .V . L ech o w ich for th e use o f th eir gas chrom atograph .
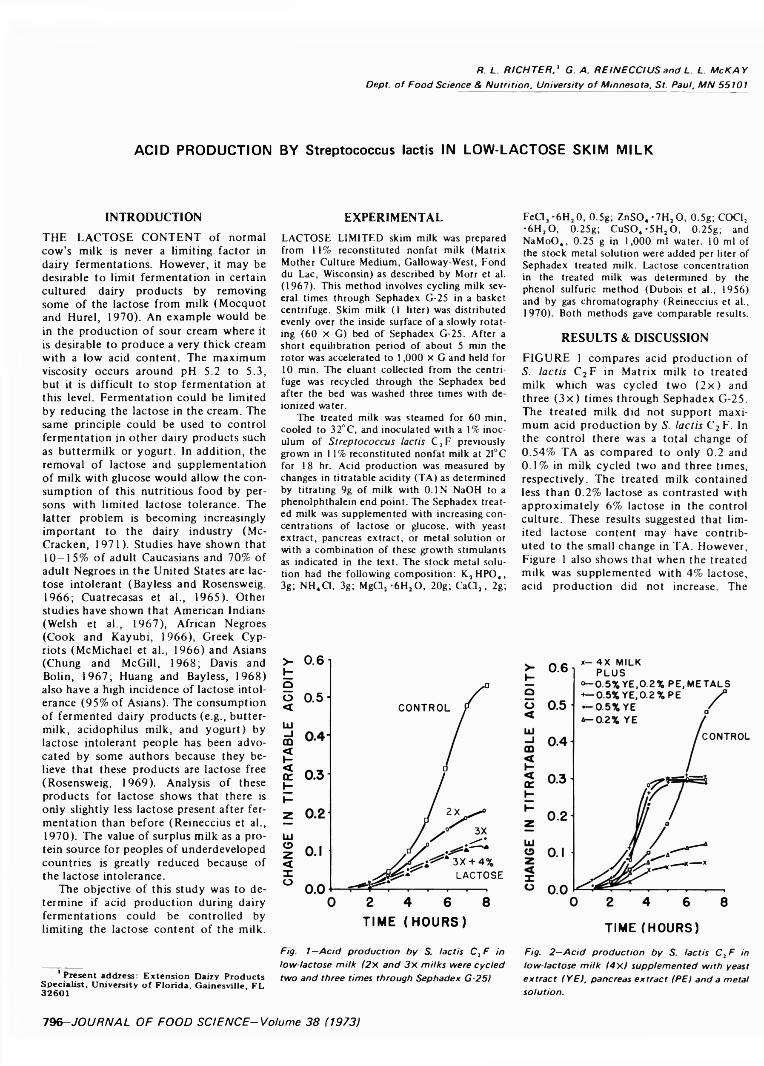
R. L . R IC H T E R .' G. A . R E IN E C C IU S and L . L . M c K A Y Dept, o f F o o d Science & Nutrition, University o f Minnesota, St. Paul, M N 55101
ACID PRODUCTION BY Streptococcus lactis IN LOW-LACTOSE SKIM M ILK
INTRODUCTIONTHE LACTOSE CONTENT of normal cow’s milk is never a limiting factor in dairy fermentations. However, it may be desirable to limit fermentation in certain cultured dairy products by removing some of the lactose from milk (Mocquot and Hurel, 1970). An example would be in the production of sour cream where it is desirable to produce a very thick cream with a low acid content. The maximum viscosity occurs around pH 5.2 to 5.3, but it is difficult to stop fermentation at this level. Fermentation could be limited by reducing the lactose in the cream. The same principle could be used to control fermentation in other dairy products such as buttermilk or yogurt. In addition, the removal of lactose and supplementation of milk with glucose would allow the consumption of this nutritious food by persons with limited lactose tolerance. The latter problem is becoming increasingly important to the dairy industry (McCracken, 1971). Studies have shown that 10-15% of adult Caucasians and 70% of adult Negroes in the United States are lactose intolerant (Bayless and Rosensweig. 1966; Cuatrecasas et al., 1965). Other studies have shown that American Indians (Welsh et al., 1967), African Negroes (Cook and Kayubi, 1966), Greek Cypriots (McMichael et al., 1966) and Asians (Chung and McGill, 1968; Davis and Bolin, 1967; Huang and Bayless, 1968) also have a high incidence of lactose intolerance (95% of Asians). The consumption of fermented dairy products (e.g., buttermilk, acidophilus milk, and yogurt) by lactose intolerant people has been advocated by some authors because they believe that these products are lactose free (Rosensweig, 1969). Analysis of these products for lactose shows that there is only slightly less lactose present after fermentation than before (Reineccius et al.,1970). The value of surplus milk as a protein source for peoples of underdeveloped countries is greatly reduced because of the lactose intolerance.
The objective of this study was to determine if acid production during dairy fermentations could be controlled by limiting the lactose content of the milk.
1 Present address: E x ten s io n Dairy P rodu cts S p ec ia lis t, U n iversity o f F lorid a, G ain esville , FL 3 2 6 0 1
EXPERIMENTALLACTOSE LIMITED skim milk was prepared from 11% reconstituted nonfat milk (Matrix Mother Culture Medium, Galloway-West, Fond du Lac, Wisconsin) as described by Morr et al.(1967). This method involves cycling milk several times through Sephadex G-25 in a basket centrifuge. Skim milk (1 liter) was distributed evenly over the inside surface of a slowly rotating (60 x G) bed of Sephadex G-25. After a short equilibration period of about 5 min the rotor was accelerated to 1,000 x G and held for 10 min. The eluant collected from the centrifuge was recycled through the Sephadex bed after the bed was washed three times with deionized water.
The treated milk was steamed for 60 min, cooled to 32°C, and inoculated with a 1% inoculum of Streptococcus lactis C2 F previously grown in 11% reconstituted nonfat milk at 21°C for 18 hr. Acid production was measured by changes in titratable acidity (TA) as determined by titrating 9g of milk with 0.1N NaOH to a phenolphthalein end point. The Sephadex treated milk was supplemented with increasing concentrations of lactose or glucose, with yeast extract, pancreas extract, or metal solution or with a combination of these growth stimulants as indicated in the text. The stock metal solution had the following composition: K, HPO„, 3g; NH„C1, 3g; M gC V 6H 20 , 20g; CaCl2 , 2g;
TIME (HOURS)
Fig. 1 —A cid production by S. tact is C2 F in low-lactose milk (2 x and 3 x milks were cycled two and three times through Sephadex G-25)
FeClj -6H20, 0.5g; ZnS04-7H20, 0.5g; COCl2 •6H2 O, 0.25g; CuS04-5H20, 0.25g; and NaMoO«, 0.25 g in 1,000 ml water. 10 ml of the stock metal solution were added per liter of Sephadex treated milk. Lactose concentration in the treated milk was determined by the phenol sulfuric method (Dubois et al., 1956) and by gas chromatography (Reineccius et al.,1970). Both methods gave comparable results.
RESULTS & DISCUSSIONFIGURE 1 compares acid production ofS. lactis C2F in Matrix milk to treated milk which was cycled two (2 x ) and three (3x ) times through Sephadex G-25. The treated milk did not support maximum acid production by S. lactis C2 F. In the control there was a total change of 0.54% TA as compared to only 0.2 and 0 . 1% in mdk cycled two and three times, respectively. The treated milk contained less than 0 .2% lactose as contrasted with approximately 6% lactose in the control culture. These results suggested that limited lactose content may have contributed to the small change in TA. However, Figure 1 also shows that when the treated milk was supplemented with 4% lactose, acid production did not increase. The
TIME (HOURS)Fig. 2 —A cid production by S. lactis C 2 F in low-lactose milk 14x1 supplem ented with yeast extract IY E ) , pancreas extract (PE) and a metal solution.
1 9 6 -J O U R N A L O F FO O D S C IF N C E -V o lu m e 3 8 (1973)
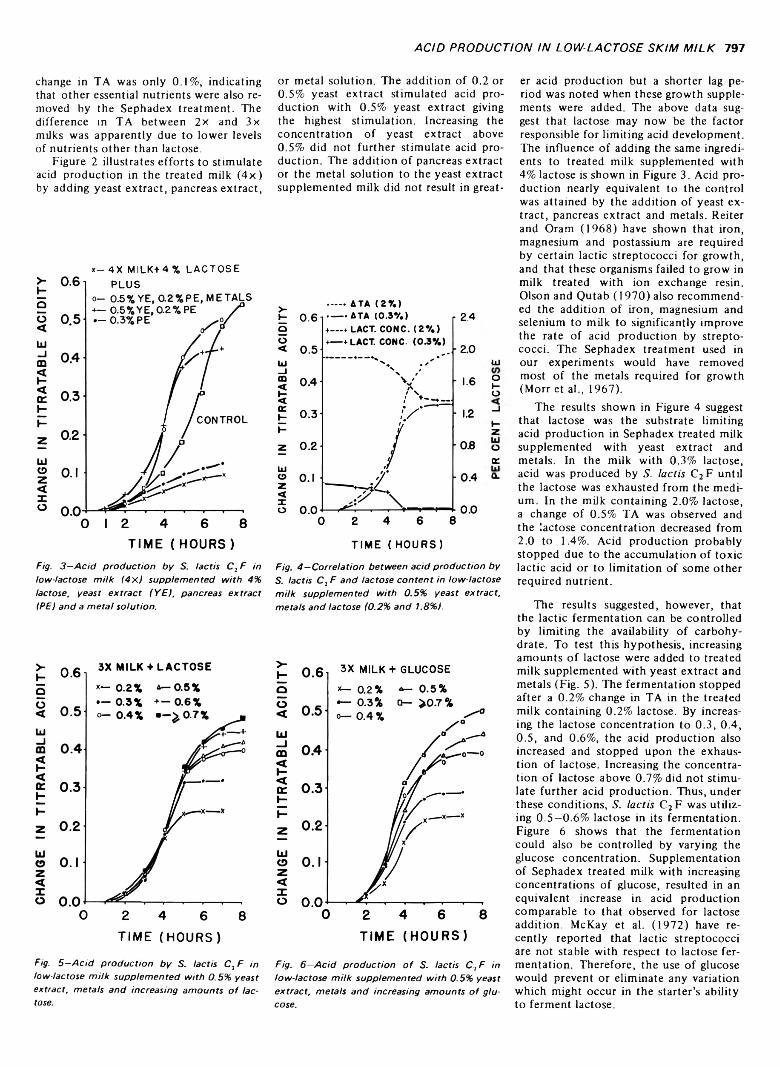
A C ID P R O D U C T IO N IN LOW -LACTO SE S K IM M IL K -7 9 7
change in TA was only 0.1%, indicating that other essential nutrients were also removed by the Sephadex treatment. The difference in TA between 2 x and 3x milks was apparently due to lower levels of nutrients other than lactose.
Figure 2 illustrates efforts to stimulate acid production in the treated milk (4x) by adding yeast extract, pancreas extract,
x— 4 X M I L K + 4 % L A C T O S E
TIME ( HOURS )Fig. 3 —A cid production by S. lactis C 2 F in low-lactose milk 14x1 supplem ented with 4% lactose, yeast extract (Y E ) , pancreas extract IPEI and a metal solution.
T I M E ( H O U R S )
Fig. 5 - A c id production by S. lactis C 2 F in low-lactose m ilk supplem ented with 0.5% yeast extract, metals and increasing am ounts o f lactose.
or metal solution. The addition of 0.2 or 0.5% yeast extract stimulated acid production with 0.5% yeast extract giving the highest stimulation. Increasing the concentration of yeast extract above 0.5% did not further stimulate acid production. The addition of pancreas extract or the metal solution to the yeast extract supplemented milk did not result in great-
TIME ( HOURS)
Fig. 4 —Correlation between acid production by S. lactis C 2 F and lactose content in low-lactose milk supplem ented with 0.5% yeast extract, metals and lactose (0.2% and 1.8%).
TIME (HOURS)
Fig. 6 —A cid production o f S. lactis C 2 F in low-lactose milk supplem ented with 0.5% yeast extract, metals and increasing amounts o f glucose.
er acid production but a shorter lag period was noted when these growth supplements were added. The above data suggest that lactose may now be the factor responsible for limiting acid development. The influence of adding the same ingredients to treated milk supplemented with 4% lactose is shown in Figure 3. Acid production nearly equivalent to the control was attained by the addition of yeast extract, pancreas extract and metals. Reiter and Oram (1968) have shown that iron, magnesium and postassium are required by certain lactic streptococci for growth, and that these organisms failed to grow in milk treated with ion exchange resin. Olson and Qutab (1970) also recommended the addition of iron, magnesium and selenium to milk to significantly improve the rate of acid production by streptococci. The Sephadex treatment used in
uj our experiments would have removed o most of the metals required for growth £ (Morr et al., 1967).j The results shown in Figure 4 suggest !_ that lactose was the substrate limiting z acid production in Sephadex treated milk o supplemented with yeast extract and tr. metals. In the milk with 0.3% lactose, q! acid was produced by S. lactis C2F until
the lactose was exhausted from the medium. In the milk containing 2.0% lactose, a change of 0.5% TA was observed and the lactose concentration decreased from 2.0 to 1.4%. Acid production probably stopped due to the accumulation of toxic lactic acid or to limitation of some other required nutrient.
The results suggested, however, that the lactic fermentation can be controlled by limiting the availability of carbohydrate. To test this hypothesis, increasing amounts of lactose were added to treated milk supplemented with yeast extract and metals (Fig. 5). The fermentation stopped after a 0.2% change in TA in the treated milk containing 0.2% lactose. By increasing the lactose concentration to 0.3, 0.4, 0.5, and 0.6%, the acid production also increased and stopped upon the exhaustion of lactose. Increasing the concentration of lactose above 0.7% did not stimulate further acid production. Thus, under these conditions, S. lactis C2F was utilizing 0.5—0.6% lactose in its fermentation. Figure 6 shows that the fermentation could also be controlled by varying the glucose concentration. Supplementation of Sephadex treated milk with increasing concentrations of glucose, resulted in an equivalent increase in acid production comparable to that observed for lactose addition. McKay et al. (1972) have recently reported that lactic streptococci are not stable with respect to lactose fermentation. Therefore, the use of glucose would prevent or eliminate any variation which might occur in the starter’s ability to ferment lactose.
798-JOURNAL OF FOOD SCIENCE-Volume 38 (1973)
In conclusion, results indicate that acid production by S. lactis C2F can be controlled by adding lactose or glucose to milk that has been passed through Sepha- dex G-25 and supplemented with yeast extract, pancreas extract and metals. The method of Morr et al. (1967) used for removing lactose from milk is being used commercially and should present few problems in manufacture. Fermented dairy products produced by the method proposed could be consumed by lactose intolerant people.
Future publications will deal with texture and flavor aspects of this research.
REFERENCESB ayless, T .M . and R osen sw eig , N .S . 1 9 6 6 . A
racial d ifferen ce in in c id en ce o f lactase d e fic ien cy : A survey o f m ilk in to leran ce and lactase d e fic ie n c y in h ea lth y adu lt m ales. J. A m er. M ed. A ssn . 1 97 : 9 6 8 .
C hung, M .H. and M cG ill, D .B . 1 9 6 8 . Lactase
d e fic ie n c y in O rientals. G astroen tero logy 54: 2 2 5 .
C o o k , G .C. and K ayu b i, S .K . 1 9 6 6 . Tribal in c id en ce o f lactase d e fic ie n c y in U ganda. L an cet 1: 7 2 5 .
C uatrecasas, P ., L o ck w o o d , D .H . and C a ldw ell, J .R . 1 9 6 5 . L actase d e fic ie n c y in th e adu lt. A c o m m o n occu rren ce . L an cet 1 : 1 4 .
D avis, A .E . and B o lin , T . 1 9 6 7 . L actose in to ler ance in A sians. N ature 2 1 6 : 1 2 4 4 .
D u b o is, M ., G iles, K .A ., H a m ilton , J .K ., R ebers,P .A . and S m ith , F . 1 9 5 6 . C olorim etric m eth o d for d e term in a tio n o f sugars and rela ted su b stan ces. A nal. C hem . 2 8 (3 ) : 3 5 0 .
H uang, S .S . and B ayless, T .M . 1 9 6 8 . M ilk and la c to se in to leran ce in h ea lth y O rientals. S c ien ce 1 6 0 : 8 3 .
M cK ay, L .L ., B aldw in , K .A . and Z o tto la , E .A .1 9 7 2 . Loss o f la c to se m eta b o lism in lactic s tr ep to c o cc i. A p p lied M icrob io l. 2 3 (6 ): 1 0 9 0 .
M cC racken, R .D . 1 9 7 1 . L actase d e fic ien cy : A n exam p le o f d ietary e v o lu tio n . Current A n th ro p o lo g y 12: 4 7 9 .
M cM ichael, H .B ., W ebb, J. and D a w so n , A .M .1 9 6 6 . Jejunal d isaccharidases and so m e o b servation s o n th e cause o f lactase d e fic ie n c y . Brit. M ed. J. 2: 1 0 3 7 .
M o cq u o t, G. and H urel, C. 1 9 7 0 . T he se le c tio n and use o f so m e m icroorgan ism s for th e m an u factu re o f ferm en ted and ac id ified
m ilk p rod u cts. J. S o c . D airy T ech . 23: 1 3 0 .Morr, C .V ., N ie lsen , M .A. and C oulter , S.T .
1 9 6 7 . C entrifu gal S ep h a d ex proced ure for fra c tio n a tio n o f co n cen tra ted sk im m ilk , w h ey and sim ilar b io lo g ica l sy stem s. J. D airy S c i. 5 0 (3 ) : 3 0 5 .
O lson , H .C . and Q utab , A .H . 1 9 7 0 . In flu en ce o f trace m inerals on th e acid p ro d u ctio n by lactic s tr ep to c o cc i. C ult. Dairy Prod. J. 5: 14 .
R e in ecc iu s, G .A ., K avanagh, T .E . and K een ey , P.G . 1 9 7 0 . Id en tif ica t io n and q u a n tita tio n o f free neutral carb oh yd rates in m ilk p ro d u cts b y gas-liquid ch rom atograp h y . J. Dairy S c i. 5 3 (8 ) : 1 0 1 8 .
R e iter , B. and Oram , J .D . 1 9 6 8 . Iron and vanad iu m req u irem en ts o f lac tic acid s trep to c o cc i. J. D airy R es. 35 : 6 7 .
R o sen sw eig , N .S . 1 9 6 9 . A d u lt hu m an m ilk in to leran ce and in testin a l lactase d e fic ie n c y . A R ev iew . J. D airy S ci. 5 3 (5 ): 5 8 5 .
W elsh, J .D ., R ohrer, V ., K n u d sen , K .B . and P au stian , E. 1 9 6 7 . Iso la ted lactase d e fic ie n c y . C orrelation o f lab oratory stu d ies and c lin ica l d ata . A rch. Ind. M ed. 1 2 0 : 2 6 1 .
Ms received 1 /1 5 /7 3 ; revised 3 /2 7 /7 3 ; a ccep ted4 / 1 / 7 3 . ___________________________________________
S c ien tific Journal Series Paper N o . 8 0 6 7 ,M innesota A gricultural E xp erim en t S ta tio n , St.Paul, MN 5 5 1 0 1 .

N A M R O D D. B E N JA M IN ' and M. W. M O N T G O M E R Y Dept, o f F o o d Science & Technology, Oregon State University, Corvallis, O R 97331
POLYPHENOL OXIDASE OF ROYAL ANN CHERRIES: PURIFICATION AND CHARACTERIZATION
PHYSIOLOGICAL INJURY to Royal Ann cherries results in a rapid formation of dark brown and reddish pigments in the injured area. This color change has been attributed to the action of polyphenol oxidase (o-diphenol: 0 2-oxido- reductase, EC 1.10.3.1) on the natural phenolic substances of plant tissues (Corse, 1964). The phenolic substances are oxidized to quinones, which either react with themselves or with other phe- nolics to form the brown pigment called melanin (Eskin et al., 1971).
Polyphenol oxidases (PPO) have been purified and studied from peaches (Wong et al., 1971), cranberries (Chan and Yang,1971), mushrooms (Kertesz and Zito, 1962; Nakamura et al., 1966), carrots (Khandobina and Geraskina, 1969), apples (Walker and Hulme, 1966; Shannon and Pratt, 1967), potato (Patil and Zucker, 1965) and bananas (Palmer,1963). The purpose of this work was to purify and study the properties of the PPO of Royal Ann cherries.
EXPERIMENTALCherry samples
Royal Ann cherries (2 4 -2 6 ° Brix) were hand picked, placed in polyethylene bags, iced and brought to the laboratory where the stems and pits were removed. After freezing at -30°C, the cherries were freeze dried. During freeze drying, the temperature of the heating plates did not exceed 32°C. Approximately 2 hr elapsed between picking and freezing of the cherries. The freeze-dried cherries were placed in enameled cans, flushed with N2 and sealed under a vacuum of 27 in. of Hg. The canned, freeze-dried cherries were stored at -2 3 °C until used.Preparation of PPO
Freeze-dried cherries were powdered in a stainless steel Waring Blendor for 2 min in the presence of liquid nitrogen. The powder was placed in a brown bottle, sealed and stored in a desiccator at 5°C until used. The extraction procedure was as follows: 6 ml o f freshly prepared 20% aqueous polyethylene glycol (PEG20,000) was added to a centrifuge tube and
IN TRO DU CTION
P resen t A ddress: S c ien tific R esearchFoundation, Palm and D ate R esearch C enter, P.O. Box 2 4 1 6 , Karradah S k ark iya, B aghdad, In<)
chilled in an ice bath. 4g of cherry powder were added to make a thick paste. This paste was allowed to stand for 3 min, mixed with 9 ml of cold acetone and gently stirred for 1 min. After centrifuging, at 31,000 x G for 5 min, the supernatant was discarded and the pellet was rinsed with 1 volume of cold acetone. The precipitate was extracted with 100 ml 0.05M acetate buffer (pH 5.6) by stirring for 12 min in an ice bath. After filtering through a nylon cloth, centrifugation of the filtrate at 27,000 X G for 10 min resulted in a clear supernatant. The active enzyme was precipitated from the supernatant by the addition of 3 volumes of cold acetone to 2 volumes of extract. This mixture was stirred for 2 min and allowed to stand for 90 min in an ice bath. The supernatant was decanted and discarded while the cloudy suspension was centrifuged at 20,000 x G for 10 min. After decanting the supernatant, the precipitate was dissolved in a minimum volume of distilled water. All operations were carried out either in a cold room or in an ice bath and all solutions were cooled before use.
Protein content o f the enzyme preparations was determined by the method of Kalckar(1947). The phenolic content was determined by the spectrophotometric method described by AOAC (1960) and expressed as Mg tannic acid per ml of enzyme preparation.
Polyphenol oxidase assay procedureEnzyme activity was determined by meas
uring the increase in absorbance at 400 nm with a Beckman DB recording spectrophotometer. The reference cuvette contained 2 ml of 0.2M
phosphate buffer (pH 7.0) and 1 ml 10 mM catechol. Sample cuvette contained 1 ml 0.2M phosphate buffer, 1 ml 10 mM catechol and 1 ml o f enzyme solution. Temperature of the reaction mixture was 30°C. Under these conditions, linearity was maintained for 2 min. One unit o f enzyme activity was defined as the amount o f enzyme that caused a change in absorbance of 0.001/m in. The initial rate of the enzyme catalyzed reaction was proportional to the concentration of the enzyme solution.
Sephadex chromatographySephadex G-100 (Pharmacia), particle size
4 0 -1 20m , was prepared as described by the manufacturer (Technical Data Sheet No. 6). A2.5 X 95 cm column was prepared and equilibrated with 0.050M acetate buffer (pH 4.5). 10 ml of the enzyme extract was dialyzed against this buffer overnight and applied to the column. Chromatography was performed with the same buffer. The eluent was continuously monitored at 280 nm and collected in 10 ml fractions.Ion-exchange chromatography
P re-swollen microgranular diethylamino- ethyl (DEAE)-cellulose with a capacity of 1.0 meq/g was obtained from Reeve Angel, Inc. and prepared according to Whatman Advanced Ion- exchange Cellulose Laboratory Manual. A 2.5 x 45 cm column of DEAE-cellulose was packed at room temperature. The packed column was equilibrated overnight with starting buffer (1 mM phosphate buffer, pH 6.2) at 4°C. After the sample was applied to the column, one void
Table 1—Extraction of cherry PPO by various methods3
AbsorbanceSpecificactivity
(units/mg)
Phenolic content
lug tannic acid/ml)
Extractionmethod
Activity(units/ml)
280(nm)
260(nm)
Protein(mg/ml)
1. Buffer15 200 6.6 6.8 4.5 44 1652. PVP + buffer 373 5.5 5.8 3.7 101 953. Acetone powder
+ buffer 420 6.0 6.5 3.9 108 904. Acetone powder
+ PVP + buffer 425 5.5 5.9 3.6 118 925. PEG + buffer 540 12.8 13.0 8.9 61 756. PEG — acetone
+ buffer 450 5.5 6.5 3.2 141 657. Dowex 1 — X8
+ buffer 210 2.5 2.3 1.9 111 523 T h e re su lts a re th e average o f th re e t r ia ls on d if fe re n t c ru d e p o w d e r p re p a ra t io n s . b O .05M a c e ta te , p H 5 .6
Volume 3 8 (1 9 7 3 )-J O U R N A L O F FOO D S C IE N C E -7 9 9
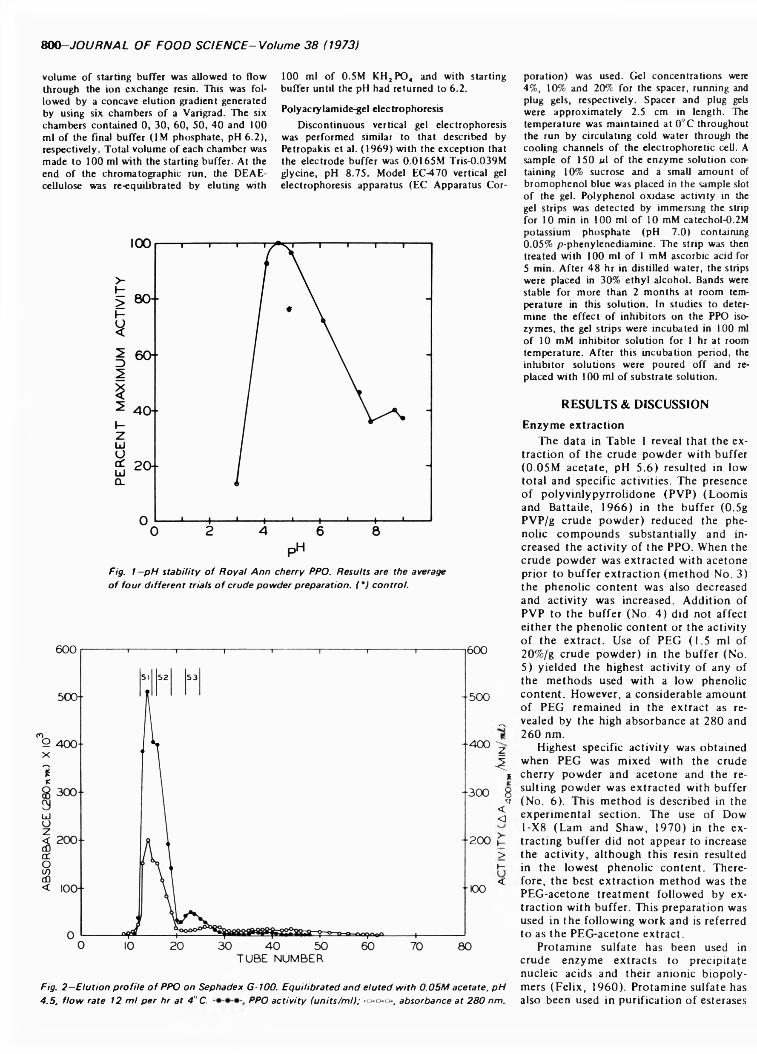
800- JOURNAL OF FOOD SCIENCE-Volume 38 (1973)
volume of starting buffer was allowed to flow through the ion exchange resin. This was followed by a concave elution gradient generated by using six chambers o f a Varigrad. The six chambers contained 0, 30, 60, 50, 40 and 100 ml of the final buffer (1M phosphate, pH 6.2), respectively. Total volume of each chamber was made to 100 ml with the starting buffer. At the end of the chromatographic run, the DEAE- cellulose was re-equilibrated by eluting with
100 ml of 0.5M KH2P 0 4 and with starting buffer until the pH had returned to 6.2.
Polyacrylamide-gel electrophoresisDiscontinuous vertical gel electrophoresis
was performed similar to that described by Petropakis et al. (1969) with the exception that the electrode buffer was 0.0165M Tris-0.039M glycine, pH 8.75. Model EC-470 vertical gel electrophoresis apparatus (EC Apparatus Cor
poration) was used. Gel concentrations were 4%, 10% and 20% for the spacer, running and plug gels, respectively. Spacer and plug gels were approximately 2.5 cm in length. The temperature was maintained at 0°C throughout the run by circulating cold water through the cooling channels o f the electrophoretic cell. A sample o f 150 pi o f the enzyme solution containing 10% sucrose and a small amount of bromophenol blue was placed in the sample slot o f the gel. Polyphenol oxidase activity in the gel strips was detected by immersing the strip for 10 min in 100 ml o f 10 mM catechol-0.2M potassium phosphate (pH 7.0) containing 0.05% p-phenylenediamine. The strip was then treated with 100 ml of 1 mM ascorbic acid for 5 min. After 48 hr in distilled water, the strips were placed in 30% ethyl alcohol. Bands were stable for more than 2 months at room temperature in this solution. In studies to determine the effect o f inhibitors on the PPO isozymes, the gel strips were incubated in 100 ml of 10 mM inhibitor solution for 1 hr at room temperature. After this incubation period, the inhibitor solutions were poured off and replaced with 100 ml o f substrate solution.
RESULTS & DISCUSSION Enzyme extraction
The data in Table 1 reveal that the extraction of the crude powder with buffer (0.05M acetate, pH 5.6) resulted in low total and specific activities. The presence of polyvinlypyrrolidone (PVP) (Loomis and Battaile, 1966) in the buffer (0.5g PVP/g crude powder) reduced the phenolic compounds substantially and increased the activity of the PPO. When the crude powder was extracted with acetone prior to buffer extraction (method No. 3) the phenolic content was also decreased and activity was increased. Addition of PVP to the buffer (No. 4) did not affect either the phenolic content or the activity of the extract. Use of PEG (1.5 ml of 20%/g crude powder) in the buffer (No.5) yielded the highest activity of any of the methods used with a low phenolic content. However, a considerable amount of PEG remained in the extract as re-
^ vealed by the high absorbance at 280 and 260 nm.
"z Highest specific activity was obtained ^ when PEG was mixed with the crude
* cherry powder and acetone and the re- g suiting powder was extracted with buffer sr (No. 6 ). This method is described in the
^ experimental section. The use of Dow1-X8 (Lam and Shaw, 1970) in the ex-
h trading buffer did not appear to increase > the activity, although this resin resulted h in the lowest phenolic content. There- < fore, the best extraction method was the
PEG-acetone treatment followed by extraction with buffer. This preparation was used in the following work and is referred to as the PEG-acetone extract.
Protamine sulfate has been used in crude enzyme extracts to precipitate nucleic acids and their anionic biopolymers (Felix, 1960). Protamine sulfate has also been used in purification of esterases
Fig. 1—p H stability o f Royal A nn cherry PPO. Results are the average o f four different trials o f crude pow der preparation. ( ' ) control.
Fig. 2 —Elution profile o f PPO on Sephadex G -100. Equilibrated and eluted with 0 .05M acetate, pH 4.5 , flow rate 12 ml per hr at 4 °C . PPO activity (units/m l); -o-o-o-, absorbance at 280 nm.
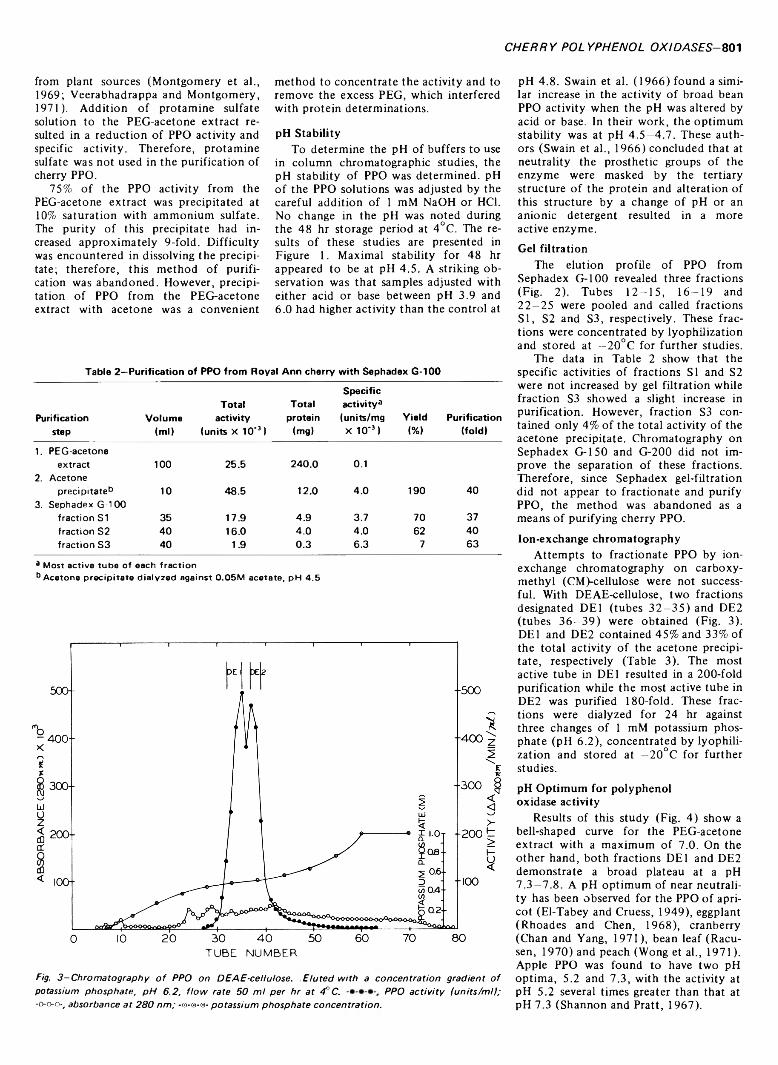
C H E R R Y P O LY P H E N O L O X ID A S E S-801from plant sources (Montgomery et al., 1969; Veerabhadrappa and Montgomery,1971). Addition of protamine sulfate solution to the PEG-acetone extract resulted in a reduction of PPO activity and specific activity. Therefore, protamine sulfate was not used in the purification of cherry PPO.
75% of the PPO activity from the PEG-acetone extract was precipitated at 10% saturation with ammonium sulfate. The purity of this precipitate had increased approximately 9-fold. Difficulty was encountered in dissolving the precipitate; therefore, this method of purification was abandoned. However, precipitation of PPO from the PEG-acetone extract with acetone was a convenient
method to concentrate the activity and to remove the excess PEG, which interfered with protein determinations.
pH StabilityTo determine the pH of buffers to use
in column chromatographic studies, the pH stability of PPO was determined. pH of the PPO solutions was adjusted by the careful addition of 1 mM NaOH or HC1. No change in the pH was noted during the 48 hr storage period at 4°C. The results of these studies are presented in Figure 1. Maximal stability for 48 hr appeared to be at pH 4.5. A striking observation was that samples adjusted with either acid or base between pH 3.9 and6.0 had higher activity than the control at
Table 2—Purification of PPO from Royal Ann cherry with Sephadex G-100Specific
Purificationstep
Volume(ml)
Total activity
(units X 10"3 )
Totalprotein
(mg)
activity3 (units/mg X 10'3)
Yield(%)
Purification(fold)
1. PEG-acetoneextract 100 25.5 240.0 0.1
2. Acetoneprecipitate13 10 48.5 12.0 4.0 190 40
3. Sephadex G-100fraction S1 35 17.9 4.9 3.7 70 37fraction S2 40 16.0 4.0 4.0 62 40fraction S3 40 1.9 0.3 6.3 7 63
a Most active tube of each frac tio nb Acetone p rec ip itate d ia lyzed against 0 .0 5 M acetate , pH 4 .5
TUBE NUMBER
Fig. 3-Chrom atography o f PPO on D EA E-cellulose. E lu ted with a concentration gradient o f potassium phosphate. p H 6.2. flow rate 50 m l per hr at 4 ° C. PPO activity (units/m il;-0 -0 -0 -, absorbance at 28 0 nm ; -a-s-e- potassium phosphate concentration.
pH 4.8. Swain et al. (1966) found a similar increase in the activity of broad bean PPO activity when the pH was altered by acid or base. In their work, the optimum stability was at pH 4.5—4.7. These authors (Swain et al., 1966) concluded that at neutrality the prosthetic groups of the enzyme were masked by the tertiary structure of the protein and alteration of this structure by a change of pH or an anionic detergent resulted in a more active enzyme.Gel filtration
The elution profile of PPO from Sephadex G-100 revealed three fractions (Fig. 2). Tubes 12—15, 16—19 and 22—25 were pooled and called fractions SI, S2 and S3, respectively. These fractions were concentrated by lyophilization and stored at —20°C for further studies.
The data in Table 2 show that the specific activities of fractions SI and S2 were not increased by gel filtration while fraction S3 showed a slight increase in purification. However, fraction S3 contained only 4% of the total activity of the acetone precipitate. Chromatography on Sephadex G-150 and G-200 did not improve the separation of these fractions. Therefore, since Sephadex gel-filtration did not appear to fractionate and purify PPO, the method was abandoned as a means of purifying cherry PPO.Ion-exchange chromatography
Attempts to fractionate PPO by ion- exchange chromatography on carboxy- methyl (CM)-cellulose were not successful. With DEAE-cellulose, two fractions designated DEI (tubes 32—35) and DE2 (tubes 36—39) were obtained (Fig. 3). DEI and DE2 contained 45% and 33% of the total activity of the acetone precipitate, respectively (Table 3). The most active tube in DEI resulted in a 200-fold purification while the most active tube in DE2 was purified 180-fold. These fractions were dialyzed for 24 hr against three changes of 1 mM potassium phosphate (pH 6.2), concentrated by lyophilization and stored at —20°C for further studies.pH Optimum for polyphenol oxidase activity
Results of this study (Fig. 4) show a bell-shaped curve for the PEG-acetone extract with a maximum of 7.0. On the other hand, both fractions DEI and DE2 demonstrate a broad plateau at a pH7.3—7.8. A pH optimum of near neutrality has been observed for the PPO of apricot (El-Tabey and Cruess, 1949), eggplant (Rhoades and Chen, 1968), cranberry (Chan and Yang, 1971), bean leaf (Racu- sen, 1970) and peach (Wong et al., 1971). Apple PPO was found to have two pH optima, 5.2 and 7.3, with the activity at pH 5.2 several times greater than that at pH 7.3 (Shannon and Pratt, 1967).

802-J O U R N A L O F FO O D S C /E N C E -V o /u m e 3 8 (1973)
Table 3—Purification of Royal Ann cherry PPO by DEAE-cellulose chromatography
Purificationstep
Volume(ml)
Total activity
(units x 10'3)
Totalprotein
(mg)
Specific activity3 (units/mg X 10'3)
Yield(%)
Purification(fold)
1. PEG-acetoneextract 80 20.4 192 0.1
2. Acetoneprecipitate0 8 43.2 8.5 5.0 211 50
3. DEAE-cellulosefraction DE1 40 19.8 1.0 20.0 97 200fraction DE2 30 14.4 OB 18.0 70 180
a M ost active tube o f each fraction13 A cetone precip itate d ia lyzed against 1 mM phosphate, pH 6 .2
pH
Fig. 4 —Effe ct of p H on PPO activity, -0 -0 -0 -, PEG-acetone extract; -X X X-, D E 1; -0 -0 -0 -, D E2 . Acetate buffer was used between pH 4 .0 - 6 .0 ; phosphate buffer, p H 6 .0 - 8 .0 ; and Tris-HCI, 8 .0 -9 .0 .
Effect of substrate concentrationThe effect of substrate concentration
on the initial reaction rate of cherry PPO was determined for each fraction. Michaelis constants (Km ) and maximal velocities (Vmax) are shown in Table 4. These were calculated from S/v vs. S plots (not shown). Polyphenol oxidase from the acetone precipitate, DEI and DE2 fractions had similar Km values which differed only slightly from the Km reported for the Bartlett pear PPO (Tate et al., 1964), but were about 80-fold different from the PPO of tobacco root (Sisler and Evans, 1958). The Vmax of fractions DEI and DE2 was the same, while that of the acetone precipitate was about 25% less.Substrate specificity
Various monophenolic and o-dipheno-
lic compounds were used to determine the substrate specificity of the acetone precipitate and fractions DEI and DE2. Protein concentration of all three fractions was adjusted to approximately 0.1 mg/ml. Rate of the reaction for the different substrates was measured at maximal wavelengths after a 5 min reaction time. Data presented in Table 5 reveal that all fractions were active towards theo-diphenols but not with monophenols. These results indicate that cherry PPO cannot catalyze the oxidation of monophenol to o-diphenol. This compares favorably with observations on the substrate specificity of other plant PPO with the exception of mushroom (Krueger,1950) and potato (Alberghina, 1964) PPO. Mason (1956) reported that mono- phenolase is less stable than o-dipheno- lase. Since the acetone precipitate did not
Table 4—Michaelis constants and maximum velocities of fractions of Royal Ann cherry PPO
k m VmaxPPO fraction (mM) (Abs)
Acetone precipitate 46 766DE1 43 1000DE2 53 1000
show monophenolase activity, if any monophenolase activity were present in the Royal Ann cherry, it was not lost during chromatography. When p-cresol was used as substrate, the three fractions did not show activity for 20 min; but when a mixture of 4-methyl catechol and p-cresol was used, activity was observed almost immediately. These results are similar to those of Long and Alben(1968). Of the substrates used in this study, pyrogallol was oxidized most rapidly by the acetone precipitate and fraction DEI, while fraction DE2 oxidized 4-methyl catechol most rapidly. This indicates that the substrate specificity of DEI and DE2 was different.Inhibitor studies
Several compounds known to reduce the enzymic browning of fruits were used as inhibitors of PPO. Sodium diethyldi- thiocarbamate (DEDTC), dithiothreitol, and potassium metabisulfite delayed the start of the reaction from 2 to 5 min. Inhibition by the various compounds was calculated from the rate of the change in absorbance at 400 nm immediately following this induction period. With catechol as substrate, the three enzyme preparations showed similar behavior towards the inhibitors (Table 6 ). All of the compounds used in this study inhibited all the preparations of cherry PPO. Sodium chloride was the least potent inhibitor of those used. DEDTC, dithiothreitol, potassium metabisulfite and potassium cyanide appear to inhibit PPO at very low concentrations. DEDTC has been shown to complex the copper prosthetic group of PPO (Swain et al., 1966; Vaughan and Butt, 1970; and Grncarevic and Hawker, 1971) and to inhibit the PPO of broad bean (Swain et al., 1966), grapes (Segal and Segal, 1969), M icrobac te rium leprae (Prabhakaran et al., 1969), grape berries (Grncarevic and Hawker, 1971) and peaches (Wong et al., 1971).Heat inactivation
5 ml of enzyme solution were placed in a prewarmed test tube at 75°C and portions were withdrawn at various intervals, cooled and assayed for residual activity. The rate of decrease of PPO activity at 75°C appears to follow first order kinetics for 7 min (Fig. 5). Differences in
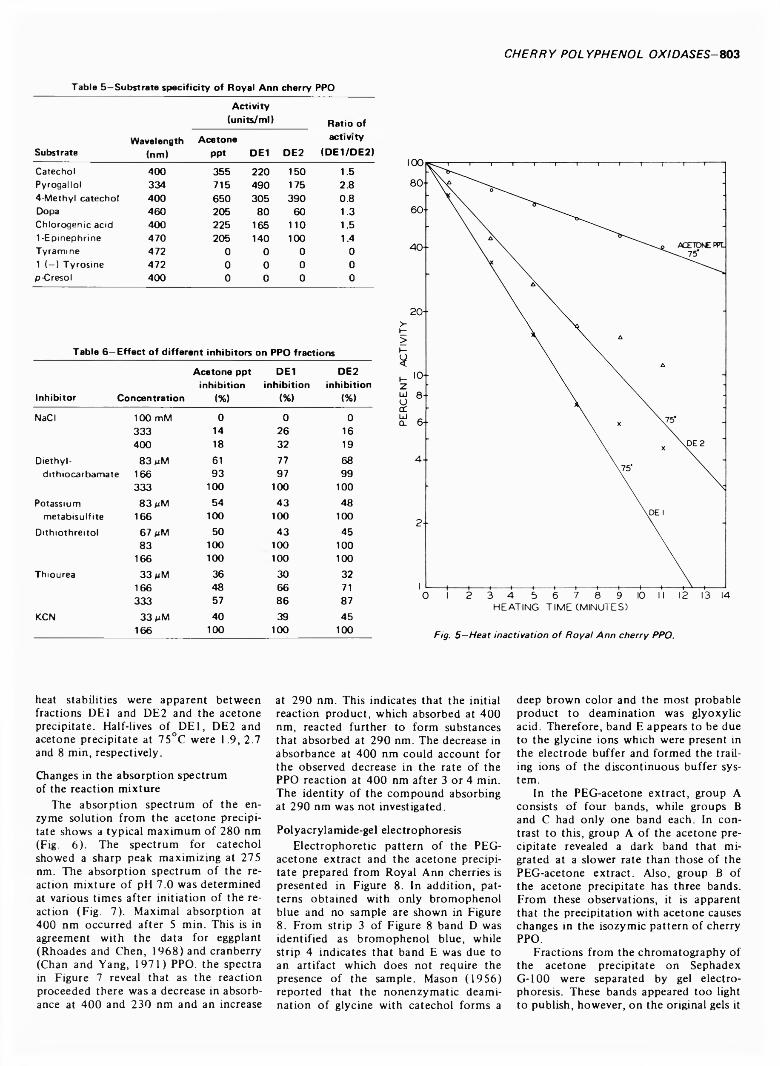
C H E R R Y P O LY P H E N O L O XID A S ES-803Table 5—Substrate specificity of Royal Ann cherry PPO
Activity(units/ml) Ratio of
Wavelength Acetone activitySubstrate (nm) ppt DEI DE2 (DE1/DE2)Catechol 400 355 220 150 1.5Pyrogallol 334 715 490 175 2.84-Methyl catechol 400 650 305 390 0.8Do pa 460 205 80 60 1.3Chlorogenic acid 400 225 165 110 1.51-Epinephrine 470 205 140 100 1.4Tyramine 472 0 0 0 01 (-) Tyrosine 472 0 0 0 0p-Cresol 400 0 0 0 0
Table 6—Effect of different inhibitors on PPO fractions
Inhibitor Concentration
Acetone ppt inhibition
(%)
DE1inhibition
(%)
DE2inhibition
i%)NaCI 100 mM 0 0 0
333 14 26 16400 18 32 19
Diethyl- 83 mM 61 77 68dithiocarbamate 166 93 97 99
333 100 100 100Potassium 83 mM 54 43 48
metabisulfite 166 100 100 100Dithiothreitol 67 mM 50 43 45
83 100 100 100166 100 100 100
Thiourea 33 mM 36 30 32166 48 66 71333 57 86 87
KCN 33 pM 40 39 45166 100 100 100 Fig. 5 —Heat inactivation o f Royal Ann cherry PPO.
heat stabilities were apparent between fractions DEI and DE2 and the acetone precipitate. Half-lives of DEI, DE2 and acetone precipitate at 75°C were 1.9, 2.7 and 8 min, respectively.
Changes in the absorption spectrum of the reaction mixture
The absorption spectrum of the enzyme solution from the acetone precipitate shows a typical maximum of 280 nm (Fig. 6 ). The spectrum for catechol showed a sharp peak maximizing at 275 nm. The absorption spectrum of the reaction mixture of pH 7.0 was determined at various times after initiation of the reaction (Fig. 7). Maximal absorption at 400 nm occurred after 5 min. This is in agreement with the data for eggplant (Rhoades and Chen, 1968) and cranberry (Chan and Yang, 1971) PPO. the spectra in Figure 7 reveal that as the reaction proceeded there was a decrease in absorbance at 400 and 230 nm and an increase
at 290 nm. This indicates that the initial reaction product, which absorbed at 400 nm, reacted further to form substances that absorbed at 290 nm. The decrease in absorbance at 400 nm could account for the observed decrease in the rate of the PPO reaction at 400 nm after 3 or 4 min. The identity of the compound absorbing at 290 nm was not investigated.
Polyacrylamide-gel electrophoresisElectrophoretic pattern of the PEG-
acetone extract and the acetone precipitate prepared from Royal Ann cherries is presented in Figure 8 . In addition, patterns obtained with only bromophenol blue and no sample are shown in Figure8 . From strip 3 of Figure 8 band D was identified as bromophenol blue, while strip 4 indicates that band E was due to an artifact which does not require the presence of the sample. Mason (1956) reported that the nonenzymatic deamination of glycine with catechol forms a
deep brown color and the most probable product to deamination was glyoxylic acid. Therefore, band E appears to be due to the glycine ions which were present in the electrode buffer and formed the trailing ions of the discontinuous buffer system.
In the PEG-acetone extract, group A consists of four bands, while groups B and C had only one band each. In contrast to this, group A of the acetone precipitate revealed a dark band that migrated at a slower rate than those of the PEG-acetone extract. Also, group B of the acetone precipitate has three bands. From these observations, it is apparent that the precipitation with acetone causes changes in the isozymic pattern of cherry PPO.
Fractions from the chromatography of the acetone precipitate on Sephadex G-100 were separated by gel electrophoresis. These bands appeared too light to publish, however, on the original gels it
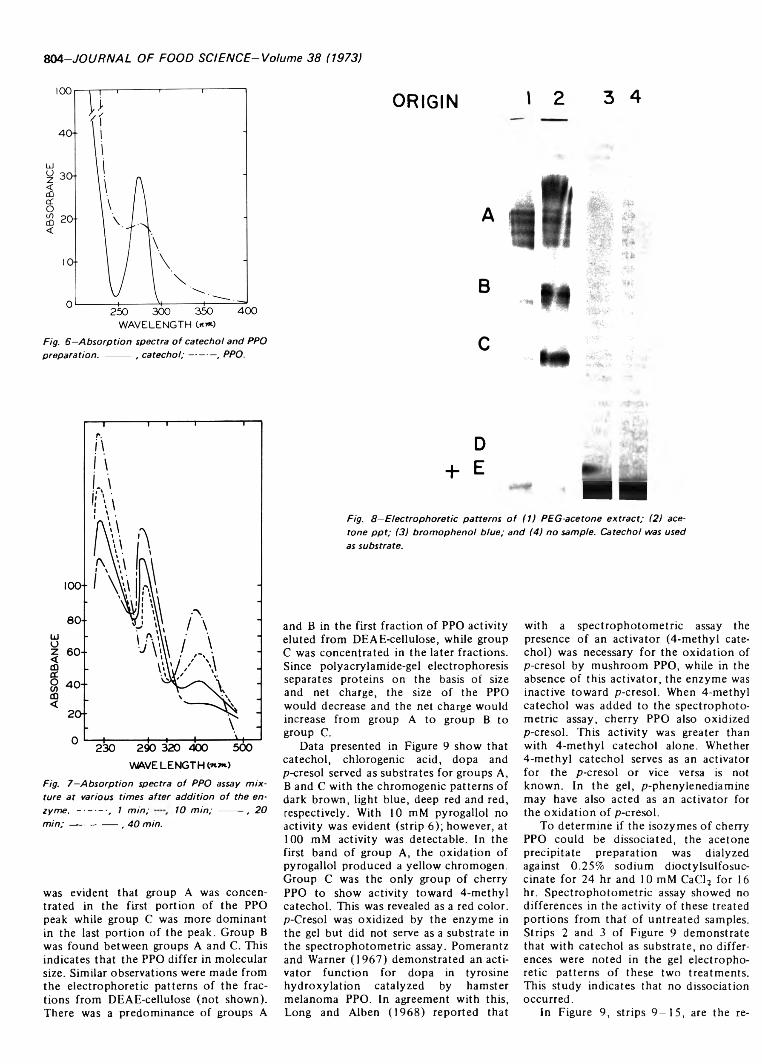
8 0 4 -J O U R N A L O F FO O D S C IE N C E -V o lu m e 3 8 (1973)
Fig. 6 —Absorption spectra o f catechol and PPO preparation. ------- , ca tec h o l;---------, PPO.
O R IG IN » 2 3 4
D
+ EM M
Fig. 8 —Electrophoretic patterns o f (1) PEG-acetone extract; (2) acetone p p t; (3) brom ophenol b lue; and (4) no sample. Catechol was used as substrate.
Fig. 7—Absorption spectra o f PPO assay m ixture at various times after addition o f the enzyme. -------- , 1 m in; 10 m in; ------- , 20m i n ;------------- , 40 min.
was evident that group A was concentrated in the first portion of the PPO peak while group C was more dominant in the last portion of the peak. Group B was found between groups A and C. This indicates that the PPO differ in molecular size. Similar observations were made from the electrophoretic patterns of the fractions from DEAE-cellulose (not shown). There was a predominance of groups A
and B in the first fraction of PPO activity eluted from DEAE-cellulose, while group C was concentrated in the later fractions. Since polyacrylamide-gel electrophoresis separates proteins on the basis of size and net charge, the size of the PPO would decrease and the net charge would increase from group A to group B to group C.
Data presented in Figure 9 show that catechol, chlorogenic acid, dopa and p-cresol served as substrates for groups A, B and C with the chromogenic patterns of dark brown, light blue, deep red and red, respectively. With 10 mM pyrogallol no activity was evident (strip 6 ); however, at 100 mM activity was detectable. In the first band of group A, the oxidation of pyrogallol produced a yellow chromogen. Group C was the only group of cherry PPO to show activity toward 4-methyl catechol. This was revealed as a red color. p-Cresol was oxidized by the enzyme in the gel but did not serve as a substrate in the spectrophotometric assay. Pomerantz and Warner (1967) demonstrated an activator function for dopa in tyrosine hydroxylation catalyzed by hamster melanoma PPO. In agreement with this, Long and Alben (1968) reported that
with a spectrophotometric assay the presence of an activator (4-methyl catechol) was necessary for the oxidation of p-cresol by mushroom PPO, while in the absence of this activator, the enzyme was inactive toward p-cresol. When 4-methyl catechol was added to the spectrophotometric assay, cherry PPO also oxidized p-cresol. This activity was greater than with 4-methyl catechol alone. Whether4-methyl catechol serves as an activator for the p-cresol or vice versa is not known. In the gel, p-phenylenediamine may have also acted as an activator for the oxidation of p-cresol.
To determine if the isozymes of cherry PPO could be dissociated, the acetone precipitate preparation was dialyzed against 0.25% sodium dioctylsulfosuc- cinate for 24 hr and 10 mM CaCl2 for 16 hr. Spectrophotometric assay showed no differences in the activity of these treated portions from that of untreated samples. Strips 2 and 3 of Figure 9 demonstrate that with catechol as substrate, no differences were noted in the gel electrophoretic patterns of these two treatments. This study indicates that no dissociation occurred.
In Figure 9, strips 9 -1 5 , are the re-
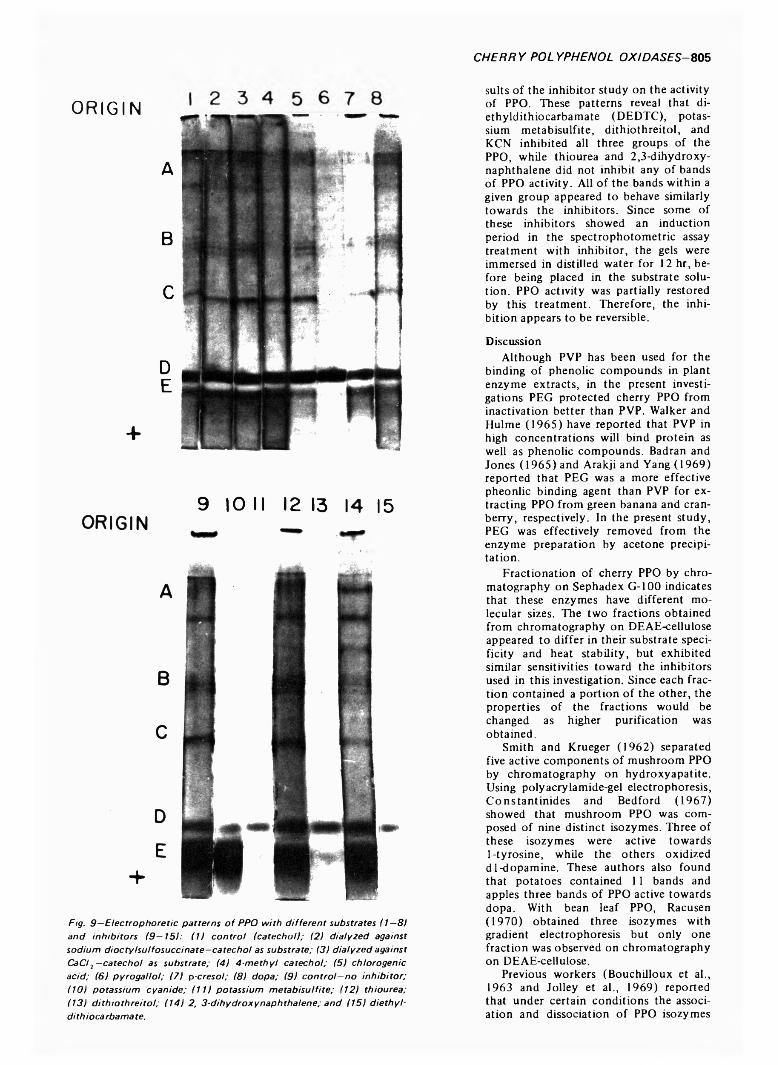
C H E R R Y P O LY P H E N O L O X ID A S E S-805
ORIGIN
A
B
C
DE
+
9 1 0 I I 12 13 14 15
Fig. 9 —Electrophoretic patterns o f PPO with different substrates (1—8) and inhibitors (9 -1 5 1 : ( I I contro l (catechol); (2) dialyzed against sodium dioctylsulfosuccinate—catechol as substrate; (3) dialyzed against CaCIj -ca te ch o l as substrate; (4) 4-m ethyl catechol; (5) chlorogenic acid; (6) pyrogallol; (7) p-cresol; (8) dopa; (9) co n tro l-n o inhibitor; (10) potassium cyanide; (11) potassium metabisulfite; (12) thiourea; (13) dithiothreitol; (14) 2, 3-dihydroxynaphthalene; and (15) diethyl- dithiocarbamate.
suits of the inhibitor study on the activity of PPO. These patterns reveal that di- ethyldithiocarbamate (DEDTC), potassium metabisulfite, dithiothreitol, and KCN inhibited all three groups of the PPO, while thiourea and 2,3-dihydroxy- naphthalene did not inhibit any of bands of PPO activity. All of the bands within a given group appeared to behave similarly towards the inhibitors. Since some of these inhibitors showed an induction period in the spectrophotometric assay treatment with inhibitor, the gels were immersed in distilled water for 12 hr, before being placed in the substrate solution. PPO activity was partially restored by this treatment. Therefore, the inhibition appears to be reversible.
DiscussionAlthough PVP has been used for the
binding of phenolic compounds in plant enzyme extracts, in the present investigations PEG protected cherry PPO from inactivation better than PVP. Walker and Hulme (1965) have reported that PVP in high concentrations will bind protein as well as phenolic compounds. Badran and Jones (1965) and Arakji and Yang (1969) reported that PEG was a more effective pheonlic binding agent than PVP for extracting PPO from green banana and cranberry, respectively. In the present study, PEG was effectively removed from the enzyme preparation by acetone precipitation.
Fractionation of cherry PPO by chromatography on Sephadex G-100 indicates that these enzymes have different molecular sizes. The two fractions obtained from chromatography on DEAE-cellulose appeared to differ in their substrate specificity and heat stability, but exhibited similar sensitivities toward the inhibitors used in this investigation. Since each fraction contained a portion of the other, the properties of the fractions would be changed as higher purification was obtained.
Smith and Krueger (1962) separated five active components of mushroom PPO by chromatography on hydroxyapatite. Using polyacrylamide-gel electrophoresis, Constantinides and Bedford (1967) showed that mushroom PPO was composed of nine distinct isozymes. Three of these isozymes were active towards1-tyrosine, while the others oxidized dl-dopamine. These authors also found that potatoes contained 11 bands and apples three bands of PPO active towards dopa. With bean leaf PPO, Racusen(1970) obtained three isozymes with gradient electrophoresis but only one fraction was observed on chromatography on DEAE-cellulose.
Previous workers (Bouchilloux et al., 1963 and Jolley et al., 1969) reported that under certain conditions the association and dissociation of PPO isozymes
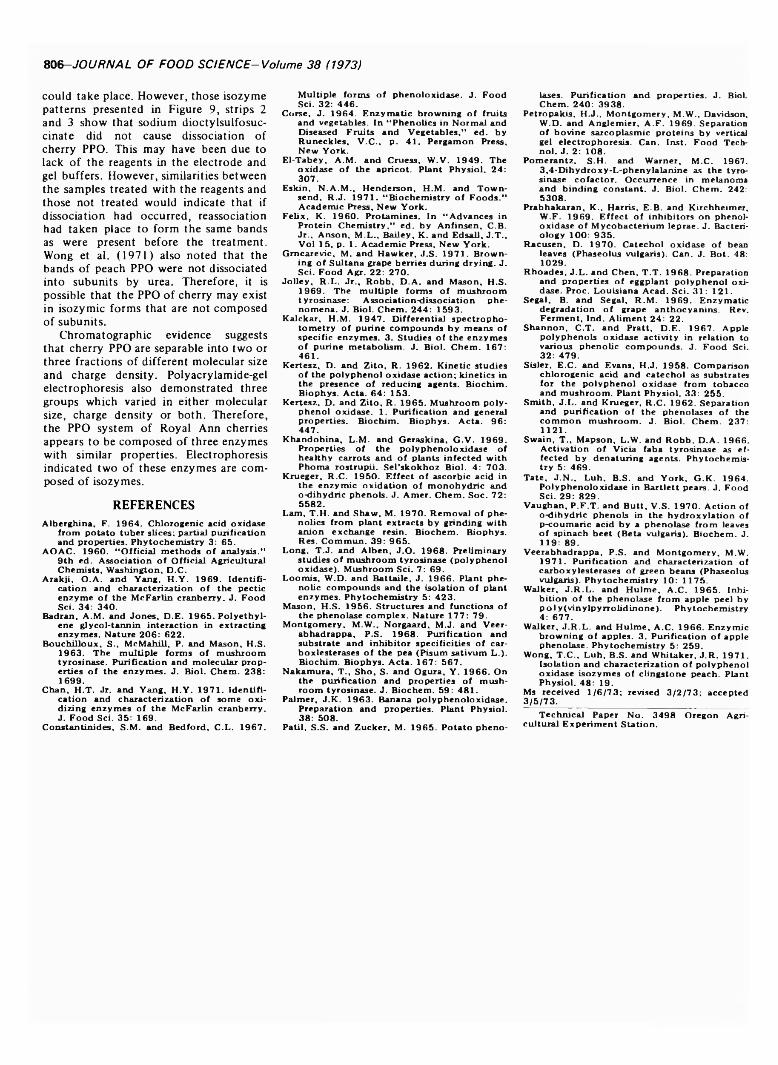
806-J O U R N A L O F FO O D S C IE N C E -V o lu m e 3 8 (1973)
could take place. However, those isozyme patterns presented in Figure 9, strips 2 and 3 show that sodium dioctylsulfosuc- cinate did not cause dissociation of cherry PPO. This may have been due to lack of the reagents in the electrode and gel buffers. However, similarities between the samples treated with the reagents and those not treated would indicate that if dissociation had occurred, reassociation had taken place to form the same bands as were present before the treatment. Wong et al. (1971) also noted that the bands of peach PPO were not dissociated into subunits by urea. Therefore, it is possible that the PPO of cherry may exist in isozymic forms that are not composed of subunits.
Chromatographic evidence suggests that cherry PPO are separable into two or three fractions of different molecular size and charge density. Polyacrylamide-gel electrophoresis also demonstrated three groups which varied in either molecular size, charge density or both. Therefore, the PPO system of Royal Ann cherries appears to be composed of three enzymes with similar properties. Electrophoresis indicated two of these enzymes are composed of isozymes.
REFERENCESA lbergh ina, F. 1 9 6 4 . C h lorogen ic acid ox id ase
from p o ta to tu ber slices; partial pu rifica tion and prop erties. P h y to ch em istry 3: 6 5 .
A O A C . 1 9 6 0 . “ O ffic ia l m eth o d s o f a n a ly sis .” 9 th ed . A sso c ia tio n o f O ffic ia l A gricu ltural C h em ists , W ashington, D .C .
A rakji, O .A . and Y ang, H .Y . 1 9 6 9 . Id en tif ic a tio n and ch aracter ization o f th e p ec tic en zy m e o f th e M cFarlin cranberry. J. F o o d S ci. 34 : 3 4 0 .
Badran, A .M . and J o n es , D .E . 1 9 6 5 . P o ly e th y lene g lyco l-tan n in in tera ctio n in extractin g e n zy m es. N ature 2 0 6 : 6 2 2 .
B o u ch illo u x , S ., M cM ahill, P. and M ason, H .S.1 9 6 3 . T he m u ltip le form s o f m u sh room tyrosin ase. P u rifica tion and m olecu lar p rop erties o f th e en z y m e s . J. B io l. C hem . 2 3 8 : 1 6 9 9 .
C han, H .T . Jr. and Y ang, H .Y . 1 9 7 1 . Id en tif ica tio n and character iza tion o f so m e o x id iz in g en zy m es o f th e M cFarlin cranberry. J. F o o d S c i. 35: 1 6 9 .
C on stan tin id es , S.M . and B ed ford , C .L . 1 9 6 7 .
M ultip le form s o f p h en o lo x id a se . J. F o o d S ci. 32 : 4 4 6 .
C orse, J. 1 9 6 4 . E n zy m a tic b row n in g o f fruits and vegetab les. In “ P h en o lics in N orm al and D iseased F ru its and V eg eta b le s ,” e d . by R u n eck les , V .C ., p . 4 1 . P ergam on Press, N ew Y ork.
E l-T ab ey , A .M . an d C ruess, W .V. 1 9 4 9 . The o x id a se o f th e ap rico t. P lant P h y sio l. 24 : 3 0 7 .
E sk in , N .A .M ., H en d erson , H.M . and T o w n sen d , R .J . 1 9 7 1 . “ B ioch em istry o f F o o d s .” A cad em ic Press, N ew Y ork .
F e lix , K. 1 9 6 0 . P rotam ines. In “ A dvances in P rotein C h em istry ,” e d . b y A n fin sen , C .B . Jr., A n son , M .L ., B ailey , K. and E dsall, J .T ., V o l 1 5 , p . 1 . A cad em ic Press, N ew Y ork .
G rncarevic, M. and H aw ker, J .S . 1 9 7 1 . B row n ing o f Su ltana grape berries during d ry in g . J. S c i. F o o d Agr. 22 : 2 7 0 .
J o lle y , R .L . Jr., R o b b , D .A . and M ason , H .S.1 9 6 9 . T he m u ltip le form s o f m u sh room ty ro sin a se: A sso c ia tio n -d isso c ia tio n p h en om en a . J. B io l. C hem . 2 4 4 : 1 5 9 3 .
K alckar, H.M . 1 9 4 7 . D ifferen tia l sp e c tro p h o to m etry o f purine co m p o u n d s b y m eans o f sp ec if ic en zy m es. 3 . S tu d ie s o f th e en zy m es o f purine m etab o lism . J. B io l. C hem . 167: 4 6 1 .
K ertesz , D . and Z ito , R . 1 9 6 2 . K in etic s tu d ies o f th e p o ly p h e n o l o x id a se a c tio n ; k in etic s in th e p resen ce o f red ucing agents. B ioch im . B iop h ys. A cta . 64 : 1 5 3 .
K ertesz, D . and Z ito , R . 1 9 6 5 . M ushroom p o ly p h en o l o x id a se . 1 . P u rifica tion and general prop erties. B ioch im . B io p h y s . A cta . 96 :4 4 7 .
K han dobin a , L.M . and G eraskina, G .V . 1 9 6 9 . P roperties o f th e p o ly p h en o lo x id a se o f h ea lth y carrots and o f p lan ts in fec te d w ith P hom a rostru p ii. S e l’sk o k h o z B io l. 4: 7 0 3 .
K rueger, R .C . 1 9 5 0 . E ffec t o f a scorb ic acid in th e en zy m ic o x id a t io n o f m o n o h y d r ic ando-d ih yd ric p h en o ls. J. A m er. C h em . S o c . 72: 5 5 8 2 .
Lam , T .H . and Sh aw , M. 1 9 7 0 . R em ova l o f ph en o lics from p lan t ex tra cts b y grinding w ith a n io n ex ch an ge resin . B io ch em . B iop h ys. R es. C om m u n . 39 : 9 6 5 .
L ong , T .J. and A lb en , J .O . 1 9 6 8 . Prelim inary s tu d ies o f m u sh ro o m tyrosin ase (p o ly p h e n o l o x id a se ). M ushroom S c i. 7: 6 9 .
L o o m is , W .D. and B atta ile , J . 1 9 6 6 . P lant ph en o lic co m p o u n d s and th e iso la tio n o f p lan t en zy m es. P h y to ch em istry 5: 4 2 3 .
M ason, H .S . 1 9 5 6 . S tru ctu res and fu n c tio n s o f th e p h en o la se c o m p le x . N ature 1 7 7 : 7 9 .
M on tgom ery , M .W ., N orgaard, M .J. and V eer- abhadrappa, P .S . 1 9 6 8 . P u rifica tion and substrate and in h ib ito r s p e c if ic itie s o f car- b o x lestera ses o f th e pea (P isu m sativum L .). B ioch im . B io p h y s. A cta . 1 6 7 : 5 6 7 .
N akam ura, T ., S h o , S . and O gura, Y . 1 9 6 6 . On th e p u rifica tio n and prop erties o f m u sh room tyrosin ase. J. B ioch em . 59 : 4 8 1 .
P alm er, J .K . 1 9 6 3 . Banana p o ly p h en o lo x id a se . Preparation and prop erties. P lant P h ysio l. 38: 5 0 8 .
P atil, S .S . and Z ucker, M. 1 9 6 5 . P o ta to p h en o-
lases. P u rifica tion and p rop erties. J. Biol. C hem . 2 4 0 : 3 9 3 8 .
P etrop ak is, H .J ., M o n tg o m ery , M .W ., D avidson, W .D. and A nglem ier , A .F . 1 9 6 9 . Separation o f b o v in e sarcop lasm ic p ro te in s by vertical gel e lectro p h o resis . Can. Inst. F o o d Tech- n o l. J. 2: 1 0 8 .
P om eran tz, S .H . and W arner, M .C. 1967 . 3 ,4 -D ih y d ro x y -L -p h en y la la n in e as th e tyrosinase c o fa c to r . O ccurrence in m elanom a and b in d in g c o n sta n t. J. B io l. C hem . 242: 5 3 0 8 .
Prabhakaran, K ., H arris, E .B . and K irchheim er, W .F. 1 9 6 9 . E ffe c t o f in h ib ito rs o n ph en olo x id a se o f M ycob acter iu m leprae. J. Bacterio lo g y 1 0 0 : 9 3 5 .
R acu sen , D . 1 9 7 0 . C atech o l o x id a se o f bean leaves (P h aseo lu s vulgaris). Can. J. B o t. 48: 1 0 2 9 .
R h o a d es, J .L . and C hen, T .T . 1 9 6 8 . Preparation and p roperties o f eggp lant p o ly p h e n o l o x id ase. Proc. L ou isiana A cad . S c i. 31 : 1 2 1 .
Sega l, B. and Sega l, R .M . 1 9 6 9 . E n zym atic d egrad ation o f grape a n th o cy a n in s . Rev. F erm en t, Ind. A lim en t 2 4 : 2 2 .
S h a n n o n , C .T . and Pratt, D .E . 1 9 6 7 . A pple p o ly p h e n o ls o x id a se a c tiv ity in rela tion to various p h en o lic c o m p o u n d s . J. F o o d Sci. 32: 4 7 9 .
S isler, E .C . and E vans, H .J. 1 9 5 8 . C om parison ch lorogen ic acid and c a te ch o l as substrates for th e p o ly p h e n o l ox id a se from tob acco and m u sh room . P lant P h y sio l. 33 : 2 5 5 .
S m ith , J .L . and K rueger, R .C . 1 9 6 2 . Separation and p u rifica tio n o f th e p h en o la ses o f the c o m m o n m u sh ro o m . J. B io l. C hem . 237 : 1121 .
S w ain , T ., M apson , L.W. and R o b b , D .A . 1 9 6 6 . A ctiv a tio n o f V icia faba tyrosin ase as e ffec ted b y d en atu rin g agen ts. P h y to ch em istry 5: 4 6 9 .
T a te , J .N ., L uh , B .S . and Y ork , G .K . 1 9 6 4 . P o ly p h e n o lo x id a se in B artle tt pears. J. F ood S c i. 2 9 : 8 2 9 .
V aughan , P .F .T . and B u tt , V .S . 1 9 7 0 . A c tio n o fo-d ih yd ric p h en o ls in th e h y d ro x y la t io n o f p-cou m aric acid by a ph en o lase from leaves o f sp inach b e e t (B eta vulgaris). B io ch em . J. 1 1 9 : 8 9 .
V eerabh adrappa, P .S . and M on tg o m ery , M.W.1 9 7 1 . P u rifica tion and ch aracter iza tion o f carb o x y lestera ses o f green beans (P haseolu s vulgaris). P h y to ch em istry 10: 1 1 7 5 .
W alker, J .R .L . and H u lm e , A .C . 1 9 6 5 . Inhib it io n o f th e ph en o lase from app le p ee l by p o ly (v in y lp y r r o lid in o n e ) . P h y to ch em istry 4: 6 7 7 .
W alker, J .R .L . and H u lm e, A .C . 1 9 6 6 . E n zym ic b row n in g o f app les. 3 . P u rifica tion o f app le p h en o la se . P h y to ch em istry 5: 2 5 9 .
W ong, T .C ., L uh , B .S . and W hitaker, J .R . 1 9 7 1 . Iso la tio n and ch aracter iza tion o f p o ly p h e n o l o x id a se iso zy m es o f c lin g sto n e peach . Plant P h y sio l. 48 : 1 9 .
Ms received 1 /6 /7 3 ; revised 3 /2 /7 3 ; a ccep ted3 /5 /7 3 .________
T ech n ica l Paper N o . 3 4 9 8 O regon A gricu ltu ral E x p erim en t S ta tio n .
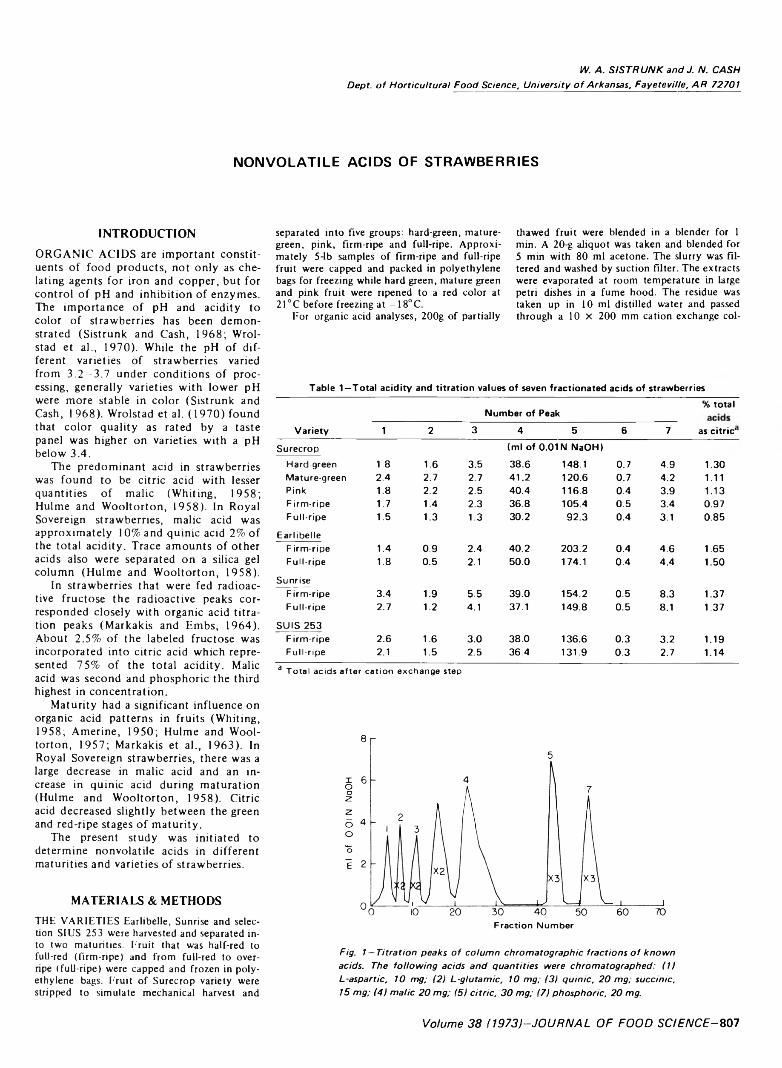
W. A . S IS T R U N K and J. N. C A SH Dept, o f Horticultural F o o d Science, University o f Arkansas, Fayeteville, A R 72701
NONVOLATILE ACIDS OF STRAWBERRIES
INTRODUCTIONORGANIC ACIDS are important constituents of food products, not only as chelating agents for iron and copper, but for control of pH and inhibition of enzymes. The importance of pH and acidity to color of strawberries has been demonstrated (Sistrunk and Cash, 1968; Wrol- stad et al., 1970). While the pH of different varieties of strawberries varied from 3 .2 -3 .7 under conditions of processing, generally varieties with lower pH were more stable in color (Sistrunk and Cash, 1968). Wrolstad et al. (1970) found that color quality as rated by a taste panel was higher on varieties with a pH below 3.4.
The predominant acid in strawberries was found to be citric acid with lesser quantities of malic (Whiting, 1958; Hulme and Wooltorton, 1958). In Royal Sovereign strawberries, malic acid was approximately 10% and quinic acid 2% of the total acidity. Trace amounts of other acids also were separated on a silica gel column (Hulme and Wooltorton, 1958).
In strawberries that were fed radioactive fructose the radioactive peaks corresponded closely with organic acid titration peaks (Markakis and Embs, 1964). About 2.5% of the labeled fructose was incorporated into citric acid which represented 75% of the total acidity. Malic acid was second and phosphoric the third highest in concentration.
Maturity had a significant influence on organic acid patterns in fruits (Whiting, 1958; Amerine, 1950; Hulme and Wooltorton, 1957; Markakis et al., 1963). In Royal Sovereign strawberries, there was a large decrease in malic acid and an increase in quinic acid during maturation (Hulme and Wooltorton, 1958). Citric acid decreased slightly between the green and red-ripe stages of maturity.
The present study was initiated to determine nonvolatile acids in different maturities and varieties of strawberries.
MATERIALS & METHODSTHE VARIETIES Earlibelle, Sunrise and selection SI US 253 were harvested and separated into two maturities. Fruit that was half-red to full-red (firm-ripe) and from full-red to overripe (full-ripe) were capped and frozen in polyethylene bags. Fruit of Surecrop variety were stripped to simulate mechanical harvest and
separated into five groups: hard-green, mature- green, pink, firm-ripe and full-ripe. Approximately 54b samples o f firm-ripe and full-ripe fruit were capped and packed in polyethylene bags for freezing while hard green, mature green and pink fruit were ripened to a red color at 21 °C before freezing at — 18°C.
For organic acid analyses, 200g of partially
thawed fruit were blended in a blender for 1 min. A 20-g aliquot was taken and blended for 5 min with 80 ml acetone. The slurry was filtered and washed by suction filter. The extracts were evaporated at room temperature in large petri dishes in a fume hood. The residue was taken up in 10 ml distilled water and passed through a 10 x 200 mm cation exchange col-
Table 1—Total acidity and titration values of seven fractionated acids of strawberries% total
Number of PeakVariety 1 2 3 4 5 6 7 as citric'
SurecropHard-green 1.8 1.6 3.5
(ml of 0.01 N NaOH)38.6 148.1 0.7 4.9 1.30
Mature-green 2.4 2.7 2.7 41.2 120.6 0.7 4.2 1.11Pink 1.8 2.2 2.5 40.4 116.8 0.4 3.9 1.13Firm-ripe 1.7 1.4 2.3 36.8 105.4 0.5 3.4 0.97Full-ripe 1.5 1.3 1.3 30.2 92.3 0.4 3.1 0.85
EarlibelleFirm-ripe 1.4 0.9 2.4 40.2 203.2 0.4 4.6 1.65Full-ripe 1.8 0.5 2.1 50.0 174.1 0.4 4.4 1.50
SunriseFirm-ripe 3.4 1.9 5.5 39.0 154.2 0.5 8.3 1.37Full-ripe 2.7 1.2 4.1 37.1 149.8 0.5 8.1 1.37
SUIS 253Firm-ripe 2.6 1.6 3.0 38.0 136.6 0.3 3.2 1.19Full-ripe 2.1 1.5 2.5 36.4 131.9 0.3 2.7 1.14
a To ta l acids after cation exchange step
Fig. 1—Titration peaks o f column chromatographic fractions o f known acids. The following acids and quantities were chromatographed: (1) Laspartic, 10 mg; (21 L-glutamic, 10 mg; (31 quinic, 20 mg; succinic, 15 mg; (41 malic 20 mg; (5) citric, 30 mg; (7) phosphoric, 20 mg.
Volum e 3 8 (1 9 7 3 )-J O U R N A L O F FO O D S C IE N C E -8 0 7

808-JOURNAL OF FOOD SCIENCE-Volume 38 (1973)
umn packed with Dowex 50W-X4 (50-100 mesh) in the H+ form to remove pigments. After collecting 60 ml through the column essentially 100% o f acids were removed. Samples were divided into two lots, one being titrated with 0.1N NaOH to obtain total acidity.
Rexyn 201 (Mfd. by Fisher Scientific Co.) in the acetate form (2 0 0 -4 0 0 mesh) was used for fractionating the organic acids. The strong anion exchange resin, Rexyn 201 chloride was converted to the acetate form by adding IN Na acetate to lOg of resin in a beaker. After standing for 1 hr the acetate was decanted off and the resin rinsed several times with distilled water and finally with 0.1N acetic acid. An 8 x 130 mm column was packed with the slurry by applying 2 lb pressure from a small pump. Glass wool was placed on the bottom and tops of column. 30 ml (lOg) o f sample was passed onto the column and six fractions were collected during adsorption. The column was filled with
2N acetic acid and attached to an automatic fraction collector with a volumetric attachment set to deliver 5 ml. The eluting solutions were in the following order: 50 ml 2N acetic acid, 50 ml 4N acetic acid, 80 ml 6N acetic acid and 150 ml of 6N formic acid. Approximately 7 2 -7 5 fractions, including the original six, were sufficient to elute the organic acids. The determinations were replicated three times and only means o f the data are shown. This method is similar to that used by Hulme and Wooltorton(1957). Fractions were transferred to petri dishes and dried in a ventilated fume hood at room temperature before titrating with 0.01 N NaOH. Also effluent volumes for known acids were established by the same procedure. The resin was forced from the column after each sample and reconditioned by rinsing with distilled water and adding IN Na acetate. By adding a small amount of resin each cycle, the resin was used repeatedly with excellent results.
Dowex 50W-X4 was reconditioned by adding a small amount o f nitric acid to the wet resin in a beaker to hydrolyze the pigments. Then the resin was washed several times with HaO before returning to the column.
The paper chromatographic technique was adapted from the method of Williams and Patterson (1964). Samples were extracted by the same procedure as stated previously. After passing through the cation exchange column to remove pigments, samples were concentrated to dryness, taken up in 5 ml aliquots o f 50% ethanol, and spotted on Whatman 3MM paper. Known acids were also spotted at the rate of1 —2 mg per spot from a solution of the acid containing 50 mg/5 ml. The Rf values o f the known acids were measured and compared with Rf values o f the unknowns in the samples.
RESULTS & DISCUSSIONTOTAL ACIDITY was lower in fruit that was riper in most varieties, especially in Surecrop where part of the fruit was ripened after harvest (Table 1 ). The total acidity was the same for the two maturities in Sunrise and not greatly different in Earlibelle and SIUS 253. The most important organic acids were identified by comparison of the Rf values (Table 1) and the titration peaks of known acids (Fig. 1). Differences in organic acids were more apparent in peak 4 (malic) and peak 5 (citric) as a result of maturity and variety (Table 1). Malic acid increased until the mature-green stage in Surecrop and then decreased through the full-ripe stage. Peaks 1 and 2 were identified as aspartic and glutamic acids since these peaks came off consistently at fraction 4 and 7 respectively. These acids were higher in mature-green fruit of Surecrop. Peak 3 (quinic) was fairly stable in green Surecrop fruit that was ripened after harvest although this peak decreased sharply in the full-ripe fruit. This was different from the results of Hulme and Wooltorton(1958) in which quinic acid increased with maturity although they did not analyze full-ripe fruit. Peak 5 (citric) was much higher in the hard-green stage and decreased rapidly with maturity in Surecrop. Peak 6 was not identified in this study but according to the data of Mar- kakis et al. (1963) peak 6 was probably chlorogenic acid. This acid was not greatly different in any of the samples. Phosphoric acid (peak 7) was higher in greener fruit, although the difference was small between firm-ripe and full-ripe fruit.
Titration curves for the firm-ripe and full-ripe fruit of Earlibelle variety reveal that there were no qualitative differences in the organic acids between the two maturities (Fig. 2). The results for the other varieties were similar in that no other peaks were present. In most instances, the fractionated acids were higher in firm-ripe as compared to full-ripe fruit (Table 1). Malic acid (peak 4) was higher in firm-ripe as compared to full ripe fruit except in Earlibelle. Citric acid
Table 2—Strawberry acids and standards separated on Whatman 3 MM paper3
AcidStrawberry
acid RfStandard acid Rf
Fraction on Rexyn 201
column
Galacturonic 12(tr)
Rf X 10012 14
Glutamic 18 18 7Quinic 38 37 11Phosphoric 42 42 52C itric 58 59 43Malic 65 64 23Chlorogenic 69 70 48Succinic - 84 16a D eve lo p ed b y ascen d in g te c h n iq u e at 2 2 ° C in n -B u ta n o l- fo rm ic acid-
w a te r ( 1 0 :3 :1 0 v /v )
Fig. 2 —Titration peaks o f firm-ripe and full-ripe Earlibelle strawberries. Tentative identification o f the acids: (1) aspartic; (2) glutamic; (3) quinic; (41 malic; (51 citric; (6) not identified; (71 phosphoric.
NONVOLATILE ACIDS OF STRAl/VBERRIES-809
(peak 5) was slightly higher in firm-ripe fruit of Sunrise and SUIS 253 but in Ear- libelle and Surecrop the differences were much greater between the two maturities. Succinic acid did not appear on either the chromatograms or anion exchange peaks although other workers have reported this acid in strawberries (Hulme and Wooltor- ton, 1958; Markakis and Embs, 1964).
Since earlier studies (Wrolstad et al., 1970; Sistrunk and Cash, 1968) have shown that pH and acidity were important for color of strawberries, it was felt that nonvolatile acid differences might provide information that would be helpful in developing varieties with better color. Firm-ripe fruit of many varieties was found to be more stable in color than full-ripe fruit in accelerated temeprature studies in a water bath (data not shown).
The only major difference between the two maturities of the four varieties reported here was the higher total acidity in greener fruit. Malic and citric acids were responsible for most of the difference (Table 1).
In conclusion, the nonvolatile acids in these varieties did not vary qualitatively but there were quantitative differences between varieties and maturities. It is possible that the ratio of citric to malic acid in different genetic lines and maturities could affect color.
REFERENCESA m erin e , M .A . 1 9 5 0 . T he acids o f C alifornia
grapes and w in es . 2 . M alic a c id . F o o d T ech n o l. 5: 1 3 .
H u lm e, A .C . and W o o lto r to n , L .S .C . 1 9 5 7 . The organic acid m eta b o lism o f ap p le fruits: C hanges in ind iv idu al acids during grow th o n th e tree . J. S c i. F o o d A gric. 8: 1 1 7 .
H u lm e, A .C . and W o o lto r to n , L .S .C . 1 9 5 8 . The acid c o n te n t o f cherries and straw berries. C hem . & Ind. (L o n d o n ) 3 6 (p t. 1): 6 5 9 .
M arkakis, P. and E m b s, R .J . 1 9 6 4 . C onversion s o f sugars to organic ac id s in th e straw berry fru it. J. F o o d S c i. 29: 6 2 9 .
M arkakis, P ., Jarczyk , A . and K rishna, S.P. 1 9 6 3 . N o n v o la tile acids o f b lu eb erries. J. A gri. & F o o d C hem . 1 1 : 8 .
S istru n k , W .A. and Cash, J. 1 9 6 8 . S tab iliz in g th e co lo r o f fro zen straw berries. Ark. Farm R es 1 7 (3 ): 2.
W hiting, G .C. 1 9 5 8 . T he n o n v o la tile organic acid s o f so m e berry fru its. J. S c i F o o d A gric. 9: 2 4 4 .
W illiam s, M.W. and P atterson , M .E. 1 9 6 4 . N o n vo la tile organic acids and core b reak d ow n o f B artlett pears. J. A gri. & F o o d C hem . 12: 8 0 .
W rolstad, R .E ., P u tm an , T .P . and V arseveld ,G.W. 1 9 7 0 . C olor q u ality o f frozen straw berries: E ffe c t o f a n th o cy a n in s , pH , to ta l a c id ity and ascorb ic acid variab ility . J. F o o d S c i. 35 : 4 4 8 .
Ms received 4 /2 1 /7 3 ; a ccep ted 5 /7 /7 3 .__________T he au th ors gra tefu lly a ck n o w led g e th e
th e assistance o f D o llie S. C oop er in co n d u ctin gth is s tu d y .
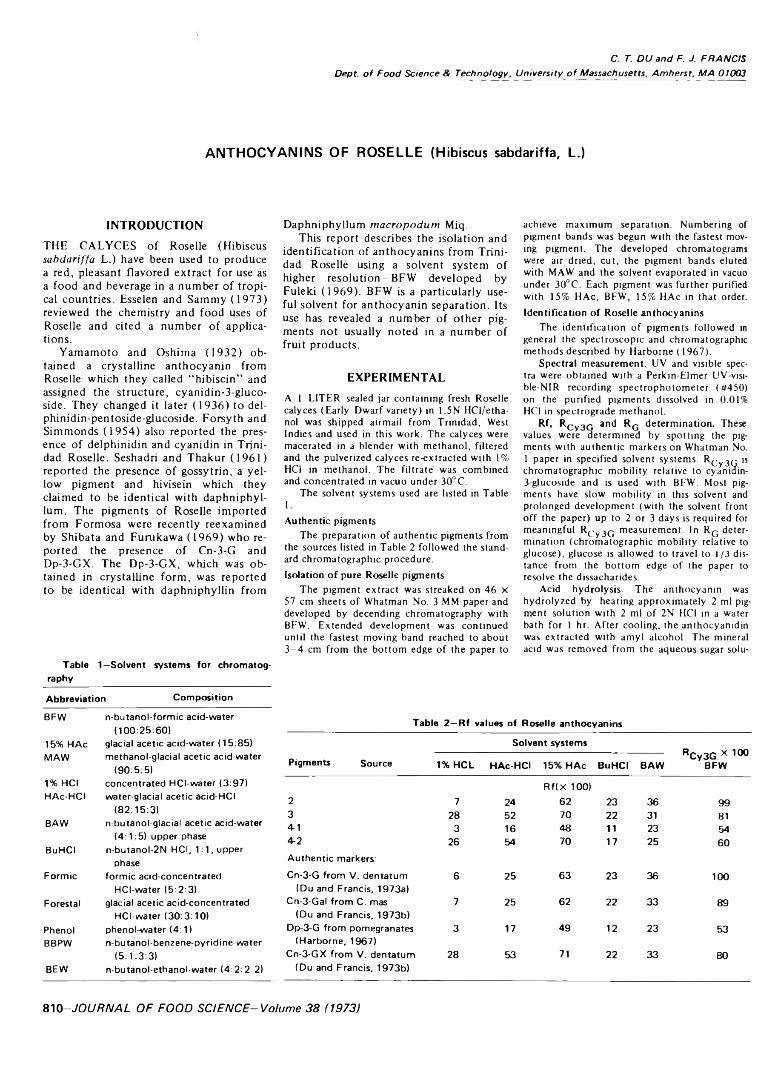
C. T. D U and F. J. F R A N C ISDept, o f F o o d Science & Technology. University o f Massachusetts, Am herst, M A 01003
ANTHOCYANINS OF ROSELLE (Hibiscus sabdariffa, L.)
INTRODUCTIONTHE CALYCES of Roselle (Hibiscus sabdariffa L.) have been used to produce a red, pleasant flavored extract for use as a food and beverage in a number of tropical countries. Esselen and Sammy (1973) reviewed the chemistry and food uses of Roselle and cited a number of applications.
Yamamoto and Oshima (1932) obtained a crystalline anthocyanin from Roselle which they called “hibiscin” and assigned the structure, cyanidin-3-gluco- side. They changed it later (1936) to del- phinidin-pentoside-glucoside. Forsyth and Simmonds (1954) also reported the presence of delphinidin and cyanidin in Trinidad Roselle. Seshadri and Thakur (1961) reported the presence of gossytrin, a yellow pigment and hivisein which they claimed to be identical with daphniphyl- lum. The pigments of Roselle imported from Formosa were recently reexamined by Shibata and Furukawa (1969) who reported the presence of Cn-3-G and Dp-3-GX. The Dp-3-GX, which was obtained in crystalline form, was reported to be identical with daphniphyllin from
Table 1—Solvent systems for chromatography
Abbreviation Composition
Daphniphyllum m acropodum Miq.This report describes the isolation and
identification of anthocyanins from Trinidad Roselle using a solvent system of higher resolution-BFW developed by Fuleki (1969). BFW is a particularly useful solvent for anthocyanin separation. Its use has revealed a number of other pigments not usually noted in a number of fruit products.
EXPERIMENTALA 1 LITER sealed jar containing fresh Roselle calyces (Early Dwarf variety) in 1.5N HCl/etha- nol was shipped airmail from Trinidad, West Indies and used in this work. The calyces were macerated in a blender with methanol, filtered and the pulverized calyces re-extracted with 1 % HC1 in methanol. The filtrate was combined and concentrated in vacuo under 30°C.
The solvent systems used are listed in Table1.Authentic pigments
The preparation of authentic pigments from the sources listed in Table 2 followed the standard chromatographic procedure.Isolation of pure Roselle pigments
The pigment extract was streaked on 46 x 57 cm sheets o f Whatman No. 3 MM paper and developed by decending chromatography with BFW. Extended development was continued until the fastest moving band reached to about3 - 4 cm from the bottom edge of the paper to
achieve maximum separation. Numbering of pigment bands was begun with the fastest moving pigment. The developed chromatograms were air dried, cut, the pigment bands eluted with MAW and the solvent evaporated in vacuo under 30°C. Each pigment was further purified with 15% HAc, BFW, 15% HAc in that order. Identification of Roselle anthocyanins
The identification o f pigments followed in general the spectroscopic and chromatographic methods described by Harborne (1967).
Spectral measurement. UV and visible spectra were obtained with a Perkin-Fdmer UV-visi- ble-NlR recording spectrophotometer (#450) on the purified pigments dissolved in 0.01% HC1 in spectrograde methanol.
Rf, R c y 3G anl* r g determination. These values were determined by spotting the pigments with authentic markers on Whatman No.1 paper in specified solvent systems. RGy3Q is chromatographic mobility relative to cyanidin-3-glucoside and is used with BFW. Most pigments have slow mobility in this solvent and prolonged development (with the solvent front off the paper) up to 2 or 3 days is required for meaningful RGy3G measurement. In RG determination (chromatographic mobility relative to glucose), glucose is allowed to travel to 1/3 distance from the bottom edge o f the paper to resolve the dissacharides.
Acid hydrolysis. The anthocyanin was hydrolyzed by heating approximately 2 ml pigment solution with 2 ml of 2N HC1 in a water bath for 1 hr. After cooling, the anthocyanidin was extracted with amyl alcohol. The mineral acid was removed from the aqueous sugar solu-
BFW n-butanol-formic acid-water (1 00 :25 :6 0 )
glacial acetic acid-water (15 :85) methanol-glacial acetic acid-water
(9 0 :5 :5 )
Table 2—Rf values of Roselle anthocyanins
15% HAc MAW Pigments Source 1% HCL
Solvent systems
HAc-HCI 15% HAc BuHCI BAWRCy3G x 100
BFW1% HCI HAc-HCI
concentrated HCI-water (3 :97) water-glacial acetic acid-HCI 2 7 24
R f ( x 100) 62 23 36 99(8 2 :1 5 :3 ) 3 28 52 70 22 31 81BAW n-butanol-glacial acetic acid-water 4-1 3 16 48 11 23 54(4 :1 :5 ) upper phase 4-2 26 54 70 17 25 60BuHCI
Form ic
n-butanol-2N HCI, 1 :1 , upper phase
formic acid-concentratedAuthentic markers: Cn-3-G from V . dentatum 6 25 63 23 36 100
ForestalHCI-water (5 :2 :3 )
glacial acetic acid-concentrated(Du and Francis. 1973a)
Cn-3-Gal from C . mas 7 25 62 22 33 89
PhenolHCI-water (3 0 :3 :1 0 )
phenol-water (4 :1 )(Du and Francis, 1973b)
Dp-3-G from pomegranates 3 17 49 12 23 53BBPW n-butanol-benzene-pyridine- water
(5 :1 :3 :3 )(Harborne, 1967)
Cn-3-GX from V . dentatum 28 53 71 22 33 80BEW n-butanol-ethanol-water (4 :2 :2 .2 ) (Du and Francis, 1973b)
810-JOURNAL OF FOOD SCIENCE-Volume 38 (1973)
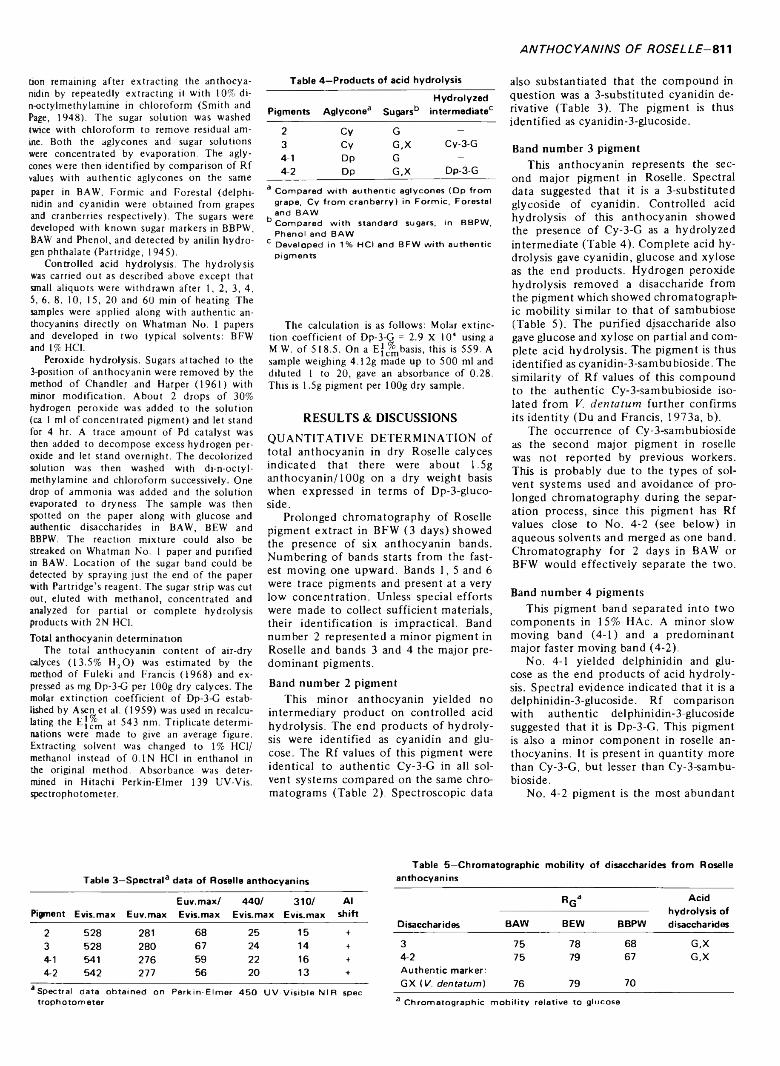
A N T H O C Y A N IN S O F R O S E LLE - 811
tion remaining after extracting the anthocya- nidin by repeatedly extracting it with 10% di- n-octylmethylamine in chloroform (Smith and Page, 1948). The sugar solution was washed twice with chloroform to remove residual amine. Both the aglycones and sugar solutions were concentrated by evaporation. The aglycones were then identified by comparison of Rf values with authentic aglycones on the same paper in BAW, Formic and Forestal (delphi- nidin and cyanidin were obtained from grapes and cranberries respectively). The sugars were developed with known sugar markers in BBPW, BAW and Phenol, and detected by anilin hydrogen phthalate (Partridge, 1945).
Controlled acid hydrolysis. The hydrolysis was carried out as described above except that small aliquots were withdrawn after 1, 2, 3, 4, 5, 6, 8, 10, 15, 20 and 60 min of heating. The samples were applied along with authentic an- thocyanins directly on Whatman No. 1 papers and developed in two typical solvents: BFW and 1% HC1.
Peroxide hydrolysis. Sugars attached to the3-position of anthocyanin were removed by the method o f Chandler and Harper (1961) with minor modification. About 2 drops of 30% hydrogen peroxide was added to the solution (ca 1 ml o f concentrated pigment) and let stand for 4 hr. A trace amount of Pd catalyst was then added to decompose excess hydrogen peroxide and let stand overnight. The decolorized solution was then washed with di-n-octyl- methylamine and chloroform successively. One drop of ammonia was added and the solution evaporated to dryness. The sample was then spotted on the paper along with glucose and authentic disaccharides in BAW, BEW and BBPW. The reaction mixture could also be streaked on Whatman No. 1 paper and purified in BAW. Location o f the sugar band could be detected by spraying just the end o f the paper with Partridge’s reagent. The sugar strip was cut out, eluted with methanol, concentrated and analyzed for partial or complete hydrolysis products with 2N HC1.Total anthocyanin determination
The total anthocyanin content o f air-dry calyces (13.5% H20 ) was estimated by the method of Fuleki and Francis (1968) and expressed as mg Dp-3-G per lOOg dry calyces. The molar extinction coefficient o f Dp-3-G established by Asen et al. (1959) was used in recalculating the E \ fm at 543 nm. Triplicate determinations were made to give an average figure. Extracting solvent was changed to 1% HC1 / methanol instead o f 0.1N HC1 in enthanol in the original method. Absorbance was determined in Hitachi Perkin-Elmer 139 UV-Vis. spectrophotometer.
Table 4—Products of acid hydrolysis
Pigments Aglycone3 SugarsbHydrolyzed
intermedia tec
2 Cy G -3 Cy G,X Cy-3-G4-1 Dp G -4-2 Dp G,X Dp-3-G
a C o m p are d w ith a u th e n t ic a g lyco n es (D p fro m grape, C y f ro m c ra n b e r ry ) in F o rm ic , F o re s ta l and B A W
b C o m p a re d w ith s ta n d a rd suga rs , in B B P W , P h en o l and B A W
c D eve lo ped in 1% H C I and B F W w ith a u th e n t ic p ig m en ts
The calculation is as follows: Molar extinction coefficient o f Dp-3-G = 2.9 X 10⁴ using a M.W. o f 518.5. On a E j^ b a s is , this is 559. A sample weighing 4.12g made up to 500 ml and diluted 1 to 20, gave an absorbance of 0.28. This is 1.5g pigment per lOOg dry sample.
RESULTS & DISCUSSIONSQUANTITATIVE DETERMINATION of total anthocyanin in dry Roselle calyces indicated that there were about 1.5g anthocyanin/lOOg on a dry weight basis when expressed in terms of Dp-3-gluco- side.
Prolonged chromatography of Roselle pigment extract in BFW (3 days) showed the presence of six anthocyanin bands. Numbering of bands starts from the fastest moving one upward. Bands 1, 5 and 6 were trace pigments and present at a very low concentration. Unless special efforts were made to collect sufficient materials, their identification is impractical. Band number 2 represented a minor pigment in Roselle and bands 3 and 4 the major predominant pigments.Band number 2 pigment
This minor anthocyanin yielded no intermediary product on controlled acid hydrolysis. The end products of hydrolysis were identified as cyanidin and glucose. The Rf values of this pigment were identical to authentic Cy-3-G in all solvent systems compared on the same chromatograms (Table 2). Spectroscopic data
also substantiated that the compound in question was a 3-substituted cyanidin derivative (Table 3). The pigment is thus identified as cyanidin-3-glucoside.
Band number 3 pigmentThis anthocyanin represents the sec
ond major pigment in Roselle. Spectral data suggested that it is a 3-substituted glycoside of cyanidin. Controlled acid hydrolysis of this anthocyanin showed the presence of Cy-3-G as a hydrolyzed intermediate (Table 4). Complete acid hydrolysis gave cyanidin, glucose and xylose as the end products. Hydrogen peroxide hydrolysis removed a disaccharide from the pigment which showed chromatographic mobility similar to that of sambubiose (Table 5). The purified disaccharide also gave glucose and xylose on partial and complete acid hydrolysis. The pigment is thus identified as cyanidin-3-sambubioside. The similarity of Rf values of this compound to the authentic Cy-3-sambubioside isolated from V. den ta tum further confirms its identity (Du and Francis, 1973a, b).
The occurrence of Cy-3-sambubioside as the second major pigment in roselle was not reported by previous workers. This is probably due to the types of solvent systems used and avoidance of prolonged chromatography during the separation process, since this pigment has Rf values close to No. 4-2 (see below) in aqueous solvents and merged as one band. Chromatography for 2 days in BAW or BFW would effectively separate the two.
Band number 4 pigmentsThis pigment band separated into two
components in 15% HAc. A minor slow moving band (4-1) and a predominant major faster moving band (4-2).
No. 4-1 yielded delphinidin and glucose as the end products of acid hydrolysis. Spectral evidence indicated that it is a delphinidin-3-glucoside. Rf comparison with authentic delphinidin-3-glucoside suggested that it is Dp-3-G. This pigment is also a minor component in roselle an- thocyanins. It is present in quantity more than Cy-3-G, but lesser than Cy-3-sambu- bioside.
No. 4-2 pigment is the most abundant
Table 3—Spectral3 data of Roselle anthocyanins
Pigment Evis.max Euv.maxEuv.max/Evis.max
440/Evis.max
310/Evis.max
Alshift
2 528 281 68 25 15 +3 528 280 67 24 14 +4-1 541 276 59 22 16 +4-2 542 277 56 20 13 +
3 Spectra l d a ta o b ta in e d on P e rk in - E lm e r 4 5 0 U V - V is ib le - N IR spec-tro p h o to m e te r
Table 5—Chromatographic mobility of disaccharides from Roselle anthocyanins
RGa Acidhydrolysis of disaccharidesDisaccharides BAW BEW BBPW
3 75 78 68 G,X4-2Authentic marker:
75 79 67 G.X
GX {V. dentatum) 76 79 70a C h ro m a to g ra p h ic m o b il it y re la t iv e to g lucose
8W—JOURNAL OF FOOD SCIENCE-Volume 38 (1973)
anthocyanin in roselle and is the major pigment responsible for its reddish-violet color. It also crystallizes more easily than most pigments. Controlled acid hydrolysis showed the presence of delphinidin-3- glucoside as an intermediate. Complete acid hydrolysis gave delphinidin, glucose and xylose as end products. Spectral data suggested that the sugars are attached to the 3-position of delphinidin. This is further indicated by the removal of a disaccharide from the 3-position by hydrogen peroxide hydrolysis. Acid hydrolysis of this disaccharide gave glucose and xylose. Thus the pigment is identified as delphi- nidin-3-sambubioside.
CONCLUSIONWITH THE EXCEPTION of detecting Cy-3-sambubioside as the second major anthocyanin in Roselle, the identification of other pigments; Cy-3-G, Dp-3-G and Dp-3-GX, are in agreement with those reported by Shibata and Furukawa (1969).
Dp-3-sambubioside and Cy-3-sambubio- side are the major pigments, Dp-3-G and Cy-3-G are present in minor concentration.
REFERENCESA sen , S ., S tu art, N .W . and Seige lm an , H.W.
1 9 5 9 . E ffe c t o f various co n cen tra tio n s o f n itrogen , p h osp h oru s and p o tass iu m on sep al co lo r o f H ydrangea m a crop h y lla , Proc. A m . S o c . H ort. S ci. 73: 4 9 5 .
C handler, B .V . and Harper, K .A . 1 9 6 1 . Id e n tif ica tio n o f saccharides in a n th o cy a n in s and o th er flavon o id s . A ustral. J. C hem . 14 : 5 8 6 .
D u, C .T . and F rancis, F .J . 1 9 7 3 a . V ibu rn um a n th o cy a n in s . J. F o o d S ci. (in press).
D u, C .T . and F rancis, F .J . 1 9 7 3 b . C o m u s anth o cy a n in s . P h y to ch em . (in press).
E sselen , W .B. and S a m m y , G.M . 1 9 7 3 . R ose lle— A natural red co lo ra n t for fo o d s . F o o d Prod. D ev elo p m en t. 7 (1 ): 80;
F o rsy th , W .G .C. and S im m o n d s, N .W . 1 9 5 4 . A survey o f th e a n th o cy a n in s o f so m e trop ica l p lan ts. Proc. R o y . S o c . 1 4 2 (B ): 5 4 9 .
F u lek i, T . 1 9 6 9 . T he a n th o cy a n in s o f straw b erry , rhubarb, radish and o n io n . J. F o o d Sci. 34: 3 6 5 .
F u lek i T. and F rancis, F .J . 1 9 6 8 . Q uan tita tive m eth o d s for a n th o cy a n in s . 1 . E x tra ctio n and d e term in a tio n o f to ta l a n th o cy a n in in cranberries. J. F o o d S c i. 33 : 72 .
H arborne, J .B . 1 9 6 7 . “ C om parative Biochemis* try o f th e F la v o n o id s .” A cadem ic Press,N .Y .
Partridge, S .M . 1 9 4 5 . A n ilin hyd rogen phthal- ate as a spraying reagent for chromatography o f sugars. N ature. 1 6 4 : 4 4 3 .
Seshadri, T .R . and T hakur, R .S . 1 9 6 1 . Constitu tio n o f gossy tr in , a new glucoside from th e flo w er p e ta ls o f H ib iscus sabdariffa. J. Indian C hem . S o c . 38 : 6 4 9 . [C h em Abs. 56: 4 7 1 8 .]
S h ib ata , M. and F u ru kaw a, M. 1 9 6 9 . Reexamin a tio n o f th e structure o f so-called “hibis- c in .” B ot. Mag. T o k y o . 32: 3 4 1 .
S m ith , E .L . and Page, J .E . 1 9 4 8 . T he acid-binding p rop erties o f lon g-ch a in aliphatic amin es. J. S o c . C hem . Inc. 67 : 48 .
Y a m a m o to , R . and O shim a, Y . 1 9 3 2 . Red j co lor in g m atter o f H isb iscu s sabdariffa L. j (A new g ly co sid e , h isb isc in ). S ci. Papers Inst. P h ys. C hem . R es. T o k y o 19: 134 [C h em . A bstr. 27: 5 2 1 .]
Y a m a m o to , R . and O shim a, Y . 1 9 3 6 . Coloring m atter o f H isb iscus sabdariffa L. (Hisbiscin) II. S ci. Papers Inst. P h ys. C h em . R es. Tokyo 30: 2 5 8 . [C h em . A bstr. 31 : 3 0 4 8 .]
Ms received 1 /2 0 /7 3 ; revised 3 /2 0 /7 3 ; accepted 4 / 1 / 7 3_________________________________________ _
A c k n o w led g em en t and th an k s are due Dr. G.M . S a m m y , D ep t, o f C h em ica l Engineering, U n iversity o f th e W est In d ies, T rinidad and to Dr. W .B. E sse len , U n iversity o f Massachusetts for su p p ly in g fresh R o se lle ca ly ces and to the Glass C on ta in er M anufacturers In stitu te , Inc., W ashington, D .C . for th eir in terest and support.
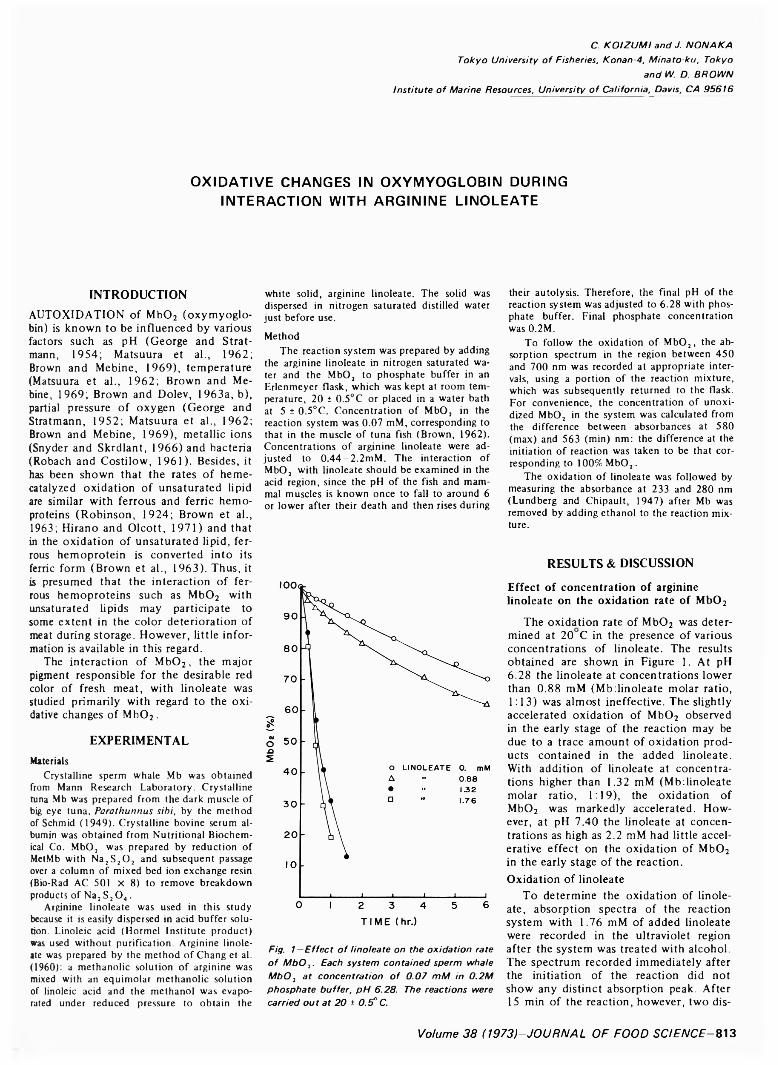
C. K O IZ U M I and J. NON A K A Tokyo University o f Fisheries, Konan-4, Minato-ku, Tokyo
and W. D. BROW N
Institute o f Marine Resources, University o f California, Davis, CA 95616
O X ID A TIVE CHANGES IN OXYMYOGLOBIN DURING INTERACTION WITH ARGININE LINOLEATE
INTRODUCTIONAUTOXIDATION of Mb02 (oxymyoglo- bin) is known to be influenced by various factors such as pH (George and Strat- mann, 1954; Matsuura et al., 1962; Brown and Mebine, 1969), temperature (Matsuura et al., 1962; Brown and Mebine, 1969; Brown and Dolev, 1963a, b), partial pressure of oxygen (George and Stratmann, 1952; Matsuura et al., 1962; Brown and Mebine, 1969), metallic ions (Snyder and Skrdlant, 1966) and bacteria (Robach and Costilow, 1961). Besides, it has been shown that the rates of heme- catalyzed oxidation of unsaturated lipid are similar with ferrous and ferric hemo- proteins (Robinson, 1924; Brown et al., 1963; Hirano and Olcott, 1971) and that in the oxidation of unsaturated lipid, ferrous hemoprotein is converted into its ferric form (Brown et al., 1963). Thus, it is presumed that the interaction of ferrous hemoproteins such as Mb02 with unsaturated lipids may participate to some extent in the color deterioration of meat during storage. However, little information is available in this regard.
The interaction of Mb02 , the major pigment responsible for the desirable red color of fresh meat, with linoleate was studied primarily with regard to the oxidative changes of Mb0 2 .
EXPERIMENTALMaterials
Crystalline sperm whale Mb was obtained from Mann Research Laboratory. Crystalline tuna Mb was prepared from the dark muscle of big eye tuna. Parathunnus sihi, by the method of Schmid (1949). Crystalline bovine serum albumin was obtained from Nutritional Biochemical Co. M b02 was prepared by reduction of MetMb with Na2S20 2 and subsequent passage over a column of mixed bed ion exchange resin (Bio-Rad AC 501 X 8) to remove breakdown products of Na2 S20 4 .
Arginine linoleate was used in this study because it is easily dispersed in acid buffer solution. Linoleic acid (Hormel Institute product) was used without purification. Arginine linoleate was prepared by the method o f Chang et al.(1960): a methanolic solution o f arginine was mixed with an equimolar methanolic solution of linoleic acid and the methanol was evaporated under reduced pressure to obtain the
white solid, arginine linoleate. The solid was dispersed in nitrogen saturated distilled water just before use.
MethodThe reaction system was prepared by adding
the arginine linoleate in nitrogen saturated water and the M b02 to phosphate buffer in an Erlenmeyer flask, which was kept at room temperature, 20 ± 0.5°C or placed in a water bath at 5 i 0.5°C. Concentration o f M b02 in the reaction system was 0.07 mM, corresponding to that in the muscle o f tuna fish (Brown, 1962). Concentrations o f arginine linoleate were adjusted to 0 .4 4 -2 .2mM. The interaction of M b02 with linoleate should be examined in the acid region, since the pH of the fish and mammal muscles is known once to fall to around 6 or lower after their death and then rises during
Fig. 1—E ffe ct o f linoleate on the oxidation rate o f M b 0 7. Each system contained sperm whale M b 0 2 at concentration o f 0 .07 m M in 0 .2M phosphate buffer, p H 6.28. The reactions were carried out at 20 ± 0 .5° C.
their autolysis. Therefore, the final pH of the reaction system was adjusted to 6.28 with phosphate buffer. Final phosphate concentration was 0.2M.
To follow the oxidation o f M b02, the absorption spectrum in the region between 450 and 700 nm was recorded at appropriate intervals, using a portion o f the reaction mixture, which was subsequently returned to the flask. For convenience, the concentration o f unoxidized M b02 in the system was calculated from the difference between absorbances at 580 (max) and 563 (min) nm: the difference at the initiation o f reaction was taken to be that corresponding to 100% M b02.
The oxidation o f linoleate was followed by measuring the absorbance at 233 and 280 nm (Lundberg and Chipault, 1947) after Mb was removed by adding ethanol to the reaction mixture.
RESULTS & DISCUSSION
Effect of concentration of arginine linoleate on the oxidation rate of Mb02
The oxidation rate of Mb02 was determined at 20 C in the presence of various concentrations of linoleate. The results obtained are shown in Figure 1. At pH6.28 the linoleate at concentrations lower than 0.88 mM (Mb:linoleate molar ratio, 1:13) was almost ineffective. The slightly accelerated oxidation of Mb02 observed in the early stage of the reaction may be due to a trace amount of oxidation products contained in the added linoleate. With addition of linoleate at concentrations higher than 1.32 mM (MbTinoleate molar ratio, 1:19), the oxidation of Mb02 was markedly accelerated. However, at pH 7.40 the linoleate at concentrations as high as 2.2 mM had little accelerative effect on the oxidation of Mb02 in the early stage of the reaction. Oxidation of linoleate
To determine the oxidation of linoleate, absorption spectra of the reaction system with 1.76 mM of added linoleate were recorded in the ultraviolet region after the system was treated with alcohol. The spectrum recorded immediately after the initiation of the reaction did not show any distinct absorption peak. After 15 min of the reaction, however, two dis-
Volum e 3 8 (1 9 7 3 )-J O U R N A L O F FO O D SCIEN C E - 813
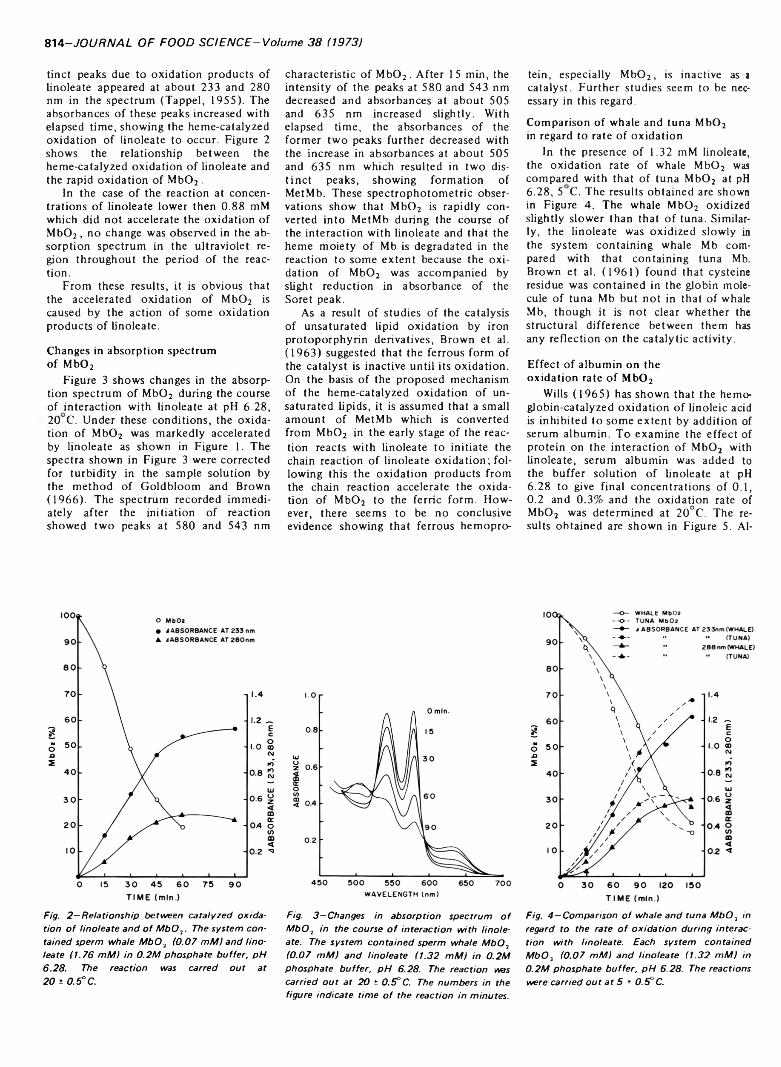
814-JOURNAL OF FOOD SCIENCE-Volume 38 (1973)
tinct peaks due to oxidation products of linoleate appeared at about 233 and 280 nm in the spectrum (Tappel, 1955). The absorbances of these peaks increased with elapsed time, showing the heme-catalyzed oxidation of linoleate to occur. Figure 2 shows the relationship between the heme-catalyzed oxidation of linoleate and the rapid oxidation of Mb02 .
In the case of the reaction at concentrations of linoleate lower then 0.88 mM which did not accelerate the oxidation of Mb02, no change was observed in the absorption spectrum in the ultraviolet region throughout the period of the reaction.
From these results, it is obvious that the accelerated oxidation of Mb02 is caused by the action of some oxidation products of linoleate.
Changes in absorption spectrum of Mb02
Figure 3 shows changes in the absorption spectrum of Mb02 during the course of interaction with linoleate at pH 6.28, 20 C. Under these conditions, the oxidation of Mb02 was markedly accelerated by linoleate as shown in Figure 1. The spectra shown in Figure 3 were corrected for turbidity in the sample solution by the method of Goldbloom and Brown(1966). The spectrum recorded immediately after the initiation of reaction showed two peaks at 580 and 543 nm
characteristic of Mb02. After 15 min, the intensity of the peaks at 580 and 543 nm decreased and absorbances at about 505 and 635 nm increased slightly. With elapsed time, the absorbances of the former two peaks further decreased with the increase in absorbances at about 505 and 635 nm which resulted in two distinct peaks, showing formation of MetMb. These spectrophotometric observations show that Mb02 is rapidly converted into MetMb during the course of the interaction with linoleate and that the heme moiety of Mb is degradated in the reaction to some extent because the oxidation of Mb02 was accompanied by slight reduction in absorbance of the Soret peak.
As a result of studies of the catalysis of unsaturated lipid oxidation by iron protoporphyrin derivatives, Brown et al. (1963) suggested that the ferrous form of the catalyst is inactive until its oxidation. On the basis of the proposed mechanism of the heme-catalyzed oxidation of unsaturated lipids, it is assumed that a small amount of MetMb which is converted from Mb02 in the early stage of the reaction reacts with linoleate to initiate the chain reaction of linoleate oxidation; following this the oxidation products from the chain reaction accelerate the oxidation of Mb02 to the ferric form. However, there seems to be no conclusive evidence showing that ferrous hemopro-
tein, especially Mb02, is inactive as a catalyst. Further studies seem to be necessary in this regard.
Comparison of whale and tuna Mb02 in regard to rate of oxidation
In the presence of 1.32 mM linoleate, the oxidation rate of whale Mb02 was compared with that of tuna Mb02 at pH 6.28, 5 C. The results obtained are shown in Figure 4. The whale Mb02 oxidized slightly slower than that of tuna. Similarly, the linoleate was oxidized slowly in the system containing whale Mb compared with that containing tuna Mb. Brown et al. (1961) found that cysteine residue was contained in the globin molecule of tuna Mb but not in that of whale Mb, though it is not clear whether the structural difference between them has any reflection on the catalytic activity.
Effect of albumin on the oxidation rate of Mb02
Wills (1965) has shown that the hemoglobin-catalyzed oxidation of linoleic acid is inhibited to some extent by addition of serum albumin. To examine the effect of protein on the interaction of Mb02 with linoleate, serum albumin was added to the buffer solution of linoleate at pH6.28 to give final concentrations of 0 .1, 0.2 and 0.3% and the oxidation rate of Mb02 was determined at 20°C. The results obtained are shown in Figure 5. Al-
Fig. 2 —Relationship between catalyzed oxidation o f linoleate and o f M b 0 7. The system contained sperm whale M b 0 7 (0.07 m M ) and linoleate (1.76 m M ) in 0 .2M phosphate buffer, pH 6.28. The reaction was carred out at 20 ± 0 .5 °C.
W A V E L E N G T H (nm )
Fig. 3-Changes in absorption spectrum o f M b 0 7 in the course o f interaction with linoleate. The system contained sperm whale M b 0 7 (0.07 m M ) and linoleate (1.32 m M ) in 0 .2M phosphate buffer, p H 6.28. The reaction was carried out at 20 ± 0 .5 ° C. The numbers in the figure indicate time o f the reaction in minutes.
Fig. 4 —Comparison o f whale and tuna M b 0 7 in regard to the rate o f oxidation during interaction with linoleate. Each system contained M b 0 7 (0.07 m M ) and linoleate (1 .32 m M ) in 0.2M phosphate buffer, p H 6.28. The reactions were carried out at 5 ± 0 .5 °C.

OXIDATION OF OXYMYOGLOBIN- 815
bumin at a concentration of 0 . 1% had no effect on the accelerated oxidation of Mb02 in its interaction with linoleate, while increased concentrations of added albumin had an inhibitory effect on the accelerated oxidation of Mb02. Following addition of albumin at levels higher than 0 .2%, no heme-catalyzed oxidation of linoleate was detected by spectro- photometric examination in the ultraviolet region.
In the course of this experiment, it was observed that the absorbances at 700 nm of the reaction systems containing albumin were usually lower than those of systems without added albumin. This indicates that the turbidity of the reaction system is reduced by the addition of the protein. The reduction of turbidity of the system seems to be ascribed to the combination of albumin with the linoleate dispersed in the buffer solution. The observed inhibitory effect of added albumin on the heme-catalyzed oxidation of linoleate may be associated with changes in micelle structure of linoleate in the system. However Wills (1965), on the basis of his results, has mentioned that the binding of linoleic acid to albumin does not significantly affect the rate of heme- catalyzed oxidation of linoleic acid.
Reduction of turbidity was also observed in the reaction system without added albumin at pH 7.40: when Mb02 was added to the linoleate dispersed in buffer solution, the turbidity of the resulting mixture was markedly reduced, showing changes in the micelle structure of linoleate in this system. Under these conditions, neither accelerated oxidation of Mb02 nor of linoleate were observed.
It is interesting to recall, in connection with the effect of a homogeneous system on the heme-catalyzed oxidation of linoleate, Lovern’s suggestion (Lovern, 1946) that if the linoleic acid is present in a solution, instead of a suspension, the hematin-catalyzed oxidation of linoleic acid does not occur.
As is shown in the present study, the mode of interaction between Mb02 and unsaturated lipids is very much influ-
Fig. 5 —Effe ct o f serum albumin on the oxidation rate o f M b O 2 during interaction with linoleate. Each system contained sperm whale M bO (0.07 m M I in 0 .2M phosphate buffer, p H 6.28. Linoleate and serum albumin were added to the system at concentrations shown in the figure. The reactions were carried out at 20 ± 0 .5 °C.
enced by the concentration of Mb02, unsaturated lipids, and protein in the reaction system.
It is obvious that there are many problems to be solved before a conclusion is drawn that the likely interaction occurs in meat systems, although the occurrence of the oxidation of Mb02 to MetMb by the above presented interaction seems to be probable in meat.
REFERENCESB row n, W .D. 1 9 6 2 . T he co n cen tra tio n o f m y o
g lob in and h em o g lo b in in tu n a flesh . J. F o o d S ci. 27: 26 .
B row n, W .D. and D o lev , A . 1 9 6 3 a . A u tox id a - t io n o f b e e f and tu n a o x y m y o g lo b in s . J. F o o d S ci. 28: 2 0 7 .
B row n , W .D. and D o lev , A . 1 9 6 3 b . E ffec t o f freezin g o n a u to x id a tio n o f o x y m y o g lo b in so lu tio n . J. F o o d S ci. 28: 2 1 1 .
B row n, W .D., Harris, L .S . and O lco tt , H .S.1 9 6 3 . C atalysis o f un satu rated lip id o x id a tio n by iron p ro top orp h yrin derivatives. A rch. B ioch em . B iop h ys. 1 0 1 : 14 .
B row n, W .D ., M artinez, M. and O lco tt, H .S. 1 9 6 1 . S u lfh y d ry l groups o f tu n a m y o g lob in s and h em o g lo b in s , w hale h em o g lo b in , to b a cc o m osa ic virus, and ova lb u m in . J. B iol. C hem . 2 3 6 : 9 2 .
B row n, W .D. and M eb ine, L .B . 1 9 6 9 . A u to x id a tio n o f o x y m y o g lo b in . J. B io l. C hem . 2 44 : 6 6 9 6 .
C hang, R .W ., Paul, S . and M oyer, F .L . 1 9 6 0 . Sa lts o f basic am in o acids and lin o le ic acid.U .S . P aten t 2 9 4 5 0 4 9 .
G eorge, P. and Stratm ann , C.J. 1 9 5 2 . T he o x id a tio n o f m y o g lo b in to m e tm y o g lo b in by o x y g en . 2. T he rela tion b e tw e e n th e first order rate c o n sta n t and th e partial pressure o f o x y g en . B ioch em . J. 51 : 4 1 8 .
G eorge, P. and S tratm an n , C.J. 1 9 5 4 . T he o x id a tio n o f m y o g lo b in to m e tm y o g lo b in by o x y g en . 3 . K in etic s tu d ies in th e p resen ce o f carbon m o n o x id e , and at d ifferen t hyd ro- gen -ion co n cen tra tio n s w ith con sid era tion s regarding th e sta b ility o f o x y m y o g lo b in . B ioch em . J. 57: 5 6 8 .
G o ld b lo o m , D .E . and B row n, W .D. 1 9 6 6 . Turb id ity correc tio n for ab sorp tion spectra o f co lo red so lu tio n . B ioch im . B iop h ys. A cta . 1 12: 5 8 4 .
H irano, Y . and O lco tt , H .S. 1 9 7 1 . E ffe c t o f h em e co m p o u n d s on lip id o x id a t io n . J. A m . Oil C hem . S o c . 48 : 5 2 3 .
L overn, J .A . 1 9 4 6 . S o m e asp ects o f recen t B ritish s tu d ies o n a n tio x id a n ts. O il and Soap . F eb: 4 0 .
L undberg, W .O. and C hip au lt, J .R . 1 9 4 7 . T he o x id a tio n o f m eth y l lin o lea te at various tem p eratu res. J. A m . O il C hem . S o c . 69: 8 3 3 .
M atsuura, F ., H a sh im oto , K ., K ikaw ada, S . and Y am aguch i, K. 1 9 6 2 . S tu d ies on th e a u to x id a tio n v e lo c ity o f fish m y o g lo b in . Bull. Japanese S o c . Sci. F ish . 28: 2 1 0 .
R ob ach , D .L . and C o stilo w , R .N . 1 9 6 1 . R o le o f bacteria in th e o x id a t io n o f m y o g lo b in . A p p lied M icrob iol. 9: 5 2 9 .
R o b in so n , M .E. 1 9 2 4 . 3 6 . H aem og lob in and m eth a em o g lo b in as o x id a tiv e cata lysts . B ioch em . J. 18 : 2 5 5 .
S ch m id , K. 1 9 4 9 . U n tersu ch u n gen iiber das W al-m yoglob in . H elv. C him . A cta . 32 : 1 0 5 .
S n yd er, H .E . and Sk rd lant, H .B . 1 9 6 6 . T he in flu en ce o f m eta llic ion s o n th e a u to x id a tio n o f o x y m y o g lo b in . J. F o o d S ci. 31 : 4 6 8 .
T appel, A .L . 1 9 5 5 . U nsaturated lip id o x id a tio n ca ta ly zed b y h em atin co m p o u n d s . J. B iol. C hem . 2 1 7 : 7 2 1 .
W ills, E .D . 1 9 6 5 . M echanism s o f lip id perox id e fo rm a tio n in tissu es. R o le o f m eta ls and h aem atin p ro te in s in th e cata lysis o f th e o x id a tio n o f un satu rated fa tty acids. B ioch im . B iop h ys. A cta . 9 8 : 2 3 8 .
Ms rece ived 3 /5 /7 3 ; revised 4 /2 8 /7 3 ; a ccep ted 5 /1 /7 3 .____________________________________________
This w ork w as su p p orted b y a grant fromth e M inistry o f E d u cation , Japan.
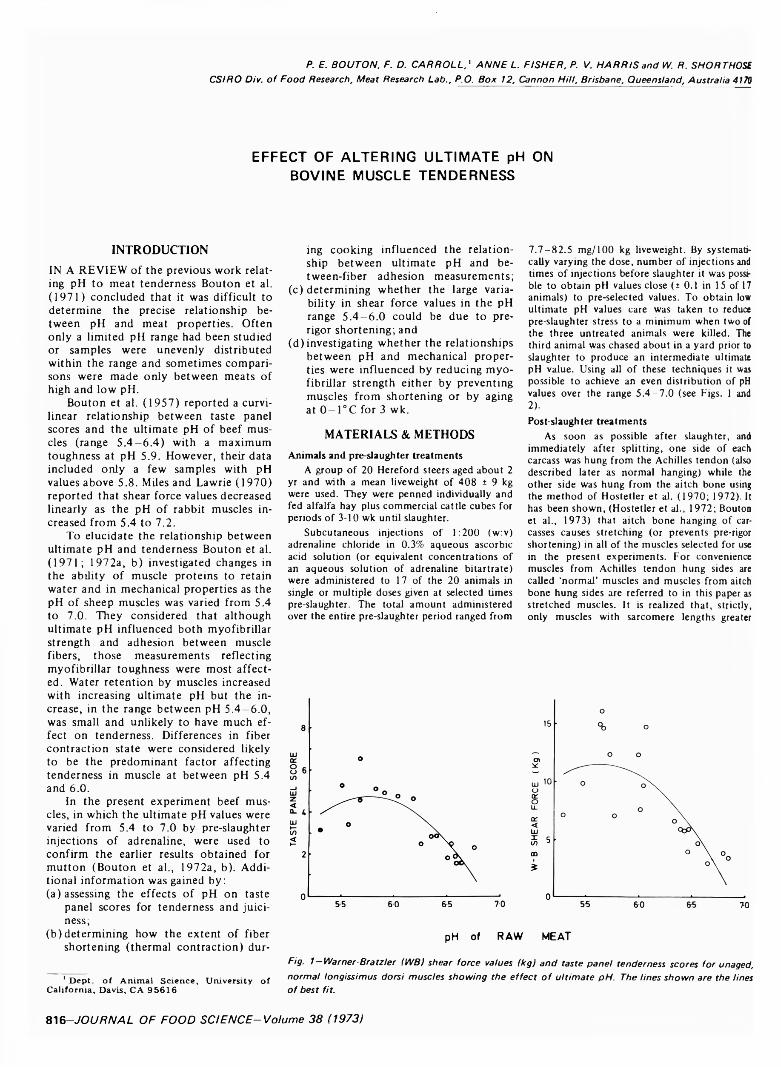
P. E . B O U TO N . F . D. C A R R O L L .' A N N E L . F IS H E R . P. V. H A R R IS and W. R . SH O RTH OSE C S IR O Div. o f F o o d Research, Meat Research Lab., P.O. Box 12, Cannon Hill, Brisbane, Queensland, Australia 4170
EFFECT OF ALTERING ULTIMATE pH ON BOVINE MUSCLE TENDERNESS
INTRODUCTIONIN A REVIEW of the previous work relating pH to meat tenderness Bouton et al.(1971) concluded that it was difficult to determine the precise relationship between pH and meat properties. Often only a limited pH range had been studied or samples were unevenly distributed within the range and sometimes comparisons were made only between meats of high and low pH.
Bouton et al. (1957) reported a curvilinear relationship between taste panel scores and the ultimate pH of beef muscles (range 5 .4 -6 .4 ) with a maximum toughness at pH 5.9. However, their data included only a few samples with pH values above 5.8. Miles and Lawrie (1970) reported that shear force values decreased linearly as the pH of rabbit muscles increased from 5.4 to 7.2.
To elucidate the relationship between ultimate pH and tenderness Bouton et al. (1971; 1972a, b) investigated changes in the ability of muscle proteins to retain water and in mechanical properties as the pH of sheep muscles was varied from 5.4 to 7.0. They considered that although ultimate pH influenced both myofibrillar strength and adhesion between muscle fibers, those measurements reflecting myofibrillar toughness were most affected. Water retention by muscles increased with increasing ultimate pH but the increase, in the range between pH 5.4—6.0, was small and unlikely to have much effect on tenderness. Differences in fiber contraction state were considered likely to be the predominant factor affecting tenderness in muscle at between pH 5.4 and 6 .0 .
In the present experiment beef muscles, in which the ultimate pH values were varied from 5.4 to 7.0 by pre-slaughter injections of adrenaline, were used to confirm the earlier results obtained for mutton (Bouton et al., 1972a, b). Additional information was gained by:(a) assessing the effects of pH on taste
panel scores for tenderness and juiciness;
(b) determining how the extent of fibershortening (thermal contraction) dur- 1
1 D ep t, o f A nim al S c ien ce , U niversity o f C alifornia, D avis, CA 9 5 6 1 6
ing cooking influenced the relationship between ultimate pH and be- tween-fiber adhesion measurements;
(c) determining whether the large variability in shear force values in the pH range 5.4—6.0 could be due to prerigor shortening; and
(d) investigating whether the relationships between pH and mechanical properties were influenced by reducing myofibrillar strength either by preventing muscles from shortening or by aging at 0 —1°C for 3 wk.
MATERIALS & METHODSAnimals and pre-slaughter treatments
A group of 20 Hereford steers aged about 2 yr and with a mean liveweight of 408 ± 9 kg were used. They were penned individually and fed alfalfa hay plus commercial cattle cubes for periods of 3-10 wk until slaughter.
Subcutaneous injections of 1:200 (w:v) adrenaline chloride in 0.3% aqueous ascorbic acid solution (or equivalent concentrations of an aqueous solution of adrenaline bitartrate) were administered to 17 of the 20 animals in single or multiple doses given at selected times pre-slaughter. The total amount administered over the entire pre-slaughter period ranged from
7 .7 -8 2 .5 mg/100 kg liveweight. By systematically varying the dose, number of injections and times of injections before slaughter it was possible to obtain pH values close (± 0.1 in 15 of 17 animals) to pre-selected values. To obtain low ultimate pH values care was taken to reduce pre-slaughter stress to a minimum when two of the three untreated animals were killed. The third animal was chased about in a yard prior to slaughter to produce an intermediate ultimate pH value. Using all o f these techniques it was possible to achieve an even distribution of pH values over the range 5 .4 -7 .0 (see Figs. 1 and 2).Post-slaughter treatments
As soon as possible after slaughter, and immediately after splitting, one side of each carcass was hung from the Achilles tendon (also described later as normal hanging) while the other side was hung from the aitch bone using the method of Hostetler et al. (1970; 1972). It has been shown, (Hostetler et al., 1972; Bouton et al., 1973) that aitch bone hanging of carcasses causes stretching (or prevents pre-rigor shortening) in all of the muscles selected for use in the present experiments. For convenience muscles from Achilles tendon hung sides are called ‘normal’ muscles and muscles from aitch bone hung sides are referred to in this paper as stretched muscles. It is realized that, strictly, only muscles with sarcomere lengths greater
pH of RAW MEAT
Fig. 1 -W arner-Bratzler (l/VBI shear force values (kg) and taste panel tenderness scores for unaged, normal longissimus dorsi muscles showing the effect o f ultimate pH. The lines shown are the lines o f best fit.
816 -J O U R N A L O F FO O D S C IF N C E -V o lu m e 3 8 (1973)
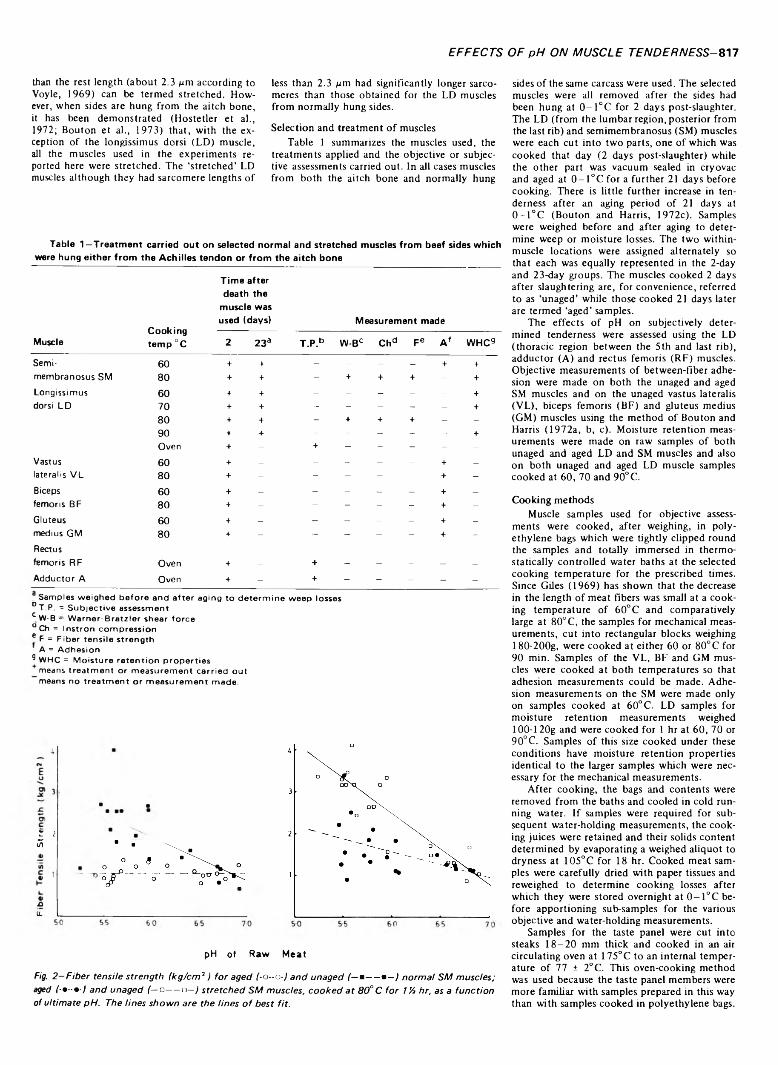
E F F E C T S O F p H O N M U S C L E T E N D E R N E S S - 817
than the rest length (about 2.3 Mm according to Voyle, 1969) can be termed stretched. However, when sides are hung from the aitch bone, it has been demonstrated (Hostetler et al., 1972; Bouton et al., 1973) that, with the exception of the longissimus dorsi (LD) muscle, all the muscles used in the experiments reported here were stretched. The ‘stretched’ LD muscles although they had sarcomere lengths of
less than 2.3 Mm had significantly longer sarcomeres than those obtained for the LD muscles from normally hung sides.
Selection and treatment o f musclesTable 1 summarizes the muscles used, the
treatments applied and the objective or subjective assessments carried out. In all cases muscles from both the aitch bone and normally hung
sides o f the same carcass were used. The selected muscles were all removed after the sides had been hung at 0 - l ° C for 2 days post-slaughter. The LD (from the lumbar region, posterior from the last rib) and semimembranosus (SM) muscles were each cut into two parts, one of which was cooked that day (2 days post-slaughter) while the other part was vacuum sealed in cryovac and aged at 0 - l ° C for a further 21 days before cooking. There is little further increase in tenderness after an aging period of 21 days at0 - l ° C (Bouton and Harris, 1972c). Samples were weighed before and after aging to determine weep or moisture losses. The two within- muscle locations were assigned alternately so that each was equally represented in the 2-day and 23-day groups. The muscles cooked 2 days after slaughtering are, for convenience, referred to as ‘unaged’ while those cooked 21 days later are termed ‘aged’ samples.
The effects o f pH on subjectively determined tenderness were assessed using the LD (thoracic region between the 5th and last rib), adductor (A) and rectus femoris (RF) muscles. Objective measurements o f between-fiber adhesion were made on both the unaged and aged SM muscles and on the unaged vastus lateralis (VL), biceps femoris (BF) and gluteus medius (GM) muscles using the method of Bouton and Harris (1972a, b, c). Moisture retention measurements were made on raw samples o f both unaged and aged LD and SM muscles and also on both unaged and aged LD muscle samples cooked at 60, 70 and 90°C.
Cooking methodsMuscle samples used for objective assess
ments were cooked, after weighing, in polyethylene bags which were tightly clipped round the samples and totally immersed in thermostatically controlled water baths at the selected cooking temperature for the prescribed times. Since Giles (1969) has shown that the decrease in the length of meat fibers was small at a cooking temperature of 60°C and comparatively large at 80° C, the samples for mechanical measurements, cut into rectangular blocks weighing 180-200g, were cooked at either 60 or 80° C for 90 min. Samples o f the VL, BF and GM muscles were cooked at both temperatures so that adhesion measurements could be made. Adhesion measurements on the SM were made only on samples cooked at 60° C. LD samples for moisture retention measurements weighed 100-120g and were cooked for 1 hr at 60, 70 or 90°C. Samples o f this size cooked under these conditions have moisture retention properties identical to the larger samples which were necessary for the mechanical measurements.
After cooking, the bags and contents were removed from the baths and cooled in cold running water. If samples were required for subsequent water-holding measurements, the cooking juices were retained and their solids content determined by evaporating a weighed aliquot to dryness at 105°C for 18 hr. Cooked meat samples were carefully dried with paper tissues and reweighed to determine cooking losses after which they were stored overnight at 0 - l ° C before apportioning sub-samples for the various objective and water-holding measurements.
Samples for the taste panel were cut into steaks 1 8 -2 0 mm thick and cooked in an air circulating oven at 175°C to an internal temperature of 77 ± 2°C. This oven-cooking method was used because the taste panel members were more familiar with samples prepared in this way than with samples cooked in polyethylene bags.
Table 1—Treatment carried out on selected normal and stretched muscles from beef sides which were hung either from the Achilles tendon or from the aitch bone
MuscleCooking temp °C
Time after death the
muscle was used (days) Measurement made
2 23a T.P .b W-Bc Chd F e A f WHC9
Semi- 60 + + - - - - + +membranosus SM 80 + + - + + + - +Longissimus 60 + + - - - - - +dorsi LD 70 + + - - - - - +
80 + + - + + + - -90 + + - - - - - +Oven + - + - - - - -
Vastus 60 + - - - - - + —lateralis V L 80 + - - - - - + -Biceps 60 + - - - - - + -femoris BF 80 + - - - - - + -Gluteus 60 + - - - - - + -medius GM 80 + - - - - - + -Rectusfemoris R F Oven + - + - - - - -Adductor A Oven + - + - - - - -
Sam ples w e igh ed b e fo re and a f te r ag ing to d e te rm in e w eep tosses ° T .P . = S u b je c t iv e assessm ent c W-B - W a rn e r-B ra tz le r sh ear fo rce a Ch = In s tro n co m p re ss io n ® F = F ib e r te n s ile s tren g th
A = A d h e s io n9 W HC = M o is tu re re te n tio n p ro p e rtie s
means tre a tm e n t o r m e asu rem e n t ca rr ie d ou t means no t re a tm e n t o r m e a su re m e n t m ade .
Z lii
aIL
pH of Raw Meat
Fig. 2 -F iber tensile strength (kg/cm 2 ) for aged f-o-o-J and unaged (— ■— • —) normal SM muscles; aged (-•-•■) and unaged (— o— a—) stretched SM muscles, cooked a t 80° C for 1 % hr, as a function of ultimate pH. The lines shown are the lines o f best fit.
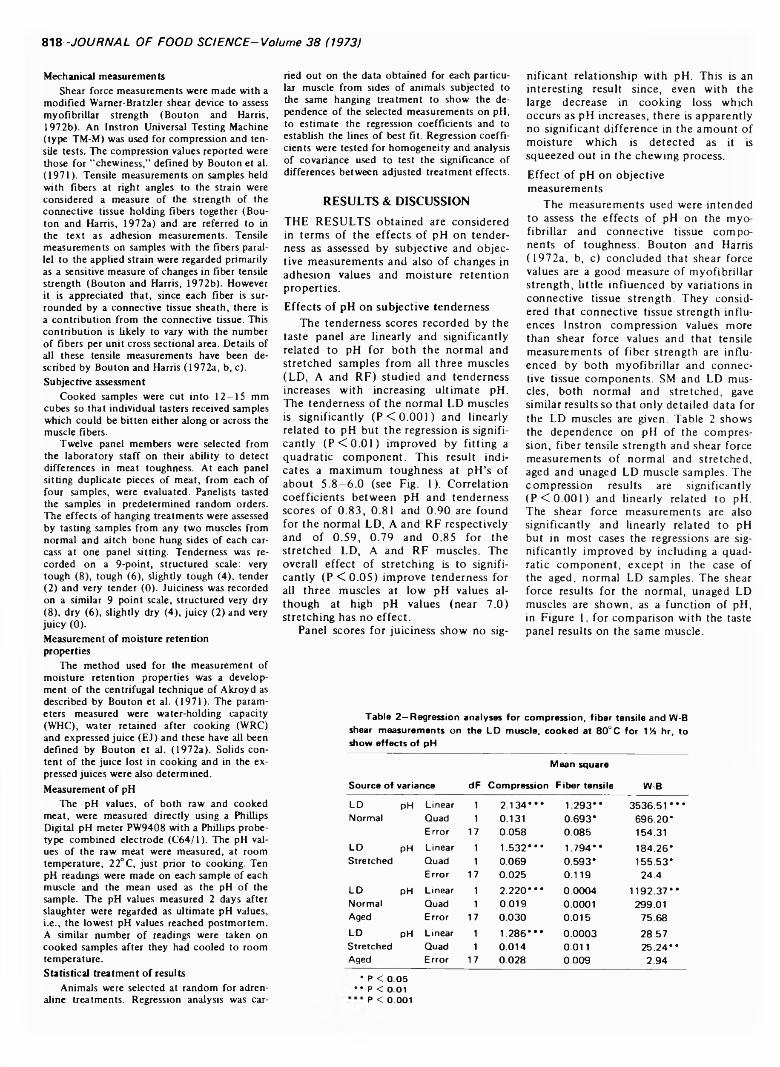
818-JOURNAL OF FOOD SCIENCE-Volume 38 (1973)
Mechanical measurementsShear force measurements were made with a
modified Wamer-Bratzler shear device to assess myofibrillar strength (Bouton and Harris, 1972b). An Instron Universal Testing Machine (type TM-M) was used for compression and tensile tests. The compression values reported were those for “chewiness,” defined by Bouton et al.(1971). Tensile measurements on samples held with fibers at right angles to the strain were considered a measure of the strength of the connective tissue holding fibers together (Bouton and Harris, 1972a) and are referred to in the text as adhesion measurements. Tensile measurements on samples with the fibers parallel to the applied strain were regarded primarily as a sensitive measure of changes in fiber tensile strength (Bouton and Harris, 1972b). However it is appreciated that, since each fiber is surrounded by a connective tissue sheath, there is a contribution from the connective tissue. This contribution is likely to vary with the number of fibers per unit cross sectional area. Details of all these tensile measurements have been described by Bouton and Harris (1972a, b, c). Subjective assessment
Cooked samples were cut into 1 2 -1 5 mm cubes so that individual tasters received samples which could be bitten either along or across the muscle fibers.
Twelve panel members were selected from the laboratory staff on their ability to detect differences in meat toughness. At each panel sitting duplicate pieces of meat, from each of four samples, were evaluated. Panelists tasted the samples in predetermined random orders. The effects o f hanging treatments were assessed by tasting samples from any two muscles from normal and aitch bone hung sides o f each carcass at one panel sitting. Tenderness was recorded on a 9-point, structured scale: very tough (8), tough (6), slightly tough (4), tender(2) and very tender (0). Juiciness was recorded on a similar 9 point scale, structured very dry(8), dry (6), slightly dry (4), juicy (2) and very juicy (0).Measurement of moisture retention properties
The method used for the measurement of moisture retention properties was a development of the centrifugal technique of Akroyd as described by Bouton et al. (1971). The parameters measured were water-holding capacity (WHC), water retained after cooking (WRC) and expressed juice (EJ) and these have all been defined by Bouton et al. (1972a). Solids content o f the juice lost in cooking and in the expressed juices were also determined. Measurement of pH
The pH values, o f both raw and cooked meat, were measured directly using a Phillips Digital pH meter PW9408 with a Phillips probe- type combined electrode (C64/1). The pH values o f the raw meat were measured, at room temperature, 22°C, just prior to cooking. Ten pH readings were made on each sample of each muscle and the mean used as the pH o f the sample. The pH values measured 2 days after slaughter were regarded as ultimate pH values,i.e., the lowest pH values reached postmortem. A similar number o f readings were taken on cooked samples after they had cooled to room temperature.Statistical treatment of results
Animals were selected at random for adrenaline treatments. Regression analysis was car
ried out on the data obtained for each particular muscle from sides o f animals subjected to the same hanging treatment to show the dependence of the selected measurements on pH, to estimate the regression coefficients and to establish the lines o f best fit. Regression coefficients were tested for homogeneity and analysis of covariance used to test the significance of differences between adjusted treatment effects.
RESULTS & DISCUSSIONTHE RESULTS obtained are considered in terms of the effects of pH on tenderness as assessed by subjective and objective measurements and also of changes in adhesion values and moisture retention properties.Effects of pH on subjective tenderness
The tenderness scores recorded by the taste panel are linearly and significantly related to pH for both the normal and stretched samples from all three muscles (LD, A and RF) studied and tenderness increases with increasing ultimate pH. The tenderness of the normal LD muscles is significantly (P < 0.001) and linearly related to pH but the regression is significantly (P < 0.01) improved by fitting a quadratic component. This result indicates a maximum toughness at pH’s of about 5 .8 -6 .0 (see Fig. 1). Correlation coefficients between pH and tenderness scores of 0.83, 0.81 and 0.90 are found for the normal LD, A and RF respectively and of 0.59, 0.79 and 0.85 for the stretched LD, A and RF muscles. The overall effect of stretching is to significantly (P < 0 .0 5 ) improve tenderness for all three muscles at low pH values although at high pH values (near 7.0) stretching has no effect.
Panel scores for juiciness show no sig
nificant relationship with pH. This is an interesting result since, even with the large decrease in cooking loss which occurs as pH increases, there is apparently no significant difference in the amount of moisture which is detected as it is squeezed out in the chewing process.Effect of pH on objective measurements
The measurements used were intended to assess the effects of pH on the myofibrillar and connective tissue components of toughness. Bouton and Harris (1972a, b, c) concluded that shear force values are a good measure of myofibrillar strength, little influenced by variations in connective tissue strength. They considered that connective tissue strength influences Instron compression values more than shear force values and that tensile measurements of fiber strength are influenced by both myofibrillar and connective tissue components. SM and LD muscles, both normal and stretched, gave similar results so that only detailed data for the LD muscles are given. Table 2 shows the dependence on pH of the compression, fiber tensile strength and shear force measurements of normal and stretched, aged and unaged LD muscle samples. The compression results are significantly (P < 0.001) and linearly related to pH. The shear force measurements are also significantly and linearly related to pH but in most cases the regressions are significantly improved by including a quadratic component, except in the case of the aged, normal LD samples. The shear force results for the normal, unaged LD muscles are shown, as a function of pH, in Figure 1. for comparison with the taste panel results on the same muscle.
Table 2—Regression analyses for compression, fiber tensile and W-B shear measurements on the LD muscle, cooked at 80°C for 154 hr, to show effects of pH
Source of variance dF Compression
Mean square
Fiber tensile W-BLD pH Linear 1 2.134*** 1.293** 3536.51 ***Normal Quad 1 0.131 0.693* 696.20*
Error 17 0.058 0.085 154.31LD pH Linear 1 1.532*** 1.794** 184.26*Stretched Quad 1 0.069 0.593* 155.53*
Error 17 0.025 0.119 24.4LD pH Linear 1 2.220*** 0.0004 1192.37**Normal Quad 1 0.019 0.0001 299.01Aged Error 17 0.030 0.015 75.68LD pH Linear 1 1.286*** 0.0003 28.57Stretched Quad 1 0.014 0.011 25.24**Aged Error 17 0.028 0.009 2.94
* P < 0 05 •• P < 0.01
P < 0 .001
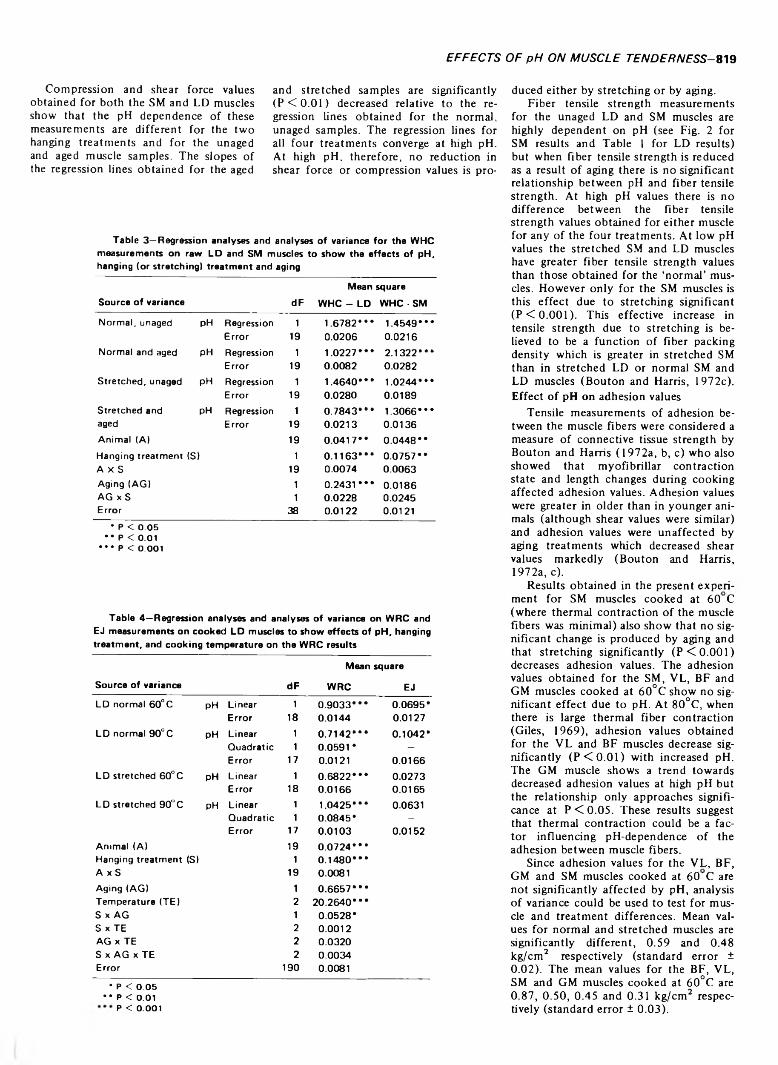
E FFE C TS O F p H O N M U S C LE T E N D E R N E S S -819
Compression and shear force values obtained for both the SM and LD muscles show that the pH dependence of these measurements are different for the two hanging treatments and for the unaged and aged muscle samples. The slopes of the regression lines obtained for the aged
and stretched samples are significantly ( P < 0 .0 1 ) decreased relative to the regression lines obtained for the normal, unaged samples. The regression lines for all four treatments converge at high pH. At high pH, therefore, no reduction in shear force or compression values is pro
duced either by stretching or by aging.Fiber tensile strength measurements
for the unaged LD and SM muscles are highly dependent on pH (see Fig. 2 for SM results and Table 1 for LD results) but when fiber tensile strength is reduced as a result of aging there is no significant relationship between pH and fiber tensile strength. At high pH values there is no difference between the fiber tensile strength values obtained for either muscle for any of the four treatments. At low pH values the stretched SM and LD muscles have greater fiber tensile strength values than those obtained for the ‘normal’ muscles. However only for the SM muscles is this effect due to stretching significant (P < 0.001). This effective increase in tensile strength due to stretching is believed to be a function of fiber packing density which is greater in stretched SM than in stretched LD or normal SM and LD muscles (Bouton and Harris, 1972c). Effect of pH on adhesion values
Tensile measurements of adhesion between the muscle fibers were considered a measure of connective tissue strength by Bouton and Harris (1972a, b, c) who also showed that myofibrillar contraction state and length changes during cooking affected adhesion values. Adhesion values were greater in older than in younger animals (although shear values were similar) and adhesion values were unaffected by aging treatments which decreased shear values markedly (Bouton and Harris, 1972a, c).
Results obtained in the present experiment for SM muscles cooked at 60 C (where thermal contraction of the muscle fibers was minimal) also show that no significant change is produced by aging and that stretching significantly (P < 0.001) decreases adhesion values. The adhesion values obtained for the SM, VL, BF and GM muscles cooked at 60°C show no significant effect due to pH. At 80°C, when there is large thermal fiber contraction (Giles, 1969), adhesion values obtained for the VL and BF muscles decrease significantly (P < 0 .0 1 ) with increased pH. The GM muscle shows a trend towards decreased adhesion values at high pH but the relationship only approaches significance at P < 0 .0 5 . These results suggest that thermal contraction could be a factor influencing pH-dependence of the adhesion between muscle fibers.
Since adhesion values for the VL, BF, GM and SM muscles cooked at 60 C are not significantly affected by pH, analysis of variance could be used to test for muscle and treatment differences. Mean values for normal and stretched muscles are significantly different, 0.59 and 0.48 kg/cm2 respectively (standard error ± 0.02). The mean values for the BF, VL, SM and GM muscles cooked at 60°C are 0.87, 0.50, 0.45 and 0.31 kg/cm2 respectively (standard error ± 0.03).
Table 3—Regression analyses and analyses of variance for the WHC measurements on raw LD and SM muscles to show the effects of pH, hanging (or stretching) treatment and aging
Source of variance dFMean square
WHC - LD WHC - SMNormal, unaged pH Regression 1 1.6782*** 1.4549***
Error 19 0.0206 0.0216Normal and aged pH Regression 1 1.0227*** 2.1322***
Error 19 0.0082 0.0282Stretched, unaged pH Regression 1 1.4640*** 1.0244***
Error 19 0.0280 0.0189Stretched and pH Regression 1 0.7843*** 1.3066***aged Error 19 0.0213 0.0136Animal (A) 19 0.0417** 0.0448**Hanging treatment (S) 1 0.1163*** 0.0757**A x S 19 0.0074 0.0063Aging (AG) 1 0.2431*** 0.0186AG x S 1 0.0228 0.0245Error 38 0.0122 0.0121
• P < 0 .0 5 • ’ P < 0.01
* ’ * P < 0 .001
Table 4—Regression analyses and analyses of variance on WRC and EJ measurements on cooked LD muscles to show effects of pH, hanging treatment, and cooking temperature on the WRC results
Mean squareSource of variance dF WRC EJLD normal 60° C pH Linear 1 0.9033*** 0.0695*
Error 18 0.0144 0.0127LD normal 90° C pH Linear 1 0.7142*** 0.1042*
Quadratic 1 0.0591* -Error 17 0.0121 0.0166
LD stretched 60°C pH Linear 1 0.6822*** 0.0273Error 18 0.0166 0.0165
LD stretched 90°C pH Linear 1 1.0425*** 0.0631Quadratic 1 0.0845* -Error 17 0.0103 0.0152
Animal (A) 19 0.0724***Hanging treatment (S) 1 0.1480***A x S 19 0.0081Aging (AG) 1 0.6657***Temperature (TE) 2 20.2640***S x AG 1 0.0528*S x TE 2 0.0012AG x TE 2 0.0320S x AG x TE 2 0.0034Error 190 0.0081
* P < 0 .0 5 •• P < 0.01
P < 0 .001
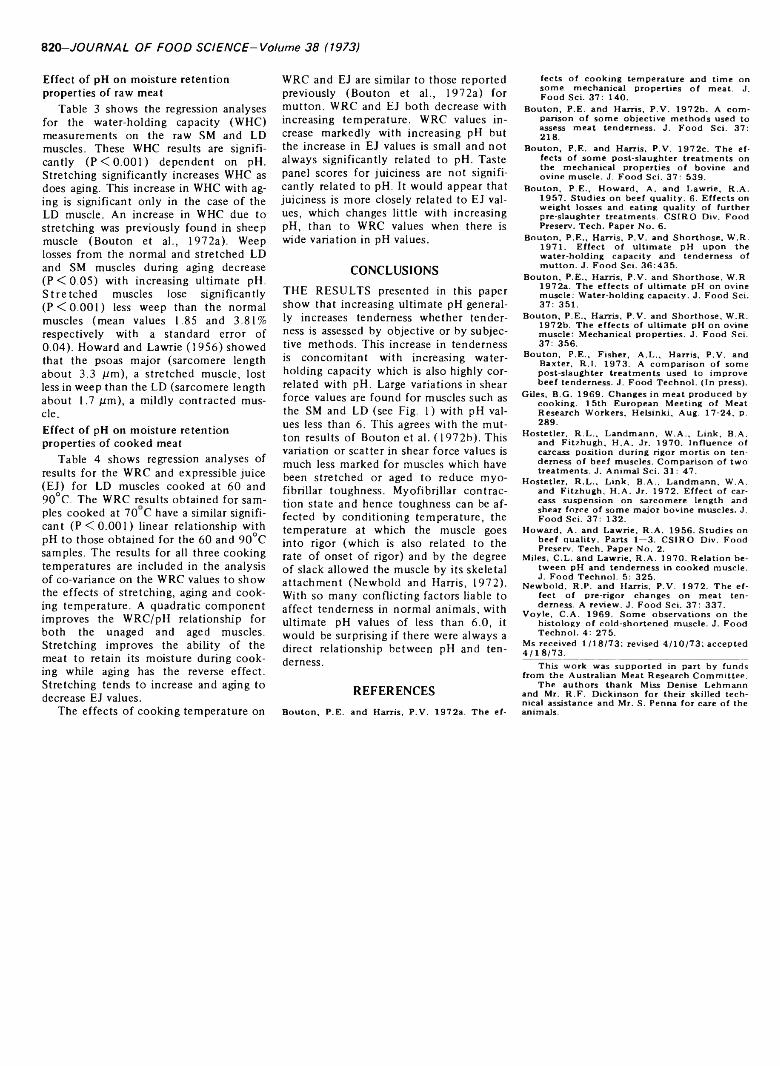
82(^-JOURNAL OF FOOD SCIENCE-Volume 38 (1973)
Effect of pH on moisture retention properties of raw meat
Table 3 shows the regression analyses for the water-holding capacity (WHC) measurements on the raw SM and LD muscles. These WHC results are significantly (P < 0.001) dependent on pH. Stretching significantly increases WHC as does aging. This increase in WHC with aging is significant only in the case of the LD muscle. An increase in WHC due to stretching was previously found in sheep muscle (Bouton et al., 1972a). Weep losses from the normal and stretched LD and SM muscles during aging decrease (P < 0.05) with increasing ultimate pH. Stretched muscles lose significantly (P < 0.001) less weep than the normal muscles (mean values 1.85 and 3.81% respectively with a standard error of 0.04). Howard and Lawrie (1956) showed that the psoas major (sarcomere length about 3.3 jum), a stretched muscle, lost less in weep than the LD (sarcomere length about 1.7 /rm), a mildly contracted muscle.Effect of pH on moisture retention properties of cooked meat
Table 4 shows regression analyses of results for the WRC and expressible juice (EJ) for LD muscles cooked at 60 and 90°C. The WRC results obtained for samples cooked at 70 C have a similar significant (P < 0.001) linear relationship with pH to those obtained for the 60 and 90°C samples. The results for all three cooking temperatures are included in the analysis of co-variance on the WRC values to show the effects of stretching, aging and cooking temperature. A quadratic component improves the WRC/pH relationship for both the unaged and aged muscles. Stretching improves the ability of the meat to retain its moisture during cooking while aging has the reverse effect. Stretching tends to increase and aging to decrease EJ values.
The effects of cooking temperature on
WRC and EJ are similar to those reported previously (Bouton et al., 1972a) for mutton. WRC and EJ both decrease with increasing temperature. WRC values increase markedly with increasing pH but the increase in EJ values is small and not always significantly related to pH. Taste panel scores for juiciness are not significantly related to pH. It would appear that juiciness is more closely related to EJ values, which changes little with increasing pH, than to WRC values when there is wide variation in pH values.
CONCLUSIONSTHE RESULTS presented in this paper show that increasing ultimate pH generally increases tenderness whether tenderness is assessed by objective or by subjective methods. This increase in tenderness is concomitant with increasing waterholding capacity which is also highly correlated with pH. Large variations in shear force values are found for muscles such as the SM and LD (see Fig. 1) with pH values less than 6 . This agrees with the mutton results of Bouton et al. (1972b). This variation or scatter in shear force values is much less marked for muscles which have been stretched or aged to reduce myofibrillar toughness. Myofibrillar contraction state and hence toughness can be affected by conditioning temperature, the temperature at which the muscle goes into rigor (which is also related to the rate of onset of rigor) and by the degree of slack allowed the muscle by its skeletal attachment (Newbold and Harris, 1972). With so many conflicting factors liable to affect tenderness in normal animals, with ultimate pH values of less than 6.0, it would be surprising if there were always a direct relationship between pH and tenderness.
REFERENCESB o u to n , P.E . and Harris, P .V . 1 9 7 2 a . T he ef-
fe c ts o f c o o k in g tem p eratu re and tim e on so m e m ech an ica l p rop erties o f m eat. J. F o o d S c i. 37 : 1 4 0 .
B o u to n , P .E . and Harris, P .V . 1 9 7 2 b . A c o m parison o f so m e o b jec tiv e m e th o d s used to assess m ea t ten d ern ess. J. F o o d S ci. 37: 2 1 8 .
B o u to n , P .E . and Harris, P .V . 1 9 7 2 c . T he e ffec ts o f so m e p ost-slau gh ter trea tm en ts on th e m ech an ica l prop erties o f b ov in e and ov in e m u scle . J. F o o d S ci. 37: 5 3 9 .
B o u to n , P .E ., H ow ard , A . and L aw rie, R .A .1 9 5 7 . S tu d ie s on b e e f q u a lity . 6 . E ffec ts on w eigh t lo sses and ea tin g q u a lity o f further pre-slaughter trea tm en ts. C SIR O D iv. F o o d Preserv. T ech . Paper N o . 6.
B o u to n , P .E ., Harris, P .V . and S h o rth o se , W .R.1 9 7 1 . E ffe c t o f u lt im a te pH u p o n the w ater-h o ld in g ca p a c ity and ten d ern ess o f m u tto n . J. F o o d S c i. 3 6 :4 3 5 .
B o u to n , P .E ., Harris, P .V . and S h o rth o se , W .R. 1 9 7 2 a . T he e ffe c ts o f u lt im a te pH o n ovine m u scle: W ater-hold ing ca p a c ity . J. F o o d S ci. 37: 3 5 1 .
B o u to n , P .E ., Harris, P .V . and S h o rth o se , W .R. 1 9 7 2 b . T he e ffe c ts o f u lt im a te pH o n ov in e m u scle: M echan ica l p rop erties. J. F o o d Sci. 37: 3 5 6 .
B o u to n , P .E ., F ish er, A .L ., Harris, P .V . and B axter, R .I. 1 9 7 3 . A co m p a r iso n o f som e p ost-slau gh ter trea tm en ts used to im prove b e e f ten d ern ess. J. F o o d T ech n o l. (In press).
G iles, B .G . 1 9 6 9 . C hanges in m eat p rod u ced by co o k in g . 1 5 th E uropean M eeting o f M eat R esearch W orkers, H elsin k i, A ug. 1 7 -2 4 , p. 2 8 9 .
H ostetler , R .L ., L andm ann, W .A ., L in k , B .A . and F itzh u g h , H .A . Jr. 1 9 7 0 . In flu en ce o f carcass p o s it io n during rigor m ortis o n ten derness o f b e e f m u scles. C om p arison o f tw o trea tm en ts. J. A nim al S c i. 31 : 4 7 .
H ostetler , R .L ., L ink , B .A ., L andm ann, W .A. and F itzh u g h , H .A . Jr. 1 9 7 2 . E ffe c t o f carcass su sp en sio n o n sarcom ere len gth and shear force o f so m e m ajor b ov in e m u scles. J. F o o d S c i. 37 : 1 3 2 .
H ow ard, A . and L aw rie, R .A . 1 9 5 6 . S tu d ies on b e e f q u a lity . Parts 1—3. CSIR O D iv. F o o d Preserv. T ech . Paper N o . 2.
M iles, C .L . and L aw rie, R .A . 1 9 7 0 . R e la tio n b e tw een pH and ten d ern ess in c o o k e d m u scle . J. F o o d T ech n o l. 5: 3 2 5 .
N ew b o ld , R .P . and Harris, P .V . 1 9 7 2 . T he e ffec t o f pre-rigor changes o n m eat te n derness. A review . J. F o o d S c i. 37 : 3 3 7 .
V o y le , C .A . 1 9 6 9 . S o m e ob serva tion s on th e h is to lo g y o f co ld -sh o rten ed m u scle . J. F o o d T ech n o l. 4: 2 7 5 .
Ms received 1 /1 8 /7 3 ; revised 4 /1 0 /7 3 ; a ccep ted 4 / 1 8 / 7 3 . _________________________
T his w ork w as su p p o rted in part by fu nds from th e A ustralian M eat R esearch C o m m ittee .
T he au th ors th an k M iss D en ise L eh m ann and Mr. R .F . D ick in so n for th eir sk illed te c h n ical assistance and Mr. S . Penna for care o f the anim als.
Ft. P. N EW B O LD , R. K. T U M E and D. J. H O R G A N C S IR O Div. o f F o o d Research, Meat Research Lab., Cannon Hill, Queensland, Australia 4170
EFFECT OF FEEDING A PROTECTED SAFFLOWER OIL SUPPLEMENT ON THE COMPOSITION AND PROPERTIES OF THE SARCOPLASMIC RETICULUM AND
ON POSTMORTEM CHANGES IN BOVINE SKELETAL MUSCLE
INTRODUCTIONRECENTLY it has been shown (Cook et al., 1970, 1972; Scott et al., 1970, 1971) that the fatty acid composition of the milk and body fats of ruminant animals is markedly altered when the diet is supplemented with a polyunsaturated oil embedded in a matrix of formaldehyde- treated casein to protect it from hydrogenation in the rumen. Such a supplement could also be expected to alter the fatty acid composition of the membrane phospholipids. It has been shown with rats that changes induced in the fatty acid composition of the phospholipids of the sarcoplasmic reticulum (SR) by certain treatments are accompanied by changes in the activity of the sarcoplasmic calcium pump (Seiler and Hasselbach, 1971; Seiler et al., 1970). It was of some interest, therefore, to determine whether supplementing the diet of ruminants with a protected polyunsaturated oil for a period immediately before slaughter affected the physical or chemical changes that take place in muscle during the period between slaughter and the development of rigor mortis.
Ox sternomandibularis muscle, the muscle used in the present work, when excised and stored at 1°C soon after slaughter shortens during the development of rigor mortis by up to about 50% of its freshly excised length (Locker and Hagyard, 1963). Similarly, when frozen soon after slaughter and then thawed this muscle may shorten by more than 70% of its freshly excised length (Marsh and Leet, 1966; Scopes and Newbold, 1968). These phenomena, known as cold shortening and thaw shortening respectively, are thought to result from the release of ca2+ from the sarcoplasmic reticulum (Bendall, 1960; Cassens and Newbold, 1967a). Stimulation of postmortem glycolysis can also be attributed to the release of Ca2+ from the SR (Scopes and Newbold, 1968).
The present paper compares (1) the fatty acid composition of the phospholipids of the SR, (2) the Ca2 + -accumu- lating and ATPase activities of the SR; and (3) postmortem physical and chemical changes believed to depend on the re
lease of Ca2+ from the SR, in muscles from cattle fed a supplement of protected safflower oil and from unsupplemented cattle.
MATERIALS & METHODSAnimals and rations
Sternomandibularis muscles from four weaner steers 9 - 1 0 months old and weighing about 200 kg and four 21-month-old steers weighing about 250 kg were used. Two animals from each age group (the control animals) were fed a diet made up o f 60% grass hay and 40% sorghum grain. The other two steers from each group (the treated animals) were fed the same diet as the controls except that it was supplemented with 22.5% by weight o f protected safflower oil made up o f two parts by weight of safflower oil and one part by weight o f casein and prepared as described by Scott et al.(1971). After 6 wk on these diets the animals were slaughtered at the local abattoir and the sternomandibularis muscles removed. All postmortem treatments and SR preparations were commenced within 2 hr after slaughter.
Measurement o f cold shortening and thaw shortening
Strips about 0.5 cm2 in cross section and5 - 6 cm long were excised from the muscles longitudinally to the direction of the fibers. Cold shortening at 1°C was measured in 2 - 3 strips o f each muscle as described by Cassens and Newbold (1967a) and thaw shortening in2 - 3 strips frozen in air at -2 2 °C and thawed at room temperature (23°C) 24 hr later as described by Scopes and Newbold (1968).
Chemical determinationsPieces o f muscle stored under N 2 at room
temperature were sampled at 2, 4, 6, 8, 10 and 26 hr postmortem for pH determination and chemical analysis. Measurements o f pH were also made at 26 hr and 7 2 -9 6 hr on samples of muscle placed at 1°C 2 hr postmortem. Methods of measuring pH, of preparing perchloric acid extracts and of analyzing these extracts for glycolytic products and intermediates and adenine nucleotides were as previously described (Newbold and Scopes, 1967, 1971).
Preparation and properties o f SRThe muscle fraction centrifuging down be
tween 8000 and 28000 x G was prepared by the method o f Martonosi et al. (1968) except that it was washed only once with 0.6M KCl-buffer and 1 mM dithiothreitol was present throughout the preparation. The final suspending medium contained 5 mM dithiothreitol.
Protein was determined by the method of Lowry et al. (1951).
The uptake and release of Ca2 + were measured at 23°C and pH 6.3 in a medium containing 100 mM KC1, 20 mM histidine, 1 mM ATP, ImM MgClj, 2.5mM phosphoenolpyruvate, 8 units o f pyruvate kinase/ml, 20 pM 45CaCl2 and 0 .0 6 -0 .1 0 mg SR protein/ml by the Milli- pore filtration method of Martonosi and Feretos (1964). Filters with an average pore diameter of 0.22 and siliconized glassware (Petroff et al., 1964) were used. The reaction was started by the addition of SR.
Basal and total ATPase activities were measured at 37°C and pH 7.2 in 50 mM Tris buffer containing 5 mM ATP, 5 mM MgCl2 and 5 mM sodium azide. When measuring basal ATPase activity the medium also contained 1 mM ethylene glycol bis-((3-aminoethyl ether);N,N'-tetra- acetic acid (EGTA). Measurements o f ATPase activity were also made in the presence of EGTA and absence o f azide. The concentration of SR used in determining basal ATPase activity was 0 .1 4 -0 .2 5 mg/ml and in determining total ATPase activity 0 .0 6 -0 .1 0 mg/ml. The reaction was started by the addition of ATP and stopped 10 min later by the addition of one volume of ice-cold 10% trichloracetic acid. Inorganic orthophosphate production was
Table 1 —Fatty acid composition of the phospholipids of SR preparations from muscles of control and treated animals3
AnimalsFatty acid Control (3) Treated (4)
14:0 0.9 ± 0.2 1.3 ± 0.216:0 14.5 ± 1.4 14.4 ± 1.016:1 3.0 ± 0.6 2.2 ± 0.418:0 15.1 ± 2.0 14.5 ± 1.318:1 22.6 ± 3.3 12.1 ± 1.1*18:2 13.3 ± 0.3 34.9 ± 1.2*18:3 2.7 ± 0.1 1.7 ± 0.520:4 9.6 ± 0.9 8.3 ± 0.922:6 3.7 ± 0.5 1.6 ± 0.7
Polyenoic Saturated +
0.53 ± 0.05 1.05 ± od
monoenoic
a V a lu e s are m ean va lu es ± S .E . and a re e x p ressed as p ercen tages o f th e to ta l f a t t y acid c o n te n t . N u m b ers o f a n im a ls are g iven In p aren th e s is .
' S ig n if ic a n t ly d i f fe re n t (P < 0 .0 5 ) fro m va lues fo r c o n tro l a n im a ls
Volume 38 (1973)-JOURNAL OF FOOD SCIENCE- 821
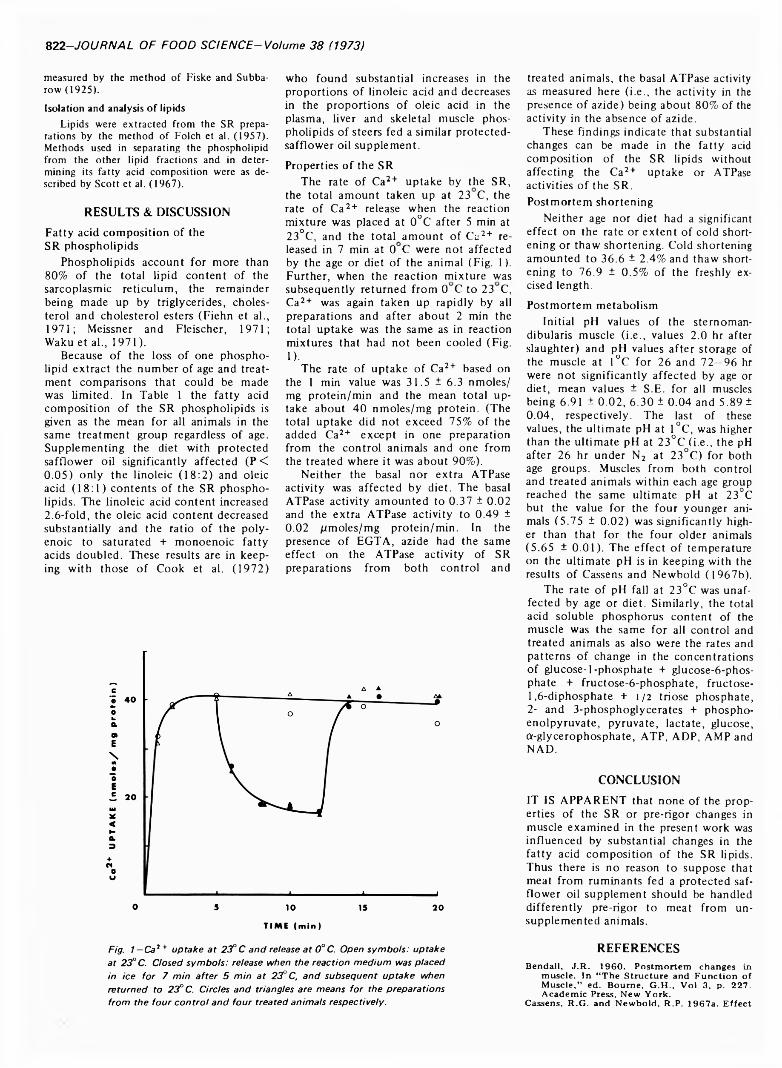
822-JOURNAL OF FOOD SCIENCE- Volume 38 (1973)
measured by the method of Fiske and Subba- row (1925).
Isolation and analysis of lipidsLipids were extracted from the SR prepa
rations by the method of Folch et al. (1957). Methods used in separating the phospholipid from the other lipid fractions and in determining its fatty acid composition were as described by Scott et al. (1967).
RESULTS & DISCUSSIONFatty acid composition of the SR phospholipids
Phospholipids account for more than 80% of the total lipid content of the sarcoplasmic reticulum, the remainder being made up by triglycerides, cholesterol and cholesterol esters (Fiehn et al., 1971; Meissner and Fleischer, 1971; Waku et al., 1971).
Because of the loss of one phospholipid extract the number of age and treatment comparisons that could be made was limited. In Table 1 the fatty acid composition of the SR phospholipids is given as the mean for all animals in the same treatment group regardless of age. Supplementing the diet with protected safflower oil significantly affected (P < 0.05) only the linoleic (18:2) and oleic acid (18:1) contents of the SR phospholipids. The linoleic acid content increased2 .6-fold, the oleic acid content decreased substantially and the ratio of the poly- enoic to saturated + monoenoic fatty acids doubled. These results are in keeping with those of Cook et al. (1972)
who found substantial increases in the proportions of linoleic acid and decreases in the proportions of oleic acid in the plasma, liver and skeletal muscle phospholipids of steers fed a similar protected- safflower oil supplement.Properties of the SR
The rate of Ca2+ uptake by the SR, the total amount taken up at 23 C, the rate of Ca2+ release when the reaction mixture was placed at 0°C after 5 min at 23°C, and the total amount of Ca2+ released in 7 min at 0 C were not affected by the age or diet of the animal (Fig. 1). Further, when the reaction mixture was subsequently returned from 0 C to 23 C, Ca2+ was again taken up rapidly by all preparations and after about 2 min the total uptake was the same as in reaction mixtures that had not been cooled (Fig. 1).
The rate of uptake of Ca2+ based on the 1 min value was 31.5 ± 6.3 nmoles/ mg protein/min and the mean total uptake about 40 nmoles/mg protein. (The total uptake did not exceed 75% of the added Ca2+ except in one preparation from the control animals and one from the treated where it was about 90%).
Neither the basal nor extra ATPase activity was affected by diet. The basal ATPase activity amounted to 0.37 ± 0.02 and the extra ATPase activity to 0.49 ± 0.02 pmoles/mg protein/min. In the presence of EGTA, azide had the same effect on the ATPase activity of SR preparations from both control and
treated animals, the basal ATPase activity as measured here (i.e., the activity in the presence of azide) being about 80% of the activity in the absence of azide.
These findings indicate that substantial changes can be made in the fatty acid composition of the SR lipids without affecting the Ca2+ uptake or ATPase activities of the SR.Postmortem shortening
Neither age nor diet had a significant effect on the rate or extent of cold shortening or thaw shortening. Cold shortening amounted to 36.6 ± 2.4% and thaw shortening to 76.9 ± 0.5% of the freshly excised length.Postmortem metabolism
Initial pH values of the sternoman- dibularis muscle (i.e., values 2.0 hr after slaughter) and pH values after storage of the muscle at 1°C for 26 and 72 -96 hr were not significantly affected by age or diet, mean values ± S.E. for all muscles being 6.91 ± 0.02, 6.30 ± 0.04 and 5.89 ± 0.04, respectively. The last of these values, the ultimate pH at 1°C, was higher than the ultimate pH at 23°C (i.e.. the pH after 26 hr under N2 at 23°C) for both age groups. Muscles from both control and treated animals within each age group reached the same ultimate pH at 23°C but the value for the four younger animals (5.75 ± 0.02) was significantly higher than that for the four older animals (5.65 ± 0.01). The effect of temperature on the ultimate pH is in keeping with the results of Cassens and Newbold (1967b).
The rate of pH fall at 23°C was unaffected by age or diet. Similarly, the total acid soluble phosphorus content of the muscle was the same for all control and treated animals as also were the rates and patterns of change in the concentrations of glucose-1-phosphate + glucose-6-phos- phate + fructose-6-phosphate, fructose-1,6-diphosphate + 1/2 trióse phosphate,2- and 3-phosphoglycerates + phospho- enolpyruvate, pyruvate, lactate, glucose, a-glycerophosphate, ATP, ADP, AMP and NAD.
CONCLUSIONIT IS APPARENT that none of the properties of the SR or pre-rigor changes in muscle examined in the present work was influenced by substantial changes in the fatty acid composition of the SR lipids. Thus there is no reason to suppose that meat from ruminants fed a protected safflower oil supplement should be handled differently pre-rigor to meat from unsupplemented animals.
Fig. 1—Ca7 + uptake at 23° C and release at 0° C. Open sym bols: uptake at 23° C. Closed sym bols: release when the reaction medium was placed in ice for 7 min after 5 min at 23° C, and subsequent uptake when returned to 23° C. Circles and triangles are means for the preparations from the four contro l and four treated animals respectively.
REFERENCESB en dall, J .R . 1 9 6 0 . P o stm ortem changes in
m u scle . In “ T h e S tru ctu re and F u n c tio n o f M u scle ,” ed . B ou rn e, G .H ., V o l 3 , p. 2 2 7 . A cad em ic Press, N ew Y ork.
C assens, R .G . and N ew b o ld , R .P . 1 9 6 7 a . E ffe c t
EFFECT OF FEEDING PROTECTED OIL ON BEEF- 823
o f tem p eratu re o n th e tim e cou rse o f rigor m ortis in o x m u scle . J. F o o d S c i. 3 2 : 2 6 9 .
Cassens, R .G . and N ew b o ld , R .P . 1 9 6 7 b . T em perature d ep en d en ce o f pH changes in ox m u scle p o st-m o rtem . J. F o o d S c i. 32 : 13 .
C ook , L .J ., S c o tt , T .W ., F a ich n ey , G .J. and D avies, H .L . 1 9 7 2 . F a tty acid in terre la tio n ships in p lasm a, liver, m u scle and ad ip ose tissu es o f ca ttle fed sa fflo w er o il p ro tec ted from rum inal h y d ro g en a tio n . L ip id s 7: 8 3 .
C ook , L ,J ., S c o tt , T .W ., F ergu son , K .A . and M cD on ald , I.W . 1 9 7 0 . P ro d u ctio n o f p o ly un satu rated ru m in an t b o d y fa ts. N ature 2 2 8 : 1 7 8 .
F ieh n , W ., P eter, J .B ., M ead, J .F . and Gan- E lep an o , M. 1 9 7 1 . L ip id s and fa tty ac id s o f sarco lem m a, sarcop lasm ic reticu lu m , and th e m ito ch o n d r ia from rat sk e leta l m u scle , J. B io l. C h em . 2 4 6 : 5 6 1 7 .
F iske, C .H . and S u b b arow , Y . 1 9 2 5 . T he c o lo r im etr ic d e term in a tio n o f p h osp h oru s. J. B io l. C hem . 6 6 : 3 7 5 .
F o lch , J ., L ees, M. and S lo a n e-S ta n ley , G .H . 1 9 5 7 . A s im p le m eth o d for th e iso la tio n and p u rifica tion o f to ta l lip ids from an im al tis sues. J. B io l. C hem . 2 2 6 : 4 9 7 .
L ock er, R .H . and H agyard, C .J. 1 9 6 3 . A co ld sh orten in g e ffe c t in b e e f m u scles. J. Sci. F o o d A gric. 14: 7 8 7 .
L ow ry , O .H ., R oseb rou gh , N .J ., Farr, A .L . and R andall, R .J. 1 9 5 1 . P ro te in m easu rem en t w ith th e F o lin p h en o l reagent. J. B io l. C h em . 1 9 3 : 2 6 5 .
M arsh, B .B . and L eet, N .G . 1 9 6 6 . S tu d ies in m eat ten d ern ess. 3 . T he e ffe c ts o f co ld sh orten in g o n ten d ern ess. J. F o o d S c i. 31: 4 5 0 .
M artonosi, A ., D o n le y , J. and H alp in , R .A .1 9 6 8 . Sarcop lasm ic reticu lu m . 3 . T he role o f p h o sp h o lip id s in th e a d en osin e tr ip h osph atase a c tiv ity and Ca++ transport. J. B io l. C hem . 2 4 3 : 61 .
M artonosi, A . and F ere tos, R . 1 9 6 4 . Sarcop lasm ic reticu lu m . 1. T he up tak e o f Ca.++ b y sarcop lasm ic reticu lu m fragm ents. J. B iol. C hem . 2 3 9 : 6 4 8 .
M eissner, G. and F leisch er, S . 1 9 7 1 . C haracteriza tio n o f sarcop lasm ic reticu lu m from sk eleta l m u scle . B ioch im . B io p h y s. A cta 2 4 1 : 3 5 6 .
N ew b o ld , R .P . and S co p es , R .K . 1 9 6 7 . P o stm ortem g ly co ly s is in ox sk e leta l m u scle . E ffe c t o f tem p eratu re o n th e co n cen tra tio n s o f g ly c o ly tic in term ed ia tes and co fa c to rs. B ioch em . J. 1 0 5 : 1 2 7 .
N ew b o ld , R .P . and S co p es , R .K . 1 9 7 1 . P o stm o rtem g ly co ly s is in o x sk e leta l m u scle: e f fe c ts o f m in cin g and o f d ilu tio n w ith or w ith o u t a d d itio n o f orth o p h o sp h a te . J. F o o d S c i. 36 : 2 0 9 .
P etro ff, C .P ., N air, P.P. and Turner, D .A . 1 9 6 4 . T he use o f s ilico n ized glass vials in p reven ting w all ab so rp tio n o f so m e inorganic rad ioactive co m p o u n d s in liq u id sc in tilla tio n co u n tin g . Int. J. A pp l. R adiat. I so to p es 15: 4 9 1 .
S co p es , R .K . and N ew b o ld , R .P . 1 9 6 8 . P ostm ortem g ly co ly s is in o x sk e leta l m u scle . E ffe c t o f pre-rigor freezin g and th aw ing on th e in term ed iary m eta b o lism . B ioch em . J. 1 0 9 : 1 9 7 .
S c o tt , T .W ., C o o k , L .J ., F ergu son , K .A ., M cD on ald , I.W ., B uchanan , R .A . and H ills,G .L . 1 9 7 0 . P ro d u ctio n o f poly-u n satu rated
m ilk fa t in d o m estic rum in ants. A u st. J. S ci. 32: 2 9 1 .
S c o tt , T .W ., C ook , L .J. and M ills, S.C . 1 9 7 1 . P ro tec tio n o f d ietary p o lyu n sa tu ra ted fa tty acids against m icrob ia l h yd ro g en a tio n in rum in ants. J. A m . O il C hem . S o c . 48 : 3 5 8 .
S c o tt , T .W ., S e tch e ll, B .P. and B assett, J.M.1 9 6 7 . C haracterization and m etab o lism o f ovin e fo e ta l lip ids. B ioch em . J. 1 0 4 : 1 0 4 0 .
Seiler , D ., K uh n , E ., F ieh n , W. and H asselbach, W. 1 9 7 0 . T he prop erties o f sarcoplasm ic vesic les from rats w ith 2 0 ,2 5 -d ia za ch o les- tero l in d u ced m y o to n ia . Eur. J. B ioch em . 12: 3 7 5 .
S eiler , D . and H asselbach, W. 1 9 7 1 . E ssentia l fa tty acid d e fic ie n c y and th e activ ity o f th e sarcop lasm ic ca lciu m p u m p . Eur. J. B io ch em . 21: 3 8 5 .
W aku, K ., U da, Y . and N akazaw a, Y . 1 9 7 1 . L ipid c o m p o s it io n in rabbit sarcoplasm ic reticu lu m and occu rren ce o f a lk y l ether p h o sp h o lip id s. J. B ioch em . 69 : 4 8 3 .
Ms received 1 /2 2 /7 3 ; revised 3 /1 2 /7 3 ; a ccep ted 3 /2 0 /7 3 .__________________________________________
T his w ork w as su p p orted in part b y th e A ustralian M eat R esearch C om m ittee .
T he anim als used in th is s tu d y w ere from an exp erim en t co n d u cted by Mr. D .A . L ittle o f th e CSIR O D iv. o f A nim al P h y sio lo g y , C unningham L ab., S t. L ucia, Q ueensland . We are gratefu l to him for m aking m u scles from th ese anim als available to us. Our th anks are a lso due to Dr.T.W . S c o tt , CSIR O D iv. o f A nim al P h y sio lo g y , Ian C lun ies R oss A nim al R esearch L ab., Prosp ec t, N ew S o u th W ales, for th e fa tty acid an alyses and to M iss M .F . S m ith and Mrs. A .M . G riffin for ex p ert te ch n ica l assistance.
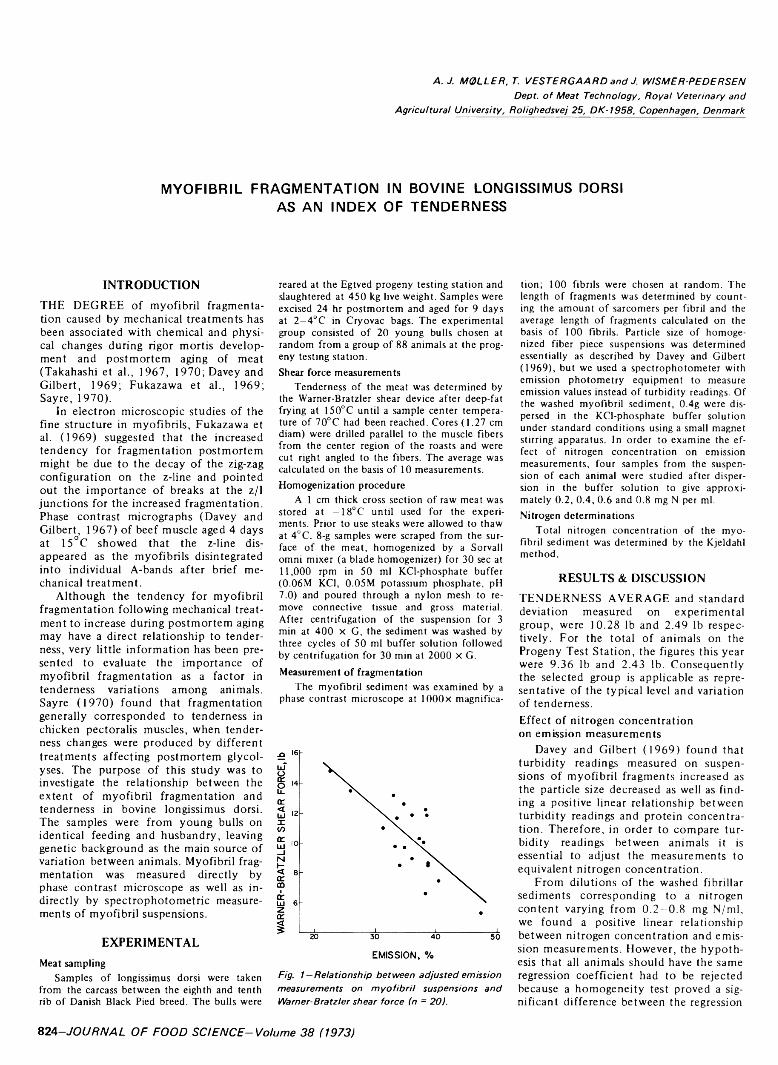
A .J. M0LLER, T. VESTERGAARD and J. WISMER-PEDERSENDept, o f Meat Technology, Royal Veterinary and
Agricultural University, Rolighedsvej 25, DK-1958, Copenhagen, Denmark
M Y O F I B R I L F R A G M E N T A T IO N IN B O V IN E L O N G IS S IM U S D O R S IA S A N IN D E X O F T E N D E R N E S S
IN T R O D U C T IO N
THE DEGREE of myofibril fragmentation caused by mechanical treatments has been associated with chemical and physical changes during rigor mortis development and postmortem aging of meat (Takahashi et al., 1967, 1970; Davey and Gilbert, 1969; Fukazawa et al., 1969; Sayre, 1970).
In electron microscopic studies of the fine structure in myofibrils, Fukazawa et al. (1969) suggested that the increased tendency for fragmentation postmortem might be due to the decay of the zig-zag configuration on the z-line and pointed out the importance of breaks at the z/I junctions for the increased fragmentation. Phase contrast micrographs (Davey and Gilbert, 1967) of beef muscle aged 4 days at 15°C showed that the z-line disappeared as the myofibrils disintegrated into individual A-bands after brief mechanical treatment.
Although the tendency for myofibril fragmentation following mechanical treatment to increase during postmortem aging may have a direct relationship to tenderness, very little information has been presented to evaluate the importance of myofibril fragmentation as a factor in tenderness variations among animals. Sayre (1970) found that fragmentation generally corresponded to tenderness in chicken pectoralis muscles, when tenderness changes were produced by different treatments affecting postmortem glycolyses. The purpose of this study was to investigate the relationship between the extent of myofibril fragmentation and tenderness in bovine longissimus dorsi. The samples were from young bulls on identical feeding and husbandry, leaving genetic background as the main source of variation between animals. Myofibril fragmentation was measured directly by phase contrast microscope as well as indirectly by spectrophotometric measurements of myofibril suspensions.
E X P E R I M E N T A L
Meat samplingSamples of longissimus dorsi were taken
from the carcass between the eighth and tenth rib of Danish Black Pied breed. The bulls were
reared at the Egtved progeny testing station and slaughtered at 450 kg live weight. Samples were excised 24 hr postmortem and aged for 9 days at 2-4°C in Cryovac bags. The experimental group consisted of 20 young bulls chosen at random from a group of 88 animals at the progeny testing station.Shear force measurements
Tenderness of the meat was determined by the Warner-Bratzler shear device after deep-fat frying at 150°C until a sample center temperature of 70°C had been reached. Cores (1.27 cm diam) were drilled parallel to the muscle fibers from the center region of the roasts and were cut right angled to the fibers. The average was calculated on the basis of 10 measurements. Homogenization procedure
A 1 cm thick cross section of raw meat was stored at -18°C until used for the experiments. Prior to use steaks were allowed to thaw at 4°C. 8-g samples were scraped from the surface of the meat, homogenized by a Sorvall omni mixer (a blade homogenizer) for 30 sec at11,000 rpm in 50 ml KCl-phosphate buffer (0.06M KC1, 0.05M potassium phosphate, pH7.0) and poured through a nylon mesh to remove connective tissue and gross material. After centrifugation of the suspension for 3 min at 400 X G, the sediment was washed by three cycles of 50 ml buffer solution followed by centrifugation for 30 min at 2000 x G.Measurement of fragmentation
The myofibril sediment was examined by a phase contrast microscope at lOOOx magnifica-
EMISSION, %
Fig. 1—R e la tio n s h ip b e tw e e n a d ju s te d e m is s io n m e a s u r e m e n ts o n m y o f ib r i l su s p e n s io n s a n d W arner-B ra tz ler sh e a r fo r c e (n = 2 0 ) .
tion; 100 fibrils were chosen at random. The length of fragments was determined by counting the amount of sarcomers per fibril and the average length of fragments calculated on the basis of 100 fibrils. Particle size of homogenized fiber piece suspensions was determined essentially as described by Davey and Gilbert(1969), but we used a spectrophotometer with emission photometry equipment to measure emission values instead of turbidity readings. Of the washed myofibril sediment, 0.4g were dispersed in the KCl-phosphate buffer solution under standard conditions using a small magnet stirring apparatus. In order to examine the effect of nitrogen concentration on emission measurements, four samples from the suspension of each animal were studied after dispersion in the buffer solution to give approximately 0.2, 0.4, 0.6 and 0.8 mg N per ml. Nitrogen determinations
Total nitrogen concentration of the myofibril sediment was determined by the Kjeldahl method.
R E S U L T S & D IS C U S S IO N
TENDERNESS AVERAGE and standard deviation measured on experimental group, were 10.28 lb and 2.49 lb respectively. For the total of animals on the Progeny Test Station, the figures this year were 9.36 lb and 2.43 lb. Consequently the selected group is applicable as representative of the typical level and variation of tenderness.Effect of nitrogen concentration on emission measurements
Davey and Gilbert (1969) found that turbidity readings measured on suspensions of myofibril fragments increased as the particle size decreased as well as finding a positive linear relationship between turbidity readings and protein concentration. Therefore, in order to compare turbidity readings between animals it is essential to adjust the measurements to equivalent nitrogen concentration.
From dilutions of the washed fibrillar sediments corresponding to a nitrogen content varying from 0 .2 -0 .8 mg N/ml, we found a positive linear relationship between nitrogen concentration and emission measurements. However, the hypothesis that all animals should have the same regression coefficient had to be rejected because a homogeneity test proved a significant difference between the regression
824-JOURNAL OF FOOD SCIENCE-Volume 38 (1973)
BOVINE MYOFIBRIL FRAGMENTATION- 825
Table 1—Simple correlation coefficients between Warner-Bratzler shear force, % nitrogen and measurements of myofibril fragmentation (n = 20)
1 2 3 4
1. Warner-Bratzler — 0.61** 0.37 -0 .7 8 ***2. No. of sarco
mers/fibril 0.37 -0 .6 2 **3. % N - - - -0 .5 0 *4. Emission - - - -
* P < 0.05 ** P < 0.01
**• P < 0.001
Table 2—Analysis of variance on Warner-Bratzler shear force measurements estimated by a two-variable model of regression
Variable3 DF R 2 F PNo. of sarcomers/fibril 17 0.64
+ emissionEmission after no. of 1 12.30 < 0.005
sarcomers/fibrilNo. of sarcomers/fibril 1 1.20 ns
after emissiona E m is s io n v a lu e s a re a d u ste d to sa m e c o n te n t o f n itro g e n .
coefficients of the emission measurements on mg N/ml (P < 0 .0 0 l) . Consequently corrections in emission measurements were made to level the nitrogen concentration in the dilutions, based on the regression coefficients calculated on each animal. The nonhomogeneity of emission regression on the nitrogen concentration is attributed to the fact that different fragment sizes affect the influence of N-concentration on emission measurements.Relationship between emission measurements and tenderness
Figure 1 shows the relationship between the Warner-Bratzler shear values of the heat-treated meat samples and the adjusted emission values measured on the myofibril suspensions from the raw meat.
Table 1 presents a number of correlation coefficients between the measured characteristics. A significant correlation between the number of sarcomers/fibril and the shear force was demonstrated (r = 0.61; P < 0.01). However, the shear force shows a higher correlation with the adjusted emission measurements (r = —0.78; P C 0 .001 ).
The high correlation coefficients are attributable to the homogeneity of the material with regard to the quantity and quality of the connective tissue, as the animals were slaughtered at practically the same age and weight. Therefore, the variation of tenderness must be due substantially to the properties of the myofibrillar proteins, in this case measured as the degree of fragmentation after standard mechanical treatment.
The relationship between percentage of N in the myofibril sediment and tenderness of the meat (r = 0.37) may be due to the fact that with increasing shear force meat shows a tendency partly towards lower water binding capacity ( Wismer-Pedersen, 1963) and partly towards larger fragment length after homogenization. This makes the sediment “pack” tighter (Davey and Gilbert,1969).
The importance of adjusting the emission measurements to the same N-con- tents in the suspension can be seen from the fact that decreasing tenderness causes decreasing emission whereas the increase in N-contents has the opposite effect,
thus concealing a part of the differences in emission values due to differences in tenderness.
Table 2 shows that the emission measurements contain all the information that the number of sarcomers/fibril gives about tenderness as the number of sarcomers/fibril contributes only slightly to further estimations of tenderness. On the contrary, the emission values contribute significantly to further estimations after considering the number of sarcomers/fibril as an explaining variable (P < 0.005).
The results of this study show that measurements of fragmentation after mechanical treatment reflect physical characteristics of the raw muscle tissue of high significance to meat tenderness in longissimus dorsi from young bulls after heat treatment. The close relationship may be due to a variable resistence in myofibril structure to physical disintegration which is unaffected by the denatura- tion and coagulation of the meat proteins as a result of heating.
Further studies have to be made to ascertain whether different degrees of myfibril fragmentation may be a function of ( 1) development if intra- and inter- myfibrillar linkage during rigor; (2) different courses of aging; or (3) whether genetic factors are involved in the resistence of myofibrils to mechanical treatment. In any event, measurement of fragmentation is a valuable micro method to predict tenderness in longissimus dorsi and the small sample size necessary for analyses makes spoilage of the carcass minimal.
R E F E R E N C E S
Davey, C.L. and Gilbert, K.V. 1967. Structural changes in meat during aging. J. Food Technol. 2: 57.
Davey, C.L. and Gilbert, K.V. 1969 . Studies in m eat tenderness. 7. Changes in the fine structure of meat during aging. J. Food Sci. 34: 69.
Fukazawa, T., Briskey, E.J., Takahashi, K. and Yasui, T. 1969. Treatment and post-mortem aging effects on the z-line o f m yofibrils from chicken pectoral muscle. J. Food Sci. 34: 606.
Sayre, R.N. 1970. Chicken m yofibril fragm entation in relation to factors influencing tenderness. J. Food Sci. 35: 7.
Takahashi, K., Fukazawa T. and Yasui, T. 1967. Formation of myofibrilar fragments and reversible contraction of sarcomeres in chicken pectoral m uscle. J. Food Sci. 32: 409.
Takahashi, K., Hattori, A. and Yasui T. 1970. E ffect o f contraction on the fragmentation of m yofibils. J. Biochem . 67: 609.
Wismer-Pedersen, J. 1963. Ktfdkvalitetsun- derstfgelser. 335. Beretning fra Fors^gslabor- atoriet, Copenhagen.
Ms received 1 /3 1 /7 3 ; revised 4 /6 /7 3 ; accepted 4 /1 8 /7 3 .
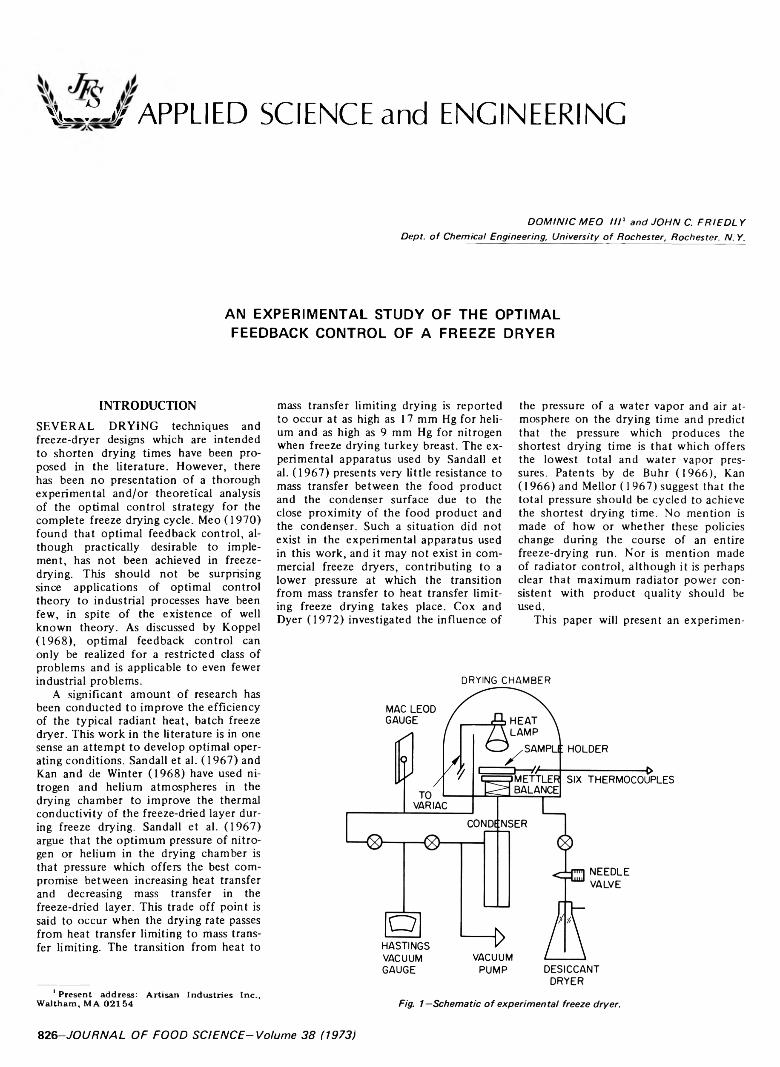
%JLér APPLIED SCIENCE and ENGINEERING
D O M IN IC M E O I I I ' a n d J O H N C. F R IE D L Y D ep t, o f C h e m ica l E n g in eerin g , U n iv e r s ity o f R o c h e s te r , R o c h e s te r . N . Y.
AN EXPERIMENTAL STUDY OF THE OPTIMAL FEEDBACK CONTROL OF A FREEZE DRYER
IN T R O D U C T IO N
SEVERAL DRYING techniques and freeze-dryer designs which are intended to shorten drying times have been proposed in the literature. However, there has been no presentation of a thorough experimental and/or theoretical analysis of the optimal control strategy for the complete freeze drying cycle. Meo (1970) found that optimal feedback control, although practically desirable to implement, has not been achieved in freeze- drying. This should not be surprising since applications of optimal control theory to industrial processes have been few, in spite of the existence of well known theory. As discussed by Koppel(1968), optimal feedback control can only be realized for a restricted class of problems and is applicable to even fewer industrial problems.
A significant amount of research has been conducted to improve the efficiency of the typical radiant heat, batch freeze dryer. This work in the literature is in one sense an attempt to develop optimal operating conditions. Sandall et al. (1967) and Kan and de Winter (1968) have used nitrogen and helium atmospheres in the drying chamber to improve the thermal conductivity of the freeze-dried layer during freeze drying. Sandall et al. (1967) argue that the optimum pressure of nitrogen or helium in the drying chamber is that pressure which offers the best compromise between increasing heat transfer and decreasing mass transfer in the freeze-dried layer. This trade off point is said to occur when the drying rate passes from heat transfer limiting to mass transfer limiting. The transition from heat to
1 Present address: Artisan Industries Inc., Waltham, MA 0 2 1 5 4
mass transfer limiting drying is reported to occur at as high as 17 mm Hg for helium and as high as 9 mm Hg for nitrogen when freeze drying turkey breast. The experimental apparatus used by Sandall et al. (1967) presents very little resistance to mass transfer between the food product and the condenser surface due to the close proximity of the food product and the condenser. Such a situation did not exist in the experimental apparatus used in this work, and it may not exist in commercial freeze dryers, contributing to a lower pressure at which the transition from mass transfer to heat transfer limiting freeze drying takes place. Cox and Dyer (1972) investigated the influence of
the pressure of a water vapor and air atmosphere on the drying time and predict that the pressure which produces the shortest drying time is that which offers the lowest total and water vapor pressures. Patents by de Buhr (1966), Kan(1966) and Mellor (1967) suggest that the total pressure should be cycled to achieve the shortest drying time. No mention is made of how or whether these policies change during the course of an entire freeze-drying run. Nor is mention made of radiator control, although it is perhaps clear that maximum radiator power consistent with product quality should be used.
This paper will present an experimen-
DRYING CHAMBER
826 - J O U R N A L O F F O O D S C I E N C E - V o l u m e 3 8 ( 1 9 7 3 )
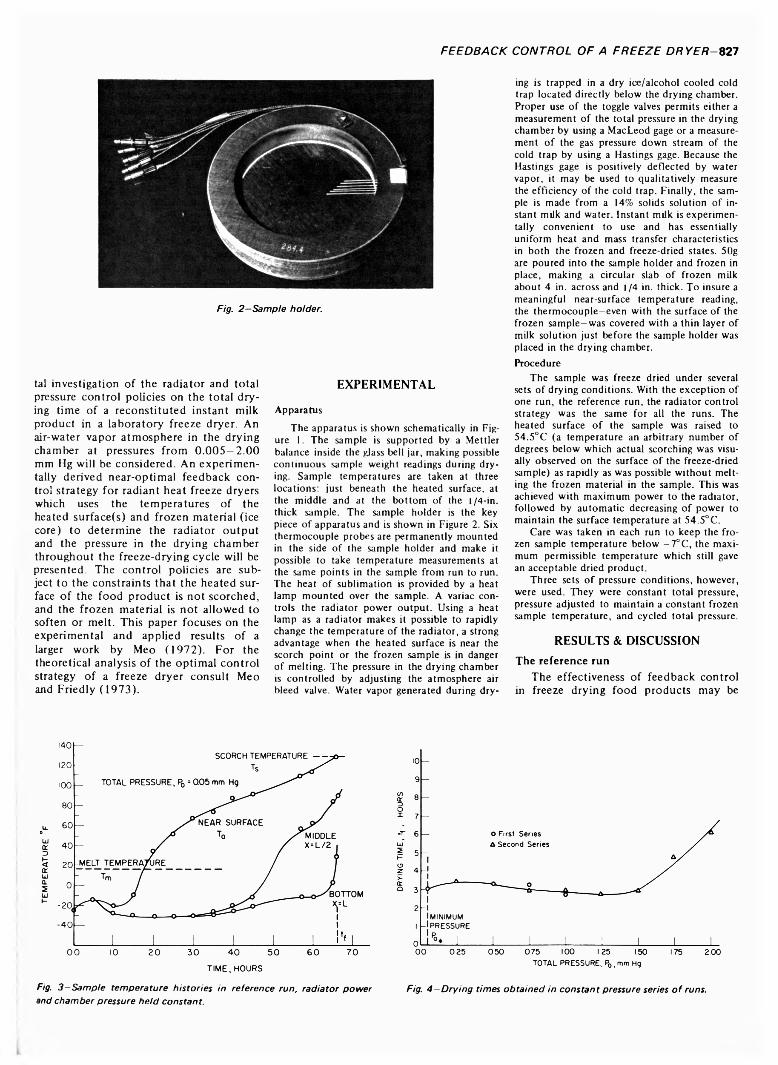
FEEDBACK CONTROL OF A FREEZE DRYER-827
tal investigation of the radiator and total pressure control policies on the total drying time of a reconstituted instant milk product in a laboratory freeze dryer. An air-water vapor atmosphere in the drying chamber at pressures from 0 .005-2 .00 mm Hg will be considered. An experimentally derived near-optimal feedback control strategy for radiant heat freeze dryers which uses the temperatures of the heated surface(s) and frozen material (ice core) to determine the radiator output and the pressure in the drying chamber throughout the freeze-drying cycle will be presented. The control policies are subject to the constraints that the heated surface of the food product is not scorched, and the frozen material is not allowed to soften or melt. This paper focuses on the experimental and applied results of a larger work by Meo (1972). For the theoretical analysis of the optimal control strategy of a freeze dryer consult Meo and Friedly (1973).
E X P E R I M E N T A L
ApparatusThe apparatus is shown schematically in Fig
ure I . The sample is supported by a Mettler balance inside the glass bell jar, making possible continuous sample weight readings during drying. Sample temperatures are taken at three locations: just beneath the heated surface, at the middle and at the bottom of the l/4-in. thick sample. The sample holder is the key piece of apparatus and is shown in Figure 2. Six thermocouple probes are permanently mounted in the side of the sample holder and make it possible to take temperature measurements at the same points in the sample from run to run. The heat of sublimation is provided by a heat lamp mounted over the sample. A variac controls the radiator power output. Using a heat lamp as a radiator makes it possible to rapidly change the temperature of the radiator, a strong advantage when the heated surface is near the scorch point or the frozen sample is in danger of melting. The pressure in the drying chamber is controlled by adjusting the atmosphere air bleed valve. Water vapor generated during dry
ing is trapped in a dry ice/alcohol cooled cold trap located directly below the drying chamber. Proper use of the toggle valves permits either a measurement of the total pressure in the drying chamber by using a MacLeod gage or a measurement of the gas pressure down stream of the cold trap by using a Hastings gage. Because the Hastings gage is positively deflected by water vapor, it may be used to qualitatively measure the efficiency of the cold trap. Finally, the sample is made from a 14% solids solution of instant milk and water. Instant milk is experimentally convenient to use and has essentially uniform heat and mass transfer characteristics in both the frozen and freeze-dried states. 50g are poured into the sample holder and frozen in place, making a circular slab of frozen milk about 4 in. across and 1/4 in. thick. To insure a meaningful near-surface temperature reading, the thermocouple-even with the surface of the frozen sample-was covered with a thin layer of milk solution just before the sample holder was placed in the drying chamber.Procedure
The sample was freeze dried under several sets of drying conditions. With the exception of one run, the reference run, the radiator control strategy was the same for all the runs. The heated surface of the sample was raised to 54.5°C (a temperature an arbitrary number of degrees below which actual scorching was visually observed on the surface of the freeze-dried sample) as rapidly as was possible without melting the frozen material in the sample. This was achieved with maximum power to the radiator, followed by automatic decreasing of power to maintain the surface temperature at 54.5°C.
Care was taken in each run to keep the frozen sample temperature below -7°C, the maximum permissible temperature which still gave an acceptable dried product.
Three sets of pressure conditions, however, were used. They were constant total pressure, pressure adjusted to maintain a constant frozen sample temperature, and cycled total pressure.
R E S U L T S & D IS C U S S IO N
The reference runThe effectiveness of feedback control
in freeze drying food products may be
Fig- 3 —S a m p le te m p e r a tu r e h is to r ie s in re fe r e n c e ru n , ra d ia to r p o w e r Fig. 4 —D ry in g tim e s o b ta in e d in c o n s ta n t p re ssu re se r ie s o f runs,and c h a m b e r p re ssu re h e ld c o n s ta n t.
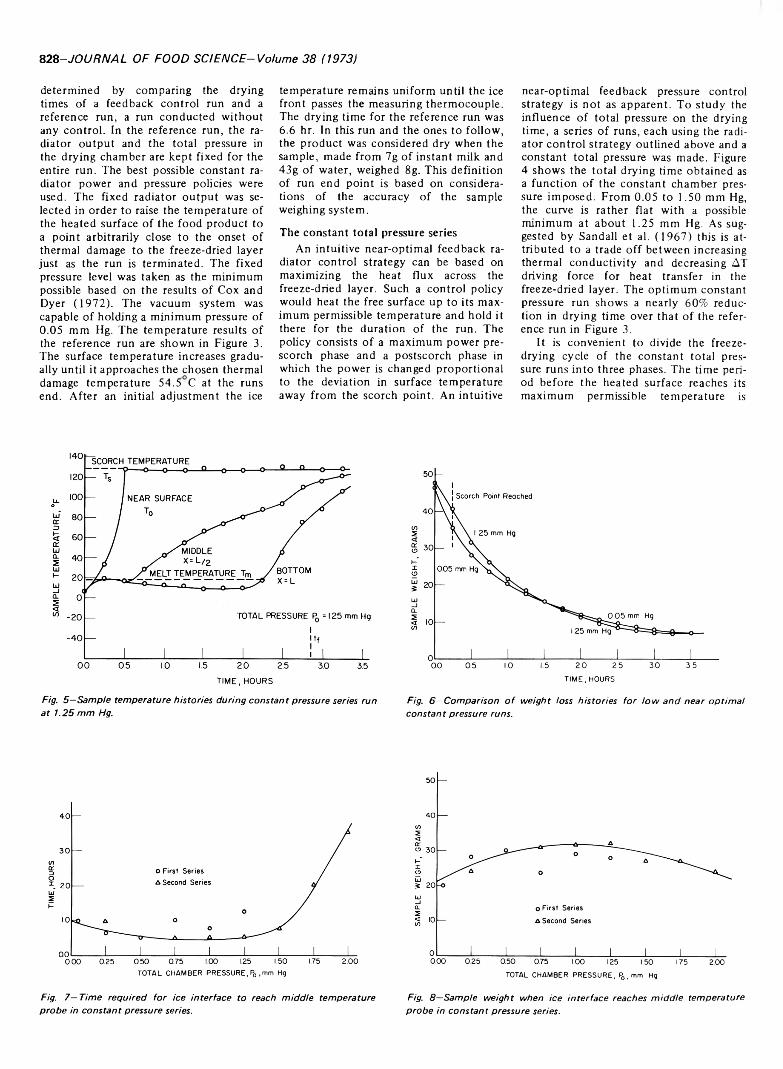
828-JOURNAL OF FOOD SCIENCE-Volume 38 (1973)
determined by comparing the drying times of a feedback control run and a reference run, a run conducted without any control. In the reference run, the radiator output and the total pressure in the drying chamber are kept fixed for the entire run. The best possible constant radiator power and pressure policies were used. The fixed radiator output was selected in order to raise the temperature of the heated surface of the food product to a point arbitrarily close to the onset of thermal damage to the freeze-dried layer just as the run is terminated. The fixed pressure level was taken as the minimum possible based on the results of Cox and Dyer (1972). The vacuum system was capable of holding a minimum pressure of 0.05 mm Hg. The temperature results of the reference run are shown in Figure 3. The surface temperature increases gradually until it approaches the chosen thermal damage temperature 54.5 C at the runs end. After an initial adjustment the ice
temperature remains uniform until the ice front passes the measuring thermocouple. The drying time for the reference run was6.6 hr. In this run and the ones to follow, the product was considered dry when the sample, made from 7g of instant milk and 43g of water, weighed 8g. This definition of run end point is based on considerations of the accuracy of the sample weighing system.
The constant total pressure seriesAn intuitive near-optimal feedback ra
diator control strategy can be based on maximizing the heat flux across the freeze-dried layer. Such a control policy would heat the free surface up to its maximum permissible temperature and hold it there for the duration of the run. The policy consists of a maximum power pre- scorch phase and a postscorch phase in which the power is changed proportional to the deviation in surface temperature away from the scorch point. An intuitive
near-optimal feedback pressure control strategy is not as apparent. To study the influence of total pressure on the drying time, a series of runs, each using the radiator control strategy outlined above and a constant total pressure was made. Figure 4 shows the total drying time obtained as a function of the constant chamber pressure imposed. From 0.05 to 1.50 mm Hg, the curve is rather flat with a possible minimum at about 1.25 mm Hg. As suggested by Sandall et al. (1967) this is attributed to a trade off between increasing thermal conductivity and decreasing AT driving force for heat transfer in the freeze-dried layer. The optimum constant pressure run shows a nearly 60% reduction in drying time over that of the reference run in Figure 3.
It is convenient to divide the freezedrying cycle of the constant total pressure runs into three phases. The time period before the heated surface reaches its maximum permissible temperature is
Fig. 5 —S a m p le te m p e r a tu r e h is to r ie s d u r in g c o n s ta n t p re ssu re series ru n a t 1 .2 5 m m Hg.
Fig. 6 —C o m p a r iso n o f w e ig h t lo ss h is to r ie s fo r lo w a n d n e a r o p t im a l c o n s ta n t p re ssu re runs.
Fig. 7—Time required for ice interface to reach middle temperature Fig. 8—Sample weight when ice interface reaches middle temperatureprobe in constant pressure series. probe in constant pressure series.
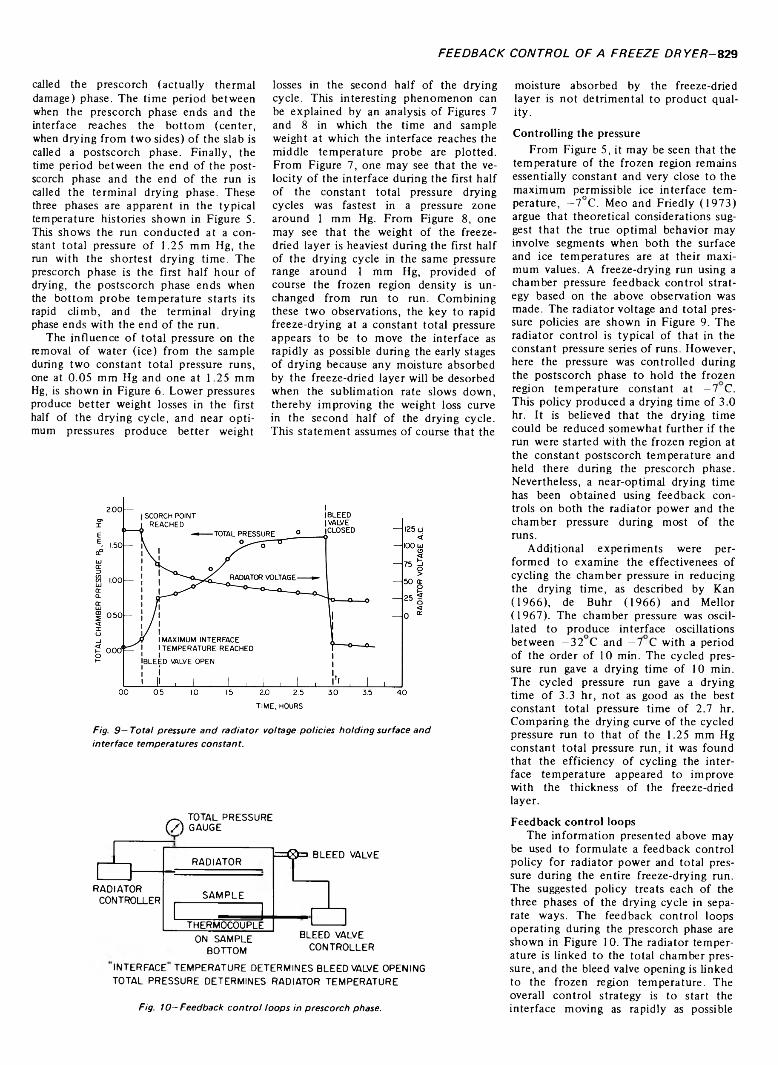
FEEDBACK CONTROL OF A FREEZE DRYER-829
called the prescorch (actually thermal damage) phase. The time period between when the prescorch phase ends and the interface reaches the bottom (center, when drying from two sides) of the slab is called a postscorch phase. Finally, the time period between the end of the postscorch phase and the end of the run is called the terminal drying phase. These three phases are apparent in the typical temperature histories shown in Figure 5. This shows the run conducted at a constant total pressure of 1.25 mm Hg, the run with the shortest drying time. The prescorch phase is the first half hour of drying, the postscorch phase ends when the bottom probe temperature starts its rapid climb, and the terminal drying phase ends with the end of the run.
The influence of total pressure on the removal of water (ice) from the sample during two constant total pressure runs, one at 0.05 mm Hg and one at 1.25 mm Hg, is shown in Figure 6 . Lower pressures produce better weight losses in the first half of the drying cycle, and near optimum pressures produce better weight
losses in the second half of the drying cycle. This interesting phenomenon can be explained by an analysis of Figures 7 and 8 in which the time and sample weight at which the interface reaches the middle temperature probe are plotted. From Figure 7, one may see that the velocity of the interface during the first half of the constant total pressure drying cycles was fastest in a pressure zone around 1 mm Hg. From Figure 8 , one may see that the weight of the freeze- dried layer is heaviest during the first half of the drying cycle in the same pressure range around 1 mm Hg, provided of course the frozen region density is unchanged from run to run. Combining these two observations, the key to rapid freeze-drying at a constant total pressure appears to be to move the interface as rapidly as possible during the early stages of drying because any moisture absorbed by the freeze-dried layer will be desorbed when the sublimation rate slows down, thereby improving the weight loss curve in the second half of the drying cycle. This statement assumes of course that the
moisture absorbed by the freeze-dried layer is not detrimental to product quality.Controlling the pressure
From Figure 5, it may be seen that the temperature of the frozen region remains essentially constant and very close to the maximum permissible ice interface temperature, —7°C. Meo and Friedly (1973) argue that theoretical considerations suggest that the true optimal behavior may involve segments when both the surface and ice temperatures are at their maximum values. A freeze-drying run using a chamber pressure feedback control strategy based on the above observation was made. The radiator voltage and total pressure policies are shown in Figure 9. The radiator control is typical of that in the constant pressure series of runs. However, here the pressure was controlled during the postscorch phase to hold the frozen region temperature constant at —7 C. This policy produced a drying time of 3.0 hr. It is believed that the drying time could be reduced somewhat further if the run were started with the frozen region at the constant postscorch temperature and held there during the prescorch phase. Nevertheless, a near-optimal drying time has been obtained using feedback controls on both the radiator power and the chamber pressure during most of the runs.
Additional experiments were performed to examine the effectivenees of cycling the chamber pressure in reducing the drying time, as described by Kan(1966) , de Buhr (1966) and Mellor(1967) . The chamber pressure was oscillated to produce interface oscillations between —32 C and —7 C with a period of the order of 10 min. The cycled pressure run gave a drying time of 10 min. The cycled pressure run gave a drying time of 3.3 hr, not as good as the best constant total pressure time of 2.7 hr. Comparing the drying curve of the cycled pressure run to that of the 1.25 mm Hg constant total pressure run, it was found that the efficiency of cycling the interface temperature appeared to improve with the thickness of the freeze-dried layer.
Feedback control loopsThe information presented above may
be used to formulate a feedback control policy for radiator power and total pressure during the entire freeze-drying run. The suggested policy treats each of the three phases of the drying cycle in separate ways. The feedback control loops operating during the prescorch phase are shown in Figure 10. The radiator temperature is linked to the total chamber pressure, and the bleed valve opening is linked to the frozen region temperature. The overall control strategy is to start the interface moving as rapidly as possible
Fig. 9 — T o ta l p re ssu re a n d ra d ia to r vo lta g e p o lic ie s h o ld in g su r fa c e a n d in te r fa c e te m p e r a tu r e s c o n s ta n t.
RADIATOR
RADIATORCONTROLLER
_ TOTAL PRESSURE ( / ) GAUGE
= ® = i BLEED VALVE
SA M PLE
ITHERMOCOUPLE
ON SAMPLE BOTTOM
BLEED VALVE CONTROLLER
INTERFACE TEM PERATURE DETERM INES BLEED VALVE OPENING TOTAL PRESSU RE DETERMINES RADIATOR TEM PERATURE
Fig. 10 —F e e d b a c k c o n tr o l lo o p s in p re sc o rc h ph a se .
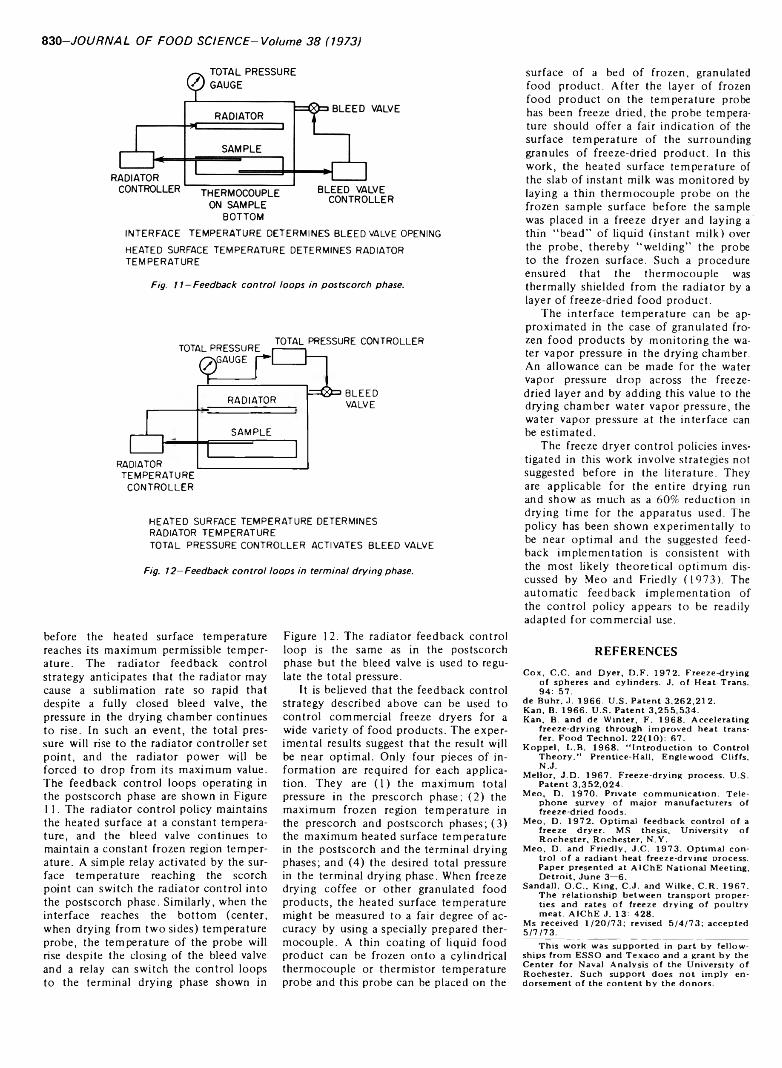
830-JOURNAL OF FOOD SCIENCE-Volume 38 (1973)
BOTTOMIN TERFA CE TEM PERATURE DETERM INES BLEED VALVE OPENINGHEATED SURFACE TEM PERATURE DETERMINES RADIATOR TEM PERATU RE
Fig. 11—F e e d b a c k c o n tr o l lo o p s in p o s ts c o r c h p h a se .
TOTAL PRESSURE TOTAL PRESSURE CONTROLLER^GAUGE |~ -
RADIATOR
RADIATOR TEM PERATURE
CONTRO LLER
SAM PLE
= & = > B LEED VALVE
HEATED SURFACE TEM PERATURE DETERMINES RADIATOR TEM PERATU RETOTAL PRESSURE CONTROLLER ACTIVATES BLEED VALVE
Fig. 12 - F e e d b a c k c o n tr o l lo o p s in te r m in a l d r y in g p h a se .
before the heated surface temperature reaches its maximum permissible temperature. The radiator feedback control strategy anticipates that the radiator may cause a sublimation rate so rapid that despite a fully closed bleed valve, the pressure in the drying chamber continues to rise. In such an event, the total pressure will rise to the radiator controller set point, and the radiator power will be forced to drop from its maximum value. The feedback control loops operating in the postscorch phase are shown in Figure11. The radiator control policy maintains the heated surface at a constant temperature, and the bleed valve continues to maintain a constant frozen region temperature. A simple relay activated by the surface temperature reaching the scorch point can switch the radiator control into the postscorch phase. Similarly, when the interface reaches the bottom (center, when drying from two sides) temperature probe, the temperature of the probe will rise despite the closing of the bleed valve and a relay can switch the control loops to the terminal drying phase shown in
Figure 12. The radiator feedback control loop is the same as in the postscorch phase but the bleed valve is used to regulate the total pressure.
It is believed that the feedback control strategy described above can be used to control commercial freeze dryers for a wide variety of food products. The experimental results suggest that the result will be near optimal. Only four pieces of information are required for each application. They are (1) the maximum total pressure in the prescorch phase; (2 ) the maximum frozen region temperature in the prescorch and postscorch phases; (3) the maximum heated surface temperature in the postscorch and the terminal drying phases; and (4) the desired total pressure in the terminal drying phase. When freeze drying coffee or other granulated food products, the heated surface temperature might be measured to a fair degree of accuracy by using a specially prepared thermocouple. A thin coating of liquid food product can be frozen onto a cylindrical thermocouple or thermistor temperature probe and this probe can be placed on the
surface of a bed of frozen, granulated food product. After the layer of frozen food product on the temperature probe has been freeze dried, the probe temperature should offer a fair indication of the surface temperature of the surrounding granules of freeze-dried product. In this work, the heated surface temperature of the slab of instant milk was monitored by laying a thin thermocouple probe on the frozen sample surface before the sample was placed in a freeze dryer and laying a thin “bead” of liquid (instant milk) over the probe, thereby “welding” the probe to the frozen surface. Such a procedure ensured that the thermocouple was thermally shielded from the radiator by a layer of freeze-dried food product.
The interface temperature can be approximated in the case of granulated frozen food products by monitoring the water vapor pressure in the drying chamber. An allowance can be made for the water vapor pressure drop across the freeze- dried layer and by adding this value to the drying chamber water vapor pressure, the water vapor pressure at the interface can be estimated.
The freeze dryer control policies investigated in this work involve strategies not suggested before in the literature. They are applicable for the entire drying run and show as much as a 60% reduction in drying time for the apparatus used. The policy has been shown experimentally to be near optimal and the suggested feedback implementation is consistent with the most likely theoretical optimum discussed by Meo and Friedly (1973). The automatic feedback implementation of the control policy appears to be readily adapted for commercial use.
R E F E R E N C E S
Cox, C.C. and Dyer, D .F. 1972. Freeze-drying of spheres and cylinders. J. o f Heat Trans. 94: 57.
de Buhr, J. 1966. U .S. Patent 3 ,2 6 2 ,2 1 2 .Kan, B. 1966. U .S. Patent 3 ,2 5 5 ,5 3 4 .Kan, B. and de Winter, F. 196 8 . Accelerating
freeze-drying through improved heat transfer. Food Technol. 22(10): 67.
Koppel, L.B. 1 968 . “ Introduction to Control T heory.” Prentice-Hall, Englew ood Cliffs,N.J.
Mellor, J.D. 1967 . Freeze-drying process. U.S. Patent 3 ,3 5 2 ,0 2 4 .
Meo, D. 197 0 . Private com m unication. T elephone survey of major manufacturers of freeze-dried foods.
Meo, D. 1 9 7 2 . Optimal feedback control o f a freeze dryer. MS thesis. University o f Rochester, Rochester, N .Y .
Meo, D. and Friedly, J.C. 1973. Optimal control o f a radiant heat freeze-drving process. Paper presented at AIChE National Meeting, D etroit, June 3—6.
Sandall, O.C., King, C.J. and Wilke, C.R. 1967. The relationship betw een transport properties and rates o f freeze drying o f poultry m eat. AIChE J. 13: 428.
Ms received 1 /2 0 /7 3 ; revised 5 /4 /7 3 ; accepted 5 /7 /73._________ ___ _________ ________
This work was supported in part by fellow ships from ESSO and T exaco and a grant by the Center for Naval Analysis o f the University o f Rochester. Such support does not im ply endorsem ent o f the content by the donors.
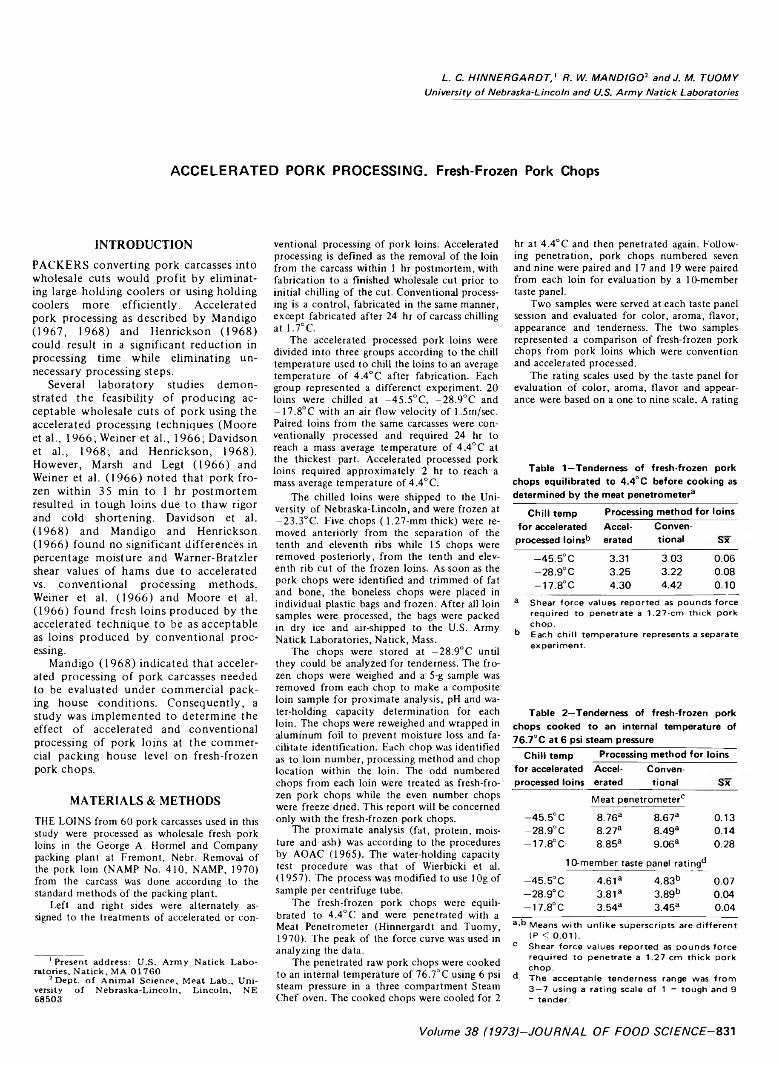
L. C. HINNERGARDT,' R. W. MANDIGO2 and J. M. TUOMYUniversity o f Nebraska-Lincoln and U.S. Arm y Natick Laboratories
ACCELERATED PORK PROCESSING. Fresh-Frozen Pork Chops
IN T R O D U C T IO N
PACKERS converting pork carcasses into wholesale cuts would profit by eliminating large holding coolers or using holding coolers more efficiently. Accelerated pork processing as described by Mandigo (1967, 1968) and Henrickson (1968) could result in a significant reduction in processing time while eliminating unnecessary processing steps.
Several laboratory studies demonstrated the feasibility of producing acceptable wholesale cuts of pork using the accelerated processing techniques (Moore et al., 1966; Weiner et al., 1966; Davidson et al., 1968; and Henrickson, 1968). However, Marsh and Legt (1966) and Weiner et al. (1966) noted that pork frozen within 35 min to 1 hr postmortem resulted in tough loins due to thaw rigor and cold shortening. Davidson et al.(1968) and Mandigo and Henrickson(1966) found no significant differences in percentage moisture and Warner-Bratzler shear values of hams due to accelerated vs. conventional processing methods. Weiner et al. (1966) and Moore et al. (1966) found fresh loins produced by the accelerated technique to be as acceptable as loins produced by conventional processing.
Mandigo (1968) indicated that accelerated processing of pork carcasses needed to be evaluated under commercial packing house conditions. Consequently, a study was implemented to determine the effect of accelerated and conventional processing of pork loins at the commercial packing house level on fresh-frozen pork chops.
M A T E R I A L S & M E T H O D S
THE LOINS from 60 pork carcasses used in this study were processed as wholesale fresh pork loins in the George A. Hormel and Company packing plant at Fremont, Nebr. Removal of the pork loin (NAMP No. 410, NAMP, 1970) from the carcass was done according to the standard methods of the packing plant.
Left and right sides were alternately assigned to the treatments of accelerated or con-
' Present address: U .S. Army Natick Laboratories, N atick, MA 0 1 7 6 0
2 Dept, o f Animal Science, Meat Lab., University o f Nebraska-Lincoln, Lincoln, NE 6 8 5 0 3
ventional processing of pork loins. Accelerated processing is defined as the removal of the loin from the carcass within 1 hr postmortem, with fabrication to a finished wholesale cut prior to initial chilling of the cut. Conventional processing is a control, fabricated in the same manner, except fabricated after 24 hr of carcass chilling at 1.7°C.
The accelerated processed pork loins were divided into three groups according to the chill temperature used to chill the loins to an average temperature of 4.4°C after fabrication. Each group represented a differenct experiment. 20 loins were chilled at -45.5°C, -28.9°C and -17.8°C with an air flow velocity of 1.5m/sec. Paired loins from the same carcasses were conventionally processed and required 24 hr to reach a mass average temperature of 4.4°C at the thickest part. Accelerated processed pork loins required approximately 2 hr to reach a mass average temperature of 4.4°C.
The chilled loins were shipped to the University of Nebraska-Lincoln, and were frozen at -23.3°C. Five chops ( 1.27-mm thick) were removed anteriorly from the separation of the tenth and eleventh ribs while 15 chops were removed posteriorly, from the tenth and eleventh rib cut of the frozen loins. As soon as the pork chops were identified and trimmed of fat and bone, the boneless chops were placed in individual plastic bags and frozen. After all loin samples were processed, the bags were packed in dry ice and air-shipped to the U.S. Army Natick Laboratories, Natick, Mass.
The chops were stored at -28.9°C until they could be analyzed for tenderness. The frozen chops were weighed and a 5-g sample was removed from each chop to make a composite loin sample for proximate analysis, pH and water-holding capacity determination for each loin. The chops were re weighed and wrapped in aluminum foil to prevent moisture loss and facilitate identification. Each chop was identified as to loin number, processing method and chop location within the loin. The odd numbered chops from each loin were treated as fresh-frozen pork chops while the even number chops were freeze dried. This report will be concerned only with the fresh-frozen pork chops.
The proximate analysis (fat, protein, moisture and ash) was according to the procedures by AO AC (1965). The water-holding capacity test procedure was that of Wierbicki et al. (1957). The process was modified to use lOg of sample per centrifuge tube.
The fresh-frozen pork chops were equilibrated to 4.4°C and were penetrated with a Meat Penetrometer (Hinnergardt and Tuomy,1970). The peak of the force curve was used in analyzing the data.
The penetrated raw pork chops were cooked to an internal temperature of 76.7°C using 6 psi steam pressure in a three compartment Steam Chef oven. The cooked chops were cooled for 2
hr at 4.4°C and then penetrated again. Following penetration, pork chops numbered seven and nine were paired and 17 and 19 were paired from each loin for evaluation by a 10-member taste panel.
Two samples were served at each taste panel session and evaluated for color, aroma, flavor, appearance and tenderness. The two samples represented a comparison of fresh-frozen pork chops from pork loins which were convention and accelerated processed.
The rating scales used by the taste panel for evaluation of color, aroma, flavor and appearance were based on a one to nine scale. A rating
Table 1—Tenderness of fresh-frozen pork chops equilibrated to 4.4°C before cooking as determined by the meat penetrometer3
Chill temp for accelerated processed loins*3
Processing method for loinsAccelerated
Conventional Sx
—45.5°C 3.31 3.03 0.06-28 .9 ° C 3.25 3.22 0.08—17.8°C 4.30 4.42 0.10
a S h e a r fo rc e v a lu e s re p o rte d as p o u n d s fo rc e re q u ire d to p e n e tra te a 1 .2 7 -c m th ic k p o rk c h o p .
b E a c h c h il l te m p e ra tu re re p re se n ts a se p a ra te e x p e r im e n t .
Table 2—Tenderness of fresh-frozen pork chops cooked to an internal temperature of 76.7°C at 6 psi steam pressure
Chill temp for accelerated processed loins
Processing method for loinsAccelerated
Conventional Sx
Meat penetrometer0-4 5 .5 °C 8.76a 8.67a 0.13-2 8 .9 ° C 8.27a 8.49a 0.14— 17.8°C 8.85a 9.06a 0.28
10-member taste panel ratingd—45.5°C 4.61a 4.83b 0.07-2 8 .9 ° C 3.81a 3.89b 0.04— 17.8°C 3.54a 3.45a 0.04
a ’b M e an s w ith u n lik e s u p e rs c r ip ts are d if fe re n t (P < 0 .0 1 ) .
c S h e a r fo r c e v a lu e s re p o rte d as p o u n d s fo rc e re q u ire d to p e n e tra te a 1 .2 7 -c m t h ic k p o rk c h o p .
d T h e a c c e p ta b le te n d e rn e s s ran ge w a s fro m 3 — 7 u sin g a ra tin g sc a le o f 1 = to u g h an d 9 = te n d e r.
V o l u m e 3 8 ( 1 9 7 3 ) - J O U R N A L O F F O O D S C I E N C E - 831
832-JOURNAL OF FOOD SCIENCE-Volume 38 (1973)
Table 3—Flavor, odor, color and acceptance of cooked pork chops evaluated by a 10 member taste panele
Chill temp for accelerated processed loins
Processing method for loinsAccelerated
Conventional Sx
Flavor
-4 5 .5 ° C 5.55a 5.62b 0.04-2 8 .9 ° C 5.58a 5.53a 0.03— 17.8°C 4.96a 5.12a 0.04
Odor-4 5 .5 ° C 5.80 5.75 0.01—28.9°C 5.97 5.96 0.01— 17.8°C 5.53 5.53 0.03
Color
—45.5°C 5.91 5.86 0.01—28.9°C 6.05 6.10 0.01-1 7 .8 °C 5.72 5.69 0.01
Acceptance
-4 5 .5 °C 5.71° 5.71° 0.03-2 8 .9 ° C 5.91c 5.95c 0.01— 17.8°C 5.56c 5.64d 0.03
a -b M e an s w ith u n lik e s u p e rs c r ip ts are d if fe re n t(P < 0 .0 5 ) .
c ’d M e an s w ith u n lik e s u p e rs c r ip ts a re d if fe re n t (P < 0 .0 1 ) .
e R a te d on a 1 —9 sc a le (1 = e x t re m e ly p o o r ; 9 = e x c e lle n t )
of one was extremely poor while a rating of nine was excellent. The tenderness rating scale was also based on a one to nine rating. It differed from the hedonic scale used for color, aroma, flavor and appearance as only three of the nine points were given a word description relating to tenderness. The number one position was labeled tough, the number five position was designated as ideal tenderness, and the number nine position was labeled tender. Tough was defined as resembling leather and tender as offering no resistance to chewing, thus being mushy or lacking texture. Ideal tenderness was defined as being slightly chewy, firm and juicy. A pretest session was held to familiarize panel members in the use of the rating scales.
Data were analyzed using analysis of variance methods described by Bennett and Franklin (1954), Snedecor (1956) and Ralston and Wilf (1960) for differences due to processing methods, loins and chops.
Table 4—Percent cooking loss of pork chops from accelerated and conventionally processed pork loins
Chill temp for accelerated processed loins
Processing method for loinsAccelerated
Conventional Sx
-4 5 .5 ° C 34.42 35.05 0.54-2 8 .9 ° C 31.96 32.54 0.37— 17.8° C 38.95 36.90 0.82
Table 5—Proximate analysis of accelerated and conventional processed pork loins
Chill temp Processing method for loinsfor accelerated processed loins
Accelerated
Conventional Sx
-45 .5 ° C
Moisture, %
70.38 70.49 .20—28.9°C 69.93 70.07 .20— 17.8°C 70.31 70.67 .17
-4 5 .5 ° C
Protein, %
22.55 22.46 .12-2 8 .9 ° C 22.48 22.32 .16— 17.8°C 22.06 22.23 .19
—45.5°CFat, %
6.52 6.11 .22—28.9"C 6.26 6.22 .16— 17.8°C 5.75 5.65 .20
-4 5 .5 ° C
Ash, %
1.11 1.13 .01—28.9°C 1.13 1.13 .01—17.8°C 1.13 1.13 .01
R E S U L T S & D IS C U S S IO N
THE UNIFORM REMOVAL of pork chops from loins of accelerated and conventionally processed pork loins did not result in any differences between chop weights for the two processing methods. Chop size varied with the size of loins used. Since loins from the same carcass were used to compare processing methods for loins, the comparison was made using matched left and right loin pork chops of approximately the same size.
Objective measurement for tenderness, both prior to cooking and following cooking to an internal temperature of 76.7°C did not indicate a difference in tenderness of pork chops due to the processing method of pork loins within each experiment (Tables 1 and 2). In two of three experiments, the taste panels found significant (P < 0.01) differences between processing methods.
The meat penetrometer was used to objectively measure tenderness of 10 pork chops from each loin while the taste panel was allowed to test only two samples from each loin for each treatment. The fact that the penetrometer had a larger sampling of the chop population than did the taste panel may account for some of the variations in the taste panel findings. Within each experiment and tenderness evaluation technique, the actual difference in tenderness was very small. While the taste panel found only small tenderness differences in pork chops due to loin processing, the differences in tenderness were consistent. However, all of the taste panel tenderness values fell within an acceptable range.
Table 6—pH and water-holding capacity of accelerated and conventional processed pork loins
Chill temp Processing method for loinsfor accelerated processed loins
Accelerated
Conventional Sx
—45.5°C
pH
5.68a 5.75b 0.02-2 8 .9 ° C 5.63“ 5.67c 0.01— 17.8° C 5.56“ 5.59“ 0.01
Water-holding capaci tyd-4 5 .5 ° C 22.88 22.38 0.83-2 8 .9 ° C 22.67 23.00 0.63— 17.8° C 24.87 24.77 0.74
a 'b M e an s w ith u n lik e s u p e rs c r ip ts are d if fe re n t(R < 0.01).
a *c M e an s w ith u n lik e s u p e rs c r ip ts are d if fe re n t (P < 0 .0 5 ) .
9 W a te r-h o ld in g c a p a c it y = p e rc e n t ju ic e lo st.
The results of the taste panel for flavor, color, aroma and appearance are summarized in Table 3. The taste panel found no differences in the flavor, color, aroma or appearance of fresh-frozen pork chops from loins processed either by the accelerated or conventional method.
The percent cooking loss of pork chops (Table 4) from accelerated and conventionally processed pork loins was approximately the same within experiments. These results tend to confirm the work of Moore et al. (1966) who found no significant difference in cooking loss attributable to the hot (accelerated) or cold (conventional) cutting methods for loin samples.
No significant differences were found within experiments for moisture, protein, fat, water-holding capacity and ash due to loin processing method (Table 5 and 6 ). Moore et al. (1966) also found no significant differences in moisture loss of pork loin roasts because of the cutting method. However, differences in moisture, protein, fat and ash were found among loins (P < 0.01) due to animal variation.
The accelerated processed pork loins demonstrated a consistently lower final pH value than the conventionally processed pork loins even though this difference was not significant in experiment three (Table 6 ).
The data presented in Tables 1 through 6 tend to confirm the laboratory findings of Davidson et al. (1968), Man- digo and Henrickson (1966), Moore et al.(1966) and Weiner et al. (1966) which demonstrated the laboratory feasibility of producing acceptable wholesale cuts of pork using the accelerated pork processing method. From this study, one could conclude that acceptable fresh-frozen pork chops can be made using the accelerated processing technique for pork car
ACCELERATED PORK PROCESSING-833
casses under commercial processing conditions.
R E F E R E N C E S
AOAC. 1 965 . “ O fficial M ethods o f A nalysis,” 10th Ed. A ssoc. O fficial Agr. Chem ists, W ashington, D.C.
Bennett, C.A. and Franklin, N .L . 1 9 5 4 . “Statistical Analysis in Chemistry and the Chemical Industry.” John Wiley & Sons, Inc. New York.
Davidson, W .D., C liplef, R .L ., Meade, R .S. and Hanson, L.E. 196 8 . Postm ortem processing treatm ent on selected characteristics o f ham and fresh pork sausage. F ood Technol. 22: 772 .
Henrickson, R.L. 1968 . High temperature processing effect on physical, chem ical, microbial and flavor properties o f pork. Proceedings of the Meat Industry Research C onference, p. 49. American Meat Institute Foundation, Chicago.
Hinnergajrdt, L.C. and T uom y, J.M. 197 0 . A
penetrom eter test to measure m eat tenderness. J. Food Sci. 35: 312.
M andigo, R.W. 1967 . H ot cutting and processing o f pork. Proc. o f the 20th Annual R eciprocal Meat Conference 20: 270 .
M andigo, R.W. 1968 . High temperature pork processing, cutting, fabricating, handling and yield . Proc. o f the Meat Industry R esearch C onference, p. 41. American Meat Institute Foundation, Chicago.
Mandigo, R.W. and Henrickson, R.L. 1966 . Influence of hot-processing pork carcasses on cured ham. Food Technol. 20: 538.
Marsh, B.B. and Legt, N .G. 196 6 . Studies in m eat tenderness. 3. The effects o f cold shortening on tenderness. J. Food Sci. 31: 450 .
M oore, R .E ., Mandigo, R.W. and Henrickson, R.L. 196 6 . The effect o f cutting, chilling, and cooking m ethod on the quality o f pork lo in . F ood Technol. 15(2): 57 .
NAMP. 1 970 . “ Meat Buyers Guide to Standardized Meat Cuts.” National A ssociation of Meat Purveyors, Chicago, 111.
R alston, A. and Wilf, H.S. 1960 . “M athematical M ethods for Digital Com puters,” V ol 1.
John Wiley & Sons, Inc., New York.Snedecor, G.W. 195 6 . “Statistical M ethods,”
5th Ed. Iowa State College Press, Ames, Iowa.
Weiner, P.D ., Kropf, D.H., M ackintosh, D.L. and K och, B.A. 1966 . E ffect o f m uscle quality o f processing pork carcasses w ithin one hour postm ortem . Food Technol. 20: 541.
Wierbicki, E., Kunkle, L.E. and Deatherage, F.E. 1 9 5 7 . Changes in the water-holding capacity and cationic shifts during the heating and freezing and thawing o f m eat as revealed by a simple centrifugal m ethod for measuring shrinkage. F ood Technol. 11: 69.
Ms received 1 2 /3 0 /7 2 ; revised 5 /2 /7 3 ; accepted5 /7 /7 3 .______________________________________
Paper Number 353 7 , Journal Series, Nebraska Agricultural Experim ent Station. Research reported was conducted under Project Number 13-23.
Supported in part by a cooperative agreem ent w ith the USDA Transportation & Facilities Research Div., ARS, and by a cooperative agreement w ith George A. Hormel and Com pany, A ustin, Minn.
L. C. HINNERGARDT,' R. W. MANDIGO2 and J. M. TUOMY'University o f Nebraska-Lincoln and U.S. Arm y Natick Laboratories
ACCELERATED PORK PROCESSING. Freeze-Dried Pork Chops
IN T R O D U C T IO N
THE ECONOMIC potential of accelerated pork processing has been recognized by Mandigo (1968) and Henrickson (1968). Moore et al. ( 1966), Weiner et al. ( 1966), Hinnergardt (1972) and Hinnergardt et al.(1973) have shown that acceptable wholesale pork loins could be produced using accelerated pork processing techniques described by Mandigo (1967).
Fresh-frozen boneless pork chops from accelerated processed pork loins were not different in tenderness, color, aroma, flavor and appearance than were chops produced from conventionally processed loins (Hinnergardt et al., 1973).
Tuomy and Felder (1964) compared internal cooking temperatures of pork chops with plate temperatures for freezedrying. They found that the freeze-dryer plate temperature was the only variable significantly affecting browning, tenderness and flavor of the final product. Aitken et al. (1962) found freeze-dried pork most acceptable when 60 C was not exceeded as the maximum freeze-dryer plate temperature. The actual temperature of the product being dried, rather than the plate temperature was the limiting factor (Tuomy and Felder, 1964). Tuomy (1970) indicated the quality of freeze-dried pork chops was lowered rapidly if the dry product temperature exceeds 54 C.
Tuomy and Helmer (1967) found that the freeze-drying process causes a toughening and a decrease in flavor acceptability in pork. They pointed out that freeze-drying resulted in tenderness and flavor variations that were greater for freeze-dried pork than comparable fresh samples.
Information has not been available on the effect of accelerated processing of pork loins with respect to the acceptability of freeze-dried pork chops. Consequently, a study was conducted to determine the effect of accelerated processing
1 Present address: U.S. Army Natick Labora- tories, Natick, MA 01760
2 Dept, o f Animal Science, Meat Lab., University o f Nebraska-Lincoln, Lincoln, NE 68503
of pork loins on fresh-frozen and freeze- dried pork chops.
M A T E R I A L S & M E T H O D S
THE PORK CHOPS used in this study were obtained from 120 pork loins processed as wholesale fresh pork loins (NAMP No. 410, NAMP,1970) in the George A. Hormel and Company packing plant at Fremont, Nebr. Removal of the pork loins from the carcass was done according to the standard methods practiced in the packing plant.
Left and right wholesale loins were alternately assigned to the treatments of accelerated or conventional processing of pork loins. The chilled loins were shipped to the University of Nebraska-Lincoln. At the University of Nebraska-Lincoln, the loins were frozen at -23.3°C. Once the loins were frozen, 1.27 cm thick chops were removed, packed in dry ice, and shipped to U.S. Army Natick Laboratories.
Ten chops from each loin were selected for freeze-drying. The fat trimmed, boneless pork chops were freeze-dried at 51.7°C plate temperature and a chamber pressure of 0.3-0.5 mm of mercury pressure. Identity of the pork chops during freeze-dehydration was maintained by use of dividers in the freeze-dehydrator trays. The dried chops were placed in plastic bags and labeled to maintain identity. The bags were then packed in beaded No. 10 cans. The oxygen in the headspace gas was reduced by evacuating the can with a vacuum of 736.6 mm on a mercury monometer for 1 min and flushing to atmospheric pressure with nitrogen gas. This procedure was repeated a second time before the can was sealed. The headspace oxygen content was reduced to approximately 0.75% as determined by the procedure outlined by Bishov and Henick (1966). The cans of freeze- dried chops were stored at 4.4°C until the chops could be analyzed.
Rehydration of the freeze-dried pork chops was accomplished by soaking the dry chops in 26.7°C water for 30 min. The freeze-dried pork chops were weighed before and after rehydration. These weights in addition to the fresh- frozen weight were used to calculate rehydration ratios and the percent of the original weight obtained upon reconstitution. The rehydrated chops were equilibrated to 4.4°C by holding 16 hr at 4.4°C.
The rehydrated, equilibrated pork chops were penetrated with a Meat Penetrometer described by Hinnergardt and Tuomy (1970). The peak of the force curve was used in analyzing the data. The penetrated freeze-dried raw pork chops were cooked to an internal temperature of 76.7°C using a 6 psi steam pressure in a three compartment Steam Chef oven. The
cooked chops were cooled for 2 hr at 4.4°C and then penetrated again. Pork chops numbered six and eight were paired and 16 and 18 were paired from each loin for evaluation by a 10-member organoleptic panel.
Two samples were served at each taste panel session and evaluated for color, aroma, flavor, appearance and tenderness. The chops were cut into 10 pieces of equal size and served to the panelists. The two samples represented a comparison of freeze-dried pork chops and pork loins which were conventionally and accelerated processed. All chops submitted to the taste panel had been tested before hand with the Meat Penetrometer.
The rating scales used by the taste panel for evaluation of color, aroma, flavor and appearance were based on a one to nine scale. A rating of one was extremely poor while a rating of nine was excellent. The tenderness rating scale was based on a one to nine rating. It differed from the hedonic scale used for color, aroma, flavor and appearance as only three of the nine points were given a word description relating to tenderness. The number one position was labeled tough, the number five position designated as ideal tenderness and the number nine position was labeled tender. Tough was defined as resembling leather and tender as offering no resistance to chewing, thus being mushy or lacking texture. Ideal tenderness was defined as being slightly chewy, firm and juicy. A pretest session was held to familiarize the panel members in the use of the rating scales.
Data were analyzed using analysis of variance methods described by Bennett and Franklin (1954), Snedecor (1956) and Ralston and Wilf (1960).
R E S U L T S & D IS C U S S IO N
THE MEAN WEIGHTS of the frozen, boneless pork chops prior to freeze- dehydration did not show a difference between pork chops from accelerated and conventionally processed pork loins (Table 1). A nonsignificant difference between pork chops from accelerated and conventionally processed pork loins was also noted in the dry weights (Table 1) and rehydrated weights (Table 2) of the freeze-dried pork chops. The rehydration ratio (Table 2) was not affected by accelerated processing.
The Meat Penetrometer (Hinnergardt and Tuomy, 1970) found no significant difference in tenderness of rehydrated, freeze-dried pork chops before cooking (Table 3). After cooking the rehydrated
8 3 4 - J O U R N A L O F F O O D S C I E N C E - V o l u m e 3 8 ( 1 9 7 3 )
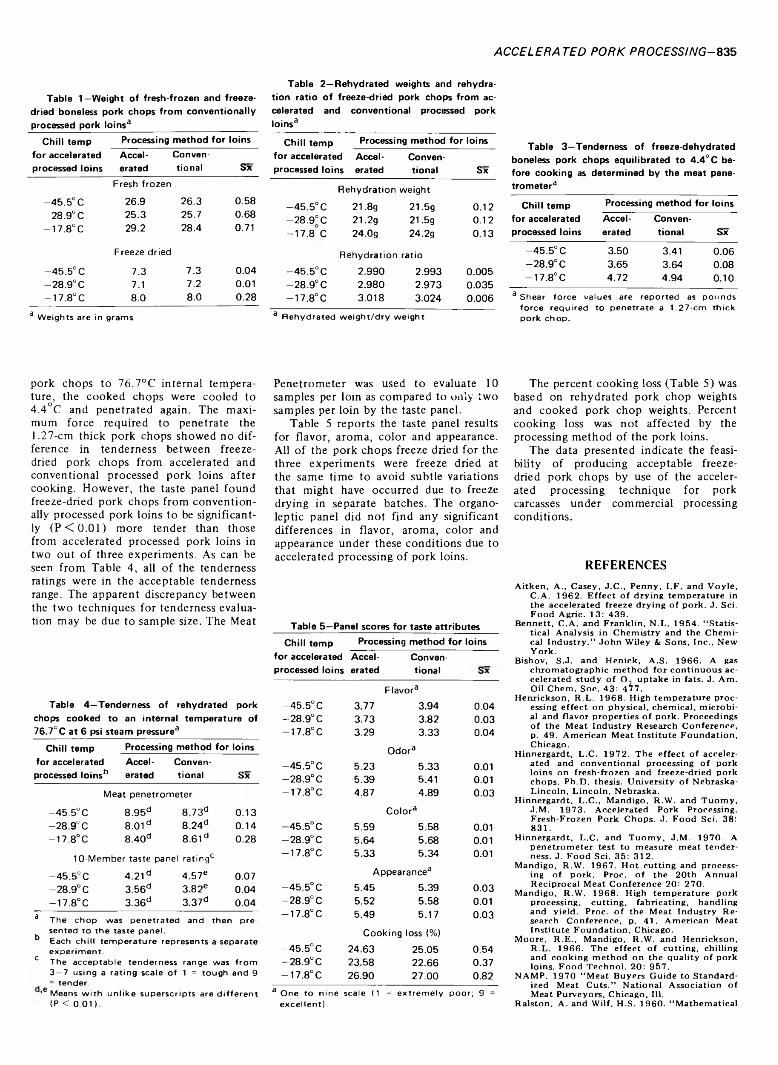
ACCELERATED PORK PROCESSING-835
Table 1—Weight of fresh-frozen and freeze- dried boneless pork chops from conventionally processed pork loins3 ________________________________
Chill temp for accelerated processed loins
Processing method for loinsAccelerated
Conventional Sx
Fresh frozen
-4 5 .5 ° C 26.9 26.3 0.58-2 8 .9 ° C 25.3 25.7 0.68— 17.8°C 29.2 28.4 0.71
Freeze dried
-4 5 .5 ° C 7.3 7.3 0.04-2 8 .9 ° C 7.1 7.2 0.01— 17.8°C 8.0 8.0 0.28
3 W e ig h ts are in g ram s
Table 2—Rehydrated weights and rehydration ratio of freeze-dried pork chops from accelerated and conventional processed pork loins3
Chill temp for accelerated processed loins
Processing method for loinsAccelerated
Conventional Sx
Rehydration weight—45.5°C 21.8g 21.5g 0.12-2 8 .9 ° C 21.2g 21,5g 0.12-1 7 .8 C 24.0g 24.2g 0.13
Rehydration ratio-4 5 .5 ° C 2.990 2.993 0.005-2 8 .9 ° C 2.980 2.973 0.035— 17.8°C 3.018 3.024 0.006
3 R e h y d ra te d w e ig h t/d ry w e ig h t
Table 3—Tenderness of freeze-dehydrated boneless pork chops equilibrated to 4.4° C before cooking as determined by the meat penetrometer3
Chill temp for accelerated processed loins
Processing method for loinsAccelerated
Conventional Sx
-45 .5 ° C 3.50 3.41 0.06-2 8 .9 ° C 3.65 3.64 0.08— 17.8°C 4.72 4.94 0.10
3 S h e a r fo rc e v a lu e s are re p o rte d as p o u n d sfo rc e re q u ire d to p e n e tra te a 1 .2 7 -c m th ic k p o rk c h o p .
pork chops to 76.7°C internal temperature, the cooked chops were cooled to 4.4°C and penetrated again. The maximum force required to penetrate the 1.27-cm thick pork chops showed no difference in tenderness between freeze- dried pork chops from accelerated and conventional processed pork loins after cooking. However, the taste panel found freeze-dried pork chops from conventionally processed pork loins to be significantly ( P < 0 .0 1 ) more tender than those from accelerated processed pork loins in two out of three experiments. As can be seen from Table 4, all of the tenderness ratings were in the acceptable tenderness range. The apparent discrepancy between the two techniques for tenderness evaluation may be due to sample size. The Meat
Table 4—Tenderness of rehydrated pork chops cooked to an internal temperature of 76.7° C at 6 psi steam pressure3
Chill temp for accelerated processed loinsb
Processing method for loinsAccelerated
Conventional Sx
Meat penetrometer
-45 .5° C 8.95d 8.73d 0.13-28 .9° C 8.01d 8.24d 0.14— 17.8° C 8.40d 8.61d 0.28
10-Member taste panel rating0-45 .5° C 4.21d 4.57e 0.07-28 .9° C 3.56d 3.82e 0.04— 17.8°C 3.36d 3.37d 0.04
3 T h e c h o p w as p e n e tra te d an d th e n p re se n te d to th e ta ste p a n e l.
b E a c h c h il l t e m p e ra tu re re p re se n ts a se p a ra te e x p e r im e n t .
c T h e a c c e p ta b le te n d e rn e s s ran ge w a s fro m 3 — 7 u sin g a ra t in g sc a le o f 1 = to u g h an d 9 - ten d er.
,e M eans w ith u n lik e s u p e rs c r ip ts are d if fe re n t (P < 0 .0 1 ) .
Penetrometer was used to evaluate 10 samples per loin as compared to only two samples per loin by the taste panel.
Table 5 reports the taste panel results for flavor, aroma, color and appearance. All of the pork chops freeze dried for the three experiments were freeze dried at the same time to avoid subtle variations that might have occurred due to freeze drying in separate batches. The organoleptic panel did not find any significant differences in flavor, aroma, color and appearance under these conditions due to accelerated processing of pork loins.
Table 5—Panel scores for taste attributesChill temp Processing method for loins
for accelerated processed loins
Accelerated
Conventional Sx
—45.5°C 3.77Flavor3
3.94 0.04-2 8 .9 ° C 3.73 3.82 0.03— 17.8° C 3.29 3.33 0.04
—45.5°C 5.23Odor3
5.33 0.01-2 8 .9 ° C 5.39 5.41 0.01— 17.8°C 4.87 4.89 0.03
-4 5 .5 ° C 5.59Color3
5.58 0.01-2 8 .9 ° C 5.64 5.68 0.01— 17.8°C 5.33 5.34 0.01
-4 5 .5 ° CAppearance3
5.45 5.39 0.03-2 8 .9 ° C 5.52 5.58 0.01— 17.8°C 5.49 5.17 0.03
—45.5°CCooking loss (%)
24.63 25.05 0.54-2 8 .9 ° C 23.58 22.66 0.37— 17.8°C 26.90 27.00 0.82
3 One to nine :scale (1 = extremely poor; 9 =e x c e lle n t ) .
The percent cooking loss (Table 5) was based on rehydrated pork chop weights and cooked pork chop weights. Percent cooking loss was not affected by the processing method of the pork loins.
The data presented indicate the feasibility of producing acceptable freeze- dried pork chops by use of the accelerated processing technique for pork carcasses under commercial processing conditions.
R E F E R E N C E S
Aitken, A., Casey, J.C., Penny, I.F . and V oyle,C.A. 1962. E ffect o f drying temperature in the accelerated freeze drying of pork. J. Sci. Food Agric. 13: 439.
Bennett, C.A. and Franklin, N.L. 1954. “ Statistical Analysis in Chemistry and the Chemical Industry.” John Wiley & Sons, Inc., New York.
Bishov, S.J. and Henick, A.S. 1966. A gas chromatographic m ethod for continuous accelerated study of 0 2 uptake in fats. J. Am. Oil Chem. Soc. 43: 477.
Henrickson, R.L. 1968. High temperature processing effect on physical, chem ical, m icrobial and flavor properties o f pork. Proceedings of the Meat Industry Research Conference, p. 49. American Meat Institute Foundation, Chicago.
Hinnergardt, L.C. 1972. The effect o f accelerated and conventional processing o f pork loins on fresh-frozen and freeze-dried pork chops. Ph.D. thesis. University o f Nebraska- Lincoln, Lincoln, Nebraska.
Hinnergardt, L.C., Mandigo, R.W. and Tuom y, J.M. 1973. Accelerated Pork Processing. Fresh-Frozen Pork Chops. J. Food Sci. 38: 831.
Hinnergardt, L.C. and T uom y, J.M. 1970. A penetrom eter test to measure m eat tenderness. J. Food Sci. 35: 312.
Mandigo, R.W. 1967. H ot cutting and processing of pork. Proc. o f the 20th Annual Reciprocal Meat Conference 20: 270.
Mandigo, R.W. 1968 . High temperature pork processing, cutting, fabricating, handling and yield. Proc. o f the Meat Industry Research Conference, p. 41. American Meat Institute Foundation, Chicago.
Moore, R.E., Mandigo, R.W. and Henrickson, R.L. 1966. The effect o f cutting, chilling and cooking m ethod on the quality o f pork loins. Food Technol. 20: 957.
NAMP. 1970 “ Meat Buyers Guide to Standardized Meat Cuts.” National A ssociation of Meat Purveyors, Chicago, 111.
Ralston, A. and Wilf, H.S. 1960. “Mathematical

836-JOURNAL OF FOOD SC/ENCE-Vo/ume 38 (1973)
M ethods for Digital Com puters,” V ol 1. John Wiley & Sons, Inc., New York.
Snedecor, G.W. 1956. “Statistical M ethods,” 5th ed. Iowa State College Press, Ames, Iowa.
Tuom y, J.M. 1970. Freeze drying of foods for the armed services. Technical Report 70-43-FL. U.S. Army Natick Laboratories, Natick, Mass.
Tuom y, J.M. and Felder, J. 1964. E ffect of processing temperature and cooking m eth
ods on the quality o f freeze-dried pork. Food Technol. 18: 1959.
Tuom y, J.M. and Helmer, R.L. 1967 . E ffect o f freeze drying on the quality o f the longissi- mus dorsi muscle o f pork. Food Technol. 21: 653.
Weiner, P.D., Kropf, D.H., M ackintosh, D.L. and K och, B.A. 1 966 . E ffect o f m uscle quality o f processing pork carcasses w ithin one hour postm ortem . Food Technol. 20: 541.
Ms received 1 2 /3 0 /7 2 ; revised 5 /2 /7 2 ; accepted 5 /7 /7 3 ._________________________________________
Paper Number 3 538 , Journal Series, Nebraska Agricultural Experim ent Station. Research reported was conducted under Project Number 13-23.
Supported in part by a cooperative agreem ent w ith the USDA Transportation & Facilities Research Div., ARS, and by a cooperative agreement with George A. Hormel and Company, Austin, Minn.
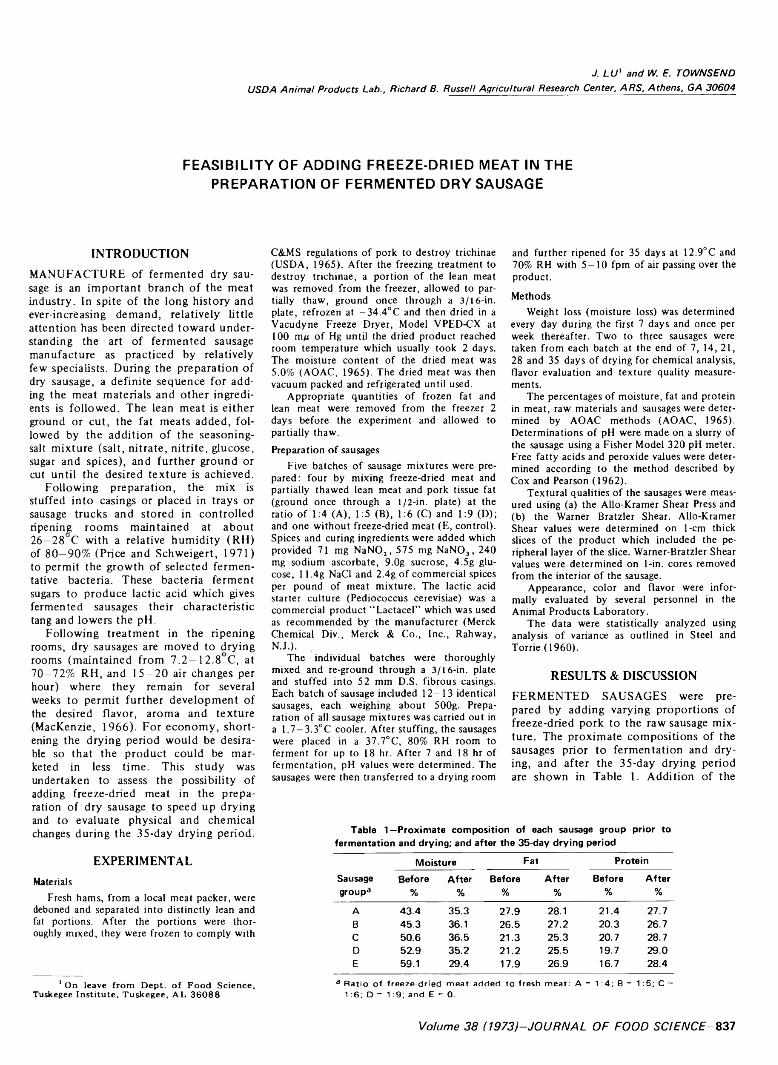
J. L U ' a n d W. E. T O W N S E N D
U S D A A n im a l P ro d u c ts L a b ., R ic h a rd B. R u sse ll A g r ic u ltu ra l R esea rch C e n te r , A R S , A th e n s , G A 3 0 6 0 4
FEASIBILITY OF ADDING FREEZE-DRIED MEAT IN THE PREPARATION OF FERMENTED DRY SAUSAGE
MANUFACTURE of fermented dry sausage is an important branch of the meat industry. In spite of the long history and ever-increasing demand, relatively little attention has been directed toward understanding the art of fermented sausage manufacture as practiced by relatively few specialists. During the preparation of dry sausage, a definite sequence for adding the meat materials and other ingredients is followed. The lean meat is either ground or cut, the fat meats added, followed by the addition of the seasoning- salt mixture (salt, nitrate, nitrite, glucose, sugar and spices), and further ground or cut until the desired texture is achieved.
Following preparation, the mix is stuffed into casings or placed in trays or sausage trucks and stored in controlled ripening rooms maintained at about 26-28 C with a relative humidity (RH) of 80—90% (Price and Schweigert, 1971) to permit the growth of selected fermentative bacteria. These bacteria ferment sugars to produce lactic acid which gives fermented sausages their characteristic tang and lowers the pH.
Following treatment in the ripening rooms, dry sausages are moved to drying rooms (maintained from 7.2—12.8 C, at 70-72% RH, and 15 -20 air changes per hour) where they remain for several weeks to permit further development of the desired flavor, aroma and texture (MacKenzie, 1966). For economy, shortening the drying period would be desirable so that the product could be marketed in less time. This study was undertaken to assess the possibility of adding freeze-dried meat in the preparation of dry sausage to speed up drying and to evaluate physical and chemical changes during the 35-day drying period.
EXPERIMENTALMaterials
Fresh hams, from a local meat packer, were deboned and separated into distinctly lean and fat portions. After the portions were thoroughly mixed, they were frozen to comply with
IN TRO D U CTIO N
1 On leave from Dept, o f Food Science, Tuskegee Institute, Tuskegee, AL 3 6088
C&MS regulations of pork to destroy trichinae (USDA, 1965). After the freezing treatment to destroy trichinae, a portion of the lean meat was removed from the freezer, allowed to partially thaw, ground once through a 3/16-in. plate, refrozen at -34.4°C and then dried in a Vacudyne Freeze Dryer, Model VPED-CX at 100 mju of Hg until the dried product reached room temperature which usually took 2 days. The moisture content of the dried meat was 5.0% (AOAC, 1965). The dried meat was then vacuum packed and refrigerated until used.
Appropriate quantities of frozen fat and lean meat were removed from the freezer 2 days before the experiment and allowed to partially thaw.Preparation of sausages
Five batches of sausage mixtures were prepared: four by mixing freeze-dried meat and partially thawed lean meat and pork tissue fat (ground once through a 1 /2-in. plate) at the ratio of 1:4 (A), 1:5 (B), 1:6 (C) and 1:9 (D); and one without freeze-dried meat (E, control). Spices and curing ingredients were added which provided 71 mg NaN02, 575 mg NaN03, 240 mg sodium ascorbate, 9.0g sucrose, 4.5g glucose, 11.4g NaCl and 2.4g of commercial spices per pound of meat mixture. The lactic acid starter culture (Pediococcus cerevisiae) was a commercial product “Lactacel” which was used as recommended by the manufacturer (Merck Chemical Div., Merck & Co., Inc., Rahway,N.J.).
The individual batches were thoroughly mixed and re-ground through a 3/16-in. plate and stuffed into 52 mm D.S. fibrous casings. Each batch of sausage included 12-13 identical sausages, each weighing about 500g. Preparation of all sausage mixtures was carried out in a 1.7-3.3°C cooler. After stuffing, the sausages were placed in a 37.7°C, 80% RH room to ferment for up to 18 hr. After 7 and 18 hr of fermentation, pH values were determined. The sausages were then transferred to a drying room
and further ripened for 35 days at 12.9°C and 70% RH with 5-10 fpm of air passing over the product.
MethodsWeight loss (moisture loss) was determined
every day during the First 7 days and once per week thereafter. Two to three sausages were taken from each batch at the end of 7, 14, 21, 28 and 35 days of drying for chemical analysis, flavor evaluation and texture quality measurements.
The percentages of moisture, fat and protein in meat, raw materials and sausages were determined by AOAC methods (AOAC, 1965). Determinations of pH were made on a slurry of the sausage using a Fisher Model 320 pH meter. Free fatty acids and peroxide values were determined according to the method described by Cox and Pearson (1962).
Textural qualities of the sausages were measured using (a) the Allo-Kramer Shear Press and(b) the Warner Bratzler Shear. Allo-Kramer Shear values were determined on 1-cm thick slices of the product which included the peripheral layer of the slice. Warner-Bratzler Shear values were determined on 1-in. cores removed from the interior of the sausage.
Appearance, color and flavor were informally evaluated by several personnel in the Animal Products Laboratory.
The data were statistically analyzed using analysis of variance as outlined in Steel and Torrie (1960).
RESULTS & DISCUSSIONFERMENTED SAUSAGES were prepared by adding varying proportions of freeze-dried pork to the raw sausage mixture. The proximate compositions of the sausages prior to fermentation and drying, and after the 35-day drying period are shown in Table 1. Addition of the
Table 1—Proximate composition of each sausage group prior to fermentation and drying; and after the 35-day drying period
Moisture Fat ProteinSausage Before After Before After Before Aftergroup3 % % % % % %
A 43.4 35.3 27.9 28.1 21.4 27.7B 45.3 36.1 26.5 27.2 20.3 26.7C 50.6 36.5 21.3 25.3 20.7 28.7D 52.9 35.2 21.2 25.5 19.7 29.0E 59.1 29.4 17.9 26.9 16.7 28.4
a R a t io o f fre e z e -d rie d m e a t ad d e d to fre sh m e a t: A = 1 :4 ; B = 1:5; C =1:6; D = 1 :9; an d E = 0.
V o l u m e 3 8 ( 1 9 7 3 ) - J O U R N A L O F F O O D S C I E N C E - 8 3 7
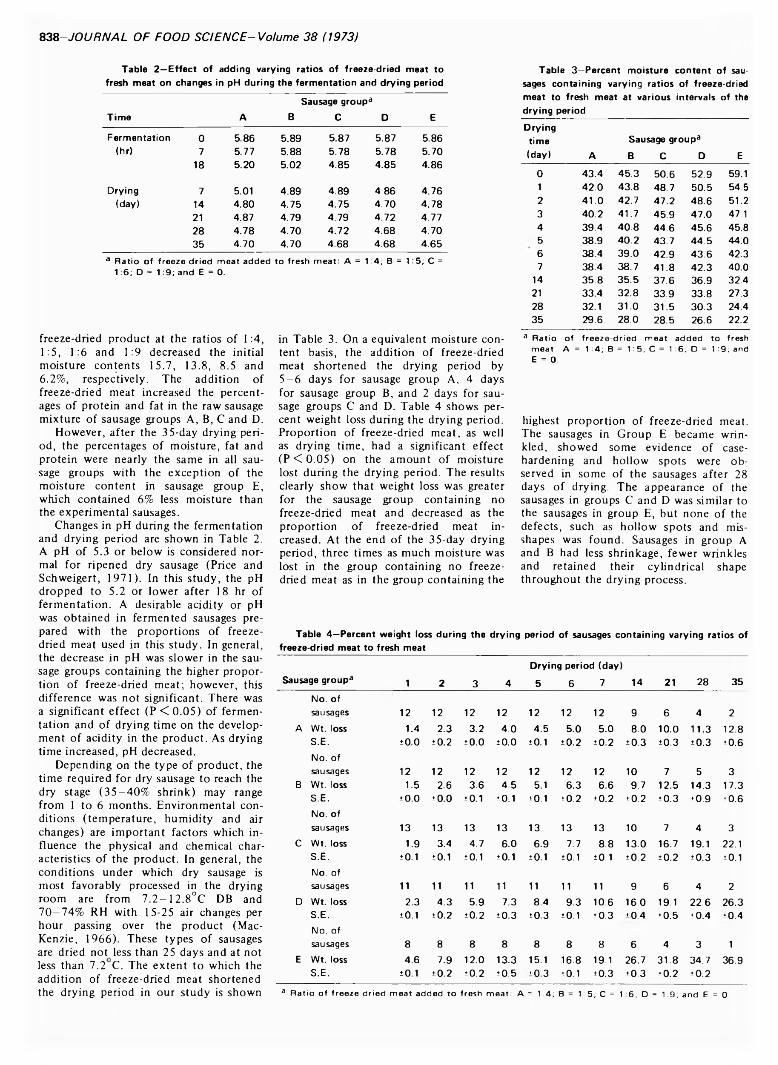
838-JOURNAL OF FOOD SCIENCE-Volume 38 (1973)
Table 2—Effect of adding varying ratios of freeze-dried meat to fresh meat on changes in pH during the fermentation and drying period
Time ASausage group3
B C D E
Fermentation 0 5.86 5.89 5.87 5.87 5.86(hr) 7 5.77 5.88 5.78 5.78 5.70
18 5.20 5.02 4.85 4.85 4.86
Drying 7 5.01 4.89 4.89 4.86 4.76(day) 14 4.80 4.75 4.75 4.70 4.78
21 4.87 4.79 4.79 4.72 4.7728 4.78 4.70 4.72 4.68 4.7035 4.70 4.70 4.68 4.68 4.65
3 R a t io o f f re e z e -d r ie d m e a t ad d e d to fre sh m e a t : A = 1 :4 ; B = 1 :5 ; C = 1 :6 ; D = 1 :9 ; an d E = 0.
freeze-dried product at the ratios of 1:4, 1:5, 1:6 and 1:9 decreased the initial moisture contents 15.7, 13.8, 8.5 and 6.2%, respectively. The addition of freeze-dried meat increased the percentages of protein and fat in the raw sausage mixture of sausage groups A, B, C and D.
However, after the 35-day drying period, the percentages of moisture, fat and protein were nearly the same in all sausage groups with the exception of the moisture content in sausage group E, which contained 6% less moisture than the experimental sausages.
Changes in pH during the fermentation and drying period are shown in Table 2. A pH of 5.3 or below is considered normal for ripened dry sausage (Price and Schweigert, 1971). In this study, the pH dropped to 5.2 or lower after 18 hr of fermentation. A desirable acidity or pH was obtained in fermented sausages prepared with the proportions of freeze- dried meat used in this study. In general, the decrease in pH was slower in the sausage groups containing the higher proportion of freeze-dried meat; however, this difference was not significant. There was a significant effect (P < 0 .0 5 ) of fermentation and of drying time on the development of acidity in the product. As drying time increased, pH decreased.
Depending on the type of product, the time required for dry sausage to reach the dry stage (35-40% shrink) may range from 1 to 6 months. Environmental conditions (temperature, humidity and air changes) are important factors which influence the physical and chemical characteristics of the product. In general, the conditions under which dry sausage is most favorably processed in the drying room are from 7 .2 -1 2 .8°C DB and 70—74% RH with 15-25 air changes per hour passing over the product (Mac- Kenzie, 1966). These types of sausages are dried not less than 25 days and at not less than 7.2 C. The extent to which the addition of freeze-dried meat shortened the drying period in our study is shown
in Table 3. On a equivalent moisture content basis, the addition of freeze-dried meat shortened the drying period by5 -6 days for sausage group A, 4 days for sausage group B, and 2 days for sausage groups C and D. Table 4 shows percent weight loss during the drying period. Proportion of freeze-dried meat, as well as drying time, had a significant effect (P < 0.05) on the amount of moisture lost during the drying period. The results clearly show that weight loss was greater for the sausage group containing no freeze-dried meat and decreased as the proportion of freeze-dried meat increased. At the end of the 35-day drying period, three times as much moisture was lost in the group containing no freeze- dried meat as in the group containing the
Table 3—Percent moisture content of sausages containing varying ratios of freeze-dried meat to fresh meat at various intervals of the drying periodDryingtime(day) A
Sausage group3 B C D E
0 43.4 45.3 50.6 52.9 59.11 42.0 43.8 48.7 50.5 54.52 41.0 42.7 47.2 48.6 51.23 40.2 41.7 45.9 47.0 47.14 39.4 40.8 44.6 45.6 45.85 38.9 40.2 43.7 44.5 44.06 38.4 39.0 42.9 43.6 42.37 38.4 38.7 41.8 42.3 40.0
14 35.8 35.5 37.6 36.9 32.421 33.4 32.8 33.9 33.8 27.328 32.1 31.0 31.5 30.3 24.435 29.6 28.0 28.5 26.6 22.2
3 R a t io o f fre e z e d r ie d im eat ad d e d to freshm e a t: A = 1 :4 ; B = 1 :5 ; C = 1 :6 ; D = 1 : 9 ; andE = 0.
highest proportion of freeze-dried meat. The sausages in Group E became wrinkled, showed some evidence of case- hardening and hollow spots were observed in some of the sausages after 28 days of drying. The appearance of the sausages in groups C and D was similar to the sausages in group E, but none of the defects, such as hollow spots and misshapes was found. Sausages in group A and B had less shrinkage, fewer wrinkles and retained their cylindrical shape throughout the drying process.
Table 4—Percent weight loss during the drying period of sausages containing varying ratios of freeze-dried meat to fresh meat
Sausage group3 1 2 3 4Drying period (day) 5 6 7 14 21 28 35
No. of sausages 12 12 12 12 12 12 12 9 6 4 2
A Wt. loss 1.4 2.3 3.2 4.0 4.5 5.0 5.0 8.0 10.0 11.3 12.8S.E . ±0.0 ±0.2 ±0.0 ±0.0 ±0.1 ±0.2 ±0.2 ±0.3 ±0.3 ±0.3 ±0.6No. of sausages 12 12 12 12 12 12 12 10 7 5 3
B Wt. loss 1.5 2.6 3.6 4.5 5.1 6.3 6.6 9.7 12.5 14.3 17.3S .E . ±0.0 ±0.0 ±0.1 ±0.1 ±0.1 ±0.2 ±0.2 ±0.2 ±0.3 ±0.9 ±0.6No. of sausages 13 13 13 13 13 13 13 10 7 4 3
C Wt. loss 1.9 3.4 4.7 6.0 6.9 7.7 8.8 13.0 16.7 19.1 22.1S.E . ±0.1 ±0.1 ±0.1 ±0.1 ±0.1 ±0.1 ±0.1 ±0.2 ±0.2 ±0.3 ±0.1No. of sausages 11 11 11 11 11 11 11 9 6 4 2
D Wt. loss 2.3 4.3 5.9 7.3 8.4 9.3 10.6 16.0 19.1 22.6 26.3S.E . ±0.1 ±0.2 ±0.2 ±0.3 ±0.3 ±0.1 ±0.3 ±0.4 ±0.5 ±0.4 ♦0.4No. of sausages 8 8 8 8 8 8 8 6 4 3 1
E Wt. loss 4.6 7.9 12.0 13.3 15.1 16.8 19.1 26.7 31.8 34.7 36.9S.E . ±0.1 ±0.2 ±0.2 ±0.5 *0.3 ±0.1 ±0.3 ±0.3 ±0.2 ±0.2
3 R a t io o f f re e z e -d r ie d m e a t ad d e d to fre sh m e a t : A = 1.4; B = 1 :5 ; C = 1 :6 ; D = 1.9; an d E = 0.

FREEZE-DRIED MEAT IN FERMENTED DRY SAUSAGE-839
Table 5—Effect of adding varying ratios of Table 7—Effect of adding varying ratios of freeze-dried meat to fresh meat on changes in freeze-dried meat to fresh meat on the amount consistency of fermented dry sausages of free fatty acids liberated during the drying perioda-b Drying------------------------------------------------------------- tim. Shear value (lb)a-bDrying (day) A B C D E
(day) A B c D E h.7 0.58 ± 0.2 0.73 ± 0.1 1.82 ± 0.6 3.05 ± 0.6 5.08 ± 0.6
0 0.54 0.55 0.55 0.56 0.55 (0 14 0.95 ± 0.2 0.95 ± 0.1 2.31 ± 0.3 4.30 ± 0.9 6.40 ± 1.27 1.78 1.66 1.56 1.42 0.98 £ 21 1.08 ± 0.2 2.45 ± 0.5 3.17 ± 0.6 3.01 ± 0.9 6.56 ± 0.7
14 2.01 1.76 1.76 1.63 1.14 © 28 1.52 ± 0.3 1.68 ± 0.2 4.50 ± 0.6 3.45 ± 0.1 9.18 ± 0.521 2.24 2.10 2.04 1.72 1.23 CO 35 1.02 ± 0.1 1.34 ± 0.2 2.65 ± 0.2 5.08 ± 0.2 7.10 ± 0.428 3.02 2.50 2.24 1.98 1.17 $35 3.08 2.86 2.53 2.47 2.08
a Ml 0 .1 N K O H / g fa tk.©c 14 7.93 ± 0.7 10.72 ± 0.6 16.00 ± 0.8 17.43 ± 0.7 28.65 ± 1.1
b A v erag e o f d u p lic a te s «k. 21 8.83 ± 1.0 12.20 ± 1.2 17.75 ± 1.6 19.45 ± 1.0 33.60 ± 1.9c R a t io of f re e z e -d r ie d im eat ad d e d to fresh * 28 12.67 ± 0.7 14.87 ± 1.2 24.61 ± 1.9 27.91 ± 1.5 53.00 ± 2.6
m e a t: A = 1 :4 ; B = 1 :5 ; C = 1 :6; D = 1: 9 ; and o 35 13.75 ± 2.1 18.16 ± 0.8 30.17 ± 1.5 37.42 ± 1.4 54.20 ±5.8E = o. <
a E a c h o b s e rv a t io n is th e m ean an d S .E . o f ten sh e a r v a lu e s f ro m e a ch sausag e g ro u p . b R a t io o f f re e z e -d r ie d m e a t ad d e d to fre sh m e a t : A = 1 :4 ; B = 1 :5 ; C = 1 :6 ; D = 1 :9 ; and E = 0 . c P o u n d s to sh e a r 1-in . c o re sd P o u n d s o f p re ssu re to sh e a r 1-cm th ic k s l ic e s o f sausageTable 6—Changes in peroxide value during
the drying period of sausages containing varying ratios of freeze-dried meat to fresh meata>b
Dryingtime Sausage groupc(day) A B c D E
0 5.10 4.85 4.85 5.15 5.1514 6.51 6.85 7.60 6.79 8.7021 6.02 6.70 8.92 9.50 6.4528 6.81 7.22 7.54 8.32 8.4335 6.93 7.52 8.06 9.28 10.30
3 Ml 0 .0 0 2 N so d iu m th io su lfa te / g fa tb A v erag e o f d u p lic a te sc R a t io o f fre e z e d r ie d m eat ad d e d to fresh
m eat: A = 1 :4 ; B = 1 : 5 ; C = 1 :6; D = 1 : 9 ; andE = 0.
The development of a desirable flavor and aroma in dry sausage depends on the addition of spices and seasonings, the decrease in pH and the enzymatic reactions that occur during the ripening process. The enzymes responsible for the reactions are indigenous to the meat itself and those produced by microflora growing in the meat. One of the important reactions occurring in the lipids of dry sausage seems to be the progressive breakdown of the various components of the pork fat by lipolytic bacteria (Cantoni et al. 1965,1966). During the ripening process of dry sausage the quantity of free fatty acids increases. Niinivaara (1968) reported a three-to-four-fold increase in free fatty acids during a 21-day ripening period. Giolitti and Massacra (1963) also reported similar increases in free fatty acids.
Table 5 shows the effect of adding freeze-dried meat to fresh meat on the liberation of free fatty acids during the35-day drying period. The results show a significant (P < 0.05) increase in the quantity of free fatty acids liberated during the drying period, and the increase in free fatty acids was greater in those
sausages containing higher proportions of freeze-dried to fresh meat. Cantoni et al.(1965) reported that the release of fatty acids is caused primarily by bacterial lipases, produced mainly by micrococci. Addition of freeze-dried meat in the sausages may have influenced the growth pattern of microorganisms, possibly favoring the growth of micrococci which resulted in the liberation of greater amounts of free fatty acids.
The development of rancidity in dry sausage is also greatly influenced by the type of microflora. Nurmi (1966) reported that micrococci decreased the peroxide number while lactobacilli increased it. The pattern of peroxide values (Table6 ) was not as consistent as that of the free fatty acids, but in general, values were higher with the sausages made without or with lesser proportions of freeze- dried meat. In addition to the microbial factor, the decline in pH value and the increase in salt concentration during drying might also have contributed to the differences noted in peroxide values. According to Watts and Peng (1947), rancidity increased when the pH value of pork sausage decreased from 6.5 to 4.8 and the salt content increased.
The development of the proper consistency (firmness) of dry sausage is generally believed to be a result of the evaporation of water from the product. The effect of the addition of freeze-dried meat on the consistency of the sausages is shown in Table 7. The results obtained with the Wamer-Bratzler Shear were somewhat irregular due to pieces of connective tissue catching between the blades of the shear, thus giving higher shear values. Nevertheless, a general trend was noted wherein firmness of sausages decreased as the proportion of freeze dried
meat to fresh meat increased. The values obtained with the Allo-Kramer Shear were more reproducible. Firmness increased with drying time, and the order of firmness was the same as that of the Wamer-Bratzler Shear. Two other important factors, type of microflora and pH, are involved in the development of the proper consistency of dry sausage. Nurmi(1966) reported that sausages inoculated with lactobacilli had distinctly higher tenderometer scores than the corresponding control and micrococci inoculated sausages. He also noted that a rapid decline in pH was closely related with the development of proper consistency in the sausage. In addition to the microbial factor, the softer texture noted in the sausage groups containing the higher proportion of freeze-dried meat might be also attributed to their higher fat and freeze-dried meat content.
One of the important changes occurring during the production of dry sausage is the development of the cured color. For some special applications (dry sausage in particular), only the nitrate salt is employed. In these instances, the products are cured for extended periods of time, thus allowing the reduction of nitrate to nitrite by the appropriate indigenous bacteria. Niinivaara (1955) has successfully used a strain of micrococci (Micrococcus strain M53) for this purpose in dry sausage. The nitrite formed reacts with myoglobin to form nitric oxide myoglobin (undenatured meat pigment), and the optimum pH range for this reaction is 5.5 —5.0. In this study, the initial curing reaction apparently was slower in the sausage groups containing the higher proportion of freeze-dried meat. However, after fermentation, all of the sausages developed a good cured color. In
M O -J O U R N A L O F FO O D S C IE N C E -V o lu m e 3 8 (1973)
itially sausages containing the higher proportions of freeze-dried meat were slightly brownish-red in color. The group without freeze-dried meat had a paler cured color which resembled the commercial products. The difference between the sausage group containing no freeze- dried meat and those groups containing lesser proportions of freeze-dried meat was slight.
In addition to color and texture, development of desirable flavor is essential. The use of the lactic acid culture decreased the pH rapidly, and an agreeable aroma and flavor had developed after only l wk of drying, although the taste was rated as “somewhat raw.” After 14 days of drying, the flavor became much milder and agreeable. None of the product developed an unpalatable flavor during the drying period.
The results of this study show that freeze-dried meat can be added to dry sausage mixes to shorten the drying period; however, with the increase in proportion of freeze-dried meat, there is a loss of quality (consistency and initial cured color development).
A comparison of all the quality attri
butes indicates that the best ratio of freeze-dried meat to fresh meat is between 1:6 and 1:9. However, practical application of these findings is contingent on several economic factors.
Additional investigations will be conducted to determine the optimum particle size of freeze-dried meat, ratio of freeze-dried meat and optimum environmental conditions needed to speed up the drying process.
REFERENCESA O A C . 1 9 6 5 . “ O ffic ia l M eth od s o f A n a ly s is ,”
1 0 th ed . A sso c ia tio n o f O ffic ia l A gricu ltural C hem ists, W ashington, D .C .
C anton i, C ., M olnar, M., R en o n , P. and G io litti, G. 1 9 6 5 . L ip o ly tic b acter ia in dry sausages.1. T he a c tiv ity o f M icrococcacae on sw ine fat. E leven th C on feren ce o f E uropean M eat R esearch W orkers, B elgrade, Y ugoslavia .
C an ton i, C ., M olnar, M ., R en o n , P. and G io litti, G. 1 9 6 6 . In vestiga tion s on th e lip id s o f dry sausages. T w elfth C on feren ce o f E uropean M eat R esearch W orkers, S an d efjord , N orw ay.
C ox , H .E . and Pearson, D . 1 9 6 2 . “ T h e C hem ical A n a lysis o f F o o d s ,” p. 4 2 1 . C hem ical Pu blish in g C o ., In c ., N ew Y ork .
G io litti, G. and M assacra, G. 1 9 6 3 . L ip o ly tic bacteria in raw sausages. N in th C on feren ce o f E uropean M eat R esearch W orkers, B udap est, H ungary.
M acK enzie, D .S . 1 9 6 6 . Prepared m eat p rod u ct
m an u factu rin g . A m erican M eat Institute, C hicago, 111.
N iinivaara, F .P . 1 9 5 5 . U ber d en E in flu ss von B akterienrein K ulturen a u f d ie R e ifu n g und U m rotu n g der R o h w u rst. A cta Agr. Fenn. 84: 1.
N iinivaara, F .P . 1 9 6 8 . A s tu d y o f th e influence o f fa ts and th eir d e c o m p o s it io n prod u cts on th e flavor and arom a o f dry sausage, to obta in in fo rm a tio n for use in d evelop in g improved dry sausage. F inal R ep o rt, Project N o . U R -E 8 -(6 0 )-1 4 , G rant N o . FG -F i-138, In stitu te o f M eat T ec h n o lo g y , U niv. o f Helsin k i, F in land .
N urm i, E. 1 9 6 6 . E ffe c t o f b acteria l in ocu lation s o n ch aracter istics and m icrob ia l flora o f dry sausage. A cta Agr. F en n . 1 0 8 : 1.
Price, J .F . and S ch w eig ert, B .S . 1 9 7 1 . “ The S c ien ce o f M eat and M eat P ro d u cts,” p. 5 0 6 . W .H. F reem an and C o ., San Francisco.
S tee l, R .G .D . and T orrie, J.H . 1 9 6 0 . “ Principles and P rocedures o f S ta tis t ic s ,” M cG raw-H ili B o o k C o ., In c ., N ew Y ork.
U S D A . 1 9 6 5 . “ R eg u la tio n s G overn ing th e Meat In sp ec tio n o f th e U n ited S ta te s D epartm ent o f A gricu ltu re ,” S ec . 3 1 8 :1 0 . U .S . G ovt. Printing O ffice , W ash ington , D .C .
W atts, B.M . and Peng, D .H . 1 9 4 7 . R ancid ity d ev e lo p m en t in raw versus p reco o k ed frozen pork sausage. J. H o m e E con . 39: 88 .
Ms rece ived 1 /6 /7 3 ; revised 2 /2 1 /7 3 ; accep ted2 /2 8 /7 3 .
R eferen ce to certa in p rod u cts or com p an ies d o e s n o t im p ly en d o rsm en t by th e U S D A over oth ers n o t m en tio n ed .
Mr. V ic to r C hew is a ck n o w led g ed for his assistance in in terp reta tio n o f th e data and Mr. Jack S tin so n for h is te ch n ica l assistan ce w ith th e p ro x im a te co m p o s it io n an alyses.
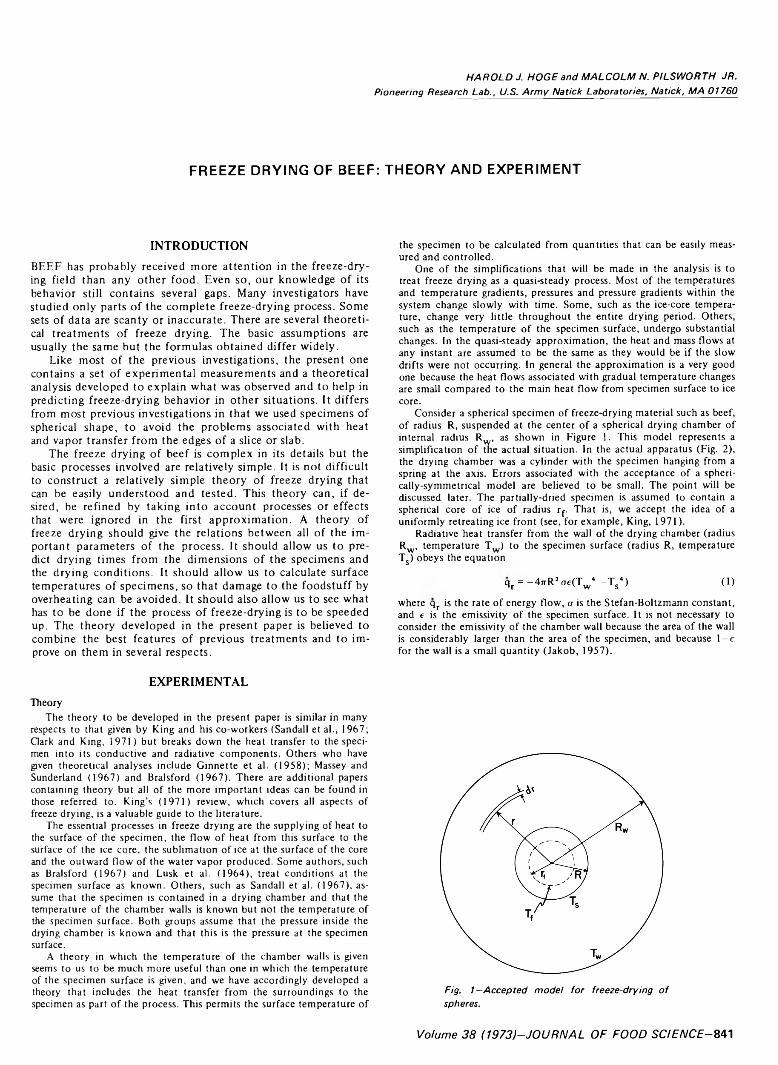
H A R O L D J. H O G E a n d M A L C O L M N . P IL S W O R T H J R .
P io n e er in g R esea rch L a b ., U .S . A r m y N a tic k L a b o ra to r ie s , N a tic k , M A 0 1 7 6 0
FREEZE DRYING OF BEEF: THEORY AND EXPERIMENT
IN T R O D U C T IO N
BEEF has probably received more attention in the freeze-drying field than any other food. Even so, our knowledge of its behavior still contains several gaps. Many investigators have studied only parts of the complete freeze-drying process. Some sets of data are scanty or inaccurate. There are several theoretical treatments of freeze drying. The basic assumptions are usually the same but the formulas obtained differ widely.
Like most of the previous investigations, the present one contains a set of experimental measurements and a theoretical analysis developed to explain what was observed and to help in predicting freeze-drying behavior in other situations. It differs from most previous investigations in that we used specimens of spherical shape, to avoid the problems associated with heat and vapor transfer from the edges of a slice or slab.
The freeze drying of beef is complex in its details but the basic processes involved are relatively simple. It is not difficult to construct a relatively simple theory of freeze drying that can be easily understood and tested. This theory can, if desired, be refined by taking into account processes or effects that were ignored in the first approximation. A theory of freeze drying should give the relations between all of the important parameters of the process. It should allow us to predict drying times from the dimensions of the specimens and the drying conditions. It should allow us to calculate surface temperatures of specimens, so that damage to the foodstuff by overheating can be avoided. It should also allow us to see what has to be done if the process of freeze-drying is to be speeded up. The theory developed in the present paper is believed to combine the best features of previous treatments and to improve on them in several respects.
E X P E R I M E N T A L
TheoryThe theory to be developed in the present paper is similar in many
respects to that given by King and his co-workers (Sandall et al., 1967; Qark and King, 1971) but breaks down the heat transfer to the specimen into its conductive and radiative components. Others who have given theoretical analyses include Ginnette et al. (1958); Massey and Sunderland (1967) and Bralsford (1967). There are additional papers containing theory but all of the more important ideas can be found in those referred to. King’s (1971) review, which covers all aspects of freeze drying, is a valuable guide to the literature.
The essential processes in freeze drying are the supplying of heat to the surface of the specimen, the flow of heat from this surface to the surface of the ice core, the sublimation of ice at the surface of the core and the outward flow of the water vapor produced. Some authors, such as Bralsford (1967) and Lusk et al. (1964), treat conditions at the specimen surface as known. Others, such as Sandall et al. (1967), assume that the specimen is contained in a drying chamber and that the temperature of the chamber walls is known but not the temperature of the specimen surface. Both groups assume that the pressure inside the drying chamber is known and that this is the pressure at the specimen surface.
A theory in which the temperature of the chamber walls is given seems to us to be much more useful than one in which the temperature of the specimen surface is given, and we have accordingly developed a theory that includes the heat transfer from the surroundings to the specimen as part of the process. This permits the surface temperature of
the specimen to be calculated from quantities that can be easily measured and controlled.
One of the simplifications that will be made in the analysis is to treat freeze drying as a quasi-steady process. Most of the temperatures and temperature gradients, pressures and pressure gradients within the system change slowly with time. Some, such as the ice-core temperature, change very little throughout the entire drying period. Others, such as the temperature of the specimen surface, undergo substantial changes. In the quasi-steady approximation, the heat and mass flows at any instant are assumed to be the same as they would be if the slow drifts were not occurring. In general the approximation is a very good one because the heat flows associated with gradual temperature changes are small compared to the main heat flow from specimen surface to ice core.
Consider a spherical specimen of freeze-drying material such as beef, of radius R, suspended at the center of a spherical drying chamber of internal radius Rw, as shown in Figure 1. This model represents a simplification of the actual situation. In the actual apparatus (Fig. 2), the drying chamber was a cylinder with the specimen hanging from a spring at the axis. Errors associated with the acceptance of a spheri- cally-symmetrical model are believed to be small. The point will be discussed later. The partially-dried specimen is assumed to contain a spherical core of ice of radius r . That is, we accept the idea of a uniformly retreating ice front (see, for example, King, 1971).
Radiative heat transfer from the wall of the drying chamber (radius Rw, temperature Tw) to the specimen surface (radius R, temperature Ts) obeys the equation
qr = -47rR2ae(Tw4 -T s4) (1)
where qr is the rate of energy flow, o is the Stefan-Boltzmann constant, and e is the emissivity of the specimen surface. It is not necessary to consider the emissivity of the chamber wall because the area of the wall is considerably larger than the area of the specimen, and because 1 —e for the wall is a small quantity (Jakob, 1957).
Fig. 1—A c c e p te d m o d e l fo r fr e e ze -d ry in g o f sp h eres .
V o l u m e 3 8 ( 1 9 7 3 ) - J O U R N A L O F F O O D S C I E N C E S 41
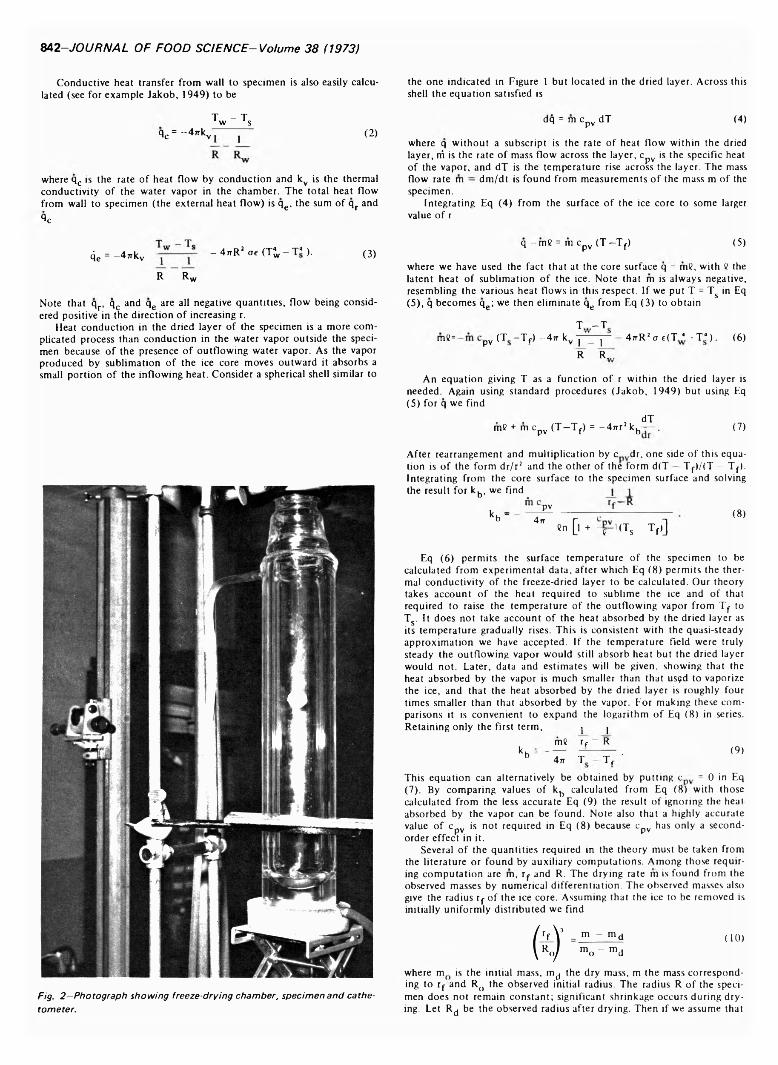
842-J O U R N A L O F FO O D S C IE N C E -V o lu m e 3 8 (1973)
Conductive heat transfer from wall to specimen is also easily calculated (see for example Jakob, 1949) to be
T - T w sqc = - 4 7 ^ “ j (2)
where qc is the rate of heat flow by conduction and kv is the thermal conductivity of the water vapor in the chamber. The total heat flow from wall to specimen (the external heat flow) is qe, the sum of qr and9C
the one indicated in Figure 1 but located in the dried layer. Across this shell the equation satisfied is
dq = m cpv dT (4)
where q without a subscript is the rate of heat flow within the dried layer, ni is the rate of mass flow across the layer, cpv is the specific heat of the vapor, and dT is the temperature rise across the layer. The mass flow rate m = dm/dt is found from measurements of the mass m of the specimen.
Integrating Eq (4) from the surface of the ice core to some larger value of r
4e = -4rrkv -4 rrR 2o e C a - T < ) . (3)
R Rw
Note that qr, qc and qe are all negative quantities, flow being considered positive in the direction of increasing r.
Heat conduction in the dried layer of the specimen is a more complicated process than conduction in the water vapor outside the specimen because of the presence of outflowing water vapor. As the vapor produced by sublimation of the ice core moves outward it absorbs a small portion of the inflowing heat. Consider a spherical shell similar to
Fig. 2 —P h o to g ra p h s h o w in g fre e ze -d ry in g c h a m b e r , s p e c im e n a n d ca th e - to m e te r .
q -m e = m cpy (T -T f) (5)
where we have used the fact that at the core surface q = me, with C the latent heat of sublimation of the ice. Note that m is always negative, resembling the various heat flows in this respect. If we put T = Ts in Eq (5), q becomes qg; we then eliminate qe from Eq (3) to obtain
T...-Tme= pv (T - T f) - 4 jt k.
VJ_R
J _R„
47rR2oe(T* -T ‘ ). (6)
An equation giving T as a function of r within the dried layer is needed. Again using standard procedures (Jakob, 1949) but using Eq (5) for q we find
dTme + m cpv (T -T f) = -47rr2kb— . (7)
After rearrangement and multiplication by c dr, one side of this equation is of the form dr/r2 and the other of the form d(T Tf)/(T - Tf). Integrating from the core surface to the specimen surface and solving the result for kp, we find
kb -pv
4nen [l + -Ç—I (Ts - Tf>]
(8)
Eq (6) permits the surface temperature of the specimen to be calculated from experimental data, after which Eq (8) permits the thermal conductivity of the freeze-dried layer to be calculated. Our theory takes account of the heat required to sublime the ice and of that required to raise the temperature of the outflowing vapor from Tf to Ts. It does not take account of the heat absorbed by the dried layer as its temperature gradually rises. This is consistent with the quasi-steady approximation we have accepted. If the temperature field were truly steady the outflowing vapor would still absorb heat but the dried layer would not. Later, data and estimates will be given, showing that the heat absorbed by the vapor is much smaller than that us?d to vaporize the ice, and that the heat absorbed by the dried layer is roughly four times smaller than that absorbed by the vapor. For making these comparisons it is convenient to expand the logarithm of Eq (8) in series. Retaining only the first term, | |
mG rf " Rkb — — --------- - (9>n 4rr T Tf
This equation can alternatively be obtained by putting c = 0 in Eq(7). By comparing values of kp calculated from Eq (8) with those calculated from the less accurate Eq (9) the result of ignoring the heat absorbed by the vapor can be found. Note also that a highly accurate value of cpv is not required in Eq (8) because cpv has only a second- order effect in it.
Several of the quantities required in the theory must be taken from the literature or found by auxiliary computations. Among those requiring computation are m, rf and R. The drying rate m is found from the observed masses by numerical differentiation. The observed masses also give the radius rf of the ice core. Assuming that the ice to be removed is initially uniformly distributed we find
(10)
where m is the initial mass, md the dry mass, m the mass corresponding to rf and R() the observed initial radius. The radius R of the specimen does not remain constant; significant shrinkage occurs during drying. Let R j be the observed radius after drying. Then if we assume that
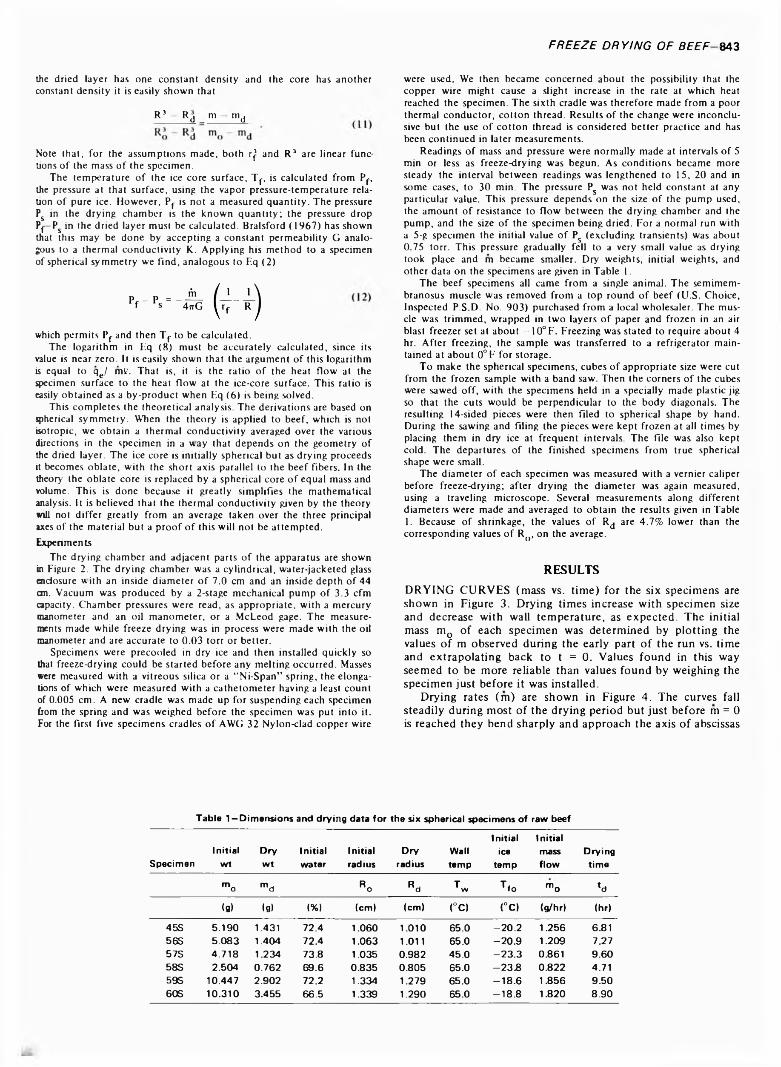
F R E E Z E D R Y IN G O F B EE F &43
the dried layer has one constant density and the core has another constant density it is easily shown that
R3 Rd ™ ™d
Note that, for the assumptions made, both rj and R3 are linear fune tions of the mass of the specimen.
The temperature of the ice core surface, Tf, is calculated from Pf, the pressure at that surface, using the vapor pressure-temperature relation of pure ice. However, Pf is not a measured quantity. The pressure Ps in the drying chamber is the known quantity; the pressure drop Pf Ps in the dried layer must be calculated. Bralsford (1967) has shown that this may be done by accepting a constant permeability G analogous to a thermal conductivity K. Applying his method to a specimen of spherical symmetry we find, analogous to Eq (2)
which permits Pf and then Tf to be calculated.The logarithm in Lq (8) must be accurately calculated, since its
value is near zero. It is easily shown that the argument of this logarithm is equal to qe/ mV. That is, it is the ratio of the heat flow at the specimen surface to the heat flow at the ice-core surface. This ratio is easily obtained as a by-product when Eq (6) is being solved.
This completes the theoretical analysis. The derivations are based on spherical symmetry. When the theory is applied to beef, which is not isotropic, we obtain a thermal conductivity averaged over the various directions in the specimen in a way that depends on the geometry of the dried layer. The ice core is initially spherical but as drying proceeds it becomes oblate, with the short axis parallel to the beef fibers. In the theory the oblate core is replaced by a spherical core of equal mass and volume. This is done because it greatly simplifies the mathematical analysis. It is believed that the thermal conductivity given by the theory will not differ greatly from an average taken over the three principal axes of the material but a proof of this will not be attempted. Experiments
The drying chamber and adjacent parts of the apparatus are shown in Figure 2. The drying chamber was a cylindrical, water-jacketed glass enclosure w ith an inside diameter of 7.0 cm and an inside depth of 44 cm. Vacuum was produced by a 2-stage mechanical pump of 3.3 cfm capacity. Chamber pressures were read, as appropriate, with a mercury manometer and an oil manometer, or a McLeod gage. The measurements made while freeze drying was in process were made with the oil manometer and are accurate to 0.03 torr or better.
Specimens were precooled in dry ice and then installed quickly so that freeze-drying could be started before any melting occurred. Masses were measured with a vitreous silica or a “Ni-Span” spring, the elongations of which were measured with a cathetometer having a least count of 0.005 cm. A new cradle was made up for suspending each specimen from the spring and was weighed before the specimen was put into it. For the first five specimens cradles of AWG 32 Nylon-clad copper wire
were used. We then became concerned about the possibility that the copper wire might cause a slight increase in the rate at which heat reached the specimen. The sixth cradle was therefore made from a poor thermal conductor, cotton thread. Results of the change were inconclusive but the use of cotton thread is considered better practice and has been continued in later measurements.
Readings of mass and pressure were normally made at intervals of 5 min or less as freeze-drying was begun. As conditions became more steady the interval between readings was lengthened to 15, 20 and in some cases, to 30 min. The pressure Ps was not held constant at any particular value. This pressure depends on the size of the pump used, the amount of resistance to flow between the drying chamber and the pump, and the size of the specimen being dried. For a normal run with a 5-g specimen the initial value of Ps (excluding transients) was about0. 75 torr. This pressure gradually fell to a very small value as drying took place and m became smaller. Dry weights, initial weights, and other data on the specimens are given in Table 1.
The beef specimens all came from a single animal. The semimembranosus muscle was removed from a top round of beef (U.S. Choice, Inspected P.S.D. No. 903) purchased from a local wholesaler. The muscle was trimmed, wrapped in two layers of paper and frozen in an air blast freezer set at about -10°F. Freezing was stated to require about 4 hr. After freezing, the sample was transferred to a refrigerator maintained at about 0°F for storage.
To make the spherical specimens, cubes of appropriate size were cut from the frozen sample with a band saw. Then the corners of the cubes were sawed off, with the specimens held in a specially made plastic jig so that the cuts would be perpendicular to the body diagonals. The resulting 14-sided pieces were then filed to spherical shape by hand. During the sawing and filing the pieces were kept frozen at all times by placing them in dry ice at frequent intervals. The file was also kept cold. The departures of the finished specimens from true spherical shape were small.
The diameter of each specimen was measured with a vernier caliper before freeze-drying; after drying the diameter was again measured, using a traveling microscope. Several measurements along different diameters were made and averaged to obtain the results given in Table1. Because of shrinkage, the values of Rd are 4.7% lower than the corresponding values of R(), on the average.
R E S U L T S
DRYING CURVES (mass vs. time) for the six specimens are shown in Figure 3. Drying times increase with specimen size and decrease with wall temperature, as expected. The initial mass mQ of each specimen was determined by plotting the values of m observed during the early part of the run vs. time and extrapolating back to t = 0. Values found in this way seemed to be more reliable than values found by weighing the specimen just before it was installed.
Drying rates (m) are shown in Figure 4. The curves fall steadily during most of the drying period but just before m = 0 is reached they bend sharply and approach the axis of abscissas
Table 1—Dimensions and drying data for the six spherical specimens of raw beef
SpecimenInitial
wtDrywt
Initialwater
Initialradius
Dryradius
Walltemp
Initialice
temp
Initialmassflow
Dryingtime
mo md Ro R d T w T fo mo ‘d
<g> (g) (%) (cm) (cm) (°C) <°C) (g/hr) (hr)
45S 5.190 1.431 72.4 1.060 1.010 65.0 -2 0 .2 1.256 6.8156S 5.083 1.404 72.4 1.063 1.011 65.0 -2 0 .9 1.209 7.2757S 4.718 1.234 73.8 1.035 0.982 45.0 -2 3 .3 0.861 9.6058S 2.504 0.762 69.6 0.835 0.805 65.0 - 2 3 3 0.822 4.7159S 10.447 2.902 72.2 1.334 1.279 65.0 -1 8 .6 1.856 9.5060S 10.310 3.455 66.5 1.339 1.290 65.0 -1 8 .8 1.820 8.90
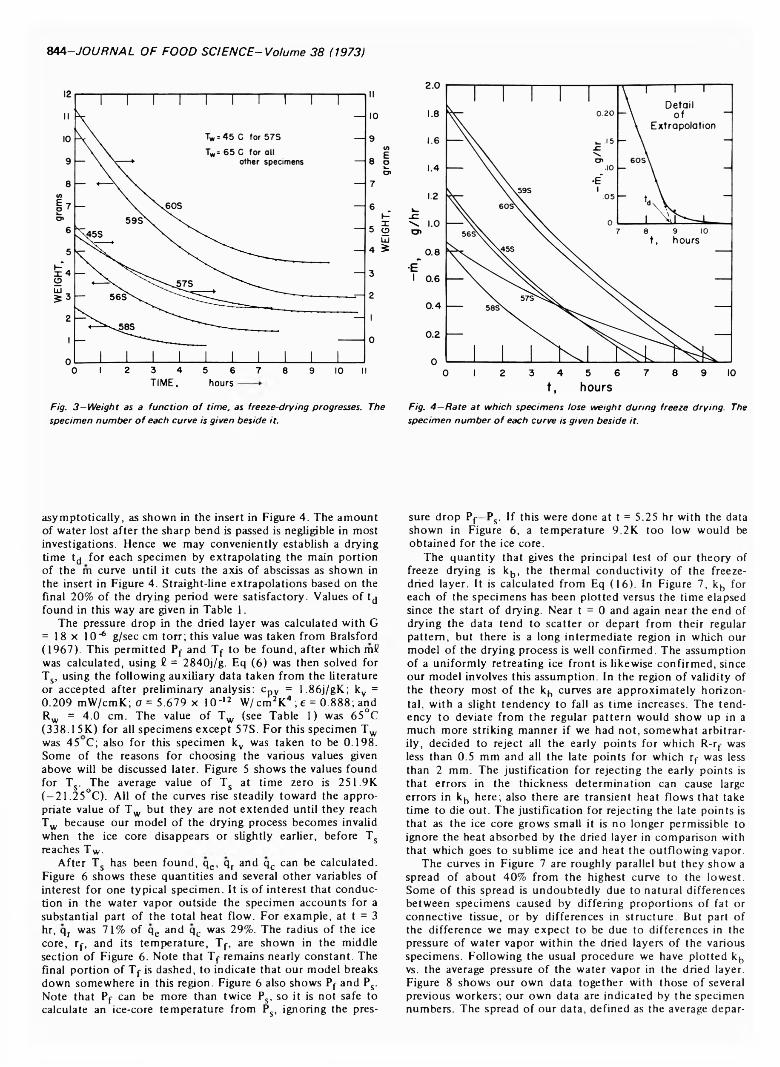
844-J O U R N A L O F FO O D S C IE N C E -V o lu m e 3 8 (1973)
TIME, hours
Fig. 3 —W e ig h t as a fu n c t io n o f t im e , as fr e e ze -d ry in g p ro g resses . T h e s p e c im e n n u m b e r o f ea ch cu rv e is g iv e n b e s id e it.
asymptotically, as shown in the insert in Figure 4. The amount of water lost after the sharp bend is passed is negligible in most investigations. Hence we may conveniently establish a drying time td for each specimen by extrapolating the main portion of the m curve until it cuts the axis of abscissas as shown in the insert in Figure 4. Straight-line extrapolations based on the final 20% of the drying period were satisfactory. Values of td found in this way are given in Table 1.
The pressure drop in the dried layer was calculated with G = 18 x lO-6 g/sec cm torr; this value was taken from Bralsford(1967). This permitted Pf and Tf to be found, after which m2 was calculated, using 2 = 2840j/g. Eq (6 ) was then solved for Ts, using the following auxiliary data taken from the literature or accepted after preliminary analysis: cpv = 1.86j/gK; kv = 0.209 mW/cmK; 0 = 5.679 x lO ' 12 W/ cm2K4 ; e = 0.888; and Rw = 4.0 cm. The value of Tw (see Table 1) was 65°C (338.15K) for all specimens except 57S. For this specimen Tw was 45 C; also for this specimen kv was taken to be 0.198. Some of the reasons for choosing the various values given above will be discussed later. Figure 5 shows the values found for Ts. The average value of Ts at time zero is 251.9K (-21.25°C ). All of the curves rise steadily toward the appropriate value of Tw but they are not extended until they reach Tw because our model of the drying process becomes invalid when the ice core disappears or slightly earlier, before Ts reaches Tw.
After Ts has been found, qe, qr and qc can be calculated. Figure 6 shows these quantities and several other variables of interest for one typical specimen. It is of interest that conduction in the water vapor outside the specimen accounts for a substantial part of the total heat flow. For example, at t = 3 hr, qr was 71% of qe and qc was 29%. The radius of the ice core, rf, and its temperature, Tf, are shown in the middle section of Figure 6 . Note that Tf remains nearly constant. The final portion of Tf is dashed, to indicate that our model breaks down somewhere in this region. Figure 6 also shows Pt- and Ps. Note that Pf can be more than twice Ps, so it is not safe to calculate an ice-core temperature from Ps, ignoring the pres
Fig. 4 —R a te a t w h ic h s p e c im e n s lo se w e ig h t d u r in g fr e e z e d ry in g . The s p e c im e n n u m b e r o f ea ch cu rv e is g iv e n b e s id e it.
sure drop Pf Ps. If this were done at t = 5.25 hr with the data shown in Figure 6 , a temperature 9.2K too low would be obtained for the ice core.
The quantity that gives the principal test of our theory of freeze drying is kb, the thermal conductivity of the freeze- dried layer. It is calculated from Eq (16). In Figure 7, kb for each of the specimens has been plotted versus the time elapsed since the start of drying. Near t = 0 and again near the end of drying the data tend to scatter or depart from their regular pattern, but there is a long intermediate region in which our model of the drying process is well confirmed. The assumption of a uniformly retreating ice front is likewise confirmed, since our model involves this assumption. In the region of validity of the theory most of the kb curves are approximately horizontal, with a slight tendency to fall as time increases. The tendency to deviate from the regular pattern would show up in a much more striking manner if we had not, somewhat arbitrarily, decided to reject all the early points for which R-r, was less than 0.5 mm and all the late points for which rf was less than 2 mm. The justification for rejecting the early points is that errors in the thickness determination can cause large errors in kb here; also there are transient heat flows that take time to die out. The justification for rejecting the late points is that as the ice core grows small it is no longer permissible to ignore the heat absorbed by the dried layer in comparison with that which goes to sublime ice and heat the outflowing vapor.
The curves in Figure 7 are roughly parallel but they show a spread of about 40% from the highest curve to the lowest. Some of this spread is undoubtedly due to natural differences between specimens caused by differing proportions of fat or connective tissue, or by differences in structure. But part of the difference we may expect to be due to differences in the pressure of water vapor within the dried layers of the various specimens. Following the usual procedure we have plotted kb vs. the average pressure of the water vapor in the dried layer. Figure 8 shows our own data together with those of several previous workers; our own data are indicated by the specimen numbers. The spread of our data, defined as the average depar-
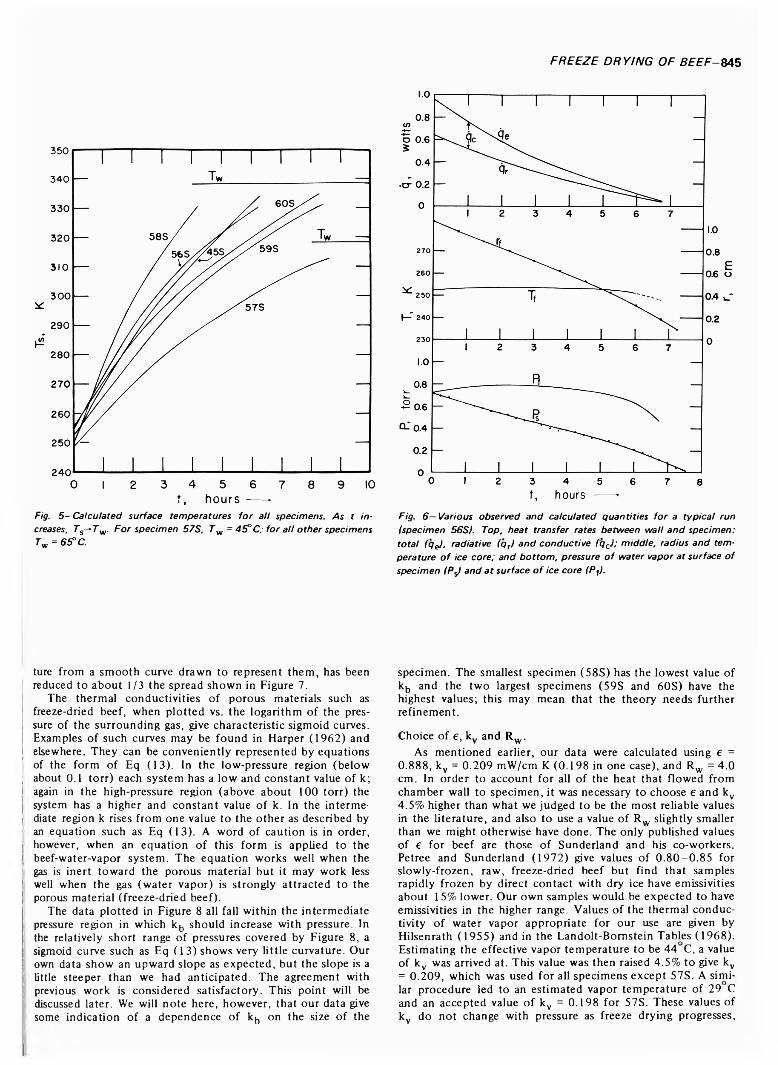
F R E E ZE D R Y IN G O F B E E F -8 4 5
t , h o u r s -------Fig. 5 —C a lc u la te d s u r fa c e te m p e r a tu r e s fo r a ll sp e c im e n s . A s t in creases, T S->TW. F o r s p e c im e n 5 7 S . T w = 4 5 °C; fo r a ll o th e r sp e c im e n s T VI = 6 E , C.
F ig. 6 — V arious o b s e r v e d a n d c a lc u la te d q u a n ti t ie s fo r a ty p ic a l ru n (sp e c im e n 5 6 S ). T o p , h e a t tra n s fe r ra te s b e tw e e n w a ll a n d sp e c im e n : to ta l (c /fj, ra d ia tiv e ( q ,) a n d c o n d u c t iv e (q cJ; m id d le , ra d iu s a n d te m p e r a tu r e o f ice c o re ; a n d b o t to m , p re ss u re o f w a te r va p o r a t su r fa c e o f s p e c im e n ( P J a n d a t su r fa c e o f ice co re (P t).
ture from a smooth curve drawn to represent them, has been reduced to about 1/3 the spread shown in Figure 7.
The thermal conductivities of porous materials such as freeze-dried beef, when plotted vs. the logarithm of the pressure of the surrounding gas, give characteristic sigmoid curves. Examples of such curves may be found in Harper (1962) and elsewhere. They can be conveniently represented by equations of the form of Eq (13). In the low-pressure region (below about 0.1 torr) each system has a low and constant value of k; again in the high-pressure region (above about 100 torr) the system has a higher and constant value of k. In the intermediate region k rises from one value to the other as described by an equation such as Eq (13). A word of caution is in order, however, when an equation of this form is applied to the beef-water-vapor system. The equation works well when the gas is inert toward the porous material but it may work less well when the gas (water vapor) is strongly attracted to the porous material (freeze-dried beef).
The data plotted in Figure 8 all fall within the intermediate pressure region in which kb should increase with pressure. In the relatively short range of pressures covered by Figure 8 , a sigmoid curve such as Eq (13) shows very little curvature. Our own data show an upward slope as expected, but the slope is a little steeper than we had anticipated. The agreement with previous work is considered satisfactory. This point will be discussed later. We will note here, however, that our data give some indication of a dependence of kb on the size of the
specimen. The smallest specimen (58S) has the lowest value of kb and the two largest specimens (59S and 60S) have the highest values; this may mean that the theory needs further refinement.
Choice of e, ky and Rw.As mentioned earlier, our data were calculated using e =
0.888, kv = 0.209 mW/cm K (0.198 in one case), and Rw = 4.0 cm. In order to account for all of the heat that flowed from chamber wall to specimen, it was necessary to choose e and kv 4.5% higher than what we judged to be the most reliable values in the literature, and also to use a value of Rw slightly smaller than we might otherwise have done. The only published values of e for beef are those of Sunderland and his co-workers. Petree and Sunderland (1972) give values of 0.80—0.85 for slowly-frozen, raw, freeze-dried beef but find that samples rapidly frozen by direct contact with dry ice have emissivities about 15% lower. Our own samples would be expected to have emissivities in the higher range. Values of the thermal conductivity of water vapor appropriate for our use are given by Hilsenrath (1955) and in the Landolt-Bomstein Tables (1968). Estimating the effective vapor temperature to be 44 C, a value of ky was arrived at. This value was then raised 4.5% to give kv = 0.209, which was used for all specimens except 57S. A similar procedure led to an estimated vapor temperature of 29 C and an accepted value of kv = 0.198 for 57S. These values of kv do not change with pressure as freeze drying progresses,
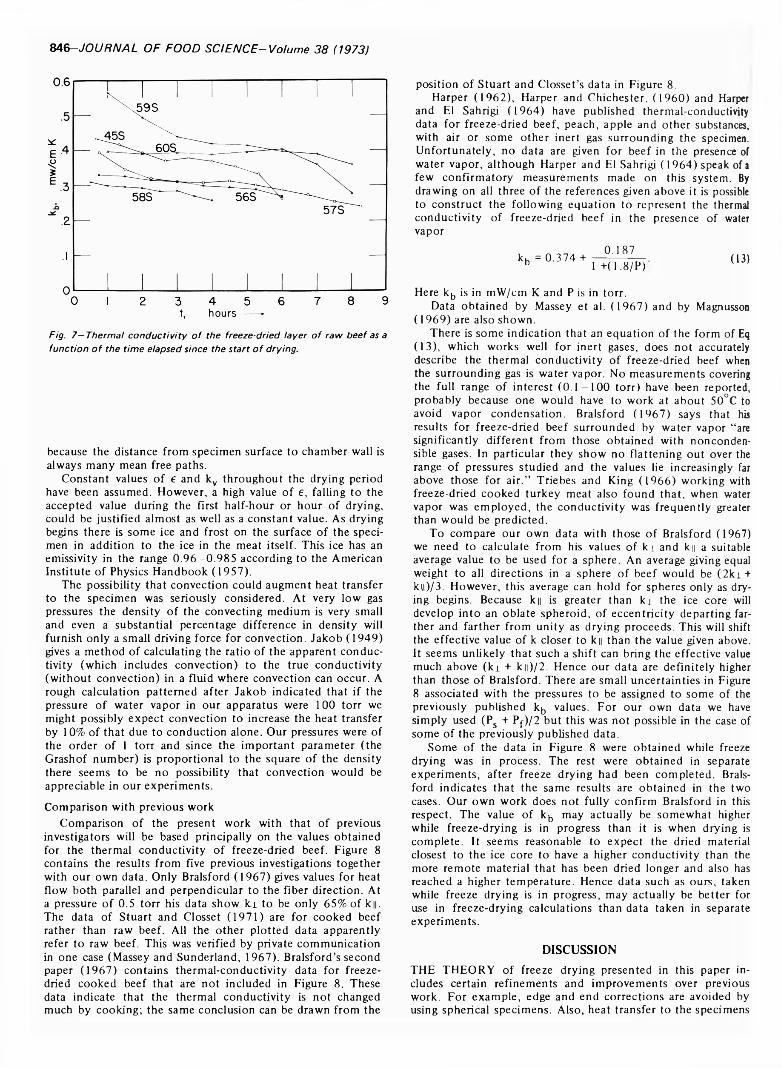
8 4 6 -J O U R N A L O F FO O D S C IE N C E -V o lu m e 3 8 (1973)
Fig. 7 —T h e rm a l c o n d u c t iv i t y o f th e fr e e ze -d r ie d la y e r o f ra w b e e f as a fu n c t io n o f th e t im e e la p s e d s in c e th e s ta r t o f d ry in g .
because the distance from specimen surface to chamber wall is always many mean free paths.
Constant values of e and kv throughout the drying period have been assumed. However, a high value of e, falling to the accepted value during the first half-hour or hour of drying, could be justified almost as well as a constant value. As drying begins there is some ice and frost on the surface of the specimen in addition to the ice in the meat itself. This ice has an emissivity in the range 0 .96-0 .985 according to the American Institute of Physics Handbook (1957).
The possibility that convection could augment heat transfer to the specimen was seriously considered. At very low gas pressures the density of the convecting medium is very small and even a substantial percentage difference in density will furnish only a small driving force for convection. Jakob (1949) gives a method of calculating the ratio of the apparent conductivity (which includes convection) to the true conductivity (without convection) in a fluid where convection can occur. A rough calculation patterned after Jakob indicated that if the pressure of water vapor in our apparatus were 100 torr we might possibly expect convection to increase the heat transfer by 10% of that due to conduction alone. Our pressures were of the order of 1 torr and since the important parameter (the Grashof number) is proportional to the square of the density there seems to be no possibility that convection would be appreciable in our experiments.
Comparison with previous workComparison of the present work with that of previous
investigators will be based principally on the values obtained for the thermal conductivity of freeze-dried beef. Figure 8 contains the results from five previous investigations together with our own data. Only Bralsford (1967) gives values for heat flow both parallel and perpendicular to the fiber direction. At a pressure of 0.5 torr his data show k i to be only 65% of k||. The data of Stuart and Closset (1971) are for cooked beef rather than raw beef. All the other plotted data apparently refer to raw beef. This was verified by private communication in one case (Massey and Sunderland, 1967). Bralsford’s second paper (1967) contains thermal-conductivity data for freeze- dried cooked beef that are not included in Figure 8 . These data indicate that the thermal conductivity is not changed much by cooking; the same conclusion can be drawn from the
position of Stuart and Closset’s data in Figure 8 .Harper (1962), Harper and Chichester, (1960) and Harper
and El Sahrigi (1964) have published thermal-conductivity data for freeze-dried beef, peach, apple and other substances, with air or some other inert gas surrounding the specimen. Unfortunately, no data are given for beef in the presence of water vapor, although Harper and El Sahrigi (1964) speak of a few confirmatory measurements made on this system. By drawing on all three of the references given above it is possible to construct the following equation to represent the thermal conductivity of freeze-dried beef in the presence of water vapor
kb = 0.374 + 0.187 1 +(1.8/P) (13)
Here kb is in mW/cm K and P is in torr.Data obtained by Massey et al. (1967) and by Magnusson
(1969) are also shown.There is some indication that an equation of the form of Eq
(13), which works well for inert gases, does not accurately describe the thermal conductivity of freeze-dried beef when the surrounding gas is water vapor. No measurements covering the full range of interest (0 . 1 -1 0 0 torr) have been reported, probably because one would have to work at about 50°C to avoid vapor condensation. Bralsford (1967) says that his results for freeze-dried beef surrounded by water vapor “are significantly different from those obtained with noncondensible gases. In particular they show no flattening out over the range of pressures studied and the values lie increasingly far above those for air.” Triebes and King (1966) working with freeze-dried cooked turkey meat also found that, when water vapor was employed, the conductivity was frequently greater than would be predicted.
To compare our own data with those of Bralsford (1967) we need to calculate from his values of k l and k|| a suitable average value to be used for a sphere. An average giving equal weight to all directions in a sphere of beef would be ( 2ki + kii)/3. However, this average can hold for spheres only as drying begins. Because k|| is greater than kj the ice core will develop into an oblate spheroid, of eccentricity departing farther and farther from unity as drying proceeds. This will shift the effective value of k closer to k|| than the value given above. It seems unlikely that such a shift can bring the effective value much above (k i + kll)/2. Hence our data are definitely higher than those of Bralsford. There are small uncertainties in Figure 8 associated with the pressures to be assigned to some of the previously published kb values. For our own data we have simply used (Ps + Pf)/2 but this was not possible in the case of some of the previously published data.
Some of the data in Figure 8 were obtained while freeze drying was in process. The rest were obtained in separate experiments, after freeze drying had been completed. Bralsford indicates that the same results are obtained in the two cases. Our own work does not fully confirm Bralsford in this respect. The value of kb may actually be somewhat higher while freeze-drying is in progress than it is when drying is complete. It seems reasonable to expect the dried material closest to the ice core to have a higher conductivity than the more remote material that has been dried longer and also has reached a higher temperature. Hence data such as ours, taken while freeze drying is in progress, may actually be better for use in freeze-drying calculations than data taken in separate experiments.
D IS C U S S IO N
THE THEORY of freeze drying presented in this paper includes certain refinements and improvements over previous work. For example, edge and end corrections are avoided by using spherical specimens. Also, heat transfer to the specimens
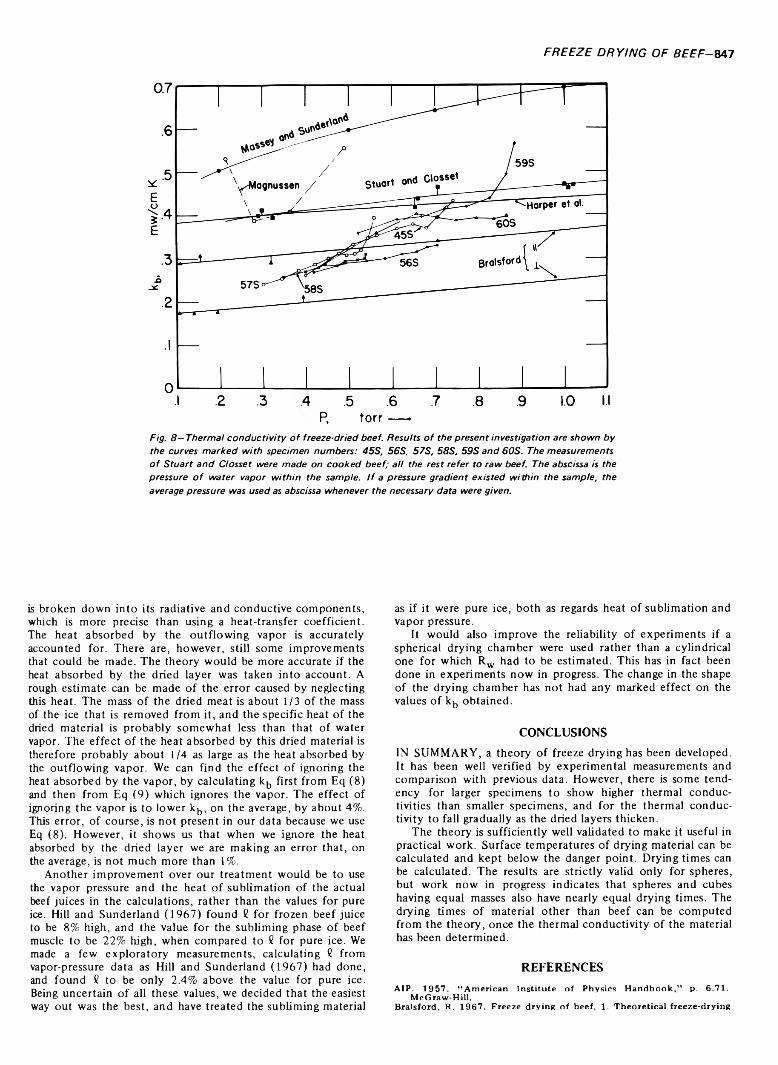
FREEZE DRYING OF B E E F -M I
.1 .2 .3 4 .5 .6 .7 .8 .9 1.0 1.1P, torr — .
Fig. 8 —T h e rm a l c o n d u c t iv i t y o f fr e e z e -d r ie d b e e f. R e s u l ts o f th e p r e s e n t in v e s tig a tio n are s h o w n b y th e cu rve s m a r k e d w ith sp e c im e n n u m b e r s : 4 5 S , 5 6 S . 5 7 S , 5 8 S , 5 9 S a n d 6 0 S . T h e m e a s u r e m e n ts o f S tu a r t a n d C lo sse t w ere m a d e o n c o o k e d b e e f; a ll th e r e s t r e fe r to ra w b e e f. T h e absc issa is th e p re ss u re o f w a te r va p o r w ith in th e sa m p le . I f a p re ss u re g r a d ie n t e x i s te d w ith in th e sa m p le , th e average p re ss u re w as u s e d as absc issa w h e n e v e r th e n ece ssa ry d a ta w e re g iven .
is broken down into its radiative and conductive components, which is more precise than using a heat-transfer coefficient. The heat absorbed by the outflowing vapor is accurately accounted for. There are, however, still some improvements that could be made. The theory would be more accurate if the heat absorbed by the dried layer was taken into account. A rough estimate can be made of the error caused by neglecting this heat. The mass of the dried meat is about 1/3 of the mass of the ice that is removed from it, and the specific heat of the dried material is probably somewhat less than that of water vapor. The effect of the heat absorbed by this dried material is therefore probably about 1 /4 as large as the heat absorbed by the outflowing vapor. We can find the effect of ignoring the heat absorbed by the vapor, by calculating kb first from Eq (8) and then from Eq (9) which ignores the vapor. The effect of ignoring the vapor is to lower kb, on the average, by about 4%. This error, of course, is not present in our data because we use Eq (8). However, it shows us that when we ignore the heat absorbed by the dried layer we are making an error that, on the average, is not much more than 1%.
Another improvement over our treatment would be to use the vapor pressure and the heat of sublimation of the actual beef juices in the calculations, rather than the values for pure ice. Hill and Sunderland (1967) found £ for frozen beef juice to be 8% high, and the value for the subliming phase of beef muscle to be 22% high, when compared to £ for pure ice. We made a few exploratory measurements, calculating £ from vapor-pressure data as Hill and Sunderland (1967) had done, and found £ to be only 2.4% above the value for pure ice. Being uncertain of all these values, we decided that the easiest way out was the best, and have treated the subliming material
as if it were pure ice, both as regards heat of sublimation and vapor pressure.
It would also improve the reliability of experiments if a spherical drying chamber were used rather than a cylindrical one for which Rw had to be estimated. This has in fact been done in experiments now in progress. The change in the shape of the drying chamber has not had any marked effect on the values of kb obtained.
C O N C L U S IO N S
IN SUMMARY, a theory of freeze drying has been developed. It has been well verified by experimental measurements and comparison with previous data. However, there is some tendency for larger specimens to show higher thermal conductivities than smaller specimens, and for the thermal conductivity to fall gradually as the dried layers thicken.
The theory is sufficiently well validated to make it useful in practical work. Surface temperatures of drying material can be calculated and kept below the danger point. Drying times can be calculated. The results are strictly valid only for spheres, but work now in progress indicates that spheres and cubes having equal masses also have nearly equal drying times. The drying times of material other than beef can be computed from the theory, once the thermal conductivity of the material has been determined.
R E F E R E N C E S
AIP. 1957 . “ American Institute of Physics H andbook,” p. 6 .71.McGraw-Hill.
Bralsford, R. 1967. Freeze drying o f beef. 1. Theoretical freeze-drying
848- JOURNAL OF FOOD SC/ENCE-Vo/ume 38 (1973)
rates o f beef; 2. A calorimetric m ethod for comparing theoretical and actual drying rates. J. Food Tech. 2: 339; 353.
Clark, J.P. and King, C.J. 1971 . Convective freeze drying in layered beds. Chem. Eng. Progress, Sym posium Ser. 67 (108): 102.
G innette, L .F ., Graham, R.P. and Morgan, A.I. Jr. 1958. Freeze-drying rates. In “ Fifth National Sym posium on Vacuum Technology, Transactions,” p. 268. San Francisco.
Harper, J.C. 1 962 . Transport properties o f gases in porous media at reduced pressures with reference to freeze drying. J. AIChE 8 : 298.
Harper, J.C. and Chichester, C.O. 1960 . Microwave spectra and physical characteristics o f fruit and animal products relative to freeze dehydration. Quartermaster Food & Container Institute for the Armed Forces, Contract D A 19-129-qm -1349, Rept. 6 (Final), 29 p.; A D -255818.
Harper, J.C. and El Sahrigi, A .F. 1964 . Thermal conductivities o f gas- filled porous solids. Ind. Eng. Chem. Fund. 3: 318.
Hill, J.E. and Sunderland, J.E. 1967 . Equilibrium vapor pressure and latent heat o f sublim ation o f frozen meats. Food Technol. 21: 1276.
Hilsenrath, J. 1955. Tables o f thermal properties o f gases, p. 462 . Natl. Bur. Stds. Circular 564.
Jakob, M. 1949 . “ Heat Transfer,” V ol. 1, p. 134; 135; 539 . John Wiley and Sons.
Jakob, M. 1957 . “ Heat Transfer,” V ol. 2, p. 5. John Wiley and Sons.King, C.J. 1971 . “Freeze drying o f F ood s,” 86 p. CRC Press. Same
material, minus a few references and a few colum ns o f tex t, appeared in CRC Crit. Reviews in Food Tech. (1 9 7 0 ) 1: 379 .
Landolt, H.H. and Bornstein, R. 1 968 . “ Numerical Values and Functions,” V ol. 2, part 5b, p. 46 . Springer.
Lusk, G., Karel, M. and G oldblith, S. 196 4 . Thermal conductivity of som e freeze-dried fish. Food Technol. 18: 1625.
Magnussen, O.M. 1969 . M easurements o f heat and mass transfer coefficients during freeze drying. In “ R ecent D evelopm ents in Freeze Drying,” V ol. 1, p. 65. Int. Inst. Refrigeration, Com m ission 10.
Massey, W.M. Jr. and Sunderland, J.E. 196 7 . M easurement o f thermal conductivity during freeze drying o f beef. Food Technol. 21: 408.
Petree, D .A . and Sunderland, J.E. 1972 . Thermal radiation properties of freeze-dried meats. J. Food Sci. 37: 209.
Sandall, O.C., King, C.J. and Wilke, C.R. 1 967 . The relationship betw een transport properties and rates o f freeze drying of poultry m eat. J. AIChE 13: 428.
Stuart, E.B. and Closset, G. 1971 . Pore size effect in the freeze drying process. J. Food Sci. 36: 388.
Triebes, T.A. and King, C.J. 1966 . Factors influencing the rate o f heat conduction in freeze drying. Ind. Eng. Chem. Process Design Devel. 5: 430.
Ms received 1 1 /6 /7 2 ; revised 3 /1 /7 3 ; accepted 3 /5 /7 3 .
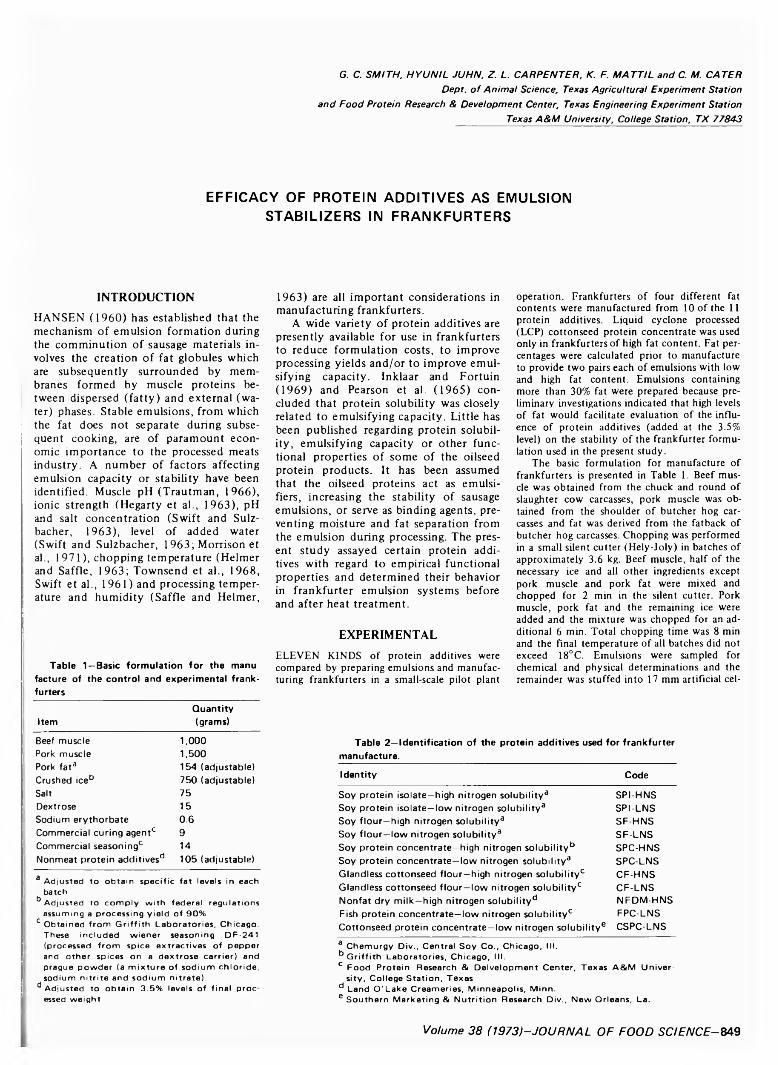
G. C. S M IT H , H Y U N IL JU H N , Z . L . C A R P E N T E R , K. F. M A T T IL a n d C. M. C A T E R
D ep t, o f A n im a l S c ie n c e , T exa s A g r ic u ltu ra l E x p e r im e n t S ta t io n
a n d F o o d P ro te in R esea rch & D e v e lo p m e n t C en te r , T exas E n g in e e rin g E x p e r im e n t S ta t io n
T exa s A & M U n ive rs ity , C o llege S ta t io n , T X 7 7 8 4 3
EFFICACY OF PROTEIN ADD ITIVES AS EMULSION STABILIZERS IN FRANKFURTERS
IN T R O D U C T IO N
HANSEN (1960) has established that the mechanism of emulsion formation during the comminution of sausage materials involves the creation of fat globules which are subsequently surrounded by membranes formed by muscle proteins between dispersed (fatty) and external (water) phases. Stable emulsions, from which the fat does not separate during subsequent cooking, are of paramount economic importance to the processed meats industry. A number of factors affecting emulsion capacity or stability have been identified. Muscle pH (Trautman, 1966), ionic strength (Hegarty et al., 1963), pH and salt concentration (Swift and Sulz- bacher, 1963), level of added water (Swift and Sulzbacher, 1963; Morrison et al., 1971), chopping temperature (Helmer and Saffle, 1963; Townsend et al., 1968, Swift et al., 1961) and processing temperature and humidity (Saffle and Helmer,
Table 1—Basic formulation for the manu facture of the control and experimental frankfurters
ItemQuantity(grams)
Beef muscle 1,000Pork muscle 1,500Pork fat3 154 (adjustable)Crushed iceb 750 (adjustable)Salt 75Dextrose 15Sodium erythorbate 0.6Commercial curing agent0 9Commercial seasoning0 14Nonmeat protein additives'1 105 (adjustable)a
b
c
d
Adjusted to obtain sp ecific fa t levels in each batchAdjusted to com p ly w ith federal regulations assuming a processing y ie ld of 90%Obtained from G r if f ith Lab orato ries , Chicago. These included w iener seasoning DF-241 (processed from spice extractives of pepper and other spices on a dextro se ca rr ie r) and Prague pow der (a m ix tu re of sodium ch loride, sodium n itr ite and sodium n itra te ).Adjusted to obtain 3 .5% levels of fin a l proc essed weight
1963) are all important considerations in manufacturing frankfurters.
A wide variety of protein additives are presently available for use in frankfurters to reduce formulation costs, to improve processing yields and/or to improve emulsifying capacity. Inklaar and Fortuin(1969) and Pearson et al. (1965) concluded that protein solubility was closely related to emulsifying capacity. Little has been published regarding protein solubility, emulsifying capacity or other functional properties of some of the oilseed protein products. It has been assumed that the oilseed proteins act as emulsifiers, increasing the stability of sausage emulsions, or serve as binding agents, preventing moisture and fat separation from the emulsion during processing. The present study assayed certain protein additives with regard to empirical functional properties and determined their behavior in frankfurter emulsion systems before and after heat treatment.
E X P E R I M E N T A L
ELEVEN KINDS of protein additives were compared by preparing emulsions and manufacturing frankfurters in a small-scale pilot plant
operation. Frankfurters of four different fat contents were manufactured from 10 of the 11 protein additives. Liquid cyclone processed (LCP) cottonseed protein concentrate was used only in frankfurters of high fat content. Fat percentages were calculated prior to manufacture to provide two pairs each of emulsions with low and high fat content. Emulsions containing more than 30% fat were prepared because preliminary investigations indicated that high levels of fat would facilitate evaluation of the influence of protein additives (added at the 3.5% level) on the stability of the frankfurter formulation used in the present study.
The basic formulation for manufacture of frankfurters is presented in Table 1. Beef muscle was obtained from the chuck and round of slaughter cow carcasses, pork muscle was obtained from the shoulder of butcher hog carcasses and fat was derived from the fatback of butcher hog carcasses. Chopping was performed in a small silent cutter (Hely-Joly) in batches of approximately 3.6 kg. Beef muscle, half of the necessary ice and all other ingredients except pork muscle and pork fat were mixed and chopped for 2 min in the silent cutter. Pork muscle, pork fat and the remaining ice were added and the mixture was chopped for an additional 6 min. Total chopping time was 8 min and the final temperature of all batches did not exceed 18°C. Emulsions were sampled for chemical and physical determinations and the remainder was stuffed into 17 mm artificial cel-
Table 2—Identification of the protein additives used for frankfurter manufacture.
Identity Code
Soy protein isolate—high nitrogen solubility3Soy protein isolate—low nitrogen solubility3Soy flour—high nitrogen solubility3Soy flour—low nitrogen solubility3Soy protein concentrate—high nitrogen solubility13Soy protein concentrate—low nitrogen solubility3Glandless cottonseed flour—high nitrogen solubility0Glandless cottonseed flour—low nitrogen solubility0Nonfat dry milk—high nitrogen solubilitydFish protein concentrate—low nitrogen solubility0Cottonseed protein concentrate—low nitrogen solubilitye
SPI-HNSSPI-LNSSF-HNSSF-LN SSPC-HNSSPC-LNSCF-HNSCF-LN SNFDM-HNSFPC-LNSCSPC-LNS
abc
de
Chem urgy D iv ., Central So y C o ., Chicago, III.G r if f ith Laboratories, Ch icago, III.Food Prote in Research & D eve lo p m en t Center, Texas A&M U n ive rs ity , College S ta tio n , Texas Land O 'La k e Cream eries, M inneapolis, M inn.Southern M arketing & N utrition Research D iv ., New O rleans, La .
V o l u m e 3 8 ( 1 9 7 3 ) - J O U R N A L O F F O O D S C I E N C E - 8 49
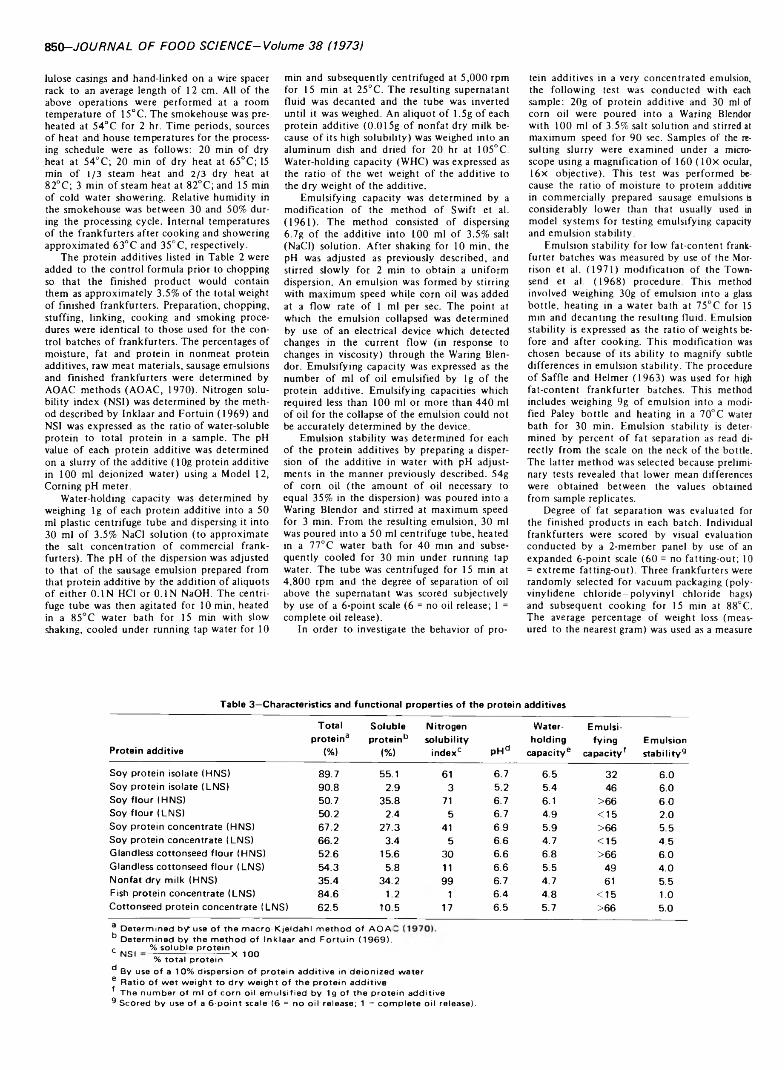
850-JOURNAL OF FOOD SCIENCE-Volume 38 (1973)
lulose casings and hand-linked on a wire spacer rack to an average length of 12 cm. All of the above operations were performed at a room temperature of 15°C. The smokehouse was preheated at 54°C for 2 hr. Time periods, sources of heat and house temperatures for the processing schedule were as follows: 20 min of dry heat at 54°C; 20 min of dry heat at 65°C; 15 min of 1/3 steam heat and 2/3 dry heat at 82°C; 3 min of steam heat at 82°C; and 15 min of cold water showering. Relative humidity in the smokehouse was between 30 and 50% during the processing cycle. Internal temperatures of the frankfurters after cooking and showering approximated 63°C and 35°C, respectively.
The protein additives listed in Table 2 were added to the control formula prior to chopping so that the finished product would contain them as approximately 3.5% of the total weight of finished frankfurters. Preparation, chopping, stuffing, linking, cooking and smoking procedures were identical to those used for the control batches of frankfurters. The percentages of moisture, fat and protein in nonmeat protein additives, raw meat materials, sausage emulsions and finished frankfurters were determined by AOAC methods (AOAC, 1970). Nitrogen solubility index (NSI) was determined by the method described by Inklaar and Fortuin (1969) and NSI was expressed as the ratio of water-soluble protein to total protein in a sample. The pH value of each protein additive was determined on a slurry of the additive (lOg protein additive in 100 ml deionized water) using a Model 12, Corning pH meter.
Water-holding capacity was determined by weighing lg of each protein additive into a 50 ml plastic centrifuge tube and dispersing it into 30 ml of 3.5% NaCl solution (to approximate the salt concentration of commercial frankfurters). The pH of the dispersion was adjusted to that of the sausage emulsion prepared from that protein additive by the addition of aliquots of either 0.1N HC1 or 0.1N NaOH. The centrifuge tube was then agitated for 10 min, heated in a 85°C water bath for 15 min with slow shaking, cooled under running tap water for 10
min and subsequently centrifuged at 5,000 rpm for 15 min at 25°C. The resulting supernatant fluid was decanted and the tube was inverted until it was weighed. An aliquot of 1.5g of each protein additive (0.015g of nonfat dry milk because of its high solubility) was weighed into an aluminum dish and dried for 20 hr at 105°C. Water-holding capacity (WHC) was expressed as the ratio of the wet weight of the additive to the dry weight of the additive.
Emulsifying capacity was determined by a modification of the method of Swift et al.(1961). The method consisted of dispersing 6.7g of the additive into 100 ml of 3.5% salt (NaCl) solution. After shaking for 10 min, the pH was adjusted as previously described, and stirred slowly for 2 min to obtain a uniform dispersion. An emulsion was formed by stirring with maximum speed while corn oil was added at a flow rate of 1 ml per sec. The point at which the emulsion collapsed was determined by use of an electrical device which detected changes in the current flow (in response to changes in viscosity) through the Waring Blen- dor. Emulsifying capacity was expressed as the number of ml of oil emulsified by lg of the protein additive. Emulsifying capacities which required less than 100 ml or more than 440 ml of oil for the collapse of the emulsion could not be accurately determined by the device.
Emulsion stability was determined for each of the protein additives by preparing a dispersion of the additive in water with pH adjustments in the manner previously described. 54g of corn oil (the amount of oil necessary to equal 35% in the dispersion) was poured into a Waring Blendor and stirred at maximum speed for 3 min. From the resulting emulsion, 30 ml was poured into a 50 ml centrifuge tube, heated in a 77°C water bath for 40 min and subsequently cooled for 30 min under running tap water. The tube was centrifuged for 15 min at 4,800 rpm and the degree of separation of oil above the supernatant was scored subjectively by use of a 6-point scale (6 = no oil release; 1 = complete oil release).
In order to investigate the behavior of pro
tein additives in a very concentrated emulsion, the following test was conducted with each sample: 20g of protein additive and 30 ml of corn oil were poured into a Waring Blendor with 100 ml of 3.5% salt solution and stirred at maximum speed for 90 sec. Samples of the resulting slurry were examined under a microscope using a magnification of 160 ( 10X ocular, 16x objective). This test was performed because the ratio of moisture to protein additive in commercially prepared sausage emulsions is considerably lower than that usually used in model systems for testing emulsifying capacity and emulsion stability.
Emulsion stability for low fat-content frankfurter batches was measured by use of the Morrison et al. (1971) modification of the Townsend et al. (1968) procedure. This method involved weighing 30g of emulsion into a glass bottle, heating in a water bath at 75°C for 15 min and decanting the resulting fluid. Emulsion stability is expressed as the ratio of weights before and after cooking. This modification was chosen because of its ability to magnify subtle differences in emulsion stability. The procedure of Saffle and Helmer (1963) was used for high fat-content frankfurter batches. This method includes weighing 9g of emulsion into a modified Paley bottle and heating in a 70°C water bath for 30 min. Emulsion stability is determined by percent of fat separation as read directly from the scale on the neck of the bottle. The latter method was selected because preliminary tests revealed that lower mean differences were obtained between the values obtained from sample replicates.
Degree of fat separation was evaluated for the finished products in each batch. Individual frankfurters were scored by visual evaluation conducted by a 2-member panel by use of an expanded 6-point scale (60 = no fatting-out; 10 = extreme fatting-out). Three frankfurters were randomly selected for vacuum packaging (poly- vinylidene chloride-polyvinyl chloride bags) and subsequent cooking for 15 min at 88°C. The average percentage of weight loss (measured to the nearest gram) was used as a measure
Table 3—Characteristics and functional properties of the protein additives
Protein additive
Totalprotein3
(%)
Solubleproteinb
(%)
Nitrogensolubility
indexc pH*
Waterholding
capacity6
Emulsifying
capacityfEmulsionstability9
Soy protein isolate (HNS) 89.7 55.1 61 6.7 6.5 32 6.0Soy protein isolate (LNS) 90.8 2.9 3 5.2 5.4 46 6.0Soy flour (HNS) 50.7 35.8 71 6.7 6.1 >66 6.0Soy flour (LNS) 50.2 2.4 5 6.7 4.9 <15 2.0Soy protein concentrate (HNS) 67.2 27.3 41 6.9 5.9 >66 5.5Soy protein concentrate (LNS) 66.2 3.4 5 6.6 4.7 <15 4.5Glandless cottonseed flour (HNS) 52.6 15.6 30 6.6 6.8 >66 6.0Glandless cottonseed flour (LNS) 54.3 5.8 11 6.6 5.5 49 4.0Nonfat dry milk (HNS) 35.4 34.2 99 6.7 4.7 61 5.5Fish protein concentrate (LNS) 84.6 1.2 1 6.4 4.8 <15 1.0Cottonseed protein concentrate (LNS) 62.5 10.5 17 6.5 5.7 >66 5.0abcdef9
Determ ined b y use of the m acro -K je ldah l m ethod of AOA< Determ ined by the m ethod of Ink laar and Fo rtu in (1 9 6 9 ).
% solub le proteinNSI % solub le protein % total protein X 100
By use of a 10% dispersion of protein additive in deionized w ater Ratio of wet weight to d ry w eight o f the protein additive The num ber of ml of corn oil em ulsified by 1 g of the protein additive Scored by use of a 6-po int scale (6 = no oil release; 1 = com plete oil release).
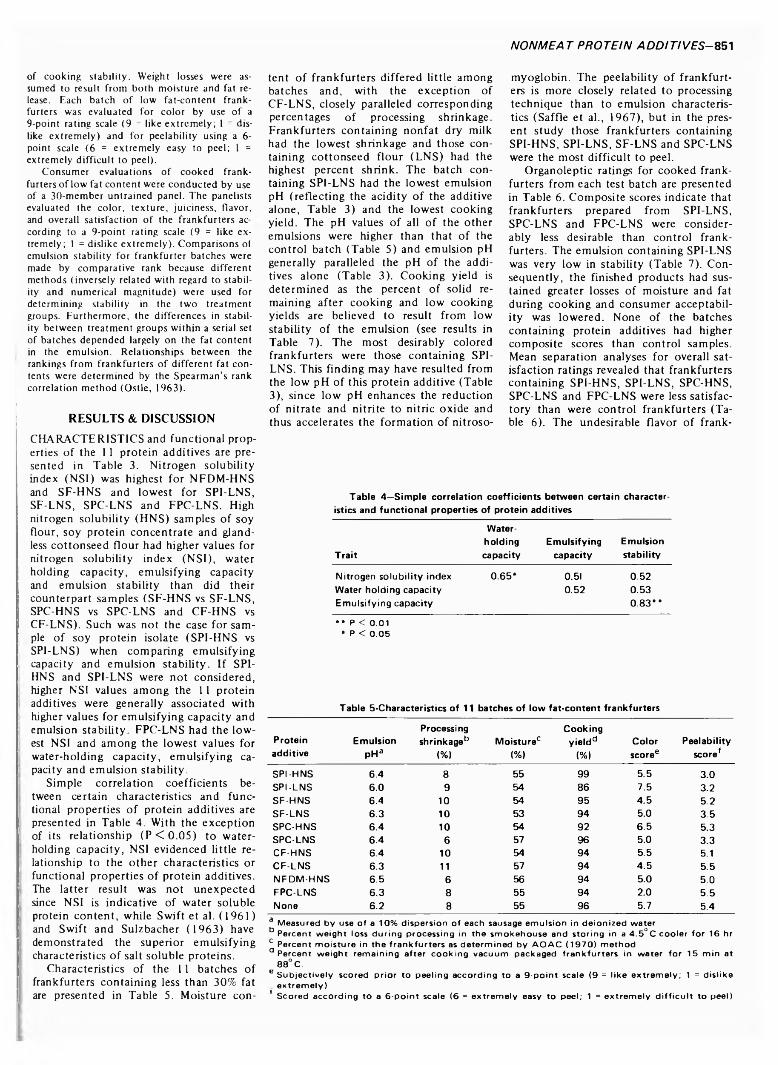
NONMEA T PROTEIN ADDITIVES- 851
of cooking stability. Weight losses were assumed to result from both moisture and fat release. Each batch of low fat-content frankfurters was evaluated for color by use of a9-point rating scale (9 = like extremely; 1 = dislike extremely) and for peelability using a 6- point scale (6 = extremely easy to peel; 1 = extremely difficult to peel).
Consumer evaluations of cooked frankfurters of low'fat content were conducted by use of a 30-member untrained panel. The panelists evaluated the color, texture, juiciness, flavor, and overall satisfaction of the frankfurters ac cording to a 9-point rating scale (9 = like extremely; 1 = dislike extremely). Comparisons of emulsion stability for frankfurter batches were made by comparative rank because different methods (inversely related with regard to stability and numerical magnitude) were used for determining stability in the two treatment groups. Furthermore, the differences in stability between treatment groups within a serial set of batches depended largely on the fat content in the emulsion. Relationships between the rankings from frankfurters of different fat contents were determined by the Spearman’s rank correlation method (Ostle, 1963).
R E S U L T S & D IS C U S S IO N
CHARACTERISTICS and functional properties of the 1 1 protein additives are presented in Table 3. Nitrogen solubility index (NSI) was highest for NFDM-HNS and SF-HNS and lowest for SPI-LNS, SF-LNS, SPC-LNS and FPC-LNS. High nitrogen solubility (HNS) samples of soy flour, soy protein concentrate and glandless cottonseed flour had higher values for nitrogen solubility index (NSI), water holding capacity, emulsifying capacity and emulsion stability than did their counterpart samples (SF-HNS vs SF-LNS, SPC-HNS vs SPC-LNS and CF-HNS vs CF-LNS). Such was not the case for sample of soy protein isolate (SPI-HNS vs SPI-LNS) when comparing emulsifying capacity and emulsion stability. If SPI- HNS and SPI-LNS were not considered, higher NSI values among the 11 protein additives were generally associated with higher values for emulsifying capacity and emulsion stability. FPC-LNS had the lowest NSI and among the lowest values for water-holding capacity, emulsifying capacity and emulsion stability.
Simple correlation coefficients between certain characteristics and functional properties of protein additives are presented in Table 4. With the exception of its relationship (P < 0 .0 5 ) to water- holding capacity, NSI evidenced little relationship to the other characteristics or functional properties of protein additives. The latter result was not unexpected since NSI is indicative of water soluble protein content, while Swift et al. (1961) and Swift and Sulzbacher (1963) have demonstrated the superior emulsifying characteristics of salt soluble proteins.
Characteristics of the 11 batches of frankfurters containing less than 30% fat are presented in Table 5. Moisture con
tent of frankfurters differed little among batches and, with the exception of CF-LNS, closely paralleled corresponding percentages of processing shrinkage. Frankfurters containing nonfat dry milk had the lowest shrinkage and those containing cottonseed flour (LNS) had the highest percent shrink. The batch containing SPI-LNS had the lowest emulsion pH (reflecting the acidity of the additive alone, Table 3) and the lowest cooking yield. The pH values of all of the other emulsions were higher than that of the control batch (Table 5) and emulsion pH generally paralleled the pH of the additives alone (Table 3). Cooking yield is determined as the percent of solid remaining after cooking and low cooking yields are believed to result from low stability of the emulsion (see results in Table 7). The most desirably colored frankfurters were those containing SPI- LNS. This finding may have resulted from the low pH of this protein additive (Table3), since low pH enhances the reduction of nitrate and nitrite to nitric oxide and thus accelerates the formation of nitroso-
myoglobin. The peelability of frankfurters is more closely related to processing technique than to emulsion characteristics (Saffle et al., 1967), but in the present study those frankfurters containing SPI-HNS, SPI-LNS, SF-LNS and SPC-LNS were the most difficult to peel.
Organoleptic ratings for cooked frankfurters from each test batch are presented in Table 6 . Composite scores indicate that frankfurters prepared from SPI-LNS, SPC-LNS and FPC-LNS were considerably less desirable than control frankfurters. The emulsion containing SPI-LNS was very low in stability (Table 7). Consequently, the finished products had sustained greater losses of moisture and fat during cooking and consumer acceptability was lowered. None of the batches containing protein additives had higher composite scores than control samples. Mean separation analyses for overall satisfaction ratings revealed that frankfurters containing SPI-HNS, SPI-LNS, SPC-HNS, SPC-LNS and FPC-LNS were less satisfactory than were control frankfurters (Table 6 ). The undesirable flavor of frank-
Table 4—Simple correlation coefficients between certain characteristics and functional properties of protein additives
Trait
Waterholdingcapacity
Emulsifyingcapacity
Emulsionstability
Nitrogen solubility index 0.65* 0.5I 0.52Water holding capacity 0.52 0.53Emulsifying capacity 0.83**
* * P < 0.01 * P < 0 .0 5
Table 5-Characteristics of 11 batches of low fat-content frankfurters
Proteinadditive
EmulsionPHa
Processingshrinkage*5
<%>Moisturec
<%)
Cookingyieldd
<%)Colorscoree
Peelabilityscoref
SPI-HNS 6.4 8 55 99 5.5 3.0SPI-LNS 6.0 9 54 86 7.5 3.2SF-HNS 6.4 10 54 95 4.5 5.2SF-LNS 6.3 10 53 94 5.0 3.5SPC-HNS 6.4 10 54 92 6.5 5.3SPC-LNS 6.4 6 57 96 5.0 3.3CF-HNS 6.4 10 54 94 5.5 5.1CF-LN S 6.3 11 57 94 4.5 5.5NFDM-HNS 6.5 6 56 94 5.0 5.0FPC-LNS 6.3 8 55 94 2.0 5.5None 6.2 8 55 96 5.7 5.4
a Measured by use of a 10% dispersion of each sausage em ulsion in deionized water b Percent weight loss during processing in the sm okehouse and storing in a 4 .5 °C cooler fo r 16 hr b Percent m oisture in the fran k fu rte rs as determ ined by A O A C (1 9 7 0 ) methoda Percent w eight rem aining after cooking vacuum packaged fran k fu rte rs in w ater fo r 15 m in at
88° C.e Su b jective ly scored p rio r to peeling according to a 9-po int scale (9 = like e x tre m e ly ; 1 = d islike
e xtrem e ly )T Scored according to a 6-po int scale (6 = extrem ely easy to peel; 1 = extrem e ly d if f ic u lt to peel)
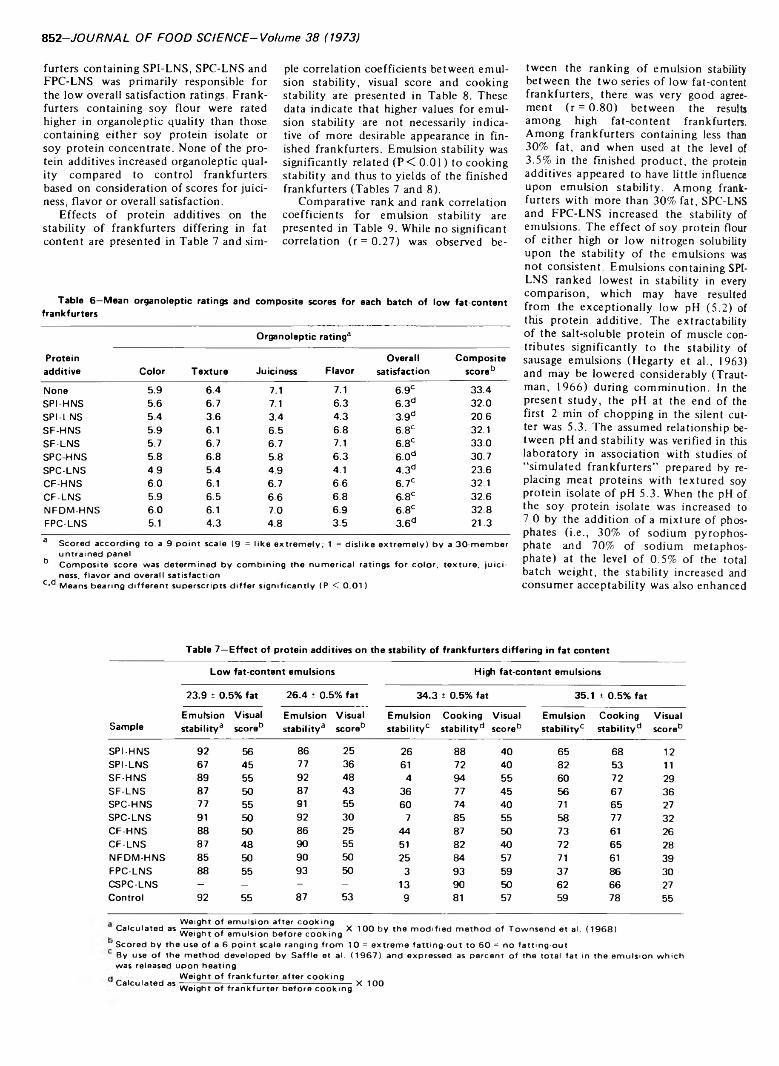
852-JOURNAL OF FOOD SCIENCE-Volume 38 (1973)
furters containing SPI-LNS, SPC-LNS and FPC-LNS was primarily responsible for the low overall satisfaction ratings. Frankfurters containing soy flour were rated higher in organoleptic quality than those containing either soy protein isolate or soy protein concentrate. None of the protein additives increased organoleptic quality compared to control frankfurters based on consideration of scores for juiciness, flavor or overall satisfaction.
Effects of protein additives on the stability of frankfurters differing in fat content are presented in Table 7 and sim
ple correlation coefficients between emulsion stability, visual score and cooking stability are presented in Table 8 . These data indicate that higher values for emulsion stability are not necessarily indicative of more desirable appearance in finished frankfurters. Emulsion stability was significantly related (P < 0.01 ) to cooking stability and thus to yields of the finished frankfurters (Tables 7 and 8 ).
Comparative rank and rank correlation coefficients for emulsion stability are presented in Table 9. While no significant correlation (r= 0 .27 ) was observed be
tween the ranking of emulsion stability between the two series of low fat-content frankfurters, there was very good agreement (r = 0.80) between the results among high fat-content frankfurters. Among frankfurters containing less than 30% fat, and when used at the level of 3.5% in the finished product, the protein additives appeared to have little influence upon emulsion stability. Among frankfurters with more than 30% fat, SPC-LNS and FPC-LNS increased the stability of emulsions. The effect of soy protein flour of either high or low nitrogen solubility upon the stability of the emulsions was not consistent. Emulsions containing SPI- LNS ranked lowest in stability in every comparison, which may have resulted from the exceptionally low pH (5.2) of this protein additive. The extractability of the salt-soluble protein of muscle contributes significantly to the stability of sausage emulsions (Hegarty et al., 1963) and may be lowered considerably (Traut- man, 1966) during comminution. In the present study, the pH at the end of the first 2 min of chopping in the silent cutter was 5.3. The assumed relationship between pH and stability was verified in this laboratory in association with studies of “simulated frankfurters” prepared by replacing meat proteins with textured soy protein isolate of pH 5.3. When the pH of the soy protein isolate was increased to7.0 by the addition of a mixture of phosphates (i.e., 30% of sodium pyrophosphate and 70% of sodium metaphosphate) at the level of 0.5% of the total batch weight, the stability increased and consumer acceptability was also enhanced
Table 6—Mean organoleptic ratings and composite scores for each batch of low fat-content frankfurters
Organoleptic rating3
Proteinadditive Color Texture Juiciness Flavor
Overallsatisfaction
Compositescore0
None 5.9 6.4 7.1 7.1 6.9C 33.4SPI-HNS 5.6 6.7 7.1 6.3 6.3d 32.0SPI-LNS 5.4 3.6 3.4 4.3 3.9d 20.6SF-HNS 5.9 6.1 6.5 6.8 6.8C 32.1SF-LNS 5.7 6.7 6.7 7.1 6.8° 33.0SPC HNS 5.8 6.8 5.8 6.3 6.0d 30.7SPC-LNS 4.9 5.4 4.9 4.1 4.3d 23.6CF-HNS 6.0 6.1 6.7 6.6 6.7C 32.1CF-LNS 5.9 6.5 6.6 6.8 6.8C 32.6NFDM-HNS 6.0 6.1 7.0 6.9 6.8C 32.8FPC-LNS 5.1 4.3 4.8 3.5 3.6d 21.3
3 Scored according to a 9-po int scale (9 = like e x tre m e ly ; 1 = d is like e xtrem e ly ) by a 30-m em ber untra ined panel
b Com posite score was determ ined by com bin ing the num erical ratings fo r co lo r, te x tu re , ju ic iness, flavo r and overall satisfaction
0,d Means bearing d iffe re n t superscrip ts d iffe r sig n ifican tly (P < 0 .0 1 )
Table 7—Effect of protein additives on the stability of frankfurters differing in fat content
Sample
Low fat-content emulsions High fat-content emulsions
23.9 ± 0.5% fat 26.4 ± 0.5% fat 34.3 ± 0.5% fat 35.1 t 0.5% fat
Emulsionstability3
Visualscoreb
Emulsionstability3
Visualscoreb
Emulsionstability0
Cookingstabilityd
Visualscoreb
Emulsionstability0
Cookingstability0*
Visualscore0
SPI-HNS 92 56 86 25 26 88 40 65 68 12SPI-LNS 67 45 77 36 61 72 40 82 53 11SF-HNS 89 55 92 48 4 94 55 60 72 29SF-LN S 87 50 87 43 36 77 45 56 67 36SPC-HNS 77 55 91 55 60 74 40 71 65 27SPC-LNS 91 50 92 30 7 85 55 58 77 32CF-HNS 88 50 86 25 44 87 50 73 61 26CF-LN S 87 48 90 55 51 82 40 72 65 28NFDM-HNS 85 50 90 50 25 84 57 71 61 39FPC-LNS 88 55 93 50 3 93 59 37 86 30CSPC-LNS - - - - 13 90 50 62 66 27Control 92 55 87 53 9 81 57 59 78 55
Calculated as Weight of em ulsion after cookingX 1 00 by the m odified m ethod of Tow nsend et al. (1 9 6 8 )Weight o f em ulsion before cooking
1 Scored by the use of a 6-po int scale ranging from 10 = extrem e fatting-out to 60 = no fatting-out By use of the m ethod developed by S a ffle et al. (1 9 6 7 ) and expressed as percent of the total fa t in the em ulsion w h ich was released upon heating
* Weight of fran k fu rte r after cooking1 Calculated as — . —j-j----- r-j---------r-—----------- — X 100Weight of fran k fu rte r before cooking
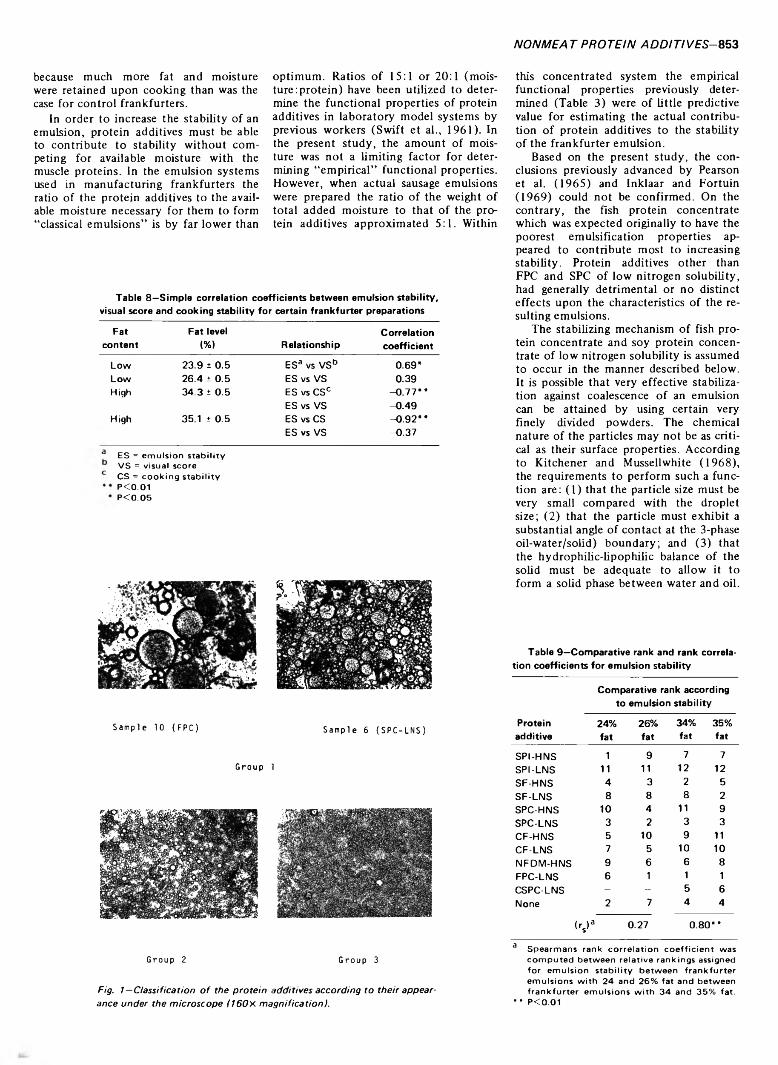
NONMEAT PROTEIN ADDITIVES- 853
because much more fat and moisture were retained upon cooking than was the case for control frankfurters.
In order to increase the stability of an emulsion, protein additives must be able to contribute to stability without competing for available moisture with the muscle proteins. In the emulsion systems used in manufacturing frankfurters the ratio of the protein additives to the available moisture necessary for them to form “classical emulsions” is by far lower than
optimum. Ratios of 15:1 or 20:1 (moisture :protein) have been utilized to determine the functional properties of protein additives in laboratory model systems by previous workers (Swift et al., 1961). In the present study, the amount of moisture was not a limiting factor for determining “empirical” functional properties. However, when actual sausage emulsions were prepared the ratio of the weight of total added moisture to that of the protein additives approximated 5:1. Within
this concentrated system the empirical functional properties previously determined (Table 3) were of little predictive value for estimating the actual contribution of protein additives to the stability of the frankfurter emulsion.
Based on the present study, the conclusions previously advanced by Pearson et al. (1965) and Inklaar and Fortuin(1969) could not be confirmed. On the contrary, the fish protein concentrate which was expected originally to have the poorest emulsification properties appeared to contribute most to increasing stability. Protein additives other than FPC and SPC of low nitrogen solubility, had generally detrimental or no distinct effects upon the characteristics of the resulting emulsions.
The stabilizing mechanism of fish protein concentrate and soy protein concentrate of low nitrogen solubility is assumed to occur in the manner described below. It is possible that very effective stabilization against coalescence of an emulsion can be attained by using certain very finely divided powders. The chemical nature of the particles may not be as critical as their surface properties. According to Kitchener and Mussellwhite (1968), the requirements to perform such a function are: (1) that the particle size must be very small compared with the droplet size; (2) that the particle must exhibit a substantial angle of contact at the 3-phaseoil-water/solid) boundary; and (3) that the hydrophilic-lipophilic balance of the solid must be adequate to allow it to form a solid phase between water and oil.
Table 9—Comparative rank and rank correlation coefficients for emulsion stability
Proteinadditive
Comparative rank according to emulsion stability
24% 26% fat fat
34%fat
35%fat
SPI-HNS 1 9 7 7SPI-LNS 11 11 12 12SF-HNS 4 3 2 5SF-LN S 8 8 8 2SPC-HNS 10 4 11 9SPC-LNS 3 2 3 3CF-HNS 5 10 9 11CF-LNS 7 5 10 10NFDM-HNS 9 6 6 8FPC-LNS 6 1 1 1CSPC-LNS - - 5 6None 2 7 4 4
<rs)a 0.27 0.80 * *
a S p e a rm a n s ra n k c o r re la t io n c o e f f ic ie n t w as c o m p u te d b e tw e e n re la t iv e ra n k in g s assign ed fo r e m u ls io n s ta b il it y b e tw e e n f ra n k fu r te r e m u ls io n s w ith 2 4 an d 2 6 % fa t an d b e tw e e n f ra n k fu r te r e m u ls io n s w ith 3 4 an d 3 5 % fat.
" P C 0 .0 1
Table 8—Simple correlation coefficients between emulsion stability, visual score and cooking stability for certain frankfurter preparations
Fatcontent
Fat level(%) Relationship
Correlationcoefficient
Low 23.9 ± 0.5 E S a vs V Sb 0.69*Low 26.4 ± 0.5 ES us VS 0.39High 34.3 ± 0.5 ES vs CSc -0 .7 7**
ES vs VS -0.49High 35.1 ± 0.5 ES vs CS -0 .9 2**
ES vs VS -0.37
E S = e m u ls io n s ta b il it y V S = v isu a l sco re C S = c o o k in g s ta b il it y P C 0 .0 1 P < 0 .0 5
Sample 10 (FPC) Sample 6 (SPC-LNS)
Group 1
Group 2 Group 3
Fig. 1—C la s sifica tio n o f th e p r o te in a d d it iv e s a cc o r d in g to th e ir a p p ea ra n c e u n d e r th e m ic r o s c o p e ( 1 6 0 x m a g n ific a tio n ! .
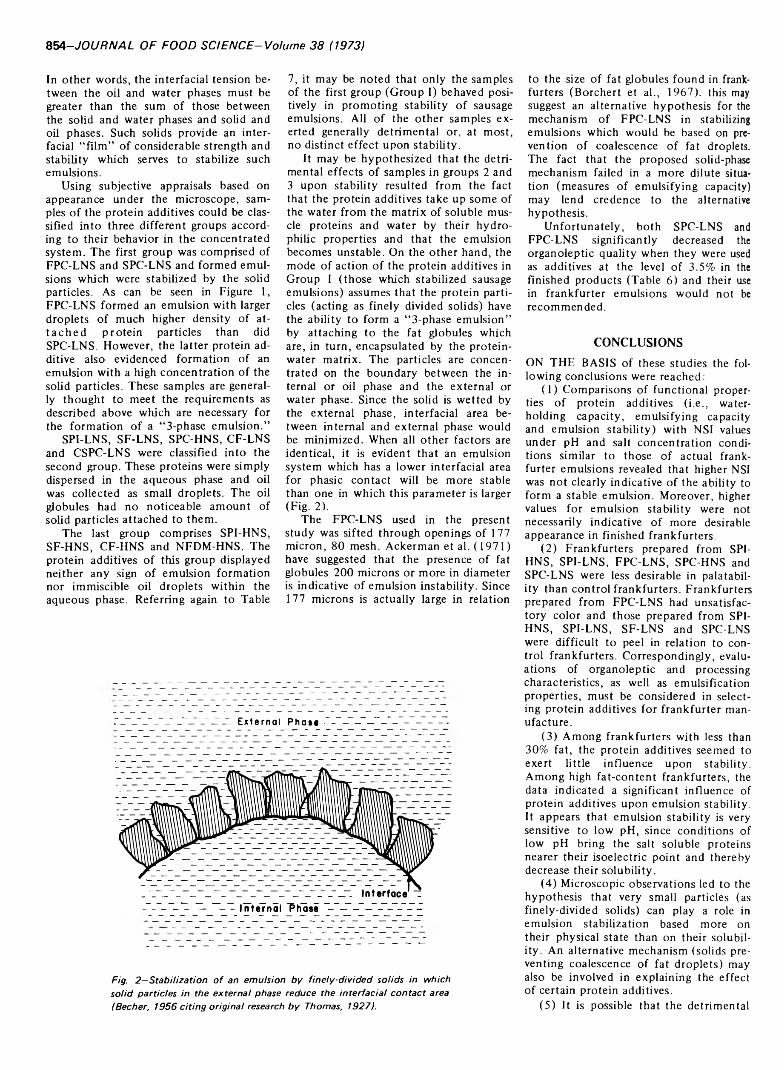
854-JOURNAL OF FOOD SCIENCE-Volume 38 (1973)
In other words, the interfacial tension between the oil and water phases must be greater than the sum of those between the solid and water phases and solid and oil phases. Such solids provide an interfacial “film” of considerable strength and stability which serves to stabilize such emulsions.
Using subjective appraisals based on appearance under the microscope, samples of the protein additives could be classified into three different groups according to their behavior in the concentrated system. The first group was comprised of FPC-LNS and SPC-LNS and formed emulsions which were stabilized by the solid particles. As can be seen in Figure 1, FPC-LNS formed an emulsion with larger droplets of much higher density of attached protein particles than did SPC-LNS. However, the latter protein additive also evidenced formation of an emulsion with a high concentration of the solid particles. These samples are generally thought to meet the requirements as described above which are necessary for the formation of a “3-phase emulsion.”
SPI-LNS, SF-LNS, SPC-HNS, CF-LNS and CSPC-LNS were classified into the second group. These proteins were simply dispersed in the aqueous phase and oil was collected as small droplets. The oil globules had no noticeable amount of solid particles attached to them.
The last group comprises SPI-HNS, SF-HNS, CF-HNS and NFDM-HNS. The protein additives of this group displayed neither any sign of emulsion formation nor immiscible oil droplets within the aqueous phase. Referring again to Table
7, it may be noted that only the samples of the first group (Group 1) behaved positively in promoting stability of sausage emulsions. All of the other samples exerted generally detrimental or, at most, no distinct effect upon stability.
It may be hypothesized that the detrimental effects of samples in groups 2 and 3 upon stability resulted from the fact that the protein additives take up some of the water from the matrix of soluble muscle proteins and water by their hydrophilic properties and that the emulsion becomes unstable. On the other hand, the mode of action of the protein additives in Group I (those which stabilized sausage emulsions) assumes that the protein particles (acting as finely divided solids) have the ability to form a “3-phase emulsion” by attaching to the fat globules which are, in turn, encapsulated by the protein- water matrix. The particles are concentrated on the boundary between the internal or oil phase and the external or water phase. Since the solid is wetted by the external phase, interfacial area between internal and external phase would be minimized. When all other factors are identical, it is evident that an emulsion system which has a lower interfacial area for phasic contact will be more stable than one in which this parameter is larger (Fig. 2).
The FPC-LNS used in the present study was sifted through openings of 177 micron, 80 mesh. Ackerman et al. (1971) have suggested that the presence of fat globules 200 microns or more in diameter is indicative of emulsion instability. Since 177 microns is actually large in relation
to the size of fat globules found in frankfurters (Borchert et al., 1967). this may suggest an alternative hypothesis for the mechanism of FPC-LNS in stabilizing emulsions which would be based on prevention of coalescence of fat droplets. The fact that the proposed solid-phase mechanism failed in a more dilute situation (measures of emulsifying capacity) may lend credence to the alternative hypothesis.
Unfortunately, both SPC-LNS and FPC-LNS significantly decreased the organoleptic quality when they were used as additives at the level of 3.5% in the finished products (Table 6) and their use in frankfurter emulsions would not be recommended.
C O N C L U S IO N S
ON THE BASIS of these studies the following conclusions were reached:
(1) Comparisons of functional properties of protein additives (i.e., waterholding capacity, emulsifying capacity and emulsion stability) with NSI values under pH and salt concentration conditions similar to those of actual frankfurter emulsions revealed that higher NSI was not clearly indicative of the ability to form a stable emulsion. Moreover, higher values for emulsion stability were not necessarily indicative of more desirable appearance in finished frankfurters.
(2) Frankfurters prepared from SPI- HNS, SPI-LNS, FPC-LNS, SPC-HNS and SPC-LNS were less desirable in payability than control frankfurters. Frankfurters prepared from FPC-LNS had unsatisfactory color and those prepared from SPI- HNS, SPI-LNS, SF-LNS and SPC-LNS were difficult to peel in relation to control frankfurters. Correspondingly, evaluations of organoleptic and processing characteristics, as well as emulsification properties, must be considered in selecting protein additives for frankfurter manufacture.
(3) Among frankfurters with less than 30% fat, the protein additives seemed to exert little influence upon stability. Among high fat-content frankfurters, the data indicated a significant influence of protein additives upon emulsion stability. It appears that emulsion stability is very sensitive to low pH, since conditions of low pH bring the salt soluble proteins nearer their isoelectric point and thereby decrease their solubility.
(4) Microscopic observations led to the hypothesis that very small particles (as finely-divided solids) can play a role in emulsion stabilization based more on their physical state than on their solubility. An alternative mechanism (solids preventing coalescence of fat droplets) may also be involved in explaining the effect of certain protein additives.
(5) It is possible that the detrimental
External Phase
Fig. 2 —S ta b i l iz a t io n o f an e m u ls io n b y f in e ly -d iv id e d so lid s in w h ich s o l id p a r tic le s in th e e x te r n a l p h a se re d u c e th e in te r fa c ia l c o n ta c t area (B ech er, 1 9 5 6 c it in g o rig in a l research b y T h o m a s, 1927).
NON ME A T PROTEIN ADDITIVES- 855
effect of certain protein additives on emulsion stability results from their competition for available moisture with the matrix of soluble meat proteins and water surrounding fat globules.
(6) These data support the belief that muscle proteins are excellent emulsion stabilizers and that they are better than most of the vegetable proteins offered to the trade for that purpose.
R E F E R E N C E S
Ackerman, S .A ., Sw ift, C.E., Carroll, R.J. and Townsend, W.E. 1971. E ffects o f types of fat and o f rates and temperatures o f com m inution on dispersion o f lipids in frankfurters. J. Food Sci. 36: 266.
AOAC. 1970 . “Official M ethods o f A nalysis,” 11th Ed, Assoc, o f O ff. Agr. Chemists, Washington, D.C.
Becher, P. 1965 . Theory of em ulsion: Stability. In “ Emulsions: Theory and Practice,” p. 95. Reinhoid Publishing Corp., N ew York.
Borchert, L.L., Greaser, M.L., Bard, J.C., Cas- sens, R.G. and Briskey, E.J. 1 967 . Electron
m icroscopy o f a meat em ulsion. J. Food Sci. 32: 419.
Hansen, L.J. 1960. Emulsion form ation in finely com m inuted sausage. Food Technol. 14: 565.
Hegarty, G.R., Bratzler, L.J. and Pearson, A.M.1963. Studies on the em ulsifying properties of som e intracellular b eef muscle proteins.J. Food Sci. 28: 663.
Helmer, R.L. and Saffle, R.L. 1963 . Effect o f chopping temperature on the stability o f sausage em ulsions. Food Technol. 17: 1195.
Inklaar, P.A. and Fortuin, J. 1969 . Determining the em ulsifying and em ulsion stabilizing capacity o f protein m eat additives. Food Technol. 23: 103.
Kitchener, J.A. and M ussellwhite, P.R. 1968. The theory o f stability o f em ulsions. In “ Em ulsion Science,” ed. Sherman, P. Academ ic Press, Inc., London and New York.
Morrison, G.S., Webb, N .B., Blumer, T .N ., Ivey,F.J. and Haq, A. 1971. Relationship betw een com position and stability o f sausage- type em ulsions. J. Food Sci. 36: 426.
Ostle, B. 1963 . Nonparametric m ethods. In “Statistics in Research,” 2nd Ed, p. 233. The Iowa State University Press, Ames, Iowa.
Pearson, A.M ., Spooner, M.E., Hegarty, G.R. and Bratzler, L.J. 1965 . The em ulsifying
capacity and stability o f soy sodium pro- teinate, potassium caseinate and nonfat dry milk. Food Technol. 19: 1841.
Saffle, R .L., Christian, J .A ., Carpenter, J.A. and Zirkle, S.B. 1967. Rapid m ethod to determine stability o f sausage em ulsions and effects o f protein temperatures and humidities. Food Technol. 21: 784.
Saffle, R.L. and Helmer, R.L. 1963. E ffect o f chopping temperature on the stability o f sausage em ulsions. Food Techol. 17: 1195.
Sw ift, C.E., Lockett, C. and Fryar, A.J. 1961. Com minuted m eat em ulsions: The capacity o f meats for em ulsifying fat. Food Technol. 15: 468.
Sw ift, C.E. and Sulzbacher, W.L. 1963. Comm inuted meat emulsions: Factors affecting meat proteins as em ulsion stabilizers. Food Technol. 17: 224.
Townsend, W.E., Witnauer, L.P., R iloof, J.A. and Sw ift, C.E. 1968. Comminuted meat emulsions: D ifferential thermal analysis for fat transitions. Food Technol. 22: 319.
Trautman, J.C. 1966 . E ffect o f temperature and pH on the soluble proteins o f ham. J. Food Sci. 31: 409.
Ms received 1 /1 3 /7 3 ; revised 2 /2 3 /7 3 ; accepted3 /2 7 /7 3 ._______________________________________
T.A. 10066 , Texas Agricultural ExperimentStation.
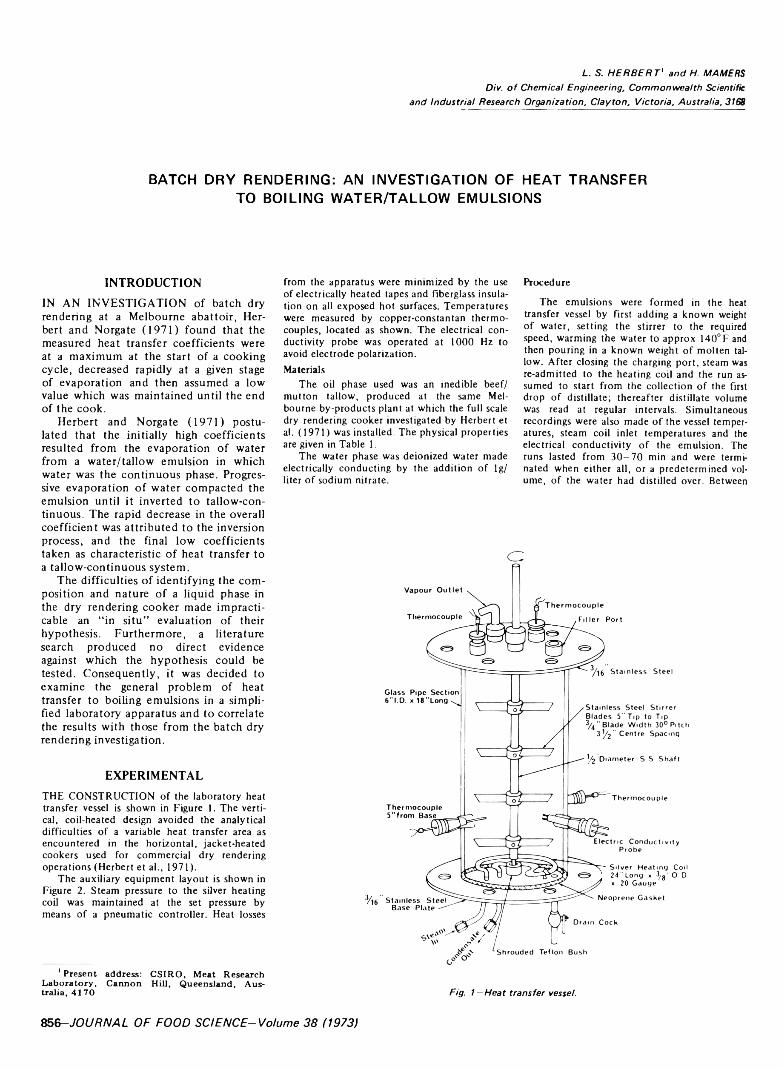
L . S. H E R B E R T ' a n d H . M A M E R S
D iv . o f C h e m ic a l E n g in e e rin g , C o m m o n w e a lth Scientific
a n d In d u s tr ia l R esearch O rg a n iz a t io n , C la y to n , V ic to r ia , A u s tra lia , 3168
BATCH DRY RENDERING: AN INVESTIGATION OF HEAT TRANSFER TO BOILING WATER/TALLOW EMULSIONS
INTRODUCTIONIN AN INVESTIGATION of batch dry rendering at a Melbourne abattoir, Herbert and Norgate (1971) found that the measured heat transfer coefficients were at a maximum at the start of a cooking cycle, decreased rapidly at a given stage of evaporation and then assumed a low value which was maintained until the end of the cook.
Herbert and Norgate (1971) postulated that the initially high coefficients resulted from the evaporation of water from a water/tallow emulsion in which water was the continuous phase. Progressive evaporation of water compacted the emulsion until it inverted to tallow-continuous. The rapid decrease in the overall coefficient was attributed to the inversion process, and the final low coefficients taken as characteristic of heat transfer to a tallow-continuous system.
The difficulties of identifying the composition and nature of a liquid phase in the dry rendering cooker made impracticable an “in situ” evaluation of their hypothesis. Furthermore, a literature search produced no direct evidence against which the hypothesis could be tested. Consequently, it was decided to examine the general problem of heat transfer to boiling emulsions in a simplified laboratory apparatus and to correlate the results with those from the batch dry rendering investigation.
EXPERIMENTALTHE CONSTRUCTION of the laboratory heat transfer vessel is shown in Figure 1. The vertical, coil-heated design avoided the analytical difficulties o f a variable heat transfer area as encountered in the horizontal, jacket-heated cookers used for commercial dry rendering operations (Herbert et al., 1971).
The auxiliary equipment layout is shown in Figure 2. Steam pressure to the silver heating coil was maintained at the set pressure by means of a pneumatic controller. Heat losses 1
1 Present address: C S IR O , M eat Research La b o ra to ry , C annon H ill , Queensland, Austra lia , 4 1 7 0
from the apparatus were minimized by the use of electrically heated tapes and fiberglass insulation on all exposed hot surfaces. Temperatures were measured by copper-constantan thermocouples, located as shown. The electrical conductivity probe was operated at 1000 Hz to avoid electrode polarization.Materials
The oil phase used was an inedible beef/ mutton tallow, produced at the same Melbourne by-products plant at which the full scale dry rendering cooker investigated by Herbert et al. (1971) was installed. The physical properties are given in Table 1.
The water phase was deionized water made electrically conducting by the addition of lg/ liter o f sodium nitrate.
Procedure
The emulsions were formed in the heat transfer vessel by first adding a known weight o f water, setting the stirrer to the required speed, warming the water to approx 140°F and then pouring in a known weight o f molten tallow. After closing the charging port, steam was re-admitted to the heating coil and the run assumed to start from the collection of the first drop o f distillate; thereafter distillate volume was read at regular intervals. Simultaneous recordings were also made o f the vessel temperatures, steam coil inlet temperatures and the electrical conductivity o f the emulsion. The runs lasted from 3 0 -7 0 min and were terminated when either all, or a predetermined volume, o f the water had distilled over. Between
c
F ig . 1—H e a t t ra n s fe r vessel.
856-JOURNAL OF FOOD SCIENCE-Volume 38 (1973)
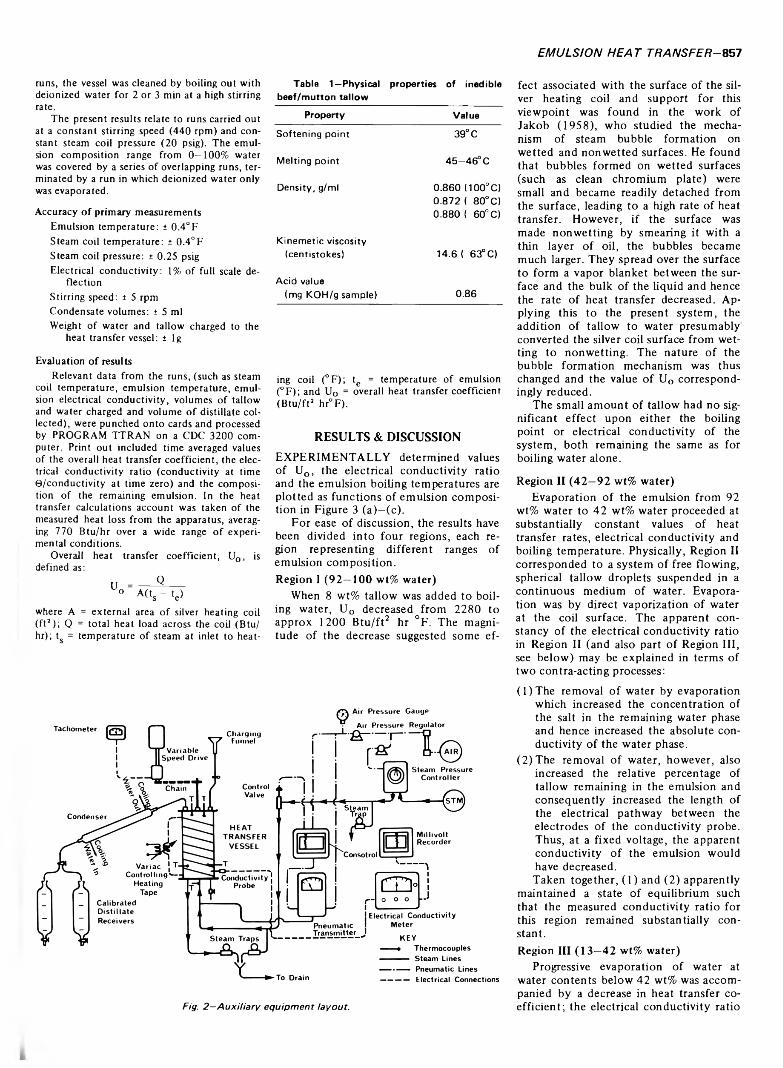
EMULSION HEAT TRANSFER- 857
runs, the vessel was cleaned by boiling out with deionized water for 2 or 3 min at a high stirring rate.
The present results relate to runs carried out at a constant stirring speed (440 rpm) and constant steam coil pressure (20 psig). The emulsion composition range from 0-100% water was covered by a series o f overlapping runs, terminated by a run in which deionized water only was evaporated.
Accuracy of primary measurementsEmulsion temperature: ± 0.4°F Steam coil temperature: ± 0.4°F Steam coil pressure: ± 0.25 psig Electrical conductivity: 1% o f full scale de
flectionStirring speed: ± 5 rpm Condensate volumes: t 5 ml Weight o f water and tallow charged to the
heat transfer vessel: ± lg
Evaluation of resultsRelevant data from the runs, (such as steam
coil temperature, emulsion temperature, emulsion electrical conductivity, volumes of tallow and water charged and volume o f distillate collected), were punched onto cards and processed by PROGRAM TTRAN on a CDC 3200 computer. Print out included time averaged values of the overall heat transfer coefficient, the electrical conductivity ratio (conductivity at time ©/conductivity at time zero) and the composition of the remaining emulsion. In the heat transfer calculations account was taken of the measured heat loss from the apparatus, averaging 770 Btu/hr over a wide range o f experimental conditions.
Overall heat transfer coefficient, U0 , is defined as:
U = ----- 2 ------° A(ts - le)
where A = external area o f silver heating coil (ftJ); Q = total heat load across the coil (Btu/ hr); ts = temperature of steam at inlet to heat
Table 1—Physical properties of inedible beef/mutton tallow
Property ValueSoftening point 39° C
Melting point 45-46 ° C
Density, g/ml 0.860 (100°C) 0.872 ( 80° C) 0.880 ( 60°C)
Kinemetic viscosity (centistokes) 14.6 ( 63° C)
Acid value (mg KOH/g sample) 0.86
ing coil (°F); te = temperature of emulsion (°F); and U0 = overall heat transfer coefficient (B tu/ft2 hr°F).
RESULTS & DISCUSSIONEXPERIMENTALLY determined values of Uc , the electrical conductivity ratio and the emulsion boiling temperatures are plotted as functions of emulsion composition in Figure 3 (a)—(c).
For ease of discussion, the results have been divided into four regions, each region representing different ranges of emulsion composition.Region I (92—100 wt% water)
When 8 wt% tallow was added to boiling water, UQ decreased from 2280 to approx 1200 Btu/ft2 hr °F. The magnitude of the decrease suggested some ef
fect associated with the surface of the silver heating coil and support for this viewpoint was found in the work of Jakob (1958), who studied the mechanism of steam bubble formation on wetted and nonwetted surfaces. He found that bubbles formed on wetted surfaces (such as clean chromium plate) were small and became readily detached from the surface, leading to a high rate of heat transfer. However, if the surface was made nonwetting by smearing it with a thin layer of oil, the bubbles became much larger. They spread over the surface to form a vapor blanket between the surface and the bulk of the liquid and hence the rate of heat transfer decreased. Applying this to the present system, the addition of tallow to water presumably converted the silver coil surface from wetting to nonwetting. The nature of the bubble formation mechanism was thus changed and the value of U0 correspondingly reduced.
The small amount of tallow had no significant effect upon either the boiling point or electrical conductivity of the system, both remaining the same as for boiling water alone.
Region II (42—92 wt% water)Evaporation of the emulsion from 92
wt% water to 42 wt% water proceeded at substantially constant values of heat transfer rates, electrical conductivity and boiling temperature. Physically, Region II corresponded to a system of free flowing, spherical tallow droplets suspended in a continuous medium of water. Evaporation was by direct vaporization of water at the coil surface. The apparent constancy of the electrical conductivity ratio in Region II (and also part of Region III, see below) may be explained in terms of two contra-acting processes:(1 ) The removal of water by evaporation
which increased the concentration of the salt in the remaining water phase and hence increased the absolute conductivity of the water phase.
(2) The removal of water, however, also increased the relative percentage of tallow remaining in the emulsion and consequently increased the length of the electrical pathway between the electrodes of the conductivity probe. Thus, at a fixed voltage, the apparent conductivity of the emulsion would have decreased.Taken together, (1) and (2) apparently
maintained a state of equilibrium such that the measured conductivity ratio for this region remained substantially constant.Region III (13—42 wt% water)
Progressive evaporation of water at water contents below 42 wt% was accompanied by a decrease in heat transfer coefficient; the electrical conductivity ratioF ig . 2 —A u x i l ia r y e q u ip m e n t la y o u t .
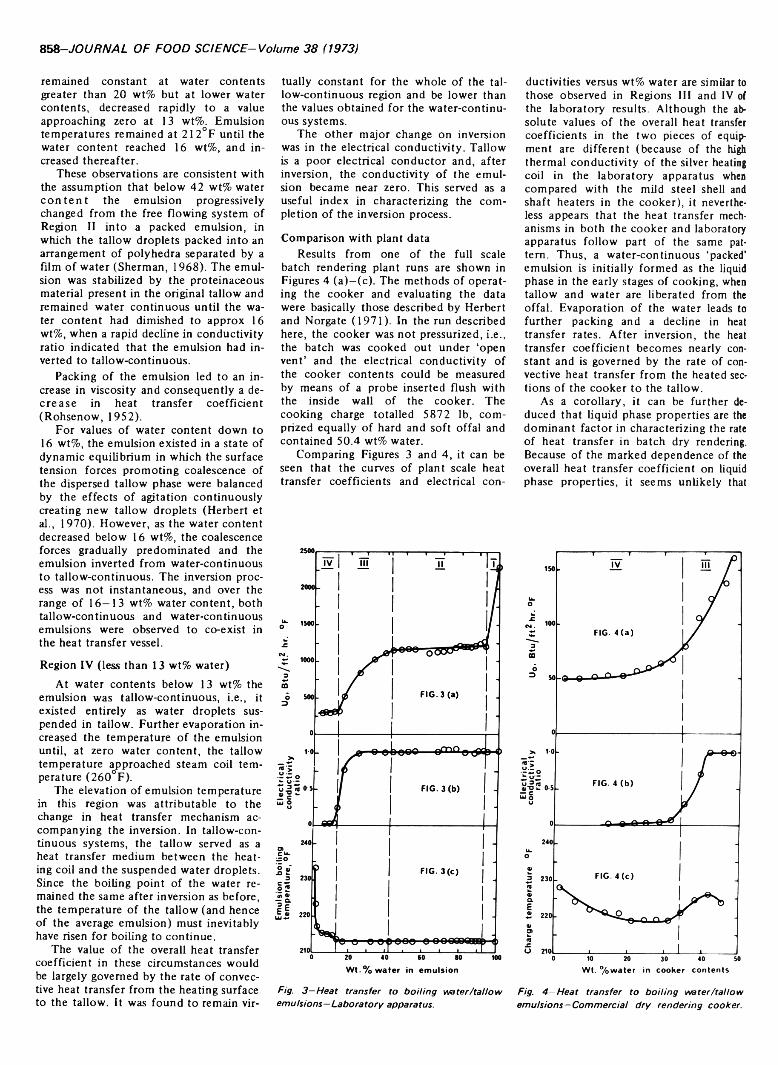
858-JOURNAL OF FOOD SCIENCE-Volume 38 (1973)
remained constant at water contents greater than 20 wt% but at lower water contents, decreased rapidly to a value approaching zero at 13 wt%. Emulsion temperatures remained at 212°F until the water content reached 16 wt%, and increased thereafter.
These observations are consistent with the assumption that below 42 wt% water con ten t the emulsion progressively changed from the free flowing system of Region II into a packed emulsion, in which the tallow droplets packed into an arrangement of polyhedra separated by a film of water (Sherman, 1968). The emulsion was stabilized by the proteinaceous material present in the original tallow and remained water continuous until the water content had dimished to approx 16 wt%, when a rapid decline in conductivity ratio indicated that the emulsion had inverted to tallow-continuous.
Packing of the emulsion led to an increase in viscosity and consequently a decrease in heat transfer coefficient (Rohsenow, 1952).
For values of water content down to 16 wt%, the emulsion existed in a state of dynamic equilibrium in which the surface tension forces promoting coalescence of the dispersed tallow phase were balanced by the effects of agitation continuously creating new tallow droplets (Herbert et al., 1 970). However, as the water content decreased below 16 wt%, the coalescence forces gradually predominated and the emulsion inverted from water-continuous to tallow-continuous. The inversion process was not instantaneous, and over the range of 16—13 wt% water content, both tallow-continuous and water-continuous emulsions were observed to co-exist in the heat transfer vessel.
Region IV (less than 13 wt% water)At water contents below 13 wt% the
emulsion was tallow-continuous, i.e., it existed entirely as water droplets suspended in tallow. Further evaporation increased the temperature of the emulsion until, at zero water content, the tallow temperature approached steam coil temperature (260°F).
The elevation of emulsion temperature in this region was attributable to the change in heat transfer mechanism accompanying the inversion. In tallow-continuous systems, the tallow served as a heat transfer medium between the heating coil and the suspended water droplets. Since the boiling point of the water remained the same after inversion as before, the temperature of the tallow (and hence of the average emulsion) must inevitably have risen for boiling to continue.
The value of the overall heat transfer coefficient in these circumstances would be largely governed by the rate of convective heat transfer from the heating surface to the tallow. It was found to remain vir
tually constant for the whole of the tallow-continuous region and be lower than the values obtained for the water-continuous systems.
The other major change on inversion was in the electrical conductivity. Tallow is a poor electrical conductor and, after inversion, the conductivity of the emulsion became near zero. This served as a useful index in characterizing the completion of the inversion process.
Comparison with plant dataResults from one of the full scale
batch rendering plant runs are shown in Figures 4 (a)—(c). The methods of operating the cooker and evaluating the data were basically those described by Herbert and Norgate (1971). In the run described here, the cooker was not pressurized, i.e., the batch was cooked out under ‘open vent’ and the electrical conductivity of the cooker contents could be measured by means of a probe inserted flush with the inside wall of the cooker. The cooking charge totalled 5872 lb, comprized equally of hard and soft offal and contained 50.4 wt% water.
Comparing Figures 3 and 4, it can be seen that the curves of plant scale heat transfer coefficients and electrical con
ductivities versus wt% water are similar to those observed in Regions III and IV of the laboratory results. Although the absolute values of the overall heat transfer coefficients in the two pieces of equipment are different (because of the high thermal conductivity of the silver heating coil in the laboratory apparatus when compared with the mild steel shell and shaft heaters in the cooker), it nevertheless appears that the heat transfer mechanisms in both the cooker and laboratory apparatus follow part of the same pattern. Thus, a water-continuous ‘packed’ emulsion is initially formed as the liquid phase in the early stages of cooking, when tallow and water are liberated from the offal. Evaporation of the water leads to further packing and a decline in heat transfer rates. After inversion, the heat transfer coefficient becomes nearly constant and is governed by the rate of convective heat transfer from the heated sections of the cooker to the tallow.
As a corollary, it can be further deduced that liquid phase properties are the dominant factor in characterizing the rate of heat transfer in batch dry rendering. Because of the marked dependence of the overall heat transfer coefficient on liquid phase properties, it seems unlikely that
F ig . 3 —H e a t t ra n s fe r to b o il in g w a t e r / t a l lo w F ig . 4 —H e a t tra n s fe r to b o il in g w a te r / ta l lo w
e m u ls io n s —L a b o ra to r y a p p a ra tu s . e m u ls io n s —C o m m e rc ia l d r y re n d e r in g c o o k e r.
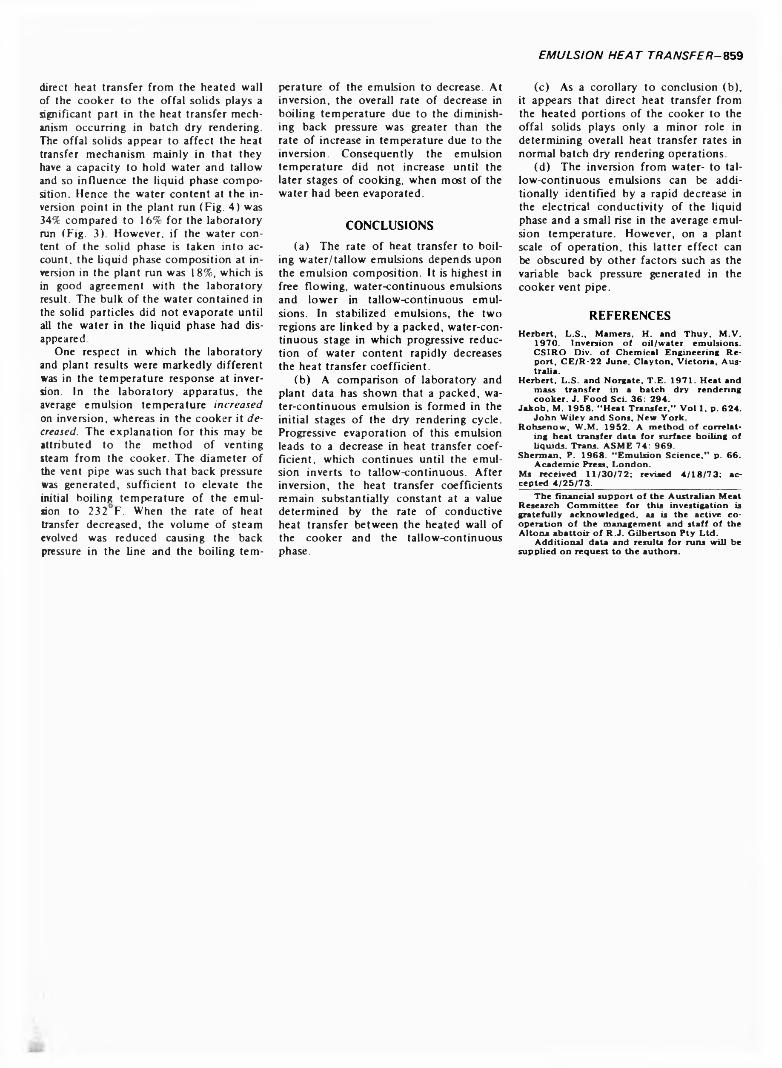
EMULSION HEAT TRANSFER-859
direct heat transfer from the heated wall of the cooker to the offal solids plays a significant part in the heat transfer mechanism occurring in batch dry rendering. The offal solids appear to affect the heat transfer mechanism mainly in that they have a capacity to hold water and tallow and so influence the liquid phase composition. Hence the water content at the inversion point in the plant run (Fig. 4) was 34% compared to 16% for the laboratory run (Fig. 3). However, if the water content of the solid phase is taken into account, the liquid phase composition at inversion in the plant run was 18%, which is in good agreement with the laboratory result. The bulk of the water contained in the solid particles did not evaporate until all the water in the liquid phase had disappeared.
One respect in which the laboratory and plant results were markedly different was in the temperature response at inversion. In the laboratory apparatus, the average emulsion temperature increased on inversion, whereas in the cooker it decreased. The explanation for this may be attributed to the method of venting steam from the cooker. The diameter of the vent pipe was such that back pressure was generated, sufficient to elevate the initial boiling temperature of the emulsion to 232 F. When the rate of heat transfer decreased, the volume of steam evolved was reduced causing the back pressure in the line and the boiling tem
perature of the emulsion to decrease. At inversion, the overall rate of decrease in boiling temperature due to the diminishing back pressure was greater than the rate of increase in temperature due to the inversion. Consequently the emulsion temperature did not increase until the later stages of cooking, when most of the water had been evaporated.
CONCLUSIONS(a) The rate of heat transfer to boil
ing water/tallow emulsions depends upon the emulsion composition. It is highest in free flowing, water-continuous emulsions and lower in tallow-continuous emulsions. In stabilized emulsions, the two regions are linked by a packed, water-continuous stage in which progressive reduction of water content rapidly decreases the heat transfer coefficient.
(b) A comparison of laboratory and plant data has shown that a packed, water-continuous emulsion is formed in the initial stages of the dry rendering cycle. Progressive evaporation of this emulsion leads to a decrease in heat transfer coefficient. which continues until the emulsion inverts to tallow-continuous. After inversion, the heat transfer coefficients remain substantially constant at a value determined by the rate of conductive heat transfer between the heated wall of the cooker and the tallow-continuous phase.
(c) As a corollary to conclusion (b), it appears that direct heat transfer from the heated portions of the cooker to the offal solids plays only a minor role in determining overall heat transfer rates in normal batch dry rendering operations.
(d) The inversion from water- to tallow-continuous emulsions can be additionally identified by a rapid decrease in the electrical conductivity of the liquid phase and a small rise in the average emulsion temperature. However, on a plant scale of operation, this latter effect can be obscured by other factors such as the variable back pressure generated in the cooker vent pipe.
REFERENCESH erb ert, L .S ., M am ers, H . and T h u y , M .V .
1 9 7 0 . Inversion o f o il/w a te r emulsions. C S IR O D iv . o f C hem ical Eng ineering R ep o rt, C E /R -2 2 June. C la y to n , V ic to r ia , Australia .
H erb ert, L .S . and N orgate, T .E . 1 97 1 . H ea t and mass transfer in a batch d ry rendering cooker. J. Fo od Sci. 3 6 : 2 94 .
Jakob, M . 1 9 5 8 . “ H ea t T ran s fer,” V o l 1, p. 6 24 .John W iley and Sons, N ew Y o rk .
Rohsenow , W .M . 1 9 5 2 . A m ethod o f co rre lating heat transfer data fo r surface bo iling o f liquids. Trans. A S M E 7 4: 9 6 9 .
Sherm an, P. 1 9 6 8 . “ Em ulsion Science,” p. 66 .A cadem ic Press, Londo n .
Ms received 1 1 /3 0 /7 2 ; revised 4 /1 8 /7 3 ; ac- cepted 4 /2 5 /7 3 .________ _____________ ____
The financial support o f the A ustra lian M eat Research C om m ittee fo r this investigation is gratefu lly acknow ledged, as is the active coop eration o f the m anagem ent and s ta ff o f the A lto n a a b a tto ir o f R .J . G ilbertson P ty L td .
A d d itio n a l data and results fo r runs w ill be supplied on request to the authors.
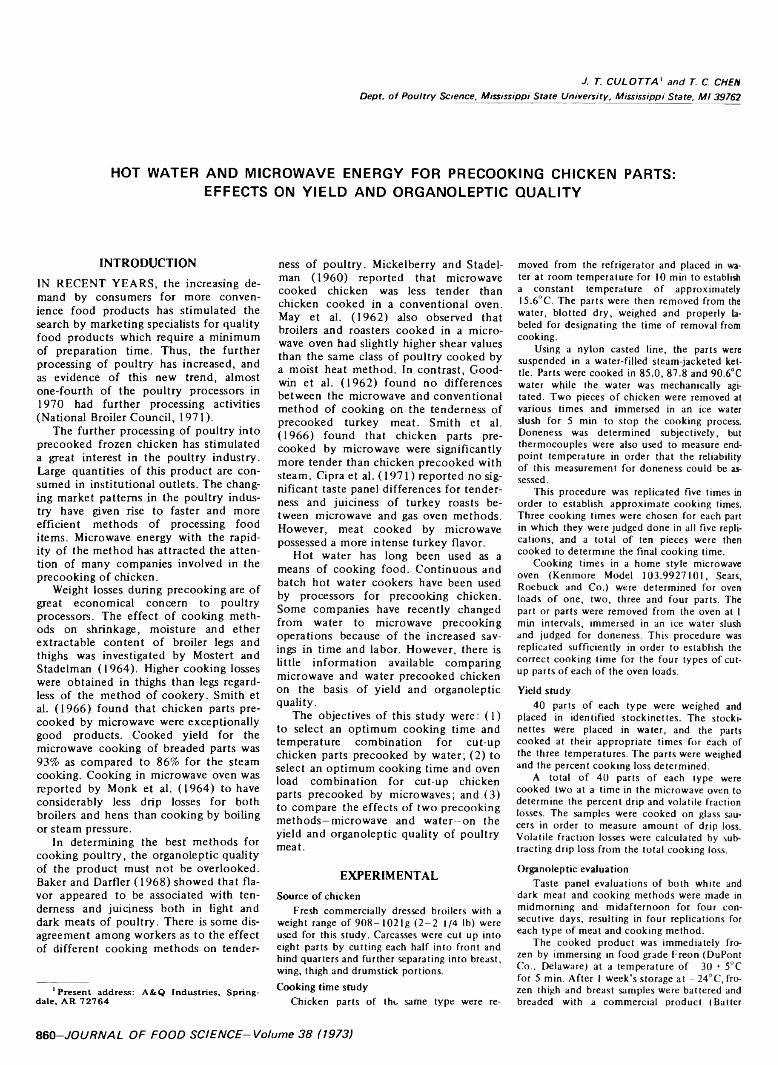
J. T. C U L O T T A ' a n d T. C. C H E N
D e p t, o f P o u lt r y S c ie n c e , M is s is s ip p i S ta te U n iv e rs ity , M is s is s ip p i S ta te , M l 3 9 7 6 2
HOT WATER AND MICROWAVE ENERGY FOR PRECOOKING CHICKEN PARTS: EFFECTS ON Y IELD AND ORGANOLEPTIC QUALITY
INTRODUCTIONIN RECENT YEARS, the increasing demand by consumers for more convenience food products has stimulated the search by marketing specialists for quality food products which require a minimum of preparation time. Thus, the further processing of poultry has increased, and as evidence of this new trend, almost one-fourth of the poultry processors in 1970 had further processing activities (National Broiler Council, 1971).
The further processing of poultry into precooked frozen chicken has stimulated a great interest in the poultry industry. Large quantities of this product are consumed in institutional outlets. The changing market patterns in the poultry industry have given rise to faster and more efficient methods of processing food items. Microwave energy with the rapidity of the method has attracted the attention of many companies involved in the precooking of chicken.
Weight losses during precooking are of great economical concern to poultry processors. The effect of cooking methods on shrinkage, moisture and ether extractable content of broiler legs and thighs was investigated by Mostert and Stadelman (1964). Higher cooking losses were obtained in thighs than legs regardless of the method of cookery. Smith et al. (1966) found that chicken parts precooked by microwave were exceptionally good products. Cooked yield for the microwave cooking of breaded parts was 93% as compared to 86% for the steam cooking. Cooking in microwave oven was reported by Monk et al. (1964) to have considerably less drip losses for both broilers and hens than cooking by boiling or steam pressure.
In determining the best methods for cooking poultry, the organoleptic quality of the product must not be overlooked. Baker and Darfler (1968) showed that flavor appeared to be associated with tenderness and juiciness both in light and dark meats of poultry. There is some disagreement among workers as to the effect of different cooking methods on tender-
1 Present address: A & Q Industries, Spring- dale, A R 7 2 7 6 4
ness of poultry. Mickelberry and Stadelman (1960) reported that microwave cooked chicken was less tender than chicken cooked in a conventional oven. May et al. (1962) also observed that broilers and roasters cooked in a micro- wave oven had slightly higher shear values than the same class of poultry cooked by a moist heat method. In contrast, Goodwin et al. (1962) found no differences between the microwave and conventional method of cooking on the tenderness of precooked turkey meat. Smith et al.(1966) found that chicken parts precooked by microwave were significantly more tender than chicken precooked with steam. Cipra et al. (1971) reported no significant taste panel differences for tenderness and juiciness of turkey roasts between microwave and gas oven methods. However, meat cooked by microwave possessed a more intense turkey flavor.
Hot water has long been used as a means of cooking food. Continuous and batch hot water cookers have been used by processors for precooking chicken. Some companies have recently changed from water to microwave precooking operations because of the increased savings in time and labor. However, there is little information available comparing microwave and water precooked chicken on the basis of yield and organoleptic quality.
The objectives of this study were: (1) to select an optimum cooking time and temperature combination for cut-up chicken parts precooked by water; (2) to select an optimum cooking time and oven load combination for cut-up chicken parts precooked by microwaves; and (3) to compare the effects of two precooking methods—microwave and water-on the yield and organoleptic quality of poultry meat.
EXPERIMENTALSource of chicken
Fresh commercially dressed broilers with a weight range of 9 0 8 -1 0 2 1 g ( 2 - 2 1 /4 lb) were used for this study. Carcasses were cut up into eight parts by cutting each half into front and hind quarters and further separating into breast, wing, thigh and drumstick portions.Cooking time study
Chicken parts o f the same type were re
moved from the refrigerator and placed in water at room temperature for 10 min to establish a constant temperature o f approximately 15.6°C. The parts were then removed from the water, blotted dry, weighed and properly labeled for designating the time of removal from cooking.
Using a nylon casted line, the parts were suspended in a water-filled steam-jacketed kettle. Parts were cooked in 85.0, 87.8 and 90.6°C water while the water was mechanically agitated. Two pieces o f chicken were removed at various times and immersed in an ice water slush for 5 min to stop the cooking process. Doneness was determined subjectively, but thermocouples were also used to measure endpoint temperature in order that the reliability of this measurement for doneness could be assessed.
This procedure was replicated five times in order to establish approximate cooking times. Three cooking times were chosen for each part in which they were judged done in all five replications, and a total o f ten pieces were then cooked to determine the final cooking time.
Cooking times in a home style microwave oven (Kenmore Model 103.9927101, Sears, Roebuck and Co.) were determined for oven loads o f one, two, three and four parts. The part or parts were removed from the oven at 1 min intervals, immersed in an ice water slush and judged for doneness. This procedure was replicated sufficiently in order to establish the correct cooking time for the four types o f cutup parts o f each o f the oven loads.
Yield study40 parts o f each type were weighed and
placed in identified stockinettes. The stockinettes were placed in water, and the parts cooked at their appropriate times for each of the three temperatures. The parts were weighed and the percent cooking loss determined.
A total o f 40 parts o f each type were cooked two at a time in the microwave oven to determine the percent drip and volatile fraction losses. The samples were cooked on glass saucers in order to measure amount of drip loss. Volatile fraction losses were calculated by subtracting drip loss from the total cooking loss.
Organoleptic evaluationTaste panel evaluations o f both white and
dark meat and cooking methods were made in midmorning and midafternoon for four consecutive days, resulting in four replications for each type of meat and cooking method.
The cooked product was immediately frozen by immersing in food grade Freon (DuPont Co., Delaware) at a temperature o f - 3 0 ± 5°C for 5 min. After 1 week’s storage at - 24°C, frozen thigh and breast samples were battered and breaded with a commercial product (Batter
860-JOURNAL OF FOOD SCIENCE-Volume 38 (1973)
PRECOOKING CHICKEN PARTS- 861
Table 1—Weight ranges, mean weights and standard deviations of broiler parts from 908—1021g carcasses3
PartWeight range
(9)Mean
(g) S.D.Breast 122-225 163 22Thigh 114-175 140 15Drumstick 61-86 76 9Wing 54-78 66 11
3 T o ta l o f 5 0 0 o f each ty p e p a rt used in these e xp e r im e n ts .
Table 2—Precooking temperatures and times of chicken parts in water3Precooking temp (°C)
Cooking times for parts (min)Breast Thigh Drumstick Wing
85.0 24 34 24 1787.8 20 28 20 1590.6 18 22 18 13
a A ll p a rts co o k e d at each o f th ese t im e s w erejudged fu l ly c o o k e d .
G70-14, Golden Dipt. Co., Illinois) and deep-fat fried at 190.6°C for 6 min in a General Electric Mark 313 Deep-Fat Fryer. Coded sampes were scored for flavor, juiciness and tenderness on a9-point scale by six experienced panelists.
Statistical analysesStatistical analyses o f data were made ac
cording to those procedures described by Steel and Torrie (1960). Duncan’s new multiple range test (1955) was used to determine whether significant differences occurred between the means.
RESULTS & DISCUSSIONSOptimum precooking temperature in water
Weight ranges, mean weights and standard deviations of broiler parts used in this study are given in Table 1. Based on the large number of parts studied, a processor could predict, with a fair degree of accuracy, the average weight and variation of these same parts for a carcass of this size.
The times and temperatures for precooking chicken parts in water are summarized in Table 2. These times were chosen because preliminary experiments indicated that they resulted in a highly acceptable product with a completely “done” appearance. Total precooking time decreased for all parts with increase in temperature. However, the thigh sustained a larger decrease in cooking time in comparison to the other parts. Both the breast and drumstick were fully cooked at the same time for all three temperatures.
Measuring internal temperature with thermocouples was not an effective means of evaluating doneness. Although chicken is usually considered fully cooked when an internal temperature of 82.2°C is attained, chicken parts with internal temperatures as high as 87.8 C as measured with a recording potentiometer were observed to be not fully cooked. In contrast, parts judged “done” by subjective determination were frequently recorded in the 76.7—82.2°C range on the potentiometer. This observation appears to indicate that exact anatomical thermocouple placement is necessary for objectively determining doneness in cut-up poultry parts. Goertz and Watson (1964) found similar results with turkey which was considered underdone when cooked to an endpoint temperature of 85°C. Stone and May (1969) also observed this phenomenon when the chicken was cooked to an 88°C endpoint at 121°C.
Total cooking losses for the various cut-up parts precooked in water at 85.0,87.8 and 90.6°C are presented in Table 3. Cooking losses for the breast were significantly affected (P < 0.05) by the three precooking temperatures used; whereas the thigh, drumstick and wing were not affected.
Results of the taste panel evaluations of flavor, juiciness and tenderness of the breast and thigh samples cooked at these temperatures are shown in Table 4.
Taste panel evaluations of white and dark meat indicated no significant difference in palatability due to the three pre
cooking temperatures. Although differences were not significant, the 87.8 C cooking treatment received the best scores for flavor, juiciness and tenderness for both types of meat. Juiciness-tenderness and juiciness-flavor scores were apparently correlated. The overwhelming preference by the panelists for dark meat in this study may be attributed to smaller overall cooking losses and the greater fat content for the thighs in comparison tc other parts.
Due to more favorable palatability scores and yields, 87.8 C was chosen as the optimum cooking temperature to be used in the comparative precooking studies with water and microwave energy. Effect of microwave oven load on total cooking loss, doneness and cooking time
The effects of microwave oven load on total cooking loss, doneness and cooking time of cut-up breasts plotted in Figure 1 showed a linear relationship between total cooking loss and cooking time for various oven loads at the point of complete doneness. Similar results were observed with the thigh pieces. As oven load and cooking time increased, only a very slight increase in cooking loss was observed for both parts at the point of doneness. However, this relationship did not exist with undercooked parts, and up to the point of doneness, an increase in oven load at the same cooking time gave a corresponding decrease in cooking loss. However, at the stage of total doneness, cooking time appears to become more important in its effect on losses.
The slight differences in cooking loss did not prove to be a restriction in determining the optimum microwave oven load for cut-up chicken parts. In the comparative study, all parts were cooked two
Table 4—Mean3 taste panel scoresb for white and dark meat precooked in water in different treatment temperature0
Palatability factorsFlavor Juiciness Tenderness
Precooking temp fC)
85.0 3.023 2.73a 3.12387.8 2.813 2.35a 2.88390.6 2.883 2.62a 3.153
Meat typeWhite 3.183 3.083 3.403Dark 2.62b 2.06b 2.69b
3 M eans w ith in a co lu m n g ro u p in g and w ith o u ta c o m m o n s u p e rsc r ip t a re s ig n if ic a n t ly d i f fe re n t (P < 0 .0 1 ) .
b P o ss ib le sco re s ranged fro m 1 to 9 w ith lo w e r sco re s in d ic a t in g g reate r a c c e p ta b ility .
0 S co re s in to p p a rt o f ta b le w e re o b ta in ed f ro m a c o m p o s ite sam p le o f m e a t co o k e d at each te m p e ra tu re .
Table 3—Mean3 percent total cooking loss of cut-up chicken parts precooked in water at 85.0, 87.8 and 90.6°C Precooking Cooking loss (%)
Temp Breast Thigh Drumstick Wingr o Mean S.D. Mean S.D. Mean S.D. Mean S.D.
85.0 15.7b 2.8 12.33 2.7 5.13 1.4 3.53 1.887.8 15.3b 2.3 12.53 2.8 5.2a 1.2 3.6a 2.090.6 17.23 3.3 12.83 2.4 5.4a 1.7 3.73 2.1
M eans w ith in a c o lu m n and w ith o u t a co m m o n su p e rsc r ip t are s ig n if ic a n t ly d i f fe re n t (P < 0 .0 5 ) . E a ch m ean rep resen ts 4 0 o b se rv a tio n s .
862-JOURNAL OF FOOD SCIENCE-Volume 38 (1973)
Table 5—Mean3 percent cooking loss of cut-up chicken parts precooked in a microwave oven and by water
Cooking loss (%)Microwave Water
Cut-up Volatile fraction Drip Total Totalparts Mean Mean Mean S.D. Mean S.D.
Breast 17.5 5.0 22.5a 3.9 16.0b 3.7Thigh 20.5 5.8 26.3a 4.7 13.0b 3.3Drumstick 14.7 5.6 20.3a 3.3 5.9b 2.1Wing 15.6 4.1 19.7a 3.8 3.9b 1.5a M ean to ta ls w ith in a ro w and w ith o u t a c o m m o n su p e rs c r ip t are
s ig n if ic a n t ly d if fe re n t ( P < 0 .0 1 ) . E a ch m ean rep resen ts 4 0 o b se rv a t io n s .
Table 6—Mean3 taste panel scoresb for dark and white meat precooked in a microwave oven and by water
Palatabilityfactors
Precooking treatment X type of meatMicrowave Water Microwave Water
dark dark white white
Flavor 2.12ab 1.96a 2.79c 2.38bJuiciness 2.12b 1.62a 2.96c 2.33bTenderness 1.96a 1,88a 3.71b 2.00a
a M eans w ith in a ro w and w ith o u t a c o m m o n s u p e rsc r ip t a re s ig n ific a n tly d if fe re n t (P < 0 .0 5 ) .
b P o ss ib le sco re s ranged fro m 1 to 9 w ith lo w e r sco re s in d ic a t in g greater a c c e p ta b i lity .
at a time because of the greater conveniences in handling and shorter cooking times. Cooking time for both the drumstick and wing portions at this oven load was three minutes; whereas, the breast and thigh were cooked for 6 min. All of these times were considerably less than those found for the water precooked parts.Comparison between microwave energy and hot water for precooking
Results shown in Table 5 reveal the influence of precooking method on the yield of cut-up chicken parts. Total cooking losses were significantly affected
( P < 0 .01 ) by the methods of precooking. Mean total cooking losses for all four parts precooked in the microwave oven were much greater than those precooked in water. These findings are in agreement with those for various meat products as reported by Kylen et al. (1964). The difference in losses between methods of precooking was much less for breasts than for the other parts. Higher cooking losses were obtained in thighs as compared to drumstick with both methods of precooking.
Volatile fraction accounted for the greatest amount of total cooking loss for
parts precooked in the microwave oven. Similar results were reported by Cipra et al. (1971) for microwave cooked turkey roasts.
No detectable difference in adhering ability of batter and breading to parts precooked in water as compared to those precooked by microwave was observed.
Results of the taste panel evaluations for flavor, juiciness and tenderness of dark and white meat precooked in water and a microwave oven are given in Table6 . Palatability for both dark and white meat were significantly (P < 0 .0 5 ) affected by method of precooking. Dark meat always received the best scores for flavor, juiciness and tenderness in comparison to white meat. Cash and Carlin(1968) found dark turkey meat to consistently receive higher taste panel scores for both flavor and juiciness than white meat.
Microwave cooked white meat received the lowest acceptability scores than any of the other precooking methods or type of meat combinations. Although not always significant, water cooked dark meat was found to be more acceptable for all of the palataiblity factors evaluated. White meat precooked in water was significantly (P < 0 .0 5 ) more acceptable in flavor, juiciness and tenderness than that cooked in the microwave oven. There was no significant difference between microwave and water cooked dark meat for either flavor or tenderness scores. Juiciness of dark meat was significantly (P < 0 .0 5 ) affected by the precooking treatments. Dark meat precooked in water received the best score.
REFERENCESBaker, R .C . and D a rfle r , J. 1 9 6 8 . A com parison
o f leghorn fo w l and fryers fo r precooked battered fried chicken. P o u ltry Sci. 47: 1 5 9 0 .
Cash, D .B . and C arlin , A .F . 1 9 6 8 . Q u a lity o f fro zen boneless tu rk e y roasts precooked to d i f f e r e n t in te rn a l tem peratures. Food Techno l. 22: 1 47 7 .
C ipra , J .A ., Bowers, J .A . and H o o p er, A .S .1 9 7 1 . Precooking and reheating o f tu rk e y . J. A m . D ie tit ic Assoc. 58: 38 .
0 3 6 9 12T I M E ( m i n )
Fig . 1 - E f f e c t o f m ic ro w a v e o v e n lo a d o n to t a l c o o k in g loss, c o o k in g
t im e a n d d o neness o f c u t-u p c h ic k e n breasts . (—• —• — 1 P a r t ; — o— a — 2
P a rts ; — 3 P a rts ; —o —o — 4 P a rts ; a n d .........O b s e rv e d d o n en ess )

PRECOOKING CHICKEN PARTS- 863
D uncan, D .B . 1 9 5 5 . N ew m u ltip le range and m u ltip le F tests. B iom etrics 11: 1.
G o ertz , G .E . and W atson, M .A . 1 9 6 4 . Palatabil- ity and doneness o f righ t and le f t sides o f tu rkeys roasted to selected end p o in t te m peratures. P o u ltry Sci. 43: 8 1 2 .
G o o d w in , T .L ., M ic k e lb e rry , W .C . and Stadel- m an, W .J. 1 9 6 2 . Th e e ffec t o f freezing, m eth od o f cook ing , and storage tim e on the tenderness o f precooked and raw tu rk ey m eat. P o u ltry Sci. 4 1 : 1 26 8 .
K y len , A .M ., M c G ra th , B .H ., H a llm a rk , E .L . and van D u y n e , F .O . 1 9 6 4 . M icrow ave and conventiona l cooking o f m eat. J. A m . D ie te tic Assoc. 4 5 : 1 3 9 .
M ay, K .N ., S a ffle , R .L . , D ow n ing , D .L . and
Powers, J.J. 1 9 6 2 . In ter-re la tions o f postm o rtem changes w ith tenderness o f chicken and p o rk . Fo od Techno l 16: 72.
M ic k e lb e rry , W .C . and S tadelm an, W .J. 1 96 0 . The e ffec t o f m ethod o f cookery on tenderness o f precooked frozen chicken m eat. P o u ltry Sci. 3 9 : 1 2 7 5 .
M o n k , J .A ., M o u n tn e y , G .J. and P rudent, 1.1 9 6 4 . E ffe c t o f phosphate trea tm e n t and cooking m eth od on m oisture losses o f po u ltry m eat. Fo od Techno l 18: 2 26 .
M ostert G .C . and S tadelm an, W .J. 1 9 6 4 . E ffe c t o f m eth o d o f cookery on shrinkage, m oistu re and e ther extractab le con ten t o f b ro ile r legs and thighs. P o u ltry Sci. 4 3 : 8 96 .
N a tio n a l B ro iler C ouncil. 1 9 7 1 . “ Survey o f
In dus try M arke ting Practices,” p . l . N ationa l B ro ile r C ouncil, W ashington, D .C .
S m ith , D .P ., Decareau, R .U . and G erlin , J.1 9 6 6 . M icrow ave cooking fo r fu rth e r processing. P o u ltry M eat 3: 65.
S teel, R .G .D . and T o rrie , J .H . 1 9 6 0 . “ Principles and Procedures o f S tatistics, ” p .1 0 9 . M c G ra w -H ill, In c ., N ew Y o rk .
S tone, E .W . Jr. and M a y , K .N . 1 9 6 9 . The e ffec t o f tim e and tem p erature o f cooking on quality o f freeze-dehydrated chicken. P ou ltry Sci. 4 8 : 813 .
Ms received 2 /1 2 /7 3 ; revised 4 /3 0 /7 3 ; accepted5 /1 /7 3.___________________________________________
Journa l Paper N o . 2 5 5 2 o f the Mississippi A gricu ltu ra l and Forestry E x p e rim en t S ta tion .
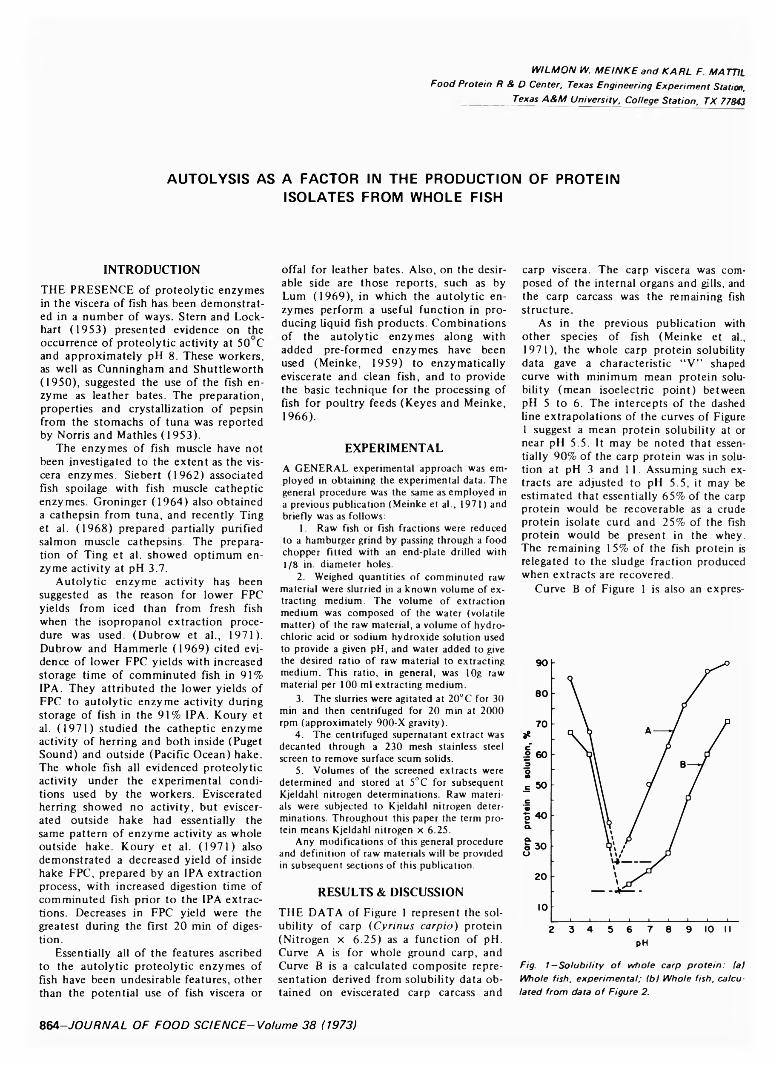
V / I L M O N W. M E I N K E a n d K A R L F . M A T T IL
F o o d P ro te in R & D C e n te r , T exas E n g in e e rin g E x p e r im e n t Station,
_________ Texas A & M U n iv e rs i t y , C o lle g e S ta t io n , T X 77843
AUTOLYSIS AS A FACTOR IN THE PRODUCTION OF PROTEIN ISOLATES FROM WHOLE FISH
INTRODUCTIONTHE PRESENCE of proteolytic enzymes in the viscera of fish has been demonstrated in a number of ways. Stern and Lockhart (1953) presented evidence on the occurrence of proteolytic activity at 50 C and approximately pH 8 . These workers, as well as Cunningham and Shuttleworth(1950), suggested the use of the fish enzyme as leather bates. The preparation, properties and crystallization of pepsin from the stomachs of tuna was reported by Norris and Mathles (1953).
The enzymes of fish muscle have not been investigated to the extent as the viscera enzymes. Siebert (1962) associated fish spoilage with fish muscle catheptic enzymes. Groninger (1964) also obtained a cathepsin from tuna, and recently Ting et al. (1968) prepared partially purified salmon muscle cathepsins. The preparation of Ting et al. showed optimum enzyme activity at pH 3.7.
Autolytic enzyme activity has been suggested as the reason for lower FPC yields from iced than from fresh fish when the isopropanol extraction procedure was used. (Dubrow et al., 1971). Dubrow and Hammerle (1969) cited evidence of lower FPC yields with increased storage time of comminuted fish in 91% IPA. They attributed the lower yields of FPC to autolytic enzyme activity during storage of fish in the 91% IPA. Koury et al. (1971) studied the catheptic enzyme activity of herring and both inside (Puget Sound) and outside (Pacific Ocean) hake. The whole fish all evidenced proteolytic activity under the experimental conditions used by the workers. Eviscerated herring showed no activity, but eviscerated outside hake had essentially the same pattern of enzyme activity as whole outside hake. Koury et al. (1971) also demonstrated a decreased yield of inside hake FPC, prepared by an IPA extraction process, with increased digestion time of comminuted fish prior to the IPA extractions. Decreases in FPC yield were the greatest during the first 20 min of digestion.
Essentially all of the features ascribed to the autolytic proteolytic enzymes of fish have been undesirable features, other than the potential use of fish viscera or
offal for leather bates. Also, on the desirable side are those reports, such as by Lum (1969), in which the autolytic enzymes perform a useful function in producing liquid fish products. Combinations of the autolytic enzymes along with added pre-formed enzymes have been used (Meinke, 1959) to enzymatically eviscerate and clean fish, and to provide the basic technique for the processing of fish for poultry feeds (Keyes and Meinke,1966).
EXPERIMENTALA GENERAL experimental approach was employed in obtaining the experimental data. The general procedure was the same as employed in a previous publication (Meinke et al., 1971) and briefly was as follows:
1. Raw fish or fish fractions were reduced to a hamburger grind by passing through a food chopper fitted with an end-plate drilled with 1/8 in. diameter holes.
2. Weighed quantities o f comminuted raw material were slurried in a known volume of extracting medium. The volume o f extraction medium was composed of the water (volatile matter) o f the raw material, a volume o f hydrochloric acid or sodium hydroxide solution used to provide a given pH, and water added to give the desired ratio o f raw material to extracting medium. This ratio, in general, was lOg raw material per 100 ml extracting medium.
3. The slurries were agitated at 20°C for 30 min and then centrifuged for 20 min at 2000 rpm (approximately 900-X gravity).
4. The centrifuged supernatant extract was decanted through a 230 mesh stainless steel screen to remove surface scum solids.
5. Volumes of the screened extracts were determined and stored at 5°C for subsequent Kjeldahl nitrogen determinations. Raw materials were subjected to Kjeldahl nitrogen determinations. Throughout this paper the term protein means Kjeldahl nitrogen x 6.25.
Any modifications of this general procedure and definition of raw materials will be provided in subsequent sections of this publication.
RESULTS & DISCUSSIONTHE DATA of Figure 1 represent the solubility of carp ( C yrinus carp io ) protein (Nitrogen x 6.25) as a function of pH. Curve A is for whole ground carp, and Curve B is a calculated composite representation derived from solubility data obtained on eviscerated carp carcass and
carp viscera. The carp viscera was composed of the internal organs and gills, and the carp carcass was the remaining fish structure.
As in the previous publication with other species of fish (Meinke et al.,1971), the whole carp protein solubility data gave a characteristic “V” shaped curve with minimum mean protein solubility (mean isoelectric point) between pH 5 to 6 . The intercepts of the dashed line extrapolations of the curves of Figure 1 suggest a mean protein solubility at or near pH 5.5. It may be noted that essentially 90% of the carp protein was in solution at pH 3 and 1 1. Assuming such extracts are adjusted to pH 5.5, it may be estimated that essentially 65% of the carp protein would be recoverable as a crude protein isolate curd and 25% of the fish protein would be present in the whey. The remaining 15% of the fish protein is relegated to the sludge fraction produced when extracts are recovered.
Curve B of Figure 1 is also an expres-
PH
F ig . 1 —S o lu b i l i ty o f w h o le c arp p r o t e in : (a )
W h o le fish , e x p e r im e n ta l; lb ) W h o le fis h , c a lc u
la te d fro m d a ta o f F ig u re 2 .
864-JOURNAL OF FOOD SCIENCE-Volume 38 (1973)
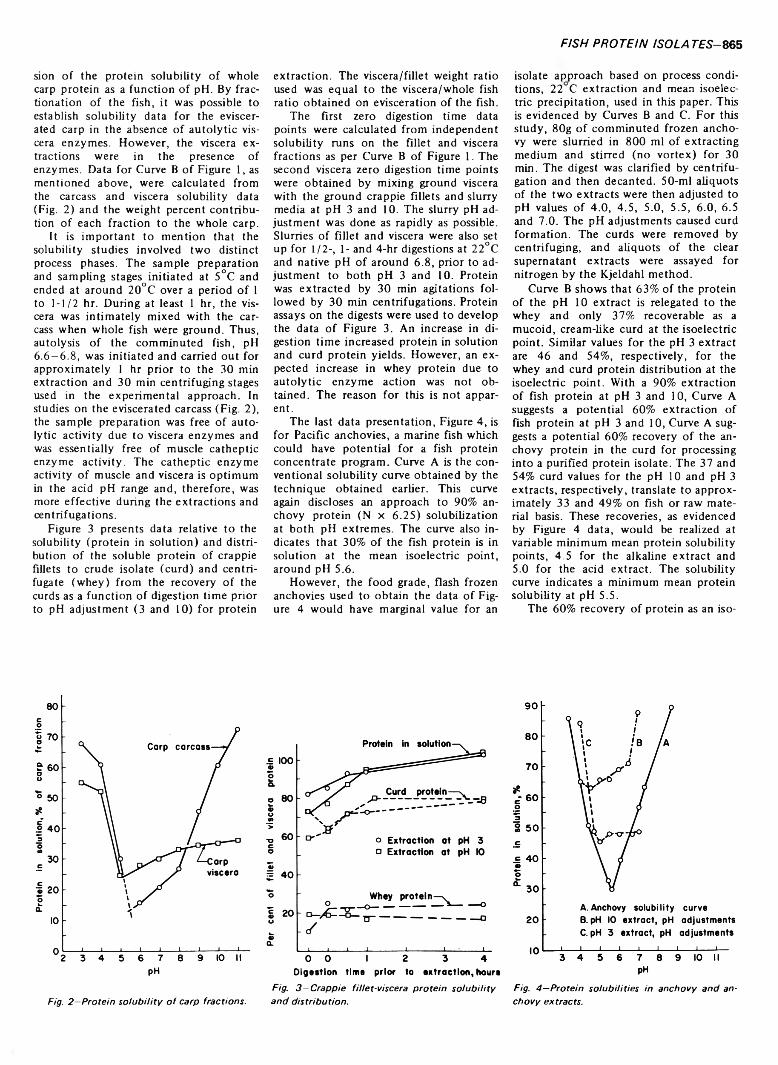
F IS H P R O T E IN IS O LA T E S - 865
sion of the protein solubility of whole carp protein as a function of pH. By fractionation of the fish, it was possible to establish solubility data for the eviscerated carp in the absence of autolytic viscera enzymes. However, the viscera extractions were in the presence of enzymes. Data for Curve B of Figure 1, as mentioned above, were calculated from the carcass and viscera solubility data (Fig. 2) and the weight percent contribution of each fraction to the whole carp.
it is important to mention that the solubility studies involved two distinct process phases. The sample preparation and sampling stages initiated at 5°C and ended at around 20°C over a period of 1 to 1-1/2 hr. During at least 1 hr, the viscera was intimately mixed with the carcass when whole fish were ground. Thus, autolysis of the comminuted fish, pH6 .6 - 6 .8 , was initiated and carried out for approximately 1 hr prior to the 30 min extraction and 30 min centrifuging stages used in the experimental approach. In studies on the eviscerated carcass (Fig. 2), the sample preparation was free of autolytic activity due to viscera enzymes and was essentially free of muscle catheptic enzyme activity. The catheptic enzyme activity of muscle and viscera is optimum in the acid pH range and, therefore, was more effective during the extractions and centrifugations.
Figure 3 presents data relative to the solubility (protein in solution) and distribution of the soluble protein of crappie fillets to crude isolate (curd) and centrifugate (whey) from the recovery of the curds as a function of digestion time prior to pH adjustment (3 and 10) for protein
Fig. 2 - P r o t e i n s o lu b il i ty o f c a rp fra c tio n s .
extraction. The viscera/fillet weight ratio used was equal to the viscera/whole fish ratio obtained on evisceration of the fish.
The first zero digestion time data points were calculated from independent solubility runs on the fillet and viscera fractions as per Curve B of Figure 1. The second viscera zero digestion time points were obtained by mixing ground viscera with the ground crappie fillets and slurry media at pH 3 and 10. The slurry pH adjustment was done as rapidly as possible. Slurries of fillet and viscera were also set up for 1/2-, 1- and 4-hr digestions at 22°C and native pH of around 6 .8 , prior to adjustment to both pH 3 and 10. Protein was extracted by 30 min agitations followed by 30 min centrifugations. Protein assays on the digests were used to develop the data of Figure 3. An increase in digestion time increased protein in solution and curd protein yields. However, an expected increase in whey protein due to autolytic enzyme action was not obtained. The reason for this is not apparent.
The last data presentation, Figure 4, is for Pacific anchovies, a marine fish which could have potential for a fish protein concentrate program. Curve A is the conventional solubility curve obtained by the technique obtained earlier. This curve again discloses an approach to 90% anchovy protein (N x 6.25) solubilization at both pH extremes. The curve also indicates that 30% of the fish protein is in solution at the mean isoelectric point, around pH 5.6.
However, the food grade, flash frozen anchovies used to obtain the data of Figure 4 would have marginal value for an
Digestion time prior to extraction, hoursF ig . 3 —C ra p p ie fille t-v is c e ra p r o te in s o lu b il ity
a n d d is tr ib u t io n .
isolate approach based on process conditions, 22 C extraction and mean isoelectric precipitation, used in this paper. This is evidenced by Curves B and C. For this study, 80g of comminuted frozen anchovy were slurried in 800 ml of extracting medium and stirred (no vortex) for 30 min. The digest was clarified by centrifugation and then decanted. 50-ml aliquots of the two extracts were then adjusted to pH values of 4.0, 4.5, 5.0, 5.5, 6.0, 6.5 and 7.0. The pH adjustments caused curd formation. The curds were removed by centrifuging, and aliquots of the clear supernatant extracts were assayed for nitrogen by the Kjeldahl method.
Curve B shows that 63% of the protein of the pH 10 extract is relegated to the whey and only 37% recoverable as a mucoid, cream-like curd at the isoelectric point. Similar values for the pH 3 extract are 46 and 54%, respectively, for the whey and curd protein distribution at the isoelectric point. With a 90% extraction of fish protein at pH 3 and 10, Curve A suggests a potential 60% extraction of fish protein at pH 3 and 10, Curve A suggests a potential 60% recovery of the anchovy protein in the curd for processing into a purified protein isolate. The 37 and 54% curd values for the pH 10 and pH 3 extracts, respectively, translate to approximately 33 and 49% on fish or raw material basis. These recoveries, as evidenced by Figure 4 data, would be realized at variable minimum mean protein solubility points, 4.5 for the alkaline extract and5.0 for the acid extract. The solubility curve indicates a minimum mean protein solubility at pH 5.5.
The 60% recovery of protein as an iso-
F ig . 4 —P ro te in s o lu b il it ie s in a n c h o v y a n d a n
c h o v y e x tra c ts .
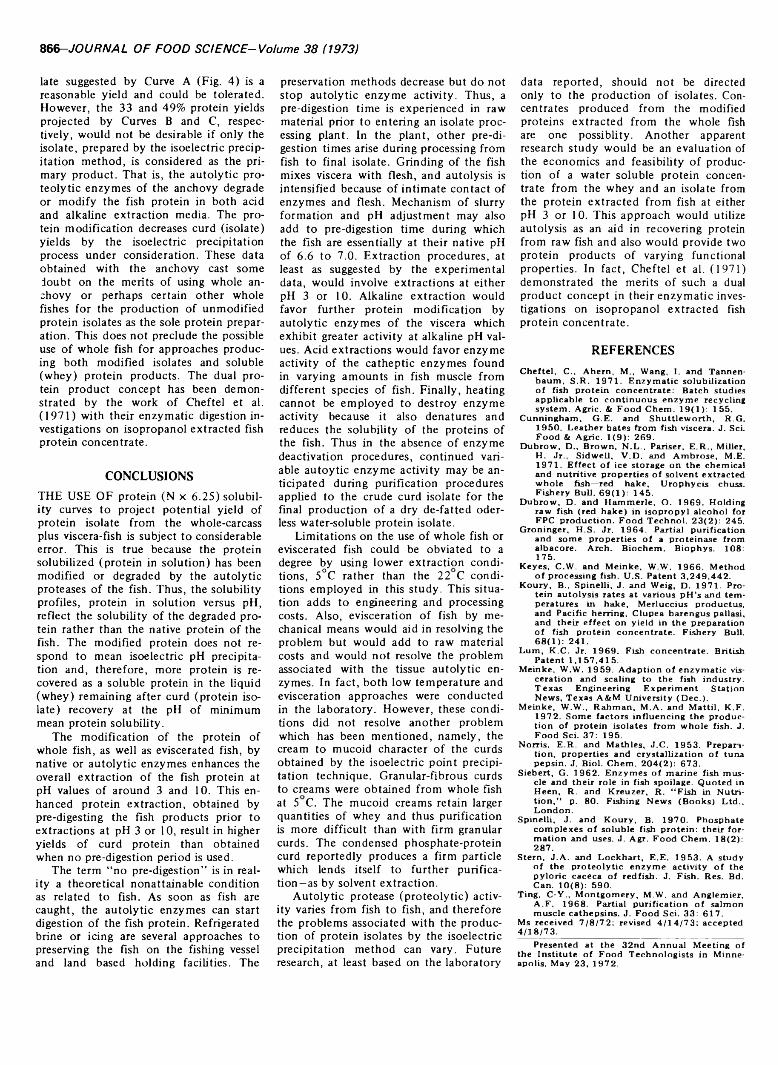
866-JOURNAL OF FOOD SCIENCE-Volume 38 (1973)
late suggested by Curve A (Fig. 4) is a reasonable yield and could be tolerated. However, the 33 and 49% protein yields projected by Curves B and C, respectively, would not be desirable if only the isolate, prepared by the isoelectric precipitation method, is considered as the primary product. That is, the autolytic proteolytic enzymes of the anchovy degrade or modify the fish protein in both acid and alkaline extraction media. The protein modification decreases curd (isolate) yields by the isoelectric precipitation process under consideration. These data obtained with the anchovy cast some doubt on the merits of using whole anchovy or perhaps certain other whole fishes for the production of unmodified protein isolates as the sole protein preparation. This does not preclude the possible use of whole fish for approaches producing both modified isolates and soluble (whey) protein products. The dual protein product concept has been demonstrated by the work of Cheftel et al. (1971) with their enzymatic digestion investigations on isopropanol extracted fish protein concentrate.
CONCLUSIONSTHE USE OF protein (N x 6.25) solubility curves to project potential yield of protein isolate from the whole-carcass plus viscera-fish is subject to considerable error. This is true because the protein solubilized (protein in solution) has been modified or degraded by the autolytic proteases of the fish. Thus, the solubility profiles, protein in solution versus pH, reflect the solubility of the degraded protein rather than the native protein of the fish. The modified protein does not respond to mean isoelectric pH precipitation and, therefore, more protein is recovered as a soluble protein in the liquid (whey) remaining after curd (protein isolate) recovery at the pH of minimum mean protein solubility.
The modification of the protein of whole fish, as well as eviscerated fish, by native or autolytic enzymes enhances the overall extraction of the fish protein at pH values of around 3 and 10. This enhanced protein extraction, obtained by pre-digesting the fish products prior to extractions at pH 3 or 10, result in higher yields of curd protein than obtained when no pre-digestion period is used.
The term “no pre-digestion” is in reality a theoretical nonattainable condition as related to fish. As soon as fish are caught, the autolytic enzymes can start digestion of the fish protein. Refrigerated brine or icing are several approaches to preserving the fish on the fishing vessel and land based holding facilities. The
preservation methods decrease but do not stop autolytic enzyme activity. Thus, a pre-digestion time is experienced in raw material prior to entering an isolate processing plant. In the plant, other pre-digestion times arise during processing from fish to final isolate. Grinding of the fish mixes viscera with flesh, and autolysis is intensified because of intimate contact of enzymes and flesh. Mechanism of slurry formation and pH adjustment may also add to pre-digestion time during which the fish are essentially at their native pH of 6.6 to 7.0. Extraction procedures, at least as suggested by the experimental data, would involve extractions at either pH 3 or 10. Alkaline extraction would favor further protein modification by autolytic enzymes of the viscera which exhibit greater activity at alkaline pH values. Acid extractions would favor enzyme activity of the catheptic enzymes found in varying amounts in fish muscle from different species of fish. Finally, heating cannot be employed to destroy enzyme activity because it also denatures and reduces the solubility of the proteins of the fish. Thus in the absence of enzyme deactivation procedures, continued variable autoytic enzyme activity may be anticipated during purification procedures applied to the crude curd isolate for the final production of a dry de-fatted oder- less water-soluble protein isolate.
Limitations on the use of whole fish or eviscerated fish could be obviated to a degree by using lower extraction conditions, 5°C rather than the 22 C conditions employed in this study. This situation adds to engineering and processing costs. Also, evisceration of fish by mechanical means would aid in resolving the problem but would add to raw material costs and would not resolve the problem associated with the tissue autolytic enzymes. In fact, both low temperature and evisceration approaches were conducted in the laboratory. However, these conditions did not resolve another problem which has been mentioned, namely, the cream to mucoid character of the curds obtained by the isoelectric point precipitation technique. Granular-fibrous curds to creams were obtained from whole fish at 5 C. The mucoid creams retain larger quantities of whey and thus purification is more difficult than with firm granular curds. The condensed phosphate-protein curd reportedly produces a firm particle which lends itself to further purification—as by solvent extraction.
Autolytic protease (proteolytic) activity varies from fish to fish, and therefore the problems associated with the production of protein isolates by the isoelectric precipitation method can vary. Future research, at least based on the laboratory
data reported, should not be directed only to the production of isolates. Concentrates produced from the modified proteins extracted from the whole fish are one possiblity. Another apparent research study would be an evaluation of the economics and feasibility of production of a water soluble protein concentrate from the whey and an isolate from the protein extracted from fish at either pH 3 or 10. This approach would utilize autolysis as an aid in recovering protein from raw fish and also would provide two protein products of varying functional properties. In fact, Cheftel et al. (1971) demonstrated the merits of such a dual product concept in their enzymatic investigations on isopropanol extracted fish protein concentrate.
REFERENCESC h efte l, C ., A hern , M ., Wang, I . and Tannen-
baum , S .R . 1 9 7 1 . E n zy m a tic so lub iliza tion o f fish p ro te in concentrate: B atch studies applicab le to continuous enzym e recycling system . A gric. & F o o d C hem . 1 9 (1 ): 1 55 .
C unn ingham , G .E . and S h u ttle w o rth , R .G . 1 9 5 0 . L ea ther bates from fish viscera. J. Sci. F o o d & A gric. 1 (9 ): 2 69 .
D u b ro w , D ., B ro w n , N .L . , Pariser, E .R ., M ille r,H . Jr., S id w e ll, V .D . and A m brose, M .E .1 9 7 1 . E ffe c t o f ice storage on the chemical and n u tritiv e properties o f solvent extracted w h ole fish—red hake, U ro phyc is chuss. Fishery Bull. 6 9 (1 ) : 1 45 .
D u b ro w , D . and H am m e rle , O . 1 9 6 9 . H old ing raw fish (red h a k e ) in isop ro py l a lcoho l for FPC p ro d u ctio n . F o o d Techno l. 2 3 (2 ) : 245.
G roninger, H .S . Jr. 1 9 6 4 . P artia l p u rific a tio n and some properties o f a proteinase from albacore. A rch . B iochem . B iophys. 108: 175 .
Keyes, C .W . and M e in k e , W .W . 1 9 6 6 . M e thod o f processing fish. U .S . P aten t 3 ,2 4 9 ,4 4 2 .
K o u ry , B., S p in e lli, J. and W eig, D . 1 9 7 1 . Prote in auto lysis rates at various p H ’s and tem peratures in hake, M erluccius productus, and Pacific herring, C lupea barengus pallasi, and th e ir e ffec t on y ie ld in the preparation o f fish p ro te in concentra te . Fishery Bull. 6 8 (1 ) : 2 41 .
L u m , K .C . Jr. 1 9 6 9 . Fish concentra te . British P aten t 1 ,1 5 7 ,4 1 5 .
M einke , W .W . 1 9 5 9 . A d a p tio n o f e nzym atic vis- ceration and scaling to the fish industry. T exas Eng ineering E x p e rim en t S ta tion N ew s, Texas A & M U nivers ity (D e c .).
M e inke , W .W ., R ah m an , M .A . and M a tt il , K .F .1 9 7 2 . Som e facto rs in fluenc in g the productio n o f p ro te in isolates fro m w h o le fish. J. Fo od Sci. 37: 1 95 .
N orris , E .R . and M athles, J .C . 1 9 5 3 . Preparatio n , properties and c ry s ta lliza tio n o f tuna pepsin. J. B io l. C hem . 2 0 4 (2 ) : 6 73 .
S iebert, G. 1 9 6 2 . Enzym es o f m arine fish muscle and th e ir ro le in fish spoilage. Q uoted in H een, R . and K re u ze r, R . “ Fish in N u tr it io n ,” p. 8 0 . F ishing N ew s (B ooks ) L td ., Londo n .
S p ine lli, J. and K o u ry , B. 1 9 7 0 . Phosphate com plexes o f soluble fish p ro te in : th e ir fo rm atio n and uses. J. A gr. Fo od C hem . 1 8 (2 ): 2 87 .
S tern , J .A . and L o c k h a rt, E .E . 1 9 5 3 . A study o f the p ro te o ly tic enzym e a ctiv ity o f the p y lo ric caceca o f red fish . J. Fish. Res. Bd. Can. 1 0 (8 ): 590 .
T ing, C -Y ., M o n tg o m e ry , M .W . and A nglem ier, A .F . 1 9 6 8 . P artia l p u rific a tio n o f salm on muscle cathepsins. J. Fo od Sci. 33: 6 1 7 .
Ms received 7 /8 /7 2 ; revised 4 /1 4 /7 3 ; accepted 4 /1 8 /7 3 ._________________________________________
Presented at the 32n d A n n u a l M eeting o f the In s titu te o f Fo od Technolog ists in M in neapolis, M ay 2 3 , 1 9 7 2 .
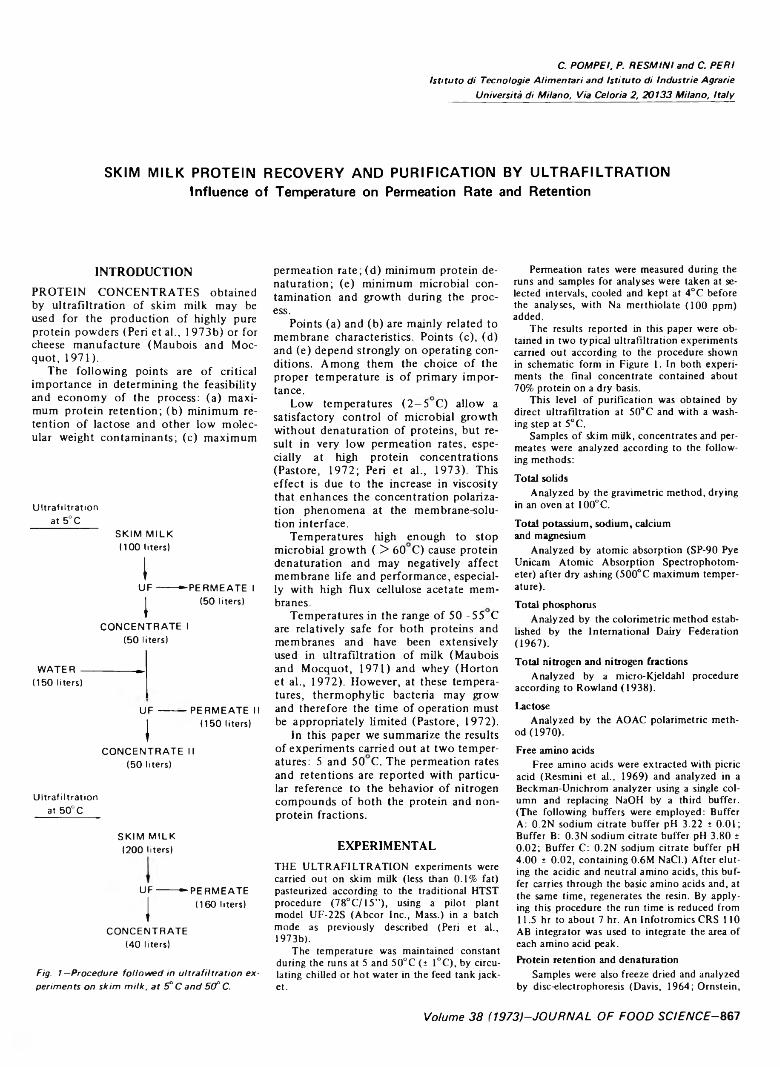
C. P O M P E I. P. R E S M IN I a n d C . P E R I
Is t i tu to d i T e c n o lo g ie A l im e n ta r i a n d Is t i tu to d i In d u s tr ie A g ra r ie
U n iv e rs ità d i M ila n o , V ia C e lo r ia 2 , 2 0 1 3 3 M ila n o , I t a ly
SKIM MILK PROTEIN RECOVERY AND PURIFICATION BY ULTRAFILTRATION Influence of Temperature on Permeation Rate and Retention
INTRODUCTIONPROTEIN CONCENTRATES obtained by ultrafiltration of skim milk may be used for the production of highly pure protein powders (Peri et al., I 973b) or for cheese manufacture (Maubois and Moc- quot, 1971).
The following points are of critical importance in determining the feasibility and economy of the process: (a) maximum protein retention; (b) minimum retention of lactose and other low molecular weight contaminants; (c) maximum
Ultrafiltration at 5°C
SKIM M ILK (100 liters)
IU F -----“-P ER M EA TE I
| (50 liters)
CO N CEN TR A TE I (50 liters)
W ATER -------------- ».(150 liters)
'UF ----- P ER M EA TE II
| (150 liters)
CO N CEN TRA TE II (50 liters)
Ultrafiltration at 50° C
SKIM M ILK (200 liters)
U F ------ “-P ER M EA TE| (160 liters)
CO N CEN TRA TE (40 liters)
Fig. 1 —P ro c e d u re fo l lo w e d in u l t r a f i l t r a t io n e x
p e rim e n ts o n s k im m ilk , a t 5° C a n d 5 0 ° C.
permeation rate; (d) minimum protein dénaturation; (e) minimum microbial contamination and growth during the process.
Points (a) and (b) are mainly related to membrane characteristics. Points (c), (d) and (e) depend strongly on operating conditions. Among them the choice of the proper temperature is of primary importance.
Low temperatures (2—5 C) allow a satisfactory control of microbial growth without dénaturation of proteins, but result in very low permeation rates, especially at high protein concentrations (Pastore, 1972; Peri et al., 1973). This effect is due to the increase in viscosity that enhances the concentration polarization phenomena at the membrane-solution interface.
Temperatures high enough to stop microbial growth ( > 60 C) cause protein dénaturation and may negatively affect membrane life and performance, especially with high flux cellulose acetate membranes.
Temperatures in the range of 5 0 -55 C are relatively safe for both proteins and membranes and have been extensively used in ultrafiltration of milk (Maubois and Mocquot, 1971) and whey (Horton et al., 1972). However, at these temperatures, thermophylic bacteria may grow and therefore the time of operation must be appropriately limited (Pastore, 1972).
In this paper we summarize the results of experiments carried out at two temperatures: 5 and 50 C. The permeation rates and retentions are reported with particular reference to the behavior of nitrogen compounds of both the protein and nonprotein fractions.
EXPERIMENTALTHE ULTRAFILTRATION experiments were carried out on skim milk (less than 0.1% fat) pasteurized according to the traditional HTST procedure (78°C /15”), using a pilot plant model UF-22S (Abcor Inc., Mass.) in a batch mode as previously described (Peri et al., 1973b).
The temperature was maintained constant during the runs at 5 and 50°C (± 1°C), by circulating chilled or hot water in the feed tank jacket.
Permeation rates were measured during the runs and samples for analyses were taken at selected intervals, cooled and kept at 4°C before the analyses, with Na merthiolate (100 ppm) added.
The results reported in this paper were obtained in two typical ultrafiltration experiments carried out according to the procedure shown in schematic form in Figure 1. In both experiments the final concentrate contained about 70% protein on a dry basis.
This level o f purification was obtained by direct ultrafiltration at 50°C and with a washing step at 5°C.
Samples o f skim milk, concentrates and permeates were analyzed according to the following methods:
Total solidsAnalyzed by the gravimetric method, drying
in an oven at 100°C.
Total potassium, sodium, calcium and magnesium
Analyzed by atomic absorption (SP-90 Pye Unicam Atomic Absorption Spectrophotometer) after dry ashing (500°C maximum temperature).
Total phosphorusAnalyzed by the colorimetric method estab
lished by the International Dairy Federation(1967).
Total nitrogen and nitrogen fractionsAnalyzed by a micro-Kjeldahl procedure
according to Rowland (1938).
LactoseAnalyzed by the AOAC polarimetric meth
od (1970).
Free amino acidsFree amino acids were extracted with picric
acid (Resmini et al., 1969) and analyzed in a Beckman-Unichrom analyzer using a single column and replacing NaOH by a third buffer. (The following buffers were employed: Buffer A: 0.2N sodium citrate buffer pH 3.22 ± 0.01; Buffer B: 0.3N sodium citrate buffer pH 3.80 ± 0.02; Buffer C: 0.2N sodium citrate buffer pH4.00 ± 0.02, containing 0.6M NaCl.) After eluting the acidic and neutral amino acids, this buffer carries through the basic amino acids and, at the same time, regenerates the resin. By applying this procedure the run time is reduced from11.5 hr to about 7 hr. An Infotromics CRS 110 AB integrator was used to integrate the area of each amino acid peak.Protein retention and denaturation
Samples were also freeze dried and analyzed by disc-electrophoresis (Davis, 1964; Ornstein,
Volume 38 (1973)-JOURNAL OF FOOD SCIENCE-867
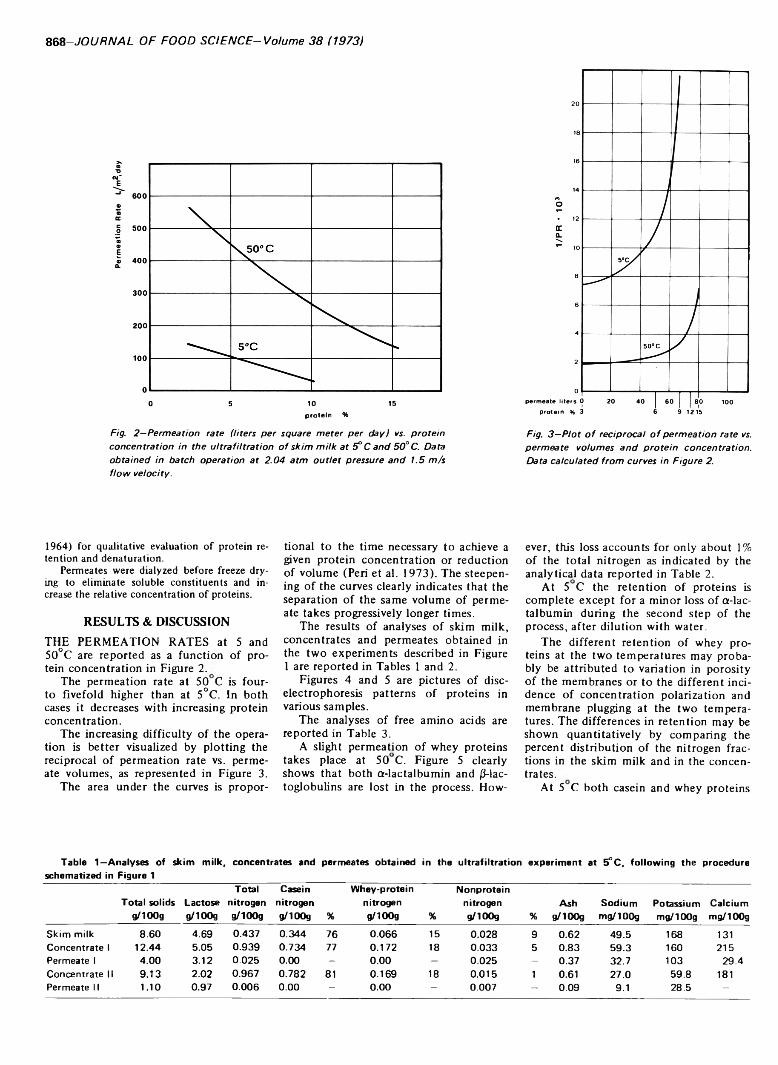
868- JOURNAL OF FOOD SC/ENCE-Vo/ume 38 (1973)
0 5 10 15protein %
Fig . 2 —P e rm e a tio n ra te (lite rs p e r sq u a re m e te r p e r d a y ) vs. p r o te in
c o n c e n tra tio n in th e u l t r a f i l t r a t io n o f s k im m ilk a t 5° C a n d 5 0 ° C. D a ta
o b ta in e d in b a tc h o p e ra t io n a t 2 .0 4 a tm o u t le t p re ss u re a n d 1 .5 m /s
f lo w v e lo c ity .
F ig . 3 —P lo t o f re c ip ro c a l o f p e r m e a t io n ra te re. p e rm e a te v o lu m e s a n d p r o t e in c o n c e n tra tio n .
D a ta c a lc u la te d f r o m cu rve s in F ig u re 2 .
1964) for qualitative evaluation o f protein retention and dénaturation.
Permeates were dialyzed before freeze drying to eliminate soluble constituents and increase the relative concentration of proteins.
RESULTS & DISCUSSIONTHE PERMEATION RATES at 5 and 50°C are reported as a function of protein concentration in Figure 2.
The permeation rate at 50 C is four- to fivefold higher than at 5°C. In both cases it decreases with increasing protein concentration.
The increasing difficulty of the operation is better visualized by plotting the reciprocal of permeation rate vs. permeate volumes, as represented in Figure 3.
The area under the curves is propor
tional to the time necessary to achieve a given protein concentration or reduction of volume (Peri et al. 1973). The steepening of the curves clearly indicates that the separation of the same volume of permeate takes progressively longer times.
The results of analyses of skim milk, concentrates and permeates obtained in the two experiments described in Figure 1 are reported in Tables 1 and 2.
Figures 4 and 5 are pictures of disc- electrophoresis patterns of proteins in various samples.
The analyses of free amino acids are reported in Table 3.
A slight permeation of whey proteins takes place at 50 C. Figure 5 clearly shows that both a-lactalbumin and 0-lac- toglobulins are lost in the process. How
ever, this loss accounts for only about 1% of the total nitrogen as indicated by the analytical data reported in Table 2.
At 5 C the retention of proteins is complete except for a minor loss of a-lactalbumin during the second step of the process, after dilution with water.
The different retention of whey proteins at the two temperatures may probably be attributed to variation in porosity of the membranes or to the different incidence of concentration polarization and membrane plugging at the two temperatures. The differences in retention may be shown quantitatively by comparing the percent distribution of the nitrogen fractions in the skim milk and in the concentrates.
At 5 C both casein and whey proteins
Table 1—Analyses of skim milk, concentrates and permeates obtained in the ultrafiltration experiment at 5°C, following the procedure schematized in Figure 1
Total solids g/100g
Lactoseg/100g
Totalnitrogeng/100g
Caseinnitrogeng/100g %
Whey-proteinnitrogeng/100g %
Nonproteinnitrogeng/IOOg %
Ashg/100g
Sodiummg/IOOg
Potassiummg/IOOg
Calciummg/IOOg
Skim milk 8.60 4.69 0.437 0.344 76 0.066 15 0.028 9 0.62 49.5 168 131Concentrate I 12.44 5.05 0.939 0.734 77 0.172 18 0.033 5 0.83 59.3 160 215Permeate I 4.00 3.12 0.025 0.00 - 0.00 - 0.025 - 0.37 32.7 103 29.4Concentrate II 9.13 2.02 0.967 0.782 81 0.169 18 0.015 1 0.61 27.0 59.8 181Permeate II 1.10 0.97 0.006 0.00 - 0.00 - 0.007 - 0.09 9.1 28.5 -
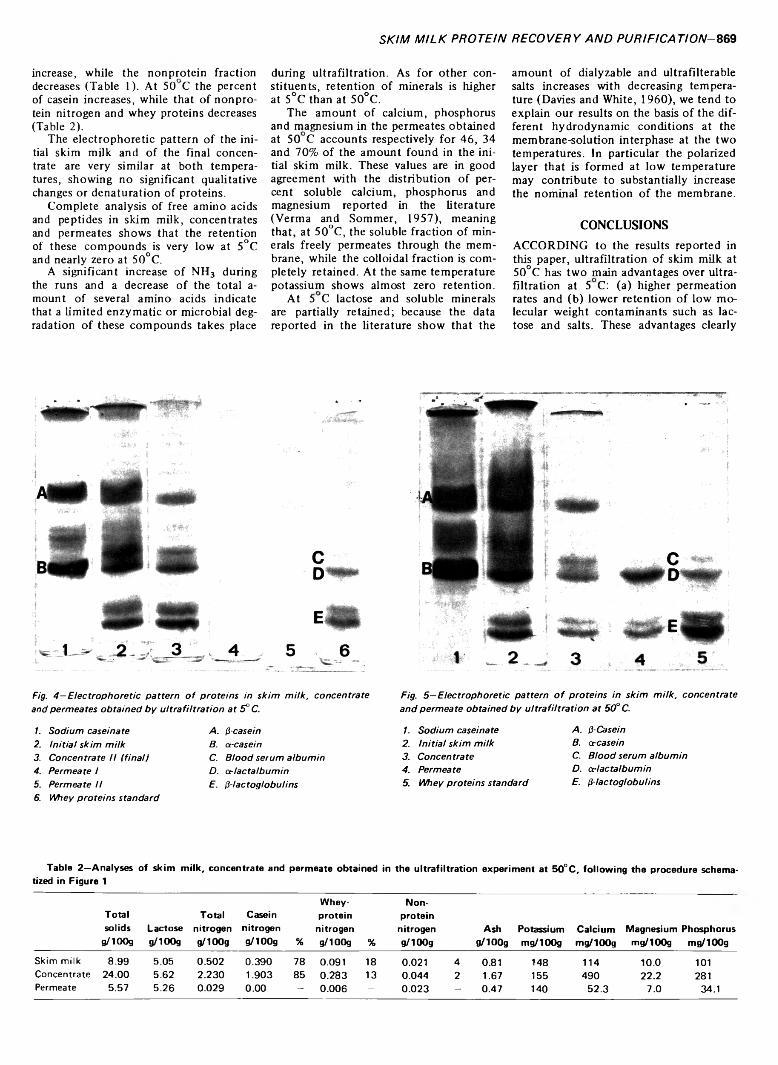
S K IM M IL K P R O T E IN R E C O V E R Y A N D P U R IF IC A T IO N -8 6 9
increase, while the nonprotein fraction decreases (Table 1). At 50 C the percent of casein increases, while that of nonprotein nitrogen and whey proteins decreases (Table 2).
The electrophoretic pattern of the initial skim milk and of the final concentrate are very similar at both temperatures, showing no significant qualitative changes or dénaturation of proteins.
Complete analysis of free amino acids and peptides in skim milk, concentrates and permeates shows that the retention of these compounds is very low at 5°C and nearly zero at 50°C.
A significant increase of NH3 during the runs and a decrease of the total a- mount of several amino acids indicate that a limited enzymatic or microbial degradation of these compounds takes place
during ultrafiltration. As for other constituents, retention of minerals is higher at 5°C than at 50°C.
The amount of calcium, phosphorus and magnesium in the permeates obtained at 50 C accounts respectively for 46, 34 and 70% of the amount found in the initial skim milk. These values are in good agreement with the distribution of percent soluble calcium, phosphorus and magnesium reported in the literature (Verma and Sommer, 1957), meaning that, at 50°C, the soluble fraction of minerals freely permeates through the membrane, while the colloidal fraction is completely retained. At the same temperature potassium shows almost zero retention.
At 5 C lactose and soluble minerals are partially retained; because the data reported in the literature show that the
amount of dialyzable and ultrafilterable salts increases with decreasing temperature (Davies and White, 1960), we tend to explain our results on the basis of the different hydrodynamic conditions at the membrane-solution interphase at the two temperatures. In particular the polarized layer that is formed at low temperature may contribute to substantially increase the nominal retention of the membrane.
CONCLUSIONSACCORDING to the results reported in this paper, ultrafiltration of skim milk at 50°C has two main advantages over ultra- filtration at 5 C: (a) higher permeation rates and (b) lower retention of low molecular weight contaminants such as lactose and salts. These advantages clearly
Fig. 4 —E le c tr o p h o re t ic p a t te rn o f p ro te in s in s k im m ilk , c o n c e n tra te F ig . 5 — E le c tro p h o re t ic p a t te rn o f p ro te in s in s k im m ilk , c o n c e n tra te
a n d p e rm e a te s o b ta in e d b y u l t r a f i l t r a t io n a t 5 ° C. a n d p e rm e a te o b ta in e d b y u l t r a f i l t r a t io n a t 5 < f C.
1. S o d iu m c as e in a te A . ¡¡-casein 1. S o d iu m c ase in ate A . ß-C asein
2. In i t ia l s k im m ilk B. oi-casein 2. In i t ia l s k im m ilk B. a -casein
3. C o n c e n tra te I I ( f in a l ) C. B lo o d s e ru m a lb u m in 3. C o n c e n tra te C. B lo o d s e ru m a lb u m in
4. P e rm e a te 1 D . o c-lac ta lbum in 4. P e rm e a te D . o r la c ta lb u m in
5. P e rm e a te I I E . 0 - la c to g lo b u lin s 5. W h e y p ro te in s s ta n d a rd E . ß -la c to g lo b u lin s
6. W h ey p ro te in s s ta n d a rd
Table 2—Analyses of skim milk, concentrate and permeate obtained in the ultrafiltration experiment at 50°C, following the procedure schematized in Figure 1
Totalsolids
g/IOOgLactoseg/100g
Totalnitrogeng/100g
Caseinnitrogeng/100g %
Whey-protein
nitrogeng/100g %
Nonprotein
nitrogeng/IOOg
Ashg/IOOg
Potassiummg/100g
Calciummg/100g
Magnesium Phosphorus m g/IOOg mg/100g
Skim milk 8.99 5.05 0.502 0.390 78 0.091 18 0.021 4 0.81 148 114 10.0 101Concentrate 24.00 5.62 2.230 1.903 85 0.283 13 0.044 2 1.67 155 490 22.2 281Permeate 5.57 5.26 0.029 0.00 - 0.006 - 0.023 - 0.47 140 52.3 7.0 34.1

870—JOURNAL OF FOOD SCIENCE-Volume 38 (1973)
Table 3—Free amino acids in skim milk, concentrates and permeates obtained by ultrafiltration at 5°C and 50°C (mcg/100ml)
5°C 50° CSkimmilk
Cone1
Permeate1
Skimmilk Cone Permeate
Hydroxyproline 77 — — 33 — 46Aspartic acid 431 564 210 250 254 71Threonine 268 442 177 64 70 70Serine 72 67 45 113 122 107Aspar. + Glutam. 346 604 200 133 69 109Sarcosine 12 8 5 - - -
Proline 268 228 214 229 180 148Glutamic acid 2534 2590 2006 3746 3900 3746Glycine 631 643 507 693 795 633Alanine 339 345 268 268 282 191a-aminobut.acid 23 16 20 7 8 -
Valine 88 107 65 125 184 108Methionine - - - 41 - 13Isoleucine 67 78 56 26 49 18Leucine 150 275 131 54 65 53Tyrosine 42 - 32 21 13 23Phenylalanine 45 57 21 18 4 127-aminobut.acid 1068 776 828 607 1215 477Ornithine 158 265 139 102 116 129nh 3 433 2750 368 555 848 1037Lysine 239 286 166 230 291 322Histidine 32 36 25 27 33 44Arginine 200 224 141 193 184 274Total 1 7524 10361 5624 7553 8682 7631Peptides 2925 3630 1454 2681 2075 2739Total II 10449 13991 7078 10234 10757 11370
compensate for the disadvantage of a small loss of whey proteins that takes place at the higher temperature and accounts for about 1% of the total protein content.
In addition, a higher level of protein concentration and purification may be achieved at 50°C by simple ultrafiltration, without the water washing step. In experiments carried out with the same apparatus and in the same operating conditions, at 50°C a maximum protein concentration of about 24% was obtained, with 30% total solids, corresponding to about 80% of protein on a dry basis (Grassi and Peri, unpublished data). At this concentration of protein permeation rate was still as high as about 85 liters/ m2, day.
The most critical point in the use of temperature in the range of 50 C is the control of microbial growth. At this temperature, after an initial lag phase of1.5—2 hr, thermophylic bacteria develop at a logarithmic rate (Pastore, 1972; Peri,1972). However, studies carried out in this laboratory have shown that microbial growth may be easily kept under control in batch ultrafiltration by choosing an appropriate length of time of operation (Pastore, 1972).
When operating on a continuous mode the concentrate substraction compensates for the increase in microbial population and the net result depends on the relative importance of average residence time, residence time distribution and specific microbial growth rate (Peri, 1972). In
general, in the continuous ultrafiltration with commercially available plants the control of microbial growth doesn’t constitute a limiting factor in the 20-hr daily operation.
As a general conclusion of our experiments we consider that ultrafiltration of skim milk at 50 C is more economical and more effective in protein purification than ultrafiltration at low temperature (5°C).
REFERENCESA O A C . 1 9 7 0 . “ O ffic ia l M ethods o f Analysis,”
1 1 th ed ., p. 2 4 9 . Assoc, o f O ffic ia l Agricultu ra l C hem ists, W ashington , D .C .
Davies, D .T . and W h ite , J .C .D . 1 9 6 0 . Th e use of u ltra filtra tio n and d ialysis in isolating the aqueous phase o f m ilk and in determ ining the p a rtit io n o f m ilk constituen ts between the aqueous and disperse phases. J. Dairy Res. 27: 1 71 .
Davis, B. 1 9 6 4 . D isc-electrophoresis. 2. M ethod and a pp lica tion to hum an serum proteins. A n n . N .Y . A cad . Sci. 1 2 1 (2 ): 4 04 .
Grassi, S. and Peri, C . un pub lished data.H o rto n , B .S ., G o ld s m ith , R .L . and A m undson,
C .H . 1 9 7 2 . M em b rane separation processes fo r sanitary C IP processing o f w h ey . Presented at the 32n d A n n u a l M eeting o f the In s titu te o f Fo od Technolog ists, M inneapolis , M ay 23.
In te rn a tio n a l D a iry Fe d e ra tio n . 1 9 6 7 . D ete rm in a tio n o f phosphorus o f m ilk . In tern . Standard F IL - ID F 42 .
M aubois, J .L . and M o c q u o t, G . 1 9 7 1 . Preparatio n de from age à p a rtir de ‘prefrom age liq u id e ’ ob ten u par u ltra fil tra tio n du la it. Le la it 5 0 8 : 4 9 5 .
O m stein , L . 1964. D isc-electrophoresis. 1. Background and th e o ry . A n n N .Y . A cad . Sci. 1 2 1 (2 ): 3 21 .
Pastore, M . 1 9 7 2 . P ro b lem i m ic ro b io lg ic i e capacità d i lavorazione n e ll’u ltra filtra z io n e d i la tte m agro. Presented a t the Sym posium A pp licazione dei processi pe r m em brana n e ll’industria lattiero-casearia , M ilan o , M ay 1 8.
Peri, C . 1 9 7 2 . P rob lem i m ic ro b io log ic i e rend im en to d e ll’u ltra filtra z io n e di la tte m agro.2. U ltra filtra z io n e continua . Presented at the S ym posium A p p licazione dei processi per m em brana n e ll’industria lattiero-casearia , M ilano . M a y 18.
Peri, C ., P om pei, C . and Pastore, M . 1 973a . In fluenza della tem p era tu ra su ll’u ltra fil tra zione d i la tte m agro. Scienza T e c h n o l. A lim . 3 (2 ): 17.
Peri, C ., P om pei, C . and Rossi F . 1 9 7 3 . Process o p tim iza tio n in skim m ilk p ro te in recovery and p u rific a tio n b y u ltra fil tra tio n . J. Fo od Sci. 38: 1 35 .
R esm ini, P ., Saracchi, S ., V o lo n te r io , G . and B ozzo lati, M . 1 9 6 9 . G li am in o ac id i lib e ri nel form aggio taleggio. I l la tte 4 3 : 2.
R o w lan d , S.J. 1 9 3 8 . D e te rm in a tio n o f n itrogen d is tr ib u tio n in m ilk . J. D a iry Res. 9: 42.
V e rm a , I.S . and S om m er, H .H . 1 9 5 7 . S tu d y o f the na tu ra lly occuring salts in m ilk . J. D a iry Sci. 4 0 : 3 31 .
Ms received 6 /2 3 /7 2 ; revised 1 2 /2 2 /7 2 ; accepted ^ 2 /2 8 /7 2 ^ _______________________________
W ork was supported by a grant from theIta lia n C .N .R . (N a tio n a l Research C o u n c il), no.7 2 .0 0 5 6 6 .1 1 .
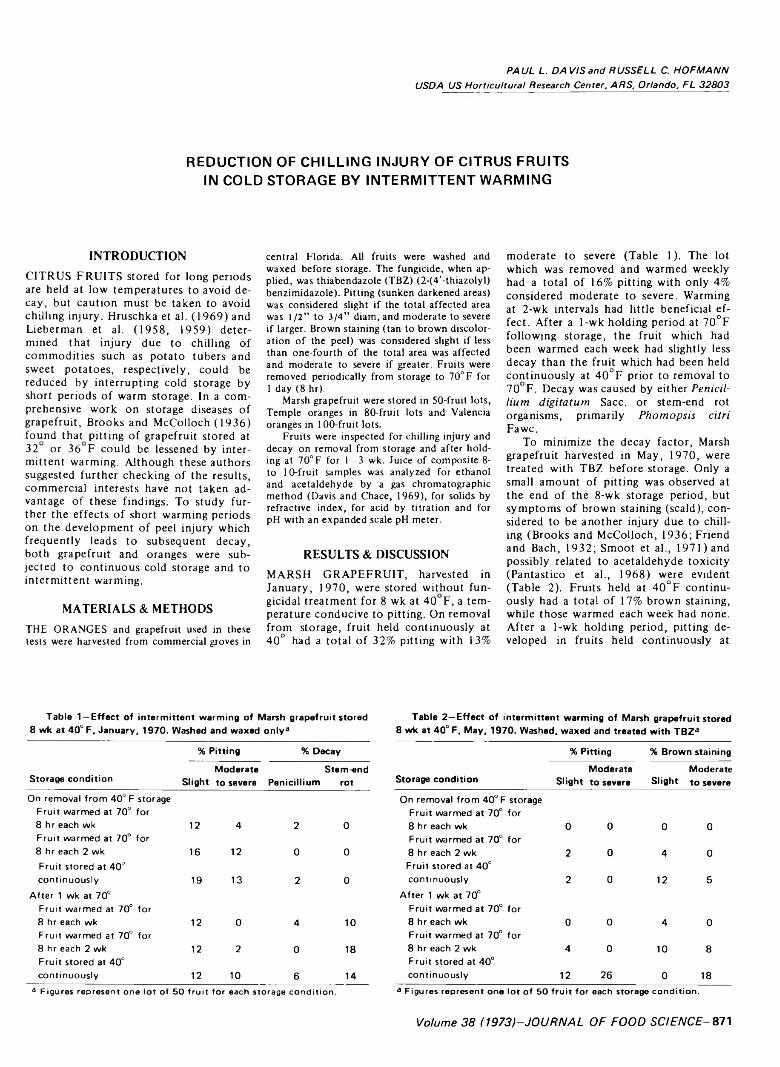
P A U L L . D A V I S a n d R U S S E L L C. H O F M A N N
U S D A U S H o r t ic u ltu r a l R esearch C e n te r , A R S , O r la n d o , F L 3 2 8 0 3
REDUCTION OF CHILLING INJURY OF CITRUS FRUITS IN COLD STORAGE BY INTERM ITTENT WARMING
INTRODUCTIONCITRUS FRUITS stored for long periods are held at low temperatures to avoid decay, but caution must be taken to avoid chilling injury. Hruschka et al. (1969) and Lieberman et al. (1958, 1959) determined that injury due to chilling of commodities such as potato tubers and sweet potatoes, respectively, could be reduced by interrupting cold storage by short periods of warm storage. In a comprehensive work on storage diseases of grapefruit, Brooks and McColloch (1936) found that pitting of grapefruit stored at 32 or 36 F could be lessened by intermittent warming. Although these authors suggested further checking of the results, commercial interests have not taken advantage of these findings. To study further the effects of short warming periods on the development of peel injury which frequently leads to subsequent decay, both grapefruit and oranges were subjected to continuous cold storage and to intermittent warming.
MATERIALS & METHODSTHE ORANGES and grapefruit used in these tests were harvested from commercial groves in
central Florida. All fruits were washed and waxed before storage. The fungicide, when applied, was thiabendazole (TBZ) (2-(4'-thiazolyl) benzimidazole). Pitting (sunken darkened areas) was considered slight if the total affected area was 1/2” to 3/4” diam, and moderate to severe if larger. Brown staining (tan to brown discoloration of the peel) was considered slight if less than one-fourth of the total area was affected and moderate to severe if greater. Fruits were removed periodically from storage to 70°F for 1 day (8 hr).
Marsh grapefruit were stored in 50-fruit lots, Temple oranges in 80-fruit lots and Valencia oranges in 100-fruit lots.
Fruits were inspected for chilling injury and decay on removal from storage and after holding at 70°F for 1-3 wk. Juice of composite 8- to 10-fruit samples was analyzed for ethanol and acetaldehyde by a gas chromatographic method (Davis and Chace, 1969), for solids by refractive index, for acid by titration and for pH with an expanded scale pH meter.
RESULTS & DISCUSSIONMARSH GRAPEFRUIT, harvested in January, 1970, were stored without fungicidal treatment for 8 wk at 40 F, a temperature conducive to pitting. On removal from storage, fruit held continuously at 40° had a total of 32% pitting with 13%
moderate to severe (Table 1). The lot which was removed and warmed weekly had a total of 16% pitting with only 4% considered moderate to severe. Warming at 2-wk intervals had little beneficial effect. After a 1-wk holding period at 70°F following storage, the fruit which had been warmed each week had slightly less decay than the fruit which had been held continuously at 40°F prior to removal to 70 F. Decay was caused by e ither P én ic illiu m d ig ita tu m Sacc. or stem-end rot organisms, primarily Phomopsis c itr i Fawc.
To minimize the decay factor, Marsh grapefruit harvested in May, 1970, were treated with TBZ before storage. Only a small amount of pitting was observed at the end of the 8-wk storage period, but symptoms of brown staining (scald), considered to be another injury due to chilling (Brooks and McColloch, 1936; Friend and Bach, 1932; Smoot et al., 1971) and possibly related to acetaldehyde toxicity (Pantastico et al., 1968) were evident (Table 2). Fruits held at 40°F continuously had a total of 17% brown staining, while those warmed each week had none. After a 1-wk holding period, pitting developed in fruits held continuously at
Table 1 —Effect of intermittent warming of Marsh grapefruit stored 8 wk at 40° F, January, 1970. Washed and waxed only3
% Pitting % Decay
Storage condition SlightModerate to severe Pénicillium
Stem-endrot
On removal from 40° F storage Fruit warmed at 70° for 8 hr each wk 12 4 2 0Fruit warmed at 70° for 8 hr each 2 wk 16 12 0 0Fruit stored at 40° continuously 19 13 2 0
After 1 wk at 70°Fruit warmed at 70° for 8 hr each wk 12 0 4 10Fruit warmed at 70° for 8 hr each 2 wk 12 2 0 18Fruit stored at 40° continuously 12 10 6 14
3 F ig u re s rep rese n t o ne lo t o f 5 0 f r u i t fo r each sto rage c o n d it io n .
Table 2—Effect of intermittent warming of Marsh grapefruit stored 8 wk at 40° F , May, 1970. Washed, waxed and treated with TB Z 3
% Pitting % Brown staining
Storage conditionModerate
Slight to severe SlightModerate to severe
On removal from 40° F storage Fruit warmed at 70° for 8 hr each wk 0 0 0 0Fruit warmed at 70° for 8 hr each 2 wk 2 0 4 0Fruit stored at 40° continuously 2 0 12 5
After 1 wk at 70°Fruit warmed at 70° for 8 hr each wk 0 0 4 0Fruit warmed at 70° for 8 hr each 2 wk 4 0 10 8Fruit stored at 40° continuously 12 26 0 18
3 F ig u re s rep rese n t o ne lo t o f 5 0 f r u i t fo r each sto rage c o n d it io n .
Volum e 3 8 (1 9 7 3 1 -JO U R N A L O F FO O D SCIENCE-871

8 7 2 -J O U R N A L O F FO O D S C IE N C E -V o lu m e 38 (1973)
Test No. I 2 I 2 I 2 1 2 1 2 1 2Warming none each each none each each
two whs wk two wks wk
F ig . 1 —E f f e c t o f in t e r m it t e n t w a rm in g o f M a rs h g r a p e fru it s to re d 8 w k
a t 4 ( f F , N o v e m b e r , 1 9 7 0 (T e s t 1) a n d J a n u a ry , 1 9 7 1 (T e s t 2 ) . W ashed ,
w a x e d a n d tre a te d w ith T B Z . ( F o r b o th tests, bars re p re s e n t a n average
o f fo u r lo ts o f f r u i t , 5 0 f r u i t p e r lo t , f o r e ac h s to ra g e c o n d it io n .)
40°F, and brown staining increased in severity.
Two additional and more extensive tests with grapefruit were performed during the 1970-1971 season, with confirmatory results (Fig. 1). Less pitting occurred in fruits warmed at 70°F for 1 day each wk than in those warmed each 2 wk. Fruits stored at 40°F continuously had the greatest amount of pitting. No brown staining occurred in either test. There
were no discernible differences in internal quality when evaluated by analyzing juice samples for ethanol, acetaldehyde, solids, acid, or pH. This indicates that the primary effect of intermittent warming is on the rind rather than on internal quality. Early grapefruit (Test 1) developed more moderate to severe pitting than did those harvested 2 months later (Test 2), but in each case there was only slight pitting in fruits warmed each wk. After a 1-wk
holding period at 70°F following cold storage, pitting increased in fruits which had been held at 40°F continuously or warmed at 2-wk intervals. Fruits warmed weekly did not develop any severe pitting nor did slight pitting increase appreciably.
Temple oranges stored continuously at 34°F for 10 wk (Table 3) developed a total of 10% pitting in one test. In a second test, pitting was a minor factor, but brown staining averaged 14% after a 2-wk holding period at 70°F. Both symptoms of chilling injury were lessened by warming each 2 wk and were virtually eliminated by weekly warming periods.
Valencia oranges treated with TBZ and stored at 34°F for 12 wk had no pitting and only a minor amount of aging (depressed areas near stem end) on removal from storage (Table 4). No decay was evident on removal of the fruit from storage. After 1 wk at 70°F, decay developed up to 7% in fruit held without warming. After 2 wk at 70°F, fruits which had been warmed each wk still had only 4% decay, while those held continuously at 34°F had 14% decay. This may indicate that chilling injury had occurred but without visible symptoms such as pitting, and that intermittent warming had prevented the injury.
Analysis of juice showed no significant change in ethanol, acetaldehyde, solids, acid, or pH attributable to intermittent warming. Fruits stored continuously at 34°F had slightly higher but not significant ethanol and acetaldehyde contents than fruits which had been warmed intermittently.
The basic causes of chilling injury in citrus fruit are still obscure. Humidity (Brooks and McColloch, 1936), accumu-
Table 3—Effect of intermittent warming of Temple oranges stored 10 wk at 3 4°F , January, 1971 (Test 1) and February, 1971 (Test 2). Washed, waxed and treated with T B Z a
% Pitting after removal +
1 wk at 70°
% Brown staining after removal +
2 wk at 70°
Storage condition SlightModerate to severe
Moderate to severe
Fruit warmed at 70° for 8 hr each wk Test no. 1 1 0 0Test no. 2 0 0 0
Fruit warmed at 70° for 8 hr each 2 wk Test no. 1 3 0 0Test no. 2 0 0 7
Fruit stored at 34° continuously Test no. 1 8 2 0Test no. 2 2 2 14
a F o r b o th te s ts , f ig u re s rep rese n t an average o f th re e lo ts o f f r u i t , 8 0 f ru it s per lo t , fo r each sto rage c o n d it io n .
Table 4—Effect of intermittent warming of Valencia oranges stored 12 wk at 34° F , April, 1970. Washed, waxed, and treated with T B Z a
% Aging on % Decay (Phomopsis citri)
removal On removal After Afterfrom 34° from 34° 1 wk 2 wk
Storage condition storage storage at 70° at 70°Fruit warmed at 70°for
8 hr each wk 0a 0 2d 4 bedFruit warmed at 70° for
8 hr each 2 wk 2a 0 3cd 8bcFruit warmed at 70° for
8 hr each 3 wk 1a 0 4 bed 7bcdFruit warmed at 70° for
8 hr each 4 wk 0a 0 4bcd 10abFruit stored at 34°
continuously 1a 0 7bcd 14aa F ig u re s rep rese n t an average o f th re e lo ts o f 1 0 0 f r u i t per lo t fo r each
sto rage c o n d it io n . L e t te rs fo llo w in g averages rep rese n t D u n ca n M u lt ip le R ange T e s t s ig n if ic a n c e va lu es at 5% le v e l. F ig u re s fo llo w e d b y no le tte rs in c o m m o n a re s ig n if ic a n t ly d if fe re n t .
C H IL L IN G IN J U R Y O F S TO R E D C IT R U S F R U IT S - 873
lation of acids (Demoise and Miller,1959), and failure of the ATP-ADP energy transfer system (Pantastico et al., 1968; Vakis et al., 1971) have been cited as possible causal factors, and further investigation in this area is needed. The problem is complicated by the fact that chilling injury is seldom exactly reproducible due to seasonal variations, maturity and preharvest environmental conditions. In addition, it manifests itself in various forms such as pitting, aging and rind staining. Intermittent warming offers one approach to the solution of the problem commercially, and further investigations are now in progress to optimize the duration and degree of warming required. There is apparently a time-tem
perature relationship in the chilling injury process, and this should furnish insight into the fundamental causal factors.
REFERENCESB rooks, C ., and M cC o llo ch , L .P . 1 9 3 6 . Som e
storage diseases o f g rape fru it. J. A gr. Res. 52: 3 1 9 .
Davis, P .L . and Chace, W .G . Jr. 1 9 6 9 . D e te rm in a tio n o f a lcoho l in citrus ju ice by gas chrom atographic analysis o f headspace. H o rt-S c i. 4: 1 1 7 .
D em oise, C .F . and M ille r, E .V . 1 9 5 9 . E ffe c t o f lo w tem peratures on the physio logy o f grape fru it. F o o d Res. 2 4 : 3 3 5 .
F r ie n d , W .H . and Bach, W .J. 1 9 3 2 . Storage experim ents w ith Texas citrus f ru it . Texas A gr. E x p . S ta. B u ll. 4 4 6 .
H ruschka, H .W ., S m ith , W .L . J r. and Baker, J .E .1 9 6 9 . R educing chilling in ju ry o f potatoes by in te rm itte n t w arm ing. A m . P ota to J. 46:38.
L ieb erm an , M ., C ra ft, C .C ., A u d ia , W .V . and W ilco x , M .S . 1 9 5 8 . B iochem ical studies o f chilling in ju ry in sweet potatoes. P lant Physio l. 3 3 : 3 0 7 .
L ieb erm an , M ., C ra ft, C .C . and W ilc o x , M .S .1 9 5 9 . E ffe c t o f chilling on the chlorogenic acid and ascorbic acid co n ten t o f P orto R ico sw eetpotatoes. Proc. A m . Soc. H o rt. Sci. 7 4 : 6 4 2 .
P antastico , E .B ., Sou le, J. and G rierson, W.1 9 6 8 . C h illing in ju ry in tro p ica l and subtro p ica l fru its . 2 . L im es and g rapefru it. Proc. T ro p . R eg ion A m . Soc. H o rt. Sci. 12: 1 7 1 .
S m o o t, J .J ., H o u c k , L .G . and Johnson, H .B .1 9 7 1 . M a rk e t diseases o f citrus and o th er subtrop ical fru its . U S D A H an d b o o k N o . 3 9 8 , p . 17 .
V ak is , N ., Sou le, J ., Biggs, R .H . and G rierson, W . 1 9 7 1 . B iochem ical changes in g rapefru it and “ M u rc o tt” c itrus fru its as re la ted to storage tem p era tu re . Proc. F lo rid a State H o rt. Soc. 8 3 : 3 0 4 .
Ms received 1 /1 5 /7 3 ; revised 3 /2 3 /7 3 ; accepted 3 /2 7 /7 3 .
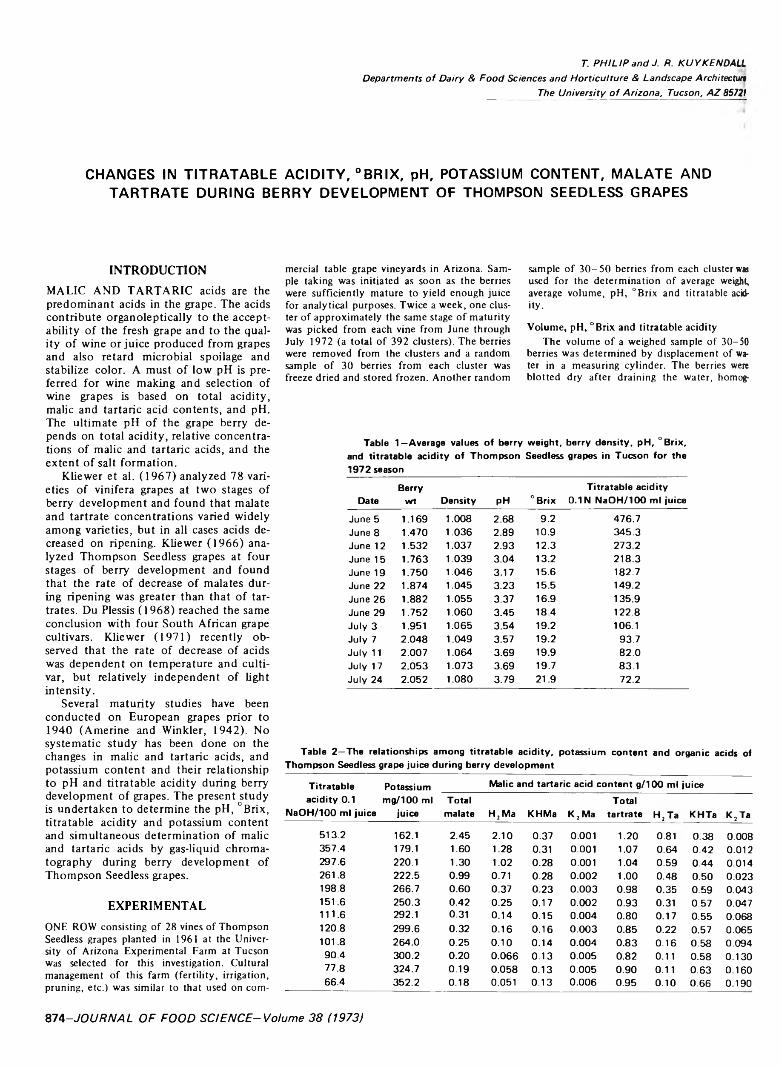
T. P H I L I P a n d J. Ft. K U Y K E N D A L L
D e p a r tm e n ts o f D a iry & F o o d S c iences a n d H o r t ic u ltu r e & L a n d s c a p e A rch itec turt
T h e U n iv e rs ity o f A r iz o n a , T u cso n , A Z 85721
CHANGES IN TITRATABLE A C ID ITY , °B R IX , pH, POTASSIUM CONTENT, MALATE AND TARTRATE DURING BERRY DEVELOPMENT OF THOMPSON SEEDLESS GRAPES
INTRODUCTIONMALIC AND TARTARIC acids are the predominant acids in the grape. The acids contribute organoleptically to the acceptability of the fresh grape and to the quality of wine or juice produced from grapes and also retard microbial spoilage and stabilize color. A must of low pH is preferred for wine making and selection of wine grapes is based on total acidity, malic and tartaric acid contents, and pH. The ultimate pH of the grape berry depends on total acidity, relative concentrations of malic and tartaric acids, and the extent of salt formation.
Kliewer et al. (1967) analyzed 78 varieties of vinifera grapes at two stages of berry development and found that malate and tartrate concentrations varied widely among varieties, but in all cases acids decreased on ripening. Kliewer (1966) analyzed Thompson Seedless grapes at four stages of berry development and found that the rate of decrease of malates during ripening was greater than that of tartrates. Du Plessis (1968) reached the same conclusion with four South African grape cultivars. Kliewer (1971) recently observed that the rate of decrease of acids was dependent on temperature and culti- var, but relatively independent of light intensity.
Several maturity studies have been conducted on European grapes prior to 1940 (Amerine and Winkler, 1942). No systematic study has been done on the changes in malic and tartaric acids, and potassium content and their relationship to pH and titratable acidity during berry development of grapes. The present study is undertaken to determine the pH, °Brix, titratable acidity and potassium content and simultaneous determination of malic and tartaric acids by gas-liquid chromatography during berry development of Thompson Seedless grapes.
EXPERIMENTALONE ROW consisting of 28 vines of Thompson Seedless grapes planted in 1961 at the University of Arizona Experimental Farm at Tucson was selected for this investigation. Cultural management of this farm (fertility, irrigation, pruning, etc.) was similar to that used on com
mercial table grape vineyards in Arizona. Sample taking was initiated as soon as the berries were sufficiently mature to yield enough juice for analytical purposes. Twice a week, one cluster of approximately the same stage of maturity was picked from each vine from June through July 1972 (a total of 392 clusters). The berries were removed from the clusters and a random sample of 30 berries from each cluster was freeze dried and stored frozen. Another random
sample of 30-50 berries from each cluster was used for the determination of average weight, average volume, pH, °Brix and titratable acidity.
Volume, pH, °Brix and titratable acidityThe volume of a weighed sample of 30-50
berries was determined by displacement of water in a measuring cylinder. The berries were blotted dry after draining the water, homog-
Table 1—Average values of berry weight, berry density, pH, °Brix, and titratable acidity of Thompson Seedless grapes in Tucson for the 1972 season
DateBerry
wt Density PH °BrixTitratable acidity
0.1 N NaOH/100 ml juice
June 5 1.169 1.008 2.68 9.2 476.7June 8 1.470 1.036 2.89 10.9 345.3June 12 1.532 1.037 2.93 12.3 273.2June 15 1.763 1.039 3.04 13.2 218.3June 19 1.750 1.046 3.17 15.6 182.7June 22 1.874 1.045 3.23 15.5 149.2June 26 1.882 1.055 3.37 16.9 135.9June 29 1.752 1.060 3.45 18.4 122.8July 3 1.951 1.065 3.54 19.2 106.1July 7 2.048 1.049 3.57 19.2 93.7July 11 2.007 1.064 3.69 19.9 82.0July 17 2.053 1.073 3.69 19.7 83.1July 24 2.052 1.080 3.79 21.9 72.2
Table 2—The relationships among titratable acidity, potassium content and organic acids of Thompson Seedless grape juice during berry development
Titratable acidity 0.1
NaOH/100 ml juice
Potassium mg/100 ml
juice
Malic and tartaric acid content g/100 ml juiceTotal
malate H2Ma KHMa K 2 MaTotal
tartrate H2 Ta KHTa K 2Ta
513.2 162.1 2.45 2.10 0.37 0.001 1.20 0.81 0.38 0.008357.4 179.1 1.60 1.28 0.31 0.001 1.07 0.64 0.42 0.012297.6 220.1 1.30 1.02 0.28 0.001 1.04 0.59 0.44 0.014261.8 222.5 0.99 0.71 0.28 0.002 1.00 0.48 0.50 0.023198.8 266.7 0.60 0.37 0.23 0.003 0.98 0.35 0.59 0.043151.6 250.3 0.42 0.25 0.17 0.002 0.93 0.31 0.57 0.047111.6 292.1 0.31 0.14 0.15 0.004 0.80 0.17 0.55 0.068120.8 299.6 0.32 0.16 0.16 0.003 0.85 0.22 0.57 0.065101.8 264.0 0.25 0.10 0.14 0.004 0.83 0.16 0.58 0.09490.4 300.2 0.20 0.066 0.13 0.005 0.82 0.11 0.58 0.13077.8 324.7 0.19 0.058 0.13 0.005 0.90 0.11 0.63 0.16066.4 352.2 0.18 0.051 0.13 0.006 0.95 0.10 0.66 0.190
874-J O U R N A L O F FO O D S C IE N C E -V o lu m e 3 8 (1973)
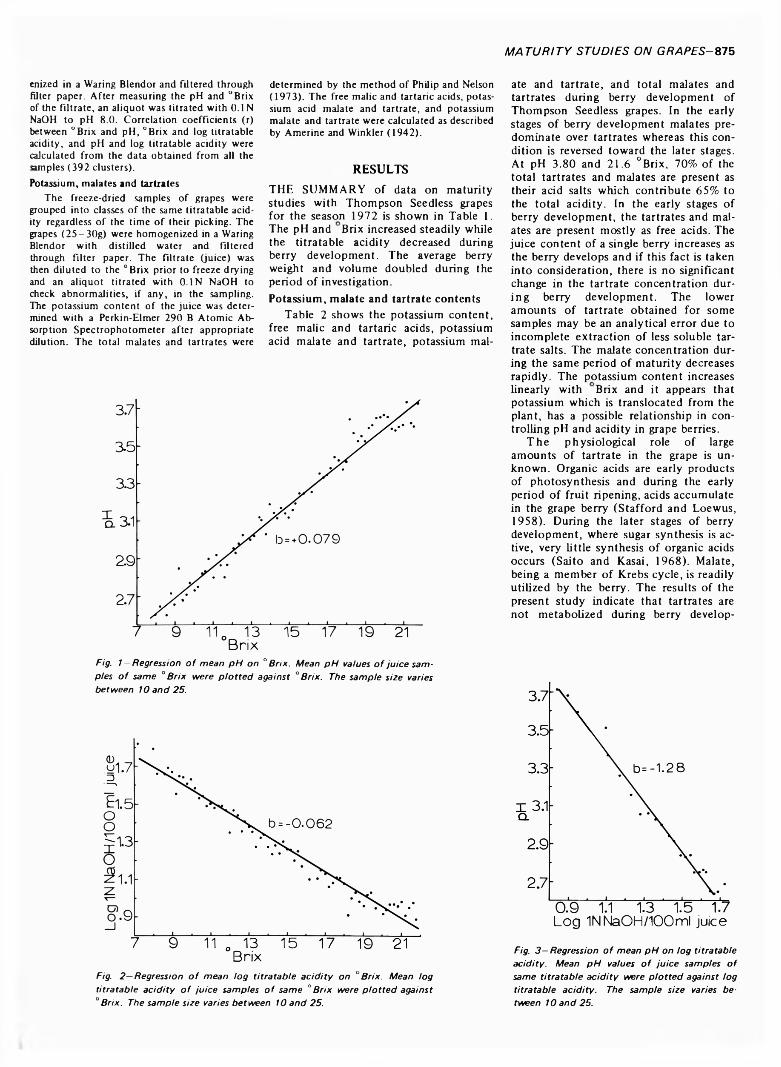
M A T U R IT Y S TU D IE S O N GRAPES-875enized in a Waring Blendor and filtered through filter paper. After measuring the pH and °Brix of the filtrate, an aliquot was titrated with 0.1N NaOH to pH 8.0. Correlation coefficients (r) between °Brix and pH, °Brix and log titratable acidity, and pH and log titratable acidity were calculated from the data obtained from all the samples (392 clusters).Potassium, malatcs and tartrates
The freeze-dried samples of grapes were grouped into classes of the same titratable acidity regardless of the time of their picking. The grapes (25-30g) were homogenized in a Waring Blendor with distilled water and filtered through filter paper. The filtrate (juice) was then diluted to the °Brix prior to freeze drying and an aliquot titrated with 0.1N NaOH to check abnormalities, if any, in the sampling. The potassium content of the juice was determined with a Perkin-Elmer 290 B Atomic Absorption Spectrophotometer after appropriate dilution. The total malates and tartrates were
determined by the method of Philip and Nelson(1973). The free malic and tartaric acids, potassium acid malate and tartrate, and potassium malate and tartrate were calculated as described by Amerine and Winkler (1942).
RESULTSTHE SUMMARY of data on maturity studies with Thompson Seedless grapes for the season 1972 is shown in Table 1. The pH and Brix increased steadily while the titratable acidity decreased during berry development. The average berry weight and volume doubled during the period of investigation.Potassium, malate and tartra te contents
Table 2 shows the potassium content, free malic and tartaric acids, potassium acid malate and tartrate, potassium mal-
ate and tartrate, and total malates and tartrates during berry development of Thompson Seedless grapes. In the early stages of berry development malates predominate over tartrates whereas this condition is reversed toward the later stages. At pH 3.80 and 21.6 °Brix, 70% of the total tartrates and malates are present as their acid salts which contribute 65% to the total acidity. In the early stages of berry development, the tartrates and malates are present mostly as free acids. The juice content of a single berry increases as the berry develops and if this fact is taken into consideration, there is no significant change in the tartrate concentration during berry development. The lower amounts of tartrate obtained for some samples may be an analytical error due to incomplete extraction of less soluble tartrate salts. The malate concentration during the same period of maturity decreases rapidly. The potassium content increases linearly with Brix and it appears that potassium which is translocated from the plant, has a possible relationship in controlling pH and acidity in grape berries.
The physiological role of large amounts of tartrate in the grape is unknown. Organic acids are early products of photosynthesis and during the early period of fruit ripening, acids accumulate in the grape berry (Stafford and Loewus,1958). During the later stages of berry development, where sugar synthesis is active, very little synthesis of organic acids occurs (Saito and Kasai, 1968). Malate, being a member of Krebs cycle, is readily utilized by the berry. The results of the present study indicate that tartrates are not metabolized during berry develop-
L o g 1 N N a O H /1 0 0 m l ju ice
Fig . 3 —R egression o f m e a n p H o n lo g t it r a ta b le
a c id ity . M e a n p H values o f ju ic e sam ples o f
sam e t i t r a ta b le a c id ity w ere p lo t t e d a g a in s t lo g
t it r a ta b le a c id ity . T h e s a m p le s ize varies b e
tw e e n l O a n d 2 5 .
Fig . 1 -R e g re s s io n o f m e a n p H o n ° B rix . M e a n p H values o f ju ic e s a m
p les o f s am e ° B r ix w e re p l o t t e d a g a in s t ° B rix . T h e s a m p le s ize varies
b e tw e e n 1 0 a n d 2 5 .
Fig. 2 —R eg ress ion o f m e a n lo g t it r a ta b le a c id ity o n ° B r ix . M e a n lo g
t it r a ta b le a c id ity o f ju ic e s am p les o f s am e ° B r ix w e re p lo t t e d a g a in s t
° B rix . T h e s a m p le s ize varies b e tw e e n 10 a n d 2 5 .

876-J O U R N A L O F FO O D S C IE N C E -V o lu m e 3 8 (1973)
ment, either due to the lack of enzymes or due to the formation of insoluble salts less susceptible to enzymic degradation.
Titratable acidity, pH and “BrixThe linear relationships between pH
and °Brix (r = 0.94), °Brix and log titratable acidity (r = 0.94), and pH and log titratable acidity (r = 0.98) of Thompson Seedless grape juice during berry development are shown in Figures 1, 2 and 3, respectively. Although a survey by Amer- ine and Winkler (1942) indicated the lack of well defined correlation between pH and titratable acidity, a high correlation (r = 0.98) between pH and log titratable acidity is obtained in this study. The pH increases steadily and titratable acidity decreases logarithmetically (Fig. 1 and 2) during berry development. Since the total tartrate concentration remains unchanged, the log decrease in titratable acidity is due to the rapid decrease in malate as well as due to the formation of potassium salts. The pH and acidity of
the ripe grape berry depend to a large degree on the extent of salt formation which, in turn, is related to the potassium content. The increase in potassium content during berry development is directly related to °Brix and pH (Table 2). Mat- tick et al. (1972) found a similar relationship between pH and potassium content of Concord grape juice.
Arizona grapes are early season grapes and are considered to be commercially ripe at 16 °Brix for consumption as table grapes. Acidity is an important factor in the quality of table grapes. The ratio of soluble solids to acid is currently used for classification of wine grapes. The relationship between potassium content and pH indicates the possibility of a simpler method of classification of wine grapes based on the potassium content.
REFERENCESA m erine , M .A . and W in k le r, A .J . 1 9 4 2 . M a tu r
ity studies w ith C a lifo rn ia grapes. 2 . The
titra ta b le a c id ity , p H and organic acid conte n t. J. A m er. Soc. H o r t . Sci. 4 0 : 3 13 .
D u Plessis, C .S . 1 9 6 8 . Changes in the major organic acids o f ripening grapes. S. A fr. J. A gric. Sci. 11: 2 3 7 .
K lie w e r, W .M . 1 9 6 6 . Sugars and organic acids o f V itis v in ifera . P lant Physiol. 41: 923 .
K liew er, W .M . 1 9 7 1 . E ffe c t o f day temperature and ligh t in ten sity on concentration of m alic and ta rta ric acids in V itis vinifera L. grapes. J. A m e r. Soc. H o rt. Sci. 9 6 (3 ): 372.
K lie w e r, W .M ., H o w a rth , L . and O m ori, M.1 9 6 7 . C oncen trations o f ta rta ric acid and m alic acids and th e ir salts in V itis vinifera grapes. A m e r. J. E n o l. V it ic . 18: 42.
M a ttic k , L .R . , Shaulis, N .J . and M o y e r, J.C.1 9 7 2 . Th e e ffe c t o f potassium fertilization on the acid con ten t o f C oncord grape juice. A m er. J. E n o l. V it ic . 2 3 (1 ): 26.
P h ilip , T . and N elson, F .E . 1 9 7 3 . A procedure fo r qu an tita tiv e estim atio n o f m alic and tartaric acids in grape ju ice . J. F o o d Sci. 38:18.
S aito , K . and Kasai, Z . 1 9 6 8 . A ccum ula tion of ta rta ric acid in the ripen ing process of grapes. P lant & C ell Physio l. 9: 5 2 9 .
S ta ffo rd , H .A . and Loew us, F .A . 1 9 5 8 . The fixa tio n o f C* 4 0 2 in to ta rta ric and m alic acids o f excised grape leaves. P la n t Physiol. 33: 1 94 .
Ms received 3 /1 7 /7 3 ; revised 5 /4 /7 3 ; accepted5 /7 /7 3 .
Journa l Paper 2 0 7 5 o f the A rizo n a Agricultu ra l E x p e rim en t S ta tio n .
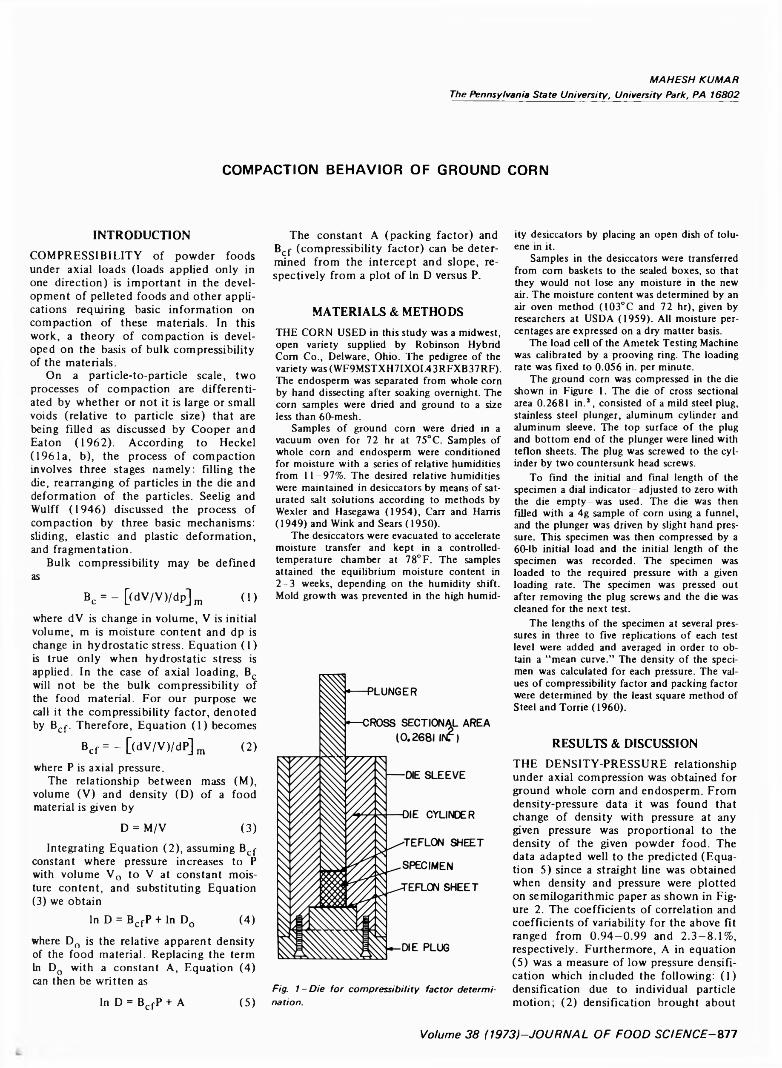
M A H E S H K U M A R
T h e P e n n s y lv a n ia S ta te U n iv e rs ity , U n iv e rs ity P a rk , P A 1 6 8 0 2
COMPACTION BEHAVIOR OF GROUND CORN
INTRODUCTIONCOMPRESSIBILITY of powder foods under axial loads (loads applied only in one direction) is important in the development of pelleted foods and other applications requiring basic information on compaction of these materials. In this work, a theory of compaction is developed on the basis of bulk compressibility of the materials.
On a particle-to-particle scale, two processes of compaction are differentiated by whether or not it is large or small voids (relative to particle size) that are being filled as discussed by Cooper and Eaton (1962). According to Heckel (1961a, b), the process of compaction involves three stages namely: filling the die, rearranging of particles in the die and deformation of the particles. Seelig and Wulff (1946) discussed the process of compaction by three basic mechanisms: sliding, elastic and plastic deformation, and fragmentation.
Bulk compressibility may be defined as
Bc = — [(dV/V)/dp]m (1)
where dV is change in volume, V is initial volume, m is moisture content and dp is change in hydrostatic stress. Equation (1) is true only when hydrostatic stress is applied. In the case of axial loading, Bc will not be the bulk compressibility of the food material. For our purpose we call it the compressibility factor, denoted by Bcf. Therefore, Equation (1) becomes
Bc f = - [ ( d v /V )/dP]m (2)
where P is axial pressure.The relationship between mass (M),
volume (V) and density (D) of a food material is given by
D = M/V (3)Integrating Equation (2), assuming Bcj-
constant where pressure increases to P with volume VQ to V at constant moisture content, and substituting Equation(3) we obtain
In D = BcfP + In DQ (4)
where D0 is the relative apparent density of the food material. Replacing the term In D0 with a constant A, Equation (4) can then be written as
lnD = BcfP + A (5)
The constant A (packing factor) and Bcf (compressibility factor) can be determined from the intercept and slope, respectively from a plot of In D versus P.
MATERIALS & METHODSTHE CORN USED in this study was a midwest, open variety supplied by Robinson Hybrid Com Co., Delware, Ohio. The pedigree of the variety was (WF9MSTXH7IXOI.43RFXB37RF). The endosperm was separated from whole corn by hand dissecting after soaking overnight. The corn samples were dried and ground to a size less than 60-mesh.
Samples of ground corn were dried in a vacuum oven for 72 hr at 75°C. Samples of whole corn and endosperm were conditioned for moisture with a series of relative humidities from 11-97%. The desired relative humidities were maintained in desiccators by means of saturated salt solutions according to methods by Wexler and Hasegawa (1954), Carr and Harris (1949) and Wink and Sears (1950).
The desiccators were evacuated to accelerate moisture transfer and kept in a controlled- temperature chamber at 78°F. The samples attained the equilibrium moisture content in2-3 weeks, depending on the humidity shift. Mold growth was prevented in the high humid-
Fig. I—Die for compressibility factor determ ination.
ity desiccators by placing an open dish of toluene in it.
Samples in the desiccators were transferred from com baskets to the sealed boxes, so that they would not lose any moisture in the new air. The moisture content was determined by an air oven method (103°C and 72 hr), given by researchers at USDA (1959). All moisture percentages are expressed on a dry matter basis.
The load cell of the Ametek Testing Machine was calibrated by a prooving ring. The loading rate was fixed to 0.056 in. per minute.
The ground corn was compressed in the die shown in Figure 1. The die of cross sectional area 0.2681 in.2, consisted of a mild steel plug, stainless steel plunger, aluminum cylinder and aluminum sleeve. The top surface of the plug and bottom end of the plunger were lined with teflon sheets. The plug was screwed to the cylinder by two countersunk head screws.
To find the initial and final length of the specimen a dial indicator-adjusted to zero with the die empty-was used. The die was then filled with a 4g sample of corn using a funnel, and the plunger was driven by slight hand pressure. This specimen was then compressed by a 60-lb initial load and the initial length of the specimen was recorded. The specimen was loaded to the required pressure with a given loading rate. The specimen was pressed out after removing the plug screws and the die was cleaned for the next test.
The lengths of the specimen at several pressures in three to five replications of each test level were added and averaged in order to obtain a “mean curve.” The density of the specimen was calculated for each pressure. The values of compressibility factor and packing factor were determined by the least square method of Steel and Torrie (1960).
RESULTS & DISCUSSIONTHE DENSITY-PRESSURE relationship under axial compression was obtained for ground whole com and endosperm. From density-pressure data it was found that change of density with pressure at any given pressure was proportional to the density of the given powder food. The data adapted well to the predicted (Equation 5) since a straight line was obtained when density and pressure were plotted on semilogarithmic paper as shown in Figure 2. The coefficients of correlation and coefficients of variability for the above fit ranged from 0 .94-0 .99 and 2.3—8.1%, respectively. Furthermore, A in equation(5) was a measure of low pressure densification which included the following: ( 1) densification due to individual particle motion; (2 ) densification brought about
Volum e 3 8 (1 9 7 3 )-J O U R N A L O F FO O D SCIEN C E-877
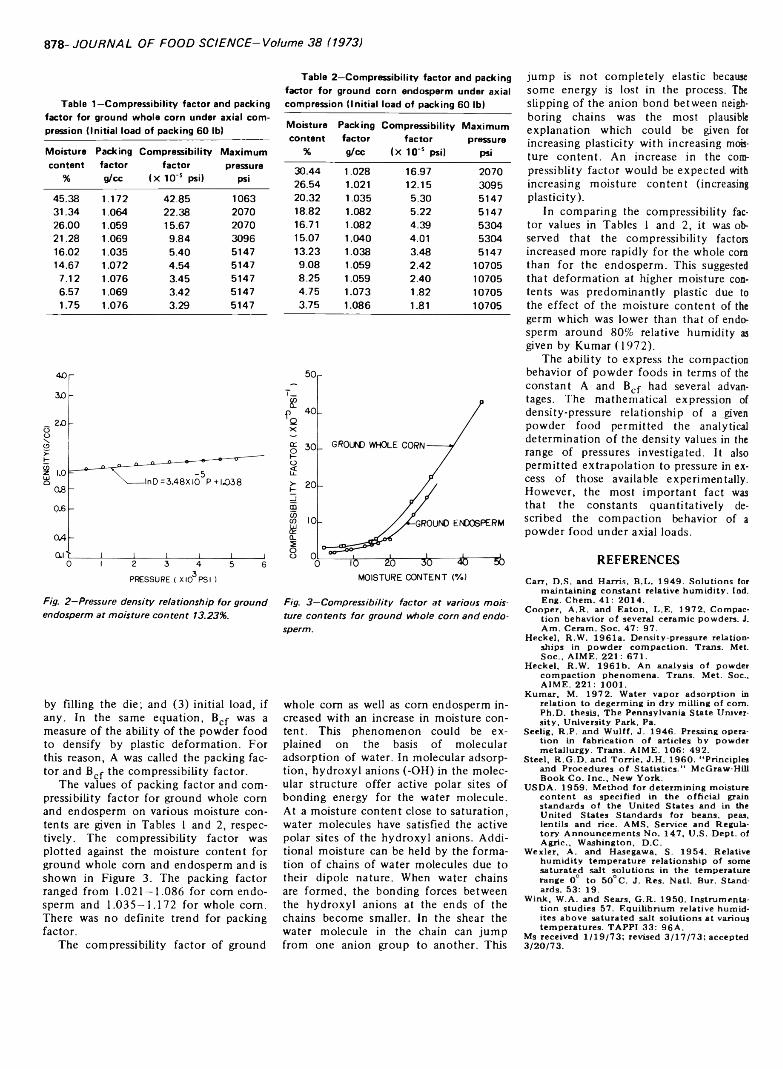
878-J O U R N A L O F FO O D S C IE N C E -V o lu m e 3 8 (1973)
Table 1—Compressibility factor and packing factor for ground whole corn under axial compression (Initial load of packing 60 lb)
Moisturecontent
%
Packingfactorg/cc
Compressibility factor
(X 10'5 psi)
Maximumpressure
psi
45.38 1.172 42.85 106331.34 1.064 22.38 207026.00 1.059 15.67 207021.28 1.069 9.84 309616.02 1.035 5.40 514714.67 1.072 4.54 51477.12 1.076 3.45 51476.57 1.069 3.42 51471.75 1.076 3.29 5147
F ig . 2 —P ressure d e n s ity re la t io n s h ip f o r g ro u n d
e n d o s p e rm a t m o is tu re c o n te n t 1 3 .2 3 % .
by filling the die; and (3) initial load, if any. In the same equation, Bcf was a measure of the ability of the powder food to densify by plastic deformation. For this reason, A was called the packing factor and Bcf the compressibility factor.
The values of packing factor and compressibility factor for ground whole com and endosperm on various moisture contents are given in Tables 1 and 2, respectively. The compressibility factor was plotted against the moisture content for ground whole com and endosperm and is shown in Figure 3. The packing factor ranged from 1.021 — 1.086 for com endosperm and 1.035—1.172 for whole com. There was no definite trend for packing factor.
The compressibility factor of ground
Table 2—Compressibility factor and packing factor for ground corn endosperm under axial compression (Initial load of packing 60 lb)
Moisture Packing Compressibility Maximum content factor factor pressure
% g/cc (X 10'5 psi) psi
30.44 1.028 16.97 207026.54 1.021 12.15 309520.32 1.035 5.30 514718.82 1.082 5.22 514716.71 1.082 4.39 530415.07 1.040 4.01 530413.23 1.038 3.48 51479.08 1.059 2.42 107058.25 1.059 2.40 107054.75 1.073 1.82 107053.75 1.086 1.81 10705
F ig . 3 —C o m p re s s ib ility fa c to r a t vario u s m o is
tu re c o n te n ts fo r g ro u n d w h o le c o m a n d e n d o
s p e rm .
whole com as well as corn endosperm increased with an increase in moisture content. This phenomenon could be explained on the basis of molecular adsorption of water. In molecular adsorption, hydroxyl anions (-OH) in the molecular structure offer active polar sites of bonding energy for the water molecule. At a moisture content close to saturation, water molecules have satisfied the active polar sites of the hydroxyl anions. Additional moisture can be held by the formation of chains of water molecules due to their dipole nature. When water chains are formed, the bonding forces between the hydroxyl anions at the ends of the chains become smaller. In the shear the water molecule in the chain can jump from one anion group to another. This
jump is not completely elastic because some energy is lost in the process. The slipping of the anion bond between neighboring chains was the most plausible explanation which could be given for increasing plasticity with increasing moisture content. An increase in the com- pressiblity factor would be expected with increasing moisture content (increasing plasticity).
In comparing the compressibility factor values in Tables 1 and 2, it was observed that the compressibility factors increased more rapidly for the whole com than for the endosperm. This suggested that deformation at higher moisture contents was predominantly plastic due to the effect of the moisture content of the germ which was lower than that of endosperm around 80% relative humidity as given by Kumar (1972).
The ability to express the compaction behavior of powder foods in terms of the constant A and Bcf had several advantages. The mathematical expression of density-pressure relationship of a given powder food permitted the analytical determination of the density values in the range of pressures investigated. It also permitted extrapolation to pressure in excess of those available experimentally. However, the most important fact was that the constants quantitatively described the compaction behavior of a powder food under axial loads.
REFERENCESC arr, D .S . and H arris , B .L . 1 9 4 9 . S o lutions for
m ain ta in ing constant rela tive h u m id ity . Ind. Eng. C hem . 4 1: 2 0 1 4 .
C ooper, A .R . and E a to n , L .E . 1 9 7 2 . Compactio n behavior o f several ceram ic powders. J. A m . C eram . Soc. 4 7 : 97 .
H ecke l, R .W . 1 9 6 1 a . D ensity-pressure relationships in po w der com paction . Trans. Met. Soc., A IM E . 2 2 1 : 6 7 1 .
H ecke l, R .W . 1 9 6 1 b . A n analysis o f powder com paction phenom ena. Trans. M e t. Soc., A IM E . 2 21 : 1 0 0 1 .
K u m ar, M . 1 9 7 2 . W ater vapor adsorption in re la tio n to degerm ing in d ry m illin g o f com. P h .D . thesis, T h e Pennsylvania S tate U nivers ity , U n ivers ity Park, Pa.
Seelig, R .P . and W u lff , J. 1 9 4 6 . Pressing operatio n in fa b ric a tio n o f articles by powder m eta llu rgy . Trans. A IM E . 106 : 4 9 2 .
S teel, R .G .D . and T o rr ie , J .H . 1 9 6 0 . “ Principles and Procedures o f S ta tis tics .” M c G raw -H ill B ook C o. In c ., N ew Y o rk .
U S D A . 1 9 5 9 . M e th o d fo r de te rm in ing m oisture c o n te n t as specified in the o ffic ia l grain standards o f the U n ite d States and in the U n ite d States Standards fo r beans, peas, len tils and rice. A M S , Service and Regulato ry A nnouncem ents N o . 1 4 7 , U .S . D ep t, of A gric ., W ashington, D .C .
W exler, A . and Hasegawa, S. 1 9 5 4 . Relative h u m id ity tem p eratu re rela tionsh ip o f some saturated salt solutions in the tem perature range 0 ° to 5 0 ° C. J. Res. N a tl. B ur. Standards. 53: 19.
W in k , W .A . and Sears, G .R . 1 9 5 0 . In s trum enta tio n studies 57. E q u ilib riu m rela tive hum id- ites above saturated salt so lutions at various tem peratures. T A P P I 3 3 : 9 6 A .
Ms received 1 /1 9 /7 3 ; revised 3 /1 7 /7 3 ; accepted 3 /2 0 /7 3 .
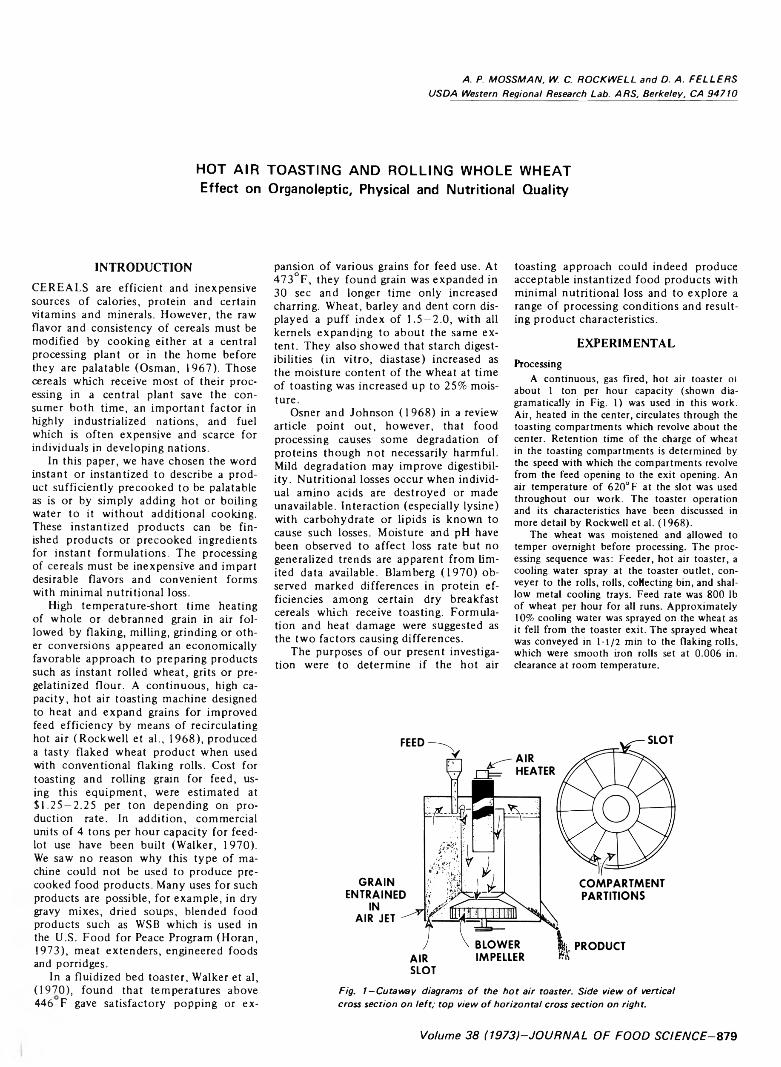
A . P. M O S S M A N , W. C. R O C K W E L L a n d D . A . F E L L E R S
U S D A W e s te rn R e g io n a l R esearch L a b . A R S , B e rk e le y , C A 9 4 7 1 0
HOT AIR TOASTING AND ROLLING WHOLE WHEAT Effect on Organoleptic, Physical and Nutritional Quality
INTRODUCTIONCEREALS are efficient and inexpensive sources of calories, protein and certain vitamins and minerals. However, the raw flavor and consistency of cereals must be modified by cooking either at a central processing plant or in the home before they are palatable (Osman, 1967). Those cereals which receive most of their processing in a central plant save the consumer both time, an important factor in highly industrialized nations, and fuel which is often expensive and scarce for individuals in developing nations.
In this paper, we have chosen the word instant or instantized to describe a product sufficiently precooked to be palatable as is or by simply adding hot or boiling water to it without additional cooking. These instantized products can be finished products or precooked ingredients for instant formulations. The processing of cereals must be inexpensive and impart desirable flavors and convenient forms with minimal nutritional loss.
High temperature-short time heating of whole or debranned grain in air followed by flaking, milling, grinding or other conversions appeared an economically favorable approach to preparing products such as instant rolled wheat, grits or pregelatinized flour. A continuous, high capacity, hot air toasting machine designed to heat and expand grains for improved feed efficiency by means of recirculating hot air (Rockwell et al., 1968), produced a tasty flaked wheat product when used with conventional flaking rolls. Cost for toasting and rolling grain for feed, using this equipment, were estimated atSI.25—2.25 per ton depending on production rate. In addition, commercial units of 4 tons per hour capacity for feed- lot use have been built (Walker, 1970). We saw no reason why this type of machine could not be used to produce precooked food products. Many uses for such products are possible, for example, in dry gravy mixes, dried soups, blended food products such as WSB which is used in the U.S. Food for Peace Program (Horan,1973), meat extenders, engineered foods and porridges.
In a fluidized bed toaster, Walker et al,(1970), found that temperatures above 446 F gave satisfactory popping or ex
pansion of various grains for feed use. At 473°F, they found grain was expanded in 30 sec and longer time only increased charring. Wheat, barley and dent corn displayed a puff index of 1.5—2.0, with all kernels expanding to about the same extent. They also showed that starch digestibilities (in vitro, diastase) increased as the moisture content of the wheat at time of toasting was increased up to 25% moisture.
Osner and Johnson (1968) in a review article point out, however, that food processing causes some degradation of proteins though not necessarily harmful. Mild degradation may improve digestibility. Nutritional losses occur when individual amino acids are destroyed or made unavailable. Interaction (especially lysine) with carbohydrate or lipids is known to cause such losses. Moisture and pH have been observed to affect loss rate but no generalized trends are apparent from limited data available. Blamberg (1970) observed marked differences in protein efficiencies among certain dry breakfast cereals which receive toasting. Formulation and heat damage were suggested as the two factors causing differences.
The purposes of our present investigation were to determine if the hot air
toasting approach could indeed produce acceptable instantized food products with minimal nutritional loss and to explore a range of processing conditions and resulting product characteristics.
EXPERIMENTALProcessing
A continuous, gas fired, hot air toaster ol about 1 ton per hour capacity (shown dia- gramatically in Fig. 1) was used in this work. Air, heated in the center, circulates through the toasting compartments which revolve about the center. Retention time of the charge of wheat in the toasting compartments is determined by the speed with which the compartments revolve from the feed opening to the exit opening. An air temperature of 620°F at the slot was used throughout our work. The toaster operation and its characteristics have been discussed in more detail by Rockwell et al. (1968).
The wheat was moistened and allowed to temper overnight before processing. The processing sequence was: Feeder, hot air toaster, a cooling water spray at the toaster outlet, conveyer to the rolls, rolls, collecting bin, and shallow metal cooling trays. Feed rate was 800 lb of wheat per hour for all runs. Approximately 10% cooling water was sprayed on the wheat as it fell from the toaster exit. The sprayed wheat was conveyed in 1-1/2 min to the flaking rolls, which were smooth iron rolls set at 0.006 in. clearance at room temperature.
F ig . 1 - C u t a w a y d iag ra m s o f th e h o t a ir to a s te r. S id e v ie w o f v e r t ic a l
cross s e c tio n o n le f t ; to p v ie w o f h o r iz o n ta l cross s e c tio n o n r ig h t.
Volum e 3 8 (1 9 7 3 )-J O U R N A L O F FO O D S C IE N C E -8 7 9
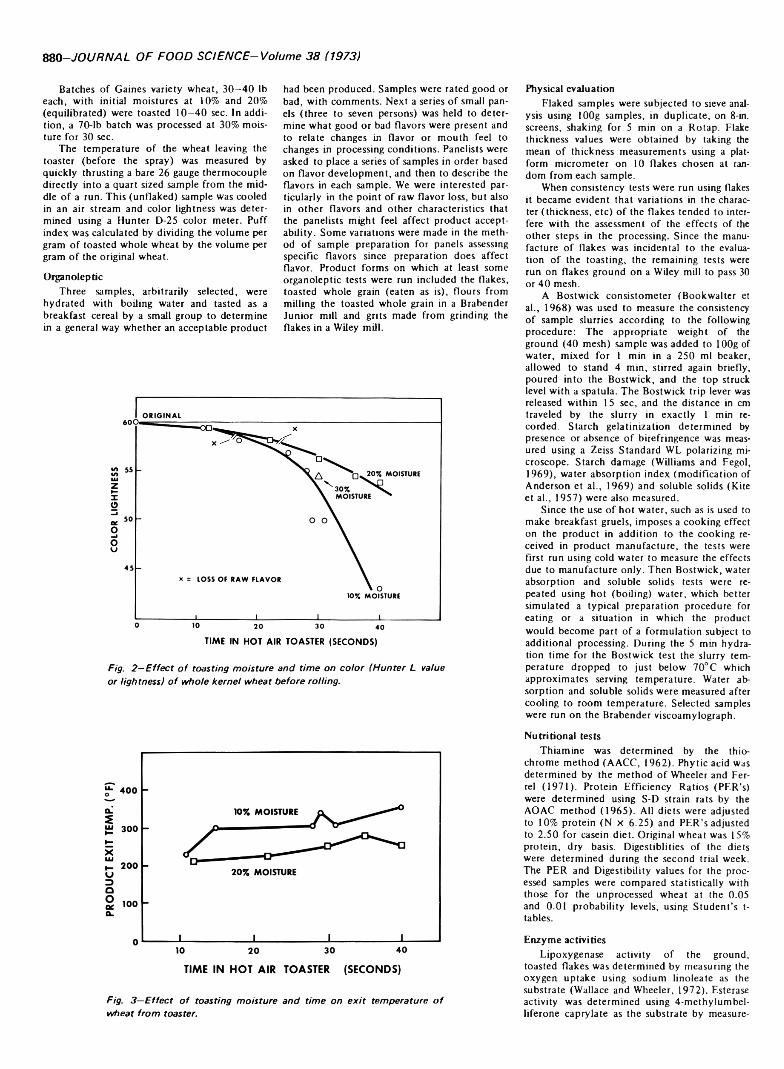
880-J O U R N A L O F FO O D S C IE N C E -V o lu m e 3 8 (1973)
Batches of Gaines variety wheat, 30-40 lb each, with initial moistures at 10% and 20% (equilibrated) were toasted 10-40 sec. In addition, a 70-lb batch was processed at 30% moisture for 30 sec.
The temperature of the wheat leaving the toaster (before the spray) was measured by quickly thrusting a bare 26 gauge thermocouple directly into a quart sized sample from the middle of a run. This (unflaked) sample was cooled in an air stream and color lightness was determined using a Hunter D-25 color meter. Puff index was calculated by dividing the volume per gram of toasted whole wheat by the volume per gram of the original wheat.
OrganolepticThree samples, arbitrarily selected, were
hydrated with boiling water and tasted as a breakfast cereal by a small group to determine in a general way whether an acceptable product
had been produced. Samples were rated good or bad, with comments. Next a series of small panels (three to seven persons) was held to determine what good or bad flavors were present and to relate changes in flavor or mouth feel to changes in processing conditions. Panelists were asked to place a series of samples in order based on flavor development, and then to describe the flavors in each sample. We were interested particularly in the point of raw flavor loss, but also in other flavors and other characteristics that the panelists might feel affect product acceptability. Some variations were made in the method of sample preparation for panels assessing specific flavors since preparation does affect flavor. Product forms on which at least some organoleptic tests were run included the flakes, toasted whole grain (eaten as is), flours from milling the toasted whole grain in a Brabender Junior mill and grits made from grinding the flakes in a Wiley mill.
Physical evaluationFlaked samples were subjected to sieve anal
ysis using 100g samples, in duplicate, on 8-in. screens, shaking for 5 min on a Rotap. Flake thickness values were obtained by taking the mean of thickness measurements using a platform micrometer on 10 flakes chosen at random from each sample.
When consistency tests were run using flakes it became evident that variations in the character (thickness, etc) of the flakes tended to interfere with the assessment of the effects of the other steps in the processing. Since the manufacture of flakes was incidental to the evaluation of the toasting, the remaining tests were run on flakes ground on a Wiley mill to pass 30 or 40 mesh.
A Bostwick consistometer (Bookwalter et al., 1968) was used to measure the consistency of sample slurries according to the following procedure: The appropriate weight of the ground (40 mesh) sample was added to 100g of water, mixed for 1 min in a 250 ml beaker, allowed to stand 4 min, stirred again briefly, poured into the Bostwick, and the top struck level with a spatula. The Bostwick trip lever was released within 15 sec, and the distance in cm traveled by the slurry in exactly 1 min recorded. Starch gelatinization determined by presence or absence of birefringence was measured using a Zeiss Standard WL polarizing microscope. Starch damage (Williams and Fegol,1969), water absorption index (modification of Anderson et al., 1969) and soluble solids (Kite et al., 1957) were also measured.
Since the use of hot water, such as is used to make breakfast gruels, imposes a cooking effect on the product in addition to the cooking received in product manufacture, the tests were first run using cold water to measure the effects due to manufacture only. Then Bostwick, water absorption and soluble solids tests were repeated using hot (boiling) water, which better simulated a typical preparation procedure for eating or a situation in which the product would become part of a formulation subject to additional processing. During the 5 min hydration time for the Bostwick test the slurry temperature dropped to just below 70° C which approximates serving temperature. Water absorption and soluble solids were measured after cooling to room temperature. Selected samples were run on the Brabender viscoamylograph.
Nutritional testsThiamine was determined by the thio-
chrome method (AACC, 1962). Phytic acid was determined by the method of Wheeler and Fer- rel (1971). Protein Efficiency Ratios (PER’s) were determined using S-D strain rats by the AOAC method (1965). All diets were adjusted to 10% protein (N X 6.25) and PER’s adjusted to 2.50 for casein diet. Original wheat was 15% protein, dry basis. Digestiblities of the diets were determined during the second trial week. The PER and Digestibility values for the processed samples were compared statistically with those for the unprocessed wheat at the 0.05 and 0.01 probability levels, using Student’s t- tables.
Enzyme activitiesLipoxygenase activity of the ground,
toasted flakes was determined by measuring the oxygen uptake using sodium linoleate as the substrate (Wallace and Wheeler, 1972). Esterase activity was determined using 4-methylumbel- liferone caprylate as the substrate by measure-
F ig . 2 —E f f e c t o f to a s tin g m o is tu re a n d t im e o n c o lo r IH u n t e r L value
o r lig h tn e s s ) o f w h o le k e rn e l w h e a t b e fo re ro ll in g .
F ig . 3 —E f f e c t o f to a s tin g m o is tu re a n d t im e o n e x i t te m p e ra tu re o f
w h e a t f r o m to a s te r.

TO A S TIN G O F W HEA 7"—881
F ig . 4 —E ffe c ts o f h o t a ir to a s tin g a n d r o ll in g o n v is c o a m y lo g ra p h c h a r
a c te r is tic s u s in g 6 5 g o f g ro u n d m a te r ia l (1 4 % m o is tu re ) in 4 5 0 m l w a
te r. P ro g ra m : h e a t a t 1 -M 2 ° C p e r m in to 9 7 ° C ; h o ld a t 9 7 ° C f o r 1 h r ;
c o o l a t 1 - M 2 ° C p e r m in to 5 0 ° C. In i t i a l m o is tu re s h o w n in %, to a s tin g
t im e s h o w n in sec.
mg the fluorescent cleavage product, 4-methyl- umbelliferone, in Tris buffer at pH 7.4 (Jacks and Kircher, 1967). A spot test was used to determine peroxidase activity using pyrogallol as hydrogen donor (Evans, 1970).
RESULTS & DISCUSSION Organoleptic
The general reaction to the three flaked samples initially hydrated with boiling water was favorable. The flakes were said to possess a flavor of mild toast as well as an intriguing and very pleasant toasted aroma, although one of the three was slightly raw and required about 1-1/2 min further cooking to develop a pleasing flavor.
When the panels were expanded in an attempt to discover flavor patterns, relate them to processing and pick exact points of flavor change, some difficulties were experienced. All panelists arranged the samples in the same order, which corresponded to the actual processing time as shown in Figure 2. They described the flavor development with increasing processing time as: raw, bland, mild toast, heavy toast and a few described one sample (10% moisture, 40 sec) as having some burnt flavor. Aromas were light and full toast. It became obvious, however, through the comments of the judges that the flavor changes were gradual. Although opinions varied on the exact points of flavor change, all judges agreed on the changes taking place. Variations in sample preparations only made matters more complex since addition of heat, salt, etc. modified the flavors being assessed. Thus the points for raw flavor loss shown in Figure 2 actually represent the areas of flavor change from raw to bland. The 20% moisture samples required several seconds more processing time to destroy raw flavor than did the 10% samples. Physical tests
Figure 3 shows the temperature of 10% and 20% moisture wheat batches, sampled at the toaster exit before the cooling water spray. The 30% moisture sample processed 30 sec, left the toaster at 230 F. The color lightness of these unflaked samples after cooling is shown in
Figure 2. It can be seen that toasting time does affect sample color with the 20 and 30% moisture samples remaining lighter than the 10% ones. In these experiments all hot air toasting treatments resulted in a puff index of about 1.5, that is, a 50% increase in the volume of the wheat.
Sieve analysis of the flakes showed a wide variation in the amount of fines produced (percent through 45 mesh) (Table 1). Correlation coefficients were developed for fines against each of the other factors in the table, first using total data, and then initial moisture groups separately. Amount of fines correlated (negatively) with initial and final moisture and flake thickness, but only when total data were used. This indicates that higher initial moisture (higher gelatinazation level) promotes greater flake integrity. Fines production was excessive for all the samples without raw flavor and would have to be reduced by some means if flakes were the desired product form.
Flake thickness (Table 1) was less than 0.025 in. for all the dry toasted series.
The thickest flakes (more than 0.030 in.) resulted from high initial moistures with shorter toasting times and were considered raw to taste by most panelists.
The consistency values (Table 2, Col. I) of the ground product when mixed with cold water fell into four distinct groups corresponding to the initial moistures of the grain at toasting, beginning with the unprocessed sample, which made the thinnest slurry, and ending with the 30% processed sample, which formed a solid gel. Variations within each group were minor when compared to the large differences between groups. One cause of these differences is indicated by the birefringence values for the starch observed in dilute slurries of the samples (Col. II). Loss of birefringence is the first step in the gelatinization sequence. Thus gelatini- zation, which enables starch to absorb water, was more developed in the wet processed groups than in the dry or unprocessed, and the average for each group followed the group pattern of the cold Bostwick. Since wheat grain is about 60%
Table 1—Physical measurements made on the toasted wheat flakes
Initial moisture3
10% 20% 30%Toasting time (sec) 11 15 25 28 29 31 40 12 22 30 35 40 30Final flake moisture3 (%) 5.9 4.4 5.3 5.3 3.1 5.0 2.8 10.4 8.1 3.1 5.4 5.1 9.2Fines (% thru 45 mesh) 18.5 23 23 20 16.5 19 16.5 5 13 13 13 21 3.5Avg flake thickness (in/1000) 24.4 23 22 22 18.5 22.5 22.8 53 40.8 — 26.4 28.9 34.8
M o istu re d e te rm in a t io n s (A A C C , 1 9 6 2 ) w e re m ad e on th e g rain b e fo re to astin g and on th e p ro d u c t im m e d ia te ly a f te r co o lin g and b e fo re sto rage a t 0 ° F . T h e f in a l m o is tu re va lu es r e f le c t ch ang es in m o is tu re d ue to w a te r sp ra y and u n c o n tro lle d co o lin g as w e ll as due to to a stin g .
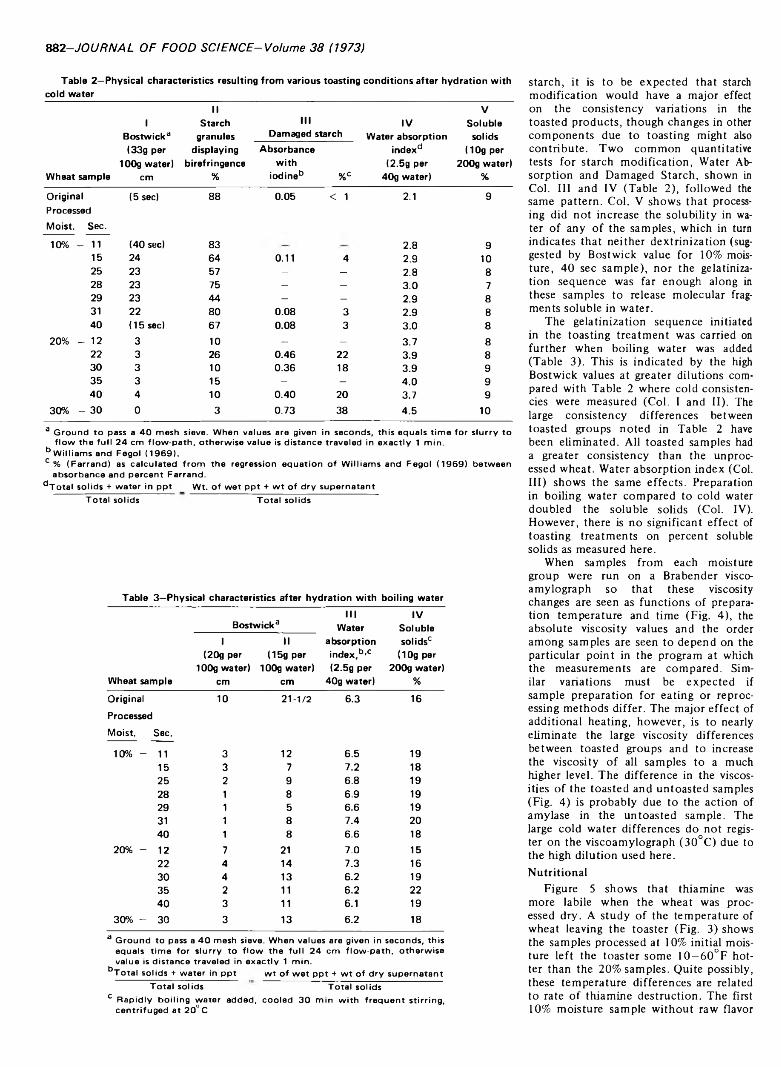
882-J O U R N A L O F FO O D S C IE N C E -V o lu m e 3 8 (1973)
Table 2—Physical characteristics resulting from various toasting conditions after hydration withcold water
Wheat sample
1Bostwick3 (33g per
100g water) cm
IIStarch
granulesdisplaying
birefringence%
IIIDamaged starch
Absorbance with
iodineb % c
IVWater absorption
indexd (2.5g per
40g water)
VSoluble solids
(10g per 200g water)
%
Original (5 sec) 88 0.05 < 1 2.1 9Processed Moist. Sec.
10% - 11 (40 sec) 83 2.8 915 24 64 0.11 4 2.9 1025 23 57 - - 2.8 828 23 75 - - 3.0 729 23 44 - - 2.9 831 22 80 0.08 3 2.9 840 (15 sec) 67 0.08 3 3.0 8
20% - 12 3 10 - — 3.7 822 3 26 0.46 22 3.9 830 3 10 0.36 18 3.9 935 3 15 - - 4.0 940 4 10 0.40 20 3.7 9
30% - 30 0 3 0.73 38 4.5 10
a G ro u n d to pass a 4 0 m esh s ieve . W hen va lu es are g iven in se co n d s , th is e q u a ls t im e fo r s lu r ry to f lo w th e fu l l 2 4 cm f lo w -p a th , o th e rw ise v a lu e is d is ta n c e tra v e led in e x a c t ly 1 m in .
b W illia m s an d Feg o l (1 9 6 9 ) .c % (F a r ra n d ) as c a lc u la te d f ro m th e reg ression e q u a t io n o f W ill ia m s and Feg o l (1 9 6 9 ) b e tw een
a b so rb a n ce and p e rc e n t F a rra n d .d T o ta l so lid s + w a te r in p p t _ W t. o f w e t p p t + w t o f d ry su p e rn a ta n t
T o ta l so lid s T o ta l so lid s
Table 3—Physical characteristics after hydration with boiling water
Wheat sample
Bostwick3 1 II
(20g per (15g per 100g water) 100g water)
cm cm
IIIWater
absorption index,b,c (2.5g per
40g water)
IVSoluble solidsc
( 10g per 200g water)
%
Original 10 21-1/2 6.3 16ProcessedMoist. Sec.
10% - 11 3 12 6.5 1915 3 7 7.2 1825 2 9 6.8 1928 1 8 6.9 1929 1 5 6.6 1931 1 8 7.4 2040 1 8 6.6 18
20% - 12 7 21 7.0 1522 4 14 7.3 1630 4 13 6.2 1935 2 11 6.2 2240 3 11 6.1 19
30% - 30 3 13 6.2 18
a G ro u n d to pass a 4 0 m esh s ie ve . W hen va lu es are g iven in se co n d s , th is e q u a ls t im e fo r s lu r ry to f lo w th e fu l l 2 4 cm f lo w -p a th , o th e rw ise v a lu e is d is ta n c e tra v e led in e x a c t ly 1 m in .
bT o ta l so lid s + w a te r in p p t w t o f w e t p p t + w t o f d ry su p e rn a ta n t T o ta l so lid s T o ta l so lid s
c R a p id ly b o ilin g w a te r ad ded , co o le d 3 0 m in w ith f re q u e n t s t ir r in g , c e n trifu g e d a t 2 0 ° C
starch, it is to be expected that starch modification would have a major effect on the consistency variations in the toasted products, though changes in other components due to toasting might also contribute. Two common quantitative tests for starch modification, Water Absorption and Damaged Starch, shown in Col. Ill and IV (Table 2), followed the same pattern. Col. V shows that processing did not increase the solubility in water of any of the samples, which in turn indicates that neither dextrinization (suggested by Bostwick value for 10% moisture, 40 sec sample), nor the gelatiniza- tion sequence was far enough along in these samples to release molecular fragments soluble in water.
The gelatinization sequence initiated in the toasting treatment was carried on further when boiling water was added (Table 3). This is indicated by the high Bostwick values at greater dilutions compared with Table 2 where cold consistencies were measured (Col. I and II). The large consistency differences between toasted groups noted in Table 2 have been eliminated. All toasted samples had a greater consistency than the unprocessed wheat. Water absorption index (Col. Ill) shows the same effects. Preparation in boiling water compared to cold water doubled the soluble solids (Col. IV). However, there is no significant effect of toasting treatments on percent soluble solids as measured here.
When samples from each moisture group were run on a Brabender visco- amylograph so that these viscosity changes are seen as functions of preparation temperature and time (Fig. 4), the absolute viscosity values and the order among samples are seen to depend on the particular point in the program at which the measurements are compared. Similar variations must be expected if sample preparation for eating or reprocessing methods differ. The major effect of additional heating, however, is to nearly eliminate the large viscosity differences between toasted groups and to increase the viscosity of all samples to a much higher level. The difference in the viscosities of the toasted and untoasted samples (Fig. 4) is probably due to the action of amylase in the untoasted sample. The large cold water differences do not register on the viscoamylograph (30°C) due to the high dilution used here.N utritional
Figure 5 shows that thiamine was more labile when the wheat was processed dry. A study of the temperature of wheat leaving the toaster (Fig. 3) shows the samples processed at 10% initial moisture left the toaster some 10—60°F hotter than the 20% samples. Quite possibly, these temperature differences are related to rate of thiamine destruction. The first 10% moisture sample without raw flavor
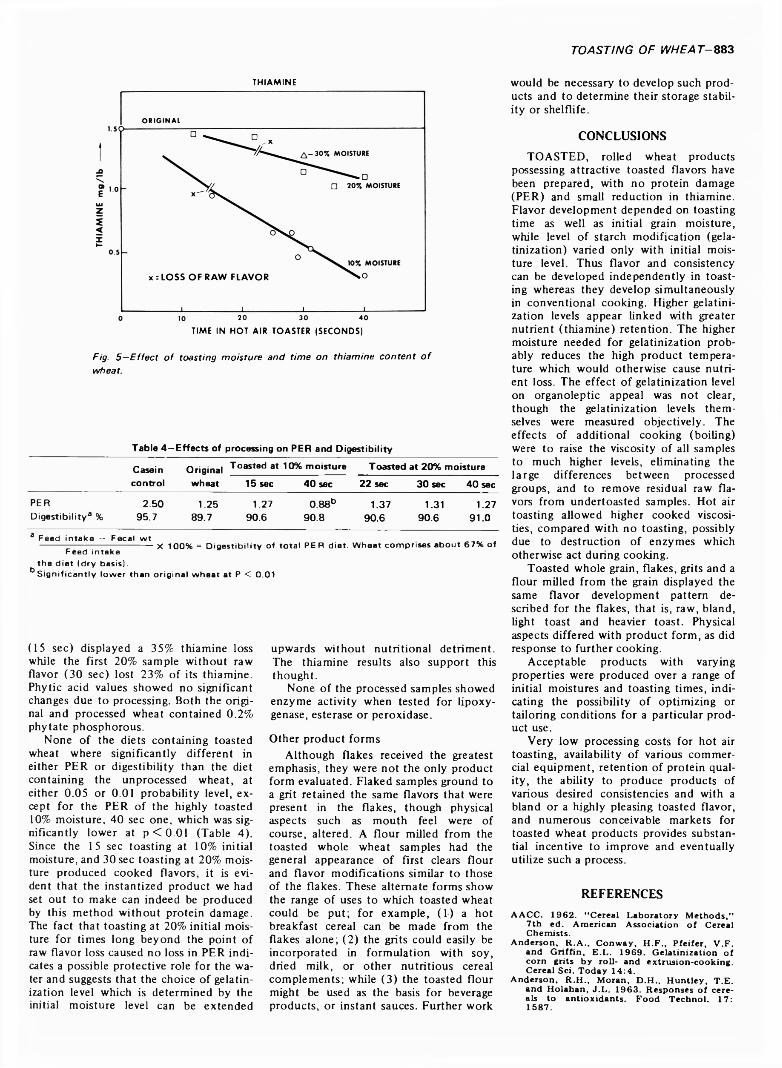
TO A S TIN G O F W H E A T-883THIAMINE
TIME IN HOT AIR TOASTER (SECONDS)
F ig . 5 —E f f e c t o f to a s tin g m o is tu re a n d t im e o n th ia m in e c o n te n t o f
w h e a t.
Table 4—Effects of processing on PER and Digestibility
Casein Original Toasted at 10% moisture Toasted at 20% moisturecontrol wheat 15 sec 40 sec 22 sec 30 sec 40 sec
PERDigestibility3 %
2.5095.7
1.2589.7
1.2790.6
0.88b90.8
1.3790.6
1.3190.6
1.2791.0
Peed in td k o _ F e c e l w t-------- - -------------------------- X 1 0 0 % = D ig e s t ib il it y o f to ta l P E R d ie t . W h eat co m p rise s a b o u t 6 7 % o f
Fee d in ta k eth e d ie t (d ry b a s is ).
b S ig n if ic a n t ly lo w e r th an o r ig in a l w h e a t a t P < 0 .0 1
(15 sec) displayed a 35% thiamine loss while the first 20% sample without raw flavor (30 sec) lost 23% of its thiamine. Phytic acid values showed no significant changes due to processing. Both the original and processed wheat contained 0 .2% phytate phosphorous.
None of the diets containing toasted wheat where significantly different in either PER or digestibility than the diet containing the unprocessed wheat, at either 0.05 or 0 .0 1 probability level, except for the PER of the highly toasted 10% moisture, 40 sec one, which was significantly lower at p < 0 .0 l (Table 4). Since the 15 sec toasting at 10% initial moisture, and 30 sec toasting at 20% moisture produced cooked flavors, it is evident that the instantized product we had set out to make can indeed be produced by this method without protein damage. The fact that toasting at 20% initial moisture for times long beyond the point of raw flavor loss caused no loss in PER indicates a possible protective role for the water and suggests that the choice of gelatin- ization level which is determined by the initial moisture level can be extended
upwards without nutritional detriment. The thiamine results also support this thought.
None of the processed samples showed enzyme activity when tested for lipoxygenase, esterase or peroxidase.
Other product formsAlthough flakes received the greatest
emphasis, they were not the only product form evaluated. Flaked samples ground to a grit retained the same flavors that were present in the flakes, though physical aspects such as mouth feel were of course, altered. A flour milled from the toasted whole wheat samples had the general appearance of first clears flour and flavor modifications similar to those of the flakes. These alternate forms show the range of uses to which toasted wheat could be put; for example, ( l ) a hot breakfast cereal can be made from the flakes alone; ( 2) the grits could easily be incorporated in formulation with soy, dried milk, or other nutritious cereal complements; while (3) the toasted flour might be used as the basis for beverage products, or instant sauces. Further work
would be necessary to develop such products and to determine their storage stability or shelflife.
CONCLUSIONSTOASTED, rolled wheat products
possessing attractive toasted flavors have been prepared, with no protein damage (PER) and small reduction in thiamine. Flavor development depended on toasting time as well as initial grain moisture, while level of starch modification (gela- tinization) varied only with initial moisture level. Thus flavor and consistency can be developed independently in toasting whereas they develop simultaneously in conventional cooking. Higher gelatini- zation levels appear linked with greater nutrient (thiamine) retention. The higher moisture needed for gelatinization probably reduces the high product temperature which would otherwise cause nutrient loss. The effect of gelatinization level on organoleptic appeal was not clear, though the gelatinization levels themselves were measured objectively. The effects of additional cooking (boiling) were to raise the viscosity of all samples to much higher levels, eliminating the large differences between processed groups, and to remove residual raw flavors from undertoasted samples. Hot air toasting allowed higher cooked viscosities, compared with no toasting, possibly due to destruction of enzymes which otherwise act during cooking.
Toasted whole grain, flakes, grits and a flour milled from the grain displayed the same flavor development pattern described for the flakes, that is, raw, bland, light toast and heavier toast. Physical aspects differed with product form, as did response to further cooking.
Acceptable products with varying properties were produced over a range of initial moistures and toasting times, indicating the possibility of optimizing or tailoring conditions for a particular product use.
Very low processing costs for hot air toasting, availability of various commercial equipment, retention of protein quality, the ability to produce products of various desired consistencies and with a bland or a highly pleasing toasted flavor, and numerous conceivable markets for toasted wheat products provides substantial incentive to improve and eventually utilize such a process.
REFERENCESA A C C . 1 9 6 2 . “ Cereal Lab o ra to ry M ethod s,”
7 th ed. A m erican Association o f Cereal Chemists.
A nderson, R .A ., C onw ay , H .F . , P fe ife r, V .F . and G r if f in , E .L . 1 9 6 9 . G e la tin iza tio n o f corn grits by ro ll- and extrusion-cooking. Cereal Sci. To day 1 4 :4 .
A nderson, R .H ., M o ra n , D .H ., H u n tle y , T .E . and H o lahan , J .L . 1 9 6 3 . Responses o f cereals to an tio xidan ts . Fo od Techno l. 17: 1 58 7 .

884-J O U R N A L O F FO O D S C /E N C E -V o /u m e 3 8 (1973)
A O A C . 1 9 6 5 . “ O ffic ia l M ethods o f A nalysis ,” 1 0 th ed. Association o f O ffic ia l A grigu ltura l Chem ists. W ashington, D .C .
B lam berg, D .L . 1 9 7 0 . P ro te in q u a lity o f dry breakfast cereals. N u tr . R ep o rt In t ’l 2 (6 ): 2 9 1 .
B ookw a lte r, G .N ., Peplinski, A .J . and P fe ifer,V .F . 1 9 6 8 . Using a B ostw ick consistom eter to measure consistencies o f processed c o m meals and th e ir C S M blends. Cereal Sci. T o day 13: 4 0 7 .
Evans, J. 1 9 7 0 . Spectra l s im ilarities and k ine tic differences o f tw o to m a to p lan t peroxidase isoenzym es. P lan t Physio l. 4 5 : 66 .
H o ran , F .E . 1 9 7 3 . W heat-soy blends. H igh -qua lity p ro te in products. Cereal Sci. T o d ay 18:11.
Jacks, T .J . and K irch er, H .W . 1 9 6 7 . F lu o ro - m etric assay fo r the h y d ro ly tic a c tiv ity o f lipase using fa tty acyl esters o f 4 -m e th y l- um b e llife ro n e . A n a l. B iochem . 2 1 : 2 7 9 .
K ite , F .E ., Schoch, T .J . and Leach, H .W . 1 9 5 7 . G ranule swelling and paste viscosity o f th ic k bo iling starches. Bakers Digest 3 1 (4 ): 4 2 .
M ustakas, G .C ., A lb re ch t, W .J., B o o k w a lte r,G .N ., M cG hee, J .E ., K w o le k , W .F . and G r if f in , E .L . 1 9 7 0 . Extruder-processing to im prove n u tritio n a l q u a lity , flavor, and keep ing q u a lity o f fu ll- fa t soy flo u r. Food Techno l. 24: 1 2 9 0 .
Osm an, E .M . 1 9 6 7 . S tarch in the food in dustry . In “ S tarch: C hem istry and T e c h n o lo g y ,” ed. W histler, R .L . and PaschaU, E .F ., p. 1 67 . A cadem ic Press, N .Y .
Osner, R .C . and Johnson, R .M . 1 9 6 8 . N u tr it io n a l changes during heat processing. J. Fo od Techno l. 3 : 8 1 .
R o c k w e ll, W .C ., L o w e , E ., W a lker, H .G . and M organ , A . I . Jr. 1 9 6 8 . H o t a ir grain popping. Feed lo t: N ov . 1 9 6 8 .
W alker, H .G . 1 9 7 0 . D ry a ir expansion to im prove grains fo r feed . Feedstuffs 4 2 (1 4 ) : 2 4 .
W alker, H .G ., L a i, B ., R o c k w e ll, W .C . and K o h le r, G .O . 1 9 7 0 P reparation and evaluation o f popped grain fo r feed use. Cereal C hem . 47: 5 1 3 .
W allace, J .M . and W heeler, E .L . 1 9 7 2 . L ip o x y
genase in ac tiv a tio n in w h eat p ro te in concentra te by heat-m o isture treatm ents . Cereal C hem . 4 9 :9 2 .
W heeler, E .L . and F e rre l, R .E . 1 9 7 1 . Phytic acid d e te rm in a tio n in w heat and wheat fractions. Cereal C hem . 4 8: 3 12 .
W illiam s, P .C . and Fego l, K .S .W . 1 96 9 . Colorim e tric d e te rm in a tio n o f damaged starch in f lo u r . Cereal C hem . 4 6 : 56 .
Ms received 2 /2 /7 2 ; revised 4 /1 1 /7 3 ; accepted4 /1 8 /7 3 .
P E R ’s and digestib ilities were run by Dr.A .N . B oo th and Miss D .J . R obbins. Damaged starch, p h ytic acid , and lipoxygenase activity were dete rm in ed by E .L . W heeler. Esterase and peroxidase activies were determ in ed by JoanM. W allace and John J. Evans, respectively. Also, we are g ra te fu l fo r p ro x im a te analyses run by the C hem ical Physics G rou p o f th is Laboratory.
R eference to a com pany or product name does n o t im p ly approval o r recom m endation of the p rod uc t by th e U .S . D ep t, o f A griculture to the exclusion o f others th a t m ay be suitable.

R. J. H E ID E L B A U E R ' a n d P . R . M ID D A U G H
D e p t, o f B a c te r io lo g y , S o u th D a k o ta S ta te U n iv e rs ity , B ro o k in g s , S D 5 7 0 0 6
INHIBITION OF STAPHYLOCOCCAL ENTEROTOXIN PRODUCTION IN CONVENIENCE FOODS
INTRODUCTIONTECHNICAL INFORMATION is needed by the food industry to establish food processing, packaging and storage conditions which will prevent the production of staphylococcal enterotoxin in foods. Previous research on staphylococcal food poisoning has been primarily concerned with the presence and growth of S taphylococcus aureus in foods. Markus and Silverman (1968, 1969) found that enterotoxin can be produced by nongrowing and nonreplicating cells. Therefore, research on cell growth or members of staphylocci alone is of little value in determining the presence of enterotoxin. In our laboratory we investigated the effect of combinations of environmental conditions on enterotoxin production in food slurries. The fluorescent antibody technique (FAT) of Stark and Middaugh(1970) was developed to detect enterotoxin producing S. aureus cells. A previous investigation in our laboratory demonstrated that individual environmental conditions were more inhibitory to enterotoxin production than to cell growth in a defined growth medium (Stark,1970). Atmospheres of C 02 and N2 have unusual effects on cell fluorescence and enterotoxin production in culture medium (Stark and Middaugh,1970). Thatcher et al. (1962) investigated the effect of gases on enterotoxin production in vacuum-packed bacon. Enterotoxin was found to be produced under 5% C 02, in 0 2 and in N2.
The present paper presents data showing the effects of combinations of environmental conditions on staphyloccocal enterotoxin B production in food slurries. The foods were used as slurries to optimize opportunities for bacterial growth. The environmental conditions tested in cheese, ham and shrimp slurries were temperature of incubation, initial pH, NaCl concentration and an atmosphere of C 02, N2, or air.
EXPERIMENTALMaterials
Staphylococcus aureus strain 243 was used
1 Present address: G reen G ian t C o ., H o llo w a y House D iv ., L a fa y e tte , IN 4 7 9 0 5
throughout this study. Strain 243, the prototype strain for enterotoxin B, was obtained through the courtesy of M.S. Bergdoll (Food Research Institute, Madison, Wise.). Highly purified enterotoxin B was supplied through the courtesy of E.J. Shantz (U.S. Army Laboratories, Fort Detrick, Md.).
Rabbit antiserum for enterotoxin B was prepared by injecting enterotoxin with incomplete Freund adjuvant. The freshly prepared antiserum was used for gel-diffusion tubes. Antiserum prepared and conjugated with fluorescein isothiocyanate by Stark (1970) was used for the FAT.
MethodsDetection of enterotoxin by gel-diffusion.
The Oakley-Fulthrope double gel-diffusion method was used to verify enterotoxin detection by the FAT. The tubes were prepared according to Hall et al. (1963) as modified by Stark and Middaugh (1970) using Noble agar (Difco) and sodium barbitol (0.8g) in 100 ml of water (pH 7.4 buffer). Cells were centrifuged from the aqueous food slurries, and portions (0.2 ml) of the supernatant fluid were added to tubes and incubated at 30°C for 48 hr.
Staining of fixed smears. Smears were prepared and stained by the method of Stark and Middaugh (1970). Cells were observed after staining and the degree of cell fluorescence was determined with a graded density filter system, on a +1 to +4 scale (Heidelbauer and Middaugh,1972). The fluorescence values presented in tables of results are averages of six replications.
All preparations were observed by using an American Optical Microscope and Fluorlume illuminator with an Osram HBO 200 W maximal-pressure mercury-vapor arc with a UGI (Corning No. 5840) as the exciter filter, and a Schott GG-99 as the barrier filter.
Production of enterotoxin under combinations of environmental conditions. Homogenized cheddar cheese (10% w/v) was used to insure growth and enterotoxin production. Additional foods included homogenized ham (10% w/v) and homogenized frozen shrimp (10% w/v). Fisher Brain Heart Infusion broth (BHI) (Fisher Scientific Co., Fairlawn, N.J.) was used throughout as a control medium for enterotoxin production and for inoculum preparation. The food slurries and BHI were sterilized at 121°C for 15 min before use.
The inherent NaCl concentrations in the food slurries were determined by modification of the Mohr titration method (Snell and Biffen, 1944).
Erlenmeyer shake flasks (250 ml) containing 70 ml of food slurries or BHI broth were used in all experiments except those involving special atmosphere control, in which case similar flasks with a side arm cleaning port fitted with a serum vial-syringe plug and a silicone rubber
stopper were used. The syringe plug allowed the evacuation of the flask and the addition of measured amounts of the gases and sampling. All culture flasks were inoculated with 10‘ organisms of an 18-hr BHI broth culture. The test cultures were shaken throughout incubation in all cases. Throughout the investigation samples were taken at 16, 24 and 40 hr of incubation and checked for cell fluorescence and enterotoxin production. Growth in all food slurries was determined with staphylococcus 110 medium (Difco) using the Standard Plate Count Method.
The investigation was planned as a multiple- stage factoral design which in one experiment would yield the optimum and minimum conditions affecting enterotoxin production by particular combinations of variable conditions. A 3 X 3 X 3 design was chosen which allowed the testing of pairs of variables and three levels of each variable. The resultant nine sets of variables were duplicated and the experiments were repeated three times. Three levels of each variable were used to represent the expected optimum, maximum and minimum levels affecting toxin production by that variable. Three sets of variables determined to be optimum were carried over to the next stage to be combined with three levels of another variable.
First, combinations of three temperatures of incubation, and three pH’s were tested. Secondly, three optima from this temperature-pH test were evaluated with three NaCl concentrations. Then three optima from step two were combined with three levels of adjusted C 02 and air atmosphere (Stark and Middaugh, 1970). In test four, the same three optima from step two were combined with three adjusted N2 and air atmospheres. Finally, representative combinations of conditions were tested with both ham and shrimp slurries.
In each case the NaCl was added to the medium prior to sterilization. The pH was adjusted aseptically after sterilization. The atmospheres of C 02 and N2 were also aseptically adjusted after sterilization (Stark and Middaugh, 1970).
In the experiments with controlled atmospheres, samples were aseptically withdrawn with sterile syringes via the side-arm stopper.
RESULTSEffect of temperature of incubation vs. initial pH on cell fluorescence and enterotoxin production
Incubation temperatures of 30°C, 37°C and 44°C were tested with pH’s of 5, 7 and 9. At a temperature of 44°C enterotoxin production was limited. The temperature of 37°C was the optimum. An apparent buffering action in the
Volum e 3 8 (1 9 7 3 1 -J O U R N A L O F FO O D S C IE N C E -8 8 5
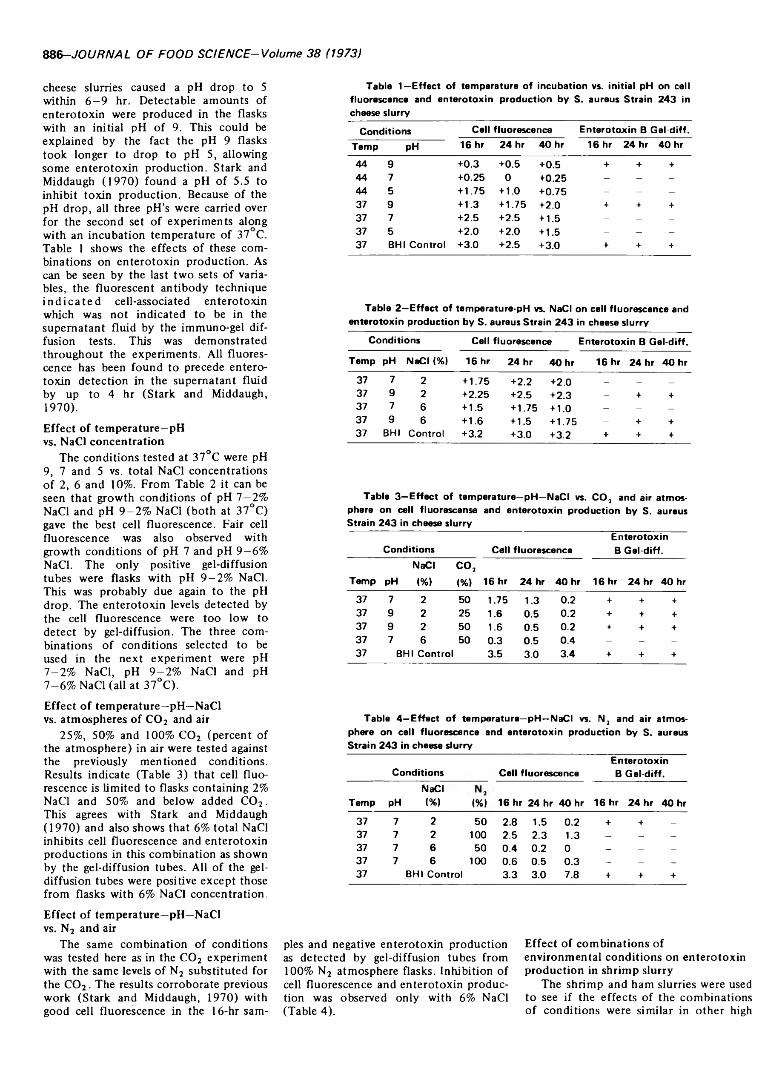
8 8 6 -J O U R N A L O F FO O D S C IE N C E -V o lu m e 3 8 (1973)
cheese slurries caused a pH drop to 5 within 6—9 hr. Detectable amounts of enterotoxin were produced in the flasks with an initial pH of 9. This could be explained by the fact the pH 9 flasks took longer to drop to pH 5, allowing some enterotoxin production. Stark and Middaugh (1970) found a pH of 5.5 to inhibit toxin production. Because of the pH drop, all three pH’s were carried over for the second set of experiments along with an incubation temperature of 37 C. Table 1 shows the effects of these combinations on enterotoxin production. As can be seen by the last two sets of variables, the fluorescent antibody technique in d icated cell-associated enterotoxin which was not indicated to be in the supernatant fluid by the immuno-gel diffusion tests. This was demonstrated throughout the experiments. All fluorescence has been found to precede enterotoxin detection in the supernatant fluid by up to 4 hr (Stark and Middaugh,1970).Effect of temperature—pH vs. N ad concentration
The conditions tested at 37°C were pH 9, 7 and 5 vs. total N ad concentrations of 2, 6 and 10%. From Table 2 it can be seen that growth conditions of pH 7—2% N ad and pH 9-2% N ad (both at 37°C) gave the best cell fluorescence. Fair cell fluorescence was also observed with growth conditions of pH 7 and pH 9—6% N ad. The only positive gel-diffusion tubes were flasks with pH 9—2% Nad. This was probably due again to the pH drop. The enterotoxin levels detected by the cell fluorescence were too low to detect by gel-diffusion. The three combinations of conditions selected to be used in the next experiment were pH7-2% N ad, pH 9-2% N ad and pH7-6% N ad (all at 37°C).Effect of temperature—pH—N ad vs. atmospheres of C 02 and air
25%, 50% and 100% C 02 (percent of the atmosphere) in air were tested against the previously mentioned conditions. Results indicate (Table 3) that cell fluorescence is limited to flasks containing 2% N ad and 50% and below added C 02 . This agrees with Stark and Middaugh(1970) and also shows that 6% total N ad inhibits cell fluorescence and enterotoxin productions in this combination as shown by the gel-diffusion tubes. All of the gel- diffusion tubes were positive except those from flasks with 6% N ad concentration.
Table 1—Effect of temperature of incubation vs. initial pH on cell fluorescence and enterotoxin production by S. aureus Strain 243 in cheese slurry
Conditions Cell fluorescence Enterotoxin B Gel-diff.Temp pH 16 hr 24 hr 40 hr 16 hr 24 hr 40 hr
44 9 +0.3 +0.5 +0.5 + + +44 7 +0.25 0 +0.25 - - -
44 5 + 1.75 +1.0 +0.75 - - -
37 9 +1.3 +1.75 +2.0 + + +37 7 +2.5 +2.5 + 1.5 - - -
37 5 +2.0 +2.0 + 1.5 - - -
37 BHI Control +3.0 +2.5 +3.0 + + +
Table 2—Effect of temperature-pH vs. NaCI on cell fluorescence and enterotoxin production by S. aureus Strain 243 in cheese slurry
Conditions Cell fluorescence Enterotoxin B Gel-diff.
Temp pH NaCI <%) 16 hr 24 hr 40 hr 16 hr 24 hr 40 hr37 7 2 + 1.75 +2.2 +2.0 - _ _
37 9 2 +2.25 +2.5 +2.3 - + +37 7 6 + 1.5 + 1.75 +1.0 - - -
37 9 6 + 1.6 +1.5 + 1.75 - + +37 BHI Control +3.2 +3.0 +3.2 + + +
Table 3—Effect of temperature—pH—NaCI vs. C O , and air atmosphere on cell fluorescense and enterotoxin production by S. aureusStrain 243 in cheese slurry
Conditions Cell fluorescenceEnterotoxin B Gel-diff.
Temp pHNaCI(%)
c o 2(%) 16 hr 24 hr 40 hr 16 hr 24 hr 40 hr
37 7 2 50 1.75 1.3 0.2 + + +37 9 2 25 1.6 0.5 0.2 + + +37 9 2 50 1.6 0.5 0.2 + + +37 7 6 50 0.3 0.5 0.4 - - —
37 BHI Control 3.5 3.0 3.4 + + +
Table 4—Effect of temperature—pH—NaCI vs. N , and air atmosphere on cell fluorescence and enterotoxin production by S. aureus Strain 243 in cheese slurry
Conditions Cell fluorescenceEnterotoxin B Gel-diff.
NaCITemp pH (%) (%) 16 hr 24 hr 40 hr 16 hr 24 hr 40 hr
37 7 2 50 2.8 1.5 0.2 + + -
37 7 2 100 2.5 2.3 1.3 - - -
37 7 6 50 0.4 0.2 0 - — —
37 7 6 100 0.6 0.5 0.3 - — —
37 BHI Control 3.3 3.0 7.8 + + +
Effect of temperature—pH—NaCI vs. N2 and air
The same combination of conditions was tested here as in the C 02 experiment with the same levels of N2 substituted for the C 02. The results corroborate previous work (Stark and Middaugh, 1970) with good cell fluorescence in the 16-hr sam
ples and negative enterotoxin production as detected by gel-diffusion tubes from 100% N2 atmosphere flasks. Inhibition of cell fluorescence and enterotoxin production was observed only with 6% NaCI (Table 4).
Effect of combinations of environmental conditions on enterotoxin production in shrimp slurry
The shrimp and ham slurries were used to see if the effects of the combinations of conditions were similar in other high
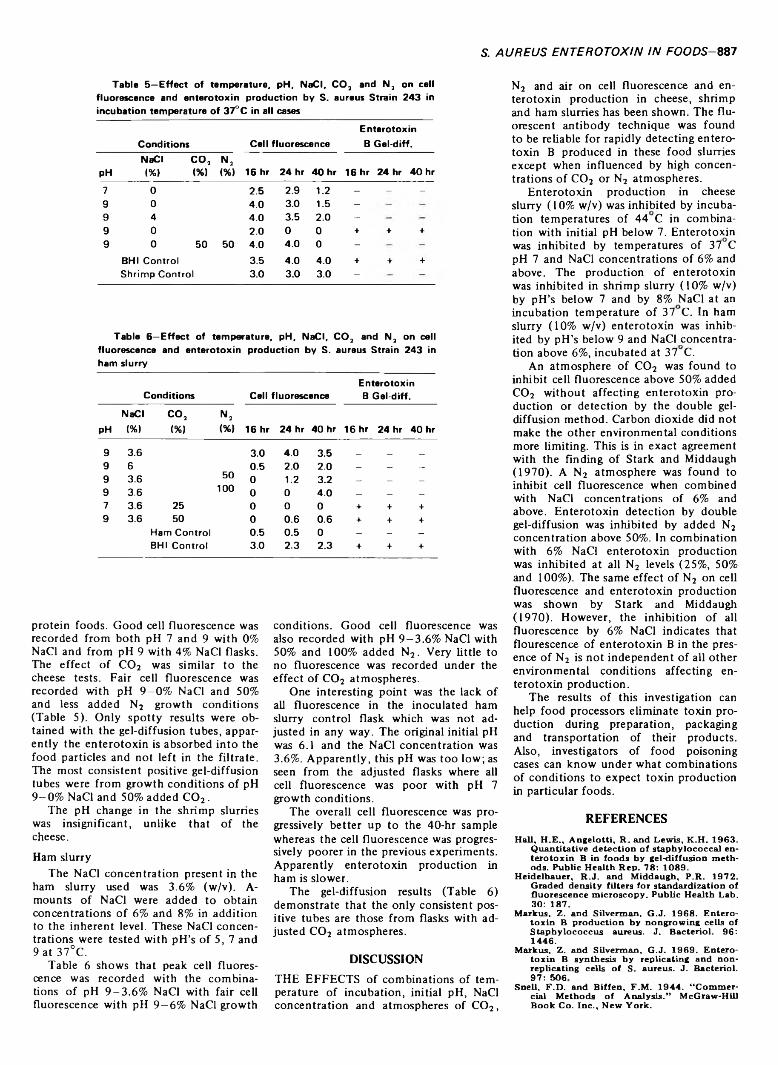
S. A U R E U S E N T E R O T O X IN IN FO O D S - 887
Table 5—Effect of temperature, pH, NaCI, C O , and N, on cell fluorescence and enterotoxin production by S. aureus Strain 243 in incubation temperature of 37°C in all cases
Conditions Cell fluorescenceEnterotoxin B Gel-diff.
NaCI C O , N ,pH (%) <%) <%) 16 hr 24 hr 40 hr 16 hr 24 hr 40 hr7 0 2.5 2.9 1.2 - - -9 0 4.0 3.0 1.5 -9 4 4.0 3.5 2.0 -9 0 2.0 0 0 + + +9 0 50 50 4.0 4.0 0 -
BHI Control 3.5 4.0 4.0 + + +Shrimp Control 3.0 3.0 3.0 -
Table 6—Effect of temperature, pH, NaCI, C O , and N, on cell fluorescence and enterotoxin production by S. aureus Strain 243 in ham slurry
EnterotoxinConditions Cell fluorescence B Gel-diff.
NaCI C O , n 2pH (%) (%) (%) 16 hr 24 hr 40 hr 16 hr 24 hr 40 hr
9 3.6 3.0 4.0 3.5 _ _ _9 6 0.5 2.0 2.0 - — —9 3.6 50 0 1.2 3.2 _ _ _9 3.6 100 0 0 4.0 — _ _7 3.6 25 0 0 0 + + +9 3.6 50 0 0.6 0.6 + + +
Ham Control 0.5 0.5 0 - - -BHI Control 3.0 2.3 2.3 + + +
protein foods. Good cell fluorescence was recorded from both pH 7 and 9 with 0% NaCI and from pH 9 with 4% NaCI flasks. The effect of C 02 was similar to the cheese tests. Fair cell fluorescence was recorded with pH 9-0% NaCI and 50% and less added N2 growth conditions (Table 5). Only spotty results were obtained with the gel-diffusion tubes, apparently the enterotoxin is absorbed into the food particles and not left in the filtrate. The most consistent positive gel-diffusion tubes were from growth conditions of pH9-0% NaCI and 50% added C 02 .
The pH change in the shrimp slurries was insignificant, unlike that of the cheese.Ham slurry
The NaCI concentration present in the ham slurry used was 3.6% (w/v). A- mounts of NaCI were added to obtain concentrations of 6% and 8% in addition to the inherent level. These NaCI concentrations were tested with pH’s of 5, 7 and 9 at 37°C.
Table 6 shows that peak cell fluorescence was recorded with the combinations of pH 9—3.6% NaCI with fair cell fluorescence with pH 9—6% NaCI growth
conditions. Good cell fluorescence was also recorded with pH 9—3.6% NaCI with 50% and 100% added N2. Very little to no fluorescence was recorded under the effect of C 02 atmospheres.
One interesting point was the lack of all fluorescence in the inoculated ham slurry control flask which was not adjusted in any way. The original initial pH was 6.1 and the NaCI concentration was 3.6%. Apparently, this pH was too low; as seen from the adjusted flasks where all cell fluorescence was poor with pH 7 growth conditions.
The overall cell fluorescence was progressively better up to the 40-hr sample whereas the cell fluorescence was progressively poorer in the previous experiments. Apparently enterotoxin production in ham is slower.
The gel-diffusion results (Table 6) demonstrate that the only consistent positive tubes are those from flasks with adjusted C 02 atmospheres.
DISCUSSIONTHE EFFECTS of combinations of temperature of incubation, initial pH, NaCI concentration and atmospheres of C 02,
N2 and air on cell fluorescence and enterotoxin production in cheese, shrimp and ham slurries has been shown. The fluorescent antibody technique was found to be reliable for rapidly detecting enterotoxin B produced in these food slurries except when influenced by high concentrations of C 02 or N2 atmospheres.
Enterotoxin production in cheese slurry ( 10% w/v) was inhibited by incubation temperatures of 44 C in combination with initial pH below 7. Enterotoxin was inhibited by temperatures of 37 C pH 7 and NaCI concentrations of 6% and above. The production of enterotoxin was inhibited in shrimp slurry ( 10% w/v) by pH’s below 7 and by 8% NaCI at an incubation temperature of 37 C. In ham slurry ( 10% w/v) enterotoxin was inhibited by pH’s below 9 and NaCI concentration above 6%, incubated at 37 C.
An atmosphere of C 02 was found to inhibit cell fluorescence above 50% added C02 without affecting enterotoxin production or detection by the double gel- diffusion method. Carbon dioxide did not make the other environmental conditions more limiting. This is in exact agreement with the finding of Stark and Middaugh(1970). A N2 atmosphere was found to inhibit cell fluorescence when combined with NaCI concentrations of 6% and above. Enterotoxin detection by double gel-diffusion was inhibited by added N2 concentration above 50%. In combination with 6% NaCI enterotoxin production was inhibited at all N2 levels (25%, 50% and 100%). The same effect of N2 on cell fluorescence and enterotoxin production was shown by Stark and Middaugh(1970). However, the inhibition of all fluorescence by 6% NaCI indicates that flourescence of enterotoxin B in the presence of N2 is not independent of all other environmental conditions affecting enterotoxin production.
The results of this investigation can help food processors eliminate toxin production during preparation, packaging and transportation of their products. Also, investigators of food poisoning cases can know under what combinations of conditions to expect toxin production in particular foods.
REFERENCESHaU, H .E ., A n g e lo tti, R . and Lew is . K .H . 1 9 6 3 .
Q u an tita tive de tection o f staphylococcal ente ro to x in B in foods by gel-d iffusion m eth ods. Public H ea lth R ep . 7 8 : 1 0 8 9 .
H eidelbauer, R .J . and M iddaugh, P .R . 1 9 7 2 . Graded density filters fo r s tan dard iza tion o f fluorescence m icroscopy. P ub lic H ea lth Lab. 30: 1 87 .
M arkus, Z . and S ilverm an, G .J. 1 9 6 8 . E n te ro to x in B p ro d u c tio n by nongrow ing cells o f Staphylococcus aureus. J. B acterio l. 9 6 : 1 4 4 6 .
M arkus, Z . and S ilverm an , G .J. 1 9 6 9 . E n te ro to x in B synthesis by rep lica ting and no n rep lica ting cells o f S. aureus. J. B acterio l. 9 7 : 506
Snell, F .D . and B iffe n , F .M . 1 9 4 4 . “ C om m ercial M ethods o f A nalysis .” M c G ra w -H ill B ook C o. In c ., N e w Y o rk .

888—JOURNAL OF FOOD SC/ENCE-Vo/ume 38 (1973)
Stark , R .L . 1 9 7 0 . Im m u n o flu o rescen t d e te c tio n o f s ta p h y lo co c c a l en te r o to x in B in fo o d and cu ltu re m edia . M .S. th esis . S o u th D ak ota S ta te U n iversity , B rook ings, S .D .
S tark , R .L . and M iddaugh, P .R . 1 9 7 0 . Im m u n o flu o rescen t d e te c tio n o f en te r o to x in B in
fo o d and a cu ltu re m ed iu m . A pp l. M icrob io l. 18: 6 3 1 .
T h atch er, F .S . R o b in so n , J. and E rdm an, I.1 9 6 2 . T he vacu u m p a ck m eth o d o f packaging fo o d s in rela tion to th e fo rm a tio n o f th e b o tu lin u m and s ta p h y lo co c c a l to x in s . J.
A pp l. B acter io l. 25 : 1 2 0 .Ms rece ived 6 /1 1 /7 2 ; revised 4 /1 5 /7 3 ; accepted 4 /1 8 /7 3 .
Paper N o . 1 1 9 8 o f th e Jou rn a l series. South D akota A gricu ltural E xp erim en t S ta tio n .
F. E. ESCHER,' P. E. KOEHLER and J.C. AYRESDept, of Food Science, University of Georgia, Athens, GA 30602
EFFECT OF ROASTING ON AFLATOXIN CONTENT OF ARTIFICIALLY CONTAMINATED PECANS
INTRODUCTIONIN THE PAST 3 years, aflatoxin-producing strains of A sperg illus flavus Link ex Fries and Asperg illus parasiticus Speare were isolated from moldy pecans. ( Carya il- linoensis Koch) (Lillard et al., 1970; Doupnik and Bell, 1971). When incubated under improper conditions, both in-shell and shelled pecans supported extensive mold growth and toxin production (Lillard et al., 1970). This observation has prompted concern regarding potential toxin contamination in processed pecans and therefore studies were initiated to control mold growth on pecans more effectively during production (Taylor and Worley, 1972) and storage (Heaton, 1972). In addition, measures that could eliminate moldy or toxin contaminated nuts during shelling and sorting operations were investigated (Tyson,1972).
Shelled pecans represent up to 85% of the pecan crop. Such nutmeats are traded in the form of halves, pieces, granules and meal and, in turn, are introduced into a wide variety of different products either commercially or in the home. It has been estimated that about 60% of all pecan meats serve as ingredients in bakery goods, confections and, to a small extent, as raw material for pecan oil recovery (Woodroof and Heaton, 1961). The remaining 40% are roasted or toasted and utilized for ice cream formulations, for salted nuts or for the preparation of pecan butter. Woodroof (1967) lists three major procedures for roasting pecan meats: dry roasting at 191°C for 12 to 15 min, roasting in vegetable oil at 191°C for 6 min and roasting in margarine at 107°C for 60 min.
Several attempts have been made to apply dry or moist heat as a means of detoxifying aflatoxin contaminated peanuts and cottonseeds (Dollear, 1969). Toxin degradation can be achieved to a certain extent although these compounds are rather heat stable (Dollear, 1969). Lee et al. (1968) showed that dry roasting of naturally contaminated single peanut
1 Present address: D ep t, o f A griculturalC hem istry, Sw iss F ederal In stitu te o f T ech n o l- ogy, Z urich , Sw itzerland
halves at 150°C for 30 min lowered the content of aflatoxin B! and B2 by 80% and 60%, respectively. Later Lee et al.(1969) reported that 65% of B! and G( in laboratory inoculated batches of peanuts was reduced during oil roasting at 163°C for 7 min or at 174°C for 3 min. Waltking (1971) roasted batches of naturally contaminated peanuts containing 200—400 ppb aflatoxin Bi and G! and20—40 ppb B2 and G2 at 204°C (no time mentioned) and found an average loss of 40-50% of Bj and Gi and of 20-40% of B2 and G2.
Pecans differ from peanuts in size, shape and chemical composition and are roasted commercially under different conditions than peanuts. For this reason, the laboratory scale study in this report was initiated to determine the effect of dry roasting and roasting in vegetable oil and margarine on the aflatoxin content of artificially contaminated pecan halves and meal. At the same time, the sterilizing effect of roasting on the mold used for inoculation was evaluated.
The observation of Cucullu et al. (1966) and Whitaker et al. (1970) with peanuts and that of Whitten and Smith(1972) with cottonseeds that natural contaminations occur in a very small proportion of those seeds with high toxin concentrations, led the present investigators to conjecture that a similar situation might prevail with pecan meats. Thus pecan halves with comparatively high initial toxin content were prepared. In pecan meal, natural contamination will probably be more uniform but at a lower level. Therefore only small toxin quantities were introduced to fresh pecan meal.
EXPERIMENTALPreparation o f samples
Halves o f an improved pecan variety (Fancy Mammoth Stuart, 240 halves per lb) and of seedling pecans (Fancy Medium Eastern Seedling, 500 halves per lb) o f the 1971 pecan crop were used. For each roasting experiment 500g o f halves were dipped into a 1 % solution of sodium hypochlorite for 45 sec, washed in sterile water, blotted dry with sterile cheese cloths and transferred into a 2800 ml Fernbach flask. The halves were inoculated by adding 50 ml of an aqueous spore suspension containing a total o f 5 million spores o f Aspergillus parasiticus
NRRL 2999 and repeatedly tumbled in the flask for an even dispersion o f the spores. The halves were incubated at 25° C for 2, 3 or 4 days to obtain meats with different toxin concentrations. The halves were then dried at 50°C to 3-4% moisture content, a level recommended by Heaton and Woodroof (1970), and stored at 4°C until used.
Pecan meal (Fancy Grade) was artificially contaminated with a crude aflatoxin extract prepared as follows: yeast extract-sucrose broth (2g and 20g per liter) was inoculated with A. parasiticus NRRL 2999 and incubated for 7 days at 27° C. The aflatoxins were extracted with chloroform, and 45 ml of the concentrated extract were sprayed on 500g o f meal. The meal was stirred for 30 min and dried for 2 hr at 50°C. Lower toxin concentrations were obtained by subsequent blending with non- contaminated meal.
Roasting proceduresA small baking and broiling oven with a 16
x 11 x 6-in. chamber (Model 303.69190, Sears, Roebuck & Co.) was preheated to 199°C. 1 7 0-200g of seedling halves (1 9 0 -2 0 0 halves) or 2 0 0 - 300g of Stuart halves (1 1 0 -1 6 0 halves) from one 500g inoculation batch were spread in the oven in a single layer on a screen. 150g of meat was spread on aluminum foil in 0.5-in. layer. A stainless steel plate between the heating elements and the screen or foil prevented direct radiation and insured more even temperature distribution. Halves and meal were roasted for 15 min at 191±10°C air temperature. Since the air temperature dropped below 191°C during the loading o f the oven, the 2 - 4 min necessary for the oven to return to this temperature was not included as roasting time.
800—900g margarine (J.M. Filbert, Inc., Baltimore, Md.) were preheated in a pan to 117°C, the same amount o f coconut fat (Dur- kee Konut, SMC Corp., Cleveland, Ohio) to 199°C. 15 0 -3 5 0 g Stuart or seedling halves from one 500-g inoculation batch were weighed into a “French fry” basket and roasted for 60 min at 107±10°C in margarine and for 6 min at 191±5°C in oil. Again, the 1 -2 min required for the oil or margarine to return to the desired temperature after immersing the halves was not counted as roasting time.
Actual temperatures o f halves and of the meal layer during roasting were measured with an iron-constantan thermocouple (0.027 OD, insulation included) which was placed into the center of a half or the meal layer.
Sampling and analytical procedures
After each roasting experiment, four 40-g samples o f roasted halves (i.e., about 40 seedling or 20 Stuart halves) and four 40-g samples
Volume 38 (19731-JOURNAL OF FOOD SCIENCE-889
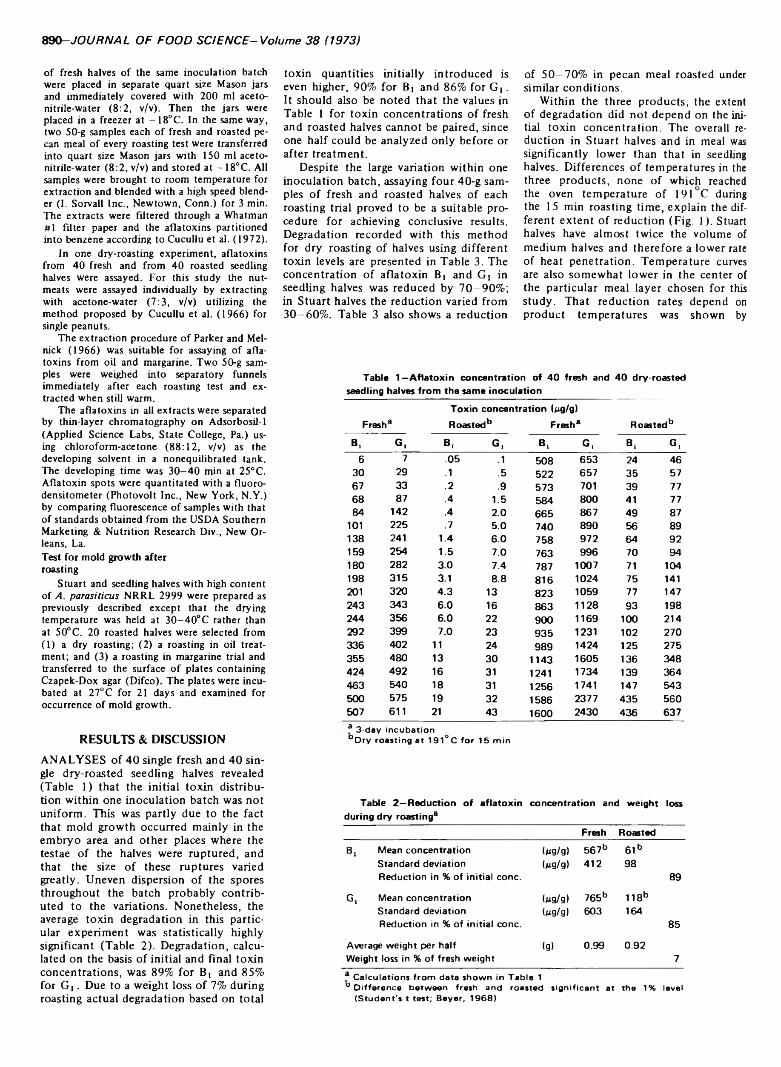
890 - JOURNAL OF FOOD SCIENCE-Volume 38 (1973)
o f fresh halves o f the same inoculation batch were placed in separate quart size Mason jars and immediately covered with 200 ml acetonitrile-water (8:2, v/v). Then the jars were placed in a freezer at -1 8 °C . In the same way, two 50-g samples each o f fresh and roasted pecan meal o f every roasting test were transferred into quart size Mason jars with 150 ml acetonitrile-water (8:2, v/v) and stored at - 18°C. All samples were brought to room temperature for extraction and blended with a high speed blender (1. Sorvall Inc., Newtown, Conn.) for 3 min. The extracts were filtered through a Whatman #1 fdter paper and the aflatoxins partitioned into benzene according to Cucullu et al. (1972).
In one dry-roasting experiment, aflatoxins from 40 fresh and from 40 roasted seedling halves were assayed. For this study the nut- meats were assayed individually by extracting with acetone-water (7:3, v/v) utilizing the method proposed by Cucullu et al. (1966) for single peanuts.
The extraction procedure o f Parker and Mel- nick (1966) was suitable for assaying o f aflatoxins from oil and margarine. Two 50-g samples were weighed into separatory funnels immediately after each roasting test and extracted when still warm.
The aflatoxins in all extracts were separated by thin-layer chromatography on Adsorbosil-1 (Applied Science Labs, State College, Pa.) using chloroform-acetone (88:1 2 , v/v) as the developing solvent in a nonequilibrated tank. The developing time was 3 0 -4 0 min at 25°C. Aflatoxin spots were quantitated with a fluoro- densitometer (Photovolt Inc., New York, N.Y.) by comparing fluorescence o f samples with that of standards obtained from the USDA Southern Marketing & Nutrition Research Div., New Orleans, La.Test for mold growth after roasting
Stuart and seedling halves with high content of A. parasiticus NRRL 2999 were prepared as previously described except that the drying temperature was held at 30 -4 0 °C rather than at 50°C. 20 roasted halves were selected from( 1 ) a dry roasting; ( 2) a roasting in oil treatment; and (3) a roasting in margarine trial and transferred to the surface o f plates containing Czapek-Dox agar (Difco). The plates were incubated at 27°C for 21 days and examined for occurrence of mold growth.
RESULTS & DISCUSSIONANALYSES of 40 single fresh and 40 single dry-roasted seedling halves revealed (Table 1) that the initial toxin distribution within one inoculation batch was not uniform. This was partly due to the fact that mold growth occurred mainly in the embryo area and other places where the testae of the halves were ruptured, and that the size of these ruptures varied greatly. Uneven dispersion of the spores throughout the batch probably contributed to the variations. Nonetheless, the average toxin degradation in this particular experiment was statistically highly significant (Table 2). Degradation, calculated on the basis of initial and final toxin concentrations, was 89% for B! and 85% for G i. Due to a weight loss of 7% during roasting actual degradation based on total
toxin quantities initially introduced is even higher, 90% for Br and 86% for G !. It should also be noted that the values in Table 1 for toxin concentrations of fresh and roasted halves cannot be paired, since one half could be analyzed only before or after treatment.
Despite the large variation within one inoculation batch, assaying four 40-g samples of fresh and roasted halves of each roasting trial proved to be a suitable procedure for achieving conclusive results. Degradation recorded with this method for dry roasting of halves using different toxin levels are presented in Table 3. The concentration of aflatoxin B] and G( in seedling halves was reduced by 70-90%; in Stuart halves the reduction varied from 30—60%. Table 3 also shows a reduction
of 50-70% in pecan meal roasted under similar conditions.
Within the three products, the extent of degradation did not depend on the initial toxin concentration. The overall reduction in Stuart halves and in meal was significantly lower than that in seedling halves. Differences of temperatures in the three products, none of which reached the oven temperature of 191 C during the 15 min roasting time, explain the different extent of reduction (Fig. 1). Stuart halves have almost twice the volume of medium halves and therefore a lower rate of heat penetration. Temperature curves are also somewhat lower in the center of the particular meal layer chosen for this study. That reduction rates depend on product temperatures was shown by
T a b le 1 —A f l a t o x i n c o n c e n t r a t i o n o f 4 0 f r e s h a n d 4 0 d r y - r o a s t e d s e e d l in g h a lv e s f r o m t h e s a m e in o c u l a t i o n
T o x i n c o n c e n t r a t i o n (p g /g )
F resh® R o a s t e d 15 F resh ® R o a s t e d 15
B , G . B , G , B , G , B , G ,6 7 .0 5 .1 5 0 8 6 5 3 24 4 6
3 0 29 .1 .5 5 2 2 6 5 7 3 5 5767 33 .2 .9 5 7 3 701 39 776 8 87 .4 1 .5 5 8 4 8 0 0 41 7784 142 .4 2 .0 6 6 5 8 6 7 4 9 87
101 2 2 5 .7 5 .0 7 4 0 8 9 0 56 89138 241 1.4 6 .0 7 5 8 9 7 2 6 4 9 2159 2 5 4 1 .5 7 .0 7 6 3 9 9 6 7 0 94180 2 8 2 3 .0 7 .4 787 1007 71 104198 3 1 5 3.1 8 .8 8 1 6 1024 75 141201 3 2 0 4 .3 13 8 2 3 1059 77 1472 4 3 3 4 3 6 .0 16 8 6 3 1 1 2 8 9 3 1982 4 4 3 5 6 6 .0 22 9 0 0 1169 100 214292 399 7 .0 2 3 9 3 5 1231 102 2 7 0336 4 0 2 11 24 9 8 9 1 424 125 2 7 53 5 5 4 8 0 13 3 0 1 143 1 6 0 5 136 3 4 84 2 4 4 9 2 16 31 1241 1734 139 3 6 44 6 3 5 4 0 18 31 1 256 1741 147 5 4 3500 5 7 5 19 32 1586 2 377 4 3 5 5 6 0507 611 21 4 3 1 600 2 4 3 0 4 3 6 6 3 7
® 3-day incubation“ D ry roasting at 1 9 1 °C fo r 15 m in
T a b le 2 —R e d u c t i o n o f a f l a t o x i n c o n c e n t r a t i o n a n d w e ig h t lo s s d u r in g d r y ro a s tin g ®
F r e s h R o a s te d
B , M ean co n cen tratio n (pg/g) 5 6 7 b 6 1 bStand ard deviation R ed uctio n in % of in itia l cone.
(pg/g) 4 1 2 988 9
G, M ean co n cen tratio n (pg/g) 7 6 5 b 118 bStand ard deviation R ed uctio n in % of in itia l cone.
(pg/g) 6 0 3 1648 5
Average w eight per half W eight loss in % of fresh w eight
(g) 0 .9 9 0 .9 27
® C a lcu lations from data show n in Tab le 1“ D ifference between fresh and roasted s ign ifican t at the 1% level
(S tu den t's t test; Beyer, 1968)
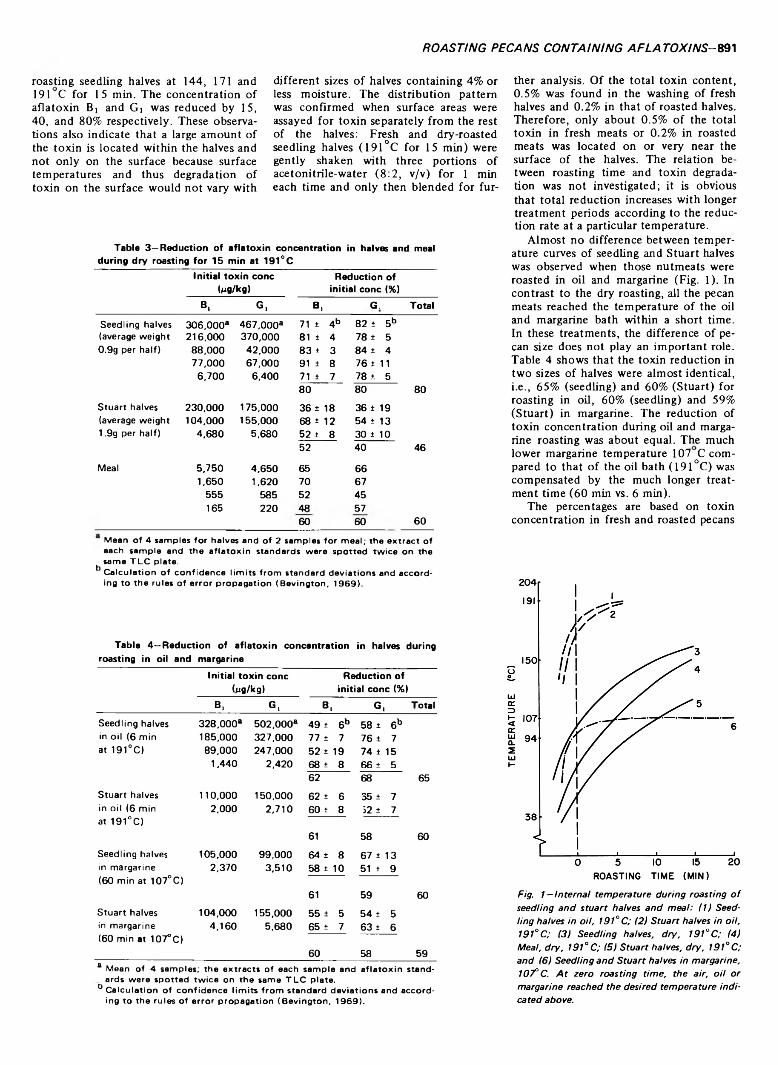
R O A S TIN G PECANS C O N T A IN IN G A F L A T O X IN S - 891
roasting seedling halves at 144, 171 and 191 C for 15 min. The concentration of aflatoxin Bj and Gi was reduced by 15, 40, and 80% respectively. These observations also indicate that a large amount of the toxin is located within the halves and not only on the surface because surface temperatures and thus degradation of toxin on the surface would not vary with
different sizes of halves containing 4% or less moisture. The distribution pattern was confirmed when surface areas were assayed for toxin separately from the rest of the halves: Fresh and dry-roasted seedling halves (191°C for 15 min) were gently shaken with three portions of acetonitrile-water (8:2, v/v) for 1 min each time and only then blended for fur
ther analysis. Of the total toxin content,0 . 5% was found in the washing of fresh halves and 0.2% in that of roasted halves. Therefore, only about 0.5% of the total toxin in fresh meats or 0.2% in roasted meats was located on or very near the surface of the halves. The relation between roasting time and toxin degradation was not investigated; it is obvious that total reduction increases with longer treatment periods according to the reduction rate at a particular temperature.
Almost no difference between temperature curves of seedling and Stuart halves was observed when those nutmeats were roasted in oil and margarine (Fig. 1). In contrast to the dry roasting, all the pecan meats reached the temperature of the oil and margarine bath within a short time. In these treatments, the difference of pecan size does not play an important role. Table 4 shows that the toxin reduction in two sizes of halves were almost identical,1. e., 65% (seedling) and 60% (Stuart) for roasting in oil, 60% (seedling) and 59% (Stuart) in margarine. The reduction of toxin concentration during oil and margarine roasting was about equal. The much lower margarine temperature 107 C compared to that of the oil bath (191 °C) was compensated by the much longer treatment time (60 min vs. 6 min).
The percentages are based on toxin concentration in fresh and roasted pecans
Fig. 1—Internal temperature during roasting o f seedling and stuart halves and meal: 11) Seedling halves in oil, 191° C; (2) Stuart halves in oil, 191°C; 13) Seedling halves, dry, 191°C ; (4) Meal, dry, 191° C; (5) Stuart halves, dry, 191° C; and (6) Seedling and Stuart halves in margarine, 107° C. A t zero roasting time, the air, o il or margarine reached the desired temperature indicated above.
T a b le 3 —R e d u c t i o n o f a f l a t o x i n c o n c e n t r a t i o n in h a lv e s a n d m e a l d u r in g d r y r o a s t in g f o r 1 5 m in a t 1 9 1 ° C
In i t i a l t o x i n c o n e R e d u c t io n o f(p g /k g ) in i t i a l c o n e (% )
B . G , B , G . T o t a l
Seedling halves 3 0 6 ,0 0 0 “ 4 6 7 ,0 0 0 “ 71 ± 4 b 8 2 ± 5 b(average w eight 2 1 6 ,0 0 0 3 7 0 ,0 0 0 81 ± 4 78 ± 50.9g per half) 8 8 ,0 0 0 4 2 ,0 0 0 8 3 ± 3 8 4 ± 4
7 7 ,0 0 0 6 7 ,0 0 0 91 ± 8 7 6 ± 116 ,7 0 0 6 ,4 0 0 71 ± 7 7 8 + 5
8 0 8 0 8 0
Stu art halves 2 3 0 ,0 0 0 1 7 5 ,0 0 0 3 6 ± 18 36 ± 19(average weight 1 0 4 ,0 0 0 1 5 5 ,0 0 0 68 ± 12 54 ± 131 .9g per half) 4 ,6 8 0 5 ,6 8 0 5 2 ± 8 30 ± 10
5 2 4 0 46
Meal 5 ,7 5 0 4 ,6 5 0 65 6 61 ,6 5 0 1 ,6 2 0 70 67
555 585 52 45165 2 2 0 48 57
60 60 6 0
Mean of 4 sam ples fo r halves and of 2 sam ples fo r m eal; the e x tra c t of each sam ple and the a fla to x in standards were spotted tw ice on the
same T L C plate.D C a lcu lation o f confidence lim its from standard deviations and accord
ing to the rules of erro r propagation (Beving ton , 1 9 6 9 ).
T a b le 4 —R e d u c t i o n o f a f l a t o x i n c o n c e n t r a t i o n in h a lv e s d u r in g ro a s t in g in o il a n d m a r g a r in e
I n i t ia l t o x i n c o n e R e d u c t i o n o f( p g /k g ) in i t i a l c o n e (% )
B , G , B , G , T o ta l
Seed ling halves 3 2 8 ,0 0 0 “ 5 0 2 ,0 0 0 “ 4 9 ± 6 b 58 ± 6 bin oil (6 m in 1 8 5 ,0 0 0 3 2 7 ,0 0 0 77 ± 7 7 6 ± 7at 1 9 1 °C ) 8 9 ,0 0 0 2 4 7 ,0 0 0 5 2 ± 19 7 4 ± 15
1 ,4 4 0 2 ,4 2 0 68 ± 8 6 6 ± 562 68 65
Stu art halves 1 1 0 ,0 0 0 1 5 0 ,0 0 0 62 ± 6 35 ± 7in oil (6 m in 2 ,0 0 0 2 ,7 1 0 6 0 ± 8 52 ± 7at 1 9 1 °C )
61 58 60
Seedling halves 1 0 5 ,0 0 0 9 9 ,0 0 0 64 ± 8 67 ± 13in m argarine 2 ,3 7 0 3 ,5 1 0 58 ± 10 51 ± 9(60 m in at 1 0 7 °C )
61 59 60
S tu art halves 1 0 4 ,0 0 0 1 5 5 ,0 0 0 5 5 ± 5 5 4 ± 5in m argarine 4 ,1 6 0 5 ,6 8 0 65 ± 7 6 3 ± 6(60 min at 1 0 7 °C )
60 58 59“ Mean o f 4 sam ples; the e x trac ts of each sam ple and a fla to x in stand
ards were spotted tw ice on the same T L C plate.D C a lcu lation o f confidence lim its from standard deviations and accord
ing to the ru les of erro r propagation (Beving ton , 1 9 6 9 ).
992-JOURNAL OF FOOD SCIENCE-Volume 38 (1973)
T a b le 5 —A v e ra g e m a s s b a la n c e s f o r r o a s t in g o f s e e d l in g h a lv e s in o il a n d m a r g a r in e
% o f a m o u n t in t r o d u c e d
B, G,300g fresh halves 100 100800g fresh oil ____cl 0
1 100g 100 100
3 1 5g roasted halves 4 0 39776g oil after roasting 3 4
1091g 4 3 4 3
A ctua l to x in degradation 57 57
150g fresh halves 100 100900g fresh m argarine 0 0
1050g 100 100
196g roasted halves 4 5 4 5721 g m argarine after roasting3 3 5917g 48 50
A ctua l to x in degradation 50 50
a Part of loss due to w ater evaporation
regardless of weight changes due to uptake of oil by the nuts and are therefore somewhat misleading. Aflatoxin could be recovered from the oil and margarine bath after roasting. Average mass balances for halves, oil, margarine and aflatoxins B! and Gi were calculated (Table 5). Whereas the reduction during roasting in oil, based on the concentrations of toxin in seedling halves, was 65%, only 57% of the initially introduced toxin quantity was actually degraded. Roasting in margarine reduced the toxin concentration in seedling halves by 60%, but degraded only 50% of the total introduced toxin amount. Immediately after roasting,2—4% of the toxin was found in the oil and margarine respectively. Experiments with Stuart halves gave similar results. Parpia and Sreenivasamurthy (1971) indicated that the degradation rate of aflatoxin in hot oil is comparable to that in pecans treated under the same conditions. Yet these authors state that aflatoxin-free products pick up significant amounts of toxin when fried in contaminated oil.
A nonaflatoxin greenish fluorescent
artifact, which Lee et al. (1969) found during their roasting trials on chromatograms at Rf values of aflatoxin G2 , was often observed in the present study. With this exception, naturally occurring substances in fresh and roasted pecans other than aflatoxins did not interfere in the methods used.
No growth of A. parasiticus or other molds occurred on any of the Stuart or seedling halves that had been incubated after roasting. Apparently the heat treatment utilized in all three roasting methods was sufficient to effectively inactivateA. parasiticus or A. flavus. Mycelium and conidia of aspergilli are substantially less resistant to dry heat than certain bacterial spores. Pitt and Christian (1970) found a similar difference in heat resistance between aspergilli and bacterial spores in aqueous systems.
Findings in the present study suggest that roasting significantly lowers the concentration of aflatoxin B! and G] in contaminated pecan halves and meal. The extent of reduction depends upon the type of product and the kind of roasting. Vegetative cells or spores of A. flavus and ofA. parasiticus on pecan halves are destroyed during roasting. Yet, potential toxicity or carcinogenicity of degradation products of aflatoxins remain as questions which require further investigation before applying roasting as a detoxification procedure.
REFERENCESB evin gton , P .R . 1 9 6 9 . “ D ata R ed u c tio n and
Error A nalysis for th e P h ysica l S c ie n c e s .” M cG raw H ill C o ., N ew Y ork.
B eyer, W .H. 1 9 6 8 . “ H a n d b o o k o f T ab les for P rob ab ility and S ta tis t ic s ,” 2nd ed . T he C hem ical R ubb er C o ., C leveland, O hio.
C ucullu , A .F ., L ee, L .S ., M ayne, R .Y . and G old b la tt, L .A . 1 9 6 6 . D eterm in ation o f a fla to x in s in ind iv idu al p ean u ts and p ean u t s ec t io n s . J. A m er. O il C hem . S o c . 43 : 8 9 .
C ucullu , A .F ., P on s, W .A. Jr. and G o ld b la tt,L .A . 1 9 7 2 . F ast screen in g m eth o d for d e te c tio n o f a f la to x in co n ta m in a tio n in c o t to n seed p rod u cts. J. AO AC. 55: 1 1 1 4 .
D ollear, F .G . 1 9 6 9 . D e to x if ic a tio n o f a fla to x in s in fo o d s and feed s. In “ A fla to x in ,” ed G o ld b la tt, L .A . A cad em ic Press, N ew Y ork , N .Y .
D o u p n ik , B. Jr. and B ell, D .K . 1 9 7 1 . T o x ic ity to ch ick s o f A sp ergillus and P en icilliu m sp ec ie s iso la ted from m o ld y p ecans. A ppl. M icro-biol. 21: 1 1 0 4 .
H ea to n , E .K . 1 9 7 2 . M oisture and m old ing of p ecan s. P roceed in gs A nnu al C on ven tion , p. 1 3 5 . S o u th ea stern P ecan G row ers Associat io n , A tlan ta , Ga.
H eaton , E .K . and W o o d ro o f, J.G . 1 9 7 0 . Humidity and w e igh t lo ss in co ld stored pecans. A S H R A E J. 1 2 (4 ): 4 9 .
L ee, L .S ., C ucu llu , A .F . and G o ld b la tt, L.A.1 9 6 8 . A p pearance and a fla to x in co n ten t of raw and dry roasted p ean u t kernels. Food T ech n o l 22: 1 1 3 1 .
L ee, L .S ., C u cu llu , A .F ., Franz, A .O . Jr. and P on s, W .A. Jr. 1 9 6 9 . D estru c tio n o f aflato x in s in p ean u ts during dry and o il roasting. J. Agr. F o o d C hem . 17: 4 5 1 .
L illard, H .S ., H anlin , R .T . and L illard, D.A.1 9 7 0 . A fla to x ig en ic iso la te s o f Aspergillus flavus from p ecan s. A p p l. M icrob iol. 19: 1 2 8 .
Parker, W .A. and M eln ik , D . 1 9 6 6 . A b sen ce of a fla to x in from refin ed vegatab le oils. J. A m er. O il C hem . S o c . 43 : 6 3 5 .
Parpia, H .A .B . and S reen ivasam u rth y , V . 1971 . Im p ortan ce o f a f la to x in in fo o d s w ith referen ce to India. 3rd In tern ation a l Congress F o o d S c ien ce and T ech n o lo g y Proceedings, p. 7 0 1 . ed S tew art, G .F . and W illey, C.L., Inst. F o o d T ech n o lo g is ts , C hicago, 111.
P itt, J .I. and C hristian, J .H .B . 1 9 7 0 . H eat resistan ce o f x ero p h ilic fu ngi based o n m icrosco p ica l a ssessm en t o f sp ore survival. Appl. M icrob iol. 20: 6 8 2 .
T aylor, J. and W orley , R .E . 1 9 7 2 . Pecan fungic id e program s a ffec t m y c o flo r a in c id en ce in n u ts. P roceed ings A n n u al C o n v en tio n , p. 29. S ou th ea stern Pecan G row ers A ssocia tion , A tlan ta , Ga.
T y so n , T.W . 1 9 7 2 . A n in v estig a tio n o f fluorescen ce as p h y sica l m ean s o f d e tec tin g aflato x in in pecan . M .S. th esis . U n iversity of G eorgia, A th en s, Ga.
W altking, A .E . 1 9 7 1 . F ate o f a f la to x in during roastin g and storage o f co n ta m in a ted peanut p rod u cts. J. A O A C 54: 5 3 3 .
W hitaker, T .B ., D ick en s , J.W . and W iser, E.H.1 9 7 0 . D esign and an a lysis o f sam plin g plans to e st im a te a fla to x in c o n cen tra tio n s in sh e lled p ecan s. J. A m er. O il C hem . S o c . 47: 5 0 1 .
W hitten , M .E . and S m ith L .L . 1 9 7 2 . E ffe c t o f storage c o n d it io n s o n increase in a fla tox in s in co tto n se e d : A sm all lo t s tu d y . J. Amer. O il C hem . S o c . 49 : 5 9 6 .
W ood roof, J .G . 1 9 6 7 . “ T ree N uts: P rod u ction , P rocessing, P ro d u cts ,” V o l 2 . T he A vi Publish ing C o., Inc. W estport, C onn.
W ood roof, J.G . and H ea to n , E .K . 1 9 6 1 . Pecans for processing . B ull. N .S . 8 0 , G eorgia Agric. E xp . S tn ., E xp erim en t, Ga.
Ms received 3 /2 1 /7 3 ; revised 4 /3 0 /7 3 ; accep ted 5 /1 /7 3 .
Paper p resen ted at th e 7 0 th A nnu al M eeting o f th e A sso c ia tio n o f S ou th ern A gricultural W orkers, F eb . 4—7 , 1 9 7 3 , A tlan ta , Ga.
T his in v estig a tio n w as su p p o rted by F ood and Drug A d m in istra tion grant F D -0 0 1 5 5 and on e o f th e au th ors (F .E .E .) by a U niversity o f G eorgia C ollege o f A gricu lture p o st-d octora l award.
T he authors th an k th e G old K ist Inc., A tlan ta , Ga. for prov id in g p ecan sam ples andR .R . Chang and K. von S te t te n for th eir te ch n ical assistance.
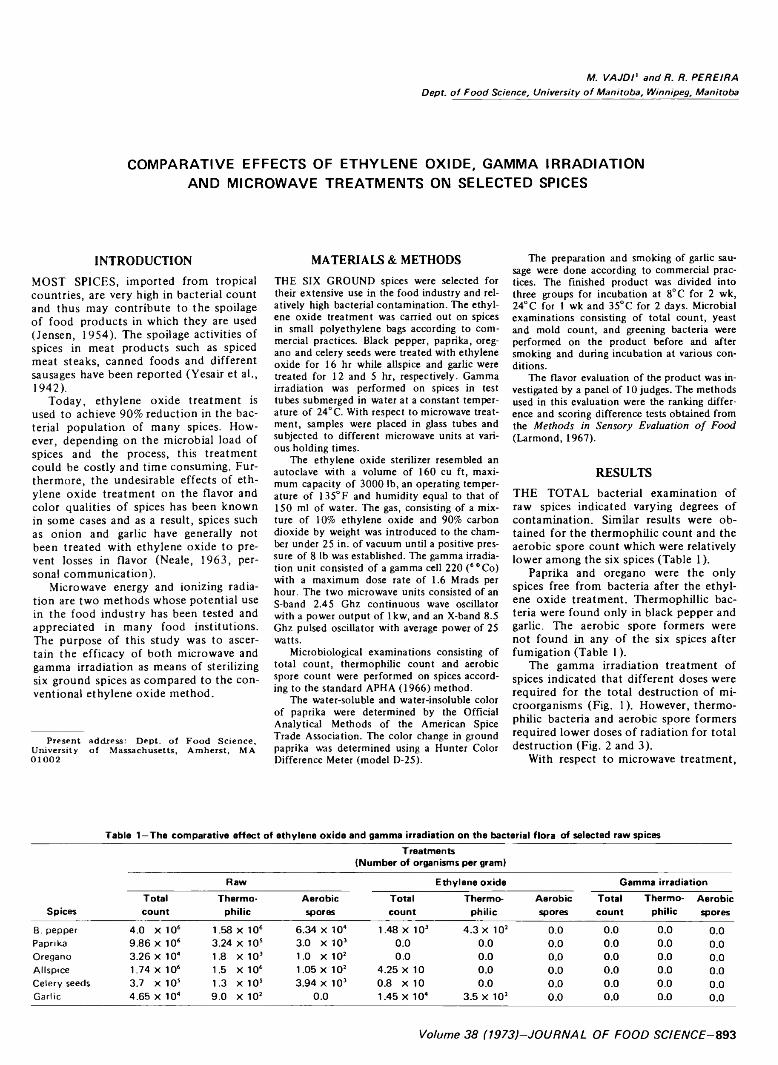
M. VAJDI' and R. R. PEREIRADept, of Food Science, University of Manitoba, Winnipeg, Manitoba
COMPARATIVE EFFECTS OF ETHYLENE OXIDE, GAMMA IRRADIATION AND MICROWAVE TREATMENTS ON SELECTED SPICES
INTRODUCTIONMOST SPICES, imported from tropical countries, are very high in bacterial count and thus may contribute to the spoilage of food products in which they are used (Jensen, 1954). The spoilage activities of spices in meat products such as spiced meat steaks, canned foods and different sausages have been reported (Yesair et al., 1942).
Today, ethylene oxide treatment is used to achieve 90% reduction in the bacterial population of many spices. However, depending on the microbial load of spices and the process, this treatment could be costly and time consuming. Furthermore, the undesirable effects of ethylene oxide treatment on the flavor and color qualities of spices has been known in some cases and as a result, spices such as onion and garlic have generally not been treated with ethylene oxide to prevent losses in flavor (Neale, 1963, personal communication).
Microwave energy and ionizing radiation are two methods whose potential use in the food industry has been tested and appreciated in many food institutions. The purpose of this study was to ascertain the efficacy of both microwave and gamma irradiation as means of sterilizing six ground spices as compared to the conventional ethylene oxide method.
P resent address: D ep t, o f F o o d S c ien ce ,U niversity o f M assachusetts, A m h erst, MA 01002
MATERIALS & METHODSTHE SIX GROUND spices were selected for their extensive use in the food industry and relatively high bacterial contamination. The ethylene oxide treatment was carried out on spices in small polyethylene bags according to commercial practices. Black pepper, paprika, oregano and celery seeds were treated with ethylene oxide for 16 hr while allspice and garlic were treated for 12 and 5 hr, respectively. Gamma irradiation was performed on spices in test tubes submerged in water at a constant temperature o f 24° C. With respect to microwave treatment, samples were placed in glass tubes and subjected to different microwave units at various holding times.
The ethylene oxide sterilizer resembled an autoclave with a volume of 160 cu ft, maximum capacity o f 3000 lb, an operating temperature o f 135°F and humidity equal to that of 150 ml of water. The gas, consisting of a mixture of 10% ethylene oxide and 90% carbon dioxide by weight was introduced to the chamber under 25 in. o f vacuum until a positive pressure of 8 lb was established. The gamma irradiation unit consisted of a gamma cell 220 (60Co) with a maximum dose rate o f 1.6 Mrads per hour. The two microwave units consisted of anS-band 2.45 Ghz continuous wave oscillator with a power output o f lkw , and an X-band 8.5 Ghz pulsed oscillator with average power of 25 watts.
Microbiological examinations consisting of total count, thermophilic count and aerobic spore count were performed on spices according to the standard APHA (1966) method.
The water-soluble and water-insoluble color o f paprika were determined by the Official Analytical Methods of the American Spice Trade Association. The color change in ground paprika was determined using a Hunter Color Difference Meter (model D-25).
The preparation and smoking of garlic sausage were done according to commercial practices. The finished product was divided into three groups for incubation at 8°C for 2 wk, 24°C for 1 wk and 35°C for 2 days. Microbial examinations consisting of total count, yeast and mold count, and greening bacteria were performed on the product before and after smoking and during incubation at various conditions.
The flavor evaluation of the product was investigated by a panel o f 10 judges. The methods used in this evaluation were the ranking difference and scoring difference tests obtained from the Methods in Sensory Evaluation o f Food (Larmond, 1967).
RESULTSTHE TOTAL bacterial examination of raw spices indicated varying degrees of contamination. Similar results were obtained for the thermophilic count and the aerobic spore count which were relatively lower among the six spices (Table 1).
Paprika and oregano were the only spices free from bacteria after the ethylene oxide treatment. Thermophillic bacteria were found only in black pepper and garlic. The aerobic spore formers were not found in any of the six spices after fumigation (Table 1 ).
The gamma irradiation treatment of spices indicated that different doses were required for the total destruction of microorganisms (Fig. 1). However, thermophilic bacteria and aerobic spore formers required lower doses of radiation for total destruction (Fig. 2 and 3).
With respect to microwave treatment,
T a b le 1 —T h e c o m p a r a t iv e e f f e c t o f e t h y l e n e o x i d e a n d g a m m a i r r a d i a t i o n o n t h e b a c t e r ia l f l o r a o f s e le c te d r a w s p ic e s
S p ic e s
T r e a t m e n t s( N u m b e r o f o r g a n is m s p e r g ra m )
R a w E t h y l e n e o x id e G a m m a i r r a d i a t i o n
T o t a lc o u n t
T h e r m o p h i l i c
A e r o b ics p o r e s
T o t a lc o u n t
T h e r m o p h i l i c
A e r o b ics p o r e s
T o t a lc o u n t
T h e r m o
p h i l i cA e r o b ics p o r e s
B. pepper 4 .0 X 106 1.58 X 10⁶ 6 .3 4 x 10⁴ 1 .48 X 1 0 3 4 .3 x 102 0 .0 0 .0 0 .0 0 .0Paprika 9 .8 6 X 10 ‘ 3 .2 4 x 1 0 s 3 .0 X 1 0 3 0 .0 0 .0 0 .0 0 .0 0 .0 0 .0Oregano 3 .2 6 X 10“ 1.8 X 1 0 3 1 .0 X 102 0 .0 0 .0 0 .0 0 .0 0 .0 0 .0A llsp ice 1 .74 X 106 1.5 X 10⁶ 1 .0 5 X 1 0 2 4 .2 5 X 10 0 .0 0 .0 0 .0 0 .0 0 .0C e le ry seeds 3 .7 X 1 0 5 1 .3 X 1 0 5 3 .9 4 x 1 0 3 0 .8 X 10 0 .0 0 .0 0 .0 0 .0 0 .0G a rlic 4 .6 5 X 10⁴ 9 .0 X 102 0 .0 1 .4 5 X 1 0 4 3 .5 x 102 0 .0 0 .0 0 .0 0 .0
Volume 38 (1973)-JOURNAL OF FOOD SCIENCE-893
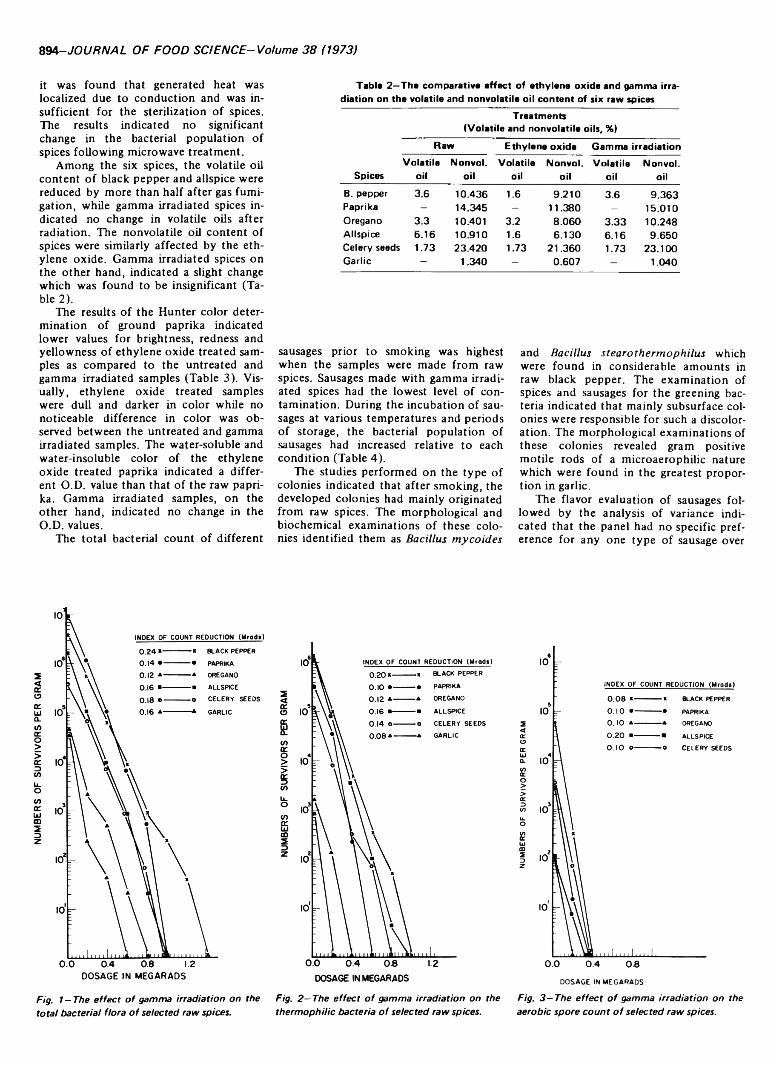
NU
MBE
RS O
F SU
RVIV
ORS
PER
GRA
M894- JOURNAL OF FOOD SCIENCE-Volume 38 (1973)
it was found that generated heat was localized due to conduction and was insufficient for the sterilization of spices. The results indicated no significant change in the bacterial population of spices following microwave treatment.
Among the six spices, the volatile oil content of black pepper and allspice were reduced by more than half after gas fumigation, while gamma irradiated spices indicated no change in volatile oils after radiation. The nonvolatile oil content of spices were similarly affected by the ethylene oxide. Gamma irradiated spices on the other hand, indicated a slight change which was found to be insignificant (Table 2).
The results of the Hunter color determination of ground paprika indicated lower values for brightness, redness and yellowness of ethylene oxide treated samples as compared to the untreated and gamma irradiated samples (Table 3). Visually, ethylene oxide treated samples were dull and darker in color while no noticeable difference in color was observed between the untreated and gamma irradiated samples. The water-soluble and water-insoluble color of the ethylene oxide treated paprika indicated a different O.D. value than that of the raw paprika. Gamma irradiated samples, on the other hand, indicated no change in the O.D. values.
The total bacterial count of different
DOSAGE IN MEGARADS
Fig. 1—The effect o f gamma irradiation on the total bacteriaI flora o f selected raw spices.
T a b le 2 —T h e c o m p a r a t i v e e f f e c t o f e t h y l e n e o x id e a n d g a m m a i r r a d i a t i o n o n t h e v o la t i l e a n d n o n v o la t i l e o i l c o n t e n t o f s ix r a w s p ic e s
S p ic e s
T r e a t m e n t s( V o la t i l e a n d n o n v o la t i l e o i l s , % )
R a w E t h y l e n e o x id e G a m m a i r r a d i a t i o n
V o la t i l eo il
N o n v o l .
o ilV o la t i l e
o ilN o n v o l .
o ilV o la t i l e
o ilN o n v o l .
o il
B. pepper 3 .6 1 0 .4 3 6 1 .6 9 . 2 1 0 3 .6 9 .3 6 3Paprika - 1 4 .3 4 5 - 1 1 .3 8 0 — 1 5 .0 1 0Oregano 3 .3 1 0 .4 0 1 3 .2 8 .0 6 0 3 . 3 3 1 0 .2 4 8A llsp ice 6 .1 6 1 0 .9 1 0 1 .6 6 . 1 3 0 6 .1 6 9 .6 5 0C e le ry seeds 1 .7 3 2 3 .4 2 0 1 .7 3 2 1 . 3 6 0 1 .7 3 2 3 . 1 0 0G a rlic - 1 .3 4 0 - 0 .6 0 7 - 1 .0 4 0
sausages prior to smoking was highest when the samples were made from raw spices. Sausages made with gamma irradiated spices had the lowest level of contamination. During the incubation of sausages at various temperatures and periods of storage, the bacterial population of sausages had increased relative to each condition (Table 4).
The studies performed on the type of colonies indicated that after smoking, the developed colonies had mainly originated from raw spices. The morphological and biochemical examinations of these colonies identified them as B acillus m ycoides
Fig. 2 —The effect o f gamma irradiation on the thermophilic bacteria o f selected raw spices.
and Bacillus s tea ro the rm oph ilus which were found in considerable amounts in raw black pepper. The examination of spices and sausages for the greening bacteria indicated that mainly subsurface colonies were responsible for such a discoloration. The morphological examinations of these colonies revealed gram positive motile rods of a microaerophilic nature which were found in the greatest proportion in garlic.
The flavor evaluation of sausages followed by the analysis of variance indicated that the panel had no specific preference for any one type of sausage over
DOSAGE IN MEGARADSFig. 3 —The effect o f gamma irradiation on the aerobic spore count o f selected raw spices.
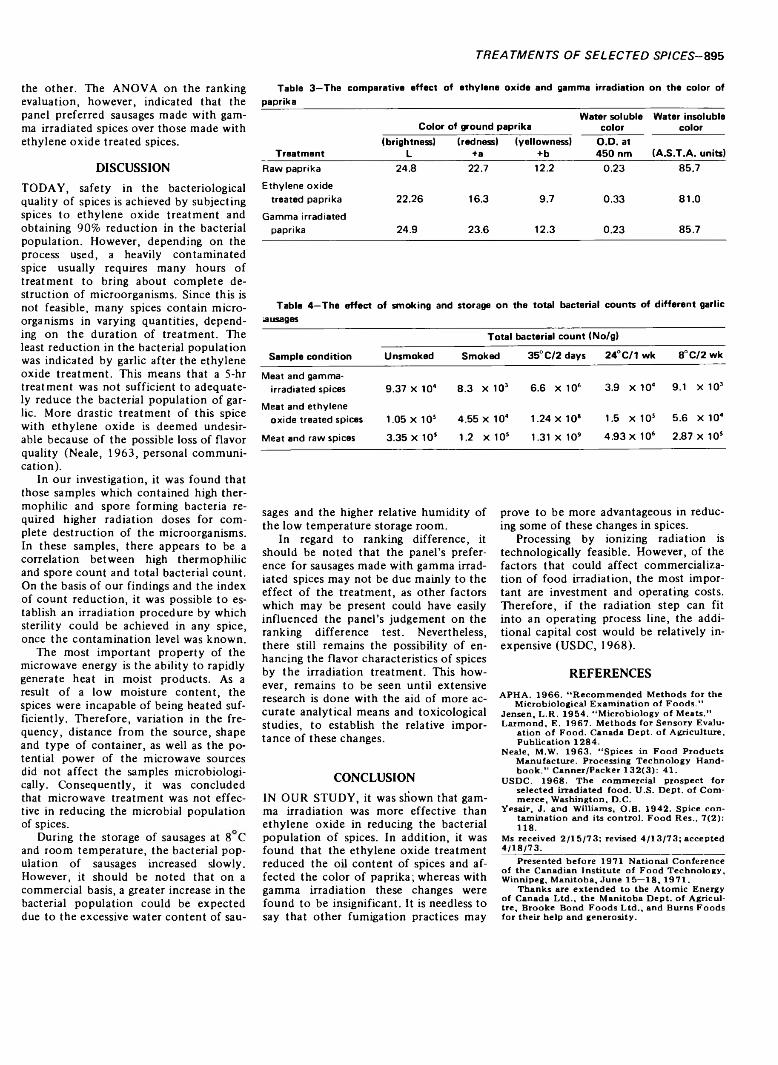
TREATMENTS OF SELECTED SPICES- 895
T a b le 3 —T h e c o m p a r a t iv e e f f e c t
p a p r ik a
o f e t h y l e n e o x id e a n d g a m m a i r r a d i a t i o n o n t h e c o l o r o f
W a te r s o lu b le W a te r in s o lu b le C o lo r o f g r o u n d p a p r ik a c o lo r c o lo r
T r e a t m e n t( b r ig h tn e s s )
L( r e d n e s s )
+ a(y e l lo w n e s s )
+ bO .D . a t4 5 0 n m ( A .S .T .A . u n i ts )
R a w paprika 2 4 .8 2 2 .7 12.2 0 .2 3 8 5 .7
E th y le n e ox id e treated paprika 2 2 .2 6 16.3 9 .7 0 .3 3 8 1 .0
G am m a irradiated paprika 2 4 .9 2 3 .6 1 2 .3 0 .2 3 8 5 .7
T a b le 4 —T h e e f f e c t o f s m o k in g a n d s to r a g e o n t h e t o t a l b a c t e r i a l c o u n t s o f d i f f e r e n t g a r lic
a u s a g e s
T o t a l b a c t e r ia l c o u n t (N o /g )
S a m p le c o n d i t i o n U n s m o k e d S m o k e d 3 5 ° C / 2 d a y s 2 4 ° C /1 w k 8 ° C / 2 w k
M eat and gamma- irradiated spices 9 .3 7 X 10" 8 .3 X 1 0 3 6 .6 X 106 3 .9 X 10“ 9.1 X 1 0 3
M eat and ethylen e o x id e treated spices 1 .05 X 1 0 s 4 .5 5 X 10" 1 .2 4 X 10* 1.5 X 1 0 5 5 .6 X 104
M eat and raw spices 3 .3 5 X 1 0 s 1.2 X 1 0 s 1.31 X 10⁹ 4 .9 3 X 10⁶ 2 .8 7 X 1 0 s
the other. The ANOVA on the ranking evaluation, however, indicated that the panel preferred sausages made with gamma irradiated spices over those made with ethylene oxide treated spices.
DISCUSSIONTODAY, safety in the bacteriological quality of spices is achieved by subjecting spices to ethylene oxide treatment and obtaining 90% reduction in the bacterial population. However, depending on the process used, a heavily contaminated spice usually requires many hours of treatment to bring about complete destruction of microorganisms. Since this is not feasible, many spices contain microorganisms in varying quantities, depending on the duration of treatment. The least reduction in the bacterial population was indicated by garlic after the ethylene oxide treatment. This means that a 5-hr treatment was not sufficient to adequately reduce the bacterial population of garlic. More drastic treatment of this spice with ethylene oxide is deemed undesirable because of the possible loss of flavor quality (Neale, 1963, personal communication).
In our investigation, it was found that those samples which contained high thermophilic and spore forming bacteria required higher radiation doses for complete destruction of the microorganisms. In these samples, there appears to be a correlation between high thermophilic and spore count and total bacterial count. On the basis of our findings and the index of count reduction, it was possible to establish an irradiation procedure by which sterility could be achieved in any spice, once the contamination level was known.
The most important property of the microwave energy is the ability to rapidly generate heat in moist products. As a result of a low moisture content, the spices were incapable of being heated sufficiently. Therefore, variation in the frequency, distance from the source, shape and type of container, as well as the potential power of the microwave sources did not affect the samples microbiologi- cally. Consequently, it was concluded that microwave treatment was not effective in reducing the microbial population of spices.
During the storage of sausages at 8 C and room temperature, the bacterial population of sausages increased slowly. However, it should be noted that on a commercial basis, a greater increase in the bacterial population could be expected due to the excessive water content of sau
sages and the higher relative humidity of the low temperature storage room.
In regard to ranking difference, it should be noted that the panel’s preference for sausages made with gamma irradiated spices may not be due mainly to the effect of the treatment, as other factors which may be present could have easily influenced the panel’s judgement on the ranking difference test. Nevertheless, there still remains the possibility of enhancing the flavor characteristics of spices by the irradiation treatment. This however, remains to be seen until extensive research is done with the aid of more accurate analytical means and toxicological studies, to establish the relative importance of these changes.
CONCLUSIONIN OUR STUDY, it was sliown that gamma irradiation was more effective than ethylene oxide in reducing the bacterial population of spices. In addition, it was found that the ethylene oxide treatment reduced the oil content of spices and affected the color of paprika; whereas with gamma irradiation these changes were found to be insignificant. It is needless to say that other fumigation practices may
prove to be more advantageous in reducing some of these changes in spices.
Processing by ionizing radiation is technologically feasible. However, of the factors that could affect commercialization of food irradiation, the most important are investment and operating costs. Therefore, if the radiation step can fit into an operating process line, the additional capital cost would be relatively inexpensive (USDC, 1968).
REFERENCESA PH A . 1 9 6 6 . “ R eco m m en d ed M eth od s tor th e
M icrob io log ica l E x a m in a tio n o f F o o d s .” J en sen , L .R . 1 9 5 4 . “ M icrob io logy o f M eats.” L arm ond, E. 1 9 6 7 . M eth od s for S ensory E valu
a tio n o f F o o d . Canada D ep t, o f A gricu lture, P u b lica tio n 1 2 8 4 .
N eale, M.W. 1 9 6 3 . “ S p ices in F o o d P rodu cts M anufacture. Processing T ech n o lo g y H andb o o k .” C anner/Packer 1 3 2 (3 ) : 4 1 .
U SD C . 1 9 6 8 . T he com m ercia l p rosp ect for se lec ted irradiated fo o d . U .S . D ep t, o f C om m erce , W ashington, D .C.
Y esair, J. and W illiam s, O .B . 1 9 4 2 . S p ice c o n ta m in a tio n and its co n tro l. F o o d R es., 7 (2 ): 1 1 8 .
Ms received 2 /1 5 /7 3 ; revised 4 /1 3 /7 3 ; a ccep ted4 /1 8 /7 3 .__________________________________________
P resented b efo re 1 9 7 1 N a tio n a l C on feren ce o f th e C anadian In stitu te o f F o o d T ech n o lo g y , W innipeg, M anitob a , Jun e 1 5 —1 8 , 1 9 7 1 .
T hanks are e x ten d ed to th e A to m ic Energy o f C anada L td ., th e M anitoba D ep t, o f A gricul- tre , B rook e B ond F o o d s L td ., and Burns F o o d s for th eir h elp and g en erosity .
1=™# RESEARCH NOTES
R. B. R O Y and M A R C U S K A R EL Dept, o f N utrition & Food Science,
Massachusetts Institute o f Technology, Cambridge, M A 02139
A Research NoteREACTION PRODUCTS OF HISTIDINE WITH AUTOXIDIZED METHYL LINOLEATE
INTRODUCTIONPEROXIDATION of lipids in biological systems and in foods results in reactions with proteins and amino acids. We found previously (Clark, 1965; Karel et al., 1966; Tjhio and Karel, 1969) that histidine, lysine and methionine affected oxidation of lipids, and underwent changes as a result of their reactions with peroxi- dizing lipids. Histidine has been found to be sensitive to other oxidizing conditions. Tomita et al. (1969) isolated and identified several products of its photooxidation, and Schubert et al. (1968) reported formation of cytotoxic compounds from histidine exposed either to hydrogen peroxide or to ionizing radiations.
As part of our study of lipid-protein interaction, we characterized products formed by reactions between histidine and peroxidizing lipids.
EXPERIMENTALHISTIDINE was reacted with autoxidized methyl linoleate in one o f the following systems: (a) dry filter paper containing the reactants; (b) anhydrous mixture o f methyl linoleate and histidine in air, or a mixture of linoleate hydroperoxides and histidine in air; and (c) concentrated aqueous dispersion.Materials
Methyl linoleate (Hormel Institute, Minneapolis, Minn.) was further purified by distillation. L-Histidine (Calbiochem, Los Angeles, Calif.) was used without further purification.
Methyl linoleate hydroperoxides were prepared by the method o f Banks et al. (1959).Experiments on filter paper
L-Histidine (3 9 -1 5 6 mg) dissolved in a minimum volume of water was dispersed dropwise on a filter paper ( 1 1 cm in diameter, weighing about 825 mg). The filter paper was dried in air (4 hr), then in a vacuum desiccator to a con
stant weight. Methyl linoleate (308 mg) dissolved in n-hexane (1 ml) was then dispersed on the paper, and the solvent was removed by vacuum evaporation.
After the incubation in air at 37°C, a small piece o f the filter paper was extracted with aqueous methanol (1:1 v/v). The extract was spotted on thin-layer plates (silica gel G) (Tjhio and Karel, 1969). The solvent system consisted of 2-propanol concentrated ammonium hy- droxide:water (8:2 : 1 ), and spots were visualized with ninhydrin or with Pauly reagent. [Diazotized sulfanilic acid in alkaline medium gives red color with imidazole-containing compounds, with at least one unsubstituted ring carbon atom (Bailey, 1962).]
The rest o f the filter paper was extracted with IN HC1, and chromatographed on a2.0-cm x 30-cm column packed with Dowex-50 (H+ form, lOlOg), with 4N HC1 and water used respectively in a gradient chromatographic technique. A total o f 14 fractions, each containing 0.5 ml, were collected.Reaction in a stirred anhydrous mixture
Histidine (155 mg) and methyl linoleate (308 mg) were magnetically stirred in a 25-ml round-bottomed flask for 14 days at 37°C. The reaction products were extracted with a mixture of light petroleum ether (b.p. 30-60°C ) and benzene (1:3, v/v) and then with aqueous
methanol (25%, v/v). The petroleum ether: benzene fraction was concentrated under reduced pressure and the residue (250 mg) was examined on TLC (alumina) with iodine vapor as reagent.Reaction in the presence of water
A mixture of 200 mg histidine, 400 mg methyl linoleate and 1 ml water was stirred for 6 days at room temperature with occasional addition of a few drops o f water. The filtrate on TLC (silica) showed two ninhydrin-positive spots.
A similar experiment was carried out in the presence o f ferrous sulfate (10 '7M). The reaction mixture turned brown, and TLC (silica) showed four ninhydrin-positive spots. When cobalt nitrate was used in place o f ferrous sulfate, two ninhydrin-positive spots were obtained.
RESULTS & DISCUSSIONREACTIONS between histidine and au- toxidizing methyl linoleate resulted in the formation of several compounds, whose nature depended on experimental conditions. Table 1 shows the Rf value on TLC (silica gel) of these compounds. Four of the isolated products were identified: I is aspartic acid; III is histidine; V is hista-
T a b le 1 —R f v a lu e s o f h i s t id in e - d e r iv e d c o m p o u n d s i s o la te d f r o m r e a c t io n s m ix tu r e s
R f o f v a r io u s r e a c t io n p r o d u c t s a
R e a c t io n I II i n IV V V I
On filte r paper 0 .5 6 (n ,s) 0 .5 9 (n ,s) 0 .6 8 (n ,s) 0 .8 3 (n )In an h yd ro u s m ixture 0 .5 6 (n ,s) 0 .5 8 (n ,s)In aqueous system 0 .5 8 (n ,s) 0 .6 8 (n ,s)In presence of Fe 0 .4 0 (n ) 0 .5 9 (n ,s) 0 .6 5 (n ) 0 .6 7 (n ,s)In presence of C o 0 .5 8 (n ,s) 0 .6 8 (n,s)
n = n in hyd rin positive ; s = Pau ly reaction positive . R^s o f au thentic am ino acids: h istid ine = 0 .5 8 ; h istam ine = 0 .6 8 ; aspartic acid = 0 .4 1 ; valine = 0 .6 5 ; e thy lam ine = 0.81
896-JOURNAL OF FOOD SCIENCE-Volume 38 (1973)
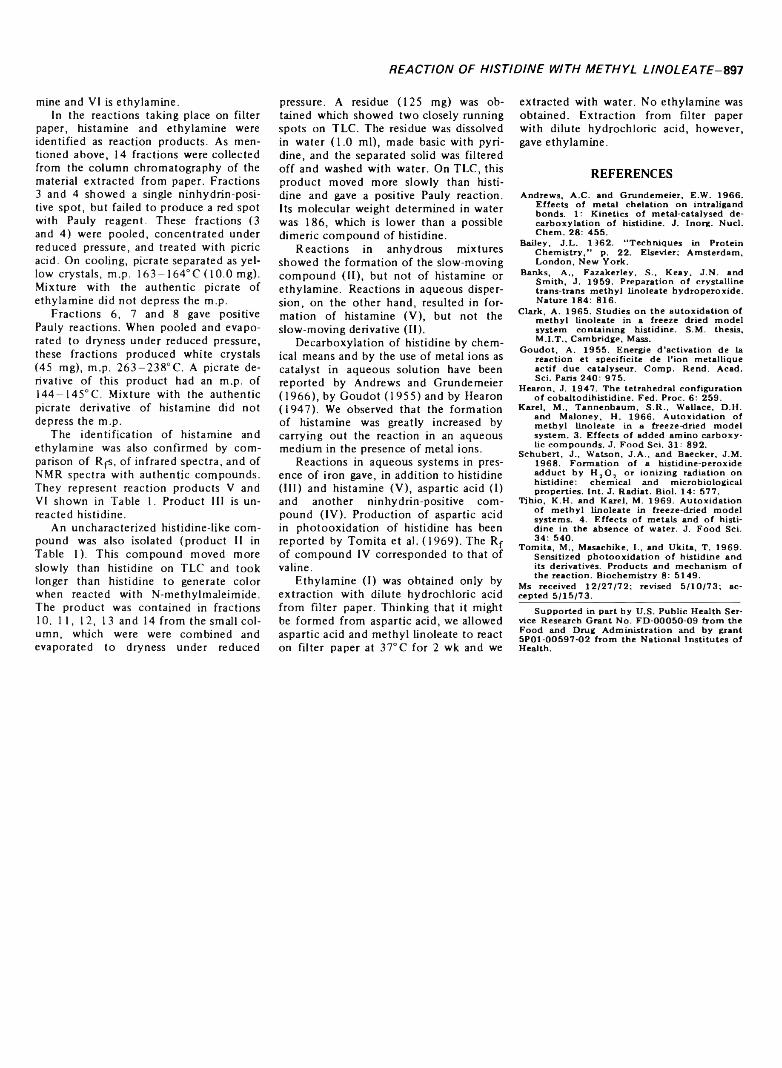
REACTION OF HISTIDINE WITH METHYL UNO LEA 7 T-897
mine and VI is ethylamine.In the reactions taking place on filter
paper, histamine and ethylamine were identified as reaction products. As mentioned above, 14 fractions were collected from the column chromatography of the material extracted from paper. Fractions 3 and 4 showed a single ninhydrin-posi- tive spot, but failed to produce a red spot with Pauly reagent. These fractions (3 and 4) were pooled, concentrated under reduced pressure, and treated with picric acid. On cooling, picrate separated as yellow crystals, m.p. 163—164°C (10.0 mg). Mixture with the authentic picrate of ethylamine did not depress the m.p.
Fractions 6, 7 and 8 gave positive Pauly reactions. When pooled and evaporated to dryness under reduced pressure, these fractions produced white crystals (45 mg), m.p. 263-238°C . A picrate derivative of this product had an m.p. of 144—145°C. Mixture with the authentic picrate derivative of histamine did not depress the m.p.
The identification of histamine and ethylamine was also confirmed by comparison of RfS, of infrared spectra, and of NMR spectra with authentic compounds. They represent reaction products V and VI shown in Table 1. Product III is unreacted histidine.
An uncharacterized histidine-like compound was also isolated (product II in Table 1). This compound moved more slowly than histidine on TLC and took longer than histidine to generate color when reacted with N-methylmaleimide. The product was contained in fractions10. 11, 12, 13 and 14 from the small column, which were were combined and evaporated to dryness under reduced
pressure. A residue (125 mg) was obtained which showed two closely running spots on TLC. The residue was dissolved in water (1.0 ml), made basic with pyridine, and the separated solid was filtered off and washed with water. On TLC, this product moved more slowly than histidine and gave a positive Pauly reaction. Its molecular weight determined in water was 186, which is lower than a possible dimeric compound of histidine.
Reactions in anhydrous mixtures showed the formation of the slow-moving compound (II), but not of histamine or ethylamine. Reactions in aqueous dispersion, on the other hand, resulted in formation of histamine (V), but not the slow-moving derivative (II).
Decarboxylation of histidine by chemical means and by the use of metal ions as catalyst in aqueous solution have been reported by Andrews and Grundemeier (1966), by Goudot (1955) and by Hearon(1947). We observed that the formation of histamine was greatly increased by carrying out the reaction in an aqueous medium in the presence of metal ions.
Reactions in aqueous systems in presence of iron gave, in addition to histidine (III) and histamine (V), aspartic acid (I) and another ninhydrin-positive compound (IV). Production of aspartic acid in photooxidation of histidine has been reported by Tomita et al. (1969). The Rf of compound IV corresponded to that of valine.
Ethylamine (I) was obtained only by extraction with dilute hydrochloric acid from filter paper. Thinking that it might be formed from aspartic acid, we allowed aspartic acid and methyl linoleate to react on filter paper at 37°C for 2 wk and we
extracted with water. No ethylamine was obtained. Extraction from filter paper with dilute hydrochloric acid, however, gave ethylamine.
REFERENCESA ndrew s, A .C . and G rundem eier, E.W . 1 9 6 6 .
E ffec ts o f m eta l ch e la tio n o n intraligand b on d s. 1: K in etics o f m eta l-cata lysed d ec a rb o x y la tio n o f h istid in e . J. Inorg. N ucl. C hem . 28: 4 5 5 .
B ailey , J .L . 1 9 6 2 . “ T ech n iq u es in P rotein C h em istry ,’* p. 2 2 . E lsevier; A m sterd am , L o n d o n , N ew Y ork.
B anks, A ., F azak erley , S ., K eay , J .N . and S m ith , J. 1 9 5 9 . Preparation o f crysta lline trans-trans m e th y l lin o lea te h y d ro p ero x id e . N ature 1 8 4 : 8 1 6 .
Clark, A. 1 9 6 5 . S tu d ies o n th e a u to x id a tio n o f m eth y l lin o lea te in a freeze dried m o d el sy stem con ta in in g h istid in e . S.M . th esis ,M .I.T ., C am bridge, Mass.
G o u d o t, A . 1 9 5 5 . E nergie d ’a ctiva tion de la reaction e t sp ec if ic ite de l ’io n m eta lliq u e a c tif d u e cata lyseu r. C om p. R end . A cad. S ci. Paris 2 4 0 : 9 7 5 .
H earon, J. 1 9 4 7 . T he tetrahedral con figu ra tion o f co b a lto d ih is tid in e . F ed . Proc. 6: 2 5 9 .
K arel, M ., T annenb aum , S .R ., W allace, D .H . and M aloney , H. 1 9 6 6 . A u to x id a tio n o f m e th y l lin o lea te in a freeze-dried m o d el sy stem . 3 . E ffec ts o f add ed am in o ca rb o x y lic c o m p o u n d s . J. F o o d S ci. 31: 8 9 2 .
S chu bert, J ., W atson, J .A ., and B aecker, J.M.1 9 6 8 . F orm ation o f a h istid in e-p erox id e a d d u ct b y H 2 0 2 or io n iz in g rad iation on h istid in e: ch em ica l and m icrob io log ica lp roperties. Int. J. R adiat. B io l. 14 : 5 7 7 .
T jhio, K .H . and K arel, M. 1 9 6 9 . A u to x id a tio n o f m eth y l lin o lea te in freeze-dried m od el sy stem s. 4. E ffec ts o f m eta ls and o f h is tid in e in th e ab sen ce o f w ater. J. F o o d Sci. 34: 5 4 0 .
T om ita , M ., M asachike, I ., and U k ita , T . 1 9 6 9 . S en sitized p h o to o x id a t io n o f h istid in e and its derivatives. P rodu cts and m ech an ism o f th e reaction . B ioch em istry 8: 5 1 4 9 .
Ms received 1 2 /2 7 /7 2 ; revised 5 /1 0 /7 3 ; ac- cep ted 5 /1 5 /7 3 .__________________________________
S u p p orted in part b y U .S . P u blic H ealth Service R esearch Grant N o . F D -0 0 0 5 0 -0 9 from th e F o o d and Drug A d m in istra tion and b y grant 5 P 0 1 -0 0 5 9 7 -0 2 from th e N ation a l In stitu tes o f H ealth .
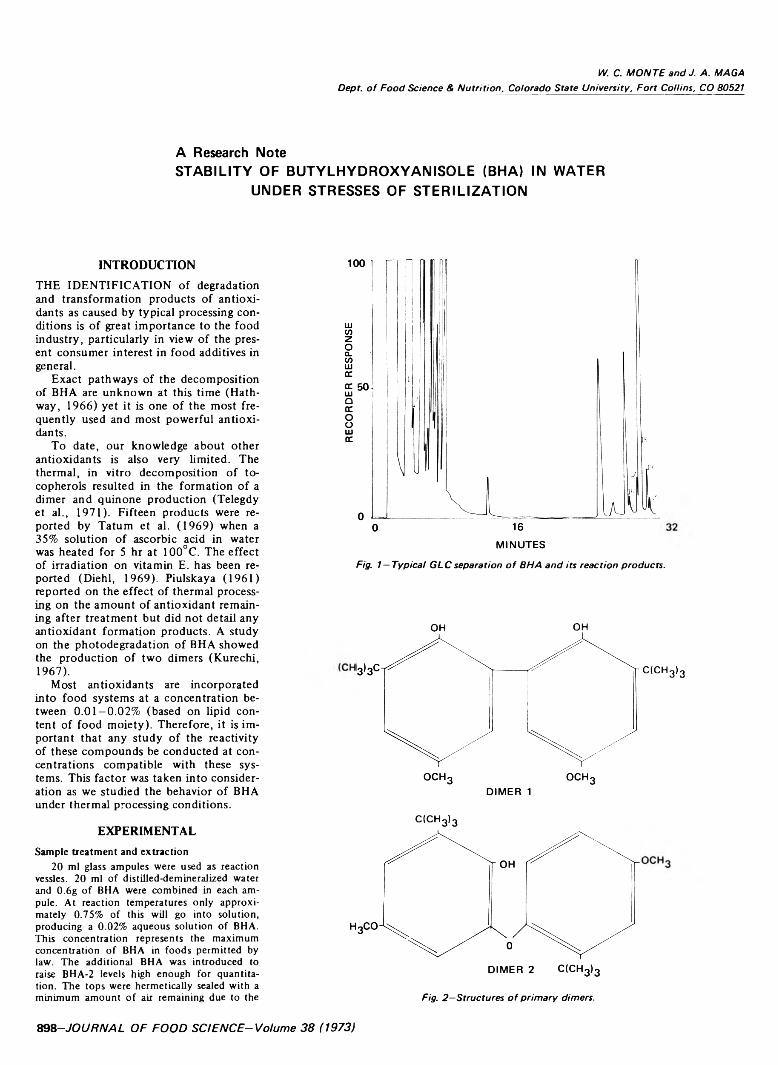
W. C. M O N T E and J. A. MAGA Dept. o f Food Science & N utrition , Colorado State University, F o rt Collins, CO 80521
A Research NoteSTABILITY OF BUTYLHYDROXYANISOLE (BHA) IN WATER
UNDER STRESSES OF STERILIZATION
INTRODUCTIONTHE IDENTIFICATION of degradation and transformation products of antioxidants as caused by typical processing conditions is of great importance to the food industry, particularly in view of the present consumer interest in food additives in general.
Exact pathways of the decomposition of BHA are unknown at this time (Hath- way, 1966) yet it is one of the most frequently used and most powerful antioxidants.
To date, our knowledge about other antioxidants is also very limited. The thermal, in vitro decomposition of to- copherols resulted in the formation of a dimer and quinone production (Telegdy et al., 1971). Fifteen products were reported by Tatum et al. (1969) when a 35% solution of ascorbic acid in water was heated for 5 hr at 100°C. The effect of irradiation on vitamin E. has been reported (Diehl, 1969). Piulskaya (1961) reported on the effect of thermal processing on the amount of antioxidant remaining after treatment but did not detail any antioxidant formation products. A study on the photodegradation of BHA showed the production of two dimers (Kurechi,1967).
Most antioxidants are incorporated into food systems at a concentration between 0.01—0.02% (based on lipid content of food moiety). Therefore, it is important that any study of the reactivity of these compounds be conducted at concentrations compatible with these systems. This factor was taken into consideration as we studied the behavior of BHA under thermal processing conditions.
EXPERIMENTALSample treatment and extraction
20 ml glass ampules were used as reaction vessles. 20 ml o f distilled-demineralized water and 0.6g o f BHA were combined in each ampule. At reaction temperatures only approximately 0.75% of this will go into solution, producing a 0.02% aqueous solution of BHA. This concentration represents the maximum concentration o f BHA in foods permitted by law. The additional BHA was introduced to raise BHA-2 levels high enough for quantitation. The tops were hermetically sealed with a minimum amount o f air remaining due to the
Fig. 1 —Typical G LC separation o f BHA and its reaction products.
OH OH
c <c h 3>3
C(C H 3)3
Fig. 2 —Structures o f prim ary dimers.
898-JOURNAL OF FOOD SCIENCE-Volume 38 (1973)
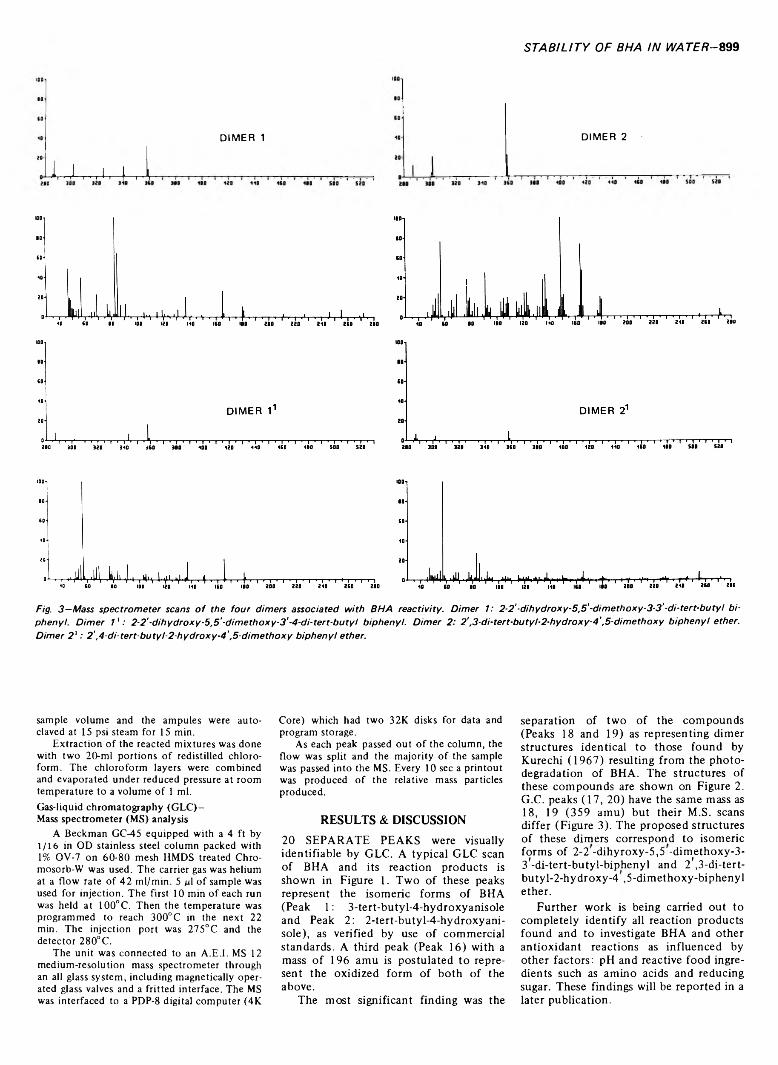
STABILITY OF BHA IN WATER- 899
,1,,,J , . , i , -u X
DIMER 1 DIMER 2
Fig. 3 —Mass spectrometer scans o f the four dimers associated with BHA reactivity. Dim er 1: 2 -2 '-d ihydroxy-5,5'-dim ethoxy-3-3'-di-tert-butyi b iphenyl. D im er 1 1: 2-2 '-dihydroxy-5,5 '-dim ethoxy-3'-4-d i-tert-butyt biphenyl. D im er 2: 2',3-di-tert-butyl-2-hydroxy-4',5-dim ethoxy biphenyl ether. Dim er 2 ' : 2 ',4-d i-tert-butyl-2-hydroxy-4',5-d im ethoxy biphenyl ether.
sample volume and the ampules were autoclaved at 15 psi steam for 15 min.
Extraction o f the reacted mixtures was done with two 20-ml portions o f redistilled chloroform. The chloroform layers were combined and evaporated under reduced pressure at room temperature to a volume o f 1 ml.Gas-liquid chromatography (G L C )- Mass spectrometer (MS) analysis
A Beckman GC-45 equipped with a 4 ft by 1/16 in OD stainless steel column packed with 1% OV-7 on 60-80 mesh HMDS treated Chro- mosorb-W was used. The carrier gas was helium at a flow rate o f 42 ml/min. 5 #d o f sample was used for injection. The first 10 min o f each run was held at 100°C. Then the temperature was programmed to reach 300°C in the next 22 min. The injection port was 275°C and the detector 280° C.
The unit was connected to an A.E.I. MS 12 medium-resolution mass spectrometer through an all glass system, including magnetically operated glass valves and a fritted interface. The MS was interfaced to a PDP-8 digital computer (4K
Core) which had two 32K disks for data and program storage.
As each peak passed out o f the column, the flow was split and the majority o f the sample was passed into the MS. Every 10 sec a printout was produced o f the relative mass particles produced.
RESULTS & DISCUSSION20 SEPARATE PEAKS were visually identifiable by GLC. A typical GLC scan of BHA and its reaction products is shown in Figure 1. Two of these peaks represent the isomeric forms of BHA (Peak 1: 3-tert-butyl-4-hydroxyanisoleand Peak 2: 2-tert-butyl-4-hydroxyani- sole), as verified by use of commercial standards. A third peak (Peak 16) with a mass of 196 amu is postulated to represent the oxidized form of both of the above.
The most significant finding was the
separation of two of the compounds (Peaks 18 and 19) as representing dimer structures identical to those found by Kurechi (1967) resulting from the photodegradation of BHA. The structures of these compounds are shown on Figure 2.G.C. peaks (17, 20) have the same mass as 18, 19 (359 amu) but their M.S. scans differ (Figure 3). The proposed structures of these dimers correspond to isomeric forms of 2-2 -dihyroxy-5,5 -dimethoxy-3- s ’-di-tert-butyl-biphenyl and 2’,3-di-tert- butyl-2-hydroxy-4 ,5-dimethoxy-biphenyl ether.
Further work is being carried out to completely identify all reaction products found and to investigate BHA and other antioxidant reactions as influenced by other factors: pH and reactive food ingredients such as amino acids and reducing sugar. These findings will be reported in a later publication.

900-JOURNAL OF FOOD SCIENCE-Volume 38 (1973)
CONCLUSION
UNDER NORMAL circumstances of concentration and time and temperature of thermal processing the food antioxidant BHA undergoes extensive rearrangement and condensation. The possible health significance of these newly formed products is not known at this time. However, rat feeding studies involving the synthesized dimers is currently under way.
REFERENCESD ieh l, J .F . 1 9 7 0 . O n th e e f fe c t o f irradiation on
V itam in E in fo o d s , o n to c o p h er o l and on to c o p h er o l a ceta te in flu en ce o f d ifferen t rad iation c o n d it io n s . Z. L eb en sm itte l-U n ter su ch U . F orsch . 1 4 2 : 1.
H ath w ay, D.W . 1 9 6 6 . M etab olic fa te in an im als o f h in dered p h en o lic a n tio x id a n ts in relatio n to th eir sa fe ty eva lu ation and a n t io x idan t fu n c tio n . A dv. in F o o d R es. 16: 1.
K urechi, T . 1 9 6 7 . S tu d ies o n th e a n tio x id a n ts.4 . P h otod egrad ation o f b u ty l h y d ro x y a n i- so le . J. H ygien e C hem . 13: 1 9 1 .
P iu lskaya, V .l . 1 9 6 2 . T he e ffe c t o f gam m a-rays and th erm al p rocessin g o n th e d estru ctio n
o f a n tio x id a n ts in lard. V ap rosy Pitaniya U S S R . 21 : 6 5 .
T atu m , J .H ., Sh aw , P .E . and Berry, R .E . 1969. D egrad ation p ro d u cts from ascorb ic acid. J. Agr. F o o d C hem . 17: 38 .
T eleg d y , R .A ., K ovats, L . and L aszio , B. 1971. In vitro d e c o m p o s it io n o f to co p h ero ls . Perio d . P o ly tech . C hem . 15 : 23 .
Ms received 4 /6 /7 3 ; a c cep ted 5 /1 5 /7 3 .
S c ien tific series paper n o . 1 7 6 7 o f th e Colorado S ta te U n iversity E xp erim en t S ta tio n .
T his s tu d y w as su p p orted in part b y a Biom ed ica l S c ien ce S u p p ort G rant to C olorado S ta te U n iversity from th e N ation a l In stitu tes of H ealth , D iv. o f R esearch R esou rces.
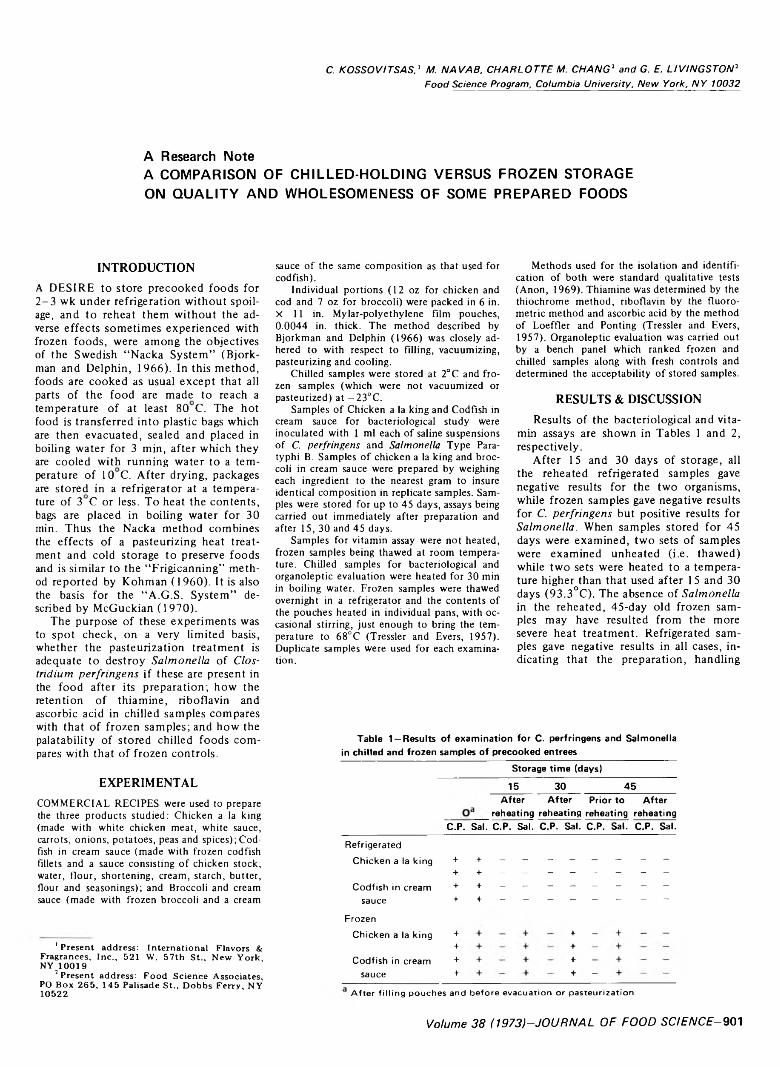
C. KOSSO VITSAS, ' M. N A V A B , C H A R L O T T E M. C H A N G 2 and G. E. L IV IN G S T O N 7 Food Science Program, Columbia University, N ew York, N Y 10032
A Research NoteA COMPARISON OF CHILLED-HOLDING VERSUS FROZEN STORAGE ON QUALITY AND WHOLESOMENESS OF SOME PREPARED FOODS
INTRODUCTIONA DESIRE to store precooked foods for2 -3 wk under refrigeration without spoilage, and to reheat them without the adverse effects sometimes experienced with frozen foods, were among the objectives of the Swedish “Nacka System” (Bjork- man and Delphin, 1966). In this method, foods are cooked as usual except that all parts of the food are made to reach a temperature of at least 80 C. The hot food is transferred into plastic bags which are then evacuated, sealed and placed in boiling water for 3 min, after which they are cooled with running water to a temperature of 10 C. After drying, packages are stored in a refrigerator at a temperature of 3 C or less. To heat the contents, bags are placed in boiling water for 30 min. Thus the Nacka method combines the effects of a pasteurizing heat treatment and cold storage to preserve foods and is similar to the “Frigicanning” method reported by Kohman (1960). It is also the basis for the “A.G.S. System” described by McGuckian (1970).
The purpose of these experiments was to spot check, on a very limited basis, whether the pasteurization treatment is adequate to destroy Salm onella of Clostrid ium perfringens if these are present in the food after its preparation; how the retention of thiamine, riboflavin and ascorbic acid in chilled samples compares with that of frozen samples; and how the palatability of stored chilled foods compares with that of frozen controls.
EXPERIMENTALCOMMERCIAL RECIPES were used to prepare the three products studied: Chicken a la king (made with white chicken meat, white sauce, carrots, onions, potatoes, peas and spices)¡Codfish in cream sauce (made with frozen codfish fillets and a sauce consisting o f chicken stock, water, flour, shortening, cream, starch, butter, flour and seasonings); and Broccoli and cream sauce (made with frozen broccoli and a cream
' Present address: In tern ation al Flavors & Fragrances, In c., 521 W. 5 7 th S t ., N ew Y ork, NY 1 0 0 1 9
2 Present address: F o o d S c ien ce A ssoc ia tes, PO B ox 2 6 5 , 1 4 5 Palisade S t ., D ob b s Ferry, NY 1 0 5 2 2
sauce o f the same composition as that used for codfish).
Individual portions (12 oz for chicken and cod and 7 oz for broccoli) were packed in 6 in. x 11 in. Mylar-polyethylene film pouches, 0.0044 in. thick. The method described by Bjorkman and Delphin (1966) was closely adhered to with respect to filling, vacuumizing, pasteurizing and cooling.
Chilled samples were stored at 2°C and frozen samples (which were not vacuumized or pasteurized) at -2 3 °C .
Samples o f Chicken a la king and Codfish in cream sauce for bacteriological study were inoculated with 1 ml each o f saline suspensions of C. perfringens and Salmonella Type Paratyphi B. Samples o f chicken a la king and broccoli in cream sauce were prepared by weighing each ingredient to the nearest gram to insure identical composition in replicate samples. Samples were stored for up to 45 days, assays being carried out immediately after preparation and after 15, 30 and 45 days.
Samples for vitamin assay were not heated, frozen samples being thawed at room temperature. Chilled samples for bacteriological and organoleptic evaluation were heated for 30 min in boiling water. Frozen samples were thawed overnight in a refrigerator and the contents o f the pouches heated in individual pans, with occasional stirring, just enough to bring the temperature to 68°C (Tressler and Evers, 1957). Duplicate samples were used for each examination.
Methods used for the isolation and identification of both were standard qualitative tests (Anon, 1969). Thiamine was determined by the thiochrome method, riboflavin by the fluoro- metric method and ascorbic acid by the method of Loeffler and Ponting (Tressler and Evers,1957). Organoleptic evaluation was carried out by a bench panel which ranked frozen and chilled samples along with fresh controls and determined the acceptability o f stored samples.
RESULTS & DISCUSSIONResults of the bacteriological and vita
min assays are shown in Tables 1 and 2, respectively.
After 15 and 30 days of storage, all the reheated refrigerated samples gave negative results for the two organisms, while frozen samples gave negative results for C. perfringens but positive results for Salm onella. When samples stored for 45 days were examined, two sets of samples were examined unheated (i.e. thawed) while two sets were heated to a temperature higher than that used after 15 and 30 days (93.3°C). The absence of Salm onella in the reheated, 45-day old frozen samples may have resulted from the more severe heat treatment. Refrigerated samples gave negative results in all cases, indicating that the preparation, handling
T a b le 1 —R e s u l t s o f e x a m in a t i o n f o r C . p e r f r in g e n s a n d S a lm o n e l la in c h i l le d a n d f r o z e n s a m p le s o f p r e c o o k e d e n t r e e s
S to r a g e t i m e (d a y s )
15 30 4 5A f te r A f t e r P r io r t o A f te r
r e h e a t in g r e h e a t in g r e h e a t in g r e h e a t in gC .P . S a l. C .P . S a l. C .P . S a l. C .P . S a l . C .P . S a l.
Refrigerated
C h ick e n a la king
C o d fish in cream sauce
Fro zen
C h ick e n a la king
C o d fish in cream sauce
++++
++++
++++
+ -+++ -
A fte r f illin g pouches and before evacuation or pasteurization
Volume 38 (19731-JOURNAL OF FOOD SCIENCE- 901
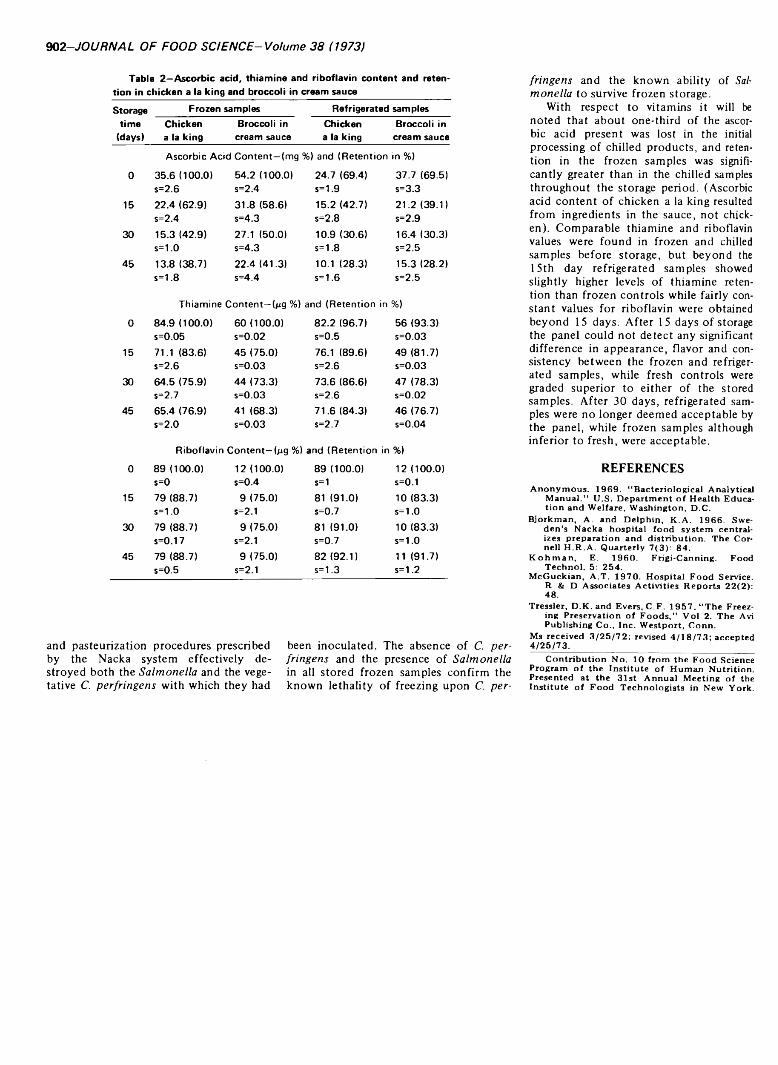
902-JOURNAL OF FOOD SCIENCE-Volume 38 (1973)
T a b le 2 —A s c o r b i c a c id , t h i a m i n e a n d r ib o f la v in c o n t e n t a n d r e te n -
t i o n in c h i c k e n a la k in g a n d b r o c c o l i in c r e a m s a u c e
S to r a g et i m e
(d a y s )
F r o z e n s a m p le s R e f r ig e r a te d s a m p le s
C h ic k e n a la k in g
B ro c c o l i in c r e a m s a u c e
C h ic k e n a la k in g
B ro c c o l i in c r e a m s a u c e
A s c o r b i c A c id C o n t e n t — (mg % ) a n d ( R e t e n t i o n in %)
0 3 5 .6 (1 0 0 .0 ) 5 4 .2 ( 1 0 0 .0 ) 2 4 .7 ( 6 9 .4 ) 3 7 .7 (6 9 .5 )
s = 2 .6 s = 2 .4 s = 1 .9 s = 3 .3
1 5 2 2 .4 ( 6 2 .9 ) 3 1 .8 ( 5 8 .6 ) 1 5 .2 ( 4 2 .7 ) 2 1 .2 ( 3 9 .1 )
s = 2 .4 s = 4 .3 s = 2 .8 s = 2 .9
3 0 1 5 .3 ( 4 2 .9 ) 2 7 .1 (5 0 .0 ) 1 0 .9 ( 3 0 .6 ) 1 6 .4 ( 3 0 .3 )s = 1 .0 s = 4 .3 s = 1 .8 s = 2 .5
4 5 1 3 .8 ( 3 8 .7 ) 2 2 .4 ( 4 1 .3 ) 1 0 .1 ( 2 8 .3 ) 1 5 .3 ( 2 8 .2 )
s = 1 .8 s = 4 .4 s = 1 .6 s = 2 .5
T h i a m in e C o n t e n t — (pg % ) a n d ( R e te n t io n in %)
0 8 4 .9 ( 1 0 0 .0 ) 6 0 ( 1 0 0 .0 ) 8 2 . 2 ( 9 6 .7 ) 5 6 ( 9 3 .3 )s = 0 .0 5 s = 0 .0 2 s = 0 .5 s = 0 .0 3
1 5 7 1 .1 ( 8 3 .6 ) 4 5 ( 7 5 .0 ) 7 6 .1 ( 8 9 .6 ) 4 9 ( 8 1 .7 )
s = 2 .6 s = 0 .0 3 s = 2 .6 s = 0 .0 3
3 0 6 4 .5 ( 7 5 .9 ) 4 4 ( 7 3 .3 ) 7 3 .6 ( 8 6 .6 ) 4 7 (7 8 .3 )s = 2 .7 s = 0 .0 3 s = 2 .6 s = 0 .0 2
4 5 6 5 .4 ( 7 6 .9 ) 4 1 ( 6 8 .3 ) 7 1 .6 ( 8 4 .3 ) 4 6 (7 6 .7 )
s = 2 .0 s = 0 .0 3 s = 2 .7 s = 0 .0 4
R ib o f la v in C o n t e n t — (pg % ) a n d ( R e t e n t i o n in %)
0 8 9 ( 1 0 0 .0 ) 1 2 ( 1 0 0 .0 ) 8 9 (1 0 0 .0 ) 1 2 ( 1 0 0 .0 )s = 0 s = 0 .4 s=1 s = 0 .1
1 5 7 9 ( 8 8 .7 ) 9 ( 7 5 .0 ) 81 ( 9 1 .0 ) 1 0 ( 8 3 .3 )s = 1 .0 s= 2 .1 s = 0 .7 s = 1 .0
3 0 7 9 (8 8 .7 ) 9 ( 7 5 .0 ) 8 1 ( 9 1 .0 ) 1 0 ( 8 3 .3 )s = 0 .1 7 s= 2 .1 s = 0 .7 s = 1 .0
4 5 7 9 ( 8 8 .7 ) 9 ( 7 5 .0 ) 8 2 ( 9 2 .1 ) 11 ( 9 1 .7 )
s = 0 .5 s= 2 .1 s = 1 .3 s = 1 .2
and pasteurization procedures prescribed by the Nacka system effectively destroyed both the S a lm o n e lla and the vegetative C. p e r fr in g e n s with which they had
been inoculated. The absence of C. p e r f r in g e n s and the presence of S a lm o n e lla in ail stored frozen samples confirm the known lethality of freezing upon C. p e r
f r in g e n s and the known ability of Salm o n e lla to survive frozen storage.
With respect to vitamins it will be noted that about one-third of the ascorbic acid present was lost in the initial processing of chilled products, and retention in the frozen samples was significantly greater than in the chilled samples throughout the storage period. (Ascorbic acid content of chicken a la king resulted from ingredients in the sauce, not chicken). Comparable thiamine and riboflavin values were found in frozen and chilled samples before storage, but beyond the 15th day refrigerated samples showed slightly higher levels of thiamine retention than frozen controls while fairly constant values for riboflavin were obtained beyond 15 days. After 1 5 days of storage the panel could not detect any significant difference in appearance, flavor and consistency between the frozen and refrigerated samples, while fresh controls were graded superior to either of the stored samples. After 30 days, refrigerated samples were no longer deemed acceptable by the panel, while frozen samples although inferior to fresh, were acceptable.
REFERENCESA n o n y m o u s . 1 9 6 9 . “ B a cter io log ica l A nalytical
M anual.” U .S . D ep artm en t o f H ealth E ducat io n and W elfare, W ash ington , D .C .
Bjorkm an, A . and D e lp h in , K .A . 1 9 6 6 . Sw ed e n ’s N acka h o sp ita l fo o d sy stem centralizes p reparation and d is tr ib u tio n . T he Cornell H .R .A . Q uarterly 7 (3 ): 8 4 .
K o h m a n , E. 1 9 6 0 . Frigi-C anning. F ood T ech n o l. 5: 2 5 4 .
M cG uckian, A .T . 1 9 7 0 . H osp ita l F o o d Service. R & D A sso c ia te s A ctiv ities R ep orts 2 2 (2 ): 48 .
T ressler, D .K . and Evers, C .F . 1 9 5 7 . “ T he Freezing P reservation o f F o o d s ,” V o l 2. T he Avi Pu blish in g C o ., Inc. W estport, C onn.
Ms received 3 /2 5 /7 2 ; revised 4 /1 8 /7 3 ; accepted 4 /2 5 /7 3 ._________________________________________
C o n tr ib u tio n N o . 1 0 from th e F o o d Science Program o f th e In stitu te o f H um an N u tr ition . Presented at th e 3 1 s t A nnu al M eeting o f the In stitu te o f F o o d T ech n o lo g is ts in N ew York.

H. S. L IL L A R D . A. A . KLOSE. R. I. H E G G E and V IC TO R CHEW USDA Richard B. Russell A gricultural Research Center, A R S. P.O. Box 5677, Athens, GA 30604
A Research NoteMICROBIOLOGICAL COMPARISON OF STEAM- (AT SUB-ATMOSPHERIC PRESSURE)
AND IMMERSION-SCALDED BROILERS
T a b le 1 —I n c id e n c e o f C. perfringens in b r o i l e r p a r t s p r i o r t o s c a ld in g a n d a f t e r w a t e r o r s u b - a tm o s p h e r i c s te a m s c a ld in g
S a m p le
S a m p l in g p o i n t
B le e d in g l in e ( p r io r t o s c a ld in g )
A f t e r w a te r s c a ld in g
A f t e r
s u b - a tm o s p h e r i c s t e a m s c a ld in g
N o .p o s i t i v e / t o t a l %
N o .p o s i t i v e / t o t a l %
N o .p o s i t i v e / t o t a l %
H e a r t 0 / 2 6 0 1 /2 6 3 .8 0 / 3 7 0Liver 0 / 2 6 0 0 / 2 6 0 0 / 3 7 0Lungs 2 / 2 6 7 .7 1 5 /2 6 5 7 .7 2 / 3 7 5 .4F le s h 0 / 2 6 0 0 / 2 6 0 0 / 3 7 0
INTRODUCTIONBACTERIOLOGICAL problems inherent in commercial scalding of poultry by submersion in water as commonly practiced are generally recognized. Lillard (1973) showed that water scalding of broilers by submersion results in contamination of the respiratory and circulatory systems and, consequently, the edible parts with microorganisms, including C. perfringens, present in the scald water. Since contaminants disseminated to the edible parts of the carcass via the respiratory and circulatory systems during submersion scalding probably are not removed or destroyed during processing, a feasible alternate method is needed.
Steam scalding at atmospheric pressure has been used successfully in turkey- and fowl-processing plants but has not proven entirely satisfactory for broilers which require lower, well-controlled temperatures to maintain skin quality and appearance.
Klose et al. (1971) and Kaufman et al.(1972) suggested the use of steam at sub-atmospheric pressures for scalding broilers. Their results show that contamination of air sacs with aerobic microorganisms is lower for birds scalded with steam at sub-atmospheric pressures than for birds scalded by submersion in water. The present study was undertaken to compare the efficacy of water scalding and sub-atmospheric steam scalding of broilers with regard to contamination of edible parts of broiler carcasses with both aerobic and anaerobic microorganisms.
MATERIALS & METHODSBROILERS were taken from a U.S. Dept, of Agriculture-inspected commercial processing plant. From four to six broilers were taken at each of three sampling points on each sampling day: (1) live broilers at the dock for sub-atmospheric steam scalding in our pilot plant; (2) broilers from the 75-sec bleeding line prior to water scalding; and (3) carcasses immediately after water scalding at 58°C for 120 sec. All birds were stunned by electric shock and killed by an automatic killer using the standard cut.
Sub-atmospheric steam scalding was accomplished by 2-min exposure of 60-sec-bled birds in a chamber having a flowing steam atmosphere maintained at 53°C and an absolute steam pressure of 2.1 lb/sq in. (0.14 kg/sq cm) (Klose et al., 1971). The 60 sec bleeding time
was used as a more severe treatment than the 75 sec bleeding time used in the processing plant. Adequacy of this scalding procedure for complete feather removal without serious skin abrasion was confirmed on each sampling day
NUMBER OF AEROBIC MICROORGANISMS/g LUNG TISSUE
Fig. 1 —Distribution o f counts o f aerobic m icroorganisms from lungs o f broilers p rio r to scalding, after water scalding and after sub-atmospheric scalding.
by including at least three birds that were scalded and picked in a free-floating, cyclic, rubber-fingered picking machine. Birds used for bacteriological sampling were scalded but not picked. Samples of hearts, liver and flesh were taken as described by Lillard (1973). Lungs were removed dorsally after flame-sterilizing the surface of the skinned carcass with a bunsen burner. C. perfringens was isolated by enrichment techniques described by Lillard (1971).1-g samples were used in making decimal dilutions for total counts. Peptone (0.5%) was used as a diluent and pour plates (Plate Count Agar, Difco) were incubated at 35°C for 48 hr.
RESULTS & DISCUSSIONBECAUSE it was shown that contamination of the respiratory system (lungs) of broilers with microorganisms present in scald water is the most likely cause of contamination of the circulatory system and edible parts of poultry (Lillard,1973), and that C. perfringens is present in water from commercial scald tanks (Lillard 1971, 1973), lungs of broilers were selected as samples indicative of the degree of contamination due to scalding. Although lungs are removed during proc- essing, portions of the connected air sac system remain with the edible carcass and contain contaminants introduced through the lungs.
Table 1 shows that C. perfringens is isolated more frequently from lungs of water-scalded broilers than from lungs of broilers prior to water scalding or of broilers scalded by steam at sub-atmospheric pressures. About 58% of lungs
Volume 38 (1973)—JOURNAL OF FOOD SCIENCE-903
904—JOURNAL OF FOOD SCIENCE-Volume 38 H973)
( 15/26 ) from water-scalded broilers were positive for C. perfringens, whereas only 7.7% of lungs ( 2/26 ) sampled prior to scalding, and 5.4% of lungs (2/37) sampled after sub-atmospheric steam scalding were positive for C. perfringens. The difference between is /26 and 2/26 is statistically significant at the 0.1% level. C. perfringens was isolated frequently from scald water in this processing plant. On sampling days when C. perfringens was not isolated from scald water, lungs of all water-scalded birds were negative.
C. perfringens was not isolated from samples of liver or flesh of broilers taken prior to scalding nor after sub-atmospheric steam or water scalding. Only one of the 26 samples of hearts was positive after water scalding, whereas none of the 26 hearts sampled from the bleeding line and none of the 37 hearts sampled after sub-atmospheric steam scalding was positive for C. perfringens.
The highest counts of aerobic microorganisms from lung samples were obtained from samples that also showed a high incidence of C. perfringens. Figure 1 shows the distribution of counts from lung samples of broilers prior to scalding, after water scalding and after scalding with steam at sub-atmospheric pressure, corresponding to mean logs and standard errors respectively of 3.51 ± 0.24, 5.53 ±
0.24 and 3.25 ± 0.24. Statistical analysis of the data using both parametric and nonparametric tests (analysis of variance of the logarithms and Friedman’s test extended to the case of several observations per experimental unit) showed a significant difference at the 0.1% level in counts from lungs of water-scalded broilers compared to counts from lungs of broilers from the bleeding line or after scalding with steam at sub-atmospheric pressure. These results confirm and extend results reported by Kaufman et al. (1972). No significant difference was found in counts between lungs of broilers from the bleeding line and from lungs after sub-atmospheric steam scalding. About 89% of lungs from the bleeding line (32/36) and 82% of lungs after sub-atmospheric steam scalding (36/44) had counts below 30,000/g whereas 97% (34/35) of lung samples from water-scalded broilers had counts over 30,000/g.
Total counts from samples of flesh, heart and liver were almost all <300/g. These samples were taken from each of 30 broilers prior to scalding, 30 after water scalding and 36 after sub-atmospheric steam scalding. These results confirm the previous report by Lillard (1973) which showed that, though contaminants present in scald water may be disseminated in the carcass during scalding, the level
found in edible parts was low and enrichment techniques had to be used for detection. The incidence of C. perfringens isolated from edible parts of water-scalded carcasses in this commercial processing plant also was lower than that reported in the previous study (Lillard, 1973). This suggests great variability in the contaminating effect of different immersion- scalding systems. Although the level of contamination in edible parts is low, the high level of contamination in lungs of immersion-scalded broilers should be of some concern. Even though lungs are normally removed, air sacs are left in the carcass.
REFERENCESK au fm a n , V .F . , K lose, A .A ., B ayne, H .G ., Pool,
M .F . and L inew eaver, H . 1 9 7 2 . P lant processing o f sub-atm ospheric steam scalded p o u ltry . P o u ltry Sci. 5 1 : 1 1 8 8 .
K lose, A .A ., K a u fm a n , V .F . and P oo l, M .F.1 9 7 1 . Scalding p o u ltry by steam at sub- atm ospheric pressures. P o u ltry Sci. 5 0 : 302.
L illa rd , H .S . 1 9 7 1 . Occurrence o f C lostridium perfringens in b ro ile r processing and further processing operations. J. F o o d Sci. 36: 1 0 0 8 .
L illa rd , H .S . 1 9 7 3 . C o n ta m in a tio n o f blood system and edib le parts o f p o u ltry with C los trid ium perfringens during w ate r scalding. J. F o o d Sci. 3 8 : 1 5 1 .
Ms received 3 /2 3 /7 3 ; revised 5 /1 9 /7 3 ; accepted 5 /2 2 /7 3 . _ ________ ______________
The authors th a n k H .W . Y o d e r and H.S. Siegel o f the Southeast P o u ltry Research Lab. fo r th e ir h e lp fu l discussion.
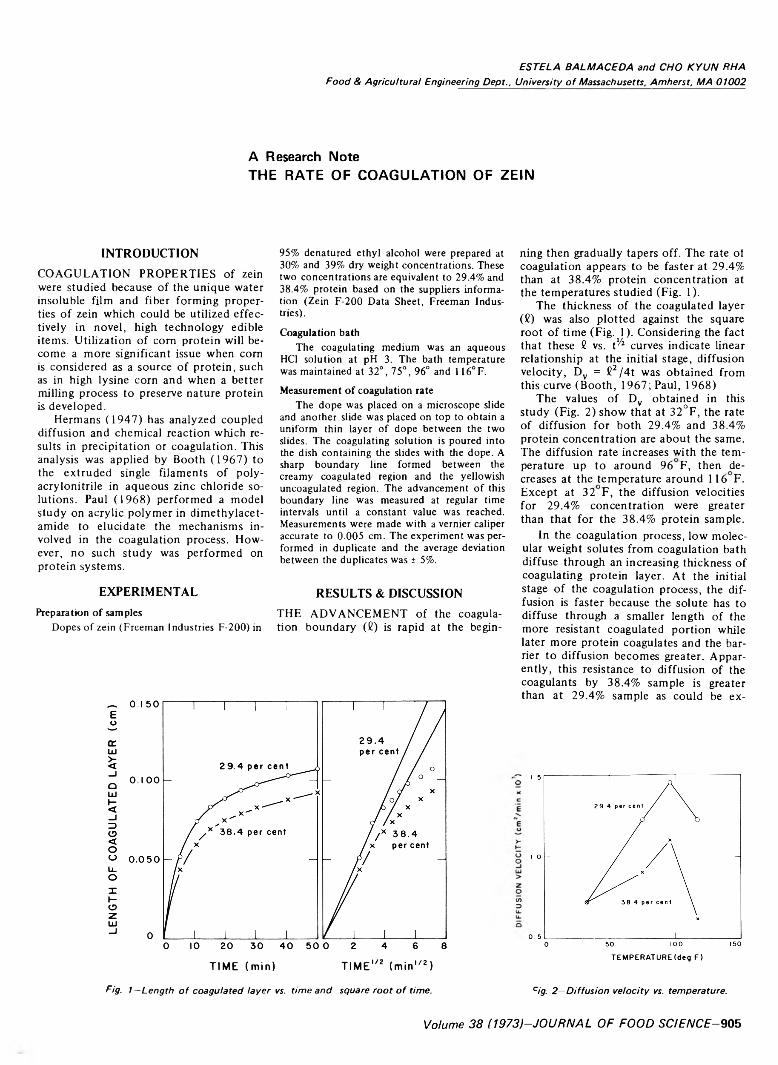
ESTELA B A LM A C E D A and C H O K Y U N RHA Food & Agricultural Engineering Dept., University o f Massachusetts, Amherst, M A 01002
A Research NoteTHE RATE OF COAGULATION OF ZEIN
INTRODUCTIONCOAGULATION PROPERTIES of zein were studied because of the unique water insoluble film and fiber forming properties of zein which could be utilized effectively in novel, high technology edible items. Utilization of com protein will become a more significant issue when corn is considered as a source of protein, such as in high lysine corn and when a better milling process to preserve nature protein is developed.
Hermans (1947) has analyzed coupled diffusion and chemical reaction which results in precipitation or coagulation. This analysis was applied by Booth (1967) to the extruded single filaments of polyacrylonitrile in aqueous zinc chloride solutions. Paul (1968) performed a model study on acrylic polymer in dimethylacet- amide to elucidate the mechanisms involved in the coagulation process. However, no such study was performed on protein systems.
EXPERIMENTAL
95% den atu red e th y l a lco h o l w ere prepared at 30% and 39% dry w e ig h t co n cen tra tio n s . T hese tw o c o n cen tra tio n s are eq u iva len t to 29.4% and 38.4% p ro te in based o n th e suppliers in form atio n (Z ein F -2 0 0 D ata S h ee t , F reem an In d u stries).
Coagulation bathT h e coagu la tin g m ed ium w as an a q u eou s
HC1 so lu tio n at pH 3. T h e b ath tem perature w as m ainta in ed at 3 2 ° , 7 5 ° , 96° and 116° F.
Measurement of coagulation rateT h e d o p e w as p laced on a m icro sco p e slide
and an oth er slide w as p laced on top to o b ta in a u n iform th in layer o f d o p e b e tw een th e tw o slides. T h e coagu la tin g so lu tio n is p oured in to the d ish co n ta in in g the slid es w ith the d o p e . A sharp b ou n dary lin e form ed b e tw een the cream y co agu la ted region and the y e llo w ish u n coagu la ted region . T h e ad van cem en t o f this b ou n dary lin e w as m easured at regular tim e in tervals u n til a co n sta n t value w as reached. M easurem ents w ere m ade w ith a vernier caliper accurate to 0 .0 0 5 cm . T h e ex p er im en t w as perform ed in d u p lica te and the average d ev iation b etw een the d u p lica tes w as ± 5%.
RESULTS & DISCUSSIONPreparation of samples THE ADVANCEMENT of the coagula-
Dopes of zein (Freeman Industries F-200) in tion boundary (C) is rapid at the begin-
TIM E (min) T IM E 1' 2 (min1' 2)
ning then gradually tapers off. The rate ol coagulation appears to be faster at 29.4% than at 38.4% protein concentration at the temperatures studied (Fig. 1).
The thickness of the coagulated layer (fi) was also plotted against the square root of time (Fig. 1). Considering the fact that these fi vs. t^2 curves indicate linear relationship at the initial stage, diffusion velocity, Dy = fi2/4t was obtained from this curve (Booth, 1967; Paul, 1968)
The values of Dv obtained in this study (Fig. 2) show that at 32°F, the rate of diffusion for both 29.4% and 38.4% protein concentration are about the same. The diffusion rate increases with the temperature up to around 96 F, then decreases at the temperature around 116 F. Except at 32 F, the diffusion velocities for 29.4% concentration were greater than that for the 38.4% protein sample.
In the coagulation process, low molecular weight solutes from coagulation bath diffuse through an increasing thickness of coagulating protein layer. At the initial stage of the coagulation process, the diffusion is faster because the solute has to diffuse through a smaller length of the more resistant coagulated portion while later more protein coagulates and the barrier to diffusion becomes greater. Apparently, this resistance to diffusion of the coagulants by 38.4% sample is greater than at 29.4% sample as could be ex-
Fig. 1—Length o f coagulated layer vs. time and square roo t o f time. cig. 2 —Diffusion velocity vs. temperature.
Volume 38 (1973)-JOURNAL OF FOOD SCIENCE-905
906-JOURNAL OF FOOD SCIENCE-Volume 38 (1973)
pected (Li and Gainer, 1968). As the temperature goes up from 32°F to 75°F to 96°F, diffusion of the coagulant solutes increases, hence the increase in the rate of coagulation. However, there is a sudden drop in the diffusion velocities from 96 F to 116 F which would indicate a conflicting mechanism like thermal coagulation.
CONCLUSIONSTHE COAGULATION data were ana
lyzed assuming a diffusion-limited chemical reaction and values of a parameter Dv which describes the boundary advancement were obtained. Dv ranged from 6.40 x 10'4cm2/min to 14.40 x 10‘4cm2/min (with maximum around 96°F) for 29.4% and 38.4% protein dope at 32°F, 70°F, 96°F and 116°F.
REFERENCESB ooth , J .R . 1 9 6 7 . D iffu s io n -lim ite d coagulation
o f w et-spun single filam ents . In “ F ib e r Spinning and D ra w in g ,” ed. C op lan , M .J ., p. 89, In terscience Publishers, N .Y .
H erm ans, J .J . 1 9 4 7 . D iffu s io n w ith d iscontinuous bo u n d ary . J. C o llo id Sci. 2: 3 87 .
H uang, F . and R h a , C .K . 1 9 7 1 . Rheological properties o f single cell p ro te in concentrate: D ope fo rm a tio n and flo w behavior. J. Food Sci. 3 6 (7 ) : 1 1 3 1 .
L i, S .N . and G ainer, J .L . 1 9 6 8 . D iffu s io n in p o ly m e r solu tions. In d . & Eng. C hem . Fund. 7 (3 ): 4 33 .
Paul D .R . 1 9 6 8 . D iffu s io n during the coagulatio n step o f w et-spinning. J. A p p . Polym er Sci. 12: 3 83 .
Ms received 5 /2 8 /7 2 ; revised 3 /2 6 /7 3 ; accepted4 /1 /7 3 .
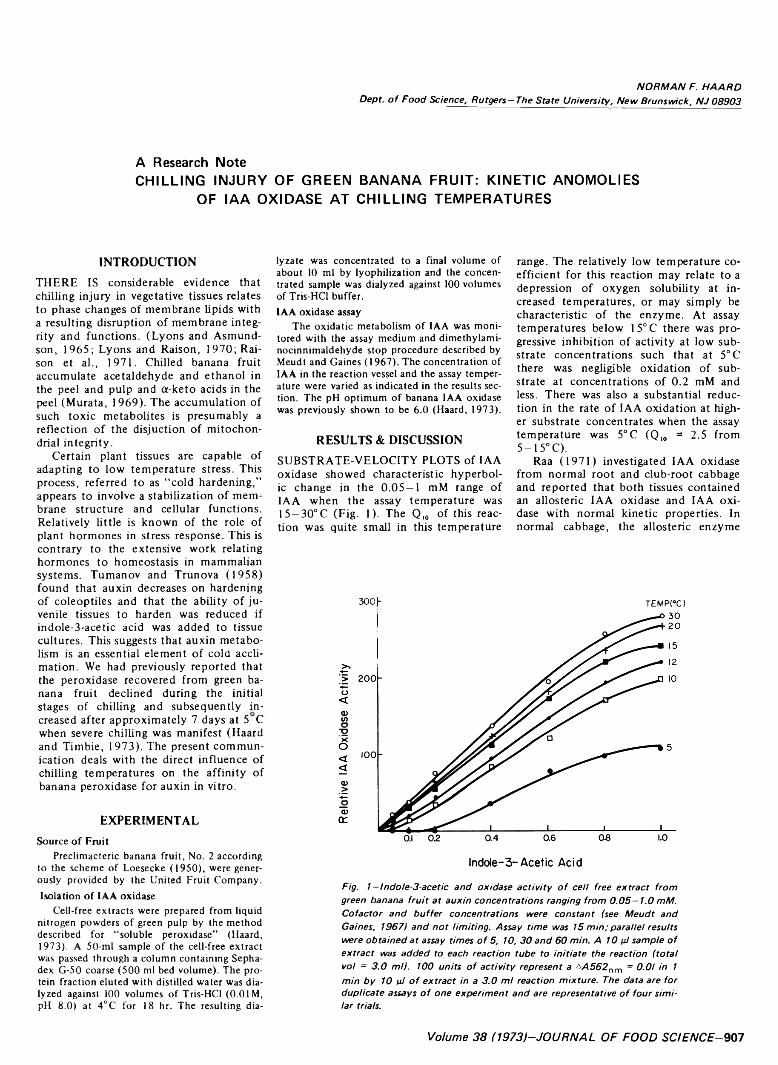
N O R M A N F. H A A R DDept, o f Food Science, R utgers-The State University, N ew Brunswick, N J 08903
A Research NoteCHILLING INJURY OF GREEN BANANA FRUIT: KINETIC ANOMOLIES
OF IAA OXIDASE AT CHILLING TEMPERATURES
INTRODUCTIONTHERE IS considerable evidence that chilling injury in vegetative tissues relates to phase changes of membrane lipids with a resulting disruption of membrane integrity and functions. (Lyons and Asmund- son, 1965; Lyons and Raison, 1970; Raison et al., 1971. Chilled banana fruit accumulate acetaldehyde and ethanol in the peel and pulp and a-keto acids in the peel (Murata, 1969). The accumulation of such toxic metabolites is presumably a reflection of the disjuction of mitochondrial integrity.
Certain plant tissues are capable of adapting to low temperature stress. This process, referred to as “cold hardening,” appears to involve a stabilization of membrane structure and cellular functions. Relatively little is known of the role of plant hormones in stress response. This is contrary to the extensive work relating hormones to homeostasis in mammalian systems. Tumanov and Trunova (1958) found that auxin decreases on hardening of coleoptiles and that the ability of juvenile tissues to harden was reduced if indole-3-acetic acid was added to tissue cultures. This suggests that auxin metabolism is an essential element of cold acclimation. We had previously reported that the peroxidase recovered from green banana fruit declined during the initial stages of chilling and subsequently increased after approximately 7 days at 5 C when severe chilling was manifest (Haard and Timbie, 1973). The present communication deals with the direct influence of chilling temperatures on the affinity of banana peroxidase for auxin in vitro.
EXPERIMENTALSource o f Fruit
Preclimacteric banana fruit, No. 2 according to the scheme of Loesecke (1950), were generously provided by the United Fruit Company. Isolation o f IAA oxidase
Cell-free extracts were prepared from liquid nitrogen powders of green pulp by the method described for “ soluble peroxidase” (Haard,1973). A 50-ml sample of the cell-free extract was passed through a column containing Sepha- dex G-50 coarse (500 ml bed volume). The protein fraction eluted with distilled water was dialyzed against 100 volumes of Tris-HCl (0.01M, pH 8.0) at 4°C for 18 hr. The resulting dia-
lyzate was concentrated to a final volume of about 10 ml by lyophilization and the concentrated sample was dialyzed against 100 volumes of Tris-HCl buffer.IAA oxidase assay
The oxidatic metabolism of IAA was monitored with the assay medium and dimethylami- nocinnimaldehyde stop procedure described by Meudt and Gaines (1967). The concentration of IAA in the reaction vessel and the assay temperature were varied as indicated in the results section. The pH optimum of banana IAA oxidase was previously shown to be 6.0 (Haard, 1973).
RESULTS & DISCUSSIONSUBSTRATE-VELOCITY PLOTS of IAA oxidase showed characteristic hyperbolic change in the 0 .05-1 mM range of IAA when the assay temperature was15-30°C (Fig. 1). The Q10 of this reaction was quite small in this temperature
range. The relatively low temperature coefficient for this reaction may relate to a depression of oxygen solubility at increased temperatures, or may simply be characteristic of the enzyme. At assay temperatures below 15°C there was progressive inhibition of activity at low substrate concentrations such that at 5°C there was negligible oxidation of substrate at concentrations of 0.2 mM and less. There was also a substantial reduction in the rate of IAA oxidation at higher substrate concentrates when the assay temperature was 5°C (Q10 = 2.5 from5-15° C).
Raa (1971) investigated IAA oxidase from normal root and club-root cabbage and reported that both tissues contained an allosteric IAA oxidase and IAA oxidase with normal kinetic properties. In normal cabbage, the allosteric enzyme
300 ( TEMP(°C)
Fig. 1 -lndole-3-acetic and oxidase activity o f cell free extract from green banana fru it a t auxin concentrations ranging from 0 .0 5 —1.0 mM. Cofactor and buffer concentrations mere constant (see M eudt and Gaines, 1967) and n o t lim iting. Assay time mas 15 m in; parallel results mere obtained a t assay times o f 5, 10, 3 0 and 60 min. A 10 pi sample o f extract mas added to each reaction tube to initiate the reaction (total vol = 3 .0 ml). 100 units o f activity represent a aA 5 6 2 nm = 0.01 in 1 m in by 10 pi o f extract in a 3 .0 m l reaction m ixture. The data are for duplicate assays o f one experim ent and are representative o f four similar trials.
Volume 38 (1973)-JOURNAL OF FOOD SCIENCE-907
908-JOURNAL OF FOOD SCIENCE-Volume 38 (1973)
was associated with cell fractions sedimenting at 20,000 and 105,000 x G and in club-root it was soluble. Although Raa assayed at 22° C the sigmoidal nature of substrate-velocity plots observed by us at low temperatures was similar to that exhibited by the “allosteric enzyme” in cabbage. There appears to be no other information available on the response of 1AA oxidase to low temperature.
The response of the IAA oxidase reaction to low temperatures may have a causal relation with chilling injury because ( 1 ) auxin catabolixm has been related to cold acclimation in hardy tissues (Tumanov and Trunova, 1958); (2) the break in linearity of substrate velocity plots occurred at temperatures coincidental with those known to promote chilling
of banana; and (3) auxins appear to exert these physiological effects at low concentrations (Price, 1970).
REFERENCESHaard, N .F . and T im b ie, D . 1 9 7 3 . C hilling in
jury in green banana fru it; C hanges in perox id a se iso zy m es in so lu b le and particu late p o o ls . J. F o o d S ci. (In press).
H aard, N .F . 1 9 7 3 . E m ergence o f p erox id ase asso c ia ted w ith cell p articu lates during ripening o f banana fruit. P h y to ch em . 12 : 55 .
L o eseck e , H. V o n . 1 9 5 0 . “ B ananas” , 2nd ed . In tersc ien ce, N ew Y ork.
L yon s, J.M . and A sm u n d son , C .M . 1 9 6 5 . S o lid ifica t io n o f u n satu red /satu red fa tty acid m ixtu res and its rela tion sh ip to ch illin g sen s itiv ity in p lan ts. J. A m . Oil C hem . S o c . 42: 1 0 5 6 .
L yon s, J.M . and R a ison , J.K . 1 9 7 0 . A tem p erature in d u ced tran sition in m ito ch o n d r ia l o x id a tio n : C ontrasts b e tw e e n warm andc o ld b lo o d ed anim als. C om p. B ioch em . P h ysio l. 42 : 1 0 5 6 .
M eudt, W.J. and G aines, T .P . 1 9 6 7 . S tu d ies on th e o x id a t io n o f in d o le -3 -a ce tic acid by pero x id a se iso zy m es . 1 . C o lor im etr ic determ in a tio n o f in d o le -3 -a ce tic acid oxidation p rod u cts. PI. P h ysio l. 42: 1 3 9 5 .
M urata, T. 1 9 6 9 . P h ysio log ica l and b iochem ical s tu d ies o f ch illin g injury in banana. Physiol. Plan. 22: 4 0 1 .
Price, C .A . 1 9 7 0 . “ M olecu lar A p p roach es to Plant P h y s io lo g y ,” p. 3 0 5 . M cG raw Hill, N ew Y ork.
Raa, J. 1 9 7 1 . In d o le -3 -a ce tic acid leve ls and the role o f in d o le -3 -a ce tic acid o x id a se in the norm al ro o t and c lu b -ro o t o f cabbage. P h ysio l. P lant. 25: 1 3 0 .
R aison , J .K ., L y o n s , J.M . and T h o m so n , W.W.1 9 7 1 . T he in flu en ce o f m em b ran es on the tem p eratu re-in d u ced ch an ges in th e k in etics o f so m e resp iratory en zy m es o f m ito ch o n dria. A rch . B io ch em . B io p h v s. 1 4 2 : 8 3 .
T u m an ov, 1.1. and T ru nova , T .I . 1 9 5 8 . T he e ffe c t o f grow th p rocesses on th e cap acity for hardening. F. Z io l. R ast. 5: 1 0 8 .
Ms received 1 /1 3 /7 3 ; revised 3 /2 2 /7 3 ; accep ted3 /2 7 /7 3 .
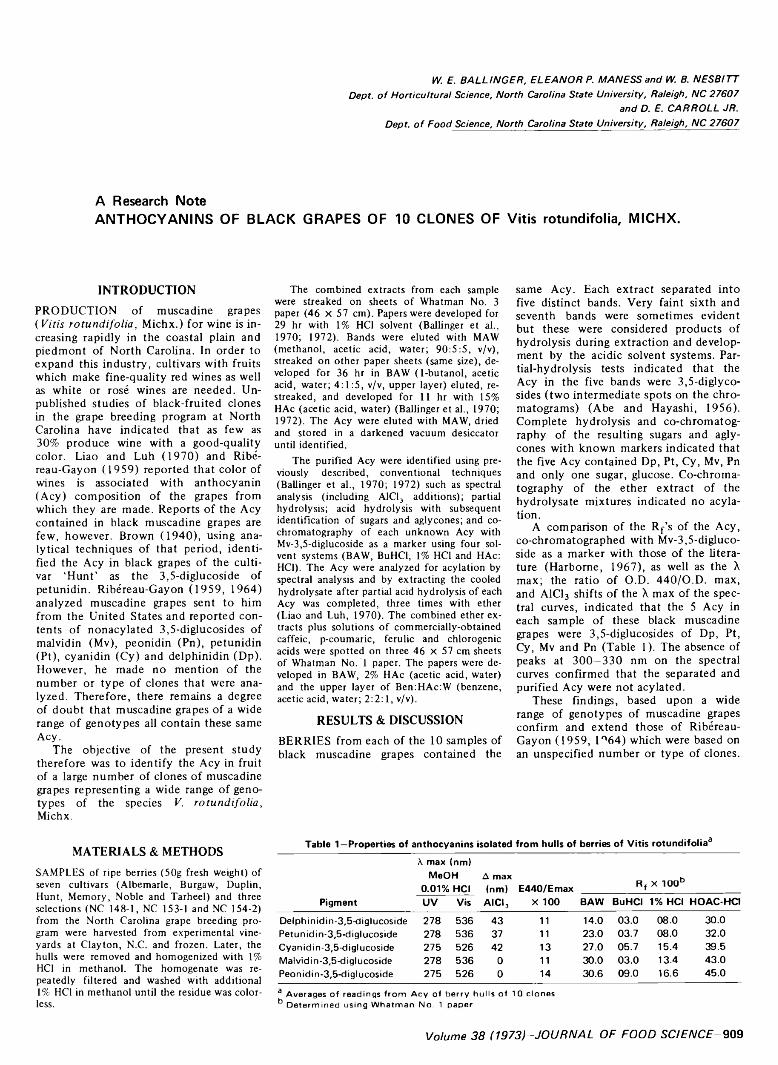
IV. E. B A L L IN G E R . E L E A N O R P. M A N ESS and IV. B. N E S B IT T Dept, o f H orticultural Science, North Carolina State University, Raleigh, N C 27 607
and D. E. C A R R O LL JR. Dept, o f Food Science, North Carolina State University, Raleigh, N C 2 7 6 0 7
A Research NoteANTHOCYANINS OF BLACK GRAPES OF 10 CLONES OF Vitis rotundifolia, MICHX.
INTRODUCTIONPRODUCTION of muscadine grapes ( V itis ro tu n d ifo lia , Michx.) for wine is increasing rapidly in the coastal plain and piedmont of North Carolina. In order to expand this industry, cultivars with fruits which make fine-quality red wines as well as white or rosé wines are needed. Unpublished studies of black-fruited clones in the grape breeding program at North Carolina have indicated that as few as 30% produce wine with a good-quality color. Liao and Luh (1970) and Ribé- reau-Gayon (1959) reported that color of wines is associated with anthocyanin (Acy) composition of the grapes from which they are made. Reports of the Acy contained in black muscadine grapes are few, however. Brown (1940), using analytical techniques of that period, identified the Acy in black grapes of the cultivar ‘Hunt’ as the 3,5-diglucoside of petunidin. Ribéreau-Gayon (1959, 1964) analyzed muscadine grapes sent to him from the United States and reported contents of nonacylated 3,5-diglucosides of malvidin (Mv), peonidin (Pn), petunidin (Pt), cyanidin (Cy) and delphinidin (Dp). However, he made no mention of the number or type of clones that were analyzed. Therefore, there remains a degree of doubt that muscadine grapes of a wide range of genotypes all contain these same Acy.
The objective of the present study therefore was to identify the Acy in fruit of a large number of clones of muscadine grapes representing a wide range of genotypes of the species V. ro tu n d ifo lia , Michx.
MATERIALS & METHODSSAMPLES of ripe berries (50g fresh weight) of seven cultivars (Albemarle, Burgaw, Duplin, Hunt, Memory, Noble and Tarheel) and three selections (NC 148-1, NC 153-1 and NC 154-2) from the North Carolina grape breeding program were harvested from experimental vineyards at Clayton, N.C. and frozen. Later, the hulls were removed and homogenized with 1% HC1 in methanol. The homogenate was repeatedly filtered and washed with additional 1% HC1 in methanol until the residue was colorless.
The combined extracts from each sample were streaked on sheets of Whatman No. 3 paper (46 X 57 cm). Papers were developed for 29 hr with 1% HCI solvent (Ballinger et al., 1970; 1972). Bands were eluted with MAW (methanol, acetic acid, water; 90:5:5, v/v), streaked on other paper sheets (same size), developed for 36 hr in BAW (1-butanol, acetic acid, water; 4:1:5, v/v, upper layer) eluted, re- streaked, and developed for 11 hr with 15% HAc (acetic acid, water) (Ballinger et al., 1970;1972). The Acy were eluted with MAW, dried and stored in a darkened vacuum desiccator until identified.
The purified Acy were identified using previously described, conventional techniques (Ballinger et al., 1970; 1972) such as spectral analysis (including A1C13 additions); partial hydrolysis; acid hydrolysis with subsequent identification of sugars and aglycones; and co- chromatography of each unknown Acy with Mv-3,5-diglucoside as a marker using four solvent systems (BAW, BuHCl, 1% HC1 and HAc: HC1). The Acy were analyzed for acylation by spectral analysis and by extracting the cooled hydrolysate after partial acid hydrolysis of each Acy was completed, three times with ether (Liao and Luh, 1970). The combined ether extracts plus solutions of commercially-obtained caffeic, p-coumaric, ferulic and chlorogenic acids were spotted on three 46 x 57 cm sheets of Whatman No. T paper. The papers were developed in BAW, 2% HAc (acetic acid, water) and the upper layer of Ben:HAc:W (benzene, acetic acid, water; 2:2:1, v/v).
RESULTS & DISCUSSIONBERRIES from each of the 10 samples of black muscadine grapes contained the
same Acy. Each extract separated into five distinct bands. Very faint sixth and seventh bands were sometimes evident but these were considered products of hydrolysis during extraction and development by the acidic solvent systems. Partial-hydrolysis tests indicated that the Acy in the five bands were 3,5-diglycosides (two intermediate spots on the chromatograms) (Abe and Hayashi, 1956). Complete hydrolysis and co-chromatography of the resulting sugars and aglycones with known markers indicated that the five Acy contained Dp, Pt, Cy, Mv, Pn and only one sugar, glucose. Co-chroma- tography of the ether extract of the hydrolysate mixtures indicated no acylation.
A comparison of the Rf’s of the Acy, co-chromatographed with Mv-3,5-digluco- side as a marker with those of the literature (Harbome, 1967), as well as the X max; the ratio of O.D. 4 4 0 /0 .D. max, and AICI3 shifts of the X max of the spectral curves, indicated that the 5 Acy in each sample of these black muscadine grapes were 3,5-diglucosides of Dp, Pt, Cy, Mv and Pn (Table 1). The absence of peaks at 300—330 nm on the spectral curves confirmed that the separated and purified Acy were not acylated.
These findings, based upon a wide range of genotypes of muscadine grapes confirm and extend those of Ribereau- Gayon (1959, 1°64) which were based on an unspecified number or type of clones.
T a b le 1 —P r o p e r t i e s o f a n t h o c y a n i n s i s o la te d f r o m h u l l s o f b e r r ie s o f V i t i s r o t u n d i f o l i a 3
\ m a x (n m )
M e O H A m a x b0 .0 1 % H C I ( n m ) E 4 4 0 / E m a x _____________ R f X 1 0 0
P ig m e n t U V V is a i c i 3 X 1 0 0 B A W B u H C l 1% H CI H O A C -H C I
D elph in id in -3 ,5-d ig lucoside 2 7 8 5 3 6 4 3 11 14.0 0 3 .0 0 8 .0 30 .0Petun id in -3 ,5-d ig luco sid e 278 5 3 6 37 11 2 3 .0 0 3 .7 0 8 .0 32 .0Cyan id in -3 ,5-d ig lu co sid e 275 5 2 6 42 13 2 7 .0 0 5 .7 15 .4 39 .5M alvid in-3,5-d ig lucoside 2 7 8 5 3 6 0 11 3 0 .0 0 3 .0 13 .4 4 3 .0Peonid in-3,5-d ig lucoside 2 7 5 5 2 6 0 14 3 0 .6 0 9 .0 16 .6 4 5 .0
a Averages o f readings from A cy of berry hu lls of 1 0 clones b Determ ined using W hatm an No. 1 paper
Volume 38 (1973)-JOURNAL OF FOOD SCIENCE- 909
910-JOURNAL OF FOOD SCIENCE-Volume 38 (1973)
REFERENCESA b e, Y . and H ayash i, K . 1 9 5 6 . F urther s tu d ies
o n paper ch rom atograp h y o f a n th ocyan in s , in vo lv in g an ex a m in a tio n o f g ly co sid e ty p es b y partia l-h yd rolysis . S tu d ie s o n a n th o cy a n in s. 2 9 . B o t. Mag. T o k y o 6 9 (8 2 2 ) : 5 7 7 .
Ballinger, W .E., M aness, E .P . and K ushm an, L .J.1 9 7 0 . A n th o cy a n in s in ripe fru it o f th e high bush b lu eb erry , V accin iu m corym - b o su m L. J. A m er. S o c . H ort. S ci. 9 5 (3 ): 2 8 3 .
Ballinger, W .E., M aness, E .P ., G alletta , G .J. and
K ushm an, L .J . 1 9 7 2 . A n th o cy a n in s o f ripe fru it o f a “ p in k -fru ited ” hyb rid o f h igh bush b lu eb err ies, V accin iu m co ry m b o su m L. J. A m er. S o c . H ort. S ci. 9 7 (3 ) : 3 8 1 .
B row n , W .L. 1 9 4 0 . T he a n th o cy a n in p igm en t o f th e ‘H u n t’ m u scad in e grape. J. A m . C hem . S o c . 62: 2 8 0 8 .
H arborne, J .B . 1 9 6 7 . “ C om parative B io ch em istry o f th e F la v o n o id s .” A cad em ic Press, Inc. (L o n d o n ) L td .
L iao , F.W .H . and L uh, B .S . 1 9 7 0 . A n th o cy a n in p igm en ts in T in to Cao grapes. J. F o o d S ci. 35: 4 1 .
R ib éreau -G ayon , P. 1 9 5 9 . R eserch es sur les a n th o cy a n n es d es v égétau x (a p p lica tio n au genre V itis ) . D o c to ra l th esis . Paris, Libravrie G enerale de L ’E n seig n m en t, 4 , R u e D ante,4.
R ib éreau -G ayon , P. 1 9 6 4 . L es c o m p o s e s phéno liq u e du raisin e t du v in . A nn . P h ysio l. V eg. 6 (3 ): 2 1 1 .
Ms rece ived 4 /1 3 /7 3 ; a c cep ted 5 /1 5 /7 3 .
Paper N o . 4 0 2 9 o f th e Journal S eries o f the N orth C arolina S ta te U n iversity A gricultural E xp erim en t S ta tio n , R aleigh .
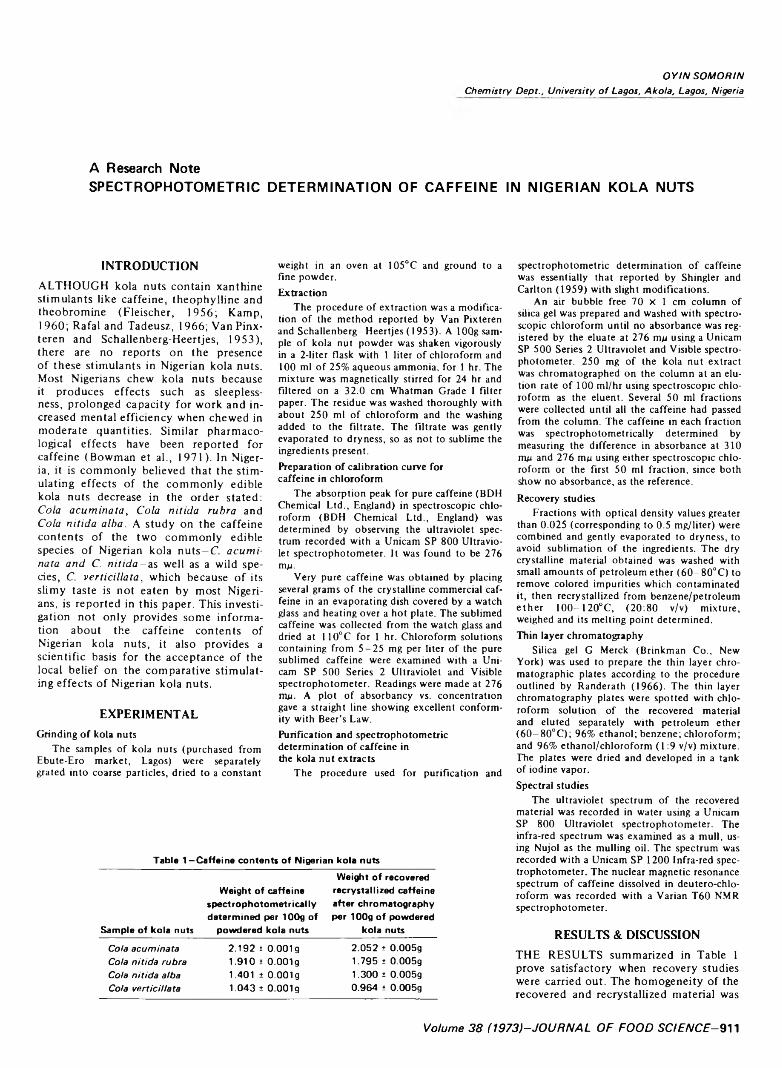
O Y I N S O M O R IN
C h e m is try D e p t ., U n iv e rs ity o f Lago s, A k o ta , Lag o s, N ig e r ia
A Research NoteSPECTROPHOTOMETRIC DETERMINATION OF CAFFEINE IN NIGERIAN KOLA NUTS
INTRODUCTIONALTHOUGH kola nuts contain xanthine stimulants like caffeine, theophylline and theobromine (Fleischer, 1956; Kamp, 1960; Rafal and Tadeusz, 1966; VanPinx- teren and Schallenberg-Heertjes, 1953), there are no reports on the presence of these stimulants in Nigerian kola nuts. Most Nigerians chew kola nuts because it produces effects such as sleeplessness, prolonged capacity for work and increased mental efficiency when chewed in moderate quantities. Similar pharmacological effects have been reported for caffeine (Bowman et al., 1971). In Nigeria, it is commonly believed that the stimulating effects of the commonly edible kola nuts decrease in the order stated: Cola acum inata, Cola n itid a rubra and Cola n itid a alba. A study on the caffeine contents of the two commonly edible species of Nigerian kola nuts-C. a cum inata and C. n it id a -a s well as a wild species, C. ve rtic illa ta , which because of its slimy taste is not eaten by most Nigerians, is reported in this paper. This investigation not only provides some information about the caffeine contents of Nigerian kola nuts, it also provides a scientific basis for the acceptance of the local belief on the comparative stimulating effects of Nigerian kola nuts.
EXPERIMENTALGrinding of kola nuts
The samples of kola nuts (purchased from Ebute-Ero market, Lagos) were separately grated into coarse particles, dried to a constant
weight in an oven at 105°C and ground to a fine powder.Extraction
The procedure of extraction was a modification of the method reported by Van Pixteren and Schallenberg-Heertjes (1953). A lOQg sample of kola nut powder was shaken vigorously in a 2-liter flask with 1 liter of chloroform and 100 ml of 25% aqueous ammonia, for 1 hr. The mixture was magnetically stirred for 24 hr and filtered on a 32.0 cm Whatman Grade I filter paper. The residue was washed thoroughly with about 250 ml of chloroform and the washing added to the filtrate. The filtrate was gently evaporated to dryness, so as not to sublime the ingredients present.Preparation of calibration curve for caffeine in chloroform
The absorption peak for pure caffeine (BDH Chemical Ltd., England) in spectroscopic chloroform (BDH Chemical Ltd., England) was determined by observing the ultraviolet spectrum recorded with a Unicam SP 800 Ultraviolet spectrophotometer. It was found to be 276 m g .
Very pure caffeine was obtained by placing several grams of the crystalline commercial caffeine in an evaporating dish covered by a watch glass and heating over a hot plate. The sublimed caffeine was collected from the watch glass and dried at 110°C for 1 hr. Chloroform solutions containing from 5-25 mg per liter of the pure sublimed caffeine were examined with a Unicam SP 500 Series 2 Ultraviolet and Visible spectrophotometer. Readings were made at 276 m/i. A plot of absorbancy vs. concentration gave a straight line showing excellent conformity with Beer’s Law.Purification and spectrophotometric determination of caffeine in the kola nut extracts
The procedure used for purification and
spectrophotometric determination of caffeine was essentially that reported by Shingler and Carlton (1959) with slight modifications.
An air bubble free 70 X 1 cm column of silica gel was prepared and washed with spectroscopic chloroform until no absorbance was registered by the eluate at 276 mju using a Unicam SP 500 Series 2 Ultraviolet and Visible spectrophotometer. 250 mg of the kola nut extract was chromatographed on the column at an elution rate of 100 ml/hr using spectroscopic chloroform as the eluent. Several 50 ml fractions were collected until all the caffeine had passed from the column. The caffeine in each fraction was spectrophotometrically determined by measuring the difference in absorbance at 310 mp and 276 mg using either spectroscopic chloroform or the first 50 ml fraction, since both show no absorbance, as the reference.Recovery studies
Fractions with optical density values greater than 0.025 (corresponding to 0.5 mg/liter) were combined and gently evaporated to dryness, to avoid sublimation of the ingredients. The dry crystalline material obtained was washed with small amounts of petroleum ether (60-80°C) to remove colored impurities which contaminated it, then recrystallized from benzene/petroleum ether 100-120°C, (20:80 v/v) mixture, weighed and its melting point determined.Thin layer chromatography
Silica gel G Merck (Brinkman Co., New York) was used to prepare the thin layer chromatographic plates according to the procedure outlined by Randerath (1966). The thin layer chromatography plates were spotted with chloroform solution of the recovered material and eluted separately with petroleum ether (60-80°C); 96% ethanol; benzene; chloroform; and 96% ethanol/chloroform (1:9 v/v) mixture. The plates were dried and developed in a tank of iodine vapor.Spectral studies
The ultraviolet spectrum of the recovered material was recorded in water using a Unicam SP 800 Ultraviolet spectrophotometer. The infra-red spectrum was examined as a mull, using Nujol as the mulling oil. The spectrum was recorded with a Unicam SP 1200 Infra-red spectrophotometer. The nuclear magnetic resonance spectrum of caffeine dissolved in deutero-chlo- roform was recorded with a Varian T60 NMR spectrophotometer.
RESULTS & DISCUSSIONTHE RESULTS summarized in Table 1 prove satisfactory when recovery studies were carried out. The homogeneity of the recovered and recrystallized material was
T a b le 1 —C a f f e in e c o n t e n t s o f N ig e r ia n k o la n u t s
S a m p le o f k o la n u t s
W e ig h t o f c a f f e in e s p e c t r o p h o t o m e t r i c a l l y d e t e r m i n e d p e r 1 0 0 g o f
p o w d e r e d k o la n u t s
W e ig h t o f r e c o v e r e d r e c r y s ta l l i z e d c a f f e in e a f t e r c h r o m a to g r a p h y p e r 1 0O g o f p o w d e r e d
k o la n u t s
C o la a c u m in a ta
C o la n it id a ru b ra
C o la n i t id a a lb a
C ola v e r t ic illa ta
2.192 ± 0.001 g 1.910 ± 0.001g 1.401 ± 0.001 g 1.043 ± 0.001 g
2.052 ± 0.005g 1.795 ± 0.005g 1.300 ± 0.005g 0.964 ± 0.005g
Volume 38 (1973)-JOURNAL OF FOOD SCIENCE- 911
9“\2—JOURNAL OF FOOD SCIENCE-Volume 38 (1973)
indicated by the presence of only a single spot in the thin layer chromatogram after eluting the plate with various solvents. The infra-red, ultraviolet, nuclear magnetic resonance spectral data and the melting point of the recovered material were found to be in excellent agreement with the spectral data and melting point reported for caffeine (Bhancca et al., 1962; Ikan, 1966; Kamp, 1960; Leal et al., 1961), hence the recovered and recrystallized material is pure caffeine.
The results in Table 1 show that C. acum inata contains more caffeine than C. n itid a rubra which is richer in caffeine content than C. n itid a alba justifying the local belief that the stimulating power of commonly edible Nigerian kola nuts decreases in the order of C. acum inata, C. N itid a rubra and C. n itid a alba.
CONCLUSIONTHIS INVESTIGATION shows that Nigerian kola nuts vary in caffeine content. The variation not only occurs from one species to another but also between varieties of the same species as exemplified by the difference in caffeine contents of C. n itida rubra and C. alba.
REFERENCESB hancca, N .S ., J o h n so n , L .F . and S ch o o lery ,
J .N . 1 9 6 2 . N .M .R . spectra o f ca ffe in e , In “ H igh R eso lu tio n N .M .R . S p ectra C ata log ,” p. 2 0 4 . N ation a l Press, W ashington D .C .
B ow m an, W .C., R and, M .J. and W est, G .B.1 9 7 1 . C entral nervous sy stem stim u lan t and drugs. In “ T ex tb o o k o f P h a rm aco logy ,” 4 th ed , p. 6 2 0 . B lack w ell S c ien tific P u b lica tion s, O xford .
F leischer, G. 1 9 5 6 . T he th eo p h y llin e co n te n ts o f tea leaves. Pharm azie 11: 2 4 8 .
Ikan, W. 1 9 6 6 . I so la tio n o f ca ffe in e from tea leaves. In “ N atural P ro d u cts,” p. 1 8 2 . Acad em ic Press, L o n d on .
K am p, W. 1 9 6 0 . D eterm in a tio n o f ca ffe in e in co la ex tra cts and co la seed s by io n exchange resins. Pharm W eekblad 95 : 4 8 1 .
Leal, A .M ., In ac io , M .M .L. and A ndrade, M.A. 1 9 6 1 . D eterm in a tio n o f ca ffe in e in co la ex tracts b y u ltrav io let sp ectro m etry . R ev. Port Farm 11: 2 5 9 .
R afal, A . and T ad eu sz, C. 1 9 6 6 . D eterm in ation o f purine a lk a lo id s in galen ic p reparations in n o n a q u eo u s m ed ia . Farm P o l. 2 2 (1 0 ) : 731 .
R anderath , K. 1 9 6 6 . T ech n iq u e o f th in layer ch rom atograp h y . In “ T hin L ayer C hrom ato g ra p h y ,” 2nd ed , p. 1 5 . A cad em ic Press, L o n d on .
Sh ingler, A .J. and C arlton , J .K . 1 9 5 9 . M ethod for th e sep ara tion and d e term in a tio n o f th eo p h y llin e , th eo b ro m in e and ca ffe in e . A nal. C hem . 31 : 1 6 7 9 .
V a n P in x teren , I.A .C . and Schallenberg- H eertjes, G. 1 9 5 8 . D eterm in a tio n o f ca ffe in e in co la seed s. Pharm W eekblad 88: 8 0 5 .
Ms received 1 1 /1 3 /7 2 ; revised 2 /2 2 /7 3 ; accep ted 2 /2 8 /7 3 .
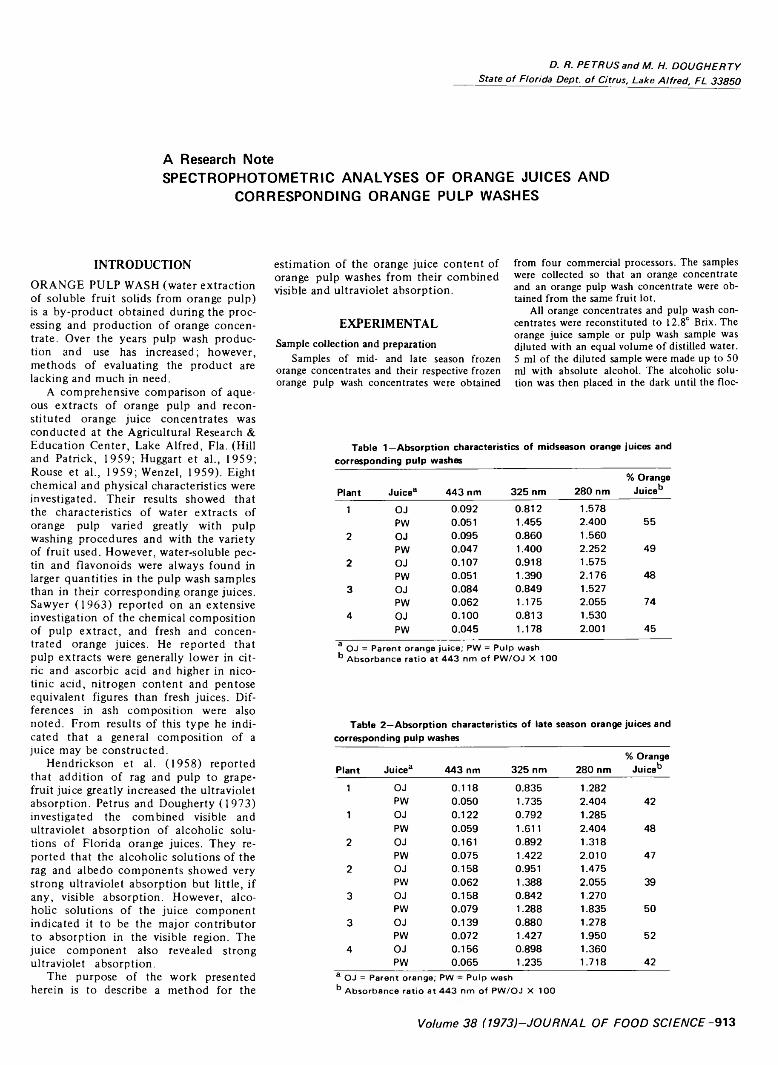
D. R. PETRUS and M. H. DOUGHERTY State o f F lorida Dept, o f Citrus, Lake A lfred, FL 33850
A Research NoteSPECTROPHOTOMETRIC ANALYSES OF ORANGE JUICES AND
CORRESPONDING ORANGE PULP WASHES
INTRODUCTIONORANGE PULP WASH (water extraction of soluble fruit solids from orange pulp) is a by-product obtained during the processing and production of orange concentrate. Over the years pulp wash production and use has increased; however, methods of evaluating the product are lacking and much in need.
A comprehensive comparison of aqueous extracts of orange pulp and reconstituted orange juice concentrates was conducted at the Agricultural Research & Education Center, Lake Alfred, Fla. (Hill and Patrick, 1959; Huggart et al., 1959; Rouse et al., 1959; Wenzel, 1959). Eight chemical and physical characteristics were investigated. Their results showed that the characteristics of water extracts of orange pulp varied greatly with pulp washing procedures and with the variety of fruit used. However, water-soluble pectin and flavonoids were always found in larger quantities in the pulp wash samples than in their corresponding orange juices. Sawyer (1963) reported on an extensive investigation of the chemical composition of pulp extract, and fresh and concentrated orange juices. He reported that pulp extracts were generally lower in citric and ascorbic acid and higher in nicotinic acid, nitrogen content and pentose equivalent figures than fresh juices. Differences in ash composition were also noted. From results of this type he indicated that a general composition of a juice may be constructed.
Hendrickson et al. (1958) reported that addition of rag and pulp to grapefruit juice greatly increased the ultraviolet absorption. Petrus and Dougherty (1973) investigated the combined visible and ultraviolet absorption of alcoholic solutions of Florida orange juices. They reported that the alcoholic solutions of the rag and albedo components showed very strong ultraviolet absorption but little, if any, visible absorption. However, alcoholic solutions of the juice component indicated it to be the major contributor to absorption in the visible region. The juice component also revealed strong ultraviolet absorption.
The purpose of the work presented herein is to describe a method for the
estimation of the orange juice content of orange pulp washes from their combined visible and ultraviolet absorption.
EXPERIMENTALSample collection and preparation
Samples of mid- and late season frozen orange concentrates and their respective frozen orange pulp wash concentrates were obtained
from four commercial processors. The samples were collected so that an orange concentrate and an orange pulp wash concentrate were obtained from the same fruit lot.
All orange concentrates and pulp wash concentrates were reconstituted to 12.8° Brix. The orange juice sample or pulp wash sample was diluted with an equal volume of distilled water. 5 ml of the diluted sample were made up to 50 ml with absolute alcohol. The alcoholic solution was then placed in the dark until the floc-
T a b le 1 —A b so rp tio n ch aracteristics o f m idseason orange ju ices and corresp ond ing pu lp w ashes
Plant Ju ic e 3 4 4 3 nm 3 2 5 nm 2 8 0 nm% Orange
Ju ice b
1 O J 0 .0 9 2 0 .8 1 2 1.578PW 0.051 1.455 2 .4 0 0 5 5
2 O J 0 .0 9 5 0 .8 6 0 1 .5 6 0PW 0 .0 4 7 1.400 2 .2 5 2 4 9
2 O J 0 .1 0 7 0 .9 1 8 1 .5 7 5PW 0.051 1 .3 9 0 2 .1 7 6 4 8
3 O J 0 .0 8 4 0 .8 4 9 1.527PW 0 .0 6 2 1.175 2 .0 5 5 7 4
4 O J 0 .1 0 0 0 .8 1 3 1 .5 3 0PW 0 .0 4 5 1.178 2.001 4 5
a O J = Parent orange ju ice ; PW = Pulp wash b Absorbance ratio at 4 4 3 nm of PW /O J X 100
T ab le 2 —A b so rp tio n ch aracteristics of late season orange ju ices and corresponding pu lp w ashes
% OrangeP lant Ju ic e 3 4 4 3 nm 3 2 5 nm 2 8 0 nm Ju ice b
1 O J 0 .1 1 8 0 .8 3 5 1.282PW 0 .0 5 0 1.735 2 .4 0 4 4 2
1 O J 0 .1 2 2 0 .7 9 2 1.285PW 0 .0 5 9 1.611 2 .4 0 4 48
2 O J 0.161 0 .8 9 2 1.318PW 0 .0 7 5 1.422 2 .0 1 0 47
2 O J 0 .1 5 8 0.951 1.475PW 0 .0 6 2 1.388 2 .0 5 5 39
3 O J 0 .1 5 8 0 .8 4 2 1.270PW 0 .0 7 9 1.288 1.835 5 0
3 O J 0 .1 3 9 0 .8 8 0 1.278PW 0 .0 7 2 1.427 1.950 52
4 O J 0 .1 5 6 0 .8 9 8 1 .3 6 0PW 0 .0 6 5 1.235 1 .7 1 8 42
3 O J = Parent orange; PW - Pulp wash b Absorbance ratio at 4 4 3 nm o f PW /O J X 100
Volume 38 (1973)-JOURNAL OF FOOD SCIENCE-913
914- JOURNAL OF FOOD SCIENCE-Volume 38 (1973)
culent precipitate formed. The precipitate was removed by centrifugation to obtain a crystal- clear solution.
A Coleman Model 124 Recording Spectrophotometer was used to scan the clear alcoholic solutions from 600—200 nm using 90% ethanol as a reference.
RESULTS & DISCUSSIONABSORPTION MAXIMA, obtained on alcoholic solutions of the reconstituted orange juices and pulp washes, were observed at 465, 443 and 425 nm of the visible spectrum and at 325, 280 and 245 nm of the ultraviolet spectrum and were in accordance with previous investigations (Petrus and Dougherty, 1973). The visible absorption was due mainly to the carotenoids present and the ultraviolet absorption due to the polyphenols (325 nm), flavonoids (280 nm) and ascorbic acid (245 nm). To simplify the discussion only the most intense and resolved absorption maxima are presented.
The spectral shape for the orange juice and pulp wash solutions were quite similar. However, there were major differences in the absorption intensities. Tables 1 and 2 present the absorption data, at the various wavelengths of interest, for the parent orange juices (OJ) and pulp washes (PW). It is evident from the tables that the visible absorption (443 nm) of the pulp wash sample decreased and the ultraviolet absorption (325, 280 nm) increased dramatically from that of the parent orange juice.
Water extraction of orange pulp, during the pulp washing process, would tend to incorporate more rag and pulp and their water extractable soluble solids into the product. This should increase the ultraviolet absorption and decrease the visible absorption since experimental results
have shown that alcoholic solutions of the rag and albedo components have little, if any, visible absorption but very strong ultraviolet absorption (Petrus and Dougherty, 1973). In contrast, however, the orange juice component was observed to be the major contributor to the visible obsorption and also showed strong ultraviolet absorption (Petrus and Dougherty,1973). Since the orange juice component was observed to be the major contributor to the visible absorption, and all pulp wash samples examined exhibited a decrease in the visible absorption (443 nm) from that of the parent orange juice, pulp wash may be considered a product containing some orange juice. Absorbances for known concentrations of alcoholic solutions of any given orange juice obeyed Beer’s law for all of the observed absorption maxima. If it may be assumed that the parent orange juices are pure juices, then the orange juice concentration in a pulp wash product may be estimated from the visible absorption at 443 nm. This is simply the absorbance ratio (at 443 nm) of PW/OJ x 100.
The orange juice contents (% orange juice) of the mid- and late season pulp wash products are presented in Tables 1 and 2. The midseason pulp wash indicated an orange juice content range from 45—74% while the late season had a range from 39—52%. The plant-to-plant variation in the orange juice content of pulp wash may be dependent upon a number of factors such as: extractor pressure, pulp washing procedures and variety and maturity of the fruit used.
CONCLUSIONSTHE COMBINED visible and ultraviolet absorption characteristics of alcoholic so
lutions of orange pulp washes differ considerably from their parent orange juices. The pulp washes are characterized by weak visible and very strong ultraviolet absorption. The weak visible absorption of the pulp wash solutions is due to the concentration of parent orange juice present, while the very strong ultraviolet absorption is the result of the parent orange juice present and incorporation of rag and pulp and their water extracted soluble solids into the product during the pulp washing process. It has been shown that the visible absorption of the pulp wash and parent orange juice may be used to estimate the orange juice content of the pulp wash. It has also been shown that this orange juice content may vary between processors.
REFERENCESH en d rick son , R ., K esterso n , J.W. and E dw ards,
G .J. 1 9 5 8 . E ffe c t o f processin g variables onU .V . ab so rp tio n o f grapefru it ju ice . Proc. Fla. State H ort. S o c . 71 : 1 9 0 .
H ill, E .C . and Patrick , R . 1 9 5 9 . M icrob io log ica l characteristics in a q u eo u s ex tra cts o f orange pu lp . Proc. F la. S ta te H ort. S o c . 72 : 2 3 3 .
H uggart, R .L ., O lsen , R .W ., W enzel, F .W ., Barron, R.W . and E ze ll, G .H . 1 9 5 9 . In tro d u c tio n and so m e character istics in a q eou s e x tracts o f orange p u lp . Proc. Fla. S ta te H ort. S o c . 72: 2 2 1 .
Petrus, D .R . and D o u g h er ty , M .H. 1 9 7 3 . S p ec tral character istics o f th ree varieties o f F lorida orange ju ice . J. F o o d S ci. 38 : 6 5 9 .
R ou se, A .H ., A tk in s, C .D . and M oore, E .L .1 9 5 9 . P ec tic su b sta n ces and rela ted character ist ic s in a q u eo u s ex tra cts o f orange pu lp . Proc. Fla. S ta te H ort. S o c . 72 : 2 2 7 .
Saw yer, R . 1 9 6 3 . C h em ica l co m p o s it io n o f so m e natural and p rocessed orange ju ices. J. S ci. Fd . A gric. 1 4 : 3 0 2 .
W enzel, F.W . 1 9 5 9 . T h e u se o f a q u eo u s ex tra cts o f orange p u lp in th e p ro d u ctio n o f frozen orange co n cen tra te . Proc. F la . S ta te H ort. S o c . 7 2 : 2 3 5 .
Ms rece ived 4 /2 3 /7 3 ; a ccep ted 5 /2 5 /7 3 .F lorid a A gricu ltural E x p erim en t S ta tio n
Journal Series N o . 4 8 2 4 .
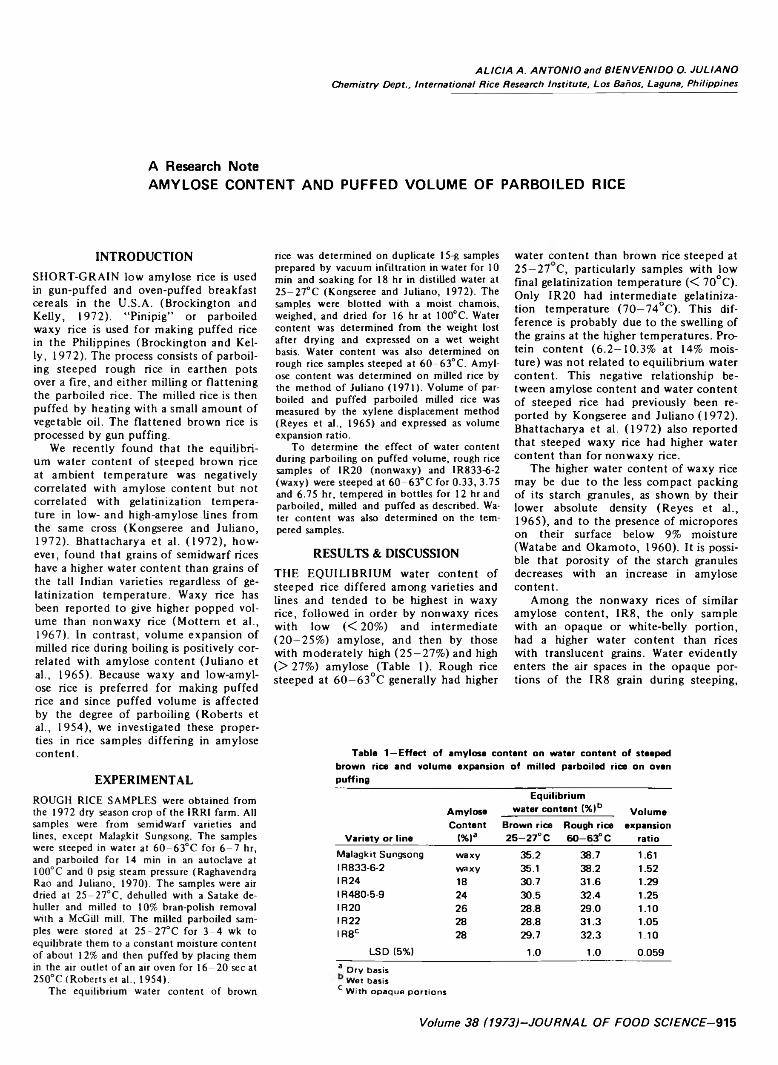
A L IC I A A . A N T O N IO and B IE N V E N ID O O. J U L IA N O Chemistry Dept., International Rice Research Institute, Los Bahos, Laguna, Philippines
A Research NoteAMYLOSE CONTENT AND PUFFED VOLUME OF PARBOILED RICE
INTRODUCTIONSHORT-GRAIN low amylose rice is used in gun-puffed and oven-puffed breakfast cereals in the U.S.A. (Brockington and Kelly, 1972). “Pinipig” or parboiled waxy rice is used for making puffed rice in the Philippines (Brockington and Kelly, 1972). The process consists of parboiling steeped rough rice in earthen pots over a fire, and either milling or flattening the parboiled rice. The milled rice is then puffed by heating with a small amount of vegetable oil. The flattened brown rice is processed by gun puffing.
We recently found that the equilibrium water content of steeped brown rice at ambient temperature was negatively correlated with amylose content but not correlated with gelatinization temperature in low- and high-amylose lines from the same cross (Kongseree and Juliano,1972). Bhattacharya et al. (1972), however, found that grains of semidwarf rices have a higher water content than grains of the tall Indian varieties regardless of gelatinization temperature. Waxy rice has been reported to give higher popped volume than nonwaxy rice (Mottem et al.,1967). In contrast, volume expansion of milled rice during boiling is positively correlated with amylose content (Juliano et al., 1965). Because waxy and low-amyl- ose rice is preferred for making puffed rice and since puffed volume is affected by the degree of parboiling (Roberts et al., 1954), we investigated these properties in rice samples differing in amylose content.
EXPERIMENTALROUGH RICE SAMPLES were obtained from the 1972 dry season crop of the IRRI farm. All samples were from semidwarf varieties and lines, except Malagkit Sungsong. The samples were steeped in water at 60-63°C for 6 -7 hr, and parboiled for 14 min in an autoclave at 100°C and 0 psig steam pressure (Raghavendra Rao and Juliano, 1970). The samples were air dried at 25-27°C, dehulled with a Satake de- huller and milled to 10% bran-polish removal with a McGill mill. The milled parboiled samples were stored at 25-27°C for 3 -4 wk to equilibrate them to a constant moisture content of about 12% and then puffed by placing them in the air outlet of an air oven for 16-20 sec at 250°C (Roberts et al., 1954).
The equilibrium water content of brown
rice was determined on duplicate 15-g samples prepared by vacuum infiltration in water for 10 min and soaking for 18 hr in distilled water at 25-27°C (Kongseree and Juliano, 1972). The samples were blotted with a moist chamois, weighed, and dried for 16 hr at 100°C. Water content was determined from the weight lost after drying and expressed on a wet weight basis. Water content was also determined on rough rice samples steeped at 60-63°C. Amylose content was determined on milled rice by the method of Juliano (1971). Volume of parboiled and puffed parboiled milled rice was measured by the xylene displacement method (Reyes et al., 1965) and expressed as volume expansion ratio.
To determine the effect of water content during parboiling on puffed volume, rough rice samples of 1R20 (nonwaxy) and 1R833-6-2 (waxy) were steeped at 60-63°C for 0.33, 3.75 and 6.75 hr, tempered in bottles for 12 hr and parboiled, milled and puffed as described. Water content was also determined on the tempered samples.
RESULTS & DISCUSSIONTHE EQUILIBRIUM water content of steeped rice differed among varieties and lines and tended to be highest in waxy rice, followed in order by nonwaxy rices with low (< 20%) and intermediate (20—25%) amylose, and then by those with moderately high (25—27%) and high (>27% ) amylose (Table 1). Rough rice steeped at 60—63°C generally had higher
water content than brown rice steeped at 25—27 C, particularly samples with low final gelatinization temperature (< 70°C). Only IR20 had intermediate gelatinization temperature (70—74°C). This difference is probably due to the swelling of the grains at the higher temperatures. Protein content (6.2—10.3% at 14% moisture) was not related to equilibrium water content. This negative relationship between amylose content and water content of steeped rice had previously been reported by Kongseree and Juliano (1972). Bhattacharya et al. (1972) also reported that steeped waxy rice had higher water content than for nonwaxy rice.
The higher water content of waxy rice may be due to the less compact packing of its starch granules, as shown by their lower absolute density (Reyes et al.,1965), and to the presence of micropores on their surface below 9% moisture (Watabe and Okamoto, 1960). It is possible that porosity of the starch granules decreases with an increase in amylose content.
Among the nonwaxy rices of similar amylose content, IR8, the only sample with an opaque or white-belly portion, had a higher water content than rices with translucent grains. Water evidently enters the air spaces in the opaque portions of the IR8 grain during steeping,
T a b le 1 —E f f e c t o f a m y lo s e c o n t e n t o n w a te r c o n t e n t o f s t e e p e d b r o w n r ic e a n d v o lu m e e x p a n s io n o f m i l le d p a r b o i l e d r ic e o n o v e n p u f f in g
V a r i e ty o r l in e
A m y lo s eC o n t e n t
(% )a
E q u i l ib r iu m w a t e r c o n t e n t (% )b
B ro w n r ic e R o u g h r ic e 2 5 - 2 7 ° C 6 0 - 6 3 ° C
V o lu m ee x p a n s io n
r a t i o
M alagkit Sungsong w ax y 3 5 .2 38 .7 1.61IR 8 3 3 -6 -2 w ax y 35.1 38 .2 1.52IR 2 4 18 30.7 3 1 .6 1 .29IR 4 8 0 -5 -9 24 3 0 .5 3 2 .4 1 .25IR 2 0 2 6 2 8 .8 2 9 .0 1 .10IR 2 2 28 2 8 .8 3 1 .3 1 .05IR 8 C 28 29.7 3 2 .3 1 .10
L S D (5%) 1.0 1.0 0 .0 5 9
* D ry basis Wet basis
c W ith opaque portions
Volume 38 (1973)-JOURNAL OF FOOD SCIENCE-9‘15
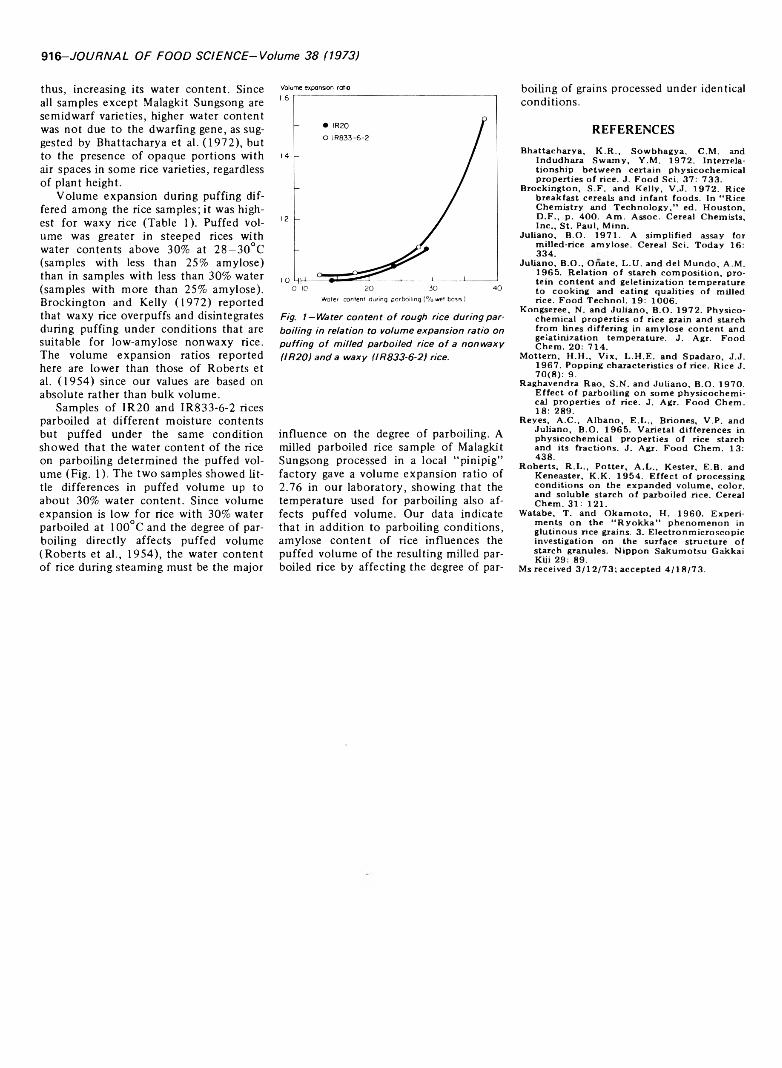
916-JOURNAL OF FOOD SCIENCE-Volume 38 (1973)
thus, increasing its water content. Since all samples except Malagkit Sungsong are semidwarf varieties, higher water content was not due to the dwarfing gene, as suggested by Bhattacharya et al. (1972), but to the presence of opaque portions with air spaces in some rice varieties, regardless of plant height.
Volume expansion during puffing differed among the rice samples; it was highest for waxy rice (Table 1). Puffed volume was greater in steeped rices with water contents above 30% at 28—30°C (samples with less than 25% amylose) than in samples with less than 30% water (samples with more than 25% amylose). Brockington and Kelly (1972) reported that waxy rice overpuffs and disintegrates during puffing under conditions that are suitable for low-amylose nonwaxy rice. The volume expansion ratios reported here are lower than those of Roberts et al. (1954) since our values are based on absolute rather than bulk volume.
Samples of IR20 and 1R833-6-2 rices parboiled at different moisture contents but puffed under the same condition showed that the water content of the rice on parboiling determined the puffed volume (Fig. 1). The two samples showed little differences in puffed volume up to about 30% water content. Since volume expansion is low for rice with 30% water parboiled at 100°C and the degree of parboiling directly affects puffed volume (Roberts et al., 1954), the water content of rice during steaming must be the major
0 10 20 30 40Water content during parboiling ( % wet basis )
Fig. 1—Water content o f rough rice during parboiling in relation to volume expansion ratio on puffing of milled parboiled rice o f a nonwaxy (IR20) and a waxy (IR833-6-2) rice.
influence on the degree of parboiling. A milled parboiled rice sample of Malagkit Sungsong processed in a local “pinipig” factory gave a volume expansion ratio of2.76 in our laboratory, showing that the temperature used for parboiling also affects puffed volume. Our data indicate that in addition to parboiling conditions, amylose content of rice influences the puffed volume of the resulting milled parboiled rice by affecting the degree of par
boiling of grains processed under identical conditions.
REFERENCESB hattach arya, K .R ., S ow b h agya , C.M . and
Indudhara S w a m y , Y .M . 1 9 7 2 . Interrelatio n sh ip b e tw e e n certa in p h y sico ch em ica l p rop erties o f rice. J. F o o d S ci. 37: 7 3 3 .
B rock in gton , S .F . and K elly , V .J . 1 9 7 2 . R ice break fast cerea ls and in fa n t fo o d s . In “ R ice C hem istry and T e c h n o lo g y ,” ed . H ou ston ,D .F ., p . 4 0 0 . A m . A ssoc . C ereal C hem ists, In c ., S t . Paul, M inn.
Ju lian o , B .O . 1 9 7 1 . A s im p lified assay for m illed -rice a m y lo se . Cereal S c i. T o d a y 16:3 3 4 .
Ju lian o , B .O ., O nate, L .U . and d e l M und o, A .M .1 9 6 5 . R e la tio n o f starch co m p o s it io n , prote in c o n te n t and g e le tin iza tio n tem p eratu re to co o k in g and ea tin g q u a lities o f m illed rice. F o o d T ech n o l. 19: 1 0 0 6 .
K ongseree, N . and J u lian o , B .O . 1 9 7 2 . P h y sico ch em ica l p rop ertie s o f rice grain and starch from lin es d iffer in g in a m y lo se c o n te n t and g e la tin iza tio n tem p eratu re . J. Agr. F o o d C hem . 20: 7 1 4 .
M ottern , H .H ., V ix , L .H .E . and Sp adaro, J.J. 1 9 6 7 . P op ping character istics o f rice. R ice J. 7 0 (8 ): 9 .
R aghavendra R ao , S .N . and Ju lian o , B .O . 1 9 7 0 . E ffe c t o f parb o ilin g o n so m e p h y s ic o c h e m ical prop erties o f r ice. J. Agr. F o o d C hem . 18: 2 8 9 .
R eyes , A .C ., A lb a n o , E .L ., B riones, V .P . and Ju lian o , B.O . 1 9 6 5 . V arieta l d ifferen ces in p h y sico ch em ica l p rop ertie s o f rice starch and its frac tion s. J. Agr. F o o d C hem . 13: 4 3 8 .
R ob erts, R .L ., P o tter , A .L ., K ester , E .B . and K eneaster, K .K . 1 9 5 4 . E ffe c t o f processin g co n d it io n s o n th e ex p a n d ed v o lu m e, co lor , and so lu b le starch o f p arb oiled rice. Cereal C hem . 31: 1 2 1 .
W atabe, T. and O k a m o to , H. 1 9 6 0 . E xp erim en ts o n th e “ R y o k k a ” p h en o m en o n in g lu tin ou s rice grains. 3 . E lectro n m icro sco p ic in vestiga tion o n th e surface stru ctu re o f starch granules. N ip p o n S a k u m o tsu Gakkai Kiji 29: 89 .
Ms received 3 /1 2 /7 3 ; a ccep ted 4 /1 8 /7 3 .