Bulletin of the United States Bureau of Labor, No. 58, Volume X
Upload
khangminh22Category
view
0download
0
JOURNAL OF FOOD SCI€NC6ournal of Food Science and IFT Information
3 May-June 1993Volume 58, No. 3
Coden: JFDAZ 58:461-690 ISSN: 0022-1147
i Author Index, Vol. 58, No. 3i Page Charge-Statement
ii Memo from Scientific Editoriii JFS Masthead —Staff & Publication Informationiv Letters to the Editor
vi UMI Microform Information688 FSTA Food Science & Technology Abstracts Information689 UMI Article Clearing House Information690 IFT Professional Membership Information
Basic Research, Applied Science & Engineering
461 Physical and sensory characteristics of low fat ground beef patties — M.F. Miller, M.K. Andersen, C.B. Ramsey & J.O. Reagan
464 Soya proteins functional and sensory characteristics improved in comminuted meats — N.B. Lecompte, J.F. Zayas & C.L. Kastner
467 Cryostabilization of functional properties of pre-rigor and post-rigor beef by dextrose polymer and/or phosphates —J.W. Park, T.C. Lanier & D.H. Pilkington
473 Polymerization of beef actomyosin induced by transglutaminase— S.-H. Kim, ¡.A. Carpenter, T.C. Lanier & L. Wicker
475 Survival and growth of Listeria monocytogenes and Yersinia enterocolitica in pork chops packaged under modified gas atmospheres —IV. Manu-Tawiah, D.J. Myers, D.C. Olson & R.A. M ol ms
480 National in-home consumer evaluation of pork roasts from pigs administered porcine somatotropin (pSt) — K.J. Prusa,C.A. Fedler & L.F. M iller
482 Sensory and textural characteristics of restructured ham coated with emulsions of different fat levels—F./C McKeith,M.S. Brewer, P.D. Osadjan, R.J. Matulis & P.J. Bechtel
484 Pre-emulsified corn o il, pork fat, or added moisture affect quality of reduced fat bologna quality—D.J. Bishop, D.C. Olson & C.L. Knipe
488 Low-fat fresh pork sausage patty stability in refrigerated storage w ith potassium lactate — D.D. Bradford, D.L. Huffman, W.R. Egbert & W.R. Jones
492 Salt, phosphate and oil temperature effects on emulsion capacity of fresh or frozen meat and sheep tail fa t—O. Zorba, H.Y. Cokalp, H. Yetim & H.W. Ockerman
497 Surim i-like products from mutton — R.J. McCormick, S. Bugren, R.A. Field, D.C. Rule & J.R. Busboom
501 Sodium tripolyphosphate stability and effect in ground turkey meat—VV. Li, J.A. Bowers, J.A. Craig & S.K. Perng
505 Vitamin B6 in raw and fried chicken by HPLC—S.J. Olds, J.T. Vanderslice & D. Brochetti
508 Sensory characteristics of selected species of freshwater fish in retail distribution — E. Chambers IV & A. Robe!
513 Lipid hydrolysis and oxidation related to astaxanthin content in light and dark muscle of frozen stored rainbow trout (Oncorhynchus mykiss) — T. Ingemansson, A. Pet- tersson & P. Kaufmann
519 Fate of Listeria monocytogenes and Aeromonas hydrophila on catfish fillets cooked in a microwave oven — Y-W. Huang, C-K. Leung, M.A. Harrison & K.W. Cates
522 Specific heat of selected fresh seafood — M.S. Rahman 525 Volatile flavor components in snow crab cooker effluent
and effluent concentrate — VJ. Cha, K.R. Cadwallader &H.H. Baek
531 Setting response of Alaska pollock surimi compared with beef myofibrils-S -H . Kim, J.A. Carpenter, T.C. Lanier & L. Wicker
535 Linear programming and response surface methodology to optimize surimi gel texture— J.S. Chen, C.M. Lee & C. Crapo
539 M g++ selectively isolates gellan gum from dairy products —H.D. C raham
544 Prefiltration using formed-in-place metallic membranes reduces microbial content of whey—S.F. Barefoot, I.Y. Han,R.L. Thomas, C.T. Cordle & L.C. Criswell
548 Heat and fermentation effects on total nonprotein nitrogen and urea in milk —6. Saidi & J.J. Wartheson
552 Vitamin D stability in m ilk — S.A. Renken & J.J. Warthesen 557 Microentrapment of Lactobacilli in calcium alginate gels —
T.Y. Sheu & R.T. Marshall562 Oat gum and p-glucan extraction from oat bran and rolled
oats: Temperature and pH effects — N.L. Dawkins & LA. Nnanna
567 Pasting of wheat flour extrudates contaming conventional baking ingredients—C.H. Ryu, P.E. Neumann & C.E. Walker
574 Melt point of encapsulated sodium bicarbonates: Effect on refrigerated batter and muffins baked in conventional and microwave ovens—C.L. Dorko & M.P. Penfield
579 Particle size of encapsulated sodium bicarbonates: Effect on refrigerated batter and muffins baked in conventional and m crowave ovens — C.L. Dorko & M.P. Penfield
583 Soybean 'lour lipoxygenase isozyme mutant effects on bread dough volatiles — K. Addo, D. Burton, M.R. Stuart, H.R. Burton & D.F. Hildebrand
586 Extraction of cookie aroma compounds from aqueous and dough model systems —C. Prost, C.Y. Lee, P. Giampaoli & H. Richard
589 Neohesperidin dihydrochalcone stability in aqueous buffer solutions—/. Canales, F. Borrego & M.C. Lindley
A PUBLICATION OFTHE INSTITUTE OF FOOD TECHNOLOGISTS
The Society for Food Science and Technology

592 Flavor modifying characteristics of the intense sweetener neohesperidin dihydrochalcone—M G . Lindey, P.K. Beyls,I. Canales & F. Borrego
595 Sweetness adaptation of some carbohydrate and high potency sweeteners — B.L. Bornstein, S.C. W/et & M. Pombo
599 Fat concentration affects sweetness and sensory profiles of sucrose, sucralose, and aspartame —S.C. W/et, S.M Ke- te/sen, T.R. Davis & P.K. Beyts
603 Proton NMR and dielectric measurements on sucrose filled agar gels and starch pastes —C.W. Padua
605 Assessing chemical form of calcium in wheat, spinach, and kale — D.A. Benway & C.M. Weaver
609 4-Hexylresorcinol, a potent inhibitor of mushroom tyrosinase— R.M. Daw ley & W.H. Flurkey
611 Dihydrocapsaicin oxidation by Capsicum annuum (var. an- nuum) peroxidase — M A. Bernal, A.A. Calderon, M .A. Pedreno, R. M unoz, A. Ros Barcelo & F. M erino de Cac- eres
614 Gluconic acid influences texture and color of canned asparagus—W.C. M cC lynn, D.R. Davis & F. Honarmand
616 Pigment changes in parsley leaves during storage in controlled or ethylene containing atmosphere — N. Yamauchi & A.E. Watada
619 Rapid enzymatic assay for ascorbic acid in various foods using peroxidase — F. Tsumura, Y. Ohsako, Y. Haraguchi,H. Kumagai, H. Sakurai & K. Ishii
623 Packaging effects on growth of Listeria innocua in shredded cabbage — M.B. Omary, R.F. Testin, S.F. Barefoot & ].W . Rushing
627 Germination and debittering lupin seeds reduce a-galac- toside and intestinal carbohydrate fermentation in humans—/..C. Trugo, A. Farah & N.M.F. Trugo
631 Organic acid changes during ripening o f processing peaches-7. Wang, A.R. Gonzalez, E.E. G bur & J.M. Aselage
633 Composition and sensory characterization of red raspberry juice concentrated by direct-osmosis or evaporation —R. E. Wrolstad, M.R. McDaniel, R.W. Durst, N. Michaels,K.A. Lampi & E.G. Beaudry
638 Cross-flow microfiltration with gas backwash of apple juice —S. K. Su, J.C. Liu & R.C. Wiley
642 Resistant starch in foods: Modified method for dietary fiber residues —7. Saura-Calixto, I. Goni, L. Bravo & E. Manas
644 Microbial growth estimation in liquid media exposed to temperature fluctuations — K-Y. Li and J.A. Torres
649 Kinetics of Clostridium sporogenes PA3679 spore destruction using computer-controlled thermoresistometer — M. Rodrigo, A. Martinez, T. Sanchez, M.J. Peris & ]. Safon
653 Cholesterol autoxidation inhibition varies among several natural antioxidants in an aqueous model system—SA. Rankin & O.A. Pike
656 Ingredient interaction effects on protein functionality: M ixture design approach — G.E. Arteaga, E. Li-Chan, S. Na- kai, S. Cofrades & F. Jimenez-Colmenero
663 Tocopherol micro-extraction method w ith application to quantitative analysis of lipophilic nutrients—A. Abdol- lahi, N.S. Rosenholtz & ].L. Garwin
667 Nonenzymatic browning and fluorescence development in a (E)-4,5-epoxy-(E)-2-heptenal/lysine model system — FJ. Hidalgo & R. Zamora
671 Browning potential of liquid smoke solutions: Comparison of two methods — W.E. Riha & W.L. Wendorff
675 Enthalpy of frozen foods determined by differential compensated c a lo rim e try -W.L. Kerr, ]. ]u & D.S. Reid
680 Component analysis of disaggregation of pectin during pkte module ultrafiltration — P.D. Hoagland, G. Konja & M L. Fishman

AUTHOR INDEX Volume 58: Number 3
Abdollahi, A., 663 Addo, K., 583 Andersen, M.K., 461 Arteaga, G.E., 656 Aselage, J.M., 631
Baek, H.H., 525 Barefoot, S.F., 544, 623 Beaudry, E.G., 633 Bechtel, P J ., 482 Ben way, DA., 605 Bernal, M A , 611 Beyts, P.K., 592, 599 Bishop, D.J., 484 Bomstein, B.L., 595 Borrego, F., 589, 592 Bowers, JA ., 501 Bradford, D.D., 488 Bravo, L., 642 Brewer, M.S., 482 Brochetti, D., 505 Bugren, S., 497 Burton, D., 583 Burton, H.R., 583 Busboom, J .R , 497
Cadwallader, K.R, 525 Calderon, AA., 611 Canales, I., 589, 592 Carpenter, JA ., 473, 531 Cha, Y J ., 525 Chambers, E. IV, 508 Chen, J.S., 535 Cofrades, S., 656 Cordle, C.T., 544 Craig, JA ., 501 Crapo, C., 535 Criswell, L.G., 544
Davis, D.R., 614 Davis, T.R., 599 Dawkins, N.L., 562 Dawley, R.M., 609 Dorko, C.L., 574, 579 Durst, R.W., 633
Egbert, W.R., 488
Farah, A , 627 Fedler, CA., 480 Field, RA., 497 Fishman, M.L., 680 Flurkey, W.H., 609
Garwin, J.L., 663 Gates, K.W., 519 Gbur, E.E., 631 Giampaoli, P., 586 Gokalp, H.Y., 492 Goni, I., 642 Gonzalez, A.R., 631 Graham, H.D., 539
Han, I.Y., 544 Haraguchi, Y., 619 Harrison, M A , 519 Hidalgo, F J . , 667 Hildebrand, D.F., 583 Hoagland, P.D., 680 Honarmand, F., 614 Huang, Y-W., 519 Huffman, D.L., 488
Ingemansson, T., 513 Ishii, K., 619
Jimenez-Colmenero, F., 656 Jones, W.R., 488 Ju, J., 675
Kästner, C.L., 464 Kaufmann, P., 513 Kerr, W.L., 675 Ketelsen, S.M., 599 Kim, S-H., 473, 531 Klein, B.P., ii Knipe, C.L., 484 Konja, G., 680 Kumagai, H., 619
Laropi, K A , 633Lanier, T.C., 467, 473, 531Lecomte, N.B., 464Lee, C M . , 535Lee, C.Y., 586Leung, C-K., 519Li, K-Y., 644Li, W., 501Li-Chan, E., 656Lindley, M.G., 589, 592Liu, J.C., 638
Manas, E., 642 Manu-Tawiah, W., 475 Marshall, RT., 557 Martinez, A , 649 Matulis, R.J., 482 McCormick, R.J., 497 McDaniel, M.R., 633 McGlynn, W.G., 614 McKeith, F.K., 482 Merino de Caceres, F., 611 Michaels, N., 633 Miller, L.F., 480 Miller, M.F., 461 Molins, R.A, 475 Mondy, N.I., iv Munoz, R., 611 Munshi, C.B., iv
Myers, D.J., 475
Nakai, S., 656 Neumann, P.E., 567 Nnanna, IA., 562
Ockerman, H.W., 492 Ohsakc, Y., 619 Olds, S J., 505 Olson, D.G., 475, 484 Omary, M.B., 623 Osadjan, P.D., 482
Padua, G.W., 603 Park, J.W., 467 PedrenD, M A , 611 Penfieli, M.P., 574, 579 Peris, M.J., 649 Pemg, S.K., 501 Pettersson, A., 513 Pike, C A., 653 Pilkington, D.H., 467 Pombo, M., 595 Prost, C., 586 Prusa, K.J., 480
Rahman, M.S., 522 Ramsey, C.B., 461 Rankir, S.A, 653 Reagar., J.O., 461 Reid, DA , 675 Renken, SA., 552 Richard, H., 586 Riha, W.E., 671 Robel, A., 508 Rodrigo, M., 649 Ros Barcelo, A., 611 Rosenholtz, N.S., 663 Rule, D.C., 497
Rushing, J.W., 623 Ryu, G.H., 567
Safon, J., 649 Saidi, B., 548 Sakurai, H., 619 Sanchez, T., 649 Saura-Calixto, F., 642 Sheu, T.Y., 557 Stuart, M.R., 583 Su, S.K., 638
Testin, R.F., 623 Thomas, R.L., 544 Torres, JA ., 644 Trugo, L.C., 627 Trugo, N.M.F., 627 Tsumura, F., 619
Vanderslice, J.T., 505
Walker, C.E., 567 Wang, T., 631 Warthesen, J.J., 548, 552 Watada, A.E., 616 Weaver, C.M., 605 Wendorff, W.L., 671 Wicker, L., 473, 531 Wiet, S.G., 595 Wiet, S.G., 599 Wiley, RC., 638 Wrolstad, RE., 633
Yamauchi, N., 616 Yetim, H., 492
Zamora, R., 667 Zayas, J.F., 464 Zorba, O., 492
NOTICE: Page Charges for Publication of Research Papers
A page charge o f $70 per printed page is effective for papers published in the JOURNAL OF FOOD SCIENCE and we sincerely hope that authors’ sources o f financial support share the prevailing view that publication costs are, in fact, part o f the cost o f doing research.
Where solely personal funds are available fc r payment o f page charges and such payment would be a hardship for the authors, application for “Waiver Under Hardship Clause” should be made-prior to publication-on a separate signed statement addressed to the Director o f Publications, Institute o f Food Technologists, Suite 300, 221 .V. LaSalle St., Chicago, IL 60601.

M e m o FROM THE SCIENTIFIC EDITOR
What’s Your H ypothesis?
ST U D E N T S in introductory statistics courses are taught that formulating a “null hypothesis” is the first step in approaching a problem. Statistical analysis, in general, helps us calculate what the probability is of seeing “no effect” w hen w e com p are tr e a tm e n ts . In teaching about “the scientific method,” we suggest that initially, one should pose a hypothesis, and then plan experiments that w ill help us decide if our postulation is reasonable. Why is it then, that so many scientists choose to state the objective of their research as though they had no idea of what was likely to happen?
Criticisms of research studies that are termed “cook and look” stem s from the apparent lack of a theoretical question, a paradigm, or a problem to be solved. Data gathering, without articulation of a rationale, can appear pointless. This does not mean that factual data about a product, ingredient or formulation are not important. They may be helpful for specific purposes. For example, the ascorbic acid content of fresh vegetables grown in central Illinois can add information to a data bank, and thus help us calculate ascorbic acid intakes of people who eat that produce. However, the use of the data may be lim ited to a geograph ical region, u n less there is some reason to believe that the ascorbic acid content m ight be affected by specific growing conditions, or the genetics of the varieties chosen. Thus, the investigator must make a decision about the hypothesis before the experiment is planned. This w ill help in choosing a design so that we can reject or not re
ject the hypothesis when the experiment is completed.
M o s t SCIENTISTS will state an objective for their experim ent in terms of w anting to see the effects of certain treatm ents. This is familiar, if slightly exaggerated, prose—“The objective of this study was to determine the effects of two heating tim es, four holding tem peratures, and three holding tim es on the nutritional and sensory quality of product A containing two emulsifiers." As editors, we have to admit that the instructions to authors states that the introduction should state the objective. As critical readers, we would like to know whether or not the experiments prove the hypothesis posed by the investigators. However, if reviewers cannot d eterm in e w hy th e researchers thought that the treatm ents would affect the quality of the product, then the im p ortan ce of th e in v e s t ig a t io n is blurred.
Experim ents that are lengthy, or exp en sive, h ave restricted am ounts of starting m aterial, or yield sm all quantities of final product tempt researchers in to tr y in g to g e t a s m uch information out of a single sample as possible. Thus, if a laboratory has the capability of m easuring flavor components by GC, texture with the Instron, structure with NMR, and vitamins with HPLC, why not do them all? The answer is that the information may not be meaningful. In trying to evaluate the quality of a written report, reviewers, and readers alike, look for the hypothesis. This enables them to sort out the
significant findings, on the basis of a question that can be answered by doing an experiment in a specific way. Statistical tests are more useful if the in vestigator has a presupposition, and does n ot s im p ly do e v e r y p o ss ib le analysis because the computer is capable of them.
M a n y OF THE PAPERS published in scientific journals have clearly discernible hypotheses. Some disciplines expect a statem ent of the null and a lternative hypotheses. It is always necessary to specifically state what problem is being investigated, and the reasons for the research should be equally obvious. In the food industry, the objective of an experim ent or test is always closely linked to a goal of the research and development or m arketing group, for example. Academic scientists should keep an overall goal in mind when explaining their own work.
As scientific investigators, we want to see our work in print so that others can use the information to continue to expand the existing knowledge base. By planning experim ents based on sound hypotheses, com m unicating their im portance to readers w ill become easier.
—Barbara P. Klein, Associate Editor, Journal of Food Science, Professor of Foods and Nutrition, U niversity of Illinois at Urbana-Champaign.

A PUBLICATION OFTHE INSTITUTE OF FOOD TECHNOLOGISTSThe Society for Food Science and Technology
JOURNAL OF FOOD SCIENCE
3 May-June 1993 Volume 58, No. 3
Coden: JFDAZ 461-690 ISSN: 0022-1147
Scientific EditorR o b e rt E. B e rry
Publisher Editorial Associate IFT Publications SubcommitteeD an ie l E. W e b e r A n n a M a y S c h e n c k C ra ig D. F is c h e r (C h a irm a n )
O. R o b e rt N o ye s (P ast C h a irm a n )Associate Scientific Editors Director of Publications Annual Index Editor R o b e rt E. B e rry
R o b e rt A . Baker J o h n B. K lis P a tric ia S ch e n ck F larry T. L aw le ssL a rry R. B e u cha t K aren M . S c h a ichR o b e rt J . B ra d d o c k Managing Editor J o h n N. S o fo sC la rk J . B rekke B e rn a rd S c h u k ra ft M y ro n S o lb e rgG ra d y W . C h ism III F red R. T a rv e r J rS ta n le y J . K azen iac D an ie l E. W e b e rB a rba ra P. K le in Isabe l D. W o lfM a n fre d K ro g e r R o m e o T . T o le d o
D an ie l E. W e b e r, IFT E x e c u tiv e D ire c to r
• PHILOSOPHY: The Journal o f Food Science is the scientific publication of the Institute of Food Technologists and serves the interests of the members of the Institute. JFS considers for publication reports of original research in all aspects of food science — from postharvest to the consumer — that concern the basic and applied aspects of the preparation, nutrition, and safety of the food supply. Manuscripts are accepted without regard for membership in IFT or origin of research provided that the studies advance knowledge in any area of food science. JFS emphasizes and promotes the highest standards of ethics in the conduct of reporting research.• AUTHOR OBLIGATIONS: The Institute of Food Technologists is proud of the high quality of the research reported in its journals, and is dedicated to maintaining its high level of professionalism. However, because of reports of fraud and plagiarism in the scientific literature, it seems worthwhile to remind authors of their obligations when submitting manuscripts for publication in IFT's journals.
Although precise guidelines do not exist, all authors listed in the manuscript should ask themselves the following questions:• Does the manuscript list all participants who made significant
contributions, and only those participants?• Have the data been reported accurately and not manipulated
to demonstrate the desired results?• Has the literature been cited sufficiently and accurately?• Have the research guidelines established by the authors' in
stitutions been followed?Submission of manuscripts to the Institute of Food Technol
ogists implies that the authors have reviewed the above questions and the conditions have been met.• MANUSCRIPTS (4 copies) should be submitted to:
Dr. Robert E. Berry IFT Scientific EditorP.O. Box 3065 Winter Haven, FL 33881
• NO RESPONSIBILITY is assumed by the Institute of Food Technologists for statements and opinions expressed by the contributors to its publications.• MANUSCRIPTS should conform to the style used in Journal of Food Science and authors are urged to consult the "IFT Style Guide for Research Papers" (see next paragraph for availability). Journal of Food Science reserves the privilege of editing manuscripts to make them conform with the adopted style of the
journal or returning them to authors for revision. Editing changes may be reviewed by authors before publication.• STYLE GUIDE: The "IFT Style Guide for Research Papers" is published annually in Journal of Food Science (last date of publication: July-August, 1992, Vol. 57, No. 4, pp. 1029-1032). Copies are also available from IFT's Director of Publications.• PAGE CHARGES for Publications: The IFT Executive Committee has established a page charge of $70 per printed page for all papers pub ¡shed in Journal of Food Science. The page charge shall not constitute a bar to acceptance of research manuscripts because the author is unable to pay the charge.• SUBSCRIPTIONS: All communications related to handling of subscriptions, including loss claims, change of address, and orders for back issues should be sent to:
Subscription Department Institute of Food Technologists 221 N. LaSalle Street, Suite 300 Chicago, IL 60601 USA
Member Subscriptions-$28 per year (Canadian residents must add 7% to magazine subscriptions).Non-Member Subscriptions-AccepXed only on a calender year basis-no refunds. Rates include postage. Payment must accompany order. Domestic, Canada, and Mexico-$82, all other des- tinations-$92 (Canadian residents must add 7% to magazine subscriptions). Reouced rates for 2- and 3-year subscriptions. Change of address notice, with old address label, is required 8 weeks before issue date.Claims for lost copies are allowed only if received within one month after publication (3 months for foreign subscribers). Single copies and available back issues, $20 each postpaid; remittance to accompany order.• REPRINTS: Single reprints are not available from Journal of Food Science. Address requests for single reprints to authors, whose addresses are found with each article. Original size and/ or microform copies of individual articles, or issues, or entire volumes may be ourchased from University Microfilms International, 300 N. Zeeb Road, Ann Arbor, Ml 48106, U.S.A. (phone 800-521-0600), or Dept. F.A., 30-32 Mortimer St., Dept. P.R., London W1N 7RA, England.
Quantity reprints can be ordered from IFT Publications Department-Minimum of 100 copies. Price schedule available upon request.
© C o p y r ig h t 1993 b y In s titu te o f F o o d T e c h n o lo g is ts . A l l r ig h ts re s e rv e d . JOURNAL OF FOOD SCIENCE ( fo rm e r ly Food Research ) is p u b lis h e d s ix tim e s a y e a r (b im o n th ly ) b y In s titu te o f F o o d T e c h n o lo g is ts , 221 N . LaS a lle S tre e t, S u ite 300 , C h ic a g o , IL. 60601 U S A . P rin te d in U S A . S e c o n d c lass p o s ta g e p a id a t C h ica g o , I l l in o is a n d a t a d d it io n a l m a ilin g o ff ic e s . P O S T M A S T E R : S e n d a d d re s s c h a n g e s to J o u rn a l o f Food Science, 221 N . LaS alle S t., S u ite 300 , C h ic a g o , IL 60601 .--------------------------------------------------------- 9 r" <!(--------------------------------------------------------------------
t f s . - ■ ' ' ^ : j 5 f n iiii
1 r n c / hl f i

Letters
I r r a d i a t i o n & P a c k a g in g A f fe c t N i t r a te - N i t r o g e n
I am disappointed that the above mentioned contribution [J. Food Sci. 57 (1992) 1357-1358: Irradiation and Packaging Affect the Nitrate-Nitrogen Concentrations of Potatoes by Mondy et al.] managed to slip past the reviewers without appropriate corrections.
The first indication of inaccuracy is the use of “ K” for “ kilo” where SI units require “ k” . Another sign is the falsely stated 788.5 minutes at a dose rate of 0.00127 kGy/min; it should be 787.4 (at least on my calculator!). Since the irradiation took about 13 hours, the facility obviously consisted of very small laboratory equipment, which raises doubts about the dose distribution achieved; the dose distribution throughout the individual tubers might well have been very inhomogeneous. The dose rate was measured by an ionization chamber which gives dose in air and ought to be converted to dose in water.
Furthermore, it is not true that 1.0 kGy for potatoes was approved in 1964; on 1 November 1964, 0.05 to 0.15 kGy was permitted and this dose range is still effective today. However, for several reasons, radiation processing of potatoes for sprout inhibition is not actually used anywhere. The research reported was therefore quite pointless—especially in the high dose range which is known to damage potatoes.
The authors give one justification for their study by referring to the fact that in the USA, according to data published in 1975, potatoes contribute up to 14% of the per capita ingestion of nitrate. In the 20 odd years which have since passed, agricultural practices as well as dietary habits have changed. The authors should surely have placed their findings within the context of the relevant nitrate limits in the USA for different items of agricultural produce, or at least have considered the appropriate WHO recommendations. As regards the significance of potatoes in the etiology of methemoglobinemia in infants, I prefer not to even discuss such a question.
—D. Ehlermann, Federal Research Center for Nutrition, Inst, of Process Engineering, Bundesforschungsanstalt Enges- serstr. 20 D-7500 Karlsruhe 1
A n d T h e R e p ly . . .The following is our response to the criticizms made by Professor D. Ehlermann regarding our recently published manuscript entitled “ Irradiation and Packaging Affect the Nitrate- Nitrogen Concentration of Potatoes” (J. Food Sci., 1992, voi 57:1357-1358). We hope that our comments will clear any doubts Dr. Ehlermann may have regarding this manuscript.
(1) Although “ k” , the SI unit for “ kilo” should have been used instead of “ K” the authors do not see how the significance of the findings can be altered by this insignificant error.
(2) The irradiation time of 788.5 min at a dose rate of 0.00127 kGy/min is not falsely stated as contended by Professor Ehlermann. The dose rate was computed to be 1.26823 Gy/min which is 0.00126823 kGy/min and was rounded off to 0.00127 kGy/min. Using this rounded off figure we find that the total dose (0.00127 kGy/min x 788.5 min) is computed as 1.001395 kGy which is only 0.14% more than the 1.00 kGy dose reported in the paper which is, in fact, the real dose received (0.00126823 kGy/min x 788.5 min = 0.999999355 kGy or1.00 kGy). If Professor Ehlermann is insistent on having absolute accuracy, then even his own computation of 787.4 min
a?C o n c e n t r a t io n s o f P o ta to e s
is inaccurate (0.00127 kGy x 787.4 min = 0.999998 kGy and not 1.0 kGy!). Surely Professor Ehlermann does not believe than an apparent difference of 0.14% could significantly alter the results of the two irradiation doses, 0.1 and 1.0 kGy, which are 90% apart?
(3) The authors agree that the question regarding the hom- ogeniety of the dose is a legitimate one. That part of the potato tuber facing the Cobalt 60 source would certainly receive more irradiation than either the center of the tuber or that part facing away from the source. Using the 1.0 kGy dose as an example, we have shown below that the differential dose received by the different sections of the tuber (front “ f” , center “ c” and back “ b” ) does not have a significant impact on the overall dose received by the tubers:
All tubers (size C, average diameter of 8 cm) were arranged within an 70.9-cm radius from the Cobalt 60 source. The tubers were placed so that the center of the tubers coincided with the circumference. Hence the front part of the tuber was 66.9 cm, the center 70.9 cm, and the back 74.9 cm from the Cobalt 60 source. Using these distances, and the inverse square law, we have calculated the total dose of gamma irradiation received by the three sections of the tuber as follows:
The dose rate at 1 cm from the Cobalt 60 source as measured by the ionization chamber = 6.38930619 kGy/min.
At 66.9 cm the dose rate = 6.38930619 kGy/min x l 2/66.92 = 0.00142758 kGy/min, and the total dose received = 0.00142758 kGy/min x 788.5 min = 1.12564945 kGy.
At 70.9 cm, the dose rate = 6.38930619 kGy/min x l 2/70.92 = 0.00127105 kGy/min, and the total dose received = 0.00127105 kGy/min x 788.5 min = 1.00221968 kGy.
At 74.9 cm, the dose rate = 6.38930619 kGy/min x l 2/74.92 = 0.00113891 kGy/min and the total dose received = 0.00113891 kGy/min x 788.5 min = 0.89803190 kGy.
iv

Since a randomized sampling was used, the differences average out as follows:
1.12564945 + 1.00221968 + 0.89803190 3
= 1.00863368 kGy or 1.00 kGy.
Similar conclusions can be arrived at using the 0.1 kGy dose. If the differential dose received by the different sections of the tuber were significant, then it would have manifested itself as a large variation during the nitrate analysis. However, no such variation was observed, our results were highly consistent, and the differences between the treatments highly significant.
Since the radiation cell, 80 sq ft, is quite small, some additional, but minor, variation in the total irradiation dose received by the tubers due to scattering of the gamma rays may be possible. However, the difference between direct and scattered irradiation in the cell was found to be only 1 - 2 % and was taken into account while measuring with an ionization chamber.
(4) Should the dose rate in air, as measured by an ionization chamber, be converted to dose in water? The authors do not believe that the difference is significant. The radiation energy of the Cobalt 60 source used in our experiment is 1.13—1.17 Mev. According to Casarett (1968), when water and soft tissue absorb gamma irradiation of an energy between 1 0 0 kev and 3 Mev, the absorbed dose per roentgen is between 0.93 and 0.98 rad (0.0000093 and 0.0000098 kGy), which is a very small amount and cannot have a significant impact on the irradiation doses, 0.1 and 1.0 kGy, used in this experiment.
(5) The use of irradiation doses up to 1.0 kGy was approved by the United States FDA in 1984 on fruits and vegetables, and not in “ 1964” as stated in the paper, and the authors recognize it as a typographical error. Professor Ehlermann’s statement that “ radiation processing of potatoes for sprout inhibition is not actually used anywhere” is not true. It is well established that Japan uses this technology commercially and we may soon see many other countries including the United States use it as well in the near future. Therefore, the research reported in our paper is not “ pointless” as contended by Professor Ehlermann. Further, Professor Ehlermann’s classification of 1.0 kGy as a “ high dose range” is entirely wrong. Irradiation doses up to 1 . 0 are classified as low doses, those between 1.0 and 10.0 kGy are medium while those between10.0 and 100.0 kGy are classified as high doses (Zurer, 1986). The authors suggest that Professor Ehlermann check his sources before making such inaccurate statements in the future.
(6 ) The justification for the study given by the authors that potatoes can contribute up to 14% of the per capita ingestion of a nitrate is perfectly reasonable. The published data of White(1975) showing that potatoes contribute up to 14% of the per
capita ingestion of the nitrates in the United States has been widely accepted and quoted with great frequency in the literature. The nitrate concentration of potato tubers has been shown to increase significantly under several conditions. For example, the past 18-20 years have witnessed a great increase in the use of nitrogen fertilizer which has, in turn, resulted in great increases in the nitrate concentration of potatoes. In our current study we have shown that high doses of gamma irradiation significantly increase the tuber concentration of nitrates. Further, the potato is one of the most widely consumed crops around the world and, therefore, it is very important to carefully monitor those factors that have been shown to increase nitrate concentration of potatoes.
(7) Professor Ehlermann does not prefer to discuss the significance of potatoes in the eteology of methemoglobinemia in infants. The authors shall, however, discuss this topic with great pleasure. Studies by Lopez de Romana et al. (1980, 1981a and 1981b) have shown that potatoes can be used to supply all the dietary requirement for protein and a significant portion of that for energy to infants and young children recovering from malnutrition. These studies have shown that (1) infants and small children can consume from 50% to 75% of their energy and up to 80% of their nitrogen requirements as potato for up to three months; and (2 ) potato protein has a sufficient ratio cf total essential amino acids to total amino acids and a balance among individual essential amino acid concentrations in order to meet the needs of infants and small children. Other studies have also shown that potato protein (particularly cultivars of higher protein) can be a good weaning food (Kaur and Gupta, 1982). Clearly, there is an increasing trend to include potatoes in the nutrition of infants and small children suggesting a great need to carefully monitor the nitrate levels in potatoes and thereby reduce the risk of methemoglobinemia.
—Nell I. Mondy and Cyrus B. Munshi, Cornell University, Ithaca, NY 14853.
REFERENCESCasarett, A.P. 1968. Radiation Biology. Prentice-Hall, Inc., New Jersey,
USA.Kaur, B. and Gupta, S.K. 1982. Utilization of potato for weaning food
manufacture. J. Food Sci. Technol. 19: 23.Lopez de Romana, G., Graham, G.G., Madrid, S., and MacLean, W.C. 1981a.
Prolonged consumption of potato diets by infants and small children. J. Nutr. I ll: 1430.
Lopez de Romana, G., MacLean, W.C., Placko, R. P., and Graham, G.G. 1981b. Fasting and postprandial plasma free amino acids of infants and children consuming exclusively potato protein. J. Nutr. I ll: 1760.
Lopez de Romana, G., Graham, G.G., David Mellits, E., and MacLean, W.C. 1980. Utilization of the protein and energy of the white potato by human infants. J. Nutr. 110: 1849.
White, J.W., Jr. 1976. Relative significance of dietary sources of nitrate and nitrite. J. Agric. Food Chem. 23: 886.
Zurer, P.S. 1986. Food Irradiation. A technology at a turning point. Chem. Eng. News. 64: 46 (May 5, 1986).
V

This publication is available in microform.
wu ü. Jr■C ¡ ¿ b A k " « n i l
i a i r a a u i i .v - 4 H B < 9M U 5 « U £ ia P 4 %_ UÉW .-.ÏÜ fc
■ c ; IsJHp- i £■ ü Hi k i i i J . »2à**- W 4 34 U C Ü *B bf t * fc* • y __ H u ]|U t H aUU 0 »■ p u at*H U P y -s ï
r ? a « n - i j u n , s / u f r i , u i . H i . i<n . tuf y — C a O l * — LL*M- *fcU£ir> « n r * » 1. *' î iîL „ •*>'# tw 3î*1
- u m s ; ? « ùU L Li l r % f y * O T l A i US " U D K S n ^ t f H P i * PU 1 ^ 3 8 ! « . * '
UMI reproduces this publication in microform: microfiche and 16 or 35mm microfilm. For information about this publication or any of the more than 16,000 periodicals and 7,000 newspapers we offer, complete and mail this coupon to UM I, 300 North Zeeb Road, Ann Arbor, Ml 48106 USA. Or call us toll-free for an immediate response: 800-521-0600. From Alaska and Michigan call collect 3 13 -76 1-4 70 0 . From Canada call toll-free 800-343-5299.
Please send me information about the titles I’ve listed below:
U M IA Bell & Howell Company 300 North Zeeb Road Ann Arbor, Ml 48106 USA 800-521-0600 toll-free313-761-4700 collect from Alaska and Michigan 800-343-5299 toll-free from Canada
Name_Title—Company/lnstitution. Address________City/State/Zip____Phone (______ )_

Physical and Sensory Characteristics of Low Fat GroundBeef Patties
M. F. MILLER, M. K. ANDERSEN, C. B. RAMSEY, and J. 0. REAGAN
----------------------------ABSTRACT-----------------------------Ground beef patties with combinations of 0 and 10% added water and 0 and 0.25% added phosphate were compared with controls (22% fat and 0 % added water and phosphate). Added water increased thaw and cooking losses but improved objective texture measurements and sensory panel ratings (P < 0.05). Added water and phosphate increased the percentage of water, decreased protein and did not affect fat. Added water and/or phosphate resulted in higher (P < 0.05) juiciness, tenderness and overall palatability scores. Low fat patties with added water were similar to 22% fat patties. Water and/or phosphate also improved sensory ratings for texture and flavor of 10% fat patties to equal those for 22% fat patties.
Key Words: ground-beef, patties, sensory, low-fat, texture
INTRODUCTION
GROUND BEEF, important in the American diet, has a per capita consumption of about 13 kg. (National Live Stock and Meat Board, 1990). Recommendations, such as those set forth by the American Heart Association, to reduce dietary fat intakes to lower serum cholesterol levels have caused a decrease in consumption of ground beef (containing about 30% fat, Hoelscher et al., 1987). Except for younger and lower income consumers, leanness has become the determining factor in buying ground beef (National Research Council, 1988). Younger and lower income groups are more influenced by price. Lean ground beef has a lower palatability linked with the decrease in fat. Several studies have shown significantly lower sensory scores for tenderness and juiciness in low fat ground beef (Berry and Leddy, 1984; Kregal et al., 1986). As fat level decreases, tenderness and juiciness also decrease. Therefore, investigations are needed on feasible methods to produce ground beef with low fat levels (about 1 0 %) but maintain acceptable palatability similar to higher fat (2 2 %, the industry average) ground beef.
A method of producing such low fat, highly palatable ground beef may be to replace the fat with water to increase juiciness. Addition of water is used to increase moisture in fresh and cooked processed meat items. Another possible addition to ground beef would be alkaline phosphates that may extract salt soluble proteins and bind more free water which may otherwise exude from the product as purge or shrink loss. Phosphates can increase the water-holding capacity of meat products, but at levels of 0.4-0.5% off-flavors may be produced (Miller et al., 1986). If the addition of water and/or low levels of phosphate to ground beef can increase juiciness and tenderness, then fat could be reduced without diminishing palatability.
Our objectives were to evaluate the effects of adding phosphate and water on physical and sensory characteristics of reduced fat (about 1 0 % fat) ground beef, and to compare such products with regular (2 2 % fat) ground beef.
Authors Miller and Ramsey are with the Dept, o f Animal Science, Texas Tech Univ., Lubbock, TX 79409-2162. Author Andersen is with the Dept, o f Animal Science, Univ. of Wyoming, Laramie, WY 82071. Author Reagan is with the National Live Stock and Meat Board, 444 Michigan Ave., Chicago, IL.
MATERIALS & METHODSProduct formulation
Four beef gooseneck rounds (IMPS #170) were defatted and ground in a Hobart (Model #4046) meat grinder (Hobart Manufacturing Co., Troy, OH) through a plate with 13-mm orifices. Subcutaneous fat from beef carcasses at our Meat Science Laboratory also was ground. The lean and fat were vacuum packaged, frozen and stored at - 20°C until proximate analyses were performed. Representative samples were withheld from both the lean and fat prior to freezing for analyses of moisture, fat and protein (AOAC, 1984). The appropriate amounts of lean trim and fat trimmings to achieve final products with 10± 1% fat and 22 ± 1 % fat were determined by calculations with simultaneous equations. For treatments with added water, the initial fat content was adjusted so that final fat content, after addition of water, would be 10 ± 1 % fat. This adjustment was made to insure that any differences in water levels were not biased by variations in fat level.The frozen trim was tempered to 2°C. Appropriate amounts of lean
and fat trim and water or phosphate were combined and mixed for 4 min and then ground through a 3.3-mm plate. The final product was formulated to one of two fat levels (10 and 22%). The 10% treatment had two levels of added water (0 and 10%) and two levels of phosphate (0 and 0.25%). The 22% fat samples served as controls. After mixing, each batch of abou: 4 kg was hand stuffed into 10-cm diameter fibrous casings (minimizirg air in the product) and frozen. Slices 1.3 cm in thickness and weighing about 113g were removed, placed on plastic foam meat trays and overwrapped with oxygen permeable film (02 transmission = 0.20 cc/min). Tbe patties then were boxed and frozen (-20°C) for 30 days until further analyzed. The entire procedure was replicated.
Cooking
Patties were removed from the freezer and allowed to thaw for 24 hr at 2°C. Weights of frozen and thawed products were recorded to determine thaw less. Model No. B300 Farberware skillets (Kidde, Inc., Bronx, NY) were heated and their controls calibrated to 149°C using a Molytek Model 3702 potentiometer (Milytek Inc., Pittsburgh, PA) and a copper/iron thermocouple probe immersed in vegetable oil. The patties were cooked 3 min, turned over, cooked 6 min, turned again, and cooked 3 min using the procedure reported by Ahmed et al. (1990) to be reliable to produce a 70°C internal temperature in pork sausage patties. The internal temperature of a few patties was measured and was near 70°C, (medium doneness). After being cooked, the patties were blotted dry with paper towels and reweighed to determine cooking loss. All weights were with a Mettler P M 400 scale balance (Mettler Instrument Corp., Highstown, NJ). The patties were cut into 1 cm3 portions and served while warm (about 65°C) to sensory panelists.
Objective texture measurements
Allo-Kramer shear force was determined by shearing six 2.5 cm wide strips treatment combination. The strips were removed from the center of cooked patties. Strips were equilibrated to 25°C and sheared using a multi-blaced Allo-Kramer shearing device attached to an In- stron Model 1122 Universal Testing Machine equipped with a Micro- con computer (Instron Corp., Canton, MA). The full scale load was set at 100 kg, crosshead speed 200 mm/min and chart speed 50 ir.m/ min.
Hardness, springiness, cohesiveness and chewiness were determined according to Bourne (1978). Six cores (2.5 cm diameter)/treat- ment combination were removed from the center of cooked patties and allowed to equilibrate to 25°C before being compressed twice to
Volume 58, No. 3, 1993-JOURNAL OF FOOD SCIENCE-461

LO W FAT G ROUND BEEF. . .
Table 1 -M e a n s fo r p ro x im a te com pos ition o f ra w a n d cooked g ro u n d b e e f p a tties in flu e n ce d b y fa t level, added w a te r an d ad ded phospha te
F o rm u la “
R aw C oo ke d
M o is tu re(% )
Fat<%)
P ro te in(% )
M o is tu re(% )
Fat(% )
P ro te in(% )
1 0 -0 -0 65.3d 10.3d 2 2 .2 b 45.9» 11.7» 40.9»
1 0 - 1 0 -0 7 2 .8b 1 0 .5C 15.2d 45.2» 1 2 .2 = 40.4»10-0-.25 70.1 “ 1 0 .6 “ 17.8C 45.2» 1 1 .8 = 40.1»10-10-,25 73.6» 10.3= 13.2“ 49.5= 1 2 .1= 36.7=2 2 -0-0 6 4 .2d 2 2 .2 b 11.7 ' 4 5 .2d 2 1 .1» 3 5 .1dSEM» 0.62 0 .2 0 0 .2 0 0.19 0.18 0.23
“ Fat level (10 or 22%); added water level (0 or 10%); added phosphate level (0 or 0.25%).»■' Means In the same column bearing unlike superscripts are different (P < 0.05). a Standard error of the mean. d.f. = 47.
70% of their original height. The full scale load was set at 20 kg, crosshead speed at 50 mm/min and chart speed at 50 mm/min.
Sensory analyses
An eight-member sensory panel was selected and trained according to procedures outlined by Cross et al. (1978). Four training sessions were held in which panelists were served patties from a wide variety of treatments to familiarize them with a wide range of scores. Training sessions were concluded when panelists were in close agreement (i.e., individual scores did not vary more than ± 1 from the mean raw score and all panelists indicated they were comfortable with the scoring system). Panelists sat in booths in an isolated room free of distractions. Green fluorescent lighting was used. Panelists were instructed to eat crackers and drink room temperature water and apple juice to cleanse the palate between samples. Panelists scored patties on a 1 to 8-point scale in which 8 = extremely juicy, springy, tender, cohesive, coarse, flavorful or palatable and 1 = extremely dry, nonspringy, tough, noncohesive, fine, unflavorful or unpalatable. Panel members also indicated whether or not they detected any off-flavors or if samples were too tough, too mushy or too dry.
Statistical analysis
Data were analyzed using a 2 (fat level) X 2 (water level) X 2 (phosphate) completely randomized factorial design (Montgomery, 1984). An analysis of variance (SAS Institute, Inc., 1985) was conducted. No significant interactions were found among main effects. When a significant main effect was detected, the means were separated with the Student-Newman-Keuls test (Montgomery, 1984), The predetermined level of probability for significance was 5 % (P < 0.05) for all comparisons.
RESULTS & DISCUSSION Proximate analysis
The proximate analysis data for the raw and cooked patties (Table 1) showed raw patties differed (P < 0.05) in moisture among formulations. All those to which water, and/or phosphate were added were higher in percentage moisture than the control 2 2 % fat patties or the 1 0 % fat patties with no added water or phosphate. The phosphate treatment with no added water (10-0-0.25) was significantly lower (P < 0.05) in moisture than the two formulations to which water had been added (10-10-0 and 10-10-0.25).
As expected, percentage protein in the raw, low fat formulations varied inversely with percentage moisture. These results agreed with Kregal et al. (1986) and Hoelscher et al.(1987). Each formulation differed (P < 0.05) from all others. The low fat formulation without added water or phosphate (10-0 -0 ) contained almost two times more protein (2 2 .2 %) than the high fat formulation (11.7%). The 22-0-0 formulation was the lowest in protein.
Cooked patties showed a different pattern from raw patties in percentage moisture among formulations. The lowest moisture content (42.5%, P < 0.05) was in the high fat formulation, which was 7% lower than that containing both added water
Table 2 —M eans fo r th a w an d cooking losses an d ob jec tive te x tu re m easurem en ts o f g ro u n d b e e f pa tties in flue nced b y fa t level, a d ded w a te r an d ad ded phospha te_______________________________________________________
F o rm u la ”
T h a wloss(% )
C o o k in gloss(%>
H a rd ness
S p r in g ine ss
C o h e s iv e n ess
C h e w ine ss
1 0 -0 -0 2.3= 3 0 .8d 49.41» 0.74= 0.48» 17.67»1 0 - 1 0 -0 3.8» 33.7»= 26.10=d 0.83» 0.38=d 8.69=d10-0-.25 4.8» 26 .5 “ 31.90= 0.79»= 0.43= 10.95=10-10-,25 4.5» 32.3=d 19.52d“ 0.75= 0 .3 5 d 5 .1 6d“2 2 -0 -0 1 .6 = 35.5» 17.40“ 0 .6 7 d 0 .3 3 d 3 .9 2 “S E M ' 0.32 0.72 2 .70 0 .0 2 0 .0 2 1.29
8 Fat level (10 or 22%); added water level (0 or 10%); adced phosphate level (0 or .25%).be Means in the same column bearing unlike superscripts are different P < 0.05). f Standard error of the mean. d.f. = 47.
and phosphate. The other three formulations did not differ in moisture. Results clearly show that the addition of water and phosphate to low fat ground beef resulted in retention of more moisture during cooking.
The 10% fat formulations did not differ (P < 0.05) in fat content in either raw or cooked states. The high fat patties had the highest fat content in both raw and cooked states. Cooking increased the percentage of fat in all formulations more than 1%. These results show that in higher fat levels in ground beef result in greater fat losses during cooking and agreed with Cross et al. (1980) and Troutt et al. (1992).
The protein percentages of the low fat patties (36.7 to 40.9%) illustrated that this cooked product was a high protein food. The 22% fat patties were lower in protein (35.1%, P < 0.05) than any other formulation.
Losses
Thaw losses were lower (P < 0.05) for formulations that did not contain either added water or phosphate than for formulations with added water and/or phosphate which were similar (3.8-4.8 %, Table 2). Cooking losses also showed significant differences among formulations. The lowest cooking losses (26.5%) were produced by low fat patties with added phosphate. The high fat patties (22-0-0) had the highest cooking losses (35.5%) but did not differ from low fat patties with added water (33.7%). Adding phosphate did not affect cooking losses of patties that had added water (P > 0.05).
Instron measurements
Means for texture analysis by the Instron Universal testing machine also (Table 2) indicated hardness was much greater (49.41) for the 10-0-0 formulation than for the others. Adding water or phosphate had similar effects on hardness. Adding fat (22-0-0) or water and phosphate (10-10-0.25) produced similar changes. Phosphate alone Had much less effect on hardness than water and phosphate in combination. Thus, hardness could be decreased (P < 0.05) with the addition of fat, water and/ or phosphate. The decrease in hardness values has important implications for production of low fat ground beef. Hardness scores were affected by fat content, with 2 2 -0 -0 being the least hard although not different form 10-10-0.25 patties.
Springiness values varied much less across formulations than did hardness. The 10-10-0 patties were more springy (P < 0.05) than all but the 10-0-0.25 treatment, while 22-0-0 was least springy (P < 0.05). No other significant differences were found for springiness values. Thus, adding water alone increased springiness, adding fat decreased springiness, and other treatments were not different from each other.
The 10-0-0 patties were the most cohesive (0.48), while no differences were found between added water and high fat treatments. Chewiness scores, as expected, decreased as water, phosphate and fat were added. The 10-0-0 treatment was chew-
462—JOURNAL OF FOOD SCIENCE-Volume 58, No. 3, 1993

Table 3 -M e a n s * fo r sensory p a n e l ra tings o f g ro u n d b e e f p a tties as in flu e n ce d b y fa t le /e l, added w a te r a n d ad ded phospha te
F o rm u la 6 J u ic in e s s S p rin g in e s s T e n d e r n e s s C o h e s iv e n e s s T e x tu r e F la v o rO v e ra ll
p a la ta b .O ff-
f la v o r
1 0 -0 -0 3 .4 d 5 .4 ' 3 .8 ' 5 .6 ' 3 .4 d 3 .9 d 3 .4 d 3 7 '1 0 -1 0 -0 5 .6 ' 5 .0 d 5 .7 d 4 .8 d 5 .6 ' 6 .2 ' 5 .9 ' 0 d1 0 -0 - .2 5 3 .7 d 5 .1 d 4 .8 ' 4 . 9 'd 3 .9 d 4 .4 d 3 .9 d 1 6 d1 0 -1 0 - .2 5 6 .3 ' 4 .4» 6 .5 ' 4 .8 d 5 .4 C 6 .5 ' 6 .5 ' 0 d2 2 -0 -0 0 .2 6 0 .2 2 0 .2 7 0 .2 5 0 .2 2 0 .2 6 0 .2 5 7 .0S E M 6 .2 ' 4 .9 6 .1 'd 5 .1 'd 5 .5 C 6 .3 ' 6 .2 ' 0 d
■ Means based on an 8-point scale where 1 = extremely dry, nonspringy, tough, noncohesive, fine, unflavorful, or unpalatable; and 8 = extremely juicy, springy, tender, cohesive, coarse, flavorful, or palatable. Off-flavor is reported as the percentage of incidents. b Fat level (10 or 22%); added water level (0 or 10%); level of phosphate added (0 or 0.25%). eA Means in the same column with different superscripts are different (P < 0.05). o Standard error of the mean. d.f. = 36
ier than the other formulations (P < 0.05). The 10-0-0.25 patties were less chewy (P < 0.05) than the 10-0-0.25 patties, but did not differ from the 10-10-0 patties. No chewiness differences were found between the 10-10-0.25 and 22-0-0 patties. Thus, adding fat or water plus phosphate had similar effects of chewiness.
Ratings by the sensory panel
Ratings by the sensory panel showed no differences (P < 0.05) for juiciness, cohesiveness, texture, flavor, overall pal- atability, and incidence of off-flavors (0 %) among the added- water formulations and the high fat formulation. However, the low-fat treatments without added water differed (P < 0.05) from the other three treatments, being lower in juiciness, texture, flavor, and overall payability, and higher in off-flavor incidence. The low fat and water levels in the 10-0-0 ground beef patties resulted in increased off-flavors. The low moisture and fat levels in these patties may have resulted in increased concentration of lean flavor components after cooking leading to the increased detection of off-flavors. Berry (1992) reported that beef flavors followed a similar pattern to these for juiciness. The differences between fat levels were minor at high fat and moisture levels but were more pronounced at lower fat levels. Berry also reported that the reduction in ground beef flavors at low fat levels was due to the presence of other flavors (30.4% metallic or liver-like and 21.2% of “ other” flavors). The results from that study suggested fat levels 5% in a ground beef product may be insufficient to mask certain flavors derived from the lean. Results from our study suggest that ground beef patties formulated to 1 0 % fat may have a higher incidence of lean-derived flavors. Thus they may result in a higher incidence of off-flavors unless more water is added or bound into the ground beef because such off-flavors were not as great in the 10-10-0 or the 10-10-0.25 ground beef formulations.
The 10-0-0 patties were more springy and less tender than the other three treatments. The 10-10-0.25 formulation was least springy. The objective texture measures of springiness made with the Instron (Table 2) contradicted sensory scores, indicating the 1 0 -0 -0 less springy than the 1 0 -1 0 - 0 formulation. Higher fat and water level treatments may have provided a lubrication effect, resulting in increased juiciness for sensory panelists, but did not affect objective texture scores. Similar results were documented by Berry and Leddy (1984). The 10-0-0.25 formulation was less tender than 10-10-0, 10-10-0.25, and 22-0-0. Cohesiveness ratings were higher for the 10-0-0 formulation than for the formulations containing added water. Sensory scores for cohesiveness agreed with Instron measurements.
Note that added water treatment samples did not differ in overall payability from the high fat treatment, while the low fat treatment samples without added water were lower (P <
0.05) than the other three treatments. These results indicate that water is an excellent replacement for fat in low fat beef patties and will maintain desirable sensory properties in low fat ground beef.
CONCLUSIONSCHARACTERISTICS of quality taste associated with regular (> 2 2 % fat) ground beef patties could be equaled in low fat ( < 1 0 %) ground beef patties with addition of water and/or phosphate. The benefits would include lower fat and higher protein than regular ground beef. Another advantage would be decreased cooking loss. Although the cooking losses were greater for ground beef with added water, this was the only advantage to low fat treatments without added water. Decreased p a y a bility was observed when the removed fat was not replaced with added water. Additional research is warranted to determine possible detrimental effects, such as excessive purge losses and storage instability from possibly higher microbial populations due to addition of water.
REFERENCESAhmed, P.O., Miller, M.F., Lyon, C.E., Vaughters, H.M., and Reagan, J.O.
Physical and sense ry characteristics of low-fat fresh pork sausage processed with various levels of added water. J. Food Sci. 55:625.
AOAC. 1984. Official Methods of Analysis, 14th ed., Association of Official Analytical Chemists, Washington, D.C.
Berry, B.W. 1992. Low fat level effects on sensory, shear, cooking and chemical properties of ground beef patties. J. Food Sci. 57:537.
Berry, B.W. and Leddy, K.F. 1984. Effects of fat level and cooking method on sensory and textural properties of ground beef patties. J. Food Sci. 49:870.
Bourne, M.C. 1978. Texture profile analysis. Food Technol. 32:62.Cross, H.R., Berrv, B.W., and Wells, L.H. 1980. Effects of fat level and
source on the chemical, sensory and cooking properties of ground beef patties. J. Food Sci. 45:791.
Cross, H.R., Moen, R., and Stanfield, M.S. 1978. Training and testing of judges for sensory analysis of meat quality. Food Technol. 36:48.
Hoelscher, L.M., Saveli, J.W., Harris, J.M., Cross, H.R., and Rhee, K.S. 1987. Effect of initial fat level and cooking method on cholesterol content and caloric value of ground beef patties. J. Food Sci. 52:883.
Kregal, K.K., Prusa, K.J., and Hughes, K.V. 1986. Cholesterol content and sensory analysis of ground beef as influenced by fat level, heating, and storage. J. Fx>d Sci. 51:1162.
Miller, M.F., Davis, G.W., Seideman, S.C., Ramsey, C.B., and Rolan, T.L. 1986. Effects of various phosphates on the palatability, appearance and storage traits of flaked and formed restructured beef steaks. J. Food Sci. 51:1435.
Montgomery, D.C. 1984. Design and Analysis of Experiments. John Wiley B ook Co., New York.
National Live Stock and Meat Board. 1990. Consumer Meat Consumption Data. National Live Stock and Meat Board, Chicago, IL.
National Research Council. 1988. Consumer concerns and animal product options. In Designing Foods, p. 63. National Academy of Sciences, National Academy Press, Washington, D.C.
SAS Institute, Inc. 1985. SASC User’s Guide: Statistics. SAS Institute, Inc., Cary, NC.
Troutt, E.S., Hunt M.C., Johnson, D.E., Claus, J.R., Kastner, C.L., Kropf, D., and Stroud, A.S. 1992. Chemical physical and sensory characterization of ground beef containing 5 to 30 percent fat. J. Food Sci. 57: 25.
Ms received 5/1/92; revised 11/12/92; accepted 1/5/93.
Volume 58, No. 3, 1993-JOURNAL OF FOOD SCIENCE-463

Soya Proteins Functional and Sensory Characteristics Improved in Comminuted Meats
N.B. LECOMTE, J.F. ZAYAS, AND C.L. KASTNER
----------------------------ABSTRACT-----------------------------Soya proteins (flour, concentrate, isolate) were incorporated in formulations of frankfurters as preemulsified fat (PEF) and as powders. Sensory analysis showed that incorporation of soya proteins as PEF resulted in a reduction of specific soybean off-flavor (beany and bitterness notes) and off-aroma. Soya proteins added as PEF increased water-holding capacity and yield, decreased cook losses, and had no detrimental effect on color. Using soya proteins as stabilizer in PEF could improve functionality of these proteins and sensory characteristics of comminuted meats to which they are added.
Key Words: frankfurters, beef, soy beans, off flavors
INTRODUCTION
SOYBEANS are an abundant and economical source of food proteins. Soya proteins used as additives in foods, especially meat products, improve functional characteristics of the system such as water binding and textural properties (Padda et al., 1985; Parks and Carpenter, 1987; Rice et al., 1989). In order to develop new foods based on soya protein or to continue using soya proteins as additives, their objectionable flavors and aroma need to be eliminated or reduced. Two major off-flavor and off-aroma notes occur in soya protein products: the grassy or beany note and the bitter and astringent characteristic (Kin- sella and Damodaran, 1980; Gremli, 1982). The bitter flavors are formed from nonvolatile, oxygenated fatty acids. Phosphatidylcholine bound to soy protein develops bitter flavors upon oxidation (lipoxygenase-mediated or autoxidation) (Kin- sella and Damodaran, 1980).
The characteristic beany flavors or aroma are partly derived from the raw materials and partly formed by oxidation of residual fats (Wilkens et al., 1967; Rackis, 1979; Oliver et al.,1981). Alcohols and carbonyl compounds were found to be the main components of the grassy or beany notes of raw soybeans. Among them, n-hexanol and n-hexanal seemed to be flavor components important in effect depending on quantity (Schutte and van den Ouweland, 1979; Oliver et al., 1981).
Research showed that n-hexanal was formed through lipoxygenase aided oxidation of lipid residues in isolated protein, n-hexanol and n-hexanal bind to soya protein and, consequently, are resistant to vacuum distillation. Thus, it has been assumed that beany odorants could not be completely removed (Kinsella and Damodaran, 1980).
Mattick and Hand (1969) isolated and identified ethyl vinyl ketone as a major cause of beaniness. This compound is formed as a result of oxidative decomposition of linolenic acid, and the reaction is almost instantaneous in the presence of lipoxygenase. Once this off-flavor is developed, it is practically impossible to eliminate or mask. Many other compounds have been found responsible for off-flavor and aroma, and interactions between various compounds may contribute to off-flavors (Kinsella and Damadoran, 1980; Oliver et al., 1981).
The elimination of such off-flavors has been an objective of
Authors Lecomte and Zayas are with the Dept, o f Foods & Nutrition, and author Kastner is with the Dept, o f Animal Science, Kansas State Univ., Manhattan, KS 66506-2602.
many studies (Mustakas et al., 1969; Rackis et al., 1972; Eskin et al., 1977). Most chemical methods and heat treatments caused protein denaturation or possibly generated cooked or toasted off-flavors. Suggested chemical methods of extraction of lipids and aromatic and flavor compounds have been noneffective. They reduced protein functionality and possibly promoted the formation of toxic substances during chemical treatment.
Our objective was to develop an effective physical method to mask specific off-flavor of soya proteins and to increase their utilization in the production of comminuted meat products. This study evaluated the functional and sensory characteristics of frankfurters made with soya flour, concentrate, or isolate incorporated in formulations either as a powder or in a form of preemulsified fat (PEF).
MATERIALS & METHODSFrankfurter preparation
All-beef frankfurters were made (Kansas State University Meat Lab). Fresh beef was ground (9.38 m m plate), mixed thoroughly, and reground through a 4.69 m m plate. The ground beef samples were randomly divided, sealed in vacuum packages (4.5 kg), and stored at - 12°C until used. Frozen meat was thawed for 24 hr; reground through a 4.69 m m plate; and mixed (Hobart mixer) with 2 % table salt, half the added ice water, and then .25% Prague powder (containing 6.25% sodium nitrite, Griffith Lab, Alsip, IL), and 1% sugar. The following soya protein samples were incorporated in formulations of frankfurters: soya flour (3.5%), soya concentrate (3.5%) (both from Central Soya, Ft. Wayne, IN.), or soya isolate (2.0%) (Protein Technology International, St. Louis, MO.), or no soya was added (CONT). Each soya protein was added during blending as a powder, and as a preemulsified fat (PEF). The treatments as powder were soya flour (SFp), soya concentrate (SCp), and soya isolate (Sip), and those with additions as PEF were designated SFe, SCe, and Sle.The three PEF samples were made by blending a mixture of soya
protein (2.0% soya isolate, or 3.5% soya flour or concentrate of the formulation weight) and water (half the added water of the formulation) in an Oster blender (model 548-41A) at 10,000 rpm for 2 min. The protein slurry as stabilizer solution was incubated for 30 min in a water bath at 80°C. Melted lard was emulsified in the blender with the stabilizer solution at 20,000 rpm for 5 min. The lard was added slowly by drops. The PEF was made 2 hr prior to addition to the batter.
After addition of soya protein as powder or PEF, unemulsified lard was added to the control and the powdered soya samples, and then the last half of the total ice water was added to all samples. The lard contained B H A and citric acid (Armour Food Co., Omaha, NE). Mixing continued for 5 min. The seven sausage batters were comminuted in an emulsifier (Griffith Design and Equipment., Chicago, IL), with a 1.7 m m plate. The final temperature of the batters was < 15°C.After the meat batters were emulsified and stored in a cooler for
10 min, they were stuffed into 24 m m casings with a vacuum stuffer (Vemag Co., Robot 500, Model 128). Links 10 cm in length were formed, hung on a cooking rack, and cooked in a Maurer smokehouse. The cooking schedule was; 48°C for 10 min, 55°C for 30 min, 55°C smoking for 5 min, and cooking at 80°C to an internal temperature of 70°C. Temperatures were measured using thermocouples and a Doric Minitrend Data Logger (Model 205B-1-C-OTF). The frankfurters were chilled by a water shower, peeled, vacuum packaged (Super-Vac, Smith Equipment Co., Clifton, NJ), and stored in a refrigerator at 3°C. The flow chart for production of the frankfurters is presented in Fig. 1.
464-JOURNAL OF FOOD SCIENCE-Volume 58, No. 3, 1993

100% ground b e e f ( f ro z e n and thaw ed)1
G rin d in g and w eighing 1
B lend ing1
COHT1 25% added w a te r , l a r d ,
SFp28. 5% addedw a te r ,l a r d ,3. 5% SF
SCp28. 5% addedw a te r ,l a r d ,3. 5% SC
S ip27. 0% addedw a te r ,l a r d ,2. 0% SI
SFePEF1 c o n ta in in g 3. 5% SF, 1/2 added w a te r , and l a r d .28. 5% t o t a l added w a te r .
SCePEF c o n ta in in g 3. 5% SC, 1/2 added w a te r , and l a r d .28. 5% t o t a l added w a te r .
S lePEF c o n ta in in g 2. 0% S I , 1/2 added w a te r and l a r d .28. 5% t o t a l added w a te r .
iE m u ls i f ic a tio n
1S tu f f in g and l in k in g
1Heat t re a tm e n t
iVacuum p ackag ing
iS to ra g e a t 3°C
p re e m u ls i f ie d f a t
Fig. 1. Flow chart of frankfurter production. ’CONT = control, SFp = soya flour added as powder, SCp = soya concentrate added as powder, Sip = soya isolate added as powder, SFe = soya flour added as PEF, SCe = soya concentrate added as PEF, Sle = soya isolate added as PEF. Also, SF, SC, SI, represent soya flour, soya concentrate and soya isolate. 2 Preemulsified fat.
The control frankfurters (no soya protein added) contained 25% added water (based on meat weight). In order to maintain a proper balance between protein, fat, and water (but recognizing the change of ionic strength), higher levels of water were added to the experimental frankfurters. These were formulated from the control frankfurters (containing 25% added water) with 1% extra added water for every 1% soya product added in the formulation. Therefore, the two experimental soya flour treatments and the two concentrate treatments contained 28.5% added water, and the experimental treatments containing soya isolate had 27.0% added water to the formulation.
Color, water-holding capacity (WHC), cook stability, and yield
Color of vacuum packaged frankfurters was determined with a Hun- terlab D54 spectrophotometer. Lab readings were acquired with illuminant C at days 5 and 45 (Francis and Clydesdale, 1975). The WHC was determined by the technique of Hamm (1972). Frankfurters weighing 100g were placed in cups with boiling water for 10 min, removed, and then reweighed to calculate cooking losses. The volume of separated fat also was measured. Yield was calculated as percent of weight loss of frankfurters during the cooking and smoking processes.
Sensory evaluations
A trained seven-member sensory panel was used to evaluate the frankfurters at day 1. Aroma characteristics evaluated were meaty, and soybean. Flavor notes evaluated were meaty, beany, and bitter. Additionally, sensory characteristics were evaluated at 15, 30 and 45 days storage (data not presented).
The panelists were trained in four sessions to be familiar with references and to recognize different concentrations of soya proteins added to frankfurters (from 2-10%). The references selected included: beef bouillon solution, frankfurters containing 15% soya flour, coffee, and soy flour and concentrate that had been stored for 2 years as examples of a strong beany flavor. Six frankfurters were randomly selected from each treatment, cooked in boiling water for 2 min, and cut into 2 cm long sections. These sections with temperature 50-55°C were served to panelists in warmed, glass, custard cups covered with a watch glass. Panelists first evaluated aroma then flavor of the frankfurters. Distilled water, apples, and salt-free crackers, were provided to clear palates. An unstructured intensity linear scale with 60 points (60 = strong, 0 = none or weak) was used for the evaluation.
Table 1 -Proximate composition of frankfurters containing soya proteinsS a m p le 8 P ro te in (% ) F a t(% ) M o is tu re (% ) A sh (% )
C o n tro l 14.97" 22 .4 5 “ 58 .41 “ 2.10 “S Fp 15.67b 21 .0 9 “ 5 8 .2 9 * 2 .4 0 'SFe 16.14 d 2 1 .5 2 ab 59 .33 “ 2 .29*SCp 1 5 .7 8 * 2 1 .8 2 * 58 .66 “» 2 .3 0 ’SCe 1 5 .9 6 * 2 1 .7 3 b 5 8 .9 0 * 2 .3 1 ’S ip 16 0 9 * 22.0 1 * 5 8 .6 9 “b 2 .34*S le 16 0 5 * 2 1 .8 1 b 5 8 .9 2 * 2 .3 2 ’
“■»•“'« Means followed by different letters in the same column are significantly different at P < 0.05.
• Means from four repl cations. SFp = soya flour added as powder, Sfe - soya flour added as pre- emulsified fat (PEF}, SCp = soya concentrate added as powder, SCe ■- soya concentrate added as PEF, Sip = soya isolate added as powde', Sle = soya isolate added as PEF.
Table 2-Surface L a b values for frankfurters containing soya proteins as powder and preemulsified fat (PEF)____________________________
S a m p le “
T im e o f s to ra g e , d a y
5 45
L a b L a b
C o n tro l 4 2 .7 2 ' 13.71“ 12.71« 4 7 .6 3 b 14.01“ 12.57«SFp 3 9 .9 3 ' 14.57“ 12.36« 47.83» 14.33“ 12.86«SFe 41.71» 14.26“ 12.12« 47.61» 14 .41 “ 12.93«SCp 4 0 .3 6 ' 13.31“ 12.69« 46.65» 13 .14 “ 12.68«SCe 4 1 .9 1 ' 13.76“ 11.90« 48.56» 12.85“ 12.27«S ip 4 1 .0 6 ' 13.79“ 12.20« 48.10» 14.41c 13.13«Sle 41.60» 13.98“ 11.09« 47.89» 14.30“ 13.00«LSD 2.91 1.51 1.74 2.41 1.71 1.44
•■»■“'« Means in same column and row with different letters are significantly different (P < 0.05).
“ Means from 8 replications. SFp = soya flour added as powder, SFe = soya flour added as PEF, SCp = soya concentrate added as powder, SCe = soya concentrate added as PEF, Sip = soya isolate added as powder, Sle = soya isolate addec as PEF.
Statistical analysisThree batches of experimental and control samples were prepared.
Three replications of the experiment were carried out. A randomized complete block design was followed to eliminate experimental error due to the replications with each replication as a block. Analysis of variance was performed using a SAS package to determine differences among treatments. In order to eliminate any differences between meat samples the block x treatment interaction term was used as the error term to distinguish differences between samples. If differences existed, Fisher’s least significant difference (LSD) was used at P < 0.05 (Steele and Torrie, 1980). Two-way analysis of variance was used to analyze the effect of storage time and treatment. Also, if significant treatment x day interactions occurred, least square mean was used to discriminate differences between samples.
RESULTS & DISCUSSION Proximate composition
All seven formulations were made in an attempt to balance the water, protein and fat content. As indicated in Table 1 this was difficult and there were some variations in the formulations. The control frankfurters had the lowest protein and moisture content probably because there was no extra protein and water (in addition to the 25%) added to the formulations. Importantly, each frankfurter sample incorporated with PEF was statistically the same as the counterpart frankfurter (powder form) in protein, moisture, and fat, except SFe sample that had slightly higher protein values (16.14%) than SFp (15.67%). No differences existed between any of the treatments for ash content.
ColorIncorporation of soya proteins as PEF or powder in frank
furter formulations caused no significant differences in color among treatments or between treatments and controls after 5 and 45 days storage (Table 2). All sample treatments had significantly higher L readings after 45 days storage resulting
Volume 58, No. 3, 1993-JOURNAL OF FOOD SCIENCE-465

S O Y PROTEINS IN COMMINUTED MEATS. . .
Table 3 - Cook stability, water-holding capacity (WHC), and yield o f frank- furters containing soy proteins and preemulsified fa t (PEF)_____________
S a m p le * C o o k s ta b ili ty (% ) ' W H C Y ie ld (% )»
C o n tro l 8 9 .1 2 * 0 .5 9 5 * 7 9 .5 7 *
S F p 9 1 .4 3 * b 0 .7 0 8 » 8 1 .3 7 *
S F e 9 4 .3 8 cd 0 .7 6 5 * “ 8 5 .9 0 »
S C p 9 1 .1 0»b 0 .7 0 4 » 8 0 .9 8 *
S C e 9 2 .9 4 » * 0 .7 5 0 * 8 4 .6 2 »
S ip 9 5 .8 5 “ 0 .7 9 5 “* 8 4 .3 1 »
S le 9 5 .4 8 “ 0 .8 0 5 * 8 9 .6 2 *
L S D 2 .5 1 0 .3 9 9 2 .8 4
•,b,c,d Means in same column with different letters are significantly different (P < 0.05).• SFp - soya flour added as powder, SFe - soya flour added as PEF, SCp - soya
concentrate added as powder, SCe «= soya concentrate added as PEF, Sip - soya isolate added as powder, Sle - soya isolate added as PEF.
' Means from 8 replications.9 Means from 3 replications.
from oxidation of pigments during storage. Neither a nor b readings changed during storage.
Cook stabilityHighest cook stability means were obtained with the SFe,
Sip and Sle, whereas the control samples showed highest losses upon cooking (Table 3). SFe had higher cook stability than the SFp samples, but cook stability of Sle and SCe frankfurter was not significantly higher compared with Sip and SCp frankfurters.
Water-holding capacityThe control frankfurters, containing no added soya proteins,
had the lowest WHC (Table 3) and hence the lowest yield (79.57%). Treatments containing soya proteins in the PEF form (SFe, SCe) had higher WHC than those containing proteins added as a powder. Similar results were reported by Lin and Zayas (1987) and Zayas (1985) where different proteins as com germ protein, blood plasma, sodium caseinate, and nonfat dry skim milk proteins incorporated as PEF increased the WHC. Increased cook stability and WHC for frankfurters with SFe and SCe resulted from higher water binding when proteins were incorporated as PEF.
Table 4 - Aroma and flavor o f frankfurters containing soya proteins aspowder and preemulsified fat (PEF) a t 1 day o f storage________________
A r o m a c h a ra c te ris tic s *- ' F la v o r c h a ra c te ris tic s *- '
S a mpie» M e a ty S o y b e a n M e a ty B itte r B e a n y
C o n tro l 4 5 .8 3 * 1 4 .3 3 * 4 1 .8 3 “ 8 .8 0 * 1 2 .5 0 *
S F p 3 4 .3 3 * 3 5 .9 3 “ 2 5 .3 3 » 2 6 .3 3 “ 3 6 .2 0 “
S F e 4 0 .3 3 » 16 .6 7 *» 4 3 .5 0 “ 16 .8 0 » * 18 .3 3 » *
S C p 2 9 .4 0 * 3 9 .0 0 “ 1 9 .8 0 * 3 0 .6 0 “ 3 9 .0 0 “
S C e 4 0 .8 3 » 2 3 .3 3 * 4 1 .8 7 “ 1 9 .6 0 * 2 1 .0 0 *
S ip 4 2 .0 0 » * 2 1 .3 3 » * 3 6 .8 0 * 2 6 .2 7 “ 2 0 .4 0 *
S le 4 1 .3 3 » * 1 9 .67*»* 4 2 .8 0 “ 13 .5 0 » 1 4 .6 0 *»
•.b.c.d Means in the same column with different letters are significantly different (P < 0.05).
• Means from three replications.' Data were collected from a 60-point scale, 0 = weak, 60 - strong, fl SFp * soya flour added as powder, SFe = soya flour added as preemulsified fat
(PEF), SCp - soya concentrate added as powder SCe - soya concentrate added as PEF, Sip « soya isolate added as powder, Sle - soya isolate added as PEF.
incorporated as powder (SFp, SCp, and Sip). The all-meat control was least bitter, and the control and Sle samples were rated lowest in beaniness. Thus PEF samples (SFe, SCe, and Sle) were rated superior to those with soya added as powder indicating a reduction of the off-flavor probably a result of physical masking.
The incorporation of soya proteins as a preemulsified fat in comminuted meat products decreased specific soybean and bitter notes, the two most objectionable flavor characteristics of meat products containing soya protein additives. Masking effect of preemulsification was probably a result of encapsulation of soy proteins and physical covering of flavor components contributing to beany and bitter attributes. In the homogenized preemulsified soy protein system the proteins were evenly distributed in the structure. Lipid component of soy protein-fat- water emulsion may participate in absorbing and binding flavor components. Soya proteins form a continuous protein gel network throughout the aqueous phase via hydrophilic groups. Utilization of preemulsified soya proteins resulted in finished products with improved sensory characteristics and enhanced functional properties. Therefore, incorporating soya protein additives as pre-emulsified fat may allow increased usage of soya proteins in meat products.
Yield REFERENCES
The yield reflects frankfurter retention of water during the cooking and smoking process (Table 3). Frankfurters with soya isolate (Sle) had the highest yield, 89.62%, whereas the control, SFp, and SCp ranked the lowest. The three frankfurters (SFe, SCe, Sle) containing soya proteins in the PEF form had higher yield than their counterparts (SFp, SCp, and Sip). This indicated better water and fat binding properties in products containing PEF. In contrast, Lin and Zayas (1987) found no increase in yield as a result of preemulsification of com germ proteins.
Sensory analysisThe sensory data for aroma and flavor characteristics (Table
4) showed no differences were detected in meaty and soybean aroma between Sle and Sip samples. The control, Sip, and Sle samples were rated most meaty. Samples containing soya proteins as the powder (SFp and SCp) had lower meaty aroma than the PEF forms (SFe and SCe). Two experimental samples containing soya as PEF (SFe and Sle) were not significantly different (P > 0.05) from the all-meat control for soybean off- aroma. Also, the SCe and SFe samples contained less soybean aroma than SCp and SFp. The control frankfurters were rated the same for meatiness as PEF samples (SFe, SCe, and Sle). The samples containing soya proteins added as PEF were more meaty, less bitter, and less beany than those with soya proteins
Eskin, B.A., Grossman, S., and Pinsky, A. 1977. Biochemistry of lipoxygenase in relation to food quality. CRC Crit. Rev. Food Sc. and Nutr: 1.
Francis, F.G. and Clydesdale, F.M. 1975. Food Colorimetry: Theory and Applications, p. 143. Van Nostram Reinhold. AVI Westport, CT.
Gremli, H. 1982. Use of soy protein in food products. S. Afr. Food Rev. 9: 65.
Hamm, R. 1972. Kolloidchemie des Fleisches, P. 95, Paul Parey, Berlin, Hamburg.
Kinsella, J.E., and Damodaran, S. 1980. Flavor problems in soy proteins. In Analysis and Control of Less Desirable Flavors in Food ana Beverage. p. 95. Academic Press, New York.
Lin, C.S. and Zayas, J.F. 1987. Microstructural comparisons of meat emulsion prepared with com protein emulsified and unemulsified fat. J. Food Sci. 52: 267.
Mattick, L.R. and Hand, D.B. 1969. Identification of a volatile component in soybeans that contribute to raw bean flavor. J. Agric. Food Chem. 17:
Mustakas, G.C., Albrecht, W.J., McGhee, J.E., Black, L.T., Brookwalter, G.N., and Griffin, E.L. 1969. Flash desolventizing defatted soybean meals washed with aqueous alcohols to yield a high protein product. J. Amer. Oil Chem. Soc. 46: 623.
Oliver, A., Hseieh, A, Hsuang, S., Chang, S. 1981. Isolation and identification of objectionable volatile flavor compounds in defatted soybean flour. J. Food Sci. 47: 16.
Padda, G.S., Rao, K.V., Keshri, R.C., Sharma, N., and Sharma, B.D. 1985. Studies on physico-chemical and organoleptic properties of ham patties extended with texturized soy proteins. J. Food Sci. Tech. 22: 362.
Parks, L.L., and Carpenter, J.A. 1987. Functionality of six nonmeat proteins in meat emulsion systems. J. Food Sci. 52: 271.
Rackis, J.J. 1979. Flavor problems of vegetable food proteins. J. Am. Oil Chem Soc. 56: 262.
Rackis, J.J., Honig, D.H., Sessa, D.J., and Moser, H.A. 1972. Lipoxygenase and peroxidase activities of soybeans as related to the flavor profile during maturation. Cereal Chem. 49: 586.
Rice, D.R., Neufer, P.A., and Sipos, E.R. 1989. Effects of soy protein blends, fat level, and cooking methods on the nutrient retention of beef patties.Food Technol. 55: 88. —Continued on page 472
466—JOURNAL OF FOOD SCIENCE—Volume 58, No. 3, 1993

Cryostabilization of Functional Properties of Pre-Rigor and Post-rigor Beef by Dextrose Polymer and/or Phosphates
J.W. PARK, T.C. LANIER, and D.H. PILKINGTON
----------------------------ABSTRACT-----------------------------Cryostabilization of functional properties of pre-rigor and post-rigor beef throughout 5 mo frozen storage was investigated as affected by the addition of 8% neutralized high molecular weight dextrose polymer (polydextrose), alone or in combination with 0.5% phosphates (a 1:1 mixture of sodium tripolyphosphate and tetrasodium pyrophosphate). Pre-rigor meat to which polydextrose had been added prior to freezing was nearly equivalent in functional properties after 5 mo frozen storage to fresh, pre-rigor meat. Addition of the same level of phosphates plus polydextrose to nontreated muscle (control) after 5 mo frozen storage resulted in higher values for most measured indices of functionality. The effect was almost totally attributable to addition of the phosphates. However, addition of phosphate did not appear to increase the protein cryoprotective effect.
Key Words: beef, dextrose, post-rigor, cryostabilization
INTRODUCTION
ALTHOUGH freezing has become one of the most important preservation methods for red meat, poultry and fish, frozen storage can produce profound effects on the structural and chemical properties of muscle foods. Changes occur in muscle fibers, lipids and proteins; all of which may significantly influence the functionality of meat and meat products. Denatur- ation and/or aggregation of myofibrillar proteins are most important in the functional quality changes of frozen stored meats (Matsumoto, 1979, 1980; Taborsky, 1979). Alterations in myofibrillar proteins and their functionality have been reported in frozen red meats and isolated protein systems as measured by protein solubility (Saffle and Galbreath, 1964; Awad et al., 1968; Miller et al., 1980; Park et al., 1987a), proteolytic degradation (Olson and Parrish, 1977; Kang et al., 1983, Park et al., 1987b), and gelation (Miller et al., 1980; Verma et al., 1985, Park et al., 1987a).
Pre-rigor beef is generally recognized to have superior functionality when used in the manufacture of processed meat products (Hamm, 1981). Salting of pre-rigor beef is known to promote maintenance of high “ binding” quality (water and fat stabilization, texture development) during short term refrigerated storage, presumably by solubilizing the protein prior to a tight association of actin and myosin. However, freezing of salted pre-rigor beef resulted in a marked loss of the high binding properties when the meat was thawed prior to processing (Hamm, 1981; Park et al., 1987a). Park et al. (1987a) demonstrated that addition of certain cryoprotective compounds, including Polydextrose,® a non-sweet dextrose polymer, to salted pre-rigor beef muscle enhanced maintenance of water-holding capacity, gel-forming ability, and protein ex- tractability properties during frozen storage. However, the presence of salt destabilized the muscle proteins such that protein denaturation was accelerated during frozen storage.
Our objective was to evaluate the protective effects of polydextrose-phosphate combinations in the maintenance of func-
Authors Lanier and Pilkington are with the Dept, of Food Science, Box 7624, North Carolina State Univ., Raleigh, NC 27695- 7624. Author Park is presently with Seafood Research Laboratory, Oregon State Univ., Astoria, OR 97103.
tional quality in pre- and post-rigor unsalted beef during frozen storage. Polyphosphates enhance the functional quality of beef, perhaps reversing the association of actin and myosin which occurs upon rigor mortis, and have been shown to act syner- gistically with sugars and sugar alcohols as cryoprotectants of washed fish muscle (surimi) (Park et al., 1988). A cryoprotective action of fully neutralized polydextrose was previously reported (Park et al., 1987a; Lanier and Akahane, 1986). The nonsweet nature of this additive would make it more suitable than sucrose or sorbitol for cryoprotection of manufactured meat products if it were sufficiently effective.
MATERIALS & METHODSPreparation of samples
Semimembranosus muscle was excised from a freshly slaughtered beef carcass obtained from and prepared at Martin’s Wholesale Meats and Abattoir (Godwin, NC). The meat was trimmed of external fat and connective tissue. A pre-rigor sample group was prepared «= 1 hr postmortem by immediately grinding muscle in a cold room using a Hobart grinder (Hobart Corp., Troy, OH) with a plate with 15 mm orifices.
An 80% (wA9 solution of Polydextrose® (Pfizer, Inc.) and a 3C% solution of phosphates (a 1:1 mixture of sodium tripolyphosphate and tetrasodium pyrophosphate; B. K. Ladenburg Corp., Cresskill, NJ) were made. The phosphate solution required mild heating to solubilize the phosphates. The pH of both solutions was adjusted to 7.0 using 6N KOH or 6N HC1 to avoid pH effects. The ground muscle was divided into a control sample and 2 samples to which 8% polydextrose alone or in combination with 0.5% phosphates were added (based on total weight). Water was added to the control sample to compensate for water in the cryoprotectant solutions. Samples were mixed by hand for 2 to 3 mins, and were transported bagged in cryogenic C02 snow to North Carolina State University (NCSU) (about 2hr transport). The samples were then chopped in a cold (4°C) room using a Stephan vacuum vertical cutter/mixer (Stephan Machinery Corp.) at 1,000 rpm for 2 min to obtain a uniform blend of muscle tissues with the ciyo- protectants. Each sample was divided into ■= 900g lots. Samples to be stored were vacuum packaged in plastic bags and then frozen and held at -28°C. Samples for the initial functionality tests were held at 4°C and processed from an unfrozen state.
The remaining boneless intact muscle was allowed to pass through rigor at 4°C for 72 hrs, and an identical set of post-rigor treatments was prepared. Two extra control samples of pre-rigor and post-rigor meat containing no cryoprotectants were stored frozen at - 28°C for 5 mo. At the end of frozen storage, polydextrose and phosphates were added in the same original percentages. This was to determine whetner the additives (polydextrose and polyphosphates) were effective during frozen storage or only during processing.
Quality parameters were monitored initially and at 1, 3, and 5 mo frozen storage. The samples were thawed in a refrigerator (4°C) overnight. The thawed meat, water sufficient to obtain a 1:5 protein : moisture ratio (based on proximate analysis of total protein and moisture), and 3.5% (based on total meat + added water weight) NaCl were blended and chopped in four 15 sec cycles (total chopping time = 1 min) in a cold (4°C) specially constructed laboratory vacuum chopper (Lanier et ah, 1982). The pastelike sol thus produced was vacuum packaged in plastic bags for subsequent extrusion and quality testing.
pH MeasurementsA 5g sol sample was homogenized in 45 mL of distilled water in
an Omni mixer model 17105 (Omni International, Waterbury, CTi at
Volume 58, No. 3, 1993-JOURNAL OF FOOD SCIENCE-467

CRYOSTABILIZATION OF BEEF M U S C LE . . .
Table 1-Comparison of treatment means by LSD. Common letters in the same column denote means not differing significantly (P<0.05)._______
p H S tre s s S tra in T E P C L 7 0 C L 9 0
P re r ig o r c o n tro l a a b a b a b c a a b
P re r ig o r + p o ly d e x tr o s e a ac c a b c
P re r ig o r + p o ly d e x tr o s e + PP a c cd a b be
P o s tr ig o r c o n tro l a b b c c d
P o s tr ig o r + p o ly d e x tr o s e a a b a b be a a
P o s tr ig o r + p o ly d e x tr o s e + PP a ac ad a b b be
a speed setting of 3 for 1 min. The pH of the slurry was measured in triplicate with an Accumet Model 420 pH meter (Fisher Scientific). All pH measurements were taken at NCSU.
Cook stabilityA 40g sol sample (4°C) was stuffed into 50 mL polyethylene tubes
(28 mm in diameter). The tubes were placed in a 50°C water bath for 10 min, and then heated to 70°C and 90°C at a heating rate of 1°C/ min as described by Park et al. (1987a). Samples were removed, drained, lightly blotted, and weighed. Cook loss (%) was calculated. Analyses were performed in triplicate for each sample.
Protein extractabilityThe protein and salt contents were held constant for each treatment.
About 30g muscle sol was ground with 150 mL cold 0.6M NaCl in an Omni mixer cup, placed in an ice chest, and mixed at a speed setting of 3 for 1 min and 8 for another 1 min. The slurry was centrifuged (4°C) at 15,000 x g for 10 min. Protein concentration of the supernatant was measured with o-phthalaldehyde (OPA) by the method of Park et al. (1987b). Analyses were performed in triplicate.
Gel-forming abilityThe muscle sol was extruded into stainless steel tubes and the tubes
were heated in a water bath at 40°C for 20 min and then at 90°C for 15 min. Cooked gels were milled into a dumbbell shape and subjected to torsional shear on a modified Brookfield viscometer (Park et al., 1987a). Shear stress and true shear strain at mechanical failure were calculated using the equations given by Hamann (1983). Analyses were performed with 10 samples/replicate.
Differential scanning calorimetry (DSC)A Perkin-Elmer DSC 4 (The Perkin-Elmer Corp, Norwalk, CT)
equipped with thermal analysis data station and using a smoothing factor #5 was employed. Muscle sol was weighed (60 ± 0.5 mg) and sealed in stainless steel large volume capsules. As a reference, a pan containing 50 p.L water was used. The scanning temperature was 15-100°C at a heating rate of 10°C/min. Analyses were performed in triplicate.
Statistical AnalysisThe main experiment was analyzed as a 2 x 3 x 4 factorial.
Analysis of variance was performed using the General Linear Models procedure of the Statistical Analysis System (Helwig and Council, 1979). Time was treated as a continuous variable, so linear and quadratic time effects were included in the analysis of variance. Mean values were compared by the least significant difference test (LSD; Table 1).
RESULTS & DISCUSSION PH
The initial pH of the unfrozen pre-rigor muscle sol (control) was 6.5 while that of the unfrozen post-rigor muscle sol (control) was 5.6 (Fig. 1). The addition of polydextrose (hereafter the term refers to a pH adjusted solution) alone or in combination with phosphates induced higher pH in pre-rigor samples, while only the polydextrose plus phosphate treatment increased pH in post-rigor muscle. The pH increase for postrigor phosphate-containing samples was probably due to the higher pH and high buffering capacity of the phosphates. The
F ro ze n S to ra g e (M onth)Fig. 1 — Changes in pH of meat during frozen storage. • :pre-rigor muscle with polydextrose; ■ pre-rigor muscle with polydextrose plus phosphates; k : pre-rigor muscle with no additives; o; postrigor muscle with polydextrose; □; post-rigor muscle with polydextrose plus phosphates; A; post-rigor muscle with no additives; 5*: samples were stored without any additives and the same percentage was added after 5 months frozen storage.
higher pH noted for pre-rigor polydextrose-treated samples may have been caused by the higher pH of the added polydextrose solution (7.0); and/or this increase may be due to an inhibition of glycolysis caused by residual glucose in the polydextrose (normally about 4%) (Young et al., 1988). The latter seems more likely as the pH of post-rigor muscle was affected less than that of the pre-rigor muscle by polydextrose addition.
The higher initial pH values of the pre-rigor samples were not maintained throughout the study. After 1 mo frozen storage, for example, the pH of all pre-rigor samples had decreased by about 0.7 pH units. After 3 and 5 mo frozen storage, the pH values for all pre-rigor samples were similar to those of similarly treated post-rigor samples. This sharp decrease in pH of the pre-rigor tissue during frozen storage probably occurred during thawing of the meat before chopping. Fischer and Hon- ikel (1980) showed that a significant pH drop occurred immediately after thawing pre-rigor frozen ground beef muscle (Sternomandibularis).
When the same percentages of polydextrose plus phosphates were added to the non-treated muscle (control) after 5 mo frozen storage, the pH of both pre-rigor and post-rigor muscle increased to around 6.0 This was near the pH of the polydextrose plus phosphate treated pre-rigor muscle after 1 mo frozen storage. This increase in pH can be attributed to the alkalinity of the phosphates. The addition of polydextrose alone to the pre- and post-rigor controls stored frozen for 5 mo did not significantly change the pH of the samples. This suggested that the higher pH of pre-rigor samples to which polydextrose was added was due to inhibition of glycolysis.
Gel-forming ability
Gel-forming ability, as measured by true shear stress and true shear strain at failure of muscle gels, was monitored as a primary indicator of protein functionality. The stress-at-failure measurement quantifies the strength of the gel, while the strain- at-failure measurement indicates the cohesive nature of the gel. Shear stress is influenced by protein concentration, processing effects, and ingredient variables, while shear strain is influenced mainly by protein quality such as protein type, pH and degree of denaturation (Hamann, 1988).
Initially, the gel-forming ability of the pre-rigor meat control sample was about 1 1 % greater in stress and about 1 0 % greater in strain than that of the post-rigor control sample containing
468-JOURNAL OF FOOD SCIENCE-Volume 58, No. 3, 1993

no polydextrose or phosphate (Fig. 2). This compares with a 65% and 20% differential in stress and strain values, respectively, between pre- and post-rigor meat in a previous study involving the same type muscle and testing procedures (Park et al., 1987a). Addition of polydextrose to pre-rigor meat increased stress and strain values initially. The same trend was reported by Park et al. (1987a) upon addition of polydextrose or a sucrose-sorbitol mixture to pre-rigor beef. The addition of phosphates in combination with polydextrose increased stress (but not strain) values even further in pre-rigor meat than did polydextrose alone. In post-rigor meat, initial stress and strain values increased with addition of phosphate plus polydextrose, but did not increase with addition of polydextrose alone.
The rate of decline in gel-forming ability was similar among similar treatments regardless of the initial state of rigor (no rigor x additive x time interaction). Untreated (control) samples had the greatest decline, decreasing by about 27% in stress and about 20% in strain over 5 mo frozen storage. Samples containing polydextrose alone generally had the least decline in gel-forming ability, decreasing by about 1 0 % in stress and 6 % in strain over 5 mo frozen storage. This was probably due to the effectiveness of polydextrose in inhibiting protein de- naturation (Park et al., 1987b).
After 5 months frozen storage, pre-rigor meat containing polydextrose had a gel-forming ability near or exceeding that of pre-rigor meat in its fresh, untreated state. Likewise, postrigor meat containing polydextrose had gel-forming ability near that of fresh, untreated post-rigor meat. Thus cryoprotectant (polydextrose) addition could be an effective means of maintaining pre-rigor and post-rigor muscle functionality even after the muscle is thawed prior to use (Fisher and Honikel, 1980).
Synergistic effects of phosphates with carbohydrates have been reported to inhibit deterioration of fish muscle protein functionality during frozen storage (Linko and Nikkila, 1961; Tamoto and Tanaka, 1962; Arai et al., 1970; Park and Lanier, 1987; Park et al., 1988). However, after 5 mo frozen storage we found no beneficial effect of phosphate addition on gelforming ability, and strain values were lower than in samples containing only polydextrose.
The same percentages of polydextrose alone and plus phosphates were added to nontreated pre-rigor and post-rigor muscle (controls) after 5 mo storage. This was to assess whether improvements in textural properties were due to prevention of denaturation/aggregation during frozen storage or if such improvements could be induced simply by ingredient addition. When polydextrose alone was added to the pre- and post-rigor control samples that had been stored frozen for 5 months, stress and strain values did not increase. They were significantly lower than those values for gels made from pre- and post-rigor meat with polydextrose added before frozen storage. Thus in pre-rigor meat, phosphate addition had a positive effect on gel stress and a negative effect on gel strain of pre-rigor muscle prior to and during frozen storage. These results confirmed that the effects of polydextrose addition were primarily a result of its cryoprotective action.
When a combination of phosphates and polydextrose was added to control samples after 5 mo frozen storage, stress values were slightly increased. Strain values increased remarkably to levels in the same range as those of samples treated with polydextrose and phosphates prior to frozen storage. Thus in pre-rigor meat, phosphate addition had a positive effect on gel stress and a negative effect on gel strain of pre-rigor muscle prior to and during frozen storage. Its addition to frozen control samples produced the greater positive effect on gel strain. In post-rigor meat, phosphate addition caused increases in both gel stress and strain values prior to and during frozen storage. The more marked effect was on gel strain when added to the untreated samples following 5 mo frozen storage. Differences in gelling properties between samples with phosphate added at time of freezing and those with phosphate added after storage and thawing may partially be due to conversion of polyphos
phate to orthophosphate during frozen storage (Molins et al.,1987).
In contrast tc effects noted with beef muscle, effects of phosphate addition on refined fish meat (surimi) were quite different. Park et al. (1988) found that addition of sodium tripolyphosphate prior to frozen storage was generally synergistic with carbohydrate cryoprotectants (polydextrose and a sucrose-sorbitol mixture) in maintaining gel-forming ability (particularly gel strain) of surimi after 8 mo storage at - 28°C. Phosphates are commonly added along with sucrose and sorbitol as cryoprotectants during commercial manufacture of frozen surimi (Suzuki, 1981). Yet phosphate addition is generally deleterious to gel-forming properties of surimi when added during gel manufacture, except in low-salt products (Higgins,1989). Thus the effects of polyphosphate addition may be quite complex, and require further studies before mechanistic explanations can be developed. Certainly both pH and ionic strength effects are important (Yasui et al., 1964; Grabowska and Hamm, 1979; Trout and Schmidt, 1984), as well as perhaps the ability of pyrophosphate to dissociate actomyosin into the constituent proteins. As to the pH effect of phosphate addition, recent studies in our laboratory (Torley and Lanier, 1992) indicate that surimi gels optimally at higher pH than post-rigor beef muscle. Surimi as manufactured has a pH near its gelling optimum (pH 7.0) while beef optimally gels at a pH > 6.0, higher than that exhibited by our non-phosphate containing post-rigor samples prior to frozen storage, or that of any beef samples after 5 mo frozen storage (Fig. 1).
The strain values after 5 mo frozen storage are nearly the same for pre-rigor muscle containing polydextrose prior to freezing and untreated pre-rigor muscle to which phosphate (and polydextrose) were added after thawing (Fig. 2). The high value for the prefreeze treatment must result from a reduced degree of denaturation while that of the post-thaw cannot be for the same reason. Rather a much higher pH is induced by the phosphate addition (Fig. 1). This, along with perhaps a specific ion effect, results in similar protein extractability (Fig.3) and gelling ability despite having probably a greater degree of denaturation than the cryoprotected pre-rigor muscle. The cryoprotected sample nonetheless had a higher gel strength (stress value) and higher cook-yield (Fig. 4).
Protein extractabilityInitially, the total extractable protein (TEP) level of fresh
pre-rigor meat was > 40% greater than that of fresh post-rigor meat (Fig. 3). Polydextrose addition had little effect on TEP of fresh meat samples. Phosphate added with polydextrose had a slight effect on pre-rigor meat TEP and a pronounced effect on TEP of post-rigor meat. In post-rigor, phosphate addition increased TEP to the same level as pre-rigor meat, probably due to the pH rise (Fig. 1). Despite this, however, the gelforming ability of the post-rigor meat containing phosphates and polydextrose was not quite as high as pre-rigor meat similarly treated (Fig. 2). The difference may be due to the lower pH of the post-rigor sample (Fig. 1). These results support the suggestion that phosphates enhance meat functionality by increasing muscle protein pH and extractability (Yasui et al., 1964; Grabowska and Hamm, 1979).
The rate of decline in TEP was greatest during the first 3 mo of frozen storage for all samples (significant quadratic time effect at P < 0.01 level) with little change in the ensuing 2 mo of the study for most samples. The greatest rate of decline in TEP occurred in the pre-rigor control and polydextrose- treated samples and in the phosphate plus polydextrose-con- taining post-rigor sample. The decline in TEP of pre-rigor samples during the first 3 mo frozen storage roughly corresponded to declines in pH over the same period (both had significant (P < 0.01) quadratic time effects) (Fig. 1).
Declines in gel stress values occurred at an even rate during 5 mo frozen storage (linear time effect was significant at P <
Volume 58, No. 3, 1993-JOURNAL OF FOOD SCIENCE-469

CRYOSTABILIZATION O F BEEF M U S C LE . . .
F ro ze n S to rag e (M onth)Fig. 2—Changes in gel-forming ability of meat during frozen storage, cooked gels (for treatments see symbols in Fig. 1).
2 . 0
G
1.24------ ------- ------- ------- -0 1 3 5 5*
F ro ze n S to rag e (M onth)Shear stress and true shear strain at mechanical failure of
Fig. 3— Changes in total extractable protein content of meat during frozen storage (for treatments see symbols in Fig. 1).
0 .0 1 ), whereas declines in gel strain occurred primarily in the first 3 mo (quadratic time effect was significant at P < 0.01) (Fig. 2). The latter seems to parallel more closely the declines in TEP (Fig. 3), reinforcing an earlier suggestion by Hamann(1988) that gel strain was the more sensitive indicator of protein quality (i.e., change from native state).
Although the addition of polydextrose alone did not substantially increase the TEP of samples initially, those containing poydextrose maintained a higher TEP than control pre-rigor samples throughout frozen storage. This indicated the ability of polydextrose to reduce protein denaturation (Park et al., 1987b). Additional evidence was the lack of effect on TEP when polydextrose was added to control samples following frozen storage.
When polydextrose plus phosphates were added to the postrigor control following frozen storage, TEP was restored to the level of those previously frozen samples to which the same additives were added at the initiation of the 5 month frozen storage period. TEP was not as high as that in fresh post-rigor meat having the same treatment. Thus phosphate addition enhanced the TEP of previously frozen meat. However, substantial freeze-denaturation had occurred which could not be reversed by such treatment. Thus, the large increase in gel failure strain induced in untreated, frozen meat by phosphate addition seemed especially remarkable and, as yet, unexplainable unless due to the pH increasing effect of phosphate addition.
Cook yieldAnother indication of protein functionality is the ability to
form a gel structure which prevents water loss during cooking. Cook loss in fresh, unfrozen samples was highest (i.e. less functionality) in the post-rigor control sample, followed by the post-rigor polydextrose treatment for both the 70° (Fig. 4a) and 90°C (Fig. 4b) endpoint cooking. Cook loss values at both temperatures for pre- and post-rigor controls increased at a similar rate as frozen storage time progressed. The cook loss in the pre-rigor control was about one-third less than that for the post-rigor control. When polydextrose alone or in combination with phosphates was added, cook loss at a 70°C endpoint was relatively constant over the 5 mo frozen storage period. Cook loss increased slightly over the storage period for these treatments with a 90°C end-point however.
When the same levels of polydextrose alone and plus phosphates were added to non-treated pre-rigor and post-rigor samples (controls) after 5 mo frozen storage, a decrease in % cook loss was observed at both end-point temperatures. Cook loss values of gels decreased to levels similar to pre- and post-rigor meat treated identically prior to 5 mo frozen storage. Marked improvements in water retention during cooking were induced by simple addition of polydextrose alone and plus phosphates to freeze-denatured meat. A cryoprotective effect of polydextrose was evident in that cook loss measured at the 70°C endpoint remained constant over 5 mo frozen storage in samples with polydextrose. Cook loss of gels measured at 90°C endpoint increased at a much lower rate over storage in polydextrose- and polydextrose plus phosphate-treated samples than in the controls.
DSC ThermogramsThe patterns of DSC thermograms were similar for all treat
ments except unfrozen pre-rigor samples (Fig. 5). Sols made from these pre-rigor treatments exhibited prominent exothermic peaks at 49.2° in the control, 50.0° in the polydextrose plus phosphate treatment, and 50.8°C in the polydextrose treatment. Park and Lanier (1988) attributed the large exothermic peak in pre-rigor fish muscle at 50.0 °C to a rapid ATP hydrolysis induced with rising temperature and confirmed this by adding ATP to post-rigor muscle to induce appearance of the exotherm in post-rigor meat.
The first endothermic peak, which corresponds to the denaturation of the thick filaments (myosin) (Wright et al., 1977; Wagnor and Anon, 1986) occurred at higher temperature for all unfrozen pre-rigor muscle sols. The same was true for the
470-JOURNAL OF FOOD SCIENCE-Volume 58, No. 3, 1993

U
Or-
(0
W *>w —OJ¿4OOO
F ro ze n S to rag e (M onth)
o•OO'4J
en10OJ
8O
0 1 3 5F ro ze n S to ra g e (M onth)
Fig. 4— Changes in cook stability of gels prepared from meat held in frozen storage. Cook loss measurements taken during ramp heating of sols tfor treatments see symbols in Fig. 1).
30.00 40.00 50.00 60.00 70.00 80.00 90.00 100.00
TEMPERATURE (°C)Fig. 5—DSC thermograms of (a) pre-rigor muscle and (b) post-rigor muscle containing additives, before and after frozen storage. (A: polydextrose; B: polydextrose plus phosphates; C; no additives; D: polydextrose; E: polydextrose plus phosphates; F: no additives; 0: unfrozen; 5: after 5 months frozen storage).
second endothermic peak, which corresponds to denaturation of the thin filaments (actin and minor proteins) (Wright et al., 1977; Wagnor and Anon, 1986), with the exception of the polydextrose plus phosphate sample. The higher temperature of these transitions in sols of fresh pre-rigor meat are an indication of a greater thermal stability in the unfrozen state. A third endothermic peak at 83.2°C was evident in the thermogram of the pre-rigor polydextrose plus phosphate treatment. The genesis of this third peak is unclear. In all unfrozen samples, polydextrose addition induced an upward shift in transition temperatures in both endothermic peaks for pre-rigor sols, and in the second endothermic peak for post-rigor sols. The additional inclusion of phosphates resulted in a backward shift in transition temperature of these peaks which had been increased by polydextrose alone.
Differences in either transition temperatures or total enthalpies (area under the curve) among thermograms of the 6 different treatments which had been frozen for 5 mo were small. Differences between fresh and frozen/stored post-rigor samples were also small. Obviously, if marked differences occurred in
the level of protein denaturation among the samples, DSC by this methodology was insensitive to them.
CONCLUSIONPOLYDEXTROSE was an effective cryoprotectant for both pre- and post-rigor beef. The effective functionality of prerigor meat indicated by cook loss measurements and gel-forming ability could be maintained or improved by addition of 8 % neutralized polydextrose prior to frozen storage. Such protection required no salting of pre-rigor (hot-boned) beef nor need to avoid thawrng. Although polydextrose addition decreased the rate of decline in salt extractability of proteins, that of prerigor samples containing polydextrose still decreased by 37%. Polydextrose primarily exerted a protective effect on functionality of frozen meat when added prior to freezing. Thus its main action is likely through maintaining proteins in a less denatured state during frozen storage. Phosphate addition did not exert or enhance cryoprotective effects, but increased pH and enhanced extractability of proteins, presumably thereby
Volume 58, No. 3, 1993-JOURNAL OF FOOD SCIENCE-471

CRYOSTABILIZATION O F BEEF M U S C LE . . .
enhancing gel-forming and water-retention properties. Polydextrose has no color, flavor (including sweetness), or odor and therefore should be undetectable in processed meat products. It could enhance and maintain the functionality, or “ bind,” of frozen manufacturing meats, particularly pre-rigor beef, for processed meat product formulations.
REFERENCES
Arai, K.} Takahashi, H., and Saito, T. 1970. Studies on muscular proteins of fish III. Inhibition by sorbitol and sucrose on the denaturation of carp actomyosin during frozen storage. Bull. Jap. Soc. Sci. Fish. 36: 232.
Awad, A., Powrie, W.D., and Fennema, O.R. 1968. Chemical deterioration of frozen bovine muscle at -4°C. J. Food Sci. 33: 227.
Fischer, C.H. and Honikel, K.O. 1980. Quick thawing of hot-frozen beef: biochemical changes, thaw contracture and water binding ability. Fleischwirtschaft 60: 1703.
Grabowska, J. and Hamm, R. 1979. Protein solubility and water binding under the conditions obtaining in Bruhwurst mixtures: Effects of NaCl- concentration, pH value and diphosphate. Fleischwirtschaft. 59(8): 1166.
Hamann, D.D. 1983. Stuctural failure in solid foods. In Physical Properties of Foods. Bagley, E.B. and Peleg, M. (Ed.). AVI Publishing Co., Westport, CT.
Hamann, D.D. 1988. Rheology as a means of evaluating functionality in processed muscle foods. Food Technol. 42(6): 66.
Hamm, R. 1981. Post-mortem changes in muscle affecting the quality of comminuted meat products. Ch. 4. In Developments in Meat Science-2, R. Lawrie (Ed.), p. 93. Applied Science Publishers, Englewood, NJ.
Hamm, R. 1977. Changes of muscle proteins during the heating of meat. In Physical, Chemical and Biological Changes in Food caused by Thermal Processing, Hoyem, T. and Kvale, 0. (Ed.). Appl. Sci. Publ., Ltd. London.
Helwig, J.T. and Council, K.A. 1979. SASC User’s Guide. SAS Institute, Inc., Cary, NC.
Higgins, V.O. 1989. The effect of phosphates on the heat gelation properties surimi. M.S. thesis, N. Carolina Univ., Raleigh.
Kang, J.O., Ito, T., and Fukazawa, T. 1983. Effect o? frozen storage on the structure and enzymatic activities of myofibrillar proteins of rabbit skeletal muscle. Meat Sci. 9: 131.
Lanier, T.C. and Akahane, T. 1986. Method of retarding denaturation of meat products. U.S. patent no. 4,572,838.
Lanier, T.C., Lin, T.S., Liu, Y.M., and Hamann, D.D. 1982. Heat gelation
froperties of actomyosin and surimi prepared from Atlantic croaker. J. ood Sci. 47: 1921.
Linko, R.R. and Nikkila, O.E. 1961. Inhibition of the denaturation by salt of myosin in Baltic herring. J. Food Sci. 26: 606.
Matsumoto, J.J. 1979. Denaturation of fish muscle proteins during frozen storage. In Proteins at Low Temperature. American Chem. Soc. Adv. Chem. Ser. 180: 205.
Matsumoto, J.J. 1980. Chemical deterioration of muscle proteins during frozen storage. In Chemical Deterioration of Proteins, Whitaker, J.R. and Fugimaki, M. (Ed.). ACS Symp. Ser. 123. Amer. Chem. Soc.
Miller, A.J., Ackerman, S.A., and Palumbo, S.A. 1980. Effects of frozen storage on functionality of meat for processing. J. Food Sci. 45: 1466.
Molins, R.A., Kraft, A.A., Walker, H.W., Rust, R.E., Olson, D.G., and Mer-
kenich, K. 1987. Effect of inorganic polyphosphates on ground beef characteristics: some chemical, physical, and sensory effects on frozen beef patties. J. Food Sci. 52: 50-52.
Olson, D.G. and Parrish, F.C. 1977. Relationship of myofibrillar index to measures of beef steak tenderness. J. Food Sci. 42: 506.
Park, J.W. and Lanier, T.C. 1987. Combined effects of phosphates and sugar or polyol on protein stabilization of fish myofibrils, J. Food Sci. 52: 1509.
Park, J.W., Lanier, T.C., Keeton, J.T., Hamann, D.D. 1987a. Use of cryo- protectants to stabilize functional properties of pre-rigor salted beef during frozen storage. J. Food Sci. 52: 537.
Park, J.W., Lanier, T.C., Swaisgood, H.E., Hamann, D.D., and Keeton, J.T. 1987b. Effects of cryoprotectants in minimizing physicochemical changes of bovine natural actomyosin during frozen storage. J. Food Biochem. 11: 143.
Park, J.W. and Lanier, T.C. 1988. Calorimetric changes during development of rigor mortis. J. Food Sci. 53: 1312.
Park, J.W., Lanier, T.C., and Green, D.P. 1988. Cryoprotective effects of sugar, polyols and/or phosphates on Alaska pollack surimi. J. Food Sci. 53: 1.
Saffle, R.L. and Galbreath, J.W. 1964. Quantitative determination of salt- soluble protein in various types of meat. Food technol. 18: 1943.
Suzuki, T. 1981. In Fish and Krill Protein: Processing Technology, p. 134. Appl. Sci. Publ., London.
Taborsky, G. 1979. Protein alteration at low temperature: an overview. In Protein at Low Temperature. Amer. Chem. Soc. Adv. Chem. Ser. 180: 1.
Tamoto, K. and Tanaka, S. 1962. Bull. Hokkaido Reg. Fish. Res. Lab. 24: 192. Quoted in Love, R.M. (1966). The Freezing of animal tissue, Ch. 7. In Cryobiology, Meryman, H.T. (Ed.) Academic Press, New York.
Torley, P.J. and Lanier, T.C. 1992. Setting ability of salted beef-pollock surimi mixtures. In Seafood Science ana Technology, (Ed.) E. Graham Gligh, p. 305-316. Fishing News Books, Ltd., Oxford, UK.
Trout, G.R. and Schmidt, G.R. 1984. The effect of phosphate type and concentration, salt level and method of preparation on binding in beef rolls. J. Food Sci. 49: 687.
Verma, M.M., Alarcon Rojo, A.D., Ledward, D.A., and Lawrie, R.A. 1985. Effect of frozen storage of minced meats on the quality of sausage prepared from them. Meat Sci. 12: 12.
Wagnor, J.R. and Anon, M.C. 1986. Effect of frozen storage on protein denaturation in bovine muscle 1. Myofibrillar ATPase activity and differential scanning calorimetric study. J. Food Tech. 21: 9.
Wright, D., Leach, I.B., and Wilding, P. 1977. Differential scanning calorimetry studies of muscle and its constituent proteins. J. Sci. Food Agr. 28: 557.
Yasui, T., Sakanishi, M., and Hashimoto, Y. 1964. Phosphate effects on meat: Effect of inorganic polyphosphates on the solubility and extract- ability of myosin B. J. Agric. Food Chem. 12(5): 392.
Young, O.A., Humphrey, S.M., and Wild, D.J.C. 1988. Effects of sugars on post mortem glycolysis in bovine muscle minces. Proc. 34th IntT Congress of Meat Sci. and Tech. Part B. Brisbane, Australia.
Ms received 7/30/92; revised 12/18/92; accepted 12/28/92.
We thank Martin’s Wholesale Meats and Abattoir for assistance in this study. Paper No. FS92-16 of the Journal Series of the Dept, of Food Science, North Carolina
State Univ., Raleigh, NC 27695-7643.Use of trade names in this publication does not imply endorsement by North Carolina
Agricultural Research Service, nor criticism of similar ones not mentioned.
SOYA PROTEIN IN COMMINUTED MEATS. . .F ro m p a g e 4 6 6
SAS Institute, Inc. 1985. SASC User’s Guide, Statistics. SAS Institute Inc., Cary, NC.
Schutte, L., and Van Den Ouweland, G.A. 1979. Flavor problems in application of soy protein materials. J. Am. Oil Chem. Soc., 56: 289.
Steele, R.C. and Torrie J.H. 1980. Principles and Procedures of Statistics.2nd ed. McGraw-Hill Book Co., New York.
Wilkens, W., Mattick, L., and Hand, D. 1967. Effect of processing method on oxidative off-flavors of soybean milk. Food Technol. 21: 1630.
Zayas, J.F. 1985. Structural and water binding properties of meat emul
sions prepared with emulsified and unemulsified fat. J. Food Sci. 50- 689.
Ms received 7/15/92; revised 12/28/92; accepted 1/7/93.
Contribution No. 92-591-J from the Kansas Agricultural Experiment Station, Manhattan, KS 66506-4008.
472-JOURNAL OF FOOD SCIENCE-Volume 58, No. 3, 1993

Polymerization of Beef Actomyosin Induced by Transglutaminase
S.-H. KIM, J. A. CARPENTER, T. C. LANIER, and L. WICKER
----------------------------ABSTRACT-----------------------------Polymerization of beef actomyosin was induced by addition of transglutaminase. The relative intensity analyzed by densitometry after sodium dodecyl sulfate polyacrylamide gel electrophoresis indicated that bands containing the polymerized myosin increased from 10.1 ± 2.2% to 20.7 ± 3.5% while the myosin monomer band decreased from20.9 ± 3.4% to 13.0 ± 2.7% as the reaction time extended from 10 to 120 min at 35°C. Polymerization of actomyosin induced by transglutaminase resulted in gelation of the actomyosin that was visualized by confocal laser scanning microscopy.
Key words: beef, actomyosin, transglutaminase, gelatin
INTRODUCTIONIN THE MEAT INDUSTRY high cost has stimulated research utilizing all animal parts to maximize yield of marketable products. This includes development of methods of restructuring low-value cuts and trimmings to improve appearance and texture and enhance market value. Restructuring usually involves size reduction, reforming and binding which is an essential requirement (Secrist, 1987).
Higginbotham (1989) demonstrated that Alaska pollock sur- imi could be used as binding agent to produce restructured beef steaks. Surimi, has the capacity to form stronger, cohesive gels at low temperatures without cooking than any other food grade protein (Lanier, 1986). This “ setting phenomenon” seems to be caused by transglutaminase, which covalently polymerizes myosin heavy chains (Seki et al., 1990; Kimura et al.,1991).
Transglutaminase (EC 2.3.2.13) catalyses a calcium-dependent acyl-transfer reaction in which the -/-carboxamide groups of peptide-bound glutaminyl residues are the acyl donors. The enzyme has been reported to catalyze in vitro cross-linking in whey proteins (Tanimoto and Kinsella, 1988; Aboumahmoud and Savello, 1990), soy proteins (Nio et al., 1985), beef myosin and casein (Kurth, 1983), and crude actomyosin refined from mechanically deboned poultry meat (Akamittath and Ball, 1990).
Electron microscopy has long been recognized as a valuable tool in relating the detailed structure of foods to properties such as texture (Sargent, 1988). However, typical electron microscopy equipment requires extensive sample preparation steps such as dehydration and fixation which may create artifacts. The confocal laser scanning microscope (CLSM) provides an image with no need for elaborate sample preparation (Miller and Foster, 1991; Goldstein and Rubin, 1990; Brakenhoff and Visscher, 1990).
The objectives of our study were to investigate the induction of low temperature cross-linking and gelation of beef actomyosin by addition of transglutaminase, monitoring progress by CLSM in conjunction with electrophoretic measurements.
Authors Carpenter and Wicker are w ith the Dept, o f Food Science & Technology, Univ. o f Georgia, Athens, GA 30601. Author Kim is with the Food Protein R&D Center, Texas A & M Univ., College Station, TX. Author Lanier is w ith the Dept, o f Food Science, North Carolina State University, Raleigh, NC.
MATERIALS & METHODSPreparation of beef actomyosin
Beef (top round) was obtained from the meat processing laboratory at the University of Georgia. Actomyosin was prepared by the method of Takashi et al. (1970) with some modifications. Extraction was conducted at 4°C. Ground beef was gently stirred three times with 600 mL of 0.1M KC1, 15.5 mM Na2HP04, 3.38 mM NaH2P04 pH7.5 solution for 30 min each stirring and centrifuged after each stirring at 8,000 x g for 15 min. The resulting residue was dispersed nto 600 mL of 0.6M KC1, 15.5 mM Na2HP04, 3.38 mM NaH2P04 pH7.5 solution for 30 min and centrifuged at 8,000 x g for 30 min. The supernatant was dialyzed against 12 L of distilled water overnight. The dialysate was centrifuged at 10,000 x g for 1 hr. The precipitate was suspended by adding a small amount of 0.6M KC1, 0.05M :ris- maleate buffer (pH 7.0), and centrifuged at 12,000 x g for 2 hr. The resulting supernatant was adjusted to a protein content of 8 mg/mL with the 0.6M KC1, 0.05M tris-maleate buffer (pH 7.0), and used as beef actomyosin.
Polymerization of beef actomyosin by transglutaminase
Each reaction mixture contained, in a total volume of 0.5 mL 0.05M tris-maleate buffer (pH 7.0), 15 mM CaCI2, 10 mM dithiothreiotol (DTT), 7 mg/mL actomyosin, and 0.25 units/mL transglutaminase (Sigma T5398, guinea pig liver). The reaction was initiated by adding the enzyme, and conducted at 35°C for 10, 30, 45, 60, and 120 min. Part of each reac:ion mixture (50 pi) was removed and 4 vol of sample buffer was addec for electrophoresis. The rest of reaction mixture was kept on ice. Each test tube was removed from ice and placed in a test tube rack and a stainless steel ball (0.166g and 0.159 cm diameter) was gently placed on the surface of the mixture. Those tubes were photographed w.thin 30 min after removing from ice. Mixtures then were kept in ice until they were examined by CLSM. Protein content was measured by the Bio-Rad protein assay using bovine globul.n as a standard protein according to Bradford (1976).
S D S P A G E
Sodium dodecyl sulfate polyacrylamide gel electrophoresis was conducted by a modification of the method of Laemmli (1970) as described by Akamittath and Ball (1990). We used 5% (w/v) separating gel and 3% (w/v) stacking gel. Acrylamide stock solution (30:0.8) had been treated with AG 501-X8 mixed bed resin (Bio-Rad) to extend shelf-life. Sample size was 20pg protein per well. Electrophoresis was performed in a 7x8x0.75cm mini-PROTEAN™ II dual slab cell (Bio-Rad) at a constant current of 30 mA. Each gel was fixec and stained in 25% methanol and 10% acetic acid with 0.2% Coomassie Blue R-250 for 3 hr and then destained in 25% methanol and 10% acetic acid overnight. High molecular weight standards (Bio-Rad) containing myosin (200,000), 0-galactosidase (116,250), phosohor- ylase b (97,400), bovine serum albumin (BSA, 66,200), anc egg ovalbumin (42,599) were used as markers. BSA alone was also applied to the gel to identify the BSA fraction in the standard molecular weight marker. GelBond PAG film (FMC Bioproducts, Rockland, ME) was used to support the gel. Each gel pattern was analyzed three times by a Zeireh soft laser scanning densitometer, model SL-TRFF (Biomed Instruments, Fullerton, CA). The average of areas integrated by a polar plan.meter was reported.
Protein banding areas of interest on the electrophoretic gels (Fig.l) were designated as the polymer band (P2), bands between P2 and M (PI), myosin band (M), and bands below the myosin band (<M) except the actir band, which was slightly separated from the tracking dye at the bottom of the gel.
Volume 58, No. 3, 1993-JOURNAL OF FOOD SCIENCE-473

TRAN SG LU TAM IN ASE AND BEEF AC TO M YO SIN . . .
Fig 1 -SDS-PAGE (3% - 5%) patterns o f beef actomyosin incubated at 35°C for 10 (lane 3), 30 (lane 4), 45 (lane 5), 60 (lane 6), and 120 (lane 7) min with 0.25 units transglutaminase/mL in the presence o f 15 m M CsCI2 and 10 m M dith iothreitol (DTTj. Lanes(1) bovine serum albumin; (2) high molecular weight standard proteins; (8) beef actomyosin in 0.05M tris-maieate buffer (pH7.0); and (9) beef actomyosin incubated at 35°C for 120 min with 15 m M CaCI2 and 10 m M dithiothreitol (DTT). P2-polym erized myosin that does not enter the 3% get; P I —intermediate size polymerized myosin heavy chain that does not enter the 5% gel; M —myosin, and A -a c tin .
474-JOURNAL OF FOOD SCIENCE-Volume 58, No. 3, 1993
-* P 2
200 kd
116 kd 9 7 kd
6 6 kd
Fig 2 - Gelatin o f beef actomyosin induced by transglutaminase. (A) reaction m ixture with no transglutaminase incubated at 35°C for 2 hr; (B) reaction m ixture with the enzyme incubate for 2 hr showing a stainless steel bearing ball (0.166g and 0.159 cm diameter) on the top o f the ge l formed.
Confocal laser scanning microscopyA drop of reaction mixture was placed on a glass slide and a cov-
erslip was placed on the sample. Microstructure of the sample was evaluated with a CLSM Model MRC 600 (Bio-Rad) with Nikon 60 x Apochromat lens (N.A. 1.4) using argon/krypton laser in the reflectance mode.
RESULTS & DISCUSSION
THE RELATIVE intensity of the actomyosin control was 2.0 ± 0.6% in the P2 and 20.8 ± 0.6% in the M region of the electrophoretic gel. Following reaction with transglutaminase, relative intensities of the P2 regions increased 10.1 ± 2.2%12.2 ± 1.9%, 16.1 ± 1.9%, 15.6 ± 1.5%, and 20.7 ± 3.5% while relative intensities of the M regions decreased 20.9
Fig 3 - Confocal laser scanning micrographs o f beef actomyosin solutions incubated at 35°C for (A) 30 m in; (B) 60 m in; and (C) 120 min. The reactions mixture included 15 m M CaCI2 and 10 m M dithiothreitol (DTT) w ith 0.25 units/mL transglutaminase.
± 3.4%, 17.1 ± 1.0%, 13.6 ± 1.4%, 16.1 ± 2.6%, and13.0 ± 2.7% as reaction time extended from 10, 30, 45, 60, and 120 min, respectively. The reaction mixtures incubated at 35°C for 120 min without transglutaminase (lane 9) showed no increase in P2 or decrease in M compared with actomyosin alone (lane 8). The decrease of myosin monomer and the increase of polymer during the reaction of muscle protein with transglutaminase was comparable with results from previous studies (Kurth, 1983; Akamittath and Ball, 1990). The reaction mixture contained dithiothreitol and the electrophoresis was carried out under denaturing and reducing conditions. Thus the proteins were dissociated into their constituent subunits. Therefore we could reasonably conclude that the polymers were created by the formation of covalent crosslinks catalyzed by transglutaminase. Relative intensity (%) of bands below myosin (< M) gradually decreased from 38 .8± 3 .1 , 36 .6±4 .9 , 36.9±2.0 and 34.4±0.7, to 31.3± 3.4 as reaction time ex-
—Continued on page 491
42 kd A

Survival and Growth of L is te ria m o n o c y to g e n e s and Y ers in ia e n te ro c o lit ic a in Pork Chops Packaged under
Modified Gas Atmospheres
W. MANU-TAWIAH, D.J. MYERS, D.G. OLSON, and R.A. MOLINS
---------------------------- ABSTRACT-----------------------------L isteria m o n o cy to g en es Scott A, serotype 4b, and Y ersin ia en te ro c o litica from vacuum-packaged pork were inoculated onto fresh pork chops. Survival and growth were determined in different atmospheres at 4 °C during 35-days. Atmospheres were gas mixtures [20/0/80, 40/ 0/60, and 40/10/50 (CCtyCtyNJ], vacuum and air. In air L. m o n o cy to g en es and Y. en te ro co litica grew slower than psychrotrophic spoilage flora. In gas atmospheres, Y. en te ro co litica grew at the same rate as psychrotrophic spoilage flora and L. m o n o cy to g en es grew more slowly. When 10% 0 2 was included in the 40% C02 mixture, growth was reduced. Vacuum packaging was no more effective than gas mixtures in retarding growth. Modified atmospheres provide an environment in the package that would allow growth of Y. en te ro co litica and potentially compromise safety of meat products.
Key Words: listeria, yersinia, pork chops, modified atmosphere
INTRODUCTIONTO MEET consumer demands for fresh meats with extended shelf life, the North American meat industry has shown increasing interest in modified atmosphere packaging (MAP) of fresh meats. This technique involves use of gas mixtures. Such mixtures generally include oxygen to maintain the desired bloomed color and to inhibit growth of strict anaerobes, and carbon dioxide to inhibit growth of aerobic bacteria (Hotchkiss and Galloway, 1989). Many modified atmospheres contain moderate to high concentrations of carbon dioxide (Farber,1991), which together with proper sanitation and refrigeration, extends shelf life by reducing microbial growth and retarding enzymatic spoilage (Young et al., 1988). Some strains of pathogenic Listeria monocytogenes and Yersinia enterocolitica reportedly grow at refrigeration temperatures (Palumbo, 1986) and these organisms are frequent contaminants of fresh meats (Bunic, 1991; Lee and McClain, 1986; Schiemann, 1980; Stem and Pierson, 1979). Toxigenic Y. enterocolitca were isolated from 49% of raw retail pork products (Schiemann, 1980). L. monocytogenes were found in up to 68% of fresh meat sampled and grew in inoculated and uninoculated raw meat (Johnson et al., 1990; Hart et al., 1991). L. monocytogenes or Y. enterocolitica infections in humans can be transmitted by consumption of raw, undercooked or recontaminated cooked meats (Aulisio et al., 1983; De Zutter and Van Hoof, 1987; Tauxe et al., 1987; Kaczmarski and Jones, 1989; Lee et al., 1990; Anonymous, 1992). Such potential infections are of particular concern in cultures, (as in European countries) that routinely eat raw meat. Because individual bacterial species on meat surfaces responded differently to C02 and 0 2 contents of the atmosphere in which meat is stored (Newton et al., 1977),
A u t h o r M y e r s i s w i t h t h e D e p t , o f F o o d S c i e n c e & H u m a n N u
t r i t i o n , a n d a u t h o r O l s o n i s w i t h t h e D e p t , o f A n i m a t S c i e n c e ,
M e a t L a b o r a t o r y , I o w a S t a t e U n i v . , A m e s , I A 5 0 0 1 1 . A u t h o r M a n u -
T a w i a h w a s f o r m e r l y w i t h t h e D e p t , o f F o o d S c i e n c e & H u m a n
N u t r i t i o n , I o w a S t a t e U n i v . a n d a u t h o r M o l i n s w a s f o r m e r l y w i t h
t h e D e p t , o f A n i m a l S c i e n c e , M e a t L a b o r a t o r y , I o w a S t a t e U n i v .
D i r e c t i n q u i r i e s t o D r . M y e r s .
many safety issues have been raised concerning these gases in modified atmospheres (MA) to package fresh meats. These include the influence of C02 and 0 2 on the survival and growth of pathogenic bacteria during extended periods at refrigeration temperatures. The gaseous environment of vacuum-packed fresh meat was reported to contain about 20 to 80% C02 (Smith et al., 1983; Taylor, 1973), formed by respiration of the muscle tissue, and/or microorganisms (Gill and Tan, 1980; Sutherland et al., 1977). Large numbers of Y. enterocolitica-Uke organisms (Hanna et al., 1976; Johnson et al., 1982; Seelye and Yearbury, 1979) and L. monocytogenes (Grau and Vander- linde, 1990) grew rapidly on vacuum-packaged beef stored at refrigeration temperatures. Gill and Reichel (1989) reported that strains of cold tolerant Y. enterocolitica sometimes grew at the same rate as spoilage microflora on high pH (>6.0) beef packaged under 100% C02 and stored at 5 °C. L. monocytogenes did not grow under the same conditions. Wimpfheimer et al. (1990) observed that L monocytogenes did not grow on raw chicken stored in an anaerobic C02 (no 0 2 present) atmosphere but proliferated on samples in an aerobic C02 (with 5% 0 2) atmosphere at 4 °C.
Pork muscles show variability in terminal pH. The growth of certain psychrotrophic pathogens in sarcoplasmic proteins also varies with species of meat (Khan et al., 1975). In addition, C02 is generally used in concentrations from 15 to 40% for commercial packaging of fresh red meats because greater concentrations can accelerate discoloration of the meat surface (Farber, 1991). Hence, the findings of Gill and Reichel (1989) and those of Wimpfheimer et al. (1990) may not be extended to pork. Preliminary studies have shown that fresh pork chops in consumer-unit sizes packaged in 20% C02 without 0 2 of 40% C02 with or without 0 2 and stored at 4 °C had a shelf life of about 6 wk. This was comparable to the 5.5 wk found by Gill and Harrison (1989) who used 100% C02 at 3 °C.
The objective of our work was to determine the effects of MA containing C02 concentrations of 20 and 40% with or without 0 2, on the growth of L. monocytogenes, Y. enterocolitica, and the resident psychrotrophic flora on fresh pork chops stored at 4 °C.
MATERIALS & METHODSO r g a n is m s
Cultures were L m o n o cy to g en es scott A serotype 4b [National Animal Disease Center (NADC), Ames, LA] and a strain of Y. en te ro co litica (isolated in our laboratory from vacuum-packed pork chops). The organisms were grown in Brain Heart Infusion broth (BHI, DIFCO, Detroit, MI, USA) at 30 °C for 24 hr to stationary phase (Gill and Reichel, 1989). At stationary phase, L. m o n o cy to g en es reached a density of 109 CFU/mL and Y. en te ro co litica reached a density of 103 CFU/mL. Samples of the cell suspensions were concentrated by centrifugation and suspended in 0.01M phosphate buffered saline (PBS). The cell suspensions were adjusted to an O.D. of 0.5 at 640 nm using a Bausch and Lomb Spectronic 20 spectrophotometer. The blank consisted of PBS. Further tenfold dilutions of each culture were prepared, spiral-plated onto All Purpose Tween (APT, BBL, Cockeysville, MD, USA) agar, anc incubated 24 hr at 37 °C for L. m on o cy to g en es or 25 °C for Y. en tero co litica .
Volume 58, No. 3, 1993-JOURNAL OF FOOD SCIENCE-475

Hea
dspa
ce C
O2 (
%)
LISTERIA & YERSINIA IN MA-PACKAGED FRESH PORK CHOPS . . .
COj/Cfe/Nj
20/0/80 I
20/0/80 U
40/0/60 I
40/0/60 U
40/10/50 I
40/10/50 U
Days of storage at 4°CF i g 1 — C h a n g e s i n t h e h e a d s p a c e C 0 2 c o n c e n t r a t i o n s o f t h e g a s
m i x t u r e s f o r i n o c u l a t e d ( I ) a n d u n i n o c u l a t e d ( U ) f r e s h p o r k c h o p s
s t o r e d a t 4 ° C .
Days of storage at 4°CF i g 2 — C h a n g e s i n t h e h e a d s p a c e 0 2 c o n c e n t r a t i o n s o f t h e g a s
m i x t u r e s f o r i n o c u l a t e d ( ! ) a n d u n i n o c u l a t e d ( U ) f r e s h p o r k c h o p s
s t o r e d a t 4 ° C .
Sample preparationBoneless pork loins were obtained directly from the processing line
of a commercial meat-packing plant. They were cut into 2.5-cm (1- in.) thick chops. The surface areas of a representative number of chops were determined by tracing the outlines of chops on acetate paper and using a planimeter (Huffman, 1974).
Remaining chops were divided into two groups. One group of chops was divided into two subgroups. The top surfaces of one subgroup were inoculated with 0.1 mL PBS containing 105 cells of L . m on oc y to g e n e s , and the top surfaces of the other subgroup were inocluated with the same concentration of Y. en te ro co litica cells. The inoculum was spread over the surface of each chop using a sterile glass rod (Gill and Reichel, 1989) to obtain an initial cell concentration of = log 3.5 CFU/cm2. Three inoculated chops were placed on one 2S plastic foam tray with inoculated surface upward. Each tray was overwrapped with gas-permeable polyethylene film (Stretch meat film, Cat # 37016, Hantover, Kansas City, MO). Some overwrapped trays were set aside and considered as air-packaged inoculated samples. Others were placed in high-barrier packaging pouches having an 0 2 permeability of <2.5 cnv7645 cm2/24 hr at 23 °C and 0% RH and water vapor transmission of <1.0 9/645 cm2/24 hr at 38 °C and 90% RH (Curlon™ 863 Saran, Curwood Inc. New London, WI).
The top surfaces of the second group of pork chops were spread with 0.1 mL of sterile PBS containing no inoculum and were packaged in the same films as those used for inoculated samples. Equal numbers of inoculated and uninoculated samples were backflushed with about 4L of 20/0/80, 40/0/60, and 04/10/50 (COj/CtyNj) atmospheres to provide a headspace: meat volume ratio of 2:1; or were packaged under vacuum and heat sealed by using a CVP machine (model A 300, CVP Systems, Inc., Downers Grove, IL). Packages were placed in cardboard boxes and stored at 4 °C. All samples were analyzed at day 0, i.e., the day of packaging and every 7 days for 35 days.
Headspace and surface pHThe 0 2 concentrations in the headspace of the packages, except the
air and vacuum packages, were measured with a digital 0 2 analyzer (Model IL 307 Ingold™, Instrumentation Laboratory Inc., Wilmington, MA). The C02 concentrations were measured using an infrared Spectrometer (AccuLab™ 2 Beckman Instruments, Inc., Palo Alto, CA). The surface pH of samples was measured with a flat-surface combination electrode (Fisher Scientific, Pittsburg, PA) after a piece was aseptically removed for microbiological analyses.
Microbiological sampling
A package from each treatment was aseptically opened on sampling days, and 25 cm2 of the top surface of each of the three chops in a package were removed with a sterile circular stainless steel borer. This allowed removal of a total of 75 cm2 of sample surface, which was homogenized for 1 min in a sterile bag containing 150 mL of
20/0/80
40/0/60
40/10/50
Vacuum
Air
F i g 3 — M e a n s u r f a c e p H v a l u e s o f i n o c u l a t e d ( ! ) a n d u n i n o c u
l a t e d ( U ) f r e s h p o r k c h o p s s t o r e d i n d i f f e r e n t a t m o s p h e r e s a t
4 ° C .
0.01M sterile PBS in a Stomacher lab blender (Model 400 Tekmar™ Co., Cincinnati, OH). Serial dilutions were prepared according to recommended microbiological procedures (Speck, 1984). Portions of suitable dilutions were spiral-plated onto APT and Listeria-selective (OXOID, Basingstoke, England) agar when the meat sample had been inoculated with L. m o n o cy to g en es (Curtis et al., 1989) or onto Cef- selodin-Irgasan-Novobiocin (CIN, DIFCO) agar when the meat sample had been inoculated with Y. en teroco litica (Gill and Reichel, 1989). The APT agar plates were incubated aerobically at 7 °C for 10 days to obtain counts of resident psychrotrophs, the L is te r ia agar plates were incubated at 37 °C for 48 hr, and the CIN-agar plates were incubated at 25 °C for 48 hr.
The numbers of L. m o n o cy to g en es and Y. en te ro co litica were determined from counts on respective agar plates. Colonies on L iste ria agar that appeared dark were assumed to be L. m o n o cy to g en es . The identity of the colonies was confirmed by using Gram stain; catalase and oxidase reactions; umbrella motility at 25 °C; CAMP B-hemolysis (Lee and McClain, 1986); nitrate reduction; and fermentation of glucose, rhamnose, esculin, mannitol and xylose. Small to medium colonies on CIN-agar with a dark red center surrounded by transparent borders were presumed to be Y. en teroco litica (Gill and Reichel, 1989). Confirming tests were Gram stain, catalase and oxidase reactions (Schiemann, 1980), and biochemical reactions using the Minitck En- te ro b a c te r ia c e a e differentiating system (Newton et al., 1977). The numbers of psychrotrophic flora other than L isteria or Y ersin ia were determined on APT agar plates of uninoculated samples. The major components of the spoilage flora were determined by selecting three to five colonies on APT agar plates of inoculated samples and iden-
476—JOURNAL OF FOOD SCIENCE-Volume 58, No. 3, 1993

Air
Vacuum
20/0/80
40/0/60
40/10/50
Days of storage at 4°C Days of storage at 4 ° C
Air
Vacuum
20/0/80
40/0,60
40/10/50
Fig 4 - Numbers o f L. monocytogenes (A), and aerobic psychotrophic bacteria on inoculated (B) and uninoculated (C) fresh pork chops packaged in air, under vacuum, or in selected gas m ixtures during storage at 4 °C.
tifying them to genera by the criteria of Harrison et al. (1981). Gramnegative organisms were further classified to species with the Minitek E n tero b a c te r ia ce a e and Nonfermenter differentiating systems.
Statistical analyses
Mean values were obtained from four replications, and data were analyzed by analysis of variance by using the General Linear Model procedure (SAS Institute Inc., 1986). Paired contrasts were used in the procedure to determine significance among means, and least squares differences were used to compare means. Linear regression equations were computed for each atmosphere over the linear part of the log growth portion of the curves to predict growth rates for L. m o n o cytogen es, Y. en te ro c o lid c a and total psychrotrophs (Wimpfheimer et al., 1990).
RESULTS & DISCUSSION
THE C02 concentrations of all gas mixtures decreased during the first 7 days of storage, and thereafter began to increase, except the 20/0/80 atmosphere (Fig. 1). No differences in concentrations of C02 were found between inoculated and uninoculated chops or between chops inoculated with Listeria and those inoculated with Yersinia (P > 0.05); hence, only one set of data is presented. From day 7 to day 21, the C02 concentration of the 40/10/50(C02/0 2/N2) mixture containing the inoculated samples was greater (P<0.05) than that of the uninoculated package in the identical gas mixture, possibly due to microbes in the inocula converting 0 2 to C02.
The initial headspace 0 2 concentration of the 20/0/80 and the 40/0/60 (CCytVN^ mixtures was about 2.3% for both inoculated and uninoculated chops and for both organisms (Fig.2). The 0 2 concentrations in all packages decreased with storage, reaching anaerobic condition of 0.5% (Lioutas, 1988) at 28 days to 35 days. The 0 2 concentration of the uninoculated chops in the 40/10/50 mixture was greater (P < 0.05) than inoculated in the identical mixture. There were no differences in 0 2 concentration between inoculated and uninoculated chops packaged in either the 20/0/80 or the 40/0/60 mixture or between the two organisms (P > 0.05).
The mean initial pH of the chops before packaging was 5.8, (Fig. 3), sufficiently high to allow uninhibited growth of test organisms during storage (Grau and Vanderlinde, 1988; Seelye and Yearbury, 1979). Values at day 0 were not different among atmospheres (P > 0.05). No differences occurred in pH between inoculated and uninoculated chops between gas mixtures or vacuum or between the two organisms (P > 0.05); hence, Fig. 3 represents values for one set of data. With exception of air-packaged chops, pH also did not vary with storage time (P
Table 1 —G row th ra tes (regression coe ffic ien ts*) o f L. m o n o c y to g e n e s in inocu la ted fresh p o rk chops an d aerob ic psych ro troph ic spo ilage flora in un in ocu la ted fresh p o rk chops packaged in d iffe re n t a tm ospheres and s to re d a t 4 °C
A tm o s p h e r e s(ccyo2)b L. m onocytogenes
A e ro b ic p s y c h o tro p h ic s p o ila g e flo ra
2 0 /0 0 .0 7 “ 0.11V40/0 0.05™ 0.11V40 /1 0 0 .04vx 0 .1 1 v
V a c u u m 0.04™ 0 .11vA ir 0.08« 0.84*
B Regression coefficients for logio growth phase. b Balanced with nitrogen.uvxv* Values with the same superscripts are not significantly different at P = 0.05.
> 0.05). The pH of all air-packaged chops increased with storage time (P < 0.05).
Changes in number of L. monocytogenes on fresh pork under different atmospheres (Fig. 4a) showed little growth during the first 14 days storage. Growth in air decreased between days 14 and 21, probably because of competition from psychrotrophic flora. After day 7, numbers of L monocytogenes in the chops packaged in the 20/0/80 mixture were not significantly different from numbers in the 40/0/60 mixture. No difference in numbers of Listeria was found between chops packaged in the 40/0/60 and 40/10/50 mixtures. This was contrary to reports of Wimpfheimer et al. (1990) who found a rapid proliferation of L. monocytogenes on raw chicken with increasing 0 2 concentration of an anaerobic C02 atmosphere to 5%. Generally, the numbers of L. monocytogenes in the air- or vacuum- packaged chops were not significantly different from numbers in chops in the gas atmospheres (P > 0.05).
Before packaging, the population of psychrotrophs other than Listeria was about log 1.5 CFU/cm2. The psychrotrophic flora grew very rapidly in both inoculated and uninoculated air- packaged chops, but numbers were much greater in the uninoculated samples. Growth of psychrotrophic flora in both inoculated (Fig. 4b) and uninoculated (Fig. 4c) chops packaged under vacuum or in gas atmospheres increased at a much slower rate (P <0.05) than that on air-packaged chops. Numbers of psychrotrophs in chops packaged under vacuum or packaged in the gas atmospheres did not reach log 7.0 CFUlcm2 (considered spoiled, Kraft, 1986), and were less than numbers in the air-packaged chops (P < 0.05). Numbers of L. monocytogenes in inoculated chops packaged in the different atmospheres did not vary significantly (Fig 4a). The growth rate of the organism in the 20/0/80 mixture was no different than that in the 40/0/60 mixture, but the growth rate of L. monocytogenes in the 40/10/50 mixture was less than in the 20/0/80 mixture. No difference in growth rates (Table 1) was found
Volume 58, No. 3, 1993-JOURNAL OF FOOD SCIENCE-477

LISTERIA & YERSINIA IN MA-PACKAGED FRESH PORK CHOPS . . .
Days of s to rag e at 4°C Days o f s to rag e at 4°C
F i g 5 — N u m b e r s o f Y, enterocolitica ( A ) , a n d a e r o b i c p s y c h o t r o p h i c b a c t e r i a o n i n o c u l a t e d ( B ) a n d u n i n o c u l a t e d ( C ) f r e s h p o r k c h o p s
p a c k a g e d i n a i r , u n d e r v a c u u m , o r i n s e l e c t e d g a s m i x t u r e s d u r i n g s t o r a g e a t 4 ° C .
Table 2 -G ro w th rates (regression coefficients’) o f Y. enterocolitica in inoculated fresh pork chops and aerobic psuchrotrophic spoilage flora in uninoculated fresh pork chops packaged in different atmospheres and stored at 4 °C.Atmospheres
(C02/02)» Y. enterocoliticaAerobic psychrotrophic
spoilage flora20/0 0.14" 0.15«40/0 0.15« 0.14"40/10 0.14" 0.15«Vacuum 0.12" 0.14"Air 0.09v 0.44'8 Regression coefficients for log growth phase. b Balanced with nitrogen.vw*yz Values with the same superscripts are not significantly different at P = 0.05.
between 40/0/60 and 40/10/50 mixtures. Vacuum was more inhibitory than MAP to Listeria with the growth rate of the organism in vacuum less in two of the three gas mixtures. The slower growth rate of Listeria in vacuum-packaged chops confirmed the findings of Gill and Reichel (1989) but was contrary to findings of Grau and Vanderlinde (1990), who observed rapid growth of L. monocytogenes on inoculated vacuum-packaged beef stored at refrigeration temperatures. The growth rate of Listeria in inoculated air-packaged chops was the lowest (P < 0.05) among the atmospheres tested (Table 1). By comparison, the growth rates of other psychrotrophic flora on uninoculated chops were greater than those of L. monocytogenes in inoculated chops in respective atmospheres (P < 0.05, Table1). The greatest growth rate of psychrotrophs (Fig. 4b,c) was in air-packaged chops (P < 0.05). No significant differences in growth rates of the psychrotrophs were found among the other atmospheres. Thus, the slow growth rate of Listeria in inoculated air-packaged chops could be attributed to competition from large numbers of other psychrotrophic bacteria that also grew on the chops. The greater growth rates of other psychrotrophic spoilage flora competing with Listeria in the modified gas atmospheres is desirable because Listeria would not reach large numbers before the product was spoiled. Note, however, that Listeria grew, though at a slow rate. Considering the relatively low does of this pathogen infectious for humans (about 102-103 cells; Griffith, 1989), particularly for low- immunity persons (Varabioff, 1990), the risk of human infection may not be reduced by MA packaging of fresh pork chops. The greater growth rates of Listeria in MA than in vacuum also indicated that fresh meats in MA may be susceptible to growth of Listeria if the package is subjected to temperature abuse.
Y. enterocolitica had no detectable lag period and grew rapidly in all atmospheres except air (Fig. 5a). Gill and Reichel(1989) reported that in beef packaged in 100% C 0 2 and stored
at 2 or 5 °C Y. enterocolitica grew only after a prolonged lag period. The absence of a lag period at 40% C 0 2 may indicate the organisms were insensitive to 40% C 0 2. Numbers of Y. enterocolitica did not differ among or between gas mixtures and vacuum (P > 0.05), though numbers on. samples packaged in the 20/0/80 mixture were greatest from days 14 to 28. Numbers of this organism in air-packaged chops increased only slightly from day 0 to day 14, (Fig. 5a) and then began to decrease. On the other hand, numbers of other psychrotrophic bacteria in both inoculated (Fig. 5b) and uninoculated (Fig. 5c) chops under vacuum or in gas mixtures were lower than those of air-packaged chops. Regression coefficients for Y. enterocolitica and the psychrotrophic spoilage flora in chops packaged in different atmospheres were compared (Table 2). No significant difference in growth rates was found among the MAs (P > 0.05). The growth rate of Y. enterocolitica in the vacuum-packaged chops was less (P < 0.05) than the growth rate in chops in the MAs. By comparison, the growth rate of Y. enterocolitica in inoculated air-packaged chops was the last among the atmospheres tested (P < 0.05). The growth rates of other psychrotrophic flora on uninoculated chops packaged in respective atmospheres (Table 2) showed no significant difference in growth rates of the psychrotrophs among the gas atmospheres (P > 0.05). The growth rate of the psychrotrophic flora in the vacuum packaged chops was less (P < 0.05) than that in chops in the 40/10/50 and 20/0/80 mixtures. The greatest growth rate of the psychrotrophic flora was obtained in air- packaged chops (Table 2). The growth rate of Y. enterocolitica in inoculated chops was not different from the growth rate of psychrotrophs in uninoculated chops in respective gas atmospheres or under vacuum. The growth rate of Y. enterocolitica in inoculated air-packaged chops was significantly less (P < 0.05) than that of psychrotrophs in uninoculated chops in air or vacuum (Table 2). These results indicate that Y. enterocolitica could.grow in competition with other psychrotrophs in chops packaged in MA or under vacuum, but Yersinia was outgrown by psychrotrophs in chops in air. This means that packaging fresh pork chops in MA containing up to 40% C 0 2
may compromise microbiological safety of the product. However, when numbers of Yersinia reached log 6.0 CFU/cm2, discoloration occurred in chops packaged in gas atmospheres. The change in the sensory characteristics of the meat would help reduce hazards of MAP for Yersinia, because consumers and retailers would be warned of spoilage before the numbers reached an infectious dose (109 cells, Swaminathan et al.,1982).
Listeria were never isolated from uninoculated chops in the atmospheres tested, but Yersinia were isolated from uninoculated chops for all atmospheres tested. The composition of
478-JOURNAL OF FOOD SCIENCE-Volume 58, No. 3, 1993

psychrotrophic flora of the inoculated chops, when maximum numbers were reached, varied with the atmosphere in which the chops were stored, but not with type of organism used to inoculate the chops. Air-packaged chops were dominated by Pseudomonas (50%), followed by Enterobacteriaceae (30%) and Brochothrix thermosphacta (15%). The vacuum packaged chops were dominated by lactic acid bacteria (50%) and Enterobacteriaceae (50%). There were no differences in composition of psychrotrophic flora of inoculated chops packaged in the MAs. The samples were dominated by lactic acid bacteria (60%), followed by Enterobacteriaceae (30%), and B. thermosphacta (5%). Pseudomonads also were isolated from chops packaged in the 40/10/60 mixture, but their numbers were very small (2 %).
CONCLUSIONSModified gas atmospheres containing C 0 2 concentrations normally used for commercial packaging of fresh red meats are unlikely to reduce the risk factor for listeriosis when uncooked or undercooked fresh pork chops or processed pork products are consumed. The atmospheres retarded, but did not stop, growth of L. monocytogenes. Instead, the atmospheres inhibited growth of resident psychrotrophic spoilage flora such that no sensory changes would serve as indicators of spoilage. The modified gas atmospheres also may lead to development of health hazards from Y. enterocolitica. The organism grew in competition with resident psychrotrophs in fresh pork chops packaged in gas atmospheres. Changes in appearance of the meat with increasing numbers of Yersinia would likely warn consumers of spoilage. Vacuum packaging was no more effective than modified gas atmospheres in reducing growth rates of Yersinia in refrigerated fresh pork chops and therefore could not guarantee safety of fresh pork contaminated with this psychrotrophic pathogen.
REFERENCESAnonymous. 1992. Listeriosis food link strengthened by CDC study. Food
Chemical News. 34(8): 3.Aulisio, C.C.G., Stanfield, J.T., Weagant, S.D., and Hill, W.E. 1983. Yer-
siniosis associated with tofu consumption: Serological, biochemical and pathogenicity studies of Y e r s in ia e n te ro co litica isolates. J. Food Prot. 46: 226.
Brackett, R.E. 1988. Presence and persistence of L is te r ia m o n o cytogenes in food and water. Food Technol. 42(4): 162.
Buncic, S. 1991. The incidence of L is te r ia m o n o cy to g en es in slaughtered animals, in meats and in meat products in Yugoslavia. J. Food Microbiol. 12: 173.
Curtis, G.D.W., Mitchell, R.G., King, A.F., and Griffin, E.J. 1989. A selective differential medium for the isolation of L is te r ia m on o cy to g en es. Lett. Appl. Microbiol. 8: 95.
De Zutter, L. and Van Hoof, J. 1987. Isolation of Y e r s in ia en tero co litica from pork meat. 33rd Int. Con. Meat Sci. Technol. 1: 72.
Doyle, M.P. 1988. Effect of environmental and processing conditions on L is te r ia m on o cy to g en es. Food Technol. 42(4): 169.
Farber, J.M. 1991. Microbiological aspects of modified-atmosphere packaging technology: a review. J. Food Prot. 54: 58.
Gill, C.O. and Harrison, J.C.L. 1989. The storage life of chilled pork packaged under carbon dioxide. Meat Sci. 26: 313.
Gill, C.O. and Reichel, M.P. 1989. Growth of the cold-tolerant pathogens Y e r s in ia en teroco litica , A e r o m o n a s h y r d o p h ila and L is te r ia m o n o cy to g e n es on high-pH beef packaged under vacuum or carbon dioxide. Food Microbiol. 6: 223.
Gill, C.O. and Tan, K.H. 1980. Effect of carbon dioxide on growth of meat spoilage bacteria. Appl. Environ. Microbiol. 39: 317.
Grau, F.H. and Vanderlinde, P.B. 1990. Growth of L is te r ia m ono cy to g en es on vacuum-packaged beef. J. Food Prot. 53: 739.
Grau, F.H. and Vanderlinde, P.B. 1988. Growth of L is te r ia m ono cy to g en es
on vacuum packaged beef. Proc. 34th Int. Cong. Meat Sci. Technol., Brisbane, pp. 518.
Griffith, M.W. 1989. L is te r ia m o n o cy to g en es: Its importance in the dairy industry. J. Sci. Food Agric. 47: 133.
Hanna, M.O., Zink, D.L., Carpenter, Z.L., and Vanderzant, C. 1976. Y e r s in ia en teroco litica -hke organisms from vacuum-packaged beef and lamb. J. Food Sci. 41: 1254.
Harrison, M.A., Melton, C.C., and Draughoun, F.A. 1981. Bacterial flora of ground beef and soy extended ground beef during storage. J. Food Sci. 46: 1088.
Hart, C.D., Mead, G.C. and Norris A.P. 1991. Effects of gaseous environment and temperature on the storage behaviour of L . m o n o c y to g e n e s on chicken breast meat. J. Appl. Bact. 70(1): 40.
Hotchkiss, J.H. and Galloway, D.E. 1989. Advances in and aspects of modified atmosphere packaging in fresh red meats. Rec. Meat Con. Proc. 42: 31.
Huffman, D.L. 1974. Effect of gas atmosphere on microbial quality of pork. J. Food Sci. 39: 723.
Johnson, J.L., Doyle, M.P. and Cassens, R.G. 1990. L is te r ia m onotycogen.es and other L is te r ia spp. in meat and meat products: A Review. J. Food Prot. 53(1): 81.
Johnson, R.W., Harris, M.E., Moran, A.B., Krumm, G.W., and Lee, W.L.1982. A comparative study of the microbiology of commercial vacuum- packaged and hanging beef. J. Food Prot. 45: 223.
Kaczmarski, E. and Jones, D.M. 1989. Listeriosis and ready-cooked chicken. Lancet. 1: 549.
Kraft, A.A. 1986. Meat Microbiology. In M u s c le a s F o o d , P.J. Bechtel (Ed.), p. 239. Academic Press, Inc., New York.
Khan, M.A., Newton, I.A., Seaman, A., and Woodbine, M. 1975. The survival of L is te r ia m o n o cy to g en es inside and outside its host. In P ro b le m s o f L is te r io s is , M. Woodbine (Ed.), p. 75. Univ. Press, Leicester, Great Britain.
Lee, L.A., Gerber, A.R., Lonsway, D.R., Smith, J.D., Carter, G.P., Puhr,N.D., Parrish, C.M., Sikes, R.K., Finton, R.J. and Tauxe, R.V. 1990. Yersinia enterocolitica 0:3 infections in infants and children associated with the household preparation of chitterlings. New Eng. J. Med. 322(4): 984.
Lee, W.H. and McClain, D. 1986. Improved L is te r ia m ono cy to g en es selective agar. Appl. Environ. Microbiol. 52: 1215.
Lioutas, T.S. 1988. Challenges of controlled and modified atmosphere packaging: A food company’s perspective. Food Technol. 42(9): 78.
Newton, K.G., Harrison, J.C.L., and Smith, K.M. 1977. The effect of storage in various gaseous atmospheres on the microflora of lamb chops held at -1 °C. J. Appl. Bacteriol. 43: 53.
Palumbo, S.A. 1986. Is refrigeration enough to restrain foodborne pathogens? J. Food Prot. 49: 1003.
SAS Institute, Inc. 1986. S A S ° U ser’s G u id e : S ta tis t ic s . SAS Institute, Cary, NC.
Schiemann, D.A. 1980. Isolation of toxigenic Y e r s in ia e n te ro co litica from retail pork products. J. Food Prot. 43: 360.
Seelye, R.J. and Yearbury, B.J. 1979. Isolation of Y e r s in ia en te ro co litica resembling organisms and A lte ro m o n a s p u tre fa c ien s from vacuum-packed chilled beef cuts. J. Appl. Bacteriol. 46: 493.
Smith, G.C., Seideman, S.C., Saveli, J.W., Dill, C.W., and Vanderzant, C.1983. Vacuum packaging versus modified atmosphere packaging of lamb loins. J. Food Prot. 46: 47.
Speck, M.L. (Ed.). 1984. C o m p e titio n o f M e th o d s fo r th e M icro b io lo g ica l E x a m in a tio n o f F oods 2nd ed. American Public Health Association, Washington, DC.
Stern, N.J. and Pierson, M.D. 1979. Y e r s in ia en te ro co litica : A review of psychrotrophic water and foodborne pathogen. J Food Sci. 44: 1736.
Sutherland, J.P., Patterson, J.T., Gibbs, P.A., and Murray, J.G. 1977. The effect of several gaseous environments on the multiplication of organisms isolated from vacuum-packaged beef. J. Food Technol. 12: 249.
Swaminathan, B., Harmon, M.C., and Mehlman, I.J. 1982. A Review: Y e r s in ia en tero co litica . J. Appl. Bacteriol. 52: 151.
Taylor, A.A. 1973. Gases in fresh meat packaging. Inst. Meat Bull. 76: 26.Tauxe, R.V., Vandepitte, J., Wauters, G., Martin, S.M., Goosens, V., Mol,
P. de Noyen and R. van Thiers, G. 1987. Y e r s in ia en te ro co litica infections and pork: The missing link. The Lancet. 1(8542): 1129.
Varabioff, Y. 1990. Incidence and recovery and L is te r ia from chicken with a pre-enrichment technique. J. Food Prot. 53: 555.
Wimpfheimer, L., Altman, N.S., and Hotchkiss, J.H. 1990. Growth of L is te r ia m o n o cy to g en es Scott A, serotype 4 and competitive spoilage organisms in raw chicken packaged under modified atmospheres and in air. Int. J. Food Microbiol. 11: 205.
Young, L.L., Reviere, R.D., and Cole, A.B. 1988. Fresh red meats: A place to apply modified atmospheres. Food Technol. 42(9): 65.
Ms received 2/18/92; revised 12/23/92; accepted 1/21/93.
Journal Paper J-14818 of the Iowa Agriculture and Home Economics Experiment Station, Ames, Iowa. Project No. 2991.
Volume 58, No. 3, 1993-JOURNAL OF FOOD SCIENCE-479

National In-Home Consumer Evaluation of Pork Roasts From Pigs Administered Porcine Somatotropin (pSt)
K.J. PRUSA, C.A. FEDLER and L.F. M ILLER
----------------------------ABSTRACT-----------------------------Boneless pork loin (longissimus) or ham (semimembranosus) roasts from 60 control and 60 porcine somatotropin-produced (pSt) pigs (3 m g daily) were analyzed for composition and evaluated by 120 families in each of three major cities. In San Antonio and Portland each family received a loin roast from a control pig and a pSt-treated pig. In Buffalo, each family received a fresh ham roast from a control pig and a pSt-treated pig. Consumers were asked to evaluate the roasts during conventional in-home meal preparation and consumption. Overall, pSt roasts contained less intramuscular fat and no differences were noted in acceptability scores when control loin or ham roasts were compared with pSt-produced loin or ham roasts. No differences were noted in the preference scores for the loin roasts; however, consumers preferred the tenderness, juiciness and flavor of the control ham roasts.
Key Words: pork, consumer-evaluation, acceptability, sensory, somatotropin
INTRODUCTION
IMPROVEMENTS in rations, genetics and management, have greatly reduced the amount of fat on pork carcasses and in pork products (Speer, 1988; Prusa et al., 1989a). However, additional reductions of carcass and intramuscular fat can be achieved with the use of recombinant porcine somatotropin (pSt) a protein produced by the pituitary gland, responsible for normal growth and development. Through genetic engineering, pSt can be produced in large quantities. Its administration to the pig during the finishing phase of growth increases efficiency and lean tissue mass and decreases fat tissue mass (Etherton, 1988; Beermann and DeVol, 1991).
Several studies have evaluated the effects of pSt administration to pigs on fresh pork composition and sensory quality. In general, individual muscles from pSt-treated pigs were larger and contained less intramuscular fat than muscles from control pigs (Prusa, 1989). Also, several studies reported that pSt administration to pigs had no effect on tenderness, juiciness or flavor of the longissimus muscle (Prusa et al., 1989b; Gardner et al., 1990; Nieuwhof et al., 1991). In contrast, other studies noted a decrease in tenderness of the longissimus muscle from pigs treated with pSt (Thiel et al., 1990; Williams et al., 1990; Boles et al., 1991). In some studies, tenderness decreases of the loin were reported only at relatively large doses of pSt (Prusa et al., 1989b; Thiel et al., 1990).
Few studies have evaluated the consumer acceptance of pork from pSt-produced pigs. Consumer-intercept tests evaluated the acceptability of summer sausage (Prusa et al., 1992) and broiled pork chops (Prusa et al., 1990). In general, summer sausage and broiled chops from pSt-produced pigs received greater acceptability scores when compared with products from control pigs. Results of an in-home consumer evaluation test conducted in Des Moines, Iowa, indicated that pSt-produced
A u t h o r s P r u s a a n d F e d 1 e r a r e w i t h t h e D é f i t , o f F o o d S c i e n c e &
H u m a n N u t r i t i o n , 1 1 7 M a c K a y H a i l , I o w a S t a t e U n i v . , A m e s , I A
5 0 0 1 1 . A u t h o r M i l l e r i s w i t h P i t m a n - M o o r e , I n c . , P . O . B o x 2 0 7 ,
T e r r e H a u t e , I N 4 7 8 0 2 .
loin roasts were as acceptable as those from control pigs (Fed- ler et al., 1991).
Most of the consumer acceptance work evaluating pSt-pro- duced pork has been carried out in the central part of the U.S. The objective of our study was to evaluate in-home consumer acceptance of pSt-produced loin and ham roasts during conventional preparation and consumption by families in three major cities across the U.S.
MATERIALS & METHODSCROSSBRED PIGS (60) were injected daily from =69 kg to an 109 kg slaughter weight with 3 mg recombinant procine somatotropin (Pitman-Moore, Inc., Terre Haute, IN). Pigs administered pSt were fed a 15.2% crude protein diet containing 1.1% total lysine. An additional 60 control pigs received no pSt injections and were fed a 13.3% crude protein diet containing 0.65% total lysine. Pigs were slaughtered according to commercial procedures at the Iowa State University Meat Laboratory. After slaughter, carcasses were chilled 24 hr at 0-l°C before fabrication.
To access the composition and consumer acceptance of pork roasts from pSt-treated pigs, a national in-home test was completed in cooperation with an advertising and public relations firm based in Des Moines, Iowa. The tests took place in three geographically dispersed cities chosen by the public relations firm on the basis of location and per capita consumption of fresh pork (each market ranked above national average). Twelve neighborhood leaders in each of the cities were recruited from an employment bureau and trained by the public relations firm to conduct the in-home test. Each leader and their family participated in the test themselves and randomly recruited nine other families to conduct the in-home test. The leaders provided the nine families with specific preparation directions, instructions on how to conduct the test and necessary evaluation forms and materials. Each family was informed that one of the roasts may be from a pig that has been supplemented with a protein, porcine somatotropin (pSt), which is biologically identical to the natural protein found in all pigs and asked to sign a release form. Each household was told that consumption of pork from pigs supplemented with pSt had been approved by the U.S. Food & Drug Administration and was consistent with public health protection. For the 120 families in San Antonio, Texas, and the 120 families in Portland, Oregon, full boneless loins (longissimus muscle) were removed from 60 control and 60 pSt-treated pigs. Each full boneless loin was trimmed of all external fat and cut in half, resulting in two roasts weighing between 1 and 2 kg. For the 120 families in Buffalo, New York, fresh ham roasts (semimembranosus muscle only) were removed from both sides of 60 control and 60 pSt-produced pigs and totally trimmed of fat. Samples of raw longissimus (loin) and semimembranosus (ham) from all pigs were ground and analyzed for moisture and crude fat content according to the AOAC procedures section 950.46B and 960.39, respectively (AOAC, 1990). Control and pSt-pro- duced roasts were alternately identified as “ A” or “ B” , wrapped, randomly assigned to a family and frozen ( - 18°C).
In San Antonio and Portland, each of the 240 families received a loin roast from a control pig and a loin roast from a
480-JOURNAL OF FOOD SCIENCE-Volume 58, No. 3, 1993

Table 1-M o is tu re and crude fa t contents o f raw boneless pork loin and ham roasts
Moisture (%) Crude Fat (%)Control pSt Control pSt
Loin roasts (San Antonio and Portland)
69.85 # 70.65 8.31 # 6.61
Ham roasts (Buffalo)
74.07 NS 74.15 3.81 # 3.13
* Means are significantly different (P<0.05); NS = Means are not significantly different (P>0.05).
pSt-treated pig. For the Buffalo test, 120 families received a fresh ham roast from a control pig and a fresh ham roast from a pSt-treated pig. The families received the roasts, cooking pans, meat thermometer (Taylor, Instant read, Bi-Therm), complete preparation instructions and evaluation sheets. Family members were asked to evaluate control and pSt-produced roasts during conventional in-home meal preparation and consumption. Primary food preparers were asked to respond to questions about the family’s pork consumption and buying habits and to evaluate the raw roasts for size and leanness.
Primary food preparers were instructed 'to heat both roasts simultaneously to 71°C in a preheated 177°C oven. All family members evaluated both roasts at the same meal. Participants were asked to categorize their age (in one of eight 1 0 -yr increments), gender and to score each roast for acceptability on a 150-mm unstructured line scale. The scale was anchored with a 0 on the left-hand side representing low acceptability and 150 on the right-hand side representing a high degree of acceptability. Also, participants were asked to indicate which of the roasts they preferred in regard to tenderness, juiciness and flavor.
Analysis of variance (SAS Institute, Inc., 1985) was used (general linear model, GLM) to test the effects of the acceptability of pSt-treated roasts. When F-values were significant, mean differences were compared by using PDIFF (SAS Institute, Inc., 1985). Differences noted in the preference scores for tenderness, juiciness and flavor were analyzed for significance by consulting a two-sided paired comparison test for difference table (Meilgaard et al., 1987).
RESULTS & DISCUSSION Compositional analysis
Moisture and crude fat concentrations of raw loin (longis- simus) and ham (semimembranosus) muscles (Table 1) showed loin muscles from pigs treated with pSt had more moisture and less crude fat than those from controls. The crude fat concentration of the pSt-produced ham muscles was significantly less than that of the control ham muscles. Other researchers also have reported a significant decrease in intramuscular fat concentration of skeletal muscle as a result of pSt treatment (No- vakofski, 1987; Prusa et al., 1989b,c; Beermann et al., 1990, 1992; Beermann and Devol, 1991; Lentsch et al., 1992; Mourot et al., 1992). In general, an increase in moisture and protein concentration has been noted in skeletal muscle to offset the decrease in crude lipid concentration noted in pSt-produced pigs.
Primary food purchasersOf the primary food purchasers interviewed, 58% served
fresh pork to their families at least once every 2-wks. When purchasing fresh pork, 73% indicated that leanness was one of the important factors that influenced their purchase decision. Leanness of meat was important to 98% of the consumers and 83% indicated that they would pay more for leaner pork if available.
Primary food purchasers in San Antonio and Portland con-
Table 2. - Roast size and leanness evaluation by prim ary food ____________________ purchasers_______________________
Number of respondents
Question Control pStLoin roasts(San Antonio and Portland)Which roast Is larger in diameter? 95 * 132Which roast diameter (size) do you prefer? 96 # 122Which roast appears leaner on the cut surface? 106 NS 123Which roast leaness do you prefer? 107 NS 123Ham roasts(Buffalo)Which roast Is large-? 55 NS 62Which roast do you prefer In regard to size? 54 NS 63Which roast appears leaner? 58 NS 59Which roast leanness do you prefer? 57 NS 60* Significantly different (P < 0.05); NS - not significantly different (P > 0.05).
Table 3 —Consumer preference o f roasts from contro l and pSt-treatedPigs__________________________________________________
Preference(Number of respondents)
Control pStLoin roasts(San Antonio and Portland)Juiciness 338 NS 331Tenderness 327 NS 339Flavor 333 NS 332Ham roasts(Buffalo)Juiciness 188 # 157Tenderness 188 * 156Flavor 191 # 154* Significantly different (P < 0.05); NS = Not significantly different (P > 0.05).
sidered loin roasts from pSt-produced pigs to be larger in diameter than those from controls (Table 2). The larger diameter of the pSt-produced loin roasts was preferred by consumers. Primary food purchasers in Buffalo indicated that there was no difference in the size of control and pSt-produced ham roasts. When the control and pSt-produced roasts were compared, respondents in the three cities reported no differences in leanness. In a similar study, Fedler et al. (1991) indicated that pSt-produced loin roasts were considered larger in diameter and leaner in appearance than control loin roasts.
Consumer acceptability and preferences
In general, the mean acceptability scores were not different for the control (91.9) and the pSt-produced (92.4) loin roasts evaluated by 635 consumers in San Antonio and Portland. In agreement, 294 consumers in Buffalo indicated both the control ham roasts (88.4) and the pSt-produced ham roasts (85.7) were not different in acceptability. No significant differences in acceptability scores were noted between control and pSt- produced loin and ham roasts in any of the 8 age classifications or when respondents were separated according to gender.
The number of respondents who preferred the juiciness, tenderness and flavor of the control loin roasts was similar to the number who preferred juiciness, tenderness and flavor of the pSt-produced loin roasts (Table 3). However, evaluating ham roasts consumers preferred the juiciness, tenderness and flavor of the controls over these traits of the pSt-produced ham roasts. The reason consumers preferred those traits of the control ham roasts is not fully understood and may warrant further investigation. In the Des Moines, Iowa, in-home study completed by Fedler et al., (1991), no differences were noted in acceptability scores or preferences for juiciness and flavor between controls and pS:-produced loin roasts. In agreement with the national study, consumers preferred the tenderness of the control roasts over :endemess of the pSt-produced roasts.
Overall, loin and ham roasts from pSt-produced pigs con-—Continued on page 496
Volume 58, No. 3, 1993-JOURNAL OF FOOD SCIENCE-481

Sensory and Textural Characteristics of Restructured Ham Coated with Emulsions of Different Fat Levels
F. K. M cKEITH, M. S. BREW ER, P. D. OSADJAN, R. J. M ATULIS, and P. J. BECHTEL
----------------------------ABSTRACT-----------------------------Emulsion-coated, restructured hams were prepared using emulsions containing 4.2, 6.9, 17.3, and 25.4% fat. Ha m chunks were emulsion coated, stuffed into 9.8 cm fibrous casings, cooked and sliced. Slices were subjected to visual and sensory evaluation and Instron binding strength evaluation. Emulsion fat content did not affect (P<0.05) sensory characteristics, Instron breaking force or tensile strength. High fat level (25.4%) reduced visual bind uniformity and overall appearance but did not affect other sensory characteristics.
Key Words: restructured ham, emulsion-coating, fat level
INTRODUCTION
THE MEAT INDUSTRY has increased production of boneless chunked and formed hams as an alternative to standard boneless and bone-in hams. Processes, such as tumbling and massaging, have been developed to extract salt soluble, heat- coagulable proteins from ham. These proteins are heat-denatured during the cooking process and facilitate the bind of meat pieces (Krause et al., 1978). Theno et al. (1977) noted that mechanical processes also improved cure distribution and product uniformity.
Tsai and Ockerman (1982) reported that emulsion coating was an alternative to tumbling cured pork products. They found that emulsion-coated and tumbled products had yields, slice- ability and overall sensory acceptance similar to noncoated products. Emulsion-coated products were more acceptable in flavor and texture. Thiel et al. (1986b) reported increased cooking yield, breaking force, moisture retention, juiciness, tenderness and taste panel acceptability of emulsion-coated hams over those conventionally processed.
Because of increased interest in producing meat products with reduced sodium and fat, an emulsion-coated ham product containing fat at more acceptably low levels that has improved processing and bind characteristics would be of interest to the meat processing industry. Thiel et al. (1986b) indicated that salt could be reduced with minimal effects when using emulsion coating. Salt reduction below 1.5% with no other production modification significantly altered sensory and binding characteristics in chunked and formed ham products (Thiel et al., 1986a). Our objective was to evaluate the effect of varying the fat content of emulsions on binding characteristics, appearance and sensory properties of emulsion-coated chunked and formed hams.
A u t h o r s M c K e i t h a n d O s a d j a n a r e a f f i l i a t e d w i t h t h e D e p . o f
A n i m a l S c i e n c e s ; a u t h o r B r e w e r i s a f f i l i a t e d w i t h t h e D i v i s i o n
o f F o o d s & N u t r i t i o n , U n i v . o f I l l i n o i s a t U r b a n a - C h a m p a i g n ,
U r b a n a , I L 6 1 8 0 1 ; a u t h o r B e c h t e l i s a f f i l i a t e d w i t h t h e D e p . o f
F o o d S c i e n c e & N u t r i t i o n , C o l o r a d o S t a t e U n i v . , F o r t C o l l i n s ,
C O ; a n d a u t h o r M a t u l i s i s a f f i l i a t e d w i t h B i l - M a r F o o d s , Z e e l a n d ,
M l . A d d r e s s r e p r i n t r e q u e s t s t o : D r . F . K . M c K e i t h , 2 0 5 M e a t
S c i e n c e L a b o r a t o r y , U n i v . o f I l l i n o i s , 1 5 0 3 S o u t h M a r y l a n d D r i v e ,
U r b a n a , I L 6 1 8 0 1 .
MATERIALS & METHODSFRESH BONELESS H A M S with subcutaneous fat removed were pumped to 110% of original weight with a cure solution containing: 77.21% water, 13.59% Melozyme (Griffith Laboratories, Alsip, IL), 4.94% special seasonings (Griffith Laboratories, Alsip, IL), 3.71% Cur-A-Phos (Stauffer Chemical Co., Washington, PA) and 0.55% sodium erythorbate. Cure was formulated to result in products containing 2.0% salt, 156 ppm nitrite, 550 ppm erythorbate and 0.37% phosphate. Samples were equilibrated 48 hr at 4°C and then cut into2.5 cm cubes. The cured ham cubes were randomized, then tumbled for 2 min in a vacuum tumbler (Universal 190 Inject Star Tumbler, Globus Labs, Hackensack, NJ) at 28 revolutions per minute. Chunks were divided into 24 3.06 kg batches.
The emulsions were prepared from lean fresh ham pieces (4.5% fat), pork fat (91.9% fat) and cure solution (added at 30% by weight). Four emulsion batches were formulated with the fat content estimated to be 5, 10, 20 and 30% fat. Emulsions were formed by chopping the ingredients in a Kramer-Grebe bowl chopper (T. W. Kutter, Inc., Avon, MS) for 2 min at less than 16°C. Coarse-cut emulsions were then passed through the 1.7 m m plate of a Bench Mince Master emulsifier (GL86, Griffith Design and Equipment, Chicago, IL).
Moisture and fat determinations were performed on the ham chunks, pork fat and raw emulsions by oven drying (105°C) for 24 hr followed by repetitive washes of warm chloroform:methanol (2:1) as described by Riss et al. (1983).
Six hams were prepared with each of the four emulsions by mixing3.06 kg ham chunks with 0.34 kg of the appropriate emulsion (10% of the total ham weight) by hand for 3 min. The coated ham chunks were then stuffed into 9.8 cm diameter fibrous casings. After 18 hr at 4°C, hams were weighed, randomly arranged on a smokehouse cart and steam cooked to internal temperature 71°C. The hams were cooled to 4°C, weighed and sliced (1 cm thick) for sensory and visual evaluation and binding strength.
Visual and sensory evaluations were performed by a six-member, experienced panel consisting of staff and graduate students with previous experience. Panelists were trained during a 1-hr training session to evaluate visual bind (degree to which chunks adhered to one another with no visible gaps), cured color uniformity (presence or absence of streaks or blotches) and overall appearance using a 15 cm unstructured line scale end anchored with 0 = not uniformly bound, nonuniform and extremely unacceptable, and 15 = uniformly bound, uniform and extremely acceptable. Panelists scored products which had been treated prior to evaluation to exhibit the characteristics of interest. Samples were evaluated in a retail case under G.E. cool white fluorescent bulbs (10.5 Lux intensity). Panelists also evaluated saltiness, texture and mouthfeel, ham flavor and off-flavor intensity using a 15 cm unstructured line scale end anchored with 0 = extremely bland, soft, none and intense, and 15 = extremely salty, firm, intense and none. Samples were served in random order at room temperature (25°C) under red light. Panelists were provided water (25°C) to cleanse the palate between samples.Three 1 cm slices from each ham were evaluated for tensile strength
(Gillett et al., 1978) and breaking force (Siegel et al., 1978) using an Instron Universal testing machine (model 1125, Instron Corp., Canton, MS). A 500 kg load cell with a crosshead speed of 100 mm/min; a chart speed of 50 mm/min; and a load cell setting of 5 kg was used. Data were subjected to Analysis of Variance and Duncan’s Multiple Range Testing Procedures (SAS Institute, Inc., 1988)
RESULTS & DISCUSSIONMEAN MOISTURE and fat contents of raw emulsions are presented in Table 1. Sensory and visual evaluations and instrumental texture measurements for the emulsion-coated hams
482-JOURNAL OF FOOD SCIENCE-Volume 58, No. 3, 1993

Table 1 -M e a n moisture and fa t contents o f raw emulsions used for emulsion-coated chunked and form ed ham s' ____
Target cooked fat
content (%)Raw fat
content (%)Raw water
content (%)5 4.17 78.52
10 6.88 75.9120 17.26 68.3530 25.42 61.26
■ Fat contents were lower than target values since a 20% cook shrink was anticipated in processing which would have increased fat content in finished emulsion.
are presented in Table 2. Visual binding score was lower (P<0.05) for the 25.4% fat emulsion-coated hams; however, the magnitude of reduction was small (=12%). Differences in total fat content of hams prepared with varying fat contents in the emulsion were expected to be slight since the emulsion was added at 1 0 % of chunk weight; the resulting range of fat added by the emulsion was calculated to be 0.42% to 2.54%. No differences (P<0.05) were observed for cured color uniformity among the different treatments, but the 4.2% fat emulsion- coated hams received higher (P<0.05) scores than the 25.4% fat emulsion-coated hams for overall appearance and visual bind uniformity. Differences in cured color uniformity were not statistically significant. Thiel et al. (1986b) reported no differences between emulsion-coated and conventionally processed chunked and formed ham products for visual binding, cured color intensity and uniformity and visual acceptability. However, emulsion coating in their study was lower than that in ham chunks.
Sensory panelists reported no differences (P<0.05) among treatments for saltiness, texture and mouthfeel, ham flavor intensity and off-flavor intensity. Thiel et al. (1986a) reported that when chunked and formed hams were formulated with 2 % salt, saltiness, juiciness, texture and tenderness of emulsion- coated products were not different from conventionally processed products. In our study textural properties of ham slices (tensile strength and breaking force) were not different (P<0.05) among the four treatments. Morrison et al. (1971) reported that with 30% added water, an emulsion required a minimum of 10- 15% fat for satisfactory physical properties such as resilience, firmness and binding, and that a 30% fat product was acceptable. However, the products they evaluated were for an emulsion type sausage, rather than a product using an emulsion as a binding aid. Thiel et al. (1986a) reported that emulsion- coated hams containing 1% or 2% salt required more (P<0.05) force to break than did conventionally processed hams; the effect of salt and emulsion coating appeared to be additive. The functions of fat in a completely emulsified product compared by a mixed product composed of 90% chunks and 10% emulsion appear to be somewhat different. Increased emulsified fat in a coated product may influence negatively the visual appearance (cured color and bind uniformity). This may be due to modifications in color intensity (by dilution, or due to differences in cured color development). Thus it would have no (P<0.05) effect on other sensory textural characteristics or instrumental measures of bind strength which measure physical strength of the bind junction. Tsai and Ockerman (1982) reported that emulsion coating increased bind (breaking force) at the 3% level in the same manner as tumbling. Theno et al. (1978a,b) have shown tumbling of meat resulted in an emul- sion-like exudate in the binding junctures of restructured products.
Our visual and sensory ratings indicated that emulsion-coated
Table 2 -M e a n visual, palatability and texture scores o f chunked and form ed hams prepared with varying emulsion fat levels______________
Fat content of emulsion, %Trait 4.2 6.9 17.3 25.4 S.E.*Visual parameters1’
Bind uniformity 12.6" 11.5* 11.8* 10.1' 0.27Cured color uniformity 9.8 8.5 8.1 8.0 0.48Overall appearance 9.6* 8.8*1 7.7®1 6.8’ 0.41
Sensory parameters'Saltiness 7.5 7.5 7.3 7.4 0.18Texture and mouthfeel 8.9 9.0 8.2 9.1 0.26Flavor intensity 10.0 10.5 9.2 10.1 0.29Off-flavor intensity 13.6 13.7 13.7 13.8 0.15
Texture parameters'1Tensile strength (kg) 1.87 1.93 2.01 1.90 0.C4Breaking force (kc) 1.96 2.07 2.00 1.94 0.C5
8 Standard error.b Sensory scale: Binding uniformityrO = not uniformly bound, 15 = uniformly bound;
Cured color uniformi:y:0 = not uniform, 15 = uniform; Overall appearance:0 = extremely unacceptable, 15 = extremely acceptable.
c Sensory scale: Saltiness:0 = extremely bland, 15 = extremely bland; Texture and mouthfeehO = soft, 15 = firm; Flavor intensity:0 = none, 15 = intense; Off-flavor intensity:!) = intense, 15 = none.
d Texture parameters were measured using a Model 1122 Instron Universal testing machine, tensile strength and breaking force using the procedures of Siegel et al. (1978).
ef Means in the same row bearing a common superscript are not significantly different (P < 0.05).
restructured ham products may be produced with a wide range of fat content in the emulsion. However, less visual bind and lower overall appearance scores can be expected when the fat content of the emulsion reaches 25%. In conclusion, no differences in sensory or textural parameters were detected among the different fat levels in emulsions. No differences in visual parameters coulc be detected using an emulsion fat content up to 17.3%.
REFERENCESGillett, T.A., Brown, C.L., Leutzinger, R.L., Cassidy, R.D., and Simon, S.
1978. Tensile strength of processed meats determined by an objective Instron technique. J. Food Sci. 43: 1121-1124.
Krause, R.J., Ockerman, H.W., Krol, B., Moerman, P.C., and Plimpton, R.F., Jr. 1978. Influence of tumbling, tumbling time, trim and sodium tripolyphosphate on quality and yield of cured hams. J. Food Sci. 43: 853-856.
Morrison, G.S., Webb, N.B., Blumer, T.N., Ivev, F.J., and Hag, A. 1971. Relationship between composition and stability of sausage-type emulsions. J. Food Sci. 24: 1071-1075.
Riss, T.L. Bechtel, P.J., Forbes, R.M., Klein, B.P., and McKeith, F.K. 1933. Nutritional content of special fed veal ribeyes. J. Food Sci. 48: 1868- 1870.
SAS, Institute, Inc. 1988. SASC User’s Guide, Statistics, 1985 edition. SAS Institute, Cary, NC.
Siegel, D.G., Theno, D.M., Schmidt, G.R., and Norton, H.W. 1978. Meat massaging: The effects of salt, phosphate and massaging on cooking less, binding strength and exudate composition of sectioned and formed nams. J. Food Sci. 43: 331-338.
Theno, D.M., Siegel, D.G., and Schmidt, G.R. 1977. Meat massaging. In Proc. Meat Ind. Research Conf. American Meat Science Association and American Meat Institute Foundation, Chicago, March 24-25, p. 53.
Theno, D.M., Siegel, D.G., and Schmidt, G.R. 1978a. Meat massaging: Effects of salt and phosphate on the microstructural composition of the muscle exudate. J. Food Sci. 43: 483-487.
Theno, D.M., Siegel, D.G., and Schmidt, G.R. 1978b. Meat massaging: Effect of salt and phosphate on the microstructure of binding junctions in sectioned and formed hams. J. Food Sci. 43: 493-496.
Thiel, L.F., Bechtel, P.J., McKeith, F.K., and Brady, P. 1986a. The influence of reduced salt on the yield, breaking force, and sensory characteristics of chunked and formed ham. J. Food Qual. 9: 355-364.
Thiel, L.F., Bechtel, P.J., McKeith, F.K., Novakofski, J., and Carr, T.R. 1986b. Effect of salt reduction on yield, breaking force and sensory characteristics of emulsion-coated chunked and formed ham. J. Food Sci. 51: 1439-1441.
Tsai, T.C. and Ockerman, H.W. 1982. Sectioned and formed product made from emulsion-coated pork tissue. J. Food Sci. 47: 1080-1083.
Ms received 7/20/92; revised 12/3/92; accepted 12/17/92.
Volume 58, No. 3, 1993-JOURNAL OF FOOD SCIENCE-493

Pre-Emulsified Corn Oil, Pork Fat, or Added Moisture Affect Quality of Reduced Fat Bologna Quality
D. J. BISHOP, D. G. OLSON, and C. L. KNIPE
----------------------------ABSTRACT-----------------------------Replacing fat with additional water prevented the increase in firmness normally associated with low-fat meat products. Pre-emulsifying the fat or oil also decreased the firmness of reduced-fat bologna. The color of reduced fat bologna was darker for all except the pre-emul- sified com oil treatments. Redness values for the intact (reduced) fat were the highest of all treatments. Pre-emulsifying fats caused a reduction in redness values for bologna. Flavor and overall acceptability scores from a consumer sensory panel did not differ among bologna samples, but juiciness scores were higher in bologna containing additional water. Accumulated purge in vacuum packages increased with water content in the products and with addition of pre-emulsified oil.
Key Words: bologna, low-fat, com oil, pork fat.
INTRODUCTIONCONSUMER interest in reducing fat and cholesterol intake have caused high fat meat products to be less-marketable. From a consumer survey for the American Meat Institute and the National Live Stock and Meat Board, Skelly (1985) reported that 6 8 % of all primary food shoppers strongly agreed that it was important to limit fat intake. When asked specifically if they would buy lower-calorie hot dogs and luncheon meats, 51% said yes. In addition, those who wish to limit cholesterol intake have been advised to limit consumption of meat products, especially those high in fat. The survey also showed that 45% of the primary shoppers made an effort to avoid foods high in cholesterol. A study conducted by the Food Marketing Institute reported similar consumer attitudes toward fat and cholesterol (Anonymous, 1986a).
Frankfurters and bologna make up a substantial segment of high fat meat products. Consumer Reports (Anonymous, 1986) from a sensory study on commercially produced frankfurters reported that consumers objected to the high fat content of most frankfurters but discovered that it was important in eating quality. Frankfurters with a low fat content (20% or less) were less juicy, had undesired texture, and overall eating quality compared to those higher in fat. The temperature at which these frankfurters were served would probably influence consumer responses. Researchers have documented that the fat content of a processed meat product was important to its juiciness and textural properties (Swift et al, 1954; Mittal and Usborne, 1986).
Historically, meats high in fat were primarily used in sausages. This produced highly palatable products from otherwise less desirable cuts of meat. Baker et al. (1969) and Lee et al. (1981) studied the effects of the type of lipid added on the sensory characteristics of frankfurters and found that as the degree of lipid hardness decreased, the shear values of the frankfurters decreased. However, Lee et al. (1981) reported that if the fat was too soft (less than 30% solid fat at 16% fat level), an unstable product resulted. Swift et al. (1968) also reported unstable meat emulsions with low melting, oily fats.
If a stable product could be produced, the use of an oil might
A u t h o r s O l s o n a n d K n i p e a r e w i t h t h e M e a t E x p o r t R e s e a r c h
C e n t e r , I o w a S t a t e U n i v . , A m e s , I A 5 0 0 1 1 . A u t h o r B i s h o p i s c u r
r e n t l y w i t h C o n A g r a , I n c . , O m a h a , N E .
be of some advantage in a reduced fat meat emulsion product. If the oil was pre-chopped with a nonmeat protein to make a pre-emulsion and then used to replace some of the fat, the firmness of the product may be reduced, improving consumer acceptability. The cholesterol content would also be reduced.
A pre-emulsion is a fat-in-water emulsion with emulsifier typically a protein of nonmeat origin. It is normally made prior to sausage production and is added as a fat ingredient to meat products. Any type fat may be used, including those which may cause stability problems such as vegetable oils (Hoogen- kemp, 1986). Since the fat has been emulsified with the nonmeat protein, more meat proteins become available to contribute to gel formation and water binding. Zayas (1985) found frankfurters with pre-emulsified fat had higher water-binding capacity than those that contained fat that was not pre-emulsified. He also noted an increase in frankfurter tenderness in those that contained pre-emulsion.
The moisture/protein ratio (as with fat/protein ratio) has an important effect on texture and juiciness of meat emulsion products. Tenderness and juiciness positively correlated with the moisture/protein ratio of bologna (Swift et al., 1954) and frankfurters (Baker et al., 1969).
Our objectives were to compare product quality characteristics of reduced-fat bologna to those of a conventional bologna; to compare the effects of addition of pre-emulsified corn oil to those of pre-emulsified or intact pork fat, and effects of replacing a portion of fat with water, on the finished product quality of bologna.
MATERIALS & METHODS
Meat and formulationBologna was produced at various levels of fat, moisture, and pro
tein. The design of the experiment (Table 1) was based on targeted proximate composition and lipid sources of seven bologna treatments. The control treatment was formulated to contain maximal allowable fat of commercial bologna products (target 30% fat in finished product). The other six treatments were targeted to contain reduced fat levels (15% fat) by using two different added moisture levels and three lipid sources. Of the reduced-fat treatments, three contained moisture levels within U S D A regulations (i.e., 4 x % protein + 10%). The other three contained an additional 15% water (based upon U S D A ’s “4 x % protein + 10%” added water regulation) (USDA, 1976) to replace the fat removed to obtain the reduced-fat level. Protein content was therefore higher in reduced-fat treatments which did
Table 1—Design o f experiment by lip id source and targeted proximate composition o f bologna treatments_______________________
Lipid source (% of total fat)Protein Water fat Emulsified Emulsified
Treatments* (%)______ (%) (%) oil fat backfatControl 11.8 57.2 30.0 — _ 100IF 14.8 69.2 15.0 — — 100EF 14.8 69.2 15.0 _ 67 33EO 14.8 69.2 15.0 67 _ 33W, IF 11.8 72.2 15.0 _ _ 100W, EF 11.8 72.2 15.0 — 67 33W, EO 11.8 72.2 15.0 67 - 33•IF = intact fat, EF = pre-emulsified fat, EO = pre-emulsified oil, W = 15% water-
added.
484-JOURNAL OF FOOD SCIENCE-Volume 58, No. 3, 1993

not contain additional moisture, as compared to control. However, the protein content of the reduced-fat treatment, which contained the additional 15% water, was targeted to equal that of controls. The treatments, containing the additional 15% water, were referred to as “water-added” treatments and identified with a “ W ” (Table 1). The reduced fat treatments without additional 15% water were identify by lipid source (Table 1). Within the 2 added water level treatments, each had a treatment which contained one of the following lipid sources: intact pork fat (IF), pre-emulsified pork fat (EF), and pre-emulsified corn oil (EO). EF and E O were added at a level of two-thirds of the tctal fat content or 10% of the formula weight. The remaining one- third of the total fat content was added as IF.
Each treatment was produced in 23-kg batches which contained a constant 11 kg lean (10% fat) beef. Varying levels of lean (20% fat) pork were added to obtain the appropriate protein content. Also, each batch contained 2.2% salt, 0.5% spice, 0.054% sodium erythorbate, and 0.015 % sodium nitrite.All meat and fat ingredients were obtained from the Iowa State
University Meat Laboratory. Frozen lean beef, lean pork, and pork backfat (50% fat) were placed in a 2°C cooler and tempered to - 2°C in preparation for production. Mazola corn oil was stored at 3° C prior to use. Sodium caseinate ( D M V Campina Inc., Stone Mountain, GA) was used to emulsify the com oil and pork fat.
Bologna production
The day before production of bologna, the fat and oil pre-emulsions were made by using a Kramer-Grebe (VSM65) vacuum chopper (T.W. Kutter, Inc., Avon, MA ) with a six-knife head. The pre-emulsions consisted of sodium caseinate, pork fat or com oil, and water at a ratio of 1:8:8, respectively. The com oil was pre-emulsified by adding the oil, water, and sodium caseinate, simultaneously, to the bowl cropper and chopping for 5 min. The temperature of both the oil and water when added was 3°C.
The pork fat was pre-emulsified by chopping the fat briefly (about 30 sec) to reduce particle size followed by addition of hot water (82°C) and sodium caseinate to the chopped fat. Using a steam-jacketed chopper, the pork fat pre-emulsion was further chopped as the temperature was increased to 49°C. In both com oil and pork fat pre-emulsions,1.5% salt was added during the final minute of chopping. These preemulsions were covered and stored in a 3°C cooler and added to the bologna the following day.
In the production of bologna, the lean meat was added to the bowl chopper and chopped 30 sec to reduce particle size. The salt and half the ice water were then added, immediately followed by the sodium nitrite and sodium erythorbate. This mixture was chopped until the temperature reached 7°C at which time, the lipid source (pre-emulsi-f.ed oil, pre-emulsified fat, or intact fat) and the remaining ice water were added. Chopping continued until a final temperature of 13°C was reached. A vacuum was applied during the last 2-3 min chopping.The product was stuffed into 69 m m x 604 m m fibrous casings
using a Vemag Robot 500 vacuum stuffer (Robert Reiser & Co., Inc., Boston, MA). After stuffing, the bologna was cooked to internal temperature 70°C in a Maurer and Sohne Allround System oven (H. Maurer & Sons, Riechenau, West Germany). After cooking, the bologna was transferred to a 1°C cooler and allowed to cool overnight. The following day, the bologna was sliced and vacuum-packaged in high-oxygen barrier pouches (nylon/surlyn/saran laminate, Curwood, Inc., New London, WI) using a Multivac chamber packaging machine (AG800, Sepp Haggenmuller KG, West Germany) with a vacuum of 33 cm mercury. Ten slices (3 m m thick) were placed in each pouch and stored at 1°C until evaluation.
Physical measurementsCooking yield and purge. Cooking yield of bologna was deter
mined by dividing the cooked weight by the uncooked weight. Percent purge (or free liquid) in the package was measured in three packages of bologna at 4 and 8 w k after production. The packages and contents were first weighed then opened and the package and product were towel-dried and weighed separately. The percent purge was calculated by the following formula:
Total wt - (dried package wt + dried product wt) Total wt - dried package wt
x 100
= Percent purge
Color. Objective color measurements were obtained from a Hunter
Table 2 - Proximate compostion o f bologna treatments‘
Treatments'5Protein
(%)Water
(%)Fat(%)
Control 12.9d 56.2' 28.2'IF 15.5' 66.3» 15.2'EF 15.2' 66.0" 15.8'OF 15.0' 66.3» 14.8'W, IF 12.0» 70.9' 14.2'W, EF 12.1* 69.6'' 15.5'W,EO 11.8' 68.8" 14.0'S.E. 0.19 0.60 0.81a N = 3 per treatment mean.b IF = intact fat, EF = pre-emulsified fat, EO = pre-emulsified oil, W = 15% water-
added.Means within the same column having different letters are significantly differ
ent (P<0.05).
Labscan Spectrocolorimeter (Hunter Associates Laboratories, Inc., Reston, VA). “ L” , “ a” , and “b” values were measured with illuminant F (cool white fluorescent) as light source. This was used because most processed meats are displayed under fluorescent light. The instrument was standardized with a white standard plate (x = 81.60, y=86.68, z = 91.18). Triplicate measurements of bologna were taken over storage time (0 and 4 wk) and time of exposure (0, 30, and 60 min) to light (170 foot candles) and air. During the exposure to light, the samples were covered with a fresh meat overwrap film (high oxygen permeability) to prevent dehydration.
Firmness. Bologna firmness was measured objectively by using the Instron Universal Testing Machine (Model 1122) with a 500 kg load cell. Peak heights were recorded using a star probe for puncturing. Crosshead speed was 100 mm/min and chart speed was 200 mm/ min. Bologna slices (20 m m thick) were vacuum packaged the day after production for the puncture test which was done at day zero and 4 wks after packag.ng. Five readings on three samples/treatment were taken.
Sensory evaluation. Four weeks after production, the 3 m m bologna slices were removed from vacuum packages and sampled by a minimum of 20 untrained consumer panelists/session. Panelists consisted of a random mixture of university undergraduate students, graduate students and other employees. Flavor, texture, juiciness and overall acceptability of unheated bologna slices were scored using a seven- point hedonic scale in which “ 7” was equivalent to extremely desirable and “ 1” was equivalent to extremely undesirable.
Chemical measurements
Proximate analysis and TBA test. Moisture, fat, and protein were determined in both experiments (AOAC, 1975). The thiobarbituric acid test (Tarladgis et al., 1960), which measures malonaldehyde concentration, was used as an indication of lipid oxidation. Samples were obtained from vacuum packaged bologna at zero, 4, and 8 wk after production.
Statistical analysis. The Statistical Analysis System (SAS, 1985) was used to determine means, standard errors and analysis of variance. This experiment was a randomized complete block design and was replicated three times. Least significant difference was used as a method of mean separation. For each sensory panel session, data were averaged over all panelists before analysis.
RESULTS AND DISCUSSION Proximate analysis
Protein, moisture, and fat levels (Table 2) showed compositions of the treatments were near the targeted levels (Table1) . The protein content of the control treatment was different (P < 0.05) from the water-added bologna, although the difference was so slight it was of little practical concern. Protein content was not different (P<0.05) between the three ncn- water-added and three water-added treatments. Generally, the protein percentages were slightly higher than formulated.
While protein tended to be higher than formulated, moisture was somewhat lower than formulated for all treatments (Table2) . The final water-added bologna contained more (P < 0.05) moisture than the other bologna and the control bologna contained the least. In the six reduced-fat treatments, no differ-
Volume 58, No. 3, 1993-JOURNAL OF FOOD SCIENCE-485

FAT REPLACEM ENT IN BO LO G N A . . .
Table 3 -C ook ing yield, purge and thlobarbituric acid (TBA) means of bologna treatments_____ ________________________________
Treatment1Cooking
yield (%)bPurge
loss (%)cTBA
(mg malonaldehyde)»Control 95.3 0.30' 0.42'-»IF 94.4 1.07h 0.41<-»EF 94.6 0.98h 0.58*EO 95.1 2.23» 0.45'»W, IF 94.7 2.77' 0.45'W, EF 94.7 2.82' 0.57*W, EO 94.7 4.79* 0.34»-'S.E. 0.54 0.185 0.0408 IF = intact fat, EF = pre-emulsified fat, EO = pre-emulsified oil, W = 15% water-
added.b N = 3 per treatment mean for cooking loss. c N = 6 per treatment mean for purge loss. d N = 9 per treatment mean for TBA values.e.f.g.h.i Means within the same column having different letters are significantly different (P<0.05).
Table 4 - Effects o f lip id type, fa t content and water content on Hunter color values8 o f bologna________________________________________Treatments'’ "L" "a" "b "
Control 60.27° 7.22’ t 9.55*IF 55.41» 8.02d 9.05'EF 59.30» 7.28* 9.65»EO 61.42' 6.86» 9.67»W, IF 53.39' 8.27' 8.67»W, EF 59.55' 7.17' 9.81'W, EO 61.18» 6.97» 9.81'S.E. 0.569 0.118 0.0518 N = 18 per treatment mean.bIF = intact fat, EF = pre-emulsified fat, EO = pre-emulsified oil, W = 15% water-added.c,d,«,f,g,h,i Means within the same column having different letters are significantly dif-ferent (P<0.05).
Table 5 —Effects o f vacuum-packaged storage tim e on Hunter color values• o f bologna
Week "L " "a " "b "
0 58.59 7.28' 9.48»4 58.70 7.51» 9.43'
S.E. 0.069 0.018 0.0138 N = 63 per week mean.b<cMeans within the same column having different letters(P<0.05).
are significantly different
Table 6 —Effects o f exposure time to a ir and light on Hunter color values' o f bologna
Time (min) "L" "a" "b"0 59.09» 8.52» 8.39»
30 58.24» 7.25' 9.72'60 58.60' 6.42» 10.26»
S.E. 0.035 0.016 0.0188 N = 42 per exposure time mean.b-c-d Means within the same column having different letters are significantly different(P<0.05).
ences (P<0.05) in fat content were found, but all treatments were lower (P<0.05) than the control.
Cooking yield and purgeAs shown (Table 3) there were no differences (P<0.05) in
cooking yield between any treatments. The purge loss values were averaged over the 4 and 8 week storage as there was no difference (P<0.05) between purge loss after 4 and 8 wk of storage. However, the various bologna treatments affected the amount of purge accumulated within the packages at each sampling time. As moisture content increased, purge also increased. The control bologna had the lowest (P<0.05) purge, followed by no water-added bologna, while the water-added bologna had the highest (P<0.05) purge loss. In comparing lipid sources, no difference (P<0.05) was found between bo
logna containing intact or emulsified pork fat. Bologna containing emulsified oil had higher purge loss (P<0.05) than that not containing oil. The higher purge of the bologna containing com oil may have been due to oil being liquid at refrigerated temperatures which allowed it to migrate easier within the protein matrix if not completely emulsified.
Thiobarbituric acid valuesTBA values (Table 3) were averaged over all storage times
because the values did not increase (P<0.05) over time. The overall low TBA values and the lack of increase over storage time indicate that lipid oxidation was not a problem in any of the treatments. Bologna containing intact fat and emulsified oil had lower TBA values than that containing emulsified fat. This difference was likely due to the heating involved in production of emulsified fat since its TBA values were higher immediately after sausage production (no significant storage effect). This would also explain why bologna containing intact fat was not different (P<0.05) from that containing emulsified oil.
The higher polyunsaturated fatty acid content of the triglycerides of corn oil did not have the effect on lipid oxidation which we expected. This could have been due to the absence of phospholipids in refined oils. Igen et al. (1980) found phospholipids had a larger total contribution to oxidative rancidity than did triglycerides. Another explanation could have been the presence of minute amounts of natural antioxidants in com oil.
ColorThe control treatment had a higher “ L” value than all IF
or EF treatments but had a lower “ L ” value than EO treate- ments (Table 4). The control treatment also had a lower (P<0.05) “ a” value than both IF treatments, and a higher “ a” value than the EO treatments but was not different (P<0.05) from EF treatments.
Reduced-fat bologna containing IF had higher (P<0.05) “ a” values and lower (P<0.05) “ L” values and “ b” values compared to all other bologna treatments. Bologna treatments with EO had higher (P<0.05) “ L” values and lower (P<0.05) “ a” values than any other reduced fat treatments.
Since the most dominant color of cured meat products is red, a difference in the “ a” value may be considered to have the greatest impact on product color. We expected the reduced- fat bologna to have a redder color, due to concentration of the lean meat. In bologna with IF a redder color was observed, however the red color of bologna containing EF was the same as the control (Table 4). Bologna containing EO had the least red color. Combining the intact fat and emulsified treatments with added-water also resulted in higher “ a” values (Table 4).
Bologna “ a” values increased (P<0.05), “ b” values decreased (P<0.05), and “ L” values were not affected (P<0.05) during 4 wk storage (Table 5). Exposure to air and light decreased (P<0.05) redness (“ a” value) and increased yellowness (“ b” value) of bologna. The lightness of the bologna varied (P<0.05), but this was difficult to explain since the “ L” value first decreased then increased (Table 6 ). Explosure to air and light had a greater effect on bologna color than did vacuum-packaged storage time although this exposure was much more severe than expected with commercial handling.
FirmnessBologna firmness was measured by recording the force (kg)
necessary to reach the yield point of a 2 0 -mm-thick bologna sample using a star punch. The reduced-fat treatment without additional moisture was firmer (P<0.05) than the control. However, the reduced fat treatments with additional water were
486-JOURNAL OF FOOD SCIENCE-Volume 58, No. 3, 1993

Table 7-E ffe c ts o f lip id type, fa t and water on sensory characteristics and firmness o f bologna________________________________________
Treatment6 Flavor Texture
Sensory*Juiciness Overall
Puncturetest0
Control 4.1 4.0d-" 4.2* 4.0 2.79'IF 4.3 4.24« 4.1* 4.0 3.70dEF 4.0 4.24” 4.1* 3.9 3.11*EO 4.0 3.9' 3.8* 3.9 3.14*W,IF 4.4 4.4d 4.9d 4.4 2.64»W, EF 4.1 4.24* 4.6d 4.1 2.24”W,EO 4.3 4.04. 4.7d 4.2 1.96'S.E. 0.19 0.16 0.12 0.17 0.253■ N * 3 per treatment mean for sensory results.b IF = intact fat, EF = pre-emulsified fat, EO = pre-emulsified oil, W = 15% water-
added.c N = 6 per treatment mean for puncture test results.d.e.f.g.h.i Means within the same column having different letters are significantly different (P<.05).
softer (P<0.05) than the control (Table 7). This indicated that the addition of intact pork fat caused a more firm bologna texture than did addition of water.
Reduced-fat bologna treatments with emulsified fat or oil (with or without additional water) were softer (P<0.05) than reduced-fat bologna with intact fat. This confirmed findings of Zayas (1985). Bologna treatments containing emulsified com oil were not different (P<0.05) in firmness compared to bologna with emulsified fat. However, in the water-added bologna, addition of emulsified com oil resulted in less firm (P<0.05) texture than that of emulsified fat.
Sensory evaluation
Sensory scores for flavor, texture, juiciness and overall acceptability of bologna (Table 7) indicate that due to thinness of slices (3 mm), panelists did not report the magnitude of textural differences between treatments that were indicated by the puncture test. Flavor desirability scores were not significantly different (P<0.05) between bologna treatments. This agreed with report of Swift et al. (1954) that fat content had no effect on flavor of bologna. However, note that some participants commented that the low-fat bologna had a higher salt flavor. This would indicate that bologna with a reduced fat content may allow salt and possibly species to be perceived more readily. The water-added treatments had higher (P<0.05) juiciness scores than the control and the non-water added treatments. Overall acceptability was not affected (P<0.05) by the various treatments. Note that most sensory differences were not significant.
CONCLUSIONSTHE FAT CONTENT of bologna was reduced without negatively affecting cooking yields or sensory characteristics, by partial replacement of fat with water, pre-emulsified fat or corn oil. Without additional water, bologna made from either intact fat or emulsified fat was firmest and closest in texture to the control. With use of additional water, bologna made from intact fat was firmest but that made from either emulsified fat or corn oil was most similar in texture to the control. No flavor differences were noted between any of the treatments. Partial replacement of animal fat with pre-emulsified corn oil would allow manufacturers to label processed meat products with lower percentages of saturated fatty acids.
REFERENCESAOAC. 1975. Official Methods of Analysis, 12th ed. Association of Official
Analytical Chemists, Washington, DC.Anonymous. 1986a. Meat board media tours give ‘red meat’ twist to health
kick. Meat Board Reports. November/December. National Live Stock and Meat Board, Chicago, IL.
Anonymous. 1986b. Hot dogs - there’s not much good about them except the way they taste. Consumer Reports 51(6): 364—367.
Baker, R.C., Darfier, J., and Vadehra, D.V. 1969. Type and level of fat and amount of protein and their effect on the quality of chicken frankfurters. Food Technol. 23: 100-103.
Hoogenkamp, H.W. 1986. Milk Proteins in Meat and Poultry Products. De Melkindustrie Veghel bv, Veghel, Netherlands.
Igen, J.O., Pearson, A.M., Dugan, L.R., Jr., and Price, J.F. 1980. Role of triglycerides and phopholipids on development of rancidity in model meat systems during frozen storage. Food Chem. 5: 263-276.
Lee, C.M., Hampson, J.W., and Abdollahi, A. 1981. Effect of plastic fats on thermal stability and mechanical properties of fat-protein gel products. J. Am.Oil Chem. Soc. 58: 983-987.
Mittal, G.S. and Usborne, W.R. 1986. Meat emulsion functionality related to fat-protein ratio and selected dairy and cereal products. Meat Sci. 18: 1-21.
SAS Institute, Inc. 1985. SAS° User's Guide: Statistics, Version 5 Edition. SAS Institute Inc., Cary, NC.
Skelly, F.R. 1985. Take 3-way action to win consumers in marketing arena.The National Provisioner. 193 (November 23): 28-38.
Swift, C.E., Townsend, W.E., and Witnauer, L.P. 1968. Comminuted meat emulsion relation of the melting characteristics of fat to emulsion stability. Food Technol. 22: 117-120.
Swift, C.E., Weir, C.E., and Hankins, O.G. 1954. The effect of variations in moisture and fat content on the juiciness and tenderness of bologna. Food Technol. 8: £39-340.
Tarladgis, B.J., Watts, B.M., Yaunathan, M.T., and Dugan, L., Jr. 1960. A distillation method for the quantitative determination of malonalde- hyde in rancid foods. J. Am. Oil Chem. Soc. 37: 44—48.
USDA. 1976. Code of Federal Regulations; Meat and Poultry Inspection Regulations, 319.180. U.S. Department of Agriculture, Food Safety Inspection Service, Washington, DC.
Zayas, J.F. 1985. Structural and water binding, properties of meat emulsions prepared with emulsified and unemulsified fat. J. Food Sci. 30: 689-692.
Ms received 1/18/92; revised 1/8/93; accepted 1/18/93.
Journal Paper No. J-13806 of the Iowa Agriculture and Home Economics Experiment Station, Ames, IA, Project No. 2780.
Volume 58, No. 3, 1993-JOURNAL OF FOOD SCIENCE-487

Low-Fat Fresh Pork Sausage Patty Stability in Refrigerated Storage with Potassium Lactate
D. D. BRADFO RD, D. L. HUFFM AN, W . R. EGBERT, and W . R. JONES
----------------------------ABSTRACT-----------------------------Typical pork sausage patties (40% fat), low-fat (8%) control patties, and low-fat (8%) patties with 20% added water and 0.4% carrageenan were compared to identical treatments containing 2 % potassium lactate. The lactate had no effect on percent discoloration or lean color during refrigerated aerobic storage. Sensory properties of pork sausage treatments were not affected by the lactate salt (P<0.05). Bacterial populations of low-fat pork sausage patties did not differ (P>0.05); however, the typical patties with 2 % potassium lactate had lower (P<0.05) microbial numbers during refrigerated storage than typical fresh pork sausage. TBARS, ‘L ’, ‘a’ and ‘b’ values were unaffected by the potassium lactate (P>0.05).
Key Words: pork, sausage, potassium lactate, low-fat, microbes
INTRODUCTIONDEVELOPMENT of low-fat products with acceptable sensory properties (Egbert et al. 1991), requires study of their storage stability. The addition of 20% water in conjunction with 0.4% carrageenan, may lead to increased microbial growth in response to greater water activity. Reagan et al. (1983) observed lower microbial numbers as fat level increased, suggesting fat reduction and water addition could be detrimental to shelf life of fresh pork sausage.
There have been several reports on the effects of potassium and sodium lactate as shelf life extenders for processed meat products. Lamkey et al. (1991) reported that sodium lactate was effective in maintaining low microbial numbers for extended times when fresh pork sausage was stored in chubs at 4 °C. Brewer et al. (1991) reported that 2 or 3% sodium lactate added to fresh pork sausage delayed microbial deterioration, pH decline, development of sour and off-flavors by 7 to 10 days at 4 °C and appeared to protect the red color of products. Hunter and Segal (1973) suggested that the effectiveness of sodium lactate was cue to its crossing molecular membranes, becoming dissociated inside the cell and acidifying the cell interior. Sodium lactate was effective in lowering water activity and thereby reducing microbial growth (Loncin, 1975). However, Papadopoulos et al. (1991), reported that water activity was not lowered in cooked beef top rounds injected with various levels of sodium lactate.
Our objectives were: to determine the effect of addition of water and carrageenan to low-fat (8 % fat) fresh pork sausage during aerobic refrigerated (5-7 °C) retail display and to determine the effects of potassium lactate addition on sensory properties of such stored low-fat, carrageenan based sausage.
MATERIALS & METHODS
T H R E E replications of three treatments were prepared to determine the effect of potassium lactate (E) on the chemical, physical, microbial and sensory properties of low-fat fresh pork sausage. Treatments consisted of typical (40% fat) fresh pork sausage patties (40), with 3 %
A u t h o r s B r a d f o r d , H u f f m a n , a n d J o n e s a r e w i t h t h e D e p . o f A n
i m a t D a i r y S c i e n c e s , A u b u r n U n i v . , A L 3 6 8 4 9 . A u t h o r E g b e r t i s
w i t h A r c h e r D a n i e l s M i d l a n d C o . , D e c a t u r , I L 6 2 5 2 6 . D i r e c t a l l
i n q u i r e s t o D r . D . L . H u f f m a n .
added water; low-fat (8% fat) control patties with 3% added water(8); and low-fat (8% fat) patties (low-fat carrageenan-based patties) with 20% added water and 0.4% carrageenan (8C) (Viscarin M E 389, F M C Corp. Philadelphia, PA). Treatments 4 (40+ L); 5 (8 + L); and 6 (8C + L) were identical to treatments 1, 2 and 3 with 2.0% potassium lactate added (pH 6.90, 60% solids; A D M , Decatur, IL).
Product preparationPatties were prepared from fresh (48 hr postmortem) boneless pork
hams, picnics and regular pork trimmings. Raw materials were coarse ground through a 1.27 cm grinder plate and analyzed for fat content using the modified Babcock method (Pearson et al., 1984). Lean and fat components in appropriate amounts were placed in a Hobart Paddle mixer Model H-120, Hobart Co., Troy, OH) and blended for 2 min on speed setting 2 (200 rpm). Preblended pork sausage seasoning (salt 73.5%, dextrose 11.4%, chopped sage 7.3%, black pepper 1.4%, and ground red pepper 6.4%) (A.C. Legg, Birmingham, AL.) were added (2.4% of block weight) during the blending process, water and carrageenan were added as necessary with the seasoning mixture. After mixing, the meat mixtures were ground through a 0.48 cm plate prior to formation into 85 g patties (Hollymatic Super 54 pattie machine). They were interleaved with waxed patty paper, stacked (5 patties per stack), placed in oxygen permeable (oxygen transmission rate = 1600 cc/m 2/24 hr/atm at 25 °C) Cryovac plastic bags and closed with metal clips. All fresh sausage patties were held at 5-7 °C for 12 days except those retained for proximate composition, which were stored at -20 °C (~1 mo for later analysis). Patties for color evaluation were placed on white plastic foam meat trays (2S, Mobil Chemical., Covington, GA.), wrapped with clear oxygen permeable film (FilmCo Aurora, OH, oxygen transmission rate = 6500 cc/M2/24 hr/atm at 25 °C) and placed under retail lighting conditions (fluorescent lighting providing 75 lumens at the meat surface). Patties were evaluated initially and at 4, 8 and 12 days.
Proximate analysis and pHMoisture, fat, and protein content were determined in triplicate for
raw and cooked product using A O A C methods (AOAC, 1988). Initially and at 4, 8 and 12 days, 10 grams of a representative sample of fresh pork sausage patties and 100 m L distilled water was slurried using a blender on speed setting 7 (John Oster Mfg. Co., Model 869- 16P, Milwaukee, WI). The pH of slurries was determined using a Fisher Accumet (model 805) digital pH meter standardized at pH 4 and 7, and equipped with a combination electrode.
Color evaluation
Instrumental color determinations were made on the surface of patties held under retail lighting conditions. Samples were evaluated for Hunter color ‘L ’, ‘a’ and ‘b’ values using a Hunter Lab Digital Color Difference Meter (Model D25D2A, Reston, Va) standardized using the pink C2 3311 standard plate (‘L’ = 68.7, ‘a’ = 23.0 and ‘b’ = 9.4).Visual color was determined by a trained visual appraisal panel for
overall color (8 = extremely red and 1 = extremely brown) and for percent surface discoloration (0 to 100%). Visual appraisal panelists were trained in 20 min sessions where they evaluated fresh pork sausage samples that varied in color and degree of discoloration. Training sessions were concluded when individual scores did not vary more than 1 unit from the mean score. Samples were evaluated under warm white fluorescent lighting positioned to provide 75 lumens at the counter surface. Color measurements were conducted for the sausage patties initially and at 4, 8 and 12 days.
488-JOURNAL OF FOOD SCIENCE-Volume 58, No. 3, 1993

Table 1 — Proximate composition o f fresh pork sausage pattie treatments
Treatment*
40 8 8C SEM6
RawMoisture, % 49.3C 71.0« 74.4* 0.28Fat, % 37.9= 7.7d 7.3d 0.60Protein, % 12.8= 19.0d 16.2* 0.57
CookedMoisture, % 40.9= 57.8d 60.9« 0.51Fat, % 40.1= 11.4d 10.0« 0.69Protein, % 18.4e 28.6d 20.0* 0.31
Cooking loss, % 31.6= 14.0« 21.3* 0.40• Treatments: 40) fresh pork sausage patties, 8) low-fat sausage patties, 8C) low-fat
sausage patties with 20% added water, and 0.4% carrageenan. b SEM = standard error of the mean.=«• Means within a row with different superscripts differ (P<0.05).
Thiobarbituric acid values (TBARS)
Lipid oxidation of refrigerated (5-7 °C) sausage patties was assessed at each storage period (initially, 4, 8, and 12 days) using the procedures outlined by Ke et al. (1984). A standard curve was prepared using 1, 1, 3, 3-tetraethoxypropane (TEP) [malonaldehyde Bis (diethyl acetal)]. Absorbance readings were taken at 538 nm (Lambda 4A, model C099-1232 spectrophotometer, Perkin-Elmer, Norwalk, CT) and compared to the standard curve to determine mg of malonaldehyde per kg of meat.
Sensory characteristics
A 10-member trained sensory panel evaluated the pork sausage patties at the initial storage period for juiciness, tenderness, off-flavor, cohesiveness, mealiness and flavor intensity. Training sessions were 30 min each where panelists were served fresh pork sausage samples that varied in the parameter to be evaluated (AMSA, 1978). Training sessions were concluded when individual scores did not vary more than 1 unit from the mean score. Patties were griddle-broiled at a surface temperature of 165 °C for 2 min on one side and 1.5 min on the other side, using a Model TG-72 Special McDonald’s grill (Wolf Range Corp). Patties were cut into wedges, and served in random order to panelists. Panelists were provided apple juice and unsalted crackers for cleansing the palate. They evaluated each sample on an 8-point scale (1 = extremely dry, extremely tough, extremely intense, extremely non-cohesive, abundant and extremely intense, 8 = extremely juicy, extremely tender, none, extremely cohesive, none, extremely intense and extremely acceptable, respectively).
Microbial determination
Microbial evaluation of pork sausage patties was completed at each storage period (initially, 4, 8 and 12 days). Samples were evaluated for aerobic, psychrotrophic and coliform populations. Meat (llg) was aseptically weighed, placed in sterile lab bags (Fisher Scientific, Pittsburgh, PA, Model Number 01-815-22) with 99 m L of 0.1M (pH 7.2) phosphate-buffered diluent. Serial dilutions were prepared in phosphate-buffered diluent and mixed for 2 min in a Colworth stomacher (Tekmar, Cincinnatti, OH). Serial dilutions were prepared in phosphate-buffered diluent and inoculated (1 mL) into appropriate media using the pour plate technique.Aerobic (48 hr at 32 °C) and psychrotrophic (14 days at 5 °C) pop
ulations were cultivated on standard plate count agar (Difco, Detroit, MI) as described by the Food & Drug Administration (1978). Coliform organism were enumerated in Violet Red Bile Agar (Difco, Detroit, MI) after incubation at 35 °C (Fishbein et al., 1976). All microbial populations were expressed as the log10 cfu/g (colony forming units/gram).
Statistical analysis
Analysis of variance procedures (SAS Institute, Inc., 1988) were employed for data analysis. Replication by treatment was used as the error term for testing for compositional or physical differences among treatments. A split-plot design (Steel and Torrie, 1980) was used to evaluate sensory and storage data. When analysis of variance revealed a significant (P<0.05) effect, means were separated using Fisher’s least significant difference procedure (Steel and Torrie, 1980). Cor-
Tabie 2 - Sensory properties o f cooked fresh pork sausage patties
Trait«
Treatment
SEM«
No lactate* Lactate6
40 8 8C 40 + L 8 + L 8C + LJuiciness 6.8" 5.3' 6.3* 6.6* 5.2’ 6.4" 0.25Tenderness 6.9* 5.5' 6.6* 6.8* 5.4* 6.9* 0.23Off-flavor 6.7* 6.8* 6.7* 6.6* 6.5* 6.4* 0.23Cohesiveness 5.3s 6.7* 6.1 >s 5.39 6.5*' 5.7» 0.24Mealiness 6.1s 6.8* 6.6*’ 6.2s 6.6*' 6.3's 0.19Flavor intensity 6.1* 6.0* 6.1* 6.3* 5.9* 6.1* 0.18■Treatments: 40) fresh pork sausage patties, 8) control sausage patties, 8C) low-fat
sausage patties with 20% added water, and 0.4% carrageenan. Sensory evaluation occurred at day zero.
b Described treatments with 2% potassium lactate added. c Juiciness, tenderness, off-flavor, cohesiveness, mealiness and pork flavor inten
sity rated on an 8-point scale where 1 = extremely dry, extremely tough, extremely strong, extremely non-cohesive, abundant and extremely bland and 8 = extremely juicy, extremely tender, none, extremely cohesive, none and extremely intense, respectively.
d SEM = Standard error of the mean.■ffl Means within a row with different superscripts differ (P<0.05).
relations were determined using M A N O V A procedures of SAS Institute, Inc. (1988).
RESULTS & DISCUSSION Pattie composition
Typical fresh pork sausage (40) had greater (P<0.05) fat, and lower (P<0.05) protein and moisture content, both in the raw and cooked state, than low-fat sausage patties (Table 1). In the raw state, carrageenan-based patties (8 C) had greater (P<0.05) moisture, and lower (P<0.05) protein content than low-fat control patties. In the cooked form, carrageenan-based patties (8 C) had greater (P<0.05) moisture and greater (P<0.05) protein content than traditional fresh pork sausage patties (40). Addition of potassium lactate to fresh pork sausage and low- fat fresh pork sausage patties, had no effect (P > 0.05) on composition (data not shown). Low-fat carrageenan-based patties (8 C) had greater (P < 0.05) cook-loss than low-fat control sausage patties (8 ). Typical sausage patties (40) had the greatest cooking loss (P<0.05).
Sensory propertiesNo interaction (P>0.05) was found between the main effect
of low-fat sausage treatment or the addition of potassium lactate with any of the sensory properties tested. Sensory panels were conducted for day zero of retail storage time. Addition of potassium lactate to fresh pork sausage patties had no effect on the sensory properties of the low-fat patties (Table 2). Typical fresh pork sausage (40), and low-fat carrageenan-based fresh pork sausage (8 C) were rated highest (P<0.05) in juiciness, and tenderness, but were not significantly different from each other (P>0.05). Off-flavor was not affected by sodium lactate, or treatment (P>0.05). Therefore potassium lactate did not produce a detectable off flavor in the fresh pork sausage patties tested. Cohesiveness was not affected by addition of sodium lactate, but was affected by fresh pork sausage treatment (P<0.05). Low-fat control patties (8 ) were rated highest (P<0.05) in cohesiveness scores among the treatments. Mealiness was not affected by sodium lactate but was affected by fresh pork sausage treatment (P>0.05). Low-fat control (8 ) and low-fat carrageenan based patties (8 C) were more (P<0.05) mealy than traditional fresh pork sausage patties (40).
TBARS valuesThe main effects of fresh pork sausage treatment, potassium
lactate and storage were not different (P>0.05) for TBARS values. Nor were there significant (P>0.05) interactions between the main effects (data not shown). The average TBARS
Volume 58, No. 3, 1993-JOURNAL OF FOOD SCIENCE-489

R R H
Table 3 —Hunter color values o f low-fat fresh pork sausage treatments
Hunter color values6
Treatment’SEM'40 8 8C
'L' 54.0d 40.7- 39.5« 0.14'a' 6.2d 8.6« 8.9« 0.08'b ' 12.9d 10.3« 10.3« 0.06
•Treatments 40) fresh pork sausage patties, 8) low-fat sausage patties, 8C) low-fat sausage patties with 20% added water, and 0.4% carrageenan.
b Hunter color values: 'L' = lightness (0 = black, 100 = white); 'a' = redness/ greenness (+ = red, - = green); 'b ' yellowness/blueness (+ = yellow, - = blue).
c SEM = Standard error of the mean.d* Means within a row with different superscripts differ (P<0.05).
Table 4 - Hunter color values o f fresh pork sausage patties during aerobic refrigerated storage__________________________________ _
Storageperiod6
Hunter color values«
'L' 'a ' ’b'
Initial 46.4' 12.5' 12.9'Day 4 45.2d 7.2d 11.2dDay 8 44.1« 6.0« 10.4«Day 12 42.5' 5.8' 10.3’
SEM" 0.18 0.06 0.03•Hunter color values: 'L' = lightness (0 = black, 100 = white); 'a' = redness/
greenness ( + = red, - = green); 'b ' yellowness/blueness ( + = yellow, - = blue).
b Aerobic storage at 5 to 7°C.cd*f Means within a column with different superscripts differ (P<0.05). Data averaged
over all treatments.8 SEM = Standard error of the mean.
value for all treatments was 0.31 mg malonaldehyde/kg meat with a standard error of the mean (SEM) of 0.04.
Hunter color valuesNo interactions (P > 0.05) were found between the main ef
fects of fresh pork sausage treatments, potassium lactate, and storage time for Hunter color ‘L’ (lightness), ‘a’ (redness) and ‘b’, (yellowness) values. However, the main effects of treatment and storage time were significant (P<0.05). No differences were found between the low-fat control (8 ) and low-fat carrageenan-based pork sausage (8 C) treatments for lightness (‘L’ value), redness (‘a’ values) or yellowness (‘b’ values). This indicates the addition of water and carrageenan had no effect on low-fat pork sausage color (Table 3).
Traditional pork sausage patties (40) had higher (P<0.05) ‘L’ and ‘b’ values and lower (P<0.05) ‘a’ values. These results were expected because 40% fat pork sausage patties would have decreased redness, and increased lightness along with greater yellowness than low-fat controls (8 ) as the result of higher fat content. Refrigerated storage of fresh pork sausage patties resulted in decreased lightness, redness and yellowness (Table 4). These color changes were probably the result of the extended exposure of fresh pork sausage patties to retail lighting conditions (Hood and Riordan, 1973; Jeremiah et al., 1972).
Microbial growth
No interaction (P>0.05) was found between fresh pork sausage treatment, time in storage, or addition of potassium lactate with aerobic plate counts, populations of psychrotrophs, and coliform populations. The main effect of fresh pork sausage treatment was not significant; however, the main effects of storage time, and addition of lactate were significant (P<0.05).
The addition of 2% potassium lactate to typical fresh pork sausage resulted in reduced (P<0.05) populations of psychrotrophs and coliforms (Table 5). However, microbial numbers were not reduced by the addition of potassium lactate to low- fat (8 ) sausage or low-fat carrageenan-based patties (8 C). The ineffectiveness of lactate to inhibit microbial growth in low- fat sausage products could be explained by the fact that lactate
Table 5 —Bacteria! populations for fresh pork sausage patties.
Bacterial populations (log,0 CFU/g)
Treatment Aerobic Psychrotrophic Coliform
No lactate«40 7.4'd 7.7' 5.5'8 7.5' 7.8' 5.5'
8C 7.5' 7.7' 5.9'2% Lactate6
4 0 + L 6.9d 6.9d 4.6d8 + L 7.0cd 7.5d 5.1'd
8C + L 7.3'd 7.5' 5.3'dSEM« 0.27 0.24 0.44
•Treatments: 40) fresh pork sausage patties, 8) low-fat sausage patties, 8C low-fat sausage patties with 20% added water, and 0.4% carrageenan.
b Described treatments with 2% potassium lactate added.cd Means within a column with different superscripts differ (P<0.05). Data for treat
ments from day 12 of storage.• SEM «= Standard error of the mean.
Table 6 - Bacterial populations for fresh pork sausage patties during aerobic refrigerated storage__________________________________________
Storageperiod*
Bacterial populations (log10 CFU/g)Aerobic Psychrotrophic Coliform
Initial 5.36 5.36 3.96Day 4 7.3' 7.7' 5.5'Day 8 8.1d 8.0' 5.6'Day 12 8.3d 8.6' 6.3'SEM’ 0.33 0.37 0.59• Aerobic storage at 5 to 7°C.*** Means within a column with different superscripts differ (P<0.05). Data averaged
over all treatments.• SEM » standard error of the mean.
is not fat soluble. With the added moisture in a low-fat sausage, there could be reduced effectiveness of lactate due to dilution of the weak undissociated acid.
Aerobic plate counts, populations of psychrotrophs and coliform populations increased (P<0.05) during refrigerated storage (Table 6 ). Aerobic plate counts correlated (P<0.01) with discoloration of the fresh pork sausage treatments (lean color scores, r = -0 .5 6 ). Psychrotrophic populations also correlated (P<0.01) with Hunter color ‘a’ values (r = -0 .5 1 ). This confirmed earlier studies which have shown the discoloration rate of fresh meat to be dependent on microbial growth (Butler et al., 1953; Ockerman and Cahill, 1977; Robach and Costilow, 1961).
pHNo interaction was found (P>0.05) between fresh pork sau
sage treatment and lactate (pH mean 5.78). The main effects of treatment, lactate and storage time were not different (P>0.05) for pH. The addition of potassium lactate had no effect on the fresh product (P>0.05), which confirmed earlier reports by Lamkey et al. (1991), that the addition of the salt form of lactate had no effect on product pH. The pH of all treatments did not change significantly (P>0.05) over the 12 day storage period.
Visual color appraisalNo interactions (P>0.05) were found for any of the varia
bles tested. In addition, the main effects of fresh pork sausage treatment and addition of 2 % potassium lactate were not significant (P>0.05). However, the main effect of time in storage was different (P<0.05). Lean color scores decreased (lean color means; day 0 = 7.1, day 4 = 5.7, day 8 = 4.1, and day 12 =3.7, SEM = 0.43), and percent surface discoloration increased for all fresh pork sausage treatments during refrigerated storage (discoloration (%) means; means; day 0 = 5.1, day 4 = 17.4, day 8 = 46.9, and day 12 = 54.2 SEM = 0.78).
There has been concern that the addition of 20% added water to low-fat fresh pork sausage may increase the rate of pigment
490-JOURNAL OF FOOD SCIENCE-Volume 58, No. 3, 1993

discoloration. From our results the addition of extra moisture did not result in increased rate of discoloration.
CONCLUSIONSBACTERIAL GROWTH in low-fat (8 C) carrageenan-based sausage patties did not differ from low-fat control fresh pork sausage (8 ) patties. Psychrotrophic and coliform populations in typical fresh pork sausage patties (40) was retarded with 2% potassium lactate. Its use did not affect sensory properties of low-fat fresh pork sausage patties. Low-fat carrageenan-based patties (8 C) did not differ from low-fat controls in percent discoloration during aerobic refrigerated storage.
REFERENCESAMSA. 1978. Guidelines for Cookery and Sensory Evaluation of Meat.
American Meat Science Association, Chicago, IL.AOAC. 1980. Official Methods of Analysis, 13th ed. Association of Official
Analytical Chemists, Washington, DC.Brewer, S.M., McKeith, F., Martin, S.E., Dallmierm, A.W., and Meyer, J.
1991. Sodium lactate effects on shelf-life, sensory, and physical characteristics of fresh pork sausage. J. Food Sci. 56: 1176.
Butler, O.D. Bratzler, L.J., and Mallmann, W.L. 1953. The effect of bacteria on the color of prepackaged retail beef cuts. Food Technol. 7: 397.
Egbert, W.R., Huffman, D.L., Chen, C., and Dylewski, D.P. 1991, Development of low-fat ground beef. Food Technol. 45: 64.
Fishbein, M., Mehlman, I.J., Chugg, L., and Olson, J.C., Jr. 1976. Coliform, fecal coliform, E. coli and enteropathogenic E. coli. pp 277-300. In Compendium of Methods for the Microbiological Examination of Foods, M.L. Speck (Ed.). Am. Public Health Assoc., Washington, DC.
Food and Drug Administration. 1978. Bacteriological analytical manual for foods. Assoc. Off. Anal. Chem., Washington DC.
Hood, D.E. and Riordan, E.B. 1973. Discoloration in pre-packaged beef: Measurements by reflectance spectrophotometry and shopper discrimination. Food Technol. 8: 333.
Hunter, D.R. and Segal, I.H. 1973. Effect of weak acids on amino acid
transport by Pénicillium chrycogenum: Evidence for proton or charge gradient as the driving force. J. Bact. 113: 1184.
Jeremiah, L.H., Smith, G.C., and Carpenter, Z.L. 1972. Vacuum packaging of lamb: Effects of certain factors on retail case-life and palatability. J. Food Sci. 37: 463.
Ke, P.J., Cervantes, E., and Robles-Martinez, C. 1984. Determination of thiobarbituric acid reactive substances (TBARS) in fish tissue by an improved distillation spectrophotometric method. J. Sci. Food Agric. 35: 1248.
Lamkey, J.W., Leak, F.W., Tuley W.B., Johnson, D.D., and West, R.L. 1991. Assessment of sodium lactate addition to fresh pork sausage. J. Food Sci. 56: 220.
Locin, M. 1975. Basic principles of moisture equilibria. In Freeze Drying and Advanced Food Technology, SA. Goldblith, L. Rey and WAV. Roth- mayr (Ed.), p. 599. Academic Press, New York.
Ockerman, H.W. and Cahill, V.R. 1977. Microbiological growth and pH effects on bovine tissue inoculated with Pseudomonas putrefaciens, Bacillus subtilis or Leuconostoc mesenteroides. J. Food Sci. 41: 141.
Papadopoulos, L.S., Miller, R.K., Acuff, G.R., Vanderzant, C., and Cross, H.R. 1991. Effect of sodium lactate on microbial and chemical composition of cooked beef during storage. J. Food Sci. 56: 341.
Pearson, A.M. and Tauber, F.W. 1984. Analytical methods, Ch. 16, in Processed Meats, 2nd ed., p. 351. Van Nostrand Reinhold Company, Reinhold, N.Y.
Reagan, J.O., Liou, F.H., Reynolds, AE., and Carpenter J.A 1983. Effect of processing variables on the microbial, physical and sensory characteristics of pork sausage. J. Food Sci. 48: 146.
Robach, D.L. and Co3tilow, R.M. 1961. Role of bacteria in the oxidation of myoglobin. Appl. Microbiol. 9: 529.
SAS Institute Inc. 1985. SAS© User's Guide: Basic, 1985, 5th Ed. SAS Institute Inc. Cary, NC.
Steel, G.D. and Torrie, J.H. 1980. Principles and Procedures of Statistics. A Biometrical Approach, 2nd ed., McGraw-Hill, Inc. New York.
Ms received 8/6/92; revised 12/8/92; accepted 12/18/92.
Alabama Agricultural Experiment Station No. 4-923281.This study was funded, in part, by a grant from the National Live Stock and Meat
Board, Pork Industry Group, 444 North Michigan Avenue, Chicago, IL 60611. We acknowledge and thank the Marine Colloids Division of FMC Corp. (Philadelphia, PA), ADM (Decatur, IL) and AC. Legg Packing Co., Inc. (Birmingham, AL) for their contributions.
TRANSGLUTAMINASE AND BEEF ACTOMYOSIN. . .F ro m p a g e 4 7 4
tended from 10 to 120 min. This indicated possible incorporation of the proteins smaller than myosin into the polymerization of transglutaminase.
Reaction mixtures with and without transglutaminase incubated at 35°C are shown in Fig. 2. The reaction mixtures with transglutaminase seemed to become thicker as incubation time increased (data not shown). However, only the mixture incubated for 2 hr formed a gel, strong enough to hold a stainless steel ball (0.166g) 0.159 cm in diameter (B in Fig. 2).
CLSM was used to visualize the transglutaminase-induced gelation of actomyosin. In the absence of tranglutaminase, beef actomyosin solutions showed no change when incubated for 10, 30, 60, and 120 min at 35°C (data not shown). After 30 min incubation with transglutaminase, early stages of network formation and aggregation was apparent at higher magnification (A in Fig. 3). After incubation of actomyosin with transglutaminase for 60 min, extensive aggregation was readily visualized. Furthermore, the gel network structure became more dense and exclusion of void spots was more apparent after incubation for 120 min (B and C in Fig. 3).
These results indicate a potential for using transglutaminase to improve or modify the functional and rheological properties of food proteins. Polymerization of actomyosin by transglutaminase may prove to be a viable method for restructuring or forming meat products without the requirement for freezing or cooking to maintain product integrity. The development of microbial transglutaminase (Nonaka et al., 1989) may accelerate future applications of transglutaminase in food processing by lowering cost.
REFERENCES
Aboumahmoud, R. and Savello, P. 1990. Crosslinking of whey protein by transglutaminase. J. Dairy Sci. 73: 256.
Akamittath, J.G. and Ball, H.R., Jr. 1990. Polymerization of crude acto
myosin refined frcm mechanically deboned poultry meat. Poultry Sci. vol. 69. Supplement. 1: 4.
Bradford, M. 1976. A rapid and sensitive method for the quantitation of microgram quantities of protein utilizing the principle of protein-dye binding. Anal. Biozhem. 72: 248.
Brakenhofî, G.J. and Visscher, K. 1990. Novel confocal imaging and visualization techniques. Transactions of the Royal Microscopical Society, New Series Volume 1: Micro 90: 247.
Goldstein, S.R. and Rubin, T. 1990. Improved acousto-optic laser scanning system for a video-rate confocal microscope with no moving parts. Transactions of the Royal Microscopical Society, New Series Volume 1: Micro 90: 255.
Higginbotham, DA 1989. Consumer evaluation of restructured beef/sur- imi steaks. M.S. thesis, Univ. of Georgia. Athens, GA
Kimura, I., Sugimoto, M., Toyoda, K., Seki, N., Arai, K., and Fuji ta, T. 1991. A study on the cross-linking reaction of myosin in Kamaboko "su- wari” gels. Nippon Suisan Gakkaishi. 57: 1389.
Kurth, L. 1983. Crosslinking of Myosin and casein by the enzyme transglutaminase. Food Technology in Australia. 35(9): 420.
Laemmli, U.K. 1970. Cleavage of structural protein during the assembly of the head of bacteriophage T4. Nature. 227: 680.
Lanier, T.C. 1986. Functional properties of surimi. Food Technol. 40: 107.Miller, W.I. and Foster, B. 1991. Fluorescence and confocal laser scan
ning microscopy: Applications in biotechnology. American Laboratory 4: 74.
Nio, N., Motoki, M., and Takinami, K. 1985. Gelation of casein and soybean globulins by transglutaminase. Agric. Biol. Chem. 49: 2283.
Nonaka, M., Tanaka, H., Okiyama, A., Motoki, M., Ando, H. Umeda, K., and Matsura, A 1989. Polymerization of several proteins by Ca independent transglutaminase derived from microorganisms. Agric. Biol. Chem. 53: 2619.
Sargent, J.A 1988. The application of cold stage scanning electron microscopy to food research. Food Microstructure 7: 123.
Secrist, J.L. 1987. Restructured meats - The past and present. In Advances in Meat Research volume III: Restructured Meat and Poultry Products, (Ed.) Pearson, A.M. and Dutson, T.R. Van Nostrand Reinhold Co., New York.
Seki, N., Uno, H., Lee, N-H., Kimura, I., Toyoda, K., Fujita, T., and Arai, K. 1990. Transglutaminase activity in Alaskan pollack muscle and surimi, and its reaction with myosin B. Nippon Suisan Gakkaishi. 56: 125.
Takashi, R., Arai, K-L, and Saito, T. 1970. Studies on muscular proteins of fish II: Preparation of actomyosin from carp muscle. Bull, of Jap. Soc. Fish. 36: 169.
Tanimoto, S. and Kinsella, J.E. 1988. Enzymatic modification of proteins: Effects of transglutaminase cross-linking on some physical properties of P-Lactoglobulin. J. Agric. Food Chem. 36: 281.
Ms received 7/1/92; revised 1/12/93; accepted 1/25/93.
Volume 58, No. 3, 1993-JOURNAL OF FOOD SCIENCE-491

Salt, Phosphate and Oil Temperature Effects on Emulsion Capacity of Fresh or Frozen Meat and Sheep Tail Fat
O. ZO R BA, H.Y. GOKALP, H. YETIM , and H.W . OCKERM AN
----------------------------ABSTRACT-----------------------------The effects of K 2H P 0 4, NaCl and oil temperature on emulsion capacity (EC) and microstructure of fresh and frozen Turkish beef was studied by utilizing a model system. EC of frozen meat was 6.4% higher than fresh meat. E C also increased with increasing phosphate levels increasing 8.5 and 10.4% over the control with 0.50 and 0.75% phosphate respectively. E C increased 1.6% for 3.0% salt over 2.5% salt. Microstructure photographs of the phosphate containing emulsions indicated the protein aggregates diminished and the emulsion was more homogeneous.
Key Words: Turkish meat, salt levels, emulsion capacity, microstructure
INTRODUCTIONFUNCTIONAL QUALITIES of emulsions can be measured by emulsion capacity (EC), emulsion stability (ES), gel strength, water-binding and fat-binding capacities. These functional properties are influenced by the amount and conformational status of protein, proportion of stroma proteins and the physico-chemical properties of the meat emulsion system (Haq et al., 1973; Mittal and Usborne, 1985).
Several factors can be optimized during frankfurter and wiener-type emulsion preparation such as cutter speed, mixing rate, environment temperature, time of water addition, pH, ionic strength, meat and fat temperature and fat addition rate (Webb et al., 1970; Lin and Zayas, 1987a, b, c; Haque and Kinsella, 1989). Meat emulsion systems have been studied to test physical, chemical and technological properties of the proteins. Such studies often reached different conclusions and have proposed alternative processing methods depending on the system (Smith et al., 1973; Lauck, 1975; Sofos et al., 1977; Ensor et al., 1987). However, some emulsion studies have been conducted employing model systems, in addition to commercial meat systems to test and compare emulsion properties of food proteins (Webb et al., 1970; Hermansson, 1975a, b, c; Galluzzo and Regenstein, 1978a, b, c; Whiting and Miller 1984; Kato et al., 1985; Haque et al., 1988). Model system studies have often been preferred because they are convenient, economical, require minimum time and are reproducible (Huang and Kinsella, 1987; Parks and Carpenter, 1987; Paulson and Tung, 1988; Haque and Kinsella, 1988, 1989).
Many emulsion stability problems have been encountered during production of emulsion type Turkish meat products, probably due to the high level of sheep tail fat used. Hence it is important to obtain reliable, practical, technological and scientific information about Turkish meats, the type of fat used and the effects of salt and phosphate.
Furthermore, frozen meat may be utilized extensively in such products. However, information is limited about emulsion properties of frozen meat as compared to fresh meat. In some areas fresh meats might be chilled for 24 hr at 0 to 5°C or
A u t h o r s Y e t i m a n d O c k e r m a n a r e w i t h t h e D e p t , o f A n i m a l S c i
e n c e , T h e O h i o S t a t e U n i v . , 2 0 2 9 F y f f e R o a d , C o l u m b u s , O H
4 3 2 1 0 . A u t h o r s Z o r b a a n d G o k a l p a r e n o w a f f i l i a t e d w i t h t h e
F o o d S c i e n c e & T e c h n o l o g y D e p t . , A t a t u r k U n i v . , E r z u r u m , T u r
k e y .
frozen and used for wiener-type meat products processing. Therefore, another objective was to investigate the EC and microstructural properties of fresh and frozen Turkish beef using a model system in the presence of phosphate and sodium chloride. Effects of different oil temperatures on the EC procedure were also studied.
MATERIALS AND METHODST H E BEEF and sheep tail fat used were purchased from a large meat packer in Erzurum, Turkey. The meat from the chuck region of 3 year old lean cattle was chilled (0 - 5°C) for 24 h after slaughter and was ground by using a lab style grinder (Kenwood A707A) with a 3 # m m diameter hole plate. Fat was determined by the Modified Babcock Method (Gokalp, 1982) and standardized with sheep tail fat to 17 to 18% fat. Samples were divided into two portions (= 150g) one for fresh treatment and the other for frozen. After wrapping with four layers of medium density polyethylene film, the meat was kept frozen at -24°C for 20 days. Analytical grade K 2H P 0 4, NaCl and refined winterized commercial grade com oil were used in emulsion preparation.
Emulsion capacity (EC) of chilled fresh meat samples was evaluated at three different oil temperatures (5, 11 and 21°C) with three levels of phosphate (0.00, 0.50 and 0.75% K 2H P 0 4) and two salt levels (2.5 and 3.0% NaCl). Then, the tests were repeated for the frozen samples. Thus, the experimental design was a 3 x 3 x 2 x 2 factorial design with three replications.
Emulsion capacity (EC)EC, an indicator of the functional properties of meat in an emulsion
system, was determined by using a model system described by Ockerman (1976). The method utilized for end point determination was described by Webb et al. (1970). NaCl and K 2H P 0 4 at the indicated percentages were combined and dissolved in water.To measure EC, 25g of ground meat and 100 m L of cold (0 - 4°C)
salt-phosphate solution (SP) were placed into a blender (Waring Blen- dor Model 34B199) jar and comminuted for 3 min at 13,000 rpm (Fig.1). Slurry (12.5g) and 37.5 m L of additional SP solution were transferred to another blender jar and homogenized 10 sec at low speed («5,000 rpm). Then, 50 m L of com oil was added. To detect break point of the emulsions, electrodes were connected to an O h m meter (Huang Chang HC-3010BZ). Oil was added at =0.7 mL/sec. The Blender rate was 13,000 rpm during emulsification. The water jacketed buret containing the oil was maintained at the specified temperature. The emulsion break point occurred when the ohm meter connected to a millivolt recorder (Karl Kolb RE541), showed a sudden increase in resistance (Fig. 1). At break point, oil addition was stopped. The total amount of oil emulsified included the first 50 m L added. E C was calculated as m L oil/g protein after determining the protein (Kjeldahl) content of the meat samples (Ockerman, 1976).
pH DeterminationThe pH values of the NaCl-K2H P 0 4 solutions and the meat plus
the NaCl-K2H P 0 4 solutions were measured (PYE U N I C A M Model 290 Mk-2). Meat (lOg) and 100 m L of an SP solution were homogenized for 1 min (Ultra Turrax, type 18-10) at =5,000 rpm, and pH was measured at 20 °C (Ockerman, 1976).
Microstructure of emulsionMicrostructure analysis was as described by Ockerman (1976). The
emulsion formed with a standard amount of oil (150 mL) was smeared
492-JOURNAL OF FOOD SCIENCE-Volume 58, No. 3, 1993

F i g . 1 - M o d e I s y s t e m f o r e m u l s i o n p r e p a r a t i o n .
Table 1 -p H o f prepared NaCI-KjHPO, solutions and the meat plus the NaCt-K^HPO, solutions__________________________________________
K2HPO„ level (%)
Solution Meat + Solution
2.5% NaCI 3.0% NaCI 2.5% NaCI 3.0% NaCI
0.00 6.96 7.04 5.73 5.740.50 7.70 7.94 6.72 6.720.75 8.16 8.39 6.97 6.97
Table 2 - EC (mL oiiig protein) o f fresh and frozen meat w ith different o il temperatures, salt and phosphate levels'
Meat
OiltempPC)
NaCIlevel(%)
K2HP04 Levels (%)0.00 0.50 0.75
5 2.5 271.8 301.1 302.63.0 290.5 310.9 313.5
Fresh 11 2.5 276.6 320.9 327.13.0 285.3 317.7 326.4
21 2.5 294.4 293.9 311.33.0 306.1 302.5 306.9
5 2.5 280.3 326.7 329.03.0 304.2 322.1 319.9
Frozen 11 2.5 297.1 341.2 374.03.0 311.4 351.2 352.3
21 2.5 280.3 326.7 329.03.0 304.2 322.1 319.9
* Results are the mean EC values o f three replications.
onto a slide and chilled 1 day at 2 °C. The slide was rinsed in 70% ethanol and stained with 0.5% Sudan IV and counterstained with 10% bromphenol blue (Ockerman, 1976). After rinsing the excessive stain, the slide was treated with 5 % ammonium hydroxide. The slide was washed with water, drained and observed under a 40X light microscope equipped with a camera. Photographs were evaluated.
Statistical analysisCollected data was subjected to analysis of variance using a random
factorial design. Basic statistics and analysis of variance were performed to test significance within replications and between treatments
Table 3 - Analysis o f variance o f the effect o f the different meats (fresh and frozen), o il temperatures, KJfPOt and NaC! levels on EC values
Source of variation
Degrees of freedom
Fvalue
Méat (M) 1 279.21*Oil température (O) 2 84.45*Phosphate level (P) 2 262.35*Sait level (S) 1 19.07*M X 0 2 16.17*M X P 2 5.57*O X P 4 44.05*M X S 1 1.72O X S 2 3.35P X S 2 24.54*M X O X P 4 3.36*M X 0 X S 2 2.15M X P X S 2 5.47*O X P X S 4 2.49Error 76Total 107* P < 0.05 Significance level.
(MSTAT, 1986). Significant treatment and interaction means were further analyzed with Duncan’s Multiple Range Tests.
RESULTS & DISCUSSION Effect of phosphate and salt levels on pH
The pH values of meat plus salt-phosphate (SP) solutions (Table 1) showed at a given salt level, when phosphate was added pH increased. At the same phosphate level, an increase in salt did not alter pH. The influence of those treatments on pH was probably a result of a combination of alkaline K2H P04
presence and the meat’s buffer capacity (Knipe et al., 1985; Paterson et al., 1988; Gokalp, 1990). Similar results were reported by Knipe. et al. (1985).
Three way interactions among different variablesEC results (Table 2) and analysis of variance (Table 3) in
dicated significant (P < 0.05) interaction (Fig. 2) of meat, phosphate level and salt level ( M X P X S). Frozen meat had
Volume 58, No. 3, 1993-JOURNAL OF FOOD SCIENCE-493

MEAT EMULSIONS, SHEEP TAIL F A T . . .
EC o f F r e s h a n d F r o z e n M e a t
Phosphate Levels (%)F i g . 2 — M e a t , s a l t a n d p h o s p h a t e l e v e l e f f e c t s o n t h e E C o f f r e s h
a n d f r o z e n m e a t ( d i f f e r e n t o i l t e m p e r a t u r e v a l u e s p o o l e d ) .
0 o. □>'51x? oCO CL CO
□EHI
Phosphate Levels (%)F i g . 4 — E f f e c t o f m é a t a n d p h o s p h a t e l e v e l ( A ) , a n d N a C l a n d
p h o s p h a t e l e v e l ( B ) .
EC of Fresh and Frozen Meat
Fresh Frozen
21 5
Oil Temperatures (*C)
F i g . 3 — M e a t , o i l t e m p e r a t u r e a n d p h o s p h a t e l e v e l s e f f e c t s o n
t h e E C o f f r e s h a n d f r o z e n m e a t ( d i f f e r e n t s a l t l e v e l s v a l u e s
p o o l e d ) .
F i g . 5 - E f f e c t o f m é a t x o i l t e m p é r a t u r e ( A ) a n d p h o s p h a t e l e v e l
x o i l t e m p é r a t u r e ( B ) .
higher EC values than fresh meat at all salt and phosphate levels. Additionally, increased phosphate level generally increased the EC, except for frozen meat samples at 3.0% salt where 0.50% phosphate resulted in higher EC than 0.75% phosphate (Fig. 2).
Significant (P < 0.05) effects of meat, oil temperature and phosphate level were found (Fig. 3). The 21°C oil temperature decreased the EC in all samples containing phosphate. The EC with phosphate was significantly (P < 0.05) higher at 11°C than at other oil temperatures. Increasing EC values resulted for frozen meat at every oil temperature and phosphate level.
Two way interactions among different variablesTwo way interactions provide additional insight (Fig. 4 and
5). EC increased with increasing phosphate level for both fresh and frozen meat (Fig. 4a). This increase was significant (P < 0.05) for each phosphate increment with fresh meat but not (P < 0.05) for frozen meats when 0.75% phosphate was compared to 0.50% phosphate (Fig. 4a). However, when three way interaction (Fig. 2) was evaluated, this was not true for frozen meat at 3.0% salt when 0.5 and 0.75% phosphate were compared (Fig. 3). This was also not true in fresh or frozen meat at 21°C oil temperature.
EC was elevated (Fig. 4b) with increasing phosphate levels at both salt levels (2.5 and 3.0%). This increase was not significant (P < 0.05) at 3.0% salt for the 0.50% phosphate as compared to the 0.75% phosphate (Fig. 2). Significant meat
Table 4 -M e a n EC values showing the effect o f different meat and o iltemperatures and levels o f K^fPO. and NaC!
Variables'Mean values of EC (mL oil/g protein)
Meat (n = 54)Fresh meat 303.37*Frozen meat 322.74»
SE 1.159
NaCI levels (n = 54)2.5% 310.52*3.0% 315.59»
SE 1.159
KjHP04 levels (n = 36)0.00% 294.54*0.50% 319.60»0.75% 325.03'
SE 1.420
Oil temperature (n = 36)5°C 306.07*
i r e 323.51»21°C 309.59*
SE 1.420,c SE: Standard error; n; Number of observations. The mean values with
the same letters w ithin a group for a variable are not significantly different (P < 0.01) from each other.
and oil temperature interactions were found (Fig. 5a). General trends are shown in Fig. 5b as well as Fig. 3.
494-JOURNAL OF FOOD SCIENCE-Volume 58, No. 3, 1993

Fig. 6—Microscopic appearance o f emulsions: (A) 0.00% phosphate (control); (B) 0.50% phosphate added; (C) an example of a broken emulsion.
Meats, oil temperatures, phosphate and salt levels affect EC
Regarding main effects (Table 4) the higher EC with frozen meat might be explained by the freezing of minced meat samples at — 24°C. Effective packaging plus low temperature storage probably caused only minimal structural damage to the meat. The aggregation of protein polypeptides with progressive chemical interactions during frozen storage has been proposed by Matsumoto (1980). Hence, exposing more hydrophobic groups during emulsification would attract more fat molecules (Mangino, 1991). Partial dénaturation of the myofibrilar meat proteins by freezing has been proposed by several researchers (Fennema et al., 1973; Matsumoto, 1980). Wagner and Anon (1986a, b) reported that frozen beef stored at — 20°C up to 13
weeks showed a partial denaturation in myofibrilar proteins, and solubility of the proteins slightly increased. The increase in EC with higher salt was expected, as it has been previously reported in other muscle systems. It can be explained by greater protein unfolding with increased ionic strength of the environment (Heinevetter, 1987).
EC was significantly (P < 0.05) increased with phosphate addition due probably to elevated pH values (Gokalp, 1989). Also, a higher EC with addition of salt and phosphate might have originated from the protein solubility enhancements. NaCl and Phosphates were reported to increase protein solubility (Wu and Smith, 1987; Paterson et al., 1988), causing an increase in the EC of meat proteins (Li-Chan et al., 1984).
The oil temperature generally produced optimal EC at 11°C. That temperature is in the range of optimum reported emulsification temperatures (Ockerman, 1976). Other research workers have reported that ideal emulsion forming temperature was generally around 11 - 15°C (Kramlich, 1971; Shut, 1976).
Microscopic character of the emulsionsNoticeable visual variations were observed between fresh
and frozen meat emulsions and the different oil temperatures and salt levels. However, the main differences were noted when phosphate was added to the emulsions (Fig. 6 ). With higher levels of phosphate, the protein mass became thinner and fat particles smaller (Fig. 6 B).
CONCLUSIONIN THIS EXPERIMENT, the EC of frozen meats was higher than EC of fresh meat. The oil temperature of 11°C increased the EC when compared to 5 and 21°C oil temperatures. The EC was also elevated significantly with increasing phosphate and salt levels, and the addition of phosphate gave a more uniform microstructure to the emulsions.
REFERENCESE n s o r , S .A ., M a n d ig o , K .W ., C a lk in s , C .D . , a n d Q u in t , L .N . 1 9 8 7 . C o m
p a r a t iv e e v a lu a t iD n o f w h e y p r o te in c o n c e n tra te , soy p r o te in is o la te a n d c a lc iu m re d u c e d n o n fa t d r y m i l k as b in d e rs in a n e m u ls io n -ty p e sau sag e . J . F oo d S c i. 5 2 : 1 1 5 5 -1 1 5 8 .
F e n n e m a , O .R ., P o w r ie , W .D . , a n d M a r t h , E .H . 1 9 7 3 . C h a r a c te r is t ic s o f food m y o s y s te m s a n d t h e i r b e h a v io r d u r in g fre e z e p r e s e rv a t io n . I n Low Temperature Preservation of Food and Living Matter, O .R . F e n n e m a (E d .), p. 2 8 2 -3 5 1 . M a r c e l D e k k e r , In c ., N e w Y o r k .
G a llu z z o , S .J . a n d R e g e n s te in , J .M . 1 9 7 8 a . E m u ls io n c a p a c ity a n d t im e d e m u ls if ic a t io n o f c h ic k e n b re a s t m u s c le m y o s in . J . F oo d S c i. 4 3 : 1 7 5 7 - 1 7 6 0 .
G a llu z z o , S .J . a n d R e g e n s te in , J .M . 1 9 8 7 b . R o le o f c h ic k e n b re a s t m u s c le p ro te in s in m e a t e m u ls io n fo rm a tio n : M y o s in , a c t in a n d s y n th e tic ac to - m v o s in . J . F oo d S ci. 4 3 : 1 7 6 1 -1 7 6 5 .
G a llu z z o , S .J . a n d R e g e n s te in , J .M . 1 9 7 8 c . R o le o f c h ic k e n b re a s t m u s c le p ro te in s in m e a t e m u ls io n fo rm a tio n : N a t u r a l a c to m y o s in , c o n tra c te d a n d u n c o n tra c te d m y o f ib r i ls . J . F oo d S c i. 4 3 : 1 7 6 6 -1 7 7 0 .
G o k a lp , H . Y . 1 9 8 2 . T u r k is h s ty le s o u d jo u k p ro d u c tio n a d d in g d i f f e r e n t s ta r te r c u ltu r e s a t d i f f e r e n t r ip e n in g te m p e r a tu r e s . A s s o c ia te P ro fe s s o rs h ip th e s is , A t a t u r k U n iv . , A g r ic . C o ll . , F o o d S c i. a n d T e c h n o l. D e p t. , E r z u r u m , T u r k e y .
G o k a lp , H . Y . 1 9 8 9 . Meat Products Technology, p . 2 6 2 . A t a t u r k U n iv . , A g ric .C o ll . , F o o d S c i. & T e c h n o l. D e p t . , E r z u r u m , T u r k e y .
G o k a lp , H . Y . 1 9 9 0 . Biochemistry, p. 4 6 6 . A t a t u r k U n iv . , A g r ic . C o ll . , Food S c i. a n d T e c h n o l. D e p t. , E r z u r u m , T u r k e y .
H a q , A . , W e b b , N .B . , W h i t f ie ld , J .K . , H o w e l l , A , a n d B a rb o u r , B .C . 1 9 7 3 . M e a s u r e m e n t o f s a u s a g e e m u ls io n s t a b i l i t y b y e le c t r ic a l re s is ta n c e . J . F oo d S c i. 3 8 : 1 2 2 4 -1 2 2 7 .
H a q u e , Z . a n d K in s e lla , J .E . 1 9 8 8 . E m u ls i fy in g p ro p e rt ie s o f food p ro te in s : B o v in e s e ru m a lb u m in . J . F o o d S c i. 5 3 : 4 1 6 -4 2 0 .
H a q u e , Z . a n d K in s e lla , J .E . 1 9 8 9 . E m u ls i fy in g p ro p e rt ie s o f food p ro te in s : D e v e lo p m e n t o f a s ta n d a rd iz e d e m u ls if ic a t io n m e th o d . J . F o o d S c i. 5 4 : 3 9 - 4 4 .
H a q u e , Z . , L e m a n , J . , a n d K in s e lla , J .E . 1 9 8 8 . E m u ls i fy in g p ro p e rt ie s o f food p ro te in s : B o v in e m ic e lla r c a s e in . J . F o o d S c i. 5 3 : 1 1 0 7 -1 1 1 0 .
H e in e v e t te r , L . , G a s s m a n n , B . a n d K r o l l , J . 1 9 8 7 . E v a lu a t io n o f th e w a te r b in d in g p ro p e rt ie s o f m e a t b in d e rs , s u b s titu te s a n d e x te n d e rs b y d i f f e r e n t p h y s ic a l a n d c h e m ic a l m e th o d s . N a h r u n g . 3 1 : 8 8 9 -8 9 2 .
H e rm a n s s o n , A .M . 1 9 7 5 a . F u n c t io n a l p ro p e rt ie s o f a d d e d p ro te in s c o rre la te d w i t h p ro p e rt ie s o f m e a t sy s te m s . E f fe c t o f c o n c e n tra t io n a n d te m p e r a tu r e on w a te r b in d in g p ro p e rt ie s o f m o d e l m e a t sy s te m s . J . F oo d Sci. 4 0 : 5 9 5 -6 0 2 .
H e rm a n s s o n , A . M 1 9 7 5 b . F u n c t io n a l p ro p e rt ie s o f ad d e d p ro te in s c o rre la te d w i t h p ro p e rt ie s o f m e a t sy s te m s . E f fe c t o f s a l t on w a te r b in d in g p ro p e rt ie s o f m o d e l m e a t sy s te m s . J . F o o d S c i. 40: 6 0 3 -6 1 0 .
Volume 58, No. 3, 1993-JOURNAL OF FOOD SCIENCE-495

H e rm a n s s o n , A . M . 1 9 7 5 c . F u n c t io n a l p ro p e rt ie s o f a d d e d p ro te in s c o rre la te d w i t h p ro p e rt ie s o f m e a t sys te m s . E f fe c t o n te x t u r e o f a m e a t p ro d u c t . J . F o o d S c i. 4 0 : 6 1 1 -6 1 4 .
H u a n g , Y . T . a n d K in s e lla , J .E . 1 9 8 7 . E f fe c t o f p h o s p h o r i la t io n on e m u l s i fy in g a n d fo a m in g p ro p e rt ie s a n d d ig e s t ib i l i t y o f y e a s t p r o te in . J . F oo d S c i. 5 2 : 1 6 8 4 -1 6 8 8 .
K a to , A . , F u jis h ig e , T . , M a ts u d o m i, N . , a n d K o b a y a s h i, K . 1 9 8 5 . D e te r m in a t io n o f e m u ls ify in g p ro p e rt ie s o f som e p ro te in s b y c o n d u c t iv ity m e a s u re m e n ts . J . F oo d S c i. 5 0 : 5 6 - 5 8 , 6 2 .
K n ip e , C .L . , O ls o n , D .G ., a n d R u s t, R .E . 1 9 8 5 . E f fe c t o f s e le c te d l n o r p m c p h o s p h a te le v e ls a n d re d u c e d s o d iu m c h lo r id e le v e ls o n p r o te in s o lu b ili t y , s t a b i l i ty a n d p H o f m e a t e m u ls io n . J . F o o d S c i. 5 0 : 1 0 1 0 -1 0 1 3 .
K r a m l ic h , W .E . 1 9 7 1 . S a u s a g e P ro d u c ts . I n The Science of Meat and Meat Products, J .F . P r ic e a n d B .S . S c h w e ig e r t (E d .) , p . 4 8 4 —5 1 3 . W .H . F r e e m a n a n d C o m p a n y , S a n F ra n c is c o , C A .
L a u c k , R .M . 1 9 7 5 . F u n c t io n a l p ro p e rt ie s o f b in d e r s in m e a t e m u ls io n s . J . F o o d S c i. 4 0 : 7 3 6 -7 4 0 .
L i -C h a n , E . , N a k a i , S ., a n d W o o d , D .F . 1 9 8 4 . H y d r o p h o b ic ity a n d s o lu b i li ty o f m e a t p ro te in s a n d t h e i r r e la t io n s h ip to e m u ls ify in g p r o p e rt ie s . J . Food S c i. 4 9 : 3 4 5 -3 5 0 .
L in , C .S . a n d Z a y a s , J . 1 9 8 7 a . In f lu e n c e o f c o m g e rm p r o te in o n y ie ld a n d u a l i t y c h a ra c te r is t ic s o f c o m m in u te d m e a t p ro d u c ts in a m o d e l s y s te m .. F o o d S c i. 5 2 : 5 4 5 -5 4 8 .
L in , C .S . a n d Z a y a s , J . 1 9 8 7 b . F u n c t io n a l i ty o f d e fa t te d c o m g e r m p ro te in s in a m o d e l sy s te m : F a t b in d in g c a p a c ity a n d w a te r r e te n t io n . J . F oo d S c i. 5 2 : 1 3 0 8 -1 3 1 1 .
L in , C .S . a n d Z a y a s , C . 1 9 8 7 c . P r o te in s o lu b i l i t y a n d e m u ls io n s t a b i l i t y a n d c a p a c ity o f tw o d e fa t te d c o m g e rm p ro te in s . J . F o o d S c i. 52: 1 6 1 5 - 1 6 1 9 .
M a n g in o , M .E . (E d .) . 1 9 9 1 . Food Proteins, p . 5 3 . T h e O S U , D e p t , o f F oo d S c i. a n d T e c h n o l., C o lu m b u s , O H .
M a ts u m o to , J .J . 1 9 8 0 . C h e m ic a l d e te r io r a t io n o f m u s c le p ro te in s d u r in g fro z e n s to ra g e . A C S S y m p o s iu m S e rie s . 123 : 9 5 - 1 2 4 .
M i t t a l , G .S . a n d U s b o m e , W .R . 1 9 8 5 . M e a t e m u ls io n e x te n d e rs . F o o d T e c h n o l. 3 8 : 1 2 1 -1 3 0 .
M S T A T . 1 9 8 6 . V e r s io n 4 .0 0 . M ic h ig a n S ta te U n iv . , E a s t L a n s in g , M I .O c k e r m a n , H .W . (E d .) . 1 9 7 6 . Quality control of Post Mortem Muscle Tissue,
1 0 th e d ., V o l . 1 . T h e O S U , D e p t , o f A n im a l S c i., C o lu m b u s , O H .P a rk s , L .L . a n d C a r p e n te r , J . A 1 9 8 7 . F u n c t io n a l i ty o f s ix n o n -m e a t p ro
te in s in m e a t e m u ls io n sy s te m s . J . F oo d S c i. 5 2 : 2 7 1 - 2 7 4 , 2 7 8 .
MEAT EMULSIONS, SHEEP TAIL F A T . . .
P a te rs o n , B .C ., P a r r is h , F .C . J r . , a n d S t r o m e r , M .H . 1 9 8 8 . E f fe c t o f s a l t a n d p h o s p h a te o n th e p h y s ic a l a n d c h e m ic a l p ro p e rt ie s o f b e e f m u s c le .J . F oo d S c i. 5 3 : 1 2 5 8 -1 7 6 5 .
P a u ls o n , A .T . a n d T u n g , M .N . 1 9 8 8 . E m u ls i f ic a t io n p r o p e rt ie s o f succi- n y la te d c a n o la p r o te in is o la te . J . F oo d S c i. 5 3 : 8 1 7 -8 2 5 .
S h u t , J . 1 9 7 6 . M e a t E m u ls io n s . In Food Emulsions, C h . 4 , S . F r ib e r g (E d .) , p . 3 8 5 -4 5 3 . M a r c e l D e k k e r , In c ., N e w Y o r k .
S m ith , G .C ., J o h n , H . , C a rp e n te r , L . , M a t t i l , K .F . , a n d C a r t e r , C .M . 1 9 7 3 . E ff ic ie n c y o f p r o te in a d d it iv e s as e m u ls io n s ta b iliz e r s in f r a n k fu r te r s . J . F oo d S c i. 3 8 : 8 4 9 -8 5 5 .
Sofos, J .N . , N o d a , I . , a n d A l le n , C .E . 1 9 7 7 . E ffe c ts o f soy p ro te in s a n d t h e i r le v e ls o f in c o rp o ra t io n o n p ro p e rt ie s o f w ie n e r - ty p e p ro d u c ts . J . F o o d S c i. 4 2 : 8 7 9 -8 8 4 .
W a g n e r , J .R . a n d A n o n , M .C . 1 9 8 6 a . E ffe c ts o f fro z e n s to ra g e o n p r o te in d e n a tu r a t io n in b o v in e m u s c le I . M y o f ib r i l l a r A T P a s e a c t iv i t y a n d d i f f e r e n t ia l s c a n n in g c a lo r im e tr ic s tu d ie s . J . F oo d T e c h n o l. 2 1 : 9 —18 .
W a g n e r , J .R . a n d A n o n , M .C . 1 9 8 6 b . E ffe c ts o f fro z e n s to ra g e o n p r o te in d e n a tu r a t io n in b o v in e m u s c le I I . In f lu e n c e o n s o lu b i l i t y , v is c o s ity a n d e le c tro p h o re t ic b e h a v io r o f m y o f ib r i la r p ro te in s . J . F oo d T e c h n o l. 21:5 4 7 —5 5 5
W e b b , N .B . , Iv e y , J .F . , C r a ig , H .B . , Jo n es V . A . , a n d M o n r o e , R .J . 1 9 7 0 . T h e m e a s u re m e n t o f e m u ls ify in g c a p a c ity b y e le c t r ic a l re s is ta n c e . J . F o o d S c i. 3 5 : 5 0 1 -5 0 4 .
W h i t in g , R .C . a n d M i l l e r , A .J . 1 9 8 4 . E v a lu a t io n o f a food p ro ce sso r fo r m a k in g m o d e l m e a t e m u ls io n s . J . F oo d S c i. 4 9 : 1 2 2 2 -1 2 2 3 , 1 2 2 7 .
W u , F .F . a n d S m ith , S .B . 1 9 8 7 . Io n ic s tr e n g th a n d m y o f ib r i l l a r p r o te in s o lu b u liz a t io n . J . A n im . S c i. 65: 5 9 7 —6 0 8 .
M s re c e iv e d 3 /1 2 /9 2 ; re v is e d 8 /2 5 /9 2 ; a c c e p te d 1 2 /4 /9 2 .
Research support provided in part by state and federal funds appropriated to the Ohio Agricultural Research & Development Center, The Ohio State Univ., Journal Article 114-91.
We are grateful for a grant from Ataturk University, Erzurum, Turkey, for supporting this research work. Also, we appreciate aid by the Ohio Agricultural Research and Development Center, The Ohio State University, particularly Dr. V.R. Cahill for assisting with statistical analyses and editorial advice.
CONSUMER EVALUATION OFpSt-PRODUCED PORK.. .F ro m p a g e 481
tained less crude fat. Although consumers preferred the juiciness, tenderness and flavor of control ham roasts over pSt- produced ham roasts, overall acceptability scores indicated pSt loin and ham roasts were as acceptable as control loin and ham roasts.
REFERENCESA O A C . 1 9 9 0 . Official Methods of Analysis, 1 5 th ed . A s s o c ia t io n o f O ff ic ia l
A n a ly t ic a l C h e m is ts , W a s h in g to n , D C .B e e r m a n n , D .H . a n d D e V o l , D .L . 1 9 9 1 . E ffe c ts o f s o m a to tro p in , s o m a to
t r o p in re le a s in g fa c to r a n d s o m a to s ta t in on g ro w th . In Growth Regulation in Farm Animals, Advances in Meat Research, A . M . P e a rs o n a n d T .R . D u ts o n (E d .) . E ls e v ie r S c ie n c e P u b lis h e rs , L td . , E s s e x , E n g la n d .
B e e r m a n n , D .H . , F is h e l l , V . K . , R o n e k e r , K . , B o y d , R .D . , A r m b r u s te r , G ., a n d S o u za , L . 1 9 9 0 . D o s e -re s p o n s e r e la t io n s h ip s b e tw e e n p o rc in e s o m a to tr o p in , m u s c le c o m p o s itio n , m u s c le f ib e r c h a ra c te r is t ic s a n d p o rk q u a li t y . J . A n im . S c i. 6 8 :2 6 9 0 .
B e e r m a n n , D .H . , T h ie l , L .F . , a n d P ru s a , K .J . 1 9 9 2 . D o s e -re s p o n s e e ffe c ts o f p o rc in e s o m a to tro p in on y ie ld , d is t r ib u t io n a n d n u t r i t io n a l c o m p o s it io n o f e d ib le carca ss tis s u e s . I n Biotechnology for Control of Growth and Product Quality in Meat Production: Implications and Acceptability, I n t e r n a t io n a l S y m p o s iu m P ro c e e d in g s , W a s h in g to n , D C . p . 1 8 3 -1 9 3 .
B o les , J . A , P a r r is h , J r . , F .C . , S k a g g s , C .L . , a n d C h r is t ia n , L .L . 1 9 9 1 . E f fe c t o f p o rc in e s o m a to tro p in , s tress s u s c e p t ib i l ity , a n d f in a l e n d p o in t o f c o o k in g on th e se n s o ry , p h y s ic a l, a n d c h e m ic a l p ro p e rt ie s o f p o r k lo in chops. J . A n im . S c i. 6 9 :2 8 6 5 .
E th e r to n , T .D . 1 9 8 8 . A n a b o lic e ffects o f p o rc in e s o m a to tro p in on p ig g ro w th . I n Designing Foods, Animal Product Options in the Marketplace, p . 1 9 4 . N a t io n a l A c a d e m y P re s s , W a s h in g to n , D C .
F e d le r , C A . , P ru s a , K .J . , a n d M e is jn g e r , D . 1 9 9 1 . In -h o m e c o n s u m e r e v a l u a t io n o f p o rk lo in f ro m p igs a d m in is te re d p o rc in e s o m a to tro p in . J . A n im . S c i. 6 9 (S u p p l. 1 ):3 4 7 .
G a r d n e r , T .L . , D o le z a l, H .G . , F o u tz , C .P ., N o v o tn y , K . K . , a n d H a n d , L .W . 1 9 9 0 . E f fe c t o f r e c o m b in a n t p o rc in e s o m a to tro p in o n carca ss g ra d e t r a it s , c h e m ic a l c o m p o s itio n a n d c o o k in g c h a ra c te r is t ic s o f b a r ro w s a n d g i lts .J . A n im . S c i. 6 8 (S u p p l. 1): 3 1 9 .
L e n ts c h , D .M . , P ru s a , K .J . , a n d M i l l e r , L .F . 1 9 9 2 . C o m p o s itio n , s e p a ra t io n a n d d e n a tu r a t io n o f lo n g is s im u s m u s c le p ro te in s f ro m p ig s t re a te d w it h p o rc in e s o m a to tro p in (p S t). J . F oo d S c i. 5 7 : 3 1 8 .
M e i lg a a r d , M . , C iv i l l e , G .V . , a n d C a r r , B .T . 1 9 8 7 . A f fe c t iv e tes ts : C o n s u m e r te s ts a n d in -h o u s e p a n e l a c c e p ta n c e tes ts . C h . 9 . I n Sensory Evaluation Techniques, V o l I I . , p . 2 5 . C R C P re s s , In c ., B o ca R a to n , F L .
M o u r o t , J . B o n n e a u , M . , C h a r lo t in , P . , a n d L e fa u c h e u r , L . 1 9 9 2 . E ffe c ts o f
e x o g e n o u s p o rc in e s o m a to tro p in (p S t) a d m in is t r a t io n o n p o r k m e a t q u a li t y . M e a t S c i. 3 1 : 2 1 9 .
N ie u w h o f , G .J ., K a n is , E . , V a n d e r H e l , W . , V e rs te g e n , M . W . A , H u is m a n , J . , a n d V a n d e r W a l , P . 1 9 9 1 . E f fe c t o f r e c o m b in a n t p o rc in e s o m a to tro p in o n b o d y c o m p o s itio n a n d m e a t q u a l i t y i n g r o w in g p ig s ; In te r a c t io n s w it h g e n o ty p e , sex a n d s la u g h te r w e ig h t . M e a t S c i. 3 0 : 2 6 5 .
N o v a k o fs k i , J .E . 1 9 8 7 . R e p a r t i t io n e d p o rk : S e n s o ry q u a l i t y a n d c o n s u m e r a c c e p ta n c e . P ro c . o f t h e U n iv . o f I L P o r k In d u s t r y C o n f., C h a m p a ig n , I L p p . 8 4 —9 2 .
P ru s a , K .J . 1 9 8 9 . N u t r i t i o n a l a n d s e n s o ry c h a ra c te r is t ic s o f p o r k f ro m p ig s a d m in is te r e d s o m a to tro p in . I n Biotechnology for Control of Growth and Product Quality in Swine—Implications and Acceptability P . V a n d e r W e il, G .J . N ie u w h o f a n d R .O . P o l i t ie k (E d ) p. 1 8 3 . P U D O C W a g e n in g e n , W a g e n in g e n , T h e N e th e r la n d s .
P ru s a , K .J . , L o v e , J .A . , a n d C h r is t ia n , L .L . 1 9 8 9 a . F a t c o n te n t a n d s e n s o ry a n a ly s is o f selected p o rk m u scles ta k e n fro m carcasses w it h v a r io u s b a c k fa t le v e ls . J . F o o d Q u a l. 12: 13 5 .
P ru s a , K .J . , L o v e , J . A , a n d M i l l e r , L .F . 1 9 8 9 b . C o m p o s itio n a n d s e n s o ry a n a ly s is o f r ib chops f ro m p ig s s u p p le m e n te d w i t h p o rc in e s o m a to tro p in (p S t). J . F o o d Q u a l. 12: 4 5 5 .
P ru s a , K .J . , L o v e , J . A , a n d M i l l e r , L .F . 1 9 8 9 c . C o m p o s itio n , w a te r -h o ld in g c a p a c ity a n d p H o f m u s c le s f ro m p ig s s u p p le m e n te d w i t h p o rc in e som a to tr o p in (p S t). J . F oo d Q u a l. 12: 4 6 7 .
P ru s a , K .J . , F e d le r , C .A . , a n d C h r is t ia n , L .L . 1 9 9 0 . C o n s u m e r a c c e p ta b ili t y o f p o r k f ro m p ig s t r e a te d w it h p o rc in e s o m a to tro p in . J . A n im . S c i 6 8 (S u p p l. 1): 3 3 8 .
P ru s a , K .J . , F e d le r , C .A . , S e b ra n e k , J .G . , L o v e , J .A . , a n d M i l l e r , L .F . 1 9 9 2 . A c c e p ta b i l i ty a n d s e n s o ry a n a ly s is o f p o r k s u m m e r s a u s a g e f ro m p ig s a d m in is te r e d p o rc in e s o m a to tro p in . J . F oo d S c i. 5 7 : 8 1 9 .
S A S . 1 9 8 5 . SAS User's Guide: Statistics. S A S In s t i t u t e , In c ., R a le ig h , N C .S p e e r, V . C . 1 9 8 8 . A l t e r in g c a rca ss m e a s u re m e n ts a n d c o m p o s it io n o f th e
p ig . I n Designing Foods, Animal Product Options in the Marketplace, N a t io n a l A c a d e m y P re s s , W a s h in g to n , D C .
T h ie l , L .F . , B e e r m a n n , D .H . , L a w le s s , H . T . , a n d B o y d , R .D . 1 9 9 0 . E ffe c ts o f s o m a to tro p in o n s e n s o ry c h a ra c te r is t ic s a n d c o m p o s it io n o f b o n e les s p o r k lo in chops. J . A n im . S c i. 6 8 (S u p p l. 1): 19 9 .
W il l ia m s , S .E ., A n d e rs o n , M .K . , R e a g a n , J .O . a n d A z a in , M .J . 1 9 9 0 . E f fects o f p o rc in e s o m a to tro p in (p S t) a n d d ie t on c h e m ic a l, s e n s o ry a n d q u a l i t y c h a ra c te r is t ic s o f p o r k lo in s . J . A n im . S c i. 6 8 (S u p p l. 1): 3 4 0 .
M s re c e iv e d 6 /1 7 /9 2 ; re v is e d 1 2 /3 0 /9 2 ; a c c ep ted 1 /5 /9 3 .
Journal Paper No. J -14978 of the Iowa Agriculture & Home Economics Experiment Station, Ames, IA. Project No. 3070.
We gratefully acknowledge the financial support of Pitman-Moo re, Inc. Appreciation i® expressed to Ken Benkstein, Meyocks Benkstein and Associates, Des Moines, Iowa, for technical assistance in coordinating the in-home study.
4 9 6 - JOURNAL OF FOOD SCIENCE-Volume 58, No. 3, 1993

Surimi-Like Products From Mutton
R.J. M cCORM ICK, S. BUGREN, R.A. FIELD, D.C. RULE, and J.R. BUSBOOM
---------------------------- ABSTRACT-----------------------------Surimi-like mutton products were produced using hand boned meat (HBM) and mechanically separated meat (MSM). Washing increased moisture and decreased fat and protein in surimi-like products. Collagen solubility and water holding capacity were higher for surimi- like products from M S M when compared to those from HB M . Washing reduced bone content of M S M . Percentage of 14:0, 16:0, 18:0 and 18:1 fatty acids tended to decrease and percentage of polyunsaturated fatty acids tended to increase with washing. Acceptable restructured beef steaks with reduced salt content were produced when washed H B M or washed M S M were included.
Key Words: mutton, surimi, composition, restructured meat, binders
INTRODUCTIONSALT functions extremely well in extracting protein but it contributes to rancidity and product discoloration, and lessens consumer appeal (Schwartz and Mandigo, 1976; Ockerman and Organisciak, 1979). Increased consumer health consciousness has created a demand for fresh refrigerated products which are easily prepared and low in salt. Development of restructured products low in salt may benefit the meat industry. Alginates, in conjunction with Ca++ ions, have been used to produce a restructured beef product which binds in both fresh chilled and cooked states (Means et al., 1986). Surimi also has been used as a binder in restructured red meat products (Lanier, 1986; Chen and Trout, 1991).
Surimi-like material from poultry and pork have been studied (Hernandez et al., 1986; Dawson et al., 1988; Stachiw, 1988; Lin and Chen, 1989), but research on surimi-like mutton has not been reported. Surimi-like mutton could be produced from mechanically separated mutton (MSM) and hand boned mutton (HBM), currently of low commercial value. Reduction of fat could make mutton more attractive for use in many products. Objectives of our study were to characterize the proteins and lipids in surimi-like ovine products. The bind and cooked yield of restructured roasts formulated with surimi-like products also were examined.
MATERIALS & METHODST H R E E DIFFERENT batches of H B M and three batches of M S M were used to produce washed mutton. The M S M was produced from vertebral column, ribs and sternum bones using a Beehive mechanical deboner (Model AUX-70S; Sandy, UT) with 0.46 holes in the cylinder. H B M was removed from the same carcasses that furnished bones for MS M . All meat was frozen in 2 kg plastic bags within 1 hr of deboning and stored at -20 °C for 1-2 m o prior to use.Surimi-like products were prepared by chopping ground H B M or
M S M , in a Hely-Joly model 428 silent cutter (Koch Supplies, Inc., Kanasa City, MO) with 5 volumes of ice water (wAv basis). Water and meat were blended for 10 min and resulting slurries were filtered through a 3 m m mesh screen. The screen was scraped periodically to remove connective tissue. Slurries were placed in a blast freezer
Authors McCormick, Field, and Rule are with the A nim al Science Dep., Univ. o f Wyoming, Laramie, WY 82071. Author Busboom is now associated w ith the Anim al Sciences Dep., Washington State Univ., Pullman, WA 99164-6310. Author Bugren's address is d o Nagib Bugren, Science and Education Headquarters, Benghazi, Libya.
(- 20 °C) until a 1-2 cm-thick frozen layer, consisting primarily of fat, was formed. After the surface layer was removed filtrates were centrifuged at 3003 x g for 20 min at room temperature and supernatants discarded. Pellets were suspended in distilled water (1:3 vol- ume/volume), mixed in a Waring Blendor and recentrifuged at 3000 x g for 20 min. Mixing and centrifugation steps were repeated four times.
Percentage moisture, hexane-extractable fat and ash were determined according to A O A C methods 24.003, 31.012 and 7.056 (1980). Protein content was determined by the rapid Kjeldahl method developed in the Labconco Laboratory (Kansas City, MO, 1988). Water holding capacity (WHC) was determined using the procedure of Rejt et al. (1978).
Sarcoplasmic proteins removed by washing and surimi-like mutton proteins were separated by electrophoresis in 12% polyacrylamide gels in the presence of sodium dodecyl sulfate (SDS-PAGE) (Laemmli, 1970). The mole ratio of actin to myosin was determined by densitometry (LKB Utrascan X L Laser Densitometer, Pharmacia, LK B Biotechnology, Inc., Piscataway, NJ) of the protein bands after SDS- P A G E and staining with Coomassie Blue R-250. Integrated peak areas of myosin and actin were converted to moles of protein by dividing individual integrated peak areas by their respective molecular weights. A Sigma diagnostic kit for quantitative colorimetric determination of total protein was used to determine the amount of protein in the first wash water. Bovine serum albumin was used as a standard.
Proportion of heat soluble collagen in HB M , surimi-like product from hand boned mutton (HBS), M S M and surimi-like product from mechanically separated meat (MSS) was determined using the procedure of Hill (1966) and hydroxyproline concentration was estimated using the spectrophotometric method of Woessner (1961). Collagen concentration was estimated assuming that the collagen in the hydrolysates weighed 7.25 times the calculated weight of hydroxyproline and collagen was expressed as a weight percent of the sample.A 50g aliquot of M S M and M S S was defatted by ether extraction
and digested in 250 m L 8 % alcoholic potassium hydroxyide at 57 °C to determine bone particle size and amount. The supernatant fraction was decanted, and the particles washed twice with 50% ethanol and three times with acetone to prevent aggregation of bone particles during oven drying at 60 °C. Bone particles in M S M and M S S were weighed and expressed as percentage of wet weight (USDA, 1982).
Lipids were extracted from samples with organic solvents (Bligh and Dyer, 1959), saponified and methyl ester derivatives of fatty acids prepared and then analyzed by gas chromatography using a glass column (1.8 m x 2 mm) packed with 10% SP-2330 chromosorb W/ A W , 100/120 mesh (Supelco, Inc., Bellefonte, PA). Column temperature was programmed from 150 °C to 210 °C at 4 °C/min. Injector temperature was 170 °C, detector temperature was 225 °C and carried gas (N2) flow rate was mL/min. Fatty acids were identified by comparing sample retention with those of fatty acid methyl ester standard.
Lean beef ground through a 3.8 cm kidney plate and mixed in a Leland Model 2000A double action mixer (Koch Supplies, Inc., Kansas City, MO ) for 10 min was used to prepare restructured control roasts as well as restructured roasts containing MSS, HB S or MS M. M S S and HB S were chopped for 2 min in a laboratory scale vertical chopper (Stephan Model VCM12, Stephan Machinery Corp, Columbus, OH) while 0.65% of a commercial sodium tripolyphosphate and sodium hexametaphosphate mixture (Hellers W 2-0052, Bedford Park, IL) was added. The mixture was chopped for another 2 min while adding 5.0% NaCl. The surimi-like product, salt and phosphate were chopped for an additional 6 min. Trimmed lean beef was mixed for 6 min while 5 % MSS, HBS or fish surimi were added. High grade frozen Alaska po lock surimi (North Pacific Seafoods, Seattle, WA ) which had 75% moisture and contained 4 % sucrose, 4 % sorbitol and 0.3% polyphosphates as cryoprotectants, was used. Frozen storage time at -20 °C was 2 months. Additional restructured roasts containing 11% M S M were prepared as described previously and compared to those containing surimi-like products from MS M. M S M was added
Volume 58, No. 3, 1993-JOURNAL OF FOOD SCIENCE-497

SURIMI-LIKE MUTTON PRODUCTS. . .
Table 1—Means and standard errors for characteristics o f surim i-like products from hand boned and mechanically separated m eat and the ir respective source materials___________________ »_________________Item HBS* M S S * H B M * M S M * S E M b
Y ie ld , % 42.5» 3 0 .8 s - - 2.25P ro te in in w a s h -w a te r,
m g /m L 0 .0 9 c 0 .1 9 s _ _ 0.03P ro te in , % 8.99» 12.36d 17.06* 18.96* 0 .80M o is tu re , % 88.42* 86 .6 4 s 60.95* 58 .0 7 ' 0 .39
Fat, % 0.25* 0.98* 2 0 .6 8 s 17.63s 2.43A s h , % 0.33* 0 .9 2 s 1.15s 2 .23* 0 .04B o n e , % — 0 .8 6 * - 2 .30s 0 .1 2W a te r-h o ld in g
c a p a c ity , % 59.64* 9 0 .9 9 s 28.29* 6 3 .7 V 1 .0 0C o lla g e n , % 2 .1 2 * 6 .60* 4 .4 4 s 3 .4 6 s 0.37C o lla g e n s o lu b il i ty , % 14.23 15.82s 13.69* 16.41s 0 .18A c tin :m y o s in ,
(m o le /m o le ) 3 .42* 3.52* 3 .6 9 s 3 .6 5 s 0 .03
■ H B S - S u r i m i - l i k e p r o d u c t f r o m h a n d b o n e d m e a t ; M S S = S u r im i-lik e p r o d u c t f r o m m e c h a n ic a lly s e p a r a te d m e e t ; H B M - H a n d b o n e d m e a t ; M S M * M e c h a n i c a lly s e p a r a te d m e a t;
b S t a n d a r d e r r o r o f th e m e a n ;M e a n s in th e s a m e r o w b e a r in g c o m m o n le tte rs a re n o t d iffe r e n t ( P < 0 .0 5 ) .
to some roasts because it contains red marrow that results in a pH increase and we had observed that mixing M S M containing red marrow resulted in protein extraction without addition of salt or phosphate. W e postulated that such proteins could act as a binder in restructured meat. Beef roasts containing 1.5% NaCl and 0.35% of the commercial phosphate mentioned previously were used as controls. All formulations were vacuum-stuffed into fibrous cellulose casings. Products were stored at <=4 °C for 48 hr and then vacuum- packaged and frozen at — 20 °C for =3 mo.
Restructured roasts were sliced from the frozen state into 1.5 cm thick steaks, grilled separately in electric frying pans to an internal temperature of 60 °C, and then cut into 2.5 cm squares. Triangle difference tests were conducted to compare restructured steaks made with fish surimi, HBS, or M S S to those made with HBS, M B S or M S M , respectively. Untrained panel members (34) were used for each comparison. Panelists were asked to choose the different restructured steak in each triangle test. The number of correct identifications relative to total choices made was used to test differences between samples (Roessler et al., 1948). Panelists also indicated whether they preferred the different cr identical samples and the reasons (flavor, texture, other attribute) for their preference.
Cooked bind was objectively assessed using the Instron universal testing maching (Model 1011; Boulder, CO) fitted with a ball burst attachment described by Field et al. (1984). A 1.27 cm diameter steel ball mounted on the Instron cross-head moving at a constant rate of 10 cm/min penetrated the slice. Binding strength was reported as peak load (kg) required for the ball to penetrate a roast slice.
Differences among HB M, HBS, M S M and M S S and differences among cooked steaks made with these items were analyzed by analysis of variance using General Linear Models procedures (SAS Institute, Inc., 1985). The least s:gnificant difference test (P<0.05) was used to separate means.
RESULTS AND DISCUSSION
YIELD of HBS was higher than that for MSS (Table 1) but yield of protein based on yield times protein content was about the same. Babbitt (1986) reported that fish tissues of different composition resulted in variable surimi yield. Field et al. (1974) found that water soluble pigments in bone marrow, not present in HBM, were incorporated into MSM. Losses of such water- soluble proteins during washing in our study was reflected in the higher protein content of wash water from MSM compared to HBM sources.
Fat content of both HBM and MSM was reduced to <1% after washing. Fat content of HBS was lower than MSS. Compositional changes of washed products are affected by the method of preparation rather than being characteristic of the washed mutton product. Nevertheless, washing mutton could obviously greatly reduce fat content. McKeith et al. (1988) re-
Table 2 —Means fo r weight-percents o f fa tty acids o f HBS, MSS, HBM and M SM •F a tty a c id H BS M S S H B M M S M SEM »
1 2 :0 0 .0 0 * 0 .0 0 * 0 .2 1 » 0 .03* 0 .0 4U n k n o w n 0 .0 0 » 0 .0 0 » 0 .26* 0 .2 1 * 0 .1 2
14:0 2.64»b 1.17» 4.54» 4.13» 0.6114:1 0.08* 0 .17* 0 .1 1 * 0 .1 2 * 0 .0312 -M e 14:0 0 .33* 0 .27* 0.33* 0 .30* 0 .0515:0 5.85* 2 .8 2 b 0 .57* 0.62» 0 .56U n k n o w n 0 .0 0 * 0 .0 0 * 0.13» 0 .1 1 » 0 .0 114 -M e 15:0 0 .48* 0 .0 0 b 0.18*» 0 .2 2 *» 0 .1 0
16:0 18.63* 18.83* 25.08» 23.81» 0 .49
16:1 3 .08* 2 . 1 0 » 3 .29* 3.02*» 0 .3 417:0 0 .8 6 * 1.41* 1.52* 1.58* 0 .2 517:1 o r
16 -M e 17:0 2 .23* 0.89» 0 .8 8 » 0.98» 0 .2 418:0 14.26* 15.29* 17.09* 18.79* 1.2418:1 31.81* 33.11*» 39.61*» 40.59» 2 .42U n k n o w n 0.13* 0.07* 0 .1 0 * 0 .1 0 * 0 .0 318:2 7.84* 11.46*» 2.51» 2.50» 1.70U n k n o w n 0.13* 0 .1 2 * 0 .13* 0 .1 2 * 0 .0318:3 2.50* 2.16* 1.33* 1 .0 2 * 0 .502 0 :1 0.83* 0.79* 0.87* 0 .99* 0 .152 0 :2 1 .0 2 * 0.31» 0 .2 1 » 0.05» 0 .1 0U n k n o w n 0.47* 4.43» 0.06» 0.17» 0 .082 0 :4 3 .02* 0.56» 0.29» 0 .0 1 » 0 .78U n k n o w n 0.28* 0 .26* 0 .03* 0 .05* 0 .1 22 0 :5 0 .73* 0.14*» 0 . 1 0 *» 0 .0 1 » 0 .192 2 :2 0 .06* 0.16* 0 .0 1 * 0 .0 1 * 0 .062 2 :3 0.28* 0 .42* 0.03» 0.08» 0 .052 2 :4 0 .1 2 * 0 .14* 0 .0 1 » 0 .0 2 » 0 .0 22 2 :5 1.55* 1.63* 0 .25* 0 .2 0 * 0 .502 2 .6 0 .91* 0 .64* 0.13» 0.05» 0 .1 0
• H B S » S u r i m i - l i k e p r o d u c t f r o m h a n d b o n e d m e a t ; M S S - S u r i m i - l i k e p r o d u c t f r o m m e c h a n ic a lly s e p a r a te d m e a t ; H B M = H a n d b o n e d m e a t ; M S M = M e c h a n i c a lly s e p a r a te d m e a t ;
b S t a n d a r d e r r o r o f th e m e a n .•*b*c M e a n s in th e s a m e r o w b e a r in g a c o m m o n le tte r a r e n o t d iffe r e n t ( P < 0 .0 5 ) .
ported a similar decrease in fat content after production of a surimi-like product from pork, beef and beef by-products.
The ash content of both HBM and MSM was significantly reduced during the washing process, although the ash content of MSS was nearly threefold greater than that of HBS (Table1). Processing MSM into MSS resulted in a reduction in bone particle weight in the surimi-like product. The decrease in bone particle weight was probably due to association of bone particles with connective tissues removed during washing. About 92% of the bone particles were smaller than 0.71 mm. A few (4-6) bone particles measuring 0.85 mm were present. In MSS, no bone particles larger than 0.71 mm were recovered and 97% of the bone particles recovered were < 0.3 mm. Bone particles of 0.85 mm are the largest allowed in mechanically separated meat (USDA, 1982).
Water-holding capacity of raw, unsalted MSS was higher than that of MSM, HBS and was much higher than that from HBM (Table 1). Muscle proteins, myosin, actin, and to some extent tropomyosin, are probably the primary contributors to WHC (Nakayama and Sato, 1971). Stachiw (1988) also reported increased WHC after washing pork meat. The significance of WHC to functionality of the material in a cooked product is not clear. However, the product containing 11% MSS (Table 3) had a similar cooked yield to that of washed products with the same salt content indicating little or no relationship between WHC and cook yield.
Processing of MSM into surimi-like material increased percentage of collagen in the product. This may have resulted from reduction of connective tissue particle size during mechanical deboning which allowed collagen to remain with the washed product. Maintenance of collagen and a reduction in fat and sarcoplasmic proteins were responsible for the increased collagen percentage.
The solubility of collagen in MSS and MSM was higher than in HBM and HBS. MSM and MSS likely contained more collagen derived from bone (Table 1). Bone contains 20 to
498—JOURNAL OF FOOD SCIENCE—Volume 58, No. 3, 1993

Table 3—Characteristics of restructured beef roast made with HBS, MBS, fish surimi or MSM
S a lt/P h o sp h a te 5% H BS” 5 % M B S *
5%Fish
s u r im i 11% M S M ’ S E W
% NaCI in f in a l p ro d u c ts 1.5 0 .54 0.50 0 .24 0 .50
% P h o sp h a te in f in a l p ro d u c ts 0 .35 0.07 0.06 0 .03 0 .06
% C oo ke d y ie ld 90 74 71 70 72
B ind s tre n g th , kgs 5 .5 5 “ 3 .4 4 ab 3.74" 2 .9 9 “ 4 .3 4 c 0.56
■•b.c.d Means in the same row bearing common letters do not have significant differences at (P<0.05).• HBS = Surimi-like product from hand boned meat; MBS = Surimi-like product from mechanically separated meat; MSM = Mechanically separated meat. 1SEM = Standard error of the mean.fl Least square means based on 1.27 cm diameter ball and 1.5 cm thick steaks cooked to 60°C internal temperature from thawed state.
30% collagen, virtually all of which is type I (Brown et al.,1972). The collagen of HBM and HBS come from skeletal muscle which is about 20 to 30% type III collagen (Light and Champion, 1984). Type I collagen is reportedly more heat soluble than type III (Burson and Hunt, 1986). Thus, differences in collagen solubility between MSM and HBM, as well as between HBS and MSS, may have been due to solubility differences between types I and III collagens.
The actin to myosin ratios were lower for HBS and MSS than for HBM or MSM, indicating that actin was sparingly soluble in the water used to prepare the surimi-like material (Table 1). This confirmed earlier observations that aqueous extracts of sarcoplasmic proteins usually contain some actin, although other myofibrillar proteins are not extracted (McCormick et al., 1988). The effect of some actin removal on functionality of washed beef in restructured roast preparation is probably minimal. Kenney et al. (1992) stated that removal of water-soluble proteins in combination with reductions in sodium, iron and magnesium seemed to improve the utility of washed cardiac muscle more than of washed skeletal muscle. Essentially all low ionic-strength soluble proteins were removed from HBM and MSM by the 4 water washings employed to produce the surimi-like material (data not shown). That material consisted of myofibrillar proteins and produced an electrophoretic pattern typical of such proteins prepared from washed myofibrils. HBS and MSS protein profiles were similar.
Long (16:0-22:6) and medium (12:0-15:0) chain fatty acid profiles for MSM and HBM were similar and there were no differences except for 12:0 (Table 2). Fatty acid profiles for both HBS and MSS were generally similar to the original materials. The proportion of all medium chain saturated and unsaturated fatty acids either decreased or remained essentially unchanged after washing. Processing HBM into HBS did not remove some of these fatty acids as effectively as processing MSM into MSS. The overall effect was to concentrate 15:0, 14-Me 15:0, and 17:1 (or 16-Me 17:0) in HBS. On the other hand, processing of MSM and HBM into surimi-like products did not remove fatty acids over 18 C as effectively as it did the medium chain fatty acids. The overall effect was to concentrate most of the longer unsaturated fatty acids in HBS and MSS. However, the concentration of these fatty acids was higher in MSS than in HBS except for 22:3. The higher concentration in longer unsaturated fatty acids found in HBS and MSS was probably due to the presence of those fatty acids in cell membranes (Cullis and Hope, 1985).
The cooked bind characteristics for all treatments were lower than the product containing salt/phosphate (Table 3) supporting tensile strength measurements of Kenney et al. (1992). Beef steaks made with HBS, MSS, fish surimi or MSM had lower cook yields and binding strengths than those containing salt/ phosphate. Steaks made with 11% MSM showed higher binding strength than those formulated with surimi or surimi-like products. Beef steaks made with 11% MSM were produced because we had observed that when MSM from bones high in red marrow and pH was mixed, the MSM became viscous and this sticky product had many of the characteristics of benefit
Table 4 - Triangle test evaluation o f restructured beef roasts containing HBS, MSS, fish surim i o r MSM ■__________________________________
T e s tN o . o f
ju d g e m e n tsN o.
c o rre c tN o .
p re fe rr in g
F ish s u r im i v s HBS 35 2 0 »S u r im i
6H BS
12
H BS vs M S S 32 12HBS
4M S S
6
M S S vs M S M 34 12M S S
1M S M
11
8 HBS = Surimi-like product from hand boned meat; MSS = Surimi-like product from mechanically separated meat; MSM = Mechanically separated meat;
b Significant discrimination between restructured beef roast containing 5% fish surimi and restructured beef roast containing 5% HBS (P<0.05).
in a mixed sausage emulsion. Field et al. (1977) reported that higher levels of MSM resulted in salt and phosphate containing restructured products with mushy interiors. Our objective was to add the maximum level of MSM to improve bind without salt and phosphate while avoiding mushiness.
The lowest binding strength was that for beef roasts made with surimi (Table 3). Kenney et al. (1992) reported that lower tensile strength of restructured beef containing 5% surimi compared to products with 5% washed beef apparently was associated with damage to surimi myosin during binder activation. According to Torley and Lanier (1991), and Funatsu and Arai(1991), if surimi were to be used in beef products, it would be necessary to keep the paste pH 6.5, since surimi forms ineffective gels when temperature increases and pH is 6.5. They further stated because the setting effect from surimi was diluted by the presence of beef proteins, the beef and surimi should be tumbled as little as possible to minimize beef protein extraction. In our study, temperature of the salted surimi increased to 10°C during chopping, pH of the product was not adjusted and the product was mixed 1 0 min before surimi was added and another 6 min after addition. Therefore, our method of preparation probably resulted in poor binding of surimi in restructured beef.
Chen and Trout (1991) reported restructured beef steaks formulated with 1.5% surimi had physical properties similar to those produced with crude myosin or calcium alginate as binders. However, bind strength was less for steaks produced with surimi than for those made with salt/phosphate. They reported lower cook yields for restructured steaks made with surimi than for those made with salt/phosphate. Our results confirmed those of Chen and Trout (1991) but were different than those of Kenney et al. (1992) who reported that cook yield of products containing surimi and washed beef were similar.
Results of the triangle test (Table 4) showed that panel members could detect the different sample when restructured beef roasts made with 5% fish surimi were compared with restructured beef roast made with HBS. Those with HBS were preferred by the majority of panelists who could detect a difference between samples. Kenney et al. (1992) found few differences in warmed-over flavor and bloody-serumy flavor of restructured beef containing 5% fish surimi when compared to that containing 5% washed or unwashed skeletal and cardiac mus
Volume 58, No. 3, 1993-JOURNAL OF FOOD SCIENCE-499

SURIM I-LIKE MUTTON PRODUCTS . . .
cle. A slight fish flavor was detected in roasts made with surimi but no mutton flavor was detected in roasts made with HBS. Differences detected by our panel may have been due to a slight fish flavor. However, 15 of the 35 panel members could not detect a difference in restructured products containing surimi or washed beef and 6 of the 18 that could detect a difference preferred the product containing surimi. No color differences were present in the restructured products and panel members were not informed that some samples contained surimi or mutton. The only instructions panel members received were to select the different sample and to indicate which sample they preferred. Restructured beef roasts containing 5% HBS were not significantly different from restructured beef roasts made with MSS. Mechanically separated meat also was evaluated as a binding system in restructured beef roasts containing low salt and phosphate. When restructured roasts containing MSM were compared with those made with MSS, panel scores were not different (P<0.05). Of 34 panelists, 12 detected a difference between the two samples. Eleven of the 12 who detected differences preferred restructured roast made with MSM.
Those cooking the steaks concluded that the most objectionable characteristics of restructured steaks pan grilled from the frozen state were the hard-to-cut surfaces and the swollen and deformed appearances. Cooking steaks after thawing improved both characteristics. Field et al. (1977) reported that cooked restructured steaks were often evaluated as having a swollen and deformed appearance, a tough hard-to-cut surface and a lack of cohesiveness. Restructured beef steaks containing different levels of MSM were evaluated by Field et al. (1977). Their data suggested that 10% MSM could improve quality of restructured beef steaks because cooked steaks containing 1 0 % MSM had a softer, more acceptable outer surface than controls. As MSM increased the steaks had a softer outer surface but there was a tendency for such steaks to have mushier interiors.
CONCLUSIONSHBS, MSS and MSM can be used commercially as a binding system in restructured roasts. HBS and MSS added to restructured roasts at 5% as well as MSM added at 11% improved quality and lowered the amount of salt and phosphate needed. Production of HBS or MSS markedly reduced the fat and bone content of MSS when compared to MSM. Production of HBS and MSS has the potential to increase the value of mutton.
REFERENCES
A O A C . 1 9 8 0 . Official Methods of Analysis, 1 3 th ed . A s s o c ia t io n o f O ff ic ia l A n a ly t ic a l C h e m is ts , W a s h in g to n , D C .
B a b b it t , J .K . 1 9 8 6 . S u i t a b i l i t y o f seafood species as r a w m a te r ia ls . Food T e c h n o l. 4 0 : 9 7 .
B l ig h , E .G . a n d D y e r , W .J . 1 9 5 9 . A r a p id m e th o d t o ta l l ip id e x t r a c t io n a n d p u r i f ic a t io n . C a n . J . B io c h e m . P h y s io l. 3 7 : 9 1 1 .
B r o w n , R .G ., A e s c h b a c k e r , H .U . , a n d F u n k , D . 1 9 7 2 . C o n n e c t iv e t is s u e
m e ta b o lis m in s w in e I V : G r o w th d e p e n d e n t c h a n g e s in th e c o m p o s itio n o f lo n g bon es in fe m a le s w in e . G r o w th 3 6 : 3 8 9 .
B u rs o n , D .E . a n d H u n t , M .C . 1 9 8 6 . H e a t - in d u c e d c h a n g e s in th e p ro p o rt io n o f ty p e s I a n d I I I c o lla g e n in b o v in e lo n g is s im u s d o rs i. M e a t S c i. 17: 1 5 3 .
C h e n , C .M . a n d T r o u t , G .R . 1 9 9 1 . S e n s o ry , in s t r u m e n ta l t e x tu r e p r o f ile a n d c o o k in g p ro p e rt ie s o f r e s t r u c tu r e d b e e f s te a k s m a d e w i t h v a r io u s b in d e rs . J . F o o d S ci. 5 6 : 1 4 5 7 .
C u ll is , P .R . a n d H o p e , M .J . 1 9 8 5 . P h y s ic a l p ro p e rt ie s a n d fu n c t io n a l ro le s o f l ip id s in m e m b ra n e s . I n Biochemistry of Lipids and Membranes, D .E . V a n c e a n d J .E . V a n c e (E d .) , p . 2 5 - 7 2 . B e n ja m in -C u m m in g s , M e n to P a r k , C A .
D a w s o n , P .L . , S h e ld o n , B .W ., a n d B a ll , H .R . 1 9 8 8 . E x t r a c t io n o f l ip id a n d p ig m e n t c o m p o n e n ts f ro m m e c h a n ic a ly d e b o n e d c h ic k e n m e a t . J . Food S c i. 5 3 : 1 6 1 5 .
F ie ld , R .A . , R i le v , M .L . , a n d C o rb r id g e , M . H . 1 9 7 4 . C h a r a c te r iz a t io n o f m e c h a n ic a lly dieboned h o t a n d co ld m u t to n carcasses. J . F o o d S c i. 3 9 : 2 8 2 .
F ie ld , R .A . , B o o re n , A . , L a r s e n , S .A ., a n d K in n is o n , S .L . 1 9 7 7 . C h a r a c te r is tic s o f r e s t r u c tu r e d b e e f s te a k s c o n ta in in g m e c h a n ic a l ly d eb o n e d m e a t . J . A n im . S c i. 4 5 : 1 2 8 9 .
F ie ld , R .A . , W i l l ia m s , J .C . , P ra s a d , V .S . , C ross, H .R . , S e c r is t , J .L . , a n d B r e w e r , M .S . 1 9 8 4 . A n o b je c t iv e m e a s u re m e n t fo r e v a lu a t io n o f b in d in r e s t r u c tu r e d la m b ro a s ts . J . T e x t . S tu d ie s . 15: 1 7 3 .
F u n a ts u , Y . a n d A r a i , K . 1 9 9 1 . T h e p H -d e p e n d e n c e o f c h a n g e s in g e l fo r m in g a b i l i t y a n d m y o s in h e a v y c h a in o f s a lt -g r o u n d m e a t f ro m w a lle y e p o llo c k . N ip p o n S u is a n G a k k a is h i 5 7 : 1 9 7 3 .
H e rn a n d e z , A . , B a k e r , R .C ., a n d H o tc h k is s , J .H . 1 9 8 6 . E x t r a c t io n o f p ig m e n ts f ro m m e c h a n ic a lly d eb o n e d t u r k e y m e a t . J . F o o d S c i. 5 1 : 8 6 5 .
H i l l , F . 1 9 6 6 . T h e s o lu b i l i ty o f in t r a m u s c u la r c o lla g e n in m e a t a n im a ls o f v a r io u s age s . J . F oo d S c i. 3 1 : 16 1 .
K e n n e y , P .B . , K a s tn e r , C .L . , a n d K r o p f, D . H . 1 9 9 2 . M u s c le w a s h in g a n d r a w m a t e r ia l so u rc e a f fe c t q u a li ty 'a n d p h y s io c h e m ic a l p r o p e rt ie s o f lo w - s a lt , lo w - fa t r e s t r u c tu r e d b e e f. J . F o o d S c i. 5 7 : 5 4 5 .
L a e m m li, U . K . 1 9 7 0 . C le a v a g e o f s t r u c tu r a l p ro te in s d u r in g th e a s s e m b ly o f th e h e a d o f th e b a c te r io p n a g e . N a tu r e . 2 2 7 : 6 8 0 .
L a n ie r , T .C . 1 9 8 6 . F u n c t io n a l p ro p e rt ie s o f s u r im i. F oo d T e c h n o l. 4 0 : 1 0 7 .L ig h t , N .D . a n d C h a m p io n , A .E . 1 9 8 4 . C h a r a c te r is a t io n o f m u s c le e p i-
m y s iu m , p e r im y s iu m a n d e n d o m y s iu m c o lla g e n s . B io c h e m . J . 2 1 9 : 1 0 1 7 .L in , S .W . a n d C h e n , T .C . 1 9 8 9 . Y ie ld s , c o lo r, a n d c o m p o s itio n s o f w a s h e d ,
k n e a d e d a n d h e a te d m e c h a n ic a lly d e b o n e d p o u lt r y m e a t . J . F o o d S c i. 5 4 : 1 9 8 9 .
M c C o r m ic k , R .J . , R e e c k , G .R ., a n d K r o p f , D . H . 1 9 8 8 . S e p a r a t io n a n d id e n t i f ic a t io n o f p ro c in e s a rc o p la s m ic p r o te in s b y re v e rs e d -p h a s e h ig h p e r fo rm a n c e l iq u id c h ro m a to g r a p h y a n d p o ly a c r y la m id e g e l e le c tro p h o re s is . J . A g r ic . F o o d C h e m . 3 6 : 1 1 9 3 .
M c K e i t h , F .K . , B e c h te l, P .J . , N o v a k o fs k i, J . , P a r k , S ., a n d A r n o ld , J .S . 1 9 8 8 . C h a r a c te r is t ic s o f s u r im i- l ik e m a t e r ia l f ro m b e e f, p o r k a n d b e e f b y -p ro d u c ts . Proc. Inti. Congress Meat Sci. Technol., Part B: 325, B r is b a n e A u s t r a l ia
M e a n s , W .J . , C la r k e , A .D . , Sofos, J .N . , a n d S c h m id t , G .R . 1 9 8 6 . B in d in g , s e n s o ry a n d s to ra g e p ro p e rt ie s o f a lg in /c a lc iu m s t r u c tu r e d b e e f s te a k s . J . F oo d S c i. 5 2 : 2 5 2 .
N a k a y a m a , T . a n d S a to , Y . 1 9 7 1 . R e la t io n s h ip b e tw e e n b in d in g q u a l i t y o f m e a t a n d m y o f ib r i l la r p ro te in s . I I . C o m b in a t io n o f n a t iv e t ro p o m y o s in a n d a c t in to th e b in d in g q u a l i t y o f m e a t . A g r ic . B io l. C h e m . 3 5 : 2 0 8 .
O c k e r m a n , H .W . a n d O rg a n is c ia k , C .S . 1 9 7 9 . Q u a l i t y o f r e s t r u c tu r e d b e e f s te a k s a f te r r e f r ig e r a te d a n d fro z e n s to ra g e . J . F oo d P ro t . 4 2 : 12 6 .
R e jt , J . , K u b ic k a , H . , a n d P is u la , A . 1 9 7 8 . C h a n g e s o f p h y s ic a l a n d c h e m ic a l p ro p e rt ie s o f h is to lo g ic a l s t r u c tu r e o f m e a t s u b je c te d to m a s s a g e u n d e r v a c u u m . M e a t S c i. 2: 14 5 .
R o e s s le r , E .B . , W a r r e n , J . , a n d G u y m o n , J .F . 1 9 4 8 . S ig n if ic a n c e in t r ia n g le ta s te te s ts . F o o d R es. 13: 5 0 4 .
S A S In s t i t u t e , In c . 1 9 8 5 . SAS User’s Guide: Statistics. S A S In s t i t u t e , In c ., C a r y , N C .
S c h w a r tz , W .C . a n d M a n d ig o , R .W . 1 9 7 6 . E f fe c t o f s a lt , S o d iu m t r ip o ly p h o s p h a te a n d s to ra g e on r e s t r u c tu r e d p o rk . J . F oo d S c i. 4 1 : 1 9 7 6 .
S ta c h iw , M .A . 1 9 8 8 . M e c h a n ic a l a n d h a n d d eb o n e d p o r k m e a t a s a b in d e r in r e s t r u c tu r e d , fo rm e d , a n d p u m p e d p o r k p ro d u c ts . P h .D . th e s is , M ic h ig a n S ta te U n iv . , E . L a n s in g .
T o r le y , P .J . a n d L a n ie r , T .C . 1 9 9 1 . S e t t in g a b i l i t y o f s a lte d b e e f/p o llo c k s u r im i m ix tu r e s . In Seafood Science and Technology, E .G . B l ig h (E d .), N e w B o oks, L td . , O x fo rd , U K .
U S D A . 1 9 8 2 . S ta n d a r d a n d la b e l l in g r e q u ir e m e n ts fo r m e c h a n ic a lly sep a r a te d species a n d p ro d u c ts in w h ic h i t is u se d . F e d . R e g . 4 7 : 2 8 2 1 4 .
W o e s s n e r, J .F . 1 9 6 1 . T h e d e te r m in a t io n o f h y d ro x y p r o lin e in t is s u e a n d
Sr o te in s a m p le s c o n ta in in g s m a ll p ro p o rt io n s o f th is a m in o a c id . A r c h , ¡ioc hem . B io p h y s . 9 3 : 4 4 0 .
M s re c e iv e d 7 /1 8 /9 2 ; re v is e d 1 0 /2 1 /9 2 ; a c c e p te d 1 2 /1 7 /9 2 .
500-JOURNAL OF FOOD SCIENCE-Volume 58, No. 3, 1993

Sodium Tripolyphosphate Stability and Effect in GroundTurkey Meat
W EI LI, JANE A. BOW ERS, JEAN A. CRAIG, and SHIAN K. PERNG
----------------------------ABSTRACT-----------------------------Ground turkey meat, cooked and uncooked, was prepared with and without 0.5% sodium tripolyphosphate (STP) and stored at 5 °C for different periods of time. STP stability was evaluated by determining soluble orthophosphate. Water-holding capacity (WHC), pH, and microbial count were also measured. STP hydrolyzed rapidly in uncooked samples. Refrigerated storage time (up to 6 days) did not affect STP hydrolysis in cooked turkey meat. Heating accelerated the rate of STP hydrolysis. End point temperatures (65, 75, and 85 °C) did not affect the extent of STP hydrolysis. STP increased W H C in both cooked and uncooked samples. STP did not inhibit total microbial growth in cooked or uncooked ground turkey meat.
Key Words: turkey, phosphate, stability, W H C , microorganism
INTRODUCTION
THE MEAT INDUSTRY uses polyphosphates widely in meat products to improve water binding, texture, color, and flavor and to protect against oxidation and microbial growth (Ellin- ger, 1972; Sofos, 1986; Dziezak, 1990). Among the various phosphate salts, sodium tripolyphosphate (STP) is most widely used, accounting for 80% of the phosphates incorporated either alone or in blends (Barbut et al., 1988). Much study has been reported on polyphosphate effects on meat products. Very little has been reported concerning hydrolysis of polyphosphate salts during heating and storage of meat.
The beneficial effects of polyphosphates on meat products are due to the chemical properties of phosphates and their reactions with meat constituents and other additivies. The main reason for adding phosphates to meat is to increase water binding or retention of juices. Phosphates cause this by increasing pH and ionic strength, and by complexing with protein-bound magnesium and calcium so actomyosin can dissociate, exposing more bonding sites and increasing the structural space of the myofibril for hydration (Wang, 1989; Parson and Knight,1990). Pyrophosphate, the smallest polyphosphate, is usually formed by breakdown of larger polyphosphates in meat and is probably the most effective in increasing water retention (Hamm and Neraal, 1977b; Offer and Knight, 1988). Chelation of metal ions by phosphates may be the mechanism for the antioxidant effect and inhibition of microbial growth (Ellinger, 1972; Tompkin, 1984; Sofos, 1986; Ang and Young, 1989).
Although polyphosphates are stable in water solution at room temperature, they break down rapidly in a meat system, probably because of the phosphatase present in meat (Sutton, 1973; Hamm and Neraal, 1977a,b; Sofos, 1986). The stability of polyphosphates in any food application is important. Theoretically, once polyphosphates break down to shorter-chain polyphosphates or orthophosphates, their effects on meat might change. Hydrolysis of polyphosphates may be advantageous in certain applications and not in others.
For example, pyrophosphates formed by the breakdown of larger polyphosphates are probably responsible for increasing water binding by inducing dissociation of actomyosin (Hamm
The authors are affiliated with the Depts. o f Food & Nutrition and Statistics, Kansas State Univ., Manhattan, KS 66506-1407
and Neraal, 1977b; Offer and Knight, 1988). When polyphosphates break down to orthophosphates (Bell, 1947), their sequestering power and polyelectrolyte properties would be less or lost. Loss of effectiveness to chelate multivalent cations could cause loss of effects of inhibiting microbial growth and preventing such ions (particulary Fe++) from catalyzing oxidation (Tompkin, 1984; Ang and Young, 1989). Puolanne and Ruusunen (1980) reported that phosphates (not specified) reduced the water holding capacity (WHC) of cooked sausage when added as a preblend but increased WHC when added during chopping. Loss of WHC may have been due to hydrolysis of phosphates during preblend processing.
The stability of polyphosphates has been studied in bovine muscle (Sutton, 1973; Hamm and Neraal, 1977a), pork (Mol- ins et al., 1985c), and shrimp (Tenhet et al„ 1981). No study has been published on the stability of polyphosphates in turkey meat or the effect of end point temperature on stability. The objectives of our study were to determine: (1 ) effects of internal cooking temperatures and storage time on the stability of STP and (2) the relationship of STP hydrolysis to WHC, pH, and microbial growth.
MATERIALS & METHODSMaterials and sample preparation
Ground turkey meat (~ 12% fat) was obtained from Dillons Food Market (Manhattan, KS) and stored at 4-5 °C until treatments were applied. Storage time did not exceed 24 hr. For each of four replications, = 6 kg ground turkey meat was premixed and divided into appropriate amounts for preparation of the following three additive treatments: (1) raw ground turkey with 5 % water added (2) raw ground turkey to which an STP solution was added; and (3) ground turkey that was heated before an STP solution was added.
For each of the first two additive treatments, = 2 kg ground turxey meat was prepared for eight 250-g patties by mixing the raw ground meat with 1) 5 % deionized water (w/w) or 2) 0.5% STP (w/w) by using O.lg STP/ml solution. The samples were mixed in a Kitchen Aid Mixer® (Model K-45, Hobart Manufacturing Co. Troy, OH) for 10 sec at speed 1 and 15 sec at speed 2. Patties were formed with a Tupperware® patty former (10 cm in diameter). Each experimental unit included two patties for each of the additive x temperature treatment combinations. Each patty was placed in a Reynolds® Oven Cooking Bag (Reynolds Metals Co.) and then placed on a 10 cm high wire rack on an aluminum broiler pan. Ten slashes, 1 cm wide, were made through the top surface of each bag. Thermometers were inserted in the center of each patty. Samples were refrigerated for 1 hr at 5 °C and then heated at 162.8 °C (325 °F) in a rotary hearth oven, two patties to each of the internal temperatures: 65, 75, or 85 °C.
For the third additive treatment, six 250-g patties were heated, two to each temperature. After cooking, patties were crumbled; 0.5% STP (in a water solution) was added to the patties; and the meat and STP were mixed in a Kitchen Aid Mixer® (Model K-45). For all treatments, two patties (for each experimental unit) were mixed and divided into four portions and packaged in Ziploc bags (1.75 mil). 3ne portion was analyzed immediately; the others were stored at 5 °C and analyzed after 1, 3, and 6 days.
Methods of analysisFor pH, lOg of meat were placed into a glass jar and blended for
1 min with 90 irL deionized water to make a 1:10 dilution. The pH of the sample was determined by a Corning pH meter 140.
Volume 58, No. 3, 1993-JOURNAL OF FOOD SCIENCE-501

fP STABILITY IN TURKEY M E A T . . .
Soluble orthophosphate was determined by using the colorimetric method of Molins et al. (1985c) with modification. W e used 8 m L reagent C (a citrate-arsenite reagent) instead of 5 mL, because our previous trials had shown that the blue color development would be more stable. The slurry used for pH determination was filtered (Fish- erbrand P8 filter paper), and then 10 m L filtrate were taken for further dilutions and for orthophosphate determination. A Brinkmann PC 800 Colorimeter with a 690 nm filter was used to read soluble orthophos- phate-P (p-g/mL) concentration directly.
Water-holding capacity (WHC) was determined by the Excess-Water method (Janicki and Walczak, 1954) with modification. Meat (lOg) was mixed with 90 m L water in a jar, blended for 1 min, and then centrifuged for 15 min at 2800 rpm, 15 °C. W H C was calculated by the difference between the residue and dry weight of meat:
residue (g) - dry meat (g)WHC = ; ~~~dry meat (g)
Moisture was determined by the oven drying method (AOAC, 1990). Total microbial count was determined by the Standard Plate Count method (32 °C, 48 hr).
Statistical analysis and designA split-split-plot design with four replications was used to evaluate
effects of additive, temperature, and storage time on the measurements made for the ground turkey meat (Cochran and Cox, 1957). Data were analyzed by analysis of variance to determine differences among means of additive treatments, temperatures, and storage time. When F-values were significant, means were compared by calculating least significant difference (LSD).
RESULTS & DISCUSSIONCooked meat
Phosphate treatment. As expected, samples with added STP had higher amounts of orthophosphates (Table 1). The samples to which STP was added before cooking had the highest orthophosphate value; ~ 70% of added STP hydrolyzed to orthophosphates in these samples. Because STP is stable in aqueous solution even when heated at 70 °C and 85 °C (Bell, 1947; our previous unpublished data), STP added to meat appeared to be hydrolyzed before and during early heating mainly by an enzymatic effect. For instance, the high hydrolysis rate of STP may have been because of heat acceleration of enzyme activity at the beginning of the cooking period. Hamm and Neraal (1977b) reported that the tripolyphosphatase and pyrophosphatase activities of comminuted bovine muscle increased with increasing temperature to about 40 °C, when denaturation of enzyme proteins occurred.
The samples to which STP was added after cooking had higher orthophosphate values than those without STP, indicating that some STP was hydrolyzed to orthophosphates in cooked meat. An end point temperature of 85 °C should be high enough to inactivate all enzymes in meat systems (Townsend and Blankenship, 1987). However, orthophosphate values were similar for samples cooked to 65, 75, and 85 °C (Table 2), indicating that an end point temperature of 65 °C was high enough to inactivate polyphosphatases that were naturally present in the turkey meat system. Thus, the slight hydrolysis of STP in samples to which STP was added after cooking was probably not due to enzymatic effects (which are responsible for the rapid STP hydrolysis in raw meat). Because the extent of STP hydrolysis did not change during storage, the slight hydrolysis of STP in cooked meat may have been due to the blending process.
Phosphate treatment affected WHC (Table 1). WHC was higher in samples with STP added before cooking than in the other two treatments, and the WHC was higher for samples with STP added after cooking than for samples with no STP. These data confirmed cooking loss data (Table 3), in which samples with STP added before cooking had the least cooking loss.
WHC was also higher for samples with STP added after
Table 1 -O rth o p h o s p h a te -P (Ortho-P) content, WHC, pH , a n d m ic ro b ia l co u n t o f cooked g ro u n d tu rkey sam ples w ith an d w ith o u t STP____________
STP tre a tm e n t S ig n if ic a n c e o f F -va lueV a ria b le 0% STP" 0 .5 % STP-BC * 0 .5 % S TP -A C 1
O rth o -P(p-g/g )9
3381» 6085» 366 8 " # * *
W H C 3.66» 3.95= 3 .8 2 " •
pH 6.63» 6 .84 " 6.91= * * *
M ic ro b ia l c o u n t" 3.76» 3.71» 3 .63* NS
■•b'c Means in a row followed by a different letter are significantly different from eachother at P < 0.05.
d 5% deionized water added, without STP.• 0.5% STP(w/w) added before cooking. f 0.5% STP(w/w) added after cooking.Q Ortho-P values based on dry meat weight, calculated as phosphorus. h Log value of total microbial count (mesophilic bacteria).NS, not significant; *, P<0.05; *** , P<0.001.
cooking than for those without STP. Thus, STP still increased WHC even in cooked meat (internal temperature from 65 °C to 85 °C) in which most proteins had been previously denatured. This might have been due to changes in pH and/or ionic strength caused by adding STP to cooked meat. Stabursvik and Martens (1980) found that NaCl (0.15M) decreased the denaturation point of actin by 4 °C. Prusa et al (1985) speculated that STP also may decrease the protein denaturation point. Although the amount of protein denaturated at low end point temperature might increase if STP were added, nevertheless, STP increased WHC and decreased cooking loss in meat systems (Prusa et al., 1985; Parsons and Knight, 1990). Further research is necessary to determine the mechanism of STP effects on WHC in cooked meat.
The pH increased when STP was added (Table 1) because of the basic properties of STP. Phosphate treatments did not affect the total microbial growth (Table 1). This agreed with the findings by Molins et al. (1985a,b), who reported that STP and sodium acid pyrophosphate (SAPP) did not affect the growth of mesophilic bacteria in cooked or uncooked bratwurst during refrigerated storage. Marcy et al. (1988) also reported that neither 0.4% tetrasodium pyrophosphate (TSPP) nor 0.4% SAPP alone or in combination inhibited microbial count in cooked pork sausage. Guthertz et al. (1976) reported that Clostridium perfringens, (52%) Salmonella, (28%) Escherichia coli (81%) Staphylococcus aureus, (80%) and fecal Streptococci (95%) were found in the percentages indicated of freshly ground turkey meat samples purchased from retail markets. Although STP did not inhibit total microbial growth, fluorescent species of Pseudomonas on the surface of the poultry meat were inhibited by the presence of polyphosphates and STP completely inhibited the growth of E. coli (Ellinger, 1972). Further work may be necessary to determine the inhibiting effect of STP and other phosphates on foodborne pathogenic and spoilage organisms in ground turkey meat.
Cooking temperature effects. Internal end point temperatures did not affect the extent of STP hydrolysis in the samples with STP added before cooking (Table 2). However, the extent of STP hydrolysis tended to increase from an end point temperature of 65 °C to 85 °C. End point temperatures did not affect hydrolysis of STP in the samples to which it was added after cooking (Table 2). Thus, an end point of 65 °C was high enough to inactivate the naturally present polyphosphatases. On Day 0, about 74% (Table 2) of added STP hydrolyzed to orthophosphate in cooked samples with STP added before cooking, whereas only 40% (Table 5) of the added STP was hydrolyzed in raw samples. This indicated that heating accelerated the hydrolysis of STP in a ground turkey meat system. Molins et al. (1985c) reported that the higher orthophosphate values of cooked pork samples containing STP or SAPP were possibly due to heat-induced hydrolysis of the compounds during cooking. Because STP is stable in water at 70 °C (Bell, 1947) and at 85 °C (previous unpublished data), these results
502-JOURNAL OF FOOD SCIENCE-Volume 58, No. 3, 1993

Table 2 - O rthophosphate-P (Ortho-P) content, WHC, pH , a n d m ic ro b ia l coun t o f g ro u n d tu rkey sam ples a t d iffe re n t en d p o in t tem pera tu res an d storage t i m e s _______________________________________________________________________________________ ___
T em p(°C )S ig n ific a n c e
o f F -va lue
D ayss to ra g e
(5°)S ig n if ic a n c e
o f F -va lue
65 75 85 T e m p 0 1 3 6 D ay
STP b e fo re c o o k in g :O rth o -P (p .g /g)d 5935 ” 6029* 6289* NS 6092* 6142» 6219» 5886» NS
S TP (% )* 62.1 * 69.8* 72.1* NS 74.3» 70.9» 62.8» 64.0» NS
W H C 4.01* 3.93» 3.90» NS 3.70* 3.94» 4 .24* 3.91»» * *
pH 6.84* 6 .84* 6.85* NS 6.87» S.81» 6.85» 6.85» NS
M ic ro b ia l c o u n t ' 3 .73 * 3 .75* 3.65* N S 3.53* 3.74»b 3.61» 3.96» t
STP a fte r c o o k in g :O rth o -P (txg /g )d 3770* 3563» 3657" NS 3439* 3643»» 3842» 3728»S T P (% )* 7.0* 6 .6 * 7.6» NS 6 .6 * 6 .6 » 7.3» 7.7» NSW H C 3 .9 3 b 3.82*» 3.71* # 3.63» 3.72»b 3.99" 3.94»* *
pH 6.90* 6.92» 6.91» NS 6.93» 6.89» 6.90» 6.91» NSM ic ro b ia l c o u n t ' 3 .73* 3 .74* 3 .43* NS 3.36» 3.74»» 3.54»» 3.89* #
W ith o u t STP:O rth o -P (p .g /g)d 3503» 3308* 3377» * 3207» 3389»» 3552» 3436» ##
W H C 3.70* 3.66» 3.61» NS 3.46» 3.59»» 3.80» 3.78» * *
pH 6.62» 6.63» 6.64» NS 6 .6 6 » 6.60» 6.62»» 6.64»» *
M ic ro b ia l c o u n t ' 3.65» 4.00» 3.62» NS 3.42» 3.80» 3.68»» 4 .14* #*
B'b'c Means in the same row followed by a different letter are significantly different from each other at P < 0.05.d Ortho-P values based on dry meat weight, calculated as phosphorus.0 Percentage of STP hydrolysis.f Log value of total microbial count (mesophilic bacteria).NS, not significant; Î , P<0.1; #, P<0.05; **, P<0.01.
Table 3 —Cooking loss o f g ro u n d tu rkey sam ples w ith an d w ith o u t STP hea ted to d iffe ren t end p o in t tem pera tu res
STPtre a tm e n t
S ig n if ic a n c e o f F -va lue
STP T e m p (°C)S ig n ific a n c e
o f F -va lue
V a ria b le 0 % d 0 .5 % * tre a tm e n t 65 75 85 T e m p
C o o k in g L oss (% )
32.12» 24.83» *» 25.80» 28.75» 30.95* # *#
a»b»c Means in a row followed by a different letter are significantly different from each other at P < 0.05. d 5% deionized water added, without STP.• 0.5% STP (w/w) added before cooking.** , P<0.01; *** , P<0.001.
Table 4 — W ater-ho ld ing capacity, pH , a n d m ic ro b ia l cou n t o f ra w tu rkey m e a t sam ples
V a ria b le
STP tre a tm e n t
S ig n ific a n c e o f F -va lue
STPtre a tm e n t
D ays s to ra g e (5°C)
S ig n ific a n c e o f F -v a lje
0 % * 0 .5 % ' 0 1 3 6 D ay
W H C 4.34» 5.06» * 4.85» 4.64» 4.76» 4.55» NSpH 6.36» 6.70» * * * 6.52» 6 .56* 6.54» 6.49» NSM ic ro b ia l coun t« 7 .00* 7.08» NS 5.61» 6.54» 7 .59* 8 .4 2 d #*#
a.tj.e.d Means in a row followed by a different letter are significantly different from each other at P < 0.05. 6 5% deionized water added, without STP.10.5% STP (w/w) added.0 Log value of total microbial count (mesophilic bacteria).NS, not significant; *, P<0.05; *** , P<0.001.
indicate, that STP added to meat hydrolyzed to orthophosphate by enzymatic action before and during initial heating.
STP added to meat reduced the negative effect of heating on WHC; i.e., the WHC was higher for samples with STP added than for samples without STP (Table 1). WHC of samples with STP added after cooking was higher at 65 °C than at 85 °C (Table 2). This indicated that STP added after cooking could improve WHC more in meat cooked to 65 °C than in meat cooked to 85 °C.
Internal end point temperature did not affect pH (Table 2). Minimal pH changes have been reported in meat during the heating process. For samples without STP, the pH increased 0.26 unit when samples were heated from the raw state to 65 °C (Table 2 and 4). The pH increased only 0.002 unit with the increase of end point temperature from 65 °C to 85 °C (Table 2). For samples with STP added before heating, the pH increased 0.14 unit when samples were heated from the raw state to 65 °C (Table 2 and 4) and increased only 0.1 unit with the increase of end point temperature from 65 °C to 85 °C
(Table 2). The smaller changes in pH values of samples containing STP were probably due to the buffering capacity of the phosphate salt.
Internal end point temperature did not affect total microbial counts (Table 2), indicating that an internal heating temperature of 65 °C was high enough to reduce the total count. Further study is needed to determine if the combination of heating and STP would decrease end point temperature required for destroying Salmonella or other foodborne pathogenic microorganisms, possibly present in ground turkey meat (Guthertz et al., 1976).
Storage Time. Samples stored for 3 days consistently had the highest orthophosphate values, although no significant differences (P<0.05) were found among samples with STP added before cooking (Table 2). If the percentage of STP hydrolyzed is considered, then storage time did not significantly affect STP hydrolysis. This indicates that STP residues were stable in cooked meat during 6 days of storage probably because heating inactivated polyphosphatases, whereas STP in raw meat was
Volume 58, No. 3. 1993-JOURNAL OF FOOD SCIENCE-503

STP STABILITY IN TURKEY M E A T . . .
Table 5 -O rth o p h o s p h a te -P (Ortho-P1 con ten t in g ro u n d ra w tu rkey m e at w ith an d w ith o u t STP _____________________________
D ays s to ra g e (5°C)
V a ria b le 0 1 3 6O rth o -P ( ixg /g )d
0 .0 % STP« 3407« 3857» 3795« 3970«
0 .5 % STP ' 5 26 8 b 8326« 8639« 9065«P e rcen tag e o f a d d e dSTP th a t h y d ro ly z e d 3 - 4 0 100 + 100 + 100 +
a.b,c Means followed by a different letter are significantly different from each other at p<0.05.
d Ortho-P values based on dry meat weight, calculated as phosphorus.* 5% deionized water added, without STP. f 0.5% STP (w/w) added.8 Percentage (based on dry weight) of added STP that hydrolyzed:
Ortho-P value ofsample with STP — Ortho-P value of_______sample without STP_______
Crth-P of added STP
hydrolyzed completely after 1 day of storage (Table 5). Molins et al. (1985c) reported that STP and SAPP residues were stable in cooked ground pork meat during 4 days storage at 5 °C.
Storage time affected WHC values (Table 2) which were lowest initially and then increased during storage to Day 3. Although orthophosphate values also were highest on Day 3, the high WHC values on Day 3 were not due to the effect of STP hydrolysis because they were found in samples with no STP (Table 2). The highest WHC and orthophosphate values were on Day 3 for all cooked samples and were very consistent. The actual relationship between WHC and orthophosphate values is not clear. Storage affected pH values in samples without STP (Table 2); however, these differences were very slight and have no practical significance.
Total microbial counts tended to rise significantly during storage at 5 °C from Day 0 to Day 6 . STP added to turkey meat before or after cooking did not inhibit microbial growth during storage (Table 2). This reaffirmed that STP did not inhibit total microbial growth in cooked turkey meat. Molins et al. (1985b) reported that STP, SAPP, and TSPP did not cause bacterial inhibition in cooked, vacuum packed bratwurst during refrigerated (5 CC) storage. Marcy et al. (1988) reported that neither SAPP nor TSPP inhibited microbial growth in cooked pork sausage during refrigerated storage up to 2 1 days.
Cooking loss. Meat samples with STP had lower cooking loss, showing about 7% more cooked yield than those without STP (Table 3). Internal end point temperature significantly affected cooking losses. Samples cooked to 65 °C had the least cooking loss; the second lowest was for samples cooked to 75 °C, whereas the highest cooking loss was for those samples cooked to 85 °C.
Raw meatWHC, pH, and total microbial count o f raw meat samples
are presented in Table 4. Orthophosphate values (Table 5) indicate the significant interactions for STP treatments and storage times. For samples without STP, no significant change in orthophosphate values occurred with storage. However, for samples with STP, orthophosphate values were higher for Days 1, 3, 6 than for Day 0. Within 3 hr of adding STP to meat, about 40% of the STP hydrolyzed to orthophosphates. After storage for 1 day at 5 °C, all STP had hydrolyzed to orthophosphates (Table 5). Thus STP was rapidly hydrolyzed, probably by enzymes naturally present in meat (Hamm and Neraal, 1977a,b; Sofos, 1986). Orthophosphate values for samples with STP were slightly higher than expected based on calculations from the amount added. Sutton (1973) reported that tripolyphosphate and pyrophosphate rapidly hydrolyzed in cod and beef even at 0 °C, and only orthophosphate remained after 30-
40 hr. Tenhet et al. (1981) found that, after 2 wk frozen storage at - 2 6 °C, only 12% of STP remained in shrimp.
The addition of phosphate significantly increased WHC. This confirmed reports by several researchers (Prusa et al., 1985; Offer and Knight, 1988; Parsons and Knight, 1990). Storage time did not significantly affect WHC, although it tended to decrease from Day 0 to Day 6 . This indicated that the effects of STP on WHC of meat proteins were not reversed when STP hydrolyzed because STP was 100% hydrolyzed to orthophosphates after 1 day of storage. The pH values were higher for samples with STP than for those without STP. Storage time did not affect pH (Table 4).
Microbial count increased rapidly in raw meat samples during storage at 5 °C (Table 4). Phosphate treatments did not affect total microbial growth, confirming results for cooked samples. Therefore, as with cooked meat, STP, when added before or after cooking, and its by-products, such as pyrophosphates and orthophosphates, had no inhibiting effect on mesophilic bacterial growth in uncooked ground turkey meat.
CONCLUSIONSSTP hydrolyzed rapidly in uncooked ground turkey meat— probably because of natural enzymes. All added STP had been converted to orthophosphates after 1 day storage at 5 °C. Heating accelerated hydrolysis of STP, probably by stimulating enzyme activities at the beginning of the cooking process. End point temperatures did not affect extent of STP hydrolysis. Heating to internal temperature of 65 °C was high enough to inactivate polyphosphatases. Refrigerated (5 °C) storage time (up to 6 days) did not affect STP hydrolysis of cooked turkey meat. Adding STP before cooking resulted in the least cooking loss and highest WHC for cooked samples. Samples with STP added after cooking had higher WHC values than those without STP, indicating STP could still affect the denatured proteins in a cooked meat system. Higher end point temperatures resulted in lower WHC of meat. STP reduced the negative effects of heating on WHC. STP did not inhibit mesophilic microbial growth in uncooked or cooked ground turkey meat.
REFERENCESAng, C.Y.W. and Young, L.L. 1989. Factors relating to oxidative stability
of cooked broiler breast patties treated with sodium tripolyphosphate. J. Food Sci. 54: 1151-1154.
AOAC. 1990. Official Methods of Analysis, 15th ed. Association of Official Analytical Chemists, Washington, DC.
Barbut, S., Maurer, A.J., and Lindsay, R.C. 1988. Effects of reduced sodium chloride and added phosphates on physical and sensory properties of turkey frankfurters. J. Food Sci. 53: 62-66.
Bell, R.N. 1947. Hydrolysis of dehydrated sodium phosphates. Ind. Eng. Chem. 39: 136-140.
Cochran, W.G. and Cox, G.M. 1957. Experimental Designs, 2nd ed. Wiley Publication in Applied Statistics, New York.
Dziezak, J.D., 1990. Phosphates improve many foods. Food Technol. 44(4): 80-92.
Ellinger, R.H., 1972. Phosphates in food processing. Ch. 15 In CRC Handbook of Food Additives, 2nd ed., (Ed.) T.E. Furia, Vol. 1. CRC Press, Inc., Boca Raton, FL.
Guthertz, L.S., Fruin, J.T., Spicer, D., and Fowler, J.L. 1976. Microbiology of fresh comminuted turkey meat. J. Milk Food Technol. 39: 823-829.
Hamm, R., and Neraal, R. 1977a. On the enzymatic breakdown of tripolyphosphate and disposphate in minced meat. Z. Lebensm Unter-Forsch. 163: 123-125; 208-212; 213-215.
Hamm, R., and Neraal, R. 1977b. On the enzymatic breakdown of tripolyphosphate and diphosphate in comminuted meat. Z. Lebensm Unter- Forsch. 164: 101-104; 243-246.
Janicki, MA, and Walczak, Z. 1954. Wateriness of meat and methods of its determination. In Hamm, R. 1960. Biochemistry of meat hydration. Adv. Food Res. 10: 355-463.
Marcy, JA , Kraft, AA, Hotchkiss, D.K., Molins, RA, Olson, D.G., Walker, H.W., and White, P.J. 1988. Effect of acid and alkaline pyrophosphate blends on the natural flora of a cooked meat system. J. Food Sci. 53: 25- 27.
Molins, R.A., Kraft, A.A., and Olson, D.G. 1985a. Effect of phosphates on bacterial growth in referigerated uncooked bratwurst. J. Food Sci. 50: 531-532.
Molins, RA, Kraft, AA, Walker, H.W., and Olson, D.G. 1985b. Effect of poly- and pyrophosphates on the natural bacterial flora and inoculated Clostridium sporogenes PA 3679 in cooked vacuum packaged bratwurst. J. Food Sci. 50: 876-880.
Molins, R.A., Kraft, A.A., and Olson, D.G. 1985c. Adaptation of a method for the determination of soluble orthophosphates in cooked and uncooked
—Continued on page 521
504-JOURNAL OF FOOD SCIENCE-Volume 58, No. 3, 1993

Vitamin B6 in Raw and Fried Chicken by HPLC
S.J. OLDS, J.T. VAN DERSLICE, and D. BROCHETTI
----------------------------ABSTRACT-----------------------------An isocratic anion exchange, high performance liquid chromatography (HPLC) method was developed to analyze for five of the six vitamers of B6. Recoveries of the B6 vitamers in a standard were 100% to 97%. Recoveries in fried chicken breast ranged from 96% for pyridoxal phosphate to 102% for pyridoxine (PN). Recoveries in raw chicken breast ranged from 86% for pyridoxamine to 102% for PN. Processing chicken by frying reduced the total vitamer by 6.5%. Vitamers of B6 were relatively stable to frying.
Key Words: Vitamin B6, chicken, HPLC, vitamin-polymers
INTRODUCTION
THE 1977-78 USDA Nationwide Food Consumption Survey, reported that vitamin B5 consumption was below the 1980 Recommended Dietary Allowances (RDA) for certain population groups (Pao and Mickle, 1981). In 1989 the RDA’s (NAS/ NRC, 1989) for vitamin B6 were decreased. When the 1989 RDA’s were compared to 1977-1978 data, females’ intakes of vitamin B6 were below the current recommendation. An important factor in evaluating such information is the lack of data on vitamin B6 content of foods. Such data are unclear without vitamin B6 data for all or a majority of commonly consumed foods.
Chicken is a leading source of vitamin Bs in the diet. Fast food fried chicken is one area that experienced a great increase in consumption from 1985 to 1990. (Anon, 1990). Consumers perceive chicken as more nutritious than pork or beef, whether fried or prepared by other cooking methods (FDA, 1987).
Many assay techniques are available for the vitamer forms of B6, as well as total vitamin Bs content. High performance liquid chromatography (HPLC) has been applied for successful separation of the six B6 vitamers: pyridoxamine (PM), pyridoxamine phosphate (PM P), pyridoxine (PN), pyridoxine phosphate (PNP), pyridoxal (PL), pyridoxal phosphate (PLP). The first system for separation of all vitamers of B6 was an anion exchange system (Vanderslice et al., 1979), but it was very complex. The system developed by Coburn and Mahuren(1983) was a cation-exchange system that separated all vitamer forms. The method required about 40 min per analysis and involved more than one buffer. Gregory and Fieldstein (1985) utilized a p,Bondapak 18 column method which used 2 buffers. Ang and coworkers (1988) developed a method using a C I8 reverse phase system with a two-buffer mobile phase, which required about 25 min. The reverse phase method is faster and less expensive. With more complex food systems, ion exchange becomes essential for the precision necessary to separate the various vitamers of Bs complex food systems (Hanmaker et al., 1985).
Our objective was to develop a method, utilizing HPLC ion exchange, to analyze the various vitamers of B6 in a complex food system. Fast food fried chicken was chosen as a complex food source to be analyzed.
Author Olds is with the Dept, o f Nutrition & Food Science, Auburn University, AL 36849-5605. Author Vanderslice is the USDA Nutrient Composition Laboratory, Beltsville, MD. Author Bro- chetti is with Hoecst Celanese, Sunette Division, Somerset, NJ. Address inquiries to Dr. S.J. Olds.
MATERIALS & METHODSHPLC
The liquid chromatography system consisted of a model 680 automated gradient controller, a model 510 HPLC dual-piston reciprocating pump, and a model U6K universal injector equipped with a 2 mL sample loading loop (Waters Associates, Milford, MA). Two 75 x 7.5 mm analytical ion exchange columns, containing diethylamino- ethyl groups bour.d to G5000 power white (PW) supports (Bio-Rad, Richmond, CA), were utilized in the analjdical system. A Bio-Gel HPHT guard column packed with 50 x 4 mm resin was positioned before the analytical columns (Bio-Rad, Richmond, CA). The Fluorescence detector was a LS-4 Perkin-Elmer fluorescence spectrometer (Perkin-Elmer, Norwalk, CT) with programming capabilities to change wavelengths of both emission and excitation. A 3 p.L illuminated volume flow cell was contained in the system.
The mobile phase, modified from Vanderslice and Maire (1980), was 0.12M NaCl, 0.02M glycine buffer, pH 9.8, flow rate 0.8 mL/ min. A second buffer of 0.40M NaCl and 0.02M glycine was used to clean columns only following analysis of chicken samples. The second buffer was started 15 min after beginning the timed program but was not detected until after the vitamers had eluted from the columns. (Thus, the second buffer was not a factor in separation of the vitamers.) The first buffer was reintroduced 25 min after beginning the run, allowing the system to re-equilibrate 5 min after completion of the run.
A postcolumn reagent, modified from Cobum and Mahuren (1983), was used. Bisulfite was dissolved in a 0.75M NaH2P04 solution brought to pH 4.90 by adding 0.75M Na2HP04. The bisulfite solution was prepared daily by adding 10 mg to the 0.75M Na2HP04/NaH2P04 solution, pH 4.90. This solution was pumped at 0.2 mL/min ty a dual-piston reciprocating pump (Waters, Milford, MA). A T-shaped mixing valve (Waters, Milford, MA) allowed the bisulfite solution to mix with the mobile phase prior to entering the fluorescence detector. The combined flow rate was 1 mL/min.
The bisulfite reagent was pumped from 0.01 sec to 10.5 min, to enhance sensitivity of detection of PM and PMP. The pump was shut off by a timed program controlled by a C-R3A Integrator and a PRG- 102A Interface (Shimadzu Corp., Kyoto, Japan). The pump was turned on again at 20.0 min to improve fluorescence of the PLP vitamer.
The excitation and emission wavelengths were changed through a timed program initiated when the sample was injected on the column. For PM and PMP the excitation was 330 nm and emission 400 nm. The wavelengths were changed to 310 nm for excitation and 400 nm for emission for PN, PL and HOP. The wavelengths were returned to the original settings (330 nm excitation and 400 nm emission), for elution of PLP. Slit widths were constant with excitation slit at 2C nm and emission slit at 15 nm.
Extraction and cleanup
Chicken samples or B6 vitamer standards were extracted and cleaned according to a modification of the method developed by Vanderslice and coworkers (1980). A 2-g sample of freeze-dried chicken or 200 jxL of stock B6 vitamer solution was placed in a Sorvall-Omni mixing chamber with 10 mL of 5% sulfosalicylic acid (SSA) to separate the protein from the vitamers. The internal standard (IS), 3-hydroxypyr- idine (HOP), was added to the SSA solution at 1.2 y.g HOP per 10 mL SSA. The contents were mixed for 10 min, with the mixing chamber packed in ice to prevent deterioration. Methylene chloride (CH2C12) was added and mixed an additional 5 min to separate fat from the samples.
After mixing, the contents of the mixing chamber were transferred to an opaque glass tube and centrifuged 10 min at 4°C at 1800 x g. The supernatant was removed and placed in a 10 cc plastic syringe covered with opaque material. The supernatant was filtered through
Volume 58, No. 3. 1993-JOURNAL OF FOOD SCIENCE-505
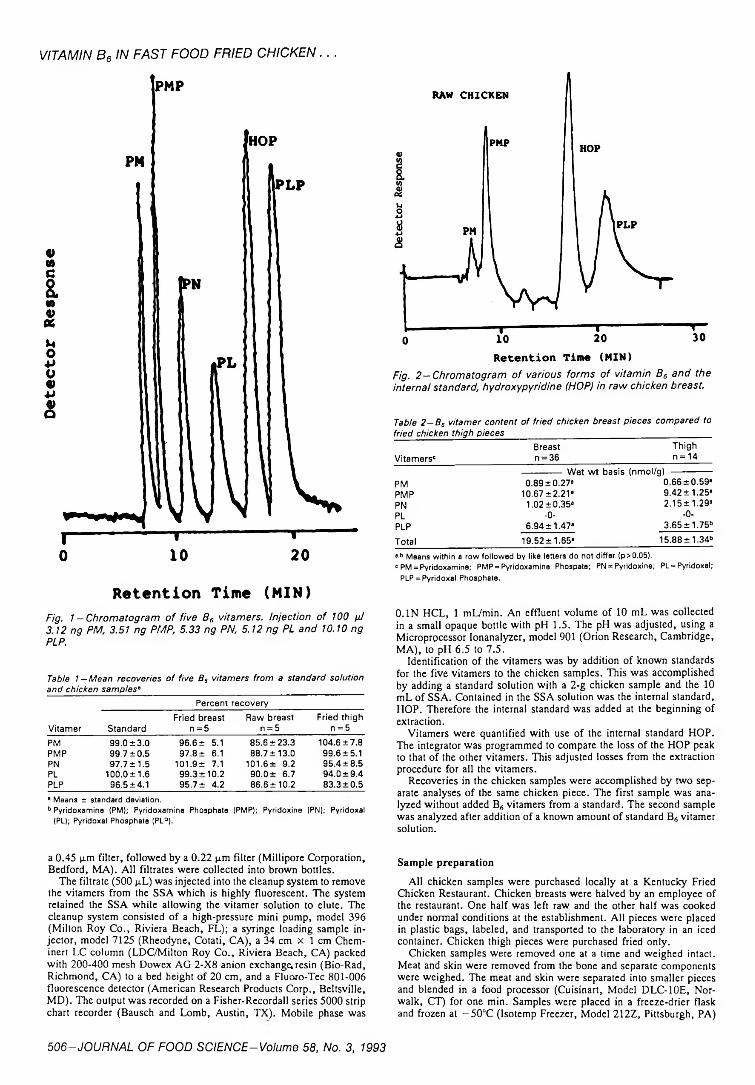
V IT A M IN Be IN F A S T F O O D F R IE D C H IC K E N . . .
Retention Time (MIN)Fig. 1 — Chromatogram of five B6 vitamers. Injection of 100 ¡J 3.12 ng PM, 3.51 ng PMP, 5.33 ng PN, 5.12 ng PL and 10.10 ng PLP.
Table 1—Mean recoveries o f five Be vitamers from a standard solution and chicken samples»______________________________________________
Vitamer
Percent recovery
StandardFried breast
n = 5Raw breast
n = 5Fried thigh
n = 5PM 99.0 ±3.0 96.6 ± 5.1 85.6 ±23.3 104.6±7.8PMP 99.7 ±0.5 97.8 ± 6.1 88.7 ± 13.0 99.6±5.1PN 97.7 ±1.5 101.9 ± 7.1 101.6+ 9.2 95.4 ±8.5PL 100.0±1.6 99.3 + 10.2 90.0+ 6.7 94.0 + 9.4PLP 96.5 ±4.1 95.7 ± 4.2 86.6 ± 10.2 83.3 + 0.50 Means ± standard deviation.b Pyridoxamine (PM); Pyridoxamine Phosphate (PMP); Pyridoxins (PN); Pyridoxal
(PL); Pyridoxal Phosphate (PL3).
a 0.45 p.m filter, followed by a 0.22 pm filter (Millipore Corporation, Bedford, MA). All filtrates were collected into brown bottles.
The filtrate (500 pL) was injected into the cleanup system to remove the vitamers from the SSA which is highly fluorescent. The system retained the SSA while allowing the vitamer solution to elute. The cleanup system consisted of a high-pressure mini pump, model 396 (Milton Roy Co., Riviera Beach, FL); a syringe loading sample injector, model 7125 (Rheodyne, Cotati, CA), a 34 cm x 1 cm Chem- inert LC column (LDC/Milton Roy Co., Riviera Beach, CA) packed with 200-400 mesh Dowex AG 2-X8 anion exchange, resin (Bio-Rad, Richmond, CA) to a bed height of 20 cm, and a Fluoro-Tec 801-006 fluorescence detector (American Research Products Corp., Beltsville, MD). The output was recorded on a Fisher-Recordall series 5000 strip chart recorder (Bausch and Lomb, Austin, TX). Mobile phase was
Fig. 2-Chromatogram of various forms of vitamin Be and the internal standard, hydroxypyrid/ne (HOP) in raw chicken breast.
Table 2 - B s vitamer content o f fried chicken breast pieces compared tofried chicken thigh pieces_______________________ ____________________
Breast ThighVitamers' n -3 6 _______________________n = 14
Wet wt basis (nmol/g)PM 0.89 ±0.27» 0.66 + 0.59»PMP 10.67±2.21» 9.42 ±1.25»PN 1.02 ±0.35» 2.15 ± 1.29»PL -0- -0-PLP 6.94 ±1.47» 3.65±1.75b
Total 19.52 + 1.65» 15.88 ±1.34»»■b Means within a row followed by like letters do not differ (p>0.05).' PM = Pyridoxamine; PMP = Pyridoxamine Phospate; PN = Pyridoxins; PL = Pyridoxal;
PLP = Pyridoxal Phosphate.
0.1N HCL, 1 mL/min. An effluent volume of 10 mL was collected in a small opaque bottle with pH 1.5. The pH was adjusted, using a Microprocessor Ionanalyzer, model 901 (Orion Research, Cambridge, MA), to pH 6.5 to 7.5.
Identification of the vitamers was by addition of known standards for the five vitamers to the chicken samples. This was accomplished by adding a standard solution with a 2 -g chicken sample and the 10 mL of SSA. Contained in the SSA solution was the internal standard, HOP. Therefore the internal standard was added at the beginning of extraction.
Vitamers were quantified with use of the internal standard HOP. The integrator was programmed to compare the loss of the HOP peak to that of the other vitamers. This adjusted losses from the extraction procedure for all the vitamers.
Recoveries in the chicken samples were accomplished by two separate analyses of the same chicken piece. The first sample was analyzed without added B6 vitamers from a standard. The second sample was analyzed after addition of a known amount of standard B6 vitamer solution.
Sample preparation
All chicken samples were purchased locally at a Kentucky Fried Chicken Restaurant. Chicken breasts were halved by an employee of the restaurant. One half was left raw and the other half was cooked under normal conditions at the establishment. All pieces were placed in plastic bags, labeled, and transported to the laboratory in an iced container. Chicken thigh pieces were purchased fried only.
Chicken samples were removed one at a time and weighed intact. Meat and skin were removed from the bone and separate components were weighed. The meat and skin were separated into smaller pieces and blended in a food processor (Cuisinart, Model DLC-10E, Norwalk, CT) for one min. Samples were placed in a freeze-drier flask and frozen at -50°C (Isotemp Freezer, Model 212Z, Pittsburgh, PA)
506-JOURNAL OF FOOD SCIENCE-Volume 58, No. 3, 1993

Table 3 - B s vitam er content o f raw compared to matched processed chicken breast halves«lo u ie z u 6
1Fried chicken breasts
2 3 Means 1Raw chicken breasts 2 3 Means
Vitamers*PM 0.40 0.15 0.36 0.30 0.30 0.25 0.54 0.36PMP 12.68 13.66 10.74 12.36 5.48 8.44 7.05 6.99PN 1.23 2.61 2.90 2.25 -0- -0- -0- -0-PLP 3.865 7.10 6.89 5.95 7.32 18.10 12.23 12.55TOTAL 20.86TOTAL WITHOUT PN 18.61 19 90
» PM = Pyridoxamine; PMP = Pyridoxamine Phosphate; PN = Pyridoxins; PLP = Pyridoxal Phosphate.
for 2 hr. After freezing, samples were weighed and dehydrated on a Freezedryer 5 (Labconco, Corp., Kansas City, MO) for ~ 15 hr. After freeze-drying, the chicken was removed, blended in a food processor (Cuisinart, Model DLC-10E, Norwalk, CT), and weighed into 2-g samples. The samples were wrapped in weighing paper, labelled, placed in plastic sealed containers blanketed with nitrogen and held at -50°C (Isotemp Freezer, Model 212Z, Pittsburgh, PA) until analysis.
Statistical analysis
Data were analyzed with use of the Statistical Analysis System (SAS Institute, Inc. 1985). Analysis of variance (PROC GLM) and Tukey’s test were used to determine significant differences among means where appropriate.
RESULTS & DISCUSSIONA TYPICAL chromatogram of the B6 vitamer standard (Fig.1) shows concentrations of standards were set to best represent each vitamer in the chicken samples. Recoveries for the B6 standard were 96% to 100% for the isocratic system (Table1). Ang and coworkers (1988) reported recoveries of 87-100% for the standard.
Limits of the systemThe limits of the analysis process were determined by ana
lyzing different amounts of standard vitamer solution. Known concentrations of each Bs vitamer were analyzed as were areas which correlated with concentrations. This was done in a progressive manner to determine if areas increased linearly with concentrations of the vitamers. Correlation coefficients were all 0.99 except PL which was 0.98. The lower levels of detection were: 0.79 ng for PM, 0.78 ng for PMP, 2.68 ng for PLP, 1.26 ng for PN, and 1.24 ng for PL.
Chicken sample recoveriesMean percent recoveries (and standard deviations) for each
of the B6 vitamers in the fried chicken breast and thigh samples were compared with those of the raw chicken breast samples (Table 1). Five recovery analyses per chicken sample were completed. Mean recoveries of vitamers in fried chicken breast samples ranged from 95.7% to 101.9%.
Recoveries of the vitamers in fried chicken thigh samples (Table 1) for PM, PMP, PN, and PL were 94% to 105%. The PLP percent recovery was lowest, 83.3%. This could be the result of the smaller PLP vitamer amounts in the thigh tissue, and thus reduced sensitivity.
The percent recoveries in the raw chicken breast samples (Table 1) were lower than the fried chicken samples. Means ranged from 86% to 101%. Reduced recoveries for PM and PMP may be explained by the smaller amounts of these vitamers in samples. A typical chromatogram for raw chicken breast samples is shown (Fig. 2).
Gregory and Feldstein (1985) reported recoveries of 78.7% for PLP and 86.7% for PL in raw pork. Vanderslice and co- workers (1984) reported recoveries of 95% and 100% for PLP and PL, respectively, in raw chicken samples. Ang and co
workers (1988) also reported lower recoveries for PLP (77.5% boiled, 78.1% fried chicken) and PL (76.9% boiled chicken) compared to recoveries of PM, PMP, and PN.
B6 vitamer content of fried chicken samplesFried chicken breast samples (36) collected from Kentucky
Fried Chicken were analyzed for various vitamers of Bs. There was no PNP or PL detected in the fried samples. PN was only in the fried chicken samples due to flour-based breading. As found by other researchers (Gregory and Feldstein, 1985; Lek- lem and Reynolds, 1988; and Vanderslice et al., 1984), PN is found in plant systems, while PMP and PLP are the primary vitamers in muscle tissues. The predominant vitamer in fried chicken breast samples was PMP (Table 2). PLP was also found in these samples but in lesser amounts. PM and PN contributed only slightly to the total vitamin Bs in the fried chicken samples. PN is bound to a glucose molecule therefore the small amounts we found are subject to incorrect measurements of this vitamer form.
Fried chicken thigh samples were analyzed to compare the content of B6 vitamers in dark meat vs. light meat. As reported by Vanderslice and coworkers (1984) there was less PLP in chicken thigh tissue samples than in chicken breast samples (Table 2). This resulted in lower total vitamin B6 in thigh tissues.
Processing effect on vitamers of B6When chicken breasts were halved and the battered and fried
halves compared to the other halves left raw, (Table 3), the loss of total B6 during processing was about 6.5%, with overall retention 93.5%. Thus the vitamers appear to be stable to deep fat frying. The breading and batter may assist by trapping the liquid and therefore decreasing loss of the water-soluble vitamin.
The vitamin B6 found in the fast food fried chicken was less than that reported by Vanderslice and coworkers (1984), but more than that reported by Ang et al. (1988). Diet, exercise, stress of the bird, breed, age and sex and other factors after slaughter may affect the amount of vitamin B6 in animal tissues. Commercial establishments purchase chicken from different areas and farms and ship to widespread restaurants. This could explain some of the variation of vitamin Bs between individual samples.
CONCLUSIONSAN HPLC method gave the precision and sensitivity to analyze complex food systems for five of the six vitamers of B6. The method was successful in both fried and raw chicken. The method is simple and can be accomplished in less than 25 min per analysis. The effectiveness of the method to analyze for vitamers of Bf was verified in a complex food system, fried chicken. Further work is needed on quantification of PN. The extraction procedure did not separate PN from glucose, but if only nonplant foods were analyzed this would not be necessary. -Continued on page 561
Volume 58, No. 3, 1993-JOURNAL OF FOOD SCIENCE-507

Sensory Characteristics of Selected Species of FreshwaterFish in Retail Distribution
EDGAR CHAM BERS IV and AN IC E ROBEL
----------------------------ABSTRACT-----------------------------Flavor and texture profiles of the cooked flesh of selected freshwater fish in retail distribution were developed by a highly trained sensory panel. The intensity of a variety of flavor, aftertaste, and texture properties was characterized for each fish, including order of appearance for flavor characteristics. These data provide a first examination of the sensory properties of a variety of freshwater fish available to the consumer. A variety of species, including tilapia and hybrid bass, had overall fish-like flavor and texture, but also had some properties similar to white meats, such as chicken. Catfish was earthier, softer, and more gelatinous than most other freshwater fish studied.
Key Words: fish, flavor, texture, sensory
INTRODUCTION
REDUCTION or depletion of many ocean fish species, has resulted in use of lesser known fish (NAS, 1978). However, successful marketing of those fish, for commercial purposes, depends on consumer acceptance of their sensory properties. The importance of flavor and texture to overall acceptance for a variety of commercial fish products has been established. Connell and Howgate (1971) and Hamilton and Bennett (1983,1984) concluded that flavor was the most important determinant of acceptability. Wesson et al. (1979) and Sawyer et al.(1988) concluded that flavor characteristics were major factors in determining consumer acceptance. However, texture was more important for fish with mild flavor, for fish that exhibited low to moderate intensity of fishy and/or oxidized flavors, or for those consumers who did not prefer fish.
Prell and Sawyer (1988) and Cardello et al. (1982) described the flavor and texture respectively, of North Atlantic fish and grouped those fish into categories with similar flavor properties. In general, the groups could be described as (1) sweet- briny shellfish flavored/low flavor intensity, (2) earthy fla- vored/low flavor intensity (3) slightly fish oil/gamey flavored,(4) moderately fish/oil gamey flavored, and (5) fish that formed their own flavor groups.
For many years, farm-raised channel catfish have been of increasing economic importance (Mustafa and Medeiros, 1985). Much research has been done to improve catfish farming and processing. For example, flavor and texture research on catfish has been related to pond conditions, seasons, diet, storage, purging, and experimental flavors (Maligalig et al., 1973, 1975). Johnsen et al. (1987) developed a standard sensory descriptive language for evaluating the flavor of pond-raised channel catfish. Rounds et al. (1992) compared consumer acceptance of brown trout and rainbow trout. They found that acceptability depended on an interaction between species and the origin of the body of water in which they were grown. However, they did not study specific descriptive sensory characteristics. No studies were found that compared sensory characteristics of catfish or other fresh-water fish potentially available in retail markets.
Authors Chambers and Robe/ are affiliated with The Sensory Analysis Center, Justin Hall, Kansas State Univ., Manhattan, KS 66506-1407.
Our objective was to compare the flavor and texture of selected fresh-water fish available in retail markets.
MATERIALS & METHODSSamples
The fish included filets of pond-raised walleye (Kansas), crappie (Kansas), catfish (Kansas and Mississippi), large mouth bass (Kansas), and hybrid striped-white bass (Kansas); raceway-raised rainbow trout (Nebraska), Coho Salmon (Nebraska), white amur (Kansas), and catfish (Kansas); and tank-raised tilapia (Kansas). Most samples were obtained from retail markets in the Manhattan, KS area. A few samples were obtained directly from producers, but had been treated by producers as for retail distribution. Samples were from retail trade, thus information about growing conditions, diet, purging, and storage was not available for these specific fish because of variations in practices of suppliers. Whether fish were raised in a pond, raceway, or tank was known or could be determined. All fish were shipped to the retail outlet packed in ice or were previously frozen and “ thawed” during distribution to be sold in the “ fresh” seafood market. Testing was conducted in late spring through mid summer. Samples were purchased within 6 hr of receipt by the retail establishment, stored at 2°C, and tested within 2 days of purchase. Fish that smelled of trimethyl amine (“ old” or “ spoiled” ) either before or after cooking was not tested.
CookingFilets were cooked by steam baking. Filets (5) of each fish were
placed in a Reynolds® oven-film bag. The bag was closed and placed on a rack (25.4 cm x 16.5 cm) in a metal baking dish, and 15 2.5 cm slits were cut in the top and bottom of the bag to allow excess steam and drip losses to escape. Samples were cooked in film to prevent surface drying and browning. A thermometer was placed in the center of one filet. Fish were cooked at 204°C to an internal temperature of 80°C. Samples were served immediately.
Panelists
Professional panelists of The Sensory Analysis Center of Kansas State University participated in this study. The highly trained and experienced panelists had completed 120 hr of training in flavor and texture analysis and a minimum of 80 hr of general sensory testing and had experience in testing fish. In addition to that training, all panelists received five additional hours of orientation with flavor and texture references appropriate for this study. Ten panelists were used; five for texture profiling and five for flavor profiling. Typically, a minimum of four panelists is used for flavor profiling and six for texture profiling (Hootman, 1992) and the validity of panels using small numbers of trained panelists has been established (Chambers et al., 1981).
Test procedure
Flavor profile (Caul, 1957) and texture profile (Brandt et al., 1963) were adapted as the methods of evaluation. Flavor and texture profile have been reported for several different types of products such as fish (Prell and Sawyer, 1988), bread (Caul and Vaden, 1972; Chang and Chambers, 1992), and turkey patties (Chambers et al., 1992). Panelists sat at tables arranged to facilitate group discussion; no pre-deter- mined ballot was used. The intensity scale was 1 = threshold (barely perceptible) to 10 = extreme or strong. Zero was not used because attributes that do not have intensity would not appear in a profile.
For flavor, each panelist chewed a small bite of fish and individ
5 0 8 -JOURNAL OF FOOD SCIENCE-Volume 58, No. 3, 1993

ually recorded flavor notes, intensities, and the order of appearance of flavor characteristics. Aftertaste was recorded 60 sec after swallowing. For fish species with both light and dark flesh, the panel members selected bites that contained both flesh types. After individual tasting, discussions were held to reach consensus regarding the flavor properties. Retasting was allowed during the discussion period, but panelists limited retasting because of potential adaptation to flavor characteristics. Panelists then individually reevaluated samples. Fresh samples were provided every 20 min to ensure constant product. Apple slices and purified (reverse osmosis, distilled, deionized, carbon filtered) water was used to cleanse the palate between bites. Three to six sessions of 1 hr were required for each type fish to produce final consensus profiles.
For texture, visual characteristics were determined before the fish was cut into 2 cm sections for tasting. Each panelist evaluated the oral textural impressions on the first bite, took a second bite to determine the order of appearance of those characteristics, and took three additional bites of each sample to determine the intensity of each texture characteristic. As with flavor, individual profiles were discussed by the panel, members retasted samples, and consensus measures were determined. Texture profiles for each type of fish usually required two to three sessions for completion.
RESULTSFLAVOR and texture vocabulary, definitions, and references (where appropriate) are listed in Tables 1 and 2. The flavor terms were similar to those of Johnsen et al. (1987) and Prell and Sawyer (1988), although our panel separated certain terms and combined others in slightly different ways. Also, two reference chemicals, geosmin and 2-methylisoborneol, used by Johnsen et al. (1987) were unavailable to our panel at the time of testing; thus, the panel used different references for some terms. Our panel used a texture vocabulary similar to that used by Cardello et al. (1982), but added terms such as cohesiveness and gelatinous to describe characteristics that had not been included previously. Our panel also evaluated juiciness three times during chewing because, more than any other attribute, the time-intensity of that characteristic appeared important.
The flavor and texture profiles are given in Tables 3 and 4. Further descriptions of flavor and texture are included in the results for each fish. The profiles are meant to be used as a general guide to the flavor or texture that might be found in that fish species. They represent the fish tested in this study and may not account for genetic or seasonal variations nor for variations in feeding, growing, harvesting, processing, or distribution that may be represented in the retail market. Fish from other producers or suppliers may differ in some characteristics, such as earthy, salty, and decaying vegetation, which relate to feeding, purging, and processing.
Unlike Prell and Sawyer (1988), who noted wide variation within each fish type, our panelists reported little variation in samples of any specific fish type. Consensus descriptions of samples cooked on different days or from different purchases were similar within a fish type.
Rainbow trout (Nebraska raceway-raised)This trout had a moderate intensity of basic fish flavor, but
individual notes lacked balance and blendedness. A distinct fresh fish flavor was modified by a fish oil characteristic. A brief white meat impression mediated the fish flavor somewhat. This fish had moderate amplitude. Initial, very low, saltiness was followed closely by fresh fish and fish oil flavors that carried throughout the profile and into the aftertaste. The white meat, nutty/buttery, and sweet aromatics tempered the flavor but were not sustained. A metallic aromatic and mouth- feel and astringency on the tongue were perceived just before swallowing and lingered into the aftertaste, diminishing slightly. The overall textural impression was a firm, fibrous fish. This was one of the least juicy fish in the study, and juiciness declined to a slight amount just before swallowing. The flesh flaked into fibers that maintained firmness throughout chewing
Table 1—Fish ftavor vocabulary, definitions, references, and intensities'(where appropriate)________________________________________________Amplitude - Combhed impression of body or fullness of the flavor, im
pact and longev ty, and the balance and blendedness of the flavor notes.
Astringent - A drawing, drying, puckering mouthfeeling (trigeminal sensation). Reference: 0.1% alum = 7.
Bitter - The fundamental taste. Reference: 0.03% caffeine solutions = 3
Corn-like — The aromatics typical of canned sweet corn. Reference: Libby's canned whole kernel corn = 10
Dairy — the aromatics commonly associated with products made from cow's milk. Reference: milk (2% mllkfat) = 6.
Decaying vegetation - Moldy/mildew-llke aromatics associated with rotting plants. Refe-ence: Fresh, green corn husks stored at room temperature in a closed container (e.g., glass jar or plastic bag) for 1 week (or slightly longe-).
Earthy — The slightly musty aromatics associated with raw potatoes and damp humus, slightly musty notes. References: forest soil, raw button Mushroom = 8, raw white Irish potato, diced = 6
Fish Oil — The aromatics associated with fish oil as found in mackerel, canned sardines, or cod liver oil. Reference: Rugby cod liver oil = 10, 1 capsule Rugby cod liver oil broken and mixed with 20 ml. of soybean oil = 3
Fresh Fish — The aromatics associated with cooked fish that distinctively characterize it as fish, yet fresh. Reference: Elodea (an aquatic plant) growing in water (capped 1 hour prior to testing to intensify the aromatics) = 7
Iodine - The aronratlcs reminiscent of Iodine.Metallic aromatic — An aromatic associated with an oxidized silver (or
other oxidized metal) utensil when it is rubbed inside the mouth Metallic feel — A mouthfeeling (trigeminal sensation) associated with an
oxidized silver (or other oxidized metal) utensil when it is rubbed inside the mouth. Reference: 0.15% solution of ferrous sulfate In water = 7
Nutty/Buttery — The aromatics associated with chopped nuts, such as pecans or walnuts, or warm melted butter. Reference: Diamond shelled walnuts = 9
Oily — The aromatics associated with soybean oil. Reference: soybean oil = 4
Roasted — The a-omatics associated with slightly roasted fleshy li.e. meat) foods.
Salty — The fundamental taste. Reference: 0.2% NaCI In water = 2, 0.5% NaCI in water = 5
Shellfish — The aromatics associated with cooked shellfish such as lobster, crab, or scallops.
Sour - The fundamental taste. Reference: 0.08% citric acid in water = 7
Sweet Aromatics - A general aromatic typically associated with sweet materials (e.g. flowers, ripe fruit, bakery goods). Reference: Aroma of C&H Golden Brown Sugar = 8
White Meat — Recognition of the sample as distinctly white lean muscle tissue rather than another type of meat or protein. Reference: Freshchicken breast - heated in a microwave oven to 80° = 2_____________
1 Intensities range from 1 = barely perceptible to 10 = extreme or strong
and resulted in a moderate level of residual particles in the mouth. The trout had a low level of gelatinous feel.
Walleye (Kansas pond-raised)Walleye had a flavor comprised mainly of fresh fish and
white meat characteristics. The flavors had high impact, were blended, and were balanced by many other flavor notes. Consequently, walleye had a high amplitude. White meat and fresh fish notes carried throughout the flavor and into the aftertaste, where they diminished gradually. Attributes including sweet aromatics, corn-like flavor notes, a dairy impression similar to sweet cream, and nutty/buttery character enhanced the flavor. An oily aromatic (not fish oil) contributed to fullness of the base flavor. Very low intensity, metallic aromatic and mouth- feel were detected just before swallowing. This fish flaked easily into fibers that stayed moderately firm throughout chewing without becoming mushy. Ease of flaking probably resulted in firmness in the moderate range. Walleye was slightly juicy and had few residual particles. A slight gelatinous character was found near the spinal area.
White AmurWhite amur had low to moderate overall flavor intensity,
with a primary identity of white meat. Base flavor lacked full-
Volume 58, No. 3, 1993-JOURNAL OF FOOD SCIENCE-509

FISH - FLAVOR - TEXTURE . . .
Table 2 - Fish texture vocabulary, definitions, references, and intensities'Iwhere appropriate) and procedures for testing each attribute__________
Attributes:Chew Count - An indication of the rapidity of sample breakdown in the
mouth. 1 chew per second until ready to swallow. Chew on one side of mouth only. Each panelist determined a personal scale to relate chew count to the 1 to 10 intensity scale.
Cohesiveness of Mass — Degree to which the chewed mass holds together (i.e., forms a ball) during mastication. Reference: Raw button mushroom = 3, Hot dog = 5, Chicken breast = 8
Fibrous — The perception of filaments or strands of muscle tissue during mastication. Reference: Hot dog = 2, deli Turkey = 5, Chicken breast = 10
Firmness — Amount of force required to bite through the flesh when the sample is placed between the molar teeth. Reference: Hot dog, with cut surfaces placed next to tooth surfaces = 4, Chicken breast, placed to bite through muscle fibers = 9
Flaky-Oral (Self-Adhesiveness) - Inverse of the force required to separate fibers with the tongue when sample is place in the mouth and manipulated by the tongue against the roof of the mouth. Reference: Chicken breast = 1, Deli turkey = 6
Flaky-Visual/Hand (Self-Adhesiveness) - The ease of breaking the fish into small pieces with a fork. Reference: Deli turkey = 2, Canned Tuna = 5
Gelatinous — Thick, viscous (sometimes semi-solid) fluid that is slimy and slippery. Reference: Knox gelatin in water = 7
Juicy-Initial (Moisture Release) - Amount of liquid released when the sample is placed on tongue and pressed to the roof of the mouth. Reference: Hot dog = 5
Juicy-Mid-point (Moisture Retention) — Amount of liquid observed in the mass after 5 chews with the molar teeth. Reference: Deli turkey = 4, Hot dog = 7
Juicy-Final (Moisture Retention and Absorption) — Amount of liquid observed in the mass immediately just prior to swallowing. Reference: Nabisco Premium Unsalted Top cracker = 3, Hot dog = 7
Residual Particles - Particles remaining in mouth after mastication and swallowing. May be fibers, flakes, and/or granules. Reference: Mushrooms 3, Chicken breast = 8
References and Preparation:Canned Tuna = Starkist Solid Albacore canned tuna (water packed):
drained, placed on a plateChicken Breast = fresh chicken breast heated in a microwave oven to
80°CDeli Turkey = Dillon's Brand, No Salt, Low Fat Turkey Breast: sliced into
1.3 cm cubesGelatin = 1 Tablespoon Knox brand gelatin dissolved in 3 cups water,
refrigerated overnight, and served at room temperatureHot Dog = Bar S All Beef Franks: heated in boiling water for 4 minues,
cut into 1.3 cm slices, and served warmMushrooms = raw, button type, peeled, cut into 1.3 cm cubes' Intensities range from 1 =■ barely perceptible to 10 - extreme or strong
ness and complexity, although it was moderately blended with other flavor notes. It had a moderate amplitude. Initial fresh fish and earthy characteristics were brief. As those characteristics diminished, slightly metallic aromatic and mouthfeel characteristics were perceived that carried throughout the profile and into the aftertaste, decreasing in intensity. A group of flavor characteristics including white meat, nutty/buttery, and oily aromatics followed closely and dominated the flavor, but only the white meat maintained its identity in the aftertaste. The overall textural impression was similar to chicken breast. The flesh flaked into firm chicken breast-like fibers during chewing. Juiciness was high and maintained throughout mastication, forming a moderately moist cohesive mass at swallowing. A perceptible level of gelatinous character was variable and was noted on the surface.
Coho salmon (Nebraska raceway-raised)The overall flavor was of fresh fish and white meat. Other
low intensity flavor attributes contributed to the complexity of the flavor. It was moderately balanced and blended with a full base. Fresh fish and a slight fish oil character were the first flavor notes and gave an immediate fish identity. That was followed closely by a flavor group consisting of bitter, metallic, and sour, which resulted in a serum-like identity. Characteristics such as white meat, nutty/buttery, and sweet and oily aromatics balanced the flavor. The fresh fish and white
meat flavor notes were sustained in the aftertaste at slight levels. The metallic aromatics and mouthfeel and the bitterness in the aftertaste were present at very low levels that were diminished compared to levels in the flavor. The flesh flaked easily into short, individual fibers that stayed firm throughout mastication, similar to chicken breast fibers. This resulted in a moderate level of residual particles after swallowing. It was moderately juicy initially, and juiciness decreased gradually during chewing. Rather than fibers being moist, pockets of juice appeared to have coagulated in depressions of the fish, especially toward the tail. Coagulated juices had a grainy texture. A slight gelatinous characteristic was noted only near the surface and where the fins had been detached.
CrappieThis fish was extremely salty and had a chemical character
described as iodine. Other flavor notes were in the slight range. Attributes were neither blended nor balanced and lacked the base flavors typical of other fish. It had low amplitude. The flavor appeared indicative of fish that had been treated in a manner inconsistent with usual practices. It had salty, chemical-like, and shell-fish characters, attributes we do not believe are typical of crappie, but were evident in all samples we obtained. Typical fish flavor notes were difficult to detect and appeared at slight levels. After the initial salty and iodine-like flavor notes, which lingered throughout the flavor, brief shellfish, white meat, and nutty/buttery notes were perceived. However, the chemical grouping of salt, iodine, bitter, and metallic aromatics and mouthfeel quickly obliterated other flavor notes. This group of chemical-type flavors was apparent 60 sec after swallowing. Crappie maintained moistness throughout mastication. The flesh quickly broke into tiny fibers that immediately formed a moist, cohesive, mush-like mass. This ease of flaking also manifested itself in a low firmness score. The fish also had low residual particles and barely detectible gelatinous character.
Tilapia (Kansas tank-raised)Tilapia had three main flavor characteristics: roasted meat,
white meat, and fresh fish. Those were blended together to give a robust, complex flavor with a full base. Consequently, this fish had a high amplitude. All flavor notes came close together. A complex group of notes (roasted, oily, nutty/buttery, and sweet aromatics) combined with a white meat characteristic to give an overall roasted meat impression that carried throughout the flavor and into the aftertaste. Following closely behind those characteristics were earthy and sometimes decaying vegetation. When both notes occurred, a slight “ muddy” impression was perceived. A slight fresh fish character enhanced flavor and diminished in intensity at swallowing. A low serum-like impression of metallic and bitter occurred late and carried into the aftertaste. The oily flavor and a lingering astringency also appeared late in the flavor profile that continued to be dominated by the roasted meat/fish character. Tex- turally, tilapia was similar to chicken breast, except that it broke into flakes initially. The flesh was firmer than that of many other fish. A gelatinous character was rarely noted and its absence was conspicuous.
Channel catfish (Kansas pond-raised)This catfish had a full base flavor with a complex group of
flavor notes that were balanced and blended. Fresh fish in combination with earthy and decaying vegetation gave the fish its impact and identity. Although the flavor attributes did not form an overlapping group, they followed each other closely. The slight corn-like, nutty/buttery, and white meat attributes complemented and mediated the fresh fish and slight muddy (from earthy and decaying vegetation) character that would
5 10-JOURNAL OF FOOD SCIENCE-Volume 58, No. 3, 1993

Table 3—Flavor profiles of cooked freshwater fish‘d Table 3 - Continued
Rainbow Trout(Nebraska Raceway)' Walleye (Pond)'
White Amur (Raceway)'
Channel Catfish (Pond)
Channel Catfish (Raceway)
Channel Catfish (Mississippi Pond)
Flavor: Flavor: Flavor:
Amplitude 7 Amplitude 9 Amplitude 6
Salty 2 Salty 1 Fresh fish 5Fresh fish 7 Fresh fish 7 Earthy 3Fish oil 5 White meat 7 Metallic aromatic 3White meat 5 Sweet aromatic 3 Metallic feel 3Nutty/buttery 4 Corn-like 3 White meat 7Sweet aromatic 2 Dairy 3 Nutty/buttery 4Metallic aromatic 3 Nutty/buttery 5 Oily aromatic 2Metallic feel 2 Oily aromatic 2 Bitter 2Astringent 2 Metallic aromatic 2
Metallic feel 2
Aftertaste: Aftertaste Aftertaste:
Fish oil 3 Fresh fish 4 White meat 3Fresh fish 3 White meat 4 Metallic aromatic 2Metallic feel 2 Metallic aromatic 1 Metallic feel 2Astringent 1Metallic aromatic 1
Coho Salmon(Nebraska Raceway)' Crappie' Tilapia (Tank)
Flavor: Flavor: Flavor:
Amplitude 8 Amplitude 3 Amplitude 9
Fresh fish 6 Salty 9 Roasted 6Fish oil 3 Iodine 6 Oily aromatic 3Salty 2 Bitter 3 Nutty/buttery 5Bitter 3 Shellfish 4 Sweet aromatic 2Metallic aromatic 3 White Meat 4 White meat 8Metallic feel 4 Nutty/buttery 3 Earthy 3Sour 2 Metallic Aromatic 4 Decaying vegeta 1
tionWhite meat 6 Metallic feel 4 Fresh fish 5Nutty/buttery 3 Metallic feel 1Sweet aromatic 2 Bitter 1Oily aromatic 3 Salty 2
Astringent 1
Aftertaste: Aftertaste: Aftertaste:
Fresh fish 3 Salty 3 Roasted 2White meat 3 Iodine 3 White meat 1Metallic aromatic 2 Bitter 2 Fresh fish 1Metallic feel 2 Metallic aromatic 3 Bitter 1Bitter 2 Metallic feel 1
Astringent 1
Flavor: Flavor: Flavor:
Amplitude 8 Amplitude 6 Amplitude 7
Salty 1 Fresh fish 7 Earthy 8Fresh fish 7 Earthy 4 Decaying vegeta- 4
tionEarthy 6 White meat 5 Salty 1Decaying vegeta- 1 Nutty/buttery 4 Fresh fish 7
tionCorn-like 3 Oily aromatic 4 Oily aromatic 7Sweet aromatic 3 Sweet aromatic 2 Nutty/buttery eNutty/buttery 5 Salty 1 Sweet aromatic 2White meat 4 Metallic feel 1 White meat 2Oily aromatic 4 Bitter 1 Bitter 2Bitter 1 Metalic aromatic 2Sour 1 Sour 2Metallc feel 1 Metallic feel 1
Astringent 5
Aftertaste: (60 sec) Aftertaste: (60 sec) Aftertaste: (60 sec)
Earthy 2 Fresh fish 1 Earthy 4Fresh fish 2 Earthy 1 Fresh fish 3Metallic feel 1 Astringent 2 Metallic feel 1Astringent 2 Astringent 4
Large Mouth Hybrid Striped-WhiteBass(Pond) Bass (Pond)
Flavor: Flavor:Amplitude 6 Amplitude 7
Fresh fish 6Salty 2 Fish oil 3Fresh fish 5 White meat 8Earthy 2 Salty 1White meat 5 Earthy 3Nutty/buttery 2 Nutty/buttery 2Sweet aromatic 2 Sweet aromatic 1Metallic aromatic 2 Bitter 1Metallic feel 2 Sour 2
Metallic feel 2Astringency 4
Aftertaste: (60 sec) Aftertaste: (60 sec)
Fresh Fish 3 Fish oil 1White Meat 2 Fresh fish 1Metallic Aromatic 1 Metallic feel 1
Astringent 3a Unless otherwise noted, fish were raised in Kansasb Intensities range fro n 1 = barely perceptible to 10 = extreme or strongc Samples were obtained as "fresh," but had been previously frozen for distribution.
have been dominant without them. Just before swallowing, oily aromatic and serum-like characters, consisting of slight bitter, sour, and metallic notes, were apparent. The flavor diminished rapidly, leaving barely perceptible levels of several characteristics in the aftertaste. These samples were highly gelatinous and high in juiciness. Flesh separated easily into segments and then into many short fibers, sometimes described as “ mushy.” It was among the least firm of the fish we studied and had few residual particles.
Channel catfish (Kansas raceway-raised)The flavor notes in this catfish were low in intensity, except
the fresh fish characteristic that combined with an earthy note to give the fish its main identity. The flavor was blended but unbalanced, with low base flavor properties. It had a low- moderate amplitude. The initial fresh fish and earthy characteristics carried throughout the flavor and into the aftertaste, decreasing in intensity. A white meat character became apparent as initial flavor diminished. That was followed closely by a group of nutty/buttery, oily, and sweet aromatics that did not last. A salty taste and a serum-like impression from metallic and bitter character occurred late in the flavor. A slight lingering astringency was apparent in the aftertaste. These raceway-raised catfish filets were smaller than the other catfish
filets. With little effort, the filets broke apart into uneven chunks. The size probably also contributed to lower fibrousness as compared to the other two types of catfish studied.
Channel catfish (Mississippi pond-raised)
This catfish had a full base flavor, but had one flavor group, “ muddy” (composed of earthy and decaying vegetation), that dominated the other flavors. It had moderate amplitude. The “ muddy” flavor of this fish (neither typical nor atypical of catfish) depends on growing and processing conditions. The earthiness combined with decaying vegetation and barely perceptible saltiness formed a tight flavor group. A moderate level of fresh fish mediated the character of the “ muddy” flavors, but did not reduce their impact or longevity. However, oily, nutty/buttery, sweet aromatics and a white meat impression also were perceived. A final group of notes described as serumlike, that consisted of bitter, sour, and metallic, was apparent. Just before swallowing, an astringent character was noted. Most flavor notes diminished gradually, leaving earthy, fresh fish, metallic, and astringent in the aftertaste. Slightly more initial gelatinous character was observed in this catfish than in the others. It also was slightly more visually flaky and slightly less
Volume 58, No. 3, 1993-JOURNAL OF FOOD SCIENCE-511

FISH - FLAVOR - TEXTURE . . .
Table 4 — Texture profiles o f cooked freshwater fish‘ d
Rainbow Trout(Nebraska Raceway)' Walleye (Pond)' White Amur*
Flaky, visual 4 Flaky, visual 6 Flaky, visual 8Gelatinous 2 Gelatinous 3 Gelatinous 1-3Juicy, initial 5 Juicy, initial 5 Juicy, initial 8Flaky, oral 6 Flaky, oral 7 Flaky, oral 9Firm 8 Firm 6 Firm 7Fibrous 7 Fibrous 6 Fibrous 8Juicy, midpoint 5 Juicy, midpoint 5 Juicy, midpoint 8Cohesive 7 Cohesive 6 Cohesive 8Juicy, final 3 Juicy, final 4 Juicy, final 6Residuals 6 Residuals 4 Residuals 6Chew count 7 Chew count 6 Chew count 7
Coho Salmon(Nebraska Raceway)' Crappie' Tilapia (Tank)
Flaky, visual 6 Flaky, visual 6 Flaky, visual 7Gelatinous 2 Gelatinous 1 Gelatinous 0-1Juicy, Initial 7 Juicy, initial 6 Flaky, oral 8Flaky, oral 8 Flaky, oral 6 Juicy, initial 7Firm 6 Firm 4 Firm 7Fibrous 8 Fibrous 6 Fibrous 8Juicy, midpoint 6 Juicy, midpoint 6 Juicy, midpoint 5Cohesive 8 Cohesive 6 Cohesive 8Juicy, final 5 Juicy, final 4 Juicy, final 4Residuals 5 Residuals 4 Residuals 6Chew count 7 Chew count 6 Chew count 7
Channel Catfish Channel Catfish Channel Catfish(Pond) (Raceway) (Mississippi Pond)
Flaky, visual 4 Flaky, visual 7 Flaky, visual 6Gelatinous 7 Gelatinous 7 Gelatinous 8Juicy, initial 8 Juicy, initial 7 Juicy, initial 8Flaky, oral 8 Flaky, oral 7 Flaky, oral 8Firm 4 Firm 7 Firm 4Fibrous 4 Fibrous 3 Fibrous 4Juicy, midpoint 8 Juicy, midpoint 6 Juicy, midpoint 8Cohesive 7 Cohesive 5 Cohesive 5Juicy, final 7 Juicy, final 5 Juicy, final 7Residuals 4 Residuals 4 Residuals 4Chew count 7 Chew count 7 Chew count 6
Large Mouth Bass Hybrid Striped*White(Pond) Bass(Pond)
Flaky, visual 5 Flaky, visual 5Gelatinous 2 Gelatinous 2Juicy, initial 6 Juicy, initial 5Flaky, oral 6 Flaky, oral 6Firm 6 Firm 7Fibrous 8 Fibrous 8Juicy, midpoint 6 Juicy, midpoint 6Cohesive 7 Cohesive 9Juicy, final 5 Juicy, final 5Residuals 4 Residuals 8Chew count 8 Chew count 10* Unless otherwise noted, fish were raised in Kansas and had never
been frozenb Intensities range from 1 = barely perceptible to 10 = extreme or strong ' Samples were obtained as "fresh", but had been previously frozen for
distribution.
cohesive than the other pond raised catfish, but generally they were similar in texture.
Large mouth bass (Kansas pond-raised)
The fresh fish and white meat characteristics gave this fish its identity. Flavor notes were balanced and blended, but lacked complexity and intensity. This fish had a low-moderate amplitude. Following a slight saltiness, the fresh fish and earthy notes came close together and were followed immediately by a white meat flavor character. Slight nutty/buttery and sweet aromatics mediated the flavor, but did not last. A slight metallic was perceived late in the profile and lingered in the aftertaste along with fresh fish and white meat characteristics. The flesh flaked easily into large segments, but individual segments were somewhat more difficult to flake. The segments gradually separated into small distinct fibers during chewing
that maintained firmness throughout mastication. It had little gelatinous character and few residual particles.
Hybrid striped white bass (Kansas pond-raised)White meat and fresh fish characteristics gave this hybrid
bass its flavor identity. It was balanced and blended with moderately intense base flavors. It had a moderate amplitude. The initial flavor notes, consisting of fresh fish, fish oil, and white meat, came very close together. The fish-like characteristics carried throughout the flavor and into the aftertaste. Occasionally, pockets of fish oil were perceived that increased fish oil flavor intensity. An earthy note also appeared along with brief nutty/buttery and sweet aromatics. A serum-like character, from bitter, sour, and metallic flavor notes, occurred late and tended to linger. An astringent character was noted just before swallowing. The texture was firm and fibrous. It was the most cohesive of any fish in this study and was slightly less juicy than others. Hybrid bass had low gelatinous character and many residual particles.
DISCUSSIONAS EXPECTED, flavors of these fish were fundamentally different from those of the North Atlantic fish described by Prell and Sawyer (1988). These fish typically had a white meat character not found in ocean fish and much less saltiness. However, some samples had flavor attributes, such as fresh fish and low levels of sour and earthy, in common with ocean species. The fish in our study represented a variety of species and methods for raising freshwater fish. Consequently, the fish afforded a variety of flavors. Pond-raised catfish had some degree of “ muddiness” not found.in all pond-raised fish nor in all catfish. Several raceway-raised fish also had low flavor intensities, and the least complex flavors in this study, suggesting that use of raceways may be appropriate for producing bland, mild flavored fish. Tilapia, the only tank-raised species in our study and of much interest, was the only fish with a roasted meaty character. Almost all the fish had perceptible levels of metallic, bitter, and sour, suggesting that these attributes are part of a more generic “ fish” flavor. Those attributes also were reported in many of the ocean species studied by Prell and Sawyer (1988).
Some of the greatest differences among the fish were reported in texture. All catfish samples were much more gelatinous than any other fish and juicier than most others. Several, including tilapia, trout, white amur, and the two types of bass, were firm and fibrous and, with exception of the flakiness typical of fish, had texture similar to chicken breast.
These fish appeared more related to ocean species in texture than in flavor. Striped bass, the only fish studied in both our freshwater research and as an ocean species by Cardello et al. (1982), had similar texture in both studies. The firm, fibrous, freshwater fish described in our study appeared to be similar in texture to the cusk, grouper, and striped bass described by Cardello et al. (1982). Similarly, the low firm, low fibrous, very juicy fish in our study (primarily catfish) may be texturally related to ocean species such as wolffish, although there were differences. The flavor and texture data from this report provide a first look at sim ilarities in sensory properties among freshwater fish species and a comparison to ocean species. Such information is important to researchers developing new fish hybrids or growing/processing facilities for freshwater fish.
REFERENCESBrandt, M.A., Skinner, E.Z., Coleman, J.A. 1963. Texture profile method.
J. Food Sci. 28: 404-409.Cardello, A.V., Sawyer, F.M., Mailer, 0., and Digman, L. 1982. Sensory
—Continued on page 561
512-JOURNAL OF FOOD SCIENCE-Volume 58, No. 3, 1993
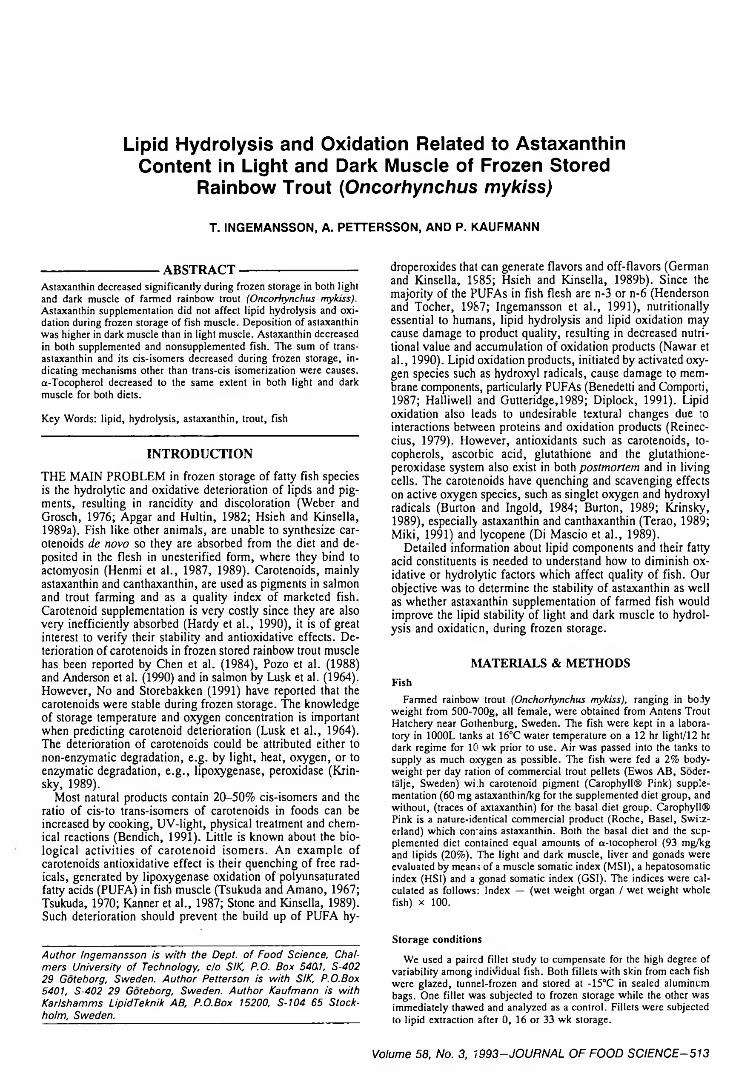
Lipid Hydrolysis and Oxidation Related to Astaxanthin Content in Light and Dark Muscle of Frozen Stored
Rainbow Trout (O n c o rh y n c h u s m ykiss)
T. ING EM ANSSO N, A. PETTERSSON, AND P. KAUFM ANN
----------------------------ABSTRACT-----------------------------Astaxanthin decreased significantly during frozen storage in both light and dark muscle of farmed rainbow trout (Oncorhynchus mykiss). Astaxanthin supplementation did not affect lipid hydrolysis and oxidation during frozen storage of fish muscle. Deposition of astaxanthin was higher in dark muscle than in light muscle. Astaxanthin decreased in both supplemented and nonsupplemented fish. The sum of trans- astaxanthin and its cis-isomers decreased during frozen storage, indicating mechanisms other than trans-cis isomerization were causes. a-Tocopherol decreased to the same extent in both light and dark muscle for both diets.
Key Words: lipid, hydrolysis, astaxanthin, trout, fish
INTRODUCTION
THE MAIN PROBLEM in frozen storage of fatty fish species is the hydrolytic and oxidative deterioration of lipds and pigments, resulting in rancidity and discoloration (Weber and Grosch, 1976; Apgar and Hultin, 1982; Hsieh and Kinsella, 1989a). Fish like other animals, are unable to synthesize carotenoids de novo so they are absorbed from the diet and deposited in the flesh in unesterified form, where they bind to actomyosin (Henmi et al., 1987, 1989). Carotenoids, mainly astaxanthin and canthaxanthin, are used as pigments in salmon and trout farming and as a quality index of marketed fish. Carotenoid supplementation is very costly since they are also very inefficiently absorbed (Hardy et al., 1990), it is of great interest to verify their stability and antioxidative effects. Deterioration of carotenoids in frozen stored rainbow trout muscle has been reported by Chen et al. (1984), Pozo et al. (1988) and Anderson et al. (1990) and in salmon by Lusk et al. (1964). However, No and Storebakken (1991) have reported that the carotenoids were stable during frozen storage. The knowledge of storage temperature and oxygen concentration is important when predicting carotenoid deterioration (Lusk et al., 1964). The deterioration of carotenoids could be attributed either to non-enzymatic degradation, e.g. by light, heat, oxygen, or to enzymatic degradation, e .g ., lipoxygenase, peroxidase (Krin- sky, 1989).
Most natural products contain 20-50% cis-isomers and the ratio of cis-to trans-isomers of carotenoids in foods can be increased by cooking, UV-light, physical treatment and chemical reactions (Bendich, 1991). Little is known about the biological activities of carotenoid isom ers. An exam ple of carotenoids antioxidative effect is their quenching of free radicals, generated by lipoxygenase oxidation of polyunsaturated fatty acids (PUFA) in fish muscle (Tsukuda and Amano, 1967; Tsukuda, 1970; Kanner et al., 1987; Stone and Kinsella, 1989). Such deterioration should prevent the build up of PUFA hy-
Author Ingemansson is with the Dept, o f Food Science, Chalmers University of Technology, c/o SIK, P.O. Box 540,1, S-402 29 Goteborg, Sweden. Author Petterson is with SIK, P.O.Box 5401, S-402 29 Goteborg, Sweden. Author Kaufmann is with Kartshamms LipidTeknik AB, P.O.Box 15200, S-104 65 Stockholm, Sweden.
droperoxides that can generate flavors and off-flavors (German and Kinsella, 1985; Hsieh and Kinsella, 1989b). Since the majority of the PUFAs in fish flesh are n-3 or n-6 (Henderson and Tocher, 1987; Ingemansson et al., 1991), nutritionally essential to humans, lipid hydrolysis and lipid oxidation may cause damage to product quality, resulting in decreased nutritional value and accumulation of oxidation products (Nawar et al., 1990). Lipid oxidation products, initiated by activated oxygen species such as hydroxyl radicals, cause damage to membrane components, particularly PUFAs (Benedetti and Comporti, 1987; Halliwell and Gutteridge,1989; Diplock, 1991). Lipid oxidation also leads to undesirable textural changes due to interactions between proteins and oxidation products (Reinec- cius, 1979). However, antioxidants such as carotenoids, to- copherols, ascorbic acid, glutathione and the glutathione- peroxidase system also exist in both postmortem and in living cells. The carotenoids have quenching and scavenging effects on active oxygen species, such as singlet oxygen and hydroxyl radicals (Burton and Ingold, 1984; Burton, 1989; Krinsky,1989), especially astaxanthin and canthaxanthin (Terao, 1989; Miki, 1991) and lycopene (Di Mascio et al., 1989).
Detailed information about lipid components and their fatty acid constituents is needed to understand how to diminish oxidative or hydrolytic factors which affect quality of fish. Our objective was to determine the stability of astaxanthin as well as whether astaxanthin supplementation of farmed fish would improve the lipid stability of light and dark muscle to hydrolysis and oxidation, during frozen storage.
M A TE R IA LS & M ETH O D SFish
Farmed rainbow trout (Onchorhynchus mykiss), ranging in body weight from 500-700g, all female, were obtained from Antens Trout Hatchery near Gothenburg, Sweden. The fish were kept in a laboratory in 1000L tanks at 16°C water temperature on a 12 hr light/12 hr dark regime for 10 wk prior to use. Air was passed into the tanks to supply as much oxygen as possible. The fish were fed a 2% body- weight per day ration of commercial trout pellets (Ewos AB, Soder- talje, Sweden) wi:h carotenoid pigment (Carophyll® Pink) supplementation (60 mg astaxanthin/kg for the supplemented diet group, and without, (traces of axtaxanthin) for the basal diet group. Carophyll® Pink is a nature-identical commercial product (Roche, Basel, Switzerland) which contains astaxanthin. Both the basal diet and the supplemented diet contained equal amounts of a-tocopherol (93 mg/kg and lipids (20%). The light and dark muscle, liver and gonads were evaluated by means of a muscle somatic index (MSI), a hepatosomatic index (HSI) and a gonad somatic index (GSI). The indices were calculated as follows: Index — (wet weight organ / wet weight whole fish) x 100 .
Storage conditions
We used a paired fillet study to compensate for the high degree of variability among individual fish. Both fillets with skin from each fish were glazed, tunnel-frozen and stored at -15°C in sealed aluminum bags. One fillet was subjected to frozen storage while the other was immediately thawed and analyzed as a control. Fillets were subjected to lipid extraction after 0, 16 or 33 wk storage.
Volume 58, No. 3, 1993-JOURNAL OF FOOD SCIENCE-513

ASTAXANTHIN AND LIPID DETERIORATION IN TROUT. . .
Total FFAs: 14:0 16:0 16:1 n-7 18:0 18:1 n-9 18:1 n-7 18:2 n-6 18:3 n-3 18:4 n-3 20:1 n-9 20:4 n-6 20:4 n-3 20:5 n-3 22:1 n-11 22: 5n-3 22:6 n-3
Table I -D e v e lo p m e n t o f free fa tty acids du ring frozen storage o f lig h t and da rk m usc le fro m fish fe d basal o r supp lem e n ted d ie t•
Basal Diet _________ ______________________Supplemented Diet____________Owk 16 wk 33 wk
Light______ Dark Light Dark Light Dark0.6 + 0.3 0.8 ±0.2 6.7 ±0.3 3.9 ±0.4 14.9 ±3.7 7.0 ±1.31.6 ±0.1 1.9 ±0.1 2.0 ±0.1 2.5 ±0.1 4.5 ±0.7 5.4 ±0.2
27.8 ±0.8 23.4 ±0.5 27.1 ±0.6 22.5 ±0.4 19.2 ±0.2 15.6 ±0.53.2 ±0.3 4.8 ±0.3 5.3 ±0.3 6.4 ±0.4 4.7 ±0.8 5.6 ±0.17.4 ±0.7 6.3 ±0.8 2.9 ±0.1 2.9 ±0.1 2.3 ±0.2 2.4 ±0.19.4 ±0.6 11.7 ±1.1 9.0 ±0.6 11.0 ±0.5 7.4 ±1.7 9.6 ±0.12.7 ±0.2 2.9 ±0.3 2.7 ±0.2 3.0 ±0.1 2.0 ±0.2 1.2 ±1.14.5 ±0.2 5.5 ±0.1 4.1 ±0.3 5.9 ±0.3 3.1 ±0.6 4.5 ±0.71.2 ±0.1 1.4 ±0.1 1.3 ±0.1 2.0 ±0.1 0.9 ±0.0 1.4 ±0.21.1 ±0.1 1.2 ±0.1 1.2 ±0.1 1.7 ±0.1 2.2 ±0.4 3.3 ±0.84.2 ±0.1 4.7 ±0.2 3.1 ±1.0 4.3 ±0.3 3.4 ±0.9 3.1 ±0.50.8 ±0.1 0.8 ±0.1 0.8 ±0.0 0.8 ±0.0 0.0 ±0.0 0.6 ±0.20.7 ±0.1 0.7 ±0.1 0.9 ±0.0 0.9 ±0.0 1.2 ±0.3 1.3 ±0.19.5 ±0.4 7.9 ±0.2 10.3 ±0.5 9.0 ±0.3 12.5 ±0.4 11.5 ±0.45.1 ±0.3 6.2 ±0.2 4.0 ±0.3 3.3 ±0.4 4.3 ±1.4 4.3 ±0.61.3 ±0.1 1.4 ±0.1 1.5 ±0.1 1.9 ±0.0 2.4 ±0.3 2.8 ±0.7
19.4 + 0.6 18.8 + 0.9 23.8 ±0.9 21.8 ±1.4 29.7 ±7.1 27.1 ±4.3
Owk 16 wk 33 wkLight Dark______ Light Dark______ Light Dark
1.1 ±0.3 1.1 ±0.3 10.2 ±0.6 5.3 ±0.7 11.2 ±1.8 7.9 ±0.41.5 ±0.2 1.9 ±0.1 2.2 ±0.1 2.4 ±0.1 4.0 ±0.4 4.8 ±0.4
27.7 ±0.9 24.9 ±0.5 26.7 ±0.7 22.5 ±0.6 18.3 ±0.8 16.2 ±1.03.2 + 0.2 4.8 + 0.5 5.3 ±0.4 6.8 ±0.2 4.6 ±0.3 6.1 ±0.78.2 ±0.6 7.5 ±0.9 2.2 ±0.2 2.4 ±0.2 1.8 ±0.1 2.2 ±0.1
10.8 ±0.7 11.7 ±2.1 9.0 ±0.5 11.3 ±0.3 6.7 ±0.4 7.8 ±0.71.3 ±0.4 1.2 ±0.2 2.4 ±0.1 2.9 ±0.1 1.6 ±0.1 1.8 ±0.14.5 ±0.3 6.4 ±0.9 3.8 ±0.1 5.7 ±0.2 3.0 ±0.2 3.8 ±0.41.2 ±0.1 1.5 ±0.1 1.1 ±0.0 1.7 ±0.2 1.0 ±0.1 1.2 ±0.20.9 ±0.1 1.3 + 0.1 1.2 ±0.1 1.7 ±0.1 2.2 ±0.1 2.5 ±0.24.2 ±0.2 4.7 ±0.2 3.9 ±0.2 4.6 ±0.2 2.8 ±0.2 3.1 ±0.30.9 ±0.1 0.9 ±0.1 0.8 ±0.0 0.8 ±0.0 0.7 ±0.0 0.7 ±0.10.7 ±0.1 0.7 ±0.1 0.8 ±0.0 0.8 ±0.0 1.0 ±0.1 1.2 ±0.18.8 ±0.4 6.7 ±0.6 10.8 ±0.5 8.9 ±0.1 13.4 ±0.6 12.1 ±0.64.7 ±0.3 5.8 ±0.4 3.9 ±0.3 4.3 ±0.4 3.3 ±0.2 3.4 ±0.41.4 ±0.1 1.5 ±0.1 1.3 ±0.1 1.6 ±0.1 1.7 ±0.5 2.7 ±0.3
20.0 ±1.3 18.4 ±0.9 24.4 ±1.5 21.7 + 1.0 33.7 ±0.9 30.3 ±1.9• Values are weight percentages ± S.E.M. of total FFAs, and total content FFA of total lipids In light and dark muscle. Number of fish, light and dark muscle, fed basal diet at 0
wk, n -7 ; at 16 wk, n= 4; at 33 wk, n -3 , and fed supplemented diet at 0 wk, n -1 0 ; at 16 wk, n -5 ; and at 33 wk, n = 5.
Table 2 - Content o f cis- and trans-astaxanthin and ot-tocopherol in basal and supplemented light and dark fish muscle measured before frozen storage with HPLC‘________________________________________________
Basal diet____________Supplemented dietLight muscletrans-astaxanthin 1.3 ± 0.2 (4) 1.9 ± 0.3 (9)
cis-astaxanthln 0.16 ± 0.03 (4) 0.33 ± 0.07 (9)a-tocopherol 4.4 ± 1.1 (5) 8.0 ± 1.5 (8)
Dark muscletrans-astaxanthin 1.3 ± 0.2 (6) 6.2 ± 0.7 (9)
cis-astaxanthln 0.14 ± 0.03 (5) 0.54 ± 0.11 (10)a-tocopherol 15.3 ± 2.3 (6) 24.8 ± 3.3 (8)
* Values are mg/kg wet tissue ± S.E.M. Number of fish in parenthesis.
Lipid analysisLipids were extracted from the light and dark muscle (separated by
manual dissection) according to Ingemansson et al. (1991). The lipid residues were stored in chloroform at -40°C in an argon atmosphere. Lipid classes were analyzed by straight-phase HPLC together with an ACS 750/14 light scattering detector according to Ingemansson et al. (1991). Methyl ester derivatives of the total fatty acids were prepared by an alkali methanolysis procedure according to Olsson et al. (1990) and Ingemansson et al. (1991) with the following modification; the methyl esters were purified on a prepacked slica cartridge (Chroma- bond, Macherey & Nagel, Diiren, Germany) and eluted with hexane/ diethylether (95.5 v). The free fatty acids (FFA) were converted to ammonium salts and separated on a SepPak silica cartridge according to the method of Ansari and Shoeman (1988). In the case of FFA the methyl esters were prepared by acidic methanolysis according to Kates(1971). The methyl estsers were analyzed by capillary GC equipped with an on-column injector, a fused silica column (DB-WAX) and a flame ionization detector according to Olsson et al. (1990) and Ingemansson et al. (1991) with the following modifications: internal diameter of the column was 0.25 mm and the temperature gradient was programmed after initial time of 2 min, from 130°C to 150°C at 50°C min' 1 and from 150°C at 3°C min' 1 to a final 220°C and with a final time interval of 15 min. This reduced the GC-analyzing time to about 40 min.
Carotenoid and a-tocopherol analysis
The light and dark muscle was prepared as for lipid analysis. The extraction of fish samples for determination of carotenoids and a- tocopherol was done according to Christophersen et al. (1989). A reversed-phase HPLC, equipped with a diode array detector (HP1090M, Hewlett Packard, Waldbronn Div., F.R.G.), was used for separation of cis- and trans-astaxanthin (Fig. 5) and a-tocopherol. The analytical column, a low carabon C18 (Vydac 201 TP54) 250 x 4.6 mm, 5 pm, was supplied with a guard cartridge (20 x 2.1 mm). Acetonitrile/ methanol (92.5/7.5 v) was used as mobile phase at 0.7 mL/min (22°C) according to modifications of Ben-Amotz et al. (1988) and Khachik(1989). With the diode array detector, we could continuously record spectra from 190 to 600 nm every 40 ms. Chromatographic signals
were recorded at 286, 350, 400 and 470 nm. The extraction and all analytical work were performed under reduced light and in a nitrogen atmosphere. Standards of astaxanthin, (Roche A/S, Denmark), can- thaxanthin (Fluka, Switzerland) and |3-carotene )Sigma, St. Louis, MO.) were dissolved in methylene chloride and diluted in n-heptane prior to analysis, but the a-tocopherol (Sigma, St. Louis, MO.) was dissolved in n-heptane. All solvents for HPLC were analytical grade except for acetonitrile and methanol which were HPLC grade.
Oxidation measurement—UV-spectra
The UV -spectra of lipid extracts were utilized for determination of the production of conjugated dienes and trienes which measure an early stage in the oxidation process (Halliwell and Gutteridge, 1989; Rossell, 1989). Lipids were extracted according to Ingemansson et al. (1991). The solvents were removed with oxygen free nitrogen and the remaining lipids were weighed and dissolved in spectro-grade cyclohexane to a concentration of 0.1 mg/mL. Spectra of the lipids from 190 nm - 400 nm were taken using cyclohexane as solvent (Janero and Burghardt, 1988) with a Beckman DU-8 kinetic spectrophotometer (Beckman Instruments GmBH, München, F.R.G.).
Multivariate data analysis
Due to the nature and the amount of data generated we used multivariate statistics (chemometrics) to extract the information presented (Table 1, 2 and 3) and draw valid conclusions. The compositional variables were: the total lipid content in light/dark muscle; the lipid classes neutral lipid (NL), phosphatidylcholine (PC), phosphatidyl- ethanolamine (PE), sphingomyelin (SPH), lyso-PE and lyso-PC, the FAs in the total lipids; the FFAs; the conjugated trienes; and the content of a-tocopherol and astaxanthin. The multivariate data analytical methods were principal components analysis (PCA) and partial least squares correlation in latent variables (PLS) (Wold, 1976, 1982: Wold et al., 1983). The principal strategy of these methods was to consider each experimental variable (e.g., fatty acid) as a coordinate axis in a k-dimensional space (k = number of variables), the measurement space (M-space). Each object (object = sample) was described by a vector representing the values of the experimental variables and represented as a point in this space. Using the same measured variables a set of objects form a swarm of points in M-space and objects similar to each other would be near each other, so that distance would constitute a measure of similarity/dissimilarity. According to the methods used, new variables that represent a maximum amount of systematic variance in the data were calculated as linear combinations of experimental variables. The new variables are often called latent variables and they describe the intrinsic, underlying variance structure of the system under study. The latent variables (principal components and PLS components) can be plotted, thus revealing natural groupings that can be utilized in classification. Although PCA and PLS are closely related, PLS specifically constitutes a means of relating different blocks of independent and dependent data to each other, i.e., multivariate calibration. The PLS method can also be used to extract
514-JOURNAL OF FOOD SCIENCE-Volume 58, No. 3, 1993

Table 3 -L ip id class content in fresh and frozen stored light and dark trout muscle8
Basal Diet Supplemented Diet0 wk 16 wk 33 wk 0 wk 16 wk 33 wk
Light Dark Light Dark Light Dark Light Dark Light Dark Light DarkNL 53.1 ±4.3 81.1 ±0.7 58.6 ±3.2 81.8 ±0.5 58.9 ±8.4 82.6 ±4.6 57.3 ±2.2 78.9 ±0.9 60.8 ±2.8 81.9 ±1.5 66.8 ±4.4 81.3 ±1.5PE 8.5 ±0.6 5.1 ±0.1 7.2 ±0.3 4.1 ±0.2 7.7 ±0.1 4.7 ±1.0 8.4 ±0.5 6.5 ±0.3 7.0 ±0.4 4.1 ±0.4 7.4 ±0.4 4.8 ±0,4PC 36.7 ±3.5 12.2 ±0.6 26.8 ±3.7 10.2 ±0.2 27.5 ±7.2 9.3 ±1.9 31.9 ±1.9 12.6 ±0.4 25.1 ±2.2 9.9 ±0.9 19.0 ±3.3 11.5 ±0.7LYSO-PE <0.1 <0.1 1.2 ±0.7 0.4 ±0.2 0.0 ±0.0 0.0 ±0.0 0.2 ±0.1 <0.1 0.3 ±0.1 0.2 ±0.1 0.5 ±0.2 0.0 ±0.0LYSO-PC <0.1 <0.1 5.2 ±1.0 2.0 ±0.3 3.9 ±1.3 2.2 ±1.6 0.3 ±0.2 <0.1 5.6 ±1.1 2.0 ±0.7 5.6 ±2.1 1.4 ±0.38 NL = neutral lipids, PE = phosphatidylethanolamine, PC = phosphatidylcholin.Values are mean wt% of total lipids. Number offish, light and dark muscle, fed basal diet at 0 wk, n = 7; at 16 wk, n = 4; at 33 wk, n = 3, and fed supplemented diet at 0 wk, n = 10; at 16 wk, n = 5; and at 33 wk, n = 5.
LIGHT MUSCLE
Fig. 1-Score plot of the first two principal components, PCI and PC2 for frozen stored light and dark muscle o f rainbow trout fed basal or supplemented diet, accounting for 25% and 20% of the total variance.
certain specified portions of systematic variance from experimental data (Wold, 1976, 1982; Wold et al., 1983).
RESULTS & DISCUSSIONNO DISEASES were observed and no abnormal stress behavior could be seen among the fish. The stage of gonadal development and the hepatosomatic index were similar among the fish fed basal or supplemented diets (data not shown). The duration of the feeding has been investigated by Choubert and Storebakken (1989) and based on their results, a feeding time of 10 wk should be sufficient for maximal deposition of as- taxanathin. The total fat content in the muscle was similar for fish fed either the basal diet or the supplemented diet, 4 wt% (1.4 ± 0 .2 and 7.8 ± 1.1 wt% in light and dark muscle for fish fed the basal diet and 1.7 ± 0 .4 and 8.1 ± 1.1 wt% in light and dark muscle for fish fed supplemented diet). A higher fat content, as in dark muscle, leads to increased deposition of astax- anthin. Since there is a higher ratio of neutral lipids (NL) to phospholipids (PL) in dark than in light muscle, NL being deposited as triacylglycerol vacuoles in the muscle (Lin et al., 1974; Ingemansson et al., 1991), the excess of astaxanthin was possibly distributed according to its solubility.
Multivariate evaluationPrincipal components analysis (PCA) of data for basal and
supplemented diet and light and dark muscle allowed calculation of two significant principal components, PC 1 and PC 2, which together accounted for 45% (25 + 20) of the total variance in the data. Three distinct groups of fish could be
PLS 1 (95%)
DARK MUSCLE
PLS 1 (95%)Fig. 2-Score plot from a partial least squares correlation analysis, extracting the time-effect in the data of frozen stored (33 wk) light and dark muscle of rainbow trout fed basal or supplemented diet.
discerned in the PCA plot (Fig. 1). The main difference between the three ¡groups was frozen storage time, with the fish given the basal diet and the astaxanthin supplemented diet evenly distributed in groups. This indicates that astaxanthin supplementation does not affect the lipid stability regarding hydrolysis and oxidation during frozen storage. A difference between light and dark muscle in the three time-separated groups (Fig.1) is confirmed in this study (Ingemansson et al., 1993). The dark muscle showed a more homogeneous response to frozen storage than light muscle. Individual control fish (0 wk had a higher variability than fish stored 16 and 33 wk (Fig. 1).
The partial least squares (PLS) method was used to extract the time dependent portion of the data, using the compositional data as the X-block and time (0 ,1 6 , 33 weeks) as the Y-block. This allowed the calculation of two significant PLS-compo- nents (PLS 1 and PLS 2) for light muscle, explaining 31% of the variance in the X-block and 98% of the variance in the Y- block (Fig. 2). It also allowed the calculation of two significant PLS-components for dark muscle, with 22% of the variance in the chemical variables explaining 98% of the variance in time (Fig. 2). This clearly shows the strong time dependence in the data, also previously seen in the PCA analysis (Fig. 1).
Volume 58, No. 3, 1993-JOURNAL OF FOOD SCIENCE-515

ASTAXANTHIN AND LIPID DETERIORATION IN TROUT.LIGHT MUSCLE
Fig. 3-A. UV-spectra of lipid extracts from dark muscle before and after frozen storage for 33 wk (after storage = solid line). B. UV-spectra of lipid extracts from light muscle before and after frozen storage for 33 wk (after storage = solid line)
The above procedure enabled the elucidation of the relation of the experimental variables to the time-factor. This relation can be expressed as the modeling power of each variable in each principal or PLS component (Sjostrom et al., 1986). This quantity varies between zero and one and is essentially the amount of each of the experimental variables variance contained in the component (data not shown). The PLS-models for light and dark muscle are mainly influenced by the individual FAs. The total lipid content in both light and dark muscle showed no influence on the model. The content of conjugated trienes had a great influence in light muscle but not in dark muscle, in accordance with the UV-spectra measurements (Figs. 3A and B). The strongest influence on the model among the lipid classes was from NL fraction and lyso-PC followed by PC and PE, in both light and dark muscle. The content of FFAs in light and dark muscle showed only weak influences. The major contribution among the total FAs was from 22:6n- 3 and 20:5n-3, followed by 16:0 in both light and dark muscle, in accordance with the changes of these FAs as FFAs (Table 1).
The PLS method was also used to extract the astaxanthin
DARK MUSCLE
Fig. 4-Score plot from PLS analysis extracting the astaxanthin- effect in the data of frozen stored (33 wk) light and dark muscle of rainbow trout fed basal or supplemented diet.
dependent portion of the data using the compositional data as the X-block and the content of astaxanthin as the Y-block. This allowed calculation of two significant PLS-components for dark muscle, with 27% of the variance in the X-block explaining 78% of the variance in the Y-block (Fig. 4). It also allowed the calculation of two significant PLS-components for the dark muscle, with 30% of the variance in the X-block explaining 74% of the variance in the Y-block (Fig. 4). However, it is clear from these two plots (Fig. 4) that frozen storage time was the overall dominating factor.
The astaxanthin content of light and dark muscle from fish fed the basal diet was equal (1.3 ± 0 .2 mg/kg wet muscle), in contrast to fish fed with supplemented diet where the astaxanthin content of the dark muscle was higher than that of the light muscle (1.9 ± 0 .0 3 light and 6.2 ± 0 .7 dark mg/kg wet weight) (Table 2). The deposition of astaxanthin in dark muscle of trout fed the supplemented diet was five times higher than for those fed the basal diet (Table 2), in contrast to light muscle where the deposition was only slightly increased by the supplemented diet. The level of trans-astaxanthin decreased during frozen storage for 33 wk both for fish fed the basal diet and for those fed the supplemented diet in both light and dark muscle. The content of trans-astaxanthin after frozen storage 33 wk was for fish fed basal diet 0 .7 2 ± 0 .1 0 mg/kg in light muscle and 0.82 ± 0 .1 0 mg/kg in dark muscle and for fish fed supplemented diet 0.65 ± 0 .1 0 mg/kg in light muscle and2.0 ± 0 .3 mg/kg for dark muscle. The sum of trans-astaxanthin and the cis-isomers (data not shown) as a measure of the total content of carotenoids in the fish muscle, also decreased significantly during frozen storage. This indicated other reasons
5 1 6 -JOURNAL OF FOOD SCIENCE-Volume 58, No. 3, 1993

Fig. S-(A) Typical chromatogram of cic/trans astaxanthin in fish muscle, before and after frozen storage, (after storage = solid line).(B) Typical spectra of trans-astaxanthin and two cis-isomers. Peak number i = cis-astaxanthin, 2 = cis-astaxanthin, 3 = transastax- anthin. Detection wavelength is 470 nm for A.
than a trans-cis isomerization were the explanation for deterioration of trans-astaxanthin. That compound (peak number 3, Fig. 5 A and B) was identified by means of UV-VIS spectra and retention time, 6.2 min. Two cis-isomers of astaxanthin (peaks one and two, Fig. 5 A and B), retention times 5.8 and6.0 were separated and preliminarily identified according to their shift in absorbance maximum (Zechmeister, 1944, 1962; Karrer and Jucker, 1950; Scott, 1964). That of peak number one (X max at 467 nm) and its strong cis-peak at 367 nm indicated a central mono-cis, probably cis-13-isomer (Englert and Vecchi, 1980). The absence of a cis-peak and X max at 467 nm in peak 2 indicated a peripheral mono-cis, probably cis-9 (Englert and Vecchi, 1980). All three peaks were found in the astaxanthin standard and in the fish diet in which the content of cis-isomers was 10 area% of the total astaxanthin. The ratio of cis/trans isomers increased from 15 to 40 area% of total remaining astaxanthin, during frozen storage in both light and dark muscle.
The a-tocopherol content of the dark muscle was significantly higher than that of light muscle as reported by Pozo et al. (1988). a-Tocopherol in light muscle and dark muscle of trout fed the supplemented diet was about 1 .5-2 times higher than for trout fed the basal diet (Table 2). This was despite the equal content of a-tocopherol in the feeds. a-Tocopherol decreased to the same extent in both light and dark muscle for both diets, except for light muscle from trout fed the basal diet, where the content decreased only half as much as the others. A possible explanation for the increased content of a - tocopherol in the carotenoid supplemented fish could be that the carotenoids indirectly protected a-tocopherol against oxidation.
Differences between lipid classes of light and dark muscle, namely significantly higher content of PLs in light muscle, mainly due to a higher content of NLs in the dark muscle were confirmed in our current study (Ingemansson et al., 1991). Changes among the lipid classes were found during frozen storage (Table 3). The NL fraction increased due to accumulating FFAs (which elute together with the other NLs in this HPLC method). The content of PC decreased followed by a subsequent increase in lyso-PC. A decreased content of PE was also established but to a lesser extent than for PC. FFAs originating due to hydrolysis by phospholipases and/or lipases from both neutral and complex lipids have been reported (Shewfelt, 1981; Toyomizu et al., 1981). The total FFAs in the control series was 1 wt% of total lipids in both light and dark muscle (Table 1). The total content of FFAs increased markedly after 16 wk frozen storage, to 4-10 wt% of total lipids and reached 7-15 wt% after 33 wk frozen storage in both light and dark muscle (Table 1 with the following FFAs predominating: 0 6 :0 , C18:In-9, C20:5n-3 (EPA) and C22:6n- 3 (DHA). The FFAs C20:5n-3 (EPA) and C22:6n-3 (DHA)
increased most. A generally higher content of FFAs in light muscle was found but there were no significant differences between fish fed the basal of supplemented diets (Table 1).
Deterioration cf carotenoids would yield products with shorter chromophores and, therefore, increased absorption in the ultraviolet region (Krinsky, 1989). Increased formation of such products during frozen storage in both light and dark muscle, has been found in the areas of 234 and 280 nm (data not shown). UV-spectra of conjugated trienes and dienes indicate an early stage in the lipid oxidation process. The double peak of conjugated trienes, keto-or oxo-dienes at 285 nm (II in Fig. 3 A and B) (Klein et al., 1984; Rossell, 1989) was well separated. Many substances in biological materials absorb UV light a round 234 nm (I in Fig. 3 A and B), where diene conjugation is measured, which causes background problems. The UV spectra showed no differences in diene and triene conjugates for the fish, whether or not their diet was supplemented, when comparing control (0 weeks) lipid extracts with those from stored fillets frozen for 16 or 33 wk. Differences between dark and light muscle regarding lipid oxidation during frozen storage were found (Fig. 3 A and B). Dark muscle showed no increase in diene and triene conjugates during frozen storage up to 33 wk while light muscle showed an increase, especially in formation of triene conjugates.
CONCLUSIONASTAXANTHIN significantly decreased during frozen storage of light and dark muscle. Astaxanthin supplementation of farmed fish, did not affect lipid stability to hydrolysis and oxidation during frozen storage.
REFERENCESAnderson, H.J., Bertelsen, G., Christophersen, A.G., Ohlen, A., and Skibsted,
L.H. 1990. Development of rancidity in salmonid steaks during retail display. Z.Lebensm. Unters. Forsch. 191: 119-122.
Ansari, K.A. and Shoeman, D. 1988. Rapid separation of free fatty acids from neutral lipid3 in brain extracts. J. Chromatogr. 439: 453—458.
Apgar, M.E. and Hultin, H.O. 1982. Lipid peroxidation in fish muscle microsomes in the frozen state. Cryobiology 19: 154-162.
Ben-Amotz, A., Lers, A., and Avron, M. 1988. Steroisomers of 3-carotene and phytoene in the alga Dunaliella bardawil. Plant Physiol. 86: 1286- 1291.
Bendich, A. 1991. Non-provitamin A activity of carotenoids: immunoenh- ancement. Trends Food Sci. Technol. May: 127-130.
Benedetti, A. and Comporti, M. 1987. Formation, reactions and toxicity of aldehydes produced in the course of lipid peroxidation in cellular membranes. Bioelectrochem. Bioenerg. 18: 187-202.
Burton, G.W. 1989. Antioxidant action of carotenoids. J. Nutr. 109-111.Burton, G.W. and Ingold, K.U. 1984. 3-Carotene: An ususual type of lipid
antioxidant. Science 224: 569-573.Chen, H-M., Meyers, S.P., Hardy, R.W., and Biede, S.L. 1984. Color sta
bility of astaxanthin pigmented rainbow trout under various packaging conditions. J.Food Sci. 49: 1337-1340.
Choubert, G. and StDrebakken, T. 1989. Dose response to astaxanthin and
Volume 58, No. 3, 1993-JOURNAL OF FOOD SCIENCE-517

ASTAXANTHIN AND LIPID DETERIORATION IN TROUT. . .
canthaxanthin pigmentation of rainbow trout fed various dietary carotenoid concentrations. Aquaculture 81: 69-77.
Christophersen, A.G., Knuthsen, P., and Skibsted, L. 1989. Determination of carotenoids in salmonids. Z.Lebensm.Unters.Forsch. 188: 413-418.
DiMascio, P., Kaiser, D.S., and Sies, H. 1989. Lycopene as the most effic ien t biological carotenoid s in g le t oxygen quencher. Arch.Biochem.Biophys. 274: 532-538.
Diplock, A.T. 1991. Antioxidant nutrients and disease prevention: an overview. Am.J.Clin.Nutr. 53: 189S-193S.
Englert, F. and Vecchi, M. 1980. trans/cis Isomerization of astaxanthin diacetate/isolation by HPLC and identification by 1H-NMR. Spectroscopy of three mono-cis-and six di-cis-isomers. Helv. Chim. Acta 63:1711— 1718.
German, J.B. and Kinsella, J.E. 1985. Lipid oxidation in fish tissue. Enzymatic initiation via lipoxgenase. J. Agric. Food Chem. 33: 680-583.
Halliwell, B., and Gutteridge, J.M.C. 1989. F ree R a d ic a ls in B io lo g y a n d M ed ic in e . Clarendon Preess, Oxford.
Hardy, R.W., Torrissen, O.J., and Scott, T.M. 1990. Absorption and distribution of 14C-labeled canthaxanthin in rainbow trout (O n c o rh y n c h u s m y k is s ) . Aquaculture 87: 331-340.
Henderson, R.J. and Tocher, D.R. 1987. The lipid composition and biochemistry of freshwater fish. J. Prog.Lip.Res., 26: 281-347.
Henmi, H., Hata, M., and Hata, M. 1989. Astaxanthin and/or canthax- anthin-actomyosin complex in salmon muscle. Nippon Suisan Gakkaishi 55:1583-1589.
Henmi, H., Iwata, T., Hata, M., and Hata, M. 1987. Studies on the carotenoids in the muscle of salmons. I. Intracellular distribution of carotenoids in the muscle. Tohoku J. Agric. Res. 37: 101-111.
Hsieh. R.J. and Kinsella, J.E. 1989a. Oxidation of polyunsaturated fatty acids: mechanisms, products, and inhibition with emphasis on fish. Adv. Food Nutr. Res. 33: 286-302.
Hsieh, R.J. and Kinsella, J.E. 1898b. Lipoxygenase generation of specific volatile flavor carbonyl compounds in fish tissue. J.Agric.Food Chem. 37: 279-286.
Ingemansson T., Olsson N.U., Herslof, B.G. and Ekstrand B. 1991. Lipids in light and dark muscle of farmed rainbow trout (O n c o rh y n c h u s m y k is s ) . J. Sci.Food Agric. 57: 443-447.
Ingemansson, T., Olsson N.U., and Kaufmann, P. 1993. Lipid composition of light and dark muscle of Rainbow trout (O n c o rh y n c h u s m y k is s ) after thermal acclimation. A multivariate approach. Aquaculture (In press).
Janero, D.R. and Burghardt, B. 1988. Analysis of cardiac membrane phospholipid peroxidation kinetics as malondialdehyde: nonspecificity of thiobarbituric acid-reactivity. Lipids 23: 452—458.
Kanner, J., German, J.B., and Kinsella, J.E. 1987. Initiation of lipid peroxidation in biological systems. Crit.Rev.Food Sci.Nutr. 25: 317-364.
Karrer, P. and Jucker, E 1950.C aro teno id s , Elsevier Publishing Company Inc., New York.
Kates, M. 1972. Separation of lipid mixtures. In L a b o ra to ry T e c h n iq u e s in B io c h e m is try a n a M o le c u la r B io lo g y , T.S. Work and E. Work (Ed.), Vol. 3, p. 393-446. North-Holland, Amsterdam.
Khachik, F., Beecher, G.R., and Lusby, W.R. 1989. Separation, identification, and quantification of the m^jor carotenoids in extracts of apricots, peaches, cantaloupe, and pink grapefruit by liquid chromatography. J. Agric. Food Chem. 37: 1465-1473.
Klein, B.P., Grossman, S., King, D., Cohen, B-S and Pinsky, A. 1984. Pigment bleaching, carbonyl production and antioxidant effects during the anaerobic lipoxygenase reaction. Biochim. Biophys. Acta 793: 72-79.
Krinsky, N.1.1989. Antioxidant functions of carotenoids. Free Rad.Biol.Med. 7: 617-635.
Lin, Y., Dobbs, G.H., and Devries, A.L. 1974. Oxygen consumption and lipid content in red and white muscles of antarctic fishes. J.Exp.Zool. 189: 369-386.
Lusk, G., Karel, M., and Goldblith, S.A. 1964. Astacene pigment loss occurring in freez-dried shrimp and salmon during storage. Food Technol. 18: 157-158.
Miki, W. 1991. Biological functions and activities of animal carotenoids. Pure Appl.Chem. 63: 141-146.
Nawar, W., Hultin, H., Li, Y., Xing, Y., Kelleher, S., and Wilhelm C. 1990. Lipid oxidation in seafoods under conventional conditions. Food DRev. Int. 6: 647-660.
No, H.K. and Storebakken, T. 1991. Color stability of rainbow trout fillets during frozen storage. J.Food Sci. 56: 969-972.
Olsson, U., Kaufmann, P., and Herslof, B.G. 1990. Multivariate optimization of a gas-liquid chromatographic analysis of fatty methyl esters of Blackcurrent seed oil. J. Chromatogr. 505: 385-394.
Pozo, R.J., Lavety J., and Love. R.M. 1988. The role of dietary a-tocopherol (Vitamin E) in stabilising the canthaxanthin and lipids of rainbow trout muscle. Aquaculture 73: 165-175.
Reineccius, G.A. 1979. Symposium on meat flavor. Off-flavors in meat and fish - A review. J.Food Sci., 44: 12-24.
Rossell, J.B. 1989. Measurement of rancidity. In R a n c id i ty on F oods, J.C. Allen and R.J. Hamilton (Ed.) 23-52. Elsevier Applied Science, London.
Scott, A.I. 1964. In te rp re ta tio n o f th e U ltra v io le t S p e c tra o f N a tu r a l P r o d uc ts. Pergamon Press, Oxford.
Shewfelt, R.L. 1981. Fish muscle lipolysis - A review. J. Food Biochem. 5: 79-100.
Sjostrom, M., Wold, S., and Söderström, B. 1986. PLS discriminant plots. P a tte rn R e c o g n itio n in P ra c tice II . E.S. Gelsema and L.N. Kanal (Ed.). 461-470. Elsevier Science, North-Holland.
Stone, R.A. and Kinsella, J.E. 1989. Bleaching of p-carotene by trout gill lipoxygenase in the presence of polyunsaturated fatty acid substrates. J.Agric. Food Chem. 37: 866-868.
Terao, J. 1989. Antioxidant activity of p-carotene-related carotenoids in solution. Lipids 24: 659-661.
Toyomizy, M, Hanaoka, K., and Yamaguchi, K. 1981. Effect of release of free fatty acids by enzymatic hydrolysis of phospholipids on lipid oxidation during frozen storage of fish. Bull. Jap Soc.Sci.Fish. 47: 615- 620.
Tsukuda, N. 1970. Studies on the discoloration of red flshes-VI. Partial purification and specificity of the lipoxidase-like enzyme responsible for carotenoid discoloration in fish skin. Bull.Jap.Soc.Sci.Fish. 36: 725- 7S3.
Tsukuda, N. and Amano, K. 1967. Studies on the discoloration of red fishes-IV. Discoloration of astaxanthin, tunaxanthin, and p-carotene by the tissue homogenates of fishes. Bull.Jap.Soc.Fish. 33: 962-969.
Weber, F. ana Grosch, W. 1976. Co-oxydation of a carotenoid by the enzyme lipoxygenase: Influence on the formation of linoleic acid hydroperoxides. Z.Lebensm.Unters.-Forsch. 161: 223-230.
Wold, S. 1976. Pattern recognition by means of disjoint principal components models. Pattern Recognition, 8: 127-139.
Wold, H. 1982. Soft modeling: The bsic design and some extensions. In S y s te m s U n d e r In d ir e c t O b serva tio n , K.G. Joreskog and H. Wold (Ed.), 307-358. North-Holland, Amsterdam.
Wold, S., Albano, C, Dunn III, W.J., Esbensen, K., Hellberg, S., Johansson, E., and Sjostrom, M. 1983. Pattern recognition: Finding and using regularities in multivariate data. F o o d R e sea rc h a n d D a ta A n a ly s is , H. Martens and H. Russwurm Jr. (Ed.). 147-188. Applied Science Publishers, London.
Zechmeister, L. 1944. Cis-trans isomerization and sterochemistry of carotenoids and diphenylpolyenes. Chem. Rev. 34: 267-344.
Zechmeister, L. 1962. C is- tra n s Iso m er ic C a ro ten o id s , V i ta m in A a n d A r - y lp o ly en e s . Springer-Verlag, Wien.
Ms received 4/18/92; revised 11/5/92; accepted 11/17/92.
This study was financially supported by a grant from the Swedish Council for Forestry and Agricultural Research (SJFR). We are grateful to Drs. Bo Ekstrand and Hans Lingnert, SIK for stimulating and valuable discussions.
518-JOURNAL OF FOOD SCIENCE-Volume 58, No. 3, 1993

Fate of L is te ria m o n o c y to g e n e s and A e ro m o n a s h y d ro p h ila on Catfish Fillets Cooked in a Microwave Oven
YAO -W EN HUANG, CH EO N G -K IT LEUNG, M ARK A. HARRISO N, and KEITH W . GATES
----------------------------ABSTRACT-----------------------------Channel catfish fillets were inoculated with * 106 cell/cm2 each of Listeria monocytogenes and Aeromonas hydrophila and cooked in a microwave oven to internal temperatures of 55, 60, and 70 °C. The fillets were either left uncovered or covered with polyvinylidene chloride films during cooking. A. hydrophila populations were reduced to nondetectable levels on covered fillets cooked to 70 °C. At 60 °C, L. monocytogenes populatoins were reduced by = 4 logs for covered and by 2 logs for uncovered fillets. Covering fillets increased lethality at each temperature; however, some pathogens could survive at <60 °C.
Key Words: Listeria, Aeromonas, catfish, microwaves
INTRODUCTION
LISTERIA MONOCYTOGENES is common in the environment and is frequently part of the naturally occurring microflora of fresh, uncooked food. Weagant et al. (1988) isolated Listeria from = 26% of frozen seafood samples tested. Little information is available on this prevalence on freshwater fish. L. monocytogenes is considered to be the most heat resistant nonspore forming foodborne pathogen (Brown, 1991). Thus, there is concern that minimal thermal processes may be inadequate to insure total elimination of the pathogen from cooked food.
Previous surveys have shown that L. monocytogenes may be present in commercially prepared cook-chill foods. This possibility has implications for the foodservice industry and the consumer. Gilbert et al. (1989), after sampling commercially available, pre-cooked, chill meals, reported that L. monocytogenes was detected in 18% of the products. Kerr and Lacey (1988) found that the L. monocytogenes populations in most cook-chill foods ranged between 1 and 103/g and that 57% of the samples remained positive for L. monocytogenes after reheating.
Aeromonas hydrophila is a pathogenic microorganism commonly associated with water, poultry, meat, and fishery products (Abeyta et al., 1986; Buchanan and Palumbo, 1985; Okrend et al., 1987). The presence of this microorganism on food is not only of concern as a pathogen but because it is also associated with spoilage of refreigerated products (Stelma, 1989). The thermal resistance of this organism is of the same degree as other Gram-negative rods of public health significance (Condon et al., 1992; Palumbo et al., 1987). Though A. hydrophila is heat sensitive, it could pose a concern if contaminated foods were improperly cooked.
To meet consumer demands for easy-to-prepare foods, convenience or ready-to-eat products have been developed. Microwave ovens are commonly used in many foodservice establishments and households to cook or re-heat food. However, there is strong concern over possible pathogen survival in contaminated food cooked in microwave ovens. The pathogen destruction mechanism is mainly due to the heating effect
Authors Huang, Leung, and Harrison are with the Dept, of Food Science & Technology, Univ. of Georgia, Athens, GA 30602. Author Gates is with the Marine Extension Service, Univ. of Georgia, Brunswick, G A 31522.
of microwaves, but food may be heated unevenly in the microwave field (Knutson et al., 1987).
The popularity of channel catfish has increased and many cookbooks suggest cooking catfish by microwaves. However little information regarding the survival of Listeria and Aerc- monas or other pathogenic bacteria following microwave cooking of catfish is available. The objective of our study was to determine the fate of L. monocytogenes and A. hydrophila on catfish fillets cocked in a microwave oven to different endpoint temperatures.
MATERIALS & METHODSBacterial stock culture
Each pure stock culture of L. monocytogenes (Scott A, LCDC, V- 7, and Brie) and A. hydrophila (ATCC 15468) was maintained on trypticase soy agar slants at 4 °C. Trypticase soy broth cultures of each strain were grown at 37 °C for 24 hr prior to inoculation onto the fillets.
Catfish samples
Channel catfish were harvested from the aquaculture pond of the University of Georgia at Cohutta, GA and immediately transported on ice to the Dept, of Food Science & Technology, Univ. of Georgia, Athens. Fish were headed, skinned, gutted and filleted. After washing, the fillets were placed into clean plastic bags, frozen, and stored at -32 .5 °C until used.
Inoculation and packagingPortions (10 mLi of each overnight broth culture of Listeria were
combined in 50-mL centrifuge tubes. The mixed cultures of L. monocytogenes (Scott A, LCDC, V-7, and Brie) and the A. hydrophila culture were washed twice by centrifuging (2500 rpm, 15 min) with Butterfield’s phospiate buffer, O.IM, pH 7.0 (Speck, 1984). Pellets were re-suspended in 50 mL Butterfield’s phosphate buffer to give 10s cell/mL of either L. monocytogenes or A. hydrophila. Washed cell suspension (100 mL) of each of the two bacteria were diluted with 800 mL of sterile phosphate buffer to give a dip suspension of = 107 cell/mL of L. monocytogenes and A. hydrophila. Each catfish fillet was inoculated by diping it into a suspension containing L. monocytogenes and A. hydrophila for 1 min. Inoculated fillets were placed onto a sterile screen and allowed to drip dry for about 5 min. Preparation of the dip solution and the dipping were done inside a class II-B laminar flow hood. Fish fillets were placed onto polystyrene trays. They were overwrapped with Saran® wrap (polyvinylidene chloride, PVDC film, Dow Chemical Co., Indianapolis, IN). These samples were then kept at 37 °C for 5 hr to allow the bacterial population to increase to IO6 cell/cm2 on the surface of the fish. The population of Listeria was confirmed by the dilution spread plate method on Listeria Selective medium (Oxoid, Basingstoke, England), while the Aeromonas population was determined by spread plating on Rim- ler-Shotts Agar (Shotts and Rimler, 1973). After incubation, samples were refrigerated a: 4 °C until cooked.
Microwave cooking
On the day following inoculation, all fish samples were cooked n a microwave oven (Model LBM 1.2A, Cober Electronics, Inc., Stamford, CT) with an adjusted rated output power of 650 watts. Disposable, microwavable Chinet paper plate were used to hold the fish fillets. One-half of each sample cooked to each end-point temperature
Volume 58, No. 3, 1993-JOURNAL OF FOOD SCIENCE-519

MICROWAVE COOKING OF C A T F IS H .
1 0 5
10<
<>
-Marnai Cantar (C)
: Marnai Cantar (U)■ | | SJbairfaca Top (C)- TKZ//A Subaurfaca Top (U)_ Subawfaca Bottom (C): b'ÒOOÒ'd S ttea laca Bottom (U); V ///////A Sitoaurtaca End (C)
■ SutsurtaeaEnd(U)
FINAL COOKING TEMPERATUREFig. 1 F-values (min) for covered (C) and uncovered (U) catfish fillets cooked in a microwave oven to 55, 60, or 70 °C. Temperatures (°Cj were monitored at the Internal Center, Subsurface Top, Subsurface Bottom, and at the Subsurface End of the fillet.
was left uncovered while the other half was overwrapped with Saran® wrap. Temperatures were monitored at various points in the fish fillet during microwave cooking using the fluoroptic thermometry system (Model 755, Luxtron Co., Mountain View, CA). Four fiber optic probes were positioned as follows: (1) at the internal center of the fillet, (2) below the surface at the dorsal center of the fillet, (3) below the surface at the ventral center of the fillet, and (4) below the dorsal surface at the tail-end of the fillet. The cooking procedure of Nettleton(1987) was used, which suggested a cooking time of 3-5 min/0.45 kg of fish depending on thickness. After microwave cooking, fillets were held in the oven 3-5 min to permit heat equilibration.
Several trials were conducted to determine the internal temperature required for well-done, just done and slightly underdone fish. Each fish fillet was cooked to the internal center temperatures of 70, 60, or 55 °C either with cr without covering to achieve the appropriate cook. F-values were calculated by using the reference temperature of 60 °C and z value of 8.4 (Harrison and Huang, 1990). Each treatment was completed in triplicate. A 5x5 cm section of each fish fillet was removed and bagged into Stomacher bags for microbiological analyses.
M icrobiological analysis
Samples were rinsed/massaged for about 1 min with 25 raL sterile Butterfield’s phosphate buffer. Appropriate serial dilutions were plated onto the following agars by spread plate methods. Listeria Selective Medium (Oxoid, Basingstoke, England) agar was used to enumerate the L. monocytogenes population. Plates were incubated at 35 °C for 48 hr. Rimler-Shotts agar (RS, Shotts and Rimler, 1973) was used to enumerate A. hydrophila. Plates were incubated at 37 °C for 20 hr. The psychrotrophic population was determined on plate count agar (Difco, Detroit, Ml) incubated at 7 °C for 10 days (Speck, 1984).
Each sampling rinse (1 mL) was also added to enrichment broths to check for presence of bacteria too low to be enumerated. Listeria enrichment broth (UVM formulation, Oxoid) was used to recover non- injured L. monocytogenes, while a nonselective enrichment broth, trypticase soy broth, was used to recover any injured cells. Trypticase- soy broth with 0.02% ampicillin was used to recover A. hydrophila (Rippey and Cabelli, 1979).
D ata analysis
Analysis of variance was performed on the data by means of PC SAS Institute, Inc. (1987). Duncan’s multiple range test was used to determine any significant differences among F-values at different temperatures and microbial populations on cooked fillets with and without covering.
RESULTS & DISCUSSIONMEAN F-values were compared (Fig. 1) for covered and uncovered catfish fillets. F-value was defined as the equivalent
Table 1 -P opula tions o f L. monocytogenes, A. hydrophila and psychro- trophs (log CFU/ cm3) on catfish fillets, w ith or w ithou t covering, cooked at different temperatures____________________________________________
Cooking te rrp . (C°)
Covered (C) Aeromonas Listeria Uncovered (U) hydrophila monocytogenes Psychrotrophs
Uncooked 6.07 6.16 6.5255 c 3.64“ 2.89» 3.46b
u 3.68“ 4.74“ 4.31“60 c NDC 2.33b 2.44b
u <1.0 4.24“ 4.26“70 c ND ND ND
u ND 3.31 3.39
a b M e a n s (n = 3 ) in a s u b c o lu m n a t th e s a m e c o o k in g te m p e r a tu r e w it h th e s a m e le tte r a r e n o t s ig n ific a n tly d if f e r e n t a t th e le v e l o f 0 .0 5
c N D = n o t d e t e c t e d b y d ir e c t p la te c o u n t in g o r in e n r i c h m e n t b r o t h .
in minutes at a given reference temperature (Trt) of all heat considered with respect to its capacity to destroy spores or vegetative cells of a particular organism. The food product, the target organism, and the heating conditions were defined. The F-value integrates the lethal effects of a heating and cooling time-temperature curve to approximate the results that would be obtained if the food product were instantly heated to the reference temperature, held at that temperature for the specified F-values in minutes, and then instantly cooled (Gates et al., 1984; Thomas and Thomas, 1983; Toledo, 1980; Ward et al., 1982). F-values can be calculated for a specific time interval during the heating process using the following formula.
F0 = (t2 - ti) {10[(T1.2 - ™)/zl}
where F0 = F-value of the time interval (t2 - tx); tj = Time of the first temperature measurement; t2 = Time of the second temperature measurement; T12 = Mean temperature in the interval (t2 - tj); T rt = Reference temperature; and Z = Z- value. Cumulative F-values are determined by summing interval F-values over time (Gates et al., 1984; Toledo, 1980).
Duncan’s differences among mean F-values for each of the four locations showed that covered and uncovered tail-end sections of fillets heated more rapidly than any other areas at 55, 60, and 70 °C (p<0.05). For covered fillets, geometric center and center ventral portions reached the second and third highest F-values at 70 °C. The top portion of a covered fillet heated at significantly faster rates than uncovered fillets at 55 and 60 °C, as determined by final F-values. Tail portion of covered fillets reached greater lethality values than uncovered fillets at 55 °C. Regression analyses showed high correlation levels between F-values and final product temperatures for three monitored conditions (defined as an r2 > 0.7 and p <0.05): (1) the center of an uncovered fillet (r2 = 0.810), (2) below the ventral surface of covered fillets (r2 = 0.926), and (3) below the ventral surface of uncovered fillets (r2 = 0.730). In our study, the temperature was maintained for 3 min after the microwave was shut off. Surface temperatures were 3 to 5 °C higher or lower than the center temperature due to uneven heating of the microwave.
L. monocytogenes, reported to be a very heat resistant as- porogenous organism, was not recovered from Listeria Selective Agar or either selective or nonselective enrichment broths following microwave cooking to 70 °C on a Saran® wrap covered plate (Table 1). At 60 and 55 °C, the covered fillets had significantly lower (p<0.05) L. monocytogenes populations than the uncovered fillets. In both covered samples, the viableL. monocytogenes populations were reduced by more than 3 log cycles, while heating on uncovered plate reduced the population by 1.4-1.9 log cycles. Harrison and Carpenter (1989) reported that microwave heating of chicken breasts to internal temperatures > 73 °C reduced the initial L. moncytogenes population by 2.5-3.8 logs. Lund et al. (1989) reported that when chicken was cooked in a microwave oven (650W) for 15 min, temperatures between the breast and the leg ranged from 60 to 87 °C, causing L. monocytogenes populations to decrease by
520—JOURNAL OF FOOD SCIENCE—Volume 58, No. 3, 1993

about 2 to 3 log cycles. When skin temperature ranged from 80 to 99 °C, no L. monocytogenes were detected.
No A. hydrophila were detected following cooking at 70 °C by either direct plating or by enrichment in broth. Some Aero- monas survived cooking at 60 °C without a cover, but the total population was reduced by * 5 log cycles. No Aeromonas were detected in fillets covered with Saran® and cooked at 60 °C. Heat trapped inside the plate allowed the sample to heat more evenly and permitted the internal temperature to increase after the microwave was turned off. Cooking at 55 °C, reduced the population by about 2.5 logs, but there were no significant differences between covered and uncovered fillets (p<0.05). Palumbo et al. (1987) reported that the D-value of A. hydrophila BA-2 at 51 °C was 1.14 min.
No psychrotrophs were detected after cooking covered fillets at 70 °C. The psychrotrophic population of covered fillets was significantly less (p<0.05) than that of uncovered fillets when cooked at 55 and 60 °C. Since the method used to determine the psychrotrophic population did not separate the Listeria or Aeromonas populations from the total, the majority of the psychrotrophic population detected on the inoculated fillets included the inoculated L. monocytogenes or A. hydrophila. Thus the lethal effect on the total psychrotrohpic population was similar to that observed for the L. monocytogenes and A. hydrophila populations when measured separately.
CO N CLU SIO NDUE TO UNEVEN heating of food during microwave cooking, it is often difficult to assure that an adequate thermal process has been applied. Since the thermal end point temperature was slightly higher in the covered product and the heating and cooling process was more even, product should be covered during microwave cooking to entrap heat. Cooking covered catfish fillets at internal temperature 70 °C, (well-done for fish), destroyed L. monocytogenes and A. hydrophila cells by a factor of 6 log cycles. L. monocytogenes was more heat resistant than A. hydrophila and a population of HP-IO4 cells/cm2 was detected after cooking at either 55 or 60 °C.
R E F E R E N C E SAbeyta, C. J r., Kaysner, C.A., W ekell, M.M., Sullivan, J .J ., and Stelma,
G.N. 1986. Recovery of A e r o m o n a s h y d ro p h ila from oysters implicated in an outbreak of foodbome illness. J . Food Prot. 49: 643-646.
S T P S T A B IL IT Y IN T U R K E Y M E A T . . .Fro m page 504
pork containing acid-labile poly- and pyrophosphates. J . Food Sci. 50: 1482-1483.
Offer, G., and Knight, P. 1988. The structu ral basis of water-holding in meat. P art 1: General prinicples and w ater uptake in m eat processing. In D e ve lo p m e n ts in M e a t S c ie n ce , 4 ed. (Ed.) Lawrie, R. Elsevier Applied Science Publishers, London.
Parsons, N., and Knight, P. 1990. Origin of variable extraction of myosin from myofibril treated w ith sa lt and pyrophosphate. J . Sci. Food Agric. 51: 71-90.
Prusa, K .J., Bowers, J.A ., and Craig, J.A . 1985. Rates of heating and In- stron m easurem ents for turkey batters w ith sodium sa lts of n itrite , chloride and phosphate. J . Food Sci. 50: 573-576.
Puolanne, E. and Ruusunen, M. 1980. Effect of sa lt and phosphate on water-binding capacity in cooked sausage. Fleischw irtschaft 60: 1359- 1363.
Sofos, J.N . 1986. Use of phosphates in low-sodium m eat products. Food Technol. 40(9): 52-69.
Stabursvik, E. and M artens, H. 1980. Therm al denaturation of proteins in
Brown, W.L. 1991. Designing L is te r ia m o n o cy to g en es therm al inactivation studies for extended snelf-life refrigerated foods. Food Tech. 45(4): 152- 153.
Buchanan, R.L. and Palumbo, S.A. 1985. A e r o m o n a s h y d r o p h ila and A e r o m o n a s s o rb ia as a potential food poisoning species: a review. J . Food Safety. 7: 15-29.
Condon, S., Garcia, M.L., Otero, A., and Sala, F .J. 1992. Effect of culture age, pre-inoculation a t low tem perature and pH on the therm al resistance of A e r o m o n a s h y d ro p h ila . J . Appl. Bact. 72: 322-326.
Gates, K.W., EuDaly, J . G., Paker, A.H., and P ittm an, L.A. 1984. Microcomputer improve quality and safety of blue crab heat processing. Georgia M arine Science Center Technical Report series Num ber 84-3. Univ of Georgia, Skidaway Island, GA.
Gilbert, R.J., Miller, K.L., and Roberts, D. 1989. L is te r ia m o n o cy to g en es and chilled foods. Lancet i: 383-384.
Harrison, M.A. and Carpenter, S.L. 1989. Survived of L is te r ia m o n o cy to g e n e s on microwave cooked poultry. Food Microbiol. 6: 153-157.
Harrison, M.A. and H uang, Y.W. 1990. Therm al death tim es for L is te r ia m o n o cy to g en es (Scott A) in crabm eat. J . Food Prot. 53: 878-880.
Kerr, K.G. and Lacey, R.W. 1988. L is te r ia in cook-chill food. Lancet, ii: 37-38.
Knutson, K.M., M arth, E.H., and W agner, M.K. 1987. Microwave heating of food. Food Sci. Technol. 20: 101-110.
Lund, B.M., Knox, M R., and Cole, M.B. 1989. Destruction of L is te r ia m o n ocytogenes during microwave cooking. Lancet. i:218.
Nettleton, J.A . 1987. S e a fo o d a n d H e a lth , p. 143. Osprey Books, New York.Okrend, A.J.G., Rose, B.E., and Bennett, B. 1987. Incidence and toxigenc-
ity of A e r o m o n a s species in retail poultry beef and pork. J . Food Prot. 50: 509-513.
Palumbo, S.A., W illiams, A.C., Buchanan, R.L., Phillips, J.G . 1987. Therm al resistance of A e r o m o n a s h y d ro p h ila . J. Food Prot. 50: 761-764.
Rippey, S.R. and Cabelli, V.J. 1979. Membrane filter procedure for enum eration of Aeromonas h y d ro p h ila in fresh waters. Appl. Environ. Microbiol. 38: 108-113.
SAS Institute, Inc. 1987. S A S I S T A T © G u id e fo r P e rso n a l C o m p u ters , V ers io n 6 e d itio n . SAS Institute, Cary, NC.
Shotts, E.B. Jr . and Rimler, R. 1973. Medium for the isolation of A e r c - m o n a s . Appl. Microbiol. 26: 550-553.
Speck, M.L. (Ed.) 1984. C o m p e n d iu m o f th e M e th o d s fo r th e M icro b io lo g ica l E x a m in a tio n o f F oods, 2nd ed. American Public H ealth Association, W ashington, DC.
Stelma, G.N. Jr . 1989. A e r o m o n a s h y d ro p h ila In F o o d b o rn e B a c te r ia l P a th o g en s , (Ed.) Doyle, M.P., p. 1-19. Marcel Dekker, New York.
Thomas, F.B. and Thomas, S.D. 1983. T e c h n ic a l O p era tio n M a n u a l fo r th e B lu e C ra b In d u s tr y . 43p. UNC Sea G rant Publication UNC-SG-83-02. Raleigh, NC.
Toledo, R.T. 1980. F u n d a m e n ta ls o f F o o d P rocess E n g in e e r in g , p. 197-281. The AVI Publishing Co. Wesport, CT.
Ward, D.R., Flick, G.J. Hebard, C.E., Cole, W.R., and Nelson, E.A. 1982. T h e r m a l P ro cess in g P a s te u r iza tio n M a n u a l. Seafood Processing and Extension Unit. Hampton, VA.
W eagant, S.D., Sado, P.N., Colbun, K.G., Torkelson, J.D., Stanley, F.A., Krane, M.H., Shields, S.C., and Thyer, C.F. 1988. The incidence of L is te r ia species in frozen seafood products. J . Food Prot. 51: 655-657.
Ms received 8/30/92; revised 12/1/92; accepted 12/12/92.
This study was supported in part by the University of Georgia Experiment Station and the Southern Regional Aquaculture Center. We appreciate Dr. George W. Lewis of the Department of Extension Aquaculture and Fisheries, and Mr. Ron Schinnick of Cohutta Fisheries Center, the University of Georgia for supplying the catfish.
post rigor muscle tissue as studied by differential scanning calorimetry. J . Sci. Food Agric. 31: 1034.
Sutton, A.H. 1973. The hydrolysis of sodium tripolyphosphate in cod and beef muscle. J . Food Technol. 8: 185-195.
Tenhet, V., Finne, G., Nickelson II R., and Toloday, D. 1981. Phosphorus levels in peeled and deveined shrim p treated w ith sodium tripolyphosphate. J . Food Sci. 46: 350-352, 356.
Tompkin, R.B. 1984. Indirect antim icrobial effects in foods: Phosphates. J. Food Prot. 46: 846-860.
Townsend, W.E. and Blankenship, L.C. 1987. Assessm ent of previous heat trea tm en t of laboratory heat-processed m eat and poultry using a comm ercial enzyme system. J. Food Sci. 52: 1445-1448.
Wang, D.W.S. 1989. Additives. Ch. 9 In M e c h a n is m a n d T h e o r y in F ood C h e m is tr y Van Nostrand Reinhold, New York.
Ms received 7/25/92; revised 12/8/92; accepted 12/16/92.
Volume 58, No. 3, 1993-JOURNAL OF FOOD SCIENCE-521

Specific Heat of Selected Fresh Seafood
MD. SHAFIUR RAHMAN
----------------------------ABSTRACT-----------------------------The specific heat of selected fresh seafood (calamari, cuttle, prawn, octopus and squid) measured by method of mixture varied from 3.29 to 3.79 kJ/kg K. A semi-empirical model based on the additive model, which included an extra term for the fraction of bound water and interaction between the phases, improved specific heat predictions based on composition.
Key Words: seafood, calamari, specific-heat, squid
INTRODUCTIONSPECIFIC HEAT of food is important in the design and control of processes where energy transfer is involved such as heating, cooling, freezing, cooking and drying. Polley et al. (1980) and Sanz et al. (1987) compiled the specific heats of food materials. Very little information exists on the specific heat of seafood. Adiabatic calorimeter, method of mixture, differential scanning calorimeter (SDC) and comparison calorimeter are commonly was used to measure the specific heats of food materials. Adiabatic calorimeter was used to measure the specific heat of flat bread by Gupta (1990), Hwang and Hayakawa(1979) for different food materials, de dios Alvarado (1991) for fruit pulps. Oguntande and Akintoye (1991) used comparison calorimeter for measuring the specific heat of cow’s milk and soymilk. Tang et al (1991) and Kasprzycka-Gultman and Odzeniak (1991) used DSC to measure the specific heats of lentil seed, fats and oil. Muzilla et al. (1990), Putranon et al.(1980) and Rice et al. (1988) used method of mixture to measure the specific heats of pork/soy hull mixture, paddy rice and potatoes.
The method of mixtures is the most widely used for measuring specific heat of food materials due to its simplicity and accuracy. A specimen of known mass and temperature is dropped into a calorimeter of known specific heat containing water of known temperature and mass. The unknown specific heat is then computed from a heat balance after temperature equilib- riation. The average specific heat of the sample was calculated as follows (Mohsenin, 1980):
r _ C U K + E)(Toc - Tem)Ws{Tos - Tem) { ’
where Ce and Cw are the specific heat of sample and water (KJ/kg K), Ww and W, are the mass of water and sample (kg), E water equivalent of the system (kg), Toc, Ta, and Tem are the initial temperature of the calorimeter and sample, and equilibrium temperature of the mixture respectively.
Linear and quadratic models to predict the specific heat as a function of moisture content are widely used. (Mohsenin,1980). Choi and Okos (1985) proposed the specific heat prediction of food materials from the proximate composition based on additive mixing rule. The model was:
c. = £ *,c, (2)i- 1
Author Rahman is with the Dep. of Food Science & Technology, Univ. of New South Wales, P.O. Box 1, Kensington, NSW 2033 Australia.
In the case of organic liquid-liquid mixtures, a number of authors confirmed a deviation in properties estimated from the mixing rule (Arimoto et al. 1990; Bravo et al. 1991; Demirel and Paksoy, 1992; Ortega et al., 1991; Rey & Martin-Gil,1989). In literature excess volume, excess enthalpy, or excess specific heat of mixture is also called excess property of mixtures. The excess property of binary mixtures showed a range of behaviors: in some cases there were a single or double peak in the plot and in some cases there were positive and negative lobes in the plots. The excess properties usually did not correlate well. The most widely used equation was given by Red- lich and Kister (1948) to correlate the excess property and can be written as:
C « = X,X2 £ A ^ X x - X2y - 1 (3)/ - 1
where Ca is the excess specific heat (J/kg K), X x and X2 are the mass fraction of component 1 and 2, Ay is the model parameter and j indicates the degree of polynomial. The above equation can be transformed into a polynomial of X 1 by expanding series terms. Here the polynomial forms of equations (linear and quadratic forms) are used.
The objective of our study was to measure the specific heat of seafood and to develop models for specific heat based upon composition and an interaction term.
M ATERIALS & M ETHODS
FRESH CALAMARI (Spirula spirula) cuttle (Sepia officinalis), octopus (Octopus cyaneus), tiger prawn (Penaeus esculentus) green prawn (Penaeus plebejus) and squid (Loligo australis) were purchased from the Sydney fish market. The head and viscera were removed and the remainder washed with tap water. Seafood meat was chopped and filled in the sample holder. Protein, fat, ash and water contents of each seafood were determined by proximate analysis as described by Rahman and Driscoll (1991) and Rahman et al. (1991).
One vacuum thermos flask (A) (1 L) with plastic cover and lid was used to equilibrate the sample at room temperature. The equilibrium temperature was measured by a glass thermometer (accuracy ± 0.2°C). Another flask (B) (1 L) with thermocouple (Type K) was placed through the lid to the midpoint of the thermos. The thermocouple had been previously calibrated with ice and boiling water. lOOg of water was placed into a conical flask with stopper dipped into ice bath. After at least 2 hr equilibration, lOOg of water was transferred from the conical flask to thermos flask B and the temperature was recorded with digital thermometer with an accuracy ± 0.1°C. After 10 min, 40g of encapsulated sample in two small thin wall glass bottles dropped into flask B and the temperature recorded at 1 min intervals initially, then at 5 min intervals. The equilibrium temperature was determined by graphical method described by Mohsenin (1980) to reduce the error due to thermal leakage. The degree of mixing was improved by slight shaking of the flask by hand. The water equivalent of the flask was determined using 40 g water at a known temperature. The sample and flask (B) were equilibrated at the same room temperature to reduce the error (as mentioned by Short et al. (1942). The method was calibrated by measuring the specific heat of water. Replicates (5 to 7) were taken for each seafood specimen.
RESULTS & DISCUSSION
TIME-TEMPERATURE PLOTS of the water in the calorimeter are shown in Fig. 1 for water, toluene and squid tentacle
522-JOURNAL OF FOOD SCIENCE-Volume 58, No. 3, 1993

Table 1 -Specific heat of fresh seafood at 17 ± 2°C
S e a fo o d s W a te r * P ro te in * Fat* A s h *S p e c if ic h e a tb
(K J /k g K )
C a la m a r i 8 3 .0 9 1 2 .2 8 3 .0 3 0 .9 3 3 .4 3(te n ta c le ) (0 .0 3 ) (1 .3 4 ) (0 .4 4 ) (0 .0 2 ) (0 .1 3 )
C a la m a ri 8 3 .9 1 1 2 .4 3 2 .9 3 0 .6 7 3 .6 9(te n ta c le ) (0 .1 2 ) (0 .3 8 ) (0 .3 0 ) (0 .0 2 ) (0 .1 2 )
C a la m a r i 8 0 .0 2 1 6 .1 5 2 .0 7 1 .2 8 3 .4 1(m a n tle ) (0 .1 8 ) (1 .2 5 ) (0 .0 8 ) (0 .0 2 ) (0 .0 7 )
C a la m a r i 7 9 .9 8 1 6 .3 5 2 .1 3 1 .2 6 3 .4 7(m a n tle ) (0 .1 0 ) (0 .4 3 ) (0 .6 6 ) (0 .0 9 ) (0 .0 9 )
C a la m a r i 8 1 .5 9 1 4 .8 5 1 .3 4 1 .3 5 3 .3 5(m a n tle ) (0 .3 7 ) (0 .8 6 ) (0 .2 3 ) (0 .0 5 ) (0 .1 4 )
C a la m a ri 8 4 .1 8 1 3 .1 5 0 .9 8 0 .9 9 3 .7 8(w in g ) (0 .0 1 ) (1 .2 3 ) (0 .2 1 ) (0 .0 9 ) (0 .0 7 )
C a la m a ri 8 3 .3 8 1 2 .01 3 .4 7 0 .9 0 3 .7 9(w in g ) (0 .3 3 ) (1 .0 9 ) (0 .1 0 ) (0 .0 5 ) (0 .1 0 )
C u ttle 8 6 .9 9 1 0 .8 9 1 .5 6 0 .3 9 3 .7 9(sk in ) (0 .1 4 ) (0 .7 8 ) (0 .1 6 ) (0 .0 1 ) (0 .1 3 )
C u ttle 8 0 .9 2 1 5 .2 5 2 .0 7 1 .1 3 3 .5 9(m a n tle ) (0 .1 8 ) (0 .8 6 ) (0 .3 3 ) (0 .0 2 ) (0 .0 9 )
K in g p ra w n 7 5 .6 3 1 6 .4 7 1 .4 8 1 .7 7 3 .4 5(g re e n ) (0 .1 1 ) (1 .0 5 ) (0 .0 9 ) (0 .0 3 ) (0 .1 3 )
K in g p ra w n 7 6 .4 9 2 0 .6 5 1 .1 8 1 .4 7 3 .4 1(tig e r) (0 .1 1 ) (0 .1 5 ) (0 .4 0 ) (0 .0 5 ) (0 .1 9 )
O c to p u s 8 0 .3 5 1 5 .7 3 1 .6 5 1 .2 6 3 .2 9(te n ta c le ) (0 .1 1 ) (0 .9 8 ) (0 .3 1 ) (0 .0 3 ) (0 .0 8 )
S q u id 8 2 .6 3 1 2 .2 4 2 .4 4 1 .2 5 3 .5 8(te n ta c le ) (0 .0 7 ) (0 .6 9 ) (0 .3 2 ) (0 .1 9 ) (0 .0 9 )
S q u id 7 9 .6 1 1 7 .3 3 1 .6 5 1 .2 5 3 .5 0(te n ta c le ) (0 .1 1 ) (0 .6 3 ) (0 .1 3 ) (0 .0 8 ) (0 .1 5 )
S q u id 8 3 .0 2 1 3 .6 9 2 .1 7 1 .0 0 3 .5 3(te n ta c le ) (0 .2 2 ) (0 .2 4 ) (0 .2 9 ) (0 .0 6 ) (0 .1 3 )
1 Average of 3 samples b Average of 5 to 7 samples
Values in parentheses are standard deviations
Table 2 - Different models used for analysing specific heatM o d e l E q u a tio n
(E m p ir ic a l) M o d e l 1 M o d e l 2
(T h e o re t ic a l) M o d e l 3
C . = 0 .4 9 + 3 .7 5 X „C . = 3 5 .0 6 - 8 1 .8 3 X W + 5 2 .8 8 X J
C . = 2 X ,C ,/-I(S e m l-e rn p lr lc a l) M o d e l 4
M o d e l 5
C . =
C . =
w h e r e I = 1 .3 9 - 1 .4 3 X „ M o d e l 6
C,
& x ’c ’ m
, s »
- [ I * ] -
- 0.20
- I
w h e r e I = - 3 3 . 7 7 + 8 5 .5 8 X „ - 5 3 .7 6 X J
Model7 c . = X [Xiic, - i,)]/-Iw h e r e f '¡x i = - 0 . 0 0 7 X W - 0 .1 8 X P - 0 .0 2 X , + 2 5 .3 3 X , - 4 .3 1 X e
Component specific heat data are taken from Choi and Okos (1985)
moisture content. The experimental data were fitted to the proposed models as shown (Table 2). Empirical models were based on statistical regression curve fitting. These models are commonly and widely used for their simplicity and accuracy.
Theoretical models are based on proportions by compositions. Semi-empirical models often have some theoretical basis but the interaction terms were again correlated by regression analysis. Theoretically the effective specific heat of a composite mixture could be divided into 3 components:
Fig. I-Time-temperature plot of water in the calorimeter: o water; □ squid (tentacle); A toluene.
Specificheat
Weighted sum of the specific heats of the components
] [" heat loss or gain "1 - due bound water |_with solids J
[heat loss or gain 1 due to interaction of the component phases J
or,
C. Xb{Cjw Qnv) 4 (4)
where Ce, and Cbw are the specific heat of composite medium, free water and bound water respectively (KJ/kg K). I is the interaction terms (KJ/kg K), Xt and Xbw are the mass fractions of ith component and bound water. It is difficult to measure the specific heat of the bound water and the interaction term separately. Hence, both terms were combined and Eq.(4) can be written as:
Cc = [ | XtCt j - / (5)
meat. After calibrating with water the method of mixture gave 3.5% reproducibility in case of water (Cw = 4.18 kJ/kg K) and 5.3% in toluene (C, = 1.70 kJ/kg K).
The proximate composition and specific heats of fresh seafoods as measured are given in Table 1. The specific heats of fresh seafoods varied from 3.29 to 3.79 kJ/kg K (Table 1). The published values for seafoods similarly varied from 3.48 to 3.77 kJ/kg K, depending on moisture content (Polley et al.,1980). But we did not find published values for specific heats of calamari, squid, prawn, cuttle and octopus. Specific heat data of seafood were presented only by Polley et al. (1980) in terms of
where I is the combined term. Values of I can be calculated by difference of experimental specific heat (2/1, C,X), and can be related to the composition of the phases by different forms of correlation.
F-ratios were calculated to test the validity of the models (Table 3). The analysis showed that all models differed significantly from :he experimental data (p<0.05). Hence, none of the models was a good explanation of the physical process. But from the F-ratio it was possible to choose the model which gave the lowest F-ratio. The quadratic model (Model 2) was thus chosen to predict the specific heats of fresh seafood (Table3). There was no significant difference between empirical and
Volume 58, No. 3, 1993-JOURNAL OF FOOD SCIENCE-523
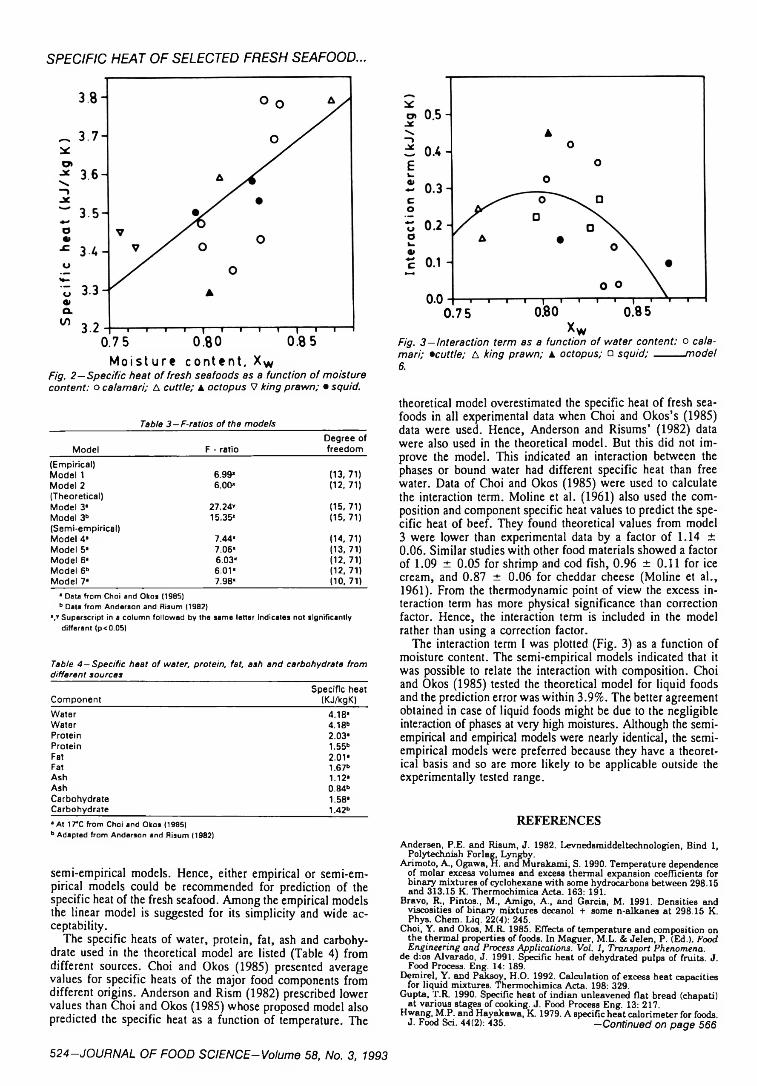
S P E C IF IC H E A T O F S E L E C T E D F R E S H S E A F O O D ...
M o i s t u r e c o n t e n t . X wFig. 2 - Specific heat of fresh seafoods as a function of moisture content: o calamari; A cuttle; A octopus V king prawn; • squid.
Table 3 -F -ra tio s o f the models
Model F - ratioDegree of freedom
(Empirical) Model 1 6.99« (13,71)Model 2 6.00« (12,71)(Theoretical) Model 3* 27.24« (15, 71)Model 3» 15.35' (15, 71)(Semi-empirical) Model 4* 7.44« (14, 71)Model 5* 7.06« (13,71)Model 6" 6.03* (12, 71)Model 6b 6.01* (12, 71)Model 7* 7.98* (10, 71)
• Data from Choi and Okos (1985) b Data from Anderson and Risum (1982)
V Superscript in a column followed by the same letter indicates not significantlydifferent (p<0.05)
Table 4 —Specific heat o f water, protein, fat, ash and carbohydrate from different sources
ComponentSpecific heat
(KJ/kgK)Water 4.18*Water 4.18»Protein 2.03«Protein 1.55bFat 2.01«Fat 1.67»Ash 1.12«Ash 0.84bCarbohydrate 1.58«Carbohydrate 1.42b• At 17°C from Choi and Okos (1985) b Adapted from Anderson and Risum (1982)
semi-empirical models. Hence, either empirical or semi-empirical models could be recommended for prediction of the specific heat of the fresh seafood. Among the empirical models the linear model is suggested for its simplicity and wide acceptability.
The specific heats of water, protein, fat, ash and carbohydrate used in the theoretical model are listed (Table 4) from different sources. Choi and Okos (1985) presented average values for specific heats of the major food components from different origins. Anderson and Rism (1982) prescribed lower values than Choi and Okos (1985) whose proposed model also predicted the specific heat as a function of temperature. The
Fig. 3—interaction term as a function of water content: o calamari; •cuttle; A king prawn; A octopus; □ sq u id ;-------- model6.
theoretical model overestimated the specific heat of fresh seafoods in all experimental data when Choi and Okos’s (1985) data were used. Hence, Anderson and Risums’ (1982) data were also used in the theoretical model. But this did not improve the model. This indicated an interaction between the phases or bound water had different specific heat than free water. Data of Choi and Okos (1985) were used to calculate the interaction term. Moline et al. (1961) also used the composition and component specific heat values to predict the specific heat of beef. They found theoretical values from model 3 were lower than experimental data by a factor of 1.14 ± 0.06. Similar studies with other food materials showed a factor of 1.09 ± 0.05 for shrimp and cod fish, 0.96 ± 0 .1 1 for ice cream, and 0.87 ± 0.06 for cheddar cheese (Moline et al., 1961). From the thermodynamic point of view the excess interaction term has more physical significance than correction factor. Hence, the interaction term is included in the model rather than using a correction factor.
The interaction term I was plotted (Fig. 3) as a function of moisture content. The semi-empirical models indicated that it was possible to relate the interaction with composition. Choi and Okos (1985) tested the theoretical model for liquid foods and the prediction error was within 3.9%. The better agreement obtained in case of liquid foods might be due to the negligible interaction of phases at very high moistures. Although the semi- empirical and empirical models were nearly identical, the semi- empirical models were preferred because they have a theoretical basis and so are more likely to be applicable outside the experimentally tested range.
REFERENCES
Andersen, P.E. and Risum, J. 1982. Levnedsmiddeltechnologien, Bind 1, Polytechnish For lag, Lyngby.
Arimoto, A., Ogawa, H. and Murakami, S. 1990. Temperature dependence of molar excess volumes and excess thermal expansion coefficients for binary mixtures of cyclohexane with some hydrocarbons between 298.15 and 313.15 K. Thermochimica Acta. 163: 191.
Bravo, R., Pintos., M., Amigo, A., and Garcia, M. 1991. Densities and viscosities of binary mixtures decanol + some n-alkanes at 298.15 K. Phys. Chem. Liq. 22(4): 245.
Choi, Y. and Okos, M.R. 1985. Effects of temperature and composition on the thermal properties of foods. In Maguer, M.L. & Jelen, P. (Ed.). Food Engineering and Process Applications. Vol. 1, Transport Phenomena.
de d:os Alvarado, J. 1991. Specific heat of dehydrated pulps of fruits. J. Food Process. Eng. 14: 189.
Demirel, Y. and Paksoy, H.O. 1992. Calculation of excess heat capacities for liquid mixtures. Thermochimica Acta. 198: 329.
Gupta, T.R. 1990. Specific heat of indian unleavened flat bread (chapati) at various stages of cooking. J. Food Process Eng. 13: 217.
Hwang, M.P. and Hayakawa, K. 1979. A specific heat calorimeter for foods. J. Food Sei. 44(2): 435. —Continued on page 566
524-JOURNAL OF FOOD SCIENCE-Volume 58, No. 3, 1993
Volatile Flavor Components in Snow Crab Cooker Effluentand Effluent Concentrate
Y.J. CHA, K.R. CADW ALLADER, and H.H. BAEK
----------------------------ABSTRACT-----------------------------Volatile compounds in snow crab cooker effluent (SCCE) and effluent concentrate (EC) were compared by simultaneous steam distillation- solvent extraction/gas chromatography/mass spectrometry (SDE/GC7 MS). Volatile compounds (122) were detected in both samples. Of these, 97 were positively identified, composed mainly of nitrogen- and sulfur-containing compounds, aromatic hydrocarbons, aldehydes, ketones, furans, and alcohols. A total of 101 compounds were detected in the cooker effluent, and 90 were detected in the concentrate. Amounts of sulfur- and nitrogen-containing compounds were 44 and7.3 times higher, respectively, in EC.
Key Words: snow crab, cooker effluent, volatile flavor
INTRODUCTIONSNOW CRAB, with its distinctive aroma and taste, has long been favored by consumers throughout the world. Snow crab is caught from unpolluted waters (600-2000m in depth) in the Korean East sea and is generally processed into a canned product. In most processing operations, the liquid effluent produced during boiling has been discarded into waterways causing a potential threat to the environment. Snow crab cooker effluent (SCCE) is believed to contain appreciable amounts of soluble compounds such as amino acids, peptides, nucleotides, and organic acids. A few seafood processing plants have been developing methods for converting this by-product into marketable flavoring agents.
Despite the large volume of processed snow crab, studies concerned with flavor attributes have been limited, with the majority focusing mainly on taste-active, nonvolative flavor components. Konosu et al. (1978) found that the taste-active flavor components in boiled snow crab extracts consisted mainly of amino acids, nucleotides and related compounds, miscellaneous organic compounds, and mineral salts. Hayashi et al.(1981) examined the sensory characteristics of a synthetic extract from 44 taste-active compounds known to exist in boiled snow crab leg meat. They concluded that 12 compounds were primarily responsible for the characteristic taste. Hayashi et al.(1990) attempted to elucidate mechanisms for changes in volatile and nonvolatile components during heating of amino acid- enriched king crab leg meat. In other studies, Flament (1990) identified 19 alcoholic constituents in a commercial crab extract powder, while Matiella and Hsieh (1990) detected 53 volatile compounds in the dynamic headspace of blue crab meat.
General methods for production and application of natural crab extracts have been addressed to a limited extent by Ochi(1980) and In (1990). In general, such extracts are prepared from fresh raw materials or from composite processing byproducts. Food flavorants have been successfully produced from ocean quahog clam juice (Burdette et al., 1983). Other dem-
Author Cha is with the Department of Chemistry, Changwon National University, Changwon 641-773, South Korea. Authors Cadwaiiader and Baek are with the Dept, o f Food Science, Louisiana Agricultural Experiment Station, Louisiana State University Agricultural Center, Baton Rouge, LA 70803-4200. Address inquiries to Dr. Cadwaiiader.
onstration projects have shown that clam wash water and clam bellies could be processed into marketable flavor extracts (Reddy et al., 1989; Reddy and Flick, 1989). Cha et al. (1992) examined the volatile profiles of crayfish flavor concentrates prepared by atmospheric evaporation of aqueous extracts of picking table by-products. Our objective was to demonstrate the feasibility of converting commercial SCCE into a marketable flavor extract through identification and comparison of volatile flavor components in both SCCE and its respective concentrate.
M ATERIALS & M ETHODSMaterials
Fresh snow crabs were transported on ice to a canning factory within 6 -8 hr of harvest. Legs, bodies, and claws of washed snow crabs (Chionoecetes japonicus) were separated using a cutting machine (Daekwang Machine Co., Daegu, Korea) and then boiled in 3% (w/w) saline water for 3-4 hr. The cooker effluent was immediately filtered through a No. 14 sieve and concentrated within 3-4 hr using a commercial single-pass spray type heat exchanger (Daehu In. Cc., Ulgin, Korea) at 170°C. SCCE and EC were obtained from Namkwang Seafood Inc., Hupo, Korea and were transported on ice in high density polyethylene bottles to the Department of Chemistry, Changwon National University within 5 hrs and stored at -20°C until analyzed. Standard flavor compounds were purchased from commercial sources or were generous gifts from Aldrich Flavor and Fragrance (Aldrich Chemical Co., Milwaukee, WI).
Composition analysis
Percent soluble solids (°Brix) was measured using a refractometer (Atago Co. LTD., Tokyo, Japan). Salt content was measured by the Mohr method (ACAC, 1980). Moisture content was determined by an oven drying method (AOAC, 1980).
Simultaneous steam distillation-solvent extraction (SDE)
Extraction was performed on 2.0L of SCCE (or EC) using a Likens and Nickerson (1964) type SDE apparatus (Cat. No. K-523010-0000, Kontes, Vineland, NJ). Sample plus 90.784 pg of internal standard (2,4,6-trimethylpyridine) were extracted for 4 hr with 100 mL redistilled diethyl ether. Details are described by Tanchotikul and Hsieh (1991). Extracts were concentrated to 0.2 mL under a gentle stream of nitrogen. EC extracts were diluted 7.5 fold prior to analysis, while SCCE extracts were analyzed without dilution. Triplicate extractions were carried out fer each sample.
Gas chromatography/mass spectrometry (GC/MS)
GC/MS system consisted of an HP 5790 GC/HP 5970B mass selective detector (MSD) (Hewlett-Packard Co., Palo Alto, CA). Each SDE extract (5pL) was injected in the splitless mode (155°C injector temperature; 30 sec valve delay) into a fused silica open-tubular column (Supelcowax 10, 60 m length x 0.25 mm i.d. x 0.25 pm film thickness; Supelco. Inc., Bellefonte, PA). Helium was used as carrier gas at a linear velocity of 25.7 cm/sec. Oven temperature was programmed from 40°C to 175°C at 2°C/min with initial hold 5 min and final hold 30 min. Oven temperature was further increased to 195'C at 5°C/min and then maintained at 195°C for 25 min. MSD conditions were as follows: capillary direct interface temperature, 200°C; ion source temperature, 200°C; ionization energy, 70 eV; mass range, 33-
Volume 58, No. 3, 1993-JOURNAL OF FOOD SCIENCE-525

SNOW CRAB FLAVOR . . .
Fig. 1—Total ion chromatogram of volatile components in snow crab cooker effluent (B1-B2). Peak numbers correspond to those listed in Table 1.
300 a.m.u.; electron multiplier voltage, 2000 V; and scan rate, 1.60 sec-1. Duplicate analyses were performed for each SDE extract.
Identification and relative amountsPeak identifications were based on comparison of GC retention
indices (RI), determined using n-alkanes (van den Dool and Kratz, 1963), and mass spectra of unknowns with those of authentic standard compounds under identical experimental conditions. Tentative identifications were based on standard MS library information (Hewlett- Packard Co., 1988). The relative amounts of each compound were expressed by the ratio of its total peak area with that of the internal standard. Peak areas of co-eluting compounds were calculated using mass chromatography, as described by Hites and Biemann (1970), to minimize chromatographic interference.
RESULTS & DISCUSSION
SNOW CRAB cooker effluent (SCCE) and concentrate (EC) were examined for volatile flavor components to assess the commercial feasibility of using EC as a flavoring agent. Soluble solids (3.6%) and salt content (2.2%) of SCCE increased to 37.8% and 21.7, respectively, while moisture content of SCCE decreased from 96.8% to 64.2% after concentration. Thus, the average degree of concentration was about 10.5-fold. Total ion chromatograms of volatile components in SCCE and EC (Fig. 1 and 2) showed a total of 122 volatile compounds were detected. These included 11 aldehydes, 14 ketones, 13 alcohols, 21 aromatic hydrocarbons, 24 nitrogen-containing compounds, 10 sulfur-containing compounds, 5 acids, 8 fur- ans, and 16 miscellaneous compounds. Among these, 97 were positively identified. As shown (Table 1), however, 101 com
pounds were detected in SCCE, while only 90 were found in EC, indicating that some loss of volatile compounds occurred during concentration.
Nine aldehydes were identified in SCCE, while only 6 were detected in EC. The total concentration of aldehydes increased13.9 times in EC compared with SCCE. Two compounds in particular, 2-methylbutanal and 3-methylbutanal, were concentrated to a high degree in EC—33.8 times and 17.3 times, respectively. However, certain other aldehydes, such as hex- anal, (E)-2-pentenal, (E)-2-hexenal, (E,E)-2,4-hexadienal, and (E,E)-2,4-heptadienal, were detected only in SCCE and were in low concentration. These straight-chain alkanals and alken- als may have originated from lipid oxidation (Karahadian and Lindsay, 1989). Furthermore, these compounds are believed to cause unpleasant oxidation flavors in many foods (Heath and Reineccius, 1986; Vejaphan et al., 1988). However, Ho et al. (1989) reported that some aldehydes, which apparently do not have detectable aromas, may act as precursors to other important aroma compounds, such as heterocyclic compounds. Miyagawa et al. (1979) reported that the hepatopancreas of snow crab contained a high percentage of odd-numbered carbon fatty acids and polyunsaturated fatty acids. Konosu et al.(1978) reported that crude fat in the hepatopancreas and ovary of snow crab was 23.3% and 11.4%, respectively. They also reported that high amounts of amino acids, such as glycine, arginine, proline, taurine, and alanine, contributed to the characteristic flavor of boiled snow crab. Lipids and free amino acids extracted from crab meat and the hepatopancreas were thought to be further degraded during heat processing, thus contributing to the characteristic flavor of SCCE and EC. Ben-
526—JOURNAL OF FOOD SCIENCE-Volume 58, No. 3, 1993

Fig. 2—Total ion chromatogram of volatile components in snow crab cooker effluent concentrate (C1-C2). Peak numbers correspond to those listed in Table 1.
zaldehyde, having a pleasant almond, nutty and fruity aroma in Crustacea (Vejaphan et al., 1988), was 5.6 times higher in EC than in SCCE. Hayashi et al. (1990) reported that benzal- dehyde was thermally generated and partially contributed to characteristic cooked crab flavor.
The concentration of ketones identified in EC was 3.7 times higher than in SCCE. 2-Heptanone, acetophenone, 2,3-buta- nedione, and 2,3-dihydro-lH-indenone were particularly high in EC. 2,3-Dihydro-lH-indenone was identified for the first time in crab. Ketones contributed to the sweet floral, fruity flavor of many Crustacea (Cha et al., 1992). The methylke- tones, such as 2-heptanone and 2-pentanone, have floral aromas (Tanchitikul and Hsieh, 1991). Acetophenone has a sweet, rose-like aroma; and 2,3-butanedione has an intense buttery and desirable aroma (Vejaphan et al., 1988; Tanchotikul and Hsieh, 1991). Kubota et al. (1982) reported that carbonyl compounds, resulting mainly from lipid and amino acid degradation, contributed a fairly strong seaweed-like odor to cooked krill.
A series of normal alcohols (C4-C8, CIO), as well as aromatic and sulfur-containing alcohols, were present in small amounts in both samples. 3-Methylthiopropanol, identified for the first time in crab, was 19 times higher in concentration in EC compared with SCCE, while the concentration of 1-penten-3-ol was 7.4 times higher in EC. 3-Methylthiopropanol, with a strong sulfury aroma, has been identified in fermented fish sauce (Mclver et al., 1982). Flament (1990) reported the presence of 19 alcohols in crab extract powder. Alcohols may not contribute to the overall flavor of snow crab because of their high threshold values (Heath and Reineccius, 1986).
Small amounts of 5 acids were identified for the first time in snow crab. Amounts of most acids did not increase appreciably during concentration with the exception of 3-methyl- butanoic acid, which increased about 29-fold in EC. Mclver et al. (1982) reported that volatile fatty acids identified in fish sauce were formed from amino acids via bacterial fermentation. These volatile fatty acids, having cheesy of ammoniacal odors depending on concentration, might contribute to the overall flavor of snow crab. For example, butanoic and hexanoic acids are important factors in determining the quality of Romano cheese (Ha and Lindsay, 1991).
Twenty aromatic hydrocarbons and phenolic compounds were identified in SCCE effluent and 15 in EC. Amounts of these compounds increased only slightly, about 1.3-fold, during concentration, while the total number of these compounds decreased during concentration. Alkylbenzenes have been reported previously in a number of Crustacea (Cha et al., 1992; Matiella and Hsieh, 1990; Kubota et al., 1982). Kubota et al. (1982) reported that xylenes and phenol contributed undesirable medicinal odors to cooked krill. Our results suggest that these potentially malodorous alkylbenzenes may evaporate during the high temperature concentration process.
Among 24 nitrogen-containing compounds detected, 9 pyr- azine were identified in SCCE and 11 in EC. The total concentration of pyrazines was about 33 times higher in EC than in SCCE. This indicated that many of these pyrazine were thermally generated during concentration. Certain pyrazines showed notable increases in concentration, in particular 2,3- dimethylpyrazine, trimethylpyrazine, 2,6-dimethylpyrazine, methylpyrazine, and tetramethylpyrazine. Trimethylpyrazine
Volume 58, No. 3, 1993-JOURNAL OF FOOD SCIENCE-527

SNOW CRAB FLAVOR
Table 1 — Volatile flavor components in snow crab cooker effluent (SCCE) and effluent concentrate (EC)
rI » SCCE EC
Peakno.
Compound name by class SCCE* ECb
Mean-arearatio1* S.D.*
Mean-arearatio S.D.
Ratio'(EC/SCCE)
Aldehydes (11) 2 .20 30.5 13.9
1 2-Methylpropanal — 808 - - 1.74 0.548 2 -Methylbutanal 914 914 0.37 0.14 12.5 3.9 33.89 3-Methylbutanal 918 918 0.62 0.20 10.7 1.5 17.3
23 (E)-2-Butenal 1039 1039 0.129 0.051 0.218 0.046 1.6925 hexanal 1079 - 0.053 0.020 — —27 2-Methyl-(E)-2-butenal - 1094 - - 0.198 0.05230 (E)-2-Pentenal 1127 — 0.031 0.014 — —43 (E)-2-Hexenal 1216 — 0.031 0.006 —73 (E,E)-2,4-Hexadienal 1401 — 0.007 0.003 - -83 (E,E)-2,4-Heptadlenal 1492 - 0.040 0.012 - -86 Benzaldehyde 1522 1522 0.92 0.17 5.14 0.37 5.59
Ketones (14) 0.86 3.14 3.67
15 2-Pentanone _ 975 _ — 0.147 0.06016 2,3-Butanedlone 979 978 0.365 0.085 0.45 0.18 1.2217 3-Methyl-3-buten-2-one* - 991 - - 0.232 0.07819 4-Methyl-2-pentanone 1007 - 0.068 0.043 - -20 1-Penten-3-one 1021 — 0.035 0.012 — —38 2-Heptanone - 1182 - - 0.78 0.1355 3-Hydroxy-2-butanone — 1283 — — 0.169 0.03856 Cyclohexanone 1285 - 0.320 0.067 - -71 2-Nonanone 1387 — 0.022 0.002 — —76 2,3-Dlmethyl-2-cyclopenten-1-one - 1444 - - 0.040 0 .01088 (E,E)-3,5-Octadlen-2-one* 1567 — 0.015 0.001 — —96 Acetophenone 1648 1648 0.029 0.002 0.526 0.035 17.7
104 Proplophenone* 1725 1725 0.004 0.004 0.194 0.022 48.4107 2,3-Dlhydro-1H-lndenone* - 1799 - - 0.602 0.084
Alcohols (13) 0.29 0.97 3.31
21 2-Butanol _ 1024 _ _ 0.148 0.04733 Butanol 1140 1140 0.047 0.023 0.025 0.016 0.5434 1-Penten-3-ol 1156 1155 0.040 0.022 0.30 0 .20 7.4061 (Z)-2-Penten-1-ol 1309 - 0.014 0.004 — —67 Hexanol 1351 1352 0.012 0.003 0.067 0.006 5.5877 1-Octen-3-ol 1447 — 0 .020 0.003 _ —78 Heptanol 1451 - 0.004 0.001 - —82 2-Ethyl-1-hexano 1486 1486 0.103 0.008 0.151 0.034 1.4687 Octanol 1553 - 0.012 0.003 — _
102 3-Methylthlopropanol* 1711 1712 0.011 0.003 0.219 0.015 19.0106 Butylcarbitol* 1787 — 0.008 0.004 — —111 Benzylalcohol 1873 1873 0.014 0.003 0.030 0.003 2.13117 Dodecanol 1962 1962 0.012 0.001 0.037 0.001 2.99
Acids (5) 0.057 0.49 8.65
89 Isobutyric acid _ 1569 _ _ 0.058 0.01891 Plvallc acid 1578 1577 0.027 0.005 0.036 0.021 1.3394 Butanoic acid 1631 — 0.012 0.010 _ _98 3-Methylbutanolc acid 1671 1669 0.014 0.006 0.40 0.11 29.4
110 Hexanolc acid 1849 - 0.006 0.005 - -
Aromatic compounds (21) 3.021 3.899 1.29
10 Benzene — 937 _ _ 0.266 0.09522 Toluene 1036 1036 0.427 0.089 0.535 0.081 1.2529 Ethylbenzene 1124 1124 0.145 0.042 0.256 0.046 1.7731 p-Xylene 1132 1131 0.115 0.029 0.114 0.030 0.9932 m-Xylene 1138 1138 0.265 0.052 0.292 0.059 1.1035 Cumene 1170 1170 0.017 0.003 0.035 0.033 2.1137 o-Xylene 1181 — 0.145 0 .02041 Propylbenzene 1206 _ 0.032 0.00744 4-Ethyltoluene 1220 1220 0.023 0.004 0.087 0.031 3.7245 3-Ethyltoluene 1223 1222 0.082 0.009 0.090 0.007 1.1047 1,3,5-T rimethylbenzene 1241 1241 0.026 0.008 0.155 0.018 6.0749 Styrene 1255 1255 0.021 0.004 0.229 0.038 11.050 2 -Ethyltoluene 1259 _ 0.025 0.00552 p-Cymene 1268 — 0.011 0.00754 1,2,4-T rimethylbenzene 1279 1279 0.039 0.006 0.036 0.005 0 9?74 1,4-Dichlorobenzene 1440 — 0.029 0.006
113 2,6-Di-ferf-butyl-p -cresol 1912 1912 0.037 0.008 0.057 0.013 1.56119 Phenol 2002 2003 0.55 0.11 0.51 0.23 0 93121 2,4,6-Trls(1, 1-dimethylethyl)-
phenol* 2038 2035 1.02 0.29 1.22 0.15 1 20122 o-Cresol 2078 — 0.009 0.001123 3-fe/t-Butyl-4-methoxyphenol* 2095 2095 0.022 0.004 0.026 0.005 1.18
—continued on page 529
528-JOURNAL OF FOOD SCIENCE-Volume 58, No. 3, 1993

Table 1 -Continued
Peakno.
Compound name by class
R.l.c SCCE EC
Ratio1(EC/SCCE)SCCE* ECb
Mean-arearatiod S.D.*
Mean-arearatio S.D.
N-Containing compounds (24) 2.70 19.8 7.32
51 Methylpyrazine 1260 1260 0.024 0.007 1.045 0.078 42.862 2,5-Dlmethylpyrazlne 1316 1316 0.140 0.019 0.935 0.069 6.6964 2,6-Dlmethylpyrazlne 1322 1323 0.040 0.007 2.67 0.20 66.265 Ethylpyrazine - 1329 — - 0.058 0.00566 2,3-Dlmethylpyrazlne 1340 1340 0.017 0.003 1.56 0.14 91.570 2-Ethyl-5-methylpyrazine 1385 1386 0.023 0.004 0.465 0.079 20.572 Trlmethylpyrazine 1397 1399 0.073 0.009 6.04 0.12 82.875 2-Ethyl-3,6 -dimethyl pyrazine - 1441 - — 0.021 0.00579 2-Ethyl-3,5-dimethylpyrazine 1456 1456 0.053 0.038 0.51 0.18 9.6281 Tetramethyl pyrazlne 1468 1468 0.011 0.004 0.366 0.040 33.493 2-Acetyl pyrazine 1622 1623 0.007 0.004 0.119 0.028 18.036 Pyridine 1175 1174 0.263 0.062 2.49 0.45 9.4842 2-Methylpyridine 1209 1209 0.013 0.004 0.119 0.021 9.2557 3-Methylpyridine* — 1286 — - 0.629 0.05858 4-Methylpyridine* 1292 1292 0.016 0.003 0.136 0.020 8.7259 4-Hydroxypyridine 1301 1301 0.021 0.008 0.051 0.010 2.4260 2(1H)-Pyridinone 1304 1305 0 .010 0.004 0 .100 0.028 9.6268 2,4,6-Trimethylpyridme (I.S.)« 1363 136385 1H-Pyrrole 1513 1513 0.48 0.11 0.294 0.052 0.61
114 4-Ethylqulnoline* 1916 - 0.006 0.004 — —
118 1,2,3,4-Tetrahydro-6-methylquinoline* 1981 1982 0.169 0.094 0.90 0.33 5.34
120 3-(2H)-lsoquinoline* 2022 2020 0.015 0.013 0.023 0.006 1.4992 Benzonitrile* 1600 1603 0.008 0.002 0.045 0.009 5.51
105 Aniline 1755 1755 0.30 0.30 0.139 0.082 0.47115 Benzeneacetonitrile 1927 1927 0.026 0.016 0.060 0.016 2.35
S-Containing compounds (10) 1.48 65.0 44.0
24 Dimethyldisulfide 1069 1072 0.64 0.23 30.5 9.0 47.869 Dimethyltrisulfide 1378 1383 0.57 0.28 33.5 3.8 58.648 Thiazole 1245 1245 0.014 0.004 0.118 0.029 8.2263 4-Methylthiazole* - 1319 - - 0.260 0.03895 2-Acetylthiazole 1644 1644 0.041 0.003 0.059 0.011 1.4599 3-Thiophenecarboxaldetiyde 1677 1677 0.014 0.003 0.097 0.006 6.89
100 2-Thlophenecarboxaldehyde 1692 1692 0.031 0.004 0.109 0.007 3.51116 Benzothiazole 1953 1954 0.113 0.047 0.088 0.011 0.7753 Methylthiocyanate - 1270 - - 0.175 0.069
109 N-Methylthioacetamide* 1821 1821 0.054 0.033 0.051 0.034 0.93
Furans (8 ) 0.104 1.90 18.3
5 2,5-Dihydrofuran _ 877 _ _ 0.094 0.02611 2-Ethylfuran — 950 — — 0 .22 0.1246 2-Pentylfuran 1230 1230 0.010 0 .002 0.040 0.029 3.9380 Furfural 1462 1462 0.071 0.014 0.250 0.039 3.5384 1 -(2-Furanyl)-ethanone# — 1502 - — 0.054 0.00790 5-Methylfurfural - 1572 — — 0.105 0.01797 Furfurylalcohol 1656 1656 0.025 0.009 1.03 0.10 41.2
103 2-Furancarboxylic acid* - 1717 - - 0.107 0.013
Miscellaneous compounds (16) 4.04 7.73 1.92
2 1,2-Dimethylcyclohexane* 833 832 0.132 0.054 0.123 0.015 0.933 2,4-Dimethylheptane* 852 850 0.433 0.089 0.530 0.055 1.224 Propylcyclopentane* 874 - 0.082 0.024 — —
6 Ethylacetate 886 886 0.643 0.098 3.5 1.2 5.507 Nonane 905 902 0.62 0 .10 1.307 0.065 2.12
12 2-Methylnonane* 958 - 0.198 0.039 — -
13 3-Methylnonane* 967 — 0.060 0.017 — -
14 1 -Isopropylcyclohexane* 971 — 0.040 0.012 - -
18 Decane 1003 1002 0.35 0.16 0.541 0.066 1.5426 1-Chloro-2-methylpropane* 1093 1090 1.21 0.66 1.63 0.99 1.3528 Undecane 1102 - 0.031 0.009 - —
39 Limonene 1195 1195 0.162 0.024 0.034 0.016 0.2140 Dodecane 1202 - 0.021 0.003 - -
101 Heptadecane 1701 1699 0.023 0.005 0.022 0.015 0.96108 Octadecane 1800 — 0.021 0.007 — —
112 Nonadecane 1903 - 0.016 0.007 - -■ SCCE - snow crab cooker effluent. b EC - effluent concentrate. c Rl = retention index.d Mean area ratio => compound peak area/I.S. peak area from the average of 3 SDE extrac
tions, and 2 injections of each extract.
• S.D. = Standard deviation of mean area ratio.f Ratio (EC/SCCE) = mean area ratio for EC/mean area ratio for SCCE. 8 I.S. « internal standard.* Compound tentatively identified by MS data only.
was in highest concentration, followed by 2,6-dimethylpyra- zine, 2,3-dimethylpyrazine, and methylpyrazine. Hayashi et al. (1990) reported that 2-ethyl-5-methylpyrazine doubled and 2-ethyl-3,6-dimethylpyrazine tripled in concentration during
heating of glycine and arginine. Pyrazines are believed to contribute to characteristic cooked flavor of snow crab meat flavor (Hayashi et al., 1990). Pyrazines also have been reported to contribute nutty, roasted, and toasted characteristics to foods
Volume 58, No. 3, 1993-JOURNAL OF FOOD SCIENCE-529

SNOW CRAB FLAVOR . . .
(Maga and Sizer, 1973). Heterocyclic compounds, such as pyrazines and pyridines, were reported to be formed by Mail- lard and pyrolysis reactions through Strecker degradations in heat processed foods (Whitfield, 1992). Moreover, alkylpyri- dines and quinolines, known to have positive or negative effects on the flavor of cooked foods (Shibamoto, 1989), were identified in both SCCE and EC.
Straight-chain (4) and heterocyclic sulfur-containing compounds (6) were identified in both samples. Dimethyldisulfide and dimethyltrisulfide accounted for more than 82.1% of the total sulfur-containing compounds in SCCE and 98.6% in EC. These compounds were reported to affect overall food aroma because of their low threshold values (Buttery et al., 1976) and are found in most thermally processed Crustacea, such as shrimp, crab, and crayfish (Kubota et al., 1986; Matiella and Hsieh, 1990; Cha et al., 1992). Shankaranarayapa et al. (1989) reported that sulfur-containing compounds gave strong, sulphurous, cooked cabbage odors in vegetables, meats, and marine products. Though heterocyclic sulfur-containing compounds, such as thiazoles and thiophenes, were identified in small amounts in both samples, these compounds were reported to be important in generating meaty flavors in marine Crustacea (Kubota et al., 1986). Vercellotti et al. (1988) reported that sulfur-containing heterocyclic compounds were derived from interactions between unsaturated fatty acids and sulfur-containing amino acids during heating. Sulfur-containing compounds identified in these samples were probably primarily responsible for the flavor of snow crab.
The number of furans increased markedly during concentration of SCCE, from 3 in SCCE to 8 in EC. The 41-fold increase in the concentration of furfuryl alcohol was notably high. Furans, in particular 2-ethylfuran, 2-pentylfuran, 5-methylfur- fural, and furfurylalcohol, were reported to contribute burnt, sweet, bitter and cooked meat flavor to foods (Maga, 1979). However, furans reportedly did not positively contribute to the flavor of crayfish tail meat (Vejaphan et al., 1988).
Alkanes comprised the majority of those volatile constituents grouped among the miscellaneous compounds. Alkanes probably did not contribute notably to the flavor of snow crab extract because of their high flavor or aroma thresholds. The decreased amount of alkanes in EC indicates that these compounds may have evaporated during processing. Accumulation of the monoterpene, limonene, in SCCE may have occurred via ingestion of seaweed and has been reported in crustaceans previously (Kubota et al., 1982; 1986).
SCCE could be effectively concentrated into a potentially marketable flavor concentrate with good retention of desirable volatile flavor compounds. Based on the types and amounts of volatile compounds identified in both samples, concentration of SCCE, with a 170°C single pass heat exchanger, resulted in thermally generated heterocyclic flavor compounds, which may have a positive impact on sensory characteristics of EC. The high level of salt in EC may present a potential disadvantage to the process. However, salt content could be reduced during production of SCCE, leading to more acceptable levels in EC. Additional sensory and chemical composition analyses are needed to determine the flavor quality of EC as compared with authentic snow crab meat.
REFEREN CES
AOAC. 1980. Official Methods o f Analysis, 13th ed. Association of Official Analytical Chemists, Inc., Washington, DC.
Burdette, J.A., Flick, G.J., Miles, JTR., Ory, R.L., St. Angelo, A.J., and Dupuy, H.P. 1983. Characterization and utilization of ocean quahog (Arctica islándica) clam juice as a liquid and dehydrated flavoring agent. J. Food Sci. 48: 353-359.
Buttery, R.G., Guadagni, D.G., Ling, L.C., Seifert, R.M., and Lipton, W.
1976. Additional volatile components of cabbage, broccoli and cauliflower. J. Agric. Food Chem, 24: 829—832.
Cha, Y.J., Baek, H.H., and Hsieh, T.C.-Y. 1992. Volatile components in flavour concentrates from crayfish processing waste. J. Sci. Food Agric. 58: 239-248. „ TJ ^
Flament, I. 1990. Analysis of boiled crab meat flavour: Identification of new alcoholic constituents. Lebensm.-Wiss. u.-Technol. 23: 274—275.
Ha, J.K., and Lindsay, R.C. 1991. Volatile branched-chain fatty acids and phenolic compounds in aged Italian cheese flavors. J. Food Sci. 56:1241— 1247.
Hayashi T., Ishii, H., and Shinohara, A. 1990. Novel model experiment for cooking flavor research on crab leg meat. Food Reviews International. 6 : 521-536. , . „
Hayashi, T„ Yamaguchi, K., and Konosu S. 1981. Sensory analysis of taste-active components in the extract of boiled snow crab meat. J. Food Sci. 46:479-183. , „ T
Heath, H.B., and Reineccius, G. 1986. Off-flavors in foods. Ch. 4. In Flavor Chemistry and Technology, Heath, H.B. and Reineccius, G. (Ed.) p. 121— 127. MacMillian Publishers LTD, Basingstoke, England.
Hewlett-Packard Co. 1988. Wiley/NBS Database (PBM format). Palo Alto, CA. ,
Hites, R.A., and Biemann, K. 1970. Computer evaluation of continuously scanned mass spectra of gas chromatographic effluents. Anal. Chem. 42: 855-860.
Ho, C.T., Bruechert, L.J., Zhang, Y., and Chiu, E.M. 1989. Contribution of lipids to the formation of heterocyclic compounds in model systems. Ch. 10. In Thermal Generation of Aromas, Parliment, T.H. and McGorrin, R.J. (Ed.), p. 105-113. American Chemical Society, Washington, DC.
In, T. 1990. Seafood Flavorants produced by enzymatic hydrolysis. In Making Profits Out of Seafood Wastes, p. 197-202. Proceedings of the International Conference on Fish By-Products. April, 1990. Anchorage, AK.
Karahadian, C., and Lindsay, R.C. 1989. Role of oxidation in the formation and stability of fish flavors. Ch. 6. In Flavor Chemistry: Trends and Developments, Teranishi, R., Buttery, R.G., and Shahidi, F. (Ed.), p. 60- 75. American Chemical Society, Washington, DC.
Konosu, S., Yamaguchi, K., and Hayashi, T. 1978. Studies on flavor components in boiled crabs-I: Amino acids and related compounds in extract. Bull. Japan. Soc. Sci. Fish. 44: 505-510.
Kubota, K., Kobayashi, A., and Yamanishi, T. 1982. Basic and neutral compounds in the cooked odor from Antarctic krill. Agric. Biol. Chem. 46(11): 2835-2839.
Kubota, K., Shijimaya, H., and Kobayashi, A. 1986. Volatile components of roasted shrimp. Agric. Biol. Chem. 50: 2867-2873.
Likens, S.T. and Nickerson, G.B. 1964. Detection of certain hop oil constituents in brewing products. Amer. Soc. Brew. Chem. Proc. pp. 5-13.
Maga, J.A. and Sizer, C.E. 1973. Pyrazines in foods: A review. J. Agric. Fcod Chem. 21: 22-30.
Maga. J.A. 1979. Furans in food. CRC Crit. Rev. Food Sci. Nutr. 11: 355- 400.
Matiella, J.E. and Hsieh, T.C.-Y. 1990. Analysis of crabmeat volatile compounds. J. Food Sci. 55: 962-966.
Mclver, R.C., Brooks, R.I., and Reineccius, G.A. 1982. Flavor of fermented fish sauce. J. Food Sci. 30: 1017-1020.
Miyagawa, M., Miwa, T.K., and Spencer, G.F. 1979. Fatty acid composition of oil in snow crab (Chionoecetes opilio) by gas chromatography/mass
o S ...............................Fcod Technol. 34(11): 51-54.
Reddy, N.R., and Flick, G.J. 1989. Composition, flavor extract, protease, ana glucosidases of clam bellies collected from clam processing plants. J. Agri. Food Chem. 37: 341-345.
Reddy, N.R., Flick, G.J., Duppy, H.P., and Boardman, G.D. 1989. Characterization and utilization of dehydrated wash waters from clam processing plants as flavoring agents. J. Food Sci. 54: 55-59, 182.
Shankaranarayana, M.L., Ragnavan, B., Abraham, K.O., and Natarajan, C.P. 1989. Sulphur compounds in flavors. Ch. III. In Food Flavours, Part A. Introduction, Morton, I.D. and Macleod, A.J. (Ed.), p. 169-281. Elsevier, New York.
Shibamoto, T. 1989. Volatile flavor chemicals formed by the Maillard reaction. Ch. 13. In Thermal Generation of Aromas, Parliment, T.H., McGorrin, R.J., and Ho, C.T. (Ed.), p. 134-142. American Chemical Society, Washington, DC.
Tanchotikul, U., and Hsieh, T.C.-Y. 1991. Analysis of volatile flavor components in steamed rangia clam by dynamic headspace sampling and simultaneous distillation and extraction. J. Food Sci. 56: 327-331.
van den Dool, H. and Kratz, P.D. 1963. A generalization of the retention index system including linear temperature programmed gas liquid partition chromatography. J. Chromatogr. 11: 463-471.
Vejaphan, W., Hsieh, T.C.-Y., and Williams, S.S. 1988. Volatile flavor components from boiled crayfish (Procambarus clarkii) tail meat. J. Food Sci. 53: 1666-1670.
Vercellotti, J.R., Kuan, J.W., Spanier, AM., and St. Angelo, A.J. 1989. Thermal generation of sulfur-containing flavor compounds in beef. Ch. 42. In Thermal Generation o f Aromas, Parliment, T.H., McGorrin, R.J., and Ho, C.T. (Ed.), p. 452—459. American Chemical Society, Washington,
Whitfield, F.B. 1992. Volatiles from interactions of Maillard reactions and lipids. CRC Crit. Rev. Food Sci. Nutr. 31: 1-58.
Ms received 9/30/92; revised 1/22/93; accepted 2/1/93.
spectrometry. J. Am. Oil Chem. Soc. 56: 834-836.'chi, IL 1980. Production and applications of natural seafood extracts.
Louisiana Agricultural Experiment Station manuscript no. 92-21-6318.
530—JOURNAL OF FOOD SCIENCE—Volume 58, No. 3, 1993

Setting Response of Alaska Pollock Surimi Compared withBeef Myofibrils
S-H. KIM, J.A. CARPENTER, T.C . LANIER, and L. W ICKER
----------------------------ABSTRACT-----------------------------Physicochemical properties of surimi after preincubation at 25-50°C and beef myofibrils at 25-60°C for up to 8 hr prior to cooking at 80°C for 20 min were evaluated by a torsion test and sodium dodecyl sulfate (SDS) polyacrylamide gel electrophoresis. Shear stress and true shear strain of surimi were more sensitive to pH changes than beef myofibrils. Maximum gel strength was found at = pH 7 for surimi and pH 6 for beef myofibrils. The myofibrils showed no setting effect at any preincubation temperatures examined, while surimi showed an optim u m setting effect at 25°C. Incorporation of beef myofibrils into surimi resulted in decrease of shear stress and true shear strain values.
Key Words: surimi, beef, myofibrils, setting-response
INTRODUCTION
SURIMI is a frozen product of water-leached minced fish myofibrils (Lanier, 1986). It is an intermediate raw material used in manufacturing of traditional Japanese kneaded foods called “ kamaboko” , and in the formulation of seafood analogs. It is also promising as a binding agent in restructured muscle foods (Sperber, 1990; Higginbotham, 1989). Two major distinguishing features of surimi are its strong gel-forming capacity and its long-term stability in frozen storage, imparted by the addition of sugars as cryoprotectants (Lee, 1984; MacDonald and Lanier, 1991).
A unique property of surimi derived from some fish species is the setting phenomenon, which is the ability of salted sols to form cohesive gels at temperatures below 40°C. Setting also enhances the physical properties of firmness and cohesiveness in the fully cooked gels (Lanier et al., 1982; Foegeding, 1988). The setting phenomenon of surimi has been attributed to the transglutaminase catalyzed cross-linking of the myosin heavy chains (Nishimoto et al., 1987; Seki et al., 1990; Kimura et al., 1991) and varies with fish species. Generally, the optimal setting temperature increases with increasing body temperatures of the fish studied (Katoh et al., 1984).
Mammalian species, such as beef, pork and whale, are classified as nonsetting species (Niwa et al., 1989). However, Ak- amittath and Ball (1990) reported that setting was induced in crude actomyosin from turkey at 4°C and 37°C with the aid of guinea pig liver transglutaminase. Torley and Lanier (1991) reported that some beef samples appeared to show setting at 25°C. Therefore, there was a need to verify the possible occurrence of setting in beef.
The objective of our study was to compare the setting of beef and Alaska pollock surimi at various conditions and to explore the interactive effects of mixing these species upon gelation of the mixed system.
Authors Carpenter and Wicker are with the Dept, of Food Science & Technology, Univ. of Georgia, Athens, GA 30602. Author Kim's current address: Food Protein R&D Center, Texas A&M Univ., College Station, TX. Author Lanier is affiliated with the Dept, of Food Science, North Carolina State Univ., Raleigh, NC. Address inquiries to Dr. J.A. Carpenter.
MATERIALS & METHODSBeef myofibrils and surimiAlaska pollock (Theragra chalcogramma) surimi was purchased
from Arctic Alaska Fisheries Corp. (Seattle, WA). Beef myofibrils were used to avoid any possible interference of soluble protein, fat, and connective tissue on gelation properties. Frozen boneless beef (top round) was purchased from Monfort Inc., (Greeley, CO). The frozen block was thawed at 4°C overnight, cut and trimmed of visible fat and connective tissue. Interior connective tissue was removed using a Miny Fish Separator (Yamaguchi, Japan). The beef was immersed twice into 5 vol of 0.1M KC1 solution for 15 min and squeezed through cheese cloth. After a third immersion, beef myofibrils were collected by centrifugation at 650 x g for 5 min at 4°C. Sucrose (8%, w/w) was added, blended and the mixture was frozen at -35°C until used.
Preparation of surimi and beef myofibril gels
Appropriate amounts of frozen surimi or beef myofibrils were thawed at 4°C overnight. Moisture was adjusted to 80% by adding distilled water. For pH adjustment, HC1 or N a O H solution replaced a portion of the distilled water. Myofibrils were mixed with 3 % (w/w) NaCl at 4°C for 15 min in a Hobart mixer (Kitchen Aid, Troy, OH). Prepared sols were immediately placed in plastic bags and vacuum applied to remove air and sealed. Each bag was cut across the comer and the paste was stuffed at 4°C into stainless steel tubes (diameter = 1.86 cm and length = 17.75 cm) through a plastic horn (diameter = 0.6 cm and length = 23 cm) by using a hand-operated sausage stuffer (15L capacity, Rost Frei, Germany). Tubes were preincubated at 25, 35, 45 and 50°C for surimi, and at 25, 35, 45, 50, 55, and 60°C for beef myofibrils, for various lengths of time, prior to a final cook at 80°C for 20 min.
Solubilization of myofibril gels
Myofibril gels (= 0.2g) were solubilized by heating with 3.5 m L 8M urea- 2 % SDS- 2-mercaptoethanol- 2 0 m M Tris-HCl (pH 8.0) solution at 100°C for 5 min (Nishimoto et al., 1987). The myofibril gel solutions were centrifuged at 10,000 x g for 30 min to clarify,
Table 1—Proximate analysis and color values of Alaska pollock and beef myofibrils
Alaska pollock surim i
Beefmyofibrils
Proximate analysis* Protein, %
Moisture, %17.0274.65
0.350.31
14.6577.97
* 0.51 ± 0.03
CIE L*a*b* values» Frozen' . * 79.30 2.23 52.21 ± 3.03
3 * 0.09 0.14 4.85 ± 0.920 * 6.26 ± 0.57 11.93 ± 1.74
Sold# 58.68 ± 0.67 57.36 ± 0.48
3 * - 1.79 ± 0.04 5.82 + 0.340* - 2.04 ± 0.07 9.44 ± 0.59
Gel'L * 79.64 ± 0.62 70.60 ± 0.383 * - 3.84 0.03 1.30 ± 0.15b* 1.78 ± 0 .22 11.28 ± 0.23
' Mean values ± standard deviation fo r triplicate measurements. b Mean values ± standard deviation fo r six determinations. c Frozen samples.d Thawed and mixed fo r 15 min w ith 3% salt.• Sol cooked at 80°C for 20 min.
Volume 58, No. 3, 1993-JOURNAL OF FOOD SCIENCE-531

Table 2 - Changes o f shear stress fkPa) o f Alaska pollock surim i and beef myofibrils preincubated at different temperatures and times followed by cooking at 80°C for 20 m in '___________________________________________ ______________________________________________________________________ _
SETTING RESPONSE OF SU R IM I COMPARED WITH B E E F . . .
Preincubation time (hr)
Preincubationtemp 0 2 4 8
25°C 44.08 1.80'-*Alaska Pollock surimi 64.31 ± 9.15b'B 78.21 ± 8.83*^ 88.16 ± 5.13sA
35°C 44.08 ± 1.80b'A 77.58 ± 6.21,A 73.31 ± 7.65sA 70.31 ± 6.36*'B45°C 44.08 ± 1.80»'A 47.24 ± 2.57sC 34.76 ± 2.18b-B 24.02 ± 4.05c'c50°C 44.08 ± 1.80S-A 41.40 ± 1.55s-0 27.97 ± 6.81 b'B 16.59 ± 1.58C'D
25°C 46.24 US»-*Beef myofibrils
55.46 ± 6.48sAB 55.46 ± 2.02sB 54.67 2.14s'035°C 46.24 ± 1,73abA 49.93 ± 6.05sBO 45.50 ± 2.32ab-D 41.87 1.22»'°45°C 46.24 ± 1.73biA 53.40 ± 4.96'-A3c 47.56 ± 6.13,b'CD 42.03 ± 3.55bD50°C 46.24 ± 1.73*-* 46.45 ± 5.79sC 51.35 2.12s'00 48.35 ± 6.89*'c55°C 46.24 ± 57.51 ± 3.92sAB 54.35 4.54s'8 59.72 Hh 3.37"'AB60°C 46.24 ± t . T & A 58.62 ± 3.33b'A 61.78 ± 2.31sbA 64.31 5.04*'A
* Mean values ± standard deviations of 5 measurements.M Mean values within the same row with different letters are significantly different (P<0.05). a- ° Mean values within the same column with different letters are significantly different (P<0.05).
Table 3 —Changes o f true shear strain (m/m) o f Alaska pollock surim i and beef myofibrils preincubated at different temperatures and times followed bycooking a t 80°C fo r 20 m in*__________________________________________________________________________________________________________________
Preincubation
temp 0 2 4 8
Alaska pollock surim i25°C 2.11 ± O.IS0-* 2.40 ± 0.05''A 2.30 ± 0.14SiA 2.32 ± O.OS*-435°C 2.11 ± O.IS6-* 2.48 ± 0.08,A 2.41 ± O .^ 1-* 2.12 ± O.O7»'045°C 2.11 ± 0.15s A 2.05 ± 0.03, B 1.64 ± 0.15b'8 1.36 ± 0.07' °50°C 2.11 ± 0.15»-* 1.82 ± 0 .10b C 1.29 ± 0.11cC 1.10 ± 0.03d O
Beef m yofibrils25°C 1.74 ± 0 .1 0 ^ 1.95 ± 0.04S-AB 1.88 ± 0.05s AB 1.93 ± 0.12s'0035°C 1.74 ± 0 .1 0 ^ 1.93 ± 0.08s AB 1.79 ± 0.04»'BO 1.81 ± 0.09» °45"C 1.74 ± 0.10s A 1.76 ± 0.03s0 1.73 ± 0.13sC 1.66 ± 0.08s 050°C 1.74 ± 0.10s A 1.83 ± 0.07s00 1.83 ± O. ^ * - 400 1.85 ± 0.09s-055°C 1.74 ± O.IO“* 1.99 ± 0.04SiA 1.89 ± 0.10S'AB 2.01 ± 0.09sAB60°C 1.74 ± 0.10AA 1.89 ± 0.05bBC 1.95 ± O.O? 0-4 2.09 ± 0.08sA
* Mean values ± standard deviations of 5 measurements.Mean values within the same row with different letters are significantly different (P<0.05).
A_D Mean values within the same column with different letters are significantly different (P<0.05).
P r e i n c u b a t i o n t i m e ( h r )Fig. 1. Changes in electrophoretic pattern of Alaska pollock surimi preincubated at 25°C followed by cooking at 80°C for 20 min. <MHC: bands of lower molecular weight than MHC; >MHC: bands of higher molecular weight than MHC; and MHC: myosin heavy chain. The average of three replications are reported.
if needed, and used for sodium dodecyl sulfate polyacrylamide gel electrophoresis.
SDS electrophoresis
According to a modified method of Weber and Osborn (1969), the gels were 2.8% (w/v) acrylamide, 0.07% bis-acrylamide, and 6M urea. The running buffer was 0.03M NaH2P04, 0.07M Na2HP04,
P r e i n c u b a t i o n t i m e ( h r )Fig. 2. Changes of electrophoretic pattern o f beef myofibrils preincubated at various preincubation temperatures followed by cooking at 80°C for 20 min. <MHC: bands of lower molecular weight than MHC; >MHC: bands of higher molecular weight than MHC; and MHC: myosin heavy chain. The average of three replications are reported.
0.001% (w/v) SDS, and pH 7.0. Electrophoresis was performed in the 7 x 8 x 0.75cm mini-PROTEAN® II dual slab cell (Bio-Rad, Richmond, CA) at a constant current of 50 mA/slab. Each gel was fixed and stained in a solution of 25% methanol and 10% acetic acid, and O.z.% Coomassie Blue R-250 for 3 hr and then destained overnight in a solution of 25% methanol and 10% acetic acid. GelBond PAG film (FMC Bioproducts, Rockland, ME) was used to support the gel. The
532-JOURNAL OF FOOD SCIENCE-Volume 58, No. 3, 1993
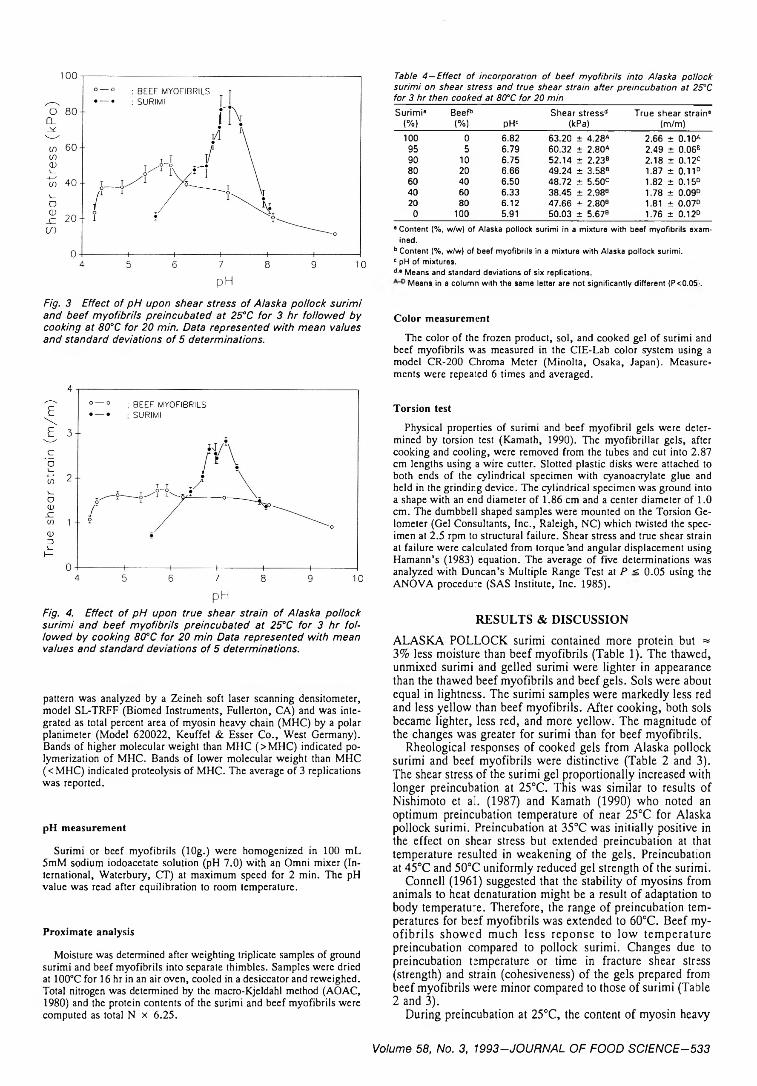
pHFig. 3 Effect of pH upon shear stress of Alaska pollock suriml and beef myofibrils preincubated at 25°C for 3 hr followed by cooking at 80°C for 20 min. Data represented with mean values and standard deviations of 5 determinations.
pHFig. 4. Effect of pH upon true shear strain of Alaska pollock surimi and beef myofibrils preincubated at 25°C for 3 hr followed by cooking 80°C for 20 min Data represented with mean values and standard deviations of 5 determinations.
pattern was analyzed by a Zeineh soft laser scanning densitometer, model SL-TRFF (Biomed Instruments, Fullerton, CA) and was integrated as total percent area of myosin heavy chain (MHC) by a polar planimeter (Model 620022, Keuffel & Esser Co., West Germany). Bands of higher molecular weight than MHC (>MHC) indicated polymerization of MHC. Bands of lower molecular weight than MHC (<MHC) indicated proteolysis of MHC. The average of 3 replications was reported.
pH measurement
Surimi or beef myofibrils (10g.) were homogenized in 100 mL 5mM sodium iodoacetate solution (pH 7.0) with an Omni mixer (International, Waterbury, CT) at maximum speed for 2 min. The pH value was read after equilibration to room temperature.
Proximate analysis
Moisture was determined after weighting triplicate samples of ground surimi and beef myofibrils into separate thimbles. Samples were dried at 100°C for 16 hr in an air oven, cooled in a desiccator and reweighed. Total nitrogen was determined by the macro-Kjeldahl method (AOAC, 1980) and the protein contents of the surimi and beef myofibrils were computed as total N x 6.25.
Table 4 —Effect o f incorporation o f beef m yofibrils into Alaska pollock surim i on shear stress and true shear strain after preincubation at 25°C fo r 3 h r then cooked at 80°C for 20 min
Surimi8<%)
Beefb(%) pHc
Shear stress'* (kPa)
True shear strain8 (m/m)
100 0 6.82 63.20 ± 4.28A 2 .66 ± 0 .10*95 5 6.79 60.32 ± 2.80A 2.49 ± 0.06B90 10 6.75 52.14 ± 2.23B 2.18 ± 0 .12C80 20 6.66 49.24 ± 3.58B 1.87 ± 0.11°60 40 6.50 48.72 ± 5.50c 1.82 ± 0.15°40 60 6.33 38.45 ± 2.98B 1.78 ± 0.09°20 80 6.12 47.66 ± 2.80B 1.81 ± 0.07°
0 100 5.91 50.03 ± 5.67B 1.76 ± 0.12°8 Content (%, w/w) of Alaska pollock surimi In a mixture with beef myofibrils exam
ined.b Content (%, w/w) of beef myofibrils in a mixture with Alaska pollock surimi. c pH of mixtures.d'8 Means and standard deviations of six replications.
Means in a column with the same letter are not significantly different (P<0.05‘.
Color measurement
The color of the frozen product, sol, and cooked gel of surimi and beef myofibrils was measured in the CIE-Lab color system using a model CR-200 Chroma Meter (Minolta, Osaka, Japan). Measurements were repeated 6 times and averaged.
Torsion test
Physical properties of surimi and beef myofibril gels were determined by torsion test (Kamath, 1990). The myofibrillar gels, after cooking and cooling, were removed from the tubes and cut into 2.87 cm lengths using a wire cutter. Slotted plastic disks were attached to both ends of the cylindrical specimen with cyanoacrylate glue and held in the grinding device. The cylindrical specimen was ground into a shape with an end diameter of 1.86 cm and a center diameter of 1.0 cm. The dumbbell shaped samples were mounted on the Torsion Ge- lometer (Gel Consultants, Inc., Raleigh, NC) which twisted the specimen at 2.5 rpm to structural failure. Shear stress and true shear strain at failure were calculated from torque 'and angular displacement using Hamann’s (1983) equation. The average of five determinations was analyzed with Duncan’s Multiple Range Test at P <. 0.05 using the ANOVA procedure (SAS Institute, Inc. 1985).
RESULTS & DISCUSSION
ALASKA POLLOCK surimi contained more protein but = 3% less moisture than beef myofibrils (Table 1). The thawed, unmixed surimi and gelled surimi were lighter in appearance than the thawed beef myofibrils and beef gels. Sols were about equal in lightness. The surimi samples were markedly less red and less yellow than beef myofibrils. After cooking, both sols became lighter, less red, and more yellow. The magnitude of the changes was greater for surimi than for beef myofibrils.
Rheological responses of cooked gels from Alaska pollock surimi and beef myofibrils were distinctive (Table 2 and 3). The shear stress of the surimi gel proportionally increased with longer preincubation at 25°C. This was similar to results of Nishimoto et al. (1987) and Kamath (1990) who noted an optimum preincubation temperature of near 25°C for Alaska pollock surimi. Preincubation at 35°C was initially positive in the effect on shear stress but extended preincubation at that temperature resulted in weakening of the gels. Preincubation at 45°C and 50°C uniformly reduced gel strength of the surimi.
Connell (1961) suggested that the stability of myosins from animals to heat denaturation might be a result of adaptation to body temperature. Therefore, the range of preincubation temperatures for beef myofibrils was extended to 60°C. Beef myo fib rils show ed much less reponse to low tem peratu re preincubation compared to pollock surimi. Changes due to preincubation temperature or time in fracture shear stress (strength) and strain (cohesiveness) of the gels prepared from beef myofibrils were minor compared to those of surimi (Table 2 and 3).
During preincubation at 25°C, the content of myosin heavy
Volume 58, No. 3, 1993-JOURNAL OF FOOD SCIENCE-533

SETTING RESPONSE O F SU R IM I COMPARED WITH B E E F . . .
chain (MHC) of Alaska pollock surimi decreased from 46.4% to 6.3% while the content of higher (>M HC) and lower (<M HC) molecular weight species increased from 17.7% to 22.4% and from 35.9% to 71.3%, respectively (Fig. 1). However, there were no marked changes in the contents of MHC, <M HC, and >M HC in beef myofibrils during preincubation at any temperature examined (Fig. 2). Niwa et al. (1989) also reported that change in myosin heavy chain of reduced setting species such as beef, chicken, pork, and whale was negligible after heating at 40°C, while changes were marked in the readily-setting species, such as flying fish, Pacific mackerel, Spanish mackerel, and Jack mackerel.
Effects of pH upon gelation of surimi and beef myofibrils were examined after preincubation at 25°C for 3 hr and cooking at 80°C for 20 min. Shear stress of Alaska pollock surimi gels revealed higher sensitivity to pH than beef myofibril gels. Only 25.8% of the maximum shear stress at pH 7.18 was observed at pH 5.58 and 31.2% at pH 8.05. Of the maximum shear stress observed at pH 5.70, beef myofibrils retained 73.8% at pH 4.41 and 69.1% of at pH 7.15. (Fig. 3). The effect of pH upon true shear strain of surimi and beef myofibrils (Fig. 4) showed a similar relationship as observed for effect of pH upon shear stress. The shear strain of surimi gels was sharply affected by pH. The shear strain of beef myofibrils gel was slightly decreased at pH extremes.
The shear stress and true shear strain of Alaska pollock surimi mixed with 0, 5, 10, 20, 40, 60, 80, and 100% beef myofibrils were examined after preincubation at 25°C for 3 hr and cooking at 80°C for 20 min (Table 4). The shear stress and the true shear strain of the mixture dropped to the same level as that of 100% beef myofibrils with addition of 5 and 10% beef myofibrils. This was similar to results of Torley and Lanier (1991) and Nishimoto et al. (1988) who reported that the setting effect of Alaska pollock surimi was decreased by mixing with beef or Chum salmon, respectively. The decrease in strength of the gel may be due; in part, to the decrease in pH (Table 4) from that optimal for surimi. However, the weakening of the mixed protein gels may also be ascribed to interruption of the surimi matrix by the beef myofibrils gel or vice versa (Torley and Lanier, 1991). A surimi gel softened pasta by interrupting the gluten matrix in a mixed surimi-wheat system (Kim et al., 1990).
CONCLUSIONS
THE LOW TEMPERATURE setting effect of beef myofibrils was negligible, while surimi showed a marked increase in cross- linked species and gel fracture stress and strain. Incorporation of beef myofibrils into surimi decreased the setting response. This may be partially due to the pH change induced by beef, but decreased setting also occurred when the pH of mixtures of beef and surimi were adjusted to the optimum. Absence of a setting response in beef myofibrils may be due to either a
lack of cross-linking enzyme activity and/or, lesser availability of substrate to enzyme activity at low temperatures. If transglutaminase activity is lacking, this may be due to absence of the enzyme or a lack of cofactors. Apparantly transglutaminase activity, if present in beef, required more than a higher temperature in order to function. It may be possible to induce setting in beef by addition of transglutaminase from another source.
REFEREN CES
Akamittath J.G. and Ball, H.R., Jr. 1990. Polymerization of crude acto- myosin refined from mechanically deboned poultry meat. Poultry Sci. 69(Suppl. 1): 4.
AOAC. 1980. Official Methods o f Analysis. Association of Official Analytical Chemists, Washington, DC.
Connell, J.J. 1961. The relative stabilities of the skeletal muscle myosins of some animals. Biochem. J. 80: 503-509.
Foegeding, E.A. 1988. Thermally induced changes in muscle proteins. Food Technol. 42: 58-62.
Hamann, D.D. 1983. Failure characteristics of solid foods. In Physical Properties of Food. Peleg, M. and Bagley, E.B. (Ed.), p. 351. AVI Publishing Co., Westport, CT.
Higginbotham, D.A. 1989. Consumer evaluation of restructured beef/sur- imi steaks. M.S. thesis, Univ. of Georgia, Athens, GA.
Kamath, G.G. 1990. Investigation of physico-chemical basis for the unique "setting” phenomenon of Alaska pollack and Atlantic croaker surimi. Ph.D. dissertation, North Carolina State Univ., Raleigh, NC.
Katoh, N., Hashimoto, A., Nozaki, H., and Arai, K. 1984. Effect of temperature on the rate for the setting of meat pastes from Alaska pollack, white croaker, and tilapia. Bull. Jap. Soc. Sci. Fish. 50: 2103-2108.
Kim, S-H., Huang, Y-W., and Carpenter, J.A. 1990. Effect of surimi addition to fresh pasta on ultra-structure and cooked firmness. J. Food Sci. 55: 1481-1482, 1484.
Kimura, I., Sugimoto, M., Toyoda, K., Seki, N., Arai, K., and Fuiita, T. 1991. A study on the cross-linking reaction of myosin in kamaboko “su- wari” gels. Nippon Suisan Gakkaishi 57: 1389-1396.
Lanier, T.C. 1986. Functional properties of surimi. Food Technol. 40: 107- 114.
Lanier, T.C., Lin, T.S., Liu, Y.M., and Hamann, D.D. 1982. Heat gelation properties of actomyosin and surimi prepared from Atlantic croaker. J. Food Sci. 47: 1921-1925.
Lee, C.M. 1984. Surimi process technology. Food technol. 38: 69-80. MacDonald, G.A. and Lanier, T.C. 1991. Carbohydrates as cryoprotectants
for meats and surimi. Food Technol. 45: 150-159.Nishimoto, S., Hashimoto, A., Seki, N., and Arai, K. 1988. Setting of mixed
salted meat paste of two fish species in relation to cross-linking reaction of myosin heavy chain. Nippon Suisan Gakkaishi 54: 1227-1235.
Nishimoto, S., Hashimoto, A., Seki. N., Kimura, I., Toyoda, K., Fujita, T., and Arai, K. 1987. Influencing factors on changes in myosin heavy chain and jelly strength of salted meat paste from Alaska pollack during setting. Nippon Suisan Gakkaishi 53: 2011-2020.
Niwa, E., Yamada, H., Kanoh, S., and Nakayama, T. 1989. Thermal behavior of actomyosin subunits during setting of salted fish flesh sol. Nippon Suisan Gakkaishi 55: 1997-2000.
SAS Institute, Inc. 1985. SA SC User’s Guide: Statistics. Version 5 Ed. SAS Institute Inc., Cary, NC.
Seki, N., Uno, H., Lee, N-H., Kimura, I., Toyoda, K., Fujita, T., and Arai,K. 1990. Transglutaminase activity in Alaska pollock muscle and surimi, and its reaction with myosin B. Nippon Suisan Gakkaishi 56: 125- 132.
Sperber, R.M. 1990. Surimi: alternate protein source for processed meat products. Foods of Tomorrow in Food Processing. February.
Torley, P.J. and Lanier, T.C. 1991. Setting ability of salted beef-pollock surimi mixtures. In Seafood Science and Technology, (ed.) E. Graham Bligh, p. 305-316. Fishing News Books, Ltd. Oxford, UK.
Weber, K. and Osborn, M. 1969. The reliability of molecular weight determined by dodecyl sulfate-polyacrylamide gel electrophoresis. J. Biol. Chem. 244: 4406-4412.
Ms received 6/26/92; revised 11/20/92; accepted 12/4/92.
534-JOURNAL OF FOOD SCIENCE-Volume 58, No. 3, 1993

Linear Programming and Response Surface Methodology toOptimize Surimi Gel Texture
J.S . CHEN, C.M. LEE, and C. CRAPO
----------------------------ABSTRACT-----------------------------A formulation optimization study was conducted on surimi gels prepared with starch, and/or raw egg white employing the stepwise method (SM), linear programming (LP), and response surface methodology (RSM). At 78% moisture, the greatest gel strengthening and reduction of expressible moisture occurred at 8% starch, 6% egg white, or a combination of 5% starch and 5% egg white for SM, 5.33% starch and 4.33% egg white for LP, and 3.5% starch and 5% egg white for RSM. RSM resulted in gels with the greatest strength (compressive and penetration forces), followed by LP and SM. The RSM enabled more accurate prediction of textural behavior of final product at various ingredient combinations than the SM or LP.
Key Words: formulation, surimi gel, linear programming, RSM, response surface methodology
INTRODUCTION
SURIMI, prepared from washed fish mince, is used to fabricate a variety of shellfish analog products. The most important property of an analog product for sensory acceptance is texture (Wesson et al., 1979), primarily a meaty texture, which is obtained by mechanical fiberization and an appropriate textural modification with aid of ingredients. Thus, proper formulation with the right types and levels o f ingredients is critical in producing products with desired texture.
The food industry uses linear programming (LP) (Swanson, 1980; William and Lynwood, 1966) or response surface methodology (RSM) (Cochran and Cox, 1957; Gacula and Singh, 1984; Saguy, 1983) for optimizing product formulations (Nor- back and Evans, 1983). LP has been employed to minimize production costs or maximize desirable properties in preblended meats (Rust, 1976), luncheon meats (IBM, 1966), ice cream (Dano, 1974; IBM, 1964), cereal-based foods (Cavins et al., 1972; Inglett et al., 1969), beer-blending (Dano, 1974), and low-cholesterol, low-fat beef stew (Bender et al., 1976). RSM has been used to optimize several food formulations: a sausage product from minced fish (Daley et al., 1978), salt and sugar levels in cured ham (Pearson et al., 1962; Bender et al., 1976), and cake products (Henika, 1972; Neville and Setser, 1986; Vaisey-Genser et al., 1987).
Although much work has been done on other products, no report has been made on formulation optimization of surimi- based products using LP and RSM except that of Lee et al.(1992) in which a general discussion on applications and examples directed toward high protein and least-cost formulas were provided. A stepwise method (SM) was previously employed for formulation optimization of surimi gels (Lee and Kim, 1986a,b). The objective of our study was to determine the optimal formulation for a surimi-based extruded product with starch, egg white and moisture using SM, LP, and RSM.
Authors Lee and Crapo are with the Dept, o f Food Science & Nutrition, Univ. of Rhode Island, Kingston, Rl 02881. Author Chen is currently affiliated with the Food Science 8t Human Nutrition Dept., Univ. of Florida, Gainesville, FL 32611-0370. Address inquiries to Dr. C.M. Lee.
M ATERIALS & M ETHODSSurimi gel preparation
Frozen Alaska pollock (Theragra chalcogramma) surimi (North Pacific Seafoods, Seattle, WA) was thawed overnight at 4°C. Batches of surimi (600-700g) were chopped 10 min with 2% salt (surimi weight basis) and a predetermined amount of chilled water in a Hobart chopper (Model 84142, Hobart Manufacturing Co., Troy, OH) with one pair of blades operating at 1,700 rpm. Final moisture levels were adjusted to 75, 77, 79, and 81%. The temperature of the paste was kept below 10°C by chopping in a temperature-controlled room at 15°C.
About two-thirds of the surimi paste was extruded into 25 mm- diameter cellulose casings (Precision Nojax, Union Carbide Corp.) using a 3.6 kg capacity hydraulic stuffer (Hubert Co., Cincinnati, OH) tied in =30 cm links, and cooked for 20 min at 90°C (85°C internal temperature) in a steam cooker (Model STM-E, Market Fcrge Co., Everett, MA). Gels were immediately cooled in running cold water ( = 12°C) for 5 min and held overnight at room temperature (21°C) before testing.
Addition of starch and egg white
Modified potato starch (hydroxypropylated, Farinex VA70; AV- EBE America Inc., Hopelawn, NJ) and raw egg white (Hygrade Egg Products Inc., Elizabeth, NJ) were added to surimi batches during chopping either singly at 0, 2, 4, 6 , 8 , and 10%, or together at a combined level of 10% with varied ratios. Modified starch was chosen for its wide usage for freeze-thaw stability in the surimi analog industry. Salt (2%) and ingredients were added and the final moisture content was adjusted to 78%, reported to result in optimal sensory quality in surimi-based products (Lee, 1984).
Gel testing
Surimi gel sausages, tempered to room temperature (21°C), were cut into 25 mm by 25 mm cylindrical plugs. An Instron testing machine (Model 1122, Instron Co., Canton, MA) was used to measure compressive and penetration forces, and expressible moisture using procedures described by Lee and Chung (1989). Unless otherwise specified, all assays were conducted twice with three different sample preparations.
Optimization by LP and RSM
Formulation optimization by LP determined the levels of starch and egg white (independent variables) necessary to achieve the greatest compressive forces (objective function). Program constraints included the amount of surimi, ingredients, product moisture content and a minimum functionality requirement. The maximum yield of the objective function was determined using linear programming software (Lionheart Press Inc., Alburg, VT). The optimum formulation determined by the program was tested by physical and sensory evaluation.
RSM was used to estimate gel strength (Y) at various combinations of two independent variables, namely, starch (X]) and egg white (X2) at 78% moisture. The RSM contour plot was obtained by employing a RSM program (National Foods Lab, Dublia, CA). The center of the smallest ellipse was used as the point of maximum response (Khuri and Cornell, 1987). A 3-D graph was drawn to show interrelationships among starch, egg white and textural properties. Since RSM is expressed on the basis of a full quadratic model, the equation derived would explore all areas in the surface without constraints. In contrast, the linear equation for LP would include limited constraints.
Volume 58, No. 3, 1993-JOURNAL OF FOOD SCIENCE-535

OPTIMIZATION OF SU R IM I GEL TEXTURE. . .
moisture (%)Fig. 1—Effect of moisture on textural properties of suri m i gels: compressive force (a), penetration force (is), expressible moisture (o).
starch (%)Fig. 2—Effect of starch on textural properties of surimi gels: compressive force (a), penetration force (A), expressible moisture (o).
Fig. 3 -E ffect of egg white on textural properties of surimi gels: compressive force fo), penetration force (A), expressible moisture (o).
Data analysis
Analysis of variance was performed with the SAS package (SAS Institute, Inc., 1985) to evaluate significant differences among treatments. Duncan’s Multiple Range test was carried out to determine the significance of mean differences. All measurements were made in
quadruplicate using gel samples from two representative links per treatment.
RESULTS & DISCUSSION Effects of moisture content
With increasing moisture levels, compressive force (cohesiveness) and penetration force (firmness) decreased significantly (P < 0.05), while expressible moisture (water binding) increased (Fig. 1). Similar observations were reported in mackerel and red hake surimi gels by Lee and Toledo (1976) and Douglas-Schwarz and Lee (1988), respectively. Water-binding ability is considered to be an important index of textural quality of gels. The relationship between water-binding ability and gel-strength was previously reported by many researchers (Lee and Toledo, 1976; Furukawa and Ohta, 1982; Lee and Chung, 1990; Chung and Lee, 1990; 1991).
Our sensory data indicated that samples with moisture levels between 77 and 79% were the most acceptable (Chen, 1988). It was thus decided to study the effects of starch and egg white on texture and freeze-thaw stability of surimi gels at the 78% moisture level.
Effect of starch and egg whiteThe addition of starch significantly (P < 0.05) changed sur
imi gel strength, but changes in penetration force with starch level were not as apparent as those in compressive force (Fig.2). Both compressive and penetration forces reached the maximum at the 8% starch level. At 8% or higher levels of starch, the gel was, however, perceived as starchy and sticky, as was previously reported by Lee and Kim (1986a). Kim and Lee(1987) suggested that the composite gel-reinforcing effect of starch in the heat-induced surimi gel was due to swelling of starch granules embedded in the protein gel matrix. This increased pressure and water-binding in the gel matrix caused the gel to become more compact and firm in a confined casing. In addition, the particle size and dispersion pattern of starch after gelatinization affected the characteristic composite-rein- forcing effect of starch on gel texture. Gels with starch added at all levels exhibited lower expressible moisture than the control. The lowest level at 8% starch showed a clear inverse relationship between expressible moisture and gel strength (compressive and penetration forces).
Egg white has been used to improve the textural properties of surimi gel. Iso et al. (1985) suggested that egg white did not increase the protein cross-linking but absorbed water in the network structure of gel. Using scanning electron microscopy, Siegal et al. (1979) found that the gel structure of a crude myosin and egg white mixture had a network similar to crude myosin. This suggested that egg white may not interfere with a network formation of myosin in contrast to the report by Okada (1964) who suggested that the water-soluble proteins interfere with network formation of myofibrillar proteins.
Changes in texturals properties of gels prepared with egg white (Fig. 3) showed significant differences (P < 0.05) in compressive and penetration forces and expressible moisture among levels of egg white. Gel strength reached maximum at 6% raw egg white (equivalent to 0.7% solid). A mushy texture was noticeable when the egg white level exceeded 8%. The expressible moisture increased markedly at 10% egg white (1.1% solid) suggesting an apparent disruption of the gel matrix.
Effect of starch/egg white combinationStarch and egg white at a combined level of 10% affected
textural properties of surimi gels (Fig. 4). The increase in compressive force was apparently a function of starch, up to 5% addition. The highest compressive force was obtained by addition of 5% starch and 5% egg white. Above that point, compressive force gradually decreased with increasing starch
536-JOURNAL OF FOOD SCIENCE-Volume 58, No. 3, 1993

6010.00
starch-egg white com bination (%)
- 0.8
- 0.7
- 0.6
0.5
0.4
(starch)
(egg white)
Fig. 4—Effect of starch-egg white combination on textural properties of surimi gels: compressive force (o), penetration force (A), expressible moisture (o), sensory score (•).
Fig. 5—Relationship among starch, egg white and gel compressive force.
and decreasing egg white levels. The maximum compressive force occurred at the 8% starch level in the previous experiment. That suggests that gel strengthening effect of starch was modified by addition of egg white. No inverse relationship between expressible moisture and gel strength was observed. This was probably due to inclusion of water-binding ingredients (Lee and Chung, 1989).
Sensory evaluation revealed that the sample with 5% starch and 5% egg white was preferred. Samples prepared with starch only were rated as more cohesive but became slightly sticky when the starch level was increased beyond 8%. Egg white levels >6% produced a texture with increasing mushiness. The addition of starch and egg white combined controlled both sticky and mushy texture through counteracting effects. An understanding of the relationship between starch and egg white and their effects on gel properties is important in optimizing gel texture. Lee and Kim (1986a,b) found no synergistic effects existed between starch and albumin proteins and their texture-modifying effects varied with ratio and level.
Three-dimensional relationships among starch, egg white and gel compressive force (Fig. 5), showed gel compressive force
7 . 5 0
«^ 5 . 00
2 . 5 0
0.00
O 5 10Starch (X)Fig. 6—Response surface contour plot of gel compressive force as a function of starch and egg white levels. D = 32.60; E = 35.80; F = 39.00; G = 42.20; H = 45.40; I = 48.60; J = 51.80.
increased uniformly with an increase in starch up to 8% and egg white to 6%. Gel compressive force uniformly decreased beyond the level of 5% starch and 5% egg white with increasing levels of both starch and egg white. This indicates that increased egg white was responsible for the decrease in gel compressive force.
Application of LP and RSMGel strength highly correlated (r = 0.99) with the level of
added starch within the range from 0-8% levels: Y = 3.55 X + 34.44, where Y = compressive force (kg) and X = starch level (%). Similarly, a high correlation (r = 0.99) existed between gel strength and added egg white within the range from 0-6% levels: Y = 2.45 X + 35.18. Based on these equations and the average sample weight of 10.2g, lg of surimi gel with no additives would have =3.5 kg compressive force (gel strength).
In determining the ingredient levels that yield maximum compressive force using a linear programming method, an equation showing the relationship between compressive force and ingredients was first established:
Y = 3.5 X, + 3.55 X2 + 2.45 X3
where Y = compressive force (kg), Xt = average weight of cylindrical gel sample (g), X2 = starch level (%) and X3 = egg white level (%). At a fixed gel sample weight (10.2g), maximum compressive force (Y) should be at the highest limits of constraints, i.e. X2 = 0.561g and X3 = 0.468g [based on the levels of starch (5.5%) and egg white (4.5%) on a sample weight that gave maximum compressive force—equivalent to 8% starch and 6% egg white on a surimi weight basis]. The moisture constraint equation was written as 0.165 X2 + 0.887 X3 < 0.507, based on the moisture percentagge of the starch (16.5%) and egg white (88.7%). The resulting computed optimal levels of starch and egg white were 5.33% and 4.33%, when random number seed, iteration, and loop were set at20,000, 30, and 3, respectively.
A response surface contour of gel compressive force as a function of starch and egg white at 78% moisture (Fig. 6) was obtained from the quadratic response surface. This was estimated by least square regression:Y = 39.67 + 1.94 X! + 4.16 X2 - 0.21 X3X2
- 0.27 Xj2 - 0.34 X22
Volume 58, No. 3, 1993-JOURNAL OF FOOD SCIENCE-537

OPTIMIZATION O F SURIM I GEL TEXTURE. . .
Table 1-V a rio u s optimization method performance on gel properties
S ta rc h -e g g w h ite
<%)
C o m p re s s iv e fo rc e(kg )
P e n e tra tio n fo rc e
(kg)
E x p re s s ib le m o is tu re
(% )
0 :0 3 5 . 7 ± 0 . 5 5 b 0 .3 5 9 ± 0 .0 0 1 b 0 . 7 4 ± 0 .0 0 4 b
5 :5 5 8 .3 ± 1 . 0 2 ' 0 .4 0 4 ± 0 .0 0 5 ' 0 . 6 7 ± 0 .0 2 6 b
LP 5 .3 3 :4 .3 3 6 3 .4 ± 0 . 2 8 “ 0 .4 0 8 ± 0 .0 0 7 ' 0 . 5 8 ± 0 . 0 7 9 b
R S M 3 .5 :5 .0 7 9 .4 ± 5 .6 3 * 0 .4 4 1 ± 0 .0 5 9 ' 0 . 5 7 ± 0 .1 1 0 b
• Control: no egg white and starch added; all gels tested had 78% moisture.*>-« Means with different letters In each column are significantly different (p < 0.05; n = 4).
where Y is a response variable (compressive force) measured at two factor variables, (starch) and X2 (egg white), and Xj*X2 is the cross-product. The center of the smallest ellipse (contour J) was a combination of 5% egg white and 3.5% starch which would result in the highest compressive force. The contour J for ge'.s with higher compressive force is encompassed by starch ranging from 0.2-7% and egg white from2-8%. In order to verify the performance of each optimization method, a separate experiment was run using the respective optimum combination of egg white and starch. Results of the analysis on gel properties (Table 1) showed that RSM formula yielded the highest compressive and penetration forces and the lowest expressible moisture. The difference between the predicted maximum compressive force values (Fig. 6) and actual measured values (Table 1) was partly due to the use of different batches of surimi. The RSM gels showed significantly greater (p < 0.05) compressive force than the others. Their penetration force was significantly greater (p < 0.05) than the control and no significant difference (p > 0.05) occurred in expressible moisture among all gels.
CONCLUSIONSGEL STRENGTH, as measured by compressive and penetration force, increased up to 8% added starch. Addition of up to 6% raw egg white had similar effects. When starch and egg white were added (combined level 10%) the gel was more cohesive but sticky when the ratio exceeded 6:4. Under the reverse conditions, a mushy texture developed at <4% starch to 6% egg white. The optimum found by RSM (3.5% starch- 5% egg white) had the greater gel strength, followed by LP (5.33% starch-4.33% egg white) and SM (5% starch-5% egg white). The RSM enabled prediction of textural behavior of final product at various ingredient combinations more accurately than stepwise and LP methods. The optimum levels we found would vary depending upon type of starch, protein and other ingredients used.
REFERENCESBender, F.E., Kramer, A., and K ahan, G. 1976. System Analysis fo r the
Food Industry. AVI Pub. Co., W estport, CT.Cavins, J.F ., Inglett, G.E., and Walls, J.S. 1972. L inear program m ing con
trols amino acid balance in food formulation. Food.Technol. 26(6): 46.Chen, J.S. 1988. Optimization in the formulation of surimi-based extruded
products. M aster’s thesis, Univ. of Rhode Island. Kingston, RI.Chung, K.H. and Lee, C.M. 1990. Relationships between physicochemical
properties of nonfish protein and textural properties of protein-incorporated surim i gel. J . Food Sci. 55: 972.
Chung, K.H. and Lee, C.M. 1991. W aterbinding and ingredient dispersion pattern effects on surim i gel texture. J . Food Sci. 56: 1263.
Cochran, W.G. and Cox, G.M. 1957. Some methods for the study of response surfaces. In Experimental Design, p. 335. John Wiley and Sons, New York.
Daley, L.H., Deng, J.C., and Cornell, J.A . 1978. Development of a sausage- type product from minced m ullet using response surface methodology. J . Food Sci. 43: 1501.
Dano, S. 1974. Linear Programming in Industry. Springer-Verlag. New York.
Douglas-Schwarz, M. and Lee, C.M. 1988. Comparison of the therm osta
bility of red hake and A laska pollock surim i during processing. J . Food Sci 53: 1347.
Furukaw a, T. and Ohta, S. 1982. Mechanical and water-binding properties of heat induced soy protein gels as related to their structu ral properties. J . Texture Study 13: 59.
Gacula, M.C. Jr . and Singh, J . 1984. Statistical Methods in Food and Con- sumer Research, p. 214. Academic Press, Inc., Orlando, FL.
Henika, R.G. 1972. Simple and effective system for use w ith response su rface methodology. Cereal Sci. Today 17: 309.
IBM, 1964. L inear program m ing—Ice cream blending. IBM, Tech. Publications Dept., W hite Plains, NY.
IBM, 1966. L inear program m ing—M eat blending. IBM, Tech. Publications Dept., W hite Plains, NY.
Inglett, G.E., Cavins, J.F ., Kwolek, W.F., and W alls, J.S . 1969. U sing a computer to optimize cereal based food composition. Cereal Sci. Today 14: 69.
Iso, N., Mizuno, H., Saito, T., Lin, C.Y., Fujita, T., and Nagahisa, E. 1985. The effects of additives (egg white and soy protein) on the rheological properties of kamaboko. Bull. Japan. Soc. Sci. Fish. 51: 485.
Khuri, A.I. and Cornell, J.A . 1987. Response surfaces: designs and analysis. Marcel Dekker Inc., New York.
Kim, J.M. and Lee, C.M. 1987. Effect of starch on tex tural properties of surim i gel. J . Food Sci. 52: 722.
Lee, C.M. 1984. Surim i process technology. Food Technol. 38(11): 69.Lee, C.M. and Chung, K.H. 1989. Analysis of surim i gel properties by
compression and penetration tests. J . Text. Study 20: 362.Lee, C.M. and Chung, K.H. 1990. The role of hydrodynamic properties of
biopolymers in texture strengthening/modification and freeze-thaw s ta bilizing of surim i gels. In Advances in Fisheries Technology and B iotechnology fo r Increased P rofitability , M. Voigt and R. Botta (Ed.), Ch. 9, p. 397-412. Technomic Pub. Co. Inc., Lancaster, PA.
Lee, C.M. and Kim, J.M. 1986a. Texture and freeze-thaw stability of su rimi gels in relation to ingredients and formulation. In Proc. o f Intern. Symp. on Engineered seafood includ ing surim i, R. M artin and R. Collette (Ec.), p. 168. N ational Fisheries Institute, W ashington, DC.
Lee, C.M. and Kim, J.M . 1986b. The relationship of composite characteristics to rheological properties of surim i sol and gel. In Food Engineering and Process Applications, Vol. 1. Transport Phenomena, M. Lemaguer and P. Je len (Ed.), p. 63. Elsevier Applied Science Pub., New York.
Lee, C.M. and Toledo, R.T. 1976. Factors affecting tex tural characteristics of cooked comminuted fish muscle. J . Food Sci. 44: 1615.
Lee, C.M., Wu, M-C., and Okada, M. 1992. Ingredient and formulation technology for surimi-based products. In S urim i Technology, T. Lanier and C. Lee (Ed.), Ch. 11, p. 273-302. Marcel Dekker Inc., New York.
Neville, N.E. and Setser, C.S. 1986. Textural optimization of reduced-calorie layer cakes using response surface methodology. Cereal Foods World 31: 744.
Norback, J .P . and Evans, S.R. 1983. Optimization and food formulation. Food Technol. 37(4): 73.
Okaca, M. 1964. Effect of washings on the jelly forming ability of fish meat. Bull. Jap . Soc. Sci. Fish. 30: 225.
Pearson, A.M., Baten, W.D., Goembel, A.J., and Spooner, M.E. 1962. Application of surface-response methodology to predicting optimum levels of salt and sugar in cured ham. Food Technol. 16(5): 137.
Rust, R.E. 1976. Sausage and Processed Meats Manufacturing. AMI Center for Continuing Education, Am. M eats Inst., W ashington, DC.
Saguy, 1 .1983. Optimization methods and applications. In Computer-aided Techniques in Food Technology, I. Saguy (Ed.), p. 263. Marcel Dekker In c , New York.
Siegel, D.G., Church, K.E., and Schmidt, G.R. 1979. Gel structure of nonm eat proteins as related to their ability to bind m eat pieces. J . Food Sci. 44: 1276.
SAS. 1985. SASC User's Guide. SAS Institu te Inc. Cary, NC.Swar.son, L.W. 1980. Linear Programming - Basic Theory and A pplica
tions. McGraw Hill Book Company, New York.Vaisey-Genser, M., Ylimaki, G., and Johnston, B. 1987. The selection of
levels of canola oil, water, and an emulsifier system in cake form ulation by response-surface methodology. Cereal Chem. 64: 50.
Wesson, J.B., Lindsay, R.C., and Stuiber, D.A. 1979. D iscrim ination of fish and seafood quality by consumer populations. J . Food Sci. 44: 878.
William, R.S. J r. and Lynwood, A.J. 1966. Introduction to L inear Programm ing w ith Applications, p. 185. Prentice-Hall, Inc., Englewood Cliffs, NJ.
Ms received 7/18/92; revised 11/30/92; accepted 12/28/92.
RI. Agricultural Experiment Station contribution number 2775. We thank the Alaska Fisheries Development Foundation for providing surimi; and AVEBE America Inc. for supplying a starch sample.
538-JOURNAL OF FOOD SCIENCE-Volume 58, No. 3, 1993

Mg2+ Selectively Isolates Gellan Gum from Dairy Products
HORACE D. GRAHAM
----------------------------ABSTRACT-----------------------------Gellan gum was precipitated from the papain digest of dairy products by 5% MgS04. The precipitate was collected by centrifugation and washed with 2.5% MgS04 until the washings were negative to the phenol H2S04 test. It was dispersed with hot 50% H2S04 and the amount in the dispersion determined by the H2S04-thiourea-cyste- ine-HCl reagent. Recovery from chocolate milk, yogurt, evaporated milk, ice cream, cream cheese, process cheese spread, flan and blue cheese (no oil) dressing ranged from 76-95%. Prior removal of fat and starch was unnecessary. Carrageenan, xanthan gum, alginate, pectin and other hydrocolloids did not interfere.
Key Words: magnesium, gellan gum, papain, milk, yogurt, ice cream
INTRODUCTION
GELLAN GUM is a heterogeneous, methylpentose-containing exopolysaccharide produced by Pseudomonas elodea. Structurally, the natural gum consists of repeating tetrasaccharide units composed of l,3,B-D-glucose, l,4,B-D-glucuronic acid,l,4,B-D-glucose and 1,4, a-L-rhamnose (Jansson and Lind- berg, 1983; O’Neill et al., 1983). The native polysaccharide has been shown to also contain acetate at C6 on about 50% of the 0-3-substituted glucose residues and L-glycerate groups at C2 on all of the same glucose residues (Kuo and Mort, 1986).
The deacetylated polymer is used in food preparations and may have potential for use in dairy products such as ice cream, yogurt, frozen desserts and imitation mayonnaise (Sanderson and Clark, 1983) and sour cream and frozen dessert. Gellan gum was recently approved for use in frostings, glazes, icings, jams, and jellies (Dziezak, 1990).
Approval for extended use in foods will be facilitated by the availability of analytical methods for its selective isolation and specific quantitative determination. There are vast differences and complexities associated with designated groups of food products. Examples are products high in fat such as mayonnaise and salad dressings and products high in proteins but moderately high in fat, such as most dairy products. It seems expedient to explore methods for determination of gellan gum in circumscribed “ groups” of food products.
Screening of 17 divalent cations and 12 food hydrocolloids showed that gellan gum was selectively precipitated by Mg2+. Based on its rhamnose moiety, gellan gum could be specifically determined in the presence of other hydrocolloids, sugars, proteins, etc., by the H2S 0 4-thiourea-cysteine hydrocholoride (HTC) reagent which is specific for methyl- pentoses (Graham, 1992). A quaternary ammonium compound (Graham, 1990) and monovalent cations (Graham, 1991) have been used to isolate gellan gum from several food products. The first approach is rather general. The second is specific, but both methods necessitate removal of fats, starch and proteins prior to quantitative colorimetric determination. Isolation of gellan gum from gelled products using n-propanol has been reported, (Baird and Smith, 1989). However, that also is a rather nonspecific precipitant.
The objective was to study the selective isolation of gellan
Author Graham is with the Dept, of Chemistry, Univ. of Puerto Rico, Mayaguez, Puerto Rico 00680.
gum from dairy products using MgS04 and its specific colorimetric determination using the HTC reagent.
MATERIALS & METHODSMaterials
Gellan gum (Kelcogel 151030), xanthan gum (lot 83971A), and alginate were obtained from Kelco (Division of Merck and Co., Ir.c., San Diego, CA). Other hydrocolloids were obtained from commercial sources. Dispersions were prepared in distilled water and stored in the refrigerator until needed. Decolorizing charcoal (Norite), MgS04-7H20 (crystals), other chemicals (all of ACS reagent grade) and glass powder, all products of the Fisher Scientific Company (Pittsburgh, PA), were used without further purification. Food products were purchased from local supermarkets. Papain (activity 2.4 units/mg solid) was obtained from Sigma Chemical Company, (St. Louis, MO).
The papain EDTA-cysteine-HCl mixture was prepared by adding 2.5g papain, 0.2g Na4EDTA and O.lg cysteine-HCl per 100 mL of 0.25M acetic acic-sodium acetate, buffer pH 5.5. The Na4EDTA and cysteine-HCl were added just prior to use. The mixture was incubated at 68 ± 2 °C for 3 3 min just prior to use in order to activate the papain. Color density was measured with a Spectronic 20 spectrophotometer at 455 nm.
Preparation of the filtration columns
For filtration of the papain digest, a glass column (30 mm i.d. x 25 cm length) with or without a stopcock was used (“ Clarification Column”). A perforated disk or some suitable trapping material was placed at the bottom of the column. A layer of glass wool, about 2.5-3.0 cm thick, was placed at the bottom of the column and packed with a glass rod to allow a flow rate of 40-60 mL/min when the column was filled with water. The column was washed successively with tap water and distilled water.
For collecting the Mg2+-hydrocolloid precipitate a 250-mL burette with a long neck and a stopcock was used (“ Collecting Column”). The neck of the column was plugged with about 150-200 mg of glass wool to allow water to filter through at about 15-20 mL/min when the burette was filled with water. The column was washed with tap water and distilled water in succession. Just before use the plug was soaked with an aqueous solution of 2.5% MgS04-7H20.
Degradation of proteins
This was done essentially as reported by Graham (1991). The food material (20g) was placed in duplicate 500-mL Erlenmeyer flasks with screw caps and 10-40 mg of gellan gum dispersed in distilled water was added. The volume was made up to 150 mL with distilled H20 . The mixture was heated in a boiling water bath for 10 min and the contents then cooled to 65-70 °C. The papain-EDTA cysteine-HCl mixture (100 mL) was added and the flasks capped tightly and shaken vigorously to mix the contents. They were then incubated for 16 hr (overnight) at 68 ± 2°C. Duplicate flasks containing all ingredients, except hydrocolloids, were included to serve as controls or blanks.
Clarification of the papain digest
The hot (68 ± 2°C) papain digest was poured through a cloth ccffee filtering bag placed over the “ Clarification Column.” The flasks were rinsed three times with 25-mL aliquots of 10'3M NaOH (pH 9-10) and the washings poured through the filtering bag. The bag was then washed with six 100-mL aliquots of 10'3M NaOH and the filtrate and washings collected in a 1000-mL Erlenmeyer flask containing 1 mL of IN acetic acic. A total volume of 1L of filtrate and washings were collected.
Volume 58, No. 3, 1993-JOURNAL OF FOOD SCIENCE-539

ISOLATES GELLAN G U M . . .Flow sheet diagram of process
Pood sample (10-20 grams or more)Add 10-40 ag gellan gum Heat 10 min at 99+°CCool 70°CDigest with papain for 16 hr
wPapain digest
FilterWash with 10'JN NaOH Collect 1000 aL
i lResidue (discard) Clarified papain digest
i Add HgSO«Add powdered glass
Mixture with precipitated Mg2* -gellan gumFiltration and centrifugation
l ----------------------------------1Filtrate and washings (discard) Hg2*-gellan complex on column and in
centrifuge bottleKlute and disperse with hot 50Z HaS04
Dispersed gellan gun in centrifuge bottle^ Heat 7-8 min at 754C and filter
Gellan gum dispersed in 50Z H2S04 (100 mL)Use 10 mL for color development
Fig. 1 —F /o w s h e e t o f d ia g r a m o f p r o c e s s .
Precipitation of gellan gum in the clarified papain digest
MgS04-7H20 (50g) was added to the cooled clarified papain digest. The flask was shaken and allowed to stand at 26 ±2 °C for 30 min. Then 2.5g glass powder was added, the flask shaken well and the mixture again held at 26 ±2 °C for 30—35 min or until filtration and centrifugation were carried out.
Collection and washing of the Mg2*-gellan gum precipitate
With minimum agitation of the mixture in the flask, the supernatant liquid was poured into the collection column. Care was taken to let none or a minimum of precipitate pass over into the column. The residue in the flask was poured into a 250-mL glass centrifuge bottle and centrifuged for 15 min at 2,500 x g . The supernatant was poured into the collection column. The residue in the centrifuge bottle was washed with 2.5% MgS04. Centrifugation and washing of the centrifugal residue and the column continued until a 2-mL aliquot of washings gave a negative phenol-H2S04 test. Filtrates and washings were discarded.
Elution and dispersion of the Mg2+-gellan precipitate
The centrifuge bottle containing the washed Mg2+-gellan precipitate was placed under the “ Collection Column.” Four 10-mL aliquots of hot (75-80°C) 50% H2S04 were added to the column and the filtrate allowed to drain slowly into the centrifuge bottle. The stopcock was kept closed at the time of addition of the H2S04. A time lapse of 2- 3 min was allowed between addition of each aliquot of acid and draining from the column. The centrifuge bottle was shaken to mix acid and precipitate and to disperse the precipitate. When necessary, a blunted glass rod was used to break up clumps of precipitate. The acidic mixture was incubated in a water bath at 75-80 °C for 7-8 min.
Collection of acidic gellan-containing eluate
The contents of the centrifuge bottle were filtered using glass fiber filter paper (11 cm diameter, without binder) or a plug of glass wool (O.lg or less) placed in an 11-cm funnel. The bottle was washed with5-mL aliquots of hot (75-80 °C) 50% H2S04 and the rinsings poured over the filter. Washing of the bottle and the residue on the filter was continued until 100 mL of eluate and washing were collected. When the eluate was colored, as in the case of chocolate milk, 0.4-0.5g decolorizing charcoal was placed in the glass fiber filter paper or directly over the plug of glass wool in the neck of the funnel. Filtration and washing were done as stated above.
Colorimetric determination of gellan gum in the eluate
The eluate (10 mL) was placed in triplicate 150 x 20 mm boro- silicate test tubes and 0.2 mL of 2.5% thiourea in 50% H2S04 was added. The tubes were shaken to mix well and heated in boiling water (99 ± 1°C) for 15 min, and cooled in an ice bath; then 0.2 mL aqueous 3% cysteine-HCl was added and the mixtures left at 26±2°C for 4 hr. The density of the color developed was measured at 455 nm, the established wavelength of maximum absorption against a “food blank,” and the amount of gellan gum present determined from a standard curve for the hydrocolloid.
Preparation of standard curve
A 1000 pg/mL aqueous dispersion of gellan gum (20 mL) was placed in a 100-mL volumetric flask and 30 mL distilled water added. The suspension was cooled in an ice bath and then 50 mL cone H2S04, kept in freezer for 2-4 hr, was added to the volumetric flask allowing the acid to flow gently down the side of the flask. The flask was shaken, while being held in an ice bath, to mix well. The volume was made up to the mark with distilled water. This preparation contained 200 pg of gellan gum/mL reagent.
Zero, 1, 2, 3, 4, 5, 6, 7, 8, 9, and 10 mL of stock suspension (200 Pg/mL) were each placed in triplicate sets of 150 x 20 mm borosil- icate test tubes. Where necessary, the volume was made up to 10 mL with 50% H2S04, and 0.2 mL of 2.5% thiourea dissolved in 50% H2S04 was added. Each tube was shaken to mix well, heated in boiling water for 15 min, cooled in an ice bath and 0.2 mL of 3% aqueous cysteine-HCl added. After 4 hr incubation at 26±2°C, the density of the color developed was measured, against the reagent blank, at 455
nm. The color developed by each level of gellan gum was plotted vs the amount of gellan gum added.
Influence of variables on isolation and colorimetric determination
During isolation, the use of ground glass in the coffee filter bag, the volume of slightly alkaline water used in washing the residue in the bag, the amount of MgS04 used to precipitate the gellan gum and the amount of glass powder used during centrifugation were assessed. For the colorimetric phase, the amount of acid used to elute the hydrocolloid from the collection column and for dispersing the hydro- colloid-Mg++ complex, the time of heating the hydrocolloid in 50% H2S04 for maximum color development and possible interference from other hydrocolloids were investigated.
RESULTS & DISCUSSIONDETAILS of the process for isolation and quantitative determination of gellan gum are outlined in Fig. 1. Preliminary heating of the mixture denatured the proteins, making them more susceptible to proteolysis by papain. Neither defatting nor hydrolysis of starch was necessary.
Adjustment of sample pH to neutrality prior to heating was not necessary. For the brief heating period employed gellan gum was apparently not degraded at the pH of the aqueous product mixture. Gellan gum was reported to be relatively stable at pH 3.5-8.0 (Anon, 1989) and has good thermal stability, withstanding several autoclaving cycles (Kang et al.,1982). Preincubation of the papain-EDTA-cysteine-HCl mixture served to activate the papain and thus hasten digestion of the preincubated food-gum mixtures. During digestion, periodic vigorous shaking of the flasks to mix the contents well aided digestion. A temperature of 68 ± 2°C was used for digestion, because it was more rapid than at lower temperatures. The optimum temperature for proteolytic activity of papain on food proteins has been reported to be about 70-80°C at neutral pH (Whitaker, 1972).
In most cases, hydrolysis of the protein, as indicated by clarification of the food-papain mixture and cursory recovery tests was essentially complete in 4 hr. However, for conve-
540—JOURNAL OF FOOD SCIENCE-Volume 58, No. 3, 1993

Gram s of MgSC>4 added/100 m LFig. 2—Influence of amount of MgS04 added.
Fig. 3—Effect of time of heating at 99 ± 1°C on color density.
nience, overnight (16 hr) hydrolysis was practiced so that the operation could be completed the next day. Similar observations were noted by Graham (1969). During washing of the coffee bag filter and clarification column, the temperature should not be allowed to fall below 60°C. Good recoveries were obtained when 500-600 mL of filtrate and washings were collected. Routinely, 1,000 mL was collected to assure high recoveries with processed cheese spread and flan.
Fat was adsorbed on the coffee bag filter and the bed of glass wool in the column. Washing with hot alkaline solution solubilized and dispersed any protein-hydrocolloid complexes. In addition, fat trapped on the coffee bag and on the pad of glass wool was saponified and so was less likely to escape into the collection flask. Addition of acetic acid to the flask neutralized the NaOH in the hot wash water. This served to maintain the original pH of digestion (5.5) and to avoid the formation of insoluble Mg(OH) 2 when the MgS04 was added.
Any readily soluble magnesium salt may be used to precipitate the gellan gum in the papain digest. Magnesium acetate, MgCl2 and MgS04-7H20 were tried. MgS04 was chosen for routine use. Magnesium chloride was considered quite undesirable due to its very hygroscopic character. A minimum final level of 2.5% MgS04-7H20 must be present to assure complete precipitation when a maximum of 40 mg of gellan gum was added to 20 mg of the food material (0.2% level). Levels up to 20% MgS04-7H20 did not result in higher recoveries of gellan gum (Fig. 2). Routinely, 5% MgS04 -7H20 was used for a maximum amount of 40 mg of gellan gum in 20g of food
W a v e le n g th (n m )
Fig. 4-Absorption spectra of gellan gum and rhamnose. (1) Aqueous dispersion of gellan gum; (2) Gellan gum recovered from yoghurt; <3} Rhamnose; (4) Reagent blank.
Micrograms of gellan gum added/m L of reagentFig. 5 - Standard curve for gellan gum.
Table 1—Recovery o f gellan gum ‘ o f other hydrocolloids
from water and m ilk in the presence
O th e r h y d ro c o llo id a d d e d R e c o v e ry (% ) fro mW a te r M ilk
N one 96.0 94.0S ta rch 92.0 93.8P ectin 93.0 93.0X a n th a n g u m 93.0 94.0C arra g e en a n 94.0 93.8G u m tra g a c a n th 94.2 93.6G u m g h a ttl 93.6 92.2G u m a rab le 95.4 94.1L o c u s t b ea n g u m 93.0 92.8
product, since in high-protein foods some of the Mg2+ would be complexed with proteins. Carefully pouring the supernatant into the collection column greatly accelerated the collection process since < 200 mL of the papain digest containing the Mg2+-precipitate had to be centrifuged. Only a small amount (2-5%) of the Mg2+-gellan complex was trapped on the column, thus almost all remained in the centrifuge bottle. Elution from the column became much easier and only 100 mL of 50% H2S 0 4 had to be used for elution and dispersion. Direct filtration of the entire 1,000 mL of the mixture containing the Mg2+- gellan complex resulted in clogging of the column, extremely slow filtration, and required use of >250 mL of hot acid to
Volume 58, No. 3, 1993-JOURNAL OF FOOD SCIENCE-541

ISOLATES GELLAN GUM . . .
Table 2 —S u m m a ry o f e ffe c ts o f va ria b le s
R ange N ee d e d fo r
V a ria b le in v e s tig a te d R e p ro d u c ib il ity R e c o m m e n d e d
Is o la t io n pha se
F ina l M o la r ity o f b u f fe r 0 .0 1 - 0.1 0 .0 8 -0 .1 0 .1 0
G ra m s p a p a in /g ra m fo o d 0 .1 -1 0.1 0 .1 0
D ig e s tio n t im e (hr) 2 -1 6 4 -6 16D ig e s tio n te m p e ra tu re 5 5 -8 0 °C 68—70°C 68—70°CF iltra tio n te m p , o f d ig e s t. 3 0 -9 8 °C — 6 8 -7 0
U se o f c o ffe e bag p re f ilte r Y es o r N o Y es Y es
A d d it io n o f g ro u n d g la ss , (C e lite o r c a rb o n to d ig e s tp r io r to f i lt ra t io n ) Y es o r N o N o N on e
m L o f f i l t ra te a nd w a s h in g s 4 0 0 -1 ,0 0 0 5 0 0 -8 0 0 1 ,0 0 0
C o lle c t io n pha seT e m p e ra tu re o f p a p a in d ig e s t p r io r to a d d it io n o f
M g S O „ 24—80°C 30°C 26 ± 2°CM g S 0 4 a d d e d (g) 0 .5 -1 0 3.5 5.0
G lass p o w d e r a d d e d (g) 0 - 2 0 2 .0 -5 .0 2.5W a s h in g o f re s id u e o n c o lle c t io n c o lu m n a nd in ce n - 0 -ne g to p h e n o l H 2S 0 4 te s t N eg to p h e n o l H 2S 0 4 N eg to p h e n o l
tr ifu g e b o tt le te s t H 2S 0 4 te s tM L 5 0 % H 2S 0 4 (70 -80°C ) n e e d e d to e lu te g e lla n 0 -6 0 3 0 -5 0 4 0 -5 0 (C o lu m n e lu a te n e g to
tra p p e d on c o lle c tio n c o lu m n p h e n o l H 2S 0 4 te s t)H e a tin g o f a c id re s id u e in c e n tr ifu g e b o tt le (m in ) n o n e - 1 0 7 -1 0 7 -8T e m p e ra tu re o f h e a tin g a c id re s id u e in c e n tr ifu g e
b o t t le (°C) 3 0 -9 8 (°C) 6 5 -8 0 (°C) 7 5 -8 0 (°C)F iltra tio n o f a c id e lu a te Y es o r N o Yes YesF ilte r used G lass w o o l o r g la ss f ib e r p a p e r e ith e r g la ss f ib e r p a p e r m o re c o n v e n i-
e n t
C o lo r im e tr ic phaseA m o u n t o f th io u re a in 5 0 % H 2S 0 4 to be a d d e d (m L) 0 -1 m L 0 .1 -0 .1 5 0.1T e m p e ra tu re o f h e a tin g m ix tu re to d e v e lo p c o lo r 6 0 -9 9 °C 99 ± 1°C 99 ± 1°C
T ab le 3 —R e c o v e ry o f g e l l an g u m fro m d a iry p ro d u c ts
P ro d u c tO th e r h y d ro c o llo id
p re s e n t
G e llang u m(% )
R e co ve ry(% )
re a g e n tb la n k
F oodb la n k
E va p o ra te dm ilk C a rra g e en a n 0 .2 0 96.4 95.0
0 .1 0 95.2 94.00.05 94.3 92.0
C h o c o la te m ilk C a rra g e en a n 0 .2 0 83.6 81.40 .1 0 82.9 80.90.05 81.6 79.4
Ice C ream C a rra g e e n a n , cm c , 0 .2 0 96.0 94.0(va n illa ) lo c u s t bean g u m
0 .1 0 89.0 8 8 .00 .05 85.0 84.1
Ice C ream C a ra g e en a n , cm c , 0 .2 0 87.4 86.3(n ea p o lita n ) lo c u s t b e a n g u m 0 .1 0 86.7 85.5
0.05 8 6 .0 84.2Y o g u r t (p la in ) P ectin 0 .2 0 91.0 89.6
0 .1 0 8 8 .2 8 6 .20.05 78.2 75.6
Y o g u rt P ectin 0 .2 0 90.0 87.8(b lu e b e rry ) 0 .1 0 89.0 86 .1
0.05 75.0 74.3C rea m chee se L o c u s t bean g u m 0 .2 0 92.0 91.0
0 .1 0 81.5 90.10.05 79.6 85.4
P rocess ch eese C arra g e en a n , cm c 0 .2 0 89.2 87.2sp re a d 0 .1 0 81.5 80.0
0.05 79.6 78.3Flan N one 0 .2 0 92.6 91.0
0 .1 0 90.2 89.00.05 89.8 8 8 .6
C o tta g e chee se X a n th a n g u m 0 .2 0 87.8 85.40 .1 0 82.6 80.60.05 79.3 76.2
P u d d in g S ta rch 0 .2 0 91.6 89.60 .1 0 89.4 8 6 .00 .05 83.2 85.0
B lue ch ee se X a n th a n g u m 0 .2 0 90.2 87.60 .1 0 88.4 85.40.05 83.8 82.9
a Declared on label b Based on 20 g of productc A v e r a g e o f d u p lic a te d e t e r m in a n ts a t e a c h le v e l o f a d d e d g e lla n g u m
hydrocolloids” alone were present, color development never exceeded an absorbance of 0.05. In their presence good re
disperse the Mg2+-gum complex and elute the gum form the column.
Elution and dispersion were best achieved when hot (75- 80°C) 50% H2S 0 4 was used. If the acid concentration was lower, the temperature had to be raised, resulting in coloration of the eluate. At 80°C dispersion in 50% H2S 0 4 by heating for9 - 10 min resulted in coloration. Heating for 4-5 min resulted in lowered results. For this reason, a heating time of 7-8 min was chosen.
The colorimetric test is based on the specific reaction of the rhamnose moiety of gellan gum to produce a color with the HTC reagent (Baird and Smith, 1989; Graham, 1990). Use of 50% H2S 0 4 as eluant and dispersant was convenient, since the10- mL aliquot of the acidic eluate could be heated directly to develop the color.
When heated at 99 ± 1 °C, color development began after4-5 min, intensifed after 7 min, was more intense after 10-12 min and reached a maximum after 15 min (Fig. 3). Further heating resulted in a slight reduction in color intensity. After 20-25 min of heating, traces of starch, sugars or such hydrocolloids as pectin, carrageenan, locust bean gum, xanthan gum or gum tragacanth, developed some color. Heating at lower temperatures necessitated extended heating periods for color development and the possibility of interference from traces of carbohydrates. Spontaneous heating (Baird and Smith, 1989; Graham, 1991) could not be used here. Gellan gum dispersed in 50% H2S 04, or recovered from foods and rhamnose dispersed in 50% H2S 04, gave the same absorption maxima (Fig.4). Color response of gellan gum was linear at added levels of 40-200 p,g/mL of reagent (Fig. 5).
Several other methylpentose-containing hydrocolloids used in foods could cause interference. Among these are pectin, gum tragacanth, and gum acacia. Others such as carrageenan and xanthan gum, at sufficiently high concentrations, could also interfere (Baird and Smith, 1989; Graham, 1991). However, none of those hydrocolloids nor starch is precipitated by Mg2+ and, thus, if present, would be almost totally eliminated during filtration and washing. If any of them were occluded in the Mg2+-gellan precipitate, their color contribution would probably be minimal. To test this, recovery of gellan gum from water and milk in the presence of other potentially interfering hydrocolloids was done (Table 1). In all cases, when “ other
542-JOURNAL OF FOOD SCIENCE-Volume 58, No. 3, 1993

coveries were obtained, indicating that color contribution from the other hydrocolloids was nil or inconsequential.
A summary of the influence of variables on the three distinct phases of the procedure appears in Table 2. The hydrocolloid, as well as the Mg2+ hydrocolloid complex, adsorbed very strongly onto decolorizing carbon. For this reason, it could not be used to clarify the papain digest. The filtered papain digest and washing was not clear because soluble proteins, and whatever material soluble in the boiling 10_3M NaOH, would pass through the coffee cloth bag and the pad of glass wool into the receiving flask. With chocolate milk and Neapolitan ice cream a maximum of 0.4-0.5g of decolorizing carbon was used to remove residual color form the acidic eluate. At this stage of the operation, and using such as small quantity of decolorizing carbon, good recoveries were still obtained. The use of Celite alone or in combination with decolorizing charcoal also resulted in lowered recoveries. Powdered glass added to the papain digest, or placed on the pad of glass wool in the column, resulted in lowered recoveries and plugged the glass column, causing filtration to be very slow. When added to the clarified papain digest after addition of MgS04 it caused the floating precipitate to settle out rapidly, leaving a clear supernatant which could be carefully poured into the collection column. A minimum of 2g of powdered glass was sufficient to obtain good recovery when 40 mg of gellan gum was added to 20g of food product. Routinely, 2.5-5.0g was used, the higher level for processed cheese spread and cream cheese. Above 5g elution, during filtration of the acidic eluate containing the gellan gum and its hydrolytic products, was more difficult due to very strong adsorption onto the powdered glass.
Table 3 summarizes the recovery of gellan gum from various commercial dairy products. Process cheese spread was by far the most difficult from which to recover the hydrocolloid. During the preliminary heating step, the mixture had to be stirred continuously to avoid adhesion to the bottom of the flask. Blending of a weighed amount of product before apportioning into flasks was also problematic since a foamy cap formed in the “ homogenate” and equal distribution was not readily achieved. Products high in starch, such as pudding, gave good recoveries. Starch, although not predigested, was apparently sufficiently dispersed by the hot alkaline wash water and discarded in the filtrate. Very little or none was apparently occluded in the precipitate. This was confirmed from data (Table 2 ).
Measurements against the reagent blanks gave higher recoveries than when readings were made vs corresponding food blanks. Those were controls containing only the food sample but without any added gellan gum. In practice no ideal food blank would be available and, since no reliable universal correction factor is available, some degree of error would be involved because readings have to be made vs a reagent blank. Results from several determinations have shown that reagent blank absorbance readings usually ranged form 0.01-0.03. Since the absorbance reading for 0 . 1 % level of gellan gum was 0 .6 , the possible error would range from about 2-5%. An average correction factor of 5% less than the actual value would appear reasonable for most dairy products.
Gellan gum will form gels in the presence of 0.1% or less of Mg2+ (Moorehouse et al., 1981; Kang et al., 1982). This concentratin of Mg2+ for gel formation is much lower than that of monovalent cations such a Na+ and K+. Graham (1969) surveyed the ability to 17 divalent cations to precipitate 16 hydrocolloids commonly used in food products. Magnesium did not precipitate any of them. At that time, gellan gum had not been developed and xanthan gum was new. A further study showed that Mg2+ precipitated gellan gum but not xanthan gum.
Sanderson and Clark (1983) stated that, at a 0.2% concentration of gellan gum, Mg2+ and Ca2+ gave maximum gel strength at about 4% of concentration of the Na+ and K+ needed for the same effect. Graham (1991) showed that, for
maximum precipitation of gellan gum by monovalent cations, a concentration of about 0.6M (2M NaCl) was needed. In these studies the divalent cation concentration needed for precipitation was about 0.05M. Therefore, for both gel formation and precipitation, the divalent cation was much more effective than monovalent cations.
Anionic polysaccharides have a strong affinity for metal cations, hence precipitation of gellan gum by Mg2+ undoubtedly involves, principally, ionic bonding between Mg2+ and the anionic groups of the polymer. Association of metal cations with anionic polymers is related to the linear charge density of the polyanion. Linear charge density has been defined as “ distance betwen perpendicular projections of adjacent charged groups on the main axis of the molecule” (Rendleman, 1978b; Ha et al., 1989). The intensity of the ionic interaction varies in direct proportion to the linear charge density, that is, the- higher the linear charge density, the stronger the interaction of the counter ion (cation) with the anionic groups of the polymer. Studies with polyuronic acids have shown differences in charge density of the molecules, but little correlation apparently exists between the chemical structure of the polymer chain and effect of charge density per se (Rendleman, 1978a).
In addition to linear charge density, several other factors may be involved in the interaction of metal ions and polysaccharides (Rendleman, 1978 a, b; Ha et al., 1989). Some of these could have contributed to precipitation of gellan gum by Mg2+. In that precipitation, the glucuronic acid molecule was the principal contribution of anions. The other uronic acid- containing polymers did not precipitate. Therefore, linear charge distribution along the uronic aid moiety was not the only factor involved. Xanthan gum, which contains both a uronic acid and a pyruvic acid moiety, did not precipitate. Therefore, total anionic charge density was evidently not a decisive factor in the precipitation reaction, at least for the samples used here.
Xanthan gum, carrageenan, alginate, pectin starch, and other common hydrocolloids did not interfere when added at the same levels as gellan gum. Since they were not precipitated by Mg2+, they were washed out during the “ collection” phase. If small quantities were occluded in the final precipitate, they were incapable of reacting with the colorimetric reagent. Thus, the procedure includes a double safety factor in the highly selective precipitating agent (Mg2+) and the extremely specific color developing reagent which reacts only with methylpen- tose-containing polymers. Starch and pectin hydrolysis and fat removal were not necessary, thus avoiding several time-consuming operations. Monovalent cations like Na+ and Li+ to isolate gellan gum (Graham, 1991) or Mg2+, as presented here, could be used in conjunction with the HTC reagent to specifically and quantitatively determine the hydrocolloid. This could facilitate fundamental studies on the mechanism of gellan biosynthesis such as that reported by Martins and Sa-Correia (1991).
REFERENCES
Anon. 1989. Gellan Gum, Kelcogel Update. Kelco Division of Merck and Co., Inc., San Diego, CA.
Baird, J.K. and Smith, W.W. 1989. Analytical procedure for gellan gum in food gels. Food Jlvdrocolloids 3: 407.
Dziezak, J.D. 1990. Gellan gum receives FDA approval. Food technol. 44(11): 1988.
Graham, H.D. 1969. Determination of alginate in dairy products. J. Dairy Sci. 53: 443.
Graham, H.D. 1990. Semi-micro method for the quantitative determination of gellan gum in food products. Food Hydrocolloids 3: 435.
Graham, H.D. 1991. Isolation of gellan gum from foods by use of monovalent cations. J. Food Sci. 56: 1342-1346.
Graham, H.D. 1992.. (Unpublished data).Ha, Y.W., Thomas. R.L., Dyck, L.A., and Kunkel, M.E. 1989. Calcium
binding of two microalgal polysaccharides and selected industrial hydrocolloids. J. Food Sci. 54: 1336.
Jansson, F.E. and Lindberg, B. 1983. Structure studies on gellan gum, and exracellular polysaccharide elaborated by Pseudomonas elodea. Carb. Res. 124: 135.
Kang, K.S, Veeder, G.T. Micrasoul, P.J., Kaneko, T., and Cottrell, I.W. 1982. Agar-like polysaccharide produced by a pseudomonas species: Production and basic properties. Applied & Environ. Microbiol. 43: 1086.
—Continued on page 566
Volume 58, No. 3, 1993-JOURNAL OF FOOD SCIENCE-543

Prefiltration Using Formed-in-Place Metallic Membranes Reduces Microbial Content of Whey
S.F. BAREFOOT, I.Y. HAN, R.L. THO M AS, C.T. CORDLE, and L.G. CR ISW ELL
--------------------------------- A B S T R A C T ----------------------------------MEMBRANES were challenged with whey containing Lactococcus lactis ssp. lactis. Logarithmic reduction values (LRV) of lactococci and rejection of immunoglobulin G (IgG) were measured. Increasing lactococci from 107 to 109 did not affect IgG rejection. Of 20 membranes formed on conventional stainless steel substrates, none achieved 5 LRV and passed >50% IgG. Challenges of 20 DS-type altered substrates with 3mM phosphate buffer containing lactococci yielded5.2 average LRV. DS-type substrates used to microfilter whey containing lactococci yielded 5.3 to 7.3 LRV and passed 66% to 77% of the IgG.
Key Words: whey, microbes, metallic membranes, formed-in-place, microfiltration
IN T R O D U C T IO N
CHEESE WHEY may be freed of microorganisms by passage through absolute membrane filters, but such filtration is impractical for high volume sterilization. Fat and other whey constituents foul membrane surfaces (Merin et al., 1983) and form gel layers at the membrane/liquid interface (Gabier, 1985). Both macromolecular gel and fouling layers decrease fluid flow through ultrafiltration (UF) or microfiltration (MF) membranes (Gabier, 1985). Rapid fouling decreases membrane performance and necessitates periodic replacement of polysulfone, cellulose acetate, or other polymeric membrane filters (Fifield and Leahy, 1983). However, phospholipoproteins (Morr, 1992), microorganisms, and other foulants have been removed from whey by prefiltration. Consequently, prefiltration can improve the efficiency and extend the useful life of absolute membrane filters (Maubois, 1980).
Merin and coworkers (1983) examined three separate filter capsules in a tangential flow MF system for removal of cells of Lactococcus lactis ssp. lactis, cremoris, and lactis biovar diacetylactis from ultrafiltered sweet cheese whey. The three microfilters had pore sizes of 0.45 pan, 0.8 pm, and 1.2 pm,, and reduced cell populations in the permeates by 175-fold, 130-fold, and 22-fold, respectively (Merin et al., 1983). There are no published reports of the application of metallic, formed- in-place (FIP) membranes for microfiltration of whey. FIP membranes are formed dynamically by deposition of organic or inorganic compounds (including metallic oxides) in the pores of porous, sintered stainless steel tubes (Thomas et al., 1986,1987,1992). FIP systems provide greater mechanical and chemical stability than conventional polymeric membranes, withstand extremes of pH (pH 2 to >pH 12) and operating temperatures (< 100°C; Spencer and Gaddis, 1983), and may be operated at high pressures (6900 kPa) with high fluxes (255 L/m2 membrane surface per hour). In contrast to polymeric membranes, FIP membranes can be cleaned or stripped and reformed in situ (Spencer and Thomas, 1991).
A tubular stainless UF system equipped with FIP metallic membranes was employed for production of clarified (Thomas
Author Barefoot is with the Depts. of Food Science and Microbiology and authors Han and Thomas are with the Dept, of Food Science, Clemson Univ., Clemson, SC 29634. Authors Cordle and Criswell are with Ross Laboratories, Columbus, OH 43216.
et al., 1986, 1987) and microbiologically stable apple juice (Thomas and Barefoot, 1988; Barefoot et al., 1989). Ultrafiltering apple puree at operating pressures of 375, 675, and 900 psig reduced the population of Saccharomyces cerevisiae (6-3 p-m; Ponte and Tsen, 1979) in the permeates by 8 logs. Pseudomonas diminuta (0.2-0.5 pm x 1.0-4.9 pm; Fifield and Leahy, 1983) and Bacillus coagulans (0.6-1.0 pm x 2.5-5.0 pm; Gordon and Smith, 1949) also had been added to the apple puree; however, exposure of the cultures to low pH (3.5) resulted in their inability to grow on selective recovery media. To minimize bacterial injury, the UF system was challenged with cells of the pseudomonad, the bacillus, and the yeast suspended in 0.1% aqueous peptone. At inlet pressures of 2070 to 2760 kPa, the juice metallic membrane (CI-201-1) reduced the numbers of yeast, bacilli and pseudomonads by >9.0, 7.6, and 5.1 logs, respectively (Barefoot et al., 1989). Those results and the application of FIP membranes for selective enrichment of proteins in pasteurized cheddar whey (Thomas et al., 1992) pointed to the possible use of FIP systems in whey prefiltration. Our objectives were to select FIP membranes that would retain at least 5 logs of an organism (L. lactis ssp. lactis) representative of the microbial content of whey while passing at least 50% of the whey protein, IgG.
MATERIALS & METHODSALL FIP MEMBRANES and membrane substrates were manufactured by DuPont Separation Systems (formerly CARRE, Inc.) of Wilmington, DE. Conventional membrane substrates were sintered stainless steel tubes, interior diameter 1.56 cm x 59.7 cm long, internal surface area 0.03 m2. Tubes for some experiments were 3.04 m long, 0.9 m2 internal surface area. Most membrane substrates with or without membranes were housed within an outer stainless steel shell that collected permeate flowing outward through the substrate and membrane. For some experiments, substrates were housed in polyethylene piping. Where present, membranes were formed in place dynamically by deposition of membrane coatings on the inner surface and in the pores of sintered stainless steel tubes according to the manufacturer’s instructions.
The metallic membrane UF system was the same as previously described (Barefoot et al., 1989) except the pumping system consisted of a diaphragm displacement pump (Wanner Engineering Inc., Minneapolis, MN) followed by a centrifugal pump (Baldor Electrical Co., Smith, AK). A line was installed to recirculate retentate to the pumps and increase the velocity of the feed stream to 4.5 m/sec as described by Thomas et al. (1992). As before (Barefoot et al., 1989), the system was operated in a 20L recirculating mode. Feeds were either 20L of rehydrated whey protein concentrate (1%; Ross Laboratories, Columbus, OH) or, for the most rigorous challenges, 20L of 3 mM aqueous potassium phosphate (pH 7) containing 0.1% of a Lactococcus (formerly Streptococcus-, Schleifer, 1987) lactis ssp. lactis culture concentrate (Miles Marschall, Madison, WI) at a final concentration of » l x 10s CFU/mL.
Permeate flux was measured by the stopwatch and graduated cylinder method (Thomas et al., 1986) and expressed as L/m2/hr. Membrane permeability was calculated by dividing flux by pressure. Feed and permeate samples (»100 mL each) were collected aseptically as previously described (Barefoot et al., 1989) and stored on wet ice. Samples were transported immediately to the food microbiology laboratory and analyzed for viable counts of L. lactis ssp. lactis as follows: Appropriate dilutions were prepared and applied to M-17 agar (Terzaghi and Sandine, 1975) by an automated plating method (Gilchrist
544-JOURNAL OF FOOD SCIENCE-Volume 58, No. 3, 1993
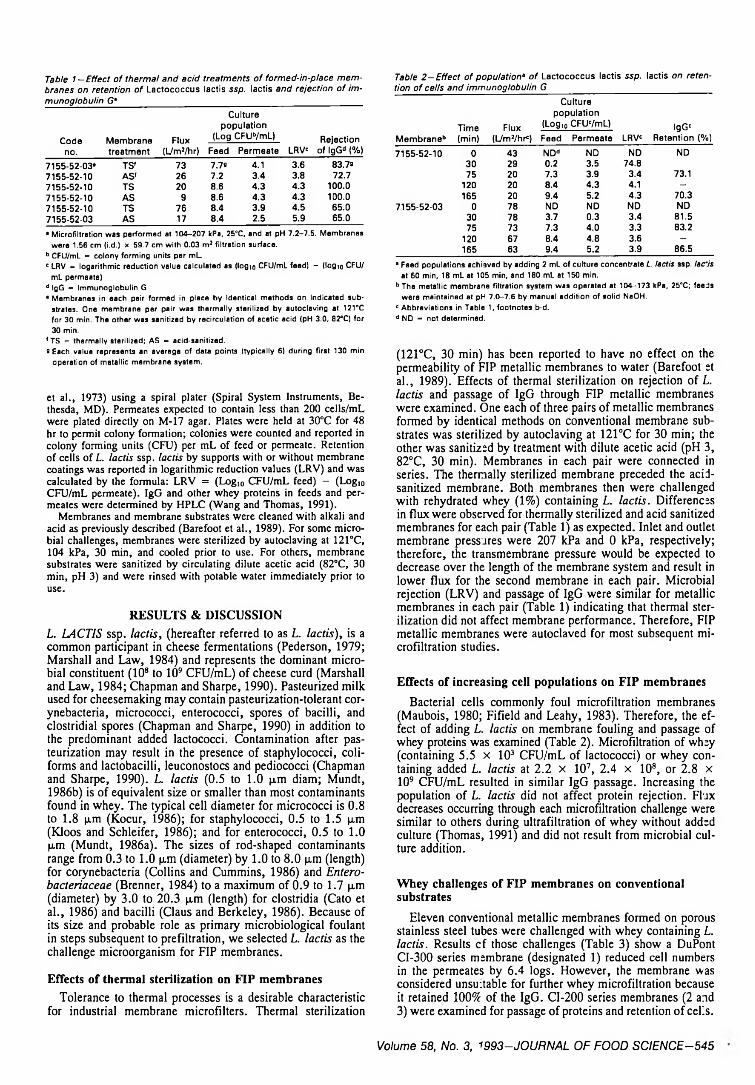
Table 1—Effect o f therm al and acid treatments o f formed-in-place membranes on retention o f L a c to c o c c u s la c tis ssp. la c tis and rejection o f im - munoglobulin G *_________________________________________________
C o d en o .
M e m b r a n et re a tm e n t
F lu x(L /n V /h r )
C u ltu re p o p u la t io n
(L o g C F U » /m L )
F e e d P e rm e a te L R V 'R e je c tio n
o f lg G d (% )
7 1 5 5 -5 2 -0 3 * T S ' 7 3 7 .7« 4 .1 3 .6 8 3 .7a7 1 5 5 -5 2 -1 0 A S ' 2 6 7 .2 3 .4 3 .8 7 2 .77 1 5 5 -5 2 -1 0 T S 2 0 8 .6 4 .3 4 .3 1 0 0 .0
7 1 5 5 -5 2 -1 0 A S 9 8 .6 4 .3 4 .3 1 0 0 .07 1 5 5 -5 2 -1 0 T S 7 6 8 .4 3 .9 4 .5 6 5 .0
7 1 5 5 -5 2 -0 3 A S 17 8 .4 2 .5 5 .9 6 5 .0
• Microfiltration was performed at 104-207 kPa, 258C, and at pH 7.2-7.5. Membranes were 1.56 cm (i.d.) x 59.7 cm with 0.03 m2 filtration surface.
b CFU/mL - colony forming units per m Lc LRV = logarithmic reduction value calculated as (logio CFU/mL feed) - (logio CFU/
mL permeate)d IgG * immunoglobulin G• Membranes in each pair formed in place by identical methods on indicated sub
strates. One membrane per pair was thermally sterilized by autoclaving at 121°C for 30 min. The other was sanitized by recirculation of acetic acid (pH 3.0, 82°C) for 30 min.
f TS = thermally sterilized; AS = acid-sanitized.8 Each value represents an average of data points (typically 6) during first 130 min
operation of metallic membrane system.
et al., 1973) using a spiral plater (Spiral System Instruments, Be- thesda, MD). Permeates expected to contain less than 200 cells/mL were plated directly on M-17 agar. Plates were held at 30°C for 48 hr to permit colony formation; colonies were counted and reported in colony forming units (CFU) per mL of feed or permeate. Retention of cells of L. lactis ssp. lactis by supports with or without membrane coatings was reported in logarithmic reduction values (LRV) and was calculated by the formula: LRV = (Log]0 CFU/mL feed) — (Log10 CFU/mL permeate). IgG and other whey proteins in feeds and permeates were determined by HPLC (Wang and Thomas, 1991).
Membranes and membrane substrates were cleaned with alkali and acid as previously described (Barefoot et al., 1989). For some microbial challenges, membranes were sterilized by autoclaving at 121°C, 104 kPa, 30 min, and cooled prior to use. For others, membrane substrates were sanitized by circulating dilute acetic acid (82°C, 30 min, pH 3) and were rinsed with potable water immediately prior to use.
RESULTS & DISCUSSIONL. LACTIS ssp. lactis, (hereafter referred to as L. lactis), is a common participant in cheese fermentations (Pederson, 1979; Marshall and Law, 1984) and represents the dominant microbial constituent (10s to 109 CFU/mL) of cheese curd (Marshall and Law, 1984; Chapman and Sharpe, 1990). Pasteurized milk used for cheesemaking may contain pasteurization-tolerant cor- ynebacteria, micrococci, enterococci, spores of bacilli, and clostridial spores (Chapman and Sharpe, 1990) in addition to the predominant added lactococci. Contamination after pasteurization may result in the presence of staphylococci, conforms and lactobacilli, leuconostocs and pediococci (Chapman and Sharpe, 1990). L. lactis (0.5 to 1.0 p.m diam; Mundt, 1986b) is of equivalent size or smaller than most contaminants found in whey. The typical cell diameter for micrococci is 0.8 to 1.8 p,m (Kocur, 1986); for staphylococci, 0.5 to 1.5 p,m (Kloos and Schleifer, 1986); and for enterococci, 0.5 to 1.0 |xm (Mundt, 1986a). The sizes of rod-shaped contaminants range from 0.3 to 1.0 p,m (diameter) by 1.0 to 8.0 pm (length) for corynebacteria (Collins and Cummins, 1986) and Entero- bacteriaceae (Brenner, 1984) to a maximum of 0.9 to 1.7 pm (diameter) by 3.0 to 20.3 pm (length) for Clostridia (Cato et al., 1986) and bacilli (Claus and Berkeley, 1986). Because of its size and probable role as primary microbiological foulant in steps subsequent to prefiltration, we selected L. lactis as the challenge microorganism for FIP membranes.
Effects of thermal sterilization on FIP membranesTolerance to thermal processes is a desirable characteristic
for industrial membrane microfilters. Thermal sterilization
Table 2 -E ffe c t o f population’ o f L a c to c o c c u s la c tis ssp. la c tis on retention o f cells and immunoglobulin G _____________________________________________
M e m b r a n e “1T im e(m in )
F lu x(L /m V h r 'l
C u ltu re p o p u la t io n
(L o g ,0 C F U '/m L )
F e e d P e rm e a te L R V 'lg G c
R e te n tio n (% )
7 1 5 5 -5 2 -1 0 0 4 3 N D d N D N D N D3 0 2 9 0 .2 3 .5 7 4 .87 5 2 0 7 .3 3 .9 3 .4 73 .1
1 2 0 2 0 8 .4 4 .3 4 .1 —1 6 5 20 9 .4 5 .2 4 .3 7 0 .3
7 1 5 5 -5 2 -0 3 0 7 8 N D N D N D N D3 0 7 8 3 .7 0 .3 3 .4 8 1 .57 5 7 3 7 .3 4 .0 3 .3 8 3 .2
1 2 0 6 7 8 .4 4 .8 3 .6 —1 6 5 6 3 9 .4 5 .2 3 .9 8 6 .5
• Feed populations achieved by adding 2 mL of culture concentrate L lactis ssp. lactis at 60 min, 18 mL at 105 min, and 180 mL at 150 min.
bThe metallic membrane filtration system was operated at 104-173 kPa, 25°C; feeds were maintained at pH 7.0-7.6 by manual addition of solid NaOH.
c Abbreviations in Table 1, footnotes b-d. d ND - not determined.
(121°C, 30 min) has been reported to have no effect on the permeability of FIP metallic membranes to water (Barefoot st al., 1989). Effects of thermal sterilization on rejection of L. lactis and passage of IgG through FIP metallic membranes were examined. One each of three pairs of metallic membranes formed by identical methods on conventional membrane substrates was sterilized by autoclaving at 121°C for 30 min; the other was sanitized by treatment with dilute acetic acid (pH 3, 82°C, 30 min). Membranes in each pair were connected in series. The thermally sterilized membrane preceded the acid- sanitized membrane. Both membranes then were challenged with rehydrated whey (1%) containing L. lactis. Differences in flux were observed for thermally sterilized and acid sanitized membranes for each pair (Table 1) as expected. Inlet and outlet membrane pressures were 207 kPa and 0 kPa, respectively; therefore, the transmembrane pressure would be expected to decrease over the length of the membrane system and result in lower flux for the second membrane in each pair. Microbial rejection (LRV) and passage of IgG were similar for metallic membranes in each pair (Table 1) indicating that thermal sterilization did not affect membrane performance. Therefore, FIP metallic membranes were autoclaved for most subsequent microfiltration studies.
Effects of increasing cell populations on FIP membranesBacterial cells commonly foul microfiltration membranes
(Maubois, 1980; Fifield and Leahy, 1983). Therefore, the effect of adding L. lactis on membrane fouling and passage of whey proteins was examined (Table 2). Microfiltration of whey (containing 5.5 X 10³ CFU/mL of lactococci) or whey containing added L. lactis at 2.2 x 10⁷, 2.4 x 10⁸, or 2.8 x 10⁹ CFU/mL resulted in similar IgG passage. Increasing the population of L. lactis did not affect protein rejection. Flux decreases occurring through each microfiltration challenge were similar to others during ultrafiltration of whey without added culture (Thomas, 1991) and did not result from microbial culture addition.
Whey challenges of FIP membranes on conventional substrates
Eleven conventional metallic membranes formed on porous stainless steel tubes were challenged with whey containing L lactis. Results cf those challenges (Table 3) show a DuPont CI-300 series membrane (designated 1) reduced cell numbers in the permeates by 6.4 logs. However, the membrane was considered unsuitable for further whey microfiltration because it retained 100% of the IgG. CI-200 series membranes (2 and3) were examined for passage of proteins and retention of cells.
Volume 58, No. 3, 1993-JOURNAL OF FOOD SCIENCE-545

METALLIC MEMBRANE WHEY PREFILTRATION...
Table 3 - Retention* o f L a c to c o c c u s la c tis ssp. la c tis and immunoglobulinG by m etallic membranes on conventional membrane substrates
M e m b r a n en o .
M e m b r a n e ty p e o r
c o d e
F lu x( L /m 2/
h rb)
C u ltu re p o p u la t io n
(L o g C F U » / m L)
lg G br e t e n t i o n
F e e d P e rm e a te L R V b <%)
1 C I-3 0 0 3 2 8 .4 2 .0 6 .4 1002 C I-2 0 0 ; 7 1 4 7 -5 2 -
1 0 -Q a6 6 8 .3 4 .5 3 .8 1 0 0
3 C I-2 0 0 ; 7 1 4 7 -5 2 - 1 0 -Q a
5 9 8 .5 5 .4 3.1 5 0
4 C I-2 0 0 J u ic e 5 4 8 .3 2 .5 5 .8 81
5 7 1 5 5 -5 2 -1 0 105 8 .3 7 .3 1 .0 2 3
6 7 1 5 5 -5 2 -0 3 7 5 8 .6 4 .2 4 .4 8 5
7 7 1 5 5 -5 2 -1 0 5 4 8 .6 5 .7 3.1 6 58 7 2 6 5 -5 2 -1 1 3 2 8 .5 5 .5 3 .0 5 2
9 S N # 1 7 1 1 -8 7 2 4 8 .5 6 .3 2 .3 3 310 7 3 0 1 -5 2 -0 1 2 A 41 8 .2 4 .6 3 .6 7 6
11 7 3 0 1 -5 2 -0 2 2 A 2 6 8 .2 4.1 4.1 7 8
•Averages of readings (typically 6) during first 130 min of operation of the metallic membrane filtration system. System operated at low pressure, 0-242 kPa, 25°C, and, except for membrane 2, at a feed pH of 7.2-7.6. For membrane 2, the feed pH dropped to 5.0 within an hour. Solid NaOH added to maintain pH -7 .0 for other membranes.
b Abbreviations Table 1, footnotes b-d.
During the challenge of membrane 2, the culture rapidly produced lactic acid and reduced the feed stream from pH 7.0 to5.0. All whey proteins were retained by the membrane near pH 5.0. The same membrane was cleaned, sterilized, designated membrane 3, and challenged with whey maintained at «pH 7.0. Microfiltration at neutral pH increased the average passage of IgG (50%). However, at both acidic (pH 5.0) and neutral pH, the CI-200 series membrane retained too few cells (3.8 and 3.1 LRV, respectively) and was eliminated from further consideration. A challenge of a DuPont CI-200 membrane (membrane 4) that had rejected 7.6 logs of bacilli from a peptone solution in an earlier study (Barefoot et al., 1989) provided acceptable cell retention (5.8 LRV) but undesirably high retention of IgG (81%). Seven additional membranes were examined (5-11) for cell rejection and protein passage (Table 3). No membranes met both LRV and protein passage criteria; that is, none passed > 50% IgG while retaining 5 to 6 logs of L. lactis. As the LRV achieved by a membrane approached acceptable levels, rejection of IgG was unacceptably high.
Thus the conventional membrane systems did not achieve the dual whey microfiltration objectives. The passage of microbial cells approximating 0.5 to 1.0 jxm in diameter coupled with the apparent complete retention of much smaller whey proteins (sensitivity 1 x 10~2; Thomas, 1991) suggested the possible presence of discontinuities in the membrane. Jernigan et al. (1990) confirmed the existence of 10 p.m pores in the porous stainless steel supports for FIP membranes using scanning electron microscopy. They postulated that membrane discontinuities occurred at sites where pores in the stainless steel were too large to permit proper filling with metal oxide particles. These data indicated the possible need to improve pore size uniformity of such stainless steel membrane substrates.
Whey challenges of new substratesTo reduce the heterogeneity responsible for membrane dis
continuities, the manufacturer altered the method for forming porous stainless steel tubes (Jernigan et al., 1990; Spencer and Thomas, 1991). Five FIP membrane substrates formed by the altered process were challenged with L. lactis (Table 4). The AS-01 substrate resulted in near target log reductions (4.0 LRV) but in unacceptable protein retention (90%). Formation of a hydrous zirconium oxide polyacrylic acid (ZOPA) membrane on an AS-01 substrate yielded complete rejection of L. lactis (8.6 LRV). ZOPA membranes act as tight ultrafilters or hyperfilters (Johnson et al., 1972, 1989); therefore, the increased
Table 4 —Retention o f L a c to c o c c u s la c tis ssp. la c tis and immunoglobulin G by five altered m etallic membrane substrates_______________________
C u ltu rep o p u la t io n
(L o g C F U b/m L ) |gQ b
M e m b r a n e * (L /m 2/h r b) F e e d P e rm e a te L R V r e je c t io n %
A S -0 1 17 8 .0 4 .0 4 .0 9 0A S -0 1 (Z O P A ) ' N D b 8.1 0 .0 8.1 N DA S -B 2 4 7 .4 2 .9 4 .5 1 0 0
A S -Q 10 7 .4 4.1 3 .3 1 0 0
W S 2 5 8 .3 5 .6 2 .7 4 3D S 41 8 .3 3 .7 4 .6 5 8
• Membrane substrates were 3.12 cm (i.d.) x 30.48 cm with 0.03 m2 filtration surface. The ultrafiltration system was operated at 69-207 kPa, 40°C, and feeds were maintained at pH 7.0 - 7.5.
b Abbreviations Table 1, footnotes b-d.c A nydrous zirconium oxide polyacrylic acid (ZOPA) membrane was formed on the
AS-01 membrane substrate. d ND - not determined.
cell retention was expected. In a separate experiment, IgG protein retention by the ZOPA-coated AS-01 substrate was 90%. Therefore, it was not considered further. Substrates AS- B and AS-Q reduced cell populations by 4.5, and 3.3 logs, respectively; however, both totally rejected IgG. Substrate WS passed nearly 60% of IgG but retained too few cells (2.7 LRV). Therefore, substrates AS-B, AS-Q, and WS were eliminated. The DS substrate retained 4.6 logs of L. lactis and permitted passage of IgG (42%). These data suggested the application of the DS-type altered substrate in prefiltration.
Buffer challenges of DS-type substratesTo further evaluate microfiltration potential of the new tubes,
20 new 3.1-meter, DS-type altered substrates representing 4 production lots (Jernigan et al., 1990) were subjected to microbial challenges. Rather than sterilizing substrates by autoclaving as in previous studies (Barefoot et al., 1989), they were sanitized by treatment with hot acetic acid. No organisms other than L. lactis were detected in viable counts of feeds or permeates, confirming the effectiveness of this treatment.
As a worst case challenge and to eliminate microbial retention due to whey foulants, each of the 20 substrates was challenged with =1 x 10⁸ cells/mL of L. lactis suspended in 20L of 3 mM aqueous potassium phosphate (pH 7). For this experiment, feeds were passed through the system at =69 kPa for about 15 min to permit system equilibration prior to sampling feeds and permeates. Mean retention of L. lactis by the 20 DS substrates was 5.2 LRV ±1.3 LRV representing a100,000-fold reduction in bacteria entering the permeates. These data indicate that the DS-type altered substrates served as microfilters without the FIP membrane coatings. Challenges of the seven substrates that comprised the first production lot resulted in a mean LRV of 4.1 ±0.8 (Table 5); the mean LRVs achieved by the second (five substrates), third (seven substrates), and fourth (one substrate) lots were 5.5 ±0.3, 6.2±0.2, and 7.8, respectively. Challenges of four additional altered substrates yielded LRVs of 5.8, 6.4, 6.7, and 5.7, respectively, with a mean LRV of 6.2±0.2 (data not shown) and provided further substantiation that the substrates without membrane coatings served as microfilters.
DS-type altered substrates as whey microGltersA substrate from the 20 substrate group was randomly se
lected, coated with FIP membrane materials, and challenged with cheese whey (pH 7) containing 1 x 10s L. lactis. The resulting LRV was 7.3 and was accompanied by 66% passage of IgG. A challenge of another coated substrate with 3.4 x 10⁵ CFU/mL L. lactis yielded 5.3 LRV and passage of 77% IgG. These data along with the report of 6 to 7 LRV and total
546-JOURNAL OF FOOD SCIENCE-Volume 58, No. 3, 1993

Table 5 - M icrobial challenges o f DS-type m etallic membrane substrates•
M e m b r a n e lo t n o .
D u P o n t c o d e fo r
m e m b r a n e sF lu x
(L /m V h r 1’)
C u ltu re p o p u la t io n (L o g 10 C F U b/m L )
F e e d ' P e rm e a te LRV»
1 6 0 2 3 -A -5 2 -0 4 8 0 7 .9 4 .7 3 .26 0 1 4 -A -5 2 -0 4 3 6 8 .2 3 .0 5 .26 0 0 3 -5 2 -1 0 4 9 8 .0 3 .8 4 .26 0 7 1 -5 2 -0 2 3 4 8 .0 2 .2 5 .86 0 1 6 -5 2 -A -0 2 3 9 7 .9 3 .9 4 .06 0 1 6 -A -5 2 -0 1 7 3 7 .9 4 .2 3 .75 6 2 9 -5 2 -0 4 3 6 7 .9 5.1 2 .8
II 6 1 2 2 -5 2 -0 4 3 7 7 .9 3 .0 4 .95 2 9 6 -5 2 -1 0 9 0 8 .2 2 .7 5 .56 0 3 0 -5 2 -1 7 1 0 4 8 .0 2 .8 5 .26 0 1 6 -A -5 2 -1 7 3 9 8 .0 2 .4 5 .65 0 1 4 -5 2 -2 2 7 0 7 .9 1.6 6 .3
III 5 2 8 2 -5 2 -0 2 51 8.1 2 .7 5 .46 0 3 0 -5 2 -2 6 31 8.1 1.9 6 .26 1 2 2 -5 2 -0 2 2 5 8 .0 2 .0 6 .06 0 9 3 -5 2 -2 6 2 0 8 .0 2 .3 5 .76 0 3 5 -5 2 -1 5 6 5 8 .0 1.3 6 .76 0 9 2 -5 2 -0 4 6 6 8 .0 2 .6 5 .46 0 1 7 -5 2 -A -1 3 3 6 8 .0 2 .4 5 .6
IV 6 0 7 1 -5 2 -2 5 3 6 8 .0 0 .2 7 .8
• Membranes were 3.12 cm (i.d.) x 3.04 m with 0.9 m2 filtration surface. The system was operated at 69 kPa, 24 to 31°C.
b Abbreviations Table I, footnotes b-d.c Feed was 3mM KH2PO4, pH 7.0, containing «1 x 10⁸ CFU/mL of L l a c t l s ssp. l a c t l s .
whey protein passage (Thomas et al., 1992) support the proposal that retention of microorganisms from cheese whey by membrane-coated altered substrates exceeds their retention from buffer. This data indicates their effectiveness as prefilters for a terminal microfilter. Key components to the successful selection of FIP microfilters were coupling microbial detection methods (sensitivity, 1 x 10~7) with protein rejection data (sensitivity, 1 x 10⁻²; Thomas, 1991) and the manufacturer’s development of alternate methods for forming porous substrates.
CONCLUSIONSTHERMAL sterilization did not affect microbial rejection and protein passage by FIP metallic membranes. Addition of up to9.4 log CFU/mL L. lactis to whey feed did not affect protein rejection. Metallic membranes retained 5 to 7 logs of microbial cells and passed more than 50% of the whey protein, IgG. Microfiltration of whey on the FIP metallic membrane system reduced lactococci by 5-7 logs but permitted passage of 66- 77% of IgG. Microfiltration yielded a permeate that could be ultrafiltered to selectively enrich for IgG. This first assessment of FIP metallic membranes as microfilters identified substrates applicable to whey prefiltration and shows the potential for such systems in prefiltration of other foods.
REFERENCESBarefoot, S.F., Tai, H.Y., Brandon, S.C., and Thomas, R.L. 1989. Produc
tion of microbiologically stable apple juice by metallic membrane ultra- filtration. J. Food Sci. 54(2); 408.
Brenner, D.J. 1984. Family I. Enterobacteriaceae. In Bergey's Manual of Systematic Bacteriology, J.G. Holt (Ed-in-Chief), Vol. 1, p. 408. Williams and Wilkins, Baltimore MD.
Cato, E.P., George, W.L., and Finegold, S.M. 1986. Genus Clostridium Prazmowaki 1880, 23. In Bergey's Manual of Systematic Bacteriology, J.G. Holt (Ed-in-Chief), Vol. 2, p. 1141. Williams and Wilkins, Baltimore MD.
Chapman, H.R. and Sharpe, M.E. 1990. Microbiology of cheese. In Dairy Microbiology: The Microbiology of Milk Products, 2nd ed., R.K. Robinson (Ed), vol. 2, p. 203. Elsevier Science Publishers, London.
Claus, D. and Berkeley, R.C.W. 1986. Genus Bacillus Cohn 1872, 174. In
Bergey's Manual of Systematic Bacteriology, J.G. Holt (Ed-in-Chief), Vol. 2, p. 1105. Williams and Wilkins, Baltimore MD.
Collins, M.D. and Cummins, C.S. 1986. Genus Corynebacterium Lehmann and Neumann 1896, 350. In Bergey's Manual of Systematic Bacteriology, J.G. Holt (Ed-in-Chief), Vol. 2, p. 1266. Williams and Wilkins, Baltimore MD.
Fifield, C.W. and Leahy, J.J. 1983. Sterilization filtration. In Disinfection, Sterilization, and Preservation, 3rd ed., S.S. Block (Ed), p. 125. Lea and Febinger, Philadelphia, PA.
Gabier, F.R. 1985. Cell processing using tangential flow filtration. In Com-f rehensive Biotechnology, M. Moo-Young (Ed), Vol. 2, p. 351, Pergamon
ress, New York NY.Gilchrist, J.E., Campbell, J.E., Donnelly, C.B., Peeler, J.T., and Delaney,
J.M. 1973. Spiral plate method for bacterial determination. Appl. Microbiol. 25: 244.
Gordon, R.E. and Smith, N.R. 1949. Aerobic sporeforming bacteria capable of growth at high temperatures. J. Bacterid. 58: 327.
Jernigan, D.A., Gaddis, J.L., and Barefoot, S.F. 1990. Development cf a coating for improved formed-in-place membranes, p. 570. Proceedings, Internat. Conf. on Membr. 1990. Chicago, IL.
Johnson, J.S. Jr., Minturn, R.E., and Wadia, P.H. 1972. Hyperfiltration XXI. Dynamically formed hydrous Zr(IV) oxide-polyacrylate membranes. J. Electroanalyt. Chem. 37: 237.
Johnson, J.S. Jr., Spencer, H.G., McClellan, D.B., Ellis, N.D., and Jernigan, D.A. 1989. Reproducibility of formed-in-place membranes on practical supports. Advances in Reverse Osmosis and Ultrafiltration, p. 357. ACS Symposium Proceedings.
Kloos, W.E. and Schleifer, K.H. 1986. Genus IV. Staphylococcus Rosenbach 1884, 18. In Bergey's Manual of Systematic Bacteriology, J.G. Holt (Ed- in-Chief), Vol. 2, p. 1013. Williams and Wilkins, Baltimore MD.
Kocur, M. 1986. Genus I. Micrococcus Cohn 1872,151. In Bergey’s Manual of Systematic Bacteriology, J.G. Holt (Ed-in-Chief), Vol. 2, p. 1004. Williams and Wilkins, Baltimore MD.
Marshall, V.M.E. and Law, B.A. 1984. The physiology and growth of dairy lactic-acid bacteria. In Advances in the Microbiology ana Biochemistry of Cheese and Fermented Milk, F.L. Davies and B.A. Law, (Ed.), p. 57. Elsevier Applied Science Publishers, New York, NY.
Maubois, J.L. 1980. Ultrafiltration of whey. J. Soc. Dairy Technol. 33< 2): 55.
Merin, U., Gordin, S., and Tanny, G.B. 1983. Microfiltration of sweet cheese whey. N. Zeal. J. Dairy Sci. Technol. 18: 153.
Morr, C.V. 1992. Improving the texture and functionality of whey protein concentrate. Fooc Technol. 46(1): 110.
Mundt, J.O. 1986a. Enterococci. In Bergey's Manual of Systematic Bacteriology, J.G. Holt (Ed-in-Chief), Vol. 2, p. 1063. Williams and Wilkins, Baltimore MD.
Mundt, J.O. 1986b. The lactic acid streptococci. In Bergey’s Manual of Systematic Bacteriology, J.G. Holt (Ed-in-Chief), Vol. 2, p. 1065. Williams and Wilkins, Baltimore MD.
Pederson, C.S. 1979. Microbiology of Food Fermentations, 2nd ed., p. 105. AVI Publishing Co., Westport, CT.
Ponte, J.G. Jr., and Tsen, C.C. 1979. Bakery products. In Food and Beverage Mycology, 1st ed, L.R. Beauchat (Ed.), p. 191. AVI-Van Nostrand Reinhold, NY
Schleifer, K.H. 1987. Recent changes in the taxonomy of lactic acid bacteria. FEMS Microbiol. Rev. 46: 201.
Spencer, G. and Thomas, R. 1991. Fouling, cleaning, and rejuvenation of formed-in-place membranes. Food Technol. 45(12): 98.
Spencer, H.G. and Gaddis, J.L. 1983. Membrane separation processes A tutorial survey presented at the 5th Membrane Separation Symposium. Clemson University, Clemson, SC.
Terzaghi, B.E. and Sandine, W.E. 1975. Improved medium for lactic streptococci and their bacteriophages. Appl. Microbiol. 29(6): 807.
Thomas, R.L. 1991. Personal communication, Clemson University. Clemson, SC.
Thomas, R.L. and Barefoot, S.F. 1988. Ultrafiltration of fruit juices with metallic membranes. In Quality Factors of Fruits and Vegetables: Chemistry and Technology, J.J. Jen (Ed.), p. 346. American Chemical Society, Washington, DC.
Thomas, R.L., Cordle, C.T., Criswell, L.G., Westfall, P.H., and Barefoot, S.F. 1992. Selective enrichment of proteins using formed-in-place membranes. J. Food Sci. 57(4): 1002-1005.
Thomas, R.L., Gaddis, J.L., Westfall, P.H., Titus, T.C., and Ellis, N.D. 1987. Optimization of apple juice production by single pass metallic membrane ultrafiltration. J. Food Sci. 52: 1263.
Thomas, R.L., Westfall, P.H., Louvieri, Z.A., and Ellis, N.D. 1986. Production of apple juice by single pass metallic membrane ultrafiltration. J. Food Sci. 51: 559.
Wang, H.J. and Thomas, R.L. 1991. High-performance liquid chromatography for the assessment of glucoamylase immobilized on metallic membranes. J. Chromatog. 536: 107.
Ms received 10/9/92; revised 1/27/93; accepted 2/7/93.
This study was supported by Ross Laboratories, Columbus, Ohio. Technical Contribution No. 3377 of the South Carolina Agricultural Experiment Station, Clemson University, Clemson SC 21634.
Volume 58, No. 3, 1993-JOURNAL OF FOOD SCIENCE-547

Heat and Fermentation Effects on Total Nonprotein Nitrogen and Urea in Milk
B. SAIDI and J.J. W ARTHESEN
----------------------------ABSTRACT-----------------------------Kinetic analysis was applied to the increase of NPN and the decrease in urea when milk was heated at 80, 100 and 120°C. NPN increase with heat followed zero-order kinetics with an energy of activation of 17 kcal/mole. Urea losses with heating followed pseudo first-order kinetics with an energy of activation of 20 kcal/mole. Commercial yogurt and leben fermentation processes were used to determine the effects of fermentation on NPN and urea. Yogurt and leben fermentations increased NPN by 150 mg/kg and 208 mg/L, respectively, but had no effect on urea.
Key Words: milk, urea, nonprotein, nitrogen, fermentation
INTRODUCTION
COMPOUNDS in the nonprotein nitrogen (NPN) fraction of milk have a low molecular weight and are not precipitated with protein in 12% trichloroacetic acid (Walstra and Jenness, 1984). The NPN fraction has biological, analytical and technological importance although a large part of it does not have the same nutritional value as proteins (Packard, 1984). The biological importance of NPN is due to the content of free amino acids (such as taurine), B vitamins, and nucleotides and their precursors such as orotic acid. Alais (1985) pointed out that the NPN fraction was important in bacterial nutrition. NPN increase was used as a measure of the milk heat treatment and proteolytic activity in UHT milk (Corradini and Pecis, 1978; Renner, 1988) and raw milk (Humbert et al., 1982) during storage.
NPN content in milk has been reported in the range 229- 390 mg/kg of milk (Juarez et al., 1979; Wolfschoon-Pombo and Klostermeyer, 1981a; Walstra and Jenness, 1984;). Several factors have been implicated as causing variations in NPN levels in milk, including heat treatments of milk (Alais et al., 1966; Ramos, 1978; Fox and Morrissey, 1977) and activity of microorganisms (Humbert et ah, 1982; Blanc et ah, 1984).
Studies on the effect of heat on NPN formation from protein have been conducted on casein solutions, but very few studies have been done on milk. Like heating, the effect of fermentation on milk NPN could also be important. Limited information is available on the effect of yogurt fermentation on NPN, and or on the effect of special fermentations, (such as leben production) on NPN. Deeth and Tamime (1981) reported that yogurt fermentation increased free amino acids and ammonia, but decreased urea, some vitamins, orotic acid and hippuric acid. Aim (1983) reported an increase in NPN in yogurt and other fermented products after fermentation.
Urea nitrogen has been reported to be 20 to 75% and 33 to 79% of milk NPN (Joumet and Rémond, 1980). Wide ranges of urea levels have been reported (Muir and Sweetsur, 1977; Bhavadasan et al., 1982; Kelly, 1982). Brun-Bellut et ah (1982) and Alais (1985) reported that the average urea content of milk was 332 and 250 mg/L, respectively.
Author Warthesen (to whom inquiries should be addressed) is with the Dept, of Food Science & Nutrition, Univ. of Minnesota, St. Paul, MN 55108. Author Saidi is with the Institut Agronomique et Vétérinaire, Rabat, Morocco.
The addition to or removal of urea from milk causes marked changes in heat stability (Muir and Sweetsur, 1977). There is a highly significant statistical correlation between seasonally observed variations in heat stability and urea contents (Kelly et ah, 1982; Banks et ah, 1984). The effect of heat on urea could be of importance for protein stability. However, available information is limited on changes in urea concentration with heat treatments. The effect of fermentation on urea could also be important. Our objective was to evaluate the influence of heat and selected fermentations on NPN and urea in milk.
MATERIALS & METHODS Determination of NPN
NPN content of Moroccan whole cows’ milk (mixed breeds) was determined on seven retail milk samples obtained in Rabat, Morocco, during the summer of 1988. The method of Rowland (1938) based on the Kjeldahl method was used for determination of NPN. For milk and leben, 10 mL of the milk product was transferred to a 50-mL volumetric flask. For yogurt, 10 mL was weighed and transferred to a 50-mL volumetric flask. The sample was diluted to the mark with 15% trichloroacetic acid (TCA) solution and mixed immediately. After the precipitate settled, the solution was filtered through a Whatman filter No. 40, 20 mL of filtrate was placed into a 200-mL Kjeldahl flask and then digested after adding 5 mL sulfuric acid, 2g potassium sulfate, 0 .2g copper sulfate and 2 drops of selenium oxychloride.
After digestion and cooling, 50 mL water and 15 mL 50% NaOH solution were added. The ammonia was then distilled into 10 mL of 0.02N sulfuric acid to which 2 drops of 0.1% methyl red solution had been added. The excess acid was titrated with 0.02N NaOH. NPN results were expressed as mg/L or kg. The true concentration of NPN compounds would be greater than that based on nitrogen, but no conversion was made to any other basis.
Determination of urea
Urea concentrations in whole milk were determined on 10 retail milk samples. These milk samples were similar to, but not the same, samples as those used for NPN studies. The method of Fawcett and Scott (1960), as modified by Muir and Sweetsur (1976), was used to measure the concentration of urea in milk products. Milk or leben (1 mL) or yogurt (lg) was diluted to 10 mL with distilled water, and then 200 p.L of the diluted sample was incubated with 100 p.L of urease solution (15 units/mL in 0.05M phosphate buffer, pH 6.5) at 37°C for 10 min. The urea in the milk was thus converted to ammonia which was estimated colorimetrically after reaction with sodium phen- ate and hypochlorite.
Heat treatments
To determine the heat effect on milk NPN, 10-mL samples were transferred to glass test tubes (16 x 125mm). The tubes were capped and placed in covered water baths at either 80 ±1 or 100±1°C. Duplicate samples were removed every hour over a 6 -hr period. For 120 ± 1°C, 10-mL milk samples were flame-sealed in glass test tubes and heated in an oil bath. Duplicate samples were removed every 10 min over a 40-min period, immediately cooled, opened, and the contents analyzed for NPN. Heating times were chosen in order to show changes in both NPN and urea concentrations. Heating conditions were more drastic than encountered in typical processing situations and heating times were extended to acquire data for accurate kinetic analysis. Also, to obtain useful data for determining the kinetics of urea degradation, milk samples were heated for time periods different
Volume 58, No. 3, 1993-JOURNAL OF FOOD SCIENCE-548

than for the NPN studies. Milk samples (2 mL) were transferred to glass test tubes as described for NPN studies. Duplicate samples were removed every 4 hr over a 28-hr period or every 3 hr over a 21-hr period for 80 and 100°C, respectively. For 120°C, 2-mL milk samples were flame-sealed in glass test tubes and heated in an oil bath. Triplicate samples were removed every 30 min over a 2-hr period, immediately cooled, opened, and the contents analyzed for urea.
Yogurt fermentationThis study was conducted in Morocco using a commercial yogurt
process. The yogurt was produced from whole milk in which the solids content was increased by addition of nonfat dry milk. Total solids and fat levels were 21 and 1.7%, respectively. The mix was homogenized, pasteurized, cooled and inoculated with S. thermophilus and L. bul- garicus. The milk was placed in consumer-size packages of 125 mL and incubated in a temperature-controlled room at 45°C. To determine the effect of fermentation on NPN, 9 samples were obtained just prior to incubation and 9 samples at the end of the process. These samples were taken from two different commercial batches with five samples from the first and four from the second batch. They were kept frozen until analyzed. To determine the effect of yogurt fermentation on urea, 12 samples were removed just prior to incubation and 12 samples were obtained at the end of the process. These samples were taken from three different commercial batches with four samples from each batch. They were kept frozen until analyzed.
Leben fermentationSamples were collected at a commercial leben processing unit in
Morocco. Leben, a popular milk drink in Morocco (Tantaoui-Elaraki et al., 1983) was produced from a milk of 1% fat in which the solids content was adjusted by addition of 10% reconstituted nonfat dry milk resulting in a total solids content of about 90 g/L and a fat level of about 5.6 g/L. The milk was then homogenized, pasteurized (95°C, 5 min), cooled to 22-23°C and inoculated with a mesophilic starter culture, “ Flora-Danica.” This lactic culture was supplied by Chr. Hansen’s Laboratory, Inc. (Copenhagen, Denmark). The milk was incubated at 22°C for 10 to 12 hr until a pH of 4.4 was reached. Then the product was cooled and packed in pouches of 0.5L or tetrabricks of 1L. To determine the effect of fermentation on NPN, nine samples were obtained just before the incubation step and nine samples were taken at the end of the process. These samples were removed from two different commercial batches with four and five samples from the first and the second batch, respectively. These samples were kept frozen until analyzed. For the determination of urea changes, the sampling of leben was the same as the sampling pattern for yogurt.
Statistical analysisLinear regression with transformation of the dependent variable (NPN
content or urea retention) was used to determine reaction order for the effects of heat on NPN and urea in milk. A linear relationship was compared to semilogarithmic relationship. An analysis of variance was used to determine whether the effects of yogurt or leben fermentation on NPN and urea were significant (Steel and Torrie, 1980).
RESULTSNPN in milk
The concentration of NPN in seven samples of retail whole milk averaged 215 mg/L, (standard deviation 29 mg/L and range 189-273 mg/L). The coefficient of variation caused by slight differences in analytical procedures between duplicates was between 0 and 1.73% (average 0.73%). The NPN in commercial Moroccan milk has not been previously reported. NPN levels were in agreement with those reported in some locations, but could also be considered low in reference to those reported in other places.
Harland et al. (1955) found a range of 230-420 mg/L in 81 samples of commercial milk throughout the USA. In France, Brun-Bellut et al. (1982) reported NPN content to be 283 ± 46 mg/L of milk. In Germany, Wolfschoon-Pombo and Klos- termeyer (1981b) found an average NPN of 268 mg/kg of milk for Black-Pied cows, while Timm et al. (1981) determined that the NPN in 136 samples of milk from 48 cows averaged
261 mg/kg of milk. In California, Bruhn and Franke (1979) determined the NPN from dairy tanks in two areas, and reported an average NPN of 286 and 326 mg/L of milk for each of two areas. In the Netherlands, de Kooning et al. (1974) reported 282-423 mg/kg of NPN in skim milk.
Several factors have been implicated in variations in NPN and may explain why NPN levels in milk from cows in Morocco were lower. These include breed, feed, season, stage and number of lactation, storage of milk, activity of microorganisms in milk, and heating of milk. Of the several factors that influence NPN level in milk, feeding practices on the farm are most important (Packard, 1984; Brun-Bellut et al., 1982).
Heat effect on NPN
The increases in NPN during heating of milk at 80, 100 and 120°C were compared (Fig. 1). Lines were determined using linear regression based on zero-order kinetics. The increase in NPN content was better described (higher r2) by a linear relationship than a semilogarithmic relationship. The r2 values were 0.98, 0.98 and 0.99 for linear relationships and 0.95, 0.96 and 0.96 for semilogarithmic relationships. Regression lines were calculated using 14, 14 and 10 data points for 80, 100 and 120°C, respectively. Calculated zero-order rate constants and r2 for NPN increase in milk were compared (Table1). At the end of 6 hr heating at 80 and 100°C, increases in NPN were 33 and 47%, respectively. After 40 min at 120°C, NPN increase was 43%. Belec and Jenness (1962) in their study of 3% caseinate solutions held at 135°C for 1 hr reported that NPN increase was linear with time. They did not indicate amounts of NPN released, so a determination of rate constant for NPN increase from caseinate solutions could not be made. They reported, however, that whole caseinate, a-caseinate solutions and p-caseinate solutions released about 15, 15 and 7%, respectively, of the nitrogen.
The graphs by Hindle and Wheelock (1970) for NPN increase with time in milk under heat treatment could not be used to determine kinetics of NPN increase. Fox and Morrissey(1977) in a review reported that the NPN released from sodium caseinate solutions was linear with time. They pointed out that
Volume 58, No. 3, 1993-JOURNAL OF FOOD SCIENCE-549

HEAT AND FERM ENTATION ON MILK NP N & UREA . . .
Table 1 -Z e ro -o rd e r rate constants and r ! values for increases in NPN during heating o f m ilk a t 80, 100 and 120°C________ __________________
TempPC)
K
(mg/L/hr) SE* r2
80 9.65 0.42 0.98100 15.80 0.61 0.98120 110.00 2.13 0.99
* SE = standard error for calculated k .
about 20% of total N was solubilized after 5 hr at 120°C. Heat and fermentation on milk NPN and urea Alais (1985), on the other hand, reported that 2% solutions of a s- or (3-casein heated between 100 and 140°C for up to 80 min released NPN which followed first-order kinetics. The Q10 was close to 2.3 and cv was more labile than [3-casein.
Our results suggested that the NPN increase in milk is very limited under practical heat processing conditions. Typical sterilization conditions (120°C for 20 min) cause an increase in milk NPN of about 18%. Davies and White (1959) showed that heating milk to between 50 and 120°C for 30 min increased NPN, but the increase was highest at 120°C (about 23%). Ramos (1978) reported that a milk heat treatment of 15 min at 120°C increased NPN by 25%, higher than we found. Hindle and Wheelock (1970) reported that the increase in milk NPN during heating was due to the release of 12% TCA-soluble peptides and glycopeptides. On that basis, they suggested that the glycopeptides released from «-casein provided an explanation of gelation during storage of heat-sterilized milk products. Walstra and Jenness (1984) hypothesized that the increase in NPN by heating was the result of release of ammonia by deamidation of glutamine and asparagine groups of the proteins. Alais et al. (1566), using soluble protein solutions (containing mainly (3-lactoglobulin and a-lactalbumin) and caseins, found that, under heat treatment, NPN increased in the case of caseins but decreased in the case of soluble proteins.
The energy of activation we obtained from Arrhenius plot slopes was 17 kcal/mole (r2 = 0.85). The calculated Q10 value at 80-90°C was 2.0. The Q10 we found was smaller than the2.3 value reported by Alais (1985). The difference may have occurred because the Q10 of Alais was determined for casein solutions, and not casein in milk. Our results showed that the increase in NPN during heat treatment of milk followed a linear relationship with time. While there are likely to be mixed mechanisms responsible for changes in NPN with heating, kinetic analysis can be used to predict heat-induced increases.
Effect of yogurt fermentation on NPN
The first batch of yogurt samples examined for NPN content averaged 254 ± 99 mg/kg prior to fermentation and averaged 390 ± 66 mg/kg after fermentation. A second batch had an unexpectedly low average NPN of 63 ± 33 mg/kg prior to fermentation, and after fermentation NPN averaged 228 ± 88 mg/kg. While the starting NPN levels in that batch were low, the increase in NPN was about the same as with the first batch. Using mean values, the increases in NPN due to fermentation were 136 and 165 rr.g/kg for the two batches. An analysis of variance indicated a significant effect (P<0.05) of fermentation on NPN increase in yogurt.
The large standard deviation found for NPN in yogurt could be attributable to variations in NPN between batches and within samples. The variation between batches could be due to differences in composition of the yogurt mixes used. The difference within samples examined could be explained by the heterogeneity of ingredients. An increase in NPN during fermentation can be due to an increase in amino acids as reported by the International Dairy Federation (1983). Aim (1983) reported also that, during fermentation, casein was degraded to a minor extent, whereas whey proteins tended to be hydrolyzed
Table 2 - First-order rate constants and r ! value for urea degradation in m ilk at 80, 100 and 120°C___________________________________________
TempPC) (hr” 1) SE* r2
80 0.016 0.001 0.94100 0.030 0.001 0.97120 0.299 0.018 0.96
■ SE = Standard error fo r calculated k.
Fig. 2—Semiiog plot of urea retention in heated milk.
more markedly. This increase in amino acids and peptides was likely due to microbial proteases liberated by the yogurt starter culture as suggested by Emmons and Tuckey (1967). Deeth and Tamime (1981) reported in their review that yogurt fermentation increased free amino acids and decreased urea. In order to explain our results, we could hypothesize that the increase in free amino acids was quantitatively more important than reduction of urea during fermentation as reported by Deeth and Tamime (1981). Other fermentation end products beside amino acids and peptides could also increase NPN.
Effect of Ieben fermentation on NPNThe effect of leben fermentation on NPN was greater than
the effect of yogurt fermentation. The two leben batches showed averages of 237 ± 25 and 190 ± 72 mg/L before fermentation, and 422 ± 78 and 421 ± 37 mg/L after fermentation. Increases in NPN were 185 and 231 mg/L. Analysis of variance showed a significant effect (P<0.05) of leben fermentation on NPN in milk. The increase in NPN during leben fermentation was also probably due to an amino acid or peptide liberation as in yogurt fermentation. Though the yogurt had higher solids, the leben showed a larger increase in NPN due probably to a more proteolytic fermentation. Leben was made with a mesophilic culture containing Lactococcus lactis subspecies cremoris, Lactococcus lactis subspecies lactis, Lactococcus lactis subspecies diacetylactis and Leuconostoc cremoris. Mesophilic lactococci have proteinases associated with the cell wall which are capable of hydrolyzing milk proteins.
Urea in milkThe average concentration of urea in commercial whole milk
for 10 samples averaged 263 mg/L, (standard deviation 32 mg/
550-JOURNAL OF FOOD SCIENCE-Volume 58, No. 3, 1993

L, range 210-310 mg/L). The urea content in retail Moroccan milk has not been previously reported, but levels were in agreement with amounts reported in other milk. Muir and Sweetsur(1976), and Bhavadasan et al. (1982) reported ranges of 190- 450 and 187-480 mg/L of milk, respectively. Brun-Bellut et al. (1982) reported that feed was the factor responsible for most variations in urea contents.
Heat effect on ureaData for urea retention in milk at 80, 100 and 120°C are
presented in (Fig. 2). Lines were determined using linear regression based on first-order kinetics. The urea degradation was better described (higher r2) by semilogarithmic than linear relationship. The r2 at 80, 100 and 120°C were, respectively, 0.94, 0.97 and 0.96 for semilogarithmic relationships and 0.93, 0.96 and 0.92 for linear relationships. Regression lines (Fig.2) were calculated using 15, 15 and 13 data points for 80, 100 and 120°C, respectively. Each sampling time had 2 data points for 80 and 100°C and 3 data points for 120°C.
Calculated first-order rate constants and r2 for urea retention in milk were compared (Table 2). Our results suggested that urea degradation in milk is limited under practical milk heat processing conditions. Sterilization at 120°C for 30 min caused a 20% loss of urea. The energy of activation obtained from the Arrhenius plot slopes was 20 kcal/mole (r2 = 0.98). The calculated Q10 value at 80-90°C was 2.2.
Activation energy or Q10 values have not been previously reported for heat degradation of urea in milk. However, these numbers can be used to propose a mechanism of the influence of urea on the heat stability of milk. Fox (1981) reported that the decrease in milk pH during heating has a Qi0 of about 2. This means that urea must acquire about the same energy as compounds responsible for pH decrease before interactions may occur. This also implies that the rate of degradation of urea might be optimal for reducing the heat-induced acidity of milk, thus enhancing its heat stability.
Effect of fermentation on ureaThe yogurt samples examined for urea content showed an
average of 209.0, 266.0 and 314.0 mg/kg for the first, second and third batch, respectively, prior to fermentation. After fermentation, the respective averages were 212.5, 265.0 and 316.0 mg/kg. An analysis of variance indicated that yogurt fermentation had no significant effect on urea content at the 5% level. The leben samples showed an average of 262.5, 257.5 and 219 mg urea/L for the first, second and third batch, respectively, prior to fermentation. After fermentation, the respective averages were 256.0, 261.0 and 217.5 mg/L. Analysis of variance indicated leben fermentation had no significant effect on urea content. This did not agree with the finding of Deeth and Tamime (1981) who reported that yogurt fermentation caused a decrease in urea. While some lactic acid bacteria used in fermented dairy products can hydrolyze urea (Tinson et al.,1982), a change was not detected in our study using commercial processing conditions.
CONCLUSIONNPN in Moroccan milk was between 189 and 273 mg/L with an average of 215 mg/L. NPN increase during heating followed zero-order kinetics with an energy of activation of 17 kcal/ mol. Urea decreased during heating and followed pseudo first- order kinetics. NPN varied in commercial yogurt and leben batches but increased during fermentation. Urea did not change with these fermentation processes.
REFERENCESAlais, C. 1985. Science du lait, principe des techniques laitieres, 4eme edi
tion. Edition SEPAIC, Paris.
Alais, C., Jollés, P., and Kiger, N. 1966. Degradation des proteines du lait au cours du chauffage. I. Libération de substances azotées et phosphorées non-protéiques. Proceedings 17th International Dairy Congress Section, B: 341-348.
Aim, L. 1983. The effect of fermentation on proteins in milk. Kieler Mil- chwirtschaftliche Forschungsberichte 35: 329-332.
Banks, W., Clapperton, J.L., Muir, D.D., Powell, A.K., and Sweetsur, A.W. 1984. The effects of dietary induced changes in milk urea levels on the heat stability of milk. J. Sci. Food Agric. 35: 165-172.
Belec, J. and Jenness, R. 1962. Dephosphorization of caseins by heat treatment. I. In caseinate solutions. J. Dairy Sci. 45: 12-19.
Bhavadasan, M.K., Rajput, Y.S., and Ganguli, N.C. 1982. A simple colorimetric method for the determinationof urea in milk. Indian J. Dairy Sci. 35: 263-266.
Blanc, B., Flückiger, E., Rüegg, M., and Steiger, G. 1984. Effects of cold storage and enrichment with psychrotrophic bacteria on the quality of UHT milk. Alimentation 23(2): 53-60.
Bruhn, J.C. and Franke, A.A. 1979. Regional differences in nitrogen fractions in California herd milks. J. Dairy Sci. 62: 1326-1328.
Brun-Bellut, J., Vignon, B., Bachacon, J., and Masson, J.P. 1982. Variations of NPN and urea concentrations in milk. Proceedings 21st International Dairy Congress. Vol. 1, Book 1:190, Mir Publications, Moscow.
Corradini, C. and Pecis, P.P. 1978. Proteolytic activity in UHT milk. Proceedings 20th International Dairy Congress, p. 716-717.
Davies, D.T. and White, J.C.D. 1959. Determination of heat-induced changes in the protein stability and chemical composition of milk. Proceedings 15th International Dairy Congress 3: 1677-1683.
de Kooning, P.J., Koops, J., and Van Rooÿen, P.J. 1974. Some features of the heat stability cf concentrated milk. III. Seasonal effects on the amounts of casein, individual whey proteins and NPN and their relation to variations in heat stability. Neth. Milk Dairy J. 27: 186-202.
Deeth, H.C. and Tamime, A.Y. 1981. Yogurt: Nutritive and therapeutic aspects. J. Food Prot. 44: 78-86.
Emmons, D.B. and Tuckev, S.L. 1967. Cottage Cheese and Other Cultured Milk Products, Pfizer Cheese Monographs 3: 130-141. Chas. Pfizer and Co., Inc, New York.
Fawcett, J.K. and Scott, J.E. 1960. A rapid and precise method for the determination of urea. J. Clin. Pathol. 13: 156-159.
Fox, P.F. 1981. Heat stability of milk: Significance of heat-induced acid formation in coagulation. Irish J. Food Sci. Tech. 5: 1-11.
Fox, P.F. and Morrissey, P.A. 1977. Reviews of the progress of Dairy Science: The heat stability of milk. J. Dairy Res. 44: 627-646.
Harland, HA, Coulter, S.T., and Jenness, R. 1955. Natural variation of milk serum proteins as a limitation of their use in evaluating the heat treatment of milk. J. Dairy Sci. 38: 858-869.
Hindle, E.J. and Wheelock, J.V. 1970. The release of peptides and glyco- peptides by the action of heat on cow’s milk. J. Dairy Res. 37: 397-405.
Humbert, G., Desnouveaux, R., and Linden, G. 1982. Application de la dissolution totale des éléments colloidaux du lait à la détermination de son activité protéinasique. Le Lait 62: 427-434.
International Dairy Federation. 1983. Cultured Dairy Foods in Human Nutrition, Doc. 159, Part 2: 18-26 IDF, Brussels, Belguim.
Journet, M. and Rémond, B. 1980. Influence de l'alimentation et de la saison sur les fractions azotées du lait de vache. Le Lait 60: 140-159.
Juarez, M., Martinez-Castro, I., Ramos, M., and Martin-Alvarez, P.J. 1979. Composition of milk in Spain. II. Ash, Na, K and nitrogen fractions. Milchwi8senschaft 34: 149-151.
Kelly, P.M. 1982. Effect of seasonal variation, urea addition and ultrafiltration on the heat stability of skim milk powder. J. Dairy Res. 49: 119-126.
Kelly, P.M., O’Keeffe, AM., Keogh, M.K., and Phelan, JA 1982. Studies of milk composition and its relationship to some processing criteria. III. Seasonal variation in heat stability of milk. Irish J. Food Sci. Technol. 6: 29- 38.
Muir, D.D. and Sweetsur, A.W.M. 1976. The influence of naturally occuring levels of urea on the heat stability of bulk milk. J. Dairy Res. 43:495- 499.
Muir, D.D. and Sweetsur, A.W.M. 1977. Effect of urea on the heat coagulation of the caseinate complex in skim-milk. J. Daily Res. 44: 249-257.
Packard, V.S. 1984. The components of milk: Some factors to consider in component pricing plans. Dairy and Food Sanit. 4: 336-347.
Ramos, M. 1978. Effects of heating on the nitrogen fractions of ewes’, goats’ and cows’ milk. Proceedings 20tn International Dairy Congress 613-614.
Renner, E. 1988. Storage stability and some nutritional aspects of milk powders and ultra-high-temperature products at high ambient temperatures. J. Dairy Res. 55: 125-142.
Rowland, S.J. 1938. The determination of the nitrogen distribution in milk. J. Daily Res. 9: 42—46.
Steel, R.G. and Torrie, J.H. 1980. Principles of Statistics, A Biomedical Approach, 2nd ed. McGraw-Hill, Inc., New York.
Tantaoui-Elaraki, A, Berrada, M., and El Marrakchi, A 1983. Study on Moroccan Iben. Le Lait 63: 230-245.
Timm, H.H., Gravert, H.O., and Pabst, K 1981. On the variation of NPN in cow’s milk. Kieler Milchwirtschaftliche Forschungsberichte 33: 213-220.
Tinson, W., Broome, M.C., Hiller, AJ., and Jago, G.R. 1982. Metabolism of Streptococcus thermophilus. 2. Production of C02 and NH3 from urea. Aust. J. Dairy Technol. 37: 14-16.
Walstra, P. and Jenness, R. 1984. Dairy Chemistry and Physics. John Wiley & Sons, Inc., New York.
Wolfschoon-Pombo, AF. and Klostermeyer, H. 1981a. NPN fraction in cow’s milk. I. Amount and composition. Milchwissenschaft 36: 598-600.
Wolfschoon-Pombo, AF. and Klostermeyer, H. 1981b. NPN fraction in cow’s milk. II. Breed differences. Milchwissenschaft 36: 680-682.
Ms received 9/21/92; revised 12/8/92; accepted 12/22/92.
Published as Paper No. 19,946 of the contribution series of the Minnesota Agricultural Experiment Station based on research conducted under Project 18-087. Supported in part by IAV Hassan II Univ. of Minnesota USAID Project 608-0160 and the International Foundation for Science, Stockholm Sweden.
Volume 58, No. 3, 1993-JOURNAL OF FOOD SCIENCE-551

Vitamin D Stability in Milk
SHELLY A. RENKEN and JOSEPH J. WARTHESEN
----------------------------ABSTRACT-----------------------------A method was developed to determine vitamin D3 in milk. It includes saponification, solid phase extraction and HPLC. Recovery of added vitamin D3 was 93%. Vitamin D3 concentrations in commercial milks were variable. Stability studies showed that on exposure to light, there was a slight loss of vitamin D3 from fortified milk. Air exposure did not affect stability in milk. Upon standing there was some stratification of the vitamin in milk containers with slightly more vitamin D3 in the top layer of milk than at the bottom.
Key Words: milk, Vitamin D, saponification, stratification
INTRODUCTION
FLUID MILK is fortified with vitamin D3 to meet U.S. federal requirements of 400 IU/0.95L. This vitamin addition fortifies the almost neglible naturally occurring concentrations of vitamin D in milk and has led to the expectation of milk to be a good source of this vitamin. Nutritional information, labeling, and regulatory enforcement assume a consistent and accurate concentration of vitamin D in milk.
Tanner et al. (1988) has shown that levels of vitamins A and D were not always in agreement with the label claim. In 158 fortified skim milk samples, 15.8% had concentrations of vitamin D which fell within 81-120% of the claimed level. In general, adherence to label claim decreased with decreasing fat content. Other researchers have noted wide variability in vitamin D concentrations. Upon analyzing 18 commercially fortified milk samples declaring 400 IU/0.95L, Henderson and Wickroski (1978) found vitamin D concentrations ranging from 81-716 IU/0.95L., while 0 ‘Keefe and Murphy (1988) found a range of values in skim milks from no fortification to 42% overfortified. Henderson and McLean (1979) reported milks containing both vitamins D2 and D3 while only one form of the vitamin was indicated on the label. Landen (1985) found infant formula with vitamin D concentrations almost twice as high as the label claim. Overfortification of milk with vitamin D has been implicated in possible toxic effects (Anonymous,1992).
There is a question whether Vitamin D variability might be due to inconsistencies in fortification or to instability of the vitamin. Early studies on stability of vitamin D2 in water and milk with a biological assay were reported by Supplee et al. (1936). They reported that propylene glycol solutions of vitamin D were unstable when diluted with water, but stable when diluted with milk. More studies on stability of propylene glycol solutions diluted with milk were reported by Huber and Barlow (1943). Using bioassays, they found no evidence of vitamin D deterioration in milk samples held 8 days at refrigeration temperature. No loss was observed in canned condensed milk stored 6 mo at 40°C or 15 mo at room temperature (= 23°C).
Variability with regard to the stability of vitamin D has also been reported. Cremin and Power (1985) stated that vitamin D was unstable to oxidation, light, and acid. Kutsky (1981) reported that vitamin D was unstable to oxidation and light but
Authors Renken and Warthesen are affiliated with the Dept, of Food Science & Nutrition, Univ. of Minnesota, 1334 Eckies Ave., St. Paul, MN 55108.
stable to acid and alkali. Pike and Brown (1984) reported that vitamin D was unstable to irradiation and acid while remaining stable to oxidation and alkali. Kreutler (1980) reported that vitamin D was remarkably stable and that exposure to light, heat, and oxygen did not affect its activity.
Many HPLC methods are capable of determining vitamin D levels in fortified milks (Thompson et al., 1982; Muniz et al., 1982; Borsje et al., 1982; Wickroski and McLean, 1984; In- dyk and Woollard, 1985; Sertl and Molitor, 1985; Bui, 1987; Agarwal, 1988; 0 ‘Keefe and Murphy, 1988). Most of these involve heated or overnight saponification, followed by extraction with organic solvent. A cleanup step is often used. A review of assay methodology was published by Ball (1988). A method capable of more rapidly and precisely quantifying vitamin D in both skim and whole milk, was needed to support stability experiments. Previously published methods had limitations including the requirement for two HPLC units, lengthy sample preparation, and long HPLC runs.
The purpose of our research was to determine whether vitamin D degradation might contribute to the under-fortification reported in processed milk. Specific objectives were: (a) To develop a more rapid and precise method to quantify vitamin D in both skim and whole milk, (b) To evaluate the stability of vitamin D3 in a model solvent system for insight into what might occur in a milk system, (c) To evaluate the stability of vitamin D3 in skim milk.
MATERIALS & METHODS Saponification and extraction from skim milk
All organic solvents were analytical reagent grade. Precautions were taken to handle all samples and standards containing vitamin D with a minimum of light exposure. Milk (35 mL) was placed into an aluminum foil-covered 125-mL glass-stoppered low-actinic Erlenmeyer flask. Aqueous KOH solution (10 mL 5%) and 20 mL of ethanolic pyrogallol solution (1% w/v in absolute ethanol) were added. A stir bar was added and the flask was swirled, flushed with nitrogen and capped. The sample was allowed to saponify with slow magnetic stirring overnight (minimum of 12 hr) at room temperature (= 23°C) in the dark. The saponified sample was transferred to a 125-mL separatory funnel. The flask was rinsed successively with 15 mL water, 5 mL ethanol, and then 20-mL and 15-mL portions of petroleum ether/ diethyl ether (90/10, v/v) adding each portion to the separatory funnel. The mixture was gently mixed by inverting 30 times and allowed to stand until the ether layer was clear. The aqueous layer was drained into a second 125-mL separatory funnel. To the second separatory funnel was added 5 mL ethanol and 35 mL petroleum ether/diethyl ether (90/10, v/v). After gentle mixing by inverting 30 times, the sample was allowed to stand > 15 min. The aqueous layer was drained and the ether layer was combined with the first ether extract. The empty separatory funnel was rinsed with 30 mL ice water and used to wash the ether extract, three more times with 30 mL ice water. A few drops of phenolphthalein were added to the last wash to ensure neutrality. The ether extract was transferred to a 250-mL round-bottom flask, concentrated to 2-3 mL on a Haake Buchler rotary evaporator (= £ 40°C), and evaporated to dryness with a nitrogen stream.
Saponification and extraction for whole milk
The saponification procedure described for skim milk was not adequate for complete hydrolysis of higher levels of fat in whole milk. To compensate for higher fat levels a stronger KOH solution was necessary. The procedure for whole milk was as described for skim
552-JOURNAL OF FOOD SCIENCE-Volume 58, No. 3, 1993

milk, except that stronger ethanolic potassium hydroxide solution (35% KOH w/v in 85% ethanol) was prepared and 35 mL was used in overnight saponification of whole milk samples.
Solid phase extractionHexane (2 mL) was added to a round-bottom flask containing the
extract and the flask vigorously swirled. After standing a 5 min the extract was transferred to a 1-mL Bond Elute SPE silica cartridge. A Vac-Elute vacuum manifold (Analytichem International, Harbor City, CA) with a vacuum of £ 5 mm Hg was used to aid elution. Separately, two more 1-mL increments of hexane were added to the flask and individually transferred onto the cartridge. Vitamin D was eluted from the cartridge with 5 mL of hexane/chloroform (21.5/78.5, v/v). The eluant was dried under nitrogen and reconstituted in 1 mL acetonitrile. After standing a 10 min, the sample was filtered through a 0.45- micron Zetapor membrane and injected onto the HPLC column.
Quantification of vitamin DQuantification of vitamin D was by HPLC using a Model 6000A
Solvent Delivery System, a Model 440 Absorbance Detector at 254 nm and a Model QA-I Data System Integrator (all by Waters Associates, Milford, MA). A Rheodyne fixed-volume loop injector was used for all injections. The column was a Vydac reverse-phase C18 (Cat# 201TP54, 4.6 mm Id x 25 cm, 5 pm particle size). Operating conditions were: ambient temperature (« 23°C); mobile phase: ace- tonitrile/methanol (90/10); flow rate: 1.5 mL/min; injection volume: 100 pL. Quantification was done by using peak areas relative to standard vitamin D3 solutions.
Diode-array detection
A Hewlett Packard 1040 diode-array detector was used to compare spectra of a vitamin D3 peak obtained from a standard solution to spectra of a vitamin D3 peak obtained from a skim milk sample. Spectra were collected from 210-390 nm. HPLC operating conditions were as described.
Recovery studies
For recovery tests unfortified skim milk was obtained from a local dairy and analyzed for traces of endogenous vitamin D. Also analyzed were five 35-mL samples to which 1 mL of 0.25 pg vitamin D^/mL acetonitrile solution had been added.
Solutions of vitamin D3 in acetonitrile
Crystalline vitamin D3 (cholecaliferol) was obtained from Sigma Chemical Co. (St. Louis, MO). Vitamin D3 (50 mg) was weighed, placed in a 100-mL volumetric flask, and brought to volume with acetonitrile. This comprised the stock solution (500 pg/mL). Stock solution (5 mL) was then added to a separate 100-mL volumetric flask and brought to volume with acetonitrile. This comprised the intermediate solution (25 pg/mL). Finally, 10 mL of intermediate solution was placed in a 1L volumetric flask and brought to volume with acetonitrile. This comprised the working solution (0.25 pg/mL). All standard solutions were stored at or below 0°C. Working solution (25 mL) was added to 32 separate 20 x 150 mm test tubes and used in the stability study.
Air, temperature, light and time treatmentsTest tubes with acetonitrile solutions of vitamin D3 were aerated by
pumping air under controlled conditions. Control samples not receiving air were flushed with nitrogen, capped and covered with parafilm. A rubber stopper, with a hole through its center, was fitted in the test tubes of samples to be aerated. A plastic pipet tip attached to plastic tubing was fitted into the hole. An aquarium aerator and several sets of four-valve air flow controllers were used to bubble air through the samples. Air flow was controlled at = 5-10 mL/min. To achieve exposure to different temperatures one experimental set-up was placed in a covered 36L aquarium tank held in a refrigerated room at 4°C. Another set-up was placed in a second aquarium tank at 21°C.
Both tanks were mounted with variable-intensity General Electric fluorescent lamps (F15T8/CW) set at 210 ft-c by General Electric Type 214 light meter. Samples not exposed to light were completely
covered with heavy-duty aluminum foil. Aliquots were removed from their respective samples at day 1, 3, 6 , 8 and 10 and analyzed by direct HPLC injection. Aerated samples showed some evaporation making it necessary to adjust to volume and mix before removing an aliquot for analysis.
The design of .his experiment was 2 x 2 x 2 x 5 factorial with air, temperature and light as whole plot treatments and time as a split plot treatment. Triplicate test tubes were used for each treatment. Therefore, a total of 120 samples were analyzed. Analysis of variance (ANOVA) with F tests was used to determine the effect of different factors: air, light, temperature, time and their interactions.
Milk samples
Skim milk was purchased from local grocery stores. Skim milk has been shown to be the least protective of milks for light-labile vitamins (Gaylord et al., 1986) and has exhibited the greatest problems with compliance to fortification claims (Tanner et al., 1988). Skim milk was collected from different locations in the St. Paul area over a period of 1 yr. Vitamin D was determined using 25 to 35 mL milk. One to five replicates of each milk sample were analyzed.
Exposure to air and/or light
To initially determine what factors would cause breakdown of vitamin D, commercially fortified skim milk was exposed to air, l;ght and a combination of both. Conditions of air and light exposure were the same as described for acetonitrile solutions of vitamin D, except that air was blown over the headspace of milk samples instead of being bubbled through. The study was carried out at 4°C. Individual samples were removed at day 0, 2, 4, 8 , and 10 and saponified.
Exposure to light only
After it was determined that light produced the greatest loss of vitamin D in milk, additional work was done with light exposure alone. Light intensity was increased to 300 ft-c. Levels of vitamin D in exposed samples were compared to those in unexposed controls. Temperature was held at 4°C and samples were analyzed in triplicate.
In these light studies, 30 mL milk was placed in 20 x 150 mm Kimax culture tubes (ca. 32 mL) positioned horizontally in light chambers. The conditions were intended to maximize chances for determining any influence of light on vitamin D levels. The horizontal position ensured maximum light exposure and the small test tubes could show sample differences that might otherwise be masked by large milk volumes. Each test tube was an individual sample and all of the milk in each test tube was used for analysis.
To understand how stability might be affected by retail distribution, 1.8L plastic containers of vitamin D-fortified skim milk were exposed to controlled lighting. This situation resembled light exposure during milk distribution. Milk was initially mixed together and repackaged to ensure homogeneity of vitamin D at time zero. Samples were placed upright in the light chambers as they would be in a refrigerator case. After 3, 6 , and 10 days, samples were drawn from the top and bottom of the container. After removing samples at each time interval, containers were discarded.
Stratification of Vitamin D3
In a manner similar to the preceding study, 13 1.8L plastic containers of skim milk were initially pooled together and repackaged. The containers were stored in the dark and sampled over 9-days. Vitamin D3 levels from the top and bottom portion of each container were quantified over time. Samples of 25 mL were collected first from just below the top surface using a syringe and then from the bottom by filling a pipet while the tip was touching the bottom of the container.
RESULTS & DISCUSSIONRETENTION TIME of vitamin D3 on a Vydac column was about 9 min; for the vitamin D2 standard retention was about1.5 min less. An unfortified skim milk sample showed no detectable amounts of D2 or D3 or interfering substances eluting in the range of the standards. The recovery averaged 93%
Volume 58, No. 3, 1993-JOURNAL OF FOOD SCIENCE-553

VITAMIN D IN M IL K . . .
Fig. 1. - Chromatograms o f fortified skim m ilk extracts w ithout Itop) and with (bottom) silica cleanup step.
with a standard deviation of 6.3% when known amounts of vitamin D3 were added to unfortified skim milk.
To further verify that the presumed vitamin D3 peak that eluted from a commercially fortified milk sample was authentic, spectral matching of the sample peak and a vitamin D3 standard was done with diode array detection. Spectral patterns matched, indicating the standard and sample peak were the same.
Overnight saponification at ambient temperature was used in this method of vitamin D analysis. Ambient temperature (=23°C) for saponification is reported in a number of other methods (Indyk and Woollard, 1985; Muniz et al., 1982; Wickroski and McLean, 1984; Thompson et al., 1982; Agar- wal, 1988). Vitamin D can thermally isomerize to its previtamin form (Keverling Buisman et al., 1968). By performing the saponification at room temperature, many of the problems associated with isomerization are avoided (Thompson et al., 1982). In addition, when the sample headspace was not replaced with nitrogen gas prior to saponification, recoveries were reported to be lowered by ~ 10-20% (Indyk and Woollard, 1984). All samples were therefore flushed with nitrogen before saponification.
Incorporation of diethyl ether in the extraction solvent improved recoveries by up to 1 0 % and reduced the tendency for emulsion formation during extraction (Indyk and Woollard,1984). Problems with emulsion formation were not experienced in skim milk when the extraction solvent contained 1 0 % diethyl ether. This method requires a clean-up step which utilizes solid phase extraction cartridges filled with silica. Silica powder has been used, in the form of cartridges, in other methods (Indyk and Woollard, 1985; Bui, 1987; Cohen and Wake- ford, 1980) and also in semipreparative HPLC (Thompson et al., 1982; van den Berg et al., 1986). Silica in a prepacked cartridge worked well because of its simplicity.
Chromatograms of skim milk compared extracts before and after solid phase cleanup (Fig. 1). In skim milk the main purpose of cleanup step was to remove later eluting compounds
D3
Fig. 2. — Chromatograms o f fortified whole m ilk extracts w ithout (top) and w ith (bottom) silica cleanup step.
which could interfere with subsequent analyses or result in increased running time.
Chromatograms of whole milk extracts before and after solid phase cleanup (Fig. 2) showed a large increase in absorbing compounds prior to elution of vitamin D3 in whole milk compared to skim. The cleanup step eliminated some of the absorbing compounds prior to elution of vitamin D3. Elimination of some of these compounds helped achieve a baseline near zero when vitamin D3 eluted. Also, in the sample which did not undergo cleanup, a peak eluted adjacent to vitamin D3
which could interfere with quantification.
Stability in acetonitrileStudies of vitamin D stability in acetonitrile were done to
determine, in a preliminary way, which factors may most influence stability. ANOVA showed that the primary factors that were significant in degradation of vitamin D3 in acetonitrile solutions, in order of importance, were air and temperature (p<0.05). Light was not a significant factor and the addition of light to air resulted in little additional degradation.
Light was not expected to be an insignificant factor since light has often been reported influencing the degradation of other vitamins. We hypothesized that degradation was due to photosensitized oxidation. In a photosensitized oxidation reaction, light excites oxygen and singlet oxygen is produced. This higher energy form of oxygen would react with susceptible bonds resulting in oxidation reactions and subsequent changes in those compounds (Nawar, 1985). Degradation did not occur in the acetonitrile samples exposed to light because, perhaps, insufficient oxygen was present for a photosensitized oxidation reaction.
Samples held at 4°C without exposure to air exhibited no degradation. Bubbling air through the solutions had the greatest effect on vitamin D stability, while 21°C showed greater losses than 4°C. The greatest change was observed in samples which received air at 21°C (Fig. 3). Samples exposed to air at
554-JOURNAL OF FOOD SCIENCE-Volume 58, No. 3, 1993

Fig. 3. -Z ero-o rder regression lines fo r the degradation o f vitamin D3 in model acetonitrile system due to a ir at temperatures o f 4 and 21°C. No exposure to light. Each po in t represents the mean o f triplicate samples.
jt
Fig. 5 .-F irs t-o rde r regression lines fo r the degradation o f vitamin D3 in skim m ilk exposed to 300 ft-c o f light in 30 mL glass test tubes. (4°C). Each point represents the mean o f triplicate samples.
Day*Fig. 4 .—First-order regression lines fo r the degradation o f vitamin D3 In skim m ilk due to exposure to air, 210 ft-c o f light, and a combination o f a ir and 210 ft-c o f light (4°C).
Table 1—Declared (400 IU/0.946 L) vs measured vitamin D levels in com- mercially fortified skim milk__________________________________
SampleReplicateanalyses
Vitamin D IU/0.946 L
1 4 ND2 5 3143 2 2844 3 2685 3 2396 3 2337 2 1268 1 2999 3 414ND - not detected
21°C had 60% loss after 10 days. All the above degradation reactions appeared to be zero-order based on the best fit regression lines and corresponding R2 values.
Results suggest that vitamin D3 in acetonitrile was least stable to air, followed by temperature changes and a combination of air and temperature. The data suggested factors in milk to further evaluate and provided insights into the reactions taking place.
Survey of vitamin D levels in milkFor examination of vitamin D levels in retail skim milk
(Table 1) the limit of detection for vitamin D3 was about 0.025
pg or 1 IU/0.946L of milk. For a period of time, vitamin D was not detected in fortified milk from one dairy. Only 11% of samples collected contained 81-120% of the vitamin D concentration claimed on the label. The majority of the samples contained only 51-80% of the levels claimed.
Milk exposed to air, light and a combination of bothWhen skim milk was exposed to air, light and a combination
thereof (Fig. 4) first-order regression lines were developed for loss. ANOVA showed light alone caused the greatest amount of breakdown, followed by a combination of air and light, and least was air alone. These results followed different trends than the results with acetonitrile solutions.
Degradation of vitamin D may occur via an oxidation reaction. Based on this hypothesis, differences observed between the milk and model systems involving exposure to air may be attributed to oxygen levels. In the model system, air was bubbled through while for the skim milk air was blown over samples. It was not feasible to bubble air through milk because of foaming and subsequent loss of sample. As a result, less oxygen and vitamin D contact occurred in the milk system where less degradation was observed. With increased distribution of air in milk, greater degradation might occur. However, there is no direct evidence that aeration of milk during processing would affect vitamin D stability.
The differences in the two systems from exposure to light alone may be attributed to small amounts of oxygen dissolved in milk samples that had been flushed with nitrogen and capped to avoid contact with air. Dissolved oxygen was less likely to be present in a sample of acetonitrile undergoing the same nitrogen flushing and capping. Neither system could be considered devoid of oxygen. The small amount of oxygen within the milk could be enough to cause oxidation reactions. The reactions apparently did not take place in the model acetonitrile system.
Milk exposed to light onlyBecause light produced the greatest loss, its influence was
examined in greater detail. Exposure of milk in test tubes (Fig.5) showed degradation of the light-exposed samples while controls remained constant. The breakdown of vitamin D occurred within the first few days only. One or more degradation products may have protected vitamin D from further degradation. A first-order regression line is shown for loss, although it was difficult to determine if loss was zero or first-order since it
Volume 58, No. 3, 1993-JOURNAL OF FOOD SCIENCE-555

VITAMIN D IN M ILK . . .
*
Fig. 6.—First-order regression lines for the degradation o f vitamin D3 in skim m ilk exposed to 300 ft-c o f light in half-gallon plastic containers (4°C).
Table 2 - Stratification of vitamin D in 1.9 L containers of skim milk stored in the dark for 9 days (Calculated as percentages relative to the initiai vitamin D set as 100%)‘_____________________________________
Time(Days)
Bottom Sampling (%)
Top Sampling (%)
0 100 .0 ± 1.2 100.0 ± 1.22 99.1 ± 3.3 98.9 ± 1.05 93.9 ± 0.2 99.9 ± 1.47 91.6 + 4.5 96.0 ± 2.09 92.3 ± 3.8 103.9 ± 3.6Note: Bottom sampling: 25 mL drawn from the bottom of the container; top sampling: 25 m l drawn from just under the top surface.‘ Mean of three samplings ± one standard deviation.
was not feasible to degrade vitamin D through more than one half-life. The R2 values for first-order regression lines were slightly higher than those for zero-order regression (0.75 vs 0.69).
In the model acetonitrile system, loss was zero-order. It is feasible that these reactions could be different. Milk is a much more complex system than the acetonitrile solution and contains riboflavin, a photosensitive compound. More interactions could occur upon exposure of the milk system to degradative factors.
The results of exposure of milk to light in 1.8L plastic containers (Fig. 6 ) with first-order regression lines shown for degradation, showed starting levels were low indicating poor fortification. The breakdown observed in the plastic containers was not as great as that observed in the glass test tubes (25% vs 50%) after 10 days. A lower degradation was expected since plastic is more opaque than glass providing a slight barrier to light. The larger volume of milk also reduced the volume of milk in contact with light.
Vitamin D loss occurred at a rate much slower than that of the other labile vitamins in milk. Using a similar system of exposing milk samples in test tubes at an equivalent intensity of light (300 ft-c) Gaylord et al. (1986) reported the rate constant for riboflavin loss was O.Oôlôh-1. Degradation of retinyl palmitate was slower with a rate constant of 0.0298h_1. Reactions for degradation of both were first-order. In comparison, the rate constant for vitamin D loss in our test tube exposure studies was 0.0009 hr-1.
Thus degradation of vitamin D can occur under severe conditions. While there was light sensitivity the loss in practical conditions was not great and exposure of fortified milk to fluorescent light in a retail grocery case should not be a concern for vitamin D. Exposure to light would more likely cause production of light-oxidized flavor and degradation of less stable vitamins.
Stratification of vitamin D3We also considered possible stratification of the added vi
tamin D in fortified milk. At the end of 9 days (Table 2) bottom samples had decreased in vitamin D by 7.7% and the top samples had increased by 3.9%. These results were similar to those reported by Zahar et al. (1986) in a study on stratification of retinal palmitate. At the end of 4 days the palmitate in the bottom layer had decreased by 13.5% and the top layer had increased by 2.5%. A partial stratification of vitamin D was observed and could be related to some gravity separation of the fat. The difference was not large enough to explain the wide discrepancies in vitamin D levels in commercial milk samples.
CONCLUSIONSMODIFICATIONS of existing HPLC methodology were made for analysis of vitamin D in milk. In model systems of vitamin D3 in acetonitrile, air and temperature affected vitamin D3 stability but light did not. Degradation of vitamin D3 in skim milk was different with light exposure producing the greatest loss. Vitamin D loss was probably due to oxidation reactions in which light acted as catalyst. Differences between the model and milk systems may be explained by the availability of oxygen. Stratification of vitamin D caused slight differences in vitamin D3 at the top compared to the bottom of milk containers. Neither rates of degradation nor partial stratification of vitamin D seemed to account for large variations reported in fluid milk vitamin D levels.
REFERENCESAnonymous 1992. FDA surveys vitamin fortification of milk. Food Chem
ical News. April 6: 44.Agarwal, V.K. 1988. Liquid chromatographic determination of vitamin D
m fortified milk. J. Assoc. Off. Anal. Chem. 71: 19.Ball, G.F.M. 1988. Fat-Soluble Vitamin Assays in Food Analysis. Elsevier
Applied Science, New York.Borsje, B., de Vries, E.J., Zeeman, J., and Mulder, F.J. 1982. Analysis of
fat-soluble vitamins. XXVI. High-performance liquid chromatographic determination of vitamin D in fortified milk and milk powder. J. Assoc. Off. Anal. Chem. 65: 1225.
Bui, M.H. 1987. Sample preparation and liquid chromatographic determination of vitamin D in food products. J. Assoc. Off. Anal. Chem. 70: 802.
Cohen, H. and Wakeford, B. 1980. High-pressure liquid chromatographic determination of vitamin D3 in instant nonfat dried milk. J. Assoc. Off. Anal. Chem. 63: 1163.
Cremin, F.M. and Power, P. 1985. Vitamins in bovine and human milks. Ch 11. In Developments in Dairy Chemistry— 3, P.F. Fox (Ed.), p. 346. Elsevier Applied Science Publishers, Essex, England.
Gaylord, A.M., Warthesen, J.J., and Smith, D.E. 1986. Influence of milk fat, milk solids, and light intensity on the light stability of vitamin A and riboflavin in lowfat milk. J. Dairy Sci. 69: 2779.
Henderson, S.K. and McLean, L.A. 1979. Screening method for vitamins A and D in fortified skim milk, chocolate milk, and vitamin D liquid concentrates. J. Assoc. Off. Anal. Chem. 62: 1358.
Henderson, S.K. and Wickroski, A.F. 1978. Reverse-phase-high pressure liquid chromatographic determination of vitamin D in fortified milk. J. Assoc. Off. Anal. Chem. 61: 1130.
Huber, W. and Barlow, O.W. 1943. Chemical and biological stability of crystalline vitamins D2 and D3 and their derivatives. J. Biol. Chem. 149: 125.
Indyk, H. and Woollard, D.C. 1984. The determination of vitamin D in milk powders by high-performance liquid chromatography. N.Z. J. Dairy Sci. Technol. 19: 19.
Indyk, H. and Woollard, D.C. 1985. The determination of vitamin D in fortified milk powders and infant formulas by HPLC. J. Micronutr. Anal. 1: 121.
Keverling Buisman, J.A., Hanewald, K.H., Mulder, F.J., Roborgh, J.R., and Keuning, K.J. 1968. Evaluation of the effect of isomerization on the chemical and biological assay of vitamin D. X. Analysis of fat soluble vitamins. J. Pharm. Sci. 57: Í326.
Kreutler, P.A. (Ed.) 1980. Fat-soluble vitamins. Ch. 6. In Nutrition in Perspective, p. 229. Prentice-Hall, Inc., Englewood Cliffs, NJ.
Kutsky, R.J. (Ed,). 1981. Vitamin D. Ch. 17. In Handbook of Vitamins, Minerals and Hormones, p. 191. Van Nostrand Reinhold Co., New York.
Landen, W.O. 1985. Liquid chromatographic determination of vitamins D2 and D3 in fortified milk and infant formulas. J. Assoc. Off. Anal. Chem. 68: 183.
Muniz, J.F., and Wehr, C.T., and Wehr, H.M. 1982. Reverse-phase liquid chromatographic determination of vitamins D2 and D3 in milk. J. Assoc. Off. Anal. Chem. 65: 791.
Nawar, W.W. 1985. Lipids. Ch. 4. In Food Chemistry, O.R. Fennema (Ed.), p. 2. Marcel Dekker, Inc., New York.
—Continued on page 566
556-JOURNAL OF FOOD SCIENCE-Volume 58, No. 3, 1993

Microentrapment of Lactobacilli in Calcium Alginate Gels
T. Y. SHEU and R. T. MARSHALL
------------------------------A B ST R A C T -------------------------------A procedure was developed to entrap culture bacteria using a two- phase (water/oil) system. It consisted of 3% sodium alginate mixed with microbial cells and suspended in an oil bath containing 0 .2% Tween 80. While stirring at 200 rpm, calcium chloride (0.05M) solution was added to break the water/oil emulsion and form calcium alginate gel. The calcium alginate beads containing microbial cells had mean diameters of 25-35 pm (range 5-100 pm). The entrapped microbial cells were released completely from the drop shaped beads by gentle shaking in 0.1M phosphate solution (pH 7.5) for 10 min. About 40% more lactobacilli survived freezing of ice milk when they were entrapped in calcium alginate than when they were not entrapped.
Key Words: lactobacilli, microbes, calcium alginate, solubilization
INTRODUCTIONCERTAIN lactic acid bacteria provide health benefits when they survive in the human intestinal tract (Gilliland et al., 1985; Goodenough and Kleyn, 1976; Wynder and Reddy, 1974). However, numbers of culture bacteria in frozen yogurt are reduced significantly by freezing (Miles and Leeder, 1981; Mashayekh and Brown, 1992). Ways to preserve culture bacteria in such frozen dairy desserts have not been reported.
Many methods have been developed to immobilize cells (Brodelius and Nilsson, 1980; Nilsson et al., 1983). Entrapment of living microbial cells in calcium alginate is simple and low cost (Brodelius and Nilsson, 1980). Furthermore, alginate is nontoxic so that it may be safely used in foods. Matrices formed by calcium alginate gel are gentle enough that entrapment of delicate cells such as animal tissue has been successful (Lim and Moss, 1981). Another advantage is the reversibility of immobilization. Alginate gels can be solubilized by sequestering calcium ions thus releasing the entrapped cells. Therefore, cells can be further studied subsequent to confinement in the immobilized state (Ohlson et al., 1979). The method of microentrapment described herein was developed to permit testing of the hypothesis that entrapped cells in calcium alginate beads would survive freezing and frozen storage better than nonentrapped cells. This report focuses on factors necessary for producing uniform and desirable bead size. The influence of microentrapments on the survival rate of lactobacilli in frozen desserts was demonstrated.
MATERIALS & METHODSBacteria and media
Lactobacillus bulgaricus L2 (University of Missouri-Columbia stock collection) and L. bulgaricus rr (kindly given by Dr. H. Morris, University of Minnesota) were transferred twice in MRS broth (Difco, Detroit) at 37°C. Cultures were collected after 18 hr by centrifugation (3000 x g, 15 min at 4°C), washed and resuspended in saline to = 5 x 10" cells/mL.
Preparation of microentrapped cultures
Cells were microentrapped by mixing one part culture concentrate with four parts sodium alginate (3%). One part of the mixture was
Authors Sheu and Marshall are with the Food Science & Human Nutrition Dept., 122 Eck/es Hall, Univ. of Missouri, Columbia, MO 65211.
then added dropwise to 5 parts vegetable oil (250 mL in an 800 mL beaker) containing Tween 80 (0.2%), which was stirred at 200 rpm by magnetic stirring. Within 10 min, an uniformly turbid emulsion was obtained with no evidence of a free aqueous phase. Calcium chloride («500 mL 0.05M) was added quickly but gently (20 mL/ sec) down the side of the beaker until the water/oil emulsion was broken. Calcium-alginate beads were formed within 10 min. The beads were collected by gentle centrifugation (350 x g , 10 min) and washed with sterile water.
Effects of surface tension and emulsifier on bead size were studied by a 3 x 3 factorial design. Surface tensions of 3% sodium alginate were varied by adding different amounts of sodium lauryl sulfate (0 , 0.1 and 0.5%), and three different concentrations of Tween 80 (0, 0.1 and 0 .2%) were added to the oil phase.
Examination of calcium alginate beads
Diameters of calcium alginate beads, stained with safranin (Difco, Detroit) were measured with an eyepiece micrometer on an optical microscope at a magnification of 400X or 1000X. At least 120 randomly selected beads were measured for each sample.
Scanning electron microscopy was employed to examine the external and internal appearance of calcium alginate beads. The beads were fixed by filtration onto a polycarbonate Nuclepore filter (Thomas Scientific, Swedesboro, NJ), and a secondary filter was used to cover the beads on the first filter. The sandwich-like device was held by a clamp and was subjected to alcohol dehydration and critical-pcint drying (Hayat, 1978; Postek et al., 1980). For study of internal structures, the beads were fixed by mixing with agar (2%). After dehydration, the agar particles were dipped into liquid nitrogen and fractured with a razor blade on a metal stage both of which had been chilled in liquid nitrogen. The sliced pieces were collected and dried at the critical-point.
The dried specimens were mounted on an aluminum stub and coated with 10 nm gold. Microscopy was performed on a JEOL Scanning Electron Microscope (Model JSM-35, Japan) at an accelerating voltage of 20 KV.
Solubilization of gel beads
The entrapped cells were released from the gel according to the method of Ohlson et al (1979). One mL of bead suspension (lg in 59 mL water) was added to 9 mL phosphate solutions (concentrations from 0.001 to 0.1M) followed by gentle shaking for 30 min. The pH of the phosphate solutions were varied from 4.8 to 8.5 by adjusting the ratio of monosodium phosphate and disodium phosphate solutions. The number of released cells was determined by plate count using MRS agar.
Freezing studiesThe entrapped and non-entrapped cells were added separately to ice
milk mixes (5% milk fat) (Prairie Farms, Carlinville, IL) that were frozen in a Technogel freezer (Model 80, Bergamo, Italy). Final cell concentrations in the mixes were = 2 x 10⁸/mL. Three replicates were performed using a Randomized Complete Block Design (RCBD). As finished product exited the freezer, samples were collected in quart containers. Samples were hardened at - 29°C for 1 day and stored at -20°C. Numbers of viable lactobacilli were determined immediately before freezing and on days 1, 4, 7 and 14 after freezing.
RESULTS & DISCUSSION Microentrapment
Although the use of calcium alginate to microentrap whole cells by a water/oil emulsion method has been reported (Nilsson et al., 1983), details of the procedures and gel structure
Volume 54, No. 3, 1993-JOURNAL OF FOOD SCIENCE-557

MICROENTRAPMENT OF LACTOBACILLI IN Ca-ALGINATE GELS . . .
Fig. 1 - Scanning electron micrograph of calcium alginate gels. (A) tear-drop shaped beads; (B) string shaped gels; (C) bead exposed to calcium solution 1 day; (D) bead exposed to water 1 day; (E) vertical cross-section of bead; (F) horizontal cross-section of bead. (Bar indicates 10 pm.)
were not discussed. Because sodium alginate has to contact calcium to form a calcium alginate gel, 2 major steps were involved in the procedures. These were reducing sphere size of the cell-alginate mixture by producing a water/oil emulsion and forming calcium alginate gel by adding calcium chloride solution to break the emulsion.
Scanning electron microscopy was used to examine the structure of calcium alginate beads. The beads obtained by the two-phase system were shaped like drops (Fig. 1A). This occurred because alginate gelled while the spheres of cell-algin- ate mixture were in a swirling motion. Diameters of the beads ranged from 5-100 p,m with means of 25-35 |xm. Yield of
558-JOURNAL OF FOOD SCIENCE-Volume 54, No. 3, 1993

Mea
n
4.5% Na-alg¡nate
Mean d iam eter (m icrom eters)Fig. 2—Diameters of calcium alginate beads; freshly prepared, exposed to water 1 day and exposed to CaC!2 1 day.
Time (hours)
Fig. 3 -Shrinkage of calcium alginate beads when freshly prepared beads were suspended in 0.05M Cad2 for 8 hr. (Each point is the mean of 120 observations.)
Table 1 - Effects o f various combinations o f Tween 80 and sodium lauryl sulfate on mean diameters o f 3% calcium alginate beads
Tween 80(%)
Mean diameter (g.m)Sodium lauryl sulfate (%)
0 0.1 0.50 109.2a 110.3* 103.7b
0.1 29.5d 26.5d* 50.4*0.2 24.9d-* 2 1 .7*-' 18.4'
*"* Mean diameters followed by the same superscript do not differ significantly (p <0.05).
microentrapped cells was over 90%. The speed of addition of calcium chloride solution was a determinant of shape of the beads. When the calcium chloride solution was added slowly (less than 10 mL/sec) or was added before an uniform emulsion had been reached, some spheres coalesced and formed a string- type gel (Fig. IB). Addition of calcium chloride at a rate greater than 20 mL/sec was necessary to break the water/oil emulsion within a few seconds and to form drop-shaped beads.
Fig. 4—Relationship between mean diameter of calcium alginate beads and viscosity of sodium alginate. Shear rate was 200 rpm. Error bar indicates standard deviation.
When the freshly made beads were stored in water, the appearance of the beads changed little (Fig. 1C). However, shrinkage of the beads ensued when they were stored overnight in a solution containing calcium. This resulted in wrinkles on the surface (Fig. ID) and a reduction in size (Fig. 2). Probably with the overnight storage additional calcium was bound to the alginate and bound water was removed; therefore, the beads shrank. The bead size decreased sharply within the first 4 hr; the rate of decrease in size slowed at about 8 hr (Fig. 3).
Previous studies showed that bacteria in beads of k-carra- geenan were near the gel surface (Mori et al., 1989). In the present study, L. bulgaricus L2 cells were uniformly dispersed in the calcium alginate beads (Fig. IE and IF). A bead of 25 p,m in diameter contained = 10 to 20 cells. Small cavities inside the beads were formed due to ungelled sodium alginate or to shrinkage during preparation for electron microscopy.
Effects of surfactant and emulsifier on bead sizeTween 80 was selected as an emulsifier because it associated
primarily with the oil phase. With this high association in the oil phase (high hydrophilic and lipophilic Balance (HLB) value), the Tween 80 was easily removed from the surface of the spheres (water phase) causing disruption of the water/oil emulsion (Govin and Leeder, 1971; Nawar, 1985). In contrast, when Span 80 (low HLB value) was used, a much higher amount of calcium chloride solution was necessary to break the water/oil emulsion, and string-type gels resulted. In addition, Tween 80 was essential to prevent spheres from coalescing before the breaking of the emulsion. The system containing Tween 80 had significantly smaller beads (p<0.001) than the system without Tween 80 (Table 1). These results were similar to those of Ishizaka et al. (1981) and Joung et al. (1987).
A solution having a low surface tension resulted in small spheres (Adamson, 1982). Thus, the increase of sodium lauryl sulfate from 0 to 0.5% in the aqueous phase resulted in a slight decrease of bead size (Table 1). However, when the concentration of Tween 80 was 0.1%, increasing the concentration of sodium lauryl sulfate from 0.1 to 0.5% caused the mean bead size to increase from 26.5 to 50.4 (am. A reasonable explanation might be that small spheres coalesced into large ones. As the cell-alginate mixture with a low surface tension (0.5% sodium lauryl sulfate) was added to the system, many small spheres were produced resulting in an increase of area of the interface between the water phase and the oil phase. This weakened the emulsion causing coalescence of small beads.
Volume 54, No. 3, 1993-JOURNAL OF FOOD SCIENCE-559

Lo
g j
0 (C
FU
/mL
)MICROENTRAPMENT OF LACTOBACILLI IN Ca-ALGINATE GELS. . .
Table 2 - Release o f cells from 3% calcium alginate beads as affected by pH
Cells released from alginate beads (CFU/ml x 10“)
pH'
4.8 5.8 6.5 7.5 8.5
(min) mean sd mean sd mean sd mean sd mean sd
0» 36 3 35 2 38 3 37 2 35 1
5 168 10 167 13 171 9 171 6 171 8
10 394 5 385 10 399 9 387 16 384 1315 380 15 377 19 391 8 372 14 389 10
30 388 11 392 11 394 14 388 7 393 1445 387 24 381 17 395 9 385 32 384 20
« The solution of 0.05M phosphate was adjusted in pH by varying the amounts of mono- and di-sodium phosphates. b Cell counts of zero time were taken from the bead suspensions without treatment with phosphate.
Time ( min )Fig. 5—Numbers of L. bulgaricus L2 cells released per minute from calcium alginate beads by 0.1, 0.01 or 0.001 M phosphate solutions. Control: Nonentrapped L. bulgaricus L2 in 0.1M phosphate solution. Cell numbers in the control approximate numbers added to the calcium alginate to make the volume of beads tested.
By increasing the concentration of Tween 80 to 0.2%, the emulsion was strengthened, resulting in a much smaller average bead size (18.4 p,m).
Effect of concentration of sodium alginate on bead sizeBeads containing different concentrations of alginate were
prepared using the two-phase system. At a stirring speed of 2 0 0 rpm, when sodium alginate concentrations were increased from 0.5% to 4.5%, the apparent viscosity increased from 40 to 460 cp (Fig. 4) and mean diameters of beads increased from15.4 to 22.1 |xm. Thus, more viscous solutions produced larger spheres in the two-phase system than did less viscous solutions. The mean diameters approached a plateau when the concentration of sodium alginate was 3%.
Release of entrapped bacteria from gel beadsTo investigate effects of freezing on entrapped bacteria, those
bacteria must be released completely from the calcium alginate gel. Optimal conditions for release of the entrapped bacteria from the gel were determined. Released bacteria were enumerated by plate count technique and numbers were compared to counts of nonentrapped bacteria. The pH of the phosphate
Fig. 6—Survivors (%) among entrapped and nonentrapped cells of L. bulgaricus L2 and L. bulgaricus rr in ice milk mixes frozen in a continuous type freezer and stored 14 days at -20°C. Error bar indicates standard deviation.
solution (0.05M), which ranged from 4.8- 8 .5, had no significant (p>0.05) effect on release rate (Table 2). Numbers of cells released by the 0.05M phosphate solution plateaued at about 10 min, implying that pH was not a significant variable.
Increasing the concentrations of phosphate solution (pH 7.5) from 0.001 to 0.1M shortened the time needed to completely release the entrapped cells (Fig. 5). A high concentration (0.1M) of phosphate solution completely released the entrapped bacteria within 5 min under gentle shaking, while release at a low concentration (0.001M) took about 30 min.
Influence of freezing on entrapped lactobacilli
When lactobacilli were added to ice milk mixes which were then frozen in a continuous ice cream freezer, numbers of viable cells decreased (Fig. 6 ). Apparent rate of death was greatest immediately after frozen product exited the freezer and slowed during storage. Thus, major freeze-damage occurred when lactobacilli were in the ice cream freezer. Probably damage to cells inside the ice cream freezer was caused by formation of ice crystals and by scraping of the cylinder wall by the blades of the mutator.
Resistance to freezing damage differed between two representative strains of L. bulgaricus, (strains L2 and rr). Percentages of entrapped cells found viable after 2 wk frozen storage were about 90 and 25 for strains L2 and rr, respectively (Fig. 6 ). Percentages of survivors among the non-entrapped cells were much lower, about 45 and 5 for strains L2 and rr, respectively. Cells of strain rr were much larger than those of
5 6 0 -JOURNAL OF FOOD SCIENCE-Volume 54, No. 3, 1993

strain L2 suggesting that the larger cells were much more susceptible to mechanical damage than smaller cells. Entrapped cells survived freezing better than did non-entrapped cells (p<0.05) when compared within the same strain. Viable counts were 40 to 45% higher when entrapped than when not entrapped. Protection by microentrapment was significant (p<0.05) both in the ice cream freezer and during frozen storage.
REFERENCESAdamson, AW. 1982. Physical Chemistry of Surfaces, 4th ed. J. Wiley &
Sons, Inc., New York.Brodelius, P. and Nilsson, K. 1980. Entrapment of plant cells in different
matrices. FEBS Lett. 122: 312.Gilliland, S.E., Nelson, C.R., and Maxwell, C. 1985. Assimilation of cho
lesterol by Lactobacillus acidophilus. Appl. Envir. Microbiol. 49: 377. Goodenough, E.R. and Kleyn, D.H. 1976. Influence of viable yogurt mi
croflora on digestion of lactose by the rat. J. Dairy Sci. 59: 601.Govin, R. and Leeder, J.G. 1971. Action of emulsifiers in ice cream utiliz
ing the HLB concept. J. Food Sci. 36: 718.Hayat, M.A 1978. Principles and Techniques of Scanning Electron Mi
croscopy, Volume 6. Van Nostrand Reinhold Company, New York. Ishizaka, T., Endo, K., and Koishi, M. 1981. Preparation of egg albumin
microcapsules and microspheres. J. Pharm. Sci. 70(4): 358.Joung, J.J., Akin, C., and Royer, G.P. 1987. Immobilization of growing
cells by polyethylenimine modified alginate. Appl. Biochem. Biotechnoi. 14: 259.
Lim, F. and Moss, R.D. 1981. Microencapsulation of living cells and tissues. J. Pharm. Sci. 70: 351.
Mashayekh, M. and Brown, R.J. 1992. Stability of Lactobacillus del- brueckii spp. bulgaricus, Steptococcus salivarius spp. thermophilus and (3-galactosidase activity in frozen cultured ice cream. Cul. Dairy Prod. J. 27(1): 4.
Miles, J.J. and Leeder, J.G. 1981. Starter culture viability in frozen yogurt. Cul. Daily Prod. J. 16(8): 12.
Mori, A, Matsumoto. N., and Imai, C. 1989. Growth behavior of immobilized acetic acid bacteria. Biotechnoi. Lett. 11(3): 183.
Nawar, W.W. 1985. Lipids. In Food Chemistry, 2nd ed., O.R. Fennema (Ed.), p. 170. Marcel Dekker, Inc., New York.
Nilsson, K., Birnbaum, S., Flygare, S., Linse, L., Schroder, U., Jeppsson, U., Larsson, P.O., Mosbach, K. and Brodelius, P. 1983. A general method for the immobilization of cells with preserved viability. Eur. J. Appl. Microbiol. Biotechnoi. 17: 319.
Ohlson, S., Larsson, P.O., and Mosbach, K. 1979. Steroid transformation by living cells immobilized in calcium alginate. Eur. J. Appl. Microbiol. Biotechnoi. 7: 103.
Postek, M.T., Howard, K.S., Johnson, A.H., and McMichael, K.L. 1980.Scanning Electron Microscopy. Ladd Research Industries, Inc., New York.
Wynder, E. and Reddy, B.S. 1974. Metabolic epidemiology of colorectal cancer. Cancer. 34: 801.
Ms received 5/16/92; revised 9/21/92; accepted 10/12/92.
Contribution from the Missouri Agricultural Experiment Station. Journal Series No. 11,671. This research was supported by the National Dairy Promotion and Research Board and by Midland United Dairy Industry’s Association.
VITA M IN B 6 IN F A S T F O O D FR IED CHICKEN. . .From page 507
REFERENCES
Ang, C.Y.W., Cenciarelli, M., and Eitenmiller, R.R. 1988. A simple liquid chromatographic method for determination of B6 vitamers in raw and cooked chicken. J. Food Sci. 53: 371.
Anon. 1990. Up, up and up for foodservice sales. Processed Poultry Products. January.
Coburn, S.P. and Mahuren, J.D. 1983. A versatile Cation-exchange procedure for measuring the major forms of vitamin Bfl in biological samples. Anal. Biochem. 129: 310.
FDA. 1987. Dining out with a healthy appetite. March.Gregory, J.F. and Feldstein, D. 1985. Determination of vitamin B6 in foods
and other biological materials by paired ion high-performance liquid chromatography. J. Agric. Food Chem. 33: 359.
Gregory, J.F. and Kirk, J.R. 1978a. Assessment of roasting effects on vitamin B6 stability and bioavailability in dehydrated food systems. J. Food Sci. 43: 1585.
Hanmaker, B., Kirksey, A., Ekanayake, A. and Borschel, M. 1985. Analysis of Be vitamers in human milk by reverse-phase liquid chromatography. Am. J. Clin. Nutr. 42: 650.
Leklem, J.E. and Reynolds, R.D. (ed.) 1988. Current topics in nutrition and disease. Volume 19. A.R. Liss, New York.
NAS/NRC. 1989. Recommended Dietary Allowances, 10th ed. National Academy of Sciences, Washington, DC.
Pao, E.M. and Mickle, S.J. 1981. Problem nutrients in the United States. Food Technol. 35: 58.
SAS Institute, Inc. 1985. SA5° User’s Guide, 5th ed. SAS Institute, Inc., Cary, NC.
Vanderslice, J.T., Brownlee, S.R., and Cortissoz, M.E. 1984. Liquid chromatographic determination of vitamin Be in foods. J.A.O.AC. 67: 999.
Vanderslice, J.T. and Maire, C.E. 1980. Liquid chromatographic separation and quantification of B8 vitamers at plasma concentration levels. J. Chromatogr. 196: 176.
Vanderslice, J.T., Maire, C.E., Doherty, R.F., and Beecher, G.R. 1980. Sul- fosalicylic acid as an extraction agent for Vitamin B6 in food. J. Agric. Food Chem. 28: 1145.
Vanderslice, J.T., Stewart, K.K., and Yarmas, M.M. 1979. Liquid chromatographic separation and quantification of B6 vitamers and their metabolite, pyridoxic acid. J. Chromatogr. 176: 280.
Ms received 9/14/92; revised 1/5/93; accepted 1/16/93.
Thanks to Dr. Nina Marable (The Univ. of Tennessee) for contributions. Supported by the Tennessee Agricultural Experiment Station, the Alabama Agricultural Experiment Station, and a grant from the U.S. Dept, of Agriculture.
F IS H -F L A V O R -T E X T U R E.. .From page 512_____
evaluation of the texture and appearance of 17 species of North Atlantic fish. J. Food Sci. 47: 181B-1823.
Caul, J.F. 1957. The profile method of flavor analysis. In Advances in Food Research, E.M. Mrak and G.F. Stewart (Ed.), Vol 7, p. 1-40. Academic Press, Inc., New York.
Caul, J.F. and Vaden, AG. 1972. Flavor of white bread as it ages. Baker’s Dig. 46(1): 39, 42-43, 60.
Chambers, E. IV, Bowers, J.A., and Dayton, A.D. 1981. Statistical designs and panel training/experience for sensory analysis. J Food Sci. 46: 1902- 1906.
Chambers, E. IV, Bowers, J.R., and Smith, E A 1992. Flavor of cooked,
ground turkey patties with added sodium tripolyphosphate as perceived y sensory panels with differing phosphate sensitivity. J. Food Sci. 57: 521-523.
Chang, C.-Y. and Chambers, E. IV. 1992. Flavor characterization of breads made from hard red winter wheat and hard white winter wheat. Cereal Chem. 69: 556-559.
Connell, J.J. and Howgate, P.F. 1971. Consumer evaluation of fresh and frozen fish. In Fish Inspection and Quality Control, R. Kreuzer (Ed.), p. 155. Fishing News Books Ltd., London.
Hamilton, M. and Bennett, R. 1983. An investigation into consumer preferences for nine fresh white fish species and the sensory attributes which determine acceptability. J Food Technol. 18(1): 75-84.
Hamilton, M. ana Bennett, R. 1984. Consumer preferences for fresh white fish species. J. Cons. Stud, and Home Econ. 8: 243.
Hootman, R.C. 1992. Manual on Descriptive Analysis Testing for Sensory Evaluation, p. 2. Amer. Soc. Testing and Materials, Philadelphia, PA.
Johnsen, P.B., Civille, G.V., and Vercellotti, J.R. 1987. A lexicon of pond- raised catfish flavor descriptors. J. Sens. Stud. 2: 85-91.
Maligalig, L.L., Caul, J.F., and Tiemeier, O. 1973. Aroma and flavor of
farm-raised channel catfish: effects of pond condition, storage, and diet. Food Prod. Develop. 7(4): 86-89.
Maligalig, L.L., Caul, J.F., Bassette, R., and Tiemeier, O. 1975. Flavoring live channel catfish experimentally: effects of refrigerated storage ana of purging on retention of experimental flavors. J. Food. Sci. 40: 1246- 1248.
Mustafa, F.A. and Medeiros, D.M. 1985. Proximate composition, Mineral content, and fatty acids of catfish (Ictalurus punctatus, Rafinesque) for different seasons and cooking methods. J. Food. Sci. 50: 585-588.
NAS/NRC. 1978. Aquaculture in the United States: Constraints and opportunities. Board on Agri. and Renewable Res., Natl. Acad, of Sciences/ Natl. Res. Council, Washington, DC.
Prell, P.A. and Sawyer, F.M. 1988. Flavor profiles of 17 species of North Atlantic fish. J. Food. Sci. 53: 1036-1042.
Rounds, R.C., Glenn, C.L., and Bush, A.O. 1992. Consumer acceptance of brown trout {Salmo trutta) as an alternative species to rainbow trout (Salmo gairdneri». J. Food Sci. 57: 572-574.
Sawyer, F.M., Cardello, A.V., and Prell, P.A. 1988. Consumer evaluation of the sensory properties of fish. J. Food Sci. 53: 12-18,24.
Wesson, J.B., Lindsay, R.C., and Steuberm, D.A. 1979. Discrimination of fish and seafood quality by consumer populations. J. Food Sci. 44: 878- 882.
Ms received 7/20/93; revised 1/8/93; accepted 2/15/93.
Contribution No. 93-9-J from the Kansas Agricultural Experiment Station, Manhattan, KS 66506
Volume 54, No. 3, 1993-JOURNAL OF FOOD SCIENCE-561

Oat Gum and 0-Glucan Extraction from Oat Bran and Rolled Oats: Temperature and pH Effects
N. L. DAWKINS and I. A. NNANNA
----------------------------ABSTRACT-----------------------------The extractability of oat gum from oat bran and rolled oats was studied using 12 treatment combinations in a factorial design (2x3x4x2) i.e. 2 oat products; 3 pH (8.0-10.5); 4 temperatures (50-70°C); 2 replications. The extraction procedure involved: (a) alkaline treatment of flour and removal of starch residue; (b) isoelectric precipitation of protein residue [namely, protein concentrates (PC)]; (c) and alcohol precipitation of oat gum/p-glucan and collection of gum by centrifugation. Extracted oat gum ranged from 2.99-6.28% for oat bran and 1.82-5.24% for rolled oats whereas p-glucan (in gum) ranged from 70-89% and 50-68%, respectively. Protein contents of the PC from oat bran was 69-91% and rolled oats 66-89%. Correspondingly, starch content of residues ranged from 30-63% and 61-87%. Oat gum/fi- glucan extracted at pH 9.2/50°C or pH 10.5/50/55°C showed little or no starch contamination.
Key Words: Oat gum, p-glucan, oat bran, extractability.
INTRODUCTION
OAT GUM, a soluble dietary fiber, is believed to be the active cholesterol-lowering component of oat bran (Anderson and Chen,1986). It is also viewed as a potential new hydrocolloid as well as a nutritionally valuable dietary component (Wood, 1986). About 70% of oat gum is (3-glucan, a mixed linked (1-3), (1- 4 p-D-glucan. While the health-promoting properties of oat gum have been well studied (Anderson and Chen., 1984; Wood et al., 1989a; Lund et al., 1989; Wood et al., 1990), its use as a potential food hydrocolloid has not been fully explored.
There are very few data on the physical properties of oat gum/p-glucan. Nevertheless, oat gum achieves high viscosity at low concentration, is extremely pseudoplastic at > 0.5% concentration and is stable to sucrose (40%) and salt (ref. in Wood, 1986). It therefore seems to compare favorably with high-viscosity neutral polysaccharides such as some substituted celluloses, guar gum, and locust bean gum (Wood, 1986). Autio et al. (1987) on flow properties of oat p-glucan solutions showed their viscosity temporarily decreased with increased temperature, sugges:ing p-glucans might have application in products in which high fluidity at elevated temperatures is desired followed by thickening upon cooling. Since oat gum exhibits remarkable thickening power (Wood et al., 1989b), characteristic of a food hydrocolloid, Carr et al. (1990) suggested that it may find application as a thickener in ice cream, sauces and salad dressings. However, isolation and commercial production of p-glucan remain difficult (Wood et al., 1989b).
Several extraction and quantitative techniques have been suggested for determination of p-glucan in oats and barley (Wood et al., 1977, 1978; Wood and Weisz, 1984; McClear and Holmes, 1985; Welch and Lloyd, 1989; Carr et al., 1990). Problems with these methods often include incomplete extraction of gum, low yields of p-glucan, and starch contamination. Early studies (Preece and Hobkirk, 1954) on barley p-glucan extraction showed that use of temperatures below the gelatin- ization temperature of starch and avoidance of strong alkali,
The authors are affiliated with the Dept, o f Nutrition & Food Science, Wayne State Univ., Rm 3009 Science Hall, Detroit, M l 48202.
minimized starch solubilization. However, with mild conditions, extraction was incomplete and yields were improved with enzyme-active flour or alkali extraction (Preece and Hobkirk, 1954, ref. in Wood, 1986). Wood et al. (1977) described an extraction of oat gum in which use of mild alkali (pH 10) and carbonate rather than sodium hydroxide minimized starch gelatinization and solubilization, even at elevated temperatures (Wood et al., 1978). Preece and Mackenzie (1952) and Preece and Hobkirk (1953) developed a method for purification of p- glucan from crude extract of oat and barley. Their method allowed for precipitation of an almost pure, pentosan-free glu- can using 20-30% ammonium sulfate (Wood, 1986). When Preece’s procedure was applied on gum isolated using Wood et al. (1978) method, 75-86% yield of precipitate containing - 98% p-glucan was observed (Wood, 1986). However, ammonium salts would probably not be acceptable for production of food grade gum (Pettitt, 1982). Additionally, the method described by Wood et al. (1977, 1978), although promising, required two or more extractions of the initial residue in the isolation of oat gum. In our study, it was intended to achieve a high yield of oat gum in one extraction by manipulating temperature -pH conditions. Utilization of oatgum/p-glucan in food products and for therapeutic purposes would increase as more information on their extractability, physicochemical and structural characteristics become available.
Our primary objective was to investigate the effect of tem- perature-pH conditions on extractability of oat gum/p-glucan with little or no starch contamination. We also evaluated the recovery of by-products, starch and protein, using the “ oat gum extraction process.”
MATERIALS & METHODSMaterials
Oat bran and rolled oats were obtained from the Quaker Oats Company (Chicago, IL). The products were ground to pass through 60 mesh (0.5 mm) and stored at 4°C until used. Takalite L-340 Bacterial alpha-amylase from Bacillus licheniformis var. and glucoamylase from Aspergillus niger var. (Diazyme L-200) were obtained from Miles Inc., Biotechnology Product Division (Elkhart, IN). Glucose oxidase/ peroxidase kit and cellulase were obtained from Sigma Chemical CO (St. Louis, MI). All other chemicals were reagent grades.
Extraction of oat gum/p-glucan
The method of Autio et al. (1987) [i.e. extraction of p-glucan at pH 9.2/70°C] was modified to include several temperature-pH conditions. A schematic outline of the extraction procedure is presented in Fig. 1. The experimental design involved a 4x3x2x2: four temperatures (50, 55, 60 and 70°C), three pH (8 , 9.2 and 10.5), two oat sources (oat bran and rolled oats), and two replicates. This design allowed 12 treatment combinations and required 48 experiments. The extraction procedure consisted of three steps: (a) alkaline treatment of the flour in a solid to solvent ratio of 1:34; (b) Isoelectric precipitation of protein residue; (c) alcohol precipitation of gum/p-glucan. Essentially, the pH of the slurry formed after combining the oat flour and distilled water was adjusted from initial pH 6.4 to the desired pH using 2M sodium hydroxide. Adjustment of pH continued until the meter reading was stable. The slurry was then heated (-30-45 min) until desired internal temperature was reached and held constant with continuous stirring for lhr. The procedure for recovery of the starch
562-JOURNAL OF FOOD SCIENCE-Volume 58, No. 3, 1993

50g Oat bran + 1700 m LH O2
ISLURRY Adjust pH & temp stir for Ihr
Centrifuged at 16300 x g for 20 min
ISTARCH
RESIDUE
YSUPERNATANT
2 M HCL added (pH 4.5) to p p t protein
Centrifuged to remove protein residue
2 M NaOH Added to raise pH to 7.0 -> * SUPERNATANT
Centrifuge at 3,000 rpmEqual amount isopropanol
GUM
Fig. 1 . -Procedure for the oat gum extraction.
residue, protein (henceforth, protein concentrates pc), and gum are shown in Fig. 1. All residual samples (i.e. gum, protein and starch) were freeze-dried and stored at -20°C until used for analysis. Nin- hydrin (Robyt and White, 1987) and iodine (Aurand et al., 1987) tests were performed on all extracted gum samples to check for presence of protein and starch, respectively.
(3-glucan assay[3-glucan assay was conducted using commercial cellulase (Sigma
C 0901) from P.funiculosum, previously heat treated as described by Carr et al. (1990), to remove contaminating amylolytic activity. Heat treated cellulase was stored at -20°C until used (l-2days). Duplicate samples (O.lg) of oat gum were dissolved in 10 mL of 0.05M sodium succinate buffer (pH 5.5) containing 0.02% sodium azide. Aliquots (0.4 mL) of solubilized oat gum were placed in glass test tubes, followed by addition of 0.2 mL enzyme and 0.4mL of succinate buffer. The tubes were incubated at 40°C for 3 hr. Sample blank, starch and commercial 3-glucan were treated similarly. The starch was used to test for amylolytic activity whereas the adequacy of the cellulase/p- glucanase activity was tested using commercial [3-glucan (Carr et al.,1990). According to the tests, there was no apparent amylolytic activity in the enzyme preparation used. The commercial [3-glucan was analysed to be -90% using this assay. All samples were analyzed for liberated glucose using glucose oxidase-peroxidase procedure (Kar- kalas, 1985).
Protein and starchThe protein content of the PC’s were determined using Kjeldahl’s
method (Nx 6.25). Starch content of the native and starch residue samples were determined by dispersing samples (0.5g) in 100 mL volumetric flasks, 50 mL of 0.2M acetate buffer (pH 5.0) was added, followed by 0.1 mL heat stable amylase (Takalite L-340). Samples were incubated in a shaking water bath for 30 min at 100°C. Samples were cooled to 60°C, after which 0.3 mL of glucoamylase (Diazyme L-200) was added and then incubated at 60°C for lhr in a shaking water bath. Volumes were brought to lOOmL and filtered. Total sugar was determined using the phenol-sulfuric method (Dubois et al., 1956) and starch content was estimated.
Statistical analysisAll statistical analysis (means, standard deviation of means, analy
sis of variance, factorial and multiple regression) were performed
Table 1 -Qualitative (iodine) test for starch contamination of gum extracted from oat bran and rolled oatsTreatments Oat bran Rolled oats
pH 8.0 50°C + + + +55 + + + + + +60 + + + + + +70 + + + + + +
pH 9.2 50°C _* -
55 + + + +60 + + + + + +70 + + + + + +
pH 10.5 50°C — —
55 - + + +60 + + + + + +70 + + + + + +
* = no visible blue color; + = faint blue color; + + = moderately blue color; + + += intense blue coler.
using MSTATC statistical software program (MSTAT, 1989). Factorial and multiple linear regression were conducted to check for interaction effects, between pH and temperature. Surface plots were performed using SYSTAT software, (SYSTAT, 1989).
RESULT & DISCUSSION Qualitative test of oat gum purity
The extracted gum samples were examined qualitatively for protein using ninhydrin (triketohydrindene hydrate) which reacts with primary and secondary amines or amino-containing compounds to produce blue or purple (Robyt and White, 1987). Starch, most dextrins, and amylodextrins give a positive iodine test. Starch reacts with iodine to form a deep blue starch-iodine complex (Aurand et al., 1987).
Ninhydrin test showed no protein in any of the oat gum extracts, verifying the effectiveness of isoelectric precipitation of protein. Most samples were apparently contaminated with starch (as judged by development of blue color, Table I) except for the pH 9.2/50°C or pH 10.5/50°C/55°C combinations. The starch contamination in many samples may have resulted from gelatinization as a function of combined effects of temperature and pH. As determined by differential scanning calorimetry, oat starches have been reported to have gelatinization onset temperatures ranging from 55.5-62.4°C, differing by starch type (Sowa and White, 1992). A slightly lower gelatinization temperature of 53-59°C for oat starch has been reported (Line- back, 1984), probably because of structural differences from different oat varieties (Sowa and White, 1992). Gelatinization of cereal starches occur in the range of 52-78°C (Leach, 1965). Starch manufacturers normally finish their products at pH values from 5-7, and, within this range, the gelatinization temperature is not affected by pH (Leach, 1965). Gelatinization temperature is a function of pH when hydrogen ion concentration is outside this range (Leach, 1965). In our study, all extraction pH (8.0-10.5) were above the pH of native oat flour (pH -6 .4 ) . Therefore, the effects reported by Leach (1965) support the hypothesis that temperature-pH combination affected the observed degree of starch contamination.
Effect of temperature and pH on oat gum/p-glucan extractability
Percent gum and B-glucan extracted ranged from 2.99-6.28% and 2.32-5.65%, respectively, for oat bran (Table 2). Correspondingly, the values ranged from 1.83-5.24% and 1.01— 2.73%, respectively, for rolled oats (Table 3). As expected, the gum values for rolled oats (Table 3) were generally lower than oat bran (Table 2) except at pH 9.2/70°C treatment combinations where little difference was observed. Percent (3-glu- can in gum ranged from 70.1-89.9% (Table 2) for oat bran and from 50.5-68.5% (Table 3) for rolled oats. The results showed significant differences (P^O.05) in gum and [3-glucan extracted using the various combinations. Based on observa-
Volume 58, No. 3. 1993-JOURNAL OF FOOD SCIENCE-563

OAT GUM EXTRACTION...
Table 2-Percentages o f gum and p-glucan from oat bran as affected by temperature and pH____________________________
T re a tm e n ts G um * p -g lu c a n '% p -g lu c a n
in g u m
pH 8 .0 50°C 55 60 70
2 .99 ± 0 .0 1 “ 3 .35 ± 0 .0 1 » 3 .1 9 ± 0 .0 1 c 6 .2 8 ± 0 .0 6 *
2 .5 9 ± 0 .0 1 » 2 .6 8 ± 0 .0 5 » 2 .32 ± 0 .0 2 ' 5 .65 ± 0 .0 4 *
8 6 .7 3 ± 0 .5 2 » 8 0 .1 5 ± 1 .4 3 ' 7 2 .7 9 ± 0 .3 6 “ 89.91 ± 1 .4 3 *
pH 9 .2 50°C 55 60 70
4 .6 2 ± 0 .0 7 ' 5 .4 4 ± 0 .0 3 * 4.71 ± 0 .0 1 ' 5 .29 ± 3 .0 0 »
3 .7 9 ± 0 .2 8 *» 3.81 ± 0 .2 8 » 3 .75 ±0 .0 5 *» 4 .23 ± 0 .0 0 *
82 .05 ± 4 .8 3 * 70 .0 8 ± 0 .3 0 » 79 .7 3 ± 0 .9 3 * 7 9 .9 4 ± 0 .0 9 *
pH 10.5 50°C 55 60 70
4 .6 9 ± 0 .1 6 ' 5 .38 ± 3 .0 0 » 5 .3 4 ± 3 .0 8 » 6 .0 4 ± 0 .0 5 *
3 .6 5 ± 0 .0 6 ' 4.51 ± 0 .1 1 *» 4 .1 0 ± 0 .0 3 » 4 .8 2 ± 0 .0 5 *
7 7 .8 4 ± 3 .0 9 * 84 .49 ± 2 .1 8 *7 6 .8 4 ± 4 .5 3 * 8 0 .3 9 ± 0 .6 5 *
•-*1 Four means (n = 8) in a column with different letters differ significantly (P^ 0.05) • Percentage, dry basis, in flour.1 Percentage, dry basis, in gun.
Table 3-Percentages o f gum and p-glucan from ro lled oats as affected by temperature and pH
T re a tm e n ts G u m “ p g lu ca n *% p -g lu c a n
in g u m
pH 8.0 50°C 55 60 70
1.83 ± 0 .0 6 » 3 .36 ± 0 .0 5 * 2 .97 ±0 .0 0» 3 .4 4 ± 0 .0 6 *
1.01 ± 0 .1 0 ' 2 .2 5 ± 0 .2 2 * 2 .03 ±0 .0 7 *» 1 .7 7 ± 0 .1 0 »
55 .42 ± 0 .9 7 » 6 6 .8 5 ± 0 .6 1 * 6 8 .5 2 ± 2 .9 6 * 5 1 .4 5 ± 2 .1 8 »
pH 9 .2 50°C 55 60 70
2 .53 ± 0 .0 1 »2 .24 ± 0 .1 5 ' 2 .47 ± 0 .0 7 »5 .2 4 ± 0 .0 0 "
1 .2 7 ± 0 .0 4 ' 1 .1 4 ± 0 .0 9 ' 1 .69 ± 0 .0 4 » 2 .73 ± 0 .0 3 *
5 0 .3 3 ± 1 .2 5 » 50 .77 ± 0 .7 5 » 68 .5 2 ± 0 .3 4 *52 .33 ± 0 .9 4 »
pH 10.5 50°C 55 60 70
2.91 ± 0 .0 2 * 3 .3 3 ± 0 .4 7 * 3.31 ± 0 .0 3 * 3 .1 7 ± 0 .0 6 *
1.63 ± 0 .0 5 * 1 .98 ± 0 .2 9 * 2.00 ± 0 .0 6 * 1 .9 9 ± 0 .1 0 *
56 .65 ± 0 .4 6 ' 5 9 .9 ± 0 .5 1 »
60 .3 7 ± 1 .3 0 *» 62.81 ± 1 .0 0 *
K Four means (n = 8) in a column with different letters differ significantly (PsO.05). d Percentage, dry weight basis, in flour • Percentage, dry weight basis, in gum
Table 4 —M ultip le linear regression m odel fo r prediction o f oat gum (OG)/ fi-glucan extraction from oatbran and ro lled oats
D e p e n d e n tv a r ia b le
In d e p e n d e n tva r ia b le s
R e g re ss io nc o e f f ic ie n t " t " v a lu e R2 F
S TDE rro r
O a tb ra nOG(n = 24)
pHT (°C)
0 .55990 .0819
4.1824.431
0 .639 18 .5 7* 0 .1340 .019
p -g lu c a n pHT (°C)
0 .38630 .0 7 64
2.8934 .144
0.549 12 7 7 * 0 .1340 .018
R o lle d o a ts G(n = 24)
PHT ( “C)
0 .11050 .0720
0.8323.923
0 .434 8 0 4 * * 0 .1330 .018
p -g lu c a n pHT (°C)
0 .05580 .0393
0.7073 .610
0.392 6 .7 6 * * 0 .0790.011
* P - 0.000 ** P«s0.001
tions from Table 1, the values obtained using treatment combinations pH 9.2/50°C or pH 10.5/50/55°C were apparently void of starch or protein, therefore, represent true values.
In a study aimed at providing information on flow properties of P-glucan, Autio et al. (1987) extracted p-glucan from oat bran of mixed Finnish commercial varieties in which a p- glucan content 12.7% was reported. No indication was given of the yield of their extract nor of the purity. The gum yield reported by Wood et al. (1977) ranged from 0.63-3.50% (dry weight basis in flour) whereas we obtained gum yield of 2 .9 9 - 6.28% (dry weight basis in flour, Table 2). Percent p-glucan yield reported by Wood et al. (1977) of pooled extracts from several different cultivars ranged from 57-84%. In our study percent p-glucan in extracted gum samples ranged from 70- 89.9% (Table 2) and 50.3-68.5% (Table 3), respectively, for oat bran and rolled oats. Note that the percent p-glucan yields reported by Wood et al. (1977) were recovered from two ex
tractions of the same oat flour sample whereas our values (Tables 2 and 3) were based on one extraction. Variations in results may be due to other factors such as extraction time, extractin temperature, pH, solid to solvent ratio, and varietal differences.
Extraction of gum was generally low at lower temperatures regardless of treatment. As temperature increased starch contamination increased due to gelatinization of starch at higher temperatures. The exception was pH 8.0 (Table 1) which sample showed contamination at all treatment combinations.
The highest amount of p-glucan (89.9%) [Table 2] was obtained using pH 8.0/70°C treatment but was also highly contaminated with starch (see Table 1). Therefore, pH 9.2/50°C (82% p-glucan in gum) and pH 10.5/55°C (84% p-glucan in gum) represent the treatment combinations of choice for extraction of oat gum/p-glucan. These conditions would minimize starch gelatinization and contamination. Despite the variability in sample matrix (i.e. oat bran and rolled oats), the general trend suggested that temperature and pH were critical in oat gum extraction. An increase in pH and temperature resulted in increased gum extractability.
To ascertain the relative effects of pH and temperature on extractability of oat gum/p-glucan, factorial analysis was conducted. The analysis indicated a significant (P< 0.05) interaction effect between temperature and pH in oat gum extraction. Oat gum/p-glucan extractability was highly influenced by pH- temperature conditions. Therefore, multiple regression models were constructed to predict the variation of regression of dependent variables (gum and p-glucan) on independent variables (pH and temperature). Significant multiple linear models were obtained (Table 4) for the prediction of oat gum/p-glucan extractability from oat bran (n = 24) and rolled oats (n = 24). The coefficients of determination (R2) for oat bran were 0.64 and 0.55 for prediction of oat gum and p-glucan extractability, respectively, whereas the coefficients for rolled oats were 0.43 (gum) and 0.39 (p-glucan). Both temperature and pH had significant linear effects on oat gum and p-glucan extracted. However, pH appeared to have greater (higher regression coefficients, Table 4) effect on gum/p-glucan extraction from oat bran and rolled oats than did temperature. The regression model for oat bran (Table 4) showed, particularly a strong dependence of oat gum/p-glucan extractability on pH.
Three dimensional surface plots (first-order model) were constructed to illustrate the relationships between pH and temperature on extractability of oat gum. The response surface of gum from oat bran and rolled oats (Fig. 2a, b, respectively) show percent gum extracted increased linearly as a function of temperature and pH. Similarly, a linear trend was observed in percent p-glucan extracted from oat bran (Fig. 3a). For the response surface of p-glucan in rolled oats (Fig. 3b), the interdependence effect of pH and temperature was not as apparent as that of oat bran (Fig. 3a). The trend (Fig. 3b) reflects the p-glucan data presented in Table 3 and also coincides with the relatively lower regression coefficients (Table 4) for pH (0.056) and temperature (0.039) compared to oat bran counterparts. The differences in models for prediction of oat gum and p-glucan extractability from rolled oats and oat bran may be due to matrix effect. Oat bran is a richer and perhaps more accessible source of gum/p-glucan than rolled oats.
Effect of extraction procedure on the percent protein and starch recovery
Percent PC recovery from oat bran and rolled oats (Table5) showed differences (P<0.05) among treatment combinations. Values for oat bran ranged from 69.6-91.4% and for rolled oats, 66.8-86.2%. This high amount of PC from both oat products suggested that protein could be recovered as well during oat gum extraction and used as a food ingredient if it has desirable functionality. The percent starch recovery (Table6 ) ranged from 30.2-63.6% for oat bran and 61.4-87.1% for
564-JOURNAL OF FOOD SCIENCE-Volume 58, No. 3, 1993

eso
Fig. 2. —Response surface for oat gum from oat bran (top) and rolled oats (bottom) as affected by temperature and pH.
Table 5 —Effect o f temperature and pH on protein concentrate recovery (%) from oat bran and ro lled oats____________________________________
Treatments Oat bran* Rolled oats*
pH 8.0 50°C 89.30±0.01* 83.46 ±0.42»55 91.42 ±1.90* 85.64±3.10»60 90.02 ±0.68» 86.23 ±0.00»70 81.71 ±0.00» 82.00 ± 0 .00»
pH 9.2 50°C 73.65±0.21b 75.84 ±0.42»55 69.56 ±1 .09 ' 66.94 ±3.05»60 74.82 ±0.45»» 66.79±0.12b70 75.54 ±0.00» 70.00 ±0.41»»
pH 10.5 50°C 73.81 ±0.08»* 73.97±0.86b55 78.06 ±1.03» 73.68±0.20b60 75.37±0.06b 79.96 ±0.06»70 72.81 ±1.04* 69.20 ±0.42*
a'c Four means (n = 8) in a column with different letters differ significantly (PsO.05). All values are expressed on dry basis.
rolled oats. Highest values were observed for rolled oats and this was expected since starch is a major component of rolled oats. The native oat bran and rolled oat starch contents ranged from 45.1%-49.0% and 65.2-68.3%, respectively. Based on starch contents of the native oat products (Table 6), most of the treatments resulted in a high degree of starch recovery. The variability in amounts of starch recovered indicates the importance of pH-temperature conditions on starch extraction.
eaos!
Fig. 3.—Response surface for p-glucan from oat bran (top) and rolled oats (bottom) as affected by temperature and pH.
Table 6—Effect o f temperature and p H on starch recovery (%) from oat bran and ro lled oats
Treatments Oat bran» Rolled oats»
pH 8.0 50°C 45.05±0.21» 75.84 ±1 02»55 49.55±0.13» 86.74 ±1.47»60 38.03 ±2.58* 61.37 ±1 .05 '70 30.21 ±0 .47d 84.99 ±0.00»
pH 9.2 50°C 63.57 ±3.82» 69.22 ±1.13»55 55.23±0.35b 66.36 ±5.26»60 57.68±3.31»b 82.71 ±3.69»70 52.86 ±0 .13» 57.92 ±3.39»
pH 10.5 50°C 56.69 ±3.07» 67.20 ±4.83»55 50.62 ±0.32» 87.12±3.69>60 47.80 ±2.32» 63.15±3.57b70 56.18± 1.48» 77.69 ±2.09»
ad Four means (n = 8) in a column with different letters differ significantly (PsC.05). Values are expressed on dry basis.
"Native oat bran and rolled oat starch contents ranged from 45.1-49.0% and 55.2- 68.3%, respectively, as determined by enzymatic/phenol-sulfuric acid method (see Materials and Methods section).
dependence of oat gum/p-glucan extractability on pH. Optimization of time of extraction and solvent ratio may also increase gum yield.
CONCLUSION
TREATMENT combinations of pH 9.2/50°C or pH 10.5/ 50°C/55°C produced oat gum with little or no starch contamination. Oat protein and starch were extracted in good yields as well. Models from multiple regression and 3-D surface plots confirmed the usefulness of temperature and pH treatment combinations in predicting extractability of oat gum/ p-glucan. The regression model for oat bran showed a strong
REFERENCESAnderson, J.W. and Chen, W.L. 1986. Cholesterol-lowering properties of
oat products. In Oats: Chemistry and Technology, F.H. Webster (Ed ), p. 308. Am. Assoc. Cereal Chem., St. Paul, MN.
Aurand, L.W., Woods, A.E., and Wells, M.R. 1987. Carbohydrates. In Food Composition and Analysis, p. 168. Van Nostrand Reinhold Co., New York.
Autio, K., Myllymaki 0., and Malkki, Y. 1987. Flow properties of solutions of oat ß-glucan. J. of Food Sei 52: 1364.
Carr, J.M., Glatter, S., Jeraci, J.L., and Lewis, B.A. 1990. Enzymatic determination of teta-glucan in cereal based food products. Cereal Chem. 67: 226.
Volume 58, No. 3, 1993-JOURNAL OF FOOD SCIENCE-565

OAT G UM EXTRACTION ...
Dubois, M., Giles, K.A., Hamilton, J.K., Rebers, PA , and Smith, F. 1956. Colorimetric method or determination of sugars and related substances. Anal. Chem. 28: 350.
Karkalas, J. 1985. An improved enzymatic method for determination of native and modified starch. J. Sci. Food Agric. 36: 1019.
Leach, H.W., 1965. Gelatinization of starch In Starch Chemistry and Technology, Whistler, R.L. and Paschall, E.F. (Eld.), p. 202. Acedemic Press New York.
Lineback, D.R. 1984. The starch granule organization and properties. Baker’s Dig. 13: 16
Lund, E.K., Gee, J.M., Brown, J.C., Wood, P.J., and Johnson, I.T. 1989. Effect of oat gum on the physical properties of gastrointestinal contents and the uptsdte of D-galactose and cholesterol by rat small intestine. British J. Nutr. 62: 91.
McClear, B.V. and Holme3, M.G. 1985. Enzymatic quantification of (l->3) (1-> 4) p-D-glucan in barley and malt. J. Inst. Brew. 91: 285.
MSTAT 1989. Version 1.2. Michigan State University East Lansing, MI. Pettit, D.J. 1982. Xanthan gum. In Food Hydrocolloids, Glicksman, M.
(Ed.), p. 131. CRC Press, Boca Raton, FL.Preece, I A- and Hobkirk, R. 1954. Non-starch polysaccharide of ceral grains.
V. Some hemicellulose fractions. J. Inst. Brew. London 60: 490.Preece, IA. and Hobkirk, R. 1953. Non-starch polysaccharide of cereal
grains. III. Higher molecular weight gums of common cereals. J. Inst. Brew. London 59: 385.
Preece, I.A. and Mackenzie, K.G. 1952. Non-starchy polysaccharide of cereal grain. II. Distribution of water-soluble gum-like materials in cereal. J. Inst. Brew. London 53: 457.
Robyt, J.F. and White, B.J. 1987. Amino acids, peptides and proteins. In Biochemical Techniques Theory and Practice, p 227. Waveland Press, Prospect Heights, IL.
Sowa H.S.M. and White P.J. 1992. Characterization of starch isolated from oat groats with different amounts of lipids. Cereal Chem. 69 (5): 521.
SYSTAT. 1989 Version 5.0. Systat Inc., Evanston, IL.Welch, R.W. and Lloyd, J.D. 1989. Kernel (l->3) (l->4) Beta D-glucan
content of oat genotypes. J. Cereal Sci. 9: 35.Wood, P.J. 1984. Physiochemical properties and technological and nutri
tional significance of cereal beta-glucan. In Cereal Polysaccharides in Technology and Nutrition, V.F. Rasper (Ed), p. 35-78. Amer. Assoc. Cereal Chem., St. Paul, MN.
Wood, P.J. 1986. Oat 3-glucan: structure, location, and properties. In Oats: Chemistry and Technology, F.H. Webster (Ed.), p 121. Amer. Assoc. Cereal Chem. St. Paul, MN.
Wood, P.J., Anderson, J.W., Braaten, J.T., Cave, N.A., Scott, F.W., and Vachon, C. 1989a. Physiological effect of beta-D-glucan rich fraction from oats. Cereal Food World 34: 878.
Wood, P.J., Braaten, J.T., Frezer, W.S., Riededel, D., and Poste, L.M. 1990. Comparison of viscous properties of oat and guar gum, and effects of these and oat bran on glycémie index. J. Agric. Food Chem. 38: 753.
Wood, P.J., Patton, D., and Siddiqui, I.R. 1977. Determination of beta- glucan in oats and barley. Cereal Chem. 54: 524.
Wood, P.J., Siddique, I.R., and Paton, D. 1978. Extraction of high viscosity gum from oats. Cereal Chem. 55: 1038.
Wood, P.J. and Weisz, J. 1984. Use of calcofluor in analysis of oat p-D- glucan. Cereal Chem. 61: 73.
Wood, P.J., Weisz, J., Fedec, P., and Burrows, V.D. 1989b. Large scale preparation and properties of oat fractions enriched in (1-3) (l-4)-p-D- glucan. Cereal Chem. 66: 97.
Ms received 7/31/92; revised 2/1/93; accepted 2/19/93.
Presented a t the 52nd Annual Meeting of the Institute of Food Technologists, New Orleans, LA June 20-24, 1992.
SPECIFIC HEAT O F SELECTED FRESH SEAFOOD. . .From page 524
Kasprzycka-Guttman and Odzeniak, 1991. Specific heats of some oils and a fat. Thermochimica Acta. 191: 41.
Mohsenin, N.N. 1980. Thermal Properties of Foods and Agricultural Materials, Gordon and Breach, New York.
Moline, S.W., Sawdye, J.A., Short, A.J. and Rinfret, A.P. 1961. Thermal properties of foods at low temperatures. I. Specific heat. Food Technol. 15(5): 225.
Muzilla, M., Unklesbay, N., Unklesbay, K., and Helsel, Z. 1990. Effect of moisture content on density, heat capacity and conductivity of restructured pork/soy hull mixtures. J. Food Sci. 55(6): 1491.
Ogutande, A.O. and Akintoye, O.A. 1991. Measurement and comparison of density, specific heat and viscosity of cow’s milk and soymilk. J. Food Eng. 13: 221.
Ortega, J., Matos, J.S. and Perez, E. 1991. Volumetric behavior of binary systems of cyclohexane with the hexanol isomers at 298.15 K. Thermochimica Acta. 180: 1.
Polley S.L., Snyder, O.P., and Kotnour, P. 1980. A compilation of thermal properties of foods. Food Technol. 34(11): 76.
Putranon, R., Bowrey, R.G., and Fowler, R.T. 1980. The effect of moisture content on the heat of sorption and specific heat of Australian paddy rice. Food Technol. Australia. 32(2): 56.
Rahman, M.S. and Driscoll, R.H. 1991. Thermal conductivity of seafoods: calamari, octopus and prawn. Food Australia 43(8): 356.
Rahman, M.S., Potluri, P.L. and Varamit, A. 1991. Thermal conductivities of fresh and dried seafood powders. Trans. ASAE 34(1): 217.
Redlich, O. and Kister, A.T. 1948. Algebraic representation of thermodynamic properties and the classification of solutions. Ind. Eng. Chem. 40: 341.
Rey, F.J. and Martin-Gil, J. 1989. Excess enthalpies of ketone-triether mixtures. Measurement and application of disquac group contribution method. Thermochimica Acta. 141: 269.
Rice, P., Selman, J.D. and Abdul-Rezzak, R.K. 1988. Effect of temperature on thermal properties of record potatoes. Int. J. Food Sci. Technol. 23: 281.
Sanz. P.D., Alonso, M.D. and Mascheroni, R.H. 1987. Thermophysical properties of meat products: General bibliography and experimental values. Trans. ASAE 30(1): 283.
Short, B.E., Woolrich, W.R. and Bartlett, L.H. 1942 Specific heats of food stuffs. Refrig. Eng. 44(6): 385.
Tang, J., Sokhansanj, S., Yannacopoulos, S. and Kasap, S.O. 1991. Specific heat capacity of lentil seeds by differential scanning calorimetry. Trans. ASAE 34(2): 517.
Ms received 5/12/92; revised 12/11/92; accepted 12/18/92.
ISOLATES GELLAN GUM. . .From page 5 4 3 ________
Kuo, M.S. and Mort, A.J. 1986. Identification and location of L-glycerate, an unusual acyl substituent in gellan gum. Carb. Res. 156: 173.
Martins, L.O. and Sa-Correia, 1991. Gellan gum biosynthetic enzymes in producing and non-producing variants of Pseudomonas elodea. Biotech. Appl. Biochem. 14: 357.
Moorehouse, R. Colegrove, G.T., Sandford, P.A., Baird, K.K., and Kang,K.S. 1981. PS-60; a new gel-forming polysaccaride. ACS Symposium Series No. 150, p. 111. American Chem. Soc., Washington, DC.
O’Neill, M.A., Selvendran, R.R., and Morris, V.J. 1983. Structure of the gelling polysaccharide produced by Pseudomonas elodea. Carb. Res. 124: 123.
Rendleman, J.A. 1978a. Metal-polysaccaride complexes Part I. Food Chem. 3: 47.
Rendleman, J.A 1978b. Metal-polysaccharide complexes Part II. Food Chem. 3: 127.
Sanderson, G.R. and Clark, R.C. 1983. Laboratory-produced microbial polysaccharide has many potential food applications as a gelling, stabilizing, and texturizing agent. Food Technol. 37: 63.
Whitaker, J.R. 1972. Principles of Enzymology for the Food Sciences, p.526. Marcel Dekker, Inc., New York.
Ms received 6/25/92; revised 11/01/92; accepted 12/30/92.
Thanks are due to Kelco Division of Merck and Co., Inc. (San Diego, CA) for samples of gellan and xanthan gums, to the companies which supplied the other hydrocolloids and to Ms. Maritza de Jesüs-Echevarria for help in preparation of illustrations.
VITAMIN D IN MILK. . .From page 556
0‘Keefe, S.F. and Murphy, P.A. 1988. Rapid determination of vitamin D in fortified skim milk. J. Chromatogr. 445: 305.
Pike, R.L. and Brown, M.L. (Ed.) 1984. Fat-soluble and other vitamins. Ch. 4. In Nutrition, an Integrated Approach, p. 137. John Wiley and Sons, Inc., New York.
Sertl, D.C. and Molitor, B.E. 1985. Liquid chromatographic determination of vitamin D in milk and infant formula. J. Assoc. Off. Anal. Chem. 68: 177.
Supplee, G.C., Ansbacher, S., Bender, R.C., and Flanigan, G.E. 1936. The influence of milk constituents on the effectiveness of vitamin D. J. Biol. Chem. 114: 95.
Tanner, J.T., Smith, J., Deflbaugh, P., Angyal, G., Villalobos, M., Bueno,M.P., McGarrahan, E.T., Wehr, H.M., Muniz, J.F., and Hollis, B.W. 1988. Survey of vitamin content of fortified milk. J. Assoc. Off. Anal. Chem. 71: 607.
Thompson, J.N., Hatina, G., Maxwell, W.B., and Duval, S. 1982. High- performance liquid chromatographic determination of vitamin D in for
tified milks, margarine, and infant formulas. J. Assoc. Off. Anal. Chem. 65: 624.
van den Berg, H., Boshuis, P.G., and Schreurs W.H.P. 1986. Determination of vitamin D in fortified and nonfortified milk powder and infant formula using a specific radioassay after purification by high-performance liquid chromatography. J. Agric. Food Chem. 34: 264.
Wickroski, A.F. and McLean, L.A. 1984. Improved reverse-phase liquid chromatographic determination of vitamins A and D in fortified milk, J. Assoc. Off. Anal. Chem. 67: 62.
Zahar, M., Smith, D.E., and Warthesen, J.J. 1986. Effect of carrier type and amount on vitamin A light degradation in fortified lowfat and skim milks. J. Dairy Sci. 69: 2038.
Ms received 9/21/92; revised 1/16/93; accepted 1/27/93.
Published as Paper No. 19,947 of the contribution series of the Minnesota Agricultural Experiment Station based on research conducted under Project 18-087. Supported in part by a grant from the National Dairy Promotion and Research Board.
566-JOURNAL OF FOOD SCIENCE-Volume 58, No. 3, 1993

Pasting of Wheat Flour Extrudates Containing ConventionalBaking Ingredients
G.H. RYU, P.E. NEUMANN, and C.E. WALKER
----------------------------ABSTRACT-----------------------------Pasting properties of extrudates affect product quality and can be controlled by addition of ingredients. We determined the effects of 6 conventional baking ingredients (sucrose, nonfat dry milk (NFDM), dry egg, shortening, glyceryl monostearate (GMS), and sodium bicarbonate) on pasting properties of wheat flour in extrusions using the Rapid Visco-Analyser (RVA). Pasting parameters determined included: initial peak, onset, and peak times; peak and breakdown viscosities and differences between them; ascending and descending slopes and the angle between their lines. Sucrose, shortening, and GMS affected pasting properties significantly. GMS had the greatest effects on peak times and viscosity values.
Key Words: wheat, flour, extrudate, pasting-properties
INTRODUCTIONEXTRUSION-COOKING is a high temperature, short-time (HTST) process finding increased applications in many food industries. Bakeries have used the process to develop and market extruded flat bread. The applications of extrusion-cooking to bakery production have been reported by several researchers (Linko et al., 1984; Mattson et al., 1985; Seiler, 1985; Sharma et al., 1988).
Pasting properties of extrudates are important when the pregelatinized extrudate powders are used as food thickeners. Changes in viscosity of extrudate powders produced under various operating conditions have been studied to determine the factors affecting pasting properties (Anderson et al., 1969; Mason and Hoseney, 1986; Lawton et al., 1972). Some research has been reported on pasting properties of extrudates produced under various extrusion conditions. Mason and Hoseney (1986) investigated operating variables affecting cold and hot paste viscosities of extrusion-cooked wheat starch by using the Amylo/Viscograph. They concluded that hot paste viscosity was affected by die temperature and an interaction between screw speed and barrel temperature, and cold paste viscosity was affected by an interaction between moisture content and production rate. They also reported that swelling peak area, calculated from the amylograph pasting curve, positively correlated with cold paste viscosity. Kim and Rottier (1980) reported that the water absorption capacity of flour, by Amylo/ Viscograph, was significantly affected by extrusion. Their results showed higher extrusion temperatures resulted in greater water absorptions.
The effects of sugars and emulsifiers on pasting properties of cereal starches have been extensively studied by using the rapid visco-analyzer (RVA) (Deffenbaugh and Walker, 1989,1990). They reported that pasting property parameters measured in the RVA agreed with data from other viscometers. The RVA requires small amounts of sample and short times (less than 18 min) to produce pasting curves (Walker et al.,1988). However, use of the RVA has not yet been reported for determining pasting properties of extrudates.
Pasting parameters generated from the RVA provide a rel-
Authors Ryu, Neumann, and Walker are affiliated with the Dept, of Grain Science & Industry, Kansas State Univ., Sheiienberger Hall, Manhattan, KS 66506-2201.
ative measure of starch gelatinization, disintegration, swelling, and gelling ability. Pasting properties of wheat flour extrudates may be influenced by prior addition of common baking ingredients. Our objective was to incorporate common baking ingredients at typical concentrations during extrusion, and report effects on the RVA pasting properties of resulting extrudates.
MATERIALS & METHODSWheat flour
Hard red wheat straight grade flour was obtained from the pilot mill, Dept, of Grain Science & Industry, Kansas State Univ. Proximate analysis were 11.6% protein (N x 5.7), 0.55% ash, and 14.4% moisture. Wet and dry gluten contents were 30.9 and 11.7%, respectively. Mixogram absorption, corrected to 14% moisture content, was 56.3% and mixing time was 4.1 min.
Baking ingredients
Conventional baking ingredients included: sucrose (Amstar Sugar Corporation, New York), spray processed nonfat dry milk (NFDM), dry whole egg powder (Universal Foods Corporation, Milwaukee, WI), dry shortening powder (Armour Food, Springfield, KY), glyceryl monostearate (GMS) (Eastman Chemical Products, Inc., Kingsport, TN), sodium bicarbonate (Church & Dwight, Inc., Princeton, NJ), and salt (NaCl).
Extrusion-cooking
The extruder was a Wenger TX52 co-rotating twin-screw extruder (Sabetha, KS). Wheat flour was blended with baking ingredients for 15 min by using a ribbon mixer (Wenger Mixer MFG., Sabetha, KS). Two die holes 4.32 mm diameter were open. Water was injected into the preconditioner and extruder barrel to adjust dough moisture to 31.1 ± 1.3%. Barrel temperature just before the die was maintained at 130°C by circulating heated oil to the jacket (Fig. 1). The mixture of wheat flour and baking ingredients was fed at 1.5 kg/min. The corotating screw speed was 400 rpm. The dual-knife cutter speed was 15 rpm. Cut extrudate was dried to = 15% moisture content using a forced air dryer (Wenger MFG., Sabetha, KS) at 110°C for 20 min.
M.C.(%) TEMPI C)
Fig. 1 -M oisture and temperature profile of dough in barrel.
Volume 58, No. 3 1993-JOURNAL OF FOOD SCIENCE-567

PASTING O F WHEAT FLOUR EXTRUDATES.. .
TEMPERATURE (°C)
Fig. 2—Sample temperature/time profile during Rapid Visco- Analyzer 18-min test.
RELATIVE VISCOSITY (%)
Fig. 3 -Pasting parameters generated from RVA curves: time- related parameters, initial peak time (IPT), onset time (OT) and peak time fPT): viscosity-related parameters, peak viscosity (P), breakdown viscosity (H) and difference between peak and breakdown viscosity (P-H); slope-related parameters, initial slope IIS), ascending slope (AS), descending slope (DS), and angle between ascending and descending lines (AN).
RVA sample preparation
After drying, cut extrudate (~ 15% moisture) was kept refrigerated at 2°C. Prior to analysis, it was redried using a forced air dryer (Chicago Surgical & Electrical CO., Chicago, IL) at 50°C for 12 hr. The dried extrudate, (= 8 % moisture), was used for analyzing physical properties. Some product was also ground using a Udy Cyclone mill (Fort Collins, CO) for the RVA test.
RVA operating conditions
Pasting properties of ground extrudate powders were measured by the Rapid Visco-Analyzer (RVA) (Newport Scientific Pty. Ltd., NSW, Australia). Each treatment was tested in triplicate.
A sample (5g) of extrudate powder (14% moisture basis) and 25 mL (plus moisture adjustment) of distilled water were placed in an aluminum sample can as previously described (Deffenbaugh and Walker,1989). Pasting properties were measured in the RVA with an 18 min test; initial equilibration 2 min at 50°C, heating 2 min to maximum of 95°C, holding 6 min at 95°C, and cooling 8 min to minimum of 5CPC (Fig. 2).
RVA curve analysis
Ten pasting parameters were determined by RVA curves. They included the time-related parameters: initial peak time (IPT), onset time (OT), and peak time (PT); the viscosity-related parameters: peak
Table 1—Experimental design for the effect o f baking ingredients on ex- trudate properties’_________________________________________________
T rt# bSucrose
(%)NFDM'
(%)Egg{%)
Shortening(%)
GMSd(%)
SBC”(%)
Salt'(%)
101 5 2 3 2.5 1 0.5 1102 10 8 3 5 1 0.1 1103 5 2 9 5 1 0.5 1104 10 8 9 5 0.25 0.1 1105 10 8 3 2.5 0.25 0.1 1106 10 8 9 2.5 1 0.1 1107 5 2 3 5 0.25 0.5 1108 5 2 9 2.5 0.25 0.5 1209 10 8 3 2.5 1 0.5 1210 10 8 3 5 0.25 0.5 1211 5 2 3 2.5 0.25 0.1 1212 5 2 9 5 0.25 0.1 1213 10 8 9 2.5 0.25 0.5 1214 5 2 3 5 1 0.1 1215 5 2 9 2.5 0.25 0.1 1216 10 8 9 5 1 0.5 1317 5 8 9 5 1 0.1 1318 5 8 3 5 0.25 0.1 1319 10 2 3 2.5 0.25 0.5 1320 5 8 9 2.5 0.25 0.1 1321 5 8 3 2.5 1 0.1 1322 10 2 9 2.5 1 0.5 1323 10 2 3 5 1 0.5 1324 10 2 9 5 0.25 0.5 1425 10 2 3 5 0.25 0.1 1426 5 8 3 5 1 0.5 1427 10 2 3 2.5 1 0.1 1428 5 8 9 5 0.25 0.5 1429 10 2 9 5 1 0.1 1430 5 8 3 2.5 0.25 0.5 1431 5 8 9 2.5 1 0.5 1432 10 2 9 2.5 0.25 0.1 1
■ Wenger TX52 twin-screw extruder was used to make samples. bTrt# 101-108 were produced on the first day (block 1). Trt# 209-216 were produced
on the second day (block 2). Trt# 317-324 were produced on the third day (block 3). Trt# 425-432 were produced on the fourth day (block 4).
c Nonfat dry milk d Glyceryl monostearate • Sodium bicarbonate 'NaCI
viscosity (P), breakdown viscosity (H), and difference between peak and breakdown viscosity (P-H ); and the slope-related parameters: initial slope (IS), ascending slope (AS), descending slope (DS), and angle between ascending and descending lines (AN) (Fig. 3).
Experimental design and statistical analysis
Formulations of raw materials were prepared according to a one- half fractional 26 factorial design (Cochran and Cox, 1957) with sucrose, NFDM, whole egg powder, dry shortening powder, glyceryl monostearate (GMS), and sodium bicarbonate (SBC) as baking ingredient factors. Ingredient concentrations for treatments were calculated on the basis of wheat flour weight (baker’s percent). The levels of added baking ingredients were (low and high concentrations): sucrose (5, 10%), NFDM (2, 8 %), whole egg powder (3, 9%), powdered shortening (2.5, 5%), GMS (0.25, 1%), and SBC (0.1, 0.5%). Salt concentration was fixed at 1%. Treatments (32) were separated into 4 blocks, because 4 days were required to complete production of the extrudate samples (Table 1). The dependent response variables were the 10 pasting parameters. Data generated from the experimental design were used to analyze the main effects of baking ingredients, two-way interactions between them (using an analysis of variance), and the mean response variables at low and high levels of baking ingredients (Statistical Analysis System, SAS Institute, Inc., 1985).
RESULTS & DISCUSSION Effects on time-related parameters
Treatment mean values and mean square errors for the time- related parameters, initial peak time (IPT), onset time (OT), and peak time (PT) were compared (Tables 2 and 3). IPT was significantly affected by GMS (P<0.05). Sucrose, NFDM, whole egg powder, shortening powder, and SBC had no significant effects on IPT. There were no interaction effects be-
568—JOURNAL OF FOOD SCIENCE-Volume 58, No. 3, 1993

( a )Table 2 - Mean values fo r time-related parameters o f RVA curves
Treatmentno. IPT3 OT» PT'
101 3.0 4.00 5.55102 3.10 4.45 8.60103 2.95 3.85 7.90104 2.70 3.90 4.95105 3.10 3.60 4.75106 3.00 4.05 5.55107 2.80 3.60 4.95108 3.75 3.85 4.70209 3.10 3.80 6.15210 2.90 3.90 5.20211 2.70 2.80 4.65212 2.75 3.55 4.70213 2.85 3.80 4.85214 2.80 3.80 6.00215 2.95 4.05 5.45216 3.15 4.05 6 .00317 3.35 3.95 5.95318 2.75 3.70 4.85319 2.75 3.65 4.90320 2.85 3.75 4.70321 3.10 4.30 5.45322 2.85 4.05 5.95323 3.00 3.80 8.05324 2.90 3.85 4.85425 2.60 3.67 4.97426 3.03 3.43 6.40427 3.27 3.80 6.23428 2.67 3.67 4.90429 3.33 3.83 6.37430 2.70 3.70 4.70431 3.47 3.97 5.60432 2.83 3.67 4.70
Mean 2.972 3.839 5.579Standard dev. .258 .210 1.025a Initial peak time (min) b Onset time (min) c Peak time (min)
Table 3 -M e a n square errors fo r tim e parameters o f RV A curves
Source IPT3 OT» PT'Sucrose 0.0006 0.0253 0.9870**NFDMd 0.0128 0.0450 0.0544Egg 0.0800 0.0221 0.5724Shortening 0.0648 0.0221 3.6181***GMS3 0.4753** 0.3872*** 17.8204***SBC 0.0128 0.0253 0.2415Block 0.1065 0.0231 0.2077Sucrose'Egg 0.1404 0.0015 1.5225NFDM'Egg 0.0435 0.0032 0.2664Sucrose'Shortenlng 0.0613 0.2648»** 0.0351NFDM*Shortening 0.0078 0.0312 0.0098Egg'Shortenlng 0.0001 0.0018 0.1985Sucrose*GMS 0.0091 0.0001 0.4005NFDM*GMS 0.0968 0.0061 0.1625Egg'GMS 0.0050 0 .0000 0.2888Shortening'GMS 0.0685 0.0242 1.9602**Egg*SBC 0.0325 0.0780 0.1225Shortening’ SBC 0.0153 0.0078 0.0276GMS'SBC 0.0648 0.0861 0.0465* P<0.1; ** P<0.05; *#* P<0.01 a Initial peak time (min)b Onset time (min) c Peak time (min) d Nonfat dry milk• Glyceryl monostearate1 Sodium bicarbonate (NaHCOa)
tween baking ingredients on IPT over the observed ranges. IPT increased from 2.85 min to 3.09 min with the increase in GMS concentration from 0.25% to 1% (Fig. 4a). OT was also significantly affected by GMS (P<0.01), and by the significant interaction between sucrose and shortening powder (P<0.01). Other ingredients did not significantly influence OT which increased from 3.73 min to 3.95 min with the increase in GMS concentration (0.25% to 1%) (Fig. 4b). Sucrose, shortening powder, and GMS significantly influenced PT (P<0.1, P<0.01, and P <0 .01 , respectively). Shortening powder significantly interacted with GMS in affecting PT (P<0.05). Mean values
( b )
cEUJ2
LUCOzo
4.0-1
SUCROSE NFDM EGO SHORTENING QMS*BAKINQ INGREDIENTS
( c )
Fig. 4—Effects of baking ingredient concentrations on time-related pasting parameters (min): (a) initial peak time (min), (b) onset time (min), and (c) peak time (min): Igdsffl, low and high concentration: * indicates significant differences (P<0.05).
of PT increased as concentrations of sucrose, shortening powder, and GMS increased from 5 to 10%, 2.5 to 5%, and 0.25 to 1%, respectively. PT increased from 5.40 min to 5.92 min (Fig. 4c) with the increase in sucrose, from 5.24 min to 5.92 min with the increase in shortening powder, and from 4.83 min to 6.33 min with the increase in GMS.
An increase in sucrose concentration from 5% to 10% sig-
Volume 58, No. 3, 1993-JOURNAL OF FOOD SCIENCE-569

PASTING OF WHEAT FLOUR EXTRUDATES. . .
Table 4 -M e a n values for viscosity-related parameters o f RVA curves
Treatmentno. p* H»
IIQ_
101 47.40 21.12 26.28102 26.65 25.11 1.54103 28.50 24.31 4.19104 32.00 10.40 21.60105 36.60 10.37 26.23106 35.45 15.59 19.86107 43.30 14.14 29.16108 50.30 10.41 39.89209 31.05 19.57 11.48210 35.20 14.24 20.96211 61.00 11.19 49.87212 45.85 10.40 35.45213 39.25 9.79 13.00214 34.00 21.81 12.19215 41.75 17.90 23.85216 25.25 17.28 7.97317 33.00 12.52 20.48318 42.05 11.00 31.05319 46.35 12.39 33.96320 43.95 9.30 34.65321 47.90 18.35 29.55322 34.65 18.10 16.55323 26.80 24.51 2.29324 35.70 9.42 26.28425 40.57 12.07 28.50426 31.20 21.80 9.40427 34.03 20.91 13.12428 41.33 11.31 30.02429 29.97 19.05 10.93430 53.07 10.90 42.17431 39.97 15.00 24.97432 39.97 9.61 30.36
Mean 38.56 15.29 22.26Standard dev. 8.28 5.09 11.85
8 Peak viscosity (%) b Breakdown viscosity (%)c Difference between peak and breakdown viscosity (%)
Table 5 —Mean square errors fo r viscosity parameters o f RVA curves
Source P* Hb (P -H ) ‘Sucrose 570.2065*** 1.6200 526.0146***NFDMd 66.7590** 18.6050** 12.3256Egg 50.7025** 75.6450*** 11.9561Shortening 538.9044»** 25.2050** 772.2450***GIVIS* 603.0865*** 579.7013*** 2219.4453***SBC 7.4305 11.2813* 15.4846Block 4.1089 5.5154 11.9281Sucrose’ Egg 28.6146* 3.5113 34.7361*NFDM»Egg 5.4780 3.7813 0.6786Sucrose'Shortenlng 52.2753** 0.2113 51.2578**NFDM'Shortenlng 3.2513 0.0313 0.3403Egg’ Shortenlng 17.9101* 3.7813 8 .0000Sucrose*GMS 7.3536 1.8050 0.0113NFDM'GMS 33.9488* 13.0050* 36.5513*Egg*GMS 11.6403 9.6800 20.3203Shortening’ GMS 15.5961 3.9200 82.7541**Egg'SBC 0.0648 0.3200 4.3071Shortenlng’ SBC 10.3512 3.6450 36.7653*GMS'SBC 13.0561 0.1513 33.6200**P<. 1; **P<.05; *"P<.01 8 Peak viscosity (%) b Breakdown viscosity (%)c Difference between peak and breakdown viscosity (%) d Nonfat dry milk • Glyceryl monostearate 1 Sodium bicarbonate (NaHC03)
nificantly affected PT (P<0.05) but did not influence IPT and OT. The effect of sucrose on wheat starch gelatinization temperature and/or time has been studied using the Amylograph (Bean and Yamazaki, 1978; D ’Appolonia, 1972), Differential Scanning Calorimetry (DSC) (Spies and Hoseney, 1982), and the RVA (Deffenbaugh and Walker, 1989). They reported that sucrose delayed starch gelatinization temperature/time. Spies and Hoseney (1982) proposed that sugar lowered water activity in a starch-water system and interacted with the starch chain, delaying starch gelatinization in starch-sucrose systems. Sucrose also restricted water available for starch gelatinization,
( a )
BAKING INGREDIENTS
( b )
( c )
Fig. 5—Effects of baking ingredient concentrations on viscosity- related pasting parameters (%): (a) peak viscosity, (b) breakdown viscosity, and (c) difference between P and H: Ijsisi-giia, low and . high concentration: * indicates significant differences (P<0.05).
so sugars could delay starch gelatinization (Bean and Yamazaki, 1978; Deffenbaugh and Walker, 1989). Our data indicate that sucrose may reduce cooking (gelatinization) of wheat flour during extrusion-cooking.
Shortening powder significantly influenced PT (P<0.01) but did not influence IPT and OT. Shortening powder (lipids),
570-JOURNAL OF FOOD SCIENCE-Volume 58, No. 3, 1993

Table 6 - Mean values fo r slope-related parameters o f RVA curves
TreStmentno. IS* AS» DSC ANd
101 0.13 7.12 -1 .9 7 23.75102 0.08 1.48 -0 .31 105.00103 0.12 1.57 -0 .5 9 91.00104 0.35 5.67 - 2.20 24.00105 0.88 5.41 -5 .6 7 21.75106 0.02 4.92 -2 .4 7 22.75107 0.90 6.83 -5 .8 6 19.00108 1.67 6.31 -8 .8 3 14.50209 0.12 3.22 - 1.01 57.25210 0.72 5.41 -3 .4 9 26.00211 2 .20 9.51 -12 .07 10.50212 1.25 6.31 -8 .4 6 15.00213 1.01 5.54 -6 .3 4 19.25214 0.14 3.28 -1 .2 4 55.00215 0.15 7.12 -4 .7 4 19.75216 0 .02 3.49 -0 .6 9 70.50317 0 .02 5.73 -2 .6 0 18.00318 1.09 5.54 -6 .5 0 31.00319 1.62 6.15 -7 .2 3 17.75320 1.14 6.72 -9 .1 5 14.50321 0.07 8.83 -4 .7 4 18.00322 0 .10 4.09 - 1.88 40.75323 0 .12 1.38 -0 .3 5 105.00324 0 .66 6.15 -5 .5 6 19.25325 0.90 6 .20 - 6.11 18.50426 0.08 2.66 -0 .9 3 70.67427 0.05 3.53 -1 .5 2 50.00428 1.07 6.17 - 6 .22 19.67429 0.06 2.28 -1 .0 9 65.83430 1.50 7.46 -9 .0 5 13.33431 0.07 6.05 -2 .5 7 25.50432 0.80 7.30 -8 .6 3 14.33
Mean 0.597 5.263 -4 .377 35.534Standard dev. 0.611 2.049 3.249 27.491• Initial slope b Ascending slope c Descending sloped Angle between ascending and descending line
acting as a lubricant, can modify some starches during extrusion-cooking. Lipids reduce the macromolecular degradation of starch, leading to a high solubility. Fatty acids form an amylose-lipid complex, but fats cannot form complexes with amylose during extrusion-cooking, because fat molecules are larger than the internal helix section of amylose (Colonna and Mercier, 1983; Mercier et al., 1980). The increase in PT with addition of shortening powder was probably caused by reduction in degradation of the starch fraction and amylose-fatty acid complex during extrusion-cooking.
GMS significantly delayed IPT (P<0.05), OT (P<0.01), and PT (P<0.01) (Fig. 4a, b, and c). A complex between amylose and GMS forms during extrusion-cooking. Galloway et al. (1989) observed by DSC thermal analysis that a complex of GMS and soft wheat flour was formed. Formation of an amylose-surfactant com plex during extrusion-cooking increases the gelatinization temperature, delays swelling and reduces solubility (Colonna and Mercier, 1983; Mercier et al.,1980). A complex of GMS and wheat flour amylose was probably responsible for the increases in IPT, OT, and PT.
Effects on viscosity-related parametersTreatment means and mean square errors for 3 viscosity-
related parameters, peak viscosity (P), breakdown viscosity (H) and differences between peak and breakdown viscosity ( P - H ) were compared (Tables 4 and 5). Dengate (1984) and Dengate and Meredith (1984) reported that peak viscosity (P) was dependent on swelling, exudation, and fragmentation of starch. On the other hand, breakdown viscosity (H) was regarded as a measure of the degree of disintegration of starch granules or substances. The extent of starch breakdown is indicated as ( P - H ) in our data.
Sucrose, NFDM, egg, shortening, and GMS significantly influenced H (P<0.01, P<0.05, P <0.05, P<0.01, and P<0.01,
Table 7—Mean square errors for slope parameters o f RVA curves
Source IS* ASb DSe ANd
Sucrose 0.5228*** 17.9850*** 29.9731*** 1495.2246***NFDM* 0.2161** 0.0009 4.6436** 16.1596Egg 0.1395* 0.1815 0.4925 683.7602**SHO' 0.4876*** 28.3693*** 39.7609*** 4272.5768***GMS" 8.4153*** 38.1283*** 213.5728*** 9126.6805***SBCh 0.0157 3.9410** 6.9658*** 522.1296*Block 0.0479 0.9973 1.2915 82.0194Sucrose*Egg 0.0226 3.7196 0.1755 320.4246NFDM*Egg 0.0053 1.1820 0.2610 376.3396Sucrose’ SFIO 0 .0102 6.0639*** 1.0404 3.6046NFDM'SHO 0.0443 1.1742 0.0063 19.1271Egg'SHO 0.0399 2.4035* 0.0504 135.7952Sucrose'GMS 0.4209*** 4.4626* 3.6788** 925.3602**NFDM'GMS 0.1070 4.3882* 8.0702** 338.5202Egg'GMS 0.0830 0.8096 0.8288 400.8696SHO'GMS 0.4536*** 7.8904*** 2.8025** 2393.2821***Egg'SBC 0.0413 0.1418 0.0810 216.6321SHO'SBC 0.0385 0.3983 0.8745 72.7821GMS'SBC 0.0043 0.4876 0.1969 535.6265*** P c .l; **P<.05; #**P<.01 a Initial slopeb Ascending slope c Descending sloped Angle between ascending and descending line• Nonfat dry milk 1 Shorteningo Glyceryl monostearate h Sodium bicarbonate (NaHCOa)
respectively), but SBC did not (Table 5). Interactions occurred between sucrose and egg powder (P < 0 .1 ), sucrose and shortening powder (P<0.05), egg and shortening powder (P < 0.1), and NFDM and GMS (P<0.1). The increase in sucrose content from 5% to 10% reduced mean P values from 42.79% to 34.34% (Fig. 5a). Increases in NFDM (2% to 8%) and whole egg powder content (3% to 9%) decreased mean P values from 40.01% to 37.12% and from 39.82% to 37.31%, respectively (Fig. 5a). The increase in shortening powder (2.5% to 5%) and GMS (0.25% to 1%) also decreased the mean P values from 47.67% to 34.48% and from 42.91% to 34.22%, respectively (Fig. 5a).
The lower P value obtained with the increase in baking ingredient concentrations suggested inhibition of swelling and amylose exudation from wheat starch granules. The formation of complexes of wheat flour and baking ingredients during extrusion-cooking would reduce P. The effect of sucrose on peak viscosity during starch gelatinization was studied using the Amylograph (D’Appolonia, 1972) and RVA (Deffenbaugh and Walker, 1989). Our results for wheat flour extrudates confirmed reports on wheat starches.
NFDM, whole egg powder, shortening powder, GMS, and SBC significantly influenced H (P< 0.05 , P < 0 .01 , P <0 .05 , P < 0 .01 , and P < 0 .1 , respectively) (Table 5). An NFDM x GMS interaction occurred (P < 0.1). Sucrose in the range 5% to 10% did not affect H. A higher H indicates less breakdown of starch granules. Increasing NFDM (2% to 8%) and egg powder (3% to 9%) concentrations reduced H from 16.08% to 14.53% and from 16.84% to 13.77%, respectively (Fig. 5b). On the other hand, increases in shortening powder (2.5% to 5%), GMS (0.25% to 1%), and SBC (0.1% to 0.5%) concentrations increased H from 14.41% to 16.21%, from 11.06% to 19.56%, and from 14.72% to 15.89%, respectively (Fig. 5b).
The degree of breakdown for wheat flour extrudate may be explained by the difference between peak and breakdown viscosity ( P - H ) . Sucrose, shortening powder, and GMS significantly influenced ( P - H ) (P<0.01) (Table 5). Interactions of sucrose x egg powder (P < 0.1), sucrose x shortening powder (P<0.05), NFDM x GMS (P < 0 .1 ), shortening powder x GMS (P<0.05), shortening powder x SBC (P<0.1), and GMS x SBC (P<0.1) also affected ( P - H ) . Sucrose, shortening powder and GMS contributed to a decrease in degree of breakdown for wheat flour extrudates during pasting. The increase in sucrose concentration (5% to 10%) reduced ( P - H ) from
Volume 58, No. 3, 1993-JOURNAL OF FOOD SCIENCE-571

PASTING OF WHEAT FLOUR EXTRUDATES. . .
( a )
SUCROSE * NPDM * EQQ SHORTENING 1BAKING INGREDIENTS
( b )
7.0-1
BAKING INGREDIENTS
( c ) ( d )
Fig. 6—Effects of baking ingredient concentrations on slope-related pasting parameters: (a) initial slope, (b) ascending slope, (c) descending slope, and (d) angle between ascending and descending lines: 1 1 1 1 1 ], low and , concentration: * indicatessignificant differences (P<0.05).
Table 8 - Correlations between time, viscosity, and slope-related pasting parameters
Time parameters Viscosity parameters Slope parametersIPT* OTb PT* P* H*
XICL IS» ASh DS' AN'IPT 1OT 0.35PT 0.31 0.43P -0 .2 4 - 0.21 -0 .7 0 *H 0.28 0.40 0.89* -0 .5 4 *(P -H ) -0 .2 8 -0 .3 2 -0 .8 9 * 0.91* 0.91*IS -0 .3 6 -0 .4 8 -0 .6 5 * 0.77* -0 .7 1 * -0 .8 1 *AS -0 .2 6 -0 .0 7 -0 .8 2 * 0.87* -0 .6 7 * 0.89* 0.59DS -0 .3 4 -0 .4 0 0.77* -0 .9 2 * 0.80* -0 .9 2 * -0 .9 1 * -0 .7 9 *AN -0 .2 4 0.25 0.94* -0 .7 5 * 0.83* -0 .8 9 * -0 .5 7 * -0 .9 0 * 0.75* 1* P<0.01■ Initial peak time (min) b Onset time (min)
c Peak time (min) d Peak viscosity (%)
• Breakdown viscosity (%)
f difference between peak and breakdown viscosities (%) o Initial slope
h Ascending slope ' Descending slope
i Angle between ascending and descending lines
27.12% to 19.12%. Increases in shortening powder (2.5% to 5%) and GMS (0.25% to 1%) also decreased (P — H) from 27.98% to 18.16% and from 31.40% to 14.74%, respectively (Fig. 5c). Inhibition of hydration was indicated by the lower breakdown in addition to the higher peak time. The higher concentration of lipid-amylose complex and less degradation of starch during extrusion-cooking inhibited breakdown of starch by pasting.
Effects on slope-related pasting parametersTreatment means and mean square errors of slope-related
pasting parameters, initial (IS), ascending (AS), and descending (DS) slopes and angle between ascending and descending lines (AN), were compared (Tables 6 and 7). These slope- related pasting parameters indicate gelatinization, swelling, or breakdown rate. IS was significantly affected by sucrose
572-JOURNAL OF FOOD SCIENCE-Volume 58, No. 3, 1993

V IS C O S IT Y (%)1 0 0 ----------
Fig. 7-RVA curves of wheat flour and extrudate samples, (a) wheat flour extrudate, (b) wheat flour extrudate containing baking Ingredients, (c) control wheat flour, and (d) wheat flour containing baking ingredients. Baking ingredient concentrations used for (d) were 5% sucrose, 2% NFDM, 9% egg powder, 5% shortening powder, 0.25% GMS, and 0.1% sodium bicarbonate.
(PcO.Ol), NFDM (P<0.05), whole egg powder (P<0.1), shortening powder (P<0.01), and GMS (P<0.01) (Table 7). There were significant effects of sucrose x GMS (PcO.Ol) and shortening x GMS (PcO.Ol) interactions on IS. With an increase in sucrose, NFDM, egg powder, and shortening powder concentrations, IS slightly decreased (Fig. 6a). An increase in GMS concentration (0.25% to 1%) resulted in a much larger decrease for IS, which highly correlated with water absorption index (WAI) of wheat flour extrudate (Ryu and Walker, unpublished data). Thus, IS may be used as the water absorption index of extrudate.
Sucrose, shortening powder, GMS, and SBC significantly decreased AS (PcO.O l, PcO .O l, PcO.Ol and P c0 .0 5 , respectively) (Fig. 6b). There were significant effects of sucrose x shortening powder (PcO.O l), egg powder x shortening powder ( P c 0.1), sucrose x GMS ( P c 0.1), NFDM x GMS (P cO .l) , and shortening powder x GMS (PcO.Ol) interactions on AS (Table 7). The decrease in AS with increases in sucrose, shortening powder, and GMS resulted from a decreasing swelling or water absorption rate of the extradâtes by hydration inhibition and by formation of a lipid-amylose complex. The complex would cause more time and energy to be required to gelatinize starch. An increase in SBC concentration (0.1% to 0.5%) decreased AS from 5.61 to 4.91 (Fig. 6b). The addition of SBC causes starch oxidation during extrusion-cooking and changes water absorption capacity and swelling of extruded starch (Lai et al., 1989).
DS indicates disintegration (fragmentation) of starch granules by energy inputs, including heat and shear. Sucrose, NFDM, shortening powder, GMS, and SBC influenced DS (P<0.01, P <0 .05 , P <0.01 , P<0.01 and P < 0 .01 , respectively) (Table7). There were effects of sucrose x GMS, NFDM x GMS and shortening powder x GMS interactions on DS (P<0.05). GMS sharply reduced DS from —6.96 to —1.79 (Fig. 6c). Interaction of sucrose with starch chains may decrease the breakdown rate of starch and reduce its viscosity. Formation of a lipid-amylose complex by shortening powder and GMS during extrusion-cooking may also reduce breakdown of the starch granules.
Sucrose, egg powder, shortening powder, GMS, and SBC significantly influenced AN (PcO.Ol, P c0 .05 , PcO.Ol, PcO.Ol and P c O .l , respectively). There were effects of sucrose x GMS ( P c 0.05), shortening powder x GMS (PcO.O l), and GMS x SBC ( P c 0.05) interactions on AN (Table 7). In-
creases in sucrose, shortening powder, GMS and SBC concentration widened AN, but egg powder decreased AN (Fig. 6d).
Relationship between pasting param eters
The relationships between pasting parameters are presented in Table 8. PT had a higher correlation with H, ( P - H ) , AS, and AN. As PT increased, AN increased (R = 0.94). P highly correlated with ( P - H ) , AS, and DS. H positively correlated with ( P - H ) , DS, and AN. On the other hand, ( P - H ) negatively correlated with IS, DS and AN. AN correlated positively with AS, but negatively with DS because DS had a negative slope. Slopes of AS and DS correlated negatively (R = —0.79).
RVA curves of non-extruded and extruded flours
Figure 7 shows the effects of extrusion and baking ingredients on RVA curve patterns. IS was increased by extrusioncooking but decreased by addition of baking ingredients. The IS may indicate the starch gelatinization degree and swelling capacity, which were increased by extrusion-cooking. Therefore, the IS of extruded wheat flour with/without baking ingredients was higher than that of the others. Sucrose, shortening powder, and GMS appeared to delay starch gelatinization during extrusion.
Extrusion also increased (P — H) and P, whereas baking ingredients decreased them. Thus addition of baking ingredients decreased the shear thinning during the pasting of wheat flour extradates. Extrusion-cooking, in addition to baking ingredients, greatly affected pasting properties of wheat flour extra- dates.
CONCLUSIONS
BAKING INGREDIENTS influenced pasting properties of wheat flour extrudates. Sucrose, shortening powder, and GMS had the most effect. Thus, pasting properties could be controlled by changing cor.centrations of such ingredients. Gelatinization, swelling, and WAI of wheat flour extrudates produced with baking ingredients could be estimated by RVA analysis. Quick measurements of extrudate pasting characteristics with the RVA could permit process operators to monitor extruder systems and optimize conditions.
REFERENCES
Anderson et al. 1969.Bean, M.M. and Yamazaki, W.T. 1978. Wheat starch gelatinization in
sugar solutions. I. Sucrose: microscopy and viscosity effects. Cereal Chem. 55: 936.
Cochran, W.G. and Cox, G.M. 1957. Experimental Design, 2nd ed. John Wiley and Sons, Inc., New York.
Colonna, P. and Merrier, C. 1983. Macromolecular modifications of manioc starch components by extrusion-cooking with and without lipids. Carbohydrate Polymer 3: 87.
D’Appolonia, B.L. 1972. Effect of bread ingredients on starch-gelatiniza- tion properties as measured by Amylograph. Cereal Chem. 49: 532.
Deffenbaugh, L.B. and Walker, C.E. 1989. Use of the rapid visco-analyzer to measure starch pasting properties. Part I: Effect of sugars. Starch 41: 461.
Deffenbaugh, L.B. and Walker, C.E. 1990. Use of the rapid visco-analyzer to measure starch pasting properties. Part II: Effect of emulsifiers and sugar-emulsifier interactions. Starch 42: 89.
Dengate, H.N. 1934. Swelling, pasting, and gelling of wheat starch. In Advances in Cereal Science and Technology, Vol. VI. Pomeranz, Y. (Ed). AACC, St. Paul, MN.
Dengate, H.N. and Meredith, P. 1984. Do cultivar, season and location of growth affect wheat starch pasting? Starch 36: 419.
Galloway, G.I., Biliaderis, C.G., ana Stanley, D.W. 1989. Properties and structure of amylose-glyceryl monostearate complexes formed in solution or on extrusion of wheat flour. J. Food Sci. 54: 950.
Kim, J.C. and Rottier, W. 1980. Modification of aestivum wheat semolina by extrusion. Cereal Foods World 24: 62.
Lai, C.S., Guetzlaff, J., and Hoseney, R.C. 1989. Role of sodium bicarbonate and trapped air in extrusion. Cereal Chem. 66: 69.
Lawton, B.T., Henderson, G.A., and Derlatka, E.J. 1972. The effect of extruder variables on the gelatinization of corn starch. Can. J. Chem. Eng. 50: 168.
Linko, P., Mattson, C., Linko, Y.Y.. and Antila, J. 1984. Production of flat-Continued on page 598
Volume 58, No. 3, 1993-JOURNAL OF FOOD SCIENCE-573

M e l t P o i n t o f E n c a p s u l a t e d S o d i u m B i c a r b o n a t e s : E f f e c t o n
R e f r i g e r a t e d B a t t e r a n d M u f f i n s B a k e d i n C o n v e n t i o n a l a n d
M i c r o w a v e O v e n s
C.L. DORKO and M.P. PENFIELD
----------------------------ABSTRACT-----------------------------Refrigerated muffin batter containing encapsulated sodium bicarbonates (ESB) differing in encapsulate melt points (EMP) and muffins baked from the batters in conventional and microwave ovens were evaluated. Muffin batter was prepared with ESB of 3 EMP (43, 52 and 60°C) and tested after 1 day (0 wk) and 1, 2, 3, and 4 wk. Batter pH increased from 0 wk to 1 wk. Specific volumes of microwave- baked muffins containing EMP 43 or 60°C increased with storage and were highest; the EMP 52°C microwave-baked muffins had the lowest specific volumes. Conventionally baked muffins were darker than microwave-baked muffins. Panelists evaluated microwave-baked muffins as flatter than conventionally baked muffins.
Key Words: encapsulation, sodium bicarbonate, muffins, batter quality, ovens, microwaves
INTRODUCTION
CONSUMER markets for foods that are convenient, high-quality, and healthy (Sills-Levy, 1989) can be partially served by refrigerated batters for quick breads such as muffins. Quality of muffins depends on the effectiveness of the leavening and loss of leavening power during refrigeration is likely. Encapsulation or microencapsulation envelopes ingredients in coatings or “capsules” (Dziezak, 1988). NaHC03 has been encapsulated by different methods and with various fats and oils which resulted in differences in coating melt points. Reaction of the NaHC03 with acid is delayed until the encapsulate melt point is reached, likely resulting in differences in quality and/or time of C02 release during baking. Product quality would, therefore, be affected.
Bakery products have mostly been formulated for baking in a conventional oven. Baking in a microwave oven would reduce time, but quality characteristics of microwave-baked products often differ from those of products baked in a conventional oven. Performance of encapsulated baking soda in microwave-baked products may differ from performance in conventionally baked products.
Published research on refrigerated batters, the effect of batter refrigeration on baked product quality, or use of encapsulated leavening agents is non-existent. In addition, limited published research shows that products baked in a microwave oven are typically of lower quality compared to conventionally baked items. No reports on use of encapsulated leavening systems for such products baked in a microwave oven were found.
The objectives of our study were to investigate the effects of NaHC03 encapsulate melt point (EMP) on batter characteristics over 4-wk storage and to investigate the effects on the sensory and quality characteristics of muffins baked from refrigerated batters in conventional or microwave ovens.
A u t h o r P e n f i e l d i s a f f i l i a t e d w i t h t h e A g r i c u l t u r a l E x p e r i m e n t
S t a t i o n a n d F o o d S c i e n c e & T e c h n o l o g y D e p t . , T h e U n i v . o f
T e n n e s s e e , K n o x v i l l e , T N 3 7 9 0 1 - 1 0 7 1 . A u t h o r D o r k o ’s c u r r e n t
a d d r e s s : E a s t m a n C h e m i c a l C o m p a n y , K i n g s p o r t , T N .
MATERIALS & METHODSExperimental design
Encapsulated sodium bicarbonates (ESB) with three melt points, 43°C (MP43), 52°C (MP52), and 60°C (MP60) were studied. NaHC03 particle size was No. 5 or coarse. The experiment was a complete block design with four factors: three melt points, five storage times (1 day or 0 wk and 1, 2, 3, 4 wk), two baking methods (conventional and microwave oven), and three replications.
Mixing and storage procedures
The formulation and sources for ingredients for pourable refrigerated bran muffin batter are given in Table 1. The bran cereal was ground in a mill (Fitz Mill, model J, Elmhurst, IL) equipped with a screen of mesh size 100. The flour, sugar, bran cereal, dried buttermilk, and salt were weighed and stored at room temperature prior to mixing. The water, cottonseed oil, whole egg, and ESB were weighed the day of mixing.
The batter was mixed in a Hobart mixer (model A200, Troy, OH) with a 19-L bowl using a flat beater for all mixing procedures. The liquid ingredients were mixed together on speed 1 for 1 min; dry ingredients then were added to liquid ingredients and blended on speed 1 for 1 min. The bowl and beater were scraped and ingredients were mixed further on speed 2 for 2 min. The batter was poured immediately into glass jars and stored in a cooler at 0-l°C. The batters and muffins were tested at each of five storage periods, 1 day after preparation (0 wk) and at 1-wk intervals thereafter. The 4-wk storage period was based on preliminary work on potential shelf life.
Batter tests
A Chittick Apparatus (VWR Scientific, Chicago, IL) was used for measuring C02 release following a modification (Veit, 1950) of AACC Method 12-10 (AACC, 1983) for residual C02. Batter (20g) was placed in the flask to which 40 mL distilled water was added followed immediately by 25 mLof 1:1 dilution of sulfuric acid (RICCA Chemical Company, Arlington, TX). Samples were stirred for 30 min and generated C 02 was determined by measuring the amount of saturated NaCl solution displaced. Amount of C02 (mL) evolved was converted to percentage of batter weight correcting for differences in temperature and pressure. The pH was measured with a Corning M215 pH meter
Table 1 — Pourable refrigerated bran m uffin batter formulation
In g re d ie n t B a k e rs p e rc e n t
w a te r 2 1 3 .6c a k e f lo u r* 1 0 0 .0sug ar*1 9 5 .4b ra n c e re a l* 8 1 .8c o tto n s e e d o lld 3 3 .4p a s te u riz e d fro z e n e g g s * 3 1 .8d r y b u tte rm ilk * 15 .1e n c a p s u la te d b a k in g so d a» v a r ia b les a lt 1 .9
• Softasilk, General Mills.b Domino Extra Fine Granulated, Amstar Corp. c All-Bran, Kelloggs.d Wesson Pure Cottonseed Oil, Hunt-Wesson, Inc.• Sunny Fresh Eggs, Cargill.f San-a-Buttermilk 985, Beatreme Foods.8 Cap-Shure(R) Encapsulated Sodium Bicarbonate BC-110-60 (5.3%), BC-140-70
(4.5%), Balchem Corp.; Durkote Sodium Bicarbonate 125-50 (6.4%), Van Den Bergh Foods Co.
574—JOURNAL OF FOOD SCIENCE—Volume 58, No. 3, 1993

Table 2 -S e n so ry characteristics, definitions, and scale anchors fo r m uffin evaluation
C h a ra c te r is t ic D e fin it io n S c a le a n c h o rs *
M o is tu re W e tn e s s o r o ilin e s s r e le a s e d b y m u ffin D R Y (A ) - M O IS T (B)
C o lo r C o lo r o f c ru m b L IG H T (C) — D A R K (D )E ase F o rc e a n d e f fo r t r e q u ire d E A S Y T O C H E W (F) —
o f c h e w in g to p r e p a re fo r s w a llo w ing
D IF F IC U L T T O C H E W (A )
A d h e s io n A m o u n t o f m u ff in s tic k in g N O N E (E) —to te e th to o r r e m a in in g in te e th
a f te r s w a llo w in gC O M P A C T M A S S (G )
S h a p e C o n fig u ra t io n o f m u ffin s u rfa c e r a n g in g f ro m p a ra lle l to b o t to m to c u rv e d as in a s e m i-c irc le
F L A T - R O U N D E D
C ru m b lin e s s D e g r e e to w h ic h m u ff in fe ll to p ie c e s w h e n c u t in h a lf w ith th e s id e o f a fo r k
N O N E (E) — C O M P L E T E (H )
a References indicated by letters in () after anchor terms are shown below.Package instructions were followed unless indicated.A-Bisquick Velvet Crumb (Use 250 g Bisquick and overbeat 5 min).B-Duncan Hines Moist Deluxe Yellow.C-Pillsbury All Ready Pie Crusts.D-Betty Crocker Gingerbread Cake & Cookie Mix.E-Betty Crocker Angel Food Cake.F-Duncan Hines Moist Deluxe Butter Recipe Golden (Overbeat on medium for 6 min).G-Pillsbury Brownie Microwave (Use 60 mL oil).H-Jiffy Golden Cake Mix (Add 32 g cornmeal).
with a calomel, combination electrode (Coming Science Products, Coming, NY) calibrated to pH 7. Measurement was determined after mixing lOg batter with 40g deionized water. Batter density also was determined.
Baking procedure
Muffins were baked at the end of each storage period. For both baking methods, batter (35 ± O.lg) was weighed into Anchor Hocking Microware (St. Paul, MN) muffin pans (248-mm diameter) that had been coated with vegetable oil cooking spray and the bottoms had been lined with waxed paper. Muffins were baked in a Sears (Chicago, IL) electric range (model 93301) at 177°C for 16 min or microwave- baked in a Quasar (Elk Grove Village, IL) countertop microwave oven (model MQS1108W, 800 watts) on a Nordic Ware (Minneapolis, MN) Compact Micro-Go-Round food rotator (model 62301). Baking time was 2.45 min on maximum power. Microwave output was tested daily (Van Zante, 1973) and averaged 538.3 ± 24.6 watts. All muffins were cooled 20 min before removing from the pan. All testing was completed on the day of baking.
Muffin and crumb tests
Three muffins from each treatment were weighed, volumes were determined by rapeseed displacement, and specific volumes (cm3/g) were calculated. Color was evaluated with a HunterLab/Difference Meter D25-2M (Hunter Associates Laboratory Inc., Reston, VA). Muffins were ground in a Black & Decker (Shelton, CT) Shortcut Food Processor (model CFP10) for 10 sec and placed in a cuvette (80-mm diameter). A tan tile (Hunter C2-21128; Hunter L, “ a” , and “ b” values of 77.0, —1.6, and 21.0, respectively) was used to standardize the instrument. Hue angles (tan-1 a/b) and chroma values (a2 + b2)m were calculated (Clydesdale, 1984; Francis, 1985). Moisture content of 2-g samples of ground muffins was determined by the Modified Vacuum-Oven AACC Method 44-40 (AACC, 1983).
Sensory evaluation
A panel of graduate students and staff (seven women, five men) attended an orientation session to define terms to be used to evaluate muffin characteristics. A lexicon of descriptors (Table 2) was adapted from those developed by McNeil (1989). A 15-cm line scale anchored at each end with opposing descriptors was used for each characteristic. Panelists were given references for each characteristic anchor (Table2). All panelists were required to review descriptors and references before beginning their first panel each week.
Panelists evaluated samples in individual booths under white fluorescent lights. Six samples (one-half muffin cut vertically) were pre
sented individually in plastic recloseable sandwich bags. White paper plates and stainless steel forks were provided with each sample. Samples, coded with three-digit random codes, were present in random order. Room temperature spring water was provided for rinsing between samples.
Statistical analysis
Data were analyzed with PROC ANOVA (Statistical Analysis System) (SAS Institute, Inc., 1985) to determine effects of ESB melt point, storage time, baking method, replication within storage time, and appropriate interactions on dependent variables. Models were reduced by eliminating all non-significant (P>0.05) interactions. Main effect and significant interaction mean differences were determined using Tukey’s Studentized Range Test (O’Mahony, 1986; SAS Institute, Inc., 1985). Differences were considered significant at P<0.05.
RESULTS & DISCUSSIONBatter tests
C02 evolution, an indicator of leavening potential, was affected significantly only by ESB melt point. As expected, the batter containing the lowest melt point ESB (MP43) yielded the greatest amount of C02 (0.23%). The intermediate melt point encapsulate, MP52, had the least amount of C02 evolved (0.13%). However, we had expected the highest melt point encapsulate, MP60 (0.18%), would yield the least amount of C02. Reasons for the low MP52 ESB yield are not apparent.
Batter pH was affected by ESB melt point and batter storage period (Fig. 1). For all encapsulates, pH increased from wk 0 to wk 1 then leveled off for the rest of the storage. The pH of the MP52 batter was lower than the pH of the other batters. The pH increase from wk-0 to wk-1 storage is attributable to release of some NaHC03 by mechanical rupture of the encapsulate during mixing and subsequent neutralizing of acid (buttermilk). The pH stabilized for the remainder of storage because the encapsulate protected the NaHC03. The lower pH with the MP52 ESB indicated less encapsulate breakdown occurred and, therefore, less C02 evolved. The MP43 and MP60 ESB had higher, nearer neutral, pH and higher amounts of C02 evolution indicating greater breakdown of encapsulate and release of NaHC03.
A significant interaction was found for effects of ESB melt point and batter storage period on batter density (Fig. 1). For all storage periods MP52 had a higher batter density than did MP43 and MP60 indicating a smaller amount of gas was present. Pyler (1988) stated that batter specific gravity or density was basically the result of type and amount of mixing; however, mixing of batters was controlled for both factors. Explanation for differences could be attributed to possible release of NaHC03 via breakdown of encapsulate of the MP43 and MP60 and subsequent production of C02 and less dense batter.
Muffin and crumb testsMuffin moisture was not affected by batter storage. How
ever, a significant interaction for the effects of baking method and ESB melt point on muffin moisture was found (Table 3). Conventionally baked muffins from batter with different melt points of ESB had significantly higher moisture than did microwave-baked muffins. Those prepared from batter containing MP52 ESB and baked in the microwave oven had significantly higher moisture than MP43 microwave-baked muffins. Neither the MP52 nor the MP43 microwave-baked muffins differed from the MP60 microwave-baked muffins. The lower moisture content of microwave-baked muffins agreed with the reports of Street and Surratt (1961) and Van Zante (1973) for cakes baked in microwave ovens.
A significant interaction between melt point and baking method for sensory scores for muffin moistness also occurred (Table 3). Muffins containing ESB of all melt points and baked in the conventional oven were evaluated significantly higher
Volume 58, No. 3, 1993—JOURNAL OF FOOD SCIENCE-575

ENCAPSULATED N aH C 03 MELT PO IN T. . .
Storage (wk)Fig. 1 . - Batter pH and density and Hunter L values o f muffins as related to m elt po in t (MP) o f encapsulated NaHC03 and batter storage time. IEach point represents the mean across three replications).
Table 3 - Characteristics o f muffins baked from batters prepared with 3 m elt points o f sodium bicarbonate and baked in conventional ICON) and microwave ovens (MW)11 ____________________________
Melt point <°C)43 52 60
Oven Oven Ovenistics CON MW CON MW CON MW
Moisture (%) 38. lx 34.3z 37.6x 35.9y 37.9x 34.7yz
Color±0.8 ±1.9 ±0.8 ±1.1 ±1.3 ±0.8
L 35.22 40.1w 35.3z 37.1x 36.2y 41.2w±1.0 ±0.9 ±0.7 ±1.0 ±0.8 ±0.6
Hue angle 21.4x 18.8y 22.3w 21.5x 21.1x 18.3x±0.6
Sensory Characteristicsb
±0.5 ±0.7 ±0.7 ±0.6 ±0.3
Moisture 99.8wx 42.1z 105.3w 70.9y 95.9x 42.6z±33.6 ±29.4 ±31.5 ±39.9 ±32.3 ±32.0
Color 94.3x 55.2z 95.9x 85.3y 93.8x 52.2z
Ease of±18.5 ±17.2 ±16.9 ±22.6 ±17.0 ±15.3
chewing 61.Ox 51.7z 59.5xy 80.1w 61.1x 53.3yz±33.3 ±33.6 ±35.4 ±: 37.1 ±35.9 ±37.2
3 n = 15; means and standard deviations across five batter storage periods and three replications. Means followed by different letters within a row are significantly different (P<0.05).
b Anchors for scales (0-150): moisture (dry-moist); color (light-dark); ease of chewing (easy-difficult).
Fig. 2. —Sensory scores fo r moisture 10 = dry, 150 = moist) and adhesion to teeth (0 = none, 150 = compact mass) for muffins baked in conventional (CON) and microwave (MW) ovens related to batter storage time. (Each point represents the mean across three m elt points, 12 panelists, and three replications).
in moisture than those baked in the microwave. Conventionally baked muffins containing MP52 ESB were scored significantly moister than those containing MP60 ESB. Muffins with MP52 ESB baked in the microwave were evaluated significantly more moist than the microwave-baked MP43 or MP60 muffins.
A significant interaction for sensory moisture also was found for baking method and batter storage period (Fig. 2). Conventionally baked muffins were evaluated as significantly more moist than microwave-baked muffins across all batter storage periods. Differences in moisture increased over time. Sensory moisture scores reflected the analyzed moisture content of the muffins (Table 3). Panelist evaluations also agreed with scores of panelists who evaluated microwave-baked cakes as less moist than conventionally baked cakes (Neuzil and Baldwin, 1962; Stinson, 1986). However, Street and Surratt (1961) reported that sensory panelists did not detect differences for moisture of cakes baked in the microwave or conventional ovens.
Interaction of ESB melt point, batter storage, and baking method was found for muffin specific volume (Fig. 3). Microwave-baked muffins with MP43 or MP60 ESB had higher specific volumes for all batter storage periods than the muffins baked in the conventional oven. The greater specific volume for those microwave-baked muffins agreed with results of published cake studies (Street and Surratt, 1961; Van Zante, 1973). Microwave-baked muffins containing MP52 ESB had a low specific volume for all batter storage periods. However, differences were not significant always from conventionally baked muffins containing MP43 or MP52 ESB. This lower specific volume was related to the higher batter density discussed previously. Another observed interaction was across storage periods, the muffins that were microwave-baked had increasing and higher specific volumes by wk 4. Some muffins baked in the conventional oven initially had higher specific volumes than after subsequent batter storage periods.
Microwave-baked muffins with MP52 ESB were visually
576-JOURNAL OF FOOD SCIENCE-Volume 58, No. 3, 1993

F i g . 3 . - M u f f i n s p e c i f i c v o l u m e r e l a t e d t o m e l t p o i n t ( M P ) o f
e n c a p s u l a t e d N a H C O y b a k i n g m e t h o d ( C O N = c o n v e n t i o n a l o v e n ,
M W = m i c r o w a v e o v e n ) , a n d b a t t e r s t o r a g e . ( E a c h p o i n t r e p
r e s e n t s t h e m e a n a c r o s s t h r e e r e p l i c a t i o n s ) .
distinct from the other muffins at all batter storage periods. They were comparatively dark and short with a flat top surface that sloped toward the middle of the baking pan. When cut open, such muffins appeared to be primarily gelatinized starch. Thus we hypothesize that the starch gelatinized before adequate NaHC03 was released from the melting ESB. Based on the ESB melt point, the NaHC03 in that product should have been released before gelatinization temperatures (56-60°C) were reached and before MP60 melted.
Hunter L values were affected by ESB melt point and batter storage (Fig. 1). Generally, muffin crumb became darker with batter storage for the MP43 and MP60 ESB products. However, muffin crumb was significantly lighter at all batter storage periods for MP60 muffins and for wk 0-2 for MP43 muffins compared to crumb color of muffins with MP52 ESB. Hunter Lvalues for muffins with MP52 did not change across storage. Differences in crumb lightness were probably attributable to differences in specific volume. Those with a greater volume would have more open structure and be lighter in color.
The effects of baking method and batter storage on Hunter L values also were related (Fig. 4). Muffins baked in the microwave oven had significantly higher Hunter L values, or were lighter, than those baked in the conventional oven for all batter storage periods. This agreed with Stinson (1986) who reported that yellow single and double layer cakes baked in a microwave/convection oven had higher Hunter L (lighter crumb) values than cakes baked in a conventional oven. Within each oven type Hunter L values fluctuated with storage time.
The effects of melt point and baking method on Hunter L values also were related (Table 3). Hunter L values were significantly greater for microwave-baked muffins than for conventionally baked muffins. Microwave-baked muffins containing MP43 and MP60 ESB were lighter than those containing MP52 ESB. Muffins containing MP60 ESB and baked in the conventional oven were lighter than conventionally baked muffins containing MP43 or MP52 ESB. The variation in lightness was related to differences in specific volumes among the melt point and baking method combinations. Patterns of differences in sensory scores were similar to those for Hunter L value data with one exception. The MP60 ESB muffins from the conventional oven were not lighter than conventionally baked MP43 or MP52 muffins (Table 3).
A significant interaction between baking method and batter storage period for hue angle was found (Fig. 4). Hue angle was greater for conventionally baked muffins than microwave- baked muffins for all batter storage periods indicating conventionally baked muffins had less red or more yellow crumb. This difference was reflected in visual observations. Conven-
F i g . 4 . - C r u m b c o l o r H u n t e r L a n d h u e a n g l e v a l u e s f o r m u f f i n s
b a k e d i n c o n v e n t i o n a l ( C O N ) a n d m i c r o w a v e ( M W ) o v e n s f r o m
b a t t e r s t o r e d f o r 5 p e r i o d s . ( E a c h p o i n t r e p r e s e n t s t h e m e a n
a c r o s s t h r e e e n c a p s u l a t e m e l t p o i n t s a n d t h r e e r e p l i c a t i o n s ) .
tionally baked muffins appeared to be golden brown. Micro- wave-baked muffins containing MP43 and MP60 ESB appeared to be tan and the microwave-baked muffins containing MP52 ESB appeared to be brownish gray. The interaction was seen in the significant change in hue angle for conventionally baked muffins from wk 0 to 1. The difference in redness or yellowness was most likely attributable to browning reactions in the conventional oven.
The effects of melt point and baking method on hue angle were related to each other (Table 3). Within conventionally baked muffins hue angle was higher for MP52 muffins than for MP43 or MP60 muffins, indicating a less red or more yellow appearance. Microwave-baked muffins with MP52 ESB did not differ from conventionally baked MP43 or MP60 ESB muffins. However, muffins with MP43 or MP60 ESB that were microwave-baked had significantly lower values or were redder than MP52 ESB muffins.
Sensory perception of muffin shape was affected by ESB melt point, baking method, and batter storage (Fig. 5). Muffins baked in the conventional oven had more rounded top surfaces than did microwave-baked muffins for all melt points throughout all batter storage periods. For conventionally baked muffins, no differences were detected in shape among muffins containing MP43 and MP60 ESB but those containing MP52 ESB were evaluated as rounder than the others. For microwave-baked muffins, there were no differences in shape at wk 0 and 4. However, those containing MP52 ESB were flatter than those containing MP43 ESB at wk 1 and 2 and MP60 ESB at wk 1, 2, and 3. Martin and Tsen (1981) reported that batter flow differences for microwave-baked cakes resulted in shape differences and more irregular surfaces compared to conventionally baked cakes. The surface contour for these cakes (Martin and Tsen, 1981) was peaked, but the microwave-baked muffins in our study tended to be flatter and more irregular than peaked.
Sensory scores for muffin crumbliness were affected by ESB
Volume 58, No. 3, 1993-JOURNAL OF FOOD SCIENCE-577

ENCAPSULATED NaHC03 MELT PO IN T...
F i g . 5 . — S e n s o r y s c o r e s f o r m u f f i n s h a p e ( 0 = f i a t , 1 5 0 = r o u n d e d )
a n d c r u m b l i n e s s ( O = n o n e , 1 5 0 = c o m p l e t e ) r e l a t e d t o m e l t p o i n t
( M P ) o f e n c a p s u l a t e d N a H C 0 3 b a k i n g m e t h o d
( C O N = c o n v e n t i o n a l o v e n , M W = m i c r o w a v e o v e n ) , a n d b a t t e r
s t o r a g e . ( E a c h p o i n t r e p r e s e n t s t h e m e a n a c r o s s 1 2 p a n e l i s t s
a n d t h r e e r e p l i c a t i o n s ) .
melt point, baking method, and batter storage time (Fig. 5). The most distinct difference was that microwave-baked muffins with MP52 ESB were evaluated as least crumbly across all batter storage periods. Panelists described this muffin as the “hockey puck” or as a “gummy glob.” It was described and discussed previously as probably primarily gelatinized starch with a flat, sloping top surface. Also the microwave-baked MP43 and MP60 ESB muffins became more crumbly with batter storage; whereas, all conventionally baked muffins became less crumbly with batter storage. Microwave-baked muffins (MP43 and MP60) were likely more crumbly because of low moisture.
For the characteristic ease of chewing, panelists were instructed to chew the muffin as they normally would. Ease of chewing was affected by batter storage time. Muffins became easier to chew as batter storage time increased. Muffins at wk 0 were most difficult to chew (70.9) whereas, those baked at wk 2, 3, and 4 were easiest to chew (58.2, 57.3, and 55.7, respectively). A significant interaction was found between melt point and baking method for ease of chewing (Table 3). Microwave-baked muffins containing MP52 (“hockey puck”) were most difficult to chew: microwave-baked muffins containing MP43 and MP60 ESB were easiest to chew reflecting lower moisture and greater crumbliness.
Panelists did not indicate differences for adhesion to teeth among muffins prepared with different melt point ESB. A sig
nificant interaction was found for effects of baking method and batter storage on adhesion. (Fig. 2). Muffins baked in the conventional oven were more adhesive than those baked in the microwave at wk 0, 1, and 3. The adhesive properties of the conventionally baked muffins were related to relatively higher moisture. Specific volume would probably affect adhesion as well since conventionally baked muffins had a smaller specific volume resulting in a more compact structure compared to the more open structure of microwave-baked muffins.
CONCLUSIONS
QUALITY effects were observed for batter and muffins related to different ESB melt points of NaHC03. The effects on instrumental and sensory measure of batter and muffin quality were varied and complex indicating that ESB melt point, batter storage time, and baking method should be considered. Microwave-baked muffins with MP52 ESB had several quality defects, therefore baking in the microwave would not be recommended. However, conventionally baked muffins prepared with this encapsulate were similar to those prepared with the other encapsulates.
REFERENCES
AACC. 1983. Approved Methods of the AACC. Amer. Assoc. Cereal Chem., St. Paul, MN.
Clydesdale, F.M. 1984. Color m easurem ent. In Food Analysis: Principles and Techniques. Voi. 1 Physical Characterization, D.W. Gruenwedel and J. W hitaker (Ed.), p. 125. Marcel Dekker, New York.
Dziezak, J.D. 1988. Microencapsulation and encapsulated ingredients. Food Technol. 42(4): 136-140, 142, 143, 146-148, 151.
Francis, F .J. 1985. Blueberries as a colorant ingredient in food products. J . Food Sci. 50: 754-756.
M artin, D.J. and Tsen, C.C. 1981. B aking high-ratio w hite layer cakes w ith microwave energy. J . Food Sci. 46: 1507-1513.
McNeil, M.A. 1989. The effects of combinations of gum, starch, and w ater on batters and microwave-baked cakes. Ph.D. dissertation, The Univ. of Tennessee, Knoxville.
Neuzil, M. and Baldwin, R.E. 1962. The effects of the electronic method of cookery on the quality of shortened cakes. Food Technol. 16(11): 110- 112.
O'Mahony, M. 1986. Sensory Evaluation of Food. Statistical Methods and Procedures. Marcel Dekker, Inc. New York.
Pyler, E.J. 1988. Baking Science and Technology Today, 3rd ed., Voi. 2. Sosland Publishing Co., M errim an, KS.
SAS Institute., Inc. 1985. SAS User’s Guide: Statistics, SAS Institute, Inc., Cary, NC.
Sills-Levy, E. 1989. U.S. food trends leading to the year 2000. Food Technol. 43(4); 128, 130-132.
Stinson, C.T. 1986. A quality comparison of devil’s food and yellow cakes baked in a microwave/convection versus a conventional oven. J . Food Sci. 51: 1578-1579.
Street, M.B. and Surratt, H.K. 1961. The effect of electronic cookery upon the appearance and palatability of a yellow cake. J . Home Econ. 53: 285- 291.
V an Zante, H.J. 1973. The Microwave Oven. Houghton Mifflin Co., Boston, MA.
Veit, M.A. 1950. The effect of freezer storage on the leavening action in muffin batters made w ith different types of baking powders. M.S. thesis, The Univ. of Tennessee, Knoxville.
Ms received 6/2/92; revised 2/8/93; accepted 2/10/93.
Presented a t the Annual Meeting of the Institute of Food Technologists, New Orleans, LA, June 20-24, 1992, Paper #710. Support was provided by USDA Hatch Project TN-854, The assistance of Dr. William Sanders with statistical design and analysis and of Emayet Spencer and Amanda Carr with laboratory work is appreciated. Appreciation is extended to Balchem Corporation, Beatreme Foods, CargiU, and Van Den Bergh Foods Company for donations of ingredients. Without the assistance of the students on the sensory panel this work would not have been possible.
The use o f trade names does not im p ly endorsement or criticism by the Tennessee A g ricu ltu ra l E xperim ent Station.
I
578-JOURNAL OF FOOD SCIENCE-Volume 58, No. 3, 1993

P a r t i c l e S i z e o f E n c a p s u l a t e d S o d i u m B i c a r b o n a t e s : E f f e c t
o n R e f r i g e r a t e d B a t t e r a n d M u f f i n s B a k e d i n C o n v e n t i o n a l
a n d M i c r o w a v e O v e n s
C. L. DORKO and M. P. PENFIELD
----------------------------ABSTRACT-----------------------------Refrigerated batter containing encapsulated sodium bicarbonate (ESB) differing in particle size (ESB 1 or powdered, ESB 5 or granular) and muffins baked in conventional and microwave ovens were evaluated. Batter was stored in glass jars at 0-l°C and tested after 1 day and 1, 2, 3, and 4 wk. Batter pH increased from 1 day to 1 wk. Microwave- baked muffins were evaluated by sensory panelists as flatter than conventionally baked muffins. All baked muffins with ESB 1 had greater specific volumes than those with ESB 5. Conventionally baked muffins had lower Hunter L values than microwave-baked regardless of particle size which agreed with sensory evaluation.
Key Words: encapsulation, muffins, sodium bicarbonate, batter quality, ovens, microwaves
INTRODUCTIONENCAPSULATED sodium bicarbonates may vary in size of NaHC03 particles. Such sizes are classified according to percentages of particles passing through various screens and include Powdered No. 1, Fine Powdered No. 3 and 3DF, Granular No. 4 and 5, and Extra Coarse Granular No. 6 (Faridi, 1991; Matz, 1972). Matz (1972) stated that a powdered NaHC03 was appropriate for most batters and doughs but a granular baking soda would be more suitable for high-water batters. Very fine particle size NaHC03 may react prematurely when mixed with acid resulting in loss of gassing power (LaBaw, 1982). If the NaHC03 particle size was too large or did not dissolve, brown or black spots on the crust and yellow spots in the interior of the baked product could result (Conn, 1965; Matz, 1972).
Our objectives were to investigate the effects of NaHC03 encapsulate particle size on batter characteristics over 4-wk storage and on sensory and quality characteristics of muffins baked in conventional and microwave ovens from refrigerated batter.
MATERIALS & METHODS
BATTER and muffins were prepared and stored as described previously (Dorko and Penfield, 1993) except that particle size of encapsulated NaHC03 (ESB) was varied. Particle size No. 1 ESB (PS1) and particle size No. 5 ESB (PS5) (Durkote 125-50 (VS) and Durkote 125-50, respectively, Van Den Bergh Foods Co. (1990)) were used at levels of 6.4% (f.w.b.) in the formula published previously (Dorko and Penfield, 1993). Encapsulated melt point was held constant (52°C). The experiment was a complete block design with four factors: two particle sizes, five batter storage times (1 day or 0 wk and 1, 2, 3, and 4 wk), two baking methods (conventional and microwave oven), and three replications.
Muffins were baked in a conventional or a microwave oven where output was monitored daily (Van Zante, 1973) and mean output was525.2 ± 32.1 watts.
Batter, muffin and crumb tests, sensory evaluation, and statistical techniques also were as described (Dorko and Penfield, 1993). These
Author Penfield is affiliated with the Agricultural Experiment Station and Food Science & Technology Dept., The Univ. of Tennessee, Knoxville, TN 37901-1071. Author Dorko's current address: Eastman Chemical Company, Kingsport, TN.
procedures were used to determine the effects of ESB particle size, storage time, baking method, replication within storage time, and appropriate interact.ons on dependent variables. Differences were considered significant at P £ 0.05.
RESULTS & DISCUSSIONBatter tests
C 02 evolution, an indicator of leavening potential, did not differ with ESB particle size or batter storage (Tables 1 and 2, respectively). Amount of C 02 evolved during testing was not expected to differ with NaHC03 particle size; however, the rate of evolution was expected to differ because of differences in surface area. Batter pH was not affected by NaHC03 particle size (Table 1). Batter pH increased significantly during the first week of refrigerated storage, then remained unchanged for the remaining storage time (Table 2). The increase in pH for the first week could be attributable to mechanical breakdown of some ESB during mixing releasing the NaHC03. When the NaHC03 reacted with the acidic component of buttermilk, the batter pH became more neutral.
Batter density was affected by particle size (Table 1) and batter storage time (Table 2). Batter containing PS1 had a slightly lower density than that with PS5, indicating more air was incorporated. Because mixing was standardized, increased aeration of batter containing PS1 was likely attributable to greater breakdown of encapsulate during mixing, allowing the NaHC03 to react with acid to produce C 0 2. Batter density increased from wk 0 to wk 1 and 2 of storage, indicating that gas was lost from the batter (Table 1).
Muffin and crumb testsMuffin moisture was greater at wk 0 than at wk 2; no dif
ferences occurred among other storage periods (Table 2). Sensory perception of muffin moisture was affected by interaction between NaHC03 particle size and baking method (Table 3). Conventionally baked muffins containing PS1 and PS5 were equally moist and higher in moisture than similar microwave- baked muffins containing either particle size ESB. Microwave- baked muffins containing PS5 were rated higher in moisture than similar muffins with PS1. Microwave-baked cakes typically had lower moisture than conventionally baked which was attributed to excessive heating and greater moisture loss (Van Zante, 1973).
Specific volumes of muffins increased with batter storage (Table 2). The difference in specific volume across batter storage could be attributable to encapsulate deterioration with stor-
Tabte 1 - Batter characteristics for 2 particle sizes o f NaHC03’ b
CharacteristicParticle size
1 5C 02(%) O.Tix ±0.03 0.14x ±0.04PH 6 .1x ± 0.1 6 .Ox ± 0.2Density (g/cm3) 1.191 y ±0.009 1.196x ±0.007a n = 15; means and standard deviations across five batter storage periods and
three replications.b Means followed by different letters within a row are significantly different
(P<0.05).
Volume 58, No. 3, 1993-JOURNAL OF FOOD SCIENCE-579

ENCAPSULATED NaHC03 PARTICLE SIZES...
Table 2 —Changes in batter and muffin characteristics during storage8
Batter storage (wk)
Characteristic 0 1 2 3 4
Batter*CO 2(%) 0 .1 2x 0 .1 2 x 0 .1 2 X 0 .1 3 x 0 .1 2 x
± 0 .0 3 ± 0 .0 4 ± 0 .0 2 ± 0 .0 6 ± 0 .0 2
PH 5 .8 y 6 .Ox 6 .1 x 6 . l x 6 .1 x
± 0 .1 ± 0 .1 ± 0 .1 ± 0 .1 ± 0 .1
Density (g/cm3) 1 .1 8 3 y 1 .1 9 7 X 1 .1 9 8 x 1 .1 9 5 x y 1 .1 9 2 x y
± 0 .0 0 8 ± 0 .0 0 6 ± 0 .0 0 3 ± 0 .0 1 1 ± 0 .0 0 6
M uffincSpecific 2 .0 y 2 .0 y 2 .1 x y 2 .1 x y 2 .2 x
volume (cm3/g) ± 0 . 3 ± 0 . 3 ± 0 . 4 ± 0 . 4 ± 0 . 4
Moisture (%) 3 6 .8 x 3 6 .4 x y 3 5 .2y 3 6 .2 x y 3 5 .9 x y
± 1 . 5 ± 1 . 7 ± 2 .1 ± 1 . 9 ± 1 . 6
Hunter L 3 7 .9 x 3 7 .0 x y 3 6 .8 y 3 6 .9 y 3 6 .7 y
± 1 . 4 ± 1 . 8 ± 2 . 3 ± 2 . 5 ± 2 . 7
Hue angle 2 1 .Ox 2 1 .Ox 2 1 .3 x 2 1 .5 x 2 1 .Ox
± 0 . 9 ± 1 .1 ± 1 . 7 ± 2 . 8 ± 1 . 9
Sensory characteristicdMoisture” 7 5 .7 X 8 2 .5 x 7 6 .2x 8 2 .2 x 8 1 .9 x
± 0 .7 ± 3 8 .9 ± 3 6 .4 ± 3 7 .9 ± 3 6 . 5
a Means followed by different letters within a row are significantly different (P<0.05).b n = 6; means and standard deviations across two particle sizes and three replications.c n = 12; means and standard deviations across two particle sizes, two baking methods, and three replications.d Means and standard deviations across two particle sizes, two baking methods, 12 panelists, and three replications. Means followed by different letters within a row are
significantly different (P<0.05).• Anchors for scale (0-150): moisture (dry-moist).
Table 3 -R e la tion o f physical and sensory characteristics o f muffins to p a rt ic le sizes o f e n ca p su la te d N aH C 03 and b a k in g m e th o d (CON = conventional, M W = microwave)_______________________________
Particle size1 5
Baking method Baking methodCharacteristics CON MW CON MWPhysical tests’Specific 2 . i y 2 .6 x 1 .9z 1 .8 z
volume (cm3/g) ± 0 . 2 ± 0 . 3 ± 0 .1 ± 0 .1
Hunter L 3 5 .8z 4 0 .2x 3 5 .3z 3 6 .9 y± 0 . 9 ± 0 .9 ± 1 .1 ± 1 . 0
Hue angle 2 1 .5 x 1 8 .9 y 2 2 .3 x 2 2 .Ox± 0 . 5 ± 0 . 8 ± 0 . 6 ± 2 . 0
Sensory characteristics^Moisture 9 8 .8 x 4 5 .2z 1 0 2 .7 X 7 1 .9 y
± 2 8 .0 ± 3 1 .5 ± 2 5 . 8 ± 3 5 .3
Color 8 9 .2 x 5 1 .3z 9 3 .4 w 8 2 .8 y± 1 8 .0 ± 1 7 .4 ± 1 8 .3 ± 2 3 .0
Ease of chewing 5 7 .2y 5 1 .1 2 6 0 .9 y 8 1 . l x± 3 1 .2 ± 3 1 .5 ± 3 1 .8 ± 3 3 .4
a n=15; means and standard deviations across five batter storage periods and three replications. Means followed by different letters within a row are significantly different (P<0.05).
b Means and standard deviations across five batter storage periods, 12 panelists, and three replications. Means followed by different letters within a row are significantly different (P < 0.05).
c Anchors for scales (0-150): color (light-dark); moisture (dry-moist); and ease of chewing (easy-difficult).
age resulting in faster and greater release of NaHC03 and production of C 02 during baking and a larger volume. Effects of particle size and baking method on specific volume were related (Table 3). Specific volumes for muffins containing PS1 baked in conventional and microwave ovens were higher than those with PS5, reflecting differences in batter density attributed to particle size (Table 1). The higher volumes of muffins containing PS1 were attributable to smaller particle sizes and consequent larger surface area enabling the water and buttermilk to mix with NaHC03 faster, thus releasing C 02 more rapidly.
With larger particle size NaHC03, C 02 production would be slower and the product would set before maximum muffin volume was achieved (Kichline and Conn, 1970). This was evident particularly with microwave-baked muffins containing
Fig. 1 .- Crumb color (Hunter L values) of muffins related to batter storage and particle sizes (PS) of encapsulated NaHCO? (Each point represents the mean across two baking methods and 3 replications.
PS5. They appeared to be primarily gelatinized starch and we concluded that gelatinization occurred and the product set before much C 02 was released. Matz (1972) stated that a granular (larger particle size) NaHC03 would be more appropriate for batters with high amounts of water. LaBaw (1982) stated that a loss of gassing power could result from premature reaction of very fine particle NaHC03 with acidic ingredients. However, those statements were made without consideration of a refrigerated batter and could not be applied to our type system. Because the NaHC03 was encapsulated, it could not react with the buttermilk (acid) until the encapsulate melted. Therefore, a smaller particle size is probably more appropriate for this refrigerated batter because most of the C 02 would not be produced until the product was baking and smaller particles would facilitate more rapid production of C 02.
The effects of particle size and batter storage on crumb color were interdependent (Fig. 1). PS1 muffins had higher Hunter L values at all batter storage periods than did muffins containing PS5, indicating lighter color. Muffins with PS5 appeared darker with batter storage; however, only muffins at batter storage wk 0 were significantly lighter than those baked after2-4 wk. A significant interaction for baking method and batter
580-JOURNAL OF FOOD SCIENCE-Volume 58, No. 3, 1993

Fig. 2. — Crumb color (Hunter L values) of muffins related to baking method (CON = conventional, MW-microwave) and batter storage. (Each point represents the mean across two particle sizes and three replications).
Fig. 3. —Sensory scores for color (0= light, 150 = dark), ease of chewing (0=easy, 150=difficult) and adhesion to teeth (O=none, 150= compact mass) for muffins as related to batter storage and particle sizes (PS) of encapsulated NaHCO» (Each point represents the mean across two baking methods, 12 panelists, and three replications).
storage for Hunter L values was found (Fig. 2). Microwave- baked muffins had higher Hunter L values at all storage periods. Conventionally baked muffins became significantly darker
Fig. 4—Sensory scores for color (0=light, 150=dark) of muffins as re la ted to baking m ethod (CON = conventional, MW = microwave MW) and batter storage. (Each point represents the mean across two particle sizes, 12 panelists, and three replications).
from wk 0 to wk 1-3 and from wk 3 to 4. Effects on Hunter L values of ESB particle size and baking method were related (Table 3). Conventionally baked muffins containing PS1 and PS5 were significantly darker than those baked in the micro- wave. Microwave-baked muffins containing PS5 were darker than those with PS1.
The effect of particle size on sensory scores for muffin color was also related to batter storage time (Fig. 3). Muffins containing PS1 were lighter than those with PS5 at all batter storage periods. For both particle sizes, muffins at batter storage wk 0 were lighter than at the remaining four storage periods for which there were no differences. Color differences attributable to particle size increased over batter storage time. A similar pattern of differences among means was seen for sensory color scores (Fig. 3) and Hunter L values for this interaction (Fig. 1).
A significant interaction for baking method and batter storage time on sensory color was found (Fig. 4). Microwave- baked muffins were lighter than conventionally baked muffins across all batter storage periods. Conventionally baked muffins at 0- and 1-wk batter storage were darker than those from 1- and 4-wk batter, respectively. Microwave-baked muffins at storage wk 1 and 3 were darker than those at wk 0. Differences in color for baking method across batter storage periods (Fig.4) were similar to differences in Hunter L values (Fig. 2).
Effects of NaHC03 particle size and baking method on color scores were related (Table 3). Muffins baked in the conventional oven were significantly darker than those microwave- baked. In either oven, muffins with PS5 were evaluated as darker than those with PS1. The difference in lightness between PS1 muffins baked in the two different ways was greater than that for PS5 muffins. These differences were similar to those found for Hunter L values except there were no differences in Hunter L values between conventionally baked muffins containing different particle sizes of NaHC03. Different leavening systems can produce baked products with different crumb colors (Lajoie and Thomas, 1991). The leavening system affects the porosity of the batter and the baked product affecting the crumb color (Pyler, 1988). The larger surface area of the PS1 would result in a faster reaction and greater production of C 02 reflected in a lighter crumb. The darker color of the conventionally baked muffins was the result of thermal, or more specifically, Maillard browning (Pyler, 1988) reactions which do not occur in the microwave. The relatively dark color of the PS5 microwave-baked muffins probably was related to low specific volumes (Table 1).
Hue angle was affected by NaHC03 particle size and baking method as seen by significant interactions (Table 3). Hue an-
Volume 58, No. 3, 1993-JOURNAL OF FOOD SCIENCE-591

ENCAPSULATED NaHC03 PARTICLE SIZES...
Fig. 5.—Sensory scores for muffin shape (0=flat, 150= rounded) and crumbliness (O=none, 150 = complete) as related to particle size (PS) o f encapsulated NaHC03, baking m ethod (CON= conventional oven, MW = microwave oven), and batter storage time. (Each point represents the mean across 12 panelists and three replications).
gles were lower for PS1 microwaved-baked muffins than for all others, indicating more red or less yellow. Visual color observations partially confirmed differences in hue angle. Muffins baked in the conventional oven appeared golden brown; those baked in the microwave containing PS1 appeared tan; and those baked in microwave containing PS5 appeared brownish-gray. The redder appearance of microwave-baked muffins containing PS1 could be attributed partly to the higher specific volume along with the lack of browning.
Scores for muffin shape were affected by NaHC03 particle size, baking method, and batter storage time (Fig. 5). Those baked in the conventional oven were evaluated rounder than microwave-baked muffins containing either particle size ESB. Conventionally baked muffins containing PS5 were rounder at wk 1-4 of batter storage than those with PS1. Shapes of microwave-baked muffins with both particle sizes were similar over time. Differences in shape were likely the result of different batter flow properties for conventionally and microwave-baked muffins. Martin and Tsen (1981) reported that batter in conventionally baked cakes had no significant interval or surface batter flow. They indicated further that batter in microwave-baked cakes appeared to remain stationary in the lower central region and expand upward in the central region. The cakes had a large cell structure in the central region and a peaked contour. Shape can also be influenced by leavening agent used. If adequate C 02 was not released from a leavening agent before the product set, a collapsed structure could result or if C 02 was released too slowly, the volume would be reduced (Conn, 1981; Kichline and Conn, 1970).
Crumbliness scores were affected by ESB particle size, baking method, and batter storage (Fig. 5). Microwave-baked muffins containing PS5 were less crumbly than any other muffin across all batter storage periods. Panelists most commonly referred to those as the “ hockey puck.” They appeared to be primarily gelatinized starch. Other trends include increasing
crumbliness for microwave-baked muffins containing PS1 from wk 0, 1, and 2 to wk 4 of batter storage. Muffins containing PS1 and baked in the conventional oven became less crumbly from batter storage wk 0 and 1 to wk 4.
Ease of chewing is related to muffin moisture. Panelists were instructed to chew as they normally would and evaluate muffins as easy or difficult to chew. A significant interaction was found for ease of chewing scores for ESB particle size and batter storage period (Fig. 3). Muffins with PS1 were easier to chew than those with PS5 at all batter storage periods but wk 0. In general, muffins with both particle sizes ESB became easier to chew with batter storage from wk 0 and 1 to wk 2-4. A significant interaction also was found for particle size and baking method (Table 3). Microwave-baked muffins with PS1 were easiest to chew. Conventionally baked muffins containing either particle size were easier to chew than microwave-baked muffins with PS5. Ease of chewing scores followed the patterns for moisture scores (Table 3) with the exception of microwave-baked muffins with PS5.
Adhesion to teeth was defined as the amount of muffin sticking to or remaining on the teeth after swallowing. This characteristic is related to muffin moisture and ease of chewing. A significant interaction for adhesion was found for batter storage time and particle size (Fig. 3). Adhesion to teeth differed with particle size only at batter storage wk 0. After wk 0, adhesion to teeth was reduced for muffins containing PS5 and from that time no differences were detected among treatments across all batter storage periods. Muffins baked in the micro- wave were less adhesive to teeth that were those baked in conventional oven. Scores were 70.2 ± 28.6 and 86.2 ±27.2, respectively.
CONCLUSIONSEFFECTS of NaHC03 particle size, batter storage time, and baking method on batter and muffin quality were varied and complex. When developing an appropriate encapsulated NaHC03 for a batter system, encapsulate melt point, other ingredients, storage time, and baking method should be considered. Particle size 1 encapsulated NaHC03 seemed to be a more suitable product for this batter system and both baking methods. PS1 was selected on the basis of higher specific volumes for both baking methods and for sensory scores that indicated PS1 muffins were easier to chew.
REFERENCESConn, J.F. 1965. Baking powders. Bakers Digest 39(2): 66-68, 70.Conn, J.F. 1981. Chemical leavening systems in flour products. Cereal
Foods World 26(3): 119-123.Dorko, C.L. and Penfield, M.P. 1993. Melt point of encapsulated sodium
bicarbonates: effect on quality of refrigerated batter and muffins baked in the conventional and microwave ovens. J. Food Sci. 58: 574-578.
Faridi, H. 1991. Soft wheat products. Ch. 17. In Handbook o f Cereal Science and Technology, Lorenz, K.J. and Kulp, K. (Ed.), p. 712. Marcel Dekker, Inc., New York.
Kichline, T.P. and Conn, J.F. 1970. Some fundamental aspects of leavening agents. Bakers Digest 44(4): 36-^10.
LaBaw, G.D. 1982. Chemical leavening agents and their use in bakery products. Bakers Digest 56(2): 16-18, 20-21.
Lajoie, M.S. and Thomas, M.C. 1991. Versatility of bicarbonate leavening bases. Cereal Foods World 36: 420-424.
Martin, D.J. and Tsen, C.C. 1981. Baking high-ratio white layer cakes with microwave energy. J. Food Sci. 46: 1507-1513.
Matz, S.J. 1972. Bakery Technology and Engineering, 2nd ed. AVI Publishing Company, Inc., Westport, CT.
Pyler, E.J. 1988. Baking Science and Technology Today, 3rd ed., Vol. 2.Sosland Publishing Co., Merriman, KS.
Van Den Bergh Food Co. 1990. Product Data: Durkote Sodium Bicarbonate 125-50. IND-326 #09579. yan Den Bergh Food Co., Chicago.
Van Zante, H.J. 1973. The Microwave Oven. Houghton Mifflin Co., Boston, MA.
Ms received 6/2/92; revised 2/1/93; accepted 2/13/93.
Support was provided by USDA Hatch Project TN-854. The assistance of Dr. William Sanders with statistical design and analysis and of Emayet Spencer and Amanda Carr with laboratory work is appreciated. Appreciation is extended to Beatreme Foods, Cargill, and Van Den Bergh Foods Company for donations of ingredients. Without the assistance of the students on the sensory panel this work would not have been possible.
The use of trade names does not imply endorsement or criticism by the Tennessee Agricultural Experiment Station.
582-JOURNAL OF FOOD SCIENCE-Volume 58, No. 3, 1993

S o y b e a n F l o u r L i p o x y g e n a s e I s o z y m e M u t a n t E f f e c t s o n
B r e a d D o u g h V o l a t i l e s
K. ADDO, D. BURTON, M.R. STUART, H.R. BURTON, and D.F. HILDEBRAND
----------------------------ABSTRACT-----------------------------Lipoxygenases are implicated in improvement of bread quality after addition of enzyme active soy flour. However, differences among the three major isozymes in soybeans in terms of impact on bread characteristics are not known. Differences exist among soybean lipoxygenase isozymes in terms of stability and generation of volatile flavor and aroma. Soybean flour with different lipoxygenase isozymes present might affect bread dough volatiles or defatting may affect activity of the isozymes. Full fat or defatted soy flour could be added to bread dough. Defatting selectively reduced lipoxygenase 2 activity with little effect on lipoxygenases 1 and 3. Addition of full fat soy flour from mutant isolines indicated that as with soybean homogenates, lipoxygenase 2 is mostly responsible for undesirable aroma compounds. Much higher levels of volatile alcohols were found in soy flour amended bread dough than in soy flour homogenates alone.
INTRODUCTIONUSING enzyme-active soy flour to fortify wheat flour for commercial production of white bread has been well documented (Frazier, 1979; Hoover, 1979; Faubion and Hoseney, 1981; Gardner, 1988; Luning and Roozen, 1991; Shiiba et al. 1991). In addition to improving nutrition, the main uses of enzyme- active soy flour in breadmaking are to: bleach flour pigments such as carotenoids, release bound lipids, improve dough rheology, and increase loaf volume (Frazier, 1979; Hoseney et al., 1980; Gardner, 1988).
The carotenoid destruction via co-oxidation and dough rheology improvement have been explained as a consequence of the oxidation of polyunsaturated fatty acids (containing cis, ds-l,4-pentadiene moieties). These are most commonly lino- leic and linolenic acids, changed by molecular oxygen and catalyzed by soy lipoxygenase (Carr et al., 1992). However, studies by Daniels et al. (1970,1971), and Frazier et al. (1971) indicated that rheological improvement of dough was linked to the binding of lipid to gluten protein. Such binding, brings about close associations between lipoxygenase, lipid, and gluten and a coupled oxidation of protein (Carr et al., 1992).
Enzyme-active soy flour is used only up to 0.5% in wheat flour-based breads due to adverse effects including formation of volatiles which cause off-flavors (Wolf, 1975; Hoover, 1979). Luning and Roozen (1991), isolated and identified volatile components of soy fortified wheat flour bread by a dynamic headspace technique and combined gas chromatography-mass spectrometry (GC-MS). They reported an increase in concentrations of hexanal, 1-hexanol, l-pentene-3-ol, 1-pentanol, and2-heptanone in bread fortified with enzyme-active soy flour. However, only 2-heptenal and l-octen-3-ol were detected in bread containing non-enzyme active soy flour. They concluded that the other volatile components probably originated from the action of soy lipoxygenase during dough making and the initial stage of breadmaking.
A few attempts have been made to isolate the different isozymes of lipoxygenase, and to investigate rheological and baking properties of wheat flours fortified with them. Shiiba et al.
The authors are affiliated with the Departments of Nutrition & Food Science and Agronomy, Univ. of Kentucky, Lexington, KY 40506. Address inquiries to Dr. Addo.
(1991) in a recent study, fractionated and purified the 3 major endogenous wheat lipoxygenase isozymes (L-l, L-2, L-3) by gel filtration and diethylaminoethyl (DEAE)-Sepharose chromatography. They reported an increase in foaming activity, and overall improvement in breadmaking quality of wheat flour supplemented with the wheat L-3 isozyme. The experiments reported by van Ruth et al. (1992) on the effects of stored soybean preparations, implied that soy L-2 and or L-3 were primarily responsible for both the bleaching of bread and the formation of volatiles. However, no reports have been published on the specific effects of individual soy lipoxygenase isozymes on breadmaking quality or production of volatiles.
Our objective was to examine the effects of different defatting treatments on lipoxygenase activities of soy mutant isolines, and to determine the isozyme(s) primarily responsible for production cf off-flavors in bread dough.
MATERIALS & METHODSTHE COMMERCIAL soybean cultivar ‘Century’ and the lipoxygenase mutant isolines backcrossed to Century (Davies and Nielsen, 1987) were grown on the University of Kentucky Agronomy research farm at Lexington, KY in 1990. The lines were designated according to their null mutant phenotype: -LI = lipoxygenase 1 null; -L2 = lipoxygenase 2 null;-L3 = lipoxygenase 3 null;-L1L3 = lipoxygenase 1 and 3 double mutant (i.e. containing only lipoxygenase 2); -L2L3 = lipoxygenase 2 and 3 double mutant.
Soy flour preparation
Commercial and mutant soy beans were processed into full-fat, enzyme-active soy flours. Seeds were cracked using a standard, screw- type, household grinder with coarse blades, and then dehulled. The meal was first ground in a Wiley Mill (0.5 mm sieve) and then in a household coffee mill (Mouliner Model 505. Mouliner Regal Inc. Virginia Beach, VA) and sieved for uniformity before using. Full-fat flours were stored at — 10°C until used.
Defatting
Samples of both Century and lipoxygenase mutant soy flours were defatted by shaking at room temperature (23°C) and in a soxhlet extractor using hexane. Flours were defatted in the soxhlet apparatus using standard methods and allowed to cycle until extracting solvent showed no evidence of fat. Room temperature defatting was accomplished by mixing flour with a minimum of 10 volumes of hexane for a 10 min. on a rotary shaker after which the meal was allowed to settle, the hexane decanted and the flour air dried. This room temperature defatting treatment was repeated 4 times.
Wheat and full-fat soy flour mixtures
Flour mixtures consisting of unbleached wheat flour and 3% full- fat soy flour were formulated for the commercial Century flours and all mutants. The soy flour was mixed with a portion of the wheat flour until uniformly distributed. Then this mixture was added to the larger amount of wheat flour and again mixed until uniform.
Enzyme activity measurements
Lipoxygenase activity of the full-fat and defatted soy flours was measured according to published methods (Hildebrand et al., 1991).
Volume 58, No. 3, 1993-JOURNAL OF FOOD SCIENCE-583

S O Y L IP O X Y G E N A S E O N B R E A D D O U G H V O L A T IL E S . . .
S o y b e a n G e n o t y p e S o y b e a n G e n o t y p e
Fig. 1 . - Effects of hexane defatting on activity o f specific lipoxygenase isozymes. Cent. = the soybean cuitivar, 'Century'. The other tines are isolines of Century developed by backcrossing. -L1L3 Is a Century isoline mutant for lipoxygenases 1 and 3 and therefore only containing lipoxygenase 2. -L2 is mutant for lipoxygenase 2 and -L1 is mutant for lipoxygenase 1. (A) Activity at pH 6.8 using linoleic acid as substrate per g of seed meal (flour); (B) Activity per mg of protein extracted from the seed meat. Rt. Defat = room temperature defatted; Soxl. Defat = soxhlet defatted.
Briefly, enzymes were extracted in an aqueous solution (1 part sample/ 100 parts water). The mixture was centrifuged 15 min and the resulting supernatant was analyzed for enzyme activity. Conjugated diene formation with linoleic acid as substrate, was monitored using a Per- kin-Elmer Lambda 3B UV/VIS Spectrophotometer set at 235 nm. Isoelectric focusing gel immunoblotting also was performed as described by Hildebrand et al. (1991) in order to determine protein levels of specific lipoxygenase isozymes.
Fig. 2. — IEF gel western immunoblots of Century and lipoxygenase null isollnes (as described in legend to Fig. 1). Sox = soxhlet defatting; RT = room temperature defatting; FF = full fat fnon-defatted). Equal amounts of protein (50 gg) were loaded per lane. (A) lipoxygenase 1-3 polyclonal antibodies were used as probes. (B) lipoxygenase 2 monoclonal antibodies were used as the probe. Alkaline phosphatase-linked second antibodies were used and the blots were developed in 5-bromo-4-chloro-3-in- doyl phosphate and p-nitro blue tétrazolium chloride. The positions of lipoxygenases 1-3 are indicated. The additional bands are alternative isoforms of the lipoxygenase isozymes. The intensity of the bands on the immunoblots are proportional to the amount of protein present.
Dough preparation and proofing
The recipe for bread dough was described by Longcare (1989). Dough preparation and proofing and punching schedules were described by Freeland-Graves and Peckham (1987).
Testing for volatiles
Volatile compounds from unproofed and proofed doughs were measured and C6-aldehydes identified as in Zhuang et al. (1991). The identity of 1-hexanol was indicated by chromatography of an authentic standard (Aldrich Chem. Co., Milwaukee, WI) and confirmed by GC- MS.
RESULTS & DISCUSSIONFOR OUR OBJECTIVE to investigate the effect of specific lipoxygenase isozymes on level of volatile off-flavors, use of defatted soybean flour would have simplified the studies. Use of full fat meal introduced notable amounts of lipid and carotenoids. It was necessary to verify that defatting, per se, did not affect activity of specific lipoxygenase isozymes. Unexpectedly, defatting resulted in a significant loss of lipoxygenase 2 activity with little effect on lipoxygenases 1 or 3 (whether based on weight of soybean flour or of protein in the extracts Fig. 1). The lack of an effect on lipoxygenase 1 was verified further by examining at pH 9 the activity (Hildebrand and Hymowitz, 1981) of the same extracts referred to in Fig. 1 (data not shown). The lack of effect on lipoxygenase 3 was implied by the minimal effects of defatting on the LI mutant (which had normal levels of lipoxygenases 2 and 3) all of which could be accounted for by loss of lipoxygenase 2 (Fig.1). The reduction of lipoxygenase 2 activity was greater with soxhlet than with room temperature defatting probably due to the higher temperature of the hexane in the soxhlet extraction. Because this result was unprecedented, it was repeated seven times with two or three replications with each set of analyses and two defatting runs. Results were similar in all experiments. Defatting soybean flour with different moisture contents might yield different results. Note however that, despite the large reduction in lipoxygenase 2 activity due to defatting, consid-
584—JOURNAL OF FOOD SCIENCE-Volume 58, No. 3, 1993

1 .0 0
0 .8 0
0 .6 0
0 .4 0
0 .2 0
0 .0 0Contr. C ent. -L1 -L2 -L3
T re a tm e n t T re a tm e n t
Fig. 3.—Major volatiles of bread dough samples mixed at 0 or 3% with soybean flour with different sets of lipoxygenase isozymes measured before (A) and after (B) proofing. AU = Flame ionizing detector response in area units.
erable lipoxygenase 2 activity remained in the soybean flour. The reduction in lipoxygenase 2 activity due to defatting was not due to differential extractability of the lipoxygenase 2 protein from the defatted flours (Fig. 2). More lipoxygenase 2 protein was extracted from the defatted flour than from the full fat flour as shown by the higher lipoxygenase 2 protein level of the extracts (Fig. 2). This was apparently due to the fact that much of the lipoxygenase 2 protein was found associated with lipid fractions (such as triglyceride and membrane lipids) in extracts. Therefore, removal of much of the lipid from the soybean flour would be expected to improve extractability of the lipoxygenase 2 protein. Thus the reduction in activity of lipoxygenase 2 was due to loss of specific lipoxygenase 2 activity (activity per amount of enzyme) because of dénaturation. Note that the loss of lipoxygenase 2 activity was not accompanied by changes in its native isoelectric point (Fig. 2 ).
A major effect of lipoxygenases on food quality is through formation of volatile flavor and aroma compounds. Increasing lipoxygenase in bread dough can improve many rheological characteristics, nutritional quality and shelf life, but can adversely affect flavor (Frazier, 1979; Hoover, 1979; Faubion and Hoseney, 1981; tuning and Roozen, 1991). The impact on levels of volatile flavor compounds from bread dough containing full fat flour of normal and lipoxygenase mutant soybeans was examined. Three major volatile compounds were detected: Hexanal which is a product of lipoxygenase and hydroperoxide lyase action on linoleic acid, Z-3-hexenal which is a product of the same enzymes acting on linolenic acid and hexanol which is consequence of hexanal being further metabolized by alcohol dehydrogenase. E-2-hexenal is a consequence of enzymatic or chemical isomerization of Z-3-hexenal (Hatanaka et al., 1986). As expected, addition of full fat soybean flour increased production of these fatty acid oxidation products with levels increasing during proofing (Fig. 3). E-2- hexenal was the most abundant volatile compound seen from the wheat flour alone. Hexanal was the most abundant volatile compound from all the dough samples containing soybean flour with the exception of the lipoxygenase 3 mutant before proofing (Fig. 3). Volatile aldehyde production was lower from the dough samples containing the lipoxygenase 2 null full fat soybean flour, although it was higher than the production of these compounds from wheat flour alone. The reduction in hexanal from soy/wheat dough mixtures with the lipoxygenase 2 null was consistent with previous studies with soybean homoge
nates alone (Matoba et al., 1985; Zhuang et al., 1991). The level of the C6-alcohol was much higher than usually reported in headspace from soybean seed homogenates handled and sampled as for the soy/wheat dough mixtures (Zhuang et al.,1991). This was likely the result of alcohol dehydrogenase(s) contributed by the wheat flour or the yeast (Hatanaka et al., 1986). Hexanol production increased greatly in the absence of lipoxygenase 3 (Fig. 3A). This was apparently due to decreased lipoxygenase/lyase product formation in the presence of lipoxygenase 3 and a consequent increase in the absence of lipoxygenase 3 (Hildebrand et al., 1990).
There was a differential effect of specific lipoxygenase isozymes on bread flavor. The impact of lipoxygenase isozymes depends on the manner in which the soybean seeds are processed. Further studies are needed to assess the impact of individual isozymes on rheological characteristics.
REFERENCESCarr, N.O., Daniels, W.R., and Frazier, P.J. 1992. Lipid interactions in
breadmaking. Crit. Rev. Food Sci. Nutr. 31: 237-258.Daniels, N.W.R., Wood, P.S., Russell Eggitt, P.W., and Coppock, J.B.M.
1970. Studies on the lipids of flour. V. Effect of air on lipid binding. J. Sci. Food Agric. 21: 377-384.
Daniels, N.W., Frazier, P.J., and Wood, P.S. 1971. Flour lipids and dough development. Baker’s Dig. 45(4): 20-26.
Davies, C.S.J. and Nielsen, N.C. 1987. Registration of soybean germplasm that lacks lipoxygenase isozymes. Crop Sci. 27: 370-371.
Faubion, J.M. and Hoseney, R.C. 1981. Lipoxygenase: Its biochemistry and role in breadmaking. Cereal Chem. 58: 175-180.
Frazier, P.J. 1979. Lipoxygenase action and lipid binding in breadmaking. Baker’s Dig. 53(6): 8-14.
Frazier, P.J., Leigh-Dugmore, F.A., Daniels, N.W.R., Russell Eggitt, P.W., and Coppock, J.B.M. 1973. The effect of lipoxygenase action on the mechanical development of wheat flour doughs. J. Sci. Food Agric. 24: 421- 436.
Freeland-Graves, J.H. and Peckham, G.C. 1987. Foundations o f Food Preparation, 5th ed. Macmillan Publishing Co., New York.
Gardner, H.W. 1938. Lipoxygenase pathway in cereals. In Advances in Cereal Science and Technology, Vol IX, Y. Pomeranz, (Ed.), p. 161-215. Am. Assoc. Cereal Chem., St. Paul, MN.
Hatanaka, A., Kajiwana, T., and Sekiya. J. 1986. Fatty acid hydroperoxide lyase in plant tissue. In Biogenesis of Aromas, p. 167-175. American Chem. Soc.
Hildebrand, D.F. and Hymowitz, T. 1981. Two soybean genotypes lacking lipoxygenase-1. J. Am. Oil Chem. Soc. 58: 583-586.
Hildebrand, D.F., Hamilton-Kemp, T.R., Ltmghrin, J.H., Ali, K., and Andersen, R.A. 1990. Lipoxygenase 3 reduced hexanal production from soybean seed homogenates. J. Agric. Food Chem. 38: 1934—1936.
Hildebrand, D.F., Versluys, R.T., and Collins, G.B. 1991. Changes in li- xygenase isozyme levels during soybean embryo development. Plant i. 75: 1-8.
Hoover, W. 1979. Use of soy proteins in baked foods. J. Am. Oil Chem. Soc. 56: 301-303.
Hoseney, R.C., Faubion, J., and Sidhu, J.S. 1980. Mixograph studies. IV.—Continued on page 608
Volume 58, No. 3, 1993-JOURNAL OF FOOD SCIENCE-585

E x t r a c t i o n o f C o o k i e A r o m a C o m p o u n d s f r o m A q u e o u s
a n d D o u g h M o d e l S y s t e m
C. PROST, C.Y. LEE, P. GIAMPAOLI, and H. RICHARD
---------------------------- ABSTRACT-----------------------------Two extraction methods, simultaneous distillation-extraction and direct extraction by solvents, were compared to analyze aroma compounds added to cookies using a model system. The optimum extraction was obtained after 1 hr of simultaneous distillation-extraction, but some compounds such as vanillin, 7 -butyrolactone, maltol, and 4-(4- hydroxyphenyl)-2-butanone were not easily distilled. However, these compounds were extracted well by direct extraction using polar or apolar solvents. These two methods are complementary and can be well adapted to cookie aroma analysis.
Key Words: extraction, aroma, cookies, distillation-extraction, biscuits, vanillin, maltol
INTRODUCTIONNUMEROUS methods have been published to isolate and concentrate volatile aroma compounds (Bemelmans, 1981; Heath and Reneccius, 1986; Adda and Richard, 1991). Steam distillation (AFNOR, 1983), molecular distillation (Nawar et al.,1988), solvent extraction (Mihara et al., 1987) or steam dis- tillation/simultaneous solvent extraction (Likens and Nickerson, 1964) methods have been used for extraction of aromatic compounds from solid and liquid foods. In addition, other methods, such as “ head-space” (Macku and Jennings, 1987) or adsorbent trapping (Buttery et al., 1987) were used to analyze volatile compounds emitted by foods.
Published data on the flavor of cookies is scant because the cookie aroma is unique. Some of the volatile flavor compounds of cookies are formed during processing but the main aroma is due to added volatiles. Since a wide range of aromatic compounds are added during processing depending on the final product, extraction and isolation procedures for all volatile compounds in cookie products are not simple. Therefore, the mode of added aroma compounds during processing and storage has not been studied. In addition, the large amount of fat in cookies creates a problem during extraction and analysis of volatile compounds due to the solubility of most aroma compounds in fatty substances or their co-solubility in organic solvents. Steam distillation may be the simplest solution for this problem, but some added aroma compounds are difficult to distill.
In order to solve similar problems in various food products, several methods have been applied. Using a model system, Schultz et al. (1977) studied the efficiency of simultaneous distillation-extraction method to isolate volatile compounds. Gagnon and Marcoux (1989) have compared three distillation procedures using reduced pressure, steam distillation and simultaneous distillation-extraction methods. They have shown that simultaneous distillation-extraction was the most efficient. Vidal and Richard (1987) extracted a model solution of 24 aroma compounds by distillation, direct extraction with dichlo- romethane, C 02 extraction with and without ethanol as a polar
Author Prost is with BSN Company, Centre Jean Thèves, 91207 Athis-Mons, France. Author Lee is on leave from Cornell University, Geneva, NY 14456. Authors Giampaoli and Richard are with Ecole Nationale Supérieure des Industries Agricoles et Alimentaires, 91305 Massy, France.
modifier. They found that only the C 02 extraction method with ethanol resulted in more than 65% yield for all the compounds studied. Products with high amounts of lipids could not be analyzed directly by this method because of simultaneous extraction of the fat and the aroma. Recently, Yong et al., (1989) studied the aroma of crackers using a direct solvent extraction method with aqueous media to extract aroma volatiles. The major aroma of crackers is known to be produced during fermentation.
Our objective was to find the most effective extraction method for the major aroma compounds in cookies, so that we could study the behavior of added aromatic compounds in cookies during processing and storage. Therefore, we used a model system by adding a mixture of aroma compounds of different chemical classes often used in cookie companies.
MATERIALS & METHODSMaterials
Aroma model solution. Selected 17 aroma compounds (Table 1) were dissolved in ethanol. The concentration in ethanol of each compound was 24 g/L.
Cookie preparation
Ingredients of the butter cookie used. Flour, concentrated butter, sucrose, eggs, corn starch, milk powder, salt, baking powder (sodium carbonate and pyrophosphate).
Processing. A local commercial processing line was used to prepare round cookies (5 cm diameter x 4 mm thickness). Cooking was carried out at 220°C for 12 min.
Aroma addition. Two types of cookies were prepared for comparison; one type had no added aroma compounds and the other type was prepared with aroma compounds, 2 .8g of aroma model solution/kg cookie dough. The quantity of aroma corresponds to a standard amount added in commercial cookie factories. Prepared cookies were immediately packaged and sealed in an aluminum pouch and kept at room temperature until analyzed.
Table 1 -Aromatic compounds in the model solution.
Aromatic compoundsMolecular
weight Source
diacetyl 86 Aldrichacetoin 88 Aldrich2-methylpyrazine 94 Aldrichfurfural 96 Aldrichmethyl 2-ethylbutyrate 130 Merckisoamyl acetate 130 Aldrich-y-butyrolactone 86 Ega-Chemiebenzaldehyde 106 Prolabolimonene 136 Aldrich2-nonanone 142 Aldrichlinalool 154 Janssen Chemicamaltol 126 Aldrichcltral 152 R. Laurentvanillin 152 Aldrichy-decalactone 170 Janssen Chemica(3-ionone 192 Aldrich4-(4-hydroxyphenyl)-2-butanone 164 Aldrich
586-JOURNAL OF FOOD SCIENCE-Volume 58, No. 3, 1993

T a b le 2 — C o n c e n ta t io n o f e x t r a c te d a r o m a t ic c o m p o u n d s ( m g /k g o f c o o k ie ) r e la t io n to s im u l ta n e o u s d is t i l la t io n - e x t r a c t io n t im e
Aromatic compounds 0.5 hr 1 hr 1.5 hr
diacetyl 2.5 2.5 2.5acetoin 0.4 0.4 0.62-methylpyrazine 2.6 2.7 2.7furfural 2.7 2.7 2.5methyl 2-ethylbutyrate 0.5 0.5 0.4isoamyl acetate 0.5 0.5 0.57 -butyrolactone 0 0 0benzaldehyde 7.6 7.9 6.9limonene 7.5 7.8 6.92-nonanone 14.1 16.0 14.5linalool 19.8 20.4 20.8maltol 0 0 0citral 11.7 13.0 13.3vanillin 0 0 0y-decalactone 8.5 10.8 12.1P-ionone 15.0 19.2 20.44-(4-hydroxyphenyl)-2-butanone 0 0 0
Total 93.4 104.4 104.2
Methods
Preparation of samples. Two types samples were used: Cookies with addition of 2 .8g aroma solution/kg cookie dough were used to determine the optimum time needed to extract the aromatic compounds adsorbed in cookie “ matrix.” These cookies have an unknown original concentration of aroma compounds because of losses during processing. Cookies made with no added aroma compounds were pulverized and mixed with aroma solution (2 .8 g/kg cookie) before extraction. These cookies of known original concentration of aroma compounds were to determine the relative extraction yield.
Extraction
Simultaneous distillation-extraction (SDE). The cookie powder (10g) was mixed with 40 mL distilled water and then loaded on an apparatus similar to that used by Likens and Nickerson (Godefroot et al., 1981). Extraction was carried out using 4 mL of dichloromethane (Prolabo, quality-Normapur) for a predetermined time. The extract was dehydrated using anhydrous sodium sulfate and concentrated 10 times under a flux of nitrogen before gas chromatographic analysis.
Direct extraction (DE). Pulverized cookie powder (50g) was mixed with 200 mL of methanol (Carlo-Erba, quality-GC) using a magnetic stirrer for a predetermined time and then filtered and concentrated under reduced pressure to final 30 mL using Rotavapor (Biichi) at 45°C. The extract was kept refrigerated at 0-2°C for 12 hr and filtered to remove the lipid fraction. The filtrate was mixed with 225 mL of distilled water containing 5g NaCl and then extracted first with 100 mLof 1,1,2-trichlorofluoroethane (Freon ™ 113, bp = 48°C, Prolabo, quality-Normapur) followed by 100 mL ethylacetate (bp = 77°C, Prolabo, quality-Pestinorm). Each extract was passed through anhydrous sodium sulfate and concentrated to 20 mL before analysis. In order to determine the distillation and extraction rates of each aroma compound, the same experiments were carried out on a known quantity of the standard aroma solution as above.
Analysis. The aroma compounds were separated by a gas chromatographic method using an apolar column (HP5, Hewlett-Packard, Stationary phase: 5% diphenyl and 95% dimethyl polysiloxane, 25m long x 0.32 mm internal diameter). Conditions: splitless injection; carrier gas, helium at 0.25 m/sec; oven temperature, initial 40°C for 4 min and a gradient of 4°C/min, to a final temperature of 250°C for 30 min; flame ionization detector at 250°C. Injection of 6 p.L of the extract (SDE) and 4p.L of the extract (DE) was carried out. Each sample was analyzed three times and the standard deviation was <15%. Before each analysis, an external calibration was performed by injecting a known quantity of aroma mixture and determining the chromatographic response coefficient for each compound. Identification of each compound was carried out by mass spectrometer (70 ev) (CPG/MS) under the same conditions as gas chromatography.
Calculation. Extraction yield (Y) was calculated by the following method,
Y Quantity of aroma compounds analyzed ^Quantity of aroma compounds added
T a b le 3 — R e la t iv e y e ld s (Y) o f p u r e a r o m a s o lu t io n a n d o f c o o k ie s b ys im u l ta n e o u s d is t i l la t io n - e x t r a c t io n a n d d i r e c t e x t r a c t io n _____________
Simultaneousdistillation-ex- Direct extraction
traction by solvents
Aromatic compounds
V (%) of
solution
Y (%) of
cookie
Y (%) of
solution
Y (%) of
cookie
diacetyl 100 75 — —
acetoin 62 36 18 92-methylpyrazine 97 61 28 17furfural 95 62 46 33methyl 2-ethylbutyrate 100 95 28 11isoamyl acetate 100 99 40 197 -butyrolactone 35 0 21 17benzaldehyde 100 86 65 45limonene 100 100 23 102-nonanone 100 88 84 63linalool 100 74 96 78maltol 53 3 51 35citral 100 54 95 40vanillin 0 0 84 767 -decalactone 100 48 95 8 4p-ionone 100 32 94 704-(4-hydroxyphenyl i-2-butanone 0 0 100 100
RESULTS & DISCUSSION Simultaneous distillation-extraction
In order to obtain the optimum time of distillation-extraction, experiments were carried out for 0.5, 1 and 1.5 hr. The 30 min distillation-extraction was not adequate for all compounds because two compounds of higher molecular weight, y-decalactone and p-ionone, were not completely extracted (Table 2). Since the 1 hr distillation-extraction yielded the maximum value, all experiments were thereafter performed at 1 hr. The extraction yield of the aroma compounds showed a wide range (Table 3). Vanillin and 4-(4-hydroxyphenyl)-2-bu- tanone were not steam distilled at all, while acetoin, y-butyr- olactone and maltol were very low in yield. We obtained a poor recovery cf acetoin because this compound has a low partition coefficient between dichloromethane and water (0.43) and is not readily steam distilled (45% after 1 hr). The other 12 compounds were distilled and extracted completely. However, when aroma compounds were added to cookies, the yield was always lower, except limonene which showed 100% yield in both cases.
Direct extractionTo find the optimum extraction time, extraction with meth
anol was carried out for 0.5, 1, 2 and 3 hr. In addition, single and double extractions were compared. The time of extraction had a very little effect. Increasing time from 30 min to 3 hr
T a b le 4 — D is t r ib u t io n o f a r o m a c o m p o u n d s in F r e o n a n d e t h y l a c e ta te
% In % inAromatic compounds Freon Ethyl acetate
diacetyl - -
acetoin 2 982-methylpyrazine 36 64furfural 23 77methyl 2-ethylbuty-ate 100 0isoamyl acetate 100 07 -butyrolactone 7 93benzaldehyde 87 13limonene 100 02-nonanone 99 1linalool 98 2maltol 6 94citral 97 3vanillin 4 967 -decalactone 98 2P-ionone 99 14-(4-hydroxyphenyl)-2-butanone 5 95
Volume 58, No. 3, 1993-JOURNAL OF FOOD SCIENCE-587
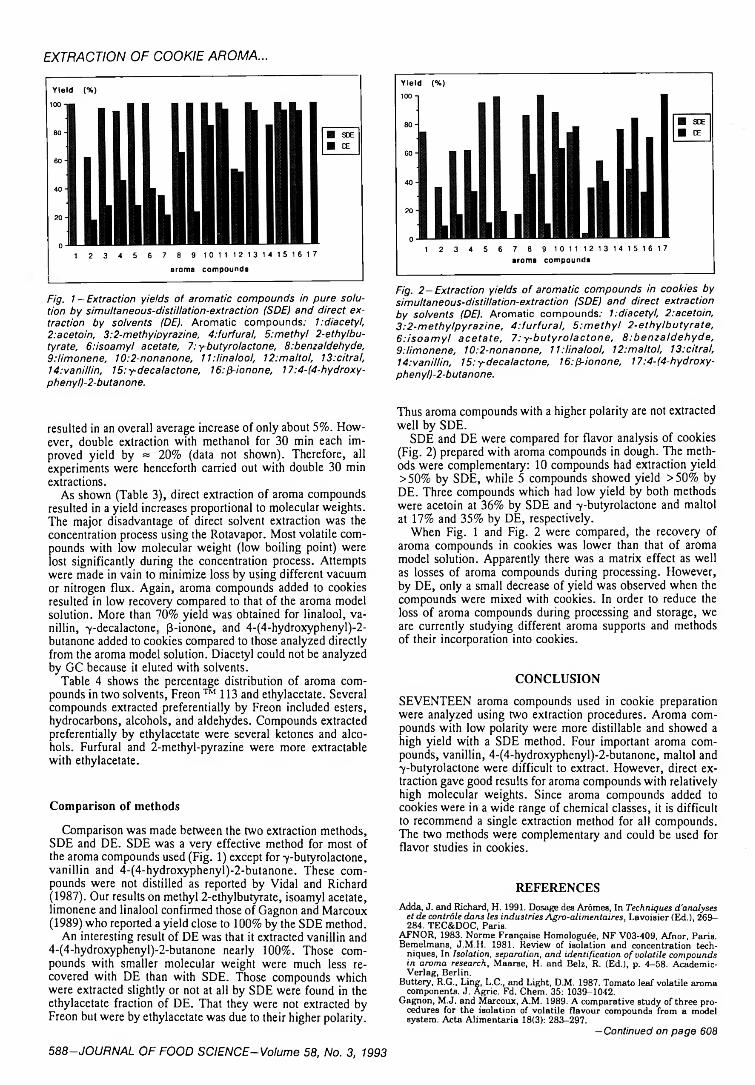
EXTR AC TIO N O F C O O K IE A R O M A ...
Yield (%)
1 2 3 4 5 6 7 8 9 1 0 1 1 1 2 1 3 1 4 1 5 1 6 1 7
aroma compounds___________________________ !------------------------------------------Fig. 1 -Extraction yields of aromatic compounds in pure solution by simultaneous-distillation-extraction (SDE) and direct extraction by solvents IDE). Aromatic compounds; 1:diacetyl, 2:acetoin, 3:2-methyipyrazine, 4:furfural, 5:methyl 2-ethylbu- tyrate, 6:isoamyl acetate, 7:y-butyrolactone, 8:benzaldehyde, 9:limonene, 10:2-nonanone, 1l:linalool, 12:maltol, I3:citral, 14:vanillin, l5:y-decalactone, 16:p-ionone, 17:4-(4-hydroxy- phenyl)-2-butanone.
Yield (%)
1 2 3 4 5 6 7 8 9 1 0 1 1 1 2 1 3 1 4 1 5 1 6 1 7aroma compounds
Fig. 2 - Extraction yields of aromatic compounds in cookies by simultaneous-distillation-extraction (SDE) and direct extraction by solvents (DE). Aromatic compounds; 1 :diacetyl, 2:acetoin, 3:2-methylpyrazine, 4:furfura l, 5 :m ethyl 2-ethylbutyrate, 6:isoam yl acetate, 7:y-butyro lactone, 8:benzaldehyde, 9:limonene, 10:2-nonanone, 11:linalool, 12:maltol, 13:citral, 14:vanillin, 15:y-decalactone, 16:(Fionone, 17:4-(4-hydroxy- phenyl)-2-butanone.
resulted in an overall average increase of only about 5%. However, double extraction with methanol for 30 min each improved yield by = 20% (data not shown). Therefore, all experiments were henceforth carried out with double 30 min extractions.
As shown (Table 3), direct extraction of aroma compounds resulted in a yield increases proportional to molecular weights. The major disadvantage of direct solvent extraction was the concentration process using the Rotavapor. Most volatile compounds with low molecular weight (low boiling point) were lost significantly during the concentration process. Attempts were made in vain to minimize loss by using different vacuum or nitrogen flux. Again, aroma compounds added to cookies resulted in low recovery compared to that of the aroma model solution. More than 70% yield was obtained for linalool, vanillin, -y-decalactone. (3-ionone, and 4-(4-hydroxyphenyl)-2- butanone added to cookies compared to those analyzed directly from the aroma model solution. Diacetyl could not be analyzed by GC because it eluted with solvents.
Table 4 shows the percentage distribution of aroma compounds in two solvents, Freon ™ 113 and ethylacetate. Several compounds extracted preferentially by Freon included esters, hydrocarbons, alcohols, and aldehydes. Compounds extracted preferentially by ethylacetate were several ketones and alcohols. Furfural and 2-methyl-pyrazine were more extractable with ethylacetate.
Comparison of methods
Comparison was made between the two extraction methods, SDE and DE. SDE was a very effective method for most of the aroma compounds used (Fig. 1) except for 7-butyrolactone, vanillin and 4-(4-hydroxyphenyl)-2-butanone. These compounds were not distilled as reported by Vidal and Richard (1987). Our results on methyl 2-ethylbutyrate, isoamyl acetate, limonene and linalool confirmed those of Gagnon and Marcoux(1989) who reported a yield close to 100% by the SDE method.
An interesting result of DE was that it extracted vanillin and4-(4-hydroxyphenyl)-2-butanone nearly 100%. Those compounds with smaller molecular weight were much less recovered with DE than with SDE. Those compounds which were extracted slightly or not at all by SDE were found in the ethylacetate fraction of DE. That they were not extracted by Freon but were by ethylacetate was due to their higher polarity.
Thus aroma compounds with a higher polarity are not extracted well by SDE.
SDE and DE were compared for flavor analysis of cookies (Fig. 2) prepared with aroma compounds in dough. The methods were complementary: 10 compounds had extraction yield >50% by SDE, while 5 compounds showed yield >50% by DE. Three compounds which had low yield by both methods were acetoin at 36% by SDE and 7-butyrolactone and maltol at 17% and 35% by DE, respectively.
When Fig. 1 and Fig. 2 were compared, the recovery of aroma compounds in cookies was lower than that of aroma model solution. Apparently there was a matrix effect as well as losses of aroma compounds during processing. However, by DE, only a small decrease of yield was observed when the compounds were mixed with cookies. In order to reduce the loss of aroma compounds during processing and storage, we are currently studying different aroma supports and methods of their incorporation into cookies.
CONCLUSION
SEVENTEEN aroma compounds used in cookie preparation were analyzed using two extraction procedures. Aroma compounds with low polarity were more distillable and showed a high yield with a SDE method. Four important aroma compounds, vanillin, 4-(4-hydroxyphenyl)-2-butanone, maltol and7-butyrolactone were difficult to extract. However, direct extraction gave good results for aroma compounds with relatively high molecular weights. Since aroma compounds added to cookies were in a wide range of chemical classes, it is difficult to recommend a single extraction method for all compounds. The two methods were complementary and could be used for flavor studies in cookies.
REFERENCESAdda, J. and Richard, H. 1991. Dosage des Arômes, In Techniques d'analyses
et de contrôle dans les industries Agro-alimentaires, Lavoisier (Ed.), 269- 284. TEC&DOC, Paris.
AFNOR, 1983. Norme Française Homologuée, NF V03-409, Afnor, Paris.Bemelmans, J.M.H. 1981. Review of isolation and concentration tech
niques, In Isolation, separation, and identification o f volatile compounds in aroma research, Maarse, H. and Belz, R. (Ed.), p. 4-58. Academic- Verlag, Berlin.
Buttery, R.G., Ling, L.C., and Light, D.M. 1987. Tomato leaf volatile aroma components. J. Agric. Fd. Chem. 35: 1039-1042.
Gagnon, M.J. and Marcoux, A.M. 1989. A comparative study of three procedures for the isolation of volatile flavour compounds from a model system. Acta Alimentaria 18(3): 283-297.
—Continued on page 608
588-JOURNAL OF FOOD SCIENCE-Volume 58, No. 3, 1993

N e o h e s p e r i d i n D i h y d r o c h a l c o n e S t a b i l i t y
i n A q u e o u s B u f f e r S o l u t i o n s
I. CANALES, F. BORREGO, AND M.G. LINDLEY
------------------------------- A B S T R A C T ---------------------------------The degradation of neohesperidin dihydrochalcone (NHDC) in solution was studied at different temperatures (30-60 °C) and pH values (1-7). Pseudo-first order kinetics were observed across the temperature and pH range. Maximum stability was at pH 3-5. These data may be used to predict sweetener stability to typical conditions prevailing during manufacture and storage of beverages and to food processing at high temperatures. Results indicate NHDC would be stable throughout the normal shelf-life of soft drinks and would also withstand pasteurization and UHT processes.
Key Words: sweetener, stability, neohesperidin, chalcone
INTRODUCTION
NEOHESPERIDIN DIHYDROCHALCONE (NHDC) is an intense sweetener and flavor modifier first prepared by Horowitz and Gentili (1963). NHDC is about 1500 times sweeter than sucrose at threshold levels (Horowitz and Gentili, 1986). Recent developments have shown it is most effective at low concentrations in combination with other intense or bulk sweeteners, where remarkable synergistic effects have been demonstrated (Lindley et al., 1991).
With regard to regulatory status, the Scientific Committee for Foods of the European Community determined in 1987, on the basis of available information, NHDC was safe for human consumption and allocated it an ADI of 5 mg/kg bw/ day (Bär et al., 1990). Currently, the sweetener is included in the EC Proposal for a Council Directive on Sweeteners, where its use in a wide range of foods is considered (E.C., 1990).
The stability of food ingredients under normal conditions of use and storage is a critical determinant of suitability for any particular product application. Functionalities of all ingredients must not change at rates which compromise the typical shelf- life expectations for each product type. This is particularly important for sweeteners. Therefore assessment of sweetener ingredient stability in controlled buffer solutions is a useful way to predict whether it would be suitable for a specific application. In spite of its relatively long history, available information about NHDC stability is limited to a few studies (Inglett et al., 1969; Crosby and Furia, 1980).
Considering the potential authorization of NHDC within the European Community, a controlled study of its degradation kinetics is of commercial and scientific interest. Our objective was to measure the stability of NHDC in aqueous buffer solutions under high temperatures (30-60 °C) as a function of pH (1.0-7.0). Such data could then be used to estimate losses during processing and storage of liquid foods containing NHDC.
M ATERIALS & M ETHODSReagents
Commercial NHDC was obtained from Zoster, S.A. (Murcia, Spain). HPLC grade methanol and 85% phosphoric acid were from Merck (Darmstadt, Germany). All other reagents were analytical grade.
Buffer solutions
Buffer compositions are listed in Table 1. NHDC concentration was in all cases 300 ppm. For experiments performed at 90 °C the same buffers and NHDC concentrations were used.
Aliquots (10 rrL) of each NHDC solution were placed in four temperature-controlled circulating water baths (±0.1 °C) at 30, 40, 50 60 °C. Incubation times were 140 days at 30 °C, 86 days at 40 °C, 56 days at 50 °C and 28 days at 60 °C. At regular, predetermined time intervals, samples were removed, cooled in ice water and frozen at -2 0 °C until HPLC analyses were performed.
HPLC methods
The HPLC system consisted of a L-6200 gradient pump and a L- 4250 UV-VIS detector, (Merck-Hitachi) and a 3396A Hewlett Packard integrator. The mobile phase consisted ot two different solvents: methanol (solvent A) and water (adjusted to pH 3.2 with phosphoric acid, solvent B). Two different gradient systems were used: system 1 for samples with pH 1 to 4 and system 2 for samples incubated at near neutral pH values. Details of gradient systems are given in Table2 .
RESULTS & DISCUSSION
THE DEGRADATION of NHDC at 60 °C and at pH 1 and 7 showed (Fig. 1) the hydrolysis of NHDC could be represented as a pseudo-first order reaction. This was observed across the range of temperatures and pH values tested. Thus, a logarithmic plot of percentage of remaining NHDC vs time was a straight line with slope Kobs.
Table 3 shows rate constants for all pH and temperature conditions studied. Figure 2 shows a log plot of half-lives (t1/2) as a function of pH for 40-60 °C. A “ bell-shaped” curve resulted where the apex corresponded to the maximum stability of NHDC, at pH 4. These data clearly indicated that the mechanism of catalysis under acid conditions was different from that at nearer neutral pH values. Two different regions could be defined: one below the optimum pH value in which acid catalysis was dominant and another above optimum pH defined by base catalyzed reactions.
The temperature dependence of a given system can be represented by the Arrhenius plot. Figure 3 shows, as examples, the Arrhenius plot for NHDC degradation at pH 1 and 7. Figure
Authors Canales and Borrego are with the Research & Development Dept., Zoster, S.A (Grupo Ferrer), Raiguero, 143, 30588 Zeneta (Murcia), Spain. Author Lindley is with Lintech, Reading University Innovation Centre, P.O. Box 68, Whiteknights, Reading, RG6 2BX, United Kingdom.
Table 1 -B uffer composition for different pH valuespH Buffer
1 KCI/HCI 0.1 M2 glycine/HCI 0.1 M3 glycine/HCI 0.1M4 citrate/phosphate 0 .1M5 citrate/phosphate 0 .1M6 phosphate 0.1M7 phosphate 0 .1M
Volume 57, No. 3, 1992-JOURNAL OF FOOD SCIENCE-589

S T A B IL IT Y O F N H D C . . .
L n (% n e o h e s p e r i d i n e D C )
T i m e ( d a y s )
Fig. 1—Log plot of NHDC degradation at 60 °C and pH 1 ( M l and 7 (9).Table 2 —HPLC gradient systems used for NHDC determination
Time(min)
Methanol (% v/v)
Water (pH = 3.2)
(% v/v)
Gradient 1 0 50 503 50 50
10 70 3015 70 3023 50 50
Gradient 2 0 40 6015 70 302D 40 60
Table 3 —Rate constants (±95% confidence lim itsI fo r NHDC degradation at different temperatures and pH values
Rate constants (d ay -' x 103)
PH30°C(r2)
40°C(r2)
50°C(r2)
60°C(r2)
1 3.03 ±0.90 12.60±3.30 57.88 + 11.92 271.44 + 45.72(0.93) (0.96) (0.97) (0.99)
2 N.A. 2.80±0.14 9.03 ±1.45 20.96 + 1.28(0.99) (0.98) (0.99)
3 N.A. 0.63 + 0.26 2.23 ±0.44 4.03 + 1.03(0.97) (0.98) (0.97)
4 N.A. 0.36 + 0.06 0.82±0.15 1.46 + 0.34(0.99) (0.99) (0.97)
5 0.41+0.005 0.71 ±0.26 1.54 ±0.38 1.94 + 0.002(0.99) (0.95) (0.97) (0.99)
6 0.65 + 0.09 1.11 ±0.31 2.21 ±0.93 6.76± 1.27(0.99) (0.95) (0.90) (0.98)
7 4.98 + 0.23 13.88 + 3.23 36.15 r± 2.26 70.19 ±7.57(0.99) (0.95) (0.99) (0.99)
N.A.: Not available
4 summarizes the Arrhenius activation energy (Ea) at each pH value, as calculated from the slopes of corresponding Arrhenius plots. From these data it is clear that in the acid region the reactions became more temperature sensitive as pH decreased. In the near neutral region the dependence of the reaction rate on temperature was slightly higher as pH increased. Since the study was performed in a simplified system (aqueous buffer
L n ( t 1 /2 )
Fig. 2—Log plot of NHDC half-life as a function of pH at 40 (9), 50 (D and 60 °C (M).
Ln (K )
1/T ("K"1 10-3)Fig. 3 - Arrhenius plot for NHDC at pH 1 (Ml and 7 (9).
solutions) these data indicate general trends only and do not consider potential interactions between NHDC and typical compounds in foods. The Arrhenius plot could also be used to predict rate constants under temperatures other than those checked empirically, which may be relevant to processing and storage of foods and beverages. To check validity of such
5 9 0 -JOURNAL OF FOOD SCIENCE-Volume 57, No. 3, 1992

E a ( K c a l / m o l )
p HFig. 4—Activation energy as a function of pH.
t 1 /2 ( y e a r s )
25 -
1 2 3 4 5 6 7
p HFig. 5—Predicted half-life of NHDC at 20 °C.
approximations, comparisons were made between experimental and calculated half-lives at 30 °C. At pH 1 (for example) the experimental half-life was 229 days, while that calculated was slightly higher: 248 days. The same trend, with slight differences between true and predicted values was observed in neutral pH range: 139 and 135 days at pH 7, respectively. Figure 5 shows extrapolated half-lives at 20 °C and Table 4 predicted remaining NHDC at 20 and 25 °C and different pH values. The high values of half-lives for NHDC from pH 2 to
Table 4 -P re d ic ted neohesperidine DC remaining after storage for 6 and 12 months a t 20 and 25 °C and at different pH values
pH
Storagetamp(”C)
Storagetime
(months)
RemainingNHDC
(%)1 20 6 91.2
12 83.025 6 80.4
12 64.22 20 6 94.9
12 89.925 6 90.8
12 82.33 20 6 98.5
12 97.025 6 97.4
12 94.84 20 6 98.6
12 97.225 6 97.9
12 95.95 20 6 96.1
12 92.325 6 94.7
12 89.66 20 6 95.9
12 91.825 6 93.6
12 87.57 20 6 71.0
12 50.025 6 56.4
12 31.3
Table 5 - 90 °C
■Predicted and experimental half-lives fo r NHDC degradation at
Half-lives (days)pH Extrapolated Experimental2 2.3 0.83 13.9 9.96 18.2 4.07 1.0 0.3
pH 6 indicated that no significant loss of sweetner would be expected during normal shelf-life of soft drinks (6-12 mo). These data confirmed previous published reports that the gly- cosidic bonds of NHDC in solution were resistant to hydrolysis by various acids above pH 2 at normal ambient temperature (Inglett et al., 1969). We also found no perceptible changes of sweetness ir. flavored soft drinks stored 1 yr at room temperature (« 23 °C).
An additional set of experiments was performed at 90 °C and pH 2, 3, 6 and 7 to check validity of the model (using data from experiments performed at 30-60 °C) to predict half- lives at higher temperatures that represent pasteurization conditions. In comparing the extrapolated results (Table 5) with those of the accelerated shelf-life study at 90 °C, model predictions were in several cases far too high. For example, extrapolated half-life at pH 2 was 2.3 days while the experimental value was 0.8 days, almost one-third. Such differences may be explained either by lack of data at intermediate temperatures or by a change of slope in the Arrhenius plot from lower (30- 60 °C) to higher (90 °C) temperatures. Similar observations were reported in an accelerated kinetic study of aspartame degradation (Tsoubeli and Labuza, 1991). Regardless of these differences, NHDC can withstand, pasteurization or other heat treatments normally used by the food industry without significant degradation.
CONCLUSIONSNHDC is sufficiently stable within the usual pH range of soft drinks (2.5-3.5) to continue to function as sweetener and flavor modifier throughout conventional beverages shelf lives. In
—Continued on page 643
Volume 57, No. 3, 1992-JOURNAL OF FOOD SCIENCE-591

F l a v o r M o d i f y i n g C h a r a c t e r i s t i c s o f t h e I n t e n s e S w e e t e n e r
N e o h e s p e r i d i n D i h y d r o c h a l c o n e
M. G. LINDLEY, P. K. BEYTS, I. CANALES, and F. BORREGO
----------------------------ABSTRACT-----------------------------Addition of 1—4 ppm neohesperidin dihydrochalcone to sweet and nonsweet food products modified the intensity of some flavor attributes in all products evaluated, as determined by a panel of trained assessors during a series of descriptive attribute analyses. Flavor enhancements were perceived in all products, although no consistent pattern of enhancement was observed across the product range. Fruit flavors were enhanced across all fruity products, as were some odor attributes. Intensity reductions of some sharp or spicy flavor attributes were also recorded. The great majority of flavor modifications induced were considered to bring about improvements in product sensory quality.
Key Words: neohesperidin dihydrochalcone, sweetener, sensory, flavor modifier
INTRODUCTION
WHEN a compound elicits sweetness it often also enhances or modifies flavor. Such enhancing or modifying effects resulting from incorporating sweeteners in food formulations are probably not simply a direct consequence of the sweetness, but may be, to some degree, sweetener dependent. For example, sucrose and fructose have been shown to enhance fruit flavors, particularly citrus (Hyvonen, 1982; Wiseman and McDaniel,1991), whereas Cliff and Noble (1990) found that increasing concentrations of glucose in a peach-flavored solution induced no significant increase in perceived levels of fruitiness.
There are many references to the flavor enhancing or modifying effects of the potent sweetener aspartame, particularly with fruit flavors (Beck, 1974; Homier, 1984; Ripper et al., 1986, Wiseman and McDaniel, 1991). All reported effects were observed when aspartame was incorporated into foods at concentrations where sweetness was elicited. In contrast, however, sucrose was reported to enhance flavors when used in foods at both sub- and supra-threshold levels (Nicol, 1982). Also, the flavor enhancing properties of the sweet protein thau- matin have been described (Higginbotham, 1983; Higginbotham et al., 1981), many of its flavor modifying effects being apparent when added to foods at sub-threshold concentrations. However, there are few other reports of sweeteners exhibiting notable flavor enhancements, particularly when incorporated into foods at sub-sweetness concentrations.
Neohesperidin dihydrochalcone (NHDC) has been known as an intense sweetener for almost 30 years since its preparation in the USDA Western Regional Research Laboratory (Horowitz and Gentili, 1963). Initial evaluations of its taste characteristics revealed that it elicits licorice-like or cooling/menthol aftertastes at high concentrations. With a growing trend towards the use of sweetener blends in foods, the potential of NHDC has been re-evaluated and some advantages of its use as a
Author Lindley is with Lintech, Reading University Innovation Centre, P. 0. Box 68, Whiteknights, Reading, RG6 2BX, England. Author Beyts is with Sensory Dimensions, Reading University Innovation Centre, P.O. Box 68, Whiteknights, Reading, RG6 2BX, England. Authors I. Canales and F. Borrego are with the Research cSi Development Dep., Zoster, S.A. (Grupo Ferrer), Rai- guero, 143, 30588 Zeneta (Murcia), Spain.
component of sweetener blends have been described (von Ry- mon Lipinski and Luck, 1976; Bar et al., 1990). In addition to its satisfactory application as a sweetener in blends with other potent sweeteners, reference has also been made to its beneficial flavor enhancing properties. Inglett et al. (1969) reported that samples of grape, root beer and cherry flavored powdered beverages containing NHDC as part of the sweetening system were more intensely flavored than control samples without the sweetener. In those studies, the effects of NHDC were observed at supra-threshold concentrations, but more recent work resulted in the first quantitative indication of flavor enhancements by sub-threshold concentrations of the sweetener in a fruit flavored beverage (Lindley et al., 1991).
In our present study, the objective was to measure, using descriptive attribute analysis procedures, the flavoring effects of incorporating NHDC into food and beverage products at sub-threshold levels of less than 5 ppm. Incorporation of NHDC into foods and beverages for sweetening effects usually requires concentrations of 20-50 ppm. Flavor enhancing and modifying characteristics were examined in a broad range of sweet and savory foods and beverages. Where possible, to avoid any potential for variation in product make-up to influence results, commercial samples had the sweetener added, and attribute analysis was carried out following preliminary determination of a suitable concentration of NHDC.
MATERIALS & METHODS Sample preparation
NHDC was from Zoster, SA (No. 29.014, Zoster, SA, 30588, Zeneta, Murcia, Spain). Commercial foods and beverages were a non- carbonated blackcurrant flavored beverage, soya milk, tomato keth- cup, and low-fat (40%) dairy margarine spread. Product ingredient lists and concentrations of added NHDC are given in Table 1. NHDC was added to these products as a 0.1% (w/w) solution in warm (40°C) water (Highland Spring Ltd, Blackford, Scotland). The same volume of water was added to the control samples of commercial products. Lemon flavored water ice was prepared according to the following method. Saccharin, citric acid and glucose syrup were combined with wanned (50°C) water. Sucrose, pectin and color were added. When all the pectin was dissolved, NHDC and flavor were added. The resulting mix was poured into molds and frozen at - 20°C. Samples were prepared 24 hr in advance, stored at 5°C (-18°C for the water ice) and served as follows: lemon flavored water ice, -18°C; blackcurrant beverage, 5°C; soya milk, tomato ketchup and margarine spread, 22°C.
Environment
Samples were tested in the sensory suite of Sensory Dimensions within the Reading University Innovation Centre (Reading, England). Panelists were seated in individual, air conditioned booths which were maintained at 20°C ± 2°C. Panelists were served with samples through sliding trap doors adjacent to the food preparation area.
Panelists
Eleven professional members (all female, aged 25^45) of the descriptive attribute analysis panel employed by Sensory Dimensions (Reading, England) were selected on the basis of experience with these sensory techniques, particularly within these product classes, and motivation. Panel selection was based on established procedures, and included tests for basic taste identification, ranking basic taste
592-JOURNAL OF FOOD SCIENCE-Volume 58, No. 3, 1993

Table 1 -F o o d products evaluated, ingredient lists, and concentrations o f added NHDC
Product Ingredients
NHDCcone(ppm)
Blackcurrantbeverage
Water; Blackcurrant juice; Glucose syrup (6.7%); Citric acid; Acesulfame-K; Aspartame; Vitamin C; Niacin;Vitamin B6 ; Vitamin B12.
2.0
Soya milk Filtered water; Dehulled whole organic soya beans.
4.0
Tomoto ketchup Tomatoes; Sucrose; Spirit vinegar; Salt Spices.
4.0
Low-fat margarine
Vegetable and hydrogenated vegetable oils;Buttermilk; Water; Gelatin; Caseinate; Salt; Emulsifier; Preservative; Color; Flavoring.
3.0
Lemon water ice Water; Sucrose; Glucose syrup; Citric acid; Sodium saccharin; Pectin; F lavoring; Color.
1.0
Table 2 - Definitions o f some flavor attributes used to standardize terminology
Product Attribute DefinitionSoyaMilk
Floury Flavor of uncooked pastry dough.
Walnut Flavor of crushed, fresh walnuts.Thickness Refers to the oral viscosity, scored from "very
th in " to "very thick."Tomato Tomato Flavor character of cooked Italian tomatoes.ketchup Standard: diluted Italian concentrate paste.
Spicy Mixture o f dried spices, including cinnamon, nutmeg, clove, black pepper.
Throat- Burning sensation in the throat, similar to thatcatching caused by Cayenne pepper.
Low-fat Oily Flavor associated w ith com m ercia l, b lockspread margarine.
Buttery Flavor associated with fresh sweet cream butter.
Floury Flavor of uncooked pastry dough.Cheese Slightly acidic flavor produced by ripe, Ched
dar cheese.Melt-rate Speed at which the product melts in the mouth.
W ater-ice
Floral Mixed floral notes; violets and roses.
solutions of differing concentrations, discrimination, simple and complex odor identification, and ability to generate product attribute descriptors.
Three terminology development sessions, (1 hr each), were conducted following standard procedures. Test and reference products, coded with 3-digit random numbers, were presented at group discussion sessions. These were held to develop vocabularies that adequately described the appearance, odor, flavor, texture and aftertaste of the products and any qualitative differences between references and tests. Generated attribute terms were discussed and standardized so that all panelists understood and agreed to the exact meaning. Some terms were universally understood, for example, ‘sweet’, ‘bitter’, and ‘acidity’. Other attributes were defined (Table 2) to minimze confusion. Reference products were not made available to further define terms, partly because of the wealth of each panelists’ experience and because of the size of this program.
Sensory method
Liquid samples (50 mL) were served in 100 mL plastic cups, tomato ketchup and low-fat margarine samples (20g of each) were served in 65 mL plastic cups, and thelemon flavored water ice (50 mL) was served as individual frozen sticks. For each product, the same amount of corresponding reference without added NHDC was supplied. Mineral water at room temperature and crackers were used to cleanse the palate between samples.
Test and reference samples within each pair were served in cups coded with 3-digit random numbers different from those used during discussion sessions. Each sample within pairs was served individually. A 5-min wait between samples within pairs, and between pairs, was enforced. Panelists evaluated three pairs of samples/session, each ses-
Table 3 - Mean sensory scores (150 m m line scales; n = 11; 3 replicates) fo r blackcurrant flavored beverage containing either 0 or 2 ppm neohes- peridine DC
Sensory Least significantscore difference (p<)
Attribute" Ref. Test Error 0.1 0.05 0.01
B/C Odor»* 29.3 36.5 3.3 5.7 6 .8 9.3Sweet 58.3 60.2 3.4 5.8 7.0 9.5Sour 39.8 34.8 7.1 12.2 14.3 19.9Bitter* 28.9 15.9 7.3 12.6 15.1 20.6Drying* 44.7 30.3 7.2 12.3 14.8 20.1Ju icy** 38.8 49.5 4.0 6.8 8.2 11.1Green 32.2 29.9 3.9 6.7 8.1 11.0Apple 28.9 33.0 3.2 5.5 6.6 9.0S yrupy*** 33.4 47.3 4.7 8.1 9.7 13.2Sweet (A/T) 46.9 47.1 3.0 5.1 6.2 8.4Sour (A/T) 28.2 24.8 3.9 6.7 8.1 11.0Bitter (A/T) 27.2 18.0 7.6 13.0 15.7 21.4Drying (A/T)* 43.0 32.9 4.9 8.4 10.1 13.7Juicy (A/T)*** 24.6 39.9 4.3 7.4 8.9 12.2Green (A/T) 26.7 27.1 3.4 5.9 7.1 9.6Cooling (A/T)** 36.5 27.5 3.9 6.6 8.0 10.9
* p <0.1 ; * * p<0.05; ***p<0.01.8 B/C = blackcurrant; A/T = aftertaste.
Table 4 —Mean sensory scores (150 m m line scales; n = 11; 3 replicates) fo r lemon flavor water-ice containing either 0 or 1 ppm neohesperidineDC __________________________________________________________
Sensory Least significantscore difference (p <)
Attribute* Ref. Test error 0.1 0.05 0.01
Total Odor 28.4 27.2 3.3 5.6 6.7 8.9Total Flavor (Bite)** 39.5 44.9 2.6 4.4 5.3 7.0Acidity (Bite) 28.9 28.4 2.5 4.1 4.9 6.5Sweet (Bite) 31.2 35.0 2.6 4.3 5.2 6.9Bitter (Bite) 18.1 17.0 2.5 4.1 4.9 6.5Lemon (Bite) 30.0 33.4 3.0 4.9 5.9 7.9Floral (Bite)** 16.8 26.2 4.5 7.6 9.1 12.1Total Flavor (Suck) 41.6 42.6 2.8 4.7 5.6 7.4Acidity (Suck)* 33.5 28.4 2.6 4.3 5.1 6.8Sweet (Suck) 33.3 35.1 2.4 4.0 4.8 6.4Bitter (Suck)*** 22.2 15.7 2.3 3.9 4.6 6.1Lemon (Suck) 32.0 34.9 2.3 3.8 4.5 6.0Floral (Suck) 18.1 24.5 4.7 7.8 9.3 12.4Length (A/T)* 34.3 38.5 2.5 4.1 4.9 6.5Sweet (A/T) 26.2 29.9 2.3 3.9 4.7 6.2Bitter (A/T) 18.5 17.2 2.5 4.2 5.1 6.8Acidity (A/T) 22.6 18.3 4.8 8.1 9.6 12.8
* p<0.1; **p<0.05; ***p <0.01. a Af t = aftertaste.
sion lasting up to 90 min. Each panelist evaluated all test and reference samples in triplicate on three separate occasions. Within each pair, order of presentation was balanced so that half the panelists received the test sample first, and the other half received the reference sample first. Sample attributes were scored on unstructured line scales of 150 mm length, anchored at each end by ‘none’ and ‘extreme’. Aftertaste ratings were assessed 10 sec after swallowing. Attribute scores were input directly by panelists through a computerized data input system (TASTE, Reading Scientific Services Ltd, Reading, England) via personal computer and mouse located in each individual taste panel booth. Data were analysed by two-way ANOVA to compare panelist, sample and panelist by sample interaction effects for each pair of products.
RESULTS & DISCUSSION
SIGNIFICANT DIFFERENCES (p<0.1) were found between each test and control product pair evaluated. The least significant difference test (LSD) at p<0.10, <0.05 and <0.01 was applied to pairs of samples to determine those differences that were statistically significant. Results for the blackcurrant flavored, noncarbonated beverage, lemon flavored water-ice, tomato ketchup, soya milk, and low-fat margarine spread are presented in Tables 3 to 7, respectively. NHDC, added to levels up to 4 ppm, induced significant changes to some flavor attributes of all these diverse flavored products. Most of these
Volume 58, No. 3, 1993-JOURNAL OF FOOD SCIENCE-593

FLAVOR M ODIFICATION B Y NEOHESPERIDINE DC. .
Table 5 - Mean sensory scores (150 mm line scales; n = 11; 3 replicates) fo r tomato ketchup containing either 0 o r 4 ppm neohesperldine DC
Sensory Least significantscore difference (p < )
__________ Std. -----------------------------A ttribute8 Ref. Test error 0.1 0.05 0.01
Total Odor 48.9 46.7 2.2 3.6 4.3 5.8Vinegar Odor* 44.6 37.2 3.8 6.3 7.6 10.1Sweet Odor* 28.6 32.4 2.2 3.7 4.4 5.9Tomato Odor** 25.0 29.7 2.1 3.4 4.1 5.5Spicy O dor*** 34.6 19.0 4.8 8.0 9.6 10.9Total Flavor 58.9 56.2 2.4 4.0 4.7 6.3Sweet Flavor 44.3 44.7 2.6 4.3 5.1 6.8Acid Flavor 46.3 41.7 3.6 6.1 7.2 9.6Salty Flavor 21.5 19.5 2.0 3.3 3.9 5.2Tomato Flavor* 32.7 37.7 2.7 4.4 5.3 7.1Spicy Flavor*** 38.7 23.5 5.0 8.3 10.0 13.3Length (A/T)* 50.7 47.1 2.1 3.5 4.2 5.6Sweet (A/T) 37.2 37.5 3.0 5.0 5.9 7.9Acidic (A/T) 32.7 29.6 3.2 5.3 6.4 8.5Tomato (A/T) 23.5 24.4 2.8 4.7 5.6 7.5Throat 31.6 22.0 4.5 7.6 9.1 12.1catching (A/T)*
* p<0.1; * * p<0.05 *' ■ A/T = aftertaste.
** p<0 01.
Table 6 -M e a n sensory scores (150 m m line scales; n = 11; 3 replicates) fo r soya m ilk containing either 0 or 4 ppm neohesperidine DC
Sensoryscore
Std.
Least significant difference (p < )
A ttribute8 Ref. Test error 0.1 0.05 0.01
Floury Odor 29.4 29.9 3.1 5.1 6.2 8 .2Floury Flavor 42.6 42.5 3.0 5.1 6.1 8.1Astringent 31.3 28.1 3.5 5.8 6.9 9.2
FlavorBitter Flavor 15.9 15.2 3.1 5.1 6.1 8 .0'Walnut' Flavor 39.1 35.8 4.2 7.0 8.4 11.2Thickness** 29.8 36.0 3.1 5.2 6.2 8.3Mouthcoating 41.0 42.5 3.9 6.4 7.7 10.3Astringent 33.3 30.9 3.4 5.7 6.9 9.1
MouthfeelFloury (A/T) 35.4 34.5 3.3 5.5 6.5 8.7'Walnut' (A/T)* 34.7 29.8 3.1 5.1 6.2 8.2Bitter (A/T) 18.5 15.9 3.2 5.3 6.4 8.5
* p<0.1; ** p<0.05; " * * p<0.01.8 A/T = aftertaste.
Table 7—Mean sensory scores (150 m m line scales; n = 11; 3 replicates) fo r low-fat margarine spread containing either 0 o r 3 ppm neohesperidine DC
Attribute8
Sensory scoreStd.error
Least significant difference (p < )
Ref. Test 0.1 0.05 0.01
Salty Odor 34.3 33.2 2.8 4.6 5.6 7.5Oily Odor 25.0 25.0 4.9 8.3 9.9 13.2Buttery Odor* 18.2 28.9 6.1 10.1 12.1 16.1Floury Odor* 29.9 20.6 4.8 8.0 9.6 12.8Salty Flavor* 55.7 51.0 2.7 4.6 5.5 7.3Butter Flavor* 27.0 38.2 6.2 10.4 12.5 16.6Sweet Flavor 18.1 21.7 3.0 5.1 6.1 8.1Cheese Flavor 26.1 20.0 7.5 12.5 14.9 19.8Bitter Flavor 16.4 14.9 3.0 5.0 6.0 8 .0Oily Flavor 28.3 27.6 2.1 3.5 4.2 5.6Acidic Flavor 21.9 20.2 3.2 5.4 6.4 8.5Melt Rate 48.1 46.0 4.5 7.6 9.1 12.0Total (A/T) 48.2 45.8 3.3 5.5 6 .6 8.7Oily (A/T) 25.1 26.1 3.3 5.6 6.7 8.8Bitter (A/T) 15.7 13.4 3.1 5.1 6.2 8.2Salty (A/T)* 40.2 35.0 3.1 5.1 6.2 8 .2Cheesy (A/T) 16.2 13.0 3.8 6.3 7.5 10.0Sweet (A/T) 11.9 16.2 3.0 5.0 6 .0 8 .0Length (A/T) 44.6 39.2 4.1 6 .8 8.1 10.8
* p<0.1; • * p<0.05; • * * p<0.01. 8 A/T = aftertaste.
modifications brought positive benefits to overall product quality, although the extent of such benefits need to be assessed on individual products.
Effects from adding NHDC at 2 ppm to the blackcurrant beverage may all be supposed as beneficial. Statistically significant increases in sensory scores for total odor, blackcurrant/ juicy flavor, apparent ‘mouthfeel’ or syrupiness, and black- currant/juicy aftertaste were perceived, along with significant reductions in drying and cooling aftertastes. Each of these magnitude and directional changes led to a positive improvement in product sensory quality. Similarly, 4 ppm NHDC added to soya milk caused a reduction in sensory score for ‘walnut’ aftertaste, (an astringent, unpleasant taste), and an increase in perceived thickness/mouthfeel, also directionally beneficial to overall product quality. In the lemon flavored water-ice, significant increases in the total flavor and floral flavor during biting were noted, and a reduction in bitterness and acidity on sucking. A slight increase in length of aftertaste was noted. All changes caused by NHDC in the low-fat margarine spread were slight. Increases in butter odor and flavor, and decreases in floury odor and slaty flavor were noted. In tomato ketchup, reductions in sensory scores for vinegar and spicy odors, spicy flavor, length of aftertaste and the ‘throat catching’ nature of aftertaste were noted. Some of these reductions may, (also suppositionally) be considered as reducing the sensory impact of this product. These modifications were counter-balanced by increases in sensory scores for sweet and tomato odors and tomato flavor.
NHDC can cause modifications to specific flavor attributes in a broad range of sweet and savory food products. The ev- idience is strong that such flavor modifications were generally independent of sweetness induction. The sweet taste threshold of NHDC in water has been variously reported as 0.7 ppm (Guadagni et al., 1974) and 7 ppm (Inglett et al., 1969). Although the recognition thresholds of NHDC were not determined in our test products, in no instance was there a significant increase in sensory score for sweet taste. Additionally, typical use levels of NHDC for sweetening are in the 20-50 ppm range.
One possible mechanism whereby NHDC may induce these changes is its reported effect on perception of bitter taste (Prat- ter, 1980). NHDC modulates perceived bitterness intensity. Consequential ‘reversal’ of the mixture suppression (Barto- shuk, 1975) caused by the bitterness originally apparent may explain why many flavor attribute modifications induced by NHDC are perceived as enhancement. Also, this explanation is consistent with the observed reduction in impact of some flavor attributes. The temporal effects of NHDC might also be contributory, although there is no objective evidence to substantiate this.
While modulation of perceived bitterness is a persuasive explanation for many reported effects those on perceived mouthfeel/syrupiness and odor intensity are not as readily explained. Increases in perceived mouthfeel or syrupiness of some products may simply be a consequence of added NHDC shifting the sweet taste profile to become more sucrose-like. Apparent increase in odor attributes might result from selective binding to NHDC molecules thus changing the odor profile such that panelists perceive the change as an increase. A similar explanation has been offered to explain some odor effects of the sweet protein thaumatin (Higginbotham, 1983).
REFEREN CES
Bar, A., Borrego, F., Benavente, 0., Castillo, J., and del Rio, J.A, 1990. Neohesperidin dihydrochalcone: properties and applications. Lebensm.- Wiss. u.-Technol., 23:371-376.
Bartoshuk, L.M. 1975. Taste mixtures: Is mixture suppression related to compression? Physiol. Behav. 14:643-649.
Beck, C.I. 1974. Sweetness, character and applications of aspartic acid based sweeteners. In Symposium: Sweeteners, G.E. Inglett (Ed.), p. 164. AVI, Wesport, CT.
Cliff, M. ana Noble, A.C. 1990. Time-intensity evaluation of sweetness and fruitness and their interaction in a model system. J. Food Sci. 55:450- 454.
Guadagni, D.E., Maier, V.P., and Turnbaugh, J.G. 1974. Effect of sub-—Continued on page 666
594-JOURNAL OF FOOD SCIENCE-Volume 58, No. 3, 1993

S w e e t n e s s A d a p t a t i o n o f S o m e C a r b o h y d r a t e a n d H i g h
P o t e n c y S w e e t e n e r s
B.L. BORNSTEIN, S.G. WIET, and M. POMBO
----------------------------ABSTRACT-----------------------------A sip-and-swallow procedure designed to provide stimulation resembling normal drinking was employed to investigate adaptation to sweetness and sourness over time in a model beverage system. Intensity judgements were made using magnitude estimation. Adaptation to sweeteners (sucrose, HFCS, sucralose and aspartame) alone and in blends was evaluated. Different degrees of sweetness adaptation were observed. Sucrose and HFCS displayed less adaptation than the high potency sweeteners, sucralose and aspartame. Blends containing two high potency sweeteners adapted to a greater degree than the individual components. Blends containing a carbohydrate and a high potency sweetener showed less adaptation than those containing two high intensity sweeteners. Sourness adaptation was not demonstrated.
Key Words: adaptation, sweetness, sourness, sensory, aspartame, sucralose
INTRODUCTION
THE NORMAL human drinking pattern consists of a series of intermittent sips and swallows. A single sip sequence typically includes moving of the drinking vessel to the lower lip, contact with the liquid (including ingestion), removal of the vessel from the lip, and finally swallowing. Stremlin and Halpern fitted a linear equation to intersip contact times: t = 2.1x -0.8, where t was the time (sec) between successive sips and x the ordinal position of the first member of the pair of sips. According to that equation, there were 1.3 sec between the first and second sips of a series, 9.7 sec between the fifth and sixth sips, 18.1 sec between the 9th and 10th sips, 22.3 sec between the eleventh and twelfth sips, etc. (Halpern, 1985). During such pattern of repeated consumption, the taste of a liquid would not be completely cleared from the mouth (Wood- worth and Schlosberg, 1954). As the liquid is consumed and new stimuli are added to the residual, adaptation to the stimulus may occur.
Adaptation is often defined as a decrease in sensitivity (increase in threshold) to a given stimulus commonly experienced under conditions of continuous or repeated exposure to that stimulus (Meilgaard et al., 1987; Meiselman, 1968). This definition is somewhat incomplete, however, since concentrations substantially lower than the adapting stimulus would also be detected as different from the adapting stimulus (Bartoshuk, 1971, 1980). Therefore, adaptation refers to a desensitization in absolute threshold accompanied by increased sensitivity to changes in concentration (increases or decreases) away from the adapting stimulus (Pfaffmann et al., 1971).
The primary methods of stimulus presentation used to study taste adaptation have been either sip-and-spit or mouth flow procedures. Differences in results among such studies have been attributed primarily to the method of presentation and evaluation procedures. Meiselman (1972) reported that the continuous anterior dorsal flow method was more likely to produce complete adaptation than either the whole mouth flow
Authors Bornstein, Wiet, and Pombo are with McNeil Specialty Products Company, 501 George Street, New Brunswick, NJ, 08903-2400.
or sip-and-spit procedures. Such methods are, however, quite different from normal drinking.
Halpern and Meiselman (1980) first published attempts at studying taste adaptation by simulating human drinking. The apparatus they used alternately delivered two continous flowing solutions (a stimulus liquid and an alternate flow liquid) to the anterior dorsum of the tongue via a delivery tube. Distilled water or an “ artificial saliva” was the alternate liquid and NaCl and Na-saccharin were stimulus compounds. Flow patterns were designed to correspond to time patterns of normal drinking. Subjects evaluated stimulus intensity using magnitude estimation. No significant taste adaptation was observed.
In a later study (Halpern et al., 1986), sodium chloride served as stimulus, alternating with artificial saliva, water, or no second liquid. Subjects again used magnitude estimation to record perceived taste intensities. The condition most closely representing normal drinking, sodium chloride solution alternating with artificial saliva, demonstrated no adaptation effect. Alternation with no second liquid sample produced a rapid decrease in taste intensity while alternation with water produced increased taste intensity. The degree of stimulus removal was an important factor relating to changes in perceived taste intensity. The maximum stimulus removal condition (NaCl-water) produced an increase in intensity, the partial removal condition produced constant intensity, while no removal (NaCl-no second liquid) decreased intensity. Those results supported the theory that a gradual buildup in concentration of a chemical in the mouth could produce a gradual decrease in perceived intensity. In a normal drinking situation, however, the effect adaptation may have is unclear. For example, when drinking a sweetened carbonated beverage, do consumers adapt to any primary taste components?
Our objective was to simultaneously investigate changes in sweetness and sourness intensities of a model beverage system. In addition, sweetener blends were tested.
MATERIALS & METHODSStimuli
Sweetened solutions were prepared at equisweet levels in an acidulated water solution (pH = 3.0) composed of 0.3% w/v citric acid (Malinckrodt, Inc., Paris, KY), 0.06% sodium citrate (Haarmann & Reimer Corp., Elkhart, IN) and deionized water (Hydro Water Company). In order to keep the model system simple and avoid complicating sweetness intensity assessments, no flavoring ingredients were added. Isosweetness levels for single sweeteners (sucrose, high fructose com syrup [HFCS], sucralose and aspartame) and sweetener blends at a 50:50 sweetness contribution ratio (aspartame/sucralose, acesul- fame-K/sucralose, acesulfame-K/aspartame, sucralose/sucrose and su- cralose/HFCS) were previously determined relative to a 9% sucrose solution in the model system, using paired comparison constant stimulus (Amerine et al., 1965). Due to its bitterness, the isosweetness level for acesulfame-K could not be found using this highly sensitive method. Isosweet concentration levels were as follows: sucrose (Malinckrodt, Inc., Paris, KY) - 90.0 g/L, 55 DE HFCS (A.E. Staley Co., Decatur, IL) - 129.7600 g/1, sucralose (McNeil Specialty Products Company, New Brunswick, NJ) - 0.1894 g/L, aspartame (Nutrasweet, Co., Deerfield, IL) - 0.5335 g/L, aspartame/sucralose - 0.278:0.099 g/L, acesulfame-K/sucralose - 0.591:0.075 g/L, acesulfame-K/aspar- tame - 0.250:0.089 g/L, sucralose/sucrose - 0.092/43.62 g/L, sucra-
Volume 58, No. 3, 1993-JOURNAL OF FOOD SCIENCE-595

SWEETNESS ADAPTATION OF SWEETENERS . . .
SWEETNESS INTENSITY
Fig 1 -Least Square Means for sweetness intensity of single sweeteners over time.
SWEETNESS INTENSITY
Fig 2—Least Square Means for sweetness intensity of blends of carbohydrate and high potency sweeteners over time.
lose/HFCS - 0.077/51.40 g/L. Solutions were prepared fresh on the day of testing and were served at room temperature (22°C ± 2°C).
Panel Procedure
Trained panelists (15) who routinely participated in sensory studies at McNeil Specialty Products Company were chosen based on ability to accurately assess sweetness intensity. These panelists had previously been trained in descriptive analysis techniques and had been participating in descriptive panels for a 6 mo. They were familiarized with magnitude estimation techniques during a 1 hr initial training session followed by nine practice sessions during which performance was monitored and feedback was provided to panelists. All panelists were naive as to the purpose of the study and identification of samples. Thus, they were not aware that they were repeatedly tasting the same stimuli in any single panel. Sensory testing was conducted in individual booths equipped with computerized data acquistition system (CompuSense) under white lighting.
Sample presentation
Panelists were first presented with a 9% sucrose reference solution, assigned a sweetness intensity and sourness intensity value of ‘100’. Panelists were instructed to sip and swallow the reference solution,
SWEETNESS INTENSITY
Fig 3—Least Square Means for sweetness intensity of biends of high potency sweeteners over time.
rinse with distilled water and wait for 1 min. They were then presented with 12 10 mL samples of a single stimulus in randomly coded 30 mL plastic cups. Panelists were instructed to consume one sample every 15 sec. Samples were to be completely consumed in a single sip and swallowed in a manner similar to normal drinking. After consuming a sample, panelists recorded the sweetness and sourness intensities relative to the reference. They did not rinse between samples. Each sweetener or blend was evaluated in a separate single test session. Panelists were not aware that they were repeatedly tasting the same stimulus multiple times in a single session.
Data analysis
Data were analyzed using the General Linear Model analysis of variance with repeated measures, in order to account for missing panelist data (SAS). Least Square Means derived from the general linear model were compared using Least Significant Differences (LSD) to evaluate differences in sweetness intensity over time for a single sweetener, and between sweeteners at each sampling point (O’Mahony, 1986). For each sweetener and blend, mean magnitude estimates for sweetness were plotted as a function of time (Fig. 1 to 3).
RESULTSIntensity differences with one sweetener
Adaptation. All sweeteners showed significant differences in sweetness intensity over time (Fig. 1). For sucrose, very little change in sweetness intensity (7%) was perceived over the tasting period. A decrease in intensity relative to the first sample was not evident until the last sample was consumed after 165 sec elapsed [F(l 1,132) = 2.55; p<0.01]. All other sweeteners demonstrated higher degrees of adaptation. The sweetness of HFCS was perceived to decrease in intensity by 18% over the evaluation. Compared to the initial evaluation, the decrease in perceived intensity was evident when the third and consequent samples were consumed [F(ll,143) = 4.97; p<.01]. Note, however, that HFCS had an initial decrease in sweetness intensity but then remained relatively constant through subsequent tastings. All other sweeteners and blends gradually declined in intensity over time. Sucralose and aspartame showed = 34% losses in sweetness over the consumption period. For sucralose, a decrease in sweetness from the first sample was evident after 45 sec [F(ll,132) = 14.82; p <0.001], The decrease in sw eetness for aspartam e was after 15 sec [F(ll,132) = 14.15; p<0.001].
Blends of sucralose and a carbohydrate sweetener (sucrose or HFCS) displayed adaptation, but the decrease in intensity over the evaluation ( = 28%) was lower than that of sucralose
596-JOURNAL OF FOOD SCIENCE-Volume 58, No. 3, 1993

alone. For the sucralose/sucrose blend, a decrease in sweetness intensity from the initial tasting was after the third sample was consumed at the 30 sec time point [F(ll,121) = 5.92; p<0.001]. For the sucralose/HFCS blend a decrease in intensity was first evident at the 45 sec sampling point [F (ll,1 2 1 ) = 5.33; pcO.OOlj.
Blends composed of two high potency sweeteners (aspar- tame/sucralose, aspartame/acesulfame-K, and sucralose/ace- sulfame-K) displayed 46%, 44% and 48% losses in sweetness from initial sweetness levels, respectively. The sweetness adaptation to the blends was greater than demonstrated for either sucralose or aspartame alone. Reductions in sweetness intensity were found for these high potency sweetener blends at the 15 sec sampling point for the two blends containing acesu- flame-K and at the 30 sec sampling point for the aspartame/ sucralose blend [aspartame/sucralose F ( l l , 132) = 18.64; p < 0 .0 0 1 , aspartam e/acesulfam e-K F(11,132) = 11.82; p < 0 .0 0 1 , sucralose/acesulfam e-K F ( l l , 132) = 13.54; p<0.001]. No changes in sourness intensity were found within a given sweetener over the time course of the evaluation (p > 0.05).
Intensity differences between sweetenersAdaptation. Adjusted sweetness intensity values for each
sweetener and blend across the time period allowed sweetness intensity comparisons to be made between sweeteners at each time point. The sweeteners were well matched for sweetness, through the paired comparison technique, and, therefore, no differences were found in initial sweetness intensity between any sweeteners or blends.
Compared to sucrose, the high potency sweetener blends containing acesulfame-K displayed a greated adaptation rate than the other blends or single sweeteners. The sucralose/acesulfame-K and aspartame/acesulfame-K blends were perceived to be less sweet than sucrose beginning at 15 sec and 30 sec evaluation points, respectively, and at each subsequent time. The aspartame/sucralose blend did not decrease in intensity relative to sucrose until the 105 sec sampling point. The sucralose/HFCS blend was consistently less sweet than sucrose beginning at the 90 sec evaluation point while the sucralose/ sucrose blend did not become consistently less sweet than sucrose throughout the evaluation.
No differences in intensity were found between sucrose and any single sweeteners until late in the tests. Sucralose and aspartame became less sweet than sucrose after 135 sec and 150 sec, respectively. HFCS was not less sweet than sucrose throughout the evaluation. Thus, adaptation to high potency sweeteners may occur more readily than to carbohydrate sweeteners. Between sweetener differences in perceived sourness also were not found at any point during evaluation (p > 0.05).
DISCUSSIONRESULTS suggest that the four single sweeteners (sucrose, HFCS, sucralose and aspartame) demonstrated different degrees of sweetness adaptation. The high potency sweeteners displayed greater adaptation than the carbohydrate sweeteners. Blends containing two high potency sweeteners appeared to be more adaptable than the individual components alone. Blends of a high potency sweetener and a carbohydrate sweetener showed degrees of adaptation intermediate to those of a carbohydrate sweetener and a high potency sweetener alone.
Our results are, to some extent, context dependent since numerous factors may affect degree of adaptation. These include the number of taste trials, intervals between successive tastings, amount of sample consumed at each trial, and sweetener concentration (Meiselman, 1968). Use of a rinsing between tastings, resulting in removal of residual stimuli, would presumably lessen the degree of adaptation (O’Mahony, 1979). Normal drinking behavior, however, does not include a rinse.
The method of evaluation used by subjects to rate taste intensity also appeared to influence the rate of adaptation. A magnitude estimation method is less likely to result in reports of complete adaptation than either a cross-adaptation procedure or a hand-raise method (Meiselman, 1975). Additionally, these results were found in a simple unflavored, citric-acid buffered, noncarbonated, aqueous solution and may not apply to more complex food or beverage systems.
No differences were found in initial sweetness intensity across all sweeteners and blends. Initial sweetness intensities of the samples varied slightly. This may have been due to methodological factors. The isosweetness levels were determined in a separate study using paired comparison to a constant stimulus. The magnitude estimation procedure is less sensitive; thus, the slight variation may be partially attributed to this. Another possible explanation stems from the fact that sucrose was used as reference for all evaluations. Based on pilot study results, sucrose was chosen as the reference because it seemed to demonstrate the least impact on subsequent samples and because it was perceived to clear the mouth relatively quickly. The variation in initial sweetness intensity with other sweeteners and blends may be attributed to sweetness character differences among samples relative to the sucrose reference.
Although varying degrees of sweetness adaptation were observed, complete adaptation did not occur. This could have been a function of the experimental procedures. Gent and McBurney (1978) however, concluded that, unless the method of stimulus delivery assures a constant state of stimulation, complete adaptation would be difficult to observe. This theory is supported by reports of no reduction in taste intensity when a simulated drinking method was employed (Halpern and Meiselman, 1980; Halpern et al., 1986). Noncontinuous stimulation is a normal aspect of drinking and thus, complete adaptation would not be expected when stimuli presentation methods resembling normal drinking were employed (Halpern and Meiselman, 1980).
Mechanisms underlying differences in adaptation rates for different sweeteners and blends found in our study remain unclear. A possible explanation involves the sweetness receptor mechanism. Shamil et al. (1988) measured the receptor affinity (average K„,) of 11 sweet substances, including three high potency sweeteners. The affinities of sucralose (K„, = 0.09), sodium saccharin (!£„, = 0.53), and acesulfame-K ( ^ = 1.47) were much greater than that of sucrose (Km = 45) (lower Kn, values reflect greater affinity). Just as receptor affinity has been found to partly govern threshold concentration and sweetness persistence, it could also be partially“ responsible for adaptation differences (Shamil et al., 1988; Jakinovich and Sugarman, 1989). The stronger affinity of high potency sweeteners to receptors may relate to the higher degree of adaptation observed. Shamil found wide differences in affinities of carbohydrate sweeteners to receptors. Of the eight carbohydrate sweeteners evaluated, sucrose had the strongest affinity (K™ = 45) followed by D-fructose (Km = 190) and D-glucose (K^ = 525). Although HFCS was not evaluated, its affinity would be expected to fall between that of D-fructose and D-glucose. If a direct relationship between affinity and adaptation exists we may expect HFCS to demonstrate less adaptation than sucrose. The 18% decrease in sweetness intensity found for HFCS was quite unexpected. As previously mentioned, however, the sweetness intensity of HFCS was not different from that of sucrose at any tasting point. Furthermore, HFCS had a slight initial decrease in sweetness intensity but then remained relatively constant through subsequent tastings.
Cross adaptation studies produced evidence that strongly suggested that sweetness was mediated by multiple receptor mechanisms. Schiffman et al. (1981) investigated cross adaptation of 14 stimuli, including seven high potency sweeteners, as well as seven carbohydrate sweeteners. When a sugar was used as adapting stimulus, a reduction in sweetness intensity was found for all other sweeteners. However, when a high
Volume 58, No. 3, 1993-JOURNAL OF FOOD SCIENCE-597
SWEETNESS ADAPTATION O F SWEETENERS . . .
potency sweetener was used as adapting stimulus, results were inconsistent. Cases of decreased sweetness intensity, enhancement, and no change in sweetness intensity were observed. Lawless and Stevens (1983) found that high potency sweeteners, aspartame, saccharin and dihydrochalcone, failed to cross adapt one another or sucrose. Those studies, and others, suggest that more than one receptor mechanism may be responsible for perception of sweet taste. Also sugars may bind to a greater number of receptor types than do high potency sweeteners (Schiffman, 1991). These mechanisms may also be, at least partially, responsible for different degrees of adaptation.
No adaptation to sourness was demonstrated in any of the stimuli solutions. Recent studies suggest that different transduction mechanisms may be responsible for perception of sourness and sweetness (Kinnamon, 1988). Therefore, adaptation would not necessarily be similar across taste modalities.
Boudreau et al. (1976) suggested that the hydrogen ion and the undissociated acid could both contribute to sourness. Possibly the H+ and the undissociated acid elicit sour taste through different processes. Curtis et al. (1984) proposed that the sourness of citric acid was partially additive. The sourness evoked by the H + ions and by the undissociated acid combine. Thus, adaptation to the undissociated acid may be counteracted by sourness provided by the H+ ions resulting in no perceived loss in overall sourness intensity (Curtis et al., 1984; Gan- zevles and Kroeze, 1987a,b).
Finally, from a practical standpoint, results indicate that adaptation may have some impact on overall taste experience. Possible adaptation effects should be considered when evaluating products in the laboratory for sensory properties and acceptability. Such product attributes may change upon repeated consumption. Evaluations based on a single sip or bite would not allow for such effects.
REFERENCESAmerine, M.A., Pangborn, R.M., and Roessler, E.B. 1965. Principles of
Sensory Evaluation o f Food. Academic Press, New York.Bartoshuk, L.M. 1968. Water taste in man. Perception & Psychophysics
3: 69-72.Bartoshuk, L.M. 1971. The chemical senses. I. Taste. In Woodworth and
Schlosberg's Experimental Psychology, 3rd ed., J.W. Kling and LA. Riggs (Ed.), p. 169-191. Holt, Rinehart, Winston, New York.
Bartoshuk, L.M. 1980. Sensory analysis of the taste of NaCl. In Biological and Behavioral Aspects o f Salt Intake, M.R. Rare, M.J. Fregley, R.A. Bernard (Ed.), p. 53-67. Lea and Febiger, Phildelphia.
Boudreau, J.C., Oravec, J., Anderson, W. Collings, V., and Nelson, T.E. 1976. Cat neural taste responses to nitrogen compounds. In ACS Sym
posium Series, Nr 26, Phenolic, Sulfur, and Nitrogen Compounds in Food Flavors, Charalambous, G. and Katz, I. (Ed.), 194—206. American Chem. Society.
Curtis, D.W., Stevens, D.A., and Lawless, H.T. 1984. Perceived intensity of the taste of sugar and acid mixtures. Chemical Senses 9: 107-120.
Ganzevles, P.G. and Kroeze, J.H.A. 1987a. The sour taste of acids. The hydrogen ion and the undissociated acid as sour agents. Chemical Senses 12: 563-576.
Ganzevles, P.G. and Kroeze, J.H.A. 1987b. Effects of adaptation and cross- adaptation to common ions on sourness intensity. Physiology & Behavior. 40: 641-646.
Gent, J.F. and McBurney, D.H. 1978. Time course of gustatory adaptation. Perception and Psychophysics 23: 171-175.
Halpern, B.P. 1985. Time as a factor in gustation: temporal patterns of taste stimulation and response. In Taste, Olfaction and the Central Nervous System, D. Pfaff (Ed.), p. 181-209. Rockefeller, New York.
Halpern, B.P. and Meiselman, H.L. 1980. Taste psychophysics based on a simulation of human drinking. Chemical Senses 5(4): 279—294.
Halpern, B.P., Kelling, S.T. and Meiselman, H.L. 1986. An analysis of the role of stimulus removal in taste adaptation by means of simulated drinking. Physiology & Behavior 36: 925-928.
Jakinovich, W. and Sugarman, D. 1989. Peripheral mechanisms of mammalian sweet taste. In Neuromechanisms in Taste, Cagan, R.H. and Rare, M.R. (Ed.), p. 163. CRC Press, Boca Raton, FL.
Kinnamon, S.C. 1988. Taste transduction: a diversity of mechanisms. Trends in Neuroscience 11: 491-496.
Lawless H.T. and Stevens, D.A. 1983. Cross adaptation of sucrose and intensive sweeteners. Chemical Senses 7: 309-315.
Meilgaard, M., Civille, G.V. and Carr, B.T. 1987. Sensory Evaluation Techniques Volume I. CRC Press, Inc., Boca Raton, FL.
Meiselman, H.L. 1968. Magnitude estimations of the course of gustatory adaptation. Perception & Psychophysics 4: 193-196.
Meiselman, H.L. 1972. Human taste perception. Chemical Rubber Company Reviews in Food Technology 4: 89-119.
Meiselman, H.L. 1975. Effect of response task on taste adaptation. Perception & Psychophysics 21:183-186.
O’Mahony, M. 1979. Salt taste adaptation: The Psychophysical effects of adapting solutions and residual stimuli from prior tasting on the taste of sodium chloride. Perception 8: 441-476.
O’Mahony, M. 1986. Sensory Evaluation of Food Statistical Methods and Procedures. Marcel Dekker, Inc., New York.
Pfaffmann, C., Bartoshuk, L.M., and McBurney, D.H. 1971. Taste psychophysics. In Taste. Handbook of Sensory Physiology, Volume TV, L.M. Beidler (Ed.), 75-101. Springer-Verlag, Berlin.
Schiffman, S.S. 1991. Receptors and Transduction Mechanisms for Sweet Taste: An Overview. In Sugars in Nutrition, M. Gracey, N. Kretchmer and E. Rossi (Ed.), p. 55-67. Nestec Ltd., Vevey/Raven Press, Ltd., New York.
Schiffman, S.S., Cahn, H., and Lindley, M.G. 1981. Multiple Receptor Sites Mediate Sweetness: Evidence from Cross Adaptation. Pharmacology Biochemistry and Behavior 15: 377-388.
Shamil, S., Birch, G.G., Jackson, A.AS.F., and Meek, S. 1988. Use of intensity-time studies as an aid to interpreting sweet taste chemorecep- tion. Chemical Senses 13: 597-605.
Woodworth, R.S. and Schlosberg, H. 1954. Experimental Psychology. Holt, Reinhart, and Winston, New York.
Ms received 7/3/92; revised 11/18/92; accepted 2/16/93.
We thank Dr. J. Richard Trout for statistical analysis and Dr. Michael Lindley for critical comments.
P A S T IN G O F W H E A T F L O U R E X T R U D A T E S . . .From page 573
bread by continuous extrusion cooking from high a-amylase flours. J. Cereal Sci. 2: 43.
Mason, W.R. and Hoseney, R.C. 1986. Factors affecting the viscosity of extrusion-cooked wheat starch. Cereal Chem. 63: 436.
Mattson, C., Antila, J., Linko, Y.Y., and Linko, P. 1985. Extrusion cooking of high a-amylase flour for baking. In Thermal Processing and Quality of Food, P. Zeuthen et al. <Ed), P. 262. Elsevier Applied Science Publishers, London.
Mercier, C., Charbonnière, R., Grebaut, J., and de la Gueriviere, J.F. 1980. Formation of amylose-lipid complexes by twin-screw extrusion cooking of manioc starch. Cereal Chem. 57: 4.
SAS Institute Inc. 1985. SA S° User’s Guide: Statistics, Version 5 Edition, SAS Institute Inc., Cary, NC.
Seiler, K. 1985. Modification of wheat flour for the preparation of flour- confectionery goods. In Thermal Processing and Quality o f Food, P. Zeuthen et al. (Ea), P. 106. Elsevier Applied Science Publisher, London.
Sharma, H.R., Rasper, V.F., and Van de Voort, F.R. 1988. Pregelatinized rice flours in composite blends for breadmaking. Can. Inst. Food Sci. Technol. J. 21: 408.
Spies, R.D. and Hoseney, R.C. 1982. Effect of sugars on starch gelatini- zation. Cereal Chem. 59: 128.
Walker, C.E., Ross, A.S., Wrigley, C.W., and McMaster, G.J. 1988. Accelerated starch-paste characterization with the Rapid Visco-Analyzer. Cereal Foods World 33: 491.
Ms received 5/2/92; revised 12/8/92; accepted 12/22/92.
Contribution No. 92-554-J from the Kansas Agricultural Experiment Station. This work was supported in part by the Kansas Wheat Commission.
5 9 8 -JOURNAL OF FOOD SCIENCE-Volume 58, No. 3, 1993

F a t C o n c e n t r a t i o n A f f e c t s S w e e t n e s s a n d S e n s o r y P r o f i l e s
o f S u c r o s e , S u c r a l o s e , a n d A s p a r t a m e
STEPHAN G. WIET, SANDRA M. KETELSEN, THOMAS R. DAVIS, and PAMELA K. BEYTS
---------------------------- ABSTRACT-----------------------------The sensory characteristics of sucralose, aspartame, and sucrose were studied in an unflavored lipid model system varying in fat levels. One study investigated the effects of fat on the potencies (vs. sucrose) of sucralose and aspartame. We also examined absolute changes in all three sweeteners in taste, temporal, and mouthfeel properties at fixed concentrations across a wide fat range. Results indicated a modest decrease in the potencies of sucralose and aspartame across fat concentrations, especially at lower sweetness levels. All sweeteners responded similarly to changes in fat concentration. Independent of fat level, sucralose was perceived more similar to aspartame in onset, bitterness, and aftertaste, than to sucrose.
Key Words: fat, high potency sweetners, sucrose, sucralose, aspartame
INTRODUCTION
DIETARY CONCERNS among consumers have resulted in increasing demands for reduced-calorie, low-fat foods (Sen- auer et al., 1991). This has spurred the development of “ light” foods and beverages with low or reduced fat, often in combination with a non-caloric, high potency sweetener. High quality products of this type require an understanding of fat-sweet interactions which introduces formulation problems. Information is needed for fat level effects on taste properties of carbohydrate and high potency sweeteners. Relationships of potencies of noncaloric sweeteners as a function of fat concentration also must be known.
Sensory studies have examined the interaction of sweetness perception and fat. Skramlik (1926) reported that sweet compounds were perceived differently in oil and water. Mackey(1958) observed that the taste of saccharin was more easily detected in water than in mineral oil, theorizing that lipid inhibited the solubility of saccharin in saliva. Drewnowski et al.(1989) evaluated the perceived sweetness and fat of a milk system varying from 0.1-52% milk fat and sweetened with 0- 20% sucrose. They reported that sweetness perception was masked slightly by increasing fat content. Wang (1987) and Pangborn (1989) showed that the sweetness of vanilla or chocolate milk containing 10% sucrose, fructose, or glucose changed little with fat concentration (0-36% milk fat). Samples sweetened with an equisweet level of aspartame, however, showed significant reductions in sweetness at high fat levels, perhaps due to its low lipid solubility. Perceived fattiness did not differ as a function of sweetener. Redlinger and Setser (1987) reported that the sweetness intensity and taste of carbohydrate and high potency sweeteners differed in aqueous or lipid systems and postulated that lipid may have coated taste receptors reducing sweetness intensity. The aqueous study was carried out at 5% sucrose sweetness equivalency and the lipid system was at 25% sucrose sweetness. Thus, direct conclusions could not be applied as to the effect of fat on sweetness intensity.
Authors Wiet, Ketelsen, and Davis are with McNeil Specialty Products Company, SOI George St., New Brunswick, NJ 08903. Author Beyts is with Sensory Dimensions, Reading University Innovation Center, Philip Lyie Building, PO Box 68, Whitek- nights, Reading, RG6 2BX, U.K.
Changes in the potencies of noncaloric sweeteners relative to sucrose have not been reported. Few studies have systematically examined changes in the taste profiles of sweeteners in systems containing different fat levels. They have relied almost exclusively on using milk fat levels to indicate total fat in milk-based solutions.
We had two general objectives: one, (Study I) was to measure the potencies, relative to sucrose, of two high potency sweeteners (sucralose and aspartame) across a range of fat concentrations. The other (Study II) was to investigate the effect of fat level on absolute sweetness intensity and other salient sensory attributes of sucrose, sucralose, and aspartame. Sucralose and aspartame were selected because of their clean, sweet taste profiles (Wiet and Beyts, 1992; Jenner, 1989; Wells, 1989; Nabors and Gelardi, 1986).
The lipid system was an unflavored milk drink containing skim milk with varying levels of sunflower oil. This oil was selected because it homogenized easily, exhibits little change in viscosity with increased fat, is devoid of flavor notes, has a positive image among consumers, and is used internationally in foods. Butte: fat was not utilized because of its impact on flavor, viscosity, and stability of the model system, as well as its high saturated fat content.
MATERIALS & METHODSSample preparation
Model systems for both studies containing five fat concentrations (0, 3, 6 , 9, and 18% w/v) were prepared using pilot scale equipment. Pasteurized skimmed milk was mixed with the appropriate levels of sunflower oil (Beoco Ltd., Bootle, England) using a high shear mixer, heated to 5°C, then homogenized at 2,000 psi (20 min). Homogenized samples were packed into 4-L glass containers and stored at 4°C until needed. Fresh batches of milk were produced every 4 days. In both studies, sucrose Tate & Lyle, Reading, England), sucralose (Tate & Lyle, Reading, England), and aspartame (Nutrasweet Co., Deerfield, IL) were added to the unflavored milk mixtures the night before tasting, then stored at 4°C until the next morning when they were warmed to room temperature (20°C). In both studies, all test samples were evaluated at 20°C, an ambient temperature at which taste properties of sweeteners can be optimally discerned (Bartoshuk et al., 1982).
Procedures
Study I (Potercy). For potency determinations, 20 trained panelists were used. Subjects were members of the Sensory Dimensions taste panel. They were screened for sensitivity to sweetness differences based on performance during screening tests. These assessed their ability to accurately identify basic tastes, correctly rank solutions differing in concentration, and describe taste properties of complex taste stimuli. All panelists had been exposed to a variety of sweeteners and fats prior to this study and had participated in sensory studies with similar systems. Subjects were well-trained in the methodology. At each of the five fat levels, the sweetness equivalency values (SEV’s) of sucralose and aspartame were determined relative to two sucrose standard sweetness levels (5% and 10% wtv) using the forced-choice paired comparison constant stimulus method (Amerine et al., 1965). A range of seven concentrations of each sweetener was prepared so that the mid-rarge concentration was about equisweet to the sucrose standard. For sucralose, these concentrations ranged from 0.0063- 0.0103% for determining the 5% SEV and 0.0185-0.0335% for the 10% SEV. Aspartame concentrations ranged from 0.020-0.034% for
Volume 58, No. 3, 1993-JOURNAL OF FOOD SCIENCE-599

FAT CONCENTRATION EFFECTS . . .
determining the 5% SEV and 0.047—0.108% for the 10% SEV. Samples (30mL) were presented in coded cups. One was the test concentration and the other the sucrose standard. Order of presentation within and between pairs was randomized. Panelists were asked to select the sweeter sample of each pair. Assessments were carried out using a sip and spit procedure, where samples were held in the mouth for 5 sec before expectorating. A double rinsing technique, warm water (43°C), then water at room temperature (20°C), was used to clear the palate. Crackers were also provided. A 1-min inter-trial interval was required between pairs. Panelists completed three SEV determinations per day. The order of completion of each SEV experiment was balanced across fat, sucrose concentration, and sweetener type.
Study I I —Fat concentration effects. The 20 panelists who participated in study 1 were used. Specific to this study, the specific attributes investigated were based on hypotheses underlying this study or common descriptive terminology generated during pilot studies. Some attributes were used in previous studies (Wiet and Beyts, 1992; Pangborn, 1989; Redlinger and Setser, 1987). Panelists were introduced to selected attributes prior to the study. They tasted the range of samples to be evaluated. The terminology was clarified where necessary and panelists were in agreement that this was an appropriate set of attributes to describe differences between the sample set. The unflavored milk samples contained five fat concentrations (0, 3, 6 , 9, and 18% w/v) and were sweetened with sucrose, sucralose, or aspartame. Two sweetness levels (5% and 10% w/v sucrose equivalency) were evaluated. At each sucrose level, a given concentration of sucralose and aspartame was used with all fat levels. These concentrations were isosweet to the sucrose-sweetened solutions containing 0 % fat (determined in study I). The 5% sucrose SEV for sucralose was 0.0077% and for aspartame 0.0269%. The 10% sucrose SEV for sucralose was 0.0256% and for aspartame 0.0813%.
The taste sessions were conducted in sets of sucrose equivalence (samples equal to 5% sucrose, and those equal to 10% sucrose). These two sets were replicated twice over a 2-day period. Although this split plot design provided less precision in estimating the main effect of sucrose equivalence, it provided excellent precision in measuring the other main effects as well as all interactions. In each set, samples containing 30 mL of each test solution were randomly presented in coded cups. Assessments were carried out using a sip and spit technique, as with study I. Each sample was evaluated using a 15 cm unstructured line scale anchored from “ none” to “ extreme” along the following attributes: maximum sweetness intensity, sweetness delay, bitterness, fattiness, milk flavor, and sweet aftertaste at 15, 45, 75, and 105 sec post expectoration. Panelsists were provided with timers. In addition, panelists recorded total sweet aftertaste duration on a scale from 0 to 200 sec.
Data analysis
In study I, probit analysis was used to determine at each sucrose target level and fat concentration the sweetener concentrations (SEV’s) and 95% confidence intervals for sucralose and aspartame at which 50% of the sample population chose the test sample as sweeter than the sucrose reference.
In study II, sensory data were analyzed using analysis of variance in a split plot design to account for the fact that sessions were conducted in sets of sucrose equivalence rather than in a completely randomized order of sucrose equivalency level by fat level by sweetener type. The panelist x sample x session interaction (df = 266) was used as a divisor in the F tests for all effects except the main effect of sucrose equivalency. For this main effect, the divisor was session within sucrose equivalency level. Post-hoc comparisons of means were performed using the LSD test.
RESULTS AND DISCUSSION Study I—Potency determinations
SEV’s for sucralose and aspartame relative to each sucrose target level were compared (Table 1). Corresponding potency values as a function of fat concentration (Fig. 1) indicate that, relative to sucrose, there was a slight but significant reduction in potencies of sucralose and aspartame with increased fat concentration. Furthermore, changes in potencies appeared more pronounced at lower sweetness levels. A 14% reduction in potency was seen for sucralose and the potency of aspartame was reduced by =10%. No significant potency changes were found for these sweeteners at the higher sweetness level. It is
Table 1 -S w eetness equivalency value* (% w/v) for sucralose and as- paríame at two sucrose concentrations as a function o f fat_____________
% Sucrose % Fat
Aspartame( X 1 0 “ 3% )
Sucralose ( X 10 -3%)
5/0 26.9 ab 7.7 a5/3 25.3 a 8.3 abc5/6 26.9 ab 8.6 b5/9 26.2 ab 8.0 ab
5/18 28.0 b 9.0 c
10/0 81.3 a 25.6 a10/3 78.2 a 24.8 a10/6 89.6 a 25.1 a10/9 82.6 a 24.4 a10/18 89.9 a 26.8 a
a For each sweetener within a target sweetness level, concentrations sharing letters are not significantly different (p>0.05).
unclear whether further reductions in the potencies would occur at fat concentrations >18%.
Study II-Sensory profilesPerceived intensity of each attribute as a function of fat
concentration for each sweetener were compared (Fig. 2 and3). Significant main effects were found for fat, sweetener type, and sucrose equivalency level along many attributes. No two- or three-way interactions involving fat were found, indicating that all three sweeteners responded similarly to changes in fat concentration along the attributes measured. Differences between sweeteners were evident, however, along several attributes when mean ratings were pooled across fat level and sweetness concentration.
A significant main effect of fat on sweetness intensity was found [F(4,266) = 2.77, p<.05]. Regardless of sweetener type or concentration, intensity peaked at around 6% fat. Although absolute changes were relatively small, post-hoc tests indicated sweetness intensity was significantly higher at 6% fat than at 0% and 18% fat (p<0.01). The interaction between sweetener type and fat was not significant. The three sweeteners changed similarly in sweetness intensity as a function of fat concentration. The results for sucrose were consistent with data published by Pangborn (1989), showing that sweetness of sucrose was modestly affected by fat content in chocolate or vanilla milks. A similar curve was reported. At 8% sucrose sweetness, perceived intensity was higher at moderate fat levels than in samples containing 0% or 36% fat. Samples containing 6% fat were not studied by Pangborn, so no comparative data were available. Pangborn also reported that, compared to sucrose, samples sweetened with aspartame showed a marked decrease in sweetness intensity as a function of fat. Although our study did not demonstrate a significant difference between sucrose and aspartame, a slight decrease in sweetness intensity was found in aspartame-sweetened samples beginning at 6% fat. The discrepancy between these two studies could be attributed to differences in model systems. In the Pangborn study, test samples were flavored and contained milk fat. Other studies (Matysiak and Nobel, 1991; Wiseman and McDaniel, 1991) have reported that the taste profile of aspartame-sweetened flavors was different from those for similar flavors containing a carbohydrate sweetener. A sweetener/flavor interaction could be responsible for sweetness differences found by Pangborn. Similarly, since the taste properties and physical characteristics of milk fat differ from sunflower oil, effects of fat on sweetness perception possibly may be fat-specific.
Although fat concentration did not affect sweetness delay, sucralose and aspartame were consistently higher than sucrose in sweetness delay regardless of fat level, [F(2,266) = 12.63, p< 0.001], These results differed from previous reports on simple aqueous systems where no onset differences were found (Wiet and Beyts, 1992; Ketelsen et al., 1991) and may reflect a medium-dependent effect. The timer approach is less informative in distinguishing temporal differences between sweet-
600-JOURNAL OF FOOD SCIENCE-Volume 58, No. 3, 1993

Mea
n Sc
ore
Mea
n Sc
ore
S u c r a l o s e A s p a r t a m e
A d d e d F a t ( % )
Fig. 1 - Potencies of sucralose and aspartame as a function of added fat.
Sweetness Sweetness Delay Bitterness
Milk Flavor Fattiness Sweet Aftertaste Duration
....EH — Sucrose ....♦ .... Aspartame ■ > — Sucralose
Fig. 2— Changes in the mean sensory properties (n =20) of sucrose, sucralose, and aspartame (5% sucrose equivalency) as a function of added fat.
eners compared to computer-assisted data collection systems (Lundahl, 1992). However, for the purposes of this study it provided an adequate means of determining relative sweetness intensity differences at discrete time points following expectoration of each sample.
Perceived bitterness was significantly reduced in all sweeteners with increasing fat [F(4,266) = 4.66, p<0.001]. Bitterness ratings were lower in the 18% fat samples (p< 0 .0 0 1 ) and 9% fat samples (p<0.01) than in 0% fat. Bitterness ratings for sucralose and aspartame pooled across fat levels and sweetness equivalency levels were significantly higher than sucrose ratings [F(2,266) = 20.19, p< 0.001]. This was slightly more pronounced at the 10% sucrose level. Despite differences in bitterness, mean scores for all sweeteners were low. Redlinger
and Setser (1987) reported that bitter aftertaste was perceived in their aspartame-sweetened solutions and model creams. Wiet and Beyts (1992), however, reported no significant differences in bitterness in an simple aqueous system.
Fat concentration did not have a major effect on sweet aftertaste. A significant fat effect was found at 105 sec aftertaste measurement [F(4,266) = 3.97, p < 0.005]. At that time point, mean sweetness intensity scores for all sweeteners were significantly higher in low fat than in high fat systems. Sweet aftertaste scores peaked in 3% fat (mean intensity = 6.04) and were significantly reduced in milk samples containing 18% fat (mean intensity = 4.12; p<.01). At all sweet aftertaste measurements, ratings pooled across fat and sucrose equivalency levels were higher for sucralose and aspartame-sweetened sam-
Volume 58, No. 3, 1993-JOURNAL OF FOOD SCIENCE-601

Mea
n Sc
ore
Mea
n Sc
ore
\T C O N C E N TR A TIO N EFFECTS . . .
Sweetness Sweetness Delay Bitterness
Milk Flavor Fattiness Sweet Aftertaste Duration
— {Ü— Sucrose ♦ Aspartame <1 Sucralose
Fig. 3—Changes in the mean sensory properties (n =20) of sucrose, sucralose, and aspartame (10% sucrose equivalency) as a function of added fat.
pies than for corresponding sucrose m ilks [15 sec: F(2,266) = 18.47, p< 0.001; 45 sec: F(2,266) = 30.67, p< 0.001; 75 sec: F(2,266) = 35.41, p<0.001; 105 sec: F(2,266) = 39.97, p < 0.001]. Sweetener differences in mean aftertaste intensity, were relatively sm all at each time point (15 sec: su- crose = 34.6, sucralose = 36.1, aspartame = 35.2; 45 sec: sucrose = 1 6 .3 , sucralose = 21.5, aspartame = 20.0; 75 sec: sucrose = 7.3, sucralose = 12.0, aspartame = 10.4; 105 sec: sucrose = 3 .2 , sucralose = 6 .8 , aspartame = 5.5). From 45 sec onward, sweet aftertaste scores for sucralose were significantly higher than those for aspartame (p<.05). A similar result was found for total sweet aftertaste duration. A significant sweetener effect was found [F(2,266) = 103.12, p <0.001]. The mean sweet aftertaste duration for sucrose (92.9 sec) was significantly shorter than sucralose (118.6 sec; p < .0 1 ) and aspartame (107.6 sec; p<.01). A difference between sucralose and aspartame was found (p<0.05). There was also significant interaction between sucrose equivalency and sweetener along this attribute reflecting a greater magnitude of change in aftertaste from lower to higher sweetness for high potency sweeteners than for sucrose [F(2,266) = 3.97, p<0.025]. Redlinger and Setser (1987) reported that aspartame had a lingering sweetness in solutions and cream systems. Using time intensity measurements, Ketelsen et al. (1992) reported the sweet aftertaste of high potency sweeteners was directionally longer than carbohydrate sweeteners in some systems.
Similarly, a significant main effect of fat was found for milk flavor intensity [F(4,266) = 4.20, p<0.005]. Regardless of sweetener type or concentration, changes in perceived milk flavor intensity followed an inverted U-shaped curve. Milk flavor was higher in the 6 % fat sample than in 18% fat (p < 0 .0 1 ). No significant differences between sweetners were found. Milk flavor was generally perceived to be greater in samples containing lower sweetness levels, presumably reflecting less masking effects of sweetness on milk flavor.
Perceived fattiness increased as a function of fat concentration [F(4,266) = 647.7, p< 0.001]. Fat concentration did not affect sweetness onset, or earlier sweet aftertaste. Although the effect of fat was similar for the three sweeteners, differences in magnitudes of sensory ratings between the three
sweeteners were evident along several attributes when mean ratings were pooled across sucrose equivalency levels and fat levels. A significant sweetener effect was found for perceived fattiness [F(2,266) = 3.90, p < 0.025] where ratings pooled across sucrose equivalency levels and fat levels were higher for sucrose than for aspartame or sucralose (p<0.05). Although sweetener differences were not reported by Pangborn (1989) in enhancing perceived fattiness sucrose has been shown to contribute to mouthfeel or viscosity of fat systems. Drew- nowski and Greenwood (1983) and Pangborn (1989) reported that the illusion of increased creaminess of fat content could be achieved by adding sucrose to skim milk. Wiet and Beyts(1992) did not find significant differences in mouthfeel between these sweeteners in simple aqueous solutions, suggesting that taste profiles of sweeteners were highly system- dependent. Additional studies are necessary to determine whether other fats or fat mimetics yield similar results. It is also of interest to determine if similar trends are found when low levels of fat are combined with thickeners and gums to maintain a product’s mouthfeel, viscosity, or functionality.
CONCLUSIONSREDUCING FAT LEVELS in food systems may lead to a slight increase in potency of sweeteners used to replace sucrose. This effect appears nonlinear and concentration-dependent, reflecting a complex interaction between fat concentration, sweetener, and sweetness level. There was little difference in effects of fat on sweetness profiles of sucrose, sucralose, and aspartame. All sweeteners changed similarly along sensory attributes, although differences between sucrose and the two high potency sweeteners were found along some attributes. Such differences may be system-dependent, and caution should be used in generalizing the results for other food and beverage systems.
REFERENCESAmerine, M.A., Pangborn, R.M., and Roessler, E.B. 1965. Principles o f
Sensory Evaluation o f Food. Academic Press, New York.—Continued on page 666
602-JOURNAL OF FOOD SCIENCE-Volume 58, No. 3, 1993

P r o t o n N M R a n d D i e l e c t r i c M e a s u r e m e n t s o n S u c r o s e F i l l e d
A g a r G e l s a n d S t a r c h P a s t e s
GRACIELA W. PADUA
----------------------------ABSTRACT-----------------------------Low-field proton NMR and high-frequency dielectric measurements were performed on sucrose-filled agar gels of 0 to 1 .2g sucrose/g water and starch pastes of concentrations between 0 .2 and lg starch/ g water. The dielectric constant decreased linearly with increasing concentration for both. The dielectric loss of sucrose-filled agar gels showed two regions, first increasing and then decreasing with concentration. The dielectric loss data for starch pastes showed a constant value close to that of pure water throughout the concentration range. Dielectric data were related to hydration models derived from proton NMR measurements.
Key Words: sugar, starch, gels, pastes, dielectric constant
INTRODUCTION
THE EFFICIENT utilization of microwave energy in food processing requires complete understanding of interactions between microwaves and food components (Mudgett, 1989). Energy absorption from an applied electric field depends on dielectric properties of materials. These are the dielectric constant ( k ' ) and the dielectric loss factor ( k " ) . The dielectric constant is a measure of the capacity of a material to store electric energy. The loss factor gives a measure of the dissipation of this energy into heat. Water content of foods largely determines their dielectric behavior at microwave frequencies (Copson, 1975), since water polarization and ion migration are responsible for absorption of energy (Hasted et al., 1948). However, in food materials water may be associated with other components forming arrays of water states that affect its structure and properties.
Dielectric parameters are sensitive to water binding (Stuchly, 1970; Dawkins et al., 1981; Khalil, 1987; Otto and Chew, 1992; Roebuck and Goldblith, 1972; Chinachoti et al., 1988). Dawkins et al. (1981) measured the permittivity and conductivity of eye lens material and concluded that as much as 25% of the water in lens material is water of hydration. Otto and Chew (1992) reported that the magnitude of the dielectric constant was a function of the water-to-solids ratio for Portland cement pastes and mortars, but the magnitude of the electric conductivity (proportional to the loss factor), responds to the type additive mixed with the cement. Roebuck and Goldblith (1972) reported the dielectric constant of sugar solutions and starch-water mixtures decreased with water content. The loss factor changed significantly with addition of sugars and gelatinized potato starch.
The dielectric properties of foods are affected by the structure and properties of water. Knowledge of the state of water in foods is essential to understand and predict their dielectric behavior. A useful technique to study the state of water in foods is nuclear magnetic resonance spectroscopy (NMR). It provides a rapid, sensitive and noninvasive determination of molecular mobility of water in complex systems such as foods (Richardson and Steinberg, 1987). NMR has been used to study
Author Padua is wit(j the Dept, of Food Science, Univ. of Illinois at Urbana-Champaign, 382 AESB, 1304 W. Pennsylvania Ave., Urbana, IL 61801.
several aspects of biopolymer hydration such as total water content, bound water capacity, mobility and associated binding mechanisms and gelation phenomena. NMR determinations of water mobility were used to characterize and quantitate the water states present in protein suspensions over a wide range of solids content (Padua et al., 1991).
In a previous report, Padua and Schmidt (1992) measured low field NMR proton longitudinal relaxation rate of sugar solutions and proposed models to explain observed sugar hydration stages. The objective of the current work was to apply models derived from NMR measurements to explain dielectric data on starch pastes and sucrose filled agar gels.
MATERIALS & METHODSSUCROSE, crystalline, reagent grade (EM Science, Gibbstown, NJ) was dissolved in distilled water to prepare solutions from 0 to 1 .2g sucrose/g water. Bacto agar (Difco Laboratories, Detroit, MI) was added to the solutions at 2% of the water. Mixtures were heated to dissolve the agar, then cooled to room temperature ( = 23°C) to obtain gels. Water losses through evaporation were monitored by weight. Starch (Mira-gel 463, granular, cold water swelling, A.E. Staley, Decatur, IL) was mixed with distilled water to prepare pastes from 0.2 to l.Og starch/g water.
Proton longitudinal relaxation rate (R,) of sucrose filled agar gels and starch pastes was determined, at room temperature, with a 10- MHz NMR spectrometer (PR-103, Praxis Corp., San Antonio, TX) equipped with a microprocessor, using a 90°-t-90° pulse sequence.
The dielectric constant and dielectric loss factor of the gels and pastes were measured at 2.47 GHz and room temperature (25°C) with an HP 85070A dielectric probe attached to an HP 8510 network analyzer (Hewlett Packard, Santa Rosa, CA). Measurement error was estimated at 5% or less.
RESULTS & DISCUSSIONTHE PROTON longitudinal relaxation rate (Ri) depended on concentration (Fig. 1) for sucrose-filled agar gels and starch pastes. All samples showed exponential relaxation. Typically, ten points of the log amplitude-vs-time curve were used in the
C o n c e n tra tio n , g/g w a te r
Fig. 1 -Dependence of the proton relaxation rate on concentration for sucrose-filled agar gels ( a ) and starch pastes ( * ).
Volume 58, No. 3, 1993-JOURNAL OF FOOD SCIENCE-603

N M R A N D D IELEC TR IC M E AS U R E M E N TS . . .
C o n c e n tra tio n , g /g w a te rFig. 2—Dependence of the dielectric constant on concentration for sucrose-filled agar gels ( □) and starch pastes ( ♦ ).
C o n c e n tra t io n , g /g w a te rFig. 3-Dependence of the dielectric loss on concentration for sucrose-filled agar gels ( □) and starch pastes ( ♦ /.
calculations for Rj. Correlation factors were 0.990 or higher. Reported measurements were averages of four determinations.The starch pastes showed a linear increase in Rj with solids content for the range tested. For the sucrose-filled gels, R! increased linearly with concentration up to 0.65g sucrose/g water; above this concentration, R, continued to increase linearly, though with a higher slope.
Concentration affected the dielectric constant (Fig. 2) and dielectric loss factor (Fig. 3) for sucrose-filled agar gels and starch pastes. The set measures the complex reflection coefficient of the probe in the material under test and calculates the complex permittivity. The instrument presents the real and imaginary parts of the complex permittivity which correspond, respectively, to the dielectric constant and dielectric loss factor of the material. The dielectric constant decreased linearly with increasing solids concentration for both materials, though linearity was less strong for the starch pastes (R2 = 0.96) than for the sucrose-filled gels (R2 = 0.98). The loss factor plot of the sucrose-filled agar gels (Fig. 3) showed two different regions. In the first, up to 0.6g sucrose/g water, the loss factor increased linearly with increasing solids (R2 = 0.99). Above that concentration the loss factor decreased, also linearly though the correlation coefficient was not as high (R2 = 0.80). The extent of each of the two regions coincided with those on the plot of NMR relaxation rate (Fig. 1). The starch pastes showed no apparent change in loss factor when solids content increased.
The linear response of the dielectric constant dependence on concentration (Fig. 2) was also reported by Roebuck and Gold- blith (1972) for high moisture content water mixtures of starch, sugars and ethanol. Mudgett et al. (1980) reported similar behavior for freeze-dried potato samples at high moisture. Roebuck and Goldblith (1972) hypothesized this behavior was due to water displacement by carbohydrate molecules that were not polarizable at microwave frequencies.
The R[ dependence on concentration for sucrose-filled agar gels (Fig. 1) resembled very closely that of a sucrose solution. This was reported by Padua and Schmidt (1992), indicating the occurrence of two hydration stages, one below and one above 0.65g sucrose/g water. Rj data indicated that agar exerted little influence on overall water rotational mobility of the system. The NMR models adopted by Padua and Schmidt (1992) to explain the different hydration stages of sugars could be applied to the present data. In that work, sucrose solutions between 0 and 0 .6 g sugar/g water were considered, as proposed by Hills (1991), to consist of units of sugar molecules with attached eight pairs of water molecules rotating freely in the continuous water medium. The increase in dielectric loss factor for sucrose-filled agar gels in the same concentration range indicated that sucrose molecules stabilized the hydrogen bonded structure of water (Tait et al., 1972). The stabilized
604-JOURNAL OF FOOD SCIENCE-Volume 58, No. 3, 1993
structure would dissipate electromagnetic energy more effectively than pure water. The agar did not appear to contribute to the dielectric loss, in agreement with the conclusions of Roebuck and Goldblith (1975).
The model proposed for sucrose solutions (0.6 to 1.2g sucrose/g water, Padua and Schmidt 1992), considered that sucrose molecules associate through water bridges (Harvey and Symons, 1978) forming loosely held clusters in the continuous water medium. A decrease in loss factor was observed in that solids-content region (Fig. 3). This suggested that as sucrose increased, water molecules participated in more than one hydrogen bond. This would hinder their rotational movement and thus their ability to respond to the electric field.
The R] dependence on concentration for starch pastes (Fig.1 ) showed an increased restriction of mobility as solids content increased. The linear response suggested that throughout the concentration range starch molecules continued to absorb free water from their surroundings. The dielectric loss (Fig. 3) maintained a value close to that of pure water ( k " = 10.5 at 25°C) throughout the concentration range. This suggested that the decrease in mobility shown by the NMR was the result of a small portion of the water molecules tightly held by the starch while a large proportion of water remained free. The slight increase in dielectric loss by the starch pastes over the loss of pure water could be due to contributions from bound water.
CONCLUSIONSTHE DIELECTRIC parameters depended on both the water content of the material and the ability of the water molecules to rotate under an applied electric field. The dielectric constant responded linearly to water content. The dielectric loss factor was affected by the rotational mobility of the water. At high water content, water bound to sucrose largely retained its mobility, rotating with sucrose molecule in a way that increased dielectric loss. At higher solids, water was less abundant resulting in possible formation of sucrose to sucrose associations sharing available water. The resulting restriction in water mobility decreased the dielectric loss. The starch molecules had limited effects on water. A small amount of the total water appeared to be tightly bound to the solid. Most water molecules remained free to rotate with the electric field. This resulted in dielectric losses near those of pure water. An alternative explanation for the dielectric behavior of the starch pastes could be that the starch formed loose associations with water molecules, adding little structure to the water.
REFERENCESChinachoti, P., Steinberg, M.P., and Payne, D.A. 1988. M easurem ent of
dielectric constant to quan tita te solute w ater in the sucrose-starch-water system. J. Food Sci. 53: 580.
—Continued on page 626

A s s e s s i n g C h e m i c a l F o r m o f C a l c i u m i n W h e a t ,
S p i n a c h , a n d K a l e
DENISE A. BENWAY and CONNIE M. WEAVER
----------------------------ABSTRACT-----------------------------Spinach, wheat and kale represent a broad range in absorption of calcium from foods (5-40%). These plants were intrinsically labeled with 45Ca and examined for 45Ca solubility characteristics, including specific enzyme treatments, subcellular distribution, and in vitro bioa- vailability. Solubility was <2% for spinach, =40% for wheat and 70% for kale, depending on the solvent. Solubility paralleled the in vitro 45Ca bioavailability results of 0.3±0.1%, 26.4±5.2%, and76.3 ± 1.2% for these three plant foods. Spinach calcium exists largely as calcium oxalate which is not easily dissociated. Phytase treatment of wheat indicated that a major portion of calcium was bound to phytate. Knowledge of the chemical form of calcium in plants can help in designing processing procedures to improve calcium absorption.
Key Words: wheat, spinach, kale, bioavailability calcium chemical form,
INTRODUCTIONCALCIUM is considered essential to human nutrition but its total mineral content and bioavailability vary with the food source. Heaney et al. (1988), Heaney and Weaver (1990), and Weaver et al. (1991) have measured calcium bioavailability from spinach, wheat bread, and kale in humans. When adjusted to similar calcium loads (250 mg) these foods represent a broad range in absorption of calcium from foods of 5-41%. Absorption was very low for spinach (5.1 ± 2.6%), and high and about equal for kale (40.9 ± 10.1%) and wheat bread (38.2%). The calcium absorption (%) from wheat bread at a 250mg Ca load was extrapolated from an equation proposed by Heaney et al. (1990a). It predicts the calcium absorption fraction for a given calcium load and accounts for endogenous calcium in the bread plus digestive juice calcium. The percent calcium absorbed from kale and wheat bread was slightly higher than that from milk at the same load.
The objective of our study was to determine solubility, sub- cellular distribution and in vitro bioavailability of 45Ca in intrinsically labeled spinach, whole wheat flour, and kale. Solubility and subcellular distribution are classical methods used in the initial determination of the chemical form of a compound or element. Specific enzyme treatments were also performed on the three foods to help elucidate the degree of association of calcium with pectin and phytic acid. Simulated digestion was performed on these foods to determine if it could be used as a simple, low-cost screening procedure to predict human bioavailability from foods.
MATERIALS & METHODSMaterials
Dialysis tubing of 6 -8 kD exclusion limit, Spectropor I, was purchased from VWR Scientific (Chicago, IL). 45CaCl2 was purchased from ICN Biomedicals, Inc. (Irvine, CA). The following materials were purchased from Sigma Chemical Company (St. Louis, MO): Pepsin (No. P-6887), pancreatin (porcine Grade II, No. P-1500), bile
Authors Benway and Weaver are with the Dept, o f Foods & Nutrition, Purdue Univ., West Lafayette, IN 47907-1264.
extract (porcine, No. B-8631), bovine serum albumin (98-99% pure, No. A-7908), phytase (No. P-1259), and pectinase (No. P-4625).
Preparation of Intrinsically Labeled 45Ca Foods
Winter wheat (“ Cold Well” ) was grown in soil or hydroponically in buckets then stem injected at milking stage with 740 |xBq 45CaCl2 per head. Following harvest, the whole kernels were finely ground into flour in a Tekmar Analytical Mill (Tekmar Company, Cincinnati, OH). Spinach (“ Giant Nobel” and “ Bloomsdale Long Standing” ) was germinated in a peat/vermiculite mixture then transferred to prerinsed OASIS Horticubes (Smithers-Oasis, Kent, OH) and grown on a modified Hoagland-Amon nutrient solution in a 40L circulating hydroponic system (Weaver, 1985). Kale (“ Dwarf Blue Curled Vates” ) was germinated in prerinsed OASIS Horticubes in water then grown as for spinach. The kale and spinach crops were intrinsically labeled with 680.6 /xBq/L and 1021.2 juBq/L 45CaCl2, respectively, by adding the radiolabel in increments to the hydroponic nutrient system starting 2 wk after germination until maturity. Following harvest, the spinach and kale were lyophilized then ground into powder in a Wiley Mill or Tekmar Analytical Mill.
Solubility characteristics
The procedure of Starks and Johnson (1985), designed for sequential extraction of wheat flour proteins, was followed for sequential extraction of 45Ca from intrinsically labeled whole wheat flour, except the supernatants were collected at 3000 x g for 30 min. The extractants in sequence, were 0.04M NaCl, 70% ethanol, 0.1M acetic acid (pH 2.9), and a 1:1:1:1 mixture of H20 , liquid phenol, glacial acetic acid, and 0.2M BaCl2. Table 1 shows the wheat protein fractions extracted by each solvent. Two grams of 45Ca whole wheat flour were extracted twice with 15mL of each extractant and shaken for 30 min before centrifugation. An aliquot of the supernatants was taken for counting and compared to the total 45Ca in the wheat. The albumins and globulins and glutelins fractions (lOmL) were dialyzed in ultra- high purity (resistivity >16 megohm-cm) water at 6 -8 kD exclusion limit to determine if the calcium was strongly associated with these proteins. Four trials were run.
Nonsequential extractions of 45Ca from intrinsically labeled wheat, spinach, and kale were performed with the following solvents: H20 , 70% ethanol, 0.04M NaCl, and 0.1M acetic acid (pH 2.9). These solvents were chosen so that the sequential extraction of calcium from wheat could be compared with the nonsequentially extractable calcium from spinach and kale. Sample (lg) was extracted twice with 15 mL of each solvent. Supernatants were collected at 3000 x g for spinach and kale. Extractions were run in quadruplicate (wheat and kale) or triplicate (spinach).
Subcellular Distribution
The procedure of Huffman and Allaway (1973) was followed for organelle separation, with some modifications. Samples (lg each)
Table 1—Prote ins seq uen tia lly e x trac ted fro m w ho le w hea t flo u r
Extractant
Percent 45Ca Extracted
(X ± S.D.) Proteins extracted0.04M NaCl 34.5 ±0.2 albumins and globulins70% ethanol 0.7±0.01 gliadins0 .1M acetic acid 43.3 ±3.3 glutenins1:1:1:1 H20 , liquid phenol,
glacial acetic acid, 0.2M BaCI2 20.0 ±1.4 remaining proteins
Volume 58, No. 3, 1993-JOURNAL OF FOOD SCIENCE-605

CHEMICAL FORM OF CALCIUM...
Table 2 —P roposed p re d o m in a n t chem ica l fo rm o f Ca in w heat, spinach, an d kale*
Plant Source Proposed predominant Ca Form
Spinach calcium oxalateWheat calcium phytateKale free Ca + +, Ca-amines, Ca:organic salts
(e.g. citrate)
* Taken from Mengel and <irby (1978).
were homogenized at 0°C in 8 mL (45Ca whole wheat flour) or 10 mL (45Ca kale and 45Ca spinach) of 10 mM potassium phosphate buffer (pH 7) containing 0.5M sucrose, 2 mM cysteine, 2 mM MgCl2, 2 mM CaCl2, and 0.1% bovine serum albumin. Differential centrifugation was used to separate the various organelle fractions. The nuclei and debris pellet was collected at 1500 x g for 2 min (wheat) or 8000 x g for 15 min (kale and spinach). The mitochondrial pellet was collected at 15,000 x g for 15 min and the microsomal pellet at100,000 x g for 60 min. The nuclei and debris pellet was washed twice with buffer, and the other pellets washed once. All washings were recombined with the supernatant. The pellets and an aliquot of the supernatant were assayed for radioactivity and compared to the total 45Ca in the sample. All experiments were run in quadruplicate (wheat and spinach) or triplicate (kale).
Enzyme treatments
45Calcium was extracted from 45Ca labeled spinach and kale with pectinase treatment alone and compared to pectinase treatment following extraction of calcium at stomach pH. For pectinase treatment alone, 0.5g samples were extracted twice with 7.5 mL of aqueous solutions at 25°C containing 50 mg pectinase for spinach and 80 mg pectinase for kale (1.1 units/mg) and adjusted to pH 4.0, the optimal temperature and pH for pectinase activity. For simulation of stomach pH followed by pectinase treatment, 0.5g samples were first extracted twice with 7.5 mL of aqueous solutions adjusted to pH 2. The remaining pellets were then extracted by pectinase treatment as described.
For all extractions, each mixture was shaken for 30 min then centrifuged at 8000 x g for 30 min. An aliquot of the supernatant was counted for 45Ca radioactivity and compared to the total 45Ca in the original spinach or kale sample. Four trials were run for each treatment. The Students t-test was used to determine significance of differences.
Simulated digestion
The procedure of Wein and Schwartz (1985) was followed for simulated digestion of 45Ca labeled spinach, wheat, and kale, with slight modifications. Samples (1 g each) were combined with 20mL of H20 then adjusted to pH 2 with cone HC1. Pepsin (250 p,L of a 40 mg/ mL pepsin in 0.1M HC1 solution) was added to give a pepsin: food weight ratio of 1%. The solutions were shaken in a water bath at 37°C for 2 hr. A dialysis bag (6 -8 kD cutoff) containing sufficient NaHC03 to increase pH to a7.0 was then placed in each solution and shaking was continued for 20 min. Pancreatin/bile (1.25 mL of 0.1M NaHC03 solution containing 4 mg/mL porcine pancreatin and 25 mg/mL bile) was then added to give an approximate pancreatin: food weight ratio of 0.5%. Water was added to bring the total reaction volume to 35 mL. After shaking for 2 hr at 37°C, the mixtures were slowly shaken at 20°C for 16 hr to allow for equilibration.
Following the dialysis period the bags were removed and the remaining mixture was vacuum filtered through Whatman #521 (fast) filter paper. The residue was ashed at 600 °C then dissolved in 10 mL of 1M HC1. A 1 mL aliquot of this solution, the dialysis bag contents, and the filtrate were assayed for 45Ca radioactivity (cpm). The cpm of 45Ca inside the dialysis bag represented bioavailable calcium. The total cpm of 4SCa in the filtrate and solid residue represented both bioavailable calcium and bound unavailable calcium. Equation (1) gives the apparent percentage of available 45Ca (Whitelaw and Weaver,1988).
Apparent % 45Ca availability =cpm unavailable bound 45Ca 1
— ----------------— x 100 (1)cpm bag + filtrate + residuej
Table 3 —Calcium , oxalic kale (mg/g, d ry w t bas is )'
ac id an d u ron ic ac id con ten t o f sp inach and
Spinach Kale
Total Ca 6.7 6.9Oxalic acid 26.3 0.7Uronic acid 28.4 12.7
* Weaver et al. (1987).
where cpm unavailable bound 45Ca = (cpm/mL filtrate-cpm/mL bag) (mL filtrate) + cpm residue.
Samples were run in quadruplicate (spinach and kale) or quintuplícate (wheat).
Simulated digestion following phytase treatmentTo determine the association of calcium with phytic acid, lg of
intrinsically labeled whole wheat flour (1.01 ± 0.04 % phytic acid, dry wt basis) was mixed with 20 mL H20 and 75 mg phytase (0.04 units/mg) then adjusted to pH 5.15. Samples were shaken at 55 °C for 35 min, then subjected to simulated digestion as described. Samples were run in quadruplicate. The students t-test was used to determine the significance of difference.
When assaying for 45Ca in all experiments, 1 mL aliquots of samples or ashed samples dissolved in 1M HC1 were combined with 15 mL of ACS Scintillation Cocktail (Amersham, Arlington Heights, IL 60005) and counted with a Beckman LS 1800 scintillation counter (Fullerton, CA).
RESULTS & DISCUSSIONKNOWLEDGE of the chemical associations with minerals in foods and the ability of an ion to be freed from insoluble, indigestible complexes during digestion may be a useful predictor of its bioavailability. Screening all foods and various processing procedures in human studies would be prohibitively expensive. The rat model is less expensive, and although useful in approximating calcium absorption from oxalate rich foods (Weaver et al, 1987), this model was not useful in determining the effect of phytic acid on calcium absorption from soybeans (Heaney et al, 1991). In vitro procedures are generally faster and less costly to perform. Little work has been done to elucidate the chemical form of calcium in foods.
A summary of the proposed predominant forms of calcium in wheat, spinach and kale is given in Table 2. Some calcium in plants is found in the middle lamella, sometimes complexed with pectin to form insoluble calcium pectinates. In oxalate- rich plants such as spinach, the calcium has been presumed to be bound to oxalate. We verified the presence of calcium oxalate crystals in spinach by scanning electron microscopy (unpublished data). In seeds, such as wheat and soybeans, where phytate is the storage form of phosphorous, calcium could be bound as calcium phytate (Mengel and Kirby, 1978). Plant components which have high concentrations of carboxylic acid residues are more likely to bind calcium through salt bridge formation. James et al. (1978) studied 45Ca binding by fiber from 29 different foods. They reported that 45Ca binding was proportional to the uronic acid content of the fibers, with each mmol of uronic acid binding 0.31 mmol of calcium. Table 3 shows the uronic acid, oxalic acid, and calcium content of spinach and kale.
Weaver and Heaney (1989) found human calcium absorption from calcium oxalate was double (10.0 ± 4.3%) that of calcium absorption from spinach (5.1 ± 2.6%). They also reported that calcium as the oxalate salt did not exchange with an extrinsic label but some exchange occurred with 45Ca endogenous to intrinsically labeled spinach. Since spinach is high in both oxalic acid and uronic aid residues, calcium in spinach may be bound to both anions as proposed by Weaver and Heaney (1991). This matrix may be open enough to allow some label exchange.
The calcium in kale contains very little oxalate and half the uronic acid content but comparable calcium content of spinach
606- JOURNAL OF FOOD SCIENCE-Volume 58, No. 3, 1993

Table 4 - S o lu b ility o f 45Ca in no nsequen tia lly ex trac ted sp inach w ho le w hea t flour, an d k a le _______________________________________________ __
Percent 45Ca of total 45Ca extracted (X ± S.D.)
Food source H20 0.04M NaCl 70% EtoH0.1 M
Acetic acid
SpinachWheatKale
1.0 ±0.3 31.6 ±2.0 69.6±2.8
1.3 ±0.4 38.0 ± 1.69 69.9 ±2.7
< 0.26.9 ±0.66.9 ±0.4
1.6±0.5 79.1 ±0.4 78.7 ±1.5
Table 5 -S u b c e lla r d is tr ib u tio n o f 45Ca in w heat, and kale
in tr in s ic a lly labe led spinach,
%«Ca of total 45Ca (X ± S.D.)
Food source
Nuclei&
Debris Mitochondria Microsomes Supernatant
SpinachWheatKale
90.6 ±1.1 70.3 ±1.5 38.1 ±2.6
<0.7 3.4 ±0.7 1.9 ±0.7
<0.7 0 .6 ± 0.1 2 .6 ± 1.0
<0.725.7 ±0.8 57.5 ±2.1
(Table 3). This could exist as free or weakly bound calcium in the vacuole or cytoplasm (Table 2). The calcium could be associated with soluble amines or readily dissociable organic salts such as calcium citrate.
Solubility characteristicsTable 1 shows the percent of total 45Ca and the proteins
sequentially extracted from 45Ca labeled whole wheat flour, with solvents listed in order of extraction. Although much of the 45Ca was extracted with 0.04M NaCl (albumins and globulins) and 0.1M acetic acid (glutenins) fractions, subsequent dialysis in H20 at 6-8,000 MW showed < 1% of the 45Ca was strongly associated with those protein fractions.
The percent of total 45Ca nonsequentially extracted from intrinsically labeled spinach, whole wheat flour, and kale were compared for the four solvents (Table 4). In general, solubility was very low for spinach (< 2 %), medium for wheat (-40% ) and high for kale (-70% ), depending on the solvent. The high solubility (79.1 ± 0.4%) of calcium in wheat extracted with 0.1M acetic acid (pH 2.9) was consistent with the hypothesis that calcium in wheat is predominantly calcium phytate, since acid would cleave the calcium from the phytate rendering it soluble. The high solubility of calcium in kale extracted with H?0 , dilute salt, and mild acid treatment was also consistent with the hypothesis that calcium is in the free ionic form or weakly bound to plant constituents or is present as a readily soluble salt.
The very low amount of extractable calcium from spinach was consistent with calcium being present as a highly insoluble salt such as calcium oxalate (K^ = 2.57 x 10~ 9 at 25 °C). The mild acid treatment (0.1M acetic acid, pH 2.9) used here would not be sufficient to dissociate calcium from the oxalate as determined on the pure salt. However, stronger acid extraction (6 N HC1) revealed a high concentration of oxalic acid in spinach (Table 3). Clark et al. (1987) reported a range in calcium oxalate content of 42 to 79% in kiwifruit leaves, depending upon leaf age.
Subcellular distributionTable 5 shows the 45Ca distribution of total 4SCa in each
organelle fraction for spinach, whole wheat flour, and kale. Spinach 45Ca was almost exclusively in the nuclei and debris fraction. For wheat, the 45Ca was predominantly in the nuclei/ debris and supernatant fractions in an approximately 2.7:1 ratio. Kale 45Ca was associated mainly in the nuclei/debris supernatant fractions in a 1:1.5 ratio, respectively. The amount of 45Ca in the supernatant relative to the nuclei/debris fraction was consistent with the solubility data i.e. very low for spinach, medium for wheat, and high for kale.
Table 6 -E x tra c ta b le 45Ca from labe led sp inach an d kale w ith an d w ith o u t pectinase tre a tm e n t____________________
%45Ca Extracted (X ± S.D.)
Foodsource
Control<H20)
Pectinasetreatment pH = 2
Pectinase treatment at
pH4 follow ing pH 2 extraction
SpinachKale
1.0 ±0.3 69.6 ±2.8
1.2 ± 0.1 74.9±0.9
5.3±0.972.4±3.9
1.0 ±0.3 7.4 ±0.7
Table 7 —P ercent 4SCa b ioava ilab le fro m se lec ted p la n ts as d e te rm in ed b y s im u la te d d ige stiona
Food sourcePercent 45Ca Bioavailable
(X ± S.D.)
SpinachWhole wheat flourWhole wheat flour (p iytase treatment) Kale
0.3 ±0.1 26.4 ±5.2" 38.9 ±5.3» 76.3 ±1.2
a Unlike superscripts derote significant difference at p<0.05.
Enzyme treatments for spinach and kaleThe percent 45Ca (of total 45Ca) extracted from spinach and
kale with pectinase treatment was compared to a simulated stomach pH extraction with and without subsequent pectinase treatment (Table 6 ). Sheikh et al. (1987) showed that solubility of calcium salts at stomach pH was a much better predictor cf human absorption than was aqueous solubility at neutral pH. For kale, the extractable calcium at pH 2 (72.4 ± 3.9%) was not significantly different from that extracted by pectinase treatment alone (74.9 ± 0.9%) or by water alone (69.6 ± 2.8%) (p<0.25). Subsequent pectinase treatment following simulated stomach pH did not yield an appreciable amount of extracted calcium (7.4 ± 0.7%). These results indicate that if the calcium was bound to certain plant constituents in kale, it was present as highly soluble salts (organics such as citrate) or only weakly associated with plant components (soluble amines).
Extractable calcium from spinach under simulated stomach pH (5.3 ± 0.9%) was higher than water extractable calcium (1.0 ± 0.3%, p<0.01) and calcium removed by pectinase treatment alone (1.2 ± 0.1%, p< 0.0025). Further pectinase treatment following pH 2 extraction yielded 1.0% soluble calcium. Calcium extracted by pectinase treatment alone was not different from that of pure water treatment alone (p> 0.05). These results suggest that calcium does not exist as calcium pectate in spinach, but pectin could be associated with calcium oxalate crystals. Pectinase treatment would not cleave the calcium from such crystals. The acid treatment step at pH 2 would not solubilize the calcium bound to oxalate.
Simulated digestion
The results of 45Ca in vitro bioavailability from the three food sources were compared (Table 7). Percent 45Ca bioavail- able was very low for spinach (0.3 ± 0.1%), medium for wheat (26.4 ± 5.2%), and high for kale (76.3 ± 1.2%). Wein and Schwartz (1983) also reported 0.3% 45Ca bioavailability from spinach. The in vitro bioavailability results were consistent with solubility data. Spinach 45Ca solubility and in vitro bioavailability values were similar to percent calcium absorption in humans (Heaney et al., 1988). However, solubility and in vitro bioavailability of 45Ca from kale was much higher than 45Ca absorption determined in human feeding studies (Heaney and Weaver, 1990b). Humans have a high variability of calcium absorption but there seems to be an individual upper limit (Heaney et al., 1990b). Endogenous calcium secretions could help to saturate the absorptive surface of the mucosa which would not be a factor in in vitro studies.
The in vitro bioavailability estimate for 45Ca from whole wheat flour was slightly lower than that observed in human
Volume 58, No. 3, 1993-JOURNAL OF FOOD SCIENCE-607

CHEMICAL FORM OF CALCIUM...
studies on calcium absorption (Weaver et al., 1991). However, in the human studies subjects were fed bread which had been leavened with yeast which contains phytase. Since phytate is the presumed binder of calcium in wheat, we tested the in vitro 45Ca bioavailability in whole wheat flour with and without prior phytase treatment. Treatment with phytase prior to simulated digestion increased calcium bioavailability (p < 0.05) by a factor of 1.5 (38.9 ± 5.3%) over wheat subjected to simulated digestion alone (26.4 ± 5.2) (Table 7). This clearly indicates that a major portion of the calcium in wheat was bound to phytate. In addition, estimated calcium bioavailability by simulated digestion of wheat subjected to phytase treatment showed excellent correlation with human absorption data for bread extrapolated to a 250 mg Ca load (Heaney et al., 1990a).
CONCLUSIONSCHEMICAL studies in vitro can help elucidate plant constituents which bind calcium. Exact bioavailability from foods cannot be predicted from such techniques which are insensitive to calcium load and physiological status. In vitro techniques measure potential absorbability, and thus, may be good predictors of relative bioavailability in humans. Knowledge of plant constituents which bind calcium, i.e. oxalate and phytate, should enable reasonable estimates of calcium bioavailability from any plant food.
REFERENCESClark, C.J., Smith, G.S., and W alker, G.D. 1987. The form, distribution
and seasonal accumulation of calcium in kiwifruit. New Phytol. 105: 477- 486.
Heaney, R.P. and Weaver, C.M. 1990. Calcium absorption from kale. Am. J. Clin. N utr. 51: 656-657.
Heaney, R.P., W eaver, C.M., and Fitzsimmons, M.L. 1990a. Influence of calcium load on absorption fraction. J . Bone Min. Res. 5: 1135-1138.
Heaney, R.P., Weaver, C.M., Fitzsimmons, M.C., and Recker, R.R. 1990b. Calcium absorptive consistency. J . Bone Min. Res. 5: 1139-1192.
Heaney R.P., Weaver, C.M., and Fitzsimmons, M.L. 1991. Soybean phytate content: effect on calcium absorption. Am. J. Clin. N utr. 53: 745-747.
Heaney, R.P., Weaver, C.M., and Recker, R.R. 1988. Calcium absorbability from spinach. Am. J. Clin. Nutr. 47: 707-709.
Huffman, E.W.D., Jr. and Allaway, W.H. 1973. Chromium in plants: distribution in tissues, organelles, extracts, and availability of bean leaf Cr. to anim als. J . Agric. Food Chem. 21: 982-986.
Jam es, W.P.T., Branch, W.J., and Southgate, D.A.T. 1978. Calcium binding by dietary fibre. Lancet 1: 638.
Mengel, K. and Kirby, E.A. 1978. Calcium. Ch. 11. In P r in c ip le s o f P la n t N u tr i t io n , p. 401-402. Bern-International Potash Institute.
Sheikh, M.S., Santa Ana, C.A., Nicar, M.J., Schiller, L.R., and Fordtran, J.S. 1987. G astrointestinal absorption of calcium from m ilk and calcium salts. N. Engl. J . Med. 31: 532-536.
Starks, T.L. and Johnson, P.E. 1985. Techniques for in trinsically labeling w heat w ith “ Zn. J. Agric. Food Chem. 33: 691-698.
W eaver, C.M. 1985. Intrinsic m ineral labeling of edible plants. Methods and uses. CRC Critical Reviews in Food Science and N utrition 23: 75- 101.
W eaver, C.M. and Heaney, R.P. 1989. Isotopic exchange of ingested calcium between labeled sources. Does dietary calcium form a common absorptive pool? Am. J. Clin. Nutr. 50: 830-832.
Weaver, C.M., Heaney, R.P., M artin, B.R., and Fitzsimmons, M.L. 1991. Hum an calcium absorption from whole-wheat products. J . N utr. 121: 1769-1775.
Weaver, C.M. and Heaney, R.P. 1991. Isotopic exchange of ingested calcium between labled sources. Evidence th a t ingested calcium does not form a common absorptive pool. Calcif. Tissue. Int. 49: 244-247.
W eaver, C.M., M artin, B.R., Ebner. J.S., and Krueger, C.A. 1987. Oxalic acid decrease calcium absorption in rats. J . N utr 117: 1903-1906.
Wein, E.M. and Schwartz, R. 1985. D ietary calcium exchangeability and bioavailability: Evaluation and potential uses of an in v itro digestion procedure. Ch. 1 p. 1-16. Am. Chem. Soc.
Wein, E.M. and Schwartz, R. 1983. Comparison of in v itro and in vivo measurements of dietary Ca exchangeability and bioavailability. J. Nutr. 113: 388-393.
W hitelaw, M.L. and Weaver, C.M. 1988. M aillard browning effects on in v itro availability of zinc. J . Food Sci. 53: 1508-1510.
Ms received 7/25/92; revised 12/14/92; accepted 1/8/93.
Supported by NIH Grant AR39221. Agricultural Experiment Station Journal Paper No. 13221.
S O Y L IPO X YG E N ASE O N B R E A D D O U G H V O L A T IL E S .. .From page 585
The mechanism by which lipoxygenase increases m ixing tolerance. Cereal Chem. 57: 163-166.
Longcare, D.J. 1989. M o r e -W ith -L e ss C ookbook. Herald Press, PA.Luning, P.A. and Roozen, J.P . 1991. Volatile composition of white bread
using enzyme active soya flour as improver. Food Chem. 41: 81-91.Matoba, T., Hidaka, H.. N arita , H., K itam ura, K., Kaizuma, N., and Kito,
M. 1985. Lipoxygenase-2 isozyme is responsible for generation of m- hexenal in soybean homogenate. J . Agric. Food Chem. 33: 852-855.
Shiiba, K., Negishi, Y., Okada, K., and Nagao, S. 1991. Purification and characterization of lipoxygenase isozymes from wheat germ. Cereal Chem. 68: 115-122.
van Ruth, S.M., Roozen, J.P ., and Moest, R.A.F.J. 1992. Effect of storage of a soya-containing tread-im prover on lipoxygenase activity, bleaching action and composition of volatiles in bread. Lebensm-Wiss. u.-Technoh 25: 1-5.
EXTR AC TIO N O F C O O K IE A R O M A . . .From page 588
Godefroot, M., Sandra, P., and Verzle, M. 1981. New Method for quantitative essential oil analysis. J . Chromatogr. 203: 325-335.
Heath, H.B., and Reneccius, G. 1986. Isolation of Food Flavours, In F la v o u r C h e m is tr y a n d T e c h n o lo g y , 3: 36-40. V an Nostrand Reinhold, MacMillan Publishers, New York.
Likens, S.T., and Nickerson, G.B. 1964. Detection of certain hop constituents in brewing products. Proc. of the American Society of Brewing Chemists 5-13.
Macku, C. and Jennings, W.G. 1987. Production of volatiles by ripening bananas. J . Sci. Fd Chem. 35: 845-848.
M ihara, S., Tateba, H., N ishim ura, O., Macho, Y., and Kishino, K. 1987. Volatile components of Chinese quince. J . Agric. Fd. Chem. 35: 532-537.
Nawar, W.W., Yoo, Y .J., Bradley, M.S., Morin, O., Potter, T., and White- man, R.C. 1988. A study of the volatile components generated from but- teroil by heat. Revue Française des Corps Gras 3: 117-122.
Wolf, W.J. 1975. Lipoxygenase and flavor of soybean protein products. J . Agric. Food Chem. 23: 136-141.
Zhuang, H., Hildebrand, D.F., Andersen, R.A., and Hamilton-Kemp, T.R. 1991. Effects of polyunsaturated free fatty acids and esterified linoleoyl derivatives on oxygen consumption and C6 aldehyde formation w ith soybean seed homogenates. J . Agric. Food Chem. 39: 1357-1364.
Ms received 7/22/92; revised 11/2/92; accepted 1/25/93.
We thank Todd Pfeiffer for producing the soybean seed used in this study and Udaya Chand for technical assistance.
Schultz, T.H., F lath, R.A., Richard Mon, T., Eggling, S.B., and Teranishi, R. 1977. Isolation of volatile components from a model system. J. Agric. Food Chem. 25(3): 446-449.
Vidal, J.P ., Richard, H. 1987. Kinetics of dense carbon dioxide extraction on a model system. Comparison w ith other extraction techniques, In F la v o u r S c ie n ce et T e c h n o lo g y , M artens M., Dalen, G.A. and Russwurm, H. (Ed.), p. 535-540. John Wiley & Sons, Ltd., Chichester.
Yong, L.F.M., Acree, T.E., Lanvin, E.H., Butts, R.M. 1989. Aroma Chemistry of Crackers, In T h e r m a l G e n era tio n o f A r o m a s , Parliem ent T.H. (Ed.), 26: 274-284. ACS Symposium Series, Los Angeles.
Ms received 9/27/92; revised 12/9/92; accepted 1/26/93.
608-JOURNAL OF FOOD SCIENCE-Volume 58, No. 3, 1993

4 - H e x y l r e s o r c i n o l , a P o t e n t I n h i b i t o r o f M u s h r o o m T y r o s i n a s e
RUTHELLEN M. DAWLEY and WILLIAM H. FLURKEY
----------------------------ABSTRACT-----------------------------4-hexylresorcinol (4HR) was a potent inhibitor of mushroom tyrosinase in crude extracts, causing 90% loss of activity at 100 p.M. The concentration of 4HR needed to cause 50% inhibition (I50) was ~ 5 pM. Partially purified tyrosinase was inhibited by lower concentrations of 4HR and was characterized with an I50 of = 1 p,M. Electrophoretic analysis, coupled with isoenzyme staining in the presence and absence of 4HR, showed inhibition of tyrosinase isoforms but not of laccase isoforms.
Key words: mushroom, tyrosinase, inhibitor 4-hexylresorcinol, enzyme
INTRODUCTION
COMMON MUSHROOMS, Agaricus bisporus, are an example of food products susceptible to enzymatic browning (Vamos-Vigyazo, 1981). The major enzyme responsible in Agaricus bisporus appears to be tyrosinase (Kumar and Flurkey, 1992). Mushroom tyrosinase oxidizes endogenous phenolic compounds to quinones which later are converted into pigmented polymers. Agaricus bisporus also contains laccase and peroxidase-like activities, but these are much less abundant than tyrosinase (Kumar and Flurkey, 1992; Wood, 1980a, b). Browning reactions are undesirable because they may decrease nutritional quality and consumer appeal. Safe and effective inhibition of such enzymes has been the subject of many investigations. Many of the most potent or effective inhibitors of tyrosinase are not safe for commercial applications.
Many compounds have been used to inhibit tyrosinase. Some are copper chelators while others reduce the quinone products to phenolic compounds (Mayer and Harel, 1979; Mayer, 1987; Vamos-Vigyazo, 1981). The latter compounds are quite effective until all the reducing agent has been depleted. Some such inhibitors include ascorbic acid and its derivatives (Sapers et al., 1989a, b; Golan-Goldhirsh and Whitaker, 1984; Hsu et al., 1988), and bisulfites (Janovitz-Klapp et al., 1990; Golan- Goldhirsh and Whitaker, 1984). Bisulfites can also act directly on tyrosinase by modifying the protein (Sayavedra-Soto and Montgomery, 1986). Cysteine can delay browning reactions by forming addition compounds with formed o-quinones (Janovitz-Klapp et al., 1990; Dudley and Hotchkiss, 1989, Richard et al., 1991). Some tyrosinases are also inhibited by cinnamic acids and p-coumaric acid (Walker and McCallion, 1980). Potent inhibitors of tyrosinase include salicylhydroxamic acid (SHAM) (Allan and Walker, 1988), tropolone (Kahn and Andrawis, 1985; Valero et al., 1991), mimosine (Kahn and An- drawis, 1985; Cabanes et al. 1987), methimazole (Andrawis and Kahn, 1986; Kahn and Andrawis, 1985) and 2, 3-nap- thalenediol (Mayer et al., 1964). Most of these are potential carcinogens, mutagens, and/or toxic.
Recently, a potent and safe alternative to sulfite inhibition of tyrosinase for shrimp black spotting was reported by McEvily et al. (1991). This alternative, 4-hexylresorcinol (4HR) was reported to inhibit tyrosinase in shrimp and also in apples,
Author Flurkey is affiliated with the Chemistry Dept, at Indiana State Univ., Terre Haute, IN 47809. Author Dawley is affiliated with the Chemistry Dept, at the Univ. of Evansville, Evansville, IN 47722.
potatoes, avocadoes and grape juice. With regard to inhibition of black spotting or melanosis in shrimp, 4HR concentrations of 5-50 ppm were effective. McEvily et al. (1991) also reported that other substituted resorcinols were effective inhibitors of black spotting. 4HR has previously been shown safe as a food additive, (Chhabra, 1988; Frankos et al. 1991) and appears to be an extremely effective inhibitor of tyrosinase in shrimp. Thus, this compound may have potential application to tyrosinase in other foods. Our objective was to determine whether mushroom tyrosinase could be inhibited by 4HR at low levels. We also examined the application of this potential inhibitor to selectively block specific isoforms of tyrosinase.
MATERIALS & METHODSMaterials
Agaricus bisporus, common mushrooms, were supplied by Moonlight Mushrooms (Worthington, PA) or obtained from local grocery stores. 4HR and SHAM were purchased from Aldrich Chemical Co. (Milwaukee, WI). Tropolone, 2,3-napthalenediol, catalase, L-0-3, 4- dihydroxyphenylalanine (DOPA), and mushroom tyrosinase (lot 26F 9515) were obtained from Sigma Chemical Co. (St. Louis, MO).
Preparation of enzyme
Crude preparations of mushroom tyrosinase were isolated from mushroom caps as detailed by Kumar and Flurkey (1992). Briefly, discs were cut from mushroom caps, frozen in liquid nitrogen, and homogenized in 6 volumes of 0.1M phosphate buffer (pH 6.5) containing 1 mM ascorbate. The homogenate was centrifuged at 13,000 x g for 10 min at 4 °C. The supernatant was frozen at -1 5 °C until use. Mushroom tyrosinase was partially purified by passage over a Sephadex G-100 column followed by chromatography on DEAE cellulose at pH 7.0. Active fractions were passed over an hydroxylapatite column at pH 7.5 and then over a Phenyl Sepharose column at pH7.5 containing 1 M ammonium sulfate.
Enzyme assays
Tyrosinase activity was determined spectrophotometrically using DOPA as substrate. The assay mixture, (2.5 mL) contained from 0.025 to 10 mM DOPA. The reactions were started by addition of 50 p.L crude tyrosinase or 8 p,L purified enzyme. The change in absorbance at 475 nm was measured using a Cary 5 UV-VIS spectrophotometer. Slopes of absorbance vs time curves were determined using the software package supplied with the instrument. Using an extinction coefficient of 3600 M-1 cm-1 for DOPAchrome, results were calculated as p.mol of DOPAchrome produced/min/mg protein. Inhibition assays were performed as described above with the addition of 4HR in 0.1M phosphate buffer (pH 6.0). The inhibition of DOPAchrome formation was expressed as percentage of activity in the presence of inhibitor compared to activity in the absence of inhibitor. The values of Km and Vmax under various concentrations of 4HR were calculated using duplicate measurements of v for each S concentration using Lineweaver-Burk plots. Protein assays were performed using the method of Lowry et al. (1951).
ElectrophoresisPreparative electrophoresis was performed using the Laemmli method
without addition of SDS (Kumar and Flurkey, 1992, 1991). Samples were applied along the surface of a 4% stacking gel polymerized on top of a 8 % separating gel. Electrophoresis was carried out using a water cooled Hoefer minigel unit. Upon completion of electrophoresis, the gels were soaked in 0.1M phosphate buffer (pH 6.0) for 10
Volume 58, No. 3, 1993-JOURNAL OF FOOD SCIENCE-609

4-H R IN H IB IT IO N O F T Y R O S IN A S E . . .
Table 1 — Inhibition o f mushroom tyrosinase by 4-hexylresorcinol
Crude extract Purified tyrosinase
4HR(m-M)
% activity remaining
4HR(ixM)
% activity remaining
0 100 0 1000.86 86 0.17 993.4 56 0.43 90
34.0 22 0 .86 72100.0 10 1.7 35
1 mM 5 3.4 1234.0 4
min and cut into 1 cm wide vertical strips. The strips were incubated for 10 min with inhibitor prior to addition of DOPA (final concentration 2 mM). The inhibitors used were 4HR (30 uM), SHAM (100 p,M), tropolone (100 uM) and 2, 3-naphthalenedioI (5 mM). Isozyme patterns were recorded using Kodak EDF duplicating film according to the manufacturer’s description (Eastman Kodak, Rochester, NY).
RESULTS & DISCUSSION
CRUDE EXTRACTS of mushroom tyrosinase and partially purified mushroom tyrosinase were inhibited by low concentrations of 4HR. Crude mushroom extracts required much higher concentrations of 4HR than partially purified samples to achieve similar levels of inhibition (Table 1). For example, 90% inhibition of tyrosinase required 100 |xM in crude extracts compared to = 4 p,M in purified samples. The amount of inhibitor needed for 50% inhibition was slightly higher in crude extracts (5.5 p,M) compared to purified enzyme (1.3 p.M). Neither crude extracts nor partially purified tyrosinase showed reversible inhibition by 4HR after dialysis (data not shown). Concentrations required for inhibition of mushroom tyrosinase were very similar to those of SHAM which inhibited mushroom tyrosinase (Allan and Walker, 1988), but were lower than those to inhibit melanosis in shrimp (McEvily et al., 1991).
Apparent Km and Vmax values in the presence and absence of 4HR were derived from Lineweaver-Burk plots and Hanes- Wolf plots (data not shown). In the absence of 4HR, crude extracts were characterized with a Km of 1 mM and a Vmax of 0.036 pmol/min. Purified enzyme showed a Km of 0.25 mM and a Vmax of 0.043 |xmol/min. In the presence of 3 |iM 4HR, the Km increased to 17 mM for tyrosinase in crude extracts and to 0.7 mM for purified tyrosinase. Apparent Vmax values also changed with increasing 4HR concentrations. Replotting the slopes of Lineweaver-Burk plots vs I concentration (Roberts, 1977) suggested that 4HR was possibly a mixed/ competitive inhibitor. However, we were not able to distin- quish between the various types of mixed/competitive inhibitors. Part of the difficulty in determining kinetics constants for mushroom tyrosinase is due to the presence of multiple enzyme forms in crude extracts and enzyme inactivation during catalysis. In addition, other enzymes are present in crude extracts which can utilize 4HR and 4HR can interact with potential oxidase substrates in a synergistic manner (data not shown,G.M. Sapers personal communication).
Electrophoretic isoenzyme analysis showed 2 bands (a and b) of tyrosinase activity in crude extracts when DOPA was used as substrate (Fig. 1). Both isoenzyme forms of tyrosinase were inhibited by 4HR although band b appeared slightly more resistant to inhibition than band a. This inhibition was similar to that observed when SHAM and tropolone were used to selectively inhibit mushroom tyrosinase. However, both isoenzyme forms were not inhibited using 2, 3-naphthalenediol (Fig.1). This was in contrast to Mayer et al. (1964) who reported that 2, 3-naphthalenediol was a specific competitive inhibitor for peach polyphenoloxidase.
Partially purified mushroom tyrosinase showed only one band after electrophoresis and isoenzyme location using DOPA. This staining was inhibited by 4HR, SHAM, and tropolone to similar extents (Fig. 1). No apparent inhibition was observed using
C r u d e P u r i f i e d
1 2 3 4 5 1 2 3 4 5Fig. 1 — Inhibition of tyrosinase isoforms by 4-hexylresorcinol Crude and partially purified tyrosinase isoforms were separated by electrophoresis and stained with DOPA (lane 1) in the presence of 4HR (lane 2), SHAM (lane 3), tropolone (lane 4), and 2, 3-naphthalenediol (lane 5).
2, 3-naphthalenediol. This indicated that 4HR was as selective as SHAM and tropolone for inhibiting tyrosinase and that this inhibition occurred at much lower concentration sof 4HR.
Our results indicated that 4HR is a potent inhibitor of mushroom tyrosinase. This inhibitor is as effective as SHAM or tropolone at equal or lower concentrations and is probably much safer to use. In crude extracts of mushroom, the levels of 4HR needed for inhibition of tyrosinase were much lower than reported by McEvily et al. (1991) although they used a dip method. Since the amount of 4HR needed to inhibit the enzyme was greater in crude extracts than in partially purified enzyme, higher levels of 4HR may be needed to prevent browning in whole mushrooms. In any case, 4HR is much safer than many known tyrosinase inhibitors, including sulfites, and was very effective at low concentrations.
REFERENCESAllan, A.C. and W alker, J.R.L. 1988. The selective inhibition of catechol
oxidases by salicylhydroxamic acid. Phytochem istry 27: 3075-3076. Andrawis, A. and Kahn, V. 1986. Effect of methimazole on the activity of
mushroom tyrosinase. Biochem. J. 235: 91-96.Cabanes, J . Garcia-Canovas, F., Tudela, J., Lozano, J.A., and Garcia-Car-
mona, F. 1987. L-mimosine, a slow binding inhibitor of mushroom ty rosinase. Phytochemistry 26: 917-919.
Chhabra, R.S. 1988. Toxicology and carcinogenesis studies of 4-hexylre- sorcinol in F344/N ra ts and B6C3F! mice (Gavage studies). N ational Toxicology Program, NIH Publication No. 88-2586.
Dudley, E.D. ana Hotchkiss, J.H . 1989. Cysteine as an inhibitor of polyphenol oxidase. J . Food Chem. 13: 65-75.
Frankos, V.H., Schmitt, D.F., Haws, L.C., McEvily, A.J., Iyengar, R., Miller, S.A., Munro, I.C., Clysedale, F.M., Forbes, A.L., and Sauer, R.M. 1991. Generally recognized as safe (GRAS) evaluation of 4-hexylresorcinol for use as a processing aid for prevention of melanosis in shrim p. Regula. Toxicol. Pharmocol. 14: 202-212.
Golan-Goldhirsh, A. and W hitaker, J.R. 1984. Effect of ascorbic acid, sodium bisulfite, and thiol compounds on mushroom polyphenol oxidase. J . Agric. Food Chem. 32: 1003-1009.
Hsu, A.F., Shieh, J .J ., Bills, D.D., and W hite, K. 1988. Inhibition of m ushroom polyphenoloxidase by ascorbic acid derivatives. J . Food Sci. 53: 765- 771.
Janovitz-Klapp, A.H., Richard, F.C., Goupy, P.M., and Nicolas, J .J . 1990. Inhibition Studies on Apple Polyphenol Oxidase. J . Agric. Food Chem. 38: 926-931.
Kahn, V. and Andrawis, A. 1985. Inhibition of mushroom tyrosinase by tropolone. Phytochem istry 24: 905-908.
Kumar, M. and Flurkey, W.H. 1991. Activity, isoenzymes and purity of mushroom tyrosinase in commercial preparations. Phytochem istry 30: 3899-3902.
—Continued on page 670
610-JOURNAL OF FOOD SCIENCE-Volume 58, No. 3, 1993

D i h y d r o c a p s a i c i n O x i d a t i o n b y C a p s i c u m a n n u u m
( v a r . a n n u u m ) P e r o x i d a s e
M ARÍA A. BERNAL, ANTO NIO A. CALDERÓ N, M ARÍA A. PEDREÑO , RO M UALDO MUÑOZ,A. ROS BARCELÓ, and F. MERINO DE CÁCERES
----------------------------ABSTRACT-----------------------------Oxidation of dihydrocapsaicin (8-methyl-N-vanillyl-6-nonanamide) by peroxidase (EC 1.11.1.7) from Capsicum annuum var. annuum fruits yielded one absorbent oxidation product with e262 = 4.7 103 M“1 c m '1. Dependence of oxidation rate on dihydrocapsaicin and H20 2 concentrations revealed Michaelis-Menten type kinetics with inhibition at high substrate concentrations and optimal pH near 6.0. Dihydrocapsaicin was oxidized by pepper peroxidase, and participation of peroxidase in capsaicinoid metabolism of pepper fruits should be taken into account.
Key Words: capsicum, peroxidase, dihydrocapsaicin, hot pepper, cap- saicinoids
INTRODUCTIONCAPSAICINOIDS are the pungent compounds of the Capsicum fruit. Dihydrocapsaicin, a major pungent compound of hot peppers, is an amide derivative of vanillylamine and 8- methylnonanoic acid (Leete and Louden, 1968; Bennett and Kirby, 1968). As with other plant alkaloids, capsaicinoids accumulate and later undergo rapid turnover and degradation during fruit development. This is particularly interesting in Capsicum annuum fruits (Iwai et al., 1979; Suzuki et al., 1980) where capsaicinoids are synthesized in the placenta (Iwai et al., 1979; Fujiwake et al., 1982). Capsaicinoids then accumulate in vacuoles of placental epidermal cells (Fujiwake et al., 1980; Suzuki et al., 1980) until metabolized to further unknown products. Thus, turnover and degradation are the final steps in capsaicinoid metabolism.
While considerable progress has been made on biosynthesis of capsaicinoids, knowledge of the enzyme reactions in the last steps in capsaicinoid turnover is incomplete. Peroxidase (EC. 1.11.1.7) is located in the vacuole of epidermal cells (Calderón et al., 1992, 1993) and, therefore, may be directly related to capsaicinoid metabolism. The vanillyl moiety of capsaicinoids is easily oxidized by this enzyme (Berlin and Barz, 1975; Zapata et al., 1992). Taking into account these factors, our objective was to investigate the ability of peroxidases from Capsicum fruits to catalyze the oxidation of dihydrocapsaicin (8-methyl-N-vanillyl-6-nonanamide), a pungent compound of hot peppers.
MATERIALS & METHODSCAPSAICIN, dihydrocapsaicin, bis(trimethylsilyl) trifluoro acetamide containing 1% trimethylchlorosilane and horseradish peroxidase (HRP, type II) were purchased from Sigma Chemical Co. (Madrid, Spain). All other chemicals were analytical grade. Capsicum annuum (var. annuum) fruits were obtained from a local market and stored at 4°C until use, but never more than 3 days.
Authors Bernal and Merino de Cáceres are with the Dept, of Plant Biology, Faculty of Sciences, Univ. of La Coruña, E-15071 La Coruña, Spain. Authors Calderón, Pedreño, Muñoz, and Ros Barceló are with the Dept, o f Plant Biology (Plant Physiology), Univ. of Murcia, £-30100 Murcia, Spain. Address inquiries to Dr.A. Ros Barceló.
Enzyme proceduresCapsicum fruits were homogenized with a mortar and pestle in
acetone at -20°C. The homogenate was immediately filtered through one layer of filter paper at 4°C in a Buchner funnel and the residue thoroughly washed with acetone at - 20°C until all pigments were removed. The protein precipitate was resuspended in 50 mM Tris (tris[hydroxymethyl]aminomethane)-HCl buffer (pH 7.5) and incubated with agitation for 1 hr at 4°C. The pepper protein solution obtained was clarified by centrifugation at 3,000 x g for 5 min. The supernatant was considered crude soluble protein and used routinely without further purification in all enzyme studies. Isoelectrofocusing in 3.0-10.0 pH gradients (Calderón et al., 1990) and zymographic staining of pepper peroxidase isoenzymes with 4-methoxy-a-naphthol (Ferrer et al., 1990), were carried out.
Spectrophotometric assays
Unless otherwise noted, the spectrophotometric assays for Capsicum peroxidase were performed at 25°C in reaction media containing 0.2 mM dihydrocapsaicin (from 10 mM stock in methanol), 0.1 mM H20 2 and 0.1M tris-acetate buffer (pH 6.0). The reaction was initiated by addition of 4.3 pkat of peroxidase. For horseradish peroxidase, the reaction medium contained 0.2 mM dihydrocapsaicin, 0.1 mM H20 2, and 16 pkat of enzyme in 0.1M tris-acetate buffer (pH 6.0). One pkat of peroxidase was defined as the amount of protein that oxidized 1 pmol/sec of 4-methoxy-a-naphthol (Ferrer et al. 1990). Both for Capsicum and for horseradish peroxidase, dihydrocapsaicin oxidation was monitored by increases in absorbance at 262 nm in an Uvikon 940 spectrophotometer (Kontron Intruments, Madrid, Spain). The oxidation rate was expressed in nmol/s for which e262 = 4.7 103 M '1 c m '1 was calculated for the oxidation product.
Instrumental analyses
Reverse phase HPLC was carried out on a 15 cm x 0.4 cm i.d. Spherisorb ODS (C18) (5 |xm) column (Tracer Analítica S.A., Barcelona, Spain). We used a Waters (Water Assoc., Millipore, Milford, MA, USA) system comprising a Model 510 pump, Model U6K sample injector, Model 730 system controller and Model 481 UV detector operated at 280 nm (0.1 a.u.f.s.). The mobile phase was metha- nohwater (60:40) (Krajewska and Powers, 1986) at a flow rate of 1.0 mL/min.
GC-MS was performed on a 5993 Hewlett Packard model coupled to a 5995 Gas Chromatograph/Mass spectrometer and to a 2648A Graphics terminal. We used a OW Chrompak 50 m x 0.20 mm i.d. column, He pressure of 0.4 MPa. The GC temperature program was 90-280°C at 10°C/min, with a 5 min hold at 280°C. The run time was 60 min with injection port at 250°C and an electron multiplier voltage of 1600V. A TMS derivative of dihydrocapsaicin for GC was prepared by adding 50 p.L pyridine and 100 p.L bis(trimethylsilyl) trifluoroac- etamide (BSTFA) containing 1% trimethylchlorosilane (TMCS) to 5 mg of dihydrocapsaicin. This was heated for 30 min at 100°C.
RESULTS & DISCUSSIONGC-MS of the TMS derivative of Sigma dihydrocapsaicin gave one homogeneous peak, with a mass fragmentation pattern whose most representative ions were at m/z = 379 (M+) and m/z = 209 ([M — RHN] + ). This was in accordance with the fragmentation patterns reported (Masada et al., 1971; Lee et al., 1976). However, HPLC analysis of Sigma dihydrocapsaicin revealed presence of two main components with R, =
Volume 58, No. 3, 1993-JOURNAL OF FOOD SCIENCE-611

D IH Y D R O C A P S A IC IN O X ID A T IO N B Y P E R O X ID A S E . . .
D H C
Fig. 1 — HPLC chromatogram of dihydrocapsaicin (DHC) separated by C,8 reverse phase chromatography in components a and b. Capsaicin (C) was detected in minor amounts in the chromatograms and may also be resolved in components a and b. O, origin.
0 .300
0.200
< 0.100 I;=, 0.000
<- 0.100
- 0.200
- 0 .3 0 0
/ ■ _
- 0 .200 - 0.100 0 .000 0.100
A i'j - Ai'j'
0.200 0 .3 0 0
Fig. 2— Graphic analysis o f consecutive spectra of reaction medium: 0.2 mM dihydrocapsaicin, 0.1 mM H f i * 16 pkat horseradish peroxidase, and 0.1M tris-acetate buffer (pH 6.0). Scan speed 500 nm/min at 1.0 min intervals. A n is absorbance at wavelength i during tracing ¡, so that A ,2 is absorbance at 250 nm during second tracing. Selected wavelengths were /, = 250 nm (m), i2 = 280 nm '•), and i3 = 300 nm (k); i ' = 260 nm; j ' = 3 (third tracing), hence the ordinate value (A250 2 - A2S03) is the difference of absorbances at 250 nm, between second and third tracing; and the abscissa value (A2S0 2 - A260 3) is the difference between second and the third tracing, taking A2603 as reference. The test of two species without restriction was applied.
17.98 min (component a) and Rt = 19.16 min (component b) (Fig. 1). Components a and b must be considered isomers since
Fig. 3-Isoenzyme patterns of pepper peroxidase separated by isoelectrofocusing in 3.0-10.0 pH gradients and stained with 4- methoxy-a-naphthol. Arrow indicates direction of protein migration. Comparative banding intensity is indicated by degree of shading. Isoenzymes numbered according to Cuenca et at. (1939).
they were not distinguishable by GC-MS of the TMS derivatives. Both GC-MS (data not shown) and HPLC (Fig. 1) analyses of this commercial preparation of dihydrocapsaicin showed minor inclusion of components a and b of capsaicin.
Components a and b of this commercial preparation were not distinguishable spectrophotometrically during oxidation of dihydrocapsaicin by horseradish peroxidase. Thus, during the course of the reaction, followed spectrophotometrically, only one stable absorbent oxidation product seemed to form. This was demonstrated by application of the graphic analysis procedure of Coleman et al. (1970) to a set of consecutive spectra of reaction media containing horseradish peroxidase and H20 2. This analysis permits the number of absorbent products present in the solution to be calculated (Ferrer et al., 1990). The coincidence at the origin of the coordinate axes of the three straight lines corresponding to each wavelength (Fig. 2) showed only two kinetically correlated species: the substrate and a stable absorbent reaction product.
Capsicum annuum fruit peroxidase is rich in a basic isoenzyme (Fig. 3), previously named isoperoxidase B6 (Cuenca et al., 1989). This is presumably located in the epidermal vacuole (data not shown) similar to its homologous isoenzymes in other plant species (Calderon et al., 1992, 1993). Oxidation of dihydrocapsaicin by this Capsicum peroxidase fraction was strictly dependent on the presence of H20 2. This was easily monitored by the study of spectral changes in reaction media with time. Consecutive spectra of the reaction medium containing dihydrocapsaicin and H20 2 showed maximal spectral changes at 262 nm (Fig. 4). Such changes did not occur in the absence of H20 2. Identical results were obtained with the oxidation of dihydrocapsaicin by horseradish peroxidase.
The apparent extinction coefficient for the oxidation product of dihydrocapsaicin was calculated spectrophotometrically from increases in A262 at t = 0 to constant A262. These values were
612-JOURNAL OF FOOD SCIENCE-Volume 58, No. 3, 1993

Wavelength (nm)Fig. 4—Spectrophotometric recording of reaction medium containing dihydrocapsaicin and pepper peroxidase (see Materials & Methods). Scan speed 500 nm/min at 1 min intervals. Line 1: 30 sec after addition of enzyme.
Fig. 6—Dependence of oxidation rate of dihydrocapsaicin by pepper peroxidase on H20 2 concentration in reaction media containing 0.2 mM dihydrocapsaicin and 4.3 pkat of enzyme, phi 6.0. Bars show SE (n = 3).
Fig. 5—Dependence of oxidation rate of dihydrocapsaicin by pepper peroxidase on dihydrocapsaicin concentration in reaction media containing 0.1 mM Fi202 and 4.3 pkat of enzyme, pH! 6.0. Bars show SE (n = 3).
obtained at up to 20 min after the reaction was begun by addition of enzyme. For this, a low concentration range (0.01 — 0.05 mM) of dihydrocapsaicin was used in the reaction media. From the plotting of the final A262 versus the initial concentration of dihydrocapsaicin, e262 = 5.3 1 03 M_I cm-1 was calculated for the oxidation product.
As with horseradish peroxidase (data not shown), the oxidation rate of dihydrocapsaicin by Capsicum peroxidase depended on dihydrocapsaicin (Fig. 5) and H20 2 (Fig. 6) concentrations. This showed a kinetic behavior of the Michae- lis-Menten type at low (noninhibitory) substrate concentrations, with inhibition at high substrate concentrations. This was especially apparent from the linearity of the Lineweaver-Burk plots. Correlation coefficients for these double reciprocal plots were r = 0.975 for dihydrocapsaicin and r = 0.986 for H20 2 (P < 0.05). Inhibition was observed at high substrate concentrations and valid KM values cannot be defined for oxidations catalyzed by peroxidases. Since these reactions show no sign of reversibility or of complex enzyme-substrate formation (Dunford and Stillman, 1976), KM values were not calculated for the peroxidase-catalyzed oxidation of dihydrocapsaicin. Even so, optimal concentrations were 0.1 mM for H20 2 and 0.2 mM for dihydrocapsaicin (Fig. 5 and 6).
The effect of pH on dihydrocapsaicin oxidation by Capsicum peroxidase (Fig. 7) indicated the optimal pH of the oxidative reaction was near 6.0 with shoulders at pH 4.0 and pH 8.0. Thus, the pH-dependence profile of dihydrocapsaicin oxidation by pepper peroxidase showed a good adaptation of the enzymatic reaction to acidic pH normally found in vacuoles (Boiler, 1982).
Fig. 7—Influence of pH on dihydrocapsaicin oxidation by pepper peroxidase (see Material & Methods) in reaction media containing 0.1M tris-acetate buffer of variable pH, 0.2 mM dihydrocapsaicin, 0.1 mM H202 and 4.3 pkat of enzyme. Bars show SE (n = 3).
REFERENCES
Bennett, D.J. and Kirby, G.W. 1968. Constitution and biosynthesis of capsaicin. J . Chem. Soc. 442.
Berlin, J . and Barz, W. 1975. Oxidative decarboxilation of p-hydroxyben- zoic acid by peroxidases under in v ivo and in v itro conditions. Z. N atur- forsch. 30c: 650.
Boiler, Th. 1982. Enzymatic equipm ent of p lan t vacuoles. Physiol Vég. 20: 247.
Calderón, A.A., García-Florenciano, E., Pedreño, M.A., Muñoz, R., and Ros Barceló, A. 1992. The vacuolar localization of grapevine peroxidase isoenzymes capable of oxidizing 4-hydroxystilbenes. Z. Naturforsch. 47c: 251.
Calderón, A.A., Pedreño, M.A., Ros Barceló, A., and Muñoz, R. 1990. Zym- ographic screening of p lan t peroxidase isoenzymes oxidizing 4-hydroxystilbenes. Electrophoresis 11: 507.
Calderón, A.A., Zapata, J.M., Muñoz, R., and Ros Barceló, A. 1993. The histochemical localization of peroxidase in grapes (V itis v in ife ra ) using nitrocellulose blotting of freezing/thawing fruits. HortScience, 28: 36.
Coleman, J.S., Varga, L.P., and Mastín, S.H. 1970. Graphical methods for determ ining the num ber of species in solution from spectrophotometric data. Inorg. C hen . 9: 1015.
Cuenca, J ., García-Florenciano, E., Ros Barceló, A. and Muñoz, R. 1939. Sequential release of both basic and acidic isoperoxidases to the media of suspension cultured cells of C a p sic u m a n n u u m . P lan t Cell Rep. 8: 471.
Dunford, H.B. and Stillman, J.S. 1976. On the function and mechanism of action of peroxidases. Coord. Chem. Rev. 19: 187.
Ferrer, M.A., Calderón, A.A., Muñoz, R., and Ros Barceló, A. 1990. 4- Methoxy-a-naphthol as a specific substrate for kinetic, zymographyc and cytochemical studies on p lant peroxidase activities. Phytochem. Anal. 1: 63.
Fujiwake, H., Suzuki, T., and Iwai, K. 1980. In tracellu lar localization of capsaicin and its analogues in C a p sic u m fruit. II. The vacuole as the in tracellu lar accumulation site of capsaicinoid in the protoplast of C a p s ic u m fruit. P lant Cell Physiol. 21: 1023.
Fujiwake, H., Suzuki, T., and Iwai, K. 1982. Capsaicinoid formation in the protoplast from the placenta of C a p sic u m fruits. Agrie. Biol. Chem. 46: 2591.
Iwai, K., Suzuki, T., and Fujiwake, H. 1979. Formation and accumulation of pungent principle of hot pepper fruits, capsaicin and it analogues, in
—Continued on page 679
Volume 58, No. 3, 1993-JOURNAL OF FOOD SCIENCE-613

G l u c o n i c A c i d I n f l u e n c e s T e x t u r e a n d C o l o r
o f C a n n e d A s p a r a g u s
W.G. McGLYNN, D.R. DAVIS, and F. HONARMAND
---------------------------- ABSTRACT-----------------------------The color and texture of canned asparagus spears were measured using a shear-press and a Gardner color difference meter. Canning spears with 1% gluconic acid reduced pH of asparagus tissue to ~ 4.1 within 24 hr. After 5 mo storage, the 1% acidified pasteurized spears were lighter, less green, and more yellow than nonacidified retorted spears. Acidification with a milder thermal process almost doubled firmness of the acidified spears.
Key Words: asparagus, color, texture, acidification, gluconic acid
INTRODUCTIONHEAT PROCESSES to insure safety of low-acid foods may have undesired effects on heat-sensitive foods. Adding acid to lower pH of foods to < 4.6 may reduce thermal degradation during processing by allowing much shorter process times with lower temperatures (FPI, 1982; Leonard et al., 1986).
Previous studies have shown gluconic acid, derived from the hydrolysis of 8 -gluconolactone in water, was an effective acidulant that contributed little flavor to canned products (Kaercher, 1989). Acidification in combination with milder thermal processing may positively influence the texture of canned vegetables (Heil and McCarthy, 1989). Our objective was to evaluate the effect of acidification with gluconic acid on color and texture of canned asparagus.
MATERIALS & METHODSSample preparation and storage
University farm facilities provided asparagus spears that were washed and cut to fit a 300 x 407 can. Spears were blanched in 100°C steam for 2 min, then packed tip up in 300x407 plain-tin cans to a fill weight of 235-245g. The cans were filled with brine to within 5 mm of the lip of the can and steam-flow sealed. Cans to be retorted were filled with a 1% NaCl brine containing 0, 1, 2, or 3% (W/V) gluconic acid. Cans to be pasteurized were prepared similarly except that a nonacidified treatment was omitted (since such asparagus would be insufficiently processed and unsafe). Retorted cans were processed at 121°C for 21 min—a process recommended by the NFPA (1982). Pasteurized cans were processed in boiling water for 10 min—found by experimentation to be adequate for an internal can temperature of = 98.9°C. Following processing, cans were placed in 24°C cooling water until they reached a can surface temperature of 38 ± 2°C. Since the amount of added acid necessary to reduce pH of the canned asparagus to a safe level was unknown, cans were placed in a cold storage room at 7.2°C to minimize chances of spoilage in pasteurized samples. All samples, including retorted cans, were placed in cold storage to provide identical storage. Canned spears were analyzed after about one day or 5 mo storage. All cans were warmed to room temperature (=23°C) before analysis.
pH measurements
The asparagus spears were prepared for analysis by draining on a # 8 screen for 5 min, then rinsing with =300 mL deionized water. Asparagus tissue pH was measured after homogenizing 85-95g of rinsed spears in 100 mL deionized water for 2 min in a Waring Blen-
The authors are with the Dept, o f Food Science, Univ. of Arkansas, Fayetteville, AFt 72703.
dor. Brine pH was also measured, and the percent acid (as gluconic) in the brine was determined by titration to endpoint pH 8 .1-8.3 using 0.101N NaOH.
Color measurementsColor of asparagus tissue was quantified by measuring the Hunter/
Gardner “ L,” “ a,” and “ b” values of homogenized tissue using a Gardner XL 20 colorimeter. A green reference plate with “ L” 50.8, “ a” -24 .7 , and “ b” 6.1 was used as standard. From these values, hue angle (tan-1 b/a, Little, 1975), was computed for each sample.
Texture measurementsTexture of the spears was measured using a modification of pre
viously devised shear-press methods (Wiley et al., 1956). Intact spears were arranged in the test cell of an Allo-Kramer shear-press perpendicular to the 10 shearing blades (sample weight 150g). The shear- press was equipped with a Food Technology Corporation 1362 kg force transducer and strip chart recorder. This gave a reading of total force to shear the spears as an area under the force curve. This total area was divided by the speed of the shearing blade to give force per unit shear value for each sample. This value, (defined as firmness) was recorded as kg of force exerted/cm travel by the shearing blade through the sample.
Statistical analysisThe data were analyzed as completely randomized experiments using
analysis of variance. Analyzing treatments as a factorial design yielded no meaningful interactions. As a result, all combinations of storage time and processing method were defined as separate treatments for the analyses presented. Means were separated using Duncan’s Multiple Range test.
RESULTS & DISCUSSION pH and titratable acidity
Retorting caused the pH of asparagus to drop about one unit compared to blanched spears without added acid (data not shown). Addition of gluconic acid at 1% lowered pH to a safe
Table 1 —pH values fo r asparagus spears and titratable acidity, calculated as percent gluconic acid remaining in the brine o f asparagus spears processed with and w ithout 1 % gluconic acid ____________
Processing treatment pH of tissue% Titratable acid in brine
1 DayRetorted (1% acid)
4.23ad 0.48»
Retorted (No added acid)
5.46» 0.18'
Pasteurized (1% acid)
5 Months
4.32' 0.48»
Retorted (1% acid)
4.11s 0.54<
Retorted (No added acid)
5.56' 0.18'
Pasteurized (1% acid)
4.19d 0.49»
8 n = 3 .w M e a n s in c o lu m n s fo ll o w e d b y th e s a m e le tte r are n o t s ig n ific a n tly d iffe r e n t (p > 0 .0 5 ) .
614-JOURNAL OF FOOD SCIENCE-Volume 58, No. 3, 1993

T a b le 2 - H u n te r in s t r u m e n t a l c o lo r a n d f i r m n e s s o f a s p a ra g u s s p e a rs p r o c e s s e d w i t h a n d w i t h o u t I % g lu c o n ic a c id _____________________
Processing treatment "L" valueHue angle (degrees)
Firmness(kg/cm)
1 DayRetorted 47.07*b 99.4* 22.65b(1% acid) Retorted 45.93** 99.3' 16.93'
(No added acid) Pasteurized 45.67** 101.3b 54.24*'(1% acid)
5 MonthsRetorted 48.80* 101.1b 17.91**
(1% acid) Retorted 42.43d 102.1* 20.67**
(No added acid) Pasteurized (1% acid) 45.0e 99.3' 55.16*
• n = 3.>** Means in columns followed by the same letter are not significantly
different (p > 0.05).' n = 2 (This sample only).
level (pH 4.6 or below) in all samples (Table 1). Following processing, the percentage of titratable acid in the brine of acidified samples dropped to about half that initially added (Table 1). This was expected since acidified brine occupied about half the volume of the cans. Because addition of acid at 1% achieved the necessaiy pH reduction, results at higher acid addition were omitted. Acidified retorted spears had pH values different from acidified pasteurized spears, both before and after storage (Table 1). Differences were probably not practically meaningful. Similarly, differences in percent acid remaining in the brine between the two processing methods were probably also not of practical importance. Some differences were noted between treatments with time, but no clear patterns emerged. However, the pH of the tissue dropped for both acidified processing treatments during storage (Table 1). Changes in pH and titratable acidity were not sharp showing that gluconic acid reached near equilibrium between the asparagus tissue and brine 1 day after processing.
Color
“ L” values. Retorted acidified asparagus spears were lighter (higher “ L” ) than pasteurized spears after 5 mo storage while retorted nonacidified spears were darker than either acidified sample (Table 2). Hunter/Gardner “ L” values increased for retorted acidified spears during storage but not for pasteurized acidified spears (Table 2). Retorted nonacidified spears became darker during storage (Table 2). Acidification may tend to ‘bleach’ or lighten color in asparagus during storage, though this effect might be mitigated by milder thermal processing of pasteurization.
Hue angle. As hue angle increases from 90° to 180°, intensity of yellow in the sample decreases and intensity of green
increases. Pasteurized acidified asparagus spears were less green and more yellow than both the acidified and nonacidified spears processed in the retort after 5 mo storage (Table 2). Hue angles changed significantly for all samples during storage, but changes were not consistent among treatments. Hue angles of pasteurized samples dropped while those of retorted samples rose (Table 2). Some changes may have been due to the “ lightening” effect of acidification revealing more relatively stable carotenoid pigments over time. Further research is needed to clarify the mechanism of this shift.
FirmnessPasteurized acidified asparagus spears were consistently much
firmer than acidified or non-acidified spears processed in the retort (Table 2). This was likely due primarily to the much milder heat treatment received by the pasteurized spears. Storage time did no: significantly influence firmness of any samples (Table 2).
CONCLUSIONSADDITION of gluconic acid to brine at 1% pH of canned asparagus tissue to a safe level of 4.6 or below within 24 hr. Tissue pH dropped during 5 mo storage, but the change was slight. Notable changes in color occurred during storage. By the end of storage, pasteurized acidified asparagus was darker than retorted acidified spears but lighter than retorted nonacidified spears. In addition, pasteurized acidified asparagus was less green and more yellow than retorted asparagus. Pasteurized acidified asparagus was much firmer (> 2 x ) than retorted asparagus both with and without added acid. No significant changes occurred in firmness during storage.
REFERENCESFPI. 1982. Canned Foods. Principles o f Thermal Process Control, A c id if i
cation and Container Closure Evaluation. The Food Processors Institute, W ashington, DC
Heil, J.R. and McCarthy, M.J. 1989. Influence of acidification on texture of canned carrots. J . Food Sci. 54: 1092.
Kaercher, R. 1989. Acidification for improved quality in canning. In Food and Beverage Technology International USA, p. 95. S terling Publications Ltd., London, UK.
Leonard, S.J., Merson, R.L., M arsh, G.L., and Heil, J.R . 1986. Estim ating therm al degradation in processing of foods. J . Agr. Food Chem. 4: 392.
Little, A. 1975. Off on a tangent. J . Food Sci. 40: 410.NFPA. 1982. Thermal processes for low-acid foods in metal containers.
N ational Food Processors Association, W ashington, DC.Wiley, R.C., Elehwany, N., Kramer, A., and Hager, F .J. 1956. The shear-
press-A n instrum ent for m easuring the quality of food. IV. Application to asparagus. Food Technol. 10: 439.
Ms received 10/9/92; revised 12/28/92; accepted 1/15/93.
Presented at the 52nd Annual Meeting of the Institute of Food Technologists, New Orleans, LA, June 20-24, 1992. We thank the University of Arkansas Vegetable Substation in Kibler, AR for asparagus.
Volume 58, No. 3, 1993-JOURNAL OF FOOD SCIENCE-615

P i g m e n t C h a n g e s i n P a r s l e y L e a v e s d u r i n g S t o r a g e i n
C o n t r o l l e d o r E t h y l e n e C o n t a i n i n g A t m o s p h e r e
NAOKI YAM AUCHI and ALLEY E. W ATADA
----------------------------ABSTRACT-----------------------------Pigments were monitored in parsley leaves stored in air, air + 10 ppm C2H4, or 10% 0 2 + 10% C02 controlled atmosphere (CA). Chlorophylls a and b, as determined with HPLC, decreased sharply in leaves held in air or air + 10 ppm C2H4. The decrease was less in leaves held in 10% 0 2 and 10% C02 CA. The oxidized product of chlorophyll a, 10-hydroxychlorophyll a, did not accumulate and chlo- rophyllide accumulated minimally. Xanthophylls decreased but new pigments, suspected to be esterified xanthophylls, formed with yellowing of leaves. Neither the pathway of Chi degradation or xantho- phyll products were altered by C2H4 or CA.
Key Words: parsley, color, chlorophyll, controlled atmosphere, storage
INTRODUCTIONYELLOWING of leafy vegetables, such as parsley and spinach, occurs with degradation of chlorophyll (Chi). Temperature is the most influential factor in rate of degradation, but the atmosphere can also have an effect. Ethylene (CyU) hastens the rate of Chi degradation (Watada, 1986), whereas, controlled atmosphere (CA) retards degradation (Kader, 1986).
In citrus fruit, C2H4 enhanced degradation of Chi resulted in increased chlorophyllase activity (Barmore, 1975; Shimo- kawa et al., 1978) and an accumulation of chlorophyllide (Amir- Shapira et al., 1987). However in spinach, a leafy tissue, increased degradation by C2H4 was not associated with increased chlorophyllide content (Yamauchi and Watada, 1991). This difference between citrus and spinach Chi degradation may be due to differences in the degradative pathway, which is not clearly understood.
Use of CA to retard color or Chi degradation has been shown with several vegetables including Brussels sprouts (Lyons and Rappaport, 1962), asparagus (Wang et al., 1971), and broccoli (Yang and Henze, 1988). Those studies showed that either green color or Chi content in the vegetable tissue was maintained under controlled atmosphere storage, but they did not describe changes in the products of Chi degradation. Knowledge of degradation products should be helpful in elucidating the mechanisms of Chi degradation.
Our objective was to describe the effects of C2H4 and controlled atmosphere storage on chlorophyll and its degraded product and also show formation of xanthophyll products, with yellowing of parsley leaves.
MATERIALS & METHODS
FRESH ‘Forest Green’ parsley (Petroselium crisum Nym.) was obtained from a local grower in Delaware and mature detached leaves free of defects or injury were used. About 150 g of leaves were placed in a lightly covered 3.8L glass jar, and triplicate lots were placed at 20°C under a stream of humidified air with or without 10 ppm C2H4 or a stream of humidified mixed gases (CA) of 10% 0 2, 10% C02,
Author Watada is with the USDA-ARS Horticultural Crops Quality Laboratory, Beltsville Agricultural Research Center, Belts- vi/le, MD 20705. Author Yamauchi's current address: Himeji College of Hyogo, Shinzaike-honcho, Himeji, Hyogo 670 Japan.
Fig. 1.-HPLC chromatogram of pigments extracted from fresh parsley leaves. Columns and solvent gradient of HPLC system described in text. Chl-chlorophyll, Chlide-chlorophyllide, Phy- pheophytin, Phb-pheophorbide.
Days in S to rage
Fig. 2. — Changes in content of chlorophylls of parsley leaves stored in air with or without 10 ppm CJ-i4 or controlled atmosphere o f 10% 0* 10% CO2.
and 30% N2, as recommended by Apeland (1971). The gases were metered at a rate to maintain respiratory C02 levels at about 0.5%. Sublots of leaves were removed for analysis after 0, 1, 2, 3 and 5 days ethylene storage or after 0, 1, 2, 4 and 6 days CA storage.
Pigments were extracted by grinding 2.5g leaves in 20 mL cold acetone with 2.5 mL of 0.1% sodium carbonate (to adjust pH to about7.0), with a mortar and pestle. The homogenate was filtered, the residue washed with 80% cold acetone until colorless, and the filtrate brought to a final volume of 50 mL. The entire extraction was done in low light and the combined extracts were kept in darkness. Aliquots
616-JOURNAL OF FOOD SCIENCE-Volume 58, No. 3, 1993

Fig. 3.—Relative changes of chlorophyll a (A), chlorophyll a-1 IB), and chlorophylllde (C) of parsley leaves held in air with or without 10 ppm CJf4 or controlled atmosphere of 10% 0* 10% CO*
were used for spectrophotometric (Shimadzu, Model UV-260) analysis or passed through a Millipore filter (0.45 pm pore size) for HPLC analysis.
The HPLC with photodiode array detector system reported previously (Yamauchi and Watada, 1991) was modified. The absorption spectra of the pigments were recorded between 200 and 600 nm at the rate of 12 spectra/min. Pigments were separated by a Vydac C, ultrasphere column, 4.6 x 250 mm, using two solvents: A, 80% methanol, and B, ethyl acetate. Ethyl acetate was added to 80% methanol at a linear rate until a 50:50 mixture was attained at the end of 20 min. The 50:50 mixture then was run for an additional 20 min. Flow rate was 1 mL/min and injection volume was 50 pL.
Identification of individual pigments from the acetone extract were carried out by methods described previously (Yamauchi and Watada,1991). Chi content was determined by the method of Amon (1949). The relative contents of 10-hydroxychlorophyll (Chi a-1) and chlo- rophyllide were reported as peak area because prepared standards were useful for peak identification, but not for quantification.
RESULTSHPLC of fresh parsley leaves showed sequential elution of neoxanthin, violaxanthin, lutein, Chi b, Chi a-1, Chi a and p- carotene during a 40 min run (Fig. 1). The elution time of chlorophyllide (Chlide) a and b, pheophorbide a and b, and pheophytin a and b are shown as reference points. Identity of each pigment was based on retention time, and in some instances were confirmed by the absorption spectra of the eluting peak.
Chi a content in parsley leaves stored in air with or without Q H 4 decreased at the same rate and were about 36% of the original level after 5 days storage (Fig. 2). Chi a of leaves exposed to air with or without C2H4 decreased at the same rate. Chi a of leaves held in CA decreased, but the rate was slower and the content was maintained 2 0 % longer than those in leaves held in air with or without QH,,. Chi b decreased in all leaves and like Chi a, the decrease in samples held in air with or without Q,H4 was greater than in those held in CA.
The relative level of Chi a-1, the oxidized form of Chi a, was about 3% that of Chi a, based on absorbance units (Fig.3). Chi a-1 of all treatments decreased by about 30% after one day of storage and then leveled off during the remainder of storage.
The relative level of chlorophyllide was 10% of Chi a-1. With storage, a small accumulation was noted initially after storage in leaves from all treatments, but the accumulation did not continue nor was it retained. The accumulation was retained longer in CA stored leaves where rate of Chi degradation was slower than that of air or C y i, treated samples. Pheophytin a content was low and decreased in leaves of all treatments (data not shown).
The contents of xanthophylls, which included lutein, violaxanthin, and neoxanthin, decreased with yellowing of the leaves. However, at the same time, several new peaks occurred on the HPLC chromatograms with the yellowing (Fig. 4). The wavelengths of maximum absorbance of the new peaks were similar to that cf the xanthophylls, such as neoxanthin, violaxanthin and lutein (Table 1). Spectral properties of these peaks were also similar to that of parent xanthophyll, as shown for peaks 6 , 7 and 9 compared with parent xanthophyll in Fig. 5. Elution times of these new peaks (except peak 1) were considerably longer than those of the xanthophylls.
DISCUSSIONChi CONTENT of parsley leaves decreased during storage at 20°C and was not hastened by 10 ppm QH., which was unexpected. The effect of QH,, may be apparent at a lower holding temperature where the degradation of the control sample would not be so rapid. CA of 10% 0 2 and 10% C 0 2 was effective in reducing the rate of Chi degradation to the extent that the shelf life would be extended about 2 0 % longer than that of air-held samples. Wang (1979) postulated that C 0 2
inhibition of Chi degradation in broccoli may be due to inhibitory effect of C 0 2 on ( y i , production or action.
In examining the degraded products of Chi associated with yellowing of parsley leaves, Chi a-1 had not accumulated whereas chlorophyllide a accumulated slightly, but not to the extent of the amount of Chi degraded. In the orange flavedo, the peroxidase reaction has been shown to bleach chlorophyll (Huff, 1982). Thus the lack of chlorophyllide accumulation in the parsley may be due to the presence of peroxidase reaction, which converted chlorophyllide to a colorless compound. The changes in the chlorophyllide were similar to those noted with spinach (Yamauchi and Watada, 1991), but were different from those of ethylene treated citrus. There chlorophyllase activity (Barmore, 1975; Shimokawa et al., 1978; Amir-Shapira et al.,1987) and chlorophyllide (Amir-Shapira et al., 1987) increased with yellowing. Neither the ethylene treatment nor CA had a significant effect on formation of Chi a-1 or chlorophyllide.
With the decrease in the xanthophyll content, new pigments (peaks) were noted with the yellowing of the leaves. The new peaks were suspected to be esterified xanthophylls based on similar spectral characteristics and elution at a considerably later time than the xanthophylls. Esterified xanthophylls have been reported to appear with ripening of citrus flavedo (Eilati et al., 1972) and senescence of beech leaves (Tevini and Stein- mailer, 1985). Others have reported that xanthophylls were esterified with fatty acids, such as palmitic and linolenic acid (Egger and Schwenker, 1966). The esterified xanthophylls are
Volume 58, No. 3, 1993-JOURNAL OF FOOD SCIENCE-617

Sca
led
A
bso
rban
ce
(43
5 n
m)
PIGM ENT C H AN G ES IN P A R SL E Y LEAVES. . .
Fig. 4 .-H P L C chrom atogram of pigments extracted from parsley leaves held In air with 10 ppm CJH4 for 5 days at 20°C. Columns and solvent gradient o f HPLC system described in text.
W a v e le n g th ( n m )Fig. 5.—Absorption spectra of xanthophyils and new compounds that developed with yellowing of parsley leaves during storage.
Table 1 -S p e c tra l maxima o f xanthophyils and new components that form ed during storage o f parsley leaves______________________________
X a n th o p h y ils a n d n e w c o m p o n e n ts W a v e le n g th (m a x )"
N e o x a n th ln 4 1 3 , 4 3 6 , 4 6 5
V lo la x a n th ln 4 1 7 , 4 3 9 , 4 6 9
L u te in 4 2 0 , 4 4 7 , 4 7 5P e a k # 1 4 1 7 , 4 4 1 , 471P e a k # 2 4 2 1 , 4 4 1 , 471
P e a k # 3 4 1 3 , 4 3 7 , 4 6 5P e a k # 4 4 1 5 , 4 3 5 , 4 6 5P e a k # 5 4 1 5 , 4 3 5 , 4 6 5P e a k # 6 4 1 3 , 4 3 7 , 4 6 5P e a k # 7 4 2 3 , 4 4 5 , 4 7 3P e a k # 8 4 2 1 , 4 4 1 , 4 7 3P e a k # 9 4 1 3 , 4 3 7 , 4 6 5
• Wavelength (max) of the pigments was measured by photodiode array detector.
deposited in the plastoglobuli during senescence (Tevini and Steinmaller, 1985). In parsley leaves, the xanthophyils may be esterified with fatty acids and accumulated in the plastoglobuli of chloroplasts.
These results imply that the pathway by which Chi is degraded in parsley leaves was not altered by C2H4 or CA treatments. The lack of effect by C2H4 on the rate of degradation needs further study, in that others have reported it to hasten color and Chi degradation. Further study is also needed to determine if formation of xanthophyll pigments is interrelated with Chi degradation. With a better understanding of the effect of C2H4 or CA individually (or in combination) on these pigment changes, the knowledge would be beneficial in developing improved handling and storage conditions to maintain color quality of parsley and other leafy vegetables. Additionally, as pathways are understood and enzymes that regulate the pathways are defined, the information would be useful in manipulating genes to develop cultivars that retain color and do not senesce rapidly.
REFERENCESAmir-Shapira, D., Goldschmidt, E.E., and Altm an, A. 1987. Chlorophyll
catabolism in senescing plant tissue: In vivo breakdown interm ediates—Continued on page 637
618-JOURNAL OF FOOD SCIENCE-Volume 58, No. 3, 1993

R a p i d E n z y m a t i c A s s a y f o r A s c o r b i c A c i d i n V a r i o u s F o o d s
U s i n g P e r o x i d a s e
F. TSUM UR A, Y. OHSAKO, Y. HARAG UCHI, H. KUM AGAI, H. SAKURAI, and K. ISHII
----------------------------ABSTRACT-----------------------------Based on direct spectrophotometry and the oxidation of ascorbic acid by guaiacol peroxidase, this method was simple, rapid and highly specific for ascorbic acid. No interference was seen for any food sample tested, including vegetables, fruits, potatoes, beans, chicken liver, processed food, tea and seaweed. This method was applicable to colored and/or sugar-rich samples, and more precise than officially adopted chemical methods.
Key Words: guaiacol peroxidase, ascorbic acid, spectrophotometry, vitamin C
INTRODUCTION
ASCORBIC ACID (AsA) is important in the biosynthesis of collagen, metabolism of amino acids, formation of adrenalin and detoxication in the liver. Fresh fruits, vegetables, animal liver, laver, green tea and green soy beans are common foods, rich in AsA. Processed foodstuffs like ham, bacon, jam and juice often contain AsA as an antioxidant. The AsA content of foods can be an index of quality, since it varies according to cultivation, storage and processing conditions. Although the 2, 4-dinitrophenylhydrazine (DNP) method and the 2,6-dich- lorophenolindophenol (DIP) method have been widely accepted as official methods for AsA determination, they are time-consuming and require many reagents (Cooke and Moxon,1981). In addition, the DNP method often produces errors. Only 85% of dehydroascorbic acid (DHA) reacts with DNP at 37°C over a 3-h period, and slight fluctuations of incubation temperature and time affect the data. Sugars react with DNP, so that sugar-rich foods like jam give much higher values than the true AsA content. The AsA content is obtained by subtracting the DHA content from total content. The DIP method, based on titrimetry using the reducing power of AsA, cannot be used for samples containing reductants or for colored samples like strawberries, laver and liver because the end-point of titration is difficult to read. High-performance liquid chromatography (HPLC) has been used for AsA assay. D-Isoascorbic acid, an isomer of AsA, can be separated from AsA by HPLC (Doner and Hicks, 1981), but purification of samples is necessary to get rid of interfering substances and high-molecular compounds. Analytical conditions like pre-treatment of samples, packing of columns and mobile phase differ with samples, so that the optimum condition must be developed for each assay (Arakawa et al., 1982). Thus, there is need for a rapid, simple and reliable method for determination of AsA.
Among studies seeking a better AsA determination, the enzymatic approach seems most favorable. Enzymes have a high specificity for substrates and reactions are usually completed within a short time. Most enzymatic techniques for AsA have used ascorbate oxidase based on spectrophotometry, which makes use of the difference in absorbance before and after oxidation of AsA (Tono and Fujita, 1981, 1982; Esaka et al.,
T h e a u t h o r s a r e w i t h t h e D e p t , o f A g r i c u l t u r a l C h e m i s t r y , C o l
l e g e o f A g r i c u l t u r e & V e t e r i n a r y M e d i c i n e , N i h o n U n i v . , 3 - 3 4 - 1 ,
S h i m o u m a , S e t a g a y a - k u , T o k y o 1 5 4 , J a p a n . A d d r e s s i n q u i r i e s
t o D r . H . K u m a g a i . _____________________________
1985; Wunderling et al., 1986). However, that enzyme is too costly for routine analysis. Moreover, since the second substrate is oxygen commonly dissolved in solution, the reaction is initiated immediately after addition of the enzyme, so the initial absorbance may be difficult to read. To obtain the exact difference in absorbance before and after reaction with ascorbate oxidase, Tono and Fujita (1981, 1982) prepared two solutions. One was for reading initial absorbance, in which the enzyme was inactivated by acid before the reaction. The other was for final absorbance. However, this method was complex and the degree of denaturation of ascorbate oxidase by acid could affect absorbance.
Kelly and Latzko (1980) used ascorbate peroxidase as an alternative. Since the second substrate of that enzyme is hydrogen peroxide (H20 2), which does not usually exist in solution, the initial absorbance is easy to detect. However, the problem here is that ascorbate peroxidase is unstable and unavailable in purified form. Therefore investigators must extract ascorbate peroxidase from vegetables every time they use this method.
In contrast to ascorbate peroxidase, guaiacol peroxidase is stable and available at reasonable cost. In addition, guaiacol peroxidase catalyzes the AsA oxidation reaction (Nakao and Asada, 1981), and guaiacol is not present in food. Thus, it would be possible to use guaiacol peroxidase for assay of AsA in food. Casella et al. (1989) developed a method using guaiacol peroxidase from horseradish. The principle was to record reaction time for absorbance at 320 nm to exceed 2.0 as an index of AsA concentration. The product formed by reaction of DHA (produced by oxidation of AsA catalyzed by guaiacol peroxidase) with 1,4-diaminobenzene absorbs at 320 nm. However, we have found that the reaction time did not always correlate with AsA concentration, and furthermore their method could not be used for samples with absorbance at 320 nm.
Our objective was to develop a method of AsA determination which directly measures the change in absorbance of AsA during oxidation by guaiacol peroxidase. Fruits, vegetables, processed foodstuffs, potatoes, animal liver, garlic, laver, green tea and green soybeans were used to examine the effects of various compounds on the assay.
MATERIALS & METHODSSamples and chemicals
Food samples were purchased at a local market. All reagents were of guaranteed grade, purchased from Wako Pure Chemical Industries, Ltd. (Tokyo, Japan). Guaiacol peroxidase from horseradish (Type II, 195-200 units/mg solid) was purchased from Sigma Chemical Co. (St. Louis, MO, USA).
Preparation of standard and sample solutions
Each working solution in a concentration range of 2.0-50.0 mg% was prepared daily by diluting AsA with 2% metaphosphoric acid (HP03) and kept in ice water. Each food sample (lOOg) was mixed with 2% HP03 and ground manually in a mortar with pestle. The homogenate was centrifuged at 2500 rpm for 15 min and the supernatant was filtered through paper (No. 2, Toyo Roshi Kaisha, Ltd., Tokyo, Japan). The filtrate was kept in ice-water and assayed within 1 hr.
Volume 58, No. 3, 1993-JOURNAL OF FOOD SCIENCE-619

ASSAY FOR ASCORBIC ACID BY PEROXIDASE. . .
Fig. 1 -Absorbance change at 265 nm during As A oxidation catalyzed by peroxidase.
£<DOeK
1 0 0 -,
8 0 -
■a 6 0 -üu
ocflX>o3<0 > • 1- 4—*
13dì
4 0
2 0 -
0 J
c_o
&oC/ÜÎX)cd13EXcd
- 2
2 0
- 1 5
- 1 0
- 5
0
1 2 3 4 5 6 7 8P H
Fig. 3—Effect of phi on enzyme activity and relative absorbance difference at maxima! absorption.
Fig. 2 - Effect of temperature on enzyme activity and relative absorbance difference at 265 nm.
AsA determinationThe following were mixed in a quartz spectrophotometer cuvette;
2.6 mL of M/30 phosphate buffer (pH 7.0), 150 p.L of guaiacol peroxidase solution in M/30 phosphate buffer (pH 7.0, containing 1.81 mM ethylenediaminetetraacetic acid (EDTA) and 0.13 mM 2-mer- captoethanol) and 0.3 mL of sample solution or AsA standard solution. The initial absorbance at 265 nm was recorded with a spectrophotometer (Model UV-240, Shimadzu Corp., Tokyo, Japan), and the reaction was initiated by adding 15 pL of 50 mM H20 2. The decrease in absorbance at 265 nm due to oxidation of AsA to DHA was recorded until absorbance reached the final value. The difference between initial and final absorbance (AA265) corresponding to AsA concentration was then calculated. Temperature was controlled by circulating water around the cuvette. When the effect of pH on AsA determination was examined, we used Mcllvaine buffer at pH 5.5 and4.0 and Clark-Lubs buffer at pH 2.0 instead of M/30 phosphate buffer (pH 7.0), and the reaction was monitored at maximal absorption. Determination of AsA by the DNP method and DIP method (Nagahara et al., 1987) was also performed to compare results. Enzyme activity was expressed as the initial decrease in absorbance caused by oxidation of AsA/min. One unit of enzyme activity was defined as the amount of enzyme producing a decrease of 1 pmol AsA/min.
RESULTS & DISCUSSION
Time course of absorbance changeA typical recording of change in absorbance at 265 nm dur
ing AsA oxidation at pH 7.0 catalyzed by guaiacol peroxidase (Fig. 1) shows absorbance increased because peroxidase itself had absorbance at 265 nm, which did not affect AA2fi5. After the initial value of absorbance had been recorded, H20 2 was added and absorbance decreased with oxidation of AsA. When 0.05 mg/mL peroxidase was used at 37°C, the reaction was usually completed within 20 min for AsA standard solution and within 5 min for the sample solution. This suggested that some compounds extracted along with AsA made the reaction faster.
Effect of temperature
To determine best assay conditions, effects of temperature, pH and enzyme concentration were examined. Temperature was varied from 20 to 50°C at pH 7.0 (Fig.2) and enzyme activity increased as temperature increased. The relative difference in absorbance at 265 nm (a A 265 relative to the largest a A 265) was almost 100% from 20 to 40°C, but slightly lower at 50°C, due probably to degradation of AsA or inactivation of peroxidase. Thus the reaction temperature was 37°C for the following experiments.
Effect of pH
Since AsA is unstable in alkaline solution, pH was varied from 2.0 to 7.0 at 37°C (Fig. 3). As pH increased, the wavelength of maximal absorption shifted from 243 to 265 nm, in agreement with reported observations (Tono and Fujita, 1982). The absorbance difference was taken at the maximal absorption. Enzyme activity was highest at pH 4.0, but relative absorbance difference at pH 4.0 was almost half that at pH 7.0. The relative absorbance difference was zero at pH 2.0 because of inactivation of the enzyme, and highest at pH 7.0. Since a higher relative absorbance difference increases accuracy of the assay, and reaction time was fast enough even at pH 7.0, we set pH 7.0 for the following experiments. However, pH 5.5 could also be used because relative absorbance difference at pH 5.5 was 94% of that at pH 7.0, and enzyme activity at pH5.5 was higher than that at pH 7.0.
620-JOURNAL OF FOOD SCIENCE-Volume 58, No. 3, 1993
Enzy
me
activ
ity (u
nits
)

Abso
rban
ce at
265
nm
Peroxidase concentration (mg/ml)Fig. 4 - Relation of peroxidase concentration to absorbance at 265 nm and reaction time for AsA standard solution and sample solution.
Table 7-Interference of potential compounds in food with the AsA assay
CompoundAsA A dded (m g% )
AsA + compoundRelative absorbance
difference (%)
None 5 100.0IAsA8 0 + 5 100.0
5 + 5 191.7Glucose 5 + 500 100.5Fructose 5 + 500 100.7Sucrose 5 + 500 101.7Cysteine 5 + 5 100.2
5 + 50 93.7Glycine 5 + 50 100.7Glutamic acid 5 + 50 100.0Glutathione 5 + 5 101.0
5 + 50 96.9Citric acid 5 + 50 100.3Na+b 5 + 1100 99.6K +b 5 + 2800 101.7Fe3+b 5 + 0.5 103.5
5 + 5 101.2Fe2+b 5 + 0.5 99.8
5 + 5 101.5Cu2+b 5 + 0.5 102.5
5 + 5 99.7Ca2+b 5 + 20 97.3Mg2+b 5 + 500 99.6• IAsA, D-lsoascorbic acid b Metal ions were added in chloride form
AsA concentration (mg%)Fig. 5-Relation of AsA to absorbance at 265 nm under standardized conditions.
Effect of enzyme concentration
Peroxidase concentration was related to absorbance at 265 nm (Fig. 4) and the reaction time for AsA standard solution and sample solution. As expected, the reaction was completed faster with increasing peroxidase concentration. When 0.5 mg/ mL peroxidase was used, reaction time was within 1 min for AsA standard solution and within 30 s for sample solution. On the other hand, since peroxidase itself absorbs at 265 nm, excess peroxidase interfered with the assay by raising initial absorbance. In the absence of AsA, the absorbance at 265 nm of 0.5 mg/mL peroxidase was about 0.3 This was not desirable for the assay of some food samples with absorbance at 265 nm, whereas that of 0.05 mg/mL peroxidase was about 0.03, which had no effect on the assay. Thus we chose 0.05 mg/mL as the peroxidase concentration.
Calibration curve for AsA
A calibration curve was obtained in the AsA concentration range 0.2-1.0 mg% using pH 7.0 phosphate buffer and 0.05 mg/mL peroxidase at 37°C (Fig. 5) (averages of five independent measurements). The plot of a A 265 vs AsA concentration gave a straight line passing through the origin. Least squares analysis of five average values in the range 0 .2 - 1 . 0 mg% gave a slope of 0.82 (correlation coefficient 0.9999). Standard error of the averages was between 0.007 and 0.036. The molar extinction coefficient for AsA was 14.4 m M -’cm-1, which was almost in accordance with the data using ascorbate oxidase at pH 6.2 (Wunderling et al., 1986) or ascorbate peroxidase at pH 7.0 (Kelly and Latzko, 1980).
Specificity and interference
Various compounds, which can be extracted along with AsA from food, were added to examine possible interferences (Table 1). D-Isoascorbic acid, sometimes added to processed foodstuffs as an antioxidant, showed the same behavior for catalysis of guaiacol peroxidase as AsA by decreasing the difference in absorbance at 265 nm. This was similar to results reported from other enzymatic and chemical methods (Cooke and Moxon, 1981; Matsumoto et al., 1981; Tono and Fujita,1982). The HPLC method might be better than the enzymatic methods. However, this deficiency would be covered if an enzyme specific for AsA but not for D-isoasocorbic acid were found. Contrary to the DNP method, sugars such as glucose, fructose and sucrose did not interfere with the peroxidase method. Although 50 mg% cysteine and glutathione decreased the relative absorbance difference by a few percent, such decrease would be too slight to affect the assay of food samples. Since both cysteine and glutathione have an SH group too much might result in some interaction with peroxidase. Glycine, glutamic acid, citric acid and ionic metals did not interfere with the assay. Ionic metals, especially copper and iron, catalyze autooxidation of AsA (Matsumoto et al., 1981; Tono and Fujita, 1982). Such autooxidation was very fast when AsA was added to buffer which contained 50 mg% ionic copper or iron. It was necessary to read the initial absorbance immediately after AsA was added when the buffer contained ionic copper or iron. With other ionic metals, however, initial absorbance was stable even when they were added in great excess.
Volume 58, No. 3, 1993-JOURNAL OF FOOD SCIENCE-621

ASSAY FOR ASCORBIC ACID BY PEROXIDASE. . .
Table 2 - Recovery determination o f added As A from various foods
SampleAsA content
(mg%) 5mg% 10mg% 20mg% 50mg% Average
Recovery
Cucumber 5.3 103.2 103.5 100.6 105.2 103.1Brassica rapa 18.5 102.0 100.0 98.4 102.6 100.8
Bean sprout 5.8 101.0 102.4 104.2 102.2 102.5Japanese radish (root) 7.8 100.4 105.1 103.4 102.7 102.9Japanese radish (sprout) 33.9 98.3 95.8 100.0 98.1 98.2Cabbage 50.8 101.3 101.3 98.5 103.7 101.2
Broccoli 103.5 104.9 105.1 103.4 102.7 104.0
Sweet pepper 68.5 101.9 99.9 102.5 103.4 101.9Cauliflower 91.0 99.4 108.2 98.2 101.2 102.0
Parsley 89.7 101.0 100.9 100.4 105.6 102.0
Kumquat 26.6 106.0 107.4 109.0 105.5 107.0Orange 32.7 99.2 97.9 101.7 102.1 100.2
Grapefruit 34.8 100.0 99.6 100.8 100.8 100.3Yuzu (Chinese lemon) 37.6 99.3 102.5 105.7 103.7 102.8
Satsuma mandarin 37.9 98.5 101.7 101.6 99.1 100.2
Lemon 39.7 109.4 108.9 107.3 106.6 108.1Strawberry 59.4 102.8 106.3 103.0 104.4 104.1Papaya 64.0 95.6 97.2 96.5 96.7 96.5Kiwi fru it 64.3 97.1 96.6 99.1 101.4 98.6Japanese persimmon 85.8 99.0 98.1 98.7 98.1 98.5
Green tea 175.7 97.8 100.4 100.0 98.8 99.3Ham 38.2 101.2 103.8 103.4 109.6 104.5Bacon 185.4 100.7 97.1 96.2 97.6 97.9Liver (chicken) 8.3 99.9 100.1 100.6 97.2 99.5Green soybean 5.4 96.4 100.3 103.5 97.5 99.4Toasted purple laver 167.0 105.4 103.5 106.9 105.4 105.3Sweet potato 15.4 101.8 98.6 98.8 102.4 100.4Potato 6.9 103.2 102.6 101.5 97.0 101.1
Garlic 5.2 97.6 97.8 101.3 104.1 100.2
Jam 2.6 104.3 106.2 104.5 109.4 106.1
As A by peroxidase method (mg%)Fig. 6—AsA content in various foods determined by the peroxidase method and DNP method.
Recovery test
A known amount of AsA was added at 5-50 mg% to various sample extracts and its recovery was examined (Table 2). Note that extracts from parsley, green tea, chicken liver and toasted purple laver did not decrease the initial absorbance, though they contained around 10 mg% Fe (Standard Tables of Food Composition in Japan, Resources Council, Science and Technology Agency, 1982). This might be because Fe in food combines with high-molecular compounds and could not catalyze autooxidation of AsA like that in FeCl2 or FeCl3 solution. Sugar-rich samples like sweet potatoes, garlic and marmalade, and colored samples like strawberries, toasted purple laver and
Fig. 7—AsA content in various foods determined by the peroxidase method and DIP method.
liver had recoveries of almost 100%. The average recovery of 30 samples was 101.6% with no significant interference, indicating none of the samples tested contained any substance producing serious interference.
Reliability in application
AsA contents in various foods determined by the peroxidase method were compared with that by the DNP method and DIP method (Fig. 7 and Fig. 8 ). The samples tested were those listed in Table 2. Garlic and marmalade could not be used with the DNP method because of high sugar content. Strawberries, toasted purple laver and chicken liver could not be used with the DIP method because their extracts had a strong reddish
-Continued on page 687622-JOURNAL OF FOOD SCIENCE-Volume 58, No. 3, 1993

P a c k a g i n g E f f e c t s o n G r o w t h o f L i s t e r i a i n n o c u a
i n S h r e d d e d C a b b a g e
M.B. OMARY, R.F. TESTIN, S.F. BAREFOOT, and J.W. RUSHING
----------------------------ABSTRACT-----------------------------Freshly shredded white cabbage was treated with citric acid and sodium erythorbate, inoculated with Listeria innocua (in lieu of Listeria monocytogenes), and packaged in 230g lots in four types of retail bags with oxygen transmission rates (OTRs) of 5.6, 1,500, 4,000, and6,000 cc OJnFllA hr, then stored 21 days at 11°C. After 14 days, L. Innocua decreased in cabbage stored in three films. After 21 days, Listeria population increased in all packages, but the increase was less (p<0.05), for cabbage packaged in film with the highest OTR (commercial film).
Key Words: cabbage, listeria, packaging, microbes
INTRODUCTIONMODIFIED atmosphere packaging (MAP) is well established. However, some aspects of MAP need further study. These include the microbiological safety of refrigerated, ready-to-eat foods with extended shelf life, product safety during temperature abuse, gas flush system failure, and loss of packaging integrity (Farber and Peterkin, 1991).
Markets for minimally processed fresh vegetables such as shredded cabbage (SC) require packages that ensure product safety while preserving freshness and extending shelf life (Mannheim, 1986, Farber, 1991). Fresh vegetables respire, and when packaged, modify atmosphere inside the package. The extent of modification is dependent upon several variables. These include gas permeability, respiration rate of the commodity and storage temperature (Henig, 1972). Such natural atmospheric modification may be applied to extend quality and shelf life. However, artificial and natural MAP create environments where pathogenic microorganisms proliferate while inhibiting growth of spoilage microorganisms. Thus, contaminated food that lacks off odors or other signs of decomposition may be unwittingly consumed (Best, 1988; Farber, 1991; Marshall et al., 1991). An outbreak of botulism was reported in Florida in December of 1987. Circus performers consumed coleslaw from packaged shredded cabbage mixed with coleslaw dressing (Solomon et al., 1990). Evidence indicated the cabbage had been packaged in a modified atmosphere and may have been stored at abuse temperature an extended time. That incident led to a study of outgrowth of spores and toxin production of C. botulinum in packaged shredded cabbage stored at room temperature under modified atmosphere (Solomon et al., 1990). Growth of spores and toxin production of C. botulinum type A occurred before the cabbage underwent unacceptable sensory change. However, C. botulinum type B neither grew spores nor produced toxins under the same conditions.
Listeria monocytogenes is a foodborne pathogen that causes human listeriosis and has been isolated from shredded cabbage. The first food-related outbreak of listeriosis (Schlech et al.,1983) resulted in 41 victims and 18 deaths. The vehicle was coleslaw, and the source of contamination was contaminated
Authors Omary, Testin, and Barefoot are with the Food Science Dept., Clemson Univ., Clemson, SC 29634-0371. Author Rushing is with the Horticulture Dept., Clemson Univ., Coastal Research Center, 2865 Savannah Hwy, Charleston, SC 29414. Address inquires to M.B. Omary.
cabbage fertilized with sheep manure. The cabbage had been stored on the farm and shipped during the following winter and spring. Prolonged storage at cold temperatures may have encouraged/enhanced growth of L. monocytogenes and reduced normal cabbage microflora (Schlech et al., 1983). Involvement of contaminated lettuce, tomatoes and celery in human outbreaks of listeriosis in Boston was also reported (Ho et al., 1986).
In previous studies, L. innocua has been substituted for L. monocytogenes as an indicator organism. Foegeding and Stanley (1991) presented a rationale for using L. innocua PFEI as a nonpathogenic thermal-processing indicator for L. monocytogenes. Fairchild and Foegeding (1991) developed L. innocua M l, a spontaneous rifampin and streptomycin-resistant culture, as a nonpathogenic thermal-processing indicator organism for L. m onocytogenes. T heir easy selec tion , nonpathogenicity and compatible heat resistance made modified L. innocua appropriate organisms for nonpathogenic thermal processing indicators. L. innocua, like L. monocytogenes, is a psychotroph. It was initially considered a non-hemolytic non-pathogenic strain of L. monocytogenes (Lovett, 1984). The organisms have similar growth (Razavilar and Genigeorgis,1992) and biochemical characteristics (Lovett, 1984). Guan- ine-plus-cytosine DNA contents are similar (Seeliger and Jones, 1986). Relatedness between L. innocua and L. monocytogenes has been strongly supported by DNA pairing data (Hartford and Sneath, 1993; Baloga and Harlander, 1991; Rocourt et al., 1982). Both organisms transform by electroporation at approximately the same rate (Alexander et al., 1990). The only phenotypic characteristics that separate L. monocytogenes fromL. innocua are production of p-hemolysin (Pine et al., 1989) and pathogenicity for mice by L. monocytogenes. L. innocua also lacks the phosphatidylinositol-specific phospholipase C (PI-PLC) activity implicated in pathogenicity (Notermans et al., 1991).
Our objective was to determine how films with different oxygen transmission rates affected growth of Listeria innocua, a psychotroph and nonpathogenic organism used in lieu of L. monocytogenes, in packaged SC stored for an extended period under abusive conditions.
MATERIALS & METHODSPACKAGING MATERIALS were retail-size bags: (1) A commercial polyethylene retail pouch, OTR 6,000 cc OJm2/24 hr (TooGooDoo Farms, Yonges Island, SC) (2) Cryovac L-340 (Cryovac Division, Grace Co., Duncan, SC) multi-ply polyolefin film OTR 4,000, (3) Cryovac experimental multi-ply polyolefin film OTR 1,500, and (4) Cryovac experimental multi-ply polyolefin film OTR 5.6. All OTR data are at 23°C.
Cabbage preparation
Danish flat type cabbage (Brassica spp.) grown in New York State for shredded cabbage (SC) processing was obtained from TooGooDoo Farms (Yonges Island, SC).
Outer leaves (6 to 8) were removed from each head. The heads were rinsed with cold tap water (0-4°C), cored, quartered, and sliced on a model-410 Hobart Slicer (Hobart Manufacturing Co., Troy, OH) to simulate commercial processing of SC.
Volume 58, No. 3, 1993-JOURNAL OF FOOD SCIENCE-623

EFFECTS OF GROWTH OF LISTERIA INNOCUA . . .
Table 1 -R ecovery o f Listeria innocuamn from inoculated shredded cabbage packaged in films of different OTRs at 11 °C
Storagetime
(days)
Film OTR (cc 0 2/m 2/24 hr)
Listeria count (MVJAP) Total plate count (TSA')
5.6 1,500 4,000 6,000 5.6 1,500 4,000 6 ,0 00 '
01421
4.64 ±0.26 3.448c±0.26 7.18» ±0.37
4.64 ±0.26 4.68b±0.26 7.31»±0.26
4.64 ±0.26 2.85“ ±0.26 7.80« ±0.37
4.64 ±0.26 2.70'±0.26 5.80» ±0.26
5.28 ±0.28 9.85 '±0.28 8.18" ±0.40
5.28 ±0.28 9.37* ±0.28 8.67*±0.28
5.28 ±0.28 9.09* ±0.28 8.60* ±0.40
5.28 ±0.28 9.10* ±0.28 8.41*±0.28
m Logio cell forming units per gram of shredded cabbage (mean values, n = 4). n Inoculum of about 1 x 10⁵ c=u/g of SC. p Modified Vogel Johnson Agar.Q Tryptic Soy Agar. r Commercial film.•be Rows only (p<0.05).
Bags formed from a double layer of Curity® cheesecloth were filled with 1.8 kg SC, and placed in a sanitized Model-24411 Kenmore washing machine containing a 0.4% solution of antioxidant consisting of citric acid and sodium erythorbate (Flavorite Laboratories, Inc., West Memphis, AK). Cabbage was mixed with antioxidant solution at 0°C for 3 min and spun for 2 min to remove excess liquid.
Culture preparation, inoculation and packagingListeria innocua LM 105 (ATCC 33090) was obtained from Dr. R.
Twedt (FDA, Washington, DC) and cultured for 24 hr at 30°C in Trypticase Soy Broth (TSB) (Difco, Laboratories, Detroit, MI) containing 0.6% yeast extract (TSBYE, Difco) (Lovett, 1984). Stock cultures were maintained by freezing in the same broth with 20% glycerol at - 60°C. Before preparing inocula for test media, cultures were activated by two consecutive 24 hr growth periods in TSBYE at 30°C. The cabbage inoculum was prepared by diluting a 24 hr TSB broth culture of L. innocua in 0.1M potassium phosphate buffer (pH7.0) to give a viable cell population of around 105 cells/mL. The cell suspension (1L) was added per l,000g of antioxidant-treated SC (Hao et al., 1987). The cabbage was mixed thoroughly (5 min) with the cell suspension and drained. Each retail-size plastic bag was filled with 230g product, manually air evacuated and closed with a model AZ4100L Tipper Tie® clipper (Tipper Tie Division, Rheem Manufacturing Co., Apex, NC), then stored at 11°C. (The temperature represents conditions at some retail supermarkets, Wyatt and Guy, 1980; Collins, 1982; Smoak, 1987; Harris, 1989; Hutton et al., 1991; Hanlin, 1992). Two bags of each film were prepared for each day of sampling. Samples were removed for microbial analysis initially and after 2 and 3 wk storage.
Detection testsBefore each analysis, the cabbage was thoroughly mixed. Then a
25g sample was aseptically removed, combined with 225 mL of sterile phosphate buffer (0.1M) and homogenized for 1 min. The fluid was serially diluted and analyzed for L. innocua and aerobic plate count (APC) (Speck, 1984) by surface plating in duplicate onto Modified Vogel Johnson Agar (MVJA) (Beuchat and Brackett, 1990; Buchanan et al., 1987; Brackett, 19S8; Cassiday and Brackett, 1989) and Tryptic Soy Agar (TSA) (Difco Laboratories, Detroit MI), respectively.
MVJA was prepared with Vogel Johnson Agar (Difco) modified with 0.005% (w/v) of nalidixic acid, 0.02% (w/v) potassium tellurite, 0.002% (w/v) bacitracin and 0.0005% moxalactam (w/v) (Brackett,1988). Values represent final concentrations.
Plates were incubated at 30°C for 48 hr. Black colonies on MVJA were identified as L. innocua by colony morphology and enumerated. A typical colony from each plate was subcultured on TSA and incubated at 30°C for 24 hr. Typical colonies were confirmed as L. innocua by further tests, including gram stains, catalase, motility and biochemical tests API20S® (Analytab Products, Plainview NY) (Brackett, 1988). Uninoculated SC designated as the control was treated with 0.1 M potassium phosphate buffer (pH 7.0) for 5 min, drained, packaged and stored with the inoculated SC.
Statistical analyses
Data were analyzed as a completely randomized design, with time and packaging materials as main effects. Means were separated using Least Significant Difference tests (SAS Institute, Inc., 1985), and statistical significances were determined at the p'<0.05 level for AN- OVA.
RESULTS & DISCUSSIONNumbers of L. innocua (Table 1) on cabbage packaged in films with 5.6, 4,000, and 6,000 OTRs decreased (p<0.05) on day 14. Aerobic plate count (APC) (Table 1) increased at 14 days storage. Several hypotheses may explain these results. First, competition may have occurred among the natural fermentative microflora in cabbage such as lactic acid bacteria (Wood, 1985), and bacterial cultures in the genera Chromobacterium and Ci- trobacter (King et al., 1976), and L. innocua. Solomon et al.(1990) speculated on a similar situation, lack of growth and toxin production by Clostridium botulinum type B in shredded cabbage packaged under modified atmosphere and stored at abuse temperature (22-25°C), could have resulted from competition with the natural microflora of the cabbage or the unsuitability of the substrate.
Second, the citric acid used as an antioxidant and the lactic acid produced by fermentation, may have decreased the pH of the system and had antibacterial effect on L. innocua. Ahamad and Marth (1990) reported acid injury of L. monocytogenes in 0.3 and 0.5% solutions of acetic, citric and lactic acid at 13 and 35°C. Citric followed by lactic acid were cited as having caused the greatest injury. In our study, we stored uninoculated SC for 21 days at 11°C, after 13 days the pH of SC in each of the films decreased similarly. For film 5.6, pH decreased from 5.39 initially to 4.23 (data not shown); pH decreased for cabbage in films 1,500 and 4,000 were no different. These results were indicative of fermentation and of an increase in lactic acid bacteria. McClimon (1990) reported that lactic acid bacteria counts increased = 2 logs after 14 days in shredded cabbage packaged at 11°C in films with OTRs 6,300, 3,000 and 0.55 cc/m2/24 hr. Several other researchers reported the antilisterial activity of organic acids (El-Shenawy and Marth, 1991; Conner et al., 1990; Ahamad and Marth, 1989; Parish and Higgins, 1989).
Production of bacteriocin or bacteriocin-like substances, although beyond the scope of our study, may have inhibited growth of L. innocua. Harris et al. (1989) studied the antimicrobial activity of 14 bacteriocinogenic strains of lactic acid against L. monocytogenes and L. innocua. Seven strains inhibited L. monocytogenes and L. innocua by the deferred antagonism assay. Ahn and Stiles (1990) investigated the antibacterial activity of lactic acid bacteria from vacuum-packaged meats against L. monocytogenes. One isolate of L. plan- tarum UAL59 inhibited L. monocytogenes. Lactobacillus plantarum is an organism commonly found in cabbage (Wood,1985).
Further evidence supporting the competition hypothesis was that after 13 days storage at 11°C (Fig. 1 and 2), uninoculated SC packaged in the same films contained less 0 2 (< 1.8%) and more C 0 2 (> 18%). These results indicate anaerobic conditions which select for the anaerobic and facultatively anaerobic species found naturally in cabbage including lactic acid bacteria (Wood, 1985, Brackett, 1987).
On day 21 (Table 1), cabbage in all films showed an increase in L. innocua beyond the initial inoculum. Samples in films 5.6, 1,500, and 4,000 contained higher numbers than cabbage in film 6,000. That in film 6,000 had a lower recovery of L.
624-JOURNAL OF FOOD SCIENCE-Volume 58, No. 3, 1993

Fig. 1 —Oxygen concentrations of uninoculated SC packaged in films of different OTRs (cc 02lm2/24 hr) at 11°C. Commercial film = 6,000. n -6 .
Fig. 2 - Carbon dioxide concentrations of uninoculated SC packaged in films of different OTRs (cc 0Jm2l24 hr) at 11°C. Commercial film = 6,000. n = 6.
innocua at day 21. In addition, on day 21 the APC decreased (compared to day 14) for cabbage packaged in all films. The count of L. innocua was lower in cabbage packaged in film6,000 after 21 days, as compared to the other films. This suggested that recovery of L. innocua and, theoretically, that of L. monocytogenes, would be less in SC stored at 11°C packaged in films with OTRs > 6,000.
No Listeria spp. were recovered from uninoculated samples of stored SC. This contrasted with the Heisick et al. (1989) report where L. monocytogenes was isolated from fresh cabbage among other vegetables purchased from local retail markets. The difference may be due to the lack of rinsing by Heisick et al. (1989) in contrast to our thorough rinsing and removal of 7 to 8 outer leaves. L. monocytogenes is widely present in plant, soil, and surface water samples (Farber and Peterkin, 1991).
Contrasting findings regarding the growth of Listeria species under MAP have been cited. Gray and Killinger (1966) reported that growth of L. monocytogenes was enhanced by elevated C 0 2 concentrations. Likewise, Seeliger (1961) noted the optimum thriving of Listeria species at reduced oxygen conditions, and excellent growth was reported after replacement of oxygen by carbon dioxide. In contrast, Razalivar and Genigeorgis (1992) demonstrated the increasing inhibitory effect of high concentrations of C 0 2 on growth of Listeria on blood agar at temperatures > 8 °C.
Berrang et al. (1989) reported that L. monocytogenes grew well at 15°C on fresh asparagus, broccoli and cauliflower stored under air or a controlled atmosphere for 10 days. Studies were also conducted at 5°C for 21 days, but growth was not as rapid as at 15°C (Berrang et al., 1989). For vegetables such as asparagus, where the organism can grow at 4°C, the increased shelf life of products with controlled atmosphere allows more time forL. monocytogenes to reach higher concentrations. According to Berrang et al. (1989), populations of L. monocytogenes increased during storage but controlled atmosphere storage did not influence rate of growth.
Kallander et al. (1991) examined the fate of L. monocytogenes inoculated into SC stored under air and under a modified atmosphere of high carbon dioxide (70%) at 5 and 25°C. The increased carbon dioxide was ineffective in controlling growth at 5°C. However, at 25°C cabbage spoilage was rapid and colony counts of listeriae declined under both atmospheres.
Marshall et al. (1991) reported that MAP inhibited growth of P. fluorescens more than growth of L. monocytogenes on precooked chicken nuggets. Though growth of L. monocytogenes was inhibited by MAP, the organism grew at 3, 7 and 11°C. The effectiveness of MAP in inhibiting Listeria decreases with increase in temperature.
Modified atmospheres have selectively inhibited spoilage bacteria such as P. fluorescens. Therefore, though there are no obvious signs of spoilage, pathogenic organisms may be in dangerously high concentrations. Consequently, food packers should verify that no contaminated vegetables are processed, and that proper packaging methods, and strict refrigeration storage are maintained (Marshall et al., 1991). Proper cleaning, disinfection with sanitizers such as quaternary ammonium or sodium hypochlorite, and post-rinsing of processing equipment are also important (Mustapha and Liewen, 1989).
Pathogenic microorganisms such as L. monocytogenes may be a health hazard if present in any vegetable, regardless of storage technique. However, when fresh vegetables are stored for long periods of time at cool temperatures, risk of foodborne illness increases because of potential for pathogens to grow.
REFERENCES
Ahamad, N. and M arth, E.H. 1989. Behavior of L is te r ia m o n o cy to g en es at 7, 13, 21 and 35°C in tryptose broth acidified with acetic, citric, or lactic acid. J . Food Prot. 52: 688.
Ahamad, N. and M arth, E.H. 1990. Acid-injury of L is te r ia m on o cy to g en es. J. Food Prot. 53: 26.
Ahn, C. and Stiles, M.E. 1990. A ntibacterial activity of lactic acid bacteria isolated from vacuum-packaged meats. J . Appl. Bacteriol. 69: 302.
Alexander, J.E ., Andrew, P .\Y , Jones, D., and Roberts, I.S. 1990. Development of an optimized system for electroporation of L is te r ia species. Lett. Appl. Microbiol. 10: 179.
Baloga, A. and H arlander, S.K. 1991. Comparison of methods for discrimination between strains of L is te r ia m o n o cy to g en es from epidemiological surveys. Appl. Environ. Microbiol. 57: 2324.
Berrang, M.E., Brackett, R.E., and Beuchat, L.R. 1989. Growth of L is te r ia m o n o cy to g en es on fresh vegetables stored under controlled atmosphere. J . Food Prot. 52: 702.
Best, D. 1988. Food industry faces off w ith microbial hazards. Prepared Foods 157(9): 188.
Beuchat, L.R., Brackett, R.E., Hao, D. Y.-Y. and Conner D.E. 1986. Growth and therm al inactivation of L is te r ia m o n o cy to g en es in cabbage and cabbage juice. Can. J . Microbiol. 32: 791.
Beuchat, L.R. and Brackett, R.E. 1990. Survival and growth of L is te r ia m ono cy to g en es on lettuce as influenced by shredding, chlorine treatm ent, modified atm osphere packaging and tem perature. J . Food Sci. 55: 755.
Brackett, R.E. 1987. Microbiological consequences of m inim ally processed fruits and vegetables. J . Fd. Qual. 10: 195.
Brackett, R.E. 1988. Personal Communication. U niversity of Georgia, Griffin, GA.
Buchanan, R.L., Stahl, H.G., and Archer, D.L. 1987. Improved plating media for simplified, quantitative detection of L . m onocytogenes in Foods. Food Microbiol. 4: 269-275.
Cassiday, P.K. and Brackett, R.E. 1989. Methods and media to isolate and enum erate L. m o n o c y to g e n e s : A review. J . Food Prot. 52(3): 207-214.
Collins, M.A. 1982. Investigations on some factors affecting the keeping quality of coleslaw. Record of A gricultural research. N ortnern Ireland. Dept, of Agriculture. 30: 53-60.
Conner, D.E., Scott, V.N., and Bernard, D.T. 1990. Growth, inhibition, and survival of L is te r ia m ono cy to g en es as affected by acidic conditions. J . Food Prot. 53: 652.
El-Shenawv, M.A. and M arth, E.H. 1991. Organic acids enhance the an- tilisteria l activity of potassium sorbate. J . Food Prot. 54: 593.
Fairchild, T. and Foegeding, P. 1991. A proposed nonpathogenic therm al processing indicator for L is te r ia m o n o cy to g en es. Poster, 18, Session 71,
Volume 58, No. 3, 1993-JOURNAL OF FOOD SCIENCE-625

EFFECTS OF GROWTH OF LISTERIA INNOCUA . . .
General m eeting of the American Society for Microbiology, Dallas, TX. May 5—9.
Farber, J.M. 1991. Microbiological aspects of modified atm osphere packaging technology—A review. J . Food Prot. 54(1): 58-70.
Farber, J.M. and Peterkin, P .1 .1991. L is te r ia m on o cy to g en es, a food-borne pathogen. Microbiol. Reviews. 55(3): 476-511.
Foegeding, P.M. and Stanley, N.M. 1991. L is te r ia in n o c u a transformed w ith an antibiotic resistance plasmid as a therm al-resistance indicator for L . m o n o cy to g en es. J. Food Prot. 54(7): 519-523.
Gray, M.L., and Killinger, A H . 1966. L is te r ia m o n o cy to g en es and listeric infections. B acterid . Rev. 30: 309.
Hanlin, J.H . 1992. Personal Communication. Campbell Soup Company, Campbell Institu te for Research and Technology, Campbell Place, Camden, NJ.
Hao, D.Y.-Y., Beuchat, L.R., and Brackett, R.E. 1987. Comparison of media and methods for detecting and enum erating L is te r ia m o n o cy to g en es in refrigerated cabbage. Applied and Environm ental Microbiol. 53(5): 955.
H arris, R.D. 1989. K raft builds safety into next generation refrigerated foods. Food Proc. 50: 111.
H arris, L.J., Daeschel, M .A , Stiles, M.E., and Klaenham m er, T.R. 1989. Antimicrobial activity of lactic acid bacteria against L is te r ia m o n o cy to g e n es . J. Food Prot. 52: 3784.
Hartford, T. and Sneath, P .H .A 1993. Optical DNA-DNA homology in the genus L is te r ia . Int. J . Syst. B acterid . 43: 26.
Heisick, J.E ., W agner, D.E., Nieman, M.L., and Peeler, J.T. 1989. L is te r ia spp. found on fresh m arket produce. Appl. Environ. Microbiol. 55(8): 1925-1927.
Henig, Y. 1972. Computer analysis of the variables affecting respiration and quality of produce packaged in polymeric films. Ph.D. dissertation, Rutgers Univ., New Jersey.
Ho, J.L., Shands, K.N., Friedman, G., Eckind, P., and Fraser, D.W. 1986. An outbreak of type 4 t L is te r ia m ono cy to g en es infection involving patien ts from eight Boston hospitals. Arch. Intern. Med. 146: 520.
Hutton, M.T., Chehak, P .A , and H anlin, J.H . 1991. Inhibition of botu- linum toxin production by P ediococcus ac id ilac tic i in tem perature abused refrigerated foods. J . Food Safety. 11: 255-267.
K allander, K.D., Hitchins, A D ., Lancette, G .A , Schmieg, J .A , G arda, G.R., Solomon, H.M., and Sofos, J.N . 1991. Fate of L is te r ia m o n o cy to g e n es in shredded cabbage stored a t 5 and 25°C under a modified a tmosphere. J . Food Prot. 54: 302.
King, A D . Jr., Michener, H.D., Bayne, H.G., and M ihara, K.L. 1976. Microbial studies on shelf life of cabbage and coleslaw. Appl. Env. Microbiology 31(3): 404.
Lovett, J . 1984. L isteria isolation. In B a c te r io lo g ica l A n a ly t ic a l M a n u a l, 6th ed. United S tates FD A Arlington, V A
Mannheim, C. 1986. The preservation of perishables by modified atm osphere packaging. In P ro c ee d in g s o f a F o o d -P ro d u c t P a cka g e C o m p a tib i l i ty S e m in a r , E ast Lansing, MI.
M arshall, D.L. 1989.M arshall, D.L., Wiese-Lehigh, P.L., Wells, J.H ., and Farr, A J . 1991. Com
parative growth of L is te r ia m o n o cy to g en es and Pseudomonads fluores- cens on precooked chicken nuggets stored under modified atmospheres. J . Food Prot. 54(11): 841-843, 851.
McClimon, L.B. 1990. Optimizing shelf life quality of shredded cabbage
through use of modified atm osphere packaging. M asters thesis, Clemson Univ., Clemson, SC.
M ustapha, A. and Liewen, M.B. 1989. Destruction of L . m o n o cy to g en es by sodium hypochlorite and quaternary ammonium sanitizers. J . Food. Prot. 52(5): 306-311.
Noterm ans, S.H.W., Dufrenne, J ., Leimeister-W achter, M., Domann, E., and Chakraborty, T. 1991. Phosphatidylinositol-specific phospholipase C activity as a m arker to distinguish between pathogenic and nonpatho- genic L is te r ia species. Appl. Environ. Microbiol. 57: 2666.
Parish, M.E. and Higgins, D.P. 1989. Survival of L is te r ia m o n o cy to g en es in low pH model broth systems. J . Food Prot. 52: 144.
Pine, L., Malcom, G.B., Brooks, J.B ., and Daneshvar, M.I. 1989. Physiological studies on the growth and utilization of sugars by L is te r ia species. Can. J . Microbiol.
Razalivar, V. and Genigeorgis, C. 1992. Interactive effect of tem perature, atm osphere and storage time on the probability of colony formation on blood agar by four L is te r ia species. 55: 88.
Rocourt, J ., Grimont, F., Grimont, P A D ., and Seeliger, H.P.R. 1982. DNA relatedness among serovars of L is te r ia m o n o cy to g en es s e n s u la to . Curr. Microbiol. 7: 383.
SAS Institu te Inc. 1985. S A S U se r ’s G u id e : S ta tis t ic s , V e r s io n 5 E d i tio n , SAS Institu te Inc., Cary, NC.
Schlech, W.F., Lavigne, P.M., Botolussi, R.A., Allen, A.C. Haldane, E.V., Wort, A.J., Hightower, A.E., Johnson, S.E., King, S.H., Nicholls, E.S., and C. V. Broome. 1983. Epidemic listeriosis-eviaence for transm ission by food. N. Engl. J . Med. 308(4): 203.
Seeliger, H.P.R. 1961. L is te r io s is . Hafner Publishing Co., New York.Seeliger, H.P.R. and Jones, D. 1986. Genus L is te r ia . In B e rg ey 's M a n u a l
o f S y s te m a tic B a c te r io lo g y , Vol 2. W illiam s and W illiams. Baltimore, MD.
Smoak, J . 1987. Personal Communication. TooGooDoo Farm s, Yonges Island SC.
Solomon, H.M., K autter, D .A , Lilly, T. and Rodehamel, E.J. 1990. O utgrowth of C lo s tr id iu m b o tu l in u m in shredded cabbage a t room tem peratu re under a modified atmosphere. J . Food. Prot. 53(10): 831-833.
Speck, M.L. 1984. C o m p e n d iu m o f M e th o d s fo r th e M icro b io lo g ic a l E x a m in a tio n o f F o o d s 2nd ed. American Public H ealth Association, W ashington, DC.
Wood, J.B . 1985. M icro b io lo g y o f F e r m e n te d F oods. Vol 1. Elsevier Applied Science Publishers, New York.
W yatt, L.D. and Guy, V. 1980. Relationships of microbial quality of retail m eat samples and san itary conditions. J . Food Prot. 43: 385-389.
Ms received 10/30/92; revised 2/1/93; accepted 2/17/93. * 20
Paper No. 375 presented a t the 1990 IFT Annual Meeting, Anaheim, CA June 16-20.
Technical contribution no. 3350 of the South Carolina Agriculture Experiment Station.
We thank Dr. R. Twedt, Division of Microbiology, FDA Washington DC, for providing strain LM105, and TooGooDoo Farms, Yonges Island SC for donating the cabbage.
N M H A N D D IELEC TR IC M E A S U R E M E N T S .. .From page 604
Copson, D.A. 1975. M icro w a v e H e a tin g . AVI. W estport, CT.Dawkins, A.W.J., Gabriel, C., Sheppard, R.J., and Grand, E.H. 1981. Elec
trical properties of lens m aterial a t microwave frequencies. Phys. Med. Biol. 26: 1.
Harvey, J.M. and Symons, M.C.R. 1978. The hydration of monosacchar- ides-A n NMR study. J. Solution Chem. 7: 571.
Hasted, J.B ., Ritson, D.M., and Collie, C.H. 1948. Dielectric properties of aqueous ionic solutions. P arts 1 and 2. J . Chem. Phys. 16: 1.
HilU, B.P. 1991. M ultinuclear NMR studies of w ater in solutions of simple carbohydrates. I. Proton and deuterium relaxation. Mol. Phys. 72: 1099.
Khalil, H.M. 1987. Evaluation of microwave energy and its potential use in food sterilization. Ph.D. thesis, Univ. of Illinois, U rbana, IL.
Mudgett, R.E., Goldblith, S .A , Wang, D.I.C., and W estphal, W.B. 1980. Dielectric behavior of a semi-solid food a t low, interm ediate and high m oisture contents. J . Microwave Power 5: 27.
Mudgett, R.E. 1989. Microwave food processing. Food Technol. 43: 117.Otto, G.P. and Chew, W.C. 1992. Electromagnetic properties of large-grain
m aterials measured w ith large coaxial sensors. In In te r n a tio n a l A d van ces in N o n -D e s tr u c tiv e T e s tin g , Vol. 17, (Ed.) W. McGonnagle. Gordon and Breach Science Publishers, New York.
Padua, G.W., Richardson, S.J., and Steinberg, M.P. 1991. W ater associated with whey protein investigated by pulsed NMR. J . Food Sci. 56: 1557.
Padua, G.W. and Schmidt, S.J. 1992. Proton nuclear magnetic resonance m easurem ents on various sugar solutions. J. Agric. Food Chem. 40:1524.
Richardson, S.J. and Steinberg, M.P. 1987. Applications of nuclear m agnetic resonance. In W a ter A c t iv ity : T h e o ry a n a A p p l ic a tio n s to F o o d (E i)L.B. Rockland and L.R. Beuchat. Marcel Dekker, New York.
Roebuck, B.D. and Goldblith, S.A. 1972. Dielectric properties of carbohydrate-w ater mixtures a t microwave frequencies. S. Food Sci. 37: 199.
Roebuck, B.D. and Goldblith, S .A 1975. Dielectric properties a t microwave frequencies of agar gels. S im ilarity to the dielectric properties of water. J . Food Sci. 40: 899.
Stuchly, S.S. 1970. Dielectric properties of some g ranu lar solids containing water. J . Microwave Power. 5: 62.
Tait, M.J., Suggett, A., Franks, F., Ablett, S., and Quickenden, P.A. 1972. Hydration of monosaccharides: A study by dielectric and nuclear m agnetic relaxation. J . Solution Chem. 1: 131.
Ms received 10/1/92; revised 12/11/92; accepted 1/27/93.
This work was supported by a grant from the Research Board, University of Illinois, Urbana. The dielectric measurements were performed at the Electromagnetics Laboratory, Dept, of Electrical and Computer Engineering, Univ. of Illinois. Thanks to Dr. David A. Payne and Dr. Weng C. Chew for useful suggestions and Gregory Otto and Francois Colomb for technical assistance.
626-JOURNAL OF FOOD SCIENCE-Volume 58, No. 3, 1993

G e r m i n a t i o n a n d D e b i t t e r i n g L u p i n S e e d s R e d u c e
a - G a l a c t o s i d e a n d I n t e s t i n a l C a r b o h y d r a t e F e r m e n t a t i o n
i n H u m a n s
LC. TRUGO, A. FARAH, and N.M.F. TRUGO
----------------------------ABSTRACT-----------------------------Subjects submitted to untreated and processed test meals of Lupinus albus and Lupinus angustifolius had decreases in breath-hydrogen concentrations (as maximum and cumulative changes), for processed samples compared to untreated samples. Maximum changes (means) in breath-hydrogen decreased from 56.7 and 66.7 Appm in untreated L. albus and L. angustifolius, respectively, to 8.4 and 5.9 Appm in debittered samples (p <0.001), and to 29.6 Appm in germinated L. albus (p<0.01). Results paralleled the decrease in a-galactoside contents of germinated and debittered samples which showed over 90% reduction. Germination and debittering were very effective but debittering was more efficient to decrease fermentation in the human colon.
Key Words: lupin seeds; a-galactosides; germination; debittering; breath hydrogen
INTRODUCTION
LUPIN SEEDS are similar to soybeans, as sources of protein and, in some species, also of oil. The limitation of a wider use of lupins has been their high content of quinolizidine alkaloids. This has been gradually overcome by the establishment of new commercial low-alkaloid varieties developed by breeding programs (Hill, 1977). In addition, lupin also has tolerance to poor soil, adaptability to temperate climates, and high nitrogen fixation capacity, which may be useful for soil enrichment (Williams, 1979). All these attributes make lupin a potential legume crop for the international grain market. The seeds must be debittered from some varieties and, after cooking, they may be used directly for human consumption as snacks, in soups, stews or mixed salads. Dried and milled grains may be also used as an ingredient for hot dishes and bakery products (Gross, 1982).
Lupin seeds, as other legumes, have relatively high levels of a-galactosides of the raffinose family (Trugo et al., 1988), which have been reported as flatulence promoters since they are not digested by humans (Calloway et al., 1971). Colonic fermentation of undigested carbohydrates from legumes and mixed diets has been evaluated by the use of the breath-hydrogen test (Calloway et al., 1971; Rosado et al., 1991; Trugo et al., 1990). This has been a reliable and relatively simple approach to assess intestinal gas production (Solomons, 1984).
Germination has been used to improve the nutritive value of legumes showing a high production yield (Chen et al., 1975). It also appears to be a viable method for reducing flatulence because of a-galactoside degradation (Trugo et al., 1990). Debittering is an ancient procedure largely used by inhabitants of Andean Highlands with the effect of washing out bitter components of lupin seeds (Gross, 1982).
Our objective was to study germination and debittering as possible means to decrease the a-galactoside content of lupin
Authors L.C. Trugo, A. Farah, and N.M.F. Trugo are with Laboratorio de Bioquímica Nutricional e de Alimentos, Departm e n t de Bioquímica, instituto de Química Universidade Federai do Rio de Janeiro, C.T. bloco A, llha do Fundao, 21949-900 Rio de Janeiro, Brasil.
seeds and their fermentation in the human colon. The gasforming properties of two species of lupin seeds in the colon were determined by the analysis of the breath-hydrogen excretion in selected volunteers. Oligosaccharide and proximate compositions, as affected by these processes, were determined in the samples used in the breath-hydrogen test, and also in other lupin species and varieties, to provide background information.
MATERIALS & METHODSLupin samples
Samples of different species and cultivars of lupin seeds were obtained from EMBRAPA, Brazil (Lupinus albus Vega, Lupinus luteus Aurea, and Lupinus angustifolius Ritter), Gorbea Agricultural Experimental Station, Chile, (Lupinus albus Multolupa), and the University of Western Australia (Lupinus angustifolius Chittik).
Debittering, germination, and cooking
Debittering, a washing process, was carried out in the laboratory by soaking the whole grains of L. albus Multolupa and L. angustifolius Chittick in distilled water for 30 min, followed by heating at 100°C for 30 min and submerging the beans in a running stream of water at room temperature for 4 days (Gross, 1982). Germination of whole seed samples was carried out according to the method of Khaleque et al. (1985) at 28°C in the dark for 1, 2, 3 and 4 days. Debittered and3-day germinated samples used later for the breath-hydrogen test were kept frozen. Germinated samples for chemical analysis were freeze- dried, milled to pass a 0.75 mm sieve and frozen.
Batches of untreated, debittered, and germinated samples used for the breath-hydrogen test were previously cooked in water (1:3, w/v) in a pressure cooker for 1 hr 50 min. The untreated seeds were soaked in distilled water for 7 hr at room temperature before cooking. Salt was added to the samples when given to the subjects.
Subjects
The subjects participating in the breath-hydrogen test (n = 13; ages 20-40 years) were selected from an initial larger group (n = 32l of students and faculty of the University. They were healthy adults of both sexes. Subjects were nonsmokers, had no recent history of gastrointestinal disorders or antibiotics usage, and did not ingest legumes or any high fiber food at least one day before each experiment. Women did not take part in the experiments when in their menstrual period.
The nature, purpose and potential risks of the study were explained to the volunteers who gave informed consent. The experimental procedures were in accord with the Helsinki Declaration of 1975, as revised in 1983.
Breath-hydrogen test
Intestinal fermentation of undigested carbohydrates was monitored in the subjects by measurement of the hydrogen produced in the colon and excreted through expired air after ingestion of untreated, debittered, and germinated lupins.
Subjects were selected to participate in the tests with lupins after measuring their breath-hydrogen responses to ingestion of water (lOOmL; negative control) and of lactulose (100 mL of a 180g/L solution; positive control), a nonabsorbable disaccharide, following an overnight fast (=12 hr). Baseline samples of expired alveolar air were
Volume 58, No. 3, 1993-JOURNAL OF FOOD SCIENCE-527

LUPIN SEED AND a-GALACTOSIDES . . .
-T— “ r ----1------ r T ■ I
A B C D E F 6
F ig . 1 — I n d iv id u a l d i s t r i b u t io n o f m a x i m u m c h a n g e s o f b r e a t h - h y d r o g e n c o n c e n t r a t i o n ( A H J in t h e s u b j e c t s a f t e r c h a l l e n g in g w i t h t h e t e s t m e a l . (A ) L a c t u l o s e s o lu t io n 1 8 % ( w /v ) ; (B) B ic e p u d d i n g ; (C l U n t r e a t e d L. albus; (D ) G e r m i n a t e d L. albus; (E) D e b i t t e r e d L. albus»- (F) U n t r e a t e d L. angustifolius; (G ) D e b i t - t e r e d L. angustifolius. I n c r e m e n t in h y d r o g e n c o n c e n t r a t i o n i s c a l c u l a t e d b y t h e d i f f e r e n c e b e t w e e n H 2 c o n c e n t r a t i o n a t a g i v e n t i m e i n t e r v a l a f t e r i n g e s t i o n o f t h e t e s t m e a l a n d t h e H 2 c o n c e n t r a t io n a t b a s e l i n e , o b t a i n e d j u s t b e f o r e t h e i n g e s t i o n o f t h e t e s t m e a l . H o r i z o n ta l b a r s r e p r e s e n t t h e m e a n s .
Table 1 — Cumulative changes (A ppm) in breath-hydrogen concentrations during tne 8 h r period o f the tests w ith lupin seeds
ndCumulative A ppm*
mean (SD)L. Albus
untreated 13 265 (122)germinated 13 109 (99)*debittered 10 25 (6 )b
L. angustifoliusuntreated 10 465 (260)debittered 10 18 (14)c
• Significantly (p < 0.01) lower than the untreated L. albus.b Significantly (p < 0.001) lower than the germinated L albus. c Significantly (p < 0.001) lower than untreated L. angustifolius. d n = number o* subjects.• Cumulative changes were calculated for each subject by summation of the changes
in breath-hydrogen concentration obtained at each sample collection (30 min intervals) during the tests.
obtained by 8 a.m., immediately before each test, carried out 3 days apart. After ingestion of water or lactulose, breath samples were collected at 30-min intervals, for 4 hr, by breathing through a low-resistance one-way valve connected to an appropriate collection bag of aluminum fo l (Quintron Instruments, USA). These samples were transferred immediately to 50 mL plastic syringes fitted with a three- way stop-cock and stored until analysis, which was performed at the end of the test day. The concentration of hydrogen in the expired air was determined using a Microlyzer Model 12 (Quintron Instruments, USA) calibrated with a standard reference gas of 104 ppm of H2 in room air (Quingas, USA). Changes in hydrogen excretion (Appm) were calculated by subtracting baseline values from subsequent test values. Only both negative responders to water (breath-hydrogen changes around baseline values, 15 ppm maximum) and positive responders to lactulose (consistent increments of 20 ppm or more in hydrogen concentration) were selected to participate in further tests.
Selected subjects (13) participated in the experiments with untreated
and with germinated L. albus Multolupa. From these, 10 took part in the tests with debittered L. albus Multolupa, and with untreated and debittered L angustifolius Chittick. The subjects received the challenge meals of cooked lupins (equivalent to 70g uncooked seeds) and were submitted to the breath-hydrogen test, allowing a 3-day interval between tests. Baseline breath samples were obtained before each challenge. Breath samples were collected at 30-min intervals for 8h, and the procedures for collection and analysis of the expired air samples were the same as those for the water and lactulose tests. During the test, the subjects were only allowed to drink water, and no other food was consumed except a standard meal of rice pudding previously tested, provided 4 hr after the challenge. Individual portions of the standard meal of rice pudding consisted of cooked polished rice (150g) mixed and further heated (100°C/15 min) with nonfat lactose-hydrolysed dry milk (Lactaid Inc., USA), reconstituted with water (7.7 g in 80ml), sugar (30g), salt (0.5g) and cinnamon (0.5g). When the rice pudding alone was previously tested all selected subjects produced responses similar to those with pure water.
The subjects were asked at the end of each breath test with lupins whether they experienced (yes or no) any of the following symptoms: (a) gas, flatulence; and (b) abdominal cramps. They were also asked to report which meal tasted better, comparing untreated and germinated or debittered samples.
Student’s “ t” test was used to evaluate the data.
Mono- and oligosaccharides determinationMono- and oligosaccharide determinations were carried out in milled
(0.75 mm sieve) samples previously defatted with light petroleum and extracted with methanol:water (4:1, v/v) (Macrae and Zan-Moghadd- dam, 1978). The extracts were analyzed by high performance liquid chromatography (Trugo et al., 1990).
Proximate analysisMoisture, ash, oil and crude protein were determined according to
standard methods (Pearson, 1976).
RESULTSTHE RESULTS obtained with the breath-hydrogen tests showed that maximum changes in hydrogen concentration in the expired air from the 13 subjects were attained at 60 to 180 min when lactulose was tested. When untreated L. albus and L. angustifolius were tested they varied from 300 to 480 min.
Maximum changes in breath-hydrogen concentration obtained with lactulose solution, the rice pudding, and the untreated, germinated and debittered lupins were compared (Fig.1). The responses to lactulose (positive control) ranged from 30 to 120 ppm. All subjects showed maximum changes in hydrogen concentration below 15 ppm in response to the rice pudding, with results being similar to those found in the test with water (negative control). All subjects presented maximum changes in hydrogen concentrations above 25 ppm (means 56.7 and 66.7 ppm for L. albus and L. angustifolius, respectively), after ingestion of untreated lupins, indicating extensive colonic carbohydrate fermentation. However, when these subjects received the germinated L. albus, 62% had responses below 20 ppm, with the mean (29.6 ppm) for all subjects lower (p < 0.01) than that for the untreated sample. When they received debittered L. albus or L. angustifolius breath-hydrogen concentration were lower for all subjects, with a marked decrease (p<0.001) in maximum changes (means 8.4 and 5.9 ppm, respectively), when compared to untreated samples. Results for debittered samples were similar to those when subjects were challenged with water or with rice pudding. Debittering decreases intestinal carbohydrate fermentation more effectively than germination (p< 0 .0 0 1 , comparing germinated and debittered L. albus).
When hydrogen excretion was expressed as cumulative changes in breath-hydrogen concentrations during the 8 hr tests (Table 1), results confirmed the findings. Debittering, mainly, and germination decreased carbohydrate fermentation in the colon. Figure 2 shows typical breath-hydrogen excretions, as
628-JOURNAL OF FOOD SCIENCE-Volume 58, No. 3, 1993

exemplified by one of the subjects, comparing the ingestion of untreated, germinated, and debittered L. albus.
During the breath-hydrogen tests with lupins all subjects reported absence of gas/flatulence or abdominal cramps when debittered and germinated samples were used. However, 40% of the subjects reported one or both symptoms when the untreated samples were tested. All subjects also indicated that treated samples tasted better than untreated, particularly in the germinated seeds.
The mono- and oligosaccharide composition of the lupin samples used in the breath-hydrogen test, were compared with those of other lupin species and varieties (Table 2). All lupin species and varieties showed very low or not detectable levels of fructose and glucose. However, there was a gradual increase in levels during germination. Sucrose was detected in all samples before treatment (1.5-5.5 g%, dry basis). As with monosaccharides, there was an increase in these values during germination. After the fourth day of germination the sucrose level of L. albus Multolupa reached >240% of the original content.
The main a-galactosides (Table 2) found in untreated seeds were stachyose, raffinose and verbascose, with stachyose predominant in all samples (3.7-6.8%) except in L. luteus, which had a higher content of verbascose (6.9%). Total a-galacto- sides varied in the range 6.2-14.0%, and L. luteus had the highest value. Germination promoted a dramatic decrease of a-galactosides in most samples. There was a more pronounced effect on L. angustifolius in which a complete disappearance of a-galactosides was observed by the second day of germination. Debittered samples had no detectable amounts of all free sugars.
The proximate composition (Table 3) was also determined in the samples and only a slight decrease of fat was observed starting on the third day of germination (dry matter basis). On the fourth day of germination L. angustifolius Chittick and L. albus Multolupa showed 19 and 15% fat loss, respectively. L. angustifolius Ritter, L. luteus Aurea and L. albus Vega showed 28, 26 and 24% fat loss after the same germination period.
DISCUSSIONTHREE economically important species of lupins were studied Lupinus albus, Lupinus angustifolius and Lupinus luteus. In the case of L. albus and L. angustifolius two varieties of each were included. One was bitter (c.v. Vega and Ritter, respectively), with high alkaloid content, and other sweet (c.v. Multolupa and Chittick, respectively), with low alkaloids. As for L. luteus, only a sweet variety (c.v. Aurea) was used.
The lupin seed samples showed expected high a-galactoside contents (Trugo et al., 1988) with stachyose predominant in most samples. Remarkably higher levels were observed in the sweet cultivars than in the bitter seeds. This increased storage of nonavailable sugars may be an alternative plant protection mechanism for compensation of the absence of alkaloids in sweet cultivars.
Germination produces a dramatic decrease of a-galactosides in all samples. The reduction of a-galactosides after the second day of germination reached 1 0 0 % for L. angustifolius and >80% for the other species. These results were somewhat higher than reported values for soybeans (Savitri and Desikachar, 1985) and for black beans (Trugo et al., 1990). This suggests that during germination the a-galactosidase in lupins was more active than in other legume seeds. The rate of a-galactoside degradation was smaller in L. luteus and higher in L. angustifolius indicating relevant genetic differences in a-galactosidase activation. The debittering process promoted complete disappearance of all free sugars due to leaching of solubles.
Proximate composition of the samples showed a high protein content in all species and higher oil levels for L. albus confirming published data (Trugo et al., 1988). During germination a sharp increase in m oisture was observed with a
Fig. 2—Increment in breath-hydrogen concentration (A HJ in one of the subjects after feeding test meals of L. albus. (A) Untreated; (o) Germinated; (a) Debittered. increment in H2 concentration calculated as in Fig. 1.
correspondent decrease in other macro components. Some researchers claim a discrete increase in crude protein during germination (d.m. basis) apparently due to net enzymic protein synthesis (Kylon and Cready, 1975; Hsu et al., 1980). In our study no differences were observed between untreated and germinated lupin seed samples (variations within method error). This same pattern was also observed for ash, although some variation has been reported for individual elements in other germinated legume seeds (Kylon and Cready, 1975). Conversely, the fat content gradually decreased in all samples (up to 28% loss in L. angustifolius Ritter) indicating lipid utilization as a source of energy for seed germination.
Intestinal fermentation with gas production (hydrogen and methane), after ingestion of legumes has been related to action of bacteria on legume a-galactosides not degraded by human digestive enzymes (Calloway et al., 1971). Flatus-promoting capacity was assessed by measuring breath-hydrogen excretion, which reflects the hydrogen produced in the colon, absorbed into the blood and eliminated by the lungs (Solomons,1984). In our work cooked seeds of untreated L. albus Multolupa and L. angustifolius Chittick produced very intense intestinal gas production. Consequently breath-hydrogen excretions were high in all subjects, in perfect agreement with the high a-galactoside contents of the samples. However, when the seeds had been debittered (L. albus and L. angustifolius) or germinated (L. albus), all or most of the subjects, showed lower breath-hydrogen. These results were consistent with changes in a-galactoside contents of samples after germination and debittering.
In a previous study with black bean (Trugo et al., 1990) germination proved to be extremely efficient in reducing intestinal fermentation. All subjects produced very low changes in breath-hydrogen excretion when compared to basal levels. Differences in our results may be due to differences in the characteristics of reserve polysaccharides between black beans and lupin seeds. Whereas starch, an easily digestible carbohydrate, is predominant in black bean cotyledons, only undi- gestible cell wall polysaccharides are found in lupin seed surrounding the cytosol (Brillouet and Riochet, 1983). These polysaccharides are extensively used as a source of energy for seed germination. Thus it is anticipated that smaller degraded
Volume 58, No. 3, 1993-JOURNAL OF FOOD SCIENCE-629

LUPIN SEED AND a-GALACTOSIDES . . .
Table 2 —Mono- and oligosaccharide composition o f lupin seeds8
Nontreated seeds and days of germination FRU GLU SUC RAF STC VER GAL TOTALL albuscm. Multolupa n.d. n.d. 4.7 1.9 6.7 5.0 13.6 18.3germination day 1 0.2 0.2 6 .0 0 .6 1.2 1.6 3.4 9.8
2 0.2 0.3 7.2 1.2 n.d. n.d. 1.2 8.93 0.2 0.3 7.5 1.8 n.d. n.d. 1.8 9.84 0.3 0.4 8.1 n.d. n.d. n.d. - 8 .8
c.v. Vega n.d. 0.1 2.0 0.7 6.8 1.5 9.0 11.1germinatiion day 1 0.2 0.3 5.7 0.4 0.6 0.6 1.6 7.8
2 0.3 0.4 5.5 0.1 0.2 n.d. 0.3 6.53 0.3 0.5 4.3 n.d. tr n.d. tr 5.14 0.3 0.5 5.3 n.d. tr n.d. tr 6.1
L angustifo/iusc.v. Chittick n.d. n.d. 5.5 3.5 6.5 1.7 11.7 17.2germination day 1 0.5 0.5 5.6 1.5 3.5 tr 5.0 11.6
2 0.6 0.7 5.7 n.d. n.d. n.d. — 7.03 0.8 0.9 5.7 n.d. n.d. n.d. — 7.4
c.v Ritter tr 0.1 2.5 1.2 3.7 1.3 6.2 8.8germination day 1 0.2 0.3 4.4 0.4 1.3 tr 1.7 6.6
2 0.9 0.9 5.7 n.d. n.d. n.d. — 7.53 0.9 0.9 5.7 n.d. n.d. n.d. — 7.54 1.0 1.1 6.9 n.d. n.d. n.d. — 9.0
L. luteusc.v. Aurea n.d. 0.2 1.5 1.2 5.9 6.9 14.0 15.7germination day 1 0.2 0.3 3.4 0.4 2.6 3.8 6.8 10.7
2 0.8 0.8 4.2 0.2 0.9 1.1 2.2 8.03 1.2 1.1 3.2 0.1 0.8 0.6 1.5 7.04 0.4 1.2 3.3 0.2 0.5 0.4 1.1 6.0
8 Results are average of duplicate determination, g% dry basis, FRU, fructose; GLU, glucose; SUC, sucrose; RAF, raffinose; STC, stachyose; VER, verbascose; GAL, total a- galactosides; n.d., not detected; tr, traces.
Table 3 -P ro x im a te composition o f lupin seeds8
L. Albus L. angustifoliusL. luteus
c.v. AureaVegaC.V.
Multolupa ChittickC.V.
Ritter
Crude protein N x 6.25)
37 .2-40.3 39 .7-43 .0 35 .7-38.7 32 .2-35 .6 33 .9 -3 8 .3
AshFatb
2 .8 - 3.0 6 .0 - 7.9
3 .4 - 3.7 6 .3 - 7.8
3 .0 - 3.25 .1 - 6.3
2 .3 - 2.6 3 .9 - 5.4
4 .5 - 5.34 .5 - 6.1
8 Figures show the range from zero to 4 days of germination, in g% dry basis. b The range for fat composition correspond to the last and zero day of germination, respectively.
molecules or even oligosaccharides were formed during germination and they may promote intestinal fermentation in sensitive subjects.
CONCLUSIONSGERMINATION did not show any advantage over debittering as a procedure to decrease a-galactosides of lupin seeds. Germination may be more rapid and may have a lower overall cost. However, both germination and specially debittering were effective processes to decrease oligosaccharides and intestinal gas-forming properties of the seeds, resulting in better products for human consumption.
REFERENCESBrillouet, J.M. and Riochet, D. 1983. Cell wall polysaccharides and lignin
in cotyledones and hulls of seeds from various lupin species. J. Sci. Food A p ic . 34: 861.
Calloway, D„ Hickey, C.A., and Murphy E.L. 1971. Reduction of in testinal gas-forming properties of legumes by traditional and experim ental food processing methods. J . Food Sci. 36: 251.
Chen, C.H., Wells, C.E., and Fordhan, J.R. 1975. Germ inated seeds for hum an consumption. J . Food Sci. 40: 1290.
Gross, R. 1982. Production and utilization of lupin. FAO: P lan t Production and Protection. 36: 159. (Spanish).
Hill, G.D. 1977. The composition and nutritive value of lupin seed N utr Abs. Rev. B: Livestock Feeds and Feeding. 47: 511.
Hsu, D., Leung, H.K., Finney, P.L., and Morad, M.M. 1980. Effect of germination on nu tritive value and baking properties of dry peas, lentils and faba beans. J . Food Sci. 45: 87.
Khaleque, A., Elias, L.G., Braham, J.E ., and Bressani, R. 1985. Studies on the development of infant foods from protein sources. P a rt I: Effect of germ ination of chickpea (Cicer arietnum ) on the nutritive value and digestibility of proteins. Arch. Latinoam. N utr. 35: 315.
Kylon, A.M. and McCready, R.M. 1975. N utrients in seeds and sprouts of alfalfa, lentils, m ung beans and soybeans. J . Food Sci. 40: 1008.
Macrae, R. and Zan-Moghaddam, A. 1978. The determ ination of the component oligosaccharides of lupin seeds by HPLC. J. Sci. Food Agric. 29: 1083.
Pearson, D. 1976. The Chemical Analysis o f Foods, p. 206 Churchill Livingstone, Edingburgh.
Rosado, J.L., Lopez, P., Morales, M., and Allen, L.H. 1991. Fiber digestibility and breath-hydrogen excretion in subjects consuming ru ra l and urban Mexican diets. Am. J. Clin. N utr. 53: 55.
Savitri, A, and Desikachar, R. 1985. A comparative study of flatus production in relation to the oligosaccharide content of some legumes. N utr. Rep. Int. 31: 337.
Solomons, N.M. 1984. Evaluation of carbohydrate absorption: The hydrogen breath test in clinical practice. Clin. N utr. 3: 71.
Trugo, L.C., Almeida, D.C.F., and Gross, R. 1988. Oligosaccharide contents in the seeds of cultivated lupins. J . Sci. Food Agric. 45: 21.
Trugo, L.C., Ramos, L.A., Trugo, N.M.F., and Souza, M.C.P. 1990. Oligosaccharide composition and trypsin inhibitor activity of P. vulgaris and the effect of germ ination on the a-galactosides composition ana ferm entation in the hum an colon. Food. Chem. 36: 53.
W illiams. W. 1979. Studies on the development of lupins for oil and nro- tein. Euphytica 28: 481.
Ms received 7/22/92; revised 11/25/92; accepted 1/8/93.
We acknowledge the financial support of CNPq and FAPERJ, (Brasil).
630-JOURNAL OF FOOD SCIENCE-Volume 58, No. 3, 1993

O r g a n i c A c i d C h a n g e s D u r i n g R i p e n i n g
o f P r o c e s s i n g P e a c h e s
T. WANG, A.R. GONZALEZ, E.E. GBUR, and J.M. ASELAGE
----------------------------ABSTRACT-----------------------------Organic acids and their changes during peach (Pninus persica L. Batsch) fruit ripening were quantified by HPLC for clingstone culti- vars, ‘Babygold 5’ and ‘Babygold 7’, and a freestone cultivar, ‘Cresthaven’. At full maturity, ‘Babygold 5’ and ‘Babygold 7’ had about 60% malic, 20% citric and 19% quinic acid; whereas ‘Cres- thaven’ had similar amounts of all three organic acids (37, 35 and 28%, respectively). During fruit ripening, ‘Babygold 5’ and ‘Babygold 7’ increased in malic acid and decreased in citric and quinic acids, whereas, ‘Cresthaven’ showed little change in these organic acids.
Key Words: organic acids, peaches, ripening, peach puree
INTRODUCTIONORGANIC ACIDS are minor components of peach (Prunus persica L. Batsch) fruits, but they are important attributes of flavor that, in combination with sugars, have an impact on sensory quality of raw and processed peach products (Leonard et al., 1953; Sweeney et al., 1970). Many qualitative and quantitative studies of organic acids in peaches have reported variable results because of different analytical methods used and/or peach cultivars studied (Schenker and Rieman, 1953; David et al., 1956; Ryugo, 1964; Li and Woodroof, 1968; Ishida et al., 1971; Souty and Andre, 1975; Wills et al., 1983a; Meredith et al., 1989; Chapman and Horvat 1990).
Malic is the predominant acid followed by citric and quinic acids; succinic have also been reported at very small quantities (Schenker and Rieman 1953; David et al., 1956; Ryugo, 1964; Ishida et al., 1971; Souty and Andre, 1975; Wills et al., 1983a; Meredith et al., 1989; Chapman and Horvat, 1990). However, Li and Woodroof (1968) reported that citric was the predominant acid in peaches, followed by malic acid. Li and Woodroof (1968), Souty and Andre (1975), Meredith et al. (1989) and Chapman and Horvat (1990) agreed that malic increased while citric acid decreased during ripening. David et al. (1956) and Ishida et al. (1971) reported that both malic and citric acid decreased during ripening.
Our objectives were to identify major organic acids in processing clingstone peaches and to quantify changes of the major organic acids during ripening.
MATERIALS & METHODSPeach fruit sampling
Two clingstone processing cultivars ‘Babygold 5’ and ‘Babygold 7’ and one freestone fresh market cultivar ‘Cresthaven’ were used. The freestone was used as reference to compare with other reported studies conducted with similar freestone cultivars. The clingstone peaches were hand picked from a 5-year-old commercial orchard at Forrest City, AR. The freestone peaches were obtained from 4-year- old trees at the University of Arkansas Department of Horticulture orchard located in Fayetteville. Twenty fruits of maturities 1,2,4 and
Authors Wang and Gonzalez are affiliated with the Dept, o f Food Science, Univ. of Arkansas, Fayetteville, AR 72703. Author Gbur is with the Agricultural Statistics Laboratory, Univ of Arkansas, and Author Aselage's present address is: Gerber Products Inc., P.O. Box 10010, Fort Smith, AR 72917-0010.
6 , as determined by comparing the greenest area of the fruit with standard color chips (Delewiche and Baumgarner, 1985), were hand harvested from each of four selected trees with uniform size and fruit bearing density. Color chip 1 corresponded to green, chip 6 to full ripe and chips 2 and 4 to intermediate ripeness. Each tree was one replicate. Within each tree, five fruits of each maturity were harvested at shoulder height from each quadrant.
Puree sample preparationThe fruits were peeled by boiling in 8.5% lye solution, rinsed, pitted
and sliced, steam blanched for 4 min, and blended by maturity. The puree samples were packed and sealed in heavy duty Ziploc® bags (Dow Brands, Inc.) then kept frozen at -20°C until analyzed.
Organic acid extraction and separationThe procedure used for organic acids extraction and separation was
a modification of the method of Wills et al. (1983b). Organic acids were extracted from a 20-g puree sample blended with 80 mL deionized water. The mixture was filtered through miracloth, and the filter cake was washed with an additional 20 mL water. The combined 100- mL filtrate was centrifuged at 27,200 x g for 10 min. The supernatant was passed through 0.45-pm membrane filter, and then through a C18 Maxi-clean cartridge (Alltech Associates, Inc., Deerfield, IL). Of this final sample 10|xL was injected into a Waters Associates HPLC system (Waters 501 HPLC pump, U6K injector, RCM 8 x 10 module, Lambda-Max model 481 LC spectrophotometer, automated gradient controller, and 740 data module from Waters Chromatography Division, Millipore Co., Milford, MA). A Radial-Pak C18 cartridge was used as separation column, eluting with 2% NH4H2P04 buffer at pH2.4 (as mobile phase) at a 1 mL/min flow rate. Organic acids were quantified by using the UV detector with wavelength set at 214 nm. The organic acids were identified and quantified by comparison of retention times and peak heights with standard solutions of known organic acids. Percent recovery was determined by adding to the puree sample known amounts of malic and citric acids. Recovery was 99.8% for malic acid and 98.2% for citric acid.
Statistical analysis
A split-plot design was used, with cultivar as the main plot, maturity stage the split factor, and trees as the replicates. Analysis of variance was performed and followed by mean separations with a protected LSD at a 5% significance level, when appropriate. All statistical analyses were carried out using SAS (SAS Release 6.04, SAS Institute Inc., Cary, NC).
RESULTS & DISCUSSION Major organic acids in tested peach cultivars
Malic, citric and quinic acids were the major organic acids in the peach cultivars tested (Fig. 1). This confirmed David et al. (1956), Wills et al. (1983a) and Chapman and Horvat (1990). However, Shenker and Rieman (1953), Ryugo (1964), Ishida (1971), Souty and Andre (1975) and Meredith et al. (1989) reported malic and citric acid were the only major organic acids in peaches. In all reports, malic acid was the predominant organic acid in peaches. In our study, quinic acid was found at concentrations slightly lower than citric in the cultivars ‘Babygold 5’ and ‘Babygold 7’. However, in the cultivar ‘Cresthaven’ in which malic and citric acids concentrations were similar, quinic acid was present at significantly lower levels
Volume 58, No. 3, 1993-JOURNAL OF FOOD SCIENCE-631

O R G A N IC A C ID S IN P R O C E S S IN G P E A C H E S . . .
M a tu rity StageFig. 7 — Changes in the major organic acids with ripening of 'Babygold 5 ' 'Babygold 7' and 'Cresthaven' peaches. For mean comparisons within cuitivars, LSD.05 values were 38.7 for malic acid, 44.8 for citric acid and 43.6 for quinic acid. For mean comparisons between cuitivars, LSD.05 values were 51.9 for malic acid, 56.4 for citric acid and 56.1 for quinic acid. Maturity stages were separated with standard color chips developed by Delew- iche and Baumgardner '1985}. Maturity 1 correspond to green, maturity 6 to full ripe and maturity 2, 3, 4 and 5 to intermediate ripeness stages.
(Fig. 1). The sum of malic, citric and quinic acids comprised 99.47, 99.71 and 99.79% of the total organic acids for ‘Babygold 5’, ‘Babygold 7’ and ‘Cresthaven’, respectively. Shi- kimic and fumaric acids were present at < 0.38% (3.8 mg 100g_1FW). The presence of shikimic acid in peaches at concentrations < 5 mg 100g_1FW has been reported by Wills et al. (1983a). Succinic acid has also been reported by Chapman and Horvat (1990) at concentrations < 10 mg 100g_1FW.
Changes in individual acid concentration with ripening
Malic acid level increased significantly while citric acid and quinic acid levels decreased during ripening for both ‘Baby- gold 5’ and ‘Babygold 7’ peaches (Fig. 1). Similar trends were reported in other cuitivars by other researchers (Li and Wood- rof, 1968; Souty and Andre, 1975; Meredith et al., 1989; Chapman and Horvat, 1990). The three major organic acids of ‘Cresthaven’ did not change during fruit ripening (Fig. 1). Overall, ‘Babygold 5’ and ‘Babygold 7’ peaches rapidly increased in malic acid but very rapidly decreased in citric and quinic acid during ripening. A similar pattern was reported in 2 clingstone cuitivars by David et al. (1956). In an investigation of non-volatile acid changes in ‘Monroe’ peaches during fruit maturation (determined by capillary GC), Chapman and Horvat (1990) concluded that quinic was the major acid in immature fruits but rapidly decreased during maturation. Changes in organic acids during fruit development indicated that organic acid content was low at early stages and increased steadily reaching maximum level at mid-season, and then steadily declined as fruit continued to mature (Ishida et al. 1971).
The different organic acid profiles between ‘Babygold 5 ’, ‘Babygold 7’ and ‘Cresthaven’ may be attributed to differences in genetic background. ‘Babygold 5’ and ‘Babygold 7’ originated from parents with similar genetic background, but ‘Cresthaven’ did not (Brooks and Olmo, 1972).
The total organic acid (malic + citric + quinic) level tended to decrease with ripening, coinciding with decreasing titratable acidity noted during fruit ripening (data not shown). At maturity 6 , all 3 cuitivars had similar total organic acid levels, but individual malic, citric and quinic levels were different. These results should help resolve disagreements in published values, concerning the acid composition of peaches.
REFERENCES
Brooks, R.M. and Olmo, H.P. 1972. Register o f New F ru it and N u t V a rieties, 2nd ed., p.333. U niversity of California Press, Berkeley.
Chapman, G.W. and Horvat, R.J. 1990. Changes in nonvolatile acids, sugars, pectin and sugar composition of pectin during peach (cv. Monroe) m aturation. J . Agric. Food Chem. 38: 383-387.
David, J .J ., Luh, B.S., and M arsh, G.L. 1956. Organic acids in peaches. Food Research 21: 184-189.
Delewiche, M.J. and Baumgardner, R.A. 1985. Ground color as a peach m aturity index. J . Amer. Soc. Hort. Sci. 110: 53-57.
Ishida, M., Inaba, A., and Sobajima, Y. 1971. Seasonal changes in the concentration of sugar and organic acids in peach fruits. Sci. Rep. Kyoto Pref. Univ. Agric. 23: 18-23.
Leonard, S., Luh, B.S., and H inreiner, E. 1953. Flavor evaluation of canned clingstone peaches. Food Technol. 12: 480-485.
Li, K.C. and Woodroof, J.G . 1968. Gas chromatographic resolution of nonvolatile organic acids in peaches. J. Agric. Food Chem. 16(3): 534-535.
Meredith, F.I., Robertson, J.A., and Horvat, R.J. 1989. Changes in physical and chemical param eters associated w ith quality and postharvest rip ening of H arvester peaches. J . Agric. Food Chem. 37(5): 1211-1214.
Ryugo, K. 1964. Relationship between malic and citric acids and titra tab le acidity in selected peach and nectarine clones, Prunus persica, L. Batsch. Proc. Amer. Soc. Hort. Sci. 85: 154-160.
Schenker, H.H. and Rieman, W. 1953. Determ ination of malic, ta rta ric and citric acids in fruits by ion exchange chromatography. Anal. Chem. 25: 1637-1639.
Souty, M. and Andre, P. 1975. Composition biochimique et qualite des peches. Ann. Technol. Agric. 24(2): 217-236.
Sweeney, J.P ., Chapman, V.J., and Hepner, P.A. 1970. Sugar, acid and flavor in fresh fruits. J . Amer. Diet Assoc. 57: 432-435.
Wills, R.B.H., Scriven, F.M., and Greenfield, H. 1983a. N utrien t composition of stone fru it cuitivars: Apricot, cherry, nectarine, peach and plum. J. Sci. Food Agric. 34: 1383-1389.
Wills, R.B.H., Lim, J.S.K., Greenfield, H., and Bayliss-Smith, T. 1983b. N utrien t composition of taro cuitivars from the papua New Guinea highlands. J . Sci. Food Agric. 34: 1137-1142.
Ms received 9/14/92; revised 10/10/92; accepted 12/22/92.
This research was supported in part by a grant from Gerber Products Co.
632-JOURNAL OF FOOD SCIENCE-Volume 58, No. 3, 1993

Composition and Sensory Characterization of Red Raspberry Juice Concentrated by
Direct-Osmosis or Evaporation
RONALD E. WROLSTAD, MINA R. McDANIEL, ROBERT W. DURST, NANCY MICHEALS, KEITH A. LAMPI, AND EDWARD G. BEAUDRY
---------------------------- ABSTRACT-----------------------------Raspberries were processed into juice and concentrated to 45 °Brix by two processes: Osmotek’s cold, direct-osmotic concentration process and conventional evaporative technology. Compositional analyses included pH, titratable acidity, formol value, total anthocyanin pigment, polymeric color, and nonvolatile acid, sugar and anthocyanin pigment profiles. Concentration by either process resulted in small anthocyanin pigment losses and formation of fumaric acid and small increases of polymerized pigment. The aroma and flavor of the experimental samples and nine commercial concentrates were evaluated in a raspberry drink formulation by a trained descriptive flavor panel. Principal component analysis revealed no significant flavor differences between the single-strength juice, the concentrates and three of the commercial samples.
Key Words: red-raspberry juice, concentrated juice, direct osmosis, evaporation, descriptive sensory
INTRODUCTIONBEAUDRY and Lampi (1990a, 1990b) reported on the effectiveness of the Osmotek direct-osmotic process for concentrating fruit juices. The patented process (Caro and Salter,1988) utilizes a thin membrane (25-100 p,m) with a molecular weight cutoff of ca. 100 daltons. High-fructose com syrup serves as the osmotic agent which flows countercurrent to the fruit juice. This system obviates the need for high pressure on the membrane.
Our primary objective was to compare the composition and sensory quality of red raspberry juice concentrated by that process with the same juice concentrated by conventional evaporation. To evaluate flavor quality, a descriptive panel was trained to characterize the flavor and aroma of red raspberry juice. Analyses were performed to determine if compositional changes occurred. Analyses of the osmotic agent before and after processing determined if transfer of compounds other than water occurred. In addition to pilot-plant processed samples, we extended the comparison to several commercial red raspberry juice concentrates.
MATERIALS & METHODSFruit and Commercial Samples
Individually quick frozen (IQF) red raspberries (Willamette variety) were purchased from Conroy Packing Company, Woodbum, OR. The berries were grown in the Willamette Valley (OR) during the 1990 season. Commercial red raspberry juice concentrates were obtained from the following firms: Clermont Inc., Hillsboro, OR; Endurance Fruit Processing Inc., Wapato, W A ; Kerr Concentrates Inc., Salem, OR; Milne Fruit Products, Inc., Prosser, W A ; Rudolf Wild G m b H & Co. KG, Eppelheim-Heidelberg, Germany; Sanofi (Bio-Industries Division), Wapato, W A ; and J. M. Smucker Co., Woodbum, OR. The
Authors Wrolstad, McDaniel, Durst, and Michaels are with the Dept, of Food Science & Technology, Wiegand Hall 100, Oregon State Univ., Corvallis, OR 97331-6602. Authors Lampi and Beaudry are with Osmotek, Inc., P.O. Box 1882, Corvallis, OR 97339.
concentrates varied as to degree of concentration (some were 45 °Brix, and others 65 °Brix). Some concentrates had essence returned and others supplied the essence as a separate material. In soliciting samples, we stated that the purpose was to compare the composition and sensory properties of commercial red raspberry juice concentrates with experimental samples. Companies were assured that individual sample identity would be kept confidential. Commercial samples are coded A (45 °Brix), B (65 °Brix), C (45 °Brix), D (65 °Brix), E (45 °Brix), F (45 °Brix), G (65 °Brix), H (65°Brix) and I (65°Brix).
Processing juice and concentratesFruit (45 kg) were used for individual processing lots. The berries
were thawed at ambient temperature and chopped with a hammermill (Model D Comminuting machine; W. J. Fitzpatrick Co., Chicago, IL) equipped with a 1.25 cm screen at a speed of 180 rpm. Depec- tinization occurred for 1 hr at 45°C with Rohapect M B liquid pectinase (Rohm Tech Inc., Malden, MA) added at 0.018 mL/Kg fmit. Cellulose press-aid (Silva-Cel; 1% by weight) was added and the fmit pressed in a Wilmes bag press. If the juice showed a positive alcohol test for pectin, more enzyme was added (0.009 mL/kg) and the juice was incubated until a negative test was obtained. The juice was pasteurized at 88-93°C for 15-30 sec using an APV-Crepaco unit. Dia- tomaceous earth (1%) was added and the juices were filtered with a multiple pad filtration unit (Herrmann Strassburger KG, Westhofen bei Worms, Germany) using S W K filters (S W K Seitz-Filter-Werke G m b H & Co., Germany). Juice from three different processing trials were mixed and combined into one lot. Total yield was 91 L (ca. 60% by weight). The single-strength juice (10.8 °Brix) was frozen in 3.75L containers and stored at -25°C for subsequent processing. (This sample was coded FST-SS).
Conventional concentration utilized the Centritherm CT-1B centrifugal film evaporator (Alfa-Laval, Inc., Newburyport, MA). Twenty- seven L of Frozen fruit juice (27L) (FST-SS) was thawed (12 hr at 5°C) and concentrated on the Centritherm. Operating conditions were: vacuum -0.82 kg/cm3, jacket temperature 86°C, head temperature 60°C and feed rate ca.1.8 L/min. The concentrate (43.5 °Brix) was divided into small lots (220g) and stored at - 25°C. (This sample is coded FST-CONC).Two concentrates were made from single-strength red raspberry
juice (FST-SS) using Osmotek’s direct-osmotic concentration (DOC) units. The sample designated Osmotek A was concentrated under chilled conditions (8°C) with total process time 10 hr. Sample labeled Osmotek B was concentrated at ambient temperature (26°C) with total process time 5 hr. High-fructose com syrup was used as osmotic agent. Argon was used to blanket the head space above the juice. Detailed processing parameters are shown in Table 1.
Compositional analysesThe compositional data for all determinations are reported on a
single strength basis, using 10.0 °Brix as standard for normalization.pH, titratable acidity (TA), and formol index were determined
using a Brinkmann Metrohm 605 pH meter, 614 Impulsomat and 655 Dosimat. T A was determined as citric acid using the procedure of Amerine and Ough (1980). Total free amino acids were determined by formol titration (AOAC, 1984) and reported as meq/100 m L juice single strength. Soluble solids as °Brix was determined on a Bausch and Lomb refractometer. Total monomeric anthocyanin pigment content, polymeric color, color density, and browning were determined using the procedures described by Wrolstad et al. (1982). Anthocyanin concentration was expressed as m g cyanidin-3-glucoside per
Volume 58, No. 3, 1993-JOURNAL OF FOOD SCIENCE-633

DIRECT-OSMOSIS RASPBERRY JUICE. . .
Table 1 -P rocessing parameters and ju ice characteristics fo r Osmotek trials A (1/9/911 and B (1/10/91).______________________________________
1/9 1/10Juice °Brix
Initial 10.1 10.0Final 45.0 44.8
Juice Amount, kgInitial 3.9 3.9Final Amount Collected 0.8 0.8
Juice Temperature, °C 8 26
Osmotic-Agent “BrixInitial 68.5 69.7Final 61.5 61.4
Osmotic-Agent Amount, kgInitial 21 31
Osmotic-Agent Temperature, °C 17 27
Processing Time, hr 10.3 5.8Average Flux Constant,
L/(mJ*hr*A°Brlx) 0.9 1.4
Processing Time In aContinuous Unit, hr 3.3 2.1
°Brix of Juice SampleFig 1 -F lu x constant (KB) relation to °Brix o f ju ice sample for Osmotek A and Osmotek B samples.
100 m L juice, using the extinction coefficient of 29,000. Individual anthocyanin pigments were separated by HP L C using the procedures of Spanos and Wrolstad (1987). Relative concentrations were expressed as percent total peak area. Sugars (glucose, fructose, sucrose and sorbitol) were determined by HP L C using the procedure of Spanos and Wrolstad (1987). Nonvolatile acids (citric, isocitric, malic and fumaric) were determined using the HP L C procedure of Coppola and Starr (1986). 13CF^C Stable isotope ratios were determined by Coastal Science Laboratory, Austin, TX.
Sensory analysisThe panel was composed of nine faculty and graduate students from
the Dept, of Food Science & Technology at Oregon State Univ. None of the panelists had previous experience with free-choice profiling but all were regular consumers of fruit juices and were familiar with sensory evaluation techniques. At early training sessions, the panel evaluated samples of 10%, 15% and 20% raspberry juice adjusted to1.5, 1.7, 2.0, 5.0, and 10.0 °Brix in order to select a level at which to evaluate juices. It was decided that first diluting the juice concentrates to 1.5 °Brix, adjusting with sucrose to 10 °Brix and then adding 5 g/L citric acid, produced a juice drink (15% fruit juice content) with a pleasant, raspberry flavor and appropriate sweetness/soumess balance.
During each training session the panel was seated together around a discussion table and evaluated three juices. Each panelist was encouraged to generate his/her own terms for aroma and flavor. The panel then discussed the juices using their own descriptors. When panelists had evaluated ali 14 juices, their individual lists of terms
Table 2 —Stable carbon isotope data‘ o f red raspberry ju ice and concentrates and the osmotic agent before and after Osmotek processing______Sample_____________________________________________ del 13C pqb
FST Single Strength -24.9FST Centrltherm Concentrate -24.8Osmotek A -24.8Osmotek B -24.9Osmotic Agent (prior to processing) -11 .2Osmotic Agent (post-process Osmotek A) -11 .6Osmotic Agent (post-process Osmotek B) -11.2■ Data are reported relative to the PDB standard and are accurate to 0.2
per mil.
Table 3 —Anthocyanin p igm ent and color indices for experimental andcommercial red raspberry juices.
Sample Total ACNColor
DensityPolymeric
Color % PolymericFST-SS 70.4 29.2 0.66 2.3FST-Conc 73.7 28.9 0.99 3.4Osmotek-A 70.6 29.1 0.84 2.9Osmotek-B 70.1 27.9 0.84 3.0
Commercialsamples
A 15.1 16.3 6.87 42.0B 25.7 12.9 2.49 19.2C 60.6 22.8 1.83 8.0D 51.2 21.6 2.43 11.3E 31.5 13.3 1.41 10.6F 47.4 18.2 2.01 11.0G 3.8 5.8 2.85 49.0H 2.9 5.2 2.40 45.71 9.4 6.6 1.74 26.2
were refined by eliminating redundant descriptors, taking care to retain descriptors they deemed important in characterizing and differentiating juices.
Sample preparationExperimental samples subjected to sensory evaluation included FST-
SS, FST-CONC, Osmotek A and Osmotek B samples. A fifth sample was the FST-CONC sample to which commercial red raspberry essence was added (labeled FST-CONC + ESS). (The O S U pilot plant does not have essence recovery equipment so we could not add back recovered original essence to the FST-CONC sample). The nine commercial samples were also tested. Samples of concentrate (with essence returned) from each of the 14 treatments were stored frozen at - 12°C in 100 m L plastic screw-top vials until the day they were to be evaluated. Thawed samples of each treatment were adjusted to 1.5 °Brix by addition of bottled spring water. The juices were then adjusted to 10 °Brix with 840 g/L sucrose, and 5.0 g/L citric acid was added to each treatment.
Evaluation procedureFor testing juices, panelists were seated in individual testing booths
with red lighting to mask color differences. Samples (30 mL) were served at 17°C, in 250 mL, clear, tulip shaped wine glasses coded with 3-digit random numbers and covered with watchglasses. Panelists were asked to evaluate the aroma of the samples for each attribute on a 16 point scale (0 = none, 15 = extreme). The samples were then rated similarly for flavor terms.
Experimental design and analyses
A randomized complete block design was used where major factors were panelists and juices. Testing was conducted at one session/day over six days. At these sessions, panelists evaluated seven samples divided randomly onto two trays. Both the order of samples on trays and the order of trays were randomized. The panel evaluated each sample 3 times.
Statistical analysis
The data matrices were derived from triplicate assessment of the 14 juices by the nine trained panelists. The scores were analyzed by
634-JOURNAL OF FOOD SCIENCE-Volume 58, No. 3, 1993

Table 4 -S o m e chemical properties and nonvolatile a d d composition o f experimental and commercial red raspberry juices
Formol
Sample pHTA*
g/1 OOmLIndex
meq/100mLMalic
mg/100mLIsocitric
mg/100mLCitric
g/100mLFumarle
mg/100mL
FST-SS 3.19 1.87 3.12 33.8 44.6 1.76 ndbFST-CONC 3.19 1.88 3.15 32.0 46.4 1.87 0.2Osmotek-A 3.20 1.85 3.18 28.5 51.4 1.81 0.1Osmotek-B 3.19 1.80 3.07 19.8 38.2 1.69 0.1
CommercialSamples
A 3.42 1.62 2.63B 3.24 1.95 3.01C 3.30 1.66 2.83D 3.33 1.84 3.27E 3.44 1.40 3.13F 3.43 1.64 3.40G 3.28 1.49 1.74H 3.39 1.58 1.79I 3.29 1.89 3.42
• TA = Total acidity b nd = not detected
Table 5 -A n thocya n in p igm ent composition o f experimental and commercial red raspberry ju ice samples
Sample Cyd-3-soph Cyd-3-glrt Cyd-3-glu Pgd-3-soph Cyd-3-rut Pgd-3-glrt
FST-SS 74.2 1.47 20.2 2.56 0.70 0.74FST-Conc 78.8 1.42 15.7 3.07 0.50 0.47Osmotek-A 78.3 1.55 16.0 3.13 0.52 0.43Osmotek-B 77.5 1.46 14.4 2.49 0.53 0.52Commercial
SamplesA 72.5 7.98 13.0 4.61 1.41 0.48B 62.3 16.4 13.0 3.03 4.04 1.03C 76.7 4.62 12.0 5.22 1.02 0.36D 77.0 3.57 12.9 5.39 0.86 0.18E 64.4 12.0 14.0 4.84 3.75 0.94F 73.4 6.07 14.5 4.32 1.47 0.12
H 43.4 3.26 49.7 3.50 0.00 0.00I 66.5 4.42 19.8 5.00 3.19 0.90
SAS° (copyright 1987, SAS Institute Ine., Cary NC) and by General Procrustes Analysis (Procrustes-PC Version 2.0; Dijksterhuis and Van Buuren, 1989).
RESULTS & DISCUSSIONProcessing
The single strength red raspberry juice was high in antho- cyanin pigment (70.4 mg/100 mL), had a sugar content slightly higher than standard for red raspberry juice concentration (1 0 . 8
vs 10.0 °Brix), and had typical red raspberry flavor with no defects or off-flavors. The processing time (Table 1) for a continuous process is the time calculated for a three-stage process using the flux constant determined in the batch run. The continuous-process retention time could be further redued by using higher velocities of juice or higher temperatures. Note the processing time for the refrigerated sample (Osmotek A) was much longer than the other. The refrigerated sample had therefore been subjected to more shear than the nonrefrigerated sample (Osmotek B).
An important calculated value in assessing system performance is flux constant, kB. This value was calculated by dividing rate of water removal (L/h) by membrane area (ca. 0.14 m2) and by the difference in °Brix between osmotic-agent solution and the juice. A decreasing flux constant would indicate membrane fouling. Note that the definition of flux constant is not thermodynamically rigorous (the difference in activity of water in the 2 solutions is the driving force), but provides an engineering assessment of performance.
Plots of flux constant vs °Brix of juice sample (Fig. 1) show the performance of the Osmotek DOC cell. The flux constant for the Osmotek A sample was much lower than that for the
Osmotek B sample, because the A sample was processed chilled. There was no evidence of membrane fouling in the plots.
Samples of the single-strength red raspberry juice, the concentrates processed by OSU and Osmotek, and the osmotic agent before and after processing were subjected to stable isotopic carbon analyses. The results (Table 2) showed that there was no transfer of osmotic agent (corn syrup) into the Osmotek samples. There may have been transfer of low molecular weight carbon materials from the raspberry juice to the Osmotek A osmotic agent sample, as that sample was slightly more negative in del13CPDB value. HPLC analysis of nonvolatile acids showed no evidence for transfer of organic acids from juice to osmotic agents. There was no visual evidence of color in the osmotic agents, indicating no leakage or osmotic transfer of anthocyanins.
Compositional analysesThe anthocyanin pigment and color indices for the Centrith-
erm and Osmotek trials (Table 3) showed no significant differences in total anthocyanins for experimental juice and concentrates. Slight increases in polymeric color and percent polymeric color were evident for both the concentrates. The color and pigment data for the commercial samples (Table 3) revealed that percent polymeric color (which is an index for the degree of anthocyanin pigment degradation) was higher in the commercial samples.
There were no significant differences (Table 4) in pH among the samples. Citric acid is the major acid in red raspberry juice and there were no apparent differences between samples. Fu- maric acid, which can be formed by dehydration of malic acid, was detected in all concentrate samples ( 1 or 2 ppm), but not in single strength juice. Slight losses of malic acid were evident
Volume 58, No. 3, 1993-JOURNAL OF FOOD SCIENCE-635

J IRECT-OSMOSIS RASPBERRY JU IC E .. .
Pan 1 Pan 2 Pan 3 Pan 4 Pan 5 Pan 6 Pan 7 Pan 8 Pan 9
AROMA
1 Fruity Fruity Raspberry Fruity Fruity Raspberry Fruity Fruity Fruity2 Raspberry Raspberry Sweet Raspberry Raspberry Cooked/Jam Raspberry Raspberry Raspberry3 Art. Grape Sweet/Cooked/ Artificial Cooked Art. Raspberry Cooked Cabbage Sweet Sweet Strawberry
4 Pungent/HarshJa nChem./RubberyVegetative
Cooked Artificial Cranberry Burlap/Dust Art. Raspberry Cooked Art. Fruit
5 Jam.-Sweet/ Cooked
Dusty/Musty
Seedy Strawberry Dusty/Cellulose Cheesy Cranberry
6 Vegetative7 Sour
Dusty Essence Dusty/Musty Earthy Cooked Jam
CookedVegetative
MustyBurlap
VegetativeMusty/Dusty
8 Cellulose/Dusty9 Overripe
10 Seedy11 Moldy/Dirty12 Solv./Nail Polish
C e llu lo s e /W o o d yC oo ke d
FLAVOR
13 Fruity Fruity Fruity Fruity Fruity Raspberry Fruity Fruity Fruity14 Raspberry Raspberry Raspberry Raspberry Raspberry Dried Prunes Raspberry Raspberry Raspberry15 Artificial ArtjCandy Cooked Sweet Cranberry Strawberry Cooked Raspberry Sweet Grape16 Metallic Metallic Essence Sour Strawberry Cooked Jam Artificial Sour Cooked17 Jam./Cooked Cooked Artificial Astringent Cooked/Jam. Cooked Cabbage Grapey Astringent Dried Fruit18 Cellulose/Woody Plastic Sweet Bitter Sweet Sweet Sweet Bitter Sweet19 Seedy20 Sweet21 Sour22 Astringent23 Bitter
SweetAcidAstringentBitter
SourAstringent
SourAstringentBitter
AcidAstringent
SourAstringentBitter
Body SourAstringent
Table 7—Means and LSD values for principal component 1 for the four-teen raspberry treatments
Treatment Mean LSD
FST concentrate + essence 0.080s 0.031E 0.067sbFST single-strength juice 0.037»=Osmotek B 0.020=dF 0.017=dsOsmotek A 0.013cdsFST Centritherm concentrate 0.010=dsD 0.000dsC — 0.007ds<B — 0.013sf1 -0.037'=G -0.050=»A -0.0608»H -0.070»
Table 8 —Means and LSD values fo r principal component 2 ( + raspberry flavor, -fru ity aroma, -artific ia l aroma) fo r the fourteen raspberry ju ice treatments
Treatment Mean LSD
FST Centritherm concentrate 0.040s 0.025Osmotek A 0.040sD 0.037sC 0.037sFST single-strength juice 0.023s»Osmotek B 0.020s»F 0.010»=A 0.007»»B — 0.007d=H — 0.023dsI -0.033sFST concentrate + essence -0.033sG -0.047s'E -0.063'
•'» Means with the same superscripts (in the same column) are not significantly different at the p£0.05 level.
for Osmotek-concentrated samples. As malic acid was not detected in the osmotic agent the losses were probably caused by chemical transformation of malic acid during processing.
There were no significant differences in anthocyanin profiles (Table 5) for Centritherm and Osmotek processed juice con-
, ! l1 1 ■
-Jammy Aroma + Flavor PA 1 +Raspberry Flavor/Aroma-Cooked Aroma + Flavor +Nail Polish-Vegatative Aroma -Grapey Flavor
+Essence Aroma
Fig 2 —Plot o f principle components 1 and 2 fo r red raspberry ju ice drink descriptive sensory profile.
centrates. For the commercial samples, G contained delphin- idin glycosides as major pigments; this provides sufficient evidence to conclude that sample G was adulterated and not authentic red raspberry juice. Sample H was very low in anthocyanin pigment and high in browning and polymeric indices. The high level of cyanidin-3-glucoside may have resulted either from partial hydrolysis of the major raspberry pigments during processing and storage, or from adulteration. Thus, Sample H was subject to storage and/or processing abuse and may also have been adulterated with an alternate anthocyanin source.
Descriptive sensory analyses
The number of terms used by panelists to describe aroma and flavor ranged from 12 to 23, though most assessors used 14 to 16. Table 6 lists sensory descriptors used by each panelist in describing the juices. The Generalized Procrustes Analysis (GPA) indicated that only the first and second principal axes
636-JOURNAL OF FOOD SCIENCE-Volume 58, No. 3, 1993

(PA) were significant (p<0.001) for the consensus graph. Juices were separated along the first PA according to the intensity of their raspberry aroma and flavor contrasted with musty, dusty, and cooked aroma and flavor. The second PA was a contrast between raspberry flavor and fruity and artificial aromas.
Means and LSD groupings for the 14 juices were compared (Table 7 and 8 ) along principal components 1 and 2, respectively. In addition, the consensus graph for all panelists for principal components 1 and 2 was developed (Fig. 2). The FST single-strength juice was not significantly different from the Osmotek-A, Osmotek-B, FST-CONC, FST-CONC + ESS and the C, D, E and F treatment juices for principal component 1. These juices were characterized as high in raspberry aroma and flavor and low in musty-dusty and cooked characters.
For principal component 2, the FST single-strength juice was additionally grouped with commercial samples A and B, but not with the FST-CONC + ESS and sample E. The former juices were characterized as high in raspberry flavor and low in fruity and/or artificial aromas, while the FST CONC + ESS and sample E juices were high in fruity and artificial aromas. Treatments H, G and I were characterized as high in fruity, artificial, musty-dusty and cooked character and relatively low in raspberry character.
The FST-CONC + ESS sample was clearly separated from the other FST/Osmotek samples, substantiating that addition of commercial essence greatly changed its sensory properties. It was located in proximity to sample E which was provided by the same firm that supplied the essence. (The essence in FST-CONC + ESS was not identical to that of sample E). Essence was added to the FST-CONC sample at levels recommended by the supplier. Some panelists commented that the aroma was too strong for this sample and sample E. The FST-CONC sample was clearly not stripped of aroma as its flavor/aroma characteristics were similar to single-strength juice. Hence the amount of essence added back to this sample was probably too high.
The commercial samples were not clearly separated according to degree of concentration. For example, Sample D was a 65 °Brix concentrate but its location (Fig. 2) was very close to the FST/Osmotek experimental samples and to samples C and F which were 45 °Brix concentrations. Sample A (a 45 °Brix concentrate) was clustered with samples H, G, I and B which were all 65 °Brix concentrates.
CONCLUSIONS
CONCENTRATION of red raspberry juice using either osmotic or evaporative processes gave juice concentrates of good quality comparable to commercial samples. Descriptive sensory analysis combined with principal component statistical techniques revealed no significant differences between the single-strength juice, the osmotic concentrates, the evaporation concentrate, and three of commercial samples. The osmotic concentrates were clustered closer to single-strength juice in red raspberry flavor and aroma than the evaporation-concentrated sample. Compositional differences between the two types of processed juice concentrates were minor.
REFERENCES
Amerine, M.A. and Ough, C.S. 1980. Methods for Analysis of Musts and Wines. John Wiley & Sons, Inc., New York.
AOAC. 1984. Official Methods of Analysis, 14th ed. Association of Official Analytical Chemists, Washington, D.C.
Beaudry, E.G. and Lampi, K.A. 1990a. Membrane technology for direct- osmosis concentration of fruit juices. Food Technol. 44(6): 121.
Beaudry, E.G. and Lampi, K.A. 1990b. Osmotic concentration of fruit juice. Fluss. Obst. 57:652-656; 663-664.
Caro, R.F. and Salter, R.J. 1988. Membrane separation apparatus and method. U.S. Patent 4,787,982, Nov. 29.
Coppola, E.D. and Starr, M.S. 1986. Liquid chromatographic determination of major organic acids in apple juice and cranberry juice cocktail: collaborative study. J. Assoc. Oft. Anal. Chem. 69: 594-507.
Dijksterhuis, G.B. and Van Buuren. 1989. PROCRUSTES-PC v 2.0 manual. OP & P, Utrecht, Holland.
Rommel, A., Heatherbell, D.A., and Wrolstad, R.E. 1990. Red Raspberry juice and wine: Effect of processing and storage on anthocyanin pigment composition, color and appearance. J. Food Sci. 55: 1011-1017.
Spanos, G.A. and Wrolstad, R.E. 1987. Anthocyanin pigment, non-volatile acid, and sugar composition of red raspberry juice. J. Assoc. Off. Anal. Chem. 70: 1036-1046.
Wrolstad, R.E., Culbertson, J.D., Cornwell, C.J., and Mattick, L.R. 1982. Detection of adulteration in blackberry juice concentrates and wines by sugar, sorbitol, nonvolatile acid and pigment analyses. J. Assoc. Off. Anal. Chem. 65: 1417-1423.
Ms received 8/13/92; revised 1/4/93; accepted 1/16/93.
Technical paper no. 9967 from the Oregon Agricultural Experiment Station. Presented (Poster #485) a t the annual meeting of the Institute of Food Technologists,
New Orleans, LA, Jane 20-24, 1992. This project was supported by a grant from the Linn-Benton Regional Strategy Applied Research Fund.
P IG M E N T C H A N G E S IN P A R S L E Y L E A V E S . . .From page 618
suggest different degradative pathways for citrus fruit and parsley leaves. Proc. Natl. Acad. Sci. 84: 1901.
Apeland, J. 1971. Factors affecting respiration and color during storage of parsley. Acta Hort. 20: 43.
Arnon, D.I. 1949. Copper enzymes in chloroplasts. Polyphenol oxidase in Beta vulgaris. Plant Physiol. 24: 1.
Barmore, C.R. 1975. Effect of ethylene on chlorophyllase activity and chlorophyll content in calamondin rind tissue. HortScience 10: 595.
Egger, K. and Schwenker, U. 1966. The esters of lutein in autumn leaves. Z. Pflanzenphysiol. 54: 407.
Eilati, S.K., Budowski, P., and Monselise, S.P. 1972. Xanthophyll esterification in the fiavedo of citrus fruit. Plant Cell Physiol. 13: 741.
Huff, A. 1982. Peroxidase-catalyzed oxidation of chlorophyll by hydrogen peroxide. PhytoChem. 21: 261.
Kader, A.A. 1986. Biochemical and physiological basis for effects of controlled and modified atmospheres on fruits and vegetables. Food Technol. 405(5): 99.
Lyons, J.M. and Rappaport, L. 1959. Effect of temperature on respiration and quality of Brussels spouts. Proc. Amer. Soc. Hort. Sci. 73: 361.
Shimokawa, K., Shimada, S., and Yaeo, K. 1978. Ethylene-enhanced chlorophyllase activity during degreening of Citrus unshiu Marc. Scientia Hort. 8: 129.
Tevini, M. and Steinmuller, D. 1985. Composition and function of plasto- globuli. II. Lipid composition of leaves and plastoglobuli during beech leaf senescence. Planta 163: 91.
Wang, C.Y. 1979. Effect of short-term high C 02 treatment on the market quality of stored broccoli. J. Food Sci. 44: 1478.
Wang, S.S., Haard, N.F., and Di Marco, G.R. 1971. Chlorophyll degradation during controlled-atmosphere storage of asparagus. J. Food Sci. 36: 657.
Watada, A.E. 1986. Effects of ethylene on the quality of fruits and vegetables. Food Technol. 405(5): 82.
Yamauchi, N. and Watada, A.E. 1991. Regulated chlorophyll degradation in spinach leaves during storage. J. Amer. Soc. Hort. Sci. 116: 58.
Yang, Y.J. and Henze, J. 1988. Influence of CA-storage on external and internal quality features in broccoli (Brassica oleacea var. italica). II. Changes in chlorophyll and carotenoid contents. Gartenbauwiss 53: 41.
Ms received 10/9,'92; revised 12/28/92; accepted 1/8/93.
We graciously thank Mr. Willard Douglas for excellent technical assistance.Use of a company or product name by the U.S. Department of Agriculture dees not
imply approval or recommendation of the product to the exclusion of others which also may be suitable.
Volume 58, No. S, 1993-JOURNAL OF FOOD SCIENCE-637

Cross-flow Microfiltration with Gas Backwash of Apple Juice
S.K. SU, J.C. LIU, and R.C. WILEY
----------------------------ABSTRACT-----------------------------Cross-flow microfiltration (MF) was applied for clarification of commercially pressed depectinized apple juices and pectin containing artificial apple juice suspensions under continuous low pressure inlet conditions (35 kPa - 209 kPa). Periodic gas backwash (air or N 2) removed solids from exteriors of 0.2 p m cut-off hollow fiber polypropylene membranes. Flux and nephelos turbidity units (NTU) of filtrates for both commercial juices and artificial juices were evaluated. Commercial juices after vacuum filtration and M F had 100-110 L/m2/hr flux during 2 hr operation. Low pectin (1%) artificial juices had =70 L/m2/hr flux during 1.5 hr. NTUs of filtrates from all treatments were <0.69. All filtrates were commercially sterile.
Key words: apple, juice, cross-flow, microfiltration membranes
INTRODUCTION
CROSS-FLOW micro filtration (MF) of fruit, vegetable juices and wines is an important operation for clarification, stabilization and sterilization of fluid products (Sachs et al. 1983; Gillot and Garcera, 1984; Lundemann, 1987; Belleville et al.,1990). MF separates 0.05 pm to 2 |xm size macro-molecules and suspended solids from the liquid stream. The small pore size openings for MF overlap with larger pore size membranes of ultrafiltration (UF) which nominally cover ranges from 0.002 pm to = 0.2 pm (Anon, 1992).
Although there have been many reports of successful UF operations for clarification of fruit and vegetable juices, especially in apple juice (Heatherbell et al., 1977; Sheu et al., 1987; Rao et al., 1987; Thomas et al., 1987; Padilla and McLellan, 1989), pear juice, (Kirk et al., 1983) and beet juice (Lee et al., 1982), there was a need for further information on separations between UF and particle filtration. Such filtrations (termed MF) usually utilize membranes with pore sizes larger than those in UF and smaller than those in particle filtration. A comparison of MF and UF for apple juice clarification was reported by Wu et al. (1990) in which UF polysulfone membranes were contrasted with a ceramic material MF membrane. The MF processed juice had higher turbidity and higher flux than UF samples under similar operating conditions.
MF systems which use membranes of polymeric materials face many of the same operational problems in juice and wine clarification that are found with UF, including compaction of membranes, concentration polarization, and fouling. Some such problems were confirmed by Belleville et al. (1990) working with red wir.es. They reported major obstacles to further development of MF were insufficient flux and alteration of wine quality due to retention of some wine constituents causing fouling of membrane surfaces.
Our objectives were to study the effect of various pectin levels in artificial apple juice suspensions as well as several operational parameters on permeate flux and turbidity using a laboratory model (1 m2) cross-flow MF system (polypropylene hollow fiber membranes) with periodic gas backwashes. Studies were conducted to determine the effects of air vs N2 (as the periodic backwash gas) on sensory characteristics of artificial apple juice suspensions. Additional objectives were to study the effects of two types of pressed depectinized commercially produced apple juices and several operational param-
Authors Su, Liu, and Wiley are affiliated with the Food Science Program, Univ. of Maryland, College Park, MD 20742-5611.
eters of a pilot scale (4 m2) MF system on permeate flux, turbidity and microbiological quality of MF apple juices.
MATERIALS & METHODSArtificial apple juice suspension
The artificial apple juice suspensions (20L) were apple flavored preparations comprised of pectin from citrus ( M W 23,000-71,000 M W range, 9.5% methoxyl content, and 85% galacturonic acid content) (Sigma Chemical, St. Louis, MO), citric acid (J.T. Baker, Inc., Phillipsburg, NJ), sucrose, and deionized water. Pectin from citrus is very similar to apple pectins which may have a 30,000 to 100,000 M W range, 7.1% methoxyl content and 85% galacturonic acid content. The sugar solids were about 10%, acid solids 0.2% and pectin concentrations 0.1%, 0.2% and 0.4%. The apple flavored suspensions (pH 2.8) were stored at 0°C for 1-2 days. This pH is slightly lower than the range of 3.2-4.0 for apple juice reported by Kilara and Van Buren (1989), but titratable acidity we used (0.2%) was similar to that reported (0.21%) for Red Delicious apples pressed for juice (Way and McLellan, 1989). Just before experimentation, samples were warmed to 20°C and 99% pure n-hexanal (10 ppm) (Aldrich Chemical Co. Inc., Milwaukee, WI) and 99% pure (±) ethyl 2-methyl butyrate (15 ppm) (Aldrich Chemical Co. Inc., Milwaukee, WI) were added directly to each of the pectin, sugar, acid suspensions to simulate apple juice aroma.
Pressed commercial apple juiceThe apple juice was produced at Knouse Foods Cooperative, Inc.,
Gardiners, P A using the Willmes press (pneumatic type, Germany). The apple blend was 75% Red Delicious and 25% other cultivars using both early season harvests and fruits from refrigerated storage. The early season fruit was tested for starch by the standardized Canadian starch test on Oct. 1 and ratings were Red Delicious 3, York Imperial 1, Golden Delicious 7, and Rome Beauty 5 (Priest and Lougheed,1981). A rating of 1 indicates high starch content while 9 means no stain or starch reaction. The percent soluble solids of the juices averaged 11.4 ± 2.2%. The pressed juice was treated from 1.0-1.5 hours with Pectinex (Novo Laboratories Inc., Danbury, CT) at about 55°C and cooled to about 13°C. The two feed types for M F were (1) decant of depectinized juice prior to vacuum filtration and (2) depectinized juice sampled immediately after vacuum filtration (Eimco Filter, Salt Lake, UT) which used diatomaceous earth with 15 p m openings.
Membrane filtration equipment
Two M F operational units were used. A M E M C O R (Timonium, MD) single module (1 m 2) type 1 MSLW-D/L (micro mini) unit was used for laboratory studies of artificial apple juice suspensions while a M E M C O R (Timonium, MD ) microcompact 4 (4 m 2) was used for commercial pilot plant studies. Both operational units allowed continuous filtration of a liquid, and rejected solids >0.2 pm. These systems used hollow fiber polypropylene membranes (350 p m i.d., 650 p m o.d., 0.4 m length) potted in polyurethane in a cross-flow configuration with = 3,000 fibers/module.
Feed juice passed over and around the hollow fibers. Impurities accumulated on the outside of the fibers while juice which passed through the membrane wall into the hollow center of the fibers formed the permeate stream. The unfiltered portion of the feed stream was continuously returned to the feed tank in more concentrated form. For gas backwash, high pressure air or N 2 (690 kPa) was periodically forced from the center of the fibers back across the membranes, thereby expanding the fibers and allowing the gas to remove accumulated rejected solids from the outside of the fibers. Each backwash procedure which included time of pressurization up to 690 kPa, depressurization, valve cut-off time, etc. required about 45 sec during which cross-flow was momentarily discontinued.
638-JOURNAL OF FOOD SCIENCE-Volume 58, No. 3, 1993

Table 1 - Operational conditions o f micro m in i unit showing mean values
Membrane surface (m2) 1Temp of breaktank juice °C) 20Pectin concentration (%) 0.1, 0.2, and 0.4Inlet pressure (kPa) 35, 69, and 140Gas backwash inlet pressure (kPa) 690Gas backwash interval (min) 30Time of microfiltration (min) 90Linear feed velocity (m/sec) 0.54Replication 3
Table 2 - Operational conditions o f microcompact 4 showing mean values
Vacuum Pre-vacuumfiltered juice filtered juice
Membrane surface (m2) 4 4Temp of breaktank juice (°C) 13.1 ±2.6 13.1 ±1.0Inlet pressure (P|) (kPa) 205 ±7 209 ±6Outlet pressure (P„) (kPa) 202 ±6 206 ±6Permeate back pressure (Pp) (kPa) 153 ±32 158 ±17Transmembrane pressure (APT) (kPa) 50 ±31 50 ±18Gas backwash inlet pressure (kPa) 690 690Gas backwash interval (min) 15 15Time of microfiltration (min) 120 120Linear feed velocity (m/sec) 0.45 0.45Replication 5 4
Table 3 -C oncen tra tions o f sweet, sour, and flavor fo r the tra in ingsamples
Flavorsucrose citric acid n-Hexanal (± ) Ethyl 2-methyl butyrate
(g/100mL) (g/100mL) (ppm) (ppm)0.050 0.005 2 30.288 0.013 4 60.526 0.021 6 90.765 0.029 8 121.000 0.037 10 15
Operational conditionsFor the artificial apple juice suspension experiments, 20L of juice
was introduced using each pectin level and inlet pressure, replicated three times for a total of 27 experiments (Table 1). The artificial apple juice suspensions in the breaktank were circulated between breaktank and a heat exchanger to maintain juice temperature at 20°C. For the commercial pressed juices, four replications of about 750L each of the decant depectinized juices and five replications of the depectinized vacuum filtered juices were processed using about 8,500L of apple juices for pilot plant experiments (Table 2).
Membrane cleaning procedureThe equipment was cleaned in place after completing each exper
iment in order to maintain flux for the next M F process series. The cleaning was accomplished using a 2 % solution of M E M C L E A N (NaOH, caustic soda, soda lye, lye) (Timonium, MD) circulated in the system for = 30 min after each experiment then allowed to stand at least 1 hr. The equipment was then rinsed and backwashed four or five times with deionized water to a rinse water pH of 7.0. The efficiency of cleaning was checked by water flux only in preliminary experiments, and rinsing time and cleaning efficiency was determined from these tests. Recovery of permeate flux and zero(O) transmembrane pressure (A Px) were also further estimates of cleaning efficiency.
Expert panel formationMembers of the expert flavor panel were trained and selected from
14 individuals chosen from the faculty, staff, and graduate students of the Food Science Program of the University of Maryland-College Park. Trainees were asked to rank five unidentified juice samples containing 25 m L of threshold concentrations of sucrose, or citric acid (ANON, 1981), or various concentrations of n-hexanal and (±) ethyl2-methylbutrate. Table 3 shows concentrations of tested samples. Sensory evaluations were conducted in a laboratory environment with 14 booths under cool white 3 4 W fluorescent lighting. Samples at « 16°C were presented in 3-digit random coded plastic cups served at 20°C.
Time (min)
Fig. 1 - Effect of pectin concentration on permeate flux of artificial apple juice suspensions.
After three replications, seven persons were found to show required accuracy and precision and were selected as members of the expert panel.
Sensory evaluationSensory expert panel tests were conducted to determine flavor pro
files of the artificial apple juice suspensions. Descriptive sensory analysis with scaling was used for samples of an artificial 0.2% pectin apple juice suspension microfiltered over a period of 90 min using air or nitrogen backwashes, and samples were collected initially and every 30 min. The prepared juices at 16°C were evaluated by the seven expert panelists for flavor intensity based on a scale of 1 to 10, where 1 was not flavorful, 10 was very flavorful. During sensory tests, panelists were requested to evaluate five unidentified juice samples each time. Each 25 m L sample had a 3-digit random number and was served at room temperature (20°C) as above. The unknowns were four microfiltered samples and one reference sample without MF. Each sensory test was replicated three times. Data from sensory evaluations were then analyzed statistically by multiple paired comparison T-:est using SY ST AT 5 program for Macintosh (Version 5.1, SYSTAT, Inc., Evanston, IL).
Microbiological analysisMicrobiological tests for the commercial apple juice samples were
conducted in duplicate using total plate, yeast, and mold counts (Snavely,1992), and direct microscopic examination. Total Plate Count (TPC) media (Difco, Detroit, MI) was used for bacteria and Potato Dextrose Agar (PDA) media (Difco, Detroit, MI) acidified with 10% tartaric acid to pH 3.5 was used for yeast and mold.
Analytical evaluationThe NTUs of artificial apple juice suspensions and commercial ap
ple juices were measured using an H.F. Scientific Inc. (Fort Myers, FL) turbidmeter (Model #20052). Flux and cross-flow rates were measured by various flowmeters and calibrated when necessary with graduated cylinders. Soluble solids were measured by an Abbe Re- fractometer (American Optical, Buffalo, NY).
RESULTS & DISCUSSION Artificial apple juice suspension
Filtrate flux. After 10 to 15 min operation and throughout the 90 min experiments, the 0.1% pectin suspension showed = 30 L/m2/hr more output than the 0.4% pectin suspensions (Fig. 1). In the model pectin concentration ranges studies (0.1%, 0.2% and 0.4%), doubling pectin concentration lowered flux by about 14 L/m2/hr. These ranges of pectin were used to simulate those levels expected in untreated apple and other fruit and vegetable juices and wines. There was a reduction of flux and then stabilization over the time period studied for all pectin
Volume 58, No. 3, 1993-JOURNAL OF FOOD SCIENCE-639

M IC R O F IL T R A T IO N O F A P P L E JU IC E . . .
concentrations. The influence of pectin on fouling of membranes and filters has been previously reported by many workers including Kirk et al. (1983), Yildiz and Wiley (1989), Tzeng and Zall (1990), Belleville et al. (1990). The higher the concentration of pectin in the juice (suspensions) the lower the flux.
Periodic gas backwash temporarily improved flux by an average of 10 L/m2/hr and stabilized flux decline. Slopes of the curves show that lower pectin concentration samples gave higher recovery of flux than did higher pectin concentration samples. Pectins were used to characterize fouling in our MF membrane separation. Belleville et al. (1990) working with MF of two red wines characterized fouling by the presence of the total polysaccahrides and protein colloidal complex rather than gal- acturonic acid residues only (pectins). Pectins, are the major contributor to fouling in apple juice filtrations and this is the basis of industry practice to add pectolytic enzymes prior to clarification and filtration to produce high clarity apple juices.
Feed and filtrate turbidityThe NTUs for the model feed pectin suspensions of 0.1%,
0.2%, and 0.4% concentration were 17.0±2.0, 31 .8±3.5 , and 64.6 ± 5 .4 , respectively. These were signficantly different (p < 0.05) but indicated the contribution of soluble pectins to untreated juice NTUs. The average permeate NTU values for these soluble pectin treatments were 0.13, 0.14, and 0.13 which were not signficantly different (p < 0.05) but indicated large reductions. The NTUs indicated reduced soluble pectin levels in the permeates and practically no turbidity. These results supported the results of Van Buren (1989) who hypothesized turbidity (haze) in clarified apple juices was due primarily to starches, dextrins, protein-tanning complexes, tannins, gums, and iron and copper and that pectin could act as a protective colloid to prevent coagulation and precipitation of such small insoluble particles. Belleville et al. (1990) working with MF of red wines affected only a 45.9% reduction in polysaccharides in filtrates of red wine “ A” and 24.7% reduction in red wine “ B” . The turbidity of wine “ A” and wine “ B” showed relatively small reductions after MF using porous alumina membranes with 0 . 2 p.m pore size.
Sensory analysisWe needed to determine whether high pressure air (690 kPa)
used for periodic gas backwash would affect flavor of the per- meat through oxidative and other changes. Feed suspensions containing volatile flavor compounds using an air backwash were contrasted with similar operations using N2 as backwash gas. In the descriptive sensory analysis of the samples back- washed with either air or N2, (Table 4) no significant differences (p<0.05) of flavor intensity were found. Also, there was no significant loss (p<0.05) of flavor through 90 min. of MF.
These results were somewhat different than Rao et al. (1987) who found loss of volatile flavors in apple juice permeates using hollow fiber polysulfone and polyamide membranes during UF operations. These differences might relate to use of polypropylene membranes and low temperature separations (20 °C) in the MF studies. Matsuura et al. (1974), Chou et al.(1991) and many others have noted increased recovery of aroma components was achieved in low temperature reverse osmosis (RO).
Commercial apple juiceData were obtained from microfiltered pressed depectinized
commercial apple juices taken either before or after vacuum filtration. The two feed juices, pre-filter and post filter were selected for study to provide high or low levels of macromolecules or precipitates which might have different MF flux. These data could provide information regarding sequencing of
■ p r e - v a c u u m f il te r e d j u i c e □ v a c u u m f il te r e d ju i c e - — g a s b a c k w a s h
Fig. 2 —Effect o f various types o f commercially pressed depectinized apple juices on permeate flux.
Table 4 - Descriptive sensory analysis - expert panel scores for flavorintensity*______________________________________________ ___________
Scores'5
Treatment 0Process time (min)
30 60 90Treatment
linear effect*Air 5.1 6.3 6.6 5.9 NSNitrogen 6.2 6.2 6.2 5.4 NSTime linear effect* NS NS NS NS1 Values reported are means of 21 observations. b 1 = not flavorful, 10 = very flavorful. c NS = not signficant at p “ 0.05.
Table 5 -M ic rob io log ica l analysis fo r the commercial apple ju ice afterm icrofiltration
TPC/mL* Yeast/mL Mold/mLSample 1 0 0 0Sample 2 0 1 0* TPC/mL = total plate count per m l.
MF in a commercial apple juice processing line. The juice was processed at 13 °C to maintain flavor and replicated 4 times for pre-vacuum and 5 times for vacuum filtered juice.
Filtrate flux. The flux of vacuum filtered juice, using Nz gas backwash every 15 min which caused flux improvement, ranged between 100 and 110 L/m2/hr for a 2 hour period (Fig.2) at a linear flow velocity of 0.45 m/sec. The pre-vacuum filtered juice stabilized at a flux between 70-80 L/m2/hr for most of the experimental time ( 2 hr). In both cases backwashes improved the flux about 11 L/m2/hr. Data in Fig. 2 were based on flux values every 15 min and are similar to Wu et al. (1990) who reported average MF flux of 111.9 L/m2/hr for a ceramic membrane. Their operating temperatures, inlet pressures, AP-jS and linear flow rates were not indicated. It is generally considered that 60 L/m2/hr is about the minimum acceptable flux for an MF operation (Vickers, 1992). Belleville et al. (1990) using porous alumina MF membranes found flux for 1987 and 1988, red wines “ A” stabilized at about 75 L/m2/hr while in red wines “ B” in 1987 and 1988, flux started at around 75LV m2/hr and then gradually decreased to about 30 L/m2/hr. They used APt of 310 kPa, flow velocity of 4.5m/sec and a temperature of 20°C. Padilla-De Zakour and McLellan (1992) showed higher flux (400-500 kg/hr • m2) using ceramic microfilters with 0 . 2 p.m pore sizes and high feed velocities of14.6 m/s, at APTs of 200-700 kPa and temperatures of 50°C.
The gas backwash stabilized flux at relatively high values of about 70-110 L/m2/hr for various types of depectinized feed apple juices and this was accomplished at low linear velocity
640-JOURNAL OF FOOD SCIENCE-Volume 58, No. 3, 1993

(0.45m/sec), temperature (13°C) and APjS of about 35-100 kPa. This type operation should reduce pumping and energy costs. The linear flow rates in Belleville et al. (1990) and Padilla-DeZakour and McLellan (1992) were 10 to 32 times higher than those we used. In gas backwash MF, the cross- flow rate was set at the start of the operation and only showed increased APT with fouling. The periodic gas backwash reduced APjS and depending on fouling could be set for a time interval between 1 and 99 min to keep APX < lOOkPa.
Feed turbidity. The turbidity of the feed juices, both decant pre-vacuum filtered juice and vacuum filtered juice, were similar at start-up 70 and 64 NTUs, respectively. Feed turbidity gradually increased to about 212 NTU for the pre-vacuum filtered juice and 180 NTU for the vacuum filtered juice at the end of the 2 hr operation. These values reflected the build-up in colloidal materials that were recycled back to the breaktank as MF continued. The gas backwash removed about 8-10% of the volume of the 60 L breaktank and was discharged to the drain. However, the backwash could be recycled to an external feed tank or to other filtering systems for further processing.
Filtrate turbidity. Filtrate turbidity values from each of the juice treatment feeds were not significantly different (p < 0.05) and averaged 0.69 NTU. This was slightly higher than the target NTU of 0.50 which would yield 70 0 Brix apple juice concentrate of about 2.0-2.5 NTU (Vickers, 1992). This value was lower than the 2.5 NTUs for ultrafiltered apple juices reported by Padilla and McLellan (1989) who used a 500,000 molecular weight cut-off (MWCO) membrane which was ~ 0.2 p,m pore size. For commercial apple juices, using prevacuum filtered feed juice, NTUs continued to increase. Filtrate NTUs remained comparatively low and increased only slightly at the end of 2 hr operations.
Transmembrane pressure (APT). Transmembrane pressure was calculated for the micro compact 4 experiments (comm ercial apple ju ice) by using the fo llow ing equation APT = (Pi + P0)/2 - Pp, where Pi was inlet pressure, P„ was outlet pressure, and Pp was permeate back pressure. In these operations the APt at the beginning of the MF was essentially zero and ranged up to 121 kPa before backwashes. In these experiments the APxs increased as fouling and compaction increased with time. The higher AP-pS were reduced by gas backwash at 15 min intervals by about 38 kPa and could also be reduced by slight downward adjustment of cross-flow rate (Q) through the module. The average APT for pre-vacuum filtered juices was 50 ± 18 kPa and for vacuum filtered juice was 50 ±31 kPa. As indicated earlier these were much lower APts than reported by Belleville et al. (1990) and Padilla- DeZakour and McLellan (1992).
Microbiological analysis. The results of the microbiological analysis (Table 5) indicated the MF juice could be considered commercially sterile. Aseptic handling and closing equipment would be required for further processing to insure safety.
CONCLUSIONSAVERAGE permeate flux of artificial apple juice suspensions containing uniform levels of sugar and acid but different levels of pectin to test fouling were 49 L/m2/hr for 0.4% to 76 L/m2/ hr for 0.1% pectin suspensions. Increasing pectin reduced flux. Use of gas backwashes every 30 min on these pectin-containing suspensions stabilized flux and yielded high quality permeates. An expert sensory panel found no significant differences (p<0.05) in flavor between air and N2 backwashed samples and no loss of flavor over a 90 min MF cycle. Flux for vacuum filtered apple juices ranged between 100 and 110 L/m2/hr after 30 min of MF and remained at these levels throughout the 2 hr experiments. Pre-vacuum filtered juice stabilized between 70 and 80 L/m2/hr after 30 min and throughout 2 hr experi
ments. The N2 gas. backwashes every 15 min tended to give recovery of flux and stabilized loss in flux. The NTUs of the feed juices were similar at start-up of experiments and gradually increased due to build-up in rejected colloidal materials that were recycled. Microbiological analysis indicated that mi- crofiltered juice could be considered commercially sterile. Continuous cross-flow MF with periodic gas backwash was useful to improve flux and clarity of non-cloud apple juices at low linear feed velocities, low temperature, and relatively low APjS. Such operational conditions should improve flavor characteristics of the filtered juices and minimize energy costs.
REFERENCES
Anonymous. 1981. ASTM-STP #758. Guidelines for the selection and training of sensory panel members, p. 11. Philadelphia, PA.
Anonymous. 1992. Filtration spectrum. Osmonics, Inc. Minnetonka, MN.Belleville, M.P., Brillouet, J.M., Tarodo, de la Fuente B., and Moutounet.
M. 1990. Polysaccharide effects on cross-flow microfiltration of two red wines with a microporous alumina membrane. J. Food Sci. 55: 1598.
Chou, F., Wiley, R.C., and Schlimme, D.V. 1991. Reverse osmosis and flavor retention in apple juice concentration. J. Food Sci. 56: 484.
Gillot, J. and Garcera, D. 1984. New ceramic filter media for cross-flow microfiltration and ultrafiltration. Paper presented at Congres FILTRAT 84, Société Française de Filtration, Paris (France), October 24.
Heatherbell, D.A., Short, J.L., and Strubi, P. 1977. Apple juice clarification by ultrafiltration. Confructa 22: 157.
Kilara, A. and Van Buren, J.P. 1989. Clarification of apple juice. Ch. 4. In Processed Apple Products, D.L. Downing (Ed.), p. 83-96. Van Nostrand, Reinhola, New York.
Kirk, D.E., Montgomery, M.W., and Kortekaas, M.G. 1983. Clarification of pear juice by nollow fiber ultrafiltration. J. Food Sci. 48: 1663.
Lee, Y.N., Wiley, R.C., Sheu, M.J., and Schlimme, D.V. 1982. Purification and concentration of betalaines by ultrafiltration and reverse osmosis. J. Food Sci. 47: 465.
Ludemann, A. 1987. Wine clarification with a crossflow microfiltration system. Am. J. Enol. Vitic. 38: 228.
Matsuura, T., Baxter, A.G., and Sourir^jan, S. 1974. Studies on reverse osmosis for concentration of fruit juice. J. Food Sci. 39: 704.
Padilla, O.I., and McLellan, M.R. 1989. Molecular weight cut-off of ultra- filtration membranes and the quality and stability of apple juice. J. Food Sci. 54: 1250.
Padilla-De Zakour, O.I. and McLellan, M.R. 1992. Optimization and modeling of apple juice cross-flow micriflltration with a ceramic membrane. Paper No. 814, presented a t Annual Meeting of Inst, of Food Technologists, New Orleans, LA, June 20-24.
Priest, K.L. and Lougheed, E.C. 1981. Evaluation of apple juice maturity using the starch iodine test. Ministry of Agriculture and Food, Ontario, Can. 81, 025: 1-4.
Rao, M.A., Acree, T.E., Cooley, H.J., and Ennis, R.W. 1987. Clarification of apple juice by hollow fiber ultrafiltration: fluxes and retention of odor- active volatiles. J. Food Sci. 52: 375.
Sachs, S.B., Gaillard, M., and Cassignard, R. 1983. Application de la microfiltration tangentielle au traitement des vins. Vignes et Vins 320: 23.
Sheu, M.J., Wiley, R.C., and Schlimme, D.V. 1987. Solute and enzyme recoveries in apple juice clarification using ultrafiltration. J. Food Sci. 52: 732.
Snavely, L.A. 1992. Personal communication. Knouse Foods Cooperative, Inc., Biglerville, PA.
Thomas, R.L., Gaddis, J.L., Westfall, P.H., Titus, T.C., and Ellis, N.D. 1987. Optimization of apple juice production by single pass metallic membrane ultrafiltration. J. Food Sci. 52: 1263.
Tzeng, W.C. and Zall, R.R. 1990. Polymers decrease cleaning time of an ultrafiltration membrane fouled with pectin. J. Food Sci. 55: 873.
Van Buren, J.P. 1989. Cause and preventing of turbidity in apple juice. Ch. 5. In Processed Apple Products, D.L. Downing (Ed.), p. 97-120. Van Nostrand, Reinhold, New York.
Vickers, J.C. 1992. Personal communication. Memcor Division, Memtec American Corporation, Timonium, MD.
Way, R.D. and McLellan, M.R. 1989. Apple cultivars for processing. Ch. 1. In Processed Apple Products, D.L. Downing (Ed.), p.1-29. Van Nostrand, Reinhold, New York.
Wu, M.L., Zall, R.R., and Tzeng, W.C. 1990. Microfiltration and ultrafiltration comparison for apple juice clarification. J. Food Sci. 55: 1162.
Yildiz, F., and Wiley, R.C. 1989. Temperature and pressure effect on tomato serum concentration by reverse osmosis. In Engineering and Food, Vol. 3, Advanced Processes, W.E.L. Spiess and H. Schubert (Ed.), p. 233- 252. Elsevier-Applied Science, London and New York.
Ms received 8/24/92; revised 11/23/92; accepted 12/23/92.
We gratefully acknowledge and thank MEMCOR for support and use of equipment and to Knouse Foods Cooperative, Inc. for generously providing the apple juice and use of pilot plant facilities.
Presented at the 53rd Annual Meeting of the Institute of Food Technologists, New Orleans, LA, June 21-24, 1992.
Scientific Article No. A6384, Contribution No. 8568 of the Maryland Agricultural Experimental Station, Food Science Program, Dept, of Horticulture.
Volume 58, No. 3, 1993-JOURNAL OF FOOD SCIENCE-641

Resistant Starch in Foods: Modified Method for DietaryFiber Residues
F. SAURA-CALIXTO, I. GOÑI, L. BRAVO and E. MAÑAS
---------------------------ABSTRACT----------------------------In a modifiée method for measuring Resistant Starch (RS) in dietary fiber residues all operations for obtaining fiber residues and determination of P.S were performed in a 50 m L centrifugation tube. This minimized error sources and simplified previous methodology.
Key Words: starch, digestibility', dietary fiber
INTRODUCTIONTHE LONG-HELD opinion that starch, the main carbohydrate source in human nutrition, is completely digested and absorbed in the small intestine has been challenged (Bjorck et al., 1987). Resistance Starch (RS) has been defined as dietary starch that does not digest in the small intestine (EURESTA GROUP,1992). Factors such as degree of milling, heating, cooling, drying and the amylose/amylopectin ratio influence food RS content (Ring et al., 1988). RS is made up of different fractions: retrograded, physically inaccessible, chemically modified fragments, starch complexes with other related food components, etc. (Saura-Calixto and Abia, 1991; Tovar, 1992).
Two general methods have specifically been proposed to determine RS. Both the Berry (1986) and the Englyst (1992) procedures remove digestible starch using different amylases, and the residual fraction is quantified after solubilization in 2M KOH. The Siljestrom and Asp procedure (1985) includes preparation and quantification of a dietary fiber residue before RS determination.
Our objective was to develop a modified procedure based on the Siljestrom and Asp method. RS was determined in fiber residues in a more simplified and more accurate way. This procedure can be used to quantify RS in foods without determining fiber. On the other hand, since RS may contribute to an overestimation of Dietary Fiber (DF) content in foods, the procedure could be used to correct DF values. DF consists of nonstarch polysaccarides plus lignin, and RS, a nonfiber constituent, may contribute to DF values from most analytical methods.
MATERIALS & METHODS Insoluble DF residues
Samples were milled to pass a 0.5 m m sieve. Duplicates (100 mg) samples were placed in 50 m L centrifuge tubes. Buffer (10 m L of 0.08M phosphate) was added to pH 6.0 ± 0.2. pH was adjusted to6.0 by adding 0.275N N a O H or 0.325N HC1. Heat-stable a-amylase solution (10 nL) (E.E. 3.2.1.1, Sigma No. A-3306) was added, and mixed thoroughly. The capped tubes were placed in a boiling water bath for 35 min with constant shaking. The tubes were removed and cooled to room temperature (=25°C). pH was adjusted to 7.5 ± 0.1 by adding =2 m L 0.275N N a O H solution.
The protease solution (100 p,L) was added and was prepared just before use (10 m g protease in 1 m L 0.08M phosphate buffer; Protease
Authors Saura-Calixto, Goñi, and Bravo are with Instituto de Nutrición y Bromatología (CSIC-UCM), Facultad de Farmacia, Ciudad Universitaria, 28040-Madrid. Spain. Author Mañas is with the Depto. de Química Analítica, Facultad de Ciencias, Univ. de Alcalá de Henares, 28871-Madrid. Spain.
Sigma No. P-5380). The solutions were incubated 35 min at 60°C with continuous agitation and cooled to room temperature (=25°C). pH was adjusted to 4.5 ± 0.1 by adding about 2 m L 0.325N HC1. Amyloglucosidase (E.C. 3.2.1.3, Sigma No. A-9913) (60 mL) was added and the solutions incubated 35 min at 60°C with continuous agitation.The tubes were centrifuged 15 min at 3000 x g, discarding the
supernatants. The remaining pellets (Insoluble Dietary Fiber, IDF) were washed successively with 10 m L distilled water, 10 m L 96% ethanol and 10 m L acetone, discarding the supernatants.
Determination of RSA freshly prepared 2 M K O H solution (6 mL) was added to the IDF
residues, mixed thoroughly and shaken continuously for 30 min at room temperature ( = 25°C). Acetate buffer (0.4M, pH 4.75 3 mL) was added as well as =5 m L 2N HC1. pH was adjusted to 4.75 using 2N HC1, if necessary. Then, 60 p.L amyloglucosidase suspension (E.C. 3.2.1.3, Boehringer Mannheim No. 102857) was added, and the solution mixed and incubated 30 min at 60°C, with continuous agitation.
Samples were centrifuged 15 min at 3000 x g and the supernatants collected. The pellet was resuspended in 10 m L distilled water and the centrifugation repeated. The supernatants were combined with the water washes, and adjusted to a final volume of 25 to 1000 m L with distilled water, depending on RS content of the sample (i.e. 50 m L for < 1 % RS; 1000 m L for >15% RS).Total glucose was analyzed using a G O D - P O D reagent (Glucose
Oxidase/Peroxidase, Boehringer Mannhein No. 676543). A glucose standard solution (10-50 mg/mL) was used. In a glass tube 0.5 m L of supernatant was pipetted and 1 m L of the reagent solution added from the combined kit for Glucose determination. The solution was mixed thoroughly and the tubes were placed in a water-bath at 37°C for 30 min. Absorbances at 500 nm were measured against blank reagent. The resistant starch was calculated as glucose (mg) x 0.9.
RESULTS & DISCUSSIONContrary, to other methods for RS, complex operations and the associated errors are eliminated in our proposed method, where all the operations are performed in the original 50 mL centrifugation tube. The RS analysis is performed in the whole free-celite DF residue, without previous drying.
The Siljestrom and Asp method (1985) determines RS in dietary fiber (DF) residues obtained by the Asp et al. (1983) or by the AO AC methods (Prosky et al, 1988). A portion of the residue, containing fiber, celite and RS, is used to quantify RS. That procedure introduces two possible error sources. In order to obtain the DF residue, samples must be dried at 105°C. As heating influences the RS content in foods, results may be modified by this step. The DF residue obtained is a mixture of fiber, celite and other food components. A portion of this mixture is used to determine DS, though its homogeneity is only assumed. Results must be referred to the DF residue. Also, blank, protein and ash corrections during determination of DF could introduce errors in the RS quantification.
Results corresponding to RS contents of different samples obtained by our modified method are shown in Table 1. Similar results with low standard deviations were obtained by different operators of the two laboratories involved in this study.
We also participated in an interlaboratory study of RS determination involving 17 laboratories which was carried out using the Siljestrom and Asp method (Champ, 1992). In that
642-JOURNAL OF FOOD SCIENCE-Volume 58, No. 3, 1993

Table 1 - Resistant starch (RS) content by the m odified m ethod (% fresh matterI
% Fresh matter* (Moisture)
Bean flakes (A) 4.76 ± 0.21 (8.1)High amylose starch (B) 6.63 ± 0.20 (5.2)Corn flakes (C) 1.59 ± 0.03 (4.5)Raw potato starch (D) 0.21 ± 0.06 (15.3)Lentil flour 0.71 ± 0.08 (8.2)Lentil flour (boiled and frozen) 0.86 ± 0.27Bean flour 0.37 ± 0.001 (11.6)Bean flour (boiled and frozen) 1.20 ± 0.27Chick pea flour 0.31 ± 0.05 (4.5)Chick pea flour (boiled and frozen) 1.31 ± 0.08* Mean values ± SD (n&6)
study, the first four samples of Table 1 were analyzed. Our results, by the modified procedure, were quite close to the mean values of that study (A -4.76± 1.71; B -8.83±4.58; C - 1.43± 0.61; and D -0.20±0.10 % fresh matter respectively). Our procedure includes modifications which minimize error sources and simplify previous methodology. It is less time and reagent consuming.
Among advantages of our procedure are: Smaller quantity of sample ( 1 0 0 mg instead of lg) and consequently lower amounts of enzymes, reagents and solvents are required. Neither the corresponding perishables (such as celite, crucibles and ethanol) nor specific commercial equipment for DF analysis are required. Centrifugation is carried out instead of filtration. Therefore, errors related to blank, ash, and protein corrections are eliminated. This method provides a celite-free residue, which could be used for further physical and physiological studies. No drying of sample is necessary and therefore the results cannot be affected by potential diying errors. It prevents errors associated with intermediate steps in the Sil- jestrom and Asp method, where only a fraction of the residue is used for RS analysis.
Any RS method must be validated by future animal and human experiments, and the development of definitive data
will probably take years. Presently, we need reasonable and acceptable methods to estimate this starch fraction of physiological and nutritional interest. Tovar (1992), reported that the RS fraction which was not digested and passed into the large intestine in rats was reasonably predicted by analysis of RS in dietary fiber residues.
REFERENCES
Asp, N.G., Johansson, C-G Hallmer, H., and Siljestrom, M. 1983. Rapid enzymatic assay of insoluble and soluble dietary fiber. J. Agric. Food Chem. 31: 476-482.
Berry, C.S. 1986. Resistant starch: Formation and measurement of starch that survives exhaustive digestion with amylolytic enzymes during the determination of dietary fibre. J. Cereal Sci. 4: 301-314.
Bjorck, I., Nyman, M., Pederson, P, Siljestrom, M., Asp, N.G., and Eggum, B.O. 1987. Formation of enzyme resistant starch during autoclaving of wheat starch: Studies in vitro and in vivo. J. Cereal Sci. 6: 159-172.
Champ, M. 1992. Determination of resistant starch in foods and food products: Interlaboratory study. Eur. J. Clin. Nutr. 46: S51-S62.
Englyst, H.N., Kingman, S.M., and Cummings, J.H. 1992. Classification and measurement of nutritionally important starch fractions. Eur. J. Clin. Nutr. 46: S33-S50.
EURESTA GROUP. 1992. Physiological implications of the consumption of resistant starch in man. Presented at Agro-industrial and forestry research technology days. FLAIR. Concerted Action. European Communities. Brussels, March 10-11.
Prosky, L., Scheweizer, T.F., De Vries, J.W., and Furba, I. 1988. Determination of insoiuble, soluble and total dietary fiber in foods and foods products: Interlaboratory study. J. Assoc. Off. Anal. Chem. 71: 1017- 1023.
Ring, S.G., Gee, J.M., Whittam, M., Orford, P„ and Johnson, I. 1988. Resistant starch. Its chemical form on food stuffs and effects on digestibility in vitro. Food Chem. 28: 97-109.
Saura-Calixto, F. and Abia, R. 1991. Resistant starch: an indigestible fraction of foods. Grtsas y Aceites 3: 239-242.
Siljestrôm, M. and Asp, N.G. 1985. Resistant starch formation during baking. Effect of baking time and temperature and variation in the recipe. Z. Lebensm. Unters Forsch. 4: 1-81.
Tovar, J. 1992. Bioavailability of starch in processed legumes. Importance of physical inaccessibility and rétrogradation. Sc. D. Thesis. Department of Applied Nutrition and Food Chemistry. University of Lund, Sweden.
Ms received 7/20/92; revised 11/12/92; accepted 12/28/92.
The financial support of the Spanish CICYT (Project ALI-92-0278) is acknowledged. Study coordinated within EURESTA (European Resistant Starch Group).
S T A B IL IT Y O F N H D C . . .From page 591 — —
addition, NHDC is also stable under more neutral conditions and would thus be suitable for use under conditions that prevail in manufacture and storage of more neutral products such as dairy desserts.
REFERENCES
Bar, A., Borrego, F., Benavente, O., Castillo, J., and del Rio, J.A. 1990. Neohesperidin dihydrochalcone: properties and applications. Lebensm. Wiss. u Technol. 23: 371.
Crosby, G.A and Furia, T.E. 1980. New sweeteners. In CRC Handbook on Food Additives, T.E. Furia (Ed.), p. 203. CRC Press, Boca Raton, CA.
E.C. 1990. Proposal for a Council Directive on Sweeteners for use in Food
stuffs. Official Journal of the European Community (27.9.90). No. C 242/4-14.
Horowitz, R.M. and Gentili, B. 1963. Dihydrochalcone derivatives and their use as sweetening agents. U. S. Patent 3.087.821.
Horowitz, R.M. and Gentili, B. 1986. Dihydrochalcone sweeteners from citrus flavanones. In Alternative Sweeteners, L. O’Brien and R.C. Gelardi (Ed.), p. 135. Marcel Dekker, Inc., New York.
Inglett, G.E., Krbechek, L., Dowling, B., and Wagner, R. 1969. Dihydrochalcone sweeteners. Sensory and stability evaluation. J. Food Sci. 34: 1 0 1 .
Lindley, M.G., Canales, I. and Borrego, F. 1991. A technical reappraisal of the intense sweetner neohesperidin dihydrochalcone. In FIE Conference Proceedings. In press.
Tsoubeli, M.N. and Labuza, T.P. 1991. Accelerated kinetic study of aspartame degradation in the neutral pH range. J. Food Sci. 56: 1671.
Ms received 6/19/92; revised 9/3/92; accepted 10/1/92.
Volume 58, No. 3, 1993-JOURNAL OF FOOD SCIENCE-643

Microbial Growth Estimation in Liquid Media Exposed to Temperature Fluctuations
KEN-YUON LI and J. ANTONIO TORRES
----------------------------ABSTRACT-----------------------------Comparisons of linear, square root and Arrhenius specific growth rate- temperature models showed no clear overall preference. At low aw and refrigeration temperature, the linear model was satisfactory for B ro ch o th rix th erm osph acta and P seu d o m o n a s f lu o r e sc e n s . A linear relationship between (specific growth rate)"1 and lag phase was observed for these two psychrotrophs. The R2 for B. th erm o sp h a cta in 3 % (aw = 0.968), 6 % (a = 0.950), and 9 % NaCl (a» = 0.943) media was 0.865, 0.946 and 0.994, respectively. In 8 % (a„ = 0.973) and 20% (aw = 0.948) glycerol media, the R2 was 0.998 and 0.999, respectively. R2 for P . fluorescen s growth in NaCl (3 or 4%) or glycerol (10 or 20%) media was >0.99. A cumulative growth adaptation function successfully estimated microbial growth at fluctuating temperatures.
Key Words: microbes, liquid media, growth, spoilage, B. thermosphacta, P. fljorescens
INTRODUCTION
ulation, and b = maximum population. These researchers found the estimation of lag time was not as accurate as that of generation time.
The effect of temperature on specific growth rate can be estimated by a linear equation:
r = r0(l + cT) (3)
where r = specific growth rate at a given temperature T (°C), r0 = rate at 0°C, and c = a constant (Spencer and Baines,1964). Another approach would be the Arrhenius model:
— H-r = A e RT (4)
where r = specific growth rate at absolute temperature T, p, = temperature characteristic or activation energy, and A = constant (Ingraham, 1958). A third model is the square root equation:
TEMPERATURE plays a major role in microbial stability but refrigerated temperature is not always kept constant during food handling. Temperature effects on microbial stability has been studied quantitatively by computer supported models based on heat transfer and microbial growth estimations (McMeekin and Olley, 1986; Buchanan, 1986; Fu et al., 1991; McMeekin et al., 1992; Buchanan, 1992; Almonacid-Merino and Torres, 1993; Almonacid-Merino et al., 1993a,b). Growth estimations include the work by Broughall et al. (1983) who used the following nonlinear Arrhenius regression model to estimate separately the effect of temperature on lag time (L) and generation time (K):
1 + e
(i)
where R = universal gas constant, r(25) = specific growth rate at 25°C, T = absolute temperature, Ha = enthalpy of activation for microbial growth, H, = enthalpy of growth inactivation caused by low temperatures, and TV2 = temperature for 50% specific growth rate reduction by lowering temperature. This equation describes the lag time when K is substituted by L. Acceptable values were obtained up to the optimal growth temperature where high temperature affects growth (Broughall et al., 1983). Values obtained from Eq. (1) have been used with the integrated form of the Verhulst differential equation (Eq. 2) to estimate microbial growth (Schoolfield et al., 1981):
(2 )
where N = microbial population at time t, N0 = initial pop-
Author Torres is with the Food Process Engineering Group, Dept, of Food Science & Technology, Oregon State Univ., Corvallis, OR 97331-6602. Author Li is currently with the Dept, of Food Science, Tur.ghai Univ., Taichung, Taiwan, R.O.C. Address inquiries with Dr. J.A. Torres.
V? = b(T - T0) (5)
where r = specific growth rate at temperature T, b = slope of the regression line, and T0 = hypothetical lowest temperature for growth (Ratkowsky et al., 1982). In the square root model, ‘r’ is sometimes defined as the reciprocal of a time, t, needed to achieve a specific increase in cell numbers and would thus include the lag phase.
The linear equation was successfully used to estimate the spoilage of cod over a temperature range of — 1 to 25°C (Spencer and Baines, 1964), however, later studies have shown that this equation was not appropriate to estimate the microbial spoilage of red meat, shellfish and poultry (Poonie and Mead,1984). The Arrhenius equation was originally derived for single chemical reactions to describe the dependence of the reaction rate constant on temperature. Thus, the linearity of Arrhenius plots for microbial growth data is a matter of dispute (Stannard et al., 1985). For example, although Ingraham (1958) and Janota-Bassalik (1963) reported such plots were straight lines, Poonie and Mead (1984) reported they were curved, while others suggested plots with two linear portions (School- field et al., 1981).
Ratkowsky et al. (1982) suggested that the relationship between temperature and growth was better represented by the square root equation. Stannard et al. (1985) compared the square root with the Arrhenius equation and reported that the square root equation was the best model for microbial growth at chill temperatures. McMeekin et al. (1987) noted that the square root equation is a special case of the Belehradek temperature function (Eq. 6 ):
r = a(T - a)“- (6)
where r = specific growth rate, a = “ biological zero” , and a, d = constants to be fitted for different organisms. McMeekin et al. (1987) analyzed the growth of Staphylococcus xylosus in media adjusted to various a„ using NaCl and found that a constant d = 2 in Eq. (6 ) could be used to estimate the effect of temperature on microbial growth.
Power et al. (1965) estimated food spoilage extent at fluctuating temperature by multiplying growth rate at the mean
644-JOURNAL OF FOOD SCIENCE-Volume 58, No. 3, 1993

temperature by a fluctuation coefficient derived from Q10 values. These were defined as the ratio of specific growth rate at (T + 10°C) divided by the value at T°C. Actual and estimated spoilage did not correlate well and the inaccuracy was attributed to variations in Q10, which may remain constant only in relatively narrow temperature ranges. In addition, the procedure did not separate the lag and exponential growth phases which are affected differently by temperature (Labuza et al., 1992; Li and Torres, 1993a,b; Almonacid et al., 1993a,b).
Further information on microbial kinetic models is found in a review by Labuza et al. (1992). Previous research has not addressed the effect of experimental error and experimental design on the precision of a shelf-life prediction. Also lacking are studies on the impact of heat transfer parameters, i.e. the insulating properties of packaging alternatives, the thermal properties of the food, and the thermal inertia associated with product size. Models based on analytical solutions are limited in application since not all predictive microbiology situations correspond to temperature fluctuations that can be represented as sinusoidal or other mathematical expressions. Information on these topics has been recently reported (Malcata, 1990; Almonacid and Torres, 1993; Almonacid et al., 1993a,b). Although the amount of quantitative microbial growth data suitable for modeling purposes continues to increase (e.g. Buchanan, 1986; Thayer et al., 1987; Li, 1988; Davey, 1991; Li and Torres, 1993a,b; Palumbo et al., 1992; Zaika et al., 1992) further work will be required to create an adequate database. Only then will predictive microbiology become an alternative to traditional microbiological assessment of food quality and safety (McMeekin et al., 1992).
Our objective was to compare microbial models to estimate the effect of temperature fluctuations on lag time and specific growth rate. These models were then evaluated for their ability to estimate microbial growth under fluctuating refrigeration temperature in liquid media. Other publications have covered solid media models (Almonacid and Torres, 1993; Almonacid et al., 1993a,b). We assumed that a detailed knowledge of the microbial ecology of a food product could be expressed as a mathematical model to enable objective evaluation of effects of processing, storage and distribution operations on microbial population changes. This would require deriving initially a mathematical model in laboratory studies, validating the model in food products and finally incorporating the information into monitoring devices (McMeekin et al., 1992).
MATERIALS & METHODSCultures
B roch o th rix th erm o sp h a cta (ATCC 12706) and P seu d o m o n a s f lu o - re scen s (ATCC 17400) were obtained from the American Type Culture Collection (Rockville, MD). The inoculum for the growth studies was prepared by transferring a loopful of culture from a slant to nutrient broth or brain heart infusion (BHI, Difco, Detroit, MI). BHI (pH 7.4 ± 0.2 at 25°C) was the medium for the growth of B. th erm o sp h a cta and nutrient broth (pH 6.1 ± 0.2 at 25°C) was used for P . f lu o re sc e n s . Media were autoclaved for 15 min at 121°C (15 psi).
Measurement and adjustment of a .The a„ of media was adjusted using glycerol, sodium chloride or
sucrose and measured after sterilization at the incubation temperature using a Hygroline sensor assembly (Model EBS, Beckman Industrial Inc., Cedar Grove, NJ) attached to an electric hygrometer recorder (Model VFB2, Beckman Industrial Inc.). The reproducibility of the instrument (recalibrated every 1-2 weeks) was ±0.1% (Beckman Industrial, Inc.). Experimental data was reported with a 0.001 a„ units precision. In the case of a„ conditions leading to long lag phases and slow growth rates, the a„ was also measured at the end of the experiment.
Growth studies at constant and fluctuating temperaturesErlenmeyer side-arm flasks (300 mL) containing 30 m L medium
were inoculated with test microorganisms (0.2 mL) in the late expo-
(TEMPERATURE, K>'1 x10⁴Fig. 1 —Arrhenius plots for the lag adaptation rate for B. thermosphacta growth in liquid media with aw adjusted by N a d and glycerol.
nential phase of growth to obtain an initial microbial density of =107 CFU/mL. The flasks were incubated at 2-26°C (±0.5°C) on an orbital shaker (Model G-33, New Brunswick Scientific Co., Inc., Edison, NJ) with agitation set at 120 rev/min. Growth rate was determined by measuring optical density (OD) at 600 n m (Spectronic 20, Bausch and Lomb, Rochester, NY). Fluctuating temperatures (2-14°C and 4- 12°C) were achieved by transferring flasks between incubators set at the two temperatures (±1°C). Preliminary experiments showed that with agitation the temperature changes of the growth medium occurred in less than 15 min. Note that although many calibration curves were conducted to estimate microbial counts from O D measurements, calibration curves would have been required for all testing conditions to obtain true kinetic constants.
Calculations and curve fittingAll calculations and curve fitting operations were performed on an
HP-41C calculator with STAT P A C ™ statistics program. An equation for O D readings as a function of time was calculated using data points from the exponential growth phase. The initial inoculation level was then substituted to estimate lag times and the slope of the equation was used in regression analysis to determine best fit lines for the linear, Arrhenius and square root models. Goodness of fit was evaluated using the coefficient of determination (R2) (Neter et a!., 1983).
RESULTS & DISCUSSION Effect of temperature on growth lag phase
Temperature effects on lag time reflect adaptation rate of a microorganism :o a new environment (Li, 1988; Li and Torres, 1993a,b). Adaptation rate, defined as the reciprocal of lag time (1/L; Li, 1988) was fitted to an Arrhenius-type equation (Fig.1). For the growth of B. thermosphacta at <20°C the plots were straight lines with R2 0.998, 0.994 and 0.990 in media with 3% (a^ = 0.968), 6 % (aw = 0.950) and 9% NaCl (aw = 0.943), respectively. Experimental runs with glycerol as the aw-controlling solute confirmed these observed effects yielding R2 = 0.991 and 0.969 in media with 8 % (a„ = 0.973) and 20% glycerol (aw = 0.948), respectively. Similar results for P. fluorescens confirmed the fit to the Arrhenius model of the lag adaptation rate here defined (Fig. 2). The systematic deviation from the model at temperatures >20°C would not invalidate predictive microbiology applications, as such temperatures would occur with a low frequency and any error would be on the conservative side.
Correlation of lag time and growth rateAn early report by Cooper (1963) noted that in some ex
amples the ratio of growth to generation time was nearly con-
Volume 58, No. 3, 1993-JOURNAL OF FOOD SCIENCE-645

M ICROBIAL GROW TH ESTIM ATION IN LIQUID MEDIA . . .
Fig. 2 - Arrhenius plots for the lag adaptation rate fo r P. fluo- rescens growth in liquid media with aw adjusted with NaC! and glycerol.
stant. This suggested a linear relationship between lag time and the reciprocal of specific growth rate and was confirmed for B. thennosphacta in media with aw controlled by NaCl (Fig. 3a) or glycerol (Fig. 3b). In media with 3% (aw = 0.968), 6 % (a* = 0.950) and 9% NaCl (a* = 0.943) the R2 were 0.865, 0.946 and 0.944, respectively. In media with 8 % (a„ = 0.973) and 20% (aw = 0.948) glycerol the R2 were 0.998 and 0.999, respectively. The linear relationship was also observed for P. fluorescens growth in media with NaCl (3 or 4%) or glycerol (10 or 20%) as the aw controlling solute (Fig.4). Fitting improved as solute concentration increased. This should facilitate modelling work because microbial growth estimations at reduced aw conditions have more practical value (i.e. longer shelf life products).
Comparison of growth rate-temperature models
The linear, Arrhenius and square root models for effects of temperature on specific growth rates were fitted to the growth of B. thermosphacta in media with 3, 6 or 9% NaCl at 8 , 12, 16, 20 and 26°C. R2 values (Table 1) showed the least fit for the Arrhenius model. Similar studies were also done in media with 8 , 20, or 30% glycerol at 4, 8 , 16 and 26°C and again the Arrhenius model showed the least fit. The Arrhenius model also gave the least fit for growth of P. fluorescens in media with 3 or 4% NaCl (Table 1). For media with 10, 15, or 20% glycerol the best fit was obtained for the square root model with the Arrhenius model being slightly better than the linear model (Table 1). Thus, experimental results confirmed the validity of the square root model (McMeekin et al., 1987; Poonie and Mead, 1984; Ratkowsky et al., 1982). However, under the experimental conditions tested, this model proved to be only slightly better than the linear model, which has the advantage of simplicity. This confirmed reports of Li and Torres (1993a,b).
McMeekin et al. (1987) reported that the square root model fit the growth-temperature relationship of S. xylosus quite well and that the Belehradek exponent was not affected by changing NaCl concentrations. In our study, the best fit d-values for the growth of B. thermosphacta in media adjusted with NaCl to aw values of 0.968, 0.950 and 0.943 were 2, 1.4 and 1, respectively. This suggested that the exponent d was a function of the medium and that it is an important parameter to describe the temperature effect on specific growth rate.
Estimation of microbial growth at fluctuating temperature
The ability to use mathematical models to estimate microbial growth in controlled media under fluctuating temperature conditions that may prevail in commercial distribution would facilitate development of refrigerated foods with reduced aw (Simpson et al., 1989; Torres, 1989). As an example, assume a refrigerated product has B. thermosphacta as an adequate microbial spoilage indicator. The minimum a„ for this bacterium in BHI broth at 4°C is 0.943 with NaCl as controlling solute. At temperatures >4°C, this microorganism grows at increasingly higher rates (Li and Torres, 1993a,b). At an a„ = 0.943 (9% NaCl), the growth lag duration could be estimated by the regression equation of the specific growth rate reciprocal (1/r) vs. lag time (L) (Fig. 3). The specific growth rate could be estimated by the linear regression equations (Table 2 ) of the specific growth rate as a function of temperature (Li, 1989; Li and Torres, 1993a,b). Goodness of fit for these two models showed that they were appropriate to describe the growth rate-temperature and the lag-growth rate relationships (Table 2).
The total lag time (0t) under fluctuating temperature conditions can be calculated as follows:
ii)■ (7><t> = Scti (8)
where L, = lag time at temperature T;, <}>; = adaptation fraction completed during time interval 0; at temperature T; (Li, 1989; Torres, 1989; Simpson et al., 1989). The lag adaptation would start with <5 = 0 and would be completed when cf> = 1. After time 0, = 20;, the microorganisms would grow exponentially and cell numbers could be calculated using Eq. (2) with L = 0,.
An example of experimental and estimated values for growth of B. thermosphacta at fluctuating temperatures, (12 hr at 4°C and 12 hr at 12°C) is shown in Fig. 5. In this experiment, aw was controlled at 0.943 (9% NaCl) slightly above the critical aw at 4°C. The predicted curve followed very closely the actual measurements and all experimental values fell within the 95% confidence interval until the growth curve reached the stationary phase. The slope of the fluctuating temperature segments seemed to be the same as the corresponding constant temperature experiment (4 or 12°C, Fig. 5). This indicated that the temperature shift from slow growth (4°C) to faster growth rate (12°C) did not cause an additional lag and was consistent with experimental data reported by Nielsen and Zeuthen (1986).
A second example of temperature fluctuation experiment (24 hr at 2°C and 24 hr at 14°C) for B. thermosphacta in BHI with aw 0.938 (10% NaCl) showed no growth at 2°C (Fig. 6 ). When the temperature was shifted from 2°C (no growth) to 14°C (fast growth), the growth rate was similar to that at constant 14°C. Again, microbial growth estimations agreed well v 'th experimental values and all growth predictions up to the stationary phase were acceptable at a 95% confidence level (Fig. 6 ).
The growth estimation examples showed that the lag time could be estimated with an acceptable degree of confidence. The definition of a temperature-dependent function to accumulate microbial adaptation (lag phase) successfully estimated total lag phase. Microbial growth estimations at fluctuating temperature confirmed that it is not appropriate to estimate microbial spoilage under fluctuating temperatures using a mean temperature (Fig. 5-6). Future research efforts should emphasize microbial estimation procedures that can be utilized for any measured or assumed temperature record. Assumptions of step-wise and sinusoidal temperature fluctuations are not universally applicable (Almonacid et al., 1993a,b).
646-JOURNAL OF FOOD SCIENCE-Volume 58, No. 3, 1993

Fig. 3 —Correlation o f lag time and specific growth rate for B. thermosphacta growth in liquid media with reduced a „ (a) N a d ; (b) glycerol.
Fig. 4 —Correlation o f lag time and specific growth rate for P. fluorescens growth in liqu id media w ith reduced aw using N a d or glycerol.
Table I — Comparison o f growth rate-temperature models fo r the growth o f B. th e rm o s p h a c ta and P. f lu o re s c e n s in liqu id media w ith reduced a w
M ic ro o rg a n is m s
G ro w th m e d ia M o d e l R 2
S o lu te (T , °C) % w /w aw A rrh e n iu s
S q u a rero o t L in e a r
B. thermosphacta N a C I 3 % 0 .9 6 8 0 .9 7 9 0 .9 8 7 0 .9 5 5(2 6 -8 ) 6 % 0 .9 5 0 0 .9 8 2 0 .9 9 4 0 .9 9 0
9 % 0 .9 4 3 0 .9 1 3 0 .9 3 0 0 .9 5 1g ly c e ro l 8 % 0 .9 7 3 0 .9 8 1 > 0 .9 9 9 0 .9 8 6
(2 6 -4 ) 2 0 % 0 .9 4 8 0 .9 5 9 0 .9 9 5 0 .9 9 63 0 % 0 .9 3 3 0 .9 6 5 0 .9 8 9 0 .9 9 0
P. fluorescens N a C I 3 % 0 .9 7 9 0 .9 3 7 0 .9 7 7 0 .9 9 7(2 6 -4 ) 4 % 0 .9 7 0 0 .9 5 1 0 .9 9 3 0 .9 9 3
g ly c e ro l 1 0 % 0 .9 7 9 0 .9 9 2 > 0 .9 9 9 0 .9 8 2(2 6 -4 ) 1 5 % 0 .9 6 4 0 .9 9 1 0 .9 9 8 0 .9 8 5
2 0 % 0 .9 5 5 0 .9 5 5 0 .9 9 7 0 .9 7 6
CONCLUSIONS
THE LINEAR RELATIONSHIP between growth lag and the inverse of specific growth rate was valid for growth of B. thermosphacta and P. fluorescens at various temperatures and aw. The coefficient of correlation increased when a„ was closer to the minimum aw for growth. No single mathematical model could estimate best the growth of all microorganisms for any
TEMPERATURE PROFILE
Fig. 5 — B. thermosphacta growth in liquid media exposed to temperature fluctuations at aw = 0.943 (9% Nad), o, constant 12°C; o, constant 4°C; + , constant 8°C. A , fluctuating temperature (12hrat4°C, 12 h r at 12°C).----- -, estimated growth curve.
Table 2-G oodness o f f it fo r specific grow th rate (h~') and lag tim e (h) models for the growth o f B. th e r m o s p h a c ta in low a w liqu id media
M o d e l R 2 F ra tio C o n fid e n c e le v e l
S p e c if ic g r o w th ra te r = 0 .0 0 6 9 + 0 .0 0 3 5 T
0 .9 8 9 1 7 8 .1 8 > 0 .9 9 "
Lag t im eL = 3 .0 1 (1 /r ) - 2 8 9 7
0 .9 9 4 5 2 1 .1 7 > 0 .9 9 9 b
1 F 1,2,0.99 = 98.5.* F 1,3,0.999 = 167.0.
given temperature and medium composition. The Belehradek function with variable d-value deserves further consideration. In some cases it leads to a simple linear expression (d = 1) as was the case of B. thermosphacta growth in low aw media.
Volume 58, No. 3, 1993-JOURNAL OF FOOD SCIENCE-647

M ICROBIAL GROW TH ESTIM ATION IN LIQUID MEDIA . .
TEMPERATURE PROFILE
EXPERIMENTAL AND PREDICTED MICROBIAL GROWTH
Fig. 6 — B. thermosphacta growth in liquid media exposed to temperature fluctuations at aw = 0.938 (10% Nad), o, constant 14°C; □, constant 8°C. A , fluctuating temperature (24 h r at 2°C, 24 h r at 14CC). ----- > estimated growth curve.
The separate estimation of lag time and growth rate appear to be best for estimating microbial spoilage.
R E F E R E N C E S
A lm onac id -M erino , S.F. and Torres, J .A . 1993. M a th e m a tica l models to eva lua te tem pera tu re abuse effects d u r in g d is tr ib u tio n o f re frige ra ted foods. J. Fcod Eng. In press.
A lm onac id -M erino , S.F., Thomas, D.R., and Torres, J .A . 1993a. N um e rica l and s ta t is t ic a l m ethodology to analyze m ic ro b ia l spoilage o f re frige ra ted so lid foods exposed to tem pera tu re abuse. J. Food Sci. In press.
A lm onac id -M erino , S.F., Thomas, D.R., and Torres, J .A . 1993b. S he lf- life m odel fo r re frige ra ted foods exposed to tem pera tu re abuse: v a r ia b il i ty ana lys is o f es tim ated values. J. Food Proc. Eng. S ubm itted .
B rou gha ll, J .M ., A nslow , P .A ., and K ils b y , D.C. 1983. H azard analysis applied to m ic ro b ia l g row th in food: D evelopm ent o f m a them a tica l model describ ing the effect o f w a te r a c tiv ity . J. A pp l. B acte rio l. 55: 101-110.
Buchanan, R .L. 1986. Processed meats as a m ic ro b ia l en v ironm ent. Food Technol. 40(4): 134, 136, 138.
Buchanan, R .L. 1992. P red ic tive m icrob io logy: m a them a tica l m ode ling o f m ic ro b ia l g row th in foods. In Food Safety Assessment, J.W . F in le y , S.F. Robinson, and D .J. A rm s tro n g (Ed.), p. 250-260. AC S Sym posium Series, A m erica n C hem ica l Society, W ash ing ton , D.C.
Cooper, K .E 1963. E ffects o f tem pera tu re on g ro w th la g o f a Staphylococcus species in peptone m edium . In Analytical Microbiology, F. K u- vanagh (Ed.), p. 46 -51. Academ ic Press, N ew Y o rk .
Davey, K .R . 1991. A p p lic a b ility o f the D avey ( lin e a r A rrh e n iu s ) p red ic tive model to the la g phase o f m ic ro b ia l g row th . J. A p p l. B ac te rio l. 70(3): 253—257.
Fu, B., Taoukis , P.S., and Labuza, T.P. 1991. P red ic tive m icro b io log y fo r m o n ito r in g spoilage o f d a iry products w ith tim e -te m p e ra tu re in te g ra tors. J . Food Sci. 56: 1209-1215.
Ing rah am , J .L . 1958. G ro w th o f psych roph ilic bacteria . J. B acte rio l. 76: 75 -80. , •
Janota -B assa lik , L . 1963. G ro w th o f psych roph ilic and m esoph ilic s tra ins o f peat bacteria . A c ta M ic ro b io l. Pol. 12: 41 -54 .
Labuza, T.P., Fu, B., and Taoukis , P.S. 1992. P red ic tio n fo r sh e lf l i fe and safe ty o f m in im a lly processed C A P /M A P ch ille d foods: A rev iew . J. Food P ro t. 55: 741-750. „ ,
L i, K .-Y . 1988. The M ic ro b ia l S ta b il ity o f In te rm e d ia te M o is tu re Foods. Ph.D . thesis, O regon S tate U n iv ., C o rva llis , OR.
L i, K .-Y . and Torres, J .A . 1993a. E ffects o f tem pera tu re and so lu te on the m in im u m w a te r a c t iv ity fo r g row th and tem pera tu re cha rac te ris tic o f selected m esophiles and psychrotrophs. J. Food Proc. Pres. S ubm itted .
L i, K .-Y . and Torres, J .A . 1993b. W a te r a c t iv ity re la tionsh ips fo r selected m esophiles and psychrotrophs a t re fr ig e ra tio n tem pera tu re . J. Food P ro t. S ubm itted .
M a lca ta , F .X . 1990. The effect o f in te rn a l th e rm a l g rad ien ts on the r e l i a b il i ty o f surface m ounted fu ll-h is to ry tim e -te m p e ra tu re ind ica to rs . J. Food Proc. P reserv. 14: 481-497.
M cM eekin , T .A . and O lley, J. 1986. P re d ic tive m icrob io logy. Food Technol. (A u s tra lia ) 38(8): 331-334.
M cM eek in , T .A ., C hand ler, R .E., Doe, P.E., G arland , C.D., O lley , J ., P utro , S., and R atkow sky, D .A . 1987. M odel fo r com bined effect o f tem pera tu re and sa lt concen tra tion /w a te r a c t iv ity on the g ro w th ra te o f Staphylococcus xylosus. J. A pp l. B acte rio l. 62: 543-550.
M cM eek in , T .A ., Ross, T., and O lley, J. 1992. A p p lic a tio n o f p red ic tive m icrob io logy to assure the q u a lity and safe ty o f fish and fish products. In t . J . Food M ic ro b io l. 15(1/2): 13-32.
N ete r, J., W asserm an, W ., and K u tn e r, M .H . 1983. Applied Linear Regression Models. R ichard D. I rw in , Inc., Homewood, IL .
N ie lsen, H .J.S. and Zeuthen, P. 1986. G ro w th o f spoilage ba c te ria in b ro th and vacuum -packed Bologna-type sausage a t f lu c tu a tin g tem pera tures and low tem pera tu re storage. J. Food P ro t. 49: 886—890.
Palum bo, S.A., W illia m s , A .C ., B uchanan, R .L., and P h illip s , J.G . 1992. M odel fo r the anaerobic g row th o f Aeromonas hydrophila K144. J. Food P ro t. 55: 260-265.
Poonie, G.S. and Mead, G.C. 1984. P rospective use o f tem pera tu re fun c tio n in te g ra tio n fo r p re d ic tin g the she lf- life o f non-frozen p o u ltry -m e a t p roducts. Food M ic ro b io l. 1: 67-78.
Power, J .J ., W eadzslaw, L., Rebecca, W ., and Theodore, P.D. 1965. Chem ic a l and m ic ro b ia l a c tiv ity ra t io under square w ave and s inuso ida l te m p e ra tu re flu c tu a tio n . J. Food Sci. 30: 520-530.
R atkow sky, D .A ., O lley, J ., M cM eek in , T .A ., and B a ll, A . 1982. R e la tio n sh ip between tem pera tu re and g row th ra te o f b a c te ria l cu ltu res . J. Bacte r io l. 149: 1-5.
Schoolfie ld, R .M ., Sharpe, P .J.H ., and M agnuson, C.E. 1981. N o n -lin e a r regression o f b io log ica l tem perature-dependent ra te m odels based on abso lu te re ac tion -ra te theory. J . Theor. B io l. 88: 719-731.
Simpson, R., L i, K .-Y ., and Torres, J .A . 1989. A m anagem ent too l to im prove th e m ic ro b ia l q u a lity o f re frige ra ted foods, p. 171-184. Proceedings o f the In te rn a tio n a l Conference on Technica l Inn ova tio ns in Freezing and R e fr ig e ra tio n o f F ru its and Vegetables, J u ly 9-12, U n iv . o f C a lifo rn ia , Davis, CA.
Spencer, R. and Baines, C.R. 1964. The effect o f tem pera tu re on the spo ilage o f w e t w h ite fish . Food Technol. 18: 769-773.
S tannard , C.J., W illia m s , A .P ., and Gibbs, P.H . 1985. T e m pe ra tu re /g row th re la tionsh ips fo r psych ro troph ic food-spoilage bacte ria . Food M ic ro b io l. 2: 115—122.
Thayer, D .W ., M u lle r , W .S., Buchanan, R .L., and P h illip s , J.G . 1987. E ffect o f N aC l, pH , tem pera ture , and atm osphere on g ro w th o f Salmonella ty- phimurium in g lucose-m inera l sa lts m edium . A p p l. E n v iro n . M ic ro b io l. 53(6): 1311-1315.
Torres, J .A . 1989. Tem pera tu re con tro l th ro u g h o u t th e d is tr ib u tio n system. Proceedings of the 1989 In s titu te o f Food Technologists Short Course: “ M in im a lly Processed R efrigera ted Foods” , June 24-25, Chicago, IL , 27 PP-
Za ika , L .L ., P h illip s , J.G ., and Buchanan, R .L. M odel fo r aerobic g row th o f Shigella flexneri under va rio us cond itions o f tem pera tu re , pH , sodium ch loride and sodium n it r i t e concentrations. J. Food P ro t. 55: 509-513.
M s received 11/16/92; revised 1/8/93; accepted 1/24/93.
648—JOURNAL OF FOOD SCIENCE—Volume 58, No. 3, 1993

Kinetics of Clostridium sporogenes PA3679 Spore Destruction Using Computer-Controlled
Thermoresistometer
M. RODRIGO, A. MARTINEZ, T. SANCHEZ, M.J. PERIS, and J. SAFON
--------------------------------- A B S T R A C T ----------------------------------A modified version of a computer-controlled thermoresistometer was used, with and without micropurge, to study the inactivation kinetics of C lostrid iu m sp o ro g en es PA 3679 spore destruction between 121— 143 °C in phosphate buffer (pH 7) and in mushroom extract acidified with citric acid. A shorter temperature come up time was observed with micropurge. The thermal death time (TDT) curve for spores in phosphate buffer with micropurge followed a straight line (z = 9.5 °C). Without micropurge the curve could be described by two lines with z = 10.0 °C for temperatures up to 132.5 °C and z = 18.3 °C for higher temperatures. The spore heat resistance in mushroom extract was lower than in phosphate buffer. D T values decreased exponentially as temperature increased, but acidification did not reduce thermal resistance at high temperatures.
Key Words: mushrooms, kinetics, microbes, thermoresistometer, C. sp o ro g en es
IN T R O D U C T IO N
HIGH TEMPERATURE-short time (HTST) treatment is an energy-saving way to sterilize foods with maximum retention of nutritional and sensory characteristics. The process involves uniform heating at high temperatures, above 121 °C and up to 150 °C. Few data are available to describe the thermal death or inactivation kinetics of bacterial spores at high temperatures and short exposure times (David and Merson, 1990), or the effect of pH or substrate at high temperatures.
Consequently, HTST processes are often based on extrapolation from thermal death time data obtained at lower temperatures, (below 121 °C). Such extrapolation could be unreliable, since reported data do not agree about the nature of the TD curves obtained at temperatures above 121 °C. Some researchers have reported nonlinear relationships for these curves (Busta, 1967; Burton et al., 1977; Jonsson et al., 1977; Perkin et al., 1980; Neaves and Jarvis, 1978; David and Merson, 1990) while others have reported no variation in the z value (Esselen and Pflug, 1956; Gaze and Brown, 1988). The equipment required for carrying out thermal death experiments at high temperatures, must subject the sample to a square wave transient temperature for very short exposure times. Differences in equipment to do this could explain the differences among published results, and the lack of inactivation kinetic data.
Advances in use of thermoresistometers in such equipment for thermal death studies in the HTST range have been made by David (1985), Brown et al. (1988) and David and Merson(1990). These all used computer-controlled reactors based on the design of Pflug and Esselen (1953). These reactors have been used to study the inactivation kinetics of Cl. botulinum and B. stearothermophilus spore destruction at high tempera-
Authors Rodrigo, Sanchez, Peris, and Safon are with Inst, de Agroquimica y Tecnologia de Alimentos, CS/C, Jaime Roig II, 46010 Valencia, Spain, Author Martinez is with Centro de Edafologia y Biologia Aplicada del Segura, Avda de la Fama sin, Murcia, Spain.
tures and are characterized by short come up and come down times, permitting operation at temperatures up to 150 °C with exposure times as short as 0.4 sec. We have a new version of Brown’s thermoresistometer providing improved manipulation features.
Knowledge o: microbial spore kinetic pattern at high temperatures is valuable when designing thermal processes for HTST treatments and validation by inoculated pack studies or bioindicators. Although much work has been done at temperatures below 121 °C, the effect of pH on thermal death kinetics of bacterial spores at high temperatures has not been sufficiently clarified. The objective of our work was to establish the suitability of the modified prototype version of the thermoresistometer originally designed by Campden Food and Drink Research Association Chipping Campden (U.K.) for making studies at HTST temperatures, with modifications we made at our Institute.
MATERIAL & METHODS
W E STUDIED the nature of the thermal death kinetics of C lostrid iu m sp o ro g en es PA 3679 spores heated in neutral phosphate buffer M/15 over the temperature range 121-143 °C. W e also studied the effect of substrate and pH on the heat resistance of PA 3679 spores at high temperatures. W e used mushroom extract as substrate because of the importance of such industry, and citric because it is the most used acid in the industry.
Organism and spore productionPutrefactive anaerobe PA 3679 was obtained from the National
Food Processors Association (NFPA), USA. This microorganism was chosen for its importance in studies focused on the calculation of heat processes for low-acid foods and their evaluation, and because it has similar physiological requirements to C lostrid iu m bo tu linu m but is nontoxic In order to obtain large amounts of test spores with comparable eat resistance, a beef heart infusion broth was used with a multiple stage inoculation procedure as described by Goldoni et al. (1980). pores were harvested by filtering the spore-growing medium through four layers of sterile cheesecloth. The filtrate was cleaned by centrifugation at 10400 x g at 4 °C for 10 min. This was repeated three times resuspending the spores in M/15 phosphate buffer pH 7. The washed spores were resuspended in M/15 phosphate buffer pH 7 and transferred to a glass bottle filled with sterile glass beads to aid resuspension of spores and break up any clumps during storage at 4 °C.
Thermoresistometer designThe apparatus was a modified version of that described by Brown
et al. (1988) a thermoresistometer with improved manipulation features. The main working parts of the reactor are shown in Fig. 1. In order to avoid condensation, the steam chamber was positioned laterally with one side open to the temperature-controlled steam supply. The other side was sealed and had a pipe for steam recirculation. An electric boiler, which produced pure steam, and steam filters were also installed. The sample transfer mechanism, which worked in the same way as the Brown et al. (1988) thermoresistometer, differed slightly from those of David (1985) and David and Merson (1990). It consisted of five stainless steel rods with O-ring seals sliding inside teflon tubes. In this configuration, five samples were carried into the
Volume 58, No. 3, 1993-JOURNAL OF FOOD SCIENCE-649

KINETICS OF C. SPOROGENES SPORE DESTRUCTION . . .
Fig. 1 -D iag ram o f thermoresistor sample transfer mechanism: (1) Steam chamber, (2) Steam supply cylinder, (3) Transfer rod, (4) Heading port and sample holder, (51 Sample thermocouple, (6) A ir pressure manifold, (7) Platinum resistor probe, (8) Glass sample bottle, and (9/ Connecting rod to piston.
exposure chamber at once. This allowed five replications of each treatment. The rods were connected to a piston located on the side of the heating chamber opposite to the loading/discharge section. A filtered pressurized air supply was provided at the loading port to prevent flash evaporation of samples as they emerged from the heating chamber. Thin wire copper costantan thermocouples were used to monitor sample surface temperature. The thermocouple assembly could be retracted to allow sample cups to be inserted into sample carrier rods. The temperature inside the heating chamber was monitored by means of 4 platinum resistor probes. An automatic control and data logging system was constructed around an IBM PC-XT computer, which was used to control all functions of the thermoresistor and to scan and record times and temperatures. Additional details of the apparatus and its performance are given by Brown et al. (1988).
140O 130
© 1 2 0
| 1 1 0
® 1 0 0 E© 9 0
800 3 6 9 12 15
Time (sec.)
P
©Q.E©
Time (sec)Fig. 2 —Temperature profiles o f samples heated in the ther- moresistometer at 137.5 °C. Lines represent the five positions on each piston stroke ... (A) Without micropurge; (B) With m icropurge.
M icropurge
When micropurge was used, this was achieved by allowing a small flow of steam to pass through the inside of the transfer rods from the heating chamber and past the silicone rubber seal between the thermocouples and the sample chamber.
Preparation of acidified mushroom extractFresh, raw mushrooms were washed, cut and sliced and placed in
454 cc jars. Various aqueous citric acid solutions were then added to obtain preestablished pH values. A batch was also prepared without acid to have samples with natural pH. The jars were seamed and thermally processed at 121 °C for 20 min. The processed product was then homogenized and filtered through cheesecloth, and pH values were tested. The extracts were placed in tubes and again sterilized at 121 °C for 20 min. and stored at 4 °C before use. The final pH values of the extracts were natural pH (6.65), 6.22, 5.34 and 4.65.
Spore inoculation and heat treatment of suspensionHeat treatment in phosphate buffer was applied by working the
reactor in 2 different ways, with and without micropurge. With extracts microparge was always used. In all cases and for each temperature-time combination, eight hydrophobic membrane filter paper discs (10 m m diameter), each inserted in an 11 m m diameter aluminum vial cap, previously autoclaved, were inoculated using a 10 p.L Hamilton syringe with 0.01 m L o: the spore suspension in phosphate buffer or extract in the ration 1:4 v/v. Five samples were placed in the ther- moresistometer transfer rods, which were specially designed to expose both sides of the paper filter to the steam, and the remaining three were used as controls for the initial number of spores. Under computer control, a piston moved the five rods holding samples into the treatment chamber, as described by Gaze and Brown (1988). When the heating period was over, the samples were retracted to the unload
position and dropped into universal bottles containing glass beads and 10 m L of sterile distilled water. These were vigorously agitated to extract the sample from the paper disc. W e established the suitability of the procedure by checking that the numbers of spores in the controls were similar to those in the stock solution. After appropriate dilutions, the spores were subcultured on duplicate plates using as recovery medium modified PA 3679 agar (Grischy et al., 1983) which showed its effectiveness in recovery of heat-injured PA 3679 spores in previous work (Rodrigo and Martinez, 1988). The plates were incubated for 6 days at 37 °C in B B L anaerobic jars and surviving spores were then enumerated. The analysis of surviving microorganisms by enumeration has been reported by many researchers (Brown et al., 1988; David and Merson, 1990). W e considered that this method had some advantages over the end point method. Enumeration data give point- to-point values of microbial survivors as a function of stress and make it possible to establish the true shape of the survivor curve.
RESULTS & DISCUSSIONPerformance of the apparatus and heat resistance in phosphate buffer
The computer provided a printout of temperatures for each sample taken every 0.3 sec. A set of profiles representative of the sample temperature pattern is shown in Fig. 2. Curve “ B” , obtained when micropurge was used, had a shorter come up time than curve “ A” without micropurge, and is comparable to the time of 0.4 sec of the David and Merson (1990) resis- tometer. Comparing both curves, we can see from the temperature pattern that samples heated using micropurge were subjected to 137.5 °C for longer than those heated without micropurge.
An analysis of variance was made in the number of decimal reductions achieved in the survivor microorganisms at 137.5 °C,
650-JOURNAL OF FOOD SCIENCE-Volume 58, No. 3, 1993

Time (sec) at 142°CFig. 3 —Survivor curve for PA 3679 heated at 142 °C in phosphate buffer pH 7.
T e m p e ra tu re (°C )Fig. 4 — Thermal death time curve fo r PA 3679 heated in phosphate buffer; Curve a, Without m icropurge; Curve b, With m icropurge; Curve c, Esselen and Pflug (1956) curve. Dashed lines are 95% confidence invervals for curve b.
Table 1—D j values (m in) fo r PA 3679 spores hea ted in phospha te b u ffe r p H 7. F igures in pa ren thes is are the coe ffic ien ts o f corre la tion r. (Five rep lica tions p e r tim e -tem pera tu re com bination)
T e m p e ra tu re W ith o u t M ic ro p u rg e W ith M ic ro p u rg e
N o. data N o. dataT O ’ p o in ts DT V a lu e p o in ts Dt V a lu e
121 54 3 .0 1 (0 .72 )*» 58 2 .6 1 (0 .5 5 )* *125 48 0 .8 6 (0 .9 1 )* * 42 1 .4 6 (0 .7 5 )**130 40 0 .4 0 (0 .9 4 )* * 32 0 .38(0 9 3 ) * *132.5 24 0 .1 8 (0 .9 5 )* *137.5 49 0 .1 5 (0 .8 0 )* * 30 0 .0 6 2 (0 .9 8 )**140 36 0 .1 3 (0 .5 1 )* *142 38 0 .0 1 8 (0 .9 2 )**143 2 2 0 .0 4 2 (0 .9 4 )**
a Five times for each temperature * * P<0.01
as affected by the use or nonuse of micropurge. It revealed significant differences (p< 0 .0 0 1 ) with the number of decimal reductions being greater in experiments with micropurge than in those without micropurge. Also an analysis of variance was performed at 121 °C, and in that case no significant differences were revealed (p<0.001). A possible explanation could be that the longer exposure times at 121 °C caused the influence of differences in come up time to be relatively less important than at 137.5 °C. This would have resulted in the number of spore deaths at the end of the exposure period at 121 °C being similar with and without micropurge.
Survivor curves were obtained by plotting the logarithm of survivor organisms or colony forming units (CFU)/mL against exposure time. Regression lines were obtained and all curves were straight lines passing through the N0. A sample curve is shown in Fig. 3. Each DT value was calculated as the negative reciprocal of the slope of the regression line. DT values for the different temperatures and the correlation coefficients of the regression lines for both experiments are shown in Table 1.
The expression of the temperature dependence of the death rate was obtained by plotting the logarithm of the Dx values against treatment temperature (Fig. 4). As we can see, the thermal death curve obtained from data without micropurge (curve “ a” ), could be represented by two slopes. The regression line using data from 121 to 132.5 °C had a correlation coefficient of 0.988 and a z value of 10 °C. Other regressions were established and they gave lower coefficients. Taking into account all data (121-143 °C), the correlation coefficient was 0.962 and the z value 13.5 C°. Using data from 132.5-143 °C, the correlation coefficient was 0.83 with a z value of 18.3 C°. On the other hand, the curve from experimental data using micropurge (Fig. 4, curve “ b” ), could be represented by a straight line in the temperature range studied (121-142 °C).
Table 2 —DT an d z values, w ith corre la tions coe ffic ien ts in parenthesis, fo r PA 3679 heated in m u shroo m s ex trac t ac id ifie d a t d iffe ren t p H values. (Five rep lica tions fo r tem pera tu re tim e com bination)______________________
pH va lu eT e m p e ra tu re M e an DT v a lu e b
(°C)a (m in) S ta n d a r d e v ia tio n
6.65 121 1.500 G 0.138 9 .5 9 (0 .9 9 7 )**125 0 .630 D 0.051130 0 .270 C 0.018135 0.086 AB 0.005140 0 .029 A 0.003
6 .2 2 121 1.640 F 0.290 1 1 .2 6 (0 .9 9 8 )**125 0 .870 E 0.130130 0 .310 C 0 .059135 0.098 AB 0.009140 0 .030 A 0.003
5 .34 121 1.774 F 0.225 1 0 .3 9 (0 .9 9 8 )**125 0.860 E 0.167130 0 .320 C 0.068135 0.091 AB 0.008140 0.027 A 0.003
4 .65 121 1.720 F 0.114 9 .5 4 (0 .9 9 8 )**125 0.680 D 0.053130 0 .190 BC 0.014135 0.059 AB 0.006140 0 .020 A 0 .0 0 2
Five times for each temperature * * P<0.01b Means with different letter are different (P = 0.05). The test of fit goodness for in
dividual D values has in all cases an associate probability > 99%
P.B. Nat. 6.22 5.34 4.65pH values
Fig. 5 —Dj values (min) as a function o f pH and temperature for spore o f Cl. sporogenes PA 3679 suspended in phosphate buffer and in mushrooms extracts. Nat. = Natural pH (pH = 6.65); P.B. = Phosphate buffer (pH = = 7).
The correlation coefficient for the regression line was 0.997, and the z value was 9.5 °C. These results agreed with those (Fig. 4, curve “ c” ) reported by Esselen and Pflug (1956), who reported nc differences in z value in the temperature range
Volume 58, No. 3, 1993-JOURNAL OF FOOD SCIENCE-651

KINETICS O F C. SPOROGENES SPORE DESTRUCTION . . .
c
Cfta>co>
pH 7(P.B.) pH 0.06(Nat) pH 0.22 pH 6.94 pH 4.66
T e m p e r a t u r e ( ° C )Fig. 6 - Thermal death time curves for Cl. sporogenes PA 3679 spores heated in phosphate buffer and in mushrooms extract adjusted at four pH values. Nat. = Natural pH (pH = 6.65). P.B. = Phosphate buffer (pH = 7).
121-143 °C and deduced a z value of 10.4 C° despite differences in heat resistance caused by different strain, method of speculation and determination techniques. A study was designed to evaluate the possibility of a loss of spores by steam distillation using micropurge. We observed no significant differences between the numbers of survivors with samples placed in pistons with or wkhout purge and treated at 121 °C for 180 sec. Such conditions minimized the effect of come up time on the count.
From the results we could say that the purge implemented in the IATA resistometer improved the pattern of sample temperatures. It also made it possible to obtain better microbiological data, particularly above 132.5 °C, where very short exposure times were applied. These improvements are reflected in :he TD curve, where we can see that the double slope of curve “ a” could be a consequence of equipment performance rather than a characteristic of spore thermal death kinetics at high temperatures.
Heat resistance as a function of substrate and pH of mushroom extracts
The thermoresistometer was used with micropurge to determine heat resistance in mushroom extracts. The results are summarized in Table 2, and Dx values as a function of pH and temperature are plotted in Fig. 5. In general, the heat resistance of spores in mushroom extracts with natural pH (6.65) was lower than those in phosphate buffer (p<0.05). However, the effect of the mushroom extract was less at the higher temperatures; e.g. D12i in extract (pH 6.65) was 57% of Di21 in phosphate buffer, whereas D , 30 in extract (pH 6.65) was 71% of D130 in phosphate buffer.
In the case of acidified mushroom extract at different pH levels, in general, we can not establish a clear effect of pH on Dx values (Table 2). As can be seen (Fig. 5) a smooth relationship between pH and heat resistance was not found. It appears that certain pH values between 5.34 and 6.22 were critical in determining PA 3679 spore heat resistance at 121— 125 °C.
In some cases, our results suggest that spores of PA 3679 may be slightly more resistant in mildly acid conditions (pH values 6.22-5.34) at these temperatures. However, Dx values were not significantly different (p<0.05) at the temperatures tested (Table 2). Comparing our results at high temperatures with those of Cameron et al (1980) between 110-121 °C, it appears that there are two kinds of reactions to pH. Up to 121 °C, pH affected Dx values more as the temperature increased while at > 125 °C pH did not affect Dx values. It may be of interest to study these changes in order to understand better the mechanisms of destruction of bacterial spores.
For all pH values, including pH 7 of phosphate buffer, when the temperature was increased the Dx value decreased expo
nentially in the temperature range tested 121-140 °C (Fig. 6 ). The z values ranged from 9.54 C° at pH 4.65 to 11.26 at pH 6.22. These values were very close to the z = 10 C° used in process calculations.
CONCLUSIONS
THE THERMORESISTOMETER was suitable for carrying out studies of heat resistance in microorganisms at high temperatures (up to 132 °C). The performance of the apparatus when it was implemented with steam separator, thermodynamic steam purge inside the chamber and micropurge in the rods was satisfactory. It provided the capability of making accurate thermal death studies in the UHT range (132-142 °C) because of improved heat transfer to the sample. Results support the use of a single value of z = 10 C° for calculating process values in the range 121-142 °C with spores of PA 3679 in phosphate buffer and in mushroom extracts acidified with citric acid. Mild acidification of mushrooms, with citric acid, would not significantly reduce the resistance of Clostridium sporogenes PA 3679 spores in the temperature range 121-140 °C. Nevertheless, considering reported contradictory results for microorganisms of interest in thermal processing, more studies are needed, using food substrates, to clarify kinetic patterns in the HTST range.
REFERENCES
Brown, K.L., Gaze, J.E., McClement, R.H., and Withers, P. 1988. Construction of computer-controlled thermoresistometer for the determination of the heat resistance of bacterial spores over the temperature range 100 to 150 °C. Inter. J. Sci. & Technol. 23: 361.
Burton, H., Perkin, A.G., Davies, F.L., and Underwood, H.M. 1977. Thermal death kinetics of Bacillus stearothermophilus spores at ultra high temperatures. Ill Relationship between data from capillary tube experiments and from UHT sterilizers. J. Food Technol. 12: 149.
Busta F.F. 1967 Thermal inactivation characteristics of bacterial spores at ultra high temperatures. Appl. Microbiol. 15: 640.
Cameron, M.S., Leonard, S.J., and Barret, E.L. 1980. Effect of moderately acidic pH on heat resistance of Clostridium sporogenes spores in Phosphate buffer and in buffered pea puree. Appl. & Environ. Microbiol. 39(5): 943-949.
David J.R. 1985. Kinetics of inactivation of bacterial spores a t high temperatures in a computer controlled reactor. Ph.D. dissertation, Univ. of California, Davis.
David, J.R. and Merson, R.L. 1990. Kinetic parameters for inactivation of Bacillus stearothermophilus at high temperatures. J. Food Sci. 55(2): 488, 515.
Esselen, W.B. and Pflug, I.J. 1956. Thermal resistance of putrefactive anaerobe PA 3679 spores in vegetables in temperature range of 250-290 °F. Food Technol. 11: 557.
Gaze, J.E. and Brown, K.L. 1988. The heat resistance of spores of Clostridium botulinum 213B over the temperature range 120 to 140 °C. Inter. J. Food Sci. Technol. 23: 373.
Goldoni, J.S., Kojima, S., Leonard, S., and Heil, J.R. 1980. Growing spores of P.A. 3679 in formulations of beef heart infusion broth. J. Food Sci. 45: 467.
Grischy, R.O., Speck, R. and Adams, D.M. 1983. New media for enumeration and detection of Clostridium sporogenes PA 3679 spores. J. Food Sci. 48: 1466.
Jonsson, W., Syng, B.G., Harnuld, B.G. and Zachrisson, T. 1977. Testing two models for the temperature dependence of the heat inactivation rate of Bacillus stearothermophilus spores. J. Food Sci. 42: 1251.
Neaves, P. and Jarvis B. 1978. Thermal inactivation kinetics of bacterial spores at ultra high temperatures with particular reference to Clostridium botulinum. Research Report N° 286, Leatherhead Food R.A.
Perkin, A.G., Davies, F.L., Neaves, P., Jarvis, B., Ayres, C.A., Brown, K.L., Falloon, W.C., Dallyn, H. and Bean, P.G. 1980. Determination of bacterial spore inactivation at high temperatures. In Microbial Growth and Survival in Extremes o f Environment. Society for Applied Bacteriology, Technical Series N° 15, G.W. Gould and J.E.L. Corry (Ed.), p. 173. Academic Press, New York,
Pflug I.J. and Esselen W.B. 1953. Development and application of an apparatus for study of thermal resistance of bacterial spores and thiamine at temperatures above 250 °F. Food Technology 7: 237.
Rodrigo, M. and Martinez, A. 1988. Determination of a process time for a new product: canned low acid artichoke hearts. Inter. J. Food Sci. & Technol. 23: 31.
M s received 6/26/92; rev ised 12/1/92; accepted 12/14/92.
We thank CICyT (AL191-1216-CO2-01) and CECAIR1-CT92-0746) for supporting this work and the Conselleria de Cultura Educació i Ciéncia de la Generalitat Valenciana for the Grant awarded to T. Sánchez. This work is part of the Ph.D. thesis of T. Sanchez.
652-JOURNAL OF FOOD SCIENCE-Volume 58, No. 3, 1993

Cholesterol Autoxidation Inhibition Varies Among Several Natural Antioxidants in an Aqueous Model System
S. A. RANKIN and O. A. PIKE
----------------------------ABSTRACT-----------------------------Inhibition of cholesterol autoxidation by several natural materials was examined in an aqueous meat model system at pH 5.50 and 80°C. Antioxidant effectiveness was measured using the induction period for7-ketocholesterol. An industrial rosemary oleoresin, quercetin, myr- icetin and B H A (included for comparison) had no antioxidant properties for cholesterol. All tocopherol treatments delayed cholesterol oxidation. The y- and 8- treatments were most effective and cx-toco- pherol was least effective. No synergistic effects were observed with tocopherol blends. Antioxidants effective against unsaturated fatty acid autoxidation may not inhibit cholesterol autoxidation.
Key Words: cholesterol, autoxidation, antioxidant, tocopherol
INTRODUCTIONCHOLESTEROL can oxidize to form cholesterol oxide products (COPS) shown to be toxic to cells (Bischoff and Byron, 1977; Ansari et al., 1982) and possibly associated with coronary heart disease (Imai et al., 1976; Peng et al., 1978, 1979). These COPS are formed in foods containing cholesterol subjected to common processing conditions such as spray-drying and deep-fat frying, and during prolonged storage. COPS have been identified in a variety of foods including raw, cooked, and dehydrated meats (De Vore, 1988; Sander et al., 1989), dairy products (Cleveland and Harris, 1987) and egg products (Naber and Biggert, 1985; Addis, 1986). Once ingested, COPS can be absorbed through the intestinal tract into the blood stream, exposing arterial tissue to their effects (Emanuel et al., 1991).
Much research has focused on developing foods with reduced amounts of cholesterol. Since all animal cells require cholesterol for vital functions it is difficult and perhaps impossible to remove it completely. Addis (1990) suggested, since there appears to be no practical method for lowering cholesterol in certain foods (like muscle tissue) that research directed at protecting cholesterol from oxidation may be more valuable. Strategies are being developed to lower cholesterol content in eggs (Elkin and Rogler, 1990) and milk (Bradley, 1989). Such products with residual cholesterol and processed meat products may benefit from inclusion of antioxidants to prevent cholesterol oxidation.
Smith (1980) indicated that cholesterol autoxidation was a free radical mechanism, similar to autoxidation of unsaturated fatty acids (Nawar, 1985). Factors affecting rate and onset of lipid oxidation include exposure to air, high temperatures, light, metal ions, and other compounds such as chlorophyll which could generate reactive components (Nawar, 1985). Both unsaturated fatty acid autoxidation and cholesterol autoxidation proceed by a free radical process. Thus compounds which inhibit unsaturated fatty acid oxidation may reasonably be expected to inhibit cholesterol oxidation.
A trend in antioxidant use is the change from synthetic antioxidants to natural compounds (Dugan, 1980; Inatani et al., 1983; Resurrección and Reynolds, 1990). Some such com-
Author Pike is with the Dept, o f Food Science & Nutrition, 475 WIDB, Brigham Young Univ., Provo, UT 84602. Author Rankin is currently with the Dept, o f Food Science & Technology, Oregon State University.
pounds include tocopherol (Piyor et al., 1988), rosemary extracts (Barbut et al., 1985), and flavanol compounds (Takahama,1985). In addition, Labuza (1971) reported that synergistic antioxidant effects have been demonstrated for blends of tocopherol isomers.
The objective of our research was to determine and compare the effectiveness of several natural antioxidants in preventing cholesterol autoxidation in aqueous solution at pH 5.50 (representative pH of some meats).
MATERIALS & METHODSCholesterol dispersion preparationOur aqueous dispersion used to examine cholesterol autoxidation
(Zulak and Maerkcr, 1989) consisted of 0.0005M cholesterol prepared by dissolving cholesterol and sodium dodecyl sulfate (SDS) in ethanol and adding 0.01M histidine buffer prepared with distilled, deionized water. The dispersion was incubated at 80°C to increase rate of oxidation and maintained at pH 5.50 (pH of some meat products, Hultin, 1985). Copper II sulfate (0.005 M) was added to promote autoxidation (Smith et al., 1967). SDS effectively dispersed the cholesterol and oxides throughout the 8-hr sampling period at 80°C with no visual indication of instability, but allowed sterol compounds to be extracted easily. Preliminary work indicated phosphate buffer slowed oxidation, therefore histidine was used. The buffer was affected by temperature, requiring pH adjustment with 2N HC1 at room temperature (=23°C) to pH 6.20. The buffer decreased to pH 5.50 when heated to 80°C. The histidine buffer effectively maintained pH at 5.50, even with excessive oxidation.
Cholesterol dispersion (40 mL) was pipetted into 50-mL Erlen- meyer flasks with ground glass stoppers and treated with 0.01% antioxidant (wAv cholesterol dissolved in 50 pL ethanol). Herbalox® a rosemary oleoresin (Kalsec, Inc., Kalamazoo, MI), myricetin, quercetin and a-, -y-, and 8-tocopherol isomers (Sigma Chemical Co., St. Louis, MO) were tested. Blends of a-, y-, and S-tocopheroI (1:1, by weight) were examined for possible synergistic effect. Butylated hy- droxyanisole (BHA) (Sigma Chemical Co., St. Louis, MO), a synthetic antioxidant, was also used for comparison. Samples were incubated at 80°C in a Blue M Magna Whirl hot water bath (General Signal, Blue Island, IL) with shaker dial set at 10. A 1.3-mL aliquot of cholesterol dispersion was removed from each flask at 30-min :n- tervals over an 8-hr period. Upon removal, aliquots were placed in 20-dram vials with Teflon-lined caps and immediately cooled ir. a water bath at room temperature. The headspace was flushed with nitrogen and aliquots were stored in a freezer at -20°C until analysis. Aliquots were thawed in a 25°C water bath and allowed to equilibrate to room temperature before extraction.
Sample extraction and preparation
A 1.00-mL sample of cholesterol dispersion was removed from each 1.3-mL aliquot and extracted three times with 2 m L ethyl acetate. Further extractions yielded no additional sterol compounds. Collected extracts were dried under nitrogen at 45°C, then dissolved in 1.00 m L reagent grade pyridine containing 5a-cholestane (Sigma Chemical Co., St. Louis, MO) as internal standard. The samples were dcrivatized using 50 pL Sylon BTZ (Supelco, Bellefonte, PA) in 20-dram vials with Teflon-lined caps (Park and Addis, 1985). Extraction efficiency for cholesterol and 7-ketocholesterol was examined using dispersions with known sterol standards. The extraction efficiency was 109% ± 3.3% for cholesterol and 106% ± 7.7% for 7-ketocholesterol (mean ± % standard deviation, n = 3).
Volume 58, No. 3, -!993-JOURNAL OF FOOD SCIENCE-653

CHOLESTEROL AUTOXIDATION INHIBITION. . .
50
1. 5<x-cnolestane (internal standard)
Fig. 1. —Sample gas chromatogram o f cholesterol oxide standards.
Fig. 2.—Induction period fo r 7-ketocholesterol with no added antioxidant. Intersection o f lines marks end o f induction period.
Gas chromatography
Gas chromatography was performed (Park and Addis, 1985) using a Hewlett Packard (HP) 5890 gas chromatograph with flame ionization detector. A HP 7673 autosampler injected samples onto a DB-1 fused silica gel cclumn (J. & W. Scientific, Inc., Rancho Cordova, CA; 0.25 m m I.D. x 15 m, bonded phase 100% dimethyl-polysiloxane with 0.25 |xm film thickness). A HP 3396 Scries II integrator quantified peaks. Flow rate of the helium carrier gas was 2 mL/min and split ratio was 1:50. Initial column temperature was 180°C increased
sDC
OGOoOuotr>
40 -
30 -
2 0 ■
1 0 ■
0
□ 7 a - h y d r o x y c h o l e s t e E 2 7 |3 - h y d r o x y c h o l e s t e ŒB C h o l e s t a n e t r i o l□ 7 - k e t o c h o l e s t e r o l
Æ h
T im e (h rs )Fig. 3. — Type and relative amounts of cholesterol oxides in model system with no added antioxidant.
to final 250°C at 3°C/min with a final hold time 2 min. Injector was 25C°C and detector 300°C. Peak identification (Fig. 1) was based on retention time of standards: cholesterol (Sigma Chemical Co., St. Louis, MO), 7a-hydroxycholesterol (cholcst-5-cne-3(3, 7a-diol), 7(3- hydroxycholesterol (cholest-5-ene-3(3, 7(3-diol), cholestanetriol (cho- lcstane-3(3, 5a, 6(3-triol), a-epoxide (5,6-a-cpoxy-5a-cholcstan- 3(3- ol), 25-hydroxycholesterol (cholest-5-ene-3(3, 25 diol), and 7 keto- cholesterol (3(3-hydroxycholest-5-en-7-one) (Steraloids, Inc., Wilton, NH). Relative retention times were similar to those previously reported (Park and Addis, 1985). Limit of detection was 0.1 pg/mL.
Experimental design
Two separate studies were performed. The first included quercetin, myricetin, Herbalox, BHA, and 8-tocophcrol. The second examined six tocopherol isomer treatments: a-, y-, and 5- and 1:1 (wt) blends: ajy, a/8 and 8/y. Both studies examined each antioxidant treatment in duplicate and included a control with no added antioxidant. W e used the induction period for a single oxide, 7-ketocholcstcrol to compare treatments. This oxide has been reported as a principal cholesterol oxide product (Maerker, 1987) and has been used as a marker of cholesterol oxidation in ground beef (De Vore, 1988).The induction period was determined by linear regression (Draper
and Smith, 1966). Several successive regressions were performed to obtain best fit of two lines to the data. The first two data points were assigned to the first line and the remaining points were assigned to the second line. The regression analysis was performed and the mean square error was recorded. Additional regressions were performed where a successive data point was added to the first regression line and removed from the second line. This process was continued until a minimum mean square error was obtained. The line equations produced at this minimum mean square error regression were set equal to each other and solved for time. This time is the point of intersection which marks the end of the induction period (Fig. 2)
A one-way analysis of variance was performed for significant treatment effect and a Tukey test compared the treatments. W e performed all statistical analyses on MINITAB 8 statistical software (Minitab Inc., State College, PA).
RESULTS & DISCUSSION Cholesterol oxides
Types and quantities of oxides formed after the induction period were comparable for all antioxidant treatments (Fig. 3). The first detectable and the most prevalent oxide formed was 7-ketocholesterol, which confirmed its use as a marker of cholesterol autoxidation. As reported by Maerker (1987) the ratios of 7o¡-hydroxycholesterol, 7(3-hydroxychoIesterol, and 7-ke- tocholesterol were = 1 :2 :6 , reflecting the thermal stability of 7-ketocholesterol. The a-epoxide and 25-hydroxycholesterol oxides were not found in any of the samples even after extensive oxidation of cholesterol. We could not explain why no a-
654—JOURNAL OF FOOD SCIENCE—Volume 58, No. 3, 1993

6-Tocopherol
Quercetin
Control
Myricetin
Herbalox
BHA
0 1 2 3 4 5 6Induction Period (hrs)
Fig. 4. — Comparison o f 7-ketocholesterol induction periods in model system for several natural antioxidants. Different tetters denote significantly different induction periods (p<0.05, n = 2, pooled standard deviation = 0.297).
A
B
B
. . . . • • B
B
B
t---- 1---- r
(Triton X-100), greater concentrations of antioxidants (0.02%, 0 .2 %, and 2 .0 %), and no prooxidant.
For the tocopherol isomer study, the most effective antioxidant treatments were 8 -, y-, and the 8/y blend (Fig. 5). The a /8 and a ly treatments were less effective and a-tocopherol was the least effective antioxidant. No synergistic effects were observed with the blends. Our results for antioxidant effectiveness of tocopnerol isomers agreed with other research on unsaturated fatty acid autoxidation (Labuza, 1971; Nawar, 1985). Tocopherol results also agreed with Sagers (1991) who demonstrated that a-tocopherol inhibited cholesterol autoxidation in an aqueous me del system at 0 .0 2 % and 0 .2 %, but at 2 .0 % exhibited pro-oxidant properties.
All compounds we examined have been effective against autoxidation in unsaturated fatty acids. However, our results demonstrated that not all of them inhibited cholesterol autoxidation in our model system. At higher concentrations more compounds may demonstrate antioxidant effects. Further studies are needed to evaluate optimum conditions for specific antioxidant applications.
Induction Period (hrs)Fig. 5. — Comparison o f 7-ketocholesterol induction periods for samples containing tocopherol isomers and blends. Different letters denote significantly different induction periods ip <0.05, n = 2, pooled standard deviation = 0.092).
epoxide was detected, since cholestanetriol, which was detected, evolves from subsequent oxidation of the epoxides. Our model system was highly pro-oxidative (oxygen-saturated, high temperature and copper-catalyzed). Thus a-epoxide may have been present below our limit of detection and been quickly oxidized to cholestanetriol. Low levels of the a- and p-epoxide (0 to 2 ppm) with increased levels of cholestanetriol (9 ± 3 ppm) have been reported in French-fried potatoes (Zhang et al„ 1991).
Antioxidant effectiveness
Figure 4 shows the induction period of the antioxidants tested in the first study. In comparison to the control, 8 -tocopherol approximately doubled the induction period of 7-ketocholesterol. In contrast none of the others showed antioxidant properties for cholesterol in aqueous dispersion. Maerker and Unruh(1986) also reported that butylated hydroxytoluene (BHT) did not inhibit cholesterol autoxidation. In contrast, Sagers (1991) demonstrated that BHA, BHT, propyl gallate, tertiary butyl- hydroquinone and a-tocopherol inhibited cholesterol autoxidation in an aqueous model system. However, that model system differed from ours with a phosphate buffer, different surfactant
REFERENCESAddis, P.B. 1986. Occurrence of lipid oxidation products in foods. Food
Chem. Toxic. 24:1021-1030.Addis, P.B. 1990. Coronary heart disease: an update with emphasis on
dietary lipid oxidation products. Nutr. Rev. 62(2): 7-10.Ansali, G.A.S., Walker, R.D., Smart, V.B., and Smith, L.L. 1982. Further
investigations of mutagenic cholesterol preparations. Food Chem. Toxic. 20: 35-41.
Barbut, S., Josephson, D.B., and Maurer, A.J. 1985. Antioxidant properties of rosemary oleoresin in turkey sausage. J. Food Sci. 50: 1356-1363.
Bischoff, F. and Byron, G. 1977. The pharmacodynamics and toxicology of steroids and related products. Adv. Lipid Res. 15: 61-67.
Bradley, R.L. 1989. Removal of cholesterol from milk fat using supercritical carbon dioxide. J. Dairy Sci. 72: 2834-40.
Cleveland, M.Z. and Harris, N.D. 1987. Oxidation of cholesterol in commercially processed cow’s milk. J. Food Protect. 50: 867-871.
De Vore, V.R. 1988. TBA values and 7-ketocholesterol in refrigerated raw and cooked ground beef. J. Food Sci. 53: 1058-1061.
Draper, N.R. and Smith, H. 1966. Applied Regression Analysis. John Wiley and Sons, Inc., New York.
Dugan, L.R. 1980. Natural antioxidants. Ch. 17, In Autoxidation in Food and Biological Systems. M.G. Simic and M. Karel (Ed.), p. 261. Plenum Press, New York.
Emanuel, H.A., Hassel, C.A., Addis, P.B., Bergmann, S.D.,and Zavoral, J.H. 1991. Plasma cholesterol oxidation products (oxysterols) in human subjects fed a meal rich in oxysterols. J. Food Sci. 56: 843-847.
Elkin, R.G. and Rogler, J.C. 1990. Reduction of the cholesterol content of eggs by the oral administration of lovastatin to laying hens. J. Agri. Food Chem. 38: 1635-41.
Hultin, H.O. 1985. Characteristics of muscle tissue. Ch. 12 in Food Chemistry. O.R. Fennema (Ed.), pp. 725-789. Marcel Dekker, New York.
Imai, H., Werthessen, N.T., Taylor, C.B., and Lee, K.T. 1976. Angiotoxicity and arteriosclerosis due to contaminants of USP-grade cholesterol. Arch. Pathol. Lab. Med. 100: 565-572.
Inatani, R., Nakatani, N., and Fuwa, H. 1983. Antioxidant effect of the constituents of rosemary (Rosmarinus officinalis) and their derivatives. Agrie. Biol. Chem 47: 521-528.
Labuza, T.P. 1971. Kinetics of lipid oxidation in foods. CRC Crit. Rev. in Food Tech. 2: 355-405.
Maerker, G. 1987. Cholesterol autoxidation - current status. J. Amer. Oil Chem. Soc. 64: 388-392.
Maerker, G. and Unruh, J. 1986. Cholesterol oxides 1. Isolation and determination of some cholesterol oxide products. J. Amer. Oil Chem. Soc. 63: 767-777.
Naber, E.C. and Biggert, M.D. 1985. Analysis for and generation of cholesterol oxide products in egg yolk by heat treatment. Poult. Sci. 64: 341-347.
Nawar, W. W. 1985. Lipids. Ch. 4. In Food Chemistry, O.R. Fennema (Ed.), p. 139-244. Marcel Dekker, New York.
Park, S.W. and Addis, P.B. 1985. Capillary column gas-liquid chromatographic resolution of oxidized cholesterol derivatives. Anal. Biochem. 149: 275-283.
Peng, S.K., Taylor, C.B., Tham, P., Werthessen, N.T., and Mikkelson, B. 1978. Effect of autoxidation products from cholesterol on aortic smooth muscle cells. Arch. Path. Lab. Med. 102: 57-61.
Peng, S.K., Tham, P., Taylor, C.B., and Mikkelson, B. 1979. Cytotoxicity of oxidation derivatives of cholesterol on cultured aortic smooth muscle cells and their effect on cholesterol biosynthesis. Am J. Clin. Nutr. 32: 1033-1042.
Pryor, W.A., Strickland, T., and Church, D.F. 1988. Comparison of the efficiencies of several natural and synthetic antioxidants in aqueous sodium dodecyl sulfate micelle solutions. J. Am. Chem. Soc. 110: 2224— 2229.
Resurrección, A.V.A and Reynolds, A.E. 1990. Evaluation of natural antioxidants in frankfurters containing chicken and pork. J. Food Sci. 55: 629-654.
Sagers, P.A. 1991. Cholesterol autoxidation inhibition by phenolic antioxidants in an aqueous model system. M.S. Thesis, Brigham Young Univ., Provo, UT. —Continued on page 687
Volume 58, No. 3, 1993-JOURNAL OF FOOD SCIENCE-6 5 5

Ingredient Interaction Effects on Protein Functionality: Mixture Design Approach
G. E. ARTEAGA, E. LI-CHAN, S. NAKAI, S. COFRADES, and F. JIMENEZ-COLMENERO
----------------------------ABSTRACT-----------------------------A ten-point augmented simplex-centroid design was used to study the effects of ingredient interactions on properties of food protein mixtures. Hydrophobicity, solubility and functional properties (emulsification and color) of three ingredients (bovine casein and salt-extractable proteins frcm chicken breast muscle and beef heart) as well as mixtures of the ingredients were tested. Significant deviations were observed between experimentally measured properties of mixtures and values calculated assuming linear addition of individual ingredient properties. Regression models including significant interaction terms were calculated for ingredient-hydrophobicity and ingredient-functionality relationships, and used in computerized optimization of two hypothetical formulations.
Key Words: protein, hydrophobicity, interactions, mixture-design
INTRODUCTION
FOOD PRODUCT quality depends on ingredient functional properties, which often result from physiocochemical properties of proteins. For example, overall quality of comminuted meat products depends not only on protein content, but also on the characteristics of meat proteins as well as non-meat binders or fillers. The type or amount of an ingredient in the blend may be constrained by undesired texture, taste, color or inadequate fat or water-binding properties (Pearson and Tauber,1984). Ingredients in processed meat products are rated using bind values, based on the maximum fat that can be emulsified by a given amount of salt-soluble protein in a model test system (Carpenter and Saffle, 1964). However, such values are not reliable in predicting final quality, since that depends not only on emulsifying properties, but also on water-holding, gelling and other characteristics (Parks et al., 1985; Regenstein, 1985; Comer and Dempster, 1981).
Linear programming has been used by meat processors to determine least cost formulations which meet specified constraints, ingredient availability and product specifications (Pearson and Tauber, 1984; Norback and Evans, 1983). Based on experience and in some cases legal requirements, processors may define constraints or limitations on ingredients or on the final composition. Such compositional variables, quality parameters and constraints must all be expressed in the form of linear equations for this approach to be applied (Hsu et al., 1977a, b).
Recently, Vazquez-Arteaga (1990) proposed an alternative to the linear programming approach to optimize formulations of comminuted meat and other food products. Computational optimization techniques based on the “ Complex” (constrained simplex) method of Box (1965) were applied to establish the best combination of ingredients meeting defined product specifications. Ingredient-functionality relationships as well as cost and composition requirements could be used as constraints or as objective functions (Dou et al., 1993).
Authors Arteaga, Li-Chan, and Nakai are with the Dept, o f Food Science, Univ. o f British Columbia, 6650 N.W. Marine Drive, Vancouver, BC V6T 1Z4, Canada. Authors Cofrades and Jime- nez-Co/menero are with Inst, del Frio (CSIC), Cuidad Universi- taria, M adrid 28040, Spain.
The Complex method uses a flexible search unit (complex) of more than n+l vertices, where n is the number of independent variables (Box, 1965). Optimization is carried out by an iterative process evaluating and comparing objective functions or responses at all feasible vertices of the complex, and replacing the vertex yielding least applicable response by a new feasible point. Contraction of the complex occurs when constraints are violated. The Complex method has been applied in areas of food processing (Saguy et al., 1984). These include the derivation of optimal temperature profiles during food dehydration (Mishkin et al., 1984) and pasteurization (Arteaga et al., 1991), optimization of a carrot dehydration process with minimum destruction of Vitamin A and color (Sullivan et al.,1981), and optimization of pie crust formulations with storage stability and sensory specifications (Moskowitz and Jacobs,1987).
The Complex method could also have potential use for formula optimization based on ingredient structure-function relationships. Investigations in our laboratory and others have demonstrated that surface hydrophobicity and solubility of proteins were related to functional properties including emulsifying, foaming and gelling (Nakai and Li-Chan, 1988). Although solubility can be considered a functional property (Kinsella, 1982; Regenstein and Regenstein, 1984), it is also a physicochemical property of proteins (Thakker and Grady, 1984; Nakai and Li-Chan, 1988; Patel and Kilara, 1990). Multivariate data analysis indicated properties such as hydrophobicity, solubility and sulfhydryl group content could be used as predictors of functionality of protein ingredients in comminuted meat products (Li-Chan et al., 1987). However, such studies only investigated structure-function relationships in single ingredient systems. Study of the effects of interactions between ingredients on the relationship between physicochemical and functional properties is needed for optimization of formulations (Agreda and Agreda, 1989; Cornell, 1990).
In contrast to the large number of publications dealing with properties of individual proteins, relatively few studies have focussed on protein mixtures (e.g. Porteous and Quinn, 1979; Nichols and Cheryan, 1982; Burgarella et al., 1985; Jackman and Yada, 1988, 1989; Bawa et al., 1988). Most studies on mixtures have reported effects of blending two proteins on properties of the mixture. Very few, if any, studies have used systematic experimental design and statistical analysis to validate the significance of ingredient interactions or to establish structure-function relationships.
The primary objective of our work was to establish suitable methodology for experimental design, modelling and analysis which could be used to study the effects of ingredient interactions on properties of proteins in mixtures. Regression models to describe the structure-function and ingredient-fur.ction relationships of such mixtures could then be used for computerized optimization.
MATERIALS & METHODSSample preparation and heat treatment
Hammarsten casein was obtained from Chemalog (South Plainfield, NJ). Chicken breast muscle and beef heart were purchased from a
656-JOURNAL OF FOOD SCIENCE-Volume 58, No. 3, 1993

Oaoa
MIXTUREFig. 1 — Ten-point augm ented s im p lex-cen tro id design fo r studying three-ingredient mixtures.
local supermarket, and salt-soluble proteins were extracted from the meat sources as described by Li-Chan et al. (1984).The ten-point augmented simplex-centroid design of Cornell (1986)
(Fig. 1), was used to formulate three-component mixture systems comprised of the salt-soluble protein extracts (SSPE) of two meat ingredients (chicken breast and beef heart) and a nonmeat protein ingredient (casein). The ten points consisted of three single ingredient systems, three two-ingredient mixtures and four three-ingredier.t mixtures. Each of the ten formulations was prepared to give a final total protein concentration of 9 mg/mL in 0.01M sodium phosphate buffer at pH 7 containing 0.6M NaCl.
Heating is commonly used in the preparation of many food products including processed meat products. Thus, the ten protein solutions formulated according to the proportions used (Fig. 1) were also subjected to heat treatment to investigate effects on ingredient interactions. A 50 m L aliquot of each solution was heated in a boiling water bath (96 °C) for 10 min, then cooled immediately in an ice water bath (1 °C).
Solubility of samples (native and heat-denatured proteins) was analyzed by determination of protein concentration in the sample solutions before and after centrifugation at 27,000 x g for 30 min, as described by Li-Chan ct al. (1984). Protein concentration was determined using a protein assay kit based on the biuret reaction and bovine serum albumin as the stancard (Sigma Chemical Co., St. Louis, MO). Percent solubility was calculated as (protein concentration in supernatant/' protein concentration in uncentrifuged sample) X 100%.
Color of samples was expressed in terms of Hunter L, a and b values measured using a HuntcrLab Labscan II spectrocolorimetcr (Hunter Associates Laboratory Inc., Reston, VA). Diameters of illuminated area and port opening were set at 25 and 50 mm, respectively. Standardization was according to recommendations of the manufacturer, using first the standard black tile followed by the standard white tile. Protein solutions were gently hand mixed by inversion for 10 sec, then transferred to flat-bottom clear glass containers. Four readings were obtaired from each sample solution, the container being rotated 90 ° in a clockwise direction between readings. Sample solutions were measured in triplicate.
Statistical analysisScheffe’s canonical special cubic equation for 3 components was
fitted to data collected at each experimental point using backward stepwise multiple regression analysis as described by Vazquez-Ar- teaga (1990) and Ccrnell (1990). The Scheffe canonical model differs from full polynomial models in that it does not contain a constant term, i.e., it has a zero intercept. It may be regarded as a full-rank reparameterization of the corresponding full polynomial model in the presence of the implicit constraints in mixture models. The proportions of the ingredients must lie between zero and one, and the sum of the ingredient proportiens is one. The special cubic model has been recommended by Cornell (1986) in situtations when the shape of the response surface is uncertain, as was the case here. Significance of the regression equations was assessed as described by Cornell (1990), Snee and Rayner (1982) and Marquadt and Snec (1974), at a probability level of a = 0.05. The following specific analyses were performed: (1) F-tcst for significance of regression model; (2) t-test of partial regression coefficients for each term in the fitted regression model; (3) evaluation of change in the adjusted coefficient of determination (Ra2) and standard error of estimate when terms were deleted from the model; and (4) analysis of residuals to detect outliers or nonrandomness. Variables in the regression models which represent two-ingredient or tnree-ingredient interaction terms were referred to as “non-linear” terms. Triangular contour plots were constructed based on these regression models as well as those assuming only linear additivity. All statistical analyses and plots were performed on a personal computer using SYSTAT-SYGRAPH version 5.01 software (Wilkinson, 1990a, b).
Formula optimizationOptimization of formulations using linear programming was per
formed using commercially available software, “ LINDO” (LINDO® Systems, Inc., 1984). Optimization based on a modified version of the Complex method of Box (1965) was carried out using a FORPLEX program written in IBM BASIC (Vazquez-Arteaga, 1990), based on the F O R T R A N pregram of Kuester and Mize (1973).
Physicochemical and functional propertiesPhysicochemical and functional properties of heated and ur.hcated
protein solutions were analyzed at least in duplicate. Coefficient of variation in all cases was less than 10%. A N S and C P A hydropho- bicities were determined on samples diluted to 0.005-0.020% protein concentration, using the fluorescence probes l-anilinonaphthalene-8- sulfonate (ANS) and cis-parinarate (CPA), as previously described (Nakai and Li-Chan, 1988), with slight modification. Relative fluorescence intensity (RFI) values of the protein solutions with added fluorescence probes were corrected for RFI of corresponding protein blanks (no added probes). The corrected RFI values for the samples were then normalized with respect to RFI values of A N S in methanol or CP A in n-decane, assigned values of 100.
Emulsifying activity index (EAI) and emulsion stability index (ESI) were determined according to the method of Pearce and Kinsella (1978) as modified by Li-Chan et al. (1985), using 0.5% protein solutions and an oil phase volume of 0.25. Emulsion stability by this methodology is related to creaming phenomena, and first order decay of emulsions was assumed in calculation of ESI.
RESULTS & DISCUSSION Hydrophobicity
ANS and CPA hydrophobicity values were compared for the ten protein solutions and mixtures (Fig 2a, b), before and after heat treatment. Among the single ingredient unheated samples, SSPE from beef heart (mixture 3) had the highest values for both ANS and CPA hydrophobicity. SSPE from chicken breast muscle (mixture 2) had the lowest ANS hydrophobicity, while casein (mixture 1) had the lowest CPA hydrophobicity. Heat treatment caused a large increase in hydrophobicity values measured for chicken SSPE, while beef heart SSPE and casein showed moderate or no change.
Synergistic as well as antagonistic effects of blending ingredients on hydrophobicity were evident for several mixtures. For example, ANS hydrophobicity of mixtures 4, 5, 8 and 9 were higher than that expected by calculating average hydro-
Volume 58, No. 3, 9 9 3 -JOURNAL OF FOOD SCIENCE-657

INGREDIENT INTERACTIONS ON FUNCTIONALITY. . .
MIXTURE MIXTURE
Fig. 2 — ANS and CPA hydrophobicity o f ingredients and mixtures. (Open bars = unheated samples; filled bars = heated samples).
MIXTUREFig. 3 .—Solubility o f ingredients and mixtures. (Open bars = unheated samples; filled bars = heated samples).
phobicity weighted according to proportion of each ingredient. ANS hydrophobicity values for heated mixtures 5 and 9 were higher than any of the three original heated ingredients, while ANS hydrophobicity for unheated mixture 6 was lower than hydrophobicity values for both constituent ingredients (beef heart and chicken SSPE). These results suggested that interactions occurred between proteins, which resulted in changes in hydrophobic groups exposed on the molecules.
Solubility
All three individual ingredients as well as their mixtures were completely soluble (Fig. 3) under these conditions. Heating drastically reduced solubility of SSPE from chicken breast muscle and beef heart, while casein remained more than 9 5 % soluble. Solubility of proteins in the mixtures generally decreased after heating. However heated mixtures were more
soluble than was expected when calculated from weighted average solubilities of individual heated components.
Emulsifying properties
Emulsifying properties (EAI and ESI) of unheated casein (mixture 1 ) were more effective than those of either chicken muscle or beef heart SSPE (Fig. 4). However, mixtures containing casein did not always retain such effective emulsifying properties. For example, ESI values of unheated mixtures 4,5, 9 and 10 were much lower than those calculated from their ingredient composition.
Heating resulted in marked decreases in EAI and ESI values for casein, while SSPE of both chicken and beef heart showed less effects of heating. Effects of blending ingredients as well as of heat treatment were complex, leading to unexpected emulsifying properties of the mixtures. Although ESI of each individual ingredient was decreased by heating, some heated mixtures showed higher ESI values than corresponding unheated mixtures (e.g. mixtures 4, 5, 9 and 10, Fig 4b). Mixture6 , a 50:50 blend of chicken and beef SSPE, showed a low EAI for the unheated mixture but high EAI after heating (Fig. 4a).
Color
Unheated chicken SSPE (mixture 2) showed the highest “ L” value indicating whiteness (Fig. 5) while beef heart SSPE (mixture 3) had the highest “ a” value, indicating redness. Heating caused pronounced increases in “ L” values (Fig. 5) for chicken and beef heart SSPE. Visual observation of the chicken and beef heart samples showed that they became turbid and whiter after heating. Heated beef heart SSPE also showed decreased redness (“ a” value) and increased yellow or brown color (“ b” value). Casein (mixture 1) showed slight decrease in :‘L” value and increase in “ b” value by heating. However, since translucent rather than opaque samples were involved, direct interpretation of such changes in Hunter values must be cautious. There would be complex interactions of transmittance, absorption, reflectance and light loss through internal scattering and trapping.
From a purely theoretical view, if colors (or colored lights) are mixed and these present simple additive or subtractive mixing, then the Hunter values should be proportional to intensities
658-JOURNAL OF FOOD SCIENCE-Volume 58, No. 3, 1993

MIXTURE MIXTUREFig. 4 - Emulsifying activity index, m 2!g and emulsion stability index, m in o f ingredients and mixtures. (Open bars = unheated samples; filled bars = heated samples).
MIXTURE MIXTURE MIXTURE
Fig. 5-H unte rLab color values for ingredients and mixtures. (Open bars = unheated samples; filled bars = heated samples).
(concentration) of each component (Billmeyer and Saltzman, 1966). However, the most common type of color mixing is the “ complex subtractive mixing” in which colorants scatter as well as absorb light. Complicated equations, e.g., Kubelka- Munk equations, are used to describe this type of mixing (Billmeyer and Saltzman, 1966; Judd and Wyseck, 1975).
In current recommendations to include color constraints in linear programming for least-cost formulations of sausages, the effects of complex mixing are not taken into consideration. Various meat ingredients are assigned color values in a ranking system based on bull meat as 1 . 0 0 and pure white as 0 .0 0 , or based on pigment content (myoglobin plus hemoglobin, mg/ 100g protein). Color constraints are then incorporated by summation of color coefficients or values multiplied by the weight of each respective ingredient (Pearson and Tauber, 1984). Hunter values of individual components and mixtures in our work demonstrated that this simple additive approach was not valid in most cases. In order to predict the color of a mixture, equations need to be developed to include complex interactions from blending and heating.
Regression Models and Prediction of Properties of Mixtures
During formulation of ingredient composition for comminuted meat products or other blended food products, quality
parameters of individual ingredients, such as bind or color values, are used to predict overall quality of the blend. This is done by calculating an average value for the parameter, weighted according to the proportion of each ingredient in the blend. This weighted average assumes no interactions between ingredients. Actual experimental values of some selected properties (Fig. 6 ) were compared to values calculated by a weighted average of component ingredient properties. Clearly, the calculated values for the mixtures virtually all deviated from experimental ly measured values. For example, ANS hydrophobicity values for unheated sample mixtures 6 , 7 and 1 0 were lower than calculated values, while those for mixtures 4, 5, 8 and 9 were higher than calculated (Fig. 6 a). All mixtures had higher solubility after heating than expected from calculated values (Fig. 6 b). Except for mixture 5, experimentally measured values of ESI were higher than calculated values for all heated mixtures (Figure 6 c). HunterLab “ a” values for redness were lower than calculated values for all heated mixtures (Fig. 6 d).
Since Fig. 6 clearly demonstrated interaction between ingredients, regression analyses of the data were carried out to establish models to describe such relationships. Quadratic as well as cubic terms, i.e. “ non-linear” terms, were significant (P<0.05) in many regression models (Table 1), confirming that interactions between proteins in the ingredients were im-
Volume 58, No. 3, 1993-JOURNAL OF FOOD SCIENCE-659

INGREDIENT INTERACTIONS ON FUNCTIONALITY. . .
Mixture Mixture■ C alculated □ Experim ental
Mixture
Fig. 6— Comparison o f experimental and theoretical values calculated by weighted average o f ingredient properties. IOpen bars = experimental values; filled bars = calculated values).
Table 1—Ing red ie n t-fu n c tio n a lity a n d ing red ie n t-p hys icoche m ica l p ro p e rty regress ion m ode ls
Dependent ______Independent variables*______ _________Nonlinear blending termsva r ia b le X , x2 X 3 X ,X 2 x,x3 x2x3 X 1X 2X 3 R2.dib S .E .E .' P
Unheated samplesA N S , % - ' 282 193 331 - . - 4 4 3 2244 0.747 31.6 0 .023C PA, % - ' 345 553 596 423 - - 2 7 6 . 0.776 35.2 0 .0 1 7EAI, m 2/ g d 55 36 46 19 - 2 5 . - 5 8 0.999 0.09 0 .0 0 0ESI, m in d 134 - - - 2 3 5 - 9 8 . . 0 .974 6.97 0 .0 0 0Ld 15 21 12 11 - - - 0.731 1.70 0 .0 1 2ad * — 1.5 - 0 . 8 9 - - - . 0.813 0.34 0 .0 0 1b d - 2 . 4 - 3 . 1 - - 11 12 - 0 .834 0 .79 0 .0 0 1
Heated samp esA N S , % - ’ 294 837 282 1553 463 . . 0 .938 60.6 0 .0 0 1C PA, % - ' 368 1164 693 591 986 164 . 0.995 16.5 0 .0 0 0ESI, m in d 35 2.9 4 .3 - 43 . . 0.980 1.82 0 .0 0 0L 12 40 30 16 - - - 0 .964 1.59 0 .0 0 0
■ - 2 . 5 * - - 5 . 5 - 4 . 1 - 1 9 0 .856 0.35 0 .0 0 2
s o lu b ili ty , % 98- 4 . 814
- 3 . 323
- 1 129 83
1625 - 2 5 2
0 .9000.999
0.990.54
0 .0 0 00 .013
• X i, X2 and X3 refer to the proportions of casein, chicken and beef heart, respectively, in the formulation.» R2.dl or adjusted multiple coefficient of determination was calculated as 1 - {[SSE/ (N -n)]/[S ST/ ( N - 1)]}, where SSE is the error or residual sum of squares (including lack
of fit and pure error sum of squares), SST is the total sum of squares, N is the total number of observations and n is the number of terms in the regression model.S.E.E. or standard error of estimate for the regression model was calculated as the square root of the residual mean square.
" Outliers were found which were not considered in the final regression model.
portant. In these models, positive values of partial regression coefficients for nonlinear terms suggested a synergistic effect of binary or ternary mixtures, while negative values suggested antagonistic effects. For example, the positive binary terms in the model for solubility of heated samples indicated that in
teractions between ingredient proteins resulted in higher solubility than expected in the absence of interactions. As shown (Fig 6 b), experimentally measured values for solubility of all heated mixtures were higher than those calculated assuming no interactions. Similarly, the positive XjX3 term in the model
6 6 0 -JOURNAL OF FOOD SCIENCE-Volume 58, No. 3, 1993

(a)
(b)
IHBeef heart (X,)
I niBeef heart (X,)
Fig. 7 -Isoresponse contour plots fo r (a) ANS hydrophobicity o f unheated samples and (b) emulsion stability index (min) o f heated samples. The isoresponse curves were calculated using (i) the regression model shown in Table 1 (linear and nonlinear blending terms), o r (II) weighted average (linear terms only).
Table 2 —Comparison o f properties p red ic ted using linea r o r m ix tu re m ode l fo r the lin e a r p ro g ra m m in g op tim ized fo rm u la tio n fo r exam ple 1‘________
Property(heated
samples) Constraints
Predicted value for formulation11
Linearmodel
Mixturemodel
Solubility, % _ C 74.2 82.5ESI, minutes £20 25.6 30.1b value £ - 1 0.68 — 2.37da Formulation problem: Find the formulation with maximum solubility which satisfies
the following constraints—proportion of casein £ 0.7, proportion of chicken s 0.15, emulsion stability index (ESI) ^ 20 min, and Hunterlab b value £ - 1 .
b Proportion of ingredients in optimized formulation: casein = 0.7, chicken = 0.15, beef heart = 0.15.
c Objective function to be maximized. d Value violating constraint.
for ESI of heated samples indicated that mixtures containing beef heart and casein would have higher ESI values than those calculated assuming a linear model. This is shown for mixtures 4, 7, 8 , 9 and 10 in Fig. 6 c. In contrast, the negative X2X3
terms in the models for ANS and CPA hydrophobicity of unheated samples suggested that chicken and beef SSPE interactions would result in lower hydrophobicity values. This is illustrated by the low ANS hydrophobicity of mixture 6 (Fig. 6 a).
Contour plots of ANS hydrophobicity of unheated samples and emulsion stability index of heated samples (Fig. 7a,b) were predicted using either (i) a “ mixture model” , i.e. the “ nonlinear” regression model in Table 1, or (ii) a “ linear model” , i.e. assuming only linear terms. These indicate that inaccurate values of ANS hydrophobicity and ESI for mixtures would be calculated if prediction were performed assuming linear additivity of individual ingredient hydrophobicity or ESI. Similar deviations were observed in plots for other properties (data not shown). Since our results showed that nonlinear terms were significant in describing effects of ingredient blending on properties of the final mixture, linear programming would not be an effective approach to formulation optimization.
The effects of neglecting non-linear terms on properties of hypothetical formulations optimized using linear programming
Table 3 —Properties p re d ic te d us ing e ith e r a lin e a r o r a m ix tu re m o de l fo r lin e a r p ro g ra m m in g op tim ized fo rm u la tio n com pare d to Forp lex op tim ized fo rm u la tion fo r exam ple 2 ’
Predicted valueLinear
programmingformulation11 Forplex
Property ConstraintsLinearmodel
Mixturemodel
Mixturemodel
Cost ($/unit) _d 1.68 1.68 1.48Solubility, % 60 60.5 68.0 60.1ESI, minutes 20 20.2 25.2 22.8•Formulation problem: Assuming unit costs of casein, chicken and beef heart to be
$2.50, $1.00 and $0.50, respectively, find the feast cost formulation satisfying the following constraints — proportion of casein £ 0.55, proportion of chicken a 0.25, emulsion stability index (ESI) £ 20 minutes and solubility £ 60%.
b Optimum proportion of ingredients in least-cost formulation using linear programming; casein = 0.53, chicken = 0.25, beef heart = 0.22
c Optimum proportion of ingredients in least-cost formulation considering mixtures model using Forplex casein = 0.42, chicken = 0.25, beef heart = 0.33.
d Objective function to be minimized.
Table 4 —Regression m ode ls describ ing the re la tionsh ip be tw een hyd ro p h o b ic ity o f m ix tu res an d th e ir s o lu b ility an d em u ls ify ing p roperties
U n h eated sam p les :EAI = 164 - 0.341 CPA - 0.205ANS + 0.000101ANS2 + 0.000205CPA2
+ 0.00C351 A N S'C PA(R„d]2 = 0.983; standard error of estimate = 0.622; P = 0.0025)
H eated sam p les :EAIh = 0.105C3Ah - 0.0000647CPAlh2
(R>di2 = 3.987; standard error of estimate = 4.683; P = 0.0001)
Solubility^ = 0.202CPAh + 0.098ANS„ - 0.000234CPAh2 _________ (R,di2 = 0 884; standard error of estimate = 20.24; P = 0.005)
were demonstrated (Tables 2 and 3). In the first example, linear programming was used to find a formulation with maximum solubility, subject to several compositional and property constraints. As shown (Table 2), the linear model underestimated both solubility and ESI of the formulation, as compared to the mixture model which considered the effects of interactions. In addition, the linear approach predicted a “ b” value of 0 .6 8 , while the mixture model predicted a “ b” value of - 2.37, which did not meet the constraints for the formulation.
In the second example, cost minimization of a formulation subject to the constraints in Table 3 was performed using either linear programming or the Complex method. The formulation optimized by linear programming was more costly than that optimized by the Complex method. This could be explained by the inability of linear programming to account for synergistic effects of ingredients on solubility and ESI, resulting in a formulation which seemed to barely meet constraints for solubility (>60%) and ESI (>20 min). However, in fact it exceeded those requirements when these properties were calculated based on a mixture or nonlinear model. We used the methodology developed by Vazquez-Arteaga (1990) and incorporated mixture models to consider effects of ingredient interactions on properties of the final formulation. An optimum formulation was found having predicted solubility and ESI values nearer to required values, and at a lower cost as compared to the “ least cost” formulation by linear programming (Table3) .
Table 1 contains highly significant regression models which expressed the relationship between ingredient composition and hydrophobicity or functional properties of various mixtures of the ingredients. Regression analysis was also performed to investigate if hydrophobicity could be used as a predictor of selected functional properties. Significant regression equations were obtained expressing relationships between hydrophobicity and EAI of unheated and heated solutions and also between hydrophobicity and the solubility of heated solutions (Table4) . Both linear and quadratic terms were significant in the regression equations, confirming findings reported previously
Volume 58, No. 3, 1993-JOURNAL OF FOOD SCIENCE-661

INGREDIENT INTERACTIONS ON FUNCTIONALITY. . .
for single ingredient systems (Li-Chan et al., 1987). The highly significant coefficients of determination for regression models supported the hypothesis that hydrophobicity is an important parameter for prediction of EAI and solubility properties in multiple, as well as single, ingredient systems. The establishment of ingredient-hydrophobicity relationships for mixtures, such as those shown (Table 1), would allow calculation of hydrophobicity properties of mixtures from hydrophobicity values of their ingredients. This would eliminate the need to measure the hydrophobicity of each proposed mixture for a formulation. The hydrophobicity properties could then be incorporated into structure-function equations (Table 4), to allow prediction of functional properties of those mixtures.
Solubility of unheated samples did not differ and there was no theoretical basis for suggesting a relationship between hydrophobicity and color parameters. Therefore, no regression models were developed for those properties. ESI was not significantly related to hydrophobicity, probably due to the fact that the methodology used measured creaming phenomena rather than coalescence. Creaming is due to differences in density between continuous and dispersed phases. Thus the nature of the interfacial film and hydrophobicity of proteins involved at the interface may not be important in this destabilization mechanism.
CONCLUSIONSINGREDIENT interactions were significant in properties of mixtures, both before and after heat treatment. Neglecting such interactions could result in deviation of expected responses in formulations. For multi-ingredient mixtures, neither physicochemical properties (hydrophobicity or solubility) nor functional properties (emulsifying properties or color) could be assumed to be weighted averages of those properties of individual ingredients. Mathematical models incorporating interaction terms and using statistical design could yield reliable equations to describe such properties as a function of ingredient composition, thus improving the accuracy of predicting final product quality.
REFERENCESAgreda, C.L. and Agrees, V.H. 1989. Designing mixture experiments.
Chemtech. 19: 573-57E.Arteaga, G., Vazquez-Arteaga, M.C., and Nakai, S. 1991. Dynamic optim
ization of the heat treatment of milk. Poster #37, Canadian Institute of Food Science and Technology 34th Annual Conference, June 16-19, 1991, Montreal, FQ.
Bawa, A.S., Usborne, W.R., and Orr, H.L. 1988. Effects of levels of fillers and extenders on the functionality of a meat system. J. Food Sci. Technol. 25(2): 84-88.
Billmeyer, F.W. Jr. and Saltzman, M. 1966. The coloring of materials in industry. Ch. 6, in Principles of Color Technology. Interscience Publish- ers-John Wiley & Sons. Inc., New York.
Box, M.J. 1965. A new method of constrained optimization and a comparison with other methods. Computer J. 8: 42-51.
Burgarella, J.C., Lanier, T.C., and Hamann, D.D. 1985. Effects of added egg white or whey protein concentrate on thermal transitions in rigidity of croaker surimi. J. Fcod Sci. 50: 1588-1594, 1606.
Carpenter, J.A. and Saffle, R.L. 1964. A simple method for estimating the emulsifying capacity of various sausage meats. J. Food Sci. 29: 774-781.
Comer, F.W. and Dempster, S. 1981. Functionality of fillers and meat ingredients in comminuted meat products. Can. Inst. Food Sci. Technol. J. 14: 295-503.
Cornell, J.A. 1986. A comparison between two ten-point designs for studying three-component mixture systems. J. Quality Technol. 18: 1-15.
Cornell, J.A. 1990. Experiments with Mixtures: Designs, Models and the Analysis of Mixture Data. Second edition. John Wiley & Sons, Inc., New York.
Dou, J., Toma, S., and Nakai, S. 1993. Random-centroid optimization for food formulation. Food Res. Int. 26: 27-37.
Hsu, H.W., Satterlee, L.E1., and Kendrick, J.G. 1977a. Computer blending
predetermines properties of protein foods. Part I: Experimental design. Food Prod. Dev. 11(7): 52-58.
Hsu, H.W., Satterlee, L.D. and Kendrick, J.G. 1977b. Computer blending predetermines properties of protein foods. Part II: Results and discussion. Food Prod. Dev. 11(8): 70-78.
Jackman, R.L. and Yada, R.Y. 1988. Functional properties of whey-potato protein composite blends in a model system. J. Food Sci. 53: 1427-1432, 1451.
Jackman, R.L. and Yada, R.Y. 1989. Functional properties of whey-pea protein composite blends in a model system. J. Food Sci. 54: 1287-1292.
Judd, D.B. and Wyszeck, G. 1975. Physics and psychophysics of colorant layers. Ch. 3, in Color in Business, Science and Industry. 3rd edition. John Wiley & Sons, Inc., New York.
Kinsella, J.E. 1982. Relationships between structure and functional properties of food proteins. In Food Proteins, P. F. Fox and S. Condon (Ed.). Applied Science Publishers, London.
Kuester, J.L. and Mize, J.H. 1973. Multivariable constrained methods. Ch. 10, in Optimisation Techniques with FORTRAN. MacGraw Hill Co., New York.
Li-Chan, E., Nakai, S. and Wood, D.F. 1987. Muscle protein structure- function relationships and discrimination of functionality by multivariate analysis. J. Food Sci. 52: 31—41.
Li-Chan, E. Nakai, S. and Wood, D.F. 1985. Relationships between functional (fat binding, emulsifying) and physicochemical properties of muscle proteins. Effect of heating, freezing, pH and species. J. Food Sci. 50: 1035-1040.
Li-Chan, E., Nakai, S., and Wood, D.F. 1984. Hydrophobicity and solubility of meat proteins and their relationships to emulsifying properties. J. Food Sci. 49: 345-350.
Marquadt, D.W. and Snee, R.D. 1974. Test statistics for mixtures models. Technometrics 16(4): 533-537.
Mishkin, M., Saguy, I., and Karel, M. 1984. Optimization of nutrient retention during processing: ascorbic acid in potato dehydration. J. Food Sci. 49: 1262-1266.
Moskowitz, H.R. and Jacobs, B.E. 1987. Consumer evaluation and optimization of food texture. Ch. 12, in Food Texture. Instrumental and Sensory Measurement, H.R. Moskowitz (Ed.). Marcel Dekker, Inc., New York.
Nakai, S. and Li-Chan, E. 1988. Hydrophobic Interactions in Food Systems. CRC Press, Boca Raton, FL.
Nichols, D.J. and Cheryan, M. 1982. Dairy and vegetable protein blends by co-extraction and co-ultrafiltration. J. Food Sci. 47: 486—490.
Norback, J.P. and Evans, S.R. 1983. Optimization and food formulation. Food Technol. 37(4): 73-76, 78, 80.
Parks, L.L., Carpenter, J.A., Rao, U.N.M., and Reagan, J.O. 1985. Prediction of bind value constants of sausage ingredients from protein or moisture content. J. Food Sci. 50: 1564-1567.
Patel, M.T. and Kilara, A. 1990. Studies on whey protein concentrate. 2. Foaming and emulsifying properties and their relationships with physicochemical properties. J. Dairy Sci. 73: 2731-2740.
Pearce, K.N. and Kinsella, J.E. 1978. Emulsifying properties of proteins: evaluation of a turbidimetric technique. J. Agric. Food Chem. 26: 716- 723.
Pearson, A.M. and Tauber, F.W. 1984. Least-cost formulation and preblending of sausage. Ch. 8, in Processed Meats, 2nd ed. AVI Publishing Co., Inc., Westport, CT.
Porteous, J.D. and Quinn, J.R. 1979. Functional property measurement of mixtures of meat and extender proteins. Can. Inst. Food Sci. Technol. J. 12: 203-206.
Regenstein, J.M. 1985. Protein-water interactions in muscle foods. Recip. Meat Conf. Proc. 37: 44—51.
Regenstein, J.M. and Regenstein, C.E. 1984. Protein functionality for food scientists. In Food Protein Chemistry, Ch. 27. Academic Press Inc., New York.
Saguy, I., Mishkin, M.A., and Karel, M. 1984. Optimization methods and available software. Part 1. CRC Crit. Rev. Food Sci. Nutr. 20: 275-299.
Snee, R.D. and Rayner, A.A. 1982. Assessing the accuracy of mixture model regression calculations. J. Quality Technol. 14(2): 67-79.
Sullivan, J.F., Konstance, R.P., Della Monica, E.S., Heiland, W.K., and Craig, J.C. Jr. 1981. Carrot dehydration-optimization process studies on the explosion-puffing process. J. Food Sci. 46: 1537-1542.
Thakker, K.D. and Grady, L.T. 1984. Solubility. In Food Analysis—Principles and Techniques, Vol. 2. Physicochemical Techniques, Gruenwedel,D.W. and Whitaker, J.R. (Ed.). Marcel Dekker, Inc., New York.
Vazquez-Arteaga, M.C. 1990. Computer-aided formula optimization. M.Sc. thesis, University of British Columbia, Vancouver, BC, Canada.
Wilkinson, L. 1990a. SYSTAT: The System for Statistics. SYSTAT, Inc., Evanston, IL.
Wilkinson, L. 1990b. SYGRAPH: The System for Graphics. SYSTAT, Inc., Evanston, IL.
Ms received 6/15/92; revised 12/11/92; accepted 12/22/92.
We gratefully acknowledge financial assistance in the form of Operating Grant 5- 83641 from the Natural Sciences and Engineering Research Council of Canada, and a scholarship from Institute del Frio (CSIC) to S. Cofrades which enabled conducting this research a t the Univ. of British Columbia. Part of this work was presented a t the IFT Annual Meeting (June 1-6, 1991) in Dallas, TX.
662-JOURNAL OF FOOD SCIENCE-Volume 58, No. 3, 1993

Tocopherol Micro-Extraction Method with Application to Quantitative Analysis of Lipophilic Nutrients
ABBAS ABDOLLAHI, NEAL S. ROSENHOLTZ, and JEFFREY L. GARWIN
----------------------------ABSTRACT-----------------------------A method proposed for determining vitamin E consists of extraction with n-hexane/2-propanol and separation by normal-phase HPLC. It was used to monitor tocopherol content of eggs metabolically enriched with vitamin E. It accurately evaluated nutritional uniformity of many samples in a relatively short time. Chromatographic resolution showed alpha-tocopherol as the only major peak in the enriched eggs. Quantification with HP L C or G C demonstrated that the extraction technique could also be used to determine cholesterol and fatty acids. Results from eggs containing varied ratios of fatty acids indicate that the method did not differentially extract different types of fatty acids.
Key Words: tocopherols, vitamin E, eggs, cholesterol, fatty acids
INTRODUCTION
THERE is growing interest in quantitative analysis of vitamin E in food and other biological systems because of its importance as a naturally occurring antioxidant in tissue and plasma (Machlin, 1984; Esterbauer et al., 1987; Ingold et al., 1987). A U.S. RDA value of 30 I.U./adult has been established for vitamin E. Due to extremely low toxicity and high potential for benefits a higher dietary intake or supplementation may be proposed (Chen et al., 1992; Traber et al., 1992). To provide nutrition information and comply with labeling requirements, a fast, reliable, and generally accepted method of analysis is essential. A survey of published methods for routine determination of vitamin E in foods clearly pointed to the need for a specific and less time-consuming procedure.
Methods reported for vitamin E in foods (Parrish, 1980) typically consist of an organic solvent extraction, followed by chromatographic separation and detection by some means. Extensive sample treatment and/or derivatization associated with some methods may cause oxidative degradation of tocopherols (Osterlof and Nyheim, 1980; Bourgeois et al., 1984; Speek et al., 1985; Piironen et al., 1991). In addition to requiring elaborate cleanup, high temperatures and poor resolution of isomers of tocopherols make gas-liquid chromatography unsuitable (Parrish, 1980; Buttriss and Diplock, 1984). Various HPLC systems have been described for separating tocopherols. Normal-phase silica columns are preferable to reverse-phase HPLC for separation of tocopherol isomers (Piironen et al., 1984; Hakansson et al., 1987; Tan and Brzuskiewicz, 1989). Fluorescence detection has higher sensitivity and good selectivity for underivatized tocopherols (Lehmann and Martin, 1982), and is probably more effective than U.V. detection.
Burton (1985) has described a sodium dodecyl sulfate (SDS) extraction method for determining the vitamin E/lipid ratio in tissue homogenates. Erickson (1991) compared that with a saponification procedure and reported that the SDS method was ineffective in recovering tocopherols, particularly from tissue structurally modified by heat. Kuksis (1992) reviewed methods for isolating egg yolk lipids. Most common procedures for extraction of total lipid, including the fat-soluble vitamin E, employ a chloroform-methanol system. However, the toxic nature of these solvents (Radin, 1981), the need for extensive washing of the lower organic phase with associated losses, and
The authors are affiliated with Eggiand's Best, Inc., 842 First Ave., King o f Prussia, PA 19406-1404.
frequent occurrence of emulsions make such techniques unsuited for routine testing of large numbers of samples. Additional problems and limitations of some extraction procedures include use of large volumes of solvents for refluxing (and associated disposal problems), filtration, evaporating and resuspending the extract, and other time-consuming steps (Fenton and Sims, 1991). No standard method exists for vitamin E analysis in foods, and AOAC procedures are lengthy, complicated, or use relatively hazardous solvents (Hung et al., 1980; Bourgeois et al., 1984; Landen et al., 1985).
In the course of monitoring a nutritionally uniform egg product, the need arose for a reliable analytical technique to quantify vitamin E in a large number of samples. Our objective was to develop a method with emphasis on the alpha-tocopherol isomer, known to possess most of the biological activity, (Bieri and McKenna, 1981) and the predominant isomer in eggs (Piironen et al., 1991).
MATERIALS & METHODSSample preparation and extractionEggs were from commercial facilities which followed a controlled
and coordinated production program, including use of feed supplemented with alpha-tocopherol acetate. Dried whole egg Standard Reference Material No. 1854 was used (National Institute of Standards and Technology, NIST, Gaithersburg, MD). Egg samples (GNE) containing high levels of n-3 fatty acids (indicated on labels), were purchased from a supermarket in Hamilton, MI. Generic eggs were obtained from a local supplier. Analytical solvents used for sample preparation and analysis were of HP L C or G C grade (J.T. Baker, Phillipsburg, NJ). Three whole shelled eggs were mixed and blended for 30 sec and lyophilized with an FTS Systems, Inc. (Stone Ridge, NY) Iyo- philizer, and 0.1 g of the freeze-dried powder was used for analysis. The sample was weighed into a 15-mL thin-walled (disposable) Pyrex tube and mixed sequentially with 1 m L water, 3 m L n-hexane, and 1 m L 2-propanol. Some samples were extracted in the presence of 5% ascorbic acid to determine the effect on efficiency of recovering tocopherols. The mixture was vortexed and subjected to bath sonication (Branson Model 5200, Branson Ultrasonic Corp., Fort Washington, PA) for s 20 min, followed by brief vortex mixing and centrifugation at 850 x g for 5 min. The upper organic solvent layer was transferred into another tube and the aqueous layer was extracted with an additional 2 m L of mixed hexane and 2-propanol (3:1). After vortexing and centrifugation, as before, the upper layer was removed and pooled with the first (total volume about 4.5 mL), vortexed briefly, and analyzed for vitamin E by HPLC. Extracts from the vitamin E-enriched eggs, but not from generic eggs, were diluted (1:5) with n-hexane before chromatography. Vitamin E isomers were monitored using a fluorescence detector with excitation wavelength at 295 nm and emission monitored at 325 nm. The same extracts were also used to determine cholesterol by directly injecting 1 q.L onto a G C or 20 ixL onto a HP L C column.
Fatty acid determination was performed on O.lg of freeze-dried sample, saponified in a tube 1 hr at 65°C (water bath) using 1.0 m L of methanolic K O H (5%, w/v K O H in 9:1 methanolrwater). Fatty acid methyl esters were prepared by transmethylation in situ by addition of 1 m L of 10% methanolic HCI (1 m L 38% HCI in 9 m L methanol, v/v) for 1 hr at 65°C in a water bath. Total fatty acid methyl esters were then extracted using the procedure described for vitaminE. Briefly, samples were sonicated, vortexed, and centrifuged in the presence of hexane and 2-propanol (3 mL:l mL). The aqueous layer was reextracted with an additional 2-mL of hexane and 2-propanol (3:1). The pooled extracts were separated by gas chromatography using l-|xL samples for injection. The fatty acid methyl esters were
Volume 58, No. 3, 1993-JOURNAL OF FOOD SCIENCE-663

TOCOPHEROL MICRO-EXTRACTION METHOD . . .
Micro-extraction method for tocopherols3 4
Fig. 1.-HPLC separation o f tocopherol isomers in the standard mixture. Peak identification: (1) solvent front (RT=3.4); (2) alpha-tocopherol (RT=5.4); 13) beta-tocopherol (RT= 7.3); (4) gamma-tocopherol (RT=11.5); (5) delta-tocopherol, [RT— 14.2).
Table 1 -A lpha-tocophero l in generic and enriched eggs
S a m p le n p g /g * % C V
E -e n ric h e d (1 p ro d u c e r) 16 5 45 ± 26 5
E -e n rich e d (5 p ro d u c e rs ) 19 5 22 ± 71 14
G e n e ric e g g s 8 61 ± 5 b 9
a Mean ± SD.b Estimated reference value for dried whole egg is 67 y.g/g (Stadelman and Cotter-
ill, 1990).
Table 2 - Cholesterol content o f dried whole eggs
S a m p le n m g /g * % C V
E -e n rich e dHPLC 9 19.59 ± 1.53 7.81GC 9 19.91 ± 1.70 8 .53
N IS T R ef # 1 8 5 4 — 19.00 ± 0.20» —
HPLC 10 19.78 ± 1.58 7 .98GC 7 19.83 ± 1.71 8 .62
G e n e ricHPLC 5 19.63 ± 1.70 8.66
a Mean ± SD.b Standard cholesterol value fo r the whole dried egg Standard Reference Material.
identified by comparing retention times with those of standards (Nu Chek Prep, Inc., Elysian, MN).
HPLC and GC operations
Perkin-Elmer (Norwalk, CT) HP L C equipment was used. It consisted of a Model LC-250 binary pump, a Model LC-240 luminescence detector, a Model ISS-100 autosampler, a solvent manifold system, and a Model 1Ó20S single-channel interface to Omega-2 software. The normal-phase column was an Alltech Lichrosorb Si60 (5 p)(Piironen et al., 1984; Hakansson et al., 1987) connected to a guard column (Alltech Associates, State College, PA). The isocratic mobile phase system consisted of hexane and 2-propanol (99:1) (Tan and Brzus- kiewicz, 1989) flow rate 1.0 mL/min. The mobile phase was purged with helium and 10 m L of the hexane and 2-propanol mixture (50:50) was pumped to wash the column prior to loading. A Hitachi Model L-4000 variable wavelength U V detector (Columbia, MD ) set at 205 nm was used to monitor cholesterol in the effluent. A mobile phase consisting of hexane and 2-propanol (95:5) flow rate 1.5 mL/min was used to separate cholesterol from other components. Retention time of cholesterol was determined by comparison to standards (Sigma Chemical Co., St. Louis, MO).A Perkin-Elmer Model 8420 gas chromatograph equipped with sin
gle-flame ionization detector, split/splitless capillary injector pressure- controlled carrier gas pneumatics, and a Model AS-8300 Autosampler was used. The column was a fused silica capillary column (PE-23; Perkin-Elmer; 0.25 p m film thickness, 50 m, 0.25 m m i.d., liquid phase cyanopropyl methyl silane). The temperature program for each run was: initial oven 150°C, increased to a final 220°C at 2°C/min. The FID and injector were held at 250°C. Helium pressure was set at 190 kPa. Hydrogen and air pressures were about 110 kPa. The temperature program for cholesterol analysis with G C was initial oven
2
MinutesFig. 2 .-T y p ic a l HPLC elution profiles o f the working standard solution (a) and o f the extract from a vitamin E-enriched egg(b). Peak identification: (a) solvent front (RT=3.5); (2) alpha- tocopherol (RT=5.1).
190°C, increased to 240°C at 5°C/min, and then subsequently increased to 265°C at l°C/min. The FID and injector were held at 270°C.
Preparation of standardsAll tocopherol standards were dissolved in n-hexane before HP L C
analysis. Alpha-tocopherol was from Fluka Chem. Corp. (Ronkon- koma, NY). Other vitamin E isomers (beta, gamma, delta) were gifts from Henkel Corp. (La Grange, IL). The cholesterol standard, from Sigma Chemical Co., was dissolved in 2-propanol and 4 pg (1 pL) was injected into the GC. For HP L C analysis, the cholesterol solution was further diluted with hexane (0.4 pg/pL) and 20 pL was used for injection. The methyl esters of fatty acids were dissolved in n-hexane, each to a final concentration of 0.5 mg/mL.An alpha-tocopherol standard curve was prepared using 10-1000
ng for HP L C injections. An external standard of alpha-tocopherol (2.5 ng/pL) was prepared in n-hexane and analyzed (50 ng) along with sample extracts. Efficiency of vitamin E recovery was estimated by analyzing the freeze-dried eggs (0.1 g) to which had been added 30 pg of either alpha-tocopherol acetate (Hakansson et al., 1987) or gamma-tocopherol. Generic eggs (O.lg) also had added alpha-tocopherol (30 pg).
RESULTS & DISCUSSION Determination of vitamin E
Across a range of concentrations (10-1000 ng) an injection of 50 ng alpha-tocopherol standard produced a fluorescence response which was on the linear portion of the standard curve.
664-JOURNAL OF FOOD SCIENCE-Volume 58, Not 3, 1993

Table 3—Relative fatty acid composition of whole egg powders (%JaF.A. E-enriched Generic GNE Ref. Val. RT
14:0 0.28 ±0.07 0.68 ±0.40 0.13±0.12 0.42 6.9816:0 25.68 ±0.54 25.94±0.22 23.76 ±0.21 25.95 9.6816:1 2.67±0.15 3.20 ±0.39 2.23 ±0.45 4.06 10.5018:0 8.52±0.29 8.27±0.21 7.96 ±0.29 8.86 13.1018:1 40.46 ±2.97 41.81 ±3.04 34.24 ±0.09 43.78 14.3018:2n-6 13.69 ±0.67 12.32±0.83 14.05 ±0.03 12.50 15.9018:3n-3 0.80 ±0.84 0.33±0.10 9.55 ±0.40 0.20 17.9020:4n-6 1.81 ±0.07 2.29±0.13 0.97 ±0.03 1.05 22.8022:6n-3 0.69 ±0.09 0.44 ±0.11 1.80 ±0.08 0.46 31.20• Mean ± SD for triplicate samples. F.A. = Fatty Acids (major fatty acids); Ref. Val. * reference value for dried whole egg (American Egg Board, 1989; Stadelman and
Cotterill, 1990); RT *» retention time (min) for gas chromatography
That amount was also about equivalent to the amount of alpha- tocopherol in 100 p,g of the lyophilized vitamin E-enriched eggs (E-enriched). In addition, the chromatographic conditions readily separated the tocopherol isomers in a standard mixture(Fig- 1).
Results of comparing the vitamin E-enriched and generic eggs (summarized in Table 1) show only the values of alpha- tocopherol because it is the biologically most active form and was the only major peak on chromatograms of enriched eggs (Fig. 2). Vitamin E-enriched eggs contained about 10 times more alpha-tocopherol than generic eggs (545 and 61 (xg/g, respectively), reflecting the feed supplementation with vitaminE. The low % coefficient of variation (CV;5%), (Table 1) for the vitamin E-enriched eggs from a single producer, indicated that the procedure was very reproducible. The higher %CV (9%) for the generic egg may have been due to the lower alpha- tocopherol content in those non-enriched samples. Results of monitoring vitamin E in eggs from 5 producers nominally using the same feed protocol are included (Table 1). Although the %CV was relatively higher (14% vs 5%), the data (522 as compared to 545 |xg alpha-tocopherol/g egg) suggested that product uniformity was possible within acceptable limits.
The HPLC-fluorescence detection system is sensitive and relatively free of interference from vitamin A and carotene (Parrish, 1980). Canthaxanthin, which may coelute with alpha- tocopherol in the conventional HPLC method (Mayne and Parker, 1988a), most likely did not interfere with our quantitative approach because it is a carotenoid which absorbs maximally at 450-474 nm (Mayne and Parker, 1988b). To test this we loaded an egg extract or the alpha-tocopherol standard supplemented with trans-canthaxanthin (20 |xg/mL; Fluka Chemical Corp., Ronkonkoma, NY) into the HPLC-fluorescence system. By comparing with the nonsupplemented extract or standard, we concluded that canthaxanthin did not affect the amount of alpha-tocopherol detected by fluorescence spectroscopy under the conditions used.
We compared several extraction procedures and found that a mixture of water:hexane:2 -propanol (1:3:1) was the solvent system that produced a clean and visible upper organic layer. The extract did not require further purification, as was apparent by the persistence of chromatographic resolution by the columns after about 1000 injections. Sonication of the samples for 20-30 min increased the yield of alpha-tocopherol by about 10%, compared to no sonication. However, saponificatirn/trans- methylation (510 ± 39 |xg/g; CV, 7%), 18 hr extracti n (553 ± 4 (x/g; CV, 0.8%), and ascorbic acid treatment (54 ± 33 ixg/g; CV, 6 %) did not significantly increase or decn ;e the efficiency of the extraction. Saponification of the egg extracts prior to vitamin E determination was not generally required, because the alpha-tocopherol acetate supplemented in the feed would be metabolically converted to alpha-tocopherol by the hen prior to accumulation in the egg yolk (Piironen et al., 1991). Although a standard reference material for vitamin E was not available, additive recoveries (> 97%) and the result for generic egg (61 ± 5 (xg/g), in close agreement with the estimated value of 67 p,g (American Egg Board, 1989; Sta
delman and Cotterill, 1990), suggested that the method was quantitatively accurate and precise for vitamin E.
Determination of cholesterol and fatty acidsThe micro-extraction method was also useful for cholesterol
and fatty acid analyses. Cholesterol determinations for dried whole egg samples and results for the NIST Reference Material (Table 2) which agreed with the standard value (19 ± 0.2 mg/ g), suggested that the method was effective for quantitatively extracting cholesterol. The results for GC (RT = 27.4 min) and HPLC (RT = 5.6 min) were similar (about 19 mg/g). The observed steady value for different samples of eggs probably reflected the cholesterol requirements of the embryo (Kuksis,1992).
The next step in evaluating the extraction was to determine fatty acid composition (Table 3) of the eggs. Comparisons of results for the generic egg with those published reference values (see “ Ref. Val.” in Table 3) were consistent. They indicated that the extraction method did not differentially extract fatty acid methyl esters of different chain lengths or degrees of unsaturation over a wide biologically relevant range, within the precision of the measurements. We did not determine the precise degree of saponification and/or methylation. However, comparative analysis of results suggested that a uniform or non-selective separation and methylation of the fatty acids had been achieved. Results also demonstrated that the eggs which had been modified to contain an altered ratio of fatty acid could be monitored with our method (See GNE eggs with a higher percentage of 18:3n-3 fatty acid).
CONCLUSIONTHE CAPABILITY of the described micro-method to quantitatively extract vitamin E, cholesterol, and fatty acids is of great advantage, particularly for foods which are important nutritional sources of these. Up to 100 samples in a day could be extracted using less than 0.7 L of solvent. Accordingly, labor and material costs would be lower than for traditional methods. Also, the technique has the potential for automation.
REFERENCESAmerican Egg Board. 1989. Nutrient values for a large raw egg. In Eggcy-
clopedia, p. 34-35. American Egg Board, Park Ridge, IL.Bieri, J.G. and McKenna, M.C. 1981. Expressing dietary values for fat-
soluble vitamins: changes in concepts and terminology. Am. J. Clin. Nutr. 34: 289-295.
Bourgeois, C., Pages, P.S., Czornomaz, A.M., Albrecht, M., Cronenberger,L.A.C., and George, P.R. 1984. Specific determination of alpha-tocopherol in food and feed by fluorometry. Part 1. Manual method. J. Assoc. Off. Anal. Chem. 67: 627-630.
Burton, G.W. 1985. A mild, rapid, and efficient method of lipid extraction for use in determining vitamin E/lipid ratios. Lipids 20: 29-39.
Buttriss, J.L. and Diplock, A.T. 1984. High-performance liquid chromatography methods for vitamin E in tissues. Methods Enzymol. 105: 131— 138.
Chen, H.W., Cook, L.R., and Hendrich, S. 1992. Gender and dietary fat affect alpha-toccpherol status in F344/N rats. Lipids 27: 844-846.
Erickson, M.C. 1991. Extraction and quantitation of tocopherol in raw and cooked channel catfish. J. Food Sci. 56: 1113-1114.
Volume 58, No. 3, 1993-JOURNAL OF FOOD SCIENCE-665

TOCOPHEROL MICRO-EXTRACTION METHOD . . .
Esterbauer, H., Jurgens, G., Quehenberger, 0., and Roller, E. 1987. Autooxidation of human low-density lipoprotein: loss of polyunsaturated fatty acids and vitamin E and generation of aldehydes. J. Lipid Res. 28: 495-509.
Fenton, M. and Sim, S. 1991. Determination of egg yolk cholesterol content by on-column capillary gas chromatography. J. Chromat. 540: 323—329
Hakanssori, E., Jagerstad, M., and Oste, R. 1987. Determination of vitamin E in wheat products by HPLC. J. Micronutr. Analysis 3: 307—318.
Hung, S.S.O.: Cho, Y.C., and Slinger, S.J. 1980. High-performance liquid chromatographic determination of alpha-tocopherol in fish liver. J. Assoc. Off. Anal. Chem. 63: 889-893.
Ingold, K., Webb, A., Witter, D., and Burton, G.W. 1987. Vitamin E remains the major lipid-soluble chain-breaking antioxidant in human plasma even in individuals suffering from severe vitamin E deficiency. Arch. Biochem. Biophys. 259: 224-225.
Kuksis, A. 1992. Yolk lipids. Biochim. Biophys. Acta 1124: 205-222.Landen, W.O , Hines, D.M., Hamill, T.W. Martin, J.I., Young, E.R., Eiten-
miller, R.R., and Soliman, A.M. 1985. Vitamin A and E content of infant formula as produced in the United States. J. Assoc. Off. Anal. Chem. 68: 509-512.
Lehmann, J. and Martin, H.L. 1982. Improved direct determination of alpha- and gamma-tocopherols in plasma and platelets by liquid chromatography, with fluorescence detection. Clin. Chem. 28: 1784-1787.
Machlin, L. 1984. Vitamin E. In H a n d b o o k o f V i ta m in s , p. 99-145. Marcel Dekker, Inc., New York.
Mayne, S.T. and Parker, R.S. 1988a. HPLC analysis of vitamin E by conversion to alpha-tocopheryl acetate in samples containing canthaxanthin or other coeluting compounds. J. Agric. Food Chem. 36: 483—485.
Mayne, S.T. and Parker, R.S. 1988b. Cis-canthaxanthin and other caro- tenoid-like compounds in canthaxanthin preparations. J. Agric. Food Chem. 36: 478-482.
Osterlof, G. end Nyheim, A. 1980. The estimation of alpha-tocopherol in
FLAVOR MODIFICATION B Y NEOHESPERIDINE DC. .
threshold concentration of limonin, naringin and sweeteners on bitterness perception. J. Sei. Fd. Agric. 25:1349.
Higginbotham, J.D. 1983. Recent developments in non-nutritive sweeteners. In D e ve lo p m e n ts in S w ee te n e rs -2 , T.H. Grenby, K.J. Parker, andM.G. Lindley (Ed.), p. 119-156. Applied Science Publishers, London and New York.
Higginbotham, J.D., Lindley, M.G., and Stephens, P. 1981. Flavour potentiating properties of Talin sweetener (Thaumatin). In the Q u a lity o f Foods a n d B evera g es, G. Charalambous and G.E. Inglett (Ed.), p. 91-111. Academic Press, New York,
Homier, B.B. 1984. Aspartame: Implications for the food scientist. In A s p a r ta m e . P hysio logy a n d B iochem istry , p. 247. Marcel Dekker, New York.
Horowitz, R.M. and Gentüi, B. 1963. Dihydrochalcone derivatives and their use as sweetening agents. US Patent 3,087,821.
Hy vonen, L. 1982. Fructose in food systems. In N u tr i t iv e S w ee te n e rs , G.G. Birch and K.J. Parker (Ed.), p. 133-144. Applied Science Publishers, London and New Jersey.
Inglett, G.E., Krbechek, L., Dowling, B., and Wagner, R. 1969. Dihydrochalcone sweeteners: Sensory and stability evaluation. J. Food Sei. 34: 101-103.
FAT CONCENTRATION EFFECTS. . .From p ag e 6 0 2 .
Bartoshuk, L.M., Rennert, K., Rodin, J., and Stevens, J.C. 1982. Effects of temperature on perceived sweetness of sucrose. Physiol. Behav. 28: 905- 91°.
Drewnowski, A. and Greenwood, M.R.C. 1983. Cream and sugar: human preferences for high fat foods. Physiol. Behav. 30: 629-633.
Drewnowski, A., Shrager, E.E., Lispky, C., Stellar, E., and Greenwood, M.R.C. 1989. Sugar and fat: Sensory and hedonic evaluation of liquid and solid foods. Physiol. Behav. 45: 177-183.
Jenner, M.R. 1989. Sucralose: unveiling its properties and applications. In P ro g ress in S w ee te n e rs , T.H. Grenby (Ed.), p. 121-142. Elsevier Applied Science, New York.
Ketelsen, S.M., Granzen, C.L., and Wiet, S.G. 1991. Time intensity parameters of sucrose and selected carbohydrate and high intensity sweeteners. Paper no. 620 presented at 51st Annual Meeting of Inst, of Food Technologists, Dallas, TX, June 2-5.
Lundahl, D.S. 1992. Comparing time-intensity to category scales in sensory evalution. Food Technol. 46(11): 98-103.
Mackey, A. 1958. Discernment of taste substances as affected by solvent medium. Food Res. 23: 580.
Matysiak, N.L. and Nobel, A.C. 1991. Comparison of temporal perception of fruitness :n model systems sweetened with aspartame, an aspartame + acesulfame K blend, or sucrose. J. Food Sci. 56: 823-826.
Nabors, L.O. and Gelardi, R.C. 1986. A lte r n a tiv e S w ee ten ers . Marcel Dekker, Inc. New York.
Pangborn, R.M. 1989. Sensory attributes and acceptance of fat, sugar, and
biological material by gas chromatography. J. Chromatogr. 183: 487- 491.
Parrish, D.B. 1980. Determination of vitamin E in food—a review. CRC Crit. Rev. Food Sci. Nutr. 13: 161-187.
Piironen, V., Varo, P., Syvaoja, E.L., Salminen, K., and Koivistoinen, P.E. 1984. High-performance liquid chromatographic determination of toco- pherols and tocotrienols and its application to diets and plasma of Fin- nishmen. I: Analytical Method. Internat. J. Vit. Nutr. Res. 53: 35—40.
Piironen, V., Liljeroos, AI., and Koivistoinen, P.E. 1991. Transfer of alpha- tocopherol stereoisomers from feed to eggs. J. Agric. Food Chem. 39: 99-101.
Radin, N. 1981. Extraction of tissue lipids with a solvent of low toxicity. Methods Enzymol. 72: 5-7.
Speek A.J., Schrijver, J., and Schreurs, W.H.P. 1985. Vitamin E composition of some seed oils as determined by high-performance liquid chromatography with fluorometric detection. J. Food Sci. 50: 121-124.
Stadelman, W.J. and Cotterill, O.J. 1990. E g g S c ie n ce a n d T e c h n o lo g y , p. 147. Food Products Press, Inc., Binghamton, NY.
Tan, B. and Brzuskiewicz, L. 1989. Separation of tocopherol and tocotrienol isomers using normal- and reverse-phase liquid chromatography. Anal. Biochem. 180: 368-373.
Traber, M.G., Burton, G.W., Hughes, L., Ingold, K.V., Hidaka, H., Malloy, M., Kane, J., Hyams, J., and Kayden, H.J. 1992. Discrimination between forms of vitamin E by humans with and without genetic abnormalities of lipoprotein metabolism. J. Lipid Res. 33: 1171-1182.
Ms received 11/5/92; revised 1/23/93; accepted 2/8/93.
We thank Ms. Dorothy Heil for professional preparation of the manuscript, and Dr. James Clark, Mr. Jeff Hunsicker, and Ms. Vereen Rozier-Martin of Henkel Corporation, LaGrange, IL, for tocopherol samples.
.From p ag e 594 .
Lindley, M.G., Borrego, F., and Canales, I. 1991. A technical re-appraisal of the intense sweetener: neohesperidin dihydrochalcone. In F o o d In g r e d ie n ts E u ro p e C on ference P roceed in g s , p. 48-51. Expoconsult Publishers, Maarssen, Holland.
Nicol, W.M. 1982. Sucrose in food technology. In N u tr i t iv e S w ee te n e rs , G.G. Birch and K.J. Parker (Ed.) p. 17-35. Applied Science Publishers, London and New Jersey.
Pratter, P.J. 1980. Neohesperidin dihydrochalcone: an updated review on a naturally derived sweetener and flavor potentiator. Perfum. Flavor.5(7):1.
Ripper, A., Homier, B.E., and Miller, G.E. 1986. A s p a r ta m e . I n A l te r n a tiv e S w ee ten ers , (Ed.) L.O. Nabors and R.C. Gelardi (Ed.) Marcel Dekker, Inc.. New York.
von Rymon Lipinski, G.-W. and Luck, E. 1976. Sweetener mixture. Ger. Offen. 2,628,294.
Wiseman, J.J. and McDaniel, M.R. 1991. Modification of fruit flavors by aspartame and sucrose. J. Food Sci. 56: 1668-1670.
Ms received 6/19/92; revised 12/11/92; accepted 1/6/93.
salt in dairy products. In F o o d A c c e p ta b ility , D.M. Thomson (Ed.), p. 413- 429. Elsevier, London.
Redlinger, P.A. and Setser, C.S. 1987. Sensory quality of selected sweeteners: aqueous and lipid systems. J. Food Sci. 52: 451^454.
Senauer, B., Asp, E., and Kinsey, J. 1991. F ood T r e n d s a n d th e C h a n g in g C o n su m e r. Eagen Press, St. Paul.
Skramlik, E. 1926. Vondie physiologie des gerushsund geschmacksinnes. In H a n d b u c h d e t P h y s io lo g ie d e s n ie rd e ren S in n e . In 1. Leipzig: Thieme.
Wang, C.T. 1987. Taste responses and caloric estimation of chocolate milk drink by American and Taiwanese students. M.S. thesis, Univ of California, Davis.
Wells, A.G. 1989. The use of intense sweeteners in soft drinks. In P ro g ress in Sw ee ten ers , T.H. Grenby (Ed.), p. 169-214. Elsevier Applied Science, New York.
Wiet, S.G. and Beyts, P.M. 1992. Sensory characteristics of sucralose and other high intensity sweeteners. J. Food Sci. 57: 1014-1019.
Wiseman, J.J. and McDaniel, M.R. 1991. Modification of fruit flavors by aspartame and sucrose. J. Food Sci. 56: 1668-1670.
Ms received 7/1/92; revised 12/9/92; accepted 1/6/93.
Paper number 520 presented at the 52nd Annual Meeting of the Institute of Food Technologists, New Orleans, LA, June 20-24, 1992.
666-JOURNAL OF FOOD SCIENCE-Volume 58, No. 3, 1993

Non-enzymatic Browning and Fluorescence Development in a (E)-4,5-Epoxy-(E)-2-heptenal/Lysine Model System
FRANCISCO J. HIDALGO AND ROSARIO ZAMORA
----------------------------ABSTRACT-----------------------------As a model system for studying oxidized lipid/protein browning, the reaction between (E)-4,5-epoxy-(E)-2-heptenai (a secondary oxidation product of o>-3 pentaenoic acids) and lysine was studied. CIELAB L*a*b* and fluorescence followed zero-order kinetics, and were always correlated, as a function of time, pH, temperature and epoxy- aldehyde/lysine ratio, suggesting parallel reactions for producing brown macromolecular pigments and fluorescent products. Activation energy, according to the Arrhenius equation, was 66.5 and 50KJ/mol for color difference and fluorescence intensity, respectively. This model system may help understand the non-enzymatic browning produced by lipids.
Key Words: nonenzymatic browning, fluorescence, heptenal-lysine, model-system
INTRODUCTIONLIPID OXIDATION is a major cause of food spoilage and is undesirable from a sensory acceptability and economic point of view. It also can cause oxidative reactions to decrease the nutritional quality of food and generate oxidation products that are potentially toxic (Frankel, 1991; Nawar, 1985). Among the reactions produced by oxidizing lipids in food, their chemical interactions with amines, amino acids and proteins have received considerable attention (Desai and Tappel, 1963; Gardner, 1979; Karel et al., 1975, Pokorny et al., 1988). This is an important deteriorative mechanism, which produces changes in the functional properties, nutritive value, flavor and color of foods (Eriksson, 1987; Hidalgo et al., 1992a). Together with flavor and texture, color plays an important role in food acceptability (deMan, 1990). Color formation is influenced primarily by degree of unsaturation of fatty acids, water activity, oxygen partial pressure and the presence of phenolic an- toxidants (Eriksson, 1987). Due to their high degree of unsaturation, fish lipids easily form colors, often referred to as lipofuscin and ceroid, which influence the appearance of fish. Chicken and pork can also undergo this type of color formation (Pokorny, 1981). In spite of its interest and the research efforts to understand the reactions, many of the mechanisms are not understood.
Our objective was to study the influence of pH, temperature and oxidized lipid/amino acid ratio on color and fluorescence development in non-enzymatic browning reactions by using a model system that consisted of (E)-4,5-epoxy-(E)-2-heptenal and L-lysine. (E)-4,5-Epoxy-(E)-2-heptenal is a product of the oxidation of w-3 pentaenoic fatty acids (Swoboda and Peers, 1976), and lysine was used because it is usually lost during the deterioration of foods produced by peroxidizing lipids (Karel, 1984; Hurrel and Finot, 1985). The epoxyaldehyde/lysine system may be representative of systems rich in polyunsaturated fatty acids where short chain secondary oxidation products are easily produced. The oxidized lipid we used was the major volatile compound formed by the copper and ot-toco- pherol induced oxidation of butterfat (Swoboda and Peers, 1978).
A u t h o r s H id a lg o a n d Z a m o r a a r e w i th I n s t i tu to d e la G r a s a y s u s D e r i v a d o s , C S IC , A v d a . P a d r e G a r c ía T e je r o , 4 , 4 1 0 1 2 S e v i l la , S p a in .
It has been assumed to be produced by cleavage of the carbon chain in an intermediate epoxyhydroperoxy fatty acid. Such fatty acids have been identified in the reaction of 13-hydro- peroxylinoleic acid with soybean extracts or ferric chloride- cystein solution (Gardner et al., 1978), and the oxoepoxy fatty acids derived from them have been recently prepared (Hidalgo et al., 1992b). We found no published reports on the role of epoxyaldehydes in food.
MATERIALS & METHODSMaterials
(E)-4,5-Epoxy-(E)-2-heptenal was prepared from (E)-2-(E)-4-hep- tadienal as described by Swoboda and Peers (1978). (E)-2-(E)-4-Hep- tadienal and L-lysine were purchased from Aldrich Chemical Co. (Milwaukee, Wl), and 3-chloroperoxybenzoic acid from Fluka Chemie A G (Buchs, Switzerland). All other chemicals were analytical grade and were purchased from reliable commercial sources.
Sample preparation
Typically, (E)-4,5-epoxy-(E)-2-heptenal (0.1 mmol) was suspended in 5 m L of 0.3 M sodium phosphate pH 7.0 and sonicated to a stable emulsion with a Braun Labsonic U sonicator. Lysine (0.2 mmol) was then added and the resulting solutions were maintained at 25 °C for different periods of time. At the end of incubation, the samples were cooled and diluted for color and fluorescence measurements.
Influence of pH on browning and fluorescence development was studied by using the following buffers: 0.3 M sodium citrate for pH3-5; 0.3M sodium phosphate for pH 6-7.5; 0.3M sodium borate for pH 8-10 and 0.3 M sodium phophate for pH 12. Epoxyaldehyde/lysine ratio studies were carried out with 0.1 and 0.2 mmol of epoxyaldehyde and 0.1, 0.2 and 0.4 mmol of lysine. To study the influence of temperature the reaction mixture was maintained at 4, 25, 40 and 80 °C.
Measurement of color
Samples for color evaluation were prepared by diluting 200 pL of the reaction with 2.8 m L of deionized water. The weighted-ordinate method was used (Hunter, 1973). Tristimulus values (X,Y,Z) were calculated from the transmittances (T) obtained in a Hewlett-Packard 8450-A UV/VIS spectrophotometer. Transmittances were recorded at constant intervals (10 nm) from 400 to 700 nm using 1 cm glass cells. These readings were then converted by means of a computer program into the corresponding tristimulus and CIELAB L*a*b* color values (CIE, 1978).The difference of color (AE) between incubated and non-incubated
(control) samples were determined by Equation (1) (Hunter, 1973).
AE = V(Aa*F + (Ab*F + (AL*)¿ (1)
Yellowness index (Yla) was expressed according to Hunter (1942) as indicated in Eq. (2):
Yla = [100(1.28X - 1.06Z)]/Y (2)
A second yellowness index (Ylb) was also calculated (Francis and Clydesdale, 1975) as indicated in Eq. (3):
Ylb = 142.86b*/L* (3)
Volume 58„ No. 3, 1993-JOURNAL OF FOOD SCIENCE-667

NON-ENZYMATIC BROWNING PRODUCED BY LIPIDS . . .Table 1 -Z e ro -o rd e r ra te constan t fo r b row n ing fk d and fluo rescence (kf) in an epoxyhep tena l/lys ine system as a fun tion o f p H ■
pH3 0.018 0.0595 0.029 0.0416 0.059 0.806.5 6.12 2.307 0.33 3.867.5 0.41 5.298 0.36 7.409 1.05 13.72
10 1.53 22.1012 2.08 51.0
8 Values given in hr-1 . Experimental conditions are described in methods.
fluorescence intensity (FI) of 50 at 450 nm, when excitation was at 350 nm.
RESULTS & DISCUSSIONF ig . 1 C o lo r d i f f e r e n c e ( D ) , y e l l o w n e s s i n d e x ( k. ) a n d f lu o r e s c e n c e i m e n s i t y ( ■ ) c h a n g e s w i th t i m e in a n e p o x y a l d e h y d e / l y s i n e m i x t u r e a t p H 7 a n d 2 5 °C. P o i n ts a r e a v e r a g e o f t r i p l i c a t e d e t e r m i n a t i o n s .
ooo
t= 24h
□ t = 4800
F ig . 2 I n f lu e n c e o f p H o n c o lo r a n d f l u o r e s c e n c e d e v e l o p m e n t o f a n e p o x y a l d e h y d e / l y s i n e m i x t u r e w i th t i m e a t 2 5 °C.
Measurement of fluorescence
Spectra were recorded on a Perkin-Elmer LS-5 fluorescence spectrophotometer of 100 p.L samples diluted with 2.9 m L of deionized water. A slit width of 5 nm was used, and the instrument was standardized with quinine sulfate (0.1 p M of 0.1N H 2S04) to give a
Color and fluorescence changes as a function of timeThe reaction between epoxyaldehyde and lysine produced
significant changes in color and fluorescence after 3 hr of reaction. Figure 1 shows AE variations at pH 7 and 25 °C as a function of time. Browning in the studied system followed zero-order kinetics (r = 0.992, p< 0.001), and was described by Eq. (4):
AE = AE0 + kt (4)
where AE0 represents the intercept, k is the rate constant and t is the time. The values for AE0 and k at pH 7.0 and 25 CC were 0.4 and 0.328 hr-1, respectively.
Analogous results were obtained for Yla and Ylb (Yla variation is shown in Fig. 1). They also followed zero-order kinetics (r>0.994, p<0.001), and are described by Eq. (5):
YI = YI0 + kt (5)
The values obtained for YI0 and k, using Yla data, were 1.8 and 0.554 hr-1, respectively. When Ylb was used, the values obtained for Yl0 and k were 1.2 and 0.483 hr-1, respectively. Because browning kinetics were described by using either AE, Yla or Ylb, in similar manner, the influence cf different reaction conditions on color variation is only discussed in the rest of this report by using AE data. Analogous conclusions were obtained for Yla and Ylb data (data not shown).
Finally, FI variation followed analogous zero-order kinetics as a function of time (r = 0.993, p< 0.001) (Fig. 1). It can also be described by Eq. (6 ):
FI = FI0 + kt (6 )
The values obtained for FI0 and k were 5 and 4.2 hr-1, respectively.
Color difference, yellowness index and fluorescence intensity not only exhibited analogous behavior as a function of time but they were correlated (r = 0.9993, p< 0.001). In order to analyze hypothetical relationship between color and fluorescence in the studied system, the influence of pH, temperature and epoxyaldehyde/lysine ratio on both measurements were studied.
Influence of pH on color and fluorescenceThe pH influenced both color and fluorescence develop
ments. Figure 2A shows AE variation as a function of pH at 2hr, 24hr and 480 hr. At the end of the period (20 days) the higher brown color was reached at neutral pHs. However, the browning rate was higher at higher pHs. (Table 1). This apparent contradiction was due to a higher initial reaction rate at higher pHs, but at these pHs the color formation stopped earlier. The data in Table 1 also suggest a basic catalysis for the browning reaction produced in the studied model system.
668-JOURNAL OF FOOD SCIENCE-Volume 58, No. 3, 1993

F ig . 3 C o lo r d i f f e r e n c e a n d f l u o r e s c e n c e i n t e n s i t y c h a n g e s w i th t i m e in a n e p o x y a l d e h y d e / l y s i n e m i x t u r e a t p H 7 a n d 4 ( □ ) , 2 5 / A ) , 4 0 ( n ) a n d 8 0 °C ( • ).
F ig . 4 A r r h e n iu s p l o t f o r c o l o r ( □ ) a n d f l u o r e s c e n c e ( A ) f o r m a t i o n in a n e p o x y h e p t e n a l / l y s i n e m ix tu r e .
Analogous results were obtained for the fluorescence development. Figure 2B shows FI variation as a function of pH at 2hr, 24hr and 480hr. After 20 days, higher fluorescence was obtained at pH around 7 and 10. However, the fluorescence rate was again higher at higher pHs (Table 1). Both color and
E/L 1:4 E/L 1:2 E/L 1:1 E/L 2:1 Epoxyaldehyde/lysine ratio
E/L 1:4 E/L 1:2 E/L 1:1 E/L 2:1Epoxyaldehyde/lysine ratio
F ig . 5 I n f lu e n c e o f t h e e p o x y a l d e h y d e / l y s i n e r a t io o n c o lo r a n d f l u o r e s c e n c e d e v e l o p m e n t a t p H 7 a n d 2 5 °C.
fluorescence correlated well at pH 5-8 (r > 0.991, p < 0.001), and also at pH 9-12 (r>0.93, p<0.01).
Influence of temperature
An increase in reaction temperature from 4 to 25 , 40 and 80 °C, increased both color and fluorescence (Fig. 3), which were correlated (r>0.90, p < 0.001). The rate constant values at different temperatures were calculated from Eq. (4) and (6 ), and used in an Arrhenius plot (Fig. 4) for calculation of activation energy (Ea) of color and fluorescence development. The values obtainec for Ea of AE and FI were 66.5 and 50 KJ/ mol, respectively. These values were one half of Ea value obtained for cclor changes in milk due to heat (Pagliarini et al., 1990; and references therein), suggesting that browning may be more easily produced by the model system we used.
Influence of epoxyaldehyde/lysine ratio
An increase in the concentration of either epoxyaldehyde or lysine increased both color and fluorescence (Fig. 5), which were correlated (r>0.98, p>0.001). The rate constants values at the different epoxyaldehyde/lysine ratios were calculated form Eq. (4) and (6 ). The k values obtained for AE were 0.57, 0.326, 0.179 and 0.636 h " 1 at 1:4, 1:2, 1:1 and 2:1 epoxyaldehyde/lysine ratios, respectively. The analogous k values for FI were 5.52, 3.86, 2.06 and 2.62 hr-1, respectively. The k values correlated with the lysine concentration at the same
Volume 58„ No. 3, 1993-JOURNAL OF FOOD SCIENCE-669

NON-ENZYMATIC BROWNING PRODUCED BY LIPIDS. ..
epoxyaldehvde concentration for AE (r = 0.9990, p<0.5), but not for FI (r = 0.98).
CONCLUSIONS
ALTHOUGH browning has been mainly related to carbohy- drate/protein (Maillard) reactions, lipid may also be important by contributing to form brown macromolecular products by reaction between oxidized lipids and amines, amino acids and proteins. This new model system may be useful for studying mechanisms by whicn such reactions are produced. This system produced color and fluorescence, which always correlated in assayed conditions, as a function of time, pH, temperature and epoxyaldehyde/lysine ratio. Thus the same reactions responsible for brown macromolecular pigment formation may be related to production of fluorescent products. Better knowledge of the compounds produced in the model system, and the mechanisms involved, would help improve understanding of the contribution of cxidized lipids to color changes in food during processing or storage.
REFERENCES
CIE. 1978. Recommendations on Uniform Color Spaces, Color-Differences Equations. Psycometric Color Terms. CIE Publication No. 15 (Suppl. 2). Bureau Central de la Commission Internationale de l’Eclairage, Paris.
deMan, J.M. 1990. Principles of Food Chemistry, 2nd ed. Van Nostrand Reinhold, New York.
Desai, I.D. and Tappel, A.L. 1963. Damage to proteins by peroxidized lipids. J. Lipid Res. 4: 204-207.
Eriksson, C.E. 1987. Oxidation of Lipids in Food Systems. Ch. 6, In Au- toxidation of Unsaturated Lipids, H.W. — S. Chan (Ed.), 207-231. Academic Press, London.
Francis, F.J. and Clydesdale, F.H. 1975. Food Colorimetry: Theory and Applications. AVI Publishing Co., Westport, CT.
Frankel, E.N. 1991. Recent advances in lipid oxidation. J. Sci. Food Agric. 54: 495-511.
Gardner, H.W. 1979. Lipid hydroperoxide reactivity with proteins and amino acids: a review. J. Agric. Food Chem. 27: 220-229.
Gardner, H.W., Weisleder, D., and Kleiman, R. 1978. Formation of trans-
4-H R INHIBITION OF TYRO SIN E . . .From p ag e 610 _
Kumar, M and Flurkey, W.H. 1992. Phenolic oxidative enzymes in Agar- icus bisporus. Phytochemistry (Life Sci. Adv.) 11: 97-103.
Lowry, O.H., Rosebrough, N.J., Farr, A.L., and Randall, R.J. 1951. Protein measurement with the Folin phenol reagent. J. Biol. Chem. 193: 265- 275.
Mayer, A.M. 1987. Polyphenol oxidases in plants - recent progress. Phytochemistry 26: 11-20.
Mayer, A.M. and Harel, E. 1979. Polyphenol oxidases in plants. Phytochemistry 18: 193-215.
Mayer, A.M., Harel. E., end Shain, Y. 1964. 2, 3-Naphthalenediol, a specific competitive inhibitor of phenolase. Phytochemistry 3: 447-451.
McEvily, A.J., Iyengar, E., ana Otwell, S. 1991. Sulfite alternative prevents shrimp melanosis. Food Technol. 45: 80-86.
Richard, F.C., Goupy, P.M., Nicolas, J.J., Lacombe, J.M., and Pavia, A.A. 1991. Cysteine as an inhibitor of enzymatic browning. 1. Isolation and characterization of addition compounds formed during oxidation of phe- nolics by apple polyphenol oxidase. J. Agric. Food Chem. 39: 841-847.
Roberts, D.V. 1977. Enzyme Kinetics. Cambridge University Press, New York.
Sapers, G.M., Hicks, K.E., Phillips, J.G., Garzarella, L., Pondish, D.L., Matulaitis, R.M., McCormack, T.J., Sondey, S. M., Seib, P.A., and El- Atawy, Y.S. 1989a. Control of enzymatic browning in apple with ascorbic acid derivatives, polyphenol oxidase inhibitors, and complexing agents. J. Food Sci. 54: 997-1002, 1012.
Sapers, G.M., El-Atawy, Y.S., Hicks, K.B., and Garzarella, L. 1989b. Effect
12,13-epoxy-9-hydroperoxy-frans-10-octadecenoic acid from 13-L-hydro- peroxy-cis-9,/rans-ll-octadecenoic acid catalyzed by either a soybean extract or cysteine-FeCL. Lipids 13: 246-252.
Hidalgo, F.J. and Kinsella, J.E. 1989. Changes induced in |3-lactoglobulin B following interactions with linoleic acid 13-hydroperoxide. J. Agric. Food Chem. 37: 860-866. , ,
Hidalgo, F.J., Zamora, R. and Alaiz, M. 1992a. Modificaciones producidas en las proteínas alimenticias por su interacción con lípidos peroxidados. II. Mecanismos conocidos de la interacción lípido (oxidado)-proteína. Grasas y Aceites 43: 31-38.
Hidalgo. F.J., Zamora, R. and Vioque, E. 1992b. Syntheses and reactions of methyl (Z)-9,10-epoxy-13-oxo-(E)-ll-octadecenoate and methyl (E)-9,10- epoxy-13-oxo-(E)-ll-octadecenoate. Chem. Phys. Lipids 60: 225-233.
Hunter, R.S. 1942. Photoelectric tristimulus colorimetry with three filters. Natl. Bur. Std. Circ. C429.
Hunter, R.S. 1973. The Measurement of Appearance. Hunter Associates Laboratory, Inc., Fairfax, Virginia.
Hurrell, R.F. and Finot, P.A. 1985. Effects of Food Processing on Protein Digestibility and Amino Acid Availability. In Digestibility and Amino Acid Availability in Cereals and Oilseeds, J.W. Finley and D.T. Hopkins (Ed.), 233-246. American Association of Cereal Chemists, Inc., St. Paul, MN.
Karel, M. 1984. Chemical effects in food stored at room temperature. J. Chem. Educ. 61: 335-339.
Karel, M., Schaich, K., and Roy, R.B. 1975. Interaction of peroxidizing methyl linoleate with some proteins and amino acids. J. Agric. Food Chem. 23: 159-163.
Nawar, W.W. 1985. Lipids. Ch. 4, In Food Chemistry, 2nd ed., O.R. Fen- nema (Ed.), 139-244. Marcel Dekker, Inc., New York.
Pagliarini, E., Vemile, M. and Peri, C. 1990. Kinetic study on color changes in milk due to heat. J. Food Sci. 55: 1766-1767.
Pokomy, J. 1981. Browning from lipid-protein interactions. In Maillard Reactions in Food, C.E. Eriksson, (Ed.), 421-428. Prog. Food Nutr. Sci., Vol 5, Pergamon Press, Oxford.
Pokorny, J., Davidek, J., Chi, T.H., Valentova, H., Matejicek, J., and Dlas- kova, Z. 1988. Reactions of oxidized lipids with protein. Part 15. Mechanism of lipoprotein formation from interactions of oxidized ethyl linoleate with egg albumin. Die Nahrung. 32: 343-350.
Swoboda, P.A.T. and Peers, K.E. 1976. Pentaenoic fatty acids in butterfat as precursors of metallic, fishy taint. Chem. Ind. (London). 160-161.
Swoboda, P.A.T. and Peers, K.E. 1978. frares-4,5-Epoxyhept-frans-2-enal. The major volatile compound formed by the copper and a-tocopherol induced oxidation of butterfat. J. Sci. Food Agric. 29: 803-807.
Ms received 7/27/92; revised 9/30/92; accepted 12/22/92.
This study was supported in part by the Comisión Interministerial de Ciencia y Technología of Spain (Project ALI 91-0409). We are indebted to Prof. E. Vioque, for the useful discussions and Mr. J. L. Navarro, for the technical assistance.
of emulsifying agents on inhibition of enzymatic browning in apple juice by ascorbyl palmitate, laurate and decanoate. J. Food Sci. 54: 1096-1097.
Sayavedra-Soto, L.M. and Montgomery, M.W. 1986. Inhibition of poly- phenoloxidase by sulfite. J. Food Sci. 51: 1531-1536.
Valero, E., Garcia-Moreno, M., Varon, R., and Garcia-Carmona, F. 1991. Time dependent inhibition of grape polyphenol oxidase by tropolone. J. Agric. Food Chem. 39: 1043-1046.
Vamos-Vigyazo. L. 1981. Polyphenoloxidase and peroxidase in fruits and vegetables. CRC Crit. Rev. Food Sci. Nutr. 15: 49-127.
Walker, J.R.L. and McCallion, R.F. 1980. The selective inhibition of ortho- and para-diphenol oxidases. Phytochemistry 19: 373-377.
Wood, D.A. 1980a. Production, purification and properties of extracellular laccase of Agaricus bisporus. J. Gen. Micro. 117 327-338.
Wood, D.A. 1980b. Inactivation of extracellular laccase during fruiting of Agaricus bisporus. J. Gen. Micro. 117: 339-345.
Ms received 7/27/92; revised 11/2/92; accepted 12/23/92.
This work was supported in part by a grant from the Office of Academic Affairs and the Alumni Association at the University of Evansville to R.M.D. Part of this work was also supported by Sylvan Foods, Inc. through the office of Director of Research and Development, Dr. Frederick Miller, by a grant to W.H.F.
670—JOURNAL OF FOOD SCIENCE—Volume 58, No. 3, 1993

Browning Potential of Liquid Smoke Solutions: Comparisonof Two Methods
W.E. RIHA and W.L. WENDORFF
----------------------------ABSTRACT-----------------------------The color-forming potential of carbonyl compounds from liquid smoke solutions with selected amino acids was determined with a colorimetric procedure used in industry and compared with a color analysis on filter paper discs. The two methods provided different evaluations of formed colors. Of the carbonyls tested, glycolaldéhyde, methyl- glyoxal and glyoxal showed significant browning potential, while formaldehyde and hydroxyacetone showed very little color formation. Measurement of browning potential of amino acids varied between the procedures. The disc assay procedure enabled better characterization of smoke colors produced.
Key Words: flavors, smoke, carbonyls, amino acids, color
INTRODUCTIONTHE COLOR of smoked foods is the first attribute used to judge acceptability of smoked products. With use of liquid smoke flavorings producers can optimize smoke color by altering the composition of the liquid smoke. The color formed on the food product is due to non-enzymic browning (Ziemba, 1967) similar to the latter stages of the Maillard reaction (Rui- ter, 1979). In that reaction, carbonyls and dicarbonyls in the smoke undergo condensation reactions with amino groups of proteins and free amino acids in food. These reactions form brown, nitrogenous polymers collectively classified as melan- oidins (Hodge, 1953). Because of the complex nature of the wood smoke and foods that may be smoked, resulting pigments are varied in structure and quantity.
Browning potential, or the ability of specific amino-carbonyl reactions to form brown pigments, has been measured using two different methods. The first was the “ browning index procedure” , which uses a glycine solution to measure the reactivity of smoke carbonyls and smoke solutions. This is the standard industry method as described in patents by Nicholson (1986) and Underwood and Graham (1989). Ashoor and Zent(1984) used a similar colorimetric method to rank the browning of amino acids with common sugars. The second method is referred to as the “ disc color assay” and is similar to the method used by Ziemba (1967). It uses filter paper discs and a Lovibond-Schofield tintometer to measure the reaction of smoke fractions with amino acids. The paper method was used because it resembles the drier conditions found on the surface of smoked foods. Our objective was to compare the browning index procedure and disc color assay for measuring the browning potential of specific amino acids with carbonyls found in wood smoke and liquid smoke solutions.
MATERIALS & METHODST H E M A J O R carbonyl compounds in smoke solutions as reported by Ruiter (1979) were used. The L-amino acids, glyoxal, methylglyoxal, hydroxyacetone, formaldehyde and diacetyl were purchased from Sigma Chemical (St. Louis, MO). The glycolaldehyde dimer was purchased
A u t h o r W e n d o r f f i s w i th t h e D e p t , o f F o o d S c i e n c e , U n iv . o f W i s c o n s i n - M a d i s o n , 1 6 0 5 L in d e n D r iv e , M a d i s o n , W l 5 3 7 0 6 . A u t h o r R ih a 's p r e s e n t a d d r e s s : D e p t , o f F o o d S c i e n c e , R u t g e r s U n iv . , N e w B r u n s w ic k , N J 0 8 9 0 3
from Aldrich Chemical Company (Milwaukee, WI). All other chemicals were analytical grade. Potassium hydrogen phthalate buffer solution was 0.1M and pH 5.5. The commercial natural smoke flavorings used were: hickcry smokes H-6 and Code-6 and mesquite smoke M- 1 0 .
Browning index procedureThe browning index procedure was adapted from the paten: by
Underwood and Graham (1989) with some modification. Amino acid solutions were made to 0.13M in phthalate buffer, and carbonyl solutions were made to 0.17M in distilled water as described. Amino acid solution (10 mL) was added to one test tube and 10 m L buffer only was added to another tube as control. The tubes were then capped with marbles and heated in a boiling water bath for 5 min. Carbonyl solution (1 mL) or diluted CharSol H-6 smoke solution (1:25 with distilled water) was then added to both tubes. The tubes were heated in a water bath 20 min, removed, and placed in an ice water bath for 2 min. Absorbance of the reacted and unreacted solutions was measured at 400 nm in 13 m m cuvettes with a Bausch and Lomb Spec- tronic 20 spectrophotometer with the buffer-amino acid solution as a blank. Reacted samples too intense to read were diluted with distilled water along witn the contents of unreacted tubes to an appropriate dilution. This was repeated for all carbonyl and amino acid pairs. Each pair was analyzed in duplicate. The browning index, a measure of the color forming potential present/unit smoke flavoring or carbonyl, was calculated using the following formula:
Browning Index = (AR — A w x df)
where A R is the absorbance of the reacted amino acid and carbonyl solution, Au is the absorbance of the control solution, and df is the dilution factor.
Disc color assay
Amino acid discs. A 0.5M amino acid solution was prepared by dissolving the amino acids in 0.1M phthalate buffer (pH 5.5). A 0.5M solution was used because that was the highest concentration at which all amino acids were soluble and that provided suitable color on the discs in preliminary studies. Whatman #2 (Whatman International Ltd., Maidstone, England) filter discs (5.5 cm diam) were then dipped and totally submerged in the amino acid solution for 5 sec. Discs were removed from the solution and allowed to dry in a dark cabinet at room temperature. Then the discs were placed in Whirl-Pack'“ (Nasco, Fort Atkinson, WI) bags and stored away from direct light.
Carbonyl application. Solutions of the four carbonyls were prepared with distilled water at 0.25, 0.5, and 1.0M. Carbonyl solution ( = 0.4 mL) was sprayed on the amino acid discs to fully wet the disk. The control discs for each amino acid were sprayed with distilled water. Then, the discs were placed in a gravity convection oven at 42°C and allowed to react for 1.5 h. The discs were removed and colorimetrically analyzed using the Hunter colorimeter (Hunter Associates Laboratory, Inc., Reston, VA).
Liquid smoke solutions. The three liquid smoke solutions, (two hickory smoke H-6, Code 6 and mesquite smoke M10) were applied to the amino acid discs in a manner similar to the carbonyls. Solutions were diluted with distilled water based on carbonyl content (as reported by manufacturer). Since a solution of == 0.5M carbonyl was desired, an average carbonyl molecular weight of 72, (that of 2-bu- tanone used by the industry), was used to calculate the dilution. Final dilutions of the H-6, M-10 and Code-6 were 38%, 86%, and 48%, respectively.
Colorimetric analysis. Reacted filter discs were colorimetrically analyzed using a Hunter D-25A-9 Tristimulus Colorimeter. The col-
Volume 58, No. 3, 1993-JOURNAL OF FOOD SCIENCE-671

SMOKE COLOR MEASUREMENT.. .
F ig . 1 — B r o w n in g i n d e x o f a m i n o a c i d s r e a c t e d w i th c a r b o n y l s f o u n d in w o o d s m o k e : g l y o x a l (G X ), g i y c o i a i d e h y d e (G A ), m e th y l - g l y o x a l (M G ,1 a n d d i a c e t y l (D i), b y t h e b r o w n i n g i n d e x p r o c e d u r e . E r r o r b a r s i n d i c a t e 9 5 % c o n f i d e n c e in t e r v a l s .
A m in o A c id
F ig . 2 — B r o w n in g i n d e x o f a m in o a c i d s r e a c t e d w i t h a h i c k o r y s m o k e s o lu t io n , a s d e t e r m i n e d b y b r o w n i n g i n d e x p r o c e d u r e . E r r o r b a r s i n d i c a t e 9 5 % c o n f i d e n c e in t e r v a l s .
Table 1—S um o f b ro w n in g p o te n tia l o f carbonyls fo r each am ino acid, as m easured b y the b ro w n in g inde x p rocedu re a n d the d isc co lo r assay
Amino acid B.I. (total)* AE (total)1*
Lysine 905.5 69.2Histidine 613.8 69.9Arginine 383.1 60.9Glycine 364.3 67.3Alanine 295.3 64.4Proline 489.8 60.8Threonine 150.6 42.3Cysteine 116.3 53.2
* Sum of browning index for all four carbonyls. b Sum of color difference for all four carbonyls.
orimeter was standardized using black and white reference plates. Filter paper discs were placed in a cup with a clear plastic bottom placed over the 5.1 cm diameter light port of the colorimeter. The L, a, and b values were read and the sample was rotated 90 degrees (Hunter, 1975). This was repeated for a total of four readings for each disc. All treatments were analyzed in duplicate. The Hunter L value assesses darkness from black (0) to white (100). The a dimension determines red-green chromacity and b dimension assesses yellow- blue chromacity. The L, a, and b, chroma, and hue values were used to characterize the color formed on the discs. A E was a measure of total color change and was used to evaluate reactivity of the system or browning potential. Chroma, hue, and A E were calculated using the following equations:
Chroma = (a2 + b2)0-5
Hue = arctan (b/a)
A E = [(L, - Lo)2 + (a, - a„)2 + (b, - b0)2f 5
where L„, a0, and b0 are color dimensions of the amino acid disc sprayed with distilled water and Lj, a,, and bj are the color dimensions of the reacted discs.
Statistical analysisStatistical analysis was by Minitab Release 8 (Minitab Inc., State
College, PA). Differences between treatments were determined using one-way analysis of variance and the post hoc Tukey’s H S D pairwise test (p < 0.05).
RESULTS & DISCUSSION Browning index procedure
The browning potentials of the carbonyl-amino acid reactions, by the browning index procedure, were compared (Fig.1) and showed a large variability between treatments. Of the
amino acids, lysine appeared to be most reactive. Hydroxy- acetone and formaldehyde yielding browning index values <5.0 with all amino acids. The sum of the browning index values for the four active carbonyls and each amino acid (Table 1) indicated that, in general, basic amino acids were more active than neutral or acidic amino acids. Lysine was expected to be most reactive due to its e-amino group. The basic amino acid arginine did not react with either glyoxal or methylglyoxal, but reacted with giycoiaidehyde and diacetyl. That arginine was not very reactive, was consistent with Ruiter (1970) who reported that there was no loss of the guanidino groups of arginine when artificial sausage casing was reacted with smoke. The reactivity of the amino acids did not agree with reactivities reported by Ashoor and Zent (1984) when these amino acids were reacted with common sugars. They found that basic amino acids, histidine and arginine, produced little color. This was not the case with our results for the browning index procedure.
Carbonyls seemed to have the greatest effect on difference in browning potential. No single carbonyl produced the most browning with all amino acids. However, the three carbonyls, giycoiaidehyde, methylglyoxal, and glyoxal known to be potent color formers (Ruiter, 1979; Hollenbeck et al., 1973; Chen and Issenberg, 1972) reacted with most amino acids. The low browning potential of formaldehyde and hydroxyacetone was consistent with reports of Ruiter (1979) and Chen and Issenberg (1972). The browning potential of amino acids with the H- 6 smoke solution (Fig. 2) showed lysine was more reactive than the other amino acids. Cysteine was the least reactive.
Disc color assay
Effect of carbonyl concentration. The results of the disc assay indicated carbonyl concentration, had minor effects on color of the discs. A plot of color difference vs carbonyl concentration for the 0.5 M glycine discs (Fig. 3) showed little color change with increase in concentration for glyoxal, methylglyoxal, and diacetyl. Color difference increased slightly with giycoiaidehyde concentration but decreased slightly as methylglyoxal concentration increased from 0.5 to 1.0 M (p < 0.05). Apparently amino acid concentration was the limiting factor. Ruiter (1971) reported that the ratio of giycoiaidehyde to aminoethanol of 3:1 produced maximum color formation at 400 and 500 nm. Ruiter (1971) also reported that an excess of aldehyde decreased visible browning at these wavelengths which may explain the decrease in color for methylglyoxal. However,
672—JOURNAL OF FOOD SCIENCE—Volume 58, No. 3, 1993

C a r b o n y l C o n c e n t r a t i o n (M)F ig . 3 — C o lo r c h a n g e o f 0 . 5 M g l y c i n e d i s c s w i th a p p l i c a t io n o f 0 .2 5 , 0 .5 , 1 .0 M c a r b o n y l s , d e t e r m i n e d b y t h e d i s c c o l o r a s s a y .
C a r b o n y l C o n c e n t r a t i o n (M)F ig . 4 - C o lo r c h a n g e o f 0 .5 M l y s i n e d i s c s w i t h a p p l i c a t i o n o f 0 .2 5 , 0 .5 , 1 .0 M c a r b o n y l s , d e t e r m i n e d b y t h e d i s c c o l o r a s s a y .
Tucker et al. (1983) found an increased loss of available lysine in bovine plasma albumin as methylglyoxal concentration increased to a carbonyl:lysine ration of 50:1 in a liquid system.
Results of the same test with 0.5M lysine discs (Fig. 4) were slightly varied as the color difference from application of glyoxal increased sharply with concentration. Since the second amino group is present in lysine, this increase in color could be expected. Glycolaldehyde and methylglyoxal caused a slight increase in color difference, and diacetyl showed a decrease in color as concentration increased from 0.25 to 0.5M. Concentration of the carbonyl solution would most likely affect the color formed at lower carbonyl concentrations. Since these amino acids did not increase color difference with in
A m in o A c id
F ig . 5 —B r o w n in g p o t e n t i a l o f 0 . 5 M a m i n o a c i d s r e a c t e d f o r 1 .5 h r w i th 0 . 5 M c a r b o n y l s f o u n d in w o o d s m o k e : g l y o x a l (G X ), g l y c o l a l d e h y d e IG A ), m e t h y l g l y o x a l (M G ), a n d d i a c e t y l (D l), a s d e t e r m i n e d b y t h e d i s c c o l o r a s s a y . E r r o r b a r s i n d i c a t e 9 5 % c o n f i d e n c e in t e r v a l s .
creased carbonyl concentrations in the range studied, an equimolar concentration of carbonyls and amino acids was used for the remainder of the study.
Browning potential. The contribution of specific amino acids and carbonyls to color was evaluated comparing the disc color assay and the browning index procedure. This contribution to color is referred to as the “ browning potential.” Results of the disc color assay are reported in terms of AE (Fig. 5). Formaldehyde and hydroxyacetone showed very little browning potential ir. the disc color assay. These data show more uniformity in browning potential of the 8 amino acids than with the browning index procedure. The basic amino acids, lysine and histidine, and the neutral amino acids, glycine and alanine, were most reactive with all four carbonyls. This is seen (Table 1) when the sums of the AE values of the four carbonyl solutions for each amino acid are compared. As with the browning index procedure, glycolaldehyde was highly reactive with glycine and alanine. The relative reactivity of these amino acids with carbonyls was different from that reported by Ashoor and Zent (1984) for amino acids reacted with common sugars. One difference was the browning potential of histidine which was not very reactive with sugars but was highly reactive with carbonyls found in smoke.
The differences in browning potential that occurred between amino acids were due to the carbonyls with which they were reacted. Glyoxal, glycolaldehyde, and methylglyoxal were the most reactive carbonyls tested. With the disc color assay, methylglyoxal was most reactive with the three basic amino acids. In the browning index procedure, diacetyl was an active color former with arginine, lysine and cysteine, however, in the disc color assay, diacetyl, did not react strongly with any of the amino acids.
The reactions of these amino acids with the three smoke solutions (Fig. 6 ) indicated that, although they were diluted to contain about the same carbonyl concentration (0.5M, calculated as 2 -butanone), there were obvious differences between their browning potential. The AE values were calculated using phthalate buffer discs (with no amino acid) which were sprayed with smoke solution as the unreacted control. Therefore, the AE values represent color changes due only to the reaction of the smoke solution with the amino acid.
One smoke solution (Fig. 6 ) was slightly more reactive than the others. These differences in reactivity most likely reflect the carbonyl compositions of the liquid smoke solutions which
Volume 58, No. 3, 1993-JOURNAL OF FOOD SCIENCE-673

SMOKE COLOR MEASUREMENT. . .
25
LYS HIS ARG GLY ALA PRO THR CYS A m in o A c id
F ig. 6 — B r o w n in g p o t e n t i a l o f 0 .5 M a m in o a c i d s r e a c t e d w i th t w o h ic k o r y s m o k e H -6 a n d C o d e - 6 , a n d a m e s q u i t e s m o k e M - 10, a s d e t e r m i n e d b y t h e d i s c c o lo r a s s a y . E r r o r b a r s i n d i c a t e 9 5 % c o n f i d e n c e in t e r v a l s .
Table 2 - M eans o f color, hue an d chrom a values fo r carbonyls reac ted on 0.5 M am ino a c id disks, average o f 8 am ino acids______________________
Carbonyl
Color dimensions L a b Hue Chroma
Glyoxal 77.7» 1.0» 16.4» 88.9» 16.6»Glycolaldehyde 79.5* - 0 .1» 19.5» 90.6» 19.6»Methylglyoxal 79.8» -0.5» 21.9» 91.1» 2 2 .0»Diacetyl 87.7b -1.7» 4.1b 113.0» 4.5»a'b Means in the same column with different superscripts are different (p < 0.05).
Table 3 - M e a n s o f color, hue an d chrom a values fo r l iq u id sm oke solu tions re acted on 0.5M am ino ac id disks, average o f a ll e igh t am ino acids
Smokesolution»
Color dimensions L a b Hue Chroma
Hickory Smoke H-6 82.4» 0.3» 24.4»' 89.5» 24.5»'Hickory Smoke Code-6 78.5» 1.5» 27.2» 86.9» 27.3»Mesquite Smoke M-10 82.4» 0 .1» 23.3' 89.8» 22.4'8 Each smoke solution was diluted to contain an equivalent concentration of carbon
yls (0.5m, calculated as 2-butanone).b'c Means in the same column with different superscripts are different (p < 0.05).
may include some carbonyls that do not contribute to smoke color production. Suc.i carbonyls could include acetol, diacetyl, or formaldehyde, all of which may be found in wood smoke, but are not potent color formers (Ruiter, 1970).
Comparison of methods
The most important difference between the two methods is the way in which the color is measured. In the browning index procedure, reacted color absorbency is assayed at 400 nm and measures the concentration of “ yellow-gold” compounds formed in the early stages of the Maillard reaction (Hodge, 1953). The rate of browning reaction and type of pigments formed may be different between different amino acids and carbonyls. Thus, the browning index procedure does not accurately measure the final melanoidin concentration in solution (brown color). In using the browning indèx with glycine it would tend to give higher readings for those solutions with higher levels of glycolaldéhyde. Since lysine reacted more uniformly with all carbonyls, using it as the amino acid in the browning index
procedure may result in a more representative measurement of browning potential.
The disc color assay measures total color change produced. That data would more accurately indicate the browning potential and overall color observed by the consumer. Several researchers (Nicholson, 1986; Riha and Wendorff, 1991) have shown that Hunter color dimensions of smoked foods correlated with sensory assessment of smoked color in those products.
CharacterizationThe disc color assay also allowed characterization of the
colors formed by specific carbonyl-amino reactions. The carbonyl seemed to have the greatest effect on specific color produced. There was no significant difference in the colors (Table2 ) produced with glyoxal, glycolaldehyde and methylglyoxal with the amino acids. The colors on the discs were yellowish brown. Diacetyl produced a significantly different hue angle (p x 0.05) which appeared as greenish-yellow or grayish on the color assay discs. The color dimensions of all the amino acids reacted with each liquid smoke solution were compared (Table 3). There was no significant difference between the two hickory smoke solutions, but the mesquite smoke solution had lower (p <0.05) b value and chroma.
CONCLUSIONSCARBONYLS in wood smoke and amino acids present in the system affect the intensity and type of color produced. Lysine, rather than glycine, may be a more effective amino acid to use in the browning index procedure by industry for measuring browning potential of liquid smoke products. The disc color assay provides a more accurate measurement of browning potential of liquid smoke solutions since it measured total color change produced by all smoke carbonyls.
REFERENCESAshoor, S.H. and Zent, J.B. 1984. Maillard browning of common amino
acids and sugars. J. Food Sci. 49: 1206-1207.Chen, L. and Issenberg, P. 1972. Interactions of some wood smoke com
ponents with c-amino groups in proteins. J. Agric. Food Chem. 20: 1113- 1115.
Hodge, J.E. 1953. Chemistry of browning reactions in model systems. J. Agric. Food Chem. 1: 928-943.
Hollenbeck, C.M., Moore, D.G., and Wendorff, W.L. 1973. Some facets of the smoke flavoring process. Proc. Meat Ind. Res. Conf. p. 119-130.
Hunter, R.S. 1975. T h e M e a s u re m e n t o f A p p e a ra n ce . John Wiley and Sons Inc. New York.
Nicholson, M.D. 1986. Preparation of tar-depleted liquid smoke treated casings. U.S. patent 4,594,251, June 10.
Riha, W.E. and Wendorff, W.L. 1991. Smoked cheese color as related to consumer acceptance and objective measurements. J. Dairy Sci. 74 (Suppl.1): 104.
Ruiter, A. 1970. The colouring of protein surfaces by the action of smoke. Lebensm. Wiss. Technol. 3: 98-100.
Ruiter, A. 1971. The browning reaction of glycolic aldehyde with aminoe- thanol. Lebensm. Wiss. Technol. 4: 38—42.
Ruiter, A. 1979. Color of smoked foods. Food Technol. 33(5): 54-63. Tucker, B.W., Riddle, V., and Liston, J. 1983. Loss of available lysine in
protein in a model Maillard reaction system. In T h e M a il la r d R e a c tio n in F o o d s a n d N u tr i t io n , G.E. Waller and M.S. Feather (Ed.), p. 395—403. American Chemical Society. Washington, DC.
Underwood, G.L. and Graham, R.G. 1989. Method of using fast pyrolysis liquids as liquid smoke. U.S. patent 4,876,108, October 24.
Ziemba, Z. 1967. Nonenzymatic browning reactions in smoked foods. J. Nutr. Dietet. 4: 122-129.
Ms received 11/24/92; revised 1/19/93; accepted 2/4/93.
This research was supported in part by the College of Agricultural and Life Sciences and the Center for Dairy Research through funding from the National Dairy Promotion and Research Board. Use of trade names does not imply endorsement by the University of Wisconsin nor criticism of ones not mentioned.
674-JOURNAL OF FOOD SCIENCE-Volume 58, No. 3, 1993

Enthalpy of Frozen Foods Determined by Differential Compensated Calorimetry
WILLIAM L. KERR, JIE JU, and DAVID S. REID
----------------------------ABSTRACT-----------------------------Frozen samples were placed in one of two insulated vessels at room temperature. Enthalpy was measured by the electrical energy required to reverse the temperature differential that developed. Tests with pure ice agreed to within 0.3% of expected values. Measurements on beef, bread, egg white, and applesauce were similar to published values. The change in average enthalpy during freezing was examined and agreed with an enthalpy-based freezing model. Differential compensated calorimetry affords several advantages and was particularly useful for rapid measurement of enthalpy in commercial freezer conditions.
Key words: frozen foods, calorimetry, enthalpy
INTRODUCTION
VARIANCE of the enthalpy of a food with state and temperature is a prime determinant of its freezing properties. Knowledge of enthalpy allows calculation of cooling and freezing loads, important because they indicate the energy that must be removed to freeze water in a product and lower it to a specified storage temperature. The enthalpy is also related to the amount of water frozen at any given temperature. In foods, water does not freeze at a unique temperature because the freezing process progressively concentrates solutes in the unfrozen liquid and continually depresses the freezing point (Reid, 1983). In addition, some portion of the water usually does not freeze at any temperature. This can be estimated from the discrepancy between the heat actually removed and the latent heat which must be removed to freeze all of the water in the food (Held- man, 1974). The enthalpy-temperature relationship is also associated with how fast a particular food freezes and is utilized in some freezing models (Mannapperuma and Singh, 1988;1989).
Both experimental and mathematical modeling approaches have been used to determine enthalpy of frozen foods. Reidel (1951; 1956; 1957a,b; 1959) used adiabatic calorimetry to measure enthalpy between - 60°C and 20°C for fish, beef, egg white, egg yolk, white bread, and fmit juices. Dickerson (1968) and the ASHRAE (1981) handbook present the results in tabulated form. Jason and Long (1955) and Charm and Moody (1966) also used adiabatic calorimetry to study muscle tissue. Fleming (1969) used an automated calorimeter to obtain enthalpy-temperature data for lamb.
Theoretical predictions have been based on more easily measured properties. Heldman (1974; 1982) presented a relationship between unfrozen water fraction and temperature that was based on the initial freezing temperature. Schwartzberg (1976) derived a formula for enthalpy as a function of solids and water content, and initial freezing point. That approach was extended by Succar and Hayakawa (1983). Joshi and Tao (1974) and Chang and Tao (1981) developed empirical equations for enthalpy, one for meats and another for fruits and vegetables.
Adiabatic calorimetry can be used to measure the enthalpy of a sample over a wide temperature range. However, with that approach it would be difficult to measure enthalpy in a
A u t h o r s K err , J u , a n d R e i d a r e w i th t h e D e p t , o f F o o d S c i e n c e , U n iv . o f C a lifo r n ia , D a v is , C A 9 5 6 1 6 - 8 5 9 8 .
sample as it is removed from a particular freezer. Our objective was to use a differential compensated calorimeter, which we tested as an alternative to adiabatic calorimetry. We were seeking a quick method for measuring enthalpy of foods from commercial freezers, which could monitor changes during transient cooling and freezing. Two situations in which the differential compensated calorimeter might prove useful were examined. First, steady state enthalpies of select frozen foods were measured. Results were compared with published values and used to calculate phase diagrams. Secondly, the enthalpy change during transient freezing was measured. Results from these experiments were compared with enthalpy changes predicted by the freezing model of Mannapperuma and Singh (1988;1989).
MATERIALS & METHODS Calorimeter designA calorimeter of the differential compensated type was used (Reid,
1976). Two identical vessels were used so that any heat loss from the sample chamber was compensated for by the reference chamber. The sample vessel was controlled to eliminate any temperature differential that developed between the two vessels once the sample was introduced. The amount of energy introduced into the sample vessel measured the heat effect. Careful control of the calorimeter temperature was not required, since the calorimeter fluid was the same temperature as that of the surrounding room.The construction of the instrument is shown in Fig. 1. The vessels
A
Volts Amps
J
Sample Reference
F ig . 1 — D if f e r e n t ia l c o m p e n s a t e d c a l o r i m e t e r f o r m e a s u r i n g f r o z e n f o o d e n th a l p y : A —m e a s u r e d p o w e r s u p p ly , B —o n /o f f s w i t c h , C — c u m u l a t i v e t im e r , D — m ix e r , E — i n s u l a t e d P V C lid , F — d e w a r f la s k , G — h e a t e r , H — t h e r m o c o u p l e s , I — a m p l i f i e r , J — c h a r t r e c o r d e r .
Volume 58, No. 3, 1993-JOURNAL OF FOOD SCIENCE-675

ENTHALPY OF FROZEN FOODS...
were made from silvered Dewar flasks 27.5 cm in diameter and 28 cm high. The inner chambers were stainless steel cups 15 cm in diameter and 15 cm deep. The covers were made from 8 m m thick PV C end cap (30.5 cm i.d.): this could be readily machined and tapped to provide needed features such as doors and screw supports. Each coyer was insulated with 5-6 cm of spray foam (Insta-Foam Products, Joliet, IL) such that it fit snugly over the Dewar.The sample chamber contained a heater constructed from 3.6 meters
of 0.25 m m diameter teflon-coated constantan wire (Omega, Stamford, CT) wrapped around a 1.27 cm diameter plexiglass rod. The heater resistance was 36 ohms at room temperature. A mixer motor (Talboy Model 104, Emerson, NJ) was mounted to the top of the cover, with a 9.5 m m diameter stainless steel shaft leading into the chamber and terminating in a 3-paddle mixer. A 7.5 x 10 cm trap door on the cover allowed samples to be introduced. To keep buoyant samples submerged in the water, a 3-sided plastic basket was fitted to a 6.3 m m plastic rod running through the chamber. The basket could be swivelled or raised and lowered in the chamber to trap the sample.
Each of the vessels was filled with water at the same temperature; the differential temperature (AT) was monitored with an 8-junction copper-constantan thermopile with alternate junctions in the sample and reference chambers. The output of the thermopile was amplified by an O M N I IIA D C millivolt amplifier (Omega, Stamford, CT.) and directed to a B D 40 linear chart recorder (Zipp and Konen, Holland). The amplifier gain and recorder sensitivity were set to give a full scale reading corresponding :o 1°C temperature differential.The heater was powered by a 50V power supply (VIZ Mfg., Phil
adelphia, PA). Voltage and current remained constant over the course of an experiment and were monitored by a built-in voltmeter and ammeter. A cross-check of power input was made by reading the voltage directly across the 36 ohm heater wire. The heater was turned on and off by a D P D T switch that activated a XL-10 cumulative timer (Kessler-EUis, Atlantic Highlands, NJ) whenever the heater was on. Accurate measurements could also be made using a hand-held stopwatch. Care was taken that heater leads and switches had minimal resistance (<0.1 ohms).
Steady-state enthalpy measurementsIn the first experiments, the enthalpy of frozen food samples in the
steady state was measured. The samples included 20% solutions of sucrose, beef round steak, white bread, egg white, and applesauce. Sample size was limited to about 20-50g. Larger samples resulted in prohibitively long measurement times, whereas smaller samples gave less reproducible results. Liquid samples were first sealed in small 2 mil polyethylene bags. All samples were placed in a series of Kenmore Coldspot chest freezers (Sears and Roebuck, Chicago, IL), modified for temperature control ± 1°C, and with temperatures between 0°C and - 35°C. Each sample was placed in a small polystyrene box with the lid off and frozen for 24 hr. The lids were then placed on the small boxes, and the small boxes were placed inside larger styrofoam containers. The entire container remained in the freezer for an additional 24 hr. This precaution was taken to limit heat losses during transport of samples from the freezer to the calorimeter. The foam containers were not necessary when the calorimeter was in the immediate vicinity of the freezer, and transfer of the sample could be made within 10-20 sec.
Enthalpy measuremenrs during transient freezingW e also determined enthalpy changes with time after samples were
placed in an air blast freezer (Frigoscandia, Sweden). Samples of beef round steak, pumpkin, and potato were cut into 3 x 3 x 5 cm slabs and placed in the air stream. Individual samples were removed at regular intervals over a 2 hr period and transferred to the calorimeter for enthalpy measurement.
RESULTS & DISCUSSION Enthalpy measurements
A typical recorder trace for enthalpy measurement of a frozen product (Fig. 2) showed (line AB) the sample and reference chambers were initially at the same temperature and showed no change in differential temperature. At point B, the mixer was turned on and, due to frictional heating, contributed to an increase in temperature at a rate of 0.018°C/min (line BC). An
Fig. 2 —Differential temperature (AT) versus tim e during enthalpy measurement o f frozen beef. AB-no sample/m ixer off, BC-mixer turned on, BB'-extrapolated increase in A T due to mixing, C-frozen sample introduced. Dark bars under figure show periods when heater was on.
extension (BB1) drawn colinear with line BC showed what the mixer contribution to temperature rise would be at any later time. A frozen sample of beef kept at -32°C was introduced at point C, causing the temperature to drop. After about 1 min, the heater was switched on and the temperature rose. Heating of the chamber was done in several steps to allow time for heat transfer into the sample. The measurement was finished when the temperature reached and followed line BB'.
The enthalpy change/g frozen product between the room temperature value (HRT) and that at the frozen storage temperature (Ht ) is given by:
AH = Hrt - Ht = ^ (1)
where V is the voltage, I the current, w the sample weight, and t the total time the heater was on.
Control and calibration experimentsThe first test of the calorimeter was to make sure no signif
icant differential heat losses occurred between vessels. This was examined by placing cold or hot water in each of the chambers and monitoring the temperature difference. That difference (AT) between chambers remained constant over at least 30 min (Fig. 3, curve A). In practice, real heat losses should be less because near adiabatic conditions were maintained by keeping the calorimeter fluid near the surrounding room temperature.
A second test of the system was to ensure that the temperature increase due to the mixer was predictable. A food sample was placed in the water in the sample chamber and both were allowed to equilibrate to room temperature. AT was followed after turning on the mixer (Fig. 3, curve B). The temperature rise was linear over the temperature range used.
The calorimeter was further checked and calibrated by measuring enthalpy changes for known weights of pure frozen water. For a sample frozen to some temperature T<0°C, the enthalpy change is given by
AH = Cp iccw(0 - T) + wAH]al + Cp,„20w(Tc - 0) (2)
where Tc is the calorimeter temperature, Cpicc=1.99 J/g°C, C p , h 2 o = 4.19 J/g°C, AHlal = 333.6 J/g, and w is the sample weight. A plot of the measured versus calculated enthalpy for several weights of water is shown in Fig. 4. The linear regres-
676—JOURNAL OF FOOD SCIENCE-Volume 58, No. 3, 1993

TIM E (m in s )
Fig. 3 -D iffe re n tia l temperature (AT) showing lack o f heat exchange with environment. A -m ixer off, no sample, vessels at 30°C; B-mixer on with equilibrated sample. Dotted lines show straight-line fits through each curve.
sion line through this data has a slope of 0.997 (r = 0.99), suggesting that there was less than 0.3% heat lost from the calorimeter. In practice, the measured enthalpy for other samples could be corrected by multiplying Equation 1 by a factor of 0.997.
Steady state measurementsThe measured enthalpy versus temperature for frozen beef,
egg white, applesauce, and white bread were compared (Fig. 5). For comparison purposes, the data were converted to a reference of H = 0 at - 40°C. The data were reproducible for triplicate measurements, with a range between ± 4 to ± 1 1
J/g. As expected, the enthalpy increased at higher temperatures and showed the most change at temperatures approaching the freezing point. Data from the ASHRAE (1981) Handbook are shown for comparison. The results were similar, particularly for beef and applesauce. The lack of perfect agreement was not surprising, however, since there were likely to be compositional differences between the samples used in this and other experiments.
The phase diagram for sucrose (Fig. 6 ) was derived from enthalpy measurements on 2 0 % sucrose as described below. After determining the enthalpy at each temperature (T) below the freezing temperature TF, the weight fraction of frozen water (y) can be calculated from:
AH = (1 - x)CpH20(Tc - TF)+ yAHlat + yCp>ice(TF - T)+ (l ~ y — x )Cp,h 2o (Tf — T)
+ XCp,solids(Tc — T) (3)
where x is the weight fraction of solids, 1 — x the fraction of water, 1-y-x the fraction of unfrozen liquid at temperature T, and CPtSOlids is taken as 1.256 J/g°C. Other terms are as given in Eq. (2). Given the amount of ice frozen at a specific temperature, the concentration of solute in the unfrozen liquid is x/(l-y-x). Equation (3) was used to determine the solute concentration in the unfrozen liquid at each frozen storage temperature. Also shown (Fig. 6 ) is a phase diagram derived from freezing point measurements of sucrose solutions of vaiying concentration (Pancoast and Junk, 1980).
Enthalpy changes during freezingEnthalpy changes during blast freezing at — 30°C were re
corded for beef round steak (Fig. 7). Enthalpy was shown as the amount of heat removed by the freezer from a sample that
Fig. A—Calibration o f calorimeter w ith known weights o f pure ice, showing measured and expected enthalpy change.
was initially 25°C. Here, the term enthalpy is used in a restricted way, and does not imply that the sample was at thermal equilibrium. There is a progression of ice interface during freezing, while thermocouple measurements show a thermal gradient exists. The calorimeter measures only how much heat, on average, was removed from the sample after a given time in the freezer.
Most of the enthalpy change occurred soon after the sample was placed in the freezer. Temperature measurements of the sample showed that it was cooled down to the freezing point within about 5 min. For beef, a steady state was approached after about 35 m:n in the freezer. The solid line (Fig. 7) shows the rate of enthalpy change in beef predicted by the model of Mannaperuma and Singh (1989), assuming an initial freezing point of Tf= — 1.3°C and a heat transfer coefficient of h = 60W/m2. The rate of change was predicted well by the model, although the steady state enthalpy of 315 J/g was slightly less than the measured value.
Several factors indicate that the differential compensated calorimeter produced reliable enthalpy measurements. First, the measured values for pure ice agreed with calculated values within 0.3%. This difference, although it did not significantly alter the results, could be corrected in calculations. Also, the steady-state enthalpy values measured here were close to those reported using adiabatic calorimetry. There may be some differences with these results due to variations in food composition. However, we would expect samples of similar composition and moisture content to have about the same enthalpy at a given storage temperature.
Measurements on frozen sucrose solutions also support the accuracy of the differential compensated calorimeter. By determining the enthalpy at a given temperature below freezing, we were able to determine the amount of ice frozen, and thus the concentration of solids in the unfrozen liquid. Comparison of the temperature vs concentration plots, with phase diagrams derived from direct freezing point measurements, showed good agreement.
The differential compensated calorimeter affords several advantages. Construction is simple and does not need high precision. The most critical features are a power supply which supplies steady current and a mixer which produces minimal and predictable heating. Temperature of the calorimeter does not need to be carefully controlled. Adiabatic conditions are easily maintained since the calorimeter fluid and surroundings are at room temperature. Typically, a 30g frozen sample placed
Volume 58, No. 3, 1993-JOURNAL OF FOOD SCIENCE-677

ENTHALPY OF FROZEN FOODS...
TEMPERATURE (°C)
Fig. 5 —Measured enthalpy o f (a) beef, (b) egg white, (c) applesauce, and (d) white bread at several frozen storage temperatures, and norm alized to H = 0 at -40°C. Error bars indicate range fo r triplicate experiments. Solid line shows ASHRAE (1981) values.
% S U C R O S E
Fig. 6 —Phase diagram fo r sucrose derived from enthalpy measurements on 20% sucrose. Solid line derived from freezing point measurements o f Junk and Pancoast (1980).
T IM E (m in)
Fig. 7—Heat removed (•) and change in center temperature (m) during air-blast freezing o f beef at -30°C. Bold line shows predicted change in enthalpy using m odel o f Mannaperuma and Singh (1989).
in the 2L sample chamber will reduce water temperature by <1°C.
Other advantages are that measurements of absolute temperature are not as critical, since the method works by mini
mizing a measured temperature difference. In addition, water can be used as the calorimeter fluid instead of organic solvents such as isopropyl alcohol (Charm and Moody, 1966) or trichloroethylene (Fleming, 1969). The differential compensated
678-JOURNAL OF FOOD SCIENCE-Volume 58, No. 3, 1993
TE
MP
ER
AT
UR
E (°C
)

calorimeter was particularly useful for measuring enthalpy of food products in specific freezer situations. The samples in these experiments were frozen in commercial freezers instead of in the calorimeter. This is especially useful for monitoring the transient part of the freezing process.
There are some limitations to the method. It is more difficult to study a wide range of equilibrated temperatures since the temperature of the freezer must be adjusted. About one day was required to adjust freezers and establish a new temperature. Also, this approach requires rapid transfer of the sample to limit heat gain. Thus, the calorimeter must be immediately adjacent to the freezer or special precautions must be used to prevent heat loss during transfer. This also necessitates relatively large samples (20-50g). Obviously, the enthalpy of samples above room temperature cannot be measured. It is also more difficult to measure enthalpy for cooled but nonfrozen samples.
In conclusion, the differential compensated calorimeter can function as an adjunct to more traditional approaches for measuring enthalpy of frozen foods. It is particularly applicable when simple construction is desired and transient enthalpy values for a particular freezing process may be required.
REFERENCES
ASHRAE. 1981. Thermal properties of foods. Ch. 31, In A S H R A E H a n d book 1981 F u n d a m e n ta ls , T.C. Elliott (Ed.), p. 1-22. American Society of Heating, Refrigerating and Air-Conditioning Engineers, Inc., Atlanta, GA.
Chang, H.D. and Tao, L.C. 1981. Correlations of enthalpies of food systems. J. Food Sci. 46: 1493-1497.
Charm, S.E. and Moody, P. 1966. Bound water in haddock muscle. ASHRAE J . 8: 39—42.
Dickerson, R.W. 1968. Thermal properties of foods. Ch. 2, In T h e F r e e z in g
P re se rva tio n o f F oods, 4th ed., Vol. 2, D.K. Tressler, W.B. Van Arsdel, and M.J. Copley (Ed.), p. 26-51. Avi Publishing, Westport, CT.
Fleming, A.K. 1969 Calorimetric properties of lamb and other meats. J. Food Technol. 4: 199-215.
Heldman, D.R. 1974. Predicting the relationship between unfrozen water fraction and temperature during food freezing using freezing point depression. Trans. ASAE 17: 63-66.
Heldman, D.R. 1982. Food properties during freezing. Food Technol. 36: 92-96.
Jason, A.C. and Long, R.A.K. 1955. The specific heat and thermal conductivity of fish muscle. Proc. 9th Inti. Congr. Refrig. Commission II. p. 160-169.
Joshi, C. and Tao, L.C. 1974. A numerical method of simulating the axi- symmetrical freezing of food systems. J. Food Sci. 39: 623-626.
Mannapperuma, J.D. and Singh, R.P. 1988. Prediction of freezing and thawing times of foods using a numerical method based on enthalpy formulation. J. Food Sci. 53: 626-630.
Mannapperuma, J.D. and Singh, R.P. 1989. A computer-aided method for the prediction of properties and freezing/thawing times of foods. J. Food Eng. 9: 275-304.
Pancoast, H.M. and Junk, W.R. 1980. H a n d b o o k o f S u g a r s , 2nd ed., p. 48. Avi Publishing, Westport, CT.
Reid, D.S. 1976. Differential microcalorimeters. J. Phys. E. 9: 601-609.Reid, D.S. 1983. Fundamental physicochemical aspects of freezing. Food
Technol. 37: 110-115.Reidel, L. 1951. The refrigerating effect required to freeze fruits and veg
etables. Refrig. Eng. 59: 670-673.Reidel, L. 1956. Kalorimetrische Untersuchungen über das gefrieren von
see fischen. Kältetechnik 8: 374-377.Reidel, L. 1957a. Kalorimetrische Untersuchungen über das gefrieren von
fleisch. Kältetechnik 9: 38—40.Reidel, L. 1957b. Kalorimetrische Untersuchungen über das gefrieren von
eiklar und eigelb. Kältetechnik 9: 342-345.Reidel, L. 1959. Kalorimetrische Untersuchungen über das gefrieren von
weissbrot und anderen mehlprodukten. Kältetechnik 11: 41—43.Schwartzberg, 1 !.G 1976. Effective heat capacities for the freezing and
thawing of Too 1. J. Food Sci. 41: 152-156.Succar, J. and H lyakawa, K. 1983. Empirical formulae for predicting ther
mal physical properties of food at freezing or defrosting temperatures. Lebensm.-Wiss. Technol. 16: 326-331.
Ms received 9/27/92; revised 12/19/92; accepted 12/29/92.
We gratefully acknowledge financial support from the Electric Power Research Institute.
D IHYDROCAPSAICIN OXIDATION B Y PEROXIDASE.
C a p sic u m a n n u u m var. annuum cv. karayatsubusa at different growth stages after flowering. Agric. Biol. Chem. 43: 2493.
Krajewska, A.M. and Powers, J.J. 1986. Isolation of naturally occurring capsaicinoids by reverse-phase low pressure liquid chromatography. J. Chromatogr. 367: 267.
Lee K.R., Suzuki, T., Kobashi, M., Hasegawa, K., and Iwai, K. 1976. Quantitative microanalysis of capsaicin, dihydrocapsaicin and nordihydrocap- saicin using mass fragmentography. J. Chromatogr. 123: 119.
Leete, E. and Louden, M.C.L. 1968. Biosynthesis of capsaicin and dihydrocapsaicin in C a p sic u m fru te sc e n s . J. Amer. Chem. Soc. 90: 6837.
Masada, Y., Hashimoto, K., Inoue, T., and Suzuki, M. 1971. Analysis of the pungent principles of C a p sic u m a n n u u m by combined gas chroma- tography-mass spectrometry. J. Food Sci. 36: 858.
Suzuki, T., Fujiwake, H., and Iwai, K. 1980. Intracellular localization of
. .From p ag e 613 ........... -
capsaicin and its analogues, capsaicinoid, in C a p sic u m fruit. 1. Microscopic investigation of the structure of the placenta of C a p sic u m a n n u u m var. annuum cv. karayatsubusa. Plant Cell Physiol. 21: 839.
Zapata, J.M., Calderón, A.A., Muñoz, R., and Ros Barceló, A. 1992. Oxidation of natural hvdroxybenzoic acids by grapevine peroxidases: kinetic characteristics and substrate specificity. Amer. J. Enol. Vitic. 43: 134.
Ms received 9/30/92; revised 12/10/92; accepted 1/16/93.
This work waa supported by a grant to F.M.C. from the Universidad de La Coruña. M.AB. holds a fellowship from the Xunta de Galicia.
Volume 58, No. 3, 1993-JOURNAL OF FOOD SCIENCE-679

Component Analysis of Disaggregation of Pectin During Plate Module Ultrafiltration
P.D. HOAGLAND, G. KONJA, and M.L. FISHMAN
------------------------------A B ST R A C T -------------------------------Concentration of commercial lime and citrus was carried out by plate module ultrafiltration with a 300K cut-off membrane with small changes in intrinsic viscosity and 48 and 55% recoveries. Subsequent ultrafiltration of permeates with a 100K cut-off membrane yielded pectins from retentâtes with lower viscosities and recoveries of 34 and 39%. Component analysis was applied to concentration and viscosity response curves from hig i performance size exclusion chromatography. Results suggested viscosity loss was due to passage through the m e m brane of small pectin molecules and/or aggregates released from breakdown of larger pectin aggregates during 300K ultrafiltration. Concentration of pectin with minimum loss of viscosity requires ultrafiltration which insures retention of small pectin aggregates. Improved component analysis was developed for characterizing solution behavior of pectin during processing.
Key Words: citrus, pectin, ultrafiltration, viscosity, aggregation
INTRODUCTION
THE ISOLATION and purification of pectin often involves large volumes of dilute aqueous solutions containing small molecules. Ultrafiltration can be applied to concentrate and purify them by removing from solutions of pectin both water ans small molecules. However, the behavior of pectin during ultrafiltration has not been extensively investigated and can be expected to be complex, due to formation of aggregates in sizes from ca. 100 kd to 10,000 kd (Fishman et al., 1992). Advances in component analysis of high performance size exclusion (HPSE) chromatographs of pectins from a variety of plants (Fishman et al., 1991a, b) allows study of the behavior of pectin during ultrafiltration in a highly aggregating system. Our objective was tc apply an improved component analysis of HPSE chromatograms to determine whether pectin could be effectively concentrated by ultrafiltration. We also determined whether the viscosity of pectin could be improved by ultrafiltration through removal of low molecular weight pectins.
EXPERIMENTALHigh Performance size exclusion chromatography (HPSEC)Waters p.-3ondagel E-High, E-1000, and SynChrom Synchropak
GPC-100 columns were used in series. The mobile phase was 0.05M aqueous N a N 0 3 (reagent grade) prepared with distilled water passed through a Modulab Polisher (Continental Water Systems Corp.) and filtered through a 0.2 p m Nucleopore. The solvent delivery system included a front-end Degasser ERC-3120 (Erma Optical Works, Ltd.) and a Beckman Model 110 Pump with a Model 421 Controller. The pump was fitted with two Waters M45 pulse dampeners and a Beckman pulse filter. A Beckman Model 210 injector valve with a 100 pL sample loop was positioned between the solvent delivery system and the column set maintained at 35° C in a thermostatted water bath. Nominal flow rate was 0.5 mL/min. Observed flow rate was determined with a horizontal 2 m L pipette connected to the RI Detector
Authors Hoag land and Fishman are w ith the Eastern Regional Research Center, NAA. ARS, USDA, 600 East M erm aid Lane, Wyndmoor, PA 19118. Author Konja is w ith the University o f Zagreb, Zagreb, Croatia.
outlet. A ca. 0.1 m L bubble was injected into the exit stream and its passage through the pipette was accurately timed (Fishman et al.,1987). Flow rates were also obtained from the maximum peak position for material eluting at the total volume (V,) of the system. This volume was determined from a series of sucrose injections (found to be 8.20 mL). Observed short term flow rate variation was <0.5%.
DetectorsA differential refractive index RI Detector Model 7510, Erma Op
tical Works, Ltd., was used with a 30x preamplifier between its lv integrator output and input to the A/D board. The detector was calibrated with dextran standards and gave a linear response from 0 to 8 mg/mL concentration of injected sample with a slope of 4843 ± 68 mv/mg/mL in the viscometer cell. A Differential Viscometer Model 100 (Viscotek Corp.) was operated at oven temperature 35° C. Periodically, inlet pressure was adjusted to 0 at zero flow to correct for drift (found related to overnight variations in room temperature). In addition to directly calculating specific viscosity from the differential pressure and inlet pressure (Fishman et al., 1989a), detector performance was evaluated with pullulan standards P-10, P-20, P-50, P-100, P-200, P-400, and P-800 from Polymer Laboratories. A plot of measured intrinsic viscosity (i.v.) vs. published i.v. for pullulans produced a straight line that passed through zero (Fig. 1). Specific viscosity, n,.p is defined by the relationship between excess pressure (DP) and inlet pressure. (P„) by (1).
4 x DP
In dilute solution, we assumed that the intrinsic viscosity, i.v. = ■q, p. /c, where c is the concentration of solute. Moreover, as described by Fishman et al. (1989a), the area under the excess pressure (DP)
Fig. 1—Measured i.v. for pullulan standards (P-10, P-20, P-50, P- 100, P-200, P-400, and P-800) compared to literature values (Fishman et at., 1987): Slope = 1.00 ± 0.01 w ith a correlation coefficient o f 0.998.
680—JOURNAL OF FOOD SCIENCE-Volume 58, No. 3, 1993

Table 1 - Weight average radius o f gyration (RSJ values fo r puiiu ian stan- dards ¡Values obtained from equations fo r plots in Fig. 2)_____________
Standard M W .*[I.v.]*dU g
P olyd ispersity*M z/M w
Vnm
Rgwnm
P-10 12,200 0.119 1.05 3.51 3.42P-20 23,700 0.181 1.01 4.95 4.93P-50 48,000 0.286 1.02 7.33 7.25P-100 100,000 0.459 1.05 11.1 10.8P-200 186,000 0.704 1.11 16.1 15.2P-400 380,000 1.155 1.05 23.1 22.5P-800 853,000 1.865 1.00 35.1 35.1
8 P o l y m e r L a b o r a to r ie s .
response curve gives the i.v. for the whole injected sample. The integrator output of each detector was input to a DT5712-PGL, Data Translation, A/D board installed in a IBM compatible PC. The digitized signals were processed with Unical 3.11 software from Viscotek. The Asyst *.DAT files from the Unical program were converted to ASCII text files in order to import raw data into other programs. P- 800 and P-400, the two highest viscosity pullulans, produced a constant ratio of observed DP (excess pressure) response to RI (refractive index). These observations supported our assumption that the concentration of polysaccharide in the pressure transducer cell was low enough for the approximation i.v. = T|, p. /c to be valid. With fractionation of pectins in the columns, dilution of sample is greater than that for nearly monodisperse pullulans.
Sample preparationSolutions of freeze-dried pectins (0.05%) were prepared with m o
bile phase and refrigerated. Each solution to be chromatographed was passed through a 0.45 p m filter before injection. The 100 pL sample loop was flushed with > 1 m L of solution to be chromatographed before injection. Samples were run in duplicate. The solutions tested were clear and showed no deterioration of properties during refrigerated storage for > 2 wk. Portions saved from original solutions of pectins used for ultrafiltration remained stable, as judged by HPSEC, for several days. Long term stability of freeze-dried pectins was verified by HPSEC.
Column calibrationCalibration of the system was carried out with the seven pullulan
standards. Weight average molecular weights ( M W w), from light scattering, polydispersities ( M W , / M W w), from equilibrium sedimentation, and i.v.’s were provided by Polymer Laboratories. Weight average radius of gyration (Rgw) values for these pullulans were obtained by curve fitting published values (Kato et al., 1982) for pullulan M W w,Rgz (nm), and i.v. (dL/g) (Table 1) to (2), and (3), the Stokes-Einstein equation (Flory, 1953).
M W w = A ^ ) “ (2)
MW»(i.v.) = B ^ ) 3«00 (3)
A = 1291 B = 35.76 d = 1.825
Rgz = R^IMW./MWJ"")) (4)
The fitted power law curves are shown in Fig. 2 and R ^ values are listed in Table 1. The elution volume, Ve, for each pullulan standard was determined by the peak maximum of the gaussian curve that fitted its concentration (RI) response curve. The sigma (half width at half height) for each gaussian curve varied with elution volume and, thereby, hydrodynamic volume. Sigma was consequently employed as an empirical measure of band spreading for each pullulan (see below). Void volumes (Vo) and total volumes (Vt = Vs - Vo) were measured according to Fishman et al. (1987). The distribution coefficient, K av was calculated from Ve with (5).
K av = (Ve - Vo)/Vt (5)
Calibration curves for logiRg»), size, and log(MWw[i.v.]), a universal plot, were constructed (Fishman et al., 1987; 1989a) (Fig. 3).
Component analysisW e developed a general method to extract information from HPSE
chromatograms by fitting gaussian components to concentration and
Table 2 —% Weight and intrinsic viscosity (i.v.) o f pectin recovered from ultrafiltrates’
% W eigh t recovered i.v., dL/g
% w e ig h t recovered x i.v.
C itrus pectin untreated 3.83300 kd retentate 55 4.25 2.34100 kd retentate 39 1.51 0.59perm eateto ta l recovered i.v.
7 n. m.2.92
Lim e pectin untreated 7.75300 kd retentate 48 7.52 3.61100 kd retentate 34 3.41 1.16perm eateto ta l recovered I.v.
19 n. m.4.75
8 A l l i .v .'s m e a s u r e d in 0 .05/W N a N 03 a t 3 5 °C d u r in g H P S E C . n . m . n o t m e a s u r a b le
viscosity response curves (Fishman et al., 1989b; 1991a, b). A gaussian component is characterized by peak elution volume, peak height, and sigma. The sigma, half-width at half-height of the gaussian component, is limited by band-spreading of the column set. The number of gaussian components required to fit a given response curve is determined by the total volume required by the curve and the sigmas assigned to the gaussian components. Peak elution volumes of neighboring gaussian components differ by about the sum of their sigmas. Two values for sigma have been applied to curve fitting (Fishman et al., 1991b). Sigma values of 0.274 m L for large Rg components of pectin and 0.11 m L for small Rg components were used in earlier work with different columns. W e observed with the present columns, that response curves for pullulan standards could be fitted by one gaussian curve and the sigma derived therefrom had a distinct dependence on peak elution volume. In Fig. 4 is shown the power plot for gaussian sigma and pullulan K AV. The linear best fit allows the sigma of each gaussian component to be related to the component elution volume during curve fitting. In the past, a concentration response curve was first fitted by a set of gaussian components. The component elutior volumes were then fixed and the same component peak positions were applied to fitting the excess pressure response curve after adjustment for detector offset. Then, only component heights were allowed to vary to obtain a fit. W e improved that approach by appending to the RI response curve the excess pressure response suitably offset by 4 to 5 m L to avoid overlap to place all experimental data points into one array. The Macintosh graphics program, Igor vl.24, (WaveMetrics, Lake Oswego, OR) enabled user defined curve fitting (up to 20 variables). The program implemented standard Gauss- Newton procedures for non-linear curve fitting (Press et al., 1988). W e adapted the program to use up to 13 gaussian components to fit the combined concentration and viscosity response curve using Eq. (6). The elution time of a given viscosity gaussian component was set equal to the time for the corresponding concentration component plus its displacement corrected for detector offset (sec Eq. 8). Thus up to seven variables representing elution times of concentration components and up to 13 or 14 variables representing heights of both concentration and viscosity components were used to fit Eq. (6) to the combined response curve. Initial estimates for variables were made to approximate a fit. The fitting procedure was well-behaved in every case, since the variables were constrained by two independent regions of the combined response curve.
fitted response area =
17 T 7 6 12 2 R L + 2 DPj(, .displace) (6 )
l - S L i-1 j-1 J
RI„ = 2 (7)t - 8
DPju +displace! = 2 (h R li)e-i<T»'i + di “ -d2'*’?l (8)/-8
Displace (min) = (5 - 0.1074)(mL)/[FR(min/mL)] (9)
RI„ was the combined RI response for each component and DPj(, „ uop/ocej was the combined excess pressure response for each component. T rii, and hp.i., were gaussian concentration component i elution time and height at peak maximum and hp was viscosity component peak height. FR was the flowrate. Component sigma (cr) was related
Volume 58, No. 3, 1993-JOURNAL OF FOOD SCIENCE-681

Table 3 -P roperties o f HPSEC components o f citrus and lim e pectins
COMPONENT ANALYSIS OF PECTIN DISAGGREGATION. ..
Components____________________________________________ vvt
Pectin 1 2 3 4 5 6 7 8 9 avg
Ra, nm :< 10 (A)Citrus untreated 410 221 133 86 58 40 30 208
Citrus 300 kd retentate 411 231 144 95 62 40 30 220Citrus 100 kd retentate 372 197 130 90 61 42 27 113
Citrus 100 kd permeate 141 96 70 53 40 86Lime untreated 1157 673 380 219 151 90 55 599Lime 300 kd -etentate 592 346 196 121 79 52 36 297Lime 100 kd retentate 354 201 124 81 54 36 181
Weight fractionCitrus untreated 0.224 0.301 0.248 0.145 0.060 0.016 0.007Citrus 300 kd retentate 0.231 0.310 0.251 0.148 0.051 0.009 0.000Citrus 100 kd retentate 0.029 0.120 0.273 0.331 0.179 0.051 0.017Citrus 100 kd permeate 0.166 0.340 0.272 0.175 0.046Lime untreated 0.233 0.278 0.291 0.086 0.065 0.029 0.019Lime 300 kd retentate 0.159 0.393 0.229 0.136 0.060 0.018 0.005Lime 100 kd retentate 0.209 0.286 0.266 0.158 0.063 0.018
i.v.. dUgCitrus untreated 8.35 4.00 2.00 1.20 0.60 3.78Citrus 300 kd retentate 8.92 4.34 2.35 1.24 0.60 4.21Citrus 100 kd retentate 8.26 3.81 1.76 0.73 0.40 1.49Lime untreated 14.44 9.95 4.70 2.50 1.68 1.10 7.85Lime 300 kd retentate 17.63 8.76 3.73 1.80 0.89 7.40Lime 100 kd retentate 8.20 3.58 1.84 0.50 3.31
F ig . 2 - F i t t e d c u r v e s o f l o g ( M W J a n d l o g ( M W J i .v J ) t o lo g (R gJ f o r p u i iu ia n s t a n d a r d s . O p e n c i r c l e s a n d s q u a r e s a r e p u l lu la n v a l u e s f r o m K a to e t a i. (1 9 8 2 ) . F i l l e d c i r c l e s a n d s q u a r e s a r e l o g s o f p u l lu la n v a l u e s in T a b le 1 a n d P -5 .
-0.62-
-0.64
- -0.66 ■ CoE'« -0.6 8 -j?
-0.70 -
-0.72 -
-0.74 -
0.55 0.60
■'8 .
—l “ 0.65
K4,0.70 0.75 0.80
F ig . 4 — S i g m a s f o r g a u s s i a n c u r v e f i t t e d t o p u l lu la n P I r e s p o n s e c u r v e s p l o t t e d a s a fu n c t io n o f KAV. L in e a r f i t u s e d f o r e q u a t i o n(9).
F ig . 3 - S i z e (RgJ a n d u n i v e r s a l ( M W J i .v J ) c a l ib r a t io n c u r v e s f o r c o lu m n s e t b a s e d o n d i s t r i b u t io n c o e f f i c i e n t s (KAJ f o r p u l lu la n s t a n d a r d s .
to T ri. component elution time with (10) obtained from the linear best fit (Fig. 4) with the following assumptions:
1. Maximum o- = 0.25 m L2. Minimum a = 0.12 m L
log(o) = -0.602 - 0.106 TRli x FR - log(FR) (10)
Global weight average i.v. was calculated as the sum of the products of component weight fraction and component i.v. A fitted i.v. response curve was calculated for each point of the fitted concentration response curve with (11). This curve was then compared to the observed i.v. response curve. The
fincd v lvi x (hR,i)e-[(TR,'-'»2,2”i!l L 6
2 OWe-to*.,-,)*»?, ¡«1
(1 1 )
observed i.v. response curve was calculated from the ratio of each point of the observed excess pressure curve, baseline and detector offset corrected, to the point of the observed concentration response curve, baseline corrected. A fitted R ^ response curve was calculated from component R ^ ’s with Eq. (12).
^ R g. x ( h RI> - i ™ . - ' > 2' ^ ]Fined ¿j 7
i” X (hRli)e-‘™'-,>2'*?' ¡-1
(12)
682-JOURNAL OF FOOD SCIENCE-Volume 58, No. 3, 1993

Elution time, min (DP + 8)F i g . 5 — 1 1 G a u s s i a n c u r v e s f i t t e d t o c o m b i n e d c o n c e n t r a t i o n ( R l )
a n d v i s c o s i t y ( e x c e s s p r e s s u r e , D P ) r e s p o n s e c u r v e f o r u n
t r e a t e d c i t r u s p e c t i n . C o m p o n e n t s a r e n u m b e r e d f r o m l e f t t o
r i g h t i n d e c r e a s i n g s i z e .
Plate module ultrafiltration
A laboratory size Minitan Ultrafiltration System, XX42MT060, Millipore Corporation, fitted with four plates, was used at room temperature (= 23°C). The system was cleaned and sterilized following recommended procedures. The sanitary stainless steel cell was fitted with four P T H K Minitan plates, 300K or 100K N M W L , part no. P T M K O M P 04. Pectin (6.0g) was dissolved in 1200 m L 0.05 M Na N 0 3. A 50 m L portion of the starting solution was set aside. Solutions were ultrafiltered at flux rate 35 mL/min, starting temperature 17°C with initial back pressure 0.5 bar. Filtration was stopped at 1.2 bar (temperature was 26°C). The 300K retentate for lime pectin was 370 m L and for citrus pectin was 320 mL. A 50 m L portion of 300K permeate was set aside. The remaining 300K permeate was then ultrafiltered through a 100K membrane, using the same starting and ending back pressures. All solutions were then dialyzed vs. water at 4°C and pectins were recovered by freeze-drying. All ultrafiltrations were completed within 2 hr. Overall 4 fold concentration was obtained.
PectinsThe lime pectin, SRS-1500, 73.9% degree méthoxylation I.F.T.
sag 231 was obtained from Grinsted Products, Inc. (Industrial Airport, KS). The citrus pectin (largely from lemon) was a rapid set, type 104, 70% degree of méthoxylation from Bulmers, Limited (Hereford, England).
RESULTSPlate module ultrafiltration
With citrus pectin, 55% of starting material was recovered from the 300K retentate (Table 2) and had an i.v. of 4.25 dL/ g. The pectin recovered from the 100K retentate, which had passed through the 300K membrane, (i.v. 1.51 dL/g) was 39% of the starting material. A net decrease of viscosity occurred as evidenced by total recovered i.v. of (0.55 x 4.23 + 0.39 x 1.51) = 2.92 dL/g. Loss of nearly 50% of the original citrus pectin by ultrafiltration through the 300K membrane resulted in a 10% improvement is viscosity. The lime pectin (i.v. 7.75 dL/g) was about twice the value for citrus pectin. Though only 48% of lime pectin was recovered from ultrafiltration through the 300K membrane, the i.v. of retentate was less (7.52 dL/g). No increase in viscosity was obtained; 34%
F i g . 6 - H P S E c h r o m a t o g r a m o f u n t r e a t e d t i m e p e c t i n w i t h c o n
c e n t r a t i o n ( R l ) a n d v i s c o s i t y ( e x c e s s p r e s s u r e ) d e t e c t i o n ( s o l i d
l i n e ) . A n a l y s i s g a v e s e v e n c o n c e n t r a t i o n c o m p o n e n t s w i t h f i v e
m a t c h i n g v i s c o s i t y c o m p o n e n t s ( l i g h t d a s h e d l i n e s ) . F l e a v y
d a s h e d l i n e i s t h e f i t t e d t o t a l r e s p o n s e o f a l l t h e r e s p e c t i v e c o m
p o n e n t s .
of original lime pectin was recovered from the 100K retentate. The 100K permeate contained 19% of lime pectin that had passed through both membranes.
Component analysisThe areas under response curves for citrus and lime pectins
were fitted by nine components. One example fit for a combined response curve for citrus pectin is shown (Fig. 5). The combined fit was used to construct a final fit. One representative final fit for lime pectin is shown (Fig. 6 ). Values for component weight fraction and i.v. are presented (Table3). An estimate of precision was made from these results and analyses of polysaccharide gums (Hoagland et al., 1993). Usually most of the weight fraction was accounted for by the first two components, with the following reproducibility errors: component 1 Rg„ < 2 %, i.v. <3%; component 2 R ^ <4%, i.v. < 6 %. Other components had larger errors associated with low weight fraction values and typically ranged for Rgw from5-10% and for i.v. from 7-15%. Whenever low signal-to- noise ratios were encountered with the excess pressure response i.v .’s were not calculated.
Citrus pectin did not have components 1 and 2 (Table 3) which were found for lime pectin. 300K retentate citrus pectin had components 3, 4, and 5 of greater weight fractions than corresponding components of original pectin. These three components also had i.v .’s greater than those corresponding from untreated citrus pectin. This accounts for the greater i.v. of 300K retentate citrus pectin. Compared to 300K retentate citrus pectin, that recovered from 100K retentate had marked reduction in weight fraction values for components 3 and 4, which accounts for the notably reduced i.v. (1.51 dL/g) of that fraction. Citrus pectin from the 100K membrane permeate showed no components 3 and 4 and was rich in components 6 and 7.
Volume 58, No. 3, 1993-JOURNAL OF FOOD SCIENCE-683

COMPONENT ANALYSIS O F PECTIN DISAGGREGATION . . .
In general, corresponding components from all citrus pectin fractions had similar values for Rgw, and i.v. Lime pectin did not exhibit values for Rgw, and i.v. for components 1-5 that corresponded to untreated and 300K retentate material. Components for 300K retentate were similar to those of 100K retentate lime pectin. Lime pectin permeate eluted almost entirely in the total (small size) volume of the column set and could not be analyzed. Component 1 of untreated lime pectin was unusually large and had a large i.v. (14.4 dL/g). Although this component was not found in 300K retentate lime pectin, a high viscosity component 2 was found in that fraction. Large-sized- component 1 lime pectin (weight fraction 0.233) upon ultrafiltration was converted to smaller-sized-component 2 material (weight fraction 0.159) with greater viscosity.
Observed i.v.In all cases close correspondence was found between ob
served i.v., calculated from the point-by-point ratio of excess pressure response to concentration (RI) response, and fitted i.v .’s from component analysis (Fig. 7). The global weight average i.v.’s (Table 3) agreed well with measured i.v. values. A weight average R ^ for each pectin was also obtained from component analysis. Plots of log(fitted i.v.) vs. log(fitted FL*) were developed (Fig. 8 ) for both citrus and lime pectins. The plots for citrus pectin were linear over the first ~ 80% of the response curves and passed through values calculated for individual components. Slopes were similar (-1 .20 ). The plot for untreated lime pectin was non-linear and did not pass exactly through component values. Linearity over the first 80% of total elution time was observed for both 300K and 100K retentate lime pectins. Slopes were: 300K retentate lime pectin, 1.45 and 100K retentate pectin, 1.37.
DISCUSSIONCitrus pectin
The results from plate module ultrafiltration of citrus pectin demonstrate improvements in i.v. were achieved with 300K membrane ultrafiltration. However, material loss was substantial and there was net loss of i.v. as based on total recovered i.v. of the 100K retentate pectin. This loss could be explained by the capacity of pectin to form stable aggregates in solution. Apparently, during ultrafiltration, as documented by changes in weight fractions for citrus pectin components (Table 3), pectin fragments (i.e., sub-aggregates or molecules) migrated from components 3 and 4, and either passed through the 300K membrane or became part of components 5-9. Much of the smaller-sized pectin that passed through the 300K membrane was retained by the 100K membrane. The size distribution of that fraction, however, was notably shifted towards the lower end (Table 3, weight averages, citrus pectin 100K retentate). This shift could be a consequence of enrichment of the fraction with low molecular weight pectin oligomers and/or neutral sugar side chain fragments that may compete with larger pectin molecules for aggregation sites. These aggregates can be very stable. Mort et al. (1991) have shown that pectin oligomers were retained after dialysis of pectin vs. water for several days, and chelating agents such as CDTA were incompletely removed by dialysis. Fishman et al. (1989b) observed that low molecular weight aggregates or molecules of tomato pectin did not dialyze vs. water, but passed through the membrane during dialysis vs 0.05M NaCl. In earlier work with citrus pectin Fishman e: al. (1984) also showed low molecular weight material recovered from dialysate could form large aggregates in water. An aggregation site is usually considered a “ junction zone” (Rees, 1982), an intermolecular union between homologous galacturonan regions of pectin molecules. Galacturonan regions are demarcated by an a -( l-2 ) rhamnose residue which introduces an abrupt redirection of the adjoining galacturonan region. This redirection has been labeled a “ kink” by Rees
Fig. 7—Fitted i.v. response curves and measured i.v. for citrus pectin (top) from 300K retentate and TOOK retentate, and for lime pectin (bottom) from 300K retentate and TOOK retentate. Dashed lines are fitted responses.
and Wight (1971). The overall shape of a large pectin molecule with one or more rhamnose residues is that of a segmented rod, since the galacturonan regions are relatively stiff and straight. Junction zones can be stabilized by multiple hydrogen bonds between -2 5 or more galacturonate residues, or by Ca+2
salt bridges between galacturonate carboxylate groups (co-operative sequential binding, Kohn, 1975). Probably hydrophobic interactions between methyl groups also stabilize them in those instances where the galacturonan region is block methyl esterified (Oakenfull and Scott, 1984). Some junction zones may be stabilized by interactions between neutral sugar side chains that are sometimes attached to rhamnose residues (1-4 linkage) and are believed to be concentrated in “ hairy regions” of some pectin molecules. Possibly, the larger citrus pectin molecules recovered from 100K retentate have a notable proportion of junction zones involved with pectin oligomers and a reduced proportion of end-to-end junction zones. This latter type junction zone would lead to formation of larger aggregates. We suspect that large pectin aggregates may consist of long end-to-end junction zone-joined segmented rods stabilized by interchain bridges made by shorter length pectin molecules. Gel networking would require at least three possible junction zone sites and chaining of pectin molecules would require at least two similar sites. These conditions apparently prevailed in structures for pectin aggregates recently visualized by transmitting electron microscopy (Fishman et al., 1992). Seen were long rod-like units joined to apparent segment-segment kink points. It is not possible now to estimate the extent of segment- segment overlap between 2 pectin molecules that form a junction zone. Many junction zones seen for pectin gel particles break up in high ionic strength solution (Fishman et al., 1992).
684-JOURNAL OF FOOD SCIENCE-Volume 58, No. 3, 1993

F ig . 8 —L o g - lo g p l o t s o f f i t t e d i .v . a g a i n s t f i t t e d f o r c i t r u s p e c t i n s ( to p ) a n d l i m e p e c t i n s ( b o t t o m ) .
Apparently, from microgel micrographs segmented rods of pectin organized into spherical macro-assemblies about 1 0 0 0 nm in diameter. The mobile phase for HPSEC was chosen to be 0.05Af NaN03 so that enough junction zones would be broken to produce sizes of pectin aggregates within the fractionating range of the column set (ca. R _ , 2 to ~ 100 nm). When water was the mobile phase for HPSEC, pectins eluted near the void volume (Fishman et al., 1989a).
Nonoverlapping binding of pectin oligomers to pectin molecules with at least two segments could be expected to have a profound effect on the i.v. of the aggregate. Compared to the original pectin molecule, the MW of the aggregate would increase whereas the length and Rg, of the aggregate would be mostly unchanged. As pointed out earlier (Fishman et al., 1991b) given the Stokes-Einstein relationship (13), (Flory, 1953),
MW(i.v.) = AR3 (13)
at constant Rg, i.v. could be expected to decrease in response to any increase in aggregate MW due to nonoverlapping binding between large pectin molecules and pectin oligomers (DP < 25, for example, see Fishman et al., 1991b). Nonoverlapping bundling of oligomers to larger pectin molecules with measurable i.v. may have contributed to overall loss of viscosity for citrus pectin during ultrafiltration.
Lime pectin
The lime pectin was distinguished from citrus pectin by its greater i.v. and by component 1 and component 2 material by HPSEC. No other pectin has been found to correspond to component 1 in our analysis. Because untreated lime pectin was analyzed directly, without dialysis or centrifugation, we believe component 1 represented microgel particles. These could be similar to gel particles visualized by TEM (Fishman et al.,
1992) and often encountered in light scattering investigations (Jordan and Brandt, 1978, Chapman et al., 1987; Berth, 1988). During ultrafiltration such gel particles were possibly opened by shearing induced by turbulent flow in the apparatus. They then appeared as large aggregates in component 2 material from lime pectin in 300K retentate (Table 3). Since gel particles are nondraining, they should exhibit lower i.v. than a more extended aggregate of about the same size. Component 2 lime pectin from the 300K retentate may represent aggregates about half the size of component 1 microgel particles with greater viscosity resulting from a less symmetrical and perhaps more freely-draining structure. The good correspondence between fitted i.v. and observed i.v. (Fig. 7) indicates that observed i.v. at any time could be expressed as combined i.v .’s of those components with measurable viscosity. Any given data point of a concentration response curve could be viewed as the summation of the contribution of each component to both fitted i.v. and R ^ . The contribution of a given component is the weight average of that component in the given data point. We therefore constructed power plots for fitted values of i.v. and R ^ (Fig. 8 ). A change in shape of macromolecular assemblies of lime pectin is suggested by distinct downward curvature at the large size end. This curvature indicates a reduction of dlog(i.v.)/dlog(R^w), with increasing size. This may reflect the contribution to observed i.v. by larger sized, lower i.v. microgel particles. Anger and Berth (1985, 1986) and Berth (1988) reported a similar downward curvature for sunflower and citrus pectins for Mark-Houwink power plots of log(i.v.) vs log(MWw). They presented strong evidence for microgel particles with lower i.v. than would be expected for single, extended large (>106 MW) pectin chains.
Similar plots for the citrus pectins (Fig. 8 ) show a common slope of ca. 1.20 for large sized pectin aggregates. This indicated that a common geometry was probably shared between component 3-5 citrus pectin aggregates. Anger and Berth (1986) found a Mark-Houwink exponent (a) of 0.73 for citrus pectin:
i.v. = (9.55 x 10⁻⁴)MW“-73. (14)
For a MWw of 100,000 an i.v. of 4.27 dL/g was calculated. These values were close to the i.v. value 4.34 dL/g for component 4 of 300K retentate citrus pectin (Table 3) and the value for MWw of 107,000 (Table 4). A Mark-Houwink a of 0.746 was obtained from a power plot for components 3-5, which represent about 80% of the weight fraction of the eluted citrus pectin.
i.v. = (7.67 x 10"4)MW°-75 (15)
The agreement between (14) and (15) is good, but can be tempered with the following considerations: if citrus pectin is aggregating then scaling laws would best apply if ( 1 ) aggregates were self-similar in shape (i.e. fractal) and (2 ) concentration of pectin monomers was negligible. The similarity of pectin aggregate shape may be evaluated by linearity of log(fitted i.v.) vs. log(fitted R ^) plots. For HPSEC with viscosity-concentration detection, a power i.v. — R ^ plot may be more precise than the Mark-Houwink plot since, in this latter instance, MWw must be calculated indirectly from a universal log(MWw[i.v.]) calibration curve. Berth (1988), Brigand et al.(1990), and Kravtchenko et al. (1992) have shown that the chemical composition of industrial pectins was not uniform throughout the elution volume during size exclusion chromatography. Therefore, any interpretation of power law plots, such as log(i.v.) vs log^R^) should take into consideration molecular inhomogeneity, aggregation size inhomogeneity, and shape changes resulting from microgel particle formation. For example, the power law plots for components for 300K retentate citrus pectin and 100K retentate lime pectin (Fig. 9) gave distinctly different slopes for iog(MWw) vs log(R ). The slope of 1.36 for lime pectin indicates more extended, relatively inflexible conformations than citrus pectin
Volume 58, No. 3. 1993-JOURNAL OF FOOD SCIENCE-685

COMPONENT ANALYSIS O F PECTIN D ISAG G R EG ATIO N . . .
P e ctin ____________________
C itru s u n tre a te d C itru s 3 0 0 kd re te n ta te C itru s TOO kd re te n ta te L im e u n tre a te d L im e 3 0 0 kd re te n ta te L im e 1 0 0 kd r e te n ta te
Table 4 - MWw of components of citrus and lime pectins from universal calibration (Fig. 3)____________________________________C o m p o n e n ts __________________________
1 2 ___________________ 3____________________ 4 ____________________5
3 0 2 .0 0 0 1 0 2 ,0 0 0 4 3 ,5 0 02 8 5 .0 0 0 1 0 7 ,0 0 0 4 7 ,7 0 02 3 1 .0 0 0 7 5 ,9 0 0 4 6 ,6 0 0
3 2 6 0 0 0 0 1 ,0 5 3 ,0 0 0 4 3 3 ,0 0 0 1 5 9 ,0 0 0 7 6 ,6 0 04 1 3 ,0 0 0 1 7 6 ,5 0 0 7 6 ,3 0 0 3 6 ,2 0 0
2 0 0 .0 0 0 ______________ 8 5 ,8 0 0 ____________ 3 8 ,1 0 0
6 71 9 ,0 0 0 1 1 ,3 0 02 4 ,7 0 0 1 4 ,2 0 03 6 ,5 0 0 2 0 ,4 0 02 4 ,1 0 01 9 ,6 0 0 1 2 ,5 0 02 2 ,3 0 0 1 1 ,1 0 0
6.0 -
5 .5 -J5S’ 5 .0 -
—r~2.0
I2.1
citrus pectin, 300 K retentate lime pectin, 100 K retentate
r~2.2
~1~2.3 2.4
~r~2.5
~r~2.6
Log (Rgw)Fig. 9 -Lo g -lo g plots for M W Ji.v.], i.v., and vs Ren. for components from TOOK retentate time pectin and 300K retentate citrus pectin. Einstein fM W Ji.v.]) p lo t has expected slope o f 3.0. Indicated slopes fo r M W „ are significantly different and suggests a difference in shapes and/or aggregation.
(slope = 1.62). This points to the possibility that citrus pectin aggregates have significantly different shapes than lime pectin aggregates.
Component analysis
This method has been applied to characterization of pectins from many sources (Fishman et ah, 1991a), to changes in pectin during fruit maturation (Fishman et ah, 1991b), and to polysaccharide gums (Hoagland et ah, 1993). We have now demonstrated that it can be applied to monitoring changes in viscosity during processing of pectin in laboratory or, presumably, in larger-scaled operations. In the past most pectins were characterized by 4-5 components with similar sigmas, 0.274 mL (Fishman et ah, 1991b). With more highly resolving columns and by determining sigmas for pullulan standards we have improved the method for analysis to include up to 7
components. Precision of the fitting procedure has also been improved by simultaneously, rather than sequentially, fitting both viscosity and concentration response curves. Component analysis can be applied to draw fine distinctions between variable pectin preparations in terms of viscosity and molecular size, and their distributions under tightly controlled conditions for chromatography. Such information may be obtained from a limited number of samples without requiring fractionation.
Meaningful results from component analysis, of course, directly rely on accurate column calibration.
CONCLUSIONSHPSEC and component analysis can be used to monitor ultrafiltration of pectin to reveal changes in distributions of aggregate size and intrinsic viscosities. The chemical diversity of pectin, along with its propensity to aggregate, are complicating factors for determining acceptable conditions for ultrafiltration. Loss of aggregate-stabilizing-small pectin molecules must be avoided by using small pore size membranes (such as 1 0 0 K) for ultrafiltration. Apparently, even when loss of low molecular weight material is prevented, little improvement in pectin viscosity may be expected. Under favorable conditions ultrafiltration could be applied to concentrate pectin.
REFERENCES
Anger, H. and Berth, G. 1985. Gel permeation chromatography of sunflower pectin. Carbohydr. Polym. 5: 241-250.
Anger, H. and Berth, G. 1986. Gel permeation chromatography and the Mark-Houwink relation for pectins with different degrees of esterification. Carbohydr. Polym. 6: 193-202.
Berth, G. 1988. Studies on the heterogeneity of citrus pectin by gel permeation chromatography on Sepharose 2 B/Sepharose 4 B. Carbohydr. Polym. 8: 105-117.
Brigand, G., Denis, A., Grail, M., and Lecacheux, D. 1990. Insight into the structure of pectin by high performance chromatographic methods. Carbohydr. Polym. 12: 61-77.
Chapman, H.D., Morris, V.J., Selvendran, R.R., and O'Neill, M.A. 1987. Static and dynamic light-scattering studies of pectic polysaccharides from the middle lamellae and primary cell wall of cider apples. Carbohydr. Res. 165: 53-68.
Fishman, M.L., Cooke, P., Levaj, B., Gillespie, D.T., Sondey, S.M., and Scorza, R. 1992. Pectin microgels and their subunit structure. Arch. Biochem. Biophys. 294: 253-260.
Fishman, M.L., Damert, W.C., Phillips, J.G., and Barford, R.A. 1987. Evaluation of root mean square radius of gyration as a parameter for universal calibration of polysaccharides. Carbohydr. Res. 160: 215-225.
Fishman, M.L. El-Atawy, Y.S., Sondey, S.M., Gillespie, D.T., and Hicks, K.B. 1991a. Component and global average radii of gyration of pectins from various sources. Carbohydr. Polym. 15: 89-104.
Fishman, M.L., Gillespie, D.T., Sondey, S.M., and Barford, R.A. 1989a. Characterization of pectins by size exclusion chromatography in conjunction with viscosity detection. J. Agric. Food Chem. 37: 584-591.
Fishman, M.L., Gillespie, D.T., Sondey, S.M., and El-Atawy, Y.S. 1991b. Intrinsic viscosity and molecular weight of pectin components. Carbohydr. Res. 215: 91-104.
Fishman, M.L., Gross, K.C., Gillespie, D.T., and Sondey, S.M. 1989b. Ma- cromolecular components of tomato fruit pectin. Arch. Biochem. Biophys. 274: 179-191.
Fishman, M.L., Pfeffer, P.E., Barford, R_A, and Doner, L.W. 1984. Studies of pectin solution properties by high performance size exclusion chromatography. J. Agric. Food Chem. 32: 372-378.
Flory, P.J. 1953. In Principles of Polymer Chemistry, p. 611. Cornell University Press, Ithaca, NY.
Hoagland, P.D., Fishman, M.L., Konja, G., and Clauss, E. 1993. Size exclusion chromatography with viscosity detection of complex polysaccharides: component analysis. J. Agric. Food Chem. Accepted for publication.
Jordan, R.C. and Brandt, D.A. 1978. An investigation of pectin and pectic acid in dilute aqueous solution. Biopolym. 17: 2885-2895.
Kato, T., Okamoto, T., Tokuya, T., and Takahashi, A. 1982. Solution properties and chain flexibility of pullulan in aqueous solution. Biopolvm. 21: 1623-1633.
Kohn, R. 1975. Ion binding of polyuronates-alginate and pectin. Pure Appl. Chem. 42: 371-397.
Kravtchenko, T.P., Berth, G., Voragen, A.G.J., and Pilnik, W. 1992. Studies on the intermolecular distribution of industrial pectins by means of preparative size exclusion chromatography. Carbohydr. Polym. 18: 253- 263.
Mort, A.J., Moerschbacher, B.M., Pierce, M.L., and Maness, N.O. 1991. Problems encountered during the extraction, purification, and chroma-
686—JOURNAL OF FOOD SCIENCE—Volume 58, No. 3, 1993

tography of pectin fragments, and some solutions to them. Carbohydr. Res. 215: 219- 227.
Oakenfitll, D. and Scott, A. 1984. Hydrophobic interaction in the gelation of high methoxyl pectins. J. Food Sei. 49: 1093- 1098.
Press, W.H., Flannery, B.P., Teukolsky, S.A., and Vetterling, W.T. 1988.Numerical Recipes in C, p. 547. Cambridge University Press, NY.
Rees, D.A. 1982. Polysaccharide conformation in solutions and gels - recent results on pectins. Carbohydr. Polym. 2: 254- 263.
Rees, D.A. and Wight, AW. 1971. Polysaccharide conformation. Part IV. Model building computations for ot-1,4 galacturonan and the kinking function of L-rhamnose residues in pectic substances. J. Chem. Soc. 1971: 1366- 1372.
Ms received 12/11/92; revised 2/10/93; accepted 2/27/93.
A S S A Y FOR A S C O R B IC ACID B Y P E R O X ID A SE .. .From p ag e 622
color. Every sample could be measured by the peroxidase method. Least squares analysis gave a slope of 1.13, an intercept of 1.53 and correlation coefficient of 0.909 for the DNP method vs the peroxidase method, and a slope of 1.17, intercept of - 2.35 and correlation coefficient of 0.985 for the DIP method. Thus this peroxidase method highly correlated with both the DIP and DNP methods. Standard errors of triplicate measurements were around 0.7 for the peroxidase method, 1.1 for the DNP method and 1.3 for the DIP method, indicating the peroxidase method was more precise than the chemical methods. The peroxidase method covered all defects of the DNP and DIP methods and was simpler, much faster, and more precise.
REFERENCES
Arakawa, N., Ohtsuka, M., and Kurata, T. 1982. Methods for assay of vitamin C. 2. High-performance liquid chromatographic methods. V ita- mins (Japan) 56(7): 307- 314.
Casella, L., Gullotti, M., Marchesini, A. and Petrarulo, M. 1989. Rapid enzymatic method for vitamin C assay in fruits and vegetables using peroxidase. J. Food Sci. 54:374—378.
Cooke, J.R. and Moxon, R.E.D. 1981. The Detection and Measurement of Vitamin C. Ch. 10, In Vitamin C (Ascorbic Acid), J.N. Counsell and D.H. Homig (Ed.), p. 167- 198. Applied Science Publishers, London and New Jersey.
Doner, L.W. and Hicks, K.B. 1981. High-performance liquid chromatographic separation of ascorbic acid, erythorbic arid, dehydroascorbic arid, aehydroerythorbic arid, diketogulonic arid, and diketogluconic arid. Anal. Biochem. 115: 225- 230.
Esaka, M., Suzuki, K., and Kubota, K. 1985. Determination method for L- ascorbic acid in foods with immobilized ascorbate oxidase. Agric. Biol. Chem. 49(10): 2955- 2960.
Kelly, G.J. and Latzko, E. 1980. Prospect of a specific enzymatic assay for ascorbic acid (vitamin C). J. Agric. Food Chem. 28: 1320- 1321.
Matsumoto, K., Yamada, K., and Osajima, Y. 1981. Ascorbate electrode for determination of L-ascorbic acid in food. Anal. Chem. 53: 1974—1979.
Nagahara, T., Iwao, Y., and Kubo, S. 1987. Shokuhin Bunseki-hou, p. 232- 246. Shibata Shoten, Tokyo.
Nakao, Y. and Asada, K. 1981. Hydrogen peroxide is scavenged by ascorbate-specific peroxidase in spinach cnloroplasts. Plant and Cell Physiol. 22(5): 867- 880.
Resources Council, Science and Technology Agency 1982. Standard Tables of Food Composition in Japan, 4th Revised Edition. Printing Bureau, The Ministry of Finance, Tokyo.
Tono, T. and Fqjita, S. 1981. Determination of ascorbic acid in foods by spectrophotometric method based on difference spectra. Agric. Biol. Chem. 45(12): 2947- 2949.
Tono, T. and Fujita, S. 1982. Spectrophotometric determination based on difference spectra of L-ascorbic acid in plant and animal foods. Agric. Biol. Chem. 46(12): 2953- 2959.
Wunderling, M., Paul, H.-H., and Lohmann, W. 1986. Evaluation of a direct spectrophotcmetric method for the rapid determination of ascorbate and dehydroascorbate in blood using ascorbate oxidase. Biol. Chem. Hoppe-Seyler 367: 1047- 1054.
Ms received 10/23/92; revised 12/23/92; accepted 2/1/93.
CHOLESTEROL AUTOXIDATION INH IBITIO N.. .From p ag e 655
Sander, B.D., Smith, B.E., Addis, P.B., and Park, S.W. 1989. Effects of prolonged and adverse storage conditions on levels of cholesterol oxidation products in dairy products. J. Food Sci. 54: 874- 879.
Smith, L.L. 1980. The autoxidation of cholesterol. In Autoxidation in Food and Biological Systems, M.G. Simic and M. Karel (Ed.), p. 119. Plenum Press, New York.
Smith, L.L., Matthews, W.S., Price, J.C., Bachmann, R.C., and Reynolds,B. 1967. Thin-layer chromatographic examination of cholesterol autoxidation. J. Chromatog. 27: 187- 205.
Takahama, U. 1985. Inhibition of lipoxygenase-dependent lipid peroxida
tion by quercetin: mechanism of antioxidative function. Phytochem. 24: 1443- 1446.
Zhang, W.B., Addis, P.B., and Krick, T.P. 1991. Quantification of 5a-cho- lestane-3p, 5, 66-triol and other cholesterol oxidation products in fast food french fried potatoes. J. Food Sci. 56: 716- 718.
Zulak, I.M. and Maerker, G. 1989. Cholesterol oxides III. Autoxidation of cholesterol in sodium stearate and sodium linoleate dispersions. J. Amer. Oil Chem. Soc. 64: 1499- 1503.
Ms received 11/3/92; revised 2/4/93; accepted 2/19/93.
Volume 58, No. 3, 1993-JOURNAL OF FOOD SCIENCE-687

SP-061-002
All rights reserved. The disc and its contents may not be duplicated on any medium without the express written permission of International Fiwd Information Service and
INTERNAliUNAt ,01! INF0RNIA110N SERVICE
. eiVjM- SIZE O f y* * r°(fa
F S T A1 9 6 9 - 1 9 9 1
^ O D S O ^ . c E A N D T E C H N O L O G Y ABSTRACTS \T h e W ui s Treading Food S cience D a tab ase
Copyright € 1990-9! i Copyright © 1990-9! SilverlMatter International N.V. \
• ..
IFIS publishes Food S cience an d Technology A bstracts (FSTA), the w orld 's leading d a ta b a se in food science an d technology. Som e 4 0 0 ,0 0 0 entries from approxim ately 2 0 0 0 sources, from 1 9 6 9 fo dafe, are now accessib le; 1 5 0 0 new entries are added every m onth.FSTA is availab le in print, online, on CD-ROM an d on diskette. It provides com prehensive coverage of the basic food sc iences (including biotechnology), food products and com m odities, an d the science an d technology of food processing and m anufacture.And - for specific information on packaging and viticulture/enology, IFIS h a s two m ore d a tab ases : PSTA and VITIS-VEA.Finding the really useful and im portant information is now easy and cost-effective. Let IFIS help you.
INTERNATIONAL FOOD INFORMATION SERVICE
IFIS GmbH • MelibocusstraSe 52 - 6000 Frankfurt a. M. 71, FRG Tel: +69/669 007-0 Fax: +69/669 007-10 IRS Publishing Lane End House ShinfiekJ, Reading RG2 9B8. UK • Tel: +734/883 895 • Fax: +734/885 065 IRS c/o Naf. Food Lab. 6363 Clark Ae. Dublin, CA 94568, USA • Tel: 800 336 FSTA (8003363782)-Fax: 510833 8795

Copies of articles from this publication are now available from UMI Article Clearinghouse.
T h e U M I A r t i c l e C l e a r i n g h o u s e o f f e r s a r
t i c l e s f r o m m o r e t h a n 1 1 , 0 0 0 c o p y r i g h t -
c l e a r e d p e r i o d i c a l s i n a w i d e r a n g e o f
s u b j e c t s . Y o u c a n p l a c e y o u r o r d e r s e l e c
t r o n i c a l l y , a s w e l l a s b y p h o n e , m a i l , a n d
t e l e f a c s i m i l e . F o r m o r e i n f o r m a t i o n ,
p l e a s e w r i t e t o : U M I A r t i c l e C l e a r i n g
h o u s e , 3 0 0 N o r t h Z e e b R o a d , B o x 1 1 ,
A n n A r b o r , M l 4 8 1 0 6 U S A . O r c a l l t o l l - f r e e
f o r i m m e d i a t e r e s p o n s e : 8 0 0 - 5 2 1 - 0 6 0 0 .
F r o m A l a s k a a n d M i c h i g a n c a l l c o l l e c t
3 1 3 - 7 6 1 - 4 7 0 0 . F r o m C a n a d a , c a l l t o l l - f r e e
8 0 0 - 3 4 3 - 5 2 9 9 .
U M IA B ell & H o w e ll C o m p a n y 3 0 0 N o r th Z e e b R o a d A m A rb o r , Ml 4 8 1 0 6 U S A

: ■
>. ■
::y : ; - y ..
'
"v t" -- V v ■ - , = -if -
Z-'l'
.- . .. .
M e m b e r s c a n v o te i n I F T
e le c t io n s . T h is v o t in g p o w e r
n a b l e s y o u to d e te r m in e w h o
w i l l l e a d a n d th e d i r e c t io n o f
t h e i r le a d e r s h ip . I n f a c t , a s a
P r o f e s s io n a l M e m b e r y o u
c a n b e c o m e a c a n d i d a t e
s u c h i m p o r t a n t
p o s i t i o n s a s L o c a l S e c t io n
O f f ic e r , C o m m it te e
C h a i r m a n , E x e c u t iv e
" ‘ "ee M e m b e r ,
' N
I te p fe : ' :
M m m
|
.
s m• t
\' J V<,5.\ &: i:
.. - .1 1 - I
“Are YouQualified forProfessionalMembership?”
T h e r e ’s o n l y o n e w a y t o f i n d o u t f o r s u r e . . .
APPLY!
H o w e v e r , th e f o l lo w in g
g u id e l in e s w il l h e lp y o u to
d e te r m in e y o u r e l ig ib i l i ty :
• D o y o u h a v e a
b a c h e lo r ’s d e g r e e o r
h i g h e r in o n e o f m o r e o f
t h e s c ie n c e s o r b r a n c h e s o f
e n g in e e r in g a s s o c ia te d w ith
f o o d t e c h n o lo g y ?
• D o y o u h a v e tw o to f i v e
y e a r s o f p r o f e s s i o n a l
e x p e r ie n c e ?
I f y o u a n s w e r e d y e s to b o th
q u e s t io n s y o u m a y q u a l i f y f o r
P r o f e s s i o n a l M e m b e r s h i p s ta tu s .
W C a l i u s a t ( 3 1 2 ) 7 8 2 - 8 4 2 4
g F a x u s a t ( 3 1 2 ) 7 8 2 - 8 3 4 8
: .
, : ■ ■■ ••
IN S T IT U T E O F F O O D TE C H N O LO G IS TSTHE SOCIETY FOR FOOD SCIENCE AND TECHNOLOGY
Copyright © 2022 FDOKUMEN