Journal of Food Science and Technology 1999 Vol.36 No.4
98
r 7 REG. No. 24918 I 64 ISSN: 0022 - 1155 CODEN: JFSTAB MI. 36, No. 4 July-August 1999
-
Upload
khangminh22 -
Category
Documents
-
view
0 -
download
0
Transcript of Journal of Food Science and Technology 1999 Vol.36 No.4

r 7 REG. No. 24918 I 64 ISSN: 0022 - 1155
CODEN: JFSTAB
MI. 36, No. 4 July-August 1999

ASSOCIATION OF FOOD SCIENTISTS AND
TECHNOLOGISTS (INDIA) MYSORE - 570 013Telephone: 515557; 518670; Telex 0846-241 FTRlIN, Cable: FOODSEARCH, MYSORE.
Fax: 518670,27697,24475 (Country code: 91. Mysore code: 0821)
Affiliated to the Institute of Food Technologists, Chicago, Illinois, U.S.A.
The Association is a professional and educational organization of Food Scientists and Technologists, with its headquarters at Mysore.
The chapters of the Association arc located at 13angalore, Bhopal, Calcutta. Chennai. Delhi, Hisar, Hyderabad.Jabalpur, Jaipur, Jammu, Kanpur, Kamal. Kharagpur, Ludhiana, Manipur, Mumbal, Nagpur, Pantnagar, Parbhani,Pune, Thiruvananthapuram and Thrissur.
Objectives :
Advancement of all the aspects of Science and Technology relating to' production, processing and distribution offood, with the ultimate objective to serve humanity through better food.
Promotion of research, development and training in the science, Technology and Enginecring of Food.
To provide a forum for exchange, discussion and dissemination of knowledge and current developments. especiallyamong Food Scientists and Technologists as well as the Public and Society at large.
Major Activities :Publication of 'Journal of Food Science and Technology' [hi-monthly) and 'Indian Food Industry' [hI-monthly).
Holding symposia/conventions on dilTercnt aspeels of Food Science, Technology and Engineering.
Arranging Lectures and Seminars for the benefit of Members and the Public.
Membership :
Membership is open to graduates and diploma holders in Food Science, Technology and Engineering as well asto those engaged in these professional activities.
Types of membership include Life Member. Life Member (Resident Abroad), Corporate Members, Full Member, Member(Resident Abroad, Affiliate Member, Student Member and Student Member (Abroad).
Each member wlll receive a frce copy of the 'Journal of Food Science and Technology' or 'Indian Food Industry',as per the option exercised.
CENTRAL EXECUTIVE COUNCIL (CEC) OF THE AFST (I)President
S.S. AryaDefence Food ResearchLaboratorySiddarthanagar,Mysore
President-Designate
G.S. ChauhanG.13. Pant University of Agriculture& Technology, Pantnagar
Immediate Past-President
C.L. NagarsekarFood Consultant2/202, Mehta Park,13hagoji Keer Marg, Mahlm,Mumbai
Vice-President (H.Q.) :
N. KeshavaCentral Food TechnologicalResearch Institute, Mysore
Vice-Presidents (Chapters) :H.R. Adhikari13habha Atomic Research CentreTrombay. Mumbai
S.D. MainiIndian Agricultural ResearchInstitute, New Delhi
N.P. Kawale13ureau of Indian StandardsHyderabad
Dheer SinghG.I3. Pant University of Agricultureand Technology, Pantnagar
Executive Secretary :
Rajesh S. MateheCentral Food TechnologicalResearch Institute, Mysore
Immediate Past-Secretary :
M.S. KrishnaprakashCentral Food TechnologicalResearch Institute, Mysore
Joint Secretary :
A.D. SemwalDefence Food ResearchLaboratory. Siddarthanagar,Mysore
Treasurer:
N. ManjunathCentral Food TechnologicalResearch Institute,Mysore
Editor-in-Chief :Journal of Food Science a,Technology
13. K. LonsaneCentral Food TechnologicalResearch Institute,Mysore
Chief Editor :Indian Food Industry
Richard JosephCentral Food TechnologicalResearch InstituteMysore
For Membership. Subscription to the Journal and Other particulars. kindly contact
The Honorary Executive SecretaryAssociation of Food Scientists and Technologists (India)
Central Food Technological Research Institute Campus, Mysore-570 013, India.

JOURNAL OF FOOD SCIENCE AND TECHNOLOGYEDITOR·IN·CHIEF
lokesh B.R.
Department 01 Biochemistryand Nutrition,
Central Food TechnologicalResearch Institute,Mysore
EDITORS
Krishnamacharyulu A.G.Central Food TechnologicalResearch Institute,Mysore
Shamala T.R.Central Food TechnologicalResearch Institute,Mysore
INDIAN
Aravinda Prasad, Mysore
Bawa A.S., Amritsar
Guha Biswas N., New Delhi
Chincholkar S.B., Jalgaon
Jamuna Prakash, Mysore
Kochar G.K., Palampur
Krishnaprakash M.S., Mysore
Kulkarni S.D., Bhopal
Rajeshwar S. Matche, Mysore
Maheshwari P.N., Kanpur
Mital B.K., Pantnagar
Muktha Bai K., Mysore
Muralidhara, Mysore
Paul Thomas, Mumbai
Pillaiyar P., Thanjavur
Polly V.H., Mysore
Rajesh Kapoor, New Delhi
Rama Murthy M.K., Bangalore
Salligeri V.D., Mysore
Sharma N., Iza\nagar
Shekar Shelly, H., Mysore
Smita lele., Mumbai
Srikar l.N., Mangalore
Srinivas P., Mysore
Upadhyay K.G., Anand
Varadaraj M.C., Mysore
Veerabasappa Gowda T., Mysore
Viiaya Rao D., Mysore
ASSOCIATE EDITORSKrishna Kantha T.P., Mysore
Narasimham P., Mysore
Sakariah K.K., Mysore
Sreemathi Hariprasad., Mysore
Sri Hari B.R., Mysore
ADVISORSArya S.S., Mysore
Asopa V.N., Ahmedabad
Chauhan. G.S., Pantnagar
Dubash P.J., Mumbai
Kumar Bhatia, New Delhi
Manju Sharma, New Delhi
Pandit S.D., Mumbai
Patil S.F., Jalgaon
Prakash V., Mysore
Thakre N.K., Pune
Thyagarajan G., Madras
EDITORIAL BOARDOVERSEAS
Brown C.M., Edinburgh. UK
Bulan Phithakpol, Bangkok. Thailand
Carlos Ricardo Soccol, Curtiba-PR, Brazil
Daniel Martinez-Carreara, Puebla, Mexico
Dietrich Knorr, Berlin, Gennany
Gumbira-Said E, Bogor, Indonesia
Jacobsen M., Frederiksberg C., Denmark
Jan Bol, Zeist, The Netherlands
Jayatissa P.M., Colombo, Sri lanka
Khalil I. Ereilej, Irbid, Jordan
Kwon T.W., Kyungsangnam-do, S. Korea
lee Yuan Kun, Singapore, Rep. of Singapore
leupold G., Freising-Weihenstephan, Gennany
lozano Y" Montpellier, France
Paolo Fantozzi, Perugia, Italy
Raimbaull M., Montpellier, France
Ramaswamy H., Quebec, Canada
Rao M.A., New York, USA
Robin Y, -Y Chiou, Chiayi, Taiwan
Rolz C.A., Guatemala City, Guatemaia
Roussos S., Reading, UK
Spencer J.F.T., Tucuman, Argentina
Viniegra-Gonzalez, Mexico City, Mexico
Zeki Berk, Haifa, Israel

Journal oj Food Science and Technology accepts advertisements from manufacturers anddealers of chemicals. glassware. Instruments. machinery as well as publishers/dlstrtbutors ofbooks/scientific journals. The J<;>urnal reaches research professionals. academicians. Industrtalistsseeking Information on the latest findings In all branches of science. technology and englneertngof foods and food products. It has wide circulation at national and International levels.
Please refer this Issue for more Information on rates for colour and black & whiteadvertisements. The advertisement matter may be In the form of art pulls. bromides. positivesand blocks. which should be sent along with the relevant remittance In the form of DD favourtng.
The Executive SecretaryAFST(IlCFTRI CampusMysore - 570 013. India'Z1' : 0821-515557, Fax: 0821-518670e-mail: [email protected]

JOURNAL OF FOOD SCIENCEAND TECHNOLOGY
RESEARCH PAPERS
Detection of Insect Infestation in Stored FoodCommoditiess. Rqjendran 283
RESEARCH NOTES
Tofu Analogue Development from Whole Soybeans bySimulated Extrusion ProcessLeslie M. NsoJor and ljeoma S. Ugwa 325
Alkali Treatment in the Milling of Discoloured SorghumN.B. Darade. J.K. Chavan and D.P. Kachare 329
Role of Palm Wine Yeasts and Bacteria in Palm WineAromaSylvia Uzochukwu. Esther Balogh. D.G. Tucknot.M.J. Lewis and P.O. Ngoddy 301
Kinetics Study of Whey Protein Denaturation to Assessthe Degree of Heat Treatment in UHT MilkK Kondal Reddy, M.H. Nguyen. K Kailasapathy.J.G. Zadow and J.F. Hardham 305
July/ August
1999
Number 4
CON TEN ·T S
Volume 36
REVIEW
Effect of Microwave Heating and ConventionalProcessing on the Nutritional Qualities ofTomato JuiceCharanjit Kaur. D.S. Khurdiya. RK Pal andH.C. Kapoor 331
Effect of Kieselguhr on Specific Cake Resistance inConstant Pressure Filtration of Pectin Extract fromOrange PeelFiliz Kar and Nurhan Arslan 334
Kinetics of Deep-Fat-Frying of A Composite Product. T.N. Indira. R Baby Latha and Maya Prakash 310
Heat Treatment Optimization for Dehulling PigeonpeaGrain Using Response Surface MethodologyP.S. Phirke. N.G. Bhole and S.H. Adhaoo 316
Growth Inhibition of Listeria monocytogenes byCommercial Nisin and Lactic Acid in Raw BuffaloMeat MinceS.B. Barbuddhe. S.V.S. Malik and KN. Bhilegaonkar 320
INDEXED AND SELECTIVELYABSTRACTED IN
• Current Contents-Agriculture,Biology and EnllironmentalSciences
• Indian Food Industry• NCI Current Contents• Chemical Abstracts• Biological Abstracts• Food Science and Technology
Abstracts• Food Technology Abstracts* Dairy Science Abstracts* Nutrition Abstracts and
Relliews-Series A-Human andExperimentals
* International PackagingAbstracts
* PIRA CD-ROM-Paper, Printingand Packaging Database
* Online PIRA Databases-DataStar, Dialog, Orbit SearchService, PFDS Online and STN
• Fisheries Relliew* Cambridge Scientific
Abs trac ts-Microbio logy,Biotechnology, Health andSafety Science
* Food Adlibra Dialog File 79.* Food Adlibra Alerting Bulletin* Food Adlibra Current
Awareness Supplements forFood Science and Seafood
* Food Adlibra CurrentAwareness Supplement forSnacks and Confectionery
* Biology Digest* NAPRALERT-Online Access Ilia
Bitel, Interest Compuserve,Prodigy and Phone Modem
* NAPRALERT-Olf-Iine Access* AGRIS Database of FAO* The Engineering Index
Monthly
'.'1... 1,1

Some Microbiological and Chemical Attributes ofMango Pulp SamplesM.R Acharya and RK Shah 339
Effect of Chromium on Fatty Acid Proffie inDeveloping Sunflower Seeds (Helianthus annuus L.)K Gupta, R Mehta, N. Kumar and D.S. Dahiya 342
Effect of Pre-milling Treatments on Protein Contentof Pigeonpea (Cajanus cajan L.) GrainS. Srivastava. B.C. Sarker. RP. Saxena andU.S. Agrawal 346
Changes in Some Water Soluble Vitamins DuringPreparation and Storage of KhoaRcyan Sharma and Darshan Lal 349
Effect of Temperature on Rheological Characteristicsof Green Chilli PureeJasim Ahmed.. H. Gangopadhya and U.S. Shivhare 352
Safety Evaluation of Lactulose Syrup in RatsV. Baskaran, K Narasimhamurthy. R Nagendra andB.R Lokesh 355
Anthocyanin Pigments of Large Cardamom (Amomumsubulatum Roxb.) PodsJ. Puru Naik. 1. Jagan Mohan Roo and KN. Gurudutt 358
Fermentative Production of Gluconic Acid UsingCheese WheyMadhavi Chaturvedi. S. Subramani and Datta Madamwar 361
A Rapid Method to Prepare Immobllised Matrix UsingIDtrasonic DeviceS. Ghosh 365
5.000/-
Rs.3.000/2.000/4.000/8.000/-
Journal of Food Science and Technology.devoted to original R&D contributions Inall branches of Science. Technology andEngineering of Foods and Food Products.Is a bimonthly publication of the Associationof Food Scientists and Technologists (India).Mysore. Review papers are also publishedto a limited extent.
No pari of the Journal should be reproducedwithout WIitten permission of the Editor.
Publication of paper In the Journalautomatically transfers the copy rightsfrom the authors to the Journal.
The Editor reserves the privilege of editingthe manuscript and adding or deletingrelevant paris. to make It suitable forpublication In the Journal.
The Editor assumes no responsibility forthe statements and opinions expressed bythe contributors.
Manuscripts for publication. books forreviewing and matter concerned withadvertisements In the Journal should beaddressed to the Editor. Journal of FoodScience and Technology. AFST (I). CFTRlCampus. Mysore-570 013. India.
The Instructions to Authors are publishedIn the January-February issue of theJournal. These are required to be followedin toto. No deviation Is accepted.
New members of AFST (I) are entitled toreceive 'Journal of Food Science andTechnology'(JFST) or 'Indlan Food Industry'(IFI).
Members opting for IFI can subscribe to'Journal of Food Science and Technology'at a concessional rate.
Those members who were earlier getting orhad opted for IFI. can now change theoption (once In a year oniy). to get gratiscopies of 'Journal of Food Science andTechnology'. if they so desire.
Advertisements from manufacturers anddealers of chemicals. glassware.Instruments. machinery as well aspublishers/distributors of books/periodicalsare accepted.
ADVERTISEMENT (per insertion)
Full Page (B&W)Half Page (B&W)Inside Cover (B&W)Inside Cover (4 colours)First page facing insidefront cover (B&W)First page facing Insidefront cover - 4 colours 8.000/-Back cover (4 colours) 10.000/-
Correspondence regarding subscription andmembership rates should be addressed tothe Executive Secretary. AFST(I). CFTRlCampus. Mysore-570 013. India.
All payments shall be made by DemandDraft or Money Order in favour of theExecutive Secretary. AFSTll). CFTRICampus. Mysore-570 013. India.
In case of Indian Institutions and nationals.the subscription through agents Is notentertained.
BOOK REVIEWS
INDIAN FOOD INDUSTRY - CONTENTS
367
Inside Cover
REVIEW J. Food Sci. Technol., 1999, Vol. 36, No.4, 283-300
Detection of Insect Infestation inStored Food Commodities
S. RAJENDRAN
Food Protectants and Infestation Control Department.Central Food Technological Research Institute, Mysore - 570 013. India.
Detection of Insect Infestation In food commodities and In their storage premises Is essential to ensure that1) the food offered Is wholesome and acceptable for consumption, 2) for regulatory compHance, 3) for diagnosis ofincipient Infestation and 4) to ascertain the success of the control measures using fumigants, Current methods detectwhole Insects or, Insect fragments directly or, Indirectly by estimating the myosin content, CO, release and urlc acidlevel In the commodities. The choice depends on the i) sensitivity required, ii) facilities available and iii) time factor.Detection of Insect eggs and larvae In Internal infestation Is a major challenge even now. In view of Its simpHcity,the sampHng and sieving method has been widely used. though It Is not sensitive, when the infestation level Is lessthan 5 insects/kg of foodgrains. ELISA test. which Is expected to play a major role In food sanitation and qualityassurance. has been elaborately Investigated for multiple and species-specific detection In different types of foodstuffs.In X-ray based grain analysis, an automated machine recognition system has been introduced for interpretation ofradiographs to replace the experl. For in situ detection and monltorlng of insect Infestation in storage and food processingfacilities, physical traps either alone or in combination with pheromones or food attractants have been used, Majorbreakthrough has been achieved in monltorlng. that the Insects are counted as they drop into the probe trap, Infrared beam and plewelectrlc sensors have been tnstalled In probe traps to facilltate taklng Insecl census dUrlng trappingand monltorlng, Automation In acoustic method has been Introduced for use In farm bins, silos and grain elevatorsto detect and monitor three predominant grain pests such as Sitophilus oryzae, Rhyzopertha dominica and Triboliwncastaneum. Insect traps, utlHzlng either pheromones or food attractants or both have a significant role in pest locationand monltorlng In food industry, foodgrain storage godowns and other storage facilities. Early pest detection usingpheromone or food baited traps has been less practised in the developing countrles, The present review discussesthe varlous Insect/infestation detection methods. their appHcabillty and their relative merits,
Keyworde: Stored food commodities, Insect pests, Infestation, Detection methods,
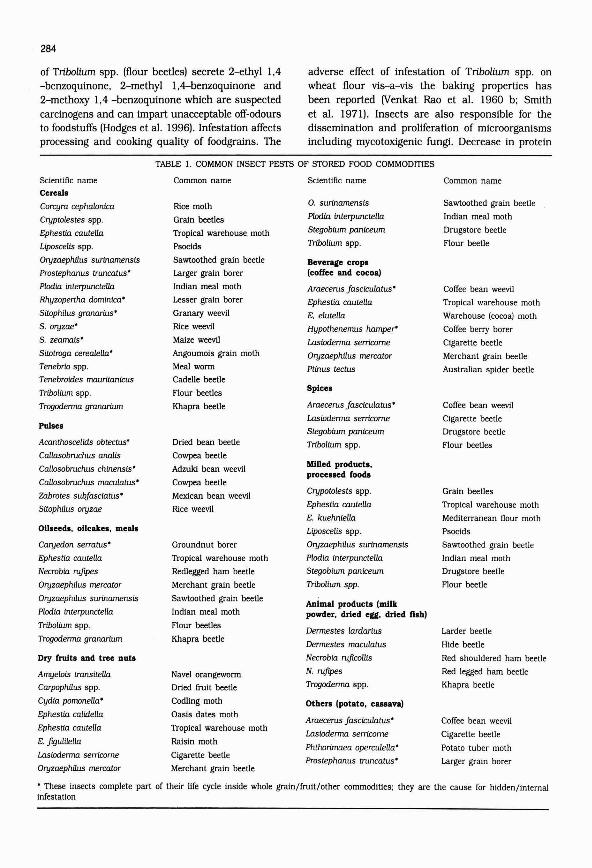
Food commodities of animal and agriculturalorigin are stored for future consumption and fortrade purposes. During storage, the quality of theproduce is affected by the attack of pest organismsbesides environmental factors. The pests includebirds, rodents, insects and microorganisms. Inputsin terms of manpower and finances Invested in theproduction of food commodities will go waste,unless the produce Is protected from the depredatingagents dUring storage, The accessibility of birds androdents to stored food commodities can be preventedby having physical barriers, whilst insects cannotbe excluded so, because the produce get infestedeven before they are taken Into storage. All typesof food commodities are prone to Insect pest attackdUring storage (Table 1). The Insects are peculiarin that they can breed on foodstuffs with less than2% carbohydrates (e.g., confused flour beetle,Tribolium conji..Lsum and cigarette beetle, Lasiodermaserricome), on dry fruits haVing as high as 60%sugar (e.g., Carpophilus spp.), on tree nuts with50 - 70% fat contents (almond moth, Ephestiacautella) and on dried fish with 20% proteins (thehide beetle, Dermestes maculatus). Insects such asAngoumols grain moth, Sitotroga cerealella onpaddy, maize weevil. Sitophilus zeamais on maize,peanut bruchld, Caryedon serratus on peanuts,
283
cowpea weevil, Callosobruchus chinensis on manypulses and dried fruit beetle. Carpophilus spp. ondifferent dried fruits commence their pest activitydUring harvest or In the standing crop itself.
Insect Infestation results in losses of the foodcommodities both In terms of quality and quantity.The various effects of Insect Infestation on storedcommodity are listed In Table 2. Weight losses (dry,matter loss) have been reported to be In the rangeof 0.5 - 17% In cereals and up to 50% In pulses(Snelson 1987). A single insect can consume at amaximum rate of 35 mg of food dUring itsdevelopment from egg to adult. However, theinsects produce frass due to other activities suchas oviposition and grain boring. Insects likeCryptolestes spp. (grain beetles), Trogodermagranarium (Khapra beetle) and Plodia interpunctella(Indian meal moth) preferentially feed on the germ,which is the most nutritious part of the foodgralns.Food commodities, when infested, get contaminatedwith Insect excreta (uric acid mainly), exuviae orcast skins and dead bodies, webbing and secretions.These contaminants pose a major quality controlproblem in food commodities. Toxicological studieshave shown that excess levels of uric acid in dietcan Induce hyperuricaemia with associatednephropathy In rats (Starvic et al. 1969). Adults
284
of Tribolium spp. (flour beetles) secrete 2--ethyl 1,4-benzoquinone, 2-methyl l,4-benzoqulnone and2-methoxy 1,4 -benzoquinone which are suspectedcarcinogens and can Impart unacceptable off-odoursto foodstuffs (Hodges et al. 1996). Infestation affectsprocessing and cooking quality of foodgrains. The
adverse effect of infestation of Tribolium spp. onwheat flour vis-a-vis the baking properties hasbeen reported (Venkat Rao et al. 1960 b: Smithet al. 1971). Insects are also responsible for thedissemination and proliferation of microorganismsIncluding mycotoxlgenic fungI. Decrease in protein
TABLE J. COMMON INSECT PESTS OF STORED FOOD COMMODITIES
Scientific name Common name Scientific name Common nameCereals
Corcyra cephalonica Rice moth O. surinamensis Sawtoothed grain beetle
Cryptolestes spp. Grain beetles Plodia interpunctella Indian meal moth
Ephestia cauteUa Tropical warehouse moth Stegobium paniceum Drugstore beetle
Liposcelis spp. Psoclds TriboUum spp. Flour beetle
OryzaephUus surinamensis Sawtoothed grain beetle Beverage cropsProstephanus truncatus' Larger grain borer (coffee and cocoa)
Plodia interpunctella Indian meal moth Araecerus fasciculatus' Coffee bean weevilRhyzopertha clominica' Lesser grain borer Ephestia cauteUa Tropical warehouse mothSitophilus granarius' Granary weevil E. elutella Warehouse [cocoa) mothS. oryzae' Rice weevil Hypothenemus hamper' Coffee berry borerS. zeamais- Maize weevil Lasioderma serricome Cigarette beetleSitotroga cerealeUa' Angoumols grain moth Oryzaephilus mercator Merchant grain beetleTenebrio spp. Meal worm Ptinus tectus Australian spider beetleTenebroicles mauritanicus Cadelle beetle
TriboUum spp. Flour beetlesSpices
Trogoderma granarium Khapra beetle Araecerus fasciculatus' Coffee bean weevil
Lasioderma serricome Cigarette beetlePulses
Stegobium paniceum Drugstore beetleAcanthoscelids obtectus' Dried bean beetle TriboUum spp. Flour beetlesCaltasobruchus analis Cowpea beetle
Callosobruchus chinensis' AdzukJ bean weevil Milled products.
Callosobruchus maculatus' Cowpea beetleprocelled foods
zabrotes subfasciatus' Mexican bean weevil Crypotolests spp. Grain beetles
Sitophilus oryzae Rice weevil Ephestia cauteUa Tropical warehouse moth
E. kuehnlella Mediterranean flour mothOllseeds, ollcakes, meals Liposcelis spp. Psoclds
Caryedon serratus' Groundnut borer OryzaephUus surinamensis Sawtoothed grain beetle
Ephestia cauteUa Tropical warehouse moth Plodia interpunctella Indian meal moth
Necrobia rufl[Jes Redlegged ham beetle Stegobium paniceum Drugstore beetle
OryzaephUus mercator Merchant grain beetle Tribolium spp. Flour beetle
OryzaephUus surinamensis Sawtoothed grain beetleAnimal products (milk
Plodia interpunctella Indian meal moth powder, dried egg, dried nsh)TriboUum spp. Flour beetles
Dermestes lardar!us Larder beetleTrogoderma granarium Khapra beetle
Dermestes maculatus Hide beetle
Dry fruits and tree nuts Necrobia "4flcollis Red shouldered ham beetle
Amyelois transitella Navel orangeworm N. ruflpes Red legged ham beetle
CarpophUus spp. Dried fruit beetle Trogoderma spp. Khapra beetle
Cydia pomoneUa' Codling moth Others (potato. cusava)Ephestia calidella Oasis dates moth
Araecerus fasciculatus' Coffee bean weevilEphestia cauteUa Tropical warehouse moth
Lasloderma serricome Cigarette beetleE. f'llulilella Raisin moth
Phthorimaea opercu/ella' Potato tuber mothLasioderma serricome Cigarette beetle
OryzaephUus mercator Merchant grain beetleProstephanus truncatus' Larger grain borer
'. These Insects complete part of their life cycle inside whole grain/fruit/other commodities; they are the cause for hidden/internalinfestation

content and changes In levels of reducing and nonreducing sugars in wheat following Infestation bylesser grain borer. Rhyzopertha dominica have beenobserved (Saxena and Singh 1994). Protein contentwas reduced in stored pulses attacked by bruchidsIRegnault-Roger et al. 1994). The cash value and
285
the marketability of the commodities are affecteddue to insect infestation. Turmeric samples heavilyInfested by drug-store beetle are shown in Plate1. In some countries. there Is a zero tolerance fordetectable insects in export grain (WhIte 1995). Innational and International trade. any lapse in
TABLE 2. DELETERIOUS EFFECTS OF INSECT INFESTATION ON STORED FOOD COMMODmES
Effect on
chemical composition
Nutritional qualtty
End - use products
Health hazards
i) Inhalant allergy
ii) Ulcerative colitis
iii) Carcinogenic quinones
iV) Carrier of toxigenic fungi
Insect
Acanthoscelides obtectus
Callosobruchus maculatus
C. chinensis
R. dominica
S. oryzae.
'lTibolium castaneum
Trogoderma granarium
Rhyzopertha dominica
Trododerma granarium
Trlboltum castaneum
Araecerus jasciculatus
S. oryzae,
A. jasciculatus
R. dominica
LaslDdrerma serricome
Callosobruchus chinensis
Callosobruchus chinensis
Tenebrio sp
'lTibolium castaneum
Trogoderma granarium
OryzaephUus surinamensis
'lTibolium castaneum
OryzaephUus spp
Necrobla rufipes
Tribolium castaneum
Carpophilus dimidlatus
Ephestla cautella
'lTibolium castaneum
Corcyra cephalonica
OryzaephUus surinamensis
S. oryzae
Trogoderma spp
'lTiboltum castaneum
Ephestla cautella
Stegobium paniceum
'lTibolium castaneum
OryzaephUus surinamensis
S.oryzae
'lTibolium caslaneum
S. zeamais
S. oryzae
R. dominica
Triboltum castaneum
Commodity
Pulses
Greengram
Redgram. Greengram
Wheat
Wheat
Sorghum.
Wheat, Maize
Wheat flour
Coffee
Cassava
Safflower
Cowpea, Maize
Redgram. Chickpea
Wheat flour
Wheat flour
Copra
Peanut
Wheat
Baby cereal
RIce
Peanut
Cumin
Wheat flour
Copra
Wheat
Maize
Maize
RIce
Reference
Regnault-Roger et aI (I994)
Singh et aI (I982)
Modgll and Mehta (1994)
Saxena and Singh (I994)
Sharma et aI (I979)
Jood et aI (I993)
Venkat Rao et aI (I960 b)
Narasimhan et aI (I972)
Premkumar et aI (I996)
Saito et aI (1990)
RaJan et aI (I975)
Daniel et aI (I977)
Smith et at (I971l
Pagani et aI (I996)
Venkat Rao et aI (I960 b)
MaJumder,
unpublished data
Srivastava (I970)
Kleine-Tebbe et aI (I992)
Phillips and Burkholder (I984)
Hodges et aI (I996)
Srinath et aI (I976)
Sinha (I994)
Dharmaputra et aI (I994)
Pande et aI [19891

286
TABLE 3. PERMISSIBLE LEVELS OF URIC ACID ANDWEEVILLED GRAINS IN FOODGRAINS UNDER THEPREVENTION OF FOOD ADULTERATION (FOURTHAMENDMEN11 RULES. 1990
100
100
Ulic acid.mg/kg
100
3
6
Weevilled grain #% by count
10
Detection methods
Methods for the detection of insect infestationare of two categories, one applicable for commoditysamples and other for in situ detection andmonitoring in bulk storages, storage facilities andfood processing establishments. The methods areeither based on physical principles or involvechemical reactions (Table 4). These methods areapplicable for different types of commodities indiverse storage situations, where the accuracyvaries. Most of the methods have the objectives ofdetecting the presence of live insects either directlyor by indirect means. Methods to detect the
Foodgrains
in detection may result in pest outbreak or heavypopulation build-up, causing severe contaminationbesides quantitative loss. Infestation detection usingappropriate techniques Is considered as the foremoststep in pest management. There has been a growingconcern across the globe about insect contaminantsand consumer aversion towards pests and pesticidesin food commodities. Quality maintenance andcontaminant reduction to meet the InternationalStandards Organization (ISO) standards and hazardanalysis critical control points (HACCP) are importantfor marketing the produce. It is for these reasonsthat detection of insect infestation in foodcommodities is important. Detection methods withreference to either commodity samples or in situ
detection and monitoring in stored grain andstorage premises have been reviewed earlier by afew workers (Semple 1992; Pedersen 1992; FleuretLessard et al. 1994; Wilkin et al. 1994). However,a review dealing with infestation detection insamples as well as in storage structures or premisesis lacking. The present review addresses both theissues.
Wheat. lice. maize. wholechickpea
Coarse grains -sorghum and spiked millet.whole pulses includinglentil and blackgram
Split pulses ldhal) - redgram.greengram. blackgram.chIckpea and lentil
Foodgralns not specified above 10 100
# 'Weevilled grains" means kernels that are partially or whollybored by Insects injulious to grain but does not include germeaten grains and egg-spotted grains
quality assurance with reference to Insectcontamination may lead to rejection of the commodityjeopardizing the reputation of the company/country.
The stored product Insects are relatively small,average adult size being 3-5 mm and are crypticand therefore, they go unnoticed when present infood commodities at low numbers. They are highlyprolific In that several generations occur In a year.Some of the stored product insects complete theirlife cycle Inside the foodgrains and this Internal orhidden Infestation Is the major cause for concernas a source of Insect fragments. Each nation hasfixed its own tolerance levels for the presence oflive or dead insects, Insect fragments and associatedcontaminants in whole grains and milled products.In India, as per Prevention of Food Adulteration(Fourth Amendment) Rules 1990, the uric acid levelin food commodity should not exceed 100 mg/kgand the number of weevilled grains should notexceed 3-10% by count (Table 3). In USA, theDefect Action Levels have been established by theFood and Drug Administration (FDA) for the presenceof live insects in foodgrains as 2 insects/kg andthe limit for insect-<iamaged grains as 32 kernels/lOOg. In wheat flour, there is a limit of 75 insectfragments/50g and in macaroni and noodle products225 fragments/225 g (Bair and Kitto 1992; Pedersen1992).
Detection of Insect infestation is essential forquality assurance and to ensure prolonged shelf lifeof the stored commodities. Detection methods areuseful in locating infestation, for early diagnosis oflow level infestations and to ascertain the successof fumigation or other control measures undertaken.In food industry, the degree of insect detection isone of the criteria for quality assessment. Any delay
Plate I. Turmeric heavily infested with drug-store beetle.Stegobium paniceum.
287
TABLE 4. MERITS AND DRAWBACKS OF VARIOUS INSECT DETECTION METHODS
TABLE 5. METHODS FOR DETECTION OF INSECTINFESTATION IN COMMODIlY SAMPLES
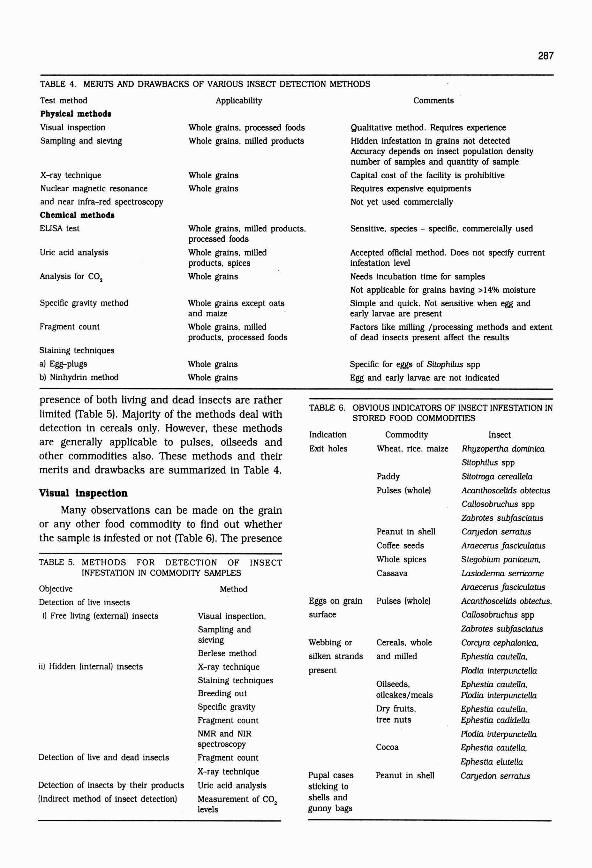
Visual inspection
Many observations can be made on the grainor any other food commodity to find out whetherthe sample is infested or not (Table 6). The presence
presence of both living and dead Insects are ratherlimited (Table 5). Majority of the methods deal withdetection In cereals only. However. these methodsare generally applicable to pulses, oilseeds andother commodities also. These methods and theirmerits and drawbacks are summarized In Table 4.
Test method
Phyllcal methodl
Visual Inspection
Sampling and sieving
X-ray technique
Nuclear magnetic resonance
and near Infra-red spectroscopy
Chemical methocll
ELISA test
Uric acid analysis
Analysis for CO,
Specific gravity method
Fragment count
Staining techniques
al Egg-plugs
bl Ninhydrin method
Objective
Detection of live insects
l) Free living lexternal) Insects
ill Hidden Ilnternal} Insects
Detection of live and dead insects
Detection of insects by their products
(Indirect method of Insect detectlonl
Applicability
Whole grains. processed foods
Whole grains. milled products
Whole grains
Whole grains
Whole grains. milled products.processed foods
Whole grains. milledproducts. spices
Whole grains
Whole grains except oatsand maize
Whole grains. milledproducts. processed foods
Whole grains
Whole grains
Method
Visual Inspection.
Sampling andsieving
Berlese method
X-ray technique
Staining techniques
Breeding out
Specific gravity
Fragment count
NMR and NIRspectroscopy
Fragment count
X-ray technique
Uric acid analySiS
Measurement of CO,levels
Comments
gualltatlve method. Requires expertence
Hidden Infestation In grains not detectedAccuracy depends on insect population densitynumber of samples and quantity of sample
Capital cost of the factllty Is prohibitive
Requires expensive equlpments
Not yet used commercially
Sensitive. species - specific. commercially used
Accepted official method. Does not specify currentinfestation level
Needs Incubation time for samples
Not applicable for grains having> 14% moisture
Simple and qUick. Not sensitive when egg andearly larvae are present
Factors like mtlllng /processing methods and extentof dead insects present affect the results
Specific for eggs of SitophUus spp
Egg and early larvae are not indicated
TABLE 6. OBVIOUS INDICATORS OF INSECT INFESTATION INSTORED FOOD COMMODITIES
Indication Commodity Insect
Exit holes Wheat. rice. maize Rhyzopertha dominfca
SitophUus spp
Paddy Sitotroga cereallela
Pulses (whole) Acanthoscelids obtectus
Callosobruchus spp
Zabrotes subjasclatus
Peanut in shell Caryedon serratus
ColTee seeds Araecerus jascfculatus
Whole spices Stegobium panfceum
Cassava Lasioderrna serrfcome
Araecerus jascfculatus
Eggs on graln Pulses (whole) Acanthoscelids obtectus.
surface Callosobruchus spp
Zabrotes subjasclatus
Webbing or Cereals. whole Corcyra cephalonfca.
silken strands and milled Ephestla cautella.
present Plodla interpunctella
011seeds. Ephestla cautella.oilcakes/meals Plodia interpunctella
Dry fruits. Ephestla cautella.tree nuts Ephestla cadideUa
Plodla interpunctella
Cocoa Ephestla cautella.
Ephestla elutella
Pupal cases Peanut in shell Caryedon serratusstlcldng toshells andgunny bags

288
of exit holes of Insects that develop Inside the graincan be noted. On pulses, the eggs of Callosobruchusspp. and Acanthoscelides obtectus are easily seenas yellowish translucent specks, which becomeopaque and white. Visibly damaged grains areobvious In case of Infestations by R. dominica andthe Khapra beetle, Trogoderma granarium Theaccumulation of exuviae or moulted cuticle of thelarvae are conspicuous In the case of Khapra beetleInfestation on ml1led rice or wheat. The presenceof webbing or strands of silk Is an evidence formoth Infestation such as Ephestia spp., Corcyracephalonica and Plodia interpunctella both In rawand processed commodities. Furthermore, the smallfaecal pellets of the larvae of Ephestia cautella andCorcyra cephalonica are quite visible to theunaided eye In the slevlngs.
Sampling and sieving method
Sampling and sieving is the oldest method,which is widely practised even now. It Is labourintensive but Instantaneously Indicates what ispresent at that exact place and time (Hagstrum1994). The method normally Involves drawing grainsamples of 0.5-1 kg, using a trier (probe) or spearsampler from bag-stacks, bulk storages and truckloads (Plate 2) and sifting the samples to recoverthe free-living forms I.e., adults and larvae. However,it has been established that the method Is reliableonly when the Infestation is sufficiently high atmore than 5 insects/kg and the insects areuniformly distributed in the grain stock (Wilkin andFleurat-Lessard 1991). The accuracy depends onthe number of samples drawn and quantity of eachsample and insect population density in the grain.
Plate 2. Spear sampling and sieving is a common practice InIndia and elsewhere to detect insect infestation in grainstocks. The types of sampler used. however. vary fromplace to place
Insects like Sitophilus zeamais are not evenlydistributed In grains and therefore, they are likelyto be missed dUring sampling (Hodges et al. 1985).Depending on the storage system, different typesof samplers such as deep bin cups. pelicansamplers, ElIis cup and mechanically operatedvacuum probe and grain dlverter are used to takegrain samples.
Currently, there are no international standardsfor the sampling and sieving method. However.national standards have been set up for local use(Wilkin et al. 1994). Sieving of samples is carriedout manually and very little research has been doneon the relative merits of manual and mechanicalsieving methods. A mechanical sieve capable ofrecovering Insect pests occurring at a low densityof 0.2 Insects/kg In wheat samples of IO kg in ashort period of 1.8 min has been developedrecently (Wilkin et al. 1994).
Sampling and sieving methods does not Indicatethe level of internal infestation. However, in viewof Its rapidity and minimum reqUirement ofequipment, the method is popular commercially. Anexpert system for grain sampling has been developedfor grain managers In USA (Hagstrum 1994).
X-ray technique (Radiography)
There are only two significant methods toensure that cereals like wheat and milled rice arefree from hidden infestation, which is the sourcefor Insect fragments. They are X-ray-basedinspection system and cracking and floatationmethod (Fragment count method). X-ray techniquewas developed for infestation detection in 1950(Milner et al. 1950) and It is an official methodIn USA (MCC 1995). Both liVing and dead insectsare detected by this method. However, the X-raytechnique is not sensitive for egg and early larvalstages. It reqUires an expensive machine to generateX-rays, films for exposure and an expert to operateand interpret the radiographs. In order to detectthe presence of insect inside the grain using Xrays, there must exist clear differences betweenbackground (grain) and foreground (insect) in theamount of absorbed radiation. The greater theabsorption difference, clearer is the image (Toliner1993). The exposure and voltage vary according tocommodity and the degree of penetration andcontrast reqUired. Grains having higher moistureneed a higher voltage for the penetration of X-rays(Semple 1992). As accuracy of 80% and above hasbeen reported for the X-ray method and theaccuracy of detection increases. as the insect

matures. It is specially useful for screening packedfoods and in food processing facilities, where anumber of samples are to be checked to meetquality control standards.
Radiographic analysis of foodgrains isconsidered quite time consuming (Schatzki andfine 1988], particularly when potassium carbonateis used as a contrasting agent for sample preparation(Sterner 1973). In recent years, attempts have beenmade to replace human visual detection with anautomated image - acquisition system (Keagy andSchatzki 1991, 1992). Machines producing soft Xrays having relatively long wavelength and weaktransmission power together with microprocessor:based image analyser have the advantage of showingclear picture about the internal infestation inindividual kernels. Unlike the hard X-rays, use ofsoft X-rays is rapid and does not involve anyelaborate preparation of the sample and can vividlydistinguish living and dead insects. An imageprocessing algOlithm has been developed for machinerecognition of insects present in wheat kernels.Thus, there is much scope for automation in Xray analysis of foodgrains with considerablereduction in the time for analysis. X-ray techniquehas also been applied for detection of the seedweevil Cryptorynchus mangiferae in mango fruits(Thomas et al. 1995).
NMR and NIR techniques
for the determination of components such aswater, proteins and oil in foodgrains, nuclearmagnetic resonance (NMR) and near-infrared (NIR)spectroscopy have been deployed. Studies haveshown that because of the insect body contents likehaemolymph, lipids and chitin, insect infested graincan be differentiated from uninfested grains utilizingthe above facilities. Chambers et al (1984)demonstrated that the hidden infestation of granaryweevil, Sitophilus granarius can be detected inwheat by NMR. but the sensitivity was very low.There was difficulty to distinguish moisture in theinsects from that of grains by NMR technique(Chambers, personal communication). NlR in thereflectance mode was investigated as a rapidmethod for detecting both internal (Sitophilusgranarius) and external (Oryzaephilus surinamensis)infestations (Ridgway and Chambers 1996). TheNIR analySis method has been successfully usedfor detecting mite infestation in animal feed bymeasuring the difference in the absorption ofhaemolymph in mites to the absorption of waterin feed (Wilkin et al. 1986). A NIR-based insect
289
detection machine is awaited for commercial useshortly (Chambers 1998).
ELISA test
Enzyme-linked immunosorbent assay (ELISA)has been extensively deployed in clinical diagnosticsand for the detection of pesticide residues andmycotoxins in food commodities. Johnson et al(1973) proposed the possible application ofimmunoassays for the detection of insect filth instored food commodities. following elaborate studies,the application of immunological techniques formeasuring insect contaminants in foodgrains wasreported by Kitto (1991). Myosin, a muscle proteinis present in all life stages, except eggs of insects.The myosin content increases as the larva becomesolder, decreases at pupal stage and again increasesin the adult stage of insects. Myosin is not foundin foodgrains and processed foods. The muscleprotein is easily extractable from infested grains(Schatzki et al. 1993). In this method, the massof insect material (myosin content) present iscorrelated to the number of insects in the infestedgrains.
In the first instance, antibodies to insectmyosin are developed. Insect protein extracted fromsample is allowed to bind with the antibodies,which have been conjugated to an enzyme in plasticmulti-well plates. The development of colour, whichis proportionate to the quantity of myosin ismeasured in colorimetric ELISA reader at 414 nm.The assay is generally linear and can detect, atpresent. one weevil/50 g grain. To carry out thetest, it needs a moderately equipped laboratory andnormally the test takes 2 h for about 20 samples(Bair and Kitto 1992). The assay gives an indicationof the amount of insect biomass accumulated overthe period of storage and not specifically theinfestation present at the time of sampling. In thetest, no distinction between the pest and beneficialinsects is made. It detects the insect pests as wellas beneficial hymenopterans, which are parasiticon insect pests in grain samples. Currently, ELISAtechnique is applicable for detecting a majority ofstored product insect pests in different types of foodcommodities. raw and processed. In somecommodities like star anise and lavender amongspices, interference due to matrix effect has beenobserved (Kitto et al. 1994). In these cases,appropriate modifications in extraction procedureshave been attempted. The technique is beingimproved for higher sensitivity and for quickdetection (Quinn et al. 1992). Species - speCific
290
assays have been reported for Khapra beetle.Trogoderma granarium and the granary weevilSitophilus granarius (Chen and Kitto 1993; Stuartet a1. 1994). Assay kits are already marketed insome countries (e.g. "Insect Detect" in USA). Therehas been a general agreement of data arrived atby immunoassays and by fragment count methodexcept at low levels of infestations. Although themethod is indirect. it is quantitative. reproducibleand relatively faster (Quinn et aI. 1992).
Uric acid analysis
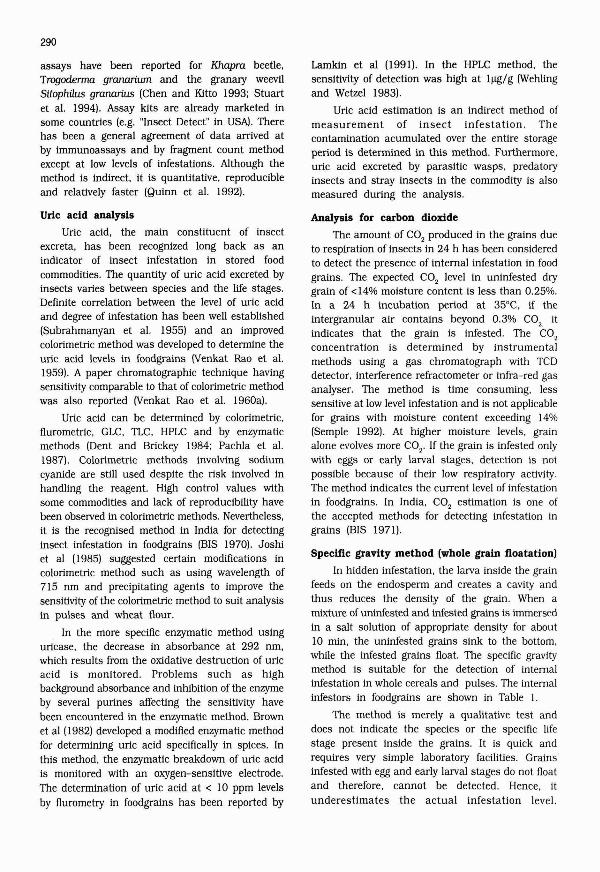
Uric acid. the main constituent of insectexcreta. has been recognized long back as anindicator of insect infestation in stored foodcommodities. The quantity of uric acid excreted byinsects varies between species and the life stages.Definite correlation between the level of uric acidand degree of infestation has been well established(Subrahmanyan et a1. 1955) and an improvedcolorimetric method was developed to determine theuric acid levels in foodgrains (Venkat Rao et aI.1959). A paper chromatographic technique havingsensitivity comparable to that of colorimetric methodwas also reported (Venkat Rao et aI. 1960a).
Uric acid can be determined by colorimetric.flurometric, GLC, TLC. HPLC and by enzymaticmethods (Dent and Brickey 1984; Pachla et aI.1987). Colorimetric methods involving sodiumcyanide are still used despite the risk involved inhandling the reagent. High control values withsome commodities and lack of reproducibility havebeen observed in colorimetric methods. Nevertheless.it is the recognised method in India for detectinginsect infestation in foodgrains (BIS 1970). Joshiet al (1985) suggested certain modifications Incolorimetric method such as using wavelength of715 nm and precipitating agents to improve thesensitivity of the colorimetric method to suit analysisIn pulses and wheat flour.
In the more specific enzymatic method usinguricase, the decrease In absorbance at 292 nm.which results from the oxidative destruction of uricacid is monitored. Problems such as highbackground absorbance and inhibition of the enzymeby several purines affecting the sensitivity havebeen encountered in the enzymatic method. Brownet a1 (1982) developed a modified enzymatic methodfor determining uric acid specifically in spices. Inthis method, the enzymatic breakdown of uric acidis monitored with an oxygen-sensitive electrode.The determination of uric acid at < 10 ppm levelsby flurometry in foodgralns has been reported by
Lamkin et aI (1991). In the HPLC method. thesensitivity of detection was high at Illg/g (Wehlingand Wetzel 1983).
Uric acid estimation is an indirect method ofmeasurement of insect infestation. Thecontamination acumulated over the entire storageperiod is determined in this method. Furthermore.uric acid excreted by parasitic wasps. predatoryinsects and stray insects in the commodity is alsomeasured dUring the analysis.
Analysis for carbon dioxide
The amount of CO2
produced in the grains dueto respiration of insects In 24 h has been consideredto detect the presence of internal infestation in foodgrains. The expected CO2 level in uninfested drygrain of <14% moisture content is less than 0.25%.In a 24 h incubation period at 35°C. if theintergranular air contains beyond 0.3% CO
2. it
indicates that the grain is infested. The CO2
concentration is determined by instrumentalmethods using a gas chromatograph with TCDdetector. interference refractometer or infra-red gasanalyser. The method is time consuming. lesssensitive at low level infestation and is not applicablefor grains with moisture content exceeding 14%(Semple 1992). At higher moisture levels. grainalone evolves more CO2, If the grain is infested onlywith eggs or early larval stages, detection is notpossible because of their low respiratory activity.The method indicates the current level of infestationin foodgrains. In India. CO2 estimation is one ofthe accepted methods for detecting infestation ingrains (BIS 1971).
Specific gravity method (whole grain floatation)
In hidden infestation, the larva inside the grainfeeds on the endosperm .and creates a cavity andthus reduces the density of the grain. When amixture of uninfested and infested grains is immersedin a salt solution of appropriate density for about10 min. the uninfested grains sink to the bottom.while the Infested grains float. The speCific gravitymethod is suitable for the detection of internalinfestation in whole cereals and pulses. The internalinfestors in foodgrains are shown in Table I.
The method is merely a qualitative test anddoes not indicate the species or the specific lifestage present Inside the grains. It is qUick andrequires very simple laboratory facilities. Grainsinfested with egg and early larval stages do not floatand therefore. cannot be detected. Hence. itunderestimates the actual infestation level.

Furthennore. defective grains such as chaff willalso float during the test. Hence. It needsconfinnation of the floating grains by dissecting andchecking them for the presence of Insects.
The density of the salt solution of floatingmedium is critical in the test. Sodium silicate.sodium chloride. ammonium or ferric nitrate andglycerol In water are used as floating media. Theeffective density of the test solution is determinedby the density of the unlnfested grain which. Intum. varies according to grain variety and cultivar.Richter and Tehalale (1994) studied the significanceof the density of the floating media on theefficiency of the specific gravity method. Whiletesting with salt solution of different densities onwheat infested with the rice weevil, Sitophilusoryzae and on legumes infested with Mexican beanweevil. 2abrotes subjasciatus. the optimum densityof the test solution was found to be 12-13% belowthe average density of uninfested grains. It wasnoted that even a small reduction In the requireddensity of the floating medium would affect thesensitivity of the method. It Is Imperative. then. thatthe exact density of the floating media has to bepredetennined by experiment before conducting thetest. The approximate density values for the testsolution for wheat is 1.15. sorghum 1.19 and peas1.27 (Semple 1992).
Specific gravity method was used for thedetection of Infestation of pea weevil Bruchuspisorum in dried peas (Somerfleld 1989) and adipteran Rhagoletis mendax in blue berry fruit(Vaccinum angustifoliuml (Dixon and Knowlton 1994).The method is reported to be not suitable for hulledseeds such as barley. oats and rice and for largeseeded grains like com (Pedersen 1992).
Fragment count
In this method. insect fragments are isolatedfrom processed foods directly and from wholegrains after grinding and then counted. It Is anaccepted official method In USA (AOAC 1984) andin India (BIS 1971). Whole grains are ground toa particle size of 1.5 mm so as to expose theinternal infestors. After digesting the grain materials,the insect parts or fragments are trapped In asystem consisting of an oil phase (mineral oil) andan aqueous phase (water). The 011 globules extractand concentrate the light insect fragments. Thetrapped insect fragments in the 011 phase are thenremoved by filtration and collected on a filter paperfor microscopic examination (Dent and Brickey1984; Gecan and Cichonicz 1984).
291
As mentioned earlier. there are tolerance limits(Defect Action Level) for Insect fragments In processedfoods In countries like USA. The number of Insectfragments present Is considered Irrespective of theirsize. Fragment count method is. therefore. significantfor the ml11ers and processed food Industries Inthose countries. Fragments such as Insect heads.cast skins and head capsules arising from live anddead Insects are collected and counted In themethod. Accordingly, the condition of infestation(dead or live Insects present) and the method ofgrinding or processing detennlne the number ofresulting fragments. The fragment count method Isapplied for various processed foods using appropriatechanges In extraction procedures In separating theInsect parts (Troller 1983). It needs a trainedtechnician to carry out the analysis (Bair and Kitto1992).
Staining techniques
Egg-plug stains; Weevils (Sitophilus spp.)attacking cereals deposit their eggs Inside the grainand plug the holes by their mucilaginous saliva.The egg-plugs can be identified after staining thegrains with suitable chemicals. The egg-plugs arestained cherry red by a 0.5% acid fuchsin solutionor purple colour by 1% gention violet solution.Soaking grains for a minute in 20 ppm aqueoussolution of berberine sulphate selectively stainseggs. which fluoresce greenish yellow. when observedunder UV light of 366 nm wavelength. The extentof infestation is estimated by the number of eggplugs noted. The staining method is applicable forweevil infestation only. With some chemicals inaddition to egg-plugs. damaged parts of the grainare also stained. Because of these limitations. themethod Is not popular.
Ninhydrin method: When the Insect body fluid(haemolyrnph) comes in contact with a paperimpregnated with ninhydrin (trlketohydrindenehydrate), an organic dye. purple colour spotsappear due to the reaction of free amino and ketoacids in haemolyrnph with the dye. This has beentaken advantage for detecting hidden Infestation infoodgrains (Dennis and Decker 1962). The indicatorpaper is Impregnated with 0.3% ninhydrin inacetone. Infested grain is allowed to be crushed onthe paper to facilitate contact of insect haemolyrnphwith the dye in the paper. FollOwing the reaction.the purple colour spots develop in less than onehour at 2Q-25°C. The development of the colourspots can be hastened. if the paper is heated to50°C for 5-10 min. The number of marked spots

292
Egg. early larva and pupa not detectedDetects the feeding activity andmovement of insectsCan be automated
Many types available commercially
Detects by exploiting the locomotoractivity of insects
Efficiency increases in the presence ofpheromones and food lures
Physical traps with infra-red or vibrationsensorsSuitable for farm bins. silos andelevators
Simple and cheaperAttracts different speciesDetects both larva and adults
Detects adult stage onlySpecies - specific generallyPlaya prominent role in monitoring andcontrol
Effective against fiying insects.exploited in insect control
Physical traps
Light traps
Pheromone traps
Method Remarks
Without attractants
Acoustic method
Computerizedauto detectiontechniques
InvolVing attractants
Traps using food lures
TABLE 7. IN SITU DETECTION lAND MONITORINGI OfINSECTS/lNfESTATION IN BULK STORAGESAND fOOD HANDLING OR PROCESSINGESTABLISHMENTS
sensors. By analysing the spectrum of the signals.one can detect the type of insect present infoodgrains and other post-harvest commodities.The technique is applicable for whole grains onlyand active stages (larva and adults) alone aredetected. The method was originally intended fordetecting internal infestation in grain samples, butlater on laboratory tests (Hagstrom et al. 1991) andfield experiments (Hagstrum et al. 1996) proved thatthe technique can be adopted for in situ detectionand monitoring of infestation in bulk storage suchas silos, bins and grain elevators. The acousticdetection and monitoring of insect pests in storedgrains has been reviewed by Hagstrum (J 991).
Larvae of Sitophilus spp. and Rhyzoperthadominica in cereals and bruchids in legumes makesounds by their feeding actiVity. In addition tofeeding, adults of R. dominica make noise by theirgrain boring activity and adult females of S. oryzaeprobe the grains for inserting their eggs inside thegrains. Adults of R. dominica are reported toproduce more than 37 times the number of soundsproduced by their larvae (Hagstrom et al. 1990).The frequency of the sound produced in a definiteperiod is considered for the level of pest activityin the grain. In this method. grain sample is takenin a sound-proof box haVing an acoustic vibrationsensor, which is connected to an amplifier and the
In situ detection and monitoring methods
The various methods applicable for detectingand monitoring insect infestation in grain storedin silos and elevators and food processingestablishments are listed in Table 7.
Acoustic detection: Insects produce mechanicalvibrations during their movement in stored grains.They also produce sound dUring feeding inside thegrain (larvae) and outside the grains (adults andlarvae). Insects developing inside foodgrains arealso known to emit ultrasonic signals. Thesemechanicai vibrations, feeding noises and ultrasonicsignals can be detected by using appropriate
are counted and the infestation level is expressedas the number of hidden insects/kg of grain.Ninhydrin method has been used in the portableAshman - Simon infestation detector (Ashman etal. 1970). The method is simple and there is noneed for any skilled technician to conduct the test.However, the drawbacks of the method are: i)insensitivity to eggs and early larvae and ii) grainwith higher moisture (> 16%) and with fungi givea faint colour reaction even in the absence of insectinfestation. The ninhydrin paper loses its sensitivityover a period due to the decomposition of ninhydrin.The paper develops purple spots, when touched byhand because of the contact of amino acids on theskin of the fingers.
Other methods
Free liVing adults and larvae present in grainsamples can be extracted by applying dry heat tothe grain taken in Berlese funnel. It will be effective,if the grain moisture is less than 14% (Wilkin etal. 1994). Unlike sieving, it is relatively a time consuming process. Hydroxyphenols are present ininsect cuticle but not in food commodities. Thehydroxyphenols can be estimated using aspectrophotometer, following the reaction of thephenols with 2. 6-- dichloroquinone chlorimide toproduce phenolidophenol dyes (Semple 1992).
. Investigations on insect detection, utilizing thechemical reaction have not been pursued further.
Hidden infestation can be detected either byalkali treatment of grain or by "breeding outmethod". In alkali treatment or sodium hydroxidegelatinisation method, grain is treated with alkaliso that the endosperm and seed coat becometranslucent and the immature insect stages becomevisible. In the breeding out method. the grainsample is incubated for 4- 6 weeks and the numberof adults emerging out are counted.

noise produced from the feeding activity istransmitted for recording (Plate 3).
The major challenge in the application ofacoustic detection is the interference of ambientnoise. The intensity of feeding and movementsounds are very low. when compared to that ofenvironment. The larvae of Sitophilus oryzae inwheat produce a mean sound pressure level of 23dB (20 ~Pa). Use of muffle-box made of multilayered wood and foam is reported to eliminatebackground noise during acoustic detection oflarvae of S. oryzae in wheat samples. This has alsobeen tested in environments. simulating commercialstorages like grain elevators (Mankin et al. 1996).Electronic sound detection devices have beendeveloped to enable automation in detection andmonitoring infestation (Shuman et al. 1993). Theacoustic method has also been deployed for detectingfruit fly larvae in grape fruits and mangoes (Webbet al. 1988).
Adams et al (1953) put forth the idea ofmonitoring the level of insect infestation by installingacoustic sensors similar to thermoscopic cablesinstead of routine grain sampling in bulk storages.This was demonstrated with R. dominica in wheatusing a piezoelectric sensor in bulk grain storage(Hagstrum et al. 1988). The accuracy of detectionwas confirmed with that of conventional samplingand sieving method. An important impediment isthat the sound produced by insects gets attenuateddue to the absorption by grain. This has beeninvestigated in detail using different types of grains.Sound transmission varied according to the size ofthe grain and its shape and the frequency of thesound itself (Hickling et al. 1995). Therefore.
Plate 3. Acoustic detection in grain samples. The devicecomprises a sound-proof box with a sensor or transducer.an amplifier and a headphone or recorder
293
installation of acoustic sensors at optimum intervalsis necessary to detect and monitor the infestationin silos and other bulk storages. Infestation levelsat 17 insects/kg have been detected for internalinsects such as R. dominica and S. oryzae andexternal insects like T. castaneum (Hagstrum et al.1996).
The detection of infestation of cowpea beetle.Callosobruchus chinensis in cowpea by monitoringultrasonic signals generated dUring feeding hasbeen reported (Shade et al. 1990). The ultrasonicsignals are detected by a system comprising anultrasonic transducer, a low-noise narrow bandamplifier, a signal conditioner and detector and aoutput recorder or other display device. Thetechnique was proposed earlier by Bailey andMcCabe (1965). The piezoelectric transducer capableof detecting ultrasonic Signals of 40 KHz is placedin direct contact with the grain. In other acousticdetection methods. the sensors can detect the noisesignals in the range of 3000 Hz up to a distanceof 15 cms and there is an interference by ambientsounds during monitoring. In contrast. the presentmethod detects ultrasonic feeding - generatedinsect noise in infested grain in close contact withthe sensor and there is no necessity for noiseshielding to avoid environment sounds. Currently,the method is applicable for detecting infestationin individual grains. but there is scope for developingimproved ultrasonic sensory capable of detectingSignals at a reasonable distance (Shade et al. 1990).
Apart from sounds due to feeding activity andmovement. some insect species produce certaincommunication Signals in the form of ultrasonicvibrations. which can be detected. Males of ricemoth. Corcyra cephalonica make sound pulses of125 KHz. which affect the behaviour of both malesand females of the same species (Spangler 1987).Likewise. males of Ephestia spp. and Plodiainterpunctella (Indian meal moth) produce ultrasonicvibrations with a frequency of about 80 KHz. It isbelieved that the sound is produced for intraspecificcommunication and it can play a role in matingbehaviour (Trematerra and Pavan 1994). So far.little attempt has been made to exploit detectingthese ultrasonic noises for monitoring mothinfestation in storages and food processingestablishments.
There has been renewed interest on acousticinsect detection. Of late. research has focussed onundertaking the sound spectrum of various insectsin order to identifY the species. There is considerablescope for improvement so that the exact species
, ,~l"'-I,{l~l~(ln

294
present and insect density can be monitored perse without drawing samples.
Physical traps
Pitfall, probe and PC traps: Insects (adults)move around or fly in stored products or storagepremises In response to i) volatiles emitted by foodcommodities and II) pheromones released by theadults and they also wander at random due to theirinnate behaviour for dispersal. This locomotoractivity of the Insects has been exploited by manto detect and monitor them using appropriatedevices known as insect traps.
In physical traps, the natural locomotor activityof the Insects has been exploited. There are threetypes of traps - pitfall, probe and pitfall cone. Pitfall(rap consists of a plastic jar with a mesh screenover the top. The trap is placed inside the grainon the surface layer of the bulk storage. Insectssuch as OryzaephUus surinamensis crawling acrossthe grain slip through the mesh into the trap andare unable to escape. Probe trap consists of aplastic cylinder perforated with approximately 2.8mm holes that are angled down into the body ofthe traps where a funnel directs the capturedinsects into a collecting tube (Plate 4). The probetrap is vertically inserted into the grain mass andleft for a week or more. Insects in the deep layerof the grains crawl Into the holes and fall Into thecollecting tube. They remain trapped inside, till thetrap is pulled out of the grain and inspected(Loschiavo 1975). The probe trap is sensitive toCryptolestes spp.. Tribolium spp. and Oryzaephilussurinamensis. Insects showing less wanderingbehaviour such as Sitophilus zeamais andR. dominica are not trapped.
Plate 4. A probe trap taken out from a bin In a grain terminalIn Australia. In developed countries probe traps areroutinely used for infestation detection and monitoringIn bins. silos and other bulk grain storages
Pitfall cone (PC) trap was developed by Coganet al (1990), combining the characteristics of pitfalland probe traps so as to trap the insects whichare active at surface level as well as in the deeplayers of the grain bulk. Comparative experimentshave shown that these physical traps were moreefficient in detecting Insect infestation overconventional sampling methods (White et al. 1990:Reed et al. 1991; Pereira et al. 1994). The trapcatch is influenced by temperature. grain moisturecontent and Insect population density. The trapdesign, location and duration of trapping alsomatter In their efficacy (Fargo et al. 1989). In probetrap, if the holes are designed to slope upwardsinstead of downwards, It helps minimising thecollection of grain debris inside the trap dUring thetrapping period (Subramanyam et al. 1989). Coatingof "Fluon" around the neck of the collecting tubein probe trap prevents the escape of trapped insectsfrom the traps (Cogan and Wakefield 1987). Theefficiency of phySical traps can be improved furtherby incorporation of food attractants or phenomonesin the trap (Cogan and Wakefield 1987; Rejesusand Butuason 1989). Interpretation of trap catchor translating the number of trapped insects intoInfestation level In commodities is still not welldefined (Hagstrum 1994). It has been observed thata combination of trap and sampling methods givemeaningful estimates of the insect population ina storage system (Reed et al. 1991; Pereira et al.1994).
Further improvements in probe traps havebeen made in recent years to automate the detectionprocedure. Normally. the traps are left inside thegrain for a week or more and then taken out toexamine the trapped insects to assess the infestationlevel. In the improved system known as ElectricGrain Probe Insect Counter (EGPICl. an infra-redbeam sensor has been Installed in the probe. whichidentifies and records the insects, as they drop intothe trap (Shuman et al. 1996). The sensor outputsignals are continuously recorded in a computerand the data analyzed. Traps with either infra-redbeam or piezoelectriC sensors have also beeninvestigated by other workers in USA and China(Vick et al. 1991; Anon 1998).
Thus, the trapping methods are applicable onlyfor Insect stages that are active and mobile. Thesemethods alert the store manager, grain traders andfood Industry about the presence of infestation inthe storage premises. They can forecast the riskof possible outbreak and stress the need for controlstrategies. They help to avoid scheduled or calendar

fumigations and spray treatments and thus, reducepesticide contaminants. Traps also help to avoidrepeated sampling, which is labour intensive andtime consuming (Wright 1989).
Multiple funnel trap
A versatile trap comprising a series of funnelsfitted vertically one above the other and withoutany bait material has been developed for detecting/trapping beetle and moth pests showing flightactivity. R. dominica, T. castaneum and C.jerruguineus in cereal warehouse and moth pestsin a flour mill in Italy have been trapped effiicientlybecause of the characteristic design or silhouetteof the trap (Tremeterra et al. 1994).
Sticky traps
Adhesive or. sticky traps have the surface,treated with sticky substances like petroleum jellyand polybutane gel. The traps have been used fordetecting and trapping flying insects includingRhyzopertha dominica, Ephestia spp., Sitotrogacerealella, Plodia interpunctella (Hagstrum et al.1994). Sticky traps in conjunction with pheromoneor food attractants have been found highly efficientin locating and monitoring insect infestation inwarehouses, grain storages, food establishmentsand in marketing channels (Karan Singh andMajumder 1987; Rejesus and Butuason 1989;Soderstrom et al. 1987; Vick et al. 1990).
Attractant traps
Ught traps: Stored product insects (adults) areattracted by light, of wavelength between 280 and600 nm. Long wavelength UV light (365 nm) andgreen light (500-560 nm) are particularly attractive(Rees 1985). However, the response of these insectstowards an attractive light source is influenced bythe insect species. age. sex, environmentalconditions, intensity of other light sources andphotoperiod. A light trap comprises a suitable lightsource and a container or sticky surface to catchand retain insects. Light trap has been exploitedmore as a control device as in electrocutors ratherthan just detection (Gilbert 1984).
Traps using food lures
Insect pests are attracted by volatiles emanatingfrom stored food commodities (Pierce et al. 1990;Phillips et al. 1993). This behavioral response hasbeen taken advantage of, for detecting andmonitoring insect pests, particularly beetles, in foodcommodities and their storage premises. Unlikepheromone traps, the food attractant traps are
295
useful in detecting and monitoring both larvae andadults and are cheaper as locally available materialscan be used.
Two types of food lures are used in the traps.In the first type. the broken grains of one or mixedtype are used in cloth. jute or plastic bags. Thesebaited bags are distributed around grain stacksand on the floor in warehouses. After a period of1-2 weeks, the bags are retrieved and insectstrapped are counted. The bait bags need replacementonce in 2 weeks. as they lose their attractivenessin due course. An important advantage with baitbags is that they attract multiple species and theattracted insects remain inside bags for aconsiderable period. Rolled barley, wheat, corn andcoffee beans have been tested earlier as food baits.Later studies proved that brown rice alone and amixture of wheat, peanuts and kibbled carobs(locust beans, Ceratonia siliqua) as most attractive(Pinniger 1991). Kibbled carobs are particularlyuseful in enhancing the effectiveness of physicaltraps like pitfall traps (Cogan and Wakefield 1987).Storing milled rice in godowns. in Indonesia. baiibags of 8 x 16 cm size. made of 'netlon' plasticcloth containing fresh brown rice. 16 g each wereevaluated for monitoring of T. castaneum and R.dominica (Hodges et al. 1985). The brown rice bagswere relatively more efficient than the bait bagsdeveloped by Pinniger (1975) or the conventionalsampling method. The efficiency of brown rice bagswas further confirmed in experiments in operationalgodowns, storing milled rice in Indonesia. The baitbags attracted in addition to beetle pests, larvaeof Ephestia cautella and Corcyra cephalonica (Haineset al. 1991).
In the second type, cereal or vegetable oils anddistillates of carob (locust bean) have been deployedas the lures in the traps. Laboratory studiesindicate that oat and corn oils attract the adultsof S. oryzae and oils of rice. soybean. wheat germand corn are attractive to the adults of T. castaneum(Phillips et al. 1993). Oat, pumpkin seed andsesame oils were more attractive to Khapra larvaethan wheat germ or corn oil (Barak 1989). Theseattractants, mainly fatty acids. have beenincorporated in pheromone traps and in physicaltraps for improved detection and monitoring (Barak1989; Pinniger 1991).
Corrugated paper acts as a refuge or hidingsite for many of the crawling beetle pests and forthe late larvae of Ephestia spp. which are aboutto pupate. The refuge seeking behaviour has beenexploited in refuge traps. The trap effiCiency gets

296
boosted. when grain oils and/or pheromones wereused as lures In these traps (Burkholder 1984).
Pheromone trapsPheromones. chemical substances secreted by
Insects as a part of their communication process.are of 2 types: i) sex pheromones and ii) aggregationpheromones. All the moth pests and some of thebeetles such as Stegobium paniceum andTrogodenna spp. release sex pheromones. In mostof the beetle pests. the males release aggregationpheromones. which lure both males and females
. of the same species. Typical cases include Triboliumspecies. Rhyzopertha dominica and Prostephanustruncatus (Table 8). Sex pheromones are relativelyeffective over longer distances (8-15 m) thanaggregation pheromones. The behavioral responsesof Insects to pheromones are Influenced by variousfactors such as age of the individual. photoperiodand temperature (Burkholder 1984; Pinniger 1991).Pheromones of more than 30 stored product Insectshave been identified and many of them have beensynthesised and commercially developed for use Intraps for detection. monitoring. mass trapping andcontrol. These pheromones along with specialadditions are Impregnated Into absorbant and slowrelease membranes for use in the traps. The trapcontains replaceable adhesive areas to which insectsstick. when they are lured inside by the pheromone.The effectiveness of the pheromone lure lasts for8 to 12 weeks and the lures need regular changing(Mueller 1998).
Commercial traps baited with pheromonesinclude (Z. E)-7.11-hexadecadien-l-ol acetate(or HAD) for Sitotroga cerealella. (Z.E)-9.
TABLE 8. INSECTS FOR WHICH PHEROMONES ARECOMMERCIALLY AVAILABLE AND ARE EXPLOITEDIN INFESTATION DETECTION AND MONITORING INSTORAGE FACILITIES AND FOOD PROCESSINGESTABLISHMENTS
12-tetradecadlen-l-ol-acetate lor TDA) for thepyralids like Ephestia spp. and Plodia interrpuncteUa.dominicalure for Rhyzopertha dominica. 1.8dlmethyldecanal for Tribolium spp.. serricomin forLasiodenna serricome and stegobinone for Stegobiumpaniceum (Phillips 1994). The traps are used atan optimum height of 2-3 meters for every 14 metrefor monitoring moth pests. The reqUired trapdensity varies according to the pests to be detectedand monitored. When the number of traps usedare below the optimum. there will be considerablereduction in trap catching IRees 1998). Theorientation of insects to the traps are said to bemediated by chemical and visual cues or stimuli.Therefore. the design and colour pattern of the trapare also important for their efficacy. Moths areattracted by traps with darker stripes on whitebackground. In addition. they are active at dimlight than In complete darkness or In day light(Quartey and Coaker 1991). As already mentioned.many of the phySical traps show improved efficiencyin trapping Insects In the presence of pheromonesIReJesus and Butuason 1989; Vlck et al. 1990).
Detection and monitoring of moth Infestationsin processed food establishments like flour mills(Loi et al. 1987). in raisin marketing channels(Soderstrom et al. 1987) and In cocoa consignmentsin transit (Mabbatt 1995) have been successfullycarried out using pheromone traps. For crawlinginsects such as Tribolium spp. and Trogodenna spp.and for the active flier Lasiodenna serricome.pheromone traps have been deployed in finishedproduct warehouses and In food Industry. Theaggregation pheromones used in the traps remainattractive around a radius of 1.5 to 3 metres only.For some of the pests such as CaUosobruchuschinensis. Oryzaephilus surinamensis andCryptolestes spp. the pheromones have beenidentified. yet they have not been commerciallyapplied (Phillips 1994).
Type
Sex pheromones
(Female produced)
Aggregation pheromones
(Male produced)
Species
E. cautella
E. elutella
E. jlgulilella
E. kuehniellaLasiDdenna serrlcome
Sitotroga cerealeUa
Stegobium pantceum
Trogodermo glabrum
T. granarium
Prostephamus truncotus
Rhyzopertha domtnfca
Tribolium castaneum
T. cor!fiJSum
Conclusion
In view of consumer concern and regulatoryrestrictions regarding contaminants of pests andpesticides In food commodities. preventive measureshave gained prominence over chemical control inrecent years. In this context. priority has shiftedto early pest detection so as to minimise thepesticide use. The traditional sampling and sievingmethod has been elaborately studied and the needfor larger sample size for the accuracy of themethod has been established. The ELISA techniquehas been shown as a valuable tool In insect

detection in raw and processed food commodities.Here again, the limitation is that eggs are notdetected by ELISA test. A sensitive method to detectall the 4 stages of an insect. in a single approachis necessary. A method applying a biD-sensor todetect insect infestation in samples is worthinvestigating.
Automation in insect detection and monitoringstrategies have been demonstrated for applicationin bulk storages in the developed countries.Progressive research has taken place on acousticmethod and use of physical traps incorporatinginfra-red beam sensors for in situ detection in bulkstored grains. With respect to storage facilities, foodestablishments and marketing channels, the use ofpheromone traps with or without food lures hasbecome inevitable. There are only a few insect pests(e.g. O. surinamensis) for which the pheromonetraps are yet to be marketed. However, estimatingthe insect density in stored commodities based ontrap catch is still not resolved. Less expensive foodattractants comprising grains or grain oils attractmultiple species and hence, are valuable tools forthe food industry in developing countries.
Acknowledgements
The author thanks the Australian Centre forInternational Agricultural Research for the literaturesearches and the Director, Central FoodTechnological Research Institute for the facilities.He is also thankful to Ms. Shrilatha, Ms. Kirti andMrs. Rekha for assistance in the preparation of thereview.
ReferencesAACC (1995) Official methods of Analysis. 9th edn. American
Association of Cereal Chemists. Minnesota. USA.
Adams. RE. Wolf JE. Milner M. Shellenberger JA (1953) Auraldetection of grain infested internally with Insects. Science118:163-164
Anon (1998) Special report: 7th International working conferenceon stored-product protection. AClAR Post-harvest Newsletter47:7-26
AOAC (1984) Official Methods of Analysis. 14th edn. Associationof Official Analytical ChemJsts. Washington
Ashman F. Elias DG. Ellison JF. Spratley R (1970) Ashmansimon Infestation detector: An instrument for detectinginsects within foodgrains. Trop Stored Prod Inf 19: 15-19
Bailey SW. McCabe JB (1965) The detection of immature stagesof insects within grains of wheal. J Stored Prod Res 1:201202
Bair J. Kitto GB (1992) New methods for rapid determinationof Insects in grain. In: Proceedings of GEAPS Exchange 1992.63rd Annual International Technical Conference andExposition of GEAPS. Grain Elevator and Processing Society.Minneapolis. MN. pp 85-94
297
Barak AV (1989) Development of a new trap to detect andmonitor Khapra beetle Trogodenna granwium J. Econ Entomol82: 147{}-1477
BIS (1970) IS: 4333 (Part V)-Determination of uric acid. Bureauof Indian Standards. New Delhi
BIS (1971) IS 6261-1971-Methods of analysis for detection ofInsect and rodent contamination in grain and mJlled products.Bureau of Indian Standards. New Delhi
Brown SM. Abbott S. Guarino PA (1982) Screening procedurefor uric acid as indicator of infestation in spices. J AssocOff Anal Chern 65:27{}-272
Burkholder WE (1984) Use of pheromones and food attractantsfor monitoring and trapping stored-product Insects. In: BaurFJ led) Insect Management for Food Storage and Processing.American Association of Cereal Chemists. Minnesota. pp 6989
Chambers J (1998) Invertebrate detection. behaviour andImpact. Paper presented at Food Protection 98. York. UK.1-3 April
Chambers J. McKevitt NJ. Stubbs MR (1984) Nuciear magneticresonance spectroscopy for studying the development anddetection of the grain weevil. SitophUus granarius (L)(Coleoptera: Curculionidae). within wheat kernels. BullEntomol Res 74:707-724
Chen W-M. Kitto GB (1993) Specie&-speciflc immunoassay forSitophUus granarius in wheal. Food Agric Immunol 5: 165175
Cogan PM. Wakefield ME (l987) Further developments in trapsused to detect low-level infestations of beetle pests in bulkstored grain. British Crop Protection Council Monograph No.37. pp161-167
Cogan PM. Wakefield ME. Pinniger DP (1990) PC. a novel andinexpensive trap for the detection of beetle pests at lowdensities in bulk grain. In: Fleurat-Lessard F. Ducom P ledslProceedings of the Fifth International Working Conferenceon Stored Product Protection. Bordeaux. France. pp 13211330
Daniel VA. RaJan P. SanJeevarayappa KY, Srinivasan KS.SwamJnathan M (1977) Effect of insect infestation on thechemical composition and the protein efficiency ratio of theproteins of Bengalgram and redgram. Indian J Nutri Olet14:7{}-73
Dennis NM, Decker RW (1962) A method for detecting liveinternal infestation in wheal. J Econ Entomol 55: 199-203
Dent RG, Brickey PM (1984) Physical and chemJcal methodsfor detecting Insect filth In foods. In: Baur FJ (ed) InsectManagement for Food Storage and Processing. AmericanAssociation of Cereal Chemists, Minnesota pp 323-328
Dharmaputra as, Halld H, SunJaya, Khlm KS (1994) The effectof SitophUus zeamais on fungal infection, aflatoxin production,moisture content and damage to kernels of stored maize.In: Highley E, Wright EJ, Banks HJ, Champ BR (eds) StoredProduct Protection: Proceedings of the 6th InternationalWorking Conference on Stored Product Protection. CABInternational, Oxon, UK. pp 981-984
Dixon PL, Knowlton AD (I 994) Post-harvest recovery of Rhagoletismendax Curran (Dlptera: Tephrltidael from low bush blueberryfruil. Canadian Entomologist 126:121-123
Fargo WS. Epperly D, Cuperus GW, Clary BC, Noyes R (1989)Effect of temperature and duration of trapping on four storedgrain Insect species, J Econ Entomol 82:97{}-973

298
Fleurat-Lessard F. Andrieu AJ. Wilkin DR (1994) New trendsIn stored-grain Infestation detection Inside storage bins forpermanent Infestation risk monitoring. In: Highley E. WrightEJ. Banks HJ. Champ BR (eds) Stored Product Protection:Proceedings of the 6th International Working Conference onStored Product Protection. CAB International. Oxon. UK. pp479--486
Gecan JS. Cichowicz SM (1984) Extraneous materials: Isolation.Grains and their products. In: Williams S (ed) OfficialMethods of Analysis of the AOAC. 14th edition. Associationof Official Analytical Chemists. Washington. USA Methods44.039 to 44.061
Gilbert 0 (1984) Insect electrocutor light traps. In: Baur FJ (ed)Insect Management for Food Storage and Processing. AmericanAssociation of Cereal Chemists. Minnesota. pp 88-108
Hagstrum OW (1991) Automated acoustical detection of storedgrain insects and Its potential in reducing Insect populations.In: Fleurat-Lessard F. Oucom P (eds) Proceedings of the FifthInternational Working Conference on Stored-ProductProtection. Bordeaux. France. pp 1341-1349
Hagstrum OW (1994) Field monitoring and prediction of storedgrain insect populations. Post-harvest News and Information5:39N-45N
Hagstrum OW. Dowdy AK. Lippert GE (1994) Early detectionof insects In stored wheat using sticky traps in binheadspace and prediction of infestation level. Environ Entomol23: 1241-1244
Hagstrum OW. Flinn PW. Shuman 0 (1996) Automated monitoringusing acoustical sensors for insects in farm-stored wheat.J Econ Entomol 89:211-217
Hagstrum OW. Vick KW. Flinn PW (1991) Automatic monitoringof Triboliwn castanewn populations in stored wheat withcomputerised acoustical detection system. J Econ Entomol84:1604-1608
Hagstrum OW. Vlck KW. Webb JC (1990) Acoustical monitoringof Ryzopertha dorninica (Coleoptera: Boslrichldae) populationin stored wheat. J Econ Entomol 83:625-628
Hagstrum OW. Webb JC. Vick KW (1988) Acoustical detectionand estimation of Rhyzopertha domintca IF) larval populationsin stored wheat. Florida Entomologist 71:441-447
Haines C. Rees OP. Ryder K. Sistyanto S. Cahyana Y (1991)Brown-rice bait-bags for monitoring Insect pest populationsIn bag-stacks of milied rice as an aid to pest controldecision-making. In: Fleurat-Lessard F. Oucom P (eds)Proceedings of the Fifth International Working Conferenceon Stored Product Protection. Bordeaux. France. pp 13511358
Hickling R. Wei W. Hagstrum OW (1995) Study of soundtransmission In various types of stored grain for acousticdetection of Insects. J Acoust Soc Amer 97:3371-3381
Hodges RJ. HalJd H. Rees OP. Melk J. SarJono J (1985) Insecttraps as an aid to pest management in milled rice stores.J Stored Prod Res 21:215-229
Hodges RJ. Robinson R. Hall DR (1996) Quinone contaminationof dehusked rice by Triboliwn castanewn (Herbest) (Coleoptera:Tenebrionidael. J Stored Prod Res 32:31-37
Johnson HM. Bokovic JA. Eisenberg WV. Vazquez AW (1973)AntigenIc properties of some Insects involved In foodcontamination. J Assoc Off Anal Chern 56:63-65
Jood S. Kapoor AC. Ramsingh (1993) Available carbohydratesof cereal grains as affected by storage and insect infestation.Plant Foods Human Nutrition 43:45-54
Joshi SV. Jaisani JC. Mathew TV (1985) Improvement inlSI method of determination of uric acid as a measure ofdegree of insect Infestation In foodgrains. Res lnd 30:2932
Karan Singh. Majumder SK (1987) Effectiveness of sex pheromonebait trap for monitoring Angoumols grain moth population.Indian J Ecol 14:261-265
Keagy PM. Schatzki TF (1991) Effect of image resolution oninsect detection in wheat radiographs. Cereal Chern 68:339343
Keagy PM. Schatzki TF (1992) Machine recognition of weevildamage in wheat radiographs. In: OeSchazer JA. Meyer GE(eds) Optics In Agriculture and Forestry: Proceedings of aConference held in Boston. USA. Society of Photo--opticalInstrumentation Engineers. Bellington. USA. pp 108-119
Kitto GB (1991) A new biochemical technique for quantitatingInsect infestation In grain. Assoc Operative Millers' Bulletin(March 1991):5835-5838
Kitto GB. Quinn FA. Burkholder WE (1994) Development ofImmunoassays for quantitative detection of insects in storedproducts. In: Highley E. Wright EJ. Banks HJ. Champ BR(eds) Stored Product Protection: Proceedings of the 6thInternational Working Conference on Stored-ProductProtection. CAB International. Oxon. UK. pp 412-420
Kleine-Tebbe J. Jeep S. Josties C. Meysel U. O'Connor A. KunkelG (1992) IgE- mediated inhalent allergy in inhabitants ofa building Infested by the rice weevil (SitophUus oryzael.Annals Allergy 69:497-504
Lamkin WM. Unruh NC. Pomeranz Y (1991) Using flurometryfor the determination of uric acid in grain: elimination ofInterfering fluorescence. Cereal Chern 68:81-86
Lol G. Conti B. Mannuci L (19871 Research on some monitoringmethods to determine the infestation of arthropods In a flourmill. Frustula Entomolgica 10: 153-180
Loschiavo SR (1975) Field tests of devices to detect insects indifferent kinds of grain storages. Canadian Entomol 107:385389
Mabbat T (1995) Pheromone traps reduce insurance fumigationfor cocoa bean pests. Inter Pest Control 37:73-74
Mankin RW. Shuman O. Coffelt JA (1996) Noise shielding ofacoustic devices for Insect detection. J Econ Entomol89:1301-1308
MJlner M. Lee MR. Katz R (1950) Application of X-ray techniqueto the detection of Internal insect infestation of grains.
. J Econ Entomol 43:933-935
Modgil R. Mehta U (1994) Effects of different levels ofCallosobruchus chinensis L. Infestation on proximateprinciples. true proteins. methiontne and uric acid contentsof greengram and redgram. J Food Sci Technol 31: 138-139
Muelier OK (1998) Stored Product Protection-A Period ofTransition. Publishers Insects Limited Inc.. Indianapolis.USA
Narasimhan KS. Balachandran A. Majumder SK, Natarajan CPo(1972) Effect of Insect infestation on the phYSical. chemicaland biological changes In coffee. Indian Coffee 36:331-333
Pachla LA. Reynolds OL. Wright OS (1987) Analytical methodsfor measuring uric acid in biological samples and foodproducts. J Assoc Off Anal Chern 70: 1-14
Pagani M. Fogllaza U. Cademartini E (1996) Effects of Triboliwncastanewn infestation on the rheological characteristics ofa baking flour. Teenlca Molltoria 47:1067-1073
Pande N. Saxena J. Mehrotra as (1989) Detennlnatlon offungaland Insect Infestation of stored cereal grains and theirreiatlonshlp. Bull Grain Technol 27:133-141
Pedersen JR (1992) Insects: Identification. damage and detection.In: Sauer DB (ed) Storage of Cereal Grains and TheirProducts. American Association of Cereal Chemists. St. Paul.MN. USA. pp 435-489
Pereira PRVS. Lazzari SMN. Almeida M (1994) Comparisonbetween two methods of Insect sampling in stored wheat.In: Highley E. Wright EJ. Banks HJ. Champ BR (eds) StoredProduct Protection: Proceedings of the 6th InternationalWorking Conference on Stored-Product Protection. CABInternational. Oxon. UK. pp 435-438
Phl\lips TW (1994) Pheromones of stored-product insects:Current status and future perspectives. In: Highley E. WrightEJ. Banks HJ. Champ BR leds) Stored Product Protection:Proceedings of the 6th International Working Conference on.Stored-Product Protection. CAB International. Oxon. UK. pp479486
Phl\lips TW. Burkholder WE 11984) Health hazards of Insectsand mites In food. In: Baur FJ (ed) Insect Management forFood Storage and Processing. American Association of CerealChemists. Minnesota. USA. pp 280-292
Phl\lips TW. Jiang Xl. Burkholder WE. Phillips JK. Tran-QuosH (1993) Behavioral responses to food volatiles by ecologicallydifferent stored-product Coleoptera. Sitophllus oryzae(Curcullonodae) and Triboliwn castaneum (Tenebrionidae). JChern Ecol 19:723-734
Pierce AM. Pierce HD. Oehlschlager AC. Border JH (1990)Attraction of OryzaephUus surinamensis (Ll and OryzaephUusmercator (Feuvel) (Coleoptera: CucujldaeJ to some commonvolatiles of food. J Chern Ecol 16:464-475
Pinniger DB (1975) A bait trap technique for assessment ofstored product beetle populations. Trop Stored Prod Inf24: 17-24
Pinnlger DB 119911 Food-baited traps; Past. present and future.J Kansas Entomol Soc 63:533-538
Premkumar T. Moorthy SN. Balagopalan C. Jayaprakash CA.Rajamma P (19"96) Quality changes In market cassava chipsinfested by insects. J Stored Prod Res 32: 183-186
Quartey GK. Coaker TH (1991) A model trap for monitoringEphestia cautella (Walker). In: Fleurat-Lessard F. DucomP leds) Proceedings of the Fifth International WorkingConference on Stored-Product Protection. Bordeaux. France.pp 1409-1415
Quinn FA. Burkholder WE. K1tto GB (1992) Immunologicaltechnique for measuring Insect contamination of grain. JEcon Entomol 85: 1463-1470
Rajan P. Sanjeevarayappa KY. Daniel VA. Paul Jayaraj A.Swaminathan M (1975) Effect of insect Infestation on thechemical composition and nutIitive value of maize andcowpea. Indian J Nutri Dletet 12:325-327
Reed CR. Wright Yr. Mize TW. Pedersen JR. Brockschmidt EJ(1991) Pitfall traps and grain samples as indicators of InsectIn farm stored wheat. J Econ Entomol 84: 1381-1387
Rees DP (1985) Review of the response of stored product Insectsto light of various wavelengths. with particular reference tothe design and use of light traps for population monitoring.Trop Sci 25:197-213
Rees DP (1998) Estimation of the optimum number of pheromonesbaited flight traps needed to monitor phycltlne moths(Ephestia caulella and Plodin interpuncteUa) at a breakfast
299
cereal factory. In: Paper Presented at 7th InternationalWorking Conference on Stored-Product Protection. Beijing.China. 14-19 October
Regnault-Rojer C. Watler C. Hamraoui (1994) Modification ofthe nutIitionai quality of nitrogen content of Leguminosaeseed damaged by Acanthoscelides obtectus (Say). Coleoptera.Bruchidae. In: Highley E. Wright EJ. Banks HJ. Champ BR(edsJ Stored Product Protection: Proceedings of the 6thInternational Working Conference on Stored-ProductProtection. CAB International. Oxon. UK. pp 704-705
Rejesus BM. Butuason EM (1989) Trapping studies with insectpheromones in stored peanuts and wheat. In: Naewbanlj JO(ed) Proceeding of the 11th ASEAN Technical Seminar onGrain Post-harvest Technology. Kuala Laumpur. ASEANGrain Post-harvest Programme. Bangkok (Thailand). pp 163173
Ridgway C. Chambers J (1996) Detection of external andInternal Insect infestation In wheat by near-Infrared reflectancespectroscopy. J Sci Food AgriC 71:251-261
Ritcher K. Tchalale P (1994) Improved early detection of internalinfestation by floatation using product-adapted salt solutions.In: Highley E. Wright EJ. Banks HJ. Champ BR (eds) StoredProduct Protection: Proceedings of the 6th InternationalWorking Conference on Stored Product Protection. CABInternational. Oxon. UK. pp 444-447
Saito K. Saito T. Enomito Y (19971 Quantitative variation insugars. lipids and proteins in flowers of dyer's saffronobtained before or after being damaged by harmful insects.Acta Agronomlca Hungarica 44:387-390
Saxena A. Singh yP (1994) Fluctuation of chemical compositionIn wheat varieties damaged by Rhyzopertha dominica Fabr.Bull Grain Technol 32: 164-167
Schatzki TK. Fine TAB (19881 Analysis of radiograms of wheatkernels for quality control. Cereal Chern 65:233-239
Schatzki IT. Wilson EK. K1tto GB. Behrens p. Heller I (1993)Detennlnatlon of hidden Sitophllus granartus (Coleoptera:Curculionldae) in wheat by myosin ELISA. J Econ Entomol86: 1584-1589
Semple RL( 1992) Inspection and detection methods for storageinsect pests. In: Semple RL. Hicks DA. Lazare JV. CastennansA (eds). Towards Integrated Commodity and Pest Managementin Grain Storage. Regional Network Inter-Country Cooperation on Post-harvest Technology and Quality Controlof Foodgrains (REGNET) pp 147-184
Shade RE. Furgason ES. Murdock LL (1990) Detection of hiddeninsect infestation by feeding-generated ultrasonic sounds.American Entomol 36:231-234
Shanna SS. Thapar VK. Simwat GS (1979) Biochemical lossesIn stored wheat due to Infestation of some stored grain Insectpests. Bull Grain Technol 17:144-147
Shuman D. Coffelt JA. Vlck KW. Mankin RW (1993) Quantitativeacoustical detection of larvae feeding Inside kernels of grain.J Econ Entomol 86:933-938
Shuman D. Coffelt JA. Weaver OK (19961 A computer-basedelectronic fall-through probe insect counter for monitoringinfestation In stored products. Transactions of the ASAE39: 1773-1780
Singh DP. Sharma SS. Thapar VK (1982) Biochemical changesIn stored moong and mash varieties due to Infestationof Callosobruchus maculatus Fab. (Bruhidae. Coleoptera).Journal of Research. Punjab Agricultural University. 19: 130135
300
Sinha AK (1994) The impact of insect pests on aflatoxincontamination of stored wheat and maize. In: Highley E,Wright EJ. Banks HJ, Champ BR (eds) Stored ProductProtection: Proceedings of the 6th International WorkingConference on Stored Product Protection. CAB Internationai,Oxon, UK. pp 1059-1063
Smith LW Jr. Pratt JJ Jr, Nil I, Umina AP (1971) Baking andtaste properties of bread made from hard wheat flour infestedwith species of Trtbollum, Tenebrto, Trogoderma andOryzaephUus.. J Stored Prod Res 6:307-316
Snelson JT (1987) Grain Protectants. ACIAR Monograph No. 3Australian Centre for International Agricultural Research,Canberra. Australia
Soderstrom EL. Hinsch RT, Bongers AJ, Brandi DG. HoogendornH (1987) Detecting aduit Phycitinae (Lepidoptera: Pyralldae)infestations in a raisin-marketing channel. J Econ Entomol80: 1229-1232
Somerfleld KG (1989) Detection of larval pea weevil Bruchuspisorum (Llnnaeus) infestation in imported peas. NZEntomolOgist 12:81-83
Spangler HG (1987) Ultrasonic communication In Corcyracephalonica (Stainton) (Lepidoptera: Pyralidae) J Stored ProdRes 23:203-211
Srinath D, Ragunathan AN. Majumder SK (1976) Stored productinsects as carriers of toxigenic fungi. Indian J Entomol38:189-191
Srivastava AS (1970) Important insect pests of stored oilseedsin India. Inter Pest Control 12: 19-26
Starvic B. Johnson WJ, Grice HC (1969) Uric acid nephropathyAn experimental model. Proc Soc Exp Bioi Med 130:512516
Sterner RA (1973) Automated X_ray inspection of grain for Insectinfestation. Trans Am Soc Agric Eng 15: 1081-1085
Stuart MK, Barak AV, Burkholder WE (1994) ImmunologicalIdentification of Trogoderma granarium Everts (Coleoptera:Dermestidae). J Stored Prod Res 30:9-16
Subrahmanyan V. Swaminathan M, Pingale SV, Kadkol SB(1955) Uric acid as an index of insect filth in cereals andmilled cereal products. Bulletin of Central Food TechnologicalResearch Institute. Mysore 4:86--87
Subramanyam Bh, Hareln PK. Cutkomp LK (1989) Field testswith probe traps for sampling adult Insects infesting farmstored grain. J Agric Entomol 6:9-21
Thomas P, Kannan A, Dagowekar VH, Ramamurthy MS (1995)Non-destructive detection of seed weevil-Infested mangofruitsby X-ray imaging. Post-harvest BioI Technol 5:161-165
Tollner JW (1993) X-ray technology for detecting physical qualityattributes in agricultural produce. Post-harvest News andInformation 4: 149N-155N
Trematerra p. Pavan G (1994) Role of ultrasound productionand chemical signals In the courtship behaviour of Ephestiacautella (Walker). Ephestia kuehnieUa Zeller and Plodiainterpunctella (Hubner) (Lepidoptera: pyralidae) In: HighleyE. Wright EJ. Banks HJ, Champ BR leds) Stored ProductProtection: Proceedings of the 6th International WorkingConference on Stored-Product Protection. CAB InternationalOxon. UK, pp 591-594
Trematerra P, Rotundo G. DeCritotaro A (1994) Trapping storedproduct Insects using an unbalted multifunnel trap. In:
Highley E. Wright &1. Banks HJ, Champ BR leds) StoredProduct Protection: Proceedings of the 6th InternationalWorking Conference on Stored Product Protection. CABInternational. Oxon, UK. pp 451-454
Troller JA (1983) Sanitation in Food Processing. Academic Press.New York
Venkat Rao S. Krishnamurthy K. SWamlnathan M, SubrahmanyanV (1959) An Improved method for the determination of uricacid in insect infested foodstuffs. Ann Biochem Exp Med19:187-190
Venkat Rao S, Krishnamurthy K. SWam\nathan M, SubrahmanyanV (l960a) Determination of uric acid In wheat flour infestedby Trtbolium castaneum Duv.. using paper chromatography.Cereal Chern 37:93-96
Venkat Rao S. Nuggehalli RN. P1ngale SV, Swaminathan M.Subrahmanyan V (1960b) The effect of infestation byTrtbollum castaneum Dev.. on the quality of wheat flour.Cereal Chern 37:97-103
Vick KW. Mankin RW. Cogburn RR. Muller M, Thorne JE. WrightVF, Cline LD (1990) Review of pheromone-baited sticky trapsfor detection of stored-product insects. J Kansas EntomoJSoc 63:526--532
Vick KW, Webb JC, Litzkow CA (19911 Insect detection usinga pitfall probe trap having vibration detection. US Patent5005 416
Webb JC. Lltzkow CA. Slaughter DC (1988) A computerizedacoustical larval detection system. Appl Eng AgrIc 4:268274
Wehling RL. Wetzel DL (1983) High-performance liquidchromatographic determination of low level uric acid ingrains and cereal products as a measure of Insect Infestation.J Chromatogr 269:191-197
WhIte NDG (1995) Insects. mites and insecticides in stored-grainecosystems. In: Jayas P. White NDG. Muir WE (eds) StoredGrain Ecosystems. Marcel Dekker Inc. New York. pp 123167
White NDG. Arbogast RT, Fields PG. Hillman RC. Loschiavo SR.Subramanyam BH, Throne JE, Wright VF 11990)The development and use of pitfall and probe traps forcapturing insects in stored grain. J Kansas Entomol Soc63:506--525
Wilkin DR. Catchpole D, Catchpole S (1994) The detection ofinsect in grain dUring transit-An assessment of the problemand the development of a practical solution. In: Highley E,Wright EJ, Banks HJ, Champ BR (eds) Stored ProductProtection: Proceedings of the 6th International WorkingConference on Stored Product Protection. CAB International.Oxon. UK. pp 463-469
Wilkin DR Cowe lA, Thind BB. McNicol JW, Cuthbertson DC(1986) The detection and measurement of mite InfestationIn animal feed using near Infra-red reflectance. J Agric Sci107:439-448
Wilkin R. Fleurat-Lessard F (1991) The detection of insects Ingrain using conventional sampling spears. In: FleuratLessard F, Ducom P (eds) Proceeding of the Fifth InternationalWorking Conference on Stored-Product Protection. BordeauxFrance. pp 1445-1453
Wright J (1989) Trapping insects In grain. Stored Grain Australia3:1-6
Received 11 June 1999; revised 21 June 1998; accepted 23 June 1999
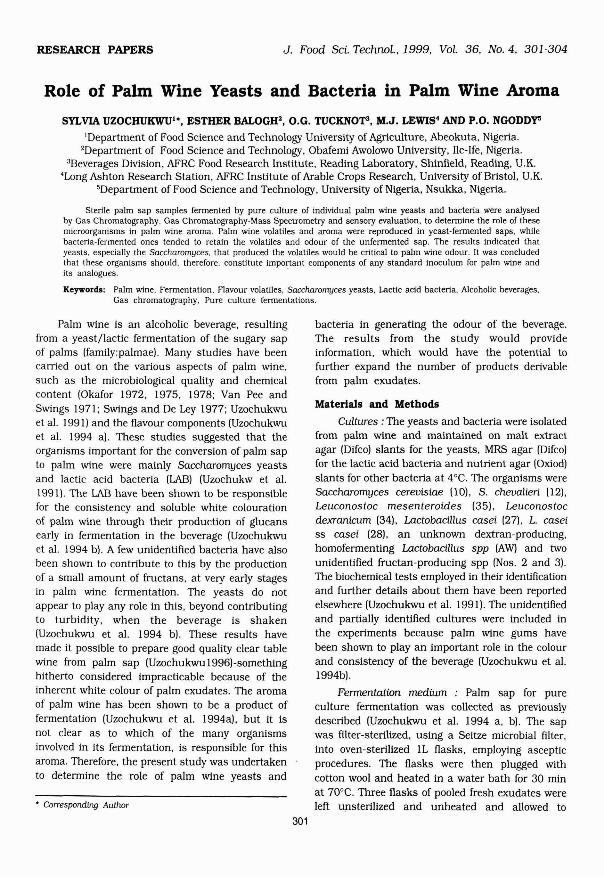
RESEARCH PAPERS J. Food Sci. Technol.. 1999. Vol. 36. No.4. 301-304
Role of Palm Wine Yeasts and Bacteria in Palm Wine Aroma
SYLVIA UZOCHUKWUh. ESTHER BALOGH', O.G. TUCKNOT3, M.J. LEWIS· AND P.O. NGODDY'l
'Department of Food Science and Technology University of Agriculture. Abeokuta, Nigeria.2Department of Food Science and Technology. Obafemi Awolowo University. Ile-Ife. Nigeria.
3Beverages Division, AFRC Food Research Institute. Reading Laboratory. Shinfield. Reading. U.K.'Long Ashton Research Station. AFRC Institute of Arable Crops Research. University of Bristol, U.K.
5Department of Food Science and Technology, University of Nigeria. Nsukka. Nigeria.
Sterile palm sap samples fermented by pure culture of individual palm wine yeasts and bacteria were analysedby Gas Chromatography. Gas Chromatography-Mass Spectrometry and sensory evaluation, to determine the role of thesemicroorganisms in palm wine aroma. Palm wine volatiles and aroma were reproduced in yeast-fermented saps. whilebacteria-fermented ones tended to retain the volatiles and odour of the unfermented sap. The results indicated thatyeasts. especially the Saccharomyces. that produced the volatiles would be critical to palm wine odour. It was concludedthat these organisms should. therefore. constitute important components of any standard inoculum for palm wine andits analogues. .
Keyword.: Palm wine. Fermentation. Flavour volatiles. Saccharomyces yeasts. Lactic acid bacteria. Alcoholic beverages.Gas chromatography. Pure culture fermentations.
Palm wine is an alcoholic beverage. resultingfrom a yeast/lactic fermentation of the sugary sapof palms (family:palmae). Many studies have beencarried out on the various aspects of palm wine,such as the microbiological quality and chemicalcontent (Okafor 1972. 1975. 1978: Van Pee andSwings 1971; Swings and De Ley 1977; Uzochukwuet aI. 199 I) and the flavour components (Uzochukwuet aI. 1994 a). These studies suggested that theorganisms important for the conversion of palm sapto palm wine were mainly Saccharomyces yeastsand lactic acid bacteria (LAB) (Uzochukw et aI.1991). The LAB have been shown to be responsiblefor the consistency and soluble white colourationof palm wine through their production of glucansearly in fermentation in the beverage (Uzochukwuet aI. 1994 b). A few unidentified bacteria have alsobeen shown to contribute to this by the productionof a small amount of fructans. at very early stagesin palm wine fermentation. The yeasts do notappear to play any role in this. beyond contributingto turbidity, when the beverage is shakenIUzochukwu et aI. 1994 b). These results havemade it possible to prepare good quality clear tablewine from palm sap (UzochukwuI996)-somethinghitherto considered impracticable because of theinherent white colour of palm exudates. The aromaof palm wine has been shown to be a product offermentation (Uzochukwu et aI. 1994a). but it Isnot clear as to which of the many organismsinvolved in its fermentation. is responsible for thisaroma. Therefore. the present study was undertakento determine the role of palm wine yeasts and
• Corresponding Author
301
bacteria in generating the odour of the beverage.The results from the study would provideinformation, which would have the potential tofurther expand the number of products derivablefrom palm exudates.
Materials and Methods
Cultures: The yeasts and bacteria were isolatedfrom palm wine and maintained on malt extractagar (Difco) slants for the yeasts. MRS agar (Difco)for the lactic acid bacteria and nutrient agar (Oxiod)slants for other bacteria at 4°C. The organisms wereSaccharomyces cerevisiae (10). S. chevalieri (121.Leuconostoc mesenteroides (35), Leuconostocdexranicum (34). Lactobacillus casei (27), L. easeiss easei (28). an unknown dextran-producing.homofermenting Lactobacillus spp (AW) and twounidentified fructan-producing spp (Nos. 2 and 3).
The biochemical tests employed in their identificationand further details about them have been reportedelsewhere (Uzochukwu et aI. 1991). The unidentifiedand partially identified cultures were included inthe experiments because palm wine gums havebeen shown to play an important role in the colourand consistency of the beverage (Uzochukwu et aI.1994b),
Fennentation medium : Palm sap for pureculture fermentation was collected as previouslydescribed (Uzochukwu et aI. 1994 a. b), The sapwas filter-sterilized. using a Seitze microbial filter.into oven-sterilized IL flasks. employing ascepticprocedures. The flasks were then plugged withcotton wool and heated in a water bath for 30 minat 70°C. Three flasks of pooled fresh exudates wereleft unsterilized and unheated and al10wed to

302
ferment spontaneously Into palm wine at 30°C."Sterile exudates" henceforth will refer to as filtersterilized and heated samples.
Inoculum and inoculation: Before use. cultureswere revived by transferring cells from slants tosterile palm exudate (sap). Mter Incubation for 24hat 30°C. a second sub-culture was prepared andIncubated for 18 h at 30°C. Each flask of 800 mlsterile exudate was inoculated with 10 ml of theappropriate dilution of one strain to give a finalconcentration of about 10 cfu/ml. Diluent used wassterile palm sap. Two of the flasks of sterilizedexudate were left uninoculated as controls andincubated at the same temperature as the Inoculatedones. The Inoculated samples were allowed toferment at 30°C for 48 h.
Efficiency oj sterilization : At the end of thefermentation period, the contents of each flaskwere examined for microbial contaminants bymicroscopic examination of droplets and examinationof colonies from streak plates. The unlnoculatedbut Incubated samples were. In addition. examinedfor turbidity.
Headspace sampling: Headspace volatiles weretrapped on Tenax GC (Scientific Glass EnglneerlngSGE. Australia), as described by Uzochukwu et al(1994 a).
Gas Chromatography (GC) and GasChromatography-Mass Spectrometry (GC-MS) :Instruments. operating conditions. columns andprocedures for GC and GC-MS were as describedby Uzochukwu et al (1994 a). Ethanol was alsodetermined by dichromate oxidation (Caputi et al.1968). All analysis were carried out in duplicate.
Sensory evaluation : Sensory evaluation wascarried out on the fermented samples for odour.using a triangular assay as described by Larmond(1986). Palm wine or sterile palm sap. respectivelyserved as reference samples. Eight trained panelistswere served 30 ml samples at room temperature(30°C) In tinted wine glasses. The panelists wereasked to state the odd sample after sniffing, thelevel of difference (slight. medium. high or extreme),and their comments. The test was performed ontwo successive days (using the same judges. butwith sample codes changed!. giving a total of 16judgements for each sample.
Results and Discussion
EJftciency oj sterilization : Incubated samplesdid not show cells or colonies differing from theoriginal organisms. The sterilized exudate In the
control flasks displayed no turbidity and no cells.There was no growth from streak plates preparedfrom them.
Headspace volatiles : Headspace volatiles havebeen employed In this study because the volatilesin the headspace are assumed to represent theodour volatiles In the proportions in which weactually perceive them. The duplicate chromatogramsobtained in this study showed no significantdifferences in the compound types or peak areas.The column used was chosen to descrlminateagainst ethanol and ethyl acetate so that theirpeaks did not mask those of other low molecularweight compounds. Thus, their proportions (Table1) did not represent their true proportions in theheadspace. The volatiles identified In the headspacevolatiles of streilized palm sap after fermentationby each of the palm wine microorganisms. as wellas those found in the uninoculated control samplesand naturally fermented palm wine are shown inTable 1.
Yeasts: Total volatiles Increased markedly inyeast-fermented samples. For S. cerevisiae. theincrease was 2.8 times. while in S. chevalieri, it was2.5 times (Table 1). About 27 additional compoundswere detected In the saps fermented by both yeastsused. Of these. 17 were esters. while 4 werealcohols. 4 terpenes and 2 hydrocarbons. New estersproduced by the yeasts made up 61.20% and65.76% of the volatiles In the headspace of the sapfermented by S. cervisiae and S. chevalieri.respectively. Of the 19 additional esters detected forboth yeasts and bacteria. only 2 were not producedby the yeasts. Additional alcohols seemed also tohave been produced exclusively by the yeasts.Ethanol production as determined by dichromateoxidation. followed the same trend as the headspaceresults. No additional carbonyl or sulphur compoundswere detected In the yeast-fermented samples. Otheradditional components produced included a fewterpenes and hydrocarbon compounds. which werealso present in the bacteria-fermented samples.Esters and alcohols. shown here have been apparentlyproduced exclusively by yeasts and associated withcharacteristic palm wine aroma (Uzochukwu et al.1994) This suggests that the yeast in palm wine.especially the Saccharomyces Is largely responsiblefor the characteristic palm wine aroma.
Lactic acid bacteria : There was an overalldecrease in total volatiles in the headspace ofbacteria-fermented saps. though additional volatilecompounds were produced. For Lactobacillus caseiss casei. the decrease was not significant. Only one
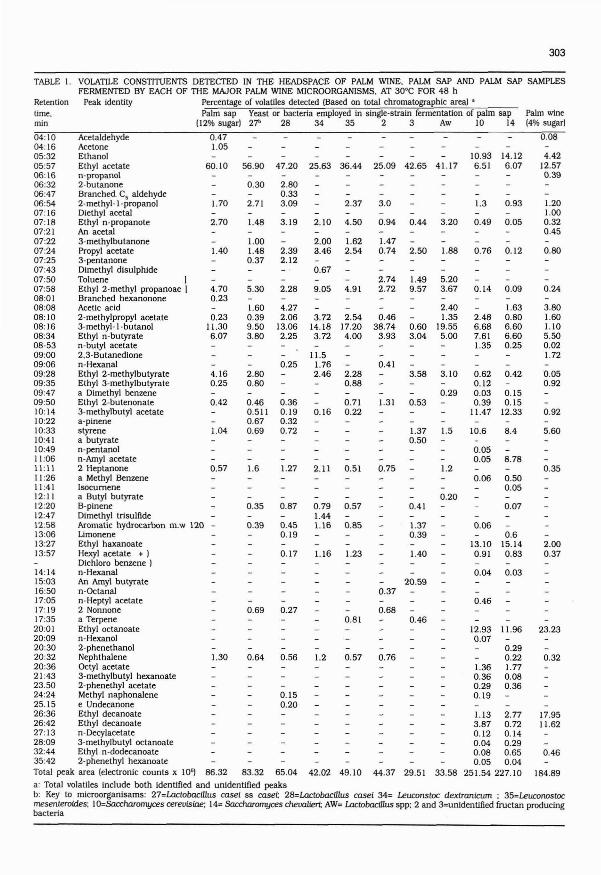
303
Palm wine(4% sugar}
TABLE 1.
RetentionUme.min
VOLATILE CONSTITUENTS DETECTED IN TIiE HEADSPACE OF PALM WINE. PALM SAP AND PALM SAP SAMPLESFERMENTED BY EACH OF TIiE MAJOR PALM WINE MICROORGANISMS. AT 30'C FOR 48 h
Peak identity Percentage of volaUles detected (Based on total chromatographic area) •Palm sap Yeast or bacteria employed in single-strain fermentation of palm sap
(12% sugar) 27" 28 34 35 2 3 Aw 10 14
0.80
1.201.000.320.45
2.000.37
0.24
5.60
3.801.601.105.500.021.72
0.35
0.32
0.92
0.46
'0.050.92
0.08
4.4212.570.39
23.23
17.9511.62
184.89
0.93
0.12
0.05
0.03
0.09
8.4
1.630.806.606.600.25
0.42
0.500.05
0.290.221.770.080.36
8.78
0.07
0.150.15
12.33
1.3
0.04
0.76
0.46
0.14
0.06
0.49
2.486.687.611.35
0.050.05
0.06
1.360.360.290.19
10.93 14.126.51 6.07
0.620.120.030.39
11.47
0.613.10 15.140.91 0.83
10.6
12.93 11.960.07
1.13 2.773.87 0.720.12 0.140.04 0.290.08 0.650.05 0.04
251.54227.10
1.88
1.2
1.5
3.20
5.203.67
3.10
0.29
0.20
2.401.35
19.555.00
1.40
2.50
1.370.39
0.46
0.44
3.58
1.499.57
0.603.04
0.41
0.53
1.370.50
20.59
1.31
2.742.72
0.37
0.68
1.470.74
3.0
0.76
0.41
0.94
0.75
25.09 42.65 41.17
0.4638.74
3.93
1.23
2.37
4.50
1.622.54
4.91
0.85
0.81
0.51
2.280.88
0.57
0.710.22
0.57
1.16
1.2
2.10
0.67
9.05
2.003.46
2.11
0.16
0.791.441.16
11.51.762.46
25.63 36.44
3.72 2.5414.18 17.203.72 4.00
2.800.333.09
2.28
2.392.12
0.25
1.27
3.19
0.17
0.56
0.27
0.150.20
0.360.190.320.72
0.87
0.450.19
4.272.06
13.062.25
47.20
1.48
0.30
2.71
1.600.399.503.80
1.001.480.37
5.30
0.69
0.64
1.6
0.35
2.800.80
0.39
0.460.5110.670.69
56.90
1.70
1.30
1.04
1.40
2.70
4.700.23
0.57
4.160.25
0.42
0.471.05
0.2311.306.07
60.10
AcetaldehydeAcetoneEthanolEthyl acetaten-propanol2-butanoneBranched. Cs aldehyde2-methyl-l-propanolDiethyl acetalEthyl n-propanoteAn acetal3-methylbutanonePropyl acetate3-pentanoneDimethyl disulphldeToluene IEthyl 2-methyl propanoae IBranched hexanononeAcetic acid2-methylpropyl acetate3-methyl-l-butanolEthyl n-butyraten-butyl acetate2.3-Butanedlonen-HexanalEthyl 2-methylbutyrateEthyl 3-methylbutyratea Dimethyl benzeneEthyl 2-butenonate3-methylbutyl acetatea-pinenestyrenea butyraten-pentanoln-Amyl acetate2 Heptanonea Methyl Benzenelsacurnenea Butyl butyrateB-pineneDimethyl trisulfideAromatic hydrocarbon m.w 120 L1moneneEthyl haxanoateHexyl acetate +)Dichloro benzene )
14: 14 n-Hexanal15:03 An Amyl butyrate16:50 n-OctanaJ17:05 n-Heptyl acetate17: 19 2 Nonnone17:35 a Terpene20:01 Ethyl octanoate20:09 n-Hexanol20:30 2-phenethanol20:32 NephthaJene20:36 Octyl acetate21 :43 3-methylbutyl hexanoate23.50 2-phenethyl acetate24:24 Methyl naphonalene25.15 e Undecanone26:36 Ethyl decanoate26:42 Ethyl decanoate27: 13 n-Decylacetate28:09 3-methylbutyl octanoate32:44 Ethyl n-dodecanoate35:42 2-phenethyl hexanoateTotal peak area (electronic counts x 10') 86.32 83.32 65.04 42.02 49.10 44.37 29.51 33.58a: Total volatiles Include both Identified and unidentified peaksb: Key to mlcroorganlsams: 27=LoctobacUlus easel ss caset 28=LoctobacUlus casei 34= Leuconstoc dextranicwn ; 35=Leuconostocmesenteroldes; 10=Soccharomyces cerevlsiae; 14= Soccharomyces chevoliert AW= LoctobacUlus spp; 2 and 3=unidentified fructan producingbacteria
04:1004:1605:3205:5706:1606:3206:4706:5407:1607:1807:2107:2207:2407:2507:4307:5007:5808:0108:0808:1008:1608:3408-5309:0009:0609:2809:3509:4709:5010:1410:2210:3310:4110:4911:0611:1111:2611:4112:1112:2012:4712:5813:0613:2713:57

304
TABLE 2. SENSORY (ODOUR) ANALYSIS OF PALM SAPFERMENTED BY PURE CULTURES OF THE VARIOUSMICROORGANISMS ISOLATED FROM PALM WINE(TRIANGULAR ASSAY)
there was a sharp difference between the odour ofbacterta-fennented palm saps and palm wine. aswell as between yeast-fennented palm sap andunfennented palm sap. Thus. It appeared that theacid. carbonyl and sulphur compounds producedby the LAB did not Significantly change the odourof the palm sap and neither did the butyratesproduced by the organism No.3.
It is concluded that It is the yeast especiallythe Saccharomyces yeasts In palm wine which aremainly responsible for palm wine's charactertsticodour. This conclusion does not preclude a role bythe volatiles produced by palm wine bacterta. inthe subtle nuances of the beverage's aroma.
Acknowledgement
The authors are grateful to Dr. A.A. Williamsof the Food Research Institute. Reading. U.K. forproviding analytical facilltles.
Ratedlevel of
difference •. b
R"= R=Palm Palmwine sap
3.1
3.3
MicroorganismInoculatedInto palm sap
Number of correctpairings out of16 judgements
R"= R=Palm Palmwine sap
Saccharomyces cereuisiae 7 16"
Saccharomyces cheualieri 9 16"
Leuconostoc mesenterotdes 16" 8 3.2
Leuconostoc dexuanicum 16" 9 3.1
LactobaciUus casel 16" 7 3.3
Lactobacillus casel S5 casel 16" 9 3.1
LactobacUlus sp . 16" 9 3.2
Unknown slime bacteria (2) 16" 8 3.7
Unknown slime bacterta (2) 16" 7 3.7
a: levels of differences are specified only when differences aresignificant: b: I = slight. 2 = medium. 3 = high. 4 = extreme:
c: R = Reference sample; .. Significant at 1% level
additional ester was detected In LAB-fennentedsaps. Similarly. no additional alcohols were detectedin these samples. However. all the 13 additionalcarbonyl compounds detected appeared to havebeen produced exclusively by the LAB. The samewas the case with the 2 additional sulphurcompounds and the only additional acid detected.The sulphur compounds were detected only In sapfermented by Leuconostoc dextranicum A fewadditional terpenes were also detected. Thoughavailable evidence does not associate carbonyl andsulphur compounds with palm wine odour(Uwchukwu et al. 1994aJ, it is known that aldehydesand ketones could significantly affect aroma Inalcoholic beverages (Nykanen and Soumalainen1983: Schrter 1979). Sulphur compounds In lowconcentrations can also contribute positively toflavour In alcoholic beverages.
Other bacteria: The non-LAB bacterta No. 2seemed to have produced no additional volatiles butLAB No. 3 produced 3 additional esters - allbutyrates. Of these. 2 were exclusive to thisorganism. of which an amyl butyrate constitutedover 20% of all volatiles in the headspace.
Sensory evaluation: Sensory evaluation resultsrevealed no significant differences in odour betweenpalm sap and the saps fennented by palm winebacteria (Table 2). There were no significantdifferences In odour between palm wine and theyeast-fennented palm saps. On the other hand.
ReferencesCaputi A, Ueda M. Brown T (1968) Spectrometric determination
of ethanol In wine by chemical oJddation. J Assoc om AnalChern 52:85-88
Larmond E (1986) Method D'appreclation sensorlelle des alimentslaboratolre. Ottawa. Agriculture Canada pp 22-23
Nykanen L. Soumalalnen H (1983) Aroma of beer. wine anddistilled beverages. Akademie Verlag. Berlin p 413
Okafor N (1972) Palm wine yeasts from parts of Nigeria. J SciFood AgrIc 23:1399-1407
Okafor N (1975) Microbiology of Nigerian palm wine withreference to bacteria. J Appl Bact 38:81-88
Okafor N (1978) Microbiology and biochemistry of oil palm wine.Adv Appl Mlcroblol 24:124-256
Schrier P (1979) Flavour composition of wines - A review. CRCCritical Reviews Food Sci Nutrl. 12:59-111
Swings JG, de Ley J (1977) Biology of Zymomonas. BacterialRev. 41:1-46
Uzochukwu SVA, Balogh E. Ngoddy PO (1991) Standard pureculture inoculum for natural and formulated palm sapfermentation. Nigerian Food J 9:67-77
Uzochukwu SVA. Ngoddy PO. Balogh E. Tucknott OG. lewisMJ (l994a) Volatile components of oil palm wine and sap.J Sci Food Agrlc 64:405-411
Uzochukwu SVA, Ngoddy PO. Balogh E (I 994b) The role ofmicrobial gums In the colour and consistency of palm wine.J Food Quality 17:393-407
Uzochukwu SVA (1996) Process for the preparation of clearundistilled alcoholic beverages such as table. sparkling andand fortified wines from palm exudates. Nigerian Patent No.RP 12459
Van Pee W. Swings JG (1971) Chemical and microbiologicalstudies on Congolese palm wine. East Afr Agrlc J 36:311314
Received 28 November 1997: revised 8 June 1999; accepted 18 June 1999

J. Food Sci. Technol., 1999. Vo1. 36. No.4. 305-309
Kinetic Study of Whey Protein Denaturation toAssess the Degree of Heat Treatment in UHT Milk
K. KONDAL REDDY", M.H. NGUYEN', K. KAILASAPATHY', J.G. ZADO'W2 AND J.F. HARDHAM"
'Department of Food Science and Technology.University of Western Sydney. Hawkesbury. Richmond. N.S.w. 2753.
2CSIRO Division of Food Processing.Highett. Victoria. 3190. Australia.
Kinetic studies on heat denaturation of three major whey protein fractions of skim milk were conducted on apilot scale UHT model system. The UHT processing was carried out at 130. 135. 140 and 145°C with holding timesof 3. 5. 8. 10 and 12 sec. by indirect processing methods with minimal pre-heating conditions. Electrophoresis coupledwith denstitometry appeared to be a rapid and convenient method for quantification of whey proteins in studyingdenaturation. The denaturation of alpha lactalbumin. beta lactoglobulin A and B fractions followed a first order reaction.The results suggested that the denaturation of alpha lactalbumin might be used as a good analytical index to assessthe heat-induced changes at UHT processing conditions.
Keywords: UHT milk. Alpha lactalbumun. Beta lactoglobulin, Denaturation, Kinetics, PAGE.
In the interest of consumers, over-processingof market milk should be avoided to minimise anyadverse changes. Heat treatment should be as mildas possible to satisty the purpose of processing Le..safety and shelf life. Though the minimumrequirements for heat treatment are defined foreach type of processed market milk. regulationsconcerning the maximum level of severity arelacking. Recently. control measures for preventingover-processing of pasteurized milk have beenestablished in some countries. Such measuresinclude positive perOXidase test by EEC (EECdirective 397/85) and soluble serum protein index(SSP) in Italy (Pagliarini et al. 1990). Thoughlactulose content was proposed as an analyticalindex to establish the difference between UHT andin-bottle sterilized milks (Andrews and Morant1987). no consistent analytical index exists toidentity the effects of heat treatment in overprocessed or re-processed UHT milk (Pagliariniet al. 1990). Of all the thermolabile componentsof milk. whey protein appears to be the mostpromising analytical index. Though the kinetics ofoverall denaturation of whey proteins has beenstudied at UHT processing conditions (Agrawalaand Reuter 1979: Mottar 1981: Anap and Agrawala1987). adequate kinetic data are lacking onindividual whey protein fractions,
The present experiment was designed to studythe kinetics of denaturation of individual wheyprotein fractions in skim milk processed by IndirectUHT method. using minimal pre-heating conditions
• Corresponding Author : Present Address : AHRD Project, ANGRAgricultural University, Hyderabad-560 030, India.
305
to assess the feasibility of determining the degreeof heat treatment.
Materials and Methods
All the chemicals used In electrophoresis werepurchased from LKB products. Sweden. The proteinstandards (BSA. alpha lactalbumin. betalactoglobulin A and B) were purchased from SigmaChemicals Co. St. Louis. USA.
MUk processing: Fresh raw skim milk obtainedfrom cows milk was heated in indirect (heatexchanger) UHT pilot plant at the CSlRO Divisionof Food Processing. Dairy Research Laboratory(DRL). Highett. Victoria. Australia. The processingwas carned out under strictly controlled conditions.It was possible to achieve short heating up andcooling down times for both types of heating withminimum pre-heating conditions. Heat-processedmilk was packaged aseptically in sterile plasticcontainers at 25-28°C In a laminar flow cabinet.
Detennination of denatured whey proteins :Fractionation and quantification of reSidualundenatured whey proteins was carned out withslight modifications (Reddy 1992) to the methodsdescribed by Hillier (1976) and Ng-Kwai-Hang andKroekar (1984).
Data analysis and application of reactionkinetics: The mean results obtained from twoexperiments were used to determine the reactionrates and their temperature dependence for thedenaturation of Individual whey proteins. Thekinetic approach outlined by Van Boekel andWalstra (1989) was used to describe the heatrelated reactions in milk.

306
The equation for the first order kinetics is given
10 II 12 13
10 II 12 13
10 II 12 13
5 6 7 8
Holding time in s
5 6 7 8
Holding time in s
.0.3 '---'---'--'--'--"---'--_'---'---'_-'--'-_.c......:~
o
·0.5
log c/co{mg/mLI0,----''--------------------,
-0.6
-0.8
·0.4
·0.3
·0.1
·0.15
·0.25
·0.2
oLog c/colmgfmll
·0.1
·0.4
Fig. 2. First order reaction plot for denaturation of betalactalbulin A in sklm milk at different UHT temperatures
Fig. I. First order reaction plot for denaturation of alphalactalbumin in sklm milk at different UHT temperatures
140°C for 12 sec. similar to the results obtainedby Lyster (1970), Hl1lier and Lyster (1979) andGough and Jenness (1962). The order of reactionfor alpha lactalbumin denaturation reported is
5 6 8
Holding time in s
Fig. 3. First order reaction plot for denaturation of betalactalbulin B In sklm mUk al different UHT lemperalures
. (I)-dc/dt = kc
as
where, dc is the concentration of undenaturedprotein at time, dt, and k. is the reaction constant.On integration, it becomes
log,o (c/c.) = -kt/2.303 ....... (2)
where Co is the initial concentration of protein. Ifa plot of log c (or log c/c.J against time (t) givesa straight line relationship. the slope of the linecan be used (multiplying by 2.303) to estimate thevalue of k (rate constant). The units of k for firstorder reaction are expressed as time' I (S·I). k isindependent of concentration and its magnitude ischaracteristic to a reaction. at any given temperature.Generally, most of the chemical reactions follow anArrehenius relationship in which the reaction rateconstant, k. is related to absolute temperature. T.by the following equation.
k = A exp (-E/R'n ....... (3)
where A = constant; E = activation energy of thereaction (J/mol) R= gas constant = 8.314 J/moloK; T = absolute temperature in (OK). A linearvariation of log k with I/T. gives a slope ofE/2.303R. Decimal reduction time (D value) canbe expressed as the time required for 90%denaturation. For a first order reaction, when rateconstant (k) is known. the D can be written as2.303/k.
Results and Discussion
Order of denaturation of different fractions: Theplots of log concentration against holding time atdifferent temperatures for the whey protein fractionsare given in Fig 1, 2 and 3. The experimental poinlsdid not deviate much from the straight line.indicating it to be the first order kinetics. Thereaction rate constants (with correlation coefficientsfor the straight lines fit) and decimal reductiontimes (D values), at each temperature are presentedin Table 1. The activation energies lin kJ/mol) fordenaturation were 65.02 for alpha lactalbumin,39.96 for beta lactoglobulin A and 31.19 for betalactoglobulin B. as calculated from the Arrheniusplots for the rate constant at different temperaturesfor each protein.
The beta lactoglobulin B showed the highestsensitivity to heat denaturation, followed by betalactoglobulin A and alpha lactalbumin. The levelof undenatured beta lactoglobulin B fraction washigher than 'A fraction after 130°C for 3 secprocessing, but it diminished after processing at

TABLE I. k AND D VALUES FOR DENATURATION OF WHEYPROTEINS BY UHT PROCESSING (INDIRECTSYSTEM) OF SKIM MILK
Temp. 'C k value, (s") r D value. seca-lactalbumin
130 0.0241 0.989 95.6
135 0.0319 0.994 72.2
140 0.0417 0.983 55.2
145 0.0476 0.998 48.4
Il-lactalbumln A130 0.0449 0.993 51.3
135 0.0552 0.996 41.7
140 0.0636 0.996 36.2
145 0.0688 0.999 33.5
Il-lactalbumln B
130 0.1020 0.997 22.6
135 0.1157 0.998 19.9140 0.1271 0.997 18.1
145 0.1432 0.997 16.1
k = reaction rate constantD = lime taken for 9()OAJ denaturationr = correlation coefficient between log c/c, and holding time (sec)
similar to that observed by Dannenberg and Kessler(1986), Hillier and Lyster (1979) and Manji andKakuda (1986). However. there was considerabledisagreement among the above authors concerningthe denaturation of two fractions of betalactoglobulin. Dannenberg and Kessler (1986)reported 1.5 order. while the latter authors reportedsecond order reaction for the denaturation of betalactoglobulin A and B fractions. Earlier, El-Shazyet al (1978) also reported a second order reactionfor the denaturation of beta lactoglobulin.
It appears that, a clear distinction can onlybe made in a fast breakdown reaction, when theextent of denaturation is very wide (Van Boekel andWalstra 1989). The denaturation range of proteinfraction in this study is well below the suggestedlevel of denaturation (90%) to make a cleardistinction of the order of reaction from first to anyhigher order. Besides, when the denaturationreaction is not proceeding very far, a first orderapproach to describe such a reaction may notcause large deviations from the experimental results(Horak 1980).
The kinetic data generation, Interpretation andIts use Is a complex process (Hill and Grieger-Block1980), The heat transfer profiles of capillary tubeexperiments differ from UHT processing system. AnUHT processing system Is a continuous flowoperation, where the milk follows an axial dispersionand a range of temperatures may exist at any givencross-section and also throughout the total process(Adams et al. 1984).
307
Activation energies : The activation energiessuggest a faster denaturation reaction of betalactoglobullon B followed by beta lactoglobulin Aa-d alpha lactalbumin. If the activation energy Isexpressed as Joules per g of protein, alphalactalbumin (mol wt. 14 kDa) needs higher activationenergy than beta lactoglobulin (A and B variants,mol wt. 18 kDa) because of the difference Inmolecular weight. The relative resistance of alphalactalbumin may be due to Its compact globularstructure. which Is stabilized by four dlsulphldebonds (Maes 1969). It Is also probable that thepresence of calcium in its structure (Hiraoka et al.1980) preserves the native conformation, reqUiringmore activation energy for unfolding the molecule.Later studies by Bernal and Jelen (1984) alsoconfirmed that the calcium binding stabilizes thenative tertiary structure of alpha lactalbumin.
Index oj heat damage - Alpha lactalbumin :Results showed that beta lactoglobulin A and Bvariants are denatured at a rapid rate and to ahigher percentage level at moderate UHT processingconditions. At severe UHT processing conditions,the beta lactoglobulin denaturation takes place ata slower rate, making It comparatively difficult tocorrectly assess the effect of heat treatment. Alphalactalbumin being relatively more resistant, cancorrectly reflect the severe UHT processing conditionsand therefore. a serious consideration should begiven for the use of this whey protein componentas an Indicator of heat-related changes In UHTmilks. The levels of undenatured alpha lactalbuminmay be used to check the over-processing of rawmilk, re-processlng of UHT milk that failed sterilitytests and to compare milks processed by differentmethods and In different plants. RealiSing theImportance of this, some techniques for the detectionand quantification of alpha lactalbumin for practicaluse have been developed (Durant! et al. 1989,1991: Resmlni et al. 1990). The maximum level ofdenaturation of alpha lactalbumin allowed in UHTmilk may be fixed to avoid over-processing of milkwith due consideration to commonly occurringbacterial spores and their thermal deathcharacteristics.
Prediction oj denaturation : UHT process Is anon-Isothermal process, resulting In a thermal lag.Although UHT treatment Is an Instantaneousprocess, a time-temperature heating curve stillexists. Dannenberg and Kessler (1986) also reporteda heating-up period of 0.3 sec, which may producesignificant changes at temperatures of 135°C andabove. The thermal lag Is expected to be variable

308
TABLE 2. EQUATIONS TO DERIVE REACTION RATECONSTANTS IK VALUES) AND CORRECTIONFACTORS ICFl FOR WHEY PROTEIN DENATURATION
Whey protein k value CFa-LA log k= 6.82-3.40 (l0'/'!1: CF= 1.397-0.0032 It)
~--LG A log k= 3.84-2.09 (10'/11 : CF= 1.546-0.0059 It)
~-LG B log k= 3.05-1.63 (10'/11: CF= 2.445-0.0125 (t)
LA = lactalbumin; LG A = lactoglobulin A ; LG B = lactoglobulinB; T = Temperature In OK; t = Temperature In °C
Results were obtained from skim milk processed by Indirect UHTmethod
with the process temperature and needs to beaccounted for predicting the changes. It is alsolikely that minimum pre-heating conditions usedin this study may produce some changes in milkbefore it enters the holding tube. These twochanges will not influence the reaction rateconstants. because they are constant at eachtemperature. As these factors (which influence thedenaturation outside the holding time) are accountedfor the data generated. the first order plots are notconverging at zero on y axis. when the holding timeis zero. The influence of residence time distributions(RTD) on non-convergence of plots through zeromay not be Significant. considering the fact thatthe flow regime gives most of the milk particles auniform velocity and very little or no considerationwas given by researchers on the effects of RTD onkinetic parameters. Most of the commercial plantsare designed to produce an optimum flow regimeto give uniform velocity to most of the milk particles.
The coefficient (intercept value) of straight lineis taken as a correction factor (CF) in calculatingthe residual undenatured whey protein. The expectedpercentage denaturation can be calculated usingthe following equation
Percentage denaturation=1l00-1l00 exp (-kt) J CF...(4)
where t is the holding time. k is the reaction rateconstant and CF is the correction factor. Thevariation of correction factors was linear with thetemperature. Correction factors for calculation ofpercentage denaturation of different proteins maybe derived from the equations given in Table 2.Correction factor being a ratio in first order plots.is not expected to change significantly with thechange in initial concentration of protein in rawmilk. The equations described (Table 2) may beused to calculate the expected rate constant atmost commonly used UHT temperatures.Extrapolation of the present results to other heattreatment conditions than UHT may not givesatisfactory predicted values.
Acknowledgement
The first author thanks the AustralianInternational Assistance Bureau for the award ofa Commonwealth fellowship dUring the course ofthis investigation.
ReferencesAdams JP. Slmunovlc J. Smith KL (1984) Temperature histories
in a UHT indirect heat exchanger. J Food Sci 49:273-277
Agrawala GR. Reuter H (1979) Effects of different temperaturesand holding times on whey protein denaturation in UHT pilotplant. Milchwlssenschaft 34:735-737
Anap SP. Agrawaia GR (1987) Studies on UHT processing ofbuffalo milk. IV. Kinetics of whey protein denaturation.Indian J Dairy Sci 40:389-392
Andrews GR. Morant SV (1987) Lactulose content. colour andorganoleptic assessment of ultra heat treated and sterilizedmilks. J Dairy Res 54:393-507
Bernal V. Jelen P (19841 Effect of calcium binding on thermaldenaturation of bovlne alpha lactalbumin. J Dairy Sci67:2452-2454
Dannenberg F. Kessler HG (1986) Reaction kinetics of thedenaturation of whey proteins. In: Maguer M Le. Jelen P(eds). Food Engineering and Process Applications VoL IElsevler Appl Sci Publ. London. 335-346
Durantl M. Pagani S. lametll S. Carpen A (1989) Heat Inducedchanges of milk proteins: Rocket immunoelectrophoresisdetection of alpha lactalbumin. Mllchwlssenschaft 44: 142·144
Duranti M. Carpen A. lametti S. Pagani S (19911 Alphalactalbumin detection In heat-treated milks by competitiveELISA Mllchwlssenschaft 46:230-232
EI-Shazly A. Mahran GA. Hoft AA (1978) Kinetics of thermaldenaturation of beta lactoglobulin. Mtlchwlssenschaft 33: 166170
Gough P. Jenness R (1962) Heat denaturation of b lactoglobulinsA and B. J Dairy Sci 45: 1033-1039
Harwalkar VR (1980) Kinetics of thermal denaturation of betalactoglobulin at pH 2.5. J Dairy Sci 63: 1052-1057
Hill Jr CG Grieger-Block RA (1980) Kinetic data: generation.Interpretation and use. Food Technol 34:56-66
Hillier RM (19761 The quantitative measurement of wheyproteins using polyacrylamide gel electrophoresis. J DairyRes 43:259-265
Hillier RM. Lyster RLJ (1979) Whey protein denaturation Inheated milk and cheese whey. J Dairy Res 46:95-102
Hiraoka Y. Segawa T. KuwaJlma K. Sugal S. Mural N (1980)Alpha lactalbumin: a calcium metallo protein. BiochemBiophys Res Commun 95: 1098-1102
Horak P (1980) Objective assessment of UHT treatment of mtlkby standardization of bacteriological and chemical effects.MS Thesis. Technical University. Munich. Federal Republicof Germany.
Lyster RLJ (1970) The denaturation of a-lactalbumin and betalactoglobulin In heated milk. J Dairy Res 37:233-243
Maes ED (1969) Bovlne alpha lactalbumln- Its stucture Insolution as compared to hen lysozyme. Arch Int PhysiolBlochem 77(2):388-390

ManJi B. and Kakuda Y (1986) Thennal denaturation of wheyproteins in skim milk. Can Inst Food Sci Technol J 19: 163166
Mottar J II 981) Reaction kinetic considerations on the UHTtreatment of milk. Le LaJt 61 :503-516
Ng-Kwai-Hang KF. Kroekar EM (1984) Rapid separation andquantification of major caseins and whey proteins of bovinemilk by polyacrylamide gel electrophoresis. J Dairy Sci67:3052-3056
Pagliar1ni E. lametti S, Peri C, Bonoml F (1990) An analyticalapproach to the evaluation of heat damage in commercialmilks, J Dairy Sci 73:4 I-44
309
Reddy KK II 992) Studies on certain storage and heat relatedchanges In UHT milk, Ph,D Thesis, UWS. Hawkwsbury,Australia,
Resmini P. Pellegrino P. Andreini R, Prati F II 990) Evaluationof whey, proteins by reverse phase HPLC, Dairy Sci Abstr52(5):411
Van Boekel MAlA, Walstra P (1989) General introduction tokinetics. Int Dairy Fed Doc No 238:3-12
Received 16 January 1998; revised 9 January 1999; accepted 18 June 1999
J. Food Sci. Technol.. 1999. Vol. 36. No.4. 310-315
Kinetics of Deep-Fat-Frying of A Composite Product
T.N. INDIRA'. R. BABY LATHA AND MAYA PRAKASHDepartment of Lipid Science and Traditional Foods.
Central Food Technological Research Institute. Mysore - 570013. India.
A traditional Indian snack. Sanwsa. was chosen for studying the kinetics of deep-fat-frying of the product. Theparameters studied were moisture diffusivity. thermal diffusivity. activation energy for moisture removal. temperatureprofile during frying and texture of the casing of the product. as affected by the time of frying and oil temperature.The diffusion model was used to correlate the casing moisture during frying operations and the diffusion coefficientwas found to be in the range. 2.62 to 3.42xI0·' m's" for the frying oil temperature from 155 to 185'C. The activationenergy for moisture removal was 14.34 kJ mol" in the range of the oil temperature studied. Thermal diffuslvity (a)of the product during frying was calculated using the rate of change of the temperature profile at the centre of theproduct and was found to vary from 4.5 to 2.72 (xIO'S) m's" in the range of the temperatures studied. An empiricalmodel was developed relating casing texture with frying time. oil temperature and product moisture. The model correlatesfairly well (r=0.833) with the experimental data obtained for texture.
Keywords: Deep-fat-frying. Kinetics. Molsutre loss. Oil uptake. Composite product. Sanwsa.
It is observed that much of the work on fryinghas been done on potato and meat products. Ageneral mathematical model was proposed afterestablishing the pattern of heat and mass transferduring frying. the experiments being conducted onpotato strips (Mittelman et al. 1983). Pravlsani andCalvelo (1986) determined the time reqUired forcooking of potato strips dUring frying. by introducinga texture parameter. Relationship between uptakeof oil and moisture loss dUring frying of potatoslices has also been reported (Gamble et al. 1987:Baumann and Escher 1995). The effectiveness ofseveral additives to reduce oil uptake of foodsdUring deep-fat-frying has been assessed with theIntroduction of a new criterion for expressing theoil uptake (Pinthus et al. 1993). Oil absorption ofseviya (a traditional Indian snack) as influenced byparticle size. starch and protein contents has been
• Corresponding AutlwrAbbreviations
a radius of the spherical product (m!
c moisture at any time t In the product (g/g dry solids)
Co concentration at the surface of the sphere (g/g drysolids)
D diffusion coefficent (m's")
Do frequency factor (m's")
E activation energy for moisture migration (kJ mol")
F maximum force during compression (kgO
p.q empirical constants in eqn (7)
correlation coefficient (dimensionless)
r" distance from the centre of the product to anypoint 1m)
R universal gas constant 18.314 J mol"K')
T temperature of frying oil IK)
I time of frying (s)
a effective thermal dlffusivity 1m's")
T,. T,. T. initial. centre and surface temperatures of theproduct. respectively I'C)
310
reported (Singh and Seetha 1993). More recently.a mathematical model has been developed for heatand mass transfer in immersion frying of a product.which is homogeneous in nature. such as. potatomass (Farkas et al. 1996). It can be mentioned herethat heat and mass transfer characteristics duringdeep-fat-frying of a composite product Is not foundin the literature.
The objective of the present research was tostudy the deep-fat-frying characteristics of atraditional popular Indian snack. samosa, a typicalcomposite product. Since food products offer uniqueproblems with regard to heat transfer, a quantitativedescription of the process is essential, emphasisingthe thermal properties and the mode of heattransfer. Fried foods have been classified under 3models (Blumenthal 199 I). such as. I) all interiorvolume with a wispy external surface and no crust.for example. food beneath batter. 2) Significantinterior volume and a significant external surface.for example. french fry and 3) no Significant interiorvolume but a very high external surface area. I.e ..an all crust and no centre product. for example.potato chips.
The samosa in the present study was foundto resemble none of the above three models.Though samosa has a Significant interior volumeand a significant external surface like french fry.the interior material did not contribute to the masstransfer dUring frying. Unlike french fry, samosais a product consisting of two different materials,casing and filling. It is a stuffed pastry with acooked vegetable filling and a fried casing of refinedwheat flour dough. which WTaps the filling. Thoughsamosa as a whole has a trihedral pyramid shape.the centre portion of the product is spherical with
the cooked vegetable as the core and refined wheatflour as the casing. Hence. for all mathematicalpurposes, this was treated as a composite spherecomprising an inner core and an outer shell. Theheat and mass transfer characteristics dUringfrying of a product of this nature have not beenstudied.
Since no work has been carried out on theheat and mass transfer characteristics during deepfat-frying of a stuffed product like samosa, thepresent investigation was conducted primarily tostudy the basic understanding of the heat andmass transfer dUring frying of this product and alsoon the changes in its different properties relating.to processing, such as mass diffusivity. texture,moisture loss and fat uptake as affected by oiltemperature and frying time. The data generatedin the present study may be used for optimisationof process variables and for scale-up operations forlarge scale manufacture of the product. asoptimisation with regard to economy and qualityrequires a better understanding of the process anda knowledge of the thermophysical propertiesinvolved.
Materials and Methods
Refined groundnut oil. potato. green chilli.peas, onion, spice mix, curry leaves, raw mangopowder, chilli powder. turmeric powder, mustardseeds. table salt and refined' wheat flour wereprocured from the local market.
Preparation of samosa
a) Filling Jor samosa : Potatoes were cooked,peeled. mashed and seasoned in the oil withmustard. onion, green chilli and curry leaves. Salt.turmeric. spice mix and raw mango powder wereadded and mixed well. The moisture content of thefilling was 63±3.5% (as is basis).
bi Casing Jor samosa : The dough of the casingwas prepared by mixing refined wheat flour. waterand fat in the ratio 10:4: I (by weight). in a Hobartmixer for 4 min. Thirty grams of the dough wassheeted to 1.9±O.1 mm thick using a sheetingmachine (chapathi/papad press, designed by theCentral Food Technological Research Institute.Mysore. India) and were cut into semi circles. Themoisture content of the casing material was 28±0.5%(as is basis). These were then folded into a funnelshape. A known quantity of the filling material wasplaced inside and the ends were sealed manuallyto give a trihedral pyramid shape. The ratio ofcasing to filling was maintained at 3:4 (w/w).
311
Ci Frying oj samosa : Samosas were fried atan oil temperature of 155. 170 and 185°C (±4°C)upto 12 min and samples were withdrawn atregular intervals for further analysis. The oil dUringfrying was continuously agitated by means of astirrer. The temperature of the samosa and thatof the oil dUring frying were measured by chromelalumel thermocouple wires. which were placed inthe frying oil, surface of the product, centre of theproduct and also at different locations in theproduct. The temperatures were recorded with thehelp of a temperature data logger (CenturyInstruments. Chandigarh, India). All the experimentswere carried out in triplicates.
Analytical methods
Moisture and Jat contents : Moisture and fatcontents of the casing and filling material ofsamosas were determined according to AGACmethods (1984)
Volume : Volume of the product before andafter frying was estimated by displacement methodusing kerosene (SpeCific Gravity - 0.821).
Texture : Casing of the fried samosa wasseparated from the filling and cut into circularshapes having an area of 100 mm2• These werethen subjected to compression testing using anInstron Universal Testing Machine (Model 4301.Instron Corp, Bucks. UK) with 500 kg load cell anda crosshead speed of 25 mm/min. Casing samplewas placed with the crosshead facing the friedsurface and compressed to 50% level. The maximumforce attained dUring compression was used as theindex for texture. All texture measurements werecarried out in quadruplets.
Results and Discussion
The results of deep-fat-frying of samosa showedmoisture loss and oil uptake by the casing only.Within the frying time studied. the filling showedno significant change in either the moisture content(59-64%) or fat content (2%). Moisture and fatcontents of the filling material before frying were63.0±3.5% and 2.0% (wb). respectively.
Moisture content ojcasing: The rate-controllingstep for mass transfer in the casing could be energytransfer to the product or diffusion of water/vapourthrough the product casing. If the liquid/waterwere to be coming from the filling towards theboundary. the casing that becomes impermeable onfrying would prevent the moisture from migrating.Hence. there is a pressure rise under the casingand in tum, the rise in temperature. as seen in

312
the present study. As the rate of evaporation wasquicker at higher temperatures, it would render thecasing a dry and impermeable surface, much beforethe heat penetrates the core, whereas at lowertemperatures (170 and 155°C), dehydration beingslower and wetness in and around the casing beingmore, steam bubbles are formed around the casingand thus the stem escapes leaving vacant sites onthe product. This renders the casing a more porousstructure at lower temperatures. Unlike in the caseof potato strips as studied by Pravisani and Calvelo(1986), higher oil temperatures produced thinnercrust in samosa. Fick's diffusion equation has beenapplied as an investigation into mass transfer.
In accordance with the opinion of Pravisaniand Calvelo (1986) and Rice and Gamble (1989)that diffusion of water vapour is the rate controllingfactor, moisture loss correlates with Fick's law ofdiffusion;
~=Da2c
at ar2p
....... (1)
Treating the product as a sphere and for theboundary conditions as under;
I) c 0, rp = 0, t > 0
2) c aco rp= a, t > 0
3) c rp flrp) t = 0 O<rp< a
The solution for a sphere is given by;
2 - ""oC"snn . nnr p (-On 2n2t )c(, J = Co - I --- SIn -- exp --2- +, rlr p 1 n a a
2 - . nflr p (-On 2n2t ) f- I sm -- exp --2-Cl"p I a a
....... (2)
This was derived from the solution given fora plane sheet, where surface concentration isconstant and initial distribution f(rp), as given byCrank (1975), where Co is the concentration at thesurface of the sphere.
Assumptions following the above solution are:
(a) only the first term in the series to beSignificant
(b) the surface moisture to be zero due to thehigh heat transfer coefficient existing dUring frying(Rice and Gamble 1989), which enables the surfacetemperature to be close to the medium temperature(based on temperature measurements) as shown inFig I. Similar observations were made earlierdUring deep-fat-frying of a snack food (Indira 1996).Hence, it is assumed that the moisture on thesurface is escaping as rapidly as it appears. Average
180 1 rJ 1.1 o 0 000
1~ t ...o 0 000
8 8 t 0
E120 t ..·o 0
~ 0
t ~ t 0
I • • • • •0 I •
~ 60 t •••
30 t ·· .••0
0 100 200 300 400 400 400Tlm,(sl
Fig. I Temperature profiles of the product durin/! rrVill~ a(different oil temperaturesSurface temperatures at: 0 = 155"C. l1 = 170"C.o = 185"C and Centre temperatures at: • = 155"C• 170"C.• = 185"C
heat transfer coefficient during deep-fat-frying hasbeen estimated to be 1800 W/m2K (Mittelman etaI. 1983). The temperature at the surface of theproduct having attained the medium temperatureduring frying has also been reported (Hayes 1990).
(cl negligible increase in volume of the productas frying proceeded beyond 2 min (there was 30%increase in volume within 2 min of frying for allthe oil temperatures in the present study). Thediameter of the spherical part. of the fried productwas 30 mm. An increase of 60% in casing thicknesswithin 2 min of frying, though considerable.remained constant (for most part of the frying) forall temperatures as frying proceeded. CaSingthickness was 3.2 mm, when fried at 155°C.whereas, it was found to be 2.8 mm after 4 minof frying, for both 170 and 185°C fryingtemperatures. Though the nominal thickness of the
. casing was seen to be 3 mm in the present study.the diffusion path was considered to be 5 mm fromthe surface, i.e., 2 mm more than the thicknessof the casing in order to cover a boundary of thefilllng to account for the moisture migration fromthe periphery of the filling to the casing. Eq (2)can, therefore, be written as;
2 . nr p -on 2 t j . nr pC = aT sm a:- exp --2- r p f (r p) 8m -a- dr
p a 0 ....... (3)
Fig. 2 shows the experimental data of moistureof the product upon frying at three differenttemperatures. The diffusion coeffiCient D, estimatedfrom the above Eqn (3) was found to be2.62xlO·8 , 2.78xlO·8 and 3.42xlO·8 m2s" for fryingtemperatures of 155, 170 and 185°C, respectively.

313
fig. 3. Experimental versus predicted moisture content of thesamasa casing
fig. 2. Moisture content of samosa casing dUring fryin/( atdifferent temperatures• = 155'C. + = 170 'C. * = 185'C
oi-o--1~:IO-:----300~---4~~--600~'--];()-' 900Time (s)
in the moisture content. thickness of the product.and composition of the product. Fig 3 shows theexperimental moisture values versus the calculatedusing Eqns (3) and (4). where r was = 0.93.
TemperatW'e : The oil temperature did notaffect the centre temperature of the product. whichtended towards 100°C. but at different positions Inthe product. there were higher gradients (FIg 4).also tending towards an asymptotic value but muchhigher than 100°C. depending on the oil temperature.Similar observations were made earlier dUringdeep-fat-frying of a snack food (Indira 1996). So.the moving boundary that prescribed thetemperature condition at the centre according toPravisanl and Calvelo (1986) must be somewhereIn the fil1lng material (below 5 mm from the casing).Investigating Into the aspect of heat transfer to theproduct. the change of temperature at the centreof the product and change of temperature In andaround the casing of the product with time. wasrelated to thermal dlffuslvlty constant. Consideringthe whole product. unsteady state heat transferequation In the same form as Flck's equation hasbeen used to find thermal dlffuslvlty as describedbelow.
For a uniform Initial temperature T, andconstant surface temperature Ts' the solution fora sphere for the governing equation of Fourier'ssecond law Is given by Crank (1975) as;
T-T l 2a ~ (-On. nnrp (.an2
n2 t)
--= I +-£.J--SIIl--exp ---T -T 1 nr p 1 n a a 2 ....... (5)
Temperature at the centre Is given by the limitof this as r
p--.-> O. Neglecting the higher order
terms. the approximate solution Is given by:
Tc·T, (_an 2 t)--= 1-2exp --Ts·T, a 2 ....... (6)
The surface temperature reaches almost asteady state after about 210 sec of frying for allfrying temperatures as seen In Fig 1. which showsthe temperature at the surface (near the surface)and at the centre of the product for 155. 170 and185°C oil temperatures. Upon frying for 8 min.highest recorded surface temperatures were 152.168 and 178°C for the above three oil temperatures.respectively. It can be seen from Fig 1 that thesurface temperatures (near the surface) are moreor less constant after 4 min of frying. indicatingthat the actual surface temperatures would havereached a constant value. Thermal diffuslvity(a). as calculated using Eqn (6) were found to be4.5x1O-s. 3.26x1O-s and 2.72x1O-s m2s-'. for 155.
•,•+ + !Ii
• +
0.4,IOi I-....I~ I... • • .1
c:iGl 0.32 •... •c: • I0 • I
0 •
iQ) ••...
0.241
::::l •... ••III •I'0 •E I ••• I
"U i IQ) ; • I
] 0.16 ! • •::::l I()
iii I i0I i
0.081 II ,
0.08 0.16 0.24 0.32 0.4
Experimental moisture content (g/g)
C 03Ql
§o 0.2Ql:;Ui 0.1'0:::i
Further. the change in the diffusion coefficientwith the oil temperature (T) could be correlated(r=0.95) using an Arrhenius type relationship givenbelow
D= Doexp(- ~) ....... (4)
The value for Do was found to be 1.44x1O-6
m2s-' and E was 14.34 kJ mol-I. while Rice andGamble (1989) have reported E as 24.2±4.0kJmol- 1 dUring frying of potato slices and Eestimated by Kozempel et al (1991) was 6.24kJmol-' dUring frying of french fries. The variationin the valu(' of E could be attributed to the change
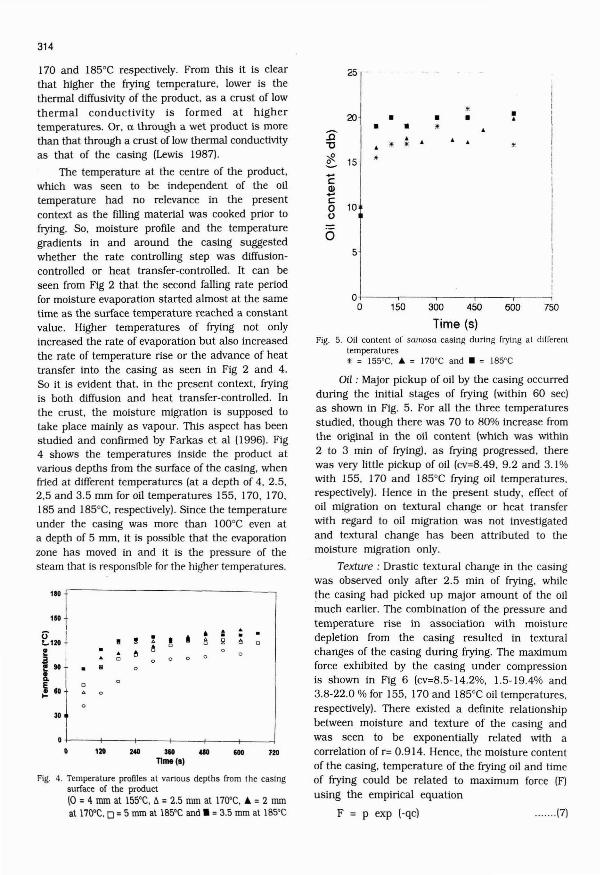
314
110 r---------------~
7506004503001500+-------,--.-------,--.-----1o
25 I
~jif.
• • • ••• • '":0 •"C ,. ,. • IF.
;:!(15 I •
~- IcQ)-C0 100
i55
Time (s)fig. 5. Oil content of salllosa casing during frying at different
temperatures* = 155'C, ... = 170'C and. = 185'C
Oil : Major pickup of oil by the casing occurredduring the initial stages of frying (within 60 sec)as shown in Fig. 5. For all the three temperaturesstudied, though there was 70 to 80% increase fromthe original in the oil content (which was within2 to 3 min of frying), as frying progressed, therewas very little pickup of oil (cv=8.49. 9,2 and 3. J%with J55, 170 and J85°C frying oil temperatures,respectively). Hence in the present study, effect ofoil migration on textural change or heat transferwith regard to oil migration was not investigatedand textural change has been attributed to themoisture migration only.
Texture: Drastic textural change in the casingwas observed only after 2.5 min of frying, whilethe casing had picked up major amount of the oilmuch earlier. The combination of the pressure andtemperature rise in association with moisturedepletion from the casing resulted in texturalchanges of the casing dUring frying. The maximumforce exhibited by the casing under compressionis shown in Fig 6 (cv=8.5-14.2%, 1.5-19.4% and3.8-22.0 % for 155, 170 and 185°C oil temperatures,respectively). There existed a definite relationshipbetween moisture and texture of the casing andwas seen to be exponentially related with acorrelation of r= 0,914. Hence, the moisture contentof the casing, temperature of the frying oil and timeof frying could be related to maximum force (F)
using the empirical equation
F = P exp (-qc) ....... (7)
120240 310 410TImets}
120O+----+---t-----+------..,f---+-_-.j
o
110
~120 t • . .. • . .! ! . • . H ~
~0 0. ~
i 0
l! 90 ~
!.E 0
~ 10 .30
170 and 185°C respectively. From this it is clearthat higher the frying temperature, lower is thethermal diffusivity of the product, as a crust of lowthermal conductivity is formed at highertemperatures. Or, 0. through a wet product is morethan that through a crust of low thermal conductivityas that of the casing (Lewis 1987).
The temperature at the centre of the product,which was seen to be independent of the oiltemperature had no relevance in the presentcontext as the filling material was cooked prior tofrying. So. moisture profile and the temperaturegradients in and around the casing suggestedwhether the rate controlling step was diffusioncontrolled or heat transfer-controlled. It can beseen from Fig 2 that the second falling rate periodfor moisture evaporation started almost at the sametime as the surface temperature reached a constantvalue. Higher temperatures of frying not onlyincreased the rate of evaporation but also increasedthe rate of temperature rise or the advance of heattransfer into the casing as seen in Fig 2 and 4.So it is evident that, in the present context, fryingis both diffusion and heat transfer-controlled. Inthe crust, the moisture migration is supposed totake place mainly as vapour. This aspect has beenstudied and confirmed by Farkas et al (1996). Fig4 shows the temperatures inside the product atvarious depths from the surface of the casing, whenfried at different temperatures (at a depth of 4, 2.5,2,5 and 3.5 mm for oil temperatures 155, 170. 170,185 and 185°C, respectively). Since the temperatureunder the casing was more than 100°C even ata depth of 5 mm, it is possible that the evaporationzone has moved in and it is the pressure of thesteam that is responsible for the higher temperatures.
fig. 4. Temperature profiles at various depths from Ihe casingsurface of the productlO =4 mm at 155'C, f::. =2.5 nun at 170'C, • =2 nunat 170'C, 0 = 5 mm at 185'C and. = 3.5 mm at 185'C

315
Acknowledgement
The authors thank Mr. K. Vajravelu of theDepartment of Central Instruments. Central FoodTechnological Research Institute. (CFTRl) for helpingin the texture measurements Dr J.V, Prabhakarand Dr G. Ramanatham. Retired Heads ofDepartment of Lipid Science and Traditional Foods.CITR!. Mysore for keen interest in this work.
ReferencesAOAC 11984) Official Methods of Analysis. 14th edn. Association
of Official Analy1ical Chemists. Washington, DC
Baumann B. Escher f (1995) Mass and heat transfer duringdeep-fat-frying of potato slices-I. Rate of drying and oiluptake. Lebensmittel-Wissenschaft und-Technologie. 28:395403
Blumenthal MM (1991) A new look at the chemistry and physicsof deep-fat-frying. food Technol 45:68-71,94
Crank J (1975) The Mathematics of Diffusion, 2nd edn,Clarendon Press, Oxford, p 47
farkas BE, Singh RP, Rumsey TR (1996) Modelling heat andmass transfer in immersion frying. II. Model solution andverification. J food Engng 29:227-248
Gamble MH, Rice P, Selman JD (1987) Relationship betweenoil uptake and moisture loss dUring frying of potato slicesfrom c.v. Record U.K. tubers. International J food SciTechnol 22:233-241
Hayes G 11990) Quality Assurance: Considerations arising inthe processing of coated fish and meat products. In: fieldRW, Howell JA (eds) Progress Engineering in the foodIndustry 2. Convenience foods and Quality AssuranceElsevier Applied Science PubI., London: pp 209-212
Indira TN (1996) Deep-fat-frying characteristics of urd vada ina model system. J food Sci Technol 33: 133-137
Kozempel Mf, Tomasula PM, Craig JC Jr (1991) Correlation ofoil and moisture concentration in French fries. LebensmittleWissenchaft und-Technologie 24:445-448
Lewis MJ (1987) Heat Transfer Mechanisms in Physical Propertiesof Foods and Food Processing Systems. Ellis Horwood Ltd.,Chichester, England
Mittelman N, Mizrahi S, Berk Z (1983) Heat and mass transferin frying. In: Meckenna B (ed) Engineering and Food. VolL Engineering Science in the Food Industry. Elsevier AppliedScience Pubt, London, pp.109-116
Pinthus EJ, Weinberg W, Saguy IS (1993) Criterion for oil uptakeduring deep-fat-frying. J Food Sci 58:204-205, 222
Pravisani CI. Calvelo A (1986) Minimum cooking time for potatostrip frying. J Food Sci 51:614-617
Rice P, Gamble MH (1989) Technical note: Modelling moistureloss during potato slice frying. International J Food SciTechnol 24: 183-187
Singh U, Seetha R (1993) Oil absorption and sensory propertiesfrom a snack food from chickpea genotypes. J food Sci58:853-856
900750150o+-----r----,---.,-----,------,------1o
301•
I.24
c;::::- •Ol '<~
Q)18()
<5-E:::J 12 • "E.~ • •~ •6
" "••" "
300 450 600
Time (5)fig. 6. Maximum force of sWflvsa casing fried at different
temperatures* = 155'C .... 170'C, • = 185'C
where p = 186,004. q= -12.62 and c was evaluatedusing Eq (3) wherein D was obtained from Eq (4).The experimental data on texture correlated fairlywell (r=0,833) with the proposed empirical modelfor texture at all the three temperatures. Incidentally.it was seen that the texture parameter as indicatedby the instrument was much higher than the steampressures developed. corresponding to thetemperatures measured, This indicated that theoutermost layer of the casing was able to withstandthe pressure under the casing developed by thesaturated steam. which otherwise would haveresulted in bursting of the casing,
Conclusions
The process of moisture migration duringdeep-fat-frying of samosa was controlled by bothheat and mass transfer. A diffusion model couldbe used to correlate the product moisture duringdeep-fat-frying of samosa. Higher temperatures offrying oil at any given time formed thinner casing.The effective thermal diffuSivity of the product wasfound to be in the range 2.72 to 4.5xlO·8 m2s"and the effective moisture diffuSivity was 2,62 to3.42x lO'8m2s" in the range of the frying temperaturesstudied. An empirical model was developed tocorrelate texture of the casing with that of oiltemperature. frying time and product moisturedUring frying and was found to give a fairly goodcorrelation of r=0.833 with the experimental textureparameter,
Received 9 February 1998: revised 2 November 1998: accepted 18 June 1999
J. Food Sci. Techno!., 1999, Va!. 36, No.4. 316-319
Heat Treatment Optimization for Dehulling PigeonpeaGrain Using Response Surface Methodology
P.S. PHIRKE*', N.G. BHOLE' AND S.H. ADHAOO'
'Post-harvest Technology Scheme,Punjabrao Krishl Vldyapeeth. Akola - 444 104. India.
ZPost-harvest Technology Centre. Indian Institute of Technology.Kharagpur - 721 302. India.
3Faculty of Agricultural Engineering. Akola - 444 104. India.
The effect of heating on the dehulling characteristics of pigeonpea (c.v. 'CII') was studied, using response surfacemethodology to optimize the levels of heating temperature and time. A maximum product recovery of 81.8% with 35.5%Grade I splits was obtained. when urea-treated-scarified grain was hot dehulled after heating at 60'C for 5 min. Thisheating temperature showed a significant effect on dehulling time and dehulling index. whereas heating time did nothave any significant effect.
Keyword.: Dehulllng time, Dehulllng index, Pigeonpea, Scarification, Response surface methodology, Optimization.
Pigeonpea Is an important and low cost sourceof proteins in Indian diets. It is mostly consumedIn the form of splits after removal of seed coat.During dehulling, the major amount of seed coatmust be removed with minimum scouring andbreakage of the cotyledons. Normally. the grain Isheated before milling. as heat treatment is requiredto break the bond between the seed coat andcotyledons to obtain satisfactory dehulllng effiCiency(Shyeth et al. 1980). Tinay et al (1983) also reportedthat pigeonpea starch gelatinized In the temperaturerange of 71-78°C. which might affect the structureof starch within the grain.
Little information is available on the dehullingcharacteristics and effect of heat treatment ondifferent cultivars of pigeonpeas. Kurien (1980)reported a method In which the seed coat wasloosened and made brittle by an Incipient roastingof grain in heated air (l20-180°C). followed bytempering under the controlled conditions oftemperature and relative humidity. In the abovemethod, since the grain attained 70-90°Ctemperature, it was suspected that slightly prolongedheating might result in the loss of taste and aromaof the product. The soybean grain was heated to93°C for 15 min and dehulled In hot condition toimprove the dehulling efficiency (Shyeth et al.1980). Ethiwe and Reichert (1987) determined thedehulling quality of different cultivars of cowpea.pigeonpea and mung bean for comparison bydetermining the different parameters like dehullingtime. dehulllng index and intact pearled grain,Phlrke (1993) optimized a chemical pre-treatmentto plgeonpea grain. Involving different chemicals
• Corresponding Autlwr
316
and determining the above parameters. It wasfound that urea pre-treatment gave the maximumdehulling index with minimum dehulling time.
The pigeonpea seed coat Is firmly attached withcotyledons due to the presence of uronic acid inthe binding material (Ramakrishnaiah and Kurien1985). which can be broken by urea (Arora 1982)to loosen the seed coat. Urea is deposited on theupper surface of grain and mostly associated withhusk and powder. which are consumed byruminants. (Saxena et al. 1990). the residual withcotyledons being in traces I.e.. 0.02% of the appliedquantity (Phirke 1993). The strength properties ofpigeonpea grain were studied by Phirke et al (1994).who reported that the least stress was required toremove the seed coat. when urea was used. Theobjective of the present study was to optimize heattreatment parameters after pre-treatment with ureaand before dehulling.
Materials and Methods
Plgeonpea grain (c.v. 'C 1I ') obtained from theCentral Research Station. Punjabrao KrishiVidyapeeth. Akola was graded (passed through a5.95 mm sieve and retained on a 4.76 mm sieve).The grain moisture content was equilibrated to 8.0± 0.2% (wb) I.e.. optimum pigeonpea grain moisturerecommended by Kurien (1980) by keeping thesamples over a saturated solution of magnesiumchloride at 50% relative humidity and 30°C temperature for 24 h (Oomah et al. 1981) for all samplesthroughout the test. Grains were either non-scarifiedor SCarified prior to pre-treatment. Scarificationwas achieved In 10 sec using a tangential abrasivedehuIllng device (Reichert et al. 1986). consisting

of eight sample cups, beneath which there was arotating emery disc with 0.5 mm clearance. Thegrain sample was placed inside the cup with 'astandard weight of 70 g (Phirke 1993) over it andscratched for 10 sec. This operation enabled theurea to react with the exposed material binding thehull to the cotyledons. Five samples, each 5 g grain,were used for each test.
Phirke (1993) optimized the urea treatment toscarified pigeonpea grain by treating the sampleswith 8% urea solution in a 25: 1 grain to solutionratio for five hours and dehulled, when grainmoisture content was 8.0±0.2% (wb). This pretreatment yielded the highest total product recovery(about 78%). These optimized levels were considered'for further heat treatment.
Two independent variables viz., heatingtemperature (x,) and heating time (x2) wereconsidered in thirteen separate experiments asshown in Table 1 (Khuri and Cornell 1987) Intriplicate. The response surface methodology wasused to develop a prediCtive equation with thesetwo variables. A second order polynomial equationwas fitted to the data, using a central rotatabledesign (Khuri and Cornell 1987). The maximumand minimum levels of heating temperature andtime were decided by conducting preliminaryexperiments so that the grain was neither overheated nor insufficiently heated (Kurien 1980).Accordingly, the central levels and intervals weredecided for the study. The models for dehullingtime (OT) and dehulling Index (DI) were developedfor each grain condition (non-scarified and SCarified).
Five samples for each experiment were dehulledin the tangential abrasive dehulling device for fivelevels of DT (pre-determined by preliminary tests)i.e.. 3,4,5,6 and 7sec. The abraded fines (AF) fromgrain were obtained separately on removal of thesample from the device by means of a vacuumsample collector and cyclone separator (Oomah etaI. 1981) and expressed as a percentage of theinitial sample weight. The abraded fines were sievedthrough a 30 BS (0.5 mm) screen, resulting Inseparation of fine powder from coarse seed coatchips and brokens. The seed coat chips werehand-sorted and weighed. The amount of seed coatwith the powder was determined by visualcomparison of colour and texture with a standardmixture of ground seed coat and cotyledons.(Teckchandani 1988). The standard mixtures wereprepared by grinding the seed coat and cotyledonsseparately in a laboratory grinder and sievingthrough 30 BS (0.5 mm) screen. The proportions
317
were 10:90, 20:80, 30:70, 40:60, 50:50, 60:40,70:30, 80:20 and 90: 10. The colour and textureof seed coat and cotyledon powder obtained fromeach experiment were compared with these standardmixtures and the proportions of seed coat andpowder were assessed to the accuracy of about oneper cent. The total weight of seed coat removed wasobtained by adding the two quantities from eachsample and was expressed as a percentage of theseed coat content In whole grain (Ethiwe andReichert 1987). The dehulling index was calculatedat 90% seed coat removal using the followingequation.
DI = 0.9 Sc/AF9(J .....(1)
where, Sc Is the weight of seed coat content inwhole grain and AF9(J Is the weight of abraded finesfrom grain, when 90% of the seed coat wasremoved.
In each experiment, five samples were dehulledfor different times and DI was determined. Thecorresponding DT for 90% seed coat removal(DI=0.9) was determined by linear regression(R2 = 0.96 to 0.98) on DI for each experiment. Threereplications were used for the determination ofaverage DT and DJ. Using the SPAR 1 program formultiple regression (Doshi and Gupta 1991), thefollowing polynomial prediction equation was used(Khuri and Cornell 1987).
where. bo is the Intercept. b" b2 , b ll , b22 and b l2
are the multiple regression coeffiCients, Xl is theheating temperature and X. is heating time.
On the basis of minimum DT and maximumDI, the factors Xl and X. were optimized by usingcontour plots as described by Khuri and Cornell(1987). The other dehulling characteristics such asseed coat removed. product recovery and intactpearled grain after dehulling were determined forthe optimized levels of factors.
Results and Discussion
The regressed results for DT and DI for eachexperiment (averages of four replications) are shownin Table 1, while the partial regression coefficientsfor the two responses are shown in Table 2. It canbe seen that the coefficients of Xl and X. terms forDT models are negative, indicating that an increasein both the temperature and time for heatingconsequently reduced the dehulling time. Quadraticterms were positive, but product terms changed tonegative after scarification. This may be due to theeffective removal of seed coat, which required less
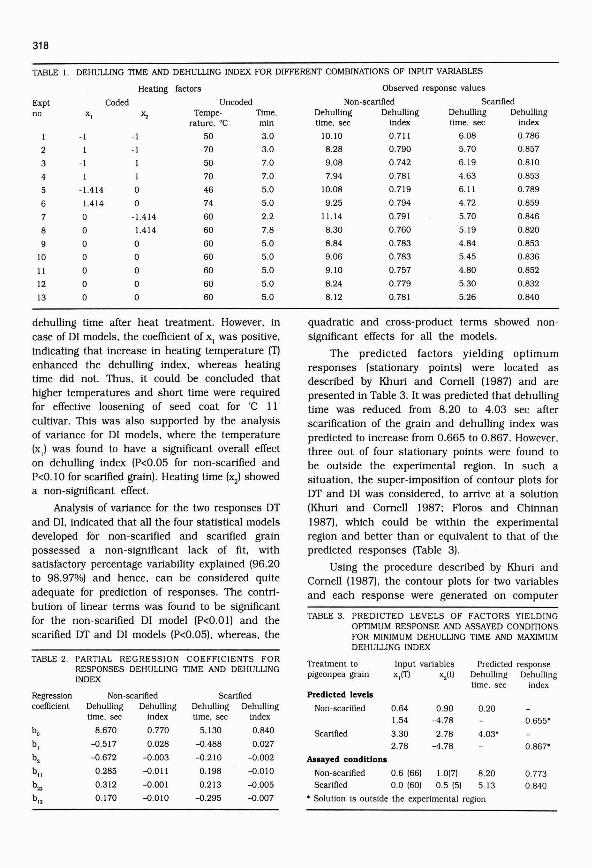
318
TABLE I. DEHULLING TIME AND DEHULLING INDEX FOR DIFFERENT COMBINATIONS OF INPUT VARIABLES
Exptno X,
Coded
Healing factors
Uncodedx., Tempe- TIme.
ratufe. °C min
Observed response values
Non-scarified ScarifiedDehulling Dehulling Dehulling Dehullingtime. sec index time. sec index
I
2
3
4
5
6
7
8
9
10
II
12
13
-I
I
-1
I
-1.414
1.414
ooooooo
-I
-I
I
I
oo
-1.414
1.414
ooooo
50
70
50
70
46
74
60
60
60
60
60
60
60
3.0
3.0
7.0
7.0
5.0
5.0
2.2
7.8
5.0
5.0
5.0
5.0
5.0
10.10 0.71 I 6.08 0.786
8.28 0.790 5.70 0.857
9.08 0.742 6.19 0.810
7.94 0.781 4.63 0.853
10.08 0.719 6.11 0.789
9.25 0.794 4.72 0.859
11.14 0.791 5.70 0.846
8.30 0.760 5.19 0.820
8.84 0.783 4.84 0.853
9.06 0.783 5.45 0.836
9.10 0.757 4.80 0.852
8.24 0.779 5.30 0.832
8.12 0.781 5.26 0.840
dehulling time after heat treatment. However. incase of DI models. the coefficient of x, was positive.indicating that increase in heating temperature (T)enhanced the dehulling index. whereas heatingtime did not. Thus. it could be concluded thathigher temperatures and short time were requiredfor effective loosening of seed coat for 'C II'cultivar. This was also supported by the analysisof variance for DI models. where the temperature(x,) was found to have a significant overall effecton dehulling index (P<0.05 for non-scarified andP<O.lO for scarified grain). Heating time (x.,) showeda non-significant effect.
AnalySis of variance for the two responses DTand DI, indicated that all the four statistical modelsdeveloped for non-scarified and scarified grainpossessed a non-significant lack of fit. withsatisfactory percentage variability explained (96.20to 98.97%) and hence. can be considered quiteadequate for prediction of responses. The contribution of linear terms was found to be significantfor the non-scarified DI model (P<O.O J) and thescarified DT and DI models (P<0.05), whereas. the
quadratic and cross-product terms showed nonsignificant effects for all the models,
The predicted factors yielding optimumresponses (stationary points) were located asdescribed by Khuri and Cornell (1987) and arepresented in Table 3. It was predicted that dehullingtime was reduced from 8.20 to 4.03 sec afterscarification of the grain and dehulling index waspredicted to increase from 0.665 to 0.867. However.three out of four stationary points were found tobe outside the experimental region. In such asituation. the super-imposition of contour plots forDT and DI was considered. to arrive at a solution(Khuri and Cornell 1987; Floros and Chinnan1987), which could be within the experimentalregion and better than or equivalent to that of thepredicted responses (Table 3).
Using the procedure described by Khuri andCornell (1987). the contour plots for two variablesand each response were generated on computer
TABLE 3, PREDICTED LEVELS OF FACTORS YIELDINGOPTIMUM RESPONSE AND ASSAYED CONDITIONSFOR MINIMUM DEHULLING TIME AND MAXIMUMDEHULLING INDEX
TABLE 2. PARTIAL REGRESSION COEFFICIENTS FORRESPONSES DEHULLING TIME AND DEHULLINGINDEX
Treatment topigeonpea grain
Input variablesx,lTl x,(t)
Predicted responseDehulling Dehullingtime. sec index
b. 8.670 0.770 5.130 0.840
b , -0.517 0.028 -0.488 0.027
b, -0.672 -0.003 -0.210 -0.002
b ll0.285 -0.011 0.198 -0.010
b" 0.312 -0.001 0.213 -0.005
b" 0,170 -0,010 -0,295 -0.007 , Solution is outside the experimental region
Assayed conditions
Non-scarified 0,6 (66)
Scarified 0,0 (60)
0.64 0,90 0.201.54 -4.78
3,30 2,78 4,03'2,78 -4,78 0.867'
0.655'
0,773
0.840
8.205.13
1.0(7}
0.5 (5)
Scarified
Predicted levels
Non-scarified
ScarifiedDehulling Dehullingtime, sec index
Regression Non-scarifiedcoefficient Dehulling Dehulling
lime. sec index

TABLE 4. DEHULLING CHARACTERISTICS OF PIGEONPEAGRAIN AFTER OPTIMIZED HEAT TREATMENT
screen. The response surfaces shown in Fig. 1 fornon-scarified grain Within the experimental rangesindicated the minimum DT and peak (maximum)for 01. Fig. 2 shows that after super-imposition ofDT and 01 plots, their minimum and maximumcould be observed at the coordinates (0.6, 1.0) fortemperature and time for non-scarified grain. Usingthe prediction equations, these coordinates yieldedDT=8.20 sec and 01=0.773 (Table 3), the latterbeing much higher than the predicted value.Similar super-imposed contour plots for scarifiedgrain showed the minimum DT (5.13 sec) and themaximum Dl (0.840) at center points of theexperimental region i.e., the coordinates (0,0). Theinput variables for the above solutions are presentedin Table 3. It can be seen that for non-scarifiedgrain. heating is required at 66°C for seven minutesand for scarified grain at 60°C for five minutes toget the maximum dehulling index Within minimumdehulling time.
The adequacy of input variables, and otherdehulling characteristics (Ethiwe and Reichert 1987)were also determined to compare the status ofdehulling for non-scarified, scarified and untreated(control) grain. In this test, the samples weredehulled after heating grain to optimized levels ofheating temperature, heating ti.me and dehullingtime (i.e., 8 sec for non-scarified and 5 sec forscarified grain). The seed coat removed, dehullingindex. product recovery and intact pearled grainwere determined. The average values given in Table4 showed that the maximum (99.67%) seed coatwas removed by urea and scarification, when grainwas dehulled after optimized heat treatment, Withthe highest total product recovery of 81.84% outof which intact pearled grain comprised 35.50%grade I and remainder were splits.
Conclusion
Temperature showed a higher Significant effecton dehulling time and dehulling index than heatingtime. Cultivar 'CII' yielded 81.84% product recovery
Dehullingcharacteristics
Dehulling time.sec
Dehulling index
Seed coat removed. %
Product recovery. %
Intact pearled grain. %
Untreated(Control)
54.30
0.65
90.00
17.56
12.32
Heat treatment to grainNon-scarified Scarified
8.00 5.00
0.77 0.83
90.00 99.67
74.10 8\.84
35.11 35.50
319
with 35.50% Grade 1 intact pearled grain withalmost all seed coat having been removed fromgrain. When other cultivars are dehulled, it isexpected that the general use of relatively hightemperature and short time to maximize quantityand quality of recovery will still be valid.
ReferencesArora SK (1982) Chemistry and Biochemistry of Legumes. OJCford
and IBH Publishing Co, New Delhi p 289
Doshi SP. Gupta KS (1991) SPAR\. Indian Agricultural StatisticalResearch Institute. New Delhi
Ethiwe AOF, Reichert RD (1987) Variability in dehulling qualityof cowpea, pigeonpea and mungbean cultivars determinedwith tangential abrasive dehulling device. Cereal Chern84:86-90
Floros JD Chinnan MS (1987) Optimization of pimiento paperlye-peeling process using response surface methodolgy.Transactions of the American Society of Agricultural Engineers30:560-565
Khuri A, Cornell JA (1987) Response Surfaces: Designs andAnalysis. 1st edn. Marcel Dekker Inc., ASQC, Quality Press.New York pp149-205
Kurlen PP (1980) Advances in milling technology of pigeonpea.In: Proceedings International Workshop on Pigeonpea, ICRIST,Patancheru, India December 15-19
Oomah B D, Reichert RD, Youngs CG (1981) A novel. multisample.tangential abrasive dehulling device. Cereal Chern 58:392395
Phirke PS (1993) Behaviour and Dehulling Characteristics ofPigeonpea Grain Influenced by Pre-treatment and RotorParmeters. Ph.D. Thesis. Indian Institute of Technology,Kharagpur
Phlrke PS, Bhole NG. Adhaoo SH [1994) Effect of pre-treatmenton strength properties of grain for dehulling. Ind J NutrDietet 31 :265-272
Ramakrishnaiah N, Kurien PP (1985) Non-starchy polysaccharidesof plgeonpea and their influence on dehulling charcteristics.J Food Sci Technol 22:429-430
Reichert RD, Tyler RT, York AE, Schwad DJ. Tataynovich JE,Mwasary MA (1986) Description of a production model ofthe tangential abrasive dehulling device and its applicationto breeders' samples. Cereal Chern 63:201-207
Saxena RP. Singh BPN, Mayende VM [1990) Electron microscopicstudies of sodium bicarbonate treated pigneonpea grain formaking dhal. In: Proceedings International EngineeringConference and Exhibition. Bangkok. Thailand, December 36, pp751-760
Shyeth BJ. Rodda ED. Nelson AI (1980) Evaluation of newsoybean dehuller. Transactions of the American Society ofAgricultural Engineers 23:330-332
Teckchandanl CK (1990) Development of Pearled Grain Separatorfor Improvement of Milling Performance of Pigeonpea. Ph.D.Thesis, Indian Institute of Technology, Kharagpur
Tinay AHE, Hardalou SBE, Nour AM (1983) Comparative studyof three legume starches. J Food Technol 18: 1-9
Received 18 February 1998: revised 6 April 1999: accepted 18 June 1999

J. Food Sci. Technol., 1999, Vol. 36, No.4, 320-324
Growth Inhibition of Listeria monocytogenes by CommercialNisin and Lactic Acid in Raw Buffalo Meat Mince
S.B. BARBUDDHE', S.V.S. MALIK AND K.N. BHILEGAONKAR
Division of Veterinary Public Health,Indian Veterinary Research Institute. lzatnagar - 243 122, India.
Survivability of Usteria monocytogenes was studied against combination of 400 and 800 IV of commercial nisin(Nisaplin) with a fmal concentration of 2% lactic acid incorporated in raw buffalo meat mince stored at 4°C for 16 daysand 37°C for 36 h. Initial microbial analysis of meat mince revealed pH. extract release volume. mesophUes and psychrophllescount as 6.04. 47 mi. 37 x 10' and 13 x 10' cfu/g of meat. respectively. The growth of L.monocytngenes in the treatedgroups showed significant inhibition. as the count of pathogen registered oniy a slight Increase whereas. in control groups.the count increased by more than 4 log cycles. The degree of inhibition increased with increase In the concentrationof nisin and decrease in the storage temperature. pH In treatment groups remained significantly lower (P<O.OI) thanthe control groups at 4°C and 37°C. Addition of lactic acid (2%) resulted in slight brownish discoloration of meat. butthere was no disagreeable odour. This combination of food grade preservatives has been found to be effective listeIiostaticin minced meat and can be used as adjunct specially in the event of "cold-chain" failure.
Keyword.: Nisin. Lactic acid. Growth inhibition. Listeria monocytogenes. Buffalo meat mince.
LIsteria monocytogenes has been recognized asan emerging food-borne pathogen (Pearson andMarth 1990). The organism being ubiquitous Innature, is found in and on' livestock as anenvironmental contaminant In food processing plants(Grau and Vanderlinde 1992). The incidence ofL. monocytogenes In raw meats varies considerably(Breer and Schopfer 1988) with reported rates ashigh as 92% (Johnson et al. 1990).
LIsteria monocytogenes has the ability to surviveand grow In a wide range of environments suchas refrigeration temperature (Glass and Doyle1989). high levels of salts (Shahamat et al. 1980)and pH as low as 4.8 In foods (Conner et al. 1986).One of the most extensively used approaches Is theaddition of preservatives like lactic acid. acetic acid,propionic acid (Surve et al. 1991). bacteriocins. likenisin (Benkerroum and Sandlne 1988) andpolyphosphates (Sofos 1986) for retarding thegrowth of spoilage as well as pathogenic organismsIn foods. Undissociated lactic and acetic acids havebeen reported to inhibit the growth ofmicroorganisms (Marcel et al. 1988) and could beused to extend the shelf life of processed broilers(Izat et al. 1989).
Nisin. produced by some strains of Lactococcuslactis has been described as the best characterizedlactic acid bacteria (LAB) bacteriocin (Donkerslootand Thompson 1990) capable of exerting Inhibitoryeffect only on most of the gram-positive bacteriaincluding L. monocytogenes, but not on the gramnegative bacteria (Chung et al. 1989). Use of a
• Corresponding Autlwr. Present address: lCAR Research CompleK,EIa. Old Goa-403 402 India.
320
combination of lactic acid and bacteriocins withbeneficial results has been suggested to beInvestigated further (El-Khateib et al. 1993) toeffectively control the pathogen in buffalo meat andmeat products especially In the event of cold chainfailure. Reports on the efficacy of nisin and lacticacid against L. monocytogenes are limited andmostly have been confined to laboratory mediainstead of extending them to meat models. Thepresent study. therefore. was designed to examinethe efficacy of the two different combinations offood grade commercial nisin "Nisaplin" and lacticacid on the surVivability of pathogeniCL.monocytogenes In raw buffalo meat mince storedat 4°C and 37°C.
Materials and Methods
Detennination oj initial microbial status oj rawmeat : The fresh raw buffalo meat purchased from
.retail outlets at Barel1ly city, Uttar Pradesh. Indiawas finely minced In sanitised meat mlncers(Electrolux, Model 320064. Stockholm. Sweden)using 8 and 6 mm sieves. The samples eachweighing 150 g were drawn from the minced meatin sterilized polyethylene sachets. The samples ofminced meat were analyzed for physico-chemicalparameters like extract release volume (ERV) (Shelef1974). pH (AOAC 1975) and microbiologicalparameters like total viable count (lVC) formesophiles and psychrophiles (ICMSF 1978). besidespresumptive L. monocytogenes count so as toadjudge the initial microbial status of buffalomeat. For ERV, IS g of minced meat was blendedwith 60 ml of distilled water In a homogenlser

(Ultra-Turrax. Type TP 18/10. Janke and Kunkel.Staufen. Germany) and homogenate was immediatelyfiltered through Whatman filter paper No. 1 of 16cm2 size. The volume of filtrate collected in first15 min was recorded as ERV of meat. To estimatemesophiles. psychrophiles and presumptive L.monocytogenes counts. 25 g meat mince washomogenized with 225 ml normal saline solution(NSS). For mesophiles and psychrophiles counts.the homogenate was diluted serially in lO-folddilutions in NSS and inoculated onto plate countagar and incubated at 37°C for 24-48 h and at7°C for 10-14 days. respectively. For presumptiveL. monocytogenes count. it was inoculated ontoDominguez-Rodriguez isolation agar (DRIA) plates(Dominguez-Rodriguez et al. 1984). The inoculatedplates were incubated at 37°C for 48 h.
Procurement and quantification ojL. monocytogenes : Pathogenic strain ofL. monocytogenes MTCCI143 (NCTC 11994) wasprocured from Institute of Microbial Technology.Chandigarh. India. The growth approximation ofstandard strain in bacterial suspension was doneby McFerland Nephelometric technique as describedby Paik and Suggs (1974). Subsequently. thebacterial growth quantified as per the method ofICMSF (1978) was adjusted so as to give countsof approximately 103 cells per 0.1 ml of thebacterial suspension.
Incorporation oj preservatives in raw meatmince : The stock of Nisaplin (Batch No. 72). acommercial product of nisin. containing 106
international units (IV) per g was provided ascourtesy by Aplin and Barret Limited (Trobridge.Wittshire. England) and its working solution wasprepared as per the method described by Bell andDelacy (1985).
Lactic acid AR (S.d. Fine Chemicals. Mumbai.India) was used at a final concentration of 2% ofthe meat.
Each of the meat sample contained inpolyethylene sachets was treated separately withthe two different combinations of commercial nisinand lactic acid as per the following groups:
Group A : 400 IV per gram commercial nisin+2% lactic acid.
Group B : 800 IU per gram commercial nisin+2% lactic acid
Group C : Control. no treatment withpreservatives.
Inoculation oj the samples : The contents ofpolyethylene sachets were inoculated with the
321
quantified and calibrated cell suspension ofL. monocytogenes at the rate of 103 bacterialcells per gram of meat. Sachets were sealed andcontents were mixed in the stomacher (Model BA6021, Seward Laboratory. London) for 3 min andthen incubated at 4°C and 37°C for 16 days and36 h. respectively. for each group under study.Vninoculated contents of polyethylene sachets servedas control.
Sampling and analysis : For each group. 10g aliquots were drawn from control and treatmentgroups on I. 4. 7. 10. 13 and 16 days frominoculated samples stored at 4°C and 12. 24 and36 h from those incubated at 37°C. Each aliquotwas then processed for the estimation of L.monocytogenes count. using DRIA and determinationof pH value. Sensory evaluation of each aliquot forodour and colour was done using 6-point and 4point standardised scales. respectively. as presCribedby Woolthius and Smulders (1985) and Acuff et al(1987).
The data obtained were statistically analyzedusing randomized block design as described bySnedecor and Cochran (1968).
Results and Discussion
The microbiological analysis of the raw meatrevealed initial total viable count (1VC) of mesophllesand psychrophiles to be 37x104 and 13x104
cfu/g of meat, respectively. with no detection ofListeria sp. The Initial pH was 6.04 and the ERVwas 47 ml. These parameters indicated that theinitial microbial status of ground beef was withinthe acceptable norms. as the normal values havebeen reported to be 5.8 for pH and 48-53 ml forERV (Jay 1986) less than lOx106 cfu/g for TVCof psychrophiles (Nickerson and Sinkey 1972) and5 to 15x106 per g TVC of mesophiles (Jay 1986).
The results of L. monocytogenes count in thecontrol and treatment groups stored at 4°C forperiod of 16 days (Fig. 1) indicated that in thecontrol group. the count increased from initial 310glO cfu/g to 8.36 10glO cfu/g by the end of 16days storage. whereas. the treatment of meat withnisin and lactic acid in both the groups (A andB) exerted a marked Iisteriostatic effect. the effectbeing more pronounced in group B. Statisticalanalysis of the data supported these observationsin that both the treatments exhibited highlysignificant (P<O.OI) bacteriostatic effect on theL. monocytogenes count and this effect wassignificantly higher (P<O.OI) in group B than ingroup A. The findings are in agreement with those
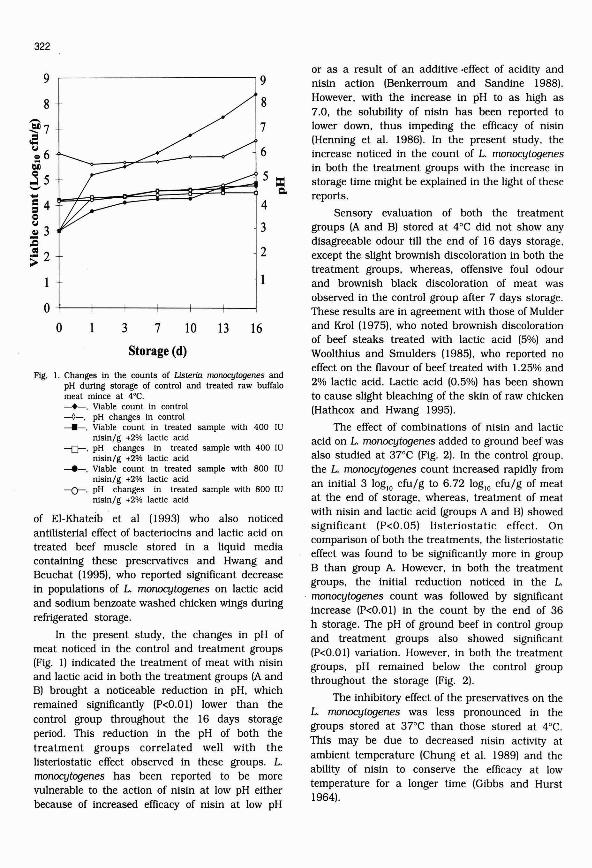
or as a result of an additive ·effect of acidity andnisin action (Benkerroum and Sandine 1988).However. with the increase in pH to as high as7.0. the solubility of nisin has been reported tolower down. thus impeding the efficacy of nisin(Henning et al. 1986). In the present study. theincrease noticed in the count of 1. monocytogenes
in both the treatment groups with the increase instorage time might be explained in the light of thesereports.
Sensory evaluation of both the treatmentgroups (A and B) stored at 4°C did not show anydisagreeable odour till the end of 16 days storage.except the slight brownish discoloration in both thetreatment groups. whereas. offensive foul odourand brownish black discoloration of meat wasobserved in the control group after 7 days storage.These results are in agreement with those of Mulderand Krol (1975). who noted brownish discolorationof beef steaks treated with lactic acid (5%) andWoolthlus and Smulders (1985). who reported noeffect on the flavour of beef treated with 1.25% and2% lactic acid. Lactic acid (0.5%) has been shownto cause slight bleaching of the skin of raw chicken(Hathcox and Hwang 1995).
The effect of combinations of nisin and lacticacid on 1. monocytogenes added to ground beef wasalso studied at 37°C (Fig. 2). In the control group.the L. monocytogenes count increased rapidly froman initial 3 loglo cfu/g to 6.72 loglo cfu/g of meatat the end of storage. whereas. treatment of meatwith nisin and lactic acid (groups A and B) showedsignificant (P<0.05) listeriostatic effect. Oncomparison of both the treatments. the listeriostaticeffect was found to be significantly more in groupB than group A. However. in both the treatmentgroups. the initial reduction noticed in the L.
. monocytogenes count was followed by significantincrease (P<O.OI) In the count by the end of 36h storage. The pH of ground beef in control groupand treatment groups also showed significant(P<O.OI) variation. However. in both the treatmentgroups. pH remained below the control groupthroughout the storage (Fig. 2).
The Inhibitory effect of the preservatives on the1. monocytogenes was less pronounced in thegroups stored at 3rC than those stored at 4°C.This may be due to decreased nisin activity atambient temperature (Chung et al. 1989) and theability of nisin to conserve the efficacy at lowtemperature for a longer time (Gibbs and Hurst1964).
1613107
Storage (d)
3
~----------,9
8
7
6
5 =W~~::::=t~P~~ 4 c.
3
2
Fig. I. Changes In the counts of Listertn rrwrwcytogenes andpH during storage of control and treated raw buffalomeat mince at 4'C.-.-. Viable count in control-0-. pH changes In control-'--. Viable count In treated sample with 400 IV
nlsln/g +2% lactlc acid-D-. pH changes in treated sample with 400 IU
nlsln/g +2% lactic acid___-. Viable count In treated sample with 800 IU
nisln/g +2% lactic acid-0--. pH changes in treated sample with 800 IU
nlsln/g +2% lactic acid
of EI-Khateib' et al (1993) who also noticedantillsterial effect of bacteriocins and lactic acid ontreated beef muscle stored in a liquid mediacontaining these preservatives and Hwang andBeuchat (1995). who reported significant decreasein populations of L. monocytogenes on lactic acidand sodium benzoate washed chicken wings dUringrefrigerated storage.
In the present study. the changes in pH ofmeat noticed in the control and treatment groups(Fig. 1) indicated the treatment of meat with nisinand lactic acid in both the treatment groups (A andB) brought a noticeable reduction in pH. whichremained significantly (P<O.OI) lower than thecontrol group throughout the 16 days storageperiod. This reduction in the pH of both thetreatment groups correlated well with thelisteriostatic effect observed in these groups. 1.monocytogenes has been reported to be morevulnerable to the action of nisin at low pH eitherbecause of increased efficacy of nisin at low pH
322
9
8.-.~7oS~6~
~5....~Hc~ 3-.c
.!! 2~
1
0
0
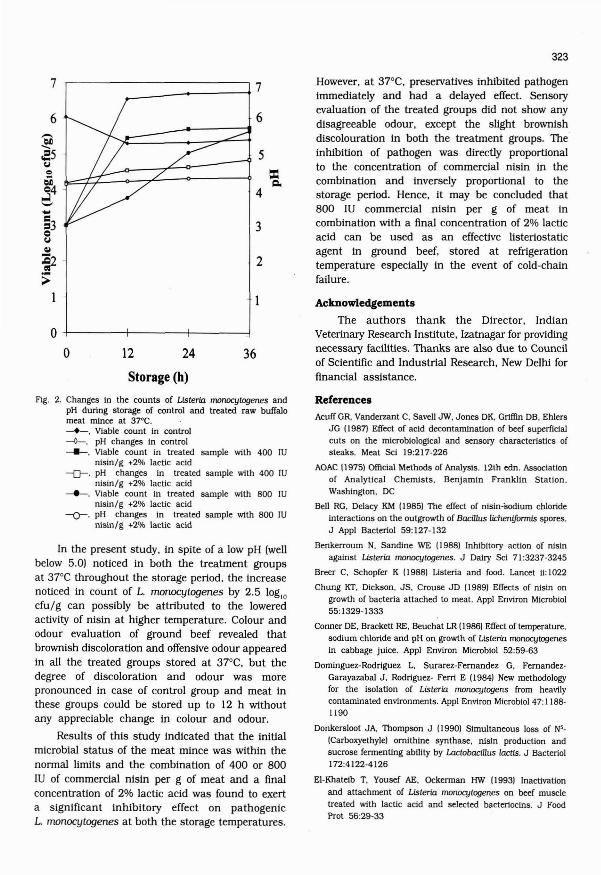
323
However, at 37°C, preservatives inhibited pathogenimmediately and had a delayed effect. Sensoryevaluation of the treated groups did not show anydisagreeable odour, except the slight brownishdiscolouration In both the treatment groups. The'inhibition of pathogen was directly proportionalto the concentration of commercial nisin in thecombination and Inversely proportional to thestorage period. Hence. it may be concluded that800 IU commercial nisin per g of meat Incombination with a final concentration of 2% lacticacid can be used as an effective listeriostaticagent in ground beef, stored at refrigerationtemperature especially in the event of cold-chainfailure.
Acknowledgements
The authors thank the Director, IndianVeterinary Research Institute, Izatnagar for providingnecessary facilities. Thanks are also due to Councilof Scientific and Industrial Research, New Delhi forfinancial assistance.
5
2
6
4
3
3624
Storage (h)
. __------i 7
12
7
6.-.l)I).......=5u...~4
...,;j'-'...~heu~
~>
1
0
0
Fig. 2. Changes In the counts of Listeria nwoocytogenes andpH dUring storage of control and treated raw buffalomeat mtnce at 37°C.-+-. Viable count in control-0-. pH changes in control___. Viable count In treated sample with 400 IV
nisin/g +2% lactic acid-0-. pH changes In treated sample with 400 IU
nlsin/g +2% lactic acid___-. Viable count In treated sample with 800 IU
nisin/g +2% lactic acid-0-. pH changes in treated sample with 800 IV
nlsin/g +2% lactic acid
In the present study, in spite of a low pH [wenbelow 5.0) noticed in both the treatment groupsat 37°C throughout the storage period, the increasenoticed in count of 1. monocytogenes by 2.5 10glOcfu/g can possibly be attributed to the loweredactivity of nisin at higher temperature. Colour andodour evaluation of ground beef revealed thatbrownish discoloration and offensive odour appearedin all the treated groups stored at 37°C, but thedegree of discoloration and odour was morepronounced in case of control group and meat inthese groups could be stored up to 12 h withoutany appreciable change in colour and odour.
Results of this study indicated that the initialmicrobial status of the meat mince was within thenormal limits and the combination of 400 or 800IU of commercial nisin per g of meat and a finalconcentration of 2% lactic acid was found to exerta Significant inhibitory effect on pathogenicL. monocytogenes at both the storage temperatures.
ReferencesAcuff GR, Vanderzant C, Savell JW, Jones DK, Griffin DB. Ehlers
JG (1987) Effect of acid decontaminatton of beef superficialcuts on the microbiological and sensory characteristics ofsteaks. Meat Sci 19:217-226
AOAC (19751 Official Methods of Analysis. 12th edn. Associattonof Analytical Chemists. Benjamin Franklin Statton.Washington. DC
Bell RG. Delacy KM (1985) The effect of nisin-Sodium chlorideInteractions on the outgrowth of Bacillus lichenifonnis spores.J Appl Bacteriol 59: 127-132
Benkerroum N. Sandine WE (1988) Inhibitory actton of nisinagainst Listeria nwnocytogenes. J Dairy Sci 71 :3237-3245
Breer C, Schopfer K (1988) Listeria and food. Lancet Ii: 1022
Chung KT, Dickson. JS, Crouse JD [1989) Effects of nisin ongrowth of bacteria attached to meat. Appl Environ Microblol55: 1329-1333
Conner DE. Brackett RE. Beuchat LR [1986} Effect of temperature.sodium chloride and pH on growth of Listeria monocytogenesin cabbage Juice. Appl Environ Microbiol 52:59-63
Dominguez-Rodriguez L, Surarez-Fernandez G, FernandezGarayazabal J. Rodriguez- Ferri E (1984) New methodologyfor the isolation of Listeria monocytogens from heavilycontaminated environments. Appl Environ Microblol 47: 11881190
Donkersloot JA. Thompson J (1990) Simultaneous loss of N'[Carboxyethyle) ornithine synthase. nisin productton andsucrose fermenting ability by Lactobacillus lactis. J Bacteriol172:4122-4126
EI-Khateib T. Yousef AE, Ockerman HW (1993) Inactivationand attachment of Listeria monocytogenes on beef muscletreated with lactic acid and selected bacterioclns. J FoodProt 56:29-33
324
Gibbs BM. Hurst A (1964) Limitations of nisin as a preservativein non-dairy foods. 4th International Symposium on FoodMicrobiol Sik. Goteborg. Sweden
Glass KA. Doyle MP (1989) Fate of Listeria TTlDnocytogenes inprocessed meat products during refrigerated storage. ApplEnviron Microbiol 55:1565-1569
Grau FH. Vanderlinde PB (1992) Occurrence. numbers andgrowth of Listeria TTlDnocytngenes on some vacuum packagedprocessed meat (Australia). J Food Prot 55:4-7
Hathcox AK. Hwang CA. Resurrecion AVA. Beuchat LR (1995)Consumer evaluation of raw and fried chicken after washingin trisodium phosphate or lactic acid/sodium benzoatesolutions. J Food Sci 60:604-605. 610
Henning S. Metz R, Hammes WP (1986) New aspects for theapplication of nisin to food products based on its mode ofaction. lnt J Food Mlcrobiol 3: 135-137
Hwang C. Beuchat LR (1995) Efficacy of a lactic acid/sodiumbenzoate wash solution in reducing bacterial contaminationof raw chicken. Int J Food Microbiol 27:91-98
ICMSF (1978) International Commission for MicrobiologicalSpecifications for Foods. Microorganisms in Foods-I. Theirsignificance and methods of enumeration. University TorontoPress. Canada. 2nd edn. ppI15-118
lzat AL. Colberg M. Adams MH. Reiber MA. Waldberg PM (1989)Production and processing studies to reduce the incidenceof salmonellas on commercial broilers. J Food Prot 52:670673
Jay JM (1986) Modern Food Microbiology. 3rd edn. VanNostrand Reinhold Co Inc.. Wayne. England. pp214. 432
Johnson JL. Doyle MP. Cassens RG (1990) Listeria TTlDnocytngenesand other Listeria species in meat and meat products: Areview. J Food Prot 53:81-91
Marcel GM. Logtestijn JQ. Mossel DM (19881 BactertologicaJquallty of broiler carcasses as affected by in-plant lactic aciddecontamination. Int J Food Microbiol 6:31-42
Mulder SJ. Krol B (1975) The effect of lactic acid on the bactertalflora and colour of fresh meat. Fleischwirschaft 55:12551268
Nickerson JT. Sinskey AJ (1972) Microbiology of Foods and FoodProcessing. Elsevier North-Holland. Inc.. NY p 92
Paik G. Suggs MT (1974) Reagents. stains and miscellaneoustest procedures. In: Spaulding EH. Traunt JP. leds): Manualof Clinical Microbiology. American Society of Microbiology.Washington DC. p 93
Pearson W. Marth EH (I990) Listeria onocytogenes-Threat toa safe food supply: A Review. J Dairy Sci 73:912-928
Shahamat M. Seaman A. Woodbine M (1980) Survival of Listeriamonocytngenes in high salt concentrations. Zentralbl BaktertolHyg Abt I Ortg A 246:506-511
Shelef LA (1974) Hydration and pH of microbially spoiling beef.J Appl Bactertol 37:531-536
Snedecor GW. Cochran WG (1968) Statistical Methods. The IowaState University Press. Ames. Iowa
Sofos IN (1986) Use of phosphates in low sodium meat products.Food Technol 40:52-69
Surve AN. Shertkar AT. Bhilegaonkar KN. Karkare UD (1991)Preservative effect of combination of acetic acid with lacticand propionic acid on buffalo meat stored at refrtgerationtemperature. Meat Sci 29:309-322
Woolthius CHJ. Smulders FJM (I985) Microbial decontaminationof calf carcasses by lactic acid sprays. J Food Prot 48:832837
Received 10 March 1998; revised 6 April 1999; accepted 22 June 1999
RESEARCH NOTES J. Food Sci. Techno!., 1999, Va!. 36. No.4. 325-328
Tofu Analogue Development from Whole Soybeans bySimulated Extrusion Process
LESLIE M. NSOFOR' AND IJEOMA S. UGWA
School of Food Science and Technology.Abia State University. Uturu. P.M.B. 2000. Okigwe. Nigeria.
Extrusion-cooking was simulated by a low-cost process that comprised boiling of whole soybean in 0.5% NaHCO,solutlon for I h. fine-milling of the tenderized dehuiled cotyledons. slow heating/stirring and coagulation of the slurrywith CaSO, to form a curd. Deep-frying of the cut and compressed curd. with added meat seasonings/spices yieldeda fried tofu-like product. Sensory evaluation of the product and fried conventional tofu (control) in a preference testshowed statistically Insignificant (p<0.05) differences In mean scores for texture and equal mean scores for flavour andappearance of the new product was preferred. Percentage nutrient composition values were 28 and 38% proteins. 26and 35% fat. 21 and 13% carbohydrates. 14 and 16% moisture. 6 and 5% minerals. 3 and 3.5% crude fibre for tofuanalogue and control. respectlvely. The analogue showed a 5 '/2 - fold yield Increase (wet weight) relative to the control.Soybean residue {okaral was not generated dUring analogue preparation. Total solids yield estimates of 0.84 and 0.19kg per kg raw soybeans utilized were deduced for the analogue and control.
Keywords: Tofu. Tofu analogue. Soybeans. Meat substitutes. Sensory evaluation. Proximate analysis.
Low-cost processes for converting hard-tocook legumes/oilseeds into palatable. nutlitiousand affordable protein-lich foods that could beutilized as substitutes for expenSive meat or fish.or eaten by vegetalians as meat replacers. need tobe developed for low income population of Aflica,Asia. and South Amelica. In parts of South-eastAsia and China, traditional soybean processing hasproduced fermented and unfermented flied productslike tempe and tofu. which serve as meat substitutes(Pederson 1979; Steinkraus 1983; Escueta et al.1985; Jeng et al. 1988). Recent low cost modificationof the tempe process (Nsofor 1996). that excludesdirect use of live Rhizopus culture. yielded asoybean product. resulting In a smoked fishsubstitute. Newer high technology extrusion-cooking(Park et al. 1993). however. has produced texturedvegetable proteins (Young 1985). which have moremeat-like texture. and are utilized in developedcountries by vegetarians as meat analogues.Simulated extrusion of protein-rich legumes/oilseeds like soybeans with simple inexpensive foodprocessing eqUipment could produce a partiallytextured curd. whose physico-chemical propertiesmay be comparable to those of tofu. The presentcommunication desclibes prelimnary studies onlow-cost simulated extruSion-cooking of hard-tocook whole-dehulled soybeans for the developmentof high-yielding tofu analogue.
• Corresponding Author: Department of Food Science and HumanNutrttiDn. 204G. Malcolm Trout. Food Science and HumanNutrition Building. Mi.chfgan Stale Untverstty. East Lansing MI.48824. USA.
325
Simulated extrusion-cooking oj soybeans :Soybeans (TOM 579' valiety; Nsofor 1996) wereprocured from the National Cereals ResearchInstitute outstation in Amakama-Olokoro. Nigelia.and I kg of it was pre-cleaned. washed in tapwater.and cooked for 1 h in 0.5% NaHC03 solution. Thecooked beans were drained, cooled, hand-dehulled.hulls separated by water floatation and thecotyledons milled in a blender (Oster SunbeanCorporation. Milwaukee. WI) to a fine slurry with2 I of boiled and cooled tapwater. The slurry wasthen heated on low flame in a sauce pan withconstant but gradual stirring. till clearly apparentincrease in viscosity occurred. Spices andseasonings were added to the slurry dUring stirlingas follows: 5 g each of curry powder. thymeseasoning (Ducros et Fils. Carpentras. France) andcrushed wet onions; monosodium glutamate andtable salt at 3 and 2 g and 4 "Maggi" bouillon cubes(Nestle Foods PLC. Nigelia). One-fourth per centCaS0
4was then finally added to the slurry by
dissolving the salt in 50 mI hot water and stirringit slowly for 2 min at a temperature of 80°C. Thespiced/seasoned and heat-textured slurry with addedcoagulant was covered and allowed to set for I hat ambient temperature (28°C).
Curd pressing and frying : A bench-top screwpress made of stainless steel was deSigned andfablicated for compressing and dewateling thecoagulated slurry (curd). The curd was cut intosmall chunks with a knife. loaded into the bin ofthe serew press about 2.5 em above the rim. thebin having been lined with double layered calico.
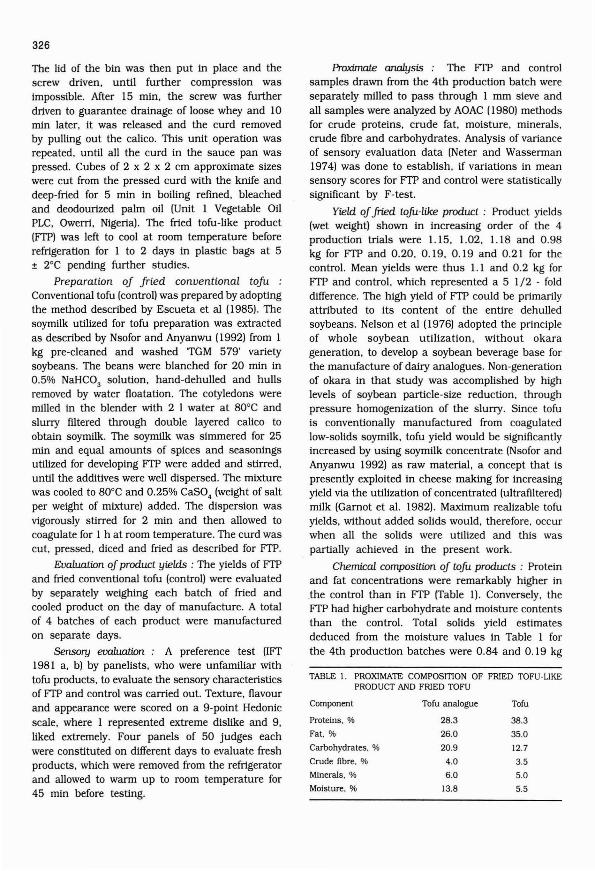
326
The lid of the bin was then put in place and thescrew driven. until further compression wasimpossible. After 15 min, the screw was furtherdriven to guarantee drainage of loose whey and 10min later, it was released and the curd removedby pulling out the calico. This unit operation wasrepeated. until all the curd in the sauce pan waspressed. Cubes of 2 x 2 x 2 em approximate sizeswere cut from the pressed curd with the knife anddeep-fried for 5 min in boiling refined, bleachedand deodourized palm oil (Unit 1 Vegetable OilPLC, Owerri, Nigeria). The fried tofu-like product(ITP) was left to cool at room temperature beforerefrigeration for 1 to 2 days in plastic bags at 5± 2°C pending further studies.
Preparation of fried conventional tofu :Conventional tofu (control) was prepared by adoptingthe method described by Escueta et al (1985). Thesoymilk utilized for tofu preparation was extractedas described by Nsofor and Anyanwu (1992) from 1kg pre-cleaned and washed 'TGM 579' varietysoybeans. The beans were blanched for 20 min in0.5% NaHC0
3solution, hand-dehulled and hulls
removed by water floatation. The cotyledons weremilled in the blender with 2 1 water at 80°C andslurry fIltered through double layered calico toobtain soymilk. The soymilk was simmered for 25min and equal amounts of spices and seasoningsutilized for developing ITP were added and stirred,until the additives were well dispersed. The mixturewas cooled to 80°C and 0.25% CaSO. (weight of saltper weight of mixture) added. The dispersion wasvigorously stirred for 2 min and then allowed tocoagulate for 1 h at room temperature. The curd wascut, pressed, diced and fried as described for ITP.
Evaluation of product yields : The yields of ITPand fried conventional tofu (control) were evaluatedby separately weighing each batch of fried andcooled product on the day of manufacture. A totalof 4 batches of each product were manufacturedon separate days.
Sensory evaluation : A preference test (lIT1981 a, b) by panelists, who were unfamiliar withtofu products, to evaluate the sensory characteristicsof ITP and control was carried out. Texture, flavourand appearance were scored on a 9-point Hedonicscale, where 1 represented extreme dislike and 9,liked extremely. Four panels of 50 judges eachwere constituted on different days to evaluate freshproducts, which were removed from the refrigeratorand allowed to warm up to room temperature for45 min before testing.
Proximate analysis: The ITP and controlsamples drawn from the 4th production batch wereseparately milled to pass through 1 mm sieve andall samples were analyzed by AOAC (1980) methodsfor crude proteins, crude fat, moisture, minerals,crude fibre and carbohydrates. Analysis of varianceof sensory evaluation data (Neter and Wasserman1974) was done to establish, if variations in meansensory scores for ITP and control were statisticallysignificant by F-test.
Yield of.fried tojU-like product : Product yields(wet weight) shown in increasing order of the 4production trials were 1.15, 1.02, 1.18 and 0.98kg for FTP and 0.20,0.19,0.19 and 0.21 for thecontrol. Mean yields were thus 1.1 and 0.2 kg forITP and control, which represented a 5 1/2 - folddifference. The high yield of ITP could be primarilyattributed to Its content of the entire dehulledsoybeans. Nelson et al (1976) adopted the prinCipleof whole soybean utilization, without okarageneration, to develop a soybean beverage base forthe manufacture of dairy analogues. Non-generationof okara in that study was accomplished by highlevels of soybean particle-size reduction. throughpressure homogenization of the slurry. Since tofuis conventionally manufactured from coagulatedlow-solids soymilk, tofu yield would be significantlyincreased by using soymilk concentrate (Nsofor andAnyanwu 1992) as raw material, a concept that ispresently exploited in cheese making for increasingyield via the utilization of concentrated (ultrafilteredlmilk (Gamot et al. 1982). Maximum realizable tofuyields, without added solids would, therefore, occurwhen all the solids were utilized and this waspartially achieved in the present work.
Chemical composition of tojU products : Proteinand fat concentrations were remarkably higher inthe control than in ITP (Table 1). Conversely, theITP had higher carbohydrate and moisture contentsthan the control. Total solids yield estimatesdeduced from the moisture values in Table 1 forthe 4th production batches were 0.84 and 0.19 kg
TABLE I. PROXIMATE COMPOSITION OF FRIED TOFU-LIKEPRODUCT AND FRIED TOFU
Component Tofu analogue Tofu
Proteins. % 28.3 38.3
Fat, % 26.0 35.0
Carbohydrates. % 20.9 12.7
Crude fibre. % 4.0 3.5
Minerals. % 6.0 5.0
Moisture. % 13.8 5.5
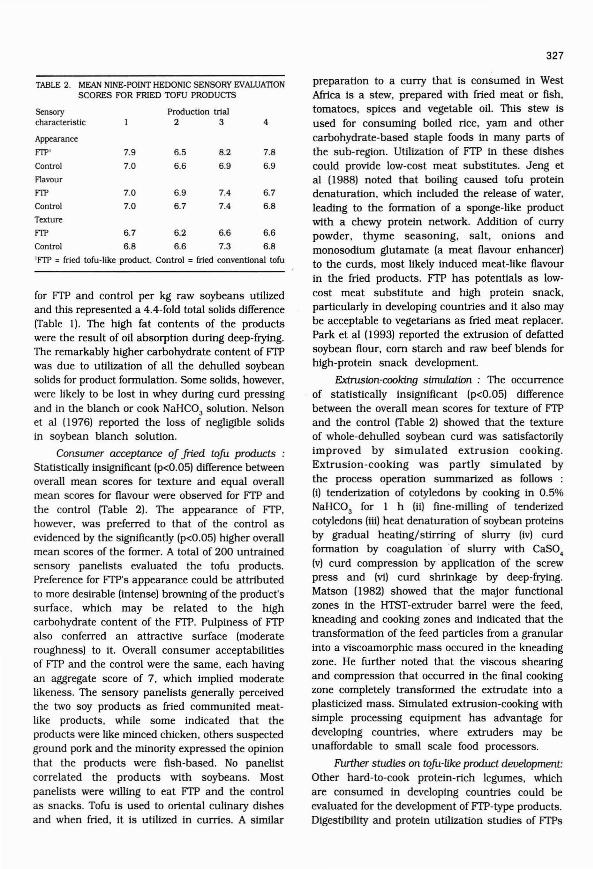
TABLE 2. MEAN NINE-POINT HEDONIC SENSORY EVALUATIONSCORES FOR FRIED TOFU PRODUCTS
Sensory Production trialcharacteristic 2 3 4
Appearance
ITP' 7.9 6.5 8.2 7.8
Control 7.0 6.6 6.9 6.9
Flavour
ITP 7.0 6.9 7.4 6.7
Control 7.0 6.7 7.4 6.8
Texture
ITP 6.7 6.2 6.6 6.6
Control 6.8 6.6 7.3 6.8
'FIT =fried tofu-like product. Control = fried conventional tofu
for FTP and control per kg raw soybeans utilizedand this represented a 4.4-fold total solids difference(Table 1). The high fat contents of the productswere the result of oil absorption dUring deep-frying.The remarkably higher carbohydrate content of FTPwas due to utilization of all the dehulled soybeansolids for product formulation. Some solids. however.were likely to be lost In whey dUring curd pressingand in the blanch or cook NaHC03 solution. Nelsonet al (1976) reported the loss of negligible solidsIn soybean blanch solution.
Consumer acceptWlCe of .fried tofu products :Statistically Insignificant (p<0.05) difference betweenoverall mean scores for texture and equal overallmean scores for flavour were observed for FTP andthe control (Table 2). The appearance of FTP.however. was preferred to that of the control asevidenced by the significantly (p<0.05) higher overallmean scores of the former. A total of 200 untrainedsensory panelists evaluated the tofu products.Preference for FTP's appearance could be attributedto more desirable (Intense) browning of the product'ssurface. which may be related to the highcarbohydrate content of the FTP. Pulpiness of FTPalso conferred an attractive surface (moderateroughness) to it. Overall consumer acceptabilitiesof FTP and the control were the same. each havingan aggregate score of 7. which implied moderatelikeness. The sensory panelists generally perceivedthe two soy products as fried communlted meatlike products. while some Indicated that theproducts were like minced chicken. others suspectedground pork and the minority expressed the opinionthat the products were fish-based. No panelistcorrelated the products with soybeans. Mostpanelists were willing to eat FTP and the controlas snacks. Tofu is used to oriental culinary dishesand when fried. it is utilized in curries. A similar
327
preparation to a curry that is consumed in WestAfrica is a stew. prepared with fried meat or fish.tomatoes. spices and vegetable oil. This stew Isused for consuming boiled rice. yam and othercarbohydrate-based staple foods in many parts ofthe sub-region. Utilization of FTP in these dishescould provide low-cost meat substitutes. Jeng etal (1988) noted that boiling caused tofu proteindenaturation. wWch Included the release of water.leading to the formation of a sponge-like productwith a chewy protein network. Addition of currypowder. thyme seasoning. salt. onions andmonosodium glutamate (a meat flavour enhancer)to the curds. most likely induced meat-like flavourin the fried products. FTP has potentials as lowcost meat substitute and high protein snack.particularly in developing countries and It also maybe acceptable to vegetarians as fried meat replacer.Park et al (1993) reported the extrusion of defattedsoybean flour. com starch and raw beef blends forhigh-protein snack development.
Extrusion-cooking simulation : The occurrenceof statistically insignificant (p<0.05) differencebetween the overall mean scores for texture of FTPand the control (Table 2) showed that the textureof whole-dehulled soybean curd was satisfactorilyImproved by simulated extrusion cooking.Extrusion-cooking was partly simulated bythe process operation summarized as follows :(I) tenderization of cotyledons by cooking in 0.5%NaHC0
3for 1 h (ii) fine-milling of tenderized
cotyledons (iii) heat denaturation of soybean proteinsby gradual heating/stirring of slurry (iv) curdformation by coagulation of slurry with CaSO.(v) curd compression by application of the screwpress and (vi) curd shrinkage by deep-frying.Matson (1982) showed that the major functionalzones in the HTST-extruder barrel were the feed.kneading and cooking zones and indicated that thetransformation of the feed particles from a granularinto a viscoamorphlc mass occured in the kneadingzone. He further noted that the viscous shearingand compression that occurred In the final cookingzone completely transformed the extrudate into aplasticized mass. Simulated extrusion-cooking withSimple processing eqUipment has advantage fordeveloping countries. where extruders may beunaffordable to small scale food processors.
Further studies on tojiJ.-like product development:Other hard-to-cook protein-rich legumes. whichare consumed In developing countries could beevaluated for the development of FTP-type products.Digestibility and protein utilization studies of FTPs

328
are crucial and the use of sprouted seeds may beinvestigated. The popular .consumption of "akara",a deep-fried whole-dehulled cowpea (Vignaunguiculata) paste in Nigeria (Phlllip and McWatters1991) has indicated the feasibility of widespreadacceptance of FTP-based low-cost meat substitutesand high protein snacks, especially in West Africa.
The authors thank E. Oti, Brown Okonkwoand Vincent Ohiri of the National Root CropsResearch Institute (NRCRiJ, Umudike, Nigeria fortheir assistance in chemical analysis at the NRCRifaclllty.
ReferencesAOAC (1980) Official Methods of Analysis. 13th edn. Association
of Official Analytical Chemists. Washington DC
Escueta EE. Bourne MC. Hood LF (1985) Effect of coconut creamaddition to soymilk on the composition. texture and sensoryproperties of tofu. J Food Sci 50: 887-890
Garnot P. Rank Te. Olson NF (1982) Influence of protein andfat contents of ultraJlltered milk on rheological propertiesof gels formed by chymosin. J Dalry Sci 65: 2267-2273
lIT (1981 a) Guidellnes for the preparation and review ofpapers reporting sensory evaluation data. Food Technol 35(4):16-17
lIT (l98Ib) Sensory evaluation guide for testing food andbeverage products. Food Technol 35(11): 50-59
Jeng CoY. Ockerman HW. Cahill VR, Peng AC (1988) Influenceof substituting two levels of tofu for fat in a cookedcommunlted meat-type product. J Food Sci 53: 97-101
Matson K (1982) What goes on in the extruder barrel. CerealsFood World 27(5): 207-210
Nelson AI. Steinberg MP. Wei LS (1976) lIlinois process forpreparation of soymilk. J Food Sci 41: 57-62
Neter J. Wasserman W (1974) Applled Linear Statistical Models.RD Irwin Inc. Homewood. IL
Nsofor LM (1996) Sultabillty of ultraJlltered soybean extract fordeveloping evaporated cow milk analogue. J Food Sci Technol33: 322-325
Nsofor LM. Amah KC (1990 Ezyme hydrolyzed soybean slurry fordeveloping smoked fish analogue. Nigertan Food J 9: 178- 184
Nsofor LM. Anyanwu KB (1992) Development and evaluation ofconcentrated soymilk beverage. J Food Sci Technol 29: 331332
Park J. Rhee KS. KIm BK. Rhee KC (1993) Single-screw extrusionof defatted soy flour. corn starch and raw beef blends. JFood Sci 58: 9-20
Pederson CS (1979) Nutritious fermented foods of the ortent.In: Microbiology of Fermented Foods. AVI Publ Co. Westport.CT. pp 310-333
Phlllips RD. McWatters KH (1990 Contrtbutlon of cowpeas tonutrttion and health. Food Technol 45(9): 127-135
Steinkraus KH (1983) Handbook of Indigenous Fermented Foods.Marcel Dekker Inc. New York
Young LS (1985) Soy protein products in processed meat anddalry foods. In: Shlbles R (ed). World Soybean ResearchConference 1Il: Westview Press. Boulder and London.pp 182-190
Received 29 November 1996; revised 10 May 1999: accepted 22 June 1999
J. Food Sci. Technol., 1999, Vol. 36, No.4, 329-330
Alkali Treatment in the Milling of Discoloured Sorghum
N.B. DARADE, J.K. CHAVAN· AND D.P. KACHARE
Department of Biochemistry,Mahatma Phule Agricultural University, Rahuri - 413 722, India.
Soaking of discoloured or black sorghum grains in 4% NaOH (1: 1 w/v) at IOO'C for 5 min followed by washingunder water. neutralization of residual alkali with 1% acetic acid. rinsing with water and drying at 60'C resultedin complete removal of discoloured seedcoat of grains. The treatment caused 15% loss in dry matter. Alkali dehulledgrains contained more proteins and less fibre. phenolics. ash. oil and sugars and produced acceptable roli with pearlywhile colour.
Keyword. : Discoloured sorghum. Alkali dehulling. Composition. Roti.
Sorghum is one of the important cereal cropsof India. It is cultivated in both kharif (Junesowing) and rrb' (October sowing) seasons. Inkharif. the crop is often caught in late rains duringgrain development. The humid and wet conditionsfavour severe discolouration or blackening ofmatured grains due to migration of phenolics ofglumes to grain surface and pigments secreted byinfecting fungi such as Fusarium. Aspergillus.Curoularia, ex AUemaria (Anon 1980; Chavan andRaut 1987). Such discoloured grains are notsuitable for human consumption. It has beenestimated that sometimes over 25 to 50% of thekharif produce becomes discoloured and as aresult. the producer. procurement agencies anddistribution agency have to suffer severe economiclosses (Darade 1997).
The discolouration is, however. limited only tosurface layer. while the inner grain portion remainspearly white. Hence. such discoloured grains canbe pearled to remove the coloured seedcoat. Sincethe mold infected grains become soft. physicalpearling may cause excessive breakage duringcomplete dehulling of such grains. Hence, anattempt has been made to standardize an alternativechemical dehulling technique to get rid of thecoloured seed coat of the grains.
Initially. a trial was attempted to extract thepigmentation of the whole grains by soakingdiscoloured grains at 27°. 50° or 100°C in variousextractants viz.. alcohol (ethanol. methanol), diluteorganic acids (acetic and citric), dilute mineralacids (sulphuric. hydrochloric and perchloric) anddilute alkali (sodium hydroxide. potassiumhydroxide and calcium hydroxide). Among thevarious extractants. only dilute mineral acids anddilute alkali could extract the pigments, that tooonly partially. as judged by visual observations.
• Corresponding Author
329
Hence, it was decided to dehull the grains afteracid or alkali treatment to remove discolouredseedcoat itself. Among the acids and alkali. dilutealkali was found to be more effective in looseningthe pericarp and its separation. Hence. a dehullingtreatment was further standardized using onlysodium hydroxide.
Nearly 100% discoloured sorghum sample wasobtained from the Sorghum Breeder. MahatmaPhule Agricultural University. Rahuri. India andsubjected to alkali treatment. The differentconcentrations of alkali used were 2. 4 or 8% eachfor 2.5, 5 or 10 min at 80 or 100°C. In each trial.grains were soaked in respective alkali solution (I; Iwiv), washed in clean water by gentle rubbing ofgrains on each other manually to loosen the bran.The washed grains were dipped in 1% acetic acidsolution for 5 min to neutralize the residual alkali.rinsed with water and dried at 60°C. The effectivenessof each treatment combination was judged by visualobservations with respect to complete removal ofdiscoloured pericarp. The control and dehulledgrains of a standardized treatment were analyzedfor proximate composition, polyphenols (AOAC 1990)and sugars (Nelson 1944). Their roti quality wasevaluated by dough rollability. moisture loss in rotiduring storage at ambient conditions andorganoleptic properties by a panel of semi-trainedjudges using a IO-polnt Hedonic scale. For doughrollability. a dough prepared from 50 g meal wasflattened Into thin circular disc by pressing withhands, until the cracks appeared at the edge. Amean di<lmeter of this thin disc was measured.
Among the various concentrations of NaOH.temperature and soaking periods. a treatmentcombination for complete removal of discolouredpericarp at a lowest level of alkali and soakingperiod was determined by visual inspection ofdehulled grains. A complete removal of pericarp
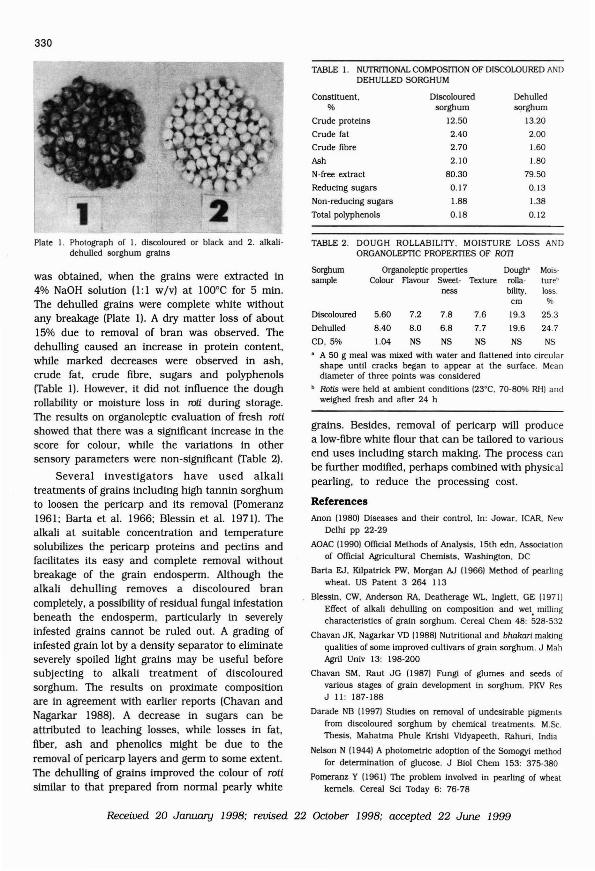
330
TABLE 1. NUTRITIONAL COMPOSmON OF DISCOLOURED ANDDEHULLED SORGHUM
Constituent.%
Crude proteins
Crude fat
Crude fibre
Ash
N-free extract
Reducing sugars
Non-reducing sugars
Total polyphenols
Discolouredsorghum
12.50
2.40
2.70
2.10
80.30
0.17
1.88
0.18
Dehulledsorghum
13.20
2.00
1.60
1.80
79.50
0.13
1.38
0.12
Plate I. Photograph of 1. discoloured or black and 2. alkalidehulled sorghum grains
was obtained. when the grains were extracted in4% NaOH solution (l: 1 wIv) at 100°C for 5 min.The dehulled grains were complete white withoutany breakage (Plate 1). A dry matter loss of about15% due to removal of bran was observed. Thedehulling caused an Increase In protein content.while marked decreases were observed In ash.crude fat. crude fibre. sugars and polyphenols(Table 1). However. It did not Influence the doughrollabllity or moisture loss In roti dUring storage.The results on organoleptic evaluation of fresh rotishowed that there was a significant increase in thescore for colour. while the variations in othersensory parameters were non-significant (Table 2).
Several Investigators have used alkalitreatments of grains Including high tannin sorghumto loosen the perlcarp and Its removal (Pomeranz1961; Barta et al. 1966; Blessln et al. 1971). Thealkali at suitable concentration and temperaturesolubllizes the perlcarp proteins and pectins andfacilitates Its easy and complete removal withoutbreakage of the grain endosperm. Although thealkali dehulling removes a discoloured brancompletely, a possibility of residual fungal infestationbeneath the endosperm. particularly in severelyinfested grains cannot be ruled out. A grading ofinfested grain lot by a density separator to eliminateseverely spoiled light grains may be useful beforesubjecting to alkali treatment of discolouredsorghum. The results on proximate compositionare in agreement with earlier reports (Chavan andNagarkar 1988). A decrease in sugars can beattributed to leaching losses. while losses in fat.fiber. ash and phenolics might be due to theremoval of perlcarp layers and germ to some extent.The dehulling of grains Improved the colour of rotisimilar to that prepared from normal pearly white
TABLE 2. DOUGH ROLLABILITY. MOISTURE LOSS ANDORGANOLEPTIC PROPERTIES OF R01l
Sorghum Organoleptic properties Dough' Mois-sample Colour Flavour Sweet- Texture rolla· lureo
ness bUily. loss.cm %
Discoloured 5.60 7.2 7.8 7.6 19.3 253
Dehulled 8.40 8.0 6.8 7.7 19.6 24.7
CD. 5% 1.04 NS NS NS NS NS
A 50 g meal was mixed wtth water and flattened into circularshape until cracks began to appear at the surface. Meandtameter of three points was considered
b Rotis were held at ambient conditions (23'C. 70-80% RH) andweighed fresh and aIIer 24 h
grains. Besides. removal of perlcarp will producea low-fibre white flour that can be tailored to variousend uses including starch making. The process canbe further modified. perhaps combined with phySicalpearling. to reduce the processing cost.
ReferencesAnon (1980) Diseases and their control, In: Jowar. ICAR. New
Delht pp 22-29
AOAC (1990) Official Methods of Analysts. 15th edn. Associationof Official Agricultural Chemists. Washington. DC
Barta EJ. Kllpatrlck PW. Morgan AJ (1966) Method of pearlingwheat. US Patent 3 264 113
Blessin. CWo Anderson RA. Deatherage WL. Inglett. GE (1971)Effect of alkal! dehulling on composition and wet, millingcharacteristics of grain sorghum. Cereal Chern 48: 528-532
Chavan JR. Nagarkar VD (1988) Nutritional and bhakari makingqual!t1es of some Improved cultlvars of grain sorghum. J MahAgril Untv 13: 198-200
Chavan SM. Raut JG (1987) Fungt of glumes and seeds ofvarious stages of grain development In sorghum. PKV ResJ II: 187-188
Darade NB (1997) Studies on removal of undesirable pigmentsfrom discoloured sorghum by chemical treatments. M.Sc.Thesis. Mahatma Phule Krishl Vidyapeeth. Rahuri. India
Nelson N (1944) A photometrlc adoption of the Somogyi methodfor determination of glucose. J Bioi Chern 153: 375-380
Pomeranz Y (1961) The problem Involved in pearling of wheatkernels. Cereal Sct Today 6: 76-78
Received 20 January 1998: revised 22 October 1998: accepted 22 June 1999
J. Food Sci. Technol., 1999, Vol. 36, No.4, 331-333
Effect of Microwave Heating and Conventional Processing onthe Nutritional Qualities of Tomato Juice
CHARANJIT KAURh, D.S. KHURDIYA, R.K. PALl AND H.C. KAPOOR"
'Division of Fruits and Horticultural Technology, Indian Agricultural Research Institute,2Dlvision of Biochemistry, Indian Agricultural Research Institute,
New Delhi- 110012, India.
Effect of microwave processing on the nutritional characteristics of tomato Juice was investigated and comparedwith conventional extraction methods such as hot break and cold break extraction. Microwave processed juice had lowelectrolytes. high viscosity and high retention of ascorbic acid and total carotenolds and lycopene contents comparedto conventlonally processed Juice.
Keywords : Microwave processing. Cold break, Hoi break, Electrolytes, Viscosity.
Tomato is an important vegetable in Indiandiets. It is largely used, in culinary preparations,Viz., cooked vegetables, soups, ketchups and salads.India produces 46,0000 MT of tomatoes as comparedto world's production of 7754.00,00 MT, (FAO1994). Apart from Its characteristic flavour andaroma, it is also a good source of Vitamins andminerals. Lycopene, the predominant carotenoidpigment of tomato contributes to Its characteristicred colour. It functions as an anti-oxidant andhelps in lowering DNA damage, malignanttransformations and other parameters of cell damageand reduces cancer risk (Stahl and Sies 1992),These findings have accelerated research activitiesin order to improve processing factors to maintainthe nutritional as well as sensory quality of tomatoproducts. Nutritional and sensory qualities of tomatojuice are primarily affected by fruit cultivar, growingconditions and processing parameters (Thakur etal. 1996). Also, the absorption of tomato carotenoidsin human body has been reported to be influencedby processing conditions of tomato (Bains andBains 1987). Hence, processing of tomato hastremendous impact on the retention of nutrients andtheir avaiJabllity in the body. In the last decade,microwave processing has emerged as an alternativeto conventional processing in a number of foodmanufactUring processes and products (Schiffmann,1992). The main objective of the present work wasto study the effect of microwave processing onnutritional quality of tomato in comparison to theconventional processing viz., hot and cold breakmethods.
Plant material: Uniformly ripened fresh andmature tomatoes of variety 'Pusa Gaurav' wereprocured from the experimental orchard of Indian
• Corresponding Author
331
Agricultural Research Institute, New DeIhl. Theywere sorted, washed under tap water, dried underthe fan and processed for juice by cold break (CBJ,hot break (HB) and microwave (MW) methods. Fivekg. lots of tomatoes were used for each treatment.
Processing: For cold break (CB) processing oftomatoes, a commercial crusher was used. Thecrushed fruits were passed through a smalllaboratory finished screen to remove seeds andskin. The extracted jUice was then heat-processedat 90°C for 1 min, packed in glass bottles andcooled under air. For hot break (HB) method, thetomatoes were quartered and heated to 50-60°C inan open steel vessel. The juice was extracted bypassing through a sieve. It was then heat-processedas done in cold break method. For microwaveprocessing (MW), the tomatoes were quartered andheated in a microwave oven (BPL, BMO-70OT,650W, 2450 MHz) for 4 min. and juice wasextracted by passing through a sieve. It was thenheat-processed again in a microwave for 4 min.
Analytical methods: Total soluble solid contentsof the juice were measured with a handrefractometer. For t1trable acidity 10 g of thesample was mixed with 50 ml of distilled waterin a 100 ml glass beaker and titrated against 0.1N NaOH solution to pH 8.1 ± 0.05, using a pHmeter. Results were expressed as percent citricacid. Ascorbic acid was estimated by titratingagainst 2, 6 dichloroindophenol dye, usingmetaphosphOric acid as extracting medium (AOAC1980). Total carotenoids and lycopene were analyzedas per the method deSCribed by Ranganna (1977),using acetone and petroleum ether and acetone asextracting solvents and measuring the absorbanceat 450 and 503 nm for carotenoids and Iycopene,respectively. ,B-carotene was estimated according to

332
TABLE I. EFFECf OF PROCESSING METHODS ON THE gUALIlY OF TOMATO JUICE
Treatment Moisture. % Yield. % Total solids. % pH Acidity
Cold break 95.70 ± 1.7 74.0 ± 5.0 5.23 ± 0.04 4.25 ± 0.05 0.406 ± 0.005
Hot break 94.80 ± 1.4 79.0 ± 4.0 5.30 ± 0.03 4.05 ± 0.05 0.425 ± 0.002
Microwave 94.70 ± 1.2 78.0 ± 4.0 5.33 ± 0.05 4.10 ± 0.04 0.448 ± 0.003
± SEM (P ~ 0.051
the method of Sadasivam and Manickam (1992).Viscosity was measured by using a Brookfieldviscometer and expressed as centipoise (cp). Totalelectrolytes were determined by measuring theelectrical conductivity of fIltered juice In a conductivitymetre (CM-8211 at a constant temperature waterbath and expressed as MHOS/cm2
•
Moisture content of the unprocessed tomatojuice was 96%. which was reduced slightly onthermal processing due to evaporation of water.Total solids content was 5.25% in fresh juice andwas least affected by processing (Table I). Totalsolids are an important quality character with highsolids. providing greater product yield and thisrequires less water for evaporation and reduces thecost. Acidity of the tomato juice greatly Influencesits processing. It not only Influences the flavourand consistency of the product but also theprocessing time and temperature of the product.No difference was recorded In the pH and acidityof the HB and MW-processed juice In comparisonwith the CB processed juice (Table 1). Thakur etal (1996) also did not find significant differencebetween hot break. microwaved and cold breakprocessed juices. Tomatoes are good sources of
ascorbic acid and so its loss is of particularinterest. Ascorbic acid content varied from 15-33mg/ 100 g component on fresh weight basis. Sinceit Is the most heat labile component. thermalprocessing had profound effect on its retention.Ascorbic acid retention was the highest in microwaveheating. followed by HB method (Fig I). Guines andBayindirh (1993) have also reported higher ascorbicacid retention in blanched green beans and carrots.processed by microwave. However. Lane et al(1984) did not find any significant differences. Mostprobably. reduced cooking time and reduced waterproduce less destruction of ascorbic acid ascompared to conventional methods. Viscosity andelectrolytes showed inverse relationships. Viscosityof CB-processed tomato juice was low and had highelectrolytes as compared to thermally processedjuice. which had low electrolytes and high viscosity(Fig 2). Again. it was MW-processed juice. whichhad the highest viscosity (97.3 cp) and lowestelectrolytes (84.100 MHOS) as compared to the HBmethod. Such relationship can easily be explainedon the basis of constitution of electrolytes.Electrolytes comprise soluble pectins. organic acidsand mineral salts. Thermal processing results indenaturation of proteins and formation of a
100 100
8 0
~80 80 8
Ea 6 c: "EE u 60 60 (.l
:0- ~Ur
.~0
'iiI J:0 .§.
(.l 4 W:c 40 Ui'
~:> !
>-'0
< U2 20 .,
W
a 0
10,-----------------,
Fig. I. Effect of blanching methods on the ascorbic acid contentin tomato juice
Fig. 2. Effect of blanching methods on the viscosity andelectrolytes tn tomato Jutce

333
2,000
2,5OO~------------------,
fig. 3. Effect of blanching methods on the ~-carotene. Totalcarotenolds and Iycopene In tomato Juice
ReferencesAOAC (1980) Association of Official Analytical Chemists. 13th
edn, Official Methods of Analysis Arlington VA
Bains UB, Balns GS (1987) Study of pectolytic factors andprocessing In relation to reheologlcal character of tomatojuice. J Food Sci Technol 24: 247-253
Chan BH (1992) Studies on the stability of carotenoids InGarland chrysanthemum (Ipomoea spp) as affected bymicrowave and conventional blanching. J Food Prot 55:296-300
Chan BH. Han LH (1990) Effects of different cooking methodson the yield of carotenolds In water convolulus. J Food Prot53: 1076-1078
FAO (1994) fAO Production Year Book. pp 7-8
Gulnes B, Bayhindirh. A (1993) Peroxidase and lipoxygenaseinactivation during blanching of green beans. green peas andcarrots. food Technol 26: 406-410
Heddleson RA. Doores S. Anantheswaran RC. Kuhn GD (1993).Destruction of Salmonella species heated In aqesh saltsolution by microwave energy. J food Prot 56: 763-768
Lane RH, Boschung MD, Abdel-Ghany M (1984) Sensorycomparison of prepared frozen vegelables processed bymicrowave and conventional methods of blanching. JConsumer Studies Home Economics 8: 83-93
Liu Lizen (1990) Effect of viscosity and sall concentration onMW heating of simulated liquid foods in cylinderical containers.MS Thesis. The Pensylvania State University. UniversityPark. PA
Ranganna S (1997) Manual of Analysis of fruit and VegetableProducts. 1st edn, Tata McGraw Hill. New Deihl. pp197-198
Sadasivam S, Manickam A (1992) Carotenes. In: BiochemicalMethods for Agricultural Sciences. Wiley Eastern Ltd.. pp181-182
Schlffmann Rf (1992) Microwave processing in U.S. FoodIndustry. Food Technol 46: 50-52. 56
Stahl W. Sies H \19921 Uptake of Iycopene and its geometricalIsomers Is greater from heat processed than from unprocessedtomato Juice In humans. J Nutrition 122: 2161-2166
Thakur BR. Singh RK, TIeman DM, Handa AK (1996) Effect ofan antisense pectin methyl esterase gene on the chemistryof pectin. J Food Sci 61: 85-87
Thakur BR. Singh RK, Nelson PE (1996) Quality attributes ofprocessed tomato products: A Review. food Rev Int 12: 375401
Walker SJ. Bowl PRo Banks JG (1989) Effect of recommendedmicrowave cooking on the survival of Listeria monocytogenesIn chilled retail products. Campden Food and Drink ResearchAssoc Chirping Campden Glos GL 556LD
Whiltenberger RT, Nutting GC !I 957) Effect of tomato cellstructures on consistency of tomato juice. Food Technol I I:19-22
Whittenberger RT. Nutting GC (1958) High viscosity of cell wallsuspensions prepared from tomato juice. Food Technol 12:420-424
LycopeneTotal carotenoidsB·carotene
• Control WJ Hot brea~ 0 Microwave
500
CIl 1,5oo8
stabilised pectin protein complex. Thus, removal offree and naturally occurring soluble pectin resultsin low electrolytes and causes the juice to thickenand semigel. Also, cell walls bear maximum electriccharges in the absence of electrolytes. As a result,the cell waJls swell, bind more water and promotehigh viscosity (Whltenberger and Nutting 1957,1958). Higher viscosity has the major implicationsfor the processer, as it lowers the amount of tomatosolids needed in a product to obtain a certain levelof quality, thus reducing the cost of the product.Microwave-processed products had the highestretention of the totaJ carotenoids, j3-carotene andlycopene (Fig 3). Similar observations have beenreported by Chan and Han (1990) and Chan (1992).Total microbiaJ count was the highest in HB andCB methods and lowest in microwave processedjuice. This is in contrast to the findings of Walkeret al (1989), who reported a higher microbial countin MW-processed products. Several factors likemoisture, ionic content of a food, specified heat ofvarious food constituents, product density, stateand load volume play an important role in achievinguniform heating with micro energy (Heddleson etal. 1993; Liu Lizen 1990). However, repeatedheating at 2450 MHz (8 min) in microwave in thepresent case might have accounted for low microbialcount.
The above findings suggest that MW-processedjuice has higher nutritional quality as comparedto conventionaJly processed ones.
CD~ 1,000
Received 29 January 1998; revised 14 January 1999; accepted 22 June 1999
J. Food Sci. Technol.. 1999. Vol. 36. No.4. 334-338
Effect of Kieselguhr on Specific Cake Resistance inConstant Pressure Filtration of Pectin Extract from Orange Peel
FILIZ KAR AND NURHAN ARSLAN·
Department of Chemical Engineeling.Faculty of Engineeling. Firat University. 23279. Elazig. Turkey.
Pectin extact was vacuum-filtered at 10. 15. 20 and 25'C under vartous pressure differences {0.20 x 10' Pa.0.33 x 10' Pa and 0.47 x 10' Pal and the average specific cake resistances obtained. lt was found that the cakeobtained from constant pressure filtration of pectin extract from orange peel was compressible and the specific cakeresistance was a function of applied pressure difference. A decrease was observed in specific cake resistance withincreasing body feed concentrations. A further decrease of specific cake resistances was observed. when pre-coatingand body feed were used together.
Keywords: Orange peel. Pectin. Filtration. Kieselguhr. Specific cake resistance.
distribution and packing of the cake particles. Thesize distlibution may be altered by adding materialsof different particle size distlibution to the slurryplior to filtration. These materials are known asfilter aids (Joslyn 1961; Sabin and Bayindirli1993).
In cake filtrations. the filter medium itself canalso be pre-coated with a thin layer of filter aidto increase the· efficiency of the filter (Joslyn 1961:Kirk and Othmer 1967). In the case of pre-coating.physical properties of the medium are not usuallyeffective on the filtration rates (Bayindirli et aI.1989). In the case of body feed. the filter aid isdispersed in the incoming non-filtered suspensionand the solids of the incoming suspension can notclog their channels with excessive accumulation(Aitken 1961). Although there are varlous methodsof filtration. operational parameters. which controlfiltration rates are generally the same. Pressure isone of the important operating parameters(Bayindirli et al. 1989).
The present experiment was designed to studythe filtration of pectin extract from orange peelunder varlous pressure differences and to investigatethe effects of pre-coating amount and body feedconcentration on specific cake resistance by usingKieselguhr as filter aid.
Extraction oj pectin from orWlge peel : Orangespurchased from a local retail market were peeled.Sun-dried orange peel was ground to 50 mesh ina hammer mill to facilitate washing and extraction.The peel oil was extracted by petroleum ether anddried. Peel was heated to 97°C in a water bath
• Corresponding Author
Foot notes:A - Filter area. m': c - Mass of dry solids per unit volume of filtrate. kg/m': dVIdt - Filtration rate. m'/s: -6P - Pressure differenceacross the filter. Pa: R - Resistance to fiow through the filter. mo
': R, - Cake resistance. m-'; Rm
- Medium resistance. mo
':
s - Cake compressibility coefficient; t - Time. sec; V - FIltrate volume. m'; Vm - FIctitious filtrate volume. m'; II 0 SpeCific cakeresistance. m/kg; ll, - Specific cake resistance at unit pressure difference. mkg-'Pa· l' - Viscosity. Pa s.
Pectic substances are complex colloidalcarbohydrate delivatlves. which occur in or areprepared from plants and contain a large proportionof anhydrogalacturonic acid units. which arethought to exist in a chain-like combination. Thecarboxyl groups of the polyuronic acids may bepartly esterified by methyl alcohol and partly orcompletely neutralized by one or more bases(McCready 1966). Although the predominantstructural feature of pectin is a chain of 1~4 linked(X-D-galacturonic acid residues. in some pecticacids. neutral monosaccharldes are linked to thebasic chain of D-galacturonic units (Zitko andBishop 1965). Pectin obtained mainly from thewaste materials after processing of apple. orange.grapefruit is generally used as a gelling agent injams and preserves (Kratchanova et al. 1991;Arslan and Togrul 1996). The pectin content ofcitrus peel is usually high. amounting to 25-30%of the dlied peel mass (Huong and Luyen 1989).
Filtration of feeds containing pectins has beenone of the main applications in the food industry(Shomer and Melin 1984; Szaniawski and Spencer1991: Tien and Chiang 1992). The gelatinousprecipitate of pectin precipitated with ethanol froman acid extract can be filtered by vacuum filtrationat constant pressure diff~rences. In cake filtration.the first layer of cake deposited may clog themedium and fluid flow virtually ceases. Even whensuch an extreme case does not exist. the economicsof the process may be modified by alteling the size
334

for about 10 min to Inactivate pectic enzymes,washed extensively with water to eliminate sugarsand flavonolds, filtered through a suction filter,dried at 50·C and sieved. A 50 mesh fraction wasused In experiments. Ten grams of dried orangepeel were mixed with 250 ml of 0.003 N hydrocWOriCacid (pH =2.5). pre-heated to 90·C In a water bath.The mixture was mechanically stirred for 90 min,while maintaining the temperature at 90·C. Theliquid phase was then separated from the fruitmass by filtering and allowed to cool and settlefor several hours. When It reached a temperatureof about 37·C, the pH was raised to about 7.5 byadding 0.1 M sodium phosphate buffer, followedby 50 mg of protease enzyme (Sigma Chemical Co.,P 5147). The extract was Incubated overnight at37·C. The acid extract was separated by filteringand pectin was precipitated with two volumes ofethanol so that the total volume was 750 ml. Thegelatinous precipitate was filtered. the pectincoagulate was washed with 70% ethanol. until thereaction was neutral and dried at 50·C. The yieldof raw pectin was determined gravimetrically.
Flltration of pectin extract: The gelatinousprecipitate, pectin extract. used as the feed forfiltration processes was vacuum-filtered undervarious constant pressure differences. Theexperimental setup was composed of three majorparts. (I) a 1.8 litre capacity jacketted stainlesssteel flIter. (Ii) vacuum section and (iii) filtrate tank(Arslan and Togrul 1996).
Experiments were carried out In duplicate at10. 15. 20 and 25·C temperatures under variouspressure differences (0.20x10⁵ Pa, 0.33xl05 Pa and0.47x105 Pal. The filtration area was 73.9 cm2 andthe fabriC filter medium. which was tightly woven(10 weft/em and 30 warp/em) synthetic clothmanufactured locally and used In the beet sugarproduction industry was employed. Kieselguhr(diatomaceous earth) purchased from Turkish SugarFactories Inc., Malatya was used to pre-coat thesurface of the filter and as body feed In the pectinextract. The pre-coating amount and filter aid dosewere changed to evaluate their effects on specificcake resistance. For pre-coating and the mixing ofthe flIter aid In the slurry, 0.3. 0.5, 0.7 and 0.9kg/m2 filter area and 0.5 x lQ-3, 1.0 x 10⁻³, 3.0X 10⁻³ and 5.0 x 10⁻³ kg/l diatomaceous earth with35.78 lIm average particle size and a specific areaof 3.1 x 10⁵ m2/m3 were used. A perforated plate,32. 1% of Its area consisting of 4 mm diameterholes. was covered with the fabric filter mediumand placed on the base of the stainless steel filter.
335
Water from a constant temperature bath at thefiltration temperature was circulated through thejacket of the stainless steel filter to maintain theconstant temperature dUring filtration. Duringconstant-pressure filtration, pressures were adjustedat 0.20 x 10⁵ Pa, 0.33 x 10⁵ Pa or 0.47 x 10⁵ Pausing vacuum pump. vacuu'm manometer andpressure control valve (by-pass). A sample of about750 ml of pectin extract from orange peel wascooled to the filtration temperature, mixed byswirling and poured Into a feed tank. When thesample reached the filtration temperature. it wasstirred and poured Into the jacketed stainless steeland filtered. The collection times for given volumesof the filtrate, which flowed Into the filtrate tankhaving graduated glass level Indicator were recordeddUring each test after the first 30 ml of filtrate wasdiscarded. The applied pressure difference wasmanually controlled to hold constant throughoutthe run by using the pressure control valve.Viscosity measurements of filtrate were carried outby using a Ubbelohde capillary viscometer No.lc(Ubbelohde, Schott-Gerate. Hofhelm. Germany).Densities were measured using a pycnometer(Teknik Cam Co., Istanbul. Turkey). The filtratevolume-time data recorded dUring each test wasused to calculate cake resistance. The maximumvariation was about ±5% In the filtrate volumes.
Filtration usually results In the formation ofa cake on the flItering medium. The surface of thiscake acts as ,the filter medium, solids beingdeposited and added to the thickness, while theliquor passes through. the flow of liquor throughthe channels Is on streamline and may berepresented by the following equation (Perry andGreen 1984; Takal et aI. 1987)
dV (-Ml)A h~P)A (-Ml)A
dt = ----pR = ll(Re+R,,) = ll(acV/ A+Rm
) .........(1)
Re• the flow resistance of the cake being'
collected, grows linearly with the volume filtered,and Its magnitude Is directly proportional to ac,when a and c are constant properties of the solidsbeing collected. R
mrepresents the resistance to flow
due to the screen and the pre-coat material. It isImportant to note that the ac term Is a propertyof the filtrate. while R
mIs a property of the filter
medium only (De Garza and Boulton 1984; Llonnet1984). The resistances of the filter material andpre-coat are combined Into a single resistancecalled the filter resistance (Earle 1983).
It Is convenient to express the filter resistanceIn terms of the resistance of a hypothetical layer

TABLE 2. CALCULATED VALUES OF SPECIFIC CAKERESISTANCE AND FICTITIOUS FILTRATE VOLUMEOBTAINED FROM AN ANALYSIS OF THEEXPERIMENTAL FILTRATION DATA
values of specific cake resistance and fictitiousfiltrate volume obtained from an analysis of theexperimental filtration data at· 10, 15, 20 and 25°Cunder 0.20 x 10⁵ Pa, 0.33 x 10⁵ Pa and 0.47 x10⁵ Pa pressure differences are given in Table 2.
The change in fictitious filtrate volume resultedfrom properties of filter cake and the tubulencecaused by rapid rate of flow (Foust et al. 1960).
In compressible cake, the specific cakeresistance varies with the pressure drop across it.This is because the cake becomes more denseunder the higher pressure and so provides fewerand smaIler passage for flow. The effect is consideredas the compressibility of the cake.
To aIlow for cake compressibility, the empiricalrelationship has been proposed (Lee and Hsu1993) :
a = ao (-I1P)' (4)
Where, ao and s are empirical constants. s isthe cake Compressibility, varying from 0 forincompressible cakes to I for very highlycompressible cakes. In a was plotted versus In(-I1P) to obtain an indication of the values of a
oand s in equation (4) by means of the specific cakeresistance under various pressure drops (Fig. 1).
A plot of In a versus In (-I1P) should give astraight line, with slope equal to s. The values ofthe constants in equation (4) for each temperatureare shown in Table 3.
From the values of the regression coefficientobtained, the power-type relationship is good indescribing the effect of filtration pressure on thespecific cake resistance. The specific cake resistanceis a strong function of applied pressure difference.which indicates the compressible character of the
336
of cake, which corresponds to the coIlection of ahypothetical volume of filtrate Vm'
Rm= acVm/A (2)
Once the inital cake has been built up, flowoccurs under a constant-pressure differential. Underthese conditions, the term (-M') in equation (1) isconstant. For constant-pressure filtration, equation(1) can be integrated to give the quantity of liquidpassing through the filter in a given time.
t/ry/ A) =pacV/2(-M')A+pRm/(-I1P) (3)
A series of runs was carried out under differentpressures and the results were used to determinethe specific cake resistances. Volume-time data for0.33 x 105 Pa filtration pressure at 10, 15, 20 and25°C are given in Table 1.
For all filtration pressures, t/ry/ A) was plottedas the ordinate versus V/ A as the abcissa and astraight line haVing the slope pac/2(-I1P) and anintercept on the vertical axis of pRm/(-I1P) wereobtained. Since p, c and -M' are known, a canbe calculated from a = 2(M') slope/pc. The accuratedetermination of the intercept was difficult becauseof large experimental errors in observing the exacttime of the start of filtration and the time/volumecorrespondence dUring the first moments, whenfiltration rate is high.
The viscosities of the filtrates at 10, 15, 20and 25°C were 3.00, 2.54, 2.37 and 2.25 mPa s,respectively. The mass of dry solids (pectin) in thefeed per unit volume of filtrate in experimentswithout a filter aid was about 2.14 kg/m3• Calculated
TABLE 1. VOLUME-TIME DATA FOR 0.33 X 10" Pa FILTRATIONPRESSURE AT DIFFERENT TEMPERATURES
v X 10'. m' 10·C 15·C 20·C 25·C
30 63 41 29 18
60 158 106 65 60
90 280 174 100 125
120 430 265 249 197
150 570 402 355 290
180 747 580 475 395
210 970 789 600 487
240 1202 991 732 604
270 1450 1191 885 729
300 1750 1424 1127 911
330 2017 1643 1342 1075
360 2332 1874 1578 1260
390 2675 2167 1830 1480
420 3063 2559 2100 1689
450 3458 2910 2406 1921
480 3878 3278 2725 2170
510 4316 3673 3049 2429
540 4774 4077 3398 2703
570 5258 4508 3766 2986
Pressure. Temperature.Pa ·C
10
0.20 X 10⁵ 15
20
25
10
0.33 x 10⁵ 15
20
25
10
0.47 x 10⁵ 15
20
25
a x 10-12 ,
m/kg2.33
2.84
2.36
2.11
3.63
4.33
3.58
3.14
5.20
5.49
5.62
4.66
VmX 104,
m'
1.510
0.737
0.854
0.826
0.727
0.392
0.266
0.346
0.284
0.118
0.088
0.145
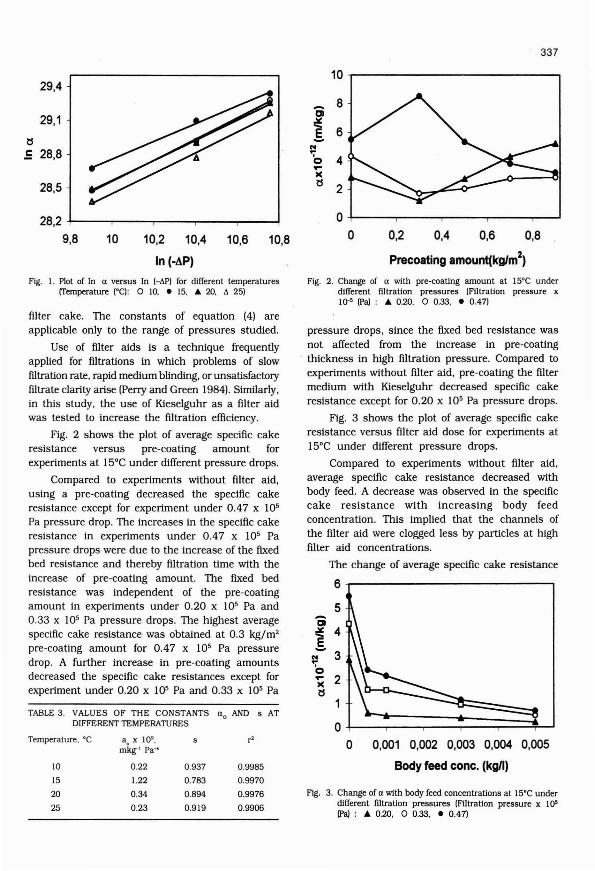
337
1029,4
Q8
29,1 Jt-lj
E 6-.E 28,8
..~o 4~
)(
28,5 lj2
28,2 0
9,8 10 10,2 10,4 10,6 10,8 0 0,2 0,4 0,6 0,8
In (-AP) Precoating amount(kglm2)
rig. I. Plot of In a versus In h~P) for different temperaturesrremperature I'C): 0 10. • 15. A 20. !J. 25)
rig. 2. Change of a with pre-coating amount at 15'C underdifferent filtration pressures (Filtration pressure x10-' (Pal : A 0.20. 0 0.33. • 0.47)
0,001 0,002 0,003 0,004 0,005
Body feed conc. (kgll)
filter cake. The constants of equation (4) areapplicable only to the range of pressures studied.
Use of fJ.lter aids is a technique frequentlyapplied for fJ.ltrations in which problems of slowfiltration rate. rapid medium blinding, or unsatisfactoryfiltrate clarity arise (Perry and Green 1984). Similarly.in this study. the use of Kieselguhr as a filter aidwas tested to increase the filtration efficiency.
Fig. 2 shows the plot of average specific cakeresistance versus pre-coating amount forexperiments at 15°C under different pressure drops.
Compared to experiments without filter aid,using a pre-coating decreased the specific cakeresistance except for experiment under 0.47 x 10⁵
Pa pressure drop. The increases in the specific cakeresistance in experiments under 0.47 x 10⁵ Papressure drops were due to the increase of the fIXedbed resistance and thereby filtration time with theincrease of pre-coating amount. The fIXed bedresistance was independent of the pre-coatingamount in experiments under 0.20 x 10⁵ Pa and0.33 x 105 Pa pressure drops. The highest averagespecific cake resistance was obtained at 0.3 kg/m2
pre-coating amount for 0.47 x 10⁵ Pa pressuredrop. A further increase in pre-coating amountsdecreased the specific cake resistances except forexperiment under 0.20 x 10⁵ Pa and 0.33 x 10⁵ Pa
TABLE 3. VALUES Or THE CONSTANTS a o AND s ATDlrrERENT TEMPERATURES
Temperature. 'C ao x 109, r'mkg-' Pa-'
10 0.22 0.937 0.9985
15 1.22 0.783 0.9970
20 0.34 0.894 0.9976
25 0.23 0.919 0.9906
pressure drops. since the fixed bed resistance wasnot affected from the increase in pre-coatingthickness in high filtration pressure. Compared toexperiments without filter aid. pre-coating the filtermedium with Kieselguhr decreased specific cakeresistance except for 0.20 x 10⁵ Pa pressure drops.
Fig. 3 shows the plot of average speCific cakeresistance versus filter aid dose for experiments at15°C under different pressure drops.
Compared to experiments without filter aid.average specific cake resistance decreased withbody feed. A decrease was observed in the specificcake resistance with increasing body feedconcentration. This implied that the channels .ofthe filter aid were clogged less by particles at highfJ.lter aid concentrations.
The change of average specific cake resistance
6-r--------------.
5
~ 4-~ 3o';( 2lj
oJ-:~=:=~:::=~~o
rig. 3. Change of a with body feed concentrations at 15'C underdifferent filtration pressures (Filtration pressure x 10'(Pal: A 0.20. 0 0.33. • 0.47)
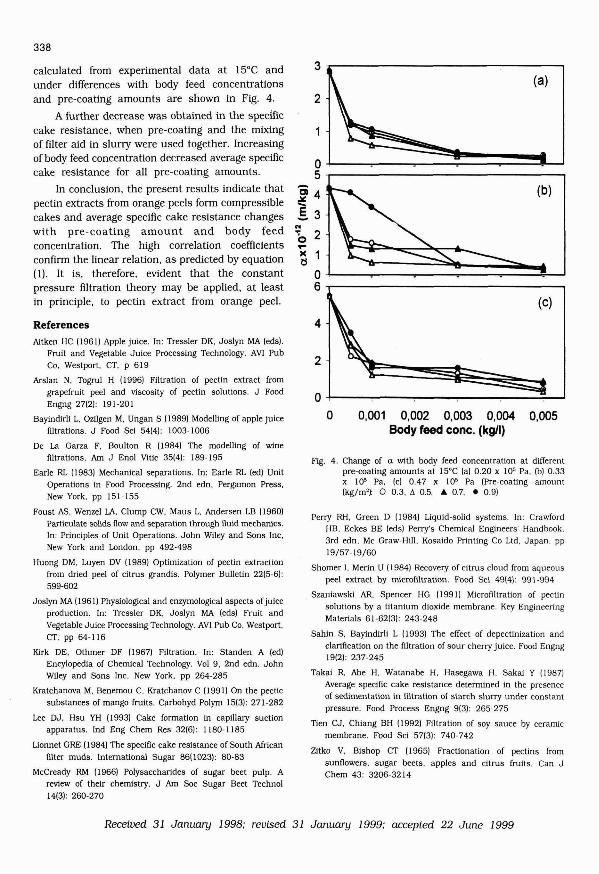
338
3-r--------------~
O+-----,.--...,....------........:::........Jo 0,001 0,002 0,003 0,004 0,005
Body feed conc. (kg/I)
(c)
(b)
(a)
2
2
4
Perry RH. Green 0 (1984) Liquid-solid systems. In: CrawfordHB. Eckes BE (eds) Perry's Chemical Engineers' Handbook.3rd edn, Mc Graw-HiIJ, Kosaido Printing Co Ltd. Japan. pp19/57-19/60
Shomer I. Merin U (1984) Recovery of citrus cloud from aqueouspeel extract by microfiltration. Food Sci 49(4): 991-994
. Szaniawski AR. Spencer HG (1991) Microfiltration of pectinsolutions by a titanium dioxide membrane. Key EngineeringMaterials 61-62(3): 243-248
Sahin S. Bayindirli L (1993) The effect of depeCtinization andclarification on the filtration of sour cherry juice. Food E;ngng19(2): 237-245
Takai R. Abe H. Watanabe H. Hasegawa H. Sakai Y (1987)Average specific cake resistance determined in the presenceof sedimentation in filtration of starch slurry under constantpressure. Food Process Engng 9(3): 265-275
Tien CJ. Chiang BH (1992) Filtration of soy sauce by ceramicmembrane. Food Sci 57(3): 740-742
Zitko V. Bishop cr (1965) Fractionation of pectins fromsunflowers. sugar beets, apples and citrus fruits. Can JChern 43: 3206-3214
Fig. 4. Change of CL with body feed concentration at differentpre-coating amounts at 15°C (a) 0.20 x 10' Pa. (b) 0.33x 10' Pa. (c) 0.47 x 10' Pa (Pre-coating amount(kg/m'l 0 0.3. {o, 0.5. A 0.7. • 0.91
oL-======~~~LJ5-..-----------------,CiJC 4....5.3..-b 2....
~ ~ L--=::::::===~=~~~U6-..----------------.
calculated from experimental data at 15°C andunder differences with body feed concentrationsand pre-coating amounts are shown in Fig. 4.
A further decrease was obtained in the specificcake resistance, when pre-coating and the mixingof filter aid in slurry were used together. Increasingof body feed concentration decreased average specificcake resistance for all pre-coating amounts.
In conclusion, the present results indicate thatpectin extracts from orange peels form compressiblecakes and average specific cake resistance changeswith pre-coating amount and body feedconcentration. The high correlation coefficientsconfirm the linear relation, as predicted by equation(1). It is, therefore, evident that the constantpressure filtration theory may be applied, at leastin principle, to pectin extract from orange peel.
ReferencesAitken HC (1961) Apple juice. In: Tressler OK. Joslyn MA (eds).
Fruit and Vegetable Juice Processing Technology. AVI PubCo, Westport. cr. p 619
Arslan N, Togrul H (1996) Filtration of pectin extract fromgrapefrUit peel and viscosity of pectin solutions. J FoodEngng 27(2): 191-201
Bayindirli L. Ozilgen M. Ungan S (1989) Modelling of apple juicefiltrations. J Food Sci 54(4): 1003-1006
Oe La Garza F, Boulton R (1984) The modelling of winefiltrations. Am J Enol Vitic 35(4): 189-195
Earle RL (1983) Mechanical separations. In: Earle RL (ed) UnitOperations in Food Processing. 2nd edn. Pergamon Press,New York. pp 151-155
Foust AS. Wenzel LA. Clump CW, Maus L. Andersen LB (1960)Particulate solids flow and separation through fluid mechanics.In: Principles of Unit Operations. John Wiley and Sons Inc.New York and London. pp 492-498
Huong OM. Luyen DV (1989) Optimization of pectin extractionfrom dried peel of citrus grandis. Polymer Bulletin 22(5-6):599-602
Joslyn MA (1961) Physiological and enzymological aspects of juiceproduction. In: Tressler OK. Joslyn MA (eds) Fruit andVegetable Juice Processing Technology. AVI Pub Co. Westport.cr. pp 64-116
Kirk DE, Othmer OF (1967) Filtration. In: Standen A (ed)Encylopedia of Chemical Technology. Vol 9, 2nd edn. JohnWiley and Sons Inc. New York. pp 264-285
Kratchanova M. Benemou C. Kratchanov C (1991) On the pecticsubstances of mango fruits. Carbohyd Polym 15(3}: 271-282
Lee OJ, Hsu YH (1993) Cake formation in capillary suctionapparatus. Ind Eng Chern Res 32(6): I180-1185
Lionnet GRE (1984) The specific cake resistance of South Africanfilter muds. International Sugar 86(1023): 80-83
McCready RM (1966) Polysaccharides of sugar beet pulp. Areview of their chemistry. J Am Soc Sugar Beet Technol14(3): 260-270
Received 31 January 1998: revised 31 January 1999: accepted 22 June 1999

J. Food Sci. Technol.. 1999. Vol. 36. No.4. 339-341
Some Microbiological and Chemical Attributes ofMango Pulp Samples
M.R. ACHARYA AND R.K. SHAH·
Department of Dairy Microbiology. Sheth M.C. College of Dairy Science.GUjarat Agricultural University. Anand Campus. Anand - 388 110. India.
A study was conducted to know the microbiological and chemical quality of mango pulp [5 samples each ofloose and tinned mango pulp) available at Anand city. The average chemical composition of the loose mango pulpshowed total solids 20.38. proteins 0.58. fat 0.61. ash 0.31. carbohydrates 18.88% and acidity 0.26 as percent citricacid. The corresponding values for tinned mango pulp were 25.68. 0.63. 0.53. 0.33. 24.19 and 0.65, respectively. Thepreservative (benzoic acid) was detected in only one loose sample and the coal-tar dyes were absent in all the samples.Among various microbial counts carried out, the average values for standard plate count, coliform count. yeast, mold,acid producers and psychrotrophic counts for loose mango pulp samples were 7.51. 4.57. 5.21. 4.70, 6.76 and 6.38log cfu/g, respectively. The tinned pulp indicated average standard plate count and psychrotrophic count of 62 and58 cfu/g, respectively. Collforms were absent in Ig product in all tins. The average values for yeasts. molds andacid producers' counts were 2, 3 and 20 cfu/g. respectively. Test for two pathogens viz.. Staphylococcus aureus andSalmoneUa spp. in 25 g product indicated presence of staphylococci in all 10 samples. However. all the isolates werecoagulase negative. On the other hand. though the packed tins showed absence of SalmoneUa spp.. they were detectedin 3 out of 5 loose samples. .
Keyword. : Mango pulp. Market samples. Microbial quality. Chemical composition. Benzoic acid, Coal-tar dyes.Pathogens, Preservatives, Food colours.
Mango fruits are very popular summerdelicacies in GUjarat and other western region ofIndia. During this period. mangoes are consumedin very large quantities In different forms viz.. fruitas such. pulp. milk shake. ice cream etc. Severalsmall scale producers generally sell loose mangopulp in the season. Eventhough. no informationis available on the exact quantities sold in theseason. according to a local survey. about a fewthousand kilograms of pulp are sold daily in theAnand market itself. In comparison to number ofloose mango pulp suppliers. there are very fewproducers. who supply tinned mango pulp. Thetinned pulp is mainly targeted for sales dUring theoff-season. The chemical and microbiologicalqualities of such preparations are likely to varyfrom producer to producer for which no data areavailable. Since the preparation contains a largeproportion of water (-80%) and added sugar. it Ishighly susceptible to microbial spoilage.
The samples (500 g) were collected from thelocai suppliers of Anand market. In case of loosesamples. generally. the suppliers gave the prepacked samples in polyethylene bags. The sampleswere brought to the laboratory and analyzedimmediately or within 1-2 h. dUring which thesamples were stored under refrigeration (4-5°C). formicrobial counts and presence of pathogens. Elevengrams of market samples of mango pulp wereadded aseptically to 99 ml sterile phosphate buffer
• Corresponding Author
339
to obtain first dilution. Subsequent dilutions wereprepared using 9 ml sterile phosphate bufferblanks. Appropriate dilutions of mango pulp wereplated on the respective media and incubated asdescribed In Compendium of Methods for theMicrobiological Examination of Foods (APHA 1992)for the following counts: standard plate count(SPC) on plate count agar at 37°C for 48 h. coliformcount (CC) on violet red bile agar at 37°C for 24h. yeast count (YC) and mold count (MC) on potatodextrose agar at 25°C for 3-5 days. acid producers'count (AP) on lactose purple agar at 37°C for48 h and psychrotrophic count (PS) on plate countagar at 7°C for 10 days. The market mango pulpsamples contatned large amount of sucrose andtherefore. the lactose was replaced by sucrose Inlactose purple agar for enumeration of acid producers.
Presence of two pathogens viz.. SA and SALwas also checked in 25 g sample as described byAPHA (1992). The staphylococci were detected bypre-enrichment of mango pulp sample in doublestrength tryptlcase soy broth. followed byenrichment In single strength trypticase soy brothand subsequently. streaking a loopful of the enrichedculture on baird parker agar (BPA). Similarly. forthe detection of SAL. first the sample was preenriched In lactose broth. and then enriched intetrathlonate broth followed by streaking onsalmonella-shigella agar as well as bismuth sulphiteagar. The typical colonies were picked up and wereexamined microscopically.

340
TABLE I. RESULTS OF' MICROBIAL COUNTS OF' MANGO PULPSAMPLES
Loose samples (log efu/g)
Standard plate count 5.98 9.08 7.51
Coliform count 3.13 6.58 4.57
Yeast count 4.64 6.96 5.21
Mold count 3.48 5.85 4.70
Yeast and mold 4.67 6.99 5.46
Acid producers count 4.40 8.22 6.76
Psychrotrophlc count 4.44 8.22 6.38
Tinned samples lefu/g)
Standard plate count I 205 62
Coliform count 0 0 0
Yeast count 0 5 2
Mold count 0 7 3
Yeast and mold 0 10 5
Acid producers count I 71 20
Psychrotrophic count 0 224 58
All counts were statistically significant (P<O.O 1)
The Isolates of SA obtained from the sampleswere purified by repeated streaking on BPA. Thepurified cultures were maintained by streaking onbrain heart infusion (BHI) agar slants. by incubatingat 37°C for 24 h followed by refrigerated storage.The isolates were activated and grown in BHI brothand were subjected to coagulase test using bothhuman as well as rabbit plasma as described byAPHA (1992).
The samples were analyzed for chemicalattributes like: total solids (TS). proteins. fat. ashand titratable acidity (as % citric acid) accordingto the methods preSCribed by AOAC (1990). Presenceof benzoic acid and coal-tar dyes were also checkedaccording to the method described by ICMR (1990).
The data obtained were analyzed statisticallyusing Two-Factor-Completely Randomized Design(Snedecor and Cochran 1967).
Results of microbial counts as well as grosschemical composition of loose and tinned mangopulp samples are given in Table I.
The SPC of the loose mango pulp samplesranged from 5.98 to 9.08 log cfu/g. Such typesof extremely high microbial counts In loose mangopulp samples can adversely affect the shelf life aswell as the product quality. The CC varied from3.13 to 6.58 log cfu/g. High CC Indicated unhygienicproduction conditions and even probable presenceof potent human enteric pathogens. The YC andMC showed variations from 4.67 to 6.99 log cfu/g.Among the two. the yeasts were higher In number.High sugar content (18-20°/0) and moderate acidity
Parameter Minimum MaJdmum Average
(0.19-{).36% as citric acid) may provide favourableenvironment for yeasts and molds. Therefore. theseorganisms can be one of the Important group ofspoilage mlcroflora of mango pulp. The AP was alsohigh. ranging from 4.40 to 8.22 log cfu/g. Thesesucrose fermenting microbes can rapidly grow inthe favourable environment and bring about spoilageof the product alongwith flavour defects likesourness. A large proportion of the microorganismscontributing to SPC could also grow at refrigerationtemperature as evident from psychrotrophic count.Presence of such high psychrotrophic count issuggestive of the potential of these microbes tospoil the product and shorten the shelf life evenunder refrigerated storage.
Detection of SA in all the 5 samples and SALin 3 samples is indicative of possible healthhazards associated with consumption of suchproducts. if stored under favourable conditions forthe growth of these pathogens. This is particularlyobjectionable because. the product enjoys Immensepopularity among the younger section of thesociety. In particular children. who could be themost vulnerable group of consumers.
The specifications for natural and sweetenedmango pulp under FPO Indicates total solublesolids not less than 12% and 15%. respectively.The minimum acidity for sweetened pulp shouldbe 0.3% as citric acid. There should not be anysign of bacterial growth. when the cans areincubated at 37°C and the product should notshow any positive pressure at sea level (FPO 1955.amended upto 31-3-1996). In the present study.one of the canned samples failed to show theminimum reqUired acidity. Even though. a smallnumber of microbes were associated with cannedsamples. no visual or organoleptic flavourdeterioration was observed. Specific microbiologicalstandards are yet to be formulated for suchproducts in India.
The average chemical composition of the loosemango pulp (Table 2) showed 20.38% (range 18.90to 22.22%) total solids. the major part of that beingfrom carbohydrates (ranging from 17.06 to 20.87%).In comparison to this. the tinned samples producedby different manufacturers had slightly higher totalsolids (average 25.68%) and carbohydrate (average24.19%). The proteins. fat as well as ash contentswere relatively low but almost comparable betweenloose and tinned samples. The acidity values(expressed as % citric acid) of the loose samples werelow and ranged from 0.19 to 0.36% (average 0.26%).
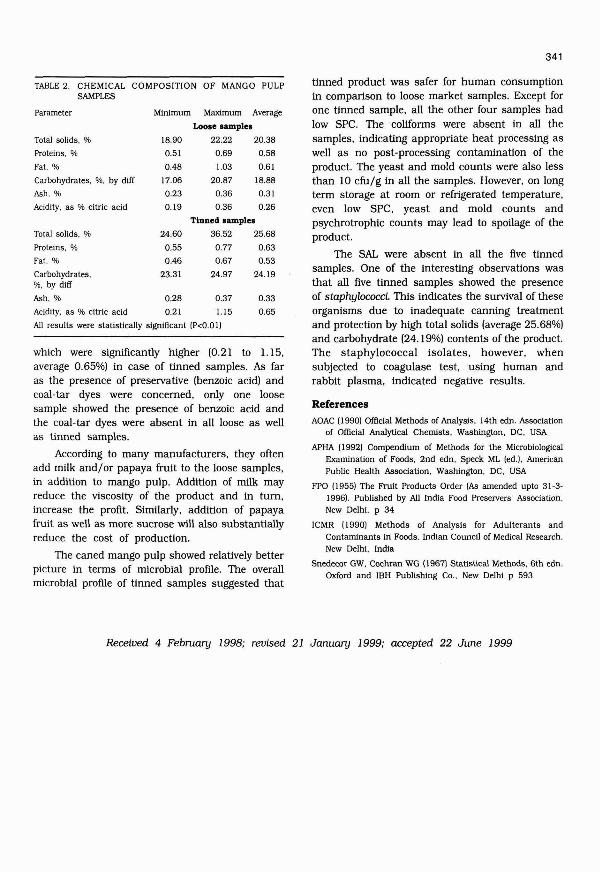
341
TABLE 2. CHEMICAL COMPOSITION OF MANGO PULPSAMPLES
which were Significantly higher (0.21 to 1.15.average 0.65%) in case of tinned samples. As faras the presence of preservative (benzoic acid) andcoal-tar dyes were concerned. only one loosesample showed the presence of benzoic acid andthe coal-tar dyes were absent in all loose as wellas tinned samples.
According to many manufacturers. they oftenadd milk and/or papaya fruit to the loose samples.in addition to mango pulp. Addition of milk mayreduce the viscosity of the product and in tum.increase the profit. Similarly. addition of papayafruit as well as more sucrose will also substantiallyreduce the cost of production.
The caned mango pulp showed relatively betterpicture in terms of microbial profile. The overallmicrobial profile of tinned samples suggested that
tinned product was safer for human consumptionin comparison to loose market samples. Except forone tinned sample. all the other four samples hadlow SPC. Thecollforms were absent in all thesamples. indicating appropriate heat processing aswell as no post-processing contamination of theproduct. The yeast and mold counts were also lessthan 10 cfu/g In all the samples. However. on longterm storage at room or refrigerated temperature.even low SPC. yeast and mold counts andpsychrotrophlc counts may lead to spoilage of theproduct.
The SAL were absent in all the five tinnedsamples. One of the Interesting observations wasthat all five tinned samples showed the presenceof staphylococci. This Indicates the survival of theseorganisms due to inadequate canning treatmentand protection by high total solids (average 25.68%)and carbohydrate (24.19%) contents of the product.The staphylococcal isolates. however. whensubjected to coagulase test. using human andrabbit plasma. indicated negative results.
ReferencesAOAC (1990) Official Methods of AnalysiS. 14th edn. Association
of Official Analytical Chemists. Washington. DC. USA
APHA (1992) Compendium of Methods for the MicrobiologicalExamination of Foods. 2nd edn. Speck ML (ed.), AmericanPublic Health Association. Washington. DC. USA
FPO (I955) The fruit Products Order (As amended upto 31-31996). Published by All India Food Preservers' Association.New Delhi. p 34
1CMR (I 990) Methods of Analysis for Adulterants andContaminants in Foods. Indian Council of Medical Research,New Delhi. India
Snedecor GW. Cochran WG (1967) Statistical Methods. 6th edn.Oxford and IBH Publishing Co.. New Delhi p 593
0.33
0.65
Maximum Average
Loose samples22.22 20.38
0.69 0.58
1.03 0.61
20.87 18.88
0.36 0.31
0.36 0.26
Tinned samples
36.52 25.68
0.77 0.63
0.67 0.53
24.97 24.19
18.90
0.51
0.48
17.06
0.23
0.19
24.60
0.55
0.46
23.31
Minimum
Total solids. %
Proteins. %
Fat. %
Carbohydrates. %. by dlff
Ash. %
Acidity. as % citric acid
Carbohydrates.%. by difT
Ash. % 0.28 0.37
Acidity. as % citric acid 0.21 1.15
All results were statistically significant (P<O.O I)
Parameter
Total solids. %
Proteins. %
Fat. %
Received 4 February 1998; revised 21 January 1999: accepted 22 June 1999
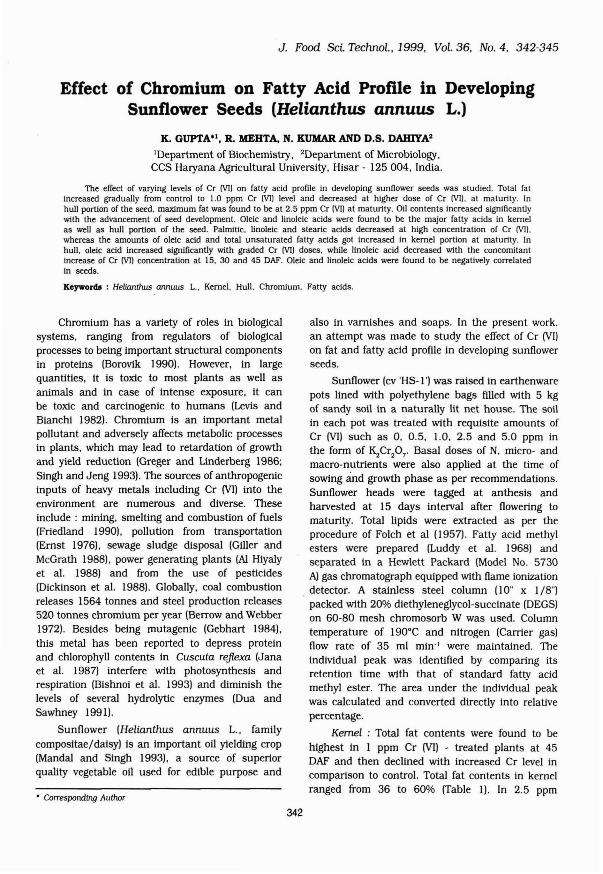
J. Food Sci. Technol., 1999, Vol. 36, No.4, 342-345
Effect of Chromium on Fatty Acid Profile in DevelopingSunflower Seeds (Helianthus annuus L.)
K. GUPTA"', R. MEHTA, N. KUMAR AND D.S. DAHIYA'
1Department of Biochemistry. 2Department of Microbiology.CCS Haryana AgIicultural University. Hisar - 125004. India.
The effect of varying levels of Cr (VI) on fatty acid profile in developing sunflower seeds was studied. Total fatIncreased gradually from control to 1.0 ppm Cr (VI) level and decreased at higher dose of Cr (VI). at maturity. Inhull portion of the seed. maximum fat was found to be at 2.5 ppm Cr (VI] at maturity. Oil contents increased significantlywith the advancement of seed development. Oleic and linoleic acids were found to be the major fatty acids In kernelas well as hull portion of the seed. Palmitic. linoleic and stearlc acids decreased at high concentration of Cr (VI).whereas the amounts of oleic acid and total unsaturated fatty acids got Increased In kernel portion at maturity. Inhull. oleic acid increased significantly with graded Cr (VI) doses. while linoleic acid decreased with the concomitantIncrease of Cr (VI) concentration at 15. 30 and 45 DAF. Oleic and linoleic acids were found to be negatively correlatedin seeds.
Keywords : Helianthus annuus L.. Kernel. Hull. Chromium. Fatty acids.
Chromium has a vanety of roles in biologicalsystems. ranging from regulators of biologicalprocesses to being important structural componentsin proteins (Borovik 1990). However, In largequantities, It is toxic to most plants as well asanimals and in case of intense exposure, It canbe toxic and carcinogenic to humans (Levis andBianchi 1982). Chromium is an important metalpollutant and adversely affects metabolic processesIn plants. which may lead to retardation of growthand yield reduction (Greger and Underberg 1986;Singh and Jeng 1993). The sources of anthropogenicInputs of heavy metals including Cr (VI) into theenvironment are numerous and diverse. Theseinclude : mining, smelting and combustion of fuels(Friedland 1990). pollution from transportation(Ernst 1976). sewage sludge disposal (Giller andMcGrath 1988). power generating plants (AI Hiyalyet al. 1988) and from the use of pesticides(Dickinson et al. 1988). Globally, coal combustionreleases 1564 tonnes and steel production releases520 tonnes chromium per year (Berrow and Webber1972). Besides being mutagenic (Gebhart 1984).this metal has been reported to depress proteinand chlorophyll contents in Cuscuta re.fl.exa (Janaet al. 1987) interfere with photosynthesis andrespiration (Bishnol et al. 1993) and diminish thelevels of several hydrolytic enzymes (Dua andSawhney 1991).
Sunflower (Helianthus annuus L., familycomposltae/daisy) Is an important 011 yielding crop(Mandal and Singh 1993), a source of supeIiorquality vegetable 011 used for edible purpose and
• Corresponding Author
342
also in varnishes and soaps. In the present work.an attempt was made to study the effect of Cr (VI)
on fat and fatty acid profile in developing sunflowerseeds.
Sunflower (cv 'HS-I ') was raised in earthenwarepots lined with polyethylene bags filled with 5 kgof sandy soil in a naturally lit net house. The soilin each pot was treated with requisite amounts ofCr (VI) such as 0, 0.5, 1.0, 2.5 and 5.0 ppm inthe form of K,Crp7' Basal doses of N. mlcro- andmacro-nutIients were also applied at the time ofsowing and growth phase as per recommendations.Sunflower heads were tagged at anthesis andharvested at 15 days Interval after flowering tomatuIity. Total lipids were extracted as per theprocedure of Folch et al (1957). Fatty acid methylesters were prepared (Luddy et al. 1968) andseparated In a Hewlett Packard (Model No. 5730A) gas chromatograph eqUipped with flame ionizationdetector. A stainless steel column (10" x 1/8")packed with 20% diethyleneglycol-succinate (DEGS)on 60-80 mesh chromosorb W was used. Columntemperature of 190·C and nitrogen (Carrier gas)flow rate of 35 ml min' l were maintained. TheIndividual peak was Identified by companng itsretention time with that of standard fatty acidmethyl ester. The area under the individual peakwas calculated and converted directly into relativepercentage.
Kernel : Total fat contents were found to behighest In I ppm Cr (VI) - treated plants at 45DAF and then declined with Increased Cr level incompanson to control. Total fat contents in kernelranged from 36 to 60% (Table I). In 2.5 ppm

TABLE I. EFFECT OF Cr (VI) ON FAT CONTENT OF KERNELAND HULL IN SUNFLOWER SEEDS (%)
OAF Treatment. Total fatppm
Kernel Hull
15 Control 38.00 15.00
0.5 36.00 13.00
1.0 40.00 11.00
2.5
5.0 '
SEM± 0.60 0.62
30 Control 46.00 14.00
0.5 43.00 13.00
1.0 42.00 13.00
2.5 36.00 11.00
5.0
SEM± 0.81 0.64
45 Control 56.00 15.00
0.5 57.00 14.00
1.0 60.00 19.00
2.5 54.00 20.20
5.0 49.00 11.00
SEM± 0.72 0.81
CD, Stages 1.04 1.43
CD, Treatments 1.04 1.43
CD, Stages x Treatments 1.81 2.49
OAF - Days after flowertng; CD (P>0.05); n;3
Cr-treated plants, total fat In kernel decreased by21. 7 and 3.5% over control at 30 and 45 OAF,respectively. With the advancement In seeddevelopment, total fat Increased significantly. Singh.et al. (1988) reported that photosynthates werebeing utilized for protein synthesis In the earlystages of seed development and subsequently foroil synthesis. At maturity, oil content was foundto be positively correlated with seed yield. Ahmedet al (1991) also reported the similar correlationof oil and seed yield. Linoleic and oleic acids werefound to be the major fatty acids (Table 2).Melgarejo et al (1995) also reported oleic andlinoleic acids to be the major fatty acids Insunflower 011. Palmitic and stearic acids Increasedsignificantly at 0.5 ppm level and decreased athigher levels of Cr (VI) at 15 OAF. However, oleicacid and total unsaturated fatty acids increasedsignificantly from control to 2.5 ppm Cr (VI) level.Significant decrease occurred in oleic acid and totalunsaturated fatty acids at 2.5 ppm Cr (VI) at 30OAF, while palmitic and stearic acid contentsincreased. Linoleic acid Increased at low Cr (VI)concentration and started decreasing at highconcentrations at 15, 30 and 45 OAF. At maturity,
343
palmitic, stearic and linoleic acids decreasedsignificantly at 5.0 ppm Cr (VI) level, but oleic acidand total unsaturated fatty acids Increased incomparison to control. The present results showedpalmitic acid was maximum at 15 OAF and linoleicacid was maximum at later stages. This Increasemay be expected as the short chain saturated fattyacids act as Intermediates In the biosynthesis ofhigher unsaturated fatty acids (Kannangara et al.1973). Aggarwal (1989) reported increase in fattyacids could be either due to Increased activity oflipases, which degrade total lipids Into free fattyacids and glycerol or increased degradation of otherlipids. Palmitic acid was found to be positivelycorrelated with linoleic acid and total unsaturatedfatty acids, while It was negatively correlated withstearic and oleic acids. Oleic and linoleic acidswere found to be negatively correlated. Goyne etal (1979), Tremoliers et al (1982) and Gupta (1990)also reported negative correlation between oleicand linoleic acids in developing seasame seeds.
Hull : In hull portion of seed, total fat rangedfrom 1I to 20% and was maximum at 45 OAF at
TABLE 2. EFFECT OF Cr (VI) ON FATlY ACID PROFILE OFKERNAL OF SUNFLOWER SEEDS (RELATIVEPERCENTAGE)
OAF Treatment. C16:0 C18:0 C 18:1 C18:2 Totalppm unsatu-
ratedfatty acids
15 Control 8.92 4.51 19.80 66.76 86.56
0.5 9.99 8.24 14.86 66.92 81.77
1.0 4.77 2.49 20.31 72.42 92.73
2.5 6.50 3.72 39.72 50.06 89.12
5.0
SEM± 0.85 0.94 0.89 0.96 1.65
30 Control 8.17 2.76 15.07 73.99 89.07
0.5 8.36 0.70 9.41 81.53 90.94
1.0 8.21 6.38 20.06 65.35 85.41
2.5 8.65 4.35 12.93 73.82 86.75
5.0
SEM± 0.16 0.85 1.59 2.37 1.36
45 Control 5.39 0.77 22.02 69.82 91.84
0.5 5.44 2.64 31.02 60.90 91.92
1.0 6.09 2.03 15.14 76.74 91.88
2.5 4.54 3.10 23.19 69.16 92.35
5.0 4.46 2.14 36.55 56.85 93.40
SEM± 0.20 0.26 2.32 2.31 0.50
CD, Stages 0.75 0.10 1.05 1.05 ?56
CD, Treatments 0.75 0.10 1.05 1.05 2.56
CD, Stages x 1.30 1.73 1.81 1.82 4.43Treatments
OAF - Days after flowertng; CD (P>0.05); n;3

344
TABLE 3. EFFECT OF Cr (VI) ON FATlY ACID PROFILE OFHULL OF SUNFLOWER SEEDS (RELATIVEPERCENTAGE)
DAF Treatment. C16•oppm
Control 7.04
0.5 8.82
1.0 10.94
2.5 15.05
5.0
CIS., Totalunsatu
ratedfatty acids
concentrations at 15 and 30 OAF (except 0.5 ppmat 30 OAF) but at maturity, significant decreaseswere found at all Cr (VI) treatments in comparisonto control. Palmitic and stearic acids decreasedwith advancement of seed development, while oleic,linoleiC and total unsaturated fatty acids weremaximum at maturity among the controls. Linoleicand oleic acids were found to be negativelycorrelated. Stearic acid was positively correlatedwith palmitic and oleic acids, while it was negativelycorrelated with linoleic acid and total unsaturatedfatty acids.1.18
78.17
83.82
84.76
81.48
2.98
71.83
52.94
69.23
64.81
3.61
6.34
30.88
15.56
16.67
1.61
14.79
7.35
4.27
3.47
0.63SEM±
15
2.5 ppm Cr (Table 1). Total fat significantly decreasedin hull with increasing Cr concentration at 15 and30 OAF. At maturity, total fat increased at lowconcentration of applied Cr and decreasedsignificantly at 5 ppm. Similarly, In hull, oleic acidand linoleic acid were found to be the major fattyacids (Table 3). With increasing Cr (VI)concentrations, palmitic and oleic acids Increasedsignificantly, while stearic and linoleiC acid contentsdecreased but maximum decrease in linoleic acid(52.94%) occurred at 0.5 ppm Cr (VI) at 15 OAF.Palmitic acid increased at 0.5 ppm and thereafter,decreased with concomitant increase of Cr (VI)concentration at 30 OAF but at maturity, It wasfound to increase at all Cr (VI) treatments ascompared to control. Stearic acid content decreasedfrom 3.99 (control) to 3.43% (2.5 ppm) at 30 OAF,and Increased from 0.49 (control) to 3.84% (5.0ppm) at maturity. Oleic acid Increased at all Cr(VI) treatments at 30 and 45 OAF, whereas linoleicacid reduced with the Increase of Cr (VI)concentration at 30 and 45 OAF, Total unsaturatedfatty acids Increased with increase of Cr (VI)
ReferencesAggarwal M (1989) Effect of cadmium on growth and chemical
composition of sunflower (Helianthus annuus L.J. M.Sc.Thesis. Haryana Agricultural University, Hisar
Ahmed g. Rana MA. Slddlque SUH (1991) Sunflower seed yieldas influenced by some agronomic and seed characters.Euphytica 56: 137-142
Al-Hiyaly BA. McNeilly T, Bradshaw AD (1988) The effects ofzinc contamination from electricity pylons-evolution in areplicated situation. New Phytol 110: 571-580
Berrow ML. Webber J (1972) Trace elements In sewage sludged.J Sci Food Agrlc 23: 93-100
Bishnoi NR. Chugh LK. Sawhney SK (1993) Effect of Cr onphotosynthesis. respiration and nitrogen fixation in pea(Piswn sativwn L.) seedlings. J Plant Physlol 142: 25-30
Borovik AJ (1990) Characteristics of metals In biological systems.In: Shaw. AJ (ed). Heavy Metal Tolerance in PlantEvolutionary Aspects. CRC Press. Boca, Raton, Floridapp 3-6
Dickinson NM, Lepp NW, Surtan GTK (1988) Lead and potentialhealth risks from subsistence food crops in urban Kenya.Environ Geochem Health 9(2): 37-42
Dua A, Sawhney SK (1991) Effect of chromium on activities ofhydrolytic enzymes In germInating pea seeds. Environ ExpBot 31: 133-139
Ernst WHO (1976) Physiological and biochemical aspects of metalpollution. In: Mansfleld, TA (ed). Effects of Air Pollutants onPlants, Cambridge University Press, Cambridge pp 115-133
Folch J, Lees M. Stanley GHS (1957) A simple method for theIsolation and puriflcation of total lipids from animal tissues.J BIoI Chern 226: 497-509
Friedland AJ (1990) Movement of metals through soils andecosystems. In: Shaw AJ led). Metal Tolerance In Plants:Evolutionary Aspects. CRC press, Boca Raton, Florida pp 2232
Gebhart F, Mutagenitat Karzinogenltat, Tetragenitat (1980) In:Merlan E (ed) Metalle in der Umwelt. Verlag Chemie,Welnhelm pp 237-247
Giller KE. McGrath SP (1988) Pollution by toxlc metals onagricultural soils. Nature. 335: 676
Goyne PJ. Simpson BW, Woodruff DR, Churchett JD (1979)Environmental Influence on sunflower achene growth. oilcontent and oil quality. Aust J Exp Agrtc Antm Husb 19:82-88
1.55
1.55
2.68
0.75
96.55
88.18
87.24
90.91
89.42
1.49
82.68
79.69
83.36
83.53
1.51
1.51
2.62
0.73
83.66
69.09
70.96
51.58
64.00
2.36
70.49
66.15
69.82
70.60
1.51
1.51
2.62
0.47
12.18
13.54
13.53
12.93
12.90
19.09
16.28
39.33
25.42
1.02
1.24
1.24
2.14
3.99
2.90
4.97
3.42
0.49
2.73
5.24
2.51
3.84
0.73
0.510.90
2.95
9.09
7.52
6.58
6.75
0.95
Control 13.32
0.5 17.41
1.0 11.67
2.5 13.04
5.0
SEM±
Control
0.5
1.0
2.5
5.0
SEM±
45
30
CD l Stages 0.94
CD, Treatments 0.94
CD, Stages x 1.63Treatments
DAF - Days after flowering; CD (P>0.05); n=3

Greger M. Underberg S (1986) Effect of Cd" and EDTA on youngsugar beets (Beta vulgaris). Cd" uptake and sugaraccumulation. Plant Physiol 66: 69-74
Gupta SK (1990) Moisture. dry weight and lipid composition asinfluenced by capsule position in developing seeds of sesame(Sesamwn indicwn L.). J Oilseeds Res 7: 10-15
Jana S. Dalal T. Barma B (1987) Effects and relative toxicityof heavy metals on Cuscuta rejlexa. Water Air Soil Pollut33: 23-28
Kannangara CG. Jackobson BS. Stumpf PK (1973) In vivo
biogenesis of linolenic acid in plants. Biochem Biophys ResCommun 52: 648
Levis AG. Bianchi V (1982) Mutagenic and cytogenic effects ofchromium compounds. In: Langard S (ed), Biological andEnvironmental Aspects of Chromium. Elsevier. Amsterdamp 171
Luddy FE. Barford RA. Herb SF. Paul M (1968) A rapidquantitative procedure for the preparation of methyl esters
345
of butter fat and other fats. J Am Oil Chem Soc 45: 549552
Mandai S. Singh R (1993) Oil and protein contents in sunflowergenotypes. J Oilseeds Res 10(1): 161-162
MelgareJo P. Salazar DM. Amoros A (1995) Total lipid contentand fatty acid composition of seed oils from six pomegranatecultlvars. J Sci Food Agric 69: 253-256
Singh BR. Jeng AS (1993) Uptake of Zn. Cd. Hg. Pb. Cr andNi by rye grass grown in a sandy soil. Norwegian J AgricSci 17: 147-157
Singh SP. Singh V. Singh PP 11988) Characterization of oil andprotein dynamics in developing sunflower (Helianthus annuusL.) seeds. J Oilseeds Res 5: 77-79
Tremollers A. Dubacq JP. Drapier D (1982) Unsaturated fattyacids in maturing seeds of sunflower and rape. Regulationby temperature and light intensity. Phytochem 24: 41-45
Received 12 February 1998: revised 19 November 1998: accepted 22 June 1999
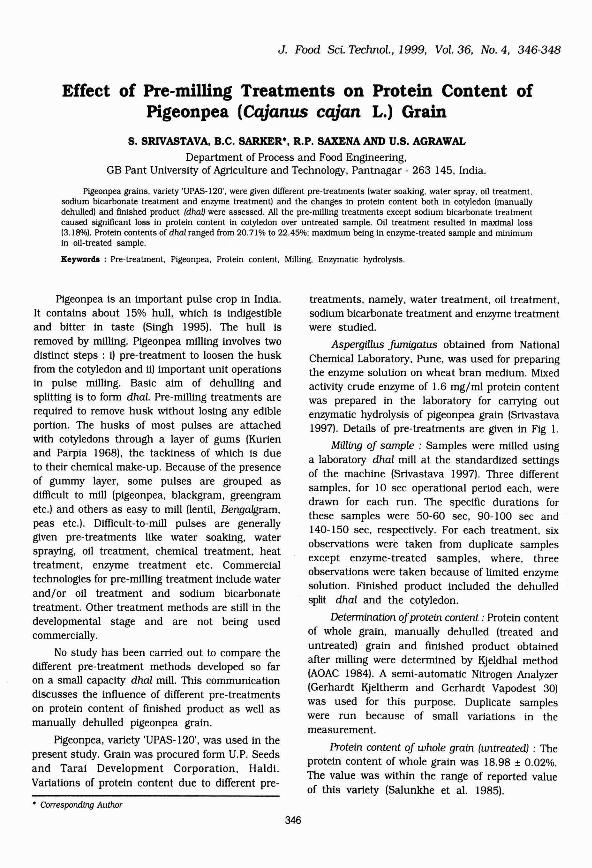
J. Food Sci. Techno!., 1999. Vol. 36. No.4. 346-348
Effect of Pre-milling Treatments on Protein Content ofPigeonpea (Cajanus cajan L.) Grain
S. SRIVASTAVA, B.C. SARKER·. R.P. SAXENA AND U.S. AGRAWAL
Department of Process and Food Engineering.GB Pant University of Agriculture and Technology. Pantnagar - 263 145. India.
Pigeonpea grains. variety 'UPAS-120', were given different pre-treatments (water soaking. water spray. 011 treatment.sodium bicarbonate treatment and enzyme treatment) and the changes In protein content both In cotyledon (manuallydehulled) and finished product (dhaij were assessed. All the pre-mllllng treatments except sodium bicarbonate treatmentcaused significant loss In protein content In cotyledon over untreated sample. Oil treatment resulted In maximal loss(3.18%). Protein contents of dhal ranged from 20.71% to 22.45%: maximum being In enzyme-treated sample and minimumIn oil-treated sample.
Keyword. : Pre-treatment, Pigeonpea, Protein content. MllIing, Enzymatic hydrolysis.
Pigeonpea is an important pulse crop in India.It contains about 15% hull. which is indigestibleand bitter in taste (Singh 1995). The hull Isremoved by milling. Pigeonpea milling involves twodistinct steps : i) pre-treatment to loosen the huskfrom the cotyledon and ii) important unit operationsin pulse milling. Basic aim of dehulling andsplitting is to form dhal. Pre-milling treatments arerequired to remove husk without losing any edibleportion. The husks of most pulses are attachedwith cotyledons through a layer of gums (Kurienand Parpia 1968), the tackiness of which is dueto their chemical make-up. Because of the presenceof gummy layer. some pulses are grouped asdifficult to mill (pigeonpea. blackgram. greengrametc.) and others as easy to mill (lentil. Bengalgram.peas etc.). Difficult-to-mill pulses are generallygiven pre-treatments like water soaking. waterspraying. 011 treatment, chemical treatment. heattreatment. enzyme treatment etc. Commercialtechnologies for pre-milling treatment include waterand/or 011 treatment and sodium bicarbonatetreatment. Other treatment methods are still In thedevelopmental stage and are not being usedcommercially.
No study has been carried out to compare thedifferent pre-treatment methods developed so faron a small capacity dhal mill. This communicationdiscusses the influence of different pre-treatmentson protein content of finished product as well asmanually dehulled plgeonpea grain.
Plgeonpea. variety 'UPAS-120'. was used in thepresent study. Grain was procured form U.P. Seedsand Taral Development Corporation. Haldl.Variations of protein content due to different pre-
• Corresponding Author
346
treatments. namely. water treatment. 011 treatment,sodium bicarbonate treatment and enzyme treatmentwere studied.
Aspergillus fumigatus obtained from NationalChemical Laboratory. Pune. was used for preparingthe enzyme solution on wheat bran medium. Mixedactivity crude enzyme of 1.6 mg/ml protein contentwas prepared In the laboratory for canylng outenzymatic hydrolysis of pigeonpea grain (Srivastava1997). Details of pre-treatments are given in Fig 1.
Milling oj sample : Samples were milled usinga laboratory dhal mill at the standardized settingsof the machine (Srivastava 1997). Three differentsamples. for 10 sec operational period each. weredrawn for each run. The speCific durations forthese samples were 50-60 sec. 90-100 sec and140-150 sec. respectively. For each treatment, sixobservations were taken from duplicate samplesexcept enzyme-treated samples. where. threeobservations were taken because of limited enzymesolution. Finished product Included the dehulledsplit dhal and the cotyledon.
Determination ojprotein content: Protein contentof whole grain. manually dehulled (treated anduntreated) grain and finished product obtainedafter milling were determined by Kjeldhal method(AOAC 1984). A semi-automatic Nitrogen Analyzer(Gerhardt Kjeltherm and Gerhardt Vapodest 30)was used for this purpose. Duplicate sampleswere run because of small variations In themeasurement.
Protein content oj whole grain (untreated) : Theprotein content of whole grain was 18.98 ± 0.02%.The value was within the range of reported valueof this variety (Salunkhe et al. 1985).

347
dting
j
Conditioning
Mixing with 10 %NaHCO] Solution (20:1grain to solution ratio)
j
Deaning and grading
p' tt .Water spraYJng
(20:1 grain waterratio)
~Conditioning (5h) Mixing with linseed Mixing with enzyme
oil (@ 300 glq of solution (26.6% moisturegrain) content JO.7g Iq grain
j .",m. 'r.........)Sun drying (3days) Moisture equilibriation! (24h)
Spraying with water FermentatioJ (43 ·C, 13h)(3%) I..l..-__--L- t-- J,
Heaping(16h)
ISoaking inwater (5h)
1Straining
Drying (65 ·C, Finalmoisture content 10%)
~ngWater
soakingWater spraying Sodium bicarbonate Oil treatment Enzyme treatment
Fig. I. Flow diagram for various pre-treatments of pigeonpea grain
TABLE I. PROTEIN CONTENT OF TREATED AND UNTREATEDGRAIN
Treatment effect on protein content
a) Manually dehulled grain : Protein contentsof manually dehulled treated grain samples (TableI) ranged from 23.30% to 25.60%. The maximumprotein content was in control sample and minimumin oil-treated sample. In case of water soakingmethod, there was about 2.3% reduction in proteincontent over control which may be attIibuted tosolubilization of protein in water. Srivastava et al(1988) and Mayande (1987) also reported reductionin protein content in water-soaked samples. Therewas maximum loss (3.18%) of proteins in oiltreated samples.' This might be attributed to the
Treatments
Untreated !control)
Water soaking
Water spray
Oil
Sodium bicarbonate
Enzyme
CD at 5%
Protein content. %Manually dehulled Finished product
25.60 ± 0.16 21.87 ± 0.23
23.30 ± 0.23 21.12 ± 0.03
24.65 ± 0.12 21.30 ± 0.02
22.42 ± 0.18 20.71 ± 0.03
25.28 ± 0.16 21.89 ± 0.10
24.73 ± 0.08 22.45 ± 0.03
0.47 0.37
action of oil on the protein embedded in the lipidbi-Iayer of the seed membrane (Saxena 1985). Thisaction might have dislocated the protein from themembrane attached to the cotyledon. Sodiumbicarbonate treatment did not Significantly changethe protein content (Table 1).
b) Finished product : The protein content offinished product was maximum (22.45%) in enzymetreated sample and minimum (20.71%) in oiltreated sample (Table 1). Based on critical difference,It could be mentioned that all the pre-treatmentsexcept sodium bicarbonate caused significantvariation in protein content over control. The mostsignificant difference was between control and oiltreated samples. Loss of protein content due tomilling was maximum (3.73%) in control sampleand minimum (1.71%) in oil-treated sample. Theloss In protein content due to milling was becauseof removal of outer surlace of the cotyledon (Saxena1985). The minimum protein loss in oil-treatedsample may be due to slight removal of outersurlace of cotyledon and increased hardness asevidenced from low finished product recovery.Percent finished product recovery values of 44.82,57.12, 65.17, 64.38, 69.70 and 74.74 were obtained

348
for untreated. water-soaked. water sprayed. oiltreated. sodium bicarbonate-treated and enzymetreated samples. respectively (Srivastava 1997).
ReferencesAOAC (990) Official Methods of Analysis. 13th edn. Association
of Official Analytical Chemists. Washington DC
Kurien PP. Parpla HAB (968) Pulse milling In India. J FoodSci Technol 56: 203-207
Mayande VM (987) Plgeonpea milling technology : Biochemicaland engineering studies. M Tech Thesis. G.B. Pant Universityof Agriculture and Technology. Pantnagar. India.
Salunkhe DR, Kadarn SS. Chavan JK (985) Post-harvestBiotechnology of Food Legumes. CRC Press Inc.. Florida. USA
Saxena RP (985) Mtlling of plgeonpea (Cqjanus cqjan L.) andassociated aspects. Ph.D Thesis. G.B. Pant University ofAgriculture and Technology. Pantnagar. India
Singh U (1995) Methods for dehulling of pulses: A criticalappraisal. J Food Sci Technol 32: 81-93
Srivastava S (997) Comparison of various pre-mtlling treatmentsof plgeonpea (Cqjanus cqjan L.) grain on a laboratory dha1
mill. M. Tech Thesis. G.B. Pant Unlveslty of Agriculture andTechnology. Pantnagar. India
Srivastava V. Mlshra DP. Laxhml Chand. Gupta RK. Singh BPN(988) Influence of soaking on various biochemical changesand dehusklng efficiency In pigeonpea (Cqjanus cajan L.)
seeds. J Food Sci Technol 26: 120-125
Received 26 June 1998; revised 28 October 1998; accepted 23 Jwte 1999

J. Food. Sci. Techno!.. 1999. Vo!. 36. No.4. 349-351
Changes in Some Water Soluble Vitamins During Preparationand Storage of Khaa
RAJAN SHARMA' AND DARSHAN LAL"
Dairy Chemistry and Microbiology Section.National Dairy Research Institute. Adugodi. Bangalore - 560030. India.
"Dairy Chemistry Division.National Dairy Research Institute. Karnal - 132001, India.
Conversion of milk Into khoo caused considerable losses of water-soluble vitamtns. These losses were 23.61. 14.46.21.28. 33.06 and 35.15 % for thiamine. riboflavin. vitamin B•. folic acid and vitamin C. respectively. During storageci khoo for 24 h at room temperature. a general decrease In water-soluble vitamins was observed. The losses in vitaminB, and vitamin C in khoo stored under light were 16.35 and 8.16%. respectively. The corresponding values for khoostored under darkness were 1.37 and 4.28%. Other vitamins were not aflected by the storage of khoo under light.
Keywords: Khoa. Thiamine. Riboflavin. Vitamin B•. Folic Acid. Vitamin C.
Khoa is' an important indigenous. heatcoagulated and partially dehydrated milk product.During preparation of khoa, milk is heated in anopen pan under atmospheric conditions withcontinuous stirring and scrapping. The fluorescentlight is generally used for illumination of displaycases (cabinets) for milk products. thereby exposingIre khoa am khoa-based sweets to light for aconsiderable period of time. Such kind of heatprocessing of milk dUring preparation of khoa andsubsequent exposure to light may lead toconsiderable vitamin losses. Therefore, the changestaking place in some water-soluble vitamins (vitaminsB,. B
2• B
6, folic acid and vitamin C) during the
conversion of milk into khoa and subsequentexposure to fluorescent light were studied.
Buffalo milk was standardized (fat:5.0-5.5%;SNF:8.8-9.01. using buffalo skim milk and convertedinto khoa (De 1980). The moisture content in khoawas 36.40%. Representative samples of standardizedmilk and khoa were collected and stored to preventexposure to light at -SoC In a deep-freezer. untilanalyzed.
To study the effect of light on changes Inwater-soluble vitamins during storage. Khoaobtained as above was taken in an aluminium tray(19 x 28 cm) and spread uniformly so as to forma layer of one Inch thickness and stored at roomtemperature (l8-2S0C) in winter season (NovemberDecember) for 24 h in a chamber fitted withfluorescent tube (2440 lumens) at a height of onefeet above the tray containing khoa. Simultaneously,control samples of khoa were stored in dark undersimilar conditions. Analysis of water-soluble
• Correspondlng Author
349
vitamins was done before and after exposure ofkhoa to light.
Thiamine was determined fluorometrically inthe UV-vis spectrophotometer (Varian-Cary 3 ModeJ)using excitation (364 nm) and emission (435 nm)filters. The vitamin was enzymatically liberatedfrom milk and milk products according to Kirk(1974) and the liberated vitamin was determinedfluorometrically according to Freed (1966). Riboflavinwas determined by fluorometric method of Rashidand Potts (1980) using excitation (436 nm) andemission (S IO nm) filters. Vitamin B
6was assayed
microbiologically using Saccharomyces carlbergensisNCIM 4228 according to Freed (1966). Sample wasextracted for assay as described by Gregory (19S9).Folic acid was determined microbiologically usingLactobacillus casei ATCC 7469 according to Freed(1966). Samples were extracted for assay asdescribed by Ford (1967). Total vitamin C. ascorbicacid and dehydroascorbic acid in milk productswere determined fluorometrically according to AOAC(1990) procedure. incorporating the modificationssuggested by Christie (197S) and Haddad andLoewenstein (1983). The contents of all the watersoluble vitamins in Initial milk as well as Khoawere calculated on total solids (TS) basis and thestatistical analysis of the data was done accordingto Snedecor and Cochran (1994).
The level of water-soluble vitamins in khoa ascompared with that of initial milk on dry matterbasis decreased substantially. indicating that theheat treatment involved dUring conversion of milkinto khoa caused significant losses (p<O.O I) ofthese vitamins (Table 1). These losses were 23.61%for thiamine. 14.46% for riboflavin. 21.28% for
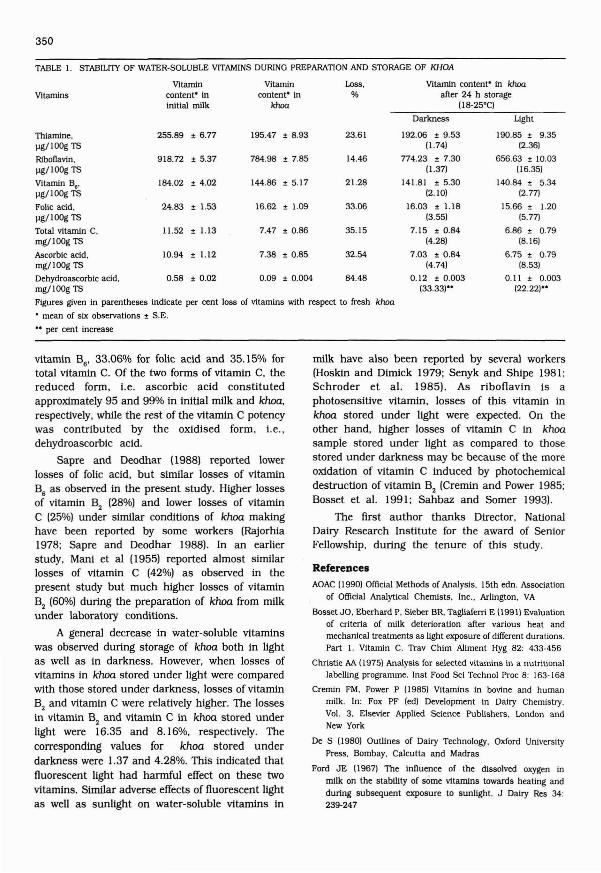
350
TABLE I. STABILnY OF WATER-SOLUBLE VlTAMlNS DURING PREPARATION AND STORAGE OF KHOA
VItaminsVitamin
content'ininitial milk
Vitamincontent· in
khoa
Loss,%
Vitamin content' in khoaafter 24 h storage
(l8-25'C)
Thiamine. 255.89 :!: 6.77 195.47 :!: 8.93 23.61Ilg/l00g TSRiboflavin. 918.72 :!: 5.37 784.98 :!: 7.85 14.461lg/IOOg TS
VItamin B., 184.02 :!: 4.02 144.86 :!: 5.17 21.281lg/IOOg TS
Folic acid. 24.83 :!: 1.53 16.62 :!: 1.09 33.06Ilg/IOOg TSTotal vitamin C, 11.52 :!: 1.13 7.47 :!: 0,86 35.15mg/100g TS
Ascorbic acid, 10.94 :!: 1.12 7.38 :!: 0.85 32.54mg/lOOg TS
Dehydroascorbic acid. 0.58 :!: 0.02 0.09 :!: 0.004 84.48mg/IOOg TS
Figures gtven in parentheses indicate per cent loss of vitamins with respect to fresh khoa
, mean of six observations:!: S.E.
•• per cent increase
Darkness
192.06 :!: 9.53(1.74)
774.23 :!: 7.30[1.37)
141.81 :!: 5.30(2.10)
16.03 :!: 1.18[3.551
7.15 :!: 0.84(4.28)
7.03 :!: 0.84[4.74)
0.12 :!: 0.003(33.33)"
Light
190.85 :!: 9.35[2.36)
656.63 :!: 10.03(16.35)
140.84 :!: 5.34[2.77)
15.66:!: 1.20(5.77)
6.86 :!: 0.79[8.161
6.75 :!: 0.79[8.53)
0.11 :!: 0.003[22.22}"
vitamin B6
, 33,06% for folic acid and 35.15% fortotal vitamin C. Of the two forms of vitamin C, thereduced form. I.e, ascorbic acid constitutedapproximately 95 and 99% in initial milk and khoa,respectively, while the rest of the vitamin C potencywas contributed by the oxidised form, I.e.,dehydroascorbic acid.
Sapre and Deodhar (1988) reported lowerlosses of folic acid, but similar losses of vitaminB
6as observed In the present study. Higher losses
of vitamin B2
(28%) and lower losses of vitaminC (25%) under similar conditions of khoo. makinghave been reported by some workers (Rajorhla1978; Sapre and Deodhar 1988). In an earlierstudy. Mani et al (1955) reported almost similarlosses of vitamin C (42%) as observed In thepresent study but much higher losses of vitaminB
2(60%) dUring the preparation of khoa from milk
under laboratory conditions.
A general decrease In water-soluble vitaminswas observed dUring storage of khoa both in lightas well as In darkness. However, when losses ofvitamins in khoa stored under light were comparedwith those stored under darkness, losses of vitaminB2 and vitamin C were relatively higher. The lossesin vitamin B2 and vitamin C in khoa stored underlight were 16,35 and 8,16%, respectively. Thecorresponding values for khaa stored underdarkness were 1.37 and 4.28%. This indicated thatfluorescent light had harmful effect on these twovitamins. Similar adverse effects of fluorescent lightas well as sunlight on water-soluble vitamins in
milk have also been reported by several workers(Hoskin and Dimick 1979; Senyk and Shipe 1981;Schroder et al. 1985). As riboflavin Is aphotosensitive vitamin. losses of this vitamin Inkhoa stored under light were expected. On theother hand. higher losses of vitamin C in khoasampie stored under light as compared to thosestored under darkness may be because of the moreoxidation of vitamin C induced by photochemicaldestruction of vitamin B2 (Cremin and Power 1985;Bosset et al. 1991; Sahbaz and Somer 1993).
The first author thanks Director, NationalDairy Research Institute for the award of SeniorFellowship. dUring the tenure of this study.
ReferencesAOAC (1990) Official Methods of Analysis, 15th edn. Association
of Official AnalytIcal Chemists, Inc., Arlington, VA
BossetJO. Eberhard P. Sieber BR Tagllafeni E (1991) Evaluationof criteria of milk deterioration after various heat andmechanical treatments as light exposure of dIfferent durations.Part I. Vltamin C. Trav Chim Aliment Hyg 82: 433-456
Christie AA (1975) Analysis for selected vitamins in a nutritionallabelling programme. Inst Food Sci Technol Proc 8: 163-168
Cremin FM, Power P (1985) Vitamins in bovine and humanmilk. In: Fox PF (ed) Development in Dairy ChemiStry.Vol. 3, Elsevier Applied Science Publishers, London andNew York
De S (1980) OutlInes of Dairy Technology, Oxford UniversityPress. Bombay, Calcutta and Madras
Ford JE (1967) The influence of the dIssolved oxygen inmilk on the stability of some vitamins towards heating andduring subsequent exposure to sunlight. J Dairy Res 34:239-247

Freed M (1966) Methods of Vitamin Assay. 3rd edn. IntersciencePublishers. New York
Gregory ME (1959) The effect of heat on vitamin B. of milk.J. Microbiological tests. J Dairy Res 26: 203-214
Haddad GS. Loewenstein M (1983) Effect of several heattreatments and frozen storage on thiamine. riboflavin. andascorbic acid contents of milk. J Dairy Sci 66: 1601-1605
Hoskin JC. Dimick PS (1979) Evaluation of fluorescent light onflavour and riboflavin content of milk held In gallonreturnable containers. J Food Prot 42: 105-109
Kirk JR (1974) Automated method for the analysis of thiaminein milk. with application to other selected foods. J AssocOff Anal Chern 57: 1081-1084
Mani GS. Lily G. Balasubramanian SC. Basu KP (1955)Composition and nutritive value of some Indigenous milkproducts. Indian J Med Res 43: 237-242
Rajorhia GS (1978) Studies on the technology of khoa. Ph.DThesis. Agra University. Agra. India
351
Rashid I. Potts D (1980) Riboflavin determination in milk. J FoodSci 45: 744-745
Sahbaz F. Somer G (1993) Photo-sensitized decomposition ofascorbic acid in the presence of riboflavin. Food Chern 46:177-182
Sapre M. Deodhar AD (1988) Retention of milk vitamins duringkhoa preparation. Indian J Dairy Sci 41: 380-382
Schroder MJA. Scott KJ. Bland MA. Bishop DR (1985) Flavourand vitamin stability in pasteurised milk in polyethylenecoated carions and in polyethylene bottles. J Soc DairyTechnol 38: 48-52
Senyk GF. Shipe WF (1981) Protecting your milk from nutrientlosses. Dairy Field 164: 81-85
Snedecor. GW. Cochran WG (1994) Statistical Methods - 8thedn. East West Press. Iowa State University Press. Ames.Iowa. USA
Received 14 March 1998; revised 16 April 1999; accepted 23 June 1999
J. Food Sci. Technol., 1999, Vol. 36, No.4, 352-354
Effect of Temperature on Rheological Characteristics ofGreen Chilli Puree
JASIM AHMED'·, H. GANGOPADHYA2 AND U.S. SHIVHARE'
'Department of Food Science and Technology,Guru Nanak Dev University, Amritsar-143 005, India.
'Department of Food Technology and Biochemical Engineering.Jadavpur University, Calcutta-700 032, India.
The rheologJcaI properties of green chlll; puree were studied at a temperature range of -5 to 70'C at a shearrate of 10 to 100 rpm. Results Indicated that the power law model fitted well the shear stress-shear rate data. Thepuree behaved as a shear-thinning fluid with a flow behaviour Index less than one. The consistency index decreased.while the flow behaviour index did not vary signiflcantly (P>0.051 with temperature. Dependence of the apparent viscosityand the consistency index on the temperature was related through the Arrhenius law. The process activation energywas In the range of 1.529 to 2.471 kcal/g mole.
Keyword. : Green chilli. Puree. Rheology. Flow behaviour index. Consistency index. Activation energy.
Several studies have been conducted on therheological properties of fruit and vegetable productsrelated to processing conditions or other physicalproperties (Harper and EI Sahrigi 1965; Saravacos1970; Holdsworth 1971; Rao et al. 1974; Vitali andRao 1984). The flow properties of paste and pureeare essential for the design and evaluation of foodprocessing equipments (Saravacos 1970). Further,these data have advantages over usual consistencymeasurement in characterizing product quality(Harper and EI Sahrtgi 1965). It has been reportedthat fruit purees behaved as non-Newtonian fluid(Holdsworth 1971). However. no information isavailable in the literature on the rheologicalcharacteristics of spice vegetable puree.
The rheological studies would prOvide informationon how best to control the flow properties of theproduct so that the desired end product can beprepared. A knowledge of the rheology of somesuspensions contributes also to a better understandingof underlying mechani~ms of momentum- and heattransfer process (Sikdar and Ore 19791. Spicevegetable pastes vary widely in their rheologicalcharacteristics and it is necessary to investigateeach product separately. The primary objective ofthe present study was to investigate the rheologicalproperties of green chilli puree as a function oftemperature. The data were obtained at wide rangeof temperature so that they can be used in theequipment design and handling of various pureedfoods.
Green chillies were procured from the localAmritsar market in the State of Punjab. The puree
• Corresponding Author
352
was prepared by destalking, followed by crushingin a hammer mill (ComitroI, USA), after which itwas passed through a 0.00 I m screen. An electricalrefractrometer (Milton and Roy. USA) and a pHmeter (Hansa Instruments, Mauritius) were usedto determine the total soluble solids (TSS) in 'Band pH of the prepared puree, respectively.
Rheological properties: Flow properties (shearstress, shear rate, and apparent viscosityl of thegreen chilli puree were measured directly with aBrookfield DV-Il+ viscometer (Brookfield Engg. Lab.Inc., Stoughton. MAl. The puree was placed in a500 ml graduated glass beaker with flat bottom.The &-14 spindle was selected for the samplemeasurement and was used without spindle guardof the viscometer. The rheological parameters forgreen chilli puree were studied in the temperaturerange of -5 to 70'C. Shear rate data of the sampleswere obtained between 10 and 100 rpm. A
thermostatic water bath (TC 500) proVided with theinstrument was used to regulate the sampletemperature. Each experiment was repeated threetimes and the average val.ues were used in theanalysis.
Computation oj flow behaviour index (n) andconsistency index (K): The power law model hasbeen extensively used to describe the rheologicaldata on several fruit and vegetable paste and pureeHarper and EI Sahrigi 1965; Saravacos 1971; Raoet al. 1974). The power law model is representedby the following expression:
1: = KY' ------------ (I)
where 1: is shear stress; y, the shear rate. K.the consistency index; n, the flow behaviour index.

353
Equation (I) may be further linearized. 100r----------------
Linear regression analysis of eqn (2) wascanied out using the least square technique. Thetemperature dependence of apparent viscosity (TI)at 100 rpm and consistency index (K) weredescribed by the Arrhenius model:
TABLE 1. POWER LAW PARAMETERS FOR GREEN CHILLIPUREE 18'B)
Temperature. Consistency Flow behaviour Correlation'C index. K. Index. n coefficient. r
Pa.sn Dimensionless
-5 52.540 ± 0.06 0.238 ± 0.03 0.981
10 49.318 ± 0.03 0.172 ± 0.02 0.985
25 36.482 ± 0.04 0.228 ± 0.02 0.989
40 29.703 ± 0.01 0.300 ± 0.00 0.999
55 26.898 ± 0.0 I 0.230 ± 0.01 1.000
70 18.808 ± 0.05 0.300 ± 0.00 0.976
Values are shown as mean ± standard error
where TI is apparent viscosity. A" is Arrheniusconstant on the basis of apparent viscosity at 100rpm; A.. is Arrhenius constant on the basis ofconsistency index; R is universal gas constant. Tis absolute temperature. E" and EK are activationenergy values. as per Eqns (3) and (4).
The TSS of the prepared puree was 8°Brix andthe pH was adjusted to 3.6 by addition of 30%citric acid solution (w/v). The above pH enhancedthe storage stability of processed spice vegetablepaste (Baranowski 1985).
Data in Table 1 refer to the power lawcoefficients for green chilli puree at differenttemperatures. The regression coefficient valueswere greater than 0.97. while the standard errorvales were less than 0.06. indicating that eqn (1)fitted adequately well the rheological data for theentire temperature range. The flow behaviour index.n. of the sample was found to vary from 0.172 to0.3 indicating pseudoplastlc nature of the puree.Further. the magnitude of the flow behaviour indexshowed no definite trends with temperature (P>0.05)for this study. Similar behaviour of n withtemperature has been reported by some researchers(Harper and EI Sahrigi 1965; Saravacos 1971). Theconsistency index. K. for the puree decreased withincreasing temperature (Table 1). The three-foldvariation in the magnitude of the consistency Index
0.0040
~served(:, (:, K observed
- eqn (3) and (4)
~..0..';;~ 10c
VI~
0..
'"
1L..:-~-----'~----..L------.J0.0028 0.0032 0.0036
lIT (11K)
F'tg. 1. Arrhenlus plot for green chilli puree
between -5°C and 70°C must be an Importantconsideration in the design of handling systems atdifferent ranges of temperatures. Similar observationwas reported by Vitali and Rao (1984) for orangejuice concentrate.
Effect oj temperature on apparent viscosity andconsistency index: The apparent viscosity (TI) andconsistency index (K) decreased with an increaseIn temperature of green chilli puree. The applicabilityof Arrhenius model (eqns 3 and 4) to describe theeffect of temperature on the apparent viscosity ata shear rate of 100s-1 and the consistency Indexof power law model were Investigated. Thecoefficients of eqns (3) and (4) were computed.using the least-squares technique. The computedvalues of A" and ETI were 0.169 Pa.s" and 1.529kcal/g. mole. respectively. while" and Ek were0.556 Pa.s" and 2.471 kcal/g. mole. respectively.The coefficient of correlation was greater than 0.94In both the cases. The activation energy valueswere consistent with those reported in literaturefor liquid food concentrates (Harper and EI Sahrigi1965; Holdsworth 1971; Wang et al. 1995). Thedata indicated that the variation of both K andTI with temperature followed the Arrhenius model(FIg. 1). The solid lines represented the valuescomputed using Eqns (3) and (4).
ReferencesBaranowski JD (1985) Storage stability of a processed ginger
paste. J Food Sci 50;932-933
Harper JC. EI Sahrlgi AF (1965) Viscometlic behaviour of tomatoconcentrates. J Food Sci 30;470-475
Holdsworth SD (1971) Applicability of rheological models to theinterpretation of flow and processing behaviour of fluid foodproducts. J Texture Studies 2;393-397
Rao MA. Otoyapalomh LN. Bernhard LW (1974) Flow propertiesof tropical fruit purees. J Food Sci 39; 160-161
Saravacos GD (1970) Effect of temperature on viscosity of fruitJuices and purees. J Food Sci 35; 122-125
---------- (3)
---------- (4)
------------ (2)In (t) = In (K)+n In (y)
TI = a" exp (EJRTl
K = A.. exp (EK/RTl

354
Sikdar SK. Ore F (1979) Viscosity measurements of nonNewtonian slurry suspension using rotating viscometer. IndEngg Chern Pro Des Dev 18;722-726
Vitali AA. Rao MA (1984) F10w properties of low pulp concentratedorange juice; Effect of temperature and concentration. J FoodSci 49:882-888
Wang WM. Slddiq M. Sinha NK. Cash IN (1995) Effect ofprocessing conditions on the physicQ-{;hemlcal and sensorycharacterisitics of Stanley plum paste. J Food Process Preserv19;65-81
Received 16 March 1998; revised 6 April 1999; accepted 23 June 1999
J. Food Sci. Technol., 1999. Vol. 36. No.4. 355-357
Safety Evaluation of Lactulose Syrup in Rats
V. BASKARAN", K. NARASIMHAMURTHY, R. NAGENDRA AND B.R. LOKESH
Department of Biochemistry and Nutrition.Central Food Technological Research Institute. Mysore-570 013. India.
The safety of lactulose to be used in Infant milk food formula as a bifidogeruc factor was assessed. Lactulosesyrup (50%) was administered lntragastrtcally to groups of male and female rats (Wlstar - CIT strain. 50g). at dosesof 2. 4. 8. 12. 24 and 36 g/kg body weight/day in split doses for 20 days. A control group of rats received lactosesolution at similar levels. The general condition of anlmals. their behaviour. food consumption and mortality If any.were recorded. The LD
50values and maximum tolerated dose were calculated. The computed LD50 values for male
and female rats were >31g and >2Ig/kg body weight and the maximum tolerated doses were 18 g and 10 g/kg bodyweight, respectively. Concentration greater than these caused transient diarrhoea. which disappeared within 5 h offeeding of lactulose. Treatment had no effect on food consumption. growth rate or behaviour and no mortality wasobserved In any of the groups. The study indicated that incorporation of lactulose at 0.5% in infant formula. as abifidogenlc factor. did not induce any adverse effects on rats.
Keywords : Lactulose. Blfidogenlc factor. Diarrhoea. Safety.
Lactulose (l3-D-fructopyranosyl-D-fructofuranose)is a disacchartde, a keto analog of lactose and ispresent in very small quantities in certain foods(Engel and Olinger 1979; Greig and Klostermeyer1983). Lactulose is also present in small amountsin unheated milk. but it has been found toincrease, when milk was subjected to heat treatmentto prepare milk products (Andrews 1984; Nagendraand Venkat Rao 1992). Ketose disaccharidesare produced in large quantities from agriculturalby-products (Hodge et al. 1972). Lactulosehas important applications in the food andpharmaceutical industries in view of its growthpromoting effects on bifidobacterium (an aneorobein the colon) in infants (Nagendra and Venkat Rao1992; lto et al. 1993). The indigenous intestinalmicroflora and their metabolites are thought toplay an important role in preserving human health(Cummings et al. 1989; Nagendra et al. 1995 a).Among the colonic microflora in man, thebifidobacterium is the most common and may exerta beneficial effect on its host (Abe et al. 1995). Inan earlier study, the beneficial effects of lactulosein promoting bifidobacteri~ growth in humansubjects are reported (Nagendra et al. 1995 a).Lactulose has also been used successfully in thetreatment of constipation and systemicencephalopathy (Bircher et al. 1966).
Recently, a milk-based infant food formulacontaining a 0.5% supplement of lactulose, whichstimulated the growth of bifidobacterium inexperimental animals as well as in human infantshas been developed (Nagendra et al. 1995 b,c).Though lactulose finds an important place as a
• Corresponding Author
355
food additive in the preparation of infant foodformulations, only very few reports are available inliterature on the toxicity of lactulose in mammals(Mendez and Olano 1979; Michaelis et al. 1986).Due to paucity of information on the safety oflactulose usage in infant formula. the presentstudy was initiated to evaluate on the short termtoxicity of lactulose syrup in groWing rats.
Lactulose preparation : Lactulose was preparedby the alkaline isomerisation method. involvingtreatment of lactose solution containing calciumhydroxide, which resulted in a 30% isomerisationof lactose to lactulose (Nagendra and Venkat Rao1992). The mixture was clarified With activatedcharcoal and concentrated. Mter removal of a partof the lactose by crystallization. a 50% syrup wasobtained, wherein lactulose constituted one half ofthe sugar mixture.
Estimation oj lactulose in the syrup : Lactulosecontent in the syrup was estimatedspectrophotometrically, according to the methodof Nagendra and Venkat Rao (1992). The syrup wasstored in the form of a 50% solution and dilutedto appropriate concentrations prior to use.
Toxicity studies : To evaluate the safety levelof lactulose syrup. before it was being used as asupplement in infant food formula as a bifidogenicfactor. short term toxicity studies were carried outin groWing male and female rats (Wistar- CFTstrain. 50 g). Rats obtained from the animal housefacility of Central Food Technological ResearchInstitute. Mysore were statistically grouped byrandomized design and assigned to various groupsof 10 animals each and were housed individuallyin polypropylene cages. They were fed on a basal
356
diarrhoea in mice. treated with lactulose at dosesgreater than 10.8 g/kg body weight and a LDsovalue of 26.48 g/kg body weight. Michaelis et al(1986) have also reported that feeding of maltuloseand lactulose for two days at 15% in the diet anda mixture of sucrose, maltose and lactose at 45%in the diet caused diarrhoea in rats. The findingsof the present study also are in agreement withthose of Michaelis and Szepesi (1976) and Michaeliset al (1978). who have reported that feeding ketosedisacchande lactulose to rats caused diarrhoea.which was attnbuted to the inability of smallintestinal enzymes to hydrolyse lactulose. Dahlqvistand Gryboski (1965) have also observed thatlactulose is not hydrolyzed in the small intestineof rat or man and therefore. cannot be consumedin large quantities without inducing diarrhoea.Nevertheless. earlier studies have shown thatlactulose at 0.5% level in the milk food formulahas no adverse effects and is considered adequateto stimulate the bifidobactenum flora similar tobreast-fed infants and prevent any laxative actiondue to lactulose (Nagendra et al. 1995 a.c).
Lactulose is also non-ealonc and does notexhibit any long term health hazard (Makinen andRekola 1975). Lactulose also has some additionalhealth benefits due to its ability to create an acidicenvironment within the colon (Michaelis and Szepesi1973; Mendez and Olano 1979). Lactulose hasbeen approved as a food material in Japan formaintenance of health and protection againstentenc infection (Tamura et al. 1993).
It may be concluded from the present studythat lactulose is safe to be used in infant foodformulations as a bifidus factor at low concentrations.
References. Abe F. Ishibashi N. Shlmamura S (1995) Effect of administration
of blfidobacterla and lactic acid bacteria in new born calvesand piglets. J Dairy Sci 78:2838-2846
Andrews GR (1984) Distinguishing pasteurized. UHT and sterilizedmilks by their lactulose content. J Soc Dairy Tech 37:9295
Baglioni A. Dublni F (1976) Lactulose. a toxJcological evaluation.Bollettino Chemico Farrnacentlco 115:596-606
Bezkorovalny A. Miller-Catchpole R (1989) Biochemistry andPhysiology of Bifidobacteria. CRC Press. Florida. pp 190-193
Bircher J. Zurich MD. Muller J. Zurich MD (1966) Treatmentof portal systemic encephalopathy with lactulose. Lancet23:890-892
Cummings JH. Macfarlane GT. Draser BS (1989) The gutmicrofiora and Its significance. In: Whitehead, R (ed)Gastrointestinal and Oesophageal Pathology. ChurchillLivingstone. London. pp 201-219
Remarks
10
Maximumtolerated
dose.g/kg bw
18>31
>21
Nil
Nil
Mortality. LDso% Ig/kg bw)
Female
diet (Krishnakumarl et al. 1979) and water wasgtven ad libitum. The lactulose syrup wasadministered intragastrically at doses of 2. 4. 8.12. 24 and 32 g/kg body weight/day in split dosesfor 20 days. Control group of rats received lactosesolution at similar levels. Daily food intake andbody weights were recorded. Animals were alsoobserved for morphological abnormalities andmortality if any. The maximum tolerated dose andLDso values were calculated according to themethod of Litchfield and Wilcoxon (1949).
The LDso and maximum tolerated doses oflactulose syrup in male rats were >31g and 18 g/kg body weight and for female rats were >21g and10 g/kg body weight. respectively (Table 1). Nomortality and clinical signs of toxicity were observeddunng the expenmental penod. Food consumptionwas normal and comparable with that of controlanimals. No treatment related changes wereobserved between control and lactulose fed rats.However, doses exceeding 12 g/kg body weight inmales and 8 g/kg body weight in females causedmild diarrhoea, the stools being semi-solid innature. Diarrhoea was observed only dunng thefirst 5 h of lactulose treatment.
These observations were similar to thosereported with other sugars. There are reports thatintake of large amounts of non-digestibledisacchandes causes overt diarrhoea in rats andhumans (Oku et al. 1984; Oku and Noda 1990;Oku 1994). These workers have attributed thecause to the osmogenic retention of fluid in bothsmall and large intestine. which. however. wasrecovered within a few days due to action of theintestinal bactena on these sugars. The toleranceto the ingestion of these sacchandes expressed asrelationship between dose and response (symptoms)showed considerable individual vanation (Oku etal. 1984). Baglioni and Dubini (1976) have reported
TABLE 1. TOXICITY OF LACTULOSE IN MALE AND FEMALERATS
Male
Sex
Mild diarrhoea wasobserved only athigher doses.was transient anddisappeared within3-5 h of posttreatment
Values are mean of triplicate treatment (10 animals per dose)Maximum tolerated dose was calculated with reference tooccurrence of diarrhoea as a response to lactulose treatment
Dahlqvist A. Gryboski JD (1965) Inability of the human smallintestinal lactase to hydrolyze lactulose. Biochem BiophysAcla 110:635-636
Engel CEo Olinger PM (1979) High pressure liquid chromatographicdetermination of saccharides in corn syrups: Collaborativestudy. J Assoc Off Anal Chern 62:527-532
Greig R. Klostermeyer H (1983) Formation of lactulose duJingheat treatment of milk. Milchwissenschaft 38:475-477
Hodge JK. Rendleman JA. Nelson EC (1972) Properties ofmaltose. Cereal Sci Today 17:180-188
Ito M. Deguchi Y. Matsumoto K. Kimura M. Orodera N. YajimaT (1993) Influence of galactooligosacchaJides on the humanfaecal microflora. J Nut Sci Vitamlnol 39:635-640
KJishnakumari MK. Rajalakshmi D. SreenivasanV. RamasundaramCP (1979) Feeding responses of young and adult albino ratsto mixed basal diet. Proc rnd Acad Sci 88: 367-375
Litchfleld JT. Wilcoxon (1949) A simplified method of evaluatingdose effect experiments. J Pharm Exp Ther 96:99-113
Makinen KK. Rekola M (1975) CompaJison between sucrose andlactulose in a suspended salivary system. J Dental Res54: 1244-1248
Mendez A. Olano A (1979) Lactulose. A review of some chemicalproperties and applications in infant nutrition and medicine.Dairy Sci Abst 41:531-535
Michaelis OE. Szepesi B (1976) Effect of galactose containingdisaccharides and trisaccharides on hepatic enzyme responsesin starved-refed rats. NutJi Res Int 14:553-559
Michaelis OE. Nace CS. Szepesi B (1978) Effect of refeeding rawand cooled starches on hepatic enzyme activities of rats. BritJ NUlri 39:85-89
357
Michaelis OE. Emberland JJ, Hicks KB (1986) Effect of feedingmaltulose and lactulose on hepatic lipogenic enzyme activitiesin the rat. NutJi Res 6:857-861
Nagendra R. Venkat Rao S (1992) An improved colorimetricmethod for the estimation of lactulose in lactose-Iactulosemixtures. Food Chern 43:399-402
Nagendra R. Vishwanatha S. Arunkumar S, Krishnamurthy B,Venkat Rao S (1995a) Effect of feeding milk formulacontaining lactulose to infants on their faecal bifidobacterialflora. Nutri Res 6: 15-24
Nagendra R. Mahadevamma. Baskaran V, Venkat Rao S (1995b)Shelf-life of spray-dried infant formula supplemented withlactulose. J Food Proc Pres 19:303-315
Nagendra R. Vishwanatha S, Narasimhamurthy K, Venkat RaoS 11995c) Effect of incorporating lactulose in Infant formulaon absorption and retention of nitrogen. calcium, phosphorusand iron in rats. Int Dairy J 4:779-788
Oku T, Tokunaga T, Hosoya N (1984) Non-digestibility of newsweetener. Neosugar in the rat. J Num 114:1574-1581
Oku T, Noda K (1990) Influence of chronic ingestion of newlydeveloped sweetener, erythritol. on growth and gastrointestinalfunction of the rats. Nutri Res 10:989-996
Oku T (1994) Special physiological function of newly developedmono- and oligo-saccharides. In: Goldberg I led) FunctionalFoods: Designer Foods, Pharma Foods, Neutraceuticals.Thomson Publishing Co.. Chapman and Hall, New York, pp202-218
Tamura Y, Mizota T, Shimamura S, Tomita M (1993) Lactuloseand its application to the food and pharmaceutical industries.Bull Int Dairy Fedn No. 289 pp 43-48
Received 16 March 1998; revised 25 March 1999; accepted 23 June 1999

J. Food Sci. Technol., 1999, Vol. 36, No.4, 358-360
Anthocyanin Pigments of Large Cardamom(Amomum subulatum Roxb.) Pods
J. PURA NAIK. L. JAGAN MOHAN RAO AND K,N. GURUDUTT"Plantation Products, Spices and Flavour Technology Department,
Central Food Technological Research Institute, Mysore-570 013, India.
Extraction of fresh large cardamom pod husk with methanolic HC I yielded a mixture of two (deep pinkish redlpigments. The pigments, present in the ratio of 1:2 were separated by paper chromatography, characterized as cyanidin3-glucoslde and cyanidin 3.5-dlglucoslde by chemical and spectroscopic analysis and confirmed by comparison withauthentic samples.
Keyworda : Zlngeberaceae. Amomum subulatum. Large cardamom. "AnthocyanIns, Cyanidin 3-glucosldde.Cyanidin 3. 5- diglucoslde.
Large cardamom (Amomum subulatum Roxb;family: Zingeberaceae). also known as greater Indiancardamom or Nepal cradamom, is a tall perennialherb with leafy stems, growing up to2.5 m in height. It is mainly cultivated in the subHimalayan region. Some of the south-east Asiancountries like Thalland, Indonesia and Laos alsogrow and market this commodity. Large cardamomis a popular spice in the Indian sub-continent andin the Middle East countries. It is used as a wholespice or in the powder form, as an Ingredient inthe spice mixes (garam masala), In Indian cuisinesand also in native medicinal preparations as weIlas mouth fresheners (Singh 1978). Most of theearlier chemical studies pertained to the volatileoil obtained from Its seeds (Gurudutt et aI. 1996).A few fatty acids and j3-sitosterol (Shankaracharyaet aI. 1997) as well as petunidin 3, 5-<liglucosideand leucocyanidin 3-o-D-glucopyranoside (VijayaLaksmi and Chauhan 1976) and subulin, anaurone glycoside (Vijaya Lakshml and Chauhan1977) have been reported from large cardamomseeds. In the present study, the pinkish redpigments, isolated from fresh large cardamom podswere subjected to systematic chemical analysis.
Fresh large cardamom pods were obtainedfrom Indian Cardamom Research Institute, Gangtok,Sikkim State, India. The pink-coloured pod huskswere separated from the seeds that had embeddedin mucilage, before extraction of the pigment.
Isolation of the pigment: The pod husk (500 g)was macerated In a blender using 500 ml methanolcontaining 1.0% HCI and the extract decanted(Ranganna 1977). This procedure was repeated fourtimes and the extracts combined, filtered andconcentrated to 80 ml under vacuum at 30°C.
• Corresponding Author
358
The concentrated coloured extract wassubjected to descending paper chromatography onWhatman No. 3 paper using AcOH:HC1:water(15:3:82) as solvent. Mter 12 h, two bands(designated as P I and P II) had separated. Thepaper was air-<lried, bands cut and eluted with0.01% methanolic HC1. The solvent was removedunder vacuum at 30°C and each extract wasfurther pUrified by paper chromatography using15% aq.AcOH as solvent. The pigments from thedried, cut strips were eluted with 0.01% methanolicHCl, concentrated In vacuo at 30°C to a smallvolume .and kept at 4°C for 72 h (Sherma 1972).The separated crystalline pigments were filteredand dried over P20 S' Their ~ values were determinedusing Whatman No. I paper and BAW, BuOH-HCIand AcOH-HCI solvent systems (Harbome 1958).
UV and visible spectra of P I and P II in 0.0 I%methanolic HCl were recorded on a Shimadzu-160spectrophotometer. Then, 2 to 3 drops of MeOHcontaining 5% AlCI
3were added to each of them.
Detennination of specific extinction coefficient(E) values : Known weights of P I (1.25 mg) andP II (1.15 mg) were dissolved in 100 and 200 mlof alcohol containing 0.1% HC!, respectively.Absorbances of the above solutions were measuredat their absorption maxima (526 and 528 nm).Using these values, E values for 1% of respectivepigments In 100 ml were calculated.
Estimation of the ratio of P I and P II : Twoanthocyanin pigments P I and P II from the totalcolour extract of the pod husk were separated bypaper chromatography as described earlier. Thecolour band due to each of them was cut. elutedquantitatively with 0.01% methanolic HCl andmade up to known volume. The absorbances ofthese coloured solutions were measured at their

absorption maxima. Ratio of the absorbance valueswas correlated to the pigment composition(KJishnamurthy et a!. 1982).
Hydrolysis oj pigments : P I and P II (20 mgeach) were hydrolyzed by treating with 2N aq.HCI(20 mil in boiling water bath for 1 h. After coolingthe mixture, the hydrolysate was extracted withisoamyl alcohol and the aqueous layer neutralisedby passing through Dowex 1 x 8 anion exchangeresin (hydroxyl form). The Rg value of sugarpresent in the acid-free aqueous layer was comparedwith that of commom monosaccharides by paperchromatography, using BuOH:pyrtdine:water (6:4:3),EtOAc:pyrtdlne:water (12:4:4), isopropanol:pyrtdine:water (12:4:3) and BuOH:ethanol:water (4: 1:2)solvent systems. The spots were detected by sprayingthe paper with anllinehydrogenphthalate (0.83 gphthalic acid + 0.5 ml distilled aniline + 2.5 mldistilled water + 47.5 ml BuOH) and heating It at!05°C for 5 min. The amount of glucose in thetest samples was determined, using a calibrationgraph constructed by the amount of sugar vsabsorbance of the coloured spot at 420 nm andtheir ratio was then calculated (Hsia et a!. 1965).
The isoamyl alcohol extract was treated witha slight excess of petroleum ether (60-80°C) andleft overnight in a refrigerator. The red crystallinepigment was decanted off from the solvent andredissolved in 0.01% methanolic HC!. The UVvisible absorption spectrum of the resultant solutionwas compared with an authentic sample of cyanidin,obtained from the fruits of Morus nigra by paperchromatography using BAW, formic, and forestalsolvent systems (Harborne 1967).
359
Estimation oj colour : Total pigment content offresh large cardamom pod husk was estimated bythoroughly extracting 50 g of the material with0.2N ethanolic HCI, SUitably diluting the extractwith the same solvent and determining absorbanceat absorption maximum 534 nm (Fuleki andFrancis 1963; Francis 1957; Servadio and Francis1963). The total anthocyanin content was calculatedusing the formula.
Total Volume x dilution factor x 00 x 100 x 100antho- " mg/l00 gcyanin Wt of sample x 98.2 x (I00-MI
Total colour intensity of the fresh largecardamom husk was found to be 0.99% on moisturefree basis. Paper chromatography of the extractfrom husk showed two deep pink bands, P I andP II. They were separated by preparative paperchromatography as flavylium salts. Their absorptionmaxima and specific extinction coefficient (inparenthesis) were 526 (932) and 528 (301) nm,respectively. Both on hydrolysis gave cyanidin, asfound by direct comparison with an authenticsample on paper (Table 1). The identification ofspots due to glucose liberated from P I and P IIshowed absorbances of 0.03 and 0.06. whichcorresponded to 17 and 32 ~g, in a calibrationgraph of the amount of sugar vs absorbance,indicating that they were mono- and di-glucoside,respectively.
Anthocyanin PI: It had a UV-Visible absorptionmaximum at 526 nm, which shifted to 566 nm withAlCI3, indicating that the 3'- and 4'-hydroxylgroups in it were free (Jurd 1962). The ratio of its
TABLE I. RG (XIOO) AND ABSORPTION MAXIMA OF ANTHOCYANINS AND THEIR AGLYCONS' IN DIFFERENT SOLVENT SYSTEMS
Rg values
Entry no. A B C D
I PI 38 25 10 28
2 Cyanidin 3 - glucoside 40 26 10 273 PII 30 7 22 504 Cyanidin 3. 5 - diglucoslde 29 8 22 505 Aglycon I 69
6 Aglycon II 69
7 Cyanidin 70
+ Optical densities were measured of methanol1c solutions containing 0.01% HCI
A SAW n-butanol-acetic acid-water (4: 1:5)
S SuOH-HCI n-butanol-2N HCI (I: I, upper layer)
C 1% HCI cone HCI-water (1:99)
D HOAc-HCI acetic acid-cone. HCl-water (15:3:821
E Formic formic acid-cone. HCl-water [5:2:3)
F Forestal acetic acid-cone. HCI-water [30:3: 10)
E
20
20
21
F
50
50
51
Abs. max. Un nm)
526. 330. 283
527. 330. 283528. 328. 283
527. 333. 282
537. 275
537, 277
537. 278
360
absorbance at 440 and 526 nm was 0.27, whichindicated that 5-hydroxyl was also free (Jurd,1962). Of the other two possibilities, viz., 3- and7-glycosylations, the former was preferred on thebasis of its pH stability and AlCI
3shift (Harborne
1958). Its identity was confirmed by a directcomparison (UV-visible spectra and co-paperchromatography, Table I) with an authentic sampleof cyanidin 3-g1ucoside, isolated from the fruits ofMortIS nigra (Harborne 1967).
Anthocyanin P II : It had UV-vlsible spectralcharacteristics similar to those of P I. On completehydrolysis, it gave cyanidin and glucose in themolar ratio of 1:2. The aglycon had the absorptionmaximum at 537 nm. The absorption maximumof P 11 at 528 nm shifted to 563 nm with AlCl;Indicating that 3'- and 4'-hydoxyl groups were free.The quotient of its absorbance at 440 and 528 nmwas 0.14. It indicated that the 3-and 5-hydroxYlgroups were glucosylated (Jurd 1962). Its identitywas confirmed by a direct comparison (UV-visiblespectra and co-paper chromatography, Table 1)
with an authentic sample of cyanidin 3, 5diglucoside, isolated from the flowers of Dahliavariabilis (Harborne 1958).
It may be concluded that the two pinkish redpigments of large cardamom pod husk are cyanidin3-g1ucoside and cyanidin 3, 5-diglucoside, presentin 2: 1 ratio. Interestingly, the polyphenoliccompounds present in its seeds are different fromthe husk pigments. The total colour content offresh large cardamom husk on moisture-free basisis 0.99%.
'Ire study was sponsored by Spices Board,Kochi and Sikkim Industrial Development andInvestment Ltd., Gangtok, India. Their financial
grant is gratefully acknowledged. Authors alsothank the authorities of ICRI, Gangtok, for a supplyof fresh large cardamom pods. .
ReferencesFrancis FJ (1957) Color and pigment in fresh cranberries. Proc
Am Soc Hort Sci 69: 296-30 I
Fulekl T. Francis FJ (1968) Quantitative methods for anthocyanins.J Food Sci 33: 78-83
Gurudult KN. Naik JP, Ravindranath B. Srinivas P (1996)Volatile oil constituents of large cardamom (Amomwn
subulatum Roxb.). Flavour and Fragr J II: 7-9
Harborne JB (1958) Spectral methods of characterisinganthocyanins. Biochem J 70: 2. 22
Harborne JB (1967) Comparative Biochemistry of the Flavonoids.Academic Press. London and New York. Chapters t and 4.
Hsia CL. Luh BS. Chichester CO (1965) Anthocyanins offreestone peaches. J Food Sci 30: 5-12
Krishnamurthy N. Lewis YS. Ravindranath B (1982) Chemicalconstituents of Kokum fruit. J Food Sci Technol t9:97-100
Jurd L (1962) The Chemistry of Flavonoids. In Geissman TA(ed) Pergamon Press. New York. Chapter 5, pp 132-134
Ranganna S (1977) Manual of Analysis of Fruits and VegetableProducts. McGraw Hill. New Delhi. Chapter 4. p 83
Servadio GJ. Francis FJ (1963) Relation between color ofcranberries and color and stability of sauce. Food Technol17: 124-128
Shankaracharya NB. Pura Naik J. Narayan MS (1997) Physicochemical characteristics and quality of large cardamom(Amomwn subulatum Roxb.) Bev Food World 24: 33-36
Sherma J (1972) Handbook of Chromatography In: Zweig G,Sherma J leds). CRC Press. Part n. pp 84. 364
Singh GB (1978) Large cardamom. Cardamom J 10: 3-13
Vijaya Laksmi. Chauhan JS (1976) Chemical examination ofseeds of Amomwn subulatum J Indian Chern Soc 53(1): 633
Vljaya Laksmi. Chauhan JS (1977) Structure of a new auroneglycoside from Amomum subulatum seeds. Indian J Chern15B: 814-815
Received 14 May 1998; revised 25 March 1999; accepted 23 June 1999

J. Food Sci. Technol.. 1999. Vol. 36. No.4. 361-364
Fermentative Production of GluconicAcid Using Cheese Whey
MADHAVI CHATURVEDJI, S. SUBRAMANJI, DATTA MADAMWAR2 •
'Post Graduate Department of Foods and Nutrition.'Post Graduate Department of Biosciences,
Sardar Patel University. Vallabh Vidyanagar. 388 120. India.
An aerobic fermentation of cheese whey using Aspergillus niger MNC" our own isolate, for gluconic acid productionas a means of pollution control has been worked out. Batch fermentations have been carried out using cheese wheyas the main constituent of the medium with the addition of salts as per the composition of synthetic medium at 28'Cand pH 6.5. A. niger exhibited gluconic acid production with high yield, when supplemented with 5% (w/v) glucose andA. niger showed the capability of utilising glucose as well as lactose for gluconic acid production. The efficiency of theconversion of sugar of cheese whey to gluconic acid was found to be 87.84% at the end of 96 h.
Keyword.: Cheese whey. Gluconic acid, fermentation. Aspergillus niger.
As a developing country. India is facing acruel dilemma on balancing the environmentalimperatives and developmental requirements. Onesuch industry with significant impact on pollutionis the dairy industry. A large number of dairiesin India dispose off their wastes. especially cheesewhey into environment in enormous quantities.Cheese whey contains 4.5-5.0 % lactose and hasa chemical oxygen demand (COD) in the range of60 to 80 gil and a biochemical oxygen demand(BOD) of 30 to 40 g/I, which often causes disposalproblems to the cheese manufacturers (GonzalezSiso 1996).
D-gluconic acid is a simple dehydrogenationproduct of D-glucose, which is widely used in food.pharmaceutical and chemical industries (Kunduand Das 1984 a. b). Its market is now over 30.000tonnes per annum and is still growing (Moksia etal. (996). This compound and its derivatives aremainly obtained by submerged cultivation ofAspergillus niger strain (Rohr et al, 1984).
Aspergillus niger has been considered to beone of the best strains for the production ofgluconic acid from glucose (Moksia et al. 1996).In spite of its advantages. the fermentation processhas not yet gained popularity among themanufacturers. This would probably be due to thehigh cost of substrate and low yield. Therefore.attempts were made in this study to utilise cheesewhey-a low cost substrate with an ultimate aimto reduce the overall cost of the process.
Culture: A strain of Aspergillus niger designatedas MNC2 was used for the production of gluconicacid. It was isolated in the Department of
• Correspofldtng Author
361
Biosciences. Sardar Patel University. VallabhVidyanagar. Aspergillus niger MNC2 was grown onpotato dextrose agar (PDA) at 26±2°C and storedat 4°C. It was sub-cultured once a month.
Inoculum: An inoculum of 5 x 10⁸ spores/mlwas prepared by harvesting one week old slant ofA. niger in sterile distilled water containing fewdrops of Tween 80. A 3 ml spore suspension wasused throughout the investigation as an inoculumfor 100 ml medium.
Fermentation: Culture was grown in 100 mlmedium dispensed in 500 ml Erlenmeyer flasks.The medium contained the following composition(g %): Glucose. 10; NH.CI, 0.12;MgSO•. 7H.o,0.025; KH
2PO•. 0.05 and its pH was 6.5 (Dave
1995). Flasks were autoclaved at 15 Ib for 15 min.The cell mass obtained in the growth medium wascentrifuged and then transferred to 500 ml offermentation medium. This was incubated ona rotary shaker with proper aeration at 26±2°Cfor 24 to 48h. Fermentation medil1m had thesame composition of growth medium except CaC0
3
which had to be added into the mediumintermittently, as per requirements to maintain thepH at 6.5. Fermentation was carried out in a 2000ml Erlenmeyer flask. The medium was autoclavedat 15 Ib for 15 min. CaC0
3was autoclaved
separately.
Cell mass recycling : To check the efficiencyof repeated cell mass of A. niger MNC
2for gluconic
acid production. the cell mass was separated afterfirst fermentation by centrifugation and re-used infresh fermentation medium for Ca-gluconateproduction. The process was repeated thrice for cellmass recycling.

362
TABLE I. EFFECT OF RECYCLING ON Ca-GLUCONATEPRODUCTION AND GLUCOSE UTILISATION USINGASPERGIlLUS NIGER MNC,
Lactose utilisation Jar Ca-gluconate production:Fermentation for Ca-gluconate production wasthen carried out, using A. niger MNC2 in the samefermentation medium by providing vaJious levelsof lactose as a carbon source instead of glucoseand in combination with glucose. The concentrationof lactose ranged from 0.03 to 0.10 g/m!.
Cheese whey Jor Ca-gluconate production:ExpeJiments were repeated for the fermentation ofCa-gluconate production using cheese whey, withaddition of salts to the fermentation medium.Cheese whey in its composition contained approximately 5% of lactose, which matched with the I: Icombination of glucose and lactose of the previousbatch. For this purpose, a 0.05 glml of glucosewas added to the medium.
Determination oj reducing sugar content :Reducing sugars, glucose and lactose were estimatedin the fermentation medium by the method ofPomeranz and Meloan (1977).
Ca-gluconate estimation : Ca~gluconate wasestimated by EDTA according to standard methods(APHA 1995).
In the present investigation, Aspergillus nigerMNC2 isolated from the local garden soil was used.This culture exhibited gluconic acid producingability within 24h, which kept Jising with incubationperiod reaching maximum on the third day.
The effiCiency of Ca-gluconate production canbe increased by the process of recycling of cell
24
48
72
24
48
72
mass, thus eliminating the initial lag phase betweenthe batches. Results presented in Table I showthat at the end of 72 h, 0.085 glml of Ca-gluconatewas produced in the first cycle with consumptionof 0.1 glml of glucose. A. niger MNC2 exhibitedan efficiency of about 79.03%, which increasedwithin 24 h at the end of the second cycle andreached the maximum of 86.4% effiCiency in thethird cycle, shOwing the production of 0.093 g/mlof Ca-gluconate. However, further recycling in thefourth cycle decreased the efficiency drastically toabout 60.48%.
The cost of the product is directly related tothe raw materials. Glucose, generally used for theCa-gluconate production, is highly expensive. Toovercome this bottleneck. low cost mateJial mainlycheese whey as a source of lactose to replaceglucose was used in the present study. Cheesewhey is readily available in large quantities. Sincelactose is the main constituent of cheese whey. thishas to be used for Ca-gluconate production. Inorder to check whether the present strain had thecapability of utilising lactose for gluconic acidproduction either alone or in combination withglucose, various batch fermentations wereperformed, using lactose as the main carbonsource along with glucose and without glucose forthe maximum exploitation of A. niger MNC
2. for Ca
gluconate production. As depicted in Fig. I A. nigerMNC
2showed extremely low ability to utilise
lactose when supplied alone. However, it showedimproved Ca-gluconate production, when themedium was supplemented with glucose.
In order to check the proper combination, theconcentration of lactose was changed from 3 to10% (wIv). Fig. I shows that the I: I combinationof glucose and lactose gave the maximum yield.However, efficiency could not be improved byfurther addition of glucose. Moreover, 5:5:glucose:lactose combination proVided easier system formedium preparation with cheese whey. Under thiscombination, percentage of lactose was 5% (wIv),which matched with the lactose content of cheesewhey, indicating that A. niger MNC
2had the
capability to utilise lactose and convert to Cagluconate.
Lactose, in cheese whey, is present at amaximum level of 5% only. In order to improve theprocess, this should be supplemented with glucose.Thus, addition of extra glucose is advisable.Moreover, presence of glucose in equal quantity tothat of lactose improves Ca-gluconate production.
9.09
13.63
79.03
21.98
43.59
84.60
23.93
39.14
60.48
34.04
52.41
86.45
Efficiency.%
Time.h
24
48
72
First cycle
Ca-gIuconate Remainingproduction. g/ml glucose. g/ml
0.009 ± 0.0009 0.085 ± 0.0086
0.014 ± 0.0017 0.081 ± 0.0082
0.085 ± 0.0039 0.022 ± 0.0061
Second cycle
0.023 ± 0.0029 0.0751 ± 0.0078
0.047 ± 0.0048 0.0502 ± 0.0061
0.091 ± 0.0072 0.0190 ± 0.0020
Third cycle
0.036 ± 0.0042 0.0621 ± 0.0061
0.056 ± 0.0058 0.0209 ± 0.0025
0.093 ± 0.0022 0.0103 ± 0.0022
Fourth cycle
24 0.025 ± 0.0022 0.079 ± 0.0052
48 0.042 ± 0.0059 0.052 ± 0.0019
72 0.065 ± 0.0031 0.028 ± 0.0053
Total initial sugar was 0.1 g/ml

363
Therefore. experiments were performed using cheesewhey with supplementation of 5% (wIv) glucose.
Fig. 2 shows that the efficiency of theconversion of sugar of cheese whey to Ca-gluconatewas 87.84% at the end of 96 h Le. about 0.094
glml of Ca-gluconate was produced by 0.1 glmlof sugar.
Motte et al (1990) have shown thatGluconobacter oxydans can utilise both glucoseand galactose for the production of gluconic acid.
0.1
80
0.08
60
0.06
40
.04
20E"-
'"0
a: >-<l: u
10.0 C> Z:::> wVI UC> ii:z LL
~w
0.1 « .~ "-w .a: 80
6U
40
20
0
24 48 72 960.0
TIME (h)
b
d
967248
TIME (h)
24J
/0.0
0.02
a
0.1
0.08
0.06
0.04
E"-
'" 0.02
z0t- 0.0 I
IU:::>00 ca:a.
~ 0.1<l:z0u3C> 0.08
t3
0.06
0.04
fig. 1. fermentative profile for the production of Ca-gluconate using combinations of sugar by Aspergillus niger MNC,. Total initialsugar concentration was 0.1 g/ml: a) Pure lactose: b) Glucose: Lactose: 3:7: c) Glucose : Lactose: 5:5: d) Glucose: Lactose:7:3. Legends Ca-gluconate production. 0-0 : Remaining sugar. A-A % Efficiency. ....

Fig. 2. Fermentative profile for the production of Ca-gluconateand utilisation of sugar using cheese wney In combinationwith 5% glucose by Aspergillus niger MNC,. Initial sugarconcentration was 0.1 gjml: Lactose Legends Cagluconate production. Q-{) ; Remaining sugar. A-A ;% Ellidency. ___
References
Motte JC. Van Huynh N. Decleire M. Wattiau P. Walravens J.Monseur X (1990) Monitoring and purification of gluconicand galactonic acids produced during fermentation of wheyhydrolysate by Gluconobacter oxydans. J Chromato 507:321·326
American Public Health Association (1995) Standard methodsfor the examination of water and waste water. 19th edn.American Public Health Association. Washington. DC
Dave P (1995) Optimisation of process parameters for Ca·gluconate production using free and Immobilised microbesand enzymes. Ph.D. Thesis. Sardar Patel University. VallabhVidyanagar. India
Gonzalez Siso MI (1996) A biotechnological utilisation of cheesewhey. A review. Bio Resource Technol 57: I-I I
Kundu P. Das A (1984 a) Utilisation of cheap carbohydratesources for production of calcium gluconate by Penicillium
Junicu10sum mutant MN238. Indian J Expt Biology 22:279·281
Kundu p. Das A (1984 bl Glucose oxidase activity strain ofAspergillus niger and Penicillium JuniculosWTL Indian J MycolRes 22(2) :97-100
Moksia J. Lorroche C. Gros JB (1996) Gluconate production bythe spores of Aspergillus niger. Biotechnol Letter 18: 10251030
i96
i72
TIME (HOURS)
364
10 10 90
E"- .......!! 8 • 70....z .!Q . >-... ;- uu ~
o ~:::>0 tr:0 Utr: « li:'"II. :::> "-
III UJUJ
~ 4'" 30 ~z z0 Zu <:::>..J :J:
'" UJ
D tr: 10u
At the end of the first cycle, it has been foundthat, Aspergillus niger MNC2 is also capable ofutilising glucose as well as lactose, however, incombination. The present study has indicated thatcheese whey could be successfully utilised for theproduction of Ca-gluconate.
Pomeranz Y. Meloan C (1977) Carbohydrates. In: Food Analysis·Theory and Practice. AVI Publishing Co. Inc. Westport.Connecticut. pp 574-617
Rohr M. Kubicek P. Kominek J (1984) Gluconic acid. In: RehmHJ. Reed G leds) Biotechnology. Vol. 3a Verlag Chemie.Florida. pp 445-456
Received 16 January 1998; revised 8 October 1998; accepted 21 October 1998

J. Food Sci. TechnoL. 1999, Vol. 36, No.4, 365-366
A Rapid Method to Prepare Immobilised MatrixUsing Ultrasonic Device
S. GHOSH
Food Technology Division.Bhabha Atomic Research Centre, Mumbal - 400 085, India.
An unJque. new. simple and rapid technique for preparation of immobilised matrix has been worked out usingultrasonJc device. Very fine immobillsed matrix of polyacrylamide containing yeast cells was prepared using this technique.The potential for commercial exploitation of the technique is discussed.
Kcyworda: Ultrasonics. Immobillsation. PolyacrylamIde. Yeast cell. Invertase activity. Irradiation. DispersIon. Immiscibleliquid.
Ultrasonic devices are Widely used fordisintegration of cells. However, they also find useIn cleanSing operation and dispersion of liquids.The cavitation generated due to the acoustic energyproduced by ultrasonics can disperse and emulsifyliquids. The emulsified mixture, when allowed tosettle, separates out the dispersed liquid from theemulsion. The dispersed liquid at the initial stageof separation is in the form of very fine particles,which grow in size with time. If the dispersed liquidis frozen immediately after sonication andpolymerised, It Is possible to obtain fine immobllisedmatrix. The present communication describes thistechnique that was developed to make Immobilisedyeast cells (S. cerevisiae) In polyacrylamide.
An aqueous mixture of acrylamlde (20%), bls(l%). and yeast cells (20%) on weight basis wasadded into toluene (l: 1). The mixture was thencooled at 2-4°C. An ultrasonic probe (Make: FargonDiehl, Model No. 16006-701, Power output=200Watts) was introduced into the beaker (500 mlcapacity, height/diameter=2). containing 200 ml ofthe above mixture. The mixture was sonicated for10 min. The mixture was then frozen Immediately,using a dry Ice-acetone bath at -75°C. The frozenmiXture was then exposed to gamma irradiation ata dose of 1.2 Krad/min at -75°C with air as thegas phase. The polymerlsed matriX was filtered outfrom toluene, allowed to thaw slowly and thenwashed with distilled water. The matrix was thentested for Invertase activity as described earlier(Ghosh 1990). Particle size up to 500 micron wasdetermined using laser diffraction technique byparticle size analyzer (Make: Malvern, U.K. model3600E). and above 500 micron, by using micrometerscrew gauge.
Polyacrylamide matrix is generally prepared In
365
the laboratory by gently forcing the acrylamide-bisyeast mixture through a syringe needle intopre-cooled toluene (-75°C). Series of syringes fixedto a surface can be used for commercial use andthe mixture can then be passed through thesyringes using air pressure. However, this operationfinds limitation in view of the high viscosity of themixture and the narrow opening of the needles.Moreover, the needles get choked due toenhancement of viscosity of the mixture with timeof operation.
It is possible to obtain matrix without theabove mentioned operational hazards by subjectingthe mixture, dispersed into another immisiclbleliquid as mentioned above. The dispersion can beachieved either by using an ultrasonic device orsimply using a mechanical stirrer. Matrix preparedby ultrasonic device was as low as 40 micron insize as compared 500 micron obtained in mechanicalstirring. The matrix prepared by ultrasonic (80%)was in the range of 55-65 micron against anuneven distribution of' particle size (500 micron10010,800 micron 18%, 1200 microns 70%) formationthrough mechanical stirring. Size of matrix formationIs dependent on the efficiency of cooling and degreeof dispersion. Since cooling conditions wereidentical, it was the dispersion efficiency thatcontributed to the different sizes in the differentprocesses employed. The dispersion effiCiency intum depends on the geometry of reaction vessel,contents of the liquid, Its physical properties andthe energy level of the sonicator used. It isIndependent on the method of polymerlsation andIts duration. A dose of 300 Krad was employed forpolymerlsation. The cells were dead but acted asa source of Invertase, whose activity wasinvestigated. In the present case, the dispersion by

366
acoustic energy was more effective than that ofmechanical dispersion (stirrer rpm=1800) undersimilar conditions.
Particle size plays an important role in thedesign of bioreactor. It also contributes to theinternal rate of diffusion. the most rate limitingfactor of immobilised reaction. Smaller the size,higher the rate of diffusion and lower the cost ofreactor. It is thus, desirable to obtain as small aspossible iIllmobllised preparation (high pressuredrop in case of packed bed) for immobllisedreaction. Therefore, activity of the matrix waschecked with respect to the size and was found
to be in the order of 1680 for free yeast cells, 1665for 40 micron-sized and 1450 for 500 micron-sizedimmobllised preparation. Thus, particle size obtainedby ultrasonics is of great significance for practicaloperation. The method of preparation is new.simple and offers ample opportunity forIndustrialists to prepare large quantities ofImmobillsed matrix.
ReferenceGhosh S. (I !!90) F'easiility of polyacrylamide as a matrix for
immobilising yeast cells for inversion of sucrose syrups.Biotechnol Tech 4:419-424
Received 1 June 1998; revised 2 March 1999; accepted 23 June 1999

BOOK REVIEWS
TOXICOLOGICAL EVALUATION OF CERTAINVETERINARY DRUG RESIDUES IN FOOD WHO food additives series - 41. Prepared bythe Fiftieth Meeting of the Joint FAO/WHOExpert Committee on Food Additives WHO. Geneva. pp. 173. Price. Sw. fro 50. indeveloping countries.
The use of drugs in animal husbandrypractices has grown tremendously in the lastfew decades. These drugs are used mainly tocure diseases. to control disease outbreaks. toimprove the efficacy of feed intake and to promotegrowth. The residues of these drugs in foodproducts of animal origin viz.. meat. milk andpoultry can be a potential health hazard toconsumers. This book covers the toxicologicalaspects of few drugs with safety data evaluated bythe expert committee.
The book in the WHO Food Additive Series 41as prepared at the fiftieth meeting of the JointFAa/WHO Expert Committee on Food Additives(JECFA), which met on February, 1998 In Rome.Italy. It has 5 sections. comprising ten monographs.which deal with the residues of veterinary drugs infoods and their safety level. Each monograph ispresented with explanation of the drug, biologicaldata such as absorption. distribution. excretion,biotransformation and safety evaluation of eachdrug. based on toxicity in experimental animals.
The first section deals with two anthelminticagents. Eprinomectln, a semi-synthetic member ofavermectin is active in animals against internaland external parasites. which in higher levels canaffect the mammalian nervous system. The secondagent is febantel, a pro-drug that can be convertedin vivo by cycllzation to febendazole or afteroxidation to oxfenbendazoles.
Antimicrobial activity of gentamycln.sarafloxacln and tetracyclines are reviewed in thesecond section. Gentamycin is an aminoglycOSidlcantibiotic. about which the committee hasconcluded that it Is unlikely to be genotoxlc orcarcinogenic. Sarafloxacin is a fluoroquinoloneantibacterial agent used for treatment and controlof bacterial infection in poultry. caused by E. coliarl Salmonella species. In higher doses.experimental rats showed auriclar condritls andarthropathy in dogs. Review of the tetracyclines,a group of drugs - oxytetracyline. chlortetracyclineand tetracycline with long history of use hasshown that these drugs have a low degree of
J. Food Sci. Techno!., 1999. Va!. 36. No.4. 367-370
toxicity. The committee has concluded that nosafety factor Is needed for these antibiotics.
The third section covers the antiprotozoalagents like diclazurll, imidocarb and nicarbazln.Diclazuril. an anticoccidial drug. is tetratogenic tor~bbits at higher doses. Imidocarb. a carbanilidederivative Is used for the treatment of babesiosisand anaplasmosis. Data on neurotoxicity andcarcinogenic potential of this drug are lacking.Nlcarbazin is a faecal and Intestinal coccidiostatin broiler chickens. Developmental toxicity studiesof this drug have shown retarded faetaldevelopment and a number of abnormalities.
The fourth section deals with evaluation of thefour analogues of bovine somatotrophlns somagrebove. sometrlbove. somavubove andsomidobove that are produced by recombinantDNA techniques. Based on the available findings.the committee has concluded that recombinantbovine somatotropins can be used without anyappreciable risk to the health of consumers.The last section deals with tranquilizingagent azaperone. a butyrophenone neuroleptictranquillizer. which Is unlikely to be genotoxic andcarcinogenic.
This volume also has four annexures.Annexure I Includes reports and other documentsresulting from previous meetings of Joint FAO/WHO Expert Committee on food additives.Annexure II covers abbreviations used In thisvolume. Annexure III lists members of the fiftiethmeeting of Joint FAa/WHO Expert Committee andthe last Annexure shows the recommendedmaximum residual limits of different compoundsevaluated.
The extensive information on all major aspectsof Important veterinary drugs and production aidsare well presented along with a broad list ofreferences for each monograph in this book byrespective experts. The committee offered thevaluable comments on the available tOXicologicalfindings for each drug at the end of the monograph.Acceptable dally intake for animals andrecommended maximum residual levels in animalfoods are also summarized. The book also describesthe detailed methodologies of tOXicological studiesin different experimental animals on acute toxicity.chronic toxicity and reproductive toxicity. whichwill be useful for research workers engaged in thefield of drug evaluation.
In conclusion. the reviewers would like to
367

368
emphasize that this publication is no doubt avaluable source of information and a very usefulreference book. It is strongly recommended thatthis publication would be an useful tool toteachers, scientists and quality control specialistsin the field of food technology, pharmacology andtoxicology as well as veterinary medicine, whowould be interested in getting instant andauthenticated glimpses of drug safety in foods.
A.S.R. ANJANEYULUI. PRINCE DAVADASON
INDIAN VETERINARY RESEARCH INSTITUTE.IZATNAGAR • 243122
ORAL HEALTH - DIET AND OTHER FACTORS- Edited by Ursula Arens, Published byElsevier for the British Nutrition Foundation,P.O. Box 211, 11000 AE, Amsterdam,The Netherlands, 1999, pp 240, Price US$ 140/-
Importance of Nutrition for healthy life is arecognised fact. It is also well documented thatmany of the diseases as well as infections can becounteracted or prevented. if the tissues haveIncreased resistance to offending agents. Wellnounshed tissues offer better resistance. Importanceof good nutntion and nch food In the field ofdentistry is also well recognised.
Dental and oral health Is closely related to dietand nutntion and through understanding of theirbiochemical and biological relationship In themaintenance of health are as Important as theirrole in causation of diseases. In modern dentistry,more emphasis is given to preventive aspects ofcaries and periodontal disease rather thanextractions. Preventive measures to preventdisorders dunng fonnative stages of tissue as wellafter their fonnations are In focus of moderndentistry. In view of this change In approach. thestudy of the role of diet and nutrition has assumedmore significance.
The book under review "Oral Health, Diet andother factors" edited by Ursula Arens is an excellentwork of compilation of reports on various aspectsof influence of nutntional and dietary elements onoral health.
Different Task Forces have gone In detail ofscientific basis on the role of diet and nutritionin preserving normal health of oral tissues. Agechanges. functional changes and external Influenceof diet on oral tissues also have been discussed.
This book In the form of report of a Task Forceconstituted to review the relationship of nutntion
and diet to oral health and to makerecommendations and identify the areas for futureresearch. The Task Force consisted of eminentteachers and specialists in this field. Every efforthas been made to go into the depth of role andsignificance of diet and nutntion on nonnal tissuesand causation of dental caries, enamel defects,periodontal diseases, mucosal health and oralcancer. Influences of dietary and nutritional factorson fetus and also old age have been discussed.
Role of fluorides and other trace elements indnnklng water and diet in prevention of canes hasbeen discussed with emphasis on externalapplication of fluoride preparations on teeth. TaskForce on fluonde is of the opinion that fluondeis the most Important prophylactic agent againstdental canes. Optional exposure to fluonde canhalve the occurrence of dental carles. Decline indental caries In U.K. is attributed mainly to theregular use of fluoride tooth paste.
Prof. D. Belghton has dealt in detail on thevarious microorganisms present in oral cavity,factors and changes In oral microflora In relationto the changes of dietary habits.
Injurious effect of betelnut, paan, tobacco onthe oral tissues In relation to changes in diet andnutrition has been elaborately discussed.
Sugar consumption in its various forms Inrelation to production of acid and deleterious effecton teeth in pre-school and school children hasbeen discussed in detail. It is suggested to encourageuse of non-cariogenic snacks and drinks betweenmeals.
Acidic foods and drinks have the potential tocause destruction of hard tissues of teeth byerosion.
Review on food habits In various socioeconomic groups and their effects on oral healthIs excellent. All the aspects have been covered.
The book under review is a good referencebook and good material of source of informationof scientific value. It also stimulates and gUidesthe specialists and post-graduate students involvedIn the field of research and clinical work.
The Important recommendations are (I) impartdental and oral health education to school children,(iI] use topical fluoride at optional level, (Iii) usenon cariogenic snacks and drinks, to avoid addingsugar to bottle feedings. to avoid paan, betelnutand tobacco chewing and (iv) use bal~ced andwell-nourished diet.
British Nutrition Foundation, Editor UrsulaArens and other specialist members and observersof the Task Force deserve to be complimented forthe excellent work.
N.S. YADAVJ.S.S. DENTAL COLLEGE.
S.S. NAGAR, MYSORE-570 015.
FOOD LIPIDS, CHEMISTRY, NUTRITION ANDBIOTECHNOLOGY. Edited by Casimir, C.Akoh and David B. Min; Published by MarcelDekker Inc., New York, 1998 pp 840, ISBN:08247-9985-2, Price US $ 225/-.
This book is the 88th volume in Food Scienceand Technology series published by Marcel andDekker Inc., New York.
It has contributions from internationallyrenowned authors and provides state-of-the-artand authoritative information that covers almostall aspects of food lipids and will serve as a uniquetext for instruction throughout the world. The textis divided into 5 main parts, namely: chemistry andproperties; processing, oxidation, nutrition andbiotechnology and biochemistry.
In the first part, there are 7 sections. In thefirst section, a brief review of the nomenclature andclassification of the lipids such as standard IUPACcommon (triVial) and shorthand (W) nomenclaturesof fatty acids. occurrence/formation, the lipidclasses, the formation of unsaturated fatty acids,hydroxy and epoxy fatty acids, trans fatty acids (EZnomenclature), furanoid fatty acids, acyl glycerols,sterols and sterol esters, waxes, plasmalogens(ether lipids), hydrocarbons and fat soluble vitaminshas been given by O'Keefe. The second partconsists of the chemistry and function ofphospholipids by M.C. Erickson. The author hashighlighted the major chemical reactions/functionsassociated with phospholipids in relation to therole in foods. when present in oils or formulatedfoods, phospholipids may have either detrimentalor benefiCial effects. As a major component ofmembranes, phospholipids playa role In impartingmembrane flUidity. The third section discusses thevarious aspects of food emulsions.
The fourth section deals with the chemistryof waxes and sterols. The authors discuss variousaspects of naturally occurring waxes, such asisolation, separation, analysis and biosynthesis.The biosynthesis, regulation, metabolism of sterolsincluding separation and analysis of these twoclasses of lipids are also covered In the section.
369
The fifth section by Dr. Shahidi andWanasundara discusses the various considerationsfor extraction and analysis of lipids. The sixthsection deals with the analysis of trans-fatty acidsby McDonald and Mossoba. The analysis of transfatty acids in both natural and hydrogenated oilsis challenging and with these newer developmentsin the area, such as silver ion HPLC, ozonolysis/GC, silver ion chromatography/CI3NMR, GC-FTIR,GC-EIMS, SFC-FTIR, LC-MS and MS-MStechniques can give reliable results.
The seventh section by K. Warner deals withthe chemistry of frying fats. with particular referenceto the review of phySical and chemical changes inoils dUring frying, including reactions that occurin the process.
The second part 'consists of 3 sections. Theeighth, ninth and tenth sections deal with recovery,refining, converting and stabilising edible oils andfats. The oil recovery aspects covered include seedstorage, cleaning. dehulling, hard screw pressing,prepress solvent extraction, direct solvent extraction,meal grinding and oil and meal storage. Extractionof oil bealing fruits and recovery of animal fats andmarine oils have also been discussed. The refiningsteps such as degumming, neutralisation, miscellarefining, drying, bleaching, dewaxing, deodourizationand physical refining aspects have also beendiscussed. Hydrogenation, interesterification andwinterization of oils, stabilising physical formssuch as plasticiZing, post-processing, tempering,stehling has been covered under the stabilizationprocess. The new aspects covered for oil refiningare membrane filtration, enzymatic degumming,supercriticalfluid refining and bleaching with silicagel.
The third part has five sections. The sections11-15 deal with lipid oxidation mechanism inedible oils, muscle foods and plant tissues, methodsof measuring oxidation and antioxidantmechanisms.
The fourth and fifth parts cover nutrition andbiotechnology plus biochemistry aspects of lipids,respectively. The topics under nutrition includeantioxidants, fats and oils in human health, omegafatty acids, dietary fats, eicosanoids and the immunesystem, dietary .fats and coronary heart disease,dietary fats and obesity and lipid-based syntheticfat substitutes.
The lipid biotechnology aspect is discussed byDr. Kumar D. MukheIjee and by others on microbiallipases, interesterification and structural lipids.

370
The genetic engineering of crops that producevegetable oil has also been included in the lastsection. In all the above areas, the authors havequoted extensive literature to make it a gUide forpost-graduates and research students and scientists.The book is a valuable addition to the library ofR&D institutes and industries.
The book is a comprehensive, modern textbook on food lipids, that will provide gUidelines tostudents and instructors of Food Lipids and UpidChemistry.
A.G. GOPALAKRISHNACENTRAL FOOD TECHNOWGICAL RESEARCH INSTITUTE,
MYSORE-570 013.

flare PUBLISHINGfor a PU RPOSE ...
Apurpose of linking~\'T.y
NISSAT I DSIR
OlRECTQRYOFCURRENT RESEARCH PRCUECTS INFOOD SCIENCE ANDTECHNOLOGY IN INOlA
NIIioNIInfOfmIlionC_,.IofFoodSeitne."'llTec:h~
CENTRAL FOOO TECHNOLOGICAL RE SEARCH INSTITUTEMYSORE - 570013.1N)1A
Tala! Pages: 237 ; Price: Rs. 900/·(DO in lavour 01 Oiretor, CFTRI)
Extra Rs. 40/· for handling& FnlWarding charges.
An investment worth making....for the information you need
that you won't find elsewhere!
'7f'--
through the ....
DIRECTORY OFCURRENTRESEARCHPROJECTS INFOOD SCIENCEANDTECHNOLOGYIN INDIAA Publication of theNational InformationCentre for Food Scienceand Technology(NICFOS)
Which covers information on477 projects pertaining to25 subject areas in Food Science andTechnology from104 institutions.
Provides• SUbject Index,• Institution Index and'• Investigator Indexfor easy retrieval.
•
Please send your order to :Head, FOsnS, Central Food Technological R....rch Institute, Cheluvamba Mlnalon, Myaora. 570 013Til: 0821-515850 /514760 Fax: 0821·517233/516308 EmIli :fOltIsOcacltrl.ran.nlc.ln lfostlsOnlcfos.emelln
•

FOODn:CHNOLOGY.<&ST crsv.a.U, I_
"""',.,.---
FOR COMPLETE
SUBSCRIBE TO
...an excellent compilation of international information forfood scientists, food engineers, technologists, researchers,managers, industrialists etc
FOODPATENTSv..... ""'.l,J....... t...
.,..-,---- .
...provide(s) up-to-date information and of immense helpto industries, consultants etc, to refresh their industriesand technology
·.FooD'··DIGES1"-"11.~J,J..,....u.
....a unique source of valuable information on new rawmaterials, trade information, legislation, etc useful forindustries, technologists, consultants, policy makers,managers etc.
~"'T"""""'-''''''''''''''MoMeoI~~"""""""~o.oo-.".."... ..................PoIW ~............ ORDER FORM
For Details Contact:Head
NICFOSNational Information Centre For FoodScience and TechnologyCentral Food Technological ResearchInstitute. Mysore - 570 013, IndiaGrams : FOODSEARCH, MysoreTelex : 846241 FTRI INPhone : 0821-515850Fax: 0821516308/517233E-mail: fostis@nicfos,ernet.in
Enter my subscription to (Tick box)
• 0 Food Technology Abstracts (Monthly) at Rs 400/per year
• 0 Food Patents (Quarterly) at Rs. 300/- per yearo Food Digest (Quarterly) at Rs. 300/- per year
o I enclose a Demand Draft (in favour of Director,Central Food Technological Research Institute,Mysore) bearing No Dated .for a sum of Rs .
• 0 Please send me the proforma invoice.
• Signature .
Name .
• Address .
• City/State ..
·.................................~

INDIAN FOOD INDUSTRYA Publication of Association of
Food Scientists and Technologists (India)Contents of May-June 1999 Issue
FROM THE CHIEF EDITOR - A Word.....
INDUSTRY NEWS
Mango Zoom' Food Ministry's Suggestion to FCI Regarding Procurement • Problems of Plentyand Government's Move' Higher Foodgrain Output Projected' Panel Recommends Increased
Cold Storage Capacity • World's Farm Majors Working out Export Strategies • India's RiceExports Show a Mixed Trend • US Anti-dumping Duty Being Imposed on Indian Mushrooms• Plea to Boost Rice Bran Oil Output' TIDCO's Project for Processing of Fruits and Vegetables• Soy futures Exchange by This Year End • Goodricke Group Working on Strategy for FutureGrowth 'Charminar Breweries Gets ISO Certification • Harrisons to Use Spencer's Name forNew Tea Brand • Aflatoxin Testing Compulsory for Groundnut Exports to EU • Budget's ColdComfort for Onions • International Trade Centre to Release Report on Organic Foods' Use ofArtificial Sweeteners Allowed • Proposed Ban on Insecticides Will Hit Two ManufacturingCompanies • Imminent Danger of Y2k Bug Damaging Food Supply Systems • Britannia'sImpressive Growth' Dispelling Suspicion of Health Hazard in Junk Food-Britannia's Ventures• Coca-Cola Takes Over Cadbury Schweppes • Turmeric Output Set to Rise by 20% • TurmeriC'Exports Likely to Achieve Target • Kissan Goes Ethnic. to Double Output • South AfricanBreweries' Major Investment in India.
FEATURE ARTICLESProcessing and Value Addition to MangoesR.S. Ram/eke, M.R. Vijayalakshmi and W.E. Eipt;son
Improved Extraction and Stabilization of Natural Food ColorantsK.D. Apama/hi and V.N. Borkhatriya
SaVing Electrical Energy in Tea Industries in North East IndiaL.S. Yadav and A.P. Srinivas/ava
Techniques to Extend the Shelf Life of Pasteurized MilkS. Sarkar
A Study on Economic Viability Indicators in Cashewnut Processing IndustriesPertaining to Goa StateP.G. Raul, H.K. PaUl and P.G. Adsule
DEPARTMENTSAdvertisers' Index
1163
1Data Bank
New Machinery 1182
1 Future Events
New Products 1187
1 JFST Contents
Research Round-up 1189
1
11541
11551
1164
1
11691
11741

Registered with the Registrar of Newspapers for India under No. 24918/64
Innovative Flavour Systems withhigh taste impact and functionality ...
.... to meet the ever growing firce competitionand demanding consumer....
Organoleptic preceptiom more particularlY taste willcontinue to be the drivingforce in acceptance of anew food product in market place. High quality andhigh performance flavourspromote innovative newfood product idea andsatisfy unique process andproduct demands. In addition - provide to variety,consumer appeal and ultimately consumer acceptance into pro essed foods.
At Food Ingredient Specialities - We haveachieved a quantum leap and professionalexpertise and are committed to providingflavours of high functionality and excellenttaste attributes to processed foods. We arecontinuously capturing natures experience.This is a continuing commitment to workclosely with user industry to bring about the
best into processed food pr.oducts, viz., - Softdrinks, Fruit and vegetable products, bakeryproducts, confectio~ery, Dairy productsincluding ice creams, snack foods and others.We are committed to consistant quality,responsive service and on-time delivery.
Experience the expertise ....
FOOD INGREDIENT SPECIALITIES PRIVATE LIMITEDRegd. Office: AI-ll1, ANNA NAGAR WEST, MADRAS - 600 040.
Phone : 0091-44-6250451/ 0091-44-6259536Telegram : 'Foodlngred' Fax: 0091-44-6264839
Published by the Secretary AFST (India) CITR!, My80re-570 013 and Printed atM/s. Jwalamukhl. Job Press, 44/1, K.R Road, Bangalore-560 004, India.