Journal of Computer Science and Information Security February 2010
311
International Journal of Computer Science & Information Security © IJCSIS PUBLICATION 2010 IJCSIS Vol. 7 No. 2, February 2010 ISSN 1947-5500
-
Upload
independent -
Category
Documents
-
view
0 -
download
0
Transcript of Journal of Computer Science and Information Security February 2010

International Journal of Computer Science
& Information Security
© IJCSIS PUBLICATION 2010
IJCSIS Vol. 7 No. 2, February 2010 ISSN 1947-5500

IJCSIS Editorial Message from Managing Editor
International Journal of Computer Science and Information Security (IJCSIS),
launched in May 2009, provides a major venue for rapid publication of high
quality research in the field of computer science and emerging technologies.
IJCSIS continues to attract the attention of Scientists and Researchers across
the work. This has only been possible due to large number of high quality
submissions and valued efforts of the reviewers.
In this February 2010 issue, we present selected publications (with acceptance
rate of ~ 29%) in the diverse area of pure and applied computer science,
networking, information retrieval, information systems, emerging
communication technologies and information security.
The editorial board and technical review committee contain some of the most
renowned specialists in their areas of expertise. We are very grateful to all the
authors who have submitted such high quality work to the Journal and the
reviewers for dealing with the manuscripts so quickly. Special thanks to our
technical sponsors for their valuable service.
Available at http://sites.google.com/site/ijcsis/
IJCSIS Vol. 7, No. 2,
February 2010 Edition
ISSN 1947-5500
© IJCSIS 2010, USA.
Indexed by (among others):

IJCSIS EDITORIAL BOARD
Dr. Gregorio Martinez Perez Associate Professor - Professor Titular de Universidad, University of Murcia (UMU), Spain Dr. M. Emre Celebi, Assistant Professor, Department of Computer Science, Louisiana State University in Shreveport, USA Dr. Yong Li School of Electronic and Information Engineering, Beijing Jiaotong University, P. R. China Prof. Hamid Reza Naji Department of Computer Enigneering, Shahid Beheshti University, Tehran, Iran Dr. Sanjay Jasola Professor and Dean, School of Information and Communication Technology, Gautam Buddha University Dr Riktesh Srivastava Assistant Professor, Information Systems, Skyline University College, University City of Sharjah, Sharjah, PO 1797, UAE Dr. Siddhivinayak Kulkarni University of Ballarat, Ballarat, Victoria, Australia Professor (Dr) Mokhtar Beldjehem Sainte-Anne University, Halifax, NS, Canada Dr. Alex Pappachen James, (Research Fellow) Queensland Micro-nanotechnology center, Griffith University, Australia
TABLE OF CONTENTS
1. Paper 31011070: Securing Iris Templates using Combined User and Soft Biometric based Password Hardened Fuzzy Vault (pp. 001-008) V. S. Meenakshi, SNR Sons College, Coimbatore, Tamil Nadu, India. Dr. G. Padmavathi, Avinashilingam University for Women, Coimbatore, Tamil Nadu, India. 2. Paper 07011059: A New Clustering Approach based on Page's Path Similarity for Navigation Patterns Mining (pp. 009-014) Heidar Mamosian, Department of Computer Engineering, Science and Research Branch, Islamic Azad University (IAU), Khouzestan, Iran Amir Masoud Rahmani, Department of Computer Engineering, Science and Research Branch, Islamic Azad University (IAU),Tehran, Iran Mashalla Abbasi Dezfouli, Department of Computer Engineering, Science and Research Branch, Islamic Azad University (IAU), Khouzestan, Iran 3. Paper 11011004: Implementing New-age Authentication Techniques using OpenID for Security Automation (pp. 015-021) Dharmendra Choukse, Institute of Engineering & Science, IPS Academy, Indore, India Umesh Kumar Singh, Institute of Computer Science, Vikram University, Ujjain, India Deepak Sukheja, Priyatam Institute of Technology and Management .Indore, India Rekha Shahapurkar, Lokmanya Tilak College,Vikram University,Ujjain, India 4. Paper 12011009: Ontology Based Query Expansion Using Word Sense Disambiguation (pp. 022-027) M. Barathi, Department of Computer Applications, S. M. K. Fomra Institute of Technology, Chennai, India S. Valli, Department of Computer Science and Engineering, Anna University, Chennai, India 5. Paper 15120915: Secured Cryptographic Key Generation From Multimodal Biometrics: Feature Level Fusion of Fingerprint and Iris (pp. 028-037) A. Jagadeesan, Research scholar / Senior Lecturer/EIE, Bannari Amman Institute of Technology, Sathyamangalam-638 401, Tamil Nadu, India Dr. K. Duraiswamy, Dean/Academic, K.S.Rangasamy College of Technology, Tiruchengode – 637 209, Tamil Nadu, India 6. Paper 20011017: The Comparison of Methods Artificial Neural Network with Linear Regression Using Specific Variables for Prediction Stock Price in Tehran Stock Exchange (pp. 038-046) Reza Gharoie Ahangar, The master of business administration of Islamic Azad University - Babol branch & Membership of young researcher club, Iran. Mahmood Yahyazadehfar, Associate Professor of Finance, University of Mazandaran, Babolsar, Iran Hassan Pournaghshband, Professor of Computer Science Department, Southern Polytechnic State University 7. Paper 21011018: A Methodology for Empirical Quality Assessment of Object-Oriented Design (pp. 047-055) Devpriya Soni, Department of Computer Applications, Maulana Azad National Institute of Technology (A Deemed University)Bhopal 462007, India Dr. Namita Shrivastava, Asst. Prof. Deptt. of Mathematics, Maulana Azad National Institute of Technology (A Deemed University)Bhopal 462007, India Dr. M. Kumar, Retd. Prof. of Computer Applications, Maulana Azad National Institute of Technology (A Deemed University)Bhopal 462007, India
8. Paper 22011020: A Computational Algorithm based on Empirical Analysis, that Composes Sanskrit Poetry (pp. 056-062) Rama N., Department of Computer Science, Presidency College, Chennai, India Meenakshi Lakshmanan, Department of Computer Science, Meenakshi College for Women Chennai, India and Research Scholar, Mother Teresa Women’s University Kodaikanal, India 9. Paper 22011021: Survey Report – State Of The Art In Digital Steganography Focusing ASCII Text Documents (pp. 063-072) Khan Farhan Rafat, Department of Computer Science, International Islamic University, Islamabad, Pakistan Muhammad Sher, Department of Computer Science, International Islamic University, Islamabad, Pakistan 10. Paper 25011023: New clustering method to decrease probability of failure nodes and increasing the lifetime in WSNs (pp. 073-076) Shahram Babaie, Department of Computer Engineering, PhD students, Islamic Azad University, Olom VA Tahghighat Branch, Tehran, Iran Ahmad Khadem Zade, Department of Computer Engineering, Iran Telecommunication Research Center, Tehran, Iran Ali Hosseinalipour, Department of Computer Engineering, Islamic Azad University- Tabriz Branch, Tabriz Iran 11. Paper 25011025: Comments on “Routh Stability Criterion” (pp. 077-078) T. D. Roopamala, Assistant Professor, Sri Jayachamarajendra college of Engineering S. K. Katti, Professor, Sri Jayachamarajendra college of Engineering 12. Paper 27011026: Concurrent Approach to Flynn’s SPMD Classification through Java (pp. 079-081) Bala Dhandayuthapani Veerasamy, Department of Computing, Mekelle University, Mekelle, Ethiopia 13. Paper 27011028: Multi-objective Geometric Programming Problem With Weighted Mean Method (pp. 082-086) A. K. Ojha, School of Basic Sciences, IIT Bhubaneswar, Orissa, Pin-751013, India Bhubaneswar-751014, India K. K. Biswal, Department of Mathematics, C.T.T.C, Bhubaneswar - 751021, Orissa, India 14. Paper 28011030: Use of Service Curve for Resource Reservation in Wired-cum-Wireless Scenario (pp. 087-093) Nitul Dutta, Sikkim Manipal Institute of Technology, Computer Science & Engg. Deptt., India Iti Saha Misra, Jadavpur University, Electronics & Telecommunication Engineering Department, India 15. Paper 28011031: Analysis, Modification, and Implementation (AMI) of Scheduling Algorithm for the IEEE 802.116e (Mobile WiMAX) (pp. 094-103) C. Ravichandiran, IT Leader, Zagro Singapore Pte Ltd, Singapore Dr. C. Pethuru Raj, Lead Architect, CR Division of Robert Bosch, Bangalore, India. Dr. V. Vaidhyanathan, Professor and HOD, Dept. of IT, SASTRA University, India 16. Paper 28011033: Current Conveyor Based Multifunction Filter (pp. 104-107) Manish Kumar, Electronics and Communication Engineering Department, Jaypee Institute of Information Technology, Noida, India M.C. Srivastava, Electronics and Communication Engineering Department, Jaypee Institute of nformation Technology, Noida, India Umesh Kumar, Electrical Engineering Department, Indian Institute of Technology, Delhi, India
17. Paper 28011034: A Secure Hash Function MD-192 With Modified Message Expansion (pp. 108-111) Harshvardhan Tiwari, Student, CSE Department, JIIT, Noida, India Dr. Krishna Asawa, Ass. Prof., CSE Department, JIIT, Noida, India 18. Paper 29011041: Integration of Rule Based Expert Systems and Case Based Reasoning in an Acute Bacterial Meningitis Clinical Decision Support System (pp. 112-118) Mariana Maceiras Cabrera, Departamento de Informática y Ciencias de la Computación, Universidad Católica del Uruguay, Montevideo, Uruguay Ernesto Ocampo Edye, Departamento de Informática y Ciencias de la Computación, Universidad Católica de l Uruguay, Montevideo, Uruguay 19. Paper 29011042: Formal Concept Analysis for Information Retrieval (pp. 119-125) Abderrahim El Qadi, Department of Computer Science, EST, University of Moulay Ismaïl, Meknes, Morocco Driss Aboutajedine, GSCM-LRIT, Faculty of Science, University of Mohammed V, Rabat-Agdal, Morocco Yassine Ennouary, GSCM-LRIT, Faculty of Science, University of Mohammed V, Rabat-Agdal, Morocco 20. Paper 29011043: Creating A Model HTTP Server Program Using java (pp. 126-130) Bala Dhandayuthapani Veerasamy, Department of Computing, Mekelle University, Mekelle, Ethiopia 21. Paper 30011045: Evaluation of E-Learners Behaviour using Different Fuzzy Clustering Models: A Comparative Study (pp. 131-140) Mofreh A. Hogo, Dept. of Electrical Engineering Technology, Higher Institution of Technology Benha, Benha University, Egypt 22. Paper 30011047: Hierarchical Approach for Online Mining--Emphasis towards Software Metrics (pp. 141-146) M . V. Vijaya Saradhi, Dept. of CSE, Astra, Hyderabad, India. Dr. B. R. Sastry, Astra, Hyderabad, India. P. Satish, Dept. of CSE, Astra, Hyderabad, India. 23. Paper 30011049: QoS Based Dynamic Web Services Composition & Execution (pp. 147-152) Farhan Hassan Khan, Saba Bashir, M. Younus Javed National University of Science & Technology, Rawalpindi, Pakistan Aihab Khan, Malik Sikandar Hayat Khiyal Fatima Jinnah Women University, Rawalpindi, Pakistan 24. Paper 30011050: Indexer Based Dynamic Web Services Discovery (pp. 153-159) Saba Bashir, Farhan Hassan Khan, M. Younus Javed National University of Science & Technology, Rawalpindi, Pakistan Aihab Khan, Malik Sikandar Hayat Khiyal, Fatima Jinnah Women University, Rawalpindi, Pakistan 25. Paper 30011051: A New Variable Threshold and Dynamic Step Size Based Active Noise Control System for Improving Performance (pp. 160-165) P. Babu, Department of ECE, K. S. Rangasamy College of Technology,Tiruchengode, Tamilnadu, India. A. Krishnan, Department of ECE, K. S. Rangasamy College of Technology, Tiruchengode, Tamilnadu, India 26. Paper 30011052: Hierarchical Web Page Classification Based on a Topic Model and Neighboring Pages Integration (pp. 166-173) Wongkot Sriurai, Department of Information Technology, King Mongkut’s University of Technology, North Bangkok, Bangkok, Thailand Phayung Meesad, Department of Teacher Training in Electrical Engineering, King Mongkut’s University of Technology, North Bangkok, Bangkok, Thailand
Choochart Haruechaiyasak, Human Language Technology Laboratory National Electronics and Computer Technology Center (NECTEC), Bangkok, Thailand 27. Paper 30011054: Clinical gait data analysis based on Spatio-Temporal features (pp. 178-183) Rohit Katiyar, Lecturer, Computer Science & Engineering Dept., Harcourt Butler Technological Institute, Kanpur (U.P.), India Dr. Vinay Kumar Pathak, Vice Chancellor, Professor, Computer Science & Engg. Dept., Uttarakhand Open University, Uttarakhand, Haldwani, India 28. Paper 30011055: Design and Performance Analysis of Unified Reconfigurable Data Integrity Unit for Mobile Terminals (pp. 184-191) L. Thulasimani, Department of Electronics and Communication Engineering, PSG College of Technology, Coimbatore-641004, India M. Madheswaran, Centre for Advanced Research, Dept. of ECE, Muthayammal Engineering College, Rasipuram-637408, India 29. Paper 30011058: Soft Computing – A step towards building Secure Cognitive WLAN (pp. 192-198) S. C. Lingareddy, KNS Institute of Technology, Bangalore, India. Dr B Stephen Charles, Stanley Stephen College of Engg, Kurnool, India. Dr Vinaya Babu, Director of Admission Dept., JNTU, Hyderabad, India Kashyap Dhruve, Planet-i Technologies, Bangalore, India. 30. Paper 31011062: A Hybrid System based on Multi-Agent System in the Data Preprocessing Stage (pp. 199-202) Kobkul Kularbphettong, Gareth Clayton and Phayung Meesad The Information Technology Faculty, King Mongkut’s University of Technology, North Bangkok, Thailand 31. Paper 31011064: New Approach to Identify Common Eigenvalues of real matrices using Gerschgorin Theorem and Bisection method (pp. 203-205) D. Roopamala , Dept. of Compute science, SJCE, Mysore, India S. K. Katti, Dept. of Compute science, SJCE, Mysore, India 32. Paper 31011066: A Survey of Naïve Bayes Machine Learning approach in Text Document Classification (pp. 206-211) Vidhya. K. A, Department of Computer Science, Pondicherry University, Pondicherry, India G. Aghila, Department of Computer Science, Pondicherry University, Pondicherry, India 33. Paper 31011067: Content based Zero-Watermarking Algorithm for Authentication of Text Documents (pp. 212-217) Zunera Jalil, Anwar M. Mirza, FAST National University of Computer and Emerging Sciences, Islamabad, Pakistan Maria Sabir, Air University, Islamabad, Pakistan 34. Paper 31011068: Secure Multicast Key Distribution for Mobile Ad Hoc Networks (pp. 218-223) D. SuganyaDevi, Asst. Prof, Department of Computer Applications, SNR SONS College, Coimbatore, Tamil Nadu, India Dr. G. Padmavathi, Prof. and Head, Dept. of Computer Science, Avinashilingam University for Women, Coimbatore, Tamil Nadu, India 35. Paper 31011071: Nonlinear Filter Based Image Denoising Using AMF Approach (pp. 224-227) T. K. Thivakaran, Asst. Professor, Dept. of I.T, Sri Venkateswara College of Engg, Chennai. Dr. R.M. Chandrasekaran, Professor, Anna University, Trichy
36. Paper 31011072: Securing Our Bluetooth Mobiles From Intruder Attack Using Enhanced Authentication Scheme And Plausible Exchange Algorithm (pp. 228-233) Ms. A. Rathika, Ms. R. Saranya, Ms. R. Iswarya VCET, Erode, India 37. Paper 31011074: Knowledge Management (pp. 234-238) Mohsen Gerami, The Faculty of Applied Science of Post and Communications, Danesh Blv, Jenah Ave, Azadi Sqr, Tehran, Iran. 38. Paper 31011075: Wireless IP Telephony (pp. 239-243) Mohsen Gerami, The Faculty of Applied Science of Post and Communications, Danesh Blv, Jenah Ave, Azadi Sqr, Tehran, Iran. 39. Paper 31011078: Reconfigurable Parallel Data Flow Architecture (pp. 244-251) Dr. Hamid Reza Naji, International Center for Science & high Technology and Environmental Sciences, Kerman Graduate University of Technology 40. Paper 31100967: Model Based Ceramic tile inspection using Discrete Wavelet Transform and Euclidean Distance (pp. 252-256) Samir Elmougy 1, Ibrahim El-Henawy 2, and Ahmed El-Azab 3 1 Dept. of Computer Science, College of Computer and Information Sciences, King Saud Univ., Riyadh 11543, Saudi Arabia 2 Dept. of Computer Science, Faculty of Computer and Information Sciences, Zagazig University, Zagazig, Egypt 3 Dept. of Computer Science, Misr for Engineering and Technology (MET) Academy, Mansoura, Egypt 41. Paper 06011047: An Analytical Approach to Document Clustering Based on Internal Criterion Function (pp. 257-261) Alok Ranjan, Department of Information Technology, ABV-IIITM, Gwalior, India Harish Verma, Department of Information Technology, ABV-IIITM, Gwalior, India Eatesh Kandpal, Department of Information Technology, ABV-IIITM, Gwalior, India Joydip Dhar, Department of Applied Sciences, ABV-IIITM, Gwalior, India 42. Paper 30011060: Role of Data Mining in E-Payment systems (pp. 262-266) Sabyasachi Pattanaik, Partha Pratim Ghosh FM University, Balasore 43. Paper 30120933: Facial Gesture Recognition Using Correlation And Mahalanobis Distance (pp. 267-272) Supriya Kapoor, Computer Science Engg., Lingaya,s Institute of Mgt & Tech., India Shruti Khanna, Computer Science Engg., Lingaya,s Institute of Mgt & Tech., India Rahul Bhatia, Information Technology Engg., Lingaya,s Institute of Mgt & Tech.,India 44. Paper 28011035: FP-tree and COFI Based Approach for Mining of Multiple Level Association Rules in Large Databases (pp. 273-279) Virendra Kumar Shrivastava, Department of Computer Science & Engineering, Asia Pacific Institute of Information Technology, Panipat (Haryana), India Dr. Parveen Kumar, Department of Computer Science & Engineering, Asia Pacific Institute of Information Technology, Panipat (Haryana), India Dr. K. R. Pardasani, Dept. of Maths & MCA, MANIT, Bhopal, India

45. Paper 28011032: A GA based Window Selection Methodology to Enhance Window based Multi wavelet transformation and thresholding aided CT image denoising technique (pp. 280-288) Syed Amjad Ali, Department of ECE, Lords Institute of Engineering and Technology, Himayathsagar, Hyderabad 8 Srinivasan Vathsal, Professor and Director, R&D, Bhaskar Engineering College, Yenkapally, Moinabad, Ranga reddy Dist K. Lal kishore, Rector, Jawahar Lal Nehru Technological University, Kukatpally , Hyderabad 46. Paper 19011015: Investigation and Assessment of Disorder of Ultrasound B-mode Images (pp. 289-293) Vidhi Rawat, Department of Biomedical Engineering Samrat Ashok Technological Institute, Vidisha, India. Alok jain, Department of electronics Engineering, Samrat Ashok Technological Institute, Vidisha, India. Vibhakar shrimali, Department of Trg. & Technical Education, Govt. of NCT Delhi, Delhi. Samrat Ashok Technological Institute, Vidisha, India.
Securing Iris Templates using Combined User and Soft Biometric based Password Hardened Fuzzy
Vault
V. S. Meenakshi SNR Sons College,
Coimbatore,Tamil Nadu, India. .
Dr. G. Padmavathi Avinashilingam University for Women, Coimbatore,
Tamil Nadu, India. .
Abstract—Personal identification and authentication is very crucial in the current scenario. Biometrics plays an important role in this area. Biometric based authentication has proved superior compared to traditional password based authentication. Anyhow biometrics is permanent feature of a person and cannot be reissued when compromised as passwords. To over come this problem, instead of storing the original biometric templates transformed templates can be stored. Whenever the transformation function is changed new revocable/cancelable templates are generated. Soft biometrics is ancillary information that can be combined with primary biometrics to identify a person in a better way. Iris has certain advantage compared to other biometric traits like fingerprint. Iris is an internal part that is less prone to damage. Moreover is very difficult for an attacker to capture an iris. The key advantage of iris biometrics is its stability or template longevity. Biometric systems are vulnerable to a variety of attacks. This work generates cancelable iris templates by applying user and soft biometric based password transformations and further secures the templates by biometric cryptographic construct fuzzy vault.
Keywords—Cancelable Biometrics, Password, Soft Biometrics, Iris, Eye color, Template security, Fuzzy Vault
I. INTRODUCTION Biometrics is automated methods of identifying a person or
verifying the identity of a person based on a physiological or behavioral characteristic. Biometric characteristics that have been commonly used are fingerprints, iris, face, hand, retina, voice, signature and keystroke dynamics. Biometrics identifies ‘you as you’. Biometrics serves as an excellent alternative to traditional token or password based authentication methods. Biometric systems are excellent compared over traditional authentication methods. Biometric traits cannot be lost or forgotten and they are inherently more reliable. It is very difficult to copy, share and distribute a biometric trait. Biometric system requires the person being authenticated to be present at the time and point of authentication.
Anyhow biometrics cannot be revoked when they are spoofed. To overcome this cancelable biometric templates are generated that can be revoked when spoofed. Further they are secured by fuzzy vault construct.
A. Merits of Iris Iris is the colored ring surrounding the pupil of the eye. Iris
biometric has certain merits compared to finger print. It is highly secure and uses a stable physiological trait. Iris is very difficult to spoof. Iris texture is different for right and left eye. They are unique even for identical twins. Iris is less prone to either intentional or unintentional modification when compared to fingerprint.
B. Soft Biometrics Soft biometrics provides ancillary information about a
person (gender, ethnicity, age, height, weight, eye color etc). They lack distinctiveness or permanence. Hence Soft biometrics alone is not enough to differentiate two individuals. Anyhow when combined with primary biometrics (Fingerprint, Iris, Retina etc) soft biometrics gives better results.
C. Cancelable Biometrics Passwords can be revoked when it is stolen. Biometrics
cannot be revoked when spoofed. This is the only disadvantage of biometrics as compared to passwords. Therefore instead of storing the biometrics as such transformed templates are stored. Whenever a transformed biometric template is spoofed another new template can be generated by changing the transformation function. This makes the biometric cancelable/ revocable similar to password. For different applications different transformation function can be used. This prevents the attacker to use the same captured template for other applications. Like passwords these transformed templates can be reissued on spoofing.
D. Operation of Fuzzy Vault Fuzzy vault is a cryptographic construct proposed by Juels
and Sudan [2]. This construct is more suitable for applications where biometric authentication and cryptography are combined together. Fuzzy vault framework thus utilizes the advantages of both cryptography and biometrics. Fuzzy vault eliminates the
(IJCSIS) International Journal of Computer Science and Information Security, Vol. 7, No. 2, February 2010
1 http://sites.google.com/site/ijcsis/ ISSN 1947-5500
(IJCSIS) International Journal of Computer Science and Information Security, Vol. 7, No. 2, 2010
key management problem as compared to other practical cryptosystems.
In fuzzy vault framework, the secret key S is locked by G, where G is an unordered set from the biometric sample. A polynomial P is constructed by encoding the secret S. This polynomial is evaluated by all the elements of the unordered set G.
A vault V is constructed by the union of unordered set G and chaff point set C which is not in G.
V = G U C The union of the chaff point set hides the genuine point set
from the attacker. Hiding the genuine point set secures the secret data S and user biometric template T.
The vault is unlocked with the query template T’. T’ is represented by another unordered set U’. The user has to separate sufficient number of points from the vault V by comparing U’ with V. By using error correction method the polynomial P can be successfully reconstructed if U’ overlaps with U and secret S gets decoded. If there is not substantial overlapping between U and U’ secret key S is not decoded.
This construct is called fuzzy because the vault will get decoded even for very near values of U and U’ and the secret key S can be retrieved. Therefore fuzzy vault construct become more suitable for biometric data which show inherent fuzziness hence the name fuzzy vault as proposed by Sudan [2].
The security of the fuzzy vault depends on the infeasibility of the polynomial reconstruction problem. The vault performance can be improved by adding more number of chaff points C to the vault.
E. Limitation of Fuzzy Vault Scheme Fuzzy vault being a proven scheme has its own limitations
[5]. (i) If the vault is compromised, the same biometric data
cannot be used to construct a new vault. Fuzzy vault cannot be revoked. Fuzzy vault is prone to cross- matching of templates across various databases.
User Password (40 bits)
Soft biometric Password
(24 bits)
User Password + Soft biometric Password (64 bits)
Fuzzy Vault
Transformation
Feature
Extraction
Transformation
Key
eration
Gen
Transformation equation from combined password
Iris
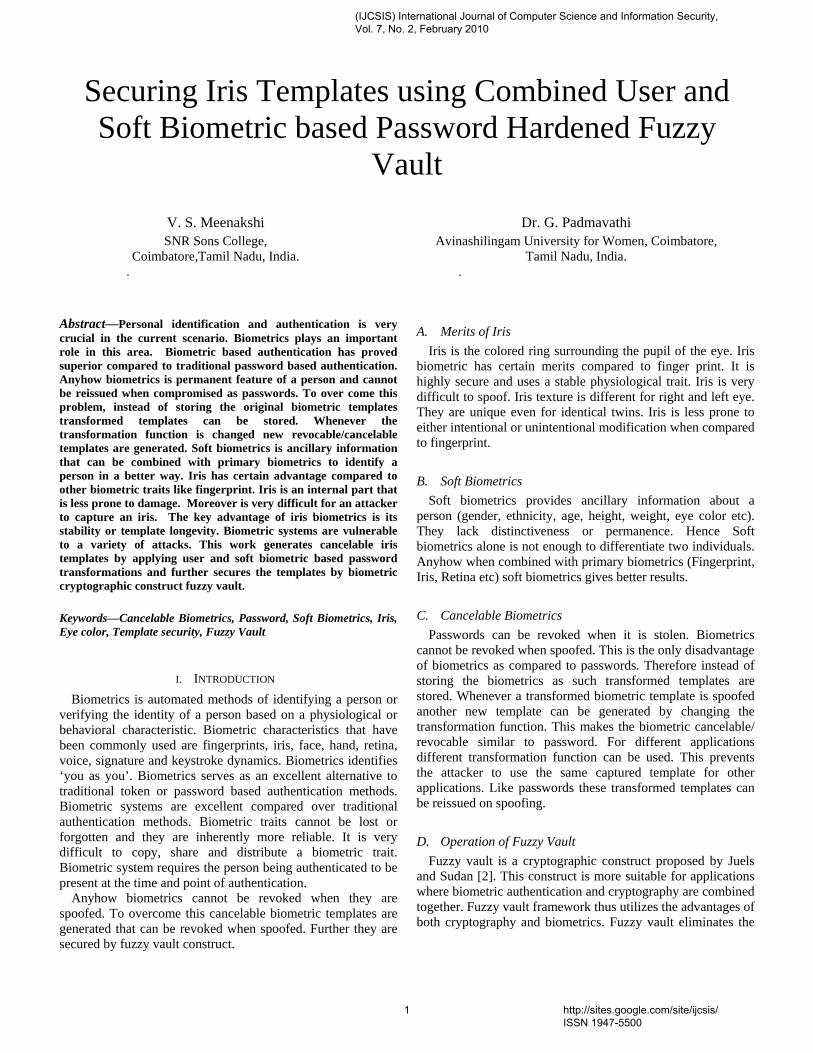
Fig. 1 Steps in combined password hardened fuzzy vault
(IJCSIS) International Journal of Computer Science and Information Security, Vol. 7, No. 2, February 2010
2 http://sites.google.com/site/ijcsis/ ISSN 1947-5500
(IJCSIS) International Journal of Computer Science and Information Security, Vol. 7, No. 2, 2010
(ii) Due to the non-uniform nature of the biometric features it is easy for an attacker to develop attacks based on statistical analysis of the points in the vault.
(iii) The vault contains more chaff points than the genuine points. This facilitates the attacker to substitute few points from his own biometric feature. Therefore the vault authenticates both the genuine user and the imposter using the same biometric identity. As a consequence, the false acceptance ratio of the system increases.
(iv) Original template of the genuine user is temporarily exposed. During this exposure the attacker can glean the template.
To overcome the limitations of fuzzy vault, password is used
as an additional authentication factor. The proposed Iris fuzzy vault is hardened by combined user and biometric password. This enhances the user-privacy and adds an additional level of security.
F. Steps in Combined Password Hardened Fuzzy Vault The hardened fuzzy vault overcomes the limitations of non-
revocability and cross-matching by introducing an additional layer of security by password. If the password is compromised the basic security and privacy provided by the fuzzy vault is not affected. However, a compromised password makes the security level same as that of a fuzzy vault. Therefore, security of the password is crucial. It is very difficult for an attacker to compromise the biometric template and the combined password at the same time. The proposed method constructs a fuzzy vault using the feature points extracted from iris. The iris biometric fuzzy vault is then hardened using the password.
Steps in hardening scheme: 1. A combined user and soft biometric password is
generated. 2. A random transformation function is derived from the
user password.
3. The password transformed function is applied to the Iris template.
4. Fuzzy vault frame work is constructed to secure the transformed templates by using the feature points from the iris.
5. The key derived from the same password is used to encrypt the vault.
Figure 1 depicts the steps involved in the construction of the password hardened multi biometric fuzzy vault. The organization of the paper is as follows: Chapter II elaborates the background study. Section III explains the proposed generation of cancelable Iris template and securing
them using fuzzy vault. Section IV discusses the experimental results and the security analysis. Section V concludes of the proposed work.
II. RELATED WORK Karthick Nandakumar et al [5] used the idea of password transformation for fingerprint and generated transformed templates. In his work those transformed templates are protected using fuzzy vault cryptographic construct in which password acts an additional layer of security. Iris based hard fuzzy vault proposed by Srinivasa Reddy [3] followed the same idea of [5] to generate revocable iris templates and secured them using password hardened fuzzy vault. The basic idea of generating cancelable iris is based on the idea derived from the work done by karthick Nandakumar et al [5] and Srinivasa Reddy[3]. Iris based hard fuzzy vault proposed by Srinivasa Reddy [3] applies a sequence of morphological operations to extract minutiae points from the iris texture. This idea is utilized in the proposed method for extracting the minutiae feature point from the Iris. The same idea is used but with combined user and soft biometric password. Soft biometrics ideas derived from [16, 17, 18, 19, 20] are used for constructing soft biometric passwords.
III. PROPOSED METHOD Revocable iris templates generation is carried out in the following three steps. In the first step the iris texture containing the highlighted minutiae feature points is subjected to simple permutation and translation. This results in the original minutiae points being transformed into new points. In the second step the soft biometric password is combined with the user password to get a new 64 bit password. In the third step, the simple transformed iris template is randomly transformed using password. This process enhances the user privacy and facilitates the generation of revocable templates and resists cross matching. This transformation reduces the similarity between the original and transformed template. The transformed templates are further secured using the fuzzy vault construct.
A. Extraction of Minutiae Feature point from Iris The idea proposed by Srinivasa Reddy [3] is utilized to extract the minutiae feature points from the iris texture. The following operations are applied to the iris images to extract lock/unlock data. Canny edge detection is applied on iris image to deduct iris. Hough transformation is applied first to iris/sclera boundary and then to iris/pupil boundary. Then thresholding is done to isolate eyelashes. Histogram equalization is performed on iris to enhance the contrast. Finally the following sequence of morphological operations is performed on the enhanced iris structure. (i) closing-by-tophat (ii) opening
(IJCSIS) International Journal of Computer Science and Information Security, Vol. 7, No. 2, February 2010
3 http://sites.google.com/site/ijcsis/ ISSN 1947-5500
(IJCSIS) International Journal of Computer Science and Information Security, Vol. 7, No. 2, 2010
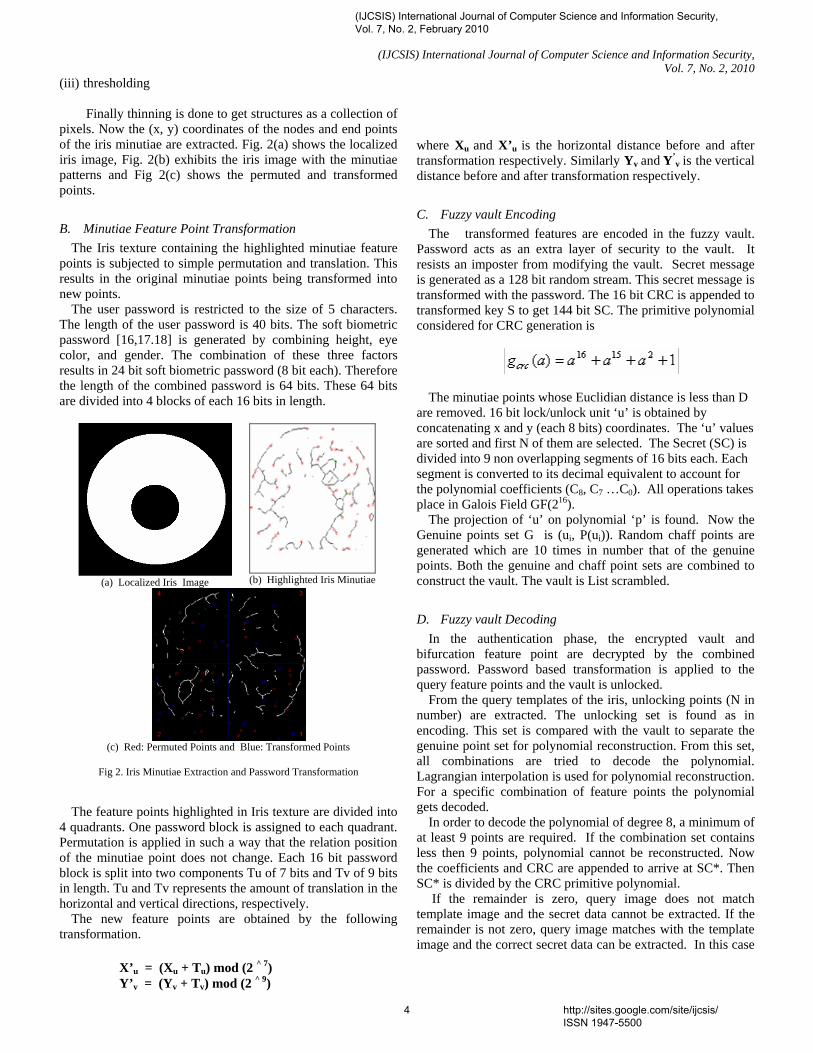
(iii) thresholding Finally thinning is done to get structures as a collection of pixels. Now the (x, y) coordinates of the nodes and end points of the iris minutiae are extracted. Fig. 2(a) shows the localized iris image, Fig. 2(b) exhibits the iris image with the minutiae patterns and Fig 2(c) shows the permuted and transformed points.
B. Minutiae Feature Point Transformation The Iris texture containing the highlighted minutiae feature
points is subjected to simple permutation and translation. This results in the original minutiae points being transformed into new points.
The user password is restricted to the size of 5 characters. The length of the user password is 40 bits. The soft biometric password [16,17.18] is generated by combining height, eye color, and gender. The combination of these three factors results in 24 bit soft biometric password (8 bit each). Therefore the length of the combined password is 64 bits. These 64 bits are divided into 4 blocks of each 16 bits in length.
(a) Localized Iris Image
(b) Highlighted Iris Minutiae
(c) Red: Permuted Points and Blue: Transformed Points
Fig 2. Iris Minutiae Extraction and Password Transformation
The feature points highlighted in Iris texture are divided into
4 quadrants. One password block is assigned to each quadrant. Permutation is applied in such a way that the relation position of the minutiae point does not change. Each 16 bit password block is split into two components Tu of 7 bits and Tv of 9 bits in length. Tu and Tv represents the amount of translation in the horizontal and vertical directions, respectively.
The new feature points are obtained by the following transformation.
where Xu and X’u is the horizontal distance before and after transformation respectively. Similarly Yv and Y’
v is the vertical distance before and after transformation respectively.
C. Fuzzy vault Encoding The transformed features are encoded in the fuzzy vault.
Password acts as an extra layer of security to the vault. It resists an imposter from modifying the vault. Secret message is generated as a 128 bit random stream. This secret message is transformed with the password. The 16 bit CRC is appended to transformed key S to get 144 bit SC. The primitive polynomial considered for CRC generation is
The minutiae points whose Euclidian distance is less than D are removed. 16 bit lock/unlock unit ‘u’ is obtained by concatenating x and y (each 8 bits) coordinates. The ‘u’ values are sorted and first N of them are selected. The Secret (SC) is divided into 9 non overlapping segments of 16 bits each. Each segment is converted to its decimal equivalent to account for the polynomial coefficients (C8, C7 …C0). All operations takes place in Galois Field GF(216).
The projection of ‘u’ on polynomial ‘p’ is found. Now the Genuine points set G is (ui, P(ui)). Random chaff points are generated which are 10 times in number that of the genuine points. Both the genuine and chaff point sets are combined to construct the vault. The vault is List scrambled.
D. Fuzzy vault Decoding In the authentication phase, the encrypted vault and
bifurcation feature point are decrypted by the combined password. Password based transformation is applied to the query feature points and the vault is unlocked.
From the query templates of the iris, unlocking points (N in number) are extracted. The unlocking set is found as in encoding. This set is compared with the vault to separate the genuine point set for polynomial reconstruction. From this set, all combinations are tried to decode the polynomial. Lagrangian interpolation is used for polynomial reconstruction. For a specific combination of feature points the polynomial gets decoded.
In order to decode the polynomial of degree 8, a minimum of at least 9 points are required. If the combination set contains less then 9 points, polynomial cannot be reconstructed. Now the coefficients and CRC are appended to arrive at SC*. Then SC* is divided by the CRC primitive polynomial.
If the remainder is zero, query image does not match template image and the secret data cannot be extracted. If the remainder is not zero, query image matches with the template image and the correct secret data can be extracted. In this case
X’u = (Xu + Tu) mod (2 ^ 7) Y’v = (Yv + Tv) mod (2 ^ 9)
(IJCSIS) International Journal of Computer Science and Information Security, Vol. 7, No. 2, February 2010
4 http://sites.google.com/site/ijcsis/ ISSN 1947-5500
(IJCSIS) International Journal of Computer Science and Information Security, Vol. 7, No. 2, 2010
SC* is divided into two parts as the 128 bit secret data and 16 bit CRC code.
E. Parameters used in implementation The parameters used in this implementation are shown in
Table 1. Chaff points hide the genuine points from the attacker. More chaff points makes the attacker to take much time to compromise the vault but consumes additional computation time. The chaff points added are 10 times in number that of the genuine points.
TABLE I PARAMETERS OF THE IRIS VAULT
Parameter Number
No. of. Genuine points(r) 20 No. of Chaff points(c) 200 Total no. of points (t = r + c)
220
IV. EXPERIMENTAL RESULTS AND ANALYSIS The Iris template is transformed for three different user
passwords to check for revocability. The Table III shows the sample bifurcation points from four quadrants after transformation using three different user passwords and soft biometric passwords generated as shown in table 2 and table 3.
Consider a 5 character user password ‘FUZZY’, whose ASCII value is given by or 40 bits. Soft biometric password component is 155BM(24 bits). Soft biometric password and User Password are combined to form the transformation password as ‘155BMFUZZY’(64 bits) whose ASCII values are (155, 66, 77 ,70, 85, 90, 90, 89,) . These 64 bits are divided into four blocks of 16 bits each. Each 16 bit is divided into 7 bits and 9 bits for transformation in horizontal and vertical direction.
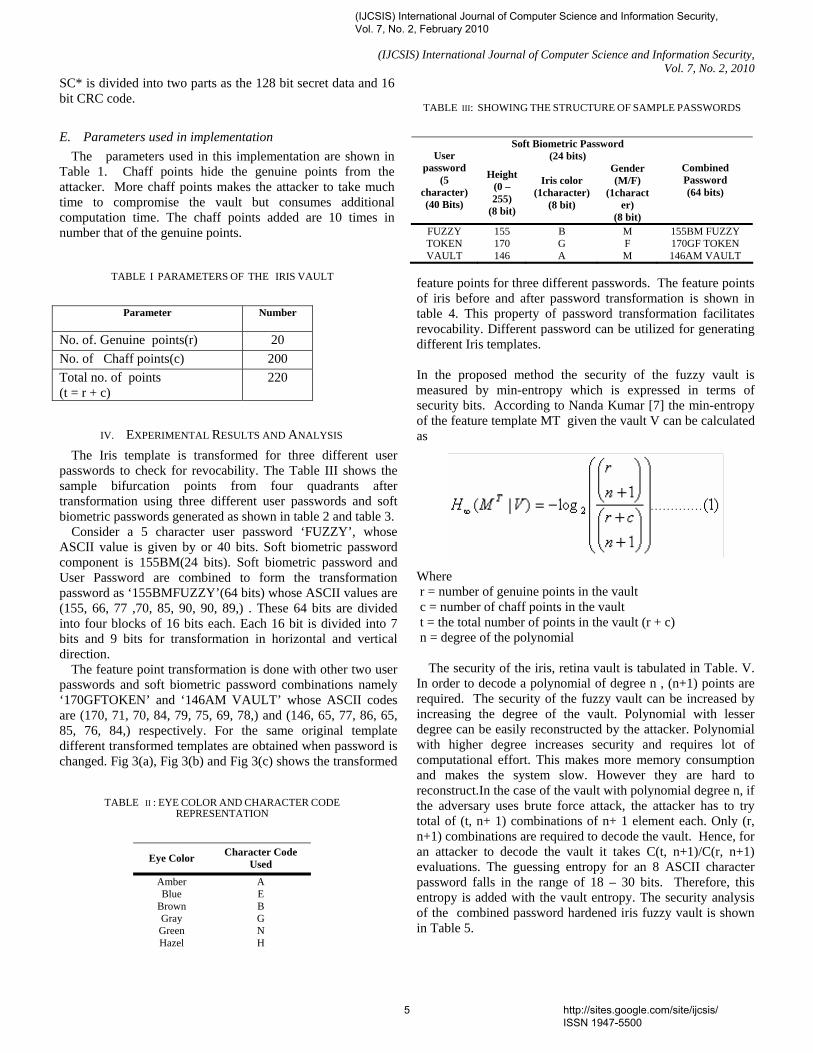
The feature point transformation is done with other two user passwords and soft biometric password combinations namely ‘170GFTOKEN’ and ‘146AM VAULT’ whose ASCII codes are (170, 71, 70, 84, 79, 75, 69, 78,) and (146, 65, 77, 86, 65, 85, 76, 84,) respectively. For the same original template different transformed templates are obtained when password is changed. Fig 3(a), Fig 3(b) and Fig 3(c) shows the transformed
feature points for three different passwords. The feature points of iris before and after password transformation is shown in table 4. This property of password transformation facilitates revocability. Different password can be utilized for generating different Iris templates.
TABLE III: SHOWING THE STRUCTURE OF SAMPLE PASSWORDS
Soft Biometric Password
(24 bits)
In the proposed method the security of the fuzzy vault is measured by min-entropy which is expressed in terms of security bits. According to Nanda Kumar [7] the min-entropy of the feature template MT given the vault V can be calculated as
Where r = number of genuine points in the vault c = number of chaff points in the vault t = the total number of points in the vault (r + c) n = degree of the polynomial
The security of the iris, retina vault is tabulated in Table. V.
In order to decode a polynomial of degree n , (n+1) points are required. The security of the fuzzy vault can be increased by increasing the degree of the vault. Polynomial with lesser degree can be easily reconstructed by the attacker. Polynomial with higher degree increases security and requires lot of computational effort. This makes more memory consumption and makes the system slow. However they are hard to reconstruct.In the case of the vault with polynomial degree n, if the adversary uses brute force attack, the attacker has to try total of (t, n+ 1) combinations of n+ 1 element each. Only (r, n+1) combinations are required to decode the vault. Hence, for an attacker to decode the vault it takes C(t, n+1)/C(r, n+1) evaluations. The guessing entropy for an 8 ASCII character password falls in the range of 18 – 30 bits. Therefore, this entropy is added with the vault entropy. The security analysis of the combined password hardened iris fuzzy vault is shown in Table 5.
User password Gender
(5 character) (40 Bits)
Height (0 – 255)
(8 bit)
Iris color (1character)
(8 bit)
(M/F) (1charact
er) (8 bit)
Combined Password (64 bits)
FUZZY 155 B M 155BM FUZZY TOKEN 170 G F 170GF TOKEN VAULT 146 A M 146AM VAULT
TABLE II : EYE COLOR AND CHARACTER CODE REPRESENTATION
Character Code
Used Eye Color
Amber A Blue E
Brown B Gray G Green N Hazel H
(IJCSIS) International Journal of Computer Science and Information Security, Vol. 7, No. 2, February 2010
5 http://sites.google.com/site/ijcsis/ ISSN 1947-5500
(IJCSIS) International Journal of Computer Science and Information Security, Vol. 7, No. 2, 2010
Fig 3. (a) PASSWORD : VAULT146AM
Fig 3. (c) PASSWORD : TOKEN170GF
Fig 3. (b) PASSWORD: FUZZY155BM
Fig 3. Transformed Retinal Features for Three Different Soft Biometric Passwords
(IJCSIS) International Journal of Computer Science and Information Security, Vol. 7, No. 2, February 2010
6 http://sites.google.com/site/ijcsis/ ISSN 1947-5500
(IJCSIS) International Journal of Computer Science and Information Security, Vol. 7, No. 2, 2010
TABLE V SECURITY ANALYSIS OF COMBINED PASSWORD HARDENED FUZZY VAULT
V. CONCLUSION Biometric templates are vulnerable to a variety of attacks.
The only disadvantage of biometrics authentication as compared to traditional password based authentication is non revocability. The idea of cancelable biometrics overcomes that disadvantage. Iris has certain advantage as compared to fingerprint. Soft biometrics is ancillary information about a person, when combined with user password gives better results. It is very difficult for an attacker to gain the biometric features, soft biometric components and user password at the same time. The security of these cancelable templates will be the guessing entropy of the 8 character ASCII password which comes to be 18 to 30 bits in strength. The user password can be changed for generating revocable biometric templates. The revocable biometric templates are further secured by applying
the ideas of fuzzy vault. Due to this the security of the iris templates increases to 52 to 64 bits.
ACKNOWLEDGEMENT A public version of the CUHK Iris Database is available
from http://www2.acae.cuhk.edu.hk.
REFERENCES [1] Umat uludag, sharath pankanti, Anil. K.Jain “Fuzzy vault for
fingerprints”, Proceedings of International conference on Audio video based person authentication, 2005.
[2] Juels and M.Sudan, “A fuzzy vault scheme”, Proceedings of IEEE International symposium Information Theory, 2002.
[3] E.Srinivasa Reddy, I. Ramesh Babu, “Performance of Iris Based Hard Fuzzy Vault”, Proceedings of IEEE 8th International conference on computers and Information technology workshops, 2008
Vault Type
Degree of polynomia
Min-entropy of the vault (in security
bits
Total no: of combinations
Combinations required
No: of Evaluations
Min-entropy + guessing entropy of the
password (in security bit )
Iris 8 34 2.8187 X 10 15 167960 1.6782 X 10¹⁰ 52 to 64
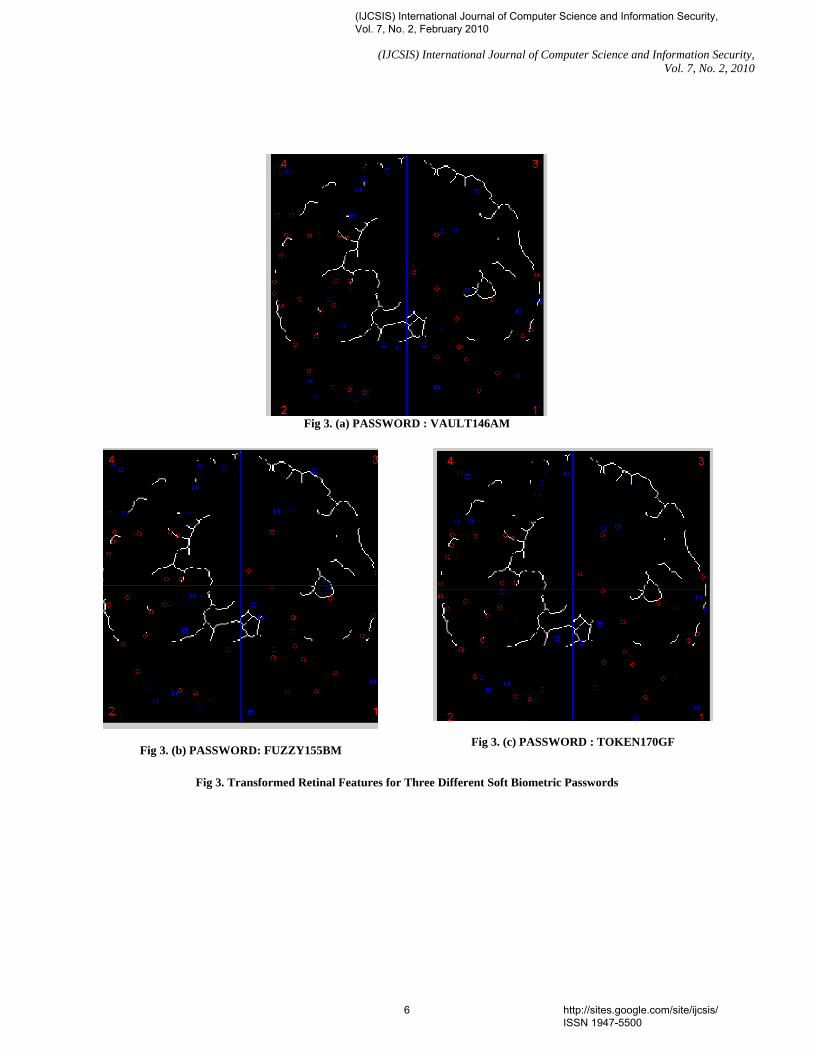
TABLE IV IRIS MINUTIAE FEATURE POINTS BEFORE AND AFTER TRANSFORMATION
Feature points before
transformation
Transformation code from
password
Feature point after transformation Quadrant
and Password Horizontal
Distance (Xu)
Vertical Distance
(Yv)
Tu
Tv
Horizontal Distance (Xu)
Vertical Distance
(Yv) I
‘155BM FUZZY’
77 322 81 61 4 123 ‘170GF TOKEN’ 85 71 89 66 ‘146AM VAULT’ 73 65 77 60
II ‘155BM FUZZY’ 38 326 173 56 135 114 ‘170GF TOKEN’ 35 84 170 70 ‘146AM VAULT’ 38 342 173 72
III ‘155BM FUZZY’ 42 346 46 224 4 134 ‘170GF TOKEN’ 39 331 43 209 ‘146AM VAULT’ 32 341 36 219
IV ‘155BM FUZZY’ 90 89 246 218 156 129 ‘170GF TOKEN’ 69 78 225 207 ‘146AM VAULT’ 76 84 232 213
(IJCSIS) International Journal of Computer Science and Information Security, Vol. 7, No. 2, February 2010
7 http://sites.google.com/site/ijcsis/ ISSN 1947-5500
(IJCSIS) International Journal of Computer Science and Information Security, Vol. 7, No. 2, 2010
[4] U.Uludag, S. Pankanti, S.Prabhakar, and A.K.Jain, “Biometric Cryptosystems: issues and challenges, Proceedings of the IEEE ,June 2004.
[5] Karthik Nandakumar, Abhishek Nagar and Anil K.Jain, “Hardening Fingerprint Fuzzy Vault using Password”, International conference on Biometrics, 2007.
[6] Karthick Nandakumar, Sharath Pankanti, Anil K. Jain, “Fingerprint-based Fuzzy Vault Implementation and Performance”, IEEE Transacations on Information Forensics and Security, December 2007.
[7] K.NandaKumar, “Multibiometric Systems: Fusion Strategies and Template Security”, PhD Thesis, Department of Computer Science and Engineering, Michigan State University, January 2008.
[8] Sharat Chikkarur, Chaohang Wu, Venu Govindaraju, “A systematic Approach for feature Extraction in Fingerprint images”, Center for Unified Biometrics and Sensors(CUBS), university at Buffalo, NY,USA.
[9] K. Jain, A. Ross, and S. Pankanti, “Biometrics: A Tool for Information Security,” IEEE Transactions on Information Forensics and Security, vol. 1, no. 2, pp. 125–143, June 2006.
[10] K. Jain, A. Ross, and U. Uludag, “Biometric Template Security: Challenges and Solutions,” in Proceedings of European Signal Processing Conference (EUSIPCO), Antalya, Turkey, September 2005.
[11] Anil K.Jain, Karthik Nanda Kumar and Abhishek Nagar, “Biometric Template Security” EURASIP Journal on Advance in Signal Processing, special issue on Biometrics, January 2008.
[12] Ratha, N.K., J.H. Connell, and R.M. Bolle, “Enhancing security and privacy in biometrics-based authentication systems”, IBM Systems Journal, vol. 40, no. 3.
[13] Jain, Anil K. Jain and Arun Ross, “Multibiometric systems,” Communications of the ACM,” January 2004, Volume 47, Number 1 (2004).
[14] A.K. Jain and A. Ross, “Learning User-specific parameters in a Multibiometric System”, Proc. IEEE International Conference on Image Processing(ICIP), Rochester, New York, September 22 – 25, 2002, pp. 57 – 60.
[15] Li Chen, IEEE Member, Xiao-Long zhang, “Feature-based image registration using bifurcation structures”, Matlab Central
[16] Anil K. Jain, Sarat C. Dass, and Karthik Nandakumar, ” Soft Biometric Traits for Personal Recognition Systems Proceedings of International Conference on Biometric Authentication”, LNCS 3072, pp. 731-738, Hong Kong, July 2004.
[17] Anil K. Jain, Karthik Nandakumar, Xiaoguang Lu, and Unsang Park,”Integrating Faces, Fingerprints, and Soft Biometric Traits for User Recognition”, Proceedings of Biometric Authentication Workshop, LNCS 3087, pp. 259-269, Prague, May 2004
[18] 18 Anil K. Jain, Sarat C. Dass and Karthik Nandakumar, ” Can soft biometric traits assist user recognition?”, Proceedings of SPIE Vol. 5404, pp. 561-572, 2004.
[19] Anil K. Jain and Unsang Park,” Facial Marks: Soft Biometric For Face Reognition”, IEEE International Conference on Image Processing (ICIP), Cairo, Nov. 2009.
[20] Jung-Eun Lee, Anil K. Jain and Rong Jin, “Scars, Marks And Tattoos (Smt): Soft Biometric For Suspect And Victim Identification”, Biometrics Symposium 2008
V. S. Meenakshi received her B.Sc (Physics) from Madurai Kamaraj University and MCA from Thiagarajar College of Engineering, Madurai in 1990 and 1993 respectively. And, she received her M.Phil degree in Computer Science from Manonmaniam Sundaranar University, Tirunelveli in 2003. She is pursuing her PhD at Avinashilingam University for Women. She is currently working as an Associate Professor in the
Department of Computer Applications, SNR Sons College, Coimbatore. She has 16 years of teaching experience. She has presented nearly 15 papers in various national and international conferences. Her research interests are Biometrics, Biometric Template Security and Network Security.
Dr. Padmavathi Ganapathi is the Professor and Head of the Department of Computer Science, Avinashilingam University for Women, Coimbatore. She has 21 years of teaching experience and one year Industrial experience. Her areas of interest include Network security and Cryptography and real time communication. She has more than 80 publications at national and International level. She is a life member of many professional organizations like CSI, ISTE, AACE, WSEAS, ISCA,
and UWA. She is currently the Principal Investigator of 5 major projects under UGC and DRDO
(IJCSIS) International Journal of Computer Science and Information Security, Vol. 7, No. 2, February 2010
8 http://sites.google.com/site/ijcsis/ ISSN 1947-5500
(IJCSIS) International Journal of Computer Science and Information Security, Vol. 7, No. 2, 2010
A New Clustering Approach based on Page's Path Similarity for Navigation Patterns Mining
Heidar Mamosian Department of Computer
Engineering, Science and Research Branch, Islamic Azad University
(IAU), Khouzestan, Iran .
Amir Masoud Rahmani Department of Computer
Engineering, Science and Research Branch, Islamic Azad University
(IAU),Tehran, Iran .
Mashalla Abbasi Dezfouli Department of Computer
Engineering, Science and Research Branch, Islamic Azad University
(IAU), Khouzestan, Iran .
Abstract—In recent years, predicting the user's next request in web navigation has received much attention. An information source to be used for dealing with such problem is the left information by the previous web users stored at the web access log on the web servers. Purposed systems for this problem work based on this idea that if a large number of web users request specific pages of a website on a given session, it can be concluded that these pages are satisfying similar information needs, and therefore they are conceptually related. In this study, a new clustering approach is introduced that employs logical path storing of a website pages as another parameter which is regarded as a similarity parameter and conceptual relation between web pages. The results of simulation have shown that the proposed approach is more than others precise in determining the clusters.
Keywords-Clustering; Web Usage Mining; Prediction of Users' Request; Web Access Log.
I. INTRODUCTION As the e-business is booming along with web services and
information systems on the web, it goes without saying that if a website cannot respond a user's information needs in a short time, the user simply refers to another website. Since websites live on their users and their number, predicting information needs of a website's users is essential, and therefore it has gained much attention by many organization and scholars. One important source which is useful in analyzing and modeling the users' behavior is the second-hand information left by the previous web users. When a web user visits a website, for one request ordered by the user one or more than one record(s) of the server is stored in the web access log. The analysis of such data can be used to understand the users' preferences and behavior in a process commonly referred to as Web Usage Mining (WUM) [1, 2].
Most WUM projects try to arrive at the best architecture and improve clustering approach so that they can provide a better model for web navigation behavior. With an eye to the hypotheses of Visit-Coherence, they attempt to achieve more precise navigation patterns through navigation of previous web users and modeling them. As such, the prediction system on large websites can be initiated only when firstly web access logs are numerous. In other words, for a long time a website should run without such system to collect such web access log,
and thereby many chances of the website are missed. Secondly, those involved in designing the website are not consulted.
Website developers usually take pages with related content and store them in different directories hierarchically. In this study, such method is combined with collected information from previous web users' navigation to introduce a new approach for pages clustering. The simulation results indicated that this method enjoys high accuracy on prediction. The rest of paper is structured as follows: section II outlines general principles. Section III described related work, and section 4 elaborates on a new clustering approach based on pages storage path. Section 5 reports on the results and section 6 is devoted to conclusion and future studies.
II. PRINCIPLES
A. Web Usage Mining process Web usage mining refers to a process where users' access
patterns on a website are studied. In general it is consists of 8 steps [3, 4]:
• Data collection. This is done mostly by the web servers; however there exist methods, where client side data are collected as well.
• Data cleaning. As in all knowledge discovery processes, in web usage mining can also be happen that such data is recorded in the log file that is not useful for the further process, or even misleading or faulty. These records have to be corrected or removed.
• User identification. In this step the unique users are distinguished, and as a result, the different users are identified. This can be done in various ways like using IP addresses, cookies, direct authentication and so on.
• Session identification. A session is understood as a sequence of activities performed by a user when he is navigating through a given site. To identify the sessions from the raw data is a complex step, because the server logs do not always contain all the information needed. There are Web server logs that do not contain enough information to reconstruct the user sessions; in this case (for example time-oriented or structure-oriented) heuristics can be used.
9 http://sites.google.com/site/ijcsis/ ISSN 1947-5500
(IJCSIS) International Journal of Computer Science and Information Security, Vol. 7, No. 2, 2010
• Feature selection. In this step only those fields are selected, that are relevant for further processing.
• Data transformation, where the data is transformed in such a way that the data mining task can use it. For example strings are converted into integers, or date fields are truncated etc.
• Executing the data mining task. This can be for example frequent itemset mining, sequence mining, graph mining, clustering and so on.
• Result understanding and visualization. Last step involves representing knowledge achieved from web usage mining in an appropriate form.
As it was shown, the main steps of a web usage mining process are very similar to the steps of a traditional knowledge discovery process.
B. Web Access Log The template is used to format your paper and style the text.
All margins, column widths, line spaces, and text fonts are prescribed; please do not alter them. You may note peculiarities. For example, the head margin in this template measures proportionately more than is customary. This measurement and others are deliberate, using specifications that anticipate your paper as one part of the entire proceedings, and not as an independent document. Please do not revise any of the current designations.
Each access to a Web page is recorded in the web access log of web server that hosts it. Each entry of web access log file consists of fields that follow a predefined format. The fields of the common log format are [5]:
remothost rfc931 authuser date “request” status bytes
In the following a short description is provided for each field:
• remotehost. Name of the computer by which a user is connected to a web site. In case the name of computer is not present on DNS server, instead the computer's IP address is recorded.
• rfc931. The remote log name of the user.
• authuser. The username as witch the user has authenticated himself, available when using password protected WWW pages.
• date. The date and time of the request.
• request. The request line exactly as it came from the client (the file, the name and the method used to retrieve it).
• status. The HTTP status code returned to the client, indicating whether or not the file was successfully retrieved and if not, what error message was returned.
• Byte. The content-length of the documents transferred.
W3C presented an improved format for Web access log files, called extended log format, partially motivated by the need to support collection of data for demographic analysis and for log summaries. This format permits customized log files to be recorded in a format readable by generic analysis tools. The main extension to the common log format is that a number of fields are added to it. The most important are: referrer, which is the URL the client was visiting before requesting that URL, user_agent, which is the software the client claims to be using and cookie, in the case the site visited uses cookies.
III. RELATED WORK In recent years, several Web usage mining projects have
been proposed for mining user navigation behavior [6-11]. PageGather (Perkowitz, et al. 2000) is a web usage mining system that builds index pages containing links to pages similar among themselves. Page Gather finds clusters of pages. Starting from the user activity sessions, the co-occurrence matrix M is built. The element Mij of M is defined as the conditional probability that page i is visited during a session if page j is visited in the same session. From the matrix M, The undirected graph G whose nodes are the pages and whose edges are the non-null elements of M is built. To limit the number of edges in such a graph a threshold filter specified by the parameter MinFreq is applied. Elements of Mij whose value is less than MinFreq are too little correlated and thus discarded. The directed acyclic graph G is then partitioned finding the graph’s cliques. Finally, cliques are merged to originate the clusters.
One important concept introduced in [6] is the hypotheses that users behave coherently during their navigation, i.e. pages within the same session are in general conceptually related. This assumption is called visit coherence.
Baraglia and Palmerini proposed a WUM system called SUGGEST, that provide useful information to make easier the web user navigation and to optimize the web server performance [8-9]. SUGGEST adopts a two levels architecture composed by an offline creation of historical knowledge and an online engine that understands user’s behavior. In this system, PageGather clustering method is employed, but the co-occurrence matrix elements are calculated according to (1):
),max( NjNi
NijMij = (1)
Where Nij is the number of sessions containing both pages i and j, Ni and Nj are the number of sessions containing only page i or j, respectively. Dividing by the maximum between single occurrences of the two pages has the effect of reducing the relative importance of index pages.
In SUGGEST a method is presented to quantify intrinsic coherence index of sessions based on visit coherence hypothesis. It measures the percentage of pages inside a user session which belong to the cluster representing the session considered. To calculate this index, the datasets obtained from the pre-processing phase is divided into two halves, apply the Clustering on one half and measure visit-coherence criterion on
10 http://sites.google.com/site/ijcsis/ ISSN 1947-5500
(IJCSIS) International Journal of Computer Science and Information Security, Vol. 7, No. 2, 2010
the basis of the second half. It is calculated according to achieved clusters. Measure of γ for each session is calculated according to 2:
{ }
i
ii
NCpsp
i∈∈
=|γ (2)
Where p is a page, Si is i-th session, Ci is the cluster representing i, and Ni is the number of pages in i-th session. The average value for γ over all NS sessions contained inside the dataset partition treated is given by:
s
N
i i
N
s∑ ==Γ 1γ
(3)
Jalali et al. [10,11] proposed a recommender system for navigation pattern mining through Web usage mining to predict user future movements. The approach is based on the graph partitioning clustering algorithm to model user navigation patterns for the navigation patterns mining phase.
All these works attempted to find an architecture and algorithm for enhancing clustering quality, but the quality of achieved clusters is still far from satisfying. In this work, a clustering approach is introduced that is based on path similarity of web pages to enhance clustering accuracy.
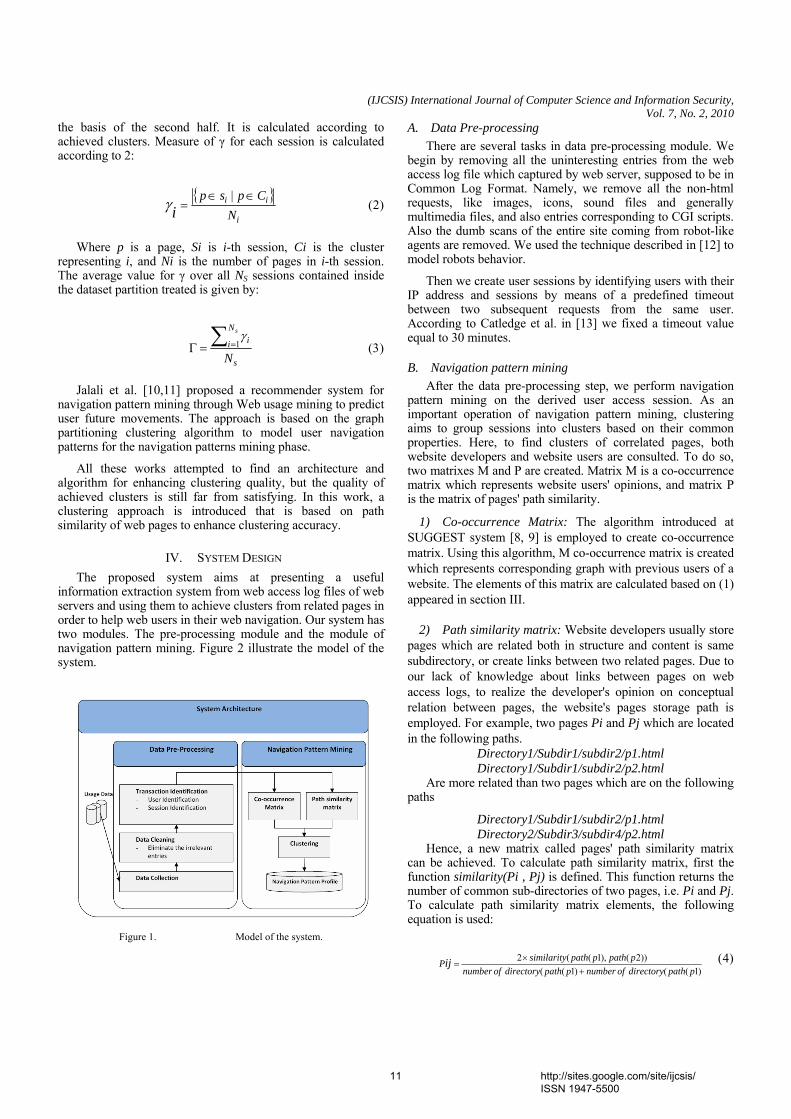
IV. SYSTEM DESIGN The proposed system aims at presenting a useful
information extraction system from web access log files of web servers and using them to achieve clusters from related pages in order to help web users in their web navigation. Our system has two modules. The pre-processing module and the module of navigation pattern mining. Figure 2 illustrate the model of the system.
Figure 1. Model of the system.
A. Data Pre-processing There are several tasks in data pre-processing module. We
begin by removing all the uninteresting entries from the web access log file which captured by web server, supposed to be in Common Log Format. Namely, we remove all the non-html requests, like images, icons, sound files and generally multimedia files, and also entries corresponding to CGI scripts. Also the dumb scans of the entire site coming from robot-like agents are removed. We used the technique described in [12] to model robots behavior.
Then we create user sessions by identifying users with their IP address and sessions by means of a predefined timeout between two subsequent requests from the same user. According to Catledge et al. in [13] we fixed a timeout value equal to 30 minutes.
B. Navigation pattern mining After the data pre-processing step, we perform navigation
pattern mining on the derived user access session. As an important operation of navigation pattern mining, clustering aims to group sessions into clusters based on their common properties. Here, to find clusters of correlated pages, both website developers and website users are consulted. To do so, two matrixes M and P are created. Matrix M is a co-occurrence matrix which represents website users' opinions, and matrix P is the matrix of pages' path similarity.
1) Co-occurrence Matrix: The algorithm introduced at SUGGEST system [8, 9] is employed to create co-occurrence matrix. Using this algorithm, M co-occurrence matrix is created which represents corresponding graph with previous users of a website. The elements of this matrix are calculated based on (1) appeared in section III.
2) Path similarity matrix: Website developers usually store
pages which are related both in structure and content is same subdirectory, or create links between two related pages. Due to our lack of knowledge about links between pages on web access logs, to realize the developer's opinion on conceptual relation between pages, the website's pages storage path is employed. For example, two pages Pi and Pj which are located in the following paths.
Directory1/Subdir1/subdir2/p1.html Directory1/Subdir1/subdir2/p2.html
Are more related than two pages which are on the following paths
Directory1/Subdir1/subdir2/p1.html Directory2/Subdir3/subdir4/p2.html
Hence, a new matrix called pages' path similarity matrix can be achieved. To calculate path similarity matrix, first the function similarity(Pi , Pj) is defined. This function returns the number of common sub-directories of two pages, i.e. Pi and Pj. To calculate path similarity matrix elements, the following equation is used:
)1(()1((
))2(),1((2ppathdirectoryofnumberppathdirectoryofnumber
ppathppathsimilarityPij+
×= (4)
11 http://sites.google.com/site/ijcsis/ ISSN 1947-5500
(IJCSIS) International Journal of Computer Science and Information Security, Vol. 7, No. 2, 2010
Where number of directory(path(Pi)) is the number of sub-directories of storage path in Pi. When two paths of two pages are close to each other, the value of each element of this matrix get closer to 1, and if there is no similarity in storage path, it becomes 0.
Example: For two pages, i.e. p1.html and p2.html which
are stored on the following paths:
Pi:/history/skylab/pi.html
Pj: /history/mercury/ma8/pj.html
Then
4.03212
=+×
=ijP
3) Clustering Algorithm: Combining these two matrixes, the new matrix C is created which shows relation between different pages of site based on a mix of users and developers opinions. To combine these two matrixes whose elements of each varies between zero and 1, Equation (5) is used to keep the values of combined matrixes still between zero and 1.
ijijij PMC ×−+×= )1( αα (5)
Where M is co-occurrence matrix and P is the path similarity matrix. To arrive at clusters of related pages, the graph corresponding to the achieved matrix is divided into strong partitions. To do this, DFS algorithm is employed as follows. When the value of Cij is higher than the MinFreq, two corresponding nodes are considered connected, and in other case they are taken disconnected. We start from one node and find all nodes connected to it through execution of DFS algorithm and put them on one cluster. Each node which is visited is labeled with a visited label. If all nodes bear visited labels, the algorithm ends, otherwise the node not visited is selected and DFS algorithm id performed on it, and so on.
V. EXPERIMENTAL EVALUATION For an experimental evaluation of the presented system, a
web access log from NASA produced by the web servers of Kennedy Center Space. Data are stored according to the Common Log Format. The characteristics of the dataset we used are given in Table 1.
TABLE I. DATASET USED IN THE EXPERIMENTS.
Dataset Size(MB) Records(thousands) Period(days) NASA 20 1494 28
All evaluation tests were run on Intel® Core™ Duo 2.4 GHz with 2GB RAM, operating system Windows XP. Our implementation have run on .Net framework 3.5 and VB.Net
and MSSqlServer 2008 have used for coding the proposed system.
TABLE II. REMOVED EXTRA ENTRIES
Page Extension Count of Web Log Entries .gif 899,883 .xbm 43,954 .pl 27,597 .bmp, .wav, …, web bots entries 165,459
Total 1,136,893
After removing extra entries, different web users are identified. This step is conducted based on remotehost field. After identified distinct web users, users' sessions are reconstructed. As sessions with one page length are free from any useful information, they are removed too. In Table 3, characteristics of web access log file is represented after performing pre-processing phase.
TABLE III. CHARACTERISTICS OF WEB ACCESS LOG FILE AFTER PERFORMING PRE-PROCESSING PHASE
Dataset Size(MB) Number of Records
Number of Distinct Users
Number of Sessions
NASA 20 357,621 42,215 69,066
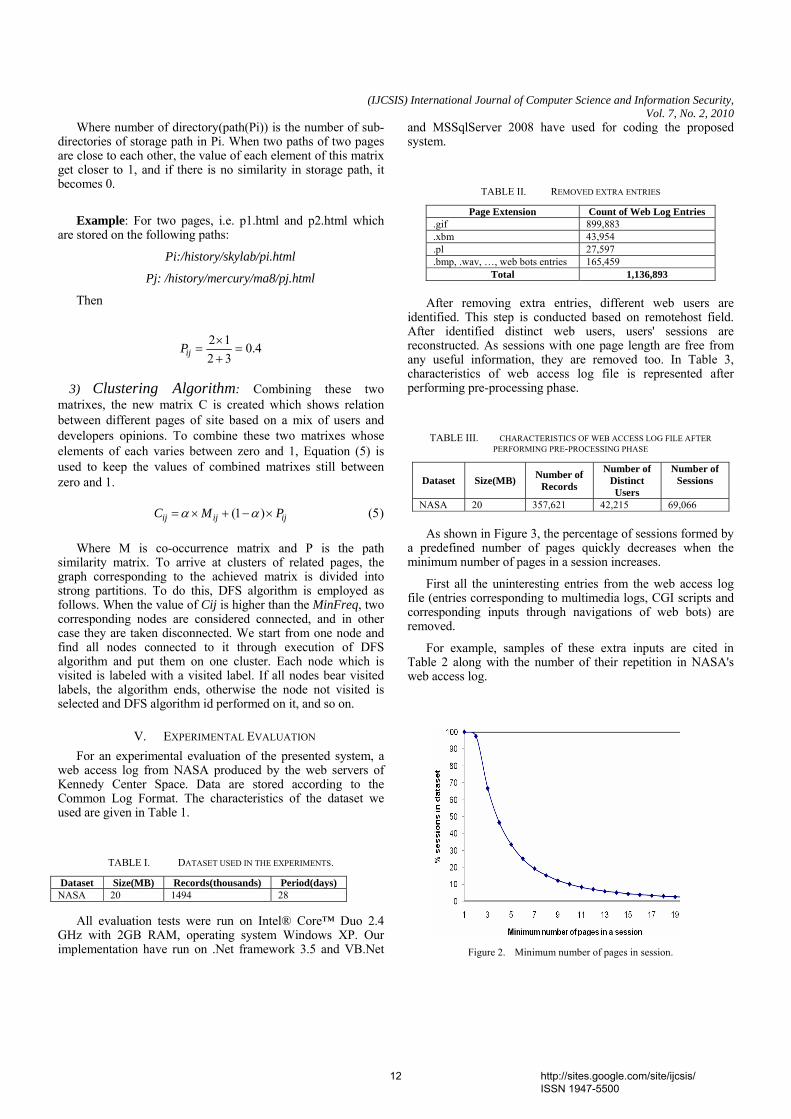
As shown in Figure 3, the percentage of sessions formed by a predefined number of pages quickly decreases when the minimum number of pages in a session increases.
First all the uninteresting entries from the web access log file (entries corresponding to multimedia logs, CGI scripts and corresponding inputs through navigations of web bots) are removed.
For example, samples of these extra inputs are cited in Table 2 along with the number of their repetition in NASA's web access log.
Figure 2. Minimum number of pages in session.
12 http://sites.google.com/site/ijcsis/ ISSN 1947-5500
(IJCSIS) International Journal of Computer Science and Information Security, Vol. 7, No. 2, 2010
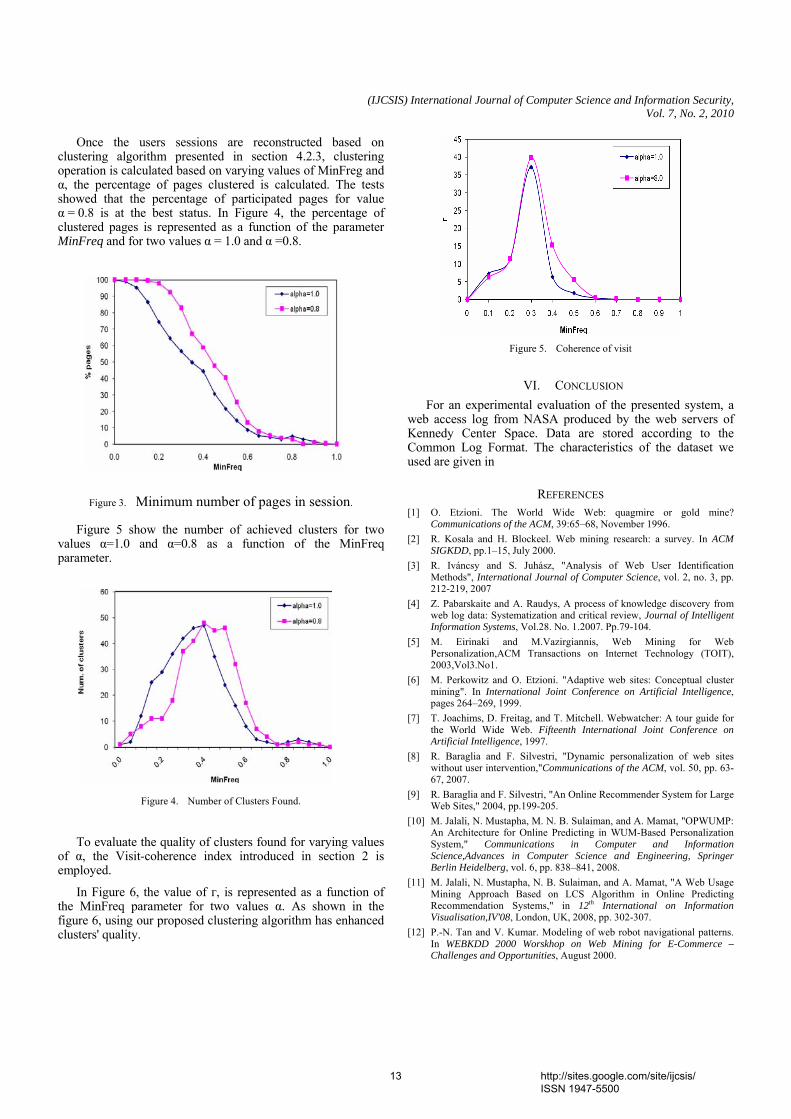
Once the users sessions are reconstructed based on
clustering algorithm presented in section 4.2.3, clustering operation is calculated based on varying values of MinFreg and α, the percentage of pages clustered is calculated. The tests showed that the percentage of participated pages for value α = 0.8 is at the best status. In Figure 4, the percentage of clustered pages is represented as a function of the parameter MinFreq and for two values α = 1.0 and α =0.8.
Figure 3. Minimum number of pages in session.
Figure 5 show the number of achieved clusters for two values α=1.0 and α=0.8 as a function of the MinFreq parameter.
Figure 4. Number of Clusters Found.
To evaluate the quality of clusters found for varying values
of α, the Visit-coherence index introduced in section 2 is employed.
In Figure 6, the value of г, is represented as a function of the MinFreq parameter for two values α. As shown in the figure 6, using our proposed clustering algorithm has enhanced clusters' quality.
Figure 5. Coherence of visit
VI. CONCLUSION For an experimental evaluation of the presented system, a
web access log from NASA produced by the web servers of Kennedy Center Space. Data are stored according to the Common Log Format. The characteristics of the dataset we used are given in
REFERENCES [1] O. Etzioni. The World Wide Web: quagmire or gold mine?
Communications of the ACM, 39:65–68, November 1996. [2] R. Kosala and H. Blockeel. Web mining research: a survey. In ACM
SIGKDD, pp.1–15, July 2000. [3] R. Iváncsy and S. Juhász, "Analysis of Web User Identification
Methods", International Journal of Computer Science, vol. 2, no. 3, pp. 212-219, 2007
[4] Z. Pabarskaite and A. Raudys, A process of knowledge discovery from web log data: Systematization and critical review, Journal of Intelligent Information Systems, Vol.28. No. 1.2007. Pp.79-104.
[5] M. Eirinaki and M.Vazirgiannis, Web Mining for Web Personalization,ACM Transactions on Internet Technology (TOIT), 2003,Vol3.No1.
[6] M. Perkowitz and O. Etzioni. "Adaptive web sites: Conceptual cluster mining". In International Joint Conference on Artificial Intelligence, pages 264–269, 1999.
[7] T. Joachims, D. Freitag, and T. Mitchell. Webwatcher: A tour guide for the World Wide Web. Fifteenth International Joint Conference on Artificial Intelligence, 1997.
[8] R. Baraglia and F. Silvestri, "Dynamic personalization of web sites without user intervention,"Communications of the ACM, vol. 50, pp. 63-67, 2007.
[9] R. Baraglia and F. Silvestri, "An Online Recommender System for Large Web Sites," 2004, pp.199-205.
[10] M. Jalali, N. Mustapha, M. N. B. Sulaiman, and A. Mamat, "OPWUMP: An Architecture for Online Predicting in WUM-Based Personalization System," Communications in Computer and Information Science,Advances in Computer Science and Engineering, Springer Berlin Heidelberg, vol. 6, pp. 838–841, 2008.
[11] M. Jalali, N. Mustapha, N. B. Sulaiman, and A. Mamat, "A Web Usage Mining Approach Based on LCS Algorithm in Online Predicting Recommendation Systems," in 12th International on Information Visualisation,IV'08, London, UK, 2008, pp. 302-307.
[12] P.-N. Tan and V. Kumar. Modeling of web robot navigational patterns. In WEBKDD 2000 Worskhop on Web Mining for E-Commerce – Challenges and Opportunities, August 2000.
13 http://sites.google.com/site/ijcsis/ ISSN 1947-5500

(IJCSIS) International Journal of Computer Science and Information Security, Vol. 7, No. 2, 2010
[13] L. D. Catledge and J. E. Pitkow. Characterizing browsing strategies in the World Wide Web. Computer Networks and ISDN Systems, 27, 1995.
14 http://sites.google.com/site/ijcsis/ ISSN 1947-5500
Implementing New-age Authentication Techniques using OpenID for Security Automation
Dharmendra Choukse Umesh Kumar Singh Deepak Sukheja Rekha Shahapurkar Institute of Engg. & Science, Institute of Comp. Science, Priyatam Institute of Tech. Lokmanya Tilak College, IPS Academy, Vikram University, and Managemnet, Vikram University, Indore, India Ujjain, India Indore, India Ujjain,India
Abstract
Security of any software can be enhanced manifolds if multiple factors for authorization and authentication are used .The main aim of this work was to design and implement an Academy Automation Software for IPS Academy which uses OpenID and Windows CardSpace as Authentication Techniques in addition to Role Based Authentication(RBA) System to ensure that only authentic users can access the predefined roles as per their Authorization level. The Automation covers different computing hardware and software that can be used to digitally create, manipulate, collect, store, and relay Academy information needed for accomplishing basic Operation like admissions and registration , student and faculty interaction, online library, medical and business development. Raw data storage, electronic transfer, and the management of electronic business information comprise the basic activities of the Academy automation system. Further Transport Layer Security (TLS) protocol has been implemented to provide security and data integrity for communications over networks. TLS encrypts the segments of network connections at the Transport Keywords: RBA, Encryption/Decryption, OpenID, windowsCardSpace, TLS (Transport LayerSecurity)
1. INTRODUCTION The World Wide Web (WWW) is a critical enabling technology for electronic commerce on the Internet. Its underlying protocol, HTTP (Hypertext Transfer Protocol [Fielding et al. 1999]), has been widely used to synthesize diverse technologies and components, to great effect in Web environments. Increased integration of Web, operating system, and database system technologies will lead to continued reliance on Web technology for enterprise computing. However, current approaches to access control on Web servers are mostly based on individual user identity; hence they do not scale to enterprise-wide systems. If the roles of individual users are provided securely, Web servers can trust and use the roles for role-based access control (RBAC [Sandhu et al. 1996; Sandhu 1998]). So a successful marriage of the Web and RBAC has the potential for making a considerable impact on deployment of effective enterprise-wide security in large-
scale systems. In this article present a comprehensive approach to RBAC on the Web to identify the user-pull and server-pull architectures and analyze their utility. To support these architectures on the Web, for relatively mature technologies and extend them for secure RBAC on the Web. In order to do so, to make use of standard technologies in use on the Web: cookies [Kristol and Montulli 1999; Moore and Freed 1999], X.509 [ITU-T Recommendation X.509 1993; 1997; Housley et al. 1998], SSL (Secure Socket Layer [Wagner and Schneier 1996; Dierks and Allen 1999]), and LDAP (Lightweight Directory Access Protocol [Howes et al. 1999]).
The Lightweight Directory Access Protocol (LDAP) directory service already available for the purpose of webmail authentication of IPS Academy, Indore users has been used to do the basic Authentication. The client can request the application server for any web application which will ask for the user credentials which will be verified in the LDAP server through an ASP.Net [19] Module. On successful verification, the authorization module will contact the user role database and fetch the roles for that user. In case of return of multiple roles, user will be given the authorization of all the roles. The access to the application will be on the basis of privilege of the role of that particular user. The role database is implementing in Microsoft SQL server [18] database.
On successful authentication, the Authentication and authorization module which has been developed for this purpose is called and the role for the user is retrieved. Privileges are granted to roles which in turn roles are granted to users. The overall database server and application server is considered for possible attacks. The proposed scheme is given in figure 3. The database server and the authentication server are in a private network and separated from the user network by a firewall. These servers can be accessed only through application server, i.e. through the authentication and authorization module. Application server has an interface in the private network but can avail only the specific service which has been explicitly allowed in the firewall. Application server has another interface which is part of user network with a firewall to restrict the clients only to the desired service.
2. OBSERVATION AND PROBLEM DESCRIPTION
(IJCSIS) International Journal of Computer Science and Information Security, Vol. 7, No. 2, February 2010
15 http://sites.google.com/site/ijcsis/ ISSN 1947-5500
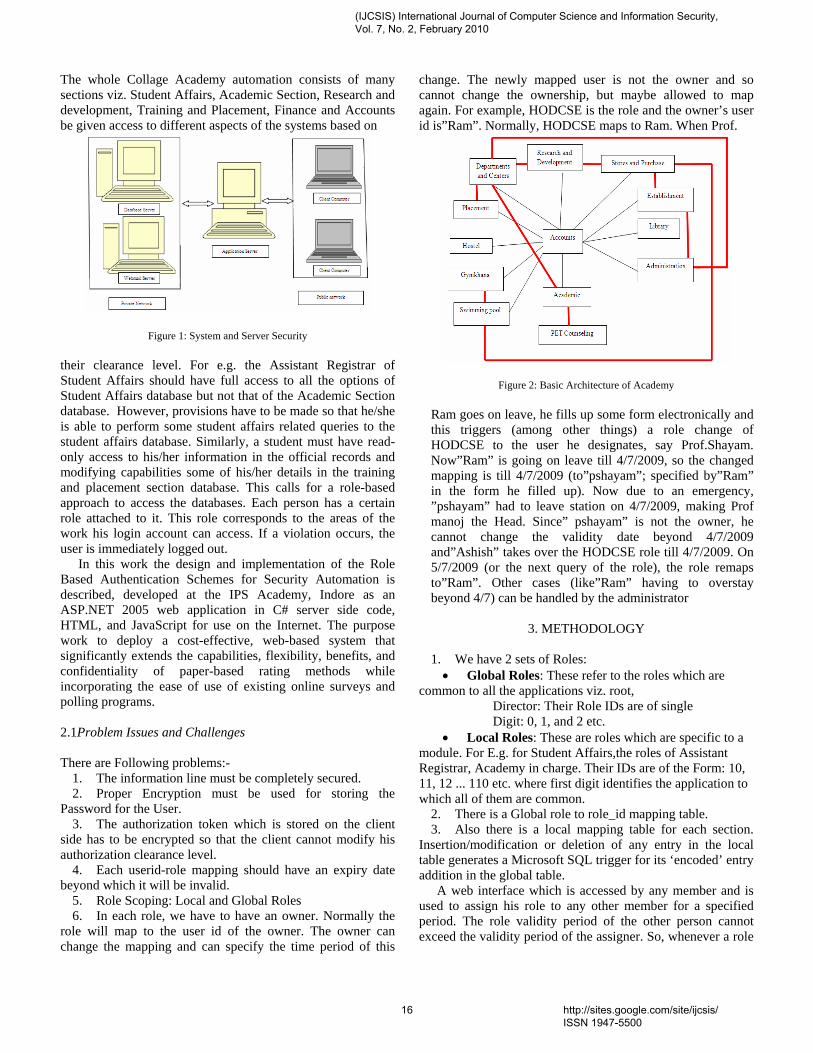
The whole Collage Academy automation consists of many sections viz. Student Affairs, Academic Section, Research and development, Training and Placement, Finance and Accounts be given access to different aspects of the systems based on
Figure 1: System and Server Security their clearance level. For e.g. the Assistant Registrar of Student Affairs should have full access to all the options of Student Affairs database but not that of the Academic Section database. However, provisions have to be made so that he/she is able to perform some student affairs related queries to the student affairs database. Similarly, a student must have read-only access to his/her information in the official records and modifying capabilities some of his/her details in the training and placement section database. This calls for a role-based approach to access the databases. Each person has a certain role attached to it. This role corresponds to the areas of the work his login account can access. If a violation occurs, the user is immediately logged out.
In this work the design and implementation of the Role Based Authentication Schemes for Security Automation is described, developed at the IPS Academy, Indore as an ASP.NET 2005 web application in C# server side code, HTML, and JavaScript for use on the Internet. The purpose work to deploy a cost-effective, web-based system that significantly extends the capabilities, flexibility, benefits, and confidentiality of paper-based rating methods while incorporating the ease of use of existing online surveys and polling programs.
2.1Problem Issues and Challenges
There are Following problems:-
1. The information line must be completely secured. 2. Proper Encryption must be used for storing the
Password for the User. 3. The authorization token which is stored on the client
side has to be encrypted so that the client cannot modify his authorization clearance level.
4. Each userid-role mapping should have an expiry date beyond which it will be invalid.
5. Role Scoping: Local and Global Roles 6. In each role, we have to have an owner. Normally the
role will map to the user id of the owner. The owner can change the mapping and can specify the time period of this
change. The newly mapped user is not the owner and so cannot change the ownership, but maybe allowed to map again. For example, HODCSE is the role and the owner’s user id is”Ram”. Normally, HODCSE maps to Ram. When Prof.
Figure 2: Basic Architecture of Academy
Ram goes on leave, he fills up some form electronically and this triggers (among other things) a role change of HODCSE to the user he designates, say Prof.Shayam. Now”Ram” is going on leave till 4/7/2009, so the changed mapping is till 4/7/2009 (to”pshayam”; specified by”Ram” in the form he filled up). Now due to an emergency, ”pshayam” had to leave station on 4/7/2009, making Prof manoj the Head. Since” pshayam” is not the owner, he cannot change the validity date beyond 4/7/2009 and”Ashish” takes over the HODCSE role till 4/7/2009. On 5/7/2009 (or the next query of the role), the role remaps to”Ram”. Other cases (like”Ram” having to overstay beyond 4/7) can be handled by the administrator
3. METHODOLOGY
1. We have 2 sets of Roles: • Global Roles: These refer to the roles which are
common to all the applications viz. root, Director: Their Role IDs are of single Digit: 0, 1, and 2 etc. • Local Roles: These are roles which are specific to a
module. For E.g. for Student Affairs,the roles of Assistant Registrar, Academy in charge. Their IDs are of the Form: 10, 11, 12 ... 110 etc. where first digit identifies the application to which all of them are common.
2. There is a Global role to role_id mapping table. 3. Also there is a local mapping table for each section.
Insertion/modification or deletion of any entry in the local table generates a Microsoft SQL trigger for its ‘encoded’ entry addition in the global table.
A web interface which is accessed by any member and is used to assign his role to any other member for a specified period. The role validity period of the other person cannot exceed the validity period of the assigner. So, whenever a role
(IJCSIS) International Journal of Computer Science and Information Security, Vol. 7, No. 2, February 2010
16 http://sites.google.com/site/ijcsis/ ISSN 1947-5500
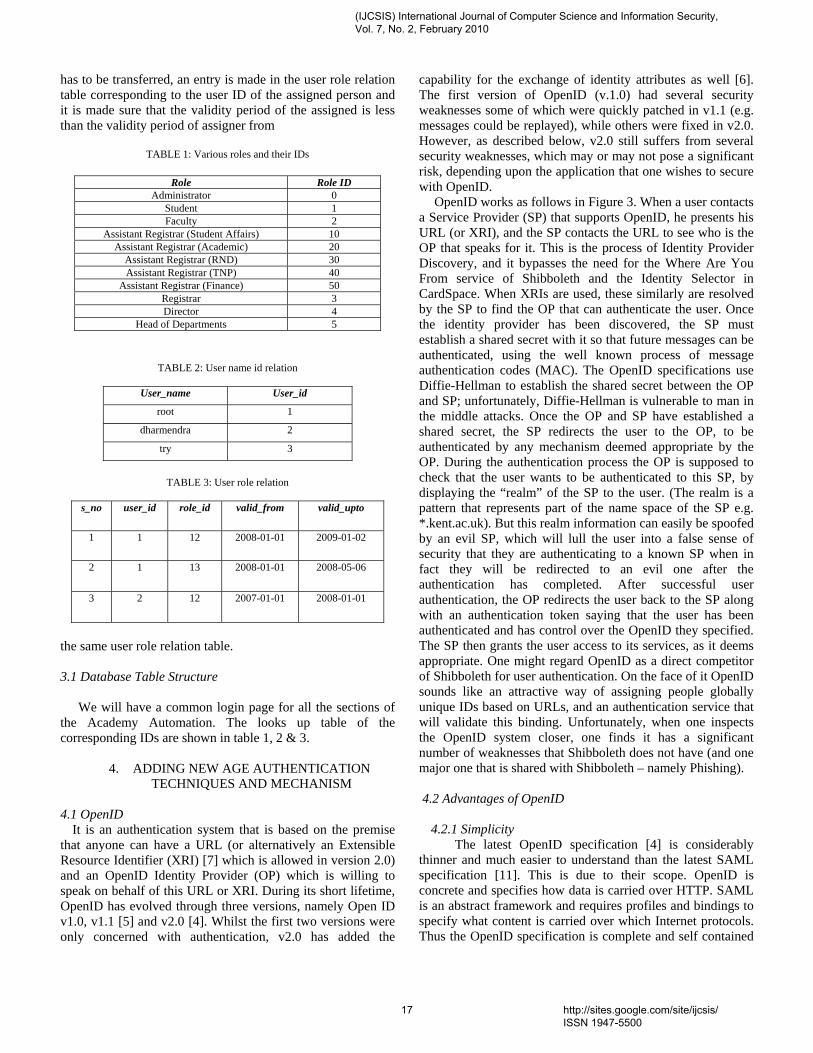
has to be transferred, an entry is made in the user role relation table corresponding to the user ID of the assigned person and it is made sure that the validity period of the assigned is less than the validity period of assigner from
TABLE 1: Various roles and their IDs
Role Role ID
Administrator 0 Student 1 Faculty 2
Assistant Registrar (Student Affairs) 10 Assistant Registrar (Academic) 20
Assistant Registrar (RND) 30 Assistant Registrar (TNP) 40
Assistant Registrar (Finance) 50 Registrar 3 Director 4
Head of Departments 5
TABLE 2: User name id relation
User_name User_id
root 1
dharmendra 2
try 3
TABLE 3: User role relation
s_no user_id role_id valid_from valid_upto
1 1 12 2008-01-01 2009-01-02
2 1 13 2008-01-01 2008-05-06
3 2 12 2007-01-01 2008-01-01
the same user role relation table. 3.1 Database Table Structure
We will have a common login page for all the sections of the Academy Automation. The looks up table of the corresponding IDs are shown in table 1, 2 & 3.
4. ADDING NEW AGE AUTHENTICATION TECHNIQUES AND MECHANISM
4.1 OpenID
It is an authentication system that is based on the premise that anyone can have a URL (or alternatively an Extensible Resource Identifier (XRI) [7] which is allowed in version 2.0) and an OpenID Identity Provider (OP) which is willing to speak on behalf of this URL or XRI. During its short lifetime, OpenID has evolved through three versions, namely Open ID v1.0, v1.1 [5] and v2.0 [4]. Whilst the first two versions were only concerned with authentication, v2.0 has added the
capability for the exchange of identity attributes as well [6]. The first version of OpenID (v.1.0) had several security weaknesses some of which were quickly patched in v1.1 (e.g. messages could be replayed), while others were fixed in v2.0. However, as described below, v2.0 still suffers from several security weaknesses, which may or may not pose a significant risk, depending upon the application that one wishes to secure with OpenID.
OpenID works as follows in Figure 3. When a user contacts a Service Provider (SP) that supports OpenID, he presents his URL (or XRI), and the SP contacts the URL to see who is the OP that speaks for it. This is the process of Identity Provider Discovery, and it bypasses the need for the Where Are You From service of Shibboleth and the Identity Selector in CardSpace. When XRIs are used, these similarly are resolved by the SP to find the OP that can authenticate the user. Once the identity provider has been discovered, the SP must establish a shared secret with it so that future messages can be authenticated, using the well known process of message authentication codes (MAC). The OpenID specifications use Diffie-Hellman to establish the shared secret between the OP and SP; unfortunately, Diffie-Hellman is vulnerable to man in the middle attacks. Once the OP and SP have established a shared secret, the SP redirects the user to the OP, to be authenticated by any mechanism deemed appropriate by the OP. During the authentication process the OP is supposed to check that the user wants to be authenticated to this SP, by displaying the “realm” of the SP to the user. (The realm is a pattern that represents part of the name space of the SP e.g. *.kent.ac.uk). But this realm information can easily be spoofed by an evil SP, which will lull the user into a false sense of security that they are authenticating to a known SP when in fact they will be redirected to an evil one after the authentication has completed. After successful user authentication, the OP redirects the user back to the SP along with an authentication token saying that the user has been authenticated and has control over the OpenID they specified. The SP then grants the user access to its services, as it deems appropriate. One might regard OpenID as a direct competitor of Shibboleth for user authentication. On the face of it OpenID sounds like an attractive way of assigning people globally unique IDs based on URLs, and an authentication service that will validate this binding. Unfortunately, when one inspects the OpenID system closer, one finds it has a significant number of weaknesses that Shibboleth does not have (and one major one that is shared with Shibboleth – namely Phishing). 4.2 Advantages of OpenID
4.2.1 Simplicity The latest OpenID specification [4] is considerably
thinner and much easier to understand than the latest SAML specification [11]. This is due to their scope. OpenID is concrete and specifies how data is carried over HTTP. SAML is an abstract framework and requires profiles and bindings to specify what content is carried over which Internet protocols. Thus the OpenID specification is complete and self contained
(IJCSIS) International Journal of Computer Science and Information Security, Vol. 7, No. 2, February 2010
17 http://sites.google.com/site/ijcsis/ ISSN 1947-5500
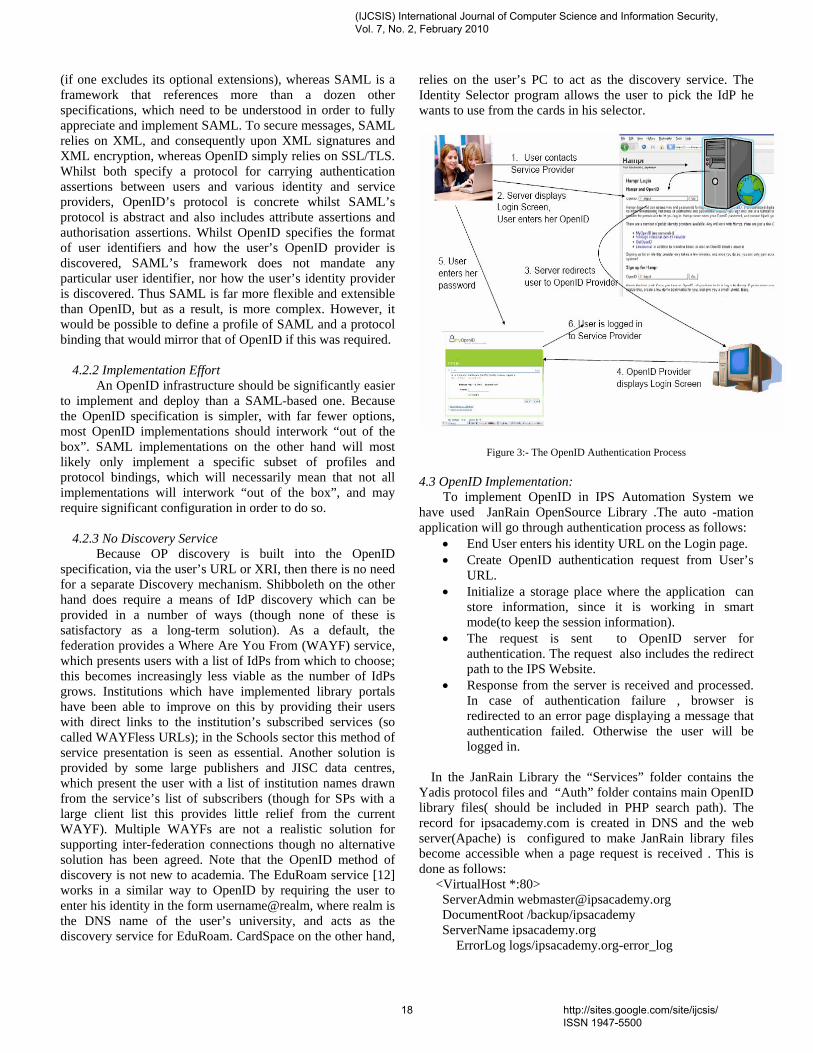
(if one excludes its optional extensions), whereas SAML is a framework that references more than a dozen other specifications, which need to be understood in order to fully appreciate and implement SAML. To secure messages, SAML relies on XML, and consequently upon XML signatures and XML encryption, whereas OpenID simply relies on SSL/TLS. Whilst both specify a protocol for carrying authentication assertions between users and various identity and service providers, OpenID’s protocol is concrete whilst SAML’s protocol is abstract and also includes attribute assertions and authorisation assertions. Whilst OpenID specifies the format of user identifiers and how the user’s OpenID provider is discovered, SAML’s framework does not mandate any particular user identifier, nor how the user’s identity provider is discovered. Thus SAML is far more flexible and extensible than OpenID, but as a result, is more complex. However, it would be possible to define a profile of SAML and a protocol binding that would mirror that of OpenID if this was required.
4.2.2 Implementation Effort
An OpenID infrastructure should be significantly easier to implement and deploy than a SAML-based one. Because the OpenID specification is simpler, with far fewer options, most OpenID implementations should interwork “out of the box”. SAML implementations on the other hand will most likely only implement a specific subset of profiles and protocol bindings, which will necessarily mean that not all implementations will interwork “out of the box”, and may require significant configuration in order to do so.
4.2.3 No Discovery Service
Because OP discovery is built into the OpenID specification, via the user’s URL or XRI, then there is no need for a separate Discovery mechanism. Shibboleth on the other hand does require a means of IdP discovery which can be provided in a number of ways (though none of these is satisfactory as a long-term solution). As a default, the federation provides a Where Are You From (WAYF) service, which presents users with a list of IdPs from which to choose; this becomes increasingly less viable as the number of IdPs grows. Institutions which have implemented library portals have been able to improve on this by providing their users with direct links to the institution’s subscribed services (so called WAYFless URLs); in the Schools sector this method of service presentation is seen as essential. Another solution is provided by some large publishers and JISC data centres, which present the user with a list of institution names drawn from the service’s list of subscribers (though for SPs with a large client list this provides little relief from the current WAYF). Multiple WAYFs are not a realistic solution for supporting inter-federation connections though no alternative solution has been agreed. Note that the OpenID method of discovery is not new to academia. The EduRoam service [12] works in a similar way to OpenID by requiring the user to enter his identity in the form username@realm, where realm is the DNS name of the user’s university, and acts as the discovery service for EduRoam. CardSpace on the other hand,
relies on the user’s PC to act as the discovery service. The Identity Selector program allows the user to pick the IdP he wants to use from the cards in his selector.
Figure 3:- The OpenID Authentication Process 4.3 OpenID Implementation:
To implement OpenID in IPS Automation System we have used JanRain OpenSource Library .The auto -mation application will go through authentication process as follows:
• End User enters his identity URL on the Login page. • Create OpenID authentication request from User’s
URL. • Initialize a storage place where the application can
store information, since it is working in smart mode(to keep the session information).
• The request is sent to OpenID server for authentication. The request also includes the redirect path to the IPS Website.
• Response from the server is received and processed. In case of authentication failure , browser is redirected to an error page displaying a message that authentication failed. Otherwise the user will be logged in.
In the JanRain Library the “Services” folder contains the
Yadis protocol files and “Auth” folder contains main OpenID library files( should be included in PHP search path). The record for ipsacademy.com is created in DNS and the web server(Apache) is configured to make JanRain library files become accessible when a page request is received . This is done as follows: <VirtualHost *:80> ServerAdmin [email protected] DocumentRoot /backup/ipsacademy ServerName ipsacademy.org
ErrorLog logs/ipsacademy.org-error_log
(IJCSIS) International Journal of Computer Science and Information Security, Vol. 7, No. 2, February 2010
18 http://sites.google.com/site/ijcsis/ ISSN 1947-5500
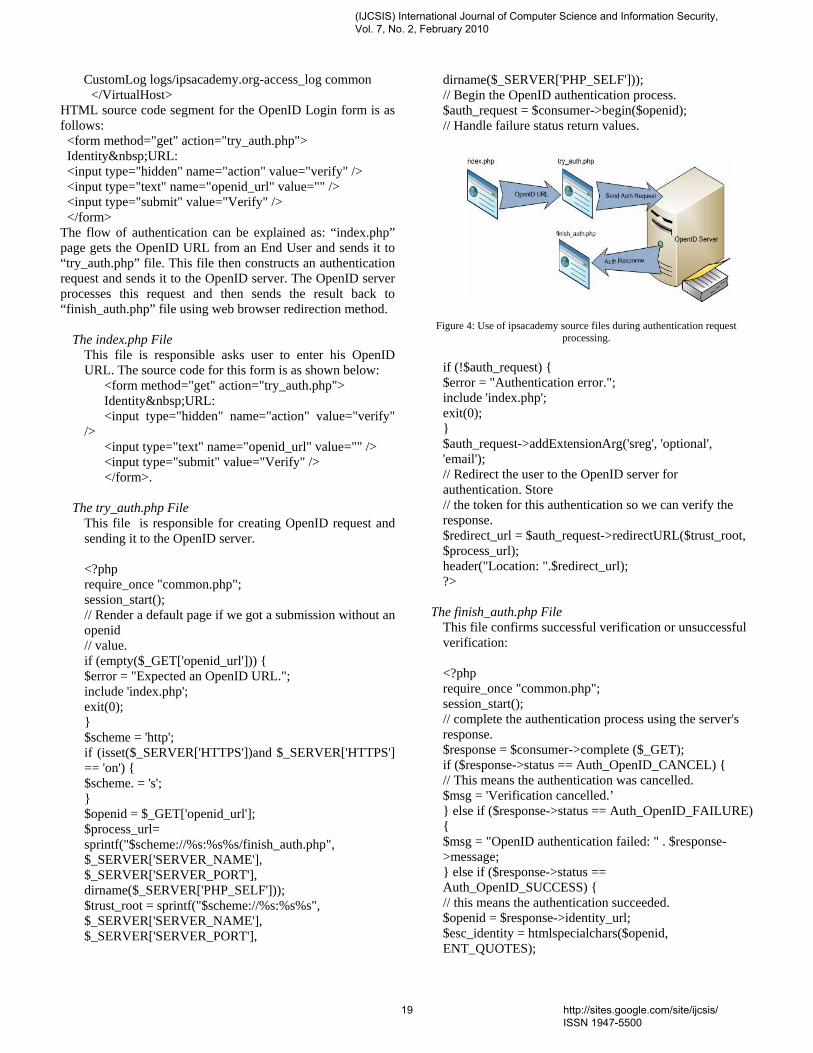
CustomLog logs/ipsacademy.org-access_log common </VirtualHost>
HTML source code segment for the OpenID Login form is as follows: <form method="get" action="try_auth.php"> Identity URL: <input type="hidden" name="action" value="verify" /> <input type="text" name="openid_url" value="" /> <input type="submit" value="Verify" /> </form> The flow of authentication can be explained as: “index.php” page gets the OpenID URL from an End User and sends it to “try_auth.php” file. This file then constructs an authentication request and sends it to the OpenID server. The OpenID server processes this request and then sends the result back to “finish_auth.php” file using web browser redirection method.
The index.php File This file is responsible asks user to enter his OpenID URL. The source code for this form is as shown below: <form method="get" action="try_auth.php"> Identity URL: <input type="hidden" name="action" value="verify" /> <input type="text" name="openid_url" value="" /> <input type="submit" value="Verify" /> </form>.
The try_auth.php File
This file is responsible for creating OpenID request and sending it to the OpenID server. <?php require_once "common.php"; session_start(); // Render a default page if we got a submission without an openid // value. if (empty($_GET['openid_url'])) { $error = "Expected an OpenID URL."; include 'index.php'; exit(0); } $scheme = 'http'; if (isset($_SERVER['HTTPS'])and $_SERVER['HTTPS'] == 'on') { $scheme. = 's'; } $openid = $_GET['openid_url']; $process_url= sprintf("$scheme://%s:%s%s/finish_auth.php", $_SERVER['SERVER_NAME'], $_SERVER['SERVER_PORT'], dirname($_SERVER['PHP_SELF'])); $trust_root = sprintf("$scheme://%s:%s%s", $_SERVER['SERVER_NAME'], $_SERVER['SERVER_PORT'],
dirname($_SERVER['PHP_SELF'])); // Begin the OpenID authentication process. $auth_request = $consumer->begin($openid); // Handle failure status return values.
Figure 4: Use of ipsacademy source files during authentication request
processing.
if (!$auth_request) { $error = "Authentication error."; include 'index.php'; exit(0); } $auth_request->addExtensionArg('sreg', 'optional', 'email'); // Redirect the user to the OpenID server for authentication. Store // the token for this authentication so we can verify the response. $redirect_url = $auth_request->redirectURL($trust_root, $process_url); header("Location: ".$redirect_url); ?>
The finish_auth.php File This file confirms successful verification or unsuccessful verification: <?php require_once "common.php"; session_start(); // complete the authentication process using the server's response. $response = $consumer->complete ($_GET); if ($response->status == Auth_OpenID_CANCEL) { // This means the authentication was cancelled. $msg = 'Verification cancelled.’ } else if ($response->status == Auth_OpenID_FAILURE) { $msg = "OpenID authentication failed: " . $response->message; } else if ($response->status == Auth_OpenID_SUCCESS) { // this means the authentication succeeded. $openid = $response->identity_url; $esc_identity = htmlspecialchars($openid, ENT_QUOTES);
(IJCSIS) International Journal of Computer Science and Information Security, Vol. 7, No. 2, February 2010
19 http://sites.google.com/site/ijcsis/ ISSN 1947-5500
$success = sprintf('You have successfully verified ' '<a href="%s">%s</a> as your identity.’ $esc_identity, $esc_identity); if ($response->endpoint->canonicalID) { $success .= ' (XRI CanonicalID: '.$response->endpoint- >canonicalID.') '; } $sreg = $response->extensionResponse('sreg'); if (@$sreg['email']) { $success .= " You also returned '".$sreg['email']."' as your email."; } } include 'index.php'; ?>
After successfully authenticating with the OpenID provider (myopenid.com), the OpenID provider redirects the client to the page originally requested (http://<ipsacademy.org>:8081) that shows the remote user, groups, and roles of which the user is a member. The remote user is the openid identity that was used to log in. The groups contain a single group, the VALID_OPENID_USER group, and the role is populated with OPENID_ROLE. If this is not the case, the user would not be authenticated because only users in the role OPENID_ROLE are permitted to access this resource.
5. RECCOMMENDATION
• The IPS Automation System should keep track of both OpenID and CardSpace identity management systems as they evolve. There is clearly a great demand for a ubiquitous secure identity management system.
• Now that a publicly available OpenID gateway has been built, publicise its availability to the community and monitor its applications and usage. If usage becomes substantial, consider productising the service.
6. CONCLUSION
The research problem and goal of the Academy Automation
is to design a highly secure and efficient framework based on Service Oriented Architecture. Keeping in mind the policies of minimum data redundancy and efficient security, the work revolved around designing a plug in for secure role based authentication. Presently the authentication is based on the traditional userid-password based approach, but as is suggested in this report, work can be done to incorporate new-age technologies such as OpenID. OpenID provides increased flexibility for application deployment by enabling applications to leverage and third-party authentication providers for handling authentication. Providers such as OpenID have become very common as more users want a single user profile across multiple sites for blogs, wikis, and other social networking activities. Additionally, many Web sites do not want to maintain, or require users to continually provide, the
same profile-related information just to ensure that the user credentials are valid.
REFERRENCE
[1] William Stallings, “Cryptography and Network Security Principles and Practices” 2003,3rdEdition,Prentice Hall.
[2] Eric Cole, Ronald L. Krutz, James Conley, “Network Security Bible” 2005, 2nd Edition, Wiley Publication.
[3] Yih-Cheng Lee, Chi-Ming Ma and ShihChien Chou,” A Service-Oriented Architecture for Design And
Development of Middleware,” Proceedings of the 12th Asia-Pacific Software Engineering
Conference (APSEC05) 0-7695- 2465-6/05 [4] [email protected] “OpenID Authentication 2.0 – Final” 5 Dec 2007.
Available from http://openid.net/specs/openid-authentication-2_0.html [5] D. Recordon B. Fitzpatrick. “Open ID Authentication 1.1”. May 2006.
Available from http://openid.net/specs/openid-authentication-1_1.html [6] D. Hardt, J. Bufu, Sxip Identity, J. Hoyt, JanRain. “OpenID Attribute
Exchange 1.0 – Final” 5 Dec 2007. Available from http://openid.net/specs/openid-attribute-exchange-
1_0.html [7] OASIS “Extensible Resource Identifier (XRI) Syntax V2.0”. Committee
Specification, 14 November 2005. Available from http://www.oasis-
open.org/committees/download.php/15376 [8] William E. Burr, Donna F. Dodson, Ray A. Perlner, W. Timothy Polk,
Sarbari Gupta, Emad A. Nabbus. “Electronic Authentication Guideline”, NIST Special
Publication NIST Special Publication 800-63-1, Feb 2008 [9] Eugene Tsyrklevich & Vlad Tsyrklevich. “OpenID: Single Sign-On for
the Internet”. Black Hat USA Briefings and Training, Las Vagas, July28- Aug 2, 2007. Available from https://www.blackhat.com/presentations/bh-usa-
07/Tsyrklevich/Whitepaper/bh-usa-07-tsyrklevich- WP.pdf [10] OpenID. “Microsoft and Google announce OpenID support”. 30 October
2008. Available from http://openid.net/2008/10/ [11] OASIS. “Assertions and Protocol for the OASIS Security Assertion
Markup Language (SAML) V2.0”, OASIS Standard, 15 March 2005 [12] L Florio, K Wierenga. “Eduroam, providing mobility for roaming
users”. Proceedings of the EUNIS 2005 Conference, Manchester, 2005 [13] Thomas Price, Jeromie Walters and Yingcai Xiao, “Role –Based Online
Evaluation System” ,2007. [14] Srinath Akula, Veerabhadram Devisetty , St. Cloud, MN 56301.” Image
Based Registration and Authentication System”, 2002. [15] Microsoft,”Visual Studio .Net”.
Website:http://msdn.microsoft.com/vstudio/ [16] Microsoft Corporation. Website: www.passport.net/ [17] OpenSSL team. Website: http://www.openssl.org/ [18] Microsoft, “SQL Server 2005”. Website:http://www.microsoft.com/sql/ [19] Microsoft,”Asp.net”. Website: http://www.asp.net/index.html.
(IJCSIS) International Journal of Computer Science and Information Security, Vol. 7, No. 2, February 2010
20 http://sites.google.com/site/ijcsis/ ISSN 1947-5500
AUTHORS PROFILE
Biographical notes:
Dharmendra Choukse holds a M.Tech in Information Technology from Devi Ahilya University, Indore-INDIA. He is currently Pursuing Ph.D. in Computer Science From Institute of Computer Science, Vikram University, Ujjain-INDIA.and He is also currently Sr Software Engineer in Institute of Engineering & Sciences,IPS Academy, Indore-INDIA. A He served as Software Engineer in Choksi Laboratories ltd,Indore. His research interest includes network security, secure electronic commerce, client-server computing and IT based education.
Dr. Umesh Kumar Singh obtained his Ph.D. in Computer Science from Devi Ahilya University, Indore-INDIA. He is currently Reader in Institute of Computer Science, Vikram University, Ujjain-INDIA. He served as professor in Computer Science and Principal in Mahakal Institute of Computer Sciences (MICS-MIT), Ujjain. He is formally Director I/c of Institute of Computer Science, Vikram University Ujjain. He has served as Engineer (E&T) in education and training division of CMC Ltd., New Delhi in initial years of his career. He has authored a book on “ Internet and Web technology “ and his various research papers are published in national and international journals of repute. Dr. Singh is reviewer of International Journal of Network Security (IJNS), ECKM Conferences and various Journals of Computer Science. His research interest includes network security, secure electronic commerce, client-server computing and IT based education.
Deepak Sukheja holeds M.Sc.,M.Tech.NIT( Govt. Engg. College) Raipur-INDIA. He is currently Pursuing Ph.D. in Computer Science From Institute of Computer Science, Vikram University, Ujjain-INDIA and He is working as a Reader in Priyatam Institute of Technology and Managemnt
Indore. He served as Sn. Software Engineer in Patni Compute System Mumbai, KPIT Pune and Tanmay Software Indore. His research interest includes network security, secure electronic commerce, client-server computing and Query Optimization.
Rekha D Shahapurkar holds a MCA from Indira Gandhi National Open University, New Delhi, INDIA. She is currently Pursuing Ph.D. in Computer Science From Institute of Computer Science, Vikram University, Ujjain-INDIA. From 2001 she is working as Asst. Professor in Lokmanya Tilak College Ujjain-INDIA. Her research interest includes network security, client-server computing and IT based education.
(IJCSIS) International Journal of Computer Science and Information Security, Vol. 7, No. 2, February 2010
21 http://sites.google.com/site/ijcsis/ ISSN 1947-5500
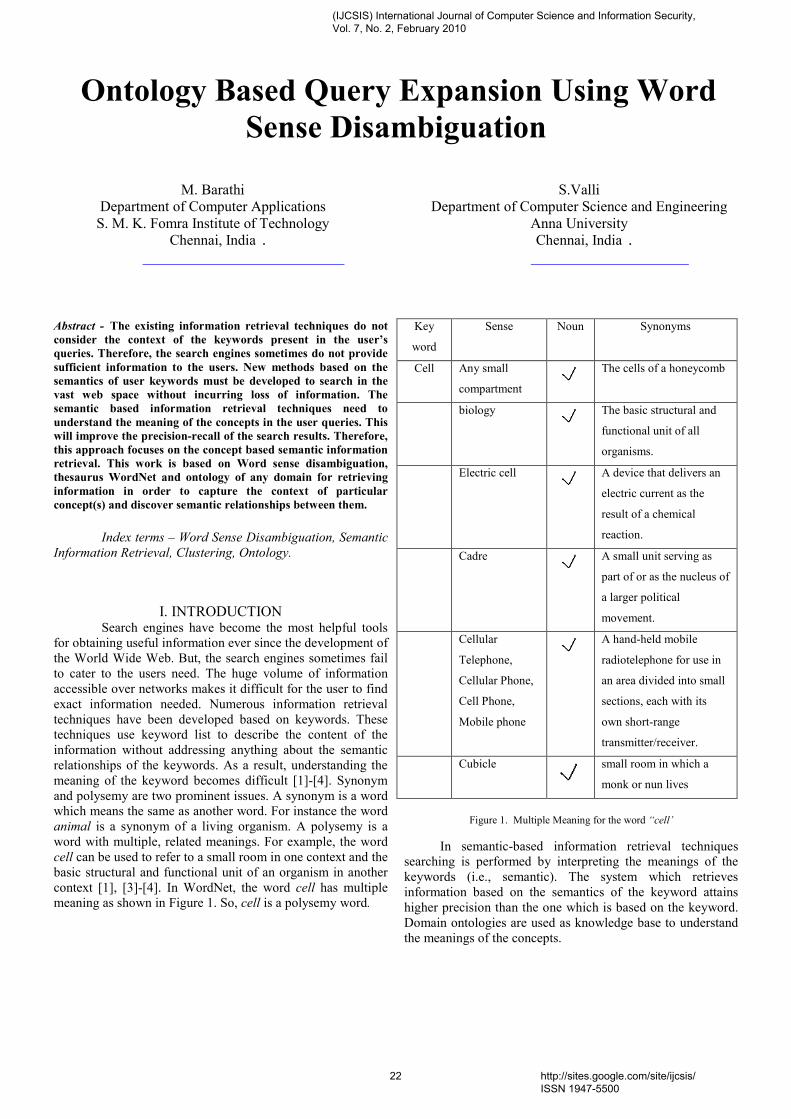
Ontology Based Query Expansion Using Word Sense Disambiguation
M. Barathi
Department of Computer Applications S. M. K. Fomra Institute of Technology
Chennai, India .
S.Valli Department of Computer Science and Engineering
Anna University Chennai, India .
Abstract - The existing information retrieval techniques do not consider the context of the keywords present in the user’s queries. Therefore, the search engines sometimes do not provide sufficient information to the users. New methods based on the semantics of user keywords must be developed to search in the vast web space without incurring loss of information. The semantic based information retrieval techniques need to understand the meaning of the concepts in the user queries. This will improve the precision-recall of the search results. Therefore, this approach focuses on the concept based semantic information retrieval. This work is based on Word sense disambiguation, thesaurus WordNet and ontology of any domain for retrieving information in order to capture the context of particular concept(s) and discover semantic relationships between them. Index terms – Word Sense Disambiguation, Semantic Information Retrieval, Clustering, Ontology.
I. INTRODUCTION Search engines have become the most helpful tools
for obtaining useful information ever since the development of the World Wide Web. But, the search engines sometimes fail to cater to the users need. The huge volume of information accessible over networks makes it difficult for the user to find exact information needed. Numerous information retrieval techniques have been developed based on keywords. These techniques use keyword list to describe the content of the information without addressing anything about the semantic relationships of the keywords. As a result, understanding the meaning of the keyword becomes difficult [1]-[4]. Synonym and polysemy are two prominent issues. A synonym is a word which means the same as another word. For instance the word animal is a synonym of a living organism. A polysemy is a word with multiple, related meanings. For example, the word cell can be used to refer to a small room in one context and the basic structural and functional unit of an organism in another context [1], [3]-[4]. In WordNet, the word cell has multiple meaning as shown in Figure 1. So, cell is a polysemy word.
Key
word
Sense Noun Synonyms
Cell Any small
compartment The cells of a honeycomb
biology
The basic structural and
functional unit of all
organisms.
Electric cell
A device that delivers an
electric current as the
result of a chemical
reaction.
Cadre
A small unit serving as
part of or as the nucleus of
a larger political
movement.
Cellular
Telephone,
Cellular Phone,
Cell Phone,
Mobile phone
A hand-held mobile
radiotelephone for use in
an area divided into small
sections, each with its
own short-range
transmitter/receiver.
Cubicle
small room in which a
monk or nun lives
Figure 1. Multiple Meaning for the word “cell’
In semantic-based information retrieval techniques
searching is performed by interpreting the meanings of the keywords (i.e., semantic). The system which retrieves information based on the semantics of the keyword attains higher precision than the one which is based on the keyword. Domain ontologies are used as knowledge base to understand the meanings of the concepts.
(IJCSIS) International Journal of Computer Science and Information Security, Vol. 7, No. 2, February 2010
22 http://sites.google.com/site/ijcsis/ ISSN 1947-5500
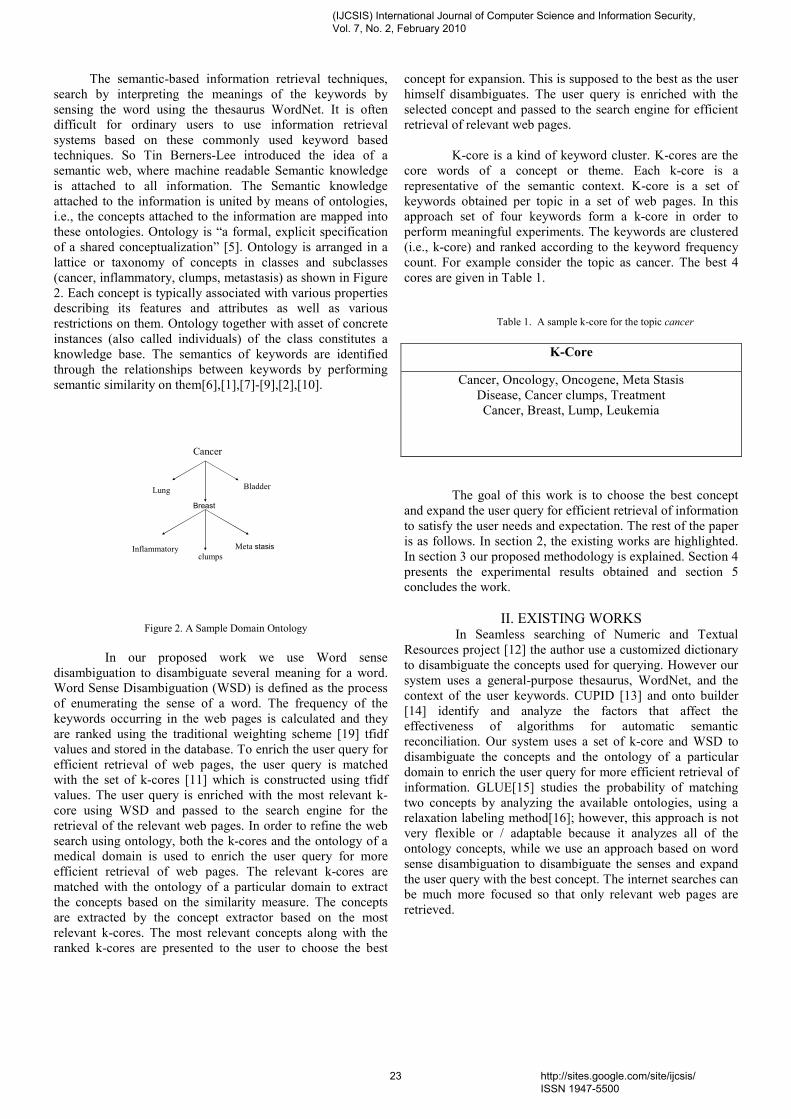
The semantic-based information retrieval techniques, search by interpreting the meanings of the keywords by sensing the word using the thesaurus WordNet. It is often difficult for ordinary users to use information retrieval systems based on these commonly used keyword based techniques. So Tin Berners-Lee introduced the idea of a semantic web, where machine readable Semantic knowledge is attached to all information. The Semantic knowledge attached to the information is united by means of ontologies, i.e., the concepts attached to the information are mapped into these ontologies. Ontology is “a formal, explicit specification of a shared conceptualization” [5]. Ontology is arranged in a lattice or taxonomy of concepts in classes and subclasses (cancer, inflammatory, clumps, metastasis) as shown in Figure 2. Each concept is typically associated with various properties describing its features and attributes as well as various restrictions on them. Ontology together with asset of concrete instances (also called individuals) of the class constitutes a knowledge base. The semantics of keywords are identified through the relationships between keywords by performing semantic similarity on them[6],[1],[7]-[9],[2],[10].
Lung
Breast
Bladder
Inflammatoryclumps
Meta stasis
Cancer
Figure 2. A Sample Domain Ontology
In our proposed work we use Word sense
disambiguation to disambiguate several meaning for a word. Word Sense Disambiguation (WSD) is defined as the process of enumerating the sense of a word. The frequency of the keywords occurring in the web pages is calculated and they are ranked using the traditional weighting scheme [19] tfidf values and stored in the database. To enrich the user query for efficient retrieval of web pages, the user query is matched with the set of k-cores [11] which is constructed using tfidf values. The user query is enriched with the most relevant k-core using WSD and passed to the search engine for the retrieval of the relevant web pages. In order to refine the web search using ontology, both the k-cores and the ontology of a medical domain is used to enrich the user query for more efficient retrieval of web pages. The relevant k-cores are matched with the ontology of a particular domain to extract the concepts based on the similarity measure. The concepts are extracted by the concept extractor based on the most relevant k-cores. The most relevant concepts along with the ranked k-cores are presented to the user to choose the best
concept for expansion. This is supposed to the best as the user himself disambiguates. The user query is enriched with the selected concept and passed to the search engine for efficient retrieval of relevant web pages.
K-core is a kind of keyword cluster. K-cores are the
core words of a concept or theme. Each k-core is a representative of the semantic context. K-core is a set of keywords obtained per topic in a set of web pages. In this approach set of four keywords form a k-core in order to perform meaningful experiments. The keywords are clustered (i.e., k-core) and ranked according to the keyword frequency count. For example consider the topic as cancer. The best 4 cores are given in Table 1.
Table 1. A sample k-core for the topic cancer
K-Core
Cancer, Oncology, Oncogene, Meta Stasis Disease, Cancer clumps, Treatment Cancer, Breast, Lump, Leukemia
The goal of this work is to choose the best concept and expand the user query for efficient retrieval of information to satisfy the user needs and expectation. The rest of the paper is as follows. In section 2, the existing works are highlighted. In section 3 our proposed methodology is explained. Section 4 presents the experimental results obtained and section 5 concludes the work.
II. EXISTING WORKS
In Seamless searching of Numeric and Textual Resources project [12] the author use a customized dictionary to disambiguate the concepts used for querying. However our system uses a general-purpose thesaurus, WordNet, and the context of the user keywords. CUPID [13] and onto builder [14] identify and analyze the factors that affect the effectiveness of algorithms for automatic semantic reconciliation. Our system uses a set of k-core and WSD to disambiguate the concepts and the ontology of a particular domain to enrich the user query for more efficient retrieval of information. GLUE[15] studies the probability of matching two concepts by analyzing the available ontologies, using a relaxation labeling method[16]; however, this approach is not very flexible or / adaptable because it analyzes all of the ontology concepts, while we use an approach based on word sense disambiguation to disambiguate the senses and expand the user query with the best concept. The internet searches can be much more focused so that only relevant web pages are retrieved.
(IJCSIS) International Journal of Computer Science and Information Security, Vol. 7, No. 2, February 2010
23 http://sites.google.com/site/ijcsis/ ISSN 1947-5500
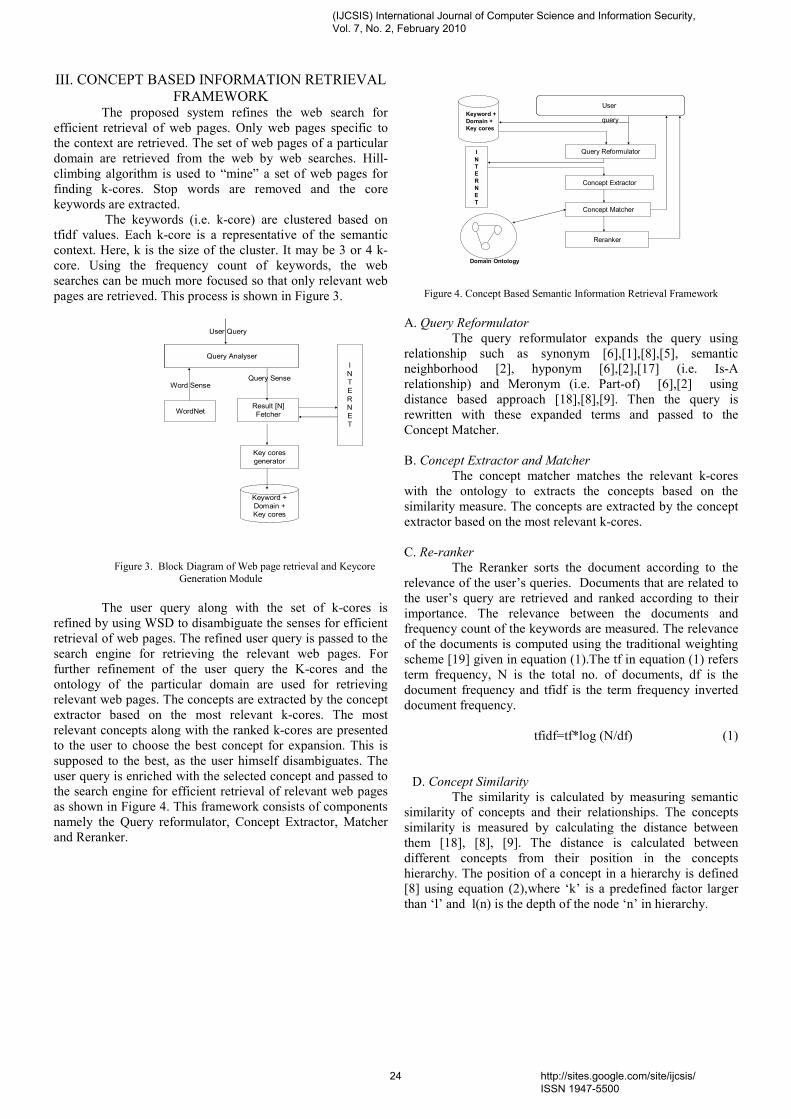
III. CONCEPT BASED INFORMATION RETRIEVAL FRAMEWORK
The proposed system refines the web search for efficient retrieval of web pages. Only web pages specific to the context are retrieved. The set of web pages of a particular domain are retrieved from the web by web searches. Hill-climbing algorithm is used to “mine” a set of web pages for finding k-cores. Stop words are removed and the core keywords are extracted.
The keywords (i.e. k-core) are clustered based on tfidf values. Each k-core is a representative of the semantic context. Here, k is the size of the cluster. It may be 3 or 4 k-core. Using the frequency count of keywords, the web searches can be much more focused so that only relevant web pages are retrieved. This process is shown in Figure 3.
WordNetResult [N]Fetcher
INTERNET
Query Analyser
Key coresgenerator
Keyword +Domain +Key cores
User Query
Word SenseQuery Sense
Figure 3. Block Diagram of Web page retrieval and Keycore
Generation Module The user query along with the set of k-cores is
refined by using WSD to disambiguate the senses for efficient retrieval of web pages. The refined user query is passed to the search engine for retrieving the relevant web pages. For further refinement of the user query the K-cores and the ontology of the particular domain are used for retrieving relevant web pages. The concepts are extracted by the concept extractor based on the most relevant k-cores. The most relevant concepts along with the ranked k-cores are presented to the user to choose the best concept for expansion. This is supposed to the best, as the user himself disambiguates. The user query is enriched with the selected concept and passed to the search engine for efficient retrieval of relevant web pages as shown in Figure 4. This framework consists of components namely the Query reformulator, Concept Extractor, Matcher and Reranker.
Query Reformulator
Concept Extractor
Concept Matcher
INTERNET
Reranker
query
Domain Ontology
UserKeyword +Domain +Key cores
Figure 4. Concept Based Semantic Information Retrieval Framework
A. Query Reformulator The query reformulator expands the query using
relationship such as synonym [6],[1],[8],[5], semantic neighborhood [2], hyponym [6],[2],[17] (i.e. Is-A relationship) and Meronym (i.e. Part-of) [6],[2] using distance based approach [18],[8],[9]. Then the query is rewritten with these expanded terms and passed to the Concept Matcher.
B. Concept Extractor and Matcher
The concept matcher matches the relevant k-cores with the ontology to extracts the concepts based on the similarity measure. The concepts are extracted by the concept extractor based on the most relevant k-cores.
C. Re-ranker The Reranker sorts the document according to the relevance of the user’s queries. Documents that are related to the user’s query are retrieved and ranked according to their importance. The relevance between the documents and frequency count of the keywords are measured. The relevance of the documents is computed using the traditional weighting scheme [19] given in equation (1).The tf in equation (1) refers term frequency, N is the total no. of documents, df is the document frequency and tfidf is the term frequency inverted document frequency.
tfidf=tf*log (N/df) (1)
D. Concept Similarity The similarity is calculated by measuring semantic similarity of concepts and their relationships. The concepts similarity is measured by calculating the distance between them [18], [8], [9]. The distance is calculated between different concepts from their position in the concepts hierarchy. The position of a concept in a hierarchy is defined [8] using equation (2),where ‘k’ is a predefined factor larger than ‘l’ and l(n) is the depth of the node ‘n’ in hierarchy.
(IJCSIS) International Journal of Computer Science and Information Security, Vol. 7, No. 2, February 2010
24 http://sites.google.com/site/ijcsis/ ISSN 1947-5500

½ Milestone (n) =
(2) K l(n)
For the root of a hierarchy, l (root) is zero. For any two concepts c1 and c2 in the hierarchy having closest common parent (ccp), the distance dc between two concepts and their ccp is calculated using equations (3) and (4).
dc(c1,c2)=dc(c1,ccp)+dc(c2,ccp) (3) dc(c1,cpp)=milestone(ccp)–milestone(c1) (4)
Thus, the similarity simc between the two concepts c1 and c2 is calculated using equation (5)
simc(c1,c2)=l-dc(c1,c2) (5)
If the concept c1 and concept c2 are synonym or acronym of each other, the distance will be 0, i.e. the similarity between these two concepts will be 1.Synonym and acronym relation between concepts are treated at the same level. E. Relations Similarity
The similarity Sim r between any two relations r1and r2 is given by equation (6)
Simr(r1,r2)=1- d r (r1, r2) (6)
The distance between two relations is also calculated by their respective positions in the relation hierarchy. F. Web Page Retrieval The web crawler receives the user query of any domain from the user interface and downloads the web pages corresponding to that domain from the web. Then it opens the URL connection and reads the content of the web page and stores it in the text file. If the web page contains another URL, it adds the URL to the end of the list of URLs to be crawled. It repeats the process until all the URLs in the list are crawled as shown in Figure 5. The field “IsCrawled” in Figure 5 represents that the particular URL has been crawled by setting the value as “t”.
CRAWLTABLE
Serial URL Address IsCrawled
123 http://localhost:8080/cancer.html t
124 http://localhost:8080/cancertypes.html t
125 http://localhost:8080/leukemia.html t
126 http://localhost:8080/causes.html t
127 http://localhost:8080/oncology.html t
128 http://localhost:8080/oncogenes.html t
Figure 5. Sample list of URLs crawled from the web
G. Refining Web Search Using Ontology
The k-cores and the ontology of the particular domain are used in enhancing the user query for more efficient retrieval of web pages. The first step matches the user query with the set of k-cores using WordNet to disambiguate the senses. Then the relevant k-cores are matched with the ontology of the particular domain based on the similarity measure. The concepts are extracted by the concept extractor based on the most relevant k-cores. The most relevant concepts along with the ranked k-cores are presented to the user to choose the best concept for expansion. This is supposed to the best as the user himself disambiguates. The user query is enriched with the selected concept and passed to the search engine for efficient retrieval of relevant web pages. The algorithm for refining the web search using Ontology is given in Figure 7. Input : User query, Domain ontology and K-cores Output : Set of relevant web pages Algorithm 1. The user query and the set of k-cores are disambiguated using thesaurus WordNet. 2. The set of relevant k-cores is matched with the concepts in the domain ontology to extract the relevant concepts based on the similarity measure. 3. The set of relevant concepts along with the k-cores are presented as options to the user to disambiguate the senses. 4. When the user selects the specific concepts he wants, the user query is enriched with that concept. 5. The enriched query is passed to the web searcher and it displays the relevant results to the user.
6. End
Figure 7. Algorithm for Refining the web search using Ontology
IV EXPERIMENTAL RESULTS
This work is implemented using Java and the medical ontology is used as the domain. In this study, around 1500 web pages have been crawled using Google search engine and stored as text document. Preprocessing is done on each document which is the text file as shown in Figure 9.
Figure 9. Text File
(IJCSIS) International Journal of Computer Science and Information Security, Vol. 7, No. 2, February 2010
25 http://sites.google.com/site/ijcsis/ ISSN 1947-5500
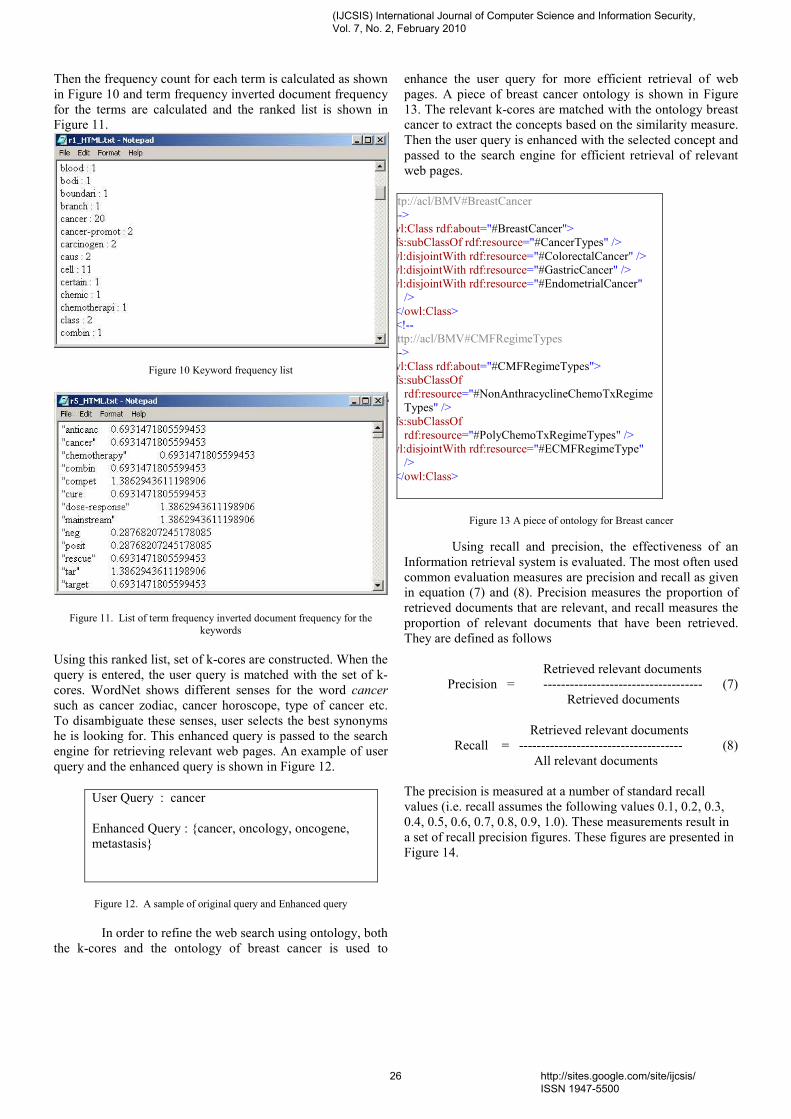
Then the frequency count for each term is calculated as shown in Figure 10 and term frequency inverted document frequency for the terms are calculated and the ranked list is shown in Figure 11.
Figure 10 Keyword frequency list
Figure 11. List of term frequency inverted document frequency for the keywords
Using this ranked list, set of k-cores are constructed. When the query is entered, the user query is matched with the set of k-cores. WordNet shows different senses for the word cancer such as cancer zodiac, cancer horoscope, type of cancer etc. To disambiguate these senses, user selects the best synonyms he is looking for. This enhanced query is passed to the search engine for retrieving relevant web pages. An example of user query and the enhanced query is shown in Figure 12.
User Query : cancer Enhanced Query : {cancer, oncology, oncogene, metastasis}
Figure 12. A sample of original query and Enhanced query
In order to refine the web search using ontology, both the k-cores and the ontology of breast cancer is used to
enhance the user query for more efficient retrieval of web pages. A piece of breast cancer ontology is shown in Figure 13. The relevant k-cores are matched with the ontology breast cancer to extract the concepts based on the similarity measure. Then the user query is enhanced with the selected concept and passed to the search engine for efficient retrieval of relevant web pages.
http://acl/BMV#BreastCancer --> owl:Class rdf:about="#BreastCancer"> rdfs:subClassOf rdf:resource="#CancerTypes" /> owl:disjointWith rdf:resource="#ColorectalCancer" /> owl:disjointWith rdf:resource="#GastricCancer" /> owl:disjointWith rdf:resource="#EndometrialCancer"
/> </owl:Class> <!-- http://acl/BMV#CMFRegimeTypes --> owl:Class rdf:about="#CMFRegimeTypes"> rdfs:subClassOf
rdf:resource="#NonAnthracyclineChemoTxRegimeTypes" />
rdfs:subClassOf rdf:resource="#PolyChemoTxRegimeTypes" />
owl:disjointWith rdf:resource="#ECMFRegimeType" />
</owl:Class>
Figure 13 A piece of ontology for Breast cancer
Using recall and precision, the effectiveness of an Information retrieval system is evaluated. The most often used common evaluation measures are precision and recall as given in equation (7) and (8). Precision measures the proportion of retrieved documents that are relevant, and recall measures the proportion of relevant documents that have been retrieved. They are defined as follows
Retrieved relevant documents Precision = ------------------------------------ (7)
Retrieved documents
Retrieved relevant documents Recall = ------------------------------------- (8)
All relevant documents The precision is measured at a number of standard recall values (i.e. recall assumes the following values 0.1, 0.2, 0.3, 0.4, 0.5, 0.6, 0.7, 0.8, 0.9, 1.0). These measurements result in a set of recall precision figures. These figures are presented in Figure 14.
(IJCSIS) International Journal of Computer Science and Information Security, Vol. 7, No. 2, February 2010
26 http://sites.google.com/site/ijcsis/ ISSN 1947-5500
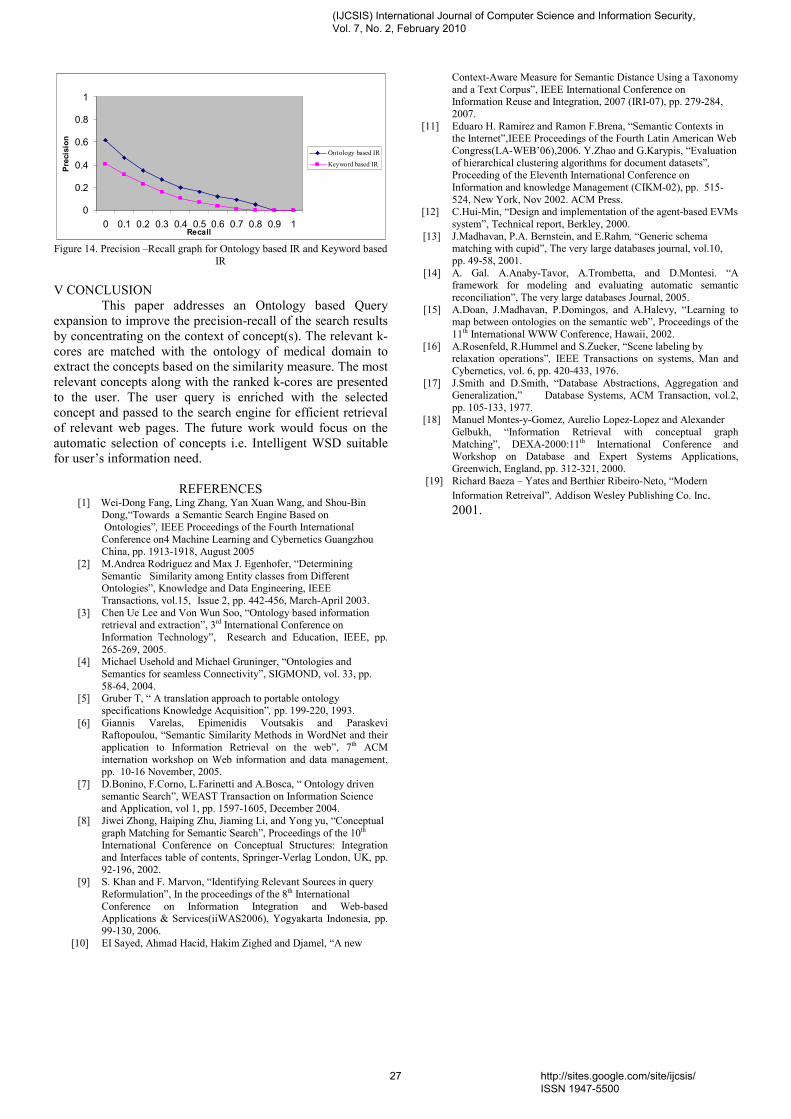
0
0.2
0.4
0.6
0.8
1
0 0.1 0.2 0.3 0.4 0.5 0.6 0.7 0.8 0.9 1Recall
Precision
Ontology based IR
Keyword based IR
Figure 14. Precision –Recall graph for Ontology based IR and Keyword based
IR V CONCLUSION This paper addresses an Ontology based Query expansion to improve the precision-recall of the search results by concentrating on the context of concept(s). The relevant k-cores are matched with the ontology of medical domain to extract the concepts based on the similarity measure. The most relevant concepts along with the ranked k-cores are presented to the user. The user query is enriched with the selected concept and passed to the search engine for efficient retrieval of relevant web pages. The future work would focus on the automatic selection of concepts i.e. Intelligent WSD suitable for user’s information need.
REFERENCES [1] Wei-Dong Fang, Ling Zhang, Yan Xuan Wang, and Shou-Bin Dong,“Towards a Semantic Search Engine Based on Ontologies”, IEEE Proceedings of the Fourth International Conference on4 Machine Learning and Cybernetics Guangzhou China, pp. 1913-1918, August 2005
[2] M.Andrea Rodriguez and Max J. Egenhofer, “Determining Semantic Similarity among Entity classes from Different Ontologies”, Knowledge and Data Engineering, IEEE Transactions, vol.15, Issue 2, pp. 442-456, March-April 2003. [3] Chen Ue Lee and Von Wun Soo, “Ontology based information
retrieval and extraction”, 3rd International Conference on Information Technology”, Research and Education, IEEE, pp. 265-269, 2005.
[4] Michael Usehold and Michael Gruninger, “Ontologies and Semantics for seamless Connectivity”, SIGMOND, vol. 33, pp. 58-64, 2004.
[5] Gruber T, “ A translation approach to portable ontology specifications Knowledge Acquisition”, pp. 199-220, 1993. [6] Giannis Varelas, Epimenidis Voutsakis and Paraskevi
Raftopoulou, “Semantic Similarity Methods in WordNet and their application to Information Retrieval on the web”, 7th ACM internation workshop on Web information and data management, pp. 10-16 November, 2005.
[7] D.Bonino, F.Corno, L.Farinetti and A.Bosca, “ Ontology driven semantic Search”, WEAST Transaction on Information Science and Application, vol 1, pp. 1597-1605, December 2004.
[8] Jiwei Zhong, Haiping Zhu, Jiaming Li, and Yong yu, “Conceptual graph Matching for Semantic Search”, Proceedings of the 10th International Conference on Conceptual Structures: Integration and Interfaces table of contents, Springer-Verlag London, UK, pp. 92-196, 2002.
[9] S. Khan and F. Marvon, “Identifying Relevant Sources in query Reformulation”, In the proceedings of the 8th International Conference on Information Integration and Web-based Applications & Services(iiWAS2006), Yogyakarta Indonesia, pp. 99-130, 2006.
[10] EI Sayed, Ahmad Hacid, Hakim Zighed and Djamel, “A new
Context-Aware Measure for Semantic Distance Using a Taxonomy and a Text Corpus”, IEEE International Conference on Information Reuse and Integration, 2007 (IRI-07), pp. 279-284, 2007. [11] Eduaro H. Ramirez and Ramon F.Brena, “Semantic Contexts in the Internet”,IEEE Proceedings of the Fourth Latin American Web Congress(LA-WEB’06),2006. Y.Zhao and G.Karypis, “Evaluation of hierarchical clustering algorithms for document datasets”, Proceeding of the Eleventh International Conference on Information and knowledge Management (CIKM-02), pp. 515- 524, New York, Nov 2002. ACM Press. [12] C.Hui-Min, “Design and implementation of the agent-based EVMs
system”, Technical report, Berkley, 2000. [13] J.Madhavan, P.A. Bernstein, and E.Rahm, “Generic schema
matching with cupid”, The very large databases journal, vol.10, pp. 49-58, 2001.
[14] A. Gal. A.Anaby-Tavor, A.Trombetta, and D.Montesi. “A framework for modeling and evaluating automatic semantic reconciliation”, The very large databases Journal, 2005.
[15] A.Doan, J.Madhavan, P.Domingos, and A.Halevy, “Learning to map between ontologies on the semantic web”, Proceedings of the 11th International WWW Conference, Hawaii, 2002.
[16] A.Rosenfeld, R.Hummel and S.Zueker, “Scene labeling by relaxation operations”, IEEE Transactions on systems, Man and Cybernetics, vol. 6, pp. 420-433, 1976.
[17] J.Smith and D.Smith, “Database Abstractions, Aggregation and Generalization,” Database Systems, ACM Transaction, vol.2, pp. 105-133, 1977.
[18] Manuel Montes-y-Gomez, Aurelio Lopez-Lopez and Alexander Gelbukh, “Information Retrieval with conceptual graph Matching”, DEXA-2000:11th International Conference and Workshop on Database and Expert Systems Applications, Greenwich, England, pp. 312-321, 2000.
[19] Richard Baeza – Yates and Berthier Ribeiro-Neto, “Modern Information Retreival”, Addison Wesley Publishing Co. Inc. 2001.
(IJCSIS) International Journal of Computer Science and Information Security, Vol. 7, No. 2, February 2010
27 http://sites.google.com/site/ijcsis/ ISSN 1947-5500
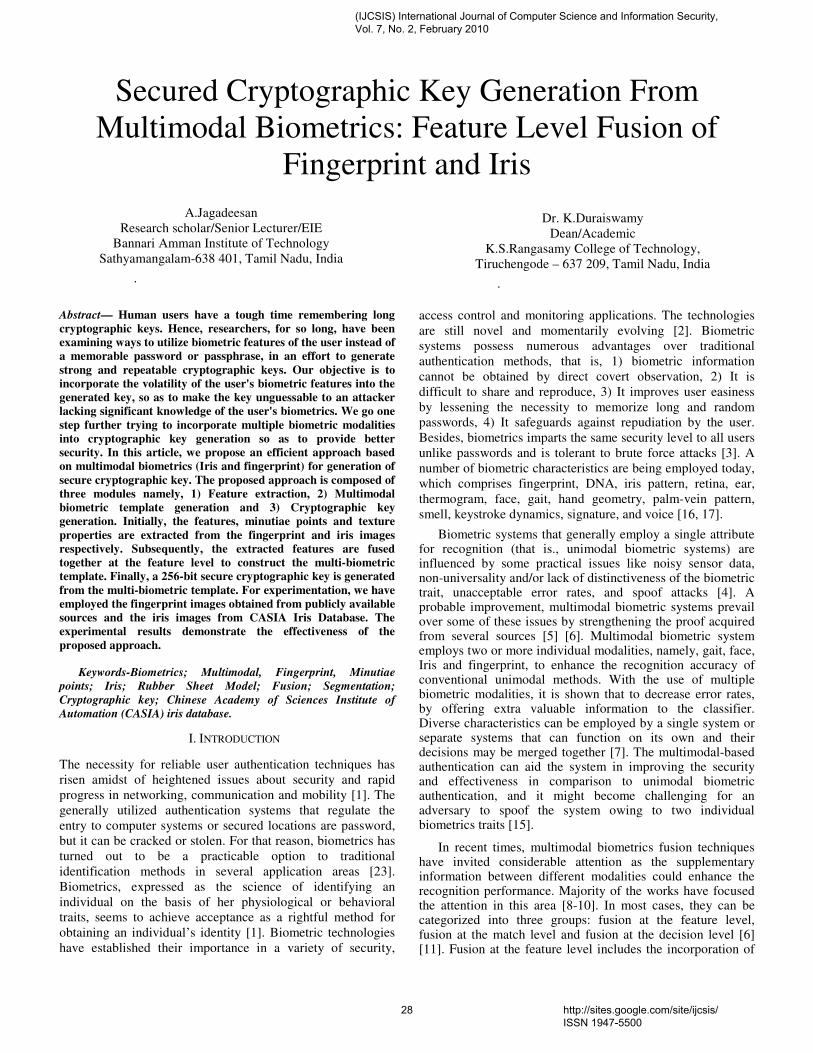
Secured Cryptographic Key Generation From
Multimodal Biometrics: Feature Level Fusion of
Fingerprint and Iris
A.Jagadeesan
Research scholar/Senior Lecturer/EIE
Bannari Amman Institute of Technology
Sathyamangalam-638 401, Tamil Nadu, India
.
Dr. K.Duraiswamy
Dean/Academic
K.S.Rangasamy College of Technology,
Tiruchengode – 637 209, Tamil Nadu, India
.
Abstract— Human users have a tough time remembering long
cryptographic keys. Hence, researchers, for so long, have been
examining ways to utilize biometric features of the user instead of
a memorable password or passphrase, in an effort to generate
strong and repeatable cryptographic keys. Our objective is to
incorporate the volatility of the user's biometric features into the
generated key, so as to make the key unguessable to an attacker
lacking significant knowledge of the user's biometrics. We go one
step further trying to incorporate multiple biometric modalities
into cryptographic key generation so as to provide better
security. In this article, we propose an efficient approach based
on multimodal biometrics (Iris and fingerprint) for generation of
secure cryptographic key. The proposed approach is composed of
three modules namely, 1) Feature extraction, 2) Multimodal
biometric template generation and 3) Cryptographic key
generation. Initially, the features, minutiae points and texture
properties are extracted from the fingerprint and iris images
respectively. Subsequently, the extracted features are fused
together at the feature level to construct the multi-biometric
template. Finally, a 256-bit secure cryptographic key is generated
from the multi-biometric template. For experimentation, we have
employed the fingerprint images obtained from publicly available
sources and the iris images from CASIA Iris Database. The
experimental results demonstrate the effectiveness of the
proposed approach.
Keywords-Biometrics; Multimodal, Fingerprint, Minutiae
points; Iris; Rubber Sheet Model; Fusion; Segmentation;
Cryptographic key; Chinese Academy of Sciences Institute of
Automation (CASIA) iris database.
I. INTRODUCTION
The necessity for reliable user authentication techniques has
risen amidst of heightened issues about security and rapid
progress in networking, communication and mobility [1]. The
generally utilized authentication systems that regulate the
entry to computer systems or secured locations are password,
but it can be cracked or stolen. For that reason, biometrics has
turned out to be a practicable option to traditional
identification methods in several application areas [23].
Biometrics, expressed as the science of identifying an
individual on the basis of her physiological or behavioral
traits, seems to achieve acceptance as a rightful method for
obtaining an individual’s identity [1]. Biometric technologies
have established their importance in a variety of security,
access control and monitoring applications. The technologies
are still novel and momentarily evolving [2]. Biometric
systems possess numerous advantages over traditional
authentication methods, that is, 1) biometric information
cannot be obtained by direct covert observation, 2) It is
difficult to share and reproduce, 3) It improves user easiness
by lessening the necessity to memorize long and random
passwords, 4) It safeguards against repudiation by the user.
Besides, biometrics imparts the same security level to all users
unlike passwords and is tolerant to brute force attacks [3]. A
number of biometric characteristics are being employed today,
which comprises fingerprint, DNA, iris pattern, retina, ear,
thermogram, face, gait, hand geometry, palm-vein pattern,
smell, keystroke dynamics, signature, and voice [16, 17].
Biometric systems that generally employ a single attribute for recognition (that is., unimodal biometric systems) are influenced by some practical issues like noisy sensor data, non-universality and/or lack of distinctiveness of the biometric trait, unacceptable error rates, and spoof attacks [4]. A probable improvement, multimodal biometric systems prevail over some of these issues by strengthening the proof acquired from several sources [5] [6]. Multimodal biometric system employs two or more individual modalities, namely, gait, face, Iris and fingerprint, to enhance the recognition accuracy of conventional unimodal methods. With the use of multiple biometric modalities, it is shown that to decrease error rates, by offering extra valuable information to the classifier. Diverse characteristics can be employed by a single system or separate systems that can function on its own and their decisions may be merged together [7]. The multimodal-based authentication can aid the system in improving the security and effectiveness in comparison to unimodal biometric authentication, and it might become challenging for an adversary to spoof the system owing to two individual biometrics traits [15].
In recent times, multimodal biometrics fusion techniques have invited considerable attention as the supplementary information between different modalities could enhance the recognition performance. Majority of the works have focused the attention in this area [8-10]. In most cases, they can be categorized into three groups: fusion at the feature level, fusion at the match level and fusion at the decision level [6] [11]. Fusion at the feature level includes the incorporation of
(IJCSIS) International Journal of Computer Science and Information Security, Vol. 7, No. 2, February 2010
28 http://sites.google.com/site/ijcsis/ ISSN 1947-5500
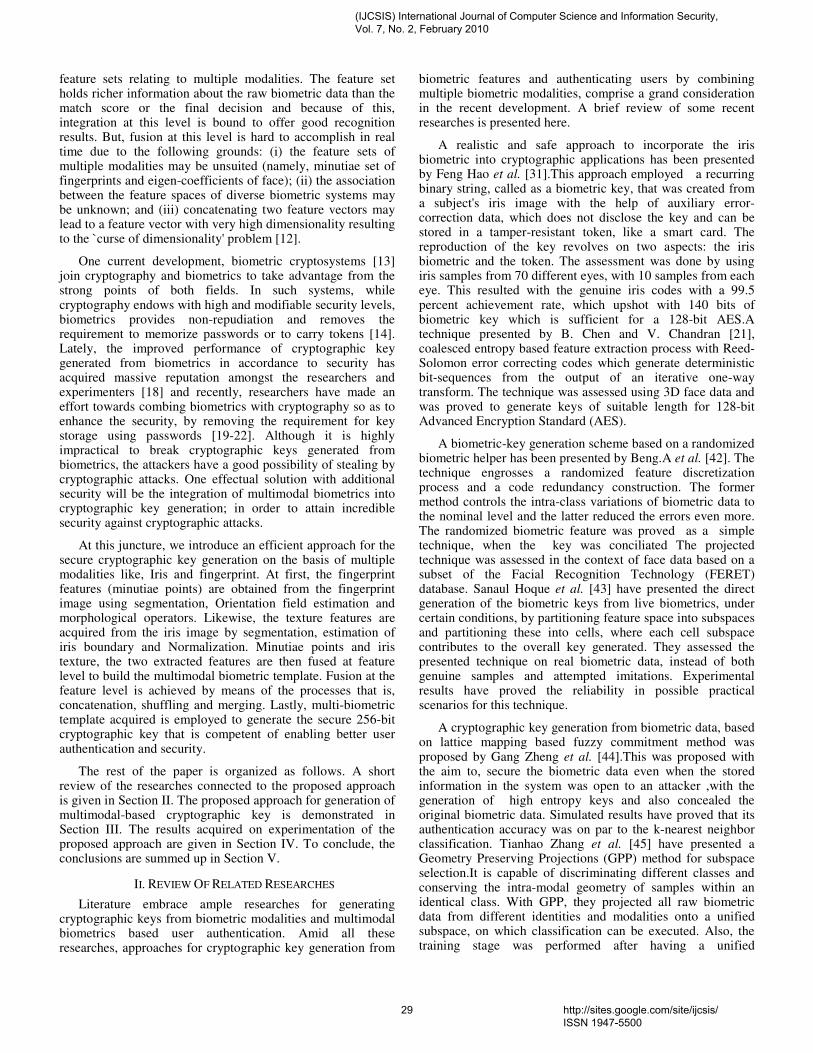
feature sets relating to multiple modalities. The feature set holds richer information about the raw biometric data than the match score or the final decision and because of this, integration at this level is bound to offer good recognition results. But, fusion at this level is hard to accomplish in real time due to the following grounds: (i) the feature sets of multiple modalities may be unsuited (namely, minutiae set of fingerprints and eigen-coefficients of face); (ii) the association between the feature spaces of diverse biometric systems may be unknown; and (iii) concatenating two feature vectors may lead to a feature vector with very high dimensionality resulting to the `curse of dimensionality' problem [12].
One current development, biometric cryptosystems [13] join cryptography and biometrics to take advantage from the strong points of both fields. In such systems, while cryptography endows with high and modifiable security levels, biometrics provides non-repudiation and removes the requirement to memorize passwords or to carry tokens [14]. Lately, the improved performance of cryptographic key generated from biometrics in accordance to security has acquired massive reputation amongst the researchers and experimenters [18] and recently, researchers have made an effort towards combing biometrics with cryptography so as to enhance the security, by removing the requirement for key storage using passwords [19-22]. Although it is highly impractical to break cryptographic keys generated from biometrics, the attackers have a good possibility of stealing by cryptographic attacks. One effectual solution with additional security will be the integration of multimodal biometrics into cryptographic key generation; in order to attain incredible security against cryptographic attacks.
At this juncture, we introduce an efficient approach for the secure cryptographic key generation on the basis of multiple modalities like, Iris and fingerprint. At first, the fingerprint features (minutiae points) are obtained from the fingerprint image using segmentation, Orientation field estimation and morphological operators. Likewise, the texture features are acquired from the iris image by segmentation, estimation of iris boundary and Normalization. Minutiae points and iris texture, the two extracted features are then fused at feature level to build the multimodal biometric template. Fusion at the feature level is achieved by means of the processes that is, concatenation, shuffling and merging. Lastly, multi-biometric template acquired is employed to generate the secure 256-bit cryptographic key that is competent of enabling better user authentication and security.
The rest of the paper is organized as follows. A short review of the researches connected to the proposed approach is given in Section II. The proposed approach for generation of multimodal-based cryptographic key is demonstrated in Section III. The results acquired on experimentation of the proposed approach are given in Section IV. To conclude, the conclusions are summed up in Section V.
II. REVIEW OF RELATED RESEARCHES
Literature embrace ample researches for generating cryptographic keys from biometric modalities and multimodal biometrics based user authentication. Amid all these researches, approaches for cryptographic key generation from
biometric features and authenticating users by combining multiple biometric modalities, comprise a grand consideration in the recent development. A brief review of some recent researches is presented here.
A realistic and safe approach to incorporate the iris biometric into cryptographic applications has been presented by Feng Hao et al. [31].This approach employed a recurring binary string, called as a biometric key, that was created from a subject's iris image with the help of auxiliary error-correction data, which does not disclose the key and can be stored in a tamper-resistant token, like a smart card. The reproduction of the key revolves on two aspects: the iris biometric and the token. The assessment was done by using iris samples from 70 different eyes, with 10 samples from each eye. This resulted with the genuine iris codes with a 99.5 percent achievement rate, which upshot with 140 bits of biometric key which is sufficient for a 128-bit AES.A technique presented by B. Chen and V. Chandran [21], coalesced entropy based feature extraction process with Reed-Solomon error correcting codes which generate deterministic bit-sequences from the output of an iterative one-way transform. The technique was assessed using 3D face data and was proved to generate keys of suitable length for 128-bit Advanced Encryption Standard (AES).
A biometric-key generation scheme based on a randomized biometric helper has been presented by Beng.A et al. [42]. The technique engrosses a randomized feature discretization process and a code redundancy construction. The former method controls the intra-class variations of biometric data to the nominal level and the latter reduced the errors even more. The randomized biometric feature was proved as a simple technique, when the key was conciliated The projected technique was assessed in the context of face data based on a subset of the Facial Recognition Technology (FERET) database. Sanaul Hoque et al. [43] have presented the direct generation of the biometric keys from live biometrics, under certain conditions, by partitioning feature space into subspaces and partitioning these into cells, where each cell subspace contributes to the overall key generated. They assessed the presented technique on real biometric data, instead of both genuine samples and attempted imitations. Experimental results have proved the reliability in possible practical scenarios for this technique.
A cryptographic key generation from biometric data, based on lattice mapping based fuzzy commitment method was proposed by Gang Zheng et al. [44].This was proposed with the aim to, secure the biometric data even when the stored information in the system was open to an attacker ,with the generation of high entropy keys and also concealed the original biometric data. Simulated results have proved that its authentication accuracy was on par to the k-nearest neighbor classification. Tianhao Zhang et al. [45] have presented a Geometry Preserving Projections (GPP) method for subspace selection.It is capable of discriminating different classes and conserving the intra-modal geometry of samples within an identical class. With GPP, they projected all raw biometric data from different identities and modalities onto a unified subspace, on which classification can be executed. Also, the training stage was performed after having a unified
(IJCSIS) International Journal of Computer Science and Information Security, Vol. 7, No. 2, February 2010
29 http://sites.google.com/site/ijcsis/ ISSN 1947-5500

transformation matrix to project different modalities. Experimental results have proved the effectiveness of the presented GPP for individual recognition tasks.
Donald E. Maurer and John P. Baker et al have presented a fusion architecture based on Bayesian belief networks [46]. The technique fully exploited the graphical structure of Bayes nets to define and explicitly model statistical dependencies between relevant variables: per sample measurements like, match scores and corresponding quality estimates and global decision variables. These statistical dependencies are in the form of conditional distributions which are modeled as Gaussian, gamma, log-normal or beta.. Each model is determined by its mean and variance, thus considerably minimizing training data needs. Furthermore, they retrieved the information from lower quality measurements by conditioning decision variables on quality as well as match score instead of rejecting them out of hand. Another characteristic of the technique was a global quality measure intended to be used as a confidence estimate supporting decision making. Introductory studies using the architecture to fuse fingerprints and voice were accounted.
Muhammad Khurram Khana and Jiashu Zhanga presented an efficient multimodal face and fingerprint biometrics authentication system on space-limited tokens, e.g. smart cards, driver license, and RFID cards [47]. Fingerprint templates were encrypted and encoded/embedded within the face images in a secure manner, so that the feature does not get changed drastically during encoding and decoding. This method of biometrics authentication on space-limited tokens, was proven to be a proficient and a cheap alternative without downgrading the overall decoding and matching performance of the biometrics system. A class-dependence feature analysis technique based on Correlation Filter Bank (CFB) technique for efficient multimodal biometrics fusion at the feature level is presented by Yan Yan and Yu-Jin Zhang [48]. In CFB, by optimizing the overall original correlation outputs the unconstrained correlation filter trained for a specific modality. So, the variation between modalities has been considered and the useful information in various modalities is completely utilized. Previous experimental outcome on the fusion of face and palmprint biometrics proved the advantage of the technique.
An authentication method presented by M.Nageshkumar et al. [24], focuses on multimodal biometric system identification using two features i.e. face and palmprint. The technique was produced for application where the training data includes a face and palmprint. Mixing the palmprint and face features has enhanced the robustness of the person authentication. The final assessment was done by fusion at matching score level architecture where features vectors were formed independently for query measures and are then evaluated to the enrolment template, which were saved during database preparation. Multimodal biometric system was expanded through fusion of face and palmprint recognition.
III. PROPOSED APPROACH FOR CRYPTOGRAPHIC KEY
GENERATION FROM MULTIMODAL BIOMETRICS
Multimodal biometric authentication has been more reliable and capable than knowledge-based (e.g. Password)
and token-based (e.g. Key) techniques and has recently emerged as an attractive research area [24]. Several researchers [45-48] have successfully made use of multiple biometric traits for achieving user authentication. Multimodal biometrics was aimed at meeting the stringent performance requirements set by security-conscious customers. Some good advantages of multimodal biometrics are 1) improved accuracy 2) secondary means of enrollment and verification or identification in case sufficient data is not extracted from a given biometric sample and 3) ability to detect attempts to spoof biometric systems through non-live data sources such as fake fingers. Two important parameters that determine the effectiveness of the multimodal biometrics are choice of the biometric traits to be combined and the application area. The different biometric traits include fingerprint, face, iris, voice, hand geometry, palmprint and more. In the proposed approach, we integrate fingerprint and iris features for cryptographic key generation. The use of multimodal biometrics for key generation provides better security, as it is made difficult for an intruder to spool multiple biometric traits simultaneously. Moreover, the incorporation of biometrics into cryptography shuns the need to remember or carry long passwords or keys. The steps involved in the proposed multimodal-based approach for cryptographic key generation are,
1) Feature extraction from fingerprint.
2) Feature extraction from iris.
3) Fusion of fingerprint and iris features.
4) Generation of cryptographic key from fused features.
A. Minutiae Points Extraction from Fingerprints
This sub-section describes the process of extracting the minutiae points from the fingerprint image. We chose fingerprint biometrics chiefly because of its two significant characteristics: uniqueness and permanence (ability to remain unchanged over the lifetime). A fingerprint can be described as a pattern of ridges and valleys found on the surface of a fingertip. The ridges of the finger form the so-called minutiae points: ridge endings (terminals of ridge lines) and ridge bifurcations (fork-like structures) [26]. These minutiae points serve as an important means of fingerprint recognition. The steps involved in the proposed approach for minutiae extraction are as follows,
1) Preprocessing: The fingerprint image is first
preprocessed by using the following methods,
• Histogram Equalization
• Wiener Filtering
Histogram Equalization: Histogram equalization (HE) is a very common technique for enhancing the contrast of an image. Here, the basic idea is to map the gray levels based on the probability distribution of the input gray levels. HE flattens and stretches the dynamic range of the image’s histogram resulting in overall contrast improvement of the image [32]. HE transforms the intensity values of the image as given by the equation,
(IJCSIS) International Journal of Computer Science and Information Security, Vol. 7, No. 2, February 2010
30 http://sites.google.com/site/ijcsis/ ISSN 1947-5500
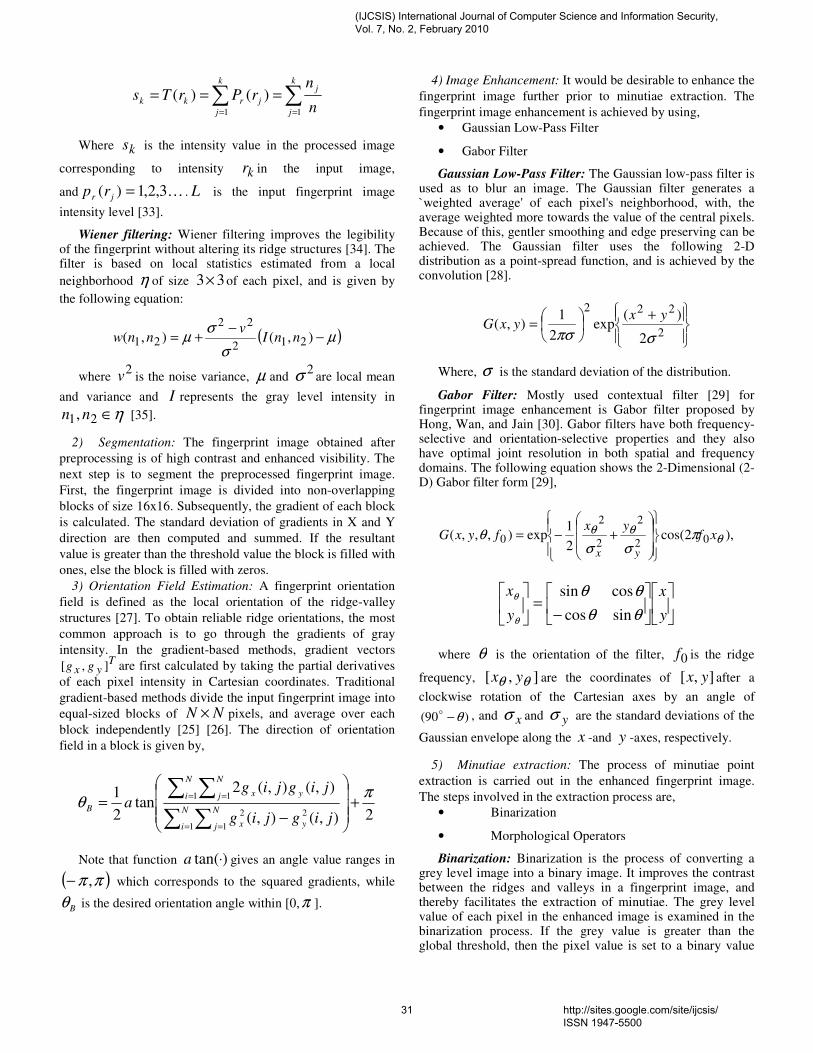
∑∑==
===k
j
j
j
k
j
rkkn
nrPrTs
11
)()(
Where ks is the intensity value in the processed image
corresponding to intensity kr in the input image,
and K3,2,1)( =jr rp . L is the input fingerprint image
intensity level [33].
Wiener filtering: Wiener filtering improves the legibility of the fingerprint without altering its ridge structures [34]. The filter is based on local statistics estimated from a local
neighborhood η of size 33× of each pixel, and is given by
the following equation:
( )µσ
σµ −
−+= ),(),( 212
22
21 nnIv
nnw
where 2
v is the noise variance, µ and 2σ are local mean
and variance and I represents the gray level intensity in
η∈21, nn [35].
2) Segmentation: The fingerprint image obtained after
preprocessing is of high contrast and enhanced visibility. The
next step is to segment the preprocessed fingerprint image.
First, the fingerprint image is divided into non-overlapping
blocks of size 16x16. Subsequently, the gradient of each block
is calculated. The standard deviation of gradients in X and Y
direction are then computed and summed. If the resultant
value is greater than the threshold value the block is filled with
ones, else the block is filled with zeros.
3) Orientation Field Estimation: A fingerprint orientation
field is defined as the local orientation of the ridge-valley
structures [27]. To obtain reliable ridge orientations, the most
common approach is to go through the gradients of gray
intensity. In the gradient-based methods, gradient vectors T
yx gg ],[ are first calculated by taking the partial derivatives
of each pixel intensity in Cartesian coordinates. Traditional
gradient-based methods divide the input fingerprint image into
equal-sized blocks of NN × pixels, and average over each
block independently [25] [26]. The direction of orientation
field in a block is given by,
2),(),(
),(),(2tan
2
1
1 1
22
1 1 πθ +
−=
∑ ∑
∑ ∑
= =
= =
N
i
N
j yx
N
i
N
j yx
B
jigjig
jigjiga
Note that function )tan(⋅a gives an angle value ranges in
( )ππ ,− which corresponds to the squared gradients, while
Bθ is the desired orientation angle within [0,π ].
4) Image Enhancement: It would be desirable to enhance the
fingerprint image further prior to minutiae extraction. The
fingerprint image enhancement is achieved by using,
• Gaussian Low-Pass Filter
• Gabor Filter
Gaussian Low-Pass Filter: The Gaussian low-pass filter is used as to blur an image. The Gaussian filter generates a `weighted average' of each pixel's neighborhood, with, the average weighted more towards the value of the central pixels. Because of this, gentler smoothing and edge preserving can be achieved. The Gaussian filter uses the following 2-D distribution as a point-spread function, and is achieved by the convolution [28].
+
=
2
222
2
)(exp
2
1),(
σπσ
yxyxG
Where, σ is the standard deviation of the distribution.
Gabor Filter: Mostly used contextual filter [29] for fingerprint image enhancement is Gabor filter proposed by Hong, Wan, and Jain [30]. Gabor filters have both frequency-selective and orientation-selective properties and they also have optimal joint resolution in both spatial and frequency domains. The following equation shows the 2-Dimensional (2-D) Gabor filter form [29],
),2cos(2
1exp),,,( 02
2
2
2
0 θθθ π
σσθ xf
yxfyxG
yx
+−=
−=
y
x
y
x
θθ
θθ
θ
θ
sincos
cossin
where θ is the orientation of the filter, 0f is the ridge
frequency, ],[ θθ yx are the coordinates of ],[ yx after a
clockwise rotation of the Cartesian axes by an angle of
)90( θ−o , and xσ and yσ are the standard deviations of the
Gaussian envelope along the x -and y -axes, respectively.
5) Minutiae extraction: The process of minutiae point
extraction is carried out in the enhanced fingerprint image.
The steps involved in the extraction process are,
• Binarization
• Morphological Operators
Binarization: Binarization is the process of converting a grey level image into a binary image. It improves the contrast between the ridges and valleys in a fingerprint image, and thereby facilitates the extraction of minutiae. The grey level value of each pixel in the enhanced image is examined in the binarization process. If the grey value is greater than the global threshold, then the pixel value is set to a binary value
(IJCSIS) International Journal of Computer Science and Information Security, Vol. 7, No. 2, February 2010
31 http://sites.google.com/site/ijcsis/ ISSN 1947-5500
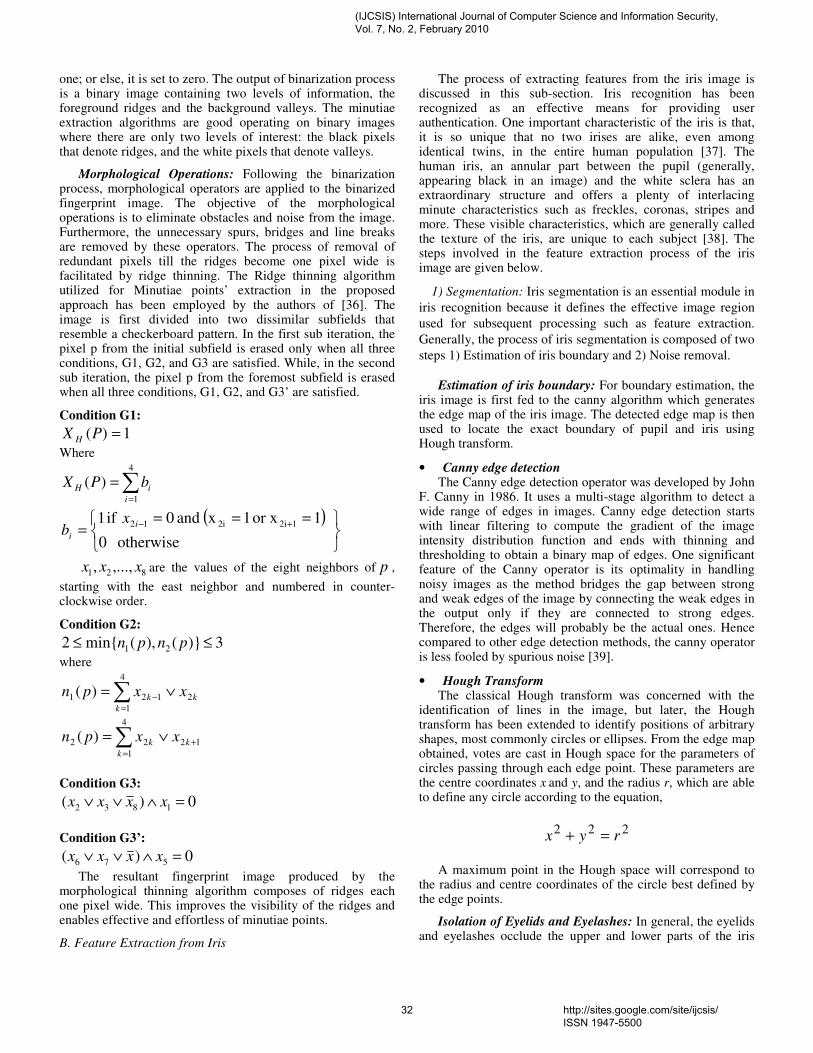
one; or else, it is set to zero. The output of binarization process is a binary image containing two levels of information, the foreground ridges and the background valleys. The minutiae extraction algorithms are good operating on binary images where there are only two levels of interest: the black pixels that denote ridges, and the white pixels that denote valleys.
Morphological Operations: Following the binarization process, morphological operators are applied to the binarized fingerprint image. The objective of the morphological operations is to eliminate obstacles and noise from the image. Furthermore, the unnecessary spurs, bridges and line breaks are removed by these operators. The process of removal of redundant pixels till the ridges become one pixel wide is facilitated by ridge thinning. The Ridge thinning algorithm utilized for Minutiae points’ extraction in the proposed approach has been employed by the authors of [36]. The image is first divided into two dissimilar subfields that resemble a checkerboard pattern. In the first sub iteration, the pixel p from the initial subfield is erased only when all three conditions, G1, G2, and G3 are satisfied. While, in the second sub iteration, the pixel p from the foremost subfield is erased when all three conditions, G1, G2, and G3’ are satisfied.
Condition G1:
1)( =PX H
Where
∑=
=4
1
)(i
iH bPX
( )
===
=+−
otherwise 0
1or x 1x and 0 if 1 12i2i12i
i
xb
821 ,...,, xxx are the values of the eight neighbors of p ,
starting with the east neighbor and numbered in counter-clockwise order.
Condition G2:
3)}(),(min{2 21 ≤≤ pnpn
where
∑=
− ∨=4
1
2121 )(k
kk xxpn
12
4
1
22 )( +
=
∨=∑ k
k
k xxpn
Condition G3:
0)( 1832 =∧∨∨ xxxx
Condition G3’:
0)( 576 =∧∨∨ xxxx
The resultant fingerprint image produced by the morphological thinning algorithm composes of ridges each one pixel wide. This improves the visibility of the ridges and enables effective and effortless of minutiae points.
B. Feature Extraction from Iris
The process of extracting features from the iris image is discussed in this sub-section. Iris recognition has been recognized as an effective means for providing user authentication. One important characteristic of the iris is that, it is so unique that no two irises are alike, even among identical twins, in the entire human population [37]. The human iris, an annular part between the pupil (generally, appearing black in an image) and the white sclera has an extraordinary structure and offers a plenty of interlacing minute characteristics such as freckles, coronas, stripes and more. These visible characteristics, which are generally called the texture of the iris, are unique to each subject [38]. The steps involved in the feature extraction process of the iris image are given below.
1) Segmentation: Iris segmentation is an essential module in
iris recognition because it defines the effective image region
used for subsequent processing such as feature extraction.
Generally, the process of iris segmentation is composed of two
steps 1) Estimation of iris boundary and 2) Noise removal.
Estimation of iris boundary: For boundary estimation, the
iris image is first fed to the canny algorithm which generates the edge map of the iris image. The detected edge map is then used to locate the exact boundary of pupil and iris using Hough transform.
• Canny edge detection The Canny edge detection operator was developed by John
F. Canny in 1986. It uses a multi-stage algorithm to detect a wide range of edges in images. Canny edge detection starts with linear filtering to compute the gradient of the image intensity distribution function and ends with thinning and thresholding to obtain a binary map of edges. One significant feature of the Canny operator is its optimality in handling noisy images as the method bridges the gap between strong and weak edges of the image by connecting the weak edges in the output only if they are connected to strong edges. Therefore, the edges will probably be the actual ones. Hence compared to other edge detection methods, the canny operator is less fooled by spurious noise [39].
• Hough Transform The classical Hough transform was concerned with the
identification of lines in the image, but later, the Hough transform has been extended to identify positions of arbitrary shapes, most commonly circles or ellipses. From the edge map obtained, votes are cast in Hough space for the parameters of circles passing through each edge point. These parameters are the centre coordinates x
and y, and the radius r, which are able
to define any circle according to the equation,
222 ryx =+
A maximum point in the Hough space will correspond to the radius and centre coordinates of the circle best defined by the edge points.
Isolation of Eyelids and Eyelashes: In general, the eyelids and eyelashes occlude the upper and lower parts of the iris
(IJCSIS) International Journal of Computer Science and Information Security, Vol. 7, No. 2, February 2010
32 http://sites.google.com/site/ijcsis/ ISSN 1947-5500

region. In addition, specular reflections can occur within the iris region corrupting the iris pattern. The removal of such noises is also essential for obtaining reliable iris information.
• Eyelids are isolated by fitting a line to the upper and lower eyelid using the linear Hough transform. A second horizontal line is then drawn, which intersects with the first line at the iris edge that is closest to the pupil; the second horizontal line allows maximum isolation of eyelid region.
• The eyelashes are quite dark compared with the
surrounding eyelid region. Therefore, thresholding is used to
isolate eyelashes.
2) Iris Normalization: Once the iris image is efficiently
localized, then the next step is to transform it into the
rectangular sized fixed image. The transformation process is
carried out using the Daugman’s Rubber Sheet Model. Daugman’s Rubber Sheet Model: Normalization process
involves unwrapping the iris and converting it into its polar equivalent. It is done using Daugman’s Rubber sheet model [40] and is shown in figure.
Figure 1. Daugman’s Rubber Sheet Model
For every pixel in the iris, an equivalent position is found out on polar axes. The process comprises of two resolutions: Radial resolution, which is the number of data points in the radial direction and Angular resolution, which is the number of radial lines generated around iris region. Using the following equation, the iris region is transformed to a 2D array with horizontal dimensions of angular resolution and vertical dimension of radial resolution.
),()],(),,([ θθθ rIryrxI →
where, ),( yxI is the iris region, ),( yx and ),( θr are the
Cartesian and normalized polar coordinates respectively. The
range of θ is ]0[ π2 and r is 1] 0[ . ),( θrx and
),( θry are defined as linear combinations set of pupil
boundary points. The formulas given in the following equations perform the transformation,
)()()1(),( θθθ ip xxrrx +−=
)()()1(),( θθθ ip yyrry +−=
)()()( 0 θθθ Cosrxx ppp +=
)()()( 0 θθθ Sinryy ppp +=
)()()( 0 θθθ Cosrxx iii +=
)()()( 0 θθθ Sinryy iii +=
where ),( pp yx and ),( ii yx are the coordinates on the
pupil and iris boundaries along the θ direction.
),( 00 pp yx , ),( 00 ii yx are the coordinates of pupil and iris
centers [39].
3) Extraction of iris texture: The normalized 2D form image
is broken up into 1D signal, and these signals are used to
convolve with 1D Gabor wavelets. The frequency response of
a Log-Gabor filter is given as,
−=
20
20
))/(log(2
))/(log(exp)(
f
fffG
σ
Where 0f represents the centre frequency, and σ gives
the bandwidth of the filter [41].
The Log-Gabor filter outputs the biometric feature (texture properties) of the iris.
C. Fusion of Fingerprint and Iris Features
We have at hand two sets of features namely, 1) Fingerprint features and 2) Iris features. The next step is to fuse the two sets of features at the feature level to obtain a multimodal biometric template that can perform biometric authentication.
Feature Representation: Fingerprint - Each minutiae point extracted from a fingerprint image is represented as ( x , y )
coordinates. Here, we store those extracted minutiae points in
two different vectors: Vector 1F contains all the x co-ordinate
values and Vector 2F contains all the y co-ordinate values.
1F = [ ]nxxxx 321 K ; 1F = n
2F = [ ]nyyy y 321 K ; 2F = n
Iris - The texture properties obtained from the log-gabor
filter are complex numbers )( iba + . Similar to fingerprint
representation, we also store the iris texture features in two
different vectors: Vector 1I contains the real part of the
complex numbers and Vector 2I contains the imaginary part of
the complex numbers.
1I = [ ]maaaa 321 K ; mI =1
2I = [ ]mbbbb 321 K ; mI =2
(IJCSIS) International Journal of Computer Science and Information Security, Vol. 7, No. 2, February 2010
33 http://sites.google.com/site/ijcsis/ ISSN 1947-5500
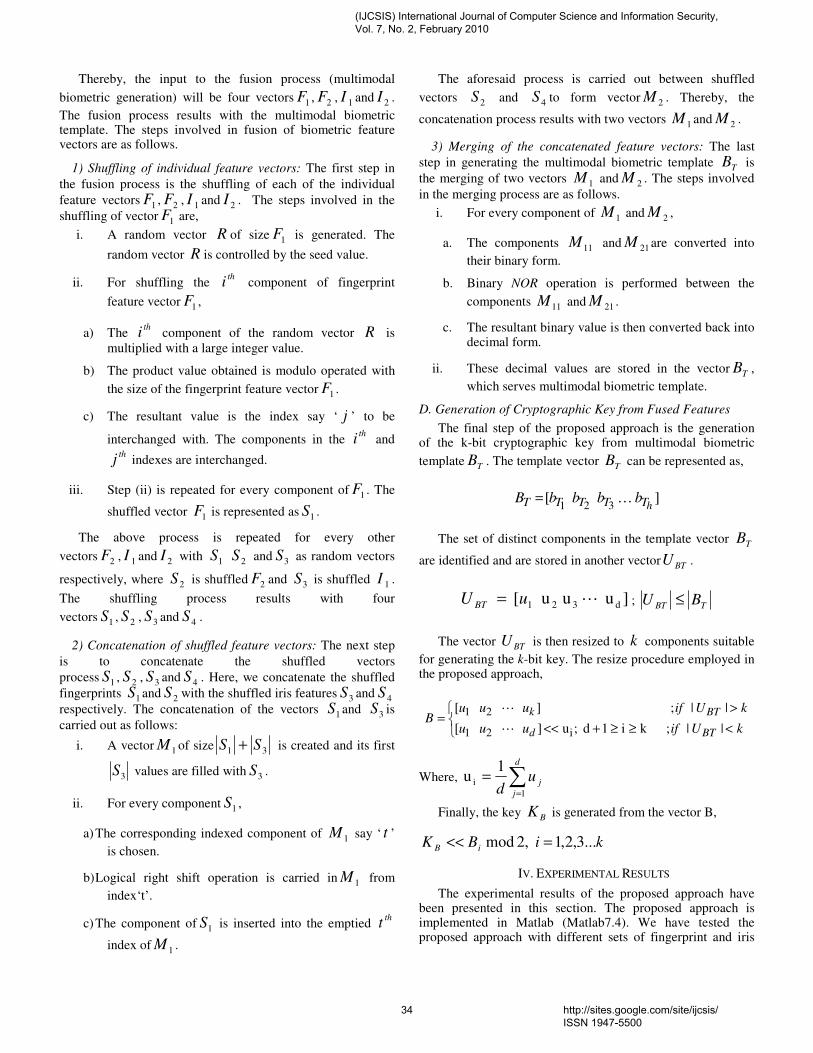
Thereby, the input to the fusion process (multimodal
biometric generation) will be four vectors 1F , 2F , 1I and 2I .
The fusion process results with the multimodal biometric template. The steps involved in fusion of biometric feature vectors are as follows.
1) Shuffling of individual feature vectors: The first step in
the fusion process is the shuffling of each of the individual
feature vectors 1F , 2F , 1I and 2I . The steps involved in the
shuffling of vector 1F are,
i. A random vector R of size 1F is generated. The
random vector R is controlled by the seed value.
ii. For shuffling the th
i component of fingerprint
feature vector 1F ,
a) The th
i component of the random vector R is
multiplied with a large integer value.
b) The product value obtained is modulo operated with
the size of the fingerprint feature vector 1F .
c) The resultant value is the index say ‘ j ’ to be
interchanged with. The components in the th
i and thj indexes are interchanged.
iii. Step (ii) is repeated for every component of 1F . The
shuffled vector 1F is represented as 1S .
The above process is repeated for every other
vectors 2F , 1I and 2I with 1S 2S and 3S as random vectors
respectively, where 2S is shuffled 2F and 3S is shuffled 1I .
The shuffling process results with four
vectors 1S , 2S , 3S and 4S .
2) Concatenation of shuffled feature vectors: The next step
is to concatenate the shuffled vectors
process 1S , 2S , 3S and 4S . Here, we concatenate the shuffled
fingerprints 1S and 2S with the shuffled iris features 3S and 4S
respectively. The concatenation of the vectors 1S and 3S is
carried out as follows:
i. A vector 1M of size 31 SS + is created and its first
3S values are filled with 3S .
ii. For every component 1S ,
a) The corresponding indexed component of 1M say ‘ t ’
is chosen.
b) Logical right shift operation is carried in 1M from
index‘t’.
c) The component of 1S is inserted into the emptied th
t
index of 1M .
The aforesaid process is carried out between shuffled
vectors 2S and 4S to form vector 2M . Thereby, the
concatenation process results with two vectors 1M and 2M .
3) Merging of the concatenated feature vectors: The last
step in generating the multimodal biometric template TB is
the merging of two vectors 1M and 2M . The steps involved
in the merging process are as follows.
i. For every component of 1M and 2M ,
a. The components 11M and 21M are converted into
their binary form.
b. Binary NOR operation is performed between the
components 11M and 21M .
c. The resultant binary value is then converted back into decimal form.
ii. These decimal values are stored in the vector TB ,
which serves multimodal biometric template.
D. Generation of Cryptographic Key from Fused Features
The final step of the proposed approach is the generation of the k-bit cryptographic key from multimodal biometric
template TB . The template vector TB can be represented as,
] [321 hTTTTT bbbbB K=
The set of distinct components in the template vector TB
are identified and are stored in another vector BTU .
]u u u [ d321 LuU BT = ; TBT BU ≤
The vector BTU is then resized to k components suitable
for generating the k-bit key. The resize procedure employed in the proposed approach,
<≥≥+<<
>=
|| ;k i1d ;u ] [
|| ; ] [
i21
21
kUifuuu
kUifuuuB
BTd
BTk
L
L
Where, ∑=
=d
j
jud 1
i
1u
Finally, the key BK is generated from the vector B,
kiBK iB ...3,2,1 ,2mod =<<
IV. EXPERIMENTAL RESULTS
The experimental results of the proposed approach have been presented in this section. The proposed approach is implemented in Matlab (Matlab7.4). We have tested the proposed approach with different sets of fingerprint and iris
(IJCSIS) International Journal of Computer Science and Information Security, Vol. 7, No. 2, February 2010
34 http://sites.google.com/site/ijcsis/ ISSN 1947-5500
images corresponding to individuals. The fingerprint images employed in the proposed approach have been collected from publicly available databases. The input fingerprint image, the extracted minutiae points and the intermediate results of the proposed approach are shown in figure 2. For iris feature extraction, we use iris images obtained from CASIA Iris
Image Database collected by Institute of Automation, Chinese Academy of Science. The input iris image, the normalized iris image and the intermediate results of the proposed approach are portrayed in figure 3. Finally, the generated 256-bit cryptographic key obtained from the proposed approach is depicted in figure 4.
Figure 2. (a) Input fingerprint image (b) Histogram Equalized Image (c) Wiener Filtered Image (d) Segmented Image (e) Enhanced image (f) Morphological
Processed Image (g) Fingerprint image with Minutiae points
Figure 3. (a) Input Iris image (b) Edge detected image (c) Located pupil and iris boundary (d) Detected top eyelid region (e) Detected top and bottom eyelid region
(f) Segmented Iris image (g) Normalized iris image
Figure 4. Generated 256 bit key
V. CONCLUSION
In this paper, we have attempted to generate a secure cryptographic key by incorporating multiple biometrics modalities of human being, so as to provide better security. An efficient approach for generation of secure cryptographic key based on multimodal biometrics (Iris and fingerprint) has been presented in this paper. The proposed approach has composed of three modules namely, 1) Feature extraction, 2) Multimodal biometric template generation and 3) Cryptographic key generation. Firstly, the features, minutiae points and texture properties have been extracted from the fingerprint and iris images respectively. Then, the extracted features have been combined together at the feature level to obtain the multi-biometric template. Lastly, a 256-bit secure cryptographic key has been generated from the multi-biometric template. For experimentation, we have employed the fingerprint images obtained from publicly available sources and the iris images from CASIA Iris Database. The experimental results have demonstrated the efficiency of the proposed approach to produce user-specific strong cryptographic keys.
REFERENCES
[1] Arun Ross and Anil K. Jain, "Multimodal Biometrics: An Overview", in proceedings of the 12th European Signal Processing Conference, pp. 1221-1224, 2004.
[2] Richard A. Wasniowski, "Using Data Fusion for Biometric Verification", in Proceedings of World Academy of Science, Engineering and Technology, vol. 5, April 2005.
[3] Parvathi Ambalakat, "Security of Biometric Authentication Systems", in proceedings of 21st Computer Science Seminar, 2005.
[4] A.K. Jain and A. Ross, “Multi-biometric systems: special issue on multimodal interfaces that flex, adapt, and persist”, Communications of the ACM, vol. 47, no. 1, pp. 34–40, 2004.
[5] L. Hong, A.K. Jain and S. Pankanti, “Can multibiometrics improve performance?”, in Proceedings of IEEE Workshop on Automatic Identification Advanced Technologies, pp. 59–64, NJ, USA, 1999.
[6] Anil Jain, Karthik Nandakumar and Arun Ross, “Score normalization in multimodal biometric systems”, Pattern Recognition, vol. 38, pp. 2270 – 2285, 2005.
[7] Eren Camlikaya, Alisher Kholmatov and Berrin Yanikoglu, "Multi-biometric Templates Using Fingerprint and Voice", Biometric technology for human identification, Vol. 6944, no5, pp: 1-9, Orlando FL, 2008.
[8] R. Wang and B. Bhanu, “Performance prediction for multimodal biometrics”, In Proceedings of the IEEE International Conference on Pattern Recognition, pp. 586-589, 2006.
[9] X. Jing, Y. Yao, D. Zhang, J. Yang, and M. Li. “Face and palm print pixel level fusion and Kernel DCV-RBF classifier for small sample biometric recognition”, Pattern Recognition, vol. 40, no.11, pp. 3209-3224, 2007.
(IJCSIS) International Journal of Computer Science and Information Security, Vol. 7, No. 2, February 2010
35 http://sites.google.com/site/ijcsis/ ISSN 1947-5500
[10] T. Zhang, X. Li, D. Tao, and J. Yang, “Multi-modal biometrics using geometry preserving projections”, Pattern Recognition, vol. 41, no. 3, pp. 805-813, 2008.
[11] Yan Yan and Yu-Jin Zhang, “Multimodal Biometrics Fusion Using Correlation Filter Bank", in proceedings of 19th International Conference on Pattern Recognition, pp. 1-4, Tampa, FL, 2008.
[12] Arun Ross and Rohin Govindarajan, "Feature Level Fusion in Biometric Systems", in proceedings of Biometric Consortium Conference (BCC), September 2004.
[13] Umut Uludag, Sharath Pankanti, Salil Prabhakar, Anil K.Jain, “Biometric Cryptosystems Issues and Challenges”, in Proceedings of the IEEE, vol. 92, pp. 948-960, 2004.
[14] P.Arul, Dr.A.Shanmugam, "Generate a Key for AES Using Biometric for VOIP Network Security", Journal of Theoretical and Applied Information Technology, vol. 5, no.2, 2009.
[15] Muhammad Khurram Khan and Jiashu Zhang, "Multimodal face and fingerprint biometrics authentication on space-limited tokens", Neurocomputing, vol. 71, pp. 3026-3031, August 2008.
[16] Kornelije Rabuzin and Miroslav Baca and Mirko Malekovic, "A Multimodal Biometric System Implemented within an Active Database Management System", Journal of software, vol. 2, no. 4, October 2007.
[17] M Baca and K. Rabuzin, “Biometrics in Network Security”, in Proceedings of the XXVIII International Convention MIPRO 2005, pp. 205-210 , Rijeka,2005.
[18] N. Lalithamani and K.P. Soman, "Irrevocable Cryptographic Key Generation from Cancelable Fingerprint Templates: An Enhanced and Effective Scheme", European Journal of Scientific Research, vol.31, no.3, pp.372-387, 2009.
[19] A. Goh and D.C.L. Ngo, “Computation of cryptographic keys from face biometrics”, International Federation for Information Processing 2003, Springer-Verlag, LNCS 2828, pp. 1–13, 2003.
[20] F. Hao, C.W. Chan, “Private Key generation from on-line handwritten signatures”, Information Management & Computer Security, vol. 10, no. 2, pp. 159–164, 2002.
[21] Chen, B. and Chandran, V., "Biometric Based Cryptographic Key Generation from Faces", in proceedings of 9th Biennial Conference of the Australian Pattern Recognition Society on Digital Image Computing Techniques and Applications, pp. 394 - 401, December 2007.
[22] N. Lalithamani and Dr. K.P. Soman, “An Effective Scheme for Generating Irrevocable Cryptographic Key from Cancelable Fingerprint Templates”, International Journal of Computer Science and Network Security, vol. 9, no.3, March 2009.
[23] Jang-Hee Yoo, Jong-Gook Ko, Sung-Uk Jung, Yun-Su Chung, Ki-Hyun Kim, Ki-Young Moon, and Kyoil Chung, "Design of an Embedded Multimodal Biometric System", ETRI-Information Security Research Division, 2007.
[24] Nageshkumar.M, Mahesh.PK and M.N. Shanmukha Swamy, “An Efficient Secure Multimodal Biometric Fusion Using Palmprint and Face Image”, IJCSI International Journal of Computer Science Issues, Vol. 2, 2009.
[25] A.M. Bazen and S.H. Gerez, "Systematic methods for the computation of the directional fields and singular points of fingerprints", IEEE Transaction on Pattern Analysis and Machine Intelligence, vol. 24, no.7, pp.905–919, 2002.
[26] Yi Wang , Jiankun Hu and Fengling Han, "Enhanced gradient-based algorithm for the estimation of fingerprint orientation fields", Applied Mathematics and Computation, vol. 185, pp.823–833, 2007.
[27] Jinwei Gu and Jie Zhou, “A Novel Model for Orientation Field of Fingerprints”, in Proceedings of the IEEE Computer Society Conference on Computer Vision and Pattern Recognition, vol.2, 2003.
[28] Keokanlaya Sihalath, Somsak Choomchuay, Shatoshi Wada and Kazuhiko Hamamoto, “ Performance Evaluation Of Field Smoothing Filters”, in Proceedings of 2th International Conference on Biomedical Engineering (BMEiCON-2009), Phuket, Thailand, August 2009.
[29] D. Maltoni, D. Maio, A. K. Jain, and s. Prabhakar, Handbook of Fingerprint Recognition, Springer-Verlag, 2003.
[30] L. Hong, Y.Wan, and AI. Jain, "Fingerprint Image Enhancement: Algorithm and Performance Evaluation," IEEE Transactions on Pattern
Analysis and Machine Intelligence, vol. 20, no. 8, pp. 777-789, August 1998.
[31] Feng Hao, Ross Anderson and John Daugman, "Combining Crypto with Biometrics Effectively", IEEE Transactions on Computers, vol. 55, no. 9, pp. 1081 - 1088, September 2006.
[32] Balasubramanian.K and Babu. P, "Extracting Minutiae from Fingerprint Images using Image Inversion and Bi-Histogram Equalization", Proceedings of SPIT-IEEE Colloquium and International Conference, Mumbai, India.
[33] M. Sepasian, W. Balachandran and C. Mares, "Image Enhancement for Fingerprint Minutiae-Based Algorithms Using CLAHE, Standard Deviation Analysis and Sliding Neighborhood", in Proceedings of the World Congress on Engineering and Computer Science 2008, San Francisco, USA, October 2008.
[34] Sharat Chikkerur, Alexander N. Cartwright and Venu Govindaraju, "Fingerprint enhancement using STFT analysis", Pattern Recognition, vol. 40, no.1, pp. 198-211, 2007.
[35] Greenberg, S. Aladjem, M. Kogan, D and Dimitrov, I, “Fingerprint image enhancement using filtering techniques” in Proceedings of the 15th International Conference on Pattern Recognition, vol.32, pp. 322-325, Barcelona, Spain, 2000.
[36] L. Lam, S. W. Lee, and C. Y. Suen, “Thinning Methodologies-A Comprehensive Survey”, IEEE Transactions on Pattern analysis and machine intelligence, vol. 14, no. 9, 1992.
[37] Debnath Bhattacharyya, Poulami Das,Samir Kumar Bandyopadhyay and Tai-hoon Kim, "IRIS Texture Analysis and Feature Extraction for Biometric Pattern Recognition", International Journal of Database Theory and Application, vol. 1, no. 1, pp. 53-60, December 2008.
[38] J. Daugman, “Statistical Richness of Visual Phase Information: Update on Recognizing Persons by Iris Patterns,” International Journal of Computer Vision, vol. 45, no. 1, pp. 25-38, 2001.
[39] S. Uma Maheswari, P. Anbalagan and T.Priya, “ Efficient Iris Recognition through Improvement in Iris Segmentation Algorithm”, International Journal on Graphics, Vision and Image Processing, vol. 8, no.2, pp. 29-35, 2008.
[40] John Daugman, “How Iris Recognition Works”, in Proceedings of International Conference on Image Processing, vol.1, pp. I-33- I-36, 2002.
[41] David J. Field, "Relations between the statistics of natural images and the response properties of cortical cells", Journal of the Optical Society of America,vol. 4, no. 12, 1987.
[42] Beng.A, Jin Teoh and Kar-Ann Toh, "Secure biometric-key generation with biometric helper”, in proceedings of 3rd IEEE Conference on Industrial Electronics and Applications, pp.2145-2150, Singapore, June 2008.
[43] Sanaul Hoque , Michael Fairhurst and Gareth Howells, "Evaluating Biometric Encryption Key Generation Using Handwritten Signatures", in Proceedings of the 2008 Bio-inspired, Learning and Intelligent Systems for Security, pp.17-22, 2008.
[44] Gang Zheng, Wanqing Li and Ce Zhan, "Cryptographic Key Generation from Biometric Data Using Lattice Mapping", in Proceedings of the 18th International Conference on Pattern Recognition, vol.4, pp. 513 - 516, 2006.
[45] Tianhao Zhang, Xuelong Li, Dacheng Tao and Jie Yang, "Multimodal biometrics using geometry preserving projections", Pattern Recognition, vol. 41 , no. 3, pp. 805-813, March 2008.
[46] Donald E. Maurer and John P. Baker, "Fusing multimodal biometrics with quality estimates via a Bayesian belief network", Pattern Recognition, vol. 41, no. 3, pp. 821-832, March 2008.
[47] Muhammad Khurram Khana and Jiashu Zhanga, "Multimodal face and fingerprint biometrics authentication on space-limited tokens ", Neurocomputing, vol. 71, no. 13-15, pp.3026-3031, August 2008.
[48] Yan Yan and Yu-Jin Zhang , "Multimodal biometrics fusion using Correlation Filter Bank", in proceedings of the 9th International Conference on Pattern Recognition, pp. 1-4,Tampa, FL, 2008.
(IJCSIS) International Journal of Computer Science and Information Security, Vol. 7, No. 2, February 2010
36 http://sites.google.com/site/ijcsis/ ISSN 1947-5500
Authors Detail:
Mr.A.Jagadeesan was born in Coimbatore, India on
June 14, 1979. He graduated from Bannari Amman
Institute of Technology in 2000 with a degree in
Electrical and Electronics Engineering. He completed
his Master of Technology in Bio-medical Signal
Processing and Instrumentation from SASTRA
University in 2002. Thereafter he joined as a Lecturer in
K.S.Rangasamy College of Technology till 2007. Now
working as a Senior Lecturer in Bannari Amman Institute of Technology. He
is a research scholar in the Department of Information and Communication
Engineering. His area of interest includes Biometrics, Digital Image
Processing, Embedded Systems and Computer Networks. He is a life member
in ISTE and BMESI. He is also a member of Association of Computers,
Electronics and Electrical Engineers (ACEE) and International Association of
Engineers (IAENG).
Dr. K.Duraiswamy received his B.E. degree in
Electrical and Electronics Engineering from P.S.G.
College of Technology, Coimbatore in 1965 and M.Sc.
(Engg) from P.S.G. College of Technology, Coimbatore
in 1968 and Ph.D. from Anna University in 1986. From
1965 to 1966 he was in Electricity Board. From 1968 to
1970 he was working in ACCET, Karaikudi. From 1970
to 1983, he was working in Government College of
Engineering Salem. From 1983 to 1995, he was with
Government College of Technology, Coimbatore as Professor. From 1995 to
2005 he was working as Principal at K.S.Rangasamy College of Technology,
Tiruchengode and presently he is serving as Dean of KSRCT. He is interested
in Digital Image Processing, Computer Architecture and Compiler Design. He
received 7 years Long Service Gold Medal for NCC. He is a life member in
ISTE, Senior member in IEEE and a member of CSI.
(IJCSIS) International Journal of Computer Science and Information Security, Vol. 7, No. 2, February 2010
37 http://sites.google.com/site/ijcsis/ ISSN 1947-5500
The Comparison of Methods Artificial Neural Network with Linear Regression Using Specific Variables for
Prediction Stock Price in Tehran Stock Exchange
Reza Gharoie Ahangar, Master of Business Administration
of Islamic Azad University – Babol branch &Membership of
young researcher club, Iran.
Mahmood Yahyazadehfar Associate Professor of Finance University of Mazandaran
Babolsar, Iran [email protected]
Hassan Pournaghshband Professor of Computer Science
Department, Southern Polytechnic State University
Abstract- In this paper, researchers estimated the stock price of activated companies in Tehran (Iran) stock exchange. It is used Linear Regression and Artificial Neural Network methods and compared these two methods.
In Artificial Neural Network, of General Regression Neural Network method (GRNN) for architecture is used. In this paper, first, researchers considered 10 macro economic variables and 30 financial variables and then they obtained seven final variables including 3 macro economic variables and 4 financial variables to estimate the stock price using Independent components Analysis (ICA). So, we presented an equation for two methods and compared their results which shown that artificial neural network method is more efficient than linear regression method.
Key words: neural network, linear regression, Tehran stock exchange, GRNN
I. INTRODUCTION
The recent upsurge in research activities into artificial neural networks (ANNs) has proven that neural networks have powerful pattern classification and prediction capabilities. ANNs have been successfully used for a variety of tasks in many fields of business, industry, and science [24]
Interest in neural networks is evident from the growth in the number of papers published in journals of diverse scientific disciplines. A search of several major databases can easily result in hundreds or even thousands of “neural networks” articles published in one year. A neural network is able to work parallel with input variables and consequently handle large sets of data quickly. The principal strength with the network is its ability to find patterns [3] ANNs provide a promising alternative tool for fore asters. The inherently nonlinear structure of neural networks is particularly useful for capturing the complex underlying relationship in many real world problems. Neural networks are perhaps more versatile methods for forecasting applications in that not only can they find nonlinear structures
in a problem, they can also model linear processes. For example, the capability of neural networks in modeling linear time series has been studied and confirmed by a number of researchers [8],[11],[26].
One of the major application areas of ANNs is forecasting. There is an increasing interest in forecasting using ANNs in recent years. Forecasting has a long history and the importance of this old subject is reflected by the diversity of its applications in different disciplines ranging from business to engineering. The ability to accurately predict the future is fundamental to many decision processes in planning, scheduling, purchasing, strategy formulation, policy making, and supply chain operations and stock price. As such, forecasting is an area where a lot of efforts have been invested in the past. Yet, it is still an important and active field of human activity at the present time and will continue to be in the future. A survey of research needs for forecasting has been provided by Armstrong [1].
Forecasting has been dominated by linear methods for many decades. Linear methods are easy to develop and implement and they are also relatively simple to understand and interpret. However, linear models have serious limitation in that they are not able to capture any nonlinear relationships in the data. The approximation of linear models to complicated nonlinear relationships is not always satisfactory. In the early 1980s, Makridakis (1982)organized a large-scale forecasting competition (often called M-competition) where a majority of commonly used linear methods were tested with more than 1,000 real time series. The mixed results show that no single linear model is globally the best, which may be interpreted as the failure of linear modeling in accounting for a varying degree of nonlinearity that is common in real world problems [10]. The financial forecasting or stock market prediction is one of the hottest fields of research lately due to its commercial applications owing to the high stakes and the kinds of
(IJCSIS) International Journal of Computer Science and Information Security, Vol. 7, No. 2, February 2010
38 http://sites.google.com/site/ijcsis/ ISSN 1947-5500
attractive benefits that it has to offer [18]. Unfortunately, stock market is essentially dynamic, non-linear, complicated, nonparametric, and chaotic in nature [21]. The time series are multi-stationary, noisy, random, and has frequent structural breaks [13],[22]. In addition, stock market’s movements are affected by many macro-economical factors ([Miao et al., 2007] and [Wang, 2003]) such as political events, firms’ policies, general economic conditions, commodity price index, bank rate, bank exchange rate, investors’ expectations, institutional investors’ choices, movements of other stock market, psychology of investors, etc.[12],[22]
Artificial neural networks are one of the technologies that have made great progress in the study of the stock markets. Usually stock prices can be seen as a random time sequence with noise, artificial neural networks, as large-scale parallel processing nonlinear systems that depend on their own intrinsic link data, provide methods and techniques that can approximate any nonlinear continuous function, without a priori assumptions about the nature of the generating process, see (Pino et al., 2008).It is obvious that several factors are effective on future stock price and the main weak point in this surrey is that all of them considered a few limit factors in future stock price and using linear methods, Regarding that fact, although previous studies highlighted the problem to some extent, none of them didn’t provide a comprehensive model to estimate the stock prince. If one estimates the prince and provides a model for it to eliminate uncertainties to a large extent it can help to increase the investments in stock exchange. Conducting the scientific surveys to obtain a suitable and desirable model to estimate the stock price is the best task. [16]
The purpose of this study is to insure the investors and provides them with suitable information for better investment. Regarding that future stock price and its estimation are important factors in accurate decision making for better investment for investors; therefore, this survey is aiming to estimate the future stock price of companies acting in Tehran (Iran) stock exchange using the most effective variables related to the stock price
II. REVIEW OF LITERATURE
Eldon Y. Li(1994) The purpose of his paper is to answer two of the most
frequently asked questions: “What are neural networks?” “Why are they so popular in today's business fields?” The paper reviews the common characteristics of neural networks and discusses the feasibility of neural-net applications in business fields. It then presents four actual application cases and identifies the limitations of the current neural-net technology. [7] Kyoung-jae Kimand & Ingoo Han(2000)
Their paper proposes genetic algorithms (GAs) approach to feature discrimination and the determination of connection weights for artificial neural networks (ANNs) to predict the stock price index. In this study, GA is employed
not only to improve the learning algorithm, but also to reduce the complexity in feature space. GA optimizes simultaneously the connection weights between layers and the thresholds for feature discrimination. The genetically evolved weights mitigate the well-known limitations of the gradient descent algorithm. In addition, globally searched feature discretization reduces the dimensionality of the feature space and eliminates irrelevant factors. Experimental results show that GA approach to the feature discrimination model outperforms the other two conventional models. [9] Shaikh A. Hamid and Zahid Iqbal(2003)
They present a primer for using neural networks for financial forecasting. They compare volatility forecasts from neural networks with implied volatility from S&P 500 Index futures options using the Barone-Adesi and Whaley (BAW) American futures options pricing model. Forecasts from neural networks outperform implied volatility forecasts and are not found to be significantly different from realized volatility. Implied volatility forecasts are found to be significantly different from realized volatility in two of three forecast horizons. [19] D. E. Allen, W. Yang,(2004)
Examines the deviation of the UK total market index from market fundamentals implied by the simple dividend discount model and identifies other components that also affect price movements. The components are classified as permanent, temporary, excess stock return and non-fundamental innovations to stock prices by employing a multivariate moving-average model as applied in [J. Financial Quant. Anal. 33 (1998) 1] and imposing relevant restrictions on the model in light of Sims–Bernanke forecast error variance decomposition. They find that time-varying discounted rates play an active role in explaining price deviations. [5] David Enke and Suraphan Thawornwong (2005)
Introduces an information gain technique used in machine learning for data mining to evaluate the predictive relationships of numerous financial and economic variables. Neural network models for level estimation and classification are then examined for their ability to provide an effective forecast of future values. A cross-validation technique is also employed to improve the generalization ability of several models. The results show that the trading strategies guided by the classification models generate higher risk-adjusted profits than the buy-and-hold strategy, as well as those guided by the level-estimation based forecasts of the neural network and linear regression models. [4] Qing Cao, Karyl B. Leggio, Marc J. Schniederjans (2005)
Their study uses artificial neural networks to predict stock price movement (i.e., price returns) for firms traded on the Shanghai stock exchange. We compare the predictive power using linear models from financial forecasting literature to the predictive power of the univariate and multivariate
(IJCSIS) International Journal of Computer Science and Information Security, Vol. 7, No. 2, February 2010
39 http://sites.google.com/site/ijcsis/ ISSN 1947-5500
neural network models. Our results show that neural networks outperform the linear models compared. These results are statistically significant across our sample firms, and indicate neural networks are a useful tool for stock price prediction in emerging markets, like China. [17] Yi-Hsien Wang(2007)
This study integrated new hybrid asymmetric volatility approach into artificial neural networks option-pricing model to improve forecasting ability of derivative securities price. Owing to combines the new hybrid asymmetric volatility method can be reduced the stochastic and nonlinearity of the error term sequence and captured the asymmetric volatility simultaneously. Hence, in the ANNS option-pricing model, the results demonstrate that Grey-GJR–GARCH volatility provides higher predictability than other volatility approaches. [25] Pei-Chann Chang andChen-Hao Liu(2008)
In their study, an integrated system, CBDWNN by combining dynamic time windows, case based reasoning (CBR), and neural network for stock trading prediction is developed and it includes three different stages: (1) screening out potential stocks and the important influential factors; (2) using back propagation network (BPN) to predict the buy/sell points (wave peak and wave trough) of stock price and (3) adopting case based dynamic window (CBDW) to further improve the forecasting results from BPN. The empirical results show that the CBDW can assist the BPN to reduce the false alarm of buying or selling decisions. [15] Sheng-Hsun Hsu and JJ Po-An Hsieh (2008)
Their study employs a two-stage architecture for better stock price prediction. Specifically, the self-organizing map (SOM) is first used to decompose the whole input space into regions where data points with similar statistical distributions are grouped together, so as to contain and capture the non-stationary property of financial series. After decomposing heterogeneous data points into several homogenous regions, support vector regression (SVR) is applied to forecast financial indices. The proposed technique is empirically tested using stock price series from seven major financial markets. The results show that the performance of stock price prediction can be significantly enhanced by using the two-stage architecture in comparison with a single SVR model. [20] Wei-Sen Chen and Yin-Kuan Dua(2008)
Their paper adopted the operating rules of the Taiwan stock exchange corporation (TSEC) which were violated by those companies that were subsequently stopped and suspended, as the range of the analysis of this research. In addition, this paper also used financial ratios, other non-financial ratios, and factor analysis to extract adaptable variables. Moreover, the artificial neural network (ANN) and data mining (DM) techniques were used to construct the
financial distress prediction model. The empirical experiment with a total of 37 ratios and 68 listed companies as the initial samples obtained a satisfactory result, which testifies for the feasibility and validity of their proposed methods for the financial distress prediction. [23] Zhang Yudong and Wu Lenan(2008)
Their paper proposed an improved bacterial chemo taxis optimization (IBCO), which is then integrated into the back propagation (BP) artificial neural network to develop an efficient forecasting model for prediction of various stock indices. Experiments show its better performance than other methods in learning ability and generalization. [27] E.L. de Faria and J.L. Gonzalez (2009)
Their work performs a predictive study of the principal index of the Brazilian stock market through artificial neural networks and the adaptive exponential smoothing method, respectively. The objective is to compare the forecasting performance of both methods on this market index, and in particular, to evaluate the accuracy of both methods to predict the sign of the market returns. Also the influence on the results of some parameters associated to both methods is studied. Their results show that both methods produce similar results regarding the prediction of the index returns. On the contrary, the neural networks outperform the adaptive exponential smoothing method in the forecasting of the market movement, with relative hit rates similar to the ones found in other developed markets. [6]
III. OBJECTIVES The present study attempts to undertake the following objectives: 1- Considering the main variables to estimate future stock price of companies acting in stock exchange. 2- Price estimation using two methods of artificial neural network and linear regression neural networks and comparison of these two methods’ results.
IV. RESEARCH METHODOLOGY
A. Sample Unit
The population of present study including all companies who were acting in Tehran stock exchange in 1380– 1386. There fore, those companies whose symbol was not active during this period were omitted and finally, 100 companies were chosen. The scope of subject in this study includes the consideration of the relationship between macro economic and financial variables with stock future price. Scope of locative of this study includes all accepted companies who were active in Tehran stock exchange from early 1379 to the end of 1386. B. Data Collection Method
In this study, we used 10 macro economic variables and 30 financial variables to study their effects on stock future price. Data related to macro economic variables were collected
(IJCSIS) International Journal of Computer Science and Information Security, Vol. 7, No. 2, February 2010
40 http://sites.google.com/site/ijcsis/ ISSN 1947-5500

through Central Bank yearbook, economic reports and balance sheet of Central Bank and Monetary and financial Research center of Iran Central Bank and data related to companies financial variables were calculated collected through companies financial statements sand informational Agency of Tehran(Iran) stock exchange.
C. Methodology Steps 1. Identifying related factors and omitting additional variables (among macro economic and financial variables) through the analysis of independent components. 2. Modeling and estimating stock future price through the linear regression equation. 3. Modeling and estimating stock future efficiency using General regression neural network. 4. Comparison of result related to these methods.
a) Independent Components Analysis (ICA)
To estimate financial time series, it is necessary to use a set of continuous descriptive input variables among a very huge set of primary inputs. It is difficult to choose a significant and suitable subset of input variables. In several scientific fields, it is difficult to find a reasonable transfer for a huge set of multi-data. Our purpose is to use a technique to summarize independent components of time series in a set of variables which is named independent components Analysis (ICA). This method will decrease the number of descriptive variables by decreasing a set of financial and economic information into smaller subsets of independent components and maintaining the suitable information. Removing the random elements from each data set will facilitate the identification of relationship between independent components and stock indexes. Independent components Analysis are process to summarize a new set of statistical independent components in a guide vector. These components will show some estimations of data main resource. This process supposes a matrix of time series which includes a compound process; so, this process will analyze the independent components by creating a matrix when we enter them, and identify the related and unrelated components and provide us with the best matrix of estimative variables. This technique will summarize as follows: • This technique will summarize independent components of time series in a set of variables. • This technique will find a way to change data with the minimum statistical dependency among the summarized components into a linear data. • If two random variables are unrelated, they will not be independent. • This technique is so special for analysis and estimation which uses two matrixes of data covariance and data changes by increasing the arrangement of linear and non-linear regression.
b) Linear Regression
If researcher wants to estimate the dependent variable by one or more independent variables, he will use a linear regression model. This model will be shown as follows. Amount of P for each set of data will result in minimum μ .When ever we use standard scores instead of raw variables in the analysis, p regression coefficients will be shown as B. This relation will be shown as.
Linear regression can be a method to estimate a set of time series. Average of financial and macro economic variables of identified resources in the beginning of each year are independent variables in these estimations. Dependent variables Q are the real output of the company in estimation model, which dependent on price data of all stocks in our sample. Dependent variable will be estimated using regression step method (OLS). All independent variables will enter to the regression equation. These in dependent variables with P values more than 5% will be omitted in estimation period and at last, we will choose a subset of independent variables. Olson & Mossman state that variables of 3 to 7 independent variable will show the best estimations for this period. According this study if step solution method chooses more than eight independent variables, P – value will be decreased to 3% or 4% , and if step solution method chooses one or two variables, P- value will be increased to 10% to include more variables.
(1)
K = the number of independent variables P = regression coefficient of independent variable I in month t Fj, i, t-1 = independent variable I for stock j at the end of previous period (month t-1). Uj, t = error terms for each regression Qj, t = price of (dependent variable) stock j in month t c) General Regression Neural Network
GRNN can approximate any arbitrary function from historical data. The major strength of GRNN compared to other Ann’s is that its internal structure is not problem dependent.
Topology of GRNN
• GRNN consists of four layers: • The first layer is responsible for reception of information. • The input neurons present the data to the second layer
(pattern neurons). • The output of the pattern neurons are forwarded to the
third layer (summation neurons). • summation neurons are sent to the fourth layer (output
neuron) And we can summarize this model as:
• This model will consider a few non- linear aspects of the estimation problem.
• This network model will be taught immediately, and will be suitable for scattered data.
tjtij
k
ititj uFPQ ,1,,
1,, * +−
== ∑
(IJCSIS) International Journal of Computer Science and Information Security, Vol. 7, No. 2, February 2010
41 http://sites.google.com/site/ijcsis/ ISSN 1947-5500
• First, data will be clustered to decrease the needed layers in hidden layer.
• This model enables to solve any problems in monotonous functions.
• This model can not ignore non-related inputs with out the main revisions in the main algorithm.
V. FACTORS FOR COMPARISION OF TWO
METHODS RESULTS In time series, it is very important to conform an
estimation model to data pattern and we can obtain the conformity of estimation method with data pattern by calculating estimation error during the time period. For example, when a technique of estimation estimates the periodical and seasonal alternations in time series, then estimation error will show the disordered or random component in time series. Error square mean index is obtained through dividing total error differences square by time series. Error percent absolute value mean is an index which will be used whenever estimation of error based on percent is more suitable. Determination coefficient is the most important factor one can explain the relationship between two variants by which.
1- MSE 2- MAPE 3- R 2
VI. CHOOSING FINAL VARIABLES AMONG
PRIMARY VARIABLES 40 financial and macroeconomic variables will enter
independent components analysis method:
A. Macroeconomic Variables Growth rates of industrial production Inflation rate Interest rate Exchange rate Rate of return on stock public Unemployment rate Oil price Gross Domestic product (GDP) Money supply 1 (M1) Money supply 2 (M2) B. Financial Variables Book value per share Sales per share Earning per share
Cash flow per share Inventory turnover rate Annual average volume of daily trading relative to annual average total market capitalization Dividend yield Dividend payout ratio Dividend per share Total of sales to total assets Bid – ask spread Market impact of a trade Price per share Trading volume Turnover rate Commission rate Indicator variables for the day of the week effect Holiday effect January month Amortized effective spread Price history Past return Size of firm Ratio of total debt to stockholder’s equity Pastor measure Ratio of absolute stock return to dollar volume Market depth Ratio of net income to book equity Operating income to total assets Operating income to total sales
Independent components analysis (ICA) most method chooses variables with minimum statistical dependency and explanation strength, and then we chose 40 variables C. Financial Variables Earning per share Size of firm Ratio of total debt to stockholder’s equity Operating income to total sales D. Macroeconomic Variables Inflation rate Money supply 1 (M1) Growth rates of industrial production
VII. RESULTS AND ANALYSES Here, we show the results of two methods and the
model created by linear regression and neural network methods and comparison of the models’ results using the above-mentioned factors.
(IJCSIS) International Journal of Computer Science and Information Security, Vol. 7, No. 2, February 2010
42 http://sites.google.com/site/ijcsis/ ISSN 1947-5500
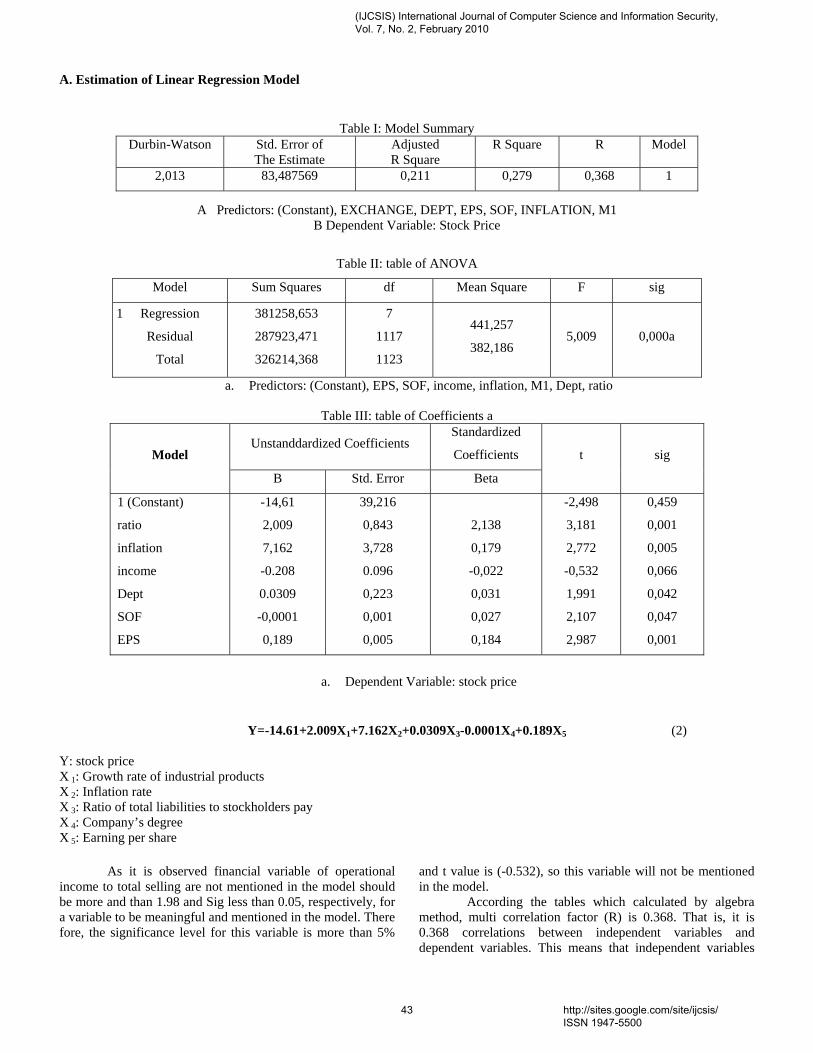
A. Estimation of Linear Regression Model
Table I: Model Summary
Durbin-Watson Std. Error of The Estimate
Adjusted R Square
R Square R Model
2,013 83,487569 0,211 0,279 0,368 1
A Predictors: (Constant), EXCHANGE, DEPT, EPS, SOF, INFLATION, M1 B Dependent Variable: Stock Price
Table II: table of ANOVA
sig F Mean Square df Sum Squares Model
0,000a 5,009 441,257
382,186
7
1117
1123
381258,653
287923,471
326214,368
1 Regression
Residual
Total
a. Predictors: (Constant), EPS, SOF, income, inflation, M1, Dept, ratio
Table III: table of Coefficients a Standardized
Coefficients Unstanddardized Coefficients
sig t
Beta Std. Error B
Model
0,459
0,001
0,005
0,066
0,042
0,047
0,001
-2,498
3,181
2,772
-0,532
1,991
2,107
2,987
2,138
0,179
-0,022
0,031
0,027
0,184
39,216
0,843
3,728
0.096
0,223
0,001
0,005
-14,61
2,009
7,162
-0.208
0.0309
-0,0001
0,189
1 (Constant)
ratio
inflation
income
Dept
SOF
EPS
a. Dependent Variable: stock price
(2) Y=-14.61+2.009X1+7.162X2+0.0309X3-0.0001X4+0.189X5 Y: stock price X 1: Growth rate of industrial products X 2: Inflation rate X 3: Ratio of total liabilities to stockholders pay X 4: Company’s degree X 5: Earning per share
As it is observed financial variable of operational income to total selling are not mentioned in the model should be more and than 1.98 and Sig less than 0.05, respectively, for a variable to be meaningful and mentioned in the model. There fore, the significance level for this variable is more than 5%
and t value is (-0.532), so this variable will not be mentioned in the model.
According the tables which calculated by algebra method, multi correlation factor (R) is 0.368. That is, it is 0.368 correlations between independent variables and dependent variables. This means that independent variables
(IJCSIS) International Journal of Computer Science and Information Security, Vol. 7, No. 2, February 2010
43 http://sites.google.com/site/ijcsis/ ISSN 1947-5500
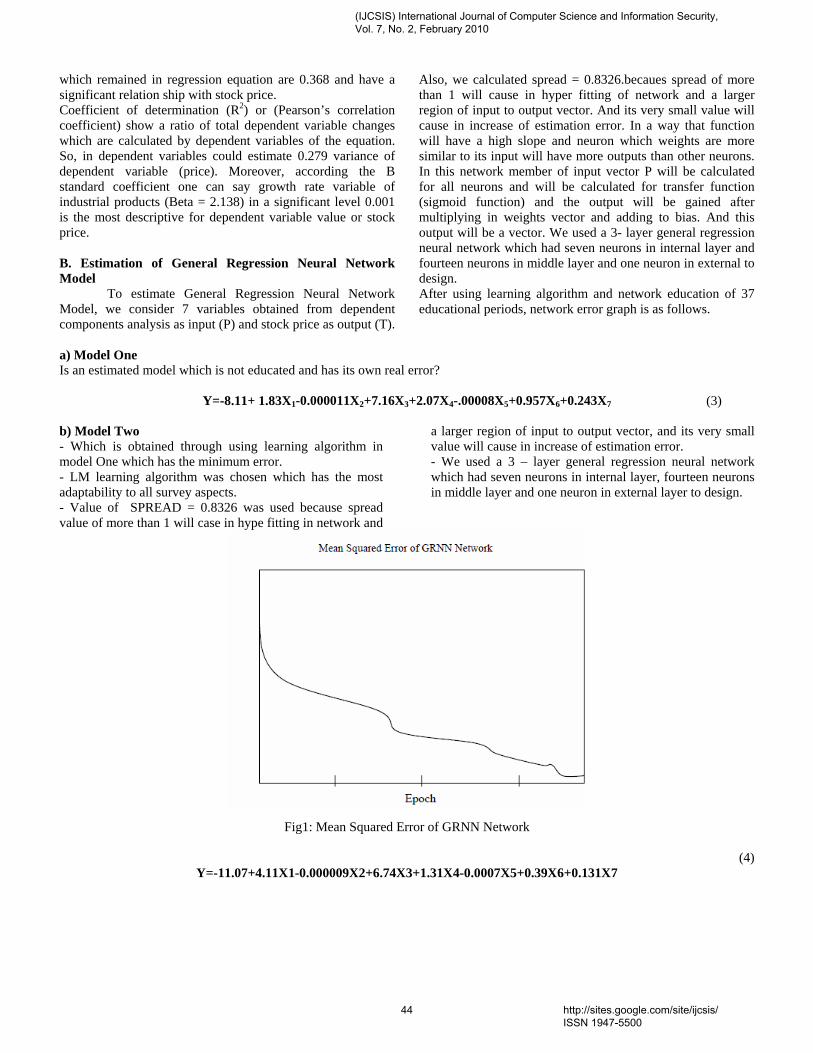
which remained in regression equation are 0.368 and have a significant relation ship with stock price. Coefficient of determination (R2) or (Pearson’s correlation coefficient) show a ratio of total dependent variable changes which are calculated by dependent variables of the equation. So, in dependent variables could estimate 0.279 variance of dependent variable (price). Moreover, according the B standard coefficient one can say growth rate variable of industrial products (Beta = 2.138) in a significant level 0.001 is the most descriptive for dependent variable value or stock price. B. Estimation of General Regression Neural Network Model
To estimate General Regression Neural Network Model, we consider 7 variables obtained from dependent components analysis as input (P) and stock price as output (T).
Also, we calculated spread = 0.8326.becaues spread of more than 1 will cause in hyper fitting of network and a larger region of input to output vector. And its very small value will cause in increase of estimation error. In a way that function will have a high slope and neuron which weights are more similar to its input will have more outputs than other neurons. In this network member of input vector P will be calculated for all neurons and will be calculated for transfer function (sigmoid function) and the output will be gained after multiplying in weights vector and adding to bias. And this output will be a vector. We used a 3- layer general regression neural network which had seven neurons in internal layer and fourteen neurons in middle layer and one neuron in external to design. After using learning algorithm and network education of 37 educational periods, network error graph is as follows.
a) Model One Is an estimated model which is not educated and has its own real error?
(3) Y=-8.11+ 1.83X1-0.000011X2+7.16X3+2.07X4-.00008X5+0.957X6+0.243X7
b) Model Two - Which is obtained through using learning algorithm in model One which has the minimum error. - LM learning algorithm was chosen which has the most adaptability to all survey aspects. - Value of SPREAD = 0.8326 was used because spread value of more than 1 will case in hype fitting in network and
a larger region of input to output vector, and its very small value will cause in increase of estimation error. - We used a 3 – layer general regression neural network which had seven neurons in internal layer, fourteen neurons in middle layer and one neuron in external layer to design.
Fig1: Mean Squared Error of GRNN Network
(4) Y=-11.07+4.11X1-0.000009X2+6.74X3+1.31X4-0.0007X5+0.39X6+0.131X7
(IJCSIS) International Journal of Computer Science and Information Security, Vol. 7, No. 2, February 2010
44 http://sites.google.com/site/ijcsis/ ISSN 1947-5500
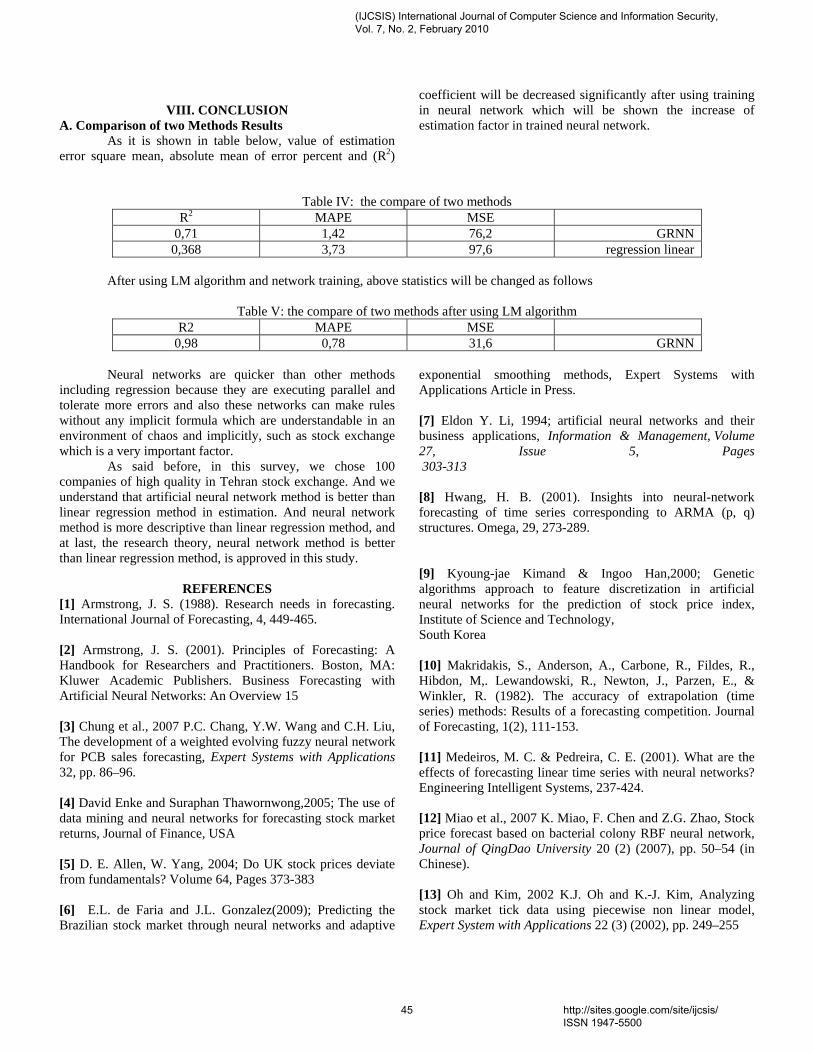
VIII. CONCLUSION A. Comparison of two Methods Results
As it is shown in table below, value of estimation error square mean, absolute mean of error percent and (R2)
coefficient will be decreased significantly after using training in neural network which will be shown the increase of estimation factor in trained neural network.
Table IV: the compare of two methods MSE MAPE R2
GRNN 76,2 1,42 0,71 regression linear 97,6 3,73 0,368
After using LM algorithm and network training, above statistics will be changed as follows
Table V: the compare of two methods after using LM algorithm
MSE MAPE R2 GRNN 31,6 0,78 0,98
Neural networks are quicker than other methods
including regression because they are executing parallel and tolerate more errors and also these networks can make rules without any implicit formula which are understandable in an environment of chaos and implicitly, such as stock exchange which is a very important factor.
As said before, in this survey, we chose 100 companies of high quality in Tehran stock exchange. And we understand that artificial neural network method is better than linear regression method in estimation. And neural network method is more descriptive than linear regression method, and at last, the research theory, neural network method is better than linear regression method, is approved in this study.
REFERENCES [1] Armstrong, J. S. (1988). Research needs in forecasting. International Journal of Forecasting, 4, 449-465. [2] Armstrong, J. S. (2001). Principles of Forecasting: A Handbook for Researchers and Practitioners. Boston, MA: Kluwer Academic Publishers. Business Forecasting with Artificial Neural Networks: An Overview 15 [3] Chung et al., 2007 P.C. Chang, Y.W. Wang and C.H. Liu, The development of a weighted evolving fuzzy neural network for PCB sales forecasting, Expert Systems with Applications 32, pp. 86–96. [4] David Enke and Suraphan Thawornwong,2005; The use of data mining and neural networks for forecasting stock market returns, Journal of Finance, USA [5] D. E. Allen, W. Yang, 2004; Do UK stock prices deviate from fundamentals? Volume 64, Pages 373-383 [6] E.L. de Faria and J.L. Gonzalez(2009); Predicting the Brazilian stock market through neural networks and adaptive
exponential smoothing methods, Expert Systems with Applications Article in Press. [7] Eldon Y. Li, 1994; artificial neural networks and their business applications, Information & Management, Volume 27, Issue 5, Pages 303-313 [8] Hwang, H. B. (2001). Insights into neural-network forecasting of time series corresponding to ARMA (p, q) structures. Omega, 29, 273-289. [9] Kyoung-jae Kimand & Ingoo Han,2000; Genetic algorithms approach to feature discretization in artificial neural networks for the prediction of stock price index, Institute of Science and Technology, South Korea [10] Makridakis, S., Anderson, A., Carbone, R., Fildes, R., Hibdon, M ., Lewandowski, R., Newton, J., Parzen, E., & Winkler, R. (1982). The accuracy of extrapolation (time series) methods: Results of a forecasting competition. Journal of Forecasting, 1(2), 111-153. [11] Medeiros, M. C. & Pedreira, C. E. (2001). What are the effects of forecasting linear time series with neural networks? Engineering Intelligent Systems, 237-424. [12] Miao et al., 2007 K. Miao, F. Chen and Z.G. Zhao, Stock price forecast based on bacterial colony RBF neural network, Journal of QingDao University 20 (2) (2007), pp. 50–54 (in Chinese). [13] Oh and Kim, 2002 K.J. Oh and K.-J. Kim, Analyzing stock market tick data using piecewise non linear model, Expert System with Applications 22 (3) (2002), pp. 249–255
(IJCSIS) International Journal of Computer Science and Information Security, Vol. 7, No. 2, February 2010
45 http://sites.google.com/site/ijcsis/ ISSN 1947-5500
[14] Olson, Dennis and Mossman, Charls (2003), neural network forecasts of Canadian stock returns using accounting ratios, international journal of foresting 19, pp 453-465. [15] Pei-Chann Chang and Chen-Hao Liu,(2008); A neural network with a case based dynamic window for stock trading prediction; Expert Systems with Applications Volume 36, Issue 3, Part 2, Pages 6889-6898. [16] Pino et al., 2008 R. Pino, J. Parreno, A. Gomez and P. Priore, Forecasting next-day price of electricity in the Spanish energy market using artificial neural networks, Engineering Applications of Artificial Intelligence 21 (2008), pp. 53–62. [17] Qing Cao, Karyl B. Leggio, Marc J. Schniederjans,2005; A comparison between Fama and French's model and artificial neural networks in predicting the Chinese stock market, Computers & Operations Research, Volume32,pages2499-2512 [18] Ritanjali Majhi and Panda, 2007 Ritanjali Majhi, & Panda, G., (2007). Stock market prediction of S&P 500 and DJIA using bacterial foraging optimization technique. In 2007 IEEE congress on evolutionary computation (CEC 2007) (pp. 2569–2579). [19] Shaikh A. Hamid and Zahid Iqbal,2003; Using neural networks for forecasting volatility of S&P 500 Index futures prices, School of Business, USA [20] Sheng-Hsun Hsu and JJ Po-An Hsieh(2008); A two-stage architecture for stock price forecasting by integrating self-
organizing map and support vector regression, Expert Systems with Applications, Volume 36, Issue 4, Pages 7947-7951. [21] Tan et al., 2005 Tan, T. Z., Quek, C., & Ng, G. S. (2005). Brain inspired genetic complimentary learning for stock market prediction. In IEEE congress on evolutionary computation, 2–5th September (Vol. 3, pp. 2653–2660). [22] Wang, 2003 Y. Wang, Mining stock prices using fuzzy rough set system, Expert System with Applications 24 (1) (2003), pp. 13–23. [23] Wei-Sen Chen and Yin-Kuan Dua, 2008; Using neural networks and data mining techniques for the financial distress prediction model, The Journal of Finance [24] Widrow, B., Rumelhart, D., & Lehr, M. A. (1994). Neural networks: Applications in industry, business and science. Communications of the ACM, [25] Yi-Hsien Wang(2007); Nonlinear neural network forecasting model for stock index option price: Hybrid GJR–GARCH approach, Expert Systems with ApplicationsVolume 36, Issue 1, Pages 564-570. [26] Zhang, G. P. (2001). An investigation of neural networks for linear time-series forecasting. Computers & Operations Research, 28, 1183-1202. [27] Zhang Yudong and Wu Lenan,2008; Stock market prediction of S&P 500 via combination of improved BCO approach and BP neural network, Expert Systems with ApplicationsVolume 36, Issue 5, Pages 8849-8854.
(IJCSIS) International Journal of Computer Science and Information Security, Vol. 7, No. 2, February 2010
46 http://sites.google.com/site/ijcsis/ ISSN 1947-5500
(IJCSIS) International Journal of Computer Science and Information Security, Vol. 7, No.2, 2010
A Methodology for Empirical Quality Assessment of Object-Oriented Design
Devpriya Soni1
Department of Computer Applications
Dr. Namita Shrivastava2
Asst. Prof. Deptt. of Mathematics
Dr. M. Kumar3
Retd. Prof. of Computer Applications
Maulana Azad National Institute of Technology (A Deemed University) Bhopal 462007, India
Abstract: The direct measurement of quality is difficult because there is no way we can measure quality factors. For measuring these factors, we have to express them in terms of metrics or models. Researchers have developed quality models that attempt to measure quality in terms of attributes, characteristics and metrics. In this work we have proposed the methodology of controlled experimentation coupled with power of Logical Scoring of Preferences to evaluate global quality of four object-oriented designs.
Keywords: Software Quality, Quantitative Measurement, LSP.
I. INTRODUCTION Software quality must be addressed during the whole
process of software development. However, design is of particular importance in developing quality software for two reasons: (i) design is the first stage in software system creation in which quality requirement can begin to be addressed. Error made at this stage can be costly, even impossible to be rectified. (ii) design decision has significant effect on quality on the final product.
Measuring quality in the early stage of software development is the key to develop high-quality software. Analyzing object-oriented software in order to evaluate its quality is becoming increasingly important as the paradigm continues to increase in popularity. A large number of software product metrics have been proposed in software engineering. While many of these metrics are based on good ideas about what is important to measure in software to capture its complexity, it is still necessary to systematically validate them. Recent software engineering literature has shown a concern for the quality of methods to validate software product metrics (e.g., see [1][2][3]). This concern is due to fact that: (i) common practices for the validation of software engineering metrics are not acceptable on scientific grounds, and (ii) valid measures are essential for effective software project
management and sound empirical research. For example, Kitchenham et.al. [2] write: "Unless the software measurement community can agree on a valid, consistent, and comprehensive theory of measurement validation, we have no scientific basis for the discipline of software measurement, a situation potentially disastrous for both practice and research."
According to Fenton [4], there are two types of validation that are recognized: internal and external. Internal and external validations are also commonly referred to as theoretical and empirical validation respectively [2]. Both types of validation are necessary. Theoretical validation requires that the software engineering community reach a consensus on what are the properties for common software maintainability metrics for object-oriented design. Software organizations can use validated product metrics in at least three ways: to identify high risk software components early, to construct design and programming guidelines, and to make system level predictions. Empirical validation can be performed through surveys, experiments and case-study.
Recently, Kumar and Soni [5] have proposed a hierarchical model to evaluate quality of object-oriented software. The proposed model of [5] has been validated both theoretically as well as empirically in a recent paper by Soni, Shrivastava and Kumar [6]. Further the model has been used for evaluation of maintainability assessment of object-oriented design quality, especially in design phase, by Soni and Kumar [7]. In this research, the authors have attempted to empirically validate the object-oriented design model of [5] using the methodology of controlled experiment. A global quality assessment of several designs have been made using the method of Logical scoring of Preferences (LSP). The Section II deals with experimental environment and data collection and the Section III deals with the method of Logical Scoring of Preferences (LSP) used to evaluate the overall quality of software design. Section IV gives the steps for design quality evaluation and Section V analyzes and compare the quality of selected designs.
47 http://sites.google.com/site/ijcsis/ ISSN 1947-5500
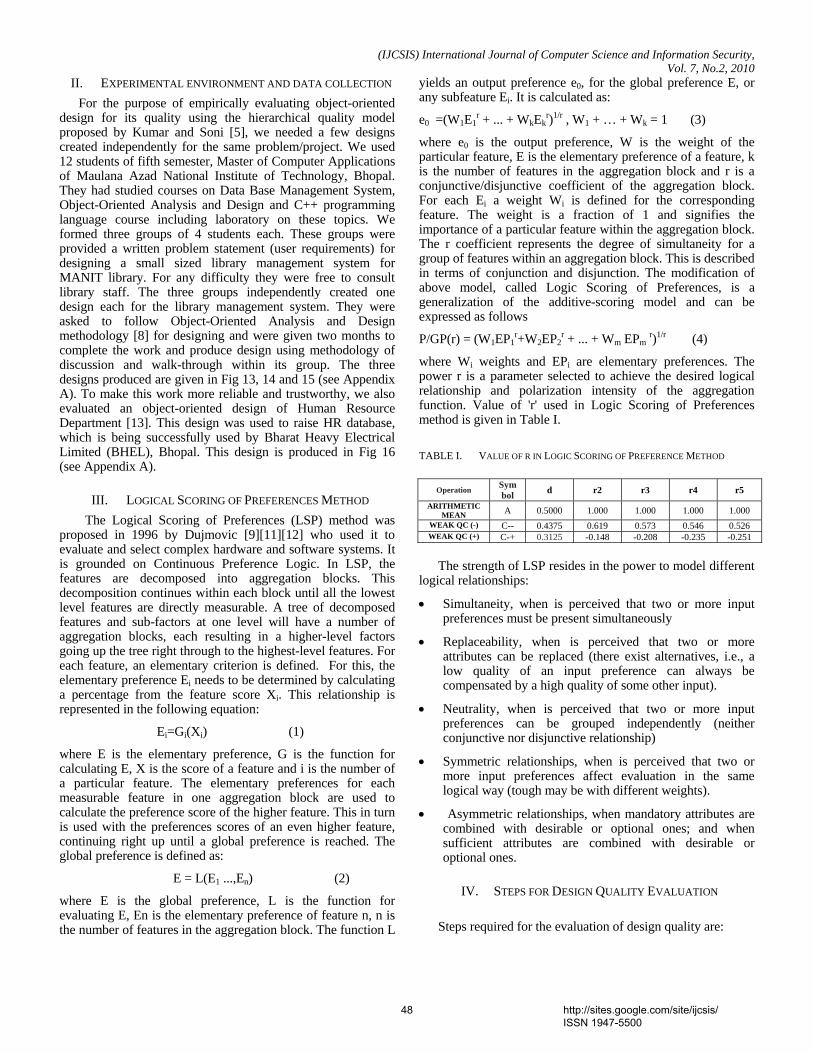
(IJCSIS) International Journal of Computer Science and Information Security, Vol. 7, No.2, 2010
II. EXPERIMENTAL ENVIRONMENT AND DATA COLLECTION For the purpose of empirically evaluating object-oriented
design for its quality using the hierarchical quality model proposed by Kumar and Soni [5], we needed a few designs created independently for the same problem/project. We used 12 students of fifth semester, Master of Computer Applications of Maulana Azad National Institute of Technology, Bhopal. They had studied courses on Data Base Management System, Object-Oriented Analysis and Design and C++ programming language course including laboratory on these topics. We formed three groups of 4 students each. These groups were provided a written problem statement (user requirements) for designing a small sized library management system for MANIT library. For any difficulty they were free to consult library staff. The three groups independently created one design each for the library management system. They were asked to follow Object-Oriented Analysis and Design methodology [8] for designing and were given two months to complete the work and produce design using methodology of discussion and walk-through within its group. The three designs produced are given in Fig 13, 14 and 15 (see Appendix A). To make this work more reliable and trustworthy, we also evaluated an object-oriented design of Human Resource Department [13]. This design was used to raise HR database, which is being successfully used by Bharat Heavy Electrical Limited (BHEL), Bhopal. This design is produced in Fig 16 (see Appendix A).
III. LOGICAL SCORING OF PREFERENCES METHOD The Logical Scoring of Preferences (LSP) method was
proposed in 1996 by Dujmovic [9][11][12] who used it to evaluate and select complex hardware and software systems. It is grounded on Continuous Preference Logic. In LSP, the features are decomposed into aggregation blocks. This decomposition continues within each block until all the lowest level features are directly measurable. A tree of decomposed features and sub-factors at one level will have a number of aggregation blocks, each resulting in a higher-level factors going up the tree right through to the highest-level features. For each feature, an elementary criterion is defined. For this, the elementary preference Ei needs to be determined by calculating a percentage from the feature score Xi. This relationship is represented in the following equation:
Ei=Gi(Xi) (1)
where E is the elementary preference, G is the function for calculating E, X is the score of a feature and i is the number of a particular feature. The elementary preferences for each measurable feature in one aggregation block are used to calculate the preference score of the higher feature. This in turn is used with the preferences scores of an even higher feature, continuing right up until a global preference is reached. The global preference is defined as:
E = L(E1 ...,En) (2)
where E is the global preference, L is the function for evaluating E, En is the elementary preference of feature n, n is the number of features in the aggregation block. The function L
yields an output preference e0, for the global preference E, or any subfeature Ei. It is calculated as:
e0 =(W1E1r + ... + WkEk
r)1/r , W1 + … + Wk = 1 (3)
where e0 is the output preference, W is the weight of the particular feature, E is the elementary preference of a feature, k is the number of features in the aggregation block and r is a conjunctive/disjunctive coefficient of the aggregation block. For each Ei a weight Wi is defined for the corresponding feature. The weight is a fraction of 1 and signifies the importance of a particular feature within the aggregation block. The r coefficient represents the degree of simultaneity for a group of features within an aggregation block. This is described in terms of conjunction and disjunction. The modification of above model, called Logic Scoring of Preferences, is a generalization of the additive-scoring model and can be expressed as follows
P/GP(r) = (W1EP1r+W2EP2
r + ... + Wm EPm r)1/r (4)
where Wi weights and EPi are elementary preferences. The power r is a parameter selected to achieve the desired logical relationship and polarization intensity of the aggregation function. Value of 'r' used in Logic Scoring of Preferences method is given in Table I.
TABLE I. VALUE OF R IN LOGIC SCORING OF PREFERENCE METHOD
The strength of LSP resides in the power to model different
logical relationships:
Simultaneity, when is perceived that two or more input preferences must be present simultaneously
Replaceability, when is perceived that two or more attributes can be replaced (there exist alternatives, i.e., a low quality of an input preference can always be compensated by a high quality of some other input).
Neutrality, when is perceived that two or more input preferences can be grouped independently (neither conjunctive nor disjunctive relationship)
Symmetric relationships, when is perceived that two or more input preferences affect evaluation in the same logical way (tough may be with different weights).
Asymmetric relationships, when mandatory attributes are combined with desirable or optional ones; and when sufficient attributes are combined with desirable or optional ones.
IV. STEPS FOR DESIGN QUALITY EVALUATION
Steps required for the evaluation of design quality are:
Operation Symbol d r2 r3 r4 r5
ARITHMETIC MEAN A 0.5000 1.000 1.000 1.000 1.000
WEAK QC (-) C-- 0.4375 0.619 0.573 0.546 0.526 WEAK QC (+) C-+ 0.3125 -0.148 -0.208 -0.235 -0.251
48 http://sites.google.com/site/ijcsis/ ISSN 1947-5500
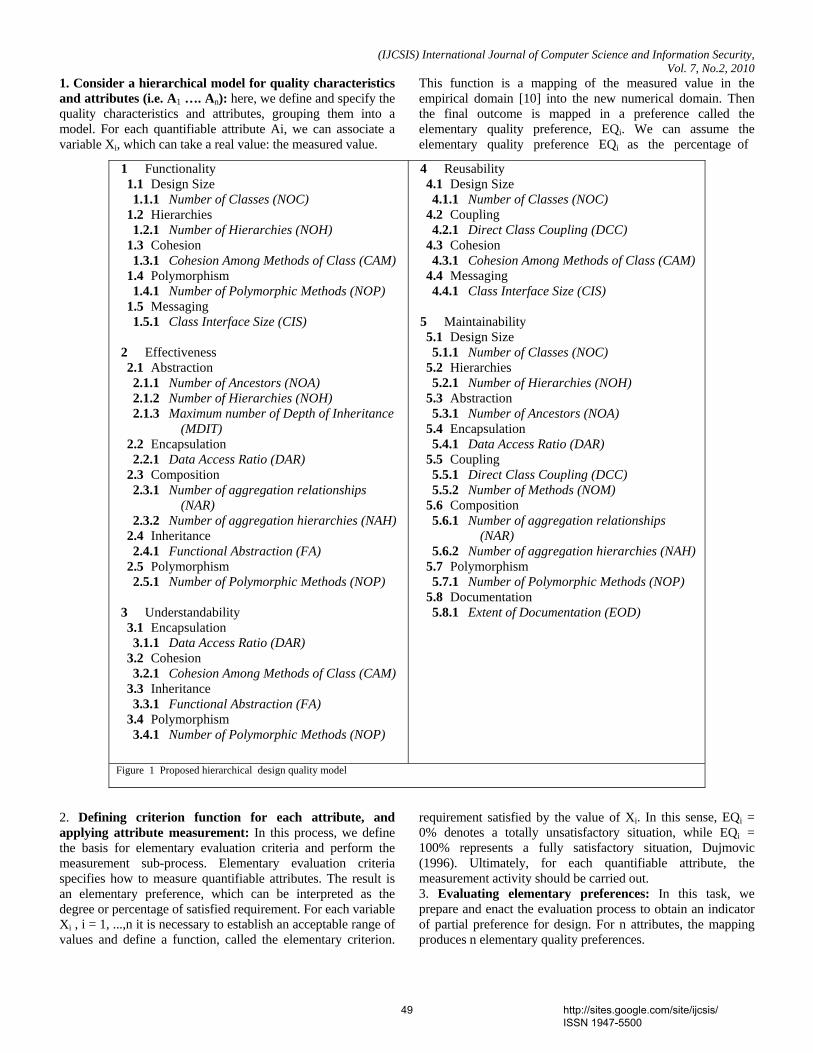
(IJCSIS) International Journal of Computer Science and Information Security, Vol. 7, No.2, 2010
1. Consider a hierarchical model for quality characteristics and attributes (i.e. A1 …. An): here, we define and specify the quality characteristics and attributes, grouping them into a model. For each quantifiable attribute Ai, we can associate a variable Xi, which can take a real value: the measured value.
2. Defining criterion function for each attribute, and applying attribute measurement: In this process, we define the basis for elementary evaluation criteria and perform the measurement sub-process. Elementary evaluation criteria specifies how to measure quantifiable attributes. The result is an elementary preference, which can be interpreted as the degree or percentage of satisfied requirement. For each variable Xi , i = 1, ...,n it is necessary to establish an acceptable range of values and define a function, called the elementary criterion.
This function is a mapping of the measured value in the empirical domain [10] into the new numerical domain. Then the final outcome is mapped in a preference called the elementary quality preference, EQi. We can assume the elementary quality preference EQi as the percentage of
requirement satisfied by the value of Xi. In this sense, EQi = 0% denotes a totally unsatisfactory situation, while EQi = 100% represents a fully satisfactory situation, Dujmovic (1996). Ultimately, for each quantifiable attribute, the measurement activity should be carried out. 3. Evaluating elementary preferences: In this task, we prepare and enact the evaluation process to obtain an indicator of partial preference for design. For n attributes, the mapping produces n elementary quality preferences.
1 Functionality 1.1 Design Size 1.1.1 Number of Classes (NOC)
1.2 Hierarchies 1.2.1 Number of Hierarchies (NOH)
1.3 Cohesion 1.3.1 Cohesion Among Methods of Class (CAM)
1.4 Polymorphism 1.4.1 Number of Polymorphic Methods (NOP)
1.5 Messaging 1.5.1 Class Interface Size (CIS)
2 Effectiveness 2.1 Abstraction 2.1.1 Number of Ancestors (NOA) 2.1.2 Number of Hierarchies (NOH) 2.1.3 Maximum number of Depth of Inheritance
(MDIT) 2.2 Encapsulation 2.2.1 Data Access Ratio (DAR)
2.3 Composition 2.3.1 Number of aggregation relationships
(NAR) 2.3.2 Number of aggregation hierarchies (NAH)
2.4 Inheritance 2.4.1 Functional Abstraction (FA)
2.5 Polymorphism 2.5.1 Number of Polymorphic Methods (NOP)
3 Understandability 3.1 Encapsulation 3.1.1 Data Access Ratio (DAR)
3.2 Cohesion 3.2.1 Cohesion Among Methods of Class (CAM)
3.3 Inheritance 3.3.1 Functional Abstraction (FA)
3.4 Polymorphism 3.4.1 Number of Polymorphic Methods (NOP)
4 Reusability 4.1 Design Size 4.1.1 Number of Classes (NOC)
4.2 Coupling 4.2.1 Direct Class Coupling (DCC)
4.3 Cohesion 4.3.1 Cohesion Among Methods of Class (CAM)
4.4 Messaging 4.4.1 Class Interface Size (CIS)
5 Maintainability 5.1 Design Size 5.1.1 Number of Classes (NOC)
5.2 Hierarchies 5.2.1 Number of Hierarchies (NOH)
5.3 Abstraction 5.3.1 Number of Ancestors (NOA)
5.4 Encapsulation 5.4.1 Data Access Ratio (DAR)
5.5 Coupling 5.5.1 Direct Class Coupling (DCC) 5.5.2 Number of Methods (NOM)
5.6 Composition 5.6.1 Number of aggregation relationships
(NAR) 5.6.2 Number of aggregation hierarchies (NAH)
5.7 Polymorphism 5.7.1 Number of Polymorphic Methods (NOP)
5.8 Documentation 5.8.1 Extent of Documentation (EOD)
Figure 1 Proposed hierarchical design quality model
49 http://sites.google.com/site/ijcsis/ ISSN 1947-5500
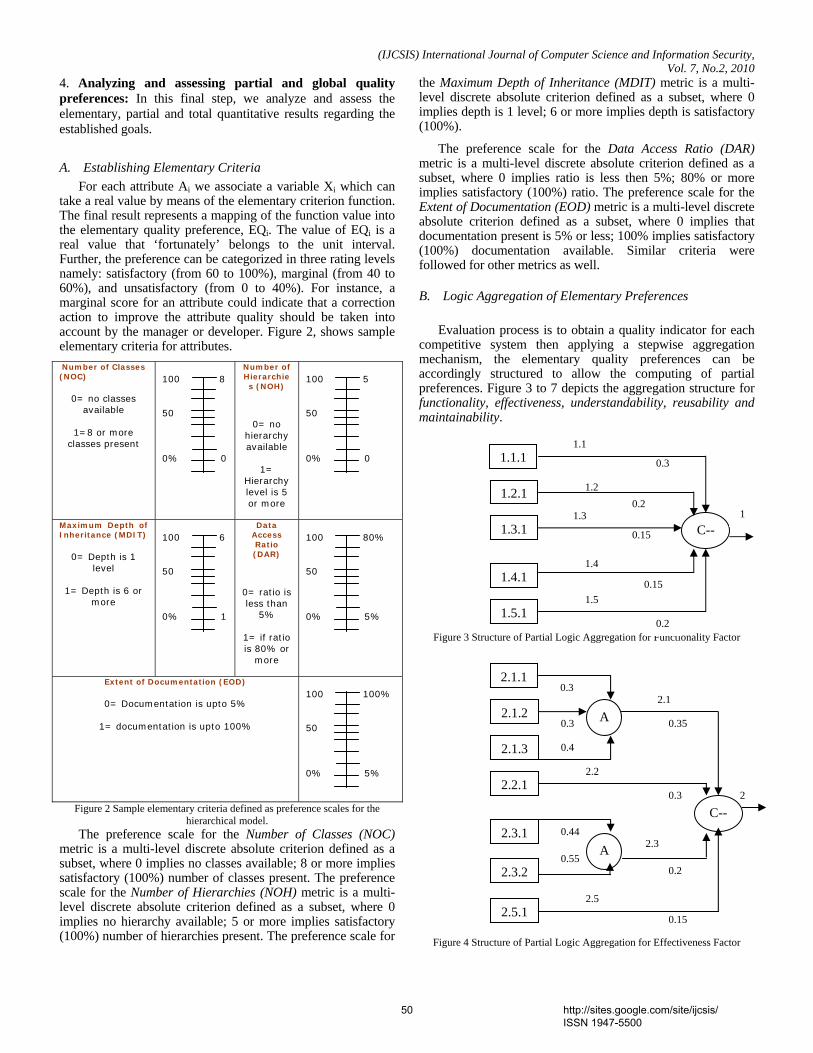
(IJCSIS) International Journal of Computer Science and Information Security, Vol. 7, No.2, 2010
1.1
0.44
0.55
0.3 2
0.3
0.4
4. Analyzing and assessing partial and global quality preferences: In this final step, we analyze and assess the elementary, partial and total quantitative results regarding the established goals.
A. Establishing Elementary Criteria For each attribute Ai we associate a variable Xi which can
take a real value by means of the elementary criterion function. The final result represents a mapping of the function value into the elementary quality preference, EQi. The value of EQi is a real value that ‘fortunately’ belongs to the unit interval. Further, the preference can be categorized in three rating levels namely: satisfactory (from 60 to 100%), marginal (from 40 to 60%), and unsatisfactory (from 0 to 40%). For instance, a marginal score for an attribute could indicate that a correction action to improve the attribute quality should be taken into account by the manager or developer. Figure 2, shows sample elementary criteria for attributes. Number of Classes (NOC)
0= no classes available
1=8 or more
classes present
100 8 50 0% 0
Number of Hierarchies (NOH)
0= no hierarchy available
1=
Hierarchy level is 5 or more
100 5 50 0% 0
Maximum Depth of Inheritance (MDIT)
0= Depth is 1 level
1= Depth is 6 or
more
100 6 50 0% 1
Data Access Ratio (DAR)
0= ratio is less than
5%
1= if ratio is 80% or
more
100 80% 50 0% 5%
Extent of Documentation (EOD)
0= Documentation is upto 5%
1= documentation is upto 100%
100 100% 50 0% 5%
Figure 2 Sample elementary criteria defined as preference scales for the hierarchical model.
The preference scale for the Number of Classes (NOC) metric is a multi-level discrete absolute criterion defined as a subset, where 0 implies no classes available; 8 or more implies satisfactory (100%) number of classes present. The preference scale for the Number of Hierarchies (NOH) metric is a multi-level discrete absolute criterion defined as a subset, where 0 implies no hierarchy available; 5 or more implies satisfactory (100%) number of hierarchies present. The preference scale for
the Maximum Depth of Inheritance (MDIT) metric is a multi-level discrete absolute criterion defined as a subset, where 0 implies depth is 1 level; 6 or more implies depth is satisfactory (100%).
The preference scale for the Data Access Ratio (DAR) metric is a multi-level discrete absolute criterion defined as a subset, where 0 implies ratio is less then 5%; 80% or more implies satisfactory (100%) ratio. The preference scale for the Extent of Documentation (EOD) metric is a multi-level discrete absolute criterion defined as a subset, where 0 implies that documentation present is 5% or less; 100% implies satisfactory (100%) documentation available. Similar criteria were followed for other metrics as well.
B. Logic Aggregation of Elementary Preferences
Evaluation process is to obtain a quality indicator for each competitive system then applying a stepwise aggregation mechanism, the elementary quality preferences can be accordingly structured to allow the computing of partial preferences. Figure 3 to 7 depicts the aggregation structure for functionality, effectiveness, understandability, reusability and maintainability.
Figure 3 Structure of Partial Logic Aggregation for Functionality Factor
Figure 4 Structure of Partial Logic Aggregation for Effectiveness Factor
1.1.1
1.2.1
1.3.1
1.4.1
1.5.1
1.2
1.3
1.4
C--
1.5
0.2
0.15
0.15
0.2
0.3
1
2.1.1
2.1.2
2.1.3
2.2.1
2.3.1
2.3.2
2.5
2.2
A
C--
2.3
0.2
0.15
0.3 0.35
2.1
2.5.1
A
50 http://sites.google.com/site/ijcsis/ ISSN 1947-5500
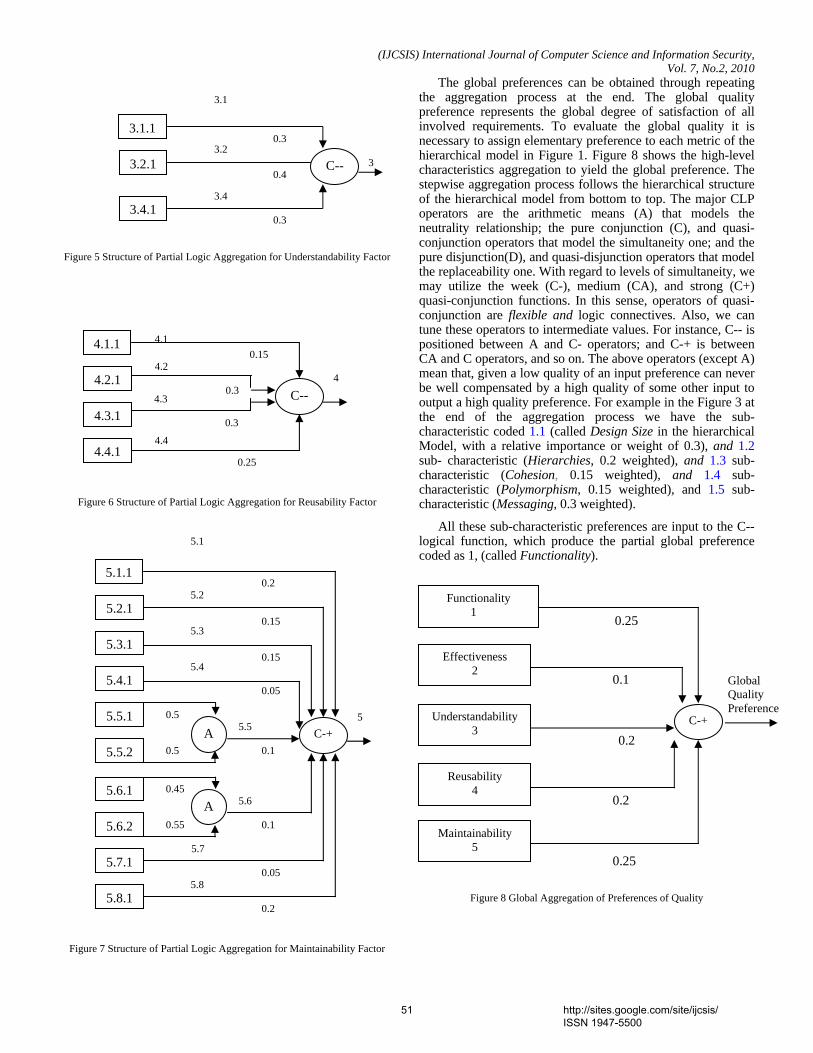
(IJCSIS) International Journal of Computer Science and Information Security, Vol. 7, No.2, 2010
3
3.1
4.1
0.5
0.05
0.45
0.55 0.1
0.05
0.2
5.6
5.7
5.8
0.2
0.1 Global Quality Preference
Figure 5 Structure of Partial Logic Aggregation for Understandability Factor
Figure 6 Structure of Partial Logic Aggregation for Reusability Factor
Figure 7 Structure of Partial Logic Aggregation for Maintainability Factor
The global preferences can be obtained through repeating the aggregation process at the end. The global quality preference represents the global degree of satisfaction of all involved requirements. To evaluate the global quality it is necessary to assign elementary preference to each metric of the hierarchical model in Figure 1. Figure 8 shows the high-level characteristics aggregation to yield the global preference. The stepwise aggregation process follows the hierarchical structure of the hierarchical model from bottom to top. The major CLP operators are the arithmetic means (A) that models the neutrality relationship; the pure conjunction (C), and quasi-conjunction operators that model the simultaneity one; and the pure disjunction(D), and quasi-disjunction operators that model the replaceability one. With regard to levels of simultaneity, we may utilize the week (C-), medium (CA), and strong (C+) quasi-conjunction functions. In this sense, operators of quasi-conjunction are flexible and logic connectives. Also, we can tune these operators to intermediate values. For instance, C-- is positioned between A and C- operators; and C-+ is between CA and C operators, and so on. The above operators (except A) mean that, given a low quality of an input preference can never be well compensated by a high quality of some other input to output a high quality preference. For example in the Figure 3 at the end of the aggregation process we have the sub-characteristic coded 1.1 (called Design Size in the hierarchical Model, with a relative importance or weight of 0.3), and 1.2 sub- characteristic (Hierarchies, 0.2 weighted), and 1.3 sub-characteristic (Cohesion, 0.15 weighted), and 1.4 sub-characteristic (Polymorphism, 0.15 weighted), and 1.5 sub-characteristic (Messaging, 0.3 weighted).
All these sub-characteristic preferences are input to the C-- logical function, which produce the partial global preference coded as 1, (called Functionality).
Figure 8 Global Aggregation of Preferences of Quality
3.1.1
3.2.1
3.4.1
3.2
3.4
C--
0.3
0.4
0.3
4.1.1
4.2.1
4.3.1
4.4.1
4.2
4.3
4.4
C--
0.25
0.3
0.3
0.15
4
5.1.1
5.2.1
5.3.1
5.4.1
5.5.1
5.5.2
5.2
5.3
5.4
A C-+ 5.5 0.5
0.1
0.15
0.15
0.2
5
5.1
5.6.1
5.6.2
5.7.1
5.8.1
A
Effectiveness 2
Understandability 3
Reusability 4
Maintainability 5
0.25
0.2 C-+
0.25
Functionality 1
51 http://sites.google.com/site/ijcsis/ ISSN 1947-5500
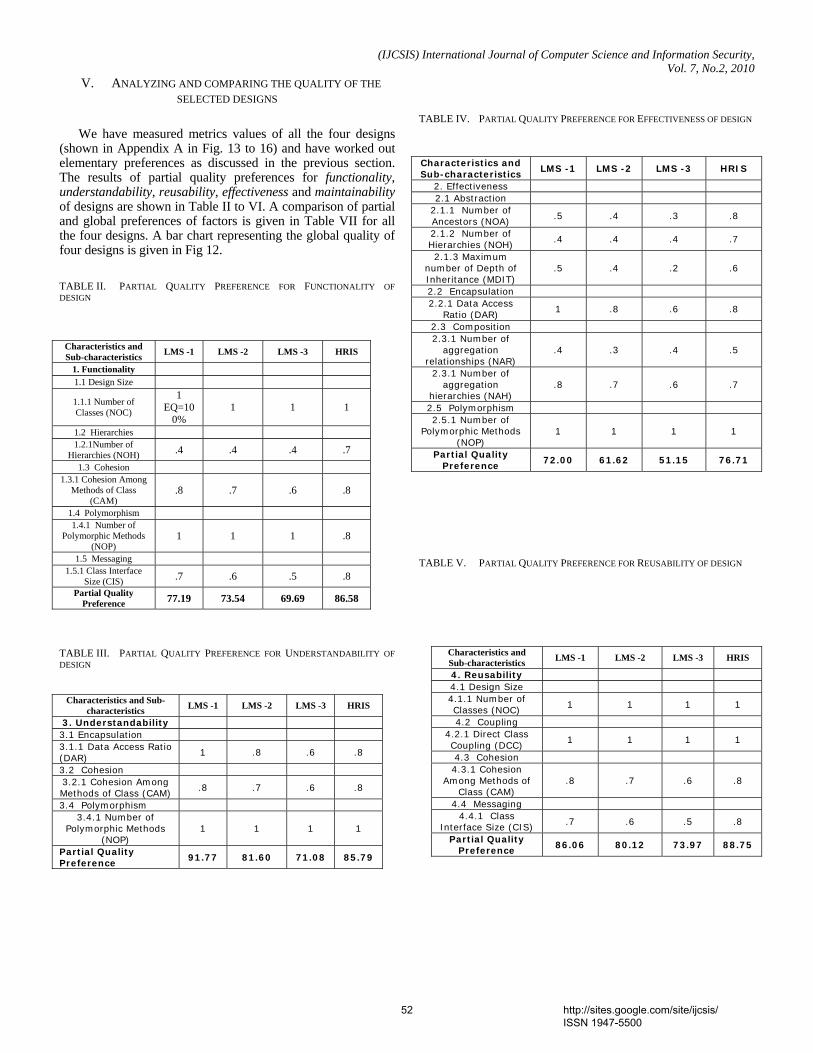
(IJCSIS) International Journal of Computer Science and Information Security, Vol. 7, No.2, 2010
V. ANALYZING AND COMPARING THE QUALITY OF THE SELECTED DESIGNS
We have measured metrics values of all the four designs
(shown in Appendix A in Fig. 13 to 16) and have worked out elementary preferences as discussed in the previous section. The results of partial quality preferences for functionality, understandability, reusability, effectiveness and maintainability of designs are shown in Table II to VI. A comparison of partial and global preferences of factors is given in Table VII for all the four designs. A bar chart representing the global quality of four designs is given in Fig 12.
TABLE II. PARTIAL QUALITY PREFERENCE FOR FUNCTIONALITY OF DESIGN
TABLE III. PARTIAL QUALITY PREFERENCE FOR UNDERSTANDABILITY OF DESIGN
TABLE IV. PARTIAL QUALITY PREFERENCE FOR EFFECTIVENESS OF DESIGN
TABLE V. PARTIAL QUALITY PREFERENCE FOR REUSABILITY OF DESIGN
Characteristics and Sub-characteristics LMS -1 LMS -2 LMS -3 HRIS
1. Functionality 1.1 Design Size
1.1.1 Number of Classes (NOC)
1 EQ=10
0% 1 1 1
1.2 Hierarchies 1.2.1Number of
Hierarchies (NOH) .4 .4 .4 .7 1.3 Cohesion
1.3.1 Cohesion Among Methods of Class
(CAM) .8 .7 .6 .8
1.4 Polymorphism 1.4.1 Number of
Polymorphic Methods (NOP)
1 1 1 .8
1.5 Messaging 1.5.1 Class Interface
Size (CIS) .7 .6 .5 .8 Partial Quality
Preference 77.19 73.54 69.69 86.58
Characteristics and Sub-characteristics LMS -1 LMS -2 LMS -3 HRIS
4. Reusability 4.1 Design Size 4.1.1 Number of Classes (NOC) 1 1 1 1
4.2 Coupling 4.2.1 Direct Class Coupling (DCC) 1 1 1 1
4.3 Cohesion 4.3.1 Cohesion
Among Methods of Class (CAM)
.8 .7 .6 .8
4.4 Messaging 4.4.1 Class
Interface Size (CIS) .7 .6 .5 .8
Partial Quality Preference 86.06 80.12 73.97 88.75
Characteristics and Sub-characteristics LMS -1 LMS -2 LMS -3 HRIS
3. Understandability 3.1 Encapsulation 3.1.1 Data Access Ratio (DAR) 1 .8 .6 .8
3.2 Cohesion 3.2.1 Cohesion Among Methods of Class (CAM) .8 .7 .6 .8
3.4 Polymorphism 3.4.1 Number of
Polymorphic Methods (NOP)
1 1 1 1
Partial Quality Preference 91.77 81.60 71.08 85.79
Characteristics and Sub-characteristics LMS -1 LMS -2 LMS -3 HRIS
2. Effectiveness 2.1 Abstraction
2.1.1 Number of Ancestors (NOA) .5 .4 .3 .8
2.1.2 Number of Hierarchies (NOH) .4 .4 .4 .7
2.1.3 Maximum number of Depth of Inheritance (MDIT)
.5 .4 .2 .6
2.2 Encapsulation 2.2.1 Data Access
Ratio (DAR) 1 .8 .6 .8
2.3 Composition 2.3.1 Number of
aggregation relationships (NAR)
.4 .3 .4 .5
2.3.1 Number of aggregation
hierarchies (NAH) .8 .7 .6 .7
2.5 Polymorphism 2.5.1 Number of
Polymorphic Methods (NOP)
1 1 1 1
Partial Quality Preference 72.00 61.62 51.15 76.71
52 http://sites.google.com/site/ijcsis/ ISSN 1947-5500
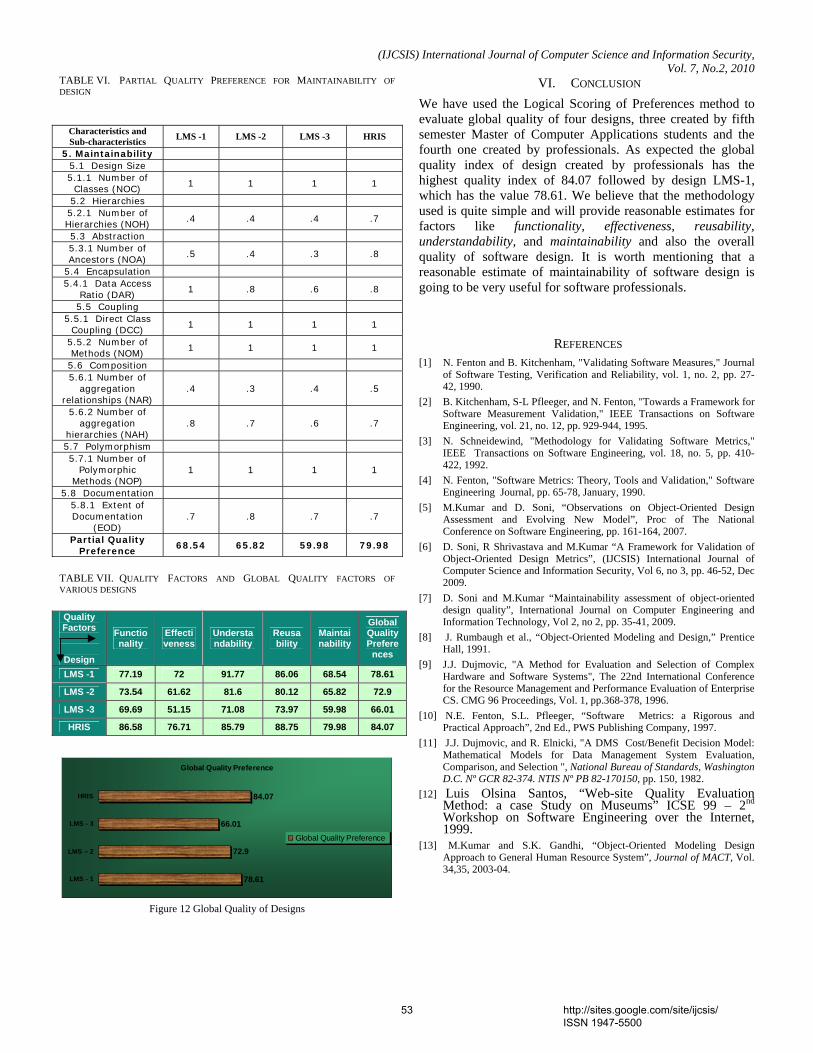
(IJCSIS) International Journal of Computer Science and Information Security, Vol. 7, No.2, 2010
TABLE VI. PARTIAL QUALITY PREFERENCE FOR MAINTAINABILITY OF DESIGN
TABLE VII. QUALITY FACTORS AND GLOBAL QUALITY FACTORS OF VARIOUS DESIGNS
Global Quality Preference
78.61
72.9
66.01
84.07
LMS - 1
LMS – 2
LMS - 3
HRIS
Global Quality Preference
Figure 12 Global Quality of Designs
VI. CONCLUSION We have used the Logical Scoring of Preferences method to evaluate global quality of four designs, three created by fifth semester Master of Computer Applications students and the fourth one created by professionals. As expected the global quality index of design created by professionals has the highest quality index of 84.07 followed by design LMS-1, which has the value 78.61. We believe that the methodology used is quite simple and will provide reasonable estimates for factors like functionality, effectiveness, reusability, understandability, and maintainability and also the overall quality of software design. It is worth mentioning that a reasonable estimate of maintainability of software design is going to be very useful for software professionals.
REFERENCES [1] N. Fenton and B. Kitchenham, "Validating Software Measures," Journal
of Software Testing, Verification and Reliability, vol. 1, no. 2, pp. 27-42, 1990.
[2] B. Kitchenham, S-L Pfleeger, and N. Fenton, "Towards a Framework for Software Measurement Validation," IEEE Transactions on Software Engineering, vol. 21, no. 12, pp. 929-944, 1995.
[3] N. Schneidewind, "Methodology for Validating Software Metrics," IEEE Transactions on Software Engineering, vol. 18, no. 5, pp. 410-422, 1992.
[4] N. Fenton, "Software Metrics: Theory, Tools and Validation," Software Engineering Journal, pp. 65-78, January, 1990.
[5] M.Kumar and D. Soni, “Observations on Object-Oriented Design Assessment and Evolving New Model”, Proc of The National Conference on Software Engineering, pp. 161-164, 2007.
[6] D. Soni, R Shrivastava and M.Kumar “A Framework for Validation of Object-Oriented Design Metrics”, (IJCSIS) International Journal of Computer Science and Information Security, Vol 6, no 3, pp. 46-52, Dec 2009.
[7] D. Soni and M.Kumar “Maintainability assessment of object-oriented design quality”, International Journal on Computer Engineering and Information Technology, Vol 2, no 2, pp. 35-41, 2009.
[8] J. Rumbaugh et al., “Object-Oriented Modeling and Design,” Prentice Hall, 1991.
[9] J.J. Dujmovic, "A Method for Evaluation and Selection of Complex Hardware and Software Systems", The 22nd International Conference for the Resource Management and Performance Evaluation of Enterprise CS. CMG 96 Proceedings, Vol. 1, pp.368-378, 1996.
[10] N.E. Fenton, S.L. Pfleeger, “Software Metrics: a Rigorous and Practical Approach”, 2nd Ed., PWS Publishing Company, 1997.
[11] J.J. Dujmovic, and R. Elnicki, "A DMS Cost/Benefit Decision Model: Mathematical Models for Data Management System Evaluation, Comparison, and Selection ", National Bureau of Standards, Washington D.C. Nº GCR 82-374. NTIS Nº PB 82-170150, pp. 150, 1982.
[12] Luis Olsina Santos, “Web-site Quality Evaluation Method: a case Study on Museums” ICSE 99 – 2nd Workshop on Software Engineering over the Internet, 1999.
[13] M.Kumar and S.K. Gandhi, “Object-Oriented Modeling Design Approach to General Human Resource System”, Journal of MACT, Vol. 34,35, 2003-04.
Characteristics and Sub-characteristics LMS -1 LMS -2 LMS -3 HRIS
5. Maintainability 5.1 Design Size 5.1.1 Number of
Classes (NOC) 1 1 1 1
5.2 Hierarchies 5.2.1 Number of Hierarchies (NOH) .4 .4 .4 .7
5.3 Abstraction 5.3.1 Number of Ancestors (NOA) .5 .4 .3 .8
5.4 Encapsulation 5.4.1 Data Access
Ratio (DAR) 1 .8 .6 .8
5.5 Coupling 5.5.1 Direct Class
Coupling (DCC) 1 1 1 1
5.5.2 Number of Methods (NOM) 1 1 1 1
5.6 Composition 5.6.1 Number of
aggregation relationships (NAR)
.4 .3 .4 .5
5.6.2 Number of aggregation
hierarchies (NAH) .8 .7 .6 .7
5.7 Polymorphism 5.7.1 Number of
Polymorphic Methods (NOP)
1 1 1 1
5.8 Documentation 5.8.1 Extent of Documentation
(EOD) .7 .8 .7 .7
Partial Quality Preference 68.54 65.82 59.98 79.98
Quality Factors
Design
Functionality
Effectiveness
Understandability
Reusability
Maintainability
Global Quality Prefere
nces
LMS -1 77.19 72 91.77 86.06 68.54 78.61
LMS -2 73.54 61.62 81.6 80.12 65.82 72.9
LMS -3 69.69 51.15 71.08 73.97 59.98 66.01
HRIS 86.58 76.71 85.79 88.75 79.98 84.07
53 http://sites.google.com/site/ijcsis/ ISSN 1947-5500
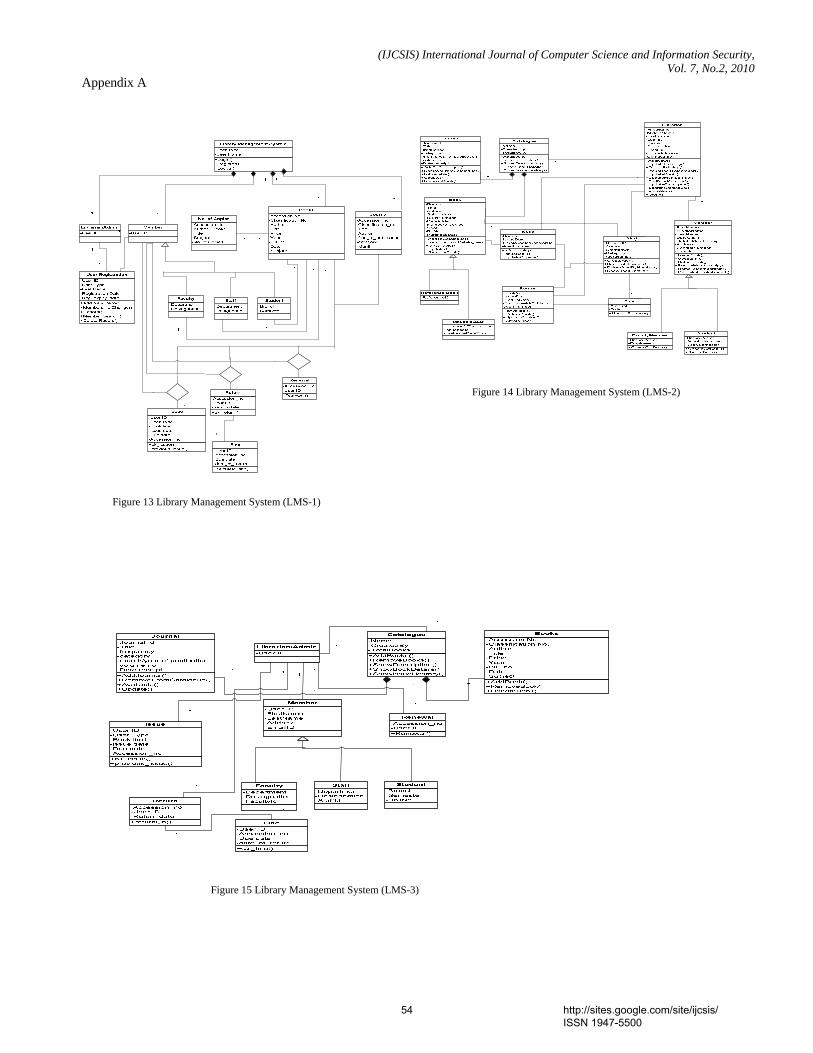
(IJCSIS) International Journal of Computer Science and Information Security, Vol. 7, No.2, 2010
Appendix A
Figure 14 Library Management System (LMS-2)
Figure 13 Library Management System (LMS-1)
Figure 15 Library Management System (LMS-3)
54 http://sites.google.com/site/ijcsis/ ISSN 1947-5500
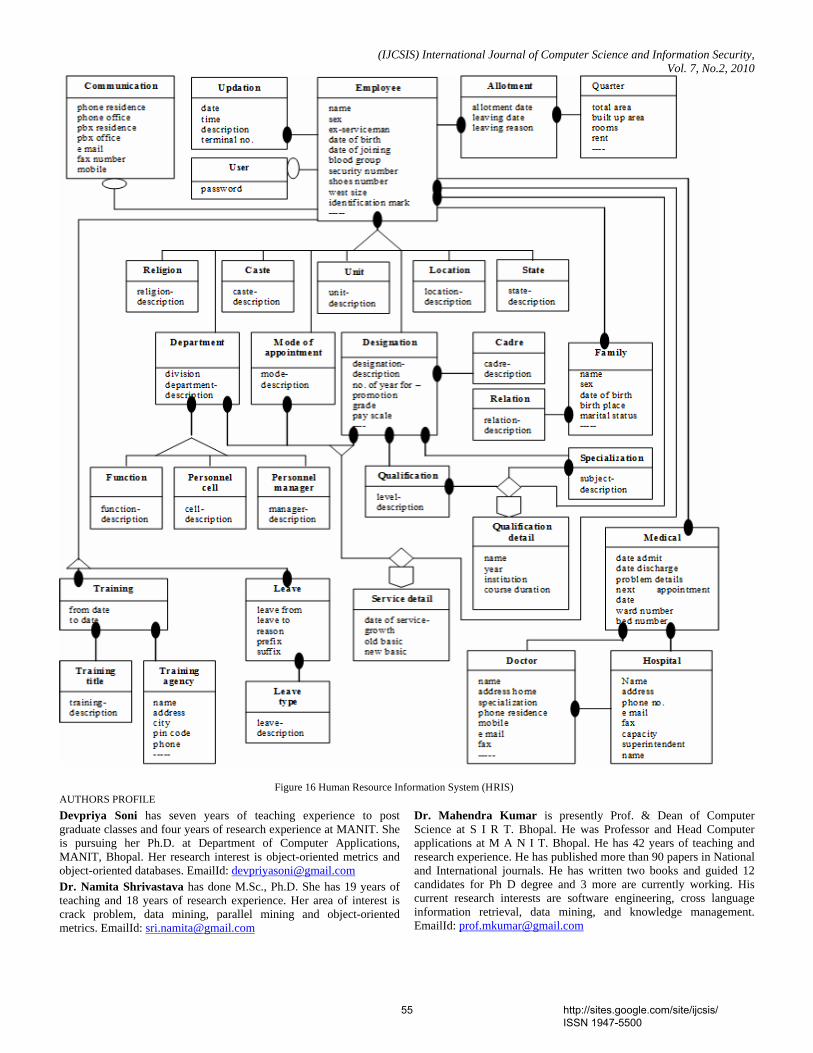
(IJCSIS) International Journal of Computer Science and Information Security, Vol. 7, No.2, 2010
Figure 16 Human Resource Information System (HRIS) AUTHORS PROFILE Devpriya Soni has seven years of teaching experience to post graduate classes and four years of research experience at MANIT. She is pursuing her Ph.D. at Department of Computer Applications, MANIT, Bhopal. Her research interest is object-oriented metrics and object-oriented databases. EmailId: [email protected] Dr. Namita Shrivastava has done M.Sc., Ph.D. She has 19 years of teaching and 18 years of research experience. Her area of interest is crack problem, data mining, parallel mining and object-oriented metrics. EmailId: [email protected]
Dr. Mahendra Kumar is presently Prof. & Dean of Computer Science at S I R T. Bhopal. He was Professor and Head Computer applications at M A N I T. Bhopal. He has 42 years of teaching and research experience. He has published more than 90 papers in National and International journals. He has written two books and guided 12 candidates for Ph D degree and 3 more are currently working. His current research interests are software engineering, cross language information retrieval, data mining, and knowledge management. EmailId: [email protected]
55 http://sites.google.com/site/ijcsis/ ISSN 1947-5500
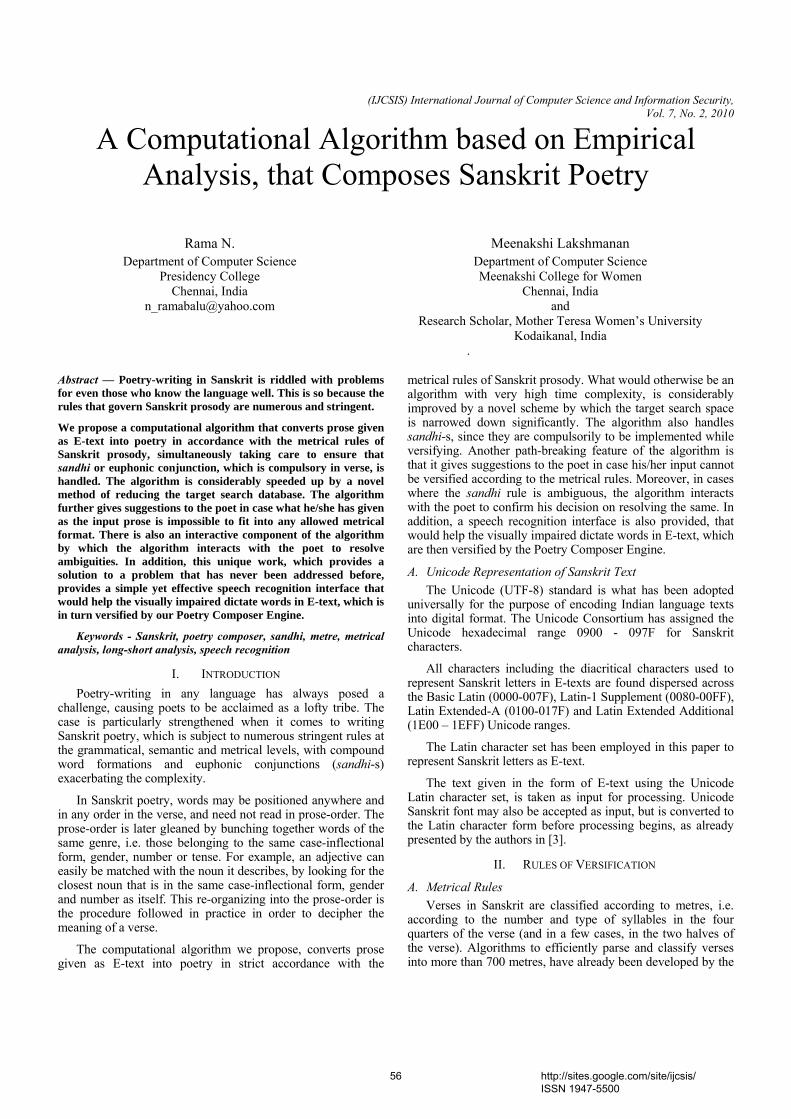
(IJCSIS) International Journal of Computer Science and Information Security, Vol. 7, No. 2, 2010
A Computational Algorithm based on Empirical Analysis, that Composes Sanskrit Poetry
Rama N. Department of Computer Science
Presidency College Chennai, India
Meenakshi Lakshmanan Department of Computer Science Meenakshi College for Women
Chennai, India and
Research Scholar, Mother Teresa Women’s University Kodaikanal, India
.
Abstract — Poetry-writing in Sanskrit is riddled with problems for even those who know the language well. This is so because the rules that govern Sanskrit prosody are numerous and stringent.
We propose a computational algorithm that converts prose given as E-text into poetry in accordance with the metrical rules of Sanskrit prosody, simultaneously taking care to ensure that sandhi or euphonic conjunction, which is compulsory in verse, is handled. The algorithm is considerably speeded up by a novel method of reducing the target search database. The algorithm further gives suggestions to the poet in case what he/she has given as the input prose is impossible to fit into any allowed metrical format. There is also an interactive component of the algorithm by which the algorithm interacts with the poet to resolve ambiguities. In addition, this unique work, which provides a solution to a problem that has never been addressed before, provides a simple yet effective speech recognition interface that would help the visually impaired dictate words in E-text, which is in turn versified by our Poetry Composer Engine.
Keywords - Sanskrit, poetry composer, sandhi, metre, metrical analysis, long-short analysis, speech recognition
I. INTRODUCTION Poetry-writing in any language has always posed a
challenge, causing poets to be acclaimed as a lofty tribe. The case is particularly strengthened when it comes to writing Sanskrit poetry, which is subject to numerous stringent rules at the grammatical, semantic and metrical levels, with compound word formations and euphonic conjunctions (sandhi-s) exacerbating the complexity.
In Sanskrit poetry, words may be positioned anywhere and in any order in the verse, and need not read in prose-order. The prose-order is later gleaned by bunching together words of the same genre, i.e. those belonging to the same case-inflectional form, gender, number or tense. For example, an adjective can easily be matched with the noun it describes, by looking for the closest noun that is in the same case-inflectional form, gender and number as itself. This re-organizing into the prose-order is the procedure followed in practice in order to decipher the meaning of a verse.
The computational algorithm we propose, converts prose given as E-text into poetry in strict accordance with the
metrical rules of Sanskrit prosody. What would otherwise be an algorithm with very high time complexity, is considerably improved by a novel scheme by which the target search space is narrowed down significantly. The algorithm also handles sandhi-s, since they are compulsorily to be implemented while versifying. Another path-breaking feature of the algorithm is that it gives suggestions to the poet in case his/her input cannot be versified according to the metrical rules. Moreover, in cases where the sandhi rule is ambiguous, the algorithm interacts with the poet to confirm his decision on resolving the same. In addition, a speech recognition interface is also provided, that would help the visually impaired dictate words in E-text, which are then versified by the Poetry Composer Engine.
A. Unicode Representation of Sanskrit Text The Unicode (UTF-8) standard is what has been adopted
universally for the purpose of encoding Indian language texts into digital format. The Unicode Consortium has assigned the Unicode hexadecimal range 0900 - 097F for Sanskrit characters.
All characters including the diacritical characters used to represent Sanskrit letters in E-texts are found dispersed across the Basic Latin (0000-007F), Latin-1 Supplement (0080-00FF), Latin Extended-A (0100-017F) and Latin Extended Additional (1E00 – 1EFF) Unicode ranges.
The Latin character set has been employed in this paper to represent Sanskrit letters as E-text.
The text given in the form of E-text using the Unicode Latin character set, is taken as input for processing. Unicode Sanskrit font may also be accepted as input, but is converted to the Latin character form before processing begins, as already presented by the authors in [3].
II. RULES OF VERSIFICATION
A. Metrical Rules Verses in Sanskrit are classified according to metres, i.e.
according to the number and type of syllables in the four quarters of the verse (and in a few cases, in the two halves of the verse). Algorithms to efficiently parse and classify verses into more than 700 metres, have already been developed by the
56 http://sites.google.com/site/ijcsis/ ISSN 1947-5500
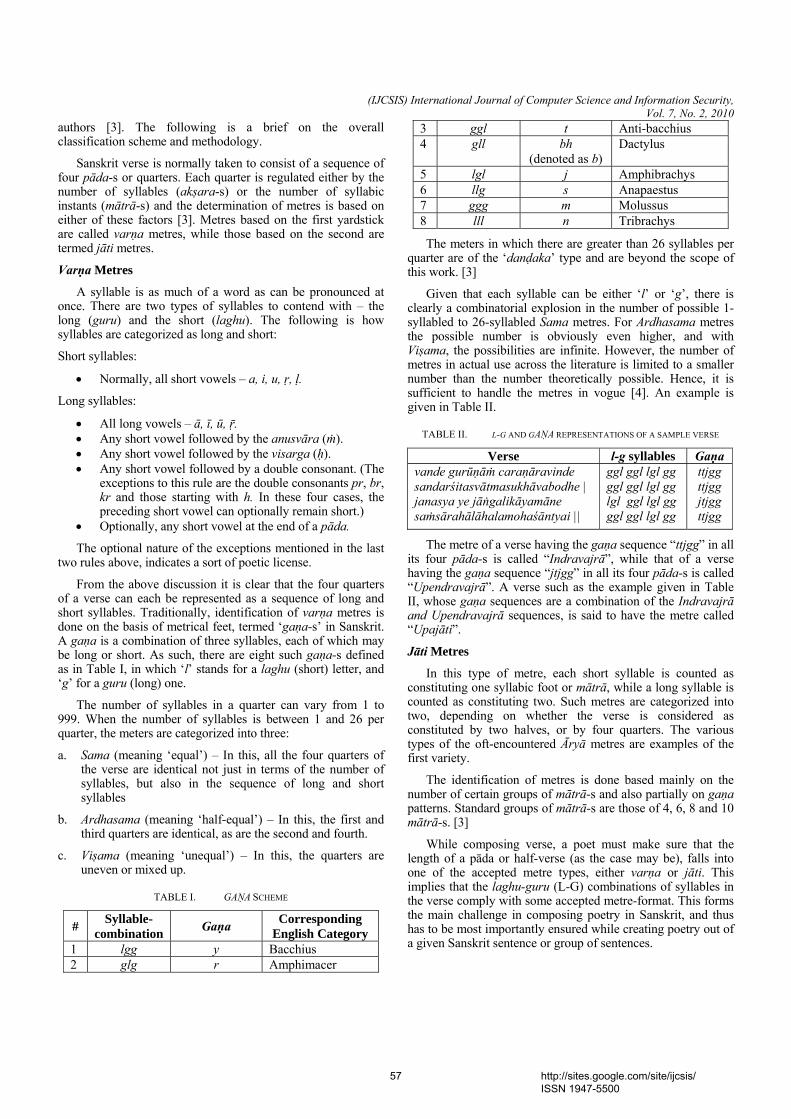
(IJCSIS) International Journal of Computer Science and Information Security, Vol. 7, No. 2, 2010
authors [3]. The following is a brief on the overall classification scheme and methodology.
Sanskrit verse is normally taken to consist of a sequence of four pāda-s or quarters. Each quarter is regulated either by the number of syllables (akṣara-s) or the number of syllabic instants (mātrā-s) and the determination of metres is based on either of these factors [3]. Metres based on the first yardstick are called varṇa metres, while those based on the second are termed jāti metres.
Varṇa Metres
A syllable is as much of a word as can be pronounced at once. There are two types of syllables to contend with – the long (guru) and the short (laghu). The following is how syllables are categorized as long and short:
Short syllables:
• Normally, all short vowels – a, i, u, ṛ, ḷ.
Long syllables:
• All long vowels – ā, ī, ū, ṝ. • Any short vowel followed by the anusvāra (ṁ). • Any short vowel followed by the visarga (ḥ). • Any short vowel followed by a double consonant. (The
exceptions to this rule are the double consonants pr, br, kr and those starting with h. In these four cases, the preceding short vowel can optionally remain short.)
• Optionally, any short vowel at the end of a pāda.
The optional nature of the exceptions mentioned in the last two rules above, indicates a sort of poetic license.
From the above discussion it is clear that the four quarters of a verse can each be represented as a sequence of long and short syllables. Traditionally, identification of varṇa metres is done on the basis of metrical feet, termed ‘gaṇa-s’ in Sanskrit. A gaṇa is a combination of three syllables, each of which may be long or short. As such, there are eight such gaṇa-s defined as in Table I, in which ‘l’ stands for a laghu (short) letter, and ‘g’ for a guru (long) one.
The number of syllables in a quarter can vary from 1 to 999. When the number of syllables is between 1 and 26 per quarter, the meters are categorized into three:
a. Sama (meaning ‘equal’) – In this, all the four quarters of the verse are identical not just in terms of the number of syllables, but also in the sequence of long and short syllables
b. Ardhasama (meaning ‘half-equal’) – In this, the first and third quarters are identical, as are the second and fourth.
c. Viṣama (meaning ‘unequal’) – In this, the quarters are uneven or mixed up.
TABLE I. GAṆA SCHEME
# Syllable-combination Gaṇa Corresponding
English Category 1 lgg y Bacchius 2 glg r Amphimacer
3 ggl t Anti-bacchius 4 gll bh
(denoted as b) Dactylus
5 lgl j Amphibrachys 6 llg s Anapaestus 7 ggg m Molussus 8 lll n Tribrachys
The meters in which there are greater than 26 syllables per quarter are of the ‘danḍaka’ type and are beyond the scope of this work. [3]
Given that each syllable can be either ‘l’ or ‘g’, there is clearly a combinatorial explosion in the number of possible 1-syllabled to 26-syllabled Sama metres. For Ardhasama metres the possible number is obviously even higher, and with Viṣama, the possibilities are infinite. However, the number of metres in actual use across the literature is limited to a smaller number than the number theoretically possible. Hence, it is sufficient to handle the metres in vogue [4]. An example is given in Table II.
TABLE II. L-G AND GAṆA REPRESENTATIONS OF A SAMPLE VERSE
Verse l-g syllables Gaṇa vande gurūṇāṁ caraṇāravinde sandarśitasvātmasukhāvabodhe | janasya ye jāṅgalikāyamāne saṁsārahālāhalamohaśāntyai ||
ggl ggl lgl gg ggl ggl lgl gg lgl ggl lgl gg ggl ggl lgl gg
ttjgg ttjgg jtjgg ttjgg
The metre of a verse having the gaṇa sequence “ttjgg” in all its four pāda-s is called “Indravajrā”, while that of a verse having the gaṇa sequence “jtjgg” in all its four pāda-s is called “Upendravajrā”. A verse such as the example given in Table II, whose gaṇa sequences are a combination of the Indravajrā and Upendravajrā sequences, is said to have the metre called “Upajāti”.
Jāti Metres
In this type of metre, each short syllable is counted as constituting one syllabic foot or mātrā, while a long syllable is counted as constituting two. Such metres are categorized into two, depending on whether the verse is considered as constituted by two halves, or by four quarters. The various types of the oft-encountered Āryā metres are examples of the first variety.
The identification of metres is done based mainly on the number of certain groups of mātrā-s and also partially on gaṇa patterns. Standard groups of mātrā-s are those of 4, 6, 8 and 10 mātrā-s. [3]
While composing verse, a poet must make sure that the length of a pāda or half-verse (as the case may be), falls into one of the accepted metre types, either varṇa or jāti. This implies that the laghu-guru (L-G) combinations of syllables in the verse comply with some accepted metre-format. This forms the main challenge in composing poetry in Sanskrit, and thus has to be most importantly ensured while creating poetry out of a given Sanskrit sentence or group of sentences.
57 http://sites.google.com/site/ijcsis/ ISSN 1947-5500
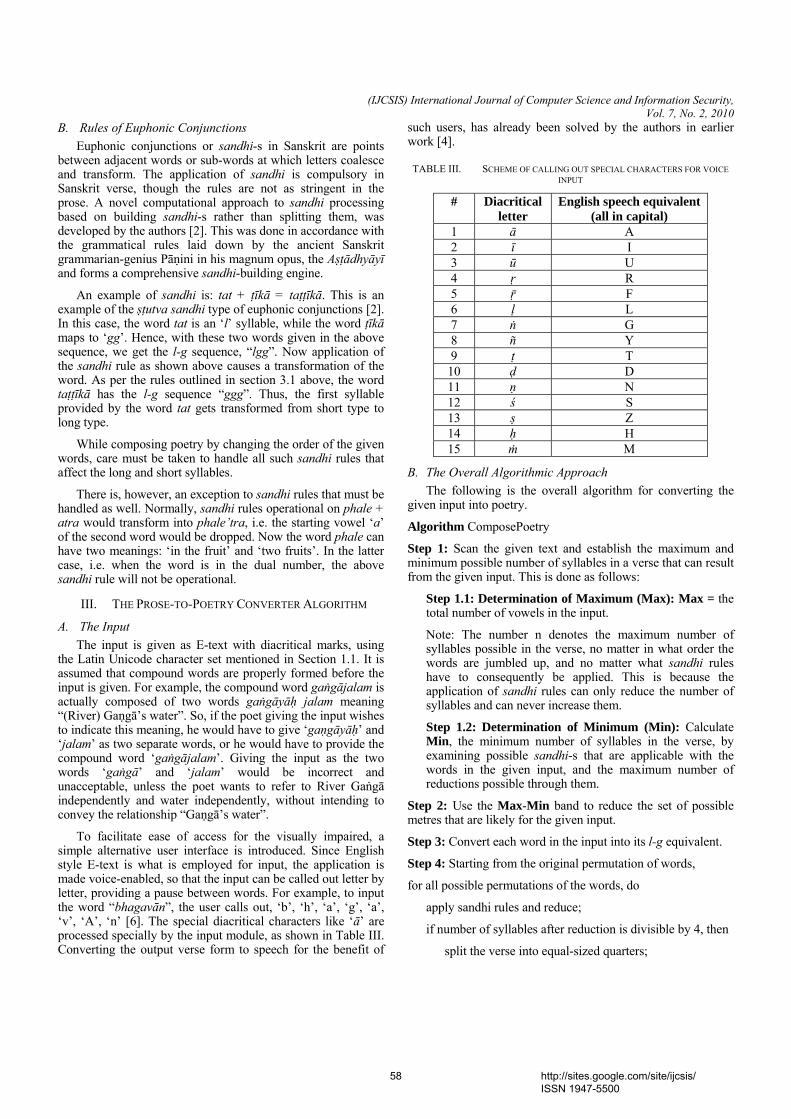
(IJCSIS) International Journal of Computer Science and Information Security, Vol. 7, No. 2, 2010
B. Rules of Euphonic Conjunctions Euphonic conjunctions or sandhi-s in Sanskrit are points
between adjacent words or sub-words at which letters coalesce and transform. The application of sandhi is compulsory in Sanskrit verse, though the rules are not as stringent in the prose. A novel computational approach to sandhi processing based on building sandhi-s rather than splitting them, was developed by the authors [2]. This was done in accordance with the grammatical rules laid down by the ancient Sanskrit grammarian-genius Pāṇini in his magnum opus, the Aṣṭādhyāyī and forms a comprehensive sandhi-building engine.
An example of sandhi is: tat + ṭīkā = taṭṭīkā. This is an example of the ṣṭutva sandhi type of euphonic conjunctions [2]. In this case, the word tat is an ‘l’ syllable, while the word ṭīkā maps to ‘gg’. Hence, with these two words given in the above sequence, we get the l-g sequence, “lgg”. Now application of the sandhi rule as shown above causes a transformation of the word. As per the rules outlined in section 3.1 above, the word taṭṭīkā has the l-g sequence “ggg”. Thus, the first syllable provided by the word tat gets transformed from short type to long type.
While composing poetry by changing the order of the given words, care must be taken to handle all such sandhi rules that affect the long and short syllables.
There is, however, an exception to sandhi rules that must be handled as well. Normally, sandhi rules operational on phale + atra would transform into phale’tra, i.e. the starting vowel ‘a’ of the second word would be dropped. Now the word phale can have two meanings: ‘in the fruit’ and ‘two fruits’. In the latter case, i.e. when the word is in the dual number, the above sandhi rule will not be operational.
III. THE PROSE-TO-POETRY CONVERTER ALGORITHM
A. The Input The input is given as E-text with diacritical marks, using
the Latin Unicode character set mentioned in Section 1.1. It is assumed that compound words are properly formed before the input is given. For example, the compound word gaṅgājalam is actually composed of two words gaṅgāyāḥ jalam meaning “(River) Gaṇgā’s water”. So, if the poet giving the input wishes to indicate this meaning, he would have to give ‘gaṇgāyāḥ’ and ‘jalam’ as two separate words, or he would have to provide the compound word ‘gaṅgājalam’. Giving the input as the two words ‘gaṅgā’ and ‘jalam’ would be incorrect and unacceptable, unless the poet wants to refer to River Gaṅgā independently and water independently, without intending to convey the relationship “Gaṇgā’s water”.
To facilitate ease of access for the visually impaired, a simple alternative user interface is introduced. Since English style E-text is what is employed for input, the application is made voice-enabled, so that the input can be called out letter by letter, providing a pause between words. For example, to input the word “bhagavān”, the user calls out, ‘b’, ‘h’, ‘a’, ‘g’, ‘a’, ‘v’, ‘A’, ‘n’ [6]. The special diacritical characters like ‘ā’ are processed specially by the input module, as shown in Table III. Converting the output verse form to speech for the benefit of
such users, has already been solved by the authors in earlier work [4].
TABLE III. SCHEME OF CALLING OUT SPECIAL CHARACTERS FOR VOICE INPUT
# Diacritical letter
English speech equivalent(all in capital)
1 ā A 2 ī I 3 ū U 4 ṛ R 5 ṝ F 6 ḷ L 7 ṅ G 8 ñ Y 9 ṭ T
10 ḍ D 11 ṇ N 12 ś S 13 ṣ Z 14 ḥ H 15 ṁ M
B. The Overall Algorithmic Approach The following is the overall algorithm for converting the
given input into poetry.
Algorithm ComposePoetry
Step 1: Scan the given text and establish the maximum and minimum possible number of syllables in a verse that can result from the given input. This is done as follows:
Step 1.1: Determination of Maximum (Max): Max = the total number of vowels in the input.
Note: The number n denotes the maximum number of syllables possible in the verse, no matter in what order the words are jumbled up, and no matter what sandhi rules have to consequently be applied. This is because the application of sandhi rules can only reduce the number of syllables and can never increase them.
Step 1.2: Determination of Minimum (Min): Calculate Min, the minimum number of syllables in the verse, by examining possible sandhi-s that are applicable with the words in the given input, and the maximum number of reductions possible through them.
Step 2: Use the Max-Min band to reduce the set of possible metres that are likely for the given input.
Step 3: Convert each word in the input into its l-g equivalent.
Step 4: Starting from the original permutation of words,
for all possible permutations of the words, do
apply sandhi rules and reduce;
if number of syllables after reduction is divisible by 4, then
split the verse into equal-sized quarters;
58 http://sites.google.com/site/ijcsis/ ISSN 1947-5500

(IJCSIS) International Journal of Computer Science and Information Security, Vol. 7, No. 2, 2010
if the l-g patterns of the four quarters are equal then
search for a match for the pattern in the reduced
table of Sama metres;
else if the alternate quarters have same l-g pattern then
search for a match for the pattern in the reduced
table of Ardhasama metres;
else
search for a match for the pattern in the reduced
tables of Viṣama and Jāti metres;
end if
if match found then
quit;
else
indicate the closest match;
suggest possible changes;
end if
else
split the verse according to possible Ardhasama metres;
search for a match for the pattern in the reduced table of
Ardhasama metres;
if match found then
quit;
else
split the verse according to possible Viṣama metres
and Jāti metres;
search for a match for the pattern in the reduced
tables of Viṣama and Jāti metres;
if match found then
quit;
else
indicate the closest match;
suggest possible changes;
end if
end if
end if
end for
end Algorithm
The following points are worthy of note with regard to the above algorithm:
a. Giving big words as input is advantageous and would yield better performance, because the number of possible permutations would reduce.
b. The given order of words in the prose text is first tried as such, because the order of words given would be meaningful, and it would be ideal if a verse form is possible in the given order itself. Other permutations of words are tried only if a verse form is not possible with the given word-order.
c. The algorithm suggests possible changes by using other words available in the input with the required pattern.
d. In case the number of syllables is greater that 26 per quarter, then the given words are split into more than one set and then Anuṣṭhup (common metres with 8 syllables per quarter) or Jāti metres are tried out for a match.
IV. ESTABLISHING THE MAX-MIN BAND The algorithm presented in Section 4.1 involves
permutation-generation and string-matching for each permutation [1]. This fact coupled with the big size of the metres database, places rather large demands on time. It is to significantly enhance the performance of the algorithm, that the novel idea of establishing the maximum-minimum band has been devised.
Once this Max-Min band is established, metres with the number of syllables lying within this band alone need to be considered for pattern matching. This approach clearly ensures a substantial savings in terms of time taken by the algorithm.
TABLE IV. THE SANSKRIT ALPHABET CATEGORIZED
# Category Letters 1 Vowels a, ā, i, ī, u, ū, ṛ, ṝ, ḷ, e, ai, o, au 2 Short vowels a, i, u, ṛ, ḷ 3 Long vowels ā, ī, ū, ṝ, e, ai, o, au 4 Consonants
(including Semi-vowels)
k, kh, g, gh, ṅ c, ch, j, jh, ñ ṭ, ṭh, ḍ, ḍh, ṇ t, th, d, dh, n p, ph, b, bh, m y, r, l, v
5 Sibilants ś, ṣ, s 6 Aspirate h 7 Anusvāra ṁ 8 Visarga ḥ
The algorithm presented in Section 4.1 defines how to find
the maximum number of syllables possible in a verse formed from the given input. The following discussion focuses on the development and establishment of equations through comprehensive empirical analysis, to determine the minimum possible number of syllables in a verse constructed from the given input text. Table IV presents the letters of the Sanskrit alphabet divided into categories referenced in the discussion below.
59 http://sites.google.com/site/ijcsis/ ISSN 1947-5500
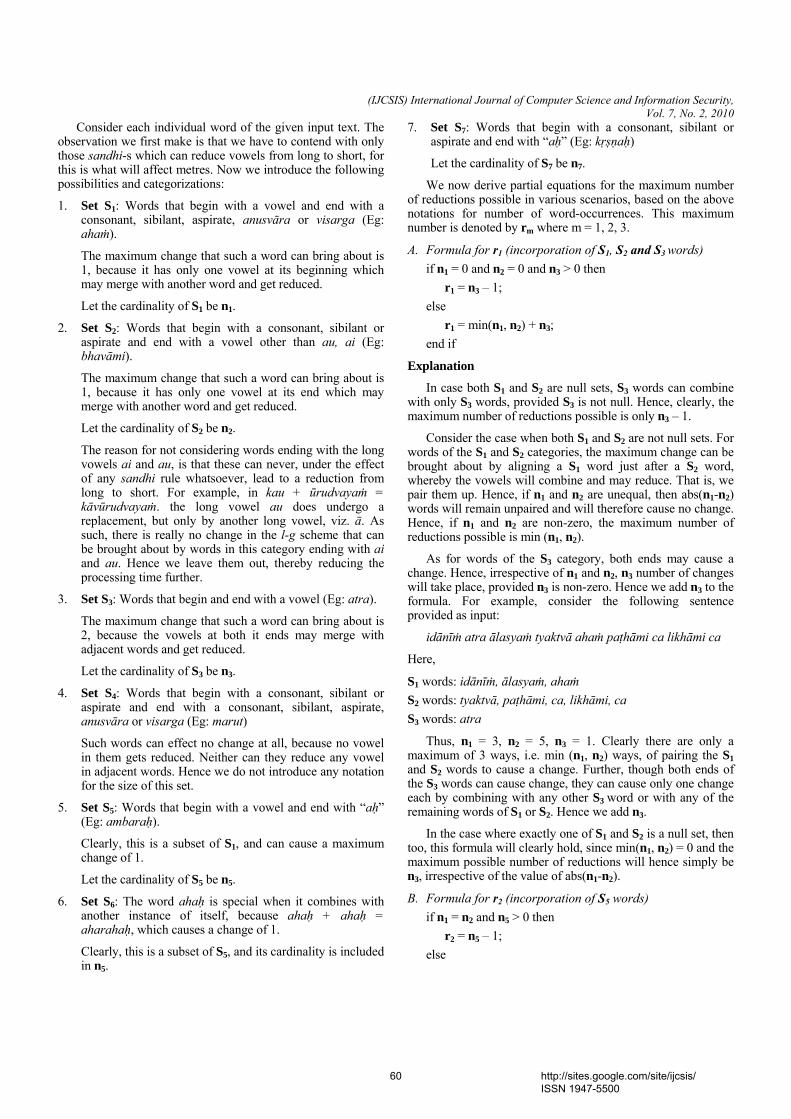
(IJCSIS) International Journal of Computer Science and Information Security, Vol. 7, No. 2, 2010
Consider each individual word of the given input text. The observation we first make is that we have to contend with only those sandhi-s which can reduce vowels from long to short, for this is what will affect metres. Now we introduce the following possibilities and categorizations:
1. Set S1: Words that begin with a vowel and end with a consonant, sibilant, aspirate, anusvāra or visarga (Eg: ahaṁ).
The maximum change that such a word can bring about is 1, because it has only one vowel at its beginning which may merge with another word and get reduced.
Let the cardinality of S1 be n1.
2. Set S2: Words that begin with a consonant, sibilant or aspirate and end with a vowel other than au, ai (Eg: bhavāmi).
The maximum change that such a word can bring about is 1, because it has only one vowel at its end which may merge with another word and get reduced.
Let the cardinality of S2 be n2.
The reason for not considering words ending with the long vowels ai and au, is that these can never, under the effect of any sandhi rule whatsoever, lead to a reduction from long to short. For example, in kau + ūrudvayaṁ = kāvūrudvayaṁ. the long vowel au does undergo a replacement, but only by another long vowel, viz. ā. As such, there is really no change in the l-g scheme that can be brought about by words in this category ending with ai and au. Hence we leave them out, thereby reducing the processing time further.
3. Set S3: Words that begin and end with a vowel (Eg: atra).
The maximum change that such a word can bring about is 2, because the vowels at both it ends may merge with adjacent words and get reduced.
Let the cardinality of S3 be n3.
4. Set S4: Words that begin with a consonant, sibilant or aspirate and end with a consonant, sibilant, aspirate, anusvāra or visarga (Eg: marut)
Such words can effect no change at all, because no vowel in them gets reduced. Neither can they reduce any vowel in adjacent words. Hence we do not introduce any notation for the size of this set.
5. Set S5: Words that begin with a vowel and end with “aḥ” (Eg: ambaraḥ).
Clearly, this is a subset of S1, and can cause a maximum change of 1.
Let the cardinality of S5 be n5.
6. Set S6: The word ahaḥ is special when it combines with another instance of itself, because ahaḥ + ahaḥ = aharahaḥ, which causes a change of 1.
Clearly, this is a subset of S5, and its cardinality is included in n5.
7. Set S7: Words that begin with a consonant, sibilant or aspirate and end with “aḥ” (Eg: kṛṣṇaḥ)
Let the cardinality of S7 be n7.
We now derive partial equations for the maximum number of reductions possible in various scenarios, based on the above notations for number of word-occurrences. This maximum number is denoted by rm where m = 1, 2, 3.
A. Formula for r1 (incorporation of S1, S2 and S3 words) if n1 = 0 and n2 = 0 and n3 > 0 then
r1 = n3 – 1; else
r1 = min(n1, n2) + n3; end if
Explanation
In case both S1 and S2 are null sets, S3 words can combine with only S3 words, provided S3 is not null. Hence, clearly, the maximum number of reductions possible is only n3 – 1.
Consider the case when both S1 and S2 are not null sets. For words of the S1 and S2 categories, the maximum change can be brought about by aligning a S1 word just after a S2 word, whereby the vowels will combine and may reduce. That is, we pair them up. Hence, if n1 and n2 are unequal, then abs(n1-n2) words will remain unpaired and will therefore cause no change. Hence, if n1 and n2 are non-zero, the maximum number of reductions possible is min (n1, n2).
As for words of the S3 category, both ends may cause a change. Hence, irrespective of n1 and n2, n3 number of changes will take place, provided n3 is non-zero. Hence we add n3 to the formula. For example, consider the following sentence provided as input:
idānīṁ atra ālasyaṁ tyaktvā ahaṁ paṭhāmi ca likhāmi ca
Here,
S1 words: idānīṁ, ālasyaṁ, ahaṁ S2 words: tyaktvā, paṭhāmi, ca, likhāmi, ca S3 words: atra
Thus, n1 = 3, n2 = 5, n3 = 1. Clearly there are only a maximum of 3 ways, i.e. min (n1, n2) ways, of pairing the S1 and S2 words to cause a change. Further, though both ends of the S3 words can cause change, they can cause only one change each by combining with any other S3 word or with any of the remaining words of S1 or S2. Hence we add n3.
In the case where exactly one of S1 and S2 is a null set, then too, this formula will clearly hold, since min(n1, n2) = 0 and the maximum possible number of reductions will hence simply be n3, irrespective of the value of abs(n1-n2).
B. Formula for r2 (incorporation of S5 words) if n1 = n2 and n5 > 0 then
r2 = n5 – 1; else
60 http://sites.google.com/site/ijcsis/ ISSN 1947-5500

(IJCSIS) International Journal of Computer Science and Information Security, Vol. 7, No. 2, 2010
r2 = n5; end if
Explanation
We consider the two cases when n1 and n2 are equal, and when they are unequal. When they are equal, they pair up completely for r1, and hence if S5 is not null, the S5 words have only themselves to combine with. For example, we may have the S5 words, itaḥ and aṁbaraḥ. Here, itaḥ + aṁbaraḥ = ito’mbaraḥ, and aṁbaraḥ + itaḥ = aṁbara itaḥ, both of which are changes. However, the first does not cause any change in the long-short scheme, while the second does. Since we are only calculating the maximum, we take it that there is a maximum reduction of 1 in this case. Clearly, therefore, the maximum number of reductions here is n5 – 1.
In the case where n1 and n2 are unequal, they pair up to reduce as per r1, leaving behind abs(n1-n2) words. Consider the example,
aṁbaraḥ na atra asti parantu aṁbaraḥ anyatra asti ataḥ ahaṁ itaḥ tatra gacchāmi
Here,
S1 words: ahaṁ S2 words: na, parantu, tatra, gacchāmi S3 words: atra, asti, anyatra, asti S5 words: aṁbaraḥ, aṁbaraḥ, ataḥ, itaḥ
Thus, n1 = 1, n2 = 4, n3 = 4, n5 = 4. Assuming that the first words of S1 and S2 combine, we have the last three words of S2 left behind. These can produce three pairs in combination with three words of S5 and cause a change. For example, we can have tatra + aṁbaraḥ = tatrāṁbaraḥ. We would thus have one word of S5 left behind, since n5 > abs(n1-n2), which would combine with one of the available compounds of S5 with S1 or S2. Continuing with the above example, tatrāmbaraḥ + itaḥ = tatrāmbara itaḥ, a change. All this means that all the S5 words contribute to a change, and hence r2 = n5 in this case.
In case n1 and n2 are unequal and n5 <= abs(n1-n2), then after pairing S5 words with the remaining from S1 or S2, we are left with no more S5 words. Hence, anyway the number of reductions is n5, i.e. the number of pairs. The only other case is n5 = 0, in which r2 should work out to zero. This possibility is subsumed in the second case presented in the formula.
C. Formula for r3 (incorporation of S7 words) if n1 > n2 and n7 > 0 then
r3 = min(n7, n1 – n2); else
r3 = 0; end if
Explanation
Clearly, we have to handle only the case when n7 > 0. Also, after calculation of r1, the remaining abs(n1 – n2) words alone have to be contended with in the calculation of r3.
Now S2 words are of no use for reduction in combination with S7 words. Consider the following sample input:
kṛṣṇaḥ idānīṁ atra ālasyaṁ tyaktvā paṭhati ca likhati ca
Here,
S1 words: idānīṁ, ālasyaṁ S2 words: tyaktvā, paṭhati, ca, likhati, ca S3 words: atra S7 words: kṛṣṇaḥ
Thus, n1 = 2, n2 = 5, n3 = 1, n7 = 1. Clearly, after the S1 and S2 words combine, three S2 words would remain, say ca, likhati and ca. Now only the ending “aḥ” of S7 words are combinable. Hence, clearly, S2 and S7 words cannot combine. Hence, if n1 <= n2, then no reduction with S7 words can take place. Hence r3 for such a scenario is zero.
When n1 > n2, then n1 – n2 words of the S1 type remain after the r1 calculation. For example, we may have the word ahaṁ of S1 remaining. Thus, kṛṣṇaḥ + ahaṁ = kṛṣṇo’haṁ, which is a reduction. Similarly, kṛṣṇaḥ + idānīṁ = kṛṣṇa idānīṁ which is again a reduction. The number of such reductions is min(n1-n2, n7) because there will be a maximum of as many reductions as there are pairs of the remaining n1-n2 words and n7 words.
D. Combined Formula for Reductions and Min Combining the formulae for r1, r2 and r3, we arrive at the
following formula for r, the maximum number of possible reductions for the given set of words:
if (n1 = n2) or (n1 > n2 and n7 = n1 – n2 and n5 > 0) then
r = n1 + n3 + n5 – 1; else if (n1 < n2) or (n1 > n2 and [(n7 > n1 – n2) or (n7 = n1 – n2 and n5 = 0)]) then
r = n1 + n3 + n5; else
r = n2 + n3 + n5 + n7; end if
Using r, we calculate Min, the minimum possible number of syllables as Min = Max – r.
V. SAMPLE SCENARIO OF PERFORMANCE ENHANCEMENT USING THE MAX-MIN BAND
Now consider an example where Max = 48. This means that in a single pāda or quarter of the verse, there can be a maximum of 48/4 = 12 syllables. Let us assume that by the above formulations, we arrive at r = 4 for this particular case. Then Min = 44, and hence the minimum number of syllables per pāda is 11. Thus, we need to only search for metres with 11 or 12 syllables in a pāda. This reduces the target search space of metres to match with, by more than 85%.
VI. CONCLUSIONS The problem of automatic conversion of prose to poetry has
never been tackled before in the literature. This solution is therefore the first of its kind. Further, the algorithm presented is
61 http://sites.google.com/site/ijcsis/ ISSN 1947-5500
(IJCSIS) International Journal of Computer Science and Information Security, Vol. 7, No. 2, 2010
comprehensive and yet efficient due to the reduction formula proposed through the Max-Min Band method. The approach also facilitates the giving of suggestions to the poet, in case the prose given cannot be set to poetry, for it finds the closest match. Lastly, and significantly, the application also easily lends itself, through available English speech recognition interfaces that come packaged with operating systems itself, for use by the visually impaired.
REFERENCES [1] Donald E. Knuth, “Fundamental Algorithms Volume 1”, Addison
Wesley, Third Edition, 1997. [2] Rama N., Meenakshi Lakshmanan, “A New Computational Schema for
Euphonic Conjunctions in Sanskrit Processing”, IJCSI International Journal of Computer Science Issues, Vol. 5, 2009 (ISSN (Online): 1694-0784, ISSN (Print): 1694-0814), Pages 43-51.
[3] Rama N., Meenakshi Lakshmanan, “A Computational Algorithm for Metrical Classification of Verse”, submitted to under review at IJCSI International Journal of Computer Science Issues, Vol. 5, 2009 (ISSN (Online): 1694-0784, ISSN (Print): 1694-0814).
[4] Rama N., Meenakshi Lakshmanan, “An Algorithm Based on Empirical Methods, for Text-to-Tuneful-Speech Synthesis of Sanskrit Verse”, submitted to and under review at IJCSNS International Journal of Computer Science and Network Security, Vol. 10. No. 1, 2010 (ISSN: 1738-7906).
[5] Vaman Shivram Apte, “Practical Sanskrit-English Dictionary”, Motilal Banarsidass Publishers Pvt. Ltd., Delhi, 1998, Revised and Enlarged Edition, 2007.
[6] Windows Speech Recognition for Windows Vista, Product Information and Tutorials can be found at http://www.microsoft.com/enable/ products/windowsvista/speech.aspx, (last accessed on 21.01.2010).
AUTHOR PROFILE Dr. Rama N. completed B.Sc. (Mathematics), Master of Computer Applications and Ph.D. (Computer Science) from the University of Madras, India. She served in faculty positions at Anna Adarsh College, Chennai and as Head of the Department of Computer Science at Bharathi Women’s College, Chennai, before moving on to Presidency College, Chennai, where she currently serves as Associate Professor. She has 20 years of teaching experience including 10 years of postgraduate (PG) teaching, and has guided 15 M.Phil. students. She has been the Chairperson of the Board of Studies in Computer Science for UG, and Member, Board of Studies in Computer Science for PG and Research at the University of Madras. Current research interests: Program Security. She is the Member of the Editorial cum Advisory Board of the Oriental Journal of Computer Science and Technology.
Meenakshi Lakshmanan Having completed B.Sc. (Mathematics), Master of Computer Applications at the University of Madras and M.Phil. (Computer Science), she is currently pursuing Ph.D. (Computer Science) at Mother Teresa Women’s University, Kodaikanal, India. She is also pursuing Level 4 Sanskrit (Samartha) of the Samskṛta Bhāṣā Pracāriṇī Sabhā, Chittoor, India. Starting off her career as an executive at SRA Systems Pvt. Ltd., she switched to academics and currently heads the Department of Computer Science, Meenakshi College for Women, Chennai, India. She is a professional member of the ACM and IEEE.
62 http://sites.google.com/site/ijcsis/ ISSN 1947-5500
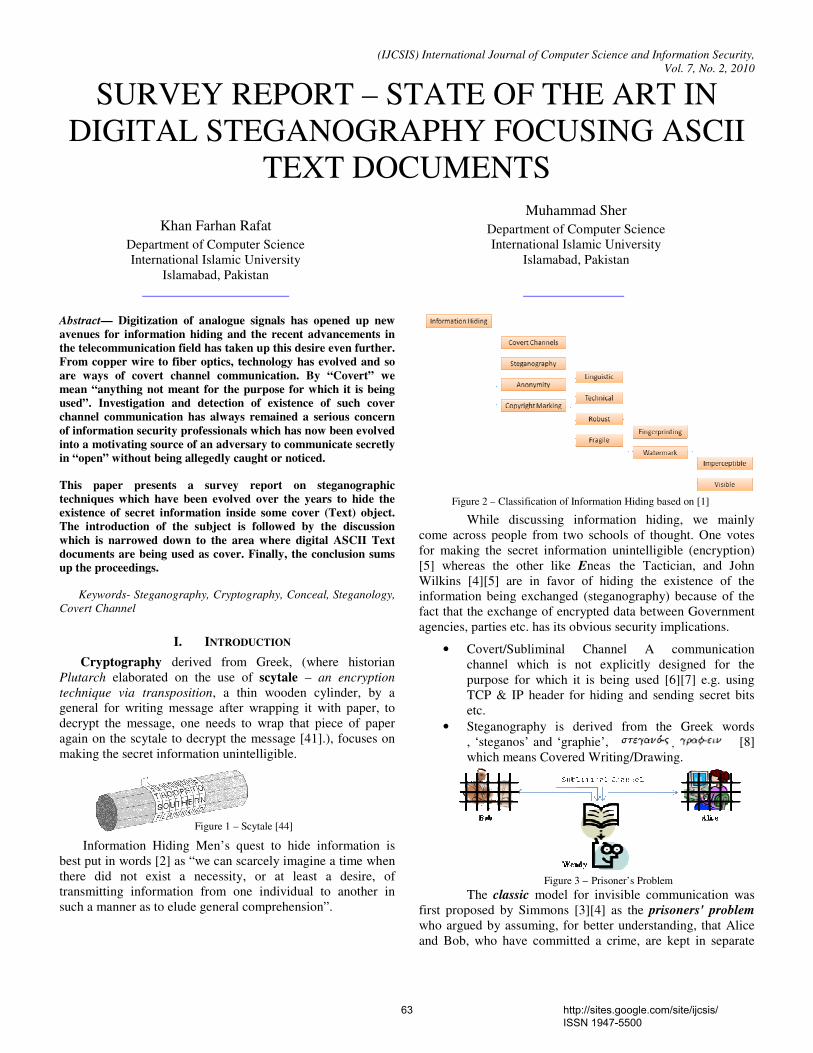
(IJCSIS) International Journal of Computer Science and Information Security,
Vol. 7, No. 2, 2010
SURVEY REPORT – STATE OF THE ART IN
DIGITAL STEGANOGRAPHY FOCUSING ASCII
TEXT DOCUMENTS
Khan Farhan Rafat
Department of Computer Science
International Islamic University
Islamabad, Pakistan
Muhammad Sher
Department of Computer Science
International Islamic University
Islamabad, Pakistan
Abstract— Digitization of analogue signals has opened up new
avenues for information hiding and the recent advancements in
the telecommunication field has taken up this desire even further.
From copper wire to fiber optics, technology has evolved and so
are ways of covert channel communication. By “Covert” we
mean “anything not meant for the purpose for which it is being
used”. Investigation and detection of existence of such cover
channel communication has always remained a serious concern
of information security professionals which has now been evolved
into a motivating source of an adversary to communicate secretly
in “open” without being allegedly caught or noticed.
This paper presents a survey report on steganographic
techniques which have been evolved over the years to hide the
existence of secret information inside some cover (Text) object.
The introduction of the subject is followed by the discussion
which is narrowed down to the area where digital ASCII Text
documents are being used as cover. Finally, the conclusion sums
up the proceedings.
Keywords- Steganography, Cryptography, Conceal, Steganology,
Covert Channel
I. INTRODUCTION
Cryptography derived from Greek, (where historian
Plutarch elaborated on the use of scytale – an encryption
technique via transposition, a thin wooden cylinder, by a
general for writing message after wrapping it with paper, to
decrypt the message, one needs to wrap that piece of paper
again on the scytale to decrypt the message [41].), focuses on
making the secret information unintelligible.
Information Hiding Men’s quest to hide information is
best put in words [2] as “we can scarcely imagine a time when
there did not exist a necessity, or at least a desire, of
transmitting information from one individual to another in
such a manner as to elude general comprehension”.
While discussing information hiding, we mainly
come across people from two schools of thought. One votes
for making the secret information unintelligible (encryption)
[5] whereas the other like Eneas the Tactician, and John
Wilkins [4][5] are in favor of hiding the existence of the
information being exchanged (steganography) because of the
fact that the exchange of encrypted data between Government
agencies, parties etc. has its obvious security implications.
• Covert/Subliminal Channel A communication
channel which is not explicitly designed for the
purpose for which it is being used [6][7] e.g. using
TCP & IP header for hiding and sending secret bits
etc.
• Steganography is derived from the Greek words
, ‘steganos’ and ‘graphie’, [8]
which means Covered Writing/Drawing.
The classic model for invisible communication was
first proposed by Simmons [3][4] as the prisoners' problem
who argued by assuming, for better understanding, that Alice
and Bob, who have committed a crime, are kept in separate
Figure 1 – Scytale [44]
Figure 2 – Classification of Information Hiding based on [1]
Figure 3 – Prisoner’s Problem
63 http://sites.google.com/site/ijcsis/ ISSN 1947-5500
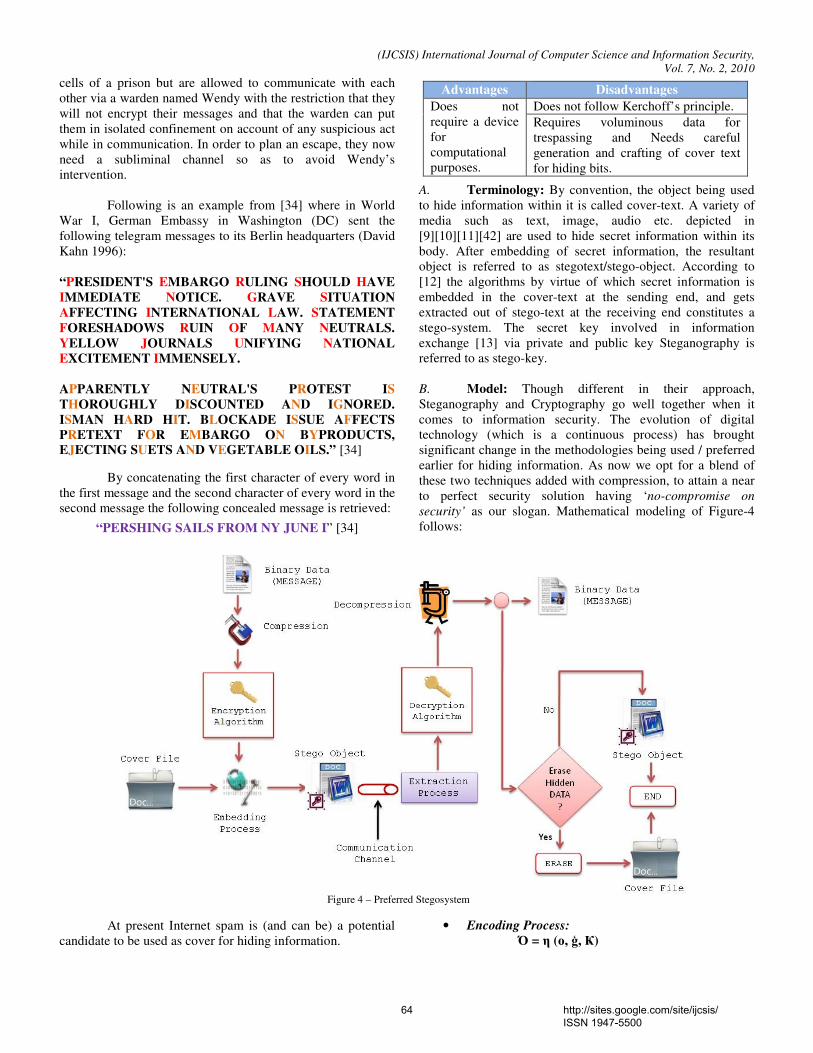
(IJCSIS) International Journal of Computer Science and Information Security,
Vol. 7, No. 2, 2010
cells of a prison but are allowed to communicate with each
other via a warden named Wendy with the restriction that they
will not encrypt their messages and that the warden can put
them in isolated confinement on account of any suspicious act
while in communication. In order to plan an escape, they now
need a subliminal channel so as to avoid Wendy’s
intervention.
Following is an example from [34] where in World
War I, German Embassy in Washington (DC) sent the
following telegram messages to its Berlin headquarters (David
Kahn 1996):
“PRESIDENT'S EMBARGO RULING SHOULD HAVE
IMMEDIATE NOTICE. GRAVE SITUATION
AFFECTING INTERNATIONAL LAW. STATEMENT
FORESHADOWS RUIN OF MANY NEUTRALS.
YELLOW JOURNALS UNIFYING NATIONAL
EXCITEMENT IMMENSELY.
APPARENTLY NEUTRAL'S PROTEST IS
THOROUGHLY DISCOUNTED AND IGNORED.
ISMAN HARD HIT. BLOCKADE ISSUE AFFECTS
PRETEXT FOR EMBARGO ON BYPRODUCTS,
EJECTING SUETS AND VEGETABLE OILS.” [34]
By concatenating the first character of every word in
the first message and the second character of every word in the
second message the following concealed message is retrieved:
“PERSHING SAILS FROM NY JUNE I” [34]
At present Internet spam is (and can be) a potential
candidate to be used as cover for hiding information.
A. Terminology: By convention, the object being used
to hide information within it is called cover-text. A variety of
media such as text, image, audio etc. depicted in
[9][10][11][42] are used to hide secret information within its
body. After embedding of secret information, the resultant
object is referred to as stegotext/stego-object. According to
[12] the algorithms by virtue of which secret information is
embedded in the cover-text at the sending end, and gets
extracted out of stego-text at the receiving end constitutes a
stego-system. The secret key involved in information
exchange [13] via private and public key Steganography is
referred to as stego-key.
B. Model: Though different in their approach,
Steganography and Cryptography go well together when it
comes to information security. The evolution of digital
technology (which is a continuous process) has brought
significant change in the methodologies being used / preferred
earlier for hiding information. As now we opt for a blend of
these two techniques added with compression, to attain a near
to perfect security solution having ‘no-compromise on
security’ as our slogan. Mathematical modeling of Figure-4
follows:
• Encoding Process:
Ό = η (ο, ģ, Ҝ)
Advantages Disadvantages
Does not
require a device
for
computational
purposes.
Does not follow Kerchoff’s principle.
Requires voluminous data for
trespassing and Needs careful
generation and crafting of cover text
for hiding bits.
Figure 4 – Preferred Stegosystem
64 http://sites.google.com/site/ijcsis/ ISSN 1947-5500
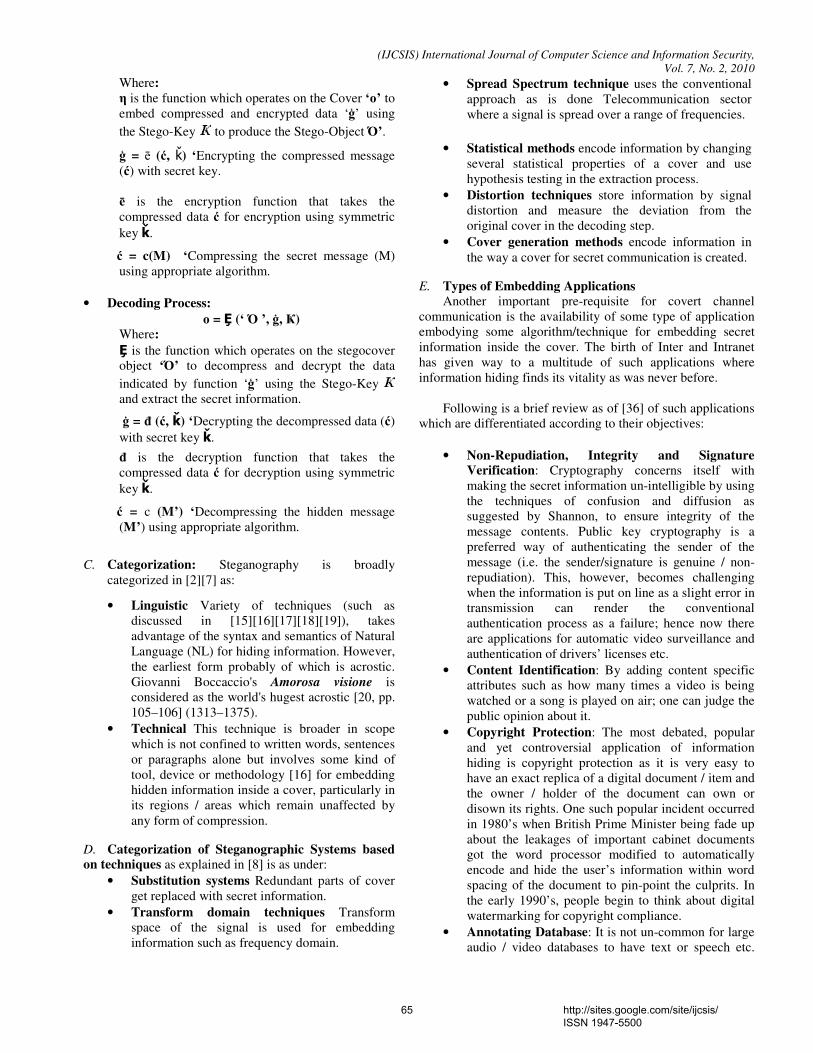
(IJCSIS) International Journal of Computer Science and Information Security,
Vol. 7, No. 2, 2010
Where:
η is the function which operates on the Cover ‘ο’ to
embed compressed and encrypted data ‘ģ’ using
the Stego-Key to produce the Stego-Object Ό’.
ģ = ē (ć, ǩ) ‘Encrypting the compressed message
(ć) with secret key.
ē is the encryption function that takes the
compressed data ć for encryption using symmetric
key ǩ.
ć = c(M) ‘Compressing the secret message (M)
using appropriate algorithm.
• Decoding Process:
ο = Ȩ (‘ Ό ’, ģ, Ҝ)
Where:
Ȩ is the function which operates on the stegocover
object ‘Ό’ to decompress and decrypt the data
indicated by function ‘ģ’ using the Stego-Key
and extract the secret information.
ģ = đ (ć, ǩ) ‘Decrypting the decompressed data (ć)
with secret key ǩ.
đ is the decryption function that takes the
compressed data ć for decryption using symmetric
key ǩ.
ć = c (M’) ‘Decompressing the hidden message
(M’) using appropriate algorithm.
C. Categorization: Steganography is broadly
categorized in [2][7] as:
• Linguistic Variety of techniques (such as
discussed in [15][16][17][18][19]), takes
advantage of the syntax and semantics of Natural
Language (NL) for hiding information. However,
the earliest form probably of which is acrostic.
Giovanni Boccaccio's Amorosa visione is
considered as the world's hugest acrostic [20, pp.
105–106] (1313–1375).
• Technical This technique is broader in scope
which is not confined to written words, sentences
or paragraphs alone but involves some kind of
tool, device or methodology [16] for embedding
hidden information inside a cover, particularly in
its regions / areas which remain unaffected by
any form of compression.
D. Categorization of Steganographic Systems based
on techniques as explained in [8] is as under:
• Substitution systems Redundant parts of cover
get replaced with secret information.
• Transform domain techniques Transform
space of the signal is used for embedding
information such as frequency domain.
• Spread Spectrum technique uses the conventional
approach as is done Telecommunication sector
where a signal is spread over a range of frequencies.
• Statistical methods encode information by changing
several statistical properties of a cover and use
hypothesis testing in the extraction process.
• Distortion techniques store information by signal
distortion and measure the deviation from the
original cover in the decoding step.
• Cover generation methods encode information in
the way a cover for secret communication is created.
E. Types of Embedding Applications
Another important pre-requisite for covert channel
communication is the availability of some type of application
embodying some algorithm/technique for embedding secret
information inside the cover. The birth of Inter and Intranet
has given way to a multitude of such applications where
information hiding finds its vitality as was never before.
Following is a brief review as of [36] of such applications
which are differentiated according to their objectives:
• Non-Repudiation, Integrity and Signature
Verification: Cryptography concerns itself with
making the secret information un-intelligible by using
the techniques of confusion and diffusion as
suggested by Shannon, to ensure integrity of the
message contents. Public key cryptography is a
preferred way of authenticating the sender of the
message (i.e. the sender/signature is genuine / non-
repudiation). This, however, becomes challenging
when the information is put on line as a slight error in
transmission can render the conventional
authentication process as a failure; hence now there
are applications for automatic video surveillance and
authentication of drivers’ licenses etc.
• Content Identification: By adding content specific
attributes such as how many times a video is being
watched or a song is played on air; one can judge the
public opinion about it.
• Copyright Protection: The most debated, popular
and yet controversial application of information
hiding is copyright protection as it is very easy to
have an exact replica of a digital document / item and
the owner / holder of the document can own or
disown its rights. One such popular incident occurred
in 1980’s when British Prime Minister being fade up
about the leakages of important cabinet documents
got the word processor modified to automatically
encode and hide the user’s information within word
spacing of the document to pin-point the culprits. In
the early 1990’s, people begin to think about digital
watermarking for copyright compliance.
• Annotating Database: It is not un-common for large
audio / video databases to have text or speech etc.
65 http://sites.google.com/site/ijcsis/ ISSN 1947-5500

(IJCSIS) International Journal of Computer Science and Information Security,
Vol. 7, No. 2, 2010
captions which can easily be got embedded inside the
relevant database to resist against various signal
processing anomalies.
• Device control: Human audio / video perceptions are
frequently being exploited by the vendors in
designing their information hiding techniques. In one
such reported technique a typical control signal,
embedded in a radio signal broadcasted by a FM
radio station was used to trigger the receiver’s
decoder.
• In-Band captioning: Just as it is not un-common to
embed data in audio-visual streams; so can be the
case where data for various services launched by
Telecom Operators can be embedded in television
and radio signals.
• Traitor Tracing: Here distinct digital signatures are
embedded and the number of copies to be distributed
is limited. The unauthorized usage of the document
can then be traced back by the intended recipient.
• Media Forensics: The tempered media gets analyzed
by experts to identify the tempering and the portions
which have been affected by it but not throw light as
to how the tempering is done.
F. Types of Steganographic Systems: According to [8]
Steganographic Systems can be segregated as:
• Pure Steganography (PS): Weakest, as is based on
the assumption that parties other than the intended
ones are not aware of such type of exchange of
secret information.
• Secret Key Steganography (SKS): In this
technique, both the sender and receiver share or
have agreed on a common set of stego-keys prior to
commencement of secret communication. The secret
information is embedded inside the cover using the
pre-agreed stego-key and gets extracted out at the
receiving end by reversing the embedding process.
The advantage lies in the fact that an adversary
needs to apply brute force etc. attack to get the
secret information out of the cover which require
resources such as computational power, time, and
determination.
• Public Key Steganography (PKS) As the name
indicates, public key steganography use a pair of
Public and Private Keys to hide secret information.
The advantage of this technique is that an attacker
first needs to come up with a public and private key-
pair and then the decoding scheme to extract the
hidden information out of the cover. The key benefit
of this technique is its robustness in execution and
easy of key management.
G. Models for Steg-Analysis
• Blind Detection Model
This model is the counterpart of cryptanalysis and
analyzes the stego-object without any prior
knowledge about the technology and the type of the
media (cover) being used in the concealing process.
• Analytical Model
The stego-object is analyzed in terms of its
associated attributes such as stego-object type,
format etc. [21] and thereafter on the basis of the
data gathered relevant known steg-analysis tools are
used to extract hidden bits and derive the meaning
out of it.
II. Related Work
This section covers a literature review of the recently
published text-based steganographic techniques such as use of
acronyms, synonyms; semantics to hide secret bits in English
Text in paras A – E, format specific techniques are discussed
in paras F – K while ways of hiding secret bits in TCP and IP
header are elaborated in para L respectively:
A. Acronym
According to the definition at [43] “an acronym
(pronounced AK-ruh-nihm, from Greek acro- in the sense of
extreme or tip and onyma or name) is an abbreviation of
several words in such a way that the abbreviation itself forms
a pronounceable word. The word may already exist or it can
be a new word. Webster's cites SNAFU and radar, two terms
of World War Two vintage, as examples of acronyms that were
created”.
Mohammad Sirali-Shahreza and M. Hassan Shirali-
Shahreza have suggested the substitution of words with their
abbreviations or viza viz in [40] to hide bits of secret message.
The proposed method works as under: Table 1
If a matched word/abbreviation is found then the bit
to be hidden is checked to see if it is under column ‘1’ or ‘0’
and based on its value (i.e., 0 or 1), word/abbreviation from
the corresponding column label is substituted in the cover
message, in case of otherwise the word/abbreviation is left
unchanged. The process is repeated till end of message.
Acronym Translation
2l8 Too late
ASAP As Soon As Possible
C See
CM Call Me
F2F Face to face
Advantages
Speedy
Flexibility: More words / abbreviation pairs can be added.
Technique can be applied in variety of fields such as
science, medicine etc.
Disadvantage
The main drawback lies in the static word/abbreviation
substitution where anyone who knows the algorithm can
easily extract the hidden bits of information and decode the
message which is against Kerckhoff’s Principle which states
that the security of the System should lie in its key, where
the algorithm is known to public.
66 http://sites.google.com/site/ijcsis/ ISSN 1947-5500
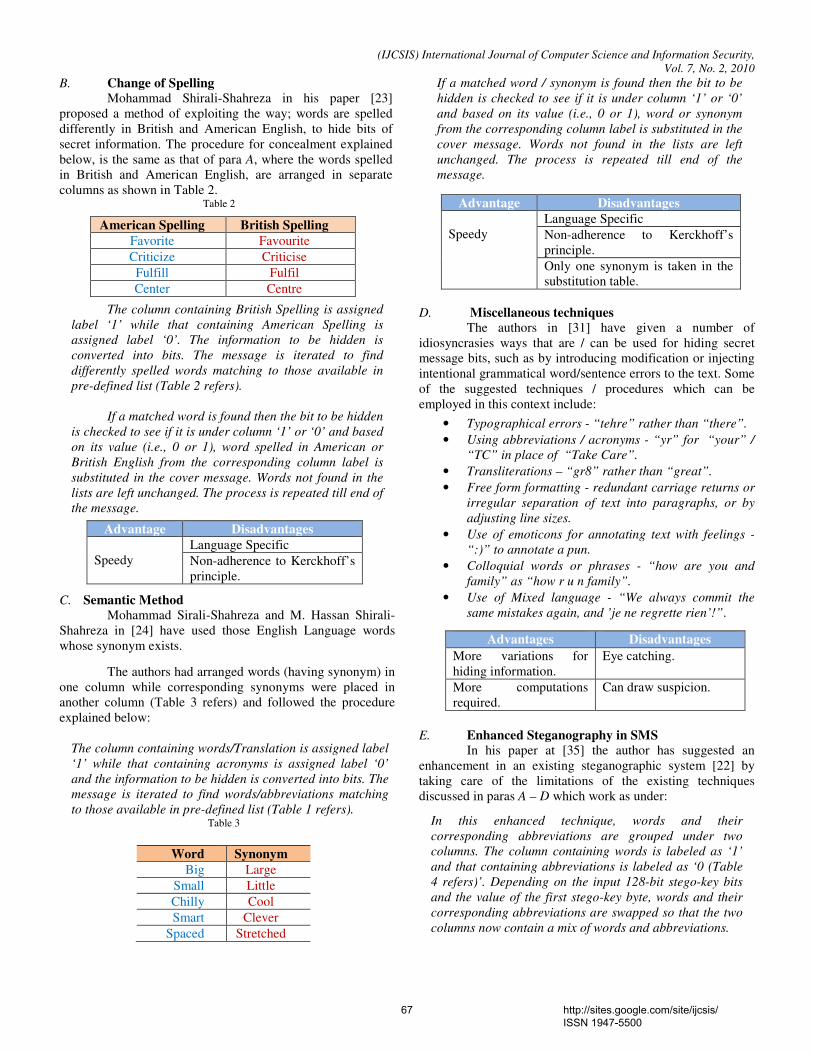
(IJCSIS) International Journal of Computer Science and Information Security,
Vol. 7, No. 2, 2010
B. Change of Spelling
Mohammad Shirali-Shahreza in his paper [23]
proposed a method of exploiting the way; words are spelled
differently in British and American English, to hide bits of
secret information. The procedure for concealment explained
below, is the same as that of para A, where the words spelled
in British and American English, are arranged in separate
columns as shown in Table 2. Table 2
The column containing British Spelling is assigned
label ‘1’ while that containing American Spelling is
assigned label ‘0’. The information to be hidden is
converted into bits. The message is iterated to find
differently spelled words matching to those available in
pre-defined list (Table 2 refers).
If a matched word is found then the bit to be hidden
is checked to see if it is under column ‘1’ or ‘0’ and based
on its value (i.e., 0 or 1), word spelled in American or
British English from the corresponding column label is
substituted in the cover message. Words not found in the
lists are left unchanged. The process is repeated till end of
the message.
C. Semantic Method
Mohammad Sirali-Shahreza and M. Hassan Shirali-
Shahreza in [24] have used those English Language words
whose synonym exists.
The authors had arranged words (having synonym) in
one column while corresponding synonyms were placed in
another column (Table 3 refers) and followed the procedure
explained below:
The column containing words/Translation is assigned label
‘1’ while that containing acronyms is assigned label ‘0’
and the information to be hidden is converted into bits. The
message is iterated to find words/abbreviations matching
to those available in pre-defined list (Table 1 refers). Table 3
If a matched word / synonym is found then the bit to be
hidden is checked to see if it is under column ‘1’ or ‘0’
and based on its value (i.e., 0 or 1), word or synonym
from the corresponding column label is substituted in the
cover message. Words not found in the lists are left
unchanged. The process is repeated till end of the
message.
D. Miscellaneous techniques
The authors in [31] have given a number of
idiosyncrasies ways that are / can be used for hiding secret
message bits, such as by introducing modification or injecting
intentional grammatical word/sentence errors to the text. Some
of the suggested techniques / procedures which can be
employed in this context include:
• Typographical errors - “tehre” rather than “there”.
• Using abbreviations / acronyms - “yr” for “your” /
“TC” in place of “Take Care”.
• Transliterations – “gr8” rather than “great”.
• Free form formatting - redundant carriage returns or
irregular separation of text into paragraphs, or by
adjusting line sizes.
• Use of emoticons for annotating text with feelings -
“:)” to annotate a pun.
• Colloquial words or phrases - “how are you and
family” as “how r u n family”.
• Use of Mixed language - “We always commit the
same mistakes again, and ’je ne regrette rien’!”.
E. Enhanced Steganography in SMS
In his paper at [35] the author has suggested an
enhancement in an existing steganographic system [22] by
taking care of the limitations of the existing techniques
discussed in paras A – D which work as under:
In this enhanced technique, words and their
corresponding abbreviations are grouped under two
columns. The column containing words is labeled as ‘1’
and that containing abbreviations is labeled as ‘0 (Table
4 refers)’. Depending on the input 128-bit stego-key bits
and the value of the first stego-key byte, words and their
corresponding abbreviations are swapped so that the two
columns now contain a mix of words and abbreviations.
American Spelling British Spelling
Favorite Favourite
Criticize Criticise
Fulfill Fulfil
Center Centre
Advantage Disadvantages
Speedy
Language Specific
Non-adherence to Kerckhoff’s
principle.
Word Synonym
Big Large
Small Little
Chilly Cool
Smart Clever
Spaced Stretched
Advantage Disadvantages
Speedy
Language Specific
Non-adherence to Kerckhoff’s
principle.
Only one synonym is taken in the
substitution table.
Advantages Disadvantages
More variations for
hiding information.
Eye catching.
More computations
required.
Can draw suspicion.
67 http://sites.google.com/site/ijcsis/ ISSN 1947-5500
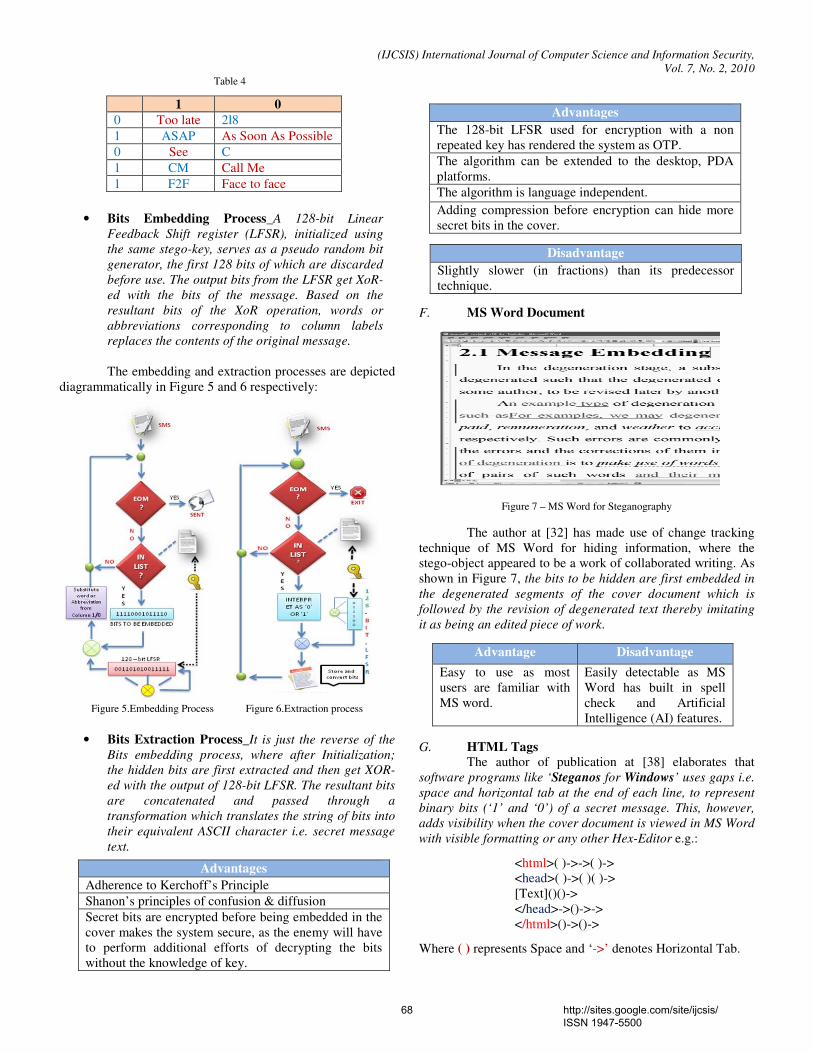
(IJCSIS) International Journal of Computer Science and Information Security,
Vol. 7, No. 2, 2010 Table 4
• Bits Embedding Process_A 128-bit Linear
Feedback Shift register (LFSR), initialized using
the same stego-key, serves as a pseudo random bit
generator, the first 128 bits of which are discarded
before use. The output bits from the LFSR get XoR-
ed with the bits of the message. Based on the
resultant bits of the XoR operation, words or
abbreviations corresponding to column labels
replaces the contents of the original message.
The embedding and extraction processes are depicted
diagrammatically in Figure 5 and 6 respectively:
• Bits Extraction Process_It is just the reverse of the
Bits embedding process, where after Initialization;
the hidden bits are first extracted and then get XOR-
ed with the output of 128-bit LFSR. The resultant bits
are concatenated and passed through a
transformation which translates the string of bits into
their equivalent ASCII character i.e. secret message
text.
F. MS Word Document
Figure 7 – MS Word for Steganography
The author at [32] has made use of change tracking
technique of MS Word for hiding information, where the
stego-object appeared to be a work of collaborated writing. As
shown in Figure 7, the bits to be hidden are first embedded in
the degenerated segments of the cover document which is
followed by the revision of degenerated text thereby imitating
it as being an edited piece of work.
G. HTML Tags
The author of publication at [38] elaborates that
software programs like ‘Steganos for Windows’ uses gaps i.e.
space and horizontal tab at the end of each line, to represent
binary bits (‘1’ and ‘0’) of a secret message. This, however,
adds visibility when the cover document is viewed in MS Word
with visible formatting or any other Hex-Editor e.g.:
<html>( )->->( )->
<head>( )->( )( )->
[Text]()()->
</head>->()->->
</html>()->()->
Where ( ) represents Space and ‘->’ denotes Horizontal Tab.
1 0
0 Too late 2l8
1 ASAP As Soon As Possible
0 See C
1 CM Call Me
1 F2F Face to face
Figure 5.Embedding Process Figure 6.Extraction process
Advantages
Adherence to Kerchoff’s Principle
Shanon’s principles of confusion & diffusion
Secret bits are encrypted before being embedded in the
cover makes the system secure, as the enemy will have
to perform additional efforts of decrypting the bits
without the knowledge of key.
Advantages
The 128-bit LFSR used for encryption with a non
repeated key has rendered the system as OTP.
The algorithm can be extended to the desktop, PDA
platforms.
The algorithm is language independent.
Adding compression before encryption can hide more
secret bits in the cover.
Disadvantage
Slightly slower (in fractions) than its predecessor
technique.
Advantage Disadvantage
Easy to use as most
users are familiar with
MS word.
Easily detectable as MS
Word has built in spell
check and Artificial
Intelligence (AI) features.
68 http://sites.google.com/site/ijcsis/ ISSN 1947-5500
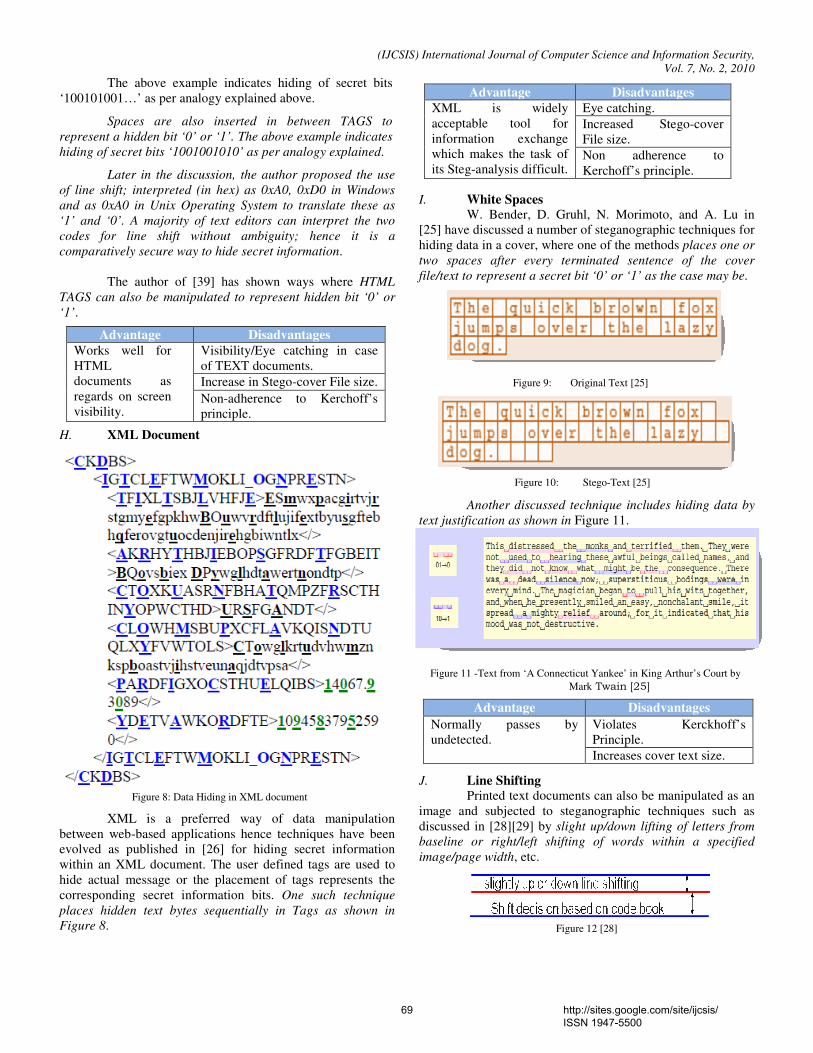
(IJCSIS) International Journal of Computer Science and Information Security,
Vol. 7, No. 2, 2010
The above example indicates hiding of secret bits
‘100101001…’ as per analogy explained above.
Spaces are also inserted in between TAGS to
represent a hidden bit ‘0’ or ‘1’. The above example indicates
hiding of secret bits ‘1001001010’ as per analogy explained.
Later in the discussion, the author proposed the use
of line shift; interpreted (in hex) as 0xA0, 0xD0 in Windows
and as 0xA0 in Unix Operating System to translate these as
‘1’ and ‘0’. A majority of text editors can interpret the two
codes for line shift without ambiguity; hence it is a
comparatively secure way to hide secret information.
The author of [39] has shown ways where HTML
TAGS can also be manipulated to represent hidden bit ‘0’ or
‘1’.
H. XML Document
Figure 8: Data Hiding in XML document
XML is a preferred way of data manipulation
between web-based applications hence techniques have been
evolved as published in [26] for hiding secret information
within an XML document. The user defined tags are used to
hide actual message or the placement of tags represents the
corresponding secret information bits. One such technique
places hidden text bytes sequentially in Tags as shown in
Figure 8.
I. White Spaces
W. Bender, D. Gruhl, N. Morimoto, and A. Lu in
[25] have discussed a number of steganographic techniques for
hiding data in a cover, where one of the methods places one or
two spaces after every terminated sentence of the cover
file/text to represent a secret bit ‘0’ or ‘1’ as the case may be.
Another discussed technique includes hiding data by
text justification as shown in Figure 11.
J. Line Shifting
Printed text documents can also be manipulated as an
image and subjected to steganographic techniques such as
discussed in [28][29] by slight up/down lifting of letters from
baseline or right/left shifting of words within a specified
image/page width, etc.
Figure 12 [28]
Advantage Disadvantages
Works well for
HTML
documents as
regards on screen
visibility.
Visibility/Eye catching in case
of TEXT documents.
Increase in Stego-cover File size.
Non-adherence to Kerchoff’s
principle.
Advantage Disadvantages
XML is widely
acceptable tool for
information exchange
which makes the task of
its Steg-analysis difficult.
Eye catching.
Increased Stego-cover
File size.
Non adherence to
Kerchoff’s principle.
Figure 9: Original Text [25]
Figure 10: Stego-Text [25]
Figure 11 -Text from ‘A Connecticut Yankee’ in King Arthur’s Court by
Mark Twain [25]
Advantage Disadvantages
Normally passes by
undetected.
Violates Kerckhoff’s
Principle.
Increases cover text size.
69 http://sites.google.com/site/ijcsis/ ISSN 1947-5500
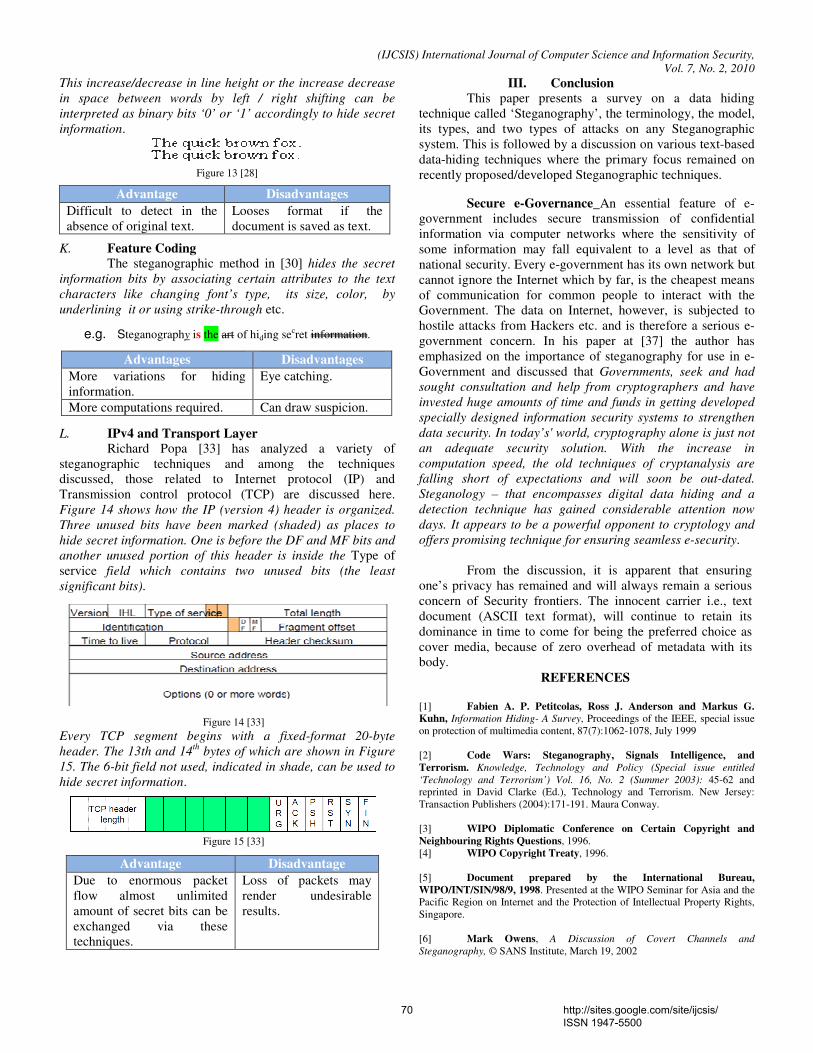
(IJCSIS) International Journal of Computer Science and Information Security,
Vol. 7, No. 2, 2010
This increase/decrease in line height or the increase decrease
in space between words by left / right shifting can be
interpreted as binary bits ‘0’ or ‘1’ accordingly to hide secret
information.
Figure 13 [28]
K. Feature Coding
The steganographic method in [30] hides the secret
information bits by associating certain attributes to the text
characters like changing font’s type, its size, color, by
underlining it or using strike-through etc.
e.g. Steganography is the art of hiding secret information.
L. IPv4 and Transport Layer
Richard Popa [33] has analyzed a variety of
steganographic techniques and among the techniques
discussed, those related to Internet protocol (IP) and
Transmission control protocol (TCP) are discussed here.
Figure 14 shows how the IP (version 4) header is organized.
Three unused bits have been marked (shaded) as places to
hide secret information. One is before the DF and MF bits and
another unused portion of this header is inside the Type of
service field which contains two unused bits (the least
significant bits).
Figure 14 [33]
Every TCP segment begins with a fixed-format 20-byte
header. The 13th and 14th
bytes of which are shown in Figure
15. The 6-bit field not used, indicated in shade, can be used to
hide secret information.
Figure 15 [33]
III. Conclusion
This paper presents a survey on a data hiding
technique called ‘Steganography’, the terminology, the model,
its types, and two types of attacks on any Steganographic
system. This is followed by a discussion on various text-based
data-hiding techniques where the primary focus remained on
recently proposed/developed Steganographic techniques.
Secure e-Governance_An essential feature of e-
government includes secure transmission of confidential
information via computer networks where the sensitivity of
some information may fall equivalent to a level as that of
national security. Every e-government has its own network but
cannot ignore the Internet which by far, is the cheapest means
of communication for common people to interact with the
Government. The data on Internet, however, is subjected to
hostile attacks from Hackers etc. and is therefore a serious e-
government concern. In his paper at [37] the author has
emphasized on the importance of steganography for use in e-
Government and discussed that Governments, seek and had
sought consultation and help from cryptographers and have
invested huge amounts of time and funds in getting developed
specially designed information security systems to strengthen
data security. In today’s' world, cryptography alone is just not
an adequate security solution. With the increase in
computation speed, the old techniques of cryptanalysis are
falling short of expectations and will soon be out-dated.
Steganology – that encompasses digital data hiding and a
detection technique has gained considerable attention now
days. It appears to be a powerful opponent to cryptology and
offers promising technique for ensuring seamless e-security.
From the discussion, it is apparent that ensuring
one’s privacy has remained and will always remain a serious
concern of Security frontiers. The innocent carrier i.e., text
document (ASCII text format), will continue to retain its
dominance in time to come for being the preferred choice as
cover media, because of zero overhead of metadata with its
body.
REFERENCES
[1] Fabien A. P. Petitcolas, Ross J. Anderson and Markus G.
Kuhn, Information Hiding- A Survey, Proceedings of the IEEE, special issue
on protection of multimedia content, 87(7):1062-1078, July 1999
[2] Code Wars: Steganography, Signals Intelligence, and
Terrorism. Knowledge, Technology and Policy (Special issue entitled
‘Technology and Terrorism’) Vol. 16, No. 2 (Summer 2003): 45-62 and
reprinted in David Clarke (Ed.), Technology and Terrorism. New Jersey:
Transaction Publishers (2004):171-191. Maura Conway.
[3] WIPO Diplomatic Conference on Certain Copyright and
Neighbouring Rights Questions, 1996.
[4] WIPO Copyright Treaty, 1996.
[5] Document prepared by the International Bureau,
WIPO/INT/SIN/98/9, 1998. Presented at the WIPO Seminar for Asia and the
Pacific Region on Internet and the Protection of Intellectual Property Rights,
Singapore.
[6] Mark Owens, A Discussion of Covert Channels and
Steganography, © SANS Institute, March 19, 2002
Advantage Disadvantages
Difficult to detect in the
absence of original text.
Looses format if the
document is saved as text.
Advantages Disadvantages
More variations for hiding
information.
Eye catching.
More computations required. Can draw suspicion.
Advantage Disadvantage
Due to enormous packet
flow almost unlimited
amount of secret bits can be
exchanged via these
techniques.
Loss of packets may
render undesirable
results.
70 http://sites.google.com/site/ijcsis/ ISSN 1947-5500

(IJCSIS) International Journal of Computer Science and Information Security,
Vol. 7, No. 2, 2010 [7] LADA Luiz, Angel, Dimitar and Andrew, The Art of Covert
Communication
[8] Dave Kleiman (Technical Editor), Kevin Cardwell, Timothy
Clinton, Michael Cross, Michael Gregg, Jesse Varsalone, The Official
CHFI Study Guide (Exam 312-49) for Computer Hacking Forensic
Investigators, Published by: Syngress Publishing, Inc., Elsevier, Inc., 30
Corporate Drive, Burlington, MA 01803, Craig Wright
[9] Stefan Katzenbeisser, Fabien A. P. Petitcolas, Information
Hiding Techniques for Steganography and Digital Watermarking, Artech
House, Boston – London
[10] Nedeljko Cvejic, Algorithms For Audio Watermarking And
Steganography, Department of Electrical and Information engineering,
Information Processing Laboratory, University of Oulu, 2004.
[11] Jessica Fridrich, Tomáš Pevný, Jan Kodovský, Statistically
Undetectable JPEG Steganography: Dead Ends, Challenges, and
Opportunities, Copyright 2007 ACM 978-1-59593-857-2/07/0009 ...$5.00.
[12] B. P_tzmann, Information hiding terminology, In Anderson [5],
pp. 347{350, ISBN 3-540-61996-8, results of an informal plenary meeting and
additional proposals.
[13] Bret Dunbar, Steganographic Techniques and their use in an
Open-Systems Environment, As part of the Information Security Reading
Room., © SANS Institute 2002
[14] Ingemar J. Cox, Matthew L. Miller, Jeffrey A. Bloom, Jessica
Fridrich, Ton Kalker, Digital Watermarking and Steganography, Second
Edition, Copyright © 2008 by Elsevier Inc. All rights reserved.
[15] Glancy, D., Privacy and Intelligent Transportation Technology,
Santa Clara Computer & High Technologies Law Journal, 1995, pp. 151.
[16] Victor Raskin, Brian Buck, Arthur Keen, Christian F.
Hempelmann, Katrina E. Triezenberg, Accessing and Manipulating
Meaning of Textual and Data Information for Information Assurance and
Security and Intelligence Information, Copyright © 2008 ACM 978-1-60558-
098-2/08/05 ... $5.00
[17] Chen Zhi-li, Huang Liu-sheng, Yu Zhen-shan, Zhao Xin-xin,
Zheng Xue-ling, Effective Linguistic Steganography Detection, IEEE 8th
International Conference on Computer and Information Technology
Workshops, 978-0-7695-3242-4/08 $25.00 © 2008 IEEE
[18] Hasan Mesut Meral, Bulent Sankur, A. Sumru Ozsoy, Tunga
Gungor, Emre Seving, Natural language watermarking via morphosyntactic
alterations, 0885-2308/$ - see front matter 2008 Elsevier Ltd. All rights
reserved.
[19] Mercan Topkara Cuneyt M. Taskiran Edward J. Delp, Natural
Language Watermarking, Security, Steganography, and Watermarking of
Multimedia Contents VII, edited by Edward J. Delp III, Ping Wah Wong, Proc.
of SPIE-IS&T Electronic Imaging, SPIE Vol. 5681 © 2005 SPIE and IS&T ·
0277-786X/05/$15
[20] Maes, M., Twin Peaks: The Histogram Attack on Fixed Depth
Image Watermarks, in Proceedings of the Second International Workshop on
Information Hiding, vol. 1525 of Lecture Notes in Computer Science,
Springer, 1998, pp. 290–305.
[21] GLENN WATT, CTA Conference, Santa Fe, NM, 2006
[22] Mohammad Sirali-Shahreza, M. Hassan Shirali-Shahreza, Text
Steganography in SMS, 0-7695-3038-9/07 © 2007 IEEE, DOI
10.1109/ICCIT.2007.100
[23] Mohammad Shirali-Shahreza, Text Steganography by Changing
Words Spelling, ISBN 978-89-5519-136-3, Feb. 17-20, 2008 ICACT 2008
[24] M. Hassan Shirali-Shahreza, Mohammad Shirali-Shahreza, A
New Synonym Text Steganography ,International Conference on Intelligent
Information Hiding and Multimedia Signal Processing 978-0-7695-3278-3/08
© 2008 IEEE
[25] W. Bender, D. Gruhl, N. Morimoto, and A. Lu, Techniques for
data hiding IBM Systems Journal, Vol. 35, Issues 3&4, pp. 313-336, 1996.
[26] Aasma Ghani Memon, Sumbul Khawaja and Asadullah Shah,
Steganography: a New Horizon for Safe Communication through XML,
www.jatit.org, JATIT ©2005 – 2008
[27] Xuan Zhou, HweeHwa Pang, KianLee Tan, Querybased
Watermarking for XML Data, ASIACCS’07, March 2022,2007,
Singapore.Copyright 2007 ACM 1595935746/07/0003 ...$5.00.
[28] Patrick Diskin, Samuel. Lau and Robert Parlett, Steganography
and Digital Watermarking, Jonathan Cummins, School of Computer Science,
The University of Birmingham, 2004
[29] S. H. Low N. F. Maxemchuk J. T. Brassil L. O'Gorman,
Document Marking and Identification using Both Line and Word Shifting,
AT&T Bell Laboratories, Murray Hill NJ 07974, 0743-166W95-1995 IEEE
[30] Lingyun Xiang, Xingming Sun, Gang Luo, Can Gan, Research
on Steganalysis for Text Steganography Based on Font Format, School of
Computer & Communication, Hunan University, Changsha, Hunan
P.R.China, 410082
[31] Mercan Topkara, Umut Topkara, Mikhail J. Atallah,
Information Hiding Through Errors: A Confusing Approach, Purdue
University
[32] Tsung-Yuan Liu, Wen-Hsiang Tsai,and Senior Member, A New
Steganographic Method for Data Hiding in Microsoft Word Documents by a
Change Tracking Technique, 1556-6013 © 2007 IEEE
[33] Richard Popa, An Analysis of Steganographic Techniques, The
'Politehnica' University of Timisoara, Faculty of Automatics and Computers,
Department of Computer Science and Software Engineering.
[34] Mark Stamp, Information Security-Principles and Practice,
Wiley Student Edition, 2006
[35] Rafat, K.F, Enhanced text steganography in SMS, Computer,
Control and Communication, 2009. IC4 2009 2nd International Conference
on 17-18 Feb. 2009, Digital Object Identifier 10.1109/IC4.2009.4909228
[36] Pierre Moulin and Ralf Koetter, Data-Hiding Codes, 0018-
9219/$20.00 © 2005 IEEE
[37] Huayin Si and Chang-Tsun Li, Maintaining Information
Security in E-Government through Steganology, Department of Computer
Science, University of Warwick, Coventry CV4 7AL, UK
[38] Stanislav S. Barilnik, Igor V. Minin, Oleg V. Minin ,Adaptation
of Text Steganographic Algorithm for HTML,ISSN 1815-3712 ISBN 978-5-
7782-0752-3 (C) Novosibirsk State Technical University.
[39] Sudeep Ghosh , StegHTML: A message hiding mechanism in
HTML tags, December 10,2007
[40] Mohammad Sirali-Shahreza, M. Hassan Shirali- Shahreza,
Text Steganography in Chat, 1-4244-1007/07 © 2007 IEEE
[41] http://mail.colonial.net/~abeckwith/encrypt.htm
71 http://sites.google.com/site/ijcsis/ ISSN 1947-5500

(IJCSIS) International Journal of Computer Science and Information Security,
Vol. 7, No. 2, 2010 [42] Chapman, Mark. A Software System for Concealing Ciphertext as
Innocuous Text, Hiding the Hidden:
http://www.NICETEXT.com/NICETEXT/doc/ thesis.pdf.1997
[43] http://searchcio-midmarket.techtarget.com/
sDefinition/0,,sid183_gci211518,00.html
[44] http://mail.colonial.net/~abeckwith/images/ scytale.gif
AUTHORS PROFILE
KHAN FARHAN RAFAT has
completed his Ph.D. course work
under supervision of Professor Dr.
Muhammad Sher, International
Islamic University, Islamabad.
He has twenty years R & D
experience in the field of
Information and communication
Security ranging from formulation
and implementation of security
policies, evolution of new and
enhancement of existing security
related Projects to software
development etc.
Professor Dr. MUHAMMAD
SHER is Head of Department of
Computer Science, International
Islamic University, Islamabad,
Pakistan. He did his Ph.D.
Computer Science from TU Berlin,
Germany, and specialized in Next
Generation Networks and Security.
He has vast research and
teaching experience and has a
number of international research
publications to his credit.
72 http://sites.google.com/site/ijcsis/ ISSN 1947-5500

(IJCSIS) International Journal of Computer Science and Information Security,
Vol. 7, No. 2, 2010
New clustering method to decrease probability of failure nodes and increasing the lifetime in WSNs
Shahram Babaie Department of Computer Engineering
PhD students, Islamic Azad University, Olom VA Tahghighat Branch,
Tehran, Iran .
Ahmad Khadem Zade Department of Computer Engineering
Iran Telecommunication Research Center Tehran, Iran
.
Ali Hosseinalipour Department of Computer Engineering
Islamic Azad University- Tabriz Branch Tabriz Iran
.
Abstract—Clustering in wireless sensor networks is one of the crucial methods for increasing of network lifetime. There are many algorithms for clustering. One of the important cluster based algorithm in wireless sensor networks is LEACH algorithm. In this paper we proposed a new clustering method for increasing of network lifetime. We distribute several sensors with a high-energy for managing the cluster head and to decrease their responsibilities in network. The performance of the proposed algorithm via computer simulation was evaluated and compared with other clustering algorithms. The simulation results show the high performance of the proposed clustering algorithm.
Keywords-Network Clustering; Nodes failure; Energy-Aware Communication; Wireless Sensor Networks
I. INTRODUCTION Recent improvements in integrated circuits (IC) have
fostered the emergence of a new generation of tiny, called Sensors. That from economical aspect they are commodious and also they are used in non military (for instance environmental managing: temperature, pressure, tremor, etc)
To consider having group of limitations such as battery life time, calculating and memory significantly they have been predicted as non recyclable and also they live until their powers fade away. So power is something rare for systems like sensor. During a special mission the correct consumption for sensors lifetime should be managed knowingly. The power of sensor can not support more than far connection. Therefore to transmit they need the architecture of multi sectional. A useful way to decrease the system lifetime is to divide them to diverse clusters [2]. Parts of a cluster-based network sensor are base stations and sensors. In this method sensors relay the data flow by head clusters. The central station always stays far from where sensors are expanded. In this manner saving the consumption energy and awareness of that to communicate with central station has various methods. Two methods of routing in articles have been proposed [5, 6]. These methods because of their route detecting and finding optimum steps in relation with central station have head load. In addition, they will have extra load on nodes that are located around central station, so most of the traffic will be from them.
To avoid these overheads and unbalanced consumption of energy some high-energy nodes called “Gateways” are deployed in the network [2]. These sensors are used as head clusters due to decrease the failure probability of head clusters. And this increases the lifetime of the network. But since this method takes a lot of expenditure so in this article we just use these sensors as manager for a number of head clusters. In this manner each one becomes gatewayamong each head cluster. This method decreases both networks lifetime and failure probability.
In the second part, the architecture of two networks and the relevant tasks will be explained. In the third part, the proposed protocol has been explained and in the fourth part the results of simulating and tests evaluation can be seen. The last part involves conclusion of the article and discussing about pattern of future researches.
II. RELATED WORKS System architecture for clustered sensor networks has been
shown in figure 1. There just two sorts of nodes, cluster joint sensors and head cluster with tolerance of energy shortcoming. Joint sensors and homogeneous head clusters with a same identity have been assumed as similar. All the connections are wireless. The connection of joint nodes with the main station is possible only with head cluster. For sending information schedule we use TDMA (Time-Division Multiple Access) protocol.
During starting the process a unique ID, primary energy and TDMA scheduling are attributed for all the sensors and gateways. We suppose that the entire node are aware from others place by the GPS. In the beginning all of the connective bridges are assumed in connection area. as the energy consumption of GPS is high , it is On at the beginning of the clustering and on the other states it is in the sleep mode. Connection scheduling among connective bridges first appears with head cluster when it establishes.
The central station always stays far from where the sensors are expanded. in this order, maintaining the consumption energy and being aware of that in relation with central station have different methods: such as LEACH (Low-energy Adaptive Clustering Hierarchy) [1] and SEP (Stable Election Protocol) [7] and also two other routing method have been
73 http://sites.google.com/site/ijcsis/ ISSN 1947-5500
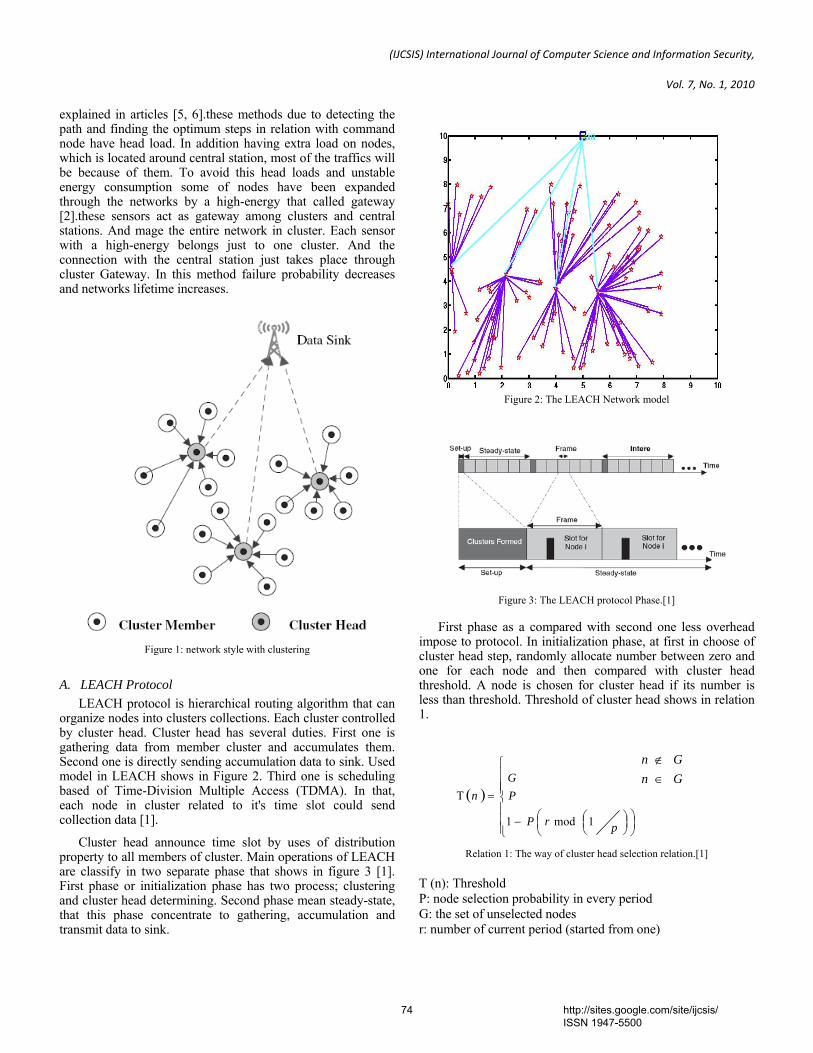
(IJCSIS) International Journal of Computer Science and Information Security,
Vol. 7, No. 1, 2010
explained in articles [5, 6].these methods due to detecting the path and finding the optimum steps in relation with command node have head load. In addition having extra load on nodes, which is located around central station, most of the traffics will be because of them. To avoid this head loads and unstable energy consumption some of nodes have been expanded through the networks by a high-energy that called gateway [2].these sensors act as gateway among clusters and central stations. And mage the entire network in cluster. Each sensor with a high-energy belongs just to one cluster. And the connection with the central station just takes place through cluster Gateway. In this method failure probability decreases and networks lifetime increases.
Figure 1: network style with clustering
A. LEACH Protocol LEACH protocol is hierarchical routing algorithm that can
organize nodes into clusters collections. Each cluster controlled by cluster head. Cluster head has several duties. First one is gathering data from member cluster and accumulates them. Second one is directly sending accumulation data to sink. Used model in LEACH shows in Figure 2. Third one is scheduling based of Time-Division Multiple Access (TDMA). In that, each node in cluster related to it's time slot could send collection data [1].
Cluster head announce time slot by uses of distribution property to all members of cluster. Main operations of LEACH are classify in two separate phase that shows in figure 3 [1]. First phase or initialization phase has two process; clustering and cluster head determining. Second phase mean steady-state, that this phase concentrate to gathering, accumulation and transmit data to sink.
Figure 2: The LEACH Network model
Figure 3: The LEACH protocol Phase.[1]
First phase as a compared with second one less overhead impose to protocol. In initialization phase, at first in choose of cluster head step, randomly allocate number between zero and one for each node and then compared with cluster head threshold. A node is chosen for cluster head if its number is less than threshold. Threshold of cluster head shows in relation 1.
( )
⎪⎪⎪
⎩
⎪⎪⎪
⎨
⎧
⎟⎠⎞
⎜⎝⎛ ⎟
⎠⎞⎜
⎝⎛−
=Τ
prP
PG
n
1mod1
GnGn
∈∉
Relation 1: The way of cluster head selection relation.[1]
T (n): Threshold P: node selection probability in every period G: the set of unselected nodes r: number of current period (started from one)
74 http://sites.google.com/site/ijcsis/ ISSN 1947-5500
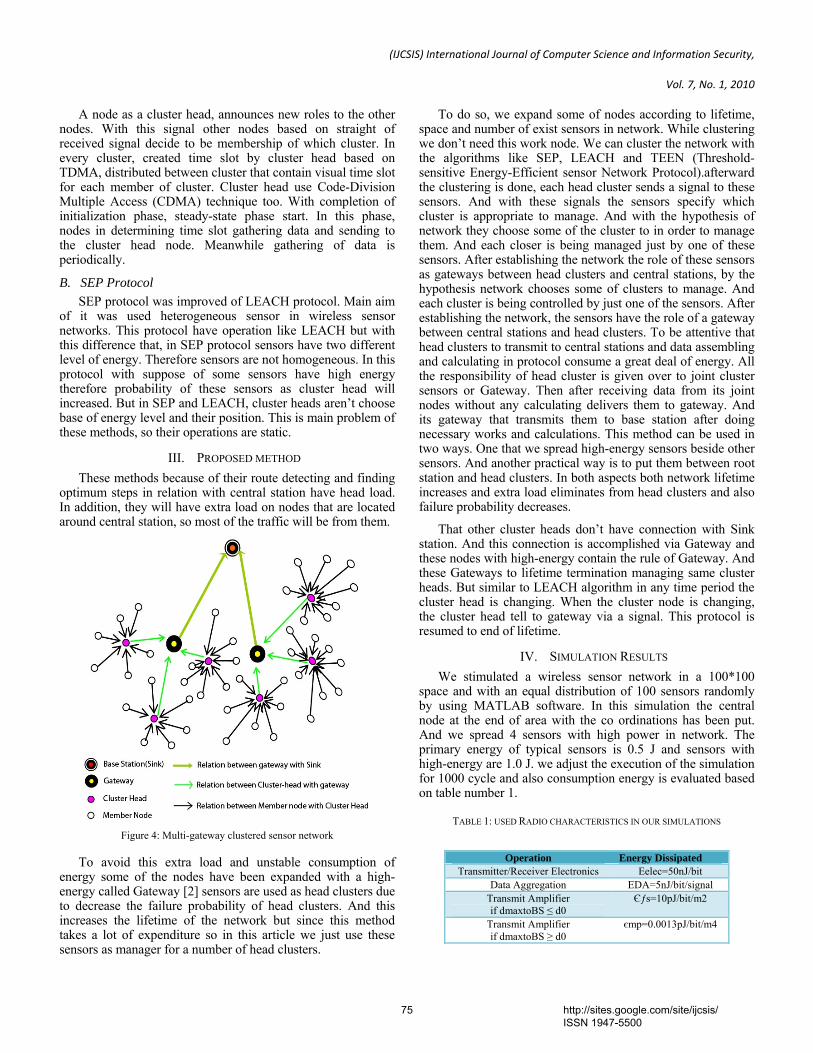
(IJCSIS) International Journal of Computer Science and Information Security,
Vol. 7, No. 1, 2010
A node as a cluster head, announces new roles to the other nodes. With this signal other nodes based on straight of received signal decide to be membership of which cluster. In every cluster, created time slot by cluster head based on TDMA, distributed between cluster that contain visual time slot for each member of cluster. Cluster head use Code-Division Multiple Access (CDMA) technique too. With completion of initialization phase, steady-state phase start. In this phase, nodes in determining time slot gathering data and sending to the cluster head node. Meanwhile gathering of data is periodically.
B. SEP Protocol SEP protocol was improved of LEACH protocol. Main aim
of it was used heterogeneous sensor in wireless sensor networks. This protocol have operation like LEACH but with this difference that, in SEP protocol sensors have two different level of energy. Therefore sensors are not homogeneous. In this protocol with suppose of some sensors have high energy therefore probability of these sensors as cluster head will increased. But in SEP and LEACH, cluster heads aren’t choose base of energy level and their position. This is main problem of these methods, so their operations are static.
III. PROPOSED METHOD These methods because of their route detecting and finding
optimum steps in relation with central station have head load. In addition, they will have extra load on nodes that are located around central station, so most of the traffic will be from them.
Figure 4: Multi-gateway clustered sensor network
To avoid this extra load and unstable consumption of energy some of the nodes have been expanded with a high-energy called Gateway [2] sensors are used as head clusters due to decrease the failure probability of head clusters. And this increases the lifetime of the network but since this method takes a lot of expenditure so in this article we just use these sensors as manager for a number of head clusters.
To do so, we expand some of nodes according to lifetime, space and number of exist sensors in network. While clustering we don’t need this work node. We can cluster the network with the algorithms like SEP, LEACH and TEEN (Threshold-sensitive Energy-Efficient sensor Network Protocol).afterward the clustering is done, each head cluster sends a signal to these sensors. And with these signals the sensors specify which cluster is appropriate to manage. And with the hypothesis of network they choose some of the cluster to in order to manage them. And each closer is being managed just by one of these sensors. After establishing the network the role of these sensors as gateways between head clusters and central stations, by the hypothesis network chooses some of clusters to manage. And each cluster is being controlled by just one of the sensors. After establishing the network, the sensors have the role of a gateway between central stations and head clusters. To be attentive that head clusters to transmit to central stations and data assembling and calculating in protocol consume a great deal of energy. All the responsibility of head cluster is given over to joint cluster sensors or Gateway. Then after receiving data from its joint nodes without any calculating delivers them to gateway. And its gateway that transmits them to base station after doing necessary works and calculations. This method can be used in two ways. One that we spread high-energy sensors beside other sensors. And another practical way is to put them between root station and head clusters. In both aspects both network lifetime increases and extra load eliminates from head clusters and also failure probability decreases.
That other cluster heads don’t have connection with Sink station. And this connection is accomplished via Gateway and these nodes with high-energy contain the rule of Gateway. And these Gateways to lifetime termination managing same cluster heads. But similar to LEACH algorithm in any time period the cluster head is changing. When the cluster node is changing, the cluster head tell to gateway via a signal. This protocol is resumed to end of lifetime.
IV. SIMULATION RESULTS We stimulated a wireless sensor network in a 100*100
space and with an equal distribution of 100 sensors randomly by using MATLAB software. In this simulation the central node at the end of area with the co ordinations has been put. And we spread 4 sensors with high power in network. The primary energy of typical sensors is 0.5 J and sensors with high-energy are 1.0 J. we adjust the execution of the simulation for 1000 cycle and also consumption energy is evaluated based on table number 1.
TABLE 1: USED RADIO CHARACTERISTICS IN OUR SIMULATIONS
Energy Dissipated Operation
Eelec=50nJ/bit Transmitter/Receiver Electronics EDA=5nJ/bit/signal Data Aggregation Єƒs=10pJ/bit/m2 Transmit Amplifier
if dmaxtoBS ≤ d0 єmp=0.0013pJ/bit/m4 Transmit Amplifier
if dmaxtoBS ≥ d0
75 http://sites.google.com/site/ijcsis/ ISSN 1947-5500
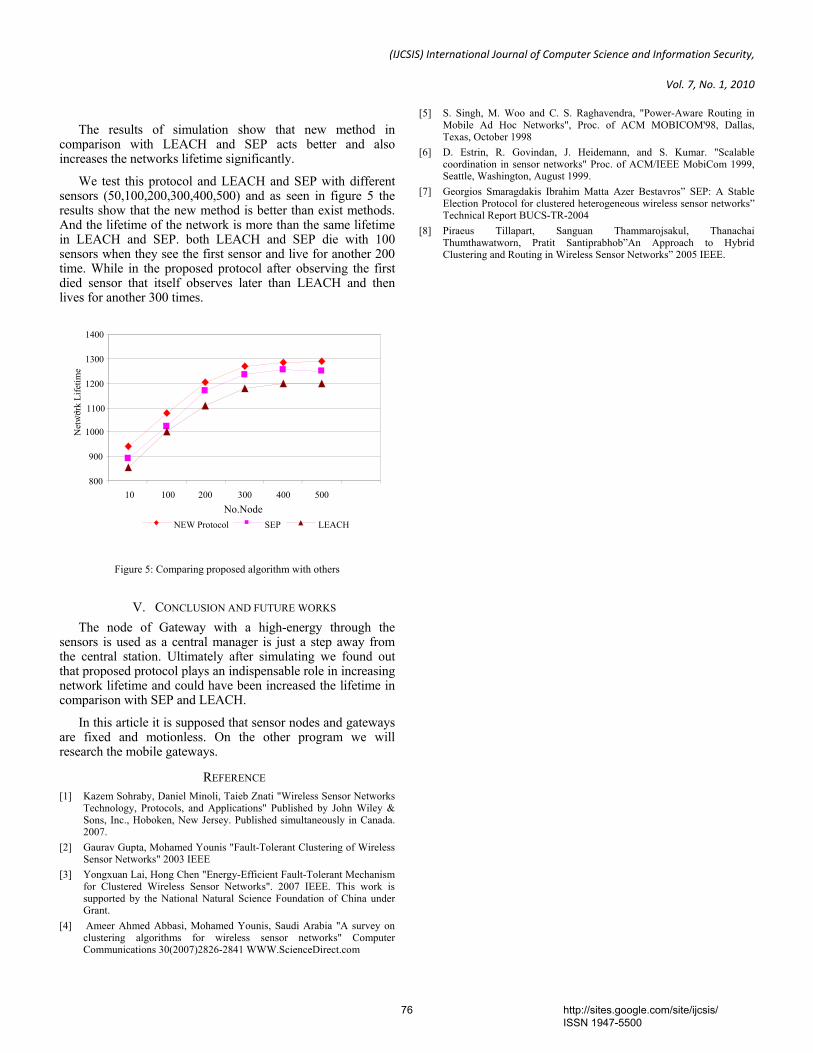
(IJCSIS) International Journal of Computer Science and Information Security,
Vol. 7, No. 1, 2010
The results of simulation show that new method in
comparison with LEACH and SEP acts better and also increases the networks lifetime significantly.
We test this protocol and LEACH and SEP with different sensors (50,100,200,300,400,500) and as seen in figure 5 the results show that the new method is better than exist methods. And the lifetime of the network is more than the same lifetime in LEACH and SEP. both LEACH and SEP die with 100 sensors when they see the first sensor and live for another 200 time. While in the proposed protocol after observing the first died sensor that itself observes later than LEACH and then lives for another 300 times.
Figure 5: Comparing proposed algorithm with others
V. CONCLUSION AND FUTURE WORKS The node of Gateway with a high-energy through the
sensors is used as a central manager is just a step away from the central station. Ultimately after simulating we found out that proposed protocol plays an indispensable role in increasing network lifetime and could have been increased the lifetime in comparison with SEP and LEACH.
In this article it is supposed that sensor nodes and gateways are fixed and motionless. On the other program we will research the mobile gateways.
REFERENCE [1] Kazem Sohraby, Daniel Minoli, Taieb Znati "Wireless Sensor Networks
Technology, Protocols, and Applications" Published by John Wiley & Sons, Inc., Hoboken, New Jersey. Published simultaneously in Canada. 2007.
[2] Gaurav Gupta, Mohamed Younis "Fault-Tolerant Clustering of Wireless Sensor Networks" 2003 IEEE
[3] Yongxuan Lai, Hong Chen "Energy-Efficient Fault-Tolerant Mechanism for Clustered Wireless Sensor Networks". 2007 IEEE. This work is supported by the National Natural Science Foundation of China under Grant.
[4] Ameer Ahmed Abbasi, Mohamed Younis, Saudi Arabia "A survey on clustering algorithms for wireless sensor networks" Computer Communications 30(2007)2826-2841 WWW.ScienceDirect.com
[5] S. Singh, M. Woo and C. S. Raghavendra, "Power-Aware Routing in Mobile Ad Hoc Networks", Proc. of ACM MOBICOM'98, Dallas, Texas, October 1998
[6] D. Estrin, R. Govindan, J. Heidemann, and S. Kumar. "Scalable coordination in sensor networks" Proc. of ACM/IEEE MobiCom 1999, Seattle, Washington, August 1999.
[7] Georgios Smaragdakis Ibrahim Matta Azer Bestavros” SEP: A Stable Election Protocol for clustered heterogeneous wireless sensor networks” Technical Report BUCS-TR-2004
[8] Piraeus Tillapart, Sanguan Thammarojsakul, Thanachai Thumthawatworn, Pratit Santiprabhob”An Approach to Hybrid Clustering and Routing in Wireless Sensor Networks” 2005 IEEE.
800
900
1000 1100
1200
1300
1400
10 100 200 300 400 500
?
Net
wor
k Li
fetim
e
NEW Protocol SEP LEACHNo.Node
76 http://sites.google.com/site/ijcsis/ ISSN 1947-5500
(IJCSIS) International Journal of Computer Science and Information Security, Vol. 7, No. 2, 2010
Comments on “Routh Stability Criterion”
T.D.Roopamala S.K.KattiAssistant Professor
Sri Jayachamarajendra college of Engineering .
Professor Sri Jayachamarajendra college of Engineering
.
Abstract— In this note, we have shown special case on Routh stability criterion, which is not discussed, in previous literature. This idea can be useful in computer science applications.
Keywords- Routh stability criterion, Routh array, Hurwitz criterion, stability.
I. INTRODUCTION The Routh stability criterion [1] is an analytical procedure
for determining if all the roots of a polynomial have negative real parts, and it is used in the stability analysis of linear time-invariants systems [6]. This stability criterion is useful in various engineering applications [7-8]. There are various special cases discussed in various literature based on Routh criterion [2, 5]. In this small note, one special case based on Routh criterion is considered which is not dealt by the previous authors, to the best of our knowledge.
II. ROUTH STABILITY CRITERION In order to ascertain the stability of a linear time-invariant system, it is necessary to determine if any of the roots of its characteristics equation lie in the right half of the s-plane. A. Hurwitz and E. J. Routh independently published the method of investigating the sufficient conditions of stability of a system [1]. The Hurwitz criterion is in terms of determinants and the Routh criterion is in terms of array formulation. A necessary and sufficient condition for stability is that all of the elements in the first column of the Routh array be positive. If this condition is not met, the system is unstable, and the number of sign changes in the elements of the first column of the Routh array corresponds to the number of roots of the characteristics equation in the right half of the s-plane. However, the standard procedure fails if we encounter any of the following situations in the formulation of the array [4]. [1] A row of all zeros appears [2] First element of a row, appearing in first column of the array is zero, but the entire row is not all zeros.
III. PROPOSED SPECIAL CASE ON ROUTH CRITERION Consider the following polynomial
4 1 0λ + = (1)
Applying Routh criterion to above polynomial, we get 4λ 1 0 1 3λ ∈ ∈ ∈ 2λ -1 0 0 (2) 1λ ∈ ∈ 0 0λ 1 0 0 In above problem, first row of the Routh’s array does not posses all non-zero elements, and the immediate second row has all the elements zeros and hence the problem considered in this note is different from the other existing cases. Now Replacing all the elements in the second row by ∈ , as shown in (2), where ∈ is a small positive number. Then, we apply Routh method to remaining array formulation. So, in the first column of the Routh array, there exist two changes in sign and hence, this polynomial has complex conjugate eigenvalues with positive real parts. The actual roots of a polynomial are
1,2
3,4
0.7171 0.7071 ,0.7171 0.7071
jj
λ
λ
= − ±
= ± (3)
ACKNOWLEDGMENT We are thankful to Dr. Yogesh V. Hote for suggestion in writing this paper.
REFERENCES [1] E. J. Routh, A Treatise on the Stability of motion, London, U. K.:
Macmillan, 1877. [2] K. Khatwani, “On Routh Hurwitz criterion,” IEEE Transactions on
Automatic Control, vol. 26, no. 2, pp. 483-582, 1981. [3] M. V. C. Rao and P. V. Rao, “Some More Comments on “ On the
Routh Hurwitz Criterion,” IEEE Transactions On automatic Control, pp. 714-716, 1975.
77 http://sites.google.com/site/ijcsis/ ISSN 1947-5500

(IJCSIS) International Journal of Computer Science and Information Security, Vol. 7, No. 2, 2010
[4] A. Lepschy, “Comments on Polynomial Factorization using Routh Criterion,” IEEE Proceedings, 1972.
[5] R. N. Clark, “The Routh-Hurwitz stability criterion, revisited,” IEEE Control system magazine, pp. 119-120, Jun. 1992.
[6] M. Gopal, Control Systems Principles and Design, Tata McGraw Hill, Second edition, 2000.
[7] K. Dekker, “ Formula Manipulation in ALGOL 68 and application to Routh’s Algorihm,” Computing, Vol. 26, pp. 167-187, 1981.
[8] A. P. Liyaw, “ Hgram patterns of Routh Stability zones in linear systems,” International Journal of Mathematical Education in Science and Technology, vol. 28, no. 2, pp. 225-241, 1997.
78 http://sites.google.com/site/ijcsis/ ISSN 1947-5500
(IJCSIS) International Journal of Computer Science and Information Security, Vol. 7, No. 2, 2010
Concurrent Approach to Flynn’s SPMD Classification Through Java
Bala Dhandayuthapani Veerasamy Department of Computing
Mekelle University Mekelle, Ethiopia
.
Abstract—Parallel programming models exist as an abstraction of hardware and memory architectures. There are several parallel programming models in commonly use; they are shared memory model, thread model, message passing model, data parallel model, hybrid model, Flynn’s models, embarrassingly parallel computations model, pipelined computations model. These models are not specific to a particular type of machine or memory architecture. This paper focuses the concurrent approach to Flynn’s SPMD classification in single processing environment through java program.
Keywords-Concurren; Flynn’s Taxonomy; Single processor Environment; Java Development Ki; Parallel;
I. INTRODUCTION Parallel programming and distributed programming [1] are
two basic approaches for achieving concurrency with a piece of software. They are two different programming paradigms that sometimes intersect. In the past programming life, we were mostly using sequential programming. But, today’s life style is going with more faster than the past decades. Also, solving problems on the computers are enormous. Parallel computer [1] can executes two or more job within a same period of time.
Two events are said to be concurrent if they occur within the same time interval. Two or more tasks executing over the same time interval are said to execute concurrently. Tasks that exist at the same time and perform in the same time period are concurrent. Concurrent tasks can execute in a single or multiprocessing environment [2]. In a single processing environment, concurrent tasks exist at the same time and execute within the same time period by context switching. In a multiprocessor environment, if enough processors are free, concurrent tasks may execute at the same instant over the same time period. The determining factor for what makes an acceptable time period for concurrency is relative to the application.
Concurrency techniques [3] [6] are used to allow a computer program to do more work over the same time period or time interval. Rather than designing the program to do one task at a time, the program is broken down in such a way that
some of the tasks can be executed concurrently. In some situations, doing more work over the same time period is not the goal. Rather, simplifying the programming solution is the goal. Sometimes it makes more sense to think of the solution to the problem as a set of concurrently executed tasks. This technique is used in the parallel computer architectures.
Java is just a computer language [5] that has secure, portable, object-oriented, multithreaded [3] [4] [6], interpreted, byte-coded, garbage-collected, language with a strongly typed exception-handling mechanism for writing distributed programs [4]. Java is an object-oriented programming language, which added the new features such as overriding, interface and etc. Java supports multithreaded programming, which allows you to do many things simultaneously on the same time interval. Java enables the creation of cross-platform programs by compiling into an intermediate representation called java byte code. JVM (Java Virtual Machine) is an interpreter for java. Java is designed for the distributed environment on the Internet. Java has technology called RMI (Remote Method Invocation) that brings unparalleled level of abstraction to client / server programming. Byte code is a highly optimized set of instructions designed to be executed by the java run-time system, which is called Java Virtual Machine (JVM). Java handles de-allocation for you automatically, this technique called garbage collection. The Java Developers Kit (JDK) is a set of command-line tools that can be used to create Java programs. The current release of the JDK is version 1.6.
II. FLYNN’S CLASSICAL TAXONOMY Parallel computers can be divided into two main categories
of control flow and data flow. Control-flow parallel computers are essentially based on the same principles as the sequential or von Neumann computer, except that multiple instructions can be executed at any given time. Data-flow parallel computers sometimes referred to as “non-von Neumann,” is completely different in that they have no pointer to active instruction(s) or a locus of control. The control is totally distributed, with the availability of operands triggering the activation of instructions. In what follows, we will focus exclusively on control-flow parallel computers.
79 http://sites.google.com/site/ijcsis/ ISSN 1947-5500
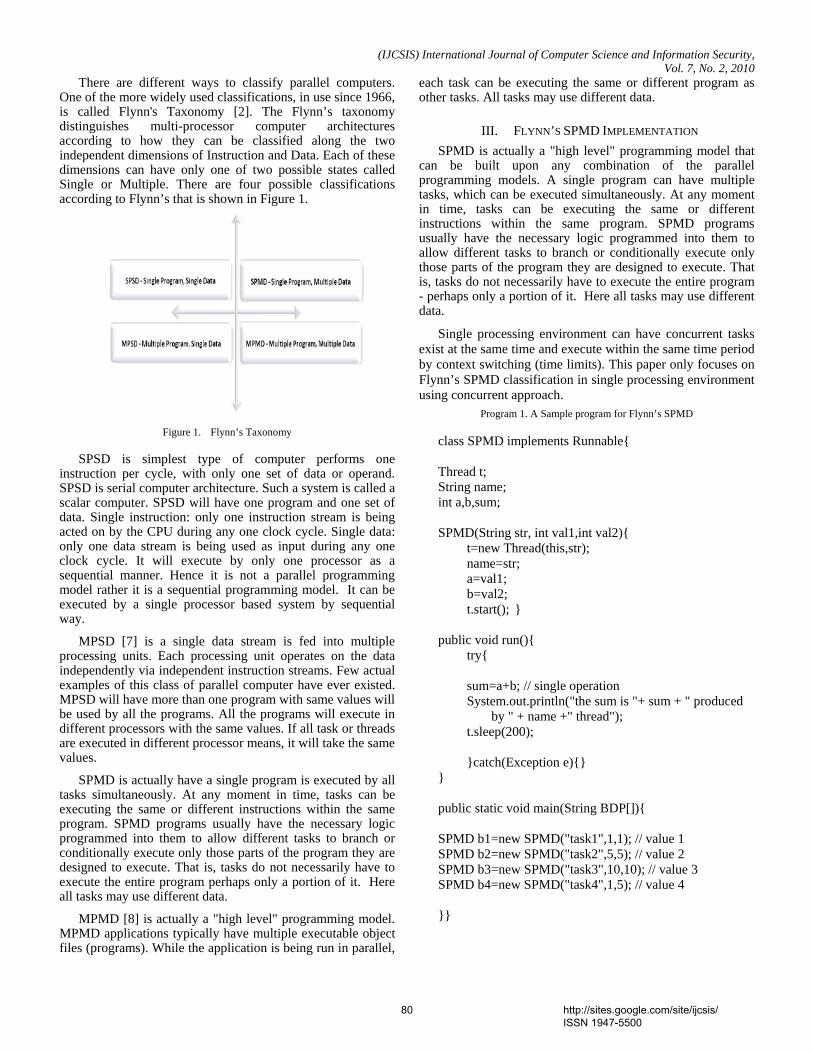
(IJCSIS) International Journal of Computer Science and Information Security, Vol. 7, No. 2, 2010
There are different ways to classify parallel computers. One of the more widely used classifications, in use since 1966, is called Flynn's Taxonomy [2]. The Flynn’s taxonomy distinguishes multi-processor computer architectures according to how they can be classified along the two independent dimensions of Instruction and Data. Each of these dimensions can have only one of two possible states called Single or Multiple. There are four possible classifications according to Flynn’s that is shown in Figure 1.
Figure 1. Flynn’s Taxonomy
SPSD is simplest type of computer performs one instruction per cycle, with only one set of data or operand. SPSD is serial computer architecture. Such a system is called a scalar computer. SPSD will have one program and one set of data. Single instruction: only one instruction stream is being acted on by the CPU during any one clock cycle. Single data: only one data stream is being used as input during any one clock cycle. It will execute by only one processor as a sequential manner. Hence it is not a parallel programming model rather it is a sequential programming model. It can be executed by a single processor based system by sequential way.
MPSD [7] is a single data stream is fed into multiple processing units. Each processing unit operates on the data independently via independent instruction streams. Few actual examples of this class of parallel computer have ever existed. MPSD will have more than one program with same values will be used by all the programs. All the programs will execute in different processors with the same values. If all task or threads are executed in different processor means, it will take the same values.
SPMD is actually have a single program is executed by all tasks simultaneously. At any moment in time, tasks can be executing the same or different instructions within the same program. SPMD programs usually have the necessary logic programmed into them to allow different tasks to branch or conditionally execute only those parts of the program they are designed to execute. That is, tasks do not necessarily have to execute the entire program perhaps only a portion of it. Here all tasks may use different data.
MPMD [8] is actually a "high level" programming model. MPMD applications typically have multiple executable object files (programs). While the application is being run in parallel,
each task can be executing the same or different program as other tasks. All tasks may use different data.
III. FLYNN’S SPMD IMPLEMENTATION SPMD is actually a "high level" programming model that
can be built upon any combination of the parallel programming models. A single program can have multiple tasks, which can be executed simultaneously. At any moment in time, tasks can be executing the same or different instructions within the same program. SPMD programs usually have the necessary logic programmed into them to allow different tasks to branch or conditionally execute only those parts of the program they are designed to execute. That is, tasks do not necessarily have to execute the entire program - perhaps only a portion of it. Here all tasks may use different data.
Single processing environment can have concurrent tasks exist at the same time and execute within the same time period by context switching (time limits). This paper only focuses on Flynn’s SPMD classification in single processing environment using concurrent approach.
Program 1. A Sample program for Flynn’s SPMD
class SPMD implements Runnable{ Thread t; String name; int a,b,sum; SPMD(String str, int val1,int val2){ t=new Thread(this,str); name=str; a=val1; b=val2; t.start(); } public void run(){ try{ sum=a+b; // single operation System.out.println("the sum is "+ sum + " produced by " + name +" thread"); t.sleep(200); }catch(Exception e){} } public static void main(String BDP[]){ SPMD b1=new SPMD("task1",1,1); // value 1 SPMD b2=new SPMD("task2",5,5); // value 2 SPMD b3=new SPMD("task3",10,10); // value 3 SPMD b4=new SPMD("task4",1,5); // value 4 }}
80 http://sites.google.com/site/ijcsis/ ISSN 1947-5500
(IJCSIS) International Journal of Computer Science and Information Security, Vol. 7, No. 2, 2010
IV. RESULTS AND DISCUSSION Sequential programming also called serial programming. It
is normally a computer programs, which involves consecutive process or sequential process. It can uses only single processing environment. There are drawbacks in sequential programming. It can be executed in a sequential manner. It will take more time for execution because instruction will execute by the processor one after another. It will have less clock speed. Biggest problems cannot be solved. The concurrent programming is also a computer program, which involves more than one process within the same time interval. Two or more tasks executing over the same time interval are said to execute concurrently. Parallel and distributed programmings are two approaches for achieving concurrency.
Java provides Thread class to create concurrent execution of tasks. Thread class has constructors and methods, which are helping to create concurrent execution of tasks. The Program 1 developed to execute in a single processing environment using Flynn’s classification with SPMD. In this program, SPMD (String str, int val1, int val2) constructor has an argument with “String str” will receive name of the task, “int val1, val2” will receive values for addition, subtraction, multiplication and division. In the main function b1, b2, b3, b4 are objects; once it has created constructor will be automatically called. The t=new Thread(this, str) creates tasks such as “Task1”, “Task2”, “Task3” and “Task4”. The t.start() method has been starting all the tasks. After starting the tasks, it will be automatically called run() method. The run() method will execute all the tasks concurrently by using t.sleep(200) method (context switching). The t.sleep(200) method pause any task for 200 milliseconds during execution and it will allow to execute waiting of any other task. Until completing all the tasks, run() method permitted to execute tasks concurrently using sleep() method and it enabled to exploit the processor idle time. Here all the tasks will use same operation with sum=a+b as the same program but it will use different data as "task1" uses 1,1; "task2" uses 5,5; "task3" uses 10,10; "task4" uses 1,5; Finally, this program will produce the following result.
the sum is 2 produced by task1 thread
the sum is 10 produced by task2 thread
the sum is 20 produced by task3 thread
the sum is 6 produced by task4 thread
Hence, this research finding introduced to use for Flynn’s SPMD classification to execute on the single processing environment using concurrent approach.
V. CONCLUSION Flynn’s classical taxonomy has four classifications, except
the first classification all other classification will utilize multiprocessing environment. While executing a single program over processor, it executes one task at a time.
Concurrent approaches can execute multiple tasks using context switching in single processor environments. It enabled to execute Flynn’s SPMD classification in single processing environment. This finding also initiated to have high performance and throughput on single processing environment. Hence, this paper recommending you to have concurrent execution of single program with multiple values on single processing environment.
REFERENCES [1] Tobias Wittwer, An Introduction to Parallel Programming, VSSD, 2006. [2] Hesham El-Rewini, Mostafa Abd-El-Barr, Advanced Computer
Architecture and Parallel, A John Wiley & Sons, Inc Publication, 2005. [3] Brian Goetz, Tim Peierls, Joshua Bloch, Joseph Bowbeer, David Holmes,
Doug Lea, Java Concurrency in Practice, Addison Wesley Professional, 2006.
[4] Charles W. Kann, Creating Components: Object Oriented, Concurrent, and Distributed Computing in Java, Auerbach Publications, 2004.
[5] Peter Norton & Wiliam Stanek, Java Programming, Sams Publishing, 1996.
[6] Stephen J. Hartley, Concurrent Programming Using Java, Oxford University Press, 1998.
[7] Bala Dhandayuthapani Veerasamy, Concurrent Approach to Flynn’s MPSD Classification through Java, International Journal of Computer Science and Network Security, Vol. 10 No. 1 pp. 126-129, January 2010.
[8] Bala Dhandayuthapani Veerasamy, Concurrent Approach to Flynn’s MPMD Classification through Java, International Journal of Computer Science and Network Security, Vol. 7 No. 2, February 2010.
AUTHORS PROFILE Bala Dhandayuthapani Veerasamy was
born in Tamil Nadu, India in the year 1979. The author was awarded his first masters degree M.S in Information Technology from Bharathidasan University in 2002 and his second masters degree M.Tech in Information Technology from Allahabad Agricultural Institute of Deemed University in 2005. He has published more than fifteen peer reviewed technical papers on various international journals and conferences. He has managed as technical chairperson of an
international conference. He has an active participation as a program committee member as well as an editorial review board member in international conferences. He is also a member of an editorial review board in international journals.
He has offered courses to Computer Science and Engineering, Information Systems and Technology, since 8 years in the academic field. His academic career started in reputed engineering colleges in India. At present, he is working as a Lecturer in the Department of Computing, College of Engineering, Mekelle University, Ethiopia. His teaching interest focuses on Parallel and Distributed Computing, Object Oriented Programming, Web Technologies and Multimedia Systems. His research interest includes Parallel and Distributed Computing, Multimedia and Wireless Computing. He has prepared teaching material for various courses that he has handled. At present, his textbook on “An Introduction to Parallel and Distributed Computing through java” is under review and is expected to be published shortly. He has the life membership of ISTE (Indian Society of Technical Education).
81 http://sites.google.com/site/ijcsis/ ISSN 1947-5500
(IJCSIS) International Journal of Computer Science and Information Security, Vol. 7, No. 2, 2010
Multi-objective Geometric Programming Problem with Weighted Mean Method
A. K. Ojha
School of Basic Sciences IIT Bhubaneswar
Orissa, Pin-751013, India .
K. K. Biswal Department of Mathematics
C.T.T.C, Bhubaneswar Orissa, India-751024
.
Abstract-Geometric programming is an important class of optimization problems that enable practitioners to model a large variety of real-world applications, mostly in the field of engineering design. In many real life optimization problem multi-objective programming plays a vital role in socio economical and industrial optimizing problems. In this paper we have discussed the basic concepts and principle of multiple objective optimization problems and developed geometric programming (GP) technique to solve this optimization problem using weighted method to obtain the non-inferior solutions. Keywords- Geometric programming, optimization, weighted method, duality theory, non-inferior solutions.
1 INTRODUCTION
Geometric Programming(GP) problems have wide range of application in production planning, location, distribution, risk managements, chemical process designs and other engineer design situations. GP problem is an excellent method when decision variable interact in a non-linear, especially, in an exponential fashion. Most of these GP applications are posynomial type with zero or few degrees of difficulty. GP problem whose parameters, except for exponents, are all positive are called posynomial problems, where as GP problems with some negative parameters are refereed to as signomial problems. The degree of difficulty is defined as the number of terms minus the number of variables minus one, and is equal to the dimension of the dual problem. When the degree of difficulty is zero, the problem can be solved analytically. For such posynomial problems, GP techniques find global optimal solutions. If the degree of difficulty is positive, then the dual feasible region must be searched to maximize the dual objective, while if the degree of difficulty is negative, the dual constraints may be inconsistent. For detail discussions of various algorithms and computational aspects for both posynomial and signomial GP refers to Beightler et al.[2], Duffin et al.[6], Ecker[7] and Phillips et al.[13]. From early 1960 a lot of research work have been done on these GP problems [3, 5, 9, 11, 14, 16, 17, 18]. Mainly, we use GP technique to solve some optimal engineering design problems[1] where we minimize cost and/or weight, maximize volume and/or efficiency etc. Generally, an engineering design problem has multiple objective
functions. In this case, it is not suitable to use any single-objective programming to find an optimal compromise solution. Biswal[4] has studied the optimal compromise solution of multi-objective programming problem by using fuzzy programming technique [20, 21]. In a recent paper Islam and Ray[8] find the Pareto optimal solution by considering a multi-objective entropy transportation problem with an additional restriction with generalized fuzzy number cost. In this paper we have developed the method to find the compromise optimal solution of certain multi-objective geometric programming problem by using weighting method. First of all the multiple objective functions transformed to a single objective by considering it as the linear combination of the multiple objectives along with suitable constants called weights. By changing the weights the most compromise optimal solution has been arrived by using GP techniques. The organization of the paper is as follows: Following the introduction, Formulation of multi-objective GP and corresponding weighting method have been discussed in Section 2 and 3. The duality theory has been discussed at Section 4 to find the optimal value of the objective function and the illustrative examples have been incorporated at Section 5 to understand the problem. Finally, at Section 6 some conclusions are drawn from the discussion.
2 FORMULATION OF MULTI-OBJECTIVE GEOMETRIC PROGRAMMING
A multi-objective geometric programming problem can be defined as:
Find Tnxxxx ),....,,( 21=
so as to
pkxCxgn
j
aj
T
ttkk
tjkk
,...,2,1,)(:min11
000
0
== ∏∑==
(2.1)
subject to
mixCxgn
j
dj
T
titi
itji
,...,2,1,1)(11
=≤= ∏∑==
(2.2)
njx j ,...,2,1,0 => (2.3)
where Ck0t for all k and t are positive real numbers and ditj and ak0tj are real numbers for all i,k, t, j.
82 http://sites.google.com/site/ijcsis/ ISSN 1947-5500
(IJCSIS) International Journal of Computer Science and Information Security, Vol. 7, No. 2, 2010
Tk0 = number of terms present in the kth objective function. Ti= number of terms present in the ith constraint. In the above multi-objective geometric program there are p number of minimization type objective function, m number of inequality type constraints and n number of strictly positive decision variables.
3 WEIGHTING METHOD OF MULTI-OBJECTIVE FUNCTIONS:
The weighting method is the simplest multi-objective optimization which has been widely applied to find the non-inferior optimal solution of multi-objective function within the convex objective space. If f1(x), f2(x),… ,fn(x) are n objective functions for any vector T
nxxxx ),....,,( 21= then we can define weighting method for their optimal solution as defined below:
Let ⎭⎬⎫
⎩⎨⎧
=>∈= ∑=
n
jji
n wwRwwW1
1,0,: to be the set of
non-negative weights. The weighted objective function for the multiple objective function defined above can be defined
as P(w) where ∑=
∈=
n
jjjXx
xfwwP1
)(min)( (3.1)
It must be made clear, however, that if the objective space of the original problem is non-convex, then the weighting method may not be capable of generating the efficient solutions on the non-convex part of the efficient frontier. It must also be noted that the optimal solution of a weighting problem should not be used as the best compromise solution, if the weights do not reflect the decision maker's preferences or if the decision maker does not accept the assumption of a linear utility function. For more detail about the weighted method refer[10]. Based on the importance of the p number of objective functions defined in (2.1) the weights w1,w2,…,wp are assigned to define a new min type objective function Z(w) which can be defined as
∑=
=p
kkk xgwxZ
10 )()(:min
= ⎟⎟⎠
⎞⎜⎜⎝
⎛∏∑∑===
n
j
aj
T
ttk
p
kk
tjkk
xCw11
01
00
(3.2)
= ∏∑∑== =
n
j
aj
p
k
T
ttkk
tjkk
xCw11 1
00
0
subject to ∑ ∏= =
=≤i
itjT
t
n
j
djit mixC
1 1
,...,2,1,1 (3.3)
njx j ,...,2,1,0 =>
where pkww k
p
kk ,...,2,1,0,1
1
=>=∑=
(3.4)
4.DUAL FORM OF GPP The model given by (3.2), (3.3) and (3.4) is a conventional geometric programming problem and it can be solved directly by using primal based algorithm for non linear primal problem or dual programming [12]. Methods due to Rajgopal and Bricker [15], Beightler and Phillips[1] and Duffin et al.[6] projected in their analysis that the dual problem has the desirable features of being linearly constrained and having an objective function with structural properties with suitable solution. According to Duffin et al.[6] the model given by (3.3) can be transformed to the corresponding dual geometric program as:
∏∏ ∏∏== = =
⎟⎟⎠
⎞⎜⎜⎝
⎛⎟⎟⎠
⎞⎜⎜⎝
⎛ iit
iti
t T
t
wit
wT
t
m
i
T
t it
iti
w
t
tkk
ww
wCw
wCw
1
)(
1 1 1
0
0
0 )(max0
0
λλ
(4.1)
subject to 10
10 =∑
=
T
ttw
01 11 1
=+∑∑∑∑= == =
m
i
T
tititj
m
i
T
tititj
ii
wdwa , j=1,2,…,n
jtwit ,0 ∀≥
pkww k
p
kk ,...,2,1,0,1
1=>=∑
=
Since it is a usual dual problem then it can be solved using method relating to the dual theory.
5 NUMERICAL EXAMPLES
For illustration we consider the following examples. Example: 1 Find x1, x2, x3, x4 so as to
432110 24104)(:min xxxxxg +++= (5.1)
32120 )(:max xxxxg = (5.2)
subject to 124
22
24
21 ≤+
xx
xx
(5.3)
1100
321
≤xxx
(5.4)
0,,, 4321 >xxxx Now the problem can be rewritten as
432110 24104)(:min xxxxxg +++= (5.5) 1
31
21
1/20 )(:min −−−= xxxxg (5.6)
Subject to 124
22
24
21 ≤+ −− xxxx (5.7)
1100 13
12
11 ≤−−− xxx (5.8)
0,,, 4321 >xxxx (5.9)
83 http://sites.google.com/site/ijcsis/ ISSN 1947-5500
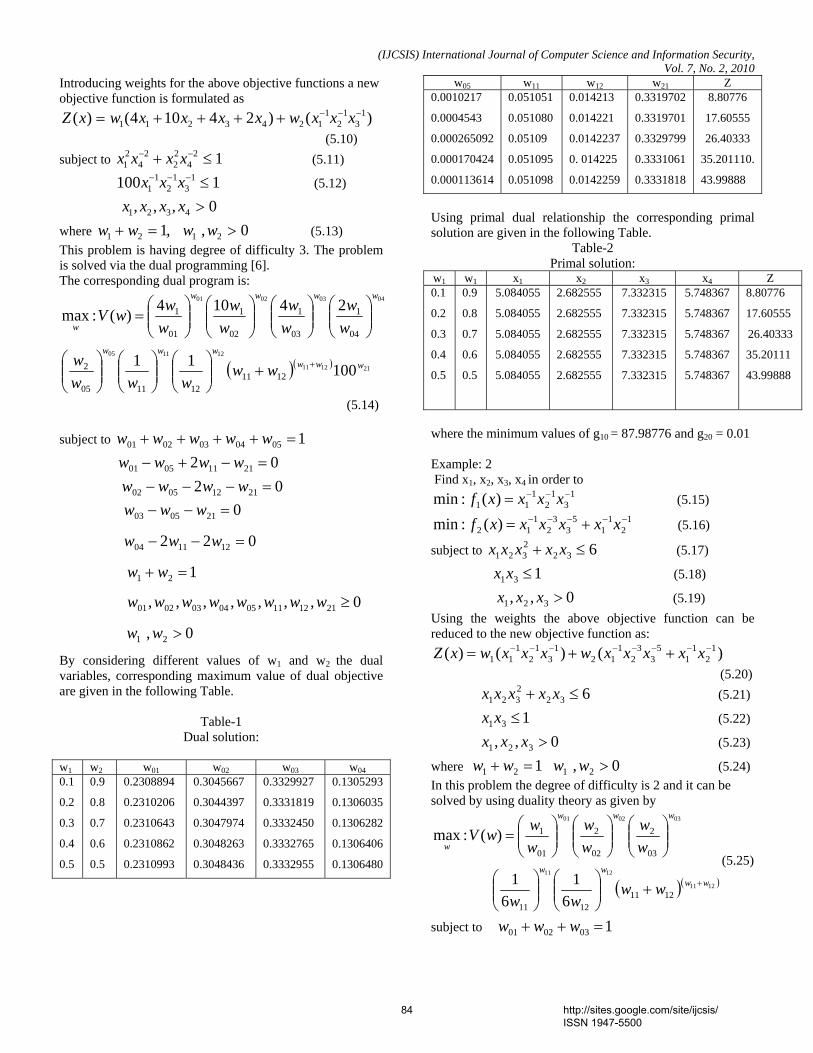
(IJCSIS) International Journal of Computer Science and Information Security, Vol. 7, No. 2, 2010
Introducing weights for the above objective functions a new objective function is formulated as
)()24104()( 13
12
11243211
−−−++++= xxxwxxxxwxZ (5.10) subject to 12
422
24
21 ≤+ −− xxxx (5.11)
1100 13
12
11 ≤−−− xxx (5.12)
0,,, 4321 >xxxx
where 0,,1 2121 >=+ wwww (5.13) This problem is having degree of difficulty 3. The problem is solved via the dual programming [6]. The corresponding dual program is:
( )( ) 211211
121105
04030201
10011
24104)(:max
1211121105
2
04
1
03
1
02
1
01
1
wwwwww
wwww
w
wwwww
w
ww
ww
ww
wwwV
++⎟⎟⎠
⎞⎜⎜⎝
⎛⎟⎟⎠
⎞⎜⎜⎝
⎛⎟⎟⎠
⎞⎜⎜⎝
⎛
⎟⎟⎠
⎞⎜⎜⎝
⎛⎟⎟⎠
⎞⎜⎜⎝
⎛⎟⎟⎠
⎞⎜⎜⎝
⎛⎟⎟⎠
⎞⎜⎜⎝
⎛=
(5.14) subject to 10504030201 =++++ wwwww
02 21110501 =−+− wwww
02 21120502 =−−− wwww
0210503 =−− www
022 121104 =−− www
121 =+ ww
0,,,,,,, 2112110504030201 ≥wwwwwwww
0, 21 >ww
By considering different values of w1 and w2 the dual variables, corresponding maximum value of dual objective are given in the following Table.
Table-1 Dual solution:
w1 w2 w01 w02 w03 w04 0.1
0.2
0.3
0.4
0.5
0.9
0.8
0.7
0.6
0.5
0.2308894
0.2310206
0.2310643
0.2310862
0.2310993
0.3045667
0.3044397
0.3047974
0.3048263
0.3048436
0.3329927
0.3331819
0.3332450
0.3332765
0.3332955
0.1305293
0.1306035
0.1306282
0.1306406
0.1306480
w05 w11 w12 w21 Z 0.0010217
0.0004543
0.000265092
0.000170424
0.000113614
0.051051
0.051080
0.05109
0.051095
0.051098
0.014213
0.014221
0.0142237
0. 014225
0.0142259
0.3319702
0.3319701
0.3329799
0.3331061
0.3331818
8.80776
17.60555
26.40333
35.201110.
43.99888
Using primal dual relationship the corresponding primal solution are given in the following Table.
Table-2 Primal solution:
w1 w1 x1 x2 x3 x4 Z 0.1
0.2
0.3
0.4
0.5
0.9
0.8
0.7
0.6
0.5
5.084055
5.084055
5.084055
5.084055
5.084055
2.682555
2.682555
2.682555
2.682555
2.682555
7.332315
7.332315
7.332315
7.332315
7.332315
5.748367
5.748367
5.748367
5.748367
5.748367
8.80776
17.60555
26.40333
35.20111
43.99888
where the minimum values of g10 = 87.98776 and g20 = 0.01 Example: 2 Find x1, x2, x3, x4 in order to
13
12
111 )(:min −−−= xxxxf (5.15)
12
11
53
32
112 )(:min −−−−− += xxxxxxf (5.16)
subject to 6322321 ≤+ xxxxx (5.17)
131 ≤xx (5.18)
0,, 321 >xxx (5.19) Using the weights the above objective function can be reduced to the new objective function as:
)()()( 12
11
53
32
112
13
12
111
−−−−−−−− ++= xxxxxwxxxwxZ (5.20)
6322321 ≤+ xxxxx (5.21)
131 ≤xx (5.22)
0,, 321 >xxx (5.23)
where 121 =+ ww 0, 21 >ww (5.24) In this problem the degree of difficulty is 2 and it can be solved by using duality theory as given by
( )( )1211
1211
030201
12111211
03
2
02
2
01
1
61
61
)(:max
wwww
www
w
wwww
ww
ww
wwwV
++⎟⎟⎠
⎞⎜⎜⎝
⎛⎟⎟⎠
⎞⎜⎜⎝
⎛
⎟⎟⎠
⎞⎜⎜⎝
⎛⎟⎟⎠
⎞⎜⎜⎝
⎛⎟⎟⎠
⎞⎜⎜⎝
⎛=
(5.25)
subject to 1030201 =++ www
84 http://sites.google.com/site/ijcsis/ ISSN 1947-5500
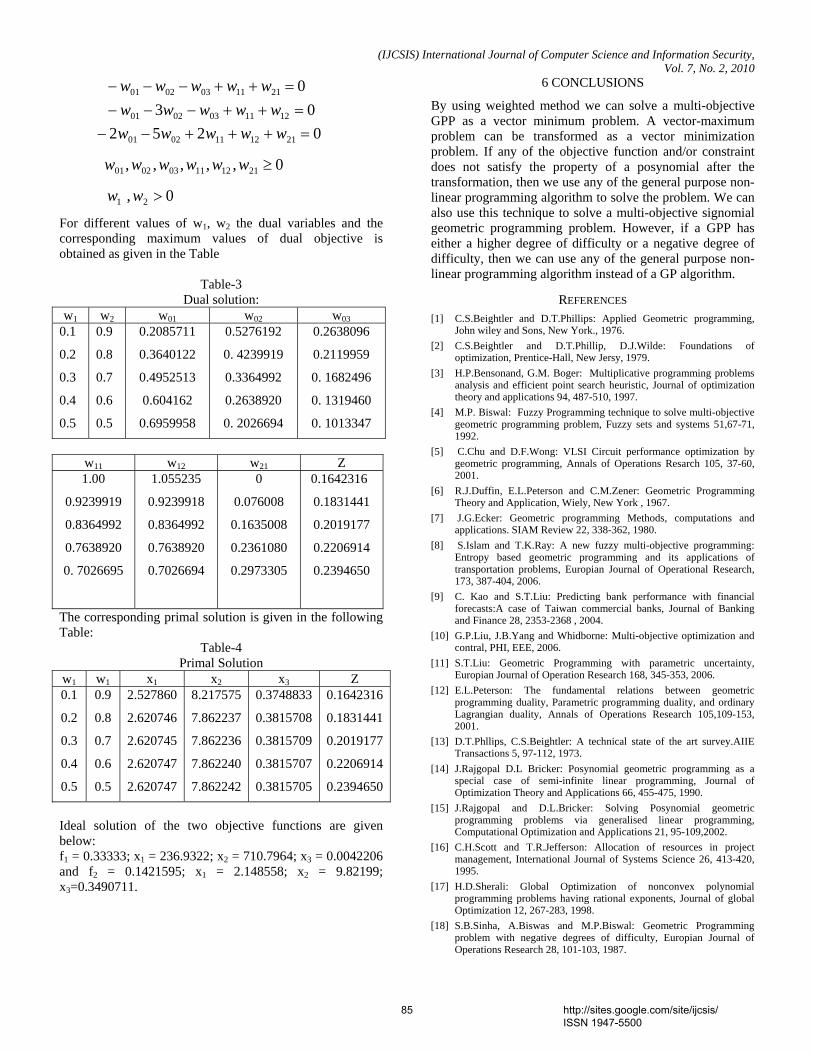
(IJCSIS) International Journal of Computer Science and Information Security, Vol. 7, No. 2, 2010
02111030201 =++−−− wwwww
03 1211030201 =++−−− wwwww
0252 2112110201 =+++−− wwwww
0,,,,, 211211030201 ≥wwwwww
0, 21 >ww
For different values of w1, w2 the dual variables and the corresponding maximum values of dual objective is obtained as given in the Table
Table-3 Dual solution:
w1 w2 w01 w02 w03 0.1
0.2
0.3
0.4
0.5
0.9
0.8
0.7
0.6
0.5
0.2085711
0.3640122
0.4952513
0.604162
0.6959958
0.5276192
0. 4239919
0.3364992
0.2638920
0. 2026694
0.2638096
0.2119959
0. 1682496
0. 1319460
0. 1013347
w11 w12 w21 Z 1.00
0.9239919
0.8364992
0.7638920
0. 7026695
1.055235
0.9239918
0.8364992
0.7638920
0.7026694
0
0.076008
0.1635008
0.2361080
0.2973305
0.1642316
0.1831441
0.2019177
0.2206914
0.2394650
The corresponding primal solution is given in the following Table:
Table-4 Primal Solution
w1 w1 x1 x2 x3 Z 0.1
0.2
0.3
0.4
0.5
0.9
0.8
0.7
0.6
0.5
2.527860
2.620746
2.620745
2.620747
2.620747
8.217575
7.862237
7.862236
7.862240
7.862242
0.3748833
0.3815708
0.3815709
0.3815707
0.3815705
0.1642316
0.1831441
0.2019177
0.2206914
0.2394650
Ideal solution of the two objective functions are given below: f1 = 0.33333; x1 = 236.9322; x2 = 710.7964; x3 = 0.0042206 and f2 = 0.1421595; x1 = 2.148558; x2 = 9.82199; x3=0.3490711.
6 CONCLUSIONS
By using weighted method we can solve a multi-objective GPP as a vector minimum problem. A vector-maximum problem can be transformed as a vector minimization problem. If any of the objective function and/or constraint does not satisfy the property of a posynomial after the transformation, then we use any of the general purpose non-linear programming algorithm to solve the problem. We can also use this technique to solve a multi-objective signomial geometric programming problem. However, if a GPP has either a higher degree of difficulty or a negative degree of difficulty, then we can use any of the general purpose non-linear programming algorithm instead of a GP algorithm.
REFERENCES [1] C.S.Beightler and D.T.Phillips: Applied Geometric programming,
John wiley and Sons, New York., 1976. [2] C.S.Beightler and D.T.Phillip, D.J.Wilde: Foundations of
optimization, Prentice-Hall, New Jersy, 1979. [3] H.P.Bensonand, G.M. Boger: Multiplicative programming problems
analysis and efficient point search heuristic, Journal of optimization theory and applications 94, 487-510, 1997.
[4] M.P. Biswal: Fuzzy Programming technique to solve multi-objective geometric programming problem, Fuzzy sets and systems 51,67-71, 1992.
[5] C.Chu and D.F.Wong: VLSI Circuit performance optimization by geometric programming, Annals of Operations Resarch 105, 37-60, 2001.
[6] R.J.Duffin, E.L.Peterson and C.M.Zener: Geometric Programming Theory and Application, Wiely, New York , 1967.
[7] J.G.Ecker: Geometric programming Methods, computations and applications. SIAM Review 22, 338-362, 1980.
[8] S.Islam and T.K.Ray: A new fuzzy multi-objective programming: Entropy based geometric programming and its applications of transportation problems, Europian Journal of Operational Research, 173, 387-404, 2006.
[9] C. Kao and S.T.Liu: Predicting bank performance with financial forecasts:A case of Taiwan commercial banks, Journal of Banking and Finance 28, 2353-2368 , 2004.
[10] G.P.Liu, J.B.Yang and Whidborne: Multi-objective optimization and contral, PHI, EEE, 2006.
[11] S.T.Liu: Geometric Programming with parametric uncertainty, Europian Journal of Operation Research 168, 345-353, 2006.
[12] E.L.Peterson: The fundamental relations between geometric programming duality, Parametric programming duality, and ordinary Lagrangian duality, Annals of Operations Research 105,109-153, 2001.
[13] D.T.Phllips, C.S.Beightler: A technical state of the art survey.AIIE Transactions 5, 97-112, 1973.
[14] J.Rajgopal D.L Bricker: Posynomial geometric programming as a special case of semi-infinite linear programming, Journal of Optimization Theory and Applications 66, 455-475, 1990.
[15] J.Rajgopal and D.L.Bricker: Solving Posynomial geometric programming problems via generalised linear programming, Computational Optimization and Applications 21, 95-109,2002.
[16] C.H.Scott and T.R.Jefferson: Allocation of resources in project management, International Journal of Systems Science 26, 413-420, 1995.
[17] H.D.Sherali: Global Optimization of nonconvex polynomial programming problems having rational exponents, Journal of global Optimization 12, 267-283, 1998.
[18] S.B.Sinha, A.Biswas and M.P.Biswal: Geometric Programming problem with negative degrees of difficulty, Europian Journal of Operations Research 28, 101-103, 1987.
85 http://sites.google.com/site/ijcsis/ ISSN 1947-5500
(IJCSIS) International Journal of Computer Science and Information Security, Vol. 7, No. 2, 2010
[19] B.M.Worrall, M.A.Hall: The analysis of an inventry central model using posynomial geometric programming, International Journal of Production Research 20, 657-667, 1982.
[20] H.J.Zimmermann : Fuzzy programming and linear programming with several objective functions, Fuzzy sets and systems 1, 46-55, 1978.
[21] H.J.Zimmermann: Fuzzy set theory and its applications, 2nd ed. Kluwer Academic publishers, Dordrecht-Boston, 1990.
AUTHORS PROFILE
Dr.A.K.Ojha: Dr.A.K.Ojha received a Ph.D(mathematics) from Utkal University in 1997. Currently he is an Asst.Prof. in Mathematics at I.I.T. Bhubaneswar, India. He is performing research in Nural Network, Geometric Programming, Genetical Algorithem, and Particle Swarm Optimization. He has served more than 27 years in different Govt. colleges in the state of Orissa. He has published 22 research papers in different journals and 7 books for degree students such as: Fortran 77 Programming, A text book of modern algebra, Fundamentals of Numerical Analysis etc.
K.K.Biswal: Mr.K.K.Biswal received M.Sc.(Mathematics) from Utkal University in 1996. Currently he is a lecturer in Mathematics at CTTC, Bhubaneswar, India. He is performing research works in Geometric Programming. He is served more than 7 years in different colleges in the state of Orissa. He has published 2 research papers in different journals.
86 http://sites.google.com/site/ijcsis/ ISSN 1947-5500
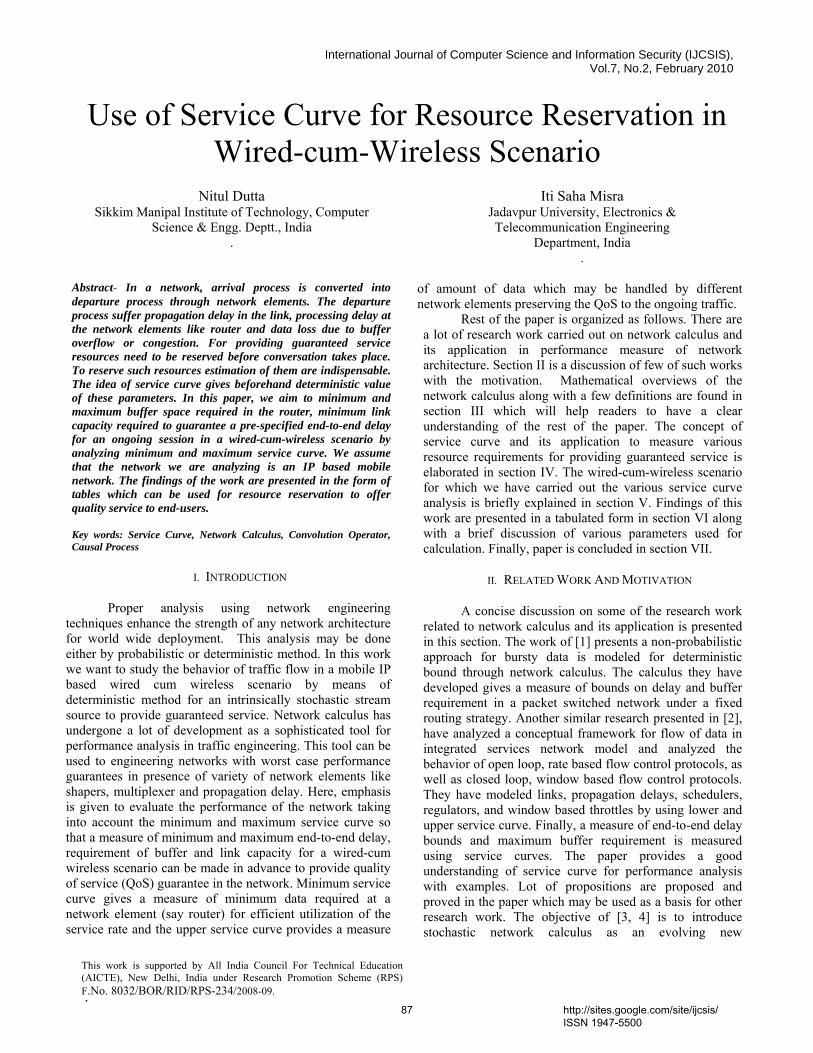
International Journal of Computer Science and Information Security (IJCSIS), Vol.7, No.2, February 2010
.
This work is supported by All India Council For Technical Education (AICTE), New Delhi, India under Research Promotion Scheme (RPS) F.No. 8032/BOR/RID/RPS-234/2008-09.
Use of Service Curve for Resource Reservation in Wired-cum-Wireless Scenario
Nitul Dutta Sikkim Manipal Institute of Technology, Computer
Science & Engg. Deptt., India .
Iti Saha Misra Jadavpur University, Electronics & Telecommunication Engineering
Department, India .
Abstract- In a network, arrival process is converted into departure process through network elements. The departure process suffer propagation delay in the link, processing delay at the network elements like router and data loss due to buffer overflow or congestion. For providing guaranteed service resources need to be reserved before conversation takes place. To reserve such resources estimation of them are indispensable. The idea of service curve gives beforehand deterministic value of these parameters. In this paper, we aim to minimum and maximum buffer space required in the router, minimum link capacity required to guarantee a pre-specified end-to-end delay for an ongoing session in a wired-cum-wireless scenario by analyzing minimum and maximum service curve. We assume that the network we are analyzing is an IP based mobile network. The findings of the work are presented in the form of tables which can be used for resource reservation to offer quality service to end-users. Key words: Service Curve, Network Calculus, Convolution Operator, Causal Process
I. INTRODUCTION
Proper analysis using network engineering techniques enhance the strength of any network architecture for world wide deployment. This analysis may be done either by probabilistic or deterministic method. In this work we want to study the behavior of traffic flow in a mobile IP based wired cum wireless scenario by means of deterministic method for an intrinsically stochastic stream source to provide guaranteed service. Network calculus has undergone a lot of development as a sophisticated tool for performance analysis in traffic engineering. This tool can be used to engineering networks with worst case performance guarantees in presence of variety of network elements like shapers, multiplexer and propagation delay. Here, emphasis is given to evaluate the performance of the network taking into account the minimum and maximum service curve so that a measure of minimum and maximum end-to-end delay, requirement of buffer and link capacity for a wired-cum wireless scenario can be made in advance to provide quality of service (QoS) guarantee in the network. Minimum service curve gives a measure of minimum data required at a network element (say router) for efficient utilization of the service rate and the upper service curve provides a measure
of amount of data which may be handled by different network elements preserving the QoS to the ongoing traffic. Rest of the paper is organized as follows. There are a lot of research work carried out on network calculus and its application in performance measure of network architecture. Section II is a discussion of few of such works with the motivation. Mathematical overviews of the network calculus along with a few definitions are found in section III which will help readers to have a clear understanding of the rest of the paper. The concept of service curve and its application to measure various resource requirements for providing guaranteed service is elaborated in section IV. The wired-cum-wireless scenario for which we have carried out the various service curve analysis is briefly explained in section V. Findings of this work are presented in a tabulated form in section VI along with a brief discussion of various parameters used for calculation. Finally, paper is concluded in section VII.
II. RELATED WORK AND MOTIVATION
A concise discussion on some of the research work related to network calculus and its application is presented in this section. The work of [1] presents a non-probabilistic approach for bursty data is modeled for deterministic bound through network calculus. The calculus they have developed gives a measure of bounds on delay and buffer requirement in a packet switched network under a fixed routing strategy. Another similar research presented in [2], have analyzed a conceptual framework for flow of data in integrated services network model and analyzed the behavior of open loop, rate based flow control protocols, as well as closed loop, window based flow control protocols. They have modeled links, propagation delays, schedulers, regulators, and window based throttles by using lower and upper service curve. Finally, a measure of end-to-end delay bounds and maximum buffer requirement is measured using service curves. The paper provides a good understanding of service curve for performance analysis with examples. Lot of propositions are proposed and proved in the paper which may be used as a basis for other research work. The objective of [3, 4] is to introduce stochastic network calculus as an evolving new
87 http://sites.google.com/site/ijcsis/ ISSN 1947-5500
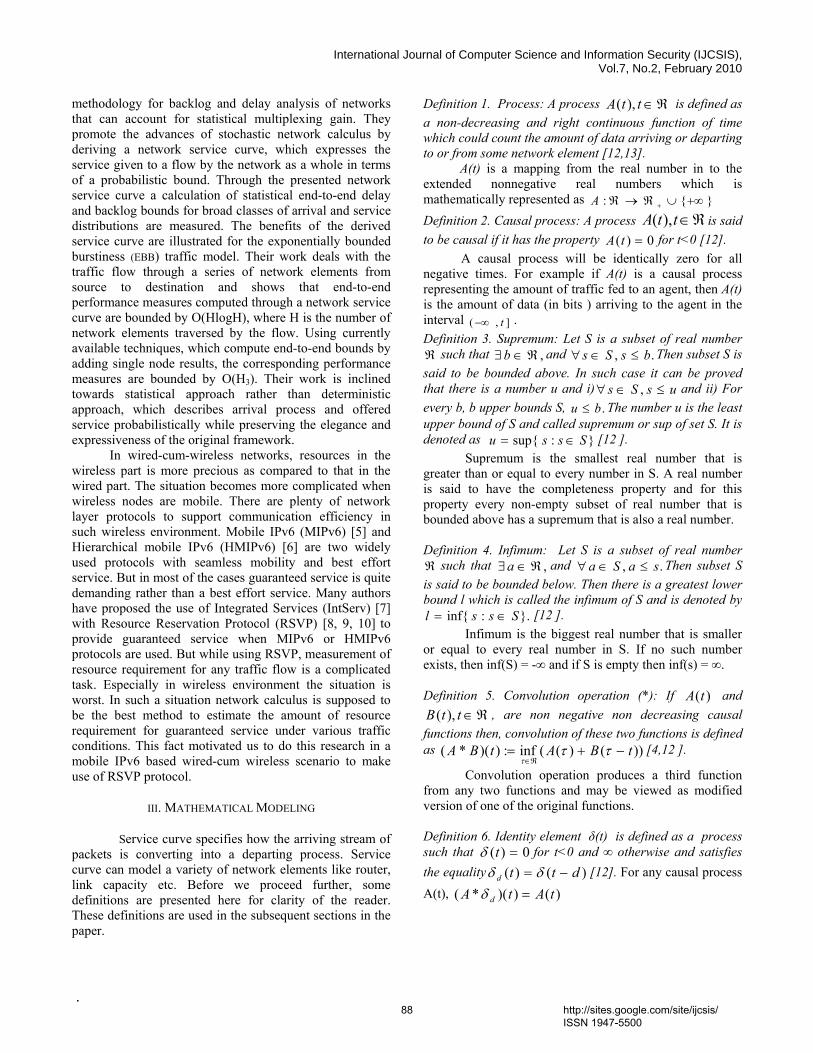
International Journal of Computer Science and Information Security (IJCSIS), Vol.7, No.2, February 2010
.
methodology for backlog and delay analysis of networks that can account for statistical multiplexing gain. They promote the advances of stochastic network calculus by deriving a network service curve, which expresses the service given to a flow by the network as a whole in terms of a probabilistic bound. Through the presented network service curve a calculation of statistical end-to-end delay and backlog bounds for broad classes of arrival and service distributions are measured. The benefits of the derived service curve are illustrated for the exponentially bounded burstiness (EBB) traffic model. Their work deals with the traffic flow through a series of network elements from source to destination and shows that end-to-end performance measures computed through a network service curve are bounded by O(HlogH), where H is the number of network elements traversed by the flow. Using currently available techniques, which compute end-to-end bounds by adding single node results, the corresponding performance measures are bounded by O(H3). Their work is inclined towards statistical approach rather than deterministic approach, which describes arrival process and offered service probabilistically while preserving the elegance and expressiveness of the original framework.
In wired-cum-wireless networks, resources in the wireless part is more precious as compared to that in the wired part. The situation becomes more complicated when wireless nodes are mobile. There are plenty of network layer protocols to support communication efficiency in such wireless environment. Mobile IPv6 (MIPv6) [5] and Hierarchical mobile IPv6 (HMIPv6) [6] are two widely used protocols with seamless mobility and best effort service. But in most of the cases guaranteed service is quite demanding rather than a best effort service. Many authors have proposed the use of Integrated Services (IntServ) [7] with Resource Reservation Protocol (RSVP) [8, 9, 10] to provide guaranteed service when MIPv6 or HMIPv6 protocols are used. But while using RSVP, measurement of resource requirement for any traffic flow is a complicated task. Especially in wireless environment the situation is worst. In such a situation network calculus is supposed to be the best method to estimate the amount of resource requirement for guaranteed service under various traffic conditions. This fact motivated us to do this research in a mobile IPv6 based wired-cum wireless scenario to make use of RSVP protocol.
III. MATHEMATICAL MODELING
Service curve specifies how the arriving stream of packets is converting into a departing process. Service curve can model a variety of network elements like router, link capacity etc. Before we proceed further, some definitions are presented here for clarity of the reader. These definitions are used in the subsequent sections in the paper.
Definition 1. Process: A process ℜ∈ttA ),( is defined as a non-decreasing and right continuous function of time which could count the amount of data arriving or departing to or from some network element [12,13]. A(t) is a mapping from the real number in to the extended nonnegative real numbers which is mathematically represented as }{: +∞∪ℜ→ℜ +ADefinition 2. Causal process: A process ℜ∈ttA ),( is said to be causal if it has the property 0)( =tA for t<0 [12].
A causal process will be identically zero for all negative times. For example if A(t) is a causal process representing the amount of traffic fed to an agent, then A(t) is the amount of data (in bits ) arriving to the agent in the interval ],( t−∞ . Definition 3. Supremum: Let S is a subset of real number ℜ such that ,ℜ∈∃b and ., bsSs ≤∈∀ Then subset S is said to be bounded above. In such case it can be proved that there is a number u and i) usSs ≤∈∀ , and ii) For every b, b upper bounds S, .bu ≤ The number u is the least upper bound of S and called supremum or sup of set S. It is denoted as }:sup{ Sssu ∈= [12 ]. Supremum is the smallest real number that is greater than or equal to every number in S. A real number is said to have the completeness property and for this property every non-empty subset of real number that is bounded above has a supremum that is also a real number.
Definition 4. Infimum: Let S is a subset of real number ℜ such that ,ℜ∈∃a and ., saSa ≤∈∀ Then subset S is said to be bounded below. Then there is a greatest lower bound l which is called the infimum of S and is denoted by
}.:inf{ Sssl ∈= [12 ]. Infimum is the biggest real number that is smaller or equal to every real number in S. If no such number exists, then inf(S) = -∞ and if S is empty then inf(s) = ∞.
Definition 5. Convolution operation (*): If )(tA and
ℜ∈ttB ),( , are non negative non decreasing causal functions then, convolution of these two functions is defined as ))()((inf:))(*( tBAtBA −+=
ℜ∈ττ
τ[4,12 ].
Convolution operation produces a third function from any two functions and may be viewed as modified version of one of the original functions. Definition 6. Identity element δ(t) is defined as a process such that 0)( =tδ for t<0 and ∞ otherwise and satisfies the equality )()( dttd −= δδ [12]. For any causal process A(t), )())(*( tAtA d =δ
88 http://sites.google.com/site/ijcsis/ ISSN 1947-5500
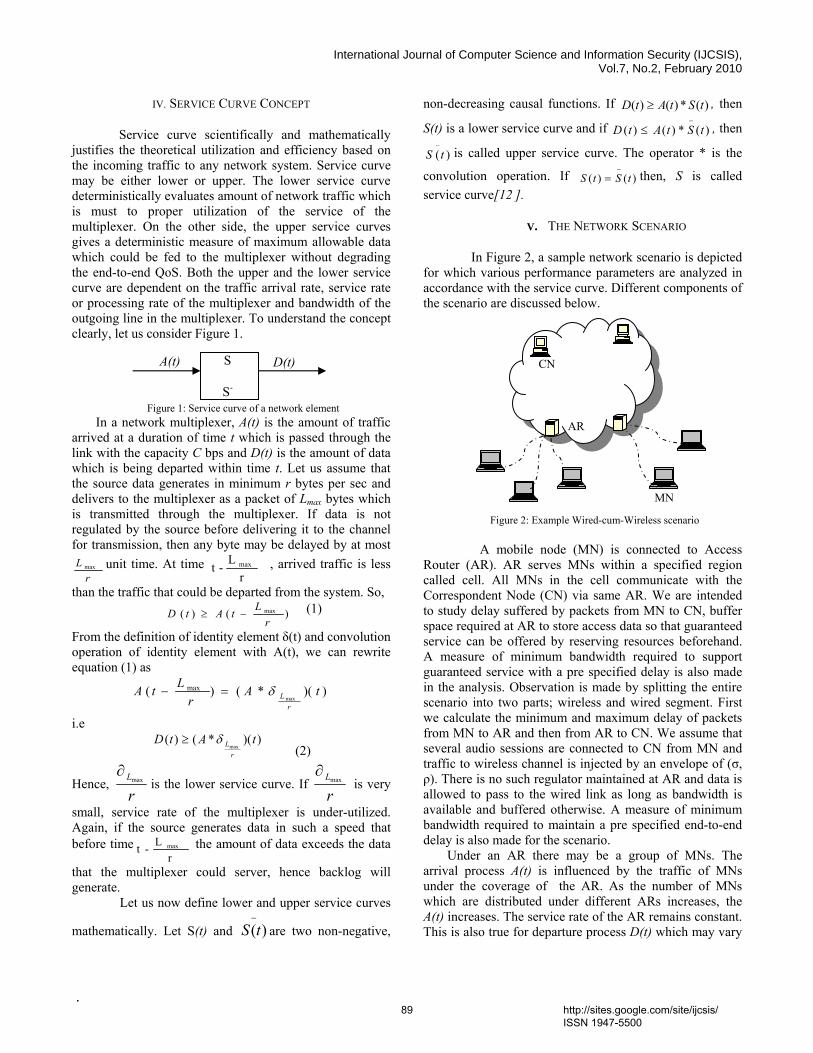
International Journal of Computer Science and Information Security (IJCSIS), Vol.7, No.2, February 2010
.
IV. SERVICE CURVE CONCEPT
Service curve scientifically and mathematically justifies the theoretical utilization and efficiency based on the incoming traffic to any network system. Service curve may be either lower or upper. The lower service curve deterministically evaluates amount of network traffic which is must to proper utilization of the service of the multiplexer. On the other side, the upper service curves gives a deterministic measure of maximum allowable data which could be fed to the multiplexer without degrading the end-to-end QoS. Both the upper and the lower service curve are dependent on the traffic arrival rate, service rate or processing rate of the multiplexer and bandwidth of the outgoing line in the multiplexer. To understand the concept clearly, let us consider Figure 1.
Figure 1: Service curve of a network element In a network multiplexer, A(t) is the amount of traffic
arrived at a duration of time t which is passed through the link with the capacity C bps and D(t) is the amount of data which is being departed within time t. Let us assume that the source data generates in minimum r bytes per sec and delivers to the multiplexer as a packet of Lmax bytes which is transmitted through the multiplexer. If data is not regulated by the source before delivering it to the channel for transmission, then any byte may be delayed by at most
rL max unit time. At time
rL-t max , arrived traffic is less
than the traffic that could be departed from the system. So, )()( max
rLtAtD −≥
(1)
From the definition of identity element δ(t) and convolution operation of identity element with A(t), we can rewrite equation (1) as
))(*()(max
max tAr
LtAr
Lδ=−
i.e ))(*()(
maxtAtD
rLδ≥
(2)
Hence, rLmax
∂is the lower service curve. If
rLmax
∂ is very
small, service rate of the multiplexer is under-utilized. Again, if the source generates data in such a speed that before time
rL-t max the amount of data exceeds the data
that the multiplexer could server, hence backlog will generate.
Let us now define lower and upper service curves
mathematically. Let S(t) and −
)(tS are two non-negative,
non-decreasing causal functions. If )(*)()( tStAtD ≥ , then
S(t) is a lower service curve and if )(*)()( tStAtD−
≤ , then −
)(tS is called upper service curve. The operator * is the
convolution operation. If )()( tStS−
= then, S is called service curve[12 ].
V. THE NETWORK SCENARIO
In Figure 2, a sample network scenario is depicted for which various performance parameters are analyzed in accordance with the service curve. Different components of the scenario are discussed below.
Figure 2: Example Wired-cum-Wireless scenario A mobile node (MN) is connected to Access Router (AR). AR serves MNs within a specified region called cell. All MNs in the cell communicate with the Correspondent Node (CN) via same AR. We are intended to study delay suffered by packets from MN to CN, buffer space required at AR to store access data so that guaranteed service can be offered by reserving resources beforehand. A measure of minimum bandwidth required to support guaranteed service with a pre specified delay is also made in the analysis. Observation is made by splitting the entire scenario into two parts; wireless and wired segment. First we calculate the minimum and maximum delay of packets from MN to AR and then from AR to CN. We assume that several audio sessions are connected to CN from MN and traffic to wireless channel is injected by an envelope of (σ, ρ). There is no such regulator maintained at AR and data is allowed to pass to the wired link as long as bandwidth is available and buffered otherwise. A measure of minimum bandwidth required to maintain a pre specified end-to-end delay is also made for the scenario.
Under an AR there may be a group of MNs. The arrival process A(t) is influenced by the traffic of MNs under the coverage of the AR. As the number of MNs which are distributed under different ARs increases, the A(t) increases. The service rate of the AR remains constant. This is also true for departure process D(t) which may vary
S
S-
A(t) D(t) CN
MN
AR
89 http://sites.google.com/site/ijcsis/ ISSN 1947-5500
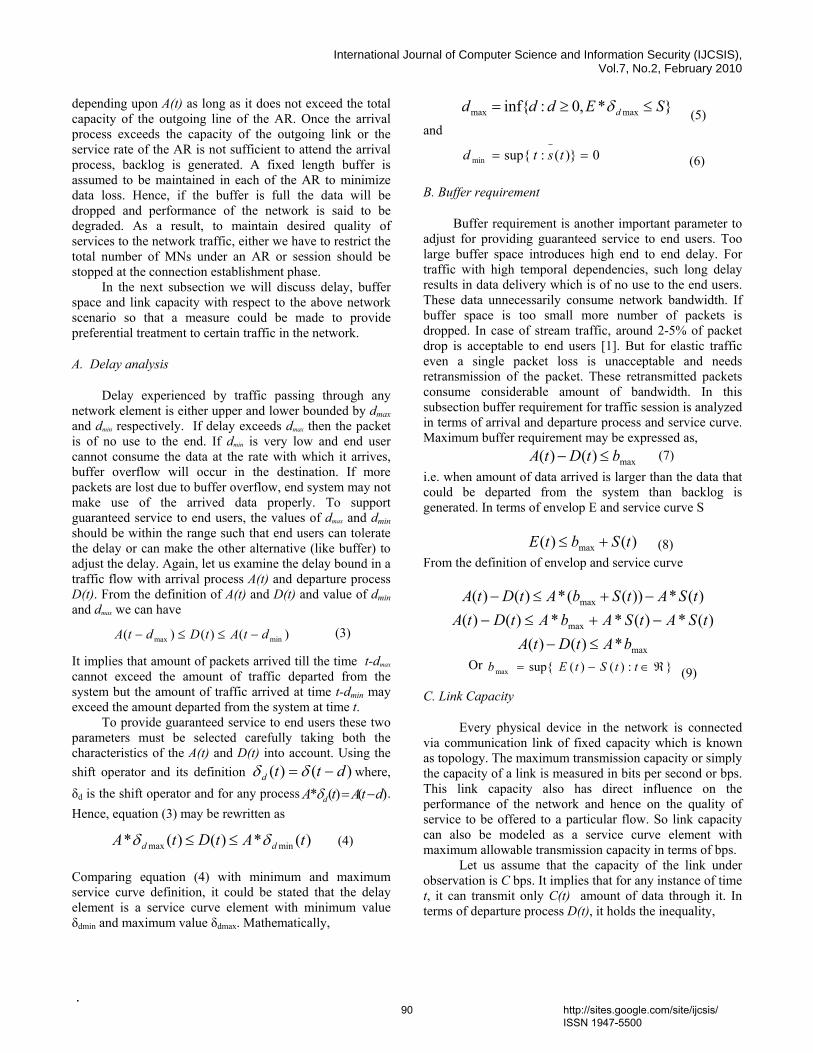
International Journal of Computer Science and Information Security (IJCSIS), Vol.7, No.2, February 2010
.
depending upon A(t) as long as it does not exceed the total capacity of the outgoing line of the AR. Once the arrival process exceeds the capacity of the outgoing link or the service rate of the AR is not sufficient to attend the arrival process, backlog is generated. A fixed length buffer is assumed to be maintained in each of the AR to minimize data loss. Hence, if the buffer is full the data will be dropped and performance of the network is said to be degraded. As a result, to maintain desired quality of services to the network traffic, either we have to restrict the total number of MNs under an AR or session should be stopped at the connection establishment phase.
In the next subsection we will discuss delay, buffer space and link capacity with respect to the above network scenario so that a measure could be made to provide preferential treatment to certain traffic in the network.
A. Delay analysis
Delay experienced by traffic passing through any network element is either upper and lower bounded by dmax and dmin respectively. If delay exceeds dmax then the packet is of no use to the end. If dmin is very low and end user cannot consume the data at the rate with which it arrives, buffer overflow will occur in the destination. If more packets are lost due to buffer overflow, end system may not make use of the arrived data properly. To support guaranteed service to end users, the values of dmax and dmin should be within the range such that end users can tolerate the delay or can make the other alternative (like buffer) to adjust the delay. Again, let us examine the delay bound in a traffic flow with arrival process A(t) and departure process D(t). From the definition of A(t) and D(t) and value of dmin and dmax we can have
)()()( minmax dtAtDdtA −≤≤− (3)
It implies that amount of packets arrived till the time t-dmax cannot exceed the amount of traffic departed from the system but the amount of traffic arrived at time t-dmin may exceed the amount departed from the system at time t. To provide guaranteed service to end users these two parameters must be selected carefully taking both the characteristics of the A(t) and D(t) into account. Using the shift operator and its definition )()( dttd −= δδ where, δd is the shift operator and for any process )()(* dtAtA d −=δ . Hence, equation (3) may be rewritten as
)(*)()(* minmax tAtDtA dd δδ ≤≤ (4)
Comparing equation (4) with minimum and maximum service curve definition, it could be stated that the delay element is a service curve element with minimum value δdmin and maximum value δdmax. Mathematically,
}*,0:inf{ maxmax SEddd d ≤≥= δ (5) and
0)}(:sup{min ==−
tstd (6)
B. Buffer requirement
Buffer requirement is another important parameter to adjust for providing guaranteed service to end users. Too large buffer space introduces high end to end delay. For traffic with high temporal dependencies, such long delay results in data delivery which is of no use to the end users. These data unnecessarily consume network bandwidth. If buffer space is too small more number of packets is dropped. In case of stream traffic, around 2-5% of packet drop is acceptable to end users [1]. But for elastic traffic even a single packet loss is unacceptable and needs retransmission of the packet. These retransmitted packets consume considerable amount of bandwidth. In this subsection buffer requirement for traffic session is analyzed in terms of arrival and departure process and service curve. Maximum buffer requirement may be expressed as,
max)()( btDtA ≤− i.e. when amount of data arrived is larger than the data that could be departed from the system than backlog is generated. In terms of envelop E and service curve S
)()( max tSbtE +≤ From the definition of envelop and service curve
)(*))((*)()( max tSAtSbAtDtA −+≤−
)(*)(**)()( max tSAtSAbAtDtA −+≤−
max*)()( bAtDtA ≤− Or }:)()(sup{max ℜ∈−= ttStEb (9)
C. Link Capacity
Every physical device in the network is connected via communication link of fixed capacity which is known as topology. The maximum transmission capacity or simply the capacity of a link is measured in bits per second or bps. This link capacity also has direct influence on the performance of the network and hence on the quality of service to be offered to a particular flow. So link capacity can also be modeled as a service curve element with maximum allowable transmission capacity in terms of bps. Let us assume that the capacity of the link under observation is C bps. It implies that for any instance of time t, it can transmit only C(t) amount of data through it. In terms of departure process D(t), it holds the inequality,
(7)
(8)
90 http://sites.google.com/site/ijcsis/ ISSN 1947-5500
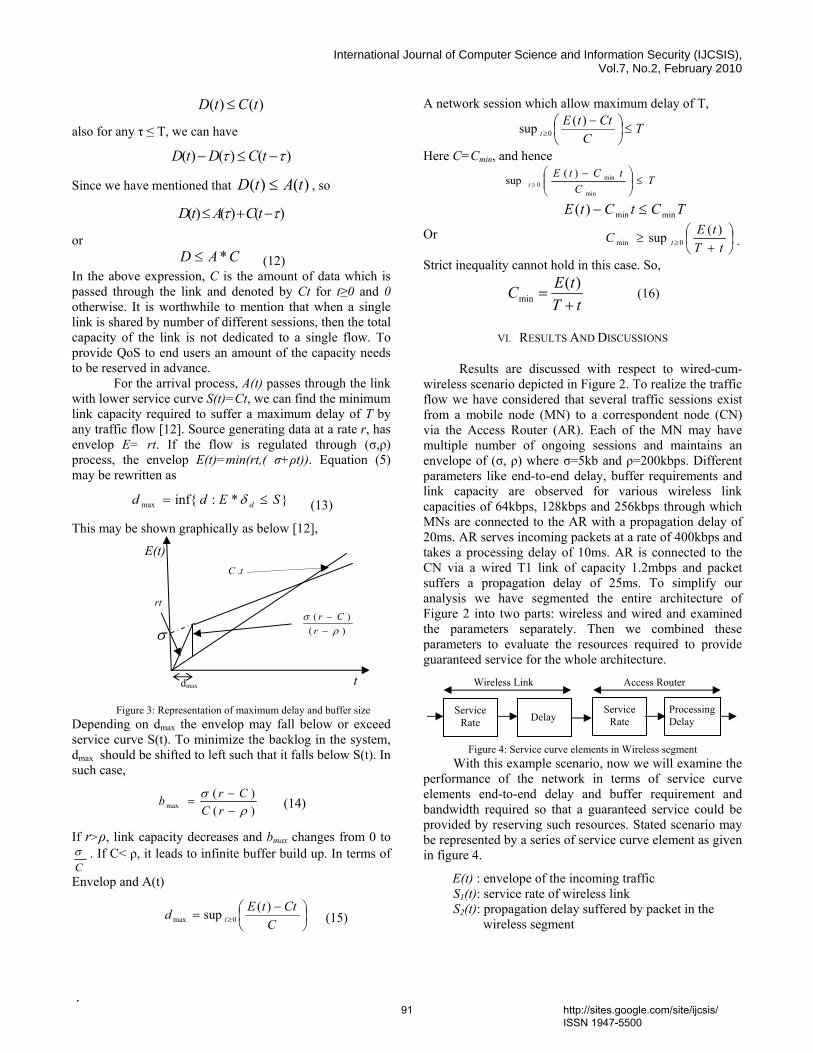
International Journal of Computer Science and Information Security (IJCSIS), Vol.7, No.2, February 2010
.
)()( tCtD ≤
also for any τ ≤ T, we can have
)()()( ττ −≤− tCDtD
Since we have mentioned that )()( tAtD ≤ , so
)()()( ττ −+≤ tCAtD
or CAD *≤ (12)
In the above expression, C is the amount of data which is passed through the link and denoted by Ct for t≥0 and 0 otherwise. It is worthwhile to mention that when a single link is shared by number of different sessions, then the total capacity of the link is not dedicated to a single flow. To provide QoS to end users an amount of the capacity needs to be reserved in advance. For the arrival process, A(t) passes through the link with lower service curve S(t)=Ct, we can find the minimum link capacity required to suffer a maximum delay of T by any traffic flow [12]. Source generating data at a rate r, has envelop E= rt. If the flow is regulated through (σ,ρ) process, the envelop E(t)=min(rt,( σ+ρt)). Equation (5) may be rewritten as
}*:inf{max SEdd d ≤= δ (13)
This may be shown graphically as below [12],
Figure 3: Representation of maximum delay and buffer size Depending on dmax the envelop may fall below or exceed service curve S(t). To minimize the backlog in the system, dmax should be shifted to left such that it falls below S(t). In such case,
)()(
max ρσ
−−
=rC
Crb (14)
If r>ρ, link capacity decreases and bmax changes from 0 to
Cσ . If C< ρ, it leads to infinite buffer build up. In terms of
Envelop and A(t)
⎟⎠⎞
⎜⎝⎛ −
= ≥ CCttEd t
)(sup 0max (15)
A network session which allow maximum delay of T,
TC
CttEt ≤⎟
⎠⎞
⎜⎝⎛ −
≥)(sup 0
Here C=Cmin, and hence
TC
tCtEt ≤⎟⎟
⎠
⎞⎜⎜⎝
⎛ −≥
min
min0
)(sup
TCtCtE minmin)( ≤−
Or ⎟⎠⎞
⎜⎝⎛
+≥ ≥ tT
tEC t)(sup 0min .
Strict inequality cannot hold in this case. So,
tTtEC+
=)(
min (16)
VI. RESULTS AND DISCUSSIONS
Results are discussed with respect to wired-cum-wireless scenario depicted in Figure 2. To realize the traffic flow we have considered that several traffic sessions exist from a mobile node (MN) to a correspondent node (CN) via the Access Router (AR). Each of the MN may have multiple number of ongoing sessions and maintains an envelope of (σ, ρ) where σ=5kb and ρ=200kbps. Different parameters like end-to-end delay, buffer requirements and link capacity are observed for various wireless link capacities of 64kbps, 128kbps and 256kbps through which MNs are connected to the AR with a propagation delay of 20ms. AR serves incoming packets at a rate of 400kbps and takes a processing delay of 10ms. AR is connected to the CN via a wired T1 link of capacity 1.2mbps and packet suffers a propagation delay of 25ms. To simplify our analysis we have segmented the entire architecture of Figure 2 into two parts: wireless and wired and examined the parameters separately. Then we combined these parameters to evaluate the resources required to provide guaranteed service for the whole architecture.
Figure 4: Service curve elements in Wireless segment With this example scenario, now we will examine the
performance of the network in terms of service curve elements end-to-end delay and buffer requirement and bandwidth required so that a guaranteed service could be provided by reserving such resources. Stated scenario may be represented by a series of service curve element as given in figure 4.
E(t) : envelope of the incoming traffic S1(t): service rate of wireless link S2(t): propagation delay suffered by packet in the
wireless segment
Service Rate Delay
Service Rate
Processing .Delay
Wireless Link Access Router dmax
σ )()(
ρσ
−−
rCr
tC .
rt
E(t)
t
91 http://sites.google.com/site/ijcsis/ ISSN 1947-5500

International Journal of Computer Science and Information Security (IJCSIS), Vol.7, No.2, February 2010
.
S3(t): rate of service offered by AR S4(t): service rate of wired link S5(t): propagation delay suffered in wired link
tkbpskbtE .2005)( += tkbpsts .64)(1 =
tmstts ms .20)()( 202 == δ tkbpskbts .4004.0)(3 +−=
tmbpsts .2.1)(4 = tmstts ms .25)()( 255 == δ
Based on discussion in section V we have represented the characteristics of different elements of example parameters in terms of service curve. Inclusion of t in all the equations is to represent them as causal process of time. Equation (17) represents the envelop maintained by the source with parameters σ=5kb and ρ=200kbps and only the rate (ρ) of injecting data in to the network is dependent on the time. Equation (18) and (20) is the service curve of wireless and wired link capacity respectively, whereas, the delay for both the links are represented by equation (19) and (22). Equation (22) models the service of AR. All though AR has a service rate of 400 kbps, in reality actual service rate is lower than 400kbps because of the processing time of the AR. The negative component of the equation (22) reflects the processing delay of the AR in is service curve.
Now from the service curve representation of individual network elements, the maximum and minimum service curve for the wireless segment is represented by equation (23) and (25) respectively. Substituting values for parameters in the equations (25) and (26) and expanding as in [2], equation (24) and (26) is derived.
21 * sss =−
and calculated as,
stkbkbs /648.72 +−=−
Similarly, minimum service curve is given by
321 ** ssss = and calculated as
tskbkbs ./644.26 +−=
Now, we will make a measure of different resources required for providing guaranteed service to end users [12,2,3]. Consider that
iθ , iφ ir and ip are the propagation delay, processing delay, transmission rate and service rate respectively at i-th service curve element. So, from S1(t),
iki rr ≤≤= 1min is the minimum service rate of the wireless
segment. Again, from S2(t), ∑=
==k
ii ms
1
20θθ where k is the
number of service curve elements that introduces
propagation delay in the wireless network. Similarly, the total processing delay in the system is for the service curve
element S3(t) and it is denoted by ∑=
==k
ii ms
110φφ where k
is the number of service curve elements that introduces processing delay in the network. Using envelop of the source σ=5kb and ρ=200kbps. There is only one router (AR) that forwards the packet with a service rate of 400 kbps and it is the total service rate of the system denoted by p, i.e. p=400 kbps. From the above discussions the following parameters are derived and given in Table -I: Minimum delay = θ=20 ms, Maximum delay = θ+σ/r=20ms+12.5ms=32.5ms Maximum buffer size = σ+ρθ=5kb+9kb=14kb
TABLE I :: DELAY AND BUFFER REQUIREMENT
Wireless Bandwidth
(kbps)
Minimum Delay (ms)
Maximum Delay (ms)
Buffer Size (kb)
64 20 32.5078125 14 128 14 38.039062 56 256 12 35.019531 100
Consider an example of a voice coder emitting 10ms speech and 10 bytes per frame. The rate of injecting data to the channel is 8kbps. In the Table-II, we have shown the minimum bandwidth required by the application and number of such sessions that can exhaust the link capacity.
TABLE II : DELAY FOR VOICE DATA
Wireless Bandwidth
(kbps)
Acceptable Delay (ms)
Buffer Space Required (kb)
Sessions Supported
64 35.078125 130 8 128 35.039062 250 16 256 35.019531 500 32
Data shown in Table–II represents maximum
tolerable delay by each of the session, total session that can exhaust entire bandwidth of a wireless link and the buffer space required to cope up with the delay by the end application. Recorded data shows that maximum end-to-end delay and buffer space required per session decreases when link capacity increases. On the other hand, total sessions supported are more if channel capacity is large. Increased supported session increases the buffer space required to provide guaranteed service at the AR of the wired-cum-wireless scenario. The AR is connected to the destination via T1 link of capacity 1.2mbps. Next follows a calculation of the above observed parameters for wired part of the network. Assumption is made that AR does not maintain any regulator and allows passing data as and when channel is free. For the AR, the following parameters are assumed φ: processing delay of AR = 10ms
(17) (18) (19)
(20) (21) (22)
(23)
(25)
(24)
(26)
92 http://sites.google.com/site/ijcsis/ ISSN 1947-5500
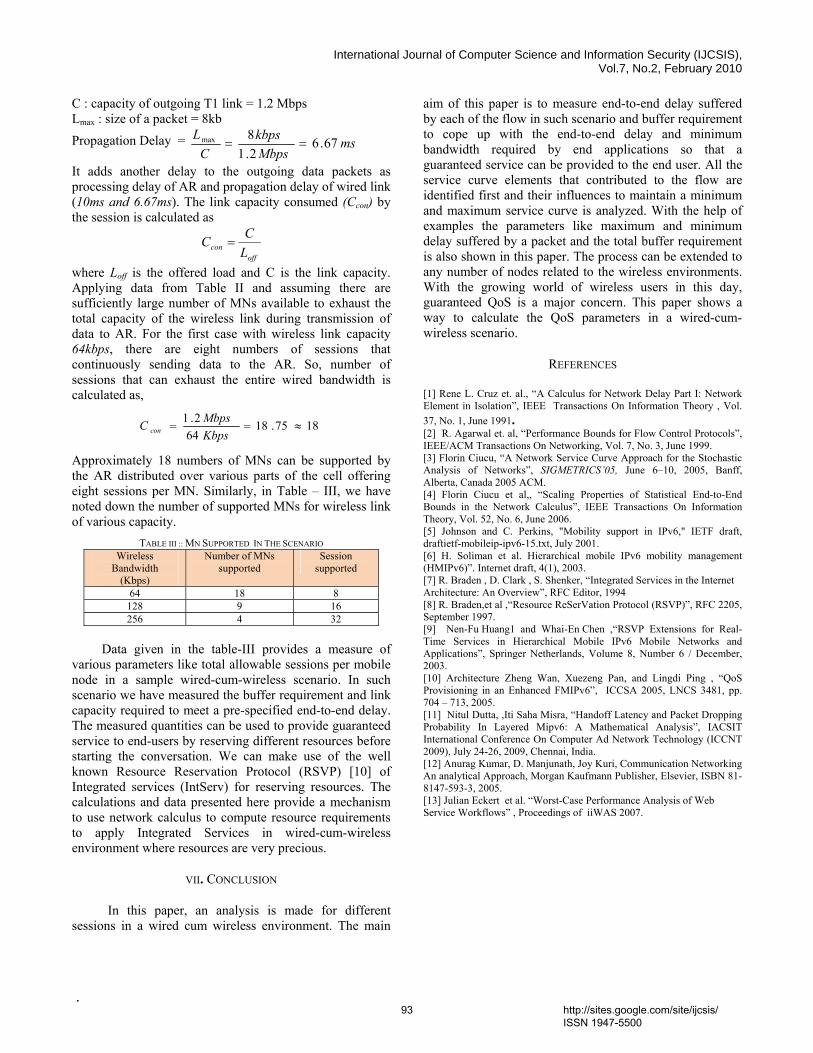
International Journal of Computer Science and Information Security (IJCSIS), Vol.7, No.2, February 2010
.
C : capacity of outgoing T1 link = 1.2 Mbps Lmax : size of a packet = 8kb Propagation Delay = ms
Mbpskbps
CL 67.6
2.18max ==
It adds another delay to the outgoing data packets as processing delay of AR and propagation delay of wired link (10ms and 6.67ms). The link capacity consumed (Ccon) by the session is calculated as
offcon L
CC =
where Loff is the offered load and C is the link capacity. Applying data from Table II and assuming there are sufficiently large number of MNs available to exhaust the total capacity of the wireless link during transmission of data to AR. For the first case with wireless link capacity 64kbps, there are eight numbers of sessions that continuously sending data to the AR. So, number of sessions that can exhaust the entire wired bandwidth is calculated as,
1875.1864
2.1≈==
KbpsMbpsC con
Approximately 18 numbers of MNs can be supported by the AR distributed over various parts of the cell offering eight sessions per MN. Similarly, in Table – III, we have noted down the number of supported MNs for wireless link of various capacity.
TABLE III :: MN SUPPORTED IN THE SCENARIO Wireless
Bandwidth (Kbps)
Number of MNs supported
Session supported
64 18 8 128 9 16 256 4 32
Data given in the table-III provides a measure of
various parameters like total allowable sessions per mobile node in a sample wired-cum-wireless scenario. In such scenario we have measured the buffer requirement and link capacity required to meet a pre-specified end-to-end delay. The measured quantities can be used to provide guaranteed service to end-users by reserving different resources before starting the conversation. We can make use of the well known Resource Reservation Protocol (RSVP) [10] of Integrated services (IntServ) for reserving resources. The calculations and data presented here provide a mechanism to use network calculus to compute resource requirements to apply Integrated Services in wired-cum-wireless environment where resources are very precious.
VII. CONCLUSION
In this paper, an analysis is made for different sessions in a wired cum wireless environment. The main
aim of this paper is to measure end-to-end delay suffered by each of the flow in such scenario and buffer requirement to cope up with the end-to-end delay and minimum bandwidth required by end applications so that a guaranteed service can be provided to the end user. All the service curve elements that contributed to the flow are identified first and their influences to maintain a minimum and maximum service curve is analyzed. With the help of examples the parameters like maximum and minimum delay suffered by a packet and the total buffer requirement is also shown in this paper. The process can be extended to any number of nodes related to the wireless environments. With the growing world of wireless users in this day, guaranteed QoS is a major concern. This paper shows a way to calculate the QoS parameters in a wired-cum-wireless scenario.
REFERENCES
[1] Rene L. Cruz et. al., “A Calculus for Network Delay Part I: Network Element in Isolation”, IEEE Transactions On Information Theory , Vol. 37, No. 1, June 1991. [2] R. Agarwal et. al, “Performance Bounds for Flow Control Protocols”, IEEE/ACM Transactions On Networking, Vol. 7, No. 3, June 1999. [3] Florin Ciucu, “A Network Service Curve Approach for the Stochastic Analysis of Networks”, SIGMETRICS’05, June 6–10, 2005, Banff, Alberta, Canada 2005 ACM. [4] Florin Ciucu et al,, “Scaling Properties of Statistical End-to-End Bounds in the Network Calculus”, IEEE Transactions On Information Theory, Vol. 52, No. 6, June 2006. [5] Johnson and C. Perkins, "Mobility support in IPv6," IETF draft, draftietf-mobileip-ipv6-15.txt, July 2001. [6] H. Soliman et al. Hierarchical mobile IPv6 mobility management (HMIPv6)”. Internet draft, 4(1), 2003. [7] R. Braden , D. Clark , S. Shenker, “Integrated Services in the Internet Architecture: An Overview”, RFC Editor, 1994 [8] R. Braden,et al ,“Resource ReSerVation Protocol (RSVP)”, RFC 2205, September 1997. [9] Nen-Fu Huang1 and Whai-En Chen ,“RSVP Extensions for Real-Time Services in Hierarchical Mobile IPv6 Mobile Networks and Applications”, Springer Netherlands, Volume 8, Number 6 / December, 2003. [10] Architecture Zheng Wan, Xuezeng Pan, and Lingdi Ping , “QoS Provisioning in an Enhanced FMIPv6”, ICCSA 2005, LNCS 3481, pp. 704 – 713, 2005. [11] Nitul Dutta, ,Iti Saha Misra, “Handoff Latency and Packet Dropping Probability In Layered Mipv6: A Mathematical Analysis”, IACSIT International Conference On Computer Ad Network Technology (ICCNT 2009), July 24-26, 2009, Chennai, India. [12] Anurag Kumar, D. Manjunath, Joy Kuri, Communication Networking An analytical Approach, Morgan Kaufmann Publisher, Elsevier, ISBN 81-8147-593-3, 2005. [13] Julian Eckert et al. “Worst-Case Performance Analysis of Web Service Workflows” , Proceedings of iiWAS 2007.
93 http://sites.google.com/site/ijcsis/ ISSN 1947-5500
(IJCSIS) International Journal of Computer Science and Information Security, Vol. 7, No. 2, 2010
Analysis, Modification, and Implementation(AMI) of Scheduling Algorithm for the IEEE 802.116e (Mobile
WiMAX)
C. Ravichandiran1, Dr. C. Pethuru Raj2, Dr. V. Vaidhyanathan3,1 IT Leader, Zagro Singapore Pte Ltd, Singapore.
2 Lead Architect, CR Division of Robert Bosch, Bangalore, India.3 Professor and HOD, Dept. of IT, SASTRA University, India.
Abstract— Mobile WiMAX (Worldwide Interoperability for Microwave Access) is being touted as the most promising and potential broadband wireless technology. And the popularity rate has been surging to newer heights as the knowledge-backed service era unfolds steadily. Especially Mobile WiMAX is being projected as a real and strategic boon for developing counties such as India due to its wireless coverage acreage is phenomenally high. Mobile WiMAX has spurred tremendous interest from operators seeking to deploy high-performance yet cost-effective broadband wireless networks. The IEEE 802.16e standard based Mobile WiMAX system will be investigated for the purpose of Quality of Service provisioning. As a technical challenge, radio resource management will be primarily considered and main is the costly spectrum and the increasingly more demanding applications with ever growing number of subscribers. It is necessary to provide Quality of Service (QoS) guaranteed with different characteristics. As a possible solution the scheduling algorithms will be taken into main consideration and the present well known algorithms will be described.
In this paper, we have highlighted the following critical issues for Mobile WiMAX technologies. This paper specifically discussed about the below mentioned in detail.
• QoS Requirements For IEEE 802.16 Service Classes, Achieving efficient radio resource management
• Deficit Round Robin (DRR) Scheduling algorithm
• Modified Deficit Round Robin (MDRR) scheduling algorithm’s attributes, properties and architecture
• System Model And Scenarios Using OPNET Modeler Software
• Simulation Limitations And Constraints
Keywords- IEEE 802.16, Mobile WiMAX (802.16e), QoS, PHY, MAC, OFDM, OFDMA, OPNET
I. INTRODUCTION
“Mobile WiMAX” refers to a rapidly growing broadband wireless access solution built upon the IEEE 802.16e-2005 air interface standard. It is equally applicable to fixed, portable and mobile applications. The Mobile WiMAX air interface utilizes
Orthogonal Frequency Division Multiple Access (OFDMA) for improved multipath performance in non-line-of-sight (NLOS) environments and high flexibility in allocating resources to users with different data rate requirements. The fundamental premise of the IEEE 802.16e media access control (MAC) architecture is QoS. Mobile WiMAX QoS features enable operators to optimize network performance depending on the service type (e.g., voice, video, and gaming) and the user’s service level. In wireless communication the task of taking care of resources being utilized falls into Radio Resource Management (RRM). RRM, in general, is responsible for the improvement of efficiency and reliability of radio links, but in particular it enables many specific operations are below:
Rate control: To be capable of utilizing the bandwidth more efficiently and maintain the quality of the radio links Adaptive Modulation and Coding (AMC) technique is used in wireless communication. Channel assignment: Mapping the most efficient subcarriers to their corresponding symbol times is done with the help of the information provided trough RRM Subcarrier permutation: Mainly there are two types of subcarrier permutation: Distributed Subcarrier Permutation: where frequency subcarriers are spread along the whole allocated transmission band pseudo‐randomly.
Scheduling System: Scheduling makes up an important part of the communication systems since it is chiefly the process of sharing the bandwidth. Therefore, has a significant effect on: The time taken by a packet to travel from one OSI (Open System Interconnection) stack layer to its corresponding peer layer. Jitter: The inter‐packet arrival time difference. Packet Loss: The amount of packet being dropped on both the Uplink (UL) and Downlink (DL). Throughput: The number of successful bits/packets per second arriving at the receiver [1].
II. IEEE 802.16E ( MOBILE WIMAX)
Mobile WiMAX is expected to deliver significant improvements over Fixed WiMAX which makes it even more attractive for fixed deployments. In wireless environments, link budget (measured in dB) and spectral efficiency are the two primary parameters used for evaluating system performance [22]. Mobile WiMAX) standard amendment as the investigation host for the discussed scheduling algorithms, thus from now on any mentioned technology will be those which are valid for the Mobile WiMAX. For instance, the multiple
94 http://sites.google.com/site/ijcsis/ ISSN 1947-5500
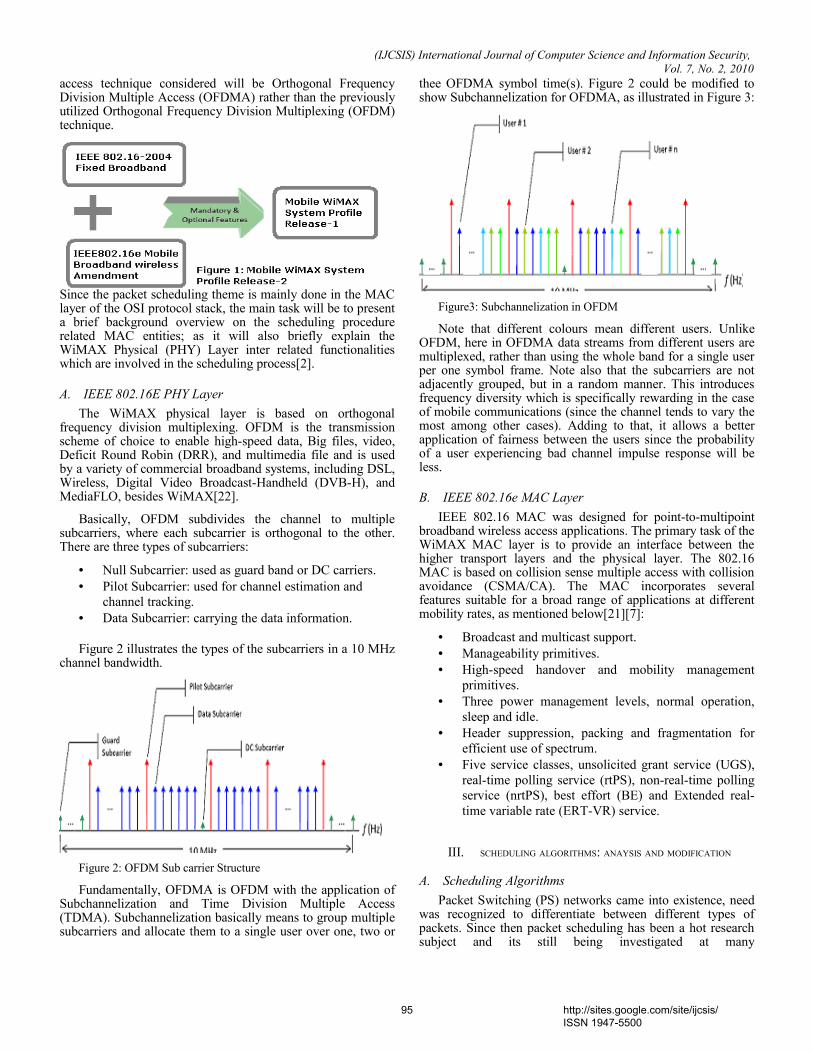
(IJCSIS) International Journal of Computer Science and Information Security, Vol. 7, No. 2, 2010
access technique considered will be Orthogonal Frequency Division Multiple Access (OFDMA) rather than the previously utilized Orthogonal Frequency Division Multiplexing (OFDM) technique.
Since the packet scheduling theme is mainly done in the MAC layer of the OSI protocol stack, the main task will be to present a brief background overview on the scheduling procedure related MAC entities; as it will also briefly explain the WiMAX Physical (PHY) Layer inter related functionalities which are involved in the scheduling process[2].
A. IEEE 802.16E PHY Layer
The WiMAX physical layer is based on orthogonal frequency division multiplexing. OFDM is the transmission scheme of choice to enable high-speed data, Big files, video, Deficit Round Robin (DRR), and multimedia file and is used by a variety of commercial broadband systems, including DSL, Wireless, Digital Video Broadcast-Handheld (DVB-H), and MediaFLO, besides WiMAX[22].
Basically, OFDM subdivides the channel to multiple subcarriers, where each subcarrier is orthogonal to the other. There are three types of subcarriers:
• Null Subcarrier: used as guard band or DC carriers. • Pilot Subcarrier: used for channel estimation and
channel tracking. • Data Subcarrier: carrying the data information.
Figure 2 illustrates the types of the subcarriers in a 10 MHz channel bandwidth.
Figure 2: OFDM Sub carrier Structure
Fundamentally, OFDMA is OFDM with the application of Subchannelization and Time Division Multiple Access (TDMA). Subchannelization basically means to group multiple subcarriers and allocate them to a single user over one, two or
thee OFDMA symbol time(s). Figure 2 could be modified to show Subchannelization for OFDMA, as illustrated in Figure 3:
Figure3: Subchannelization in OFDM
Note that different colours mean different users. Unlike OFDM, here in OFDMA data streams from different users are multiplexed, rather than using the whole band for a single user per one symbol frame. Note also that the subcarriers are not adjacently grouped, but in a random manner. This introduces frequency diversity which is specifically rewarding in the case of mobile communications (since the channel tends to vary the most among other cases). Adding to that, it allows a better application of fairness between the users since the probability of a user experiencing bad channel impulse response will be less.
B. IEEE 802.16e MAC Layer
IEEE 802.16 MAC was designed for point-to-multipoint broadband wireless access applications. The primary task of the WiMAX MAC layer is to provide an interface between the higher transport layers and the physical layer. The 802.16 MAC is based on collision sense multiple access with collision avoidance (CSMA/CA). The MAC incorporates several features suitable for a broad range of applications at different mobility rates, as mentioned below[21][7]:
• Broadcast and multicast support.• Manageability primitives.• High-speed handover and mobility management
primitives.• Three power management levels, normal operation,
sleep and idle.• Header suppression, packing and fragmentation for
efficient use of spectrum.• Five service classes, unsolicited grant service (UGS),
real-time polling service (rtPS), non-real-time polling service (nrtPS), best effort (BE) and Extended real-time variable rate (ERT-VR) service.
III. SCHEDULING ALGORITHMS: ANAYSIS AND MODIFICATION
A. Scheduling Algorithms
Packet Switching (PS) networks came into existence, need was recognized to differentiate between different types of packets. Since then packet scheduling has been a hot research subject and its still being investigated at many
95 http://sites.google.com/site/ijcsis/ ISSN 1947-5500

(IJCSIS) International Journal of Computer Science and Information Security, Vol. 7, No. 2, 2010
institutions/company. This is basically because scheduling means bandwidth sharing.
Traditionally, the First Come First Served (FCFS) scheme had been used for packet scheduling. Packets coming from all the input links were enqueued into a First In First Out (FIFO) memory stack, then they were dequeued one by one on to the output link. This is shown in Figure 4‐(a). Since unlike packets were mixed and treated equally, packets requiring urgent delivery could not be achieved. So there is no scheduling action taking place in this case.
In the present time different queues are specified to non similar packets for achieving packet classification. In this case scheduling should be done. The main task of the embedded scheduling algorithm is to choose the next packet to be dequeued from the available multi queues and forwarded onto the output link. This is illustrated in Figure 4‐ (b) shown below.
B. Scheduling Algorithm Aim
The main aims behind the concept of packet scheduling could be simply defined by four points:
• The first and foremost goal of a scheduling algorithm is to be able to share the total system bandwidth fairly.
• The algorithm should be able to guarantee the minimum bandwidth per SS. This consequently leads to the separation of different demanding SSs.
• To be capable of meeting packet drop guarantees. • To be able to assure latency guarantees. • To be capable of reducing latency variation.
C. Scheduling Algorithm Criterions
On the other hand, metrics on which scheduling algorithms will be compared are as follows:
Simplicity: This criterion in particular is of significant importance to the high‐speed networks available in the present time since a simply implemented algorithm directly leads to a faster operation and thus lower packet latency. In addition, a less complex algorithm may also mean a lower implementation cost. Furthermore, simplicity of the algorithm would also benefit mobile devices that possess a limited power resource.
Fairness: Fairness can be defined such that: “If two flows are backlogged, difference between their weighted throughputs is bounded.” Since mobile subscriber stations are considered equal regardless their location, distance from the BS and channel quality, a scheduling algorithm should be able to recompense users with poor channel quality and it is based on the “Max‐min fair share”.
Flexibility: A scheduling algorithm should be capable of accommodating users with different QoS requirements.
Link Utilization: Maximizing the link utilization, especially in the case of wireless communications, is of great significance to service providers. Since the produced income is directly proportional to this criteria.
Protection: A scheduling algorithm is required to protect well‐behaving users from the misbehaving users. Well‐behaving users are those who stick to the Service Level Agreements (SLA), while the misbehaving users are those who do not comply with the SLA at all times and thus causes unpredictability in the network.
IV. FUNDAMENTAL SCHEDULING ALGORITHM
In the coming subsections the fundamental scheduling algorithms will be briefly described. These basic algorithms make up the foundation of target scheduling algorithm, the Modified Deficit Round Robin (MDRR). Afterwards, a detailed investigation of MDRR will be carried out, emphasizing the modifications made to adjust the algorithm.
A. Round Robin(RR)
Round‐Robin as a scheduling algorithm is considered the most basic and the least complex scheduling algorithm. Basically the algorithm services the backlogged queues in a round robin fashion. Each time the scheduler pointer stop at a particular queue, one packet is dequeued from that queue and then the scheduler pointer goes to the next queue. This is shown in Figure 5.
96 http://sites.google.com/site/ijcsis/ ISSN 1947-5500
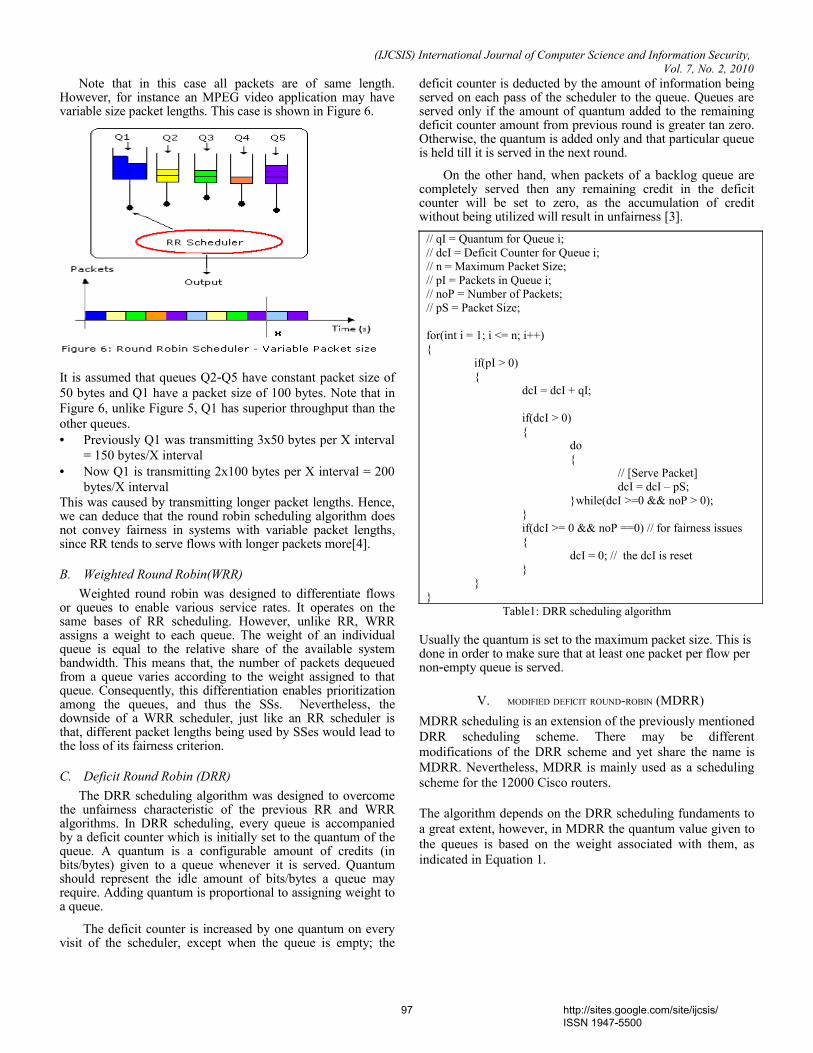
(IJCSIS) International Journal of Computer Science and Information Security, Vol. 7, No. 2, 2010
Note that in this case all packets are of same length. However, for instance an MPEG video application may have variable size packet lengths. This case is shown in Figure 6.
It is assumed that queues Q2‐Q5 have constant packet size of 50 bytes and Q1 have a packet size of 100 bytes. Note that in Figure 6, unlike Figure 5, Q1 has superior throughput than the other queues.• Previously Q1 was transmitting 3x50 bytes per X interval
= 150 bytes/X interval • Now Q1 is transmitting 2x100 bytes per X interval = 200
bytes/X intervalThis was caused by transmitting longer packet lengths. Hence, we can deduce that the round robin scheduling algorithm does not convey fairness in systems with variable packet lengths, since RR tends to serve flows with longer packets more[4].
B. Weighted Round Robin(WRR)
Weighted round robin was designed to differentiate flows or queues to enable various service rates. It operates on the same bases of RR scheduling. However, unlike RR, WRR assigns a weight to each queue. The weight of an individual queue is equal to the relative share of the available system bandwidth. This means that, the number of packets dequeued from a queue varies according to the weight assigned to that queue. Consequently, this differentiation enables prioritization among the queues, and thus the SSs. Nevertheless, the downside of a WRR scheduler, just like an RR scheduler is that, different packet lengths being used by SSes would lead to the loss of its fairness criterion.
C. Deficit Round Robin (DRR)
The DRR scheduling algorithm was designed to overcome the unfairness characteristic of the previous RR and WRR algorithms. In DRR scheduling, every queue is accompanied by a deficit counter which is initially set to the quantum of the queue. A quantum is a configurable amount of credits (in bits/bytes) given to a queue whenever it is served. Quantum should represent the idle amount of bits/bytes a queue may require. Adding quantum is proportional to assigning weight to a queue.
The deficit counter is increased by one quantum on every visit of the scheduler, except when the queue is empty; the
deficit counter is deducted by the amount of information being served on each pass of the scheduler to the queue. Queues are served only if the amount of quantum added to the remaining deficit counter amount from previous round is greater tan zero. Otherwise, the quantum is added only and that particular queue is held till it is served in the next round.
On the other hand, when packets of a backlog queue are completely served then any remaining credit in the deficit counter will be set to zero, as the accumulation of credit without being utilized will result in unfairness [3].
// qI = Quantum for Queue i;// dcI = Deficit Counter for Queue i;// n = Maximum Packet Size;// pI = Packets in Queue i;// noP = Number of Packets;// pS = Packet Size;
for(int i = 1; i <= n; i++){
if(pI > 0){
dcI = dcI + qI;
if(dcI > 0){
do{
// [Serve Packet]dcI = dcI – pS;
}while(dcI >=0 && noP > 0);}if(dcI >= 0 && noP ==0) // for fairness issues{
dcI = 0; // the dcI is reset}
}}
Table1: DRR scheduling algorithm
Usually the quantum is set to the maximum packet size. This is done in order to make sure that at least one packet per flow per non‐empty queue is served.
V. MODIFIED DEFICIT ROUND-ROBIN (MDRR)
MDRR scheduling is an extension of the previously mentioned DRR scheduling scheme. There may be different modifications of the DRR scheme and yet share the name is MDRR. Nevertheless, MDRR is mainly used as a scheduling scheme for the 12000 Cisco routers.
The algorithm depends on the DRR scheduling fundaments to a great extent, however, in MDRR the quantum value given to the queues is based on the weight associated with them, as indicated in Equation 1.
97 http://sites.google.com/site/ijcsis/ ISSN 1947-5500
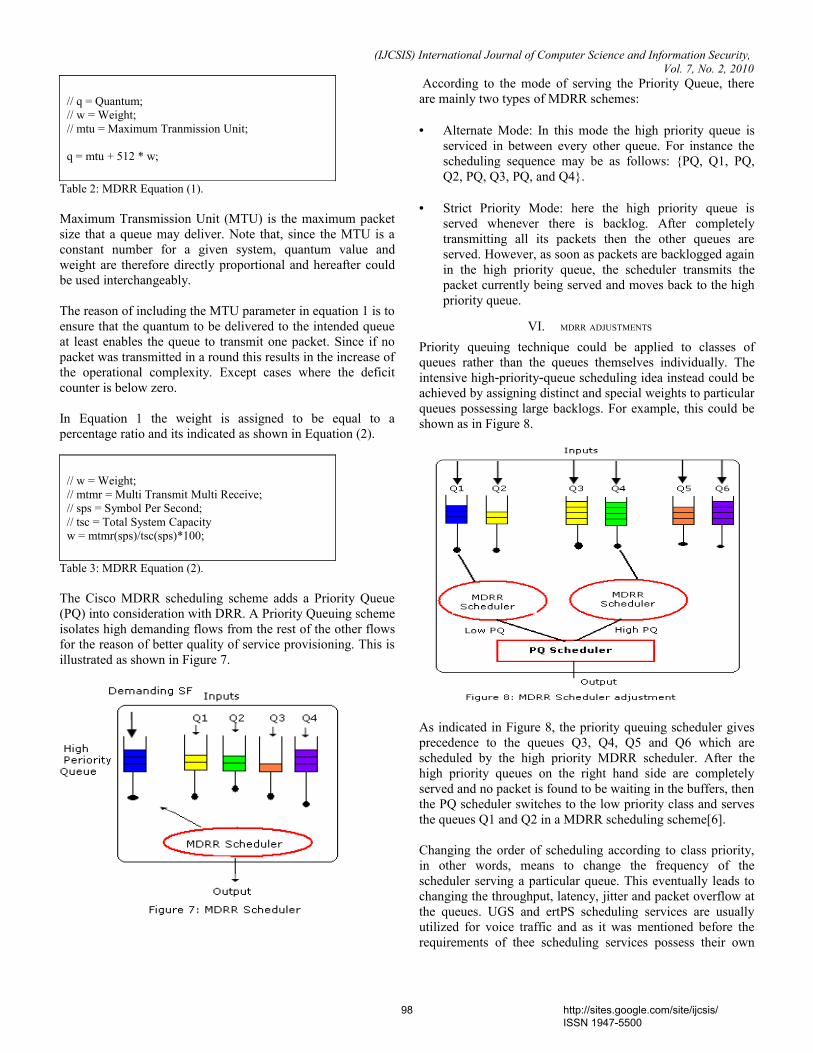
(IJCSIS) International Journal of Computer Science and Information Security, Vol. 7, No. 2, 2010
// q = Quantum;// w = Weight;// mtu = Maximum Tranmission Unit;
q = mtu + 512 * w;
Table 2: MDRR Equation (1).
Maximum Transmission Unit (MTU) is the maximum packet size that a queue may deliver. Note that, since the MTU is a constant number for a given system, quantum value and weight are therefore directly proportional and hereafter could be used interchangeably.
The reason of including the MTU parameter in equation 1 is to ensure that the quantum to be delivered to the intended queue at least enables the queue to transmit one packet. Since if no packet was transmitted in a round this results in the increase of the operational complexity. Except cases where the deficit counter is below zero.
In Equation 1 the weight is assigned to be equal to a percentage ratio and its indicated as shown in Equation (2).
// w = Weight;// mtmr = Multi Transmit Multi Receive;// sps = Symbol Per Second;// tsc = Total System Capacityw = mtmr(sps)/tsc(sps)*100;
Table 3: MDRR Equation (2).
The Cisco MDRR scheduling scheme adds a Priority Queue (PQ) into consideration with DRR. A Priority Queuing scheme isolates high demanding flows from the rest of the other flows for the reason of better quality of service provisioning. This is illustrated as shown in Figure 7.
According to the mode of serving the Priority Queue, there are mainly two types of MDRR schemes:
• Alternate Mode: In this mode the high priority queue is serviced in between every other queue. For instance the scheduling sequence may be as follows: {PQ, Q1, PQ, Q2, PQ, Q3, PQ, and Q4}.
• Strict Priority Mode: here the high priority queue is served whenever there is backlog. After completely transmitting all its packets then the other queues are served. However, as soon as packets are backlogged again in the high priority queue, the scheduler transmits the packet currently being served and moves back to the high priority queue.
VI. MDRR ADJUSTMENTS
Priority queuing technique could be applied to classes of queues rather than the queues themselves individually. The intensive high‐priority‐queue scheduling idea instead could be achieved by assigning distinct and special weights to particular queues possessing large backlogs. For example, this could be shown as in Figure 8.
As indicated in Figure 8, the priority queuing scheduler gives precedence to the queues Q3, Q4, Q5 and Q6 which are scheduled by the high priority MDRR scheduler. After the high priority queues on the right hand side are completely served and no packet is found to be waiting in the buffers, then the PQ scheduler switches to the low priority class and serves the queues Q1 and Q2 in a MDRR scheduling scheme[6].
Changing the order of scheduling according to class priority, in other words, means to change the frequency of the scheduler serving a particular queue. This eventually leads to changing the throughput, latency, jitter and packet overflow at the queues. UGS and ertPS scheduling services are usually utilized for voice traffic and as it was mentioned before the requirements of thee scheduling services possess their own
98 http://sites.google.com/site/ijcsis/ ISSN 1947-5500
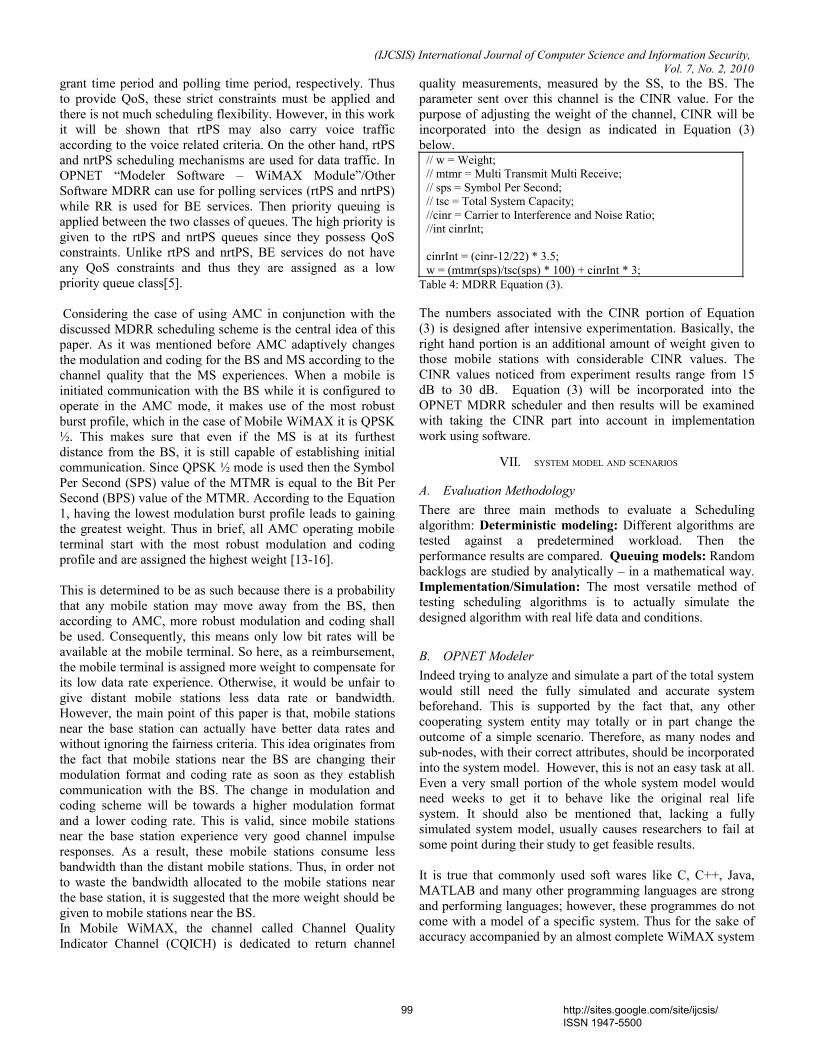
(IJCSIS) International Journal of Computer Science and Information Security, Vol. 7, No. 2, 2010
grant time period and polling time period, respectively. Thus to provide QoS, these strict constraints must be applied and there is not much scheduling flexibility. However, in this work it will be shown that rtPS may also carry voice traffic according to the voice related criteria. On the other hand, rtPS and nrtPS scheduling mechanisms are used for data traffic. In OPNET “Modeler Software – WiMAX Module”/Other Software MDRR can use for polling services (rtPS and nrtPS) while RR is used for BE services. Then priority queuing is applied between the two classes of queues. The high priority is given to the rtPS and nrtPS queues since they possess QoS constraints. Unlike rtPS and nrtPS, BE services do not have any QoS constraints and thus they are assigned as a low priority queue class[5].
Considering the case of using AMC in conjunction with the discussed MDRR scheduling scheme is the central idea of this paper. As it was mentioned before AMC adaptively changes the modulation and coding for the BS and MS according to the channel quality that the MS experiences. When a mobile is initiated communication with the BS while it is configured to operate in the AMC mode, it makes use of the most robust burst profile, which in the case of Mobile WiMAX it is QPSK ½. This makes sure that even if the MS is at its furthest distance from the BS, it is still capable of establishing initial communication. Since QPSK ½ mode is used then the Symbol Per Second (SPS) value of the MTMR is equal to the Bit Per Second (BPS) value of the MTMR. According to the Equation 1, having the lowest modulation burst profile leads to gaining the greatest weight. Thus in brief, all AMC operating mobile terminal start with the most robust modulation and coding profile and are assigned the highest weight [13-16].
This is determined to be as such because there is a probability that any mobile station may move away from the BS, then according to AMC, more robust modulation and coding shall be used. Consequently, this means only low bit rates will be available at the mobile terminal. So here, as a reimbursement, the mobile terminal is assigned more weight to compensate for its low data rate experience. Otherwise, it would be unfair to give distant mobile stations less data rate or bandwidth. However, the main point of this paper is that, mobile stations near the base station can actually have better data rates and without ignoring the fairness criteria. This idea originates from the fact that mobile stations near the BS are changing their modulation format and coding rate as soon as they establish communication with the BS. The change in modulation and coding scheme will be towards a higher modulation format and a lower coding rate. This is valid, since mobile stations near the base station experience very good channel impulse responses. As a result, these mobile stations consume less bandwidth than the distant mobile stations. Thus, in order not to waste the bandwidth allocated to the mobile stations near the base station, it is suggested that the more weight should be given to mobile stations near the BS.In Mobile WiMAX, the channel called Channel Quality Indicator Channel (CQICH) is dedicated to return channel
quality measurements, measured by the SS, to the BS. The parameter sent over this channel is the CINR value. For the purpose of adjusting the weight of the channel, CINR will be incorporated into the design as indicated in Equation (3) below.
// w = Weight;// mtmr = Multi Transmit Multi Receive;// sps = Symbol Per Second;// tsc = Total System Capacity;//cinr = Carrier to Interference and Noise Ratio;//int cinrInt;
cinrInt = (cinr-12/22) * 3.5;w = (mtmr(sps)/tsc(sps) * 100) + cinrInt * 3;
Table 4: MDRR Equation (3).
The numbers associated with the CINR portion of Equation (3) is designed after intensive experimentation. Basically, the right hand portion is an additional amount of weight given to those mobile stations with considerable CINR values. The CINR values noticed from experiment results range from 15 dB to 30 dB. Equation (3) will be incorporated into the OPNET MDRR scheduler and then results will be examined with taking the CINR part into account in implementation work using software.
VII. SYSTEM MODEL AND SCENARIOS
A. Evaluation Methodology
There are three main methods to evaluate a Scheduling algorithm: Deterministic modeling: Different algorithms are tested against a predetermined workload. Then the performance results are compared. Queuing models: Random backlogs are studied by analytically – in a mathematical way. Implementation/Simulation: The most versatile method of testing scheduling algorithms is to actually simulate the designed algorithm with real life data and conditions.
B. OPNET Modeler
Indeed trying to analyze and simulate a part of the total system would still need the fully simulated and accurate system beforehand. This is supported by the fact that, any other cooperating system entity may totally or in part change the outcome of a simple scenario. Therefore, as many nodes and sub‐nodes, with their correct attributes, should be incorporated into the system model. However, this is not an easy task at all. Even a very small portion of the whole system model would need weeks to get it to behave like the original real life system. It should also be mentioned that, lacking a fully simulated system model, usually causes researchers to fail at some point during their study to get feasible results.
It is true that commonly used soft wares like C, C++, Java, MATLAB and many other programming languages are strong and performing languages; however, these programmes do not come with a model of a specific system. Thus for the sake of accuracy accompanied by an almost complete WiMAX system
99 http://sites.google.com/site/ijcsis/ ISSN 1947-5500
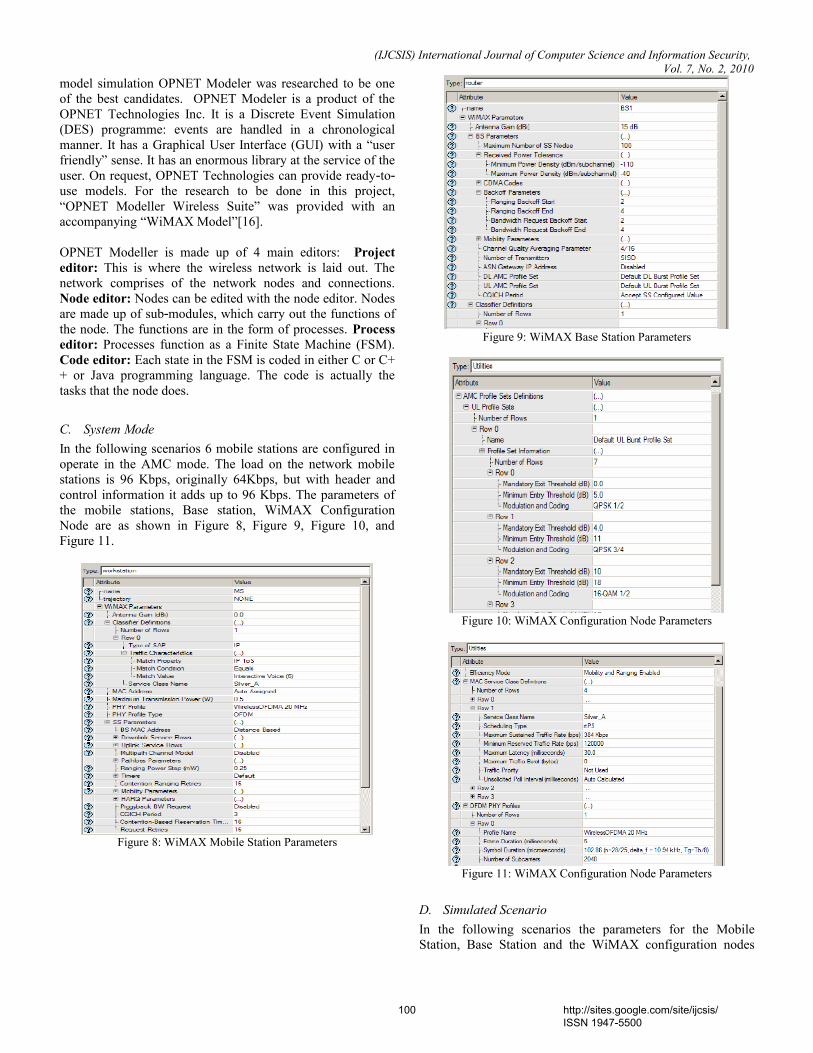
(IJCSIS) International Journal of Computer Science and Information Security, Vol. 7, No. 2, 2010
model simulation OPNET Modeler was researched to be one of the best candidates. OPNET Modeler is a product of the OPNET Technologies Inc. It is a Discrete Event Simulation (DES) programme: events are handled in a chronological manner. It has a Graphical User Interface (GUI) with a “user friendly” sense. It has an enormous library at the service of the user. On request, OPNET Technologies can provide ready‐to‐use models. For the research to be done in this project, “OPNET Modeller Wireless Suite” was provided with an accompanying “WiMAX Model”[16].
OPNET Modeller is made up of 4 main editors: Project editor: This is where the wireless network is laid out. The network comprises of the network nodes and connections. Node editor: Nodes can be edited with the node editor. Nodes are made up of sub‐modules, which carry out the functions of the node. The functions are in the form of processes. Process editor: Processes function as a Finite State Machine (FSM). Code editor: Each state in the FSM is coded in either C or C++ or Java programming language. The code is actually the tasks that the node does.
C. System Mode
In the following scenarios 6 mobile stations are configured in operate in the AMC mode. The load on the network mobile stations is 96 Kbps, originally 64Kbps, but with header and control information it adds up to 96 Kbps. The parameters of the mobile stations, Base station, WiMAX Configuration Node are as shown in Figure 8, Figure 9, Figure 10, and Figure 11.
Figure 8: WiMAX Mobile Station Parameters
Figure 9: WiMAX Base Station Parameters
Figure 10: WiMAX Configuration Node Parameters
Figure 11: WiMAX Configuration Node Parameters
D. Simulated Scenario
In the following scenarios the parameters for the Mobile Station, Base Station and the WiMAX configuration nodes
100 http://sites.google.com/site/ijcsis/ ISSN 1947-5500
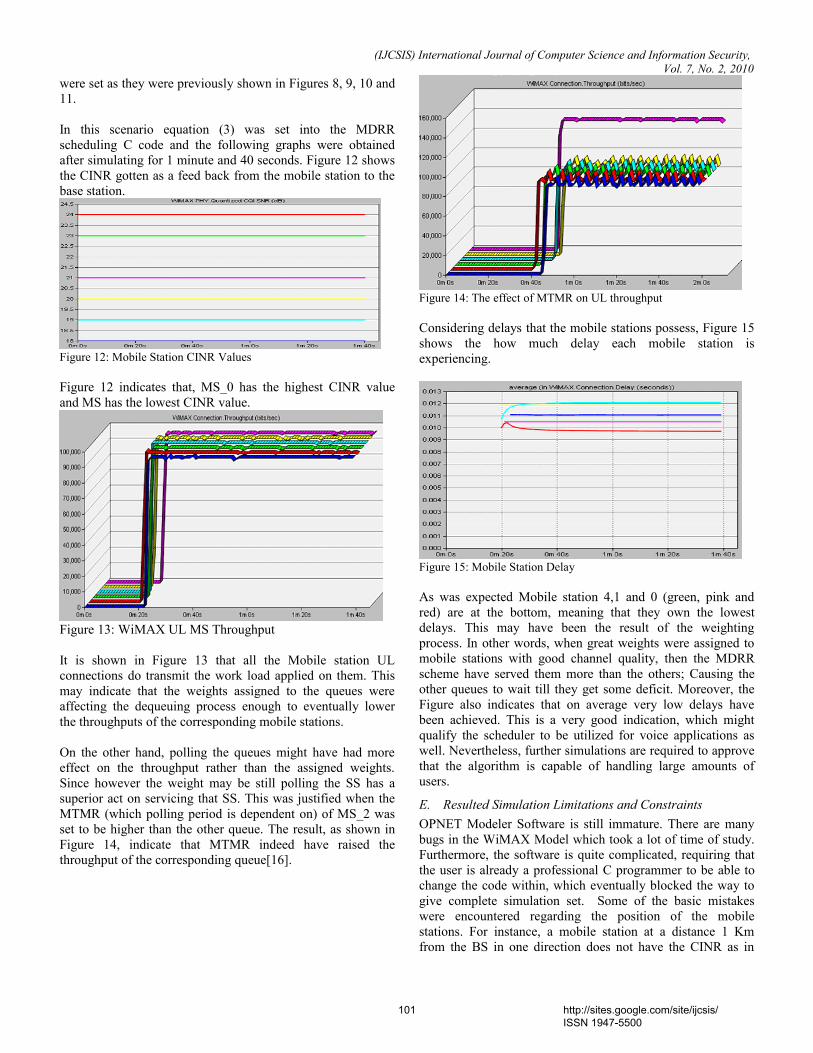
(IJCSIS) International Journal of Computer Science and Information Security, Vol. 7, No. 2, 2010
were set as they were previously shown in Figures 8, 9, 10 and 11.
In this scenario equation (3) was set into the MDRR scheduling C code and the following graphs were obtained after simulating for 1 minute and 40 seconds. Figure 12 shows the CINR gotten as a feed back from the mobile station to the base station.
Figure 12: Mobile Station CINR Values
Figure 12 indicates that, MS_0 has the highest CINR value and MS has the lowest CINR value.
Figure 13: WiMAX UL MS Throughput
It is shown in Figure 13 that all the Mobile station UL connections do transmit the work load applied on them. This may indicate that the weights assigned to the queues were affecting the dequeuing process enough to eventually lower the throughputs of the corresponding mobile stations.
On the other hand, polling the queues might have had more effect on the throughput rather than the assigned weights. Since however the weight may be still polling the SS has a superior act on servicing that SS. This was justified when the MTMR (which polling period is dependent on) of MS_2 was set to be higher than the other queue. The result, as shown in Figure 14, indicate that MTMR indeed have raised the throughput of the corresponding queue[16].
Figure 14: The effect of MTMR on UL throughput
Considering delays that the mobile stations possess, Figure 15 shows the how much delay each mobile station is experiencing.
Figure 15: Mobile Station Delay
As was expected Mobile station 4,1 and 0 (green, pink and red) are at the bottom, meaning that they own the lowest delays. This may have been the result of the weighting process. In other words, when great weights were assigned to mobile stations with good channel quality, then the MDRR scheme have served them more than the others; Causing the other queues to wait till they get some deficit. Moreover, the Figure also indicates that on average very low delays have been achieved. This is a very good indication, which might qualify the scheduler to be utilized for voice applications as well. Nevertheless, further simulations are required to approve that the algorithm is capable of handling large amounts of users.
E. Resulted Simulation Limitations and Constraints
OPNET Modeler Software is still immature. There are many bugs in the WiMAX Model which took a lot of time of study. Furthermore, the software is quite complicated, requiring that the user is already a professional C programmer to be able to change the code within, which eventually blocked the way to give complete simulation set. Some of the basic mistakes were encountered regarding the position of the mobile stations. For instance, a mobile station at a distance 1 Km from the BS in one direction does not have the CINR as in
101 http://sites.google.com/site/ijcsis/ ISSN 1947-5500
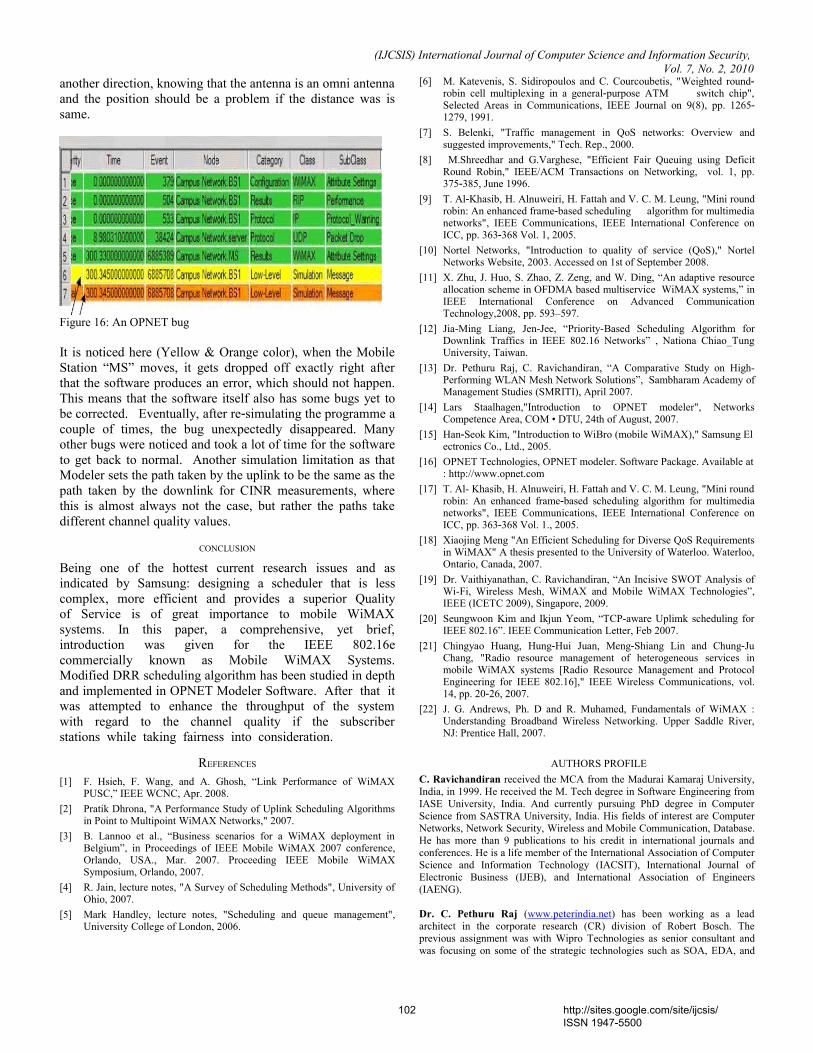
(IJCSIS) International Journal of Computer Science and Information Security, Vol. 7, No. 2, 2010
another direction, knowing that the antenna is an omni antenna and the position should be a problem if the distance was is same.
Figure 16: An OPNET bug
It is noticed here (Yellow & Orange color), when the Mobile Station “MS” moves, it gets dropped off exactly right after that the software produces an error, which should not happen. This means that the software itself also has some bugs yet to be corrected. Eventually, after re‐simulating the programme a couple of times, the bug unexpectedly disappeared. Many other bugs were noticed and took a lot of time for the software to get back to normal. Another simulation limitation as that Modeler sets the path taken by the uplink to be the same as the path taken by the downlink for CINR measurements, where this is almost always not the case, but rather the paths take different channel quality values.
CONCLUSION
Being one of the hottest current research issues and as indicated by Samsung: designing a scheduler that is less complex, more efficient and provides a superior Quality of Service is of great importance to mobile WiMAX systems. In this paper, a comprehensive, yet brief, introduction was given for the IEEE 802.16e commercially known as Mobile WiMAX Systems. Modified DRR scheduling algorithm has been studied in depth and implemented in OPNET Modeler Software. After that it was attempted to enhance the throughput of the system with regard to the channel quality if the subscriber stations while taking fairness into consideration.
REFERENCES
[1] F. Hsieh, F. Wang, and A. Ghosh, “Link Performance of WiMAX PUSC,” IEEE WCNC, Apr. 2008.
[2] Pratik Dhrona, "A Performance Study of Uplink Scheduling Algorithms in Point to Multipoint WiMAX Networks," 2007.
[3] B. Lannoo et al., “Business scenarios for a WiMAX deployment in Belgium”, in Proceedings of IEEE Mobile WiMAX 2007 conference, Orlando, USA., Mar. 2007. Proceeding IEEE Mobile WiMAX Symposium, Orlando, 2007.
[4] R. Jain, lecture notes, "A Survey of Scheduling Methods", University of Ohio, 2007.
[5] Mark Handley, lecture notes, "Scheduling and queue management", University College of London, 2006.
[6] M. Katevenis, S. Sidiropoulos and C. Courcoubetis, "Weighted round‐robin cell multiplexing in a general purpose ATM switch chip",‐ Selected Areas in Communications, IEEE Journal on 9(8), pp. 1265‐1279, 1991.
[7] S. Belenki, "Traffic management in QoS networks: Overview and suggested improvements," Tech. Rep., 2000.
[8] M.Shreedhar and G.Varghese, "Efficient Fair Queuing using Deficit Round Robin," IEEE/ACM Transactions on Networking, vol. 1, pp. 375 385, June 1996. ‐
[9] T. Al Khasib, H. Alnuweiri, H. Fattah and V. C. M. Leung, "Mini round‐ robin: An enhanced frame based scheduling algorithm for multimedia‐ networks", IEEE Communications, IEEE International Conference on ICC, pp. 363 368 Vol. 1, 2005. ‐
[10] Nortel Networks, "Introduction to quality of service (QoS)," Nortel Networks Website, 2003. Accessed on 1st of September 2008.
[11] X. Zhu, J. Huo, S. Zhao, Z. Zeng, and W. Ding, “An adaptive resource allocation scheme in OFDMA based multiservice WiMAX systems,” in IEEE International Conference on Advanced Communication Technology,2008, pp. 593–597.
[12] Jia-Ming Liang, Jen-Jee, “Priority-Based Scheduling Algorithm for Downlink Traffics in IEEE 802.16 Networks” , Nationa Chiao_Tung University, Taiwan.
[13] Dr. Pethuru Raj, C. Ravichandiran, “A Comparative Study on High-Performing WLAN Mesh Network Solutions”, Sambharam Academy of Management Studies (SMRITI), April 2007.
[14] Lars Staalhagen,"Introduction to OPNET modeler", Networks Competence Area, COM • DTU, 24th of August, 2007.
[15] Han Seok‐ Kim, "Introduction to WiBro (mobile WiMAX)," Samsung Electronics Co., Ltd., 2005.
[16] OPNET Technologies, OPNET modeler. Software Package. Available at: http://www.opnet.com
[17] T. Al- Khasib, H. Alnuweiri, H. Fattah and V. C. M. Leung, "Mini round robin: An enhanced frame based scheduling algorithm for multimedia‐ networks", IEEE Communications, IEEE International Conference on ICC, pp. 363 368 Vol. 1., 2005. ‐
[18] Xiaojing Meng "An Efficient Scheduling for Diverse QoS Requirements in WiMAX" A thesis presented to the University of Waterloo. Waterloo, Ontario, Canada, 2007.
[19] Dr. Vaithiyanathan, C. Ravichandiran, “An Incisive SWOT Analysis of Wi-Fi, Wireless Mesh, WiMAX and Mobile WiMAX Technologies”, IEEE (ICETC 2009), Singapore, 2009.
[20] Seungwoon Kim and Ikjun Yeom, “TCP-aware Uplimk scheduling for IEEE 802.16”. IEEE Communication Letter, Feb 2007.
[21] Chingyao Huang, Hung Hui Juan, Meng Shiang Lin and Chung Ju‐ ‐ ‐ Chang, "Radio resource management of heterogeneous services in mobile WiMAX systems [Radio Resource Management and Protocol Engineering for IEEE 802.16]," IEEE Wireless Communications, vol. 14, pp. 20 26, 2007. ‐
[22] J. G. Andrews, Ph. D and R. Muhamed, Fundamentals of WiMAX : Understanding Broadband Wireless Networking. Upper Saddle River, NJ: Prentice Hall, 2007.
AUTHORS PROFILE
C. Ravichandiran received the MCA from the Madurai Kamaraj University, India, in 1999. He received the M. Tech degree in Software Engineering from IASE University, India. And currently pursuing PhD degree in Computer Science from SASTRA University, India. His fields of interest are Computer Networks, Network Security, Wireless and Mobile Communication, Database. He has more than 9 publications to his credit in international journals and conferences. He is a life member of the International Association of Computer Science and Information Technology (IACSIT), International Journal of Electronic Business (IJEB), and International Association of Engineers (IAENG).
Dr. C. Pethuru Raj (www.peterindia.net) has been working as a lead architect in the corporate research (CR) division of Robert Bosch. The previous assignment was with Wipro Technologies as senior consultant and was focusing on some of the strategic technologies such as SOA, EDA, and
102 http://sites.google.com/site/ijcsis/ ISSN 1947-5500

(IJCSIS) International Journal of Computer Science and Information Security, Vol. 7, No. 2, 2010
Cloud Computing for three years. Before that, he worked in a couple of research assignments in leading Japanese universities for 3.5 years. He has 8 years of IT industry experiences after the successful completion of his UGC-sponsored PhD in formal language theory / fine automata in the year 1997. He worked as a CSIR research associate in the department of computer science and automation (CSA), Indian institute of science (IISc), Bangalore for 14 memorable months. He has been authoring research papers for leading journals and is currently involved in writing a comprehensive and informative book on Next-Generation Service Oriented Architecture (SOA).
Dr. V. Vaidhyanathan received the PhD degree from the Alagappa University, Karaikudi, India. He is currently Professor and HOD-IT in School
of Computing, SASTRA University, and Thanjavur, India. He has more than 19 years of experience in teaching and research. He has been guiding more than 25 M.Tech Projects, 5 PhD and thesis. His fields of interests are various techniques in Image Processing, Computer vision for shape identification, Reconstruction, noise removal, online correction of an image by developing software and in the area of cryptography. Various applications of soft computing techniques for object identifications. He has more than 40 publications to his credit in international journals and conferences. He has visited many universities in India.
103 http://sites.google.com/site/ijcsis/ ISSN 1947-5500
(IJCSIS) International Journal of Computer Science and Information Security, Vol. 7, No. 2, 2010
Current Conveyor Based Multifunction Filter
Manish Kumar Electronics and Communication
Engineering Department Jaypee Institute of Information
Technology Noida, India
.
M.C. Srivastava Electronics and Communication
Engineering Department Jaypee Institute of Information
Technology Noida, India
.
Umesh Kumar Electrical Engineering Department
Indian Institute of Technology Delhi, India
.
Abstract—The paper presents a current conveyor based multifunction filter. The proposed circuit can be realized as low pass, high pass, band pass and elliptical notch filter. The circuit employs two balanced output current conveyors, four resistors and two grounded capacitors, ideal for integration. It has only one output terminal and the number of input terminals may be used. Further, there is no requirement for component matching in the circuit. The parameter resonance frequency (ω0) and bandwidth (ω0 /Q) enjoy orthogonal tuning. The complementary metal oxide semiconductor (CMOS) realization of the current conveyor is given for the simulation of the proposed circuit. A HSPICE simulation of circuit is also studied for the verification of theoretical results. The non-ideal analysis of CCII is also studied. (Abstract)
Keywords- Active filters, Current Conveyor, Voltage- mode.
I. INTRODUCTION (HEADING 1) Active filters are widely used in the signal processing and
instrumentation area. The well known advantage of current mode operation, such as better linearity, simple circuitry, low power consumption and greater bandwidth becomes more attractive as compared to voltage-mode counterpart with introduction of Current Conveyor II(CCII). The application and advantages in the realization of various active filters using current conveyors has received considerable attention [1]-[5]. Some voltage mode multifunction filter using current conveyors have also been proposed. In 1995 Soliman [1] proposed Kerwin-Huelsman-Newcomb (KHN) biquad with single input and three outputs, which realizes low-pass, band-pass and high-pass filter. The circuit employs five current conveyor (CCII), two capacitors and six resistors. In 1997 Higahimura et al. [2] proposed a universal voltage-mode filter that can realize low-pass, high-pass, band-pass, all-pass and notch filter using seven current conveyors, two capacitors and eight resistors. Ozoguz et. al. [3] realized high-pass, low-pass and band-pass filter using three positive current conveyor and five passive components. In 1999 Chang and Lee [4] proposed voltage mode low-pass, band-pass and high-pass filter with single input and three outputs employing only current conveyors, two grounded capacitors and three resistors. Toker et. al. [5] realized high output impedance transadmittance type continuous time multifunction filter (low-pass, high-pass and
band-pass) employing three positive type current conveyor and five passive components. The circuit proposes high output impedance.
In this paper a circuit employing two balanced output current conveyors, four resistors and two grounded capacitors is proposed. This circuit has one output terminal and four input terminals. All the basic filters (low pass, high pass, band pass and notch filter) may be realized by selecting appropriate input terminals of the circuit.
The following section presents circuit description of the balanced output current conveyor. The sensitivity analysis, nonideal analysis of balanced output current conveyors, simulation results and conclusion are discussed in the subsequent sections.
II. CIRCUIT DESCRIPTION The balanced output current conveyor is shown in fig 1
with its symbol, characterized by the port relations as given by “(1)”
Figure 1. Symbol of balanced output current Conveyor
104 http://sites.google.com/site/ijcsis/ ISSN 1947-5500
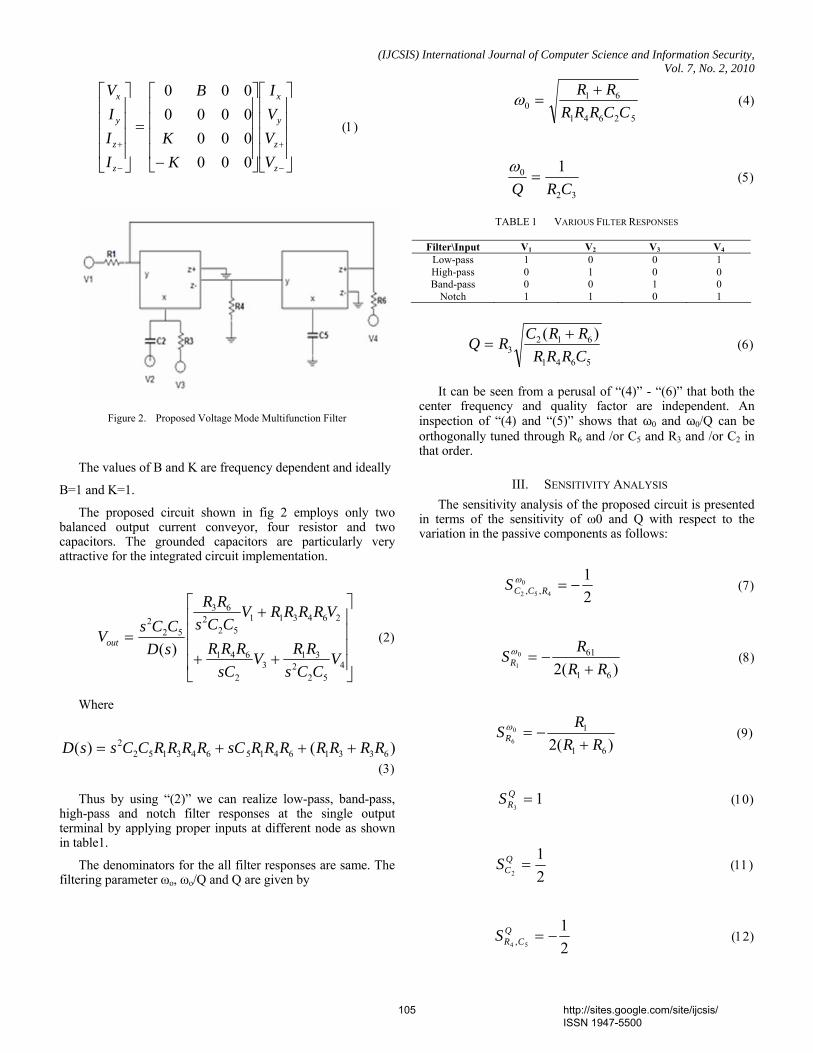
(IJCSIS) International Journal of Computer Science and Information Security, Vol. 7, No. 2, 2010
⎥⎥⎥⎥
⎦
⎤
⎢⎢⎢⎢
⎣
⎡
⎥⎥⎥⎥
⎦
⎤
⎢⎢⎢⎢
⎣
⎡
−
=
⎥⎥⎥⎥
⎦
⎤
⎢⎢⎢⎢
⎣
⎡
−
+
−
+
z
z
y
x
z
z
y
x
VVVI
KK
B
IIIV
0000000000000
(1)
Figure 2. Proposed Voltage Mode Multifunction Filter
The values of B and K are frequency dependent and ideally
B=1 and K=1.
The proposed circuit shown in fig 2 employs only two balanced output current conveyor, four resistor and two capacitors. The grounded capacitors are particularly very attractive for the integrated circuit implementation.
⎥⎥⎥⎥
⎦
⎤
⎢⎢⎢⎢
⎣
⎡
++
+
=
452
231
32
641
26431152
263
522
)( VCCs
RRVsC
RRR
VRRRRVCCs
RR
sDCCsVout (2)
Where
)()( 633164156431522 RRRRRRRsCRRRRCCssD +++=
(3)
Thus by using “(2)” we can realize low-pass, band-pass, high-pass and notch filter responses at the single output terminal by applying proper inputs at different node as shown in table1.
The denominators for the all filter responses are same. The filtering parameter ωo, ωo/Q and Q are given by
52641
610 CCRRR
RR +=ω (4)
32
0 1CRQ
=ω
(5)
TABLE 1 VARIOUS FILTER RESPONSES
Filter\Input V1 V2 V3 V4 Low-pass 1 0 0 1 High-pass 0 1 0 0 Band-pass 0 0 1 0
Notch 1 1 0 1
5641
6123
)(CRRRRRCRQ +
= (6)
It can be seen from a perusal of “(4)” - “(6)” that both the center frequency and quality factor are independent. An inspection of “(4) and “(5)” shows that ω0 and ω0/Q can be orthogonally tuned through R6 and /or C5 and R3 and /or C2 in that order.
III. SENSITIVITY ANALYSIS The sensitivity analysis of the proposed circuit is presented
in terms of the sensitivity of ω0 and Q with respect to the variation in the passive components as follows:
21
0
452 ,, −=ωRCCS (7)
)(2 61
610
1 RRRSR +
−=ω (8)
)(2 61
10
6 RRRSR +
−=ω (9)
13
=QRS (10)
21
2=Q
CS (11)
21
54 , −=QCRS (12)
105 http://sites.google.com/site/ijcsis/ ISSN 1947-5500
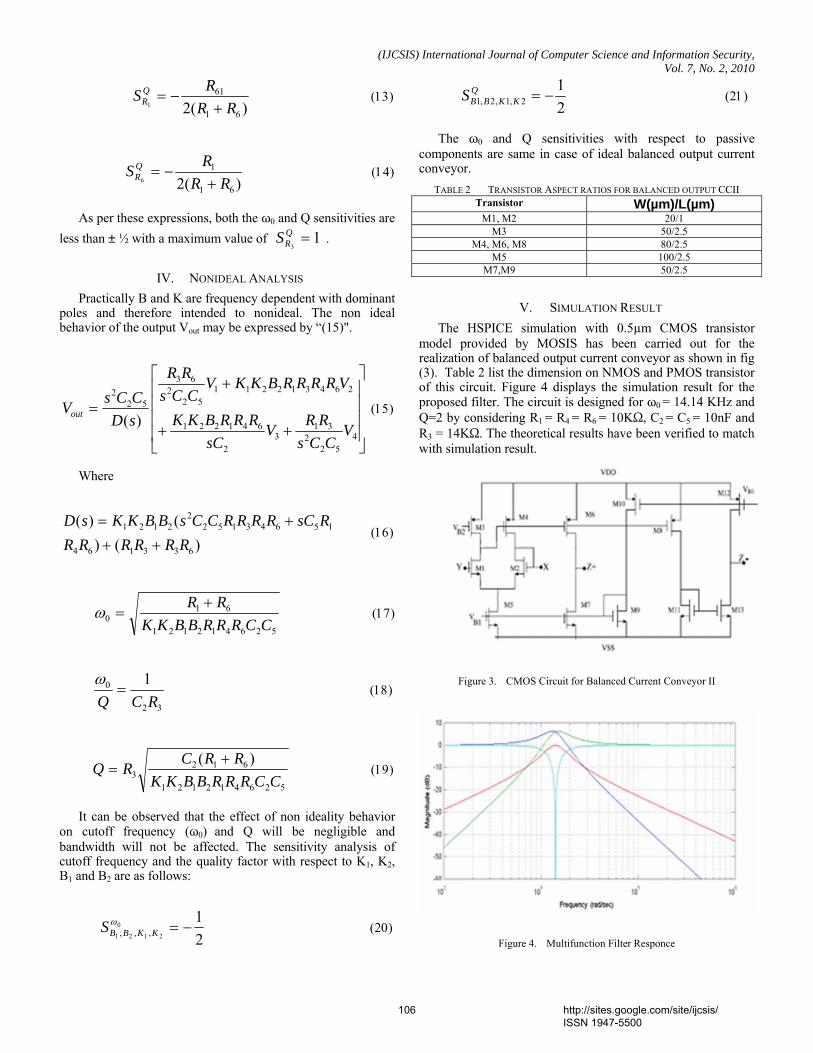
(IJCSIS) International Journal of Computer Science and Information Security, Vol. 7, No. 2, 2010
)(2 61
611 RR
RS QR +
−= (13)
)(2 61
16 RR
RS QR +
−= (14)
As per these expressions, both the ω0 and Q sensitivities are less than ± ½ with a maximum value of 1
3=Q
RS .
IV. NONIDEAL ANALYSIS Practically B and K are frequency dependent with dominant
poles and therefore intended to nonideal. The non ideal behavior of the output Vout may be expressed by “(15)".
⎥⎥⎥⎥
⎦
⎤
⎢⎢⎢⎢
⎣
⎡
++
+
=
452
231
32
641221
26431221152
263
522
)( VCCs
RRVsC
RRRBKK
VRRRRBKKVCCs
RR
sDCCsVout (15)
Where
)()()(
633164
156431522
2121
RRRRRRRsCRRRRCCsBBKKsD
+++=
(16)
526412121
610 CCRRRBBKK
RR +=ω (17)
32
0 1RCQ
=ω
(18)
526412121
6123
)(CCRRRBBKK
RRCRQ += (19)
It can be observed that the effect of non ideality behavior on cutoff frequency (ω0) and Q will be negligible and bandwidth will not be affected. The sensitivity analysis of cutoff frequency and the quality factor with respect to K1, K2, B1 and B2 are as follows:
21
0
2121 ,,, −=ωKKBBS (20)
21
2,1,2,1 −=QKKBBS (21)
The ω0 and Q sensitivities with respect to passive components are same in case of ideal balanced output current conveyor.
TABLE 2 TRANSISTOR ASPECT RATIOS FOR BALANCED OUTPUT CCII Transistor W(µm)/L(µm)
M1, M2 20/1 M3 50/2.5
M4, M6, M8 80/2.5 M5 100/2.5
M7,M9 50/2.5
V. SIMULATION RESULT The HSPICE simulation with 0.5µm CMOS transistor
model provided by MOSIS has been carried out for the realization of balanced output current conveyor as shown in fig (3). Table 2 list the dimension on NMOS and PMOS transistor of this circuit. Figure 4 displays the simulation result for the proposed filter. The circuit is designed for ω0 = 14.14 KHz and Q=2 by considering R1 = R4 = R6 = 10KΩ, C2 = C5 = 10nF and R3 = 14KΩ. The theoretical results have been verified to match with simulation result.
Figure 3. CMOS Circuit for Balanced Current Conveyor II
Figure 4. Multifunction Filter Responce
106 http://sites.google.com/site/ijcsis/ ISSN 1947-5500
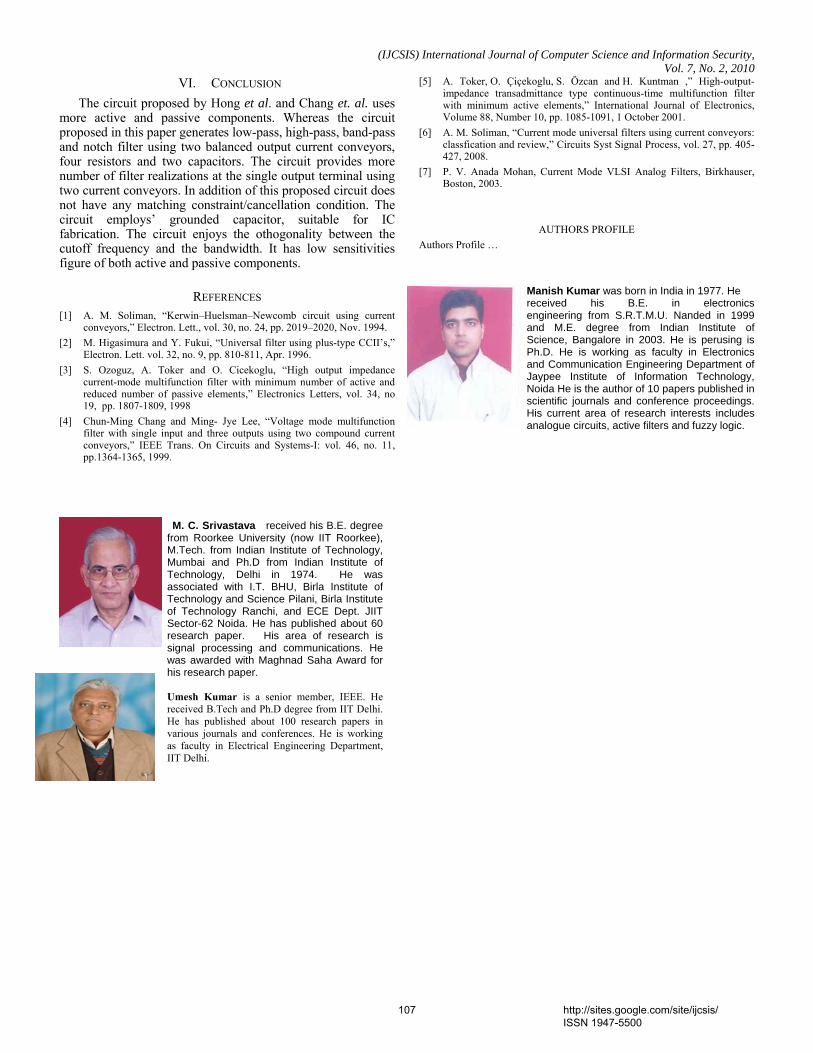
(IJCSIS) International Journal of Computer Science and Information Security, Vol. 7, No. 2, 2010
VI. CONCLUSION The circuit proposed by Hong et al. and Chang et. al. uses
more active and passive components. Whereas the circuit proposed in this paper generates low-pass, high-pass, band-pass and notch filter using two balanced output current conveyors, four resistors and two capacitors. The circuit provides more number of filter realizations at the single output terminal using two current conveyors. In addition of this proposed circuit does not have any matching constraint/cancellation condition. The circuit employs’ grounded capacitor, suitable for IC fabrication. The circuit enjoys the othogonality between the cutoff frequency and the bandwidth. It has low sensitivities figure of both active and passive components.
REFERENCES [1] A. M. Soliman, “Kerwin–Huelsman–Newcomb circuit using current
conveyors,” Electron. Lett., vol. 30, no. 24, pp. 2019–2020, Nov. 1994. [2] M. Higasimura and Y. Fukui, “Universal filter using plus-type CCII’s,”
Electron. Lett. vol. 32, no. 9, pp. 810-811, Apr. 1996. [3] S. Ozoguz, A. Toker and O. Cicekoglu, “High output impedance
current-mode multifunction filter with minimum number of active and reduced number of passive elements,” Electronics Letters, vol. 34, no 19, pp. 1807-1809, 1998
[4] Chun-Ming Chang and Ming- Jye Lee, “Voltage mode multifunction filter with single input and three outputs using two compound current conveyors,” IEEE Trans. On Circuits and Systems-I: vol. 46, no. 11, pp.1364-1365, 1999.
[5] A. Toker, O. Çiçekoglu, S. Özcan and H. Kuntman ,” High-output-impedance transadmittance type continuous-time multifunction filter with minimum active elements,” International Journal of Electronics, Volume 88, Number 10, pp. 1085-1091, 1 October 2001.
[6] A. M. Soliman, “Current mode universal filters using current conveyors: classfication and review,” Circuits Syst Signal Process, vol. 27, pp. 405-427, 2008.
[7] P. V. Anada Mohan, Current Mode VLSI Analog Filters, Birkhauser, Boston, 2003.
AUTHORS PROFILE Authors Profile …
Manish Kumar was born in India in 1977. He received his B.E. in electronics engineering from S.R.T.M.U. Nanded in 1999 and M.E. degree from Indian Institute of Science, Bangalore in 2003. He is perusing is Ph.D. He is working as faculty in Electronics and Communication Engineering Department of Jaypee Institute of Information Technology, Noida He is the author of 10 papers published in scientific journals and conference proceedings. His current area of research interests includes analogue circuits, active filters and fuzzy logic.
M. C. Srivastava received his B.E. degree from Roorkee University (now IIT Roorkee), M.Tech. from Indian Institute of Technology, Mumbai and Ph.D from Indian Institute of Technology, Delhi in 1974. He was associated with I.T. BHU, Birla Institute of Technology and Science Pilani, Birla Institute of Technology Ranchi, and ECE Dept. JIIT Sector-62 Noida. He has published about 60 research paper. His area of research is signal processing and communications. He was awarded with Maghnad Saha Award for his research paper. Umesh Kumar is a senior member, IEEE. He received B.Tech and Ph.D degree from IIT Delhi. He has published about 100 research papers in various journals and conferences. He is working as faculty in Electrical Engineering Department, IIT Delhi.
107 http://sites.google.com/site/ijcsis/ ISSN 1947-5500
(IJCSIS) International Journal of Computer Science and Information Security, Vol. VII , No. II, FEB2010 .
1
A Secure Hash Function MD-192 With Modified
Message Expansion
Harshvardhan Tiwari Student, CSE Department
JIIT Noida, India
Dr. Krishna Asawa Asst. Prof., CSE/IT Department
JIIT Noida, India
Abstract—Cryptographic hash functions play a central role in cryptography. Hash functions were introduced in cryptology to provide message integrity and authentication. MD5, SHA1 and RIPEMD are among the most commonly used message digest algorithm. Recently proposed attacks on well known and widely used hash functions motivate a design of new stronger hash function. In this paper a new approach is presented that produces 192 bit message digest and uses a modified message expansion mechanism which generates more bit difference in each working variable to make the algorithm more secure. This hash function is collision resistant and assures a good compression and preimage resistance.
Keywords-Cryptology,Hashfunction,MD5,SHA1,RIPEMD, Message Integrity and Authentication,Message expansion.
I. INTRODUCTION Function of hash algorithms is to convert arbitrary length
data into fixed length data hash value and they are used in cryptographic operations such as integrity checking and user authentication. For the cryptographic hash function following properties are required:
• Preimage resistance: It is computationally infeasible to find any input which hashes to any prespecified output.
• Second preimage resistance: It is computationally infeasible to find any second input which has the same output as any specified input.
• Collision resistance: It is computationally infeasible to find a collision, i.e. two distinct inputs that hash to the same result.
For an ideal hash function with an m-bit output, finding a preimage or a second preimage requires about 2m operations and the fastest way to find a collision is a birthday attack which needs approximately 2m/2 operations [1].
The three SHA (Secure Hash Algorithms) algorithms [2, 7] SHA-0, SHA-1 and SHA-2 have different structures. The SHA-2 family uses an identical algorithm with a variable digest
size. In the past few years, there have been significant research advances in the analysis of hash functions and it was shown that none of the hash algorithm is secure enough for critical purposes. The structure of proposed hash function, MD-192, is based on SHA-1. There are six chaining variables in suggested hash function. The extra 32 bit chaining variable makes the algorithm more secure against the brute force attack. The randomness of the bits in the working variables is not more when the original SHA-0 and SHA-1 codes were considered, because of this both SHA-0 and SHA-1 are totally broken using the differential attack by Wang[3,5,6]. Wang attacked on the poor message expansion of the hash function’s compression function. In the suggested hash function a modified expansion mechanism is used, based on the modification to the standard SHA-1 hash function’s message expansion proposed by Jutla and Patthak [11], in such a way that the minimum distance between the similar words is greater compared with SHA-0 and SHA-1. Because of the additional conditions in between the steps 16 and 79 there will be an additional security against the differential attack. Some other changes like, shifting of variables and addition of variables, have been made in order to make the algorithm more secure. The design goal of this algorithm is that, it should have performance as competitive as that of SHA-2 family.
II. PREVIOUS WORKS In this section we discuss about SHA hash functions and
their weaknesses. The original design of the hash function SHA was designed by NSA (National Security Agency) and published by NIST in 1993. It was withdrawn in 1995 and replaced by SHA-1. Both SHA-0 and SHA-1 are based on the principle of MD5 [4] and are mainly used in digital signature schemes. They hash onto 160 bits and use Merkle-Damgard construction [1] from 160 x 512 → 160 compression function. At CRYPTO’98 Chabaud and Joux [9] proposed a theoretical attack on the full SHA-0 with the complexity of 261. In 2004, Biham and Chen [10] presented an algorithm to produce near collisions. In 2005 Biham et al. presented optimization to the attack but the main improvement came from Wang. Both these algorithm (SHA-0 and SHA-1) generate a message digest of
108 http://sites.google.com/site/ijcsis/ ISSN 1947-5500
(IJCSIS) International Journal of Computer Science and Information Security, Vol. VII , No. II, FEB2010
2
length 160 bits by accepting a message of maximum length 264 – 1 bits. In each of these hash function, message M is divided into r-blocks each of length 512bits such that, M= (m1, m2, m3………. mr).Then each block is further divided into sixteen 32 bit words such that mi= w1, w2……….w16, for 1≤i≤r. These 32 bit words are then linearly expanded into eighty 32 bit words wt:
wt = wt-3 wt-8 wt-14 wt-16, for16≤t≤79
the only difference is that the SHA-1 uses a single bitwise rotation in the message schedule in its compression function where as SHA-0 does not. Both hash functions use an update function for processing each message block. This update function consists of eighty steps divided into four rounds. A,B,C,D,E are five 32 bit registers used as buffer for updating the contents. For each of the eighty rounds the registers are updated with a new 32 bit value. The starting value of these registers is known as initial value represented as IV0 = (A0 , B0 , C0 , D0 , E0). In general, IVt = (At, Bt , Ct , Dt , Et) for 0≤t≤79. For step t the value wt is used to update the whole registers. Each step uses a fixed constant kt and a bitwise Boolean operation F which depends on the specific round, IF B THEN C ELSE D in first round, B XOR C XOR D in second and fourth round, MAJ(B,C,D) in third round. The process can be formally represented as:
(At, Bt , Ct , Dt , Et) = ((wt-1+ At-1<<5+F(Bt -1 , Ct-1 , Dt-1)+ Et-1+ kt-1), At-1, (Bt-1<<30), Ct-1, Dt-1)
In 2002 NIST developed three new hash functions SHA-256,384 and 512 [2] whose hash value sizes are 256,384 and 512 bits respectively. These hash functions are standardized with SHA-1 as SHS(Secure Hash Standard),and a 224-bit hash function, SHA-224, based on SHA-256,was added to SHS in 2004 but moving to other members of the SHA family may not be a good solution, so efforts are underway to develop improved alternatives.
III. DESCRIPTION OF MD-192 The new dedicated hash function is algorithmically similar to SHA-1. The word size and the number of rounds are same as that of SHA-1.In order to increase the security aspects of the algorithm the number of chaining variables is increased by one (six working variables) to give a message digest of length 192 bits. Also a different message expansion is used in such a way that, the message expansion becomes stronger by generating more bit difference in each chaining variable. The extended sixteen 32 bit into eighty 32 bit words are given as input to the round function and some changes have been done in shifting of bits in chaining variables. Steps of algorithm are as follows:
Step 1: Padding The first step in MD-192 is to add padding bits to the original message. The aim of this step is to make the length of the original message equal to a value, which is 64 bits less than an exact multiple of 512. We pad message M with one bit equal to 1, followed by a variable number of zero bits.
Step 2: Append length After padding bits are added, length of the original message is calculated and expressed as 64 bit value and 64bits are appended to the end of the original message + padding.
Step 3: Divide the input into 512bit blocks Divide the input message into blocks, each of length 512bits, i.e. cut M into sequence of 512 bit blocks M1,M2…..MN Each of Mi parsed into sixteen 32bit wordsMi
0,Mi1……...Mi
15.
Step 4: Initialize chaining variables H0 = IV, a fixed initial value. The hash is 192 bits used to hold the intermediate and final results. Hash can be represented as six 32 bit word registers, A,B,C,D,E,F. Initial values of these chaining variables are:
A = 01234567
B = 89ABCDEF
C = FEDCBA98
D = 76543210
E = C3D2E1F0
F = 1F83D9AB
The compression function maps 192 bit value H=(A,B,C,D,E,F) and 512 bit block Mi into 192 bit value. The shifting of some of the chaining variables by 15 bits in each round will increase the randomness in bit change in the next successive routines. If the minimum distance of the similar words in the sequence is raised then the randomness will significantly raises. A different message expansion is employed in this hash function in such a way that the minimum distance between the similar words is greater compared with existing hash functions.
Step 5: Processing After preprocessing is completed each message block is processed in order using following steps:
I) For i = 1 to N prepare the message schedule.
Mit , 0≤t≤15
Wt = Wt-3 Wt-8 Wt-14 Wt-16
(( Wt-1 Wt-2 Wt-15 )<<<1) ,
16≤t<20
Wt-3 Wt-8 Wt-14 Wt-16
((Wt-1 Wt-2 Wt-15 Wt-20) <<<1),
20≤t≤63
Wt-3 Wt-8 Wt-14 Wt-16
((Wt-1 Wt-2 Wt-15 Wt-20) <<< 13),
64≤t≤79
II) Initialize the six working variables A,B,C,D,E,F with (i-1)st hash value.
Figure1. Expansion of Message words
109 http://sites.google.com/site/ijcsis/ ISSN 1947-5500
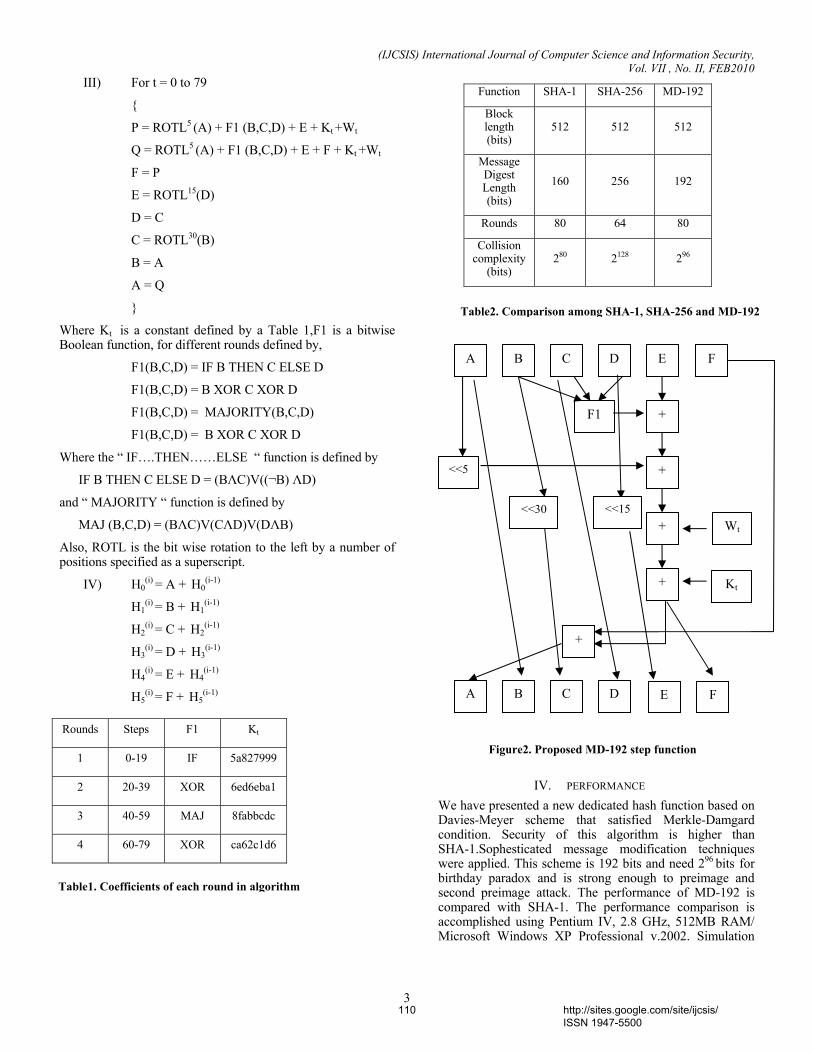
(IJCSIS) International Journal of Computer Science and Information Security, Vol. VII , No. II, FEB2010
3
III) For t = 0 to 79
{
P = ROTL5 (A) + F1 (B,C,D) + E + Kt +Wt
Q = ROTL5 (A) + F1 (B,C,D) + E + F + Kt +Wt
F = P
E = ROTL15(D)
D = C
C = ROTL30(B)
B = A
A = Q
}
Where Kt is a constant defined by a Table 1,F1 is a bitwise Boolean function, for different rounds defined by,
F1(B,C,D) = IF B THEN C ELSE D
F1(B,C,D) = B XOR C XOR D
F1(B,C,D) = MAJORITY(B,C,D)
F1(B,C,D) = B XOR C XOR D
Where the “ IF….THEN……ELSE “ function is defined by
IF B THEN C ELSE D = (BΛC)V((¬B) ΛD)
and “ MAJORITY “ function is defined by
MAJ (B,C,D) = (BΛC)V(CΛD)V(DΛB)
Also, ROTL is the bit wise rotation to the left by a number of positions specified as a superscript.
IV) H0(i) = A + H0
(i-1)
H1(i) = B + H1
(i-1)
H2(i) = C + H2
(i-1)
H3(i) = D + H3
(i-1)
H4(i) = E + H4
(i-1)
H5(i) = F + H5
(i-1)
IV. PERFORMANCE We have presented a new dedicated hash function based on Davies-Meyer scheme that satisfied Merkle-Damgard condition. Security of this algorithm is higher than SHA-1.Sophesticated message modification techniques were applied. This scheme is 192 bits and need 296 bits for birthday paradox and is strong enough to preimage and second preimage attack. The performance of MD-192 is compared with SHA-1. The performance comparison is accomplished using Pentium IV, 2.8 GHz, 512MB RAM/ Microsoft Windows XP Professional v.2002. Simulation
Rounds Steps F1 Kt
1 0-19 IF 5a827999
2 20-39 XOR 6ed6eba1
3 40-59 MAJ 8fabbcdc
4 60-79 XOR ca62c1d6
Function SHA-1 SHA-256 MD-192
Block length (bits)
512 512 512
Message Digest Length (bits)
160 256 192
Rounds 80 64 80
Collision complexity
(bits) 280 2128 296
A B C D E
+
+
+
+
C D B A
F1
<<5
<<30
F
F E
Wt
Kt
+
<<15
Table1. Coefficients of each round in algorithm
Figure2. Proposed MD-192 step function
Table2. Comparison among SHA-1, SHA-256 and MD-192
110 http://sites.google.com/site/ijcsis/ ISSN 1947-5500
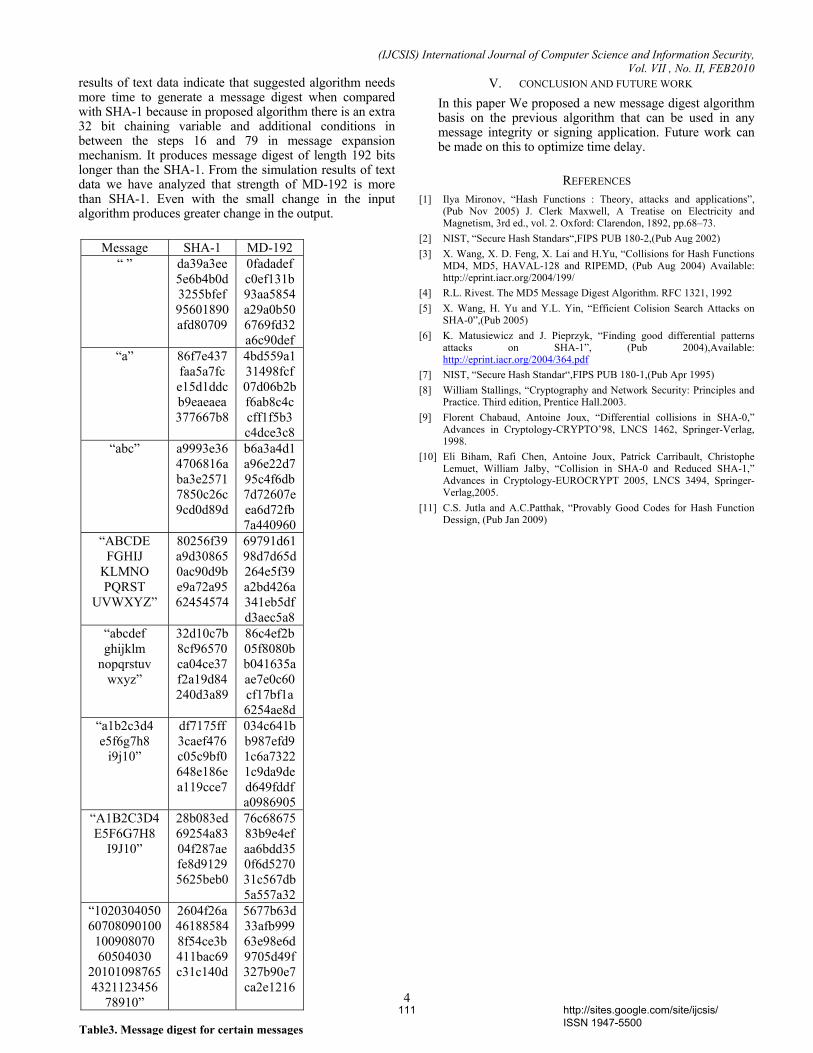
(IJCSIS) International Journal of Computer Science and Information Security, Vol. VII , No. II, FEB2010
4
results of text data indicate that suggested algorithm needs more time to generate a message digest when compared with SHA-1 because in proposed algorithm there is an extra 32 bit chaining variable and additional conditions in between the steps 16 and 79 in message expansion mechanism. It produces message digest of length 192 bits longer than the SHA-1. From the simulation results of text data we have analyzed that strength of MD-192 is more than SHA-1. Even with the small change in the input algorithm produces greater change in the output.
V. CONCLUSION AND FUTURE WORK In this paper We proposed a new message digest algorithm basis on the previous algorithm that can be used in any message integrity or signing application. Future work can be made on this to optimize time delay.
REFERENCES [1] Ilya Mironov, “Hash Functions : Theory, attacks and applications”,
(Pub Nov 2005) J. Clerk Maxwell, A Treatise on Electricity and Magnetism, 3rd ed., vol. 2. Oxford: Clarendon, 1892, pp.68–73.
[2] NIST, “Secure Hash Standars“,FIPS PUB 180-2,(Pub Aug 2002) [3] X. Wang, X. D. Feng, X. Lai and H.Yu, “Collisions for Hash Functions
MD4, MD5, HAVAL-128 and RIPEMD, (Pub Aug 2004) Available: http://eprint.iacr.org/2004/199/
[4] R.L. Rivest. The MD5 Message Digest Algorithm. RFC 1321, 1992 [5] X. Wang, H. Yu and Y.L. Yin, “Efficient Colision Search Attacks on
SHA-0”,(Pub 2005) [6] K. Matusiewicz and J. Pieprzyk, “Finding good differential patterns
attacks on SHA-1”, (Pub 2004),Available: http://eprint.iacr.org/2004/364.pdf
[7] NIST, “Secure Hash Standar“,FIPS PUB 180-1,(Pub Apr 1995) [8] William Stallings, “Cryptography and Network Security: Principles and
Practice. Third edition, Prentice Hall.2003. [9] Florent Chabaud, Antoine Joux, “Differential collisions in SHA-0,”
Advances in Cryptology-CRYPTO’98, LNCS 1462, Springer-Verlag, 1998.
[10] Eli Biham, Rafi Chen, Antoine Joux, Patrick Carribault, Christophe Lemuet, William Jalby, “Collision in SHA-0 and Reduced SHA-1,” Advances in Cryptology-EUROCRYPT 2005, LNCS 3494, Springer-Verlag,2005.
[11] C.S. Jutla and A.C.Patthak, “Provably Good Codes for Hash Function Dessign, (Pub Jan 2009)
Message SHA-1 MD-192 “ ” da39a3ee
5e6b4b0d 3255bfef 95601890 afd80709
0fadadef c0ef131b 93aa5854 a29a0b50 6769fd32 a6c90def
“a” 86f7e437 faa5a7fc e15d1ddc b9eaeaea 377667b8
4bd559a1 31498fcf 07d06b2b f6ab8c4c cff1f5b3 c4dce3c8
“abc” a9993e36 4706816a ba3e2571 7850c26c 9cd0d89d
b6a3a4d1 a96e22d7 95c4f6db 7d72607e ea6d72fb 7a440960
“ABCDE FGHIJ
KLMNO PQRST
UVWXYZ”
80256f39 a9d30865 0ac90d9b e9a72a95 62454574
69791d61 98d7d65d 264e5f39 a2bd426a 341eb5df d3aec5a8
“abcdef ghijklm
nopqrstuv wxyz”
32d10c7b 8cf96570 ca04ce37 f2a19d84 240d3a89
86c4ef2b 05f8080b b041635a ae7e0c60 cf17bf1a 6254ae8d
“a1b2c3d4 e5f6g7h8
i9j10”
df7175ff 3caef476 c05c9bf0 648e186e a119cce7
034c641b b987efd9 1c6a7322 1c9da9de d649fddf a0986905
“A1B2C3D4 E5F6G7H8
I9J10”
28b083ed 69254a83 04f287ae fe8d9129 5625beb0
76c68675 83b9e4ef aa6bdd35 0f6d5270 31c567db 5a557a32
“1020304050 60708090100 100908070 60504030
20101098765 4321123456
78910”
2604f26a 46188584 8f54ce3b 411bac69 c31c140d
5677b63d 33afb999 63e98e6d 9705d49f 327b90e7 ca2e1216
Table3. Message digest for certain messages
111 http://sites.google.com/site/ijcsis/ ISSN 1947-5500
(IJCSIS) International Journal of Computer Science and Information Security,
Vol. 7, No. 2, 2010
Integration of Rule Based Expert Systems and Case Based Reasoning in an Acute Bacterial Meningitis
Clinical Decision Support System
Mariana Maceiras Cabrera Departamento de Informática y Ciencias de la
Computación Universidad Católica del Uruguay
Montevideo, Uruguay .
Ernesto Ocampo Edye Departamento de Informática y Ciencias de la
Computación Universidad Católica del Uruguay
Montevideo, Uruguay
Abstract—This article presents the results of the research carried
out on the development of a medical diagnostic system applied to
the Acute Bacterial Meningitis, using the Case Based Reasoning
methodology. The research was focused on the implementation of
the adaptation stage, from the integration of Case Based
Reasoning and Rule Based Expert Systems. In this adaptation
stage we use a higher level RBC that stores and allows reutilizing
change experiences, combined with a classic rule-based inference
engine. In order to take into account the most evident clinical
situation, a pre-diagnosis stage is implemented using a rule
engine that, given an evident situation, emits the corresponding
diagnosis and avoids the complete process.
Keywords-Case-Based Reasoning; Medical Diagnosis; Expert
Systems; Acute Bacterial Meningitis
I. INTRODUCTION Clinical Decision Support Systems (hereafter CDSSs) have
become paramount in the medical environment, providing support to the clinical expert in the diagnosing process, mainly assisting the analysis and synthesis of bulk information in little time. These systems enable the reduction of the intrinsic degree of uncertainty that any decision-making process in the medical environment entails. [1], [2]
Several aspects related to a specific kind of CDSS, Medical Diagnostic Systems (hereafter MDSs), will be addressed throughout this document. From a set of symptoms and signs shown by the patient, the MDS are capable of suggesting a set of differential diagnoses, possibly with a certainty degree associated to each of them. [1], [3]
While developing MDSs, either in their construction and application, several problems arise: 1) Representation of the domain knowledge; 2) Processing of such knowledge; 3) Obtaining results that are accurate enough and 4) Presentation of the results to the user, and their explanation. Each of these problems is solved in a particular way, depending on the method applied to the development of the system. In this document is presented an alternative way to solve these problems using Case Based Reasoning. [1], [4]
This research is focused on the development of an Acute Bacterial Meningitis MDS integrating Case Based Reasoning (hereafter CBR) with Rule Based Expert Systems (hereafter RBR).
This document is organized in the following way: in Section 2 is presented the case study used in the research: Diagnosis of Acute Bacterial Meningitis, followed in section 3 by the presentation of the addressed problem. Section 4 presents a brief summary of state-of-the-art techniques and referred applications. Afterwards, section 5 describes the proposed computer solution in detail, while in section 6 is described the composition of the knowledge base, which represents reality and is used in simulations, and the way it was built. Section 7 presents the results of the system’s
performance assessment and section 8 outlines the conclusions of this work.
II. CASE STUDY: DIAGNOSIS OF ACUTE BACTERIAL MENINGITIS
The medical diagnosing task consists in “translating” the relation between a set of signs and symptoms found in a patient, and the possible pathologies she or he might suffer from. [3], [1] This work addresses the medical diagnosis of the disease known as Acute Bacterial Meningitis (hereafter ABM).
ABM is an infectious disease caused by bacteria that attack the meninges (a membrane system that covers the Central Nervous System – brain and spinal cord). The meningitis is an inflammatory process of the leptomeninges (pia mater and arachnoid mater), and the cerebrospinal fluid (CSF) contained inside them [5]. The Meningitis poses a great threat to optical, facial and auditory nerves, and other kinds of neurologic sequels.
In this research we have taken as a reference a subset of the typical signs and symptoms of this disease – a total of 81 symptoms have been considered - which are: convulsions, depression, fever, hypertense fontanelle, nape stiffness, trunk stiffness, skin purpuric syndrome, vomits, somnolence,
112 http://sites.google.com/site/ijcsis/ ISSN 1947-5500
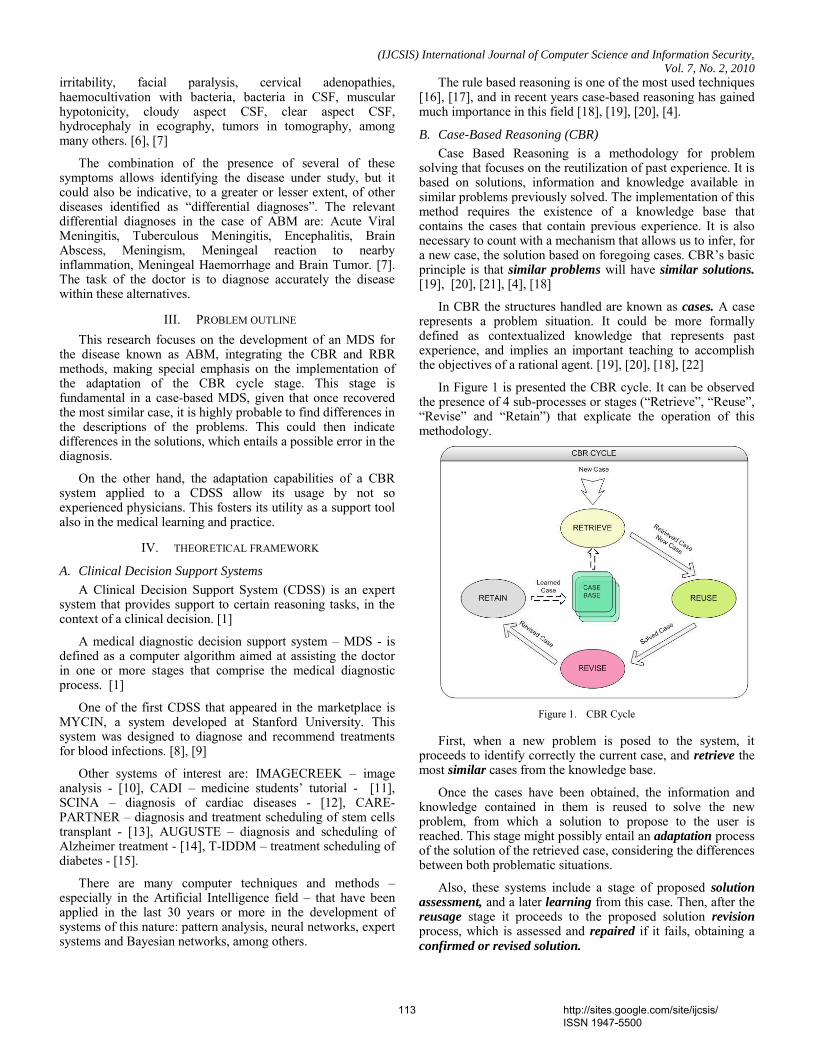
(IJCSIS) International Journal of Computer Science and Information Security,
Vol. 7, No. 2, 2010
irritability, facial paralysis, cervical adenopathies, haemocultivation with bacteria, bacteria in CSF, muscular hypotonicity, cloudy aspect CSF, clear aspect CSF, hydrocephaly in ecography, tumors in tomography, among many others. [6], [7]
The combination of the presence of several of these symptoms allows identifying the disease under study, but it could also be indicative, to a greater or lesser extent, of other diseases identified as “differential diagnoses”. The relevant differential diagnoses in the case of ABM are: Acute Viral Meningitis, Tuberculous Meningitis, Encephalitis, Brain Abscess, Meningism, Meningeal reaction to nearby inflammation, Meningeal Haemorrhage and Brain Tumor. [7]. The task of the doctor is to diagnose accurately the disease within these alternatives.
III. PROBLEM OUTLINE This research focuses on the development of an MDS for
the disease known as ABM, integrating the CBR and RBR methods, making special emphasis on the implementation of the adaptation of the CBR cycle stage. This stage is fundamental in a case-based MDS, given that once recovered the most similar case, it is highly probable to find differences in the descriptions of the problems. This could then indicate differences in the solutions, which entails a possible error in the diagnosis.
On the other hand, the adaptation capabilities of a CBR system applied to a CDSS allow its usage by not so experienced physicians. This fosters its utility as a support tool also in the medical learning and practice.
IV. THEORETICAL FRAMEWORK
A. Clinical Decision Support Systems
A Clinical Decision Support System (CDSS) is an expert system that provides support to certain reasoning tasks, in the context of a clinical decision. [1]
A medical diagnostic decision support system – MDS - is defined as a computer algorithm aimed at assisting the doctor in one or more stages that comprise the medical diagnostic process. [1]
One of the first CDSS that appeared in the marketplace is MYCIN, a system developed at Stanford University. This system was designed to diagnose and recommend treatments for blood infections. [8], [9]
Other systems of interest are: IMAGECREEK – image analysis - [10], CADI – medicine students’ tutorial - [11], SCINA – diagnosis of cardiac diseases - [12], CARE-PARTNER – diagnosis and treatment scheduling of stem cells transplant - [13], AUGUSTE – diagnosis and scheduling of Alzheimer treatment - [14], T-IDDM – treatment scheduling of diabetes - [15].
There are many computer techniques and methods – especially in the Artificial Intelligence field – that have been applied in the last 30 years or more in the development of systems of this nature: pattern analysis, neural networks, expert systems and Bayesian networks, among others.
The rule based reasoning is one of the most used techniques [16], [17], and in recent years case-based reasoning has gained much importance in this field [18], [19], [20], [4].
B. Case-Based Reasoning (CBR)
Case Based Reasoning is a methodology for problem solving that focuses on the reutilization of past experience. It is based on solutions, information and knowledge available in similar problems previously solved. The implementation of this method requires the existence of a knowledge base that contains the cases that contain previous experience. It is also necessary to count with a mechanism that allows us to infer, for a new case, the solution based on foregoing cases. CBR’s basic principle is that similar problems will have similar solutions. [19], [20], [21], [4], [18]
In CBR the structures handled are known as cases. A case represents a problem situation. It could be more formally defined as contextualized knowledge that represents past experience, and implies an important teaching to accomplish the objectives of a rational agent. [19], [20], [18], [22]
In Figure 1 is presented the CBR cycle. It can be observed the presence of 4 sub-processes or stages (“Retrieve”, “Reuse”, “Revise” and “Retain”) that explicate the operation of this methodology.
Figure 1. CBR Cycle
First, when a new problem is posed to the system, it proceeds to identify correctly the current case, and retrieve the most similar cases from the knowledge base.
Once the cases have been obtained, the information and knowledge contained in them is reused to solve the new problem, from which a solution to propose to the user is reached. This stage might possibly entail an adaptation process of the solution of the retrieved case, considering the differences between both problematic situations.
Also, these systems include a stage of proposed solution assessment, and a later learning from this case. Then, after the reusage stage it proceeds to the proposed solution revision process, which is assessed and repaired if it fails, obtaining a confirmed or revised solution.
113 http://sites.google.com/site/ijcsis/ ISSN 1947-5500
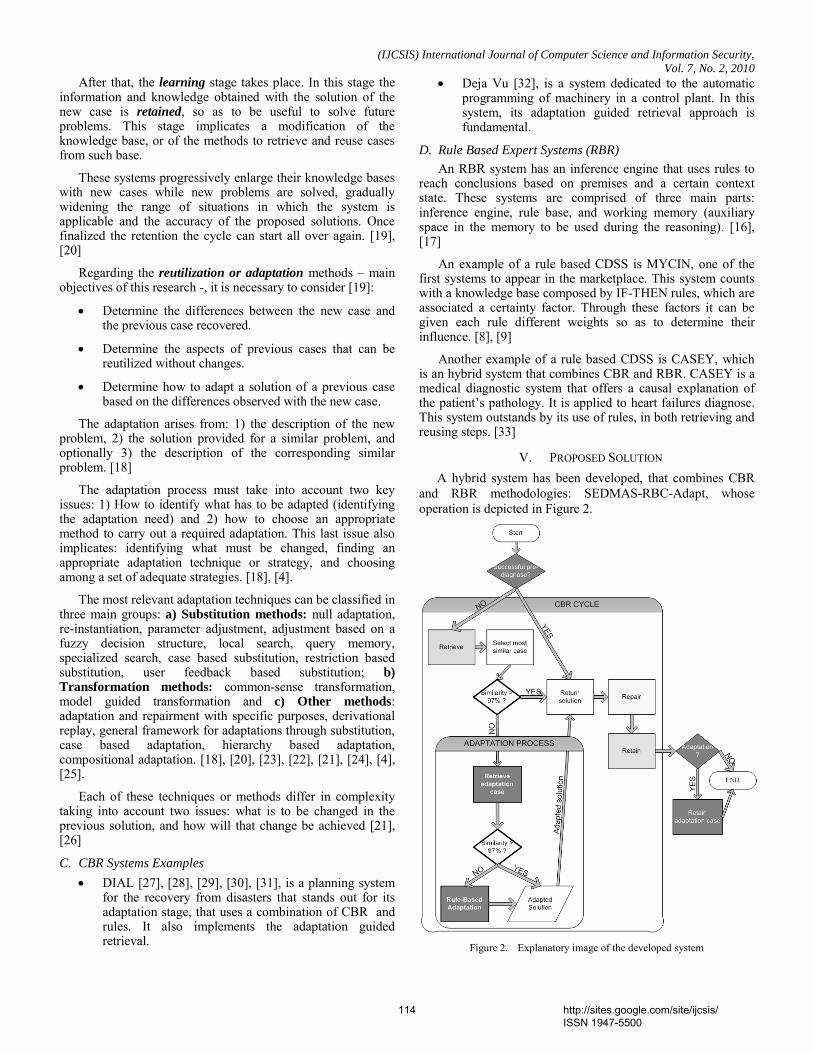
(IJCSIS) International Journal of Computer Science and Information Security,
Vol. 7, No. 2, 2010
After that, the learning stage takes place. In this stage the information and knowledge obtained with the solution of the new case is retained, so as to be useful to solve future problems. This stage implicates a modification of the knowledge base, or of the methods to retrieve and reuse cases from such base.
These systems progressively enlarge their knowledge bases with new cases while new problems are solved, gradually widening the range of situations in which the system is applicable and the accuracy of the proposed solutions. Once finalized the retention the cycle can start all over again. [19], [20]
Regarding the reutilization or adaptation methods – main objectives of this research -, it is necessary to consider [19]:
Determine the differences between the new case and the previous case recovered.
Determine the aspects of previous cases that can be reutilized without changes.
Determine how to adapt a solution of a previous case based on the differences observed with the new case.
The adaptation arises from: 1) the description of the new problem, 2) the solution provided for a similar problem, and optionally 3) the description of the corresponding similar problem. [18]
The adaptation process must take into account two key issues: 1) How to identify what has to be adapted (identifying the adaptation need) and 2) how to choose an appropriate method to carry out a required adaptation. This last issue also implicates: identifying what must be changed, finding an appropriate adaptation technique or strategy, and choosing among a set of adequate strategies. [18], [4].
The most relevant adaptation techniques can be classified in three main groups: a) Substitution methods: null adaptation, re-instantiation, parameter adjustment, adjustment based on a fuzzy decision structure, local search, query memory, specialized search, case based substitution, restriction based substitution, user feedback based substitution; b) Transformation methods: common-sense transformation, model guided transformation and c) Other methods: adaptation and repairment with specific purposes, derivational replay, general framework for adaptations through substitution, case based adaptation, hierarchy based adaptation, compositional adaptation. [18], [20], [23], [22], [21], [24], [4], [25].
Each of these techniques or methods differ in complexity taking into account two issues: what is to be changed in the previous solution, and how will that change be achieved [21], [26]
C. CBR Systems Examples
DIAL [27], [28], [29], [30], [31], is a planning system for the recovery from disasters that stands out for its adaptation stage, that uses a combination of CBR and rules. It also implements the adaptation guided retrieval.
Deja Vu [32], is a system dedicated to the automatic programming of machinery in a control plant. In this system, its adaptation guided retrieval approach is fundamental.
D. Rule Based Expert Systems (RBR)
An RBR system has an inference engine that uses rules to reach conclusions based on premises and a certain context state. These systems are comprised of three main parts: inference engine, rule base, and working memory (auxiliary space in the memory to be used during the reasoning). [16], [17]
An example of a rule based CDSS is MYCIN, one of the first systems to appear in the marketplace. This system counts with a knowledge base composed by IF-THEN rules, which are associated a certainty factor. Through these factors it can be given each rule different weights so as to determine their influence. [8], [9]
Another example of a rule based CDSS is CASEY, which is an hybrid system that combines CBR and RBR. CASEY is a medical diagnostic system that offers a causal explanation of the patient’s pathology. It is applied to heart failures diagnose. This system outstands by its use of rules, in both retrieving and reusing steps. [33]
V. PROPOSED SOLUTION A hybrid system has been developed, that combines CBR
and RBR methodologies: SEDMAS-RBC-Adapt, whose operation is depicted in Figure 2.
Figure 2. Explanatory image of the developed system
114 http://sites.google.com/site/ijcsis/ ISSN 1947-5500
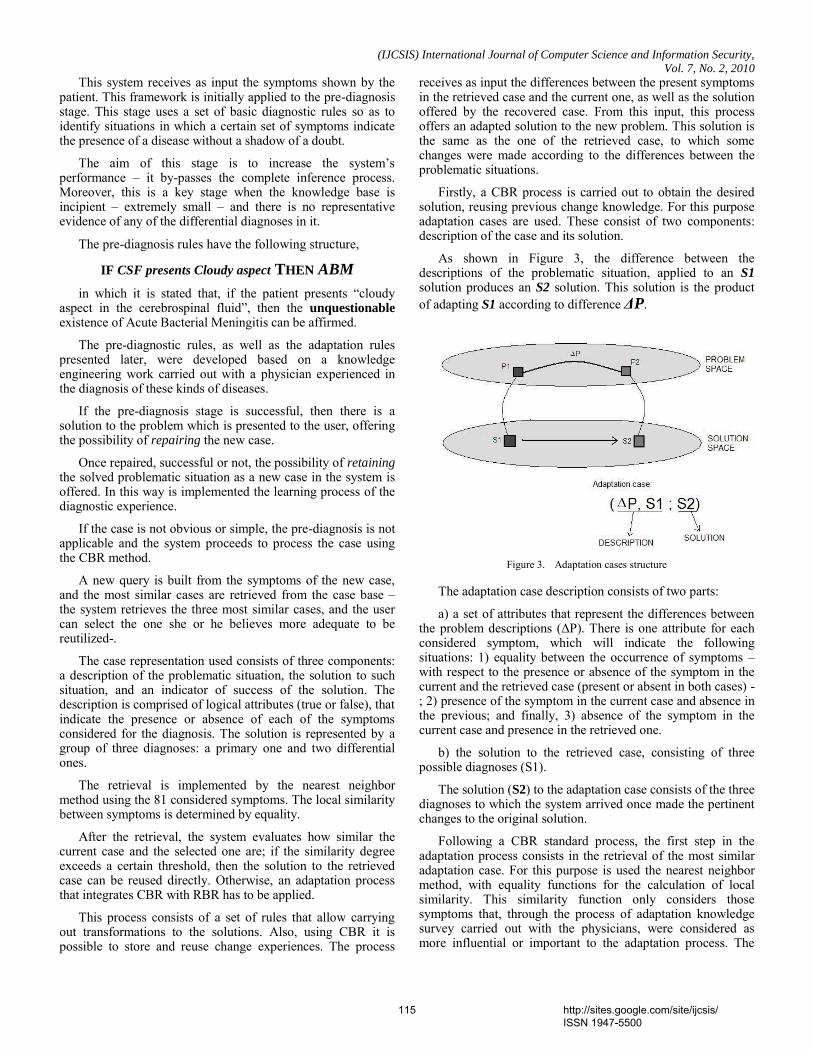
(IJCSIS) International Journal of Computer Science and Information Security,
Vol. 7, No. 2, 2010
This system receives as input the symptoms shown by the patient. This framework is initially applied to the pre-diagnosis stage. This stage uses a set of basic diagnostic rules so as to identify situations in which a certain set of symptoms indicate the presence of a disease without a shadow of a doubt.
The aim of this stage is to increase the system’s performance – it by-passes the complete inference process. Moreover, this is a key stage when the knowledge base is incipient – extremely small – and there is no representative evidence of any of the differential diagnoses in it.
The pre-diagnosis rules have the following structure,
IF CSF presents Cloudy aspect THEN ABM
in which it is stated that, if the patient presents “cloudy aspect in the cerebrospinal fluid”, then the unquestionable existence of Acute Bacterial Meningitis can be affirmed.
The pre-diagnostic rules, as well as the adaptation rules presented later, were developed based on a knowledge engineering work carried out with a physician experienced in the diagnosis of these kinds of diseases.
If the pre-diagnosis stage is successful, then there is a solution to the problem which is presented to the user, offering the possibility of repairing the new case.
Once repaired, successful or not, the possibility of retaining the solved problematic situation as a new case in the system is offered. In this way is implemented the learning process of the diagnostic experience.
If the case is not obvious or simple, the pre-diagnosis is not applicable and the system proceeds to process the case using the CBR method.
A new query is built from the symptoms of the new case, and the most similar cases are retrieved from the case base – the system retrieves the three most similar cases, and the user can select the one she or he believes more adequate to be reutilized-.
The case representation used consists of three components: a description of the problematic situation, the solution to such situation, and an indicator of success of the solution. The description is comprised of logical attributes (true or false), that indicate the presence or absence of each of the symptoms considered for the diagnosis. The solution is represented by a group of three diagnoses: a primary one and two differential ones.
The retrieval is implemented by the nearest neighbor method using the 81 considered symptoms. The local similarity between symptoms is determined by equality.
After the retrieval, the system evaluates how similar the current case and the selected one are; if the similarity degree exceeds a certain threshold, then the solution to the retrieved case can be reused directly. Otherwise, an adaptation process that integrates CBR with RBR has to be applied.
This process consists of a set of rules that allow carrying out transformations to the solutions. Also, using CBR it is possible to store and reuse change experiences. The process
receives as input the differences between the present symptoms in the retrieved case and the current one, as well as the solution offered by the recovered case. From this input, this process offers an adapted solution to the new problem. This solution is the same as the one of the retrieved case, to which some changes were made according to the differences between the problematic situations.
Firstly, a CBR process is carried out to obtain the desired solution, reusing previous change knowledge. For this purpose adaptation cases are used. These consist of two components: description of the case and its solution.
As shown in Figure 3, the difference between the descriptions of the problematic situation, applied to an S1 solution produces an S2 solution. This solution is the product of adapting S1 according to difference ΔP.
Figure 3. Adaptation cases structure
The adaptation case description consists of two parts:
a) a set of attributes that represent the differences between the problem descriptions (ΔP). There is one attribute for each considered symptom, which will indicate the following situations: 1) equality between the occurrence of symptoms – with respect to the presence or absence of the symptom in the current and the retrieved case (present or absent in both cases) -; 2) presence of the symptom in the current case and absence in the previous; and finally, 3) absence of the symptom in the current case and presence in the retrieved one.
b) the solution to the retrieved case, consisting of three possible diagnoses (S1).
The solution (S2) to the adaptation case consists of the three diagnoses to which the system arrived once made the pertinent changes to the original solution.
Following a CBR standard process, the first step in the adaptation process consists in the retrieval of the most similar adaptation case. For this purpose is used the nearest neighbor method, with equality functions for the calculation of local similarity. This similarity function only considers those symptoms that, through the process of adaptation knowledge survey carried out with the physicians, were considered as more influential or important to the adaptation process. The
115 http://sites.google.com/site/ijcsis/ ISSN 1947-5500
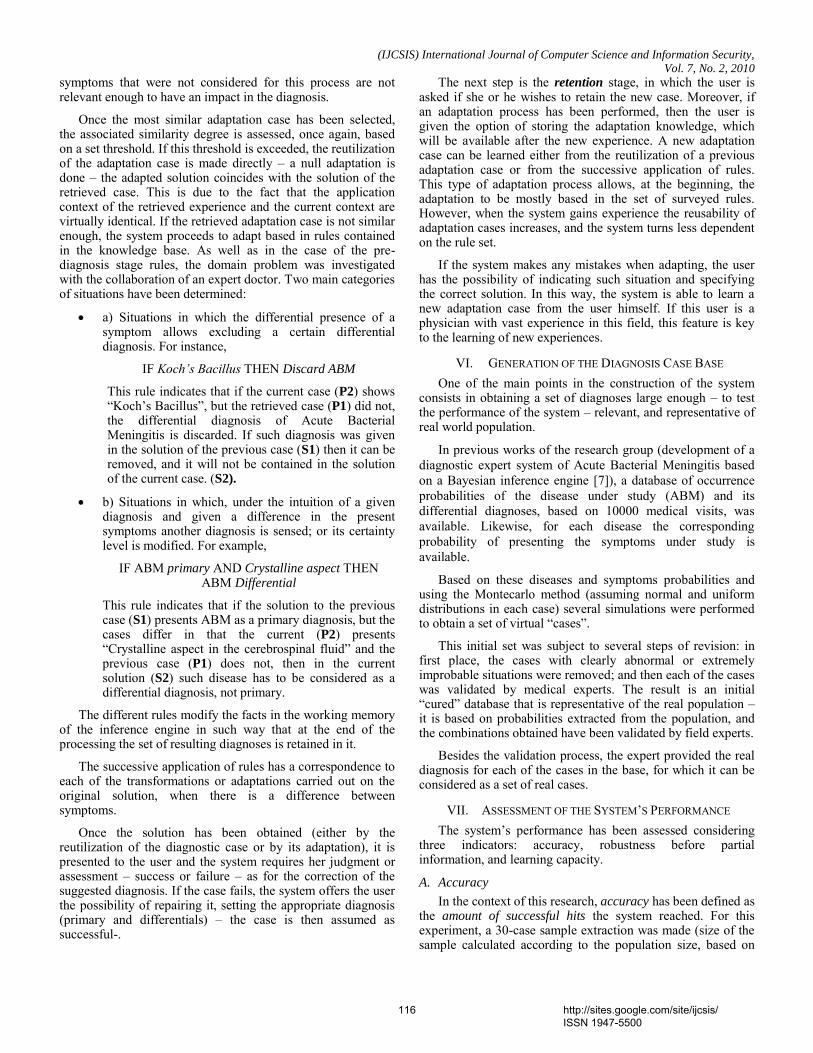
(IJCSIS) International Journal of Computer Science and Information Security,
Vol. 7, No. 2, 2010
symptoms that were not considered for this process are not relevant enough to have an impact in the diagnosis.
Once the most similar adaptation case has been selected, the associated similarity degree is assessed, once again, based on a set threshold. If this threshold is exceeded, the reutilization of the adaptation case is made directly – a null adaptation is done – the adapted solution coincides with the solution of the retrieved case. This is due to the fact that the application context of the retrieved experience and the current context are virtually identical. If the retrieved adaptation case is not similar enough, the system proceeds to adapt based in rules contained in the knowledge base. As well as in the case of the pre-diagnosis stage rules, the domain problem was investigated with the collaboration of an expert doctor. Two main categories of situations have been determined:
a) Situations in which the differential presence of a symptom allows excluding a certain differential diagnosis. For instance,
IF Koch’s Bacillus THEN Discard ABM
This rule indicates that if the current case (P2) shows “Koch’s Bacillus”, but the retrieved case (P1) did not, the differential diagnosis of Acute Bacterial Meningitis is discarded. If such diagnosis was given in the solution of the previous case (S1) then it can be removed, and it will not be contained in the solution of the current case. (S2).
b) Situations in which, under the intuition of a given diagnosis and given a difference in the present symptoms another diagnosis is sensed; or its certainty level is modified. For example,
IF ABM primary AND Crystalline aspect THEN ABM Differential
This rule indicates that if the solution to the previous case (S1) presents ABM as a primary diagnosis, but the cases differ in that the current (P2) presents “Crystalline aspect in the cerebrospinal fluid” and the previous case (P1) does not, then in the current solution (S2) such disease has to be considered as a differential diagnosis, not primary.
The different rules modify the facts in the working memory of the inference engine in such way that at the end of the processing the set of resulting diagnoses is retained in it.
The successive application of rules has a correspondence to each of the transformations or adaptations carried out on the original solution, when there is a difference between symptoms.
Once the solution has been obtained (either by the reutilization of the diagnostic case or by its adaptation), it is presented to the user and the system requires her judgment or assessment – success or failure – as for the correction of the suggested diagnosis. If the case fails, the system offers the user the possibility of repairing it, setting the appropriate diagnosis (primary and differentials) – the case is then assumed as successful-.
The next step is the retention stage, in which the user is asked if she or he wishes to retain the new case. Moreover, if an adaptation process has been performed, then the user is given the option of storing the adaptation knowledge, which will be available after the new experience. A new adaptation case can be learned either from the reutilization of a previous adaptation case or from the successive application of rules. This type of adaptation process allows, at the beginning, the adaptation to be mostly based in the set of surveyed rules. However, when the system gains experience the reusability of adaptation cases increases, and the system turns less dependent on the rule set.
If the system makes any mistakes when adapting, the user has the possibility of indicating such situation and specifying the correct solution. In this way, the system is able to learn a new adaptation case from the user himself. If this user is a physician with vast experience in this field, this feature is key to the learning of new experiences.
VI. GENERATION OF THE DIAGNOSIS CASE BASE One of the main points in the construction of the system
consists in obtaining a set of diagnoses large enough – to test the performance of the system – relevant, and representative of real world population.
In previous works of the research group (development of a diagnostic expert system of Acute Bacterial Meningitis based on a Bayesian inference engine [7]), a database of occurrence probabilities of the disease under study (ABM) and its differential diagnoses, based on 10000 medical visits, was available. Likewise, for each disease the corresponding probability of presenting the symptoms under study is available.
Based on these diseases and symptoms probabilities and using the Montecarlo method (assuming normal and uniform distributions in each case) several simulations were performed to obtain a set of virtual “cases”.
This initial set was subject to several steps of revision: in first place, the cases with clearly abnormal or extremely improbable situations were removed; and then each of the cases was validated by medical experts. The result is an initial “cured” database that is representative of the real population – it is based on probabilities extracted from the population, and the combinations obtained have been validated by field experts.
Besides the validation process, the expert provided the real diagnosis for each of the cases in the base, for which it can be considered as a set of real cases.
VII. ASSESSMENT OF THE SYSTEM’S PERFORMANCE The system’s performance has been assessed considering
three indicators: accuracy, robustness before partial information, and learning capacity.
A. Accuracy
In the context of this research, accuracy has been defined as the amount of successful hits the system reached. For this experiment, a 30-case sample extraction was made (size of the sample calculated according to the population size, based on
116 http://sites.google.com/site/ijcsis/ ISSN 1947-5500
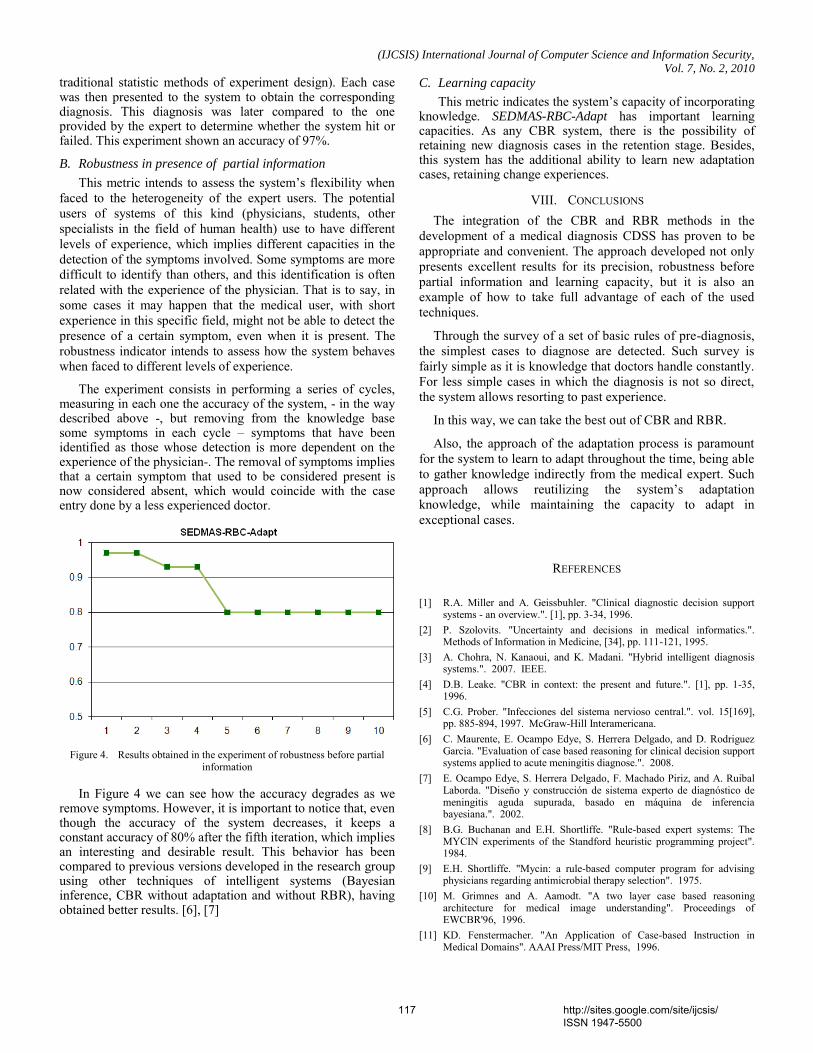
(IJCSIS) International Journal of Computer Science and Information Security,
Vol. 7, No. 2, 2010
traditional statistic methods of experiment design). Each case was then presented to the system to obtain the corresponding diagnosis. This diagnosis was later compared to the one provided by the expert to determine whether the system hit or failed. This experiment shown an accuracy of 97%.
B. Robustness in presence of partial information
This metric intends to assess the system’s flexibility when
faced to the heterogeneity of the expert users. The potential users of systems of this kind (physicians, students, other specialists in the field of human health) use to have different levels of experience, which implies different capacities in the detection of the symptoms involved. Some symptoms are more difficult to identify than others, and this identification is often related with the experience of the physician. That is to say, in some cases it may happen that the medical user, with short experience in this specific field, might not be able to detect the presence of a certain symptom, even when it is present. The robustness indicator intends to assess how the system behaves when faced to different levels of experience.
The experiment consists in performing a series of cycles, measuring in each one the accuracy of the system, - in the way described above -, but removing from the knowledge base some symptoms in each cycle – symptoms that have been identified as those whose detection is more dependent on the experience of the physician-. The removal of symptoms implies that a certain symptom that used to be considered present is now considered absent, which would coincide with the case entry done by a less experienced doctor.
Figure 4. Results obtained in the experiment of robustness before partial
information
In Figure 4 we can see how the accuracy degrades as we remove symptoms. However, it is important to notice that, even though the accuracy of the system decreases, it keeps a constant accuracy of 80% after the fifth iteration, which implies an interesting and desirable result. This behavior has been compared to previous versions developed in the research group using other techniques of intelligent systems (Bayesian inference, CBR without adaptation and without RBR), having obtained better results. [6], [7]
C. Learning capacity
This metric indicates the system’s capacity of incorporating knowledge. SEDMAS-RBC-Adapt has important learning capacities. As any CBR system, there is the possibility of retaining new diagnosis cases in the retention stage. Besides, this system has the additional ability to learn new adaptation cases, retaining change experiences.
VIII. CONCLUSIONS The integration of the CBR and RBR methods in the
development of a medical diagnosis CDSS has proven to be appropriate and convenient. The approach developed not only presents excellent results for its precision, robustness before partial information and learning capacity, but it is also an example of how to take full advantage of each of the used techniques.
Through the survey of a set of basic rules of pre-diagnosis, the simplest cases to diagnose are detected. Such survey is fairly simple as it is knowledge that doctors handle constantly. For less simple cases in which the diagnosis is not so direct, the system allows resorting to past experience.
In this way, we can take the best out of CBR and RBR.
Also, the approach of the adaptation process is paramount for the system to learn to adapt throughout the time, being able to gather knowledge indirectly from the medical expert. Such approach allows reutilizing the system’s adaptation
knowledge, while maintaining the capacity to adapt in exceptional cases.
REFERENCES
[1] R.A. Miller and A. Geissbuhler. "Clinical diagnostic decision support systems - an overview.". [1], pp. 3-34, 1996.
[2] P. Szolovits. "Uncertainty and decisions in medical informatics.". Methods of Information in Medicine, [34], pp. 111-121, 1995.
[3] A. Chohra, N. Kanaoui, and K. Madani. "Hybrid intelligent diagnosis systems.". 2007. IEEE.
[4] D.B. Leake. "CBR in context: the present and future.". [1], pp. 1-35, 1996.
[5] C.G. Prober. "Infecciones del sistema nervioso central.". vol. 15[169], pp. 885-894, 1997. McGraw-Hill Interamericana.
[6] C. Maurente, E. Ocampo Edye, S. Herrera Delgado, and D. Rodriguez Garcia. "Evaluation of case based reasoning for clinical decision support systems applied to acute meningitis diagnose.". 2008.
[7] E. Ocampo Edye, S. Herrera Delgado, F. Machado Piriz, and A. Ruibal Laborda. "Diseño y construcción de sistema experto de diagnóstico de meningitis aguda supurada, basado en máquina de inferencia bayesiana.". 2002.
[8] B.G. Buchanan and E.H. Shortliffe. "Rule-based expert systems: The MYCIN experiments of the Standford heuristic programming project". 1984.
[9] E.H. Shortliffe. "Mycin: a rule-based computer program for advising physicians regarding antimicrobial therapy selection". 1975.
[10] M. Grimnes and A. Aamodt. "A two layer case based reasoning architecture for medical image understanding". Proceedings of EWCBR'96, 1996.
[11] KD. Fenstermacher. "An Application of Case-based Instruction in Medical Domains". AAAI Press/MIT Press, 1996.
117 http://sites.google.com/site/ijcsis/ ISSN 1947-5500
(IJCSIS) International Journal of Computer Science and Information Security,
Vol. 7, No. 2, 2010 [12] M. Haddad, KP. Adlassnig, and G. Porenta. "Feasibility analysis of a
case-based reasoning system for automated detection of coronary heart disease from myocardial scintigrams". Artificial Intelligence in Medicine, vol. 9[1], pp. 61-78, 1997.
[13] I. Bichindaritz, E. Kansu, and Sullivan KM. "Case-Based Reasoning in CARE-PARTNER: Gathering Evidence for Evidence-Based Medical Practice". 1998.
[14] C. Marling and P. Whitehouse. "Case-based reasoning in the Care of Alzheimer's Disease Patients". 2001.
[15] S. Montani, R. Bellazzi, L. Portinale, and M. Stefanelli. "A Multi-Modal Reasoning Methodology for Managing IDDM Patients". International Journal of Medical Informatics, 2002.
[16] E. Friedman-Hill. "Jess in action.". 2003. Manning. [17] E. Morales and L.E. Sucar. "Representación de conocimiento.". 1999. [18] J. Kolodner. "Case-based reasoning.". 1993. Morgan Kaufmann
Publishers, Inc. [19] A. Aamodt and E. Plaza. "Case-based reasoning: foundational issues,
methodological variations, and system approaches.". AI Communications, vol. 7[1], pp. 39-59, 1994.
[20] S.K. Pal and S.C.K. Shiu. "Foundations of soft case-based reasoning.". 2004. John Wiley & Sons, Inc.
[21] R. Lopez de Mantaras, D. McSherry, D. Bridge, D.B. Leake, B. Smyth, S. Craw, B. Faltings, M.L. Maher, M.T. Cox, K. Forbus, M. Keane, A. Aamodt, and I. Watson. "Retrieval, reuse, revision, and retention in case-based reasoning.". 2006.
[22] I. Watson. "Applying case-based reasoning: techniques for enterprise systems.". 1997. Morgan Kaufmann Publishers, *Inc.
[23] Wilke Wolfgang and Bergmann Ralph. "Techniques and knowledge used for adaptation during case-Based problem solving". 1998.
[24] S. Manzoni, F. Sartori, and G. Vizzari. "Towards a general framework for substitutional adaptation in case-based reasoning". 2005.
[25] R. Bergmann and W. Wilke. "On the role of abstraction in case-based reasoning.". 1996.
[26] P. Cunningham, D. Finn, and S. Slattery. "Knowledge engineering requirements in derivational analogy.". Topics in Case-Based Reasoning, pp. 234-245, 1994.
[27] D.B. Leake, A. Kinley, and D.C. Wilson. "Acquiring case adaptation knowledge: a hybrid approach.". AAAI Press/MIT Press, 1996.
[28] D.B. Leake, A. Kinley, and D.C. Wilson. "Multistrategy learning to apply cases for case-based reasoning.". AAAI Press/MIT Press, 1996.
[29] D.B. Leake, A. Kinley, and D.C. Wilson. "Linking adaptation and similarity learning.". 1996.
[30] D.B. Leake. "Combining rules and cases to learn case adaptation.". 1995.
[31] D.B. Leake. "Becoming an expert case-based reasoner: learning to adapt prior cases.". 1995.
[32] K. Doi, Y. Kamigane, M. Ito, and Y. Uehara. "Software generation system for mill operation". Hitachi Review, vol. 42[4], pp. 175-178, 1993.
[33] P. Koton. "Using experience in learning and problem solving.". 1989.
118 http://sites.google.com/site/ijcsis/ ISSN 1947-5500
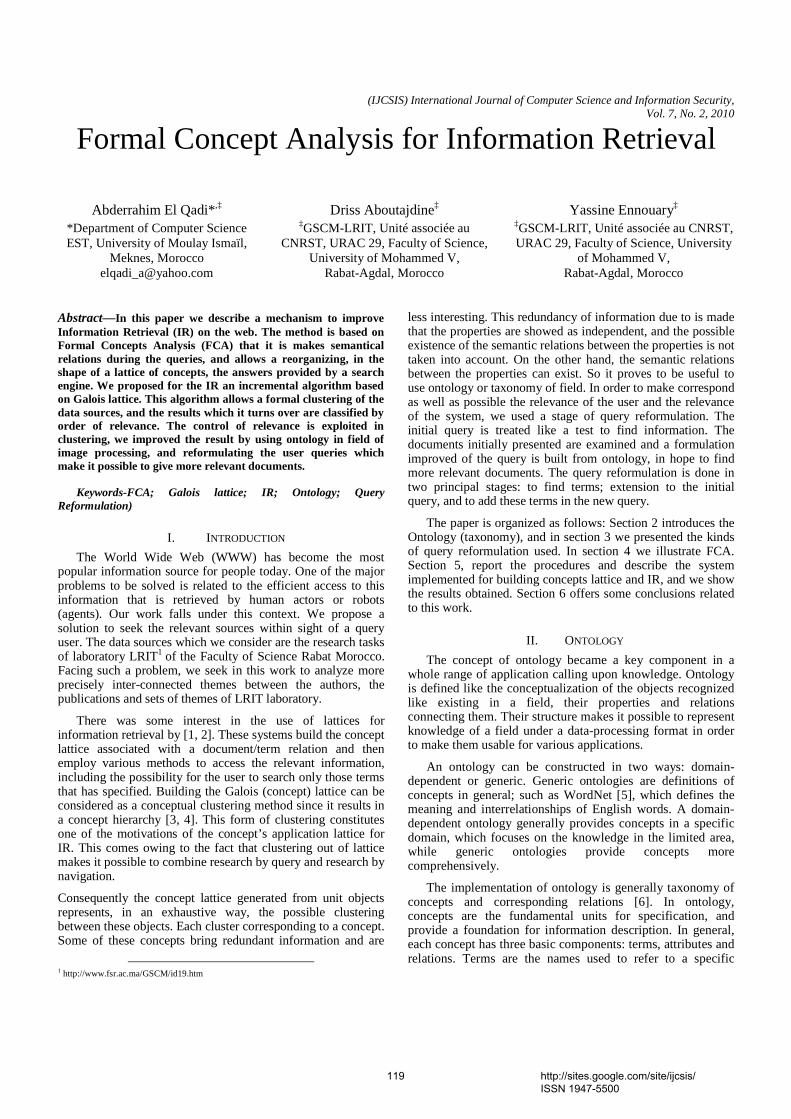
(IJCSIS) International Journal of Computer Science and Information Security, Vol. 7, No. 2, 2010
Formal Concept Analysis for Information Retrieval
Abderrahim El Qadi*,‡ *Department of Computer Science EST, University of Moulay Ismaïl,
Meknes, Morocco [email protected]
Driss Aboutajdine‡ ‡GSCM-LRIT, Unité associée au
CNRST, URAC 29, Faculty of Science, University of Mohammed V,
Rabat-Agdal, Morocco
Yassine Ennouary‡ ‡GSCM-LRIT, Unité associée au CNRST, URAC 29, Faculty of Science, University
of Mohammed V, Rabat-Agdal, Morocco
Abstract—In this paper we describe a mechanism to improve Information Retrieval (IR) on the web. The method is based on Formal Concepts Analysis (FCA) that it is makes semantical relations during the queries, and allows a reorganizing, in the shape of a lattice of concepts, the answers provided by a search engine. We proposed for the IR an incremental algorithm based on Galois lattice. This algorithm allows a formal clustering of the data sources, and the results which it turns over are classified by order of relevance. The control of relevance is exploited in clustering, we improved the result by using ontology in field of image processing, and reformulating the user queries which make it possible to give more relevant documents.
Keywords-FCA; Galois lattice; IR; Ontology; Query Reformulation)
I. INTRODUCTION
The World Wide Web (WWW) has become the most popular information source for people today. One of the major problems to be solved is related to the efficient access to this information that is retrieved by human actors or robots (agents). Our work falls under this context. We propose a solution to seek the relevant sources within sight of a query user. The data sources which we consider are the research tasks of laboratory LRIT1 of the Faculty of Science Rabat Morocco. Facing such a problem, we seek in this work to analyze more precisely inter-connected themes between the authors, the publications and sets of themes of LRIT laboratory.
There was some interest in the use of lattices for information retrieval by [1, 2]. These systems build the concept lattice associated with a document/term relation and then employ various methods to access the relevant information, including the possibility for the user to search only those terms that has specified. Building the Galois (concept) lattice can be considered as a conceptual clustering method since it results in a concept hierarchy [3, 4]. This form of clustering constitutes one of the motivations of the concept’s application lattice for IR. This comes owing to the fact that clustering out of lattice makes it possible to combine research by query and research by navigation.
Consequently the concept lattice generated from unit objects represents, in an exhaustive way, the possible clustering between these objects. Each cluster corresponding to a concept. Some of these concepts bring redundant information and are
1 http://www.fsr.ac.ma/GSCM/id19.htm
less interesting. This redundancy of information due to is made that the properties are showed as independent, and the possible existence of the semantic relations between the properties is not taken into account. On the other hand, the semantic relations between the properties can exist. So it proves to be useful to use ontology or taxonomy of field. In order to make correspond as well as possible the relevance of the user and the relevance of the system, we used a stage of query reformulation. The initial query is treated like a test to find information. The documents initially presented are examined and a formulation improved of the query is built from ontology, in hope to find more relevant documents. The query reformulation is done in two principal stages: to find terms; extension to the initial query, and to add these terms in the new query.
The paper is organized as follows: Section 2 introduces the Ontology (taxonomy), and in section 3 we presented the kinds of query reformulation used. In section 4 we illustrate FCA. Section 5, report the procedures and describe the system implemented for building concepts lattice and IR, and we show the results obtained. Section 6 offers some conclusions related to this work.
II. ONTOLOGY
The concept of ontology became a key component in a whole range of application calling upon knowledge. Ontology is defined like the conceptualization of the objects recognized like existing in a field, their properties and relations connecting them. Their structure makes it possible to represent knowledge of a field under a data-processing format in order to make them usable for various applications.
An ontology can be constructed in two ways: domain-dependent or generic. Generic ontologies are definitions of concepts in general; such as WordNet [5], which defines the meaning and interrelationships of English words. A domain-dependent ontology generally provides concepts in a specific domain, which focuses on the knowledge in the limited area, while generic ontologies provide concepts more comprehensively.
The implementation of ontology is generally taxonomy of concepts and corresponding relations [6]. In ontology, concepts are the fundamental units for specification, and provide a foundation for information description. In general, each concept has three basic components: terms, attributes and relations. Terms are the names used to refer to a specific
119 http://sites.google.com/site/ijcsis/ ISSN 1947-5500
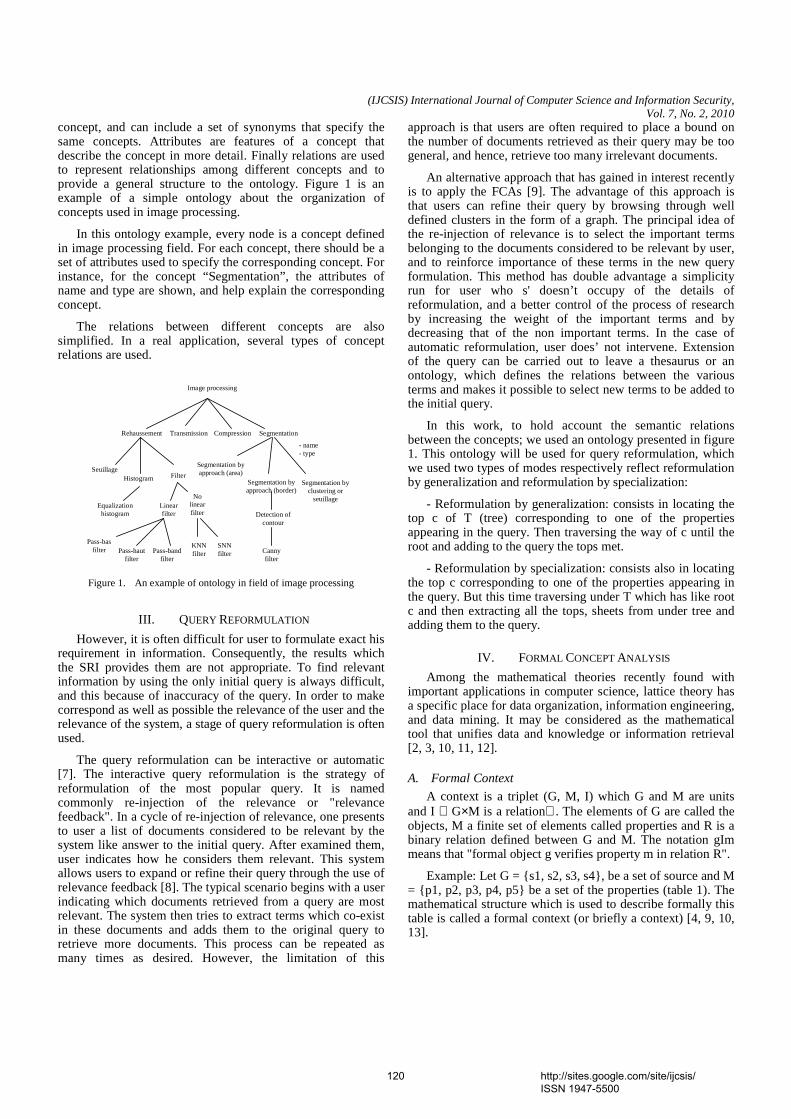
(IJCSIS) International Journal of Computer Science and Information Security, Vol. 7, No. 2, 2010
concept, and can include a set of synonyms that specify the same concepts. Attributes are features of a concept that describe the concept in more detail. Finally relations are used to represent relationships among different concepts and to provide a general structure to the ontology. Figure 1 is an example of a simple ontology about the organization of concepts used in image processing.
In this ontology example, every node is a concept defined in image processing field. For each concept, there should be a set of attributes used to specify the corresponding concept. For instance, for the concept “Segmentation”, the attributes of name and type are shown, and help explain the corresponding concept.
The relations between different concepts are also simplified. In a real application, several types of concept relations are used.
Figure 1. An example of ontology in field of image processing
III. QUERY REFORMULATION
However, it is often difficult for user to formulate exact his requirement in information. Consequently, the results which the SRI provides them are not appropriate. To find relevant information by using the only initial query is always difficult, and this because of inaccuracy of the query. In order to make correspond as well as possible the relevance of the user and the relevance of the system, a stage of query reformulation is often used.
The query reformulation can be interactive or automatic [7]. The interactive query reformulation is the strategy of reformulation of the most popular query. It is named commonly re-injection of the relevance or "relevance feedback". In a cycle of re-injection of relevance, one presents to user a list of documents considered to be relevant by the system like answer to the initial query. After examined them, user indicates how he considers them relevant. This system allows users to expand or refine their query through the use of relevance feedback [8]. The typical scenario begins with a user indicating which documents retrieved from a query are most relevant. The system then tries to extract terms which co-exist in these documents and adds them to the original query to retrieve more documents. This process can be repeated as many times as desired. However, the limitation of this
approach is that users are often required to place a bound on the number of documents retrieved as their query may be too general, and hence, retrieve too many irrelevant documents.
An alternative approach that has gained in interest recently is to apply the FCAs [9]. The advantage of this approach is that users can refine their query by browsing through well defined clusters in the form of a graph. The principal idea of the re-injection of relevance is to select the important terms belonging to the documents considered to be relevant by user, and to reinforce importance of these terms in the new query formulation. This method has double advantage a simplicity run for user who s' doesn’t occupy of the details of reformulation, and a better control of the process of research by increasing the weight of the important terms and by decreasing that of the non important terms. In the case of automatic reformulation, user does’ not intervene. Extension of the query can be carried out to leave a thesaurus or an ontology, which defines the relations between the various terms and makes it possible to select new terms to be added to the initial query.
In this work, to hold account the semantic relations between the concepts; we used an ontology presented in figure 1. This ontology will be used for query reformulation, which we used two types of modes respectively reflect reformulation by generalization and reformulation by specialization:
- Reformulation by generalization: consists in locating the top c of T (tree) corresponding to one of the properties appearing in the query. Then traversing the way of c until the root and adding to the query the tops met.
- Reformulation by specialization: consists also in locating the top c corresponding to one of the properties appearing in the query. But this time traversing under T which has like root c and then extracting all the tops, sheets from under tree and adding them to the query.
IV. FORMAL CONCEPT ANALYSIS
Among the mathematical theories recently found with important applications in computer science, lattice theory has a specific place for data organization, information engineering, and data mining. It may be considered as the mathematical tool that unifies data and knowledge or information retrieval [2, 3, 10, 11, 12].
A. Formal Context
A context is a triplet (G, M, I) which G and M are units and I ⊆ G×M is a relationℜ. The elements of G are called the objects, M a finite set of elements called properties and R is a binary relation defined between G and M. The notation gIm means that "formal object g verifies property m in relation R".
Example: Let G = {s1, s2, s3, s4}, be a set of source and M = {p1, p2, p3, p4, p5} be a set of the properties (table 1). The mathematical structure which is used to describe formally this table is called a formal context (or briefly a context) [4, 9, 10, 13].
Image processing
Transmission Compression Segmentation Rehaussement
Filter
Segmentation by approach (area)
Segmentation by approach (border)
Seuillage Histogram
Segmentation by clustering or
seuillage Linear filter
No linear filter Detection of
contour
Equalization histogram
Pass-band filter
KNN filter
SNN filter
Pass-bas filter Pass-haut
filter Canny filter
- name - type
120 http://sites.google.com/site/ijcsis/ ISSN 1947-5500
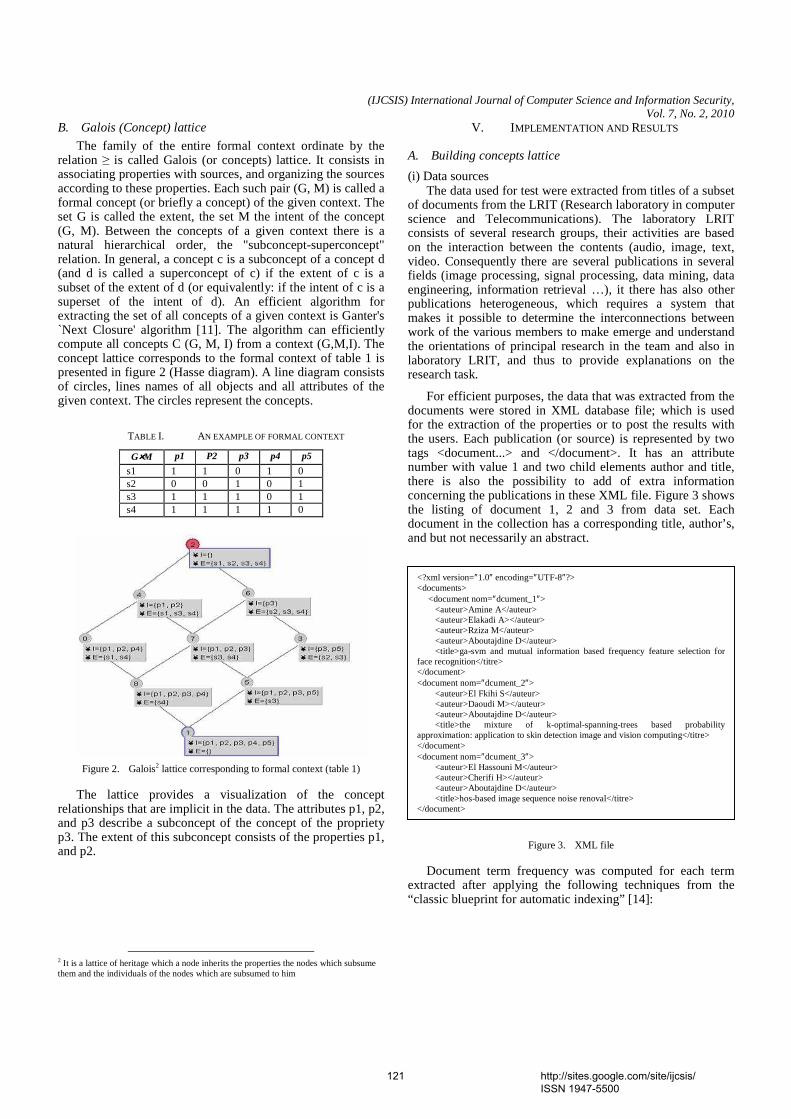
(IJCSIS) International Journal of Computer Science and Information Security, Vol. 7, No. 2, 2010
B. Galois (Concept) lattice
The family of the entire formal context ordinate by the relation ≥ is called Galois (or concepts) lattice. It consists in associating properties with sources, and organizing the sources according to these properties. Each such pair (G, M) is called a formal concept (or briefly a concept) of the given context. The set G is called the extent, the set M the intent of the concept (G, M). Between the concepts of a given context there is a natural hierarchical order, the "subconcept-superconcept" relation. In general, a concept c is a subconcept of a concept d (and d is called a superconcept of c) if the extent of c is a subset of the extent of d (or equivalently: if the intent of c is a superset of the intent of d). An efficient algorithm for extracting the set of all concepts of a given context is Ganter's `Next Closure' algorithm [11]. The algorithm can efficiently compute all concepts C (G, M, I) from a context (G,M,I). The concept lattice corresponds to the formal context of table 1 is presented in figure 2 (Hasse diagram). A line diagram consists of circles, lines names of all objects and all attributes of the given context. The circles represent the concepts.
TABLE I. AN EXAMPLE OF FORMAL CONTEXT
G××××M p1 P2 p3 p4 p5
s1 1 1 0 1 0 s2 0 0 1 0 1 s3 1 1 1 0 1 s4 1 1 1 1 0
Figure 2. Galois2 lattice corresponding to formal context (table 1)
The lattice provides a visualization of the concept relationships that are implicit in the data. The attributes p1, p2, and p3 describe a subconcept of the concept of the propriety p3. The extent of this subconcept consists of the properties p1, and p2.
2 It is a lattice of heritage which a node inherits the properties the nodes which subsume them and the individuals of the nodes which are subsumed to him
V. IMPLEMENTATION AND RESULTS
A. Building concepts lattice
(i) Data sources The data used for test were extracted from titles of a subset
of documents from the LRIT (Research laboratory in computer science and Telecommunications). The laboratory LRIT consists of several research groups, their activities are based on the interaction between the contents (audio, image, text, video. Consequently there are several publications in several fields (image processing, signal processing, data mining, data engineering, information retrieval …), it there has also other publications heterogeneous, which requires a system that makes it possible to determine the interconnections between work of the various members to make emerge and understand the orientations of principal research in the team and also in laboratory LRIT, and thus to provide explanations on the research task.
For efficient purposes, the data that was extracted from the documents were stored in XML database file; which is used for the extraction of the properties or to post the results with the users. Each publication (or source) is represented by two tags <document...> and </document>. It has an attribute number with value 1 and two child elements author and title, there is also the possibility to add of extra information concerning the publications in these XML file. Figure 3 shows the listing of document 1, 2 and 3 from data set. Each document in the collection has a corresponding title, author’s, and but not necessarily an abstract.
Figure 3. XML file
Document term frequency was computed for each term extracted after applying the following techniques from the “classic blueprint for automatic indexing” [14]:
<?xml version=″1.0″ encoding=″UTF-8″?> <documents> <document nom=″dcument_1″> <auteur>Amine A</auteur> <auteur>Elakadi A></auteur> <auteur>Rziza M</auteur> <auteur>Aboutajdine D</auteur> <title>ga-svm and mutual information based frequency feature selection for face recognition</titre> </document> <document nom=″dcument_2″> <auteur>El Fkihi S</auteur> <auteur>Daoudi M></auteur> <auteur>Aboutajdine D</auteur> <title>the mixture of k-optimal-spanning-trees based probability approximation: application to skin detection image and vision computing</titre> </document> <document nom=″dcument_3″> <auteur>El Hassouni M</auteur> <auteur>Cherifi H></auteur> <auteur>Aboutajdine D</auteur> <title>hos-based image sequence noise renoval</titre> </document>
121 http://sites.google.com/site/ijcsis/ ISSN 1947-5500

(IJCSIS) International Journal of Computer Science and Information Security, Vol. 7, No. 2, 2010
− Segmentation: this is the process of selecting distinct terms from the individual documents in the collection. For our implementations, we broke hyphenated terms into their constituents, as well as ignoring punctuation and case.
− Stop wording: this is the process of removing frequently occurring terms such as ‘is’, and ‘of’ which make little discrimination between documents.
(ii) Lattice construction The problem of calculation of the concepts lattice from a
formal context made object of several research tasks. Many algorithms have been proposed for generating the Galois lattice from a binary relation [2, 4, 9, 13, 15, 16]. A comparison of the performances of the algorithms proposed for the generation of the lattices and their corresponding Hasse diagrams are presented in algorithm Add Intent [10]. Among the algorithms proposed, some have specificity to perform an incremental building of concepts lattices starting from formal contexts [2, 4, 10]. This aspect is particularly interesting for the application of concepts lattices to our problem of research in the publications of the LRIT. Indeed, the queries users can be inserted in the lattice representing the documents (or publications). Following this insertion, it is possible to determine the most relevant documents guarantors with the criteria expressed by user in his query.
Our procedure for implementation FCA’s, concept lattice involves three stages : constructing a matrix of document-term relations using data stored from XML file ; concept extraction using Add Intent algorithm; and partial ordering of formal concepts. The resulting internal data structure is ten written out to a file where it may be later used for querying (figure 4).
Figure 4. Process of building of concepts lattice
(iii) Query Insertion Our idea is to consider the user query as a new source
whose properties are the terms of the query. This source will be added to the lattice Li produced by I first objects of the context in ways incremental using the algorithm Add Intent [10]. This addition will transform the lattice Li; new nodes will be added and others will be modified. It is necessary all the same to notice the appearance of a new concept which has like intention exactly the terms of the query.
Figure 5. Query Insertion
(iv) Document Ranking Documents were ranked based on the number of edges
away from the concept in which the query had mapped in the augmented lattice. Formal concepts in the lattice were considered for ranking only when its attribute set intersects with those of the query and that it is neither the supremum nor the infimum. Documents that were equally distant from the query would achieve the same rank. The lattice traversal implementation was simply done using a breadth-first search.
B. Discussion of Results
− In first let us assume that we have an example of context for 5 documents and 6 properties (table 2). The lattice corresponding is presented in the figure 6.
TABLE II. AN EXAMPLE OF FORMAL CONTEXT FROM DATABASE SOURCE
M\G d1 d2 d3 d4 d5 image 1 1 1 0 0 detection 0 0 0 1 1 Segmentation 1 1 0 1 0 Classification 0 0 1 0 0 vision 0 0 0 0 1 probability 1 0 0 1 0
The Galois lattice establishes a clustering of the data
sources. Each formal concept of the lattice represents in fact a class. For example, the concept ({d1, d4}, {probability, segmentation}) puts in the same class the data sources d1 and d4. These two sources are in this class because they are the only ones to share the properties probability, segmentation. The lattice establishes also a hierarchy between the classes. One can read that there formal concept is ({d1, d4}, {probability, segmentation}) more particular than ({d1, d2, d4}, {segmentation}) in the direction where it has more properties it is what results in the fact that {d1, d2} included {d1, d2, d4}. We note that this hierarchy is with double directions, i.e., the lattice is a kind of “tree structure” with two “roots”: ({d1, d2, d3, d4, d5}, {}) and ({}, {classification, detection, image, probability, segmentation, vision}) that we will respectively call top and bottom. Displacement towards top corresponds to generalization and that towards bottom to specialization.
Recovery
of the
context
Segmen-tation
Stop -word
Term frequency
Context.txt
Docs.xml
Extract Concepts and
relation of subsumptions
Build Lattice
ConceptsLattice.txt
Update Lattice with
Query
Re-Build Context and
Lattice
Concepts Lattice.txt
122 http://sites.google.com/site/ijcsis/ ISSN 1947-5500
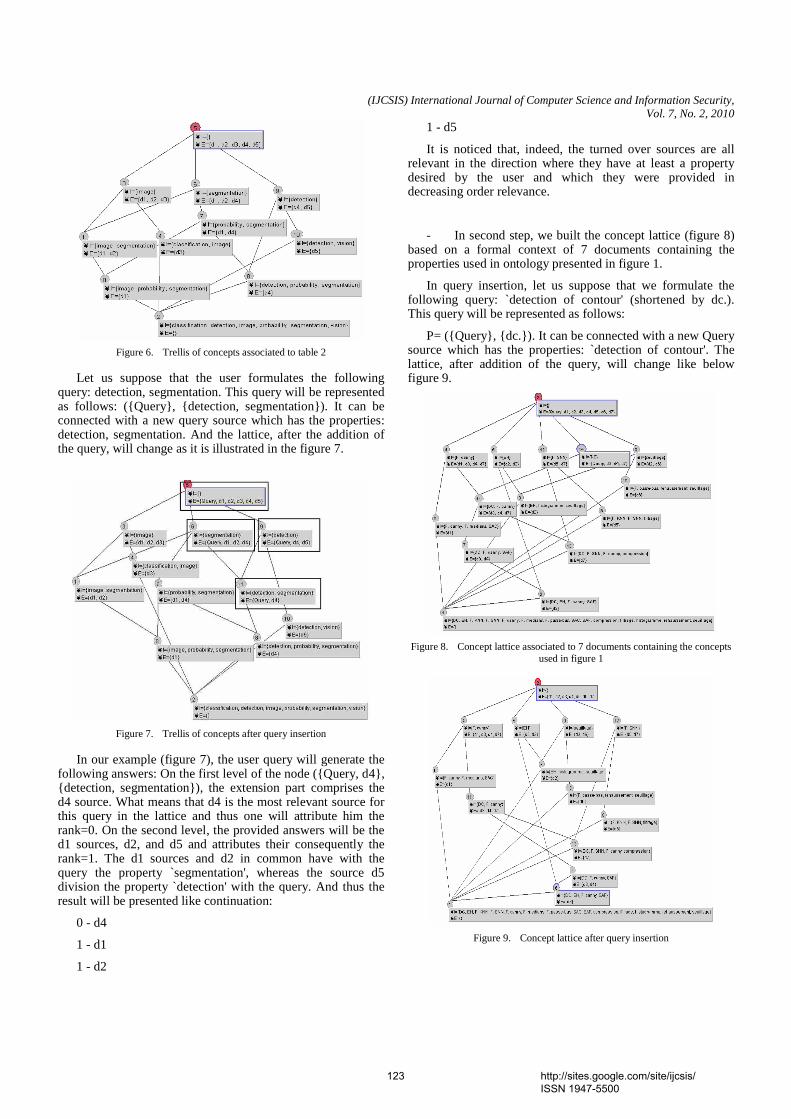
(IJCSIS) International Journal of Computer Science and Information Security, Vol. 7, No. 2, 2010
Figure 6. Trellis of concepts associated to table 2
Let us suppose that the user formulates the following query: detection, segmentation. This query will be represented as follows: ({Query}, {detection, segmentation}). It can be connected with a new query source which has the properties: detection, segmentation. And the lattice, after the addition of the query, will change as it is illustrated in the figure 7.
Figure 7. Trellis of concepts after query insertion
In our example (figure 7), the user query will generate the following answers: On the first level of the node ({Query, d4}, {detection, segmentation}), the extension part comprises the d4 source. What means that d4 is the most relevant source for this query in the lattice and thus one will attribute him the rank=0. On the second level, the provided answers will be the d1 sources, d2, and d5 and attributes their consequently the rank=1. The d1 sources and d2 in common have with the query the property `segmentation', whereas the source d5 division the property `detection' with the query. And thus the result will be presented like continuation:
0 - d4
1 - d1
1 - d2
1 - d5
It is noticed that, indeed, the turned over sources are all relevant in the direction where they have at least a property desired by the user and which they were provided in decreasing order relevance.
- In second step, we built the concept lattice (figure 8) based on a formal context of 7 documents containing the properties used in ontology presented in figure 1.
In query insertion, let us suppose that we formulate the following query: `detection of contour' (shortened by dc.). This query will be represented as follows:
P= ({Query}, {dc.}). It can be connected with a new Query source which has the properties: `detection of contour'. The lattice, after addition of the query, will change like below figure 9.
Figure 8. Concept lattice associated to 7 documents containing the concepts
used in figure 1
Figure 9. Concept lattice after query insertion
123 http://sites.google.com/site/ijcsis/ ISSN 1947-5500
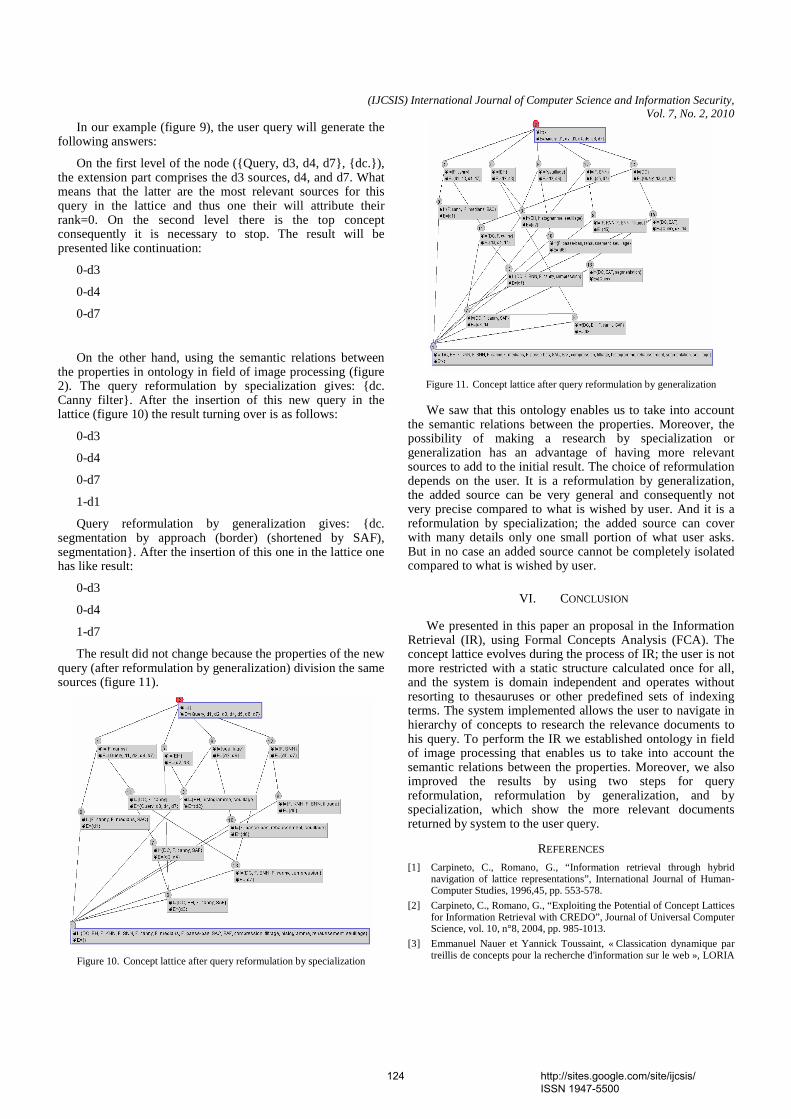
(IJCSIS) International Journal of Computer Science and Information Security, Vol. 7, No. 2, 2010
In our example (figure 9), the user query will generate the following answers:
On the first level of the node ({Query, d3, d4, d7}, {dc.}), the extension part comprises the d3 sources, d4, and d7. What means that the latter are the most relevant sources for this query in the lattice and thus one their will attribute their rank=0. On the second level there is the top concept consequently it is necessary to stop. The result will be presented like continuation:
0-d3
0-d4
0-d7
On the other hand, using the semantic relations between the properties in ontology in field of image processing (figure 2). The query reformulation by specialization gives: {dc. Canny filter}. After the insertion of this new query in the lattice (figure 10) the result turning over is as follows:
0-d3
0-d4
0-d7
1-d1
Query reformulation by generalization gives: {dc. segmentation by approach (border) (shortened by SAF), segmentation}. After the insertion of this one in the lattice one has like result:
0-d3
0-d4
1-d7
The result did not change because the properties of the new query (after reformulation by generalization) division the same sources (figure 11).
Figure 10. Concept lattice after query reformulation by specialization
Figure 11. Concept lattice after query reformulation by generalization
We saw that this ontology enables us to take into account the semantic relations between the properties. Moreover, the possibility of making a research by specialization or generalization has an advantage of having more relevant sources to add to the initial result. The choice of reformulation depends on the user. It is a reformulation by generalization, the added source can be very general and consequently not very precise compared to what is wished by user. And it is a reformulation by specialization; the added source can cover with many details only one small portion of what user asks. But in no case an added source cannot be completely isolated compared to what is wished by user.
VI. CONCLUSION
We presented in this paper an proposal in the Information Retrieval (IR), using Formal Concepts Analysis (FCA). The concept lattice evolves during the process of IR; the user is not more restricted with a static structure calculated once for all, and the system is domain independent and operates without resorting to thesauruses or other predefined sets of indexing terms. The system implemented allows the user to navigate in hierarchy of concepts to research the relevance documents to his query. To perform the IR we established ontology in field of image processing that enables us to take into account the semantic relations between the properties. Moreover, we also improved the results by using two steps for query reformulation, reformulation by generalization, and by specialization, which show the more relevant documents returned by system to the user query.
REFERENCES [1] Carpineto, C., Romano, G., “Information retrieval through hybrid
navigation of lattice representations”, International Journal of Human-Computer Studies, 1996,45, pp. 553-578.
[2] Carpineto, C., Romano, G., “Exploiting the Potential of Concept Lattices for Information Retrieval with CREDO”, Journal of Universal Computer Science, vol. 10, n°8, 2004, pp. 985-1013.
[3] Emmanuel Nauer et Yannick Toussaint, « Classication dynamique par treillis de concepts pour la recherche d'information sur le web », LORIA
124 http://sites.google.com/site/ijcsis/ ISSN 1947-5500
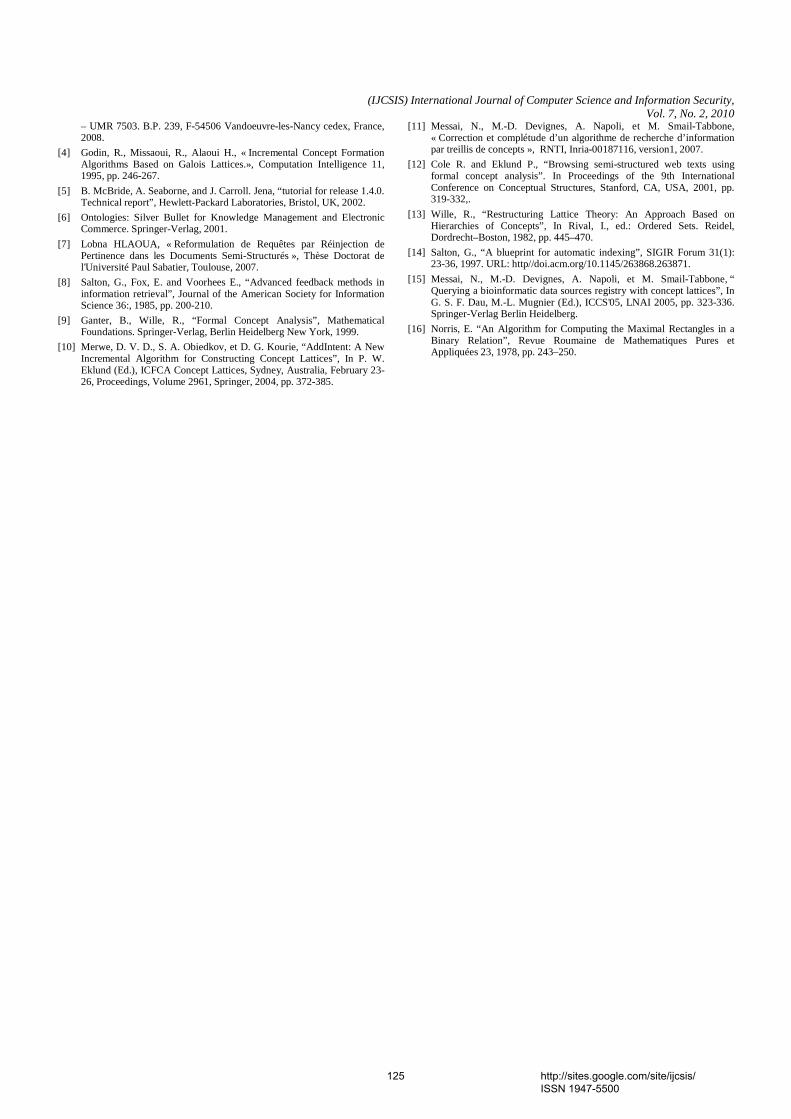
(IJCSIS) International Journal of Computer Science and Information Security, Vol. 7, No. 2, 2010
– UMR 7503. B.P. 239, F-54506 Vandoeuvre-les-Nancy cedex, France, 2008.
[4] Godin, R., Missaoui, R., Alaoui H., « Incremental Concept Formation Algorithms Based on Galois Lattices.», Computation Intelligence 11, 1995, pp. 246-267.
[5] B. McBride, A. Seaborne, and J. Carroll. Jena, “tutorial for release 1.4.0. Technical report”, Hewlett-Packard Laboratories, Bristol, UK, 2002.
[6] Ontologies: Silver Bullet for Knowledge Management and Electronic Commerce. Springer-Verlag, 2001.
[7] Lobna HLAOUA, « Reformulation de Requêtes par Réinjection de Pertinence dans les Documents Semi-Structurés », Thèse Doctorat de l'Université Paul Sabatier, Toulouse, 2007.
[8] Salton, G., Fox, E. and Voorhees E., “Advanced feedback methods in information retrieval”, Journal of the American Society for Information Science 36:, 1985, pp. 200-210.
[9] Ganter, B., Wille, R., “Formal Concept Analysis”, Mathematical Foundations. Springer-Verlag, Berlin Heidelberg New York, 1999.
[10] Merwe, D. V. D., S. A. Obiedkov, et D. G. Kourie, “AddIntent: A New Incremental Algorithm for Constructing Concept Lattices”, In P. W. Eklund (Ed.), ICFCA Concept Lattices, Sydney, Australia, February 23-26, Proceedings, Volume 2961, Springer, 2004, pp. 372-385.
[11] Messai, N., M.-D. Devignes, A. Napoli, et M. Smail-Tabbone, « Correction et complétude d’un algorithme de recherche d’information par treillis de concepts », RNTI, Inria-00187116, version1, 2007.
[12] Cole R. and Eklund P., “Browsing semi-structured web texts using formal concept analysis”. In Proceedings of the 9th International Conference on Conceptual Structures, Stanford, CA, USA, 2001, pp. 319-332,.
[13] Wille, R., “Restructuring Lattice Theory: An Approach Based on Hierarchies of Concepts”, In Rival, I., ed.: Ordered Sets. Reidel, Dordrecht–Boston, 1982, pp. 445–470.
[14] Salton, G., “A blueprint for automatic indexing”, SIGIR Forum 31(1): 23-36, 1997. URL: http//doi.acm.org/10.1145/263868.263871.
[15] Messai, N., M.-D. Devignes, A. Napoli, et M. Smail-Tabbone, “ Querying a bioinformatic data sources registry with concept lattices”, In G. S. F. Dau, M.-L. Mugnier (Ed.), ICCS'05, LNAI 2005, pp. 323-336. Springer-Verlag Berlin Heidelberg.
[16] Norris, E. “An Algorithm for Computing the Maximal Rectangles in a Binary Relation”, Revue Roumaine de Mathematiques Pures et Appliquées 23, 1978, pp. 243–250.
125 http://sites.google.com/site/ijcsis/ ISSN 1947-5500
(IJCSIS) International Journal of Computer Science and Information Security, Vol. 7, No. 2, 2010
Creating A Model HTTP Server Program Using java
Bala Dhandayuthapani Veerasamy Department of Computing
Mekelle University Mekelle, Ethiopia
Abstract— HTTP Server is a computer programs that serves webpage content to clients. A webpage is a document or resource of information that is suitable for the World Wide Web and can be accessed through a web browser and displayed on a computer screen. This information is usually in HTML format, and may provide navigation to other webpage’s via hypertext links. WebPages may be retrieved from a local computer or from a remote HTTP Server. WebPages are requested and served from HTTP Servers using Hypertext Transfer Protocol (HTTP). WebPages may consist of files of static or dynamic text stored within the HTTP Server's file system. Client-side scripting can make WebPages more responsive to user input once in the client browser. This paper encompasses the creation of HTTP server program using java language, which is basically supporting for HTML and JavaScript.
Keywords- HTTP Server; Hyper Text Trasfer Protocol; Hyper Text Markup Language; WebPage;
I. INTRODUCTION The Client-server [1] architecture is based on the principle
where the ‘client’ program installed on the user’s computer communicates with the ‘server’ program installed on the host computer to exchange information through the network. The client program is loaded on the PCs of users hooked to the Internet where as the server program is loaded on to the ‘host’ that may be located at a remote place. The concept of client-server computing has particular importance on the Internet because most of the programs are built using this design. The most important concepts and underlying mechanism that make the web works are Web Browser, Universal Resource Locators (URLs)[2], Hypertext Transfer Protocol (HTTP)[2], Hypertext Mark-up Language (HTML) [3] and Web Server [3].
Web browsers [3] are the applications that allow a user to view WebPages from a computer connected to the Internet. Web browser can read files created with WebPages and display them to the user. There are two important graphical browsers available for browsing WebPages [3], are Microsoft Internet Explorer [3] and Netscape Navigator. Most of the browser can be downloaded at without charge. The basic capabilities of a browser are to retrieve documents from the web, jump to links specified in the retrieved document, save, print the retrieved documents, find text on the document, and send information over the Internet. A web browser is a client program that uses the HTTP to make requests to the HTTP
Servers on behalf of the user. Web documents are written in a text formatting language called Hypertext Mark-up Language (HTML) [3]. The HTML is used to create hypertext documents that can be accessed on the web. Basically it is a set of ‘mark-up’ tags or codes inserted in a web file that tells the web browser how to display a web page for the user.
The Hypertext Transfer Protocol (HTTP) [2] is a set of rules for exchanging hypermedia documents on the World Wide Web. Hypermedia [3] simply combines hypertext and multimedia. Multimedia is any mixture of text, graphics, art, sound, animation and video with links and tools that let the person navigate, interact, and communicate with the computer. The web browser is an HTTP client, sending requests to server machines. When a user requests for a file through web browser by typing a Uniform Resource Locator then browser sends HTTP request that the destination server machine receives the request and, after any necessary processing, the requested file is returned to the client web browser.
The URL [3] is a compact string representation for a resource available on the Internet. URLs contain all of the information needed for the client to find and retrieve a HTML document such as protocol, domain name or IP address and webpage. Every HTTP Server has an IP address and usually a domain name, e.g. www.mu.edu.et. Server software runs exclusively on server machines, handling the storage and transmission of documents. In contrast, client software such as, Netscape, Internet Explorer, etc. runs on the end-user’s computer accessing, translating and displaying documents.
A server is a computer system that is accessed by other computers and / or workstations at remote locations. A web server [3] is a software or program that process HTML documents for viewing by web browsers such as IIS, Apache HTTP Server [5] and WebLogic Server [6]. The server enables users on other sites to access document and it sends the document requested back to the requesting client. The client interprets and presents the document. The client is responsible for document presentation. The language that web clients and servers use to communicate with each other is called the HTTP. All web clients and servers must be able to communicate HTTP in order to send and receive hypermedia documents. For this reason, web servers are often called HTTP servers.
126 http://sites.google.com/site/ijcsis/ ISSN 1947-5500
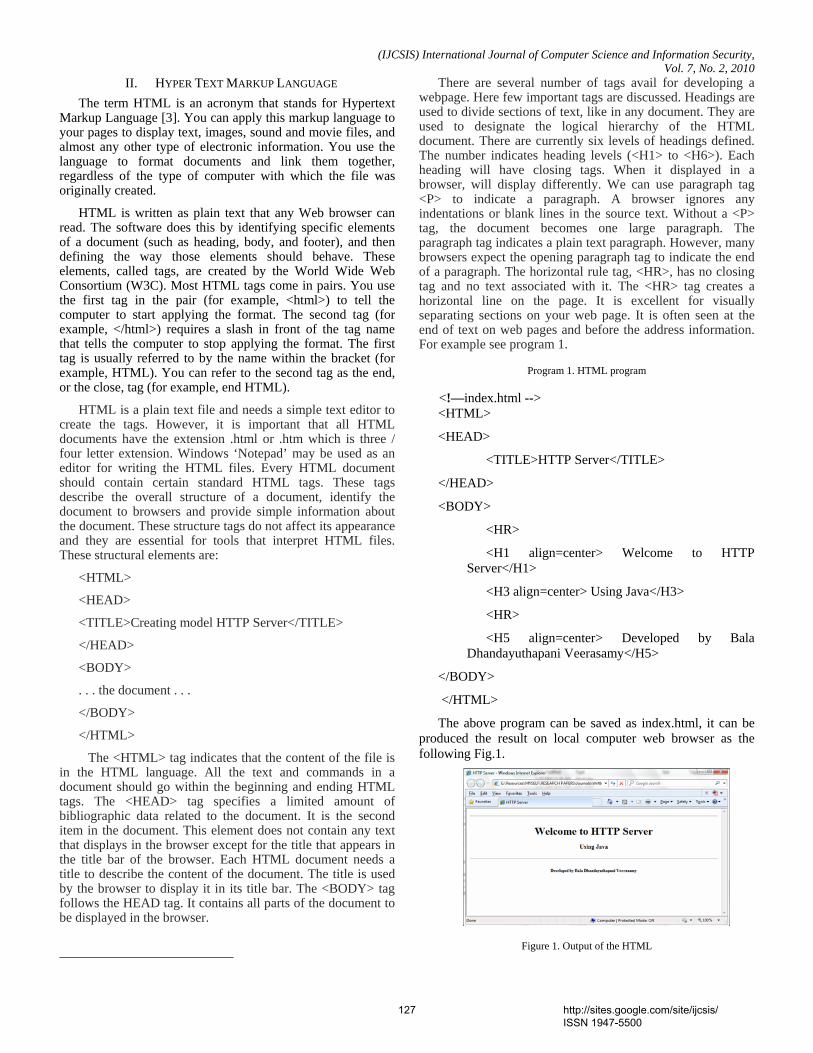
(IJCSIS) International Journal of Computer Science and Information Security, Vol. 7, No. 2, 2010
II. HYPER TEXT MARKUP LANGUAGE The term HTML is an acronym that stands for Hypertext
Markup Language [3]. You can apply this markup language to your pages to display text, images, sound and movie files, and almost any other type of electronic information. You use the language to format documents and link them together, regardless of the type of computer with which the file was originally created.
HTML is written as plain text that any Web browser can read. The software does this by identifying specific elements of a document (such as heading, body, and footer), and then defining the way those elements should behave. These elements, called tags, are created by the World Wide Web Consortium (W3C). Most HTML tags come in pairs. You use the first tag in the pair (for example, <html>) to tell the computer to start applying the format. The second tag (for example, </html>) requires a slash in front of the tag name that tells the computer to stop applying the format. The first tag is usually referred to by the name within the bracket (for example, HTML). You can refer to the second tag as the end, or the close, tag (for example, end HTML).
HTML is a plain text file and needs a simple text editor to create the tags. However, it is important that all HTML documents have the extension .html or .htm which is three / four letter extension. Windows ‘Notepad’ may be used as an editor for writing the HTML files. Every HTML document should contain certain standard HTML tags. These tags describe the overall structure of a document, identify the document to browsers and provide simple information about the document. These structure tags do not affect its appearance and they are essential for tools that interpret HTML files. These structural elements are:
<HTML>
<HEAD>
<TITLE>Creating model HTTP Server</TITLE>
</HEAD>
<BODY>
. . . the document . . .
</BODY>
</HTML>
The <HTML> tag indicates that the content of the file is in the HTML language. All the text and commands in a document should go within the beginning and ending HTML tags. The <HEAD> tag specifies a limited amount of bibliographic data related to the document. It is the second item in the document. This element does not contain any text that displays in the browser except for the title that appears in the title bar of the browser. Each HTML document needs a title to describe the content of the document. The title is used by the browser to display it in its title bar. The <BODY> tag follows the HEAD tag. It contains all parts of the document to be displayed in the browser.
There are several number of tags avail for developing a webpage. Here few important tags are discussed. Headings are used to divide sections of text, like in any document. They are used to designate the logical hierarchy of the HTML document. There are currently six levels of headings defined. The number indicates heading levels (<H1> to <H6>). Each heading will have closing tags. When it displayed in a browser, will display differently. We can use paragraph tag <P> to indicate a paragraph. A browser ignores any indentations or blank lines in the source text. Without a <P> tag, the document becomes one large paragraph. The paragraph tag indicates a plain text paragraph. However, many browsers expect the opening paragraph tag to indicate the end of a paragraph. The horizontal rule tag, <HR>, has no closing tag and no text associated with it. The <HR> tag creates a horizontal line on the page. It is excellent for visually separating sections on your web page. It is often seen at the end of text on web pages and before the address information. For example see program 1.
Program 1. HTML program
<!—index.html --> <HTML>
<HEAD>
<TITLE>HTTP Server</TITLE>
</HEAD>
<BODY>
<HR>
<H1 align=center> Welcome to HTTP Server</H1>
<H3 align=center> Using Java</H3>
<HR>
<H5 align=center> Developed by Bala Dhandayuthapani Veerasamy</H5>
</BODY>
</HTML>
The above program can be saved as index.html, it can be produced the result on local computer web browser as the following Fig.1.
Figure 1. Output of the HTML
127 http://sites.google.com/site/ijcsis/ ISSN 1947-5500
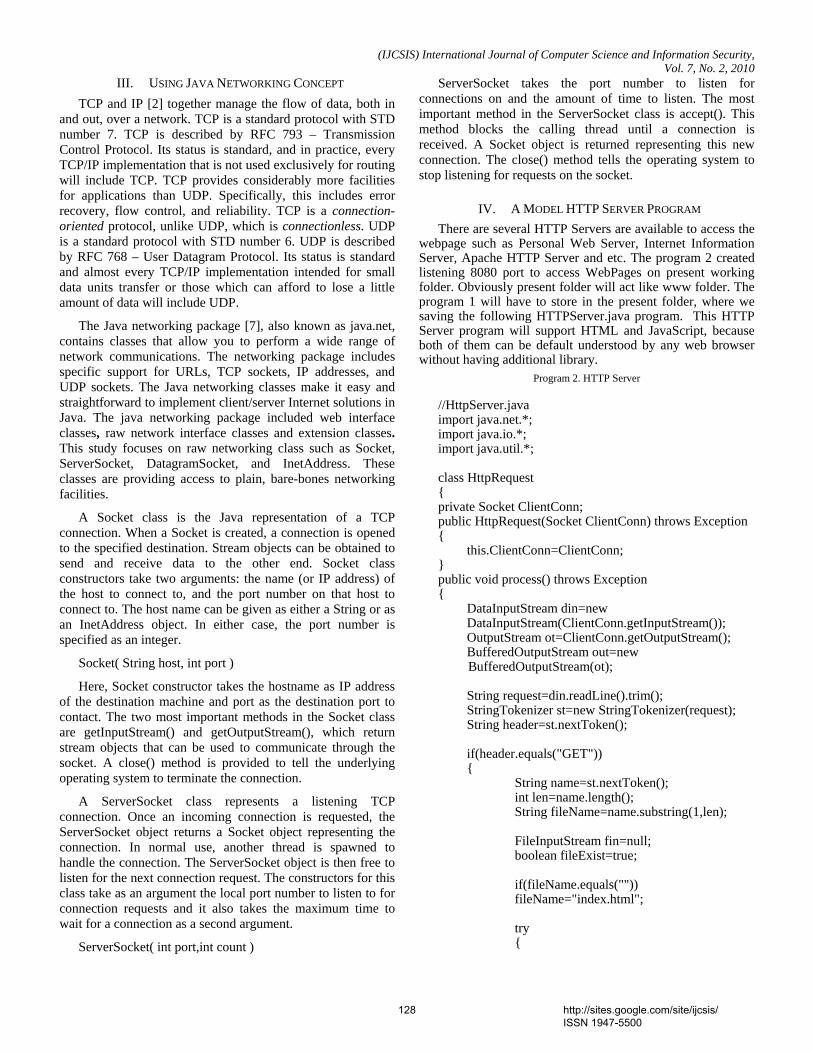
(IJCSIS) International Journal of Computer Science and Information Security, Vol. 7, No. 2, 2010
III. USING JAVA NETWORKING CONCEPT TCP and IP [2] together manage the flow of data, both in
and out, over a network. TCP is a standard protocol with STD number 7. TCP is described by RFC 793 – Transmission Control Protocol. Its status is standard, and in practice, every TCP/IP implementation that is not used exclusively for routing will include TCP. TCP provides considerably more facilities for applications than UDP. Specifically, this includes error recovery, flow control, and reliability. TCP is a connection-oriented protocol, unlike UDP, which is connectionless. UDP is a standard protocol with STD number 6. UDP is described by RFC 768 – User Datagram Protocol. Its status is standard and almost every TCP/IP implementation intended for small data units transfer or those which can afford to lose a little amount of data will include UDP.
The Java networking package [7], also known as java.net, contains classes that allow you to perform a wide range of network communications. The networking package includes specific support for URLs, TCP sockets, IP addresses, and UDP sockets. The Java networking classes make it easy and straightforward to implement client/server Internet solutions in Java. The java networking package included web interface classes, raw network interface classes and extension classes. This study focuses on raw networking class such as Socket, ServerSocket, DatagramSocket, and InetAddress. These classes are providing access to plain, bare-bones networking facilities.
A Socket class is the Java representation of a TCP connection. When a Socket is created, a connection is opened to the specified destination. Stream objects can be obtained to send and receive data to the other end. Socket class constructors take two arguments: the name (or IP address) of the host to connect to, and the port number on that host to connect to. The host name can be given as either a String or as an InetAddress object. In either case, the port number is specified as an integer.
Socket( String host, int port )
Here, Socket constructor takes the hostname as IP address of the destination machine and port as the destination port to contact. The two most important methods in the Socket class are getInputStream() and getOutputStream(), which return stream objects that can be used to communicate through the socket. A close() method is provided to tell the underlying operating system to terminate the connection.
A ServerSocket class represents a listening TCP connection. Once an incoming connection is requested, the ServerSocket object returns a Socket object representing the connection. In normal use, another thread is spawned to handle the connection. The ServerSocket object is then free to listen for the next connection request. The constructors for this class take as an argument the local port number to listen to for connection requests and it also takes the maximum time to wait for a connection as a second argument.
ServerSocket( int port,int count )
ServerSocket takes the port number to listen for connections on and the amount of time to listen. The most important method in the ServerSocket class is accept(). This method blocks the calling thread until a connection is received. A Socket object is returned representing this new connection. The close() method tells the operating system to stop listening for requests on the socket.
IV. A MODEL HTTP SERVER PROGRAM There are several HTTP Servers are available to access the
webpage such as Personal Web Server, Internet Information Server, Apache HTTP Server and etc. The program 2 created listening 8080 port to access WebPages on present working folder. Obviously present folder will act like www folder. The program 1 will have to store in the present folder, where we saving the following HTTPServer.java program. This HTTP Server program will support HTML and JavaScript, because both of them can be default understood by any web browser without having additional library.
Program 2. HTTP Server
//HttpServer.java import java.net.*; import java.io.*; import java.util.*; class HttpRequest { private Socket ClientConn; public HttpRequest(Socket ClientConn) throws Exception { this.ClientConn=ClientConn; } public void process() throws Exception {
DataInputStream din=new DataInputStream(ClientConn.getInputStream());
OutputStream ot=ClientConn.getOutputStream(); BufferedOutputStream out=new BufferedOutputStream(ot);
String request=din.readLine().trim(); StringTokenizer st=new StringTokenizer(request); String header=st.nextToken(); if(header.equals("GET")) { String name=st.nextToken(); int len=name.length(); String fileName=name.substring(1,len); FileInputStream fin=null; boolean fileExist=true; if(fileName.equals("")) fileName="index.html"; try {
128 http://sites.google.com/site/ijcsis/ ISSN 1947-5500
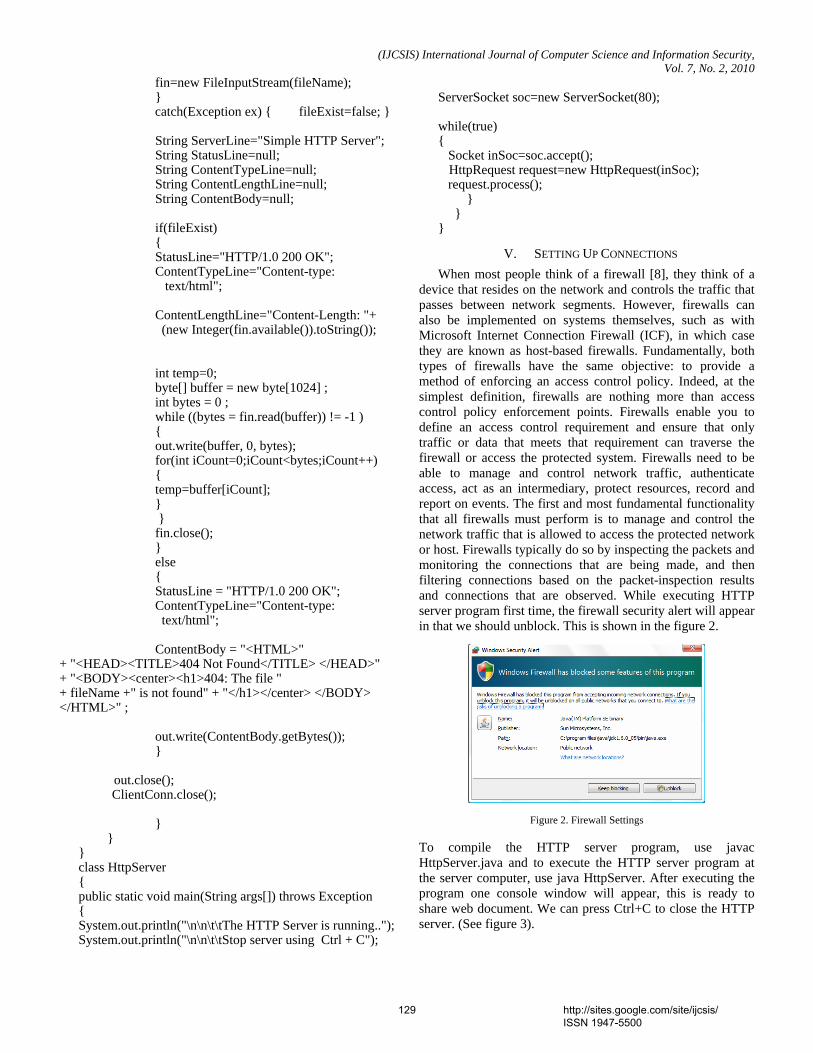
(IJCSIS) International Journal of Computer Science and Information Security, Vol. 7, No. 2, 2010
fin=new FileInputStream(fileName); } catch(Exception ex) { fileExist=false; } String ServerLine="Simple HTTP Server"; String StatusLine=null; String ContentTypeLine=null; String ContentLengthLine=null; String ContentBody=null; if(fileExist) { StatusLine="HTTP/1.0 200 OK"; ContentTypeLine="Content-type: text/html";
ContentLengthLine="Content-Length: "+ (new Integer(fin.available()).toString());
int temp=0; byte[] buffer = new byte[1024] ; int bytes = 0 ; while ((bytes = fin.read(buffer)) != -1 ) { out.write(buffer, 0, bytes); for(int iCount=0;iCount<bytes;iCount++) { temp=buffer[iCount]; } } fin.close(); } else { StatusLine = "HTTP/1.0 200 OK"; ContentTypeLine="Content-type: text/html"; ContentBody = "<HTML>"
+ "<HEAD><TITLE>404 Not Found</TITLE> </HEAD>" + "<BODY><center><h1>404: The file " + fileName +" is not found" + "</h1></center> </BODY> </HTML>" ;
out.write(ContentBody.getBytes()); } out.close(); ClientConn.close(); } } } class HttpServer { public static void main(String args[]) throws Exception { System.out.println("\n\n\t\tThe HTTP Server is running.."); System.out.println("\n\n\t\tStop server using Ctrl + C");
ServerSocket soc=new ServerSocket(80); while(true) { Socket inSoc=soc.accept();
HttpRequest request=new HttpRequest(inSoc); request.process(); } } }
V. SETTING UP CONNECTIONS When most people think of a firewall [8], they think of a
device that resides on the network and controls the traffic that passes between network segments. However, firewalls can also be implemented on systems themselves, such as with Microsoft Internet Connection Firewall (ICF), in which case they are known as host-based firewalls. Fundamentally, both types of firewalls have the same objective: to provide a method of enforcing an access control policy. Indeed, at the simplest definition, firewalls are nothing more than access control policy enforcement points. Firewalls enable you to define an access control requirement and ensure that only traffic or data that meets that requirement can traverse the firewall or access the protected system. Firewalls need to be able to manage and control network traffic, authenticate access, act as an intermediary, protect resources, record and report on events. The first and most fundamental functionality that all firewalls must perform is to manage and control the network traffic that is allowed to access the protected network or host. Firewalls typically do so by inspecting the packets and monitoring the connections that are being made, and then filtering connections based on the packet-inspection results and connections that are observed. While executing HTTP server program first time, the firewall security alert will appear in that we should unblock. This is shown in the figure 2.
Figure 2. Firewall Settings
To compile the HTTP server program, use javac HttpServer.java and to execute the HTTP server program at the server computer, use java HttpServer. After executing the program one console window will appear, this is ready to share web document. We can press Ctrl+C to close the HTTP server. (See figure 3).
129 http://sites.google.com/site/ijcsis/ ISSN 1947-5500
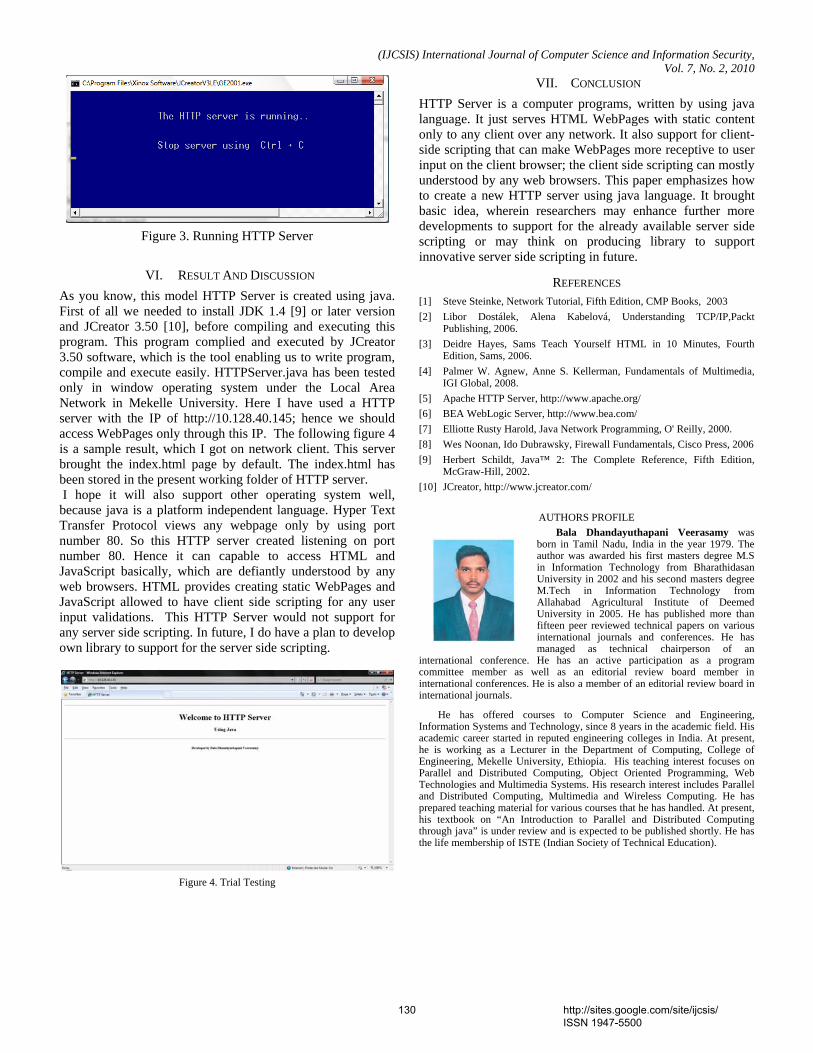
(IJCSIS) International Journal of Computer Science and Information Security, Vol. 7, No. 2, 2010
Figure 3. Running HTTP Server
VI. RESULT AND DISCUSSION As you know, this model HTTP Server is created using java. First of all we needed to install JDK 1.4 [9] or later version and JCreator 3.50 [10], before compiling and executing this program. This program complied and executed by JCreator 3.50 software, which is the tool enabling us to write program, compile and execute easily. HTTPServer.java has been tested only in window operating system under the Local Area Network in Mekelle University. Here I have used a HTTP server with the IP of http://10.128.40.145; hence we should access WebPages only through this IP. The following figure 4 is a sample result, which I got on network client. This server brought the index.html page by default. The index.html has been stored in the present working folder of HTTP server. I hope it will also support other operating system well, because java is a platform independent language. Hyper Text Transfer Protocol views any webpage only by using port number 80. So this HTTP server created listening on port number 80. Hence it can capable to access HTML and JavaScript basically, which are defiantly understood by any web browsers. HTML provides creating static WebPages and JavaScript allowed to have client side scripting for any user input validations. This HTTP Server would not support for any server side scripting. In future, I do have a plan to develop own library to support for the server side scripting.
Figure 4. Trial Testing
VII. CONCLUSION HTTP Server is a computer programs, written by using java language. It just serves HTML WebPages with static content only to any client over any network. It also support for client-side scripting that can make WebPages more receptive to user input on the client browser; the client side scripting can mostly understood by any web browsers. This paper emphasizes how to create a new HTTP server using java language. It brought basic idea, wherein researchers may enhance further more developments to support for the already available server side scripting or may think on producing library to support innovative server side scripting in future.
REFERENCES [1] Steve Steinke, Network Tutorial, Fifth Edition, CMP Books, 2003 [2] Libor Dostálek, Alena Kabelová, Understanding TCP/IP,Packt
Publishing, 2006. [3] Deidre Hayes, Sams Teach Yourself HTML in 10 Minutes, Fourth
Edition, Sams, 2006. [4] Palmer W. Agnew, Anne S. Kellerman, Fundamentals of Multimedia,
IGI Global, 2008. [5] Apache HTTP Server, http://www.apache.org/ [6] BEA WebLogic Server, http://www.bea.com/ [7] Elliotte Rusty Harold, Java Network Programming, O' Reilly, 2000. [8] Wes Noonan, Ido Dubrawsky, Firewall Fundamentals, Cisco Press, 2006 [9] Herbert Schildt, Java™ 2: The Complete Reference, Fifth Edition,
McGraw-Hill, 2002. [10] JCreator, http://www.jcreator.com/
AUTHORS PROFILE Bala Dhandayuthapani Veerasamy was
born in Tamil Nadu, India in the year 1979. The author was awarded his first masters degree M.S in Information Technology from Bharathidasan University in 2002 and his second masters degree M.Tech in Information Technology from Allahabad Agricultural Institute of Deemed University in 2005. He has published more than fifteen peer reviewed technical papers on various international journals and conferences. He has managed as technical chairperson of an
international conference. He has an active participation as a program committee member as well as an editorial review board member in international conferences. He is also a member of an editorial review board in international journals.
He has offered courses to Computer Science and Engineering, Information Systems and Technology, since 8 years in the academic field. His academic career started in reputed engineering colleges in India. At present, he is working as a Lecturer in the Department of Computing, College of Engineering, Mekelle University, Ethiopia. His teaching interest focuses on Parallel and Distributed Computing, Object Oriented Programming, Web Technologies and Multimedia Systems. His research interest includes Parallel and Distributed Computing, Multimedia and Wireless Computing. He has prepared teaching material for various courses that he has handled. At present, his textbook on “An Introduction to Parallel and Distributed Computing through java” is under review and is expected to be published shortly. He has the life membership of ISTE (Indian Society of Technical Education).
130 http://sites.google.com/site/ijcsis/ ISSN 1947-5500
(IJCSIS) International Journal of Computer Science and Information Security, Vol. 7, No. 2, 2010
.
Evaluation of E-Learners Behaviour using Different Fuzzy Clustering Models: A Comparative Study
Mofreh A. Hogo* Dept. of Electrical Engineering Technology, Higher Institution of Technology Benha, Benha University, Egypt.
.
Abstract— This paper introduces an evaluation methodologies for the e-learners’ behaviour that will be a feedback to the decision makers in e-learning system. Learner's profile plays a crucial role in the evaluation process to improve the e-learning process performance. The work focuses on the clustering of the e-learners based on their behaviour into specific categories that represent the learner's profiles. The learners' classes named as regular, workers, casual, bad, and absent. The work may answer the question of how to return bad students to be regular ones. The work presented the use of different fuzzy clustering techniques as fuzzy c-means and kernelized fuzzy c-means to find the learners’ categories and predict their profiles. The paper presents the main phases as data description, preparation, features selection, and the experiments design using different fuzzy clustering models. Analysis of the obtained results and comparison with the real world behavior of those learners proved that there is a match with percentage of 78%. Fuzzy clustering reflects the learners’ behavior more than crisp clustering. Comparison between FCM and KFCM proved that the KFCM is much better than FCM in predicting the learners’ behaviour.
Keywords: E-Learning, Learner Profile, Fuzzy C-Means Clustering, Kernelized FCM.
I. INTRODUCTION The development of web-based education systems have grown exponentially in the last years [1]. These systems accumulate a great deal of information; which is very valuable in analyzing students’ behavior and assisting teachers in the detection of possible errors, shortcomings and improvements. However, due to the vast quantities of data these systems can generate daily, it is very difficult to manage manually, and authors demand tools which assist them in this task, preferably on a continuous basis. The use of data mining is a promising area in the achievement of this objective [2]. In the knowledge discovery in databases (KDD) process, the data mining step consists of the automatic extraction of implicit and interesting patterns from large data collections. A list of data mining techniques or tasks includes statistics, clustering, classification, outlier detection, association rule mining, sequential pattern mining, text mining, or subgroup discovery, among others [3]. In recent years, researchers have begun to investigate various data mining methods in order to help teachers improve e-learning systems. A review can be seen in
[2]; these methods allow the discovery of new knowledge based on students’ usage data. Subgroup discovery is a specific method for discovering descriptive rules [4,5].
II. SURVEY ON E-LEARNING
A. Clustering The first application of clustering methods in e-learning [6], a network-based testing and diagnostic system was implemented. It entails a multiple-criteria test-sheet-generating problem and a dynamic programming approach to generate test sheets. The proposed approach employs fuzzy logic theory to determine the difficulty levels of test items according to the learning status and personal features of each student, and then applies an Artificial Neural Network model: Fuzzy Adaptive Resonance Theory (Fuzzy ART) [7] to cluster the test items into groups, as well as dynamic programming [8] for test sheet construction. In [9], an in-depth study describing the usability of Artificial Neural Networks and, more specifically, of Kohonen’s Self-Organizing Maps (SOM) [10] for the evaluation of students in a tutorial supervisor (TS) system, as well as the ability of a fuzzy TS to adapt question difficulty in the evaluation process, was carried out. An investigation on how Data Mining techniques could be successfully incorporated to e-learning environments, and how this could improve the learning processes was presented in [11]. Here, data clustering is suggested as a means to promote group-based collaborative learning and to provide incremental student diagnosis. In [12], user actions associated to students’ Web usage were gathered and preprocessed as part of a Data Mining process. The Expectation Maximization (EM) algorithm was then used to group the users into clusters according to their behaviors. These results could be used by teachers to provide specialized advice to students belonging to each cluster. The simplifying assumption that students belonging to each cluster should share Web usage behavior makes personalization strategies more scalable. The system administrators could also benefit from this acquired knowledge by adjusting the e-learning environment they manage according to it. The EM algorithm was also the method of choice in [13], where clustering was used to discover user behavior patterns in collaborative activities in e-
131 http://sites.google.com/site/ijcsis/ ISSN 1947-5500
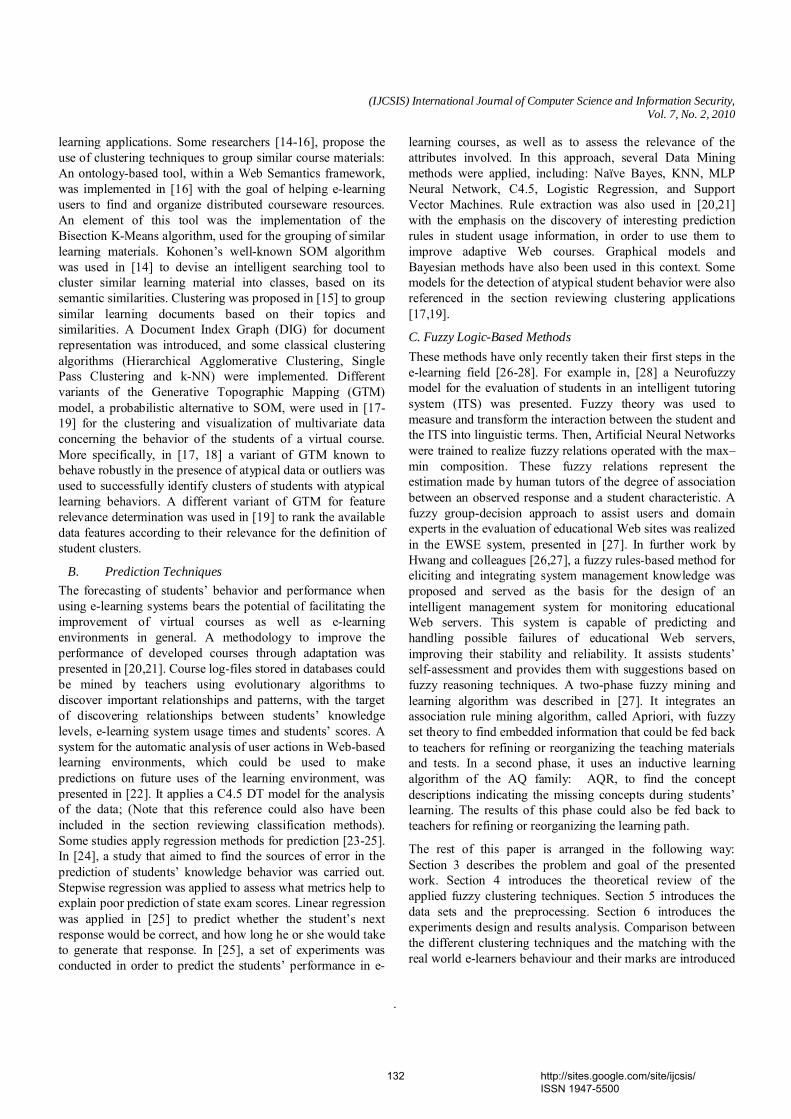
(IJCSIS) International Journal of Computer Science and Information Security, Vol. 7, No. 2, 2010
.
learning applications. Some researchers [14-16], propose the use of clustering techniques to group similar course materials: An ontology-based tool, within a Web Semantics framework, was implemented in [16] with the goal of helping e-learning users to find and organize distributed courseware resources. An element of this tool was the implementation of the Bisection K-Means algorithm, used for the grouping of similar learning materials. Kohonen’s well-known SOM algorithm was used in [14] to devise an intelligent searching tool to cluster similar learning material into classes, based on its semantic similarities. Clustering was proposed in [15] to group similar learning documents based on their topics and similarities. A Document Index Graph (DIG) for document representation was introduced, and some classical clustering algorithms (Hierarchical Agglomerative Clustering, Single Pass Clustering and k-NN) were implemented. Different variants of the Generative Topographic Mapping (GTM) model, a probabilistic alternative to SOM, were used in [17-19] for the clustering and visualization of multivariate data concerning the behavior of the students of a virtual course. More specifically, in [17, 18] a variant of GTM known to behave robustly in the presence of atypical data or outliers was used to successfully identify clusters of students with atypical learning behaviors. A different variant of GTM for feature relevance determination was used in [19] to rank the available data features according to their relevance for the definition of student clusters.
B. Prediction Techniques The forecasting of students’ behavior and performance when using e-learning systems bears the potential of facilitating the improvement of virtual courses as well as e-learning environments in general. A methodology to improve the performance of developed courses through adaptation was presented in [20,21]. Course log-files stored in databases could be mined by teachers using evolutionary algorithms to discover important relationships and patterns, with the target of discovering relationships between students’ knowledge levels, e-learning system usage times and students’ scores. A system for the automatic analysis of user actions in Web-based learning environments, which could be used to make predictions on future uses of the learning environment, was presented in [22]. It applies a C4.5 DT model for the analysis of the data; (Note that this reference could also have been included in the section reviewing classification methods). Some studies apply regression methods for prediction [23-25]. In [24], a study that aimed to find the sources of error in the prediction of students’ knowledge behavior was carried out. Stepwise regression was applied to assess what metrics help to explain poor prediction of state exam scores. Linear regression was applied in [25] to predict whether the student’s next response would be correct, and how long he or she would take to generate that response. In [25], a set of experiments was conducted in order to predict the students’ performance in e-
learning courses, as well as to assess the relevance of the attributes involved. In this approach, several Data Mining methods were applied, including: Naïve Bayes, KNN, MLP Neural Network, C4.5, Logistic Regression, and Support Vector Machines. Rule extraction was also used in [20,21] with the emphasis on the discovery of interesting prediction rules in student usage information, in order to use them to improve adaptive Web courses. Graphical models and Bayesian methods have also been used in this context. Some models for the detection of atypical student behavior were also referenced in the section reviewing clustering applications [17,19].
C. Fuzzy Logic-Based Methods These methods have only recently taken their first steps in the e-learning field [26-28]. For example in, [28] a Neurofuzzy model for the evaluation of students in an intelligent tutoring system (ITS) was presented. Fuzzy theory was used to measure and transform the interaction between the student and the ITS into linguistic terms. Then, Artificial Neural Networks were trained to realize fuzzy relations operated with the max–min composition. These fuzzy relations represent the estimation made by human tutors of the degree of association between an observed response and a student characteristic. A fuzzy group-decision approach to assist users and domain experts in the evaluation of educational Web sites was realized in the EWSE system, presented in [27]. In further work by Hwang and colleagues [26,27], a fuzzy rules-based method for eliciting and integrating system management knowledge was proposed and served as the basis for the design of an intelligent management system for monitoring educational Web servers. This system is capable of predicting and handling possible failures of educational Web servers, improving their stability and reliability. It assists students’ self-assessment and provides them with suggestions based on fuzzy reasoning techniques. A two-phase fuzzy mining and learning algorithm was described in [27]. It integrates an association rule mining algorithm, called Apriori, with fuzzy set theory to find embedded information that could be fed back to teachers for refining or reorganizing the teaching materials and tests. In a second phase, it uses an inductive learning algorithm of the AQ family: AQR, to find the concept descriptions indicating the missing concepts during students’ learning. The results of this phase could also be fed back to teachers for refining or reorganizing the learning path.
The rest of this paper is arranged in the following way: Section 3 describes the problem and goal of the presented work. Section 4 introduces the theoretical review of the applied fuzzy clustering techniques. Section 5 introduces the data sets and the preprocessing. Section 6 introduces the experiments design and results analysis. Comparison between the different clustering techniques and the matching with the real world e-learners behaviour and their marks are introduced
132 http://sites.google.com/site/ijcsis/ ISSN 1947-5500
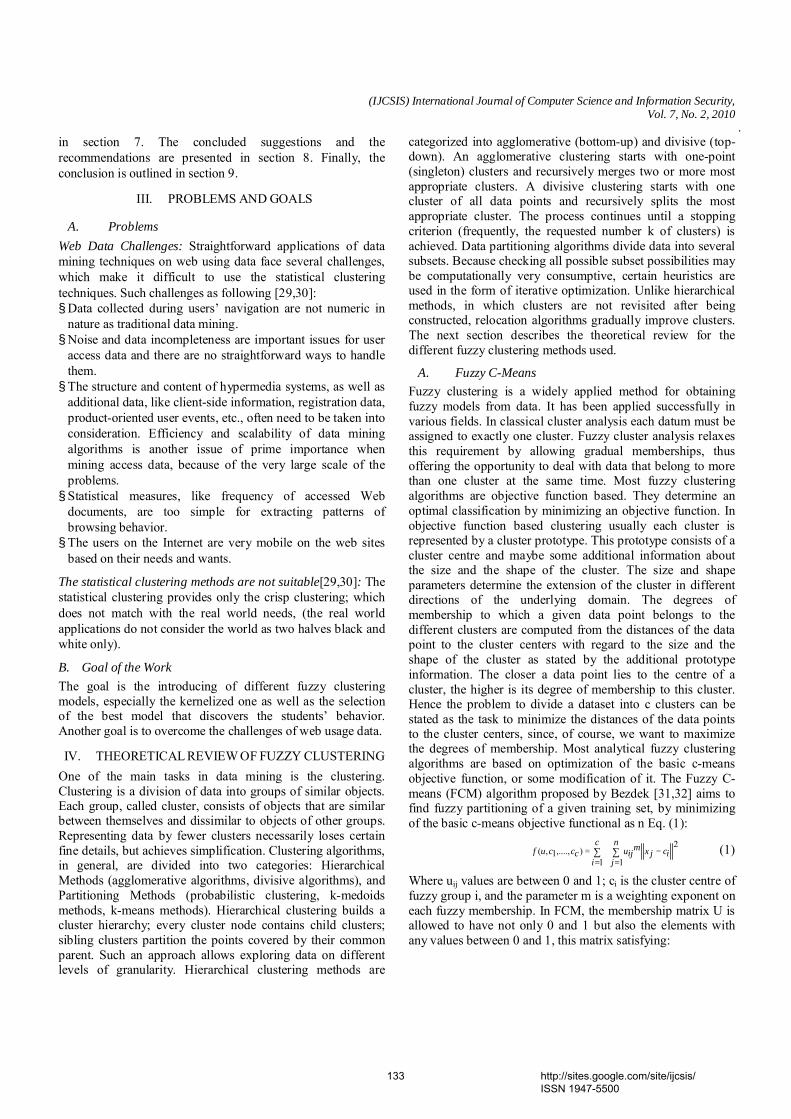
(IJCSIS) International Journal of Computer Science and Information Security, Vol. 7, No. 2, 2010
.
in section 7. The concluded suggestions and the recommendations are presented in section 8. Finally, the conclusion is outlined in section 9.
III. PROBLEMS AND GOALS
A. Problems Web Data Challenges: Straightforward applications of data mining techniques on web using data face several challenges, which make it difficult to use the statistical clustering techniques. Such challenges as following [29,30]: § Data collected during users’ navigation are not numeric in
nature as traditional data mining. § Noise and data incompleteness are important issues for user
access data and there are no straightforward ways to handle them. § The structure and content of hypermedia systems, as well as
additional data, like client-side information, registration data, product-oriented user events, etc., often need to be taken into consideration. Efficiency and scalability of data mining algorithms is another issue of prime importance when mining access data, because of the very large scale of the problems. § Statistical measures, like frequency of accessed Web
documents, are too simple for extracting patterns of browsing behavior. § The users on the Internet are very mobile on the web sites
based on their needs and wants.
The statistical clustering methods are not suitable[29,30]: The statistical clustering provides only the crisp clustering; which does not match with the real world needs, (the real world applications do not consider the world as two halves black and white only).
B. Goal of the Work The goal is the introducing of different fuzzy clustering models, especially the kernelized one as well as the selection of the best model that discovers the students’ behavior. Another goal is to overcome the challenges of web usage data.
IV. THEORETICAL REVIEW OF FUZZY CLUSTERING One of the main tasks in data mining is the clustering. Clustering is a division of data into groups of similar objects. Each group, called cluster, consists of objects that are similar between themselves and dissimilar to objects of other groups. Representing data by fewer clusters necessarily loses certain fine details, but achieves simplification. Clustering algorithms, in general, are divided into two categories: Hierarchical Methods (agglomerative algorithms, divisive algorithms), and Partitioning Methods (probabilistic clustering, k-medoids methods, k-means methods). Hierarchical clustering builds a cluster hierarchy; every cluster node contains child clusters; sibling clusters partition the points covered by their common parent. Such an approach allows exploring data on different levels of granularity. Hierarchical clustering methods are
categorized into agglomerative (bottom-up) and divisive (top-down). An agglomerative clustering starts with one-point (singleton) clusters and recursively merges two or more most appropriate clusters. A divisive clustering starts with one cluster of all data points and recursively splits the most appropriate cluster. The process continues until a stopping criterion (frequently, the requested number k of clusters) is achieved. Data partitioning algorithms divide data into several subsets. Because checking all possible subset possibilities may be computationally very consumptive, certain heuristics are used in the form of iterative optimization. Unlike hierarchical methods, in which clusters are not revisited after being constructed, relocation algorithms gradually improve clusters. The next section describes the theoretical review for the different fuzzy clustering methods used.
A. Fuzzy C-Means Fuzzy clustering is a widely applied method for obtaining fuzzy models from data. It has been applied successfully in various fields. In classical cluster analysis each datum must be assigned to exactly one cluster. Fuzzy cluster analysis relaxes this requirement by allowing gradual memberships, thus offering the opportunity to deal with data that belong to more than one cluster at the same time. Most fuzzy clustering algorithms are objective function based. They determine an optimal classification by minimizing an objective function. In objective function based clustering usually each cluster is represented by a cluster prototype. This prototype consists of a cluster centre and maybe some additional information about the size and the shape of the cluster. The size and shape parameters determine the extension of the cluster in different directions of the underlying domain. The degrees of membership to which a given data point belongs to the different clusters are computed from the distances of the data point to the cluster centers with regard to the size and the shape of the cluster as stated by the additional prototype information. The closer a data point lies to the centre of a cluster, the higher is its degree of membership to this cluster. Hence the problem to divide a dataset into c clusters can be stated as the task to minimize the distances of the data points to the cluster centers, since, of course, we want to maximize the degrees of membership. Most analytical fuzzy clustering algorithms are based on optimization of the basic c-means objective function, or some modification of it. The Fuzzy C-means (FCM) algorithm proposed by Bezdek [31,32] aims to find fuzzy partitioning of a given training set, by minimizing of the basic c-means objective functional as n Eq. (1):
∑ ∑= =
−=c
i
n
jicjxmijucccuf
1 1
2),....,1,( (1)
Where uij values are between 0 and 1; ci is the cluster centre of fuzzy group i, and the parameter m is a weighting exponent on each fuzzy membership. In FCM, the membership matrix U is allowed to have not only 0 and 1 but also the elements with any values between 0 and 1, this matrix satisfying:
133 http://sites.google.com/site/ijcsis/ ISSN 1947-5500
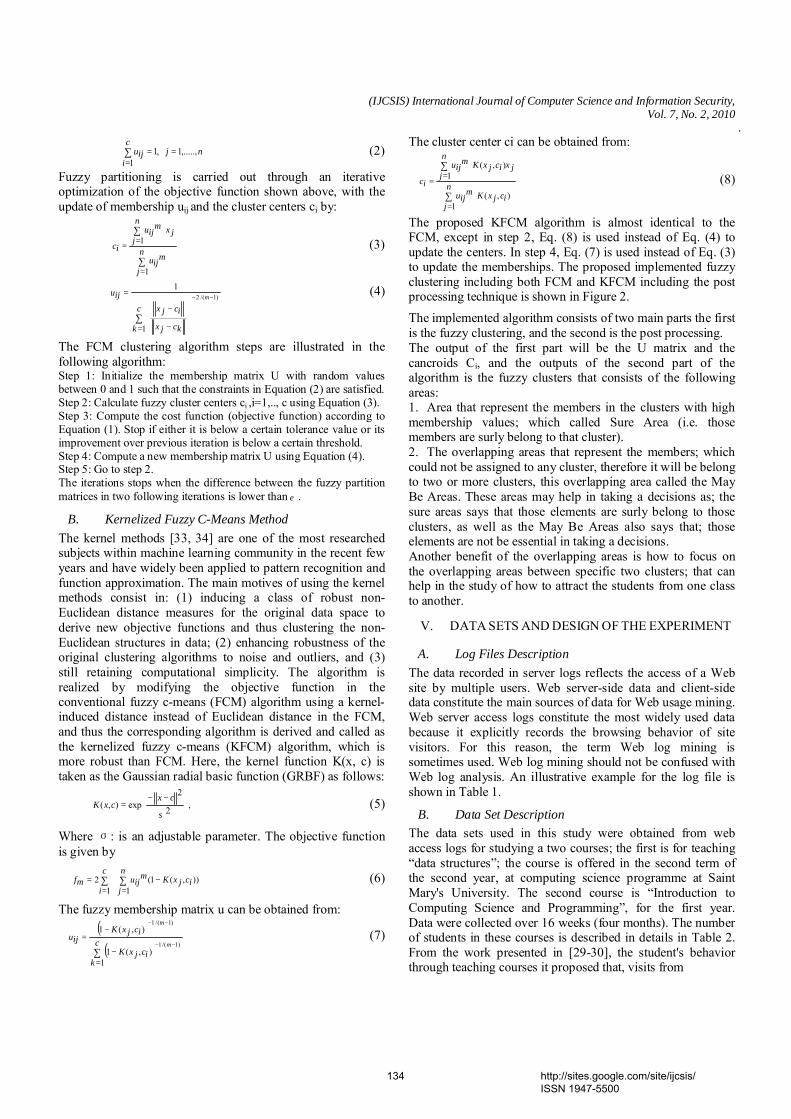
(IJCSIS) International Journal of Computer Science and Information Security, Vol. 7, No. 2, 2010
.
njc
iiju ,.....,1,1
1=∀=
=∑ (2)
Fuzzy partitioning is carried out through an iterative optimization of the objective function shown above, with the update of membership uij and the cluster centers ci by:
∑
∑
=
== n
j
miju
jxn
j
miju
ic
1
1 (3)
∑=
−
−
= −−
c
k kcjx
icjxiju m
1
1)1/(2 (4)
The FCM clustering algorithm steps are illustrated in the following algorithm: Step 1: Initialize the membership matrix U with random values between 0 and 1 such that the constraints in Equation (2) are satisfied. Step 2: Calculate fuzzy cluster centers ci ,i=1,.., c using Equation (3). Step 3: Compute the cost function (objective function) according to Equation (1). Stop if either it is below a certain tolerance value or its improvement over previous iteration is below a certain threshold. Step 4: Compute a new membership matrix U using Equation (4). Step 5: Go to step 2. The iterations stops when the difference between the fuzzy partition matrices in two following iterations is lower than ε .
B. Kernelized Fuzzy C-Means Method The kernel methods [33, 34] are one of the most researched subjects within machine learning community in the recent few years and have widely been applied to pattern recognition and function approximation. The main motives of using the kernel methods consist in: (1) inducing a class of robust non-Euclidean distance measures for the original data space to derive new objective functions and thus clustering the non-Euclidean structures in data; (2) enhancing robustness of the original clustering algorithms to noise and outliers, and (3) still retaining computational simplicity. The algorithm is realized by modifying the objective function in the conventional fuzzy c-means (FCM) algorithm using a kernel-induced distance instead of Euclidean distance in the FCM, and thus the corresponding algorithm is derived and called as the kernelized fuzzy c-means (KFCM) algorithm, which is more robust than FCM. Here, the kernel function K(x, c) is taken as the Gaussian radial basic function (GRBF) as follows:
,2
2exp),(
−−=
σ
cxcxK (5)
Where σ: is an adjustable parameter. The objective function is given by
)1 1
),(1(2 ∑ ∑= =
−=c
i
n
jicjxKm
ijumf (6)
The fuzzy membership matrix u can be obtained from: ( )
( )∑=
−
−=
−−
−−
c
kicjxK
icjxKiju
m
m
1),(1
),(1)1/(1
)1/(1
(7)
The cluster center ci can be obtained from:
∑
∑
=
== n
jicjxKm
iju
jxn
jicjxKm
iju
ic
1),(
1),(
(8)
The proposed KFCM algorithm is almost identical to the FCM, except in step 2, Eq. (8) is used instead of Eq. (4) to update the centers. In step 4, Eq. (7) is used instead of Eq. (3) to update the memberships. The proposed implemented fuzzy clustering including both FCM and KFCM including the post processing technique is shown in Figure 2. The implemented algorithm consists of two main parts the first is the fuzzy clustering, and the second is the post processing. The output of the first part will be the U matrix and the cancroids Ci, and the outputs of the second part of the algorithm is the fuzzy clusters that consists of the following areas: 1. Area that represent the members in the clusters with high membership values; which called Sure Area (i.e. those members are surly belong to that cluster). 2. The overlapping areas that represent the members; which could not be assigned to any cluster, therefore it will be belong to two or more clusters, this overlapping area called the May Be Areas. These areas may help in taking a decisions as; the sure areas says that those elements are surly belong to those clusters, as well as the May Be Areas also says that; those elements are not be essential in taking a decisions. Another benefit of the overlapping areas is how to focus on the overlapping areas between specific two clusters; that can help in the study of how to attract the students from one class to another.
V. DATA SETS AND DESIGN OF THE EXPERIMENT
A. Log Files Description The data recorded in server logs reflects the access of a Web site by multiple users. Web server-side data and client-side data constitute the main sources of data for Web usage mining. Web server access logs constitute the most widely used data because it explicitly records the browsing behavior of site visitors. For this reason, the term Web log mining is sometimes used. Web log mining should not be confused with Web log analysis. An illustrative example for the log file is shown in Table 1.
B. Data Set Description The data sets used in this study were obtained from web access logs for studying a two courses; the first is for teaching “data structures”; the course is offered in the second term of the second year, at computing science programme at Saint Mary's University. The second course is “Introduction to Computing Science and Programming”, for the first year. Data were collected over 16 weeks (four months). The number of students in these courses is described in details in Table 2. From the work presented in [29-30], the student's behavior through teaching courses it proposed that, visits from
134 http://sites.google.com/site/ijcsis/ ISSN 1947-5500
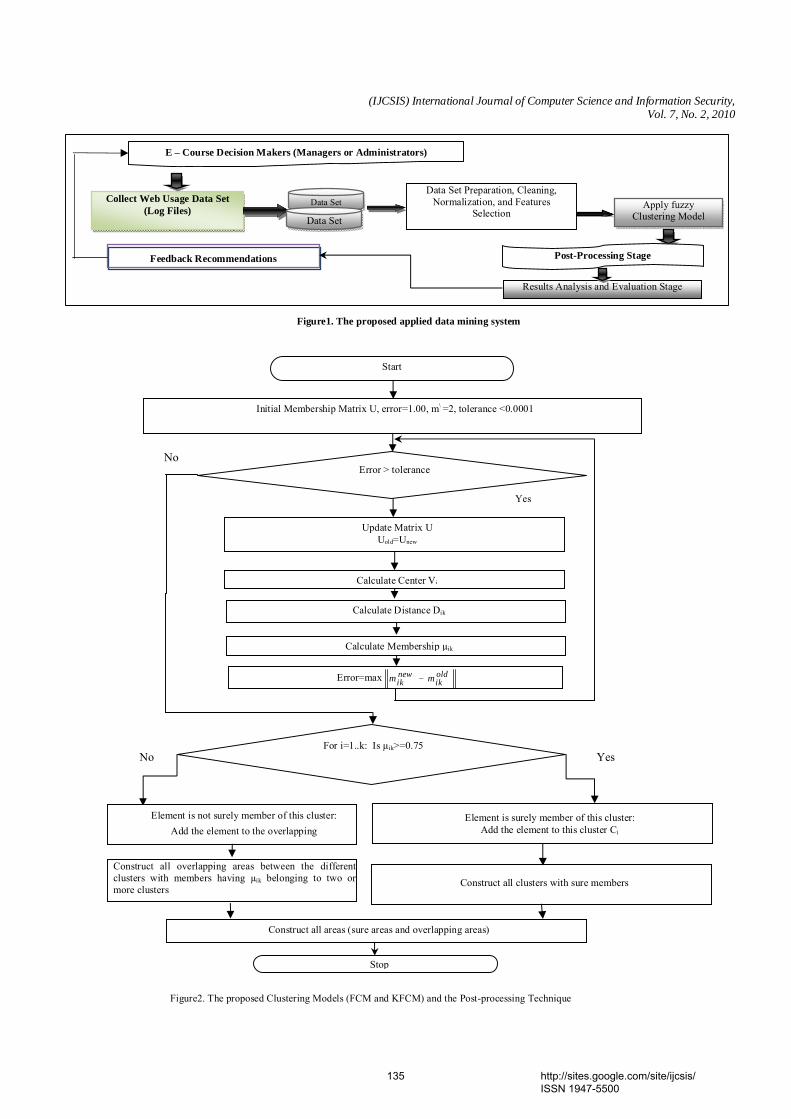
(IJCSIS) International Journal of Computer Science and Information Security, Vol. 7, No. 2, 2010
5
Yes For i=1..k: Is µik>=0.75
Element is not surely member of this cluster: Add the element to the overlapping
Construct all overlapping areas between the different clusters with members having µik belonging to two or more clusters
Construct all clusters with sure members
Construct all areas (sure areas and overlapping areas)
Figure2. The proposed Clustering Models (FCM and KFCM) and the Post-processing Technique
Initial Membership Matrix U, error=1.00, m\ =2, tolerance <0.0001
Start
Error > tolerance
Update Matrix U Uold=Unew
Calculate Center Vi
Calculate Distance Dik
Calculate Membership µik
Error=max oldik
newik µµ −
Element is surely member of this cluster: Add the element to this cluster Ci
Stop
No
Yes
No
Figure1. The proposed applied data mining system
Knowledge
Data Set Preparation, Cleaning, Normalization, and Features
Selection Collect Web Usage Data Set
(Log Files)
Results Analysis and Evaluation Stage
E – Course Decision Makers (Managers or Administrators)
Apply fuzzy Clustering Model
Feedback Recommendations Post-Processing Stage
Data Set
Data Set
135 http://sites.google.com/site/ijcsis/ ISSN 1947-5500
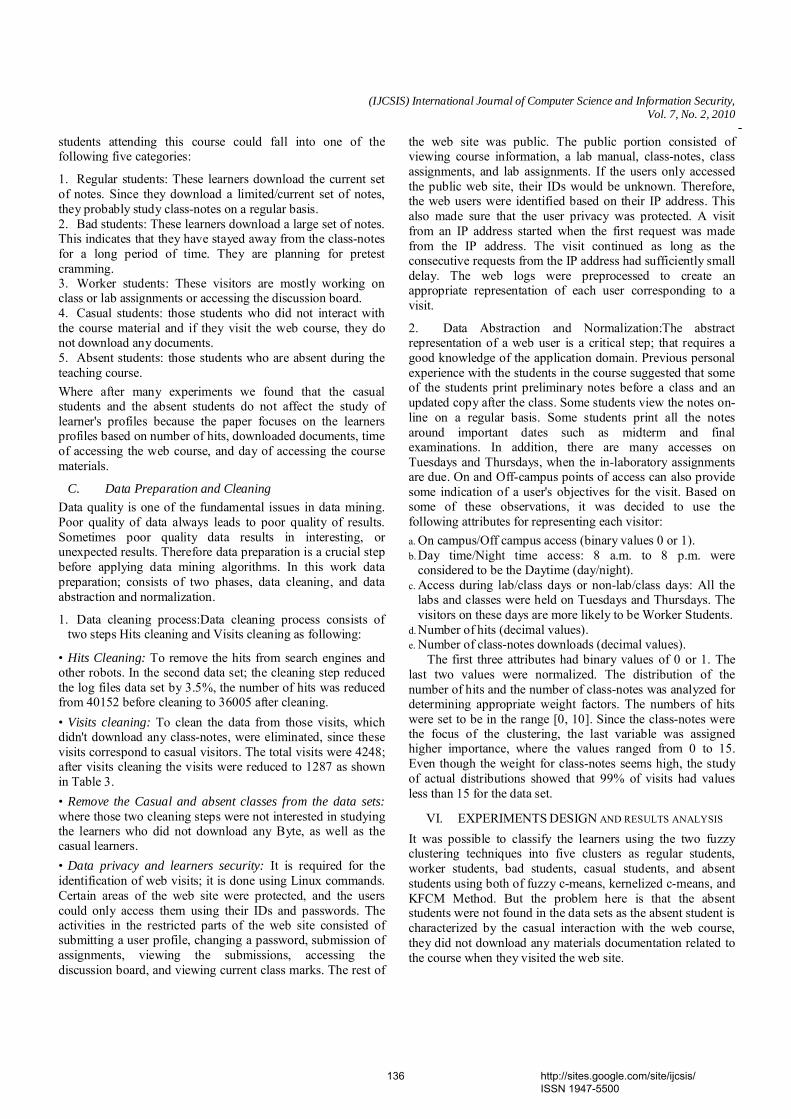
(IJCSIS) International Journal of Computer Science and Information Security, Vol. 7, No. 2, 2010
-
students attending this course could fall into one of the following five categories:
1. Regular students: These learners download the current set of notes. Since they download a limited/current set of notes, they probably study class-notes on a regular basis. 2. Bad students: These learners download a large set of notes. This indicates that they have stayed away from the class-notes for a long period of time. They are planning for pretest cramming. 3. Worker students: These visitors are mostly working on class or lab assignments or accessing the discussion board. 4. Casual students: those students who did not interact with the course material and if they visit the web course, they do not download any documents. 5. Absent students: those students who are absent during the teaching course. Where after many experiments we found that the casual students and the absent students do not affect the study of learner's profiles because the paper focuses on the learners profiles based on number of hits, downloaded documents, time of accessing the web course, and day of accessing the course materials.
C. Data Preparation and Cleaning Data quality is one of the fundamental issues in data mining. Poor quality of data always leads to poor quality of results. Sometimes poor quality data results in interesting, or unexpected results. Therefore data preparation is a crucial step before applying data mining algorithms. In this work data preparation; consists of two phases, data cleaning, and data abstraction and normalization.
1. Data cleaning process:Data cleaning process consists of two steps Hits cleaning and Visits cleaning as following:
• Hits Cleaning: To remove the hits from search engines and other robots. In the second data set; the cleaning step reduced the log files data set by 3.5%, the number of hits was reduced from 40152 before cleaning to 36005 after cleaning. • Visits cleaning: To clean the data from those visits, which didn't download any class-notes, were eliminated, since these visits correspond to casual visitors. The total visits were 4248; after visits cleaning the visits were reduced to 1287 as shown in Table 3. • Remove the Casual and absent classes from the data sets: where those two cleaning steps were not interested in studying the learners who did not download any Byte, as well as the casual learners. • Data privacy and learners security: It is required for the identification of web visits; it is done using Linux commands. Certain areas of the web site were protected, and the users could only access them using their IDs and passwords. The activities in the restricted parts of the web site consisted of submitting a user profile, changing a password, submission of assignments, viewing the submissions, accessing the discussion board, and viewing current class marks. The rest of
the web site was public. The public portion consisted of viewing course information, a lab manual, class-notes, class assignments, and lab assignments. If the users only accessed the public web site, their IDs would be unknown. Therefore, the web users were identified based on their IP address. This also made sure that the user privacy was protected. A visit from an IP address started when the first request was made from the IP address. The visit continued as long as the consecutive requests from the IP address had sufficiently small delay. The web logs were preprocessed to create an appropriate representation of each user corresponding to a visit.
2. Data Abstraction and Normalization:The abstract representation of a web user is a critical step; that requires a good knowledge of the application domain. Previous personal experience with the students in the course suggested that some of the students print preliminary notes before a class and an updated copy after the class. Some students view the notes on-line on a regular basis. Some students print all the notes around important dates such as midterm and final examinations. In addition, there are many accesses on Tuesdays and Thursdays, when the in-laboratory assignments are due. On and Off-campus points of access can also provide some indication of a user's objectives for the visit. Based on some of these observations, it was decided to use the following attributes for representing each visitor: a. On campus/Off campus access (binary values 0 or 1). b. Day time/Night time access: 8 a.m. to 8 p.m. were
considered to be the Daytime (day/night). c. Access during lab/class days or non-lab/class days: All the
labs and classes were held on Tuesdays and Thursdays. The visitors on these days are more likely to be Worker Students.
d. Number of hits (decimal values). e. Number of class-notes downloads (decimal values).
The first three attributes had binary values of 0 or 1. The last two values were normalized. The distribution of the number of hits and the number of class-notes was analyzed for determining appropriate weight factors. The numbers of hits were set to be in the range [0, 10]. Since the class-notes were the focus of the clustering, the last variable was assigned higher importance, where the values ranged from 0 to 15. Even though the weight for class-notes seems high, the study of actual distributions showed that 99% of visits had values less than 15 for the data set.
VI. EXPERIMENTS DESIGN AND RESULTS ANALYSIS It was possible to classify the learners using the two fuzzy clustering techniques into five clusters as regular students, worker students, bad students, casual students, and absent students using both of fuzzy c-means, kernelized c-means, and KFCM Method. But the problem here is that the absent students were not found in the data sets as the absent student is characterized by the casual interaction with the web course, they did not download any materials documentation related to the course when they visited the web site.
136 http://sites.google.com/site/ijcsis/ ISSN 1947-5500
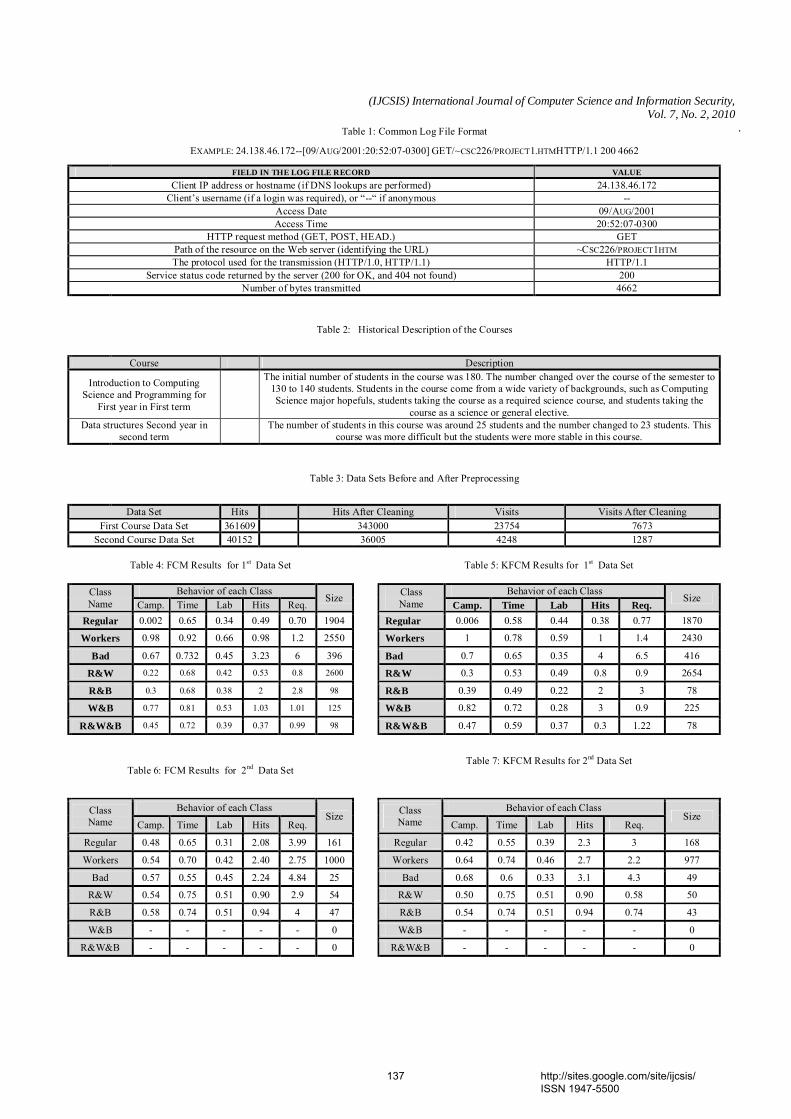
(IJCSIS) International Journal of Computer Science and Information Security, Vol. 7, No. 2, 2010
.
Table 1: Common Log File Format
EXAMPLE: 24.138.46.172--[09/AUG/2001:20:52:07-0300] GET/~CSC226/PROJECT1.HTMHTTP/1.1 200 4662
FIELD IN THE LOG FILE RECORD VALUE Client IP address or hostname (if DNS lookups are performed) 24.138.46.172
Client’s username (if a login was required), or “--“ if anonymous -- Access Date 09/AUG/2001 Access Time 20:52:07-0300
HTTP request method (GET, POST, HEAD.) GET Path of the resource on the Web server (identifying the URL) ~CSC226/PROJECT1HTM The protocol used for the transmission (HTTP/1.0, HTTP/1.1) HTTP/1.1
Service status code returned by the server (200 for OK, and 404 not found) 200 Number of bytes transmitted 4662
Table 2: Historical Description of the Courses
Course Description
Introduction to Computing Science and Programming for
First year in First term
The initial number of students in the course was 180. The number changed over the course of the semester to 130 to 140 students. Students in the course come from a wide variety of backgrounds, such as Computing Science major hopefuls, students taking the course as a required science course, and students taking the
course as a science or general elective. Data structures Second year in
second term The number of students in this course was around 25 students and the number changed to 23 students. This
course was more difficult but the students were more stable in this course.
Table 3: Data Sets Before and After Preprocessing
Data Set Hits Hits After Cleaning Visits Visits After Cleaning
First Course Data Set 361609 343000 23754 7673 Second Course Data Set 40152 36005 4248 1287
Table 4: FCM Results for 1st Data Set
Table 5: KFCM Results for 1st Data Set
Class Name
Behavior of each Class Size
Class Name
Behavior of each Class Size
Camp. Time Lab Hits Req. Camp. Time Lab Hits Req. Regular 0.002 0.65 0.34 0.49 0.70 1904 Regular 0.006 0.58 0.44 0.38 0.77 1870
Workers 0.98 0.92 0.66 0.98 1.2 2550 Workers 1 0.78 0.59 1 1.4 2430
Bad 0.67 0.732 0.45 3.23 6 396 Bad 0.7 0.65 0.35 4 6.5 416
R&W 0.22 0.68 0.42 0.53 0.8 2600 R&W 0.3 0.53 0.49 0.8 0.9 2654
R&B 0.3 0.68 0.38 2 2.8 98 R&B 0.39 0.49 0.22 2 3 78
W&B 0.77 0.81 0.53 1.03 1.01 125 W&B 0.82 0.72 0.28 3 0.9 225
R&W&B 0.45 0.72 0.39 0.37 0.99 98 R&W&B 0.47 0.59 0.37 0.3 1.22 78
Table 6: FCM Results for 2nd Data Set
Table 7: KFCM Results for 2nd Data Set
Class Name
Behavior of each Class Size
Class Name
Behavior of each Class Size
Camp. Time Lab Hits Req. Camp. Time Lab Hits Req.
Regular 0.48 0.65 0.31 2.08 3.99 161 Regular 0.42 0.55 0.39 2.3 3 168
Workers 0.54 0.70 0.42 2.40 2.75 1000 Workers 0.64 0.74 0.46 2.7 2.2 977
Bad 0.57 0.55 0.45 2.24 4.84 25 Bad 0.68 0.6 0.33 3.1 4.3 49
R&W 0.54 0.75 0.51 0.90 2.9 54 R&W 0.50 0.75 0.51 0.90 0.58 50
R&B 0.58 0.74 0.51 0.94 4 47 R&B 0.54 0.74 0.51 0.94 0.74 43
W&B - - - - - 0 W&B - - - - - 0
R&W&B - - - - - 0 R&W&B - - - - - 0
137 http://sites.google.com/site/ijcsis/ ISSN 1947-5500
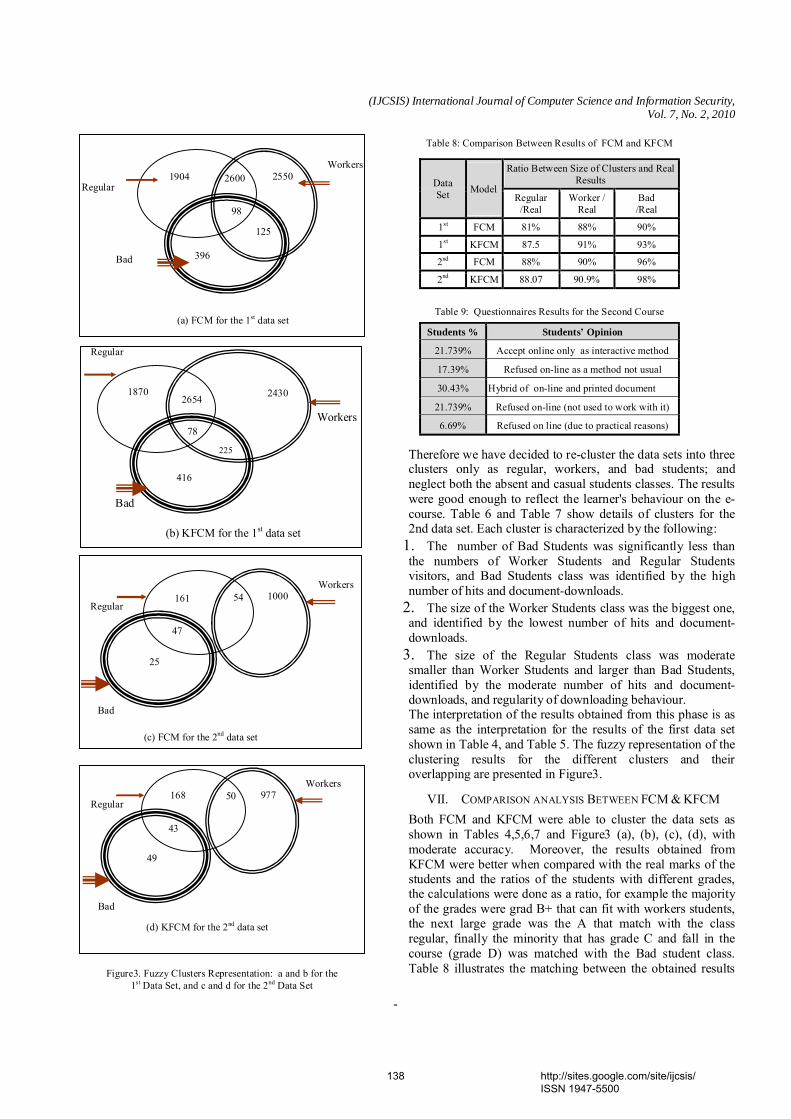
(IJCSIS) International Journal of Computer Science and Information Security, Vol. 7, No. 2, 2010
-
Therefore we have decided to re-cluster the data sets into three clusters only as regular, workers, and bad students; and neglect both the absent and casual students classes. The results were good enough to reflect the learner's behaviour on the e-course. Table 6 and Table 7 show details of clusters for the 2nd data set. Each cluster is characterized by the following:
1. The number of Bad Students was significantly less than the numbers of Worker Students and Regular Students visitors, and Bad Students class was identified by the high number of hits and document-downloads.
2. The size of the Worker Students class was the biggest one, and identified by the lowest number of hits and document-downloads.
3. The size of the Regular Students class was moderate smaller than Worker Students and larger than Bad Students, identified by the moderate number of hits and document-downloads, and regularity of downloading behaviour. The interpretation of the results obtained from this phase is as same as the interpretation for the results of the first data set shown in Table 4, and Table 5. The fuzzy representation of the clustering results for the different clusters and their overlapping are presented in Figure3.
VII. COMPARISON ANALYSIS BETWEEN FCM & KFCM Both FCM and KFCM were able to cluster the data sets as shown in Tables 4,5,6,7 and Figure3 (a), (b), (c), (d), with moderate accuracy. Moreover, the results obtained from KFCM were better when compared with the real marks of the students and the ratios of the students with different grades, the calculations were done as a ratio, for example the majority of the grades were grad B+ that can fit with workers students, the next large grade was the A that match with the class regular, finally the minority that has grade C and fall in the course (grade D) was matched with the Bad student class. Table 8 illustrates the matching between the obtained results
Table 8: Comparison Between Results of FCM and KFCM
Data Set Model
Ratio Between Size of Clusters and Real Results
Regular /Real
Worker / Real
Bad /Real
1st FCM 81% 88% 90%
1st KFCM 87.5 91% 93%
2nd FCM 88% 90% 96%
2nd KFCM 88.07 90.9% 98%
Table 9: Questionnaires Results for the Second Course
Students % Students’ Opinion
21.739% Accept online only as interactive method
17.39% Refused on-line as a method not usual
30.43% Hybrid of on-line and printed document
21.739% Refused on-line (not used to work with it)
6.69% Refused on line (due to practical reasons)
(a) FCM for the 1st data set
98
125
2600
396
1904 2550
Bad
Workers
Regular
(b) KFCM for the 1st data set
Bad
Workers
Regular
78
225
2654
416
1870 2430
47
54
25
161 1000
Bad
Workers
Regular
(c) FCM for the 2nd data set
43
50
49
168 977
Bad
Workers
Regular
(d) KFCM for the 2nd data set
Figure3. Fuzzy Clusters Representation: a and b for the 1st Data Set, and c and d for the 2nd Data Set
138 http://sites.google.com/site/ijcsis/ ISSN 1947-5500
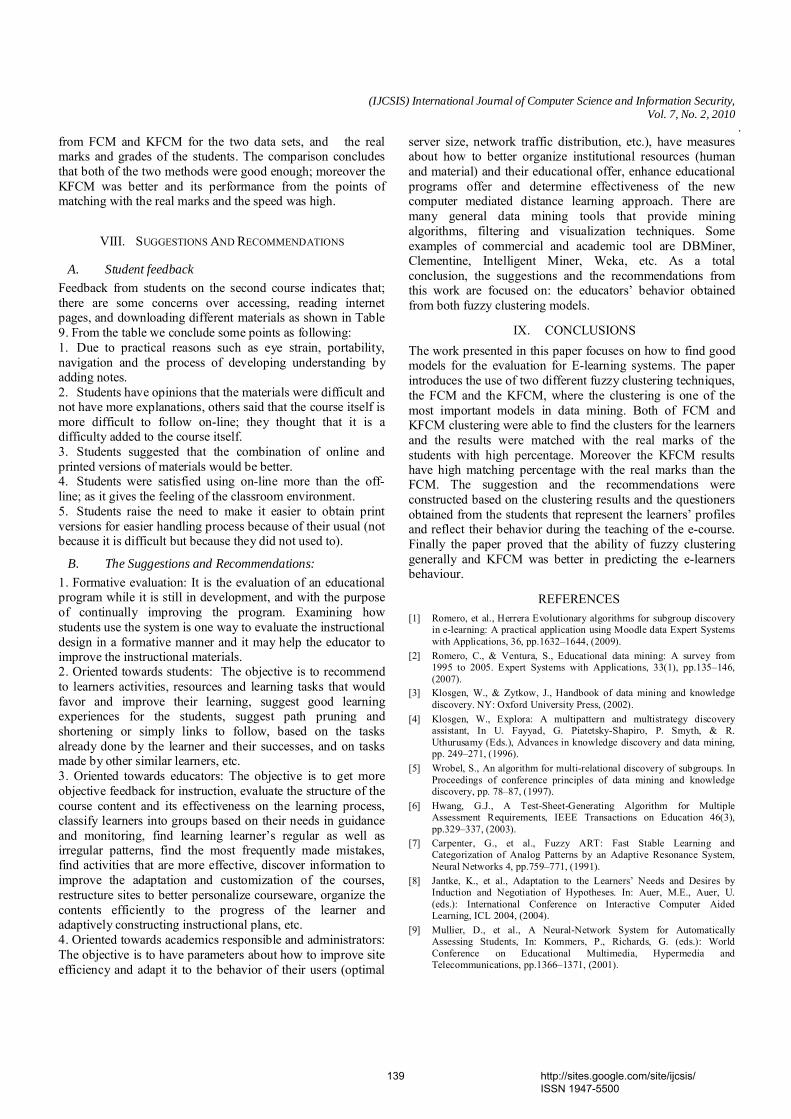
(IJCSIS) International Journal of Computer Science and Information Security, Vol. 7, No. 2, 2010
.
from FCM and KFCM for the two data sets, and the real marks and grades of the students. The comparison concludes that both of the two methods were good enough; moreover the KFCM was better and its performance from the points of matching with the real marks and the speed was high.
VIII. SUGGESTIONS AND RECOMMENDATIONS
A. Student feedback Feedback from students on the second course indicates that; there are some concerns over accessing, reading internet pages, and downloading different materials as shown in Table 9. From the table we conclude some points as following: 1. Due to practical reasons such as eye strain, portability, navigation and the process of developing understanding by adding notes. 2. Students have opinions that the materials were difficult and not have more explanations, others said that the course itself is more difficult to follow on-line; they thought that it is a difficulty added to the course itself. 3. Students suggested that the combination of online and printed versions of materials would be better. 4. Students were satisfied using on-line more than the off-line; as it gives the feeling of the classroom environment. 5. Students raise the need to make it easier to obtain print versions for easier handling process because of their usual (not because it is difficult but because they did not used to).
B. The Suggestions and Recommendations: 1. Formative evaluation: It is the evaluation of an educational program while it is still in development, and with the purpose of continually improving the program. Examining how students use the system is one way to evaluate the instructional design in a formative manner and it may help the educator to improve the instructional materials. 2. Oriented towards students: The objective is to recommend to learners activities, resources and learning tasks that would favor and improve their learning, suggest good learning experiences for the students, suggest path pruning and shortening or simply links to follow, based on the tasks already done by the learner and their successes, and on tasks made by other similar learners, etc. 3. Oriented towards educators: The objective is to get more objective feedback for instruction, evaluate the structure of the course content and its effectiveness on the learning process, classify learners into groups based on their needs in guidance and monitoring, find learning learner’s regular as well as irregular patterns, find the most frequently made mistakes, find activities that are more effective, discover information to improve the adaptation and customization of the courses, restructure sites to better personalize courseware, organize the contents efficiently to the progress of the learner and adaptively constructing instructional plans, etc. 4. Oriented towards academics responsible and administrators: The objective is to have parameters about how to improve site efficiency and adapt it to the behavior of their users (optimal
server size, network traffic distribution, etc.), have measures about how to better organize institutional resources (human and material) and their educational offer, enhance educational programs offer and determine effectiveness of the new computer mediated distance learning approach. There are many general data mining tools that provide mining algorithms, filtering and visualization techniques. Some examples of commercial and academic tool are DBMiner, Clementine, Intelligent Miner, Weka, etc. As a total conclusion, the suggestions and the recommendations from this work are focused on: the educators’ behavior obtained from both fuzzy clustering models.
IX. CONCLUSIONS The work presented in this paper focuses on how to find good models for the evaluation for E-learning systems. The paper introduces the use of two different fuzzy clustering techniques, the FCM and the KFCM, where the clustering is one of the most important models in data mining. Both of FCM and KFCM clustering were able to find the clusters for the learners and the results were matched with the real marks of the students with high percentage. Moreover the KFCM results have high matching percentage with the real marks than the FCM. The suggestion and the recommendations were constructed based on the clustering results and the questioners obtained from the students that represent the learners’ profiles and reflect their behavior during the teaching of the e-course. Finally the paper proved that the ability of fuzzy clustering generally and KFCM was better in predicting the e-learners behaviour.
REFERENCES [1] Romero, et al., Herrera Evolutionary algorithms for subgroup discovery
in e-learning: A practical application using Moodle data Expert Systems with Applications, 36, pp.1632–1644, (2009).
[2] Romero, C., & Ventura, S., Educational data mining: A survey from 1995 to 2005. Expert Systems with Applications, 33(1), pp.135–146, (2007).
[3] Klosgen, W., & Zytkow, J., Handbook of data mining and knowledge discovery. NY: Oxford University Press, (2002).
[4] Klosgen, W., Explora: A multipattern and multistrategy discovery assistant, In U. Fayyad, G. Piatetsky-Shapiro, P. Smyth, & R. Uthurusamy (Eds.), Advances in knowledge discovery and data mining, pp. 249–271, (1996).
[5] Wrobel, S., An algorithm for multi-relational discovery of subgroups. In Proceedings of conference principles of data mining and knowledge discovery, pp. 78–87, (1997).
[6] Hwang, G.J., A Test-Sheet-Generating Algorithm for Multiple Assessment Requirements, IEEE Transactions on Education 46(3), pp.329–337, (2003).
[7] Carpenter, G., et al., Fuzzy ART: Fast Stable Learning and Categorization of Analog Patterns by an Adaptive Resonance System, Neural Networks 4, pp.759–771, (1991).
[8] Jantke, K., et al., Adaptation to the Learners’ Needs and Desires by Induction and Negotiation of Hypotheses. In: Auer, M.E., Auer, U. (eds.): International Conference on Interactive Computer Aided Learning, ICL 2004, (2004).
[9] Mullier, D., et al., A Neural-Network System for Automatically Assessing Students, In: Kommers, P., Richards, G. (eds.): World Conference on Educational Multimedia, Hypermedia and Telecommunications, pp.1366–1371, (2001).
139 http://sites.google.com/site/ijcsis/ ISSN 1947-5500
(IJCSIS) International Journal of Computer Science and Information Security, Vol. 7, No. 2, 2010
.
[10] Kohonen, T., Self-Organizing Maps. 3rd edition, Springer, Berlin Heidelberg New York, (2000).
[11] Tang, C., et al., Personalized Courseware Construction Based on Web Data Mining. In: The First international Conference on Web information Systems Engineering, WISE’00. IEEE Computer Society. June 19–20, Washington, USA,pp.204–211, (2000).
[12] Tang, T.Y.&McCalla, G., Smart Recommendation for an Evolving e-Learning System: Architecture and Experiment. International Journal on e-Learning 4(1), pp.105–129, (2005).
[13] Talavera, L.&Gaudioso, E., Mining Student Data to Characterize Similar Behavior Groups in Unstructured Collaboration Spaces. In: Workshop in Artificial Intelligence in Computer Supported Collaborative Learning in conjunction with 16th European Conference on Artificial Intelligence, ECAI’2003. Valencia, Spain, pp.17–22, (2004).
[14] Castro, F., et al., Finding Relevant Features to Characterize Student Behavior on an e-Learning System. In: Hamid, R.A. (ed.): Proceedings of the International Conference on Frontiers in Education: Computer Science and Computer Engineering, FECS’05. Las Vegas, USA, pp.210–216, (2005).
[15] Hammouda, K. & Kamel, M., Data Mining in e-Learning. In: Pierre, S. (ed.): e-Learning Networked Environments and Architectures: A Knowledge Processing Perspective, Springer, Berlin Heidelberg New York, (2005).
[16] Tane, J., et al., Semantic Resource Management for the Web: An e-Learning Application, In: Fieldman, S., Uretsky, M. (eds.): The 13th World Wide Web Conference 2004, WWW2004. ACM, New York, pp. 1–10, (2004).
[17] Castro, F., et al., Detecting Atypical Student Behaviour on an e-Learning System, In: VI Congreso Nacional de Informática Educativa, Simposio Nacional de Tecnologías de la Información y las Comunicaciones en la Educación, SINTICE’2005. September 14–16, Granada, Spain, pp.153–160, (2005).
[18] Drigas, A.&Vrettaros, J., An Intelligent Tool for Building e-Learning Contend-Material Using Natural Language in Digital Libraries, WSEAS Transactions on Information Science and Applications 5(1), pp.1197–1205, (2004).
[19] Trella, M., et al., An Open Service-Based Learning Platform for Developing Intelligent Educational Systems for the Web, In: The 12th International Conference on Artificial Intelligence in Education. July 18–22, Amsterdam, pp. 27–34, (2005).
[20] Romero, C.,et al., Discovering Prediction Rules in AHA! Courses. In: User Modelling Conference. June 2003, Johnstown, Pennsylvania, pp. 35–44, (2003).
[21] Romero, C., et al., Knowledge Discovery with Genetic Programming for Providing Feedback to Courseware. User Modeling and User-Adapted Interaction 14(5), pp. 425–464, (2004).
[22] Muehlenbrock, M., Automatic Action Analysis in an Interactive Learning Environment. In: The 12th International Conference on Artificial Intelligence in Education, AIED 2005. July 18, Amsterdam, The Netherlands, pp. 73–80, (2005).
[23] Beck, J., Woolf, B., High-Level Student Modeling with Machine Learning. In: Gauthier, G., et al. (eds.): Intelligent Tutoring Systems, ITS 2000. Lecture Notes in Computer Science, Vol. 1839. Springer, Berlin Heidelberg New York, pp. 584–593, (2000).
[24] Feng, M., et al., Looking for Sources of Error in Predicting Student’s Knowledge, In: The Twentieth National Conference on Artificial Intelligence by the American Association for Artificial Intelligence, AAAI’05, Workshop on Educational Data Mining, pp. 54–61, (2005).
[25] Kotsiantis, S., et al., Predicting Students’ Performance in Distance Learning Using Machine Learning Techniques. Applied Artificial Intelligence 18(5), pp. 411–426, (2004).
[26] Hwang, G., A Group-Decision Approach for Evaluating Educational Web Sites, Computers & Education, pp. 42 65–86, (2004).
[27] Hwang, G. et al., Development of an Intelligent Management System for Monitoring Educational Web Servers. In: The 10th Pacific Asia Conference on Information Systems, PACIS 2004, pp.2334–2340, (2004).
[28] Stathacopoulou, G., Grigoriadou, M.: Neural Network-Based Fuzzy Modeling of the Student in Intelligent Tutoring Systems, In: International Joint Conference on Neural Networks. Washington, pp.3517–3521, (1999).
[29] Lingras, P., Hogo, M., Snorek, M., 2004. Interval Set Clustering of Web Users using Modified Kohonen Self-Organizing Maps based on the Properties of Rough Sets, Web Intelligence and Agent Systems: An International Journal, Vol. 2, No. 3, pp. 217-230
[30] Mofreh Hogo, Miroslav Snorek. “Temporal web usage mining using the modified Kohonen SOM”, international journal of NNW (neural network world) volume 13 number 4, 2003 ISSN 1210-0552.
[31] Bezdek J., Pattern Recognition with Fuzzy Objective Function, Plenum, New York, (1981).
[32] Bezdek J. Some, non-standard clustering algorithms, In: Legendre, P. & Legendre, L. Developments in Numerical Ecology. NATO ASI Series, Vol. G14. Springer-Verlag, (1987).
[33] Muller KR., Mika S., et al., An introduction to kernel-based learning algorithms, IEEE Trans Neural Networks, 12(2), pp.181—202, (2001).
[34] Carl G. A., fuzzy clustering and fuzzy merging algorithm, Technical Report, CS-UNR-101, (1999).
[35] Hwang, G., A Knowledge-Based System as an Intelligent Learning Advisor on Computer Networks, J. Systems, Man, and Cybernetics 2, pp. 153–158, (1999).
Mofreh A. Hogo is a lecturer at Benha University, Egypt. He is a lecturer of Computer Science and Engineering. Dr. Hogo holds a PhD in Informatics Technology from Czech Technical University in Prague, Computer Science and Engineering Dept. 2004. He is the author of over 40 papers that have been published in refereed international Journals (Information Sciences, Elsiver, UBICC, IJICIS, IJCSIS, IJPRAI, ESWA, IJEL, Web Intelligence and Agent Systems, Intelligent Systems,
international journal of NNW, IJAIT Journal of Artificial Intelligence Tools, IJCI) and Book chapters (Neural Networks Applications in Information Technology and Web Engineering Book, Encyclopedia of Data Warehousing and Mining, and Lecture Notes in Artificial Intelligence Series), and international conferences (Systemics, Cybernetics and Informatics Information Systems Management, IEEE/WIC, IEEE/WIC/ACM, ICEIS). His areas of interest include Digital Image Processing, Multimedia Networks, Intrusion detection, Data Mining, Data Clustering and classification, pattern Recognition, character recognition, fuzzy clustering, artificial Neural Networks, Expert systems, Software Engineering.
140 http://sites.google.com/site/ijcsis/ ISSN 1947-5500
Hierarchical Approach for Online Mining –Emphasis towards Software Metrics
M .V.VIJAYA SARADHI B.R.SASTRY P.SATISH
Dept. of Comp. Sc & Eng. Director Dept. of CSE
ASTRA ASTRA VIE
Hyderabad, India. Hyderabad, India Hyderabad, India
Abstract ----Several multi-pass algorithms have been proposed for Association Rule Mining from static repositories. However, such algorithms are incapable of online processing of transaction streams. In this paper we introduce an efficient single-pass algorithm for mining association rules, given a hierarchical classification amongest items. Processing efficiency is achieved by utilizing two optimizations, hierarchy aware counting and transaction reduction, which become possible in the context of hierarchical classification. This paper considers the problem of integrating constraints that are Boolean expression over the presence or absence of items into the association discovery algorithm. This paper present three integrated algorithms for mining association rules with item constraints and discuss their tradeoffs. It is concluded that the variation of complexity depends on the measure of DIT (Depth of Inheritance Tree) and NOC (Number of Children) in the context of Hierarchical Classification. Keywords: Frequent item sets; Association Rules; Time stamps; DIT; NOC; Software Metrics; Complexity; Measurement
I. INTRODUCTION The aim of Association Rule Mining is to find latent associations among data entities in database repositories, a typical example of which is the transaction database maintained by a supermarket. An association rule is an implication of the form A=> B, which conveys that customers buying set of items A would also with a high probability buy set of items B. The concept of association rule mining was first introduced in [4]. Typically the problem is decomposed into two phases. Phase I of the problem involves in finding the frequent item sets in the
database, based on a pre- defined frequency threshold minsupport. Phase II of the problem involves generating the association rules from the frequent item sets found in Phase I. Typically, the reported approaches in Phase I re- quire multiple passes over the transaction database to determine the frequent item sets of deferent lengths [1, 2, 3]. All these approaches assume that a static database is available, so that multiple scans can be made over it. With online systems, it is desirable to make decisions on the fly, processing data-streams in- stead of stored databases. In this paper, we aim at a online algorithm, capable of processing online streams of transactions. Assume that the algorithm has computed its result up to and including the first n transactions. A true online algorithm should be capable of updating the result for the (n + 1). The transaction, without requiring a re-scan over the past n transactions. In this way such an algorithm can handle transaction streams. In fact it is true that items in an online shopping mart or a supermarket are categorized into sub-classes, which in turn make up classes at a higher level, and so on. Besides the usual rules that involve individual items, learning association rules at a particular sub- class or class level is also of much potential use and significance, e.g. an item-specific rule such as Customers buying Brand A sports shoes tend to buy Brand B tee- shirts" may be of less practical use than a more general rule such as Customers buying sports shoes tend to buy tee-shirts". With this aim, we can be made of commonly employed hierarchical classification of items to devise a simple and efficient rule mining algorithm. [2] Proposes a single-pass algorithm for hierarchical online association rule mining. In this paper, we refer to this algorithm as HORM. The present work carries forward the idea of [1], and proposes an efficient algorithm for Phase I. The present work also looks at Phase II, i.e. the
(IJCSIS) International Journal of Computer Science and Information Security, Vol. 7, No. 2, February 2010
141 http://sites.google.com/site/ijcsis/ ISSN 1947-5500

generation of association rules. [9] Proposes an algorithm to generate non-redundant rules. We present a modified algorithm for Phase II that better suits the need to mine hierarchical association rules. For example, they may only want rules that contain a specific item or rules that contain children of a specific item in a hierarchy. While such constraints can be applied as a post processing step, integrating them into the mining algorithm can dramatically reduce the execution time. In practice, users are often interested only in a sub set of associations, for instance, those containing at least one item from a user-defined subset of items. When taxonomies are present, this set of items may be specified using the taxonomy, e.g. all descendants of a given item. While the output of current algorithms can be filtered out in a post-processing step, it is much more efficient to incorporate such constraints into the association’s discovery algorithm. Design choices on the hierarchy employed to represent the application are essentially choices about restricting or expanding the scope of properties of the classes of objects in the application. Two design decisions which relate to the inheritance hierarchy can be defined [11]. They are depth of inheritance (DIT) of a class and the number of children of the class (NOC).Depth of Inheritance of the class is the DIT metric for the class. The DIT (Depth of Inheritance Tree) will be the maximum length from the node to the root of the tree. The deeper a class is in the hierarchy, the greater the number of methods it is likely to inherit, making it more complex to predict its behavior. The Deeper trees constitute greater design complexity. The deeper a particular class is in the hierarchy, the greater the potential reuse of inherited methods. The inheritance hierarchy is a directed acyclic graph, which can be described as a tree structure with classes as nodes, leaves and a root. The NOC (Number of Children) is the number of immediate subclasses subordinated to a class in the class hierarchy. It is a measure of how many subclasses are going to inherit the methods of the parent class. The number of children gives an idea of the potential influence a class has on the design. If a class has a large number of children, it may require more testing of the methods in that class. The Greater the number of children (NOC), greater the likelihood of improper abstraction of the parent class. If a class has a large number of children; it may be a case of misuse of sub classing. In this paper, we consider constraints that are boolean expressions over the presence or absence of items in the rules. When taxonomies are present, we allow the elements of the boolean expression to be of the form ancestors (item) or descendants (item) rather than just a single item.
Clothes Footwear Outer wear Shirts Shoes Hiking Boots Jackets Ski Phants Figure 1. Example for taxonomy For example,(Jacket A Shoes) V (descendants (Clothes) A7 ancestors (Hiking Boots)) expresses the constraint that we want any rules that either (a) contain both Jackets and Shoes, or (b) contain Clothes or any descendants of clothes and do not contain Hiking Boots or Footwear.
II. THEORY A. Basic Concepts and Problem Formulation Hierarchical classification of data means that the items which make up a transaction are categorized into Classes, sub-classes, and so on. While doing Hierarchical Classification of data, some measures to be consider. Design of a class involves decisions on the scope of the methods declared within the class. We have to consider four major features in the Hierarchical classification of data in terms of Classification tree 1.Identification of classes.2.Identify the semantics of classes.3.Identify relations between classes.4.Implementation of classes. Using several metrics can help designers, who may be unable to review design complexity for the entire application [11]. The Depth of inheritance Tree (DIT) and Number of children (NOC) metrics check whether the application is getting too heavy (i.e .too many classes at the root level declaring many methods).Classes with high values of DIT tend to complex classes. Evidently it is possible to mine for two types of rules: an item-specific rule such as Customers buying soap of brand A tend to buy canned soup of brand B", or a more general Rule such as Customers buying soaps tend buy canned soup". The latter is an association on classes or sub-classes, rather than on individual items. Let I be the set of all items stored in, say, a typical supermarket.
(IJCSIS) International Journal of Computer Science and Information Security, Vol. 7, No. 2, February 2010
142 http://sites.google.com/site/ijcsis/ ISSN 1947-5500
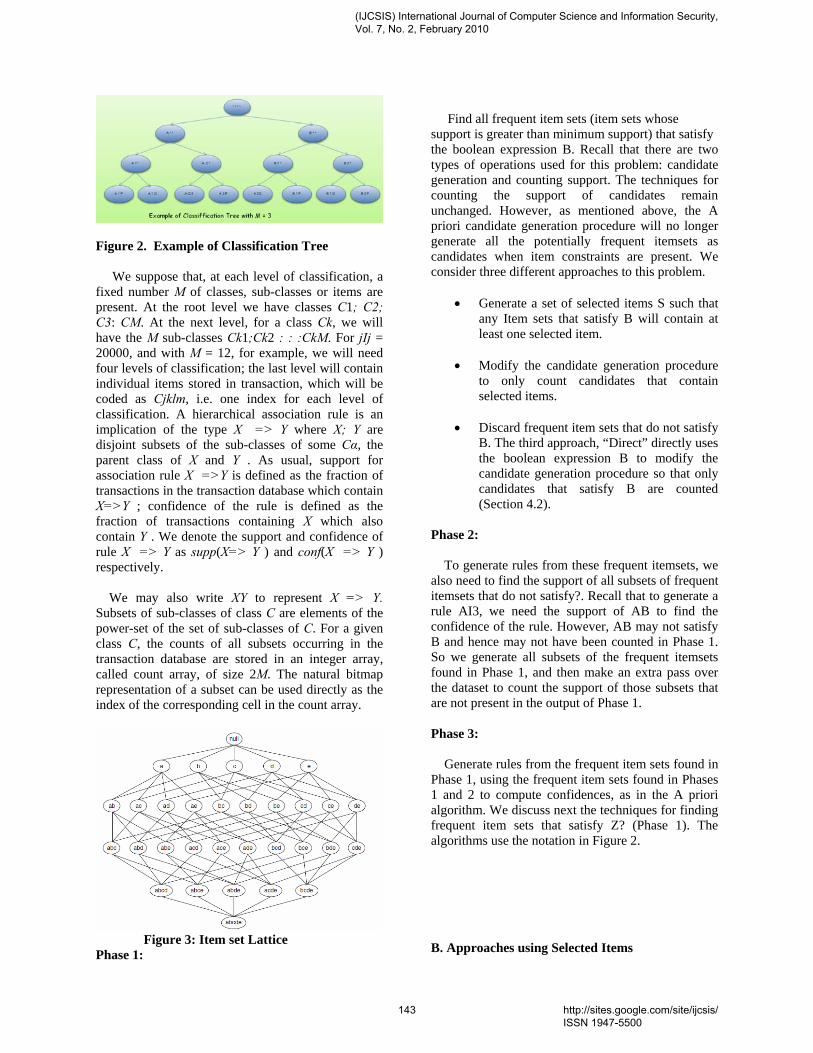
Figure 2. Example of Classification Tree We suppose that, at each level of classification, a fixed number M of classes, sub-classes or items are present. At the root level we have classes C1; C2; C3: CM. At the next level, for a class Ck, we will have the M sub-classes Ck1;Ck2 : : :CkM. For jIj = 20000, and with M = 12, for example, we will need four levels of classification; the last level will contain individual items stored in transaction, which will be coded as Cjklm, i.e. one index for each level of classification. A hierarchical association rule is an implication of the type X => Y where X; Y are disjoint subsets of the sub-classes of some Cα, the parent class of X and Y . As usual, support for association rule X =>Y is defined as the fraction of transactions in the transaction database which contain X=>Y ; confidence of the rule is defined as the fraction of transactions containing X which also contain Y . We denote the support and confidence of rule X => Y as supp(X=> Y ) and conf(X => Y ) respectively. We may also write XY to represent X => Y. Subsets of sub-classes of class C are elements of the power-set of the set of sub-classes of C. For a given class C, the counts of all subsets occurring in the transaction database are stored in an integer array, called count array, of size 2M. The natural bitmap representation of a subset can be used directly as the index of the corresponding cell in the count array.
Figure 3: Item set Lattice Phase 1:
Find all frequent item sets (item sets whose support is greater than minimum support) that satisfy the boolean expression B. Recall that there are two types of operations used for this problem: candidate generation and counting support. The techniques for counting the support of candidates remain unchanged. However, as mentioned above, the A priori candidate generation procedure will no longer generate all the potentially frequent itemsets as candidates when item constraints are present. We consider three different approaches to this problem.
• Generate a set of selected items S such that any Item sets that satisfy B will contain at least one selected item.
• Modify the candidate generation procedure
to only count candidates that contain selected items.
• Discard frequent item sets that do not satisfy
B. The third approach, “Direct” directly uses the boolean expression B to modify the candidate generation procedure so that only candidates that satisfy B are counted (Section 4.2).
Phase 2: To generate rules from these frequent itemsets, we also need to find the support of all subsets of frequent itemsets that do not satisfy?. Recall that to generate a rule AI3, we need the support of AB to find the confidence of the rule. However, AB may not satisfy B and hence may not have been counted in Phase 1. So we generate all subsets of the frequent itemsets found in Phase 1, and then make an extra pass over the dataset to count the support of those subsets that are not present in the output of Phase 1. Phase 3: Generate rules from the frequent item sets found in Phase 1, using the frequent item sets found in Phases 1 and 2 to compute confidences, as in the A priori algorithm. We discuss next the techniques for finding frequent item sets that satisfy Z? (Phase 1). The algorithms use the notation in Figure 2. B. Approaches using Selected Items
(IJCSIS) International Journal of Computer Science and Information Security, Vol. 7, No. 2, February 2010
143 http://sites.google.com/site/ijcsis/ ISSN 1947-5500
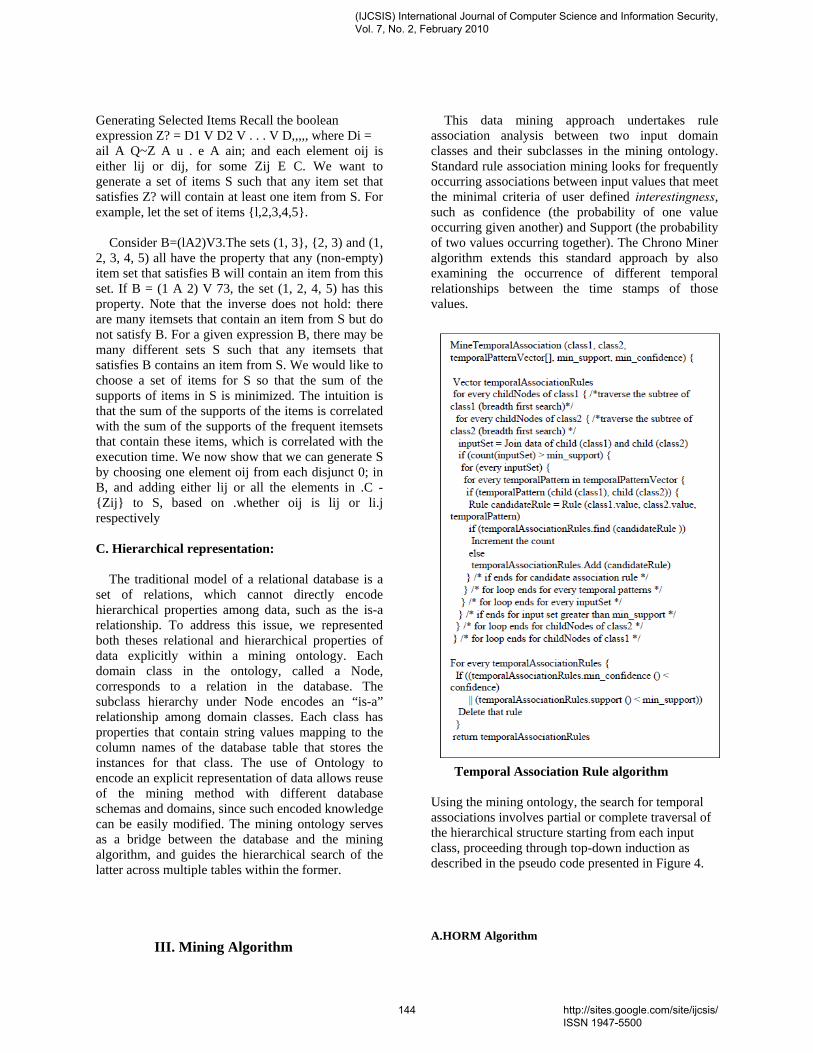
Generating Selected Items Recall the boolean expression Z? = D1 V D2 V . . . V D,,,,, where Di = ail A Q~Z A u . e A ain; and each element oij is either lij or dij, for some Zij E C. We want to generate a set of items S such that any item set that satisfies Z? will contain at least one item from S. For example, let the set of items {l,2,3,4,5}. Consider B=(lA2)V3.The sets (1, 3}, {2, 3) and (1, 2, 3, 4, 5) all have the property that any (non-empty) item set that satisfies B will contain an item from this set. If B = (1 A 2) V 73, the set (1, 2, 4, 5) has this property. Note that the inverse does not hold: there are many itemsets that contain an item from S but do not satisfy B. For a given expression B, there may be many different sets S such that any itemsets that satisfies B contains an item from S. We would like to choose a set of items for S so that the sum of the supports of items in S is minimized. The intuition is that the sum of the supports of the items is correlated with the sum of the supports of the frequent itemsets that contain these items, which is correlated with the execution time. We now show that we can generate S by choosing one element oij from each disjunct 0; in B, and adding either lij or all the elements in .C - {Zij} to S, based on .whether oij is lij or li.j respectively C. Hierarchical representation: The traditional model of a relational database is a set of relations, which cannot directly encode hierarchical properties among data, such as the is-a relationship. To address this issue, we represented both theses relational and hierarchical properties of data explicitly within a mining ontology. Each domain class in the ontology, called a Node, corresponds to a relation in the database. The subclass hierarchy under Node encodes an “is-a” relationship among domain classes. Each class has properties that contain string values mapping to the column names of the database table that stores the instances for that class. The use of Ontology to encode an explicit representation of data allows reuse of the mining method with different database schemas and domains, since such encoded knowledge can be easily modified. The mining ontology serves as a bridge between the database and the mining algorithm, and guides the hierarchical search of the latter across multiple tables within the former. III. Mining Algorithm
This data mining approach undertakes rule association analysis between two input domain classes and their subclasses in the mining ontology. Standard rule association mining looks for frequently occurring associations between input values that meet the minimal criteria of user defined interestingness, such as confidence (the probability of one value occurring given another) and Support (the probability of two values occurring together). The Chrono Miner algorithm extends this standard approach by also examining the occurrence of different temporal relationships between the time stamps of those values.
Temporal Association Rule algorithm Using the mining ontology, the search for temporal associations involves partial or complete traversal of the hierarchical structure starting from each input class, proceeding through top-down induction as described in the pseudo code presented in Figure 4. A.HORM Algorithm
(IJCSIS) International Journal of Computer Science and Information Security, Vol. 7, No. 2, February 2010
144 http://sites.google.com/site/ijcsis/ ISSN 1947-5500
From the classes and sub-classes which make up the classification tree, the user selects a set of classes of interest [4], to be denoted here as SIC. Association rules to be mined are of the type X => Y where X and Y are disjoint subsets of a class or sub-class of interest. The problem of hierarchical association rule mining is now defined as: Find all association rules of the type X => Y, within each class of interest in SIC, which have a specified minimum support and confidence in the transaction database or stream. To find associations within a class or sub-class of interest, we need to maintain counts for all its subsets. For the class A***, with M = 4, for example, we need to count the occurrences in the transaction database of all the subsets of {A1***A2*** A3***A4***}. Clearly there are 2M ¡ 1 non-empty subset combinations for a sub-class with M elements. Therefore a count array of size 2M ¡1 needs to be maintained for each class or sub-class of interest. HORM algorithm takes as input the i.e. support values, in the transaction database of all the subsets of the classes or sub-classes of interest. The time complexity of this algorithm is O(jDjK2M) [6]. The memory requirement of HORM is K2M, since each element of SIC requires an array of size 2M. IV. Enhancements Proposed A. Hierarchy-Aware Counting In HORM, each transaction is checked against all the classes or sub-classes in SIC. But suppose we have two classes or sub-classes in SIC of which one is itself a sub-class of the other. In HORM, the per-transaction code is executed once for each of these elements of SIC, without taking into account this hierarchical relationship between the two. But clearly if the first iteration suggests that the current transaction does not support, say PQ**, we do not need to iterate for any of its sub-class such as PQR*. We apply this intuition to speed up the algorithm: If a transaction does not support a class or sub-class, it does not support any of its sub-classes either. We call this first enhancement hierarchy-aware counting. B. Transaction Reduction This second enhancement reduces the computation within the inner loop. For every class or sub-class in SIC, HORM processes the current transaction in its entirety. However, suppose we have two classes or sub-classes in SIC which do not share an ancestor- descendant relationship. Once we have matched the entire transaction against the first class or sub-class clearly it is not necessary to again match the entire transaction against the second one as well. Suppose A*** and B*** are two classes of interest, and let the
current transaction T be {A1Q6;A2P6;B2Q6;B1Q7;A2P7;B2P7}. While T is being checked against A***, the algorithm in fact traverses through the items of T and finds the sub- transaction T=A*** = {A1Q6;A2P6;A2P7}, which may be called the projection of class A*** on T. Clearly T=A*** does not contain any items that belong to B***, because the sub-classes of A*** and B*** are disjoint. Thus we can remove T=A*** from T and pass the remaining items T1 = T ¡ T=A*** to match against B***. Thus the part of a transaction that is a projection of a class can be removed to obtain a reduced transaction to match against disjoint classes. We call this second enhancement transaction reduction. C. Non-Redundant Rule Generation The version implemented in the present work is based on the basic concepts proposed in [5]. The hierarchical rule mining technique described here does not require a separate adjacency lattice of the classes or subclasses of interest. The count arrays described above can themselves be viewed as adjacency lattices used in [5], leading to very clean design and implementation. CONCLUSIONS This proposed algorithm, Modified Hierarchical online rule mining, or MHORM, which optimizes the time requirements of the earlier reported algorithm HORM [8]. We considered the problem of discovering association rules in the presence of constraints that are Boolean expressions over the presence of absence of items. Such constraints allow users to specify that they are interested in we presented three such integrated algorithm, and discussed the tradeoffs between them. Empirical evaluation of the Multiple Joins algorithm on three real-life datasets showed that integrating item constraints can speed up the algorithm by a factor of 5 to 20 for item constraints with selectivity between 0.1 and 0.01.For candidates that were not frequent in the sample but were frequent in the datasets, only those extensions of such candidates that satisfied those constraints would be counted in the additional pass. It is concluded that while constructing Classification Tree, the measure of Depth of Inheritance Tree (DIT) with respect to Number of children (NOC) place a dominant role, which is evidence from the fact that the complexity depends on the depth of inheritance Tree (DIT) with respect to
(IJCSIS) International Journal of Computer Science and Information Security, Vol. 7, No. 2, February 2010
145 http://sites.google.com/site/ijcsis/ ISSN 1947-5500
Number of children (NOC). Both DIT and NOC directly relate to the layout of the class hierarchy. In an Classification Tree, Classes with high DIT values are associated with a higher number of defects. REFERENCES [1] R. Agrawal, T. Imielinski and A. Swami, Mining Association Rules between Sets of Items in Large Databases, Proceedings of the ACM SIGMOD Conference, 1993. [2] G. Mao, X. Wu, X. Zhu, G. Chen, and C. Liu. Mining maximal frequent itemsets from data streams. Information Science, pages 251-262, 2007. [3] B. Mozafari, H. Thakkar, and C. Zaniolo. Verifying and mining frequent patterns from large windows over data streams. ICDE, pages 179-188 2008M. Ester, H.-P. Kriegel, J. Sander, M. Wimmer, and X. Xu. Incremental clustering for mining in a data warehousing environment. In VLDB, pages 323-333, 1998. [4] F. Guillet and H. J. Hamilton, editors. Quality Measures in Data Mining. Studies in Computational Intelligence. Springer, 2007. [5] J. Han, J. Pei, and Y. Yin. Mining frequent patterns without candidate generation. In SIGMOD, pages 1-12, 2000. [6] N. Jiang and D. L. Gruenwald. Cfi-stream: mining closed frequent itemsets in data streams. In SIGKDD, pages 592-597, 2006. [7] N. Jiang and L. Gruenwald. Research issues in data stream association rule mining. SIGMOD Record, pages 14-19, 2006. [8] K. B. Kumar and N. Jotwani. Efficient algorithm for hierarchical online mining of association rules. COMAD, 2006. [9] R. Agrawal and R. Srikanth, Fast Algorithms for Mining Association Rules, Proceedings of the 20th VLDB Conference, 1994. [10] S. Brin, R. Motwani, J. D. Ullman and S. Tsur, Dynamic Itemset Counting and Implication Rules for Market Basket Data, Proceedings of the ACM SIGMOD International Conference on Management of Data, 1997. [11] Chidamber S.R. and Kemerer C.F. “A Metric Suit for Object Oriented Design”,IEEE Trans.Software.Eng, Vol.20, pp.476-493 (1994).
AUTHORS PROFILE
M.V.Vijaya Saradhi is Currently Associated Professor in the Department of Computer Science and Engineering (CSE) at Aurora's Scientific, Technological and Research Academy, (ASTRA), Bandlaguda, Hyderabad, India, where he teaches Several Courses in the area of Computer Science. He is Currently Pursuing the PhD degree in Computer Science at Osmania University, Faculty of Engineering, Hyderabad, India. His main research interests are Software Metrics, Distributed Systems, Object-Oriented Modeling (UML), Object-Oriented Software Engineering, Data Mining, Design Patterns, Object- Oriented Design Measurements and Empirical Software Engineering. He is a life member of various professional bodies like MIETE, MCSI, MIE, MISTE. E-mail: [email protected]
Dr. B. R. Sastry is currently working as Director, Astra, Hyderabad, India. He earlier worked for 12 years in Industry that developed indigenous computer systems in India. His areas of research includes Computer Architecture, Network Security, Software Engineering, Data Mining and Natural Language Processing, He is currently concentrating on improving academic standards and imparting quality engineering
P. Satish is Currently Asst Professor in Department of computer Science & Engineering at Vivekananda Institute of Engineering (VIE), Hyderabad, India.
(IJCSIS) International Journal of Computer Science and Information Security, Vol. 7, No. 2, February 2010
146 http://sites.google.com/site/ijcsis/ ISSN 1947-5500
QoS Based Dynamic Web Services Composition &
Execution
Farhan Hassan Khan, M.Younus Javed, Saba Bashir
National University of Science & Technology
Rawalpindi, Pakistan
,
Aihab Khan, Malik Sikandar Hayat Khiyal Fatima Jinnah Women University
Rawalpindi, Pakistan
Abstract---The use of web services has dominated software
industry. Existing technologies of web services are
extended to give value added customized services to
customers through composition. Automated web service
composition is a very challenging task. This paper
proposed the solution of existing problems and proposed a
technique by combination of interface based and
functionality based rules. The proposed framework also
solves the issues related to unavailability of updated
information and inaccessibility of web services from
repository/databases due to any fault/failure. It provides
updated information problem by adding aging factor in
repository/WSDB (Web Services Database) and
inaccessibility is solved by replication of WSDB. We
discussed data distribution techniques and proposed our
framework by using one of these strategies by considering
quality of service issues. Finally, our algorithm eliminates
the dynamic service composition and execution issues,
supports web service composition considering QoS
(Quality of Service), efficient data retrieval and updation,
fast service distribution and fault tolerance.
Keywords---composition of services; dynamic
composition; UDDI registry; web services.
I. INTRODUCTION
Web services are software applications that are available on
the web and used for machine to machine interaction by using
URI (Uniform Resource Identifier) on the distributed
environment of internet. SOAP (Simple Object Access
Protocol) messages are used for communication mechanism
by using HTTP (Hyper Text Transfer Protocol) protocol. Each
web service has an API (Application Program Interface) that
can be accessed over the network and executes the web service
at host location [1]. Every service provides a role, such as
service provider, a requester or a broker. In other words, web
services make possible the effective processing of machine
readable information.
For business to business and enterprise level application
integration, composition of web services plays an important
role. Sometimes a single web service does not fulfill the user’s
desired requirements and different web services are combined
through composition method in order to achieve a specific
goal [2]. Service compositions reduce the development time
and create new applications. Web services can be categorized
in two ways on the basis of their functionality.1) Semantic
annotation describes the functionality of web service and 2)
functional annotation describes how it performs its
functionality. WSDL (Web Services Description Language) is
used for specification of messages that are used for
communication between service providers and requesters [3].
There are two methods for web services composition
[4,5,6]. One is static web service composition and other is
automated/dynamic web service composition. In static web
service composition, composition is performed manually, that
is each web service is executed one by one in order to achieve
the desired goal/requirement. It is a time consuming task
which requires a lot of effort. In automated web service
composition, agents are used to select a web service that may
be composed of multiple web services but from user’s
viewpoint, it is considered as a single service [7].
The main interest of web service compositions is to give
value-added services to existing web services and introduce
automated web services. Also they provide flexibility and
agility. There are few problems in dynamic web service
composition as discussed in [8].
• First, the number of web services is increasing with time
and it is difficult to search the whole repository for
desired service in order to use it for the fulfillment of
specific goal.
• Second, web services are dynamically created and
updated so the decision should be taken at execution time
and based on recent information.
• Third, different web service providers use different
conceptual models and there is a need of one structure so
that web services easily access each other without any
technical effort.
• Forth, only authorized persons can access few of these
web services.
The two approaches in web services composition are
centralized dataflow and decentralized dataflow. In case of
dynamic web services composition, both have advantages and
some limitations. The limitation of centralized dataflow is that
(IJCSIS) International Journal of Computer Science and Information Security, Vol. 7, No. 2, February 2010
147 http://sites.google.com/site/ijcsis/ ISSN 1947-5500
all component services must pass through a composite service.
This results the bottleneck problem which causes the increase
in throughput and response time. The disadvantage of
decentralized dataflow is that as each web service directly
shares data with web servers resulting in increasing the load at
each node and delay in response time and throughput. The
decentralized dataflow is very efficient in case of dynamic
web services composition as it reduce the tight coupling
between clients and servers by adding a middleware (UDDI
(Universal Discovery, Description and Integration), WS (Web
Service) coordination or WS transaction etc) [9]. In the
proposed model we have used decentralized dataflow model
which results in high throughput, minimum response time and
latency.
Mostly automated composition techniques are interface
based and functionality based. In interface based composition,
on the bases of inputs and outputs through interfaces users get
composite services and after composition desired results are
achieved. The drawback of this approach is that functionality
is not guaranteed, whereas in functionality based composition,
with inputs and outputs user provides the formula that explains
logic into interface information.
A. Contribution
The major contribution of this paper is that it presents a
method for automated and dynamic web service composition
by combination of interface based and functionality based
approaches. It focuses on the data distribution issues, QoS
issues and defines how execution problems can be avoided.
This research also resolves the problems of decentralized
dataflow and provides a framework that has minimum latency,
maximum throughput and response time. This paper proposed
a solution for researchers who are facing the problems of web
service composition due to constant changes in input/output
parameters, networking issues and independent nature of
different web services.
Section 2 presents the introduction of existing dynamic web
services composition techniques and highlights the advantages
and disadvantages of these techniques. Section 3 presents a
detailed overview of web services composition and dynamic
web services composition. Section 4 describes the proposed
framework and its working. Section 5 is concerned with
proposed technique including methodology and algorithms.
Implementation and evaluation is described in section 6.
Finally, conclusion and future work is given in section 7.
II. RELATED WORK
Incheon Paik, Daisuke Maruyama [2] proposes a framework
for automated web services composition through AI (Artificial
Intelligence) planning technique by combining logical
combination (HTN) and physical composition (CSP
(Constraint Satisfaction Problem)). This paper discusses the
real life problems on the web that is related to planning and
scheduling. It provides task ordering to reach at desired goal.
OWL-S (Ontology Web Language-Semantic) and BPEL4WS
(Business Process Execution Language for Web Services) are
used for composition which removes the limitations of HTN
(Hierarchical Task Network) that are lack of interactive
environment for web services, lack of autonomy etc. Then the
proposed model is compared with HTN according to web
services invocation. It tackles the following given problems
faced by planner alone; First, it does not deal with various web
users requests for information. Second, it is inefficient for
automated finding of solutions in given state space. Third, its
maintenance is weak due to frequent user requests. The
proposed framework provides intelligent web services for web
users. It uses CSP which provides problem space for planning,
scheduling and automation of desired task.
Faisal Mustafa, T. L. McCluskey [9] outlined the main
challenges faced by automated web services composition that
are related to distributed, dynamic and uncertain nature of
web. The proposed model is semi-automatic and fixes some
issues of dynamic web services composition that are listed as
follows. First, repository has large number of web services and
it is not possible to analyze and integrate them from
repository. Second, updated web service information is
required from repository when it is selected to fulfill the
specific task. Third, multiple services are written in different
languages and there is a need of conceptual model to describe
them in a single service. The proposed technique has few
drawbacks. First, if a server goes down then input/output
issues may arise. Second, new uploaded information is not
available in repository as it does not update its contents.
Pat. P. W. Chan and Michael R. Lyu [10] proposed the
dynamic web service composition technique by using N-
version programming technique which improves the reliability
of system for scheduling among web services. If one server
fails, other web servers provide the required services. Web
services are described by WSDL (Web Services Description
Language) and their interaction with other web services is
described by WSCI (Web Services Choreography Interface).
The composed web services are deadlock free and reduce
average composition time. Also the proposed system is
dynamic, as it works with updated versions without rewriting
the specifications. At the end experimental evaluation and
results are presented to verify the correctness of algorithm.
LIU AnFeng et al. [11] presents the technique based on web
services interfaces and peer to peer ontology. It provides an
overlay network with peer to peer technologies and provides a
model for web services composition. The web services
composition is based on domain ontology and Distributed
Hash Table (DHT) is used for discovery and composition. The
analysis shows that it is easy to understand because of loosely
coupled due to the separation of interfaces from underlying
details. The proposed model is based on ontology and service
composition interface. It provides QoS based composition, fast
composition rate, fault tolerant and efficient discovery.
Kazuto Nakamura, Mikio Aoyama [12] proposed a
technique for dynamic web service composition that is value
based and provides composed web services based on QoS.
Value meta-model and its representation language VSDL
(Value-based Service Description Language) are presented.
Values are used to define quality of web services. Value added
(IJCSIS) International Journal of Computer Science and Information Security, Vol. 7, No. 2, February 2010
148 http://sites.google.com/site/ijcsis/ ISSN 1947-5500
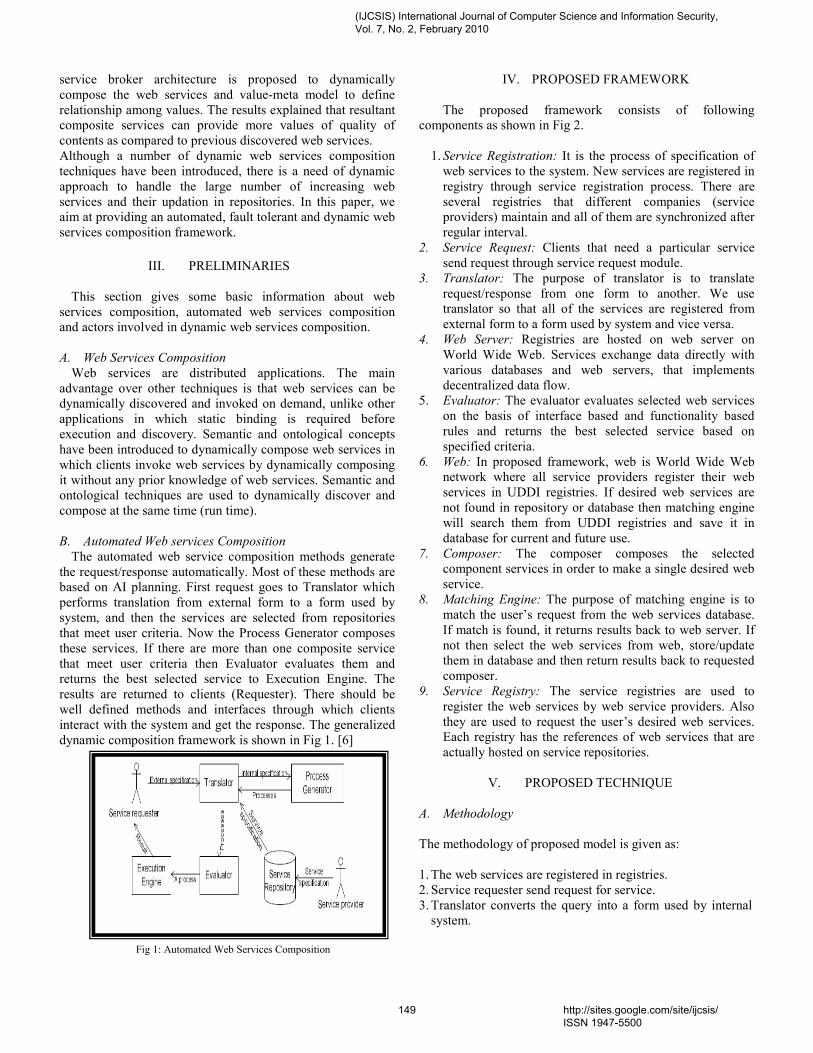
service broker architecture is proposed to dynamically
compose the web services and value-meta model to define
relationship among values. The results explained that resultant
composite services can provide more values of quality of
contents as compared to previous discovered web services.
Although a number of dynamic web services composition
techniques have been introduced, there is a need of dynamic
approach to handle the large number of increasing web
services and their updation in repositories. In this paper, we
aim at providing an automated, fault tolerant and dynamic web
services composition framework.
III. PRELIMINARIES
This section gives some basic information about web
services composition, automated web services composition
and actors involved in dynamic web services composition.
A. Web Services Composition
Web services are distributed applications. The main
advantage over other techniques is that web services can be
dynamically discovered and invoked on demand, unlike other
applications in which static binding is required before
execution and discovery. Semantic and ontological concepts
have been introduced to dynamically compose web services in
which clients invoke web services by dynamically composing
it without any prior knowledge of web services. Semantic and
ontological techniques are used to dynamically discover and
compose at the same time (run time).
B. Automated Web services Composition
The automated web service composition methods generate
the request/response automatically. Most of these methods are
based on AI planning. First request goes to Translator which
performs translation from external form to a form used by
system, and then the services are selected from repositories
that meet user criteria. Now the Process Generator composes
these services. If there are more than one composite service
that meet user criteria then Evaluator evaluates them and
returns the best selected service to Execution Engine. The
results are returned to clients (Requester). There should be
well defined methods and interfaces through which clients
interact with the system and get the response. The generalized
dynamic composition framework is shown in Fig 1. [6]
Fig 1: Automated Web Services Composition
IV. PROPOSED FRAMEWORK
The proposed framework consists of following
components as shown in Fig 2.
1. Service Registration: It is the process of specification of
web services to the system. New services are registered in
registry through service registration process. There are
several registries that different companies (service
providers) maintain and all of them are synchronized after
regular interval.
2. Service Request: Clients that need a particular service
send request through service request module.
3. Translator: The purpose of translator is to translate
request/response from one form to another. We use
translator so that all of the services are registered from
external form to a form used by system and vice versa.
4. Web Server: Registries are hosted on web server on
World Wide Web. Services exchange data directly with
various databases and web servers, that implements
decentralized data flow.
5. Evaluator: The evaluator evaluates selected web services
on the basis of interface based and functionality based
rules and returns the best selected service based on
specified criteria.
6. Web: In proposed framework, web is World Wide Web
network where all service providers register their web
services in UDDI registries. If desired web services are
not found in repository or database then matching engine
will search them from UDDI registries and save it in
database for current and future use.
7. Composer: The composer composes the selected
component services in order to make a single desired web
service.
8. Matching Engine: The purpose of matching engine is to
match the user’s request from the web services database.
If match is found, it returns results back to web server. If
not then select the web services from web, store/update
them in database and then return results back to requested
composer.
9. Service Registry: The service registries are used to
register the web services by web service providers. Also
they are used to request the user’s desired web services.
Each registry has the references of web services that are
actually hosted on service repositories.
V. PROPOSED TECHNIQUE
A. Methodology
The methodology of proposed model is given as:
1. The web services are registered in registries.
2. Service requester send request for service.
3. Translator converts the query into a form used by internal
system.
(IJCSIS) International Journal of Computer Science and Information Security, Vol. 7, No. 2, February 2010
149 http://sites.google.com/site/ijcsis/ ISSN 1947-5500
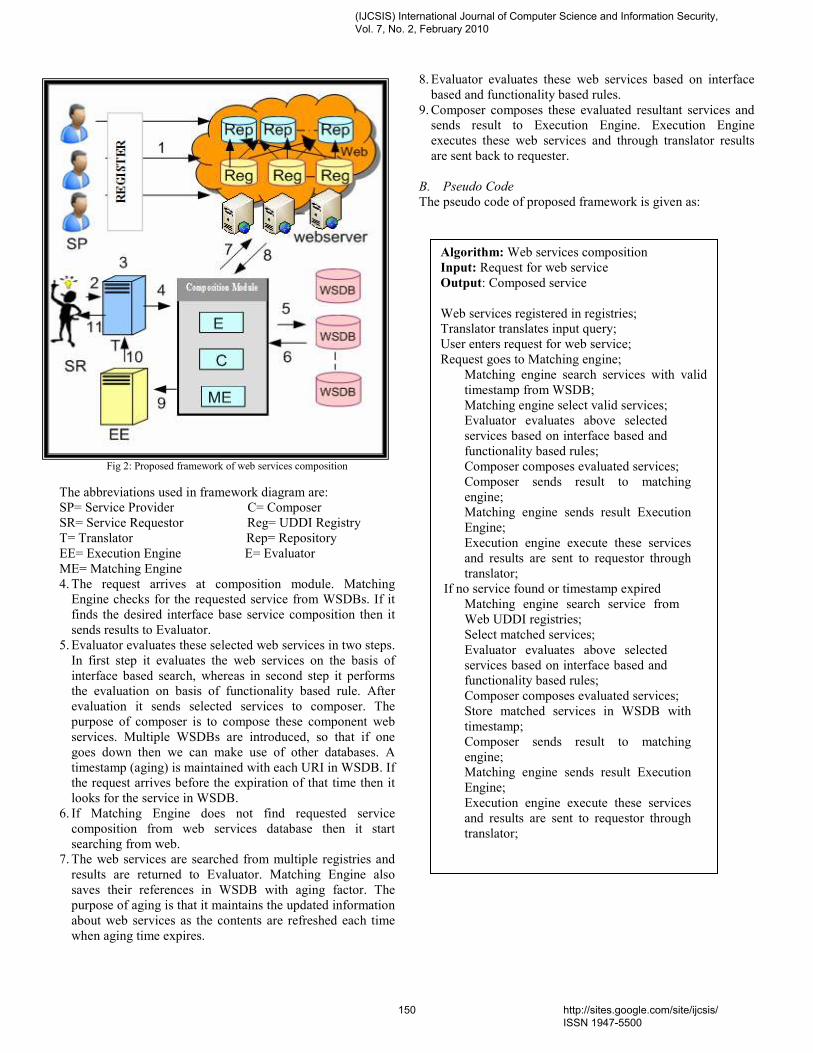
Fig 2: Proposed framework of web services composition
The abbreviations used in framework diagram are:
SP= Service Provider C= Composer
SR= Service Requestor Reg= UDDI Registry
T= Translator Rep= Repository
EE= Execution Engine E= Evaluator
ME= Matching Engine
4. The request arrives at composition module. Matching
Engine checks for the requested service from WSDBs. If it
finds the desired interface base service composition then it
sends results to Evaluator.
5. Evaluator evaluates these selected web services in two steps.
In first step it evaluates the web services on the basis of
interface based search, whereas in second step it performs
the evaluation on basis of functionality based rule. After
evaluation it sends selected services to composer. The
purpose of composer is to compose these component web
services. Multiple WSDBs are introduced, so that if one
goes down then we can make use of other databases. A
timestamp (aging) is maintained with each URI in WSDB. If
the request arrives before the expiration of that time then it
looks for the service in WSDB.
6. If Matching Engine does not find requested service
composition from web services database then it start
searching from web.
7. The web services are searched from multiple registries and
results are returned to Evaluator. Matching Engine also
saves their references in WSDB with aging factor. The
purpose of aging is that it maintains the updated information
about web services as the contents are refreshed each time
when aging time expires.
8. Evaluator evaluates these web services based on interface
based and functionality based rules.
9. Composer composes these evaluated resultant services and
sends result to Execution Engine. Execution Engine
executes these web services and through translator results
are sent back to requester.
B. Pseudo Code
The pseudo code of proposed framework is given as:
Algorithm: Web services composition
Input: Request for web service
Output: Composed service
Web services registered in registries;
Translator translates input query;
User enters request for web service;
Request goes to Matching engine;
Matching engine search services with valid
timestamp from WSDB;
Matching engine select valid services;
Evaluator evaluates above selected
services based on interface based and
functionality based rules;
Composer composes evaluated services;
Composer sends result to matching
engine;
Matching engine sends result Execution
Engine;
Execution engine execute these services
and results are sent to requestor through
translator;
If no service found or timestamp expired
Matching engine search service from
Web UDDI registries;
Select matched services;
Evaluator evaluates above selected
services based on interface based and
functionality based rules;
Composer composes evaluated services;
Store matched services in WSDB with
timestamp;
Composer sends result to matching
engine;
Matching engine sends result Execution
Engine;
Execution engine execute these services
and results are sent to requestor through
translator;
(IJCSIS) International Journal of Computer Science and Information Security, Vol. 7, No. 2, February 2010
150 http://sites.google.com/site/ijcsis/ ISSN 1947-5500
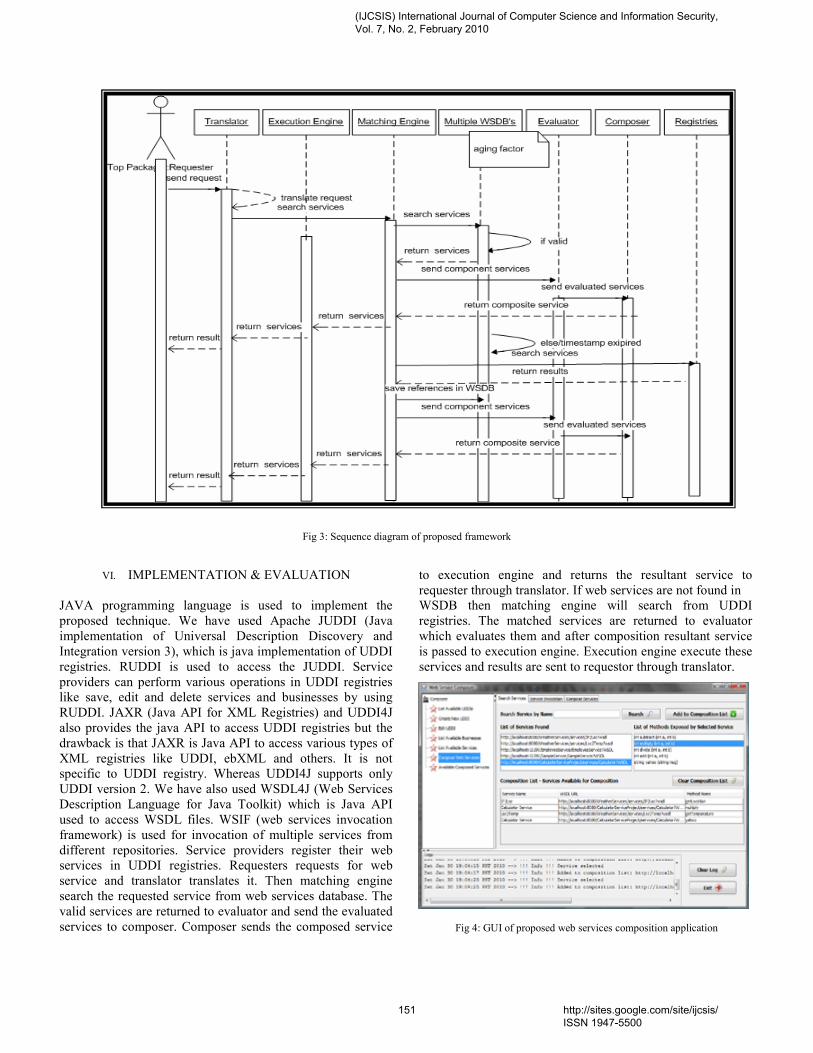
Fig 3: Sequence diagram of proposed framework
VI. IMPLEMENTATION & EVALUATION
JAVA programming language is used to implement the
proposed technique. We have used Apache JUDDI (Java
implementation of Universal Description Discovery and
Integration version 3), which is java implementation of UDDI
registries. RUDDI is used to access the JUDDI. Service
providers can perform various operations in UDDI registries
like save, edit and delete services and businesses by using
RUDDI. JAXR (Java API for XML Registries) and UDDI4J
also provides the java API to access UDDI registries but the
drawback is that JAXR is Java API to access various types of
XML registries like UDDI, ebXML and others. It is not
specific to UDDI registry. Whereas UDDI4J supports only
UDDI version 2. We have also used WSDL4J (Web Services
Description Language for Java Toolkit) which is Java API
used to access WSDL files. WSIF (web services invocation
framework) is used for invocation of multiple services from
different repositories. Service providers register their web
services in UDDI registries. Requesters requests for web
service and translator translates it. Then matching engine
search the requested service from web services database. The
valid services are returned to evaluator and send the evaluated
services to composer. Composer sends the composed service
to execution engine and returns the resultant service to
requester through translator. If web services are not found in
WSDB then matching engine will search from UDDI
registries. The matched services are returned to evaluator
which evaluates them and after composition resultant service
is passed to execution engine. Execution engine execute these
services and results are sent to requestor through translator.
Fig 4: GUI of proposed web services composition application
(IJCSIS) International Journal of Computer Science and Information Security, Vol. 7, No. 2, February 2010
151 http://sites.google.com/site/ijcsis/ ISSN 1947-5500
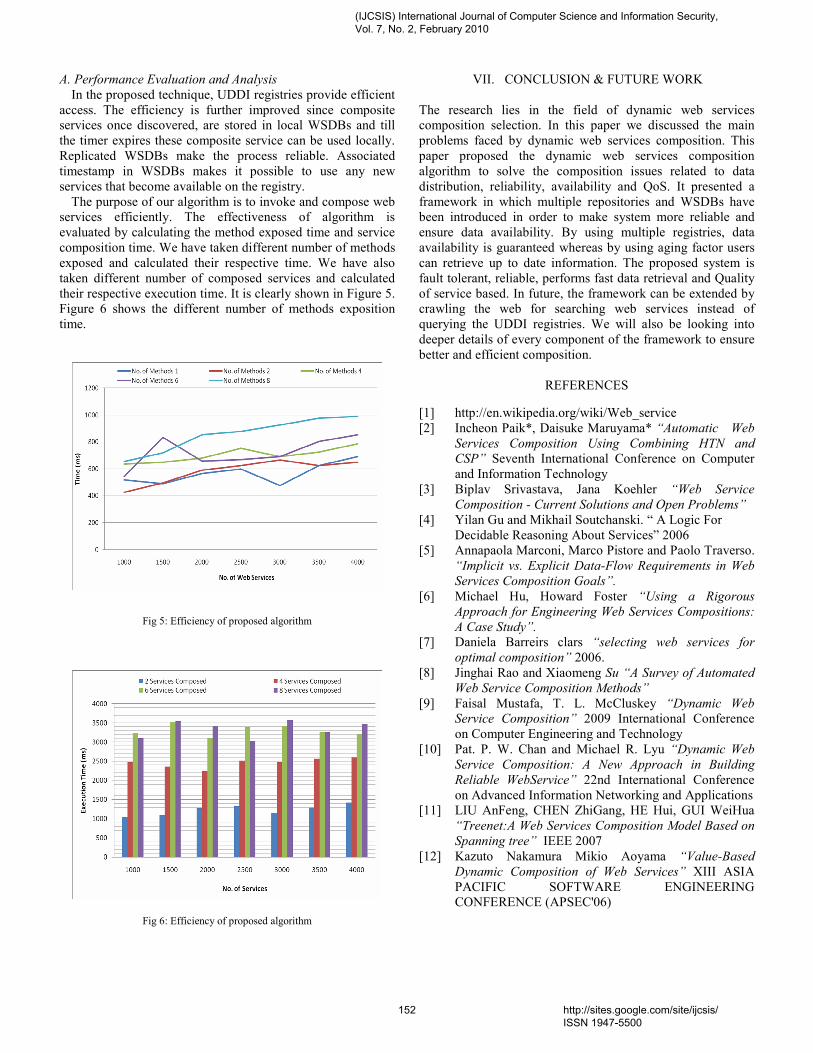
A. Performance Evaluation and Analysis
In the proposed technique, UDDI registries provide efficient
access. The efficiency is further improved since composite
services once discovered, are stored in local WSDBs and till
the timer expires these composite service can be used locally.
Replicated WSDBs make the process reliable. Associated
timestamp in WSDBs makes it possible to use any new
services that become available on the registry.
The purpose of our algorithm is to invoke and compose web
services efficiently. The effectiveness of algorithm is
evaluated by calculating the method exposed time and service
composition time. We have taken different number of methods
exposed and calculated their respective time. We have also
taken different number of composed services and calculated
their respective execution time. It is clearly shown in Figure 5.
Figure 6 shows the different number of methods exposition
time.
Fig 5: Efficiency of proposed algorithm
Fig 6: Efficiency of proposed algorithm
VII. CONCLUSION & FUTURE WORK
The research lies in the field of dynamic web services
composition selection. In this paper we discussed the main
problems faced by dynamic web services composition. This
paper proposed the dynamic web services composition
algorithm to solve the composition issues related to data
distribution, reliability, availability and QoS. It presented a
framework in which multiple repositories and WSDBs have
been introduced in order to make system more reliable and
ensure data availability. By using multiple registries, data
availability is guaranteed whereas by using aging factor users
can retrieve up to date information. The proposed system is
fault tolerant, reliable, performs fast data retrieval and Quality
of service based. In future, the framework can be extended by
crawling the web for searching web services instead of
querying the UDDI registries. We will also be looking into
deeper details of every component of the framework to ensure
better and efficient composition.
REFERENCES
[1] http://en.wikipedia.org/wiki/Web_service
[2] Incheon Paik*, Daisuke Maruyama* “Automatic Web
Services Composition Using Combining HT- and
CSP” Seventh International Conference on Computer
and Information Technology
[3] Biplav Srivastava, Jana Koehler “Web Service
Composition - Current Solutions and Open Problems”
[4] Yilan Gu and Mikhail Soutchanski. “ A Logic For
Decidable Reasoning About Services” 2006
[5] Annapaola Marconi, Marco Pistore and Paolo Traverso.
“Implicit vs. Explicit Data-Flow Requirements in Web
Services Composition Goals”.
[6] Michael Hu, Howard Foster “Using a Rigorous
Approach for Engineering Web Services Compositions:
A Case Study”.
[7] Daniela Barreirs clars “selecting web services for
optimal composition” 2006.
[8] Jinghai Rao and Xiaomeng Su “A Survey of Automated
Web Service Composition Methods”
[9] Faisal Mustafa, T. L. McCluskey “Dynamic Web
Service Composition” 2009 International Conference
on Computer Engineering and Technology
[10] Pat. P. W. Chan and Michael R. Lyu “Dynamic Web
Service Composition: A -ew Approach in Building
Reliable WebService” 22nd International Conference
on Advanced Information Networking and Applications
[11] LIU AnFeng, CHEN ZhiGang, HE Hui, GUI WeiHua
“Treenet:A Web Services Composition Model Based on
Spanning tree” IEEE 2007
[12] Kazuto Nakamura Mikio Aoyama “Value-Based
Dynamic Composition of Web Services” XIII ASIA
PACIFIC SOFTWARE ENGINEERING
CONFERENCE (APSEC'06)
(IJCSIS) International Journal of Computer Science and Information Security, Vol. 7, No. 2, February 2010
152 http://sites.google.com/site/ijcsis/ ISSN 1947-5500
INDEXER BASED DYNAMIC WEB
SERVICES DISCOVERY
Saba Bashir, M.Younus Javed,Farhan Hassan Khan
National University of Science & Technology
Rawalpindi, Pakistan
,
Aihab Khan, Malik Sikandar Hayat Khiyal Fatima Jinnah Women University
Rawalpindi, Pakistan
Abstract-Recent advancement in web services plays an
important role in business to business and business to
consumer interaction. Discovery mechanism is not only
used to find a suitable service but also provides
collaboration between service providers and consumers by
using standard protocols. A static web service discovery
mechanism is not only time consuming but requires
continuous human interaction. This paper proposed an
efficient dynamic web services discovery mechanism that
can locate relevant and updated web services from service
registries and repositories with timestamp based on
indexing value and categorization for faster and efficient
discovery of service. The proposed prototype focuses on
quality of service issues and introduces concept of local
cache, categorization of services, indexing mechanism,
CSP (Constraint Satisfaction Problem) solver, aging and
usage of translator. Performance of proposed framework
is evaluated by implementing the algorithm and
correctness of our method is shown. The results of
proposed framework shows greater performance and
accuracy in dynamic discovery mechanism of web services
resolving the existing issues of flexibility, scalability, based
on quality of service, and discovers updated and most
relevant services with ease of usage.
Keywords-component: Classification of services; Dynamic
discovery; Indexing; UDDI registry; Web services.
I. INTRODUCTION
As an enabling technology, web services are software
components that are used to present services on internet. Each
web service has standard interface through which it
communicates with other web services in order to provide
different functionalities. Service providers register their web
services in registries, typically in UDDI (Universal
Description Discovery and Integration). HTTP (Hyper Text
Transfer Protocol) protocol is used for communication of
SOAP (Simple Object Access Protocol) messages exchanged
between service providers and consumers.
With the increasing technology it is becoming more critical
to find a service that satisfies user requirements. Service
discovery is a mechanism used to find the appropriate service
that meets desired criteria. Three main roles in web services
are providers, consumers and registries. Service providers
publish their web services in registries and clients discover
their desired services by querying them using SOAP message
protocol [1].
In manual discovery process a human uses a discovery
service, which involves the input of user requirements and
through matchmaking process, output the desired results [2].
The main obstacle in this mechanism is heterogeneity problem
[3]. Different types of heterogeneities are:
• Technological heterogeneities (different platforms or
different data formats).
• Ontological heterogeneity (difference in domain specific
terms and concepts).
• Pragmatic heterogeneity (different development of
domain-specific processes)
This makes the technology limited in terms of efficiency
and availability. Whereas in dynamic discovery process an
agent performs the above task either at design or run time, but
there are different constraints of this process for example
interface requirements, standardization of protocols and trust
of stakeholders etc. This paper focuses on the dynamic web
services discovery approach.
With the increasing number of web services, it is becoming
more difficult to manage description on distributed
environment such as on web. Key limitations of current
approaches for dynamic web services discovery are:
1. Lack of fully dynamic web services discovery
mechanism.
2. Lack of mechanism that solves heterogeneity problems.
3. Clients cannot learn from past experiences to improve
future decisions.
4. Need of mechanism which store and retrieve up to date
information on consumer’s request.
5. Need of mechanism which gives in time response of
query in case of searching services from web.
(IJCSIS) International Journal of Computer Science and Information Security, Vol. 7, No. 2, February 2010
153 http://sites.google.com/site/ijcsis/ ISSN 1947-5500

6. In existing approaches, clients have to search from web
(registries) each time when they request for services
which is time consuming task and requires lot of effort.
7. Service providers and consumers don’t use same language
for registration and discovery.
Keyword based discovery is one possible way to discover
the web services. The advantage of UDDI is that it filters and
ranks services quickly. The drawback is that it contains only
metadata. It is based on keyword matching and it has only
single search criteria. In some cases it may not produce the
desired results due to the words that are semantically related
with each other [2].
In order to take a full advantage of web services, user must
discover and invoke them dynamically. Semantic web services
are a possible solution for automated web service discovery in
which services are semantically described and accessed. It
resolves the heterogeneity as well as interoperability problems.
Ontologies are used for manipulation of data. There are two
drawbacks of semantic web services discovery approach. First,
it is impossible for all service providers to publish their
services in same ontology. Second, already existing web
services does not have associated semantics and it is not
possible to convert all of them into same ontology [4].
A. Contribution
This research paper proposed a framework that presents
solutions to most of the problems in dynamic web service
discovery. More precisely, it uses the translator to convert
service requests and responses in one form that can be easily
used by the system. Indexer is used to index services to
simplify search process. CSP solver is used to select most
appropriate service. Aging factor helps to maintain updated
information. The discovery process is fastened by the use of
local cache which allows clients to discover services based on
previous experiences.
The organization of paper is such that Section 2 describes
the previous research on dynamic services discovery. In
section 3, some basic information about service discovery and
dynamic service discovery is given. Section 4 presents the
detailed overview of proposed technique including framework
and key mechanisms. Section 5 describes the working and
algorithms of proposed framework. Section 6 presents the
implementation and analysis of proposed framework. Finally,
the conclusion and future work is given in section 7.
II. RELATED WORK
Web services are XML (Extensible Markup Language)
based software components [5, 6]. These components can be
retrieved based on signature matching and the discovery
process is based on interface matching. The advantage of this
approach is that discovery process totally depends on
properties of component. WSDL (Web Services Description
Language) is used as interface definition language to describe
the functionality of web services. It is an XML based format
used to describe both abstraction operations and network
bindings [7].
UDDI is used in discovery process where keywords are
matched by using intelligent algorithms. The research is XML
schema matching where various string comparison techniques
are applied like suffix, prefix, and infix for keyword matching.
This technique is useful where many acronym, jargons etc are
used in web services [8].
Liang-Jie Zhang, Qun Zhou [9] proposed a dynamic web
services discovery framework for web services representation
chain. It solves the manual search process problems in linked
documents. The multiple linked documents are searched using
WSIL (Web Services Inspection Language) chains and results
are aggregated and returned them to users all at once. It also
re-explores the nested WSIL documents by using pre-fetched
link calculation and caching methods.
Sudhir Agarwal [10] proposed a goal specification language
to discover the web services. It describes that the constraints
should be specified on functional and non functional
properties in goal specification language. Then this goal
specification language is used to discover the desired services.
The language is novel combination of SHIQ(D) and µ-
calculus. It covers resources, behavior and policies of agents
involve in discovery process. Java API (Application
Programming Interface) is used to describe goals and concrete
syntax is used so that end users can easily write the formulas
through interface.
Fu Zhi Zhang et al. [2] presented an algorithm for dynamic
web services discovery. The proposed algorithm is based on
composition of web services with the process model. It is
based on OWL-S (Ontology Web Language-Semantic)
ontology. Unlike previous proposed models for dynamic
discovery it can have multiple executions and matchmaking
for a single service request and return desired service.
Paul Palathingal [11] presented an agent based approach for
service discovery and utilization. Agents acts instead of users
and dynamically discover, invoke and execute web services.
Through this technology sender object must not know the
receiver’s address. Also the interoperability between
distributed services is being achieved through these software
components. The selected agents match the desired query from
their respected repositories and send the retrieved results to
composition agent who composes the web services and sends
back to requester.
Stephan Pöhlsen and Christian Werner [12] proposed a
dynamic web services discovery framework in large networks.
It solves the discovery problem of mobile ad-hoc networks by
introducing a Discovery Proxy (DP). Through Discovery
proxy clients can easily search desired web services through
service providers and get updated information as services does
not have to register in proxy unlike UDDI. The drawback of
given technique is that all information is not centralized and
global DNS (Domain Name System) cannot be easily located.
Aabhas V. Paliwal [13] proposed dynamic web services
discovery through hyper clique pattern discovery and semantic
association ranking. It solves the discovery problem that is,
when user input a query, multiple services that meet the
desired criteria are retrieved as output and user cannot identify
most relevant service. The proposed model presents the
(IJCSIS) International Journal of Computer Science and Information Security, Vol. 7, No. 2, February 2010
154 http://sites.google.com/site/ijcsis/ ISSN 1947-5500
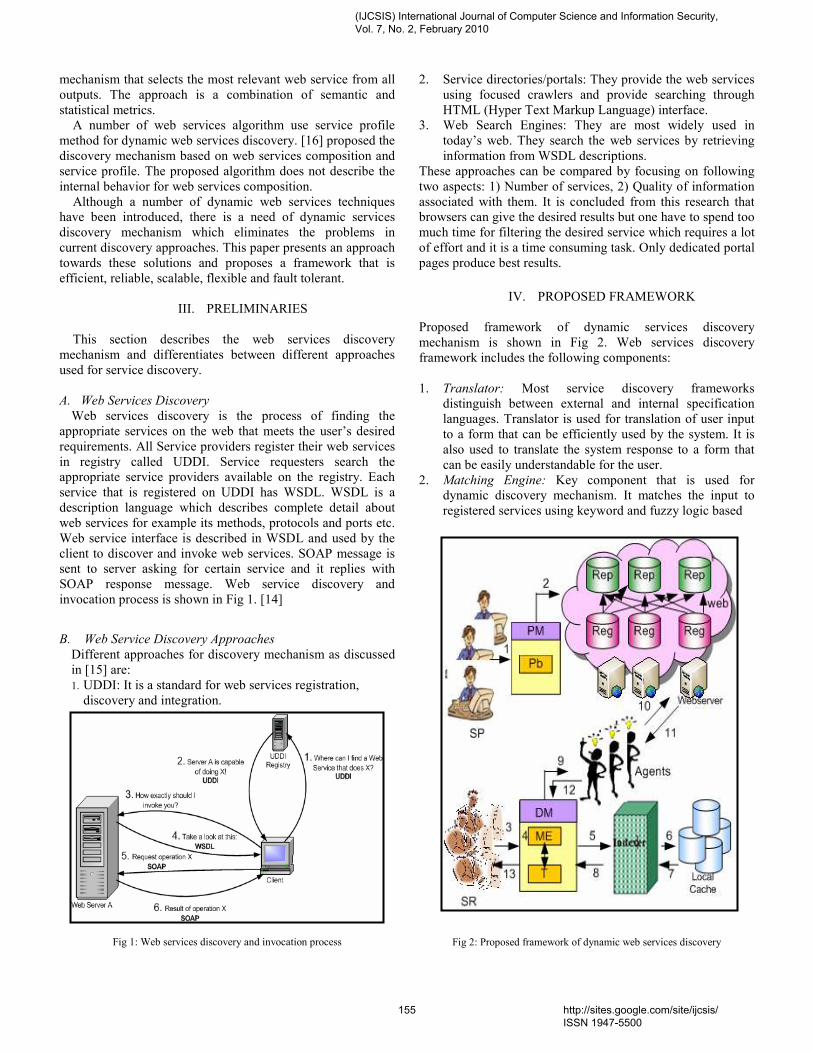
mechanism that selects the most relevant web service from all
outputs. The approach is a combination of semantic and
statistical metrics.
A number of web services algorithm use service profile
method for dynamic web services discovery. [16] proposed the
discovery mechanism based on web services composition and
service profile. The proposed algorithm does not describe the
internal behavior for web services composition.
Although a number of dynamic web services techniques
have been introduced, there is a need of dynamic services
discovery mechanism which eliminates the problems in
current discovery approaches. This paper presents an approach
towards these solutions and proposes a framework that is
efficient, reliable, scalable, flexible and fault tolerant.
III. PRELIMINARIES
This section describes the web services discovery
mechanism and differentiates between different approaches
used for service discovery.
A. Web Services Discovery
Web services discovery is the process of finding the
appropriate services on the web that meets the user’s desired
requirements. All Service providers register their web services
in registry called UDDI. Service requesters search the
appropriate service providers available on the registry. Each
service that is registered on UDDI has WSDL. WSDL is a
description language which describes complete detail about
web services for example its methods, protocols and ports etc.
Web service interface is described in WSDL and used by the
client to discover and invoke web services. SOAP message is
sent to server asking for certain service and it replies with
SOAP response message. Web service discovery and
invocation process is shown in Fig 1. [14]
B. Web Service Discovery Approaches
Different approaches for discovery mechanism as discussed
in [15] are:
1. UDDI: It is a standard for web services registration,
discovery and integration.
Fig 1: Web services discovery and invocation process
2. Service directories/portals: They provide the web services
using focused crawlers and provide searching through
HTML (Hyper Text Markup Language) interface.
3. Web Search Engines: They are most widely used in
today’s web. They search the web services by retrieving
information from WSDL descriptions.
These approaches can be compared by focusing on following
two aspects: 1) Number of services, 2) Quality of information
associated with them. It is concluded from this research that
browsers can give the desired results but one have to spend too
much time for filtering the desired service which requires a lot
of effort and it is a time consuming task. Only dedicated portal
pages produce best results.
IV. PROPOSED FRAMEWORK
Proposed framework of dynamic services discovery
mechanism is shown in Fig 2. Web services discovery
framework includes the following components:
1. Translator: Most service discovery frameworks
distinguish between external and internal specification
languages. Translator is used for translation of user input
to a form that can be efficiently used by the system. It is
also used to translate the system response to a form that
can be easily understandable for the user.
2. Matching Engine: Key component that is used for
dynamic discovery mechanism. It matches the input to
registered services using keyword and fuzzy logic based
Fig 2: Proposed framework of dynamic web services discovery
(IJCSIS) International Journal of Computer Science and Information Security, Vol. 7, No. 2, February 2010
155 http://sites.google.com/site/ijcsis/ ISSN 1947-5500
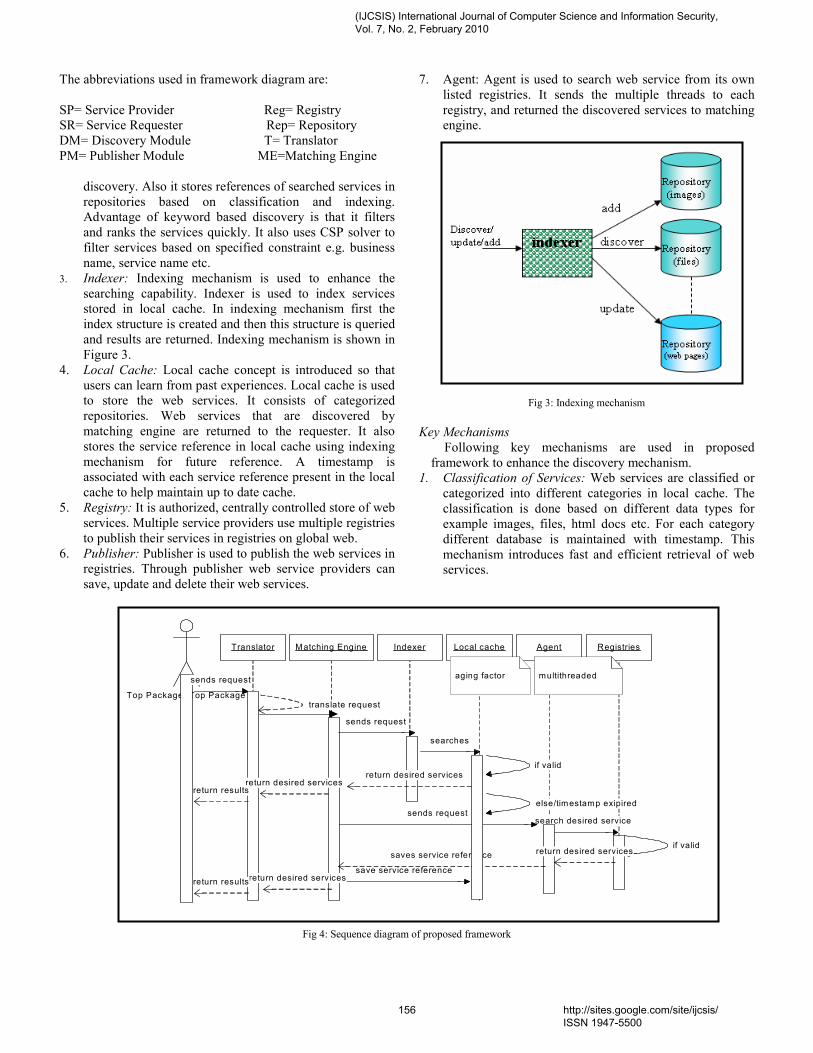
The abbreviations used in framework diagram are:
SP= Service Provider Reg= Registry
SR= Service Requester Rep= Repository
DM= Discovery Module T= Translator
PM= Publisher Module ME=Matching Engine
discovery. Also it stores references of searched services in
repositories based on classification and indexing.
Advantage of keyword based discovery is that it filters
and ranks the services quickly. It also uses CSP solver to
filter services based on specified constraint e.g. business
name, service name etc.
3. Indexer: Indexing mechanism is used to enhance the
searching capability. Indexer is used to index services
stored in local cache. In indexing mechanism first the
index structure is created and then this structure is queried
and results are returned. Indexing mechanism is shown in
Figure 3.
4. Local Cache: Local cache concept is introduced so that
users can learn from past experiences. Local cache is used
to store the web services. It consists of categorized
repositories. Web services that are discovered by
matching engine are returned to the requester. It also
stores the service reference in local cache using indexing
mechanism for future reference. A timestamp is
associated with each service reference present in the local
cache to help maintain up to date cache.
5. Registry: It is authorized, centrally controlled store of web
services. Multiple service providers use multiple registries
to publish their services in registries on global web.
6. Publisher: Publisher is used to publish the web services in
registries. Through publisher web service providers can
save, update and delete their web services.
7. Agent: Agent is used to search web service from its own
listed registries. It sends the multiple threads to each
registry, and returned the discovered services to matching
engine.
Fig 3: Indexing mechanism
Key Mechanisms
Following key mechanisms are used in proposed
framework to enhance the discovery mechanism.
1. Classification of Services: Web services are classified or
categorized into different categories in local cache. The
classification is done based on different data types for
example images, files, html docs etc. For each category
different database is maintained with timestamp. This
mechanism introduces fast and efficient retrieval of web
services.
Fig 4: Sequence diagram of proposed framework
Translator Matching Engine Indexer Local cache Agent Registries
Top Package::Top Packagetranslate request
if valid
else/timestamp exipired
search desired service
if valid
sends request
return desired servicesreturn desired services
sends request
save service reference
sends request
searches
return results
return desired servicessaves service reference
return desired servicesreturn results
aging factor multithreaded
(IJCSIS) International Journal of Computer Science and Information Security, Vol. 7, No. 2, February 2010
156 http://sites.google.com/site/ijcsis/ ISSN 1947-5500
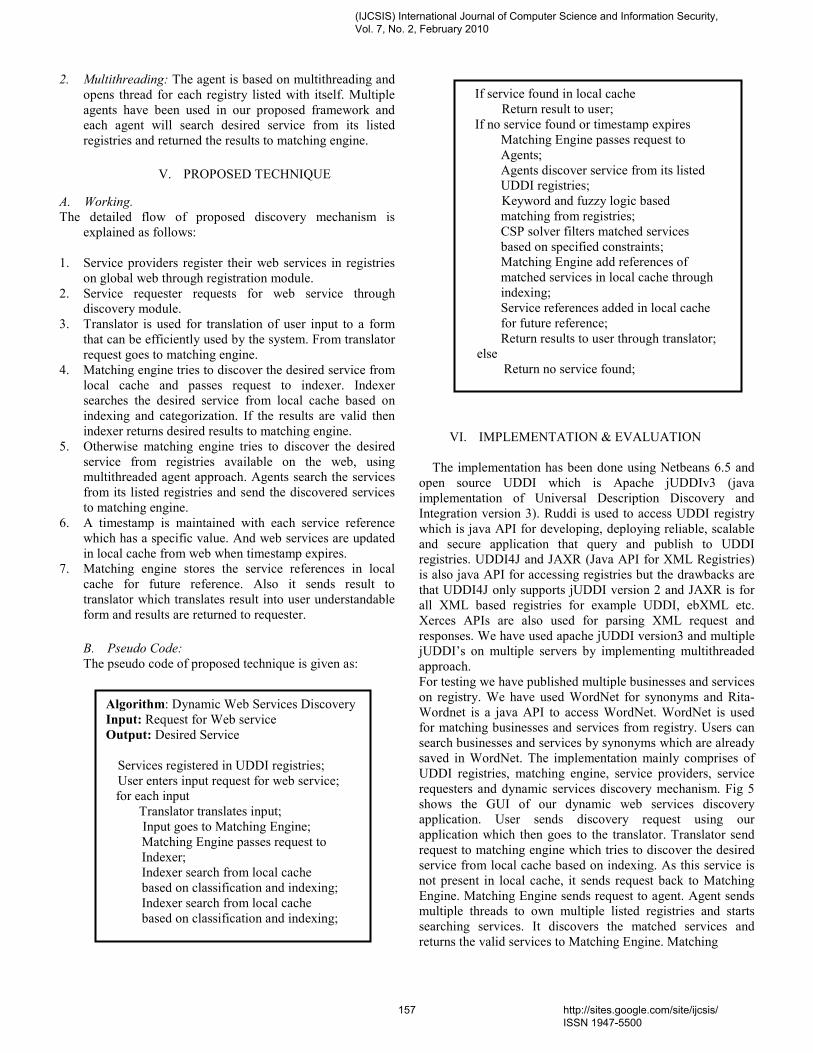
2. Multithreading: The agent is based on multithreading and
opens thread for each registry listed with itself. Multiple
agents have been used in our proposed framework and
each agent will search desired service from its listed
registries and returned the results to matching engine.
V. PROPOSED TECHNIQUE
A. Working.
The detailed flow of proposed discovery mechanism is
explained as follows:
1. Service providers register their web services in registries
on global web through registration module.
2. Service requester requests for web service through
discovery module.
3. Translator is used for translation of user input to a form
that can be efficiently used by the system. From translator
request goes to matching engine.
4. Matching engine tries to discover the desired service from
local cache and passes request to indexer. Indexer
searches the desired service from local cache based on
indexing and categorization. If the results are valid then
indexer returns desired results to matching engine.
5. Otherwise matching engine tries to discover the desired
service from registries available on the web, using
multithreaded agent approach. Agents search the services
from its listed registries and send the discovered services
to matching engine.
6. A timestamp is maintained with each service reference
which has a specific value. And web services are updated
in local cache from web when timestamp expires.
7. Matching engine stores the service references in local
cache for future reference. Also it sends result to
translator which translates result into user understandable
form and results are returned to requester.
B. Pseudo Code:
The pseudo code of proposed technique is given as:
VI. IMPLEMENTATION & EVALUATION
The implementation has been done using Netbeans 6.5 and
open source UDDI which is Apache jUDDIv3 (java
implementation of Universal Description Discovery and
Integration version 3). Ruddi is used to access UDDI registry
which is java API for developing, deploying reliable, scalable
and secure application that query and publish to UDDI
registries. UDDI4J and JAXR (Java API for XML Registries)
is also java API for accessing registries but the drawbacks are
that UDDI4J only supports jUDDI version 2 and JAXR is for
all XML based registries for example UDDI, ebXML etc.
Xerces APIs are also used for parsing XML request and
responses. We have used apache jUDDI version3 and multiple
jUDDI’s on multiple servers by implementing multithreaded
approach.
For testing we have published multiple businesses and services
on registry. We have used WordNet for synonyms and Rita-
Wordnet is a java API to access WordNet. WordNet is used
for matching businesses and services from registry. Users can
search businesses and services by synonyms which are already
saved in WordNet. The implementation mainly comprises of
UDDI registries, matching engine, service providers, service
requesters and dynamic services discovery mechanism. Fig 5
shows the GUI of our dynamic web services discovery
application. User sends discovery request using our
application which then goes to the translator. Translator send
request to matching engine which tries to discover the desired
service from local cache based on indexing. As this service is
not present in local cache, it sends request back to Matching
Engine. Matching Engine sends request to agent. Agent sends
multiple threads to own multiple listed registries and starts
searching services. It discovers the matched services and
returns the valid services to Matching Engine. Matching
Algorithm: Dynamic Web Services Discovery
Input: Request for Web service
Output: Desired Service
Services registered in UDDI registries;
User enters input request for web service;
for each input
Translator translates input;
Input goes to Matching Engine;
Matching Engine passes request to
Indexer;
Indexer search from local cache
based on classification and indexing;
Indexer search from local cache
based on classification and indexing;
If service found in local cache
Return result to user;
If no service found or timestamp expires
Matching Engine passes request to
Agents;
Agents discover service from its listed
UDDI registries;
Keyword and fuzzy logic based
matching from registries;
CSP solver filters matched services
based on specified constraints;
Matching Engine add references of
matched services in local cache through
indexing;
Service references added in local cache
for future reference;
Return results to user through translator;
else
Return no service found;
(IJCSIS) International Journal of Computer Science and Information Security, Vol. 7, No. 2, February 2010
157 http://sites.google.com/site/ijcsis/ ISSN 1947-5500
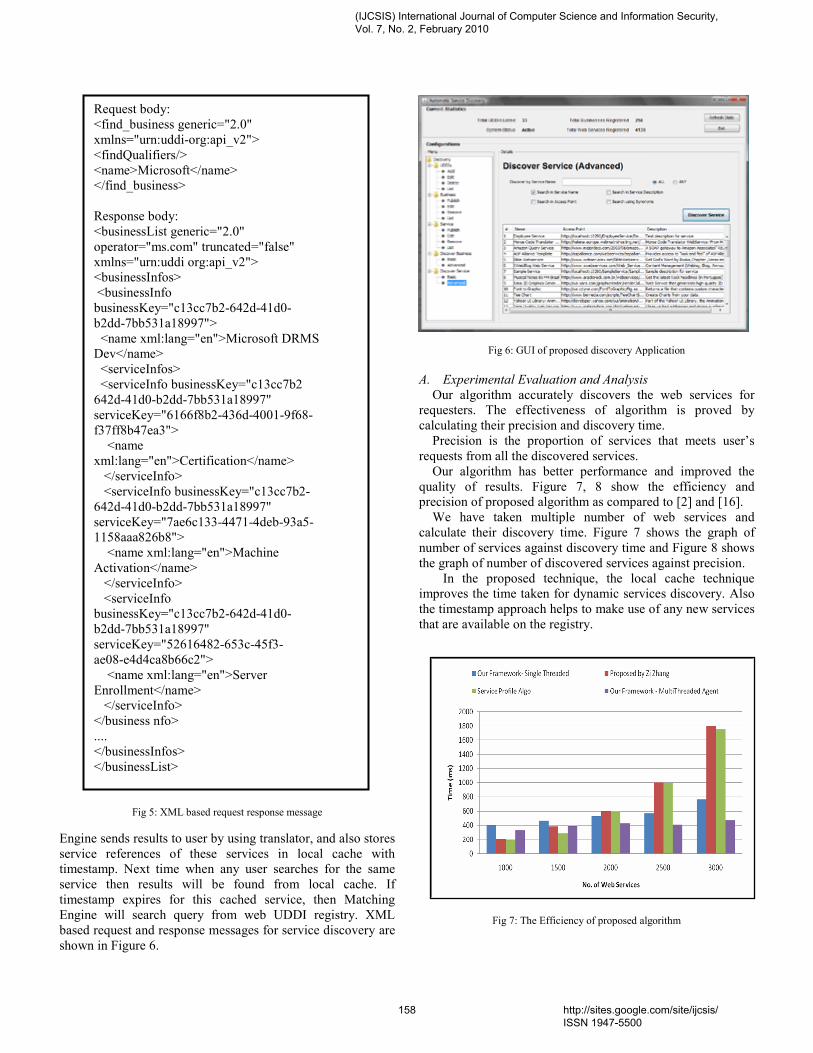
Fig 5: XML based request response message
Engine sends results to user by using translator, and also stores
service references of these services in local cache with
timestamp. Next time when any user searches for the same
service then results will be found from local cache. If
timestamp expires for this cached service, then Matching
Engine will search query from web UDDI registry. XML
based request and response messages for service discovery are
shown in Figure 6.
Fig 6: GUI of proposed discovery Application
A. Experimental Evaluation and Analysis
Our algorithm accurately discovers the web services for
requesters. The effectiveness of algorithm is proved by
calculating their precision and discovery time.
Precision is the proportion of services that meets user’s
requests from all the discovered services.
Our algorithm has better performance and improved the
quality of results. Figure 7, 8 show the efficiency and
precision of proposed algorithm as compared to [2] and [16].
We have taken multiple number of web services and
calculate their discovery time. Figure 7 shows the graph of
number of services against discovery time and Figure 8 shows
the graph of number of discovered services against precision.
In the proposed technique, the local cache technique
improves the time taken for dynamic services discovery. Also
the timestamp approach helps to make use of any new services
that are available on the registry.
Fig 7: The Efficiency of proposed algorithm
Request body:
<find_business generic="2.0"
xmlns="urn:uddi-org:api_v2">
<findQualifiers/>
<name>Microsoft</name>
</find_business>
Response body:
<businessList generic="2.0"
operator="ms.com" truncated="false"
xmlns="urn:uddi org:api_v2">
<businessInfos>
<businessInfo
businessKey="c13cc7b2-642d-41d0-
b2dd-7bb531a18997">
<name xml:lang="en">Microsoft DRMS
Dev</name>
<serviceInfos>
<serviceInfo businessKey="c13cc7b2
642d-41d0-b2dd-7bb531a18997"
serviceKey="6166f8b2-436d-4001-9f68-
f37ff8b47ea3">
<name
xml:lang="en">Certification</name>
</serviceInfo>
<serviceInfo businessKey="c13cc7b2-
642d-41d0-b2dd-7bb531a18997"
serviceKey="7ae6c133-4471-4deb-93a5-
1158aaa826b8">
<name xml:lang="en">Machine
Activation</name>
</serviceInfo>
<serviceInfo
businessKey="c13cc7b2-642d-41d0-
b2dd-7bb531a18997"
serviceKey="52616482-653c-45f3-
ae08-e4d4ca8b66c2">
<name xml:lang="en">Server
Enrollment</name>
</serviceInfo>
</business nfo>
....
</businessInfos>
</businessList>
(IJCSIS) International Journal of Computer Science and Information Security, Vol. 7, No. 2, February 2010
158 http://sites.google.com/site/ijcsis/ ISSN 1947-5500
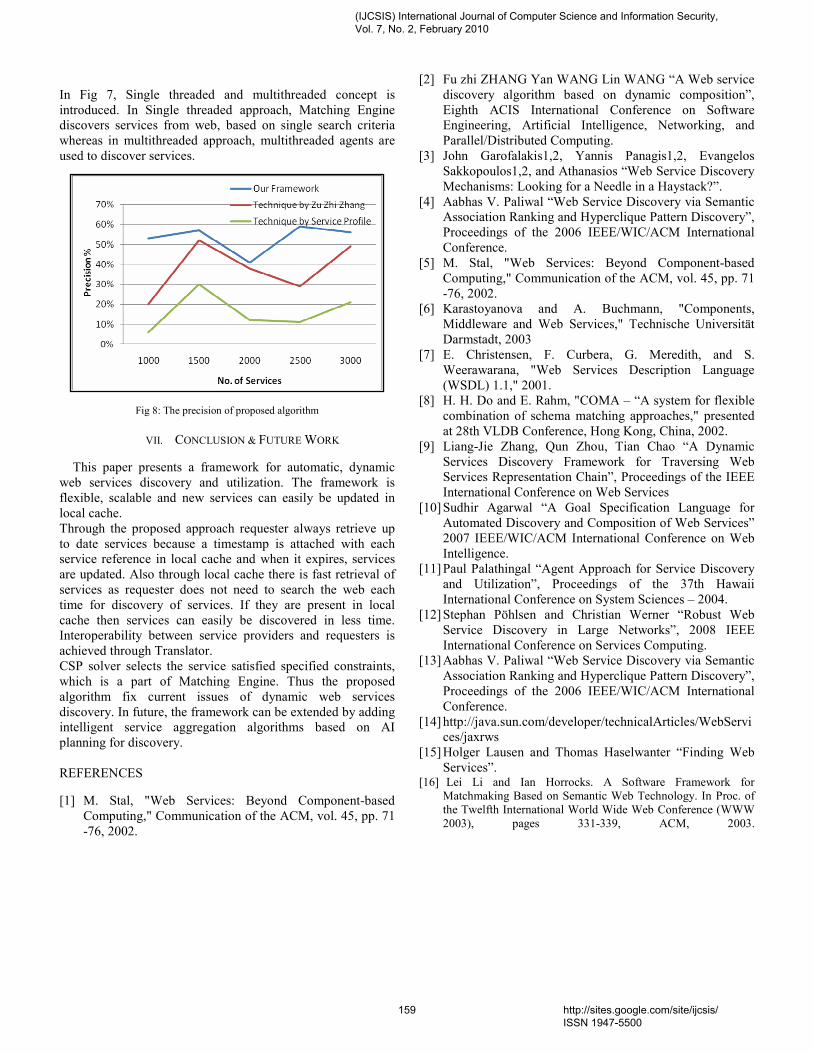
In Fig 7, Single threaded and multithreaded concept is
introduced. In Single threaded approach, Matching Engine
discovers services from web, based on single search criteria
whereas in multithreaded approach, multithreaded agents are
used to discover services.
Fig 8: The precision of proposed algorithm
VII. CONCLUSION & FUTURE WORK
This paper presents a framework for automatic, dynamic
web services discovery and utilization. The framework is
flexible, scalable and new services can easily be updated in
local cache.
Through the proposed approach requester always retrieve up
to date services because a timestamp is attached with each
service reference in local cache and when it expires, services
are updated. Also through local cache there is fast retrieval of
services as requester does not need to search the web each
time for discovery of services. If they are present in local
cache then services can easily be discovered in less time.
Interoperability between service providers and requesters is
achieved through Translator.
CSP solver selects the service satisfied specified constraints,
which is a part of Matching Engine. Thus the proposed
algorithm fix current issues of dynamic web services
discovery. In future, the framework can be extended by adding
intelligent service aggregation algorithms based on AI
planning for discovery.
REFERENCES
[1] M. Stal, "Web Services: Beyond Component-based
Computing," Communication of the ACM, vol. 45, pp. 71
-76, 2002.
[2] Fu zhi ZHANG Yan WANG Lin WANG “A Web service
discovery algorithm based on dynamic composition”,
Eighth ACIS International Conference on Software
Engineering, Artificial Intelligence, Networking, and
Parallel/Distributed Computing.
[3] John Garofalakis1,2, Yannis Panagis1,2, Evangelos
Sakkopoulos1,2, and Athanasios “Web Service Discovery
Mechanisms: Looking for a Needle in a Haystack?”.
[4] Aabhas V. Paliwal “Web Service Discovery via Semantic
Association Ranking and Hyperclique Pattern Discovery”,
Proceedings of the 2006 IEEE/WIC/ACM International
Conference.
[5] M. Stal, "Web Services: Beyond Component-based
Computing," Communication of the ACM, vol. 45, pp. 71
-76, 2002.
[6] Karastoyanova and A. Buchmann, "Components,
Middleware and Web Services," Technische Universität
Darmstadt, 2003
[7] E. Christensen, F. Curbera, G. Meredith, and S.
Weerawarana, "Web Services Description Language
(WSDL) 1.1," 2001.
[8] H. H. Do and E. Rahm, "COMA – “A system for flexible
combination of schema matching approaches," presented
at 28th VLDB Conference, Hong Kong, China, 2002.
[9] Liang-Jie Zhang, Qun Zhou, Tian Chao “A Dynamic Services Discovery Framework for Traversing Web
Services Representation Chain”, Proceedings of the IEEE
International Conference on Web Services
[10] Sudhir Agarwal “A Goal Specification Language for Automated Discovery and Composition of Web Services”
2007 IEEE/WIC/ACM International Conference on Web
Intelligence.
[11] Paul Palathingal “Agent Approach for Service Discovery and Utilization”, Proceedings of the 37th Hawaii
International Conference on System Sciences – 2004.
[12] Stephan Pöhlsen and Christian Werner “Robust Web
Service Discovery in Large Networks”, 2008 IEEE
International Conference on Services Computing.
[13] Aabhas V. Paliwal “Web Service Discovery via Semantic
Association Ranking and Hyperclique Pattern Discovery”,
Proceedings of the 2006 IEEE/WIC/ACM International
Conference.
[14] http://java.sun.com/developer/technicalArticles/WebServi
ces/jaxrws
[15] Holger Lausen and Thomas Haselwanter “Finding Web
Services”. [16] Lei Li and Ian Horrocks. A Software Framework for
Matchmaking Based on Semantic Web Technology. In Proc. of the Twelfth International World Wide Web Conference (WWW
2003), pages 331-339, ACM, 2003.
(IJCSIS) International Journal of Computer Science and Information Security, Vol. 7, No. 2, February 2010
159 http://sites.google.com/site/ijcsis/ ISSN 1947-5500
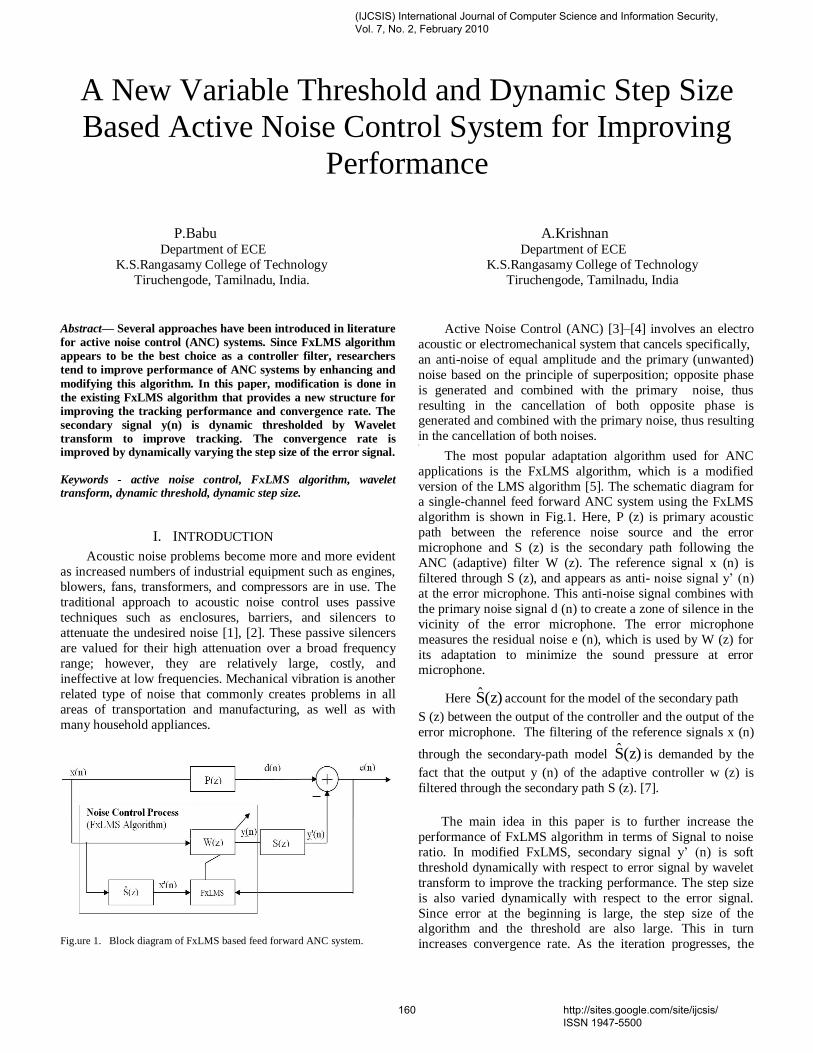
A New Variable Threshold and Dynamic Step Size
Based Active Noise Control System for Improving
Performance
P.Babu Department of ECE
K.S.Rangasamy College of Technology
Tiruchengode, Tamilnadu, India.
A.Krishnan Department of ECE
K.S.Rangasamy College of Technology
Tiruchengode, Tamilnadu, India
Abstract— Several approaches have been introduced in literature
for active noise control (ANC) systems. Since FxLMS algorithm
appears to be the best choice as a controller filter, researchers
tend to improve performance of ANC systems by enhancing and
modifying this algorithm. In this paper, modification is done in
the existing FxLMS algorithm that provides a new structure for
improving the tracking performance and convergence rate. The
secondary signal y(n) is dynamic thresholded by Wavelet
transform to improve tracking. The convergence rate is improved by dynamically varying the step size of the error signal.
Keywords - active noise control, FxLMS algorithm, wavelet transform, dynamic threshold, dynamic step size.
I. INTRODUCTION
Acoustic noise problems become more and more evident
as increased numbers of industrial equipment such as engines,
blowers, fans, transformers, and compressors are in use. The
traditional approach to acoustic noise control uses passive
techniques such as enclosures, barriers, and silencers to
attenuate the undesired noise [1], [2]. These passive silencers
are valued for their high attenuation over a broad frequency
range; however, they are relatively large, costly, and
ineffective at low frequencies. Mechanical vibration is another
related type of noise that commonly creates problems in all
areas of transportation and manufacturing, as well as with
many household appliances.
Fig.ure 1. Block diagram of FxLMS based feed forward ANC system.
Active Noise Control (ANC) [3]–[4] involves an electro
acoustic or electromechanical system that cancels specifically,
an anti-noise of equal amplitude and the primary (unwanted)
noise based on the principle of superposition; opposite phase
is generated and combined with the primary noise, thus
resulting in the cancellation of both opposite phase is generated and combined with the primary noise, thus resulting
in the cancellation of both noises. {
The most popular adaptation algorithm used for ANC
applications is the FxLMS algorithm, which is a modified
version of the LMS algorithm [5]. The schematic diagram for a single-channel feed forward ANC system using the FxLMS
algorithm is shown in Fig.1. Here, P (z) is primary acoustic
path between the reference noise source and the error
microphone and S (z) is the secondary path following the
ANC (adaptive) filter W (z). The reference signal x (n) is
filtered through S (z), and appears as anti- noise signal y’ (n)
at the error microphone. This anti-noise signal combines with
the primary noise signal d (n) to create a zone of silence in the
vicinity of the error microphone. The error microphone
measures the residual noise e (n), which is used by W (z) for
its adaptation to minimize the sound pressure at error microphone.
Here (z)S account for the model of the secondary path
S (z) between the output of the controller and the output of the
error microphone. The filtering of the reference signals x (n)
through the secondary-path model (z)S is demanded by the
fact that the output y (n) of the adaptive controller w (z) is
filtered through the secondary path S (z). [7].
The main idea in this paper is to further increase the
performance of FxLMS algorithm in terms of Signal to noise
ratio. In modified FxLMS, secondary signal y’ (n) is soft
threshold dynamically with respect to error signal by wavelet
transform to improve the tracking performance. The step size
is also varied dynamically with respect to the error signal.
Since error at the beginning is large, the step size of the algorithm and the threshold are also large. This in turn
increases convergence rate. As the iteration progresses, the
(IJCSIS) International Journal of Computer Science and Information Security, Vol. 7, No. 2, February 2010
160 http://sites.google.com/site/ijcsis/ ISSN 1947-5500
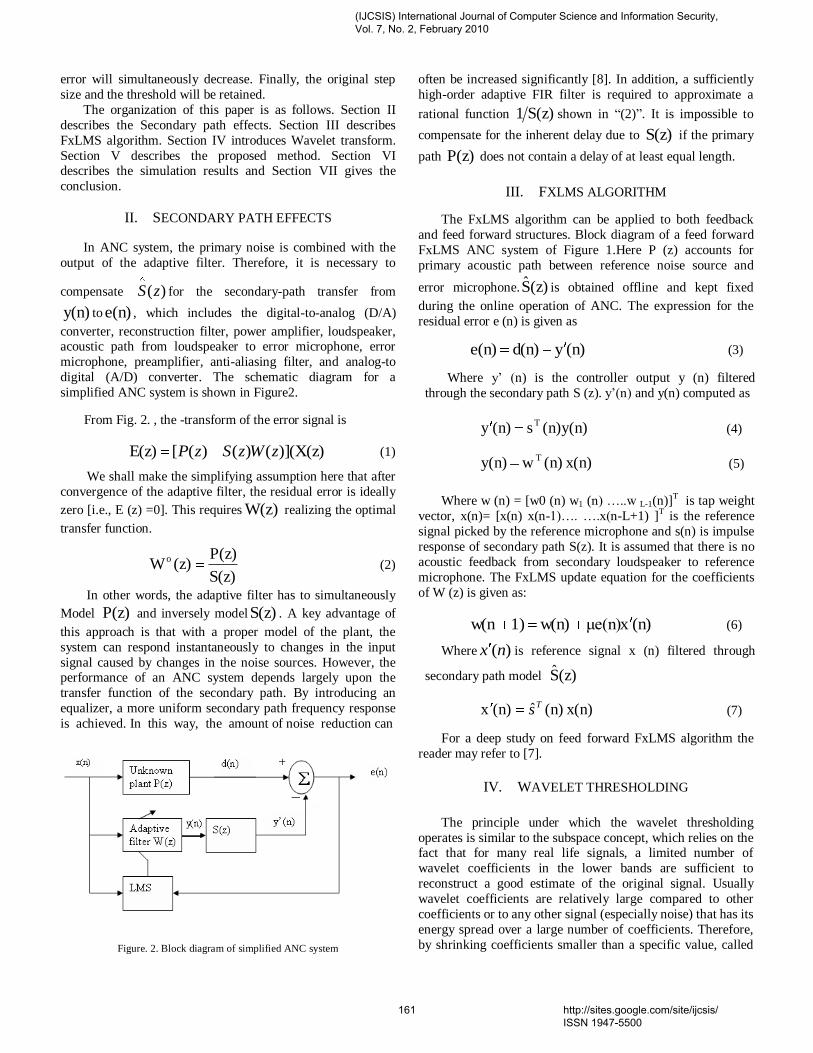
error will simultaneously decrease. Finally, the original step
size and the threshold will be retained.
The organization of this paper is as follows. Section II
describes the Secondary path effects. Section III describes
FxLMS algorithm. Section IV introduces Wavelet transform.
Section V describes the proposed method. Section VI describes the simulation results and Section VII gives the
conclusion.
II. SECONDARY PATH EFFECTS
In ANC system, the primary noise is combined with the
output of the adaptive filter. Therefore, it is necessary to
compensate )(zS for the secondary-path transfer from
y(n) to )e(n , which includes the digital-to-analog (D/A)
converter, reconstruction filter, power amplifier, loudspeaker, acoustic path from loudspeaker to error microphone, error
microphone, preamplifier, anti-aliasing filter, and analog-to
digital (A/D) converter. The schematic diagram for a
simplified ANC system is shown in Figure2.
From Fig. 2. , the -transform of the error signal is
X(z))](()()([E(z) zWzSzP (1)
We shall make the simplifying assumption here that after
convergence of the adaptive filter, the residual error is ideally
zero [i.e., E (z) =0]. This requires )W(z realizing the optimal
transfer function.
S(z)
P(z)(z)Wo
(2)
In other words, the adaptive filter has to simultaneously
Model P(z) and inversely modelS(z) . A key advantage of
this approach is that with a proper model of the plant, the
system can respond instantaneously to changes in the input
signal caused by changes in the noise sources. However, the performance of an ANC system depends largely upon the
transfer function of the secondary path. By introducing an
equalizer, a more uniform secondary path frequency response
is achieved. In this way, the amount of noise reduction can
Figure. 2. Block diagram of simplified ANC system
often be increased significantly [8]. In addition, a sufficiently
high-order adaptive FIR filter is required to approximate a
rational function S(z)1 shown in “(2)”. It is impossible to
compensate for the inherent delay due to S(z) if the primary
path P(z) does not contain a delay of at least equal length.
III. FXLMS ALGORITHM
The FxLMS algorithm can be applied to both feedback
and feed forward structures. Block diagram of a feed forward
FxLMS ANC system of Figure 1.Here P (z) accounts for
primary acoustic path between reference noise source and
error microphone. (z)S is obtained offline and kept fixed
during the online operation of ANC. The expression for the
residual error e (n) is given as
(n)yd(n)e(n) (3)
Where y’ (n) is the controller output y (n) filtered
through the secondary path S (z). y’(n) and y(n) computed as
(n)y(n)s (n)y T (4)
x(n)(n) w y(n) T (5)
Where w (n) = [w0 (n) w1 (n) …..w L-1(n)]T is tap weight
vector, x(n)= [x(n) x(n-1)…. ….x(n-L+1) ]T is the reference
signal picked by the reference microphone and s(n) is impulse
response of secondary path S(z). It is assumed that there is no
acoustic feedback from secondary loudspeaker to reference
microphone. The FxLMS update equation for the coefficients
of W (z) is given as:
(n)xμe(n)w(n)1)w(n (6)
Where )(nx is reference signal x (n) filtered through
secondary path model (z)S
x(n)(n)ˆ(n)x Ts (7)
For a deep study on feed forward FxLMS algorithm the
reader may refer to [7].
IV. WAVELET THRESHOLDING
The principle under which the wavelet thresholding
operates is similar to the subspace concept, which relies on the fact that for many real life signals, a limited number of
wavelet coefficients in the lower bands are sufficient to
reconstruct a good estimate of the original signal. Usually
wavelet coefficients are relatively large compared to other
coefficients or to any other signal (especially noise) that has its
energy spread over a large number of coefficients. Therefore,
by shrinking coefficients smaller than a specific value, called
(IJCSIS) International Journal of Computer Science and Information Security, Vol. 7, No. 2, February 2010
161 http://sites.google.com/site/ijcsis/ ISSN 1947-5500
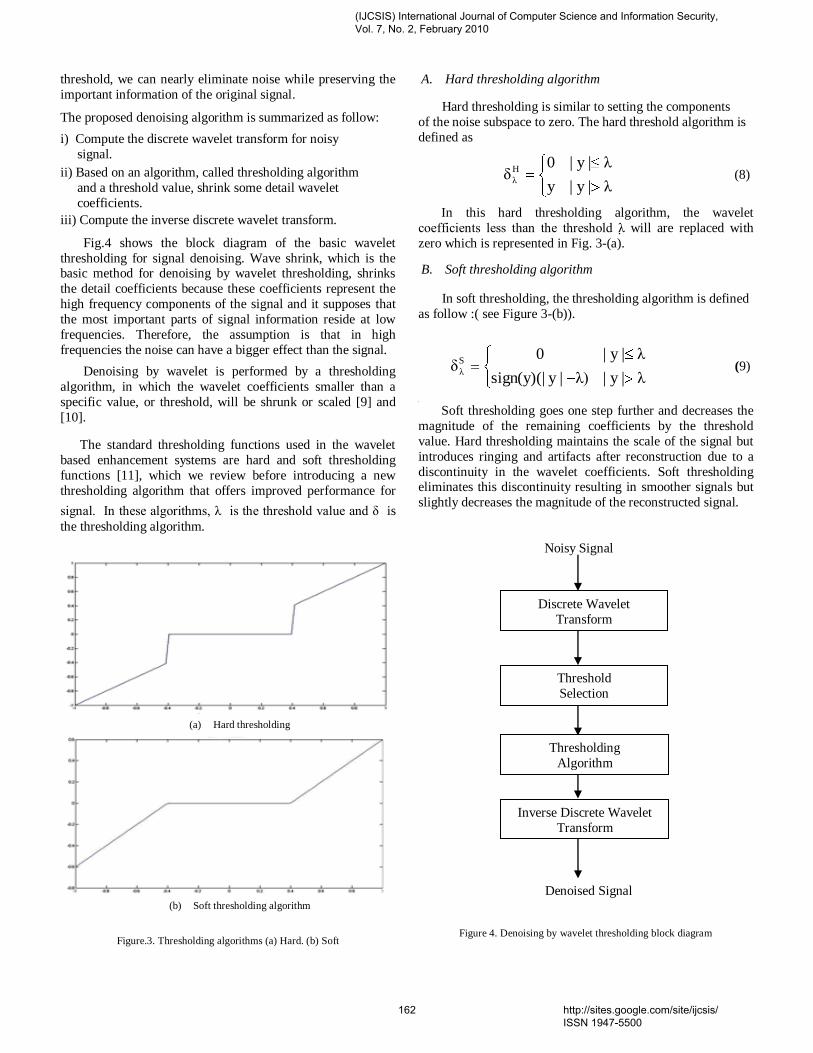
threshold, we can nearly eliminate noise while preserving the
important information of the original signal.
The proposed denoising algorithm is summarized as follow:
i) Compute the discrete wavelet transform for noisy
signal.
ii) Based on an algorithm, called thresholding algorithm
and a threshold value, shrink some detail wavelet
coefficients.
iii) Compute the inverse discrete wavelet transform.
Fig.4 shows the block diagram of the basic wavelet
thresholding for signal denoising. Wave shrink, which is the basic method for denoising by wavelet thresholding, shrinks
the detail coefficients because these coefficients represent the
high frequency components of the signal and it supposes that
the most important parts of signal information reside at low
frequencies. Therefore, the assumption is that in high
frequencies the noise can have a bigger effect than the signal.
Denoising by wavelet is performed by a thresholding
algorithm, in which the wavelet coefficients smaller than a
specific value, or threshold, will be shrunk or scaled [9] and
[10].
The standard thresholding functions used in the wavelet
based enhancement systems are hard and soft thresholding
functions [11], which we review before introducing a new
thresholding algorithm that offers improved performance for
signal. In these algorithms, λ is the threshold value and δ is
the thresholding algorithm.
(a) Hard thresholding
(b) Soft thresholding algorithm
Figure.3. Thresholding algorithms (a) Hard. (b) Soft
A. Hard thresholding algorithm
Hard thresholding is similar to setting the components
of the noise subspace to zero. The hard threshold algorithm is
defined as
λ|y|y
λ|y|0δH
λ (8)
In this hard thresholding algorithm, the wavelet
coefficients less than the threshold λ will are replaced with
zero which is represented in Fig. 3-(a).
B. Soft thresholding algorithm
In soft thresholding, the thresholding algorithm is defined
as follow :( see Figure 3-(b)).
λ|y|λ)|ysign(y)(|
λ|y|0δS
λ (9)
[[
Soft thresholding goes one step further and decreases the
magnitude of the remaining coefficients by the threshold
value. Hard thresholding maintains the scale of the signal but
introduces ringing and artifacts after reconstruction due to a
discontinuity in the wavelet coefficients. Soft thresholding eliminates this discontinuity resulting in smoother signals but
slightly decreases the magnitude of the reconstructed signal.
Noisy Signal
Denoised Signal
Denoised Signal
Figure 4. Denoising by wavelet thresholding block diagram
Discrete Wavelet
Transform
Threshold
Selection
Thresholding
Algorithm
Inverse Discrete Wavelet
Transform
(IJCSIS) International Journal of Computer Science and Information Security, Vol. 7, No. 2, February 2010
162 http://sites.google.com/site/ijcsis/ ISSN 1947-5500
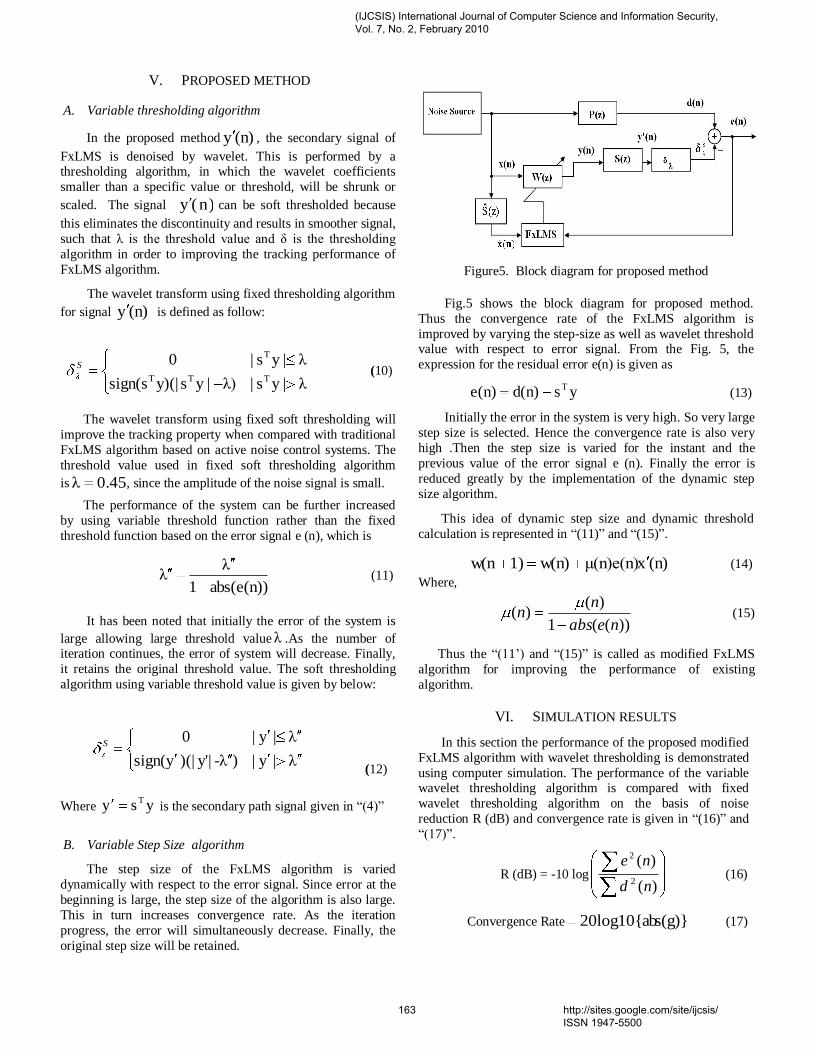
V. PROPOSED METHOD
A. Variable thresholding algorithm
In the proposed method (n)y , the secondary signal of
FxLMS is denoised by wavelet. This is performed by a thresholding algorithm, in which the wavelet coefficients
smaller than a specific value or threshold, will be shrunk or
scaled. The signal (n)y can be soft thresholded because
this eliminates the discontinuity and results in smoother signal,
such that λ is the threshold value and δ is the thresholding
algorithm in order to improving the tracking performance of
FxLMS algorithm.
The wavelet transform using fixed thresholding algorithm
for signal (n)y is defined as follow:
λ|ys|λ)|ysy)(|sign(s
λ|ys|0TTT
T
S (10)
The wavelet transform using fixed soft thresholding will
improve the tracking property when compared with traditional
FxLMS algorithm based on active noise control systems. The
threshold value used in fixed soft thresholding algorithm
is 0.45λ , since the amplitude of the noise signal is small.
The performance of the system can be further increased
by using variable threshold function rather than the fixed
threshold function based on the error signal e (n), which is
abs(e(n))1
λλ (11)
It has been noted that initially the error of the system is
large allowing large threshold valueλ .As the number of iteration continues, the error of system will decrease. Finally,
it retains the original threshold value. The soft thresholding
algorithm using variable threshold value is given by below:
λ|y|)λ-|y')(| ysign(
λ|y|0S
(12)
Where ysy T is the secondary path signal given in “(4)”
B. Variable Step Size algorithm
The step size of the FxLMS algorithm is varied
dynamically with respect to the error signal. Since error at the
beginning is large, the step size of the algorithm is also large.
This in turn increases convergence rate. As the iteration
progress, the error will simultaneously decrease. Finally, the
original step size will be retained.
Figure5. Block diagram for proposed method
Fig.5 shows the block diagram for proposed method.
Thus the convergence rate of the FxLMS algorithm is
improved by varying the step-size as well as wavelet threshold value with respect to error signal. From the Fig. 5, the
expression for the residual error e(n) is given as
ysd(n)e(n) T (13)
Initially the error in the system is very high. So very large
step size is selected. Hence the convergence rate is also very
high .Then the step size is varied for the instant and the
previous value of the error signal e (n). Finally the error is
reduced greatly by the implementation of the dynamic step
size algorithm.
This idea of dynamic step size and dynamic threshold
calculation is represented in “(11)” and “(15)”.
(n)xμ(n)e(n)w(n)1)w(n (14)
Where,
))((1
)()(
neabs
nn (15)
Thus the “(11’) and “(15)” is called as modified FxLMS
algorithm for improving the performance of existing
algorithm.
VI. SIMULATION RESULTS
In this section the performance of the proposed modified
FxLMS algorithm with wavelet thresholding is demonstrated
using computer simulation. The performance of the variable wavelet thresholding algorithm is compared with fixed
wavelet thresholding algorithm on the basis of noise
reduction R (dB) and convergence rate is given in “(16)” and
“(17)”.
R (dB) = -10 log)(
)(
2
2
nd
ne (16)
Convergence Rate s(g)}20log10{ab (17)
(IJCSIS) International Journal of Computer Science and Information Security, Vol. 7, No. 2, February 2010
163 http://sites.google.com/site/ijcsis/ ISSN 1947-5500
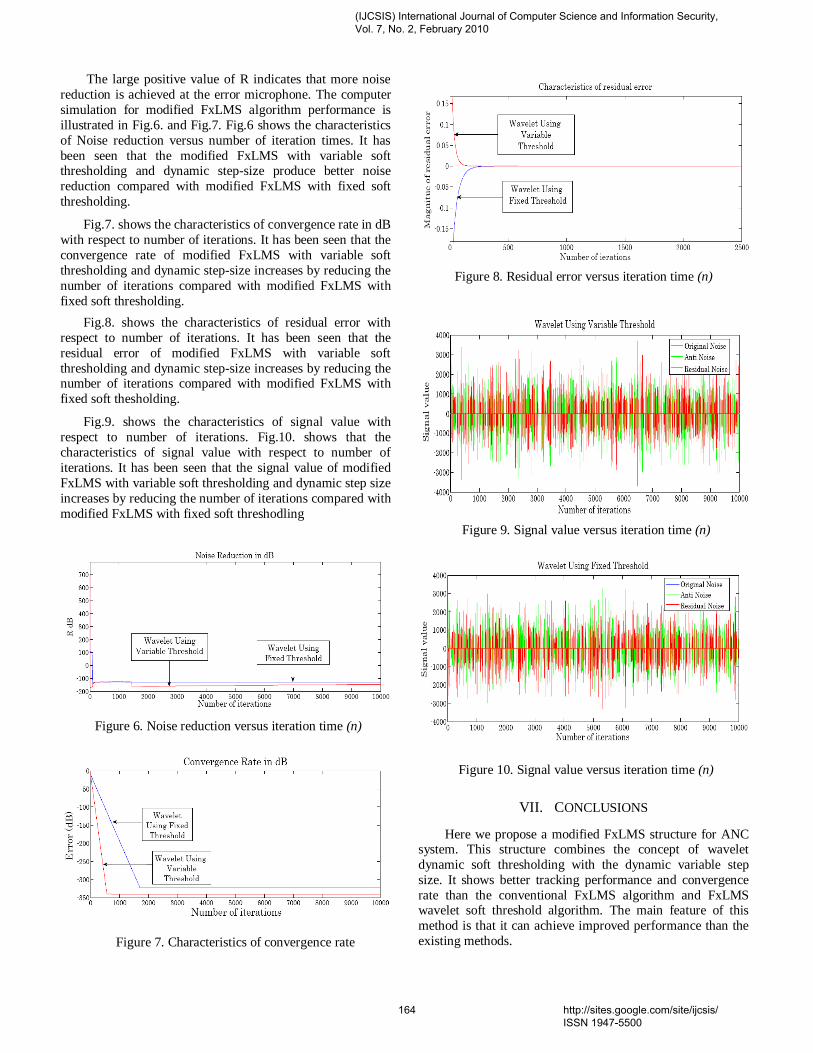
The large positive value of R indicates that more noise
reduction is achieved at the error microphone. The computer
simulation for modified FxLMS algorithm performance is
illustrated in Fig.6. and Fig.7. Fig.6 shows the characteristics
of Noise reduction versus number of iteration times. It has
been seen that the modified FxLMS with variable soft thresholding and dynamic step-size produce better noise
reduction compared with modified FxLMS with fixed soft
thresholding.
Fig.7. shows the characteristics of convergence rate in dB
with respect to number of iterations. It has been seen that the
convergence rate of modified FxLMS with variable soft
thresholding and dynamic step-size increases by reducing the
number of iterations compared with modified FxLMS with
fixed soft thresholding.
Fig.8. shows the characteristics of residual error with
respect to number of iterations. It has been seen that the
residual error of modified FxLMS with variable soft
thresholding and dynamic step-size increases by reducing the number of iterations compared with modified FxLMS with
fixed soft thesholding.
Fig.9. shows the characteristics of signal value with
respect to number of iterations. Fig.10. shows that the
characteristics of signal value with respect to number of
iterations. It has been seen that the signal value of modified
FxLMS with variable soft thresholding and dynamic step size
increases by reducing the number of iterations compared with
modified FxLMS with fixed soft threshodling
Figure 6. Noise reduction versus iteration time (n)
Figure 7. Characteristics of convergence rate
Figure 8. Residual error versus iteration time (n)
Figure 9. Signal value versus iteration time (n)
Figure 10. Signal value versus iteration time (n)
VII. CONCLUSIONS
Here we propose a modified FxLMS structure for ANC system. This structure combines the concept of wavelet
dynamic soft thresholding with the dynamic variable step
size. It shows better tracking performance and convergence
rate than the conventional FxLMS algorithm and FxLMS wavelet soft threshold algorithm. The main feature of this
method is that it can achieve improved performance than the
existing methods.
(IJCSIS) International Journal of Computer Science and Information Security, Vol. 7, No. 2, February 2010
164 http://sites.google.com/site/ijcsis/ ISSN 1947-5500
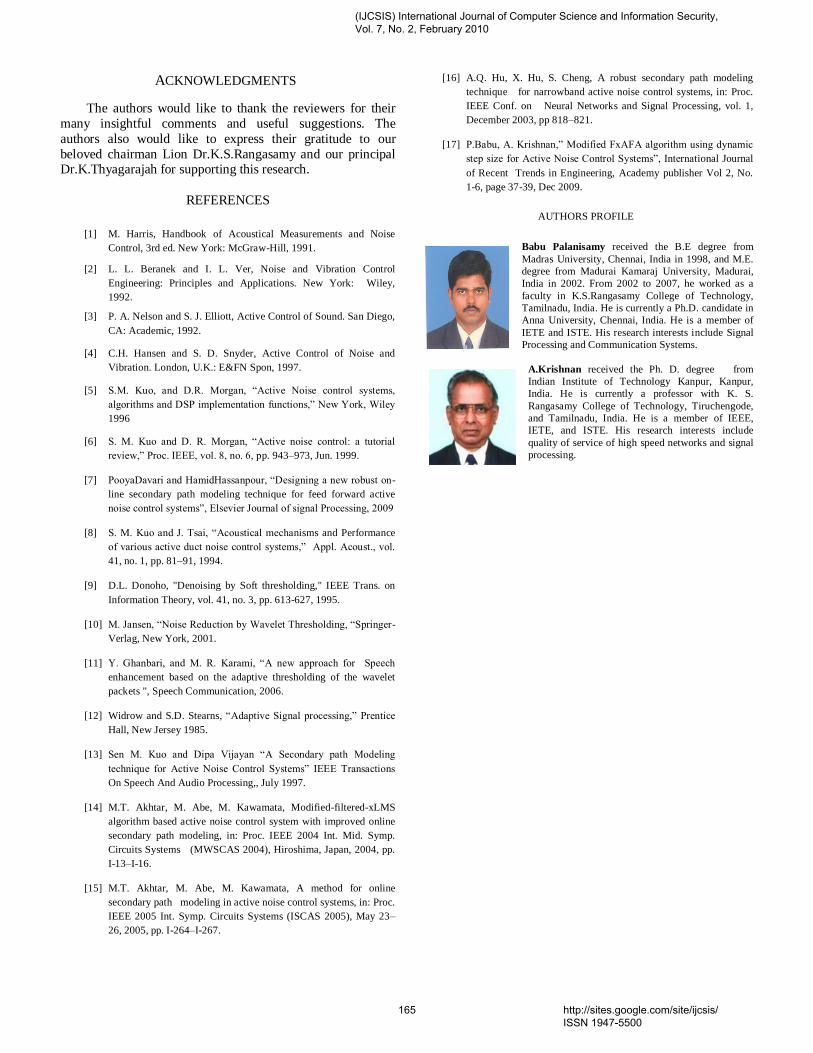
ACKNOWLEDGMENTS
The authors would like to thank the reviewers for their
many insightful comments and useful suggestions. The
authors also would like to express their gratitude to our
beloved chairman Lion Dr.K.S.Rangasamy and our principal Dr.K.Thyagarajah for supporting this research.
REFERENCES
[1] M. Harris, Handbook of Acoustical Measurements and Noise
Control, 3rd ed. New York: McGraw-Hill, 1991.
[2] L. L. Beranek and I. L. Ver, Noise and Vibration Control
Engineering: Principles and Applications. New York: Wiley,
1992.
[3] P. A. Nelson and S. J. Elliott, Active Control of Sound. San Diego,
CA: Academic, 1992.
[4] C.H. Hansen and S. D. Snyder, Active Control of Noise and
Vibration. London, U.K.: E&FN Spon, 1997.
[5] S.M. Kuo, and D.R. Morgan, “Active Noise control systems,
algorithms and DSP implementation functions,” New York, Wiley
1996
[6] S. M. Kuo and D. R. Morgan, “Active noise control: a tutorial
review,” Proc. IEEE, vol. 8, no. 6, pp. 943–973, Jun. 1999.
[7] PooyaDavari and HamidHassanpour, “Designing a new robust on-
line secondary path modeling technique for feed forward active
noise control systems”, Elsevier Journal of signal Processing, 2009
[8] S. M. Kuo and J. Tsai, “Acoustical mechanisms and Performance
of various active duct noise control systems,” Appl. Acoust., vol.
41, no. 1, pp. 81–91, 1994.
[9] D.L. Donoho, "Denoising by Soft thresholding," IEEE Trans. on
Information Theory, vol. 41, no. 3, pp. 613-627, 1995.
[10] M. Jansen, “Noise Reduction by Wavelet Thresholding, “Springer-
Verlag, New York, 2001.
[11] Y. Ghanbari, and M. R. Karami, “A new approach for Speech
enhancement based on the adaptive thresholding of the wavelet
packets ", Speech Communication, 2006.
[12] Widrow and S.D. Stearns, “Adaptive Signal processing,” Prentice
Hall, New Jersey 1985.
[13] Sen M. Kuo and Dipa Vijayan “A Secondary path Modeling
technique for Active Noise Control Systems” IEEE Transactions
On Speech And Audio Processing,, July 1997.
[14] M.T. Akhtar, M. Abe, M. Kawamata, Modified-filtered-xLMS
algorithm based active noise control system with improved online
secondary path modeling, in: Proc. IEEE 2004 Int. Mid. Symp.
Circuits Systems (MWSCAS 2004), Hiroshima, Japan, 2004, pp.
I-13–I-16.
[15] M.T. Akhtar, M. Abe, M. Kawamata, A method for online
secondary path modeling in active noise control systems, in: Proc.
IEEE 2005 Int. Symp. Circuits Systems (ISCAS 2005), May 23–
26, 2005, pp. I-264–I-267.
[16] A.Q. Hu, X. Hu, S. Cheng, A robust secondary path modeling
technique for narrowband active noise control systems, in: Proc.
IEEE Conf. on Neural Networks and Signal Processing, vol. 1,
December 2003, pp 818–821.
[17] P.Babu, A. Krishnan,” Modified FxAFA algorithm using dynamic
step size for Active Noise Control Systems”, International Journal
of Recent Trends in Engineering, Academy publisher Vol 2, No.
1-6, page 37-39, Dec 2009.
AUTHORS PROFILE
Babu Palanisamy received the B.E degree from
Madras University, Chennai, India in 1998, and M.E.
degree from Madurai Kamaraj University, Madurai,
India in 2002. From 2002 to 2007, he worked as a
faculty in K.S.Rangasamy College of Technology,
Tamilnadu, India. He is currently a Ph.D. candidate in
Anna University, Chennai, India. He is a member of
IETE and ISTE. His research interests include Signal
Processing and Communication Systems.
A.Krishnan received the Ph. D. degree from
Indian Institute of Technology Kanpur, Kanpur,
India. He is currently a professor with K. S.
Rangasamy College of Technology, Tiruchengode,
and Tamilnadu, India. He is a member of IEEE,
IETE, and ISTE. His research interests include
quality of service of high speed networks and signal
processing.
(IJCSIS) International Journal of Computer Science and Information Security, Vol. 7, No. 2, February 2010
165 http://sites.google.com/site/ijcsis/ ISSN 1947-5500
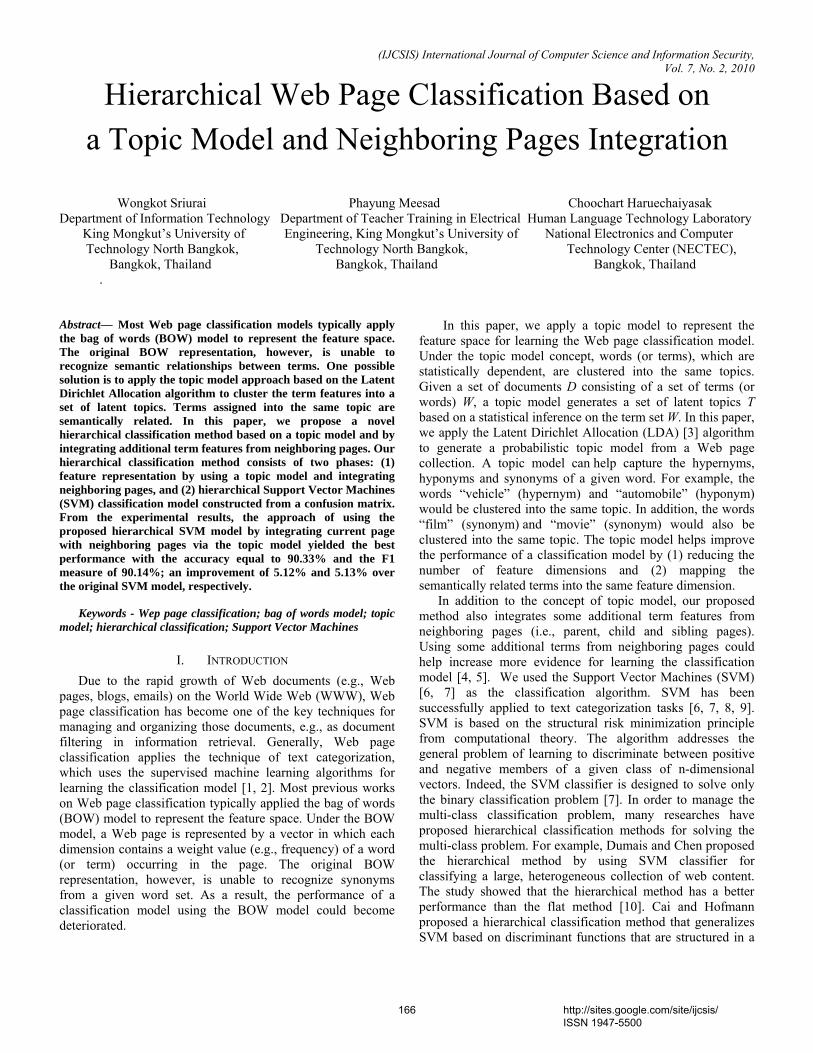
(IJCSIS) International Journal of Computer Science and Information Security, Vol. 7, No. 2, 2010
Hierarchical Web Page Classification Based on a Topic Model and Neighboring Pages Integration
Wongkot Sriurai Phayung Meesad Choochart Haruechaiyasak Department of Information Technology Department of Teacher Training in Electrical Human Language Technology Laboratory King Mongkut’s University of Engineering, King Mongkut’s University of National Electronics and Computer Technology North Bangkok, Technology North Bangkok, Technology Center (NECTEC), Bangkok, Thailand Bangkok, Thailand Bangkok, Thailand .
Abstract— Most Web page classification models typically apply the bag of words (BOW) model to represent the feature space. The original BOW representation, however, is unable to recognize semantic relationships between terms. One possible solution is to apply the topic model approach based on the Latent Dirichlet Allocation algorithm to cluster the term features into a set of latent topics. Terms assigned into the same topic are semantically related. In this paper, we propose a novel hierarchical classification method based on a topic model and by integrating additional term features from neighboring pages. Our hierarchical classification method consists of two phases: (1) feature representation by using a topic model and integrating neighboring pages, and (2) hierarchical Support Vector Machines (SVM) classification model constructed from a confusion matrix. From the experimental results, the approach of using the proposed hierarchical SVM model by integrating current page with neighboring pages via the topic model yielded the best performance with the accuracy equal to 90.33% and the F1 measure of 90.14%; an improvement of 5.12% and 5.13% over the original SVM model, respectively.
Keywords - Wep page classification; bag of words model; topic model; hierarchical classification; Support Vector Machines
I. INTRODUCTION Due to the rapid growth of Web documents (e.g., Web pages, blogs, emails) on the World Wide Web (WWW), Web page classification has become one of the key techniques for managing and organizing those documents, e.g., as document filtering in information retrieval. Generally, Web page classification applies the technique of text categorization, which uses the supervised machine learning algorithms for learning the classification model [1, 2]. Most previous works on Web page classification typically applied the bag of words (BOW) model to represent the feature space. Under the BOW model, a Web page is represented by a vector in which each dimension contains a weight value (e.g., frequency) of a word (or term) occurring in the page. The original BOW representation, however, is unable to recognize synonyms from a given word set. As a result, the performance of a classification model using the BOW model could become deteriorated.
In this paper, we apply a topic model to represent the feature space for learning the Web page classification model. Under the topic model concept, words (or terms), which are statistically dependent, are clustered into the same topics. Given a set of documents D consisting of a set of terms (or words) W, a topic model generates a set of latent topics T based on a statistical inference on the term set W. In this paper, we apply the Latent Dirichlet Allocation (LDA) [3] algorithm to generate a probabilistic topic model from a Web page collection. A topic model can help capture the hypernyms, hyponyms and synonyms of a given word. For example, the words “vehicle” (hypernym) and “automobile” (hyponym) would be clustered into the same topic. In addition, the words “film” (synonym) and “movie” (synonym) would also be clustered into the same topic. The topic model helps improve the performance of a classification model by (1) reducing the number of feature dimensions and (2) mapping the semantically related terms into the same feature dimension. In addition to the concept of topic model, our proposed method also integrates some additional term features from neighboring pages (i.e., parent, child and sibling pages). Using some additional terms from neighboring pages could help increase more evidence for learning the classification model [4, 5]. We used the Support Vector Machines (SVM) [6, 7] as the classification algorithm. SVM has been successfully applied to text categorization tasks [6, 7, 8, 9]. SVM is based on the structural risk minimization principle from computational theory. The algorithm addresses the general problem of learning to discriminate between positive and negative members of a given class of n-dimensional vectors. Indeed, the SVM classifier is designed to solve only the binary classification problem [7]. In order to manage the multi-class classification problem, many researches have proposed hierarchical classification methods for solving the multi-class problem. For example, Dumais and Chen proposed the hierarchical method by using SVM classifier for classifying a large, heterogeneous collection of web content. The study showed that the hierarchical method has a better performance than the flat method [10]. Cai and Hofmann proposed a hierarchical classification method that generalizes SVM based on discriminant functions that are structured in a
166 http://sites.google.com/site/ijcsis/ ISSN 1947-5500
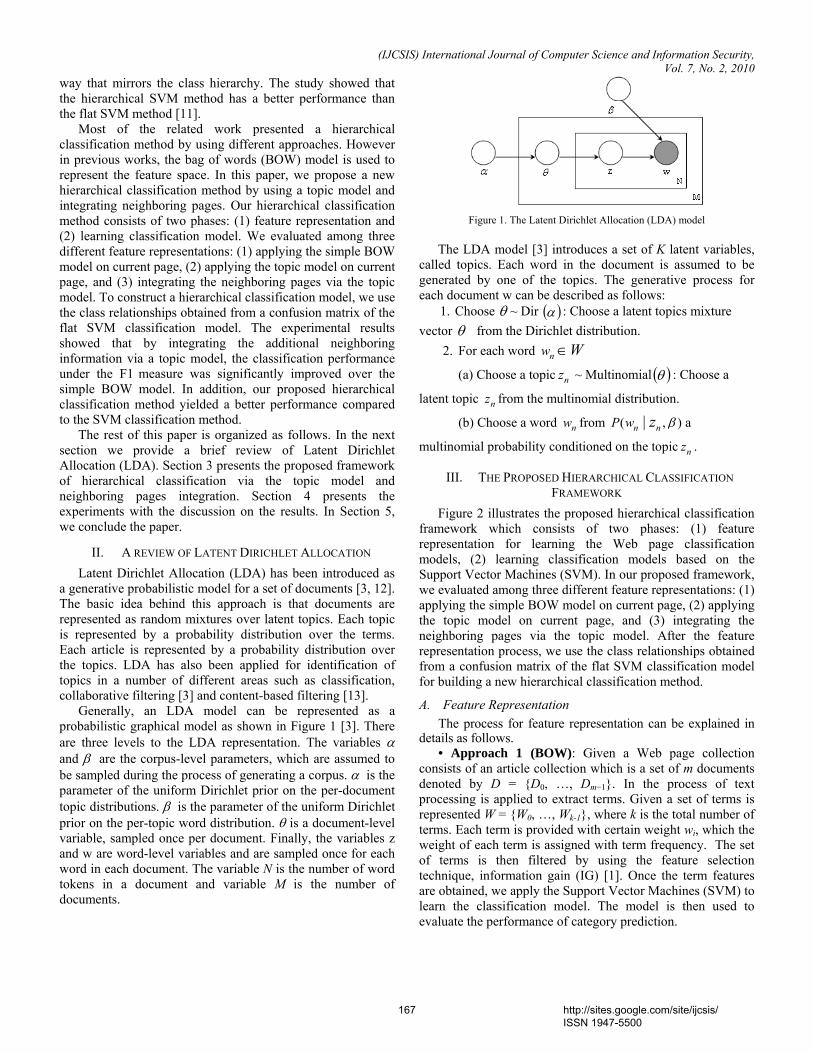
(IJCSIS) International Journal of Computer Science and Information Security, Vol. 7, No. 2, 2010
way that mirrors the class hierarchy. The study showed that the hierarchical SVM method has a better performance than the flat SVM method [11]. Most of the related work presented a hierarchical classification method by using different approaches. However in previous works, the bag of words (BOW) model is used to represent the feature space. In this paper, we propose a new hierarchical classification method by using a topic model and integrating neighboring pages. Our hierarchical classification method consists of two phases: (1) feature representation and (2) learning classification model. We evaluated among three different feature representations: (1) applying the simple BOW model on current page, (2) applying the topic model on current page, and (3) integrating the neighboring pages via the topic model. To construct a hierarchical classification model, we use the class relationships obtained from a confusion matrix of the flat SVM classification model. The experimental results showed that by integrating the additional neighboring information via a topic model, the classification performance under the F1 measure was significantly improved over the simple BOW model. In addition, our proposed hierarchical classification method yielded a better performance compared to the SVM classification method. The rest of this paper is organized as follows. In the next section we provide a brief review of Latent Dirichlet Allocation (LDA). Section 3 presents the proposed framework of hierarchical classification via the topic model and neighboring pages integration. Section 4 presents the experiments with the discussion on the results. In Section 5, we conclude the paper.
II. A REVIEW OF LATENT DIRICHLET ALLOCATION Latent Dirichlet Allocation (LDA) has been introduced as a generative probabilistic model for a set of documents [3, 12]. The basic idea behind this approach is that documents are represented as random mixtures over latent topics. Each topic is represented by a probability distribution over the terms. Each article is represented by a probability distribution over the topics. LDA has also been applied for identification of topics in a number of different areas such as classification, collaborative filtering [3] and content-based filtering [13]. Generally, an LDA model can be represented as a probabilistic graphical model as shown in Figure 1 [3]. There are three levels to the LDA representation. The variables α and β are the corpus-level parameters, which are assumed to be sampled during the process of generating a corpus. α is the parameter of the uniform Dirichlet prior on the per-document topic distributions. β is the parameter of the uniform Dirichlet prior on the per-topic word distribution. θ is a document-level variable, sampled once per document. Finally, the variables z and w are word-level variables and are sampled once for each word in each document. The variable N is the number of word tokens in a document and variable M is the number of documents.
Figure 1. The Latent Dirichlet Allocation (LDA) model
The LDA model [3] introduces a set of K latent variables, called topics. Each word in the document is assumed to be generated by one of the topics. The generative process for each document w can be described as follows:
1. Choose θ ~ Dir ( )α : Choose a latent topics mixture vector θ from the Dirichlet distribution.
2. For each word nw W∈
(a) Choose a topic ~ Multinomialnz ( )θ : Choose a
latent topic from the multinomial distribution. nz
(b) Choose a word from nw ( ,|n nP w z )β a
multinomial probability conditioned on the topic . nz
III. THE PROPOSED HIERARCHICAL CLASSIFICATION FRAMEWORK
Figure 2 illustrates the proposed hierarchical classification framework which consists of two phases: (1) feature representation for learning the Web page classification models, (2) learning classification models based on the Support Vector Machines (SVM). In our proposed framework, we evaluated among three different feature representations: (1) applying the simple BOW model on current page, (2) applying the topic model on current page, and (3) integrating the neighboring pages via the topic model. After the feature representation process, we use the class relationships obtained from a confusion matrix of the flat SVM classification model for building a new hierarchical classification method.
A. Feature Representation The process for feature representation can be explained in
details as follows. • Approach 1 (BOW): Given a Web page collection
consists of an article collection which is a set of m documents denoted by D = {D0, …, Dm−1}. In the process of text processing is applied to extract terms. Given a set of terms is represented W = {W0, …, Wk-1}, where k is the total number of terms. Each term is provided with certain weight wi, which the weight of each term is assigned with term frequency. The set of terms is then filtered by using the feature selection technique, information gain (IG) [1]. Once the term features are obtained, we apply the Support Vector Machines (SVM) to learn the classification model. The model is then used to evaluate the performance of category prediction.
167 http://sites.google.com/site/ijcsis/ ISSN 1947-5500
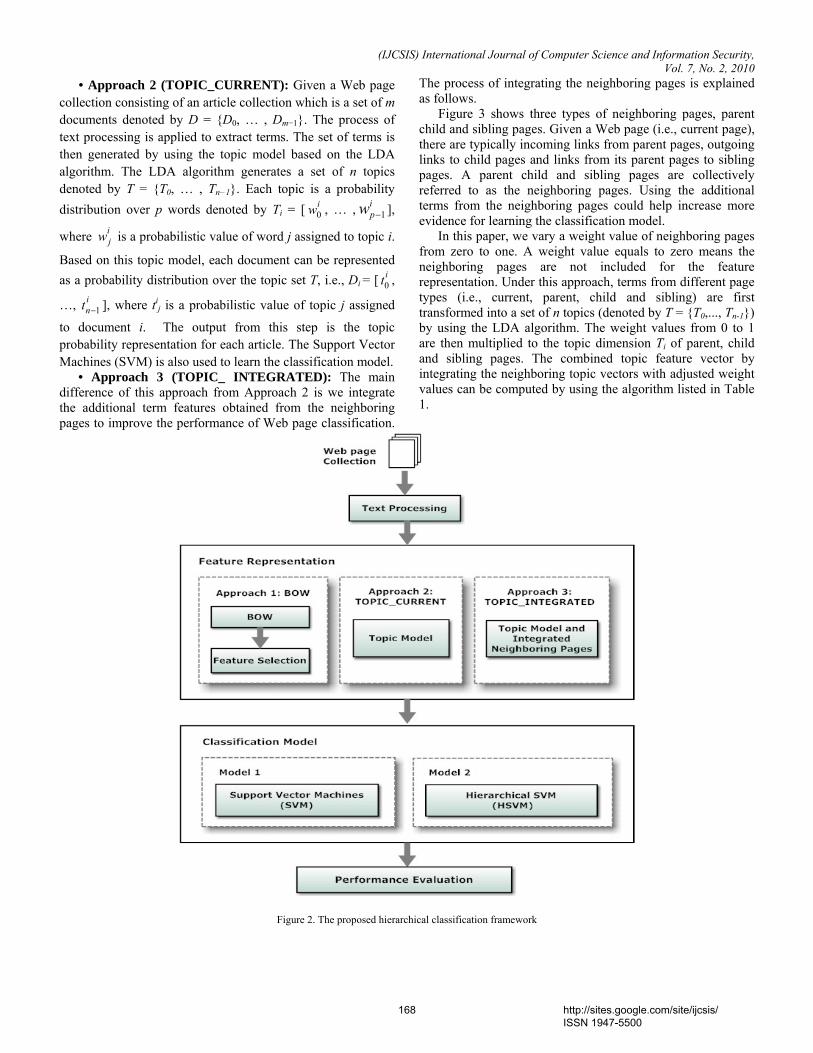
(IJCSIS) International Journal of Computer Science and Information Security, Vol. 7, No. 2, 2010
• Approach 2 (TOPIC_CURRENT): Given a Web page collection consisting of an article collection which is a set of m documents denoted by D = {D0, … , Dm−1}. The process of text processing is applied to extract terms. The set of terms is then generated by using the topic model based on the LDA algorithm. The LDA algorithm generates a set of n topics denoted by T = {T0, … , Tn−1}. Each topic is a probability distribution over p words denoted by Ti = [ , … , ],
where
0iw i
pw 1−
ijw is a probabilistic value of word j assigned to topic i.
Based on this topic model, each document can be represented as a probability distribution over the topic set T, i.e., Di = [ ,
…, ], where t0it
1int −
ij is a probabilistic value of topic j assigned
to document i. The output from this step is the topic probability representation for each article. The Support Vector Machines (SVM) is also used to learn the classification model. • Approach 3 (TOPIC_ INTEGRATED): The main difference of this approach from Approach 2 is we integrate the additional term features obtained from the neighboring pages to improve the performance of Web page classification.
The process of integrating the neighboring pages is explained as follows.
Figure 3 shows three types of neighboring pages, parent child and sibling pages. Given a Web page (i.e., current page), there are typically incoming links from parent pages, outgoing links to child pages and links from its parent pages to sibling pages. A parent child and sibling pages are collectively referred to as the neighboring pages. Using the additional terms from the neighboring pages could help increase more evidence for learning the classification model. In this paper, we vary a weight value of neighboring pages from zero to one. A weight value equals to zero means the neighboring pages are not included for the feature representation. Under this approach, terms from different page types (i.e., current, parent, child and sibling) are first transformed into a set of n topics (denoted by T = {T0,..., Tn-1}) by using the LDA algorithm. The weight values from 0 to 1 are then multiplied to the topic dimension Ti of parent, child and sibling pages. The combined topic feature vector by integrating the neighboring topic vectors with adjusted weight values can be computed by using the algorithm listed in Table 1.
Figure 2. The proposed hierarchical classification framework
168 http://sites.google.com/site/ijcsis/ ISSN 1947-5500
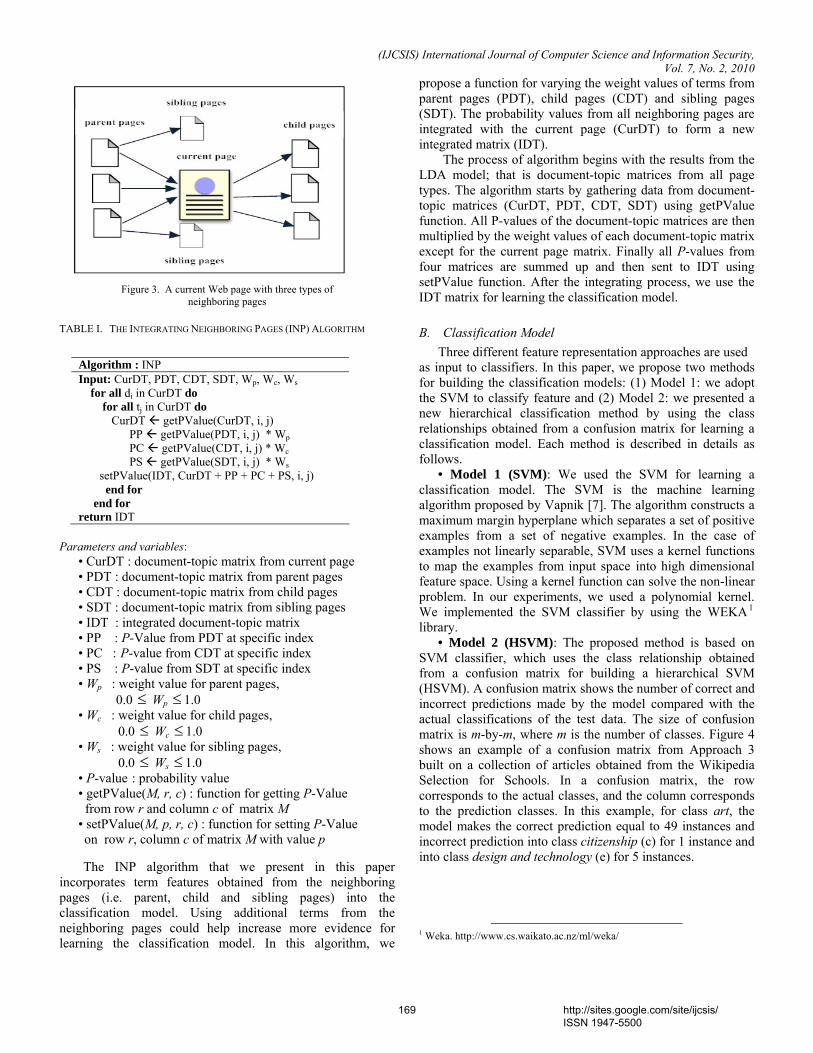
(IJCSIS) International Journal of Computer Science and Information Security, Vol. 7, No. 2, 2010
Figure 3. A current Web page with three types of neighboring pages
TABLE I. THE INTEGRATING NEIGHBORING PAGES (INP) ALGORITHM
Algorithm : INP Input: CurDT, PDT, CDT, SDT, Wp, Wc, Ws for all di in CurDT do for all tj in CurDT do CurDT getPValue(CurDT, i, j) PP getPValue(PDT, i, j) * Wp PC getPValue(CDT, i, j) * Wc PS getPValue(SDT, i, j) * Ws setPValue(IDT, CurDT + PP + PC + PS, i, j) end for end for return IDT
Parameters and variables: • CurDT : document-topic matrix from current page • PDT : document-topic matrix from parent pages • CDT : document-topic matrix from child pages • SDT : document-topic matrix from sibling pages • IDT : integrated document-topic matrix • PP : P-Value from PDT at specific index • PC : P-value from CDT at specific index • PS : P-value from SDT at specific index • Wp : weight value for parent pages, 0.0 ≤ Wp 1.0 ≤
• Wc : weight value for child pages, 0.0 W≤ c ≤ 1.0 • Ws : weight value for sibling pages, 0.0 W≤ s 1.0 ≤• P-value : probability value • getPValue(M, r, c) : function for getting P-Value from row r and column c of matrix M • setPValue(M, p, r, c) : function for setting P-Value on row r, column c of matrix M with value p
The INP algorithm that we present in this paper incorporates term features obtained from the neighboring pages (i.e. parent, child and sibling pages) into the classification model. Using additional terms from the neighboring pages could help increase more evidence for learning the classification model. In this algorithm, we
propose a function for varying the weight values of terms from parent pages (PDT), child pages (CDT) and sibling pages (SDT). The probability values from all neighboring pages are integrated with the current page (CurDT) to form a new integrated matrix (IDT). The process of algorithm begins with the results from the LDA model; that is document-topic matrices from all page types. The algorithm starts by gathering data from document-topic matrices (CurDT, PDT, CDT, SDT) using getPValue function. All P-values of the document-topic matrices are then multiplied by the weight values of each document-topic matrix except for the current page matrix. Finally all P-values from four matrices are summed up and then sent to IDT using setPValue function. After the integrating process, we use the IDT matrix for learning the classification model.
B. Classification Model Three different feature representation approaches are used
as input to classifiers. In this paper, we propose two methods for building the classification models: (1) Model 1: we adopt the SVM to classify feature and (2) Model 2: we presented a new hierarchical classification method by using the class relationships obtained from a confusion matrix for learning a classification model. Each method is described in details as follows. • Model 1 (SVM): We used the SVM for learning a classification model. The SVM is the machine learning algorithm proposed by Vapnik [7]. The algorithm constructs a maximum margin hyperplane which separates a set of positive examples from a set of negative examples. In the case of examples not linearly separable, SVM uses a kernel functions to map the examples from input space into high dimensional feature space. Using a kernel function can solve the non-linear problem. In our experiments, we used a polynomial kernel. We implemented the SVM classifier by using the WEKA 1 library. • Model 2 (HSVM): The proposed method is based on SVM classifier, which uses the class relationship obtained from a confusion matrix for building a hierarchical SVM (HSVM). A confusion matrix shows the number of correct and incorrect predictions made by the model compared with the actual classifications of the test data. The size of confusion matrix is m-by-m, where m is the number of classes. Figure 4 shows an example of a confusion matrix from Approach 3 built on a collection of articles obtained from the Wikipedia Selection for Schools. In a confusion matrix, the row corresponds to the actual classes, and the column corresponds to the prediction classes. In this example, for class art, the model makes the correct prediction equal to 49 instances and incorrect prediction into class citizenship (c) for 1 instance and into class design and technology (e) for 5 instances.
1 Weka. http://www.cs.waikato.ac.nz/ml/weka/
169 http://sites.google.com/site/ijcsis/ ISSN 1947-5500
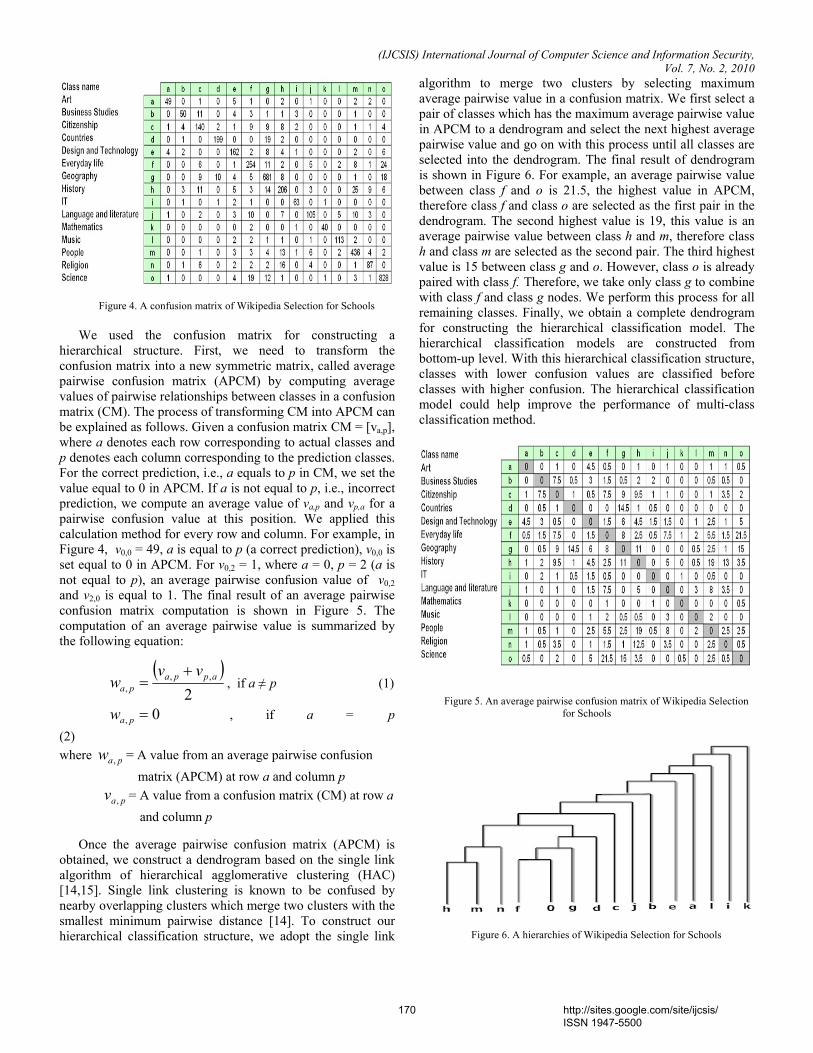
(IJCSIS) International Journal of Computer Science and Information Security, Vol. 7, No. 2, 2010
Figure 4. A confusion matrix of Wikipedia Selection for Schools
We used the confusion matrix for constructing a
hierarchical structure. First, we need to transform the confusion matrix into a new symmetric matrix, called average pairwise confusion matrix (APCM) by computing average values of pairwise relationships between classes in a confusion matrix (CM). The process of transforming CM into APCM can be explained as follows. Given a confusion matrix CM = [va,p], where a denotes each row corresponding to actual classes and p denotes each column corresponding to the prediction classes. For the correct prediction, i.e., a equals to p in CM, we set the value equal to 0 in APCM. If a is not equal to p, i.e., incorrect prediction, we compute an average value of va,p and vp,a for a pairwise confusion value at this position. We applied this calculation method for every row and column. For example, in Figure 4, v0,0 = 49, a is equal to p (a correct prediction), v0,0 is set equal to 0 in APCM. For v0,2 = 1, where a = 0, p = 2 (a is not equal to p), an average pairwise confusion value of v0,2 and v2,0 is equal to 1. The final result of an average pairwise confusion matrix computation is shown in Figure 5. The computation of an average pairwise value is summarized by the following equation:
( )
2,,
,appa
pa
vvw
+= , if a ≠ p (1)
, if a =0, =paw p (2) where = A value from an average pairwise confusion paw ,
matrix (APCM) at row a and column p = A value from a confusion matrix (CM) at row a pav ,
and column p
Once the average pairwise confusion matrix (APCM) is obtained, we construct a dendrogram based on the single link algorithm of hierarchical agglomerative clustering (HAC) [14,15]. Single link clustering is known to be confused by nearby overlapping clusters which merge two clusters with the smallest minimum pairwise distance [14]. To construct our hierarchical classification structure, we adopt the single link
algorithm to merge two clusters by selecting maximum average pairwise value in a confusion matrix. We first select a pair of classes which has the maximum average pairwise value in APCM to a dendrogram and select the next highest average pairwise value and go on with this process until all classes are selected into the dendrogram. The final result of dendrogram is shown in Figure 6. For example, an average pairwise value between class f and o is 21.5, the highest value in APCM, therefore class f and class o are selected as the first pair in the dendrogram. The second highest value is 19, this value is an average pairwise value between class h and m, therefore class h and class m are selected as the second pair. The third highest value is 15 between class g and o. However, class o is already paired with class f. Therefore, we take only class g to combine with class f and class g nodes. We perform this process for all remaining classes. Finally, we obtain a complete dendrogram for constructing the hierarchical classification model. The hierarchical classification models are constructed from bottom-up level. With this hierarchical classification structure, classes with lower confusion values are classified before classes with higher confusion. The hierarchical classification model could help improve the performance of multi-class classification method.
Figure 5. An average pairwise confusion matrix of Wikipedia Selection for Schools
Figure 6. A hierarchies of Wikipedia Selection for Schools
170 http://sites.google.com/site/ijcsis/ ISSN 1947-5500

(IJCSIS) International Journal of Computer Science and Information Security, Vol. 7, No. 2, 2010
IV. EXPERIMENTS AND DISCUSSION
A. Web page collection In our experiments, we used a collection of articles obtained from the Wikipedia Selection for Schools which is available from the SOS Children's Villages Web site2. There are 15 categories: art, business studies, citizenship, countries, design and technology, everyday life, geography, history, IT, language and literature, mathematics, music, people, religion and science. The total number of articles is 4,625. Table 2 lists the first-level subject categories available from the collection. Organizing articles into the subject category set provides users a convenient way to access the articles on the same subject. Each article contains many hypertext links to other articles which are related to the current article.
TABLE II. THE SUBJECT CATEGORIES UNDER THE WIKIPEDIA SELECTION FOR SCHOOL
B. Experiments
We used the LDA algorithm provided by the linguistic analysis tool called LingPipe 3 to run our experiments. LingPipe is a suite of Java tools designed to perform linguistic analysis on natural language data. In this experiment, we applyed the LDA algorithm provided under the LingPipe API and set the number of topics equal to 200 and the number of epochs to 2,000.For text classification process, we used WEKA, an open-source machine learning tool, to perform the experiments.
C. Evaluation Metrics The standard performance metrics for evaluating the text classification used in the experiments are accuracy, precision, recall and F1 measure [16]. We tested all algorithms by using the 10-fold cross validation. Accuracy, precision, recall and F1 measure are defined as:
2 SOS Children's Villages Web site. http://www.soschildrensvillages.org.uk/ charity-news/wikipedia-for- schools.htm 3 LingPipe. http://alias-i.com/lingpipe
the number of correctly classified test documentsAccuracytotal number of test documents
= (3)
the number of correct positive predictionsPrecision =
the number of positive predictions (4)
the number of correct positive predictionsRecall = the number of positive data
(5)
recallprecision
recallprecisionF+××
=21 (6)
where Accuracy represents the percentage of correct predictions in total predictions. Precision (P) is the percentage of the predicted documents for a given category that are classified correctly. Recall (R) is the percentage of the documents for a given category that are classified correctly. F1 measure is a single measure that tries to combine precision and recall. F1 measure ranges from 0 to 1 and the higher the better.
D. Experimental results We started by evaluating the weight values of neighboring pages under Approach 3. Table 3 shows the results of combination the weight value of neighboring pages on our algorithm. For the SVM model, the best combination of neighboring pages with the accuracy equal to 85.21% and the F1 measure of 0.8501 by weight of parent pages, child pages and sibling pages equal to 0.4, 0.0 and 0.3, respectively and for the HSVM model has the best combination of neighboring pages with the accuracy equal to 90.33% and the F1 measure of 0.9014 by weight the same SVM model. The results showed that using information from parent pages and sibling pages are more effective than child pages for improving the performance of a classification model.
TABLE III. CLASSIFICATION RESULTS BY INTEGRATING NEIGHBORING PAGES
Models Wp Wc Ws P R F1 Accuracy (%)
SVM 0.4 0.0 0.3 0.8583 0.8337 0.8501 85.21 HSVM 0.4 0.0 0.3 0.8984 0.9046 0.9014 90.33
From Table 4, the results of classification model based on two models between the SVM model and the hierarchical SVM (HSVM), the approach of integrating current page with the neighboring pages via the topic model (TOPIC_INTEGRATED) yielded a higher accuracy compared to applying the topic model on current page (TOPIC_CURRENT) and applying the BOW model. For the SVM model, on the TOPIC_INTEGRATED approach, the highest accuracy is 85.21%; improvement of 23.96% over the BOW model. For the HSVM model, on the TOPIC_INTEGRATED approach, the highest accuracy is 90.33%; improvement of 4.64% over the BOW model.
Category No. of Articles
Category No. of
Articles
Art 74 Business Studies 88
Citizenship 224 Countries 220
Design and Technology 250 Everyday life 380
Geography 650 History 400
IT 64 Language and literature 196
Mathematics 45 Music 140
People 680 Religion 146
Science 1068
171 http://sites.google.com/site/ijcsis/ ISSN 1947-5500
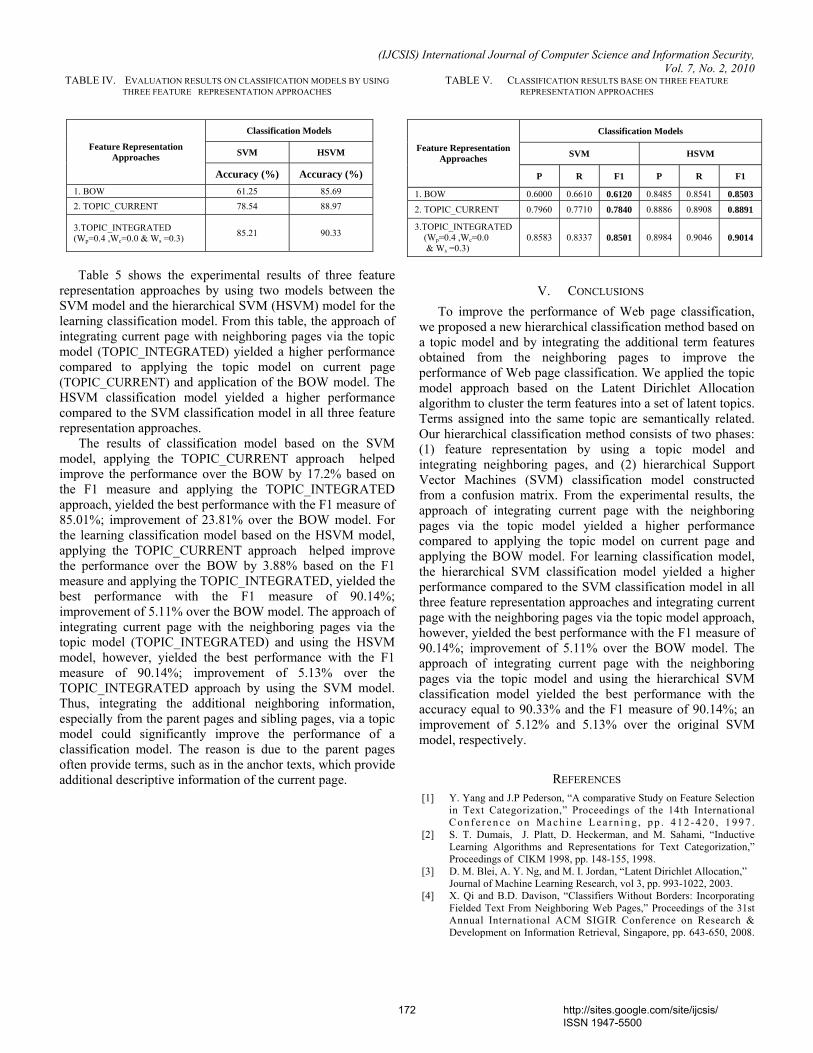
(IJCSIS) International Journal of Computer Science and Information Security, Vol. 7, No. 2, 2010
TABLE IV. EVALUATION RESULTS ON CLASSIFICATION MODELS BY USING THREE FEATURE REPRESENTATION APPROACHES
Table 5 shows the experimental results of three feature representation approaches by using two models between the SVM model and the hierarchical SVM (HSVM) model for the learning classification model. From this table, the approach of integrating current page with neighboring pages via the topic model (TOPIC_INTEGRATED) yielded a higher performance compared to applying the topic model on current page (TOPIC_CURRENT) and application of the BOW model. The HSVM classification model yielded a higher performance compared to the SVM classification model in all three feature representation approaches.
The results of classification model based on the SVM model, applying the TOPIC_CURRENT approach helped improve the performance over the BOW by 17.2% based on the F1 measure and applying the TOPIC_INTEGRATED approach, yielded the best performance with the F1 measure of 85.01%; improvement of 23.81% over the BOW model. For the learning classification model based on the HSVM model, applying the TOPIC_CURRENT approach helped improve the performance over the BOW by 3.88% based on the F1 measure and applying the TOPIC_INTEGRATED, yielded the best performance with the F1 measure of 90.14%; improvement of 5.11% over the BOW model. The approach of integrating current page with the neighboring pages via the topic model (TOPIC_INTEGRATED) and using the HSVM model, however, yielded the best performance with the F1 measure of 90.14%; improvement of 5.13% over the TOPIC_INTEGRATED approach by using the SVM model. Thus, integrating the additional neighboring information, especially from the parent pages and sibling pages, via a topic model could significantly improve the performance of a classification model. The reason is due to the parent pages often provide terms, such as in the anchor texts, which provide additional descriptive information of the current page.
TABLE V. CLASSIFICATION RESULTS BASE ON THREE FEATURE REPRESENTATION APPROACHES
V. CONCLUSIONS To improve the performance of Web page classification, we proposed a new hierarchical classification method based on a topic model and by integrating the additional term features obtained from the neighboring pages to improve the performance of Web page classification. We applied the topic model approach based on the Latent Dirichlet Allocation algorithm to cluster the term features into a set of latent topics. Terms assigned into the same topic are semantically related. Our hierarchical classification method consists of two phases: (1) feature representation by using a topic model and integrating neighboring pages, and (2) hierarchical Support Vector Machines (SVM) classification model constructed from a confusion matrix. From the experimental results, the approach of integrating current page with the neighboring pages via the topic model yielded a higher performance compared to applying the topic model on current page and applying the BOW model. For learning classification model, the hierarchical SVM classification model yielded a higher performance compared to the SVM classification model in all three feature representation approaches and integrating current page with the neighboring pages via the topic model approach, however, yielded the best performance with the F1 measure of 90.14%; improvement of 5.11% over the BOW model. The approach of integrating current page with the neighboring pages via the topic model and using the hierarchical SVM classification model yielded the best performance with the accuracy equal to 90.33% and the F1 measure of 90.14%; an improvement of 5.12% and 5.13% over the original SVM model, respectively.
REFERENCES [1] Y. Yang and J.P Pederson, “A comparative Study on Feature Selection
in Text Categorization,” Proceedings of the 14th International C o n f e r e n c e o n M a c h i n e L e a r n i n g , p p . 4 1 2 - 4 2 0 , 1 9 9 7 .
[2] S. T. Dumais, J. Platt, D. Heckerman, and M. Sahami, “Inductive Learning Algorithms and Representations for Text Categorization,” Proceedings of CIKM 1998, pp. 148-155, 1998.
[3] D. M. Blei, A. Y. Ng, and M. I. Jordan, “Latent Dirichlet Allocation,” Journal of Machine Learning Research, vol 3, pp. 993-1022, 2003. [4] X. Qi and B.D. Davison, “Classifiers Without Borders: Incorporating Fielded Text From Neighboring Web Pages,” Proceedings of the 31st Annual International ACM SIGIR Conference on Research & Development on Information Retrieval, Singapore, pp. 643-650, 2008.
Classification Models
SVM HSVM Feature Representation Approaches
Accuracy (%) Accuracy (%) 1. BOW 61.25 85.69 2. TOPIC_CURRENT 78.54 88.97
3.TOPIC_INTEGRATED (Wp=0.4 ,Wc=0.0 & Ws =0.3) 85.21 90.33
Classification Models
SVM HSVM Feature Representation Approaches
P R F1 P R F1
1. BOW 0.6000 0.6610 0.6120 0.8485 0.8541 0.8503
2. TOPIC_CURRENT 0.7960 0.7710 0.7840 0.8886 0.8908 0.8891
3.TOPIC_INTEGRATED (Wp=0.4 ,Wc=0.0 & Ws =0.3)
0.8583 0.8337 0.8501 0.8984 0.9046 0.9014
172 http://sites.google.com/site/ijcsis/ ISSN 1947-5500
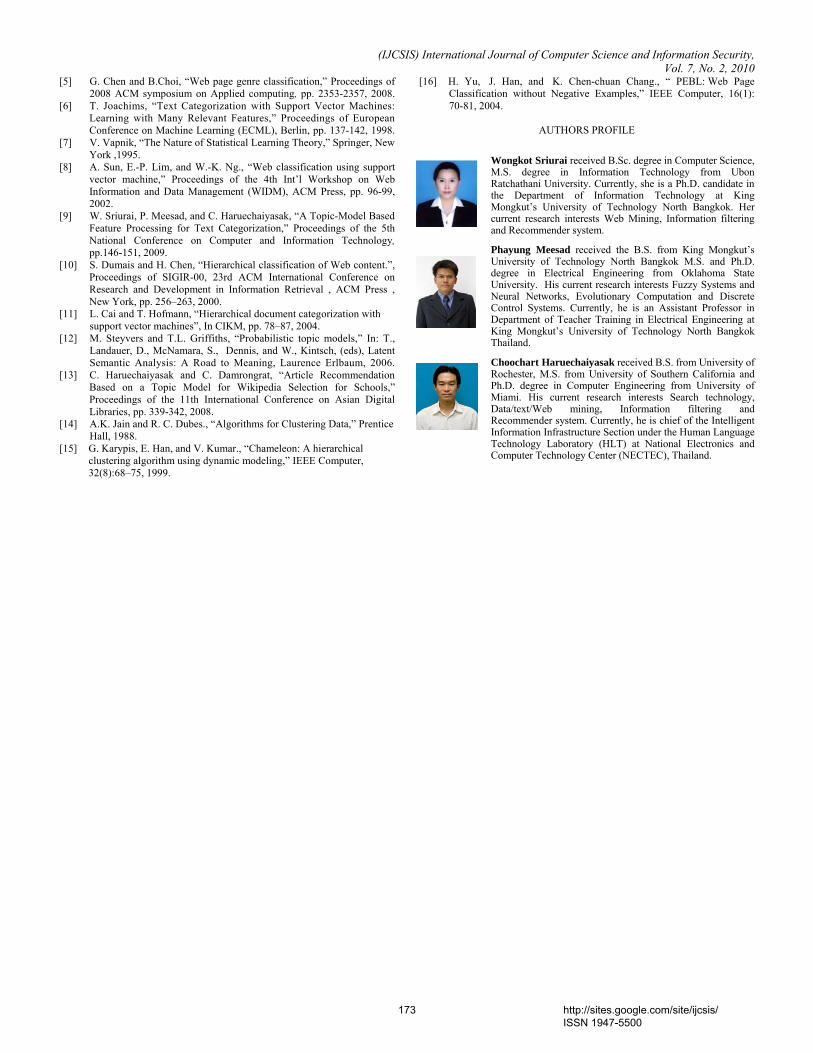
(IJCSIS) International Journal of Computer Science and Information Security, Vol. 7, No. 2, 2010
[5] G. Chen and B.Choi, “Web page genre classification,” Proceedings of 2008 ACM symposium on Applied computing, pp. 2353-2357, 2008. [6] T. Joachims, “Text Categorization with Support Vector Machines:
Learning with Many Relevant Features,” Proceedings of European Conference on Machine Learning (ECML), Berlin, pp. 137-142, 1998.
[7] V. Vapnik, “The Nature of Statistical Learning Theory,” Springer, New York ,1995.
[8] A. Sun, E.-P. Lim, and W.-K. Ng., “Web classification using support vector machine,” Proceedings of the 4th Int’l Workshop on Web Information and Data Management (WIDM), ACM Press, pp. 96-99, 2002.
[9] W. Sriurai, P. Meesad, and C. Haruechaiyasak, “A Topic-Model Based Feature Processing for Text Categorization,” Proceedings of the 5th National Conference on Computer and Information Technology, pp.146-151, 2009.
[10] S. Dumais and H. Chen, “Hierarchical classification of Web content.”, Proceedings of SIGIR-00, 23rd ACM International Conference on Research and Development in Information Retrieval , ACM Press , New York, pp. 256–263, 2000.
[11] L. Cai and T. Hofmann, “Hierarchical document categorization with support vector machines”, In CIKM, pp. 78–87, 2004. [12] M. Steyvers and T.L. Griffiths, “Probabilistic topic models,” In: T.,
Landauer, D., McNamara, S., Dennis, and W., Kintsch, (eds), Latent Semantic Analysis: A Road to Meaning, Laurence Erlbaum, 2006. [13] C. Haruechaiyasak and C. Damrongrat, “Article Recommendation
Based on a Topic Model for Wikipedia Selection for Schools,” Proceedings of the 11th International Conference on Asian Digital Libraries, pp. 339-342, 2008.
[14] A.K. Jain and R. C. Dubes., “Algorithms for Clustering Data,” Prentice Hall, 1988. [15] G. Karypis, E. Han, and V. Kumar., “Chameleon: A hierarchical clustering algorithm using dynamic modeling,” IEEE Computer, 32(8):68–75, 1999.
[16] H. Yu, J. Han, and K. Chen-chuan Chang., “ PEBL: Web Page Classification without Negative Examples,” IEEE Computer, 16(1): 70-81, 2004.
AUTHORS PROFILE
Wongkot Sriurai received B.Sc. degree in Computer Science, M.S. degree in Information Technology from Ubon Ratchathani University. Currently, she is a Ph.D. candidate in the Department of Information Technology at King Mongkut’s University of Technology North Bangkok. Her current research interests Web Mining, Information filtering and Recommender system.
Phayung Meesad received the B.S. from King Mongkut’s University of Technology North Bangkok M.S. and Ph.D. degree in Electrical Engineering from Oklahoma State University. His current research interests Fuzzy Systems and Neural Networks, Evolutionary Computation and Discrete Control Systems. Currently, he is an Assistant Professor in Department of Teacher Training in Electrical Engineering at King Mongkut’s University of Technology North Bangkok Thailand.
Choochart Haruechaiyasak received B.S. from University of Rochester, M.S. from University of Southern California and Ph.D. degree in Computer Engineering from University of Miami. His current research interests Search technology, Data/text/Web mining, Information filtering and Recommender system. Currently, he is chief of the Intelligent Information Infrastructure Section under the Human Language Technology Laboratory (HLT) at National Electronics and Computer Technology Center (NECTEC), Thailand.
173 http://sites.google.com/site/ijcsis/ ISSN 1947-5500
(IJCSIS) International Journal of Computer Science and Information Security, Vol. VII, No. II, February, 2010
Clinical gait data analysis based on Spatio-Temporal features
Rohit Katiyar, Lecturer Computer Science & Engineering Dept. Harcourt Butler Technological Institute
Kanpur (U.P.), India .
Dr. Vinay Kumar Pathak, Vice Chancellor Professor, Computer Science & Engg. Dept. Uttarakhand Open University, Uttarakhand
Haldwani, India .
Abstract—Analysing human gait has found considerable interest in recent computer vision research. So far, however, contributions to this topic exclusively dealt with the tasks of person identification or activity recognition. In this paper, we consider a different application for gait analysis and examine its use as a means of deducing the physical well-being of people. The proposed method is based on transforming the joint motion trajectories using wavelets to extract spatio-temporal features which are then fed as input to a vector quantiser; a self-organising map for classification of walking patterns of individuals with and without pathology. We show that our proposed algorithm is successful in extracting features that successfully discriminate between individuals with and without locomotion impairment.
Keywords- Human locomotion; Gait analysis; Feature extraction; Self-organising maps; Diagnostic signatures
1. INTRODUCTION
1.1. Human locomotion
Normal walking in humans may be defined as a method of locomotion involving the use of two legs, alternately, to provide both support and propulsion, with at least one foot in contact with the ground at all times. Walking is a periodic process and gait describes the manner or the style of walking—rather than the walking process itself [1]. Fig. 1 illustrates the repetitive events of gait. The stance phase starts by heel strike (or foot contact with ground) passes through midstance and ends by taking the toe off the ground to start the swing phase. The time interval between two successive occurrences of one of the repetitive events of walking is known as the gait cycle and it is usually defined between two consecutive heel-strikes of the same foot. One characteristic phase of walking is the double support interval, i.e. when both feet are in contact with the ground. This time interval decreases as the velocity of the subject increases until it vanishes; the subject is then considered to be running. The development of photographic methods of recording a series of displacements during locomotion by the end of the 19th century encouraged researchers from different disciplines to study human motion. The images were so useful as studies of the human form in motion that the noted poet and physician Oliver Wendell Holmes, who was interested in providing artificial limbs for veterans of the American Civil War,
proclaimed that it was photography which assisted him in the study of the “complex act” of walking [2]. Experiments of the American photographer Eadweard Muybridge of photographing animals (e.g. horse during trotting) and humans in motion (e.g. athletes while practising a sport) perfected the study of animal and human locomotion [3]. Early experiments to study human locomotion were done by Marey, the first scientist in Europe to study motion and its visual implications [4]. Marey observed an actor dressed in a black body stocking with white strips on his limbs. He studied the motion through observing the traces left on photographic plates as the actor walked laterally across the field of view of the camera [5]. Later, at the end of the century, two German scientists Braune and Fischer used a similar approach to study human motion [6], but they used light rods attached to the actor’s limbs instead. Following those pioneers, lots of researchers from different disciplines studied human locomotion. Since the early seventies of the last century, biomechanics researchers have used a technique similar to the ones used by Marey for gait analysis and assessment. In Ref. [7] a method is described for measurement of gait movement from a motion picture film where three cameras were placed such that two are on the sides and one is at the front of a walkway—and a barefooted subject walked across the walkway. Measurements of the flexion/extension of knee and ankle in the sagittal plane and rotation of the pelvis, femur and foot in the transverse plane were measured with this system which had the advantage of being painless and did not involve any encumbering apparatus attached to the patient. In Ref. [8] a television/computer system is designed to estimate the spatial coordinates of markers attached to a subject indicating anatomical landmarks. The system was designed and tested for human locomotion analysis. Another attempt at kinematic analysis using a video camera, frame grabbers and a PC was proposed in Ref. [9]. The approach was based on tracking passive markers attached on specific body landmarks and the results were depicted as an animated stick diagram as well as graphs of joints’ flexion/extension. Interest of researchers was not confined to patterns of normal subjects, it extended to the study of the pathological gait [10, 11]. The method of using markers attached to joints or points of interest of a subject or an articulated object is similar to what is known in the literature of motion perception as Moving light
174 http://sites.google.com/site/ijcsis/ ISSN 1947-5500
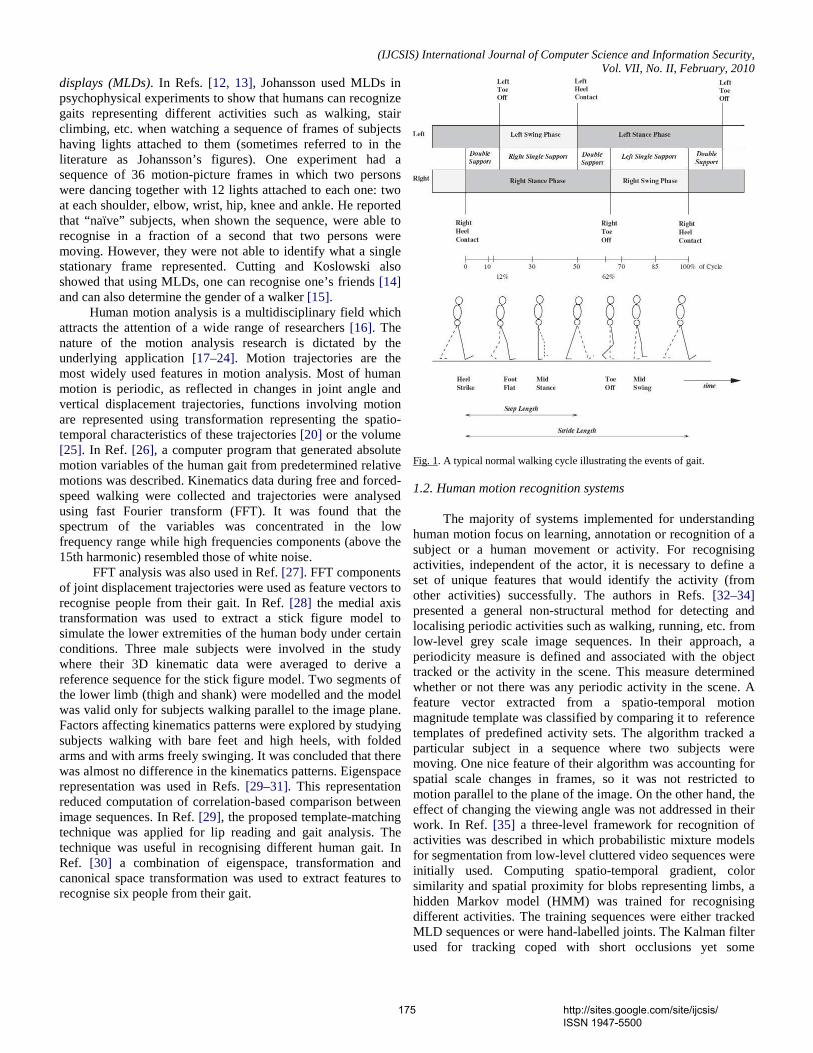
(IJCSIS) International Journal of Computer Science and Information Security, Vol. VII, No. II, February, 2010
displays (MLDs). In Refs. [12, 13], Johansson used MLDs in psychophysical experiments to show that humans can recognize gaits representing different activities such as walking, stair climbing, etc. when watching a sequence of frames of subjects having lights attached to them (sometimes referred to in the literature as Johansson’s figures). One experiment had a sequence of 36 motion-picture frames in which two persons were dancing together with 12 lights attached to each one: two at each shoulder, elbow, wrist, hip, knee and ankle. He reported that “naïve” subjects, when shown the sequence, were able to recognise in a fraction of a second that two persons were moving. However, they were not able to identify what a single stationary frame represented. Cutting and Koslowski also showed that using MLDs, one can recognise one’s friends [14] and can also determine the gender of a walker [15]. Human motion analysis is a multidisciplinary field which attracts the attention of a wide range of researchers [16]. The nature of the motion analysis research is dictated by the underlying application [17–24]. Motion trajectories are the most widely used features in motion analysis. Most of human motion is periodic, as reflected in changes in joint angle and vertical displacement trajectories, functions involving motion are represented using transformation representing the spatio-temporal characteristics of these trajectories [20] or the volume [25]. In Ref. [26], a computer program that generated absolute motion variables of the human gait from predetermined relative motions was described. Kinematics data during free and forced-speed walking were collected and trajectories were analysed using fast Fourier transform (FFT). It was found that the spectrum of the variables was concentrated in the low frequency range while high frequencies components (above the 15th harmonic) resembled those of white noise. FFT analysis was also used in Ref. [27]. FFT components of joint displacement trajectories were used as feature vectors to recognise people from their gait. In Ref. [28] the medial axis transformation was used to extract a stick figure model to simulate the lower extremities of the human body under certain conditions. Three male subjects were involved in the study where their 3D kinematic data were averaged to derive a reference sequence for the stick figure model. Two segments of the lower limb (thigh and shank) were modelled and the model was valid only for subjects walking parallel to the image plane. Factors affecting kinematics patterns were explored by studying subjects walking with bare feet and high heels, with folded arms and with arms freely swinging. It was concluded that there was almost no difference in the kinematics patterns. Eigenspace representation was used in Refs. [29–31]. This representation reduced computation of correlation-based comparison between image sequences. In Ref. [29], the proposed template-matching technique was applied for lip reading and gait analysis. The technique was useful in recognising different human gait. In Ref. [30] a combination of eigenspace, transformation and canonical space transformation was used to extract features to recognise six people from their gait.
Fig. 1. A typical normal walking cycle illustrating the events of gait. 1.2. Human motion recognition systems The majority of systems implemented for understanding human motion focus on learning, annotation or recognition of a subject or a human movement or activity. For recognising activities, independent of the actor, it is necessary to define a set of unique features that would identify the activity (from other activities) successfully. The authors in Refs. [32–34] presented a general non-structural method for detecting and localising periodic activities such as walking, running, etc. from low-level grey scale image sequences. In their approach, a periodicity measure is defined and associated with the object tracked or the activity in the scene. This measure determined whether or not there was any periodic activity in the scene. A feature vector extracted from a spatio-temporal motion magnitude template was classified by comparing it to reference templates of predefined activity sets. The algorithm tracked a particular subject in a sequence where two subjects were moving. One nice feature of their algorithm was accounting for spatial scale changes in frames, so it was not restricted to motion parallel to the plane of the image. On the other hand, the effect of changing the viewing angle was not addressed in their work. In Ref. [35] a three-level framework for recognition of activities was described in which probabilistic mixture models for segmentation from low-level cluttered video sequences were initially used. Computing spatio-temporal gradient, color similarity and spatial proximity for blobs representing limbs, a hidden Markov model (HMM) was trained for recognising different activities. The training sequences were either tracked MLD sequences or were hand-labelled joints. The Kalman filter used for tracking coped with short occlusions yet some
175 http://sites.google.com/site/ijcsis/ ISSN 1947-5500
(IJCSIS) International Journal of Computer Science and Information Security, Vol. VII, No. II, February, 2010
occlusions resulted in misclassification of activity. Sequences seemed to have only one subject in the scene moving parallel to the image plane. In Ref. [36] features from displacements of the body parts in the vertical and horizontal directions were extracted and a classifier based on HMM was used to identify different activities (walking, hopping, running and limping). A different perspective for recognising activities was portrayed in Ref. [37] by Johansson. His approach focused on high level representations through modelling human recognition of MLDs. He showed that recognition of gait can be achieved through multiresolution feature hierarchies extracted from motion rather than shape information. He applied his approach to recognise three gaits (walking, running and skipping) performed by four different subjects. A similar approach was used in Ref. [38] where techniques based on space curves were developed assuming the availability of 3D Cartesian tracking data to represent movements of ballet dancers. The system learned and recognised nine movements from an un-segmented stream of motion. The idea was based on representing each movement with a set of unique constraints which were extracted from a phase-space that related the independent variables of the body motion. A potential application given by the authors was video annotation for the ever increasing video databases in, for example, entertainment companies and sports teams. For recognising individuals, examples of research attempts to develop systems to recognise individuals from their gait have been previously discussed. One other attempt [39] computed the optical flow for an image sequence of a walking person and characterised the shape of the motion with a set of sinusoidally varying scalars. Extracting feature vectors composed of the phases of the sinusoids which have shown significant statistical variation, the system was able to discriminate among five subjects. The representation is model-free and only considered subjects walking across the field of view of a stationary camera. Following the above and other studies, gait has been considered as a biometric for individual authentication [40–42]. The idea of the existence of human gait signatures has been widely accepted, e.g. Refs. [43,44]. In this article, we extend this idea to explore the existence of clinical diagnostic signatures from gait data. 1.3. Clinical gait analysis Normal walking depends on a continual interchange between mobility and stability. Free passive mobility and appropriate muscle action are basic constituents. Any abnormality restricting the normal free mobility of a joint or altering either the timing or intensity of muscle action creates an abnormal gait. Abnormal gait may be due to an injury, disease, pain or problems of motor control. The subject’s ability to compensate for the abnormality determines the amount of functionality retained. However, when these compensations introduce penalties in joint strain, muscle overuse, lack of normal muscle growth or soft tissue contracture, then clinical intervention becomes a
necessity. In determining appropriate intervention, gait analysis is used to identify gait defects. Clinical gait analysis comprises visual assessment, measurement of stride and temporal parameters such as stance, cadence and walking velocity, kinematics dealing with the analysis of joint movements, angles of rotations, etc. and kinetics involving analysis of forces and moments acting on joints and electromyography (EMG) measuring muscle activity [1]. Gait analysis mainly is to document deviations from normal pattern (deviations might be due to habit, pathological reasons or old age), to determine the abnormalities, their severity and their causes, to plan for future treatment which might involve surgery, physiotherapy, or the use of braces, orthosis or any other walking aid, to evaluate the effect of intervention, and finally to measure and assess the change over time with treatment. Gait analysis instrumentation based on infra-red (IR) cameras and computer-aided systems recording the 3D positions of markers attached to the subject has been used to record gait cycles of the patient and produce patterns and plots for clinicians to assess and hence diagnose. To measure kinematics, the subject is filmed while walking using cameras placed on both sides and in front of the walkway such that each marker is seen by at least two cameras at any instant. For kinetics measurements, the subject activates force plates embedded in the walkway. The output of the cameras and the force plates is fed to the computer which estimates the 3D coordinates of the markers and the moments and torques applied on each joint. Kinematics, kinetics measurements and movement trajectories of the joints in the three different planes of movement are plotted for each patient. The pathological traces are plotted together with normal ones to show the variations resulting from the impairment and at the upper left corner of the figure, different gait parameters, e.g. cadence, velocity, etc. are also estimated for the patient. These graphs are then assessed by the specialists. The number of graphs plotted for gait analysis is immense and extracting useful information from such graphs to accomplish the gait analysis objectives mentioned earlier is a demanding and challenging task. This is due to various reasons that include the complexity of the walking process itself, variability of patients’ response to treatment, uncertainty in data quality and the difficulty in distinguishing between primary abnormalities and compensations in the gait pattern. Gait interpretation involves evaluation of all measurements of kinematics, kinetics and EMG to identify abnormalities in gait and hence suggesting and assessing treatment alternatives. The experience of the clinicians’ team is the key element for a successful interpretation and this must include the understanding of normal gait, efficient and rigorous data collection and adequate data reduction [45]. Early studies by Murray [46,47] aimed to establish ranges of normal values for normal human walking for both men and women from kinematics data analysis. Her studies involved 60 men of 20–65 years of age and 30 women of 20–80 years of age. The main aim of the study was to provide standards concerning speed, stride dimensions as well as angular and linear displacement of the trunk and extremities with which abnormal gait patterns
176 http://sites.google.com/site/ijcsis/ ISSN 1947-5500
(IJCSIS) International Journal of Computer Science and Information Security, Vol. VII, No. II, February, 2010
could be compared. Moreover, the study went further trying to find correlations between different parameters, e.g. height and gait parameters; age and displacement patterns. Developing automatic systems for clinical gait analysis provides objective analysis and interpretation of gait signals. In developing an automatic system for analysis and recognition of gait signals, signal processing not only forms a key element in the analysis extraction and interpretation of information but also plays an important role in the dimensionality reduction [41]. Some artificial intelligence (AI) methods, as artificial neural networks, due to their inherent abilities of generalization, interpolation and fault tolerance offer means to assist in dealing with the challenge of processing huge amounts of data, classifying it through extracting generic diagnostic signatures. A review of the use of these techniques in analysing clinical gait data can be found in Refs. [48,49]. Moreover, psychophysical experiments carried out by Johansson [12,13] and others showed that humans can recognise activities from a sequence of frames containing only points corresponding to specific body landmarks of a subject. The research presented in this article is motivated by the capabilities of humans to perceive gait from reduced spatiotemporal trajectories, and attempts to give machines a similar gait perception capability. It builds upon Murray’s ideas of setting standards for normal walking and investigates the existence of diagnostic signatures that can be extracted from kinematics based features for both normal and pathological subjects. Our objective is to automatically find salient features within trajectories of locomotion from which normal gait standards could be set. Similarly, for abnormal gait, those features could be used for diagnosis of abnormal walking or for establishing relationships among spatio-temporal parameters, gaits and impairment. The long term objective of this work is to provide clinicians with tools for data reduction, feature extraction and gait profile understanding.
2. METHODS
2.1. Gait data Experiments involved gait data of 89 subjects with no disabilities of 4–71 years of age and 32 pathological cases of polio, spina-bifida and cerebral palsy (CP) including symmetrical diplegias (dp), left and right asymmetrical (la, ra) diplegias and left and right hemiplegias (lh, rh) were used in our experiments. The data were collected using a Vicon_ 3D motion capture system at the Anderson Gait Lab in Edinburgh, with markers placed in accordance with Ref. [50]. Temporal and distance parameters of each subject such as cadence, speed, stride length, etc. were calculated. In this work, the focus is concentrated on sagittal angles of the hip and knee joints from which the aim is to extract salient features and diagnostic gait signatures. 2.2. Spatio-temporal feature extraction
Kinematics gait signals (e.g. knee flexion/extension trajectory) are non-stationary signals that are rich in dynamic time related data and partly disturbed by noise and artifacts. Extracting generic features as well as specific ones from such a signal implies that the analysis of the signal ought to be done on an adaptable time scale. The wavelet transform is an effective tool for analysis of non stationary biomedical signals [51]. It provides spectral decomposition of the signal onto a set of basis functions, wavelets, in which representation of temporal dynamics is retained [52]. The continuous wavelet transform (CWT) for a 1D signal x(t) is defined as the inner product of the signal function x(t) and the wavelet family. This is expressed by the following:
where ψ∗(t) is the conjugate of the transforming function also called the mother wavelet, τ is the translation parameter, i.e. representing the shift in the time domain, s(>0) is the scale parameter and is proportional to 1/frequency. The transform is convenient for analysing hierarchical structures where it behaves as a mathematical microscope with properties independent of the magnification factor. In other words, low scales correspond to detailed information of a pattern in the signal whereas high scales correspond to global information of the signal while pattern properties are maintained. Given the advantage of providing a spectrum for a signal whilst maintaining its temporal dynamics on an adaptable time scale, we choose to use the CWT to analyze the joint angle trajectories and we use the Morlet wavelet as the mother wavelet. The Morlet wavelet [53] is a locally periodic wave-train. It is obtained by taking a complex sine wave and localising it with a Gaussian envelope as in the following equations:
where vo is a constant which satisfies the admissibility condition if vo >0.8. Once we extract the spatio-temporal features using CWT, the next step in developing an automatic analysing and recognition system is to determine a classification that is most likely to have generated the observed data. Since neither the classes nor their number are defined a priori, this is a typical problem of unsupervised classification. We will consider clustering methods to tackle the problem at hand. Clustering methods facilitate the visualisation where one is able to see the groupings of samples which are close together. Encouraged by extensive literature on data exploration from self-organising maps (SOM), e.g. Refs. [54–56], the SOM is the favored technique for vector quantisation in this analysis. Moreover, the SOM’s primary goal is not one of classification but presentation of structures in data, without the need for a priori class definitions [57, 58]. This is typical of the case here where we do not want to enforce specified classification based on prior knowledge of the subjects involved in the study. The SOM also exposes new structures that might not be obvious by
177 http://sites.google.com/site/ijcsis/ ISSN 1947-5500
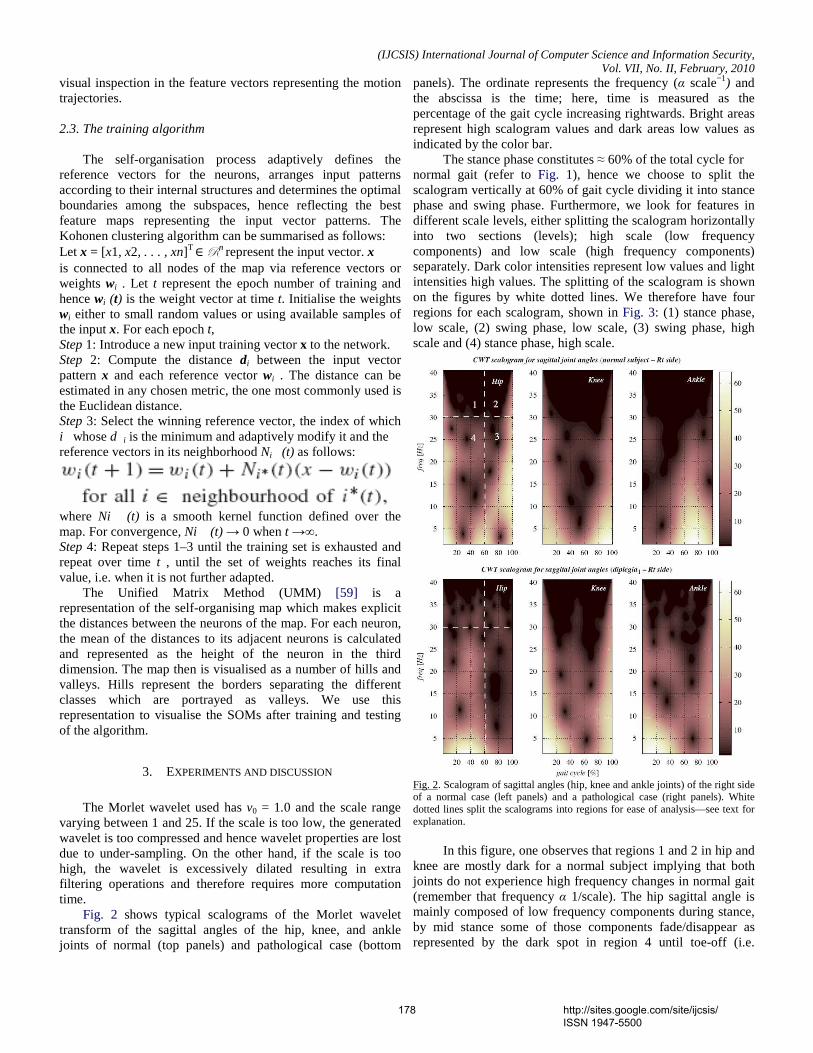
(IJCSIS) International Journal of Computer Science and Information Security, Vol. VII, No. II, February, 2010
visual inspection in the feature vectors representing the motion trajectories. 2.3. The training algorithm The self-organisation process adaptively defines the reference vectors for the neurons, arranges input patterns according to their internal structures and determines the optimal boundaries among the subspaces, hence reflecting the best feature maps representing the input vector patterns. The Kohonen clustering algorithm can be summarised as follows: Let x = [x1, x2, . . . , xn]T
∈ en represent the input vector. x is connected to all nodes of the map via reference vectors or weights wi . Let t represent the epoch number of training and hence wi (t) is the weight vector at time t. Initialise the weights wi either to small random values or using available samples of the input x. For each epoch t, Step 1: Introduce a new input training vector x to the network. Step 2: Compute the distance di between the input vector pattern x and each reference vector wi . The distance can be estimated in any chosen metric, the one most commonly used is the Euclidean distance. Step 3: Select the winning reference vector, the index of which i� whose d�i is the minimum and adaptively modify it and the reference vectors in its neighborhood Ni� (t) as follows:
where Ni� (t) is a smooth kernel function defined over the map. For convergence, Ni� (t) → 0 when t →∞. Step 4: Repeat steps 1–3 until the training set is exhausted and repeat over time t , until the set of weights reaches its final value, i.e. when it is not further adapted. The Unified Matrix Method (UMM) [59] is a representation of the self-organising map which makes explicit the distances between the neurons of the map. For each neuron, the mean of the distances to its adjacent neurons is calculated and represented as the height of the neuron in the third dimension. The map then is visualised as a number of hills and valleys. Hills represent the borders separating the different classes which are portrayed as valleys. We use this representation to visualise the SOMs after training and testing of the algorithm.
3. EXPERIMENTS AND DISCUSSION
The Morlet wavelet used has v0 = 1.0 and the scale range varying between 1 and 25. If the scale is too low, the generated wavelet is too compressed and hence wavelet properties are lost due to under-sampling. On the other hand, if the scale is too high, the wavelet is excessively dilated resulting in extra filtering operations and therefore requires more computation time. Fig. 2 shows typical scalograms of the Morlet wavelet transform of the sagittal angles of the hip, knee, and ankle joints of normal (top panels) and pathological case (bottom
panels). The ordinate represents the frequency (α scale−1) and the abscissa is the time; here, time is measured as the percentage of the gait cycle increasing rightwards. Bright areas represent high scalogram values and dark areas low values as indicated by the color bar. The stance phase constitutes ≈ 60% of the total cycle for normal gait (refer to Fig. 1), hence we choose to split the scalogram vertically at 60% of gait cycle dividing it into stance phase and swing phase. Furthermore, we look for features in different scale levels, either splitting the scalogram horizontally into two sections (levels); high scale (low frequency components) and low scale (high frequency components) separately. Dark color intensities represent low values and light intensities high values. The splitting of the scalogram is shown on the figures by white dotted lines. We therefore have four regions for each scalogram, shown in Fig. 3: (1) stance phase, low scale, (2) swing phase, low scale, (3) swing phase, high scale and (4) stance phase, high scale.
Fig. 2. Scalogram of sagittal angles (hip, knee and ankle joints) of the right side of a normal case (left panels) and a pathological case (right panels). White dotted lines split the scalograms into regions for ease of analysis—see text for explanation. In this figure, one observes that regions 1 and 2 in hip and knee are mostly dark for a normal subject implying that both joints do not experience high frequency changes in normal gait (remember that frequency α 1/scale). The hip sagittal angle is mainly composed of low frequency components during stance, by mid stance some of those components fade/disappear as represented by the dark spot in region 4 until toe-off (i.e.
178 http://sites.google.com/site/ijcsis/ ISSN 1947-5500
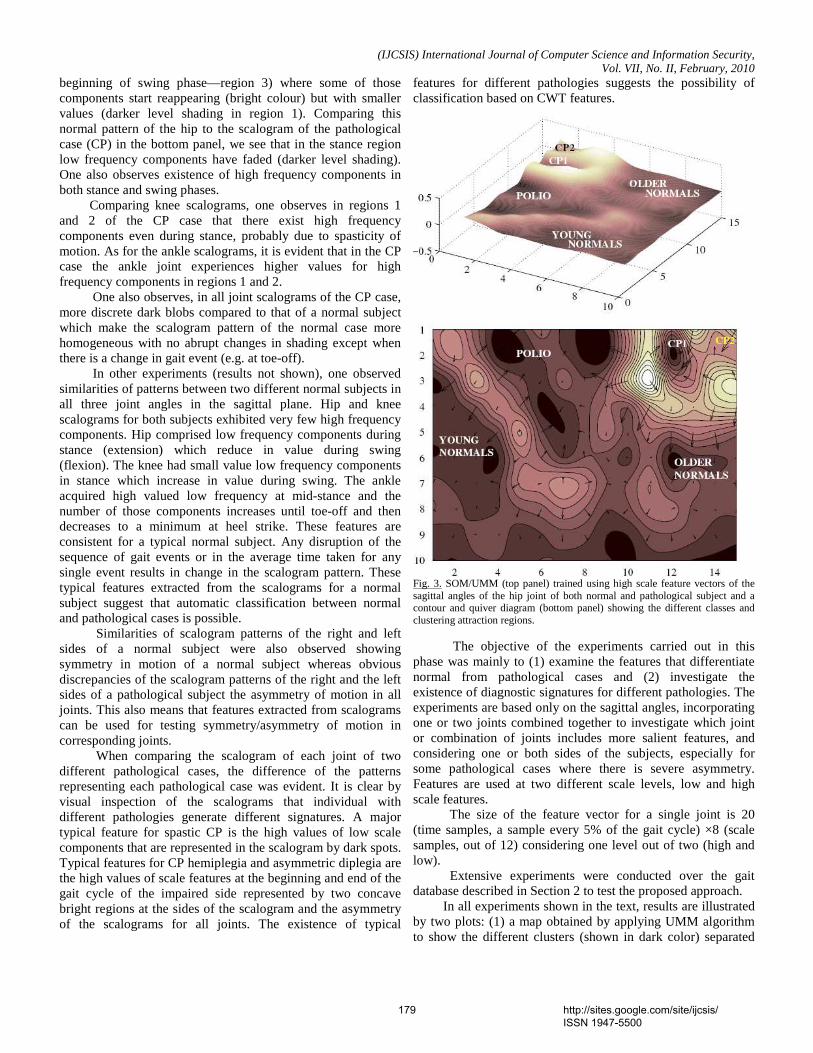
(IJCSIS) International Journal of Computer Science and Information Security, Vol. VII, No. II, February, 2010
beginning of swing phase—region 3) where some of those components start reappearing (bright colour) but with smaller values (darker level shading in region 1). Comparing this normal pattern of the hip to the scalogram of the pathological case (CP) in the bottom panel, we see that in the stance region low frequency components have faded (darker level shading). One also observes existence of high frequency components in both stance and swing phases. Comparing knee scalograms, one observes in regions 1 and 2 of the CP case that there exist high frequency components even during stance, probably due to spasticity of motion. As for the ankle scalograms, it is evident that in the CP case the ankle joint experiences higher values for high frequency components in regions 1 and 2. One also observes, in all joint scalograms of the CP case, more discrete dark blobs compared to that of a normal subject which make the scalogram pattern of the normal case more homogeneous with no abrupt changes in shading except when there is a change in gait event (e.g. at toe-off). In other experiments (results not shown), one observed similarities of patterns between two different normal subjects in all three joint angles in the sagittal plane. Hip and knee scalograms for both subjects exhibited very few high frequency components. Hip comprised low frequency components during stance (extension) which reduce in value during swing (flexion). The knee had small value low frequency components in stance which increase in value during swing. The ankle acquired high valued low frequency at mid-stance and the number of those components increases until toe-off and then decreases to a minimum at heel strike. These features are consistent for a typical normal subject. Any disruption of the sequence of gait events or in the average time taken for any single event results in change in the scalogram pattern. These typical features extracted from the scalograms for a normal subject suggest that automatic classification between normal and pathological cases is possible. Similarities of scalogram patterns of the right and left sides of a normal subject were also observed showing symmetry in motion of a normal subject whereas obvious discrepancies of the scalogram patterns of the right and the left sides of a pathological subject the asymmetry of motion in all joints. This also means that features extracted from scalograms can be used for testing symmetry/asymmetry of motion in corresponding joints. When comparing the scalogram of each joint of two different pathological cases, the difference of the patterns representing each pathological case was evident. It is clear by visual inspection of the scalograms that individual with different pathologies generate different signatures. A major typical feature for spastic CP is the high values of low scale components that are represented in the scalogram by dark spots. Typical features for CP hemiplegia and asymmetric diplegia are the high values of scale features at the beginning and end of the gait cycle of the impaired side represented by two concave bright regions at the sides of the scalogram and the asymmetry of the scalograms for all joints. The existence of typical
features for different pathologies suggests the possibility of classification based on CWT features.
Fig. 3. SOM/UMM (top panel) trained using high scale feature vectors of the sagittal angles of the hip joint of both normal and pathological subject and a contour and quiver diagram (bottom panel) showing the different classes and clustering attraction regions. The objective of the experiments carried out in this phase was mainly to (1) examine the features that differentiate normal from pathological cases and (2) investigate the existence of diagnostic signatures for different pathologies. The experiments are based only on the sagittal angles, incorporating one or two joints combined together to investigate which joint or combination of joints includes more salient features, and considering one or both sides of the subjects, especially for some pathological cases where there is severe asymmetry. Features are used at two different scale levels, low and high scale features. The size of the feature vector for a single joint is 20 (time samples, a sample every 5% of the gait cycle) ×8 (scale samples, out of 12) considering one level out of two (high and low). Extensive experiments were conducted over the gait database described in Section 2 to test the proposed approach. In all experiments shown in the text, results are illustrated by two plots: (1) a map obtained by applying UMM algorithm to show the different clusters (shown in dark color) separated
179 http://sites.google.com/site/ijcsis/ ISSN 1947-5500
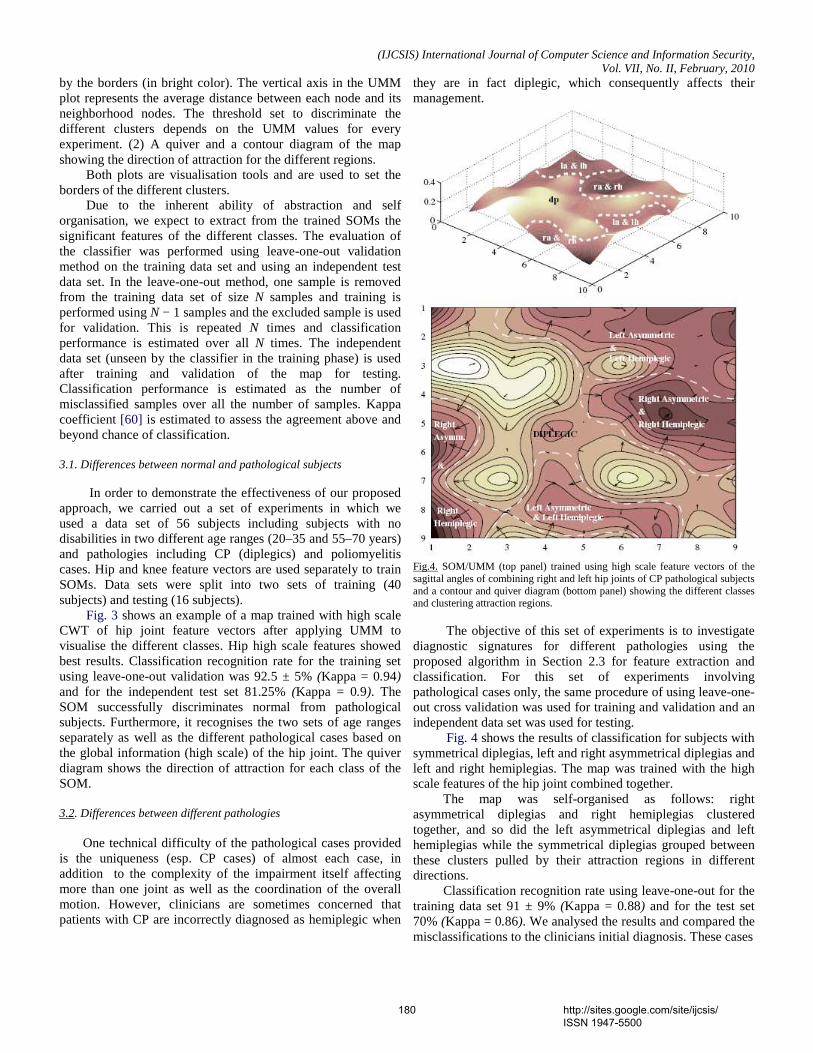
(IJCSIS) International Journal of Computer Science and Information Security, Vol. VII, No. II, February, 2010
by the borders (in bright color). The vertical axis in the UMM plot represents the average distance between each node and its neighborhood nodes. The threshold set to discriminate the different clusters depends on the UMM values for every experiment. (2) A quiver and a contour diagram of the map showing the direction of attraction for the different regions. Both plots are visualisation tools and are used to set the borders of the different clusters. Due to the inherent ability of abstraction and self organisation, we expect to extract from the trained SOMs the significant features of the different classes. The evaluation of the classifier was performed using leave-one-out validation method on the training data set and using an independent test data set. In the leave-one-out method, one sample is removed from the training data set of size N samples and training is performed using N − 1 samples and the excluded sample is used for validation. This is repeated N times and classification performance is estimated over all N times. The independent data set (unseen by the classifier in the training phase) is used after training and validation of the map for testing. Classification performance is estimated as the number of misclassified samples over all the number of samples. Kappa coefficient [60] is estimated to assess the agreement above and beyond chance of classification. 3.1. Differences between normal and pathological subjects In order to demonstrate the effectiveness of our proposed approach, we carried out a set of experiments in which we used a data set of 56 subjects including subjects with no disabilities in two different age ranges (20–35 and 55–70 years) and pathologies including CP (diplegics) and poliomyelitis cases. Hip and knee feature vectors are used separately to train SOMs. Data sets were split into two sets of training (40 subjects) and testing (16 subjects). Fig. 3 shows an example of a map trained with high scale CWT of hip joint feature vectors after applying UMM to visualise the different classes. Hip high scale features showed best results. Classification recognition rate for the training set using leave-one-out validation was 92.5 ± 5% (Kappa = 0.94) and for the independent test set 81.25% (Kappa = 0.9). The SOM successfully discriminates normal from pathological subjects. Furthermore, it recognises the two sets of age ranges separately as well as the different pathological cases based on the global information (high scale) of the hip joint. The quiver diagram shows the direction of attraction for each class of the SOM. 3.2. Differences between different pathologies One technical difficulty of the pathological cases provided is the uniqueness (esp. CP cases) of almost each case, in addition to the complexity of the impairment itself affecting more than one joint as well as the coordination of the overall motion. However, clinicians are sometimes concerned that patients with CP are incorrectly diagnosed as hemiplegic when
they are in fact diplegic, which consequently affects their management.
Fig.4. SOM/UMM (top panel) trained using high scale feature vectors of the sagittal angles of combining right and left hip joints of CP pathological subjects and a contour and quiver diagram (bottom panel) showing the different classes and clustering attraction regions. The objective of this set of experiments is to investigate diagnostic signatures for different pathologies using the proposed algorithm in Section 2.3 for feature extraction and classification. For this set of experiments involving pathological cases only, the same procedure of using leave-one-out cross validation was used for training and validation and an independent data set was used for testing. Fig. 4 shows the results of classification for subjects with symmetrical diplegias, left and right asymmetrical diplegias and left and right hemiplegias. The map was trained with the high scale features of the hip joint combined together. The map was self-organised as follows: right asymmetrical diplegias and right hemiplegias clustered together, and so did the left asymmetrical diplegias and left hemiplegias while the symmetrical diplegias grouped between these clusters pulled by their attraction regions in different directions. Classification recognition rate using leave-one-out for the training data set 91 ± 9% (Kappa = 0.88) and for the test set 70% (Kappa = 0.86). We analysed the results and compared the misclassifications to the clinicians initial diagnosis. These cases
180 http://sites.google.com/site/ijcsis/ ISSN 1947-5500
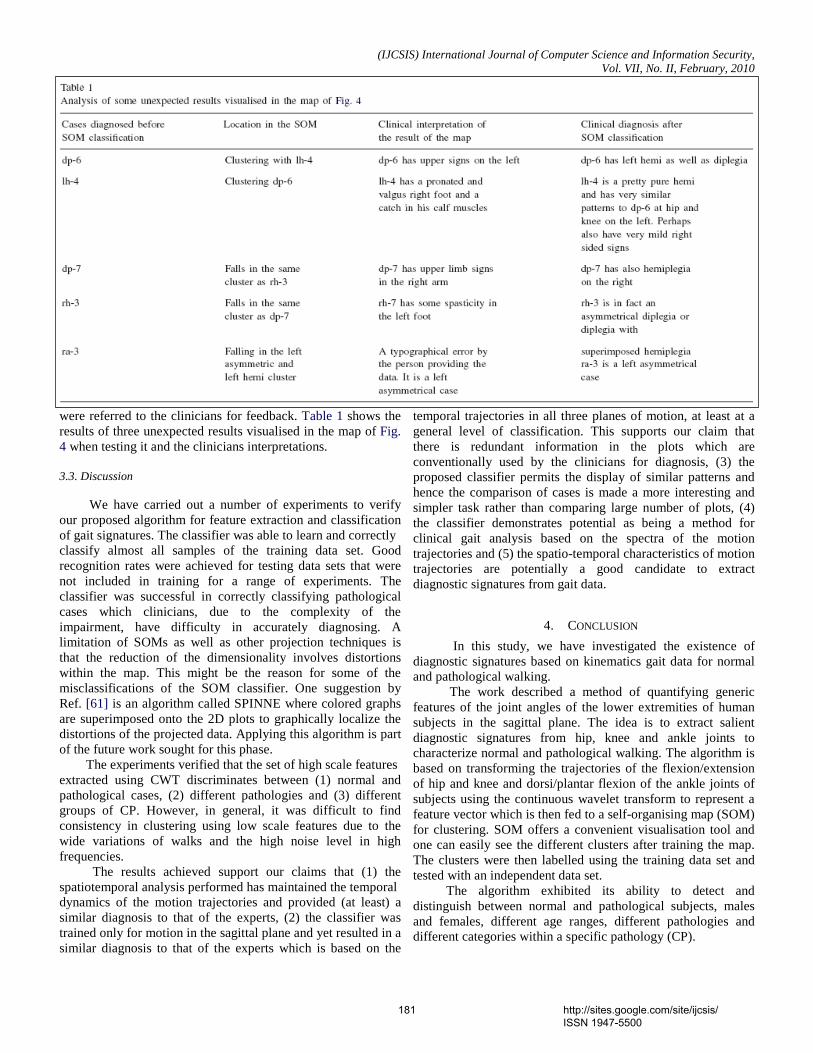
(IJCSIS) International Journal of Computer Science and Information Security, Vol. VII, No. II, February, 2010
were referred to the clinicians for feedback. Table 1 shows the results of three unexpected results visualised in the map of Fig. 4 when testing it and the clinicians interpretations. 3.3. Discussion We have carried out a number of experiments to verify our proposed algorithm for feature extraction and classification of gait signatures. The classifier was able to learn and correctly classify almost all samples of the training data set. Good recognition rates were achieved for testing data sets that were not included in training for a range of experiments. The classifier was successful in correctly classifying pathological cases which clinicians, due to the complexity of the impairment, have difficulty in accurately diagnosing. A limitation of SOMs as well as other projection techniques is that the reduction of the dimensionality involves distortions within the map. This might be the reason for some of the misclassifications of the SOM classifier. One suggestion by Ref. [61] is an algorithm called SPINNE where colored graphs are superimposed onto the 2D plots to graphically localize the distortions of the projected data. Applying this algorithm is part of the future work sought for this phase. The experiments verified that the set of high scale features extracted using CWT discriminates between (1) normal and pathological cases, (2) different pathologies and (3) different groups of CP. However, in general, it was difficult to find consistency in clustering using low scale features due to the wide variations of walks and the high noise level in high frequencies. The results achieved support our claims that (1) the spatiotemporal analysis performed has maintained the temporal dynamics of the motion trajectories and provided (at least) a similar diagnosis to that of the experts, (2) the classifier was trained only for motion in the sagittal plane and yet resulted in a similar diagnosis to that of the experts which is based on the
temporal trajectories in all three planes of motion, at least at a general level of classification. This supports our claim that there is redundant information in the plots which are conventionally used by the clinicians for diagnosis, (3) the proposed classifier permits the display of similar patterns and hence the comparison of cases is made a more interesting and simpler task rather than comparing large number of plots, (4) the classifier demonstrates potential as being a method for clinical gait analysis based on the spectra of the motion trajectories and (5) the spatio-temporal characteristics of motion trajectories are potentially a good candidate to extract diagnostic signatures from gait data.
4. CONCLUSION
In this study, we have investigated the existence of diagnostic signatures based on kinematics gait data for normal and pathological walking. The work described a method of quantifying generic features of the joint angles of the lower extremities of human subjects in the sagittal plane. The idea is to extract salient diagnostic signatures from hip, knee and ankle joints to characterize normal and pathological walking. The algorithm is based on transforming the trajectories of the flexion/extension of hip and knee and dorsi/plantar flexion of the ankle joints of subjects using the continuous wavelet transform to represent a feature vector which is then fed to a self-organising map (SOM) for clustering. SOM offers a convenient visualisation tool and one can easily see the different clusters after training the map. The clusters were then labelled using the training data set and tested with an independent data set. The algorithm exhibited its ability to detect and distinguish between normal and pathological subjects, males and females, different age ranges, different pathologies and different categories within a specific pathology (CP).
181 http://sites.google.com/site/ijcsis/ ISSN 1947-5500
(IJCSIS) International Journal of Computer Science and Information Security, Vol. VII, No. II, February, 2010
The procedure correctly classified some difficult pathological cases which were initially misclassified by specialists. This demonstrated its potential as a method of gait analysis and automatic diagnostic signature extraction.
References [1] M. Whittle, Gait Analysis: An Introduction, Butterworth-Heinemann,
London, 2001. [2] N. Rosenbaum, A World History of Photography, Abbeville Press, New
York, 1989. [3] E. Muybridge, Animals in Motion: An Electro-Photographic Investigation
of Consecutive Phases of Muscular Actions, Chapman & Hall, London, 1899.
[4] Centre Nationale d’Art Moderne, E-J Marey 1830/1904: La Photographie Du Mouvement Paris Centre Georges Pompidou, Musee national d’art moderne, Paris, 1977.
[5] E. Marey, Movement, William Heineman, London, 1895, reprinted 1972. [6] W. Braune, O. Fischer, Der Gang Des Menschen/The Human Gait,
(translated ed.), Springer, Berlin, 1904. [7] D. Sutherland, Gait Disorders in Childhood and Adolescence, Williams &
Wilkins, Baltimore, London, 1984. [8] M.O. Jarett, A Television/Computer System for Human Locomotion
Analysis, Ph.D. Thesis, University of Strathclyde, Glasgow, Scotland 1976. [9] M. O’Malley, D.A.M. de Paor, Kinematic analysis of human walking gait
using digital image processing, Med. Biol. Comput. 31 (1993) 392–398. [10] D. Sutherland, J. Hagy, Measurement of gait movement from motion
picture film, J. Bone Joint Surg. 54A (1972) 787–797. [11] J.R. Gage, Gait Analysis in Cerebral Palsy, McKeith Press, London, 1991. [12] G. Johansson, Visual perception of biological motion and a model for its
analysis, Percept. Psycophys. 14 (1973) 210–211. [13] G. Johansson, Visual motion perception, Sci. Am. 232 (1975) 76–88. [14] J.E. Cutting, L. Kozlowski, Recognising friends by their walk: gait
perception without familiarity cues, Bull. Psychonometric Soc. 9 (5) (1997) 353–356.
[15] J.E. Cutting, L. Kozlowski, Recognising the sex of a walker from dynamic point-light displays, Percept. Psychophys. 21 (1997) 575–580.
[16] J.K. Aggarwal, Q. Cai, Human motion analysis: a review, Computer Vision Image Understanding 73 (1999) 428–440.
[17] D.C. Hogg, Model-based vision: a program to see a walking person, Image Vision Comput. 1 (1983) 5–19.
[18] A. Bobick, J. Davis, The recognition of human movement using temporal templates, IEEE Trans. Pattern Anal. Mach. Intell. 23 (2001) 257–267. [19] R. Cutler, L. Davis, Robust real-time periodic motion detection, analysis and applications, IEEE Trans. Pattern Anal. Mach. Intell. 22 (2000) 781–
796. [20] I. Laptev, Local spatio-temporal image features for motion interpretation,
Technical Report, KTH, Computational Vision and Active Perception Laboratory, Stockholm, Sweden, Ph.D. Thesis, 2004.
[21] L. Lee, Gait analysis for classification, Technical Report, MIT, AI Lab., MIT, Massachusetts, Ph.D. Thesis, 2002. [22] H. Lakany, G.M. Hayes, M.E. Hazlewood, S.J. Hillman, Human walking: tracking and analysis, in: Proceedings of the IEE Colloquium on Motion
Analysis and Tracking, 1999, pp. 5/1-5/14. [23] H. Lakany, M.E. Hazlewood, S.J. Hillman, Extracting diagnostic gait signatures for cerebral palsy patients, Gait Posture 18 (2003) 31. [24] R. Baker, Gait analysis methods in rehabilitation, J. NeuroEngineering Rehabil. 3 (2006) 1–10. [25] Y. Ohara, R. Sagawa, T. Echigo, Y. Yagi, Gait volume: spatio-temporal analysis of walking, in: Proceedings of the 5th Workshop on Omni
Directional Vision, 2004, pp. 79–90. [26] M. Zarrugh, C. Radcliffe, Computer generation of human gait kinematics,
J. Biomechanics 12 (2A) (1979) 99–111. [27] A. Birbilis, Recognising walking people, Technical Report, M.Sc. Thesis, University of Edinburgh, Edinburgh, UK, 1995. [28] A. Bharatkumar, K. Daigle, M. Pandy, Q. Cai, J. Aggarwal, Lower limb
kinematics of human walking with the medial axis transformation, in: Proceedings of the 1994 IEEE Workshop on Motion of Non-Rigid and Articulated Objects, 1994, pp. 70–77.
[29] H. Murase, R. Sakai, Moving object recognition in Eigenspace representation: gait analysis and lip reading, Pattern Recognition Lett. 17 (1996) 155–162.
[30] P.S. Huang, C.J. Harris, M. Nixon, Comparing different template features for recognizing people by their gait, in: Proceedings of the British Machine
Vision Conference, 1998, pp. 639–648. [31] C. BenAbdelkader, R. Cutler, L. Davis, Motion-based recognition of
people in eigengait space, In: Proceedings of the 5th International Conference on Automatic Face and Gesture Recognition.
[32] R. Polana, R. Nelson, Detecting activities, Technical Report 14627, Department of Computer Science, University of Rochester, Rochester, New York, 1993.
[33] R. Polana, R. Nelson, Low level recognition of human motion, in: Proceedings of the 1994 IEEE Workshop on Motion of Non–Rigid and Articulated Objects, 1994.
[34] R. Polana and R. Nelson, Nonparametric Recognition of Non-Rigid Motion, Department of Computer Science, University of Rochester, Rochester, New York, 1995.
[35] C. Bregler, Learning and recognizing human dynamics in video sequences, in: Proceedings of the IEEE Conference on Computer Vision and Pattern Recognition, CVPR’97, 1997, pp. 568–574.
[36] D. Meyer, J. Pösl, H. Niemann, Gait classification with HMMs for trajectories of body parts extracted by mixture densities, in: Proceedings of the British Machine Vision Conference, 1998, pp. 459–468.
[37] N.H. Goddard, The perception of articulated motion: recognizing moving light displays, Technical Report, Department of Computer Science,
University of Rochester, Rochester, NY, 405, 1992. [38] L. Campbell, A. Bobick, Recognition of human body motion using phase space constraints, Technical Report TR-309, MIT Media Lab, Perceptual
Computing Section, MIT, 20 Ames St., Cambridge, MA 02139, TR-309, 1995.
[39] J.J. Little, J.E. Boyd, Recognizing people by their gait: the shape of motion, Videre: J. Comp. Vision Res. 1 (1998) 1–33. [40] M.S. Nixon, T. Tan, R. Chellapa, Human Identification Based on Gait, first
ed., Springer, Berlin, 2005, p. 187. [41] N.V. Boulgouris, D. Hatzinakos, K.N. Plataniotos, Gait Recognition: a
challenging signal processing technology for biometric identification, IEEE Signal Process. Mag. 78-84 (2005).
[42] J. Rönkkönen, Video based gait analysis in biometric person authentication: a brief overview, available: _http://www.it.lut.fi/ kurssit/03-04/010970000/seminars/Ronkkonen.pdf .
[43] H. Lakany, A generic kinematic pattern for human walking, Neurocomputing 35 (2000) 27–54.
[44] J. Yoo, D. Hwang, M.S. Nixon, Gender classification in human gait using support vector machine, in: Advanced Concepts for Intelligent Vision Systems: 7th International Conference, ACIVS 2005, 2005, pp. 138.
[45] R.B. Davis, Reflections on clinical gait analysis, J. Electromyogr. Kinesiology 7 (1997) 251–257.
[46] M. Murray, A. Drought, R.C. Kory, Walking patterns of normal men, J. Bone Joint Surg. 46A (1964) 335–360.
[47] M. Murray, R.C. Kory, S. Sepic, Walking patterns of normal women, Arch. Phys. Med. Rehabil. 51 (1970) 637–650.
[48] T. Chau, A review of analytical techniques for gait data. Part 1, Gait Posture 13 (2001) 48–66.
[49] T. Chau, A review of analytical techniques for gait data. Part 2, Gait Posture 13 (2001) 102–120.
[50] R.B. Davis, S. Ounpuu, D. Tyburski, J.R. Gage, A Gait Analysis Collection and Reduction Technique, Hum. Movement Sci. 10 (1991) 575–587.
[51] M. Akay, Wavelets in biomedical engineering, Ann. Biomed. Eng. 2 (1995) 531–542.
[52] Y. Meyer, Wavelets, Springer, Berlin, 1989. [53] P. Goupillaud, A. Grossmann, J. Morlet, Cycle-octave and related
transforms in seismic signal analysis, Geoexploration 23 (1984/1985) 85–102.
[54] M. Ishikawa, R. Miikkulainen, H. Ritter, New developments in selforganizing systems, Neural Networks 17 (2004) 1037.
[55] S. Kaski, Data exploration using self-organising maps, Technical Report, Helsinki University, Neural Networks Research Centre, Rakentajanaukio 2C, FIN-02150, Espoo, Finland, Ph.D. Thesis, 1997.
182 http://sites.google.com/site/ijcsis/ ISSN 1947-5500

(IJCSIS) International Journal of Computer Science and Information Security, Vol. VII, No. II, February, 2010
[56] J. Vesanto, Data mining techniques based on the self-organising map, Technical Report, Department of Engineering Physics and Mathematics, Helsinki University of Technology, Finland, M.Sc. Thesis, 1997.
[57] T. Kohonen, Self-Organizing Maps, third extended ed., vol. 30, Springer, Berlin, 2001, p. 501.
[58] T. Kohonen, The self-organising map, Proc. IEEE 78 (1990) 1464–1479. [59] A. Ultsch and H. Siemon, Kohonen’s self organizing feature maps for
exploratory data analysis, in: Proceedings of International Neural Network Conference, 1990, pp. 305–308.
[60] J. Cohen, A coefficient of agreement for nominal scales, Educ. Psychol. Meas. 20 (1960) 27–46.
[61] B. Bienfait, J. Gasteiger, Checking the projection display of multivariate data with colored graphs, J. Mol. Graphics Modelling 15 (1997) 203–215, 254–258.
183 http://sites.google.com/site/ijcsis/ ISSN 1947-5500
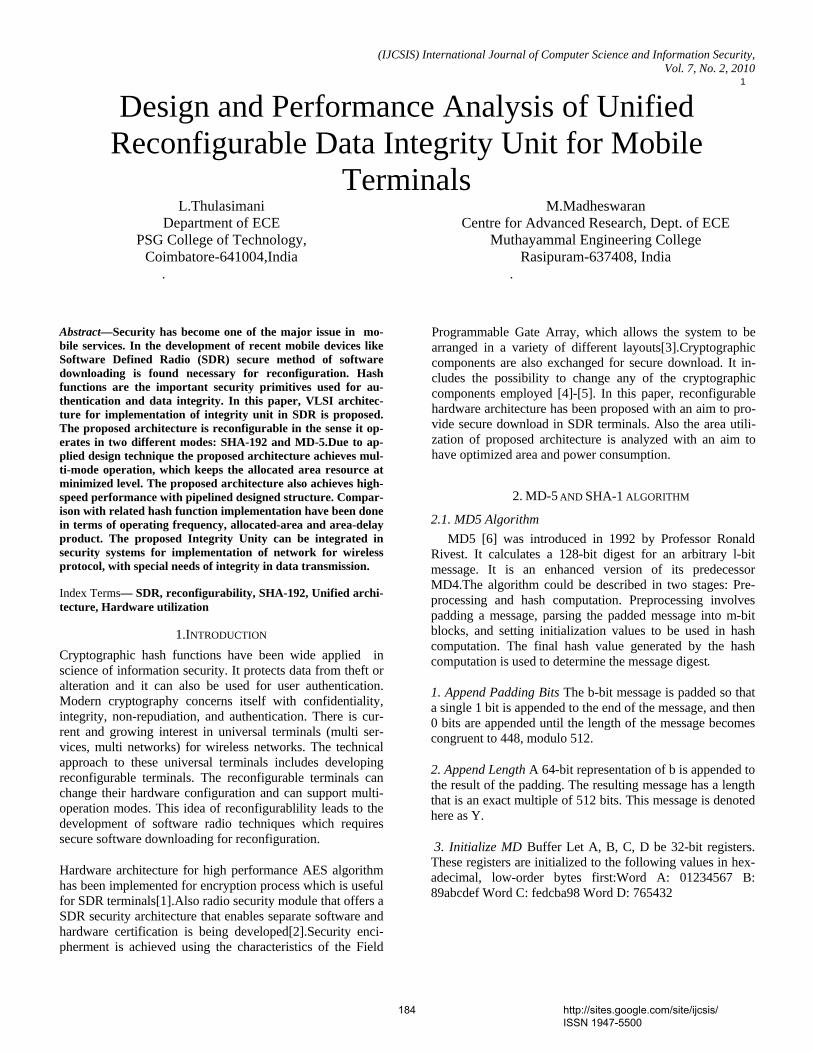
(IJCSIS) International Journal of Computer Science and Information Security, Vol. 7, No. 2, 2010
1
Design and Performance Analysis of Unified
Reconfigurable Data Integrity Unit for Mobile Terminals
L.Thulasimani Department of ECE
PSG College of Technology, Coimbatore-641004,India
.
M.Madheswaran Centre for Advanced Research, Dept. of ECE
Muthayammal Engineering College Rasipuram-637408, India
.
Abstract—Security has become one of the major issue in mo-bile services. In the development of recent mobile devices like Software Defined Radio (SDR) secure method of software downloading is found necessary for reconfiguration. Hash functions are the important security primitives used for au-thentication and data integrity. In this paper, VLSI architec-ture for implementation of integrity unit in SDR is proposed. The proposed architecture is reconfigurable in the sense it op-erates in two different modes: SHA-192 and MD-5.Due to ap-plied design technique the proposed architecture achieves mul-ti-mode operation, which keeps the allocated area resource at minimized level. The proposed architecture also achieves high-speed performance with pipelined designed structure. Compar-ison with related hash function implementation have been done in terms of operating frequency, allocated-area and area-delay product. The proposed Integrity Unity can be integrated in security systems for implementation of network for wireless protocol, with special needs of integrity in data transmission.
Index Terms— SDR, reconfigurability, SHA-192, Unified archi-tecture, Hardware utilization
1.INTRODUCTION
Cryptographic hash functions have been wide applied in science of information security. It protects data from theft or alteration and it can also be used for user authentication. Modern cryptography concerns itself with confidentiality, integrity, non-repudiation, and authentication. There is cur-rent and growing interest in universal terminals (multi ser-vices, multi networks) for wireless networks. The technical approach to these universal terminals includes developing reconfigurable terminals. The reconfigurable terminals can change their hardware configuration and can support multi-operation modes. This idea of reconfigurablility leads to the development of software radio techniques which requires secure software downloading for reconfiguration.
Hardware architecture for high performance AES algorithm has been implemented for encryption process which is useful for SDR terminals[1].Also radio security module that offers a SDR security architecture that enables separate software and hardware certification is being developed[2].Security enci-pherment is achieved using the characteristics of the Field
Programmable Gate Array, which allows the system to be arranged in a variety of different layouts[3].Cryptographic components are also exchanged for secure download. It in-cludes the possibility to change any of the cryptographic components employed [4]-[5]. In this paper, reconfigurable hardware architecture has been proposed with an aim to pro-vide secure download in SDR terminals. Also the area utili-zation of proposed architecture is analyzed with an aim to have optimized area and power consumption.
2. MD-5 AND SHA-1 ALGORITHM
2.1. MD5 Algorithm
MD5 [6] was introduced in 1992 by Professor Ronald Rivest. It calculates a 128-bit digest for an arbitrary l-bit message. It is an enhanced version of its predecessor MD4.The algorithm could be described in two stages: Pre-processing and hash computation. Preprocessing involves padding a message, parsing the padded message into m-bit blocks, and setting initialization values to be used in hash computation. The final hash value generated by the hash computation is used to determine the message digest.
1. Append Padding Bits The b-bit message is padded so that a single 1 bit is appended to the end of the message, and then 0 bits are appended until the length of the message becomes congruent to 448, modulo 512.
2. Append Length A 64-bit representation of b is appended to the result of the padding. The resulting message has a length that is an exact multiple of 512 bits. This message is denoted here as Y.
3. Initialize MD Buffer Let A, B, C, D be 32-bit registers. These registers are initialized to the following values in hex-adecimal, low-order bytes first:Word A: 01234567 B: 89abcdef Word C: fedcba98 Word D: 765432
184 http://sites.google.com/site/ijcsis/ ISSN 1947-5500
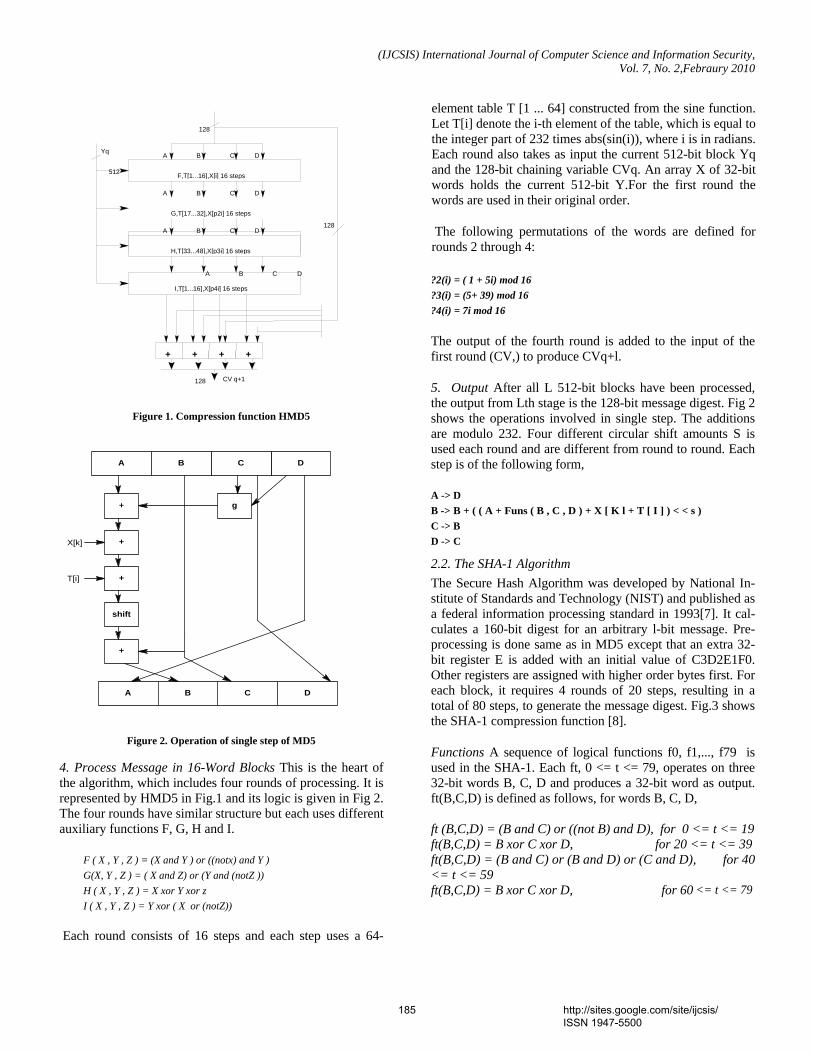
(IJCSIS) International Journal of Computer Science and Information Security, Vol. 7, No. 2,Febraury 2010
G,T[17...32],X[p2i] 16 steps
F,T[1...16],X[i] 16 steps
H,T[33...48],X[p3i] 16 steps
I,T[1...16],X[p4i] 16 steps
+ + +
+
512
128
128
CV q+1
Yq
A B C D
A B C D
A B C D
A B C D
128
Figure 1. Compression function HMD5
Figure 2. Operation of single step of MD5
4. Process Message in 16-Word Blocks This is the heart of the algorithm, which includes four rounds of processing. It is represented by HMD5 in Fig.1 and its logic is given in Fig 2. The four rounds have similar structure but each uses different auxiliary functions F, G, H and I.
F ( X , Y , Z ) = (X and Y ) or ((notx) and Y )
G(X, Y , Z ) = ( X and Z) or (Y and (notZ ))
H ( X , Y , Z ) = X xor Y xor z
I ( X , Y , Z ) = Y xor ( X or (notZ))
Each round consists of 16 steps and each step uses a 64-
element table T [1 ... 64] constructed from the sine function. Let T[i] denote the i-th element of the table, which is equal to the integer part of 232 times abs(sin(i)), where i is in radians. Each round also takes as input the current 512-bit block Yq and the 128-bit chaining variable CVq. An array X of 32-bit words holds the current 512-bit Y.For the first round the words are used in their original order.
The following permutations of the words are defined for rounds 2 through 4:
?2(i) = ( 1 + 5i) mod 16
?3(i) = (5+ 39) mod 16
?4(i) = 7i mod 16
The output of the fourth round is added to the input of the first round (CV,) to produce CVq+l.
5. Output After all L 512-bit blocks have been processed, the output from Lth stage is the 128-bit message digest. Fig 2 shows the operations involved in single step. The additions are modulo 232. Four different circular shift amounts S is used each round and are different from round to round. Each step is of the following form,
A -> D
B -> B + ( ( A + Funs ( B , C , D ) + X [ K l + T [ I ] ) < < s )
C -> B D -> C
2.2. The SHA-1 Algorithm
The Secure Hash Algorithm was developed by National In-stitute of Standards and Technology (NIST) and published as a federal information processing standard in 1993[7]. It cal-culates a 160-bit digest for an arbitrary l-bit message. Pre-processing is done same as in MD5 except that an extra 32-bit register E is added with an initial value of C3D2E1F0. Other registers are assigned with higher order bytes first. For each block, it requires 4 rounds of 20 steps, resulting in a total of 80 steps, to generate the message digest. Fig.3 shows the SHA-1 compression function [8].
Functions A sequence of logical functions f0, f1,..., f79 is used in the SHA-1. Each ft, 0 <= t <= 79, operates on three 32-bit words B, C, D and produces a 32-bit word as output. ft(B,C,D) is defined as follows, for words B, C, D,
ft (B,C,D) = (B and C) or ((not B) and D), for 0 <= t <= 19 ft(B,C,D) = B xor C xor D, for 20 <= t <= 39 ft(B,C,D) = (B and C) or (B and D) or (C and D), for 40 <= t <= 59 ft(B,C,D) = B xor C xor D, for 60 <= t <= 79
A DCB
A DCB
+
+
+
shift
+
g
X[k]
T[i]
185 http://sites.google.com/site/ijcsis/ ISSN 1947-5500
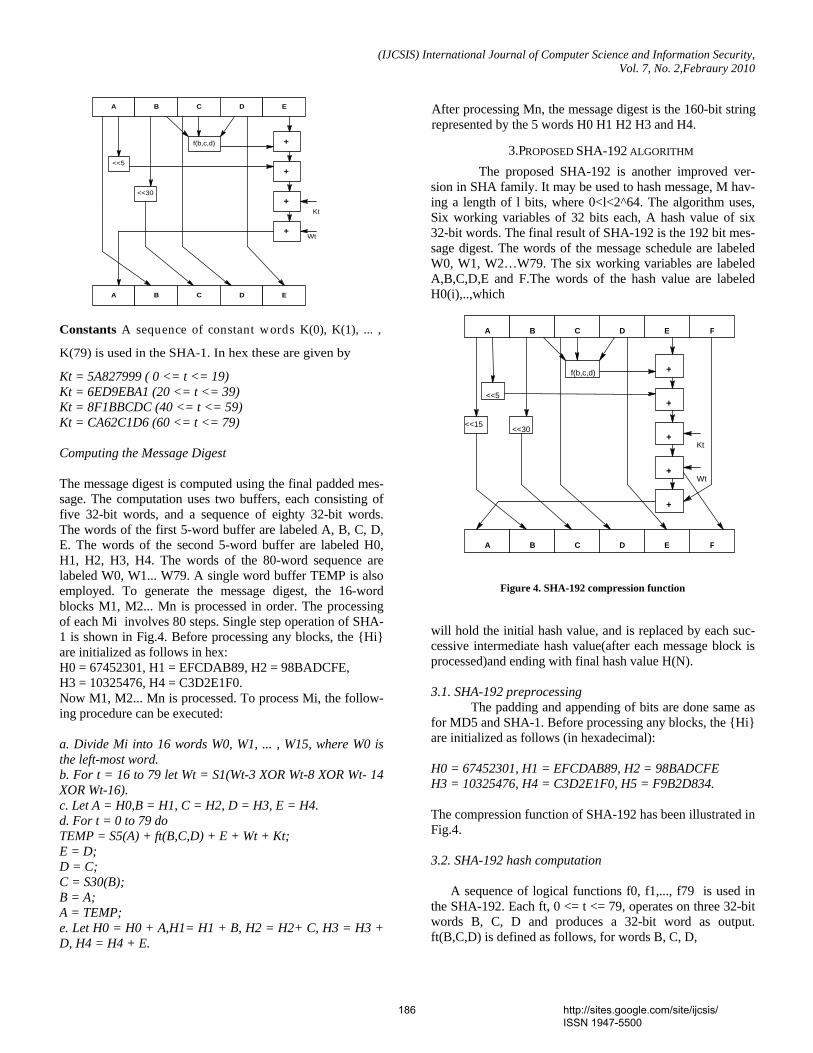
(IJCSIS) International Journal of Computer Science and Information Security, Vol. 7, No. 2,Febraury 2010
F
Figure 3. Operation of single step of SHA-1
Constants A sequence of constant words K(0), K(1), ... ,
K(79) is used in the SHA-1. In hex these are given by
Kt = 5A827999 ( 0 <= t <= 19) Kt = 6ED9EBA1 (20 <= t <= 39) Kt = 8F1BBCDC (40 <= t <= 59) Kt = CA62C1D6 (60 <= t <= 79)
Computing the Message Digest
The message digest is computed using the final padded mes-sage. The computation uses two buffers, each consisting of five 32-bit words, and a sequence of eighty 32-bit words. The words of the first 5-word buffer are labeled A, B, C, D, E. The words of the second 5-word buffer are labeled H0, H1, H2, H3, H4. The words of the 80-word sequence are labeled W0, W1... W79. A single word buffer TEMP is also employed. To generate the message digest, the 16-word blocks M1, M2... Mn is processed in order. The processing of each Mi involves 80 steps. Single step operation of SHA-1 is shown in Fig.4. Before processing any blocks, the {Hi} are initialized as follows in hex: H0 = 67452301, H1 = EFCDAB89, H2 = 98BADCFE, H3 = 10325476, H4 = C3D2E1F0. Now M1, M2... Mn is processed. To process Mi, the follow-ing procedure can be executed:
a. Divide Mi into 16 words W0, W1, ... , W15, where W0 is the left-most word. b. For t = 16 to 79 let Wt = S1(Wt-3 XOR Wt-8 XOR Wt- 14 XOR Wt-16). c. Let A = H0,B = H1, C = H2, D = H3, E = H4. d. For t = 0 to 79 do TEMP = S5(A) + ft(B,C,D) + E + Wt + Kt; E = D; D = C; C = S30(B); B = A; A = TEMP; e. Let H0 = H0 + A,H1= H1 + B, H2 = H2+ C, H3 = H3 + D, H4 = H4 + E.
After processing Mn, the message digest is the 160-bit string represented by the 5 words H0 H1 H2 H3 and H4.
3.PROPOSED SHA-192 ALGORITHM
The proposed SHA-192 is another improved ver-sion in SHA family. It may be used to hash message, M hav-ing a length of l bits, where 0<l<2^64. The algorithm uses, Six working variables of 32 bits each, A hash value of six 32-bit words. The final result of SHA-192 is the 192 bit mes-sage digest. The words of the message schedule are labeled W0, W1, W2…W79. The six working variables are labeled A,B,C,D,E and F.The words of the hash value are labeled H0(i),..,which
Figure 4. SHA-192 compression function
will hold the initial hash value, and is replaced by each suc-cessive intermediate hash value(after each message block is processed)and ending with final hash value H(N).
3.1. SHA-192 preprocessing The padding and appending of bits are done same as for MD5 and SHA-1. Before processing any blocks, the {Hi} are initialized as follows (in hexadecimal):
H0 = 67452301, H1 = EFCDAB89, H2 = 98BADCFE H3 = 10325476, H4 = C3D2E1F0, H5 = F9B2D834.
The compression function of SHA-192 has been illustrated in Fig.4.
3.2. SHA-192 hash computation
A sequence of logical functions f0, f1,..., f79 is used in the SHA-192. Each ft, 0 <= t <= 79, operates on three 32-bit words B, C, D and produces a 32-bit word as output. ft(B,C,D) is defined as follows, for words B, C, D,
A B C D E
A B C D E
+
+
+
+
f(b,c,d)
<<5
<<30
Kt
Wt
A B C D E F
A B C D E F
+
+
+
+
+
f(b,c,d)
<<5
<<15 <<30
Kt
Wt
186 http://sites.google.com/site/ijcsis/ ISSN 1947-5500
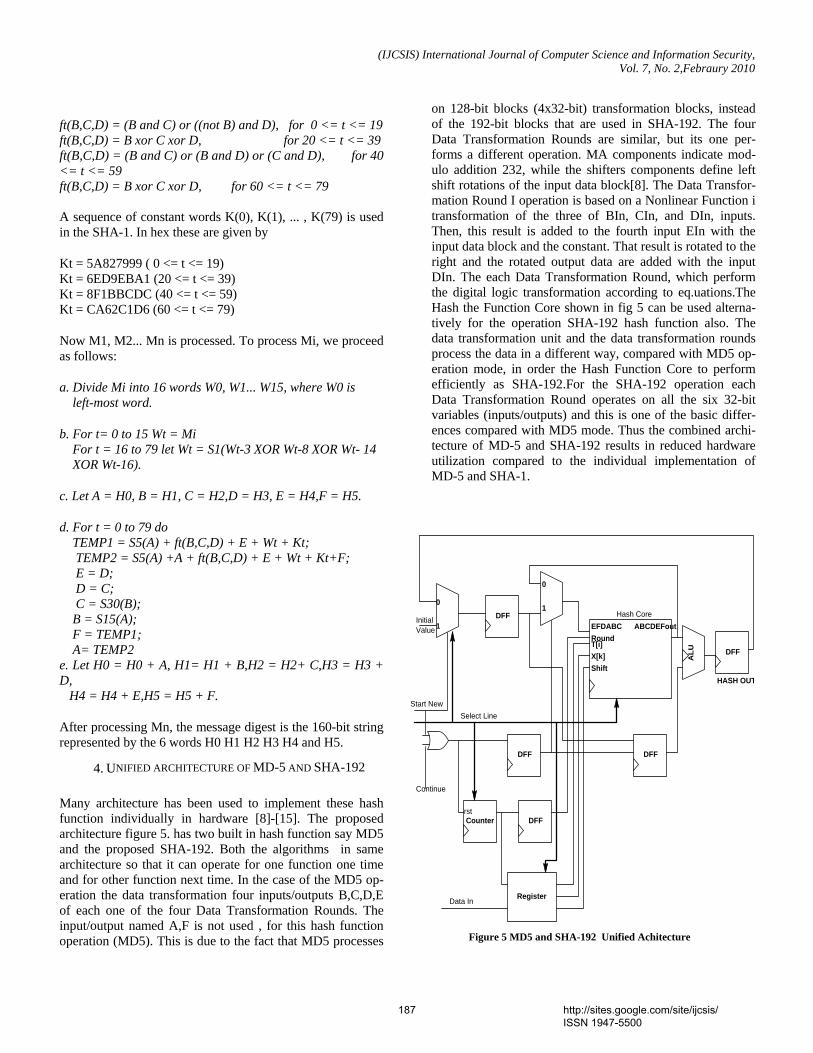
(IJCSIS) International Journal of Computer Science and Information Security, Vol. 7, No. 2,Febraury 2010
ft(B,C,D) = (B and C) or ((not B) and D), for 0 <= t <= 19 ft(B,C,D) = B xor C xor D, for 20 <= t <= 39 ft(B,C,D) = (B and C) or (B and D) or (C and D), for 40 <= t <= 59 ft(B,C,D) = B xor C xor D, for 60 <= t <= 79
A sequence of constant words K(0), K(1), ... , K(79) is used in the SHA-1. In hex these are given by
Kt = 5A827999 ( 0 <= t <= 19) Kt = 6ED9EBA1 (20 <= t <= 39) Kt = 8F1BBCDC (40 <= t <= 59) Kt = CA62C1D6 (60 <= t <= 79)
Now M1, M2... Mn is processed. To process Mi, we proceed as follows:
a. Divide Mi into 16 words W0, W1... W15, where W0 is left-most word.
b. For t= 0 to 15 Wt = Mi For t = 16 to 79 let Wt = S1(Wt-3 XOR Wt-8 XOR Wt- 14 XOR Wt-16).
c. Let A = H0, B = H1, C = H2,D = H3, E = H4,F = H5.
d. For t = 0 to 79 do TEMP1 = S5(A) + ft(B,C,D) + E + Wt + Kt; TEMP2 = S5(A) +A + ft(B,C,D) + E + Wt + Kt+F; E = D; D = C; C = S30(B); B = S15(A); F = TEMP1; A= TEMP2 e. Let H0 = H0 + A, H1= H1 + B,H2 = H2+ C,H3 = H3 + D, H4 = H4 + E,H5 = H5 + F.
After processing Mn, the message digest is the 160-bit string represented by the 6 words H0 H1 H2 H3 H4 and H5.
4. UNIFIED ARCHITECTURE OF MD-5 AND SHA-192
Many architecture has been used to implement these hash function individually in hardware [8]-[15]. The proposed architecture figure 5. has two built in hash function say MD5 and the proposed SHA-192. Both the algorithms in same architecture so that it can operate for one function one time and for other function next time. In the case of the MD5 op-eration the data transformation four inputs/outputs B,C,D,E of each one of the four Data Transformation Rounds. The input/output named A,F is not used , for this hash function operation (MD5). This is due to the fact that MD5 processes
on 128-bit blocks (4x32-bit) transformation blocks, instead of the 192-bit blocks that are used in SHA-192. The four Data Transformation Rounds are similar, but its one per-forms a different operation. MA components indicate mod-ulo addition 232, while the shifters components define left shift rotations of the input data block[8]. The Data Transfor-mation Round I operation is based on a Nonlinear Function i transformation of the three of BIn, CIn, and DIn, inputs. Then, this result is added to the fourth input EIn with the input data block and the constant. That result is rotated to the right and the rotated output data are added with the input DIn. The each Data Transformation Round, which perform the digital logic transformation according to eq.uations.The Hash the Function Core shown in fig 5 can be used alterna-tively for the operation SHA-192 hash function also. The data transformation unit and the data transformation rounds process the data in a different way, compared with MD5 op-eration mode, in order the Hash Function Core to perform efficiently as SHA-192.For the SHA-192 operation each Data Transformation Round operates on all the six 32-bit variables (inputs/outputs) and this is one of the basic differ-ences compared with MD5 mode. Thus the combined archi-tecture of MD-5 and SHA-192 results in reduced hardware utilization compared to the individual implementation of MD-5 and SHA-1.
Register
AL
U DFF
DFF
DFF DFF
DFFCounter
Initial Value
Hash Core
Data In
Select Line
Start New
Continue
EFDABC ABCDEFout
RoundT[i]
X[k]
Shift
HASH OUT
0
1
1
0
rst
Figure 5 MD5 and SHA-192 Unified Achitecture
187 http://sites.google.com/site/ijcsis/ ISSN 1947-5500
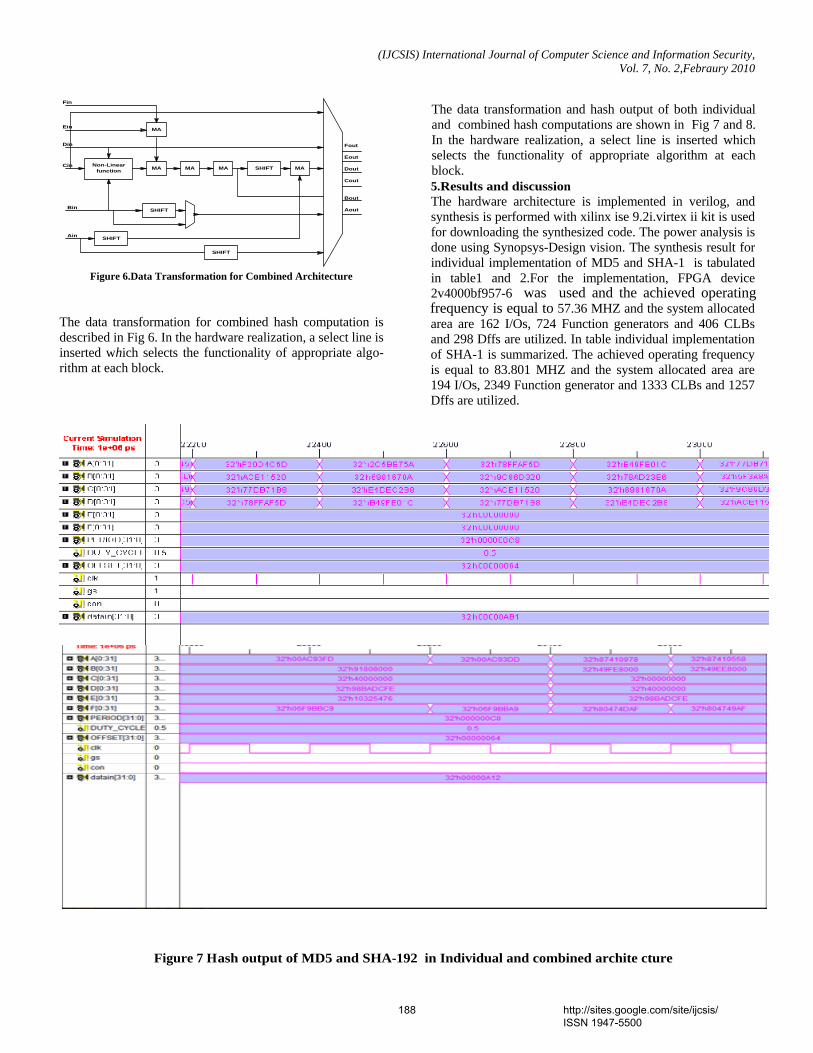
(IJCSIS) International Journal of Computer Science and Information Security, Vol. 7, No. 2,Febraury 2010
Non-Linear function MA MA MA MASHIFT
SHIFT
SHIFT
MA
Fout
Eout
Dout
Cout
Bout
Aout
Ain
Bin
Cin
Din
Ein
Fin
SHIFT
Figure 6.Data Transformation for Combined Architecture
The data transformation for combined hash computation is described in Fig 6. In the hardware realization, a select line is inserted which selects the functionality of appropriate algo-rithm at each block.
The data transformation and hash output of both individual and combined hash computations are shown in Fig 7 and 8. In the hardware realization, a select line is inserted which selects the functionality of appropriate algorithm at each block. 5.Results and discussion The hardware architecture is implemented in verilog, and synthesis is performed with xilinx ise 9.2i.virtex ii kit is used for downloading the synthesized code. The power analysis is done using Synopsys-Design vision. The synthesis result for individual implementation of MD5 and SHA-1 is tabulated in table1 and 2.For the implementation, FPGA device 2v4000bf957-6 was used and the achieved operating frequency is equal to 57.36 MHZ and the system allocated area are 162 I/Os, 724 Function generators and 406 CLBs and 298 Dffs are utilized. In table individual implementation of SHA-1 is summarized. The achieved operating frequency is equal to 83.801 MHZ and the system allocated area are 194 I/Os, 2349 Function generator and 1333 CLBs and 1257 Dffs are utilized.
Figure 7 Hash output of MD5 and SHA-192 in Individual and combined archite cture
188 http://sites.google.com/site/ijcsis/ ISSN 1947-5500
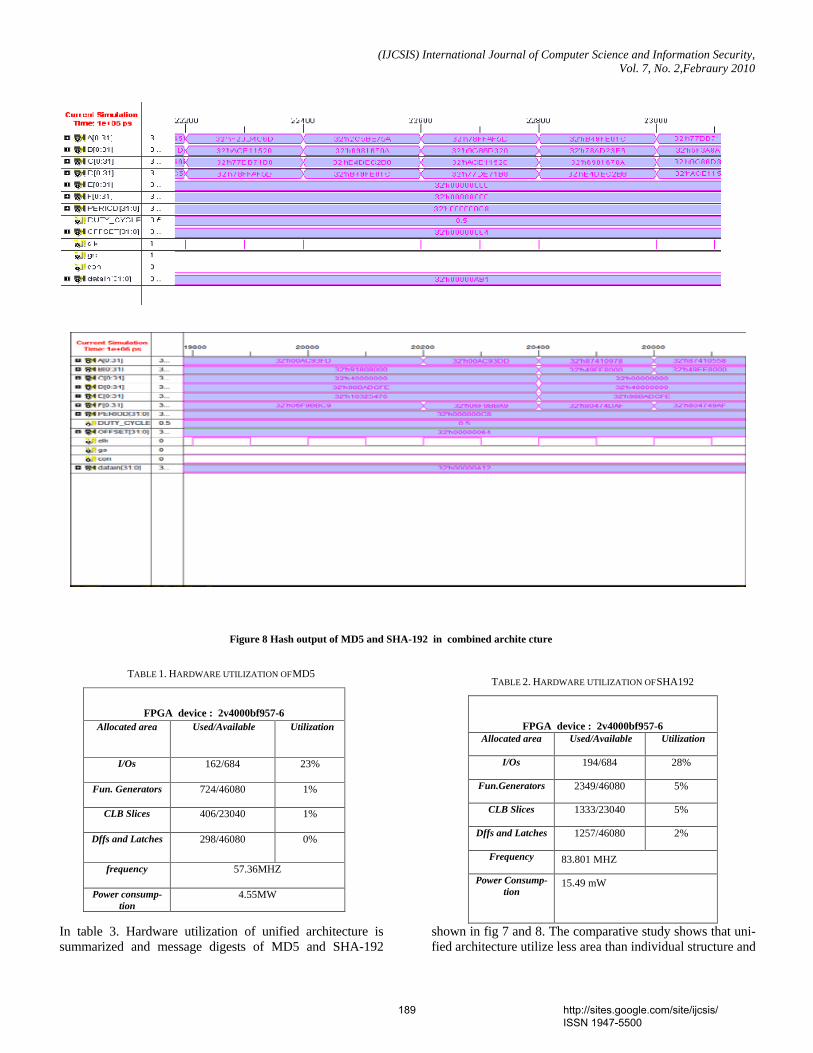
(IJCSIS) International Journal of Computer Science and Information Security, Vol. 7, No. 2,Febraury 2010
TABLE 1. HARDWARE UTILIZATION OF MD5
FPGA device : 2v4000bf957-6 Allocated area Used/Available Utilization
I/Os 162/684 23%
Fun. Generators 724/46080 1%
CLB Slices 406/23040 1%
Dffs and Latches 298/46080 0%
frequency 57.36MHZ
Power consump-tion
4.55MW
TABLE 2. HARDWARE UTILIZATION OF SHA192
FPGA device : 2v4000bf957-6
Allocated area Used/Available Utilization
I/Os 194/684 28%
Fun.Generators 2349/46080 5%
CLB Slices 1333/23040 5%
Dffs and Latches 1257/46080 2%
Frequency 83.801 MHZ
Power Consump-tion
15.49 mW
In table 3. Hardware utilization of unified architecture is summarized and message digests of MD5 and SHA-192
shown in fig 7 and 8. The comparative study shows that uni-fied architecture utilize less area than individual structure and
Figure 8 Hash output of MD5 and SHA-192 in combined archite cture
189 http://sites.google.com/site/ijcsis/ ISSN 1947-5500
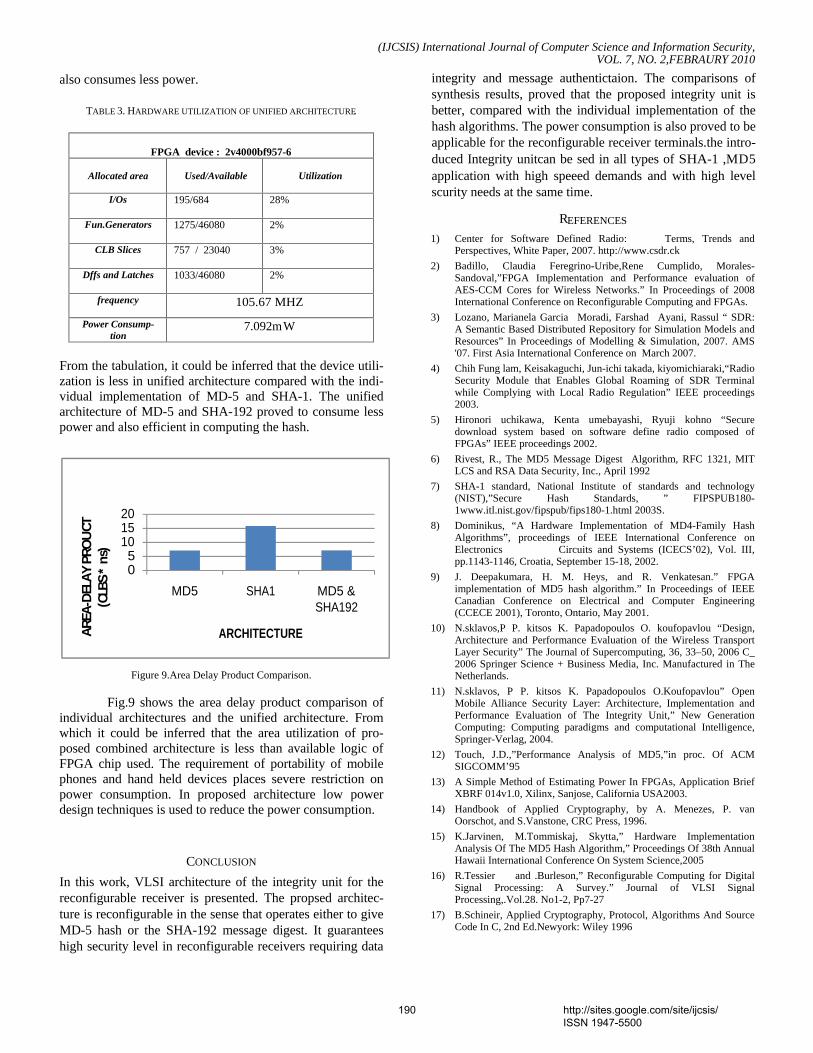
(IJCSIS) International Journal of Computer Science and Information Security, VOL. 7, NO. 2,FEBRAURY 2010
also consumes less power.
TABLE 3. HARDWARE UTILIZATION OF UNIFIED ARCHITECTURE.
FPGA device : 2v4000bf957-6
Allocated area Used/Available Utilization
I/Os 195/684 28%
Fun.Generators 1275/46080 2%
CLB Slices 757 / 23040 3%
Dffs and Latches 1033/46080 2%
frequency 105.67 MHZ
Power Consump-tion
7.092mW
From the tabulation, it could be inferred that the device utili-zation is less in unified architecture compared with the indi-vidual implementation of MD-5 and SHA-1. The unified architecture of MD-5 and SHA-192 proved to consume less power and also efficient in computing the hash.
Figure 9.Area Delay Product Comparison.
Fig.9 shows the area delay product comparison of individual architectures and the unified architecture. From which it could be inferred that the area utilization of pro-posed combined architecture is less than available logic of FPGA chip used. The requirement of portability of mobile phones and hand held devices places severe restriction on power consumption. In proposed architecture low power design techniques is used to reduce the power consumption.
CONCLUSION
In this work, VLSI architecture of the integrity unit for the reconfigurable receiver is presented. The propsed architec-ture is reconfigurable in the sense that operates either to give MD-5 hash or the SHA-192 message digest. It guarantees high security level in reconfigurable receivers requiring data
integrity and message authentictaion. The comparisons of synthesis results, proved that the proposed integrity unit is better, compared with the individual implementation of the hash algorithms. The power consumption is also proved to be applicable for the reconfigurable receiver terminals.the intro-duced Integrity unitcan be sed in all types of SHA-1 ,MD5 application with high speeed demands and with high level scurity needs at the same time.
REFERENCES
1) Center for Software Defined Radio: Terms, Trends and Perspectives, White Paper, 2007. http://www.csdr.ck
2) Badillo, Claudia Feregrino-Uribe,Rene Cumplido, Morales-Sandoval,”FPGA Implementation and Performance evaluation of AES-CCM Cores for Wireless Networks.” In Proceedings of 2008 International Conference on Reconfigurable Computing and FPGAs.
3) Lozano, Marianela Garcia Moradi, Farshad Ayani, Rassul “ SDR: A Semantic Based Distributed Repository for Simulation Models and Resources” In Proceedings of Modelling & Simulation, 2007. AMS '07. First Asia International Conference on March 2007.
4) Chih Fung lam, Keisakaguchi, Jun-ichi takada, kiyomichiaraki,“Radio Security Module that Enables Global Roaming of SDR Terminal while Complying with Local Radio Regulation” IEEE proceedings 2003.
5) Hironori uchikawa, Kenta umebayashi, Ryuji kohno “Secure download system based on software define radio composed of FPGAs” IEEE proceedings 2002.
6) Rivest, R., The MD5 Message Digest Algorithm, RFC 1321, MIT LCS and RSA Data Security, Inc., April 1992
7) SHA-1 standard, National Institute of standards and technology (NIST),”Secure Hash Standards, ” FIPSPUB180-1www.itl.nist.gov/fipspub/fips180-1.html 2003S.
8) Dominikus, “A Hardware Implementation of MD4-Family Hash Algorithms”, proceedings of IEEE International Conference on Electronics Circuits and Systems (ICECS’02), Vol. III, pp.1143-1146, Croatia, September 15-18, 2002.
9) J. Deepakumara, H. M. Heys, and R. Venkatesan.” FPGA implementation of MD5 hash algorithm.” In Proceedings of IEEE Canadian Conference on Electrical and Computer Engineering (CCECE 2001), Toronto, Ontario, May 2001.
10) N.sklavos,P P. kitsos K. Papadopoulos O. koufopavlou “Design, Architecture and Performance Evaluation of the Wireless Transport Layer Security” The Journal of Supercomputing, 36, 33–50, 2006 C_ 2006 Springer Science + Business Media, Inc. Manufactured in The Netherlands.
11) N.sklavos, P P. kitsos K. Papadopoulos O.Koufopavlou” Open Mobile Alliance Security Layer: Architecture, Implementation and Performance Evaluation of The Integrity Unit,” New Generation Computing: Computing paradigms and computational Intelligence, Springer-Verlag, 2004.
12) Touch, J.D.,”Performance Analysis of MD5,”in proc. Of ACM SIGCOMM’95
13) A Simple Method of Estimating Power In FPGAs, Application Brief XBRF 014v1.0, Xilinx, Sanjose, California USA2003.
14) Handbook of Applied Cryptography, by A. Menezes, P. van Oorschot, and S.Vanstone, CRC Press, 1996.
15) K.Jarvinen, M.Tommiskaj, Skytta,” Hardware Implementation Analysis Of The MD5 Hash Algorithm,” Proceedings Of 38th Annual Hawaii International Conference On System Science,2005
16) R.Tessier and .Burleson,” Reconfigurable Computing for Digital Signal Processing: A Survey.” Journal of VLSI Signal Processing,.Vol.28. No1-2, Pp7-27
17) B.Schineir, Applied Cryptography, Protocol, Algorithms And Source Code In C, 2nd Ed.Newyork: Wiley 1996
05
101520
MD5 SHA1 MD5 & SHA192
ARE
A-D
ELA
Y P
ROU
CT
(CLB
S *
ns)
ARCHITECTURE
190 http://sites.google.com/site/ijcsis/ ISSN 1947-5500
(IJCSIS) International Journal of Computer Science and Information Security, VOL. 7, NO. 2,FEBRAURY 2010
18) Randal.K.Nicholas and Pannos.C.Lekkas, Wireless Security: models, threats and solution, Tata McGraw-Hill 2006.
19) Esam Khan, M.Watheq El-Kharashi, Fayez Geballi, and Mostafa Abd-El-Barr,”Design and Performance Analysis of A Unified Reconfigurable HMAC Hash Unit,”IEEE Transaction on Circuits and Systems, Vol.54.N0.12 Pp.2683-2695. December 2007.
L.Thulasimani has obtained her BE and ME degree from Coimbatore Institute of Technology, India in 1998 and 2001 respectively. She has started her teaching profession in the year 2001 in PSNA engineering college, Dindigul. At present she is an Lecturer in department of Electronic and Communication Engineering in PSG college of Technology, Coimbatore .She has published 4 research papers in International and National conferences. She is a part time Ph.D research scalar in Anna University Chennai. His areas of interest are Wireless security, Networking and signal processing. She is a life member of ISTE.
Dr. M. Madheswaran has obtained his Ph.D. degree in Electronics Engineering from Institute of Technology, Banaras Hindu University, Varanasi in 1999 and M.E degree in Microwave Engineering from Birla Institute of Technology, Ranchi, India. He has started his teaching profession in the year 1991 to serve his parent Institution Mohd. Sathak Engineering College, Kilakarai where he obtained his Bachelor Degree in ECE. He has served KSR college of Technology from 1999 to 2001 and PSNA College of Engineering and Technology, Dindigul from 2001 to 2006. He has been awarded Young Scientist Fellowship by the Tamil Nadu State Council for Science and Technology and Senior Research Fellowship by Council for Scientific and Industrial Research, New Delhi in the year 1994 and 1996 respectively. His research project entitled “Analysis and simulation of OEIC receivers for tera optical networks” has been funded by the SERC Division, Department of Science and Technology, Ministry of Information Technology under the Fast track proposal for Young Scientist in 2004. He has published 120 research papers in International and National Journals as well as conferences. He has been the IEEE student branch counselor at Mohamed Sathak Engineering College, Kilakarai during 1993-1998 and PSNA College of Engineering and Technology, Dindigul during 2003-2006. He has been awarded Best Citizen of India award in the year 2005 and his name is included in the Marquis Who's Who in Science and Engineering, 2006-2007 which distinguishes him as one of the leading professionals in the world. His field of interest includes semiconductor devices, microwave electronics, optoelectronics and signal processing. He is a member of IEEE, SPIE, IETE, ISTE, VLSI Society of India and Institution of Engineers (India).
191 http://sites.google.com/site/ijcsis/ ISSN 1947-5500
Soft Computing – A step towards building Secure
Cognitive WLAN
S.C.Lingareddy1
Dr B Stephen Charles2 Dr Vinaya Babu
3 Kashyap Dhruve
4
Asst. professor and HOD, CSE, Principal Professor of CSE, Technical Director
KNS Institute of Technology, Stanley Stephen College of Engg, Director of Admission Dept. Planet-i Technologies
Bangalore, India. Kurnool, India. JNTU, Hyderabad, India. Bangalore, India.
Abstract— Wireless Networks rendering varied services has not
only become the order of the day but the demand of a large pool
of customers as well. Thus, security of wireless networks has
become a very essential design criterion. This paper describes our
research work focused towards creating secure cognitive wireless
local area networks using soft computing approaches. The
present dense Wireless Local Area Networks (WLAN) pose a
huge threat to network integrity and are vulnerable to attacks.
In this paper we propose a secure Cognitive Framework
Architecture (CFA). The Cognitive Security Manager (CSM) is
the heart of CFA. The CSM incorporates access control using
Physical Architecture Description Layer (PADL) and analyzes
the operational matrices of the terminals using multi layer neural
networks, acting accordingly to identify authorized access and
unauthorized usage patterns.
Keywords- Cognitive Networks , Back Propogation , Soft
Computing, IEEE 802.11, WLAN Security,Cognitive Framework
Architecture, Multilayered Feedforward Neural Network (MFNN),
Physical Architecture Description Layer(PADL), Cognitive Security
Manager(CSM).
I. INTRODUCTION
Wireless Networks have become an integral part of the Information Technology (IT) Infrastructure especially Wireless Local Area Network (WLAN). The Institute of Electrical and Electronics Engineers (IEEE) have described certain standards and specification for efficient communication over the wireless medium IEEE 802.11[26]. WLAN’s have seen a tremendous growth because of their ability to provide flexible and mobility options to the user. WLAN’s are now an integral part of both Enterprise Network and Public Networks. With such dense WLAN’s available to user’s, security is indeed a major concern. The security features provided in the current deployed WLAN’s are vulnerable [1].
Cognitive Networks also known as smart networks [2] could be a solution to this security and data integrity concern. Cognitive Networks are recognized for their self aware, self management and self healing properties. Wireless networks have been studied as complex, heterogeneous and dynamic environments and cognition of these are still under research [3]. Cognitive networks could be used to improve resource management [4],[17], quality of service (QoS)[5], security and access control[6]. We propose to introduce a CFA to secure WLAN’s.
Computational Intelligence is defined as the study and design of intelligent components. To impart computational intelligence we propose to use soft computing techniques. Soft Computing encapsulates various several intelligence imparting technologies including fuzzy logic, neural networks, probabilistic computing, artificial immune systems etc. We intend to use multilayer neural networks in our CFA.
In this paper we put forward the CFA where we would use multiple layers of neural networks to impart intelligence to the proposed framework. The intelligence parameters of the CFA are analyzed in the Experimental Setup.
II. RELATED WORK
WLANS are one of the most lucrative and fast growing deployments for connectivity options for networks. The WLANS are established by Access Points (AP). The AP that are provided by the manufactures or service providers. Based on the literature provided to the users they feel that the AP’s are secure which is not the fact [7]. The AP’s provide security in multiple ways like WEP [8], [22], WPA [9] ,TKIP[10], etc which are vulnerable and could be easily rendered ineffective. Even the authentication schemes provided in the AP, based on the user node hardware are ineffective. The current AP’s provide Ethernet MAC based filtering for access control but this too was found to be insecure [11]. It is very clear that the WLAN has been known for its non secure nature [7]. Many protocols have been developed with a hope to provide better security [27]. However, much research is ongoing to solve this security issue [10][13][14].
Based on our research we believe that these WLANS could be made intelligent and the access control mechanism could be improved to negate these security deficiencies. Much work has been done towards securing wireless networks based on cognitive approaches. When we speak of cognition terms like software defined radio and cognitive radio [4], they are often misunderstood. Software defined radio is simply the radio layer which transmits the radio frequencies and intermediate frequencies. Cognitive Radio on the other hand rests above the software defined radio layer and is intelligent. The cognitive radio layer controls the software defined radio and determines which modes of operation to be assigned to the software defined radio.
(IJCSIS) International Journal of Computer Science and Information Security, Vol. 7, No. 2, February 2010
192 http://sites.google.com/site/ijcsis/ ISSN 1947-5500
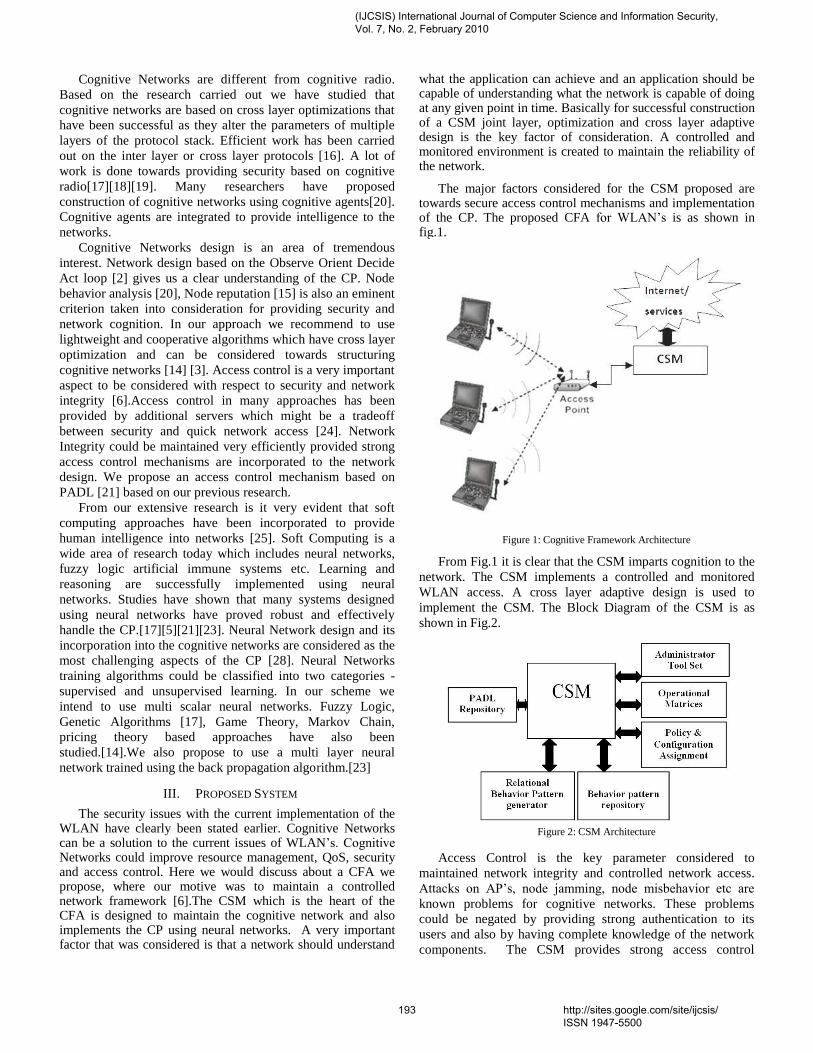
Cognitive Networks are different from cognitive radio.
Based on the research carried out we have studied that
cognitive networks are based on cross layer optimizations that
have been successful as they alter the parameters of multiple
layers of the protocol stack. Efficient work has been carried
out on the inter layer or cross layer protocols [16]. A lot of
work is done towards providing security based on cognitive
radio[17][18][19]. Many researchers have proposed
construction of cognitive networks using cognitive agents[20].
Cognitive agents are integrated to provide intelligence to the
networks.
Cognitive Networks design is an area of tremendous
interest. Network design based on the Observe Orient Decide
Act loop [2] gives us a clear understanding of the CP. Node
behavior analysis [20], Node reputation [15] is also an eminent
criterion taken into consideration for providing security and
network cognition. In our approach we recommend to use
lightweight and cooperative algorithms which have cross layer
optimization and can be considered towards structuring
cognitive networks [14] [3]. Access control is a very important
aspect to be considered with respect to security and network
integrity [6].Access control in many approaches has been
provided by additional servers which might be a tradeoff
between security and quick network access [24]. Network
Integrity could be maintained very efficiently provided strong
access control mechanisms are incorporated to the network
design. We propose an access control mechanism based on
PADL [21] based on our previous research.
From our extensive research is it very evident that soft
computing approaches have been incorporated to provide
human intelligence into networks [25]. Soft Computing is a
wide area of research today which includes neural networks,
fuzzy logic artificial immune systems etc. Learning and
reasoning are successfully implemented using neural
networks. Studies have shown that many systems designed
using neural networks have proved robust and effectively
handle the CP.[17][5][21][23]. Neural Network design and its
incorporation into the cognitive networks are considered as the
most challenging aspects of the CP [28]. Neural Networks
training algorithms could be classified into two categories -
supervised and unsupervised learning. In our scheme we
intend to use multi scalar neural networks. Fuzzy Logic,
Genetic Algorithms [17], Game Theory, Markov Chain,
pricing theory based approaches have also been
studied.[14].We also propose to use a multi layer neural
network trained using the back propagation algorithm.[23]
III. PROPOSED SYSTEM
The security issues with the current implementation of the WLAN have clearly been stated earlier. Cognitive Networks can be a solution to the current issues of WLAN’s. Cognitive Networks could improve resource management, QoS, security and access control. Here we would discuss about a CFA we propose, where our motive was to maintain a controlled network framework [6].The CSM which is the heart of the CFA is designed to maintain the cognitive network and also implements the CP using neural networks. A very important factor that was considered is that a network should understand
what the application can achieve and an application should be capable of understanding what the network is capable of doing at any given point in time. Basically for successful construction of a CSM joint layer, optimization and cross layer adaptive design is the key factor of consideration. A controlled and monitored environment is created to maintain the reliability of the network.
The major factors considered for the CSM proposed are towards secure access control mechanisms and implementation of the CP. The proposed CFA for WLAN’s is as shown in fig.1.
Figure 1: Cognitive Framework Architecture
From Fig.1 it is clear that the CSM imparts cognition to the
network. The CSM implements a controlled and monitored
WLAN access. A cross layer adaptive design is used to
implement the CSM. The Block Diagram of the CSM is as
shown in Fig.2.
Figure 2: CSM Architecture
Access Control is the key parameter considered to
maintained network integrity and controlled network access.
Attacks on AP’s, node jamming, node misbehavior etc are
known problems for cognitive networks. These problems
could be negated by providing strong authentication to its
users and also by having complete knowledge of the network
components. The CSM provides strong access control
(IJCSIS) International Journal of Computer Science and Information Security, Vol. 7, No. 2, February 2010
193 http://sites.google.com/site/ijcsis/ ISSN 1947-5500
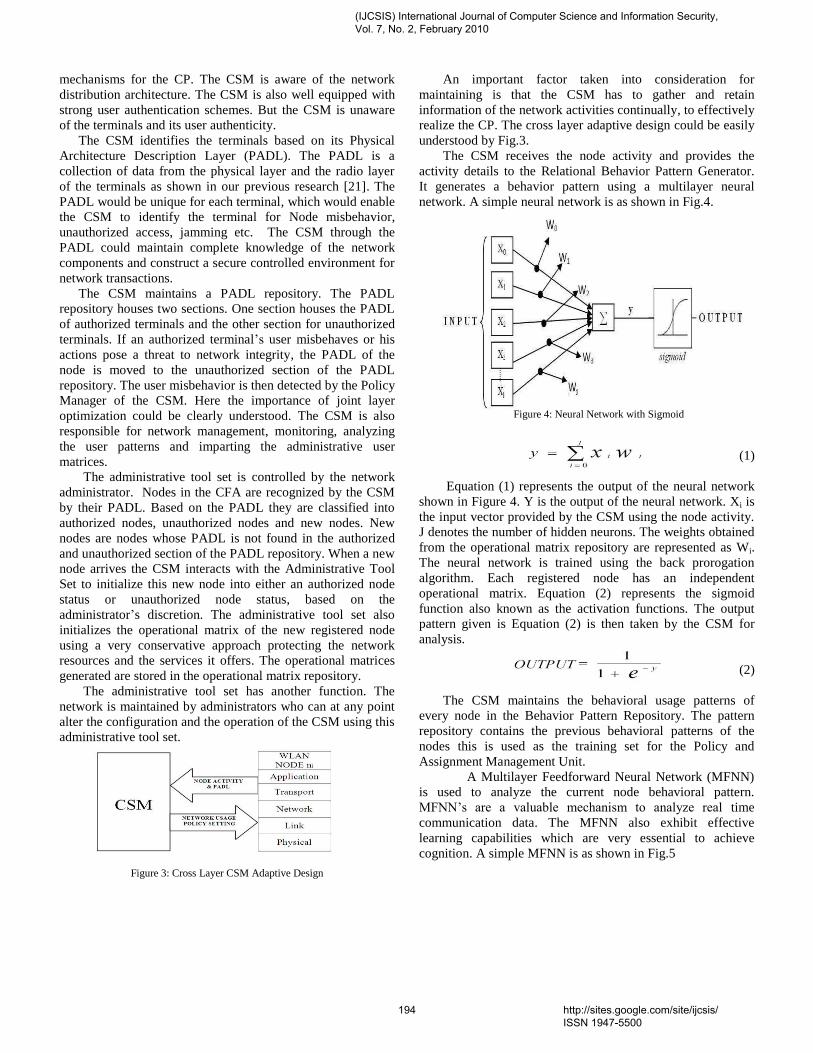
mechanisms for the CP. The CSM is aware of the network
distribution architecture. The CSM is also well equipped with
strong user authentication schemes. But the CSM is unaware
of the terminals and its user authenticity.
The CSM identifies the terminals based on its Physical
Architecture Description Layer (PADL). The PADL is a
collection of data from the physical layer and the radio layer
of the terminals as shown in our previous research [21]. The
PADL would be unique for each terminal, which would enable
the CSM to identify the terminal for Node misbehavior,
unauthorized access, jamming etc. The CSM through the
PADL could maintain complete knowledge of the network
components and construct a secure controlled environment for
network transactions.
The CSM maintains a PADL repository. The PADL
repository houses two sections. One section houses the PADL
of authorized terminals and the other section for unauthorized
terminals. If an authorized terminal’s user misbehaves or his
actions pose a threat to network integrity, the PADL of the
node is moved to the unauthorized section of the PADL
repository. The user misbehavior is then detected by the Policy
Manager of the CSM. Here the importance of joint layer
optimization could be clearly understood. The CSM is also
responsible for network management, monitoring, analyzing
the user patterns and imparting the administrative user
matrices.
The administrative tool set is controlled by the network
administrator. Nodes in the CFA are recognized by the CSM
by their PADL. Based on the PADL they are classified into
authorized nodes, unauthorized nodes and new nodes. New
nodes are nodes whose PADL is not found in the authorized
and unauthorized section of the PADL repository. When a new
node arrives the CSM interacts with the Administrative Tool
Set to initialize this new node into either an authorized node
status or unauthorized node status, based on the
administrator’s discretion. The administrative tool set also
initializes the operational matrix of the new registered node
using a very conservative approach protecting the network
resources and the services it offers. The operational matrices
generated are stored in the operational matrix repository.
The administrative tool set has another function. The
network is maintained by administrators who can at any point
alter the configuration and the operation of the CSM using this
administrative tool set.
Figure 3: Cross Layer CSM Adaptive Design
An important factor taken into consideration for
maintaining is that the CSM has to gather and retain
information of the network activities continually, to effectively
realize the CP. The cross layer adaptive design could be easily
understood by Fig.3.
The CSM receives the node activity and provides the
activity details to the Relational Behavior Pattern Generator.
It generates a behavior pattern using a multilayer neural
network. A simple neural network is as shown in Fig.4.
Figure 4: Neural Network with Sigmoid
(1)
Equation (1) represents the output of the neural network
shown in Figure 4. Y is the output of the neural network. Xi is
the input vector provided by the CSM using the node activity.
J denotes the number of hidden neurons. The weights obtained
from the operational matrix repository are represented as Wi.
The neural network is trained using the back prorogation
algorithm. Each registered node has an independent
operational matrix. Equation (2) represents the sigmoid
function also known as the activation functions. The output
pattern given is Equation (2) is then taken by the CSM for
analysis.
(2)
The CSM maintains the behavioral usage patterns of
every node in the Behavior Pattern Repository. The pattern
repository contains the previous behavioral patterns of the
nodes this is used as the training set for the Policy and
Assignment Management Unit.
A Multilayer Feedforward Neural Network (MFNN)
is used to analyze the current node behavioral pattern.
MFNN’s are a valuable mechanism to analyze real time
communication data. The MFNN also exhibit effective
learning capabilities which are very essential to achieve
cognition. A simple MFNN is as shown in Fig.5
(IJCSIS) International Journal of Computer Science and Information Security, Vol. 7, No. 2, February 2010
194 http://sites.google.com/site/ijcsis/ ISSN 1947-5500
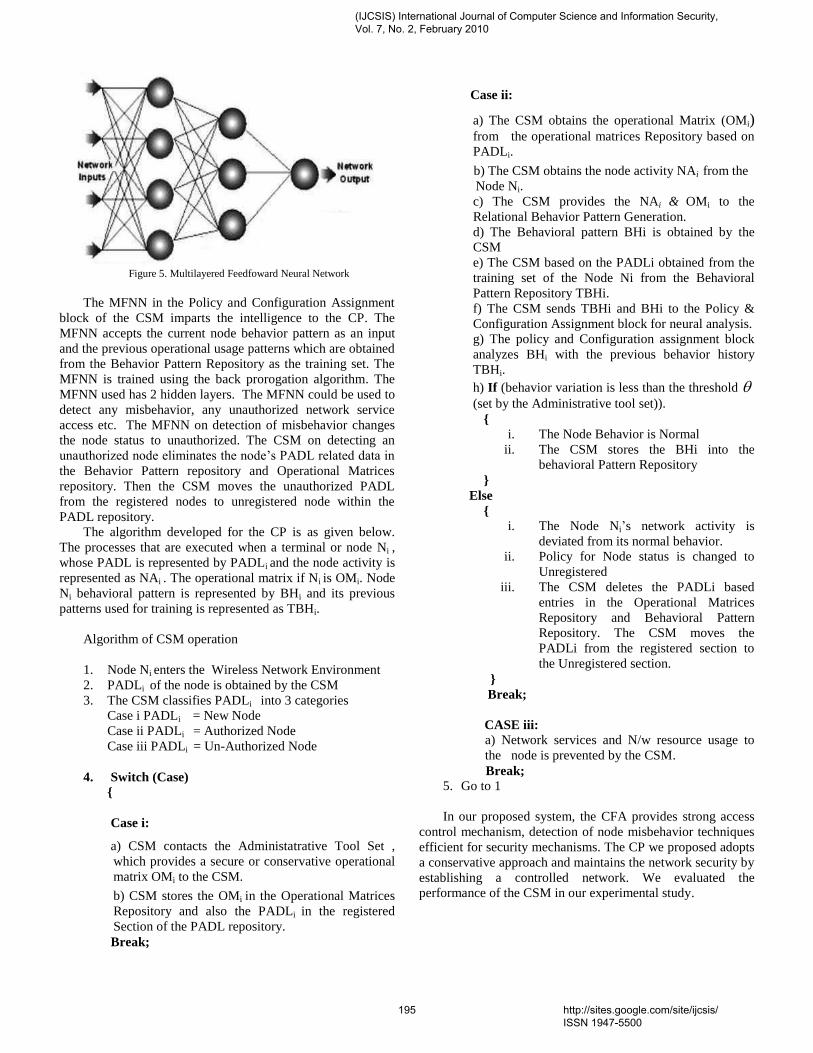
Figure 5. Multilayered Feedfoward Neural Network
The MFNN in the Policy and Configuration Assignment
block of the CSM imparts the intelligence to the CP. The
MFNN accepts the current node behavior pattern as an input
and the previous operational usage patterns which are obtained
from the Behavior Pattern Repository as the training set. The
MFNN is trained using the back prorogation algorithm. The
MFNN used has 2 hidden layers. The MFNN could be used to
detect any misbehavior, any unauthorized network service
access etc. The MFNN on detection of misbehavior changes
the node status to unauthorized. The CSM on detecting an
unauthorized node eliminates the node’s PADL related data in
the Behavior Pattern repository and Operational Matrices
repository. Then the CSM moves the unauthorized PADL
from the registered nodes to unregistered node within the
PADL repository.
The algorithm developed for the CP is as given below.
The processes that are executed when a terminal or node Ni , whose PADL is represented by PADLi and the node activity is
represented as NAi . The operational matrix if Ni is OMi. Node
Ni behavioral pattern is represented by BHi and its previous
patterns used for training is represented as TBHi.
Algorithm of CSM operation
1. Node Ni enters the Wireless Network Environment
2. PADLi of the node is obtained by the CSM
3. The CSM classifies PADLi into 3 categories
Case i PADLi = New Node
Case ii PADLi = Authorized Node
Case iii PADLi = Un-Authorized Node
4. Switch (Case)
{
Case i:
a) CSM contacts the Administatrative Tool Set ,
which provides a secure or conservative operational
matrix OMi to the CSM.
b) CSM stores the OMi in the Operational Matrices
Repository and also the PADLi in the registered
Section of the PADL repository.
Break;
Case ii:
a) The CSM obtains the operational Matrix (OMi)
from the operational matrices Repository based on
PADLi.
b) The CSM obtains the node activity NAi from the
Node Ni.
c) The CSM provides the NAi & OMi to the
Relational Behavior Pattern Generation.
d) The Behavioral pattern BHi is obtained by the
CSM
e) The CSM based on the PADLi obtained from the
training set of the Node Ni from the Behavioral
Pattern Repository TBHi.
f) The CSM sends TBHi and BHi to the Policy &
Configuration Assignment block for neural analysis.
g) The policy and Configuration assignment block
analyzes BHi with the previous behavior history
TBHi.
h) If (behavior variation is less than the threshold
(set by the Administrative tool set)).
{
i. The Node Behavior is Normal
ii. The CSM stores the BHi into the
behavioral Pattern Repository
}
Else
{
i. The Node Ni’s network activity is
deviated from its normal behavior.
ii. Policy for Node status is changed to
Unregistered
iii. The CSM deletes the PADLi based
entries in the Operational Matrices
Repository and Behavioral Pattern
Repository. The CSM moves the
PADLi from the registered section to
the Unregistered section.
}
Break;
CASE iii:
a) Network services and N/w resource usage to
the node is prevented by the CSM.
Break;
5. Go to 1
In our proposed system, the CFA provides strong access
control mechanism, detection of node misbehavior techniques
efficient for security mechanisms. The CP we proposed adopts
a conservative approach and maintains the network security by
establishing a controlled network. We evaluated the
performance of the CSM in our experimental study.
(IJCSIS) International Journal of Computer Science and Information Security, Vol. 7, No. 2, February 2010
195 http://sites.google.com/site/ijcsis/ ISSN 1947-5500
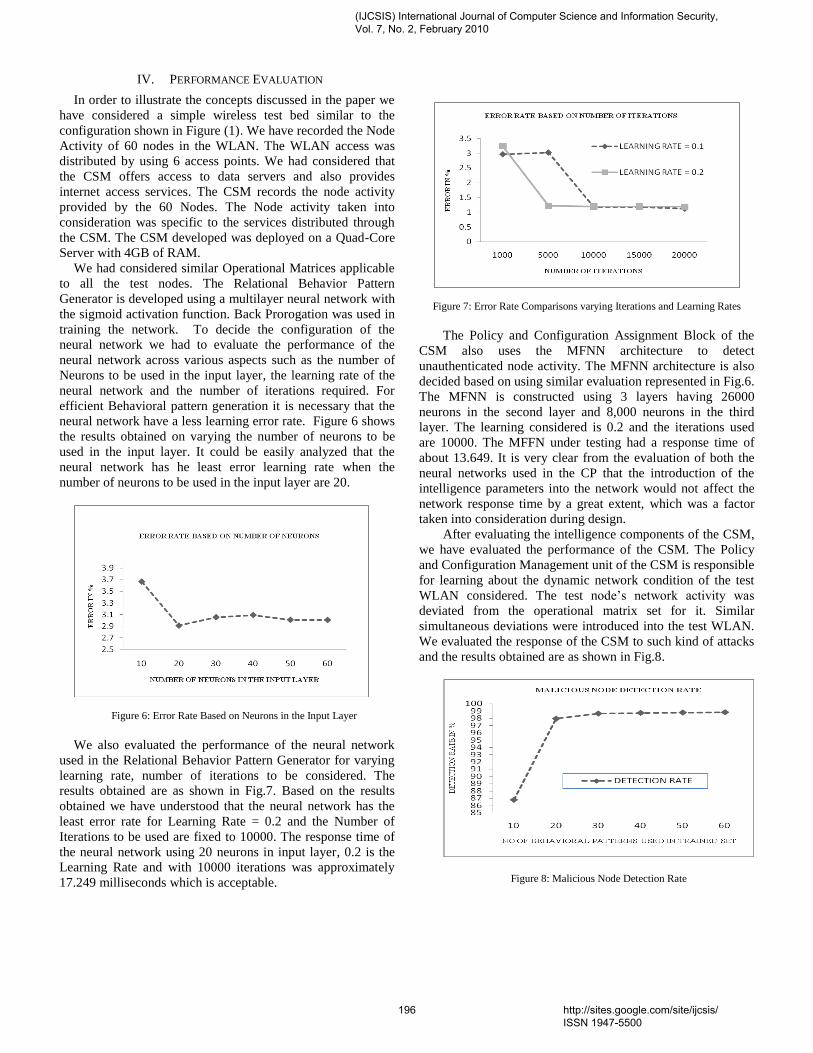
IV. PERFORMANCE EVALUATION
In order to illustrate the concepts discussed in the paper we
have considered a simple wireless test bed similar to the
configuration shown in Figure (1). We have recorded the Node
Activity of 60 nodes in the WLAN. The WLAN access was
distributed by using 6 access points. We had considered that
the CSM offers access to data servers and also provides
internet access services. The CSM records the node activity
provided by the 60 Nodes. The Node activity taken into
consideration was specific to the services distributed through
the CSM. The CSM developed was deployed on a Quad-Core
Server with 4GB of RAM.
We had considered similar Operational Matrices applicable
to all the test nodes. The Relational Behavior Pattern
Generator is developed using a multilayer neural network with
the sigmoid activation function. Back Prorogation was used in
training the network. To decide the configuration of the
neural network we had to evaluate the performance of the
neural network across various aspects such as the number of
Neurons to be used in the input layer, the learning rate of the
neural network and the number of iterations required. For
efficient Behavioral pattern generation it is necessary that the
neural network have a less learning error rate. Figure 6 shows
the results obtained on varying the number of neurons to be
used in the input layer. It could be easily analyzed that the
neural network has he least error learning rate when the
number of neurons to be used in the input layer are 20.
Figure 6: Error Rate Based on Neurons in the Input Layer
We also evaluated the performance of the neural network
used in the Relational Behavior Pattern Generator for varying
learning rate, number of iterations to be considered. The
results obtained are as shown in Fig.7. Based on the results
obtained we have understood that the neural network has the
least error rate for Learning Rate = 0.2 and the Number of
Iterations to be used are fixed to 10000. The response time of
the neural network using 20 neurons in input layer, 0.2 is the
Learning Rate and with 10000 iterations was approximately
17.249 milliseconds which is acceptable.
Figure 7: Error Rate Comparisons varying Iterations and Learning Rates
The Policy and Configuration Assignment Block of the
CSM also uses the MFNN architecture to detect
unauthenticated node activity. The MFNN architecture is also
decided based on using similar evaluation represented in Fig.6.
The MFNN is constructed using 3 layers having 26000
neurons in the second layer and 8,000 neurons in the third
layer. The learning considered is 0.2 and the iterations used
are 10000. The MFFN under testing had a response time of
about 13.649. It is very clear from the evaluation of both the
neural networks used in the CP that the introduction of the
intelligence parameters into the network would not affect the
network response time by a great extent, which was a factor
taken into consideration during design.
After evaluating the intelligence components of the CSM,
we have evaluated the performance of the CSM. The Policy
and Configuration Management unit of the CSM is responsible
for learning about the dynamic network condition of the test
WLAN considered. The test node’s network activity was
deviated from the operational matrix set for it. Similar
simultaneous deviations were introduced into the test WLAN.
We evaluated the response of the CSM to such kind of attacks
and the results obtained are as shown in Fig.8.
Figure 8: Malicious Node Detection Rate
(IJCSIS) International Journal of Computer Science and Information Security, Vol. 7, No. 2, February 2010
196 http://sites.google.com/site/ijcsis/ ISSN 1947-5500
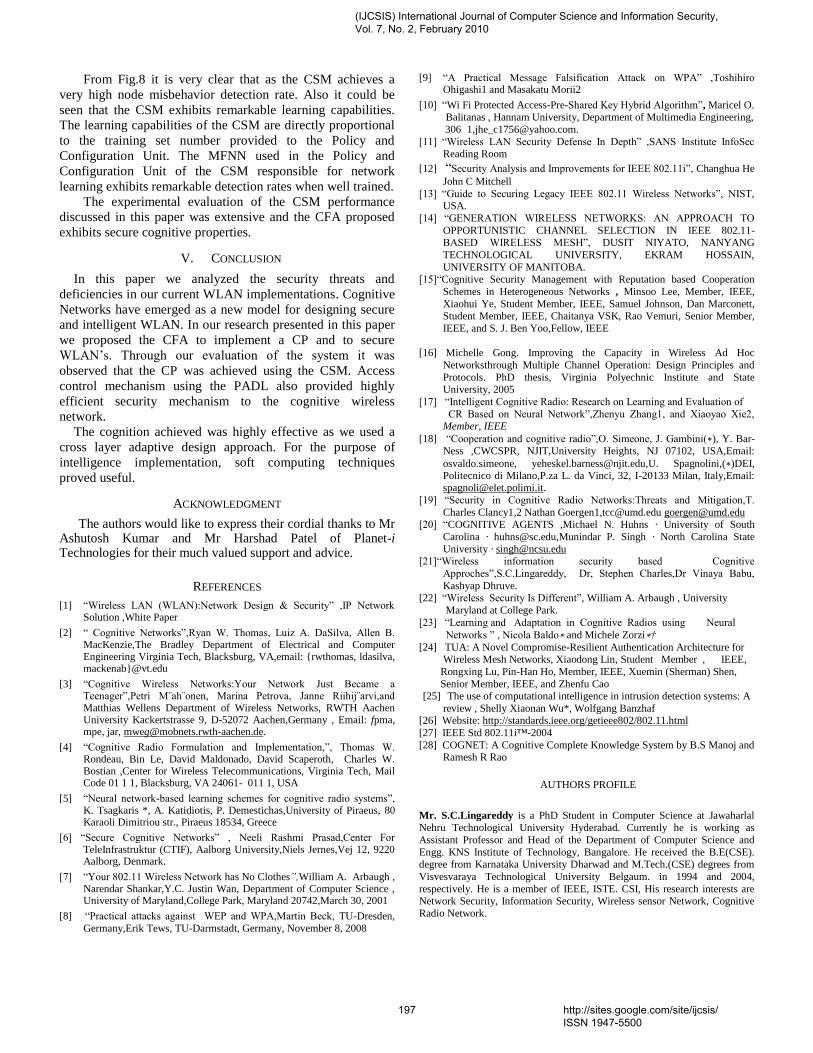
From Fig.8 it is very clear that as the CSM achieves a
very high node misbehavior detection rate. Also it could be
seen that the CSM exhibits remarkable learning capabilities.
The learning capabilities of the CSM are directly proportional
to the training set number provided to the Policy and
Configuration Unit. The MFNN used in the Policy and
Configuration Unit of the CSM responsible for network
learning exhibits remarkable detection rates when well trained.
The experimental evaluation of the CSM performance
discussed in this paper was extensive and the CFA proposed
exhibits secure cognitive properties.
V. CONCLUSION
In this paper we analyzed the security threats and
deficiencies in our current WLAN implementations. Cognitive
Networks have emerged as a new model for designing secure
and intelligent WLAN. In our research presented in this paper
we proposed the CFA to implement a CP and to secure
WLAN’s. Through our evaluation of the system it was
observed that the CP was achieved using the CSM. Access
control mechanism using the PADL also provided highly
efficient security mechanism to the cognitive wireless
network.
The cognition achieved was highly effective as we used a
cross layer adaptive design approach. For the purpose of
intelligence implementation, soft computing techniques
proved useful.
ACKNOWLEDGMENT
The authors would like to express their cordial thanks to Mr Ashutosh Kumar and Mr Harshad Patel of Planet-i Technologies for their much valued support and advice.
REFERENCES
[1] “Wireless LAN (WLAN):Network Design & Security” ,IP Network Solution ,White Paper
[2] “ Cognitive Networks”,Ryan W. Thomas, Luiz A. DaSilva, Allen B. MacKenzie,The Bradley Department of Electrical and Computer Engineering Virginia Tech, Blacksburg, VA,email: {rwthomas, ldasilva, mackenab}@vt.edu
[3] “Cognitive Wireless Networks:Your Network Just Became a Teenager”,Petri M¨ah¨onen, Marina Petrova, Janne Riihij¨arvi,and Matthias Wellens Department of Wireless Networks, RWTH Aachen University Kackertstrasse 9, D-52072 Aachen,Germany , Email: fpma, mpe, jar, [email protected].
[4] “Cognitive Radio Formulation and Implementation,”, Thomas W. Rondeau, Bin Le, David Maldonado, David Scaperoth, Charles W. Bostian ,Center for Wireless Telecommunications, Virginia Tech, Mail Code 01 1 1, Blacksburg, VA 24061- 011 1, USA
[5] “Neural network-based learning schemes for cognitive radio systems”, K. Tsagkaris *, A. Katidiotis, P. Demestichas,University of Piraeus, 80 Karaoli Dimitriou str., Piraeus 18534, Greece
[6] “Secure Cognitive Networks” , Neeli Rashmi Prasad,Center For TeleInfrastruktur (CTIF), Aalborg University,Niels Jernes,Vej 12, 9220 Aalborg, Denmark.
[7] “Your 802.11 Wireless Network has No Clothes”,William A. Arbaugh , Narendar Shankar,Y.C. Justin Wan, Department of Computer Science , University of Maryland,College Park, Maryland 20742,March 30, 2001
[8] “Practical attacks against WEP and WPA,Martin Beck, TU-Dresden,
Germany,Erik Tews, TU-Darmstadt, Germany, November 8, 2008
[9] “A Practical Message Falsification Attack on WPA” ,Toshihiro Ohigashi1 and Masakatu Morii2
[10] “Wi Fi Protected Access-Pre-Shared Key Hybrid Algorithm”, Maricel O.
Balitanas , Hannam University, Department of Multimedia Engineering,
306 1,[email protected].
[11] “Wireless LAN Security Defense In Depth” ,SANS Institute InfoSec Reading Room
[12] “Security Analysis and Improvements for IEEE 802.11i”, Changhua He
John C Mitchell
[13] “Guide to Securing Legacy IEEE 802.11 Wireless Networks”, NIST, USA.
[14] “GENERATION WIRELESS NETWORKS: AN APPROACH TO
OPPORTUNISTIC CHANNEL SELECTION IN IEEE 802.11- BASED WIRELESS MESH”, DUSIT NIYATO, NANYANG
TECHNOLOGICAL UNIVERSITY, EKRAM HOSSAIN,
UNIVERSITY OF MANITOBA. [15]“Cognitive Security Management with Reputation based Cooperation
Schemes in Heterogeneous Networks , Minsoo Lee, Member, IEEE,
Xiaohui Ye, Student Member, IEEE, Samuel Johnson, Dan Marconett, Student Member, IEEE, Chaitanya VSK, Rao Vemuri, Senior Member,
IEEE, and S. J. Ben Yoo,Fellow, IEEE
[16] Michelle Gong. Improving the Capacity in Wireless Ad Hoc
Networksthrough Multiple Channel Operation: Design Principles and
Protocols. PhD thesis, Virginia Polyechnic Institute and State University, 2005
[17] “Intelligent Cognitive Radio: Research on Learning and Evaluation of
CR Based on Neural Network”,Zhenyu Zhang1, and Xiaoyao Xie2, Member, IEEE
[18] “Cooperation and cognitive radio”,O. Simeone, J. Gambini(∗), Y. Bar-Ness ,CWCSPR, NJIT,University Heights, NJ 07102, USA,Email:
osvaldo.simeone, [email protected],U. Spagnolini,(∗)DEI, Politecnico di Milano,P.za L. da Vinci, 32, I-20133 Milan, Italy,Email: [email protected].
[19] “Security in Cognitive Radio Networks:Threats and Mitigation,T.
Charles Clancy1,2 Nathan Goergen1,[email protected] [email protected] [20] “COGNITIVE AGENTS ,Michael N. Huhns · University of South
Carolina · [email protected],Munindar P. Singh · North Carolina State
University · [email protected] [21]“Wireless information security based Cognitive
Approches”,S.C.Lingareddy, Dr, Stephen Charles,Dr Vinaya Babu,
Kashyap Dhruve.
[22] “Wireless Security Is Different”, William A. Arbaugh , University
Maryland at College Park.
[23] “Learning and Adaptation in Cognitive Radios using Neural
Networks ” , Nicola Baldo∗ and Michele Zorzi∗†
[24] TUA: A Novel Compromise-Resilient Authentication Architecture for Wireless Mesh Networks, Xiaodong Lin, Student Member , IEEE,
Rongxing Lu, Pin-Han Ho, Member, IEEE, Xuemin (Sherman) Shen,
Senior Member, IEEE, and Zhenfu Cao [25] The use of computational intelligence in intrusion detection systems: A
review , Shelly Xiaonan Wu*, Wolfgang Banzhaf [26] Website: http://standards.ieee.org/getieee802/802.11.html
[27] IEEE Std 802.11i™-2004
[28] COGNET: A Cognitive Complete Knowledge System by B.S Manoj and Ramesh R Rao
AUTHORS PROFILE
Mr. S.C.Lingareddy is a PhD Student in Computer Science at Jawaharlal
Nehru Technological University Hyderabad. Currently he is working as
Assistant Professor and Head of the Department of Computer Science and
Engg. KNS Institute of Technology, Bangalore. He received the B.E(CSE). degree from Karnataka University Dharwad and M.Tech.(CSE) degrees from
Visvesvaraya Technological University Belgaum. in 1994 and 2004,
respectively. He is a member of IEEE, ISTE. CSI, His research interests are Network Security, Information Security, Wireless sensor Network, Cognitive
Radio Network.
(IJCSIS) International Journal of Computer Science and Information Security, Vol. 7, No. 2, February 2010
197 http://sites.google.com/site/ijcsis/ ISSN 1947-5500
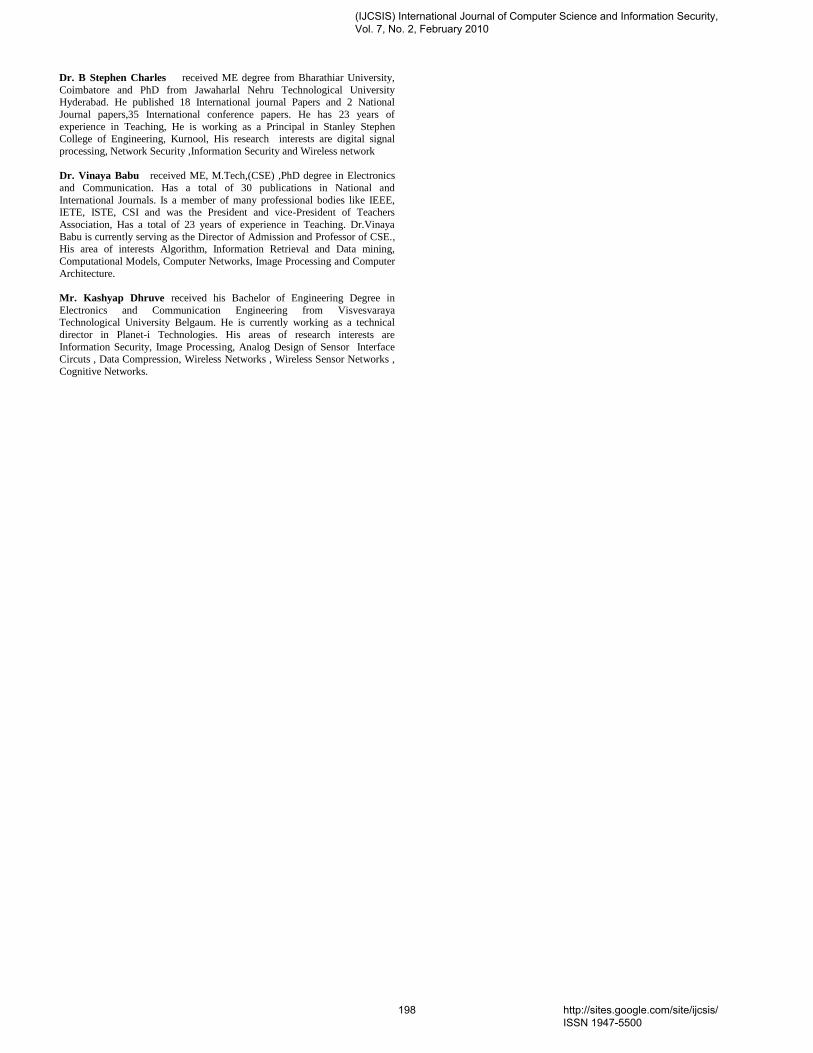
Dr. B Stephen Charles received ME degree from Bharathiar University,
Coimbatore and PhD from Jawaharlal Nehru Technological University Hyderabad. He published 18 International journal Papers and 2 National
Journal papers,35 International conference papers. He has 23 years of
experience in Teaching, He is working as a Principal in Stanley Stephen College of Engineering, Kurnool, His research interests are digital signal
processing, Network Security ,Information Security and Wireless network
Dr. Vinaya Babu received ME, M.Tech,(CSE) ,PhD degree in Electronics
and Communication. Has a total of 30 publications in National and
International Journals. Is a member of many professional bodies like IEEE, IETE, ISTE, CSI and was the President and vice-President of Teachers
Association, Has a total of 23 years of experience in Teaching. Dr.Vinaya
Babu is currently serving as the Director of Admission and Professor of CSE., His area of interests Algorithm, Information Retrieval and Data mining,
Computational Models, Computer Networks, Image Processing and Computer
Architecture.
Mr. Kashyap Dhruve received his Bachelor of Engineering Degree in
Electronics and Communication Engineering from Visvesvaraya Technological University Belgaum. He is currently working as a technical
director in Planet-i Technologies. His areas of research interests are
Information Security, Image Processing, Analog Design of Sensor Interface
Circuts , Data Compression, Wireless Networks , Wireless Sensor Networks ,
Cognitive Networks.
(IJCSIS) International Journal of Computer Science and Information Security, Vol. 7, No. 2, February 2010
198 http://sites.google.com/site/ijcsis/ ISSN 1947-5500
(IJCSIS) International Journal of Computer Science and Information Security, Vol. 7, No. 2, 2010
A Hybrid System based on Multi-Agent System in the Data Preprocessing Stage
Kobkul Kularbphettong, Gareth Clayton and Phayung Meesad The Information Technology Faculty,
King Mongkut’s University of Technology North Bangkok, Thailand
Abstract—We describe the usage of the Multi-agent system in the data preprocessing stage of an on-going project, called e-Wedding. The aim of this project is to utilize MAS and various approaches, like Web services, Ontology, and Data mining techniques, in e-Business that want to improve responsiveness and efficiency of systems so as to extract customer behavior model on Wedding Businesses. However, in this paper, we propose and implement the multi-agent-system, based on JADE, to only cope data preprocessing stage specified on handle with missing value techniques. JADE is quite easy to learn and use. Moreover, it supports many agent approaches such as agent communication, protocol, behavior and ontology. This framework has been experimented and evaluated in the realization of a simple, but realistic. The results, though still preliminary, are quite.
Keywords-component; multi-agent system, data preprocessing stage, Web services, ontology, data mining techniques, e-Wedding, JADE.
I. INTRODUCTION Data Preprocessing is one of the significant factors that
affects on the success of Data Mining and Machine Learning approaches. Generally, data preprocessing stage represents the quality of data. The more incorrect and incomplete data presents, the more result is unreliable. Moreover, data preprocessing task is time consuming because it includes many phases like data cleaning, data integrating, data transforming and data reducing. However, the best performance of the data pre-processing algorithms is relied on the nature of each data set. Hence, it would be nice if it have the interested methodology to adapt for choosing the best performance of the data preprocessing algorithms for each data set.
Recently, although there are much of researches applied MAS (Multi-agent system) in a wide range of problem in Data Mining and Machine Learning techniques, very few researches are focused on using MAS in the data preprocessing step. A multi agent system is a computational system, or a loosely coupled network in which two or more agents interact or work together to perform a set of tasks or to satisfy a set of goals. Each agent is considered as a locus of a problem-solving activity which operates asynchronously with respect to the other agents [1]. Therefore, in this paper we propose the MAS
framework of an on-going project, called e-Wedding, that merely focuses on using MAS to handle in the problems of data preprocessing stage.
The remainder of this paper is organized as follows. Section 2 reviews about related literatures and research works in the use of multi-agent system for data mining. Section 3 presents the related methodologies used in this work. Section 4 presents the experimental results based on the purposed model based on multi-agent framework. This prototype demonstrates how to success for adapting multi-agent system in data preprocessing stage. Finally, we conclude the paper with future research issues in section 5.
II. RELATED WORKS A literature search shows that most of the related researches have been deployed multi-agent to cope with the data mining techniques specified on the data preprocessing algorithms by following this: According to [5], they showed a prototype of the system using the JADE platform in the context of travel industry. Furthermore, other research works show that agent technologies are deployed as a significant tool for developing e-Commerce applications [2]-[7]. Hence, multi-agent technology, a promising approach, trends to handle internet transaction for customers. Moreover, other researchers propose an agent-based framework representing in various ways that are related with data mining techniques [8]-[10]. For instances, Chien-Ho Wu, Yuehjen E. Shao, Jeng-Fu Liu, and Tsair-Yuan Chang[[11] applied agent technology to collect and integrate data distributed over various computing platforms to facilitate statistical data analysis in replacing the missing values by using either Approximate Bayesian Bootstrap (ABB) or Ratio Imputation and using MAS improves the execution time at different by focusing on spatial knowledge in order to extract knowledge in Predictive Modeling Markup Language (PMML) format [9]. From previous literature works, it appears that there are many research studies exploiting various techniques blended with multi-agent technology and data mining techniques. Consequently, in order to success on e-Commerce, agent should have abilities to perform as a behalf of user to handle
199 http://sites.google.com/site/ijcsis/ ISSN 1947-5500
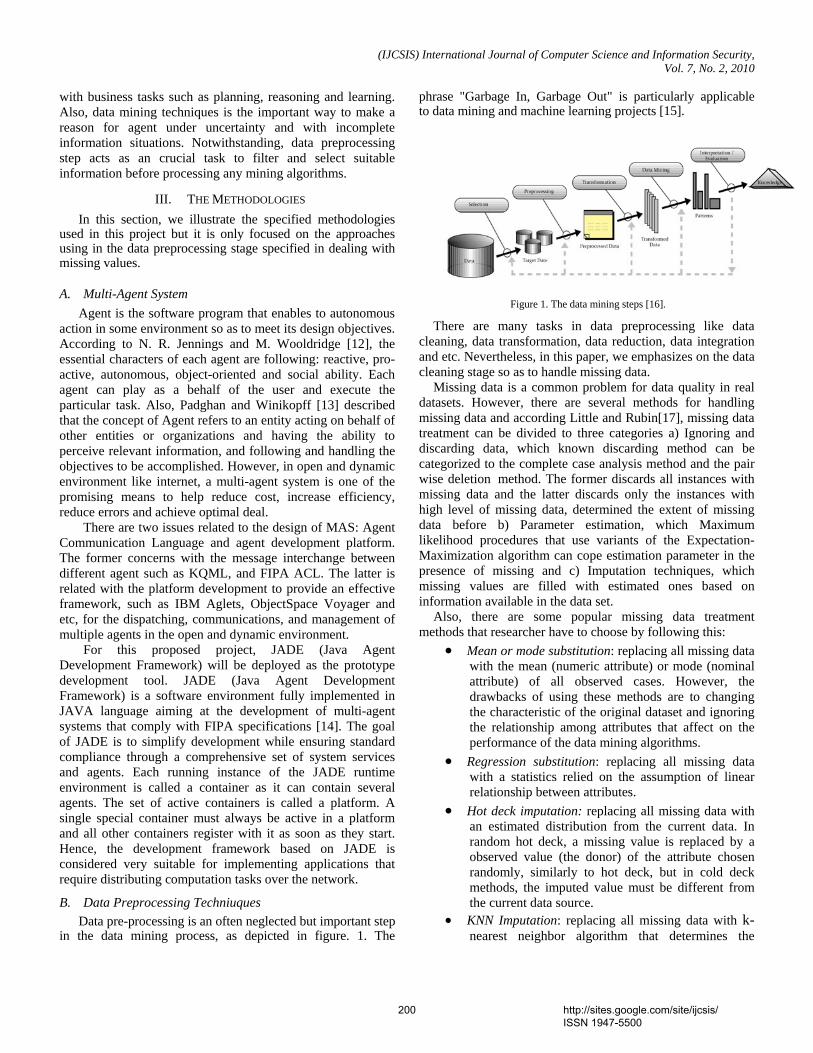
(IJCSIS) International Journal of Computer Science and Information Security, Vol. 7, No. 2, 2010
[15]. with business tasks such as planning, reasoning and learning. Also, data mining techniques is the important way to make a reason for agent under uncertainty and with incomplete information situations. Notwithstanding, data preprocessing step acts as an crucial task to filter and select suitable information before processing any mining algorithms.
III. THE METHODOLOGIES In this section, we illustrate the specified methodologies
used in this project but it is only focused on the approaches using in the data preprocessing stage specified in dealing with missing values.
A. Multi-Agent System Agent is the software program that enables to autonomous
action in some environment so as to meet its design objectives. According to N. R. Jennings and M. Wooldridge [12], the essential characters of each agent are following: reactive, pro-active, autonomous, object-oriented and social ability. Each agent can play as a behalf of the user and execute the particular task. Also, Padghan and Winikopff [13] described that the concept of Agent refers to an entity acting on behalf of other entities or organizations and having the ability to perceive relevant information, and following and handling the objectives to be accomplished. However, in open and dynamic environment like internet, a multi-agent system is one of the promising means to help reduce cost, increase efficiency, reduce errors and achieve optimal deal. There are two issues related to the design of MAS: Agent Communication Language and agent development platform. The former concerns with the message interchange between different agent such as KQML, and FIPA ACL. The latter is related with the platform development to provide an effective framework, such as IBM Aglets, ObjectSpace Voyager and etc, for the dispatching, communications, and management of multiple agents in the open and dynamic environment. For this proposed project, JADE (Java Agent Development Framework) will be deployed as the prototype development tool. JADE (Java Agent Development Framework) is a software environment fully implemented in JAVA language aiming at the development of multi-agent systems that comply with FIPA specifications [14]. The goal of JADE is to simplify development while ensuring standard compliance through a comprehensive set of system services and agents. Each running instance of the JADE runtime environment is called a container as it can contain several agents. The set of active containers is called a platform. A single special container must always be active in a platform and all other containers register with it as soon as they start. Hence, the development framework based on JADE is considered very suitable for implementing applications that require distributing computation tasks over the network.
B. Data Preprocessing Techniuques Data pre-processing is an often neglected but important step
in the data mining process, as depicted in figure. 1. The
phrase "Garbage In, Garbage Out" is particularly applicable to data mining and machine learning projects
Figure 1. The data mining steps [16].
There are many tasks in data preprocessing like data cleaning, data transformation, data reduction, data integration and etc. Nevertheless, in this paper, we emphasizes on the data cleaning stage so as to handle missing data.
Missing data is a common problem for data quality in real datasets. However, there are several methods for handling missing data and according Little and Rubin[17], missing data treatment can be divided to three categories a) Ignoring and discarding data, which known discarding method can be categorized to the complete case analysis method and the pair wise deletion method. The former discards all instances with missing data and the latter discards only the instances with high level of missing data, determined the extent of missing data before b) Parameter estimation, which Maximum likelihood procedures that use variants of the Expectation-Maximization algorithm can cope estimation parameter in the presence of missing and c) Imputation techniques, which missing values are filled with estimated ones based on information available in the data set.
Also, there are some popular missing data treatment methods that researcher have to choose by following this:
• Mean or mode substitution: replacing all missing data with the mean (numeric attribute) or mode (nominal attribute) of all observed cases. However, the drawbacks of using these methods are to changing the characteristic of the original dataset and ignoring the relationship among attributes that affect on the performance of the data mining algorithms.
• Regression substitution: replacing all missing data with a statistics relied on the assumption of linear relationship between attributes.
• Hot deck imputation: replacing all missing data with an estimated distribution from the current data. In random hot deck, a missing value is replaced by a observed value (the donor) of the attribute chosen randomly, similarly to hot deck, but in cold deck methods, the imputed value must be different from the current data source.
• KNN Imputation: replacing all missing data with k-nearest neighbor algorithm that determines the
200 http://sites.google.com/site/ijcsis/ ISSN 1947-5500
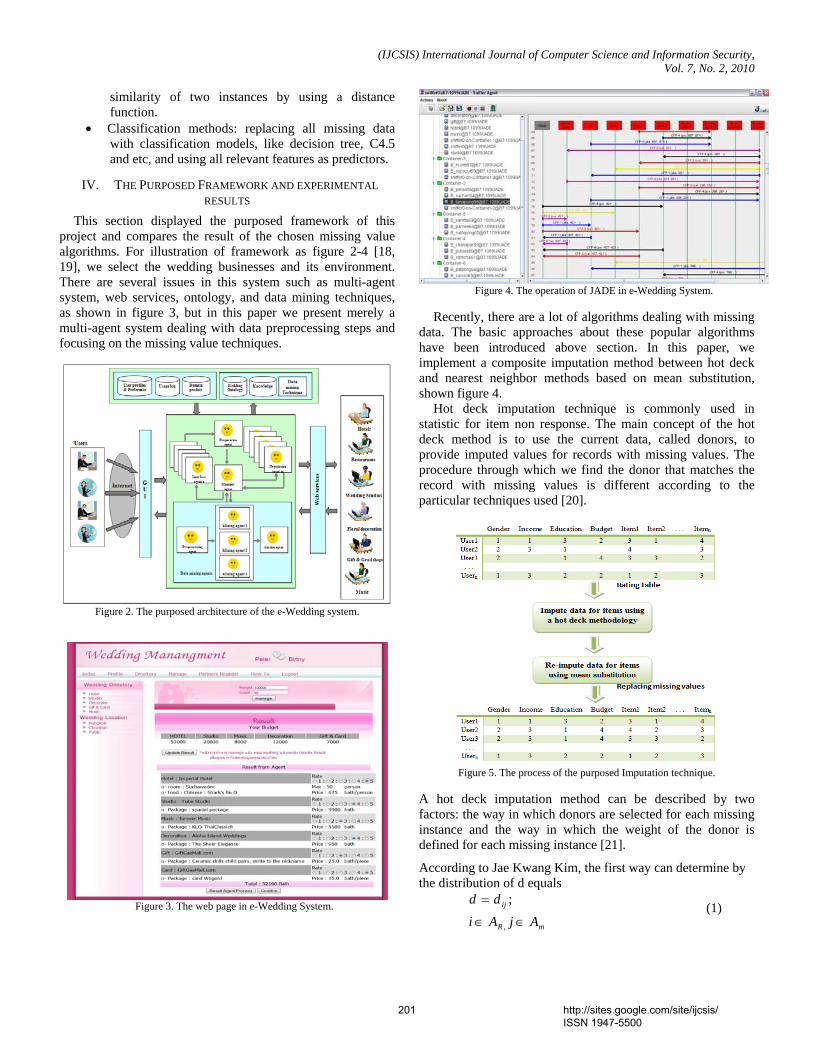
(IJCSIS) International Journal of Computer Science and Information Security, Vol. 7, No. 2, 2010
similarity of two instances by using a distance function.
• Classification methods: replacing all missing data with classification models, like decision tree, C4.5 and etc, and using all relevant features as predictors.
IV. THE PURPOSED FRAMEWORK AND EXPERIMENTAL RESULTS
This section displayed the purposed framework of this project and compares the result of the chosen missing value algorithms. For illustration of framework as figure 2-4 [18, 19], we select the wedding businesses and its environment. There are several issues in this system such as multi-agent system, web services, ontology, and data mining techniques, as shown in figure 3, but in this paper we present merely a multi-agent system dealing with data preprocessing steps and focusing on the missing value techniques.
Figure 2. The purposed architecture of the e-Wedding system.
Figure 3. The web page in e-Wedding System.
Figure 4. The operation of JADE in e-Wedding System.
Recently, there are a lot of algorithms dealing with missing
data. The basic approaches about these popular algorithms have been introduced above section. In this paper, we implement a composite imputation method between hot deck and nearest neighbor methods based on mean substitution, shown figure 4.
Hot deck imputation technique is commonly used in statistic for item non response. The main concept of the hot deck method is to use the current data, called donors, to provide imputed values for records with missing values. The procedure through which we find the donor that matches the record with missing values is different according to the particular techniques used [20].
Figure 5. The process of the purposed Imputation technique.
A hot deck imputation method can be described by two factors: the way in which donors are selected for each missing instance and the way in which the weight of the donor is defined for each missing instance [21].
According to Jae Kwang Kim, the first way can determine by the distribution of d equals
mR
ij
AjAi
dd
∈∈
=
,
; (1)
201 http://sites.google.com/site/ijcsis/ ISSN 1947-5500
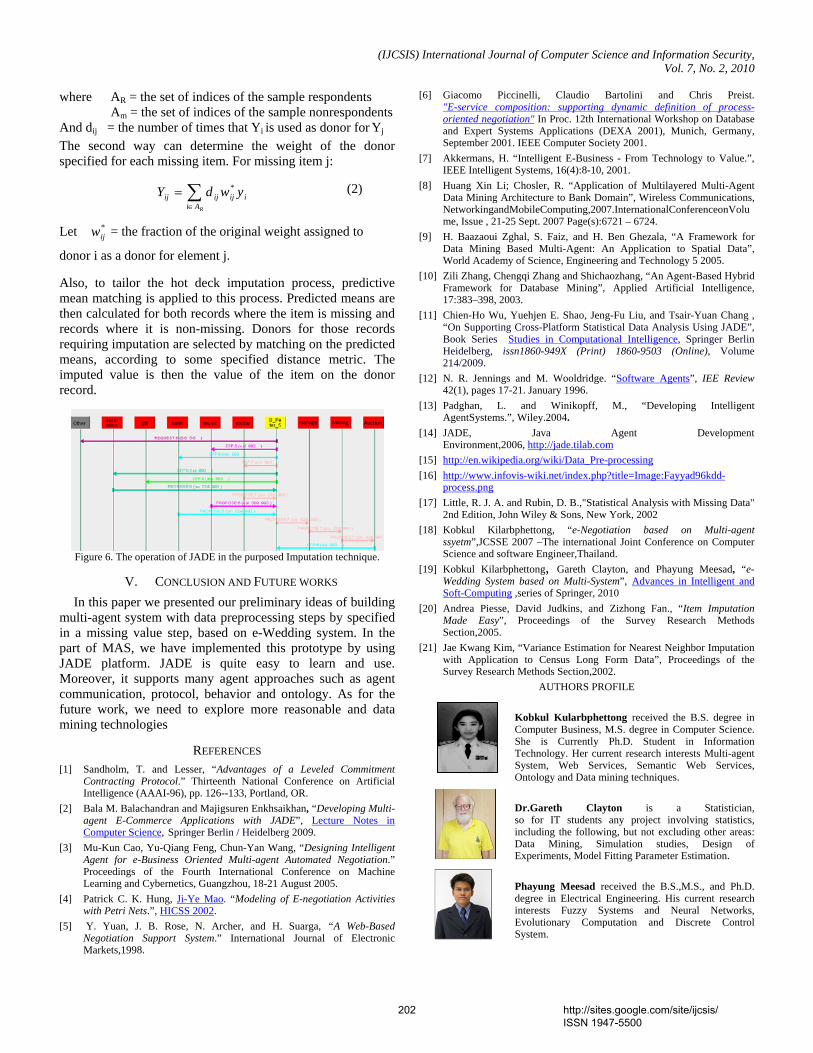
(IJCSIS) International Journal of Computer Science and Information Security, Vol. 7, No. 2, 2010
where AR = the set of indices of the sample respondents [6] Giacomo Piccinelli, Claudio Bartolini and Chris Preist.
"E-service composition: supporting dynamic definition of process-oriented negotiation" In Proc. 12th International Workshop on Database and Expert Systems Applications (DEXA 2001), Munich, Germany, September 2001. IEEE Computer Society 2001.
Am = the set of indices of the sample nonrespondents And dij = the number of times that Yi is used as donor for Yj
The second way can determine the weight of the donor specified for each missing item. For missing item j: [7] Akkermans, H. “Intelligent E-Business - From Technology to Value.”,
IEEE Intelligent Systems, 16(4):8-10, 2001.
∑∈
=RAi
iijijij ywdY * (2) [8] Huang Xin Li; Chosler, R. “Application of Multilayered Multi-Agent Data Mining Architecture to Bank Domain”, Wireless Communications, NetworkingandMobileComputing,2007.InternationalConferenceonVolume, Issue , 21-25 Sept. 2007 Page(s):6721 – 6724.
Let = the fraction of the original weight assigned to
donor i as a donor for element j.
*ijw [9] H. Baazaoui Zghal, S. Faiz, and H. Ben Ghezala, “A Framework for
Data Mining Based Multi-Agent: An Application to Spatial Data”, World Academy of Science, Engineering and Technology 5 2005.
[10] Zili Zhang, Chengqi Zhang and Shichaozhang, “An Agent-Based Hybrid
Framework for Database Mining”, Applied Artificial Intelligence, 17:383–398, 2003.
Also, to tailor the hot deck imputation process, predictive mean matching is applied to this process. Predicted means are then calculated for both records where the item is missing and records where it is non-missing. Donors for those records requiring imputation are selected by matching on the predicted means, according to some specified distance metric. The imputed value is then the value of the item on the donor record.
[11] Chien-Ho Wu, Yuehjen E. Shao, Jeng-Fu Liu, and Tsair-Yuan Chang , “On Supporting Cross-Platform Statistical Data Analysis Using JADE”, Book Series Studies in Computational Intelligence, Springer Berlin Heidelberg, issn1860-949X (Print) 1860-9503 (Online), Volume 214/2009.
[12] N. R. Jennings and M. Wooldridge. “Software Agents”, IEE Review 42(1), pages 17-21. January 1996.
[13] Padghan, L. and Winikopff, M., “Developing Intelligent AgentSystems.”, Wiley.2004.
[14] JADE, Java Agent Development Environment,2006, http://jade.tilab.com
[15] http://en.wikipedia.org/wiki/Data_Pre-processing [16] http://www.infovis-wiki.net/index.php?title=Image:Fayyad96kdd-
process.png [17] Little, R. J. A. and Rubin, D. B.,"Statistical Analysis with Missing Data"
2nd Edition, John Wiley & Sons, New York, 2002 [18] Kobkul Kilarbphettong, “e-Negotiation based on Multi-agent
ssyetm”,JCSSE 2007 –The international Joint Conference on Computer Science and software Engineer,Thailand. Figure 6. The operation of JADE in the purposed Imputation technique.
[19] Kobkul Kilarbphettong, Gareth Clayton, and Phayung Meesad, “e-Wedding System based on Multi-System”, Advances in Intelligent and Soft-Computing ,series of Springer, 2010
V. CONCLUSION AND FUTURE WORKS In this paper we presented our preliminary ideas of building
multi-agent system with data preprocessing steps by specified in a missing value step, based on e-Wedding system. In the part of MAS, we have implemented this prototype by using JADE platform. JADE is quite easy to learn and use. Moreover, it supports many agent approaches such as agent communication, protocol, behavior and ontology. As for the future work, we need to explore more reasonable and data mining technologies
[20] Andrea Piesse, David Judkins, and Zizhong Fan., “Item Imputation Made Easy”, Proceedings of the Survey Research Methods Section,2005.
[21] Jae Kwang Kim, “Variance Estimation for Nearest Neighbor Imputation with Application to Census Long Form Data”, Proceedings of the Survey Research Methods Section,2002.
AUTHORS PROFILE
Kobkul Kularbphettong received the B.S. degree in Computer Business, M.S. degree in Computer Science. She is Currently Ph.D. Student in Information Technology. Her current research interests Multi-agent System, Web Services, Semantic Web Services, Ontology and Data mining techniques.
REFERENCES [1] Sandholm, T. and Lesser, “Advantages of a Leveled Commitment
Contracting Protocol.” Thirteenth National Conference on Artificial Intelligence (AAAI-96), pp. 126--133, Portland, OR.
Dr.Gareth Clayton is a Statistician, so for IT students any project involving statistics, including the following, but not excluding other areas: Data Mining, Simulation studies, Design of Experiments, Model Fitting Parameter Estimation.
[2] Bala M. Balachandran and Majigsuren Enkhsaikhan, “Developing Multi-agent E-Commerce Applications with JADE”, Lecture Notes in Computer Science, Springer Berlin / Heidelberg 2009.
[3] Mu-Kun Cao, Yu-Qiang Feng, Chun-Yan Wang, “Designing Intelligent Agent for e-Business Oriented Multi-agent Automated Negotiation.” Proceedings of the Fourth International Conference on Machine Learning and Cybernetics, Guangzhou, 18-21 August 2005.
Phayung Meesad received the B.S.,M.S., and Ph.D. degree in Electrical Engineering. His current research interests Fuzzy Systems and Neural Networks, Evolutionary Computation and Discrete Control System.
[4] Patrick C. K. Hung, Ji-Ye Mao. “Modeling of E-negotiation Activities with Petri Nets.”, HICSS 2002.
[5] Y. Yuan, J. B. Rose, N. Archer, and H. Suarga, “A Web-Based Negotiation Support System.” International Journal of Electronic Markets,1998.
202 http://sites.google.com/site/ijcsis/ ISSN 1947-5500
(IJCSIS) International Journal of Computer Science and Information Security, Vol. 7, No. 2, 2010
New Approach to Identify Common Eigenvalues of real matrices using Gerschgorin Theorem and
Bisection method
T. D. Roopamala S. K. Katti
Dept. of Computer science and Engg; Dept. of Computer science and Engg,
SJCE, Mysore, India. SJCE, Mysore, India.
. Abstract—In this paper, a new approach is presented to determine common eigenvalues of two matrices. It is based on Gerschgorin theorem and Bisection method. The proposed approach is simple and can be useful in image processing and noise estimation.
Keywords- Common Eigenvalues, Gerschgorin theorem, Bisection method, real matrices.
INTRODUCTION Eigenvalues play vary important role in engineering
applications. A vast amount of literature is also available for computing eigenvalues of a given matrix. Moreover, various numerical techniques such as bisection method, Newton Raphson method, Regula falsi method etc., are available for computing eigenvalues [3]. These methods are applied in various engineering applications. In practice, for some applications, common eigenvalues of the matrices are required. These eigenvalues can be calculated using above methods. In [5], an algorithm is presented to identify common eigenvalues of a two matrices without computing actual eigenvalues of the matrices. But, this method requires Hessenberg transformation of matrices. While going various literature survery, it is observed that except algorithm as proposed [5], no algorithm is available which can be used to identify common eigenvalues of matrices.
In practice identification of common eigenvalues are required in various image processing, control systems, and noise estimation applications. Therefore, in this paper attempt has been made to identify common eigenvalues using Gerschgorin theorem and Bisection method. The proposed approach is improvement over the bisection method for computing common eigenvalues.
In this paper, Gerschgorin circles have been drawn for two matrices. Then by selecting intersection area of two matrices, bound under which all real common eigenvalues lying are determined. This improved bound is considered as initial approximation for computing eigenvalues of two system matrices using Bisection method. These are compared with the Bisection method with approximate (trial) approximation.
II. GERSCHGORIN THEOREM [1]
For a given matrix A of order ( n n× ), let kP be the sum of
the moduli of the elements along the thk row excluding the diagonal elements kka . Then every eigenvalues of A lies inside the boundary of atleast one of the circles
kk ka Pλ − = (1)
Suppose above eq.(1) is for row-wise matrix, then similarly, using Gerschgorin theorem, we can write equation for column wise matrix. The intersection region gives the actual eigenvalues of the matrix A.
III. BISECTION METHOD [ 3 ] This is one of the simplest iterative methods and it is based on the property of intervals. To find a root using this method, let the function ( )f x be continuous between a and b . Suppose ( )f a is positive and ( ), , 0f b b a t t= + > is negative. Then there is a root of ( ) 0f x = lying between a and b .
III. PROPOSED APPROACH FOR DETERMINING COMMON EIGENVALUES OF THE MATRICES
Suppose there are two matrices A and .B We need to determine common eigenvalues of above matrices. The various steps involved in determining common eigenvalues of the matrices as follows. Step 1: Drawing Gerschgorin circles of matrices A and .B Step 2: Determining intersection region of two matrices. Step 3: Based on intersection region, determining bounds on the real axis in the s-plane.
203 http://sites.google.com/site/ijcsis/ ISSN 1947-5500
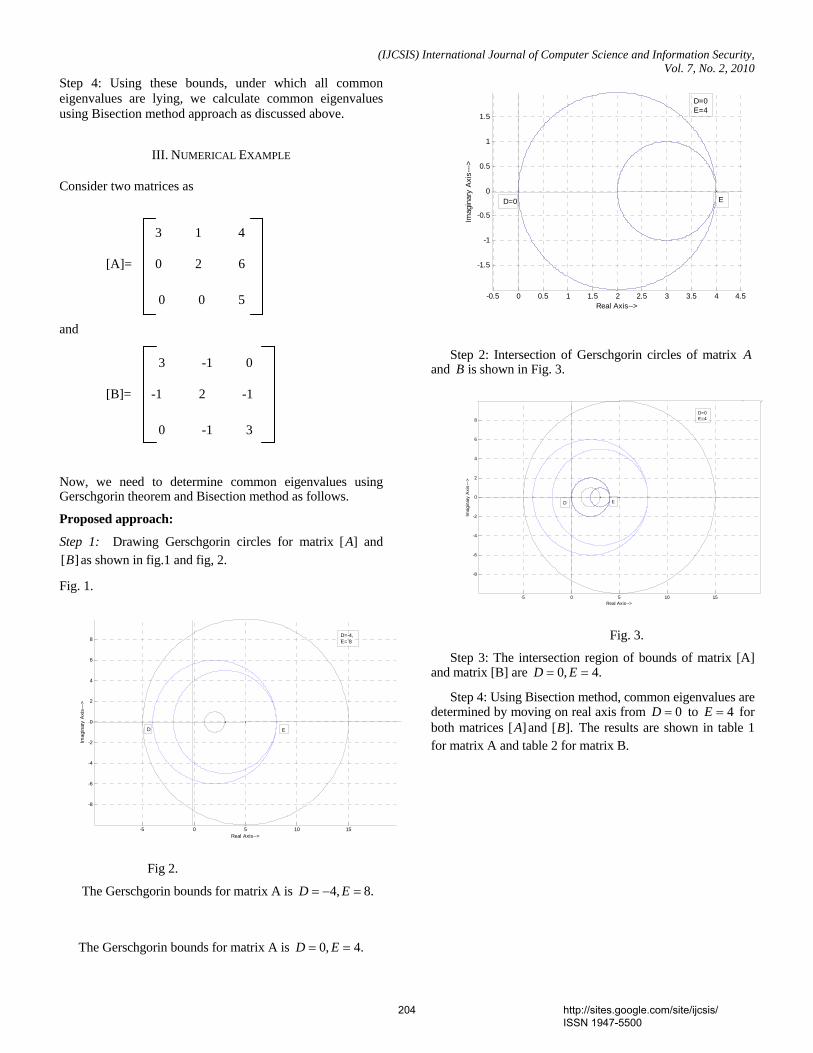
(IJCSIS) International Journal of Computer Science and Information Security, Vol. 7, No. 2, 2010
Step 4: Using these bounds, under which all common eigenvalues are lying, we calculate common eigenvalues using Bisection method approach as discussed above.
III. NUMERICAL EXAMPLE
Consider two matrices as
3 1 4
[A]= 0 2 6 0 0 5
and
3 -1 0
[B]= -1 2 -1 0 -1 3
Now, we need to determine common eigenvalues using Gerschgorin theorem and Bisection method as follows.
Proposed approach:
Step 1: Drawing Gerschgorin circles for matrix [ ]A and [ ]B as shown in fig.1 and fig, 2.
Fig. 1.
-5 0 5 10 15
-8
-6
-4
-2
0
2
4
6
8
Real Axis-->
Imag
inar
y A
xis-
-->
D E
D=-4,E= 8
Fig 2.
The Gerschgorin bounds for matrix A is 4, 8.D E= − =
The Gerschgorin bounds for matrix A is 0, 4.D E= =
-0.5 0 0.5 1 1.5 2 2.5 3 3.5 4 4.5
-1.5
-1
-0.5
0
0.5
1
1.5
Real Axis-->
Imag
inar
y A
xis-
-->
D=0 E
D=0E=4
Step 2: Intersection of Gerschgorin circles of matrix A and B is shown in Fig. 3.
-5 0 5 10 15
-8
-6
-4
-2
0
2
4
6
8
Real Axis-->
Imag
inar
y A
xis-
-->
D E
D=0E=4
Fig. 3.
Step 3: The intersection region of bounds of matrix [A] and matrix [B] are 0, 4.D E= =
Step 4: Using Bisection method, common eigenvalues are determined by moving on real axis from 0D = to 4E = for both matrices [ ]A and [ ].B The results are shown in table 1 for matrix A and table 2 for matrix B.
204 http://sites.google.com/site/ijcsis/ ISSN 1947-5500
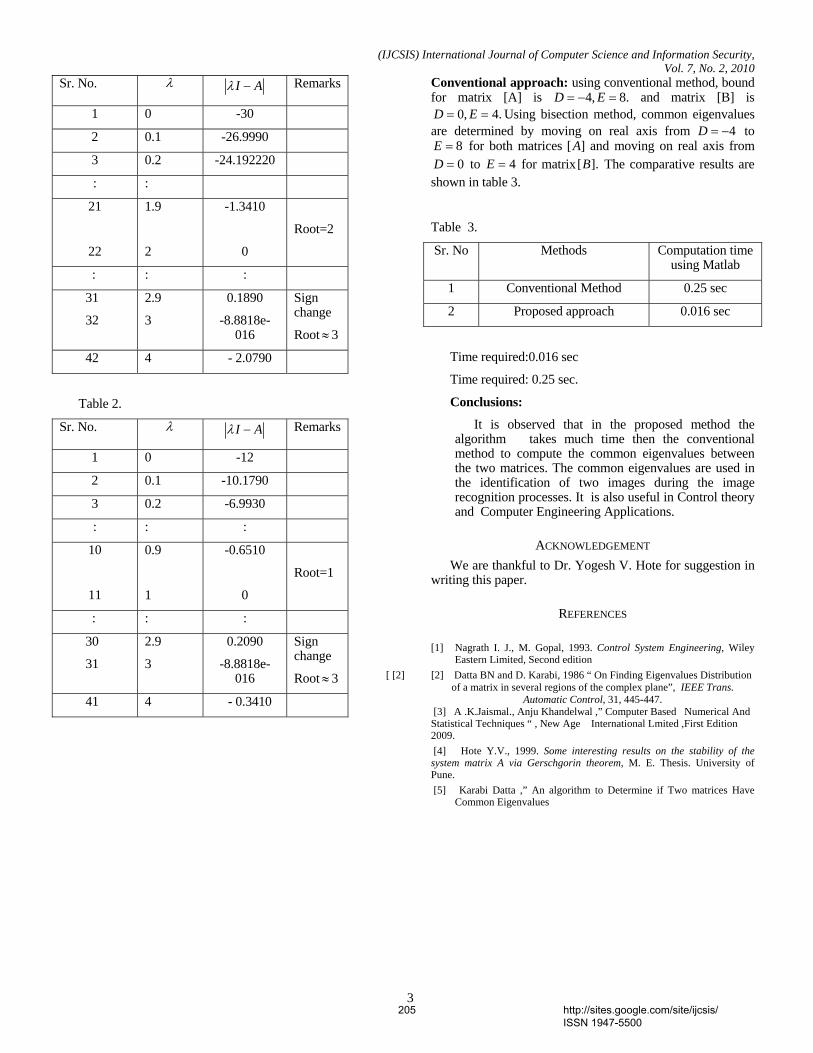
(IJCSIS) International Journal of Computer Science and Information Security, Vol. 7, No. 2, 2010
3
Sr. No. λ I Aλ − Remarks
1 0 -30
2 0.1 -26.9990
3 0.2 -24.192220
: :
21
22
1.9
2
-1.3410
0
Root=2
: : :
31
32
2.9
3
0.1890
-8.8818e-016
Sign change
Root ≈ 3
42 4 - 2.0790
Table 2.
Sr. No. λ I Aλ − Remarks
1 0 -12
2 0.1 -10.1790
3 0.2 -6.9930
: : :
10
11
0.9
1
-0.6510
0
Root=1
: : :
30
31
2.9
3
0.2090
-8.8818e-016
Sign change
Root ≈ 3
41 4 - 0.3410
Conventional approach: using conventional method, bound for matrix [A] is 4, 8.D E= − = and matrix [B] is
0, 4.D E= = Using bisection method, common eigenvalues are determined by moving on real axis from 4D = − to
8E = for both matrices [ ]A and moving on real axis from 0D = to 4E = for matrix[ ].B The comparative results are
shown in table 3.
Table 3.
Sr. No Methods Computation time using Matlab
1 Conventional Method 0.25 sec
2 Proposed approach 0.016 sec
Time required:0.016 sec
Time required: 0.25 sec.
Conclusions:
It is observed that in the proposed method the algorithm takes much time then the conventional method to compute the common eigenvalues between the two matrices. The common eigenvalues are used in the identification of two images during the image recognition processes. It is also useful in Control theory and Computer Engineering Applications.
ACKNOWLEDGEMENT We are thankful to Dr. Yogesh V. Hote for suggestion in
writing this paper.
REFERENCES
[1] Nagrath I. J., M. Gopal, 1993. Control System Engineering, Wiley Eastern Limited, Second edition
[ [2] [2] Datta BN and D. Karabi, 1986 “ On Finding Eigenvalues Distribution of a matrix in several regions of the complex plane”, IEEE Trans.
Automatic Control, 31, 445-447. [3] A .K.Jaismal., Anju Khandelwal ,” Computer Based Numerical And Statistical Techniques “ , New Age International Lmited ,First Edition 2009. [4] Hote Y.V., 1999. Some interesting results on the stability of the system matrix A via Gerschgorin theorem, M. E. Thesis. University of Pune. [5] Karabi Datta ,” An algorithm to Determine if Two matrices Have
Common Eigenvalues
205 http://sites.google.com/site/ijcsis/ ISSN 1947-5500
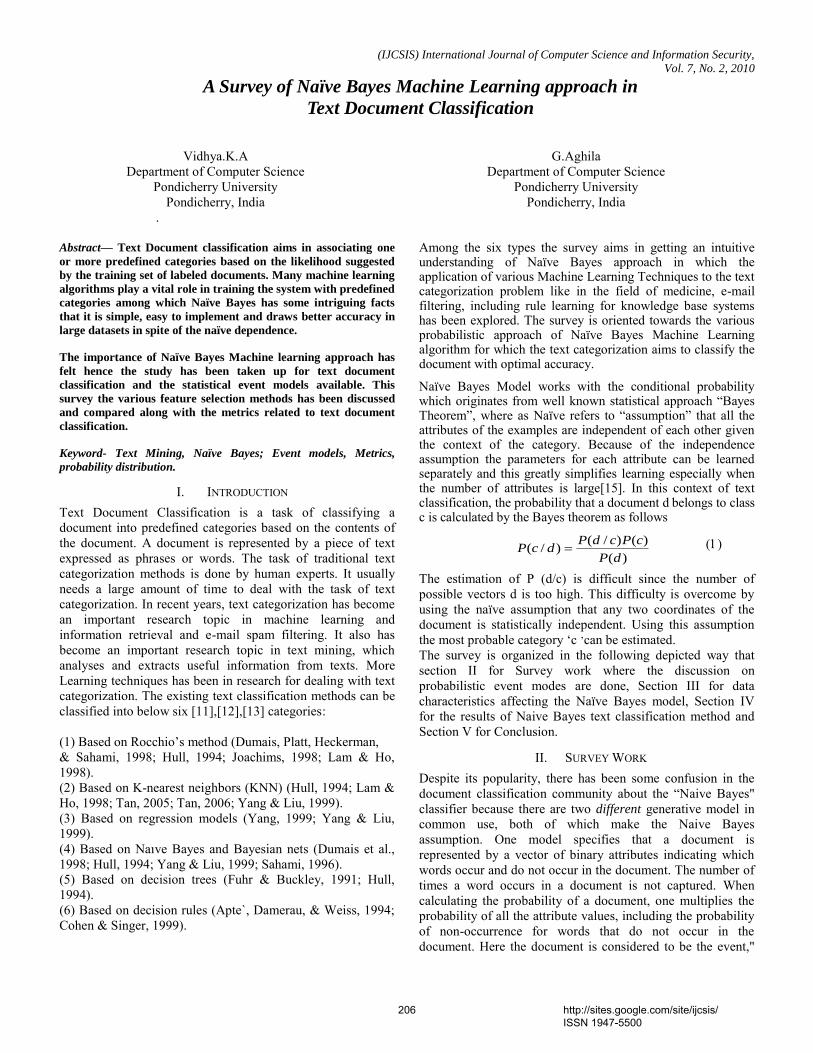
(IJCSIS) International Journal of Computer Science and Information Security,
Vol. 7, No. 2, 2010
A Survey of Naïve Bayes Machine Learning approach in
Text Document Classification
Vidhya.K.A
Department of Computer Science Pondicherry University
Pondicherry, India .
G.Aghila
Department of Computer Science Pondicherry University
Pondicherry, India
Abstract— Text Document classification aims in associating one
or more predefined categories based on the likelihood suggested
by the training set of labeled documents. Many machine learning
algorithms play a vital role in training the system with predefined
categories among which Naïve Bayes has some intriguing facts
that it is simple, easy to implement and draws better accuracy in
large datasets in spite of the naïve dependence.
The importance of Naïve Bayes Machine learning approach has
felt hence the study has been taken up for text document
classification and the statistical event models available. This
survey the various feature selection methods has been discussed
and compared along with the metrics related to text document
classification.
Keyword- Text Mining, Naïve Bayes; Event models, Metrics,
probability distribution.
I. INTRODUCTION Text Document Classification is a task of classifying a document into predefined categories based on the contents of the document. A document is represented by a piece of text expressed as phrases or words. The task of traditional text categorization methods is done by human experts. It usually needs a large amount of time to deal with the task of text categorization. In recent years, text categorization has become an important research topic in machine learning and information retrieval and e-mail spam filtering. It also has become an important research topic in text mining, which analyses and extracts useful information from texts. More Learning techniques has been in research for dealing with text categorization. The existing text classification methods can be classified into below six [11],[12],[13] categories: (1) Based on Rocchio‟s method (Dumais, Platt, Heckerman, & Sahami, 1998; Hull, 1994; Joachims, 1998; Lam & Ho, 1998). (2) Based on K-nearest neighbors (KNN) (Hull, 1994; Lam & Ho, 1998; Tan, 2005; Tan, 2006; Yang & Liu, 1999). (3) Based on regression models (Yang, 1999; Yang & Liu, 1999). (4) Based on Naıve Bayes and Bayesian nets (Dumais et al., 1998; Hull, 1994; Yang & Liu, 1999; Sahami, 1996). (5) Based on decision trees (Fuhr & Buckley, 1991; Hull, 1994). (6) Based on decision rules (Apte`, Damerau, & Weiss, 1994; Cohen & Singer, 1999).
Among the six types the survey aims in getting an intuitive understanding of Naïve Bayes approach in which the application of various Machine Learning Techniques to the text categorization problem like in the field of medicine, e-mail filtering, including rule learning for knowledge base systems has been explored. The survey is oriented towards the various probabilistic approach of Naïve Bayes Machine Learning algorithm for which the text categorization aims to classify the document with optimal accuracy.
Naïve Bayes Model works with the conditional probability which originates from well known statistical approach “Bayes Theorem”, where as Naïve refers to “assumption” that all the attributes of the examples are independent of each other given the context of the category. Because of the independence assumption the parameters for each attribute can be learned separately and this greatly simplifies learning especially when the number of attributes is large[15]. In this context of text classification, the probability that a document d belongs to class c is calculated by the Bayes theorem as follows
)(
)()/()/(
dP
cPcdPdcP
The estimation of P (d/c) is difficult since the number of possible vectors d is too high. This difficulty is overcome by using the naïve assumption that any two coordinates of the document is statistically independent. Using this assumption the most probable category „c ‟can be estimated. The survey is organized in the following depicted way that section II for Survey work where the discussion on probabilistic event modes are done, Section III for data characteristics affecting the Naïve Bayes model, Section IV for the results of Naive Bayes text classification method and Section V for Conclusion.
II. SURVEY WORK Despite its popularity, there has been some confusion in the document classification community about the “Naive Bayes" classifier because there are two different generative model in common use, both of which make the Naive Bayes assumption. One model specifies that a document is represented by a vector of binary attributes indicating which words occur and do not occur in the document. The number of times a word occurs in a document is not captured. When calculating the probability of a document, one multiplies the probability of all the attribute values, including the probability of non-occurrence for words that do not occur in the document. Here the document is considered to be the event,"
206 http://sites.google.com/site/ijcsis/ ISSN 1947-5500
(IJCSIS) International Journal of Computer Science and Information Security,
Vol. 7, No. 2, 2010
and the absence or presence of words to be attributes of the event. This describes the two models Multi-variate Bernoulli event model and Multinomial model as follows:
A. Event Models For Naïve Bayes
Multi-variate Bernoulli Model:
In the multi-variate Bernoulli Model a document is a binary vector over the space of words. Given a vocabulary V, each dimension of the space t, t∈ {1,…,.|V|}, corresponds to word wt from the vocabulary. Dimension „t‟ of the vector for document di is written as Bit, and is either 0 or 1, indicating whether word wt occurs at least once in the document[6]. In such a document representation, the Naive Bayes assumption is made such that the probability of each word occurring in a document is independent of the occurrence of other words in a document [8]. Then, the probability of a document given its class from Equation 2 is simply the product of the probability of the attribute values over all word attributes: 𝑃 𝑑𝑖 𝑐𝑗 ; 𝜃 = (𝐵𝑖𝑡𝑃(𝑤𝑡 |𝑐𝑗
𝑉 𝑡=1 ; 𝜃) +
1 − 𝐵𝑖𝑡 (1 − 𝑃 𝑤𝑡 𝑐𝑗 ; 𝜃 )) (1) Word Probability Estimate:
𝜃𝑤𝑡 |𝑐𝑗 = 𝑃 𝑤𝑡 𝑐𝑗 ; 𝜃𝑗 = 1+ 𝐵𝑖𝑡𝑃 (𝑐𝑗 |𝑑𝑖 )
|𝐷 |𝑖=1
2+ 𝐷 𝑖=1 𝑃(𝑐𝑗 |𝑑𝑖 )
(2)
Maximumlikehood Estimate:
𝑃 𝑐𝑗 𝜃 = 1+ 𝑃(𝑐𝑗 |𝑑𝑖 )
|𝐷 |𝑖=1
|𝐷| (3)
Working mode:
This model does not capture the number of times each word occurs, and that it explicitly includes the non-occurrence probability of words that do not appear in the document. To summarize, the definition of Naive Bayes learning algorithm is precisely given by describing the parameters that must be estimated, and how we may estimate them. When the n input attributes Xi each take on J possible discrete values, and Y is a discrete variable [10] taking on K possible values, then the learning task is to estimate two sets of parameters. Estimation is done for these parameters using either maximum likelihood estimates (3) based on calculating the relative frequencies of the different events in the data or using Bayesian MAP estimates that is observed data with prior distributions over the values of these parameters.
Multinomial model:
In the multinomial model [10], a document is an ordered sequence of word events, drawn from the same vocabulary V. The assumption is made that the lengths of documents are independent of class. There again make a similar Naive Bayes assumption: that the probability of each word event in a document is independent of the word's context and position in the document. Thus, each document di is drawn from a multinomial distribution of words with as many independent
trials as the length of di. This yields the familiar “bag of
words" representation for documents. Define Nit to be the count of the number of times word wt occurs in document di. Then, the probability of a document given its class from Equation 5 is simply the multinomial distribution:
𝑃 𝑑𝑖 𝑐𝑗 ; 𝜃 = 𝑃 𝑑𝑖 𝑑𝑖 ! 𝑃(𝑤𝑡 |𝑐𝑗 ;𝜃)𝑁𝑖𝑡
𝑁𝑖𝑡 !
|𝑉|𝑡=1 (4)
Word Probability Estimate:
𝜃𝑤𝑡 |𝑐𝑗 = 𝑃 𝑤𝑡 𝑐𝑗 ; 𝜃𝑗 = 1+ 𝑁𝑖𝑡𝑃 (𝑐𝑗 |𝑑𝑖 )
|𝐷 |𝑖=1
𝑉 + 𝑁𝑖𝑠 𝐷 𝑖=1
𝑉 𝑠=1 𝑃(𝑐𝑗 |𝑑𝑖 )
(5)
Maximumlikehood Estimate:
𝑃 𝑐𝑗 𝑑𝑖 ; 𝜃 =𝑃 𝑐𝑗 𝜃 𝑃(𝑑𝑖|𝑐𝑖 ;𝜃𝑗 )
𝑃(𝑑𝑖|𝜃) (6)
Working Mode:
In contrast to the multi-variate Bernoulli event model, the multinomial model captures word frequency information in documents. In case of continuous inputs Xi, we can of course continue to use equations (4) and (5) as the basis for designing a Naive Bayes classifier. However, when the Xi are continuous we must choose some other way to represent the distributions P(XijY). One common approach is to assume that for each possible discrete value yk of Y, the distribution of each continuous Xi is Gaussian, and is defined by a mean and standard deviation specific to Xi and yk. In order to train such a Naïve Bayes classifier the mean and standard deviation of each of these Gaussians should be estimated.
Logistic Regression:
Logistic Regression is an approach to learning functions of the form f: X! Y, or P (Yj|X) in the case where Y is discrete-valued, and X = hX1::Xni is any vector containing discrete or continuous variables. In this section the case where Y is a boolean variable is considered, in order to simplify notation. In the final subsection we extend our treatment to the case where Y takes on any finite number of discrete values. Logistic Regression [4] assumes a parametric form for the distribution P (Yj|X), then directly estimates its parameters from the training data. The parametric model assumed by Logistic Regression in the case where Y is boolean is:
𝑃 𝑌 = 1 𝑋 = 1
1 + exp( 𝑤0 + 𝑤𝑖𝑋𝑖𝑛𝑖=1 )
(7)
𝑃 𝑌 = 1 𝑋 = exp(𝑤0 + 𝑤𝑖𝑋𝑖
𝑛𝑖=1 )
1 + exp( 𝑤0 + 𝑤𝑖𝑋𝑖𝑛𝑖=1 )
(8) One highly convenient property of this form for P(Y|X) is that is leads to a simple linear expression for classification. To
207 http://sites.google.com/site/ijcsis/ ISSN 1947-5500
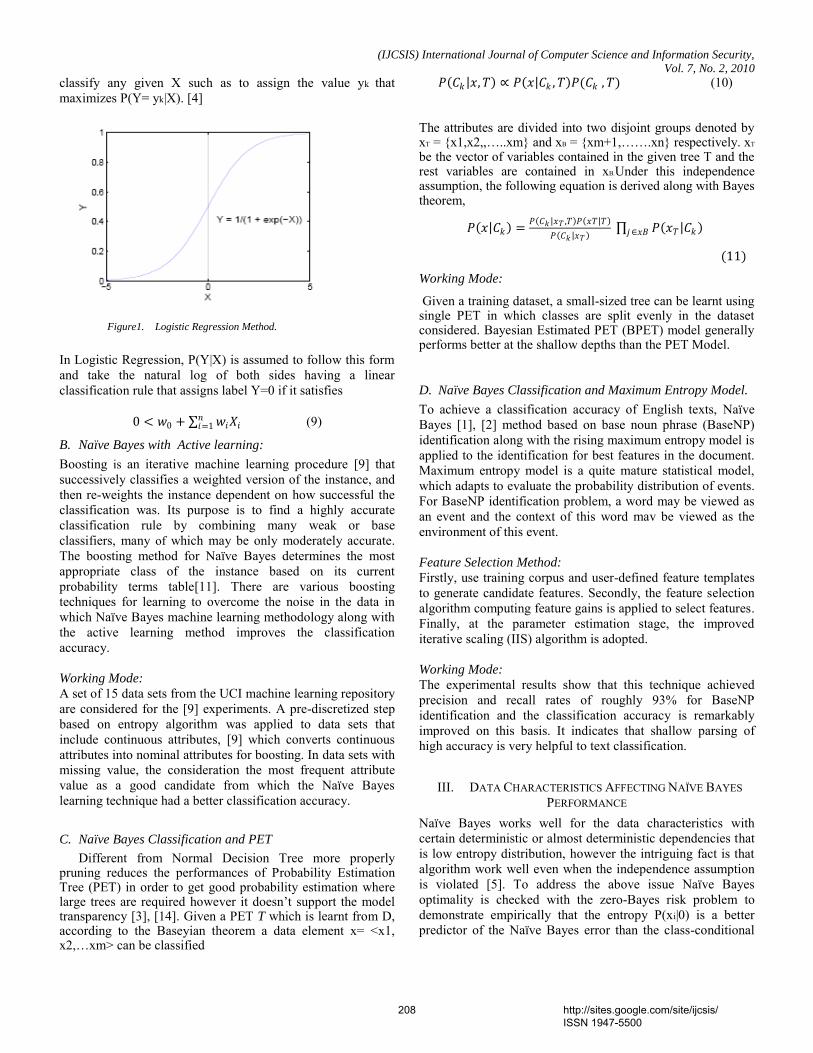
(IJCSIS) International Journal of Computer Science and Information Security,
Vol. 7, No. 2, 2010
classify any given X such as to assign the value yk that maximizes P(Y= yk|X). [4]
Figure1. Logistic Regression Method.
In Logistic Regression, P(Y|X) is assumed to follow this form and take the natural log of both sides having a linear classification rule that assigns label Y=0 if it satisfies
0 < 𝑤0 + 𝑤𝑖𝑋𝑖𝑛𝑖=1 (9)
B. Naïve Bayes with Active learning:
Boosting is an iterative machine learning procedure [9] that successively classifies a weighted version of the instance, and then re-weights the instance dependent on how successful the classification was. Its purpose is to find a highly accurate classification rule by combining many weak or base classifiers, many of which may be only moderately accurate. The boosting method for Naïve Bayes determines the most appropriate class of the instance based on its current probability terms table[11]. There are various boosting techniques for learning to overcome the noise in the data in which Naïve Bayes machine learning methodology along with the active learning method improves the classification accuracy.
Working Mode:
A set of 15 data sets from the UCI machine learning repository are considered for the [9] experiments. A pre-discretized step based on entropy algorithm was applied to data sets that include continuous attributes, [9] which converts continuous attributes into nominal attributes for boosting. In data sets with missing value, the consideration the most frequent attribute value as a good candidate from which the Naïve Bayes learning technique had a better classification accuracy.
C. Naïve Bayes Classification and PET
Different from Normal Decision Tree more properly pruning reduces the performances of Probability Estimation Tree (PET) in order to get good probability estimation where large trees are required however it doesn‟t support the model transparency [3], [14]. Given a PET T which is learnt from D, according to the Baseyian theorem a data element x= <x1, x2,…xm> can be classified
𝑃 𝐶𝑘 𝑥, 𝑇 ∝ 𝑃 𝑥 𝐶𝑘 , 𝑇 𝑃(𝐶𝑘 , 𝑇) (10)
The attributes are divided into two disjoint groups denoted by xT = {x1,x2,,…..xm} and xB = {xm+1,…….xn} respectively. xT be the vector of variables contained in the given tree T and the rest variables are contained in xB.Under this independence assumption, the following equation is derived along with Bayes theorem,
𝑃 𝑥 𝐶𝑘 =𝑃 𝐶𝑘 𝑥𝑇 ,𝑇 𝑃 𝑥𝑇 𝑇
𝑃 𝐶𝑘 𝑥𝑇 𝑃 𝑥𝑇 𝐶𝑘 𝑗 ∈𝑥𝐵
(11)
Working Mode:
Given a training dataset, a small-sized tree can be learnt using single PET in which classes are split evenly in the dataset considered. Bayesian Estimated PET (BPET) model generally performs better at the shallow depths than the PET Model.
D. Naïve Bayes Classification and Maximum Entropy Model.
To achieve a classification accuracy of English texts, Naïve Bayes [1], [2] method based on base noun phrase (BaseNP) identification along with the rising maximum entropy model is applied to the identification for best features in the document. Maximum entropy model is a quite mature statistical model, which adapts to evaluate the probability distribution of events. For BaseNP identification problem, a word may be viewed as an event and the context of this word mav be viewed as the environment of this event.
Feature Selection Method:
Firstly, use training corpus and user-defined feature templates to generate candidate features. Secondly, the feature selection algorithm computing feature gains is applied to select features. Finally, at the parameter estimation stage, the improved iterative scaling (IIS) algorithm is adopted.
Working Mode: The experimental results show that this technique achieved precision and recall rates of roughly 93% for BaseNP identification and the classification accuracy is remarkably improved on this basis. It indicates that shallow parsing of high accuracy is very helpful to text classification.
III. DATA CHARACTERISTICS AFFECTING NAÏVE BAYES PERFORMANCE
Naïve Bayes works well for the data characteristics with certain deterministic or almost deterministic dependencies that is low entropy distribution, however the intriguing fact is that algorithm work well even when the independence assumption is violated [5]. To address the above issue Naïve Bayes optimality is checked with the zero-Bayes risk problem to demonstrate empirically that the entropy P(xi|0) is a better predictor of the Naïve Bayes error than the class-conditional
208 http://sites.google.com/site/ijcsis/ ISSN 1947-5500
(IJCSIS) International Journal of Computer Science and Information Security,
Vol. 7, No. 2, 2010
mutual information between features. There are some data characteristics for which the Naïve Bayes works as follows,
Monte Carlo simulations, is used to show that Naïve Bayes works best in two cases: completely independent [5] features (as expected by the assumptions made) and functionally dependent features. Naive Bayes has its worst performance between these extremes. Zero-Bayes Risk Problem:
For the above mentioned reason in order to prove Naive Bayes optimality (Domingos & Pazzani, 1997) for some problems classes that have a high degree of feature dependencies, such as disjunctive and conjunctive concepts are studied. The data characteristics are explored that make naive Bayes work well, for zero-Bayes-risk problems, [5] it has been proved the Naive Bayes optimality for any two-class concept with nominal features where only one example has class 0 (or class 1), thus generalizing the results for conjunctive and disjunctive concepts. Then, using Monte-Carlo simulation, the behaviour of Naïve Bayes for increasing prior probability was studied and compared.
Working Mode:
Naive Bayes classifier is optimal for any two class concept with nominal features that assigns class 0 to exactly one example and class 1 to the other examples, [5] with probability 1. Thus entropy of class-conditional marginal is a better indicator of Naïve Bayes error than the mutual information between the features. However, the variance of such prediction is quickly increasing with ______ and is quite high when ______ gets closer to 0.5.
IV. EXPERIMENTAL METHODOLOGY- RESULTS WITH DATASETS
Naïve Bayes generally outperforms for large datasets in text classification problem in spite of the Naïve independence assumption but as of small data sets Naïve Bayes doesn‟t show
promising results in accuracy or performance.[6] Even though Naïve Bayes technique achieves better accuracy, to fine tune the classification accuracy it‟s combined with the other machine learning technique like SVM, neural networks , decision trees which has been discussed above. Basically Naïve Bayes work with the conditional probability derived from the idea of Bayes theorem which is modified according to the application of Naïve Bayes for text classification. To evaluate the text classifier system with the Naïve Bayes approach there are two metrics factor, precision, recall and F1-measure can be used to find the effectiveness of document classifier which is given by, tp (True Positive): The number of documents correctly classified to that class.
tn (True Negative): The number of documents correctly rejected from that class. fp (False Positive): The number of documents incorrectly rejected from that class. fn (False Negative): The number of documents incorrectly classified to that class.
)/(Pr: fptptpecisionP
)/(Re: fntptpcallR
)/()..(21 RPRPMeasureF
The formulas for precision, recall and F-measure is given in (12), (13), (14). The performance of Naïve Bayes Machine learning technique when combined with the other method shows better performance. The discussion about the Naïve Bayes performance with the micro F1-measure values for the multinomial methods available from paper [15] such that the variants of the classifiers significantly outperform the traditional multinomial Naive Bayes at least when the 20-Newsgroup is used. In the graph showing the microF1 values, SRF _ l at _of 0.2 achieves the best performance. RF _ u and SRF _ u also achieve better performance [15] than baseline performance and less so than the Rf _ l or SRF _ l, but trivial. It means that there is no significant difference between using the number of tokens and the number of unique terms. The biggest difference between the microF1 and macroF1 is that the performance increase by the normalization over the baseline is much greater in the case of macroF1 (0.2238 for the baseline versus 0.5066 for RF-l). Since macroF1 values in the Reuters21578 collection tend to be dominated by a large number of small categories, which have a small number of training documents [15], From the above survey of this paper it is understood that the proposed normalization methods are quite effective, particularly in the categories where the number of positive training documents is small where the traditional Naïve Bayes Technique fails, the author have done subsequent experiments and found the method is quite effective.
For Text categorization there are various benchmark datasets available like Reuters21578, Cora, WebKB and 20Newsgroup. Reuters21578 and 20Newsgroup datasets are designed with either set of long or short document. There are predefined categories where the hierarchy structure for each category is specified. The dataset WebKB is generally preferred for spam mail classification simulation. However the results of the Naïve Bayes along with the other hybrid methods for text document classification with these datasets and feature selection technique is depicted in the following Table1. Performance of Naïve Bayes when combined with other methods,
209 http://sites.google.com/site/ijcsis/ ISSN 1947-5500
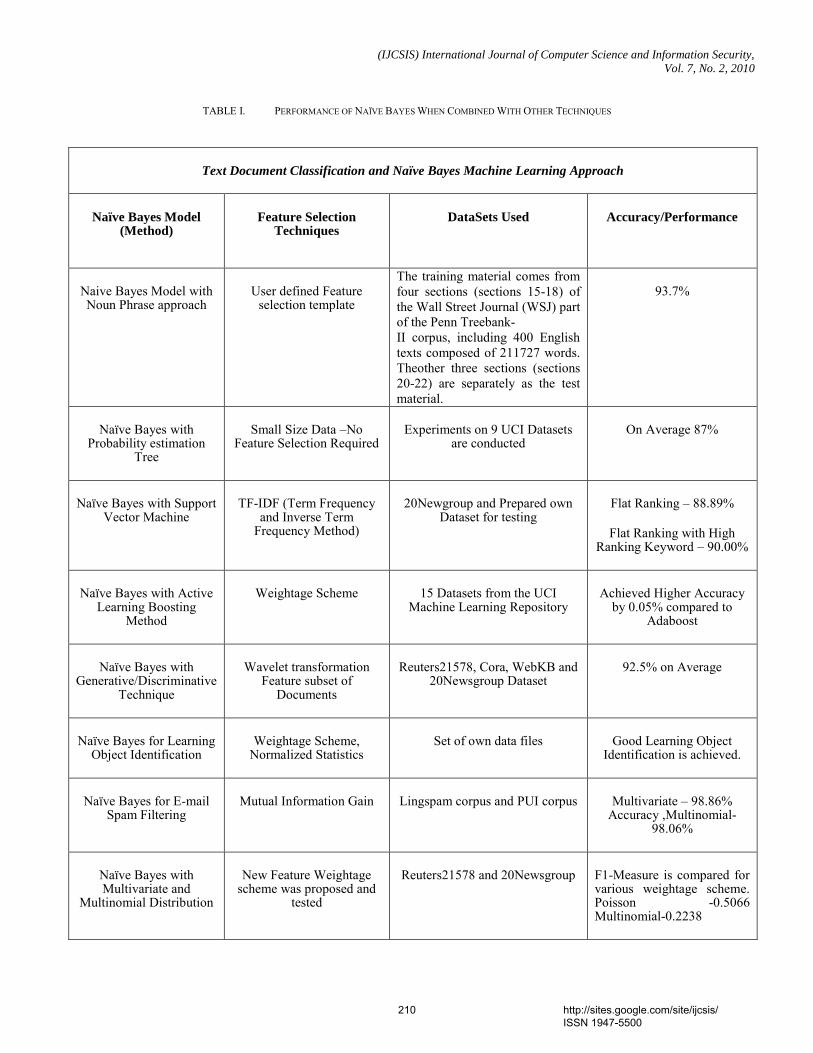
(IJCSIS) International Journal of Computer Science and Information Security,
Vol. 7, No. 2, 2010
TABLE I. PERFORMANCE OF NAÏVE BAYES WHEN COMBINED WITH OTHER TECHNIQUES
Text Document Classification and Naïve Bayes Machine Learning Approach
Naïve Bayes Model (Method)
Feature Selection Techniques
DataSets Used Accuracy/Performance
Naive Bayes Model with Noun Phrase approach
User defined Feature selection template
The training material comes from four sections (sections 15-18) of the Wall Street Journal (WSJ) part of the Penn Treebank- II corpus, including 400 English texts composed of 211727 words. Theother three sections (sections 20-22) are separately as the test material.
93.7%
Naïve Bayes with Probability estimation
Tree
Small Size Data –No Feature Selection Required
Experiments on 9 UCI Datasets are conducted
On Average 87%
Naïve Bayes with Support Vector Machine
TF-IDF (Term Frequency and Inverse Term
Frequency Method)
20Newgroup and Prepared own Dataset for testing
Flat Ranking – 88.89%
Flat Ranking with High Ranking Keyword – 90.00%
Naïve Bayes with Active Learning Boosting
Method
Weightage Scheme 15 Datasets from the UCI Machine Learning Repository
Achieved Higher Accuracy by 0.05% compared to
Adaboost
Naïve Bayes with Generative/Discriminative
Technique
Wavelet transformation Feature subset of
Documents
Reuters21578, Cora, WebKB and 20Newsgroup Dataset
92.5% on Average
Naïve Bayes for Learning Object Identification
Weightage Scheme, Normalized Statistics
Set of own data files Good Learning Object Identification is achieved.
Naïve Bayes for E-mail Spam Filtering
Mutual Information Gain Lingspam corpus and PUI corpus Multivariate – 98.86% Accuracy ,Multinomial-
98.06%
Naïve Bayes with Multivariate and
Multinomial Distribution
New Feature Weightage scheme was proposed and
tested
Reuters21578 and 20Newsgroup F1-Measure is compared for various weightage scheme. Poisson -0.5066 Multinomial-0.2238
210 http://sites.google.com/site/ijcsis/ ISSN 1947-5500
(IJCSIS) International Journal of Computer Science and Information Security,
Vol. 7, No. 2, 2010
CONCLUSION
Text Document Classification has been in research for decade in which various researchers has experimented with available machine learning techniques in which each method has been aimed to improve the classification accuracy; Among which Naïve Bayes works well in large datasets even with the simple learning algorithm had been a great inspirations in doing this survey. From the survey the inference made is that the Naïve Bayes technique performs better and yields higher classification accuracy when combined with the other techniques. The other inference is that Multinomial Naïve Bayes event model is more suitable when the dataset is large when compared to the Multi-variate Bernoulli Naïve Bayes Model.
REFERENCES
[1] “Yu-Chuan Chang, Shyi-Ming Chen, Churn-Jung Liau. “Multilabel text categorization based on a new linear classifier
learning method and a category-sensitive refinement method”. Expert Systems with Applications 34 (2008).
[2] Lin Lv,Yu-Shu Liu, “Research and realization of naïve bayes english text classification method based on base noun phrase identification,” School ofComputer Science and Technology, Beijing Institute ofTechnology, Beiang 100081, China
[3] Zengchang Qin “Naive Bayes Classification Given Probability
estimation Trees” Proceedings of the 5th International Conference
on Machine Learning and Applications (ICMLA'06). [4] www.cs.cmu.edu/_tom/mlbook.html - Chapter1 [5] Irina Rish, Joseph Hellerstein , Jayram Thathachar “An analysis of
data characteristics that affect naive Bayes performance” 2001.
[6] Akinori Fujino, Naronori Ueda and Kazumi saito ”Semisupervised Learning for a Hybrid Generative/Discriminative Classifier Based on the maximum Entropy Principle” IEEE Transactions on Pattern Analysis and Machine Intelligence. March 2008.
[7] Dino Isa, Lam Hong Kee, V.P. kallimani and R.Rajkumar “Text Document Pre-processing with Bayes formula for classification using SVM” IEEE Transactions on Knowledge and Data Engineering -2008.
[8] Karl-Michael Schneider,”A Comparison of event Models for Naïve Bayes Anti-spam E-mail Filtering” 2003.
[9] Li-mm wang', Sen-mia yuan', Ling Liz, Hai-Jun Liz “Boosting Navie Bayes by Active Learning"
[10] A McCallum, K.Nigam. A comparison of event models for naïve Bayes text classification. AAAA-98 workshop on Learning for text Categorization, 2004.
[11] Tom M.Mitchell, “Machine Learning,” Carnegie Mellon
University, McGraw-Hill Book Co, 1997. [12] YI-Hsing Chang, Hsiu-Yi Huang, “An automatic document
classification Based on Naïve Bayes Classifier and Ontology”.Proceedings of the seventh International conference on Machine Learning and Cybernetics,2008.
[13] Vishal Gupta , Gurpreet S. Lehal “A Survey of Text Mining
Techniques and Applications” Journal of Emerging Technologies
in Web Intelligence, VOL 1, No.1, August 2009. [14] “Tzung-Shi Chen and Shih-Chun Hsu”Mining frequent tree-like
patterns in large datasets “Data & Knowledge Engineering August 2006.
[15] Sang-Bum kim, Kyong-soo Han, Hae-Chang Rim, Sung Hyon Myaeng “Some Effective techniques for Naïve Bayes Text
Classification” IEEE Transactions on Knowledge and Data Engineering -2006.
211 http://sites.google.com/site/ijcsis/ ISSN 1947-5500
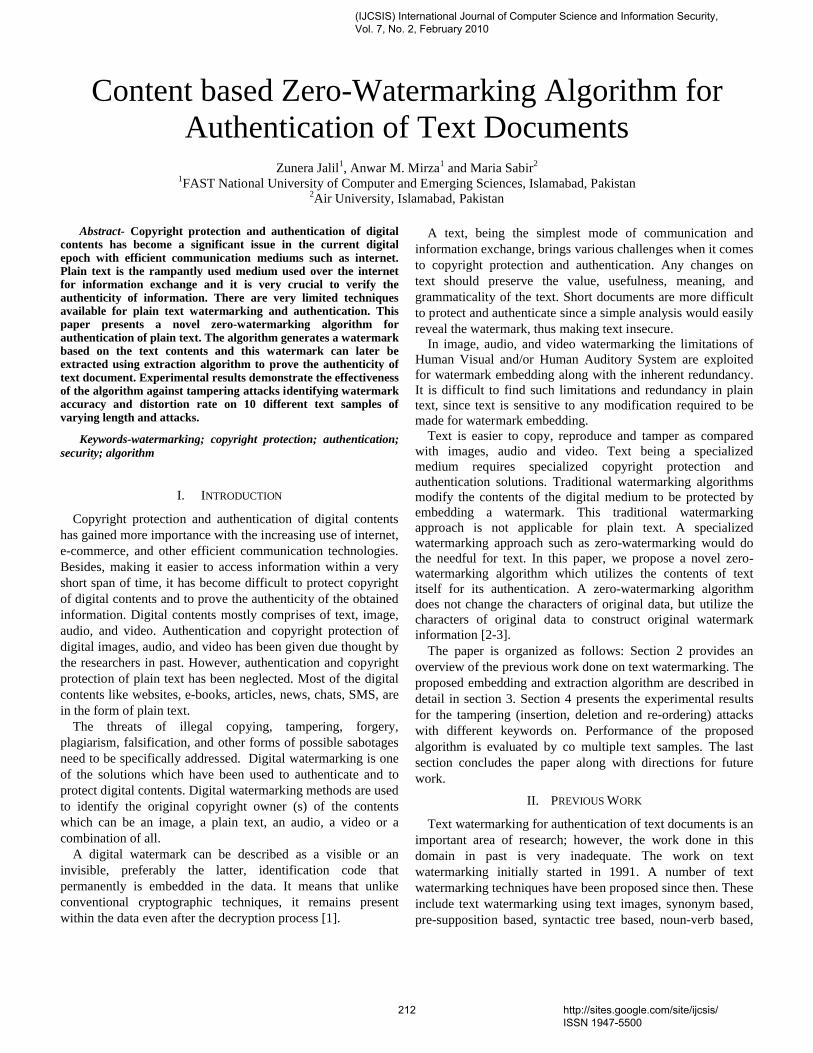
Content based Zero-Watermarking Algorithm for Authentication of Text Documents
Zunera Jalil1, Anwar M. Mirza1 and Maria Sabir2
1FAST National University of Computer and Emerging Sciences, Islamabad, Pakistan2Air University, Islamabad, Pakistan
Abstract- Copyright protection and authentication of digital contents has become a significant issue in the current digital epoch with efficient communication mediums such as internet. Plain text is the rampantly used medium used over the internet for information exchange and it is very crucial to verify the authenticity of information. There are very limited techniques available for plain text watermarking and authentication. This paper presents a novel zero-watermarking algorithm for authentication of plain text. The algorithm generates a watermark based on the text contents and this watermark can later be extracted using extraction algorithm to prove the authenticity of text document. Experimental results demonstrate the effectiveness of the algorithm against tampering attacks identifying watermark accuracy and distortion rate on 10 different text samples of varying length and attacks.
Keywords-watermarking; copyright protection; authentication; security; algorithm
I. INTRODUCTION
Copyright protection and authentication of digital contents has gained more importance with the increasing use of internet, e-commerce, and other efficient communication technologies. Besides, making it easier to access information within a very short span of time, it has become difficult to protect copyright of digital contents and to prove the authenticity of the obtained information. Digital contents mostly comprises of text, image, audio, and video. Authentication and copyright protection of digital images, audio, and video has been given due thought by the researchers in past. However, authentication and copyright protection of plain text has been neglected. Most of the digital contents like websites, e-books, articles, news, chats, SMS, are in the form of plain text.
The threats of illegal copying, tampering, forgery, plagiarism, falsification, and other forms of possible sabotagesneed to be specifically addressed. Digital watermarking is one of the solutions which have been used to authenticate and to protect digital contents. Digital watermarking methods are used to identify the original copyright owner (s) of the contents which can be an image, a plain text, an audio, a video or a combination of all.
A digital watermark can be described as a visible or an invisible, preferably the latter, identification code that permanently is embedded in the data. It means that unlike conventional cryptographic techniques, it remains present within the data even after the decryption process [1].
A text, being the simplest mode of communication and information exchange, brings various challenges when it comes to copyright protection and authentication. Any changes on text should preserve the value, usefulness, meaning, andgrammaticality of the text. Short documents are more difficult to protect and authenticate since a simple analysis would easily reveal the watermark, thus making text insecure.
In image, audio, and video watermarking the limitations of Human Visual and/or Human Auditory System are exploited for watermark embedding along with the inherent redundancy. It is difficult to find such limitations and redundancy in plain text, since text is sensitive to any modification required to be made for watermark embedding.
Text is easier to copy, reproduce and tamper as compared with images, audio and video. Text being a specialized medium requires specialized copyright protection and authentication solutions. Traditional watermarking algorithms modify the contents of the digital medium to be protected by embedding a watermark. This traditional watermarking approach is not applicable for plain text. A specialized watermarking approach such as zero-watermarking would do the needful for text. In this paper, we propose a novel zero-watermarking algorithm which utilizes the contents of text itself for its authentication. A zero-watermarking algorithm does not change the characters of original data, but utilize the characters of original data to construct original watermark information [2-3].
The paper is organized as follows: Section 2 provides an overview of the previous work done on text watermarking. The proposed embedding and extraction algorithm are described in detail in section 3. Section 4 presents the experimental results for the tampering (insertion, deletion and re-ordering) attackswith different keywords on. Performance of the proposed algorithm is evaluated by co multiple text samples. The last section concludes the paper along with directions for future work.
II. PREVIOUS WORK
Text watermarking for authentication of text documents is an important area of research; however, the work done in this domain in past is very inadequate. The work on text watermarking initially started in 1991. A number of text watermarking techniques have been proposed since then. These include text watermarking using text images, synonym based, pre-supposition based, syntactic tree based, noun-verb based,
(IJCSIS) International Journal of Computer Science and Information Security, Vol. 7, No. 2, February 2010
212 http://sites.google.com/site/ijcsis/ ISSN 1947-5500
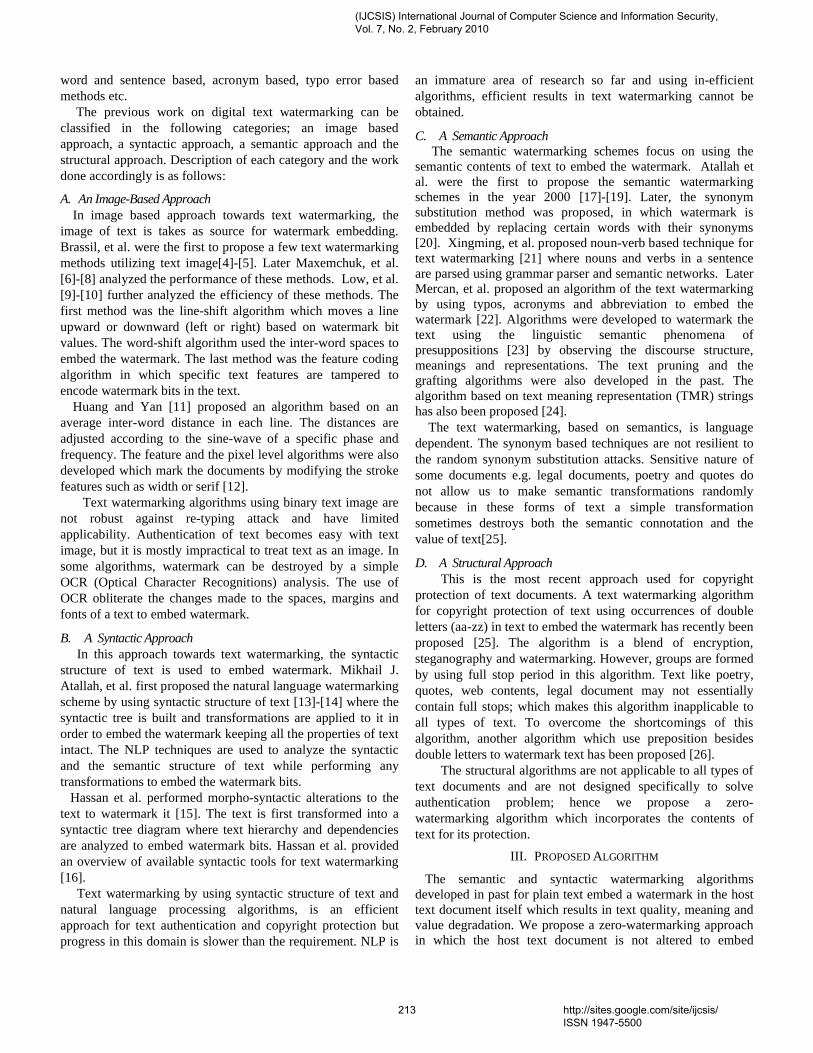
word and sentence based, acronym based, typo error based methods etc.
The previous work on digital text watermarking can be classified in the following categories; an image based approach, a syntactic approach, a semantic approach and the structural approach. Description of each category and the work done accordingly is as follows:
A. An Image-Based ApproachIn image based approach towards text watermarking, the
image of text is takes as source for watermark embedding.Brassil, et al. were the first to propose a few text watermarking methods utilizing text image[4]-[5]. Later Maxemchuk, et al. [6]-[8] analyzed the performance of these methods. Low, et al. [9]-[10] further analyzed the efficiency of these methods. The first method was the line-shift algorithm which moves a line upward or downward (left or right) based on watermark bit values. The word-shift algorithm used the inter-word spaces to embed the watermark. The last method was the feature coding algorithm in which specific text features are tampered to encode watermark bits in the text.
Huang and Yan [11] proposed an algorithm based on an average inter-word distance in each line. The distances are adjusted according to the sine-wave of a specific phase and frequency. The feature and the pixel level algorithms were also developed which mark the documents by modifying the stroke features such as width or serif [12].
Text watermarking algorithms using binary text image are not robust against re-typing attack and have limited applicability. Authentication of text becomes easy with text image, but it is mostly impractical to treat text as an image. In some algorithms, watermark can be destroyed by a simple OCR (Optical Character Recognitions) analysis. The use of OCR obliterate the changes made to the spaces, margins and fonts of a text to embed watermark.
B. A Syntactic Approach In this approach towards text watermarking, the syntactic structure of text is used to embed watermark. Mikhail J. Atallah, et al. first proposed the natural language watermarking scheme by using syntactic structure of text [13]-[14] where the syntactic tree is built and transformations are applied to it in order to embed the watermark keeping all the properties of text intact. The NLP techniques are used to analyze the syntactic and the semantic structure of text while performing any transformations to embed the watermark bits. Hassan et al. performed morpho-syntactic alterations to the text to watermark it [15]. The text is first transformed into a syntactic tree diagram where text hierarchy and dependenciesare analyzed to embed watermark bits. Hassan et al. provided an overview of available syntactic tools for text watermarking [16]. Text watermarking by using syntactic structure of text and natural language processing algorithms, is an efficient approach for text authentication and copyright protection but progress in this domain is slower than the requirement. NLP is
an immature area of research so far and using in-efficient algorithms, efficient results in text watermarking cannot be obtained.
C. A Semantic Approach The semantic watermarking schemes focus on using the semantic contents of text to embed the watermark. Atallah et al. were the first to propose the semantic watermarking schemes in the year 2000 [17]-[19]. Later, the synonym substitution method was proposed, in which watermark is embedded by replacing certain words with their synonyms [20]. Xingming, et al. proposed noun-verb based technique for text watermarking [21] where nouns and verbs in a sentence are parsed using grammar parser and semantic networks. Later Mercan, et al. proposed an algorithm of the text watermarking by using typos, acronyms and abbreviation to embed the watermark [22]. Algorithms were developed to watermark the text using the linguistic semantic phenomena of presuppositions [23] by observing the discourse structure, meanings and representations. The text pruning and the grafting algorithms were also developed in the past. The algorithm based on text meaning representation (TMR) strings has also been proposed [24]. The text watermarking, based on semantics, is language dependent. The synonym based techniques are not resilient to the random synonym substitution attacks. Sensitive nature of some documents e.g. legal documents, poetry and quotes do not allow us to make semantic transformations randomly because in these forms of text a simple transformation sometimes destroys both the semantic connotation and the value of text[25].
D. A Structural Approach This is the most recent approach used for copyright
protection of text documents. A text watermarking algorithm for copyright protection of text using occurrences of double letters (aa-zz) in text to embed the watermark has recently been proposed [25]. The algorithm is a blend of encryption, steganography and watermarking. However, groups are formed by using full stop period in this algorithm. Text like poetry, quotes, web contents, legal document may not essentially contain full stops; which makes this algorithm inapplicable to all types of text. To overcome the shortcomings of this algorithm, another algorithm which use preposition besides double letters to watermark text has been proposed [26].
The structural algorithms are not applicable to all types of text documents and are not designed specifically to solve authentication problem; hence we propose a zero-watermarking algorithm which incorporates the contents of text for its protection.
III. PROPOSED ALGORITHM
The semantic and syntactic watermarking algorithms developed in past for plain text embed a watermark in the host text document itself which results in text quality, meaning and value degradation. We propose a zero-watermarking approach in which the host text document is not altered to embed
(IJCSIS) International Journal of Computer Science and Information Security, Vol. 7, No. 2, February 2010
213 http://sites.google.com/site/ijcsis/ ISSN 1947-5500
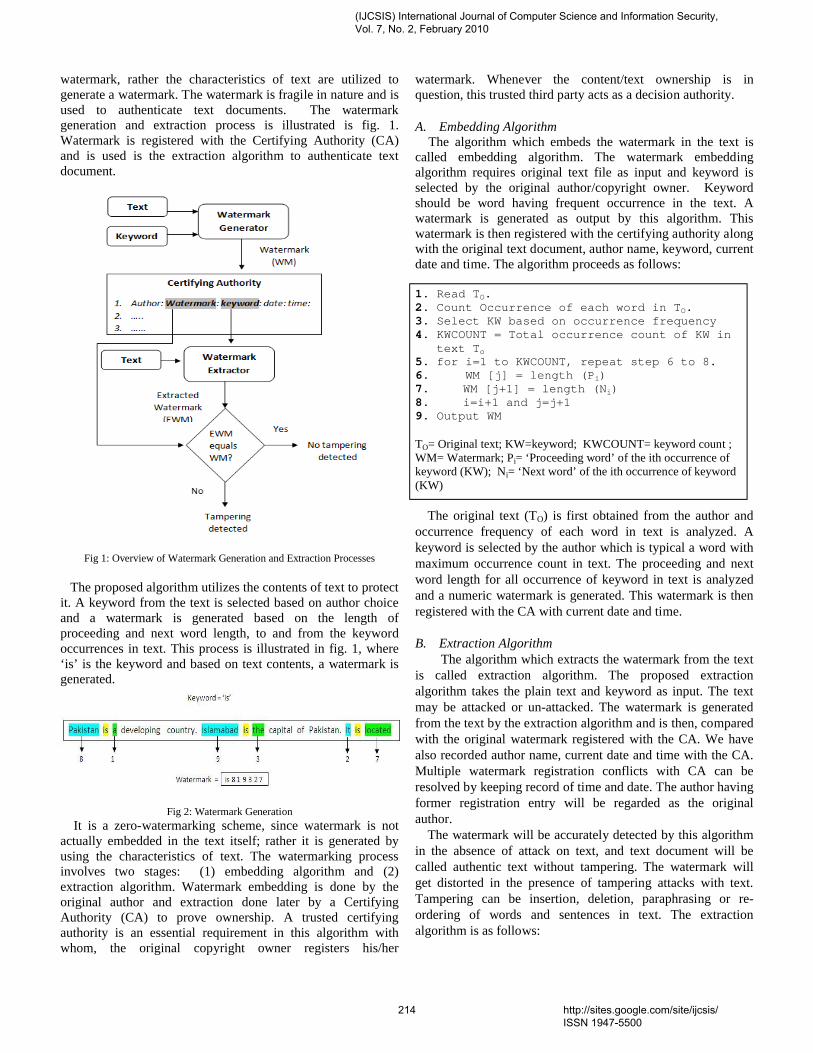
watermark, rather the characteristics of text are utilized to generate a watermark. The watermark is fragile in nature and is used to authenticate text documents. The watermark generation and extraction process is illustrated is fig. 1.Watermark is registered with the Certifying Authority (CA) and is used is the extraction algorithm to authenticate text document.
Fig 1: Overview of Watermark Generation and Extraction Processes
The proposed algorithm utilizes the contents of text to protect it. A keyword from the text is selected based on author choice and a watermark is generated based on the length of proceeding and next word length, to and from the keyword occurrences in text. This process is illustrated in fig. 1, where ‘is’ is the keyword and based on text contents, a watermark is generated.
Fig 2: Watermark Generation It is a zero-watermarking scheme, since watermark is not actually embedded in the text itself; rather it is generated by using the characteristics of text. The watermarking process involves two stages: (1) embedding algorithm and (2) extraction algorithm. Watermark embedding is done by the original author and extraction done later by a Certifying Authority (CA) to prove ownership. A trusted certifying authority is an essential requirement in this algorithm with whom, the original copyright owner registers his/her
watermark. Whenever the content/text ownership is in question, this trusted third party acts as a decision authority.
A. Embedding Algorithm The algorithm which embeds the watermark in the text is called embedding algorithm. The watermark embedding algorithm requires original text file as input and keyword is selected by the original author/copyright owner. Keyword should be word having frequent occurrence in the text. A watermark is generated as output by this algorithm. This watermark is then registered with the certifying authority along with the original text document, author name, keyword, current date and time. The algorithm proceeds as follows:
1. Read TO.2. Count Occurrence of each word in TO.3. Select KW based on occurrence frequency4. KWCOUNT = Total occurrence count of KW in text To5. for i=1 to KWCOUNT, repeat step 6 to 8.6. WM [j] = length (Pi)7. WM [j+1] = length (Ni)8. i=i+1 and j=j+19. Output WM
TO= Original text; KW=keyword; KWCOUNT= keyword count ; WM= Watermark; Pi= ‘Proceeding word’ of the ith occurrence of keyword (KW); Ni= ‘Next word’ of the ith occurrence of keyword (KW)
The original text (TO) is first obtained from the author and occurrence frequency of each word in text is analyzed. A keyword is selected by the author which is typical a word with maximum occurrence count in text. The proceeding and next word length for all occurrence of keyword in text is analyzed and a numeric watermark is generated. This watermark is then registered with the CA with current date and time.
B. Extraction Algorithm The algorithm which extracts the watermark from the text
is called extraction algorithm. The proposed extraction algorithm takes the plain text and keyword as input. The text may be attacked or un-attacked. The watermark is generated from the text by the extraction algorithm and is then, compared with the original watermark registered with the CA. We have also recorded author name, current date and time with the CA. Multiple watermark registration conflicts with CA can be resolved by keeping record of time and date. The author having former registration entry will be regarded as the original author.
The watermark will be accurately detected by this algorithm in the absence of attack on text, and text document will be called authentic text without tampering. The watermark willget distorted in the presence of tampering attacks with text. Tampering can be insertion, deletion, paraphrasing or re-ordering of words and sentences in text. The extraction algorithm is as follows:
(IJCSIS) International Journal of Computer Science and Information Security, Vol. 7, No. 2, February 2010
214 http://sites.google.com/site/ijcsis/ ISSN 1947-5500
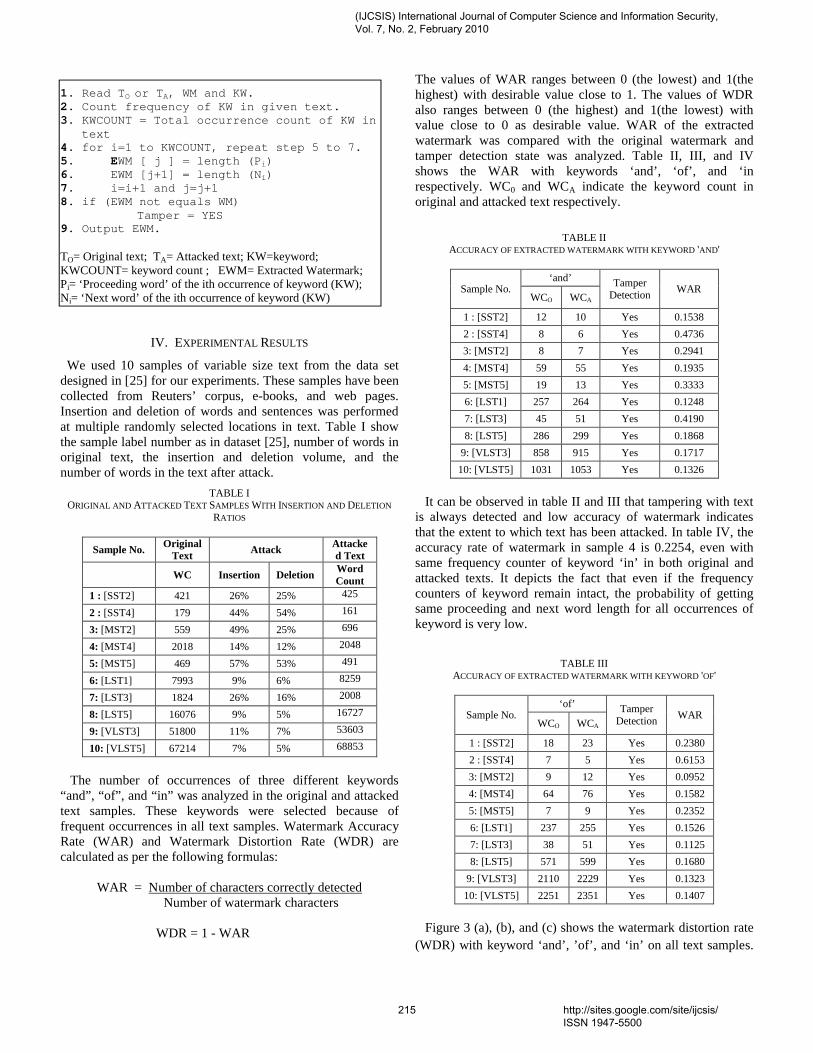
1. Read TO or TA, WM and KW.2. Count frequency of KW in given text.3. KWCOUNT = Total occurrence count of KW in text4. for i=1 to KWCOUNT, repeat step 5 to 7.5. EWM [ j ] = length (Pi)6. EWM [j+1] = length (Ni)7. i=i+1 and j=j+18. if (EWM not equals WM)
Tamper = YES9. Output EWM.
TO= Original text; TA= Attacked text; KW=keyword; KWCOUNT= keyword count ; EWM= Extracted Watermark; Pi= ‘Proceeding word’ of the ith occurrence of keyword (KW);Ni= ‘Next word’ of the ith occurrence of keyword (KW)
IV. EXPERIMENTAL RESULTS
We used 10 samples of variable size text from the data set designed in [25] for our experiments. These samples have been collected from Reuters’ corpus, e-books, and web pages. Insertion and deletion of words and sentences was performed at multiple randomly selected locations in text. Table I show the sample label number as in dataset [25], number of words in original text, the insertion and deletion volume, and the number of words in the text after attack.
TABLE IORIGINAL AND ATTACKED TEXT SAMPLES WITH INSERTION AND DELETION
RATIOS
Sample No. Original Text Attack Attacke
d Text
WC Insertion Deletion Word Count
1 : [SST2] 421 26% 25% 425
2 : [SST4] 179 44% 54% 161
3: [MST2] 559 49% 25% 696
4: [MST4] 2018 14% 12% 2048
5: [MST5] 469 57% 53% 491
6: [LST1] 7993 9% 6% 8259
7: [LST3] 1824 26% 16% 2008
8: [LST5] 16076 9% 5% 16727
9: [VLST3] 51800 11% 7% 53603
10: [VLST5] 67214 7% 5% 68853
The number of occurrences of three different keywords “and”, “of”, and “in” was analyzed in the original and attacked text samples. These keywords were selected because of frequent occurrences in all text samples. Watermark AccuracyRate (WAR) and Watermark Distortion Rate (WDR) are calculated as per the following formulas:
WAR = Number of characters correctly detected Number of watermark characters
WDR = 1 - WAR
The values of WAR ranges between 0 (the lowest) and 1(the highest) with desirable value close to 1. The values of WDR also ranges between 0 (the highest) and 1(the lowest) with value close to 0 as desirable value. WAR of the extracted watermark was compared with the original watermark and tamper detection state was analyzed. Table II, III, and IVshows the WAR with keywords ‘and’, ‘of’, and ‘in respectively. WC0 and WCA indicate the keyword count inoriginal and attacked text respectively.
TABLE IIACCURACY OF EXTRACTED WATERMARK WITH KEYWORD 'AND'
Sample No.‘and’ Tamper
Detection WARWCO WCA
1 : [SST2] 12 10 Yes 0.15382 : [SST4] 8 6 Yes 0.47363: [MST2] 8 7 Yes 0.29414: [MST4] 59 55 Yes 0.19355: [MST5] 19 13 Yes 0.33336: [LST1] 257 264 Yes 0.12487: [LST3] 45 51 Yes 0.41908: [LST5] 286 299 Yes 0.1868
9: [VLST3] 858 915 Yes 0.171710: [VLST5] 1031 1053 Yes 0.1326
It can be observed in table II and III that tampering with text is always detected and low accuracy of watermark indicates that the extent to which text has been attacked. In table IV, the accuracy rate of watermark in sample 4 is 0.2254, even with same frequency counter of keyword ‘in’ in both original and attacked texts. It depicts the fact that even if the frequency counters of keyword remain intact, the probability of getting same proceeding and next word length for all occurrences of keyword is very low.
TABLE IIIACCURACY OF EXTRACTED WATERMARK WITH KEYWORD 'OF'
Sample No.‘of’ Tamper
Detection WARWCO WCA
1 : [SST2] 18 23 Yes 0.23802 : [SST4] 7 5 Yes 0.61533: [MST2] 9 12 Yes 0.09524: [MST4] 64 76 Yes 0.15825: [MST5] 7 9 Yes 0.23526: [LST1] 237 255 Yes 0.15267: [LST3] 38 51 Yes 0.11258: [LST5] 571 599 Yes 0.1680
9: [VLST3] 2110 2229 Yes 0.132310: [VLST5] 2251 2351 Yes 0.1407
Figure 3 (a), (b), and (c) shows the watermark distortion rate (WDR) with keyword ‘and’, ’of’, and ‘in’ on all text samples.
(IJCSIS) International Journal of Computer Science and Information Security, Vol. 7, No. 2, February 2010
215 http://sites.google.com/site/ijcsis/ ISSN 1947-5500
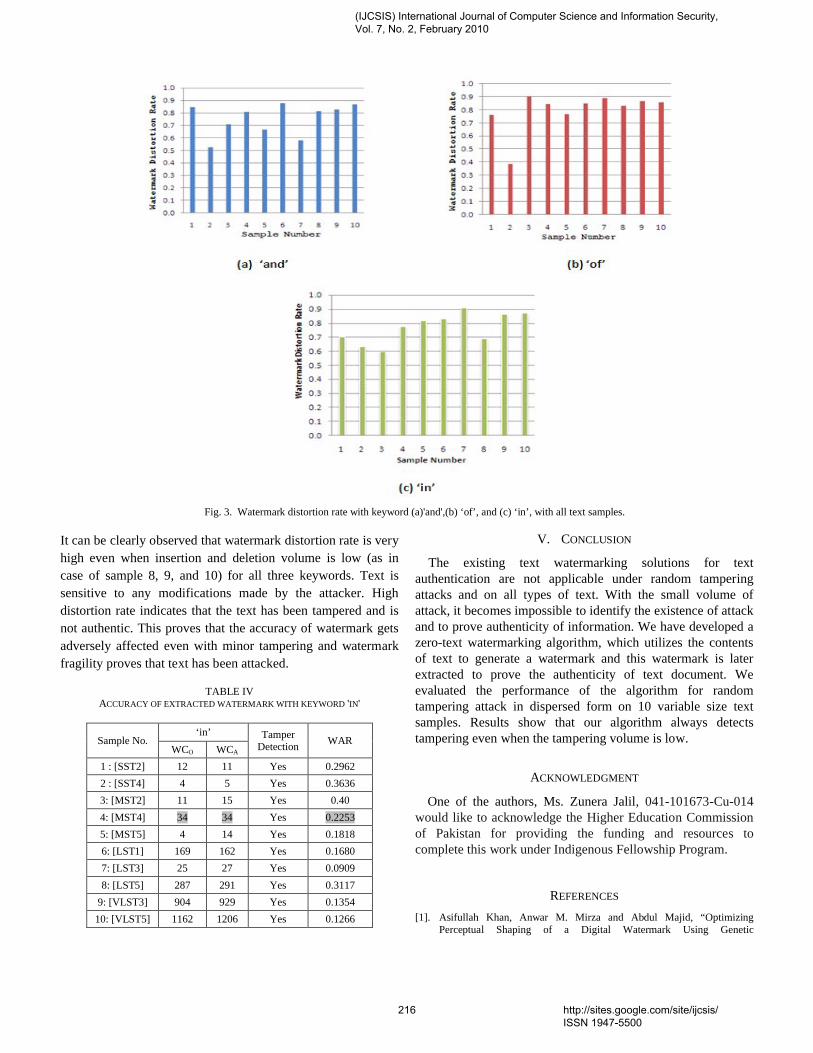
It can be clearly observed that watermark distortion rate is very high even when insertion and deletion volume is low (as in case of sample 8, 9, and 10) for all three keywords. Text is sensitive to any modifications made by the attacker. High distortion rate indicates that the text has been tampered and is not authentic. This proves that the accuracy of watermark gets adversely affected even with minor tampering and watermark fragility proves that text has been attacked.
TABLE IVACCURACY OF EXTRACTED WATERMARK WITH KEYWORD 'IN'
Sample No.‘in’ Tamper
Detection WARWCO WCA
1 : [SST2] 12 11 Yes 0.29622 : [SST4] 4 5 Yes 0.36363: [MST2] 11 15 Yes 0.404: [MST4] 34 34 Yes 0.22535: [MST5] 4 14 Yes 0.18186: [LST1] 169 162 Yes 0.16807: [LST3] 25 27 Yes 0.09098: [LST5] 287 291 Yes 0.3117
9: [VLST3] 904 929 Yes 0.135410: [VLST5] 1162 1206 Yes 0.1266
V. CONCLUSION
The existing text watermarking solutions for text authentication are not applicable under random tampering attacks and on all types of text. With the small volume of attack, it becomes impossible to identify the existence of attack and to prove authenticity of information. We have developed a zero-text watermarking algorithm, which utilizes the contents of text to generate a watermark and this watermark is later extracted to prove the authenticity of text document. We evaluated the performance of the algorithm for random tampering attack in dispersed form on 10 variable size text samples. Results show that our algorithm always detects tampering even when the tampering volume is low.
ACKNOWLEDGMENT
One of the authors, Ms. Zunera Jalil, 041-101673-Cu-014 would like to acknowledge the Higher Education Commission of Pakistan for providing the funding and resources to complete this work under Indigenous Fellowship Program.
REFERENCES
[1]. Asifullah Khan, Anwar M. Mirza and Abdul Majid, “Optimizing Perceptual Shaping of a Digital Watermark Using Genetic
Fig. 3. Watermark distortion rate with keyword (a)'and',(b) ‘of’, and (c) ‘in’, with all text samples.
(IJCSIS) International Journal of Computer Science and Information Security, Vol. 7, No. 2, February 2010
216 http://sites.google.com/site/ijcsis/ ISSN 1947-5500
Programming”, Iranian Journal of Electrical and Computer Engineering, vol. 3, pp. 144-150, 2004.
[2]. Anbo Li, Bing-xian Lin, Ying Chen, “Study on copyright authentication of GIS vector data based on Zero-watermarking”, The International Archives of the Photogrammetry, Remote Sensing and Spatial Information Sciences. Vol. VII. Part B4, pp.1783-1786, 2008.
[3]. Zhou, Xinmin , Zhao, Weidong, Wang, Zhicheng, Pan, Li , “Security theory and attack analysis for text watermarking”, 2009 International Conference on E-Business and Information System Security, EBISS 2009.
[4]. J. T. Brassil, S. Low, N. F. Maxemchuk, and L. O’Gorman, “Electronic Marking and Identification Techniques to Discourage Document Copying,” IEEE Journal on Selected Areas in Communications, vol. 13, no. 8, October 1995, pp. 1495-1504.
[5]. J. T. Brassil, S. Low, and N. F. Maxemchuk, "Copyright Protection for the Electronic Distribution of Text Documents," Proceedings of the IEEE, vol. 87, no. 7, July 1999, pp.1181-1196.
[6]. N. F. Maxemchuk, S. H. Low, “Performance Comparison of Two Text Marking Methods,” IEEE Journal of Selected Areas in Communications (JSAC), May 1998. vol. 16 no. 4 1998. pp. 561-572.
[7]. N. F. Maxemchuk, “Electronic Document Distribution,” AT&T Technical Journal, September 1994, pp. 73-80. 6.
[8]. N. F. Maxemchuk and S. Low, “Marking Text Documents,” Proceedings of the IEEE International Conference on Image Processing, Washington, DC, Oct. 26-29, 1997, pp. 13-16.
[9]. S. H. Low, N. F. Maxemchuk, and A. M. Lapone, "Document Identification for Copyright Protection Using Centroid Detection," IEEE Transactions on Communications, Mar. 1998, vol. 46, no.3, pp 372-381.
[10]. S. H. Low and N. F. Maxemchuk, “Capacity of Text Marking Channel,” IEEE Signal Processing Letters, vol. 7, no. 12 , Dec. 2000, pp. 345 -347.
[11]. D. Huang and H. Yan, "Interword distance changes represented by sine waves for watermarking text images," IEEE Trans. Circuits and Systems for Video Technology, Vol.11, No.12, pp.1237-1245, Dec 2001.
[12]. T. Amano and D. Misaki, "A feature calibration method for watermarking of document images," Proceedings of ICDAR, pp.91-94,1999.
[13]. M. J. Atallah, C. McDonough, S. Nirenburg, and V. Raskin, “Natural Language Processing for Information Assurance and Security: An Overview and Implementations”, Proceedings 9th ACM/SIGSAC New Security Paradigms Workshop, September, 2000, Cork, Ireland, pp. 51–65.
[14]. M. J. Atallah, V. Raskin, M. C. Crogan, C. F. Hempelmann, F. Kerschbaum, D. Mohamed, and S.Naik, “Natural language watermarking: Design,analysis, and a proof-of-concept implementation”, Proceedings of the Fourth Information HidingWorkshop, vol. LNCS 2137, 25-27 April 2001, Pittsburgh, PA.
[15]. Hassan M. Meral et al., “Natural language watermarking via morphosyntactic alterations”, Computer Speech and Language, 23, 107-125, 2009.
[16]. Hasan M. Meral, Emre Sevinç, Ersin Ünkar, Bülent Sankur, A. Sumru Özsoy, Tunga Güngör, Syntactic tools for text watermarking, 19th SPIE Electronic Imaging Conf. 6505: Security, Steganography, and Watermarking of Multimedia Contents, Jan. 2007, San Jose.
[17]. M. Atallah, C. McDonough, S. Nirenburg, and V. Raskin, “Natural Language Processing for Information Assurance and Security: An Overview and Implementations,” Proceedings 9th ACM/SIGSAC New Security Paradigms Workshop, September, 2000, Cork, Ireland, pp. 51–65.
[18]. M. Atallah, V. Raskin, C. F. Hempelmann, M. Karahan, R. Sion, U.Topkara, and K. E. Triezenberg, “Natural Language Watermarking and Tamperproofing”, Fifth Information Hiding Workshop, vol. LNCS, 2578, October, 2002, Noordwijkerhout, The Netherlands, Springer-Verlag.
[19]. M. Topkara, C. M. Taskiran, and E. Delp, “Natural language watermarking,” Proceedings of the SPIE International Conference on Security, Steganography, and Watermarking of Multimedia Contents VII, 2005.
[20]. U. Topkara, M. Topkara, M. J. Atallah, “The Hiding Virtues of Ambiguity: Quantifiably Resilient Watermarking of Natural Language Text through Synonym Substitutions”. In Proceedings of ACM Multimedia and Security Conference, Geneva, 2006.
[21]. Xingming Sun, Alex Jessey Asiimwe. Noun-Verb Based Technique of Text Watermarking Using Recursive Decent Semantic Net Parsers.
Lecture Notes in Computer Science (LNCS) 3612: 958-961, Springer Press, August 2005.
[22]. Topkara, M., Topraka, U., Atallah, M.J., 2007. Information hiding through errors: a confusing approach. In: Delp III, E.J., Wong, P.W. (Eds.), Security, Steganography, and watermarking of Multimedia Contents IX. Proceedings of SPIE-IS&T Electronic Imaging SPIE 6505. pp. 65050V-1–65050V-12.
[23]. B. Macq and O. Vybornova, “A method of text watermarking using presuppositions,” in Proceedings of the SPIE International Conference on Security, Steganography, and Watermarking of Multimedia Contents, January 2007.
[24]. Peng Lu et al., “An optimized natural language watermarking algorithm based on TMR”, on proceedings of 9th International Conference for Young Computer Scientists, 2009.
[25]. Z. Jalil and A.M. Mirza, “A Novel Text Watermarking Algorithm Based on Double Letters”, International Journal of Computer Mathematics. (Submitted)
[26]. Z. Jalil and A. M. Mirza, “A Preposition based Algorithm for Copyright Protection of Text Documents”, Journal of the Chinese Institute of Engineers. (Submitted)
(IJCSIS) International Journal of Computer Science and Information Security, Vol. 7, No. 2, February 2010
217 http://sites.google.com/site/ijcsis/ ISSN 1947-5500
(IJCSIS) International Journal of Computer Science and Information Security, Vol. 7, No. 2, 2010
Secure Multicast Key Distribution for Mobile Adhoc Networks
D.SuganyaDevi Asst.Prof, Department of Computer Applications
SNR SONS College Coimbatore, Tamil Nadu, India
.
Dr.G.Padmavathi Prof. and Head, Dept. of Computer Science,
Avinashilingam University for Women, Coimbatore, Tamil Nadu, India
.
Abstract— Many emerging applications in mobile adhoc networks involve group-oriented communication. Multicast is an efficient way of supporting group oriented applications, mainly in mobile environment with limited bandwidth and limited power. For using such applications in an adversarial environment as military, it is necessary to provide secure multicast communication. Key management is the fundamental challenge in designing secure multicast communications. In many multicast interactions, new member can join and current members can leave at any time and existing members must communicate securely using multicast key distribution within constrained energy for mobile adhoc networks. This has to overcome the challenging element of “1 affects n” problem which is due to high dynamicity of groups. Thus this paper shows the specific challenges towards multicast key management protocols for securing multicast key distribution in mobile ad hoc networks, and present relevant multicast key management protocols in mobile ad hoc networks. A comparison is done against some pertinent performance criteria.
Keywords - Key Management, MANET, Multicast Communication and Security
I. INTRODUCTION A MANET (Mobile Adhoc Network) is an autonomous
collection of mobile users that offers infrastructure-free communication over a shared wireless medium. It is formed spontaneously without any preplanning. Multicasting is a fundamental communication paradigm for group-oriented communications such as video conferencing, discussion forums, frequent stock updates, video on demand (VoD), pay per view programs, and advertising.
The combination of an adhoc environment [1, 2] with multicast services induces new challenges towards the security infrastructure to enable acceptance and wide deployment of multicast communication. Indeed, several sensitive applications based on multicast communications have to be secured within adhoc environments. For example military applications such as group communication in a battlefield and also public security operations involving fire brigades and policemen have to be secured.
To prevent attacks and eavesdropping, basic security services such as authentication, data integrity, and group confidentiality are necessary for collaborative applications. Among which group confidentiality is the most important service for military applications. These security services can
be facilitated if group members share a common secret, which in turn makes key management [3] a fundamental challenge in designing secure multicast communication systems.
To ensure group confidentiality during the multicast session, the sender (source) shares a secret symmetric key with all valid group members, called Traffic Encryption Key (TEK). To multicast a secret message, the source encrypts the message with the TEK using a symmetric encryption algorithm. Upon receiving the encrypted multicast message, each valid member that knows the TEK can decrypt it with TEK and recover the original one. Key management includes creating, distributing and updating the keys then it constitutes a basic block for secure multicast communication applications.
Each member holds a key to encrypt and decrypt the multicast data. When a member joins and leaves a group, the key has to be updated and distributed to all group members in order to meet the above requirements. The process of updating the keys and distributing them to the group members is called rekeying operation [4]. Rekeying is required in secure multicast to ensure that a new member cannot decrypt the stored multicast data (before its joining) and prevents a leaving member from eavesdropping future multicast data.
A critical problem with any rekey technique is scalability. The rekey process should be done after each membership change, and if the membership changes are frequent, key management will require a large number of key exchanges per unit time in order to maintain both forward and backward secrecies. The number of TEK update messages in the case of frequent join and leave operations induces “1 affects n” phenomenon [5].
To overcome this problem, several approaches propose a multicast group clustering [5,6 and 7]. Clustering is dividing the multicast group into several sub-groups. A Local Controller (LC) manages each sub group, which is responsible for local key management within the cluster. Thus, after Join or Leave procedures, only members within the concerned cluster are affected by rekeying process, and the local dynamics of a cluster does not affect the other clusters of the group. Moreover, few solutions for multicast group clustering did consider the energy and latency issues to achieve an efficient key distribution process, whereas energy and latency constitutes main issue in ad hoc environments. This paper extends and presents taxonomy of multicast key distribution protocols, dedicated to operate in ad hoc networks for secure multicast communications.
218 http://sites.google.com/site/ijcsis/ ISSN 1947-5500

(IJCSIS) International Journal of Computer Science and Information Security, Vol. 7, No. 2, 2010
The remainder of this paper is structured as follows. Section 2 emphasizes the challenges of securing multicast communications within ad hoc environments. Section 3 presents the key management requirements. Section 4 describes Taxonomy of Multicast key management approaches. Section 5 discusses the approaches. Finally, Section 6 concludes the paper.
II. CHALLENGES AND CONSTRAINTS OF SECURING MULTICAST KEY DISTRIBUTION FOR MOBILE AD HOC
NETWORKS The principal constraints and challenges induced by the ad
hoc environment [8] are as follows. • Wireless Links: The wireless links make the network
easily prone to passive malicious attacks like sniffing, or active attacks like message replay or message alteration.
• Absence of Infrastructure: The absence of infrastructure is one of the main characteristics of ad hoc networks.
• Autonomous No centralized administration entity is available to manage the operation of the different mobile nodes.
• Dynamic topology Nodes are mobile and can be connected dynamically in an arbitrary manner. Links of the network vary timely and are based on the proximity of one node to another node.
• Device discovery Identifying relevant newly moved in nodes and informing about their existence need dynamic update to facilitate automatic optimal route selection.
• Bandwidth optimization Wireless links have significantly lower capacity than the wired links.
• Limited Power: Adhoc networks are composed of low powered devices. These devices have limited energy, bandwidth and CPU, as well as low memory capacities.
• Scalability defined as whether the network is able to provide an acceptable level of service even in the presence of a large number of nodes.
• Self operated Self healing feature demands MANET should realign itself to blanket any node moving out of its range.
• Poor Transmission Quality This is an inherent problem of wireless communication caused by several error sources that result in degradation of the received signal.
• Ad hoc addressing Challenges in standard addressing scheme to be implemented.
• Network configuration The whole MANET infrastructure is dynamic and is the reason for dynamic connection and disconnection of the variable links.
• Topology maintenance Updating information of dynamic links among nodes in MANETs is a major challenge.
Consequently, achieving secure multicast communications in adhoc networks should take into account additional factors including the energy consumption efficiency, the optimal selection of group controllers and saves the bandwidth.
III. KEY MANAGEMENT REQUIREMENTS Key management includes creating, distributing and
updating the keys then it constitutes a basic block for secure multicast communication applications. Group confidentiality requires that only valid users could decrypt the multicast data. Efficient key management protocols should take into consideration of miscellaneous requirements [4]. Figure 1 summarizes these.
Figure 1. Group Key Management Requirements
A. Security requirements • Forward secrecy This ensures that a member cannot
decrypt data after it leaves the group. To assure forward secrecy, a re-key of the group with a new TEK after each leave from the group is the ultimate solution.
• Backward secrecy This ensures that a member cannot decrypt data sent before it joins the group. To assure backward secrecy, a re-key of the group with a new TEK after each join to the group is the ultimate solution.
• Collusion freedom requires that any set of fraudulent users should not be able to deduce the current traffic encryption key.
• Key independence: This ensures that any subset of a group keys must not be able to discover any other group key.
• Trust relationship: In mobile ad hoc groups there is no trusted central authority that is actively involved in the computation of group key that is all participants have equal rights during computation process. This is emphasized by definition of verifiable trust relationship that consists of two requirements: One as Group members are trusted not to reveal the group key or
219 http://sites.google.com/site/ijcsis/ ISSN 1947-5500

(IJCSIS) International Journal of Computer Science and Information Security, Vol. 7, No. 2, 2010
secret values that may lead to its computation to any other party, and another as group members must be able to verify the computation steps of the group key management protocol.
B. Quality of service requirement • Low bandwidth overhead: the re-key of the group
should not induce a high number of messages, especially for dynamic groups. Ideally, this should be independent from the group size.
• 1-affects-n: a protocol suffers from the 1-affects-n phenomenon if a single membership change in the group affects all the other group members. This happens typically when a single membership change requires that all group members commit to a new TEK.
• Minimal delays: many applications that are built over the multicast service (typically, multimedia applications) are sensitive to jitters and delays in packet delivery. Therefore, any key management scheme should take this into consideration and hence minimizes the impact of key management on the delays of packet delivery.
• Service availability: the failure of a single entity in the key management architecture must not prevent the operation of the whole multicast session.
C. Key server and Group Member requirements The key management scheme induces high storage of keys
and high computation overhead at the key server or group members.
Thus securing multicast group communication in ad hoc network should focus on both security and Qos requirements.
IV. KEY MANAGEMENT APPROACHES Key management approaches can be classified into three
classes: centralized, distributed or decentralized. Figure 2 illustrates this classification.
Figure 2. Classification of key management Approaches
A. Centralized Approaches In centralized approaches, a designated entity (e.g., the
group leader or a key server) is responsible for calculation and
distribution of the group key to all the participants. Centralized protocols are further classified into three sub-categories namely Pairwise key approach; Secure locks and Hierarchy of keys approach.
1.Pairwise key approach: In this approach, the key server shared pairwise keys with each participant. For example, in GKMP [9], apart from pairwise keys and the group key, all current group participants know a group key encryption key (gKEK). If a new participant joins the group, the server generates a new group key and a new gKEK. These keys are sent to the new member using the key it shares with key server, and to the old group member using the old gKEK.
2.Secure Locks: Chiou and Chen [10] proposed Secure Lock; a key management protocol where the key server requires only a single broadcast to establish the group key or to re-key the entire group in case of a leave. This protocol minimizes the number of re-key messages. However, it increases the computation at the server due to the Chinese Remainder calculations before sending each message to the group.
3. Hierarchy of Keys Approach: Most efficient approach to rekeying in the centralized case is the hierarchy of keys approach. Here, the key server shares keys with subgroups of the participants, in addition to the pair wise keys. Thus, the hierarchical approach trades off storage for number of transmitted messages.
Logical key hierarchy was proposed independently in [11]. The key server maintains a tree with subgroup keys in the intermediate nodes and the individual keys in the leaves. Apart from the individual keys shared with the key server, each node knows all keys on the path to the root. In root, the group key is stored. As the depth of the balanced binary tree is logarithmical in the number of the leaves, each member stores a logarithmical number of keys, and the number of rekey messages is also logarithmic in the number of group members instead of linear, as in previously described approaches.
One-way function trees (OFT) [12] enables the group members to calculate the new keys based on the previous keys using a one-way function, which further reduces the number of rekey messages.
TABLE I. CENTRALIZED APPROACHES
220 http://sites.google.com/site/ijcsis/ ISSN 1947-5500
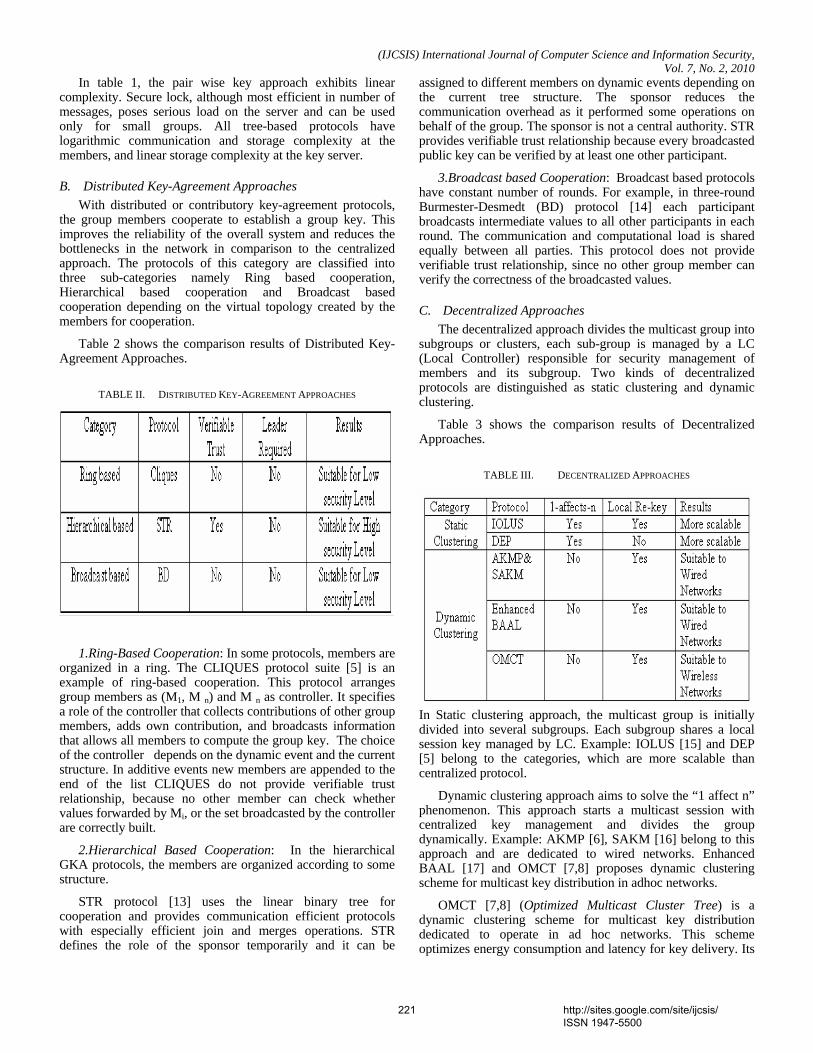
(IJCSIS) International Journal of Computer Science and Information Security, Vol. 7, No. 2, 2010
In table 1, the pair wise key approach exhibits linear complexity. Secure lock, although most efficient in number of messages, poses serious load on the server and can be used only for small groups. All tree-based protocols have logarithmic communication and storage complexity at the members, and linear storage complexity at the key server.
B. Distributed Key-Agreement Approaches With distributed or contributory key-agreement protocols,
the group members cooperate to establish a group key. This improves the reliability of the overall system and reduces the bottlenecks in the network in comparison to the centralized approach. The protocols of this category are classified into three sub-categories namely Ring based cooperation, Hierarchical based cooperation and Broadcast based cooperation depending on the virtual topology created by the members for cooperation.
Table 2 shows the comparison results of Distributed Key-Agreement Approaches.
TABLE II. DISTRIBUTED KEY-AGREEMENT APPROACHES
1.Ring-Based Cooperation: In some protocols, members are organized in a ring. The CLIQUES protocol suite [5] is an example of ring-based cooperation. This protocol arranges group members as (M1, M n) and M n as controller. It specifies a role of the controller that collects contributions of other group members, adds own contribution, and broadcasts information that allows all members to compute the group key. The choice of the controller depends on the dynamic event and the current structure. In additive events new members are appended to the end of the list CLIQUES do not provide verifiable trust relationship, because no other member can check whether values forwarded by Mi, or the set broadcasted by the controller are correctly built.
2.Hierarchical Based Cooperation: In the hierarchical GKA protocols, the members are organized according to some structure.
STR protocol [13] uses the linear binary tree for cooperation and provides communication efficient protocols with especially efficient join and merges operations. STR defines the role of the sponsor temporarily and it can be
assigned to different members on dynamic events depending on the current tree structure. The sponsor reduces the communication overhead as it performed some operations on behalf of the group. The sponsor is not a central authority. STR provides verifiable trust relationship because every broadcasted public key can be verified by at least one other participant.
3.Broadcast based Cooperation: Broadcast based protocols have constant number of rounds. For example, in three-round Burmester-Desmedt (BD) protocol [14] each participant broadcasts intermediate values to all other participants in each round. The communication and computational load is shared equally between all parties. This protocol does not provide verifiable trust relationship, since no other group member can verify the correctness of the broadcasted values.
C. Decentralized Approaches The decentralized approach divides the multicast group into
subgroups or clusters, each sub-group is managed by a LC (Local Controller) responsible for security management of members and its subgroup. Two kinds of decentralized protocols are distinguished as static clustering and dynamic clustering.
Table 3 shows the comparison results of Decentralized Approaches.
TABLE III. DECENTRALIZED APPROACHES
In Static clustering approach, the multicast group is initially divided into several subgroups. Each subgroup shares a local session key managed by LC. Example: IOLUS [15] and DEP [5] belong to the categories, which are more scalable than centralized protocol.
Dynamic clustering approach aims to solve the “1 affect n” phenomenon. This approach starts a multicast session with centralized key management and divides the group dynamically. Example: AKMP [6], SAKM [16] belong to this approach and are dedicated to wired networks. Enhanced BAAL [17] and OMCT [7,8] proposes dynamic clustering scheme for multicast key distribution in adhoc networks.
OMCT [7,8] (Optimized Multicast Cluster Tree) is a dynamic clustering scheme for multicast key distribution dedicated to operate in ad hoc networks. This scheme optimizes energy consumption and latency for key delivery. Its
221 http://sites.google.com/site/ijcsis/ ISSN 1947-5500
(IJCSIS) International Journal of Computer Science and Information Security, Vol. 7, No. 2, 2010
main idea is to elect the local controllers of the created clusters [7,8]. OMCT needs the geographical location information of all group members in the construction of the key distribution tree.
Once the clusters are created within the multicast group, the new LC becomes responsible for the local key management and distribution to their local members, and also for the maintenance of the strongly correlated cluster property. The election of local controllers is done according to the localization and GPS (Global Positioning System) information of the group members, which does not reflect the true connectivity between nodes.
Optimized Multicast Cluster Tree with Multipoint Relays (OMCT with MPR) [18], whose main idea is to use information of Optimized Link State Routing Protocol (OLSR) to elect the local controllers of the created clusters. OMCT with MPRs assumes that routing control messages have been exchanged before the key distribution. It does not acknowledge the transmission and hence results in retransmission which consumes more energy.
Based on the literature reviewed, OMCT is the efficient dynamic clustering approach for secure multicast distribution in mobile adhoc networks. To enhance its efficiency, it is necessary to overcome the criteria, as OMCT needs geographical location information in the construction of key distribution tree by reflecting true connectivity between nodes.
V. DISCUSSIONS
In centralized protocols GKMP achieves an excellent result for storage at the members. However this result is achieved by providing no method for rekeying the group after a member has left, except re-creating the entire group which induces O(n) rekey message overhead where ‘n’ is the number of the remaining group members. Secure Lock achieves also excellent results for storage and communication overheads on both members and the key server. However, these results are achieved by increasing the computation overhead at the key server due to the Chinese Remainder calculations.
Distributed key agreement protocols do not rely on a group leader have an advantage over those with a group leader because, without a leader, all members are treated equally and if one or more members fail to complete the protocol, it will not affect the whole group. In the protocols with a group leader, a leader failure is fatal for creating the group key and the operation has to be restarted from scratch. The 1-affects-n phenomenon is not considered because in distributed protocols all the members are contributors in the creation of the group key and hence all of them should commit to the new key whenever a membership change occurs in the group.
In Decentralized protocols, protocols belong to the static clustering approaches are more scalable than centralized protocol. These protocols are dedicated to operate within wired networks.
Dynamic clustering approach aims to solve the “1 affect n” phenomenon. Dynamic clustering scheme are well suited for multicast key distribution in adhoc networks. OMCT
(Optimized Multicast Cluster Tree) is a dynamic clustering scheme for multicast key distribution dedicated to operate in ad hoc networks. This scheme optimizes energy consumption and latency for key delivery.
VI. CONCLUSION
Secure multicast communication is a significant requirement in emerging applications in adhoc environments like military or public emergency network applications. Membership dynamism is a major challenge in providing complete security in such networks. This dynamicity affects considerably the performance of the key management protocol. Most of the protocols suffer from 1-affects-n phenomenon.
This paper presents challenges, constraints and requirements for securing multicast key distribution for mobile ad hoc networks. It also presents taxonomy of key management protocols. This paper suggests OMCT (Optimized Multicast Cluster Tree) is a scalable scheme, which provides secure multicast communication in mobile adhoc network. This scheme is based on simple technique of clustering and key management approach. Thus this approach is scalable and efficient for dynamic multicast groups.
REFERENCES
[1] T. Chiang and Y. Huang. Group keys and the multicast security in ad hoc networks. In Proceedings of the 2003 International Conference on Parallel Processing Workshops, 2003.
[2] T. Kaya, G. Lin, G. Noubir, and A. Yilmaz. Secure multicast groups on ad hoc networks. In Proceedings of the 1st ACM workshop on security of ad hoc and sensor networks, pages 94–102. ACM Press, 2003.
[3] D.Huang, D.Medhi, A Secure Group Key Management scheme for Hierarchical Mobile Adhoc Networks, Adhoc Networks, June 2008.
[4] Y. Challal, H. Seba. Group Key Management Protocols: A novel Taxonomy. In International Journal of Information Technology 2005.
[5] L. Dondeti, S. Mukherjee, and A. Samal. Secure one-to many group communication using dual encryption. In ComputCom-mun.23, 17 (November), 1999.
[6] H. Bettahar, A. Bouabdallah, and Y. Challal. An adaptive key management protocol for secure multicast. In ICCCN, Florida USA, October 2002.
[7] M. Bouassida, I. Chrisment, and O. Festor. Efficient Clustering for Multicast Key Distribution in MANETs. In Networking 2005, Waterloo, CANADA, May 2005.
[8] M.S. Bouassida, I. Chrisment and O.Feastor. Group Key Management in MANETs, May 2006.
[9] H. Harney and C. Muckenhirn. Group key management protocol (gkmp) specification. RFC2093, 1997.
[10] G. H. Chiou and W. T. Chen. Secure Broadcast using Secure Lock. IEEE Transactions on Software Engineering, August 1989.
[11] Chung KeiWong, Mohamed Gouda, and Simon S. Lam. Secure group communications using key graphs. IEEE/ACM Trans.2000.
[12] Alan T. Sherman and David A. McGrew. Key establishment in large dynamic groups using one-way function trees. 2003.
[13] Yongdae Kim, Adrian Perrig, and Gene Tsudik. Tree-based group key agreement. ACM Trans. Inf. Syst. Secur., 2004.
[14] Mike Burmester and Yvo Desmedt. A secure and scalable group key exchange system. Information Processing Letters, May 2005.
[15] S. Mittra. Iolus: A framework for scalable secure multicasting. In SIGCOMM, pages 277–288, 1997.
222 http://sites.google.com/site/ijcsis/ ISSN 1947-5500
(IJCSIS) International Journal of Computer Science and Information Security, Vol. 7, No. 2, 2010
[16] Y. Challal, H. Bettahar, and A. Bouabdallah. SAKM: A Scalable and Adaptive Key Management Approach for Multicast Communications. ACM SIGCOMM, April 2004.
[17] M. Bouassida, I. Chrisment, and O. Festor. An Enhanced Hybrid Key Management Protocol for Secure Multicast in Ad Hoc Networks. In Networking 2004, Greece, May 2004.
[18] M. Bouassida, I. Chrisment, and O. Festor: Efficient Group Key Management Protocol in MANETs using the Multipoint Relaying Technique. International Conference on Mobile Communications 2006.
AUTHORS PROFILE
D. Suganya Devi received her B.Sc (Chemistry) and MCA from PSGR Krishnammal College for Women, Coimbatore in 1996 and 1999 respectively. And, she received her M.Phil degree in Computer Science in the
year of 2003 from Manonmaniam Sundaranar University, Thirunelveli. She is pursuing her PhD at Avinashilingam University for Women. She is currently working as an Assistant Professor in the Department of computer Applications, SNR Sons College, Coimbatore. She has 10 years of teaching experience. She has presented 15 papers in various national, international conferences and journals. Her research interests Multicast Communication, MANET and Network Security.
Dr. Padmavathi Ganapathi is the professor and head of Department of Computer Science, Avinashilingam University for Women, Coimbatore. She has 21 years of teaching experience and one year Industrial experience. Her areas of interest include Network security and Cryptography and real time communication. She has more than 60 publications at national and International level. She is a life member of many professional organizations
like CSI, ISTE, AACE, WSEAS, ISCA, and UWA.
223 http://sites.google.com/site/ijcsis/ ISSN 1947-5500
(IJCSIS) International Journal of Computer Science and Information Security, Vol. 7, No. 2, 2010
Nonlinear Filter Based Image Denoising Using AMF Approach
*T.K.Thivakaran *Asst.professor, Department of Information Technology,
Sri Venkateswara College of Engineering, Post bag.No.3, Pennalur, Sri perumbudhur - 602105. .
**Dr.RM.Chandrasekaran ** Professor, Department of CSE,
Anna University, Trichy.
Abstract: This paper proposes a new technique based on nonlinear Adaptive Median filter (AMF) for image restoration. Image denoising is a common procedure in digital image processing aiming at the removal of noise, which may corrupt an image during its acquisition or transmission, while retaining its quality. This procedure is traditionally performed in the spatial or frequency domain by filtering. The aim of image enhancement is to reconstruct the true image from the corrupted image. The process of image acquisition frequently leads to degradation and the quality of the digitized image becomes inferior to the original image. Filtering is a technique for enhancing the image. Linear filter is the filtering in which the value of an output pixel is a linear combination of neighborhood values, which can produce blur in the image. Thus a variety of smoothing techniques have been developed that are non linear. Median filter is the one of the most popular non-linear filter. When considering a small neighborhood it is highly efficient but for large window and in case of high noise it gives rise to more blurring to image. The Centre Weighted Median (CWM) filter has got a better average performance over the median filter [8]. However the original pixel corrupted and noise reduction is substantial under high noise condition. Hence this technique has also blurring affect on the image. To illustrate the superiority of the proposed approach by overcoming the existing problem, the proposed new scheme (AMF) Adaptive Median Filter has been simulated along with the standard ones and various performance measures have been compared.
Key words: Noise; Image Filters; AMF Filter; PSNR.
INTRODUCTION In an image, edges and fine details are high frequency
content and carry very important information for visual perception. Filters having good edge and image detail preservation properties are highly suitable for digital image filtering. When one would like to remove the noise, it follows certain filtering operation where the signal has to be passed through a filter and the filter in turn removes the undesirable components. Many linear and nonlinear filtering algorithms have been proposed for image denoising [5].
A. Noise Models:
When it has been discussed on noise it can be getting introduced in the image, either at the time of image generation (or) at the time of image transmission. Noise having Gaussian-like distribution is very often encountered in acquired data.
Generally, Gaussian noise is added to every part of the image and it affects each pixel in the image from its original value by a (usually) small amount based on noise standard deviation. Gaussian noise can easily be removed by locally averaging the pixels inside the window and replace the processing pixel with this average value. Another kind of noise that is present during the image transmission is Salt-Pepper noise [1].It appears as black and/or white impulse of the image. Third type of noise is Impulse noise is classified as fixed valued impulse noise and random valued impulse noise. Generally, impulse noise corrupts certain pixels in the image by either a very low value (Smin) or very high (Smax) intensity value with or without equal probability.
B. Image Filters
Elimination of noise is one of the major works to be done in computer vision and image processing, as noise leads to the error in the image. Presence of noise is manifested by undesirable information, which is not at all related to the image under study, but in turn disturbs the information present in the image. It is translated into values, which are getting added or subtracted to the true gray level values on a gray level pixel. A digital filter [8] [9] is used to remove noise from the degraded image. As any noise in the image can be result in serious errors. Noise is an unwanted signal, which is manifested by undesirable information. Thus the image, which gets contaminated by the noise, is the degraded image and using different filters can filter this noise. Thus filter is an important subsystem of any signal processing systems. Thus filters are used for image enhancement, as it removes undesirable signal components from the signal of interest. Filters are of different type i.e. linear filters or nonlinear filters. Linear filters generally blur sharp edges, destroy lines and other fine details present in the image. To overcome the problem of linear filtering, non-linear filtering techniques become popular as an alternative to preserve signal structure. Order Statistic filters are one of the most important families of nonlinear image filters that have shown to posses excellent robustness properties in presence of impulsive noise while preserving the edge information. The median filter is the most popular order statistics filter first suggested by Tukey in 1971.It does not posses the drawbacks of linear filters and can effectively eliminate the effects of impulsive noise while preserving the edge information.
224 http://sites.google.com/site/ijcsis/ ISSN 1947-5500
(IJCSIS) International Journal of Computer Science and Information Security, Vol. 7, No. 2, 2010
PROBLEM FORMULATION As it had seen that noise elimination is a main concern in
computer vision and image processing. Noise presence is manifested by undesirable information, not related to the scene under study, which perturbs the information relative to the form observable in the image. It is translated to more or less severe values, which are added (or) subtracted to the original values on a number of pixels. Noise is of many types. Thus image noise can be Gaussian, Uniform or impulsive distribution. Here we will discuss about the, impulse noise. This impulse noise can be eliminated or the degraded image can be enhanced by the use of advance filter. Due to certain disadvantages of linear filters, nonlinear method of filtering has been proposed in this paper. Nonlinear filter can be very effective in removing the impulse noise. The median filter is the most popular order statistics filter first suggested by Tukey in 1971.It does not posses the drawbacks of linear filters and can effectively eliminate the effects of impulsive noise while preserving the edge information.
It replaces current pixel to be processed by median value of a filtering window around the pixel. Normally, impulse noise has high or low magnitude and is isolated. When we sort pixels in the moving window, noise pixels are usually at the ends of the array. Several techniques have been proposed which try to take the advantage of the average performance of the median filter, either to evaluate noise density, set up parameters or to guide the filtering process. Since the median value must actually be the value of one of the pixels in the neighborhood, the median filter does not create new unrealistic pixel values when the filters overlap an edge. One of the major problems with the median filter is that it is relatively expensive and complex to compute. To find the median it is necessary to sort all the values in the neighborhood into numerical order and this is relatively slow, even with fast sorting algorithms such as quick sort.
The weighted median (WM) filter [3] is an extension of the median filter. The basic idea is to give higher weight to some samples, according to their position with respect to the center of the window. Generally, weights are integers, they specify how many times a sample is replicated in the ordered array . The weighted median filter structure with weights as a=(a1,a2,a3……….ai) and the inputs x=(X1,X2,X3……..Xi) is given by Weight Med(X1,X2,X3……..Xi) = MED{(a1 ◊X1, a2◊X2, ...ai◊ Xi)} where ◊ is the replication operator.
A special case of WM filter is called center weighted median (CWM) filter [6]. This filter gives more weight only to the central pixel of a window. This leads to improved detail preservation properties at the expense of lower noise suppression. Some of the impulses may not be removed by the filter.
C. Solution Methodology
A nonlinear filter namely the Adaptive Median Filter (AMF) is proposed to reduce impulsive-like noise while modifying the gray levels of the image as little as possible, resulting in a maximum preservation of the original information [4]. In this paper thrust has been made to devise a filtering scheme to remove impulse noise from images such
that the scheme should work at high noise conditions and should perform superior to the existing schemes in terms of noise rejection and retention of original image properties. The detection scheme is devised keeping the CWM filters in mind whereas the median filter is used for the filtering operation for detected noisy pixels. Extensive simulation has been carried out to compare the performance of the proposed filter with other standard schemes. Since impulse noise is not uniformly distributed across the image, it is desirable to replace the Corrupted ones through a suitable filter. For this purpose, a preprocessing is required to detect the corrupted location prior to filtering.
D. Proposed Algorithms
Algorithm : AMF Filter Si,j=filtering window and Yi,j=Center pixel in the window
Smin=Minimum gray level value in the filtering window
Smed =Median gray level value in the filtering window
Step1. Initialize W=3
Step2. Compute Smin, Smed and Smax, which are minimum, median and maximum of pixel values in Si,j, respectively.
Step3. If Smin < Smed < Smax, then go to step 5. Otherwise, Set W =W+2 until the maximum allowed size is reached.
Step4. If W ≤Wmax, go to step 2. Otherwise, we replace Yi,j by Smed.
Step5. If Smin < Yi,j < Smax, then Yi,j is not a noise candidate, else we replace Yi,j by Smed. Filter to the test filter in the window W.
Step6. Stop.
E. Mathematical Analysis
To assess the performance of the proposed filters for removal of impulse noise and to evaluate their comparative Performance, standard performance indices are defined as follows:
i) Peak Signal to Noise Ratio (PSNR): It is measured in decibel (dB) and for gray scale image it is defined as:
msePSNR
2
10255
log10 dB
Where mse is the mean square error between the original and the denoised image with size I×J. The higher the PSNR in the restored image, the better is its quality.
ii) Percentage of Noise Attenuated (PONA): It may be defined as the number of pixels getting improved
after being filtered.
PONA = (Number of noisy pixels getting improved / Total number of noisy pixels) × 100.
225 http://sites.google.com/site/ijcsis/ ISSN 1947-5500
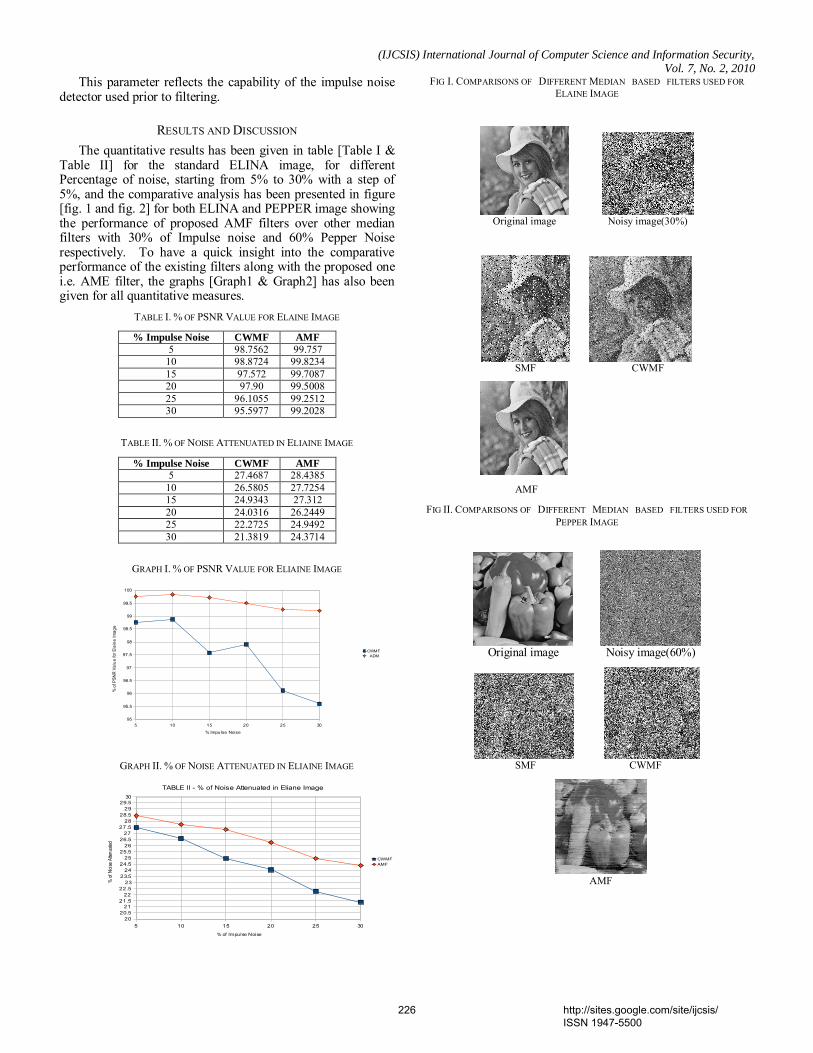
(IJCSIS) International Journal of Computer Science and Information Security, Vol. 7, No. 2, 2010
5 10 15 20 25 3095
95.5
96
96.5
97
97.5
98
98.5
99
99.5
100
CWMF ADM
% Impulse Noise
% o
f PSN
R Va
lue
for E
lain
e Im
age
5 10 15 20 25 3020
20.521
21.522
22.523
23.524
24.525
25.526
26.527
27.528
28.529
29.530
TABLE II - % of Noise Attenuated in Eliane Image
CWMFAMF
% of Impulse Noise
% of
Noise
Atte
nuate
d
This parameter reflects the capability of the impulse noise detector used prior to filtering.
RESULTS AND DISCUSSION The quantitative results has been given in table [Table I &
Table II] for the standard ELINA image, for different Percentage of noise, starting from 5% to 30% with a step of 5%, and the comparative analysis has been presented in figure [fig. 1 and fig. 2] for both ELINA and PEPPER image showing the performance of proposed AMF filters over other median filters with 30% of Impulse noise and 60% Pepper Noise respectively. To have a quick insight into the comparative performance of the existing filters along with the proposed one i.e. AME filter, the graphs [Graph1 & Graph2] has also been given for all quantitative measures.
TABLE I. % OF PSNR VALUE FOR ELAINE IMAGE
% Impulse Noise CWMF AMF
5 98.7562 99.757 10 98.8724 99.8234 15 97.572 99.7087 20 97.90 99.5008 25 96.1055 99.2512 30 95.5977 99.2028
TABLE II. % OF NOISE ATTENUATED IN ELIAINE IMAGE
% Impulse Noise CWMF AMF
5 27.4687 28.4385 10 26.5805 27.7254 15 24.9343 27.312 20 24.0316 26.2449 25 22.2725 24.9492 30 21.3819 24.3714
GRAPH I. % OF PSNR VALUE FOR ELIAINE IMAGE
GRAPH II. % OF NOISE ATTENUATED IN ELIAINE IMAGE
FIG I. COMPARISONS OF DIFFERENT MEDIAN BASED FILTERS USED FOR ELAINE IMAGE
Original image Noisy image(30%)
SMF CWMF
AMF
FIG II. COMPARISONS OF DIFFERENT MEDIAN BASED FILTERS USED FOR PEPPER IMAGE
Original image Noisy image(60%)
SMF CWMF
AMF
226 http://sites.google.com/site/ijcsis/ ISSN 1947-5500
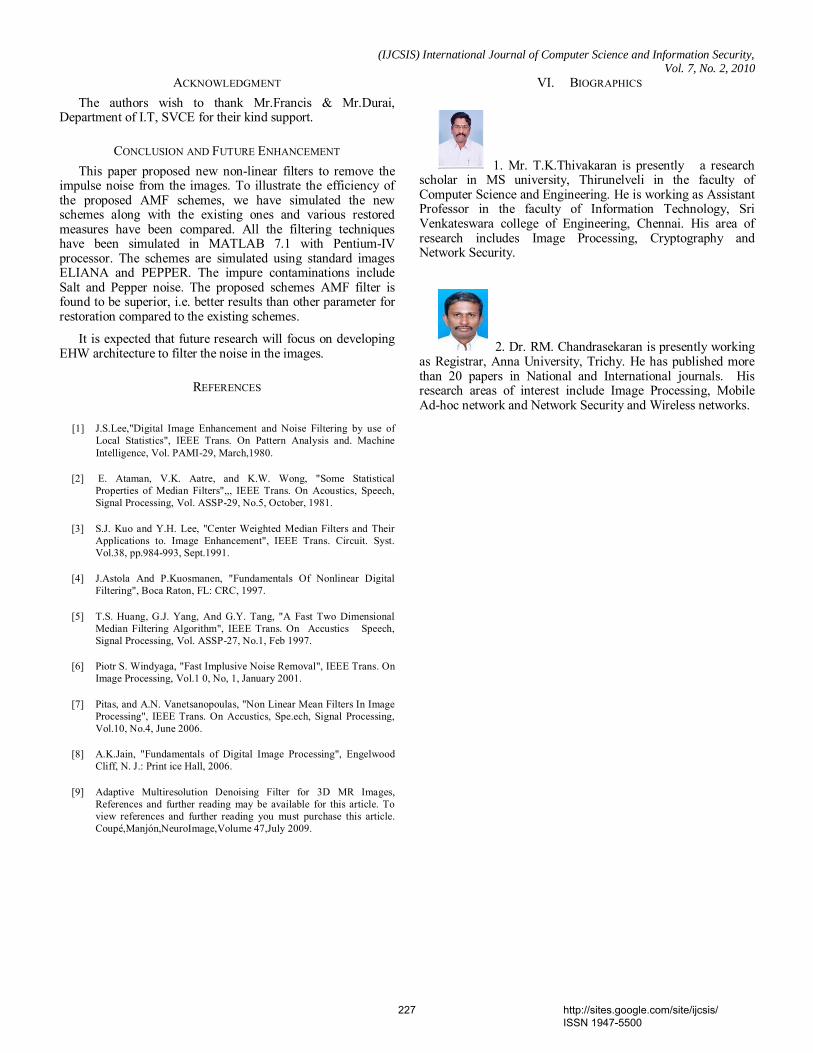
(IJCSIS) International Journal of Computer Science and Information Security, Vol. 7, No. 2, 2010
ACKNOWLEDGMENT The authors wish to thank Mr.Francis & Mr.Durai,
Department of I.T, SVCE for their kind support.
CONCLUSION AND FUTURE ENHANCEMENT This paper proposed new non-linear filters to remove the
impulse noise from the images. To illustrate the efficiency of the proposed AMF schemes, we have simulated the new schemes along with the existing ones and various restored measures have been compared. All the filtering techniques have been simulated in MATLAB 7.1 with Pentium-IV processor. The schemes are simulated using standard images ELIANA and PEPPER. The impure contaminations include Salt and Pepper noise. The proposed schemes AMF filter is found to be superior, i.e. better results than other parameter for restoration compared to the existing schemes.
It is expected that future research will focus on developing EHW architecture to filter the noise in the images.
REFERENCES
[1] J.S.Lee,"Digital Image Enhancement and Noise Filtering by use of Local Statistics", IEEE Trans. On Pattern Analysis and. Machine Intelligence, Vol. PAMI-29, March,1980.
[2] E. Ataman, V.K. Aatre, and K.W. Wong, "Some Statistical Properties of Median Filters",,, IEEE Trans. On Acoustics, Speech, Signal Processing, Vol. ASSP-29, No.5, October, 1981.
[3] S.J. Kuo and Y.H. Lee, "Center Weighted Median Filters and Their Applications to. Image Enhancement", IEEE Trans. Circuit. Syst. Vol.38, pp.984-993, Sept.1991.
[4] J.Astola And P.Kuosmanen, "Fundamentals Of Nonlinear Digital Filtering", Boca Raton, FL: CRC, 1997.
[5] T.S. Huang, G.J. Yang, And G.Y. Tang, "A Fast Two Dimensional Median Filtering Algorithm", IEEE Trans. On Accustics Speech, Signal Processing, Vol. ASSP-27, No.1, Feb 1997.
[6] Piotr S. Windyaga, "Fast Implusive Noise Removal", IEEE Trans. On Image Processing, Vol.1 0, No, 1, January 2001.
[7] Pitas, and A.N. Vanetsanopoulas, "Non Linear Mean Filters In Image Processing", IEEE Trans. On Accustics, Spe.ech, Signal Processing, Vol.10, No.4, June 2006.
[8] A.K.Jain, "Fundamentals of Digital Image Processing", Engelwood Cliff, N. J.: Print ice Hall, 2006.
[9] Adaptive Multiresolution Denoising Filter for 3D MR Images, References and further reading may be available for this article. To view references and further reading you must purchase this article. Coupé,Manjón,NeuroImage,Volume 47,July 2009.
VI. BIOGRAPHICS
1. Mr. T.K.Thivakaran is presently a research scholar in MS university, Thirunelveli in the faculty of Computer Science and Engineering. He is working as Assistant Professor in the faculty of Information Technology, Sri Venkateswara college of Engineering, Chennai. His area of research includes Image Processing, Cryptography and Network Security.
2. Dr. RM. Chandrasekaran is presently working as Registrar, Anna University, Trichy. He has published more than 20 papers in National and International journals. His research areas of interest include Image Processing, Mobile Ad-hoc network and Network Security and Wireless networks.
227 http://sites.google.com/site/ijcsis/ ISSN 1947-5500
SECURING OUR BLUETOOTH MOBILES FROM INTRUDER ATTACK USING ENHANCED AUTHENTICATION SCHEME AND PLAUSIBLE
EXCAHNGE ALGORITHM
Ms.A.Rathika Ms. R.Saranya Ms.R.Iswarya Assistant Professor Final Year UG Student Final Year UG Student VCET, Erode, India VCET, Erode, India VCET, Erode, India .
ABSTRACT- When Bluetooth devices come within the range of another, an electronic conversation takes place to determine whether the devices in range are known or whether one needs to control the other. Most Bluetooth devices do not require any form of user interaction for this to occur. If devices within range are known to one another, the devices automatically form a network-known as a pairing.
Authentication addresses the identity of each communicating device. The sender sends an encrypted authentication request frame to the receiver. The receiver sends an encrypted challenge frame back to the sender. Both perform a predefined algorithm. The sender sends its findings back to the receiver, which in turn either allows or denies the connection.
There are three different functions for authentication in Bluetooth-E1, E2, and E3. E1 is used when encrypting the authorization challenge-response values.E2 is for generating different link keys.E3 is used when creating the encryption key.
Key words: link key, primitive root, challenge response scheme
GENERALIZATION OF INITIALIZATION KEY:
The creation of an initialization key is used when no other keys are present. The key is derived from a random number, a PIN, length of the PIN and a unit’s hardware address. The PIN code can either be a factory value or the user can enter a maximum of 16 octets.
GENERALIZATION OF LINK KEY AND LINK KEY EXCHANGE:
When a link key is established between two units they will use that key for authentication. A link key is 128 bits long and a shared between two or more units, a new link key can be derived whenever to improve security.
Each device creates a random no and encrypts it together with its hardware address and produces initialization key..
AUTHENTICATION:
The Bluetooth authentication procedure is based on a challenge-response scheme. Two devices interacting in an authentication procedure are referred to as the claimant and the verifier. The verifier is the blue tooth device validating the identity of another device. The claimant is the device attempting to prove its identity.
The challenge-response protocol validates devices by verifying the knowledge of a secret key- a Bluetooth link key. The steps in the authentication process are the following:
• Step1: the claimant transmits its 48-bit address (BD_ADD) to the verifier.
• Step2: the verifier transmits a 128-bit random challenge (AU_RAND) to the claimant.
• Step3: the verifier uses the E1 algorithm to compute an authentication response using the address, link key and random challenge as inputs.
• Step4: the claimant returns the computed response SRES, to the verifier.
(IJCSIS) International Journal of Computer Science and Information Security, Vol. 7, No. 2, February 2010
228 http://sites.google.com/site/ijcsis/ ISSN 1947-5500
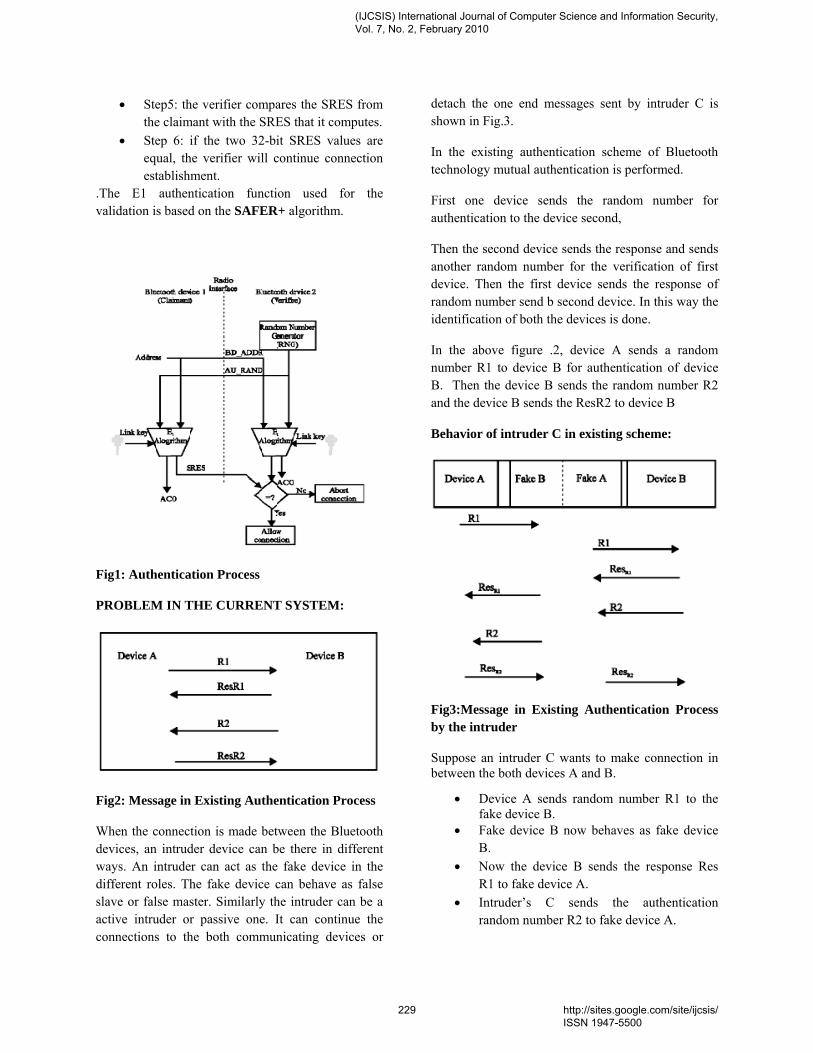
• Step5: the verifier compares the SRES from the claimant with the SRES that it computes.
• Step 6: if the two 32-bit SRES values are equal, the verifier will continue connection establishment.
.The E1 authentication function used for the validation is based on the SAFER+ algorithm.
Fig1: Authentication Process
PROBLEM IN THE CURRENT SYSTEM:
Fig2: Message in Existing Authentication Process
When the connection is made between the Bluetooth devices, an intruder device can be there in different ways. An intruder can act as the fake device in the different roles. The fake device can behave as false slave or false master. Similarly the intruder can be a active intruder or passive one. It can continue the connections to the both communicating devices or
detach the one end messages sent by intruder C is shown in Fig.3.
In the existing authentication scheme of Bluetooth technology mutual authentication is performed.
First one device sends the random number for authentication to the device second,
Then the second device sends the response and sends another random number for the verification of first device. Then the first device sends the response of random number send b second device. In this way the identification of both the devices is done.
In the above figure .2, device A sends a random number R1 to device B for authentication of device B. Then the device B sends the random number R2 and the device B sends the ResR2 to device B
Behavior of intruder C in existing scheme:
Fig3:Message in Existing Authentication Process by the intruder
Suppose an intruder C wants to make connection in between the both devices A and B.
• Device A sends random number R1 to the fake device B.
• Fake device B now behaves as fake device B.
• Now the device B sends the response Res R1 to fake device A.
• Intruder’s C sends the authentication random number R2 to fake device A.
(IJCSIS) International Journal of Computer Science and Information Security, Vol. 7, No. 2, February 2010
229 http://sites.google.com/site/ijcsis/ ISSN 1947-5500
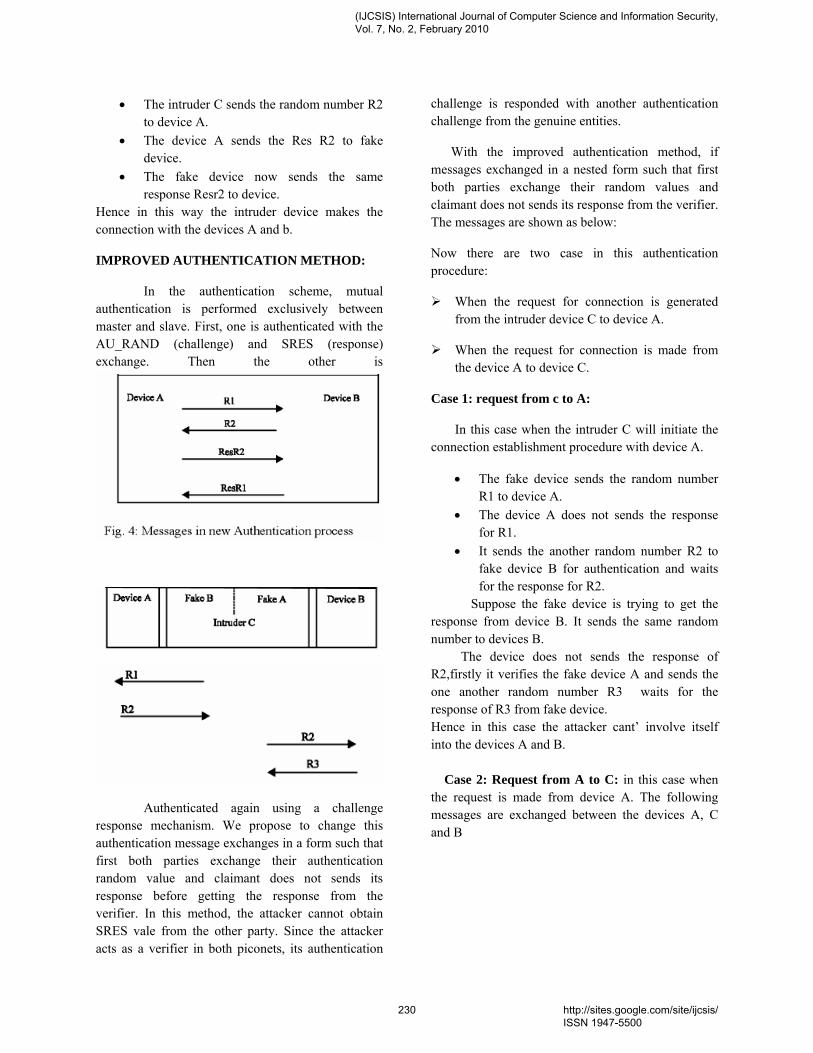
• The intruder C sends the random number R2 to device A.
• The device A sends the Res R2 to fake device.
• The fake device now sends the same response Resr2 to device.
Hence in this way the intruder device makes the connection with the devices A and b.
IMPROVED AUTHENTICATION METHOD:
In the authentication scheme, mutual authentication is performed exclusively between master and slave. First, one is authenticated with the AU_RAND (challenge) and SRES (response) exchange. Then the other is
Authenticated again using a challenge response mechanism. We propose to change this authentication message exchanges in a form such that first both parties exchange their authentication random value and claimant does not sends its response before getting the response from the verifier. In this method, the attacker cannot obtain SRES vale from the other party. Since the attacker acts as a verifier in both piconets, its authentication
challenge is responded with another authentication challenge from the genuine entities.
With the improved authentication method, if messages exchanged in a nested form such that first both parties exchange their random values and claimant does not sends its response from the verifier. The messages are shown as below:
Now there are two case in this authentication procedure:
When the request for connection is generated from the intruder device C to device A.
When the request for connection is made from the device A to device C.
Case 1: request from c to A:
In this case when the intruder C will initiate the connection establishment procedure with device A.
• The fake device sends the random number R1 to device A.
• The device A does not sends the response for R1.
• It sends the another random number R2 to fake device B for authentication and waits for the response for R2.
Suppose the fake device is trying to get the response from device B. It sends the same random number to devices B. The device does not sends the response of R2,firstly it verifies the fake device A and sends the one another random number R3 waits for the response of R3 from fake device. Hence in this case the attacker cant’ involve itself into the devices A and B. Case 2: Request from A to C: in this case when the request is made from device A. The following messages are exchanged between the devices A, C and B
(IJCSIS) International Journal of Computer Science and Information Security, Vol. 7, No. 2, February 2010
230 http://sites.google.com/site/ijcsis/ ISSN 1947-5500

First the authentication random number R1 is sent by device A.
• The device C sends the same random number R1 to device B.
• The device C does not send the response of R1,it sends the another random number R2 to fake device A for authentication.
• The device C transmits the random number R2 to device A and waits for the response of R2 from A.
• The device A gives the response ‘ResR2’ of R2.
• The device C gives theResR2 to device b. • The device B sends the ResR1in response to
the number R1 to device C. • The resR1 is sent as it is to device A by the
device C. Hence the connection is made between the devices A and C and C and B, but this is only possible only when the request is initiated by the device A and simultaneously there is a connection between the device A and B.
Integrity is maintained, but the confidentiality is disturbed.
IMPLEMENTING MORE SECURITY FOR RANDOM NUMBER EXCHANGE:
The scheme implemented in case 2 was insecure obviously. So by implementing the encryption in key exchange we can have a new
improved authenticated system with more security to avoid the above said intruder attack.
PLAUSIBLE EXCHANGE
DIFFIE-HELLMAN KEY EXCHANGE:
Device A selects a random number R1 such that R1 < P a prime number which is having α as its primitive root and calculates S1= aR1mod p. Similarly device Selects R2 such that R2 < p and calculates S2 = aR2mod p. Each side keeps the R value Private and S values Public.
Device A computes K = S2R1mod p and B computes K = s1R2 mod p so the produce identical results.
So even though the intruder knows the P, S and α value they can predict the S1 and S2 values. But they couldn’t predict the original random number.
Device A Fake B Fake A
Intruder
Device B
R1 S1
S1 R1
S2 R2
R2 S2
Res R2
Res R1
PROCEDURE TO EXCHANGE KEYS:
Device A: S1= aR1mod p
Device B: S2 = aR2mod p
Device A: K = s2R1mod p
Device B: K = s1R2 mod p
(IJCSIS) International Journal of Computer Science and Information Security, Vol. 7, No. 2, February 2010
231 http://sites.google.com/site/ijcsis/ ISSN 1947-5500
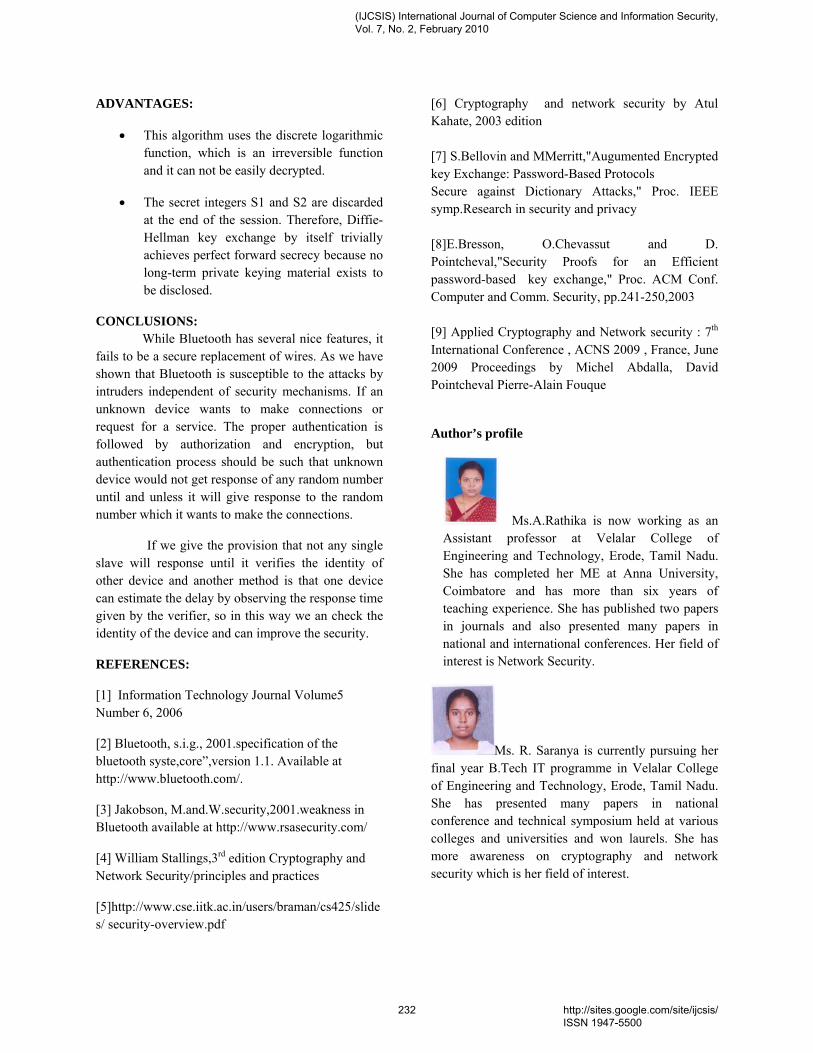
ADVANTAGES:
• This algorithm uses the discrete logarithmic function, which is an irreversible function and it can not be easily decrypted.
• The secret integers S1 and S2 are discarded at the end of the session. Therefore, Diffie-Hellman key exchange by itself trivially achieves perfect forward secrecy because no long-term private keying material exists to be disclosed.
CONCLUSIONS: While Bluetooth has several nice features, it fails to be a secure replacement of wires. As we have shown that Bluetooth is susceptible to the attacks by intruders independent of security mechanisms. If an unknown device wants to make connections or request for a service. The proper authentication is followed by authorization and encryption, but authentication process should be such that unknown device would not get response of any random number until and unless it will give response to the random number which it wants to make the connections.
If we give the provision that not any single slave will response until it verifies the identity of other device and another method is that one device can estimate the delay by observing the response time given by the verifier, so in this way we an check the identity of the device and can improve the security.
REFERENCES:
[1] Information Technology Journal Volume5 Number 6, 2006
[2] Bluetooth, s.i.g., 2001.specification of the bluetooth syste,core”,version 1.1. Available at http://www.bluetooth.com/.
[3] Jakobson, M.and.W.security,2001.weakness in Bluetooth available at http://www.rsasecurity.com/
[4] William Stallings,3rd edition Cryptography and Network Security/principles and practices
[5]http://www.cse.iitk.ac.in/users/braman/cs425/slides/ security-overview.pdf
[6] Cryptography and network security by Atul Kahate, 2003 edition [7] S.Bellovin and MMerritt,"Augumented Encrypted key Exchange: Password-Based Protocols Secure against Dictionary Attacks," Proc. IEEE symp.Research in security and privacy [8]E.Bresson, O.Chevassut and D. Pointcheval,"Security Proofs for an Efficient password-based key exchange," Proc. ACM Conf. Computer and Comm. Security, pp.241-250,2003 [9] Applied Cryptography and Network security : 7th International Conference , ACNS 2009 , France, June 2009 Proceedings by Michel Abdalla, David Pointcheval Pierre-Alain Fouque
Author’s profile
Ms.A.Rathika is now working as an Assistant professor at Velalar College of Engineering and Technology, Erode, Tamil Nadu. She has completed her ME at Anna University, Coimbatore and has more than six years of teaching experience. She has published two papers in journals and also presented many papers in national and international conferences. Her field of interest is Network Security.
Ms. R. Saranya is currently pursuing her final year B.Tech IT programme in Velalar College of Engineering and Technology, Erode, Tamil Nadu. She has presented many papers in national conference and technical symposium held at various colleges and universities and won laurels. She has more awareness on cryptography and network security which is her field of interest.
(IJCSIS) International Journal of Computer Science and Information Security, Vol. 7, No. 2, February 2010
232 http://sites.google.com/site/ijcsis/ ISSN 1947-5500

Ms. R. Iswarya is doing her final year B.Tech IT programme in Velalar College of Engineering and Technology, Erode, Tamil Nadu. She has participated and presented many technical papers in national level technical symposium and conferences and gained laurels. Her area of interest is Ethical Hacking and Information Security.
(IJCSIS) International Journal of Computer Science and Information Security, Vol. 7, No. 2, February 2010
233 http://sites.google.com/site/ijcsis/ ISSN 1947-5500

(IJCSIS) International Journal of Computer Science and Information Security,Vol. 7, No. 2, 2010
Knowledge Management
Mohsen GeramiThe Faculty of Applied Science of Post and Communications
Danesh Blv, Jenah Ave, Azadi Sqr, Tehran, Iran.Postal code: 1391637111
Abstract-This paper discusses the important process of knowledgeand its management, and differences between tacit and explicitknowledge and understanding the culture as a key issue for thesuccessful implementation of knowledge management, in additionto, this paper is concerned with the four-stage model for theevolution of information technology (IT) support for knowledgemanagement in law firms.
Keywords-component; Knowledge Management; Information;Tacit Knowledge; Explicit Knowledge; Law
INTRODUCTIONI.
The move from an industrially-based economy toknowledge or information-based one in the 21st Centurydemands a top-notch knowledge management system tosecure a competitive edge and a capacity for learning.Currently, governments around the world, multinationalcorporations, and a multitude of companies are interested,even concerned with the concept of knowledge management.The new source of wealth is knowledge, and not labor, land,or financial capital. It is the intangible, intellectual assets thatmust be managed. The key challenge of the knowledge-basedeconomy is to foster innovation [1].
From a management perspective the key differencebetween information and knowledge is that information ismuch more easily identified, organized and distributed.Knowledge, on the other hand, cannot really be managedbecause it resides in one's mind. Thus, KM is essentiallylimited to creating the right conditions for individuals to learn(using information and experiencing the world) and applytheir knowledge to the benefit of the organization [2]
WHAT IS KNOWLEDGE AND HOW DO WE USE IT
Knowledge is power.
But mere knowledge is not power; it is only possibility.Action is power; and its highest manifestation is when it isdirected by knowledge. (Francis Bacon)
Knowledge is:
DATA: Facts
INFORMATION: Data organised for a purpose that whichreduces uncertainty
KNOWLEDGE: That which enlightens decisions andaction [3]Or we can write the knowledge process as:
Data: Flight AZ240. Arrival time 7:40 a.m
Information: I'm booked on AZ240 & it's 60 minuteslate
Understanding: It might make up the time but it probablywon't
Relevance: It might make up the time but it probablywon't
Knowledge: It happened before & we met @ the airportor I may be able to fly BA instead
Utilisation: I'll call John and ask him to come or tell himmy new flight arrangements
Knowledge can only be volunteered, not conscripted. Wealways know more than we can tell, and tell more than wecan write down. We only know what we know when we needto know it (David Snowden) [4]In others words we have to understand levels of knowledge
[Symbols (+syntax)
Data (+meaning)
Information (+context, experiences)
Knowledge (+applied)
Know- how (+will to do)
Action (+adapted implementation to specificcontext)
Competence (+unique combination)
Competitiveness]
to improve operational and strategic knowledgemanagement [5]
234 http://sites.google.com/site/ijcsis/ ISSN 1947-5500
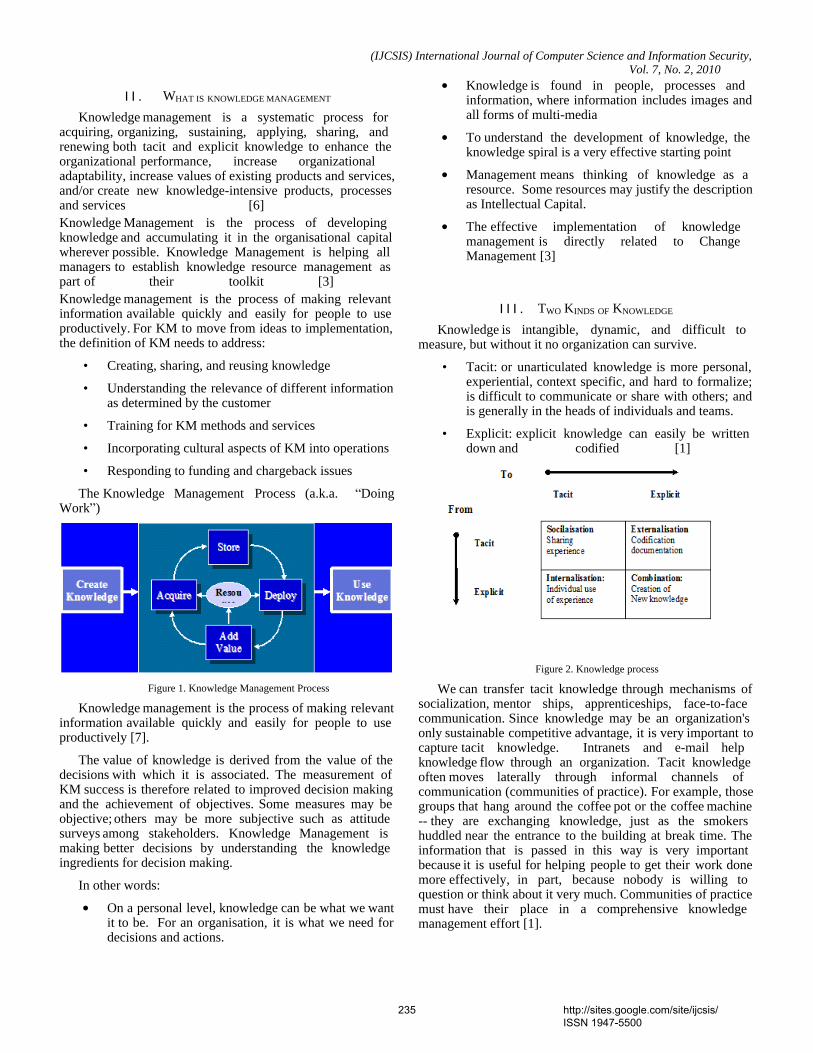
(IJCSIS) International Journal of Computer Science and Information Security,Vol. 7, No. 2, 2010
WHAT IS KNOWLEDGE MANAGEMENTII.
Knowledge management is a systematic process foracquiring, organizing, sustaining, applying, sharing, andrenewing both tacit and explicit knowledge to enhance theorganizational performance, increase organizationaladaptability, increase values of existing products and services,and/or create new knowledge-intensive products, processesand services [6]Knowledge Management is the process of developingknowledge and accumulating it in the organisational capitalwherever possible. Knowledge Management is helping allmanagers to establish knowledge resource management aspart of their toolkit [3]Knowledge management is the process of making relevantinformation available quickly and easily for people to useproductively. For KM to move from ideas to implementation,the definition of KM needs to address:
Creating, sharing, and reusing knowledge
Understanding the relevance of different informationas determined by the customer
Training for KM methods and services
Incorporating cultural aspects of KM into operations
Responding to funding and chargeback issues
The Knowledge Management Process (a.k.a. DoingWork )
Figure 1. Knowledge Management Process
Knowledge management is the process of making relevantinformation available quickly and easily for people to useproductively [7].
The value of knowledge is derived from the value of thedecisions with which it is associated. The measurement ofKM success is therefore related to improved decision makingand the achievement of objectives. Some measures may beobjective; others may be more subjective such as attitudesurveys among stakeholders. Knowledge Management ismaking better decisions by understanding the knowledgeingredients for decision making.
In other words:
On a personal level, knowledge can be what we wantit to be. For an organisation, it is what we need fordecisions and actions.
Knowledge is found in people, processes andinformation, where information includes images andall forms of multi-media
To understand the development of knowledge, theknowledge spiral is a very effective starting point
Management means thinking of knowledge as aresource. Some resources may justify the descriptionas Intellectual Capital.
The effective implementation of knowledgemanagement is directly related to ChangeManagement [3]
TWO KINDS OF KNOWLEDGEIII.
Knowledge is intangible, dynamic, and difficult tomeasure, but without it no organization can survive.
Tacit: or unarticulated knowledge is more personal,experiential, context specific, and hard to formalize;is difficult to communicate or share with others; andis generally in the heads of individuals and teams.
Explicit: explicit knowledge can easily be writtendown and codified [1]
Figure 2. Knowledge process
We can transfer tacit knowledge through mechanisms ofsocialization, mentor ships, apprenticeships, face-to-facecommunication. Since knowledge may be an organization'sonly sustainable competitive advantage, it is very important tocapture tacit knowledge. Intranets and e-mail helpknowledge flow through an organization. Tacit knowledgeoften moves laterally through informal channels ofcommunication (communities of practice). For example, thosegroups that hang around the coffee pot or the coffee machine-- they are exchanging knowledge, just as the smokershuddled near the entrance to the building at break time. Theinformation that is passed in this way is very importantbecause it is useful for helping people to get their work donemore effectively, in part, because nobody is willing toquestion or think about it very much. Communities of practicemust have their place in a comprehensive knowledgemanagement effort [1].
235 http://sites.google.com/site/ijcsis/ ISSN 1947-5500
(IJCSIS) International Journal of Computer Science and Information Security,Vol. 7, No. 2, 2010
Different cultural approaches different KM, Europeconcentrates on knowledge valuation; United States on themanagement of explicit knowledge; Both result from theCartesian perspective of a differentiation between mind andbody, subject and object, knowledge and the knowing person.The Japanese approach concentrates on the creation ofknowledge, in a perspective of unity of mind and body.
Occident puts the emphasis on explicit knowledge, Japanon implicit one [5]
CULTURE - AND CULTURE CHANGE
Understanding the culture is a key issue for the successfulimplementation of knowledge management. The existingculture can amplify or inhibit knowledge managementprojects.
Knowledge management initiatives can support a changein organisational culture [3]Changing the culture is imperative. To create a climate inwhich employees volunteer their creativity and expertise,managers need to look beyond the traditional tools at theirdisposal: finding ways to build trust and develop fair process.That means getting the gatekeepers to facilitate the flow ofinformation rather than hoard it and offering rewards andincentives.
The elements of fair process are simple: 1. Engagepeople's input in decisions that directly affect them. 2.Explain why decisions are made the way they are. 3. Makeclear what will be expected of employees after the changes aremade. Fair process may sound like a soft issue, but it iscrucial to building trust and unlocking ideas.
Adds Buckman Laboratories' Koskiniemi: "Successfulknowledge sharing is 90 percent cultural, 5 percent tools and5 percent magic. All the technology and tools in the worldwon't make you a knowledge-based organization if you do notestablish a culture that believes in sharing."
Organizations must offer a high level of psychologicalsafety and capacity for openness.
Rewards and incentives signal what behaviors andoutcomes are most valued by management. It should not besurprising that knowledge accumulation and sharing are notvalued. Management sends strong signals through itscompensation policies; different roles are perceived of valueaccording to their allocated compensation. So be carefulsending mixed signals. But culture is more than justcompensation, and it is responsive to influences other thanpaychecks. Management sends signals about what isimportant through its recruiting priorities, promotions, and,possibly more than anything, through its own behavior. Thesedeeply embedded cultural assumptions are significant [1]
KM AND LAW
Here will define a four-stage model for the evolution ofinformation technology (IT) support for knowledgemanagement. The purpose of the model is both to understandthe current situation in a firm in terms of a specific stage andto develop strategies for moving to a higher stage in thefuture. The model is applied to law firms where the
knowledge of professional experts is a core asset and thecareful management of this asset has special importance [8]
Law Firms
A law firm can be understood as a social communityspecializing in speed and efficiency in the creation andtransfer of legal knowledge [9]. Many law firms representlarge corporate enterprises, organizations or entrepreneurswith a need for continuous and specialized legal services thatcan only be supplied by a team of lawyers. The client is acustomer of the firm, rather than a particular lawyer.Relationships with clients tend to be enduring [10].
Lawyers can be defined as knowledge workers. They areprofessionals who have gained knowledge through formaleducation (explicit) and through learning on the job (tacit).After completing their advanced educational requirements,most professionals enter their careers as associates in law. Inthis role, they continue to learn and, thus, they gainsignificant tacit knowledge through 'learning by doing' [8]Lawyers work in law firms and law firms belong to the legalindustry. The legal industry will change rapidly in the futurebecause of three important trends. First, global companiesincreasingly seek out law firms that can provide consistentsupport at all business locations and integrated cross-borderassistance for significant mergers and acquisitions as well ascapital market transactions. Second, client loyalty isdecreasing as companies increasingly base purchases of legalservices on a more objective assessment of their value,defined as the benefits net of price. Finally, new competitorshave entered the market, such as accounting firms andInternet-based legal services firms [11]Montana was not convinced that law firms will change,arguing that law stands out as an anachronism in the age ofknowledge management. Law is entirely man-made: there areno hidden physical principles. A person researching somequestion of law ought to be able to derive an answer withcertainty quickly and easily. According to Montana nothing isfurther from the truth [12]
The Knowledge Management Technology Stage Model
The stages of knowledge management technology is arelative concept concerned with IT's ability to processinformation for knowledge work. IT at later stages is moreuseful to knowledge work than IT at earlier stages. Therelative concept implies that IT is more directly involved inknowledge work at higher stages and that IT is able tosupport more advanced knowledge work at higher stages.
236 http://sites.google.com/site/ijcsis/ ISSN 1947-5500
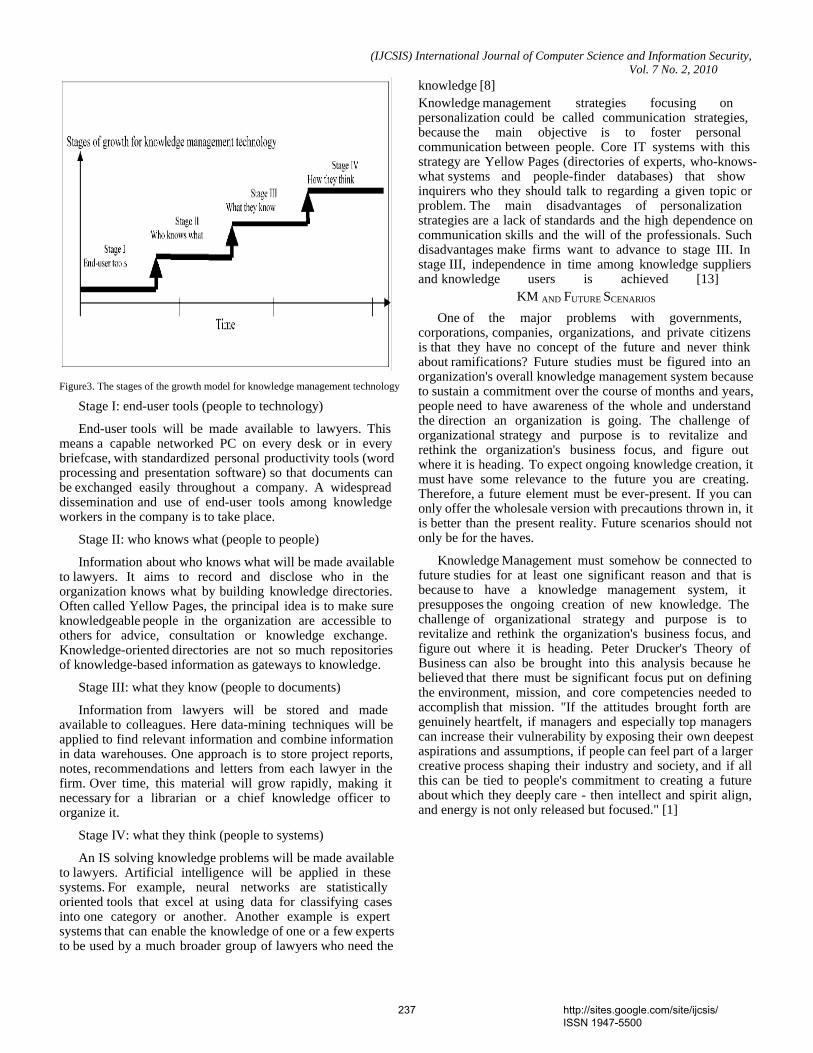
(IJCSIS) International Journal of Computer Science and Information Security,Vol. 7 No. 2, 2010
Figure3. The stages of the growth model for knowledge management technology
Stage I: end-user tools (people to technology)
End-user tools will be made available to lawyers. Thismeans a capable networked PC on every desk or in everybriefcase, with standardized personal productivity tools (wordprocessing and presentation software) so that documents canbe exchanged easily throughout a company. A widespreaddissemination and use of end-user tools among knowledgeworkers in the company is to take place.
Stage II: who knows what (people to people)
Information about who knows what will be made availableto lawyers. It aims to record and disclose who in theorganization knows what by building knowledge directories.Often called Yellow Pages, the principal idea is to make sureknowledgeable people in the organization are accessible toothers for advice, consultation or knowledge exchange.Knowledge-oriented directories are not so much repositoriesof knowledge-based information as gateways to knowledge.
Stage III: what they know (people to documents)
Information from lawyers will be stored and madeavailable to colleagues. Here data-mining techniques will beapplied to find relevant information and combine informationin data warehouses. One approach is to store project reports,notes, recommendations and letters from each lawyer in thefirm. Over time, this material will grow rapidly, making itnecessary for a librarian or a chief knowledge officer toorganize it.
Stage IV: what they think (people to systems)
An IS solving knowledge problems will be made availableto lawyers. Artificial intelligence will be applied in thesesystems. For example, neural networks are statisticallyoriented tools that excel at using data for classifying casesinto one category or another. Another example is expertsystems that can enable the knowledge of one or a few expertsto be used by a much broader group of lawyers who need the
knowledge [8]Knowledge management strategies focusing onpersonalization could be called communication strategies,because the main objective is to foster personalcommunication between people. Core IT systems with thisstrategy are Yellow Pages (directories of experts, who-knows-what systems and people-finder databases) that showinquirers who they should talk to regarding a given topic orproblem. The main disadvantages of personalizationstrategies are a lack of standards and the high dependence oncommunication skills and the will of the professionals. Suchdisadvantages make firms want to advance to stage III. Instage III, independence in time among knowledge suppliersand knowledge users is achieved [13]
KM AND FUTURE SCENARIOS
One of the major problems with governments,corporations, companies, organizations, and private citizensis that they have no concept of the future and never thinkabout ramifications? Future studies must be figured into anorganization's overall knowledge management system becauseto sustain a commitment over the course of months and years,people need to have awareness of the whole and understandthe direction an organization is going. The challenge oforganizational strategy and purpose is to revitalize andrethink the organization's business focus, and figure outwhere it is heading. To expect ongoing knowledge creation, itmust have some relevance to the future you are creating.Therefore, a future element must be ever-present. If you canonly offer the wholesale version with precautions thrown in, itis better than the present reality. Future scenarios should notonly be for the haves.
Knowledge Management must somehow be connected tofuture studies for at least one significant reason and that isbecause to have a knowledge management system, itpresupposes the ongoing creation of new knowledge. Thechallenge of organizational strategy and purpose is torevitalize and rethink the organization's business focus, andfigure out where it is heading. Peter Drucker's Theory ofBusiness can also be brought into this analysis because hebelieved that there must be significant focus put on definingthe environment, mission, and core competencies needed toaccomplish that mission. "If the attitudes brought forth aregenuinely heartfelt, if managers and especially top managerscan increase their vulnerability by exposing their own deepestaspirations and assumptions, if people can feel part of a largercreative process shaping their industry and society, and if allthis can be tied to people's commitment to creating a futureabout which they deeply care - then intellect and spirit align,and energy is not only released but focused." [1]
237 http://sites.google.com/site/ijcsis/ ISSN 1947-5500
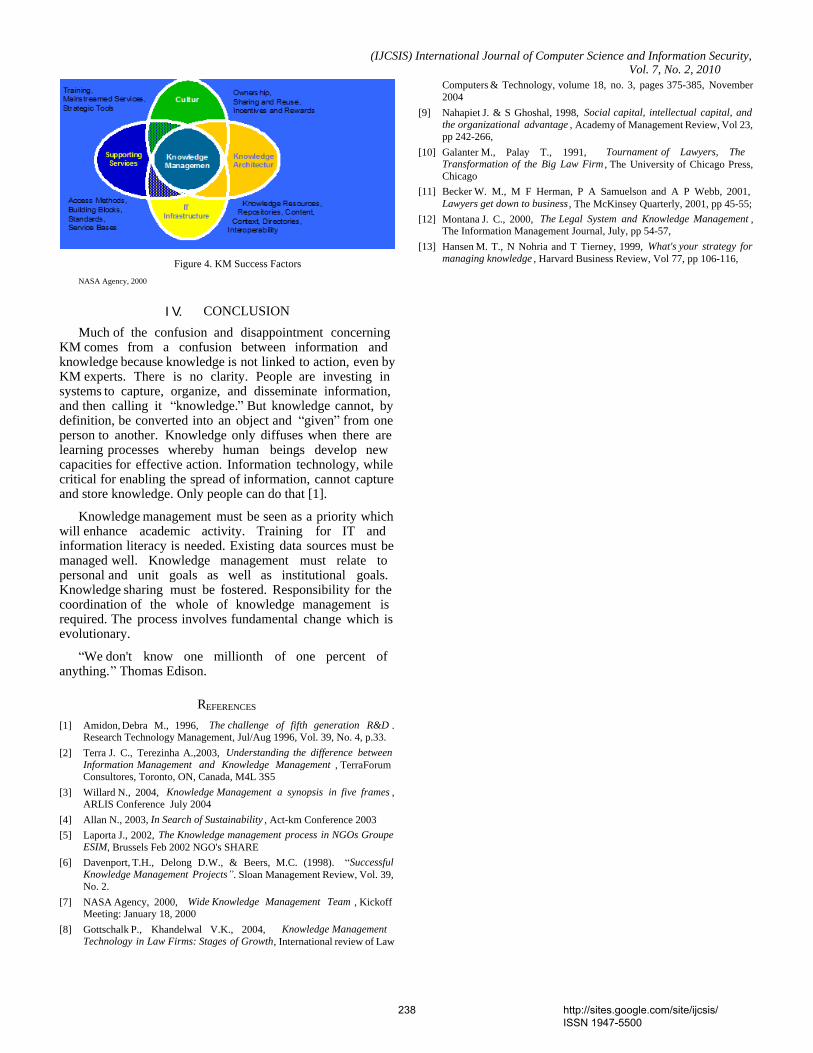
(IJCSIS) International Journal of Computer Science and Information Security,Vol. 7, No. 2, 2010
Figure 4. KM Success Factors
NASA Agency, 2000
CONCLUSIONIV.
Much of the confusion and disappointment concerningKM comes from a confusion between information andknowledge because knowledge is not linked to action, even byKM experts. There is no clarity. People are investing insystems to capture, organize, and disseminate information,and then calling it knowledge. But knowledge cannot, bydefinition, be converted into an object and given from oneperson to another. Knowledge only diffuses when there arelearning processes whereby human beings develop newcapacities for effective action. Information technology, whilecritical for enabling the spread of information, cannot captureand store knowledge. Only people can do that [1].
Knowledge management must be seen as a priority whichwill enhance academic activity. Training for IT andinformation literacy is needed. Existing data sources must bemanaged well. Knowledge management must relate topersonal and unit goals as well as institutional goals.Knowledge sharing must be fostered. Responsibility for thecoordination of the whole of knowledge management isrequired. The process involves fundamental change which isevolutionary.
We don't know one millionth of one percent ofanything. Thomas Edison.
REFERENCES
Amidon, Debra M., 1996, The challenge of fifth generation R&D .[1]Research Technology Management, Jul/Aug 1996, Vol. 39, No. 4, p.33.
Terra J. C., Terezinha A.,2003, Understanding the difference between[2]Information Management and Knowledge Management , TerraForumConsultores, Toronto, ON, Canada, M4L 3S5
Willard N., 2004, Knowledge Management a synopsis in five frames ,[3]ARLIS Conference July 2004
Allan N., 2003, In Search of Sustainability , Act-km Conference 2003[4]
Laporta J., 2002, The Knowledge management process in NGOs Groupe[5]ESIM, Brussels Feb 2002 NGO's SHARE
Davenport, T.H., Delong D.W., & Beers, M.C. (1998). Successful[6]Knowledge Management Projects . Sloan Management Review, Vol. 39,No. 2.
NASA Agency, 2000, Wide Knowledge Management Team , Kickoff[7]Meeting: January 18, 2000
Gottschalk P., Khandelwal V.K., 2004, Knowledge Management[8]Technology in Law Firms: Stages of Growth, International review of Law
Computers & Technology, volume 18, no. 3, pages 375-385, November2004
Nahapiet J. & S Ghoshal, 1998, Social capital, intellectual capital, and[9]the organizational advantage , Academy of Management Review, Vol 23,pp 242-266,
Galanter M., Palay T., 1991, Tournament of Lawyers, The[10]Transformation of the Big Law Firm , The University of Chicago Press,Chicago
Becker W. M., M F Herman, P A Samuelson and A P Webb, 2001,[11]Lawyers get down to business , The McKinsey Quarterly, 2001, pp 45-55;
Montana J. C., 2000, The Legal System and Knowledge Management ,[12]The Information Management Journal, July, pp 54-57,
Hansen M. T., N Nohria and T Tierney, 1999, What's your strategy for[13]managing knowledge , Harvard Business Review, Vol 77, pp 106-116,
238 http://sites.google.com/site/ijcsis/ ISSN 1947-5500
(IJCSIS) International Journal of Computer Science and Information Security,
Vol. 7, No. 2, 2010
WIRELESS IP TELEPHONY
Mohsen Gerami
The Faculty of Applied Science of Post and Communications
Danesh Blv, Jenah Ave, Azadi Sqr, Tehran, Iran.
Postal code: 1391637111
Abstract—The convergence of traditional telecommunications
and the Internet is creating new network-based service delivery
opportunities for telecommunications companies carriers, service
providers, and network equipment providers. Voice over
Wireless IP is one of the most exciting new developments
emerging within the telephony market. It is set to revolutionize
the delivery of mobile voice Services and provide exciting new
opportunities for operators and service providers alike. This
survey discusses principal of Wireless IP Telephony.
Keywords- IP telephony; Convergence; Wireless; Internet; Wi-
Fi;
I. INTRODUCTION
"IP will eat everything" meaning all systems and networks will eventually use Internet-based protocols. Convergence of communications and applications will become a reality--networks will be the computer. There is a huge computing power sitting on company networks. Wireless Internet will be big and will drive mobility. [1]
Wireless VoIP utilizes wireless LAN technology, the same wireless infrastructure used for your corporate network, in order to communicate. Just as you use PDAs and laptops to gain access to information within this wireless infrastructure, now you can use wireless IP phones to access your corporate telephony system as this technology combines the telephony function directly into an already existing data network infrastructure.
One of the major benefits of the wireless IP phone is that it allows you to carry your office extension with you inside a wireless networked environment. Unlike your cell phone, the wireless IP phone is part of your corporate phone system, and carries your personal extension and the same features that your office phone system has.
IP telephony offers many benefits to users in both large and small organizations, but the major gain will be in productivity. By extending mobile communications throughout the enterprise, wireless IP telephony helps users increase their productivity when they are not working at their desk. By enabling users to answer critical business calls anywhere anytime within a wireless campus environment, improved business response results.
Cost savings are also realized with a wireless IP phone system because it offers easy mobility for organizations where employee offices change often. Additionally, with VoIP
telephony, expanding the communications system is easier and less costly. Because the wireless infrastructure is designed to handle voice and data, new employees can be assigned a phone and instantly be on line and mobile without having to install lines and jacks.
An estimated $7.6 billion will be spent on wireless data services by 2006. Industries that are ripe for this technology include healthcare, manufacturing, transportation, and education -- any industry where people need highly mobile, feature rich communications capabilities in a campus like environment.
A large cargo shipping container terminal company is preparing to deploy wireless IP phones at their terminal facilities. They already have an 802.11b wireless infrastructure in place to support a tablet PC-based manifest and custom application, so the addition of the wireless IP phones was a natural next step. Equipped with wireless IP phones, the cargo handlers and custom brokers can stay in constant communication no matter where they are in the container yard
Manufacturing -- Constant Communications Even in the Factory!
Employees walking the shop floors need access to their office phones. Today, they may be carrying 2-way radios or cell phones to communicate. With wireless IP phones, they can carry their real office phone with them wherever they want, no matter where they are within the facility.
As this technology becomes more available, you'll see it everywhere. Eventually you may be able to walk into a coffee shop, a Starbucks for example that's wired with this technology, and use your IP phone. Pay a small subscription fee and upon entering the coffee shop your phone activates itself, connects back to your corporate network, and gives you access to your office extension while sitting there. The possibilities are very real and are here today. [2]
II. WIRELESS INTERNET TELEPHONY
As Figure 1 shows, a recent report by the Yankee Group, a market research firm, predicts the US consumer Internet telephony market will explode from 130,000 subscribers at the end of 2003 to 17.5 million subscribers in 2008.
239 http://sites.google.com/site/ijcsis/ ISSN 1947-5500
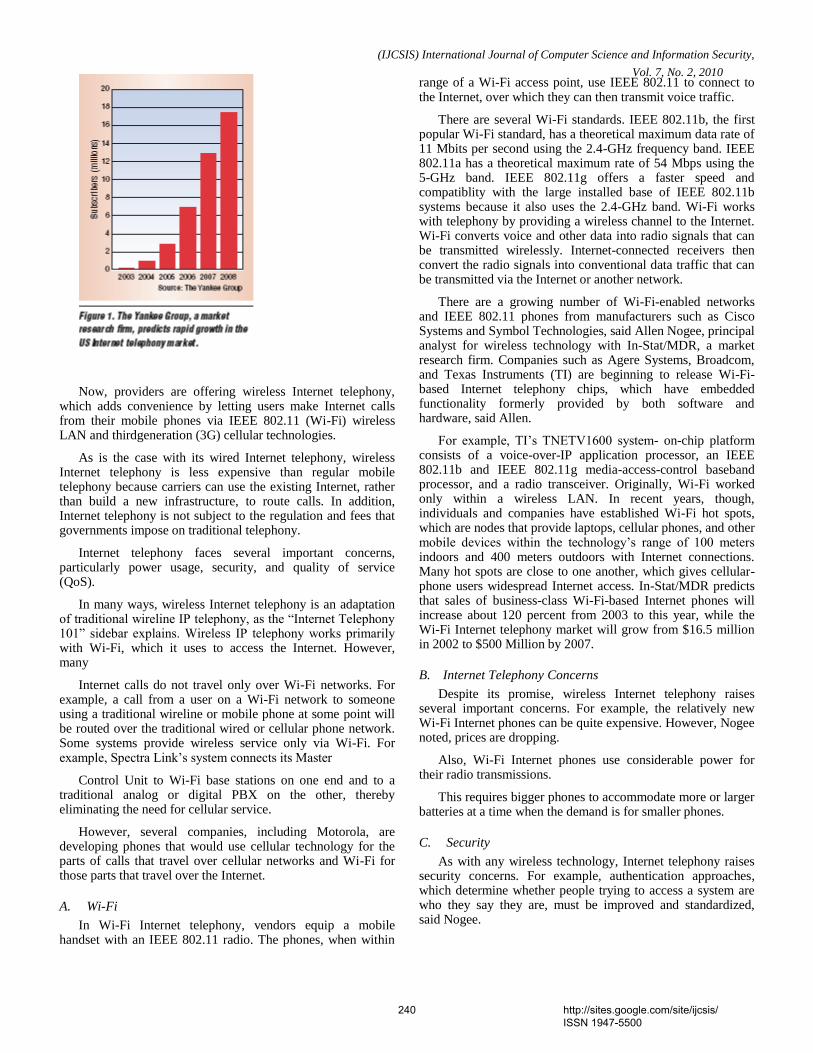
(IJCSIS) International Journal of Computer Science and Information Security,
Vol. 7, No. 2, 2010
Now, providers are offering wireless Internet telephony, which adds convenience by letting users make Internet calls from their mobile phones via IEEE 802.11 (Wi-Fi) wireless LAN and thirdgeneration (3G) cellular technologies.
As is the case with its wired Internet telephony, wireless Internet telephony is less expensive than regular mobile telephony because carriers can use the existing Internet, rather than build a new infrastructure, to route calls. In addition, Internet telephony is not subject to the regulation and fees that governments impose on traditional telephony.
Internet telephony faces several important concerns, particularly power usage, security, and quality of service (QoS).
In many ways, wireless Internet telephony is an adaptation of traditional wireline IP telephony, as the ―Internet Telephony 101‖ sidebar explains. Wireless IP telephony works primarily with Wi-Fi, which it uses to access the Internet. However, many
Internet calls do not travel only over Wi-Fi networks. For example, a call from a user on a Wi-Fi network to someone using a traditional wireline or mobile phone at some point will be routed over the traditional wired or cellular phone network. Some systems provide wireless service only via Wi-Fi. For example, Spectra Link’s system connects its Master
Control Unit to Wi-Fi base stations on one end and to a traditional analog or digital PBX on the other, thereby eliminating the need for cellular service.
However, several companies, including Motorola, are developing phones that would use cellular technology for the parts of calls that travel over cellular networks and Wi-Fi for those parts that travel over the Internet.
A. Wi-Fi
In Wi-Fi Internet telephony, vendors equip a mobile handset with an IEEE 802.11 radio. The phones, when within
range of a Wi-Fi access point, use IEEE 802.11 to connect to the Internet, over which they can then transmit voice traffic.
There are several Wi-Fi standards. IEEE 802.11b, the first popular Wi-Fi standard, has a theoretical maximum data rate of 11 Mbits per second using the 2.4-GHz frequency band. IEEE 802.11a has a theoretical maximum rate of 54 Mbps using the 5-GHz band. IEEE 802.11g offers a faster speed and compatiblity with the large installed base of IEEE 802.11b systems because it also uses the 2.4-GHz band. Wi-Fi works with telephony by providing a wireless channel to the Internet. Wi-Fi converts voice and other data into radio signals that can be transmitted wirelessly. Internet-connected receivers then convert the radio signals into conventional data traffic that can be transmitted via the Internet or another network.
There are a growing number of Wi-Fi-enabled networks and IEEE 802.11 phones from manufacturers such as Cisco Systems and Symbol Technologies, said Allen Nogee, principal analyst for wireless technology with In-Stat/MDR, a market research firm. Companies such as Agere Systems, Broadcom, and Texas Instruments (TI) are beginning to release Wi-Fi-based Internet telephony chips, which have embedded functionality formerly provided by both software and hardware, said Allen.
For example, TI’s TNETV1600 system- on-chip platform consists of a voice-over-IP application processor, an IEEE 802.11b and IEEE 802.11g media-access-control baseband processor, and a radio transceiver. Originally, Wi-Fi worked only within a wireless LAN. In recent years, though, individuals and companies have established Wi-Fi hot spots, which are nodes that provide laptops, cellular phones, and other mobile devices within the technology’s range of 100 meters indoors and 400 meters outdoors with Internet connections. Many hot spots are close to one another, which gives cellular-phone users widespread Internet access. In-Stat/MDR predicts that sales of business-class Wi-Fi-based Internet phones will increase about 120 percent from 2003 to this year, while the Wi-Fi Internet telephony market will grow from $16.5 million in 2002 to $500 Million by 2007.
B. Internet Telephony Concerns
Despite its promise, wireless Internet telephony raises several important concerns. For example, the relatively new Wi-Fi Internet phones can be quite expensive. However, Nogee noted, prices are dropping.
Also, Wi-Fi Internet phones use considerable power for their radio transmissions.
This requires bigger phones to accommodate more or larger batteries at a time when the demand is for smaller phones.
C. Security
As with any wireless technology, Internet telephony raises security concerns. For example, authentication approaches, which determine whether people trying to access a system are who they say they are, must be improved and standardized, said Nogee.
240 http://sites.google.com/site/ijcsis/ ISSN 1947-5500
(IJCSIS) International Journal of Computer Science and Information Security,
Vol. 7, No. 2, 2010 Without standardization, competing technologies from
vendors could cause system incompatibilities.
Meanwhile, wireless security itself is only now overcoming some early problems. Many users complained that the Wired Equivalent Privacy Protocol, used in early Wi-Fi applications, was not strong enough. The industry has since evolved to Wi-Fi Protected Access and now WPA2, based on the IEEE 802.11i wireless-security standard, which uses the new Advanced Encryption Standard. Regardless, wireless Internet telephony security will require the exchange of additional information between senders and receivers and thus slow data transmissions, which will affect voice quality, explained ON World’s Hatler.
D. Quality of service
QoS is a key issue for Internet telephony. IP networks must prioritize telephony traffic because, unlike other data traffic with which it shares the Internet, voice data must be transmitted in real time. If not, voice quality degrades and latency becomes a problem.
Currently, several approaches, mostly proprietary, provide some QoS for Internet telephony. According to Nogee, the proposed IEEE 802.11e standard would provide a way to address Wi-Fi-based QoS. The standard, currently under consideration, would accomplish this by prioritizing packets based on traffic type, enabling access points to schedule resources based on transmission rates and latencies, and otherwise improving bandwidth efficiency. [3]
III. SIMPLE IDEA, COMPLEX EXECUTION
The technology behind voice over wireless — varyingly referred to as wireless IP telephony, wireless VoIP, and Wi-Fi telephony — is straightforward. Mobile handsets connect to the network over wireless access points, routing the voice traffic to the telephony server or digital PBX in the same way that VoIP handsets connect to the network over Ethernet cables, routing their voice traffic to the telephony server or digital PBX . That apparent simplicity is why many enterprises consider implementing voice over wireless when they implement a VoIP system. Chances are they’re also deploying wireless access points for data usage, so they believe that most of the infrastructure required to make VoIP mobile is already in place.
-point placement to reduce contention for the access point’s bandwidth and require deployment in areas like hallways, elevator shafts, and facilities service areas in which data usage would not occur. That means greater hardware and installation costs.
limited to anywhere from four to two dozen, depending on the wireless LAN’s implementation and architecture, as well as actual usage.
ience interruptions or even dropped calls due to contention for access points.
deployments, so enterprises must over engineer their wireless LANs to accommodate future VoIP deployments.[4]
IV. CONVERGENCE
One of the greatest advantages of the New World IP telephony system is the ease of intelligent integration with existing applications. In the New World, IP PBX voice mail and e-mail are all part of the same application running in a distributed fashion across the entire corporate network. A single mailbox can now hold a user's voice messages, e-mail, fax, and video clips.
Convergence is being driven by cost and by applications that demand voice/data integration, such as real-time distance learning, videoconferencing, integrated voice mail and e-mail messaging, and voice-enabled desktop applications.
A. Data/Voice/Video Integration Cost Effective
If you look at the overall bandwidth requirements of voice compared to the rest of the data network, then it is miniscule. On a per-packet or per-kilobit charge, voice is basically free. Therefore, adding voice to a data network is very cost effective.
B. Operations Simplified
One of the greatest advantages of the integrated voice and data system is the ease of intelligent integration with existing applications.
End users can use their Web browsers to define graphically a personal rules engine that can filter incoming calls, scan and organize voice mail, create personal phone configurations such as speed dial, and build a valet service that scans a personal calendar to intelligently route calls. A single mailbox can now hold voice messages, e-mail, fax, and video clips.
Another benefit is that expensive PBX equipment can be eliminated. Traditional PBX call routing and embedded features are based on proprietary applications that are specific to that particular system. Traditional PBXs are like an island, independent of all the other applications running on the corporate network. In the new system, IP PBX, voice mail, and e-mail are all part of the same application that runs in a distributed fashion across the entire corporate network.
C. Competitive Advantage
The Internet has created the capability for almost any computer system to communicate with any other. With Internet business solutions, companies can redefine how they share relevant information with the key constituents in their business, not just their internal functional groups, but also customers, partners, and suppliers.
This ubiquitous connectivity created by Internet business solutions creates tighter relationships across the company's extended enterprise, and can be as much of a competitive advantage for the company as its core products and services.[5]
241 http://sites.google.com/site/ijcsis/ ISSN 1947-5500
(IJCSIS) International Journal of Computer Science and Information Security,
Vol. 7, No. 2, 2010 V. HOW VOIP WORKS
VoIP (Voice over Internet Protocol) is the way to use the advantages of internet to transmit voice and place cheap international calls. VoIP technologies are designed to take analog audio signals like that used on traditional telephone lines and to turn them into digital data like that used on the Internet.
Why VoIP is so popular today? VoIP solutions are simple to use and unbelievably cheap. The reason is that VoIP uses standard internet connection to place phone calls therefore you do not need to use the services of phone companies. Hence you pay only for your internet connection. Besides, most VoIP providers offer either free international calls or low cost international calls and VoIP providers are likely to supply you with VoIP software.
A number of VoIP service providers have already been working in the market for a number of years and settled several calling plans so that you may choose the one that meets your needs best. VoIP services expand greatly and telecommunication companies are to offer more and more VoIP options for customers.
VoIP is a convenient replacement of a traditional phone system. What make VoIP more attractive is that there are several ways to use VoIP services today:
VoIP services are available through using your ordinary phone with the ATA (analog telephone adaptor). The ATA connects your phone line to the internet and convert the analog data of the telephone lines to digital data of the internet and vice versa. When you purchase VoIP services the ATA will very probably be included into the package supplied by VoIP providers. To make the entire system work you should only connect your phone to the ATA with the cable that usually goes to the socket. Some types of the ATA are released with VoIP software to configure the ATA on your computer. However the VoIP adapters are very simple to use and do not require special maintenance.
VoIP phones are used instead of ordinary phones to make calls using VoIP services. IP phones look like ordinary phones but have an Ethernet connector and work with digital data. IP phones are connected to the router and have all the hardware and VoIP software necessary for placing and receiving calls through IP.
The easiest way to perform VoIP communication is to place calls from computer to computer. VoIP software is offered by many VoIP companies for free and moreover you can make free long distance calls. To use VoIP services through your computer you should have Internet connection, a sound card, a microphone and speakers [6].
VI. REGULATORY ISSUSE
Should VoIPbe regulated? Why? What form of regulation is appropriate?
Should some existing requirements of voice telephone services be abolished or changed?
Should there should be regulatory forbearance to allow VoIPto develop in the market?
What happens to telephone numbers?
How can universal service obligations, emergency call features, lawful access etc. be achieved in this environment?
Initial Responses to VoIP
Some regulators have removed restrictions; in developing countries, most regulators have applied restrictions
VoIP competition has reduced prices significantly
In developed countries, incumbent operators response is to bundle:
National tariffs, but excluding fixed to mobile
DSL plus telephony (video etc.)
Offering in-bound numbers in other countries
In developing countries, most incumbents have tried to restrict VoIP [7].
VII. THE DISAVANTAGES OF IP TELEPHANY
Despite their relatively young age VoIP technologies have already started to replace traditional phone systems. The number of customers that prefer IP telephony to other means of telecommunications grows rapidly that may lead to a complete dominance of IP telephony in the telecommunication market. Eventually phone companies and businesses are likely to switch to VoIP services completely.
However VoIP technologies as any other emerging technologies have a lot to think about and modernize. VoIP providers can't satisfy all the customers' requirements yet as IP technologies still have drawbacks.
The disadvantages of VoIP services:
VoIP phones depend on wall power. Whether you use VoIP software installed on your PC or VoIP phones you are dependent on power while your conventional phone relies on the power supplied by a separate line from the central office. If your power goes off you still can use your ordinary phone but not the VoIP phone (unless it is powered by batteries).
Many other systems you may use in your home are integrated with conventional phone lines – digital video recorders, subscription TV services, home security systems and others still can't be integrated with VoIP.
Calling 911 with VoIP can cause problems. An emergency 911 call from an ordinary phone is received by the 911 operator and your current location can be easily identified. But IP address used by VoIP can't tell where you are situated and the central 911 office does not know where to route your call and what is the nearest emergency service station to you. VoIP providers and developers try to solve this issue but including geographic information into IP address may deprive VoIP of its other benefits.
VoIP uses Internet connection therefore all the factors that affect the quality of your internet are to affect the quality of
242 http://sites.google.com/site/ijcsis/ ISSN 1947-5500
(IJCSIS) International Journal of Computer Science and Information Security,
Vol. 7, No. 2, 2010 your conversation. Latencies, jitters, packet losses may distort or even frustrate your session.
As any other information stored on your computer and transmitted through Internet Protocol VoIP is susceptible to viruses and hacking.
Much depends on the processor your computer uses and other requirements. If you run several programs simultaneously your VoIP phone call may be distorted. The program may either slow down or even crash in the middle of an important conversation.
VoIP providers and developers are now working to solve these issues and optimize the benefits of VoIP [6].
VIII. IP TELEPHONY MARKET
As VoIP continues to improve in quality and security becomes less of a threat when partnered with robust applications, the technology is gaining traction. Enterprises are realizing that the benefits of IP telephony exceed basic cost reduction.
Companies have also come to appreciate the fact that merging voice and data into a single network provides an enhanced communication experience. As a result, these organizations are increasingly interested in the convergence that IP communication grants and the integration of multiple applications in a single interface or device.
According to new analysis from Frost & Sullivan, North American Enterprise IP Telephony End-Point Markets, 2006 showed market earned revenues of $1.02 billion. This market is estimated to reach $2.79 billion in 2011 [8].
Analyst firm Dell'Oro Group sees the carrier IP Telephony market breaking out of its current slump in 2010, according to a recent report. While the group said the carrier IP telephony market in 2009 will be down around 14 percent from 2008, Dell'Oro expects the market to rebound to $4 billion by 2013 [9].
By the end of 2008, the Asia-Pac enterprise telephony market is predicted to grow by 9.4 percent (year-on-year) to reach revenues of close to $2.98 billion, with IP telephony estimated to account for 59.2 percent ($1.76 billion) of this total.
According to Frost & Sullivan, the main motivator behind IP deployments is the need to bridge present-day enterprise communication needs through the use of next-generation applications, which enables convenience, cost savings and enhanced productivity [10].
Converged communications are becoming increasingly important in the enterprise. As such, those operating in this space must be proactive by anticipating trends and demands and offering products and services that address the challenges that organizations face in trying to achieve seamless integration of both data and voice. By doing so, a win-win situation is created, helping to drive growth for both vendors and targeted organizations [8].
IX. CONCLUSION
VoIP is really ―Everything over IP‖. VoIP and 802.11 technologies are relatively young; many businesses are unwilling to commit a critical communications infrastructure to them until they have proven themselves.
Many businesses are moving to wireless VoIP. They tend to be in highly mobile industries. Major regulatory issues raised by VoIP. The biggest challenge towards quicker and larger-scale uptake of IP telephony is the issue of legacy equipment. Concerns relating to VoIP really relate to convergence generally.
REFERENCES
[1] Eslambolchi AT&T's president of global networking technology services, chief technology officer, and CIO. May 2005.
[2] Shelton Smith Practice Director, IP Communications Wireless IP Telephony - The Next Revolution in Workforce Mobility
[3] Lee Garber, Internet Telephony Jumps off the Wires
[4] Info World: VoWIP untethers the office phone
[5] http://www.oneunified.net/services/iptelephony/voip.html
[6] http://www.2pocall.com/the-disadvantages-of-ip-telephony.html,2010
[7] WH Melody, T Kelly,2007, LIRNEasia training course on strategies, lakevoip.com
[8] http://www.tmcnet.com/enews/e-newsletters/Show-Daily/20070517/6941-ip-telephony-market-expected-produce-significant-growth-2011.htm
[9] http://www.fiercevoip.com/story/report-carrier-ip-telephony-market-14-2009/2009-08-10
[10] http://ip-pbx.tmcnet.com/topics/ip-pbx/articles/37070-frost-sullivan-asia-pacific-ip-telephony-market-hit.htm
243 http://sites.google.com/site/ijcsis/ ISSN 1947-5500
.
Reconfigurable Parallel Data Flow Architecture
Hamid Reza Naji International Center for Science and High Technology & Environmental Sciences
Abstract- This paper presents a reconfigurable parallel data flow architecture. This architecture uses the concepts of multi-agent paradigm in reconfigurable hardware systems. The utilization of this new paradigm has the potential to greatly increase the flexibility, efficiency, expandability of data flow systems and to provide an attractive alternative to the current set of disjoint approaches that are currently applied to this problem domain. The ability of methodology to implement data flow type processing with different models is presented in this paper. Key Words: Dataflow, Reconfigurable Systems, Multi-agents
I. Introduction The focus of this paper is to illustrate how multi-agent concept can be employed within today's reconfigurable hardware design environments for data flow processing. We call these new agents that run inside reconfigurable logic “Hardware Agents [10],” as opposed to the more traditional software agents that normally reside in computer program memory (RAM) and execute using commercially available microprocessors. Such design environments often utilize hardware description languages such as VHDL to capture the design and use synthesis tools to translate this high level description of the system into a low level bit stream that can be used to program the reconfigurable devices. We will utilize and adapt a reduced form of the Belief, Desire and Intention (BDI) architecture [9] for our agents. In this architecture, the term, beliefs, represent the set of working assumptions that the agent has about itself and the environment in which it functions. This forms informational state of a BDI agent -- where such information may be incomplete and inaccurate but often can be modified in a local manner by the agent as a byproduct of the agent's interactions with other agents and the environment. The term, desires, represent the high-level set of objectives and goals that the agent is trying to achieve. The agent’s desires must be realistic and must not conflict with each other. Intentions represent the deliberative state of the BDI agent. It is here that the detailed sequences of actions, called plans, made to the environment and other cooperating agents through actuators are maintained. Section 2 introduces the basic concepts associated with the hardware multi-agent paradigm and reconfigurable computing environment. In section 3, paper illustrates the
implementing hardware agents for data/control flow type environments in four models: two models that describe deterministic hardware agents in fine and coarse grain modes; one model of hardware agents handling both control flow and data flow; and one intelligent, non-deterministic model that hints at some of the more advanced possibilities of hardware agent use. Section 4 presents implementation and results. The results of implementing dataflow operations with hardware agents show the high processing speed of input tokens and producing results in compare to software agents implementation. Section 5 provides conclusions.
II. Reconfigurable Hardware Agents The current state of Field Programmable Gate Array (FPGA) technology and other reconfigurable hardware [13] makes it possible for hardware implementations to enjoy much of the flexibility that was formally only associated with software. Unlike conventional fixed hardware systems, reconfigurable hardware has the potential to be configured in a manner that matches the structure of the application. In some cases, this can be done statically before execution begins where the structure of the hardware will remain unchanged as the system operates. In other cases it is possible to re-configure the hardware dynamically as the systems is operating to allow it to adapt to changes in the environment or the state of the system itself. In other words, the design of the hardware may actually change in response to the demands placed upon the system throughout the scope of the application. The system could be a hybrid of both low-level hardware based agents and higher-level software implementations of agents which cooperate to achieve the desired results. Implementation of agent techniques in re-configurable hardware[11,12] allows for creation of high-speed systems that can exploit a much finer grained parallelism than is possible with distributed software based systems. It is assumed that an embedded system will be created that utilizes adaptable (reconfigurable) hardware which can be created using FPGA, System on a Chip (SOC)[14], or custom technology. In such an architecture, the functionality of the reconfigurable hardware is controlled by placing design information directly into the configuration memory. In this way, the external environment has the capability to either change the hardware’s functionality dynamically or at the time that the application is created by introducing agents into the appropriate area of configuration memory that controls
(IJCSIS) International Journal of Computer Science and Information Security, Vol. 7, No. 2, February 2010
244 http://sites.google.com/site/ijcsis/ ISSN 1947-5500
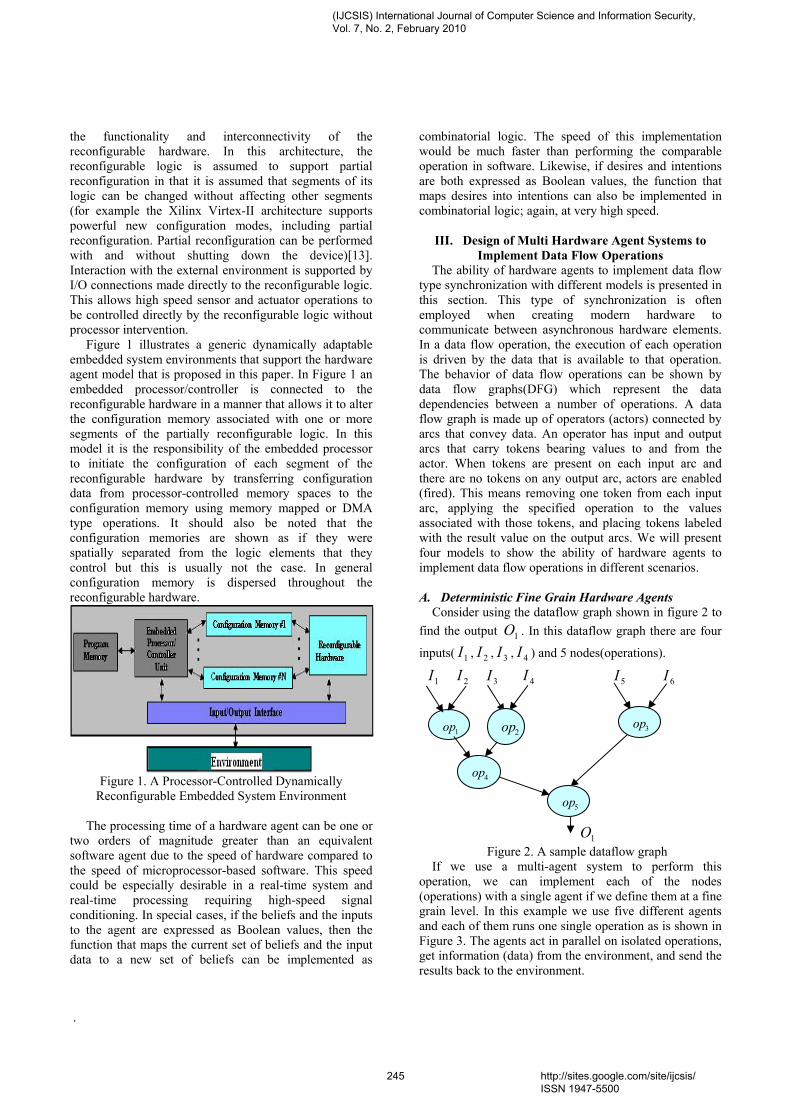
.
the functionality and interconnectivity of the reconfigurable hardware. In this architecture, the reconfigurable logic is assumed to support partial reconfiguration in that it is assumed that segments of its logic can be changed without affecting other segments (for example the Xilinx Virtex-II architecture supports powerful new configuration modes, including partial reconfiguration. Partial reconfiguration can be performed with and without shutting down the device)[13]. Interaction with the external environment is supported by I/O connections made directly to the reconfigurable logic. This allows high speed sensor and actuator operations to be controlled directly by the reconfigurable logic without processor intervention. Figure 1 illustrates a generic dynamically adaptable embedded system environments that support the hardware agent model that is proposed in this paper. In Figure 1 an embedded processor/controller is connected to the reconfigurable hardware in a manner that allows it to alter the configuration memory associated with one or more segments of the partially reconfigurable logic. In this model it is the responsibility of the embedded processor to initiate the configuration of each segment of the reconfigurable hardware by transferring configuration data from processor-controlled memory spaces to the configuration memory using memory mapped or DMA type operations. It should also be noted that the configuration memories are shown as if they were spatially separated from the logic elements that they control but this is usually not the case. In general configuration memory is dispersed throughout the reconfigurable hardware.
Figure 1. A Processor-Controlled Dynamically
Reconfigurable Embedded System Environment The processing time of a hardware agent can be one or two orders of magnitude greater than an equivalent software agent due to the speed of hardware compared to the speed of microprocessor-based software. This speed could be especially desirable in a real-time system and real-time processing requiring high-speed signal conditioning. In special cases, if the beliefs and the inputs to the agent are expressed as Boolean values, then the function that maps the current set of beliefs and the input data to a new set of beliefs can be implemented as
combinatorial logic. The speed of this implementation would be much faster than performing the comparable operation in software. Likewise, if desires and intentions are both expressed as Boolean values, the function that maps desires into intentions can also be implemented in combinatorial logic; again, at very high speed.
III. Design of Multi Hardware Agent Systems to Implement Data Flow Operations
The ability of hardware agents to implement data flow type synchronization with different models is presented in this section. This type of synchronization is often employed when creating modern hardware to communicate between asynchronous hardware elements. In a data flow operation, the execution of each operation is driven by the data that is available to that operation. The behavior of data flow operations can be shown by data flow graphs(DFG) which represent the data dependencies between a number of operations. A data flow graph is made up of operators (actors) connected by arcs that convey data. An operator has input and output arcs that carry tokens bearing values to and from the actor. When tokens are present on each input arc and there are no tokens on any output arc, actors are enabled (fired). This means removing one token from each input arc, applying the specified operation to the values associated with those tokens, and placing tokens labeled with the result value on the output arcs. We will present four models to show the ability of hardware agents to implement data flow operations in different scenarios. A. Deterministic Fine Grain Hardware Agents Consider using the dataflow graph shown in figure 2 to find the output 1O . In this dataflow graph there are four
inputs( 1I , 2I , 3I , 4I ) and 5 nodes(operations).
1I 2I 3I 4I 5I 6I
1O Figure 2. A sample dataflow graph If we use a multi-agent system to perform this operation, we can implement each of the nodes (operations) with a single agent if we define them at a fine grain level. In this example we use five different agents and each of them runs one single operation as is shown in Figure 3. The agents act in parallel on isolated operations, get information (data) from the environment, and send the results back to the environment.
1op 2op 3op
5op
4op
(IJCSIS) International Journal of Computer Science and Information Security, Vol. 7, No. 2, February 2010
245 http://sites.google.com/site/ijcsis/ ISSN 1947-5500

.
4op
1I 2I 3I 4I 5I 6I Agent1 Agent2 Agent3 Agent4 Agent5 1O
Figure 3. A multi-agent system to implement the data flow operations of Figure 2
By implementing this data flow graph with hardware agents we benefit from the speed of the specialized hardware in processing the input tokens and producing the results. Five hardware agents cooperate together to form a multi-agent architecture for this data flow graph. As Figure 4 shows, in this structure, Agent1, Agent2, and Agent3 receive the input tokens from the enviroment, process them and send the results to Agent4 and Agent5. Finally Agent5 sends the overall result to the environment. A signal from the environment activates this multi-agent system and when each agent completes the operation on its input tokens it will set its done signal and send the value of that result to the agent in the next level. It will inform that agent by sending its done signal to the strobe signal of its successive agent. In this model, hardware agents use done and strobe signals for handshaking. Multi Hardware Agent System 1I 2I 3I 4I 5I
6I activate multi-agent system Figure 4. Multi hardware agent system of figure3
According to Figure 4, Agent1,Agent2,and Agent3 sends intermediate results through their TR_Agent port and Agent4 and Agent5 receive this information through their RS_Agent port. Agent1, Agent2, Agent3 can use their Request and Acknowledge signals to interact with the environment (send a request which means the agent is free and ready to receive new tokens, and send an acknowledge which means the agent has received the input tokens). Agent5, after processing the final operation, sends the result through its Output port to the environment and informs the environment by setting its done signal. As we mentioned before, the most important advantage of hardware agents for implementing data flow operations is the the high speed for processing data inputs and producing the outputs. Thus, the speed of information flow can be several times the speed of the flow of information when the same flow graph is implemented in software. Using the reconfigurability of hardware agents we can reconfigure the agents in the same multi-agent system to implement a different data flow graph. For example, different data flow graphs can be implemented using the same multi-agent system of Figure 4 as we will see later. In this model agents are small, simple and easy to implement for simple operations, but to implement a complex system we need many agents and a lot of communication between agents with high latency. So, deterministic fine grain hardware agents system is suitable for simple deterministic systems. 1O
Inpu
t fro
m E
nviro
nmen
t In
put f
rom
Env
ironm
ent
Output to Environm
ent
Sel Done(1) Str(1) Req(1) Ack(1) In (1) TR(1) In (2)
HW Agent1
Sel Done(1) Str(1) Req(1) Ack(1) In (1) TR(1) In (2)
HW Agent2
Sel Done(1) Str(1) Req(1) Ack(1) In (1) TR(1) In (2)
HW Agent3
Sel Done (1) Str (1) Req (1) Str (2) Ack (1) Ack (2) RS (1) TR (1) RS (2)
Sel Done (1) Str (1) Str (2) RS (1) Out (1) RS (2)
HW Agent4
HW Agent5
1op 2op 3op
5op
(IJCSIS) International Journal of Computer Science and Information Security, Vol. 7, No. 2, February 2010
246 http://sites.google.com/site/ijcsis/ ISSN 1947-5500
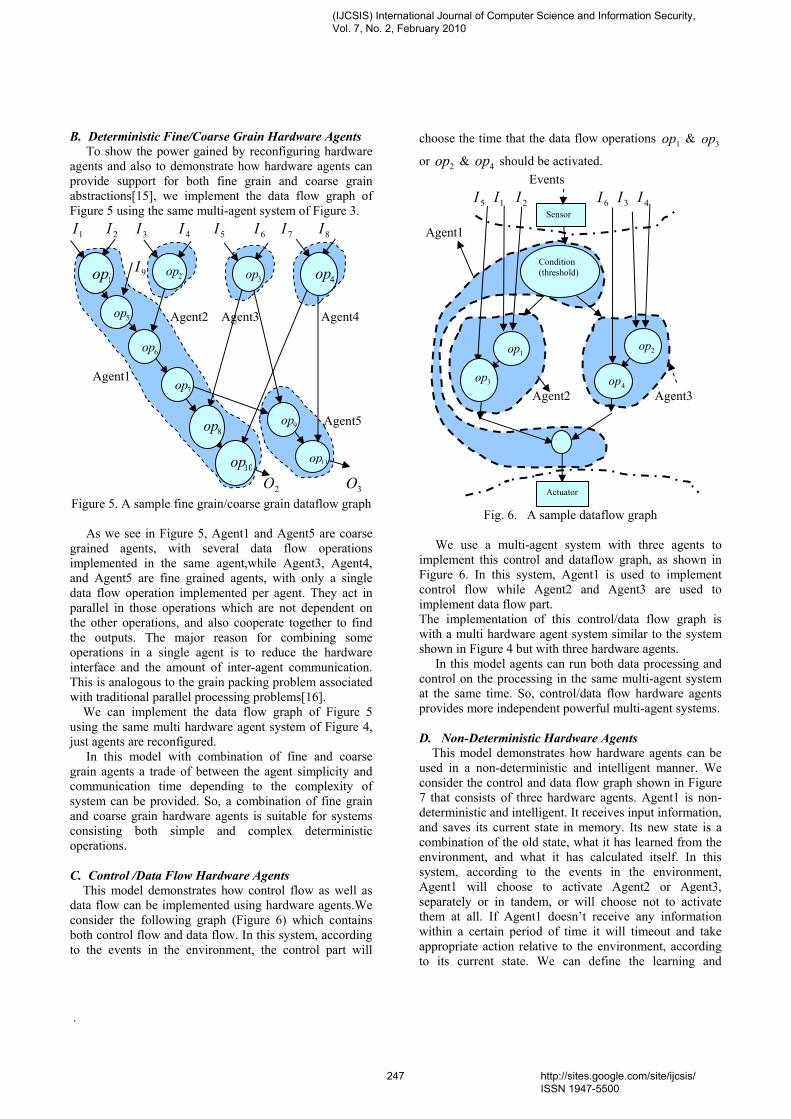
.
Sensor
B. Deterministic Fine/Coarse Grain Hardware Agents To show the power gained by reconfiguring hardware agents and also to demonstrate how hardware agents can provide support for both fine grain and coarse grain abstractions[15], we implement the data flow graph of Figure 5 using the same multi-agent system of Figure 3.
1I 2I 3I 4I 5I 6I 7I 8I
9I
Agent2 Agent3 Agent4
Agent1
Agent5
2O 3O Figure 5. A sample fine grain/coarse grain dataflow graph As we see in Figure 5, Agent1 and Agent5 are coarse grained agents, with several data flow operations implemented in the same agent,while Agent3, Agent4, and Agent5 are fine grained agents, with only a single data flow operation implemented per agent. They act in parallel in those operations which are not dependent on the other operations, and also cooperate together to find the outputs. The major reason for combining some operations in a single agent is to reduce the hardware interface and the amount of inter-agent communication. This is analogous to the grain packing problem associated with traditional parallel processing problems[16]. We can implement the data flow graph of Figure 5 using the same multi hardware agent system of Figure 4, just agents are reconfigured. In this model with combination of fine and coarse grain agents a trade of between the agent simplicity and communication time depending to the complexity of system can be provided. So, a combination of fine grain and coarse grain hardware agents is suitable for systems consisting both simple and complex deterministic operations. C. Control /Data Flow Hardware Agents This model demonstrates how control flow as well as data flow can be implemented using hardware agents.We consider the following graph (Figure 6) which contains both control flow and data flow. In this system, according to the events in the environment, the control part will
choose the time that the data flow operations 1op & 3op
or 2op & 4op should be activated. Events 5I 1I 2I 6I 3I 4I Agent1
Agent2 Agent3
Fig. 6. A sample dataflow graph
We use a multi-agent system with three agents to implement this control and dataflow graph, as shown in Figure 6. In this system, Agent1 is used to implement control flow while Agent2 and Agent3 are used to implement data flow part. The implementation of this control/data flow graph is with a multi hardware agent system similar to the system shown in Figure 4 but with three hardware agents. In this model agents can run both data processing and control on the processing in the same multi-agent system at the same time. So, control/data flow hardware agents provides more independent powerful multi-agent systems. D. Non-Deterministic Hardware Agents This model demonstrates how hardware agents can be used in a non-deterministic and intelligent manner. We consider the control and data flow graph shown in Figure 7 that consists of three hardware agents. Agent1 is non-deterministic and intelligent. It receives input information, and saves its current state in memory. Its new state is a combination of the old state, what it has learned from the environment, and what it has calculated itself. In this system, according to the events in the environment, Agent1 will choose to activate Agent2 or Agent3, separately or in tandem, or will choose not to activate them at all. If Agent1 doesn’t receive any information within a certain period of time it will timeout and take appropriate action relative to the environment, according to its current state. We can define the learning and
1op
11op
9op8op
2op
7op
6op
5op
3op 4op
10op
Condition (threshold)
1op 2op
4op
Actuator
3op
(IJCSIS) International Journal of Computer Science and Information Security, Vol. 7, No. 2, February 2010
247 http://sites.google.com/site/ijcsis/ ISSN 1947-5500
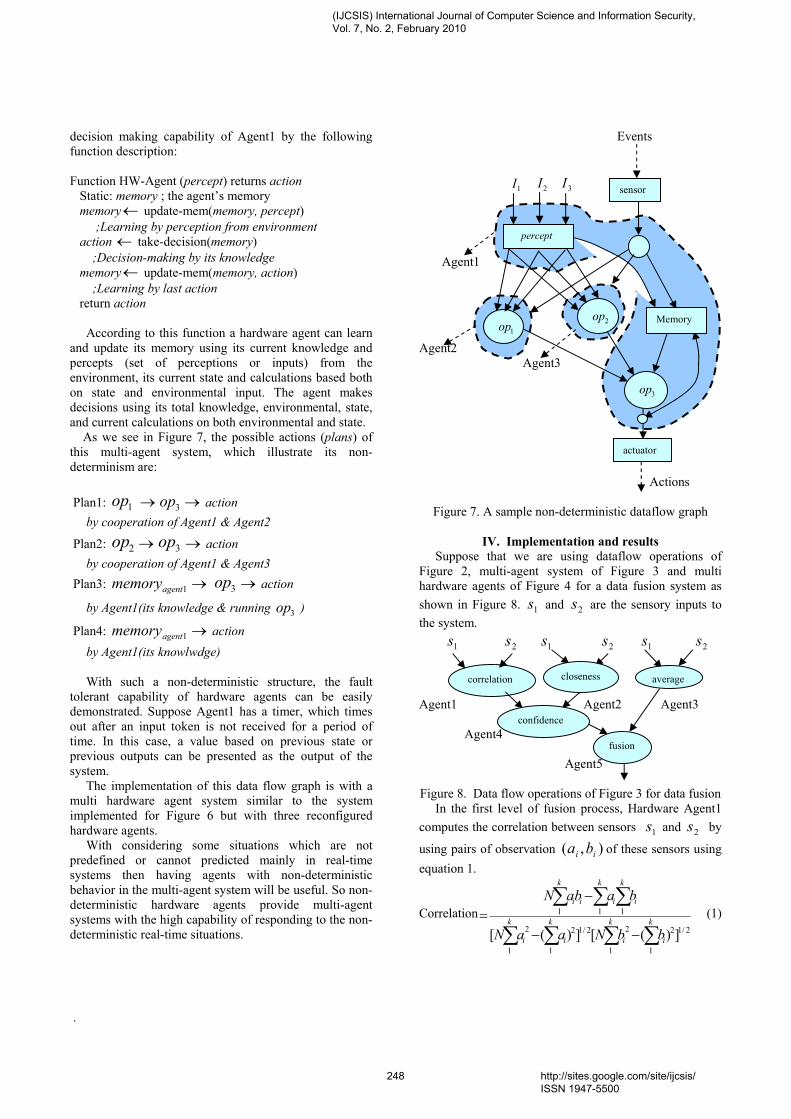
.
decision making capability of Agent1 by the following function description: Function HW-Agent (percept) returns action Static: memory ; the agent’s memory memory← update-mem(memory, percept) ;Learning by perception from environment action ← take-decision(memory) ;Decision-making by its knowledge memory← update-mem(memory, action) ;Learning by last action return action According to this function a hardware agent can learn and update its memory using its current knowledge and percepts (set of perceptions or inputs) from the environment, its current state and calculations based both on state and environmental input. The agent makes decisions using its total knowledge, environmental, state, and current calculations on both environmental and state. As we see in Figure 7, the possible actions (plans) of this multi-agent system, which illustrate its non-determinism are: Plan1: 1op → 3op → action by cooperation of Agent1 & Agent2
Plan2: 2op → 3op → action by cooperation of Agent1 & Agent3 Plan3: 1agentmemory → 3op → action
by Agent1(its knowledge & running 3op )
Plan4: 1agentmemory → action by Agent1(its knowlwdge) With such a non-deterministic structure, the fault tolerant capability of hardware agents can be easily demonstrated. Suppose Agent1 has a timer, which times out after an input token is not received for a period of time. In this case, a value based on previous state or previous outputs can be presented as the output of the system. The implementation of this data flow graph is with a multi hardware agent system similar to the system implemented for Figure 6 but with three reconfigured hardware agents. With considering some situations which are not predefined or cannot predicted mainly in real-time systems then having agents with non-deterministic behavior in the multi-agent system will be useful. So non-deterministic hardware agents provide multi-agent systems with the high capability of responding to the non-deterministic real-time situations.
Events 1I 2I 3I Agent1 Agent2 Agent3
Actions
Figure 7. A sample non-deterministic dataflow graph
IV. Implementation and results
Suppose that we are using dataflow operations of Figure 2, multi-agent system of Figure 3 and multi hardware agents of Figure 4 for a data fusion system as shown in Figure 8. 1s and 2s are the sensory inputs to the system. 1s 2s 1s 2s 1s 2s
Agent1 Agent2 Agent3 Agent4
Agent5
Figure 8. Data flow operations of Figure 3 for data fusion In the first level of fusion process, Hardware Agent1 computes the correlation between sensors 1s and 2s by
using pairs of observation ),( ii ba of these sensors using equation 1.
Correlation2/12
11
22/12
11
2
111
])([])([ ∑∑∑∑
∑∑∑
−−
−= k
i
k
i
k
i
k
i
k
i
k
i
k
ii
bbNaaN
babaN (1)
sensor
actuator
1op 2op
percept
Memory
3op
correlation closeness average
confidence
fusion
(IJCSIS) International Journal of Computer Science and Information Security, Vol. 7, No. 2, February 2010
248 http://sites.google.com/site/ijcsis/ ISSN 1947-5500
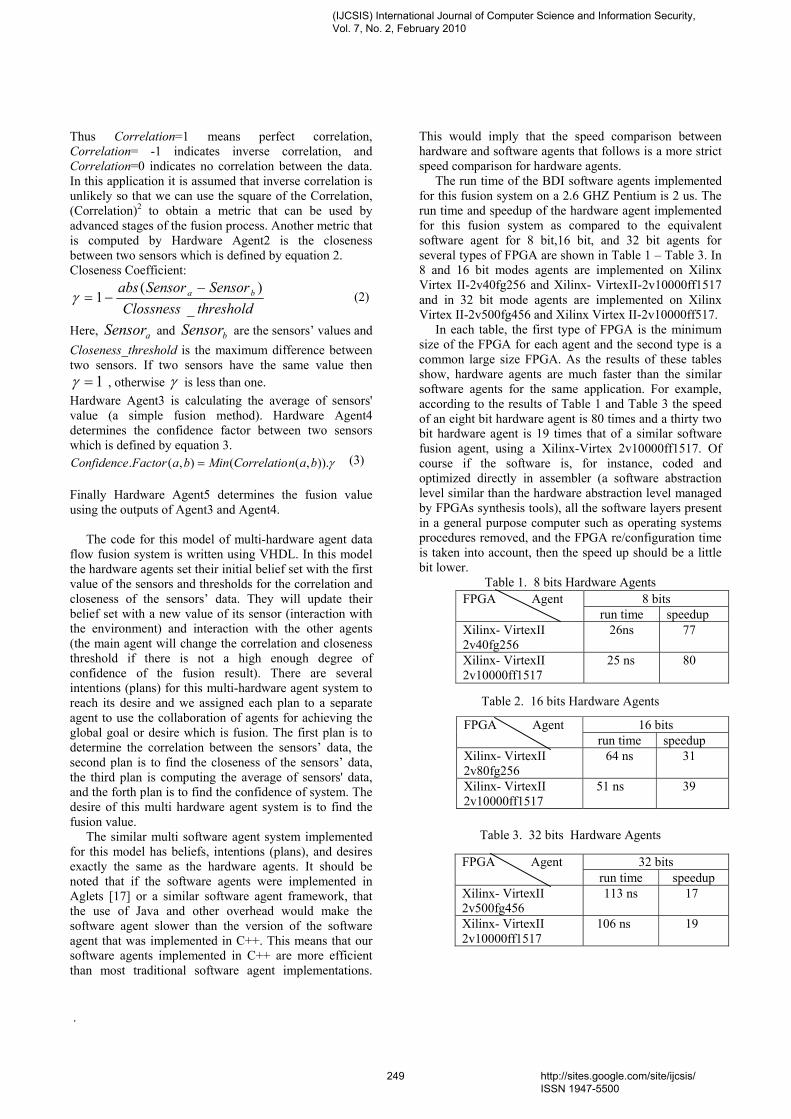
.
Thus Correlation=1 means perfect correlation, Correlation= -1 indicates inverse correlation, and Correlation=0 indicates no correlation between the data. In this application it is assumed that inverse correlation is unlikely so that we can use the square of the Correlation, (Correlation)2 to obtain a metric that can be used by advanced stages of the fusion process. Another metric that is computed by Hardware Agent2 is the closeness between two sensors which is defined by equation 2. Closeness Coefficient:
thresholdClossnessSensorSensorabs ba
_)(
1−
−=γ (2)
Here, aSensor and bSensor are the sensors’ values and Closeness_threshold is the maximum difference between two sensors. If two sensors have the same value then
1=γ , otherwise γ is less than one. Hardware Agent3 is calculating the average of sensors' value (a simple fusion method). Hardware Agent4 determines the confidence factor between two sensors which is defined by equation 3.
(3) Finally Hardware Agent5 determines the fusion value using the outputs of Agent3 and Agent4.
The code for this model of multi-hardware agent data flow fusion system is written using VHDL. In this model the hardware agents set their initial belief set with the first value of the sensors and thresholds for the correlation and closeness of the sensors’ data. They will update their belief set with a new value of its sensor (interaction with the environment) and interaction with the other agents (the main agent will change the correlation and closeness threshold if there is not a high enough degree of confidence of the fusion result). There are several intentions (plans) for this multi-hardware agent system to reach its desire and we assigned each plan to a separate agent to use the collaboration of agents for achieving the global goal or desire which is fusion. The first plan is to determine the correlation between the sensors’ data, the second plan is to find the closeness of the sensors’ data, the third plan is computing the average of sensors' data, and the forth plan is to find the confidence of system. The desire of this multi hardware agent system is to find the fusion value. The similar multi software agent system implemented for this model has beliefs, intentions (plans), and desires exactly the same as the hardware agents. It should be noted that if the software agents were implemented in Aglets [17] or a similar software agent framework, that the use of Java and other overhead would make the software agent slower than the version of the software agent that was implemented in C++. This means that our software agents implemented in C++ are more efficient than most traditional software agent implementations.
This would imply that the speed comparison between hardware and software agents that follows is a more strict speed comparison for hardware agents. The run time of the BDI software agents implemented for this fusion system on a 2.6 GHZ Pentium is 2 us. The run time and speedup of the hardware agent implemented for this fusion system as compared to the equivalent software agent for 8 bit,16 bit, and 32 bit agents for several types of FPGA are shown in Table 1 – Table 3. In 8 and 16 bit modes agents are implemented on Xilinx Virtex II-2v40fg256 and Xilinx- VirtexII-2v10000ff1517 and in 32 bit mode agents are implemented on Xilinx Virtex II-2v500fg456 and Xilinx Virtex II-2v10000ff517. In each table, the first type of FPGA is the minimum size of the FPGA for each agent and the second type is a common large size FPGA. As the results of these tables show, hardware agents are much faster than the similar software agents for the same application. For example, according to the results of Table 1 and Table 3 the speed of an eight bit hardware agent is 80 times and a thirty two bit hardware agent is 19 times that of a similar software fusion agent, using a Xilinx-Virtex 2v10000ff1517. Of course if the software is, for instance, coded and optimized directly in assembler (a software abstraction level similar than the hardware abstraction level managed by FPGAs synthesis tools), all the software layers present in a general purpose computer such as operating systems procedures removed, and the FPGA re/configuration time is taken into account, then the speed up should be a little bit lower.
Table 1. 8 bits Hardware Agents
Table 2. 16 bits Hardware Agents
Table 3. 32 bits Hardware Agents
FPGA Agent 32 bitsrun time speedup
Xilinx- VirtexII 2v500fg456
113 ns 17
Xilinx- VirtexII 2v10000ff1517
106 ns 19
FPGA Agent 8 bits run time speedup
Xilinx- VirtexII 2v40fg256
26ns 77
Xilinx- VirtexII 2v10000ff1517
25 ns 80
FPGA Agent 16 bits run time speedup
Xilinx- VirtexII 2v80fg256
64 ns 31
Xilinx- VirtexII 2v10000ff1517
51 ns 39
γ)).,((),(. banCorrelatioMinbaFactorConfidence =
(IJCSIS) International Journal of Computer Science and Information Security, Vol. 7, No. 2, February 2010
249 http://sites.google.com/site/ijcsis/ ISSN 1947-5500
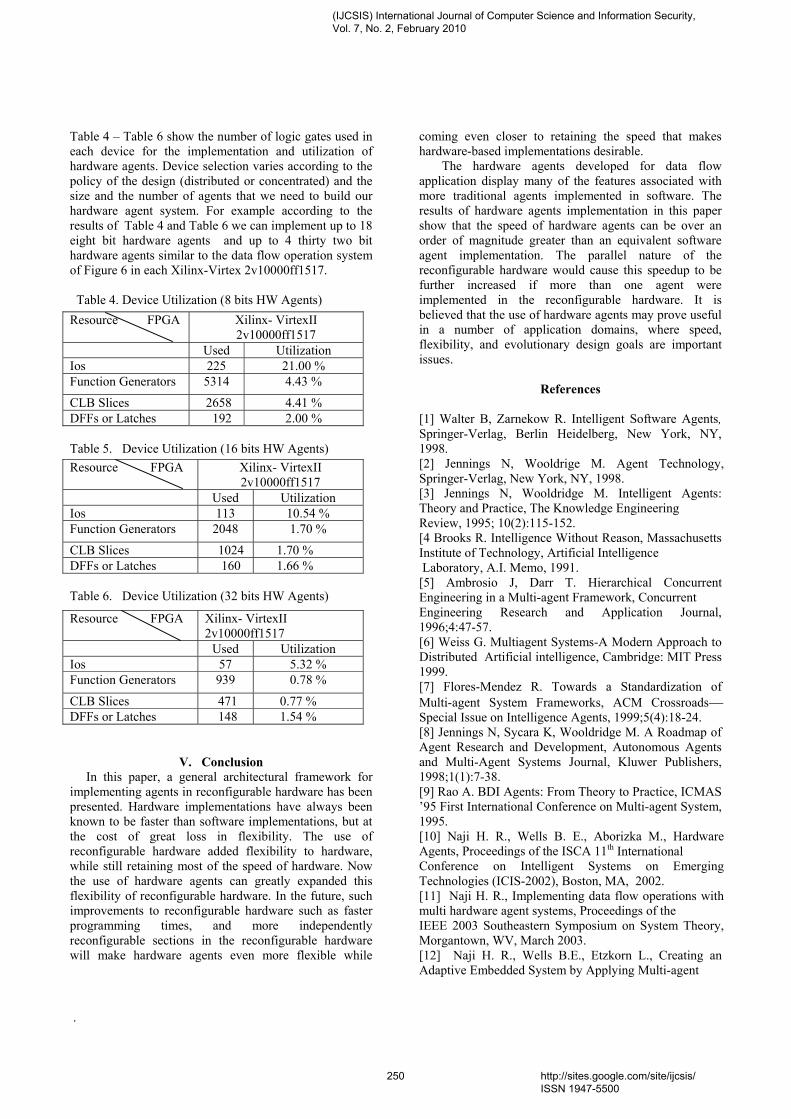
.
Table 4 – Table 6 show the number of logic gates used in each device for the implementation and utilization of hardware agents. Device selection varies according to the policy of the design (distributed or concentrated) and the size and the number of agents that we need to build our hardware agent system. For example according to the results of Table 4 and Table 6 we can implement up to 18 eight bit hardware agents and up to 4 thirty two bit hardware agents similar to the data flow operation system of Figure 6 in each Xilinx-Virtex 2v10000ff1517. Table 4. Device Utilization (8 bits HW Agents)
Table 5. Device Utilization (16 bits HW Agents)
Table 6. Device Utilization (32 bits HW Agents)
V. Conclusion In this paper, a general architectural framework for implementing agents in reconfigurable hardware has been presented. Hardware implementations have always been known to be faster than software implementations, but at the cost of great loss in flexibility. The use of reconfigurable hardware added flexibility to hardware, while still retaining most of the speed of hardware. Now the use of hardware agents can greatly expanded this flexibility of reconfigurable hardware. In the future, such improvements to reconfigurable hardware such as faster programming times, and more independently reconfigurable sections in the reconfigurable hardware will make hardware agents even more flexible while
coming even closer to retaining the speed that makes hardware-based implementations desirable. The hardware agents developed for data flow application display many of the features associated with more traditional agents implemented in software. The results of hardware agents implementation in this paper show that the speed of hardware agents can be over an order of magnitude greater than an equivalent software agent implementation. The parallel nature of the reconfigurable hardware would cause this speedup to be further increased if more than one agent were implemented in the reconfigurable hardware. It is believed that the use of hardware agents may prove useful in a number of application domains, where speed, flexibility, and evolutionary design goals are important issues.
References
[1] Walter B, Zarnekow R. Intelligent Software Agents, Springer-Verlag, Berlin Heidelberg, New York, NY, 1998. [2] Jennings N, Wooldrige M. Agent Technology, Springer-Verlag, New York, NY, 1998. [3] Jennings N, Wooldridge M. Intelligent Agents: Theory and Practice, The Knowledge Engineering Review, 1995; 10(2):115-152. [4 Brooks R. Intelligence Without Reason, Massachusetts Institute of Technology, Artificial Intelligence Laboratory, A.I. Memo, 1991. [5] Ambrosio J, Darr T. Hierarchical Concurrent Engineering in a Multi-agent Framework, Concurrent Engineering Research and Application Journal, 1996;4:47-57. [6] Weiss G. Multiagent Systems-A Modern Approach to Distributed Artificial intelligence, Cambridge: MIT Press 1999. [7] Flores-Mendez R. Towards a Standardization of Multi-agent System Frameworks, ACM Crossroads Special Issue on Intelligence Agents, 1999;5(4):18-24. [8] Jennings N, Sycara K, Wooldridge M. A Roadmap of Agent Research and Development, Autonomous Agents and Multi-Agent Systems Journal, Kluwer Publishers, 1998;1(1):7-38. [9] Rao A. BDI Agents: From Theory to Practice, ICMAS ’95 First International Conference on Multi-agent System, 1995. [10] Naji H. R., Wells B. E., Aborizka M., Hardware Agents, Proceedings of the ISCA 11th International Conference on Intelligent Systems on Emerging Technologies (ICIS-2002), Boston, MA, 2002. [11] Naji H. R., Implementing data flow operations with multi hardware agent systems, Proceedings of the IEEE 2003 Southeastern Symposium on System Theory, Morgantown, WV, March 2003. [12] Naji H. R., Wells B.E., Etzkorn L., Creating an Adaptive Embedded System by Applying Multi-agent
Resource FPGA Xilinx- VirtexII 2v10000ff1517
Used Utilization Ios 225 21.00 % Function Generators 5314 4.43 %
CLB Slices 2658 4.41 % DFFs or Latches 192 2.00 %
Resource FPGA Xilinx- VirtexII 2v10000ff1517
Used Utilization Ios 113 10.54 % Function Generators 2048 1.70 %
CLB Slices 1024 1.70 % DFFs or Latches 160 1.66 %
Resource FPGA Xilinx- VirtexII 2v10000ff1517
Used Utilization Ios 57 5.32 % Function Generators 939 0.78 %
CLB Slices 471 0.77 % DFFs or Latches 148 1.54 %
(IJCSIS) International Journal of Computer Science and Information Security, Vol. 7, No. 2, February 2010
250 http://sites.google.com/site/ijcsis/ ISSN 1947-5500
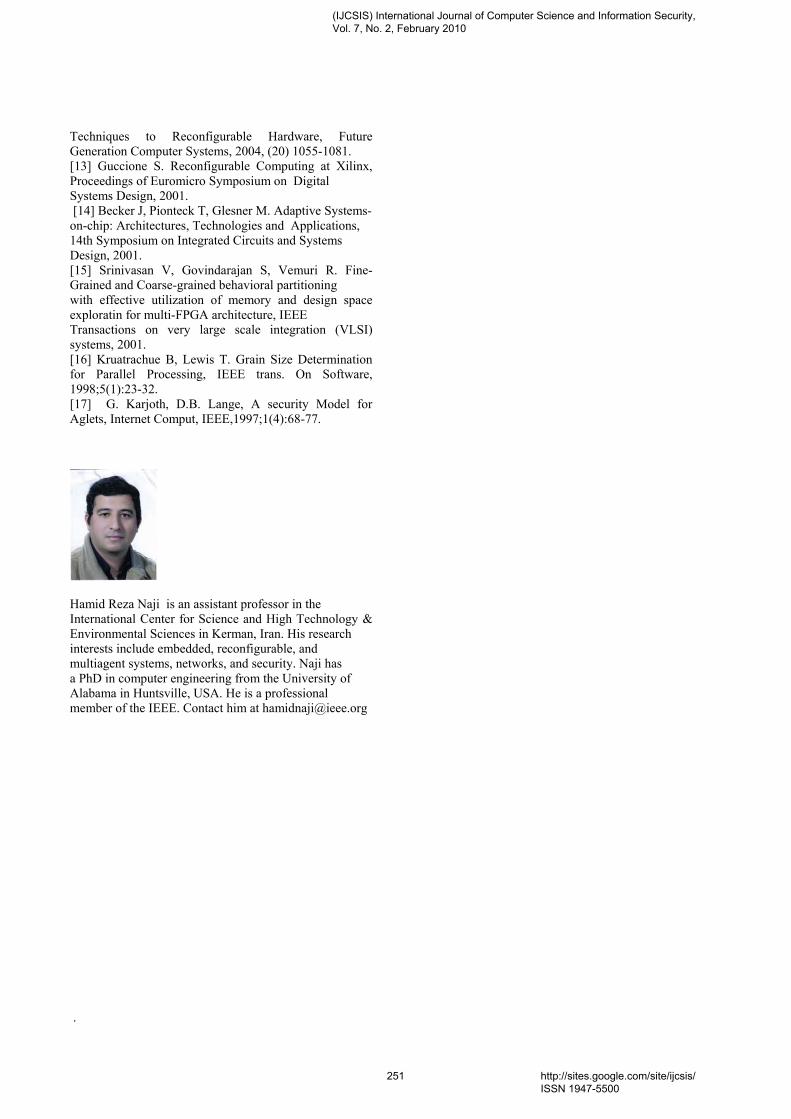
.
Techniques to Reconfigurable Hardware, Future Generation Computer Systems, 2004, (20) 1055-1081. [13] Guccione S. Reconfigurable Computing at Xilinx, Proceedings of Euromicro Symposium on Digital Systems Design, 2001. [14] Becker J, Pionteck T, Glesner M. Adaptive Systems-on-chip: Architectures, Technologies and Applications, 14th Symposium on Integrated Circuits and Systems Design, 2001. [15] Srinivasan V, Govindarajan S, Vemuri R. Fine-Grained and Coarse-grained behavioral partitioning with effective utilization of memory and design space exploratin for multi-FPGA architecture, IEEE Transactions on very large scale integration (VLSI) systems, 2001. [16] Kruatrachue B, Lewis T. Grain Size Determination for Parallel Processing, IEEE trans. On Software, 1998;5(1):23-32. [17] G. Karjoth, D.B. Lange, A security Model for Aglets, Internet Comput, IEEE,1997;1(4):68-77.
Hamid Reza Naji is an assistant professor in the International Center for Science and High Technology & Environmental Sciences in Kerman, Iran. His research interests include embedded, reconfigurable, and multiagent systems, networks, and security. Naji has a PhD in computer engineering from the University of Alabama in Huntsville, USA. He is a professional member of the IEEE. Contact him at [email protected]
(IJCSIS) International Journal of Computer Science and Information Security, Vol. 7, No. 2, February 2010
251 http://sites.google.com/site/ijcsis/ ISSN 1947-5500
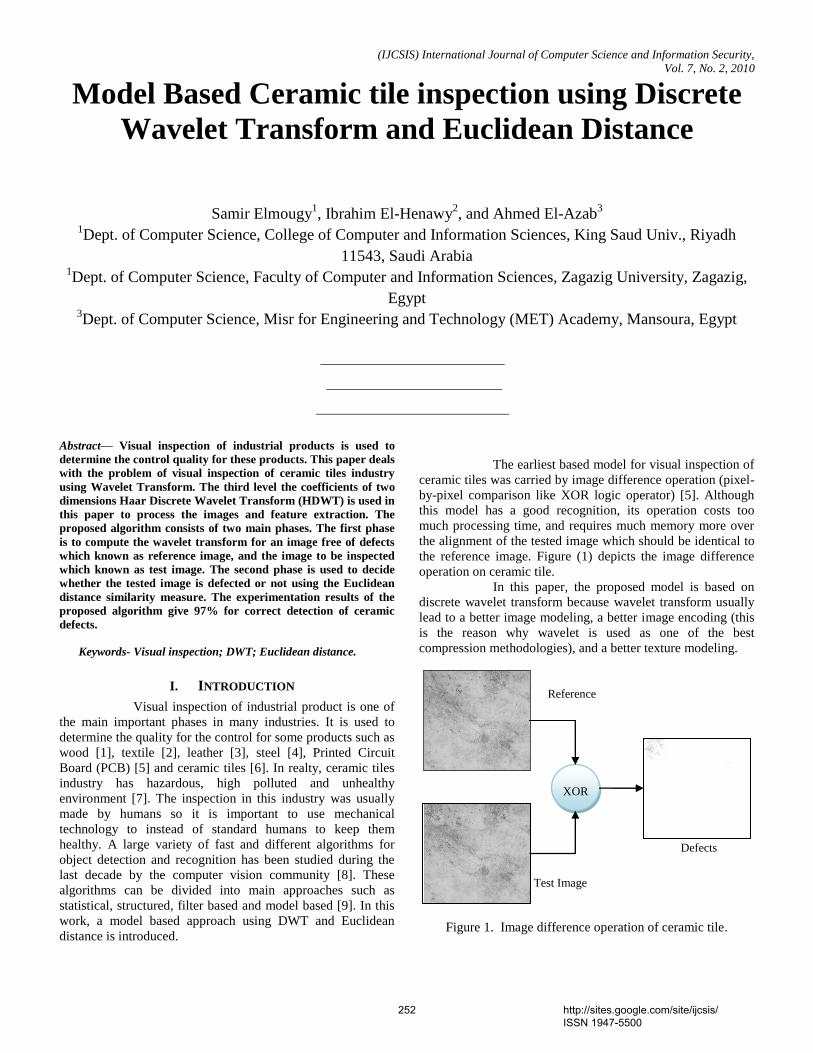
(IJCSIS) International Journal of Computer Science and Information Security,
Vol. 7, No. 2, 2010
Model Based Ceramic tile inspection using Discrete
Wavelet Transform and Euclidean Distance
Samir Elmougy1, Ibrahim El-Henawy
2, and Ahmed El-Azab
3
1Dept. of Computer Science, College of Computer and Information Sciences, King Saud Univ., Riyadh
11543, Saudi Arabia 1Dept. of Computer Science, Faculty of Computer and Information Sciences, Zagazig University, Zagazig,
Egypt 3Dept. of Computer Science, Misr for Engineering and Technology (MET) Academy, Mansoura, Egypt
Abstract— Visual inspection of industrial products is used to
determine the control quality for these products. This paper deals
with the problem of visual inspection of ceramic tiles industry
using Wavelet Transform. The third level the coefficients of two
dimensions Haar Discrete Wavelet Transform (HDWT) is used in
this paper to process the images and feature extraction. The
proposed algorithm consists of two main phases. The first phase
is to compute the wavelet transform for an image free of defects
which known as reference image, and the image to be inspected
which known as test image. The second phase is used to decide
whether the tested image is defected or not using the Euclidean
distance similarity measure. The experimentation results of the
proposed algorithm give 97% for correct detection of ceramic
defects.
Keywords- Visual inspection; DWT; Euclidean distance.
I. INTRODUCTION
Visual inspection of industrial product is one of
the main important phases in many industries. It is used to
determine the quality for the control for some products such as
wood [1], textile [2], leather [3], steel [4], Printed Circuit
Board (PCB) [5] and ceramic tiles [6]. In realty, ceramic tiles
industry has hazardous, high polluted and unhealthy
environment [7]. The inspection in this industry was usually
made by humans so it is important to use mechanical
technology to instead of standard humans to keep them
healthy. A large variety of fast and different algorithms for
object detection and recognition has been studied during the
last decade by the computer vision community [8]. These
algorithms can be divided into main approaches such as
statistical, structured, filter based and model based [9]. In this
work, a model based approach using DWT and Euclidean
distance is introduced.
The earliest based model for visual inspection of
ceramic tiles was carried by image difference operation (pixel-
by-pixel comparison like XOR logic operator) [5]. Although
this model has a good recognition, its operation costs too
much processing time, and requires much memory more over
the alignment of the tested image which should be identical to
the reference image. Figure (1) depicts the image difference
operation on ceramic tile.
In this paper, the proposed model is based on
discrete wavelet transform because wavelet transform usually
lead to a better image modeling, a better image encoding (this
is the reason why wavelet is used as one of the best
compression methodologies), and a better texture modeling.
Figure 1. Image difference operation of ceramic tile.
XOR
Reference
Image
Test Image
Defects
252 http://sites.google.com/site/ijcsis/ ISSN 1947-5500
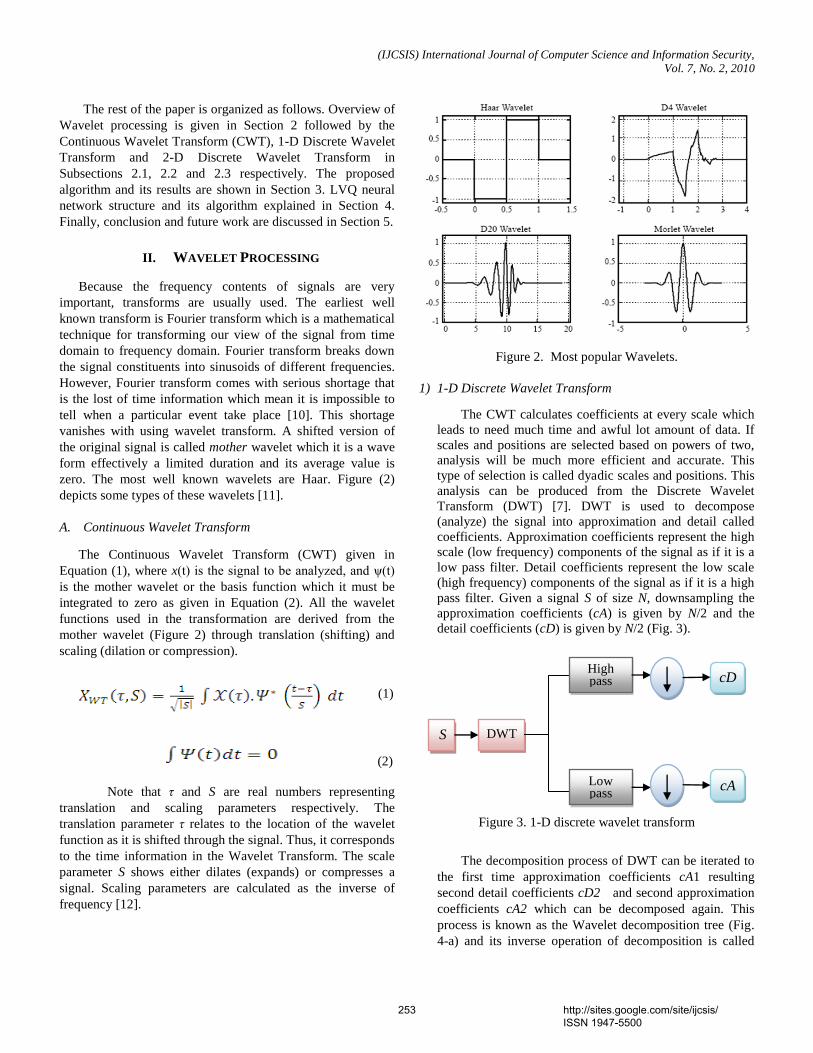
(IJCSIS) International Journal of Computer Science and Information Security,
Vol. 7, No. 2, 2010
The rest of the paper is organized as follows. Overview of
Wavelet processing is given in Section 2 followed by the
Continuous Wavelet Transform (CWT), 1-D Discrete Wavelet
Transform and 2-D Discrete Wavelet Transform in
Subsections 2.1, 2.2 and 2.3 respectively. The proposed
algorithm and its results are shown in Section 3. LVQ neural
network structure and its algorithm explained in Section 4.
Finally, conclusion and future work are discussed in Section 5.
II. WAVELET PROCESSING
Because the frequency contents of signals are very
important, transforms are usually used. The earliest well
known transform is Fourier transform which is a mathematical
technique for transforming our view of the signal from time
domain to frequency domain. Fourier transform breaks down
the signal constituents into sinusoids of different frequencies.
However, Fourier transform comes with serious shortage that
is the lost of time information which mean it is impossible to
tell when a particular event take place [10]. This shortage
vanishes with using wavelet transform. A shifted version of
the original signal is called mother wavelet which it is a wave
form effectively a limited duration and its average value is
zero. The most well known wavelets are Haar. Figure (2)
depicts some types of these wavelets [11].
A. Continuous Wavelet Transform
The Continuous Wavelet Transform (CWT) given in
Equation (1), where x(t) is the signal to be analyzed, and ψ(t)
is the mother wavelet or the basis function which it must be
integrated to zero as given in Equation (2). All the wavelet
functions used in the transformation are derived from the
mother wavelet (Figure 2) through translation (shifting) and
scaling (dilation or compression).
(1)
(2)
Note that τ and S are real numbers representing
translation and scaling parameters respectively. The
translation parameter τ relates to the location of the wavelet
function as it is shifted through the signal. Thus, it corresponds
to the time information in the Wavelet Transform. The scale
parameter S shows either dilates (expands) or compresses a
signal. Scaling parameters are calculated as the inverse of
frequency [12].
Figure 2. Most popular Wavelets.
1) 1-D Discrete Wavelet Transform
The CWT calculates coefficients at every scale which
leads to need much time and awful lot amount of data. If
scales and positions are selected based on powers of two,
analysis will be much more efficient and accurate. This
type of selection is called dyadic scales and positions. This
analysis can be produced from the Discrete Wavelet
Transform (DWT) [7]. DWT is used to decompose
(analyze) the signal into approximation and detail called
coefficients. Approximation coefficients represent the high
scale (low frequency) components of the signal as if it is a
low pass filter. Detail coefficients represent the low scale
(high frequency) components of the signal as if it is a high
pass filter. Given a signal S of size N, downsampling the
approximation coefficients (cA) is given by N/2 and the
detail coefficients (cD) is given by N/2 (Fig. 3).
Figure 3. 1-D discrete wavelet transform
The decomposition process of DWT can be iterated to
the first time approximation coefficients cA1 resulting
second detail coefficients cD2 and second approximation
coefficients cA2 which can be decomposed again. This
process is known as the Wavelet decomposition tree (Fig.
4-a) and its inverse operation of decomposition is called
S DWT
High pass filter
Low pass filter
cD
cA
253 http://sites.google.com/site/ijcsis/ ISSN 1947-5500
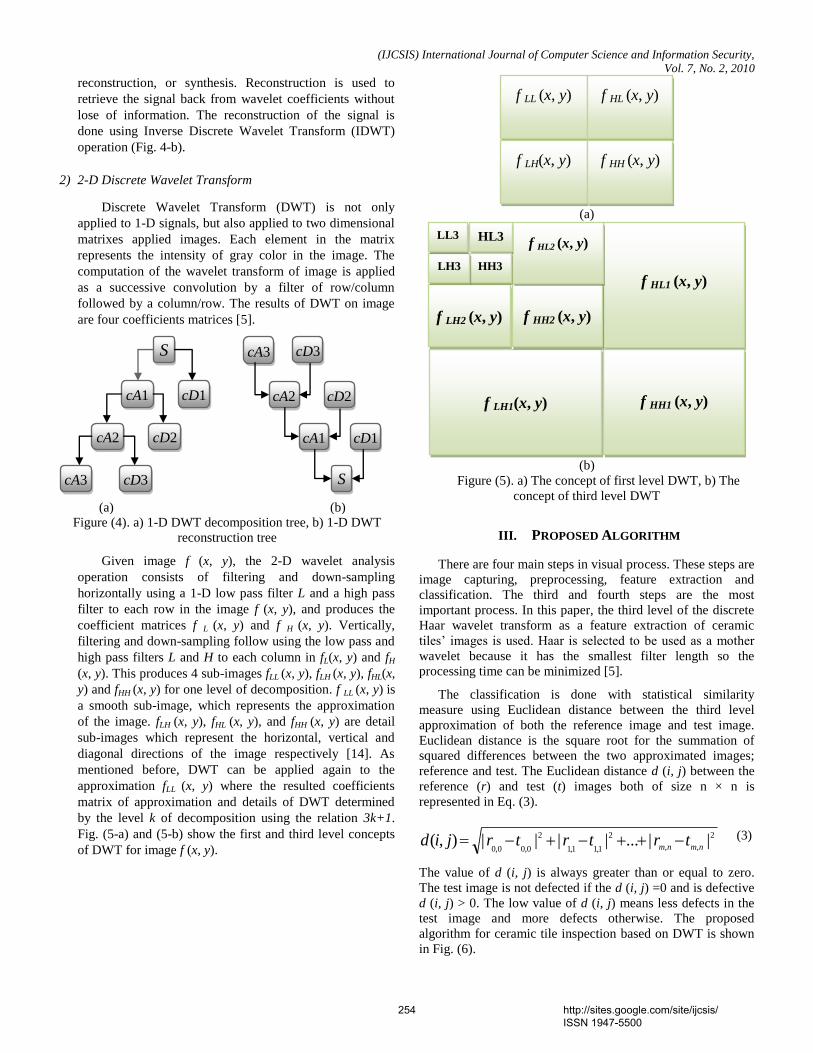
(IJCSIS) International Journal of Computer Science and Information Security,
Vol. 7, No. 2, 2010
reconstruction, or synthesis. Reconstruction is used to
retrieve the signal back from wavelet coefficients without
lose of information. The reconstruction of the signal is
done using Inverse Discrete Wavelet Transform (IDWT)
operation (Fig. 4-b).
2) 2-D Discrete Wavelet Transform
Discrete Wavelet Transform (DWT) is not only
applied to 1-D signals, but also applied to two dimensional
matrixes applied images. Each element in the matrix
represents the intensity of gray color in the image. The
computation of the wavelet transform of image is applied
as a successive convolution by a filter of row/column
followed by a column/row. The results of DWT on image
are four coefficients matrices [5].
Figure (4). a) 1-D DWT decomposition tree, b) 1-D DWT
reconstruction tree
Given image f (x, y), the 2-D wavelet analysis
operation consists of filtering and down-sampling
horizontally using a 1-D low pass filter L and a high pass
filter to each row in the image f (x, y), and produces the
coefficient matrices f L (x, y) and f H (x, y). Vertically,
filtering and down-sampling follow using the low pass and
high pass filters L and H to each column in fL(x, y) and fH
(x, y). This produces 4 sub-images fLL (x, y), fLH (x, y), fHL(x,
y) and fHH (x, y) for one level of decomposition. f LL (x, y) is
a smooth sub-image, which represents the approximation
of the image. fLH (x, y), fHL (x, y), and fHH (x, y) are detail
sub-images which represent the horizontal, vertical and
diagonal directions of the image respectively [14]. As
mentioned before, DWT can be applied again to the
approximation fLL (x, y) where the resulted coefficients
matrix of approximation and details of DWT determined
by the level k of decomposition using the relation 3k+1.
Fig. (5-a) and (5-b) show the first and third level concepts
of DWT for image f (x, y).
(a)
(b)
Figure (5). a) The concept of first level DWT, b) The
concept of third level DWT
III. PROPOSED ALGORITHM
There are four main steps in visual process. These steps are
image capturing, preprocessing, feature extraction and
classification. The third and fourth steps are the most
important process. In this paper, the third level of the discrete
Haar wavelet transform as a feature extraction of ceramic
tiles’ images is used. Haar is selected to be used as a mother
wavelet because it has the smallest filter length so the
processing time can be minimized [5].
The classification is done with statistical similarity
measure using Euclidean distance between the third level
approximation of both the reference image and test image.
Euclidean distance is the square root for the summation of
squared differences between the two approximated images;
reference and test. The Euclidean distance d (i, j) between the
reference (r) and test (t) images both of size n × n is
represented in Eq. (3).
2
,,
2
1,11,1
2
0,00,0||...||||),(
nmnmtrtrtrjid (3)
The value of d (i, j) is always greater than or equal to zero.
The test image is not defected if the d (i, j) =0 and is defective
d (i, j) > 0. The low value of d (i, j) means less defects in the
test image and more defects otherwise. The proposed
algorithm for ceramic tile inspection based on DWT is shown
in Fig. (6).
f LH2 (x, y)
f HL1 (x, y)
f LH1(x, y)
f HH1 (x, y)
f HH2 (x, y)
f HL2 (x, y)
HL3
HH3 LH3
LL3
S
cD1 cA1
cD2 cA2
cD3 cA3 S
cD1 cA1
cD2 cA2
cD3 cA3
(a) (b)
f LL (x, y)
f HL (x, y)
f LH(x, y)
f HH (x, y)
254 http://sites.google.com/site/ijcsis/ ISSN 1947-5500
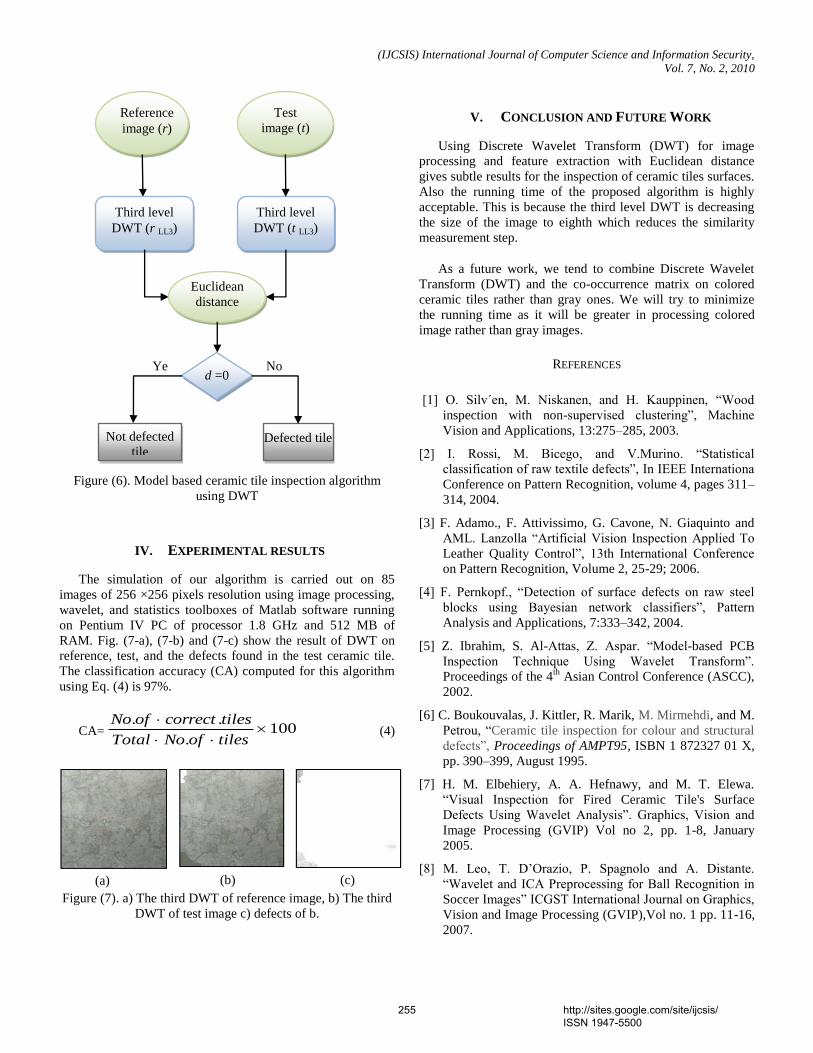
(IJCSIS) International Journal of Computer Science and Information Security,
Vol. 7, No. 2, 2010
Figure (6). Model based ceramic tile inspection algorithm
using DWT
IV. EXPERIMENTAL RESULTS
The simulation of our algorithm is carried out on 85
images of 256 ×256 pixels resolution using image processing,
wavelet, and statistics toolboxes of Matlab software running
on Pentium IV PC of processor 1.8 GHz and 512 MB of
RAM. Fig. (7-a), (7-b) and (7-c) show the result of DWT on
reference, test, and the defects found in the test ceramic tile.
The classification accuracy (CA) computed for this algorithm
using Eq. (4) is 97%.
CA= 100.
..
tilesofNoTotal
tilescorrectofNo (4)
Figure (7). a) The third DWT of reference image, b) The third
DWT of test image c) defects of b.
V. CONCLUSION AND FUTURE WORK
Using Discrete Wavelet Transform (DWT) for image
processing and feature extraction with Euclidean distance
gives subtle results for the inspection of ceramic tiles surfaces.
Also the running time of the proposed algorithm is highly
acceptable. This is because the third level DWT is decreasing
the size of the image to eighth which reduces the similarity
measurement step.
As a future work, we tend to combine Discrete Wavelet
Transform (DWT) and the co-occurrence matrix on colored
ceramic tiles rather than gray ones. We will try to minimize
the running time as it will be greater in processing colored
image rather than gray images.
REFERENCES
[1] O. Silv´en, M. Niskanen, and H. Kauppinen, “Wood
inspection with non-supervised clustering”, Machine
Vision and Applications, 13:275–285, 2003.
[2] I. Rossi, M. Bicego, and V.Murino. “Statistical
classification of raw textile defects”, In IEEE Internationa
Conference on Pattern Recognition, volume 4, pages 311–
314, 2004.
[3] F. Adamo., F. Attivissimo, G. Cavone, N. Giaquinto and
AML. Lanzolla “Artificial Vision Inspection Applied To
Leather Quality Control”, 13th International Conference
on Pattern Recognition, Volume 2, 25-29; 2006.
[4] F. Pernkopf., “Detection of surface defects on raw steel
blocks using Bayesian network classifiers”, Pattern
Analysis and Applications, 7:333–342, 2004.
[5] Z. Ibrahim, S. Al-Attas, Z. Aspar. “Model-based PCB
Inspection Technique Using Wavelet Transform”.
Proceedings of the 4th
Asian Control Conference (ASCC),
2002.
[6] C. Boukouvalas, J. Kittler, R. Marik, M. Mirmehdi, and M.
Petrou, “Ceramic tile inspection for colour and structural
defects”, Proceedings of AMPT95, ISBN 1 872327 01 X,
pp. 390–399, August 1995.
[7] H. M. Elbehiery, A. A. Hefnawy, and M. T. Elewa.
“Visual Inspection for Fired Ceramic Tile's Surface
Defects Using Wavelet Analysis”. Graphics, Vision and
Image Processing (GVIP) Vol no 2, pp. 1-8, January
2005.
[8] M. Leo, T. D’Orazio, P. Spagnolo and A. Distante.
“Wavelet and ICA Preprocessing for Ball Recognition in
Soccer Images” ICGST International Journal on Graphics,
Vision and Image Processing (GVIP),Vol no. 1 pp. 11-16,
2007.
(a) (b) (c)
Reference
image (r)
Third level
DWT (r LL3)
Third level
DWT (t LL3)
Test
image (t)
Euclidean
distance
(d)
d =0
Defected tile Not defected
tile
Ye
s
No
255 http://sites.google.com/site/ijcsis/ ISSN 1947-5500

(IJCSIS) International Journal of Computer Science and Information Security,
Vol. 7, No. 2, 2010
[9] XianghuaXie. “A ReviewofRecentAdvancesin Surface
Defect Detection using Texture analysis Techniques”
Electronic Letters on Computer Vision and Image
Analysis vol. (3):1-22, 2008.
[10] Matlab Wavelet toolbox documentation. “The language
of technical computing” from mathworks. Version 7.0,
2006.
[11] C.H. Lee, Y.J. Wang and W.L. Huang. “A Literature
Survey of Wavelets in Power Engineering Applications”.
Proceeding National Science Council. Vol. 24, no. 4, pp.
249-258, 2000.
[12] E. Bozzi, G. Cavaccini, M. Chimenti, M. G. Di Bono and
O. Salvetti. “Defect detection in C -scan maps”. Pattern
Recognition and Image Analysis, Vol. 17, No. 4, pp. 545–
553, 2007.
[13] D.M. Tsai and B. Hsiao. “Automatic surface inspection
using wavelet reconstruction”, Pattern Recognition. Vol.
34 no. 6, pp. 1285–1305, 2001.
256 http://sites.google.com/site/ijcsis/ ISSN 1947-5500

An Analytical Approach to Document Clustering Based on Internal Criterion
Function
Alok Ranjan
Department of Information Technology
ABV-IIITM
Gwalior, India
Harish Verma
Department of Information Technology
ABV-IIITM
Gwalior, India
Eatesh Kandpal
Department of Information Technology
ABV-IIITM
Gwalior, India
Joydip Dhar
Department of Applied Sciences
ABV-IIITM
Gwalior, India
Abstract—Fast and high quality document clustering is an
important task in organizing information, search engine results obtaining from user query, enhancing web crawling and information retrieval. With the large amount of data available and with a goal of creating good quality clusters, a variety of algorithms have been developed having quality-complexity trade-offs. Among these, some algorithms seek to minimize the computational complexity using certain criterion functions which are defined for the whole set of clustering solution. In this paper, we are proposing a novel document clustering algorithm based on an internal criterion function. Most commonly used partitioning clustering algorithms (e.g. k-means) have some drawbacks as they suffer from local optimum solutions and creation of empty clusters as a clustering solution. The proposed algorithm usually does not suffer from these problems and converge to a global optimum, its performance enhances with the increase in number of clusters. We have checked our algorithm against three different datasets for four different values of k (required number of clusters).
Keywords—Document clustering; partitioning clustering
algorithm; criterion function; global optimization
I. INTRODUCTION
Developing an efficient and accurate clustering algorithm has been one of the most favorite areas of research in various scientific fields. Various algorithms have been developed over a period of years [2, 3, 4, 5]. These algorithms can be broadly classified into agglomerative [6, 7, 8] or partitioning [9] approaches based on the methodology used or into hierarchical or non-hierarchical solutions based on the structure of solution obtained.
Hierarchical solutions are those which are in the form of a tree called dendograms [15], which can be obtained by using agglomerative algorithms, in which, first each object is assigned to its own cluster and then pair of clusters are repeatedly joined until a certain stopping condition is not satisfied. On the other hand , partitioning algorithms such as k-means [5], k-medoids [5], graph-partioning-based [5] consider whole data as a single cluster and then find clustering solution by bisecting or partitioning it into number of predetermined classes. However, a repeated application of partitioning application can give a hierarchical clustering solution.
There always involves tradeoffs between a clustering
solution quality and complexity of algorithm. Various
researchers have shown that partitioning algorithms in
terms of clustering quality are inferior in comparison to
agglomerative algorithms [10]. However, for large
document datasets they perform better because of small
complexity involved [10, 11].
Partitioning algorithms work using a particular criterion function with the prime aim to optimize it, which determines the quality of clustering solution involved. In [12, 13] seven criterion functions are described categorized into internal, external and hybrid criterion functions. The Best way to optimize these criterion functions in partitioning algorithmic approach is to use greedy approach as in k-means. However the solution obtained may be sub-optimal because many a times these algorithms converge to a local-minima or maxima. Probability of getting good quality clusters depends on the initial clustering solution [1]. We have used an internal criterion function and proposed a novel algorithm for initial clustering based on partitioning clustering algorithm. In particular we have compared our approach with the approach described in [1] and implementation results show that our approach performs better then the above method.
II. Basics
In this paper documents have been represented using a
vector-space model [14]. This model visualizes each
document, d as a vector in the term-space or more in more
precise way each document d is represented by a term-
frequency (T-F) vector.
𝑑𝑡𝑓 𝑡𝑓1 𝑡𝑓2 𝑡𝑓𝑚
where 𝑡𝑓𝑖 denotes the frequency of the 𝑖𝑡 term in the
document. In particular we have used a term-inverse
document frequency (tf-idf) term weighing model [14].
This model works better when some terms appearing more
frequently in documents having little discrimination power
need to be de-emphasized. Value of idf is given by log (N
(IJCSIS) International Journal of Computer Science and Information Security, Vol. 7, No. 2, February 2010
257 http://sites.google.com/site/ijcsis/ ISSN 1947-5500

/𝑑𝑓𝑖 ), where N is the total number of documents and 𝑑𝑓𝑖
is the number of documents that contain the 𝑖𝑡 term.
𝑑𝑡𝑓−𝑖𝑑𝑓 = (𝑡𝑓1 log(N/𝑑𝑓1), 𝑡𝑓2 log(N/𝑑𝑓2),................,
𝑡𝑓𝑚 log(N/𝑑𝑓𝑚 )).
As the documents are of varying length, the document
vectors are normalized thus rendering them of unit length
(|𝑑𝑡𝑓−𝑖𝑑𝑓 |=1).
In order to compare the document vectors, certain
similarity measures have been proposed. One of them is
cosine function [14] as follows
Cos (𝑑𝑖 , 𝑑𝑗 ) = 𝑑𝑖𝑡𝑑𝑗
||𝑑𝑖|| ||𝑑𝑗||
Where, 𝑑𝑖 , 𝑑𝑗 are the two documents under
consideration, || 𝑑𝑖 || and ||𝑑𝑗 || are the lengths of vector
𝑑𝑖 and 𝑑𝑗 respectively. This formula , owing to the fact
that 𝑑𝑖 and 𝑑𝑗 are normalized vectors ,converges into
Cos (𝑑𝑖 , 𝑑𝑗 ) = 𝑑𝑖𝑡𝑑𝑗
.The other measure is based on Euclidean distance, given
by
Dis (𝑑𝑖 , 𝑑𝑗 ) = (𝑑𝑖 − 𝑑𝑗 )𝑡(𝑑𝑖 − 𝑑𝑗 ) = || 𝑑𝑖 − 𝑑𝑗
||.
Let A be the set of document vectors, the centroid vector
𝐶𝐴 is defined to be
𝐶𝐴 = 𝐷𝐴 |𝐴|
where, 𝐷𝐴 represents composite vector given by 𝑑𝑑Є𝐴
III. DOCUMENT CLUSTERING
Clustering is an unsupervised machine learning technique.
Given a set 𝐴𝑛 of documents, we define clustering as a
technique to group similar documents together without the
prior knowledge of group definition. Thus, we are
interested in finding k smaller subsets 𝑆𝑖 (i = 1, 2,.........k)
of 𝐴𝑛 such that documents in same set are more similar to
each other while documents in different sets are more
dissimilar. Moreover, our aim is to find the clustering
solution in the context of internal criterion function.
A. Internal Criterion Function
Internal criterion functions account for finding clustering
solution by optimizing a criterion function defined over
documents which are in same set only and doesn't consider
the effect of documents in different sets.
The criterion function we have chosen for our study
attempts to maximize the similarity of a document within a
cluster with its cluster centroid [11]. Mathematically it is
expressed as
Maximize Τ = 𝐶𝑜𝑠 (𝑑𝑖 , 𝐶𝑟 ) 𝑑 Є 𝑆𝑟=1
Where, 𝑑𝑖 is the 𝑖𝑡 document and 𝐶𝑟 is the centroid of
the 𝑟𝑡 cluster.
IV. ALGORITHM DESCRIPTION
Our algorithm is basically a greedy one, unlike other
partitioning algorithm (e.g. k-means) it generally does not
converge to a local minimum.
Our algorithm consists of mainly two phases (i) initial
clustering (ii) refinement.
A. Initial clustering
This phase consists of determining initial clustering
solution which is further refined in refinement phase, with
the assumption
In this phase of algorithm, our aim is to select K
documents, hereafter called seeds, which will be used as
initial centroid of K clusters required.
We select the document which has minimum sum of
squared distances from the previously selected documents.
In the process we get the document having largest
minimum distance from previously selected documents,
i.e., document which is not in the neighborhood of
currently present documents.
Let at some time we have m documents in the selected
list, we check the sum S = 𝐷𝑖𝑠𝑡 𝑑𝑖 , 𝑎 2𝑘
𝑖=1 for all
documents a in set A, where set A contains the documents
having largest sum of distances from previously selected m
documents, and finally the document having minimum
value of S, is selected as the (m+1)th document. We
continue this operation until we have K documents in the
selected list.
1) Algorithm:
Step1: DIST adjacency matrix of document
vectors
Step2: R regulating parameter
Step3: LIST set of document vectors
Step4: N number of document vectors
(IJCSIS) International Journal of Computer Science and Information Security, Vol. 7, No. 2, February 2010
258 http://sites.google.com/site/ijcsis/ ISSN 1947-5500

Step5: K number of clusters required
Step6: ARR_SEEDS list of seeds initially empty
Step7: Add a randomly selected document to
ARR_SEEDS
Step8: Add to ARR_SEEDS a new document
farthest from the residing document in
ARR_SEEDS
Step9: Repeat steps 10 to 13 while ARR_SEEDS
has less than K elements
Step10: STORE set of pair ( sum of distances of
all current seeds from each document,
document ID)
Step11: Add in STORE the pair(sum of distances of
all current seeds from each document,
document ID)
Step12: Repeat Step 13 R times
Step13: Add to ARR_SEEDS the document having
least sum of squared distances from available
seeds
Step14: Repeat 15 and 16 for all remaining
documents
Step15: Select a document
Step16: Assign selected document to the cluster
corresponding to its nearest seed
2) Description: The Algorithm begins with putting
up of a randomly selected document into an empty list of
seeds named ARR_SEEDS. We define a seed as a
document which represents a cluster. Thus we aim to
choose K seeds each representing a single cluster. The
most distant document from the formerly selected seed is
again inserted into ARR_SEEDS. After the selection of
two initial seeds, others are to be selected through an
iterative process where in each iteration we put all the
documents in descending order of their sum of distance
from the currently residing seeds in ARR_SEEDS and then
from the ordered list we take top R (regulating variable
which is to be decided by the total number of documents,
the distribution of the clusters in K-dimensional space and
the total number of clusters K) documents to find the
document having minimum sum of squared distances from
the currently residing seeds in the list, the document thus
found is added immediately into ARR_SEEDS and more
iterations follow until number of seeds reach K. The
variable R is a regulating variable which is to be decided
by the total number of documents, the distribution of the
clusters in K-dimensional space and the total number of
clusters K.
Now we have K seeds in ARR_SEEDS each representing
a cluster. For the remaining N-K documents, each
document is assigned to the cluster corresponding to its
nearest seed.
B. Refinement
The refinement phase consists of many iterations. In each
iteration all the documents are visited in random order, a
document 𝑑𝑖 is selected from a cluster and it is moved to
other k-1 clusters so as to optimize the value of criterion
function. If a move leads to an improvement in the
criterion function value then 𝑑𝑖 is moved to that cluster. A
soon as all the documents are visited an iteration ends. If in
an iteration there are no documents remaining, such that
their movement leads to improvement in the criterion
function, the refinement phase ends.
1) Algorithm:
Step1: S Set of clusters obtained from initial
clustering
Step2: Repeat steps 3 to 9 until even a single
document moved between clusters
Step3: Unmark all documents
Step4: Repeat steps 5 to 9 while each document is
not marked
Step5: Select a random document X from S
Step6: If X is not marked , perform Steps 7 to 9
Step7: Mark X
Step8: Search cluster C in T in which X lies
Step9: Move X to any cluster other than C by which
the overall criterion function value of S goes
down. If no such cluster exists don't move X.
V. IMPLEMENTATION DETAILS
To test our algorithm we have coded it and the older one in
Java Programming language. The rest of this section
describes about the input dataset and cluster quality metric
entropy which we have used in our paper.
A. Input Dataset
For testing purpose we have used both a synthetic dataset
and a real dataset.
1) Synthetic Dataset
This dataset contains a total 15 classes from different
books and articles related to different fields such as art,
philosophy, religion, politics etc. The description is as
follows.
(IJCSIS) International Journal of Computer Science and Information Security, Vol. 7, No. 2, February 2010
259 http://sites.google.com/site/ijcsis/ ISSN 1947-5500
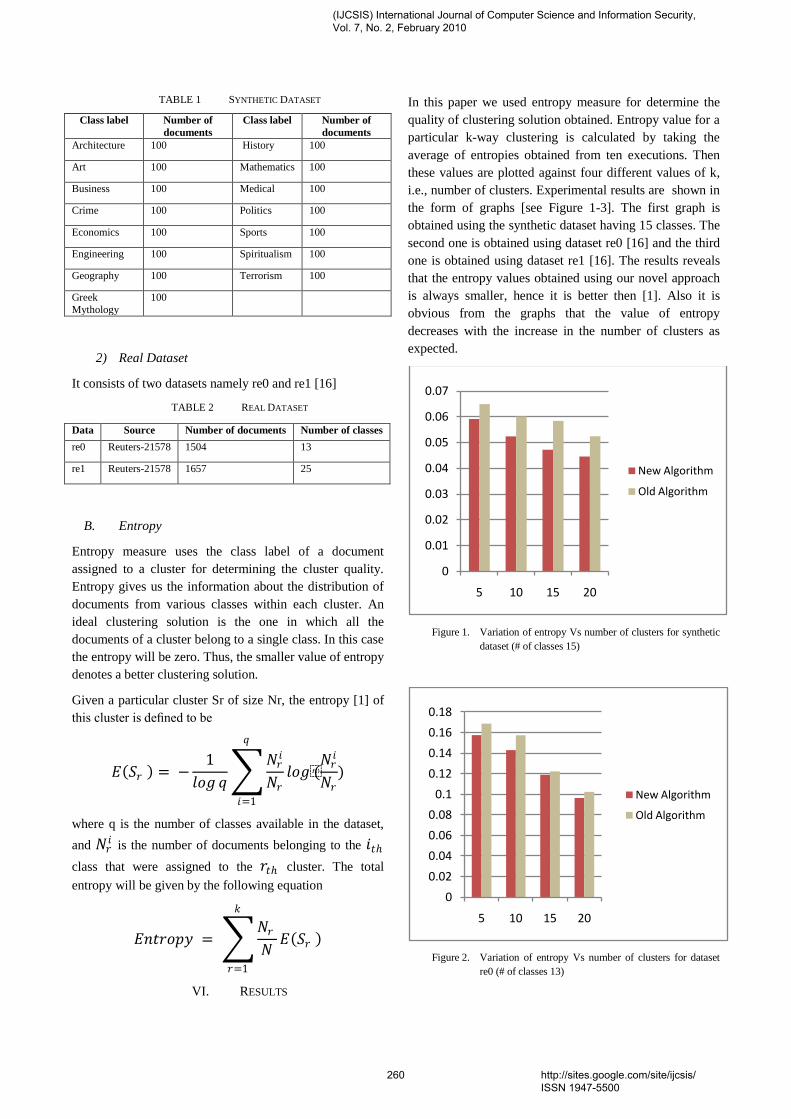
TABLE 1 SYNTHETIC DATASET
Class label Number of
documents
Class label Number of
documents
Architecture 100 History 100
Art 100 Mathematics 100
Business 100 Medical 100
Crime 100 Politics 100
Economics 100 Sports 100
Engineering 100 Spiritualism 100
Geography 100 Terrorism 100
Greek
Mythology
100
2) Real Dataset
It consists of two datasets namely re0 and re1 [16]
TABLE 2 REAL DATASET
Data Source Number of documents Number of classes
re0 Reuters-21578 1504 13
re1 Reuters-21578 1657 25
B. Entropy
Entropy measure uses the class label of a document
assigned to a cluster for determining the cluster quality.
Entropy gives us the information about the distribution of
documents from various classes within each cluster. An
ideal clustering solution is the one in which all the
documents of a cluster belong to a single class. In this case
the entropy will be zero. Thus, the smaller value of entropy
denotes a better clustering solution.
Given a particular cluster Sr of size Nr, the entropy [1] of
this cluster is defined to be
𝐸 𝑆𝑟 = −1
𝑙𝑜𝑔 𝑞
𝑁𝑟𝑖
𝑁𝑟
𝑞
𝑖=1
𝑙𝑜𝑔(𝑁𝑟
𝑖
𝑁𝑟)
where q is the number of classes available in the dataset,
and 𝑁𝑟𝑖 is the number of documents belonging to the 𝑖𝑡
class that were assigned to the 𝑟𝑡 cluster. The total
entropy will be given by the following equation
𝐸𝑛𝑡𝑟𝑜𝑝𝑦 = 𝑁𝑟
𝑁𝐸 𝑆𝑟
𝑘
𝑟=1
VI. RESULTS
In this paper we used entropy measure for determine the
quality of clustering solution obtained. Entropy value for a
particular k-way clustering is calculated by taking the
average of entropies obtained from ten executions. Then
these values are plotted against four different values of k,
i.e., number of clusters. Experimental results are shown in
the form of graphs [see Figure 1-3]. The first graph is
obtained using the synthetic dataset having 15 classes. The
second one is obtained using dataset re0 [16] and the third
one is obtained using dataset re1 [16]. The results reveals
that the entropy values obtained using our novel approach
is always smaller, hence it is better then [1]. Also it is
obvious from the graphs that the value of entropy
decreases with the increase in the number of clusters as
expected.
Figure 1. Variation of entropy Vs number of clusters for synthetic
dataset (# of classes 15)
Figure 2. Variation of entropy Vs number of clusters for dataset
re0 (# of classes 13)
0
0.01
0.02
0.03
0.04
0.05
0.06
0.07
5 10 15 20
New Algorithm
Old Algorithm
0
0.02
0.04
0.06
0.08
0.1
0.12
0.14
0.16
0.18
5 10 15 20
New Algorithm
Old Algorithm
(IJCSIS) International Journal of Computer Science and Information Security, Vol. 7, No. 2, February 2010
260 http://sites.google.com/site/ijcsis/ ISSN 1947-5500
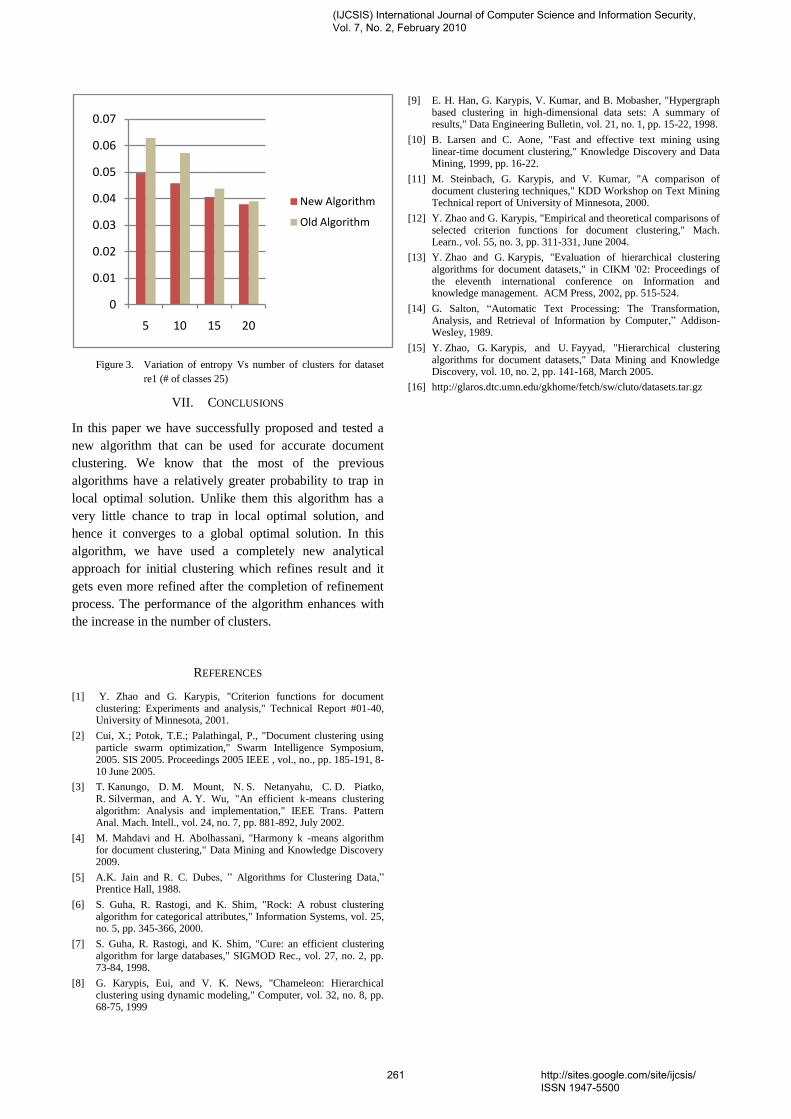
Figure 3. Variation of entropy Vs number of clusters for dataset
re1 (# of classes 25)
VII. CONCLUSIONS
In this paper we have successfully proposed and tested a
new algorithm that can be used for accurate document
clustering. We know that the most of the previous
algorithms have a relatively greater probability to trap in
local optimal solution. Unlike them this algorithm has a
very little chance to trap in local optimal solution, and
hence it converges to a global optimal solution. In this
algorithm, we have used a completely new analytical
approach for initial clustering which refines result and it
gets even more refined after the completion of refinement
process. The performance of the algorithm enhances with
the increase in the number of clusters.
REFERENCES
[1] Y. Zhao and G. Karypis, "Criterion functions for document clustering: Experiments and analysis," Technical Report #01-40, University of Minnesota, 2001.
[2] Cui, X.; Potok, T.E.; Palathingal, P., "Document clustering using particle swarm optimization," Swarm Intelligence Symposium, 2005. SIS 2005. Proceedings 2005 IEEE , vol., no., pp. 185-191, 8-10 June 2005.
[3] T. Kanungo, D. M. Mount, N. S. Netanyahu, C. D. Piatko, R. Silverman, and A. Y. Wu, "An efficient k-means clustering algorithm: Analysis and implementation," IEEE Trans. Pattern Anal. Mach. Intell., vol. 24, no. 7, pp. 881-892, July 2002.
[4] M. Mahdavi and H. Abolhassani, "Harmony k -means algorithm for document clustering," Data Mining and Knowledge Discovery 2009.
[5] A.K. Jain and R. C. Dubes, ” Algorithms for Clustering Data,” Prentice Hall, 1988.
[6] S. Guha, R. Rastogi, and K. Shim, "Rock: A robust clustering algorithm for categorical attributes," Information Systems, vol. 25, no. 5, pp. 345-366, 2000.
[7] S. Guha, R. Rastogi, and K. Shim, "Cure: an efficient clustering algorithm for large databases," SIGMOD Rec., vol. 27, no. 2, pp. 73-84, 1998.
[8] G. Karypis, Eui, and V. K. News, "Chameleon: Hierarchical clustering using dynamic modeling," Computer, vol. 32, no. 8, pp. 68-75, 1999
[9] E. H. Han, G. Karypis, V. Kumar, and B. Mobasher, "Hypergraph based clustering in high-dimensional data sets: A summary of results," Data Engineering Bulletin, vol. 21, no. 1, pp. 15-22, 1998.
[10] B. Larsen and C. Aone, "Fast and effective text mining using linear-time document clustering," Knowledge Discovery and Data Mining, 1999, pp. 16-22.
[11] M. Steinbach, G. Karypis, and V. Kumar, "A comparison of document clustering techniques," KDD Workshop on Text Mining Technical report of University of Minnesota, 2000.
[12] Y. Zhao and G. Karypis, "Empirical and theoretical comparisons of selected criterion functions for document clustering," Mach. Learn., vol. 55, no. 3, pp. 311-331, June 2004.
[13] Y. Zhao and G. Karypis, "Evaluation of hierarchical clustering algorithms for document datasets," in CIKM '02: Proceedings of the eleventh international conference on Information and knowledge management. ACM Press, 2002, pp. 515-524.
[14] G. Salton, “Automatic Text Processing: The Transformation, Analysis, and Retrieval of Information by Computer,” Addison-Wesley, 1989.
[15] Y. Zhao, G. Karypis, and U. Fayyad, "Hierarchical clustering algorithms for document datasets," Data Mining and Knowledge Discovery, vol. 10, no. 2, pp. 141-168, March 2005.
[16] http://glaros.dtc.umn.edu/gkhome/fetch/sw/cluto/datasets.tar.gz
0
0.01
0.02
0.03
0.04
0.05
0.06
0.07
5 10 15 20
New Algorithm
Old Algorithm
(IJCSIS) International Journal of Computer Science and Information Security, Vol. 7, No. 2, February 2010
261 http://sites.google.com/site/ijcsis/ ISSN 1947-5500
Role of Data Mining in E-Payment systems Sabyasachi Pattanaik,Partha Pratim Ghosh
FM University, Balasore
Abstract Data Mining deals extracting hidden knowledge, unexpected pattern and new rules from large database. Various customized data mining tools have been developed for domain specific applications such as Biomedicine, DNA analysis and telecommunication. Trends in data mining include further efforts towards the exploration of new application areas and methods for handling complex data types, algorithm scalability, constraint based data mining and visualization methods. In this paper we will present domain specific Secure Multiparty computation technique and applications. Data mining has matured as a field of basic and applied research in computer science in general. In this paper, we survey some of the recent approaches and architectures where data mining has been applied in the fields of e-payment systems. In this paper we limit our discussion to data mining in the context of e-payment systems. We also mention a few directions for further work in this domain, based on the survey. Key words: Distributed Data Mining (DDM), Secure Multiparty Computation (SMC), Privacy preserving Data Mining (PPDM), web mining, application service providers (ASP). 1. Introduction E-payment has changed the face of most business functions in competitive enterprises. Internet technologies have faultlessly automated interface processes between customers and retailers, retailers and distributors, distributors and factories, and factories and their numerous suppliers. In general, e-commerce and e-business have enabled on-line Payment transactions. Also, generating large scale real-time data has never been easier. With data pertaining to various views of business transactions being readily available, it is only apposite to seek the services of data mining to make (business) sense out of these data sets. Data mining (DM) has as its dominant goal, the generation of non-obvious yet useful information for decision makers from very large databases. The various mechanisms of this generation include abstractions, aggregations, summarizations, and characterizations of data [1]. These forms, in turn, are the results of applying sophisticated modeling techniques from the diverse fields of statistics, artificial intelligence, and database management and computer graphics. The success of a DM exercise is driven to a very large extent by the following factors ([2]).
1.1 Availability of Data with Rich Descriptions This means that unless the relations captured in the database are of high degree, extracting hidden patterns and relationships among the various attributes will not make any practical sense. 1.2 Availability of Large Volume of Data This is mostly mandated for statistical significance of the rules to hold. Absences of say, at least a hundred thousand transactions will most likely reduce the usefulness of the rules generated from the transactional database. 1.3 Ease of Quantification of the Return on Investment (ROI) in Data Mining Although the earlier two factors may be favorable, unless a strong business case can be easily made, investments in the next level DM efforts may not be possible. In other words, the utility of the DM exercise needs to be quantified vis-à-vis the domain of application. 1.4 Ease of Interfacing with Legacy System It is commonplace to find large organizations run on several legacy systems that generate huge volumes of data. A DM exercise, which is usually preceded by other exercises like extract, transformation and loading (ETL), data filtering etc, should not add more overheads to system integration. It must now be noted that e-commerce data, being the result of on-line transactions, do satisfy all the above proper criteria for data mining. We observe that once the back-end databases are properly designed to capture customer-buying behavior, and provided that default data take care of missing and non-existent data, the first issue of availability of data with rich descriptions is taken care of. Similarly, the reliability of data collected is also ensured because it is possible to increase the so-called no-touch-throughput in e-Payment transactions. Technologies like BizTalk and RosettaNet enhance the quality of data that is generated. Improved web server availability results in faster transactions, thus increasing the revenue. Observe that increasing the number of transactions directly results in improved profits. Lastly, e-payment systems usually follow the MVC (Model-View-Controller) pattern with the business execution systems conforming to the model tier, the browser being the view tier and interfacing mechanisms like Java Servlets or Microsoft ASP forming the
(IJCSIS) International Journal of Computer Science and Information Security, Vol. 7, No. 2, February 2010
262 http://sites.google.com/site/ijcsis/ ISSN 1947-5500
controller tier. Data mining mostly relies on the controller for generating the data to mine on. Thus integration issues also do not surface in this case. In summary, it is little surprise that e-payment transaction is the killer application for data mining ([3]). 2. A Review of Data-Mining Methods The challenge in data mining is to disclose hidden relationships among various attributes of data and between several snapshots of data over a period of time. These hidden patterns have enormous potential in predictions and personalization in e-payment systems. Data mining has been pursued as a research topic by at least three communities: the statisticians, the artificial intelligence researchers, and the database engineers. We now present a brief overview of some of the features of each of these approaches. 2.1 Role of Statistics in Data Mining Extracting causal information from data is often one of the principal goals of data mining and more generally of statistical inference. Data for decades; thus DM has actually existed from the time large-scale statistical modeling has been made possible. Statisticians consider the causal relationship between the dependent variables and independent variables as proposed by the user (usually the domain expert), and try to capture the degree and nature of dependence between the variables. Modeling methods include simple linear regression, multiple regressions, and nonlinear regression. Such models are often parameter driven and are arrived at after solving attendant optimization models. For a more detailed overview of regression methods, the reader is referred to [3] & [4]. The regression methods may be considered analogous to the association rules in data mining. In the latter case, rule-mining algorithms propose the correlation of item sets in a database, across various attributes of the transactions. For instance, rules could be of the form if a customer visits Page A.html, 90% of the times she will also visit Page B.html. We assume here that the database (here, the web logs) has transactions recorded on a per-customer basis. Each record in the database indicates whether the customer visited a page during her entire session. Such rules can and need to be validated using the well-known statistical regression methods. Also, in some cases, the number of association rules may be very large. To draw meaningful rules that has real business value, it may be worthwhile to select the statistically most significant set of rules from the large pool of rules generated by a rule-mining algorithm. Data mining involves designing a search architecture requiring evaluation of hypotheses at the stages of the search, evaluation of the search output, and appropriate use of the results. Although Statistics may have little to offer in understanding search architectures, it has indeed a great deal to offer in evaluation of hypotheses in the above stages ([5]). While the statistical literature has a wealth of technical procedures and results to offer data mining, one has to take note of the following while using statistics to validate the rules generated using data mining.
• �Prove that the estimation and search procedures used in data mining are consistent under conditions reasonably assumed to apply in applications.
• �Use and reveal uncertainty and not hide it; some data-mining approaches ignore the causal relations due to lack of sufficient data. Such caveats can be unearthed using statistical methods.
• �Calibrate the errors of search to take advantages of model averaging. This is relevant where predicting the future is important, as in data mining applied to forecasting a time series. Model averaging is beneficial where several models may be relevant to build a forecast.
2.2 The Role of AI in Data Mining Artificial intelligence, on the other hand, has provided a number of useful methods for DM. Machine learning is a set of methods that enable a computer to learn relations from the given data sets. With minimal or no hypothesis from the user, learning algorithms do come up with meaningful relations and also explain them well. Some of the most popular learning systems include the neural networks and support vector machines. We briefly present the relevant issues below. Neural networks are predominantly used to learn linear and nonlinear relationships between variables of interest. The architecture, in general, consists of a preceptor with input and output nodes with weighted edges connecting the two nodes. A neural network with two layers is thus a bi-partite acyclic graph. The preceptor, which is the learning machine, is ‘trained’ in order to arrive at an optimal ‘weight vector’. The output is then expressed as a (weighted) linear combination of the inputs. Learning consists of solving an underlying optimization model which is solved using gradient descent based methods. It is worth noting here that the corresponding statistical methods available for estimating nonlinear relationships are based on the Maximum Likelihood Estimate problem. This problem is rather unwieldy since it requires the solution of highly nonlinear optimization problems; this result in tedious computations involved in solving algebraic equations. It is here that neural networks outperform their statistical counterparts, by resorting to the supervised learning methods based on gradient descent to solve such estimation problems. In other words, instead of explicitly solving equations to arrive at the maximum likelihood weights, neural networks ‘learn’ these weights via gradient descent based search methods. To learn more complex relationships including multi-variant nonlinear ones, it is not uncommon to have more layers than two. Such layers are called the hidden layers. The empiricism associated with neural networks is due to the non-availability of methods that would help fix the rate of convergence and the optimal number of
(IJCSIS) International Journal of Computer Science and Information Security, Vol. 7, No. 2, February 2010
263 http://sites.google.com/site/ijcsis/ ISSN 1947-5500
layers. In the above learning process, if the outputs are Boolean, the problem is essentially a supervised learning mechanism to classify data sets. In such cases, often-times, a sigmoid function (a nonlinear transformation) is applied to obtain the relevant output. Apart from learning relationships as above, neural networks are also useful in clustering data sets. The most popular method available to cluster data sets is the K-means algorithm. Given an M-dimensional data set, the idea is to try and locate the minimal number of centroids around which the data set clusters itself. Thus the onus is to define an appropriate distance vector that helps partition the data sets into as minimally overlapping sub-sets as possible. The advantages of neural networks over the conventional statistical analysis methods are as follows ([6]).
• �Neural networks are good at modeling nonlinear relationships and interaction while conventional statistical analysis in most cases assumes linear relationship between independent variables and dependent variables. Neural networks build their own models with the help of learning process whether the relationships among variables are linear or not.
• �Neural networks perform well with missing or incomplete data. A single missing value in regression analysis leads to removal of the entire observation or removal of the associated variable from all observations in the data set being analyzed. However, neural networks update weights between input, output, and intermediate nodes, so that even incomplete data can contribute to learning and produce desired output results.
Neural networks do not require scale adjustment or statistical assumptions, such as normality or independent error terms. For a more detailed and comprehensive overview of neural computation and the underlying theories, the interested reader is referred to [7] & [8] 2.3 The Role of Database Research in Data Mining Keeping in mind that data mining approaches rely heavily on the availability of high quality data sets, the database community has invented an array of relevant methods and mechanisms that need to be used prior to any DM exercise. Extract, transform and load (ETL) applications are worthy of mention in this context. Given an enterprise system like an enterprise resource planning system (ERP), it is likely that the number of transactions that happen by the minute could run into hundreds, if not thousands. Data mining can certainly not be run on the transaction databases in their native state. It requires be extracting at periodic intervals, transforming into a form usable for analysis & loading on to the servers and applications that work on the transformed data.
3. E-Payments and Data Mining In this section, we survey articles that are very specific to DM implementations in e-payment systems. The salient applications of DM techniques are presented first. Later in this section, architecture and data collection issues are discussed. 3.1 DM in Customer Profiling It may be observed that customers drive the revenues of any organization. Acquiring new customers, delighting and retaining existing customers, and predicting buyer behavior will improve the availability of products and services and hence the profits. Thus the end goal of any DM exercise in e-Payment is to improve processes that contribute to delivering value to the end customer. 3.2 DM in Recommendation Systems Systems have also been developed to keep the customers automatically informed of important events of interest to them. The article by [9] discusses an intelligent framework called PENS that has the ability to not only notify customers of events, but also to predict events and event classes that are likely to be triggered by customers. The event notification system in PENS has the following components: Event manager, event channel manager, registries, and proxy manager. The event-prediction system is based on association rule-mining and clustering algorithms. The PENS system is used to actively help an e-commerce service provider to forecast the demand of product categories better. Data mining has also been applied in detecting how customers may respond to promotional offers made by a credit card company ([11]). Techniques including fuzzy computing and interval computing are used to generate if-then-else rules. 3.3 DM and Multimedia Applications in virtual multimedia catalogs are highly interactive, as in e-malls selling Multimedia content based products. It is difficult in such situations to estimate resource demands required for presentation of catalog contents. [10] propose a method to predict presentation resource demands in interactive multimedia catalogs. The prediction is based on the results of mining the virtual mall action log file that contains information about previous user interests and browsing and buying behavior. 3.4 DM and Buyer Behavior in E-Payment Transactions For a successful e-payment site, reducing user-perceived latency is the second most important quality after good site-navigation quality. The most successful approach towards reducing user perceived latency has been the extraction of path traversal patterns from past users access history to predict future user traversal behavior and to pre-fetch the
(IJCSIS) International Journal of Computer Science and Information Security, Vol. 7, No. 2, February 2010
264 http://sites.google.com/site/ijcsis/ ISSN 1947-5500
required resources. The core of their approach involves extracting knowledge from integrated data of purchase and path traversal patterns of past users (obtainable from web server logs) to predict the purchase and traversal behavior of future users. In the context of web mining, clustering could be used to cluster similar click-streams to determine learning behaviors in the case of e-learning or general site access behaviors in ecommerce. 4. Data Collection and Software Architecture 4.1 Enabling Data Collection in E-Payment Systems It may be observed that there are various ways of procuring data relevant to e-payments DM. Web server log files, web server plug-ins (instrumentation), TCP/IP packet sniffing, application server instrumentation are the primary means of collecting data. Other sources include transactions that the user performs, marketing programs (banner advertisements, emails etc), demographic (obtainable from site registrations and subscriptions), call centers and ERP systems. 4.2 An Architecture for DM In a B2B e-commerce setting, it is very likely that vendors, customers and application service providers (ASP) (usually the middlemen) have varying DM requirements. Vendors would be interested in DM tailored for market basket analysis to know customer segments. On the other hand, end customers are keen to know updates on seasonal offerings and discounts all the while. The role of the ASP is then to be the common meeting ground for vendors and customers. [12] propose a distributed DM architecture that enables a DM to be conducted in such a naturally distributed environment. The proposed distributed data mining system is intended for the ASP to provide generic data mining services to its subscribers. In order to support the robust functioning of the system it possesses certain characteristics such as heterogeneity, costing infrastructure availability, presence of a generic optimization engine, security and extensibility. Heterogeneity implies that the system can mine data from heterogeneous and distributed locations. The proposed system is designed to support user requirements with respect to different distributed computing paradigms (including the client-server and mobile agent based models). The costing infrastructure refers to the system having a framework for estimating the costs of different tasks. This implies that a task that requires higher computational resources and/or faster response time should cost the users more on a relative scale of costs. Further, the system should be able to optimize the distributed data mining process to provide the users with the best response time possible (given the constraints of the mining environment and the expenses the user is willing to incur). The authors have indeed designed and implemented such a framework. Maintaining security implies that in some instances, the user might be mining highly sensitive data that should
not leave the owner’s site. In such cases, the authors provide the option to use the mobile-agent model where the mining algorithm and the relevant parameters are shipped to the data site and at the end of the process the mobile agent is destroyed on the site itself. 5. DM Applied to Retail Payment System They share their experience in terms of lessons that they learnt. They classify the important issues in practical studies, into two categories: business-related and technology related. We now summarize their findings on the technical issues here.
• �Collecting data at the right level of abstraction is very important. Web server logs were originally meant for debugging the server software. Hence they convey very little useful information on customer-related transactions. Approaches including sessioning the web logs may yield better results. A preferred alternative would be have the application server itself log the user related activities. This is certainly going to be richer in semantics compared to the state-less web logs, and is easier to maintain compared to state-full web logs.
• �Designing user interface forms needs to consider the DM issues in mind. For instance, disabling default values on various important attributes like Gender, Marital status, Employment status, etc., will result in richer data collected for demographical analysis. The users should be made to enter these values, since it was found by [14] that several users left the default values untouched.
• �Certain important implementation parameters in retail payment sites like the automatic time outs of user sessions due to perceived inactivity at the user end need to be based not purely on DM algorithms, but on the relative importance of the users to the organization. It should not turn out that large clients are made to lose their shopping carts due to the time outs that were fixed based on a DM of the application logs.
• �Generating logs for several million transactions is a costly exercise. It may be wise to generate appropriate logs by conducting random sampling, as is done in statistical quality control. But such a sampling may not capture rare events, and in some cases like in advertisement referral based compensations, the data capture may be mandatory. Techniques thus need to be in place that can do this sampling in an intelligent fashion.
• �Auditing of data procured for mining, from data warehouses, is mandatory. This is due to the fact that the data warehouse might have collated data from several disparate systems with a high chance of data
(IJCSIS) International Journal of Computer Science and Information Security, Vol. 7, No. 2, February 2010
265 http://sites.google.com/site/ijcsis/ ISSN 1947-5500
being duplicated or lost during the ETL operations.
• �Mining data at the right level of granularity is essential. Otherwise, the results from the DM exercise may not be correct.
Conclusions and Future Work In this paper, we have presented how web mining is applicable in improving the services provided by e-payment based enterprises. Statistics, AI and database methods were surveyed and their relevance to DM in general was discussed. Later, we also highlighted architectural and implementation issues. We now present some ways in which web mining can be extended for future work. With the growing interest in the notion of semantic web, an increasing number of sites use structured semantics and domain ontologies as part of the site design, creation, and content delivery. The primary challenge for the next-generation of personalization systems is to effectively integrate semantic knowledge from domain ontologies into the various parts of the process, including the data preparation, pattern discovery, and recommendation phases. Such a process must involve some or all of the following tasks and activities
• �Data transformations: There are two sets of transformations that need to take place:
(i) Data must be brought in from the operational system to build a data warehouse.
(ii) Data may need to undergo transformations to answer a specific business question, a process that involves operations such as defining new columns, binning data, and aggregating it. While the first set of transformations needs to be modified infrequently (only when the site changes), the second set of
transformations provides a significant challenge faced by many data mining
tools today. • Scalability of data mining algorithms: With
a large amount of data, two scalability issues arise:
(i) most data mining algorithms cannot process the amount of data gathered at
web sites in reasonable time, especially because they scale nonlinearly.
(ii) generated models are too complicated for humans to comprehend.
References [1].Carbone P L 2000 Expanding the meaning of and applications for data mining. In IEEE Int. Conf. On Systems, Man, and Cybernetics 1872–1873. [2]. Kohavi R 2001 Mining e-commerce data: The good, the bad, and the ugly. In Proceedings of the Seventh ACMSIGKDD International Conference on Knowledge Discovery and Data Mining (KDD 2001) pp 8–13.
[3]. Neter J, Kutner M, Nachtsheim C J,WassermanW 1996 Applied linear statistical models (New York: McGraw-Hill/Irwin) [4]. Gujarati D 2002 Basic econometrics (New York: McGraw-Hill/Irwin) [5]. Glymour C, Madigan D, Pregibon D, Smyth P 1996 Statistical inference and data mining. [6]. Park S 2000 Neural networks and customer grouping in e-commerce: a framework using fuzzy art. In Academia/Industry Working Conference on Research Challenges, pp 331–336. [7].Haykin S 1998 Neural networks: A comprehensive foundation 2nd edn (Englewood Cliffs, NJ: Prentice-Hall) [8]. Hertz J, Krogh A, Palmer R G 1994 Introduction to the theory of neural computation (Reading, MA:Addison-Wesley) [9] Jeng J J, Drissi Y 2000 Pens: a predictive event notification system for e-commerce environment. In The 24th Annu. Int. Computer Software and Applications Conference, COMPSAC 2000, pp 93–98. [10] Hollfelder S, Oria V, Ozsu M T 2000 Mining user behavior for resource prediction in interactive electronic malls. In IEEE Int. Conf. on Multimedia and Expo (New York: IEEE Comput. Soc.) pp 863–866. [11] Zhang Y Q, Shteynberg M, Prasad S K, Sunder Raman R 2003 Granular fuzzy web intelligence techniques for profitable data mining. In 12th IEEE Int. Conf. on Fuzzy Systems, FUZZ ’03 (New York: IEEE Comput. Soc.) pp 1462–1464. [12] Krishnaswamy S, Zaslavsky A, Loke S W 2000 An architecture to support distributed data mining services in e-commerce environments, pp 239–246.
(IJCSIS) International Journal of Computer Science and Information Security, Vol. 7, No. 2, February 2010
266 http://sites.google.com/site/ijcsis/ ISSN 1947-5500
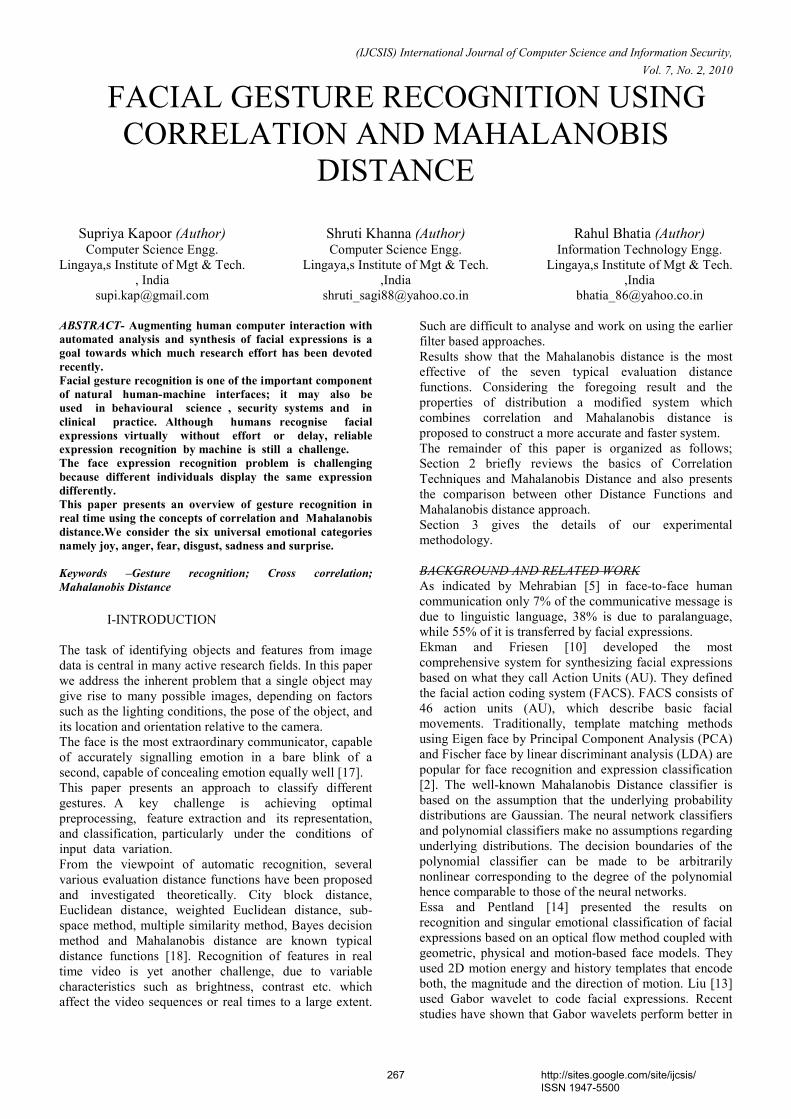
(IJCSIS) International Journal of Computer Science and Information Security,
Vol. 7, �o. 2, 2010
FACIAL GESTURE RECOGNITION USING
CORRELATION AND MAHALANOBIS
DISTANCE
Supriya Kapoor (Author)
Computer Science Engg.
Lingaya,s Institute of Mgt & Tech.
, India
Shruti Khanna (Author) Computer Science Engg.
Lingaya,s Institute of Mgt & Tech.
,India
Rahul Bhatia (Author) Information Technology Engg.
Lingaya,s Institute of Mgt & Tech.
,India
ABSTRACT- Augmenting human computer interaction with
automated analysis and synthesis of facial expressions is a
goal towards which much research effort has been devoted
recently.
Facial gesture recognition is one of the important component
of natural human-machine interfaces; it may also be
used in behavioural science , security systems and in
clinical practice. Although humans recognise facial
expressions virtually without effort or delay, reliable
expression recognition by machine is still a challenge.
The face expression recognition problem is challenging
because different individuals display the same expression
differently.
This paper presents an overview of gesture recognition in
real time using the concepts of correlation and Mahalanobis
distance.We consider the six universal emotional categories
namely joy, anger, fear, disgust, sadness and surprise.
Keywords –Gesture recognition; Cross correlation;
Mahalanobis Distance
I-INTRODUCTION
The task of identifying objects and features from image
data is central in many active research fields. In this paper
we address the inherent problem that a single object may
give rise to many possible images, depending on factors
such as the lighting conditions, the pose of the object, and
its location and orientation relative to the camera.
The face is the most extraordinary communicator, capable
of accurately signalling emotion in a bare blink of a
second, capable of concealing emotion equally well [17].
This paper presents an approach to classify different
gestures. A key challenge is achieving optimal
preprocessing, feature extraction and its representation,
and classification, particularly under the conditions of
input data variation.
From the viewpoint of automatic recognition, several
various evaluation distance functions have been proposed
and investigated theoretically. City block distance,
Euclidean distance, weighted Euclidean distance, sub-
space method, multiple similarity method, Bayes decision
method and Mahalanobis distance are known typical
distance functions [18]. Recognition of features in real
time video is yet another challenge, due to variable
characteristics such as brightness, contrast etc. which
affect the video sequences or real times to a large extent.
Such are difficult to analyse and work on using the earlier
filter based approaches.
Results show that the Mahalanobis distance is the most
effective of the seven typical evaluation distance
functions. Considering the foregoing result and the
properties of distribution a modified system which
combines correlation and Mahalanobis distance is
proposed to construct a more accurate and faster system.
The remainder of this paper is organized as follows;
Section 2 briefly reviews the basics of Correlation
Techniques and Mahalanobis Distance and also presents
the comparison between other Distance Functions and
Mahalanobis distance approach.
Section 3 gives the details of our experimental
methodology.
BACKGROU�D A�D RELATED WORK
As indicated by Mehrabian [5] in face-to-face human
communication only 7% of the communicative message is
due to linguistic language, 38% is due to paralanguage,
while 55% of it is transferred by facial expressions.
Ekman and Friesen [10] developed the most
comprehensive system for synthesizing facial expressions
based on what they call Action Units (AU). They defined
the facial action coding system (FACS). FACS consists of
46 action units (AU), which describe basic facial
movements. Traditionally, template matching methods
using Eigen face by Principal Component Analysis (PCA)
and Fischer face by linear discriminant analysis (LDA) are
popular for face recognition and expression classification
[2]. The well-known Mahalanobis Distance classifier is
based on the assumption that the underlying probability
distributions are Gaussian. The neural network classifiers
and polynomial classifiers make no assumptions regarding
underlying distributions. The decision boundaries of the
polynomial classifier can be made to be arbitrarily
nonlinear corresponding to the degree of the polynomial
hence comparable to those of the neural networks.
Essa and Pentland [14] presented the results on
recognition and singular emotional classification of facial
expressions based on an optical flow method coupled with
geometric, physical and motion-based face models. They
used 2D motion energy and history templates that encode
both, the magnitude and the direction of motion. Liu [13]
used Gabor wavelet to code facial expressions. Recent
studies have shown that Gabor wavelets perform better in
267 http://sites.google.com/site/ijcsis/ ISSN 1947-5500
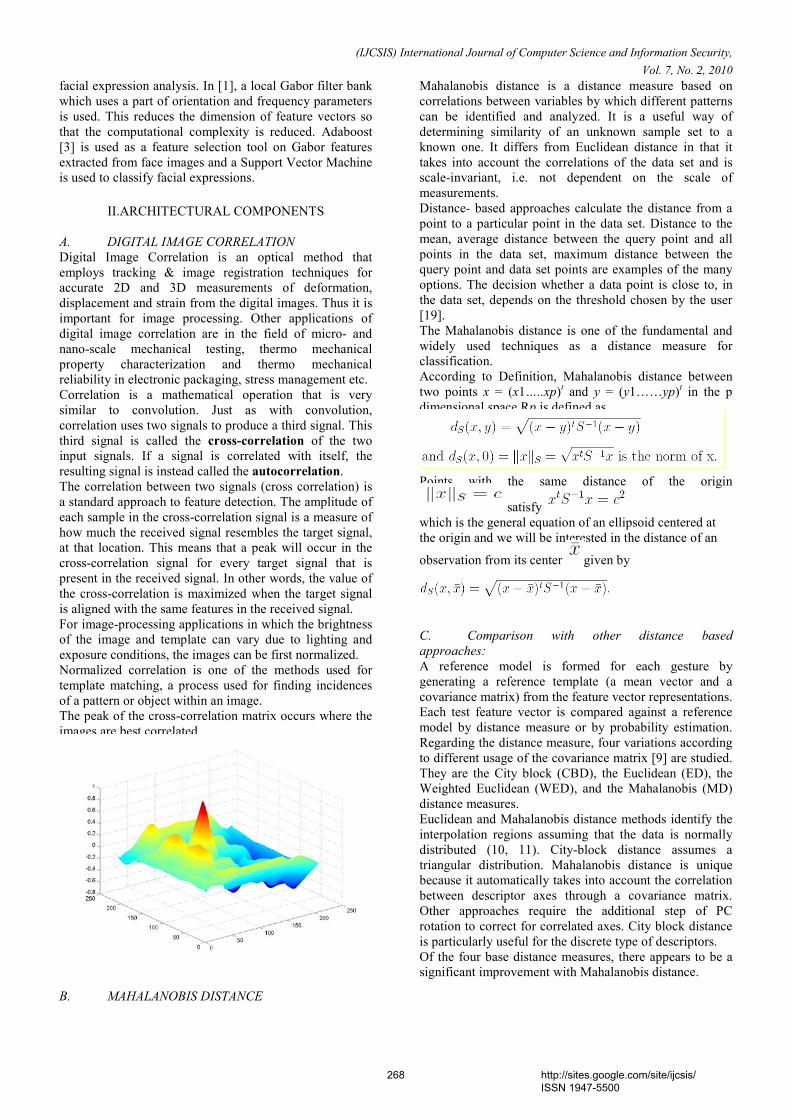
(IJCSIS) International Journal of Computer Science and Information Security,
Vol. 7, �o. 2, 2010
facial expression analysis. In [1], a local Gabor filter bank
which uses a part of orientation and frequency parameters
is used. This reduces the dimension of feature vectors so
that the computational complexity is reduced. Adaboost
[3] is used as a feature selection tool on Gabor features
extracted from face images and a Support Vector Machine
is used to classify facial expressions.
II.ARCHITECTURAL COMPONENTS
A. DIGITAL IMAGE CORRELATIO�
Digital Image Correlation is an optical method that
employs tracking & image registration techniques for
accurate 2D and 3D measurements of deformation,
displacement and strain from the digital images. Thus it is
important for image processing. Other applications of
digital image correlation are in the field of micro- and
nano-scale mechanical testing, thermo mechanical
property characterization and thermo mechanical
reliability in electronic packaging, stress management etc.
Correlation is a mathematical operation that is very
similar to convolution. Just as with convolution,
correlation uses two signals to produce a third signal. This
third signal is called the cross-correlation of the two
input signals. If a signal is correlated with itself, the
resulting signal is instead called the autocorrelation.
The correlation between two signals (cross correlation) is
a standard approach to feature detection. The amplitude of
each sample in the cross-correlation signal is a measure of
how much the received signal resembles the target signal,
at that location. This means that a peak will occur in the
cross-correlation signal for every target signal that is
present in the received signal. In other words, the value of
the cross-correlation is maximized when the target signal
is aligned with the same features in the received signal.
For image-processing applications in which the brightness
of the image and template can vary due to lighting and
exposure conditions, the images can be first normalized.
Normalized correlation is one of the methods used for
template matching, a process used for finding incidences
of a pattern or object within an image.
The peak of the cross-correlation matrix occurs where the
images are best correlated.
B. MAHALA�OBIS DISTA�CE
Mahalanobis distance is a distance measure based on
correlations between variables by which different patterns
can be identified and analyzed. It is a useful way of
determining similarity of an unknown sample set to a
known one. It differs from Euclidean distance in that it
takes into account the correlations of the data set and is
scale-invariant, i.e. not dependent on the scale of
measurements.
Distance- based approaches calculate the distance from a
point to a particular point in the data set. Distance to the
mean, average distance between the query point and all
points in the data set, maximum distance between the
query point and data set points are examples of the many
options. The decision whether a data point is close to, in
the data set, depends on the threshold chosen by the user
[19].
The Mahalanobis distance is one of the fundamental and
widely used techniques as a distance measure for
classification.
According to Definition, Mahalanobis distance between
two points x = (x1…..xp)t and y = (y1……yp)
t in the p
dimensional space Rp is defined as
Points with the same distance of the origin
satisfy
which is the general equation of an ellipsoid centered at
the origin and we will be interested in the distance of an
observation from its center given by
C. Comparison with other distance based
approaches:
A reference model is formed for each gesture by
generating a reference template (a mean vector and a
covariance matrix) from the feature vector representations.
Each test feature vector is compared against a reference
model by distance measure or by probability estimation.
Regarding the distance measure, four variations according
to different usage of the covariance matrix [9] are studied.
They are the City block (CBD), the Euclidean (ED), the
Weighted Euclidean (WED), and the Mahalanobis (MD)
distance measures. Euclidean and Mahalanobis distance methods identify the
interpolation regions assuming that the data is normally
distributed (10, 11). City-block distance assumes a
triangular distribution. Mahalanobis distance is unique
because it automatically takes into account the correlation
between descriptor axes through a covariance matrix.
Other approaches require the additional step of PC
rotation to correct for correlated axes. City block distance
is particularly useful for the discrete type of descriptors.
Of the four base distance measures, there appears to be a
significant improvement with Mahalanobis distance.
268 http://sites.google.com/site/ijcsis/ ISSN 1947-5500
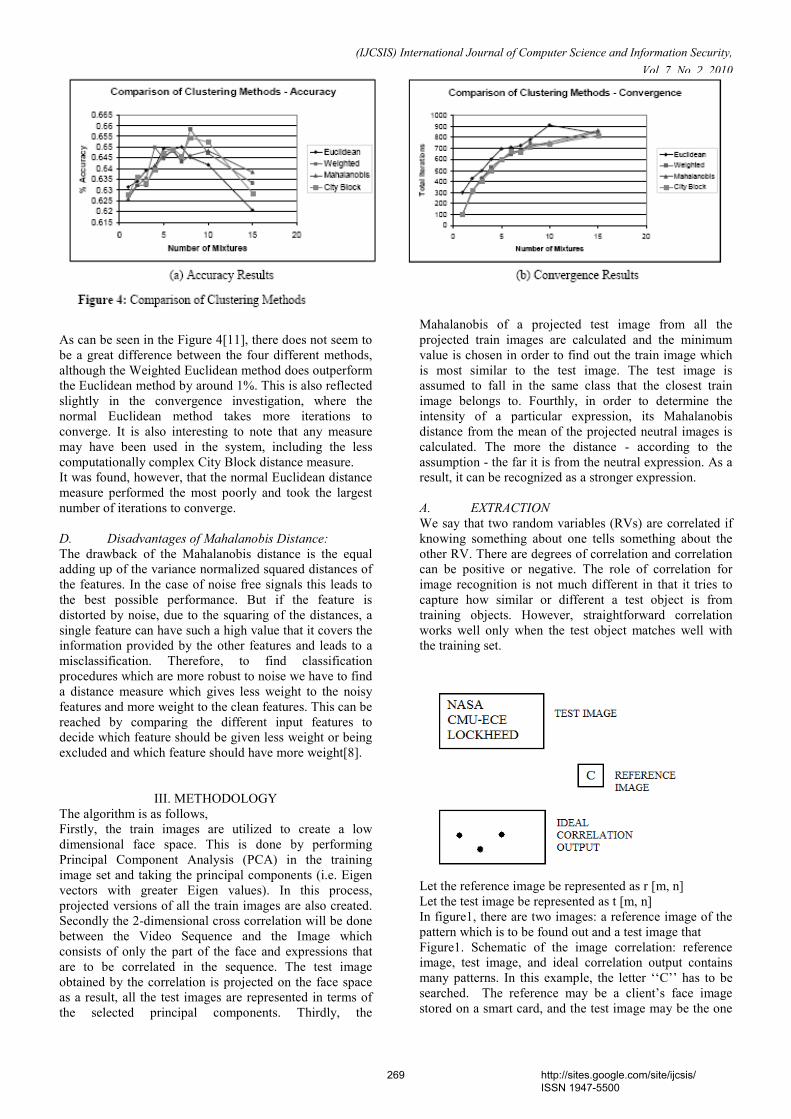
(IJCSIS) International Journal of Computer Science and Information Security,
Vol. 7, �o. 2, 2010
As can be seen in the Figure 4[11], there does not seem to
be a great difference between the four different methods,
although the Weighted Euclidean method does outperform
the Euclidean method by around 1%. This is also reflected
slightly in the convergence investigation, where the
normal Euclidean method takes more iterations to
converge. It is also interesting to note that any measure
may have been used in the system, including the less
computationally complex City Block distance measure.
It was found, however, that the normal Euclidean distance
measure performed the most poorly and took the largest
number of iterations to converge.
D. Disadvantages of Mahalanobis Distance:
The drawback of the Mahalanobis distance is the equal
adding up of the variance normalized squared distances of
the features. In the case of noise free signals this leads to
the best possible performance. But if the feature is
distorted by noise, due to the squaring of the distances, a
single feature can have such a high value that it covers the
information provided by the other features and leads to a
misclassification. Therefore, to find classification
procedures which are more robust to noise we have to find
a distance measure which gives less weight to the noisy
features and more weight to the clean features. This can be
reached by comparing the different input features to
decide which feature should be given less weight or being
excluded and which feature should have more weight[8].
III. METHODOLOGY
The algorithm is as follows,
Firstly, the train images are utilized to create a low
dimensional face space. This is done by performing
Principal Component Analysis (PCA) in the training
image set and taking the principal components (i.e. Eigen
vectors with greater Eigen values). In this process,
projected versions of all the train images are also created.
Secondly the 2-dimensional cross correlation will be done
between the Video Sequence and the Image which
consists of only the part of the face and expressions that
are to be correlated in the sequence. The test image
obtained by the correlation is projected on the face space
as a result, all the test images are represented in terms of
the selected principal components. Thirdly, the
Mahalanobis of a projected test image from all the
projected train images are calculated and the minimum
value is chosen in order to find out the train image which
is most similar to the test image. The test image is
assumed to fall in the same class that the closest train
image belongs to. Fourthly, in order to determine the
intensity of a particular expression, its Mahalanobis
distance from the mean of the projected neutral images is
calculated. The more the distance - according to the
assumption - the far it is from the neutral expression. As a
result, it can be recognized as a stronger expression.
A. EXTRACTIO�
We say that two random variables (RVs) are correlated if
knowing something about one tells something about the
other RV. There are degrees of correlation and correlation
can be positive or negative. The role of correlation for
image recognition is not much different in that it tries to
capture how similar or different a test object is from
training objects. However, straightforward correlation
works well only when the test object matches well with
the training set.
Let the reference image be represented as r [m, n]
Let the test image be represented as t [m, n]
In figure1, there are two images: a reference image of the
pattern which is to be found out and a test image that
Figure1. Schematic of the image correlation: reference
image, test image, and ideal correlation output contains
many patterns. In this example, the letter ‘‘C’’ has to be
searched. The reference may be a client’s face image
stored on a smart card, and the test image may be the one
269 http://sites.google.com/site/ijcsis/ ISSN 1947-5500
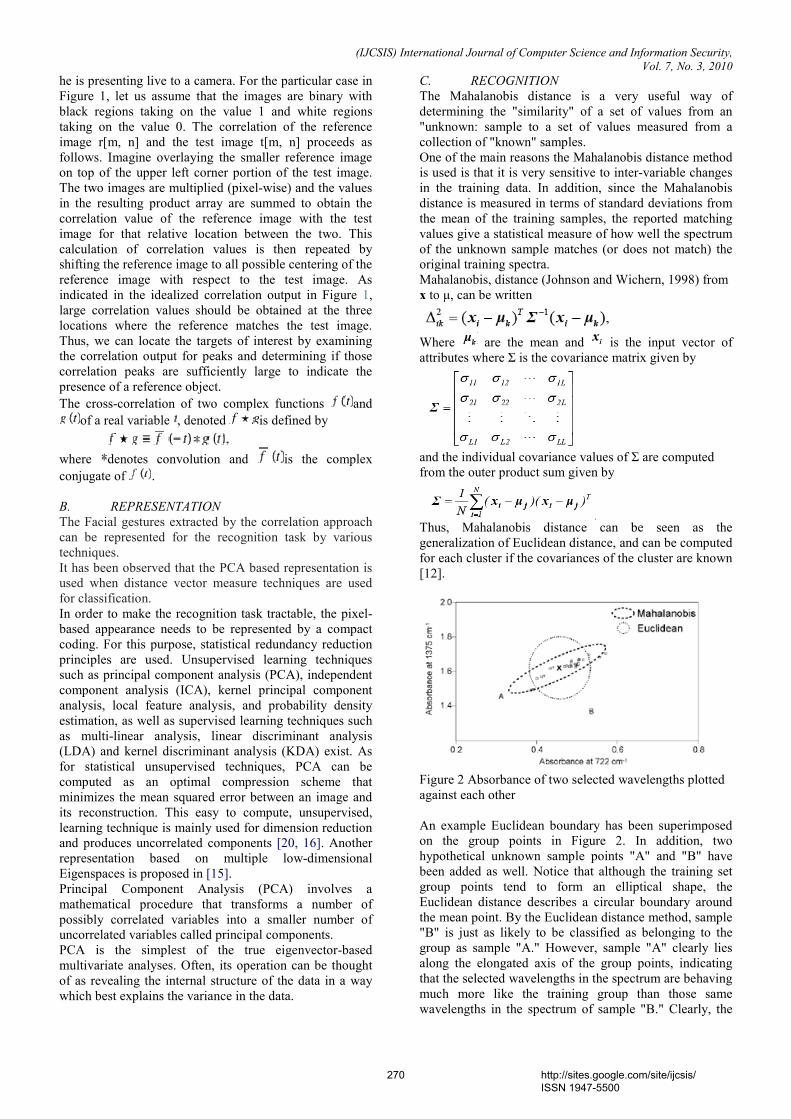
(IJCSIS) International Journal of Computer Science and Information Security,
Vol. 7, �o. 3, 2010
he is presenting live to a camera. For the particular case in
Figure 1, let us assume that the images are binary with
black regions taking on the value 1 and white regions
taking on the value 0. The correlation of the reference
image r[m, n] and the test image t[m, n] proceeds as
follows. Imagine overlaying the smaller reference image
on top of the upper left corner portion of the test image.
The two images are multiplied (pixel-wise) and the values
in the resulting product array are summed to obtain the
correlation value of the reference image with the test
image for that relative location between the two. This
calculation of correlation values is then repeated by
shifting the reference image to all possible centering of the
reference image with respect to the test image. As
indicated in the idealized correlation output in Figure 1,
large correlation values should be obtained at the three
locations where the reference matches the test image.
Thus, we can locate the targets of interest by examining
the correlation output for peaks and determining if those
correlation peaks are sufficiently large to indicate the
presence of a reference object.
The cross-correlation of two complex functions and
of a real variable , denoted is defined by
where denotes convolution and is the complex
conjugate of .
B. REPRESE�TATIO�
The Facial gestures extracted by the correlation approach
can be represented for the recognition task by various
techniques.
It has been observed that the PCA based representation is
used when distance vector measure techniques are used
for classification.
In order to make the recognition task tractable, the pixel-
based appearance needs to be represented by a compact
coding. For this purpose, statistical redundancy reduction
principles are used. Unsupervised learning techniques
such as principal component analysis (PCA), independent
component analysis (ICA), kernel principal component
analysis, local feature analysis, and probability density
estimation, as well as supervised learning techniques such
as multi-linear analysis, linear discriminant analysis
(LDA) and kernel discriminant analysis (KDA) exist. As
for statistical unsupervised techniques, PCA can be
computed as an optimal compression scheme that
minimizes the mean squared error between an image and
its reconstruction. This easy to compute, unsupervised,
learning technique is mainly used for dimension reduction
and produces uncorrelated components [20, 16]. Another
representation based on multiple low-dimensional
Eigenspaces is proposed in [15].
Principal Component Analysis (PCA) involves a
mathematical procedure that transforms a number of
possibly correlated variables into a smaller number of
uncorrelated variables called principal components.
PCA is the simplest of the true eigenvector-based
multivariate analyses. Often, its operation can be thought
of as revealing the internal structure of the data in a way
which best explains the variance in the data.
C. RECOG�ITIO�
The Mahalanobis distance is a very useful way of
determining the "similarity" of a set of values from an
"unknown: sample to a set of values measured from a
collection of "known" samples.
One of the main reasons the Mahalanobis distance method
is used is that it is very sensitive to inter-variable changes
in the training data. In addition, since the Mahalanobis
distance is measured in terms of standard deviations from
the mean of the training samples, the reported matching
values give a statistical measure of how well the spectrum
of the unknown sample matches (or does not match) the
original training spectra.
Mahalanobis, distance (Johnson and Wichern, 1998) from
x to µ, can be written
Where are the mean and is the input vector of
attributes where Σ is the covariance matrix given by
and the individual covariance values of Σ are computed
from the outer product sum given by
Thus, Mahalanobis distance can be seen as the
generalization of Euclidean distance, and can be computed
for each cluster if the covariances of the cluster are known
[12].
Figure 2 Absorbance of two selected wavelengths plotted
against each other
An example Euclidean boundary has been superimposed
on the group points in Figure 2. In addition, two
hypothetical unknown sample points "A" and "B" have
been added as well. Notice that although the training set
group points tend to form an elliptical shape, the
Euclidean distance describes a circular boundary around
the mean point. By the Euclidean distance method, sample
"B" is just as likely to be classified as belonging to the
group as sample "A." However, sample "A" clearly lies
along the elongated axis of the group points, indicating
that the selected wavelengths in the spectrum are behaving
much more like the training group than those same
wavelengths in the spectrum of sample "B." Clearly, the
270 http://sites.google.com/site/ijcsis/ ISSN 1947-5500
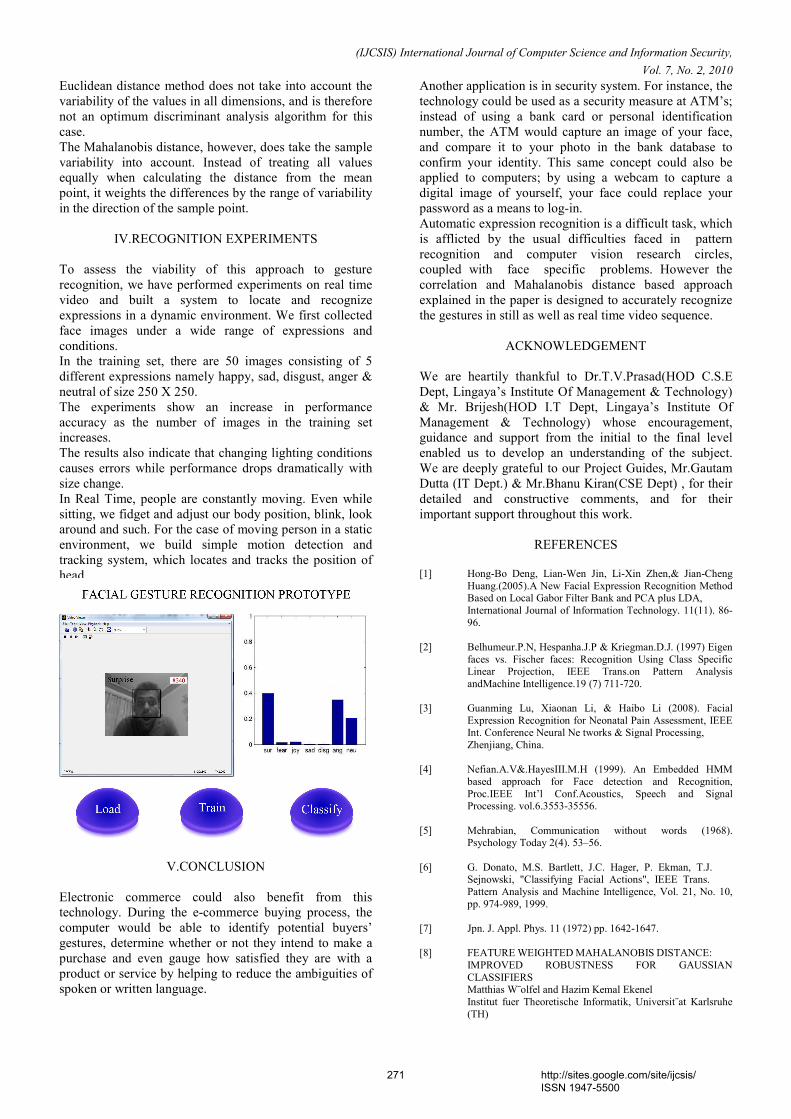
(IJCSIS) International Journal of Computer Science and Information Security,
Vol. 7, �o. 2, 2010
Euclidean distance method does not take into account the
variability of the values in all dimensions, and is therefore
not an optimum discriminant analysis algorithm for this
case.
The Mahalanobis distance, however, does take the sample
variability into account. Instead of treating all values
equally when calculating the distance from the mean
point, it weights the differences by the range of variability
in the direction of the sample point.
IV.RECOGNITION EXPERIMENTS
To assess the viability of this approach to gesture
recognition, we have performed experiments on real time
video and built a system to locate and recognize
expressions in a dynamic environment. We first collected
face images under a wide range of expressions and
conditions.
In the training set, there are 50 images consisting of 5
different expressions namely happy, sad, disgust, anger &
neutral of size 250 X 250.
The experiments show an increase in performance
accuracy as the number of images in the training set
increases.
The results also indicate that changing lighting conditions
causes errors while performance drops dramatically with
size change.
In Real Time, people are constantly moving. Even while
sitting, we fidget and adjust our body position, blink, look
around and such. For the case of moving person in a static
environment, we build simple motion detection and
tracking system, which locates and tracks the position of
head.
V.CONCLUSION
Electronic commerce could also benefit from this
technology. During the e-commerce buying process, the
computer would be able to identify potential buyers’
gestures, determine whether or not they intend to make a
purchase and even gauge how satisfied they are with a
product or service by helping to reduce the ambiguities of
spoken or written language.
Another application is in security system. For instance, the
technology could be used as a security measure at ATM’s;
instead of using a bank card or personal identification
number, the ATM would capture an image of your face,
and compare it to your photo in the bank database to
confirm your identity. This same concept could also be
applied to computers; by using a webcam to capture a
digital image of yourself, your face could replace your
password as a means to log-in.
Automatic expression recognition is a difficult task, which
is afflicted by the usual difficulties faced in pattern
recognition and computer vision research circles,
coupled with face specific problems. However the
correlation and Mahalanobis distance based approach
explained in the paper is designed to accurately recognize
the gestures in still as well as real time video sequence.
ACKNOWLEDGEMENT
We are heartily thankful to Dr.T.V.Prasad(HOD C.S.E
Dept, Lingaya’s Institute Of Management & Technology)
& Mr. Brijesh(HOD I.T Dept, Lingaya’s Institute Of
Management & Technology) whose encouragement,
guidance and support from the initial to the final level
enabled us to develop an understanding of the subject.
We are deeply grateful to our Project Guides, Mr.Gautam
Dutta (IT Dept.) & Mr.Bhanu Kiran(CSE Dept) , for their
detailed and constructive comments, and for their
important support throughout this work.
REFERENCES
[1] Hong-Bo Deng, Lian-Wen Jin, Li-Xin Zhen,& Jian-Cheng
Huang.(2005).A New Facial Expression Recognition Method Based on Local Gabor Filter Bank and PCA plus LDA,
International Journal of Information Technology. 11(11). 86-
96.
[2] Belhumeur.P.N, Hespanha.J.P & Kriegman.D.J. (1997) Eigen
faces vs. Fischer faces: Recognition Using Class Specific Linear Projection, IEEE Trans.on Pattern Analysis
andMachine Intelligence.19 (7) 711-720.
[3] Guanming Lu, Xiaonan Li, & Haibo Li (2008). Facial
Expression Recognition for Neonatal Pain Assessment, IEEE Int. Conference Neural Ne tworks & Signal Processing,
Zhenjiang, China.
[4] Nefian.A.V&.HayesIII.M.H (1999). An Embedded HMM
based approach for Face detection and Recognition,
Proc.IEEE Int’l Conf.Acoustics, Speech and Signal Processing. vol.6.3553-35556.
[5] Mehrabian, Communication without words (1968). Psychology Today 2(4). 53–56.
[6] G. Donato, M.S. Bartlett, J.C. Hager, P. Ekman, T.J. Sejnowski, "Classifying Facial Actions", IEEE Trans.
Pattern Analysis and Machine Intelligence, Vol. 21, No. 10,
pp. 974-989, 1999.
[7] Jpn. J. Appl. Phys. 11 (1972) pp. 1642-1647.
[8] FEATURE WEIGHTED MAHALANOBIS DISTANCE:
IMPROVED ROBUSTNESS FOR GAUSSIAN
CLASSIFIERS Matthias W¨olfel and Hazim Kemal Ekenel
Institut fuer Theoretische Informatik, Universit¨at Karlsruhe
(TH)
271 http://sites.google.com/site/ijcsis/ ISSN 1947-5500
(IJCSIS) International Journal of Computer Science and Information Security,
Vol. 7, �o. 2, 2010 Am Fasanengarten 5, 76131 Karlsruhe, Germany
[9] R.E. Wohlford, E.H. Wrench, and B.P. Landell (1980). "A comparison of four techniques for automatic speaker
recognition", ICASSP-80, pp. 908-911.
[10] Ekman. P. & Friesen. W. V. (1978) Facial Action Coding
System: Investigator’s Guide.
Palo Alto, CA: Consulting Psychologists Press.
[11] ON THE CONVERGENCE OF GAUSSIAN MIXTURE
MODELS: IMPROVEMENTS THROUGH VECTOR QUANTIZATION1
Moody, J., Slomka, S., Pelecanos, J. &, Sridharan, S.
Speech Research Laboratory Queensland University of Technology
GPO Box 2434, Brisbane, Q 4001, Australia
[12] Mahalanobis clustering, with applications to AVO
classification and seismic reservoir parameter estimation
Brian H. Russell and Laurence R. Lines
[13] Liu. C & Wechsler. H (2002). Gabor Feature Based
Classification Using the Enhanced Fisher Linear Discriminant Model for Face Recognition. IEEE Trans. Image
Processing, Vol. 11.467-476.
[14] Essa. I.A. & Pentland. (1997). A.P. Coding analysis
interpretation and recognition of facial expressions. IEEE
Transactions on Pattern Analysis and Machine Intelligence.19 (7). 757–763.
[15] A. Leonardis, H. Bischof, J. Maver, Multiple eigenspaces, Pattern Recognition 35 (11) (2002) 2613–2627.
[16] M. Turk, A. Pentland, Eigenfaces for recognition, J. Cognitive Neurosci. 3 (1) (1991) 71–86.
[17] Blum D. Faceit! (1998 October) Psychology Today. 32–66.
[18] A handwritten character recognition system using modified
Mahalanobis distance Nei Kato *, Masato Abe, Yoshiaki Nemoto Graduate School of Information Sciences, Tohoku
University, Sendai, Japan 980-77
[19] Review of methods for QSAR applicability domain
estimation by the training set
Dr Joanna Jaworska (Procter & Gamble, Strombeek – Bever, Belgium)
Dr Tom Aldenberg (RIVM, Bilthoven, NL) Dr Nina Nikolova (Bulgarian Academy of Sciences, Sofia,
Bulgaria)
[20] B. Moghaddam, Principal manifolds and probabilistic
subspaces for visual recognition, IEEE Trans. Pattern
Anal. Machine Intell. 24 (6) (2002) 780–788.
AUTHORS PROFILE
Supriya Kapoor, a final year computer science student at Lingaya’s Institute of Mgt. & Tech., Faridabad, Haryana, India. Her areas of interest
include Image processing, Artificial Neural Networks, software development life cycle, and project
management-areas.
Shruti Khanna, a final year computer science student at Lingaya’s Institute of Mgt. & Tech.,
Faridabad, Haryana, India. Her areas of interest
include Image processing, Computer architecture and Artificial Neural-Networks.
Rahul Bhatia, a final year information technology
student at Lingaya’s Institute of Mgt. & Tech., Faridabad, Haryana, India. His areas of interest
include Image processing, Artificial Neural
Networks, Computer organization and Operating System.
272 http://sites.google.com/site/ijcsis/ ISSN 1947-5500
(IJCSIS) International Journal of Computer Science and Information Security, Vol. 7 No. 2, 2010
Corresponding Author | Virendra Kumar Shrivastava, Department of Computer Engineering, Singhania University, Pacheri Bari (Rajsthan) India Mob: +91 9896239684 Email: [email protected], [email protected]
FP-tree and COFI Based Approach for Mining of Multiple Level Association Rules in Large Databases
Virendra Kumar Shrivastava
Department of Computer Engineering, Singhania University,
Pacheri Bari, (Rajsthan), India [email protected]
Dr. Parveen Kumar Department of Computer Science & Engineering,Asia Pacific Institute of Information Technology,
Panipat (Haryana), India [email protected]
Dr. K. R. Pardasani Dept. of Maths & MCA,
Maulana Azad National Inst. Of Tech., Bhopal, (M. P.) India
[email protected] Abstract In recent years, discovery of association rules among itemsets in a large database has been described as an important database-mining problem. The problem of discovering association rules has received considerable research attention and several algorithms for mining frequent itemsets have been developed. Many algorithms have been proposed to discover rules at single concept level. However, mining association rules at multiple concept levels may lead to the discovery of more specific and concrete knowledge from data. The discovery of multiple level association rules is very much useful in many applications. In most of the studies for multiple level association rule mining, the database is scanned repeatedly which affects the efficiency of mining process. In this research paper, a new method for discovering multilevel association rules is proposed. It is based on FP-tree structure and uses co-occurrence frequent item tree to find frequent items in multilevel concept hierarchy. Keywords: Data mining, discovery of association rules, multiple-level association rules, FP-tree, FP(l)-tree, COFI-tree, concept hierarchy. 1. Introduction
Association Analysis [1, 2, 5, 11] is the discovery of association rules attribute-value conditions that occur frequently together in a given data set. Association analysis is widely used for market basket or transaction data analysis.
Association Rule mining techniques can be used to
discover unknown or hidden correlation between items found in the database of transactions. An association rule [1,3,4,7] is a rule, which implies certain association relationships among a set of objects (such as ‘occurs together’ or ‘one implies to other’) in a database. Discovery of association rules can help in business decision making, planning marketing strategies etc.
Apriori was proposed by Agrawal and Srikant in 1994. It is also called the level-wise algorithm. It is the most popular and influent algorithm to find all the frequent sets.
The mining of multilevel association is involving items at different level of abstraction. For many applications, it is difficult to find strong association among data items at low or primitive level of abstraction due to the sparsity of data in multilevel dimension. Strong associations discovered at higher levels may represent common sense knowledge. For example, instead of discovering 70% customers of a supermarket that buy milk may also buy bread. It is also interesting to know that 60% customer of a super market buys white bread if they buy skimmed milk. The association relationship in the second statement is expressed at lower level but it conveys more specific and concrete information than that in the first one.
To describe multilevel association rule mining, there
is a requirement to find frequent items at multiple level of abstraction and find efficient method for generating association rules. The first requirement can be full filled by providing concept taxonomies from the primitive level concepts to higher level. There are possible to way to explore efficient discovery of multiple level association rules. One way is to apply the existing single level association rule mining method to mine multilevel association rules. If we apply same minimum support and minimum confidence thresholds (as single level) to the multiple levels, it may lead to some undesirable results. For example, if we apply Apriori algorithm [1] to find data items at multiple level of abstraction under the same minimum support and minimum confidence thresholds. It may lead to generation of some uninteresting associations at higher or intermediate levels.
1. Large support is more likely to exist at high
concept level such as bread and butter rather than at low concept levels, such as a particular
273 http://sites.google.com/site/ijcsis/ ISSN 1947-5500
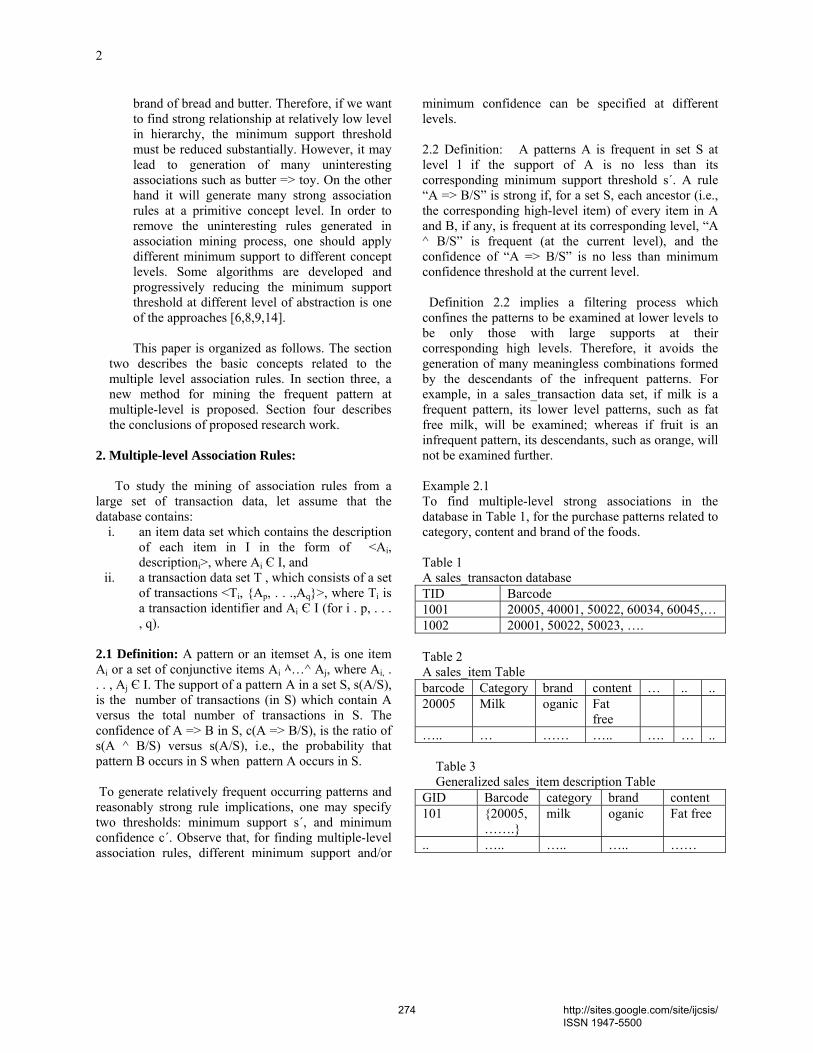
2
brand of bread and butter. Therefore, if we want to find strong relationship at relatively low level in hierarchy, the minimum support threshold must be reduced substantially. However, it may lead to generation of many uninteresting associations such as butter => toy. On the other hand it will generate many strong association rules at a primitive concept level. In order to remove the uninteresting rules generated in association mining process, one should apply different minimum support to different concept levels. Some algorithms are developed and progressively reducing the minimum support threshold at different level of abstraction is one of the approaches [6,8,9,14].
This paper is organized as follows. The section
two describes the basic concepts related to the multiple level association rules. In section three, a new method for mining the frequent pattern at multiple-level is proposed. Section four describes the conclusions of proposed research work.
2. Multiple-level Association Rules:
To study the mining of association rules from a large set of transaction data, let assume that the database contains:
i. an item data set which contains the description of each item in I in the form of <Ai, descriptioni>, where Ai Є I, and
ii. a transaction data set T , which consists of a set of transactions <Ti, {Ap, . . .,Aq}>, where Ti is a transaction identifier and Ai Є I (for i . p, . . . , q).
2.1 Definition: A pattern or an itemset A, is one item Ai or a set of conjunctive items Ai ٨…^ Aj, where Ai, . . . , Aj Є I. The support of a pattern A in a set S, s(A/S), is the number of transactions (in S) which contain A versus the total number of transactions in S. The confidence of A => B in S, c(A => B/S), is the ratio of s(A ^ B/S) versus s(A/S), i.e., the probability that pattern B occurs in S when pattern A occurs in S. To generate relatively frequent occurring patterns and reasonably strong rule implications, one may specify two thresholds: minimum support s΄, and minimum confidence c΄. Observe that, for finding multiple-level association rules, different minimum support and/or
minimum confidence can be specified at different levels. 2.2 Definition: A patterns A is frequent in set S at level l if the support of A is no less than its corresponding minimum support threshold s΄. A rule “A => B/S” is strong if, for a set S, each ancestor (i.e., the corresponding high-level item) of every item in A and B, if any, is frequent at its corresponding level, “A ^ B/S” is frequent (at the current level), and the confidence of “A => B/S” is no less than minimum confidence threshold at the current level. Definition 2.2 implies a filtering process which confines the patterns to be examined at lower levels to be only those with large supports at their corresponding high levels. Therefore, it avoids the generation of many meaningless combinations formed by the descendants of the infrequent patterns. For example, in a sales_transaction data set, if milk is a frequent pattern, its lower level patterns, such as fat free milk, will be examined; whereas if fruit is an infrequent pattern, its descendants, such as orange, will not be examined further. Example 2.1 To find multiple-level strong associations in the database in Table 1, for the purchase patterns related to category, content and brand of the foods. Table 1 A sales_transacton database TID Barcode 1001 20005, 40001, 50022, 60034, 60045,… 1002 20001, 50022, 50023, ….
Table 2 A sales_item Table barcode Category brand content … .. .. 20005 Milk oganic Fat
free
….. … …… ….. …. … .. Table 3 Generalized sales_item description Table
GID Barcode category brand content 101 {20005,
…….} milk oganic Fat free
.. ….. ….. ….. ……
274 http://sites.google.com/site/ijcsis/ ISSN 1947-5500
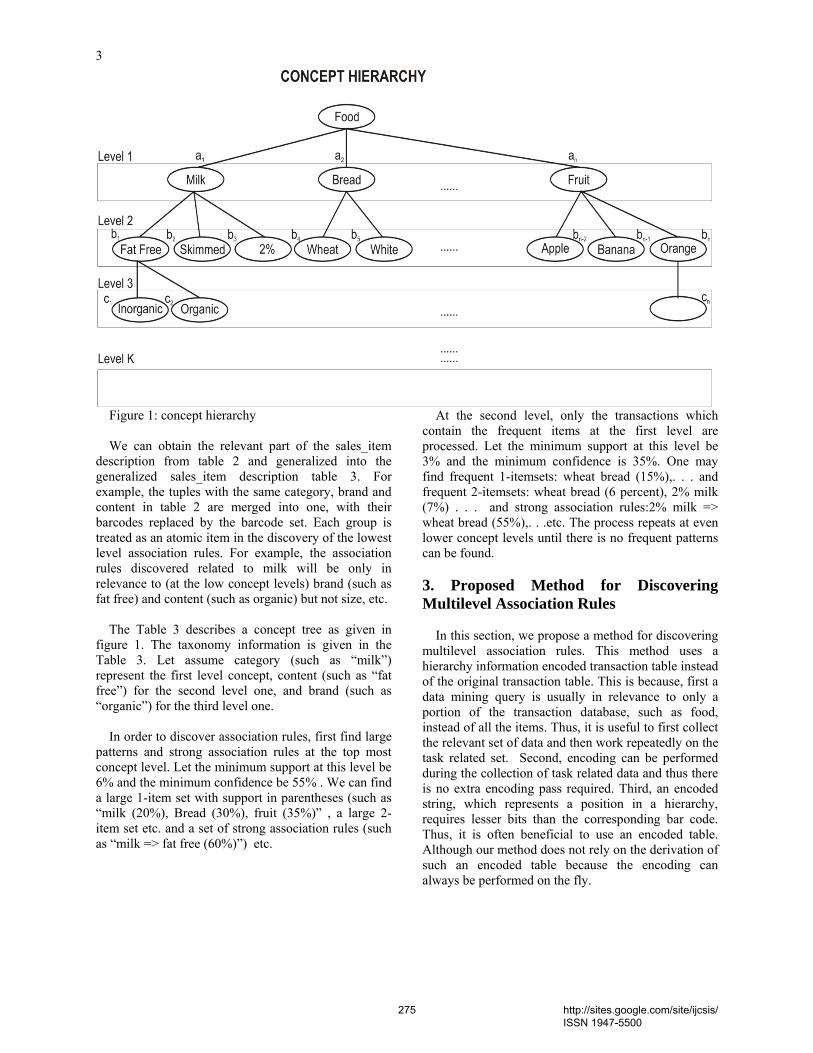
3
Figure 1: concept hierarchy We can obtain the relevant part of the sales_item description from table 2 and generalized into the generalized sales_item description table 3. For example, the tuples with the same category, brand and content in table 2 are merged into one, with their barcodes replaced by the barcode set. Each group is treated as an atomic item in the discovery of the lowest level association rules. For example, the association rules discovered related to milk will be only in relevance to (at the low concept levels) brand (such as fat free) and content (such as organic) but not size, etc. The Table 3 describes a concept tree as given in figure 1. The taxonomy information is given in the Table 3. Let assume category (such as “milk”) represent the first level concept, content (such as “fat free”) for the second level one, and brand (such as “organic”) for the third level one. In order to discover association rules, first find large patterns and strong association rules at the top most concept level. Let the minimum support at this level be 6% and the minimum confidence be 55% . We can find a large 1-item set with support in parentheses (such as “milk (20%), Bread (30%), fruit (35%)” , a large 2-item set etc. and a set of strong association rules (such as “milk => fat free (60%)”) etc.
At the second level, only the transactions which contain the frequent items at the first level are processed. Let the minimum support at this level be 3% and the minimum confidence is 35%. One may find frequent 1-itemsets: wheat bread (15%),. . . and frequent 2-itemsets: wheat bread (6 percent), 2% milk (7%) . . . and strong association rules:2% milk => wheat bread (55%),. . .etc. The process repeats at even lower concept levels until there is no frequent patterns can be found. 3. Proposed Method for Discovering Multilevel Association Rules
In this section, we propose a method for discovering multilevel association rules. This method uses a hierarchy information encoded transaction table instead of the original transaction table. This is because, first a data mining query is usually in relevance to only a portion of the transaction database, such as food, instead of all the items. Thus, it is useful to first collect the relevant set of data and then work repeatedly on the task related set. Second, encoding can be performed during the collection of task related data and thus there is no extra encoding pass required. Third, an encoded string, which represents a position in a hierarchy, requires lesser bits than the corresponding bar code. Thus, it is often beneficial to use an encoded table. Although our method does not rely on the derivation of such an encoded table because the encoding can always be performed on the fly.
275 http://sites.google.com/site/ijcsis/ ISSN 1947-5500
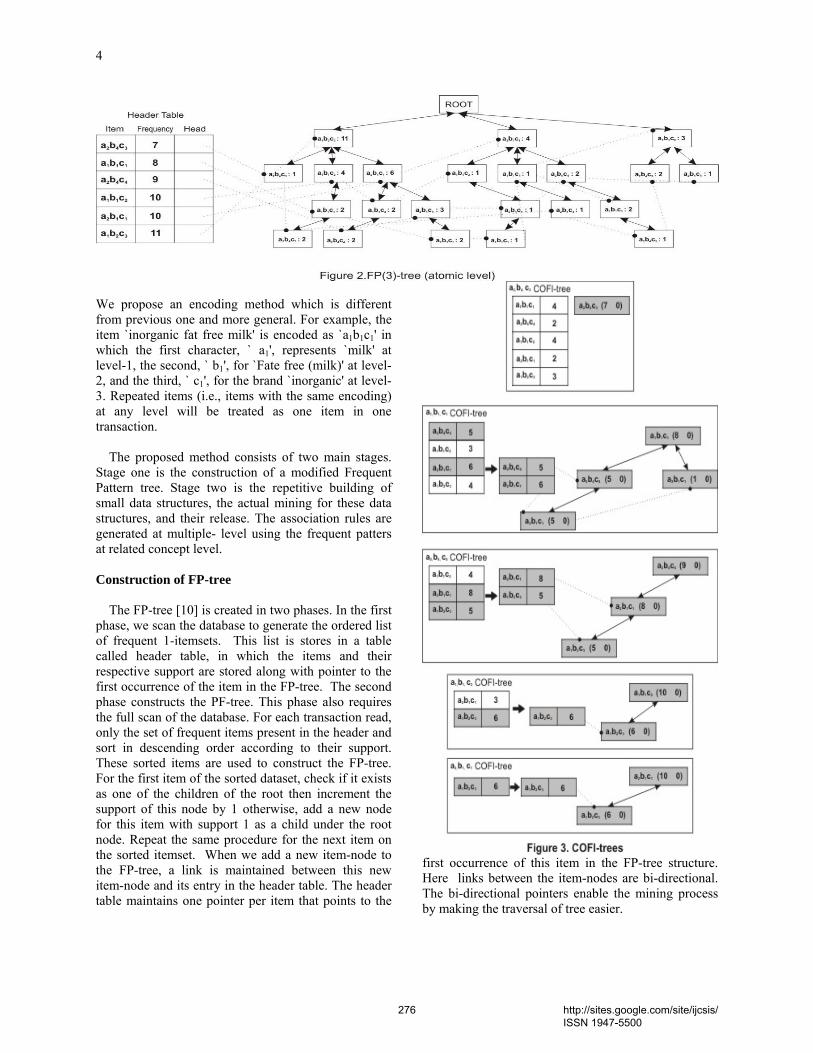
4
We propose an encoding method which is different from previous one and more general. For example, the item `inorganic fat free milk' is encoded as `a1b1c1' in which the first character, ` a1', represents `milk' at level-1, the second, ` b1', for `Fate free (milk)' at level-2, and the third, ` c1', for the brand `inorganic' at level-3. Repeated items (i.e., items with the same encoding) at any level will be treated as one item in one transaction.
The proposed method consists of two main stages. Stage one is the construction of a modified Frequent Pattern tree. Stage two is the repetitive building of small data structures, the actual mining for these data structures, and their release. The association rules are generated at multiple- level using the frequent patters at related concept level. Construction of FP-tree The FP-tree [10] is created in two phases. In the first phase, we scan the database to generate the ordered list of frequent 1-itemsets. This list is stores in a table called header table, in which the items and their respective support are stored along with pointer to the first occurrence of the item in the FP-tree. The second phase constructs the PF-tree. This phase also requires the full scan of the database. For each transaction read, only the set of frequent items present in the header and sort in descending order according to their support. These sorted items are used to construct the FP-tree. For the first item of the sorted dataset, check if it exists as one of the children of the root then increment the support of this node by 1 otherwise, add a new node for this item with support 1 as a child under the root node. Repeat the same procedure for the next item on the sorted itemset. When we add a new item-node to the FP-tree, a link is maintained between this new item-node and its entry in the header table. The header table maintains one pointer per item that points to the
first occurrence of this item in the FP-tree structure. Here links between the item-nodes are bi-directional. The bi-directional pointers enable the mining process by making the traversal of tree easier.
276 http://sites.google.com/site/ijcsis/ ISSN 1947-5500
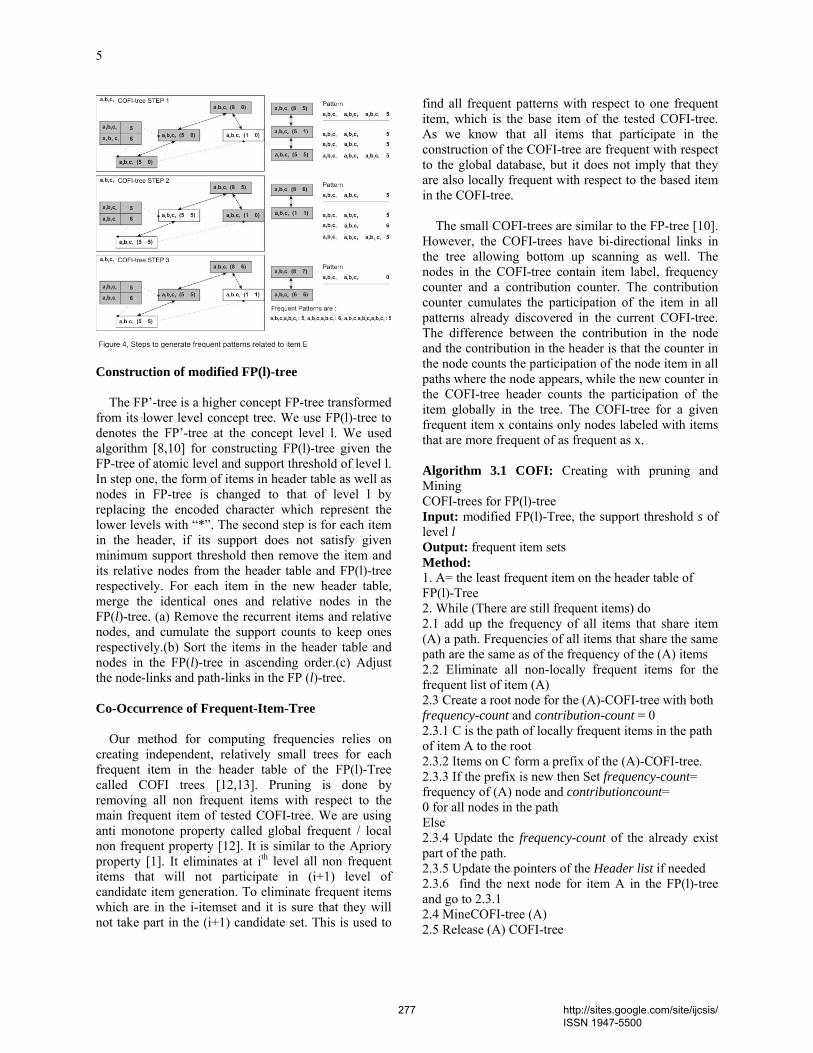
5
Construction of modified FP(l)-tree The FP’-tree is a higher concept FP-tree transformed from its lower level concept tree. We use FP(l)-tree to denotes the FP’-tree at the concept level l. We used algorithm [8,10] for constructing FP(l)-tree given the FP-tree of atomic level and support threshold of level l. In step one, the form of items in header table as well as nodes in FP-tree is changed to that of level l by replacing the encoded character which represent the lower levels with “*”. The second step is for each item in the header, if its support does not satisfy given minimum support threshold then remove the item and its relative nodes from the header table and FP(l)-tree respectively. For each item in the new header table, merge the identical ones and relative nodes in the FP(l)-tree. (a) Remove the recurrent items and relative nodes, and cumulate the support counts to keep ones respectively.(b) Sort the items in the header table and nodes in the FP(l)-tree in ascending order.(c) Adjust the node-links and path-links in the FP (l)-tree. Co-Occurrence of Frequent-Item-Tree Our method for computing frequencies relies on creating independent, relatively small trees for each frequent item in the header table of the FP(l)-Tree called COFI trees [12,13]. Pruning is done by removing all non frequent items with respect to the main frequent item of tested COFI-tree. We are using anti monotone property called global frequent / local non frequent property [12]. It is similar to the Apriory property [1]. It eliminates at ith level all non frequent items that will not participate in (i+1) level of candidate item generation. To eliminate frequent items which are in the i-itemset and it is sure that they will not take part in the (i+1) candidate set. This is used to
find all frequent patterns with respect to one frequent item, which is the base item of the tested COFI-tree. As we know that all items that participate in the construction of the COFI-tree are frequent with respect to the global database, but it does not imply that they are also locally frequent with respect to the based item in the COFI-tree. The small COFI-trees are similar to the FP-tree [10]. However, the COFI-trees have bi-directional links in the tree allowing bottom up scanning as well. The nodes in the COFI-tree contain item label, frequency counter and a contribution counter. The contribution counter cumulates the participation of the item in all patterns already discovered in the current COFI-tree. The difference between the contribution in the node and the contribution in the header is that the counter in the node counts the participation of the node item in all paths where the node appears, while the new counter in the COFI-tree header counts the participation of the item globally in the tree. The COFI-tree for a given frequent item x contains only nodes labeled with items that are more frequent of as frequent as x. Algorithm 3.1 COFI: Creating with pruning and Mining COFI-trees for FP(l)-tree Input: modified FP(l)-Tree, the support threshold s of level l Output: frequent item sets Method: 1. A= the least frequent item on the header table of FP(l)-Tree 2. While (There are still frequent items) do 2.1 add up the frequency of all items that share item (A) a path. Frequencies of all items that share the same path are the same as of the frequency of the (A) items 2.2 Eliminate all non-locally frequent items for the frequent list of item (A) 2.3 Create a root node for the (A)-COFI-tree with both frequency-count and contribution-count = 0 2.3.1 C is the path of locally frequent items in the path of item A to the root 2.3.2 Items on C form a prefix of the (A)-COFI-tree. 2.3.3 If the prefix is new then Set frequency-count= frequency of (A) node and contributioncount= 0 for all nodes in the path Else 2.3.4 Update the frequency-count of the already exist part of the path. 2.3.5 Update the pointers of the Header list if needed 2.3.6 find the next node for item A in the FP(l)-tree and go to 2.3.1 2.4 MineCOFI-tree (A) 2.5 Release (A) COFI-tree
277 http://sites.google.com/site/ijcsis/ ISSN 1947-5500
6
2.6 A = next frequent item from the header table of FP(l)-Tree 3. Goto 2 Function: MineCOFI-tree (A) 1. nodeA = select next node //Selection of nodes starts with the node of most locally frequent item and following its chain, then the next less frequent item with its chain, until we reach the least frequent item in the Header list of the (A)-COFI-tree 2. while (there are still nodes) do 2.1 D = set of nodes from nodeA to the root 2.2 F = nodeA.frequency-count-nodeA. contribution-count 2.3 Generate all Candidate patterns X from items in D. Patterns that do not have A will be discarded. 2.4 Patterns in X that do not exist in the A-Candidate List will be added to it with frequency = F otherwise just increment their frequency with F 2.5 Increment the value of contribution-count by F for all items in D 2.6 nodeA = select next node 3. Goto 2 4. Based on support threshold s remove non-frequent patterns from A Candidate List. Algorithm 3.2 Input: Candidate rule-set R
1, FP(L)-tree for each
concept level, support threshold s and confidence c at each concept level. A
i - the antecedent of rule r
iR
1 represents
;
n - the total transactions; im
- the item which has the lowest concept level among the items in r
i;
FP(l)-tree - the corresponding FP-tree of the concept level of i
m.
Output: The confirmed rule-set R1.
Method:
For each rule ri, if its support and confidence are
NULL, calculate its support and confidence by following steps: (a) Start from the head (in header table) of i
m, and
follow its node-links and located paths in FP(l)-tree to find all other items, which belong to the lower concept levels of the items in r
i
(b) Calculate the support counts of ri and A
i with the
COFI-tree and item im
derives, and sum them respectively to get the support count s
i of r
i and the
support count si’ of A
i.
(c) If si/ns and s
i/s
i’≥c, then keep the rule r
i in the R
1
and delete the corresponding rules which have the same group ID if they are atomic rules; else delete r
i from the R
1.
4. Conclusion In this research works, we have proposed a generalized encoding method and combining FP growth tree with COFI for mining of multilevel association rules from large database. This proposed approach uses FP(l)-tree to construct FP-tree for the level l. To find frequent patters this new method creates COFI-tree which reduces the memory usage in comparison to FP-growth effectively in efficient way. Therefore, it can mine larger database with smaller main memory available. This method uses the non recursive mining process and a simple traversal of the COFI-tree, a full set of frequent items can be generated. It also uses an efficient pruning method that is to remove all locally non frequent patters, leaving the COFI-tree with only locally frequent items. It reaps the advantages of both the FP growth and COFI. References [1] R. Agrawal, T. Imielinski, and A. Swami.. “Mining
association rules between sets of items in large databases”. In Proceedings of the 1993 ACM SIG- MOD International Conference on Management of Data, pages 207-216, Washington, DC, May 26-28 1993.
[2] R Srikant, Qouc Vu and R Agrawal. “Mining Association Rules with Item Constrains”. IBM Research Centre, San Jose, CA 95120, USA.
[3] Ashok Savasere, E. Omiecinski and Shamkant
Navathe “An Efficient Algorithm for Mining Association Rules in Large Databases”. Proceedings of the 21st VLDB conference Zurich, Swizerland, 1995.
[4] R. Agrawaland R, Shrikanth, “Fast Algorithm for Mining Association Rules”. Proceedings Of VLDB conference, pp 487 – 449, Santigo, Chile, 1994.
[5] Arun K Pujai “Data Mining techniques”. University Press (India) Pvt. Ltd. 2001.
[6] Jiawei Han and Yongjian Fu “Discovery of Multiple-Level Association Rules from Large Databases”. Proceedings of the 21st VLDB Conference Zurich, Swizerland, 1995.
[7] J. Han and M. Kamber. Data Mining: Concepts and
278 http://sites.google.com/site/ijcsis/ ISSN 1947-5500
7
Techniques. Morgan Kaufman, San Francisco, CA, 2001.
[8] Yin-bo Wan, Yong Liang, Li-ya Ding ”Mining multilevel association rules with dynamic concept hierarchy”. In proceedings of the seventh international conference on machine learning and cybernetics, kunming, 12-15 july 2008.
[9] Jiawei Han and Yongjian Fu “Discovery of Multiple-Level Association Rules from Large Databases”. IEEE Trans. on Knowledge and Data Eng. Vol. 11 No. 5 pp 798-804, 1999.
[10] J. Han, J, Pei and Y Yin. “Mining Frequent Patterns Without Candidate Generation”. In ACM SIGMOD Conf. Management of Data, May 2000.
[11] Y. Wang, Y. He and J. Han. “Mining Frequent Item Sets Using Support Constraints.” In Proceedings 2000 Int Conference VLDB’00, Carid; Egypt, Sep. 2000, Page 43-52.
[12] Mohammad El-Hajj and Osmar R. Za¨ıane. “COFI- tree Mining: A New Approach to Pattern Growth with in the context of interactive mining. In Proc. 2003 Int’l Conf. on Data Mining and Knowledge Discovery (ACM SIGKDD), August 2003.
[13] M. El-Hajj and O. R. Za¨ıane. Inverted matrix: Efficient discovery of frequent items in large datasets in the context of interactive mining. In proce. 2003Int' Conf. on Data Mining and Knowledge Discovery (ACM SIGKDD), August 2003.
[14] R. S. Thakur, R. C. Jain and K. R. Pardasani ” Fast Algorith for mining multi-level association rules in large databases”. Asian Journal of International Management 1(1):19-26, 2007.
AUTHORS PROFILE Virendra Kumar Shrivastava has completed his M. Tech. (Computer Technology) from School of IT, RGPV (Sate Technological University of M. P.) Bhopal, India. He is Associate Professor at Asia Pacific Institute of Information Technology SD India Panipat (Haryana) India. His research area is Data Mining. Presently he is perusing Ph. D. in Department of Computer Engineering, Singhania University, Pacheri Bari (Raj.) India. Dr. Parveen Kumar has obtained Ph. D. in Computer Science from Kurukshetra University, Kurukshetra (Haryana), India. Presently he is working as Professor cum Director Research at Asia Pacific Institute of Information Technology SD India, Panipat (Haryana) india. His research interest includes Check Point and Data Mining. Dr. Kamal Raj Pardasani is working as Professor and Head in Department of Mathematics and Dean Research and Development Maulana Azad National Institute of Technology, Bhopal. He did his Ph. D. in applied Mathematics in 1988. His current research interests are Computational Biology, Data Mining, Bio-computing and Finite Element Modeling.
279 http://sites.google.com/site/ijcsis/ ISSN 1947-5500
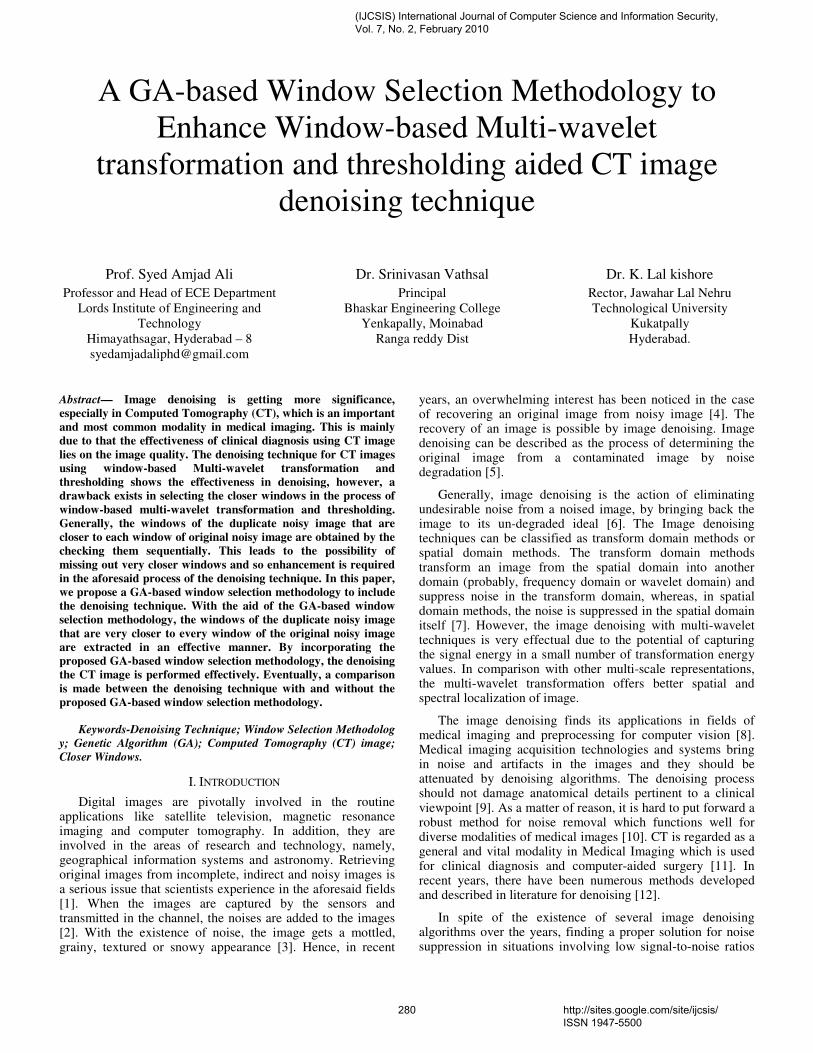
A GA-based Window Selection Methodology to
Enhance Window-based Multi-wavelet
transformation and thresholding aided CT image
denoising technique
Prof. Syed Amjad Ali
Professor and Head of ECE Department
Lords Institute of Engineering and
Technology
Himayathsagar, Hyderabad – 8
Dr. Srinivasan Vathsal
Principal
Bhaskar Engineering College
Yenkapally, Moinabad
Ranga reddy Dist
Dr. K. Lal kishore
Rector, Jawahar Lal Nehru
Technological University
Kukatpally
Hyderabad.
Abstract— Image denoising is getting more significance,
especially in Computed Tomography (CT), which is an important
and most common modality in medical imaging. This is mainly
due to that the effectiveness of clinical diagnosis using CT image
lies on the image quality. The denoising technique for CT images
using window-based Multi-wavelet transformation and
thresholding shows the effectiveness in denoising, however, a
drawback exists in selecting the closer windows in the process of
window-based multi-wavelet transformation and thresholding.
Generally, the windows of the duplicate noisy image that are
closer to each window of original noisy image are obtained by the
checking them sequentially. This leads to the possibility of
missing out very closer windows and so enhancement is required
in the aforesaid process of the denoising technique. In this paper,
we propose a GA-based window selection methodology to include
the denoising technique. With the aid of the GA-based window
selection methodology, the windows of the duplicate noisy image
that are very closer to every window of the original noisy image
are extracted in an effective manner. By incorporating the
proposed GA-based window selection methodology, the denoising
the CT image is performed effectively. Eventually, a comparison
is made between the denoising technique with and without the
proposed GA-based window selection methodology.
Keywords-Denoising Technique; Window Selection Methodolog
y; Genetic Algorithm (GA); Computed Tomography (CT) image;
Closer Windows.
I. INTRODUCTION
Digital images are pivotally involved in the routine applications like satellite television, magnetic resonance imaging and computer tomography. In addition, they are involved in the areas of research and technology, namely, geographical information systems and astronomy. Retrieving original images from incomplete, indirect and noisy images is a serious issue that scientists experience in the aforesaid fields [1]. When the images are captured by the sensors and transmitted in the channel, the noises are added to the images [2]. With the existence of noise, the image gets a mottled, grainy, textured or snowy appearance [3]. Hence, in recent
years, an overwhelming interest has been noticed in the case of recovering an original image from noisy image [4]. The recovery of an image is possible by image denoising. Image denoising can be described as the process of determining the original image from a contaminated image by noise degradation [5].
Generally, image denoising is the action of eliminating undesirable noise from a noised image, by bringing back the image to its un-degraded ideal [6]. The Image denoising techniques can be classified as transform domain methods or spatial domain methods. The transform domain methods transform an image from the spatial domain into another domain (probably, frequency domain or wavelet domain) and suppress noise in the transform domain, whereas, in spatial domain methods, the noise is suppressed in the spatial domain itself [7]. However, the image denoising with multi-wavelet techniques is very effectual due to the potential of capturing the signal energy in a small number of transformation energy values. In comparison with other multi-scale representations, the multi-wavelet transformation offers better spatial and spectral localization of image.
The image denoising finds its applications in fields of medical imaging and preprocessing for computer vision [8]. Medical imaging acquisition technologies and systems bring in noise and artifacts in the images and they should be attenuated by denoising algorithms. The denoising process should not damage anatomical details pertinent to a clinical viewpoint [9]. As a matter of reason, it is hard to put forward a robust method for noise removal which functions well for diverse modalities of medical images [10]. CT is regarded as a general and vital modality in Medical Imaging which is used for clinical diagnosis and computer-aided surgery [11]. In recent years, there have been numerous methods developed and described in literature for denoising [12].
In spite of the existence of several image denoising algorithms over the years, finding a proper solution for noise suppression in situations involving low signal-to-noise ratios
(IJCSIS) International Journal of Computer Science and Information Security, Vol. 7, No. 2, February 2010
280 http://sites.google.com/site/ijcsis/ ISSN 1947-5500
remains a complex task [13]. In the earlier work, an efficient denoising technique for CT images employing window-based Multi-wavelet transformation and thresholding has been presented [32]. There the multi-wavelet has been favored since it betters single wavelets by its characteristics particularly, orthogonality, short support, symmetry, and high degree of vanishing moments. The technique has denoised the CT images degraded by AWGN and enhances the quality of the image. However, a drawback persists in choosing the closer windows in the process of window-based multi-wavelet transformation and thresholding. Normally, the windows of the duplicate noisy image that are closer to each window of original noisy image are acquired by the inspecting them sequentially. This results in the possibility of missing out very closer windows and so enhancement is needed in the aforesaid process of the denoising technique.
Here, we propose a GA-based window selection methodology to incorporate the denoising technique. With the aid of the GA-based window selection methodology, the windows of the duplicate noisy image that are very closer to every window of the original noisy image are extracted in an effectual way. By incorporating the proposed GA-based window selection methodology, the denoising is carried out more successfully. Eventually, a comparison is made between the denoising technique with and without the proposed GA-based window selection methodology. The rest of the paper is organized as follows. Section II briefly reviews the recent research works in the literature and Section III gives a short introduction about the GA. Section IV explains the window selection methodology of the denoising technique proposed in the previous work. Section V describes the proposed GA-based window selection methodology with required illustrations and mathematical formulations. Section VI discusses about the implementation results and Section VII concludes the paper.
II. RELATED WORKS
Lanzolla et al. [14] have evaluated the effect of different noise reduction filters on computed tomography (CT) images. Especially, they have presented a denoising filter on the basis of a combination of Gaussian and Prewitt operators. Simulation results have proved that their presented technique has enhanced the image quality, and then permitted to use low radiation dose protocol in CT examinations. Their work was carried out in association with "G.Moscati" Hospital of Taranto (Italy), that offered all the images and technical materials employed in the proposed algorithm. Bing-gang Ye and Xiao-ming Wu [15] have addressed that the prior detection of small hepatocellular carcinoma (SHCC) has significant clinic value, and wavelet denoising arithmetic research of SHCC CT image, on the basis of image processing technology has aided to diagnose the SHCC focus. In accordance with the wavelet coefficient correlation, their work has reduced the figures and eliminated the feeble or irrelated coefficient of noise of SHCC CT image, and finally removed the noise.
The objective of Jin Li et al. [7] was to lessen the noise and artifacts in the industrial CT image by anisotropic diffusion. Anisotropic diffusion algorithms which could maintain
significant edges sharp and spatially fixed at the same time as filtering noise and small edges eliminated the noise from an image by altering the image through a partial differential equation. In conventional anisotropic diffusions which lead to the loss of image details and cause false contours, 4-neighborhood directions are employed generally except diagonal directions of the image. To remove the drawbacks of the conventional anisotropic diffusion methods, an anisotropic diffusion method for industrial CT image based on the types of gradient directions was presented. In their work, one parameter K is calculated first by the histogram of the gradient. Then Sobel operator was made use of to calculate the directions of gradient. The directions of the gradient were classified. Experimental results have revealed that their presented algorithm could eliminate noise and artifacts from industrial CT volume data sets that were better than the Gaussian filter and other traditional algorithm.
Hossein Rabbani [16] have presented an image denoising algorithm based on the modeling of coefficients in each sub-band of steerable pyramid employing a Laplacian probability density function (PDF) with local variance. That PDF was able to model the heavy-tailed nature of steerable pyramid coefficients and the empirically observed correlation between the coefficient amplitudes. Within that framework, he has described a method for image denoising based on designing both maximum a posteriori (MAP) and minimum mean squared error (MMSE) estimators, which has relied on the zero-mean Laplacian random variables with high local correlation. Despite the simplicity of his spatially adaptive denoising method, both in its concern and implementation, his denoising results has achieved better performance than several published methods such as Bayes least squared Gaussian scale mixture (BLS-GSM) technique that was a state-of-the-art denoising technique.
H.Rabbani et al. [17] have proposed noise reduction algorithms that could be employed to improve image quality in several medical imaging modalities like magnetic resonance and multidetector CT. The acquired noisy 3-D data were first transformed by discrete complex wavelet transform. Employing a nonlinear function, they have modeled the data as sum of the clean data plus additive Gaussian or Rayleigh noise. They employed a mixture of bivariate Laplacian probability density functions for the clean data in the transformed domain. The MAP and minimum mean-squared error (MMSE) estimators enabled them to effectively reduce the noise. In addition, they have calculated the parameters of the model using local information. Experimental results on CT images revealed that among their derived shrinkage functions, generally, BiLapGausMAP has given images with higher peak SNR.
Skiadopoulos et al. [18] have carried out a comparative study between a multi-scale platelet denoising method and the well-established Butterworth filter, which was employed as a pre- and post-processing step on image reconstruction. The comparison was performed with and/or without attenuation correction. Quantitative evaluation was executed by using 1) a cardiac phantom comprising of two different size cold defects, employed in two experiments done to simulate conditions with and without photon attenuation from myocardial surrounding
(IJCSIS) International Journal of Computer Science and Information Security, Vol. 7, No. 2, February 2010
281 http://sites.google.com/site/ijcsis/ ISSN 1947-5500
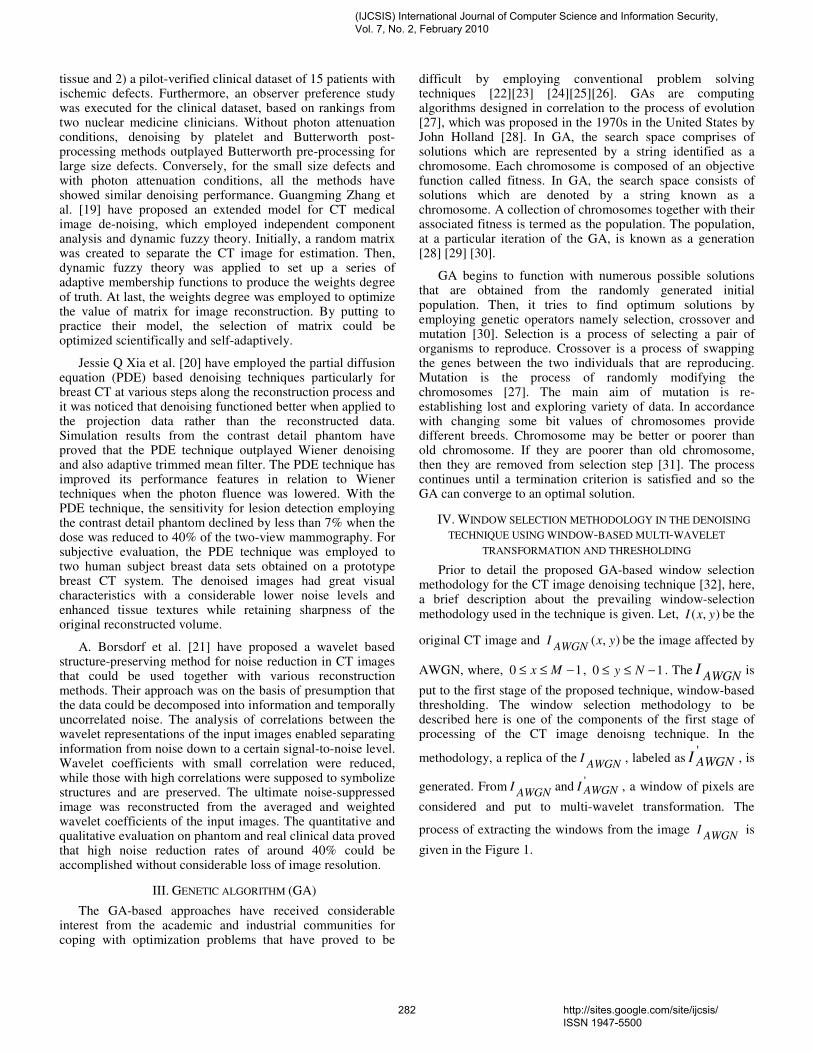
tissue and 2) a pilot-verified clinical dataset of 15 patients with ischemic defects. Furthermore, an observer preference study was executed for the clinical dataset, based on rankings from two nuclear medicine clinicians. Without photon attenuation conditions, denoising by platelet and Butterworth post-processing methods outplayed Butterworth pre-processing for large size defects. Conversely, for the small size defects and with photon attenuation conditions, all the methods have showed similar denoising performance. Guangming Zhang et al. [19] have proposed an extended model for CT medical image de-noising, which employed independent component analysis and dynamic fuzzy theory. Initially, a random matrix was created to separate the CT image for estimation. Then, dynamic fuzzy theory was applied to set up a series of adaptive membership functions to produce the weights degree of truth. At last, the weights degree was employed to optimize the value of matrix for image reconstruction. By putting to practice their model, the selection of matrix could be optimized scientifically and self-adaptively.
Jessie Q Xia et al. [20] have employed the partial diffusion equation (PDE) based denoising techniques particularly for breast CT at various steps along the reconstruction process and it was noticed that denoising functioned better when applied to the projection data rather than the reconstructed data. Simulation results from the contrast detail phantom have proved that the PDE technique outplayed Wiener denoising and also adaptive trimmed mean filter. The PDE technique has improved its performance features in relation to Wiener techniques when the photon fluence was lowered. With the PDE technique, the sensitivity for lesion detection employing the contrast detail phantom declined by less than 7% when the dose was reduced to 40% of the two-view mammography. For subjective evaluation, the PDE technique was employed to two human subject breast data sets obtained on a prototype breast CT system. The denoised images had great visual characteristics with a considerable lower noise levels and enhanced tissue textures while retaining sharpness of the original reconstructed volume.
A. Borsdorf et al. [21] have proposed a wavelet based structure-preserving method for noise reduction in CT images that could be used together with various reconstruction methods. Their approach was on the basis of presumption that the data could be decomposed into information and temporally uncorrelated noise. The analysis of correlations between the wavelet representations of the input images enabled separating information from noise down to a certain signal-to-noise level. Wavelet coefficients with small correlation were reduced, while those with high correlations were supposed to symbolize structures and are preserved. The ultimate noise-suppressed image was reconstructed from the averaged and weighted wavelet coefficients of the input images. The quantitative and qualitative evaluation on phantom and real clinical data proved that high noise reduction rates of around 40% could be accomplished without considerable loss of image resolution.
III. GENETIC ALGORITHM (GA)
The GA-based approaches have received considerable interest from the academic and industrial communities for coping with optimization problems that have proved to be
difficult by employing conventional problem solving techniques [22][23] [24][25][26]. GAs are computing algorithms designed in correlation to the process of evolution [27], which was proposed in the 1970s in the United States by John Holland [28]. In GA, the search space comprises of solutions which are represented by a string identified as a chromosome. Each chromosome is composed of an objective function called fitness. In GA, the search space consists of solutions which are denoted by a string known as a chromosome. A collection of chromosomes together with their associated fitness is termed as the population. The population, at a particular iteration of the GA, is known as a generation [28] [29] [30].
GA begins to function with numerous possible solutions that are obtained from the randomly generated initial population. Then, it tries to find optimum solutions by employing genetic operators namely selection, crossover and mutation [30]. Selection is a process of selecting a pair of organisms to reproduce. Crossover is a process of swapping the genes between the two individuals that are reproducing. Mutation is the process of randomly modifying the chromosomes [27]. The main aim of mutation is re-establishing lost and exploring variety of data. In accordance with changing some bit values of chromosomes provide different breeds. Chromosome may be better or poorer than old chromosome. If they are poorer than old chromosome, then they are removed from selection step [31]. The process continues until a termination criterion is satisfied and so the GA can converge to an optimal solution.
IV. WINDOW SELECTION METHODOLOGY IN THE DENOISING
TECHNIQUE USING WINDOW-BASED MULTI-WAVELET
TRANSFORMATION AND THRESHOLDING
Prior to detail the proposed GA-based window selection methodology for the CT image denoising technique [32], here, a brief description about the prevailing window-selection methodology used in the technique is given. Let, ),( yxI be the
original CT image and ),( yxIAWGN
be the image affected by
AWGN, where, 10 −≤≤ Mx , 10 −≤≤ Ny . TheAWGN
I is
put to the first stage of the proposed technique, window-based thresholding. The window selection methodology to be described here is one of the components of the first stage of processing of the CT image denoisng technique. In the
methodology, a replica of theAWGN
I , labeled as'AWGNI , is
generated. FromAWGN
I and 'AWGNI , a window of pixels are
considered and put to multi-wavelet transformation. The
process of extracting the windows from the image AWGN
I is
given in the Figure 1.
(IJCSIS) International Journal of Computer Science and Information Security, Vol. 7, No. 2, February 2010
282 http://sites.google.com/site/ijcsis/ ISSN 1947-5500
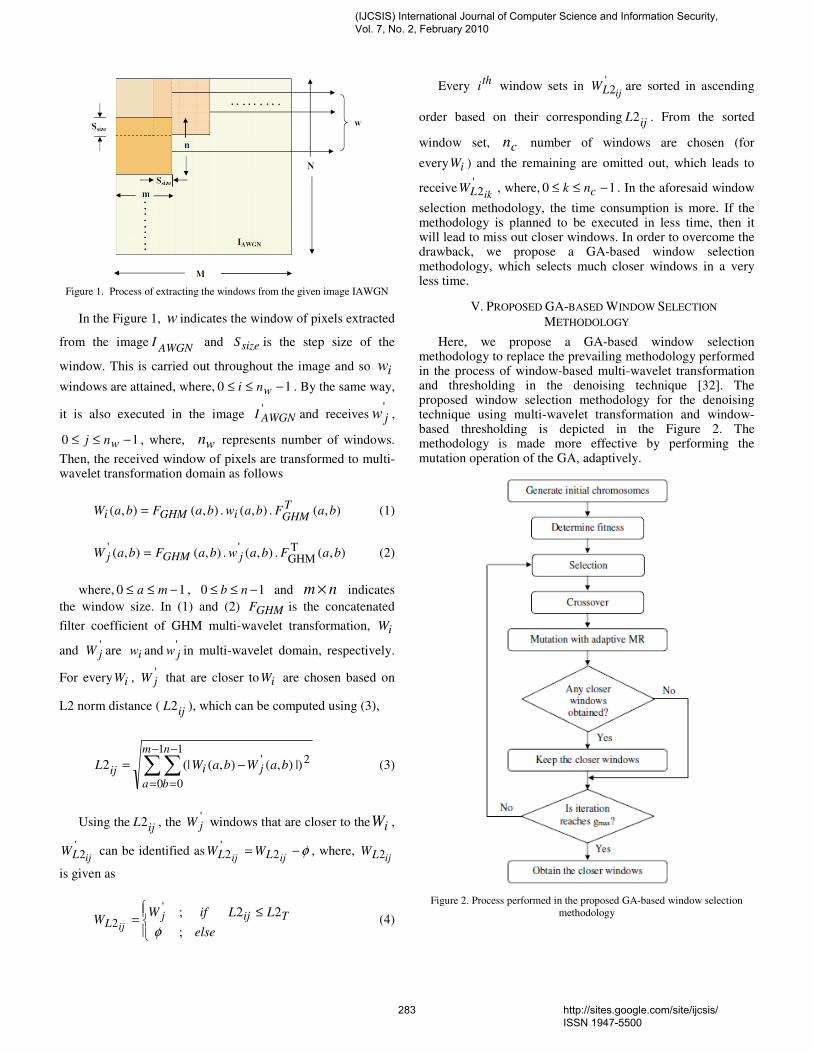
Figure 1. Process of extracting the windows from the given image IAWGN
In the Figure 1, w indicates the window of pixels extracted
from the imageAWGN
I and sizeS is the step size of the
window. This is carried out throughout the image and so iw
windows are attained, where, 10 −≤≤ wni . By the same way,
it is also executed in the image 'AWGNI and receives
'jw ,
10 −≤≤ wnj , where, wn represents number of windows.
Then, the received window of pixels are transformed to multi-wavelet transformation domain as follows
),( . ),( . ),(),( baFbawbaFbaWTGHMiGHMi = (1)
),( . ),( . ),(),(TGHM
''baFbawbaFbaW jGHMj = (2)
where, 10 −≤≤ ma , 10 −≤≤ nb and nm × indicates
the window size. In (1) and (2) GHMF is the concatenated
filter coefficient of GHM multi-wavelet transformation, iW
and 'jW are iw and
'jw in multi-wavelet domain, respectively.
For every iW , 'jW that are closer to iW are chosen based on
L2 norm distance ( ijL2 ), which can be computed using (3),
∑∑−
=
−
=
−=
1
0
1
0
2' |)),(),((|2
m
a
n
b
jiij baWbaWL (3)
Using the ijL2 , the 'jW windows that are closer to the iW ,
'2ijLW can be identified as φ−=
ijij LL WW 2'2 , where,
ijLW 2
is given as
≤
=else
LLifWW Tijj
L ij;
22;'
2φ
(4)
Every th
i window sets in '2ijLW are sorted in ascending
order based on their corresponding ijL2 . From the sorted
window set, cn number of windows are chosen (for
every iW ) and the remaining are omitted out, which leads to
receive'2ikLW , where, 10 −≤≤ cnk . In the aforesaid window
selection methodology, the time consumption is more. If the methodology is planned to be executed in less time, then it will lead to miss out closer windows. In order to overcome the drawback, we propose a GA-based window selection methodology, which selects much closer windows in a very less time.
V. PROPOSED GA-BASED WINDOW SELECTION
METHODOLOGY
Here, we propose a GA-based window selection methodology to replace the prevailing methodology performed in the process of window-based multi-wavelet transformation and thresholding in the denoising technique [32]. The proposed window selection methodology for the denoising technique using multi-wavelet transformation and window-based thresholding is depicted in the Figure 2. The methodology is made more effective by performing the mutation operation of the GA, adaptively.
Figure 2. Process performed in the proposed GA-based window selection
methodology
(IJCSIS) International Journal of Computer Science and Information Security, Vol. 7, No. 2, February 2010
283 http://sites.google.com/site/ijcsis/ ISSN 1947-5500
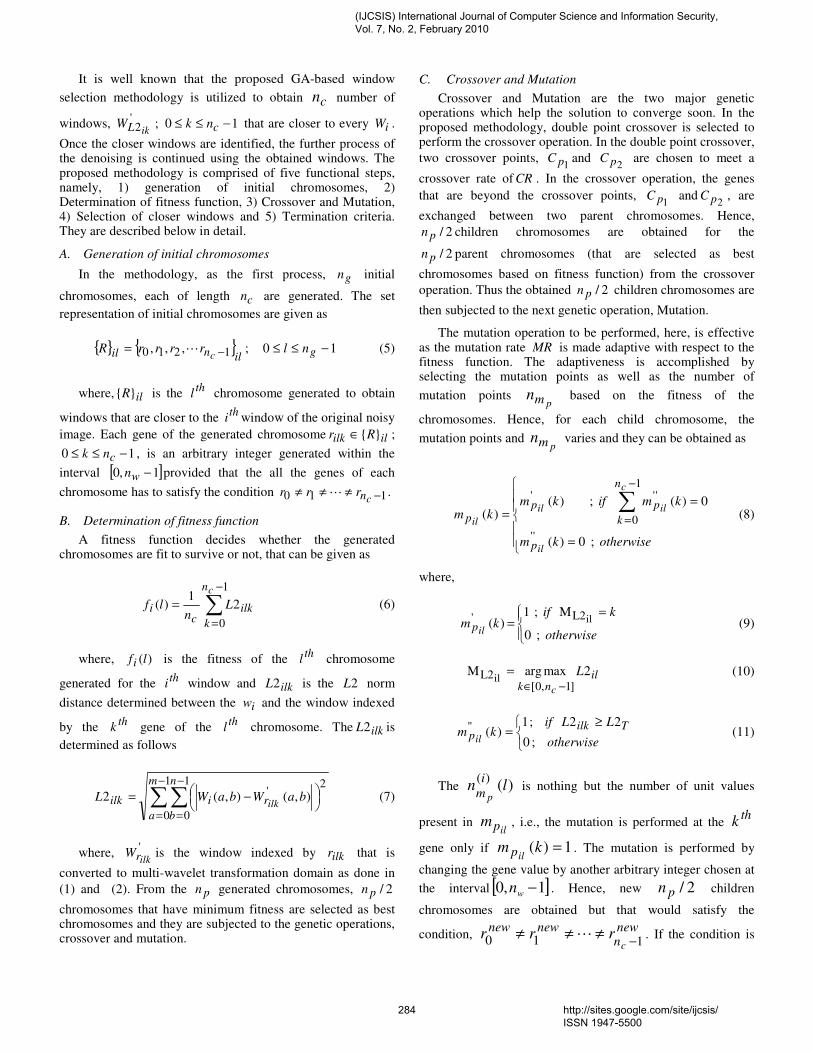
It is well known that the proposed GA-based window
selection methodology is utilized to obtain cn number of
windows, '2ikLW ; 10 −≤≤ cnk that are closer to every iW .
Once the closer windows are identified, the further process of the denoising is continued using the obtained windows. The proposed methodology is comprised of five functional steps, namely, 1) generation of initial chromosomes, 2) Determination of fitness function, 3) Crossover and Mutation, 4) Selection of closer windows and 5) Termination criteria. They are described below in detail.
A. Generation of initial chromosomes
In the methodology, as the first process, gn initial
chromosomes, each of length cn are generated. The set
representation of initial chromosomes are given as
{ } { }ilnil c
rrrrR 1210 ,,, −= L ; 10 −≤≤ gnl (5)
where, ilR}{ is the th
l chromosome generated to obtain
windows that are closer to the th
i window of the original noisy
image. Each gene of the generated chromosome ililk Rr }{∈ ;
10 −≤≤ cnk , is an arbitrary integer generated within the
interval [ ]1,0 −wn provided that the all the genes of each
chromosome has to satisfy the condition 110 −≠≠≠cnrrr L .
B. Determination of fitness function
A fitness function decides whether the generated chromosomes are fit to survive or not, that can be given as
∑−
=
=
1
0
21
)(
cn
k
ilkc
i Ln
lf (6)
where, )(lfi is the fitness of the th
l chromosome
generated for the th
i window and ilkL2 is the 2L norm
distance determined between the iw and the window indexed
by the th
k gene of the th
l chromosome. The ilkL2 is
determined as follows
∑∑−
=
−
=
−=
1
0
1
0
2' ),(),(2
m
a
n
b
riilk baWbaWLilk
(7)
where, 'ilkrW is the window indexed by ilkr that is
converted to multi-wavelet transformation domain as done in
(1) and (2). From the pn generated chromosomes, 2/pn
chromosomes that have minimum fitness are selected as best chromosomes and they are subjected to the genetic operations, crossover and mutation.
C. Crossover and Mutation
Crossover and Mutation are the two major genetic operations which help the solution to converge soon. In the proposed methodology, double point crossover is selected to perform the crossover operation. In the double point crossover,
two crossover points, 1pC and
2pC are chosen to meet a
crossover rate of CR . In the crossover operation, the genes
that are beyond the crossover points, 1pC and
2pC , are
exchanged between two parent chromosomes. Hence,
2/pn children chromosomes are obtained for the
2/pn parent chromosomes (that are selected as best
chromosomes based on fitness function) from the crossover
operation. Thus the obtained 2/pn children chromosomes are
then subjected to the next genetic operation, Mutation.
The mutation operation to be performed, here, is effective as the mutation rate MR is made adaptive with respect to the fitness function. The adaptiveness is accomplished by selecting the mutation points as well as the number of
mutation points pmn based on the fitness of the
chromosomes. Hence, for each child chromosome, the
mutation points and pmn varies and they can be obtained as
=
==
∑−
=
otherwisekm
kmifkmkm
il
c
ilil
il
p
n
k
ppp
; 0)(
0)( ; )()(
''
1
0
'''
(8)
where,
=
=otherwise
kifkm
ilp ; 0
M ; 1 )( ilL2'
(9)
ilnk
L
c
2maxargM]1,0[
L2il−∈
= (10)
≥
=otherwise
LLifkm
Tilkpil ; 0
22 ; 1)(" (11)
The )()(
lni
m p is nothing but the number of unit values
present in ilpm , i.e., the mutation is performed at the
thk
gene only if 1)( =kmilp . The mutation is performed by
changing the gene value by another arbitrary integer chosen at
the interval [ ]1,0 −wn . Hence, new 2/pn children
chromosomes are obtained but that would satisfy the
condition, newn
newnew
crrr
110 −≠≠≠ L . If the condition is
(IJCSIS) International Journal of Computer Science and Information Security, Vol. 7, No. 2, February 2010
284 http://sites.google.com/site/ijcsis/ ISSN 1947-5500
not satisfied, the mutation is performed in the corresponding child chromosome until it gets satisfied. Once, the mutation operation gets completed, the population pool is filled up by
the selected best 2/pn initial chromosomes and 2/pn new
children chromosomes. Hence, the population pool is
comprised of pn chromosomes and they are subjected to the
selection of closer windows.
D. Selection of closer windows
The closer windows are selected by identifying the
windows which has minimum L2-norm distance with the th
i
window as follows Tilkilkisel LLifrR 22 ; }{ <<< . From the
set iselR }{ , the closer cn windows are selected either by
sorting the iselR }{ elements in ascending order based on the
corresponding 2L norm distance (if cn> |R| isel ) or by
selecting the iselR }{ elements as the best closer windows
(if cisel nR ≤|| ). Thus the selected elements occupy the
set ibestR }{ . Now, with the pn chromosomes in the
population pool, the process is repeated from Step 2 until it satisfies the termination criteria. At every iteration, the
elements in the ibestR }{ are updated, if any windows are
obtained closer than the windows indicated by
the ibestR }{ elements. Hence, when every iteration gets
completed, the closer cn windows are obtained rather than
the windows obtained at the previous iteration.
E. Termination Criteria
The process is repeated until the iteration reaches the
maximum generation maxg . Once the iteration gets reached
the maxg , then the ibestR }{ is checked for the
condition cibest nR =|| . If this condition gets satisfied, the
process is terminated and the ibestR }{ are considered as the
closer cn windows for the th
i window, otherwise, iteration is
continued for another maxg .
Thus, obtained ibestR }{ is the
'2ikLW and it is subjected
to the further steps of the denoising technique, thresholding, reconstruction and enhancement of the image [32].
VI. RESULT AND DISCUSSION
The proposed window selection methodology has been implemented in the working platform of MATLAB (version
7.8). As described in denoising technique [32], 16=cn
number of windows has to be selected for every iw . Hence, in
the proposed methodology, the gene length of 16=cn has
been selected. The methodology has been initialized with a
population size of 10=gn with a maximum generation of
100max =g and the each gene of the chromosome has been
generated in the interval ]3965,0[ (i.e. 6363×=wn ). In the
genetic operations, crossover has been performed by selecting
the crossover points as 51
=pC and 122
=pC and so
5.0=CR has been met by the operation. As the mutation has
been made adaptive, the pmn and so MR change
dynamically. Once the process has been terminated, closer cn
windows have been obtained for every iw . This has been
subjected to the further process of CT image denoising technique using window-based multi-wavelet transformation and thresholding. The proposed methodology has been evaluated by giving some CT images that are affected by
AWGN at different levels ( 50 d 40 ,30 ,20 ,10 an=σ ). The
results obtained for the noisy image, denoised image by the denoising technique with and without the proposed GA-based window selection methodology is given below.
(a)
(b)
(c)
(d)
(e)
Figure 3. (a) original CT image of abdomen, (b), (c), (d) and (e) the image
affected by AWGN at the levels of σ=20,30,40 and 50, respectively and the
corresponding denoised image using the denoising technique with and without
proposed GA-based window selection methodology.
(IJCSIS) International Journal of Computer Science and Information Security, Vol. 7, No. 2, February 2010
285 http://sites.google.com/site/ijcsis/ ISSN 1947-5500
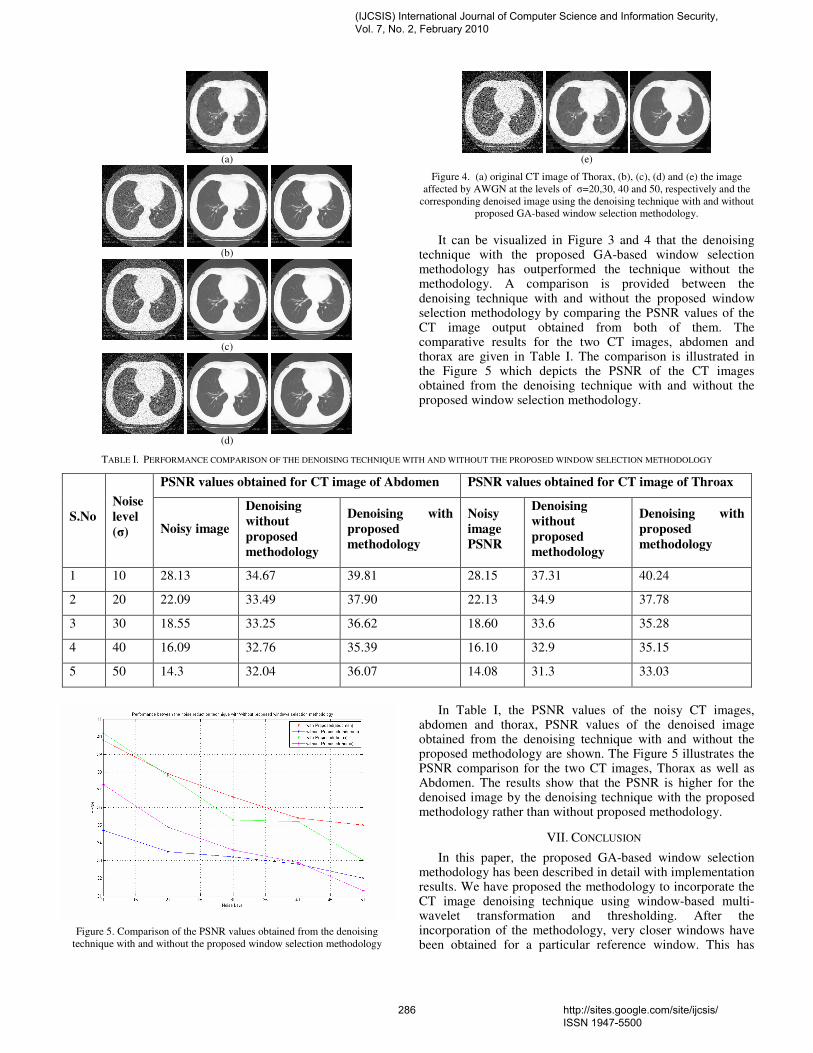
(a)
(b)
(c)
(d)
(e)
Figure 4. (a) original CT image of Thorax, (b), (c), (d) and (e) the image
affected by AWGN at the levels of σ=20,30, 40 and 50, respectively and the
corresponding denoised image using the denoising technique with and without
proposed GA-based window selection methodology.
It can be visualized in Figure 3 and 4 that the denoising technique with the proposed GA-based window selection methodology has outperformed the technique without the methodology. A comparison is provided between the denoising technique with and without the proposed window selection methodology by comparing the PSNR values of the CT image output obtained from both of them. The comparative results for the two CT images, abdomen and thorax are given in Table I. The comparison is illustrated in the Figure 5 which depicts the PSNR of the CT images obtained from the denoising technique with and without the proposed window selection methodology.
TABLE I. PERFORMANCE COMPARISON OF THE DENOISING TECHNIQUE WITH AND WITHOUT THE PROPOSED WINDOW SELECTION METHODOLOGY
PSNR values obtained for CT image of Abdomen PSNR values obtained for CT image of Throax
S.No
Noise
level
(σ) Noisy image
Denoising
without
proposed
methodology
Denoising with
proposed
methodology
Noisy
image
PSNR
Denoising
without
proposed
methodology
Denoising with
proposed
methodology
1 10 28.13 34.67 39.81 28.15 37.31 40.24
2 20 22.09 33.49 37.90 22.13 34.9 37.78
3 30 18.55 33.25 36.62 18.60 33.6 35.28
4 40 16.09 32.76 35.39 16.10 32.9 35.15
5 50 14.3 32.04 36.07 14.08 31.3 33.03
Figure 5. Comparison of the PSNR values obtained from the denoising
technique with and without the proposed window selection methodology
In Table I, the PSNR values of the noisy CT images, abdomen and thorax, PSNR values of the denoised image obtained from the denoising technique with and without the proposed methodology are shown. The Figure 5 illustrates the PSNR comparison for the two CT images, Thorax as well as Abdomen. The results show that the PSNR is higher for the denoised image by the denoising technique with the proposed methodology rather than without proposed methodology.
VII. CONCLUSION
In this paper, the proposed GA-based window selection methodology has been described in detail with implementation results. We have proposed the methodology to incorporate the CT image denoising technique using window-based multi-wavelet transformation and thresholding. After the incorporation of the methodology, very closer windows have been obtained for a particular reference window. This has
(IJCSIS) International Journal of Computer Science and Information Security, Vol. 7, No. 2, February 2010
286 http://sites.google.com/site/ijcsis/ ISSN 1947-5500
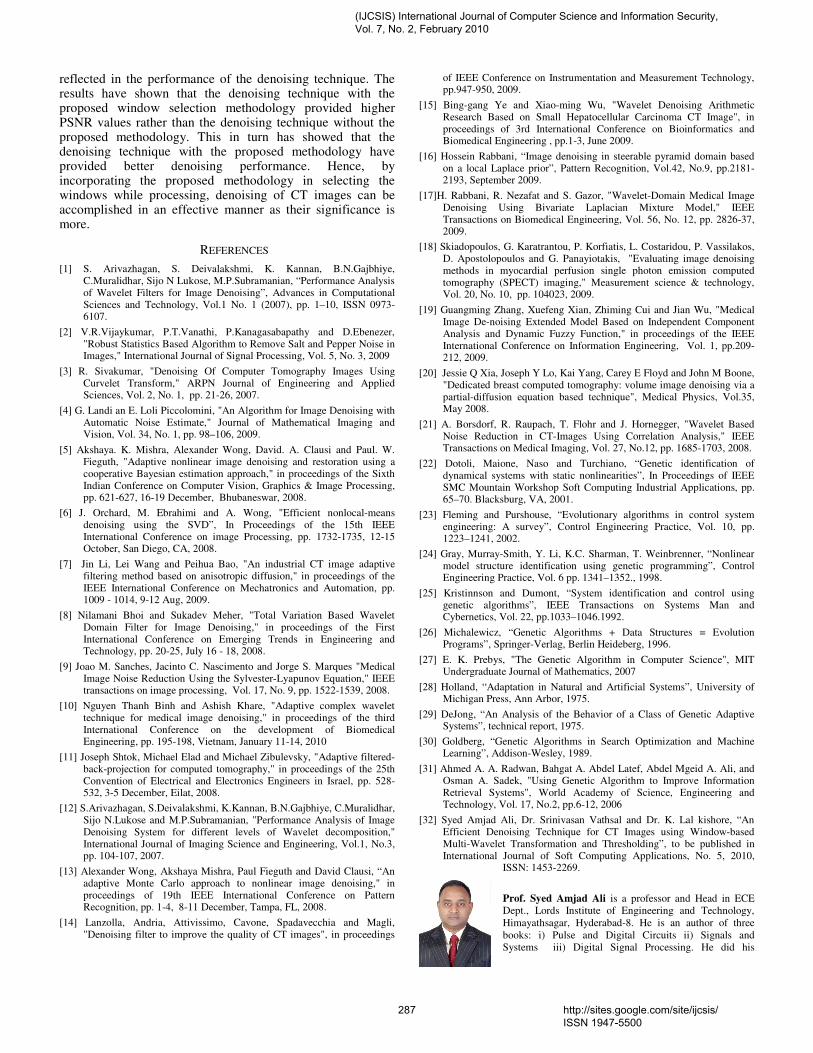
reflected in the performance of the denoising technique. The results have shown that the denoising technique with the proposed window selection methodology provided higher PSNR values rather than the denoising technique without the proposed methodology. This in turn has showed that the denoising technique with the proposed methodology have provided better denoising performance. Hence, by incorporating the proposed methodology in selecting the windows while processing, denoising of CT images can be accomplished in an effective manner as their significance is more.
REFERENCES
[1] S. Arivazhagan, S. Deivalakshmi, K. Kannan, B.N.Gajbhiye, C.Muralidhar, Sijo N Lukose, M.P.Subramanian, “Performance Analysis of Wavelet Filters for Image Denoising”, Advances in Computational Sciences and Technology, Vol.1 No. 1 (2007), pp. 1–10, ISSN 0973-6107.
[2] V.R.Vijaykumar, P.T.Vanathi, P.Kanagasabapathy and D.Ebenezer, "Robust Statistics Based Algorithm to Remove Salt and Pepper Noise in Images," International Journal of Signal Processing, Vol. 5, No. 3, 2009
[3] R. Sivakumar, "Denoising Of Computer Tomography Images Using Curvelet Transform," ARPN Journal of Engineering and Applied Sciences, Vol. 2, No. 1, pp. 21-26, 2007.
[4] G. Landi an E. Loli Piccolomini, "An Algorithm for Image Denoising with Automatic Noise Estimate," Journal of Mathematical Imaging and Vision, Vol. 34, No. 1, pp. 98–106, 2009.
[5] Akshaya. K. Mishra, Alexander Wong, David. A. Clausi and Paul. W. Fieguth, "Adaptive nonlinear image denoising and restoration using a cooperative Bayesian estimation approach," in proceedings of the Sixth Indian Conference on Computer Vision, Graphics & Image Processing, pp. 621-627, 16-19 December, Bhubaneswar, 2008.
[6] J. Orchard, M. Ebrahimi and A. Wong, "Efficient nonlocal-means denoising using the SVD”, In Proceedings of the 15th IEEE International Conference on image Processing, pp. 1732-1735, 12-15 October, San Diego, CA, 2008.
[7] Jin Li, Lei Wang and Peihua Bao, "An industrial CT image adaptive filtering method based on anisotropic diffusion," in proceedings of the IEEE International Conference on Mechatronics and Automation, pp. 1009 - 1014, 9-12 Aug, 2009.
[8] Nilamani Bhoi and Sukadev Meher, "Total Variation Based Wavelet Domain Filter for Image Denoising," in proceedings of the First International Conference on Emerging Trends in Engineering and Technology, pp. 20-25, July 16 - 18, 2008.
[9] Joao M. Sanches, Jacinto C. Nascimento and Jorge S. Marques "Medical Image Noise Reduction Using the Sylvester-Lyapunov Equation," IEEE transactions on image processing, Vol. 17, No. 9, pp. 1522-1539, 2008.
[10] Nguyen Thanh Binh and Ashish Khare, "Adaptive complex wavelet technique for medical image denoising," in proceedings of the third International Conference on the development of Biomedical Engineering, pp. 195-198, Vietnam, January 11-14, 2010
[11] Joseph Shtok, Michael Elad and Michael Zibulevsky, "Adaptive filtered-back-projection for computed tomography," in proceedings of the 25th Convention of Electrical and Electronics Engineers in Israel, pp. 528-532, 3-5 December, Eilat, 2008.
[12] S.Arivazhagan, S.Deivalakshmi, K.Kannan, B.N.Gajbhiye, C.Muralidhar, Sijo N.Lukose and M.P.Subramanian, "Performance Analysis of Image Denoising System for different levels of Wavelet decomposition," International Journal of Imaging Science and Engineering, Vol.1, No.3, pp. 104-107, 2007.
[13] Alexander Wong, Akshaya Mishra, Paul Fieguth and David Clausi, “An adaptive Monte Carlo approach to nonlinear image denoising," in proceedings of 19th IEEE International Conference on Pattern Recognition, pp. 1-4, 8-11 December, Tampa, FL, 2008.
[14] Lanzolla, Andria, Attivissimo, Cavone, Spadavecchia and Magli, "Denoising filter to improve the quality of CT images", in proceedings
of IEEE Conference on Instrumentation and Measurement Technology, pp.947-950, 2009.
[15] Bing-gang Ye and Xiao-ming Wu, "Wavelet Denoising Arithmetic Research Based on Small Hepatocellular Carcinoma CT Image", in proceedings of 3rd International Conference on Bioinformatics and Biomedical Engineering , pp.1-3, June 2009.
[16] Hossein Rabbani, “Image denoising in steerable pyramid domain based on a local Laplace prior”, Pattern Recognition, Vol.42, No.9, pp.2181-2193, September 2009.
[17]H. Rabbani, R. Nezafat and S. Gazor, "Wavelet-Domain Medical Image Denoising Using Bivariate Laplacian Mixture Model," IEEE Transactions on Biomedical Engineering, Vol. 56, No. 12, pp. 2826-37, 2009.
[18] Skiadopoulos, G. Karatrantou, P. Korfiatis, L. Costaridou, P. Vassilakos, D. Apostolopoulos and G. Panayiotakis, "Evaluating image denoising methods in myocardial perfusion single photon emission computed tomography (SPECT) imaging," Measurement science & technology, Vol. 20, No. 10, pp. 104023, 2009.
[19] Guangming Zhang, Xuefeng Xian, Zhiming Cui and Jian Wu, "Medical Image De-noising Extended Model Based on Independent Component Analysis and Dynamic Fuzzy Function," in proceedings of the IEEE International Conference on Information Engineering, Vol. 1, pp.209-212, 2009.
[20] Jessie Q Xia, Joseph Y Lo, Kai Yang, Carey E Floyd and John M Boone, "Dedicated breast computed tomography: volume image denoising via a partial-diffusion equation based technique", Medical Physics, Vol.35, May 2008.
[21] A. Borsdorf, R. Raupach, T. Flohr and J. Hornegger, "Wavelet Based Noise Reduction in CT-Images Using Correlation Analysis," IEEE Transactions on Medical Imaging, Vol. 27, No.12, pp. 1685-1703, 2008.
[22] Dotoli, Maione, Naso and Turchiano, “Genetic identification of dynamical systems with static nonlinearities”, In Proceedings of IEEE SMC Mountain Workshop Soft Computing Industrial Applications, pp. 65–70. Blacksburg, VA, 2001.
[23] Fleming and Purshouse, “Evolutionary algorithms in control system engineering: A survey”, Control Engineering Practice, Vol. 10, pp. 1223–1241, 2002.
[24] Gray, Murray-Smith, Y. Li, K.C. Sharman, T. Weinbrenner, “Nonlinear model structure identification using genetic programming”, Control Engineering Practice, Vol. 6 pp. 1341–1352., 1998.
[25] Kristinnson and Dumont, “System identification and control using genetic algorithms”, IEEE Transactions on Systems Man and Cybernetics, Vol. 22, pp.1033–1046.1992.
[26] Michalewicz, “Genetic Algorithms + Data Structures = Evolution Programs”, Springer-Verlag, Berlin Heideberg, 1996.
[27] E. K. Prebys, "The Genetic Algorithm in Computer Science", MIT Undergraduate Journal of Mathematics, 2007
[28] Holland, “Adaptation in Natural and Artificial Systems”, University of Michigan Press, Ann Arbor, 1975.
[29] DeJong, “An Analysis of the Behavior of a Class of Genetic Adaptive Systems”, technical report, 1975.
[30] Goldberg, “Genetic Algorithms in Search Optimization and Machine Learning”, Addison-Wesley, 1989.
[31] Ahmed A. A. Radwan, Bahgat A. Abdel Latef, Abdel Mgeid A. Ali, and Osman A. Sadek, "Using Genetic Algorithm to Improve Information Retrieval Systems", World Academy of Science, Engineering and Technology, Vol. 17, No.2, pp.6-12, 2006
[32] Syed Amjad Ali, Dr. Srinivasan Vathsal and Dr. K. Lal kishore, “An Efficient Denoising Technique for CT Images using Window-based Multi-Wavelet Transformation and Thresholding”, to be published in International Journal of Soft Computing Applications, No. 5, 2010,
ISSN: 1453-2269.
Prof. Syed Amjad Ali is a professor and Head in ECE
Dept., Lords Institute of Engineering and Technology,
Himayathsagar, Hyderabad-8. He is an author of three
books: i) Pulse and Digital Circuits ii) Signals and
Systems iii) Digital Signal Processing. He did his
(IJCSIS) International Journal of Computer Science and Information Security, Vol. 7, No. 2, February 2010
287 http://sites.google.com/site/ijcsis/ ISSN 1947-5500
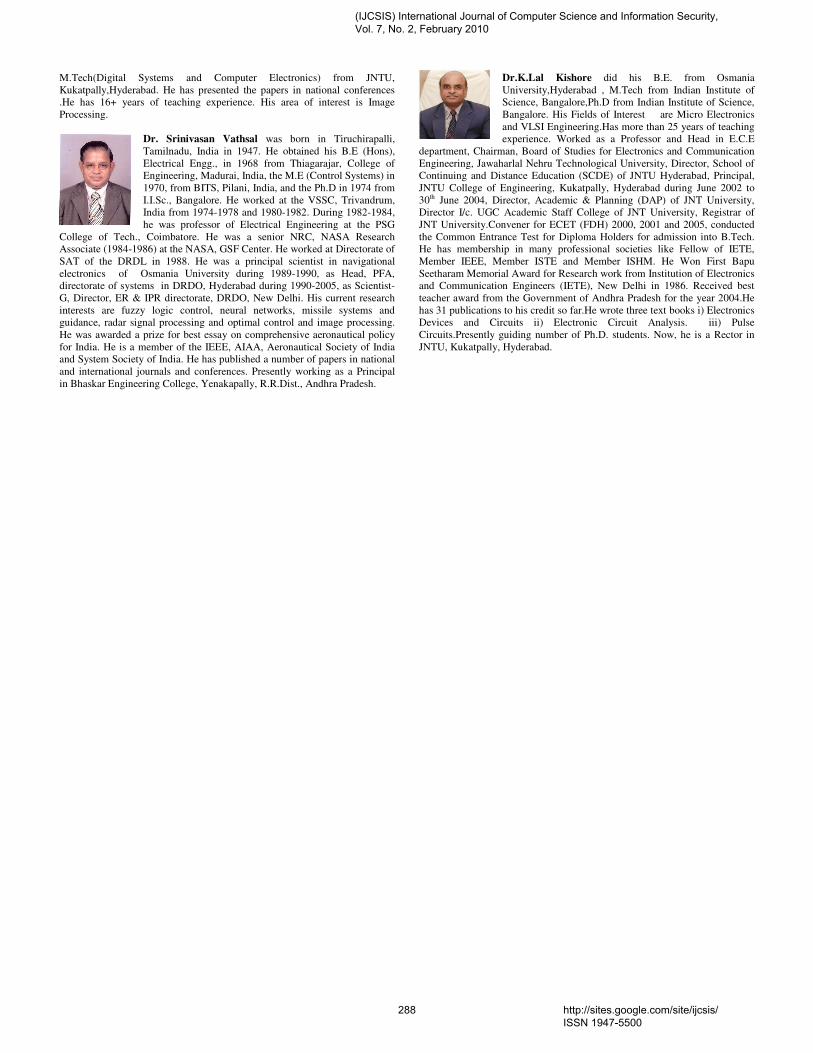
M.Tech(Digital Systems and Computer Electronics) from JNTU,
Kukatpally,Hyderabad. He has presented the papers in national conferences
.He has 16+ years of teaching experience. His area of interest is Image
Processing.
Dr. Srinivasan Vathsal was born in Tiruchirapalli,
Tamilnadu, India in 1947. He obtained his B.E (Hons),
Electrical Engg., in 1968 from Thiagarajar, College of
Engineering, Madurai, India, the M.E (Control Systems) in
1970, from BITS, Pilani, India, and the Ph.D in 1974 from
I.I.Sc., Bangalore. He worked at the VSSC, Trivandrum,
India from 1974-1978 and 1980-1982. During 1982-1984,
he was professor of Electrical Engineering at the PSG
College of Tech., Coimbatore. He was a senior NRC, NASA Research
Associate (1984-1986) at the NASA, GSF Center. He worked at Directorate of
SAT of the DRDL in 1988. He was a principal scientist in navigational
electronics of Osmania University during 1989-1990, as Head, PFA,
directorate of systems in DRDO, Hyderabad during 1990-2005, as Scientist-
G, Director, ER & IPR directorate, DRDO, New Delhi. His current research
interests are fuzzy logic control, neural networks, missile systems and
guidance, radar signal processing and optimal control and image processing.
He was awarded a prize for best essay on comprehensive aeronautical policy
for India. He is a member of the IEEE, AIAA, Aeronautical Society of India
and System Society of India. He has published a number of papers in national
and international journals and conferences. Presently working as a Principal
in Bhaskar Engineering College, Yenakapally, R.R.Dist., Andhra Pradesh.
Dr.K.Lal Kishore did his B.E. from Osmania
University,Hyderabad , M.Tech from Indian Institute of
Science, Bangalore,Ph.D from Indian Institute of Science,
Bangalore. His Fields of Interest are Micro Electronics
and VLSI Engineering.Has more than 25 years of teaching
experience. Worked as a Professor and Head in E.C.E
department, Chairman, Board of Studies for Electronics and Communication
Engineering, Jawaharlal Nehru Technological University, Director, School of
Continuing and Distance Education (SCDE) of JNTU Hyderabad, Principal,
JNTU College of Engineering, Kukatpally, Hyderabad during June 2002 to
30th June 2004, Director, Academic & Planning (DAP) of JNT University,
Director I/c. UGC Academic Staff College of JNT University, Registrar of
JNT University.Convener for ECET (FDH) 2000, 2001 and 2005, conducted
the Common Entrance Test for Diploma Holders for admission into B.Tech.
He has membership in many professional societies like Fellow of IETE,
Member IEEE, Member ISTE and Member ISHM. He Won First Bapu
Seetharam Memorial Award for Research work from Institution of Electronics
and Communication Engineers (IETE), New Delhi in 1986. Received best
teacher award from the Government of Andhra Pradesh for the year 2004.He
has 31 publications to his credit so far.He wrote three text books i) Electronics
Devices and Circuits ii) Electronic Circuit Analysis. iii) Pulse
Circuits.Presently guiding number of Ph.D. students. Now, he is a Rector in
JNTU, Kukatpally, Hyderabad.
(IJCSIS) International Journal of Computer Science and Information Security, Vol. 7, No. 2, February 2010
288 http://sites.google.com/site/ijcsis/ ISSN 1947-5500

Investigation and Assessment of Disorder of Ultrasound B-mode Images
Vidhi Rawat *,Alok jain**,Vibhakar shrimali***,
*Department of Biomedical Engineering **Department of electronics Engineering
*** Department of Trg. & Technical Education, Govt. of NCT Delhi, Delhi. Samrat Ashok Technological Institute
Vidisha, India. [email protected]
Abstract— Digital image plays a vital role in the early detection of cancers, such as prostate cancer, breast cancer, lungs cancer, cervical cancer. Ultrasound imaging method is also suitable for early detection of the abnormality of fetus. The accurate detection of region of interest in ultrasound image is crucial. Since the result of reflection, refraction and deflection of ultrasound waves from different types of tissues with different acoustic impedance. Usually, the contrast in ultrasound image is very low and weak edges make the image difficult to identify the fetus region in the ultrasound image. So the analysis of ultrasound image is more challenging one. We try to develop a new algorithmic approach to solve the problem of non clarity and find disorder of it. Generally there is no common enhancement approach for noise reduction. This paper proposes different filtering techniques based on statistical methods for the removal of various noise. The quality of the enhanced images is measured by the statistical quantity measures: Signal-to-Noise Ratio (SNR), Peak Signal-to-Noise Ratio (PSNR), and Root Mean Square Error (RMSE).
Keywords- fetus image,Signal-to-Noise Ratio (SNR), Peak Signal-to-Noise Ratio (PSNR), and Root Mean Square Error (RMSE).
I. INTRODUCTION
Ultrasound imaging method is suitable to diagnose and progenies [1]. The accurate detection of region of interest in ultrasound image is crucial. Since the result of reflection, refraction and deflection of ultrasound waves from different types of tissues with different acoustic impedance. Usually, the contrast in ultrasound image is very low and boundary between region of interest and background are fuzzy [2]. fetus region in the ultrasound image is not approachable. So the analysis of ultrasound image is more challenging one .Noise is considered to be any measurement that is not part of the phenomena of interest .Digital image plays a vital role in the early detection of abnormality in the fetus. Processes going on in the production and capture of real signal. Ultrasound is safe, radiation free, faster and cheaper. Ultrasound images themselves will not give a clear view of an affected region. So digital processing can improve the quality of raw ultrasound images. In this work a software tool called Image Processing Tool has been developed by employing the histogram equalization and region growing approach to give a clearer
view of the affected regions in the abdomen. Ultrasound is applied for obtaining images of almost the entire range of internal organs, these include the kidney, liver, pancreas, bladder, the fetus during pregnancy. Today, B-mode ultrasound imaging is one of the most frequently used diagnostic tools, not only because of its real time capabilities, as it allows faster and more accurate procedures, but also because there is low risk to the patient and low cost as compared to other image modalities.
A proposed algorithm has been successfully developed to semi-automate noninvasive examination of the fetus. Such a system can be helpful in reducing costs, minimizing exposure of the fetus to ultrasonic radiation, and providing a uniform ex-amination and interpretation of the results.
II. OBSTETRICAL ULTRASOUND IMAGING
Normally ultrasound images will contain a mixture of
different types of noises. Removal of noises is crucial since ultrasound images themselves will not give a clear view of an affected region. It is easy to remove the noises if the images are digitized. Then it is possible to develop software that suits to remove a type of noise. After removing the noises, clear view of affected regions can be pinpointed. In the ideal case of a continuous probability distribution of the gray levels, histogram equalization produces a uniform histogram. Ultrasound exams do not use ionizing radiation (as used in x-rays). Because ultrasound images are captured in real-time. Ultrasound imaging is a noninvasive medical test that helps physicians diagnose and treat medical conditions. Obstetrical ultrasound provides pictures of an embryo or fetus within a woman's uterus.
A. properties of ultrasonography
1. Most ultrasound scanning is noninvasive (no needles
or injections) and is usually painless.
2. Ultrasound is widely available, easy-to-use and less expensive than other imaging methods.
(IJCSIS) International Journal of Computer Science and Information Security, Vol. 7, No. 2, February 2010
289 http://sites.google.com/site/ijcsis/ ISSN 1947-5500
3. Ultrasound scanning gives a clear picture of soft tissues that do not show up well on x-ray images.
4. Ultrasound causes no health problems and may be repeated as often as is necessary.
5. Ultrasound is the preferred imaging modality for the diagnosis and monitoring of pregnant women and their unborn babies.
6. Ultrasound has been used to evaluate pregnancy for nearly four decades and there has been no evidence of harm to the patient, embryo or fetus. Nevertheless, ultrasound should be performed only when clinically indicated.
B. Obstetrical ultrasound is a useful clinical test to
� Establish the presence of a living embryo/fetus.
� Estimate the age of the pregnancy.
� Diagnose congenital abnormalities of the fetus.
� Evaluate the position of the fetus.
� Evaluate the position of the placenta.
� Determine if there are multiple pregnancies.
� Determine the amount of amniotic fluid around the baby.
� Check for opening or shortening of the cervix or mouth of the womb.
� Assess fetal growth.
C. Limitations of Obstetrical Ultrasound Imaging
Obstetric ultrasound cannot identify all fetal abnormalities.
Consequently, when there are clinical or laboratory suspicions for a possible abnormality, a pregnant woman may have to undergo nonradiologic testing such as amniocentesis (the evaluation of fluid taken from the sac surrounding the fetus) or chorionic villus sampling (evaluation of placental tissue) to determine the health of the fetus, or she may be referred by her primary care provider to a gerontologist (an obstetrician specializing in high-risk pregnancies).
III. ELEMENTS OF BIOMEDICAL IMAGE PROCESSING
A. Image Enhancement
Enhancement algorithms are used to reduce image noise
and increase the contrast of structure of interest. when in images the distinction between normal and abnormal tissue is occur then accurate interpretation may become difficult if noise level are relatively high. Enhancement improve the quality of image and facilitates diagnosis. Enhancement techniques are generally used to provide a clear image for a human observer.
Image enhancement is especially relevant in mammography where the contrast between the soft tissues. These approaches all use a reversible wavelet decomposition, which may be redundant or not, and perform the enhancement by selective modification (Amplification) of certain wavelet coefficients prior to reconstruction. When the weighting scheme is linear, this approach can be interpreted as a multiscale version of traditional unsharp masking.
B. Image segmentation
Segmentation is the stage where significant commitment is made during automated analysis by delineating structures of interest and discriminating them from background tissues. Segmentation algorithm operate on the intensity texture variations of the image using technique that include thresholding,region growing and pattern recognition technique such as neural network. Image segmentation is a useful tool in many realms including industry, health care, astronomy, and various other fields. Segmentation in concept is a very simple idea. Simply looking at an image, one can tell what regions are contained in a picture. This paper discusses two different region determination techniques: one that focuses on edge detection as its main determination characteristic and another that uses region growing to locate separate areas of the image.
IV. PROBLEM DESCRIPTION
An image may be defined as a two dimensional function
f(x, y), where x and y are spatial (plane) coordinates, and the amplitude of f at any pair of co-ordinates (x, y) is called the intensity or grey level of the image at that point [5]. Data sets collected by image sensor are generally contaminated by noise. The region of interest in the image can be degraded by the impact of imperfect instrument, the problem with data acquisition process and interfering natural phenomena. Therefore the original image may not be suitable for applying image processing techniques and analysis. Thus image enhancement technique is often necessary and should be taken as the first and foremost step before image is analysed. Another common form of noise is data dropout noise generally referred to as speckle noise. This noise is, in fact, caused by errors in data transmission [13, 14]. The corrupted pixels are either set to the maximum value, which is something like a snow in image or have single bits flipped over.
A. Image Data Independent Noise
It is described by an additive noise model, where the recorded image, i(m, n) is the sum of the true image t(m, n) and the noise n(m, n)[5, 8, 9]
i(m,n)=t(m,n)+n(m,n) The noise n(m, n) is often zero-mean and described by its variance . In fact, the impact of the noise on the image is often described by the SNR [6], which is given by
(IJCSIS) International Journal of Computer Science and Information Security, Vol. 7, No. 2, February 2010
290 http://sites.google.com/site/ijcsis/ ISSN 1947-5500

2
21t
n
SNRσσ
= −
Where, 2tσ and
2nσ are the variances of the true image and
the recorded image respectively. In many cases, additive noise is evenly distributed over the frequency domain (white noise), whereas an image contains mostly low frequency information. Therefore, such a noise is dominant for high frequencies and is generally referred as Gaussian noise and it is observed in natural images [10, 11].
B. Image Data Dependent Noise
Data-dependent noise (e.g. arising when monochromatic
radiation is scattered from a surface whose roughness is of the order of a wavelength, causing wave interference which results in image speckle), it is possible to model noise with a multiplicative, or non-linear, model. These models are mathematically more complicated; hence, if possible, the noise is assumed to be data independent.
1) Speckle Noise
Another common form of noise is data dropout noise generally referred to as speckle noise. This noise is, in fact, caused by errors in data transmission [13, 14]. The corrupted pixels are either set to the maximum value, which is something like a snow in image or have single bits flipped over. This kind of noise affects the ultrasound images [14]. Speckle noise has the characteristic of multiplicative noise [15]. Speckle noise
follows a gamma distribution and is given as
( )1 /
( )1 !
g ag ef g
a
α
αα
− = −
2) Salt and Pepper Noise
This type of noise is also caused by errors in data
transmission and is a special case of data dropout noise when in some cases single, single pixels are set alternatively to zero or to the maximum value, giving the image a salt and pepper like appearance [16]. Unaffected pixels always remain unchanged. The noise is usually quantified by the percentage of pixels which are corrupted. It is found in mammogram images [17]. It probability distribution of function is in [8].
V. SPATIAL FILTER
The primary objective of the image enhancement is to adjust the digital image so that the resultant image is more suitable than the original image for a specific application [5, 8, and 9]. There are many image enhancement techniques. They can be categorized into two general categories. The first category is based on the direct manipulation of pixels in an image, for instance: image negative, low pass filter (smoothing), and high pass filter (sharpening). Second category is based on the position manipulation of pixels of an image, for instance image scaling.In the first category, the image processing function in a spatial domain can be expressed as
g (x , y) = T (f(x, y))
Where, T is the transformation function, f (x, y) is the pixel value of input image, and g(x, y) is the pixel value of the processed image [5, 8, 9]. The median, mean, high pass, low pass filtering techniques have been applied for denoising the different images [5, 9].
A. Max Filter
The max filter plays a key role in low level image
processing and vision. It is identical to the mathematical morphological operation: dilation [19]. The brightest pixel gray level values are identified by this filter. It has been applied by many researchers to remove pepper noise. Though it removes the pepper noise it also removes the block pixel in the border [5]. This filter has not yet applied to remove the speckle in the ultrasound medical image. Hence it is proposed for speckle noise removal from the ultrasound medical image. it is expressed as:
( , ) max{ ( , )}f x y g s t=
Figure 1. original image
ORIGINAL ULTRASOUND IMAGE OF FETUS
(IJCSIS) International Journal of Computer Science and Information Security, Vol. 7, No. 2, February 2010
291 http://sites.google.com/site/ijcsis/ ISSN 1947-5500
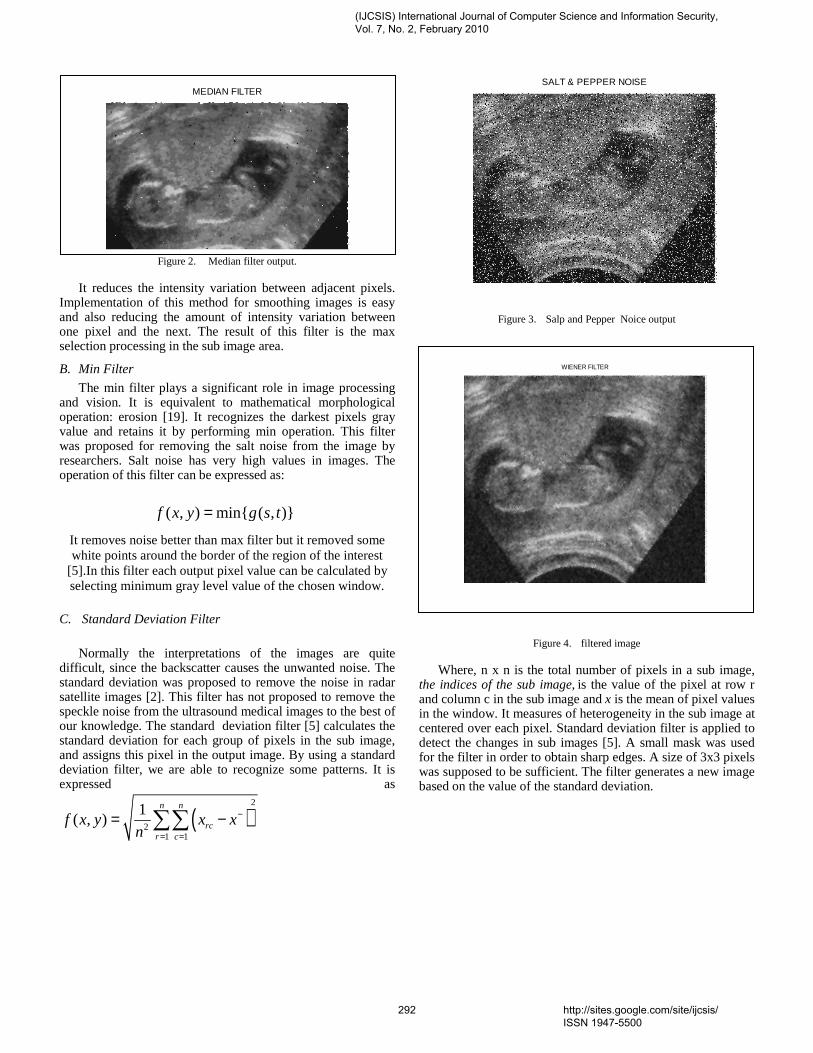
MEDIAN FILTER
WIENER FILTER
Figure 2. Median filter output.
It reduces the intensity variation between adjacent pixels. Implementation of this method for smoothing images is easy and also reducing the amount of intensity variation between one pixel and the next. The result of this filter is the max selection processing in the sub image area.
B. Min Filter
The min filter plays a significant role in image processing and vision. It is equivalent to mathematical morphological operation: erosion [19]. It recognizes the darkest pixels gray value and retains it by performing min operation. This filter was proposed for removing the salt noise from the image by researchers. Salt noise has very high values in images. The operation of this filter can be expressed as:
( , ) min{ ( , )}f x y g s t=
It removes noise better than max filter but it removed some white points around the border of the region of the interest
[5].In this filter each output pixel value can be calculated by selecting minimum gray level value of the chosen window.
C. Standard Deviation Filter
Normally the interpretations of the images are quite
difficult, since the backscatter causes the unwanted noise. The standard deviation was proposed to remove the noise in radar satellite images [2]. This filter has not proposed to remove the speckle noise from the ultrasound medical images to the best of our knowledge. The standard deviation filter [5] calculates the standard deviation for each group of pixels in the sub image, and assigns this pixel in the output image. By using a standard deviation filter, we are able to recognize some patterns. It is expressed as
( )2
21 1
1( , )
n n
rcr c
f x y x xn
−
= =
= −∑∑
Figure 3. Salp and Pepper Noice output
Figure 4. filtered image
Where, n x n is the total number of pixels in a sub image, the indices of the sub image, is the value of the pixel at row r and column c in the sub image and x is the mean of pixel values in the window. It measures of heterogeneity in the sub image at centered over each pixel. Standard deviation filter is applied to detect the changes in sub images [5]. A small mask was used for the filter in order to obtain sharp edges. A size of 3x3 pixels was supposed to be sufficient. The filter generates a new image based on the value of the standard deviation.
SALT & PEPPER NOISE
(IJCSIS) International Journal of Computer Science and Information Security, Vol. 7, No. 2, February 2010
292 http://sites.google.com/site/ijcsis/ ISSN 1947-5500
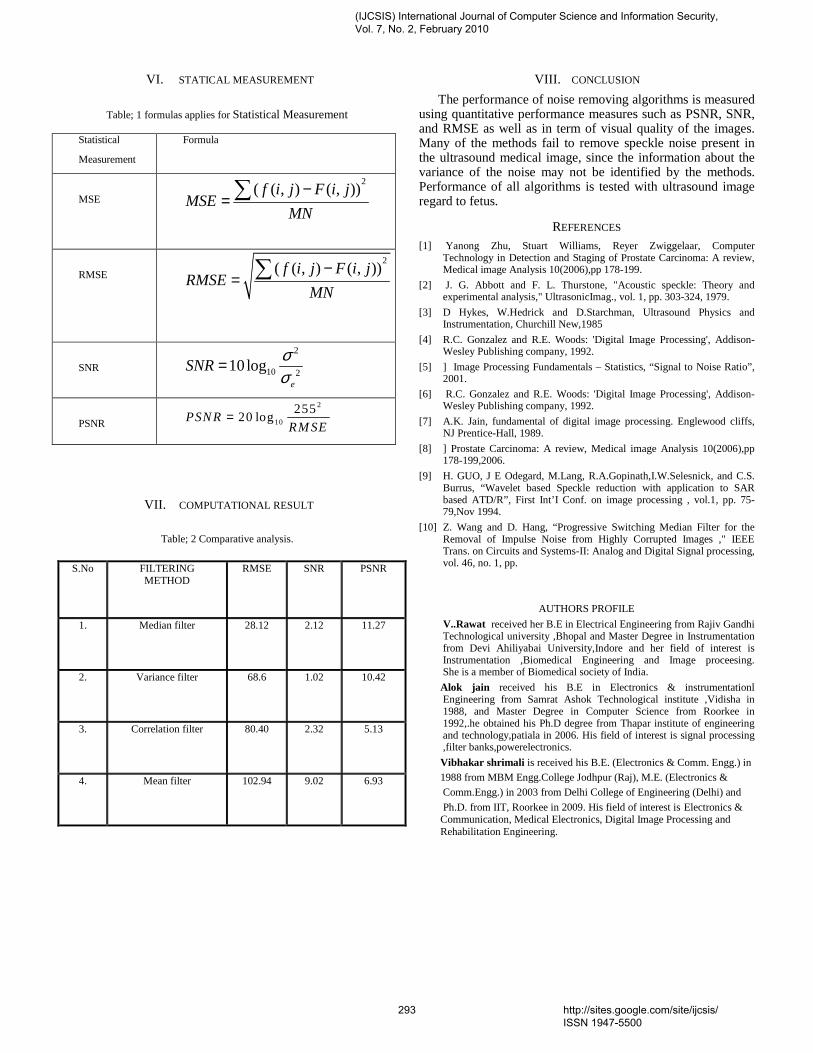
VI. STATICAL MEASUREMENT
Table; 1 formulas applies for Statistical Measurement
Statistical
Measurement
Formula
MSE
2( ( , ) ( , ))f i j F i j
MSEMN
−= ∑
RMSE 2
( ( , ) ( , ))f i j F i jRMSE
MN
−= ∑
SNR
2
10 210log
e
SNRσσ
=
PSNR
2
10
25520 logPSN R
RM SE=
VII. COMPUTATIONAL RESULT
Table; 2 Comparative analysis.
S.No FILTERING
METHOD RMSE SNR PSNR
1. Median filter 28.12 2.12 11.27
2. Variance filter 68.6 1.02 10.42
3. Correlation filter 80.40 2.32 5.13
4. Mean filter 102.94 9.02 6.93
VIII. CONCLUSION
The performance of noise removing algorithms is measured using quantitative performance measures such as PSNR, SNR, and RMSE as well as in term of visual quality of the images. Many of the methods fail to remove speckle noise present in the ultrasound medical image, since the information about the variance of the noise may not be identified by the methods. Performance of all algorithms is tested with ultrasound image regard to fetus.
REFERENCES [1] Yanong Zhu, Stuart Williams, Reyer Zwiggelaar, Computer
Technology in Detection and Staging of Prostate Carcinoma: A review, Medical image Analysis 10(2006),pp 178-199.
[2] J. G. Abbott and F. L. Thurstone, "Acoustic speckle: Theory and experimental analysis," UltrasonicImag., vol. 1, pp. 303-324, 1979.
[3] D Hykes, W.Hedrick and D.Starchman, Ultrasound Physics and Instrumentation, Churchill New,1985
[4] R.C. Gonzalez and R.E. Woods: 'Digital Image Processing', Addison-Wesley Publishing company, 1992.
[5] ] Image Processing Fundamentals – Statistics, “Signal to Noise Ratio”, 2001.
[6] R.C. Gonzalez and R.E. Woods: 'Digital Image Processing', Addison-Wesley Publishing company, 1992.
[7] A.K. Jain, fundamental of digital image processing. Englewood cliffs, NJ Prentice-Hall, 1989.
[8] ] Prostate Carcinoma: A review, Medical image Analysis 10(2006),pp 178-199,2006.
[9] H. GUO, J E Odegard, M.Lang, R.A.Gopinath,I.W.Selesnick, and C.S. Burrus, “Wavelet based Speckle reduction with application to SAR based ATD/R”, First Int’I Conf. on image processing , vol.1, pp. 75-79,Nov 1994.
[10] Z. Wang and D. Hang, “Progressive Switching Median Filter for the Removal of Impulse Noise from Highly Corrupted Images ," IEEE Trans. on Circuits and Systems-II: Analog and Digital Signal processing, vol. 46, no. 1, pp.
AUTHORS PROFILE
V..Rawat received her B.E in Electrical Engineering from Rajiv Gandhi Technological university ,Bhopal and Master Degree in Instrumentation from Devi Ahiliyabai University,Indore and her field of interest is Instrumentation ,Biomedical Engineering and Image proceesing. She is a member of Biomedical society of India.
Alok jain received his B.E in Electronics & instrumentationl Engineering from Samrat Ashok Technological institute ,Vidisha in 1988, and Master Degree in Computer Science from Roorkee in 1992,.he obtained his Ph.D degree from Thapar institute of engineering and technology,patiala in 2006. His field of interest is signal processing ,filter banks,powerelectronics.
Vibhakar shrimali is received his B.E. (Electronics & Comm. Engg.) in 1988 from MBM Engg.College Jodhpur (Raj), M.E. (Electronics & Comm.Engg.) in 2003 from Delhi College of Engineering (Delhi) and
Ph.D. from IIT, Roorkee in 2009. His field of interest is Electronics & Communication, Medical Electronics, Digital Image Processing and Rehabilitation Engineering.
(IJCSIS) International Journal of Computer Science and Information Security, Vol. 7, No. 2, February 2010
293 http://sites.google.com/site/ijcsis/ ISSN 1947-5500
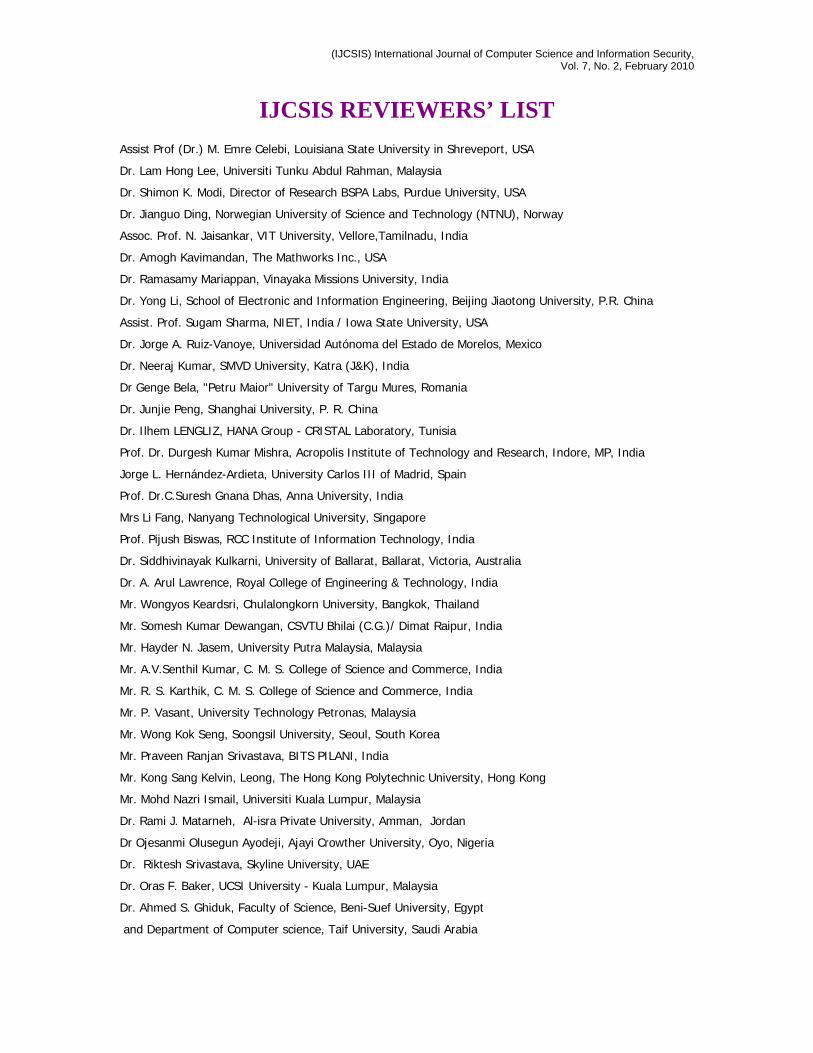
(IJCSIS) International Journal of Computer Science and Information Security, Vol. 7, No. 2, February 2010
IJCSIS REVIEWERS’ LIST Assist Prof (Dr.) M. Emre Celebi, Louisiana State University in Shreveport, USA
Dr. Lam Hong Lee, Universiti Tunku Abdul Rahman, Malaysia
Dr. Shimon K. Modi, Director of Research BSPA Labs, Purdue University, USA
Dr. Jianguo Ding, Norwegian University of Science and Technology (NTNU), Norway
Assoc. Prof. N. Jaisankar, VIT University, Vellore,Tamilnadu, India
Dr. Amogh Kavimandan, The Mathworks Inc., USA
Dr. Ramasamy Mariappan, Vinayaka Missions University, India
Dr. Yong Li, School of Electronic and Information Engineering, Beijing Jiaotong University, P.R. China
Assist. Prof. Sugam Sharma, NIET, India / Iowa State University, USA
Dr. Jorge A. Ruiz-Vanoye, Universidad Autónoma del Estado de Morelos, Mexico
Dr. Neeraj Kumar, SMVD University, Katra (J&K), India
Dr Genge Bela, "Petru Maior" University of Targu Mures, Romania
Dr. Junjie Peng, Shanghai University, P. R. China
Dr. Ilhem LENGLIZ, HANA Group - CRISTAL Laboratory, Tunisia
Prof. Dr. Durgesh Kumar Mishra, Acropolis Institute of Technology and Research, Indore, MP, India
Jorge L. Hernández-Ardieta, University Carlos III of Madrid, Spain
Prof. Dr.C.Suresh Gnana Dhas, Anna University, India
Mrs Li Fang, Nanyang Technological University, Singapore
Prof. Pijush Biswas, RCC Institute of Information Technology, India
Dr. Siddhivinayak Kulkarni, University of Ballarat, Ballarat, Victoria, Australia
Dr. A. Arul Lawrence, Royal College of Engineering & Technology, India
Mr. Wongyos Keardsri, Chulalongkorn University, Bangkok, Thailand
Mr. Somesh Kumar Dewangan, CSVTU Bhilai (C.G.)/ Dimat Raipur, India
Mr. Hayder N. Jasem, University Putra Malaysia, Malaysia
Mr. A.V.Senthil Kumar, C. M. S. College of Science and Commerce, India
Mr. R. S. Karthik, C. M. S. College of Science and Commerce, India
Mr. P. Vasant, University Technology Petronas, Malaysia
Mr. Wong Kok Seng, Soongsil University, Seoul, South Korea
Mr. Praveen Ranjan Srivastava, BITS PILANI, India
Mr. Kong Sang Kelvin, Leong, The Hong Kong Polytechnic University, Hong Kong
Mr. Mohd Nazri Ismail, Universiti Kuala Lumpur, Malaysia
Dr. Rami J. Matarneh, Al-isra Private University, Amman, Jordan
Dr Ojesanmi Olusegun Ayodeji, Ajayi Crowther University, Oyo, Nigeria
Dr. Riktesh Srivastava, Skyline University, UAE
Dr. Oras F. Baker, UCSI University - Kuala Lumpur, Malaysia
Dr. Ahmed S. Ghiduk, Faculty of Science, Beni-Suef University, Egypt
and Department of Computer science, Taif University, Saudi Arabia

(IJCSIS) International Journal of Computer Science and Information Security, Vol. 7, No. 2, February 2010
Mr. Tirthankar Gayen, IIT Kharagpur, India
Ms. Huei-Ru Tseng, National Chiao Tung University, Taiwan
Prof. Ning Xu, Wuhan University of Technology, China
Mr Mohammed Salem Binwahlan, Hadhramout University of Science and Technology, Yemen
& Universiti Teknologi Malaysia, Malaysia.
Dr. Aruna Ranganath, Bhoj Reddy Engineering College for Women, India
Mr. Hafeezullah Amin, Institute of Information Technology, KUST, Kohat, Pakistan
Prof. Syed S. Rizvi, University of Bridgeport, USA
Mr. Shahbaz Pervez Chattha, University of Engineering and Technology Taxila, Pakistan
Dr. Shishir Kumar, Jaypee University of Information Technology, Wakanaghat (HP), India
Mr. Shahid Mumtaz, Portugal Telecommunication, Instituto de Telecomunicações (IT) , Aveiro, Portugal
Mr. Rajesh K Shukla, Corporate Institute of Science & Technology Bhopal M P
Dr. Poonam Garg, Institute of Management Technology, India
Mr. S. Mehta, Inha University, Korea
Mr. Dilip Kumar S.M, University Visvesvaraya College of Engineering (UVCE), Bangalore University,
Bangalore
Prof. Malik Sikander Hayat Khiyal, Fatima Jinnah Women University, Rawalpindi, Pakistan
Dr. Virendra Gomase , Department of Bioinformatics, Padmashree Dr. D.Y. Patil University
Dr. Irraivan Elamvazuthi, University Technology PETRONAS, Malaysia
Mr. Saqib Saeed, University of Siegen, Germany
Mr. Pavan Kumar Gorakavi, IPMA-USA [YC]
Dr. Ahmed Nabih Zaki Rashed, Menoufia University, Egypt
Prof. Shishir K. Shandilya, Rukmani Devi Institute of Science & Technology, India
Mrs.J.Komala Lakshmi, SNR Sons College, Computer Science, India
Mr. Muhammad Sohail, KUST, Pakistan
Dr. Manjaiah D.H, Mangalore University, India
Dr. S Santhosh Baboo, D.G.Vaishnav College, Chennai, India
Prof. Dr. Mokhtar Beldjehem, Sainte-Anne University, Halifax, NS, Canada
Dr. Deepak Laxmi Narasimha, Faculty of Computer Science and Information Technology, University of
Malaya, Malaysia
Prof. Dr. Arunkumar Thangavelu, Vellore Institute Of Technology, India
Mr. M. Azath, Anna University, India
Mr. Md. Rabiul Islam, Rajshahi University of Engineering & Technology (RUET), Bangladesh
Mr. Aos Alaa Zaidan Ansaef, Multimedia University, Malaysia
Dr Suresh Jain, Professor (on leave), Institute of Engineering & Technology, Devi Ahilya University, Indore
(MP) India,
Mr. Mohammed M. Kadhum, Universiti Utara Malaysia
Mr. Hanumanthappa. J. University of Mysore, India
Mr. Syed Ishtiaque Ahmed, Bangladesh University of Engineering and Technology (BUET)
Mr Akinola Solomon Olalekan, University of Ibadan, Ibadan, Nigeria
(IJCSIS) International Journal of Computer Science and Information Security, Vol. 7, No. 2, February 2010
Mr. Santosh K. Pandey, Department of Information Technology, The Institute of Chartered Accountants of
India
Dr. P. Vasant, Power Control Optimization, Malaysia
Dr. Petr Ivankov, Automatika - S, Russian Federation
Dr. Utkarsh Seetha, Data Infosys Limited, India
Mrs. Priti Maheshwary, Maulana Azad National Institute of Technology, Bhopal
Dr. (Mrs) Padmavathi Ganapathi, Avinashilingam University for Women, Coimbatore
Assist. Prof. A. Neela madheswari, Anna university, India
Prof. Ganesan Ramachandra Rao, PSG College of Arts and Science, India
Mr. Kamanashis Biswas, Daffodil International University, Bangladesh
Dr. Atul Gonsai, Saurashtra University, Gujarat, India
Mr. Angkoon Phinyomark, Prince of Songkla University, Thailand
Mrs. G. Nalini Priya, Anna University, Chennai
Dr. P. Subashini, Avinashilingam University for Women, India
Assoc. Prof. Vijay Kumar Chakka, Dhirubhai Ambani IICT, Gandhinagar ,Gujarat
Mr Jitendra Agrawal, : Rajiv Gandhi Proudyogiki Vishwavidyalaya, Bhopal
Mr. Vishal Goyal, Department of Computer Science, Punjabi University, India
Dr. R. Baskaran, Department of Computer Science and Engineering, Anna University, Chennai
Assist. Prof, Kanwalvir Singh Dhindsa, B.B.S.B.Engg.College, Fatehgarh Sahib (Punjab), India
Dr. Jamal Ahmad Dargham, School of Engineering and Information Technology, Universiti Malaysia Sabah
Mr. Nitin Bhatia, DAV College, India
Dr. Dhavachelvan Ponnurangam, Pondicherry Central University, India
Dr. Mohd Faizal Abdollah, University of Technical Malaysia, Malaysia
Assist. Prof. Sonal Chawla, Panjab University, India
Dr. Abdul Wahid, AKG Engg. College, Ghaziabad, India
Mr. Arash Habibi Lashkari, University of Malaya (UM), Malaysia
Mr. Md. Rajibul Islam, Ibnu Sina Institute, University Technology Malaysia
Professor Dr. Sabu M. Thampi, .B.S Institute of Technology for Women, Kerala University, India
Mr. Noor Muhammed Nayeem, Université Lumière Lyon 2, 69007 Lyon, France
Dr. Himanshu Aggarwal, Department of Computer Engineering, Punjabi University, India
Prof R. Naidoo, Dept of Mathematics/Center for Advanced Computer Modelling, Durban University of
Technology, Durban,South Africa
Prof. Mydhili K Nair, M S Ramaiah Institute of Technology(M.S.R.I.T), Affliliated to Visweswaraiah
Technological University, Bangalore, India
M. Prabu, Adhiyamaan College of Engineering/Anna University, India
Mr. Swakkhar Shatabda, Department of Computer Science and Engineering, United International University,
Bangladesh
Dr. Abdur Rashid Khan, ICIT, Gomal University, Dera Ismail Khan, Pakistan
Mr. H. Abdul Shabeer, I-Nautix Technologies,Chennai, India
Dr. M. Aramudhan, Perunthalaivar Kamarajar Institute of Engineering and Technology, India

(IJCSIS) International Journal of Computer Science and Information Security, Vol. 7, No. 2, February 2010
Dr. M. P. Thapliyal, Department of Computer Science, HNB Garhwal University (Central University), India
Prof Ekta Walia Bhullar, Maharishi Markandeshwar University, Mullana (Ambala), India
Dr. Shahaboddin Shamshirband, Islamic Azad University, Iran
Mr. Zeashan Hameed Khan, : Université de Grenoble, France
Prof. Anil K Ahlawat, Ajay Kumar Garg Engineering College, Ghaziabad, UP Technical University, Lucknow
Mr. Longe Olumide Babatope, University Of Ibadan, Nigeria
Associate Prof. Raman Maini, University College of Engineering, Punjabi University, India
Dr. Maslin Masrom, University Technology Malaysia, Malaysia
Sudipta Chattopadhyay, Jadavpur University, Kolkata, India
Dr. Dang Tuan NGUYEN, University of Information Technology, Vietnam National University - Ho Chi Minh
City
Dr. Mary Lourde R., BITS-PILANI Dubai , UAE
Dr. Abdul Aziz, University of Central Punjab, Pakistan
Mr. Karan Singh, Gautam Budtha University, India
Mr. Avinash Pokhriyal, Uttar Pradesh Technical University, Lucknow, India
Associate Prof Dr Zuraini Ismail, University Technology Malaysia, Malaysia
Assistant Prof. Yasser M. Alginahi, College of Computer Science and Engineering, Taibah University, Madinah
Munawwarrah, KSA
Mr. Dakshina Ranjan Kisku, West Bengal University of Technology, India
Mr. Raman Kumar, Dr B R Ambedkar National Institute of Technology, Jalandhar, Punjab, India
Associate Prof. Samir B. Patel, Institute of Technology, Nirma University, India
Dr. M.Munir Ahamed Rabbani, B. S. Abdur Rahman University, India
Asst. Prof. Koushik Majumder, West Bengal University of Technology, India
Dr. Alex Pappachen James, Queensland Micro-nanotechnology center, Griffith University, Australia
Assistant Prof. S. Hariharan, B.S. Abdur Rahman University, India
Asst Prof. Jasmine. K. S, R.V.College of Engineering, India
Mr Naushad Ali Mamode Khan, Ministry of Education and Human Resources, Mauritius
Prof. Mahesh Goyani, G H Patel Collge of Engg. & Tech, V.V.N, Anand, Gujarat, India
Dr. Mana Mohammed, University of Tlemcen, Algeria
Prof. Jatinder Singh, Universal Institutiion of Engg. & Tech. CHD, India
Mrs. M. Anandhavalli Gauthaman, Sikkim Manipal Institute of Technology, Majitar, East Sikkim
Dr. Bin Guo, Institute Telecom SudParis, France
Mrs. Maleika Mehr Nigar Mohamed Heenaye-Mamode Khan, University of Mauritius
Prof. Pijush Biswas, RCC Institute of Information Technology, India
Mr. V. Bala Dhandayuthapani, Mekelle University, Ethiopia
Mr. Irfan Syamsuddin, State Polytechnic of Ujung Pandang, Indonesia
Mr. Kavi Kumar Khedo, University of Mauritius, Mauritius
Mr. Ravi Chandiran, Zagro Singapore Pte Ltd. Singapore
Mr. Milindkumar V. Sarode, Jawaharlal Darda Institute of Engineering and Technology, India
Dr. Shamimul Qamar, KSJ Institute of Engineering & Technology, India

(IJCSIS) International Journal of Computer Science and Information Security, Vol. 7, No. 2, February 2010
Dr. C. Arun, Anna University, India
Assist. Prof. M.N.Birje, Basaveshwar Engineering College, India
Prof. Hamid Reza Naji, Department of Computer Enigneering, Shahid Beheshti University, Tehran, Iran
Assist. Prof. Debasis Giri, Department of Computer Science and Engineering, Haldia Institute of Technology
Subhabrata Barman, Haldia Institute of Technology, West Bengal
Mr. M. I. Lali, COMSATS Institute of Information Technology, Islamabad, Pakistan
Dr. Feroz Khan, Central Institute of Medicinal and Aromatic Plants, Lucknow, India
Mr. R. Nagendran, Institute of Technology, Coimbatore, Tamilnadu, India
Mr. Amnach Khawne, King Mongkut’s Institute of Technology Ladkrabang, Ladkrabang, Bangkok, Thailand
Dr. P. Chakrabarti, Sir Padampat Singhania University, Udaipur, India
Mr. Nafiz Imtiaz Bin Hamid, Islamic University of Technology (IUT), Bangladesh.
Shahab-A. Shamshirband, Islamic Azad University, Chalous, Iran
Prof. B. Priestly Shan, Anna Univeristy, Tamilnadu, India
Venkatramreddy Velma, Dept. of Bioinformatics, University of Mississippi Medical Center, Jackson MS USA
Akshi Kumar, Dept. of Computer Engineering, Delhi Technological University, India

CALL FOR PAPERS International Journal of Computer Science and Information Security
IJCSIS 2010 ISSN: 1947-5500
http://sites.google.com/site/ijcsis/ International Journal Computer Science and Information Security, now at its sixth edition, is the premier scholarly venue in the areas of computer science and security issues. IJCSIS 2009-2010 will provide a high profile, leading edge platform for researchers and engineers alike to publish state-of-the-art research in the respective fields of information technology and communication security. The journal will feature a diverse mixture of publication articles including core and applied computer science related topics. Authors are solicited to contribute to the special issue by submitting articles that illustrate research results, projects, surveying works and industrial experiences that describe significant advances in the following areas, but are not limited to. Submissions may span a broad range of topics, e.g.: Track A: Security Access control, Anonymity, Audit and audit reduction & Authentication and authorization, Applied cryptography, Cryptanalysis, Digital Signatures, Biometric security, Boundary control devices, Certification and accreditation, Cross-layer design for security, Security & Network Management, Data and system integrity, Database security, Defensive information warfare, Denial of service protection, Intrusion Detection, Anti-malware, Distributed systems security, Electronic commerce, E-mail security, Spam, Phishing, E-mail fraud, Virus, worms, Trojan Protection, Grid security, Information hiding and watermarking & Information survivability, Insider threat protection, Integrity Intellectual property protection, Internet/Intranet Security, Key management and key recovery, Language-based security, Mobile and wireless security, Mobile, Ad Hoc and Sensor Network Security, Monitoring and surveillance, Multimedia security ,Operating system security, Peer-to-peer security, Performance Evaluations of Protocols & Security Application, Privacy and data protection, Product evaluation criteria and compliance, Risk evaluation and security certification, Risk/vulnerability assessment, Security & Network Management, Security Models & protocols, Security threats & countermeasures (DDoS, MiM, Session Hijacking, Replay attack etc,), Trusted computing, Ubiquitous Computing Security, Virtualization security, VoIP security, Web 2.0 security, Submission Procedures, Active Defense Systems, Adaptive Defense Systems, Benchmark, Analysis and Evaluation of Security Systems, Distributed Access Control and Trust Management, Distributed Attack Systems and Mechanisms, Distributed Intrusion Detection/Prevention Systems, Denial-of-Service Attacks and Countermeasures, High Performance Security Systems, Identity Management and Authentication, Implementation, Deployment and Management of Security Systems, Intelligent Defense Systems, Internet and Network Forensics, Large-scale Attacks and Defense, RFID Security and Privacy, Security Architectures in Distributed Network Systems, Security for Critical Infrastructures, Security for P2P systems and Grid Systems, Security in E-Commerce, Security and Privacy in Wireless Networks, Secure Mobile Agents and Mobile Code, Security Protocols, Security Simulation and Tools, Security Theory and Tools, Standards and Assurance Methods, Trusted Computing, Viruses, Worms, and Other Malicious Code, World Wide Web Security, Novel and emerging secure architecture, Study of attack strategies, attack modeling, Case studies and analysis of actual attacks, Continuity of Operations during an attack, Key management, Trust management, Intrusion detection techniques, Intrusion response, alarm management, and correlation analysis, Study of tradeoffs between security and system performance, Intrusion tolerance systems, Secure protocols, Security in wireless networks (e.g. mesh networks, sensor networks, etc.), Cryptography and Secure Communications, Computer Forensics, Recovery and Healing, Security Visualization, Formal Methods in Security, Principles for Designing a Secure Computing System, Autonomic Security, Internet Security, Security in Health Care Systems, Security Solutions Using Reconfigurable Computing, Adaptive and Intelligent Defense Systems, Authentication and Access control, Denial of service attacks and countermeasures, Identity, Route and
Location Anonymity schemes, Intrusion detection and prevention techniques, Cryptography, encryption algorithms and Key management schemes, Secure routing schemes, Secure neighbor discovery and localization, Trust establishment and maintenance, Confidentiality and data integrity, Security architectures, deployments and solutions, Emerging threats to cloud-based services, Security model for new services, Cloud-aware web service security, Information hiding in Cloud Computing, Securing distributed data storage in cloud, Security, privacy and trust in mobile computing systems and applications, Middleware security & Security features: middleware software is an asset on its own and has to be protected, interaction between security-specific and other middleware features, e.g., context-awareness, Middleware-level security monitoring and measurement: metrics and mechanisms for quantification and evaluation of security enforced by the middleware, Security co-design: trade-off and co-design between application-based and middleware-based security, Policy-based management: innovative support for policy-based definition and enforcement of security concerns, Identification and authentication mechanisms: Means to capture application specific constraints in defining and enforcing access control rules, Middleware-oriented security patterns: identification of patterns for sound, reusable security, Security in aspect-based middleware: mechanisms for isolating and enforcing security aspects, Security in agent-based platforms: protection for mobile code and platforms, Smart Devices: Biometrics, National ID cards, Embedded Systems Security and TPMs, RFID Systems Security, Smart Card Security, Pervasive Systems: Digital Rights Management (DRM) in pervasive environments, Intrusion Detection and Information Filtering, Localization Systems Security (Tracking of People and Goods), Mobile Commerce Security, Privacy Enhancing Technologies, Security Protocols (for Identification and Authentication, Confidentiality and Privacy, and Integrity), Ubiquitous Networks: Ad Hoc Networks Security, Delay-Tolerant Network Security, Domestic Network Security, Peer-to-Peer Networks Security, Security Issues in Mobile and Ubiquitous Networks, Security of GSM/GPRS/UMTS Systems, Sensor Networks Security, Vehicular Network Security, Wireless Communication Security: Bluetooth, NFC, WiFi, WiMAX, WiMedia, others This Track will emphasize the design, implementation, management and applications of computer communications, networks and services. Topics of mostly theoretical nature are also welcome, provided there is clear practical potential in applying the results of such work. Track B: Computer Science Broadband wireless technologies: LTE, WiMAX, WiRAN, HSDPA, HSUPA, Resource allocation and interference management, Quality of service and scheduling methods, Capacity planning and dimensioning, Cross-layer design and Physical layer based issue, Interworking architecture and interoperability, Relay assisted and cooperative communications, Location and provisioning and mobility management, Call admission and flow/congestion control, Performance optimization, Channel capacity modeling and analysis, Middleware Issues: Event-based, publish/subscribe, and message-oriented middleware, Reconfigurable, adaptable, and reflective middleware approaches, Middleware solutions for reliability, fault tolerance, and quality-of-service, Scalability of middleware, Context-aware middleware, Autonomic and self-managing middleware, Evaluation techniques for middleware solutions, Formal methods and tools for designing, verifying, and evaluating, middleware, Software engineering techniques for middleware, Service oriented middleware, Agent-based middleware, Security middleware, Network Applications: Network-based automation, Cloud applications, Ubiquitous and pervasive applications, Collaborative applications, RFID and sensor network applications, Mobile applications, Smart home applications, Infrastructure monitoring and control applications, Remote health monitoring, GPS and location-based applications, Networked vehicles applications, Alert applications, Embeded Computer System, Advanced Control Systems, and Intelligent Control : Advanced control and measurement, computer and microprocessor-based control, signal processing, estimation and identification techniques, application specific IC’s, nonlinear and adaptive control, optimal and robot control, intelligent control, evolutionary computing, and intelligent systems, instrumentation subject to critical conditions, automotive, marine and aero-space control and all other control applications, Intelligent Control System, Wiring/Wireless Sensor, Signal Control System. Sensors, Actuators and Systems Integration : Intelligent sensors and actuators, multisensor fusion, sensor array and multi-channel processing, micro/nano technology, microsensors and microactuators, instrumentation electronics, MEMS and system integration, wireless sensor, Network Sensor, Hybrid

Sensor, Distributed Sensor Networks. Signal and Image Processing : Digital signal processing theory, methods, DSP implementation, speech processing, image and multidimensional signal processing, Image analysis and processing, Image and Multimedia applications, Real-time multimedia signal processing, Computer vision, Emerging signal processing areas, Remote Sensing, Signal processing in education. Industrial Informatics: Industrial applications of neural networks, fuzzy algorithms, Neuro-Fuzzy application, bioInformatics, real-time computer control, real-time information systems, human-machine interfaces, CAD/CAM/CAT/CIM, virtual reality, industrial communications, flexible manufacturing systems, industrial automated process, Data Storage Management, Harddisk control, Supply Chain Management, Logistics applications, Power plant automation, Drives automation. Information Technology, Management of Information System : Management information systems, Information Management, Nursing information management, Information System, Information Technology and their application, Data retrieval, Data Base Management, Decision analysis methods, Information processing, Operations research, E-Business, E-Commerce, E-Government, Computer Business, Security and risk management, Medical imaging, Biotechnology, Bio-Medicine, Computer-based information systems in health care, Changing Access to Patient Information, Healthcare Management Information Technology. Communication/Computer Network, Transportation Application : On-board diagnostics, Active safety systems, Communication systems, Wireless technology, Communication application, Navigation and Guidance, Vision-based applications, Speech interface, Sensor fusion, Networking theory and technologies, Transportation information, Autonomous vehicle, Vehicle application of affective computing, Advance Computing technology and their application : Broadband and intelligent networks, Data Mining, Data fusion, Computational intelligence, Information and data security, Information indexing and retrieval, Information processing, Information systems and applications, Internet applications and performances, Knowledge based systems, Knowledge management, Software Engineering, Decision making, Mobile networks and services, Network management and services, Neural Network, Fuzzy logics, Neuro-Fuzzy, Expert approaches, Innovation Technology and Management : Innovation and product development, Emerging advances in business and its applications, Creativity in Internet management and retailing, B2B and B2C management, Electronic transceiver device for Retail Marketing Industries, Facilities planning and management, Innovative pervasive computing applications, Programming paradigms for pervasive systems, Software evolution and maintenance in pervasive systems, Middleware services and agent technologies, Adaptive, autonomic and context-aware computing, Mobile/Wireless computing systems and services in pervasive computing, Energy-efficient and green pervasive computing, Communication architectures for pervasive computing, Ad hoc networks for pervasive communications, Pervasive opportunistic communications and applications, Enabling technologies for pervasive systems (e.g., wireless BAN, PAN), Positioning and tracking technologies, Sensors and RFID in pervasive systems, Multimodal sensing and context for pervasive applications, Pervasive sensing, perception and semantic interpretation, Smart devices and intelligent environments, Trust, security and privacy issues in pervasive systems, User interfaces and interaction models, Virtual immersive communications, Wearable computers, Standards and interfaces for pervasive computing environments, Social and economic models for pervasive systems, Active and Programmable Networks, Ad Hoc & Sensor Network, Congestion and/or Flow Control, Content Distribution, Grid Networking, High-speed Network Architectures, Internet Services and Applications, Optical Networks, Mobile and Wireless Networks, Network Modeling and Simulation, Multicast, Multimedia Communications, Network Control and Management, Network Protocols, Network Performance, Network Measurement, Peer to Peer and Overlay Networks, Quality of Service and Quality of Experience, Ubiquitous Networks, Crosscutting Themes – Internet Technologies, Infrastructure, Services and Applications; Open Source Tools, Open Models and Architectures; Security, Privacy and Trust; Navigation Systems, Location Based Services; Social Networks and Online Communities; ICT Convergence, Digital Economy and Digital Divide, Neural Networks, Pattern Recognition, Computer Vision, Advanced Computing Architectures and New Programming Models, Visualization and Virtual Reality as Applied to Computational Science, Computer Architecture and Embedded Systems, Technology in Education, Theoretical Computer Science, Computing Ethics, Computing Practices & Applications Authors are invited to submit papers through e-mail [email protected]. Submissions must be original and should not have been published previously or be under consideration for publication while being evaluated by IJCSIS. Before submission authors should carefully read over the journal's Author Guidelines, which are located at http://sites.google.com/site/ijcsis/authors-notes .

© IJCSIS PUBLICATION 2010 ISSN 1947 5500