
Journal of Computer Science and Information Security December 2011
130
International Journal of Computer Science & Information Security © IJCSIS PUBLICATION 2011 IJCSIS Vol. 9 No. 12, December 2011 ISSN 1947-5500
-
Upload
independent -
Category
Documents
-
view
2 -
download
0
Transcript of Journal of Computer Science and Information Security December 2011

International Journal of Computer Science
& Information Security
© IJCSIS PUBLICATION 2011
IJCSIS Vol. 9 No. 12, December 2011 ISSN 1947-5500

Editorial Message from Managing Editor
International Journal of Computer Science and Information Security (IJCSIS) invites researchers, editors, scientists & scholars to publish their scientific research papers in its forthcoming issue. The International Journal IJCSIS is an archival, monthly journal committed to the timely publications of peer-reviewed and original papers that advance the state-of-the-art and practical applications of computer science and security. It provides a publication vehicle for complete coverage of all topics of interest to computer science professionals and brings to its readers the latest and most important findings in computer science and information security. The journal covers the frontier issues in the engineering and the computer science and their applications in business, industry and other subjects. (See monthly Call for Papers) Since 2009, IJCSIS is published using an open access publication model, free access to the journal online without the need for a subscription. On behalf of the editorial committee, I would like to express my sincere thanks to all authors and reviewers for their great contribution. For complete details about IJCSIS archives publications, abstracting/indexing, editorial board and other important information, please refer to IJCSIS homepage. We look forward to receive your valuable papers. If you have further questions please do not hesitate to contact us at [email protected]. Our team is committed to provide a quick and supportive service throughout the publication process. A complete list of journals can be found at:
Available at http://sites.google.com/site/ijcsis/
IJCSIS Vol. 9, No. 12, December 2011 Edition
ISSN 1947-5500 © IJCSIS, USA.
Journal Indexed by (among others):

IJCSIS EDITORIAL BOARD Dr. Yong Li School of Electronic and Information Engineering, Beijing Jiaotong University, P. R. China Prof. Hamid Reza Naji Department of Computer Enigneering, Shahid Beheshti University, Tehran, Iran Dr. Sanjay Jasola Professor and Dean, School of Information and Communication Technology, Gautam Buddha University Dr Riktesh Srivastava Assistant Professor, Information Systems, Skyline University College, University City of Sharjah, Sharjah, PO 1797, UAE Dr. Siddhivinayak Kulkarni University of Ballarat, Ballarat, Victoria, Australia Professor (Dr) Mokhtar Beldjehem Sainte-Anne University, Halifax, NS, Canada Dr. Alex Pappachen James (Research Fellow) Queensland Micro-nanotechnology center, Griffith University, Australia Dr. T. C. Manjunath ATRIA Institute of Tech, India.
Prof. Elboukhari Mohamed Department of Computer Science, University Mohammed First, Oujda, Morocco

TABLE OF CONTENTS
1. Paper 30111138: Address Resolution using Direct Dynamic Neighbor Mechanism for Packet Transmission in IPv6 (pp. 1-6) Abdulaleem Ali ALmazroi (1), Rahmat Budiarto (2), Merza Abbas (3) 1,3 Center of Instructional Technology and Multimedia, Universiti Sains Malaysia, Penang, Malaysia 2 InterNetWorks Research Groups, UUM College of Arts and Sciences, Universiti Utara Malaysia, Sintok, Malaysia 2. Paper 28111124: Recognizing P2P Botnets Characteristic Through TCP Destinctive Behaviour (pp. 7-11) Raihana Syahirah Abdullah, Mohd Zaki Mas’ud, Mohd Faizal Abdollah, Shahrin Sahib, Robiah Yusof Faculty of Information and Communication Technology Universiti Teknikal Malaysia Melaka, Hang Tuah Jaya, 76100 Durian Tunggal, Melaka 3. Paper 31101069: Wireless Sensor Networks Support Educators (pp. 12-16) Homa Edalatifard, Centre for Instructional Technology and Multimedia, Universiti Sains Malaysia, Pulau Pinang, Malaysia Merza Abbas, Centre for Instructional Technology and Multimedia, Universiti Sains Malaysia, Pulau Pinang, Malaysia Zaidatun Tasir, Faculty of Education, Universiti Teknologi Malaysia, Johor, Malaysia 4. Paper 24111112: Design, Optimization & Evaluation of Tapered Waveguide With Cylindrical Waveguide (pp. 17-19) Harshukumar Khare, Prof R. D. Patane Terna engineering college, Nerul, Navi-mumbai 5. Paper 27111116: Shape Content Based Image Retrieval using LBG Vector Quantization (pp. 20-25) Dr. H.B. Kekre 1 , Dr. Sudeep D. Thepade 2 , Shrikant P. Sanas 3 , Sowmya Iyer 4 , Jhuma Garg 5 . 1Sr.Professor, 2 Associate Professor and HoD, 3Lecturer, 4,5B.E Student. 1,2 MPSTME, SVKM’s NMIMS (Deemed to be University), Mumbai. 3,4,5 RAIT, Nerul, Navi Mumbai 6. Paper 27111120: Energy Issues In Mobile Telecom Network: A Detailed Analysis (pp. 26-28) P. Balagangadhar Rao Electronics and Telecommunications Engineering, Sreekavitha Engineering College, Karepalli 507 122, INDIA 7. Paper 28111121: Performance Comparison Of Neural Networks For Identification Of Diabetic Retinopathy (pp. 29-35) Mr. R. Vijayamadheswaran #1, Dr.M.Arthanari #2, Mr.M.Sivakumar #3 # 1Doctoral Research Scholar, Anna University, Coimbatore, India

# 3Doctoral Research Scholar, Anna University, Coimbatore, India # 2Director,Bharathidhasan School of Computer Applications, Ellispettai, Erode, India 8. Paper 28111122: ZCEA&ZERA: Two-Step Cross Layer Congestion Control Routing Protocol (pp. 36-44) Prof. K. Srinivas, Dept. of Computer Science, Kottam College of Engineering, Kurnool, Andhrapradesh, India Prof. A. A. Chari, Director (Research studies), Rayalaseema University, Kurnool, Andhrapradesh, India 9. Paper 28111126: An Adaptive Neuro-Fuzzy Inference System based on Vorticity and Divergence for Rainfall forecasting (pp. 45-53) Kavita Pabreja Research Scholar, Birla Institute of Technology and Science, Pilani, Rajasthan, India Assistant Professor, Maharaja Surajmal Institute (an affiliate of GGSIP University), New Delhi, India 10. Paper 30091163: Highly Dynamic Nature of Mobile AD-HOC Networks (MANETs): Requirement of Stringent Security Measures (pp. 54-56) Prof P. Balagangadhar Rao, Electronics and Telecommunications, Sreekavitha Engineering College, Karepalli, India 11. Paper 30111141: A Novel Preprocessing Directed Acyclic Graph Technique for Session Construction (pp. 57-61) S. Chitra, Department of Computer Science, Government Arts College (Autonomous), Coimbatore - 641 018 Dr. B. Kalpana, Department of Computer Science, Avinashilingam University for Women, Coimbatore - 641 043 12. Paper 30111160: Performance Evaluation of Likert Weight Measure (pp. 62-67) N. Sudha, Asst. Professor, Department of computer science, Bishop Appasamy College of Arts & Science , Coimbatore -18, Tamil Nadu, India. Lt. Dr. Santhosh Baboo, Reader PG & Research Department of computer applications, DG Vaishnav college, Chennai -600 106, Tamil Nadu India 13. Paper 30111162: Classifying Wine Quality Using K-Nearest Neighbor Based Associations (pp. 68-72) Lailil Muflikhah, Computer Science Department, University of Brawijaya, Malang, Indonesia Made Putra Adnyana, Computer Science Department, University of Brawijaya, Malang, Indonesia 14. Paper 30111163: Scene Change Detection Algorithms & Techniques: A Survey (pp. 73-77) Dolley Shukla, Dept. of information Technology, Shri Shankaracharya College of Engg., Tech. Bhilai, India Manisha Sharma, dept. of Electronics & Telecommunacation, Bhilai Institute of Technology, Durg Durg, India 15. Paper 30111166: Fingerprint Classification using KFCG Algorithm (pp. 78-81) Dr. H.B.Kekre, Dr. Sudeep D. Thepade, Dimple Parekh, MPSTME, SVKM‘s NMIMS Deemed to be University, Mumbai, Maharashtra 400056, India

16. Paper 30111168: On the Use of Stochastic Activity Networks and Game Theory for Quantitative Security Evaluation (pp. 82-92) Abdolsattar Vakili, Department of Computer Engineering, Islamic Azad University, Aq Qala Center, Aq Qala, Iran Akbar Jangi Aghdam, School of Computer Engineering, Iran University of Science and Technology, Tehran, Iran Taymaz Esmaeili, Department of Civil Engineering, Islamic Azad University, Aq Qala Center, Aq Qala, Iran 17. Paper 30111169: Rule Based Decision Mining With JDL Data Fusion Model For Computer Forensics: A Hypothetical Case Analysis (pp. 93-100) Suneeta Satpathy, P.G Department of Computer Application, CEB, BPUT, Bhubaneswar Sateesh K. Pradhan & B. B. Ray, P.G Department of Computer Application, Utkal University, Bhubaneswar, India 18. Paper 31081165: Harnessing High Speed Transmissions For Computer Communications With WiMax Technology (pp. 101-103) Prof P.Balagangadhar Rao. Electronics and Telecommunications, Sreekavitha Engineering College, Karepalli, India 19. Paper 31101179: Design an Algorithm To Discover The Misdirection Attack For Increasing The Life Time in Computer Network (pp. 104-108) Fu Omar Tariq Saleh Al-Khalidy Computer Science Department, College of Computer Science and Mathematics, Mosul University, Mosul, Iraq
1
Address Resolution using Direct Dynamic Neighbor Mechanism for Packet Transmission in IPv6
Abdulaleem Ali ALmazroi1, Rahmat Budiarto2, Merza Abbas3
1,3Centre of Instructional Technology and Multimedia, Universiti Sains Malaysia, Penang, Malaysia
2InterNetWorks Research Groups, UUM College of Arts and Sciences, Universiti Utara Malaysia, Sintok, Malaysia
E-mail: [email protected], [email protected], [email protected]
Abstract—Packet transmission by means of address resolution has been the main backbone of Internet communication through transmission of packets among computer networks. Packet transmission was either implemented in both IPv4 and IPv6 with the focus gradually moving to IPv6 because IPv6 has more address spaces of 128bits and supports billions of IP addresses as compared to IPv4. Packet transmission functions through the mapping of various addresses among computer on the networks before packets are transmitted to final destination. And this is where address resolution comes into play. IPv6 packets are resolved in two different ways namely, Direct Mapping and Dynamic binding which is most commonly used. However, the research will focus its attention on Direct mapping approach with new methodology known direct dynamic neighbor which is a combination of Dynamic Binding and Direct mapping methods to send packets in the same network. With the new approach, packet transmission will be enhanced significantly as packet can be sent directly to destination. The research will also briefly compare the methodologies of each approach in order to ascertain the efficiency of each technique. Other areas to be compared are packet transmission for each technique, the number of steps of each method takes to deliver packet from source to final destination.
Keywords: Direct mapping, Dynamic binding, Neighbor Discovery Protocol, Packets Transmission, Direct Dynamic Neighbor
I. INTRODUCTION Packet Transmissions are conducted through Internet Protocols (IPs), namely IPv4, and the recently introduced IPv6 as one of the major sources of transmitting packets among network computers. The procedures for packet transmissions are to map IP and MAC addresses among computers through address resolution before the packets are sent to final destinations. The processes of packet transmission are implemented in two ways, namely, direct mapping and dynamic binding. With Dynamic binding, the process of sending packets involves higher delay times because it requires the application of a protocol to send back and forth Neighbor Discovery (ND) messages such as Neighbor Solicitation (NS) and Neighbor Advertisements (NA) to resolve addresses before packets are transmitted leading to delays in time and packet delivery efficiency [1].
With Direct mapping in IPv6, the destination’s physical address (receiving computer) is already known through the IPv6 Interface Identifier and hence avoids numerous negotiations before packets are transmitted to final the destination through the help Neighbor Discovery Protocol (NDP). The transmission of packets over the networks originates from TCP/IP where both IP addresses and physical MAC addresses of the network computers are resolved through a process known as Address resolution, which maps a host network to another to validate links and communication [2]. For instance, when a network computer intends to transmit a packet or datagram to another network host, the IP address is mapped to the exact physical address of the intended recipient through Address resolution methods [3]. The prime responsibility of Direct mapping is to map IP address to physical address, the MAC address of computer to ensure quicker accessibility times and efficient delivery of packets to the exact hosts. Direct mapping and Dynamic binding uses a protocol known as ND for discovery of link nodes, link layer addresses of various nodes and as well as search for availability of routers within discovery range in order to send packets [3]. In IPv6, the issues of direct mapping approach of transmitting packets have become simpler with the introduction of a built-in interface embedded in IPv6 protocol known as IPv6 Interface Identifier which ensures direct transmission of packets to final destinations, because the destination MAC address of receiving computer have already been built in IPv6 Interface Identifier which then improves the overall packets transmission rate [4]. The implementation of Neighbor Discovery Protocol is such that it can run across any networks and its main purpose is helping to solve addresses and physical MAC addresses as well as discovering all neighboring routers within the same link to transmit packets because NDP nodes functions by exchanging messages by means of ICMPv6 (Internet Control Message Protocol v6) which is part of ICMPv6 packet with NDP specified fields, encapsulated by IPv6 header as well as link layer headers [5]. To enable fast and convenient transmission, the research intends to come up with algorithm for resolving addresses before packets are sent, known as Direct Dynamic Neighbor (DDN), which is the extraction from the best features of direct mapping, dynamic binding and NDP. The proposed new technique, DDN, will reduce the time
(IJCSIS) International Journal of Computer Science and Information Security, Vol. 9, No. 12, December 2011
http://sites.google.com/site/ijcsis/ ISSN 1947-5500
2
taken to transmit packets in the network and also to ensure efficiency of packets transmission as the destination for the receiving host is recognized the IPv6 Identifier [6]. The outcome will evaluate the new technique against that of Dynamic binding in terms of time and efficiency.
II. Related study Earlier research works carried out confirmed packet transmission in IPv6 is much more efficient in sending packets in direct mapping when compared to dynamic binding. Kozirok [7] investigated how to convert and map MAC address, EUI-64 and to IPv6 Interface Identifiers. Studies on the IPv6 packet transmission through direct mapping and dynamic binding have shown that Neighbor Discovery (ND) protocol enables the discovery of link nodes, link layer addresses of various nodes as well as search for availability routers within discovery range in order to send packets. Kim et al [12] investigated how Neighbor Discovery runs across any networks and its main purpose is to resolve IP addresses and physical addresses as well as discovering all neighboring routers within the same link in order to send packets. ND can automatically generate the interface Identifier based on the MAC 48 bits or EUI-64 address of the hosts’ interface. Also ND nodes functions by exchanging messages by means of ICMPv6 (Internet Control Message Protocol v6) which is part of ICMPv6 packet within ND specified fields, encapsulated by IPv6 header as well as link layer headers. Narten et al [6] describe the various types of addresses found in IPv6 source and destination address fields to be comprised of link-local addresses, global unicast addresses and multicast addresses which are used exclusively by Neighbor Discovery for packet transmission over the networks. Hines [14] identifies Next-hop determination in ND as an algorithm to map and find out IP final destination address before forwarding the packet to the IP address of destination neighbor. In other words, the algorithm resolves mapping for an IP destination address to the IP address of the traffic neighbor. The ND node keeps a Destination Cache for already mapped IPv6 addresses of lately transmitted packets for the Next hop neighbor noted for forwarding packets.
III. MATERIALS AND METHODS The procedures needed for this research are simulations of how IPv6 packets are transmitted directly from source to destination and how addresses are resolved through DDN before a packet is transmitted. The methodology proposes a new transmission algorithm for IPv6 packets. The algorithm intends to apply some of the functions of ND mechanisms in transmitting packets such as neighbor cache and to conform to direct mapping approach as well. So the new DDN algorithm uses Interface Identifiers in IPv6 because it has lower 64 bits embedded with 48 bits MAC addresses through EUI 64 mapping which have source destination already embedded so transmission can take place without many network negotiations. The IPv6 Interface Identifier, MAC address, network topology, simulation of nodes were implemented in the same network [10]. The DDN technique for packet
transmission applied the IEEE EUI-64 that defined a standard for mapping MAC 48 bit address to IPv6 lower 64 bits. Additionally the new algorithm used Interface Identifiers in IPv6 because it has lower 64 bits embedded with 48 bits MAC addresses through EUI-64 mapping that determines the final destination where packets are to be transmitted. Because the EUI-64 is packed with the missing bits in the center with 15 ones and zero for the data link layer and also network layer filled in with the network address [11]. The procedures for implemented DDN for address resolution before packets are transmitted include: • Only one of several NDP message types was retained to
support the new DDN technique which was Neighbor cache, others like Neighbor Solicitation (NS) and Neighbor Advertisements (NA), among others were not taken into consideration.
The link layer addresses are encoded as Interface Identifier of IPv6 lower 64 bits and have a destination target of packets to be transmitted and so it is prudent to keep track records of network information through some of NDP mechanism for reference and security purposes and hence the reason why only Neighbor Cache was chosen out of the many NDP messages types. Figure 1 explains more on the process flow of the proposed algorithm DDN and shows an elaborative process of how the DDN packets are sent. The numbers of transmission paths for packets are reduced by using the proposed DDN. From Figure 1, all the proposed DDN mechanism needs to do is to get the necessary destination MAC address from Neighbor cache and transmit the packet to final destination. The time of sending the packet is lesser because no address resolutions need to be resolved and also no exchange of ND messages such as NS and NA are required. The destination address is thus obtained much faster as it has already been encoded as part of IPv6 Interface Identifier ID and so a packet is then transmitted to its final destination.
Packets also can be sent at a faster rate at this stage because the longer steps employed in sending packets in Dynamic binding have been eliminated.
(IJCSIS) International Journal of Computer Science and Information Security, Vol. 9, No. 12, December 2011
http://sites.google.com/site/ijcsis/ ISSN 1947-5500
3
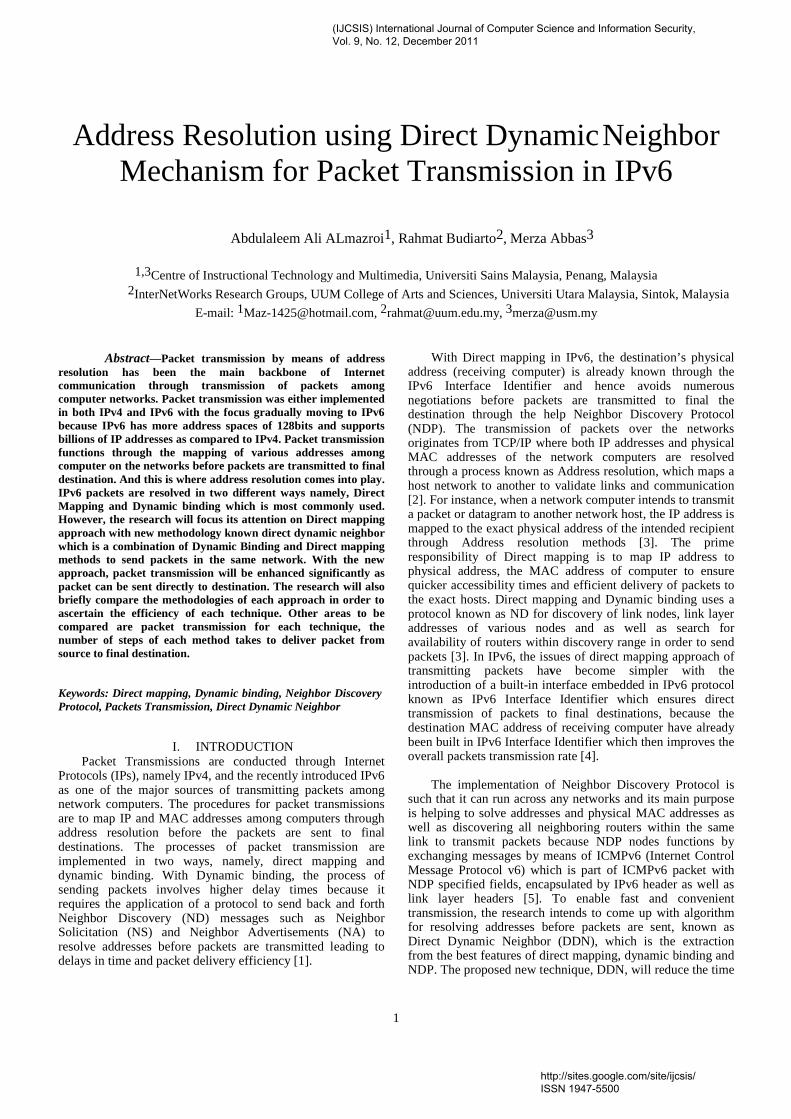
Figure-1: Algorithm of DDN for link layer
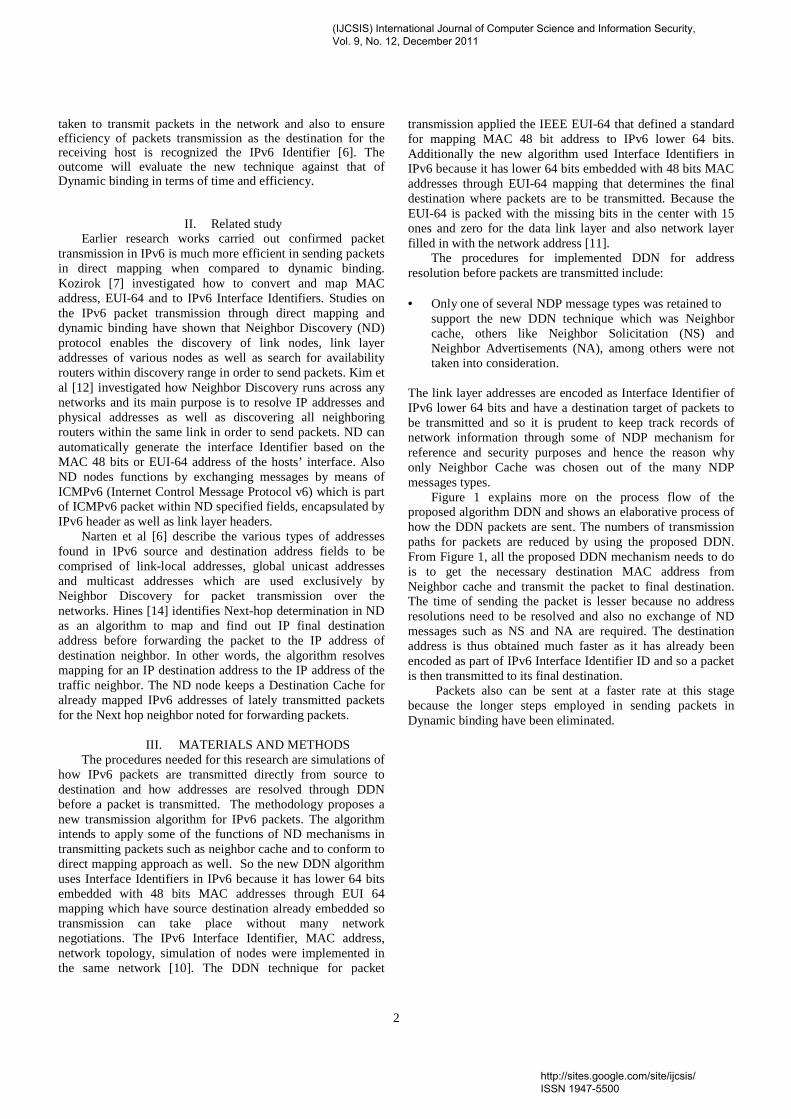
Figure-2: Proposed DDN for address resolution
This section explains how the proposed DDN algorithm sends the packets. In DDN Whenever a packet arrives from a higher protocol say, TCP/IP, the algorithm verifies the destination address for packet to be sent if it does not have any previous information stored in the Neighbor Cache. If so, the destination address is extracted from IPv6 Interface Identifier which already has the destination MAC address of the
receiving host before the packet is sent. If the destination is already known because there have been previous communications among source and receiving hosts, and the information is already stored in the Neighbor Cache, the information needed to send the packet is retrieved from the Neighbor Cache before packet is transmitted to destination. Figure 2 illustrates this, that is, when Device W intends to transmit a packet to Device Y, after applying the required NDP mechanism proposed for the DDN algorithm, the packet is transmitted from Device W to Device Y and not to Devices Z, B and X because devices Z, B and X do not have the destination MAC address that Device W wants. Also, when Device W wants to send packet to Device Y for the second time the transmission information will be retrieved from the Neighbor cache because it had stored information from earlier communication. Transmission protocols such as switches are obliged to send the packet because the destination is already resolved through the Direct mapping approach of the lower bits of IPv6 Interface Identifier ID and the DDN applied both technique functions to send packet. Thus, by using the new DDN the packet transmission steps in DDN are significantly reduced. It is possible because with the DDN, the source address and destination MAC address are already known and resolved in IPv6 Interface Identifier so the packet can be transmitted easily without having to pass through many routes as seen when using Dynamic binding approach.
IV. Evaluation DDN as illustrated in Figure 2 has the capability to reduce the transmission time of packets as well as sending the packet to the final destination directly by avoiding various protocol negotiations, and that only the essential transmission mechanisms in sending packets are needed. The evaluation of the proposed DDN was evaluated by the following:
• Latency/Delay. • Efficiency.
Latency is analyzed in terms of time, i.e. the time taken for the packet to reach receiving host destination. The overall latency also should improved due to shortened transmission routes the packets travel when the new algorithm DDN is used because it eliminated routes which are not necessary for the packets to reach their final destination. The proposed methodology will also be measured by efficiency where each steps of transmission from the source to targeted destination will be estimated to determine a safe delivery of packets. Figure 2 shows packet steps from A to B.
(IJCSIS) International Journal of Computer Science and Information Security, Vol. 9, No. 12, December 2011
http://sites.google.com/site/ijcsis/ ISSN 1947-5500
4
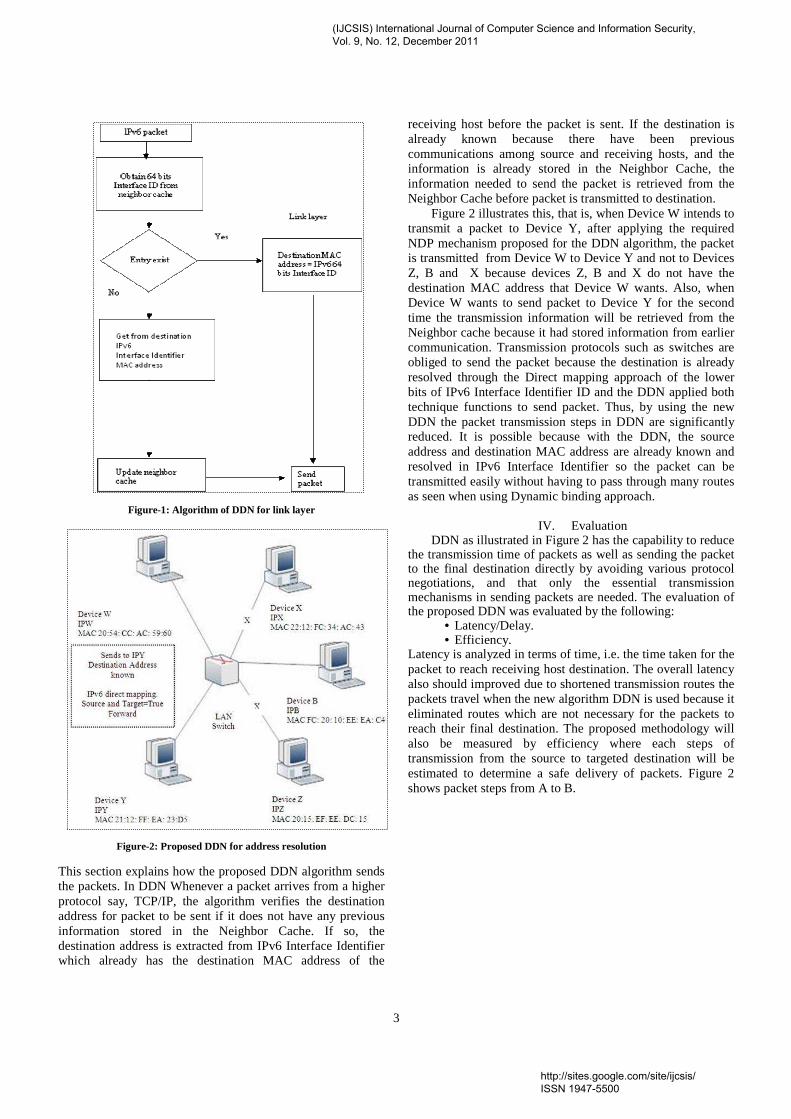
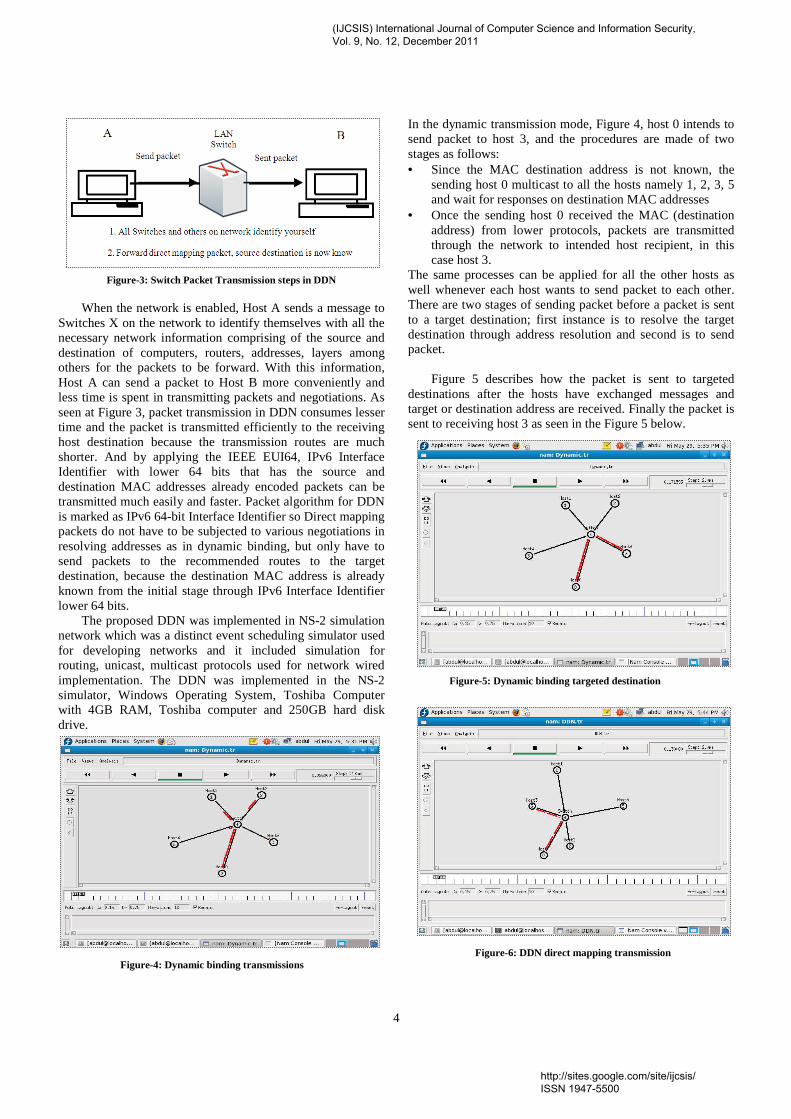
Figure-3: Switch Packet Transmission steps in DDN When the network is enabled, Host A sends a message to Switches X on the network to identify themselves with all the necessary network information comprising of the source and destination of computers, routers, addresses, layers among others for the packets to be forward. With this information, Host A can send a packet to Host B more conveniently and less time is spent in transmitting packets and negotiations. As seen at Figure 3, packet transmission in DDN consumes lesser time and the packet is transmitted efficiently to the receiving host destination because the transmission routes are much shorter. And by applying the IEEE EUI64, IPv6 Interface Identifier with lower 64 bits that has the source and destination MAC addresses already encoded packets can be transmitted much easily and faster. Packet algorithm for DDN is marked as IPv6 64-bit Interface Identifier so Direct mapping packets do not have to be subjected to various negotiations in resolving addresses as in dynamic binding, but only have to send packets to the recommended routes to the target destination, because the destination MAC address is already known from the initial stage through IPv6 Interface Identifier lower 64 bits. The proposed DDN was implemented in NS-2 simulation network which was a distinct event scheduling simulator used for developing networks and it included simulation for routing, unicast, multicast protocols used for network wired implementation. The DDN was implemented in the NS-2 simulator, Windows Operating System, Toshiba Computer with 4GB RAM, Toshiba computer and 250GB hard disk drive. Figure-4: Dynamic binding transmissions
In the dynamic transmission mode, Figure 4, host 0 intends to send packet to host 3, and the procedures are made of two stages as follows: • Since the MAC destination address is not known, the
sending host 0 multicast to all the hosts namely 1, 2, 3, 5 and wait for responses on destination MAC addresses
• Once the sending host 0 received the MAC (destination address) from lower protocols, packets are transmitted through the network to intended host recipient, in this case host 3.
The same processes can be applied for all the other hosts as well whenever each host wants to send packet to each other. There are two stages of sending packet before a packet is sent to a target destination; first instance is to resolve the target destination through address resolution and second is to send packet. Figure 5 describes how the packet is sent to targeted destinations after the hosts have exchanged messages and target or destination address are received. Finally the packet is sent to receiving host 3 as seen in the Figure 5 below. Figure-5: Dynamic binding targeted destination Figure-6: DDN direct mapping transmission
(IJCSIS) International Journal of Computer Science and Information Security, Vol. 9, No. 12, December 2011
http://sites.google.com/site/ijcsis/ ISSN 1947-5500
5
Figure 6 describes the simulation for direct mapping results. The concept of DDN is straightforward as the algorithm extracts the best features from dynamic binding and direct mapping to send a packet. Packets are transmitted directly to final destinations without having to do multicasting to lower protocols for resolving addresses but instead they are sent directly to target destination address because of IPv6 Interface Identifier. In the Figure 6, host 0 sends packets to host 3 directly to destination through the switch because destination address is established through IPv6 Interface Identifier. If hosts 0 or 3 decided to send a packet to each other next time, the process would be even faster because the destination addresses for each packet in formations are already stored in the Neighbor Cache. Moreover two steps are needed to send a packet in the DDN approach.
V. RESULTS Results were obtained for both DDN direct mapping and dynamic binding using the NS-2 Simulator and on five network computers with the performance criteria being latency and efficiency on packets delivery. The results are presented in Figures 7-9.
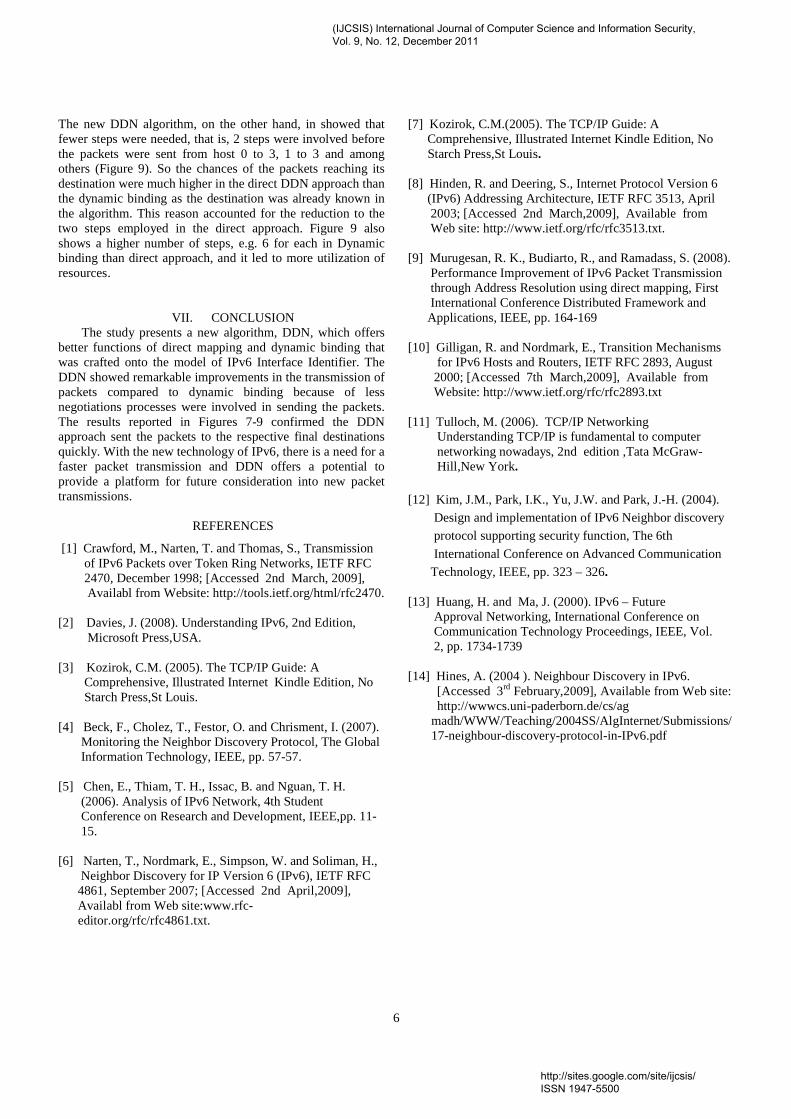
Figure-7: dynamic binding time
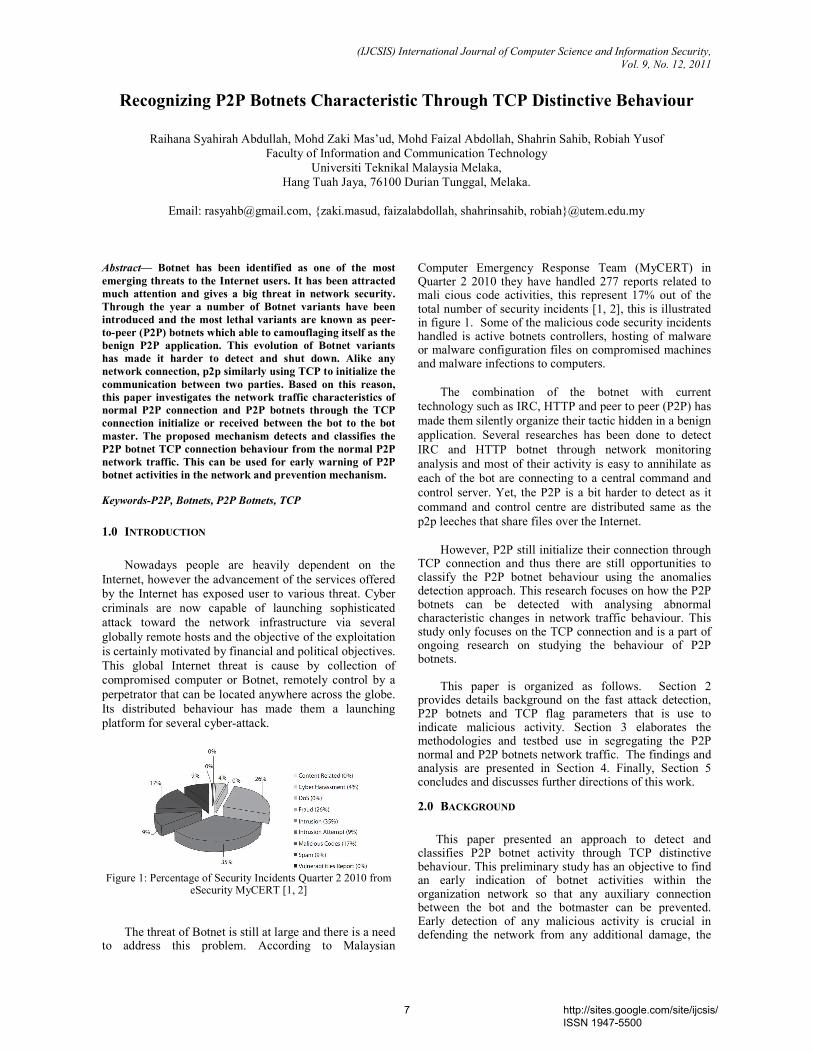
Figure-8: DDN direct mapping time
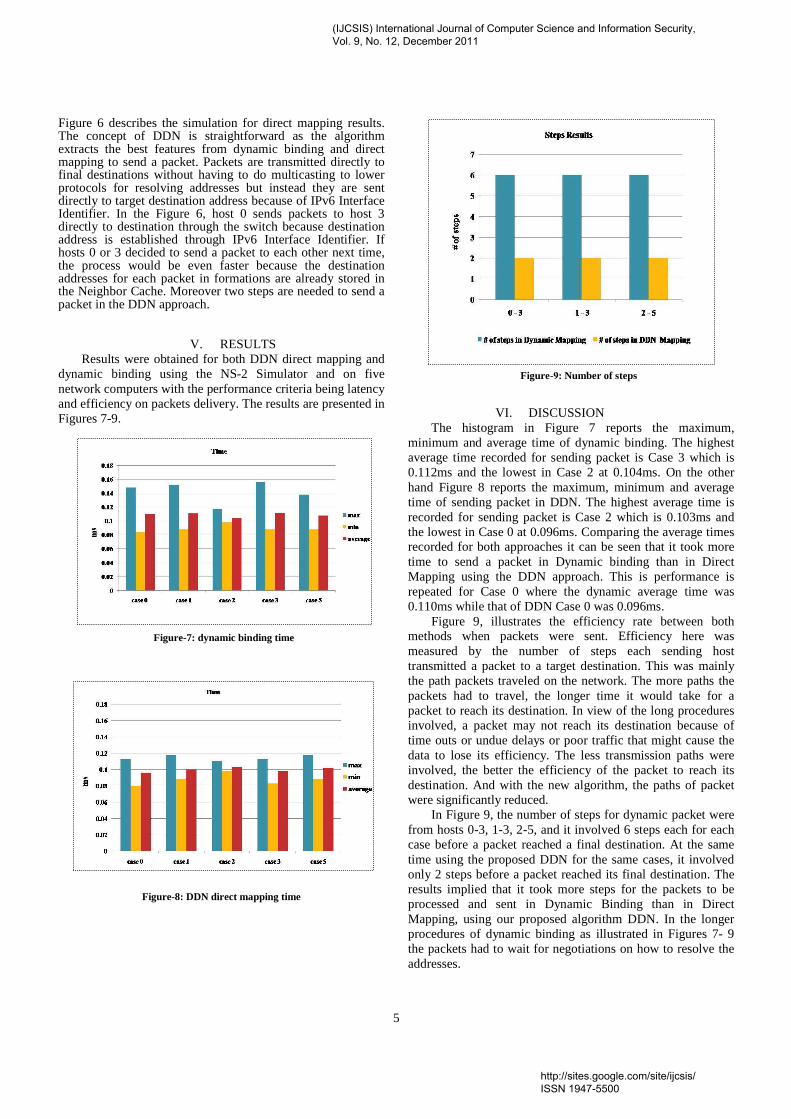
Figure-9: Number of steps
VI. DISCUSSION The histogram in Figure 7 reports the maximum, minimum and average time of dynamic binding. The highest average time recorded for sending packet is Case 3 which is 0.112ms and the lowest in Case 2 at 0.104ms. On the other hand Figure 8 reports the maximum, minimum and average time of sending packet in DDN. The highest average time is recorded for sending packet is Case 2 which is 0.103ms and the lowest in Case 0 at 0.096ms. Comparing the average times recorded for both approaches it can be seen that it took more time to send a packet in Dynamic binding than in Direct Mapping using the DDN approach. This is performance is repeated for Case 0 where the dynamic average time was 0.110ms while that of DDN Case 0 was 0.096ms. Figure 9, illustrates the efficiency rate between both methods when packets were sent. Efficiency here was measured by the number of steps each sending host transmitted a packet to a target destination. This was mainly the path packets traveled on the network. The more paths the packets had to travel, the longer time it would take for a packet to reach its destination. In view of the long procedures involved, a packet may not reach its destination because of time outs or undue delays or poor traffic that might cause the data to lose its efficiency. The less transmission paths were involved, the better the efficiency of the packet to reach its destination. And with the new algorithm, the paths of packet were significantly reduced. In Figure 9, the number of steps for dynamic packet were from hosts 0-3, 1-3, 2-5, and it involved 6 steps each for each case before a packet reached a final destination. At the same time using the proposed DDN for the same cases, it involved only 2 steps before a packet reached its final destination. The results implied that it took more steps for the packets to be processed and sent in Dynamic Binding than in Direct Mapping, using our proposed algorithm DDN. In the longer procedures of dynamic binding as illustrated in Figures 7- 9 the packets had to wait for negotiations on how to resolve the addresses.
(IJCSIS) International Journal of Computer Science and Information Security, Vol. 9, No. 12, December 2011
http://sites.google.com/site/ijcsis/ ISSN 1947-5500
6
The new DDN algorithm, on the other hand, in showed that fewer steps were needed, that is, 2 steps were involved before the packets were sent from host 0 to 3, 1 to 3 and among others (Figure 9). So the chances of the packets reaching its destination were much higher in the direct DDN approach than the dynamic binding as the destination was already known in the algorithm. This reason accounted for the reduction to the two steps employed in the direct approach. Figure 9 also shows a higher number of steps, e.g. 6 for each in Dynamic binding than direct approach, and it led to more utilization of resources.
VII. CONCLUSION
The study presents a new algorithm, DDN, which offers better functions of direct mapping and dynamic binding that was crafted onto the model of IPv6 Interface Identifier. The DDN showed remarkable improvements in the transmission of packets compared to dynamic binding because of less negotiations processes were involved in sending the packets. The results reported in Figures 7-9 confirmed the DDN approach sent the packets to the respective final destinations quickly. With the new technology of IPv6, there is a need for a faster packet transmission and DDN offers a potential to provide a platform for future consideration into new packet transmissions.
REFERENCES
[1] Crawford, M., Narten, T. and Thomas, S., Transmission of IPv6 Packets over Token Ring Networks, IETF RFC 2470, December 1998; [Accessed 2nd March, 2009], Availabl from Website: http://tools.ietf.org/html/rfc2470. [2] Davies, J. (2008). Understanding IPv6, 2nd Edition, Microsoft Press,USA. [3] Kozirok, C.M. (2005). The TCP/IP Guide: A Comprehensive, Illustrated Internet Kindle Edition, No Starch Press,St Louis. [4] Beck, F., Cholez, T., Festor, O. and Chrisment, I. (2007). Monitoring the Neighbor Discovery Protocol, The Global Information Technology, IEEE, pp. 57-57.
[5] Chen, E., Thiam, T. H., Issac, B. and Nguan, T. H. (2006). Analysis of IPv6 Network, 4th Student Conference on Research and Development, IEEE,pp. 11- 15. [6] Narten, T., Nordmark, E., Simpson, W. and Soliman, H., Neighbor Discovery for IP Version 6 (IPv6), IETF RFC 4861, September 2007; [Accessed 2nd April,2009], Availabl from Web site:www.rfc- editor.org/rfc/rfc4861.txt.
[7] Kozirok, C.M.(2005). The TCP/IP Guide: A Comprehensive, Illustrated Internet Kindle Edition, No Starch Press,St Louis. [8] Hinden, R. and Deering, S., Internet Protocol Version 6 (IPv6) Addressing Architecture, IETF RFC 3513, April 2003; [Accessed 2nd March,2009], Available from Web site: http://www.ietf.org/rfc/rfc3513.txt. [9] Murugesan, R. K., Budiarto, R., and Ramadass, S. (2008). Performance Improvement of IPv6 Packet Transmission through Address Resolution using direct mapping, First International Conference Distributed Framework and Applications, IEEE, pp. 164-169 [10] Gilligan, R. and Nordmark, E., Transition Mechanisms for IPv6 Hosts and Routers, IETF RFC 2893, August 2000; [Accessed 7th March,2009], Available from Website: http://www.ietf.org/rfc/rfc2893.txt [11] Tulloch, M. (2006). TCP/IP Networking Understanding TCP/IP is fundamental to computer networking nowadays, 2nd edition ,Tata McGraw- Hill,New York.
[12] Kim, J.M., Park, I.K., Yu, J.W. and Park, J.-H. (2004).
Design and implementation of IPv6 Neighbor discovery
protocol supporting security function, The 6th
International Conference on Advanced Communication
Technology, IEEE, pp. 323 – 326.
[13] Huang, H. and Ma, J. (2000). IPv6 – Future Approval Networking, International Conference on Communication Technology Proceedings, IEEE, Vol. 2, pp. 1734-1739 [14] Hines, A. (2004 ). Neighbour Discovery in IPv6. [Accessed 3rd February,2009], Available from Web site: http://wwwcs.uni-paderborn.de/cs/ag
madh/WWW/Teaching/2004SS/AlgInternet/Submissions/17-neighbour-discovery-protocol-in-IPv6.pdf
(IJCSIS) International Journal of Computer Science and Information Security, Vol. 9, No. 12, December 2011
http://sites.google.com/site/ijcsis/ ISSN 1947-5500
(IJCSIS) International Journal of Computer Science and Information Security,
Vol. 9, No. 12, 2011
Recognizing P2P Botnets Characteristic Through TCP Distinctive Behaviour
Raihana Syahirah Abdullah, Mohd Zaki Mas’ud, Mohd Faizal Abdollah, Shahrin Sahib, Robiah Yusof
Faculty of Information and Communication Technology
Universiti Teknikal Malaysia Melaka,
Hang Tuah Jaya, 76100 Durian Tunggal, Melaka.
Email: [email protected], {zaki.masud, faizalabdollah, shahrinsahib, robiah}@utem.edu.my
Abstract— Botnet has been identified as one of the most
emerging threats to the Internet users. It has been attracted
much attention and gives a big threat in network security.
Through the year a number of Botnet variants have been
introduced and the most lethal variants are known as peer-
to-peer (P2P) botnets which able to camouflaging itself as the
benign P2P application. This evolution of Botnet variants
has made it harder to detect and shut down. Alike any
network connection, p2p similarly using TCP to initialize the
communication between two parties. Based on this reason,
this paper investigates the network traffic characteristics of
normal P2P connection and P2P botnets through the TCP
connection initialize or received between the bot to the bot
master. The proposed mechanism detects and classifies the
P2P botnet TCP connection behaviour from the normal P2P
network traffic. This can be used for early warning of P2P
botnet activities in the network and prevention mechanism.
Keywords-P2P, Botnets, P2P Botnets, TCP
1.0 INTRODUCTION
Nowadays people are heavily dependent on the
Internet, however the advancement of the services offered
by the Internet has exposed user to various threat. Cyber
criminals are now capable of launching sophisticated
attack toward the network infrastructure via several
globally remote hosts and the objective of the exploitation
is certainly motivated by financial and political objectives.
This global Internet threat is cause by collection of
compromised computer or Botnet, remotely control by a
perpetrator that can be located anywhere across the globe.
Its distributed behaviour has made them a launching
platform for several cyber-attack.
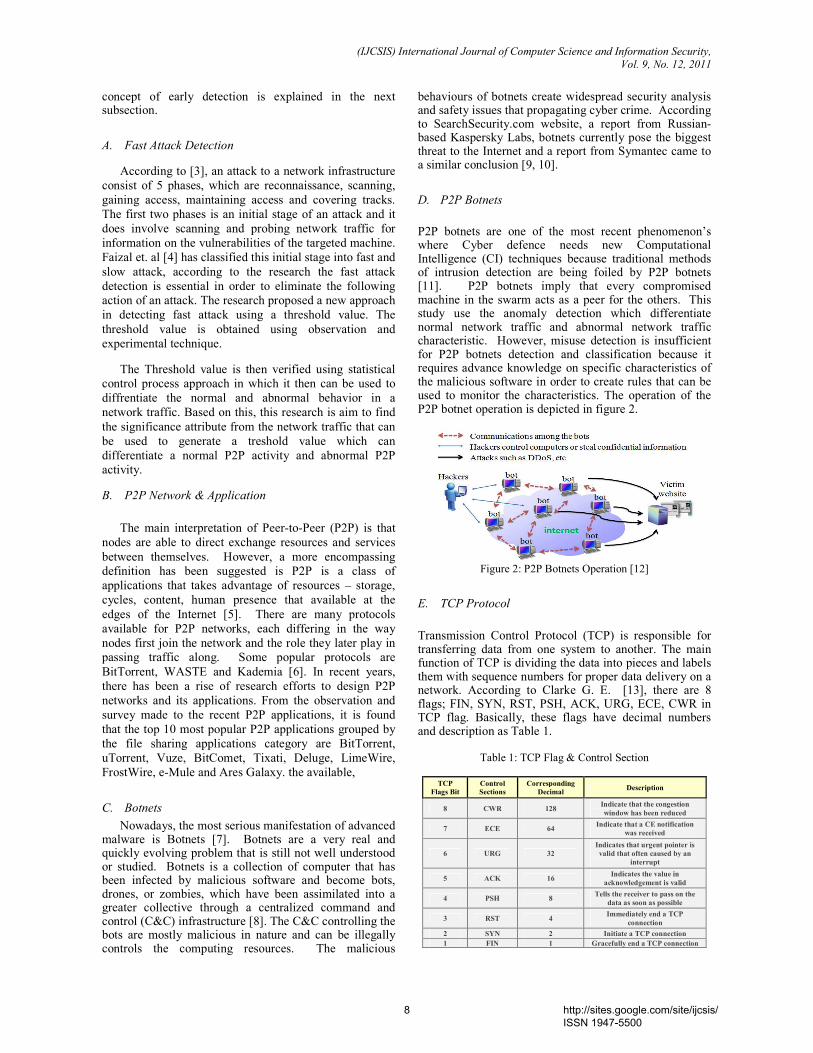
Figure 1: Percentage of Security Incidents Quarter 2 2010 from
eSecurity MyCERT [1, 2]
The threat of Botnet is still at large and there is a need
to address this problem. According to Malaysian
Computer Emergency Response Team (MyCERT) in Quarter 2 2010 they have handled 277 reports related to mali cious code activities, this represent 17% out of the total number of security incidents [1, 2], this is illustrated in figure 1. Some of the malicious code security incidents handled is active botnets controllers, hosting of malware or malware configuration files on compromised machines and malware infections to computers.
The combination of the botnet with current
technology such as IRC, HTTP and peer to peer (P2P) has
made them silently organize their tactic hidden in a benign
application. Several researches has been done to detect
IRC and HTTP botnet through network monitoring
analysis and most of their activity is easy to annihilate as
each of the bot are connecting to a central command and
control server. Yet, the P2P is a bit harder to detect as it
command and control centre are distributed same as the
p2p leeches that share files over the Internet.
However, P2P still initialize their connection through
TCP connection and thus there are still opportunities to classify the P2P botnet behaviour using the anomalies detection approach. This research focuses on how the P2P botnets can be detected with analysing abnormal characteristic changes in network traffic behaviour. This study only focuses on the TCP connection and is a part of ongoing research on studying the behaviour of P2P botnets.
This paper is organized as follows. Section 2
provides details background on the fast attack detection, P2P botnets and TCP flag parameters that is use to indicate malicious activity. Section 3 elaborates the methodologies and testbed use in segregating the P2P normal and P2P botnets network traffic. The findings and analysis are presented in Section 4. Finally, Section 5 concludes and discusses further directions of this work.
2.0 BACKGROUND
This paper presented an approach to detect and
classifies P2P botnet activity through TCP distinctive behaviour. This preliminary study has an objective to find an early indication of botnet activities within the organization network so that any auxiliary connection between the bot and the botmaster can be prevented. Early detection of any malicious activity is crucial in defending the network from any additional damage, the
7 http://sites.google.com/site/ijcsis/ ISSN 1947-5500
(IJCSIS) International Journal of Computer Science and Information Security,
Vol. 9, No. 12, 2011
concept of early detection is explained in the next subsection.
A. Fast Attack Detection
According to [3], an attack to a network infrastructure
consist of 5 phases, which are reconnaissance, scanning,
gaining access, maintaining access and covering tracks.
The first two phases is an initial stage of an attack and it
does involve scanning and probing network traffic for
information on the vulnerabilities of the targeted machine.
Faizal et. al [4] has classified this initial stage into fast and
slow attack, according to the research the fast attack
detection is essential in order to eliminate the following
action of an attack. The research proposed a new approach
in detecting fast attack using a threshold value. The
threshold value is obtained using observation and
experimental technique.
The Threshold value is then verified using statistical
control process approach in which it then can be used to
diffrentiate the normal and abnormal behavior in a
network traffic. Based on this, this research is aim to find
the significance attribute from the network traffic that can
be used to generate a treshold value which can
differentiate a normal P2P activity and abnormal P2P
activity.
B. P2P Network & Application
The main interpretation of Peer-to-Peer (P2P) is that
nodes are able to direct exchange resources and services
between themselves. However, a more encompassing
definition has been suggested is P2P is a class of
applications that takes advantage of resources – storage,
cycles, content, human presence that available at the
edges of the Internet [5]. There are many protocols
available for P2P networks, each differing in the way
nodes first join the network and the role they later play in
passing traffic along. Some popular protocols are
BitTorrent, WASTE and Kademia [6]. In recent years,
there has been a rise of research efforts to design P2P
networks and its applications. From the observation and
survey made to the recent P2P applications, it is found
that the top 10 most popular P2P applications grouped by
the file sharing applications category are BitTorrent,
uTorrent, Vuze, BitComet, Tixati, Deluge, LimeWire,
FrostWire, e-Mule and Ares Galaxy. the available,
C. Botnets
Nowadays, the most serious manifestation of advanced malware is Botnets [7]. Botnets are a very real and quickly evolving problem that is still not well understood or studied. Botnets is a collection of computer that has been infected by malicious software and become bots, drones, or zombies, which have been assimilated into a greater collective through a centralized command and control (C&C) infrastructure [8]. The C&C controlling the bots are mostly malicious in nature and can be illegally controls the computing resources. The malicious
behaviours of botnets create widespread security analysis and safety issues that propagating cyber crime. According to SearchSecurity.com website, a report from Russian-based Kaspersky Labs, botnets currently pose the biggest threat to the Internet and a report from Symantec came to a similar conclusion [9, 10].
D. P2P Botnets
P2P botnets are one of the most recent phenomenon’s where Cyber defence needs new Computational Intelligence (CI) techniques because traditional methods of intrusion detection are being foiled by P2P botnets [11]. P2P botnets imply that every compromised machine in the swarm acts as a peer for the others. This study use the anomaly detection which differentiate normal network traffic and abnormal network traffic characteristic. However, misuse detection is insufficient for P2P botnets detection and classification because it requires advance knowledge on specific characteristics of the malicious software in order to create rules that can be used to monitor the characteristics. The operation of the P2P botnet operation is depicted in figure 2.
Figure 2: P2P Botnets Operation [12]
E. TCP Protocol
Transmission Control Protocol (TCP) is responsible for transferring data from one system to another. The main function of TCP is dividing the data into pieces and labels them with sequence numbers for proper data delivery on a network. According to Clarke G. E. [13], there are 8 flags; FIN, SYN, RST, PSH, ACK, URG, ECE, CWR in TCP flag. Basically, these flags have decimal numbers and description as Table 1.
Table 1: TCP Flag & Control Section
TCP
Flags Bit
Control
Sections
Corresponding
Decimal Description
8 CWR 128 Indicate that the congestion
window has been reduced
7 ECE 64 Indicate that a CE notification
was received
6 URG 32
Indicates that urgent pointer is
valid that often caused by an
interrupt
5 ACK 16 Indicates the value in
acknowledgement is valid
4 PSH 8 Tells the receiver to pass on the
data as soon as possible
3 RST 4 Immediately end a TCP
connection
2 SYN 2 Initiate a TCP connection
1 FIN 1 Gracefully end a TCP connection
8 http://sites.google.com/site/ijcsis/ ISSN 1947-5500
(IJCSIS) International Journal of Computer Science and Information Security,
Vol. 9, No. 12, 2011
In line with that, Ezzeldin H. [14] has covered out the TCP Flag combination that probably performs to attack the network by an illegal attacker. A list of TCP Flag combination parameters that needs to give attention are:
a) TCP SYN (Half Open) Scan (tcp.flags==2)
b) TCP SYN/ACK Scan (tcp.flags==18)
c) TCP FIN Scan (tcp.flags==1)
d) TCP XMAS Scan (tcp.flags==41)
e) TCP NULL Scan (tcp.flags==0)
These parameters are an indicator that a malicious
activity is luring in the network. This paper utilizes this
parameter in differentiating a normal P2P and abnormal
P2P.
3.0 IMPLEMENTATION
This section will describe the methodology and the
testbed environment used in this study.
A. Proposed Framework
The framework used in this study is P2P Botnets
Detection Framework that depicted in Figure 4 which
involves five main phases: P2P Network Traffic,
Filtering, Traffic Monitoring, Malicious Activity Detector
and Analyzer [15].
Figure 4: General P2P Botnet Detection Framework [15]
To improve the detection, the study also combined the general P2P botnet detection framework with the P2P botnet detection model proposed by L. Dan et al. [16] as depicted in figure 5. The model is divided into three sequent steps: detection of the P2P-nodes, clustering of P2P-nodes and detection of the botnets action. The output of the previous step is the input of the next step.
Figure 5: P2P botnet detection model
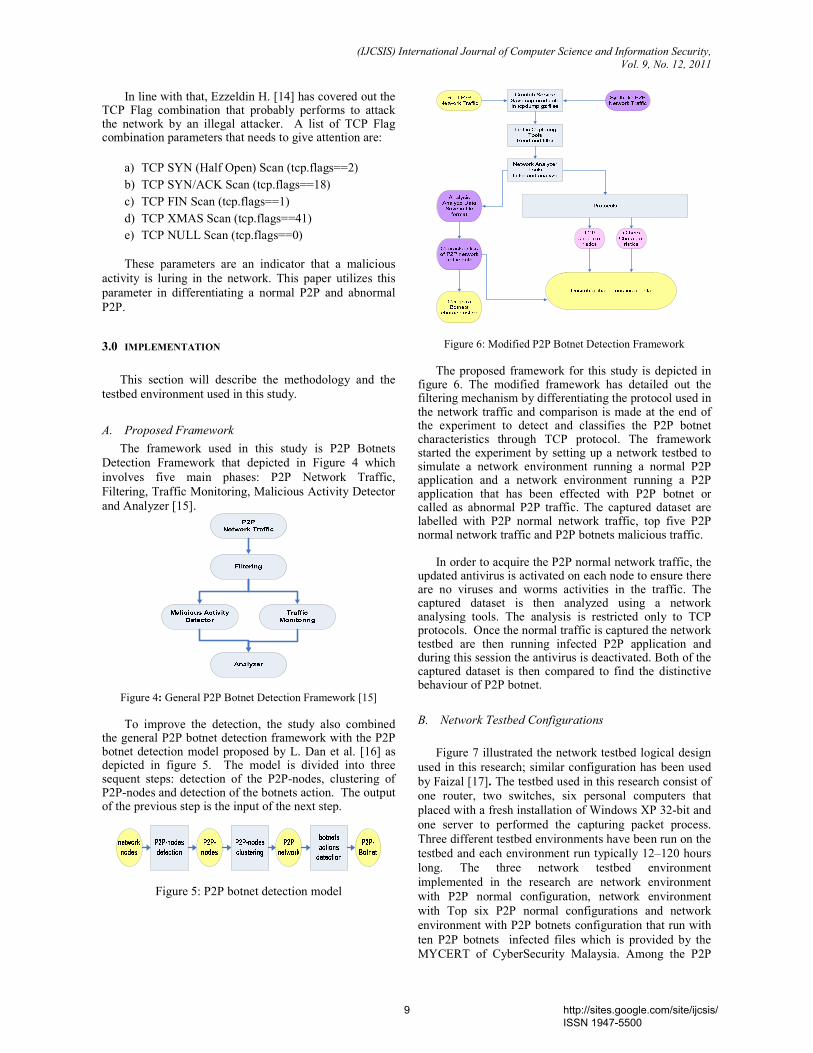
Figure 6: Modified P2P Botnet Detection Framework
The proposed framework for this study is depicted in
figure 6. The modified framework has detailed out the filtering mechanism by differentiating the protocol used in the network traffic and comparison is made at the end of the experiment to detect and classifies the P2P botnet characteristics through TCP protocol. The framework started the experiment by setting up a network testbed to simulate a network environment running a normal P2P application and a network environment running a P2P application that has been effected with P2P botnet or called as abnormal P2P traffic. The captured dataset are labelled with P2P normal network traffic, top five P2P normal network traffic and P2P botnets malicious traffic.
In order to acquire the P2P normal network traffic, the
updated antivirus is activated on each node to ensure there are no viruses and worms activities in the traffic. The captured dataset is then analyzed using a network analysing tools. The analysis is restricted only to TCP protocols. Once the normal traffic is captured the network testbed are then running infected P2P application and during this session the antivirus is deactivated. Both of the captured dataset is then compared to find the distinctive behaviour of P2P botnet.
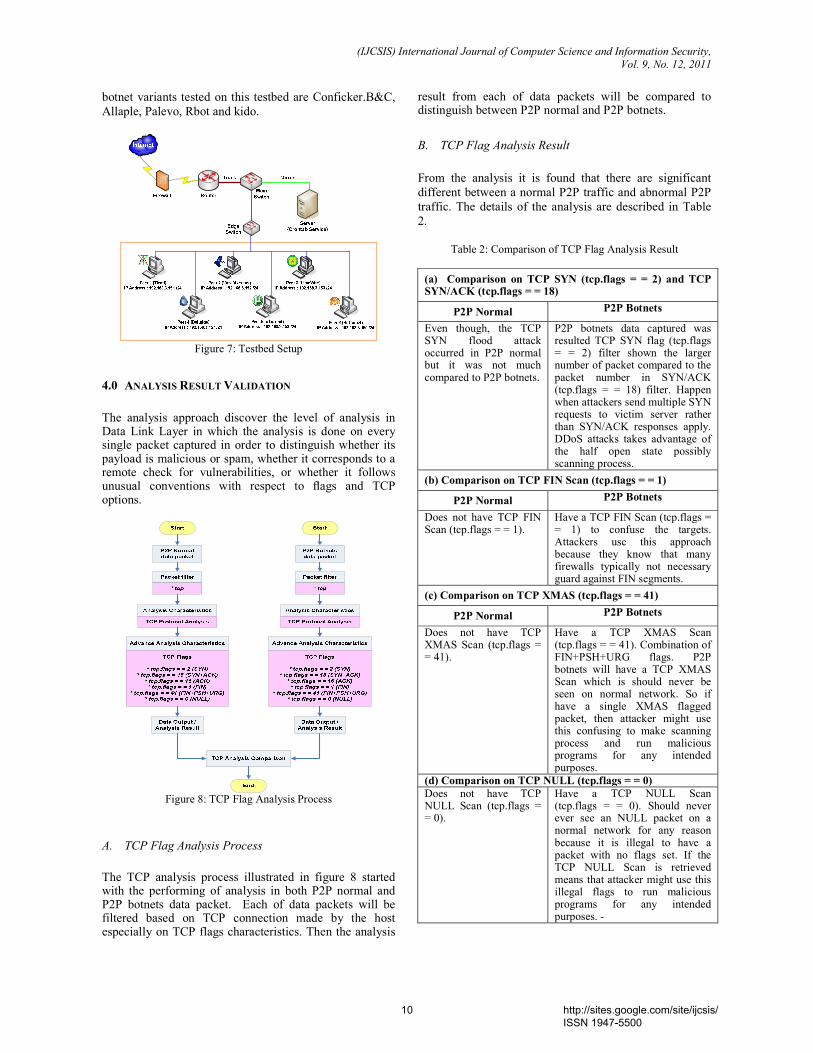
B. Network Testbed Configurations
Figure 7 illustrated the network testbed logical design
used in this research; similar configuration has been used
by Faizal [17]. The testbed used in this research consist of
one router, two switches, six personal computers that
placed with a fresh installation of Windows XP 32-bit and
one server to performed the capturing packet process.
Three different testbed environments have been run on the
testbed and each environment run typically 12–120 hours
long. The three network testbed environment
implemented in the research are network environment
with P2P normal configuration, network environment
with Top six P2P normal configurations and network
environment with P2P botnets configuration that run with
ten P2P botnets infected files which is provided by the
MYCERT of CyberSecurity Malaysia. Among the P2P
9 http://sites.google.com/site/ijcsis/ ISSN 1947-5500
(IJCSIS) International Journal of Computer Science and Information Security,
Vol. 9, No. 12, 2011
botnet variants tested on this testbed are Conficker.B&C,
Allaple, Palevo, Rbot and kido.
Figure 7: Testbed Setup
4.0 ANALYSIS RESULT VALIDATION
The analysis approach discover the level of analysis in Data Link Layer in which the analysis is done on every single packet captured in order to distinguish whether its payload is malicious or spam, whether it corresponds to a remote check for vulnerabilities, or whether it follows unusual conventions with respect to flags and TCP options.
Figure 8: TCP Flag Analysis Process
A. TCP Flag Analysis Process
The TCP analysis process illustrated in figure 8 started with the performing of analysis in both P2P normal and P2P botnets data packet. Each of data packets will be filtered based on TCP connection made by the host especially on TCP flags characteristics. Then the analysis
result from each of data packets will be compared to distinguish between P2P normal and P2P botnets.
B. TCP Flag Analysis Result
From the analysis it is found that there are significant
different between a normal P2P traffic and abnormal P2P
traffic. The details of the analysis are described in Table
2.
Table 2: Comparison of TCP Flag Analysis Result
(a) Comparison on TCP SYN (tcp.flags = = 2) and TCP SYN/ACK (tcp.flags = = 18)
P2P Normal P2P Botnets
Even though, the TCP SYN flood attack occurred in P2P normal but it was not much compared to P2P botnets.
P2P botnets data captured was resulted TCP SYN flag (tcp.flags = = 2) filter shown the larger number of packet compared to the packet number in SYN/ACK (tcp.flags = = 18) filter. Happen when attackers send multiple SYN requests to victim server rather than SYN/ACK responses apply. DDoS attacks takes advantage of the half open state possibly scanning process.
(b) Comparison on TCP FIN Scan (tcp.flags = = 1)
P2P Normal P2P Botnets
Does not have TCP FIN Scan (tcp.flags = = 1).
Have a TCP FIN Scan (tcp.flags = = 1) to confuse the targets. Attackers use this approach because they know that many firewalls typically not necessary guard against FIN segments.
(c) Comparison on TCP XMAS (tcp.flags = = 41)
P2P Normal P2P Botnets
Does not have TCP XMAS Scan (tcp.flags = = 41).
Have a TCP XMAS Scan (tcp.flags = = 41). Combination of FIN+PSH+URG flags. P2P botnets will have a TCP XMAS Scan which is should never be seen on normal network. So if have a single XMAS flagged packet, then attacker might use this confusing to make scanning process and run malicious programs for any intended purposes.
(d) Comparison on TCP NULL (tcp.flags = = 0)
Does not have TCP NULL Scan (tcp.flags = = 0).
Have a TCP NULL Scan (tcp.flags = = 0). Should never ever see an NULL packet on a normal network for any reason because it is illegal to have a packet with no flags set. If the TCP NULL Scan is retrieved means that attacker might use this illegal flags to run malicious programs for any intended purposes. -
10 http://sites.google.com/site/ijcsis/ ISSN 1947-5500
(IJCSIS) International Journal of Computer Science and Information Security,
Vol. 9, No. 12, 2011
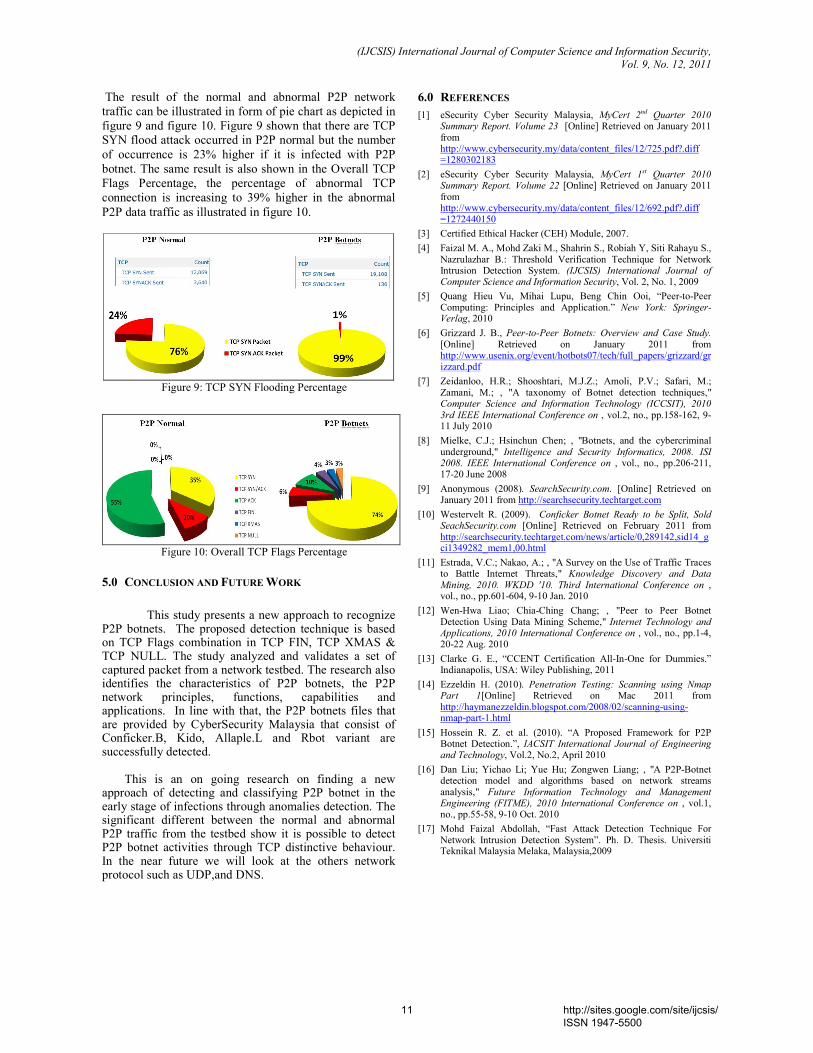
The result of the normal and abnormal P2P network
traffic can be illustrated in form of pie chart as depicted in
figure 9 and figure 10. Figure 9 shown that there are TCP
SYN flood attack occurred in P2P normal but the number
of occurrence is 23% higher if it is infected with P2P
botnet. The same result is also shown in the Overall TCP
Flags Percentage, the percentage of abnormal TCP
connection is increasing to 39% higher in the abnormal
P2P data traffic as illustrated in figure 10.
Figure 9: TCP SYN Flooding Percentage
Figure 10: Overall TCP Flags Percentage
5.0 CONCLUSION AND FUTURE WORK
This study presents a new approach to recognize P2P botnets. The proposed detection technique is based on TCP Flags combination in TCP FIN, TCP XMAS & TCP NULL. The study analyzed and validates a set of captured packet from a network testbed. The research also identifies the characteristics of P2P botnets, the P2P network principles, functions, capabilities and applications. In line with that, the P2P botnets files that are provided by CyberSecurity Malaysia that consist of Conficker.B, Kido, Allaple.L and Rbot variant are successfully detected.
This is an on going research on finding a new approach of detecting and classifying P2P botnet in the early stage of infections through anomalies detection. The significant different between the normal and abnormal P2P traffic from the testbed show it is possible to detect P2P botnet activities through TCP distinctive behaviour. In the near future we will look at the others network protocol such as UDP,and DNS.
6.0 REFERENCES
[1] eSecurity Cyber Security Malaysia, MyCert 2nd Quarter 2010 Summary Report. Volume 23 [Online] Retrieved on January 2011 from http://www.cybersecurity.my/data/content_files/12/725.pdf?.diff =1280302183
[2] eSecurity Cyber Security Malaysia, MyCert 1st Quarter 2010 Summary Report. Volume 22 [Online] Retrieved on January 2011 from http://www.cybersecurity.my/data/content_files/12/692.pdf?.diff =1272440150
[3] Certified Ethical Hacker (CEH) Module, 2007.
[4] Faizal M. A., Mohd Zaki M., Shahrin S., Robiah Y, Siti Rahayu S., Nazrulazhar B.: Threshold Verification Technique for Network Intrusion Detection System. (IJCSIS) International Journal of Computer Science and Information Security, Vol. 2, No. 1, 2009
[5] Quang Hieu Vu, Mihai Lupu, Beng Chin Ooi, “Peer-to-Peer Computing: Principles and Application.” New York: Springer-Verlag, 2010
[6] Grizzard J. B., Peer-to-Peer Botnets: Overview and Case Study. [Online] Retrieved on January 2011 from http://www.usenix.org/event/hotbots07/tech/full_papers/grizzard/grizzard.pdf
[7] Zeidanloo, H.R.; Shooshtari, M.J.Z.; Amoli, P.V.; Safari, M.; Zamani, M.; , "A taxonomy of Botnet detection techniques," Computer Science and Information Technology (ICCSIT), 2010 3rd IEEE International Conference on , vol.2, no., pp.158-162, 9-11 July 2010
[8] Mielke, C.J.; Hsinchun Chen; , "Botnets, and the cybercriminal underground," Intelligence and Security Informatics, 2008. ISI 2008. IEEE International Conference on , vol., no., pp.206-211, 17-20 June 2008
[9] Anonymous (2008). SearchSecurity.com. [Online] Retrieved on January 2011 from http://searchsecurity.techtarget.com
[10] Westervelt R. (2009). Conficker Botnet Ready to be Split, Sold SeachSecurity.com [Online] Retrieved on February 2011 from http://searchsecurity.techtarget.com/news/article/0,289142,sid14_gci1349282_mem1,00.html
[11] Estrada, V.C.; Nakao, A.; , "A Survey on the Use of Traffic Traces to Battle Internet Threats," Knowledge Discovery and Data Mining, 2010. WKDD '10. Third International Conference on , vol., no., pp.601-604, 9-10 Jan. 2010
[12] Wen-Hwa Liao; Chia-Ching Chang; , "Peer to Peer Botnet Detection Using Data Mining Scheme," Internet Technology and Applications, 2010 International Conference on , vol., no., pp.1-4, 20-22 Aug. 2010
[13] Clarke G. E., “CCENT Certification All-In-One for Dummies.” Indianapolis, USA: Wiley Publishing, 2011
[14] Ezzeldin H. (2010). Penetration Testing: Scanning using Nmap Part 1[Online] Retrieved on Mac 2011 from http://haymanezzeldin.blogspot.com/2008/02/scanning-using-nmap-part-1.html
[15] Hossein R. Z. et al. (2010). “A Proposed Framework for P2P Botnet Detection.”, IACSIT International Journal of Engineering and Technology, Vol.2, No.2, April 2010
[16] Dan Liu; Yichao Li; Yue Hu; Zongwen Liang; , "A P2P-Botnet detection model and algorithms based on network streams analysis," Future Information Technology and Management Engineering (FITME), 2010 International Conference on , vol.1, no., pp.55-58, 9-10 Oct. 2010
[17] Mohd Faizal Abdollah, “Fast Attack Detection Technique For Network Intrusion Detection System”. Ph. D. Thesis. Universiti Teknikal Malaysia Melaka, Malaysia,2009
11 http://sites.google.com/site/ijcsis/ ISSN 1947-5500

(IJCSIS) International Journal of Computer Science and Information Security, Vol. 9, No. 12, 2011
Wireless Sensor Networks Support Educators
Homa Edalatifard Centre for Instructional Technology
and Multimedia Universiti Sains Malaysia Pulau Pinang, Malaysia
Merza Abbas Centre for Instructional Technology
and Multimedia Universiti Sains Malaysia Pulau Pinang, Malaysia
Zaidatun Tasir Faculty of Education
Universiti Teknologi Malaysia Johor, Malaysia
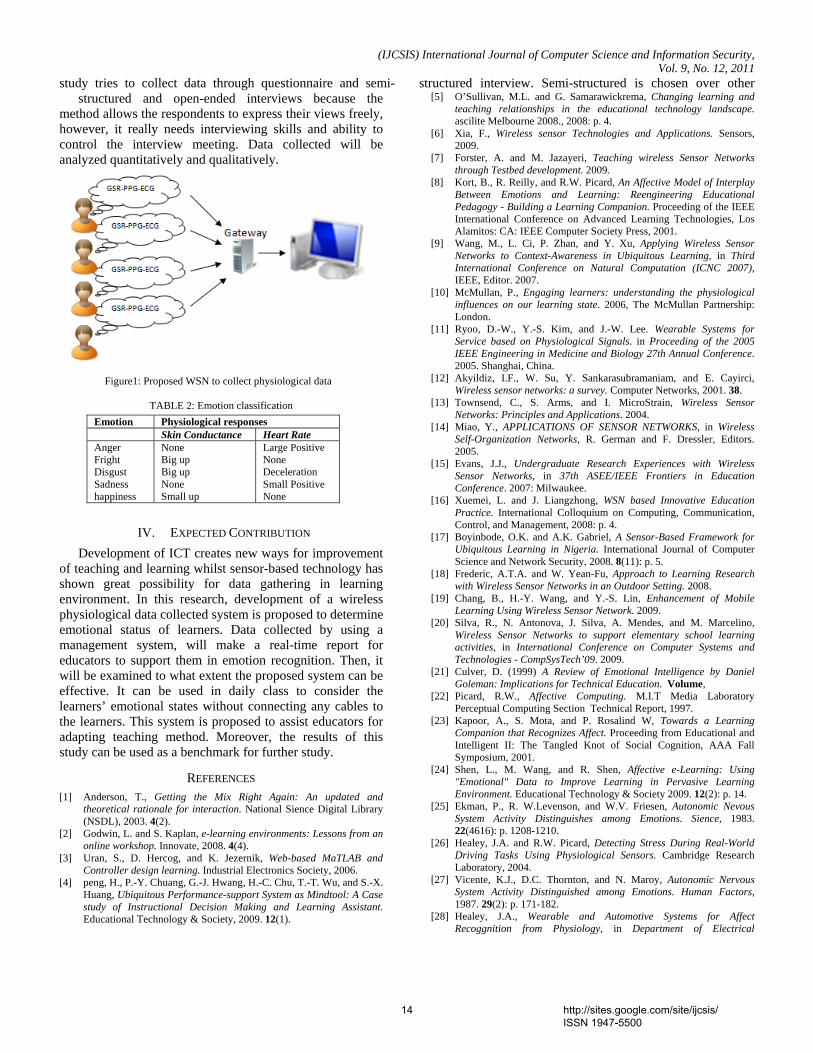
Abstract—The use of WSNs has a great progress in different fields as well as providing new possibilities for education. Sensor nodes can be applied to recognize learners’ emotional states while understanding the students’ emotion enhances learning. So, this study tries to design and implement a WSN to collect physiological data via 3 sensors: GSR, PPG, and ECG. A management system after analyzing data collected will report the learners’ emotion to the educator. Then it will be considered to what extent the proposed system can support educators in emotion recognition.
Keywords-component; Wireless sensor network, emotion recognition, improved teaching method
“The extent to which emotional upsets can interfere with mental life is no news to teachers. Students who are anxious, angry, or depressed don’t learn; people who are caught in these states do not take in information efficiently or deal with it well.”
Daniel Goleman, Emotional Intelligence
I. INTRODUCTION Applying Information Communication Technology (ICT)
to the educational fields has been one of the crucial techniques. In fact, the advent of ICT in education, is an ingenious shortcut for teachers to make an active learning when there are many studies which recommend emphatically the positive effects of ICTs in education [1-4]. As [5] explain: “The use of ICTs to foster new forms of learning through enabling new learning relationships is indeed a challenge for many teachers who are comfortable using conventional e-learning and teaching approaches within the learning management system platform…”
Meanwhile, development of wireless communication has enabled the develpoment of multifunctional sensor nodes. Wireless sensor nodes are usually small devices equipped with sensing ability, data processing unit, wireless communication unit, and also power supplies [6]. Both low-cost and small size of wireless sensor nodes have been providing new possibilities for a wide range of application [7] as well as education.
On the other hand, educators have usually focused on conveying information and some of them ignored the students’ feeling such as confused, frustration, dispirited, and enthusiasm
[8]. Identifying the learners’ emotional state is a critical mentoring skill [8, 9], however, expert teachers can guess the students’ emotion by considering the facial expression.
Moreover, as [10] expresses, learning styles, individual characteristics, and also physiological changes can affect learning abilities. Therefore, knowing such factors will allow educators to structure learning events to appeal to a great numbers of learners. Evaluating human emotion changes can be considered as a solution to improve learning while those changes are related to the sympathetic nervous and parasympathetic nervous system [11].
The organization of this paper is as follows: Section 2 presents a review of Sensor Networks application, particularly in education. The research methodology is introduced in section 3. Finally, this paper concluded with some expected result on section 4.
II. BACKGROUND Nowadays, Sensor Networks have penetrated to our daily
life which is a pervasive technology for data-gathering. It refers to composed of a large number of sensor nodes which they can monitor different phenomena such as temperature, humidity, lightning condition, pressure, soil makeup, noise levels, and the presence or absence of certain kinds of objects [12].
Generally, sensor nodes consist of 3 components: sensing unit, data processing unit, and communicating unit [12]; while, a Wireless Sensor Network (WSN) consists of gateway and sensor nodes. In this case, gateway communicates with a numbers of sensor nodes via wireless links [13].
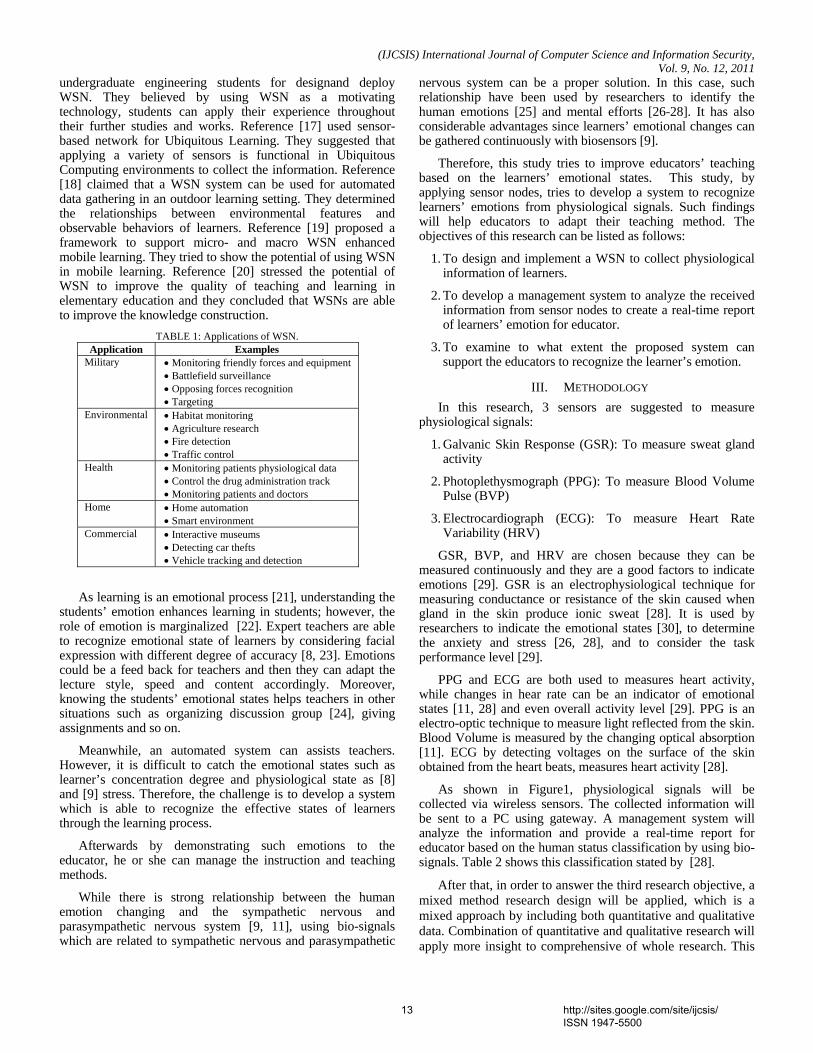
Usually sensor nodes are low-power and low-cost, small and smart and also easy to install [13]. They can be used in different kinds of application. Table 1 indicates some applications of WSN in a variety of fields [12, 14].
Many researchers also tried to apply WSN in teaching and learning process. Reference [9] employed WSNs to introduce a model of context-awareness in ubiquitous learning. They collected learners’ contextual information such as location, activity, physiology and surrounding context information in ubiquitous learning. To make a practice for design and implement of WSN for soil parameter monitoring, [15] hired undergraduate students. After that, [16] also had included
12 http://sites.google.com/site/ijcsis/ ISSN 1947-5500
(IJCSIS) International Journal of Computer Science and Information Security, Vol. 9, No. 12, 2011
undergraduate engineering students for designand deploy WSN. They believed by using WSN as a motivating technology, students can apply their experience throughout their further studies and works. Reference [17] used sensor-based network for Ubiquitous Learning. They suggested that applying a variety of sensors is functional in Ubiquitous Computing environments to collect the information. Reference [18] claimed that a WSN system can be used for automated data gathering in an outdoor learning setting. They determined the relationships between environmental features and observable behaviors of learners. Reference [19] proposed a framework to support micro- and macro WSN enhanced mobile learning. They tried to show the potential of using WSN in mobile learning. Reference [20] stressed the potential of WSN to improve the quality of teaching and learning in elementary education and they concluded that WSNs are able to improve the knowledge construction.
TABLE 1: Applications of WSN. Application Examples
Military • Monitoring friendly forces and equipment • Battlefield surveillance • Opposing forces recognition • Targeting
Environmental • Habitat monitoring • Agriculture research • Fire detection • Traffic control
Health • Monitoring patients physiological data • Control the drug administration track • Monitoring patients and doctors
Home • Home automation • Smart environment
Commercial • Interactive museums • Detecting car thefts • Vehicle tracking and detection
As learning is an emotional process [21], understanding the students’ emotion enhances learning in students; however, the role of emotion is marginalized [22]. Expert teachers are able to recognize emotional state of learners by considering facial expression with different degree of accuracy [8, 23]. Emotions could be a feed back for teachers and then they can adapt the lecture style, speed and content accordingly. Moreover, knowing the students’ emotional states helps teachers in other situations such as organizing discussion group [24], giving assignments and so on.
Meanwhile, an automated system can assists teachers. However, it is difficult to catch the emotional states such as learner’s concentration degree and physiological state as [8] and [9] stress. Therefore, the challenge is to develop a system which is able to recognize the effective states of learners through the learning process.
Afterwards by demonstrating such emotions to the educator, he or she can manage the instruction and teaching methods.
While there is strong relationship between the human emotion changing and the sympathetic nervous and parasympathetic nervous system [9, 11], using bio-signals which are related to sympathetic nervous and parasympathetic
nervous system can be a proper solution. In this case, such relationship have been used by researchers to identify the human emotions [25] and mental efforts [26-28]. It has also considerable advantages since learners’ emotional changes can be gathered continuously with biosensors [9].
Therefore, this study tries to improve educators’ teaching based on the learners’ emotional states. This study, by applying sensor nodes, tries to develop a system to recognize learners’ emotions from physiological signals. Such findings will help educators to adapt their teaching method. The objectives of this research can be listed as follows:
1. To design and implement a WSN to collect physiological information of learners.
2. To develop a management system to analyze the received information from sensor nodes to create a real-time report of learners’ emotion for educator.
3. To examine to what extent the proposed system can support the educators to recognize the learner’s emotion.
III. METHODOLOGY In this research, 3 sensors are suggested to measure
physiological signals:
1. Galvanic Skin Response (GSR): To measure sweat gland activity
2. Photoplethysmograph (PPG): To measure Blood Volume Pulse (BVP)
3. Electrocardiograph (ECG): To measure Heart Rate Variability (HRV)
GSR, BVP, and HRV are chosen because they can be measured continuously and they are a good factors to indicate emotions [29]. GSR is an electrophysiological technique for measuring conductance or resistance of the skin caused when gland in the skin produce ionic sweat [28]. It is used by researchers to indicate the emotional states [30], to determine the anxiety and stress [26, 28], and to consider the task performance level [29].
PPG and ECG are both used to measures heart activity, while changes in hear rate can be an indicator of emotional states [11, 28] and even overall activity level [29]. PPG is an electro-optic technique to measure light reflected from the skin. Blood Volume is measured by the changing optical absorption [11]. ECG by detecting voltages on the surface of the skin obtained from the heart beats, measures heart activity [28].
As shown in Figure1, physiological signals will be collected via wireless sensors. The collected information will be sent to a PC using gateway. A management system will analyze the information and provide a real-time report for educator based on the human status classification by using bio-signals. Table 2 shows this classification stated by [28].
After that, in order to answer the third research objective, a mixed method research design will be applied, which is a mixed approach by including both quantitative and qualitative data. Combination of quantitative and qualitative research will apply more insight to comprehensive of whole research. This
13 http://sites.google.com/site/ijcsis/ ISSN 1947-5500
(IJCSIS) International Journal of Computer Science and Information Security, Vol. 9, No. 12, 2011
study tries to collect data through questionnaire and semi- structured interview. Semi-structured is chosen over other structured and open-ended interviews because the
method allows the respondents to express their views freely, however, it really needs interviewing skills and ability to control the interview meeting. Data collected will be analyzed quantitatively and qualitatively.
Figure1: Proposed WSN to collect physiological data
TABLE 2: Emotion classification
IV. EXPECTED CONTRIBUTION Development of ICT creates new ways for improvement
of teaching and learning whilst sensor-based technology has shown great possibility for data gathering in learning environment. In this research, development of a wireless physiological data collected system is proposed to determine emotional status of learners. Data collected by using a management system, will make a real-time report for educators to support them in emotion recognition. Then, it will be examined to what extent the proposed system can be effective. It can be used in daily class to consider the learners’ emotional states without connecting any cables to the learners. This system is proposed to assist educators for adapting teaching method. Moreover, the results of this study can be used as a benchmark for further study.
REFERENCES [1] Anderson, T., Getting the Mix Right Again: An updated and
theoretical rationale for interaction. National Sience Digital Library (NSDL), 2003. 4(2).
[2] Godwin, L. and S. Kaplan, e-learning environments: Lessons from an online workshop. Innovate, 2008. 4(4).
[3] Uran, S., D. Hercog, and K. Jezernik, Web-based MaTLAB and Controller design learning. Industrial Electronics Society, 2006.
[4] peng, H., P.-Y. Chuang, G.-J. Hwang, H.-C. Chu, T.-T. Wu, and S.-X. Huang, Ubiquitous Performance-support System as Mindtool: A Case study of Instructional Decision Making and Learning Assistant. Educational Technology & Society, 2009. 12(1).
[5] O’Sullivan, M.L. and G. Samarawickrema, Changing learning and teaching relationships in the educational technology landscape. ascilite Melbourne 2008., 2008: p. 4.
[6] Xia, F., Wireless sensor Technologies and Applications. Sensors, 2009.
[7] Forster, A. and M. Jazayeri, Teaching wireless Sensor Networks through Testbed development. 2009.
[8] Kort, B., R. Reilly, and R.W. Picard, An Affective Model of Interplay Between Emotions and Learning: Reengineering Educational Pedagogy - Building a Learning Companion. Proceeding of the IEEE International Conference on Advanced Learning Technologies, Los Alamitos: CA: IEEE Computer Society Press, 2001.
[9] Wang, M., L. Ci, P. Zhan, and Y. Xu, Applying Wireless Sensor Networks to Context-Awareness in Ubiquitous Learning, in Third International Conference on Natural Computation (ICNC 2007), IEEE, Editor. 2007.
[10] McMullan, P., Engaging learners: understanding the physiological influences on our learning state. 2006, The McMullan Partnership: London.
[11] Ryoo, D.-W., Y.-S. Kim, and J.-W. Lee. Wearable Systems for Service based on Physiological Signals. in Proceeding of the 2005 IEEE Engineering in Medicine and Biology 27th Annual Conference. 2005. Shanghai, China.
[12] Akyildiz, I.F., W. Su, Y. Sankarasubramaniam, and E. Cayirci, Wireless sensor networks: a survey. Computer Networks, 2001. 38.
[13] Townsend, C., S. Arms, and I. MicroStrain, Wireless Sensor Networks: Principles and Applications. 2004.
[14] Miao, Y., APPLICATIONS OF SENSOR NETWORKS, in Wireless Self-Organization Networks, R. German and F. Dressler, Editors. 2005.
[15] Evans, J.J., Undergraduate Research Experiences with Wireless Sensor Networks, in 37th ASEE/IEEE Frontiers in Education Conference. 2007: Milwaukee.
[16] Xuemei, L. and J. Liangzhong, WSN based Innovative Education Practice. International Colloquium on Computing, Communication, Control, and Management, 2008: p. 4.
[17] Boyinbode, O.K. and A.K. Gabriel, A Sensor-Based Framework for Ubiquitous Learning in Nigeria. International Journal of Computer Science and Network Security, 2008. 8(11): p. 5.
[18] Frederic, A.T.A. and W. Yean-Fu, Approach to Learning Research with Wireless Sensor Networks in an Outdoor Setting. 2008.
[19] Chang, B., H.-Y. Wang, and Y.-S. Lin, Enhancement of Mobile Learning Using Wireless Sensor Network. 2009.
[20] Silva, R., N. Antonova, J. Silva, A. Mendes, and M. Marcelino, Wireless Sensor Networks to support elementary school learning activities, in International Conference on Computer Systems and Technologies - CompSysTech’09. 2009.
[21] Culver, D. (1999) A Review of Emotional Intelligence by Daniel Goleman: Implications for Technical Education. Volume,
[22] Picard, R.W., Affective Computing. M.I.T Media Laboratory Perceptual Computing Section Technical Report, 1997.
[23] Kapoor, A., S. Mota, and P. Rosalind W, Towards a Learning Companion that Recognizes Affect. Proceeding from Educational and Intelligent II: The Tangled Knot of Social Cognition, AAA Fall Symposium, 2001.
[24] Shen, L., M. Wang, and R. Shen, Affective e-Learning: Using "Emotional" Data to Improve Learning in Pervasive Learning Environment. Educational Technology & Society 2009. 12(2): p. 14.
[25] Ekman, P., R. W.Levenson, and W.V. Friesen, Autonomic Nevous System Activity Distinguishes among Emotions. Sience, 1983. 22(4616): p. 1208-1210.
[26] Healey, J.A. and R.W. Picard, Detecting Stress During Real-World Driving Tasks Using Physiological Sensors. Cambridge Research Laboratory, 2004.
[27] Vicente, K.J., D.C. Thornton, and N. Maroy, Autonomic Nervous System Activity Distinguished among Emotions. Human Factors, 1987. 29(2): p. 171-182.
[28] Healey, J.A., Wearable and Automotive Systems for Affect Recoggnition from Physiology, in Department of Electrical
Emotion Physiological responses Skin Conductance Heart Rate Anger Fright Disgust Sadness happiness
None Big up Big up None Small up
Large Positive None Deceleration Small Positive None
14 http://sites.google.com/site/ijcsis/ ISSN 1947-5500

(IJCSIS) International Journal of Computer Science and Information Security, Vol. 9, No. 12, 2011
Engineering and Computeer Science 2000, assachusetts Institutes of Technology: Massachusetts. p. 158.
[29] Lin, T. and W. Hu. DO PHYSIOLOGICAL DATA RELATE TO TRADITIONAL USABILITY INDEXES? 2005. Canberra, Australia: OZCHI.
[30] Yoo, S.K., C.K. Lee, and Y.J. Park. Determination of Biological Signal for Emotion Identification in World Congress on Medical Physics and Biomedical Engineering 2006. Seoul, Korea Springer Berlin Heidelberg.
15 http://sites.google.com/site/ijcsis/ ISSN 1947-5500

(IJCSIS) International Journal of Computer Science and Information Security, Vol. 9, No. 12, 2011
AUTHORS PROFILE
Homa Edalatifard received her Bachelor Degree in Computer Software Engineering from Iran (2000) and her Master in Educational Technology from University Technology Malaysia (UTM). She got the Vice Chancelor award from UTM on 2010. Currently, she is doing her PhD by research in University of Science Malaysia (USM) under fellowship schema.
Merza Abbas is an Associate Professor and Director of the Centre for Instructional Technology and Multimedia, University of Science Malaysia. He was previously the Chair for Graduate Studies at the Centre. He graduated with MSc (Ed) from Northern Illinois University, USA, and PHD from University of Science Malaysia. His research interests are in the areas of instructional design and mobile learning.
Zaidatun Tasir is an Associate Professor and a Deputy Dean (Social Science) of School of Graduate Studies, Universiti Teknologi Malaysia. Prior to that, she was also a Deputy Dean (Postgraduate Studies & Research) of Faculty of Education, Universiti Teknologi Malaysia. She earned her first degree, B. Sc. Comp. with Edu. (Math) (Hons.) from UTM (1995), M. Ed. (Educational Media Computers) from Arizona State University, USA (1998), and Ph.D (Educational Technology) from Universiti Teknologi Malaysia (2002). Her research interests and expertise include Design and Development of Computer and web-based Instructions, Multiple Intelligence through computer-based instruction, Problem-based learning through technology, and Social Networking Tools in Education. She had written 36 books in computer and multimedia in education and more than 70 journal and conference papers related to her research areas.
16 http://sites.google.com/site/ijcsis/ ISSN 1947-5500

Design, optimization & evaluation of Tapered waveguide with cylindrical waveguide
* Harshukumar Khare, **Prof R.D.Patane *M.E (EXTC) Final year student
**Asst. Proffessor (EXTC) Terna engineering college,Nerul, Navi-mumbai
*[email protected] *[email protected]
Abstract: Tapered Waveguide is a waveguide in which a physical or electrical characteristic changes continuously with distance along the axis of the waveguide. Tapered waveguide offer an excellent means of converting microwave mode sizes to connect Microwave devices of different cross-sectional dimensions. This paper discusses the waveguide component for interconnecting rectangular and circular waveguide using elliptical tapering. Model is designed for the frequency range from 2 to 4 GHz. Dominant Mode conversions ie from TE10 to TM11 is considered for tapering techniques. All simulations are done with CST Microwave studio. Simulation result shows that wave is properly propagated with no power reflection and low power loss. The resonant frequency is mainly varied with the diameter of cylindrical waveguide. Key words: Elliptical Tapering, Cylindrical waveguide, CST,S parameter
Introduction: A rectangular waveguide supports TM and
TE modes but not TEM waves. A rectangular waveguide cannot propagate below some certain frequency. This frequency is called the cut-off frequency.
Circular waveguides offer implementation advantages over rectangular waveguide in that installation is much simpler when forming runs for turns and offsets - particularly when large radii are involved and the wind loading is less on a round cross-section, meaning towers do not need to be as robust. Manufacturing is generally simpler, too, since only one dimension the radius needs to be maintained. Applications where differential rotation is required, like a rotary joint for a radar antenna, absolutely require a circular cross-section, so even if
rectangular waveguide is used for the primary routing, a transition to circular and then possibly back to rectangular is needed. Calculations for circular waveguide require the application of Bessel functions, so working equations with a cheap calculator is not going to happen. However, even spreadsheets have Bessel function capability nowadays, so determining cutoff frequencies, field strengths, and any of the other standard values associated with circular waveguide can be done relatively easily.
A waveguide taper can always be built to
have as low a mode conversion as is wanted in a certain frequency band merely by making it long enough. However, an optimally designed taper has the smallest possible length for a given difference in diameters at its two ends for a specified unwanted mode level in a given frequency band. Tapered waveguide for matching impedance is nothing but a tapered waveguide in which only one mode is propagating. Power can only be converted into reflected waves, and it is this reflected power which is kept small in a properly designed transmission line taper. If more than one mode is propagating, power will be scattered not only into the reflected wave but also into the other propagating modes. In fact , the power scattered into backward traveling waves is quite small compared to the power scattered into forward traveling waves, and only the latter need be considered in a multimode waveguide taper. Therefore, the mode conversion in the waveguide transition corresponds to the reflection in transmission line taper.
A waveguide mode is a unique arrangement of the electric and magnetic fields propagating in the z-direction that satisfies all Maxwell equations and boundary conditions imposed by the geometry of the
(IJCSIS) International Journal of Computer Science and Information Security, Vol. 9, No. 12, December 2011
17 http://sites.google.com/site/ijcsis/ ISSN 1947-5500

conductors of the transmission system. Various waveguide modes are TEM, TE, TM and Hybrid modes. Dominant mode in Rectangular waveguide is TE10 and in circular waveguide TE11. To convert dominant mode in rectangular waveguide to dominant mode in circular waveguide tapered waveguide is used. There are different types of tapering such as step tapering, conical tapering elliptical tapering, etc. Analysis has been done using elliptical tapering with CST Microwave Studio.
Design aspect: The simulation was done by Transient solver
of CST Microwave Studio. The Cartesian coordinate system (x, y, and z) is used to model the 3D structure. Elliptical Design consists of three different parts ie. Ellipse, Brick (Rectangular waveguide), Cylinder. Ellipse has X radius and Y radius as 75mm and 50 mm respectively. Brick has three components u, v & w in which they have dimensions in mm minimum to maximum -10 to 30, -35 to 10 & -10 to 10 respectively. Cylinder has Outer radius 31mm & Length 29mm. The Transient solver is used to get field distribution and S parameters. This solver module is used to optimize the inner diameter of the cylindrical waveguide and dimensions of tapered waveguide for the frequency range of 2 to 4 GHz. The S-parameters are optimized by changing the diameter of cylindrical waveguide and the locations of tapering waveguide simultaneously for the desired operation frequency. The front view, Top & side view of 3D model of the Elliptical tapered waveguide & the cylindrical waveguide is shown in fig 1 (a), (b), (c). .
Fig 1 (a) Front View
Fig 1 (b) Top View
Fig 1 (c) Side View
Fig 1 3D Model of Elliptical tapering
RESULT & CONCLUSION The total simulation process was done by CST Microwave Studio. The resonant frequency is mainly varied with the diameter of cylindrical waveguide. The required resonant frequency is obtained for the cylindrical waveguide radius of 31 mm. Simulation result shows that wave is properly propagated with no power reflection and low power loss. Only TE10 mode is propagating of the cylindrical waveguide even if other modes are generated they are not supported by the structure. E Field distribution for the structure is shown in fig 2.
(IJCSIS) International Journal of Computer Science and Information Security, Vol. 9, No. 12, December 2011
18 http://sites.google.com/site/ijcsis/ ISSN 1947-5500
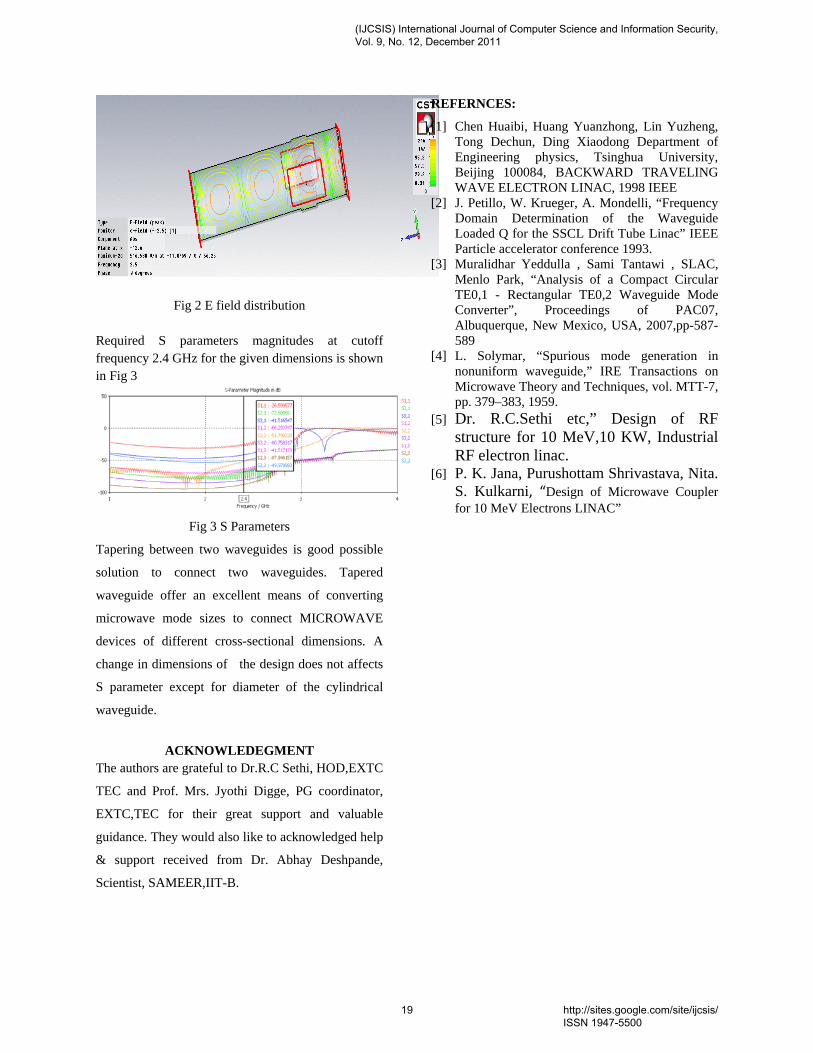
Fig 2 E field distribution
Required S parameters magnitudes at cutoff frequency 2.4 GHz for the given dimensions is shown in Fig 3
Fig 3 S Parameters
Tapering between two waveguides is good possible
solution to connect two waveguides. Tapered
waveguide offer an excellent means of converting
microwave mode sizes to connect MICROWAVE
devices of different cross-sectional dimensions. A
change in dimensions of the design does not affects
S parameter except for diameter of the cylindrical
waveguide.
ACKNOWLEDEGMENT
The authors are grateful to Dr.R.C Sethi, HOD,EXTC
TEC and Prof. Mrs. Jyothi Digge, PG coordinator,
EXTC,TEC for their great support and valuable
guidance. They would also like to acknowledged help
& support received from Dr. Abhay Deshpande,
Scientist, SAMEER,IIT-B.
REFERNCES:
[1] Chen Huaibi, Huang Yuanzhong, Lin Yuzheng, Tong Dechun, Ding Xiaodong Department of Engineering physics, Tsinghua University, Beijing 100084, BACKWARD TRAVELING WAVE ELECTRON LINAC, 1998 IEEE
[2] J. Petillo, W. Krueger, A. Mondelli, “Frequency Domain Determination of the Waveguide Loaded Q for the SSCL Drift Tube Linac” IEEE Particle accelerator conference 1993.
[3] Muralidhar Yeddulla , Sami Tantawi , SLAC, Menlo Park, “Analysis of a Compact Circular TE0,1 - Rectangular TE0,2 Waveguide Mode Converter”, Proceedings of PAC07, Albuquerque, New Mexico, USA, 2007,pp-587-589
[4] L. Solymar, “Spurious mode generation in nonuniform waveguide,” IRE Transactions on Microwave Theory and Techniques, vol. MTT-7, pp. 379–383, 1959.
[5] Dr. R.C.Sethi etc,” Design of RF structure for 10 MeV,10 KW, Industrial RF electron linac.
[6] P. K. Jana, Purushottam Shrivastava, Nita. S. Kulkarni, “Design of Microwave Coupler for 10 MeV Electrons LINAC”
(IJCSIS) International Journal of Computer Science and Information Security, Vol. 9, No. 12, December 2011
19 http://sites.google.com/site/ijcsis/ ISSN 1947-5500
Shape Content Based Image Retrieval using LBG Vector Quantization.
Dr. H.B.Kekre1 , Dr. Sudeep D. Thepade2 , Shrikant P. Sanas3 ,
Sowmya Iyer4 , Jhuma Garg5 . 1Sr.Professor, 2 Associate Professor and HoD, 3Lecturer, 4,5B.E Student.
1,2 MPSTME, SVKM’s NMIMS (Deemed to be University), Mumbai. 3,4,5 RAIT, Nerul, Navi Mumbai
[email protected], [email protected], [email protected]
Abstract The paper presents improved image retrieval techniques based on shape features extracted using seven proposed gradient masks like Robert, Sobel, Prewitt, Canny, Laplace, Frei-Chen and Kirsch along with LBG Vector Quantization Technique. Here first the edge images are obtained using the gradient mask and slope magnitude method. Then shape feature are extracted by applying LBG codebook generation algorithm on the edge images. Seven gradient mask and seven codebook sizes (from 8 to 512) results into 49 variations of the proposed image retrieval method. These proposed image retrieval techniques are applied on augmented Wang image database with 1000 images. The database comprises of 11 categories of images from which 55 images (5 images from each category) are taken as query images to find precision and recall values. The crossover point of precision and recall is considerd as performance comaprision criteria for proposed image retrieval techniques. Best performance is observed in LBG Codebook sizes 16 and 32 when used with Robert Gradient mask for feature extraction. Keywords: CBIR, Robert, Sobel, Prewitt, Canny, Laplace, Frei-Chen, Kirsch, VQ, LBG. 1. Introduction Ever since , a lot of research has been done on different techniques based on color, shape and texture features for
automatic retrieval of an image from a database. The need of Content-based Image Retrieval arises from the fact that it is difficult to search for a desired image simply by browsing from a large collection of images in a database. Searching by keywords may seem like a solution but manually naming and describing metadata for every image in the database too, is a laborious task. There are many methods in Content-based Image Retrieval that roots from the field of Image Processing and Computer Vision. Hence many consider Content-based Image Retrieval as a subset of the Image Processing field. Areas where content-based image retrieval has proved to be useful are Crime Prevention, the military, Intellectual Property, Architectural and Engineering, Fashion and Interior Designing, Journalism and Advertising, Medical diagnosis, Geographical information and remote sensing systems, Cultural heritage, Education and Training, Home entertainment, Web searching, Retail catalogs, Photograph archives and Art collections.
CBIR system retrieves stored images from large databases using feature of the image such as color, shape, texture and others. The user submits his query in the form of an image and is searching for matching image from database. The system then retrieves images by comparing the query image with all the images in its database using content of the image.
(IJCSIS) International Journal of Computer Science and Information Security, Vol. 9, No. 12, December 2011
20 http://sites.google.com/site/ijcsis/ ISSN 1947-5500

Shape based matching uses two main types of shape feature [2]– global features such as aspect ratio, circularity and moment invariants and local features such as sets of consecutive boundary segments. This paper preposes the shape based image retrieval techniques[12] using vector quantization with Linde Buzo Gray codebook generation algorithm. 2. Edge Detection Masks Edge Detection is the process of identifying and locating sharp discontinuities. The cross section of an edge has the shape of a ramp. The first derivative assumes a local maximum at an edge. The various gradient operators used for edge detection[14] are Robert, Prewitt, Sobel, Canny, Laplace, Frei-Chen and Kirsch. The Robert operator [6] uses only 2x2 mask to detect edges that are 45° to the pixel grid. It is applied in both the orientations and then combined to get the magnitude of the gradient. Robert mask are given in equation 1.
(1)
The Robert operator is easily susceptible to noise and cannot detect edges unless they are very sharp. Prewitt’s Operator[6] is a 3x3 mask to detect edges that are horizontally and vertically relative to the pixel grid. Equation 2 shows the prewitt mask.
Sobel’s operator[7] is similar to Prewitt’s Operator, which detects
edges horizontal and vertical to its pixel grid. Sobel mask are shown in equation 3.
(3)
The Canny edge detector[8] first smoothes the image to eliminate any noise. After the image is smoothened and the noise is eliminated, the Sobel operator is applied to get the gradient. The Laplace Operator[9] is used to detect regions in the image that shows rapid intensity change. It is often applied on an image which is smoothened first i.e with Gaussian filter. Equation 4 shows laplas mask.
(4)
Frei-Chen Operator [10] is also a first-order operator like the ones discussed above. Frei-chen mask are shown in equation 5.
(5)
Kirsch Operator [11] is a non-linear edge detector with 8 pre-detemined directions of which the best direction is the direction with the maximum edge strength. Kirsch mask in two directions are shown below in equation 6.
(6)
Slope Magnitude Method The edge extraction using the different gradient operators[13] simply gives us edges either in horizontal or vertical directions. But for the Shape based matching, one needs both the
(2)
(IJCSIS) International Journal of Computer Science and Information Security, Vol. 9, No. 12, December 2011
21 http://sites.google.com/site/ijcsis/ ISSN 1947-5500
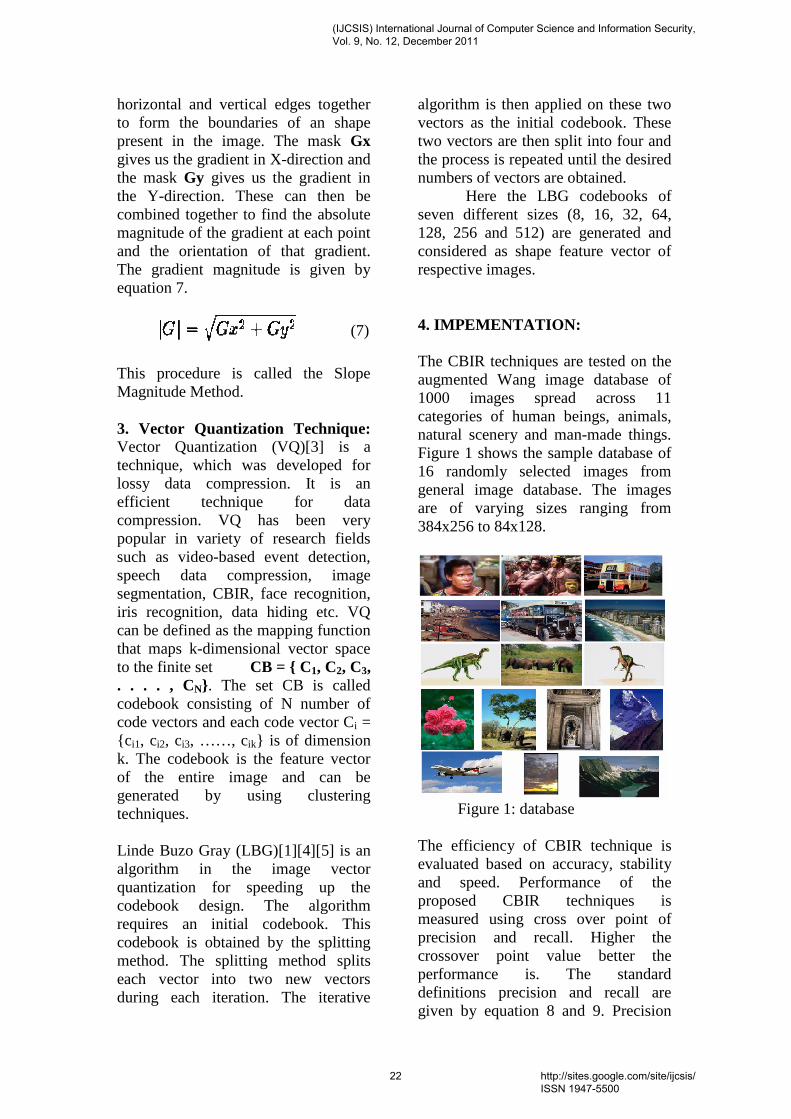
horizontal and vertical edges together to form the boundaries of an shape present in the image. The mask Gx gives us the gradient in X-direction and the mask Gy gives us the gradient in the Y-direction. These can then be combined together to find the absolute magnitude of the gradient at each point and the orientation of that gradient. The gradient magnitude is given by equation 7.
(7)
This procedure is called the Slope Magnitude Method. 3. Vector Quantization Technique: Vector Quantization (VQ)[3] is a technique, which was developed for lossy data compression. It is an efficient technique for data compression. VQ has been very popular in variety of research fields such as video-based event detection, speech data compression, image segmentation, CBIR, face recognition, iris recognition, data hiding etc. VQ can be defined as the mapping function that maps k-dimensional vector space to the finite set CB = { C1, C2, C3, . . . . , CN}. The set CB is called codebook consisting of N number of code vectors and each code vector Ci = {c i1, ci2, ci3, ……, cik} is of dimension k. The codebook is the feature vector of the entire image and can be generated by using clustering techniques. Linde Buzo Gray (LBG)[1][4][5] is an algorithm in the image vector quantization for speeding up the codebook design. The algorithm requires an initial codebook. This codebook is obtained by the splitting method. The splitting method splits each vector into two new vectors during each iteration. The iterative
algorithm is then applied on these two vectors as the initial codebook. These two vectors are then split into four and the process is repeated until the desired numbers of vectors are obtained. Here the LBG codebooks of seven different sizes (8, 16, 32, 64, 128, 256 and 512) are generated and considered as shape feature vector of respective images. 4. IMPEMENTATION: The CBIR techniques are tested on the augmented Wang image database of 1000 images spread across 11 categories of human beings, animals, natural scenery and man-made things. Figure 1 shows the sample database of 16 randomly selected images from general image database. The images are of varying sizes ranging from 384x256 to 84x128.
Figure 1: database The efficiency of CBIR technique is evaluated based on accuracy, stability and speed. Performance of the proposed CBIR techniques is measured using cross over point of precision and recall. Higher the crossover point value better the performance is. The standard definitions precision and recall are given by equation 8 and 9. Precision
(IJCSIS) International Journal of Computer Science and Information Security, Vol. 9, No. 12, December 2011
22 http://sites.google.com/site/ijcsis/ ISSN 1947-5500
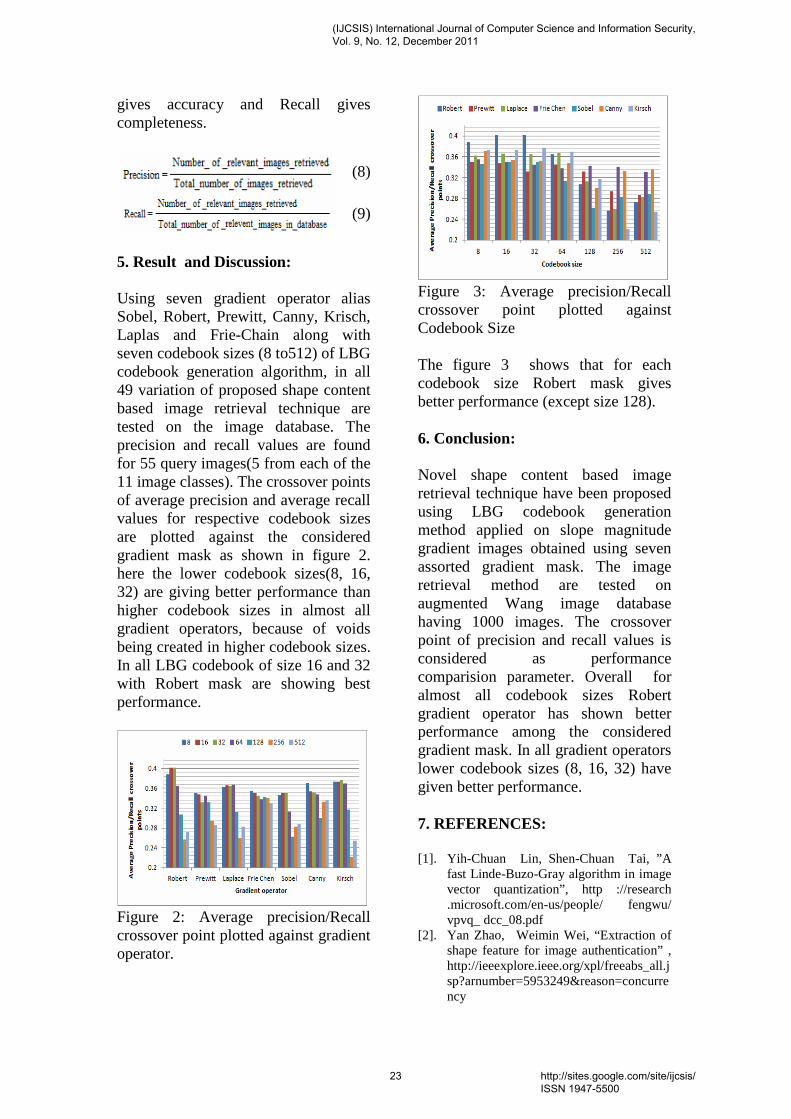
gives accuracy and Recall gives completeness.
(8)
(9)
5. Result and Discussion: Using seven gradient operator alias Sobel, Robert, Prewitt, Canny, Krisch, Laplas and Frie-Chain along with seven codebook sizes (8 to512) of LBG codebook generation algorithm, in all 49 variation of proposed shape content based image retrieval technique are tested on the image database. The precision and recall values are found for 55 query images(5 from each of the 11 image classes). The crossover points of average precision and average recall values for respective codebook sizes are plotted against the considered gradient mask as shown in figure 2. here the lower codebook sizes(8, 16, 32) are giving better performance than higher codebook sizes in almost all gradient operators, because of voids being created in higher codebook sizes. In all LBG codebook of size 16 and 32 with Robert mask are showing best performance.
Figure 2: Average precision/Recall crossover point plotted against gradient operator.
Figure 3: Average precision/Recall crossover point plotted against Codebook Size The figure 3 shows that for each codebook size Robert mask gives better performance (except size 128). 6. Conclusion: Novel shape content based image retrieval technique have been proposed using LBG codebook generation method applied on slope magnitude gradient images obtained using seven assorted gradient mask. The image retrieval method are tested on augmented Wang image database having 1000 images. The crossover point of precision and recall values is considered as performance comparision parameter. Overall for almost all codebook sizes Robert gradient operator has shown better performance among the considered gradient mask. In all gradient operators lower codebook sizes (8, 16, 32) have given better performance. 7. REFERENCES: [1]. Yih-Chuan Lin, Shen-Chuan Tai, ”A
fast Linde-Buzo-Gray algorithm in image vector quantization”, http ://research .microsoft.com/en-us/people/ fengwu/ vpvq_ dcc_08.pdf
[2]. Yan Zhao, Weimin Wei, “Extraction of shape feature for image authentication” , http://ieeexplore.ieee.org/xpl/freeabs_all.jsp?arnumber=5953249&reason=concurrency
(IJCSIS) International Journal of Computer Science and Information Security, Vol. 9, No. 12, December 2011
23 http://sites.google.com/site/ijcsis/ ISSN 1947-5500

[3]. H.B.Kekre, Tanuja Sarode, Sudeep D. Thepade, “Color-Texture Feature based Image Retrieval using DCT applied on Kekre’s Median Codebook”, International Journal on Imaging (IJI), Volume 2, Number A09, Autumn 2009,pp. 55-65. Available online at www.ceser.res.in/iji.html.
[4]. H.B.Kekre, Tanuja K. Sarode, Sudeep D. Thepade, Vaishali Suryavanshi,“Improved Texture Feature Based Image Retrieval using Kekre’s Fast Codebook Generation Algorithm”, Springer-International Conference on Contours of Computing Technology (Thinkquest-2010), BGIT, Mumbai, 13-14 March 2010. Is uploaded on online Springerlink.
[5]. H. B. Kekre, Kamal Shah, Tanuja K. Sarode, Sudeep D. Thepade, ”Performance Comparison of Vector Quantization Technique – KFCG with LBG, Existing Transforms and PCA for Face Recognition”, International Journal of Information Retrieval (IJIR), Vol. 02, Issue 1, pp.: 64-71, 2009.
[6]. Mamta Juneja , Parvinder Singh Sandhu “Performance evaluation of edge detection techniques for Image in SpatialDomain”. International Journal of Computer Theory and Engineering, Vol. 1, No. 5, December, 2009 http : // www. ijcte. Org /papers/100-G205-621.pdf
[7]. O. R. Vincent, O. Folorunso. “A Descriptive algorithm for sobel image Detection” Proceedings of Informing Science & IT Education Conference (InSITE) 2009.
[8]. Hong Shan Neoh, Asher Hazanchuk. “Adaptive Edge Detection for Real-Time Video Processing using FPGAs”.http://www.altera.com/literature/cp/gspx/edge-detection.pdf.
[9]. Raman Maini & Dr. Himanshu Aggarwal. “ Study and Comparison of Various Image Edge Detection Techniques.” IJIP , http :// www . csc journals.org/csc/manuscript/Journals/IJIP/volume3/Issue1/IJIP-15.pdf
[10]. Rae-Hong Park,Kang Sik Yoon W. Y. Choi. “Eight_point discrete Hartley transform as an edge operator and its interpretation in the frequency domain”. ACM http :// dl.acm. org / citation.cfm?id=292159&CFID=67876164&CFTOKEN=65457950
[11]. Sudeep K C , Dr. Jharna Majumdar.“ A Novel Architecture for Real Time Implementation of Edge Detectors on
FPGA”. http ://www .ijcsi.org/papers/IJCSI-8-1-193-202.pdf
[12]. Shan Li, “Complex Zernike Moments Features for Shape-Based Image Retrieval” http://www.sftw.umac.mo/~fstpcm/pub/SMCA09.pdf
[13]. Dr.H.B.Kekre,Priyadarshini Mukherjee, Shobhit Wadhwa, “Image Retrieval with Shape Features Extracted using Gradient Operators and Slope Magnitude Technique with BTC”, http://www.ijcaonline.org/volume6/number8/pxc3871430.pdf
[14]. Narendra V G, Hareesh K S, “Study and comparison of various image edge detection techniques used in quality inspection and evaluation of agricultural and food products by computer vision” , http://www.ijabe.org/index.php/ijabe/article/277/279
Author Biographies
Dr. H. B. Kekre has received B.E. (Hons.) in Telecomm. Engineering. from Jabalpur University in 1958, M.Tech (Industrial Electronics) from IIT Bombay in 1960, M.S.Engg.
(Electrical Engg.) from University of Ottawa in 1965 and Ph.D. (System Identification) from IIT Bombay in 1970 He has worked as Faculty of Electrical Engg. and then HOD Computer Science and Engg. at IIT Bombay. For 13 years he was working as a professor and head in the Department of Computer Engg. at Thadomal Shahani Engineering. College, Mumbai. Now he is Senior Professor at MPSTME, SVKM’s NMIMS. He has guided 17 Ph.Ds, more than 100 M.E./M.Tech and several B.E./ B.Tech projects. His areas of interest are Digital Signal processing, Image Processing and Computer Networking. He has more than 270 papers in National / International Conferences and Journals to his credit. He was Senior Member of IEEE. Presently He is Fellow of IETE and Life Member of ISTE Recently seven students working under his guidance have received best paper awards. Currently 10 research scholars are pursuing Ph.D. program under his guidance.
Dr. Sudeep D. Thepade has Received B.E.(Computer) degree from North Maharashtra University with Distinction in 2003. M.E. in
(IJCSIS) International Journal of Computer Science and Information Security, Vol. 9, No. 12, December 2011
24 http://sites.google.com/site/ijcsis/ ISSN 1947-5500
Computer Engineering from University of Mumbai in 2008 with Distinction, Ph.D. from SVKM’s NMIMS in 2011, Mumbai. He has about 09 years of experience in teaching and industry. He was Lecturer in Dept. of Information Technology at Thadomal Shahani Engineering College, Bandra(w), Mumbai for nearly 04 years. Currently working as Associate Professor and HoD Computer Engineering at Mukesh Patel School of Technology Management and Engineering, SVKM’s NMIMS, Vile Parle(w), Mumbai, INDIA. He is member of International Advisory Committee for many International Conferences, acting as reviewer for many referred international journals/transactions including IEEE and IET. His areas of interest are Image Processing and Biometric Identification. He has guided five M.Tech. projects and several B.Tech projects. He more than 125 papers in National/International Conferences/Journals to his credit with a Best Paper Award at International Conference SSPCCIN-2008, Second Best Paper Award at ThinkQuest-2009, Second Best Research Project Award at Manshodhan 2010, Best Paper Award for paper published in June 2011 issue of International Journal IJCSIS (USA), Editor’s Choice Awards for papers published in International Journal IJCA (USA) in 2010 and 2011.
Shrikant Sanas has received B.E. (Computer) degree from Mumbai University with First Class in 2008. M.-Tech. in Computer Engineering from Mukesh Patel School of Tech.
Mgmt. and Engineering. SVKM’s NMIMS University Mumbai. in 2011 with Distinction. Currently working as Lecturer in Ramrao Adik Institute of Technology. Nerul, Navi Mumbai. His areas of interest are Image Processing and Computer Vision. He has 05 papers in International Journals
Sowmya C. Iyer is pursuing a B.E. degree in Information Technology from RamraoAdik Institute of Technology , Navi Mumbai. Her interests lie in the field of Image Processing and
Website Development.
Jhuma Garg is pursuing a B.E. degree in Information Technology from RamraoAdik Institute of Technology , Navi Mumbai. Her interests lie in the
field of Image Processing and Website Designing.
(IJCSIS) International Journal of Computer Science and Information Security, Vol. 9, No. 12, December 2011
25 http://sites.google.com/site/ijcsis/ ISSN 1947-5500

.
ENERGY ISSUES IN MOBILE TELECOM NETWORK:A DETAILED ANALYSIS
P.Balagangadhar Rao Electronics and Telecommunications Engineering.
Sreekavitha Engineering College. Karepalli 507 122, INDIA.
Abstract: Diesel and Conventional energy costs are increasing at twice the growth rate of revenues of Mobile Telecom Network infrastructure industry. There is an urgent need to reduce the Operating Expenditure (OPEX) in this front. While bridging the rural and urban divide, Telecom Operators should adopt stronger regulations for climate control by reducing the Green house gases like CO2.This strengthens the business case for renewable energy technology usage.
Solutions like Solar, Fuel Cells, Wind, Biomass, and Geothermal can be explored and implemented in the arena of energy starving Telecom sector. Such sources provide clean and green energy. They are free and infinitely available. These technologies which use the natural resources are not only suitable for stand alone applications but also have long life span. Their maintenance cost is quite minimal. Most important advantage of the use of these natural resources is to have a low Carbon foot print. These are silent energy sources. Out of these, Solar-based solutions are available as Ground (or) Tower mounted variants. Hybrid Technology solutions like Solar-Solar, Solar-DCDG (Direct Current Diesel Generators) or Solar-battery bank are to be put into use in order to cut down the OPEX (Operating Expenditure). Further, a single Multi Fuel Cell can also be used, which can run on Ethanol/Bio Fuel/Compressed Natural Gas (CNG)/Liquefied Petroleum Gas (LPG)/Pyrolysis oil. Also, storage solutions like Lithium ion batteries reduce the Diesel Generator run hours, offering about fifty percent of savings in operating expenditure front.
A detailed analysis is made in this paper in respect of the Energy requirements of Mobile Telecom Network; Minimising the Operating Costs by the usage of the technologies that harvest Natural resources; Sharing the Infrastructure by different Operators and bringing Energy efficiency by adopting latest Storage back up technologies.
Keywords: Fuel Cells, B.T.S (Base Tran-Receivers) Towers, Bio Fuel, L.P.G (Liquefied Petroleum Gas), Hybrid Technologies, Renewable Energy.)
I. INTRODUCTION The current environment of Tariff wars and high Spectrum prices are greatly influencing the profitability of
Mobile Operators. Over the past few years, energy costs have increased exponentially as against the telecom revenues. This has become a key issue to the survival of the industry since Average Revenue per Unit (ARPU) call has dropped with the entry of new operators and intensifying competition. To tackle this increase in operating expenditure, telecom operators are looking into explore energy efficient solutions in network design and maintenance .An analysis of the available figures on the mobile network operating costs, indicates that power and fuel account for 32 percent of total network Operating costs. Obviously, this figure is on high side. The typical energy costs for a Mobile Telecom Tower Site, when power is supplied by the Electricity Board, are estimated at Rs.26, 179 per month for an Indoor Site and Rs.22, 774 per month for an Outdoor Site. When there is no supply of power through a State Electricity Board, these figures inflate to Rs.37, 787 per month and Rs.33, 029 per month for an Indoor and Outdoor site, respectively.
Mobile telecom network Operators need to take several measures to manage their energy costs. On the supply side, alternative sources of energy like Solar Cell- hybrids, Wind energy mills and Gas turbines can be used instead of conventional sources. Hybrid projects of Solar panels and Diesel Generators can be deployed at Mobile Tower sites that are located farthest from the available grid supply in rural areas. Small wind turbines of 3KiloWatt capacity can be utilised for harvesting the wind energy, in areas where the average wind speed is over four meters per second (4 m/s). A gas based generator or a micro turbine works on Natural gas and lot cheaper than Diesel oil.
Energy efficiency measures that can be adopted by operators include integrated cell site power management, usage of Direct Current Diesel Generators (DCDG), adoption of Fuel Catalysts, and remote monitoring of Diesel Generator runtime and Fuel consumption. Such measures can increase the operational efficiency and bring down energy costs at Mobile Cell sites.
(IJCSIS) International Journal of Computer Science and Information Security, Vol. 9, No. 12, December 2011
26 http://sites.google.com/site/ijcsis/ ISSN 1947-5500

. Energy consumption by telecom operators can be broadly divided into three main categories. The first and most important category is the consumption by Base Transceiver Station (BTS) sites and the second one is by Core Switch. The last category is the consumption by the Corporate Offices. The corporate offices have a share of about 14 percent in total fuel consumption. Though this has been constant for several years now, the share of BTSs in fuel usage has been on increasing side.
At a passive site, Diesel Generator (DG), electrical works and battery racks account for around 33 percent of the CAPEX. The cost of passive infrastructure for a Ground-Based Tower (GBT) is around Rs.2.5 million and for a Roof Top Tower (RTT) is about 1.4 million. The key equipments deployed in these sites are Diesel Generators, Air-Conditioning facility, Batteries along with racks, Cables etc.
Primarily, power consuming elements on the active side of a telecom network include BTSs, Microwave Radio Equipment, Switches, Antenna, Air-Conditioning equipment and Trans-Receivers. Out of all these, Air Conditioning and BTS's alone consume about 80% of the energy at a Mobile Site. Forty percent of the existing telecom towers are in regions experiencing power shortages (even urban, semi-urban, rural areas etc.,). Costs increase on account of running the Diesel Generator for supplying the required power for the functioning of Telecom Equipment and for cooling requirements.
The cost of a DG set may range from Rs.3, 00,000 to Rs.10, 00,000 depending on the wattage and type. Based on the number of hours of operation, fuel costs vary from Rs.1, 00,000 per year per site to Rs.6, 00,000 per year per site. Fuel and space theft contributes to another 10 percent of fuel costs. Also, the replacement of the diesel-generator set is required with an operation of eight hours a day over a five year period. That means, it is going to be an additional burden on CAPEX.
The Operating Expenditure (OPEX) of a Telecom Tower used for serving the Base Trans-Receiver(BTS) is estimated as Energy-related costs (32%) ,Capital and Depreciation cost (38%),Security and Taxes(10%), Rent(8%), Over heads(4%), Maintenance(5%) and Insurance(3%).The Site's total power requirement is about 7,884 Kilo watt hours per year, of which about 3,833Kilo Watt hours per year is planned to be derived from Solar Energy while remaining is provided by Diesel Generator (DG)set. Also, it is estimated that the running cost of Solar-DG hybrids is Rs.34 per unit of electricity, while that of running only the DG is Rs.67 per unit. Thus the savings derived by using the Solar-DG hybrid versus the DG will be
Rs.33.5per unit (or) 49 percent.
II. BENEFITS OF SHARING THE TOWER INFRASTRUCTURE BY MOBILE OPERATORS:
Power and fuel expenses reduce significantly with an increase in tenancy .Each additional tenant reduces the cost per tenant by about 20 percent.
Fuel and power costs are around Rs.20, 000 with one tenant, Rs.30, 000 with two tenants, Rs.35, 000 with three tenants, Rs.42, 000 with four tenants. Accordingly, fuel and power costs per operator reduce from Rs.20, 000 to Rs.15, 000, Rs.12, 000 and Rs.10, 000 respectively. While the rural segment is a major contributor for Mobile network growth, the Operators need to look at innovative business models for improving their operating margins. Naturally, this condition leads the operators to explore alternative energy solutions. These can be classified, broadly into three types:
(a)OFF-GRID SOLUTIONS: These solutions, based on SOLAR and WIND power, reduce the generator runtime by up to one-tenth; fuel consumption to 2,000 lines per year per site and CO2 emissions per site to 5 tonnes per year
(b)BAD GRID SITE SOLUTIONS: These are relevant to sites with limited grid availability. Such Mobile tower sites are typically located in rural and suburban areas.
(c)GREEN ENERGY SOLUTIONS: Most energy companies offer green energy control systems to site related parameters to provide improved site maintenance by remote monitoring solutions. This greatly helps to reduce OPEX (operating expenditure).However, the business viability of alternative energy solutions is a critical aspect. These technologies are at the incubation stage and involve a little more capital cost in order to derive the fruits in the form of reduction in operating expenditure. Large-scale production of equipment for these technologies will greatly reduce even the capital cost.
Several other initiatives have been taken by Mobile network operators to minimise power and fuel usage. The Energy efficiency is being harvested by certain operators by experimenting through several catalysts like fuel cells, Solar-DG hybrid, DC free cooling units, integrated project management solutions, Fuel Catalyst and Variable Speed Diesel Generators. These initiatives are aimed at saving 57million litres of diesel and reducing 1, 54,000 metric tonnes of CO2 annually as well as achieving energy cost saving of 25percent.However, concerns remain with regard to the use of renewable energy. While panel prices have dropped over the
(IJCSIS) International Journal of Computer Science and Information Security, Vol. 9, No. 12, December 2011
27 http://sites.google.com/site/ijcsis/ ISSN 1947-5500
. past few years, this has not been translated into cost reductions for solar installations.
III. BATTERY BACK-UP ISSUES: It is quite obvious to have battery backup for extending round the clock-service to the subscribers of a Mobile network. Batteries are a critical back-up resource. They are powering Telecom infrastructure to a great extent. However, there have been instances when batteries have failed to support the load in exigencies, primarily, due to the presence of gaps in the technology, make, design and usage. Further, there are typical failure modes such as low back-up, long charge duration, low current acceptance, high charge voltages and premature failures that result in poor functioning and lower efficiency of the batteries. These contribute significantly to increasing energy costs, which, in turn increase the operational expenditure of the Mobile cell sites.
The features of a battery play a crucial role in influencing the operating expenditure. Poor recharge efficiency, resulting from long diesel generator running hours and under sized DG sets, impact energy costs. Most of the batteries of the present technology have low battery efficiency and are unable to accept high-charging currents. Further, these are unsuitable for Partial State-of-Charge (PSOC) and out door operation because of their increased sensitivity to high temperatures. The best solution, thus, is to have a battery model that gets recharged quickly, does not require high maintenance and is suitable for out-door applications. One of the optimal solutions is usage of MFVRLA (Maintenance Free Value Regulated Lead Acid) batteries. These have a higher life and are highly suitable for extreme outdoor charging conditions. Another significant improvement in the MFVRLA batteries is the adoption of AGM (Absorbed Glass Mat) technology which will further enhance the efficiency of the battery when used out-doors.
IV. BATTERY TECHNOLOGY OPTIONS: There are different technology options available which help in arresting the additional energy costs. These include Na-metal Halide, Pb-Carbon, Blue battery, Vanadium, Lithium and AGMVRLA (Absorbed Glass Mat Value Regulated Lead Acid) batteries. The performance of these battery solutions varies across different performance parameters, in terms of specific energy (measured in Watt-hour per Kilogram). Na-metal halide, Pb-Carbon and Lithium batteries give excellent performance. As far as safety is concerned, Lithium batteries are considered the least safe. Charge recovery after deep discharge is one parameter on which many of the battery options deliver an attractive performance. Further, Na-metal Halide, Vanadium and Lithium batteries have a high recharge
capability at 2.3 Volts.
Understanding the value proposition of each technology is important to arrive at an optimal battery solution. Merits like life cycle, Kilowatt-hours delivered, Cost per unit, CAPEX and OPEX requirements and saving per annum are also deciding factors for choosing an appropriate set of batteries.In the recent past, experiments of usage of “Green Shelter” arrangements for batteries are being done by certain companies. By this arrangement, no external heat is allowed to enter the battery compartment. This reduces the effect of heat caused by direct solar radiation by about 5 degrees, when compared to normal out-door cabinets. The reduction of operating temperature increases the life of the battery by at least 20 percent.
A healthy and effective maintenance of batteries is being achieved by certain operators with the use of Information and Communication technologies which is considered as a very cost effective solution. Remote monitoring creates a platform for easy collection of data, on the basis of which the condition of the battery can be estimated. This is done by analysing the parameters, external to the battery, by using sensor network. With this, the operators will benefit with the timely notice of failures, lesser down time and reduction in operating expenditure. It eliminates continuous monitoring by a human activity.
V. CONCLUSION:
It is high time to deploy new technologies that harvest the huge amount of Energy required for the ever growing Telecom industry, from natural resources like solar, wind ,bio mass Etc. Also, Operators to explore the introduction of various types of hybrid solutions for power generation, as per site requirement, to minimise the operating expenses. At a time when the fuel reserves are fast depleting and at the same time when the demand is increasing, the natural choice is to see towards the unconventional energy resources. Such an attempt will be profitable not only to the Mobile operators but also to the entire global environment as a whole, since the green house gases (like CO2) will be contained in a big way.
REFERENCES (1)Tele.net magazine, October 2011.
(2)Telecommunication journal, 2011.
AUTHORS PROFILE
The author is presently working as a professor in an engineering college.
(IJCSIS) International Journal of Computer Science and Information Security, Vol. 9, No. 12, December 2011
28 http://sites.google.com/site/ijcsis/ ISSN 1947-5500

.
PERFORMANCE COMPARISON OF NEURAL NETWORKS FOR IDENTIFICATION OF
DIABETIC RETINOPATHY Mr. R. Vijayamadheswaran#1, Dr.M.Arthanari#2, Mr.M.Sivakumar#3
# 1Doctoral Research Scholar, Anna University, Coimbatore. # 2Director,Bharathidhasan School of Computer Applications, Ellispettai, Erode. # 3Doctoral Research Scholar, Anna University, Coimbatore
Abstract— This paper implements radial basis function (RBF)
and Echo state neural networks (ESNN) for identification of hard exudates in diabetic retinopathy from fundus images. Features of 3 X 3 windows are extracted using contextual clustering algorithm. The features are further used to train the RBF network and ESNN network. The quality of the features extracted using contextual clustering is based on the size of the moving window ( apportion of the image) used to consider pixels in the original image. The performances of the networks are compared. Keywords- Diabetic retinopathy, fundus image, exudates detection, radial basis function, contextual clustering, echo state neural network
I. INTRODUCTION
Diabetic Retinopathy (DR) cause blindness [12]. The prevalence of retinopathy varies with the age of onset of diabetes and the duration of the disease. Color fundus images are used by ophthalmologists to study eye diseases like diabetic retinopathy [2]. Big blood clots called hemorrhages are found. Hard exudates are yellow lipid deposits which appear as bright yellow lesions. The bright circular region from where the blood vessels emanate is called the optic disk. The fovea defines the center of the retina, and is the region of highest visual acuity. The spatial distribution of exudates and microaneurysms and hemorrhages, especially in relation to the fovea can be used to determine the severity of diabetic retinopathy. The classification of exudates is treated as texture segmentation by learning the existing database[13-16].
Hard exudates are shinny and yellowish intraretinal protein deposits, irregular shaped, and found in the posterior pole of the fundus [9]. Hard exudates may be observed in several retinal vascular pathologies. Diabetic macular edema is the main cause of visual impairment in diabetic patients. Exudates are well contrasted with respect to the background that surrounds them and their shape and size vary considerably [1]. Hard and soft exudates can be distinguished because of
their color and the sharpness of their borders. Various methods have been reported for the detection of Exudates. Efficient algorithms for the detection of the optic disc and retinal exudates have been presented in [11][8].
Thresholding and region growing methods were used to detect exudates [4][3], use a median filter to remove noise, segment bright lesions and dark lesions by thresholding, perform region growing, then identify exudates regions with Bayesian, Mahalanobis, and nearest neighbor (NN) classifiers. Recursive region growing segmentation (RRGS).[6], have been used for an automated detection of diabetic retinopathy Adaptive intensity thresholding and combination of RRGS were used to detect exudates,[7], [5], combine color and sharp edge features to detect exudate. First they find yellowish objects, then they find sharp edges using various rotated versions of Kirsch masks on the green component of the original image. Yellowish objects with sharp edges are classified as exudates. [10], use morphological reconstruction techniques to detect contours typical of exudates.
Training The RBF/ ESNN
Testing the RBF / ESNN
Fig.1 Schematic diagram
(IJCSIS) International Journal of Computer Science and Information Security, Vol. 9, No. 12, December 2011
29 http://sites.google.com/site/ijcsis/ ISSN 1947-5500

.
II. PROPOSED METHODOLOGY A This research work proposes contextual clustering
(CC) for feature extraction and RBF/ ESNN network for identification of exudates. CC is used for feature extraction. The extracted features are input to the RBF/ESNN network. In order to achieve maximum identification of the exudates, proper data input for RBF/ESNN, optimum topology of RBF/ESNN and correct training of RBF/ESNN with suitable parameters is a must.
A large amount of exudates and non exudates images are collected. Features are extracted from the images using contextual clustering segmentation. The features are input to the RBF/ESNN and labeling is given in the output layer of RBF/ESNN. The labeling indicates the exudates. The final weights obtained after training the RBF/ESNN is used to identify the exudates. Figure 1 explains the overall sequence of proposed methodology.
A. CONTEXTUAL CLUSTERING Image segmentation is a subjective and context-
dependent cognitive process. It implicitly includes not only the detection and localization but also the delineation of the activated region. In medical imaging field, the precise and computerized delineation of anatomic structures from image data sequences is still an open problem. Countless methods have been developed, but as a rule, user interaction cannot be negated or the method is said to be robust only for unique kinds of images.
Contextual segmentation refers to the process of
partitioning a data into multiple regions. The goal of segmentation electrical disturbance data is to simplify and / or change the representation of data into something that is more meaningful and easier to analyze. Data segmentation is typically used to locate data in a vector. The result of contextual data segmentation is a set of regions that collectively cover the entire data. Each value in a data is similar with respect to some characteristics. Adjacent regions are significantly different with respect to the same characteristics. Several general-purpose algorithms and techniques have been developed for data segmentation. Contextual clustering algorithms which segments a data into one category (ω0) and another category (ω1). The data of the background are assumed to be drawn from standard normal distribution[17].
B. RADIAL BASIS FUNCTION Radial basis function neural network (RBF) is a
supervised neural network. The network has an input layer, hidden layer (RBF layer) and output layer. The 2 features obtained are used as inputs for the network and the target values for training each exudate is given in the output layer[17].
C. ECHOSTATE NEURAL NETWORK The echo state network (ESN), Figure 1, with a
concept new topology has been found by [18]. ESNs possess a highly interconnected and recurrent topology of nonlinear PEs that constitutes a “reservoir of rich dynamics” and contain information about the history of input and output patterns. The outputs of these internal PEs (echo states) are fed to a memoryless but adaptive readout network (generally linear) that produces the network output. The interesting property of ESN is that only the memory less readout is trained, whereas the recurrent topology has fixed connection weights. This reduces the complexity of RNN training to simple linear regression while preserving a recurrent topology, but obviously places important constraints in the overall architecture that have not yet been fully studied.
The echo state condition is defined in terms of the
spectral radius (the largest among the absolute values of the eigenvalues of a matrix, denoted by ( || || ) of the reservoir’s weight matrix (|| W || < 1). This condition states that the dynamics of the ESN is uniquely controlled by the input, and the effect of the initial states vanishes. The current design of ESN parameters relies on the selection of spectral radius. There are many possible weight matrices with the same spectral radius, and unfortunately they do not all perform at the same level of mean square error (MSE) for functional approximation.
The echo state condition is defined in terms of the spectral radius (the largest among the absolute values of the eigenvalues of a matrix, denoted by (|| || ) of the reservoir’s weight matrix (|| W || < 1). This condition states that the dynamics of the ESNN is uniquely controlled by the input, and the effect of the initial states vanishes. The current design of ESNN parameters relies on the selection of spectral radius. There are many possible weight matrices with the same spectral radius, and unfortunately they do not perform at the same level of mean square error (MSE) for functional approximation.
The recurrent network is a reservoir of highly interconnected dynamical components, states of which are called echo states. The memory less linear readout is trained to produce the output.
Consider the recurrent discrete-time neural network given in Figure 3 with M input units, N internal PEs, and L output units. The value of the input unit at time n is u(n) = [u1(n), u2(n), . . . , uM(n)]T , The internal units are x(n) = [x1(n), x2(n), . . . , xN(n)]T , and Output units are y(n) = [y1(n), y2(n), . . . , yL (n)]T. The connection weights are given
• in an (N x M) weight
matrixbackij
back WW = for connections
between the input and the internal PEs,
(IJCSIS) International Journal of Computer Science and Information Security, Vol. 9, No. 12, December 2011
30 http://sites.google.com/site/ijcsis/ ISSN 1947-5500

• in an N × N matrix inij
in WW = for
connections between the internal PEs
• in an L × N matrix outij
out WW = for
connections from PEs to the output units and
• in an N × L matrix backij
back WW = for the
connections that project back from the output to the internal PEs.
The activation of the internal PEs (echo state) is updated according to x(n + 1) = f(Win u(n + 1) + Wx(n) +Wbacky(n)), where f = ( f1, f2, . . . , fN) are the internal PEs’ activation functions.
Here, all fi’s are hyperbolic tangent functionsxx
xx
eeee−
−
+
−. The
output from the readout network is computed according to y(n + 1) = fout(Woutx(n + 1)), . where
),....,,( 21outL
outoutout ffff = are the output unit’s nonlinear
functions.
D. PROPOSED METHOD FOR INTELLIGENT SEGMENTATION
In this work, much concentration is done for the best segmentation of the fundus image by implementing an ESNN.
1) Preprocess the image : Removal of noise and enhancing the image.
2) Feature extraction: CC is used to extract the features of 3 X 3 windows in the image and labeling done
3. Training the ANN: The features and the labels are trained using RBF /ESNN to obtain final weights of RBF/ESNN
4. Segmentation: New fundus image is segmented using the final weights of RBF / ESNN
Module 1: Transform image to a reference image Apply histogram equalization Segmentation using contextual clustering Generate features
1. Containing average of 3x3 pixel values. 2. Output of the contextual clustering. 3. Target values 0.1 / 0.9 Where 0.1 indicates values of black (intensity 0) in the segmented image and 0.9 indicates values of white (intensity 255) in the segmented image. Store the three features and block size in a file.
Module 2: Read the three features and block size. Choose all the patterns corresponding to 0.9and 0.1 for training. Initialize random weights. Develop training data for the ESNN Train the ESSN Store the final weights. Module3: Read an eye image. Read the final weights. Segment the image using final weights. Do template matching with the segmented features. Echostate Neural Network Training Decide the input features of the fundus image Fix the target values Set no. of inputs=2; Set no of reservoir = 20; Set no. of output = 1 Create weight matrix(no of reservoirs,no.of inputs)= random numbers -0.5 Create weight backup matrix(no.of outputs, no of reservoirs)= (random numbers -0.5)/2 Create weight not (w0)(no.of reservoirs, no of reservoirs)= (random numbers -0.5) Create temp matrix (te)(no.of reservoirs, no of reservoirs)= random numbers Calculate w0 = w0.* (te <0.3) Calculate w0 = w0.* (w0 <0.3) Follow the heuristics v = eig(w0) lamda = max(abs(v)) w1= w0/lamda w = .9* w1 Create network training dynamics state = zeros(no_reservoir,1) desired = 0; for loop input = x(i:i+nipp-1) F=wt_input* input' TT=w*state TH=wt_back' * desired next_state = tanh( F+TT + TH) state = next_state desired = x(i+nipp-1) desired_1 = desired end Echostate Neural Network segmentation (Testing) Network testing: input = x(i:i+nipp-1); F=wt_input* input'; TTH=wt_back' * output_d;
(IJCSIS) International Journal of Computer Science and Information Security, Vol. 9, No. 12, December 2011
31 http://sites.google.com/site/ijcsis/ ISSN 1947-5500
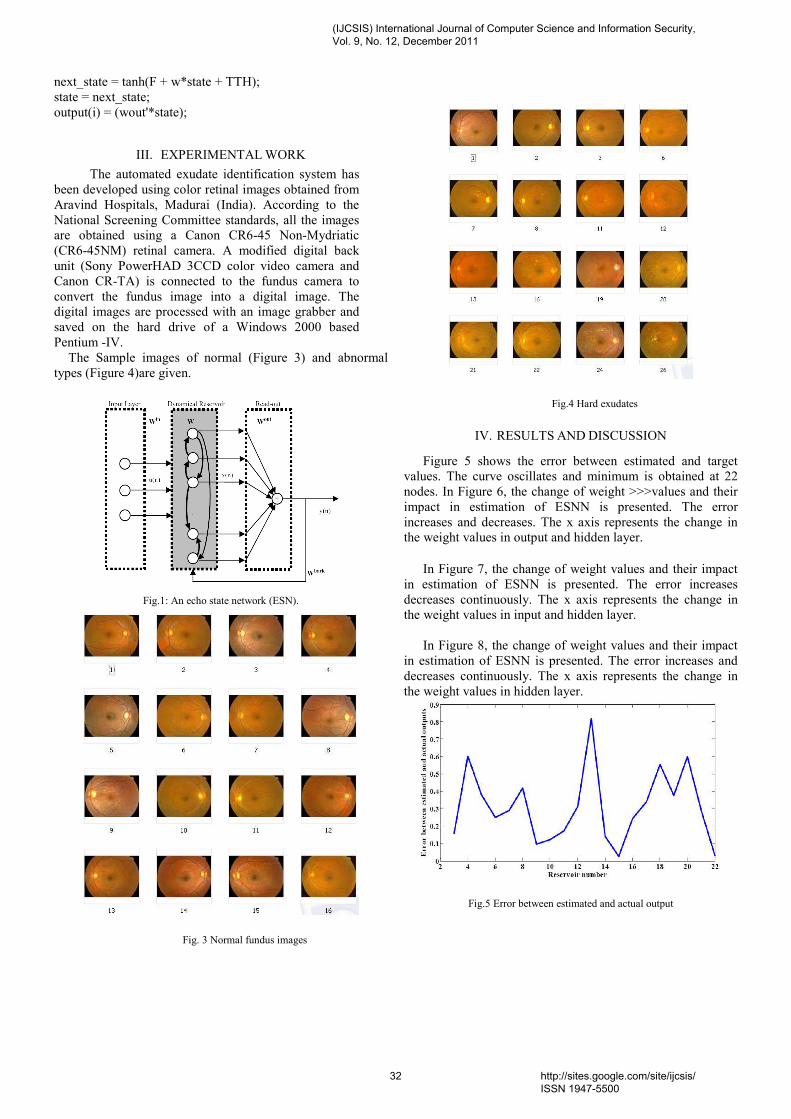
next_state = tanh(F + w*state + TTH); state = next_state; output(i) = (wout'*state);
III. EXPERIMENTAL WORK The automated exudate identification system has
been developed using color retinal images obtained from Aravind Hospitals, Madurai (India). According to the National Screening Committee standards, all the images are obtained using a Canon CR6-45 Non-Mydriatic (CR6-45NM) retinal camera. A modified digital back unit (Sony PowerHAD 3CCD color video camera and Canon CR-TA) is connected to the fundus camera to convert the fundus image into a digital image. The digital images are processed with an image grabber and saved on the hard drive of a Windows 2000 based Pentium -IV.
The Sample images of normal (Figure 3) and abnormal types (Figure 4)are given.
Fig.1: An echo state network (ESN).
Fig. 3 Normal fundus images
Fig.4 Hard exudates
IV. RESULTS AND DISCUSSION
Figure 5 shows the error between estimated and target values. The curve oscillates and minimum is obtained at 22 nodes. In Figure 6, the change of weight >>>values and their impact in estimation of ESNN is presented. The error increases and decreases. The x axis represents the change in the weight values in output and hidden layer.
In Figure 7, the change of weight values and their impact
in estimation of ESNN is presented. The error increases decreases continuously. The x axis represents the change in the weight values in input and hidden layer.
In Figure 8, the change of weight values and their impact
in estimation of ESNN is presented. The error increases and decreases continuously. The x axis represents the change in the weight values in hidden layer.
Fig.5 Error between estimated and actual output
(IJCSIS) International Journal of Computer Science and Information Security, Vol. 9, No. 12, December 2011
32 http://sites.google.com/site/ijcsis/ ISSN 1947-5500
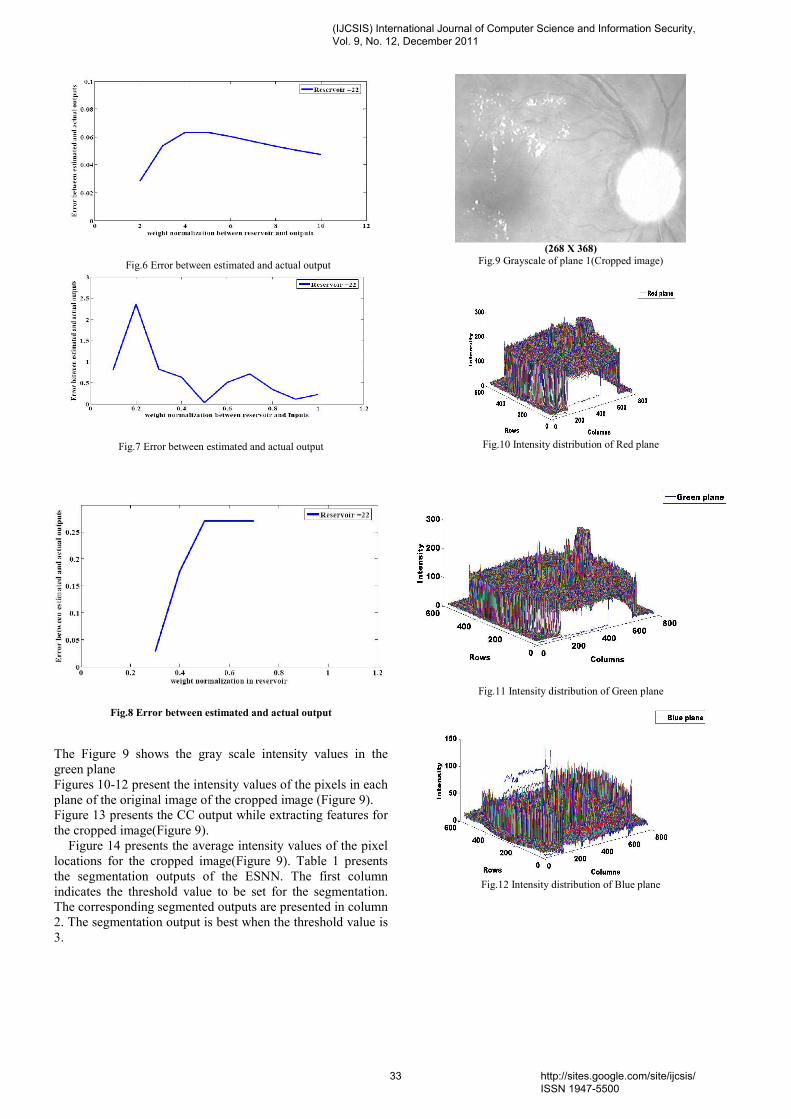
Fig.6 Error between estimated and actual output
Fig.7 Error between estimated and actual output
Fig.8 Error between estimated and actual output
The Figure 9 shows the gray scale intensity values in the green plane Figures 10-12 present the intensity values of the pixels in each plane of the original image of the cropped image (Figure 9). Figure 13 presents the CC output while extracting features for the cropped image(Figure 9).
Figure 14 presents the average intensity values of the pixel locations for the cropped image(Figure 9). Table 1 presents the segmentation outputs of the ESNN. The first column indicates the threshold value to be set for the segmentation. The corresponding segmented outputs are presented in column 2. The segmentation output is best when the threshold value is 3.
(268 X 368)
Fig.9 Grayscale of plane 1(Cropped image)
Fig.10 Intensity distribution of Red plane
Fig.11 Intensity distribution of Green plane
Fig.12 Intensity distribution of Blue plane
(IJCSIS) International Journal of Computer Science and Information Security, Vol. 9, No. 12, December 2011
33 http://sites.google.com/site/ijcsis/ ISSN 1947-5500
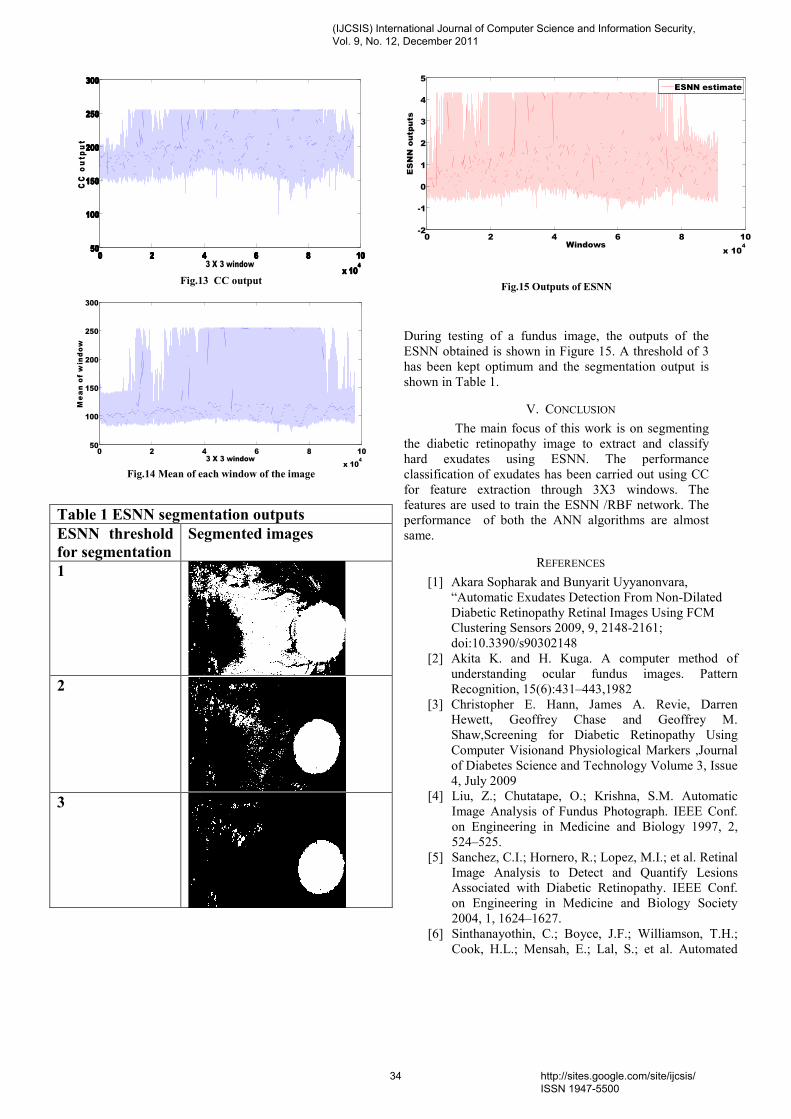
0000 2222 4444 6666 8888 10101010
x 10x 10x 10x 104444
50505050
100100100100
150150150150
200200200200
250250250250
300300300300
3 X 3 window
CC outp
ut
Fig.13 CC output
0 2 4 6 8 10
x 104
50
100
150
200
250
300
3 X 3 window
Mean of window
Fig.14 Mean of each window of the image
Table 1 ESNN segmentation outputs ESNN threshold for segmentation
Segmented images
1
2
3
0 2 4 6 8 10
x 104
-2
-1
0
1
2
3
4
5
Windows
ESNN outputs
ESNN estimate
Fig.15 Outputs of ESNN
During testing of a fundus image, the outputs of the ESNN obtained is shown in Figure 15. A threshold of 3 has been kept optimum and the segmentation output is shown in Table 1.
V. CONCLUSION The main focus of this work is on segmenting
the diabetic retinopathy image to extract and classify hard exudates using ESNN. The performance classification of exudates has been carried out using CC for feature extraction through 3X3 windows. The features are used to train the ESNN /RBF network. The performance of both the ANN algorithms are almost same.
REFERENCES [1] Akara Sopharak and Bunyarit Uyyanonvara,
“Automatic Exudates Detection From Non-Dilated Diabetic Retinopathy Retinal Images Using FCM Clustering Sensors 2009, 9, 2148-2161; doi:10.3390/s90302148
[2] Akita K. and H. Kuga. A computer method of understanding ocular fundus images. Pattern Recognition, 15(6):431–443,1982
[3] Christopher E. Hann, James A. Revie, Darren Hewett, Geoffrey Chase and Geoffrey M. Shaw,Screening for Diabetic Retinopathy Using Computer Visionand Physiological Markers ,Journal of Diabetes Science and Technology Volume 3, Issue 4, July 2009
[4] Liu, Z.; Chutatape, O.; Krishna, S.M. Automatic Image Analysis of Fundus Photograph. IEEE Conf. on Engineering in Medicine and Biology 1997, 2, 524–525.
[5] Sanchez, C.I.; Hornero, R.; Lopez, M.I.; et al. Retinal Image Analysis to Detect and Quantify Lesions Associated with Diabetic Retinopathy. IEEE Conf. on Engineering in Medicine and Biology Society 2004, 1, 1624–1627.
[6] Sinthanayothin, C.; Boyce, J.F.; Williamson, T.H.; Cook, H.L.; Mensah, E.; Lal, S.; et al. Automated
(IJCSIS) International Journal of Computer Science and Information Security, Vol. 9, No. 12, December 2011
34 http://sites.google.com/site/ijcsis/ ISSN 1947-5500
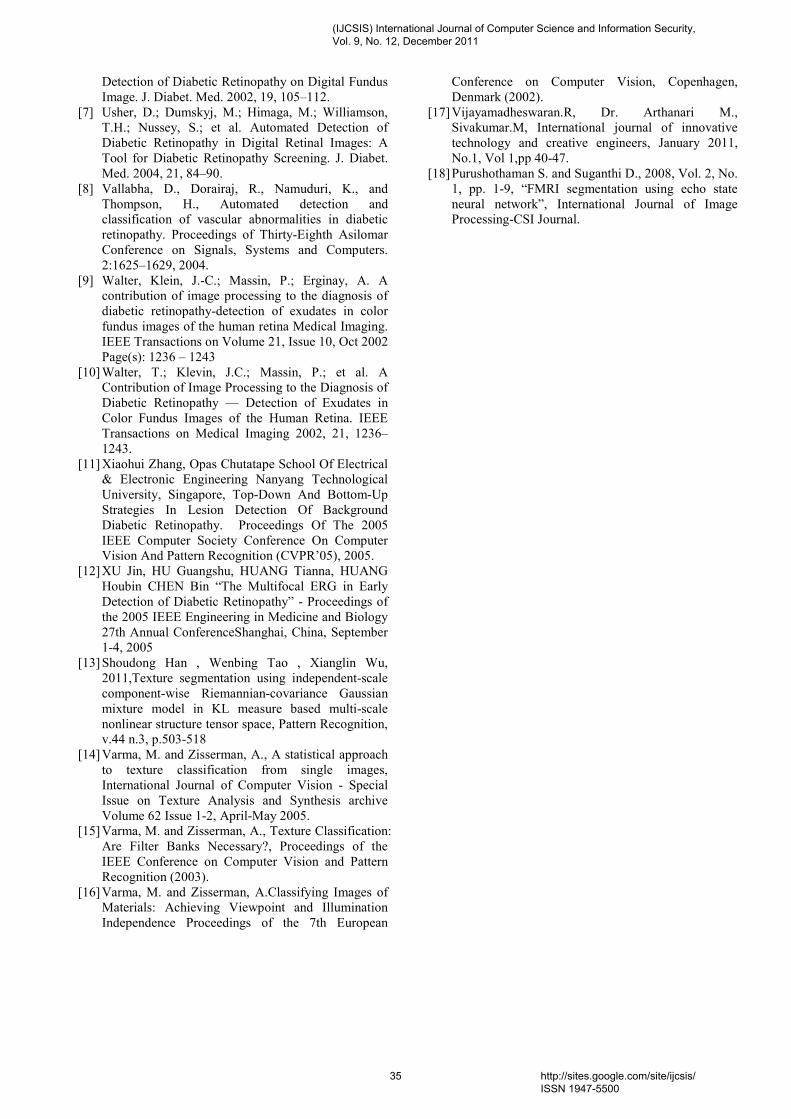
Detection of Diabetic Retinopathy on Digital Fundus Image. J. Diabet. Med. 2002, 19, 105–112.
[7] Usher, D.; Dumskyj, M.; Himaga, M.; Williamson, T.H.; Nussey, S.; et al. Automated Detection of Diabetic Retinopathy in Digital Retinal Images: A Tool for Diabetic Retinopathy Screening. J. Diabet. Med. 2004, 21, 84–90.
[8] Vallabha, D., Dorairaj, R., Namuduri, K., and Thompson, H., Automated detection and classification of vascular abnormalities in diabetic retinopathy. Proceedings of Thirty-Eighth Asilomar Conference on Signals, Systems and Computers. 2:1625–1629, 2004.
[9] Walter, Klein, J.-C.; Massin, P.; Erginay, A. A contribution of image processing to the diagnosis of diabetic retinopathy-detection of exudates in color fundus images of the human retina Medical Imaging. IEEE Transactions on Volume 21, Issue 10, Oct 2002 Page(s): 1236 – 1243
[10] Walter, T.; Klevin, J.C.; Massin, P.; et al. A Contribution of Image Processing to the Diagnosis of Diabetic Retinopathy — Detection of Exudates in Color Fundus Images of the Human Retina. IEEE Transactions on Medical Imaging 2002, 21, 1236–1243.
[11] Xiaohui Zhang, Opas Chutatape School Of Electrical & Electronic Engineering Nanyang Technological University, Singapore, Top-Down And Bottom-Up Strategies In Lesion Detection Of Background Diabetic Retinopathy. Proceedings Of The 2005 IEEE Computer Society Conference On Computer Vision And Pattern Recognition (CVPR’05), 2005.
[12] XU Jin, HU Guangshu, HUANG Tianna, HUANG Houbin CHEN Bin “The Multifocal ERG in Early Detection of Diabetic Retinopathy” - Proceedings of the 2005 IEEE Engineering in Medicine and Biology 27th Annual ConferenceShanghai, China, September 1-4, 2005
[13] Shoudong Han , Wenbing Tao , Xianglin Wu, 2011,Texture segmentation using independent-scale component-wise Riemannian-covariance Gaussian mixture model in KL measure based multi-scale nonlinear structure tensor space, Pattern Recognition, v.44 n.3, p.503-518
[14] Varma, M. and Zisserman, A., A statistical approach to texture classification from single images, International Journal of Computer Vision - Special Issue on Texture Analysis and Synthesis archive Volume 62 Issue 1-2, April-May 2005.
[15] Varma, M. and Zisserman, A., Texture Classification: Are Filter Banks Necessary?, Proceedings of the IEEE Conference on Computer Vision and Pattern Recognition (2003).
[16] Varma, M. and Zisserman, A.Classifying Images of Materials: Achieving Viewpoint and Illumination Independence Proceedings of the 7th European
Conference on Computer Vision, Copenhagen, Denmark (2002).
[17] Vijayamadheswaran.R, Dr. Arthanari M., Sivakumar.M, International journal of innovative technology and creative engineers, January 2011, No.1, Vol 1,pp 40-47.
[18] Purushothaman S. and Suganthi D., 2008, Vol. 2, No. 1, pp. 1-9, “FMRI segmentation using echo state neural network”, International Journal of Image Processing-CSI Journal.
(IJCSIS) International Journal of Computer Science and Information Security, Vol. 9, No. 12, December 2011
35 http://sites.google.com/site/ijcsis/ ISSN 1947-5500
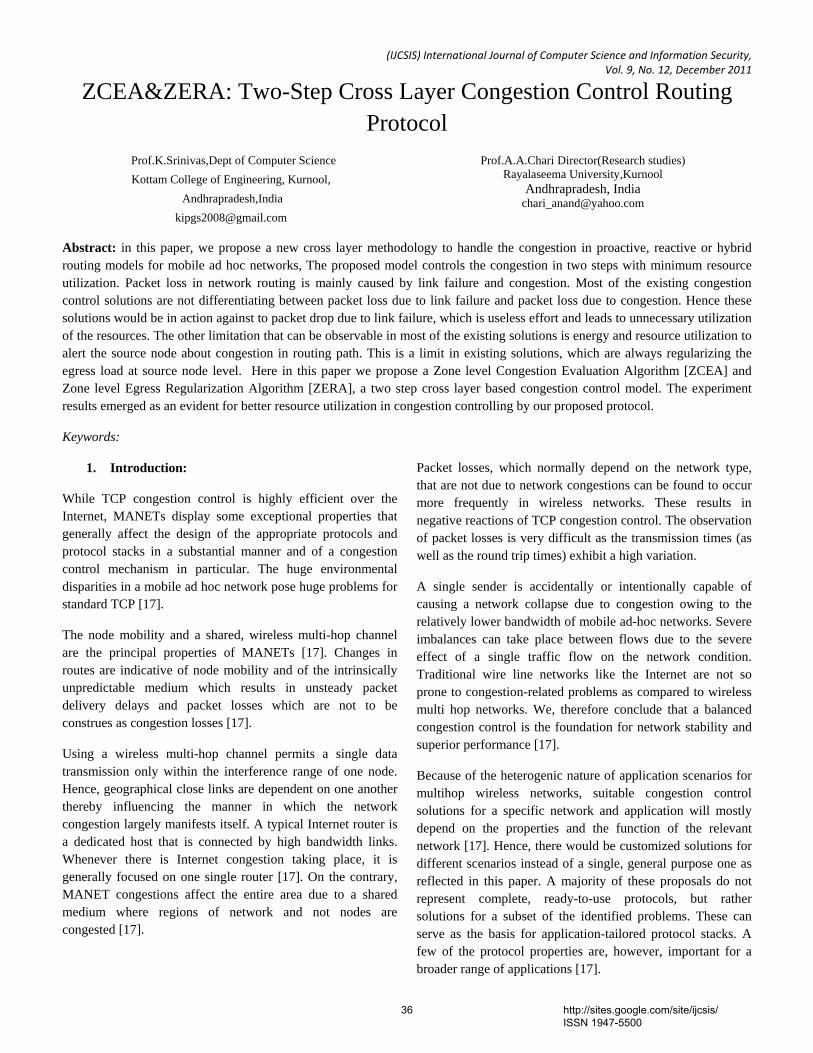
(IJCSIS) International Journal of Computer Science and Information Security, Vol. 9, No. 12, December 2011
ZCEA&ZERA: Two-Step Cross Layer Congestion Control Routing Protocol
Prof.K.Srinivas,Dept of Computer Science Kottam College of Engineering, Kurnool,
Andhrapradesh,India [email protected]
Prof.A.A.Chari Director(Research studies) Rayalaseema University,Kurnool
Andhrapradesh, India [email protected]
Abstract: in this paper, we propose a new cross layer methodology to handle the congestion in proactive, reactive or hybrid routing models for mobile ad hoc networks, The proposed model controls the congestion in two steps with minimum resource utilization. Packet loss in network routing is mainly caused by link failure and congestion. Most of the existing congestion control solutions are not differentiating between packet loss due to link failure and packet loss due to congestion. Hence these solutions would be in action against to packet drop due to link failure, which is useless effort and leads to unnecessary utilization of the resources. The other limitation that can be observable in most of the existing solutions is energy and resource utilization to alert the source node about congestion in routing path. This is a limit in existing solutions, which are always regularizing the egress load at source node level. Here in this paper we propose a Zone level Congestion Evaluation Algorithm [ZCEA] and Zone level Egress Regularization Algorithm [ZERA], a two step cross layer based congestion control model. The experiment results emerged as an evident for better resource utilization in congestion controlling by our proposed protocol.
Keywords:
1. Introduction:
While TCP congestion control is highly efficient over the Internet, MANETs display some exceptional properties that generally affect the design of the appropriate protocols and protocol stacks in a substantial manner and of a congestion control mechanism in particular. The huge environmental disparities in a mobile ad hoc network pose huge problems for standard TCP [17].
The node mobility and a shared, wireless multi-hop channel are the principal properties of MANETs [17]. Changes in routes are indicative of node mobility and of the intrinsically unpredictable medium which results in unsteady packet delivery delays and packet losses which are not to be construes as congestion losses [17].
Using a wireless multi-hop channel permits a single data transmission only within the interference range of one node. Hence, geographical close links are dependent on one another thereby influencing the manner in which the network congestion largely manifests itself. A typical Internet router is a dedicated host that is connected by high bandwidth links. Whenever there is Internet congestion taking place, it is generally focused on one single router [17]. On the contrary, MANET congestions affect the entire area due to a shared medium where regions of network and not nodes are congested [17].
Packet losses, which normally depend on the network type, that are not due to network congestions can be found to occur more frequently in wireless networks. These results in negative reactions of TCP congestion control. The observation of packet losses is very difficult as the transmission times (as well as the round trip times) exhibit a high variation.
A single sender is accidentally or intentionally capable of causing a network collapse due to congestion owing to the relatively lower bandwidth of mobile ad-hoc networks. Severe imbalances can take place between flows due to the severe effect of a single traffic flow on the network condition. Traditional wire line networks like the Internet are not so prone to congestion-related problems as compared to wireless multi hop networks. We, therefore conclude that a balanced congestion control is the foundation for network stability and superior performance [17].
Because of the heterogenic nature of application scenarios for multihop wireless networks, suitable congestion control solutions for a specific network and application will mostly depend on the properties and the function of the relevant network [17]. Hence, there would be customized solutions for different scenarios instead of a single, general purpose one as reflected in this paper. A majority of these proposals do not represent complete, ready-to-use protocols, but rather solutions for a subset of the identified problems. These can serve as the basis for application-tailored protocol stacks. A few of the protocol properties are, however, important for a broader range of applications [17].
36 http://sites.google.com/site/ijcsis/ ISSN 1947-5500

(IJCSIS) International Journal of Computer Science and Information Security, Vol. 9, No. 12, December 2011
The past couple of years have seen the reception of extensive focus on the problem of congestion control both in the Internet context, in addition to an ad-hoc network context. Much of the research focus has been on modeling, analysis, algorithm development of end-to-end control schemes (such as TCP), and adaptation of such schemes to ad-hoc networks. Algorithms that unite and stabilize operations have been developed, given the routing path and the bandwidth constrains. However, in the context of a wireless network, another main constrain is due to the MAC (Media Access Control) layer [17]. Most wireless MACs utilize a time-division strategy for accessing channel where at any point in space; the physical channel can be accessed by a single user at each moment of time (a time constraint).
The rest of the paper organized as in section 2 we explored the works most frequently cited in literature. Section 3 elaborates proposed protocol in detail Section 4 reveals the simulations and their results, that fallowed by conclusion and references.
2. Related Work:
Congestion awareness and control in networks is the issue that attains reasonable attention in from researchers. QoS centric congestion control solution can be found in [1]. Metrics based solution for congestion aware routing was proposed in[4]. Et al., [2] introduced metrics to evaluate data-rate, MAC overhead and buffer delay, which helps to identify and deal the congestion contention area in network. Hongqiang Zhai, et al., [3] proposed a solution by arguing that congestion and severe medium contention is interrelated. Yung Yi et al., [4] proposed a hop level congestion control model. Tom Goff, Nael et al., [5] discussed a set of algorithms that initiates alternative path usage when the quality of a path in use becomes suspect. Xuyang et al., [6] present a cross-layer hop-by-hop congestion control scheme designed to improve TCP performance in multihop wireless networks. Dzmitry et al [7] presents the impact congestion on transport layer that degrades the performance. Duc et al., [8] argued that current designs for routing are not congestion-adaptive.
Most of the existing models are aimed to identify the congestion through packet loss in routing path. Fair amount of times this packet loss can be an impact of link failure. Hence an attempt to egress regularization to control the packet loss that occurs against link failure is a useless effort. The other expensive approach that opted by most of the existing solutions is regularizing the egress at all nodes participating in routing. Most of the times it is possible to control the congestion at hop level [4][15]. Hence egress regularization at each node of the network would be an expensive in resource utilization. Here in this paper we argue that it is an essential
requirement to identify the reason for packet loss. Hence we can avoid the congestion control process via egress regularization against link failure circumstances. And also we continue argument that hop level congestion control is not enough, because the when hop level nodes are not able to regularize the egress load to control the congestion, the resource utilization remain same as in source level egress regularization models.
Here we propose a new cross layer congestion control model, which considers
• The heterogeneity in node capacities and resources • Cross layer model to confirm the congestion related
packet losses.
3. Two-Step Cross Layered Congestion Control Routing Protocol:
The packet dropping is a very frequent and unavoidable circumstance in Manets. The reasons for this packet dropping can be classified as
o Transmission Link failure. o Inferred Transmission due to overwhelmed
Ingress that leads Ingress receiving strength to low. This also can claim as packet dropping due to congestion at routing.
Initially network will be partitioned into zones, for each zone zone-head will be selected and then status of congestion will be evaluated in two stages
• The Status of congestion at intra zone level • The status of congestion at inter zone level
This can helps Source level Egress regularization cost can be minimized; energy utilization for congestion status alerts can also be balanced
Table1: Notations used in proposed model
Zone A geographical area, which is the part of selected mobile ad hoc network
ZCEA Zone level congestion evaluation algorithm
ZERA Zone level Egress Regularization Algorithm ERA Egress Regularization Algorithm DPG Distance Power Gradient EIL Ingress inferred Loss LFL Link Failure Loss IRS Ingress receiving strength
37 http://sites.google.com/site/ijcsis/ ISSN 1947-5500

(IJCSIS) International Journal of Computer Science and Information Security, Vol. 9, No. 12, December 2011
pIRS Present Ingress receiving strength
eIRS Expected Ingress Receiving Strength
RP Routing Path
ndt Delay time at node n
N Number of nodes in entire network
iZn Number of nodes in a zone i
izh Zone head of the thi zone
'izh Reserved Zone head of the thi zone
cZ Current zone in the hierarchy
pZ Preceding zone to the current zone cZ in hierarchy
fZ Fallowing zone to the current zone cZ in hierarchy
iZ thi Zone in the routing path
zn Zone of the node n
Zζ Zone level Transmission Load Threshold
nζ Node level Transmission Load Threshold
Tζ Predefined threshold that represents interval between two transmissions at one hop level
tζ Actual interval between last two transmissions
etζ Elapsed time since last transmission at one hop level
IRSTζ
Average Ingress receiving strength threshold observed for predefined interval Tζ
'∂ Average slopping threshold of the receiving strength
IRSce Expected Ingress receiving strength threshold at current interval
IRSr Ingress receiving strength ratio
crIRS Current ingress receiving strength ratio
nBT Buffering time at node n
izdil Zone level degree of ingress load, here i is a zone id.
kndil Node level degree of ingress load, here k is the node id of zone i
A. Network and Node activities under proposed protocol:
Split the entire network in to geographical zones.
For each zone i where 1.. | |i Z= ; (| |Z is total number of
zones )
Select zone-head for each zone i
Find transmission load threshold nζ for each zone i
By utilizing nζ of each zone measure the Transmission load threshold for entire network.
B. Splitting the network in to zones:
We opt to the approach described by Mohammad M. Qabajeh et al[8]. The area containing the Ad hoc network is partitioned into equal size zones, this partitioning must be known to all participating nodes. The zone shape are chosen to be hexagonal, this is because this shape can completely cover a two-dimensional region without overlap. Also, it enables communication with more neighbors than the other shapes because it is closely resemble the nearly circular coverage area of a transmitter.
The availability of small, inexpensive low power GPS receiver makes it possible to apply position-based in MANETs. We denote the transmission range of a node as R and the side length of the hexagon zone as L. The relation between R and L
is set as L= 2R
to guarantee that each pair of nodes in the
same zone are always within the effective transmission range. So, each two nodes inside the zone can communicate with each other directly.
Each zone has a Zone Identity ( zid ), Zone Header ( zh ) and
Zone Leader Backup ( 'zh ). The zh node is responsible for maintaining information about all the nodes in that zone including their positions and IDs. Also, it is responsible to maintain information about the zh of the neighboring zones as shown in the figure 1. The responsibility of CLB node is to keep a copy of the data stored at the zh in order not to be lost when the zh node is off or moving the zone. By knowing the coordinates of a node position, nodes can perform our self-mapping algorithm of their physical locations onto the current zone and calculate its zid easily. Figure 1.shows the general overview of the network architecture.
C. Selecting Zone-Heads
A zone-Head selection occurs under the influence of the fallowing metrics:
1. Node positions: A node with position p that closure to the center of the zone is optimal to act as zone head
2. Energy available to serve: A node with max energy level e is optimal to act as zone head
38 http://sites.google.com/site/ijcsis/ ISSN 1947-5500

(IJCSIS) International Journal of Computer Science and Information Security, Vol. 9, No. 12, December 2011
3. Computational ability: A node with highest computational ability c is optimal to act as zone head
4. Mobility of the node: Node with low mobility m is optimal to act as zone head.
Each node of the zone broadcasts its ( , , , )p e c m . The
node that identified itself as most optimal in ( , , , )p e c m
metrics, announces itself as zone head zh . The next optimal node in sequence claims itself as reserve zone
head 'zh .
Figure 1[8]: General overview of the Zone partitions in network.
D. Information sharing at intra zone level [between Node and zone head]:
Each node n that belongs to zone Z verifies the Ingress load and shares degree of ingress load ndil with zone head. Once
kndil received from each node k of the zone i , the zone head
zh measures the degree of ingress load at zone level izdil .
1
znindilk
kzdilzi zni
∑==
Information sharing at inter-zone level [between zone heads]:
A zone head receives zdil of its hierarchical counterpart zones, and transmits the same along with that zone’s zdil to its hierarchical counter parts. This communication occurs in broadcasting approach [12]. Then the source zone head measures network level degree of ingress load dil and update source node. So that source node can regularize its degree of Egress load such that the egress load is not creating congestion.
| |
1| |
Zzdili
idilZ
∑==
E. Zone level Congestion Evaluation Algorithm (ZCEA)
Zone level congestion evaluation algorithm in short can refer as ZCEA explored in this section. ZCEA is an optimal algorithm that helps to find the state of the packet dropping under congestion. This evaluation occurs under Mac layer and then alerts network layer.
Fig2: ZCEA for determining congestion caused packet dropping
At an event of ingress receiving by node i : Updating Ingress receiving strength:
( )
1 1' ': ( )2 2
:
(( ) ( ))
':
:
if dot TIRS IRScr T
t
t T tIRS IRS IRScrT TT T
endif
if dot TIRS IRScr T
t
IRS IRScrT
endif
ζ ζ
ζδ δζ
ζ ζ ζζ ζζ ζ
ζ ζ
ζδζ
ζ
<
−⎛ ⎞= +⎜ ⎟⎜ ⎟
⎝ ⎠
⎛ ⎞ ⎛ ⎞−= +⎜ ⎟ ⎜ ⎟
⎝ ⎠ ⎝ ⎠
¬<
−=
=
Detecting packet drop at Mac layer level '
( )
:
:
IRS IRSce etT
if IRS IRS doce r
macAlert link failure
else
MacAlert congestion
endif
δ ζζ= +
<
−
39 http://sites.google.com/site/ijcsis/ ISSN 1947-5500

(IJCSIS) International Journal of Computer Science and Information Security, Vol. 9, No. 12, December 2011
F. Zone Level Egress regularization Algorithm (ZERA)
This event occurs if Mac-layer alert indicates the congestion circumstance. Once the routing protocol [13] got an alert from the Mac layer about the congestion at a node i , it alerts the neighbor node that is source node s for contention node i .
Hence s evaluates it’s sdil by comparing with zdil of
cZ (zone of the node s). If sdil is greater than czzdil and
difference between sdil and zszdil is greater than equal to
egress threshold ε then node s regularize the egress load by
increasing its buffering time sBT such
thatz zs s sndil zdil ε≥ + .
Here ε can be measured with fallowing equation
1
jzn
j kk
jj
zdil dil
znε =
−=∑
If node s not able to regularize its egress such that contention
node i prevents from congestion then it alerts the zszh (zone-
head of the cZ , cs Z∈ ). In the sequence of that event
czzh alerts the all nodes in the zone. Hence the nodes those are
in upstream side of the source node s in routing path attempt to regularize their egress load using the methodology discussed above in this section. Then all nodes update their ndil and sends to zone-head
czzh , then zone-head
czzh measures zdil and verifies integrity of the zdil by
comparing with dil . cZzdil dil ε≥ + concludes that
congestion at contention node handled by egress regularization at current zone level. If
czzdil dil ε< + then CEA will be
initiated at pZ , which is immediate upstream zone to cZ in
hierarchy. In this process zone head of the cZ initially alerts
the zone head of the counterpart pZ then pzzh alerts all nodes
that belongs to pZ , which are part of the route path. The
whole process of egress regularization at zone level discussed above can be referred as ZERA(Zone level Egress Regularization Algorithm). Hence the nodes belong to
pZ attempt to regularize their egress load by using ZERA and
alerts zone-head about their updated degree of ingress load ndil . Then
pzzh measures pzzdil and verifies weather
pZzdil dil ε≥ + is true or false. True concludes that the
congestion at contention zone has been minimized or removed because of the egress load regularization at zone pZ , if false
then zone head of the pZ alerts all other zone heads using a
broadcasting[12] approach about the congestion at immediate zone in downstream of the hierarchy. Hence all zones in the upstream side of the pZ applies ZERA and the zones in
downstream side of the pZ updates their zdil . Then all zones
sends their zdil to source zone in broadcast manner. Hence the source zone revaluate the dil . Then based on the dil source node regularize its egress load.
Fig 3: Zone Level Egress Regularization Algorithm
Notations used in Algorithm: i: Node that effected by congestion s: source node of the i.
cZ : current zone where , ci s Z∈
pZ : Immediate zone to cZ in upstream side of the hierarchy.
1 2{ , ,..., }cu u uk Zn n n : All upstream nodes to s .
1 2{ , ,..., }cd d dk Zn n n : All downstream nodes to s .
1 2{ , , ,..., }S u u ukZ Z Z Z : Set of upstream zones to pZ in
routing path, here SZ is a zone that contains source node of the routing path
1 2{ , ,..., ,..., }d d dm TZ Z Z Z : Set of downstream zones to
pZ in routing path, here TZ is a zone that contains target node of the routing path ε : Zone level egress threshold ε : Network level Egress threshold Algorithm: Mac layer alerts about the congestion at node of zone cZ to routing protocol, hence the fallowing steps performed in sequence
1
znZczdil dilZ kc
kZc znZcε
−∑==
Perform fallowing at node s If
cs Zndil zdil> and c cs Z Zndil zdil ε− ≥ begin
s sBT BT bt= + Note: Value of buffer threshold bt should be decided
40 http://sites.google.com/site/ijcsis/ ISSN 1947-5500

(IJCSIS) International Journal of Computer Science and Information Security, Vol. 9, No. 12, December 2011
such that dil zdils Z Zc cε≥ +
Return. Endif s sends alert to
cZzh about contention node i .
cZzh alerts all nodes that belongs to zone cZ
1 2{ , ,..., }cu u uk Zn n n updates their ndil by applying ZERA
recursively and alerts cZzh
1 2{ , ,..., }cd d dk Zn n n measures their ndil and alerts
cZzh
cZzh Measures zdil as fallows
1
znZcndilk
kzdilz znc Zc
∑==
If
cZzdil dil> and ( )cZzdil dil ε− ≥ begin
Alert: congestion at contention node handled at current zone cZ level.
Return. Endif
cZzh Alerts pZzh
Zpzh Alerts all nodes that belongs to zone pZ
Foreach node pn Z∈ begin
Ifpn Zndil zdil> and
p pn Z Zndil zdil ε− ≥ begin
n nBT BT bt= +
Note: Value of buffer threshold bt should be decided such that dil zdiln Z Zc cε≥ +
Endif Find ndil and send ndil to
pZzh
End-of-foreach
pZzh measures pZzdil
ifpZzdil dil> and ( )
pZzdil dil ε− ≥ begin
Alert: Egress regularization at pZ leads to overcome congestion situation at contention zone.
Return; Endif
pZzh Alerts all zone heads in network about congestion
contention zone. Foreach zone z in 1 2{ , , ,..., }S u u ukZ Z Z Z begin
zzh Alerts all nodes that belongs to zone z Foreach node n z∈ begin
If n zndil zdil> and
n z zndil zdil ε− ≥ begin
n nBT BT bt= +
Note: Value of buffer threshold bt should be decided such that
dil zdiln z zε≥ +
Endif Find ndil and send ndil to zzh
End-of-foreach
zzh measures zzdil and broadcasts towards source zone.
End-of-foreach Foreach zone z in 1 2{ , ,..., ,..., }d d dm TZ Z Z Z begin
Foreach node n belongs to zone z begin Measure nndil and sends to zzh
End-of-foreach
zzh measures zzdil as
1
znzndilk
kzdilz znz
∑==
zzh Sends zzdil to source zone via broadcasting [12] End-of-foreach
SZ Measures dil as | |
1| |
Zzdili
idilZ
∑==
Hence source node S of zone ZS, which is source node of the routing path regularize it’s egress load to routing path.
4. Simulations and results discussion
In this section we explore the simulations conducted using Madhoc simulator [16]. We conducted performance evaluation using madhoc with considerations described in table 2.
No of Hops: 225 Approximate Hop distance
300 meters
Approximate total network
1000X1000 meters
Approximate Zone Rdious
100X100 meters
Physical channel bandwidth
2mbps
Mac Layer: 802.11 DCF with option of handshaking prier to data transferring
Physical layer representation
802:11B
41 http://sites.google.com/site/ijcsis/ ISSN 1947-5500
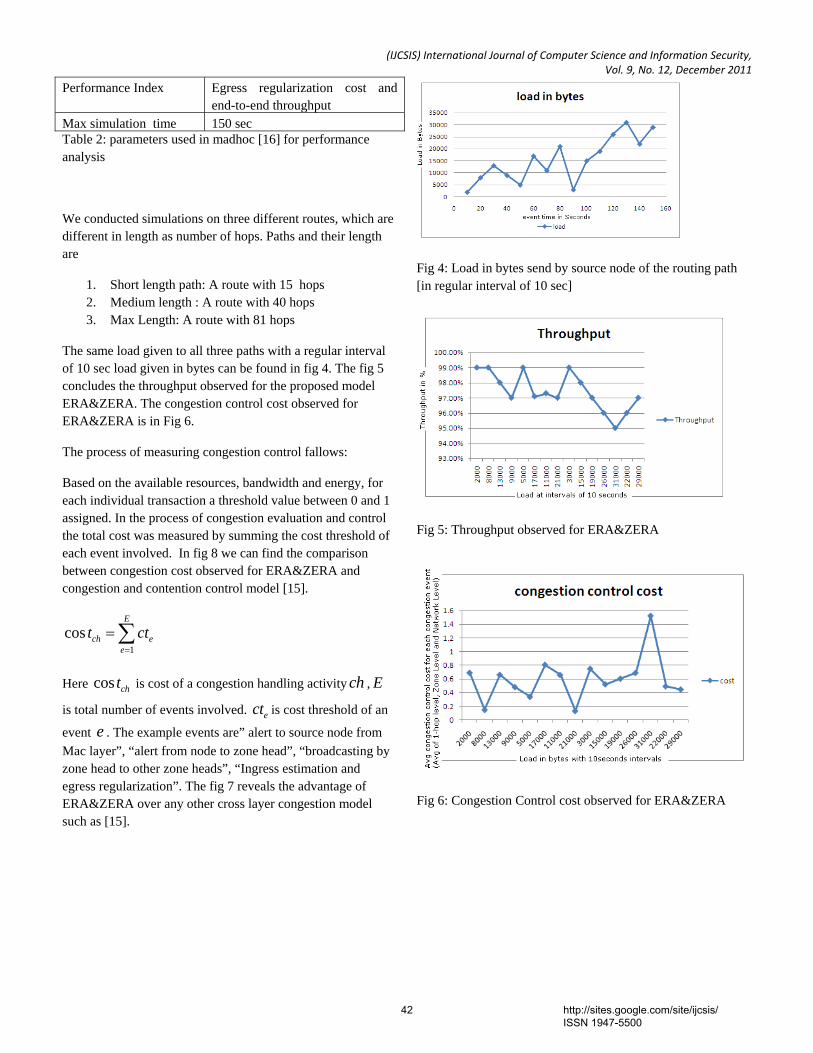
(IJCSIS) International Journal of Computer Science and Information Security, Vol. 9, No. 12, December 2011
Performance Index Egress regularization cost and end-to-end throughput
Max simulation time 150 sec Table 2: parameters used in madhoc [16] for performance analysis
We conducted simulations on three different routes, which are different in length as number of hops. Paths and their length are
1. Short length path: A route with 15 hops 2. Medium length : A route with 40 hops 3. Max Length: A route with 81 hops
The same load given to all three paths with a regular interval of 10 sec load given in bytes can be found in fig 4. The fig 5 concludes the throughput observed for the proposed model ERA&ZERA. The congestion control cost observed for ERA&ZERA is in Fig 6.
The process of measuring congestion control fallows:
Based on the available resources, bandwidth and energy, for each individual transaction a threshold value between 0 and 1 assigned. In the process of congestion evaluation and control the total cost was measured by summing the cost threshold of each event involved. In fig 8 we can find the comparison between congestion cost observed for ERA&ZERA and congestion and contention control model [15].
1cos
E
ch ee
t ct=
= ∑
Here cos cht is cost of a congestion handling activity ch , E
is total number of events involved. ect is cost threshold of an
event e . The example events are” alert to source node from Mac layer”, “alert from node to zone head”, “broadcasting by zone head to other zone heads”, “Ingress estimation and egress regularization”. The fig 7 reveals the advantage of ERA&ZERA over any other cross layer congestion model such as [15].
Fig 4: Load in bytes send by source node of the routing path [in regular interval of 10 sec]
Fig 5: Throughput observed for ERA&ZERA
Fig 6: Congestion Control cost observed for ERA&ZERA
42 http://sites.google.com/site/ijcsis/ ISSN 1947-5500
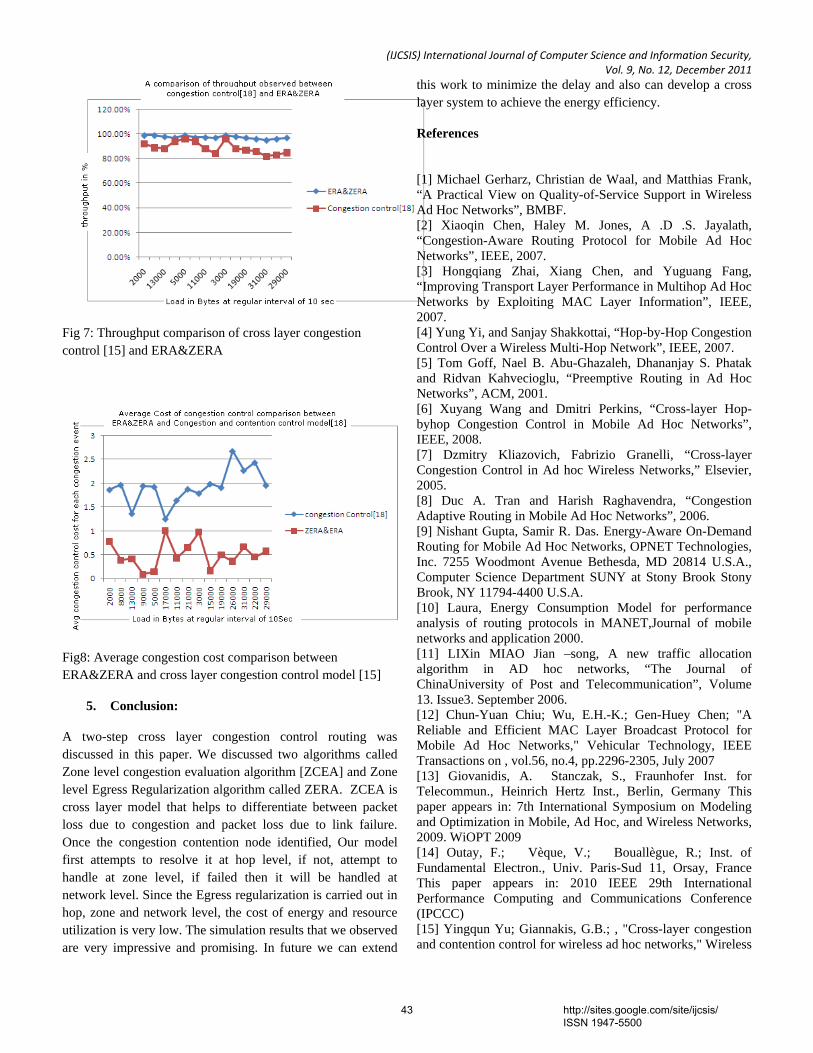
(IJCSIS) International Journal of Computer Science and Information Security, Vol. 9, No. 12, December 2011
Fig 7: Throughput comparison of cross layer congestion control [15] and ERA&ZERA
Fig8: Average congestion cost comparison between ERA&ZERA and cross layer congestion control model [15]
5. Conclusion:
A two-step cross layer congestion control routing was discussed in this paper. We discussed two algorithms called Zone level congestion evaluation algorithm [ZCEA] and Zone level Egress Regularization algorithm called ZERA. ZCEA is cross layer model that helps to differentiate between packet loss due to congestion and packet loss due to link failure. Once the congestion contention node identified, Our model first attempts to resolve it at hop level, if not, attempt to handle at zone level, if failed then it will be handled at network level. Since the Egress regularization is carried out in hop, zone and network level, the cost of energy and resource utilization is very low. The simulation results that we observed are very impressive and promising. In future we can extend
this work to minimize the delay and also can develop a cross layer system to achieve the energy efficiency.
References
[1] Michael Gerharz, Christian de Waal, and Matthias Frank, “A Practical View on Quality-of-Service Support in Wireless Ad Hoc Networks”, BMBF. [2] Xiaoqin Chen, Haley M. Jones, A .D .S. Jayalath, “Congestion-Aware Routing Protocol for Mobile Ad Hoc Networks”, IEEE, 2007. [3] Hongqiang Zhai, Xiang Chen, and Yuguang Fang, “Improving Transport Layer Performance in Multihop Ad Hoc Networks by Exploiting MAC Layer Information”, IEEE, 2007. [4] Yung Yi, and Sanjay Shakkottai, “Hop-by-Hop Congestion Control Over a Wireless Multi-Hop Network”, IEEE, 2007. [5] Tom Goff, Nael B. Abu-Ghazaleh, Dhananjay S. Phatak and Ridvan Kahvecioglu, “Preemptive Routing in Ad Hoc Networks”, ACM, 2001. [6] Xuyang Wang and Dmitri Perkins, “Cross-layer Hop-byhop Congestion Control in Mobile Ad Hoc Networks”, IEEE, 2008. [7] Dzmitry Kliazovich, Fabrizio Granelli, “Cross-layer Congestion Control in Ad hoc Wireless Networks,” Elsevier, 2005. [8] Duc A. Tran and Harish Raghavendra, “Congestion Adaptive Routing in Mobile Ad Hoc Networks”, 2006. [9] Nishant Gupta, Samir R. Das. Energy-Aware On-Demand Routing for Mobile Ad Hoc Networks, OPNET Technologies, Inc. 7255 Woodmont Avenue Bethesda, MD 20814 U.S.A., Computer Science Department SUNY at Stony Brook Stony Brook, NY 11794-4400 U.S.A. [10] Laura, Energy Consumption Model for performance analysis of routing protocols in MANET,Journal of mobile networks and application 2000. [11] LIXin MIAO Jian –song, A new traffic allocation algorithm in AD hoc networks, “The Journal of ChinaUniversity of Post and Telecommunication”, Volume 13. Issue3. September 2006. [12] Chun-Yuan Chiu; Wu, E.H.-K.; Gen-Huey Chen; "A Reliable and Efficient MAC Layer Broadcast Protocol for Mobile Ad Hoc Networks," Vehicular Technology, IEEE Transactions on , vol.56, no.4, pp.2296-2305, July 2007 [13] Giovanidis, A. Stanczak, S., Fraunhofer Inst. for Telecommun., Heinrich Hertz Inst., Berlin, Germany This paper appears in: 7th International Symposium on Modeling and Optimization in Mobile, Ad Hoc, and Wireless Networks, 2009. WiOPT 2009 [14] Outay, F.; Vèque, V.; Bouallègue, R.; Inst. of Fundamental Electron., Univ. Paris-Sud 11, Orsay, France This paper appears in: 2010 IEEE 29th International Performance Computing and Communications Conference (IPCCC) [15] Yingqun Yu; Giannakis, G.B.; , "Cross-layer congestion and contention control for wireless ad hoc networks," Wireless
43 http://sites.google.com/site/ijcsis/ ISSN 1947-5500

(IJCSIS) International Journal of Computer Science and Information Security, Vol. 9, No. 12, December 2011
Communications, IEEE Transactions on , vol.7, no.1, pp.37-42, Jan. 2008 [16] http://www-lih.univ-lehavre.fr/~hogie/madhoc/ [17] Prof.K.Srinivas and Prof.A.A.Chari. Article: Cross Layer Congestion Control in MANETs and Current State of Art. International Journal of Computer Applications 29(6):28-35, September 2011. Published by Foundation of Computer Science, New York, USA
44 http://sites.google.com/site/ijcsis/ ISSN 1947-5500
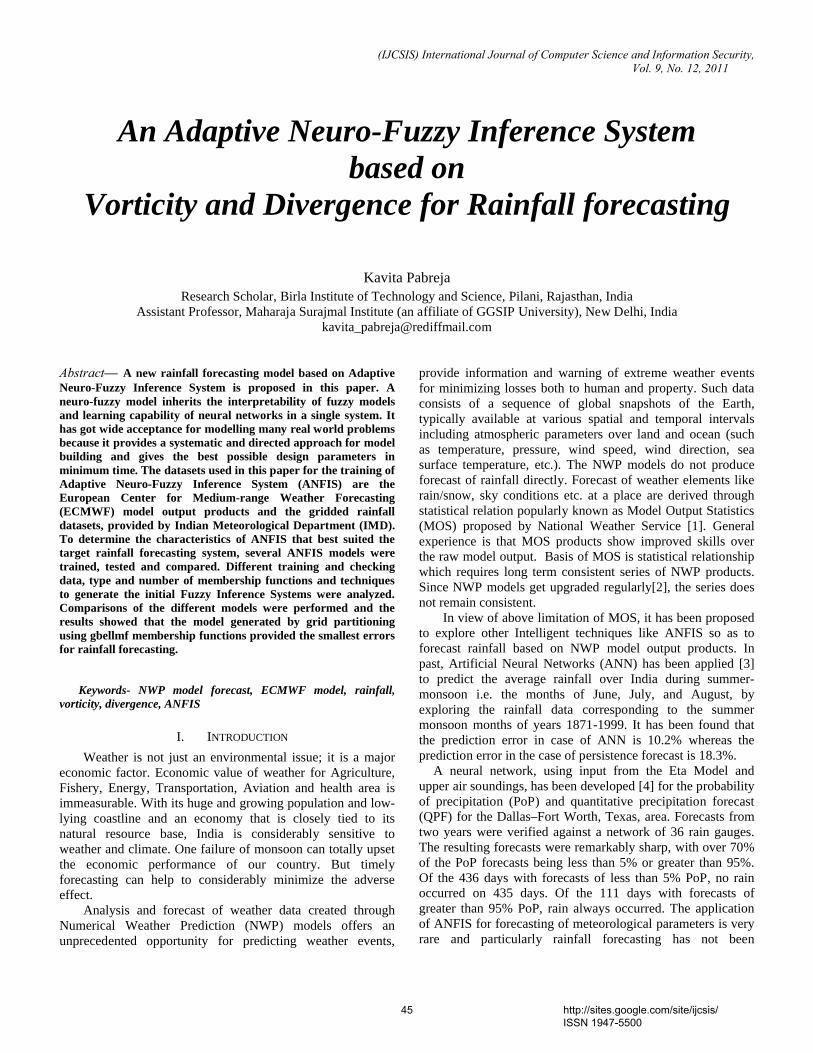
(IJCSIS) International Journal of Computer Science and Information Security, Vol. 9, No. 12, 2011
An Adaptive Neuro-Fuzzy Inference System based on
Vorticity and Divergence for Rainfall forecasting
Kavita Pabreja Research Scholar, Birla Institute of Technology and Science, Pilani, Rajasthan, India
Assistant Professor, Maharaja Surajmal Institute (an affiliate of GGSIP University), New Delhi, India [email protected]
Abstract— A new rainfall forecasting model based on Adaptive Neuro-Fuzzy Inference System is proposed in this paper. A neuro-fuzzy model inherits the interpretability of fuzzy models and learning capability of neural networks in a single system. It has got wide acceptance for modelling many real world problems because it provides a systematic and directed approach for model building and gives the best possible design parameters in minimum time. The datasets used in this paper for the training of Adaptive Neuro-Fuzzy Inference System (ANFIS) are the European Center for Medium-range Weather Forecasting (ECMWF) model output products and the gridded rainfall datasets, provided by Indian Meteorological Department (IMD). To determine the characteristics of ANFIS that best suited the target rainfall forecasting system, several ANFIS models were trained, tested and compared. Different training and checking data, type and number of membership functions and techniques to generate the initial Fuzzy Inference Systems were analyzed. Comparisons of the different models were performed and the results showed that the model generated by grid partitioning using gbellmf membership functions provided the smallest errors for rainfall forecasting.
Keywords- NWP model forecast, ECMWF model, rainfall, vorticity, divergence, ANFIS
I. INTRODUCTION
Weather is not just an environmental issue; it is a major economic factor. Economic value of weather for Agriculture, Fishery, Energy, Transportation, Aviation and health area is immeasurable. With its huge and growing population and low-lying coastline and an economy that is closely tied to its natural resource base, India is considerably sensitive to weather and climate. One failure of monsoon can totally upset the economic performance of our country. But timely forecasting can help to considerably minimize the adverse effect.
Analysis and forecast of weather data created through Numerical Weather Prediction (NWP) models offers an unprecedented opportunity for predicting weather events,
provide information and warning of extreme weather events for minimizing losses both to human and property. Such data consists of a sequence of global snapshots of the Earth, typically available at various spatial and temporal intervals including atmospheric parameters over land and ocean (such as temperature, pressure, wind speed, wind direction, sea surface temperature, etc.). The NWP models do not produce forecast of rainfall directly. Forecast of weather elements like rain/snow, sky conditions etc. at a place are derived through statistical relation popularly known as Model Output Statistics (MOS) proposed by National Weather Service [1]. General experience is that MOS products show improved skills over the raw model output. Basis of MOS is statistical relationship which requires long term consistent series of NWP products. Since NWP models get upgraded regularly[2], the series does not remain consistent.
In view of above limitation of MOS, it has been proposed to explore other Intelligent techniques like ANFIS so as to forecast rainfall based on NWP model output products. In past, Artificial Neural Networks (ANN) has been applied [3] to predict the average rainfall over India during summer-monsoon i.e. the months of June, July, and August, by exploring the rainfall data corresponding to the summer monsoon months of years 1871-1999. It has been found that the prediction error in case of ANN is 10.2% whereas the prediction error in the case of persistence forecast is 18.3%.
A neural network, using input from the Eta Model and upper air soundings, has been developed [4] for the probability of precipitation (PoP) and quantitative precipitation forecast (QPF) for the Dallas–Fort Worth, Texas, area. Forecasts from two years were verified against a network of 36 rain gauges. The resulting forecasts were remarkably sharp, with over 70% of the PoP forecasts being less than 5% or greater than 95%. Of the 436 days with forecasts of less than 5% PoP, no rain occurred on 435 days. Of the 111 days with forecasts of greater than 95% PoP, rain always occurred. The application of ANFIS for forecasting of meteorological parameters is very rare and particularly rainfall forecasting has not been
45 http://sites.google.com/site/ijcsis/ ISSN 1947-5500
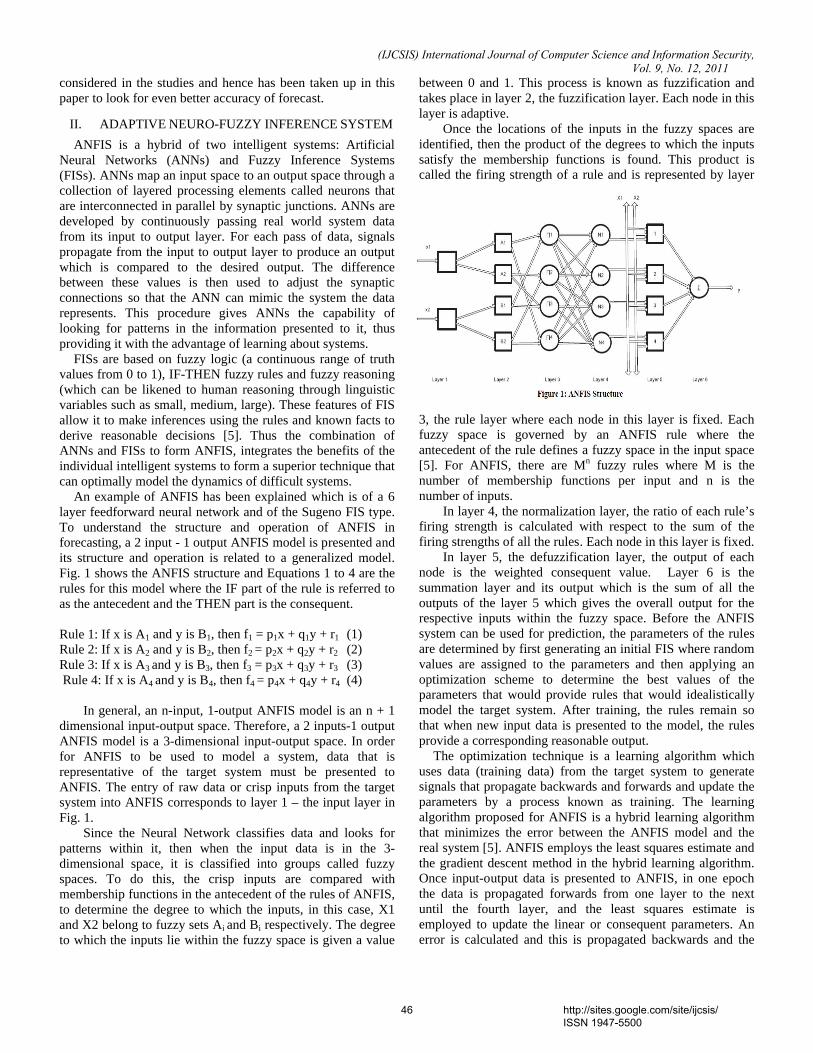
(IJCSIS) International Journal of Computer Science and Information Security, Vol. 9, No. 12, 2011
considered in the studies and hence has been taken up in this paper to look for even better accuracy of forecast.
II. ADAPTIVE NEURO-FUZZY INFERENCE SYSTEMANFIS is a hybrid of two intelligent systems: Artificial
Neural Networks (ANNs) and Fuzzy Inference Systems (FISs). ANNs map an input space to an output space through a collection of layered processing elements called neurons that are interconnected in parallel by synaptic junctions. ANNs are developed by continuously passing real world system data from its input to output layer. For each pass of data, signals propagate from the input to output layer to produce an output which is compared to the desired output. The difference between these values is then used to adjust the synaptic connections so that the ANN can mimic the system the data represents. This procedure gives ANNs the capability of looking for patterns in the information presented to it, thus providing it with the advantage of learning about systems.
FISs are based on fuzzy logic (a continuous range of truth values from 0 to 1), IF-THEN fuzzy rules and fuzzy reasoning (which can be likened to human reasoning through linguistic variables such as small, medium, large). These features of FIS allow it to make inferences using the rules and known facts to derive reasonable decisions [5]. Thus the combination of ANNs and FISs to form ANFIS, integrates the benefits of the individual intelligent systems to form a superior technique that can optimally model the dynamics of difficult systems.
An example of ANFIS has been explained which is of a 6 layer feedforward neural network and of the Sugeno FIS type. To understand the structure and operation of ANFIS in forecasting, a 2 input - 1 output ANFIS model is presented and its structure and operation is related to a generalized model. Fig. 1 shows the ANFIS structure and Equations 1 to 4 are the rules for this model where the IF part of the rule is referred to as the antecedent and the THEN part is the consequent.
Rule 1: If x is A1 and y is B1, then f1 = p1x + q1y + r1 (1)Rule 2: If x is A2 and y is B2, then f2 = p2x + q2y + r2 (2)Rule 3: If x is A3 and y is B3, then f3 = p3x + q3y + r3 (3)Rule 4: If x is A4 and y is B4, then f4 = p4x + q4y + r4 (4)
In general, an n-input, 1-output ANFIS model is an n + 1 dimensional input-output space. Therefore, a 2 inputs-1 output ANFIS model is a 3-dimensional input-output space. In order for ANFIS to be used to model a system, data that is representative of the target system must be presented to ANFIS. The entry of raw data or crisp inputs from the target system into ANFIS corresponds to layer 1 – the input layer in Fig. 1.
Since the Neural Network classifies data and looks for patterns within it, then when the input data is in the 3-dimensional space, it is classified into groups called fuzzy spaces. To do this, the crisp inputs are compared with membership functions in the antecedent of the rules of ANFIS, to determine the degree to which the inputs, in this case, X1 and X2 belong to fuzzy sets Ai and Bi respectively. The degree to which the inputs lie within the fuzzy space is given a value
between 0 and 1. This process is known as fuzzification and takes place in layer 2, the fuzzification layer. Each node in this layer is adaptive.
Once the locations of the inputs in the fuzzy spaces are identified, then the product of the degrees to which the inputs satisfy the membership functions is found. This product is called the firing strength of a rule and is represented by layer
3, the rule layer where each node in this layer is fixed. Each fuzzy space is governed by an ANFIS rule where the antecedent of the rule defines a fuzzy space in the input space [5]. For ANFIS, there are Mn fuzzy rules where M is the number of membership functions per input and n is the number of inputs.
In layer 4, the normalization layer, the ratio of each rule’s firing strength is calculated with respect to the sum of the firing strengths of all the rules. Each node in this layer is fixed.
In layer 5, the defuzzification layer, the output of each node is the weighted consequent value. Layer 6 is the summation layer and its output which is the sum of all the outputs of the layer 5 which gives the overall output for the respective inputs within the fuzzy space. Before the ANFIS system can be used for prediction, the parameters of the rules are determined by first generating an initial FIS where random values are assigned to the parameters and then applying an optimization scheme to determine the best values of the parameters that would provide rules that would idealistically model the target system. After training, the rules remain so that when new input data is presented to the model, the rules provide a corresponding reasonable output.
The optimization technique is a learning algorithm which uses data (training data) from the target system to generate signals that propagate backwards and forwards and update the parameters by a process known as training. The learning algorithm proposed for ANFIS is a hybrid learning algorithm that minimizes the error between the ANFIS model and the real system [5]. ANFIS employs the least squares estimate and the gradient descent method in the hybrid learning algorithm. Once input-output data is presented to ANFIS, in one epoch the data is propagated forwards from one layer to the next until the fourth layer, and the least squares estimate is employed to update the linear or consequent parameters. An error is calculated and this is propagated backwards and the
46 http://sites.google.com/site/ijcsis/ ISSN 1947-5500
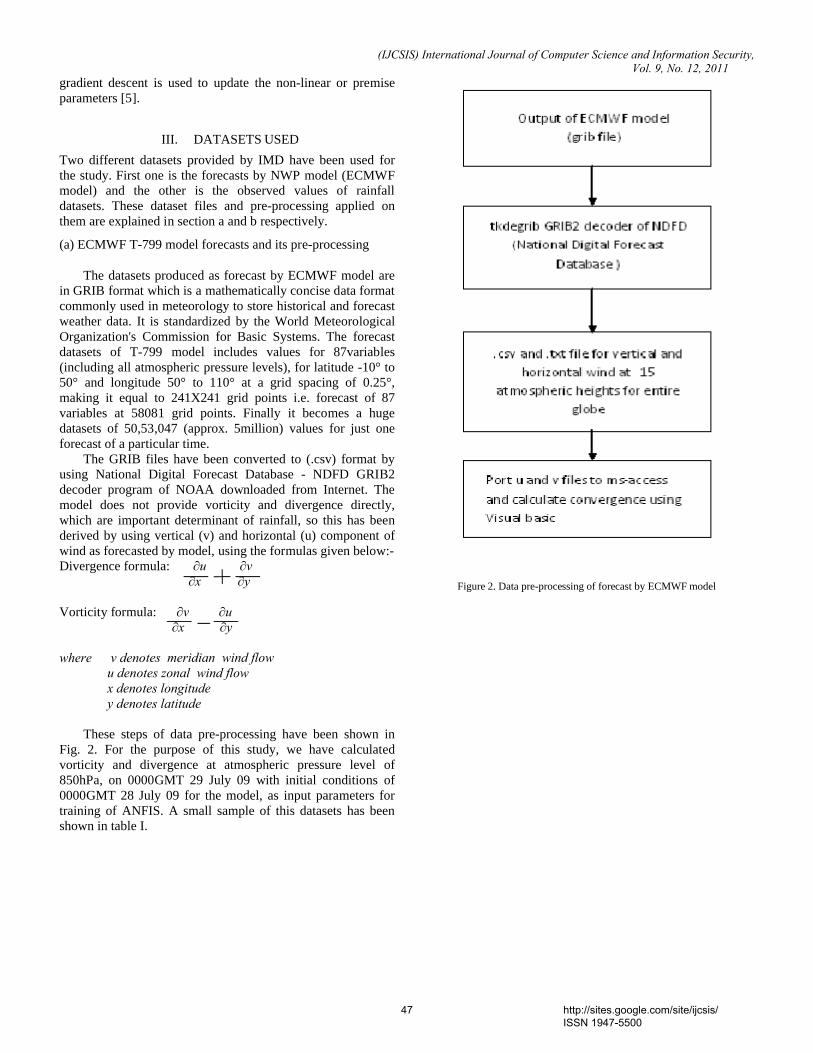
(IJCSIS) International Journal of Computer Science and Information Security, Vol. 9, No. 12, 2011
gradient descent is used to update the non-linear or premise parameters [5].
III. DATASETS USEDTwo different datasets provided by IMD have been used for the study. First one is the forecasts by NWP model (ECMWF model) and the other is the observed values of rainfall datasets. These dataset files and pre-processing applied on them are explained in section a and b respectively.
(a) ECMWF T-799 model forecasts and its pre-processing
The datasets produced as forecast by ECMWF model are in GRIB format which is a mathematically concise data format commonly used in meteorology to store historical and forecastweather data. It is standardized by the World Meteorological Organization's Commission for Basic Systems. The forecast datasets of T-799 model includes values for 87variables (including all atmospheric pressure levels), for latitude -10° to 50° and longitude 50° to 110° at a grid spacing of 0.25°, making it equal to 241X241 grid points i.e. forecast of 87 variables at 58081 grid points. Finally it becomes a huge datasets of 50,53,047 (approx. 5million) values for just one forecast of a particular time.
The GRIB files have been converted to (.csv) format by using National Digital Forecast Database - NDFD GRIB2 decoder program of NOAA downloaded from Internet. The model does not provide vorticity and divergence directly, which are important determinant of rainfall, so this has been derived by using vertical (v) and horizontal (u) component of wind as forecasted by model, using the formulas given below:-Divergence formula: ∂u ∂v
∂x ∂y
Vorticity formula: ∂v ∂u ∂x ∂y
where v denotes meridian wind flowu denotes zonal wind flow x denotes longitudey denotes latitude
These steps of data pre-processing have been shown in Fig. 2. For the purpose of this study, we have calculated vorticity and divergence at atmospheric pressure level of 850hPa, on 0000GMT 29 July 09 with initial conditions of 0000GMT 28 July 09 for the model, as input parameters for training of ANFIS. A small sample of this datasets has been shown in table I.
Figure 2. Data pre-processing of forecast by ECMWF model
47 http://sites.google.com/site/ijcsis/ ISSN 1947-5500
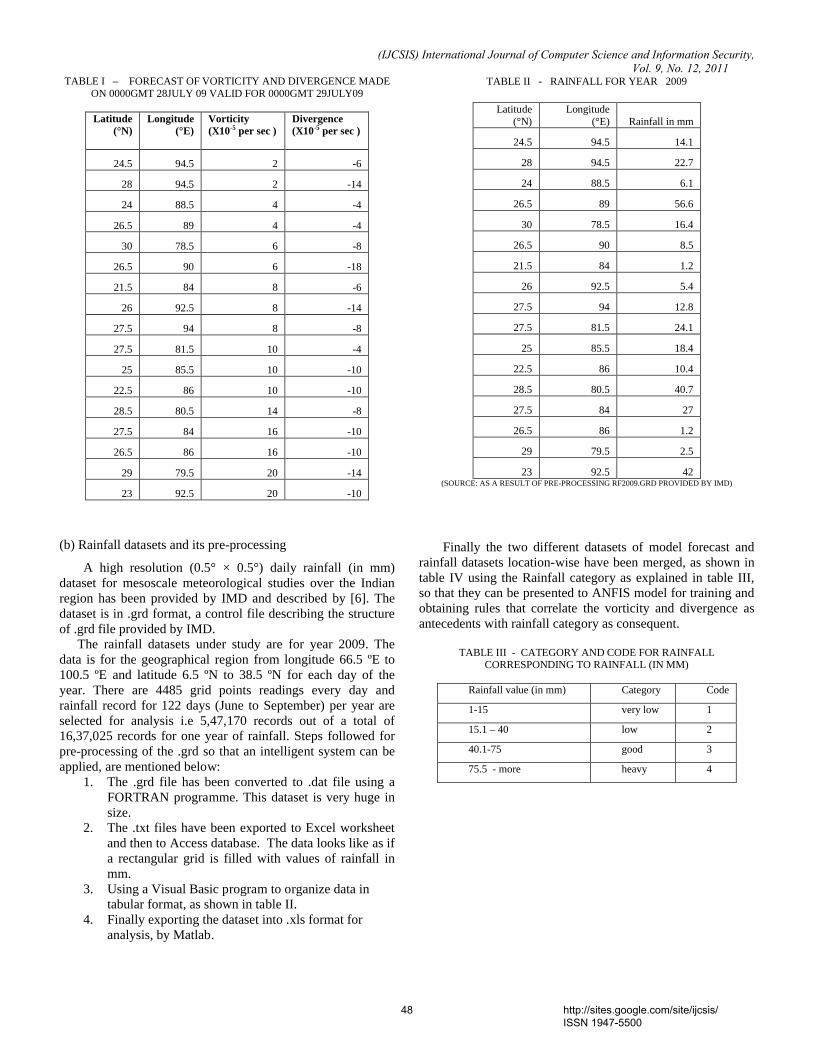
(IJCSIS) International Journal of Computer Science and Information Security, Vol. 9, No. 12, 2011
TABLE I – FORECAST OF VORTICITY AND DIVERGENCE MADE ON 0000GMT 28JULY 09 VALID FOR 0000GMT 29JULY09
Latitude (°N)
Longitude (°E)
Vorticity(X10-5 per sec )
Divergence (X10-5 per sec )
24.5 94.5 2 -6
28 94.5 2 -14
24 88.5 4 -4
26.5 89 4 -4
30 78.5 6 -8
26.5 90 6 -18
21.5 84 8 -6
26 92.5 8 -14
27.5 94 8 -8
27.5 81.5 10 -4
25 85.5 10 -10
22.5 86 10 -10
28.5 80.5 14 -8
27.5 84 16 -10
26.5 86 16 -10
29 79.5 20 -14
23 92.5 20 -10
(b) Rainfall datasets and its pre-processing
A high resolution (0.5° × 0.5°) daily rainfall (in mm) dataset for mesoscale meteorological studies over the Indian region has been provided by IMD and described by [6]. The dataset is in .grd format, a control file describing the structure of .grd file provided by IMD.
The rainfall datasets under study are for year 2009. The data is for the geographical region from longitude 66.5 ºE to 100.5 ºE and latitude 6.5 ºN to 38.5 ºN for each day of the year. There are 4485 grid points readings every day and rainfall record for 122 days (June to September) per year are selected for analysis i.e 5,47,170 records out of a total of 16,37,025 records for one year of rainfall. Steps followed for pre-processing of the .grd so that an intelligent system can be applied, are mentioned below:
1. The .grd file has been converted to .dat file using a FORTRAN programme. This dataset is very huge in size.
2. The .txt files have been exported to Excel worksheet and then to Access database. The data looks like as if a rectangular grid is filled with values of rainfall in mm.
3. Using a Visual Basic program to organize data in tabular format, as shown in table II.
4. Finally exporting the dataset into .xls format for analysis, by Matlab.
TABLE II - RAINFALL FOR YEAR 2009
Latitude (°N)
Longitude(°E) Rainfall in mm
24.5 94.5 14.1
28 94.5 22.7
24 88.5 6.1
26.5 89 56.6
30 78.5 16.4
26.5 90 8.5
21.5 84 1.2
26 92.5 5.4
27.5 94 12.8
27.5 81.5 24.1
25 85.5 18.4
22.5 86 10.4
28.5 80.5 40.7
27.5 84 27
26.5 86 1.2
29 79.5 2.5
23 92.5 42(SOURCE: AS A RESULT OF PRE-PROCESSING RF2009.GRD PROVIDED BY IMD)
Finally the two different datasets of model forecast and rainfall datasets location-wise have been merged, as shown in table IV using the Rainfall category as explained in table III, so that they can be presented to ANFIS model for training and obtaining rules that correlate the vorticity and divergence as antecedents with rainfall category as consequent.
TABLE III - CATEGORY AND CODE FOR RAINFALL CORRESPONDING TO RAINFALL (IN MM)
Rainfall value (in mm) Category Code
1-15 very low 1
15.1 – 40 low 2
40.1-75 good 3
75.5 - more heavy 4
48 http://sites.google.com/site/ijcsis/ ISSN 1947-5500

(IJCSIS) International Journal of Computer Science and Information Security, Vol. 9, No. 12, 2011
TABLE IV - FORECASTED VALUE OF VORTICITY AND DIVERGENCE BY ECMWF MODEL AND OBSERVED VALUE OF
RAINFALL CATEGORY
Vorticity (X10-5 per second )
Divergence(X10-5 per second ) Rainfall code
2 -6 1
4 -10 1
6 -18 1
8 -14 1
18 -10 1
20 -14 1
20 -4 1
2 -18 2
8 -8 2
10 -10 2
10 -4 2
16 -10 2
18 -8 2
26 -18 2
44 -8 2
4 -4 3
14 -8 3
16 -4 3
20 -10 3
-8 4 4
IV. GENERATION OF ANFIS
ANFIS in this study was trained and simulated using Matlab 7.0 (matrix laboratory) designed and developed by Math Works Inc. The fuzzy inference commonly used in ANFIS is first order Sugeno fuzzy model because of its simplicity, high interpretability, and computational efficiency, built- in optimal and adaptive techniques. A typical architecture of an ANFIS has already been shown in Fig. 1. Among many FIS models, the Sugeno fuzzy model is the most widely applied one for its high interpretability and computational efficiency, and built-in optimal and adaptive techniques.
Generation of ANFIS involves selecting a structure for the ANFIS model by determining the number of membership functions per input, type/shape of the membership functions for the premise part of the rule and the output membership functions for the consequent part of the rule. MATLAB 7.0 offers two methods for generating the initial FIS: Grid Partitioning and Subtractive Clustering. Subtractive partitioning is used if number of inputs is more than 6 so as to
avoid curse of dimensionality problem [7]. Therefore we have opted for Grid partitioning as we have just 2 input parameters viz. vorticity and divergence.
Once the grid partitioning technique is applied at the beginning of training, a uniformly partitioned grid which is defined by membership functions (MFs) with a random set of parameters is taken as the initial state of ANFIS. During training, this grid evolves as the parameters in the MFs change. With the grid partitioning technique, the number of MFs in the premise part of the rules must be determined. Negnevitsky et al. [8] stated that a larger number of MFs better represents a complex system and therefore should produce better results. However, a large number of inputs or MFs in the premise part of the rules can produce a large number of fuzzy rules which can cause the learning complexity of ANFIS to suffer an exponential explosion, called the curse of dimensionality which can adversely affect the performance of ANFIS [7, 9, 10].
We have generated 5 different ANFIS models by grid-partitioning. The idea was to explore the ANFIS generation first with different shapes of membership functions, keeping the dataset for training, checking fixed at original values (i.e. no normalization done) and number of membership functions fixed. Next it was decided to explore the ANFIS generation with increase in membership functions. Finally, it was decided to normalize datasets [-1 1] for training and checking and observing the FIS outputs after training. All these parameters for different models are explained in table V.
The number of MFs was increased with one of the ANFIS models (number 1 in table V) to get a greater understanding of the impact on the performance of ANFIS with this change. In generating the Rainfall forecasting FIS, by grid partitioning, the bell-shaped MF was favored over the other types since it offered more parameters which provided a greater number of degrees of freedom. The generalized bell-shaped MF is standard for ANFIS because of its smoothness and concise notation [7, 8, 9]. Other function such as Gaussian was used as well to evaluate the performance with different types of MFs. For the consequent part of the rules the MFs responsible for defuzzification were the Sugeno type of first order. The output MF is chosen to be linear for the rainfall forecasting models since, the higher the order of output MFs, the greater is the likelihood of ANFIS fitting the target system [11].
TABLE V - DIFFERENT ANFIS MODELS USED IN THE STUDY
ANFIS
Model
Type of membership function
for input parameters
Number of
membership
functions for
Vorticity
Number of
membership
functions for
Divergence
I gbellmf (original data) 5 3
II gaussmf (original data) 5 3
III gbellmf (original data) 7 5
IV gaussmf (normalized data) 5 3
V gbellmf (normalized data) 5 3
49 http://sites.google.com/site/ijcsis/ ISSN 1947-5500
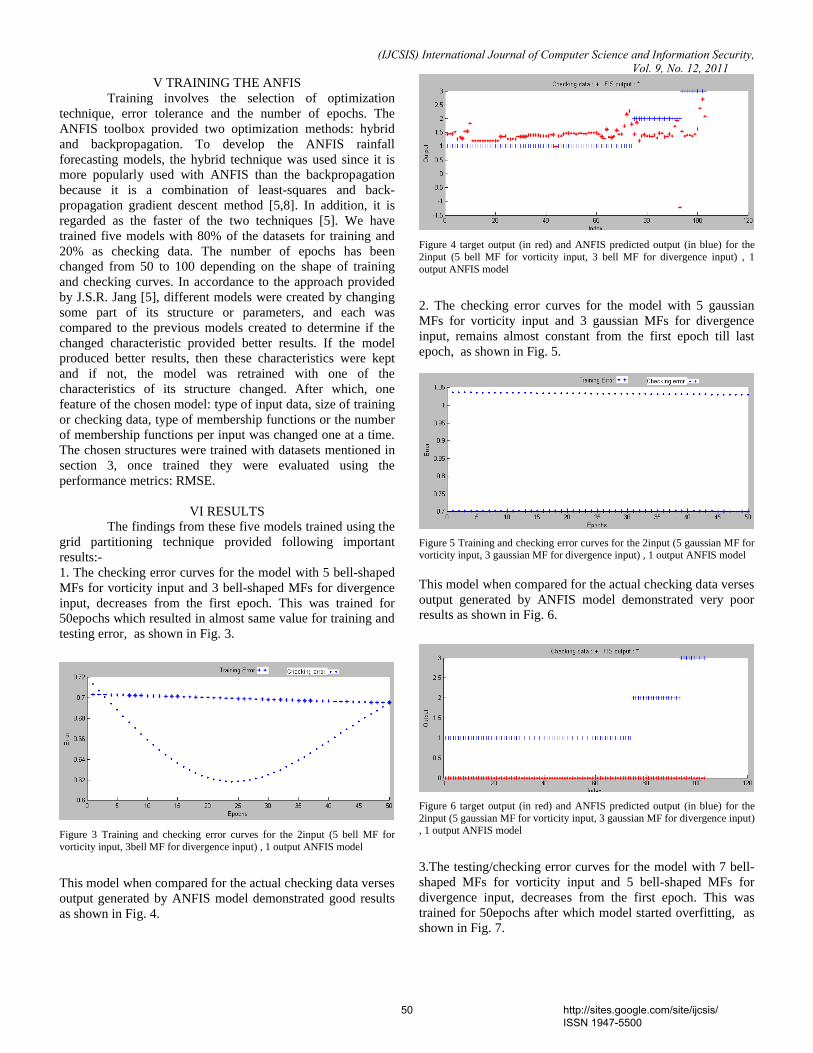
(IJCSIS) International Journal of Computer Science and Information Security, Vol. 9, No. 12, 2011
V TRAINING THE ANFISTraining involves the selection of optimization
technique, error tolerance and the number of epochs. The ANFIS toolbox provided two optimization methods: hybrid and backpropagation. To develop the ANFIS rainfall forecasting models, the hybrid technique was used since it is more popularly used with ANFIS than the backpropagation because it is a combination of least-squares and back-propagation gradient descent method [5,8]. In addition, it is regarded as the faster of the two techniques [5]. We have trained five models with 80% of the datasets for training and 20% as checking data. The number of epochs has been changed from 50 to 100 depending on the shape of training and checking curves. In accordance to the approach provided by J.S.R. Jang [5], different models were created by changing some part of its structure or parameters, and each was compared to the previous models created to determine if the changed characteristic provided better results. If the model produced better results, then these characteristics were kept and if not, the model was retrained with one of the characteristics of its structure changed. After which, one feature of the chosen model: type of input data, size of training or checking data, type of membership functions or the number of membership functions per input was changed one at a time. The chosen structures were trained with datasets mentioned in section 3, once trained they were evaluated using the performance metrics: RMSE.
VI RESULTSThe findings from these five models trained using the
grid partitioning technique provided following important results:-1. The checking error curves for the model with 5 bell-shaped MFs for vorticity input and 3 bell-shaped MFs for divergence input, decreases from the first epoch. This was trained for 50epochs which resulted in almost same value for training and testing error, as shown in Fig. 3.
Figure 3 Training and checking error curves for the 2input (5 bell MF for vorticity input, 3bell MF for divergence input) , 1 output ANFIS model
This model when compared for the actual checking data verses output generated by ANFIS model demonstrated good results as shown in Fig. 4.
Figure 4 target output (in red) and ANFIS predicted output (in blue) for the 2input (5 bell MF for vorticity input, 3 bell MF for divergence input) , 1 output ANFIS model
2. The checking error curves for the model with 5 gaussian MFs for vorticity input and 3 gaussian MFs for divergence input, remains almost constant from the first epoch till last epoch, as shown in Fig. 5.
Figure 5 Training and checking error curves for the 2input (5 gaussian MF for vorticity input, 3 gaussian MF for divergence input) , 1 output ANFIS model
This model when compared for the actual checking data verses output generated by ANFIS model demonstrated very poor results as shown in Fig. 6.
Figure 6 target output (in red) and ANFIS predicted output (in blue) for the 2input (5 gaussian MF for vorticity input, 3 gaussian MF for divergence input) , 1 output ANFIS model
3.The testing/checking error curves for the model with 7 bell-shaped MFs for vorticity input and 5 bell-shaped MFs for divergence input, decreases from the first epoch. This was trained for 50epochs after which model started overfitting, as shown in Fig. 7.
50 http://sites.google.com/site/ijcsis/ ISSN 1947-5500
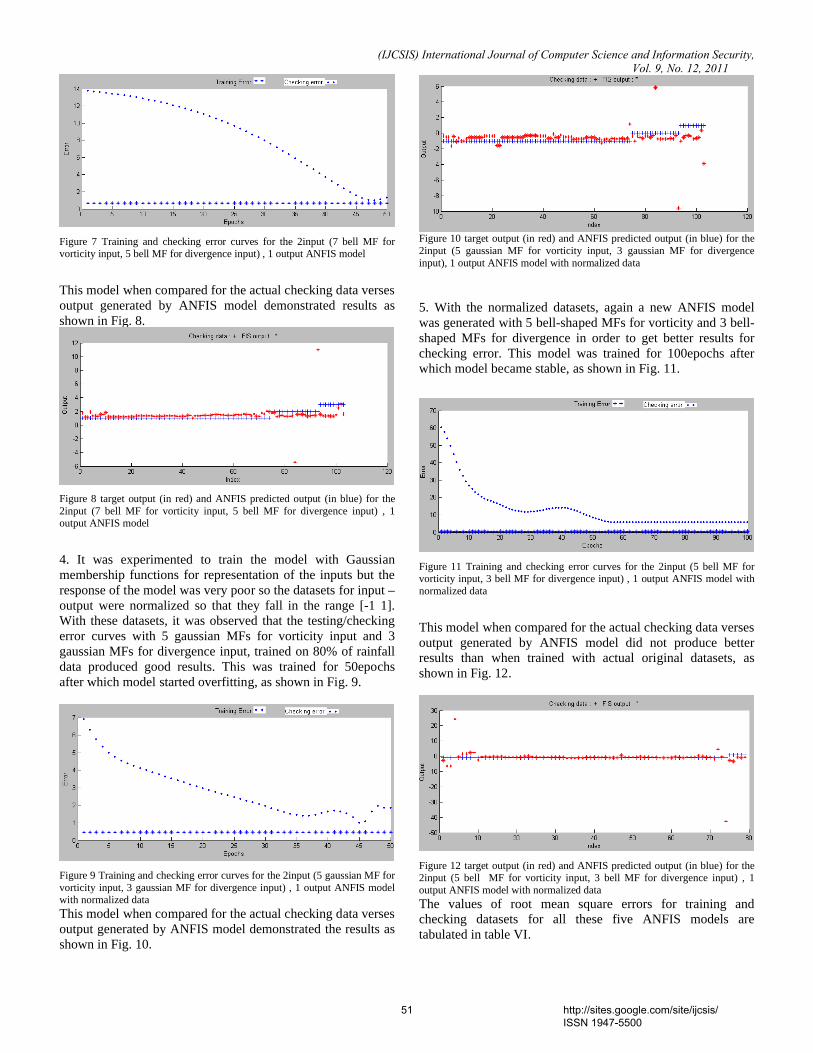
(IJCSIS) International Journal of Computer Science and Information Security, Vol. 9, No. 12, 2011
Figure 7 Training and checking error curves for the 2input (7 bell MF for vorticity input, 5 bell MF for divergence input) , 1 output ANFIS model
This model when compared for the actual checking data verses output generated by ANFIS model demonstrated results as shown in Fig. 8.
Figure 8 target output (in red) and ANFIS predicted output (in blue) for the 2input (7 bell MF for vorticity input, 5 bell MF for divergence input) , 1 output ANFIS model
4. It was experimented to train the model with Gaussian membership functions for representation of the inputs but the response of the model was very poor so the datasets for input –output were normalized so that they fall in the range [-1 1]. With these datasets, it was observed that the testing/checking error curves with 5 gaussian MFs for vorticity input and 3 gaussian MFs for divergence input, trained on 80% of rainfall data produced good results. This was trained for 50epochs after which model started overfitting, as shown in Fig. 9.
Figure 9 Training and checking error curves for the 2input (5 gaussian MF for vorticity input, 3 gaussian MF for divergence input) , 1 output ANFIS model with normalized dataThis model when compared for the actual checking data verses output generated by ANFIS model demonstrated the results as shown in Fig. 10.
Figure 10 target output (in red) and ANFIS predicted output (in blue) for the2input (5 gaussian MF for vorticity input, 3 gaussian MF for divergence input), 1 output ANFIS model with normalized data
5. With the normalized datasets, again a new ANFIS model was generated with 5 bell-shaped MFs for vorticity and 3 bell-shaped MFs for divergence in order to get better results for checking error. This model was trained for 100epochs after which model became stable, as shown in Fig. 11.
Figure 11 Training and checking error curves for the 2input (5 bell MF for vorticity input, 3 bell MF for divergence input) , 1 output ANFIS model with normalized data
This model when compared for the actual checking data verses output generated by ANFIS model did not produce better results than when trained with actual original datasets, as shown in Fig. 12.
Figure 12 target output (in red) and ANFIS predicted output (in blue) for the 2input (5 bell MF for vorticity input, 3 bell MF for divergence input) , 1 output ANFIS model with normalized dataThe values of root mean square errors for training and checking datasets for all these five ANFIS models aretabulated in table VI.
51 http://sites.google.com/site/ijcsis/ ISSN 1947-5500
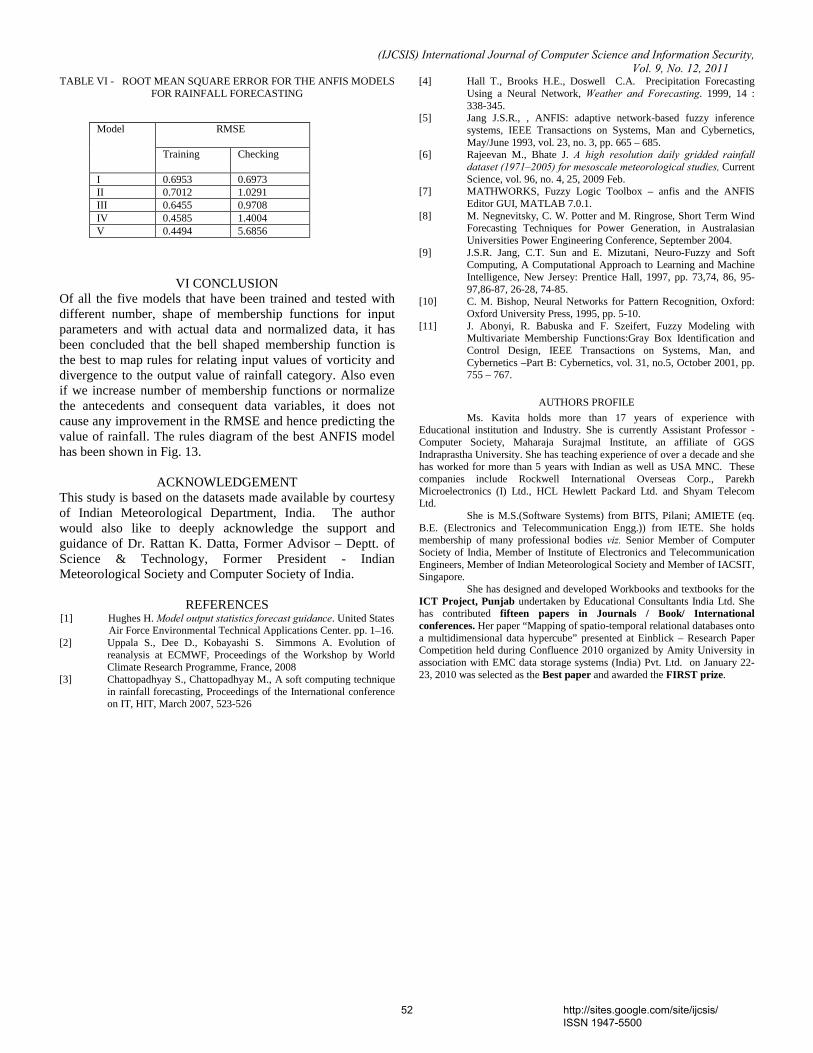
(IJCSIS) International Journal of Computer Science and Information Security, Vol. 9, No. 12, 2011
TABLE VI - ROOT MEAN SQUARE ERROR FOR THE ANFIS MODELS FOR RAINFALL FORECASTING
Model RMSE
Training Checking
I 0.6953 0.6973II 0.7012 1.0291III 0.6455 0.9708IV 0.4585 1.4004V 0.4494 5.6856
VI CONCLUSIONOf all the five models that have been trained and tested with different number, shape of membership functions for input parameters and with actual data and normalized data, it has been concluded that the bell shaped membership function is the best to map rules for relating input values of vorticity and divergence to the output value of rainfall category. Also even if we increase number of membership functions or normalize the antecedents and consequent data variables, it does not cause any improvement in the RMSE and hence predicting the value of rainfall. The rules diagram of the best ANFIS model has been shown in Fig. 13.
ACKNOWLEDGEMENTThis study is based on the datasets made available by courtesy of Indian Meteorological Department, India. The author would also like to deeply acknowledge the support and guidance of Dr. Rattan K. Datta, Former Advisor – Deptt. of Science & Technology, Former President - Indian Meteorological Society and Computer Society of India.
REFERENCES[1] Hughes H. Model output statistics forecast guidance. United States
Air Force Environmental Technical Applications Center. pp. 1–16.[2] Uppala S., Dee D., Kobayashi S. Simmons A. Evolution of
reanalysis at ECMWF, Proceedings of the Workshop by World Climate Research Programme, France, 2008
[3] Chattopadhyay S., Chattopadhyay M., A soft computing technique in rainfall forecasting, Proceedings of the International conference on IT, HIT, March 2007, 523-526
[4] Hall T., Brooks H.E., Doswell C.A. Precipitation Forecasting Using a Neural Network, Weather and Forecasting. 1999, 14 : 338-345.
[5] Jang J.S.R., , ANFIS: adaptive network-based fuzzy inference systems, IEEE Transactions on Systems, Man and Cybernetics, May/June 1993, vol. 23, no. 3, pp. 665 – 685.
[6] Rajeevan M., Bhate J. A high resolution daily gridded rainfall dataset (1971–2005) for mesoscale meteorological studies, Current Science, vol. 96, no. 4, 25, 2009 Feb.
[7] MATHWORKS, Fuzzy Logic Toolbox – anfis and the ANFIS Editor GUI, MATLAB 7.0.1.
[8] M. Negnevitsky, C. W. Potter and M. Ringrose, Short Term Wind Forecasting Techniques for Power Generation, in Australasian Universities Power Engineering Conference, September 2004.
[9] J.S.R. Jang, C.T. Sun and E. Mizutani, Neuro-Fuzzy and Soft Computing, A Computational Approach to Learning and Machine Intelligence, New Jersey: Prentice Hall, 1997, pp. 73,74, 86, 95-97,86-87, 26-28, 74-85.
[10] C. M. Bishop, Neural Networks for Pattern Recognition, Oxford: Oxford University Press, 1995, pp. 5-10.
[11] J. Abonyi, R. Babuska and F. Szeifert, Fuzzy Modeling with Multivariate Membership Functions:Gray Box Identification and Control Design, IEEE Transactions on Systems, Man, and Cybernetics –Part B: Cybernetics, vol. 31, no.5, October 2001, pp. 755 – 767.
AUTHORS PROFILEMs. Kavita holds more than 17 years of experience with
Educational institution and Industry. She is currently Assistant Professor -Computer Society, Maharaja Surajmal Institute, an affiliate of GGS Indraprastha University. She has teaching experience of over a decade and she has worked for more than 5 years with Indian as well as USA MNC. These companies include Rockwell International Overseas Corp., Parekh Microelectronics (I) Ltd., HCL Hewlett Packard Ltd. and Shyam Telecom Ltd.
She is M.S.(Software Systems) from BITS, Pilani; AMIETE (eq. B.E. (Electronics and Telecommunication Engg.)) from IETE. She holds membership of many professional bodies viz. Senior Member of Computer Society of India, Member of Institute of Electronics and Telecommunication Engineers, Member of Indian Meteorological Society and Member of IACSIT, Singapore.
She has designed and developed Workbooks and textbooks for theICT Project, Punjab undertaken by Educational Consultants India Ltd. She has contributed fifteen papers in Journals / Book/ International conferences. Her paper “Mapping of spatio-temporal relational databases onto a multidimensional data hypercube” presented at Einblick – Research Paper Competition held during Confluence 2010 organized by Amity University in association with EMC data storage systems (India) Pvt. Ltd. on January 22-23, 2010 was selected as the Best paper and awarded the FIRST prize.
52 http://sites.google.com/site/ijcsis/ ISSN 1947-5500
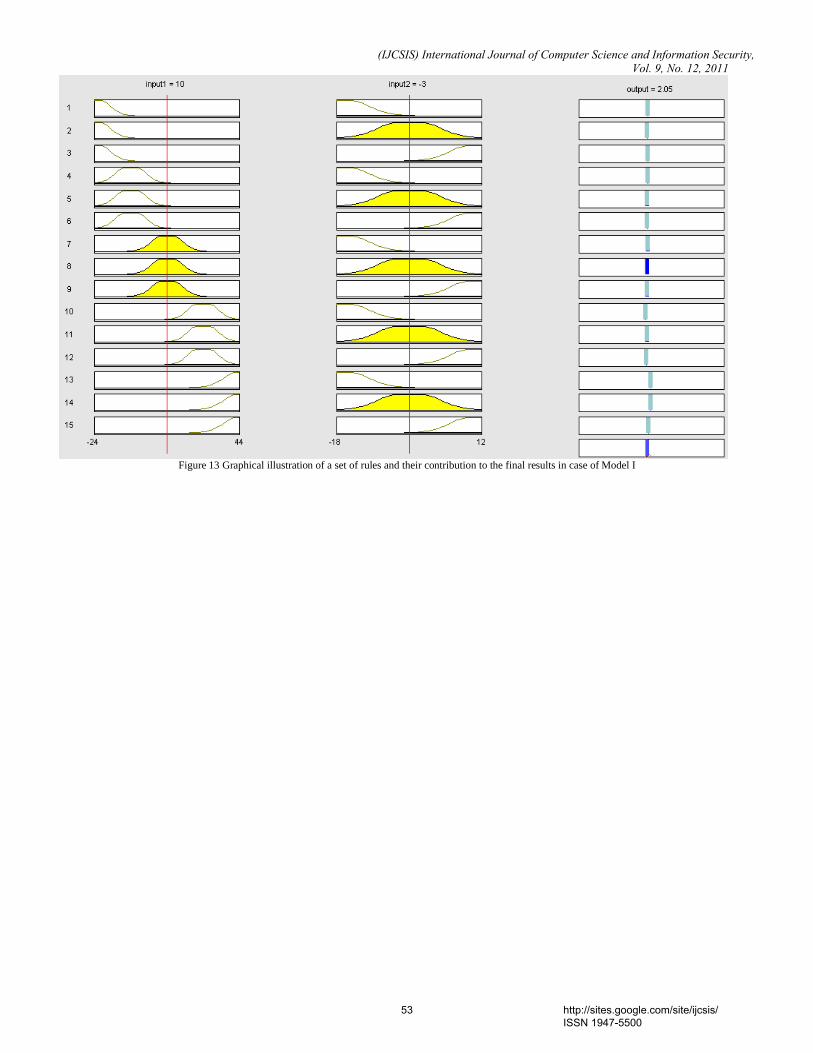
(IJCSIS) International Journal of Computer Science and Information Security, Vol. 9, No. 12, 2011
Figure 13 Graphical illustration of a set of rules and their contribution to the final results in case of Model I
53 http://sites.google.com/site/ijcsis/ ISSN 1947-5500

(IJCSIS) International Journal of Computer Science and Information Security, Vol. 9, No. 12, 2011
Highly Dynamic Nature of Mobile AD-HOC Networks (MANETs): Requirement of Stringent
Security Measures.
Prof P.Balagangadhar Rao Electronics and Telecommunications
Sreekavitha Engineering College Karepalli (INDIA) [email protected]
Abstract— Wireless mobile AD-HOC networks (MANETs) can be established on demand and disappear when there is no need. Each mobile node in the network acts both as a terminal and also as a router. Thus, each mobile node is having a capability of forwarding packets of information to other peer nodes. The nodes are, basically, self-organized wireless interconnecting communication devices which can either extend or operate in concert with the wired networking infrastructure. Lot of research is going on, in this field, regarding the unique characteristics of AD-HOC networks such as open peer-to-peer network architecture, highly dynamic topology, shared wireless medium, stringent resource control etc. These limitations make a strong case for a desirable network performance with reasonably good security measures for the information interchange. Unlike networks that have dedicated routers, the nodes in the MANETs are highly dynamic in nature, there by liable for easy security breaches. Security Strength and network performance (Q.O.S) are the two sides of a coin. If one of these is enhanced, the other will suffer. Achieving a good trade-off between these two extremes is a fundamental challenging task in security design for mobile AD-HOC networks since these networks are characterized by an open and distributed communication environment where there is no central authorization facility that ensures more stringent security. An attempt is made in this paper to discuss certain topologies and security problems like (i) Denial-of-service attacks, (ii) Secured authentication, (iii) Protecting routing and forwarding of packets, (iv) End-to-end Communication through data encryption, (v) Preventing viruses, worms and application abuses at different layers. .
Keywords-: Mobile Ad-hoc Networks, Q.O.S. (quality of service), Security Solutions, Net- Work Layers, Link-layer, Viruses, Worms, Nodes.
I. INTRODUCTION
Wireless technologies like GSM (Global System for Mobile), CDMA (Code Division Multiple Access) are technologies with robust infrastructure and central administration by which
these can survive with security measures which are not so stringent. The BTS (Base Transceiver Station), BSC (Base Station Controller), MSC (Mobile Switching Centre), Radio resource allocation, Channel assignment etc, all put together give a broad idea of the topology of such wireless networks. It is comparatively easy to detect and rectify various problems of these networks by proper monitoring and analyzing the parameters of the network traffic, at various levels. But, the case is not so with wireless Mobile AD-HOC networks (MANETs) which are basically a cluster of “Mobile Devices” which use wireless transmission for communication. The greatest advantage of AD-HOC networks is that they can be setup “anywhere” and “any time” as they do not require any predefined infrastructure and centralized administration. AD-HOC networks could be integrated with fixed infrastructure technologies (like GSM, CDMA etc) so that the operators can derive the benefit of extending services in those areas where the signal coverage is poor. In order to optimize the benefits by such integration, issues pertaining to Medium Access Control (MAC), Routing, Multi-casting and transport protocols, Q.O.S (Quality of Service) provisioning, Energy management, Security, Multi-hop pricing etc are to be adequately addressed in the area of MANETs. In the absence of stringent security measures, there is every possibility of collapse of the AD-HOC networks.
II. NET WORK TOPOLOGY DISCOVERY
A very important task for routing of messages through MANETs is to discover the topology of the network. Traditional approaches for the discovery of topology may not yield good results in the case of MANETs which are highly dynamic in nature in changing the topology. Therefore, special types of Mobile Intelligent agents (decision making entities) are to be used to discover the topology of such networks. We can use Hybrid multi-agent systems, also, in such an environment. Hybrid multi-agent system can make the machine-agents and task- agents to interact with each other to
54 http://sites.google.com/site/ijcsis/ ISSN 1947-5500

(IJCSIS) International Journal of Computer Science and Information Security, Vol. 9, No. 12, 2011
solve the local or autonomous agent’s objectives [3]. Also, an approach to provide mobile agents with planning capability for peer- to-peer environment could be implemented for discovering topology of the MANETs.
To support more reliable communications, efficient network management and high resource’s utilization, “distributed clustering protocols” have been considered as a solution to introduce some kind of hierarchy in the MANET by means of dynamic and adaptive virtual infrastructures. To cope up with the system dynamics, Medium Access Control (MAC) protocol is expected to exploit existing clustering scheme and to be adoptive to the topology.
To support the QOS (Quality of service) in MANETs, we can use ”intelligent agent-based” resource reservation approach. The mobile intelligent agents are having the ability to move across wide area networks, operate autonomously on foreign hosts and perform tasks on behalf of the originating hosts .Because mobile intelligent agents carry the mobile network’s QOS requirement and administration specification and mobility association together with the necessary executable codes, they can discover alternate routes, dynamically.
Service discovery architectures and cluster-assisted routing protocols in MANETs heavily use formation and maintenance of a virtual back bone (VB) where the most stable mobile nodes with higher node degree are dynamically selected as the back bone nodes. The backbone formation algorithm gives preference to the nodes with the smaller number of link changes and higher degree [4].The quality of service routing selects a path to be used by peers based on their Q.O.S requirements such as bandwidth or delay.
III. SECURITY SOLUTIONS
Security has become a primary concern in order to provide protected communication between nodes in a potentially hostile environment .Security services such as authentication, confidentiality, integrity, anonymity and availability are the ultimate goals of the security solutions for mobile ad-hoc networks. In order to achieve these goals, the security solutions should be provided in the entire protocol stack of network-layers which perform various functionalities in a computer network. [2] (a) Preventing signal jamming and denial of service attacks at “Physical layer” level. (b) Protecting the wireless MAC (medium access control) protocol and providing link-layer security support at “Link layer” level.
(c) Protecting the ad-hoc routing and forwarding protocols at ”Network layer” level. (d) Authenticating and securing end-to-end communications through data encryption at “Transport layer” level. (e) Detecting and preventing viruses, worms, malicious codes and application abuses at “Application layer” level. Viruses, Worms are software programmes by hackers in order to destroy or steal or damage or intrude into the data of others, in an unauthorized way. By ensuring above mentioned security solutions at different layers of mobile AD-HOC networks, we can securely transport of information.
IV. CHALLENGES: As there will not be any dedicated routers as in the case of wired networks, each mobile node in an ad-hoc network should function as a router and forward packets of information to other peer nodes. Unfortunately, both the legitimate network users as well as the malicious attackers are having an equal chance to access the wireless channel. There is no well defined place where traffic monitoring or access control mechanisms can be deployed. As a result, the boundary that separates the inside network from the outside world becomes thin. The existing protocols assume a trusted and co-operative environment. As a result, a malicious attacker can readily become a router and disrupt network operations by intentionally disobeying the protocol specifications. There are basically to approaches to protect such networks. The first one is “proactive” where as the other one is “reactive”. The “proactive” approach attempts to prevent an attacker from launching attacks in the first place, typically through various cryptographic techniques. In contrast, the “reactive” approach reacts, suitably, after detecting a security threat. A complete security solution should integrate both these approaches for preventing, detecting and reacting to security threats. Security is a chain, and it is only as secure as that of the weakest link.
V. CONSTRAINTS
(a) The stringent resource constraints in mobile ad-hoc networks constitute another serious challenge to security design. The wireless channel is bandwidth constrained and shared among multiple network entities.
(b) The computational capability of certain type of mobile nodes is limited. For example, such as PDAs
55 http://sites.google.com/site/ijcsis/ ISSN 1947-5500

(IJCSIS) International Journal of Computer Science and Information Security, Vol. 9, No. 12, 2011
(Personnel Digital Assistance), can hardly perform computation-intensive tasks like asymmetric cryptographic computation.
(c) As mobile devices are typically powered by batteries, they may have limited energy availability.
(d) The network topology is highly dynamic as nodes as nodes frequently join or leave the network, and roam in the network on their own will. The wireless channel is subject to interferences like co-channel interference or adjacent channel interference, thus prone for errors.
(e) The security scheme adopted by each device has to work with in its own resource limitations and is a challenging job because of the limited wireless transmission range, broad cast nature of wireless, node mobility, limited power resource.[2]
Mobile users may request at “any time”, “any where” the security services as they move from one place to another. The above characteristics of mobile ad-hoc networks clearly make a case for building multi-fence security solutions that achieve both broad protection and desirable network performance, simultaneously. As there is no well defined place/infrastructure where we can deploy a single security solution, the deployment of security is not a trivial task. Moreover, portable devices as well as the system security information they store are vulnerable to compromise or physical capture, especially low-end devices with weak protection. Attackers may sneak into the network through these weak links and incur a serious damaging effect of security breaches in the system.
VI. CONCLUSION Security never comes free. When more security features are introduced into the network, the result is the ever-increasing computation, communication, and management overhead. Consequently, network performance in terms of scalability, service availability, robustness, and so on of the security solutions, becomes an important concern in a resource-constrained AD-HOC network. While many contemporary proposals focus on the security stand point, the leave the network performance aspect largely unaddressed. In fact, both dimensions of security strength and network performance are equally important, and achieving a good trade-off between the two extremes is the real challenge in security design for mobile ad-hoc networks.
Advantages of using ad-hoc wireless networks include easy and speedy deployment. Also, it is a robust, adaptive and self organizing network. Designing a secure AD-HOC wireless communication is a challenging task due to (1)Insecure wireless communication links (2)Absence of a fixed infrastructure (3) Resource constraints like battery power, band width , memory , CPU (central processing unit of a computer) capacity. (4) Node mobility that triggers a dynamic network topology. The main requirements of a robust security routing protocol are (1) Detection of malicious nodes. Avoiding routing of messages from such nodes (2) Guarantee of correct route to destination (3) Confidentiality of network topology to prevent attacks by an attacker on the weak links (4) Stability against attacks, so that the routing protocol must be able to resume the normal operation with in a reasonable time after an attack. By ensuring above mentioned security solutions at different layers of mobile AD-HOC networks, we can securely transport the information over MANETs REFERENCES [1] A. Kumar, P.Kumar, C.Kant and R.Sharma “Integration of mobile ad-hoc networks for wireless systems” International Journal of Information technology and knowledge management, Volume 1. Number 1, June 2008 [2] R. Nath and P.K.Sehgal “Secure information flow in mobile ad-hoc network: A Challenge” International Journal of Information technology and knowledge management, Volume 1. Number 1, June 2008 [3] A.Madureira, J.Santoes, N.G “Hybrid – multi agent system for co operative dynamic scheduling through meta – Heuristics”, ISDA07 proceedings [4] H.Ibrahim, M.V.Uyar, M.A.Fecko”Journal wireless networks “volume 14, issue1, Jan 2008.
AUTHORS PROFILE
The author worked as General Manager in the Department of Telecommunications in INDIA.,with considerable experience in Telecom instllations. Presently working as a professor in Sreekavitha Engineering College.(INDIA)
56 http://sites.google.com/site/ijcsis/ ISSN 1947-5500

A Novel Preprocessing Directed Acyclic Graph
Technique for Session Construction
S. Chitra Dr. B. Kalpana
Assistant Professor Associate Professor
Department of Computer Science Department of Computer Science
Government Arts College (Autonomous) Avinashilingam University for Women
Coimbatore - 641 018 Coimbatore - 641 043
Email : [email protected] Email : [email protected]
Abstract---Log file data can provide precious insight into
web usage mining. Web access log analysis is to analyze the
patterns of web site usage and the features of user‟s behavior. It
is the fact that the normal Log data is very noisy and unclear
and it is vital to preprocess the log data for efficient web usage
mining process. Preprocessing comprises of three phases which
includes data cleaning, user identification and session
construction. Session construction is very vital and numerous
real world problems can be modeled as traversals on graph and
mining from these traversals would provide the requirement for
preprocessing phase. On the other hand, the traversals on
unweighted graph have been taken into consideration in
existing works. This paper oversimplifies this to the case where
vertices of graph are given weights to reflect their significance.
Patterns are closed frequent Directed Acyclic Graphs with page
browsing time. The proposed method constructs sessions as a
Directed Acyclic Graph which contains pages with calculated
weights. This will help site administrators to find the interesting
pages for users and to redesign their web pages. After
weighting each page according to browsing time a DAG
structure is constructed for each user session.
Keywords---Web Usage Mining, Session Construction,
Directed Acyclic Graph (DAG), Preprocessing, Robots
Cleaning
I. INTRODUCTION
In this present internet world web sites on the internet are a
source of useful information. As a result there is a huge
improvement in its volume of traffic and the size and difficulty
of web sites. World Wide Web develops rapidly day by day. So
researchers are paying more and more attention on the
efficiency of services offered to the users over the internet.
Web usage mining is an active, technique used in this field of
research. It is also called web log mining in which data mining
techniques are applied to web access log. A web access log is a
time series record of user‟s requests each of which is sent to a
web server whenever a user sent a request. Due to different
server setting parameters, there are many types of web logs, but
typically the log files share the same basic information such as
client IP address, request time, requested URL, HTTP status
code, referrer etc.
Web usage mining extracts regularities of user access
behavior as patterns, which are defined by combinations, orders
or structures of the pages accessed by the internet. Web usage
mining consists of three main steps:
Data Preprocessing
Knowledge Extraction
Analysis of Extracted Results
Preprocessing is a significant step since the Web architecture
is very complex in nature and 80% of the mining process is
done at this phase.
Administrators of the web sites have to know about the users
background and their needs. For this statistical analysis such as
Google Analytics are used to analyze the logs in terms of page
views, page exit ratio, visit duration etc. With the help of this
analysis administrators can know about frequently accessed
page, average view time and so on. But there are few
drawbacks in statistical analysis. It gives low level error report
on unauthorized entry points, invalid urls are not found
properly etc. Web usage mining enables administrators to
provide complete analysis than statistical methods. It extracts a
lot of patterns for administrators to analyze. This paper
provides a method which analyses log files and extracts access
patterns containing browsing time of each page using graphs
[16].
Graph and traversal are extensively used to model a number
of classes of real world problems. For example, the structure of
Web site can be modeled as a graph in which the vertices
represent Web pages, and the edges correspond to hyperlinks
between the pages [7]. Mining using graphs turns out to be a
center of interest. Traversals on the graphs are the models of
User navigations on the Web site [14]. Once a graph and its
traversals are specified, important information can be
discovered. Frequent substructure pattern mining is an
emerging data mining problem with many scientific and
commercial applications [15]. This paper provides a new
version to the previous works by considering weights attached
to the vertices of graph. Such vertex weight may reflect the
importance of vertex. For example, each Web page may have
different consequence which reflects the value of its contents.
There are three phases in this method. First one is
preprocessing phase which includes data cleaning, user
identification, session identification, DAG construction. The
(IJCSIS) International Journal of Computer Science and Information Security, Vol. 9, No. 12, December 2011
57 http://sites.google.com/site/ijcsis/ ISSN 1947-5500

second phase is pattern extraction phase using clustering and
the third phase is pattern analysis phase. This paper discusses
elaborately about the first phase and briefs about other phases.
II. RELATED WORKS
Various commercially available web server log analysis tools
are not designed for high traffic web servers and provide less
relationship analysis of data among accessed files which is
essential to fully utilize the data gathered in the server logs [3].
The statistical analysis introduces a set of parameters to
describe user‟s access behaviors. With those parameters it
becomes easy for administrators to define concrete goals for
organizing their web sites and improve the sites according to
the goals. But the drawback in this analysis is that the results
are independent from page to page. Since user‟s behavior is
expected to be different dependent on length of browsing time,
the calculation of accurate browsing time is more important [5].
A labeled graph is a tuple , where is the set
of vertices, is the set of edges and is a labeling
function with a finite set of labels [9]. For an edge is the parent of and is the child of . If there is a set of
vertices V such that
, is called a path,
is an ancestor of un and is a descendant of . There is a
cycle in the graph if a path can be found from a vertex to itself.
An edge of the graph is said to be a transitive edge if
besides the edge , there also exists another path from to
in . A labeled DAG is a labeled graph without cycles. Let
be a set of labeled DAGs and be an
absolute frequency threshold. DIGDAG algorithm specifies that
a DAG P is a frequent embedded sub-DAG of D if it is
embedded in at least DAGs of D.
Prediction of users interest is the most important aspect of
web usage mining. For this frequency and order of visited
pages are considered. But Time spent on web pages is more
important factor which is estimated from the log information
and it is used as an indicator in other fields such as information
retrieval, human-computer interaction (HCI) and E-Learning
[2].
Duration time is the time that a user spends on reading a
page in a session. Let and are two adjacent pages in a
session. The timestamp field of is Ti, and of is Ti+1.
Suppose is the loading time of , and is the loading time
ancillary files. By subtracting the time required for loading
and the ancillary files from the time difference between the
requests of and that of , the duration time of can be
calculated [4].
The browsing time of an accessed page equals the difference
between the access time of the next and present page. But with
a more careful analysis, this difference includes not only user's
browsing time, but also the time consumed by transferring the
data over internet, launching the applications to play the audio
or video files on the web page and so on. The user's real
browsing time is difficult to be determined; it depends on the
content of the page, the real-time network transfer rate, user's
actions and computer‟s specifications and so on [13].
All of these works attempt mainly to find the exact browsing
time of users so that web administrators can understand the
interest of their users in web pages. In the proposed method a
more accurate browsing time is found and creation of sessions
as graphs depending on the time accessed. Clustering of
patterns in the form is very easier in which the next phase in
web usage mining is.
III. PREPROCESSING
The quality of session construction significantly affects the
whole performance of a web usage mining system. To improve
the quality log data should be reliable. Preprocessing is a vital
phase before mining to select the reliable data. Data Cleaning,
user identification, sessions construction are the steps in
preprocessing.
3.1. Data Cleaning
Data Cleaning enables to filter out useless data which reduce
the log file size to use less storage space and to facilitate
upcoming tasks [8]. It is the first step in data preprocessing.
The log format used in this method is Extended Common Log
Format with the fields as follows: “ipaddress,
username,password,date/timestamp, url, version ,status-code,
bytes-sent, referrer-url, user-agent”.
If a user needs a particular page from server entries like gif,
JPEG, etc., are also downloaded which are not helpful for
further investigation are eliminated. The records with failed
status code are also eliminated from logs. Automated programs
like web robots, spiders and crawlers are also to be eradicated
from log files. Thus removal process includes elimination of
irrelevant records as follows:
If the status code of all record is fewer than 200 and
better than 299 then those records are eradicated.
The cs-stem-url field is verified for its extension
filename. If the filename has gif, jpg, JPEG, CSS, and so on
they are eradicated.
The records which request robots.txt are eradicated
and if the time taken is incredibly little like less than 2 seconds
are considered as automated programs traversal and they are
also eradicated [8].
All the records which have the name “robots.txt” in
the requested resource name (URL) are recognized and
straightly eradicated.
3.2. User Identification
In this step users are identified from log files. Sites which
need registration stores the user data in log records. But those
sites are few and often neglected by users. IPaddress, referrer
URL and user agent in the log record is considered for this task.
Unique users are identified as follows:
If two records has dissimilar IP address they are
differentiated as two different users else if both IP address are
similar then User agent field is verified.
If the browser and operating system information in
user agent field is dissimilar in two records then they are
recognized as different users else if both are identical then
(IJCSIS) International Journal of Computer Science and Information Security, Vol. 9, No. 12, December 2011
58 http://sites.google.com/site/ijcsis/ ISSN 1947-5500
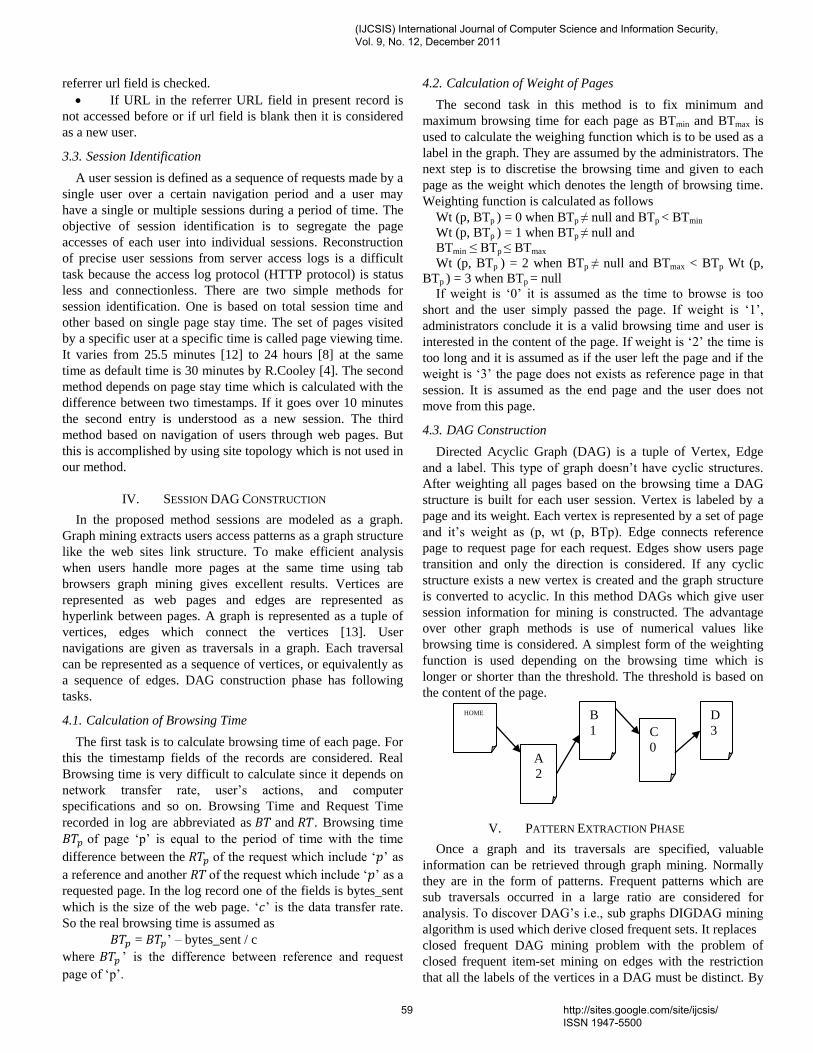
referrer url field is checked.
If URL in the referrer URL field in present record is
not accessed before or if url field is blank then it is considered
as a new user.
3.3. Session Identification
A user session is defined as a sequence of requests made by a
single user over a certain navigation period and a user may
have a single or multiple sessions during a period of time. The
objective of session identification is to segregate the page
accesses of each user into individual sessions. Reconstruction
of precise user sessions from server access logs is a difficult
task because the access log protocol (HTTP protocol) is status
less and connectionless. There are two simple methods for
session identification. One is based on total session time and
other based on single page stay time. The set of pages visited
by a specific user at a specific time is called page viewing time.
It varies from 25.5 minutes [12] to 24 hours [8] at the same
time as default time is 30 minutes by R.Cooley [4]. The second
method depends on page stay time which is calculated with the
difference between two timestamps. If it goes over 10 minutes
the second entry is understood as a new session. The third
method based on navigation of users through web pages. But
this is accomplished by using site topology which is not used in
our method.
IV. SESSION DAG CONSTRUCTION
In the proposed method sessions are modeled as a graph.
Graph mining extracts users access patterns as a graph structure
like the web sites link structure. To make efficient analysis
when users handle more pages at the same time using tab
browsers graph mining gives excellent results. Vertices are
represented as web pages and edges are represented as
hyperlink between pages. A graph is represented as a tuple of
vertices, edges which connect the vertices [13]. User
navigations are given as traversals in a graph. Each traversal
can be represented as a sequence of vertices, or equivalently as
a sequence of edges. DAG construction phase has following
tasks.
4.1. Calculation of Browsing Time
The first task is to calculate browsing time of each page. For
this the timestamp fields of the records are considered. Real
Browsing time is very difficult to calculate since it depends on
network transfer rate, user‟s actions, and computer
specifications and so on. Browsing Time and Request Time
recorded in log are abbreviated as and . Browsing time
of page „p‟ is equal to the period of time with the time
difference between the of the request which include „ ‟ as
a reference and another of the request which include „ ‟ as a
requested page. In the log record one of the fields is bytes_sent
which is the size of the web page. „ ‟ is the data transfer rate.
So the real browsing time is assumed as
= ‟ – bytes_sent / c
where ‟ is the difference between reference and request
page of „p‟.
4.2. Calculation of Weight of Pages
The second task in this method is to fix minimum and
maximum browsing time for each page as BTmin and BTmax is
used to calculate the weighing function which is to be used as a
label in the graph. They are assumed by the administrators. The
next step is to discretise the browsing time and given to each
page as the weight which denotes the length of browsing time.
Weighting function is calculated as follows
Wt (p, BTp ) = 0 when BTp ≠ null and BTp < BTmin
Wt (p, BTp ) = 1 when BTp ≠ null and
BTmin ≤ BTp ≤ BTmax
Wt (p, BTp ) = 2 when BTp ≠ null and BTmax < BTp Wt (p,
BTp ) = 3 when BTp = null
If weight is „0‟ it is assumed as the time to browse is too
short and the user simply passed the page. If weight is „1‟,
administrators conclude it is a valid browsing time and user is
interested in the content of the page. If weight is „2‟ the time is
too long and it is assumed as if the user left the page and if the
weight is „3‟ the page does not exists as reference page in that
session. It is assumed as the end page and the user does not
move from this page.
4.3. DAG Construction
Directed Acyclic Graph (DAG) is a tuple of Vertex, Edge
and a label. This type of graph doesn‟t have cyclic structures.
After weighting all pages based on the browsing time a DAG
structure is built for each user session. Vertex is labeled by a
page and its weight. Each vertex is represented by a set of page
and it‟s weight as (p, wt (p, BTp). Edge connects reference
page to request page for each request. Edges show users page
transition and only the direction is considered. If any cyclic
structure exists a new vertex is created and the graph structure
is converted to acyclic. In this method DAGs which give user
session information for mining is constructed. The advantage
over other graph methods is use of numerical values like
browsing time is considered. A simplest form of the weighting
function is used depending on the browsing time which is
longer or shorter than the threshold. The threshold is based on
the content of the page.
V. PATTERN EXTRACTION PHASE
Once a graph and its traversals are specified, valuable
information can be retrieved through graph mining. Normally
they are in the form of patterns. Frequent patterns which are
sub traversals occurred in a large ratio are considered for
analysis. To discover DAG‟s i.e., sub graphs DIGDAG mining
algorithm is used which derive closed frequent sets. It replaces
closed frequent DAG mining problem with the problem of
closed frequent item-set mining on edges with the restriction
that all the labels of the vertices in a DAG must be distinct. By
HOME
A
2
B
1 C
0
D
3
(IJCSIS) International Journal of Computer Science and Information Security, Vol. 9, No. 12, December 2011
59 http://sites.google.com/site/ijcsis/ ISSN 1947-5500
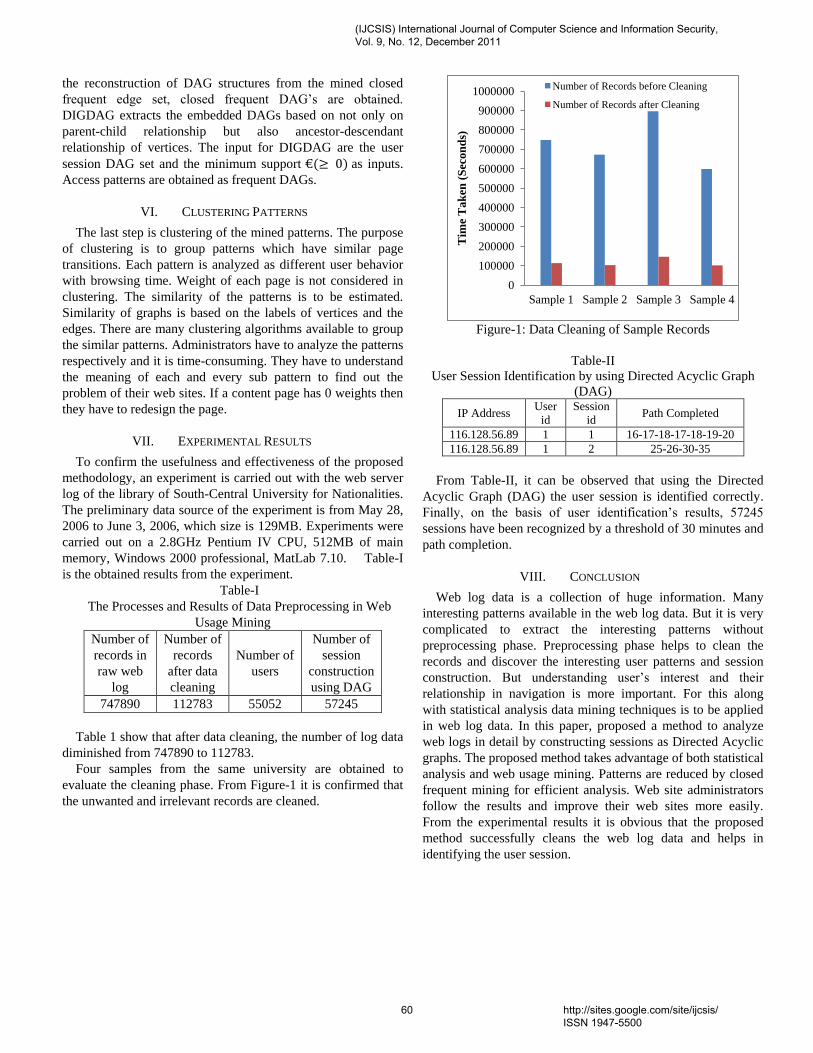
the reconstruction of DAG structures from the mined closed
frequent edge set, closed frequent DAG‟s are obtained.
DIGDAG extracts the embedded DAGs based on not only on
parent-child relationship but also ancestor-descendant
relationship of vertices. The input for DIGDAG are the user
session DAG set and the minimum support as inputs.
Access patterns are obtained as frequent DAGs.
VI. CLUSTERING PATTERNS
The last step is clustering of the mined patterns. The purpose
of clustering is to group patterns which have similar page
transitions. Each pattern is analyzed as different user behavior
with browsing time. Weight of each page is not considered in
clustering. The similarity of the patterns is to be estimated.
Similarity of graphs is based on the labels of vertices and the
edges. There are many clustering algorithms available to group
the similar patterns. Administrators have to analyze the patterns
respectively and it is time-consuming. They have to understand
the meaning of each and every sub pattern to find out the
problem of their web sites. If a content page has 0 weights then
they have to redesign the page.
VII. EXPERIMENTAL RESULTS
To confirm the usefulness and effectiveness of the proposed
methodology, an experiment is carried out with the web server
log of the library of South-Central University for Nationalities.
The preliminary data source of the experiment is from May 28,
2006 to June 3, 2006, which size is 129MB. Experiments were
carried out on a 2.8GHz Pentium IV CPU, 512MB of main
memory, Windows 2000 professional, MatLab 7.10. Table-I
is the obtained results from the experiment.
Table-I
The Processes and Results of Data Preprocessing in Web
Usage Mining
Number of
records in
raw web
log
Number of
records
after data
cleaning
Number of
users
Number of
session
construction
using DAG
747890 112783 55052 57245
Table 1 show that after data cleaning, the number of log data
diminished from 747890 to 112783.
Four samples from the same university are obtained to
evaluate the cleaning phase. From Figure-1 it is confirmed that
the unwanted and irrelevant records are cleaned.
Figure-1: Data Cleaning of Sample Records
Table-II
User Session Identification by using Directed Acyclic Graph
(DAG)
IP Address User
id
Session
id Path Completed
116.128.56.89 1 1 16-17-18-17-18-19-20
116.128.56.89 1 2 25-26-30-35
From Table-II, it can be observed that using the Directed
Acyclic Graph (DAG) the user session is identified correctly.
Finally, on the basis of user identification‟s results, 57245
sessions have been recognized by a threshold of 30 minutes and
path completion.
VIII. CONCLUSION
Web log data is a collection of huge information. Many
interesting patterns available in the web log data. But it is very
complicated to extract the interesting patterns without
preprocessing phase. Preprocessing phase helps to clean the
records and discover the interesting user patterns and session
construction. But understanding user‟s interest and their
relationship in navigation is more important. For this along
with statistical analysis data mining techniques is to be applied
in web log data. In this paper, proposed a method to analyze
web logs in detail by constructing sessions as Directed Acyclic
graphs. The proposed method takes advantage of both statistical
analysis and web usage mining. Patterns are reduced by closed
frequent mining for efficient analysis. Web site administrators
follow the results and improve their web sites more easily.
From the experimental results it is obvious that the proposed
method successfully cleans the web log data and helps in
identifying the user session.
0
100000
200000
300000
400000
500000
600000
700000
800000
900000
1000000
Sample 1 Sample 2 Sample 3 Sample 4
Tim
e T
ak
en (
Sec
on
ds)
Number of Records before Cleaning
Number of Records after Cleaning
(IJCSIS) International Journal of Computer Science and Information Security, Vol. 9, No. 12, December 2011
60 http://sites.google.com/site/ijcsis/ ISSN 1947-5500
REFERENCES
[1] Bamshad Mobasher “Data Mining for Web
Personalization,”, LCNS, Springer-Verleg Berlin
Heidelberg, 2007.
[2] Catlegde L. and Pitkow J., “Characterising browsing
behaviours in the World Wide Web”, Computer Networks
and ISDN systems, 1995.
[3] Cooley, R., Mobasher, B., and Srivastava, J. (1999).
“Data preparation for mining World Wide Web browsing
patterns”, Knowledge and Information Systems, 1999.
[4] Cooley, R., Mobasher, B., and Srivastava, J., “Web
mining:Information and Pattern Discovery on the World
Wide Web,”,International conference on Tools with
Artificial Intelligence, pages 558-567, Newport Beach,
IEEE,1997.
[5] Koichiro Mihara, Masahiro Terabe and Kazuo
Hashimoto,” A Novel web usage mining method Mining
and Clustering of DAG Access Patterns Considering Page
Browsing Time”,2008
[6] Peter I. Hofgesang , “Methodology for Preprocessing and
Evaluating the Time Spent on Web Pages”, Proceedings
of the IEEE/WIC/ACM International Conference on Web
Intelligence ,2006.
[7] Seong Dae Lee, Hyu Chan Park, “Mining Weighted
Frequent Patterns from Path Traversals on Weighted
Graph “, IJCSNS International Journal of Computer
Science and Network Security, VOL.7 No.4, April 2007.
[8] Spilipoulou M.and Mobasher B, Berendt B. “A
framework for the Evaluation of Session Reconstruction
Heuristics in Web Usage Analysis,” INFORMS Journal
on Computing Spring, 2003.
[9] Suresh R.M. and Padmajavalli .R “An Overview of Data
Preprocessing in Data and Web usage Mining, “IEEE,
2006.
[10] Termier, A., Tamada, Y., Numata, K., Imoto, S.,Washio,
T., and Higuchi, T. (2007). DIGDAG, a first algorithm to
mine closed frequent embedded sub-DAGs. In The 5th
International Workshop on Mining and Learning with
Graphs (MLG ‟07).
[11] WANG Tong,HE Pi-Lian”Find Duration Time Maximal
Frequent Traversal Sequence on Web Sites”, IEEE
International Conference On Control and Automation ,
2007.
[12] Yan Li, Boqin FENG and Qinjiao MAO, “Research on
Path Completion Technique in Web Usage Mining”,
International Symposium on Computer Science and
Computational Technology, IEEE, 2008.
[13] Yan Li and Boqin FENG “The Construction of
Transactions for Web Usage Mining”, International
Conference on Computational Intelligence and Natural
Computing, IEEE, 2009.
[14] Etminani, K., Delui, A.R., Yanehsari, N.R. and Rouhani,
M., "Web Usage Mining: Discovery of the Users'
Navigational Patterns Using SOM", First International
Conference on Networked Digital Technologies, Pp.224-
249, 2009.
[15] Nina, S.P., Rahman, M., Bhuiyan, K.I. and Ahmed, K.,
"Pattern Discovery of Web Usage Mining", International
Conference on Computer Technology and Development,
Vol. 1, Pp.499-503, 2009.
[16] Chu-Hui Lee and Yu-Hsiang Fu, "Web Usage Mining
Based on Clustering of Browsing Features", Eighth
International Conference on Intelligent Systems Design
and Applications, Vol. 1, Pp. 281-286, 2008.
AUTHORS PROFILE
Mrs. S. Chitra is an Assistant Professor of
Computer Science in Government Arts
College, Coimbatore, Tamilnadu, India. She
received her Masters‟ degree in Computer
Science from Avinashilingam University,
Coimbatore. She has around 14 years of
teaching experience at the post graduate and
under graduate levels. Presently she is a Ph.D
research scholar in Avinashilingam
University. Her areas of interest are Data
Mining and Web Mining.
Dr. B. Kalpana is an Associate Professor of
Computer Science in Avinashilingam
University, Coimbatore, Tamilnadu, India.
She received her Ph. D in Computer Science
from Avinashilingam University, Coimbatore.
She specializes in Data mining. She has
around 20 years of teaching experience at the
post graduate and under graduate levels. She
has published and presented papers in several
refereed international journals and
conferences. She is a member of the
International Association of Engineers and
Computer Scientists, Hongkong, Indian
Association for Research in Computing
Sciences (IARCS) and the Computer Society
of India.
(IJCSIS) International Journal of Computer Science and Information Security, Vol. 9, No. 12, December 2011
61 http://sites.google.com/site/ijcsis/ ISSN 1947-5500

(IJCSIS) International Journal of Computer Science and Information Security,
Vol. 9, No. 12, December 2011
PERFORMANCE EVALUATION OF LIKERT
WEIGHT
N.SUDHA
Asst. Professor, Department of computer science
Bishop Appasamy College of Arts & Science
Coimbatore -18, Tamil Nadu, India.
Lt.Dr.SANTHOSH BABOO
Reader PG & Research Department of computer
applications, DG Vaishnav college
Chennai -600 106, Tamil Nadu India.
Abstract - Association rule is a widely used data mining technique
that searches through an entire data set for rules revealing the nature
and frequency of relationships or associations between data entities.
Supplier selection is a significant work in supply chain management.
The main objective of supplier selection process is to reduce purchase
risk and maximize overall value to the purchaser. In this paper, the
supplier selection can be viewed as the problem of mining best
supplier for a product. The proposed method Likert Weight Measure
(LWM) incorporates a light weight association rule mining to
compute supplier weight. This research outperforms well compared
to traditional AHP algorithm and helps us to select the best supplier
for a product.
Keywords: Data Mining, Likert Weight Measure (LWM), WARM,
AHP.
I. INTRODUCTION
Association rule learning is a popular and well researched
method for discovering interesting relations between variables
in large databases. Association rules [1] have been widely
used to determine customer buying patterns from market
basket data. The task of mining association rules is mainly to
discover association rules (with strong support and high
confidence) in large databases. Classical Association Rule
Mining (ARM) deals with the relationships among the items
present in transactional databases [2, 4].
Today in industry supplier selection is an important process
which needs more expertise to select a supplier as the
technology complexity has increased. Frequently as there is a
change in the market it will be better if flexibility is
maintained. In any industry the cost of the component and the
components purchased are the external sources and is
important to take decision in the purchase activity.
The search of new suppliers is a continuous process for
companies in order to upgrade the variety of product range.
There may be more number of suppliers for any product
therefore selecting a supplier is more important. There are
different aspects to select a supplier and to determine the
number of suppliers and the mode of relationships with them
and select a best supplier among the various existing
alternatives.
Motwani et al., (1999)[13] studied supplier selection decisions
are complicated by the fact that various criteria must be
considered in decision making process. Supplier selection and
evaluation have become one of the major topics in production
and operations management literature, especially in advanced
manufacturing technologies and environment.
Li et al., (1997)[10] express the main objective of supplier
selection process is to reduce purchase risk, maximize overall
value to the purchaser and develop closeness and long-term
relationships between buyers and suppliers which is effective
in helping the company to achieve “Just-In-Time” (JIT)
production.
Petroni, A. (2000)[14] studied the increase in use of Total
Quality Management (TQM) and Just-In-Time (JIT) concepts
by a wide range of firms, the supplier selection question has
become extremely important. Choosing the right method for
supplier selection effectively leads to optimize the cost with
preferred quality.
Let D be a database consisting of one table over n attributes
{a1, a2, . . . , an}. Let this table contain k instances. The
attributes values of each ai are nominal. In many real world
applications (such as the retail sales data) the attribute values
are even binary (presence or absence of one item in a
particular market basket). In the following an attribute-value-
62 http://sites.google.com/site/ijcsis/ ISSN 1947-5500

(IJCSIS) International Journal of Computer Science and Information Security,
Vol. 9, No. 12, December 2011
pair will be called an item. An item set is a set of distinct
attribute-value-pairs. Let d be a database record. d satisfies an
item set X {a1, a2, . . . , an} if X d. An association rule is
an implication X Y where X, Y {a1, a2, . . . , an}, Y 0
and X Y = 0. The support s(X) of an item set X is the
number of database records d which satisfy X. Therefore the
support s(X Y) of an association rule is the number of
database records that satisfy both the rule body X and the rule
head Y. Note that we define the support as the number of
database records satisfying X Y, in many papers the support
is defined as s(X Y)/k. They refer to our definition of support
as support count. The confidencec(X Y of an association
rule X Y is the fraction c(X Y) = s(X Y)/s(X). From a
logical point of view the body X is a conjunction of distinct
attribute-value-pairs and the head Y is a disjunction of
attribute-value-pairs where s(X Y) = 0.
Weighted frequent item sets mining has been suggested to find
important frequent item sets by considering the weights of
item sets. Some weighted frequent pattern mining algorithms
MINWAL [5], WARM [8], WAR [21] have been developed
based on the Apriori algorithm. The first FP-tree based
weighted frequent pattern algorithms WFIM [19], WIP
[20] show that the weighted support of an item set does not
have the property of downward closure. By using an efficient
tree structure, Ahmed et al propose a sliding window based
novel technique Weighted Frequent Pattern Mining over Data
Streams (WFPMDS). It requires only a single-pass of data
stream for tree construction and mining operations [9].
II. RELATED WORKS
A number of evaluation criteria have been proposed to
supplier‟s selection. The criteria have been developed for
supplier evaluation and selection problem since1966.
Dickson[7] identified 23 different criteria for suppliers
selection including quality, on-time delivery, price,
performance history, warranties policy, technical capability
and financial, and so on.
Tao et al., [18] studied traditional model of association rule
mining is adapted to handle weighted association rule mining
problems where each item is allowed to have a weight. The
goal is to steer the mining focus to those significant
relationships involving items with significant weights rather
than being flooded in the combinatorial explosion of
insignificant relationships. The study identifies the challenge
of using weights in the iterative process of generating large
item sets. The problem of invalidation of the “downward
closure property” in the weighted setting is solved by using an
improved model of weighted support measurements and
exploiting a “weighted downward closure property”. A new
algorithm called WARM (Weighted Association Rule Mining)
is developed based on the improved model. The algorithm is
both scalable and efficient in discovering significant
relationships in weighted settings as illustrated by experiments
performed on simulated datasets.
Li Cheng-jun, Yang Tian-qi (2010) [11], were compared to
some generalized weighted association rules mining, it proves
that the method can quickly and efficiently mine important
association rules.
A. Haery et al. (2008) [3] the effective factors on supplier
selection. He reviewed the proposal as criteria selecting &
information gathering, performing association rule mining,
validation & constituting rule base. Afterwards a few of
applications of rule base is explained. Then, a numerical
example is presented and analyzed by Clementine software.
Chin-Nung Liao (2010), [6] proposed an integrated modified
Delphi technique, Analytical Hierarchical Process, and
Taguchi loss functions to valuation and selection of suppliers.
The advantages of these methods are widely acknowledged:
increased important performance criteria use in suppliers and
improved efficiency in decision-making. This proposal
provides an effective decision approach for decision-makers to
solve a multiple criteria decision-making for supplier selection
problems.
III. LWM ALGORITHM
Likert Weight Measure (LWM)[16] is considered as a light
weight supplier selection model. A Likert scale is a
psychometric scale commonly used in questionnaires, and is
the most widely used scale in survey research, such that the
term is often used interchangeably with rating scale even
though the two are not synonymous. Analytical Hierarchical
Process (AHP) is a structured technique for dealing with
63 http://sites.google.com/site/ijcsis/ ISSN 1947-5500
(IJCSIS) International Journal of Computer Science and Information Security,
Vol. 9, No. 12, December 2011
complex decisions. It provides a comprehensive and rational
framework for structuring a decision problem, for representing
and quantifying its elements, for relating those elements to
overall goals, and for evaluating alternative solutions. The
Analytic Hierarchy Process (AHP)[15] has found widespread
application in decision making problems, involving multiple
criteria in systems of many levels (Liu & Hai [12], 2005). This
method has the ability to structure complex, multi-person,
multi-attribute, and multi-period problem hierarchically
(Yusuff, PohYee & Hashmi [23], 2001).
The AHP can be very useful in involving several decision-
makers with different conflicting objectives to arrive at a
consensus decision (Tam & Tummala [17], 2001). The AHP
method is identified to assist in decision making to resolve the
supplier selection problem in choosing the optimal supplier
combination (Yu & Jing [22], 2004).
Considering the existing problems in the company initiating
from incorrect supplier selection, owing to the human
mistakes in judging the raw materials, or paying too much
attention to one factor only, such as price, cost and other
similar and unexpected problems, the AHP model is highly
recommended to handle the supplier selection more accurately
in order to alleviate, or better yet, eradicate the mistakes in this
line. AHP has some weak points; one of these is the
complexity of this method which makes it implementation
quite inconvenient. Moreover, if more than one person is
working on this method, different opinions about the weight of
each criterion can complicate matters. AHP also requires data
based on experience, knowledge and judgment which are
subjective for each decision-maker. A further disadvantage of
this method is that it does not consider risks and uncertainties
regarding the supplier‟s performances (Yusuff et al.,[23]
2001). In addition to that it required high computation power
to predict the rank order.
Recently many organizations are migrating to business
intelligence applications, which explore more insight about
their business. Most of the applications gather supplier
selection insights from the recent business history of the
supplier. Yet, this is an efficient system and followed by major
vendors such as SAP, Oracle and Microsoft. In order to reduce
the more computation power and include psychometric
technique, we put forward a novel solution by Likert Weight
Measure (LWM) corresponding weight to attribute of different
importance called weighted association rule mining. A Likert
item is simply a statement which the respondents asked to
evaluate according to any kind of subjective or objective
criteria; generally the level of agreement or disagreement is
measured.
The following Table-1 represents the sample scenario of
suppliers and products relationship depicted in twenty records.
It contains nine products and three suppliers. It contains 20
records, in which three suppliers, nine products and five
criteria customer feedback. The five criteria are respectively,
easy availability, price, quality, on-time delivery, and
flexibility. In this paper, criteria weighted measured in three
points, namely high (3), moderate (2) and low (1). Our
algorithm allows different scaling factors. In order to
standardize the feedback, novel refactoring method is applied
to inverse original feedback given by the customer. Number of
criteria and its scaling factor may different from one dataset to
another dataset. In our dataset, most preferred price feedback
is low (1) whereas quality feedback is high (3), hence
refactoring is applied to inverse the specified feedback.
Table-1: Sample Dataset
SNo. Supplier Products C1 C2 C3 C4 C5
1 S1 P1 1 3 1 2 2
2 S1 P2 3 3 2 1 2
3 S3 P4 3 2 2 2 1
4 S1 P3 3 1 3 2 2
5 S1 P4 3 3 1 2 2
6 S2 P2 2 2 3 2 3
7 S3 P2 2 2 2 2 2
8 S2 P3 2 2 1 2 3
9 S2 P4 2 1 2 1 2
10 S1 P5 2 2 3 1 2
11 S2 P5 2 2 2 2 3
12 S1 P6 2 2 2 2 2
13 S3 P6 2 1 3 1 2
14 S2 P1 1 2 3 2 1
15 S2 P6 1 1 3 2 2
16 S2 P8 3 2 2 3 3
17 S3 P7 2 2 3 2 2
18 S1 P7 2 3 3 1 3
19 S2 P7 3 1 2 2 3
20 S2 P9 1 1 2 1 2
64 http://sites.google.com/site/ijcsis/ ISSN 1947-5500
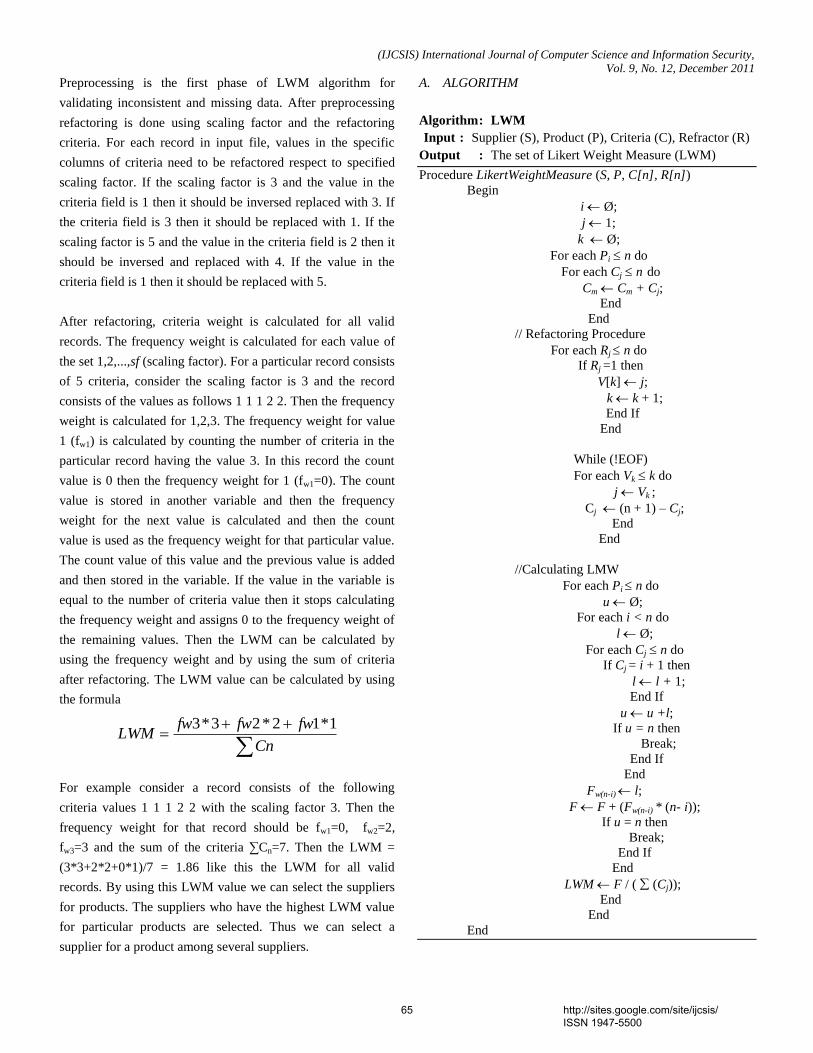
(IJCSIS) International Journal of Computer Science and Information Security,
Vol. 9, No. 12, December 2011
Preprocessing is the first phase of LWM algorithm for
validating inconsistent and missing data. After preprocessing
refactoring is done using scaling factor and the refactoring
criteria. For each record in input file, values in the specific
columns of criteria need to be refactored respect to specified
scaling factor. If the scaling factor is 3 and the value in the
criteria field is 1 then it should be inversed replaced with 3. If
the criteria field is 3 then it should be replaced with 1. If the
scaling factor is 5 and the value in the criteria field is 2 then it
should be inversed and replaced with 4. If the value in the
criteria field is 1 then it should be replaced with 5.
After refactoring, criteria weight is calculated for all valid
records. The frequency weight is calculated for each value of
the set 1,2,...,sf (scaling factor). For a particular record consists
of 5 criteria, consider the scaling factor is 3 and the record
consists of the values as follows 1 1 1 2 2. Then the frequency
weight is calculated for 1,2,3. The frequency weight for value
1 (fw1) is calculated by counting the number of criteria in the
particular record having the value 3. In this record the count
value is 0 then the frequency weight for 1 (fw1=0). The count
value is stored in another variable and then the frequency
weight for the next value is calculated and then the count
value is used as the frequency weight for that particular value.
The count value of this value and the previous value is added
and then stored in the variable. If the value in the variable is
equal to the number of criteria value then it stops calculating
the frequency weight and assigns 0 to the frequency weight of
the remaining values. Then the LWM can be calculated by
using the frequency weight and by using the sum of criteria
after refactoring. The LWM value can be calculated by using
the formula
Cn
fwfwfwLWM
1*12*23*3
For example consider a record consists of the following
criteria values 1 1 1 2 2 with the scaling factor 3. Then the
frequency weight for that record should be fw1=0, fw2=2,
fw3=3 and the sum of the criteria ∑Cn=7. Then the LWM =
(3*3+2*2+0*1)/7 = 1.86 like this the LWM for all valid
records. By using this LWM value we can select the suppliers
for products. The suppliers who have the highest LWM value
for particular products are selected. Thus we can select a
supplier for a product among several suppliers.
A. ALGORITHM
Algorithm : LWM
Input : Supplier (S), Product (P), Criteria (C), Refractor (R)
Output : The set of Likert Weight Measure (LWM)
Procedure LikertWeightMeasure (S, P, C[n], R[n])
Begin
i Ø;
j 1;
k Ø;
For each Pi n do
For each Cj n do
Cm Cm + Cj;
End
End
// Refactoring Procedure
For each Rj n do
If Rj =1 then
V[k] j;
k k + 1;
End If
End
While (!EOF)
For each Vk k do
j Vk ;
Cj (n + 1) – Cj;
End
End
//Calculating LMW
For each Pi n do
u Ø;
For each i < n do
l Ø;
For each Cj n do
If Cj = i + 1 then
l l + 1;
End If
u u +l;
If u = n then
Break;
End If
End
Fw(n-i) l;
F F + (Fw(n-i) * (n- i));
If u = n then
Break;
End If
End
LWM F / ( (Cj));
End
End
End
65 http://sites.google.com/site/ijcsis/ ISSN 1947-5500
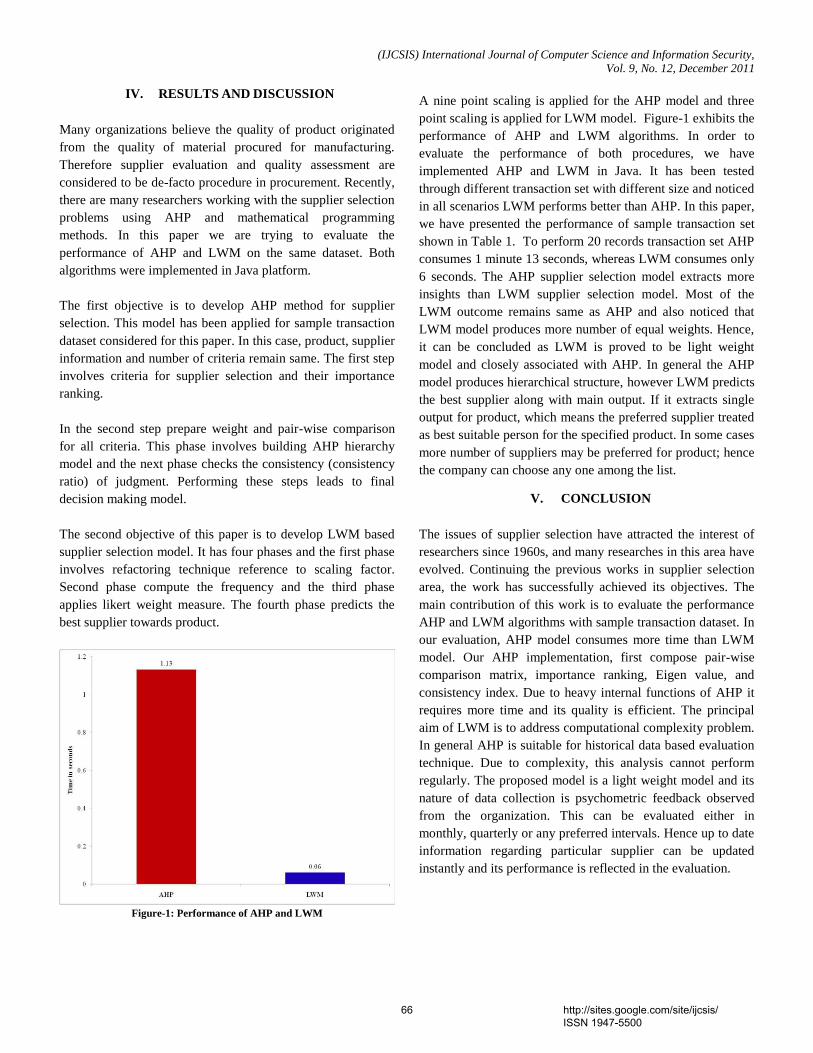
(IJCSIS) International Journal of Computer Science and Information Security,
Vol. 9, No. 12, December 2011
IV. RESULTS AND DISCUSSION
Many organizations believe the quality of product originated
from the quality of material procured for manufacturing.
Therefore supplier evaluation and quality assessment are
considered to be de-facto procedure in procurement. Recently,
there are many researchers working with the supplier selection
problems using AHP and mathematical programming
methods. In this paper we are trying to evaluate the
performance of AHP and LWM on the same dataset. Both
algorithms were implemented in Java platform.
The first objective is to develop AHP method for supplier
selection. This model has been applied for sample transaction
dataset considered for this paper. In this case, product, supplier
information and number of criteria remain same. The first step
involves criteria for supplier selection and their importance
ranking.
In the second step prepare weight and pair-wise comparison
for all criteria. This phase involves building AHP hierarchy
model and the next phase checks the consistency (consistency
ratio) of judgment. Performing these steps leads to final
decision making model.
The second objective of this paper is to develop LWM based
supplier selection model. It has four phases and the first phase
involves refactoring technique reference to scaling factor.
Second phase compute the frequency and the third phase
applies likert weight measure. The fourth phase predicts the
best supplier towards product.
Figure-1: Performance of AHP and LWM
A nine point scaling is applied for the AHP model and three
point scaling is applied for LWM model. Figure-1 exhibits the
performance of AHP and LWM algorithms. In order to
evaluate the performance of both procedures, we have
implemented AHP and LWM in Java. It has been tested
through different transaction set with different size and noticed
in all scenarios LWM performs better than AHP. In this paper,
we have presented the performance of sample transaction set
shown in Table 1. To perform 20 records transaction set AHP
consumes 1 minute 13 seconds, whereas LWM consumes only
6 seconds. The AHP supplier selection model extracts more
insights than LWM supplier selection model. Most of the
LWM outcome remains same as AHP and also noticed that
LWM model produces more number of equal weights. Hence,
it can be concluded as LWM is proved to be light weight
model and closely associated with AHP. In general the AHP
model produces hierarchical structure, however LWM predicts
the best supplier along with main output. If it extracts single
output for product, which means the preferred supplier treated
as best suitable person for the specified product. In some cases
more number of suppliers may be preferred for product; hence
the company can choose any one among the list.
V. CONCLUSION
The issues of supplier selection have attracted the interest of
researchers since 1960s, and many researches in this area have
evolved. Continuing the previous works in supplier selection
area, the work has successfully achieved its objectives. The
main contribution of this work is to evaluate the performance
AHP and LWM algorithms with sample transaction dataset. In
our evaluation, AHP model consumes more time than LWM
model. Our AHP implementation, first compose pair-wise
comparison matrix, importance ranking, Eigen value, and
consistency index. Due to heavy internal functions of AHP it
requires more time and its quality is efficient. The principal
aim of LWM is to address computational complexity problem.
In general AHP is suitable for historical data based evaluation
technique. Due to complexity, this analysis cannot perform
regularly. The proposed model is a light weight model and its
nature of data collection is psychometric feedback observed
from the organization. This can be evaluated either in
monthly, quarterly or any preferred intervals. Hence up to date
information regarding particular supplier can be updated
instantly and its performance is reflected in the evaluation.
66 http://sites.google.com/site/ijcsis/ ISSN 1947-5500

(IJCSIS) International Journal of Computer Science and Information Security,
Vol. 9, No. 12, December 2011
REFERENCES
[1] Agrawal, R., Imielinski, T., Swami, A.(1993), “Mining Association
Rules Between Sets of Items in Large Databases”, In: 12th ACM SIGMOD
on Management of Data, pp. 207-216
[2] Agrawal, R., Srikant, R.(1994), “Fast Algorithms for Mining
Association Rules”, In: 20th VLDB Conference, pp. 487-499.
[3] A.Haery et al., (2008), “Application of Association Rule Mining in
Supplier Selection Criteria”, Proceeding of World Academy of Science
Engineering and Technology, pp. 358-362.
[4] Bodon,F.(2003), “A Fast Apriori implementation”, In: ICDM
Workshop on Frequent Itemset Mining Implementations, vol.90,
Melbourne, Florida, USA.
[5] C.H.Cai, Ada W.C. Fu, C.H. Cheng and W.W. Kwong (1998), Mining
Association Rules with Weighted Items. Proceedings of the 1998
International Symposium on Database Engineering & Applications,
Cardiff, Wales, pp. 68-77.
[6] Chin-Nung Liao (2010), “Supplier Selection Project using an Integrated
Delphi, AHP and Taguchi Loss Function”,
[7] Dickson, G.W. (1966). "An Analysis of Supplier Selection Systems
and Decisions," Journal of Purchasing, Volume 2, Number 1, 5-17.
[8] Feng Tao, Fionn Murtagh, Mohsen Farid, (2003), “Weighted
Association Rule Mining using Weighted Support and Significant
Framework”, In Proceedings of the 9th ACM SIGKDD, Knowledge
Discovery and Data Mining, pp.661-666.
[9] Guangyuan Li; Bingru Yang; Ma Nan; Jianwei Guo (2010),
“Weighted Frequent Pattern Mining Over Data Streams”, 2nd International
conference on industrial information systems, pp. 262-265.
[10] Li, C. C., Y. P. Fun & Hung, J.S. (1997). “A new measure for supplier
performance evaluation.” IEEE Transactions 29: pp.753-758.
[11] Li Cheng-jun, Yang Tian-qi (2010), “Effective Mining of Fuzzy
Quantitative Weighted Association Rules”, International Conference on E-
Business and E-Government (ICEE), IEEE 2010, pp.1418-1421.
[12] Liu, F.-H.F. and Hai, H.L. (2005). The voting analytic hierarchy
process method for selecting supplier. Int. J. Prod. Econ. 97 (3):308-317.
[13] Motwani, J. and Youssef, M. (1999), “Supplier selection in developing
countries: a model development”, Emerald, 10(13):154-162.
[14] Petroni, A. (2000), “Vendor Selection using Principal Component
Analysis”, The JSCM, 1(13):63-69.
[15] Saaty, T. (1980). The Analytic Hierarchy Process, New York,
McGraw-Hill.
[16] Sudha N, Santhosh Baboo (2011), “Evolution of new WARM using
Likert Weight Measure”, International Journal of Computer Science and
Network Security, VOL.11 No.5, pp. 1-6.
[17] Tam, M.C.Y. and Tummala, V.M.R (2001), “An Application of the
AHP in vendor selectionf a telecommunications system”, Omega, 29(2):
171-182.
[18] Tao, F., Murtagh, F. and Farid, M. (2003), “Weighted Association
Rule Mining using Weighted Support and Significance Framework”, In:
The Ninth ACM SIGKDD International Conference on Knowledge
Discovery and Data Mining (ACM SIGKDD 2003), August 24 - 27,
Washington DC, USA. pp. 661-666.
[19] U. Yun, J.J. Leggett (2005), “WFIM: weighted frequent itemset
mining with a weight range and a minimum weight”, In Proceedings of the
15th SIAM International Conference on Data Mining (SDM‟05), pp.636-
640.
[20] U. Yun (2007), “Efficient Mining of weighted interesting patterns with
a strong weight and/or support affinity”, Information Sciences, Vol.177,
pp.3477-3499.
[21] W. Wang, J. Yang and P. Yu, (2000), “Efficient mining of weighted
association rules (WAR)”, Proc. of the ACM SIGKDD Conf. on
Knowledge Discovery and Data Mining, 270-274.
[22] Yu, X. and Jing, S. (2004), “A Decision Model for Supplier Selection
Considering Trust”, Chinese Business Review, 3(6):15-20
[23] Yusuff, R.D. and Poh Yee, K. (2001), “A preliminary study on the
potential use of the analytical hierarchical process (AHP) to predict
advanced manufacturing technology (AMT) implementation”, Robotics and
Computer Integrated Manufacturing. 17:421-427.
AUTHOR’S PROFILE
N.Sudha has done her Under-Graduation and
Post-Graduation and Master of Philosophy in Computer science. She is currently pursuing her
Ph.D in Computer Science in Dravidian
University, Kuppam, Andhra Pradesh. Also, she is working as Assistant professor, Department of
Computer Science , Bishop Appasamy College of
Arts and Science, Coimbatore, affiliated to Bharathiar University. She has organized various
National and State level seminars, and Technical
Symposium. She has participated in various National conferences. She has 2 years of industrial experience and 12 years of teaching experience. Her
research area is Data Mining.
Lt.Dr.S.Santhosh Baboo, aged forty, has
around twenty two years of postgraduate
teaching experience in Computer Science,
which includes Six years of administrative
experience. He is a member, board of studies,
in several autonomous colleges, and designs
the curriculum of undergraduate and
postgraduate programmes. He is a consultant
for starting new courses, setting up computer
labs, and recruiting lecturers for many colleges. Equipped with a Masters
degree in Computer Science and a Doctorate in Computer Science, he is a
visiting faculty to IT companies. It is customary to see him at several
national/international conferences and training programmes, both as a
participant and as a resource person. He has been keenly involved in
organizing training programmes for students and faculty members. His
good rapport with the IT companies has been instrumental in on/off campus
interviews, and has helped the post graduate students to get real time
projects. He has also guided many such live projects. Lt.Dr. Santhosh
Baboo has authored a commendable number of research papers in
international/national Conference/journals and also guides research
scholars in Computer Science. Currently he is Reader in the Postgraduate
and Research department of Computer Science at Dwaraka Doss
Goverdhan Doss Vaishnav College (accredited at „A‟ grade by NAAC),
one of the premier institutions in Chennai.
67 http://sites.google.com/site/ijcsis/ ISSN 1947-5500

(IJCSIS) International Journal of Computer Science and Information Security,
Vol.9, No. 12. 2011
Classifying Wine Quality Using K-Nearest Neighbor
Based Associations
Lailil Muflikhah
Computer Science Department
University of Brawijaya
Malang, Indonesia
[email protected], [email protected]
Made Putra Adnyana
Computer Science Department
University of Brawijaya
Malang, Indonesia
Abstract—Assessment of wine quality is conducted through
chemical and sensory analysis. However, the sensory analysis
which includes taste, color and smell requires time consuming
and high cost. Therefore, we propose to apply k-Nearest
Neighbor Based Associations (KNNBA) of their attributes by
embedded weight for calculating the dissimilarity between
records which is used Euclidean distance. The association of the
attribute weights can be determined by the value of group
support and confidence in each attribute. The advantage of the
method is applicable for data reduction based on irrelevant
attribute.
Keywords-wine; k-nearest neighbor; associations; irrelevant
attribute; Euclidean
I. INTRODUCTION
Wine is the fermented juice [1]. Certification of wine
quality is an important step for production and sales processes
[2]. The certification that includes quality assessment carried
out to prevent fraud and ensure the quality of wine in the
market [3]. A method which can be used for assessment of
quality wine is the objective and subjective measurements [4].
The objective measurements are carried out through laboratory
tests to determine physicochemical of wine data set such as:
density, alcohol content or pH value. However, the subjective
measurements are carried out by experts through sensory
analysis by assessing the characteristics of wine including
taste, color and smell test. The sensory analysis requires high
cost and time consuming. According to Smyth (2005),
although the chemical and sensory analysis of wine developed
separately, advances in multivariate data analysis techniques
allows the chemical composition of wine is connected with
sensory characteristics. Moreover, the sense is the least
understood by humans, so that the classification of wine
quality becomes difficult [2, 4].
The analysis techniques which are made to get information
from the data collection based on the pattern of their
characteristics is known as one of data mining techniques. The
pattern of data collections can be found from their
relationship. Association rule is a procedure to find the
relationship between items within a specified set of data [5].
Therefore, by applying the association rule into one of
classification methods for adding information (as weight of the
records), we proposed into this research.
II. PREVIOUS WORK
Research of wine quality classification has been done by
Cortez (2009) using Support Vector Machine (SVM) method. The method applied three regression techniques which performs simultaneous variable and model selection. The accuracy rate has been achieved at 62.4% for red wine data set and 64.6% for white wine data sets. However, the simplest and most applicable method for classification is K-Nearest Neighbor (KNN) algorithm which used distance measure based to define the certain class. K-Nearest Neighbor Based Association (KNNBA) is the development of KNN by giving the weight to use the association rule. Mehdi Moradian and Ahmad Baarani (2009) suggested that the weighting of attribute is used to find the most relevant attributes. Giving appropriate weight to each attribute can improve the classification accuracy. Based on the result of research on 15 UCI datasets such as Balance, Breast-cancer, Breast-cancer w, Ecoli, Glass, Haberman, Hayes, Heart-statlog, Labor, Parkinson's, Teaching-Assistant, Vehicle, Wine, Yeast and Zoo data sets, the average of accuracy rate was obtained that classification using KNNBA has increased 7% more than the KNN algorithm. [6]
III. RESEARCH METHOD
A. Wine
In general, grapes are used as raw materials in the
manufacturing process to make wine. A method that can be
used for assessment of wine quality is the objective
measurement (analysis of volatile compounds) and subjective
measurements (sensory analysis) that can provide reliable
information about the quality of wine [4]. The objective
measurement through laboratory tests is used to determine
physical chemical data wines such as: density, alcohol content
or pH value. However, the subjective measurements through
sensory analysis performed by assessing the characteristics of
the wine such as taste test, color and odor by experts. Physical
chemical data include: [7, 8]
68 http://sites.google.com/site/ijcsis/ ISSN 1947-5500

(IJCSIS) International Journal of Computer Science and Information Security,
Vol.9, No. 12. 2011
1. Fixed acidity is all organic acids are not included in the
category of volatile / volatile. This acid is quantitatively
adjusted the pH of the wine.
2. Volatile acidity is an acid that can be easily removed by
steam distillation. This creates a spicy sour aroma of
wine. Levels of volatile acidity of wine that is both
below 1.2 g /L.
3. Citric acid or citric acid is an acid found in many fruits,
including grapes. This acid gives a fresh taste. Wine is
good, have lower levels of citric acid in 1 g/L.
4. Residual sugar is a sugar residue which is found on the
wine after fermentation is complete. The amount of
residual sugar affects the sweet taste of wine.
5. Chlorides serve to adjust the pH to stay within an
acceptable range.
6. Free sulfur dioxide is a sulfite that still does not react
with other molecules, such as sugar.
7. Total sulfur dioxide is totally free of sulfur dioxide and
sulfite has reacted with other molecules in the wine.
8. Density relates to the amount of sugar dissolved in
wine. The default value density value is between 0.987
to 1.076 g/cm3
9. The pH is associated with the acidity of wine and the
values are corresponding to the wine range 2.9 to 4.2.
10. Sulphates are the content of sulfate in wines that have
maximum levels as 2g /L.
11. Alcohol content of wine is 9% to 14%.
B. Association Rules
The data analysis techniques have made to get information
from the data collection based on the pattern of their
characteristics. The pattern of data collections can be found
from their relationship. Association rule is a procedure to find
the relationship between items within a specified set of data.
Also, there are steps of association rule as follows [5]:
1. To find the most frequent combination of an itemset
2. To establish conditions and results for conditional
association rule
In determining an association rule, there are two measures
of confidence gained from the data processing with specific
calculation:
a. Support is a rule that shows how much the dominance
level of overall item set transaction
b. Confidence is a measure that shows the relationship
between two items conditionally.
The both measures provide a minimum support threshold
and minimum confidence be used to determine interesting
association rules. If there is association rule such as A B,
then based on probability theory, the value of support and
confidence can be shown in Equation 1 and 2.
( 1)
C. K-Nearest Neighbor (KNN)
K-Nearest Neighbor algorithm is often used for
classification. The advantages of KNN algorithm are
simple and easy to implement [9]. These algorithms
look for k training record (neighbors) who have the
shortest distance from the new record, to predict the
class of the new record. To calculate the Euclidean
distance is used the distance function shown by
Equation 3.
x1 = (x11,x12,….,x1n)
x2 = (x21,x22,….,x2n)
dist(x1,x2) = (3)
where, x1 and x2 are two records with n attributes.
This equation calculates the distance between x1 and
x2, with the aim to determine the difference between
the values of attributes in a record x1 and x2.
Then, the distance between the records is taken as k
nearest neighbors to predict the class label of a new
record using the neighbor class labels.
D. Combination Function
To provide classification decisions for the new
record, do a combination of similar records, with the
combination function. There are two types of
combination function, un-weighted voting and
weighted voting. In the un-weighted voting, class label
for the new record, it is selected based on the class
label most (majority) owned by neighbors. Meanwhile,
the weighted voting is done by giving weight to some
neighbors that are close to a new record. This
weighting can give more influence in determining the
class label. Weighted voting is shown by Equation 4.
Weight (neighbor) = (4)
where, DISTANCE (neighbor, newRecord) is the
distance between the new records with neighbors. The
weight is the sum of weighted neighbors who have the
same class label. Class label of the new record is the
class label of the record that the greatest amount of
weight to its neighbors.
E. K-Nearest Neighbor Based Association(KNNBA)
( 2)
K-NN algorithm is as one of classification methods which
using dissimilarity concept to define the class for each record.
KNNBA is extension of KNN by embedding weight into
69 http://sites.google.com/site/ijcsis/ ISSN 1947-5500
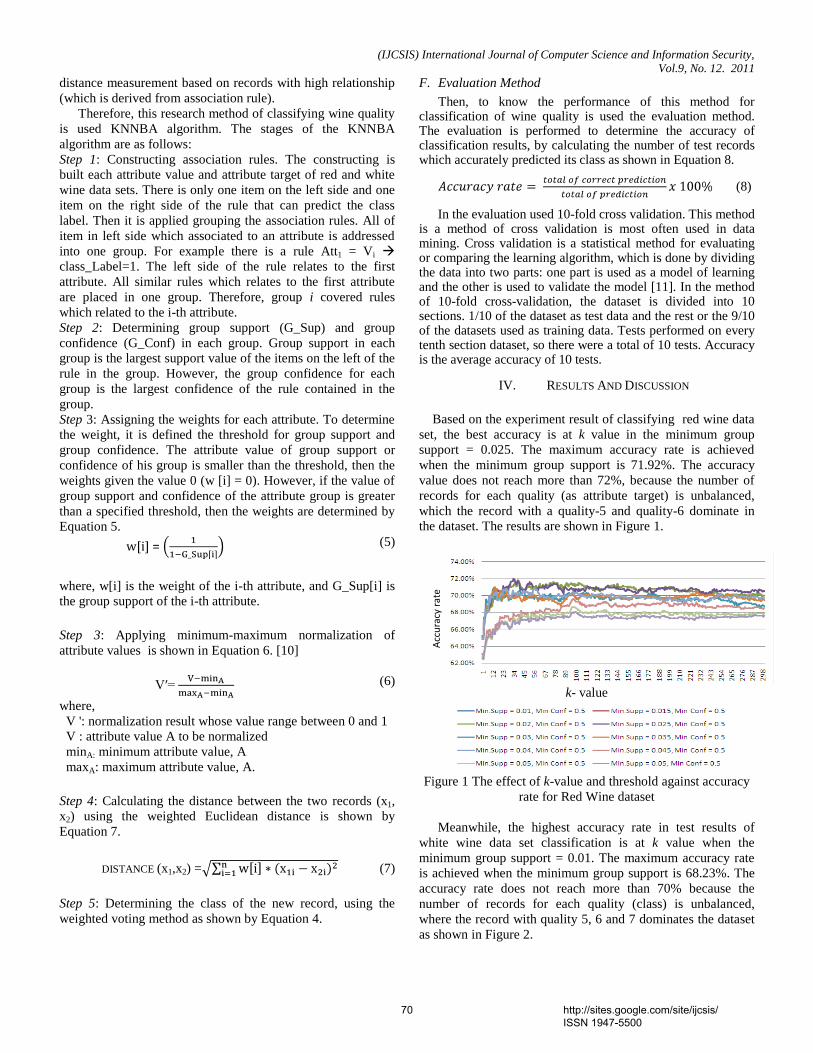
(IJCSIS) International Journal of Computer Science and Information Security,
Vol.9, No. 12. 2011
distance measurement based on records with high relationship
(which is derived from association rule).
Therefore, this research method of classifying wine quality
is used KNNBA algorithm. The stages of the KNNBA
algorithm are as follows:
Step 1: Constructing association rules. The constructing is
built each attribute value and attribute target of red and white
wine data sets. There is only one item on the left side and one
item on the right side of the rule that can predict the class
label. Then it is applied grouping the association rules. All of
item in left side which associated to an attribute is addressed
into one group. For example there is a rule Att1 = Vi
class_Label=1. The left side of the rule relates to the first
attribute. All similar rules which relates to the first attribute
are placed in one group. Therefore, group i covered rules
which related to the i-th attribute.
Step 2: Determining group support (G_Sup) and group
confidence (G_Conf) in each group. Group support in each
group is the largest support value of the items on the left of the
rule in the group. However, the group confidence for each
group is the largest confidence of the rule contained in the
group.
Step 3: Assigning the weights for each attribute. To determine
the weight, it is defined the threshold for group support and
group confidence. The attribute value of group support or
confidence of his group is smaller than the threshold, then the
weights given the value 0 (w [i] = 0). However, if the value of
group support and confidence of the attribute group is greater
than a specified threshold, then the weights are determined by
Equation 5.
w[i] = (5)
where, w[i] is the weight of the i-th attribute, and G_Sup[i] is
the group support of the i-th attribute.
Step 3: Applying minimum-maximum normalization of
attribute values is shown in Equation 6. [10]
V′= (6)
where,
V ': normalization result whose value range between 0 and 1
V : attribute value A to be normalized
minA: minimum attribute value, A
maxA: maximum attribute value, A.
Step 4: Calculating the distance between the two records (x1,
x2) using the weighted Euclidean distance is shown by
Equation 7.
DISTANCE (x1,x2) = (7)
Step 5: Determining the class of the new record, using the
weighted voting method as shown by Equation 4.
F. Evaluation Method
Then, to know the performance of this method for classification of wine quality is used the evaluation method. The evaluation is performed to determine the accuracy of classification results, by calculating the number of test records which accurately predicted its class as shown in Equation 8.
(8)
In the evaluation used 10-fold cross validation. This method is a method of cross validation is most often used in data mining. Cross validation is a statistical method for evaluating or comparing the learning algorithm, which is done by dividing the data into two parts: one part is used as a model of learning and the other is used to validate the model [11]. In the method of 10-fold cross-validation, the dataset is divided into 10 sections. 1/10 of the dataset as test data and the rest or the 9/10 of the datasets used as training data. Tests performed on every tenth section dataset, so there were a total of 10 tests. Accuracy is the average accuracy of 10 tests.
IV. RESULTS AND DISCUSSION
Based on the experiment result of classifying red wine data
set, the best accuracy is at k value in the minimum group
support = 0.025. The maximum accuracy rate is achieved
when the minimum group support is 71.92%. The accuracy
value does not reach more than 72%, because the number of
records for each quality (as attribute target) is unbalanced,
which the record with a quality-5 and quality-6 dominate in
the dataset. The results are shown in Figure 1.
Acc
ura
cy r
ate
k- value
Figure 1 The effect of k-value and threshold against accuracy
rate for Red Wine dataset
Meanwhile, the highest accuracy rate in test results of
white wine data set classification is at k value when the
minimum group support = 0.01. The maximum accuracy rate
is achieved when the minimum group support is 68.23%. The
accuracy rate does not reach more than 70% because the
number of records for each quality (class) is unbalanced,
where the record with quality 5, 6 and 7 dominates the dataset
as shown in Figure 2.
70 http://sites.google.com/site/ijcsis/ ISSN 1947-5500
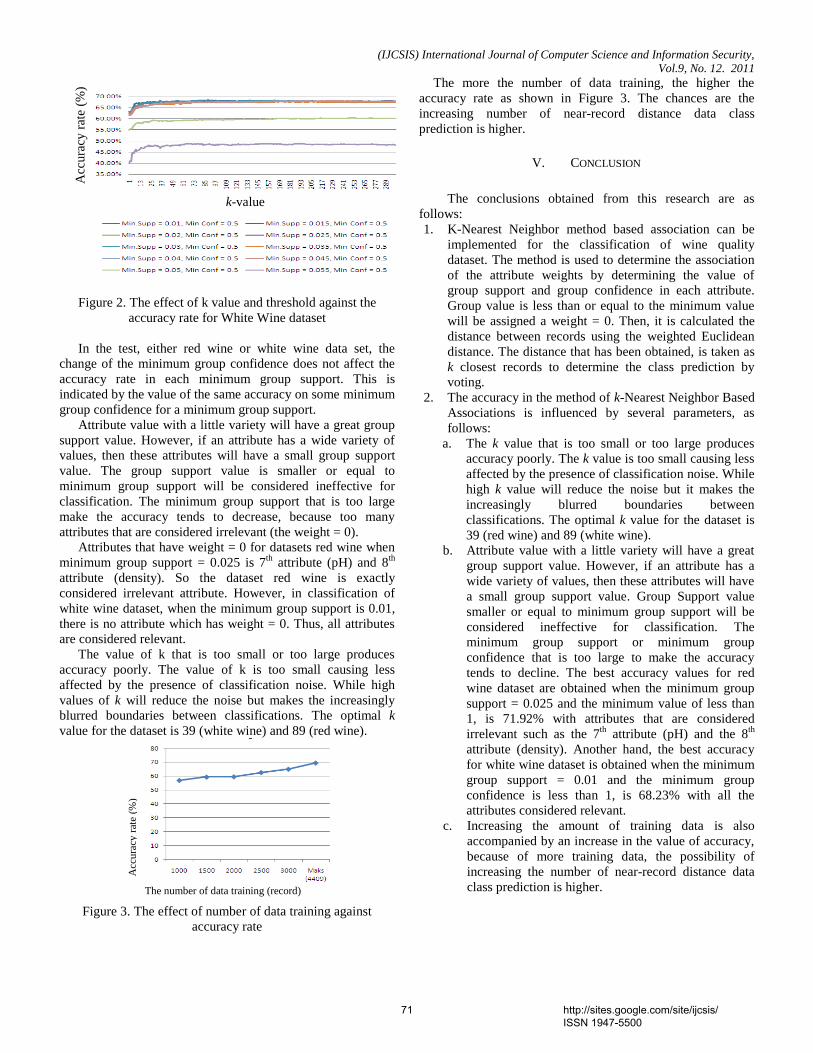
(IJCSIS) International Journal of Computer Science and Information Security,
Vol.9, No. 12. 2011
Acc
ura
cy r
ate
(%)
k-value
Figure 2. The effect of k value and threshold against the
accuracy rate for White Wine dataset
In the test, either red wine or white wine data set, the
change of the minimum group confidence does not affect the
accuracy rate in each minimum group support. This is
indicated by the value of the same accuracy on some minimum
group confidence for a minimum group support.
Attribute value with a little variety will have a great group
support value. However, if an attribute has a wide variety of
values, then these attributes will have a small group support
value. The group support value is smaller or equal to
minimum group support will be considered ineffective for
classification. The minimum group support that is too large
make the accuracy tends to decrease, because too many
attributes that are considered irrelevant (the weight = 0).
Attributes that have weight = 0 for datasets red wine when
minimum group support = 0.025 is 7th
attribute (pH) and 8th
attribute (density). So the dataset red wine is exactly
considered irrelevant attribute. However, in classification of
white wine dataset, when the minimum group support is 0.01,
there is no attribute which has weight = 0. Thus, all attributes
are considered relevant.
The value of k that is too small or too large produces
accuracy poorly. The value of k is too small causing less
affected by the presence of classification noise. While high
values of k will reduce the noise but makes the increasingly
blurred boundaries between classifications. The optimal k
value for the dataset is 39 (white wine) and 89 (red wine).
Acc
ura
cy r
ate
(%)
The number of data training (record)
Figure 3. The effect of number of data training against
accuracy rate
The more the number of data training, the higher the
accuracy rate as shown in Figure 3. The chances are the
increasing number of near-record distance data class
prediction is higher.
V. CONCLUSION
The conclusions obtained from this research are as
follows:
1. K-Nearest Neighbor method based association can be
implemented for the classification of wine quality
dataset. The method is used to determine the association
of the attribute weights by determining the value of
group support and group confidence in each attribute.
Group value is less than or equal to the minimum value
will be assigned a weight = 0. Then, it is calculated the
distance between records using the weighted Euclidean
distance. The distance that has been obtained, is taken as
k closest records to determine the class prediction by
voting.
2. The accuracy in the method of k-Nearest Neighbor Based
Associations is influenced by several parameters, as
follows:
a. The k value that is too small or too large produces
accuracy poorly. The k value is too small causing less
affected by the presence of classification noise. While
high k value will reduce the noise but it makes the
increasingly blurred boundaries between
classifications. The optimal k value for the dataset is
39 (red wine) and 89 (white wine).
b. Attribute value with a little variety will have a great
group support value. However, if an attribute has a
wide variety of values, then these attributes will have
a small group support value. Group Support value
smaller or equal to minimum group support will be
considered ineffective for classification. The
minimum group support or minimum group
confidence that is too large to make the accuracy
tends to decline. The best accuracy values for red
wine dataset are obtained when the minimum group
support = 0.025 and the minimum value of less than
1, is 71.92% with attributes that are considered
irrelevant such as the 7th
attribute (pH) and the 8th
attribute (density). Another hand, the best accuracy
for white wine dataset is obtained when the minimum
group support = 0.01 and the minimum group
confidence is less than 1, is 68.23% with all the
attributes considered relevant.
c. Increasing the amount of training data is also
accompanied by an increase in the value of accuracy,
because of more training data, the possibility of
increasing the number of near-record distance data
class prediction is higher.
71 http://sites.google.com/site/ijcsis/ ISSN 1947-5500

(IJCSIS) International Journal of Computer Science and Information Security,
Vol.9, No. 12. 2011
REFERENCES
[1] Seldon, Philip. 2000. The Complete Idiot’s Guide to Wine Second
Edition.Indianapolis : Macmillan USA, Inc.
[2] Cortez, P., Cerdeira, A., Almeida, F., Matos, T., and Reis, J. 2009. Modeling Wine Preferences by Data Mining from Physicochemical
Properties. Portugal : University of Minho.
[3] Neagoe, Victor E. 2010. Ant Colony Optimization for Logistic Regression and Its Application to Wine Quality Assessment.
[4] Smyth, H. E. 2005. The Compositional Basis of The Aroma of Riesling and
Unwooded Chardonnay Wine. Adelaide : The University of Adelaide. [5] Han, J. dan Kamber, M. 2000. Data Mining: Concepts and Techniques.
San Fransisco : Morgan Kaufmann Publishers.
[6] Moradian, M. dan Baarani, A. 2009. KNNBA: k-Nearest-Neighbor-Based-
Association Algorithm .
[7] Jackson, Ronald S. 2008. Wine Science : Priciples and Applications. London : Acdemic Press.
[8] Simmonds, Charles. 1919. Alcohol, Its Production, Properties, Chemistry,
And Industrial Applications. London : Macmillan and Co. [9] Sarkar, M. dan Leong, T. 2000. Application of K-Nearest Neighbors
Algorithm on Breast Cancer Diagnosis Problem. Singapore : The
National University of Singapore. [10] Jayalakshmi, T. and Santhakumaran, A. 2011. Statistical Normalization
and Backpropagation for Classification. [11] Refaeilzadeh, Payam, Tang, Lei dan Liu, H. 2008. Cross-Validation.
Arizona State University
72 http://sites.google.com/site/ijcsis/ ISSN 1947-5500
(IJCSIS) International Journal of Computer Science and Information Security, Vol. 9, No. 12, December 2011
Scene Change Detection Algorithms & Techniques: A Survey
Dolley Shukla1 dept. of information Technology
Shri Shankaracharya College of Engg., Tech. Bhilai, India
Manisha Sharma2
dept. of Electronics & Telecommunacation Bhilai Institute of Technology, Durg
Durg, India [email protected]
Abstract— A video scene change detection method is necessary for managing the growing amount of video information efficiently. For recognizing the video content, many advanced video applications such as video on demand (VOD), digital library and digital watermarking, requires the scene change detection. Different techniques on scene change detection are used for compressed & uncompressed videos. Scene change detection has been studied and researched over the last three decades. As a result, many scene change detection techniques have been proposed and published in the literature. This paper gives a brief description of different algorithms and comparative analysis of different scene change detection techniques. The classification of algorithms into a relatively small number of categories will provide useful guidance to the algorithm designer. (Abstract)
Keywords-Scene change detection;compressed & uncompressed video; histogram;pixel difference ; abrupt scene change (key words)
I. INTRODUCTION Video is the most effective media for capturing the world around us. Video scene change detection is a fundamental operation used in many multimedia applications such as digital libraries, video on demand and digital watermarking. Scene change detection is the procedure for identifying changes in the scene content of a video sequence. Video data can be divided into different shots. A shot is a video sequence that consists of continuous video frames for one action. Scene change detection is an operation that divides video data into physical shots. Generally scene changes are divided into two types: Abrupt scene change and Gradual scene change. Abrupt scene changes result from editing “cuts” and detecting them is called cut detection either by colour histogram comparison on the uncompressed video or by
DCT coefficient comparison. Gradual scene changes result from chromatic edits, spatial edits and combined edits. Gradual scene changes include special effects like zoom, camera pan, dissolve and fade in/out etc.
II Systematic Survey on Scene change detection
Scene change detection has received a great interest in the research community. In this section a survey on significant scene change detection techniques of videos has been presented. Scene change detection algorithms are based on the pixel differences[1], compressed(MPEG-2)domains, temporal segmentation luminance histograms based framework for temporal segmentation, sudden scene change detection for MPEG-2 compressed video, algorithm using direct edge information extraction from MPEG video data is used. Lock Ye0 and Bede Liu et al proposed rapid scene analysis algorithms for detecting scene changes and flashlight scenes directly on compressed video[2].These algorithms operate on the DC sequence which can be readily extracted from video compressed using Motion JPEG or MPEG without full-frame decompression. The DC images occupy only a small fraction of the original data size while retaining most of the essential “global” information. Operating on these images offers a significant computation saving. Experimental results show that the proposed algorithms are fast and effective in detecting abrupt scene changes, gradual transitions including fade-ins and fade-outs, flashlight scenes and in deriving intrashot variations. The temporal segmentation is done only on compressed video, not for uncompressed video. K. Tse et al presents scene change detection algorithms which is based on the pixel differences and compressed(MPEG-2) domains[3]. The main problem of this method is that it suffers from the variations incurred
73 http://sites.google.com/site/ijcsis/ ISSN 1947-5500
(IJCSIS) International Journal of Computer Science and Information Security, Vol. 9, No. 12, December 2011
by camera motion. This algorithm has the potential to detect gradual scene changes.
Haitao Jiang et al presents a scene change detection techniques for video database system[4] which provide automatic segmentation, annotation, and indexing of video data. It provide a taxonomy that classifies the existing algorithms into three categories: full video image based, compressed-video-based and model-based algorithms. P.Bouthemy et al gives approach to scene change detection & characterization[5]. The method relies on statistical technique robustness and efficiency for compressed video. The image is represented in 2D affine model. Xinying Wang' et al suggested a twice difference of luminance histograms based framework for temporal segmentation[6].The proposed method utilizes the luminance histogram twice difference in order to determine the dynamic threshold needed to evaluate the break. The adaptive determination of the threshold, minimizes the number of incorrect decisions leading to a robust and accurate determination of the actual scene break. The method is simple, computationally attractive and capable of detecting changes in a variety of visual inputs. Experimental results indicate that the new method constantly outperforms existing techniques that are based on static thresholds However, this method need to be further explored to detect complex transitions between scene change as fades and dissolve.
Seong-Whan Lee has presented a method for scene change detection algorithm using direct edge information extraction from MPEG video data[7].The paper proposed a fast scene change detection algorithm using direct feature extraction from MPEG compressed videos, and evaluate this technique using sample video data. This process was made possible by a new mathematical formulation for deriving the edge information directly from the discrete cosine transform coefficients. W. A. C. Fernando proposed a novel algorithm for sudden scene change detection for MPEG-2 compressed video[8].This uses the number of interpolated macroblocks in B-frames to identify the sudden scene changes. A gradual scene change detection algorithm based on statistical features is also presented.
Shu-Ching Chen1 et al proposed a technique for uncompressed video data[9].It presents an effective scene change detection method using an unsupervised segmentation algorithm and the technique of object tracking based on the result of the segmentation. This method can perform not only accurate scene change
detection, but also obtain object level information of the video frames, which is very useful for video content indexing and analysis. The algorithm compares the segmentation mask maps between two successive video frames & cannot be used for compressed video. Anastasios Dimou et al proposed a scene change detection for H.264[10]. It describes the correlation between local statistical characteristics, scene duration and scene change. It uses only previous frames for the detection. Priyadarshinee Adhikari et al proposed a new segmentation method based on colour difference histogram[11]. In these developed a new scene change detection method by scaling the histogram difference between the two frames. It provide the scaled frame difference that is dynamically compressed by log formula and it is more convenient to decide the threshold. Its approach is on edge detection which is based on detecting edges in two neighbouring images and comparing these images. Purnima. S. Mittalkod et al present a paper in which it gives the classification of shot boundary detection algorithms,including those that deal with gradual shot transitions[12].The paper compares different shot boundary detection algorithms and techniques & concluded that these techniques can be further refined and implemented for automatic shot detection. However, video analysis remains a challenging task with respect to unstructured home videos. III. Different Techniques on scene change detection There are a number of methods for video scene change detection in the literature. Many of them use the low-level global features such as the luminance pixel-wise difference[13],luminance or color histogram difference to compare two consecutive frames. However, since luminance or color is sensitive to small change, these low-level features cannot give a satisfactory answer to the problem of scene change detection. The major techniques that have been used for scene change detection are pixel differences, sum of absolute differences, block differences, statistical differences, histogram differences, edge tracking and compression differences. This section gives a brief description of different techniques used for scene change detection.
A. Pixel differences This method proves to be the easiest, As its basis consists
of counting the number of pixels that have changed considerably between two consecutive images, deciding if the difference is higher than a predefined threshold. After counting has been accomplished, it will check if the amount is enough to be considered a scene change comparing it with a second threshold. But the main problem of this method is
74 http://sites.google.com/site/ijcsis/ ISSN 1947-5500

(IJCSIS) International Journal of Computer Science and Information Security, Vol. 9, No. 12, December 2011
that it suffers from the variations incurred by camera motion[3].
B. Sum of absolute differences (SAD) In this method, the absolute mean value of intensity
difference between consecutive frames is computed and a large difference is assumed to be a scene change. The difference is calculated from the intensity mean matrix. The main problem of this method is that it is quite susceptible to noise.
C. Statistical difference
This technique is based on the assumption that the frame intensity variances in a shot do not demonstrate large fluctuations while that of the neighbouring shot will be different. Because it is possible for the variance to remain the same as the mean values differ, the use of both intensity mean and variance may be more robust. This method proves to work better when camera and object motion is present but is sensitive to object appearance and disappearance and fast pans and zooms[5]. D. Block differences
Unlike other previous methods, which may be susceptible to local changes, block differences methods have been proposed to handle local changes better. These start with block division for each frame and calculate the differences between the collocated or matching (in the sense of motion compensation) blocks in two frames.
E. Histograms differences
A colour histogram is a representation of the distribution
of colours in an image. The difference between the histograms of two consecutive frames is evaluated resulting in the metrics [6]. Histogram comparisons are usually based on one of the following three distance metrics: bin-to-bin difference, chi-square and histogram intersection. Among these, histogram intersection is the best of them all. Histograms are robust to object and camera changes. On the other hand, they are sensitive to intensity variations, such as flashlight and shadow effects. Furthermore, as it is a global measure, two frames with considerably different content may have the same histogram, which results in higher amount of missed detections. The colour histogram of an image can be computed by dividing a colour space, e.g., RGB, into discrete image colours called bins and counting the number of pixels falling into each bin.
F. Edge tracking
To fight against intensity variations, such as illumination changes due to flashlight, edge information can be used. The percentage of edges that enter and exit between two frames was computed and scene changes were recognized by looking for large edge change percentages. Dissolves and fades were identified by looking at their relative values of the entering and existing percentages.
G. Scene change Detection Using Macroblocks One of the approaches to handle different shot boundaries is using Macroblock. Depending on the types of the macroblock the MPEG pictures have different attributes corresponding to the Macroblock. The Macroblock types can be divided into forward prediction, backward prediction or no prediction at all[8]. IV Comparison among different techniques Table 1 compares different scene change detection techniques with advantages & limitations of the proposed techniques.
Identify applicable sponsor/s here. (sponsors)
75 http://sites.google.com/site/ijcsis/ ISSN 1947-5500
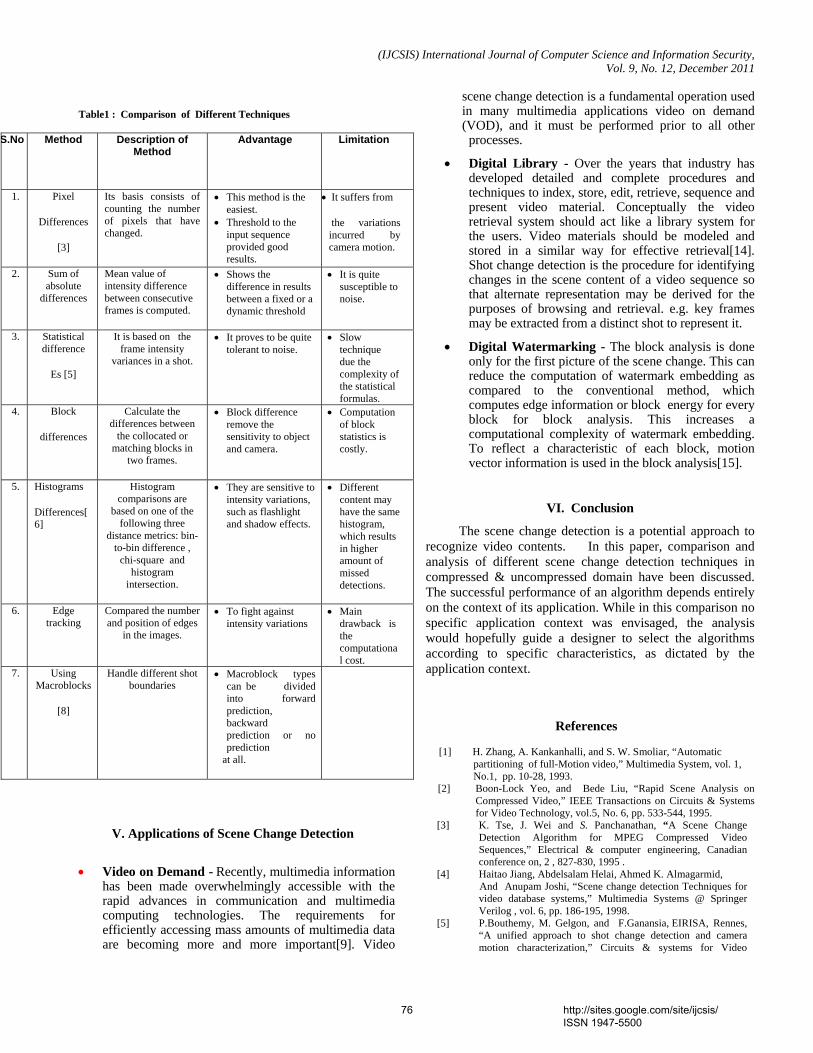
(IJCSIS) International Journal of Computer Science and Information Security, Vol. 9, No. 12, December 2011
Table1 : Comparison of Different Techniques
V. Applications of Scene Change Detection
• Video on Demand - Recently, multimedia information has been made overwhelmingly accessible with the rapid advances in communication and multimedia computing technologies. The requirements for efficiently accessing mass amounts of multimedia data are becoming more and more important[9]. Video
scene change detection is a fundamental operation used in many multimedia applications video on demand (VOD), and it must be performed prior to all other
processes.
• Digital Library - Over the years that industry has developed detailed and complete procedures and techniques to index, store, edit, retrieve, sequence and present video material. Conceptually the video retrieval system should act like a library system for the users. Video materials should be modeled and stored in a similar way for effective retrieval[14]. Shot change detection is the procedure for identifying changes in the scene content of a video sequence so that alternate representation may be derived for the purposes of browsing and retrieval. e.g. key frames may be extracted from a distinct shot to represent it.
• Digital Watermarking - The block analysis is done only for the first picture of the scene change. This can reduce the computation of watermark embedding as compared to the conventional method, which computes edge information or block energy for every block for block analysis. This increases a computational complexity of watermark embedding. To reflect a characteristic of each block, motion vector information is used in the block analysis[15].
VI. Conclusion
The scene change detection is a potential approach to recognize video contents. In this paper, comparison and analysis of different scene change detection techniques in compressed & uncompressed domain have been discussed. The successful performance of an algorithm depends entirely on the context of its application. While in this comparison no specific application context was envisaged, the analysis would hopefully guide a designer to select the algorithms according to specific characteristics, as dictated by the application context.
References
[1] H. Zhang, A. Kankanhalli, and S. W. Smoliar, “Automatic partitioning of full-Motion video,” Multimedia System, vol. 1, No.1, pp. 10-28, 1993.
[2] Boon-Lock Yeo, and Bede Liu, “Rapid Scene Analysis on Compressed Video,” IEEE Transactions on Circuits & Systems for Video Technology, vol.5, No. 6, pp. 533-544, 1995.
[3] K. Tse, J. Wei and S. Panchanathan, “A Scene Change Detection Algorithm for MPEG Compressed Video Sequences,” Electrical & computer engineering, Canadian conference on, 2 , 827-830, 1995 .
[4] Haitao Jiang, Abdelsalam Helai, Ahmed K. Almagarmid, And Anupam Joshi, “Scene change detection Techniques for
video database systems,” Multimedia Systems @ Springer Verilog , vol. 6, pp. 186-195, 1998.
[5] P.Bouthemy, M. Gelgon, and F.Ganansia, EIRISA, Rennes, “A unified approach to shot change detection and camera motion characterization,” Circuits & systems for Video
S.No
Method Description of Method
Advantage Limitation
1. Pixel
Differences
[3]
Its basis consists of counting the number of pixels that have changed.
• This method is the easiest.
• Threshold to the input sequence provided good results.
• It suffers from
the variations incurred by camera motion.
2. Sum of absolute
differences
Mean value of intensity difference between consecutive frames is computed.
• Shows the difference in results between a fixed or a dynamic threshold
• It is quite susceptible to noise.
3. Statistical difference
Es [5]
It is based on the frame intensity
variances in a shot.
• It proves to be quite tolerant to noise.
• Slow technique due the complexity of the statistical formulas.
4. Block
differences
Calculate the differences between
the collocated or matching blocks in
two frames.
• Block difference remove the sensitivity to object and camera.
• Computation of block statistics is costly.
5. Histograms
Differences[6]
Histogram comparisons are
based on one of the following three
distance metrics: bin-to-bin difference ,
chi-square and histogram
intersection.
• They are sensitive to intensity variations, such as flashlight and shadow effects.
• Different content may have the same histogram, which results in higher amount of missed detections.
6. Edge tracking
Compared the number and position of edges
in the images.
• To fight against intensity variations
• Main drawback is the computational cost.
7. Using Macroblocks
[8]
Handle different shot boundaries
• Macroblock types can be divided into forward prediction, backward prediction or no prediction
at all.
76 http://sites.google.com/site/ijcsis/ ISSN 1947-5500
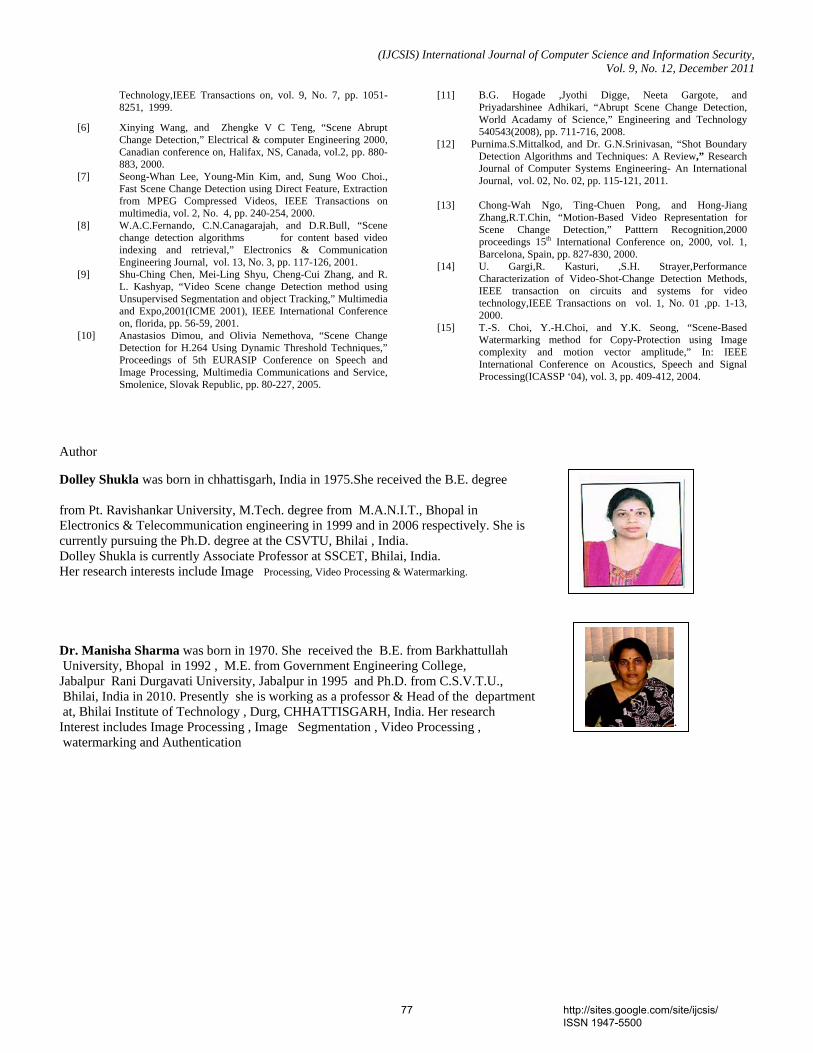
(IJCSIS) International Journal of Computer Science and Information Security, Vol. 9, No. 12, December 2011
Technology,IEEE Transactions on, vol. 9, No. 7, pp. 1051-8251, 1999.
[6] Xinying Wang, and Zhengke V C Teng, “Scene Abrupt Change Detection,” Electrical & computer Engineering 2000, Canadian conference on, Halifax, NS, Canada, vol.2, pp. 880-883, 2000.
[7] Seong-Whan Lee, Young-Min Kim, and, Sung Woo Choi., Fast Scene Change Detection using Direct Feature, Extraction from MPEG Compressed Videos, IEEE Transactions on multimedia, vol. 2, No. 4, pp. 240-254, 2000.
[8] W.A.C.Fernando, C.N.Canagarajah, and D.R.Bull, “Scene change detection algorithms for content based video indexing and retrieval,” Electronics & Communication Engineering Journal, vol. 13, No. 3, pp. 117-126, 2001.
[9] Shu-Ching Chen, Mei-Ling Shyu, Cheng-Cui Zhang, and R. L. Kashyap, “Video Scene change Detection method using Unsupervised Segmentation and object Tracking,” Multimedia and Expo,2001(ICME 2001), IEEE International Conference on, florida, pp. 56-59, 2001.
[10] Anastasios Dimou, and Olivia Nemethova, “Scene Change Detection for H.264 Using Dynamic Threshold Techniques,” Proceedings of 5th EURASIP Conference on Speech and Image Processing, Multimedia Communications and Service, Smolenice, Slovak Republic, pp. 80-227, 2005.
[11] B.G. Hogade ,Jyothi Digge, Neeta Gargote, and Priyadarshinee Adhikari, “Abrupt Scene Change Detection, World Acadamy of Science,” Engineering and Technology 540543(2008), pp. 711-716, 2008.
[12] Purnima.S.Mittalkod, and Dr. G.N.Srinivasan, “Shot Boundary Detection Algorithms and Techniques: A Review,” Research Journal of Computer Systems Engineering- An International Journal, vol. 02, No. 02, pp. 115-121, 2011.
[13] Chong-Wah Ngo, Ting-Chuen Pong, and Hong-Jiang
Zhang,R.T.Chin, “Motion-Based Video Representation for Scene Change Detection,” Patttern Recognition,2000 proceedings 15th International Conference on, 2000, vol. 1, Barcelona, Spain, pp. 827-830, 2000.
[14] U. Gargi,R. Kasturi, ,S.H. Strayer,Performance Characterization of Video-Shot-Change Detection Methods, IEEE transaction on circuits and systems for video technology,IEEE Transactions on vol. 1, No. 01 ,pp. 1-13, 2000.
[15] T.-S. Choi, Y.-H.Choi, and Y.K. Seong, “Scene-Based Watermarking method for Copy-Protection using Image complexity and motion vector amplitude,” In: IEEE International Conference on Acoustics, Speech and Signal Processing(ICASSP ‘04), vol. 3, pp. 409-412, 2004.
Author Dolley Shukla was born in chhattisgarh, India in 1975.She received the B.E. degree from Pt. Ravishankar University, M.Tech. degree from M.A.N.I.T., Bhopal in Electronics & Telecommunication engineering in 1999 and in 2006 respectively. She is currently pursuing the Ph.D. degree at the CSVTU, Bhilai , India. Dolley Shukla is currently Associate Professor at SSCET, Bhilai, India. Her research interests include Image Processing, Video Processing & Watermarking.
Dr. Manisha Sharma was born in 1970. She received the B.E. from Barkhattullah University, Bhopal in 1992 , M.E. from Government Engineering College, Jabalpur Rani Durgavati University, Jabalpur in 1995 and Ph.D. from C.S.V.T.U., Bhilai, India in 2010. Presently she is working as a professor & Head of the department at, Bhilai Institute of Technology , Durg, CHHATTISGARH, India. Her research Interest includes Image Processing , Image Segmentation , Video Processing , watermarking and Authentication
t
77 http://sites.google.com/site/ijcsis/ ISSN 1947-5500
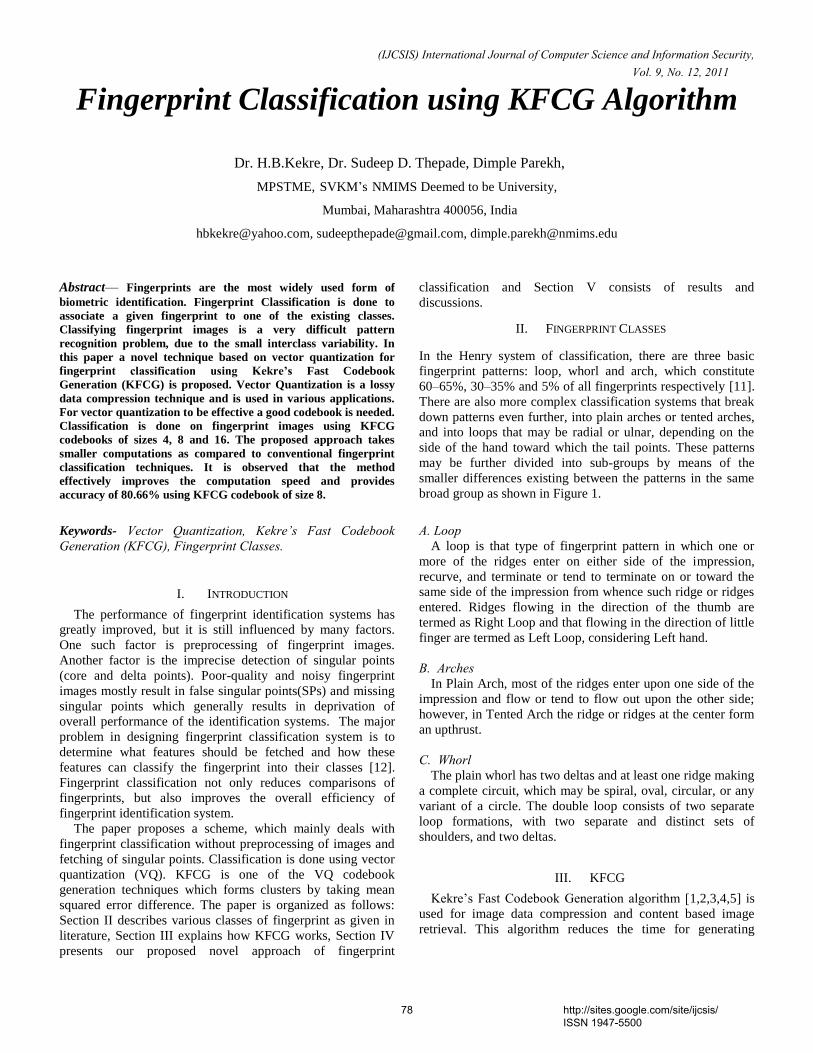
(IJCSIS) International Journal of Computer Science and Information Security, Vol. 9, No. 12, 2011
Fingerprint Classification using KFCG Algorithm
Dr. H.B.Kekre, Dr. Sudeep D. Thepade, Dimple Parekh,
MPSTME, SVKM‘s NMIMS Deemed to be University,
Mumbai, Maharashtra 400056, India
[email protected], [email protected], [email protected]
Abstract— Fingerprints are the most widely used form of
biometric identification. Fingerprint Classification is done to
associate a given fingerprint to one of the existing classes.
Classifying fingerprint images is a very difficult pattern
recognition problem, due to the small interclass variability. In
this paper a novel technique based on vector quantization for
fingerprint classification using Kekre’s Fast Codebook
Generation (KFCG) is proposed. Vector Quantization is a lossy
data compression technique and is used in various applications.
For vector quantization to be effective a good codebook is needed.
Classification is done on fingerprint images using KFCG
codebooks of sizes 4, 8 and 16. The proposed approach takes
smaller computations as compared to conventional fingerprint
classification techniques. It is observed that the method
effectively improves the computation speed and provides
accuracy of 80.66% using KFCG codebook of size 8.
Keywords- Vector Quantization, Kekre’s Fast Codebook
Generation (KFCG), Fingerprint Classes.
I. INTRODUCTION
The performance of fingerprint identification systems has
greatly improved, but it is still influenced by many factors.
One such factor is preprocessing of fingerprint images.
Another factor is the imprecise detection of singular points
(core and delta points). Poor-quality and noisy fingerprint
images mostly result in false singular points(SPs) and missing
singular points which generally results in deprivation of
overall performance of the identification systems. The major
problem in designing fingerprint classification system is to
determine what features should be fetched and how these
features can classify the fingerprint into their classes [12].
Fingerprint classification not only reduces comparisons of
fingerprints, but also improves the overall efficiency of
fingerprint identification system.
The paper proposes a scheme, which mainly deals with
fingerprint classification without preprocessing of images and
fetching of singular points. Classification is done using vector
quantization (VQ). KFCG is one of the VQ codebook
generation techniques which forms clusters by taking mean
squared error difference. The paper is organized as follows:
Section II describes various classes of fingerprint as given in
literature, Section III explains how KFCG works, Section IV
presents our proposed novel approach of fingerprint
classification and Section V consists of results and
discussions.
II. FINGERPRINT CLASSES
In the Henry system of classification, there are three basic
fingerprint patterns: loop, whorl and arch, which constitute
60–65%, 30–35% and 5% of all fingerprints respectively [11].
There are also more complex classification systems that break
down patterns even further, into plain arches or tented arches,
and into loops that may be radial or ulnar, depending on the
side of the hand toward which the tail points. These patterns
may be further divided into sub-groups by means of the
smaller differences existing between the patterns in the same
broad group as shown in Figure 1.
A. Loop A loop is that type of fingerprint pattern in which one or
more of the ridges enter on either side of the impression,
recurve, and terminate or tend to terminate on or toward the
same side of the impression from whence such ridge or ridges
entered. Ridges flowing in the direction of the thumb are
termed as Right Loop and that flowing in the direction of little
finger are termed as Left Loop, considering Left hand.
B. Arches
In Plain Arch, most of the ridges enter upon one side of the
impression and flow or tend to flow out upon the other side;
however, in Tented Arch the ridge or ridges at the center form
an upthrust.
C. Whorl The plain whorl has two deltas and at least one ridge making
a complete circuit, which may be spiral, oval, circular, or any
variant of a circle. The double loop consists of two separate
loop formations, with two separate and distinct sets of
shoulders, and two deltas.
III. KFCG
Kekre‘s Fast Codebook Generation algorithm [1,2,3,4,5] is
used for image data compression and content based image
retrieval. This algorithm reduces the time for generating
78 http://sites.google.com/site/ijcsis/ ISSN 1947-5500
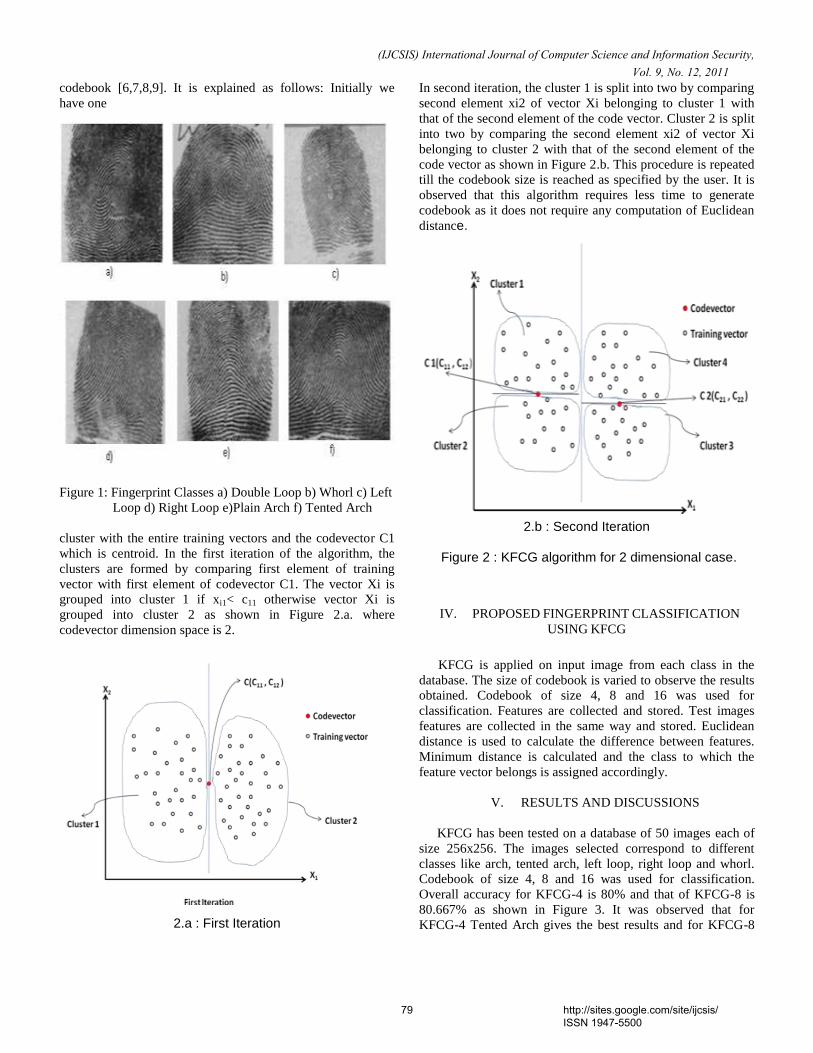
(IJCSIS) International Journal of Computer Science and Information Security, Vol. 9, No. 12, 2011
codebook [6,7,8,9]. It is explained as follows: Initially we
have one
Figure 1: Fingerprint Classes a) Double Loop b) Whorl c) Left
Loop d) Right Loop e)Plain Arch f) Tented Arch
cluster with the entire training vectors and the codevector C1
which is centroid. In the first iteration of the algorithm, the
clusters are formed by comparing first element of training
vector with first element of codevector C1. The vector Xi is
grouped into cluster 1 if xi1< c11 otherwise vector Xi is
grouped into cluster 2 as shown in Figure 2.a. where
codevector dimension space is 2.
2.a : First Iteration
In second iteration, the cluster 1 is split into two by comparing
second element xi2 of vector Xi belonging to cluster 1 with
that of the second element of the code vector. Cluster 2 is split
into two by comparing the second element xi2 of vector Xi
belonging to cluster 2 with that of the second element of the
code vector as shown in Figure 2.b. This procedure is repeated
till the codebook size is reached as specified by the user. It is
observed that this algorithm requires less time to generate
codebook as it does not require any computation of Euclidean
distance.
2.b : Second Iteration
Figure 2 : KFCG algorithm for 2 dimensional case.
IV. PROPOSED FINGERPRINT CLASSIFICATION
USING KFCG
KFCG is applied on input image from each class in the
database. The size of codebook is varied to observe the results
obtained. Codebook of size 4, 8 and 16 was used for
classification. Features are collected and stored. Test images
features are collected in the same way and stored. Euclidean
distance is used to calculate the difference between features.
Minimum distance is calculated and the class to which the
feature vector belongs is assigned accordingly.
V. RESULTS AND DISCUSSIONS
KFCG has been tested on a database of 50 images each of
size 256x256. The images selected correspond to different
classes like arch, tented arch, left loop, right loop and whorl.
Codebook of size 4, 8 and 16 was used for classification.
Overall accuracy for KFCG-4 is 80% and that of KFCG-8 is
80.667% as shown in Figure 3. It was observed that for
KFCG-4 Tented Arch gives the best results and for KFCG-8
79 http://sites.google.com/site/ijcsis/ ISSN 1947-5500
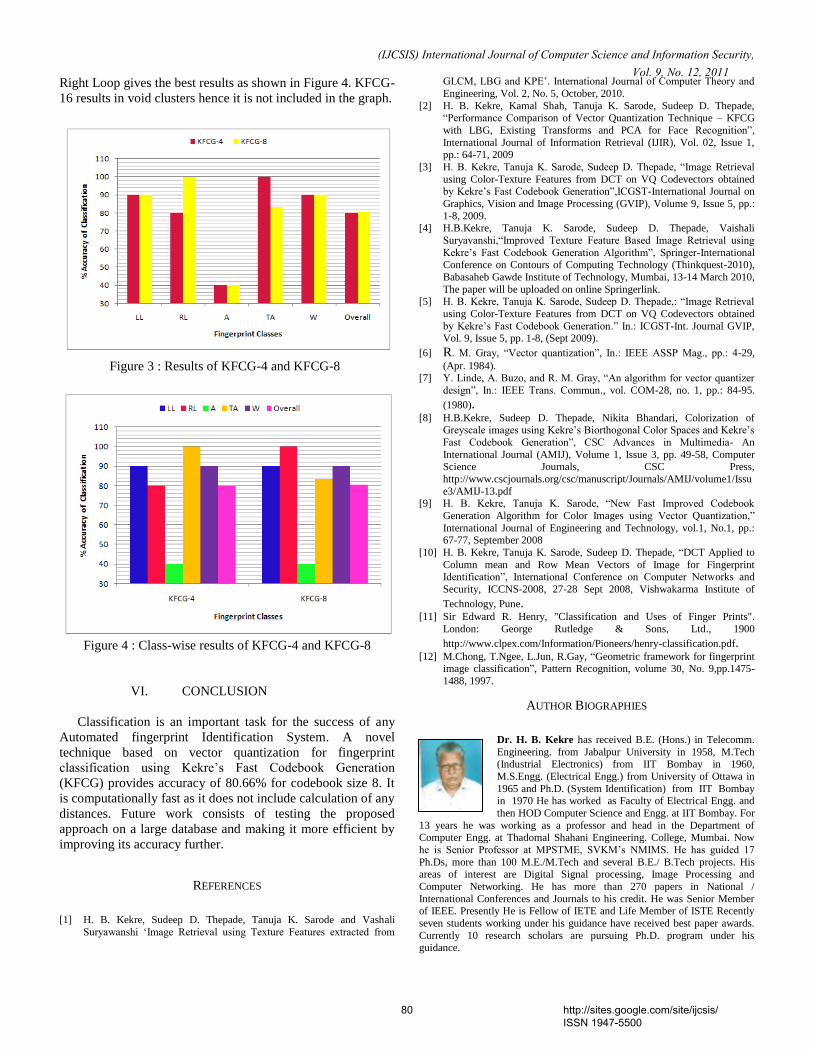
(IJCSIS) International Journal of Computer Science and Information Security, Vol. 9, No. 12, 2011
Right Loop gives the best results as shown in Figure 4. KFCG-
16 results in void clusters hence it is not included in the graph.
Figure 3 : Results of KFCG-4 and KFCG-8
Figure 4 : Class-wise results of KFCG-4 and KFCG-8
VI. CONCLUSION
Classification is an important task for the success of any
Automated fingerprint Identification System. A novel
technique based on vector quantization for fingerprint
classification using Kekre‘s Fast Codebook Generation
(KFCG) provides accuracy of 80.66% for codebook size 8. It
is computationally fast as it does not include calculation of any
distances. Future work consists of testing the proposed
approach on a large database and making it more efficient by
improving its accuracy further.
REFERENCES
[1] H. B. Kekre, Sudeep D. Thepade, Tanuja K. Sarode and Vashali
Suryawanshi ‗Image Retrieval using Texture Features extracted from
GLCM, LBG and KPE‘. International Journal of Computer Theory and
Engineering, Vol. 2, No. 5, October, 2010.
[2] H. B. Kekre, Kamal Shah, Tanuja K. Sarode, Sudeep D. Thepade, ―Performance Comparison of Vector Quantization Technique – KFCG
with LBG, Existing Transforms and PCA for Face Recognition‖,
International Journal of Information Retrieval (IJIR), Vol. 02, Issue 1, pp.: 64-71, 2009
[3] H. B. Kekre, Tanuja K. Sarode, Sudeep D. Thepade, ―Image Retrieval
using Color-Texture Features from DCT on VQ Codevectors obtained by Kekre‘s Fast Codebook Generation‖,ICGST-International Journal on
Graphics, Vision and Image Processing (GVIP), Volume 9, Issue 5, pp.:
1-8, 2009. [4] H.B.Kekre, Tanuja K. Sarode, Sudeep D. Thepade, Vaishali
Suryavanshi,―Improved Texture Feature Based Image Retrieval using
Kekre‘s Fast Codebook Generation Algorithm‖, Springer-International Conference on Contours of Computing Technology (Thinkquest-2010),
Babasaheb Gawde Institute of Technology, Mumbai, 13-14 March 2010,
The paper will be uploaded on online Springerlink. [5] H. B. Kekre, Tanuja K. Sarode, Sudeep D. Thepade,: ―Image Retrieval
using Color-Texture Features from DCT on VQ Codevectors obtained
by Kekre‘s Fast Codebook Generation.‖ In.: ICGST-Int. Journal GVIP, Vol. 9, Issue 5, pp. 1-8, (Sept 2009).
[6] R. M. Gray, ―Vector quantization‖, In.: IEEE ASSP Mag., pp.: 4-29,
(Apr. 1984). [7] Y. Linde, A. Buzo, and R. M. Gray, ―An algorithm for vector quantizer
design‖, In.: IEEE Trans. Commun., vol. COM-28, no. 1, pp.: 84-95.
(1980). [8] H.B.Kekre, Sudeep D. Thepade, Nikita Bhandari, Colorization of
Greyscale images using Kekre‘s Biorthogonal Color Spaces and Kekre‘s
Fast Codebook Generation‖, CSC Advances in Multimedia- An
International Journal (AMIJ), Volume 1, Issue 3, pp. 49-58, Computer Science Journals, CSC Press,
http://www.cscjournals.org/csc/manuscript/Journals/AMIJ/volume1/Issu
e3/AMIJ-13.pdf [9] H. B. Kekre, Tanuja K. Sarode, ―New Fast Improved Codebook
Generation Algorithm for Color Images using Vector Quantization,‖
International Journal of Engineering and Technology, vol.1, No.1, pp.: 67-77, September 2008
[10] H. B. Kekre, Tanuja K. Sarode, Sudeep D. Thepade, ―DCT Applied to
Column mean and Row Mean Vectors of Image for Fingerprint Identification‖, International Conference on Computer Networks and
Security, ICCNS-2008, 27-28 Sept 2008, Vishwakarma Institute of
Technology, Pune. [11] Sir Edward R. Henry, "Classification and Uses of Finger Prints".
London: George Rutledge & Sons, Ltd., 1900
http://www.clpex.com/Information/Pioneers/henry-classification.pdf. [12] M.Chong, T.Ngee, L.Jun, R.Gay, ―Geometric framework for fingerprint
image classification‖, Pattern Recognition, volume 30, No. 9,pp.1475-
1488, 1997.
AUTHOR BIOGRAPHIES
Dr. H. B. Kekre has received B.E. (Hons.) in Telecomm.
Engineering. from Jabalpur University in 1958, M.Tech (Industrial Electronics) from IIT Bombay in 1960,
M.S.Engg. (Electrical Engg.) from University of Ottawa in
1965 and Ph.D. (System Identification) from IIT Bombay in 1970 He has worked as Faculty of Electrical Engg. and
then HOD Computer Science and Engg. at IIT Bombay. For
13 years he was working as a professor and head in the Department of Computer Engg. at Thadomal Shahani Engineering. College, Mumbai. Now
he is Senior Professor at MPSTME, SVKM‘s NMIMS. He has guided 17
Ph.Ds, more than 100 M.E./M.Tech and several B.E./ B.Tech projects. His areas of interest are Digital Signal processing, Image Processing and
Computer Networking. He has more than 270 papers in National /
International Conferences and Journals to his credit. He was Senior Member of IEEE. Presently He is Fellow of IETE and Life Member of ISTE Recently
seven students working under his guidance have received best paper awards.
Currently 10 research scholars are pursuing Ph.D. program under his guidance.
80 http://sites.google.com/site/ijcsis/ ISSN 1947-5500

(IJCSIS) International Journal of Computer Science and Information Security, Vol. 9, No. 12, 2011
Dr. Sudeep D. Thepade has Received B.E.(Computer)
degree from North Maharashtra University with Distinction in 2003. M.E. in Computer Engineering from
University of Mumbai in 2008 with Distinction, Ph.D.
from SVKM‘s NMIMS in 2011, Mumbai. He has about 09 years of experience in teaching and industry. He was
Lecturer in Dept. of Information Technology at Thadomal
Shahani Engineering College, Bandra(w), Mumbai for nearly 04 years. Currently working as Associate Professor and HoD Computer Engineering at
Mukesh Patel School of Technology Management and Engineering, SVKM‘s
NMIMS, Vile Parle(w), Mumbai, INDIA. He is member of International Advisory Committee for many International Conferences, acting as reviewer
for many referred international journals/transactions including IEEE and IET.
His areas of interest are Image Processing and Biometric Identification. He has guided five M.Tech. projects and several B.Tech projects. He more than
125 papers in National/International Conferences/Journals to his credit with a
Best Paper Award at International Conference SSPCCIN-2008, Second Best
Paper Award at ThinkQuest-2009, Second Best Research Project Award at Manshodhan 2010, Best Paper Award for paper published in June 2011 issue
of International Journal IJCSIS (USA), Editor‘s Choice Awards for papers
published in International Journal IJCA (USA) in 2010 and 2011.
Dimple A Parekh currently working as Asst. Professor
in IT Department has completed M.Tech(I.T) from
Mukesh Patel School of Technology and Engineering, SVKM‘s NMIMS Deemed to be University in 2011,
B.Tech(I.T) from Thakur College of Engineering and
Technology in 2005. She has worked in the area of Fingerprint Classification. Her areas of interest are
Image processing, Computer Vision and Data Mining.
81 http://sites.google.com/site/ijcsis/ ISSN 1947-5500
(IJCSIS) International Journal of Computer Science and Information Security,
Vol. 9, No. 12, 2011
On the Use of Stochastic Activity Networks and
Game Theory for Quantitative Security Evaluation
Abdolsattar Vakili
Department of Computer Engineering
Islamic Azad University, Aq Qala Center
Aq Qala, Iran
Akbar Jangi Aghdam
School of Computer Engineering
Iran University of Science and
Technology
Tehran, Iran
Taymaz Esmaeili
Department of Civil Engineering
Islamic Azad University, Aq Qala Center
Aq Qala, Iran
Abstract— Modeling and evaluation of the security of
computer systems and networks is an important issue. Several
methods have been examined for assessing the security of these
systems. However, introducing a comprehensive method for
modeling and quantitative evaluation of security is still an open
problem. On the other hand, stochastic modeling techniques
and tools have been used for performance and dependability
evaluation for many years. Since the nature of stochastic
models is to model accidental events rather than intentional
events corresponding to the malicious actions of attackers, they
fail to model security. In a previous work, game theory has
been used in combination of CTMCs for modeling attacker
behavior and to obtain attacker's decision probabilities. Our
aim has been to extend this work to use stochastic activity
networks (SANs) as a high-level formalism for modeling the
system. In this paper, we present an approach for quantitative
security evaluation based on SANs and stochastic game theory.
The advantages of the proposed approach are twofold: (1) the
proposed approach is based on a high-level modeling
formalism supported by a powerful modeling tool, and (2) it is
possible to use any general probability distributions to model
the effort or the time required for attack processes.
Keywords-Security modeling;security evaluation;quantitative
evaluation;stochastic activity networks (SANs);game theory
I. INTRODUCTION
Information and communication technology (ICT) is the infrastructure of today economy and business. This infrastructure should be trustworthy. "A system is trustworthy if it had both dependability and security together [1]." For this purpose, it is required that the dependability and security aspects of ICT systems to be designed and evaluated using rigorous engineering methods.
Today, it is widely accepted that, "due to the unavoidable presence of vulnerabilities, design faults and administrative errors, an ICT system will never be totally secure." [2] On the other hand, "the original definition of dependability is the ability to deliver service that can justifiably be trusted [1].” In elder references, security is defined as an attribute of dependability. However, based on [1], dependability has five main attributes, including reliability, availability, integrity, safety and maintainability, while security includes three attributes, including confidentiality, integrity and availability.
Security of operational computer systems usually is a parameter of the quality of service (QoS). "However, to be able to offer a security dimension to QoS architectures, it is important to find quantitative measures of security [3].” Security and its attributes are classified as non-functional requirements of computer systems, which should be evaluated using a quantitative method. The aim of quantitative security evaluation is to calculate some security measures that can be used to compare different alternatives or to see how much the security requirements are met.
In dependability community, there are effective and well-known methods to quantify reliability, availability, and safety. Using state space-based modeling methods, operational measures such as mean time to failure (MTTF) and mean time between failures (MTBF) for system is computable [4]. There were some studies to apply dependability methods to security in the last decade. It worked out by comparing system failure and security breach, and measures such as mean time to security compromise in quantification gained [3].
Several mature techniques, including various stochastic, state space and combinatorial methods, have been used for dependability modeling and evaluation. At least two out of three attributes of security is same as the attributes of dependability. Concerning this overlapping, it seems useful for both aspects of trustworthiness if we can use traditional dependability modeling methods to model and evaluate security attributes. It will allow us to use the existing techniques and tools to obtain the required quantitative security measures.
In recent years, various approaches have been introduced and examined for modeling and evaluation of security, one of which is stochastic models. However, since the nature of stochastic models is to model accidental events, they fail to model non-accidental and intentional events corresponding to the malicious actions of intruders and attackers.
In a previous work [2, 3, 5, 6, 7, 8], game theory is used in combination of CTMCs for modeling the attacker behavior. The main drawbacks of this approach are using simple and low-level CTMCs as the model of system and using the exponential distribution for modeling attack intensity. Our aim has been to extend this work as follows:
82 http://sites.google.com/site/ijcsis/ ISSN 1947-5500
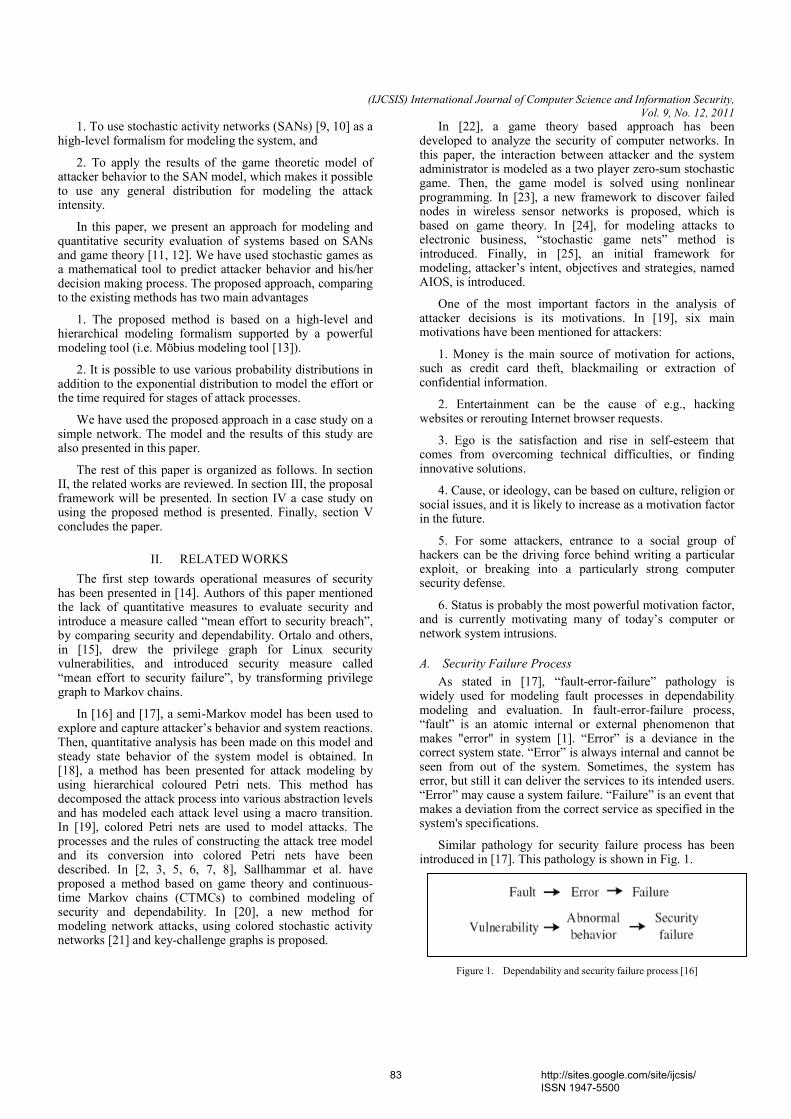
(IJCSIS) International Journal of Computer Science and Information Security,
Vol. 9, No. 12, 2011
1. To use stochastic activity networks (SANs) [9, 10] as a high-level formalism for modeling the system, and
2. To apply the results of the game theoretic model of attacker behavior to the SAN model, which makes it possible to use any general distribution for modeling the attack intensity.
In this paper, we present an approach for modeling and quantitative security evaluation of systems based on SANs and game theory [11, 12]. We have used stochastic games as a mathematical tool to predict attacker behavior and his/her decision making process. The proposed approach, comparing to the existing methods has two main advantages
1. The proposed method is based on a high-level and hierarchical modeling formalism supported by a powerful modeling tool (i.e. Möbius modeling tool [13]).
2. It is possible to use various probability distributions in addition to the exponential distribution to model the effort or the time required for stages of attack processes.
We have used the proposed approach in a case study on a simple network. The model and the results of this study are also presented in this paper.
The rest of this paper is organized as follows. In section II, the related works are reviewed. In section III, the proposal framework will be presented. In section IV a case study on using the proposed method is presented. Finally, section V concludes the paper.
II. RELATED WORKS
The first step towards operational measures of security has been presented in [14]. Authors of this paper mentioned the lack of quantitative measures to evaluate security and introduce a measure called “mean effort to security breach”, by comparing security and dependability. Ortalo and others, in [15], drew the privilege graph for Linux security vulnerabilities, and introduced security measure called “mean effort to security failure”, by transforming privilege graph to Markov chains.
In [16] and [17], a semi-Markov model has been used to explore and capture attacker’s behavior and system reactions. Then, quantitative analysis has been made on this model and steady state behavior of the system model is obtained. In [18], a method has been presented for attack modeling by using hierarchical coloured Petri nets. This method has decomposed the attack process into various abstraction levels and has modeled each attack level using a macro transition. In [19], colored Petri nets are used to model attacks. The processes and the rules of constructing the attack tree model and its conversion into colored Petri nets have been described. In [2, 3, 5, 6, 7, 8], Sallhammar et al. have proposed a method based on game theory and continuous-time Markov chains (CTMCs) to combined modeling of security and dependability. In [20], a new method for modeling network attacks, using colored stochastic activity networks [21] and key-challenge graphs is proposed.
In [22], a game theory based approach has been developed to analyze the security of computer networks. In this paper, the interaction between attacker and the system administrator is modeled as a two player zero-sum stochastic game. Then, the game model is solved using nonlinear programming. In [23], a new framework to discover failed nodes in wireless sensor networks is proposed, which is based on game theory. In [24], for modeling attacks to electronic business, “stochastic game nets” method is introduced. Finally, in [25], an initial framework for modeling, attacker’s intent, objectives and strategies, named AIOS, is introduced.
One of the most important factors in the analysis of attacker decisions is its motivations. In [19], six main motivations have been mentioned for attackers:
1. Money is the main source of motivation for actions, such as credit card theft, blackmailing or extraction of confidential information.
2. Entertainment can be the cause of e.g., hacking websites or rerouting Internet browser requests.
3. Ego is the satisfaction and rise in self-esteem that comes from overcoming technical difficulties, or finding innovative solutions.
4. Cause, or ideology, can be based on culture, religion or social issues, and it is likely to increase as a motivation factor in the future.
5. For some attackers, entrance to a social group of hackers can be the driving force behind writing a particular exploit, or breaking into a particularly strong computer security defense.
6. Status is probably the most powerful motivation factor, and is currently motivating many of today’s computer or network system intrusions.
A. Security Failure Process
As stated in [17], “fault-error-failure” pathology is widely used for modeling fault processes in dependability modeling and evaluation. In fault-error-failure process, “fault” is an atomic internal or external phenomenon that makes "error" in system [1]. “Error” is a deviance in the correct system state. “Error” is always internal and cannot be seen from out of the system. Sometimes, the system has error, but still it can deliver the services to its intended users. “Error” may cause a system failure. “Failure” is an event that makes a deviation from the correct service as specified in the system's specifications.
Similar pathology for security failure process has been introduced in [17]. This pathology is shown in Fig. 1.
Figure 1. Dependability and security failure process [16]
83 http://sites.google.com/site/ijcsis/ ISSN 1947-5500
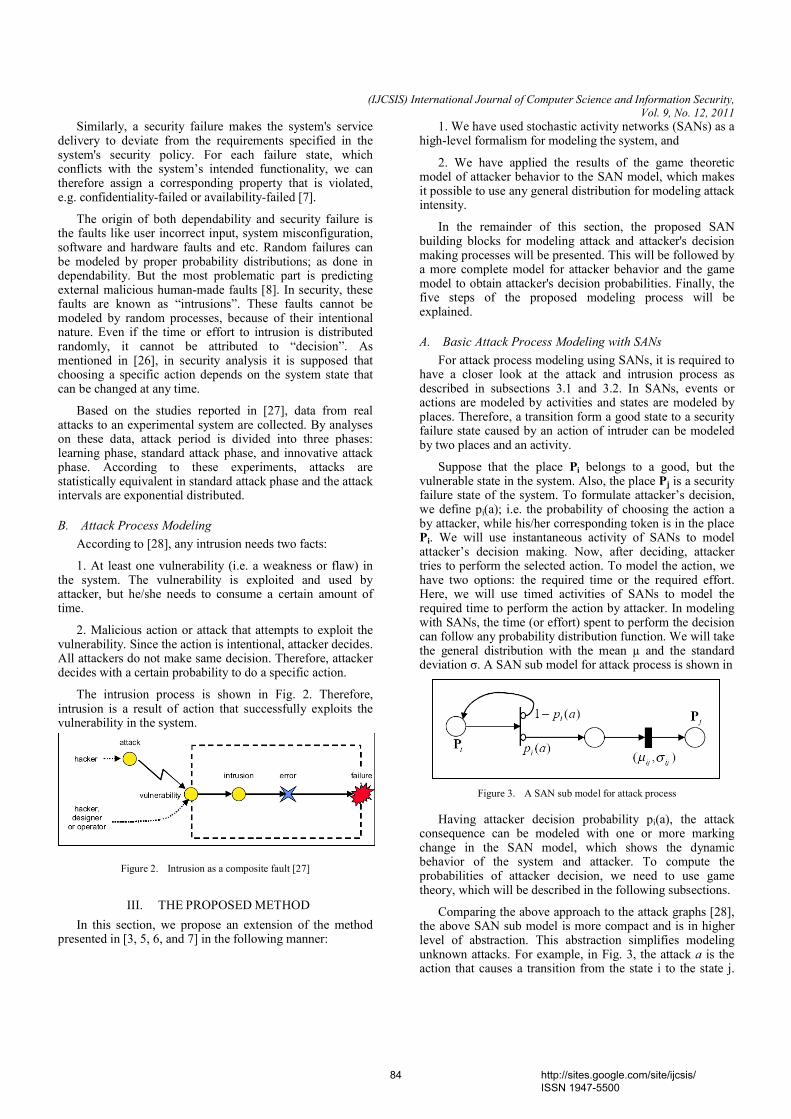
(IJCSIS) International Journal of Computer Science and Information Security,
Vol. 9, No. 12, 2011
Similarly, a security failure makes the system's service delivery to deviate from the requirements specified in the system's security policy. For each failure state, which conflicts with the system’s intended functionality, we can therefore assign a corresponding property that is violated, e.g. confidentiality-failed or availability-failed [7].
The origin of both dependability and security failure is the faults like user incorrect input, system misconfiguration, software and hardware faults and etc. Random failures can be modeled by proper probability distributions; as done in dependability. But the most problematic part is predicting external malicious human-made faults [8]. In security, these faults are known as “intrusions”. These faults cannot be modeled by random processes, because of their intentional nature. Even if the time or effort to intrusion is distributed randomly, it cannot be attributed to “decision”. As mentioned in [26], in security analysis it is supposed that choosing a specific action depends on the system state that can be changed at any time.
Based on the studies reported in [27], data from real attacks to an experimental system are collected. By analyses on these data, attack period is divided into three phases: learning phase, standard attack phase, and innovative attack phase. According to these experiments, attacks are statistically equivalent in standard attack phase and the attack intervals are exponential distributed.
B. Attack Process Modeling
According to [28], any intrusion needs two facts:
1. At least one vulnerability (i.e. a weakness or flaw) in the system. The vulnerability is exploited and used by attacker, but he/she needs to consume a certain amount of time.
2. Malicious action or attack that attempts to exploit the vulnerability. Since the action is intentional, attacker decides. All attackers do not make same decision. Therefore, attacker decides with a certain probability to do a specific action.
The intrusion process is shown in Fig. 2. Therefore, intrusion is a result of action that successfully exploits the vulnerability in the system.
Figure 2. Intrusion as a composite fault [27]
III. THE PROPOSED METHOD
In this section, we propose an extension of the method presented in [3, 5, 6, and 7] in the following manner:
1. We have used stochastic activity networks (SANs) as a high-level formalism for modeling the system, and
2. We have applied the results of the game theoretic model of attacker behavior to the SAN model, which makes it possible to use any general distribution for modeling attack intensity.
In the remainder of this section, the proposed SAN building blocks for modeling attack and attacker's decision making processes will be presented. This will be followed by a more complete model for attacker behavior and the game model to obtain attacker's decision probabilities. Finally, the five steps of the proposed modeling process will be explained.
A. Basic Attack Process Modeling with SANs
For attack process modeling using SANs, it is required to have a closer look at the attack and intrusion process as described in subsections 3.1 and 3.2. In SANs, events or actions are modeled by activities and states are modeled by places. Therefore, a transition form a good state to a security failure state caused by an action of intruder can be modeled by two places and an activity.
Suppose that the place Pi belongs to a good, but the vulnerable state in the system. Also, the place Pj is a security failure state of the system. To formulate attacker’s decision, we define pi(a); i.e. the probability of choosing the action a by attacker, while his/her corresponding token is in the place Pi. We will use instantaneous activity of SANs to model attacker’s decision making. Now, after deciding, attacker tries to perform the selected action. To model the action, we have two options: the required time or the required effort. Here, we will use timed activities of SANs to model the required time to perform the action by attacker. In modeling with SANs, the time (or effort) spent to perform the decision can follow any probability distribution function. We will take the general distribution with the mean µ and the standard deviation σ. A SAN sub model for attack process is shown in
Figure 3. A SAN sub model for attack process
Having attacker decision probability pi(a), the attack consequence can be modeled with one or more marking change in the SAN model, which shows the dynamic behavior of the system and attacker. To compute the probabilities of attacker decision, we need to use game theory, which will be described in the following subsections.
Comparing the above approach to the attack graphs [28], the above SAN sub model is more compact and is in higher level of abstraction. This abstraction simplifies modeling unknown attacks. For example, in Fig. 3, the attack a is the action that causes a transition from the state i to the state j.
84 http://sites.google.com/site/ijcsis/ ISSN 1947-5500
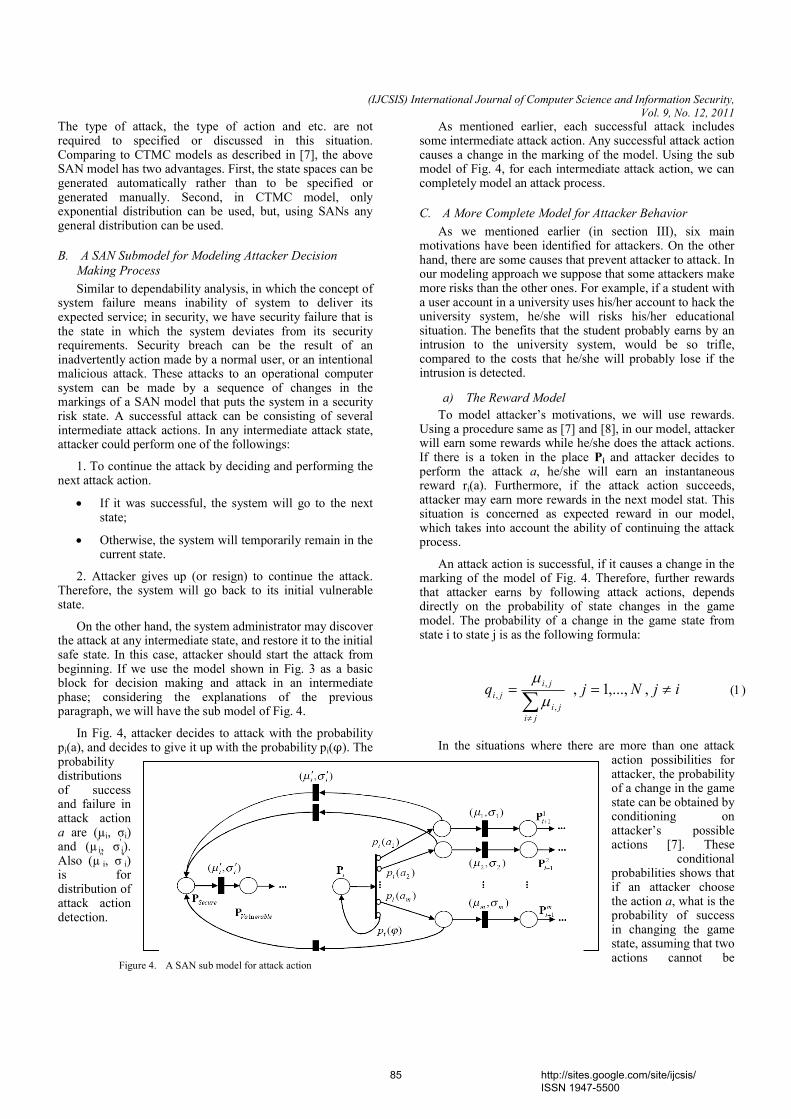
(IJCSIS) International Journal of Computer Science and Information Security,
Vol. 9, No. 12, 2011
The type of attack, the type of action and etc. are not required to specified or discussed in this situation. Comparing to CTMC models as described in [7], the above SAN model has two advantages. First, the state spaces can be generated automatically rather than to be specified or generated manually. Second, in CTMC model, only exponential distribution can be used, but, using SANs any general distribution can be used.
B. A SAN Submodel for Modeling Attacker Decision
Making Process
Similar to dependability analysis, in which the concept of system failure means inability of system to deliver its expected service; in security, we have security failure that is the state in which the system deviates from its security requirements. Security breach can be the result of an inadvertently action made by a normal user, or an intentional malicious attack. These attacks to an operational computer system can be made by a sequence of changes in the markings of a SAN model that puts the system in a security risk state. A successful attack can be consisting of several intermediate attack actions. In any intermediate attack state, attacker could perform one of the followings:
1. To continue the attack by deciding and performing the next attack action.
• If it was successful, the system will go to the next state;
• Otherwise, the system will temporarily remain in the current state.
2. Attacker gives up (or resign) to continue the attack. Therefore, the system will go back to its initial vulnerable state.
On the other hand, the system administrator may discover the attack at any intermediate state, and restore it to the initial safe state. In this case, attacker should start the attack from beginning. If we use the model shown in Fig. 3 as a basic block for decision making and attack in an intermediate phase; considering the explanations of the previous paragraph, we will have the sub model of Fig. 4.
In Fig. 4, attacker decides to attack with the probability pi(a), and decides to give it up with the probability pi(φ). The probability distributions of success and failure in attack action a are (µi, σi) and (µ
'i, σ
'i).
Also (µ''i, σ
''i)
is for distribution of attack action detection.
Figure 4. A SAN sub model for attack action
As mentioned earlier, each successful attack includes some intermediate attack action. Any successful attack action causes a change in the marking of the model. Using the sub model of Fig. 4, for each intermediate attack action, we can completely model an attack process.
C. A More Complete Model for Attacker Behavior
As we mentioned earlier (in section III), six main motivations have been identified for attackers. On the other hand, there are some causes that prevent attacker to attack. In our modeling approach we suppose that some attackers make more risks than the other ones. For example, if a student with a user account in a university uses his/her account to hack the university system, he/she will risks his/her educational situation. The benefits that the student probably earns by an intrusion to the university system, would be so trifle, compared to the costs that he/she will probably lose if the intrusion is detected.
a) The Reward Model
To model attacker’s motivations, we will use rewards. Using a procedure same as [7] and [8], in our model, attacker will earn some rewards while he/she does the attack actions. If there is a token in the place Pi and attacker decides to perform the attack a, he/she will earn an instantaneous reward ri(a). Furthermore, if the attack action succeeds, attacker may earn more rewards in the next model stat. This situation is concerned as expected reward in our model, which takes into account the ability of continuing the attack process.
An attack action is successful, if it causes a change in the marking of the model of Fig. 4. Therefore, further rewards that attacker earns by following attack actions, depends directly on the probability of state changes in the game model. The probability of a change in the game state from state i to state j is as the following formula:
ijNjq
ji
ji
ji
ji ≠==∑
≠
,,...,1,,
,
, µ
µ (1)
In the situations where there are more than one attack action possibilities for attacker, the probability of a change in the game state can be obtained by conditioning on attacker’s possible actions [7]. These
conditional probabilities shows that if an attacker choose the action a, what is the probability of success in changing the game state, assuming that two actions cannot be
85 http://sites.google.com/site/ijcsis/ ISSN 1947-5500

(IJCSIS) International Journal of Computer Science and Information Security,
Vol. 9, No. 12, 2011
performed simultaneously.
To model payoffs resulted by deterrent motivations of attack, we will introduce negative reward as cost. Cost will be taken into account, if the attack is detected and the system reacts.
D. The Game Model
To complete the modeling framework shown in Fig. 4, we will utilize the stochastic game theory as a mathematical tool, to compute attacker behavior. The interaction between attacker and the system can be presented as a game of Fig. 5.
Figure 5. The interaction between attacker and system modeled as a two-
player game [6]
a) A Stochastic Game between Attacker and the
System
Game theory is used to predict human behavior in the fields such as economy, politics and sociology. Stochastic game, in operational security of ICT systems, is a two player, zero-sum and multistage game [6]. In every stage of the game, which is equivalent to an attack decision making process, a static two player game runs between attacker and the system. Therefore, in our framework the stochastic game to compute attacker strategy or probabilities of attacker decision is written as (2) [7, 11]:
},...,2,1,{ zii =Γ=∆ (2)
Where, Γi is a game element that indicates an attacker decision process.
Each element of a stochastic game is a static game that has been described in section 2.1. Since we assumed that the system has only two actions: able or unable to detect the attack; each attacker in each decision making process could choose one action among mi actions, the game element Γi will be a matrix with mi × 2 dimensions, as (3) [7, 8 and 11]:
},...,,{,)()( 2121 imkkikii aaaaauau ∈
=Γ
MM
MM
(3)
Where, the first column indicates that the system cannot detect the attack, and the second column indicates detection of attack by the system. Rows also indicate payoffs (the rewards attacker gets by doing the attack action equivalent to every row). Each entry of the matrix of (10) is as (4):
)|()(
)()|()(
2
,..,2,1
,1
DETECTEDarau
aqUNDETECTEDarau
kiki
zj
jkjikiki
=
Γ×+= ∑= (4)
Where, qi,j is gained by the (1), described in section 4.3.1. Therefore, if attacker takes the action ak in stage Γi of game, and this action is not detected by the system, attacker will get ri(ak| UNDETECTED) reward; and if attacker succeeds to continue the game to stage Γj, he/she will get expected reward, too. If the system detects the attack action, attacker will get negative reward or cost ri(ak| DETECTED) and the game will end.
b) Computing Attacker's Decision Probabilities
If the action set A is all of the attack actions that attacker can choose in stage Γi (i.e. attacker strategies), attacker mixed strategy will be indicated by P, which is as follows:
}|)({
},...,1|{
Ap
pP
∈=
==
aap
zi
ii
i (5)
Where, Pi is a vector of probabilities that shows the selection probabilities of attack actions by attacker in stage Γi. Actually, this vector shows the probabilities of attacker decision that we would like to compute. Therefore, to obtain attacker decision probabilities, we should compute attacker’s
strategy. In (5), A∈∀≤≤ aapi ,1)(0 and
iaapi ,,1)( A∈∀=∑ should be valid.
On the other hand, we could also rewrite these equations for the system. Action set of system is equal to },{ UNDETECTEDDETECTED=B , so the (5) will be
similar to the (6) for system, as follows:
}|)({
}2,1|{
Bq
∈=
==
aaq
i
ii
i (6)
Where, Q is a counterstrategy in stochastic game between attacker and the system. Attacker’s expected reward in stage Γi by using the strategy P will be as follows:
( )∑∈∀
+−=A
qpa
iiiiiii auaqauqqapE )()()())(1()(),( 21 (7)
According to the basic assumption of game theory, an attacker, as a player in the game, is rational. It means that attacker is trying to maximize his/her own rewards. Now, if Pi* is the vector that maximizes the (7), attacker will use this
vector and (8) will be valid.
),( iiEMaxi
qpp
(8)
86 http://sites.google.com/site/ijcsis/ ISSN 1947-5500
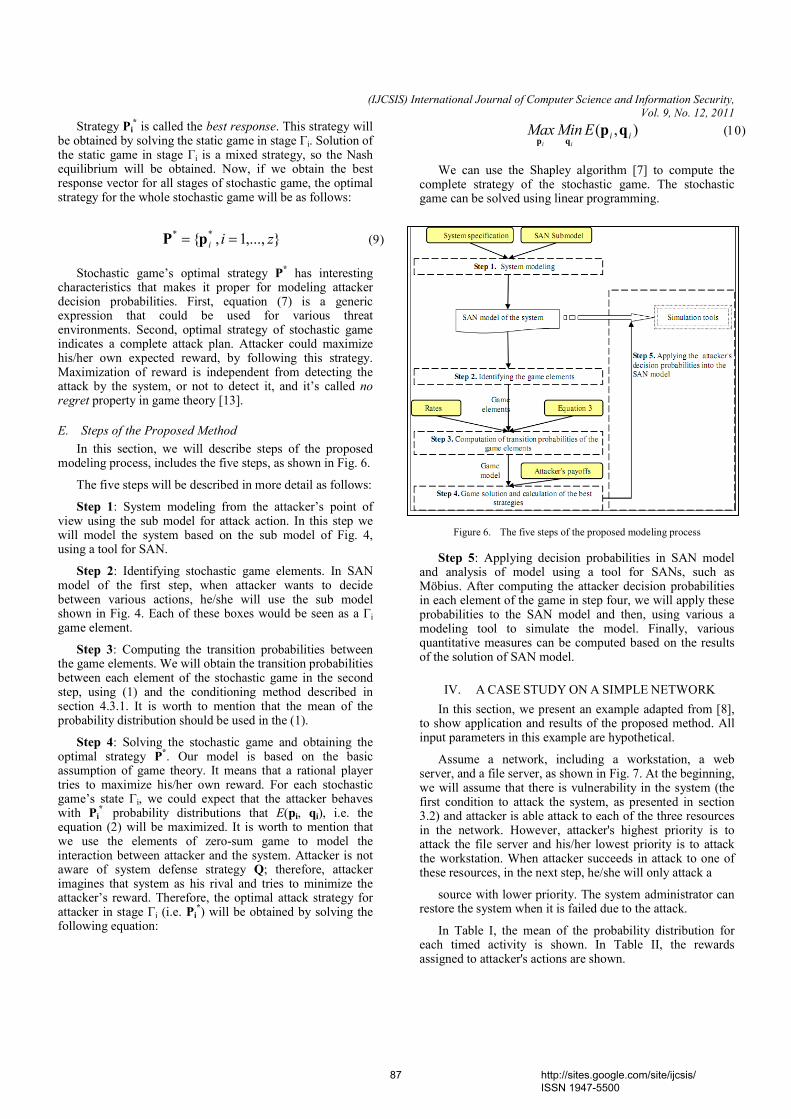
(IJCSIS) International Journal of Computer Science and Information Security,
Vol. 9, No. 12, 2011
Strategy Pi* is called the best response. This strategy will
be obtained by solving the static game in stage Γi. Solution of the static game in stage Γi is a mixed strategy, so the Nash equilibrium will be obtained. Now, if we obtain the best response vector for all stages of stochastic game, the optimal strategy for the whole stochastic game will be as follows:
},...,1,{**
zii == pP (9)
Stochastic game’s optimal strategy P* has interesting
characteristics that makes it proper for modeling attacker decision probabilities. First, equation (7) is a generic expression that could be used for various threat environments. Second, optimal strategy of stochastic game indicates a complete attack plan. Attacker could maximize his/her own expected reward, by following this strategy. Maximization of reward is independent from detecting the attack by the system, or not to detect it, and it’s called no regret property in game theory [13].
E. Steps of the Proposed Method
In this section, we will describe steps of the proposed modeling process, includes the five steps, as shown in Fig. 6.
The five steps will be described in more detail as follows:
Step 1: System modeling from the attacker’s point of view using the sub model for attack action. In this step we will model the system based on the sub model of Fig. 4, using a tool for SAN.
Step 2: Identifying stochastic game elements. In SAN model of the first step, when attacker wants to decide between various actions, he/she will use the sub model shown in Fig. 4. Each of these boxes would be seen as a Γi game element.
Step 3: Computing the transition probabilities between the game elements. We will obtain the transition probabilities between each element of the stochastic game in the second step, using (1) and the conditioning method described in section 4.3.1. It is worth to mention that the mean of the probability distribution should be used in the (1).
Step 4: Solving the stochastic game and obtaining the optimal strategy P
*. Our model is based on the basic
assumption of game theory. It means that a rational player tries to maximize his/her own reward. For each stochastic game’s state Γi, we could expect that the attacker behaves with Pi
* probability distributions that E(pi, qi), i.e. the
equation (2) will be maximized. It is worth to mention that we use the elements of zero-sum game to model the interaction between attacker and the system. Attacker is not aware of system defense strategy Q; therefore, attacker imagines that system as his rival and tries to minimize the attacker’s reward. Therefore, the optimal attack strategy for attacker in stage Γi (i.e. Pi
*) will be obtained by solving the
following equation:
),( iiEMinMaxii
qpqp
(10)
We can use the Shapley algorithm [7] to compute the complete strategy of the stochastic game. The stochastic game can be solved using linear programming.
Figure 6. The five steps of the proposed modeling process
Step 5: Applying decision probabilities in SAN model and analysis of model using a tool for SANs, such as Möbius. After computing the attacker decision probabilities in each element of the game in step four, we will apply these probabilities to the SAN model and then, using various a modeling tool to simulate the model. Finally, various quantitative measures can be computed based on the results of the solution of SAN model.
IV. A CASE STUDY ON A SIMPLE NETWORK
In this section, we present an example adapted from [8], to show application and results of the proposed method. All input parameters in this example are hypothetical.
Assume a network, including a workstation, a web server, and a file server, as shown in Fig. 7. At the beginning, we will assume that there is vulnerability in the system (the first condition to attack the system, as presented in section 3.2) and attacker is able attack to each of the three resources in the network. However, attacker's highest priority is to attack the file server and his/her lowest priority is to attack the workstation. When attacker succeeds in attack to one of these resources, in the next step, he/she will only attack a
source with lower priority. The system administrator can restore the system when it is failed due to the attack.
In Table I, the mean of the probability distribution for each timed activity is shown. In Table II, the rewards assigned to attacker's actions are shown.
87 http://sites.google.com/site/ijcsis/ ISSN 1947-5500
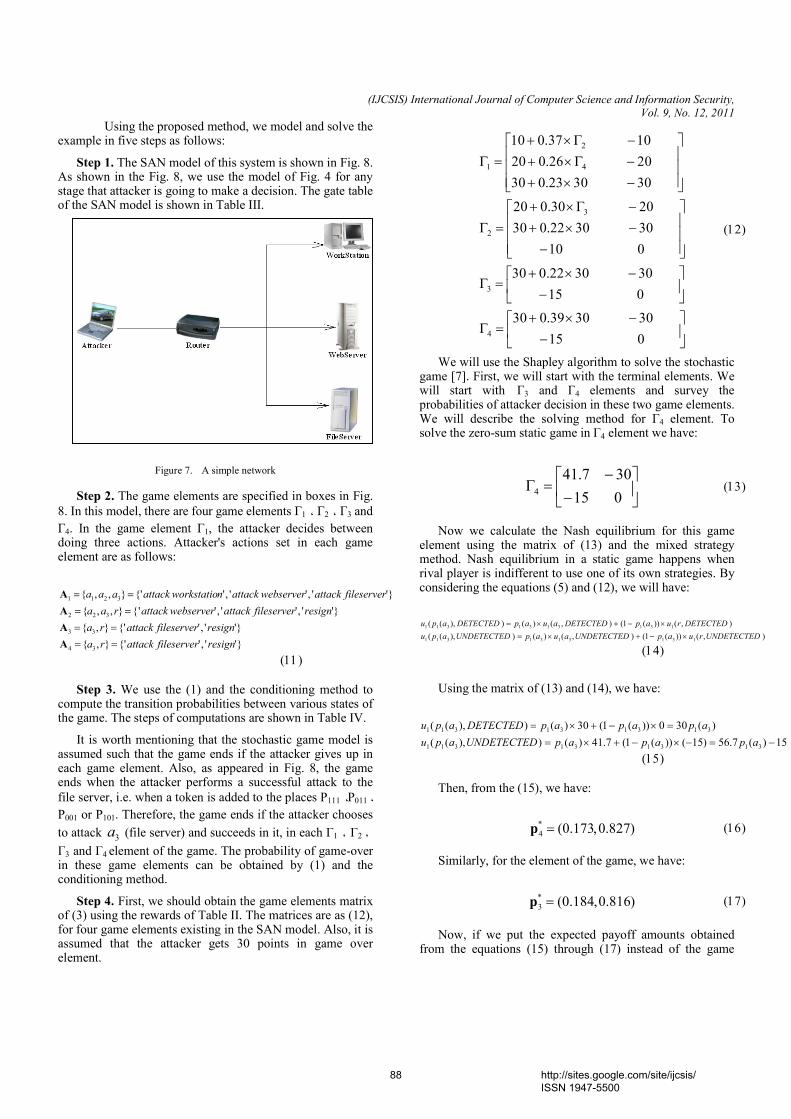
(IJCSIS) International Journal of Computer Science and Information Security,
Vol. 9, No. 12, 2011
Using the proposed method, we model and solve the example in five steps as follows:
Step 1. The SAN model of this system is shown in Fig. 8. As shown in the Fig. 8, we use the model of Fig. 4 for any stage that attacker is going to make a decision. The gate table of the SAN model is shown in Table III.
Figure 7. A simple network
Step 2. The game elements are specified in boxes in Fig.
8. In this model, there are four game elements Γ1 ، Γ2 ، Γ3 and
Γ4. In the game element Γ1, the attacker decides between doing three actions. Attacker's actions set in each game element are as follows:
}'','{'},{
}'','{'},{
}'','',''{},,{
}'','','{'},,{
34
33
322
3211
resignfileserverattackra
resignfileserverattackra
resignfileserverattackwebserverattackraa
fileserverattackwebserverattacknworkstatioattackaaa
==
==
==
==
A
A
A
A
(11)
Step 3. We use the (1) and the conditioning method to compute the transition probabilities between various states of the game. The steps of computations are shown in Table IV.
It is worth mentioning that the stochastic game model is assumed such that the game ends if the attacker gives up in each game element. Also, as appeared in Fig. 8, the game ends when the attacker performs a successful attack to the
file server, i.e. when a token is added to the places P111 ،P011 ،
P001 or P101. Therefore, the game ends if the attacker chooses
to attack 3a (file server) and succeeds in it, in each Γ1 ، Γ2 ،
Γ3 and Γ4 element of the game. The probability of game-over in these game elements can be obtained by (1) and the conditioning method.
Step 4. First, we should obtain the game elements matrix of (3) using the rewards of Table II. The matrices are as (12), for four game elements existing in the SAN model. Also, it is assumed that the attacker gets 30 points in game over element.
−
−×+=Γ
−
−×+=Γ
−
−×+
−Γ×+
=Γ
−×+
−Γ×+
−Γ×+
=Γ
015
303039.030
015
303022.030
010
303022.030
2030.020
303023.030
2026.020
1037.010
4
3
3
2
4
2
1
(12)
We will use the Shapley algorithm to solve the stochastic game [7]. First, we will start with the terminal elements. We will start with Γ3 and Γ4 elements and survey the probabilities of attacker decision in these two game elements. We will describe the solving method for Γ4 element. To solve the zero-sum static game in Γ4 element we have:
−
−=Γ
015
307.414 (13)
Now we calculate the Nash equilibrium for this game element using the matrix of (13) and the mixed strategy method. Nash equilibrium in a static game happens when rival player is indifferent to use one of its own strategies. By considering the equations (5) and (12), we will have:
),())(1(),()()),((
),())(1(),()()),((
1313131311
1313131311
UNDETECTEDruapUNDETECTEDauapUNDETECTEDapu
DETECTEDruapDETECTEDauapDETECTEDapu
×−+×=
×−+×=
(14)
Using the matrix of (13) and (14), we have:
15)(7.56)15())(1(7.41)()),((
)(300))(1(30)()),((
313131311
313131311
−=−×−+×=
=×−+×=
apapapUNDETECTEDapu
apapapDETECTEDapu
(15)
Then, from the (15), we have:
)827.0,173.0(*
4 =p (16)
Similarly, for the element of the game, we have:
)816.0,184.0(*
3 =p (17)
Now, if we put the expected payoff amounts obtained from the equations (15) through (17) instead of the game
88 http://sites.google.com/site/ijcsis/ ISSN 1947-5500
(IJCSIS) International Journal of Computer Science and Information Security,
Vol. 9, No. 12, 2011
element Γ3 in the matrix of the game element Γ2 of (12) and then repeat the previous process, we will have:
)0,0,1(
)806.0,0.0,194.0(
*
1
*
2
=
=
p
p (18)
Finally, using equations (9) through (18), we will get the optimal attacker strategy or attacker's decision probabilities in each decision making process, as follows:
)}827.0,173.0(),816.0,184.0(),806.0,0,194.0(),0,0,1{(},,,{ *
4
*
3
*
2
*
1
* == ppppP
(19)
Step 5. By applying the attacker decision probabilities to the SANs model of Fig. 8 and numerical solution or simulation of the model using Möbius, various quantitative measures can be obtained.
To calculate the quantitative measures:
• The attacker's decision probabilities obtained from (19) are applied to the SAN model of the network.
• The SAN model is solved using Möbius. The obtained steady state probabilities for each place are shown in Table V.
Now, we can compute the following quantitative security measures using the steady state probabilities of Table V:
• Availability, A(t): If the state of the system is secure or vulnerable, the system is available. Considering the probabilities of Table V, we can calculate the steady state availability of the system as follows:
709299.0)(sec)()(sec)( 321 =+++=+=∞→
pppurepvunerablepureptAt
(20)
• Confidentiality, )(tC : In the system of this example,
we assumed that each of the situations where the Web server, workstation or file server is compromised by the attacker, there is the possibility of information disclosure. Therefore, the steady state confidentiality of the system can be obtained as follows:
709299.0)(1
)(1)(
0010111111016001754
011111101110001010100
=++++++++−
=++++++−=∞→
ppppppppp
ppppppptCt
(21)
• Integrity, )(tI : The attacker in this system causes an
integrity failure by successful attack to the file server
and altering the files. Then, the integrity can be obtained as follows:
86149.0)(1)( 011111101001 =+++−=→∞
pppptIt
(22)
V. CONCLUSIONS
In this paper, we presented an approach for modeling and quantitative security evaluation based on stochastic activity networks (SANs) and game theory. We have used the stochastic games as a mathematical tool to predict attacker behavior and his/her decision making process. The proposed approach, comparing to the methods based on attack graphs, is more high-level and is capable of considering the attack process as some state changes in a SAN model. Also, based on the features of SANs and the Möbius modeling tool, the proposed method eliminates some major drawbacks of the method presented in [7]. The proposed method is high-level and hierarchical and it is possible to use various probability distribution functions in addition to the exponential distribution functions to model the effort or the time required for stages of attack processes.
In future, we intend to extend the proposed method as follows:
• Using other types of game models, such as the repeated games, dynamic games, cooperative games, and etc. to model attacker's decision making process.
• Consider the diversity of attackers and their skills. In the proposed method, we have considered the existence of only one attacker. However, it is required to consider more attackers with different levels of skills and motivations.
• Propose a solution to calculate the rewards granted to attackers. In the proposed method, the quantities related to attacker's rewards are hypothetical. To make this method more useful for real world, we should obtain an approach to quantify attacker's motivations for showing his/her rewards in each stage of the game.
• Computing the proper probability distributions functions. In the CTMC model presented in [7 and 8], the probability distribution functions or the time spent by attacker to perform an attack action, follows the exponential distribution. In the proposed model, the effort or time can follow any general distributions with mean and standard deviation (σ, µ). However, there is the lack of an applicable method to obtain appropriate distribution functions for accumulated failure intensity.
89 http://sites.google.com/site/ijcsis/ ISSN 1947-5500
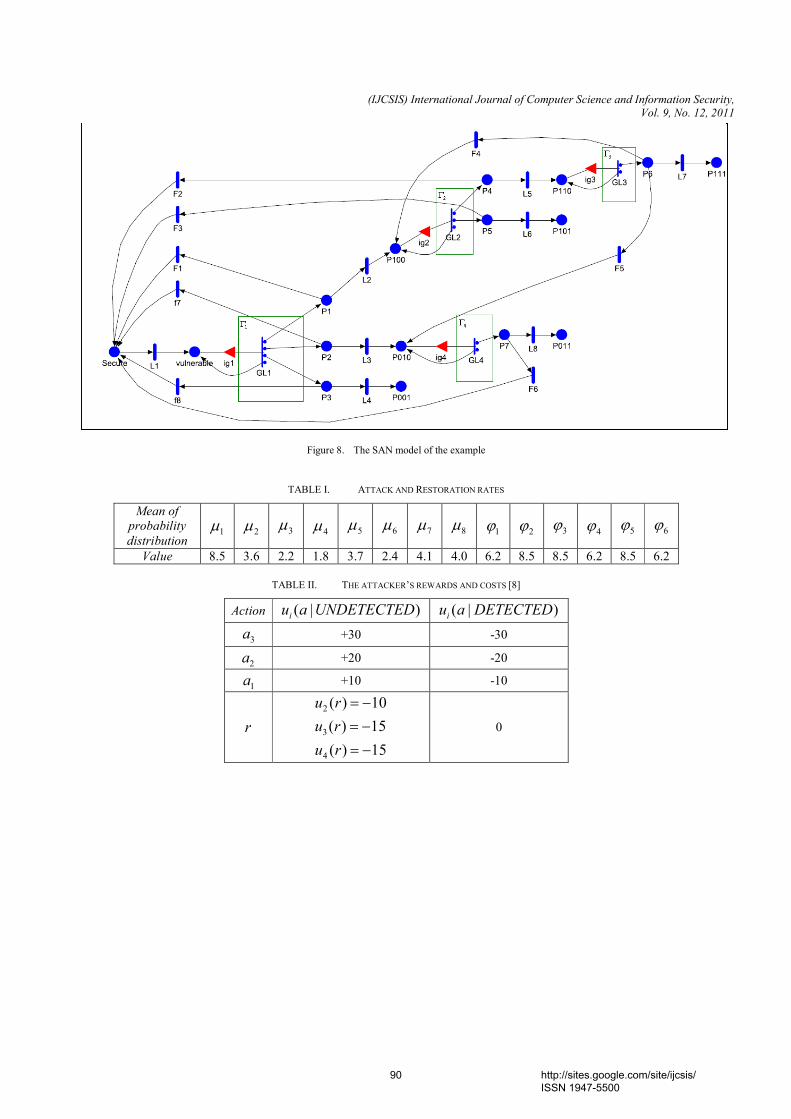
(IJCSIS) International Journal of Computer Science and Information Security,
Vol. 9, No. 12, 2011
Figure 8. The SAN model of the example
TABLE I. ATTACK AND RESTORATION RATES
6ϕ 5ϕ 4ϕ 3ϕ
2ϕ 1ϕ 8µ 7µ 6µ 5µ 4µ 3µ
2µ 1µ
Mean of
probability
distribution
6.2 8.5 6.2 8.5 8.5 6.2 4.0 4.1 2.4 3.7 1.8 2.2 3.6 8.5 Value
TABLE II. THE ATTACKER’S REWARDS AND COSTS [8]
)|( DETECTEDaui )|( UNDETECTEDaui Action
-30 +30 3a
-20 +20 2a
-10 +10 1a
0
15)(
15)(
10)(
4
3
2
−=
−=
−=
ru
ru
ru
r
90 http://sites.google.com/site/ijcsis/ ISSN 1947-5500

(IJCSIS) International Journal of Computer Science and Information Security,
Vol. 9, No. 12, 2011 TABLE III. GATE TABLE FOR SAN MODEL
Function Enabling Predicate Gate
0;= Mark()>-vulnerable 0== Mark()>Secure-
&& 1 == Mark()>-vulnerable 1ig
0; = Mark()>P100-
0 == Mark()>P001-
&& 0 == Mark()>P010-
&& 1 == Mark()>P100-
2ig
0; = Mark()>P110-
0 == Mark()>P001-
&& 0 == Mark()>P101-
&& 1 == Mark()>P110-
3ig
0; = Mark()>P010- 0 == Mark()>P001-
&& 1 == Mark()>P010- 4ig
TABLE IV. TRANSITION PROBABILITIES AMONG GAME ELEMENTS
4Γ 3Γ 2Γ 1Γ ji ΓΓ ,
26.013
3 =+ ϕµ
µ - 37.0
12
2 =+ϕµ
µ -
1Γ
- 30.025
5 =+ϕµµ
- - 2Γ
45.0574
5 =++ ϕµϕ
ϕ - 33.0
574
4 =++ ϕµϕ
ϕ - 3Γ
- - - - 4Γ
REFERENCES
[1] A. Avizienis, J.-C. Laprie, B. Randell, and C. Landwehr, “Basic concepts and taxonomy of dependable and secure computing,” IEEE Trans. on Dependable and Secure Computing, Vol. 1, No. 1, pp. 11–33, Jan. 2004.
[2] K. Sallhammar, B. E. Helvik, and S. J. Knapskog, “Towards a stochastic model for integrated security and dependability evaluation,” Proc. of the First International Conference on Availability, Reliability and Security (AReS’06), Vienna, Austria, pp. 156-165, 2006.
[3] K. Sallhammar and S. J. Knapskog, “Using game theory in stochastic models for quantifying security,” Proc. of the 9th Nordic Workshop on Secure IT-Systems (Nordsec’04), Espoo, Finland, pp. 41-50, Dec. 2004.
[4] G. Bolch, S. Greiner, H. de Meer, K. S. Trividi, Queuing networks and markov chains, modeling and performance evaluation with computer science applications, 2nd Edition, John Wiley and Sons, 2006.
[5] K. Sallhammar, B. E. Helvik, and S. J. Knapskog, “A framework for predicting security and dependability measures in real-time,” International Journal of Computer Science and Network Security (IJCSNS), Vol. 7, No. 3, pp. 169-183, Mar. 2007.
[6] K. Sallhammar, S.J. Knapskog, and B.E. Helvik, “Using stochastic game theory to compute the expected behavior of attackers,” Proc. of the 2005 International Symposium on Applications and the Internet Workshops (Saint’05), Trento, Italy, pp. 102-105, Jan/Feb 2005.
[7] K. Sallhammar, B. E. Helvik and S. J. Knapskog, “On stochastic modeling for integrated security and dependability evaluation,” The Journal of Networks, Vol. 1, No. 5, pp. 31-42, Sep/Oct 2006.
[8] K. Sallhammar, B. E. Helvik and S. J. Knapskog, “Incorporating attacker behavior in stochastic models of security,” Proc. of the 2005 International Conference on Security and Management (SAM’05). Las Vegas, Nevada, USA. June 20-23, pp. 79-85, 2005.
[9] A. Movaghar and J.F. Meyer, “Performability modeling with stochastic activity networks,” Proc. of the 1984 Real-Time Systems Symp., Austin, TX, Dec. 1984, pp. 215-224.
[10] W. H. Sanders, J.F. Meyer, "Stochastic Activity Networks: Formal Definitions and Concepts," In: Brinksma, E., Hermanns, H., Katoen, J. P. (eds.): Lectures on Formal Methods and Performance Analysis, Lecture Notes in Computer Science, Vol. 2090. Springer- Verlag, Berlin Heidelberg, 2001, pp. 315-343.
[11] N. Nisan, Algorithmic Game Theory, T. Roughgarden, E. Tardos, and V. V. Vazirani, Eds,. Cambridge University Press, 2007.
[12] R. Gibbons, A Primer in Game Theory, Prentice Hall, 1994.
[13] "The Möbius Tool," URL: http://www.mobius.uiuc.edu/
91 http://sites.google.com/site/ijcsis/ ISSN 1947-5500
(IJCSIS) International Journal of Computer Science and Information Security,
Vol. 9, No. 12, 2011 [14] B. Littlewood, et al., “Towards operational measures of computer
security,” Journal of Computer Security, Vol. 2, pp. 211-229, Oct. 1993.
[15] R. Ortalo, Y. Deswarte, and M. Kaaniche, “Experimenting with quantitative evaluation tools for monitoring operational security,” IEEE Transactions on Software Engineering, Vol. 25, No. 5, pp. 633-650, Sep./Oct. 1999.
[16] B.B. Madan, K. Vaidyanathan, and K.S. Trivedi, “Modeling and quantification of security attributes of software systems,” Proc. of the International Conference on Dependable Systems and Networks (DSN’02), Washington DC, United States of America, pp. 505-514, 2002.
[17] K. B. B. Madan, K. Vaidyanathan Goseva-Popstojanova, and K. S. Trivedi, “A method for modeling and quantifying the security attributes of intrusion tolerant systems,” Performance Evaluation, Vol. 56, pp. 167-186, 2004.
[18] R. Wu, W. Li, and H. Huang, “An attack modeling based on hierarchical coloured Petri nets,” Proc. of the International Conference on Computer and Electrical Engineering, pp. 918-921, 2008.
[19] S. Zhou, Z. Qin, F.Zhang, X.Zhang, W. Chen, and J. Liu, “Coloured Petri net based attack modeling,” LNAI 2639, pp. 715-718, 2003.
[20] M. Kiviharju, T. Venäläinen, and S. Kinnunen, “Towards modelling information security with key-challenge Petri nets,” Proc. of the NordSec’09, LNCS 5838, pp. 190-206, 2009.
[21] M. Abdollahi Azgomi, A. Movaghar, “Coloured stochastic activity networks: definitions and behavior,” Proc. of the 20th Annual UK Performance Engineering Workshop (UKPEW'04), Bradford, UK, July 7-8, pp. 297-308, 2004.
[22] K. Lye and J. M. Wing, “Game strategies in network security,” International Journal of Information Security, vol. 4, no. 1-2, pp. 71-86, Feb. 2005.
[23] Y. B. Reddy, “A game theory approach to detect malicious nodes in wireless sensor networks,” Proc. of the 3rd International Conference on Sensor Technologies and Applications, Athens, Greece, pp. 462-468, 2009.
[24] Y. Wang, C. Lin, K. Meng, “Analysis of attack actions for e-commerce based on stochastic game nets model,” Journal of Computers, Vol. 4, No. 6, pp. 461-468, June 2009.
[25] P. Liu and W. Zang, “Incentive-based modeling and inference of attacker intent, objectives, and strategies,” Proc. of the 10th ACM Conference on Computer and Communication Security, vol. 8, no. 1, pp. 78-118, Feb. 2005.
[26] D. M. Nicol, W. H. Sanders, and K. S. Trivedi, “Model-based evaluation: from dependability to security,” IEEE Transactions on Dependable and Secure Computing, Vol. 1, No.1, pp. 48-65, Jan./Mar. 2004.
[27] E. Jonsson and T. Olovsson, “A quantitative model of the security intrusion process based on attacker behavior,” IEEE Trans. on Software Eng., Vol. 4, No. 25, pp. 235-245, Apr. 1997.
[28] D. Powell and R. Stroud, “Malicious- and accidental-fault tolerance for internet applications - conceptual model and architecture, University of Newcastle, Newcastle, Technical Report CS-TR-749, 2001.
[29] S. Jha, O. Sheyner, and J. Wing, “Two formal analyses of attack graphs,” Proc. of the 2002 Computer Security Foundations Workshop, 2002.
AUTHORS PROFILE
Abdolsattar Vakili received the B.Sc. and M.Sc. degree in computer engineering (software) (2007 and 2010, respectively) from school of computer engineering, Iran University of Science and Technology (IUST). His research interests include network security, modelling and evaluation and game theory. He has published several papers in national conferences. Mr. Vakili is currently a faculty member at the department of computer engineering, Islamic Azad University (IAU), Aq-Qala Center, Aq-Qala, Iran.
Akbar JangiAghdam received the B.Sc. degree in computer engineering (hardware) (2008) from school of computer engineering, Iran University of Science and Technology (IUST). His research interests include computer networks, network security, modelling and evaluation. He has published national papers in national conferences. Mr. Jangiaghdam is currently engaged in a national IT project in data center network section under supervision of Iran telecommunication ministry in TCT at Tehran, co-working with ITNet company.
Taymaz Esmaeili is a M.Sc. graduated in Hydraulic Structures from Islamic Azad University-South Tehran Branch (2010) and now with the newly established university Islamic Azad University, Aq-Qala Center as a junior lecturer. He is a scientific board member of the faculty since March, 2011 and also work as the expert of civil and construction sector in the university. Due to his interest in river engineering and the importance of providing the safety of structures that are constructed in the rivers (i.e. bridges, groynes, abutments, drops and etc) he has focused on local scouring around bridge piers and groynes.
92 http://sites.google.com/site/ijcsis/ ISSN 1947-5500
1
RULE BASED DECISION MINING WITH
JDL DATA FUSION MODEL
FOR
COMPUTER FORENSICS: A Hypothetical Case Analysis Suneeta Satpathy
[1] Sateesh K. Pradhan
[2] B.N.B. Ray
[3]
[1] P.G Department of Computer Application,
[2] P.G Department of Computer Application,
[3] P.G Department of Computer Application
CEB, BPUT, Bhubaneswar. Utkal University, Bhubaneswar, INDIA Utkal University, Bhubaneswar, INDIA
Abstract
Law enforcement and the legal
establishment are facing a new challenge as
criminal acts are being committed and the evidence
of these activities is recorded in electronic form. An
epistemic uncertainty is an unavoidable attribute
which is present in such type of investigations and
could affect negatively the investigation process.
Desktops and laptops serve as the principal means
by which internet is misused and illegal works are
done. So law enforcement is in a perpetual race with
criminals and requires the development of tools to
systematically search digital devices for pertinent
evidence. Another part of this race, and perhaps
more crucial, is the development of a methodology
in computer forensics that encompasses the forensic
analysis of digital crime scene investigations.
In this paper we have presented a
hypothetical case (misuse of internet) analyzed by
adopting data fusion methodology along with the
decision tree rules; by which conflicting
information due to the unavoidable uncertainty can
be captured at different levels of fusion and
processed and intelligence analysis can be
correlated with various crime types. Thus it holds
the promise of alleviating such problems. The
decision rules are formed by studying the normal
user behavior and hence the investigation model can
be trained automatically and efficiently so that it
will have a low error rate.
Keywords - Computer Forensic, Digital
Investigation, Digital evidence, Data
Fusion, Decision tree.
1. Introduction
Any device used for calculation,
computation, or information storage may be used
for criminal activity, by serving as a convenient
storage mechanism for evidence or in some cases as
a target of attacks threatening the confidentiality,
integrity, or availability of information and services.
Computer forensic analysis [7] [17] focuses on the
extraction, processing, and interpretation of digital
evidence.
The tracing of an attack [7] [11] from
the victim back to the attacker often is very difficult
and may, under certain circumstances, be
impossible using only back tracing techniques.
Although forensics investigations can vary
drastically in their level of complexity, each
investigative process must follow a rigorous path.
So a comprehensive tool for forensic investigations
is important for standardizing terminology, defining
requirements, and supporting the development of
new techniques for investigators. Current
approaches to Security System generate enormous
amounts of data; higher priority must be given to
systems that can analyze rather than merely collect
such data, while still retaining collections of
essential forensic data.
The core concept of this paper is the
importance of data fusion along with decision tree
application in computer forensics. It begins with
definitions of digital investigation and evidence,
followed by a brief overview of the investigation
tool “A Fusion based digital investigation tool” [18]
developed using JDL data fusion model [4][9][10]
and decision tree technique for analysis. Finally this
paper justifies the use of the tool and application of
decision tree rules in post incident analysis of a
hypothetical case of misusing the internet. The
ability to model the investigation and its outcome
lends materially to the confidence that the
investigation truly represents the actual events.
(IJCSIS) International Journal of Computer Science and Information Security, Vol. 9, No. 12, December 2011
93 http://sites.google.com/site/ijcsis/ ISSN 1947-5500
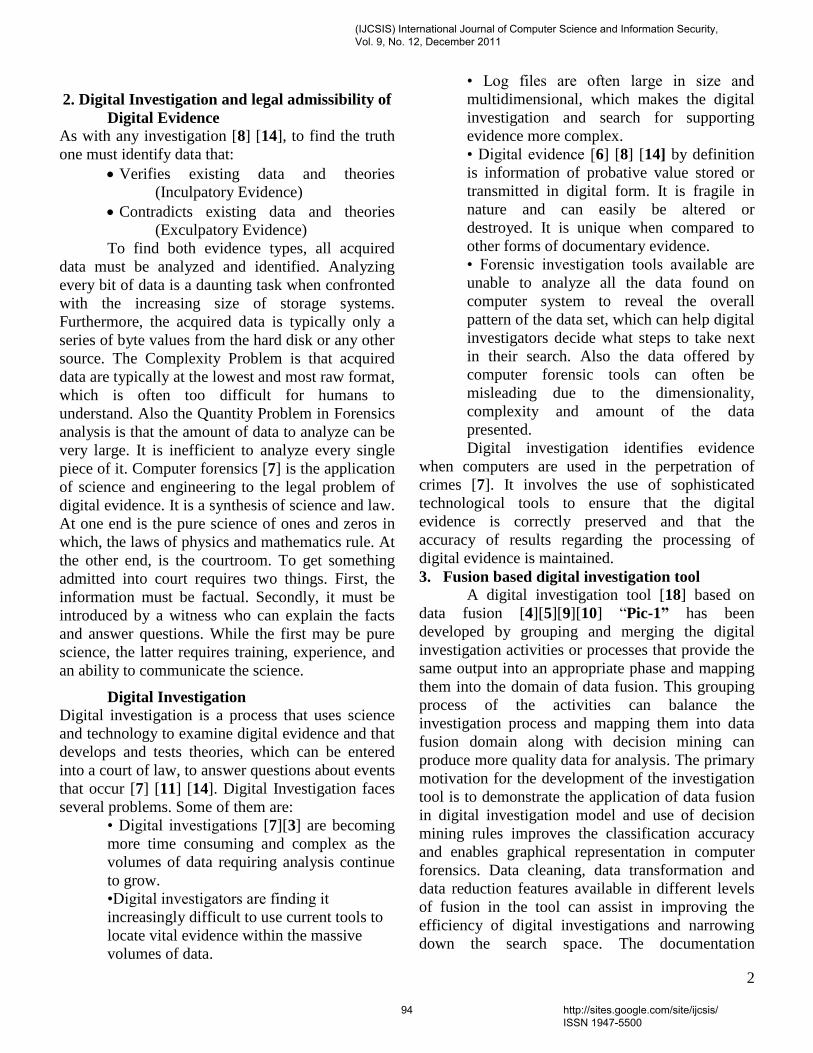
2
2. Digital Investigation and legal admissibility of
Digital Evidence
As with any investigation [8] [14], to find the truth
one must identify data that:
Verifies existing data and theories
(Inculpatory Evidence)
Contradicts existing data and theories
(Exculpatory Evidence)
To find both evidence types, all acquired
data must be analyzed and identified. Analyzing
every bit of data is a daunting task when confronted
with the increasing size of storage systems.
Furthermore, the acquired data is typically only a
series of byte values from the hard disk or any other
source. The Complexity Problem is that acquired
data are typically at the lowest and most raw format,
which is often too difficult for humans to
understand. Also the Quantity Problem in Forensics
analysis is that the amount of data to analyze can be
very large. It is inefficient to analyze every single
piece of it. Computer forensics [7] is the application
of science and engineering to the legal problem of
digital evidence. It is a synthesis of science and law.
At one end is the pure science of ones and zeros in
which, the laws of physics and mathematics rule. At
the other end, is the courtroom. To get something
admitted into court requires two things. First, the
information must be factual. Secondly, it must be
introduced by a witness who can explain the facts
and answer questions. While the first may be pure
science, the latter requires training, experience, and
an ability to communicate the science.
Digital Investigation
Digital investigation is a process that uses science
and technology to examine digital evidence and that
develops and tests theories, which can be entered
into a court of law, to answer questions about events
that occur [7] [11] [14]. Digital Investigation faces
several problems. Some of them are:
• Digital investigations [7][3] are becoming
more time consuming and complex as the
volumes of data requiring analysis continue
to grow.
•Digital investigators are finding it
increasingly difficult to use current tools to
locate vital evidence within the massive
volumes of data.
• Log files are often large in size and
multidimensional, which makes the digital
investigation and search for supporting
evidence more complex.
• Digital evidence [6] [8] [14] by definition
is information of probative value stored or
transmitted in digital form. It is fragile in
nature and can easily be altered or
destroyed. It is unique when compared to
other forms of documentary evidence.
• Forensic investigation tools available are
unable to analyze all the data found on
computer system to reveal the overall
pattern of the data set, which can help digital
investigators decide what steps to take next
in their search. Also the data offered by
computer forensic tools can often be
misleading due to the dimensionality,
complexity and amount of the data
presented.
Digital investigation identifies evidence
when computers are used in the perpetration of
crimes [7]. It involves the use of sophisticated
technological tools to ensure that the digital
evidence is correctly preserved and that the
accuracy of results regarding the processing of
digital evidence is maintained.
3. Fusion based digital investigation tool
A digital investigation tool [18] based on
data fusion [4][5][9][10] “Pic-1” has been
developed by grouping and merging the digital
investigation activities or processes that provide the
same output into an appropriate phase and mapping
them into the domain of data fusion. This grouping
process of the activities can balance the
investigation process and mapping them into data
fusion domain along with decision mining can
produce more quality data for analysis. The primary
motivation for the development of the investigation
tool is to demonstrate the application of data fusion
in digital investigation model and use of decision
mining rules improves the classification accuracy
and enables graphical representation in computer
forensics. Data cleaning, data transformation and
data reduction features available in different levels
of fusion in the tool can assist in improving the
efficiency of digital investigations and narrowing
down the search space. The documentation
(IJCSIS) International Journal of Computer Science and Information Security, Vol. 9, No. 12, December 2011
94 http://sites.google.com/site/ijcsis/ ISSN 1947-5500
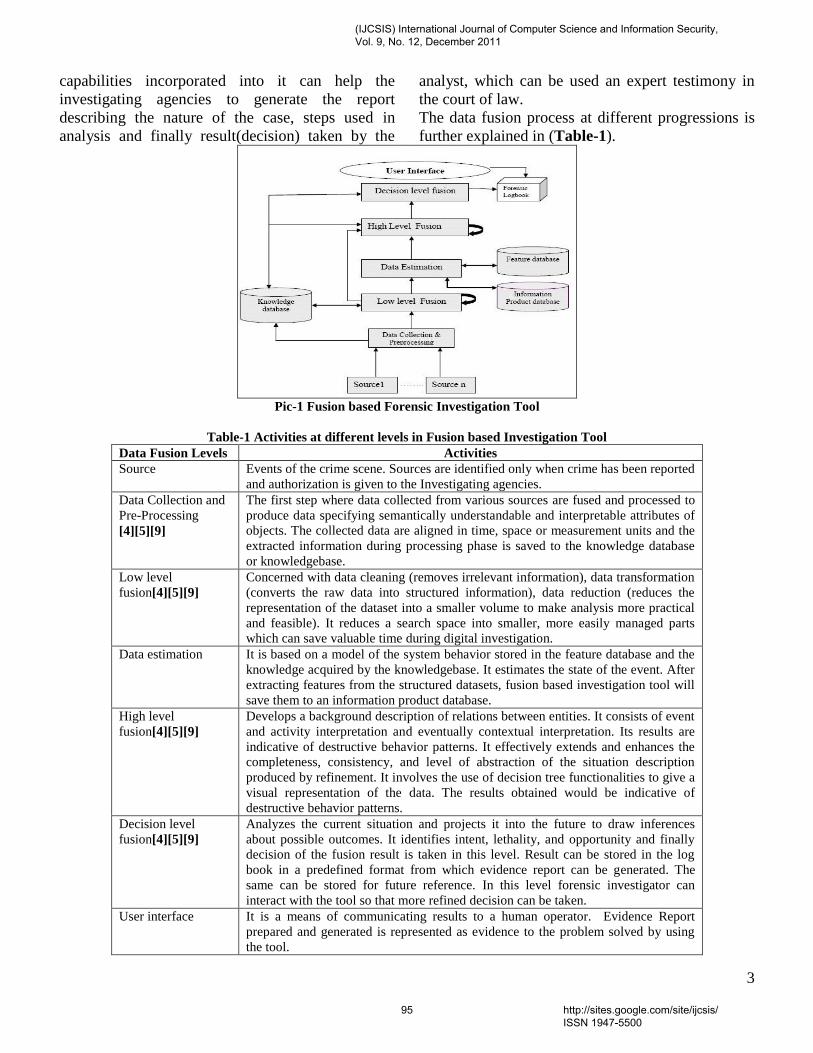
3
capabilities incorporated into it can help the
investigating agencies to generate the report
describing the nature of the case, steps used in
analysis and finally result(decision) taken by the
analyst, which can be used an expert testimony in
the court of law.
The data fusion process at different progressions is
further explained in (Table-1).
Pic-1 Fusion based Forensic Investigation Tool
Table-1 Activities at different levels in Fusion based Investigation Tool
Data Fusion Levels Activities
Source Events of the crime scene. Sources are identified only when crime has been reported
and authorization is given to the Investigating agencies.
Data Collection and
Pre-Processing
[4][5][9]
The first step where data collected from various sources are fused and processed to
produce data specifying semantically understandable and interpretable attributes of
objects. The collected data are aligned in time, space or measurement units and the
extracted information during processing phase is saved to the knowledge database
or knowledgebase.
Low level
fusion[4][5][9]
Concerned with data cleaning (removes irrelevant information), data transformation
(converts the raw data into structured information), data reduction (reduces the
representation of the dataset into a smaller volume to make analysis more practical
and feasible). It reduces a search space into smaller, more easily managed parts
which can save valuable time during digital investigation. Data estimation It is based on a model of the system behavior stored in the feature database and the
knowledge acquired by the knowledgebase. It estimates the state of the event. After
extracting features from the structured datasets, fusion based investigation tool will
save them to an information product database.
High level
fusion[4][5][9]
Develops a background description of relations between entities. It consists of event
and activity interpretation and eventually contextual interpretation. Its results are
indicative of destructive behavior patterns. It effectively extends and enhances the
completeness, consistency, and level of abstraction of the situation description
produced by refinement. It involves the use of decision tree functionalities to give a
visual representation of the data. The results obtained would be indicative of
destructive behavior patterns. Decision level
fusion[4][5][9]
Analyzes the current situation and projects it into the future to draw inferences
about possible outcomes. It identifies intent, lethality, and opportunity and finally
decision of the fusion result is taken in this level. Result can be stored in the log
book in a predefined format from which evidence report can be generated. The
same can be stored for future reference. In this level forensic investigator can
interact with the tool so that more refined decision can be taken. User interface It is a means of communicating results to a human operator. Evidence Report
prepared and generated is represented as evidence to the problem solved by using
the tool.
(IJCSIS) International Journal of Computer Science and Information Security, Vol. 9, No. 12, December 2011
95 http://sites.google.com/site/ijcsis/ ISSN 1947-5500

4
Forensic Log Book
[7][8][14]
The digital information are recorded with a pre-defined format like date and time of
the event, type of event, and success or failure of the event, origin of request for
authentication data and name of object for object introduction and deletion. A time
stamp is added to all data logged. The time line can be seen as a recording of the
event. The log book can be used as an expert opinion or legal digital evidence.
5. A Case Analysis (Dealing with Misuse of
Internet)
Employees with access to the Internet via
their computer system at work can use the World
Wide Web as an important resource. However, as
stated earlier, excessive Internet usage for non-job
purposes and the deliberate misuse of the Internet,
such as accessing web sites that promote unethical
activities, has become a serious problem in many
organizations. Since storage media are steadily
growing in size, forensic analysis of a single
machine is becoming increasingly cumbersome.
Moreover, the process of analyzing or investigating
a large number of machines has become extremely
difficult or even impossible. However, chief
importance in this environment is the detection of
suspicious behavior.
Preparation
The behavior of computer system users doing
similar kind of work is studied. As the first principle
of digital investigation is never to work on the
original, Forensic Toolkit (FTK) [1] was used to
create an image of the seized hard drive. Once the
image had been created, Files can be extracted from
the hard disk and analyzed using fusion based
investigation tool for evidence. Since the case is to
deal with misuse of Internet our main focus is to
extract all the image files and video files and MP3
files. We use the FTK toolkit to collect all the image
files and audio and video files even if the file
extension has been changed. Along with the file
type to study the suspicious behavior we need to
focus on the date and time of the day (working or
non working hour) of browsing. Finally the
following points can be considered for analyzing the
above case.
1. From all the files (image files, video
files, mp3 files) collected from various
sources Investigator has to classify the
files as Graphical Image files, MP3 files
and other files.
2. To examine the graphical image files we
use 4 attributes of files as given in the
following table.
The symbolic attribute are (Table-2):
Table-2
Attribute Possible values
File Type Image(bmp,jpeg,gif,tiff),MP3 files, Other Files
File Creation Date Older files(with earlier creation date), New files
File Creation Time Early hours of morning(12am to 6am)
Day time(6am to 7pm)
Night(7pm to 6am)
File creation day Beginning of the week(Monday, Tuesday)
Middle of the week(Wednesday, Thursday)
End of week(Friday, Saturday, Sunday)
File Size Small, Large
File Creation Date field has been expanded into
three fields. 1. Creation Date (YYYYMMDD) 2.
Creation Day 3. Creation Time (HHMM). For file
creation Date attribute values we have specified two
values that is older file when file creation date <=c
and New file when file creation date>=c. C is the
date value which has been decided when the case
was prepared and investigated. File type are used to
indicate the function of a given set of files for
analysis. File type has three attributes file creation
date, File creation day, file creation time each of
them specifying a specific purpose. We give
importance to file creation time and day that
specifies the time at which illegally internet use has
been done in the work place.
(IJCSIS) International Journal of Computer Science and Information Security, Vol. 9, No. 12, December 2011
96 http://sites.google.com/site/ijcsis/ ISSN 1947-5500
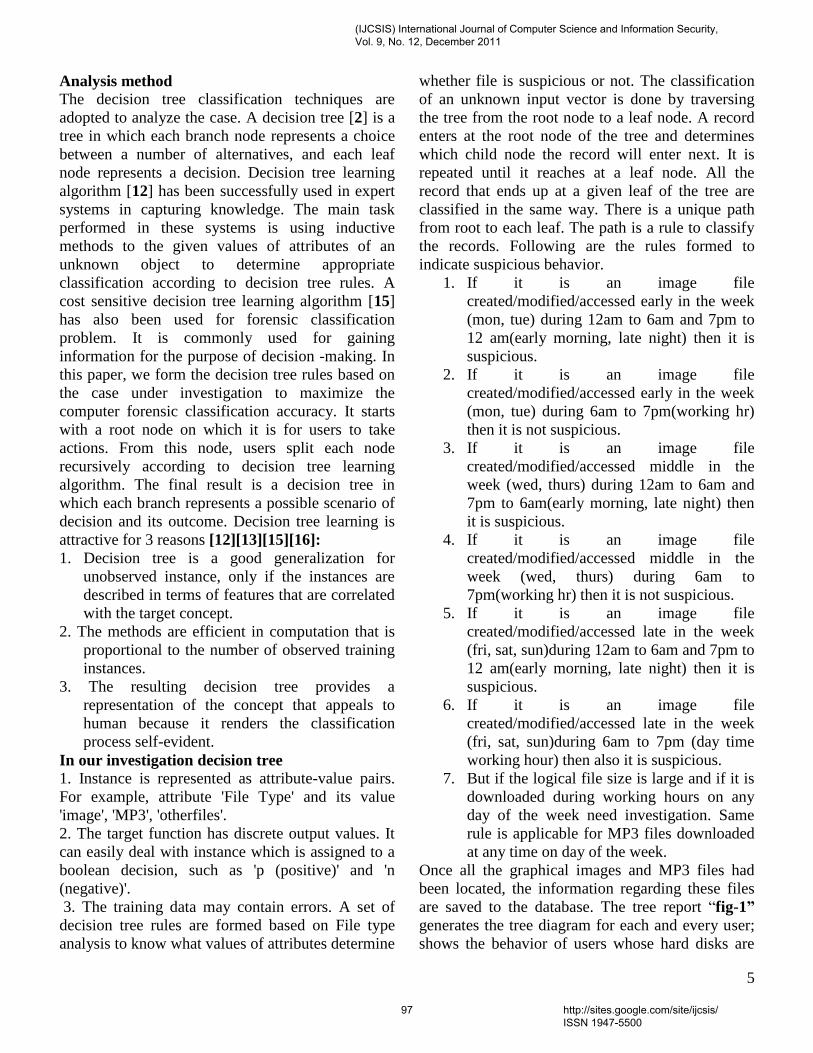
5
Analysis method
The decision tree classification techniques are
adopted to analyze the case. A decision tree [2] is a
tree in which each branch node represents a choice
between a number of alternatives, and each leaf
node represents a decision. Decision tree learning
algorithm [12] has been successfully used in expert
systems in capturing knowledge. The main task
performed in these systems is using inductive
methods to the given values of attributes of an
unknown object to determine appropriate
classification according to decision tree rules. A
cost sensitive decision tree learning algorithm [15]
has also been used for forensic classification
problem. It is commonly used for gaining
information for the purpose of decision -making. In
this paper, we form the decision tree rules based on
the case under investigation to maximize the
computer forensic classification accuracy. It starts
with a root node on which it is for users to take
actions. From this node, users split each node
recursively according to decision tree learning
algorithm. The final result is a decision tree in
which each branch represents a possible scenario of
decision and its outcome. Decision tree learning is
attractive for 3 reasons [12][13][15][16]:
1. Decision tree is a good generalization for
unobserved instance, only if the instances are
described in terms of features that are correlated
with the target concept.
2. The methods are efficient in computation that is
proportional to the number of observed training
instances.
3. The resulting decision tree provides a
representation of the concept that appeals to
human because it renders the classification
process self-evident.
In our investigation decision tree
1. Instance is represented as attribute-value pairs.
For example, attribute 'File Type' and its value
'image', 'MP3', 'otherfiles'.
2. The target function has discrete output values. It
can easily deal with instance which is assigned to a
boolean decision, such as 'p (positive)' and 'n
(negative)'.
3. The training data may contain errors. A set of
decision tree rules are formed based on File type
analysis to know what values of attributes determine
whether file is suspicious or not. The classification
of an unknown input vector is done by traversing
the tree from the root node to a leaf node. A record
enters at the root node of the tree and determines
which child node the record will enter next. It is
repeated until it reaches at a leaf node. All the
record that ends up at a given leaf of the tree are
classified in the same way. There is a unique path
from root to each leaf. The path is a rule to classify
the records. Following are the rules formed to
indicate suspicious behavior.
1. If it is an image file
created/modified/accessed early in the week
(mon, tue) during 12am to 6am and 7pm to
12 am(early morning, late night) then it is
suspicious.
2. If it is an image file
created/modified/accessed early in the week
(mon, tue) during 6am to 7pm(working hr)
then it is not suspicious.
3. If it is an image file
created/modified/accessed middle in the
week (wed, thurs) during 12am to 6am and
7pm to 6am(early morning, late night) then
it is suspicious.
4. If it is an image file
created/modified/accessed middle in the
week (wed, thurs) during 6am to
7pm(working hr) then it is not suspicious.
5. If it is an image file
created/modified/accessed late in the week
(fri, sat, sun)during 12am to 6am and 7pm to
12 am(early morning, late night) then it is
suspicious.
6. If it is an image file
created/modified/accessed late in the week
(fri, sat, sun)during 6am to 7pm (day time
working hour) then also it is suspicious.
7. But if the logical file size is large and if it is
downloaded during working hours on any
day of the week need investigation. Same
rule is applicable for MP3 files downloaded
at any time on day of the week.
Once all the graphical images and MP3 files had
been located, the information regarding these files
are saved to the database. The tree report “fig-1”
generates the tree diagram for each and every user;
shows the behavior of users whose hard disks are
(IJCSIS) International Journal of Computer Science and Information Security, Vol. 9, No. 12, December 2011
97 http://sites.google.com/site/ijcsis/ ISSN 1947-5500
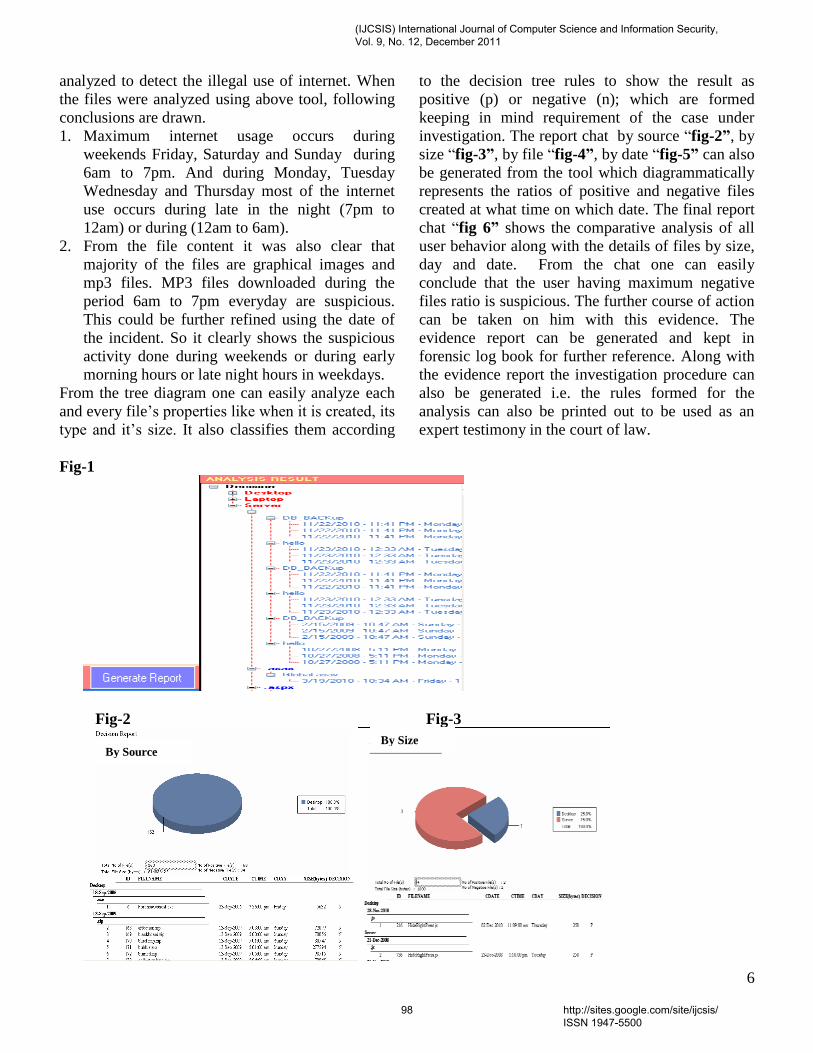
6
analyzed to detect the illegal use of internet. When
the files were analyzed using above tool, following
conclusions are drawn.
1. Maximum internet usage occurs during
weekends Friday, Saturday and Sunday during
6am to 7pm. And during Monday, Tuesday
Wednesday and Thursday most of the internet
use occurs during late in the night (7pm to
12am) or during (12am to 6am).
2. From the file content it was also clear that
majority of the files are graphical images and
mp3 files. MP3 files downloaded during the
period 6am to 7pm everyday are suspicious.
This could be further refined using the date of
the incident. So it clearly shows the suspicious
activity done during weekends or during early
morning hours or late night hours in weekdays.
From the tree diagram one can easily analyze each
and every file’s properties like when it is created, its
type and it’s size. It also classifies them according
to the decision tree rules to show the result as
positive (p) or negative (n); which are formed
keeping in mind requirement of the case under
investigation. The report chat by source “fig-2”, by
size “fig-3”, by file “fig-4”, by date “fig-5” can also
be generated from the tool which diagrammatically
represents the ratios of positive and negative files
created at what time on which date. The final report
chat “fig 6” shows the comparative analysis of all
user behavior along with the details of files by size,
day and date. From the chat one can easily
conclude that the user having maximum negative
files ratio is suspicious. The further course of action
can be taken on him with this evidence. The
evidence report can be generated and kept in
forensic log book for further reference. Along with
the evidence report the investigation procedure can
also be generated i.e. the rules formed for the
analysis can also be printed out to be used as an
expert testimony in the court of law.
Fig-1
Fig-2 Fig-3
By Source By Size
(IJCSIS) International Journal of Computer Science and Information Security, Vol. 9, No. 12, December 2011
98 http://sites.google.com/site/ijcsis/ ISSN 1947-5500
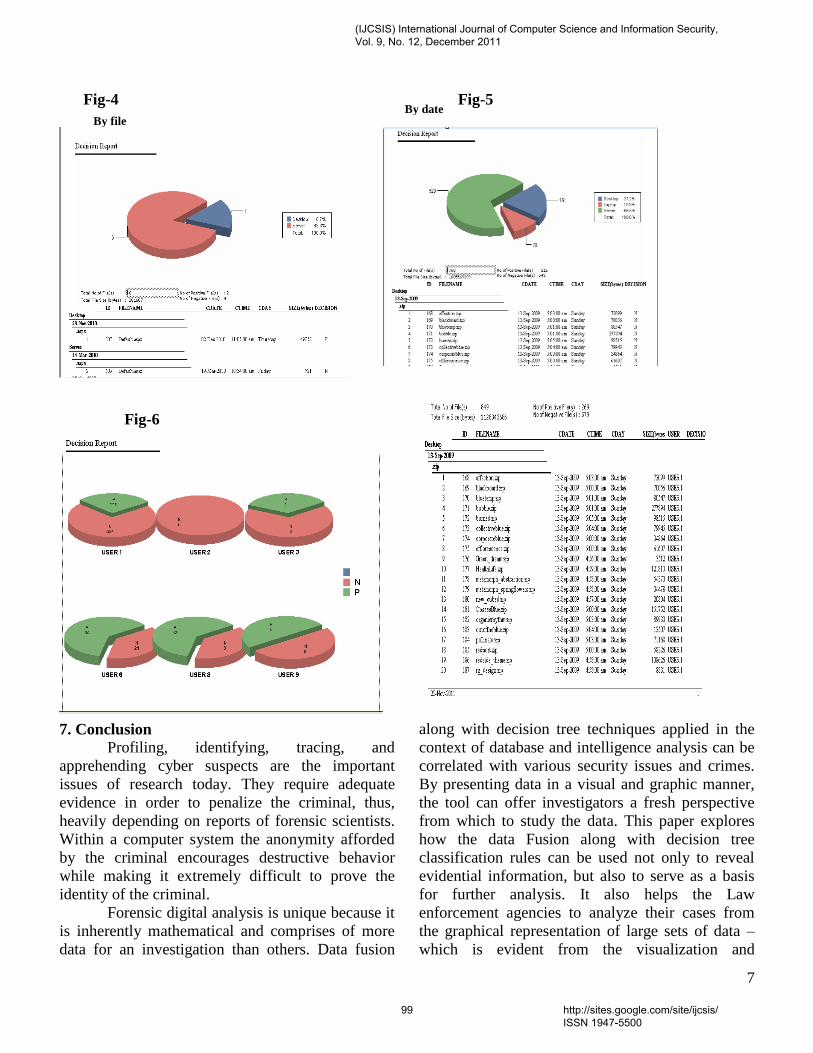
7
Fig-4 Fig-5
7. Conclusion
Profiling, identifying, tracing, and
apprehending cyber suspects are the important
issues of research today. They require adequate
evidence in order to penalize the criminal, thus,
heavily depending on reports of forensic scientists.
Within a computer system the anonymity afforded
by the criminal encourages destructive behavior
while making it extremely difficult to prove the
identity of the criminal.
Forensic digital analysis is unique because it
is inherently mathematical and comprises of more
data for an investigation than others. Data fusion
along with decision tree techniques applied in the
context of database and intelligence analysis can be
correlated with various security issues and crimes.
By presenting data in a visual and graphic manner,
the tool can offer investigators a fresh perspective
from which to study the data. This paper explores
how the data Fusion along with decision tree
classification rules can be used not only to reveal
evidential information, but also to serve as a basis
for further analysis. It also helps the Law
enforcement agencies to analyze their cases from
the graphical representation of large sets of data –
which is evident from the visualization and
By file By file By date
Fig-6
(IJCSIS) International Journal of Computer Science and Information Security, Vol. 9, No. 12, December 2011
99 http://sites.google.com/site/ijcsis/ ISSN 1947-5500
8
interpretation of tree diagram formed and report
being generated.
8. References
[1] AccessData Corporation. 2005.
(http://www.accessdata.com).
[2] Adriaans, P. and Zantige, D., Data Mining,
Addison Wesley, Harlow England, 1997. [3] Beebe, N. and Clark, J., Dealing with terabyte
data sets in digital investigations. Advances in
Digital Forensics, 2005, pp. 3-16. Springer.
[4] David L. Hall, Sonya A.H. McMullen,
Mathematical Techniques in Multisensor Data
Fusion, 2nd edition, Artech House, 2004.
[5] David L. Hall and James Llinas, An Introduction
to Multisensor Data Fusion. In Proceedings of The
IEEE, volume 85, January.
[6] D. Brezinski and T. Killalea, Guidelines for
Evidence Collection and Archiving, RFC3227,
February 2002.
[7] E. Casey (ed.), Handbook of Computer Crime
Investigation, Academic Press, 2001.
[8] E. Casey, Digital Evidence and Computer
Crime, 2nd Edition, Elsevier Academic Press, 2004.
[9] E. Waltz and J. Linas, Multisensor Data Fusion,
Artech House, Boston, MA, 1990
[10] http://www.data-fusion.org.
[11] H Lipson, Tracking and Tracing Cyber
Attacks: Technical Challenges and Global Policy
Issues (CMU/SEI-2002-SR-009), CERT
Coordination Center, November 2002.
[12] Han, J. and Kamber, M., Data mining: concepts
and techniques, second edition 2005.
[13] IU Qin Data Mining Method Based on
Computer Forensics-based ID3 Algorithm.
[14] J. Danielsson, Project Description A system for
collection and analysis of forensic evidence,
Application to NFR, April 2002.
[15] Jason V. Davis, Jungwoo Ha, Christopher J.
Rossbach, Hany E. Ramadan, and Emmett Witchel
Cost-Sensitive Decision Tree Learning for Forensic
Classification.
[16] Marcelo Mendoza1, and Juan Zamora
Building Decision trees to identify the intent of a
user query.
[17] Meyers, M. and Rogers, M. 2004, Computer
forensics: the need for standardization and
Certification, International Journal of Digital
Evidence, vol. 3, no. 2.
[18] Suneeta Satpathy Sateesh K. Pradhan B.B.
Ray, A Digital Investigation Tool based on Data
Fusion in Management of Cyber Security Systems,
International Journal of Information Technology ad
Knowledge management, 2010.
(IJCSIS) International Journal of Computer Science and Information Security, Vol. 9, No. 12, December 2011
100 http://sites.google.com/site/ijcsis/ ISSN 1947-5500
(IJCSIS) International Journal of Computer Science and Information Security, Vol. 9, No. 12, 2011
HARNESSING HIGH SPEED TRANSMISSIONS FOR COMPUTER COMMUNICATIONS WITH
WiMAX TECHNOLOGY
Prof P.Balagangadhar Rao. Electronics and Telecommunications.
Sreekavitha Engineering College Karepalli (INDIA)
Abstract— In the recent past, there is a Every school and college in the world is going to have a P.C and also an Internet connection. Those kids and students who never knew P.Cs will now be used to using them at these schools or colleges. They in turn will make way for their family members owning a P.C and therefore an internet connection. What will further fuel the penetration of computers is the content (voice, data, text, multi-media) which is more relevant to the user. More applications suitable to the respective social context will come up in the next few years which will in turn force to harness high speed transmission for computer communication. WiMAX (World Wide Interoperability for Microwave Access) is the next generation wireless technology which delivers data, video, voice and multi-media at a very low cost .It is designed to enable pervasive, high speed internet access to the widest array of devices including notebook PCs, handsets, smart phones and consumer electronic devices such as gaming devices, cameras, camcorders, music players etc. Being the first all IP (Internet Protocol) network, it is going to be the best choice for mobile Internet solutions. WiMAX is the natural choice at places where it is not feasible to use DSL (Digital Subscriber Line) or Cable Internet. A typical example is a remote location where it is not economically feasible to have DSL or Cable Internet. Compared to other technologies, WiMAX is more reliable due to its wireless nature of communication between the user and the base station. This particular feature is very useful in developing countries like INDIA where the reliability and quality of land-line infrastructure is often poor. An attempt is made in this paper to analyze various strengths of WiMAX technology which could be harnessed for the benefit of deriving high speed communications among computers as well as for the enrichment of the computer comfort of the users. Keywords: WiMAX (Worldwide Interoperability for Microwave Access) , DSL(Digital Subscriber Line), I.P(Internet Protocol), Cable Internet, GSM (Global System for Mobile).
I. INTRODUCTION . In the recent past, there is a striking improvement in the wireless communication technologies making the users to have an affordable and reliable access to the INTERNET. Gone are the days, where the people are office- centric
because of the nature of “fixed- wired network”. The combined power of the wireless technologies and web applications like web 2.0, cloud computing and powerful protocols for reliable transportation of digital information set to transform the styles of information interchange of the people. Lot of research is going on, in the area of wireless technologies for transporting maximum amount of digital information in less time by using minimum power and spectrum. Bluetooth, G.S.M, C.D.M.A, WiMAX etc are some of the areas where the advancement is witnessed in multi-fold. The economic development of a community or society or an individual, mainly depends upon how best one can take advantage of the available technology. The astonishing developments in Information and communication technologies giving such wonderful opportunities to boost ones own economic conditions, especially to the poor. II. RECENT DEVELOPMENTS IN WIRELESS TECHNOLOGIES . "Analog" signals like voice are to be carried by the First Generation (1G) of wireless technologies. They were not capable of sending the digital information on the space. The second generation (2G) started a new era in the digital world, enabling us to transport not only "voice" but also "data" with limited speeds. By using architectures like G.P.R.S.( General Packet Radio Switching) users can send and receive, the digital information upto128 kbp/s ( kilo bits per second) . In the subsequent revision of the second generation wireless technologies (2.5 G), the speed of transmission has been increased to 384 kbp/s. with the use of another advanced architecture, namely, E.D.G.E (enhanced data rates of global evolution). In this way, tremendous improvement is being witnessed through research, in the speed of transportation of digital information of the forms like image, audio, video, text and multi-media. The third generation (3G) of wireless technologies, totally revamped the situation with its amazing power of speed, to handle the digital signals with high bit rates of the order of 2Mbp/s (Mega bits per second). This particular attribute of
101 http://sites.google.com/site/ijcsis/ ISSN 1947-5500

(IJCSIS) International Journal of Computer Science and Information Security, Vol. 9, No. 12, 2011
the 3G wireless system enabled the users to make it as a natural choice for a variety of web-based applications to run. . A few examples are cited in this presentation, where the economic growth, medical information, community development, disaster management etc are drastically improved through the concept of "any where, any time" of information flow. .
III. WiMAX: A WIRELESS TECHNOLOGY POISED
FOR HIGH SPEED COMPUTER COMMUNICATION.
WiMAX is a technology based on IEEE envisaged standards, enabling the delivery of last mile wireless broadband access as an alternative to conventional DSL (Digital Subscriber Line) and Cable Internet technologies. WiMAX technology provides up to 70 Mbp/s (Mega Bits per Second) symmetric broadband speeds without the need of any cable.WiMAX can provide Broadband Wireless Access (BWA) up to 50 K.M for fixed stations and a maximum of 15 K.M.s for mobile stations. In contrast, the Wi-Fi technology is limited to only 30 to100 Meters. WiMAX operates on both licensed and unlicensed frequencies, providing a regulated environment and viable economic model for wireless carriers. The bandwidth and range of WiMAX make it suitable for a variety of potential applications. Connecting Wi-Fi hot spots to the Internet, providing wireless alternative to Cable and DSL for “last mile” broadband access, providing Data and Telecommunication services, providing portable connectivity are few examples of applications of WiMAX. The need for broadband Internet connectivity is the wanting requirement in villages with the transformation ability to leap forward and fuel economic growth. Such a growth is highly essential since millions of people live in theses remote areas in a relatively deprived situation. Most of the people in these areas have seen very little benefits to them arising out of the recent worldwide economic growth. At the same time the reach of televisions in rural areas has enabled them to see the transformation that is taking place else where in the world. The urgent attention to rural growth is absolutely essential simply because a large number of people continue to live in inaccessible, remote and unprivileged areas. Such large number of people cannot be left behind. It is clear that transformation from narrowband to broadband depends on the penetration of Internet to the “last mile”. Rural areas therefore need the broadband connections at the earliest. For narrowband users, the connectivity, speed, email service and customer support and service are significantly important whereas for broadband users speed, customer support and service are the two significant important factors to be kept in mind.
IV. IS WiMAX A PREFFERED TECHNOLOGY?
Given the limited wired infrastructure in some developing countries, the cost to install a WiMAX station in conjunction with an existing cellular tower or even as a solitary hub is likely to be small in comparison to developing a “Wired”
solution. Areas of low population density and flat terrain are more suited to WiMAX and its range. For those countries that have skipped “Wired” infrastructure as a result of prohibitive costs and unsympathetic geography, WiMAX can enhance wireless infrastructure in an inexpensive, decentralized, deployment-friendly and effective manner. WiMAX is a possible replacement candidate for cellular phone technologies such as GSM and CDMA. It can also be used as a layover to increase the efficiency and capacity.”Backhaul” for cellular networks is typically provided via Satellite or OFC (Optical Fiber Cable). Both developed and developing countries are considering WiMAX as a wireless “backhaul” technology for 2G, 3G and 4G networks because of its easy way of deployment. Being an Internet-oriented system, WiMAX has been designed from the ground up to support strong Q.O.S (Quality of Service) and Security. That is why WiMAX is sometimes viewed as the technology that will make the current cellular networks obsolete. Once fully deployed, it will simply provide the roaming global Internet access that will bring VoIP (Voice over Internet Protocol) to the same corners of the earth that cellular towers have covered today and could spread that coverage even farther. With all these attributes, WiMAX is going to be the first choice of the users as well operators.
V. TOPOLOGY OF WiMAX The topology of WiMAX is a very simpler and flatter one. Because it has been designed as a Data Network from the ground up, it has a much simpler network topology than cellular networks that have had to add extra layers to enable their technology to handle Data. WiMAX takes less equipment and less time to set up than traditional cellular infrastructure or wide-scale Wi-Fi. As the architecture of WiMAX is very simpler, it takes lower Capital Expenditure (CAPEX) and lower Operating Expenditure (OPEX) to maintain them. Naturally, this can result in lower service costs for end users. The scaling for lower traffic may be slow but it quickly scales higher to meet large growth on demand.
VI. ECONOMIC CONSIDERATIONS FAVOURING WiMAX
Chip set makers like INTEL and SEQUENS have always thought of WiMAX as a mass market technology and so have architected WiMAX chip solutions aimed at large production and low cost. This has resulted in inexpensive network interface devices such as WiMAX Modems and P.C Cards, but more important, making it easier for computer and consumer electronics makers to soon embed WiMAX chips into a lot of different kinds of devices. Cellular technologies such as HSPA (High Speed Packet Access) simply will not be able to match that scale for one simple reason that SIM (Subscriber Identity Module) cards which connect the users to
102 http://sites.google.com/site/ijcsis/ ISSN 1947-5500
(IJCSIS) International Journal of Computer Science and Information Security, Vol. 9, No. 12, 2011
the cellular network are more expensive than WiMAX chips. It is not that easy to deploy and manage these SIM cards. In the place of SIM cards, WiMAX uses software encryption modules that are much more configurable, flexible and scalable.[2] While 3G cellular operators advocate and demonstrate HSPA bandwidth speeds that are equivalent to WiMAX. It does not necessarily mean that the performance is the same. Because WiMAX is basically IP-based at the core and has a much simpler topology, it should have better spectral efficiency and lower latency than cellular networks. Spectral efficiency is a measure of the amount Data that can be transmitted over a certain amount of bandwidth. In essence, WiMAX has both spectral efficiency as well as economic viability.
V. CERTAIN CASE STUDIES
(A) There are many instances, worldwide, where WiMAX technology came handy to assist the effected people in need, during Tsunamis and Hurricanes. The entire communication infrastructure at ACEH in INDONESIA was totally crippled because of a tsunami in December 2004.The situation was so pathetic that the survivors were in a grip of fear without any food, water and medical assistance. Also, they were unable to communicate with people outside the disaster area and vice versa. At this stage, the Government of Indonesia triggered WiMAX into operation to effectively cope up with the situation by providing broadband access that helped to regenerate communications to and from ACEH. In another instance, WiMAX was used by INTEL to assist the FCC and FEMA, in their communications efforts in the area that was affected by Hurricane Katrina in U.S.A.
(B) Majority of the population in ALASKA live in subsistence life-style. For bringing transformation in their economic and social condition ICT along with WiMAX technology is adopted by using Polycom Video over INTERNET protocol [1]. The Polycom units work on real-time. To bring communications between sites, instructors and individuals along with various content resources use a visualiser to broadcast printed media and detailed analyses of exhibits. A smart board and smart board sympodium are used to provide more interactive methods for information exchange. Emergency group services, Community health organization services, Community development services etc are made available to these unprivileged, remote people of ALASKA.
(C) During the recent International game meet organized by Singapore, CLOUD COMPUTING and WiMAX were used to cut short the expenditure, drastically. Cloud computing is an area of computing where IT scalable capacity is provided in the form of services delivered via INTERNET. The users can use cloud
computing depending on the type of service may be it is an Infrastructure service or Platform service or Software service.[1]
(D) I-Stoode is a mobile learning system developed by Italian national research council which uses smart phones and portable devices to simulate collaborative learning in order to reduce digital divide. On-site learning activities are optimized by the use of I-Stoode along with WiMAX.
VI. CONCLUSION
Rapid advancements in Wireless Technologies made it possible to bring a noticeable change in the economic and social conditions of the remote, unprivileged, marginalized sections of the society. Lot of research is going on in both information and communication technologies for opening new horizons in the economics of the people. Deep penetration of technologies like WiMAX will not only help in harnessing high speed computer communications at an affordable price but also amuse those with tech-savvy. References: [1] Application of cloud computing”---Z.Bogdovinac [2]Telecommunication journal-September2008
AUTHOR”S PROFILE The author worked as General Manager in the Department of Telecommunications in INDIA with an experience of 28 years. Presently, performing the duties of DEAN in Sreekavitha Engineering College, Karepalli,(INDIA).
103 http://sites.google.com/site/ijcsis/ ISSN 1947-5500
(IJCSIS) International Journal of Computer Science and Information Security, Vol. 9, No. 12, December 2011
Design an Algorithm To Discover The Misdirection Attack For Increasing The Life Time in Computer
Network
Omar Tariq Saleh Al-Khalidy Computer Science Department
College of Computer Science and Mathematics Mosul University
Mosul, Iraq [email protected]
Abstract - The wireless computer networks face many types of attacks, one of this type is a misdirection attack. Therefore; it is necessary to make the wireless network gives a good performance by discovering and dropping this attack. So the life time and the energy of the wireless networks almost be save. New method has been invented in this paper for discovering the misdirection attack. The obtained results show that the misdirection attack has a significant negative effect that causes consumption of network resources. The major benefit of this work is to show the importance of reducing energy and time consumption. As these two factors are very significant in data transmission and reducing them make transmission process more efficient and reliable. Index Terms – misdirection, attack, time, energy.
I. INTRODUCTION
Without security controls, the computer network and data
might be subjected to an attack. A common network attacks are classified into two types: passive, which means that information is monitored. The second type is active, meaning the information is changed, or the packet path is altered. Your networks and data are vulnerable to attacks if you do not have a security plan in place [1]. Misdirection attack is one of the more active attacks, forwards messages along wrong paths, by fabricating malicious route advertisements. As a mechanism for redirecting path away from its intended destination, this DoS attack targets the sender. The DoS attack can target an arbitrary victim by misdirecting many traffic streams in one direction [2].
In the network security field, very little research is aimed toward locating the source of network attacks. Up to this day, very little work has been intended to locate the source of network attacks [3].
Hence, a new approach has been introduces in this paper to discover the misdirection attack in wireless computer network
environment. With this approach the source node from which the packet starts is identified. Also, this approach shows the benefit of reducing energy and time consumption. As these two factors are very significant in data transmission and reducing them make transmission process more efficient and reliable and increase performance.
The paper is structured as follows: Section 2 gives an overview of related works. Section 3 discusses the wireless network security issues. Section 4 gives the existing challenges. Security threats are presented in section 5. Practical part of the work is illustrated in section 6. The algorithms of this method are explained in section 7. In section 8 the results and discussion are presented. Finally, section 9 contains the conclusions and the future works.
II. RELATED WORKS
In [4] the Denial of Service (DoS), which prevents
authorized users from gaining access to the networks attacks, is detected and mitigated. They propose a novel Cross layer based Intrusion Detection System (CIDS) to identify the malicious node(s).
This paper [5] addressed the difficulties and challenges facing the wireless sensor networks on the battlefield cased by misdirection attack.
This paper [3] models the technical aspects of attack traceback. By analyzing the model of attack traceback, two fundamental technical problems can be identified: determining the immediate source of packets (which may be disguised through IP spoofing) and determining causality for packets arriving at and issuing from a host. Also a discussion of some of the legal and societal roadblocks to a technical solution is shown.
A development of a formal framework which can automatically verify different wireless routing protocols against DoS attacks exhaustively is performed in [6]. In this paper the formal framework is applied against a secure ad-hoc
104 http://sites.google.com/site/ijcsis/ ISSN 1947-5500
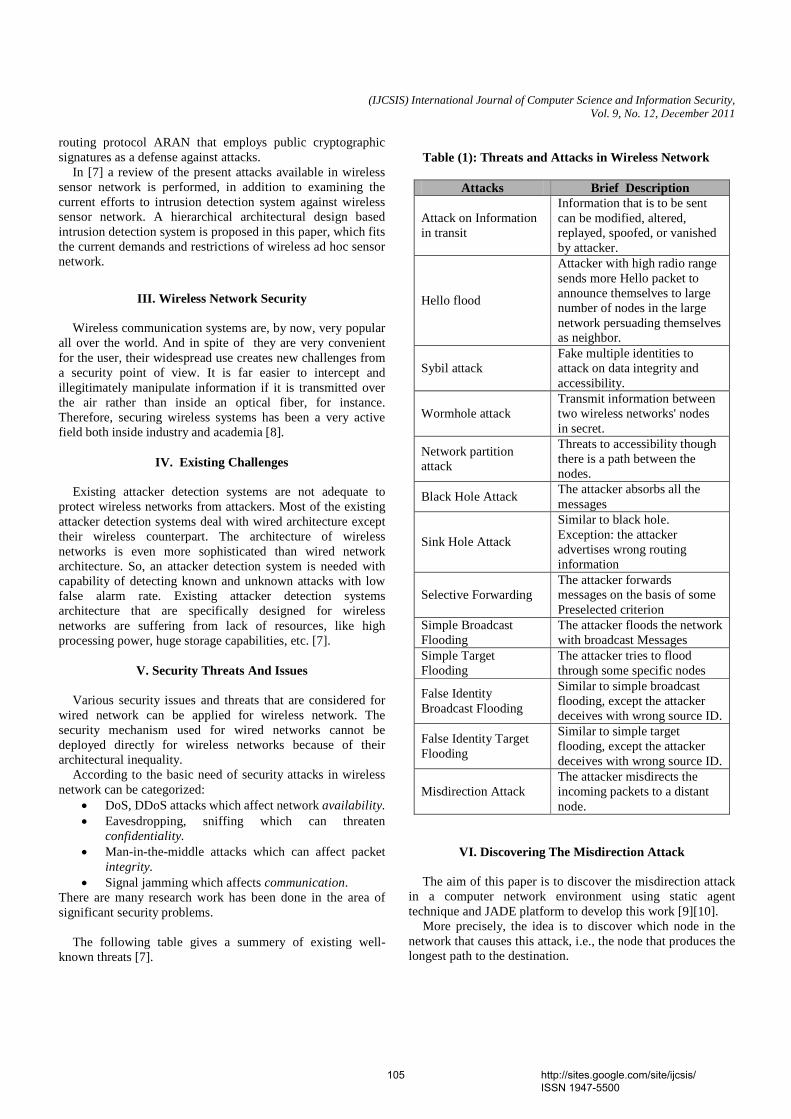
(IJCSIS) International Journal of Computer Science and Information Security, Vol. 9, No. 12, December 2011
routing protocol ARAN that employs public cryptographic signatures as a defense against attacks.
In [7] a review of the present attacks available in wireless sensor network is performed, in addition to examining the current efforts to intrusion detection system against wireless sensor network. A hierarchical architectural design based intrusion detection system is proposed in this paper, which fits the current demands and restrictions of wireless ad hoc sensor network.
III. Wireless Network Security
Wireless communication systems are, by now, very popular all over the world. And in spite of they are very convenient for the user, their widespread use creates new challenges from a security point of view. It is far easier to intercept and illegitimately manipulate information if it is transmitted over the air rather than inside an optical fiber, for instance. Therefore, securing wireless systems has been a very active field both inside industry and academia [8].
IV. Existing Challenges
Existing attacker detection systems are not adequate to
protect wireless networks from attackers. Most of the existing attacker detection systems deal with wired architecture except their wireless counterpart. The architecture of wireless networks is even more sophisticated than wired network architecture. So, an attacker detection system is needed with capability of detecting known and unknown attacks with low false alarm rate. Existing attacker detection systems architecture that are specifically designed for wireless networks are suffering from lack of resources, like high processing power, huge storage capabilities, etc. [7].
V. Security Threats And Issues
Various security issues and threats that are considered for
wired network can be applied for wireless network. The security mechanism used for wired networks cannot be deployed directly for wireless networks because of their architectural inequality.
According to the basic need of security attacks in wireless network can be categorized:
· DoS, DDoS attacks which affect network availability. · Eavesdropping, sniffing which can threaten
confidentiality. · Man-in-the-middle attacks which can affect packet
integrity. · Signal jamming which affects communication.
There are many research work has been done in the area of significant security problems.
The following table gives a summery of existing well-known threats [7].
Table (1): Threats and Attacks in Wireless Network
Attacks Brief Description
Attack on Information in transit
Information that is to be sent can be modified, altered, replayed, spoofed, or vanished by attacker.
Hello flood
Attacker with high radio range sends more Hello packet to announce themselves to large number of nodes in the large network persuading themselves as neighbor.
Sybil attack Fake multiple identities to attack on data integrity and accessibility.
Wormhole attack Transmit information between two wireless networks' nodes in secret.
Network partition attack
Threats to accessibility though there is a path between the nodes.
Black Hole Attack The attacker absorbs all the messages
Sink Hole Attack
Similar to black hole. Exception: the attacker advertises wrong routing information
Selective Forwarding The attacker forwards messages on the basis of some Preselected criterion
Simple Broadcast Flooding
The attacker floods the network with broadcast Messages
Simple Target Flooding
The attacker tries to flood through some specific nodes
False Identity Broadcast Flooding
Similar to simple broadcast flooding, except the attacker deceives with wrong source ID.
False Identity Target Flooding
Similar to simple target flooding, except the attacker deceives with wrong source ID.
Misdirection Attack The attacker misdirects the incoming packets to a distant node.
VI. Discovering The Misdirection Attack
The aim of this paper is to discover the misdirection attack in a computer network environment using static agent technique and JADE platform to develop this work [9][10].
More precisely, the idea is to discover which node in the network that causes this attack, i.e., the node that produces the longest path to the destination.
105 http://sites.google.com/site/ijcsis/ ISSN 1947-5500
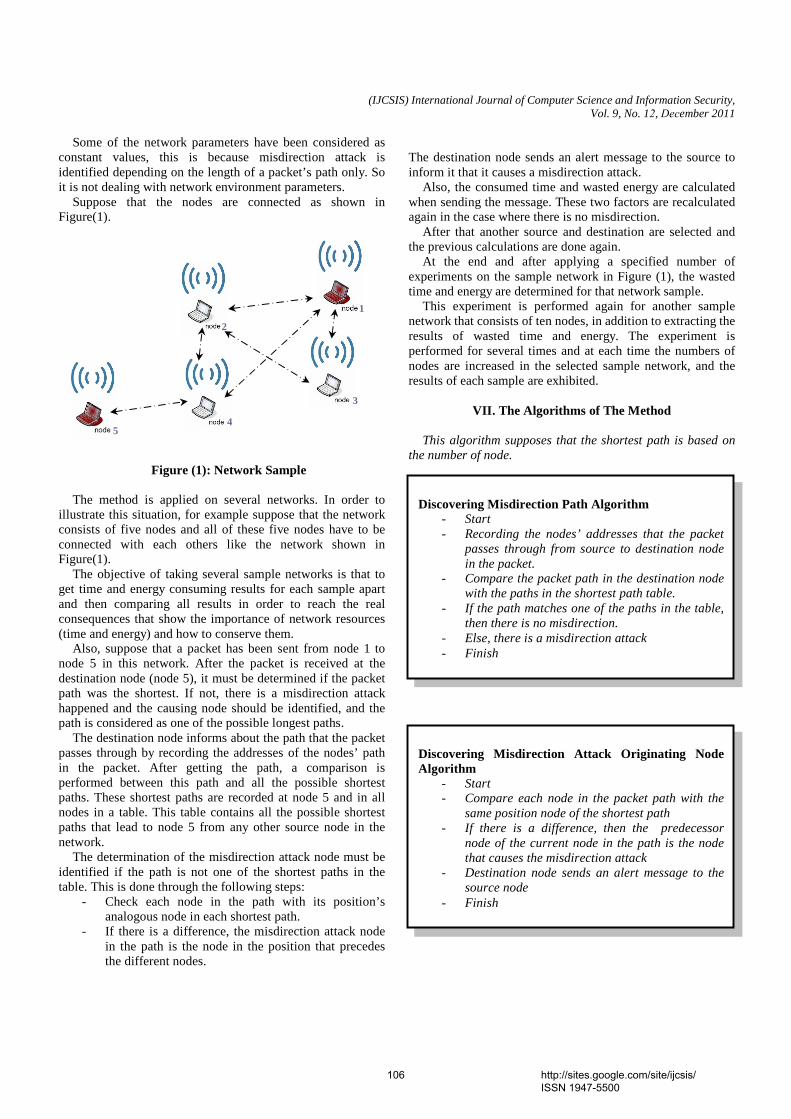
(IJCSIS) International Journal of Computer Science and Information Security, Vol. 9, No. 12, December 2011
Some of the network parameters have been considered as
constant values, this is because misdirection attack is identified depending on the length of a packet’s path only. So it is not dealing with network environment parameters.
Suppose that the nodes are connected as shown in Figure(1).
Figure (1): Network Sample The method is applied on several networks. In order to
illustrate this situation, for example suppose that the network consists of five nodes and all of these five nodes have to be connected with each others like the network shown in Figure(1).
The objective of taking several sample networks is that to get time and energy consuming results for each sample apart and then comparing all results in order to reach the real consequences that show the importance of network resources (time and energy) and how to conserve them.
Also, suppose that a packet has been sent from node 1 to node 5 in this network. After the packet is received at the destination node (node 5), it must be determined if the packet path was the shortest. If not, there is a misdirection attack happened and the causing node should be identified, and the path is considered as one of the possible longest paths.
The destination node informs about the path that the packet passes through by recording the addresses of the nodes’ path in the packet. After getting the path, a comparison is performed between this path and all the possible shortest paths. These shortest paths are recorded at node 5 and in all nodes in a table. This table contains all the possible shortest paths that lead to node 5 from any other source node in the network.
The determination of the misdirection attack node must be identified if the path is not one of the shortest paths in the table. This is done through the following steps:
- Check each node in the path with its position’s analogous node in each shortest path.
- If there is a difference, the misdirection attack node in the path is the node in the position that precedes the different nodes.
The destination node sends an alert message to the source to inform it that it causes a misdirection attack.
Also, the consumed time and wasted energy are calculated when sending the message. These two factors are recalculated again in the case where there is no misdirection.
After that another source and destination are selected and the previous calculations are done again.
At the end and after applying a specified number of experiments on the sample network in Figure (1), the wasted time and energy are determined for that network sample.
This experiment is performed again for another sample network that consists of ten nodes, in addition to extracting the results of wasted time and energy. The experiment is performed for several times and at each time the numbers of nodes are increased in the selected sample network, and the results of each sample are exhibited.
VII. The Algorithms of The Method
This algorithm supposes that the shortest path is based on
the number of node.
1
2
3
4 5
Discovering Misdirection Path Algorithm
- Start - Recording the nodes’ addresses that the packet
passes through from source to destination node in the packet.
- Compare the packet path in the destination node with the paths in the shortest path table.
- If the path matches one of the paths in the table, then there is no misdirection.
- Else, there is a misdirection attack - Finish
Discovering Misdirection Attack Originating Node Algorithm
- Start - Compare each node in the packet path with the
same position node of the shortest path - If there is a difference, then the predecessor
node of the current node in the path is the node that causes the misdirection attack
- Destination node sends an alert message to the source node
- Finish
106 http://sites.google.com/site/ijcsis/ ISSN 1947-5500
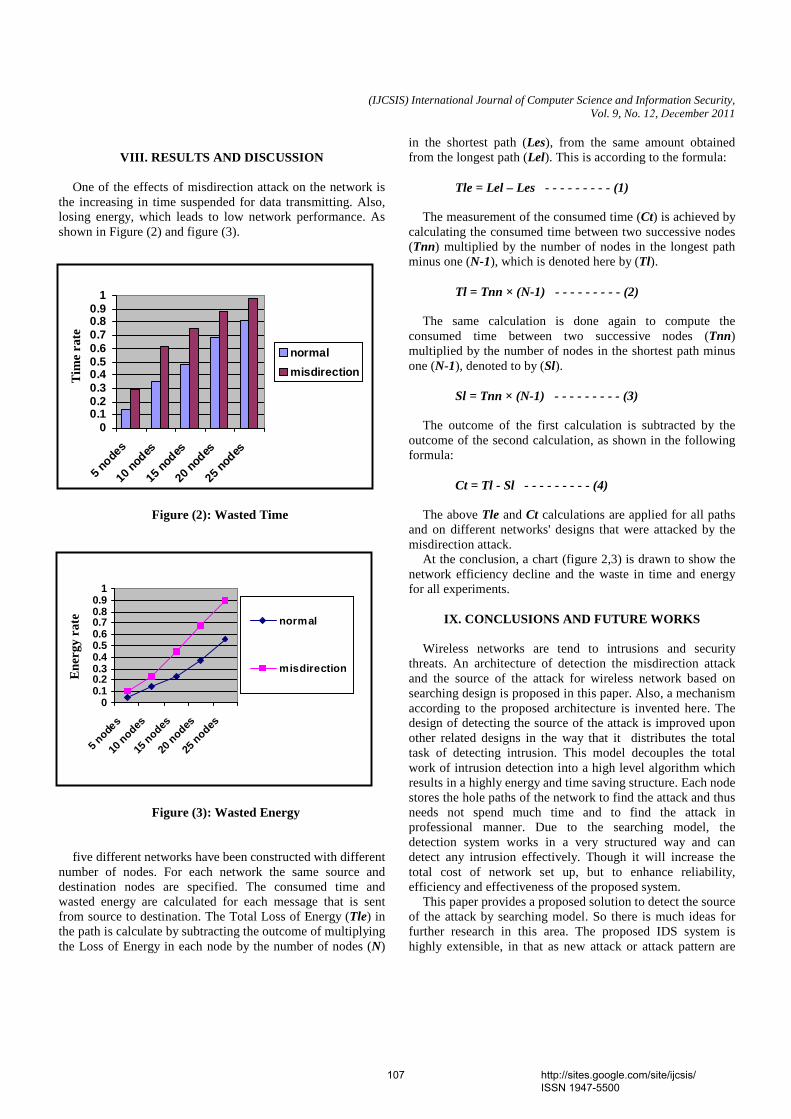
(IJCSIS) International Journal of Computer Science and Information Security, Vol. 9, No. 12, December 2011
VIII. RESULTS AND DISCUSSION
One of the effects of misdirection attack on the network is the increasing in time suspended for data transmitting. Also, losing energy, which leads to low network performance. As shown in Figure (2) and figure (3).
Figure (2): Wasted Time
Figure (3): Wasted Energy
five different networks have been constructed with different
number of nodes. For each network the same source and destination nodes are specified. The consumed time and wasted energy are calculated for each message that is sent from source to destination. The Total Loss of Energy (Tle) in the path is calculate by subtracting the outcome of multiplying the Loss of Energy in each node by the number of nodes (N)
in the shortest path (Les), from the same amount obtained from the longest path (Lel). This is according to the formula:
Tle = Lel – Les - - - - - - - - - (1)
The measurement of the consumed time (Ct) is achieved by calculating the consumed time between two successive nodes (Tnn) multiplied by the number of nodes in the longest path minus one (N-1), which is denoted here by (Tl).
Tl = Tnn × (N-1) - - - - - - - - - (2)
The same calculation is done again to compute the consumed time between two successive nodes (Tnn) multiplied by the number of nodes in the shortest path minus one (N-1), denoted to by (Sl).
Sl = Tnn × (N-1) - - - - - - - - - (3)
The outcome of the first calculation is subtracted by the outcome of the second calculation, as shown in the following formula:
Ct = Tl - Sl - - - - - - - - - (4)
The above Tle and Ct calculations are applied for all paths and on different networks' designs that were attacked by the misdirection attack.
At the conclusion, a chart (figure 2,3) is drawn to show the network efficiency decline and the waste in time and energy for all experiments.
IX. CONCLUSIONS AND FUTURE WORKS
Wireless networks are tend to intrusions and security
threats. An architecture of detection the misdirection attack and the source of the attack for wireless network based on searching design is proposed in this paper. Also, a mechanism according to the proposed architecture is invented here. The design of detecting the source of the attack is improved upon other related designs in the way that it distributes the total task of detecting intrusion. This model decouples the total work of intrusion detection into a high level algorithm which results in a highly energy and time saving structure. Each node stores the hole paths of the network to find the attack and thus needs not spend much time and to find the attack in professional manner. Due to the searching model, the detection system works in a very structured way and can detect any intrusion effectively. Though it will increase the total cost of network set up, but to enhance reliability, efficiency and effectiveness of the proposed system.
This paper provides a proposed solution to detect the source of the attack by searching model. So there is much ideas for further research in this area. The proposed IDS system is highly extensible, in that as new attack or attack pattern are
00.10.20.30.40.50.60.70.80.9
1
5 node
s
10 no
des
15 no
des
20 no
des
25 no
des
normalmisdirectionT
ime
rate
00.10.20.30.40.50.60.70.80.9
1
5 node
s
10 nodes
15 nodes
20 nodes
25 nodes
normal
misdirection
Ene
rgy
rate
107 http://sites.google.com/site/ijcsis/ ISSN 1947-5500
(IJCSIS) International Journal of Computer Science and Information Security, Vol. 9, No. 12, December 2011
identified, new detection algorithm can be incorporated to policy. Possible spots for future works include:
· Present model can be manipulated with the network with all its circumstances, like the cost of the paths and bandwidth and so on.
· The focus in this paper is on the general idea of detection the source of misdirection attack but not to manipulate the attack and fix it. So an extensive work needs to be done to fix the source of the attack.
REFERENCES
[1] http://technet.microsoft.com/en-us/library/cc959354.aspx [2] Wood A. D. and Stankovic J. A., "Denial of Service in
Sensor Networks", IEEE Computer Society, Vol. 35, 10 December 2002, pp. 54-62.
[3] Lee S. C. and Shields C., "Tracing the Source of Network Attack: A Technical, Legal and Societal Problem", Workshop on Information Assurance and Security, U.S. Military Academy, West Point, NY, 5-6 June, 2001.
[4] Thamilarasu G., Balasubramanian A., Mishra S. and Sridhar R., "A Cross-layer Based Intrusion Detection Approach for Wireless Ad hoc Networks", IEEE International Conference of Mobile Adhoc and Sensor Systems, Nov. 2005.
[5] Abdullah M. Y. and Alsharabi N., "Wireless Sensor Networks Misdirection Attacker Challenges and Solutions", IEEE International Conference of Information and Automation ICIA., June 2008, pp. 369-373.
[6] Saghar K., Henderson W., Kendall D. and Bouridane A., "Applying Formal Modelling to Detect DoS Attacks in Wireless Medium", 7th IEEE International Symposium of Communication Systems Networks and Digital Signal Processing (CSNDSP), July 2010, pp. 896-900.
[7] Mamun M. S. and Kabir A. F., "Hierarchical Design Based Intrusion Detection System for Wireless Ad hoc Sensor Network", International Journal of Network Security & Its Applications (IJNSA), Vol.2, No.3, July 2010, pp. 102-117.
[8] Imai H., Rahman M. G. and Kobara K., "Wireless Communications Security", ARTECH HOUSE, INC., 2006.
[9] Bellifemine F. and Caire G., "Developing Multi-Agent Systems with JADE", John Wiley & Sons Ltd., 2007.
[10] Singh A., Juneja D. and Sharma A. K., "Agent Development Toolkits", International Journal of Advancements in Technology, Vol.2, No.1, 2011.
AUTHOR'S PROFILE
Mr. Omar T. Al-Khalidy
- Assistant Lecturer at Mosul University-College of Computer Science and Mathematics-Computer Science Department.
- MSc. degree in Computer Networks
Science2005 from Iraqi Commission for Computers and Informatics – Baghdad-Iraq
- Specialized in Computer Networks
and Parallel Programming Techniques.
- Have a CISCO Certificate - Instructor in CISCO Academy
(Mosul University)
108 http://sites.google.com/site/ijcsis/ ISSN 1947-5500

(IJCSIS) International Journal of Computer Science and Information Security, Vol. 9, No. 12, December 2011
IJCSIS REVIEWERS’ LIST Assist Prof (Dr.) M. Emre Celebi, Louisiana State University in Shreveport, USA
Dr. Lam Hong Lee, Universiti Tunku Abdul Rahman, Malaysia
Dr. Shimon K. Modi, Director of Research BSPA Labs, Purdue University, USA
Dr. Jianguo Ding, Norwegian University of Science and Technology (NTNU), Norway
Assoc. Prof. N. Jaisankar, VIT University, Vellore,Tamilnadu, India
Dr. Amogh Kavimandan, The Mathworks Inc., USA
Dr. Ramasamy Mariappan, Vinayaka Missions University, India
Dr. Yong Li, School of Electronic and Information Engineering, Beijing Jiaotong University, P.R. China
Assist. Prof. Sugam Sharma, NIET, India / Iowa State University, USA
Dr. Jorge A. Ruiz-Vanoye, Universidad Autónoma del Estado de Morelos, Mexico
Dr. Neeraj Kumar, SMVD University, Katra (J&K), India
Dr Genge Bela, "Petru Maior" University of Targu Mures, Romania
Dr. Junjie Peng, Shanghai University, P. R. China
Dr. Ilhem LENGLIZ, HANA Group - CRISTAL Laboratory, Tunisia
Prof. Dr. Durgesh Kumar Mishra, Acropolis Institute of Technology and Research, Indore, MP, India
Jorge L. Hernández-Ardieta, University Carlos III of Madrid, Spain
Prof. Dr.C.Suresh Gnana Dhas, Anna University, India
Mrs Li Fang, Nanyang Technological University, Singapore
Prof. Pijush Biswas, RCC Institute of Information Technology, India
Dr. Siddhivinayak Kulkarni, University of Ballarat, Ballarat, Victoria, Australia
Dr. A. Arul Lawrence, Royal College of Engineering & Technology, India
Mr. Wongyos Keardsri, Chulalongkorn University, Bangkok, Thailand
Mr. Somesh Kumar Dewangan, CSVTU Bhilai (C.G.)/ Dimat Raipur, India
Mr. Hayder N. Jasem, University Putra Malaysia, Malaysia
Mr. A.V.Senthil Kumar, C. M. S. College of Science and Commerce, India
Mr. R. S. Karthik, C. M. S. College of Science and Commerce, India
Mr. P. Vasant, University Technology Petronas, Malaysia
Mr. Wong Kok Seng, Soongsil University, Seoul, South Korea
Mr. Praveen Ranjan Srivastava, BITS PILANI, India
Mr. Kong Sang Kelvin, Leong, The Hong Kong Polytechnic University, Hong Kong
Mr. Mohd Nazri Ismail, Universiti Kuala Lumpur, Malaysia
Dr. Rami J. Matarneh, Al-isra Private University, Amman, Jordan
Dr Ojesanmi Olusegun Ayodeji, Ajayi Crowther University, Oyo, Nigeria
Dr. Riktesh Srivastava, Skyline University, UAE
Dr. Oras F. Baker, UCSI University - Kuala Lumpur, Malaysia
Dr. Ahmed S. Ghiduk, Faculty of Science, Beni-Suef University, Egypt
and Department of Computer science, Taif University, Saudi Arabia
Mr. Tirthankar Gayen, IIT Kharagpur, India
Ms. Huei-Ru Tseng, National Chiao Tung University, Taiwan

(IJCSIS) International Journal of Computer Science and Information Security, Vol. 9, No. 12, December 2011
Prof. Ning Xu, Wuhan University of Technology, China
Mr Mohammed Salem Binwahlan, Hadhramout University of Science and Technology, Yemen
& Universiti Teknologi Malaysia, Malaysia.
Dr. Aruna Ranganath, Bhoj Reddy Engineering College for Women, India
Mr. Hafeezullah Amin, Institute of Information Technology, KUST, Kohat, Pakistan
Prof. Syed S. Rizvi, University of Bridgeport, USA
Mr. Shahbaz Pervez Chattha, University of Engineering and Technology Taxila, Pakistan
Dr. Shishir Kumar, Jaypee University of Information Technology, Wakanaghat (HP), India
Mr. Shahid Mumtaz, Portugal Telecommunication, Instituto de Telecomunicações (IT) , Aveiro, Portugal
Mr. Rajesh K Shukla, Corporate Institute of Science & Technology Bhopal M P
Dr. Poonam Garg, Institute of Management Technology, India
Mr. S. Mehta, Inha University, Korea
Mr. Dilip Kumar S.M, University Visvesvaraya College of Engineering (UVCE), Bangalore University,
Bangalore
Prof. Malik Sikander Hayat Khiyal, Fatima Jinnah Women University, Rawalpindi, Pakistan
Dr. Virendra Gomase , Department of Bioinformatics, Padmashree Dr. D.Y. Patil University
Dr. Irraivan Elamvazuthi, University Technology PETRONAS, Malaysia
Mr. Saqib Saeed, University of Siegen, Germany
Mr. Pavan Kumar Gorakavi, IPMA-USA [YC]
Dr. Ahmed Nabih Zaki Rashed, Menoufia University, Egypt
Prof. Shishir K. Shandilya, Rukmani Devi Institute of Science & Technology, India
Mrs.J.Komala Lakshmi, SNR Sons College, Computer Science, India
Mr. Muhammad Sohail, KUST, Pakistan
Dr. Manjaiah D.H, Mangalore University, India
Dr. S Santhosh Baboo, D.G.Vaishnav College, Chennai, India
Prof. Dr. Mokhtar Beldjehem, Sainte-Anne University, Halifax, NS, Canada
Dr. Deepak Laxmi Narasimha, Faculty of Computer Science and Information Technology, University of
Malaya, Malaysia
Prof. Dr. Arunkumar Thangavelu, Vellore Institute Of Technology, India
Mr. M. Azath, Anna University, India
Mr. Md. Rabiul Islam, Rajshahi University of Engineering & Technology (RUET), Bangladesh
Mr. Aos Alaa Zaidan Ansaef, Multimedia University, Malaysia
Dr Suresh Jain, Professor (on leave), Institute of Engineering & Technology, Devi Ahilya University, Indore
(MP) India,
Dr. Mohammed M. Kadhum, Universiti Utara Malaysia
Mr. Hanumanthappa. J. University of Mysore, India
Mr. Syed Ishtiaque Ahmed, Bangladesh University of Engineering and Technology (BUET)
Mr Akinola Solomon Olalekan, University of Ibadan, Ibadan, Nigeria
Mr. Santosh K. Pandey, Department of Information Technology, The Institute of Chartered Accountants of
India
Dr. P. Vasant, Power Control Optimization, Malaysia
Dr. Petr Ivankov, Automatika - S, Russian Federation

(IJCSIS) International Journal of Computer Science and Information Security, Vol. 9, No. 12, December 2011
Dr. Utkarsh Seetha, Data Infosys Limited, India
Mrs. Priti Maheshwary, Maulana Azad National Institute of Technology, Bhopal
Dr. (Mrs) Padmavathi Ganapathi, Avinashilingam University for Women, Coimbatore
Assist. Prof. A. Neela madheswari, Anna university, India
Prof. Ganesan Ramachandra Rao, PSG College of Arts and Science, India
Mr. Kamanashis Biswas, Daffodil International University, Bangladesh
Dr. Atul Gonsai, Saurashtra University, Gujarat, India
Mr. Angkoon Phinyomark, Prince of Songkla University, Thailand
Mrs. G. Nalini Priya, Anna University, Chennai
Dr. P. Subashini, Avinashilingam University for Women, India
Assoc. Prof. Vijay Kumar Chakka, Dhirubhai Ambani IICT, Gandhinagar ,Gujarat
Mr Jitendra Agrawal, : Rajiv Gandhi Proudyogiki Vishwavidyalaya, Bhopal
Mr. Vishal Goyal, Department of Computer Science, Punjabi University, India
Dr. R. Baskaran, Department of Computer Science and Engineering, Anna University, Chennai
Assist. Prof, Kanwalvir Singh Dhindsa, B.B.S.B.Engg.College, Fatehgarh Sahib (Punjab), India
Dr. Jamal Ahmad Dargham, School of Engineering and Information Technology, Universiti Malaysia Sabah
Mr. Nitin Bhatia, DAV College, India
Dr. Dhavachelvan Ponnurangam, Pondicherry Central University, India
Dr. Mohd Faizal Abdollah, University of Technical Malaysia, Malaysia
Assist. Prof. Sonal Chawla, Panjab University, India
Dr. Abdul Wahid, AKG Engg. College, Ghaziabad, India
Mr. Arash Habibi Lashkari, University of Malaya (UM), Malaysia
Mr. Md. Rajibul Islam, Ibnu Sina Institute, University Technology Malaysia
Professor Dr. Sabu M. Thampi, .B.S Institute of Technology for Women, Kerala University, India
Mr. Noor Muhammed Nayeem, Université Lumière Lyon 2, 69007 Lyon, France
Dr. Himanshu Aggarwal, Department of Computer Engineering, Punjabi University, India
Prof R. Naidoo, Dept of Mathematics/Center for Advanced Computer Modelling, Durban University of
Technology, Durban,South Africa
Prof. Mydhili K Nair, M S Ramaiah Institute of Technology(M.S.R.I.T), Affliliated to Visweswaraiah
Technological University, Bangalore, India
M. Prabu, Adhiyamaan College of Engineering/Anna University, India
Mr. Swakkhar Shatabda, Department of Computer Science and Engineering, United International University,
Bangladesh
Dr. Abdur Rashid Khan, ICIT, Gomal University, Dera Ismail Khan, Pakistan
Mr. H. Abdul Shabeer, I-Nautix Technologies,Chennai, India
Dr. M. Aramudhan, Perunthalaivar Kamarajar Institute of Engineering and Technology, India
Dr. M. P. Thapliyal, Department of Computer Science, HNB Garhwal University (Central University), India
Dr. Shahaboddin Shamshirband, Islamic Azad University, Iran
Mr. Zeashan Hameed Khan, : Université de Grenoble, France
Prof. Anil K Ahlawat, Ajay Kumar Garg Engineering College, Ghaziabad, UP Technical University, Lucknow
Mr. Longe Olumide Babatope, University Of Ibadan, Nigeria
Associate Prof. Raman Maini, University College of Engineering, Punjabi University, India

(IJCSIS) International Journal of Computer Science and Information Security, Vol. 9, No. 12, December 2011
Dr. Maslin Masrom, University Technology Malaysia, Malaysia
Sudipta Chattopadhyay, Jadavpur University, Kolkata, India
Dr. Dang Tuan NGUYEN, University of Information Technology, Vietnam National University - Ho Chi Minh
City
Dr. Mary Lourde R., BITS-PILANI Dubai , UAE
Dr. Abdul Aziz, University of Central Punjab, Pakistan
Mr. Karan Singh, Gautam Budtha University, India
Mr. Avinash Pokhriyal, Uttar Pradesh Technical University, Lucknow, India
Associate Prof Dr Zuraini Ismail, University Technology Malaysia, Malaysia
Assistant Prof. Yasser M. Alginahi, College of Computer Science and Engineering, Taibah University,
Madinah Munawwarrah, KSA
Mr. Dakshina Ranjan Kisku, West Bengal University of Technology, India
Mr. Raman Kumar, Dr B R Ambedkar National Institute of Technology, Jalandhar, Punjab, India
Associate Prof. Samir B. Patel, Institute of Technology, Nirma University, India
Dr. M.Munir Ahamed Rabbani, B. S. Abdur Rahman University, India
Asst. Prof. Koushik Majumder, West Bengal University of Technology, India
Dr. Alex Pappachen James, Queensland Micro-nanotechnology center, Griffith University, Australia
Assistant Prof. S. Hariharan, B.S. Abdur Rahman University, India
Asst Prof. Jasmine. K. S, R.V.College of Engineering, India
Mr Naushad Ali Mamode Khan, Ministry of Education and Human Resources, Mauritius
Prof. Mahesh Goyani, G H Patel Collge of Engg. & Tech, V.V.N, Anand, Gujarat, India
Dr. Mana Mohammed, University of Tlemcen, Algeria
Prof. Jatinder Singh, Universal Institutiion of Engg. & Tech. CHD, India
Mrs. M. Anandhavalli Gauthaman, Sikkim Manipal Institute of Technology, Majitar, East Sikkim
Dr. Bin Guo, Institute Telecom SudParis, France
Mrs. Maleika Mehr Nigar Mohamed Heenaye-Mamode Khan, University of Mauritius
Prof. Pijush Biswas, RCC Institute of Information Technology, India
Mr. V. Bala Dhandayuthapani, Mekelle University, Ethiopia
Dr. Irfan Syamsuddin, State Polytechnic of Ujung Pandang, Indonesia
Mr. Kavi Kumar Khedo, University of Mauritius, Mauritius
Mr. Ravi Chandiran, Zagro Singapore Pte Ltd. Singapore
Mr. Milindkumar V. Sarode, Jawaharlal Darda Institute of Engineering and Technology, India
Dr. Shamimul Qamar, KSJ Institute of Engineering & Technology, India
Dr. C. Arun, Anna University, India
Assist. Prof. M.N.Birje, Basaveshwar Engineering College, India
Prof. Hamid Reza Naji, Department of Computer Enigneering, Shahid Beheshti University, Tehran, Iran
Assist. Prof. Debasis Giri, Department of Computer Science and Engineering, Haldia Institute of Technology
Subhabrata Barman, Haldia Institute of Technology, West Bengal
Mr. M. I. Lali, COMSATS Institute of Information Technology, Islamabad, Pakistan
Dr. Feroz Khan, Central Institute of Medicinal and Aromatic Plants, Lucknow, India
Mr. R. Nagendran, Institute of Technology, Coimbatore, Tamilnadu, India
Mr. Amnach Khawne, King Mongkut’s Institute of Technology Ladkrabang, Ladkrabang, Bangkok, Thailand

(IJCSIS) International Journal of Computer Science and Information Security, Vol. 9, No. 12, December 2011
Dr. P. Chakrabarti, Sir Padampat Singhania University, Udaipur, India
Mr. Nafiz Imtiaz Bin Hamid, Islamic University of Technology (IUT), Bangladesh.
Shahab-A. Shamshirband, Islamic Azad University, Chalous, Iran
Prof. B. Priestly Shan, Anna Univeristy, Tamilnadu, India
Venkatramreddy Velma, Dept. of Bioinformatics, University of Mississippi Medical Center, Jackson MS USA
Akshi Kumar, Dept. of Computer Engineering, Delhi Technological University, India
Dr. Umesh Kumar Singh, Vikram University, Ujjain, India
Mr. Serguei A. Mokhov, Concordia University, Canada
Mr. Lai Khin Wee, Universiti Teknologi Malaysia, Malaysia
Dr. Awadhesh Kumar Sharma, Madan Mohan Malviya Engineering College, India
Mr. Syed R. Rizvi, Analytical Services & Materials, Inc., USA
Dr. S. Karthik, SNS Collegeof Technology, India
Mr. Syed Qasim Bukhari, CIMET (Universidad de Granada), Spain
Mr. A.D.Potgantwar, Pune University, India
Dr. Himanshu Aggarwal, Punjabi University, India
Mr. Rajesh Ramachandran, Naipunya Institute of Management and Information Technology, India
Dr. K.L. Shunmuganathan, R.M.K Engg College , Kavaraipettai ,Chennai
Dr. Prasant Kumar Pattnaik, KIST, India.
Dr. Ch. Aswani Kumar, VIT University, India
Mr. Ijaz Ali Shoukat, King Saud University, Riyadh KSA
Mr. Arun Kumar, Sir Padam Pat Singhania University, Udaipur, Rajasthan
Mr. Muhammad Imran Khan, Universiti Teknologi PETRONAS, Malaysia
Dr. Natarajan Meghanathan, Jackson State University, Jackson, MS, USA
Mr. Mohd Zaki Bin Mas'ud, Universiti Teknikal Malaysia Melaka (UTeM), Malaysia
Prof. Dr. R. Geetharamani, Dept. of Computer Science and Eng., Rajalakshmi Engineering College, India
Dr. Smita Rajpal, Institute of Technology and Management, Gurgaon, India
Dr. S. Abdul Khader Jilani, University of Tabuk, Tabuk, Saudi Arabia
Mr. Syed Jamal Haider Zaidi, Bahria University, Pakistan
Dr. N. Devarajan, Government College of Technology,Coimbatore, Tamilnadu, INDIA
Mr. R. Jagadeesh Kannan, RMK Engineering College, India
Mr. Deo Prakash, Shri Mata Vaishno Devi University, India
Mr. Mohammad Abu Naser, Dept. of EEE, IUT, Gazipur, Bangladesh
Assist. Prof. Prasun Ghosal, Bengal Engineering and Science University, India
Mr. Md. Golam Kaosar, School of Engineering and Science, Victoria University, Melbourne City, Australia
Mr. R. Mahammad Shafi, Madanapalle Institute of Technology & Science, India
Dr. F.Sagayaraj Francis, Pondicherry Engineering College,India
Dr. Ajay Goel, HIET , Kaithal, India
Mr. Nayak Sunil Kashibarao, Bahirji Smarak Mahavidyalaya, India
Mr. Suhas J Manangi, Microsoft India
Dr. Kalyankar N. V., Yeshwant Mahavidyalaya, Nanded , India
Dr. K.D. Verma, S.V. College of Post graduate studies & Research, India
Dr. Amjad Rehman, University Technology Malaysia, Malaysia

(IJCSIS) International Journal of Computer Science and Information Security, Vol. 9, No. 12, December 2011
Mr. Rachit Garg, L K College, Jalandhar, Punjab
Mr. J. William, M.A.M college of Engineering, Trichy, Tamilnadu,India
Prof. Jue-Sam Chou, Nanhua University, College of Science and Technology, Taiwan
Dr. Thorat S.B., Institute of Technology and Management, India
Mr. Ajay Prasad, Sir Padampat Singhania University, Udaipur, India
Dr. Kamaljit I. Lakhtaria, Atmiya Institute of Technology & Science, India
Mr. Syed Rafiul Hussain, Ahsanullah University of Science and Technology, Bangladesh
Mrs Fazeela Tunnisa, Najran University, Kingdom of Saudi Arabia
Mrs Kavita Taneja, Maharishi Markandeshwar University, Haryana, India
Mr. Maniyar Shiraz Ahmed, Najran University, Najran, KSA
Mr. Anand Kumar, AMC Engineering College, Bangalore
Dr. Rakesh Chandra Gangwar, Beant College of Engg. & Tech., Gurdaspur (Punjab) India
Dr. V V Rama Prasad, Sree Vidyanikethan Engineering College, India
Assist. Prof. Neetesh Kumar Gupta, Technocrats Institute of Technology, Bhopal (M.P.), India
Mr. Ashish Seth, Uttar Pradesh Technical University, Lucknow ,UP India
Dr. V V S S S Balaram, Sreenidhi Institute of Science and Technology, India
Mr Rahul Bhatia, Lingaya's Institute of Management and Technology, India
Prof. Niranjan Reddy. P, KITS , Warangal, India
Prof. Rakesh. Lingappa, Vijetha Institute of Technology, Bangalore, India
Dr. Mohammed Ali Hussain, Nimra College of Engineering & Technology, Vijayawada, A.P., India
Dr. A.Srinivasan, MNM Jain Engineering College, Rajiv Gandhi Salai, Thorapakkam, Chennai
Mr. Rakesh Kumar, M.M. University, Mullana, Ambala, India
Dr. Lena Khaled, Zarqa Private University, Aman, Jordon
Ms. Supriya Kapoor, Patni/Lingaya's Institute of Management and Tech., India
Dr. Tossapon Boongoen , Aberystwyth University, UK
Dr . Bilal Alatas, Firat University, Turkey
Assist. Prof. Jyoti Praaksh Singh , Academy of Technology, India
Dr. Ritu Soni, GNG College, India
Dr . Mahendra Kumar , Sagar Institute of Research & Technology, Bhopal, India.
Dr. Binod Kumar, Lakshmi Narayan College of Tech.(LNCT)Bhopal India
Dr. Muzhir Shaban Al-Ani, Amman Arab University Amman – Jordan
Dr. T.C. Manjunath , ATRIA Institute of Tech, India
Mr. Muhammad Zakarya, COMSATS Institute of Information Technology (CIIT), Pakistan
Assist. Prof. Harmunish Taneja, M. M. University, India
Dr. Chitra Dhawale , SICSR, Model Colony, Pune, India
Mrs Sankari Muthukaruppan, Nehru Institute of Engineering and Technology, Anna University, India
Mr. Aaqif Afzaal Abbasi, National University Of Sciences And Technology, Islamabad
Prof. Ashutosh Kumar Dubey, Trinity Institute of Technology and Research Bhopal, India
Mr. G. Appasami, Dr. Pauls Engineering College, India
Mr. M Yasin, National University of Science and Tech, karachi (NUST), Pakistan
Mr. Yaser Miaji, University Utara Malaysia, Malaysia
Mr. Shah Ahsanul Haque, International Islamic University Chittagong (IIUC), Bangladesh

(IJCSIS) International Journal of Computer Science and Information Security, Vol. 9, No. 12, December 2011
Prof. (Dr) Syed Abdul Sattar, Royal Institute of Technology & Science, India
Dr. S. Sasikumar, Roever Engineering College
Assist. Prof. Monit Kapoor, Maharishi Markandeshwar University, India
Mr. Nwaocha Vivian O, National Open University of Nigeria
Dr. M. S. Vijaya, GR Govindarajulu School of Applied Computer Technology, India
Assist. Prof. Chakresh Kumar, Manav Rachna International University, India
Mr. Kunal Chadha , R&D Software Engineer, Gemalto, Singapore
Mr. Mueen Uddin, Universiti Teknologi Malaysia, UTM , Malaysia
Dr. Dhuha Basheer abdullah, Mosul university, Iraq
Mr. S. Audithan, Annamalai University, India
Prof. Vijay K Chaudhari, Technocrats Institute of Technology , India
Associate Prof. Mohd Ilyas Khan, Technocrats Institute of Technology , India
Dr. Vu Thanh Nguyen, University of Information Technology, HoChiMinh City, VietNam
Assist. Prof. Anand Sharma, MITS, Lakshmangarh, Sikar, Rajasthan, India
Prof. T V Narayana Rao, HITAM Engineering college, Hyderabad
Mr. Deepak Gour, Sir Padampat Singhania University, India
Assist. Prof. Amutharaj Joyson, Kalasalingam University, India
Mr. Ali Balador, Islamic Azad University, Iran
Mr. Mohit Jain, Maharaja Surajmal Institute of Technology, India
Mr. Dilip Kumar Sharma, GLA Institute of Technology & Management, India
Dr. Debojyoti Mitra, Sir padampat Singhania University, India
Dr. Ali Dehghantanha, Asia-Pacific University College of Technology and Innovation, Malaysia
Mr. Zhao Zhang, City University of Hong Kong, China
Prof. S.P. Setty, A.U. College of Engineering, India
Prof. Patel Rakeshkumar Kantilal, Sankalchand Patel College of Engineering, India
Mr. Biswajit Bhowmik, Bengal College of Engineering & Technology, India
Mr. Manoj Gupta, Apex Institute of Engineering & Technology, India
Assist. Prof. Ajay Sharma, Raj Kumar Goel Institute Of Technology, India
Assist. Prof. Ramveer Singh, Raj Kumar Goel Institute of Technology, India
Dr. Hanan Elazhary, Electronics Research Institute, Egypt
Dr. Hosam I. Faiq, USM, Malaysia
Prof. Dipti D. Patil, MAEER’s MIT College of Engg. & Tech, Pune, India
Assist. Prof. Devendra Chack, BCT Kumaon engineering College Dwarahat Almora, India
Prof. Manpreet Singh, M. M. Engg. College, M. M. University, India
Assist. Prof. M. Sadiq ali Khan, University of Karachi, Pakistan
Mr. Prasad S. Halgaonkar, MIT - College of Engineering, Pune, India
Dr. Imran Ghani, Universiti Teknologi Malaysia, Malaysia
Prof. Varun Kumar Kakar, Kumaon Engineering College, Dwarahat, India
Assist. Prof. Nisheeth Joshi, Apaji Institute, Banasthali University, Rajasthan, India
Associate Prof. Kunwar S. Vaisla, VCT Kumaon Engineering College, India
Prof Anupam Choudhary, Bhilai School Of Engg.,Bhilai (C.G.),India
Mr. Divya Prakash Shrivastava, Al Jabal Al garbi University, Zawya, Libya

(IJCSIS) International Journal of Computer Science and Information Security, Vol. 9, No. 12, December 2011
Associate Prof. Dr. V. Radha, Avinashilingam Deemed university for women, Coimbatore.
Dr. Kasarapu Ramani, JNT University, Anantapur, India
Dr. Anuraag Awasthi, Jayoti Vidyapeeth Womens University, India
Dr. C G Ravichandran, R V S College of Engineering and Technology, India
Dr. Mohamed A. Deriche, King Fahd University of Petroleum and Minerals, Saudi Arabia
Mr. Abbas Karimi, Universiti Putra Malaysia, Malaysia
Mr. Amit Kumar, Jaypee University of Engg. and Tech., India
Dr. Nikolai Stoianov, Defense Institute, Bulgaria
Assist. Prof. S. Ranichandra, KSR College of Arts and Science, Tiruchencode
Mr. T.K.P. Rajagopal, Diamond Horse International Pvt Ltd, India
Dr. Md. Ekramul Hamid, Rajshahi University, Bangladesh
Mr. Hemanta Kumar Kalita , TATA Consultancy Services (TCS), India
Dr. Messaouda Azzouzi, Ziane Achour University of Djelfa, Algeria
Prof. (Dr.) Juan Jose Martinez Castillo, "Gran Mariscal de Ayacucho" University and Acantelys research
Group, Venezuela
Dr. Jatinderkumar R. Saini, Narmada College of Computer Application, India
Dr. Babak Bashari Rad, University Technology of Malaysia, Malaysia
Dr. Nighat Mir, Effat University, Saudi Arabia
Prof. (Dr.) G.M.Nasira, Sasurie College of Engineering, India
Mr. Varun Mittal, Gemalto Pte Ltd, Singapore
Assist. Prof. Mrs P. Banumathi, Kathir College Of Engineering, Coimbatore
Assist. Prof. Quan Yuan, University of Wisconsin-Stevens Point, US
Dr. Pranam Paul, Narula Institute of Technology, Agarpara, West Bengal, India
Assist. Prof. J. Ramkumar, V.L.B Janakiammal college of Arts & Science, India
Mr. P. Sivakumar, Anna university, Chennai, India
Mr. Md. Humayun Kabir Biswas, King Khalid University, Kingdom of Saudi Arabia
Mr. Mayank Singh, J.P. Institute of Engg & Technology, Meerut, India
HJ. Kamaruzaman Jusoff, Universiti Putra Malaysia
Mr. Nikhil Patrick Lobo, CADES, India
Dr. Amit Wason, Rayat-Bahra Institute of Engineering & Boi-Technology, India
Dr. Rajesh Shrivastava, Govt. Benazir Science & Commerce College, Bhopal, India
Assist. Prof. Vishal Bharti, DCE, Gurgaon
Mrs. Sunita Bansal, Birla Institute of Technology & Science, India
Dr. R. Sudhakar, Dr.Mahalingam college of Engineering and Technology, India
Dr. Amit Kumar Garg, Shri Mata Vaishno Devi University, Katra(J&K), India
Assist. Prof. Raj Gaurang Tiwari, AZAD Institute of Engineering and Technology, India
Mr. Hamed Taherdoost, Tehran, Iran
Mr. Amin Daneshmand Malayeri, YRC, IAU, Malayer Branch, Iran
Mr. Shantanu Pal, University of Calcutta, India
Dr. Terry H. Walcott, E-Promag Consultancy Group, United Kingdom
Dr. Ezekiel U OKIKE, University of Ibadan, Nigeria
Mr. P. Mahalingam, Caledonian College of Engineering, Oman

(IJCSIS) International Journal of Computer Science and Information Security, Vol. 9, No. 12, December 2011
Dr. Mahmoud M. A. Abd Ellatif, Mansoura University, Egypt
Prof. Kunwar S. Vaisla, BCT Kumaon Engineering College, India
Prof. Mahesh H. Panchal, Kalol Institute of Technology & Research Centre, India
Mr. Muhammad Asad, University of Engineering and Technology Taxila, Pakistan
Mr. AliReza Shams Shafigh, Azad Islamic university, Iran
Prof. S. V. Nagaraj, RMK Engineering College, India
Mr. Ashikali M Hasan, Senior Researcher, CelNet security, India
Dr. Adnan Shahid Khan, University Technology Malaysia, Malaysia
Mr. Prakash Gajanan Burade, Nagpur University/ITM college of engg, Nagpur, India
Dr. Jagdish B.Helonde, Nagpur University/ITM college of engg, Nagpur, India
Professor, Doctor BOUHORMA Mohammed, Univertsity Abdelmalek Essaadi, Morocco
Mr. K. Thirumalaivasan, Pondicherry Engg. College, India
Mr. Umbarkar Anantkumar Janardan, Walchand College of Engineering, India
Mr. Ashish Chaurasia, Gyan Ganga Institute of Technology & Sciences, India
Mr. Sunil Taneja, Kurukshetra University, India
Mr. Fauzi Adi Rafrastara, Dian Nuswantoro University, Indonesia
Dr. Yaduvir Singh, Thapar University, India
Dr. Ioannis V. Koskosas, University of Western Macedonia, Greece
Dr. Vasantha Kalyani David, Avinashilingam University for women, Coimbatore
Dr. Ahmed Mansour Manasrah, Universiti Sains Malaysia, Malaysia
Miss. Nazanin Sadat Kazazi, University Technology Malaysia, Malaysia
Mr. Saeed Rasouli Heikalabad, Islamic Azad University - Tabriz Branch, Iran
Assoc. Prof. Dhirendra Mishra, SVKM's NMIMS University, India
Prof. Shapoor Zarei, UAE Inventors Association, UAE
Prof. B.Raja Sarath Kumar, Lenora College of Engineering, India
Dr. Bashir Alam, Jamia millia Islamia, Delhi, India
Prof. Anant J Umbarkar, Walchand College of Engg., India
Assist. Prof. B. Bharathi, Sathyabama University, India
Dr. Fokrul Alom Mazarbhuiya, King Khalid University, Saudi Arabia
Prof. T.S.Jeyali Laseeth, Anna University of Technology, Tirunelveli, India
Dr. M. Balraju, Jawahar Lal Nehru Technological University Hyderabad, India
Dr. Vijayalakshmi M. N., R.V.College of Engineering, Bangalore
Prof. Walid Moudani, Lebanese University, Lebanon
Dr. Saurabh Pal, VBS Purvanchal University, Jaunpur, India
Associate Prof. Suneet Chaudhary, Dehradun Institute of Technology, India
Associate Prof. Dr. Manuj Darbari, BBD University, India
Ms. Prema Selvaraj, K.S.R College of Arts and Science, India
Assist. Prof. Ms.S.Sasikala, KSR College of Arts & Science, India
Mr. Sukhvinder Singh Deora, NC Institute of Computer Sciences, India
Dr. Abhay Bansal, Amity School of Engineering & Technology, India
Ms. Sumita Mishra, Amity School of Engineering and Technology, India
Professor S. Viswanadha Raju, JNT University Hyderabad, India

(IJCSIS) International Journal of Computer Science and Information Security, Vol. 9, No. 12, December 2011
Mr. Asghar Shahrzad Khashandarag, Islamic Azad University Tabriz Branch, India
Mr. Manoj Sharma, Panipat Institute of Engg. & Technology, India
Mr. Shakeel Ahmed, King Faisal University, Saudi Arabia
Dr. Mohamed Ali Mahjoub, Institute of Engineer of Monastir, Tunisia
Mr. Adri Jovin J.J., SriGuru Institute of Technology, India
Dr. Sukumar Senthilkumar, Universiti Sains Malaysia, Malaysia
Mr. Rakesh Bharati, Dehradun Institute of Technology Dehradun, India
Mr. Shervan Fekri Ershad, Shiraz International University, Iran
Mr. Md. Safiqul Islam, Daffodil International University, Bangladesh
Mr. Mahmudul Hasan, Daffodil International University, Bangladesh
Prof. Mandakini Tayade, UIT, RGTU, Bhopal, India
Ms. Sarla More, UIT, RGTU, Bhopal, India
Mr. Tushar Hrishikesh Jaware, R.C. Patel Institute of Technology, Shirpur, India
Ms. C. Divya, Dr G R Damodaran College of Science, Coimbatore, India
Mr. Fahimuddin Shaik, Annamacharya Institute of Technology & Sciences, India
Dr. M. N. Giri Prasad, JNTUCE,Pulivendula, A.P., India
Assist. Prof. Chintan M Bhatt, Charotar University of Science And Technology, India
Prof. Sahista Machchhar, Marwadi Education Foundation's Group of institutions, India
Assist. Prof. Navnish Goel, S. D. College Of Enginnering & Technology, India
Mr. Khaja Kamaluddin, Sirt University, Sirt, Libya
Mr. Mohammad Zaidul Karim, Daffodil International, Bangladesh
Mr. M. Vijayakumar, KSR College of Engineering, Tiruchengode, India
Mr. S. A. Ahsan Rajon, Khulna University, Bangladesh
Dr. Muhammad Mohsin Nazir, LCW University Lahore, Pakistan
Mr. Mohammad Asadul Hoque, University of Alabama, USA
Mr. P.V.Sarathchand, Indur Institute of Engineering and Technology, India
Mr. Durgesh Samadhiya, Chung Hua University, Taiwan
Dr Venu Kuthadi, University of Johannesburg, Johannesburg, RSA
Dr. (Er) Jasvir Singh, Guru Nanak Dev University, Amritsar, Punjab, India
Mr. Jasmin Cosic, Min. of the Interior of Una-sana canton, B&H, Bosnia and Herzegovina
Dr S. Rajalakshmi, Botho College, South Africa
Dr. Mohamed Sarrab, De Montfort University, UK
Mr. Basappa B. Kodada, Canara Engineering College, India
Assist. Prof. K. Ramana, Annamacharya Institute of Technology and Sciences, India
Dr. Ashu Gupta, Apeejay Institute of Management, Jalandhar, India
Assist. Prof. Shaik Rasool, Shadan College of Engineering & Technology, India
Assist. Prof. K. Suresh, Annamacharya Institute of Tech & Sci. Rajampet, AP, India
Dr . G. Singaravel, K.S.R. College of Engineering, India
Dr B. G. Geetha, K.S.R. College of Engineering, India
Assist. Prof. Kavita Choudhary, ITM University, Gurgaon
Dr. Mehrdad Jalali, Azad University, Mashhad, Iran
Megha Goel, Shamli Institute of Engineering and Technology, Shamli, India

(IJCSIS) International Journal of Computer Science and Information Security, Vol. 9, No. 12, December 2011
Mr. Chi-Hua Chen, Institute of Information Management, National Chiao-Tung University, Taiwan (R.O.C.)
Assoc. Prof. A. Rajendran, RVS College of Engineering and Technology, India
Assist. Prof. S. Jaganathan, RVS College of Engineering and Technology, India
Assoc. Prof. A S N Chakravarthy, Sri Aditya Engineering College, India
Assist. Prof. Deepshikha Patel, Technocrat Institute of Technology, India
Assist. Prof. Maram Balajee, GMRIT, India
Assist. Prof. Monika Bhatnagar, TIT, India
Prof. Gaurang Panchal, Charotar University of Science & Technology, India
Prof. Anand K. Tripathi, Computer Society of India
Prof. Jyoti Chaudhary, High Performance Computing Research Lab, India
Assist. Prof. Supriya Raheja, ITM University, India
Dr. Pankaj Gupta, Microsoft Corporation, U.S.A.
Assist. Prof. Panchamukesh Chandaka, Hyderabad Institute of Tech. & Management, India
Prof. Mohan H.S, SJB Institute Of Technology, India
Mr. Hossein Malekinezhad, Islamic Azad University, Iran
Mr. Zatin Gupta, Universti Malaysia, Malaysia
Assist. Prof. Amit Chauhan, Phonics Group of Institutions, India
Assist. Prof. Ajal A. J., METS School Of Engineering, India
Mrs. Omowunmi Omobola Adeyemo, University of Ibadan, Nigeria
Dr. Bharat Bhushan Agarwal, I.F.T.M. University, India
Md. Nazrul Islam, University of Western Ontario, Canada
Tushar Kanti, L.N.C.T, Bhopal, India
Er. Aumreesh Kumar Saxena, SIRTs College Bhopal, India
Mr. Mohammad Monirul Islam, Daffodil International University, Bangladesh
Dr. Kashif Nisar, University Utara Malaysia, Malaysia
Dr. Wei Zheng, Rutgers Univ/ A10 Networks, USA
Associate Prof. Rituraj Jain, Vyas Institute of Engg & Tech, Jodhpur – Rajasthan
Assist. Prof. Apoorvi Sood, I.T.M. University, India
Dr. Kayhan Zrar Ghafoor, University Technology Malaysia, Malaysia
Mr. Swapnil Soner, Truba Institute College of Engineering & Technology, Indore, India
Ms. Yogita Gigras, I.T.M. University, India
Associate Prof. Neelima Sadineni, Pydha Engineering College, India Pydha Engineering College
Assist. Prof. K. Deepika Rani, HITAM, Hyderabad
Ms. Shikha Maheshwari, Jaipur Engineering College & Research Centre, India
Prof. Dr V S Giridhar Akula, Avanthi's Scientific Tech. & Research Academy, Hyderabad
Prof. Dr.S.Saravanan, Muthayammal Engineering College, India
Mr. Mehdi Golsorkhatabar Amiri, Islamic Azad University, Iran
Prof. Amit Sadanand Savyanavar, MITCOE, Pune, India
Assist. Prof. P.Oliver Jayaprakash, Anna University,Chennai
Assist. Prof. Ms. Sujata, ITM University, Gurgaon, India
Dr. Asoke Nath, St. Xavier's College, India
Mr. Masoud Rafighi, Islamic Azad University, Iran

(IJCSIS) International Journal of Computer Science and Information Security, Vol. 9, No. 12, December 2011
Assist. Prof. RamBabu Pemula, NIMRA College of Engineering & Technology, India
Assist. Prof. Ms Rita Chhikara, ITM University, Gurgaon, India
Mr. Sandeep Maan, Government Post Graduate College, India
Prof. Dr. S. Muralidharan, Mepco Schlenk Engineering College, India
Associate Prof. T.V.Sai Krishna, QIS College of Engineering and Technology, India
Mr. R. Balu, Bharathiar University, Coimbatore, India
Assist. Prof. Shekhar. R, Dr.SM College of Engineering, India
Prof. P. Senthilkumar, Vivekanandha Institue of Engineering And Techology For Woman, India
Mr. M. Kamarajan, PSNA College of Engineering & Technology, India
Dr. Angajala Srinivasa Rao, Jawaharlal Nehru Technical University, India
Assist. Prof. C. Venkatesh, A.I.T.S, Rajampet, India
Mr. Afshin Rezakhani Roozbahani, Ayatollah Boroujerdi University, Iran
Mr. Laxmi chand, SCTL, Noida, India
Dr. Dr. Abdul Hannan, Vivekanand College, Aurangabad
Prof. Mahesh Panchal, KITRC, Gujarat
Dr. A. Subramani, K.S.R. College of Engineering, Tiruchengode
Assist. Prof. Prakash M, Rajalakshmi Engineering College, Chennai, India
Assist. Prof. Akhilesh K Sharma, Sir Padampat Singhania University, India
Ms. Varsha Sahni, Guru Nanak Dev Engineering College, Ludhiana, India
Associate Prof. Trilochan Rout, NM Institute Of Engineering And Technlogy, India
Mr. Srikanta Kumar Mohapatra, NMIET, Orissa, India
Mr. Waqas Haider Bangyal, Iqra University Islamabad, Pakistan
Dr. S. Vijayaragavan, Christ College of Engineering and Technology, Pondicherry, India
Prof. Elboukhari Mohamed, University Mohammed First, Oujda, Morocco
Dr. Muhammad Asif Khan, King Faisal University, Saudi Arabia
Dr. Nagy Ramadan Darwish Omran, Cairo University, Egypt.
Assistant Prof. Anand Nayyar, KCL Institute of Management and Technology, India
Mr. G. Premsankar, Ericcson, India
Assist. Prof. T. Hemalatha, VELS University, India
Prof. Tejaswini Apte, University of Pune, India
Dr. Edmund Ng Giap Weng, Universiti Malaysia Sarawak, Malaysia
Mr. Mahdi Nouri, Iran University of Science and Technology, Iran
Associate Prof. S. Asif Hussain, Annamacharya Institute of technology & Sciences, India
Mrs. Kavita Pabreja, Maharaja Surajmal Institute (an affiliate of GGSIP University), India

CALL FOR PAPERS International Journal of Computer Science and Information Security
January - December IJCSIS 2012 ISSN: 1947-5500
http://sites.google.com/site/ijcsis/ International Journal Computer Science and Information Security, IJCSIS, is the premier scholarly venue in the areas of computer science and security issues. IJCSIS 2011 will provide a high profile, leading edge platform for researchers and engineers alike to publish state-of-the-art research in the respective fields of information technology and communication security. The journal will feature a diverse mixture of publication articles including core and applied computer science related topics. Authors are solicited to contribute to the special issue by submitting articles that illustrate research results, projects, surveying works and industrial experiences that describe significant advances in the following areas, but are not limited to. Submissions may span a broad range of topics, e.g.: Track A: Security Access control, Anonymity, Audit and audit reduction & Authentication and authorization, Applied cryptography, Cryptanalysis, Digital Signatures, Biometric security, Boundary control devices, Certification and accreditation, Cross-layer design for security, Security & Network Management, Data and system integrity, Database security, Defensive information warfare, Denial of service protection, Intrusion Detection, Anti-malware, Distributed systems security, Electronic commerce, E-mail security, Spam, Phishing, E-mail fraud, Virus, worms, Trojan Protection, Grid security, Information hiding and watermarking & Information survivability, Insider threat protection, Integrity Intellectual property protection, Internet/Intranet Security, Key management and key recovery, Language-based security, Mobile and wireless security, Mobile, Ad Hoc and Sensor Network Security, Monitoring and surveillance, Multimedia security ,Operating system security, Peer-to-peer security, Performance Evaluations of Protocols & Security Application, Privacy and data protection, Product evaluation criteria and compliance, Risk evaluation and security certification, Risk/vulnerability assessment, Security & Network Management, Security Models & protocols, Security threats & countermeasures (DDoS, MiM, Session Hijacking, Replay attack etc,), Trusted computing, Ubiquitous Computing Security, Virtualization security, VoIP security, Web 2.0 security, Submission Procedures, Active Defense Systems, Adaptive Defense Systems, Benchmark, Analysis and Evaluation of Security Systems, Distributed Access Control and Trust Management, Distributed Attack Systems and Mechanisms, Distributed Intrusion Detection/Prevention Systems, Denial-of-Service Attacks and Countermeasures, High Performance Security Systems, Identity Management and Authentication, Implementation, Deployment and Management of Security Systems, Intelligent Defense Systems, Internet and Network Forensics, Large-scale Attacks and Defense, RFID Security and Privacy, Security Architectures in Distributed Network Systems, Security for Critical Infrastructures, Security for P2P systems and Grid Systems, Security in E-Commerce, Security and Privacy in Wireless Networks, Secure Mobile Agents and Mobile Code, Security Protocols, Security Simulation and Tools, Security Theory and Tools, Standards and Assurance Methods, Trusted Computing, Viruses, Worms, and Other Malicious Code, World Wide Web Security, Novel and emerging secure architecture, Study of attack strategies, attack modeling, Case studies and analysis of actual attacks, Continuity of Operations during an attack, Key management, Trust management, Intrusion detection techniques, Intrusion response, alarm management, and correlation analysis, Study of tradeoffs between security and system performance, Intrusion tolerance systems, Secure protocols, Security in wireless networks (e.g. mesh networks, sensor networks, etc.), Cryptography and Secure Communications, Computer Forensics, Recovery and Healing, Security Visualization, Formal Methods in Security, Principles for Designing a Secure Computing System, Autonomic Security, Internet Security, Security in Health Care Systems, Security Solutions Using Reconfigurable Computing, Adaptive and Intelligent Defense Systems, Authentication and Access control, Denial of service attacks and countermeasures, Identity, Route and
Location Anonymity schemes, Intrusion detection and prevention techniques, Cryptography, encryption algorithms and Key management schemes, Secure routing schemes, Secure neighbor discovery and localization, Trust establishment and maintenance, Confidentiality and data integrity, Security architectures, deployments and solutions, Emerging threats to cloud-based services, Security model for new services, Cloud-aware web service security, Information hiding in Cloud Computing, Securing distributed data storage in cloud, Security, privacy and trust in mobile computing systems and applications, Middleware security & Security features: middleware software is an asset on its own and has to be protected, interaction between security-specific and other middleware features, e.g., context-awareness, Middleware-level security monitoring and measurement: metrics and mechanisms for quantification and evaluation of security enforced by the middleware, Security co-design: trade-off and co-design between application-based and middleware-based security, Policy-based management: innovative support for policy-based definition and enforcement of security concerns, Identification and authentication mechanisms: Means to capture application specific constraints in defining and enforcing access control rules, Middleware-oriented security patterns: identification of patterns for sound, reusable security, Security in aspect-based middleware: mechanisms for isolating and enforcing security aspects, Security in agent-based platforms: protection for mobile code and platforms, Smart Devices: Biometrics, National ID cards, Embedded Systems Security and TPMs, RFID Systems Security, Smart Card Security, Pervasive Systems: Digital Rights Management (DRM) in pervasive environments, Intrusion Detection and Information Filtering, Localization Systems Security (Tracking of People and Goods), Mobile Commerce Security, Privacy Enhancing Technologies, Security Protocols (for Identification and Authentication, Confidentiality and Privacy, and Integrity), Ubiquitous Networks: Ad Hoc Networks Security, Delay-Tolerant Network Security, Domestic Network Security, Peer-to-Peer Networks Security, Security Issues in Mobile and Ubiquitous Networks, Security of GSM/GPRS/UMTS Systems, Sensor Networks Security, Vehicular Network Security, Wireless Communication Security: Bluetooth, NFC, WiFi, WiMAX, WiMedia, others This Track will emphasize the design, implementation, management and applications of computer communications, networks and services. Topics of mostly theoretical nature are also welcome, provided there is clear practical potential in applying the results of such work. Track B: Computer Science Broadband wireless technologies: LTE, WiMAX, WiRAN, HSDPA, HSUPA, Resource allocation and interference management, Quality of service and scheduling methods, Capacity planning and dimensioning, Cross-layer design and Physical layer based issue, Interworking architecture and interoperability, Relay assisted and cooperative communications, Location and provisioning and mobility management, Call admission and flow/congestion control, Performance optimization, Channel capacity modeling and analysis, Middleware Issues: Event-based, publish/subscribe, and message-oriented middleware, Reconfigurable, adaptable, and reflective middleware approaches, Middleware solutions for reliability, fault tolerance, and quality-of-service, Scalability of middleware, Context-aware middleware, Autonomic and self-managing middleware, Evaluation techniques for middleware solutions, Formal methods and tools for designing, verifying, and evaluating, middleware, Software engineering techniques for middleware, Service oriented middleware, Agent-based middleware, Security middleware, Network Applications: Network-based automation, Cloud applications, Ubiquitous and pervasive applications, Collaborative applications, RFID and sensor network applications, Mobile applications, Smart home applications, Infrastructure monitoring and control applications, Remote health monitoring, GPS and location-based applications, Networked vehicles applications, Alert applications, Embeded Computer System, Advanced Control Systems, and Intelligent Control : Advanced control and measurement, computer and microprocessor-based control, signal processing, estimation and identification techniques, application specific IC’s, nonlinear and adaptive control, optimal and robot control, intelligent control, evolutionary computing, and intelligent systems, instrumentation subject to critical conditions, automotive, marine and aero-space control and all other control applications, Intelligent Control System, Wiring/Wireless Sensor, Signal Control System. Sensors, Actuators and Systems Integration : Intelligent sensors and actuators, multisensor fusion, sensor array and multi-channel processing, micro/nano technology, microsensors and microactuators, instrumentation electronics, MEMS and system integration, wireless sensor, Network Sensor, Hybrid

Sensor, Distributed Sensor Networks. Signal and Image Processing : Digital signal processing theory, methods, DSP implementation, speech processing, image and multidimensional signal processing, Image analysis and processing, Image and Multimedia applications, Real-time multimedia signal processing, Computer vision, Emerging signal processing areas, Remote Sensing, Signal processing in education. Industrial Informatics: Industrial applications of neural networks, fuzzy algorithms, Neuro-Fuzzy application, bioInformatics, real-time computer control, real-time information systems, human-machine interfaces, CAD/CAM/CAT/CIM, virtual reality, industrial communications, flexible manufacturing systems, industrial automated process, Data Storage Management, Harddisk control, Supply Chain Management, Logistics applications, Power plant automation, Drives automation. Information Technology, Management of Information System : Management information systems, Information Management, Nursing information management, Information System, Information Technology and their application, Data retrieval, Data Base Management, Decision analysis methods, Information processing, Operations research, E-Business, E-Commerce, E-Government, Computer Business, Security and risk management, Medical imaging, Biotechnology, Bio-Medicine, Computer-based information systems in health care, Changing Access to Patient Information, Healthcare Management Information Technology. Communication/Computer Network, Transportation Application : On-board diagnostics, Active safety systems, Communication systems, Wireless technology, Communication application, Navigation and Guidance, Vision-based applications, Speech interface, Sensor fusion, Networking theory and technologies, Transportation information, Autonomous vehicle, Vehicle application of affective computing, Advance Computing technology and their application : Broadband and intelligent networks, Data Mining, Data fusion, Computational intelligence, Information and data security, Information indexing and retrieval, Information processing, Information systems and applications, Internet applications and performances, Knowledge based systems, Knowledge management, Software Engineering, Decision making, Mobile networks and services, Network management and services, Neural Network, Fuzzy logics, Neuro-Fuzzy, Expert approaches, Innovation Technology and Management : Innovation and product development, Emerging advances in business and its applications, Creativity in Internet management and retailing, B2B and B2C management, Electronic transceiver device for Retail Marketing Industries, Facilities planning and management, Innovative pervasive computing applications, Programming paradigms for pervasive systems, Software evolution and maintenance in pervasive systems, Middleware services and agent technologies, Adaptive, autonomic and context-aware computing, Mobile/Wireless computing systems and services in pervasive computing, Energy-efficient and green pervasive computing, Communication architectures for pervasive computing, Ad hoc networks for pervasive communications, Pervasive opportunistic communications and applications, Enabling technologies for pervasive systems (e.g., wireless BAN, PAN), Positioning and tracking technologies, Sensors and RFID in pervasive systems, Multimodal sensing and context for pervasive applications, Pervasive sensing, perception and semantic interpretation, Smart devices and intelligent environments, Trust, security and privacy issues in pervasive systems, User interfaces and interaction models, Virtual immersive communications, Wearable computers, Standards and interfaces for pervasive computing environments, Social and economic models for pervasive systems, Active and Programmable Networks, Ad Hoc & Sensor Network, Congestion and/or Flow Control, Content Distribution, Grid Networking, High-speed Network Architectures, Internet Services and Applications, Optical Networks, Mobile and Wireless Networks, Network Modeling and Simulation, Multicast, Multimedia Communications, Network Control and Management, Network Protocols, Network Performance, Network Measurement, Peer to Peer and Overlay Networks, Quality of Service and Quality of Experience, Ubiquitous Networks, Crosscutting Themes – Internet Technologies, Infrastructure, Services and Applications; Open Source Tools, Open Models and Architectures; Security, Privacy and Trust; Navigation Systems, Location Based Services; Social Networks and Online Communities; ICT Convergence, Digital Economy and Digital Divide, Neural Networks, Pattern Recognition, Computer Vision, Advanced Computing Architectures and New Programming Models, Visualization and Virtual Reality as Applied to Computational Science, Computer Architecture and Embedded Systems, Technology in Education, Theoretical Computer Science, Computing Ethics, Computing Practices & Applications Authors are invited to submit papers through e-mail [email protected]. Submissions must be original and should not have been published previously or be under consideration for publication while being evaluated by IJCSIS. Before submission authors should carefully read over the journal's Author Guidelines, which are located at http://sites.google.com/site/ijcsis/authors-notes .

© IJCSIS PUBLICATION 2011 ISSN 1947 5500