Journal of Coastal Environment COES ISSN 2229-7839 Volume 4, Number 1, 2013 Frequency : Biannual...
96
Journal of Coastal Environment COES ISSN 2229-7839 Volume 4, Number 1, 2013 JCE JCE JCE
-
Upload
independent -
Category
Documents
-
view
0 -
download
0
Transcript of Journal of Coastal Environment COES ISSN 2229-7839 Volume 4, Number 1, 2013 Frequency : Biannual...
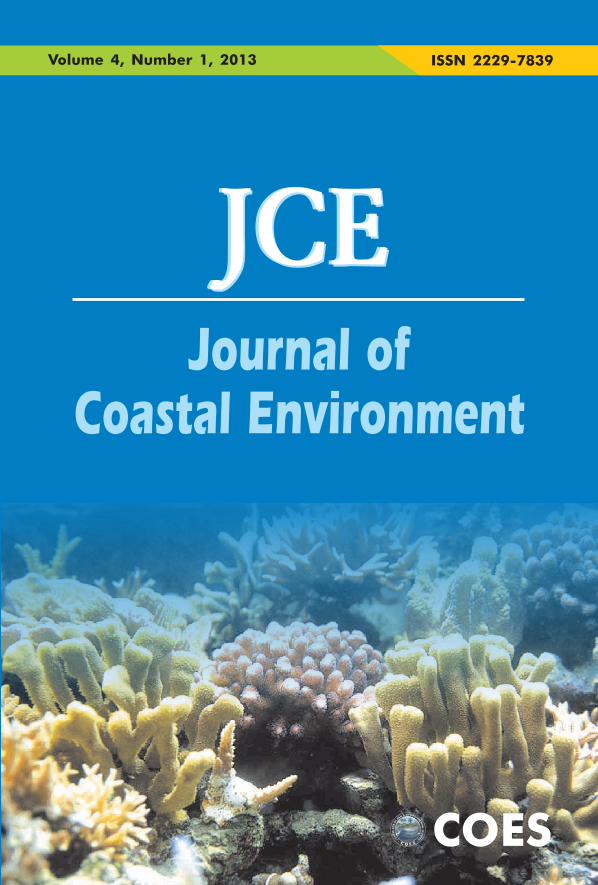
Journal of Coastal Environment
COES
ISSN 2229-7839Volume 4, Number 1, 2013
JCEJCEJCE
Journal of Coastal EnvironmentJournal of Coastal Environment (JCE) is published by the Centre for Ocean and Environmental Studies, New Delhi twice a year. The Journal promotes the study and analyses of scientific, economic and policy issues related to ecology of the oceans and coasts, as well as its impact on the land and the atmosphere. The emphasis is to involve a large community of scientists and scholars from India and abroad in developing a framework of discussion and debate on conservation and sustainable development.
Frequency : Biannual
Editor-in-Chief : S.Z. Qasim, Chairman, Centre for Ocean and Environmental Studies, New Delhi
Editor : Kishore Kumar, Secretary & ConsultantCentre for Ocean and Environmental Studies, New Delhi
© Journal of Coastal Environment (JCE). All rights reserved. No portion of material can be
reproduced in part or full without the prior permission of the Editor.
Note : The views expressed herein are the opinions of contributors and the Editor, and do
not reflect the stated policies of the Centre for Ocean and Environmental Studies.
Correspondence: All enquiries, editorial, business and any other, may be addressed to:
The Editor, Journal of Coastal Environment (JCE), A-2, East of Kailash (Basement), New
Delhi 110 065; Tel: 91-11-46078340; E-mail: [email protected]; [email protected];
Website: www.coes-india.orgISSN : 2229-7839
K. KathiresanProfessor, Centre of Advanced Study in Marine Biology, Annamalai University, Tamil Nadu
M.C. VermaIAS (Retd.) and former Member, Forest Advisory Committee (MoEF), New Delhi
B. MeenakumariDeputy Director-General, Indian Council of Agricultural Research, New Delhi
Satish R. ShetyeVice-Chancellor, Goa University
Malti GoelFormer Adviser, Ministry of Science & Technology, New Delhi
S.W.A. NaqviDirector, CSIR - National Institute of
Oceanography, Goa
S. RajanDirector, National Centre for Antarctic
and Ocean Research, Goa
Amalesh ChoudhuryFounder & former Head, Department of Marine Science, University of Calcutta, Kolkata
Rasik RavindraPanikkar Professor, Cryosphere and Geoscience Research, Ministry of Earth Sciences, Govt. of India
Anil ChatterjeeInstitute of Tropical AquacultureUniversity Malaysia Terengganu, Malaysia
Sudhir K. ChopraFellow, University of Cambridge at Rue de
Neufchateau, Arlon, Belgium
Baishnab Charan TripathyVice-Chancellor, Ravenshaw University, Cuttack
Vijay SakhujaDirector (Research), Indian Council of World
Affairs, New Delhi
Dinabandhu SahooProfessor, Department of Botany,University of Delhi
Editorial Board
Journal of Coastal Environment
JCE
Volume 4, Number 1, 2013
Centre for Ocean and Environmental StudiesA-2, East of Kailash (Basement), New Delhi 110 065; Tel/Fax: 91-11-46078340
E-mail: [email protected]; [email protected];
Website: www.coes-india.org

The fourth volume of the Journal of Coastal Environment has been slightly
delayed due to unavoidable reasons. The first issue of this volume is now
ready to be sent to the press, covering a variety of subjects related to
coastal and marine ecosystems.
The paper on the enhancement of phytoplanktons by iron fertilization, by
Sufia Zaman, et.al., is the result of a study of six species in the Indian
Sundarbans. The study has great relevance in the field of pisciculture,
with phytoplanktons acting as direct natural feed for fish on both surface
and bottom of the pond. The next paper by Maria-Judith Gonsalves, et.al.,
from NIO (Goa) deals with adaptation of marine organisms for their
existence and survival in the sea. These include adaptation to light,
temperature, pressure, pH level, etc., underlining their defensive and
sustenance adaptability in extreme environments including those in polar
areas, hydrothermal vents, etc. Sharmila Chandra from Viswa Bharati
University, Shanti Niketan, in her paper on mangrove exploitation in the
Sundarbans, warns against threats to the said ecosystem by both natural
and anthropogenic hazards. These have led to large scale coastal erosion
and land degradation, prompting the government to set up the National
Mangrove Committee (1976) for the scientific management leading to
conservation and protection.
The fourth paper on Sceleractinians Corals in the Andaman and Nicobar,
by Tamal Mondal, et.al., deals with the distributional range of some
threatened species that are placed in the IUCN Red List category. The team
explored the corals and associated faunal communities during August to
October 2012 by employing SCUBA diving and Snorkeling, as well as by
examining their detailed morphological character for taxonomic study.
These specimens are registered in the Zoological Survey of India
(Andaman & Nicobar Regional Centre, Port Blair) as database of
vulnerable / threatened species of corals, calling for their conservation
and protection. The next paper on socio-economic impact of disasters in
coastal Orissa by B. Ramaswamy, et.al., underlines the fact that the poor
community suffer the most in the eventuality of disasters, and this is the
Editorial
reason the state should look beyond disaster mitigation and preparedness,
with a view to finding a long term solution to issues related to their safety
and livelihood.
The paper by V. Madhan Chakkravarthy is on the discovery of a new
species of Tapes, under the National Coral Reef Research Institute, from
Malacca at Car Nicobar in A&N Islands. The shell was collected from coral
rubbles area during a research trip to Malacca in 2009, and is commonly
named the “Malacca Butterfly Clam”. The paper on Puffer Fish in the
South Andaman Sea by Pravin Kumar, et.al., from Pondicherry University
(Port Blair Campus), describes the species as very important in marine
food web for its toxicity, and its consumption without proper processing
may prove to be fatal. Still, it is consumed by aborigines in the island, as
well as in Southeast Asian countries, Japan, Gulf of Suez and Red Sea
region. The paper pertains to the study by the team about the feeding
behaviour of the fish in order to assess the probable sources of toxins that
impact the marine food chain.
The papers included in this issue of the Journal give a varied account of
the coastal and marine biodiversity, leading to threats faced by them as
well as by the coastal communities. The information could help
immensely in sustainable utilisation of coastal resources with a view to
strengthening and managing this important ecosystem in the interest of
the nation and the population.S.Z. Qasim
This publication has been supported by the Ministry of
Earth Sciences (MoES), Government of India.
Enhancement of Phytoplankton Community 1
of Brackishwater System by Iron Fertilization
Sufia Zaman, Subhro Bikash Bhattacharyya,
Md. Aftab Alam, Harekrishna Jana, Mahua Roy Chowdhury, Subhasmita Sinha, Kunal Mondal and Abhijit Mitra
Marine Organisms and their Adaptation 15
Maria-Judith Gonsalves, Anindita Das
and P.A. Loka Bharathi
Incidence and Consequences of Mangrove 23
Exploitation in the Sunderbans
Sharmila Chandra
Vulnerable Scleractinians Corals from 37
Andaman and Nicobar Islands Tamal Mondal, C. Raghunathan and K. Venkataraman
Socio Economic Impact of Natural 51
Disasters : A Case Study of Orissa
B. Ramaswamy, Manvendra Bhattacharya and P. C. Sinha
Discovery of a New Species of Clams in 67
Coral Rubbles of Andaman and Nicobar Islands
V. Madhan Chakkaravarthy
Studies on Biology and Feeding Habit of Puffer 73
Fish Species from South Andaman Sea
Pravin Kumar, J. K. Mishra, Ysamin and C. Santosh Kumar
C o n t e n t s

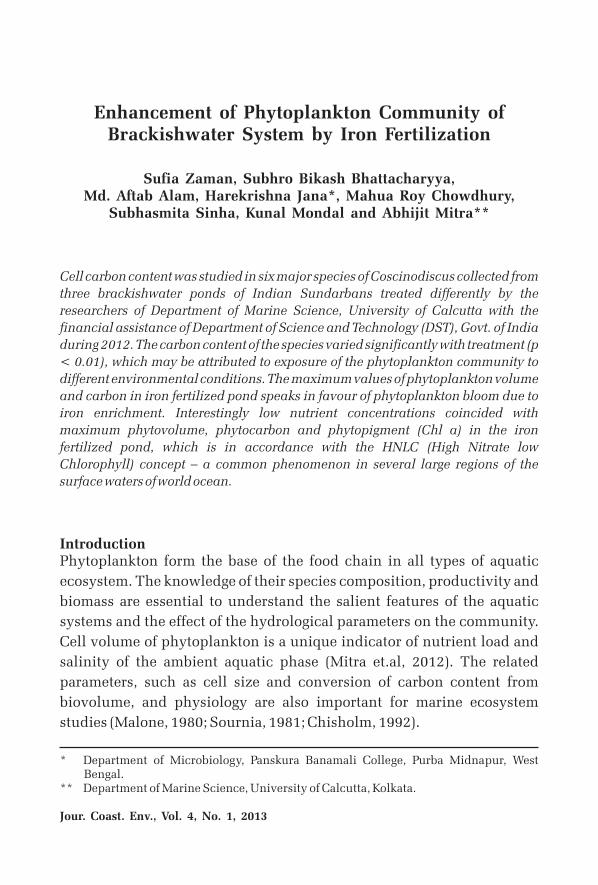
Enhancement of Phytoplankton Community of Brackishwater System by Iron Fertilization
Sufia Zaman, Subhro Bikash Bhattacharyya, Md. Aftab Alam, Harekrishna Jana*, Mahua Roy Chowdhury,
Subhasmita Sinha, Kunal Mondal and Abhijit Mitra**
Cell carbon content was studied in six major species of Coscinodiscus collected from
three brackishwater ponds of Indian Sundarbans treated differently by the
researchers of Department of Marine Science, University of Calcutta with the
financial assistance of Department of Science and Technology (DST), Govt. of India
during 2012. The carbon content of the species varied significantly with treatment (p
< 0.01), which may be attributed to exposure of the phytoplankton community to
different environmental conditions. The maximum values of phytoplankton volume
and carbon in iron fertilized pond speaks in favour of phytoplankton bloom due to
iron enrichment. Interestingly low nutrient concentrations coincided with
maximum phytovolume, phytocarbon and phytopigment (Chl a) in the iron
fertilized pond, which is in accordance with the HNLC (High Nitrate low
Chlorophyll) concept – a common phenomenon in several large regions of the
surface waters of world ocean.
IntroductionPhytoplankton form the base of the food chain in all types of aquatic
ecosystem. The knowledge of their species composition, productivity and
biomass are essential to understand the salient features of the aquatic
systems and the effect of the hydrological parameters on the community.
Cell volume of phytoplankton is a unique indicator of nutrient load and
salinity of the ambient aquatic phase (Mitra et.al, 2012). The related
parameters, such as cell size and conversion of carbon content from
biovolume, and physiology are also important for marine ecosystem
studies (Malone, 1980; Sournia, 1981; Chisholm, 1992).
* Department of Microbiology, Panskura Banamali College, Purba Midnapur, West Bengal.
** Department of Marine Science, University of Calcutta, Kolkata.
Jour. Coast. Env., Vol. 4, No. 1, 2013
Phytoplankton cell size varies greatly among different genera or even between different individuals. Sizes range from a few micrometres (or even less than 1 mm) to a few millimetres. Hence, there is a wide range of nine orders in magnitude for cell biovolume of phytoplankton. Several automated and semi-automatic methods for biovolume estimation have been described in the literature, such as the Coulter Counter (Hastings et. al, 1962; Maloney et. al, 1962; Boyd et. al, 1995), the micrographic image analysis system (Gordon, 1974; Krambeck et. al, 1981; Estep et. al, 1986), flow cytometry (Olson et. al, 1985; Wood et. al, 1985; Steen, 1990) and holographic scanning technology (Brown et. al, 1989). In this programme we have estimated the biovolumes and carbon content of six major Coscinodiscus species from three brackishwater ponds in the Kakdwip region of Indian Sundarbans. These ponds were treated with iron salt (FeSO ) and mangrove litter and one of the ponds was kept as control with 4
only brackish water stored in it. Simultaneously the Chlorophyll a pigment was also estimated in the three ponds to monitor the growth of phytoplankton due to different types of treatment.
Methods
Study sitesSundarbans delta is one of the dynamic mangrove dominated estuarine deltas of the world (Banerjee et. al, 2012), which is situated at the apex of Bay of Bengal. A major portion of this delta (62%) lies in Bangladesh and the remaining 38% is within the Indian sub-continent. In the Indian Sundarbans, approximately 2069 sq. km of area is occupied by the tidal river system or estuaries, which finally end up in the Bay of Bengal. These estuaries feed several brackishwater ponds in the area. We selected three
0ponds in the Kakdwip area of Indian Sundarbans (21 52'35.7"N & 0
88 11'55.0?E) and treated them differently to observe the effect of iron addition on cell volume and cell carbon of six major Coscinodiscus species available in the present study area (Mitra et. al, 2004). The variation of phytoplankton standing stock is reflected through phytopigment level and therefore chlorophyll a along with nutrients were also analysed simultaneously in these three ponds.
Salinity The surface water salinity in the selected ponds was recorded by means of
an optical refractometer (Atago, Japan) and cross-checked in laboratory
using Mohr-Knudsen method. The correction factor was found out by
titrating silver nitrate solution against standard seawater (IAPO standard
seawater service Charlottenlund, Slot Denmark, chlorinity = 19.376 psu).
Journal of Coastal Environment2
Dissolved ironSurface water samples were collected from the three ponds using 10-l
Teflon-lined Go-Flo bottles fitted with Teflon taps and deployed on a
rosette or on Kevlar line, with additional surface sampling carried out by
hand. Shortly after collection, samples were filtered through Nuclepore
filters (0.4 µm pore diameter) and aliquots of the filters were acidified with
sub-boiling distilled nitric acid to a pH of about 2 and stored in cleaned
low-density polyethylene bottles. Dissolved Fe was separated and pre-
concentrated from the brackishwater using dithiocarbamate
complexation and subsequent extraction into Freon TF, followed by back
extraction into HNO (Danielsson et. al, 1978). Extract was analysed for 3
dissolved Fe by Atomic Absorption Spectrophotometer (Perkin Elmer:
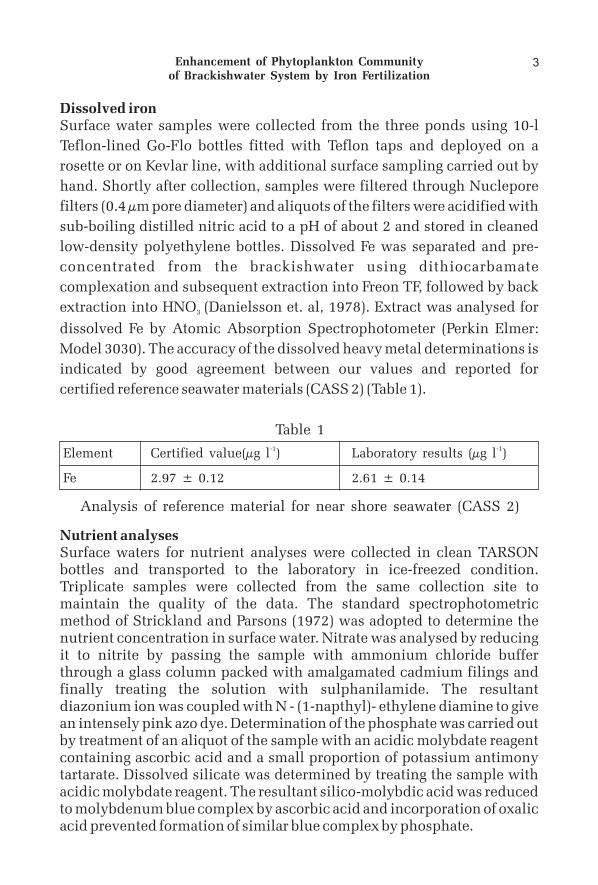
Model 3030). The accuracy of the dissolved heavy metal determinations is
indicated by good agreement between our values and reported for
certified reference seawater materials (CASS 2) (Table 1).
Nutrient analysesSurface waters for nutrient analyses were collected in clean TARSON bottles and transported to the laboratory in ice-freezed condition. Triplicate samples were collected from the same collection site to maintain the quality of the data. The standard spectrophotometric method of Strickland and Parsons (1972) was adopted to determine the nutrient concentration in surface water. Nitrate was analysed by reducing it to nitrite by passing the sample with ammonium chloride buffer through a glass column packed with amalgamated cadmium filings and finally treating the solution with sulphanilamide. The resultant diazonium ion was coupled with N - (1-napthyl)- ethylene diamine to give an intensely pink azo dye. Determination of the phosphate was carried out by treatment of an aliquot of the sample with an acidic molybdate reagent containing ascorbic acid and a small proportion of potassium antimony tartarate. Dissolved silicate was determined by treating the sample with acidic molybdate reagent. The resultant silico-molybdic acid was reduced to molybdenum blue complex by ascorbic acid and incorporation of oxalic acid prevented formation of similar blue complex by phosphate.
Analysis of reference material for near shore seawater (CASS 2)
Table 1-1 -1Element Certified value(µg l ) Laboratory results (µg l )
Fe 2.97 ± 0.12 2.61 ± 0.14
3Enhancement of Phytoplankton Community of Brackishwater System by Iron Fertilization
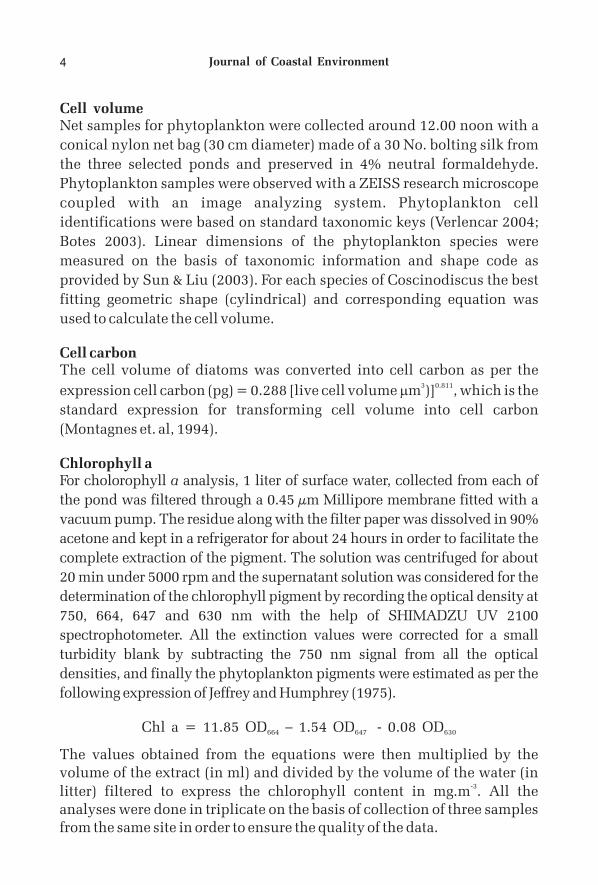
Cell volume Net samples for phytoplankton were collected around 12.00 noon with a
conical nylon net bag (30 cm diameter) made of a 30 No. bolting silk from
the three selected ponds and preserved in 4% neutral formaldehyde.
Phytoplankton samples were observed with a ZEISS research microscope
coupled with an image analyzing system. Phytoplankton cell
identifications were based on standard taxonomic keys (Verlencar 2004;
Botes 2003). Linear dimensions of the phytoplankton species were
measured on the basis of taxonomic information and shape code as
provided by Sun & Liu (2003). For each species of Coscinodiscus the best
fitting geometric shape (cylindrical) and corresponding equation was
used to calculate the cell volume.
Cell carbonThe cell volume of diatoms was converted into cell carbon as per the
0.811expression cell carbon (pg) = 0.288 [live cell volume mm )] , which is the
standard expression for transforming cell volume into cell carbon
(Montagnes et. al, 1994).
Chlorophyll aFor cholorophyll a analysis, 1 liter of surface water, collected from each of
the pond was filtered through a 0.45 µm Millipore membrane fitted with a
vacuum pump. The residue along with the filter paper was dissolved in 90%
acetone and kept in a refrigerator for about 24 hours in order to facilitate the
complete extraction of the pigment. The solution was centrifuged for about
20 min under 5000 rpm and the supernatant solution was considered for the
determination of the chlorophyll pigment by recording the optical density at
750, 664, 647 and 630 nm with the help of SHIMADZU UV 2100
spectrophotometer. All the extinction values were corrected for a small
turbidity blank by subtracting the 750 nm signal from all the optical
densities, and finally the phytoplankton pigments were estimated as per the
following expression of Jeffrey and Humphrey (1975).
Chl a = 11.85 OD – 1.54 OD - 0.08 OD664 647 630
The values obtained from the equations were then multiplied by the volume of the extract (in ml) and divided by the volume of the water (in
-3litter) filtered to express the chlorophyll content in mg.m . All the analyses were done in triplicate on the basis of collection of three samples from the same site in order to ensure the quality of the data.
3
Journal of Coastal Environment4
Fluorescence studyFluorescence study was done with fluorescence microscope (Olympus IX71, Tokyo, Japan) after staining with Acridine Orange (AO), which is a metachromatic dye that differentially stains double-stranded (ds) and single-stranded (ss) nucleic acids of the phytoplankton. When AO intercalates into dsDNA it emits green fluorescence on excitation at 480-490 nm.
Statistical analysisTo explore the relationships between phytoplankton cell volume and cell
carbon, scatterplots and allometric equations were computed. To assess
whether cell volume, carbon content and environmental variables varied
significantly between the ponds, two-way ANOVA was performed. All
statistical calculations were performed with SPSS 9.0 for Windows.
Results31. The average cell volume of phytoplankton ranged from (3839.30 µm
3in Coscindiscus oculusiridis in control pond) to (70918.19 µm in Coscindiscus radiatus in FeSO treated pond) (Table 2).4
2. Phytoplankton cell volume was maximum in FeSO treated pond 4
3(average value 28042.42 µm ) followed by mangrove litter treated
3pond (average value 13789.43 µm ) and control pond (average value 3
13253.95 µm ) (Table 2).
3. The average cell carbon of phytoplankton ranged from (232.39 picogram in Coscindiscus oculusiridis in control pond) to (2473.80 picogram in Coscindiscus radiatus in FeSO treated pond) (Table 2).\4
4. Phytoplankton cell carbon content was maximum in FeSO treated 4
pond (average value 1108.38 picogram) followed by mangrove litter treated pond (average value 612.51 picogram) and control pond (average value 591.87 picogram) (Table 2).
5. The phytopigment concentrations was maximum in FeSO treated 4
3pond (75.2 mg/m ), followed by mangrove litter treated pond (46.5
3 3mg/m ) and control pond (29.2 mg/m ) (Fig. 1).
6. The nitrate concentrations ranged in the order control pond (28.22 µgat/l) > mangrove litter treated pond (14.65 µgat/l) > FeSO treated 4
pond (5.28 µgat/l). Phosphate and silicate exhibited similar trends with highest values in the control ponds (7.57 µgat/l and 68.67 µgat/l respectively), followed by mangrove litter pond (2.19 µgat/l and 39.17 µgat/l respectively) and FeSO treated pond (0.33 µgat/l and 21.44 4
µgat/l respectively) (Fig 1).
5Enhancement of Phytoplankton Community of Brackishwater System by Iron Fertilization
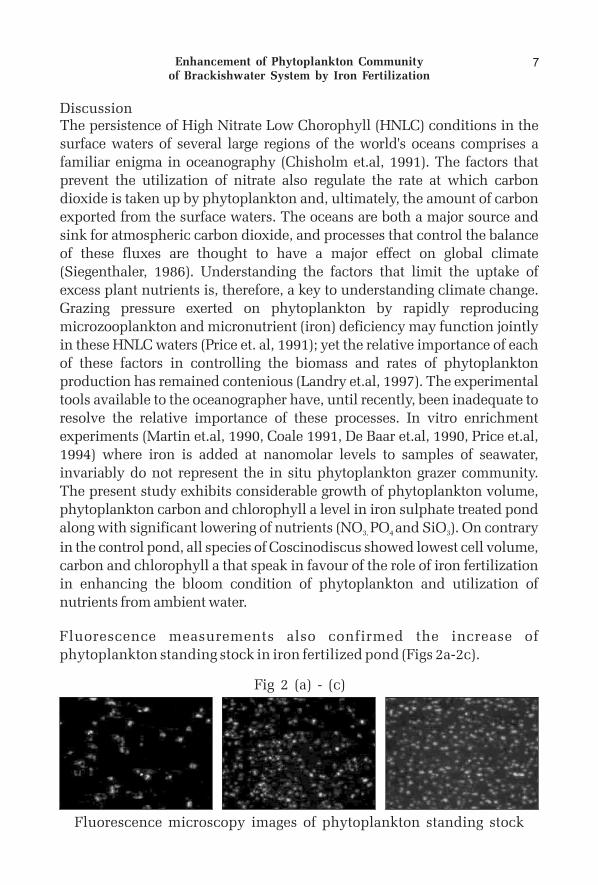
7. Maximum fluorescence was observed in FeSO treated pond (Fig 2c) 4
followed by mangrove litter treated pond (Fig 2b) and control pond (Fig 2a).
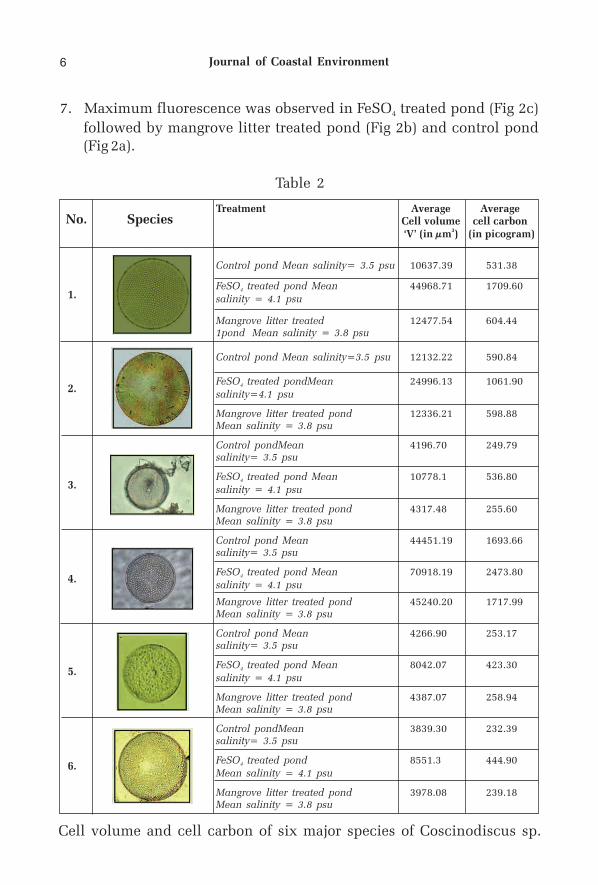
Table 2
Cell volume and cell carbon of six major species of Coscinodiscus sp.
No. SpeciesTreatment Average Average
Cell volume cell carbon3‘V’ (in µm ) (in picogram)
Control pond Mean 10637.39 531.38
FeSO treated pond Mean 44968.71 1709.604
salinity = 4.1 psu
Mangrove litter treated 12477.54 604.441pond Mean salinity = 3.8 psu
Control pond Mean salinity=3.5 psu 12132.22 590.84
FeSO treated pondMean 24996.13 1061.904
salinity=4.1 psu
Mangrove litter treated pond 12336.21 598.88Mean salinity = 3.8 psu
Control pondMean 4196.70 249.79salinity= 3.5 psu
FeSO treated pond Mean 10778.1 536.804
salinity = 4.1 psu
Mangrove litter treated pond 4317.48 255.60Mean salinity = 3.8 psu
Control pond Mean 44451.19 1693.66salinity= 3.5 psu
FeSO treated pond Mean 70918.19 2473.804
salinity = 4.1 psu
Mangrove litter treated pond 45240.20 1717.99Mean salinity = 3.8 psu
Control pond Mean 4266.90 253.17salinity= 3.5 psu
FeSO treated pond Mean 8042.07 423.304
salinity = 4.1 psu
Mangrove litter treated pond 4387.07 258.94Mean salinity = 3.8 psu
Control pondMean 3839.30 232.39salinity= 3.5 psu
FeSO treated pond 8551.3 444.904
Mean salinity = 4.1 psu
Mangrove litter treated pond 3978.08 239.18Mean salinity = 3.8 psu
salinity= 3.5 psu
1.
3.
5.
2.
4.
6.
Journal of Coastal Environment6
DiscussionThe persistence of High Nitrate Low Chorophyll (HNLC) conditions in the surface waters of several large regions of the world's oceans comprises a familiar enigma in oceanography (Chisholm et.al, 1991). The factors that prevent the utilization of nitrate also regulate the rate at which carbon dioxide is taken up by phytoplankton and, ultimately, the amount of carbon exported from the surface waters. The oceans are both a major source and sink for atmospheric carbon dioxide, and processes that control the balance of these fluxes are thought to have a major effect on global climate (Siegenthaler, 1986). Understanding the factors that limit the uptake of excess plant nutrients is, therefore, a key to understanding climate change. Grazing pressure exerted on phytoplankton by rapidly reproducing microzooplankton and micronutrient (iron) deficiency may function jointly in these HNLC waters (Price et. al, 1991); yet the relative importance of each of these factors in controlling the biomass and rates of phytoplankton production has remained contenious (Landry et.al, 1997). The experimental tools available to the oceanographer have, until recently, been inadequate to resolve the relative importance of these processes. In vitro enrichment experiments (Martin et.al, 1990, Coale 1991, De Baar et.al, 1990, Price et.al, 1994) where iron is added at nanomolar levels to samples of seawater, invariably do not represent the in situ phytoplankton grazer community. The present study exhibits considerable growth of phytoplankton volume, phytoplankton carbon and chlorophyll a level in iron sulphate treated pond along with significant lowering of nutrients (NO PO and SiO ). On contrary 3, 4 3
in the control pond, all species of Coscinodiscus showed lowest cell volume, carbon and chlorophyll a that speak in favour of the role of iron fertilization in enhancing the bloom condition of phytoplankton and utilization of nutrients from ambient water.
Fluorescence measurements also confirmed the increase of phytoplankton standing stock in iron fertilized pond (Figs 2a-2c).
Fig 2 (a) - (c)
Fluorescence microscopy images of phytoplankton standing stock
7Enhancement of Phytoplankton Community of Brackishwater System by Iron Fertilization
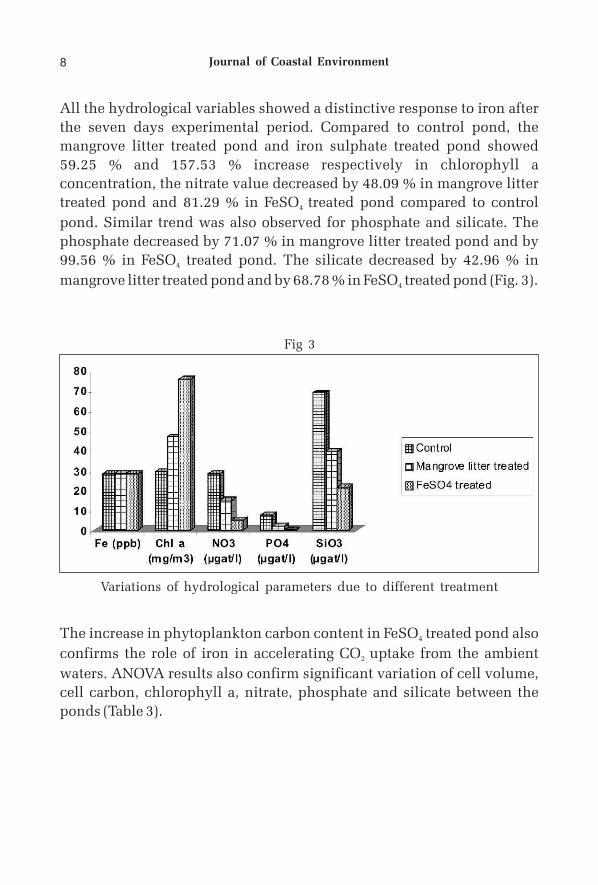
All the hydrological variables showed a distinctive response to iron after
the seven days experimental period. Compared to control pond, the
mangrove litter treated pond and iron sulphate treated pond showed
59.25 % and 157.53 % increase respectively in chlorophyll a
concentration, the nitrate value decreased by 48.09 % in mangrove litter
treated pond and 81.29 % in FeSO treated pond compared to control 4
pond. Similar trend was also observed for phosphate and silicate. The
phosphate decreased by 71.07 % in mangrove litter treated pond and by
99.56 % in FeSO treated pond. The silicate decreased by 42.96 % in 4
mangrove litter treated pond and by 68.78 % in FeSO treated pond (Fig. 3). 4
The increase in phytoplankton carbon content in FeSO treated pond also 4
confirms the role of iron in accelerating CO uptake from the ambient 2
waters. ANOVA results also confirm significant variation of cell volume,
cell carbon, chlorophyll a, nitrate, phosphate and silicate between the
ponds (Table 3).
Fig 3
Variations of hydrological parameters due to different treatment
Journal of Coastal Environment8
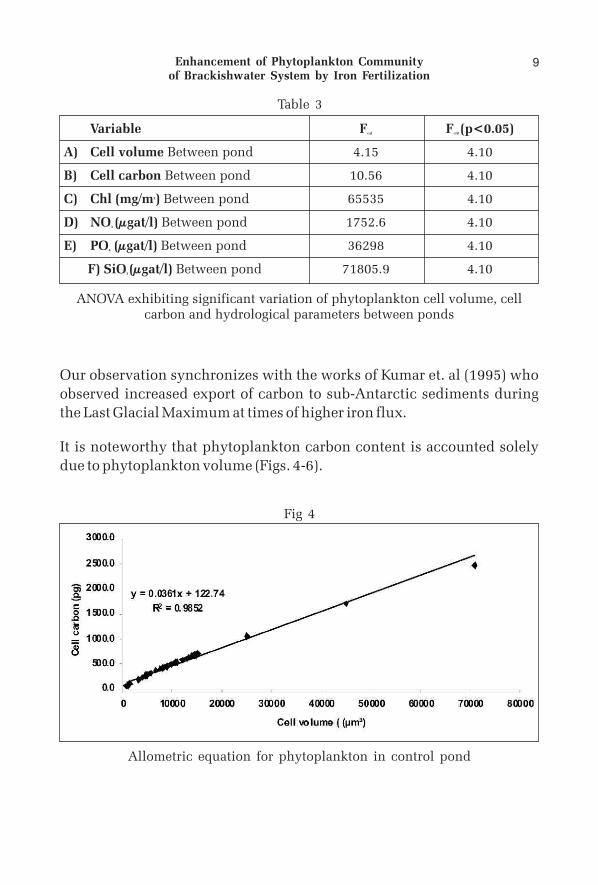
ANOVA exhibiting significant variation of phytoplankton cell volume, cell carbon and hydrological parameters between ponds
Variable F F (p<0.05)cal crit
A) Cell volume Between pond 4.15 4.10
B) Cell carbon Between pond 10.56 4.10
3C) Chl (mg/m ) Between pond 65535 4.10
D) NO (µgat/l) Between pond 1752.6 4.103
E) PO (µgat/l) Between pond 36298 4.104
F) SiO (µgat/l) Between pond 71805.9 4.103
Our observation synchronizes with the works of Kumar et. al (1995) who
observed increased export of carbon to sub-Antarctic sediments during
the Last Glacial Maximum at times of higher iron flux.
It is noteworthy that phytoplankton carbon content is accounted solely
due to phytoplankton volume (Figs. 4-6).
Table 3
Fig 4
Allometric equation for phytoplankton in control pond
9Enhancement of Phytoplankton Community of Brackishwater System by Iron Fertilization
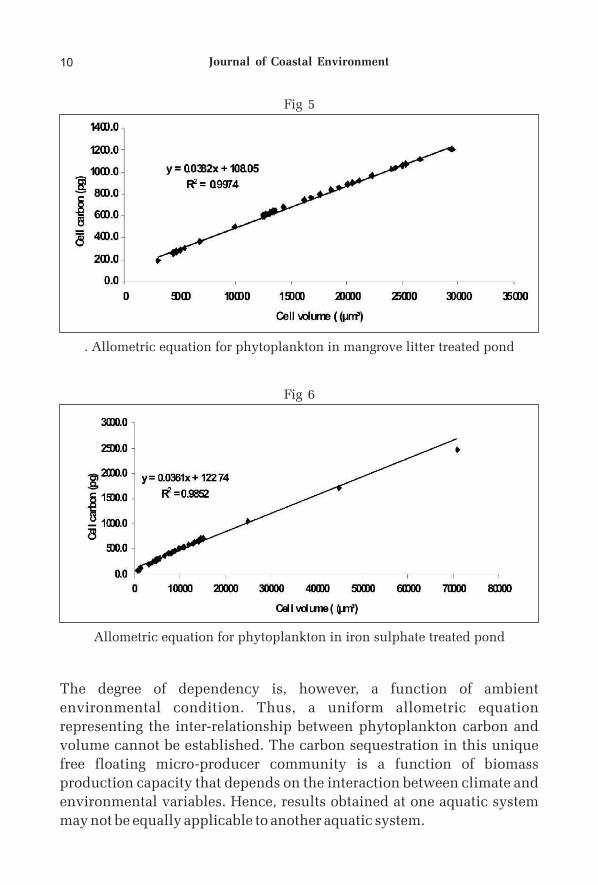
The degree of dependency is, however, a function of ambient
environmental condition. Thus, a uniform allometric equation
representing the inter-relationship between phytoplankton carbon and
volume cannot be established. The carbon sequestration in this unique
free floating micro-producer community is a function of biomass
production capacity that depends on the interaction between climate and
environmental variables. Hence, results obtained at one aquatic system
may not be equally applicable to another aquatic system.
Fig 5
. Allometric equation for phytoplankton in mangrove litter treated pond
Fig 6
Allometric equation for phytoplankton in iron sulphate treated pond
Journal of Coastal Environment10
The present study has great relevance in the field of pisciculture as the
overgrowth of phytoplankton can act as direct natural feed for surface
feeders (like Rohu, Catla) and bottom feeders (like giant fresh water
Prawn) after the algal crash.
Reference
Banerjee K., Senthilkumar B., Purvaja R. and Ramesh R. 2012.
Sedimentation and trace metal distribution in selected locations of
Sundarbans mangroves and Hooghly estuary, Northeast coast of India,
Environ. Geochem. Health, 34: 27-42.
Botes L. 2003. Phytoplankton Identification Catalogue, Saldanha Bay,
South Africa, (GloBallast Monograph Series No. 7. IMO London).
Boyd CM and Johnson CW. 1995., Precision of size determination of
resistive electronic particle counters, J. Plankton Res., 17: 41–58.
Brown LM, Gargantini I, Brown DJ, Atkinson HJ, Govindarajan J and
Vanlerberghe GC. 1989. Computer-based image analysis for the automated
counting and morphological description of microalgae in culture. J. Appl.
Phycol., 1: 211–225.
Chisholm SW and Morel FMM. 1991. What controls phytoplankton
production in nutrient-rich areas of the open sea? Limnol. Oceanogr., 38:
1507-1964.
Chisholm SW. 1992. Phytoplankton size. In Falkowski, PG and Woodhead,
AD. (eds), Primary Productivity and Biogeochemical Cycles in the Sea,
(Plenum Press, New York) 213–237.
Coale KH. 1991. Effects of iron, manganese, copper and zinc enrichments
on productivity and biomass in the subarctic Pacific. Limnol. Oceanogr.,
36: 1865-1878.
Danielsson LG, Magnusson B and Westerlund S. 1978. An improved metal
extraction procedure for the determination of trace metals in seawater by
atomic absorption spectrometry with electrothermal atomization.
Analytical Chem. Acta., 98: 45 – 57.
De Baar HJW, Buma AGJ, Nolting RF, Cadée GC, Jacques G and Tréguer P.
1990. On iron limitation of the Southern Ocean: Experimental
observations in the Weddell and Scotias seas. Mar. Ecol. Progr. Ser., 65: 105-
122.
11Enhancement of Phytoplankton Community of Brackishwater System by Iron Fertilization
Estep KW, MacIntyre F, Hjorleifsson E Sieburth JM. 1986. MacImage: a
user friendly image-analysis system for the accurate mensuration of
marine organisms. Mar. Ecol. Prog. Ser., 33: 243–253.
Gordon R. 1974. A tutorial on ART (algebraic reconstruction techniques),
IEEE Trans. Nucl. Sci., 21: 78–93.
Hastings JW, Sweeney BM and Mullin MM. 1962. Counting and sizing of
unicellular marine organisms, Ann. N. Y. Acad. Sci., 99: 180–289.
Jeffrey SW and Humphrey GF. 1975. New spectrophotometric equations
for determining chlorophylls a, b, c and c in higher plants, algae and 1 2
natural phytoplankton. Biochem. Physiol. Pflanzen. 167: 191 – 194.
Krambeck C, Krambeck HJ and Overbeck J. 1981. Microcomputer-assisted
biomass determination of plankton bacteria on scanning electron
micrographs. Appl. Environ. Microbiol., 42: 142–149.
Kumar N, Anderson RF, Mortlock RA, Froelich PN, Kubik P, Dittrich
Hannen B and Suter M (1995), Increased biological productivity and
export production in the glacial Southern Ocean. Nature., 378: 675-680.
Landry MR, Barber RT, Bidigare RR, Chai F, Coale KH, Dam HG, Lewis MR,
Lindley ST, McCarthy JJ, Roman MR, Stoecker DK, Verity PG and White JR.
1997. Iron and grazing constraints on primary production in the central
equatorial Pacific: An EqPac synthesis. Limnol. Oceanogr., 42 (3): 405-418.
Malone TC. 1980. Algal size, In: Morris, I. (ed.), The Physiol. Ecol.
Phytoplankton, (University of California Press, California) 433–463.
Maloney TE, Donovan EJ JR and Robinson EL. 1962. Determination of
numbers and sizes of algal cells with an electronic particle counter.
Phycologia., 2: 1–8.
Mitra A, Banerjee K and Bhattacharyya DP. 2004. The Other Face of
Mangroves, (Department of Environment, Govt. of West Bengal, India).
Mitra A, Zaman S, Kanti Ray S, Sinha, S and Banerjee K. 2012. Inter-
relationship between phytoplankton cell volume and aquatic salinity in
Indian Sundarbans. Natl. Ac. of Sc. Lett., (SPRINGER DOI 10.1007/s40009-
012-0083-1), 1-7.
Montagnes DJS and Berges JA. 1994. Estimating carbon, nitrogen, protein,
and chlorophyll a from volume in marine phytoplankton. Limnol.
Oceanogr., 39: 1044-1060.
and
Journal of Coastal Environment12
Olson RJ, Vaulot D and Chisholm SW. 1985. Marine phytoplankton
distributions measured using shipboard flow cytometry. Deep-Sea Res.,
32: 1273–1280.
Price NM, Andersen LF and Morel FM. 1991. Iron and nitrogen nutrition of
equatorial Pacific plankton. Deep-Sea Res., 38: 1361-1378.
Price NM, Ahner BA and Morel FMM. 1994. The equatorial Pacific Ocean:
grazer-controlled phytoplankton in an iron-limited ecosystem. Limnol.
Oceanogr., 69: 520-534.
Siegenthaler U. 1986. Carbon dioxide its natural cycle and anthropogenic
perturbations (In: The Role of An Sea Exchange in Geochenucal C\clim>
(P Buat-Menard, ed ), Reidel) 209-247.
Sournia A. 1981. Morphological base of competition and succession, Can.
Bull. Fish. Aquat. Sci., 210: 339–346.
Steen HB. 1990. Characters of flow cytometers, (In Melamed MR, Lindmo
T and Mendelsohn ML (eds), Flow Cytometry and Sorting, 2nd edn. Wiley-
Liss, New York) 11–25.
Strickland JDH and Parsons TR. 1972. A Practical Handbook of Seawater
Analysis. The Alger Press Ltd. Ottowa.
Sun J and Liu DY. 2003. Geometric models for calculating cell biovolume
and surface area for phytoplankton. J. Plankton Res., 25: 1331-1346.
Verlencar XN and Desai S. 2004. Phytoplankton Identification Manual,
First Edition: National Institute of Oceanography Dona Paula, Goa, India.
Wood AM, Horan PK, Muirhead K, Phinney DA, Yentsch CM and
Waterbury JB. 1985. Discrimination between pigment types of marine
Synechococcus spp. by scanning spectroscopy, epifluorescence
microscopy, and flow cytometry. Limnol. Oceanogr., 30: 1303–1315.
13Enhancement of Phytoplankton Community of Brackishwater System by Iron Fertilization

Journal of Coastal Environment14
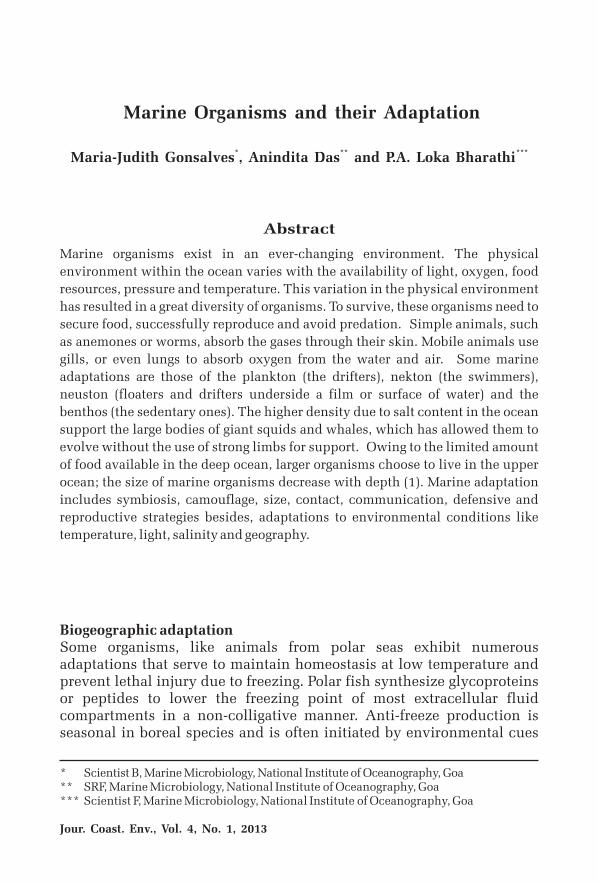
Marine Organisms and their Adaptation
* ** ***Maria-Judith Gonsalves , Anindita Das and P.A. Loka Bharathi
Marine organisms exist in an ever-changing environment. The physical
environment within the ocean varies with the availability of light, oxygen, food
resources, pressure and temperature. This variation in the physical environment
has resulted in a great diversity of organisms. To survive, these organisms need to
secure food, successfully reproduce and avoid predation. Simple animals, such
as anemones or worms, absorb the gases through their skin. Mobile animals use
gills, or even lungs to absorb oxygen from the water and air. Some marine
adaptations are those of the plankton (the drifters), nekton (the swimmers),
neuston (floaters and drifters underside a film or surface of water) and the
benthos (the sedentary ones). The higher density due to salt content in the ocean
support the large bodies of giant squids and whales, which has allowed them to
evolve without the use of strong limbs for support. Owing to the limited amount
of food available in the deep ocean, larger organisms choose to live in the upper
ocean; the size of marine organisms decrease with depth (1). Marine adaptation
includes symbiosis, camouflage, size, contact, communication, defensive and
reproductive strategies besides, adaptations to environmental conditions like
temperature, light, salinity and geography.
Biogeographic adaptationSome organisms, like animals from polar seas exhibit numerous adaptations that serve to maintain homeostasis at low temperature and prevent lethal injury due to freezing. Polar fish synthesize glycoproteins or peptides to lower the freezing point of most extracellular fluid compartments in a non-colligative manner. Anti-freeze production is seasonal in boreal species and is often initiated by environmental cues
* Scientist B, Marine Microbiology, National Institute of Oceanography, Goa** SRF, Marine Microbiology, National Institute of Oceanography, Goa*** Scientist F, Marine Microbiology, National Institute of Oceanography, Goa
Jour. Coast. Env., Vol. 4, No. 1, 2013
Abstract
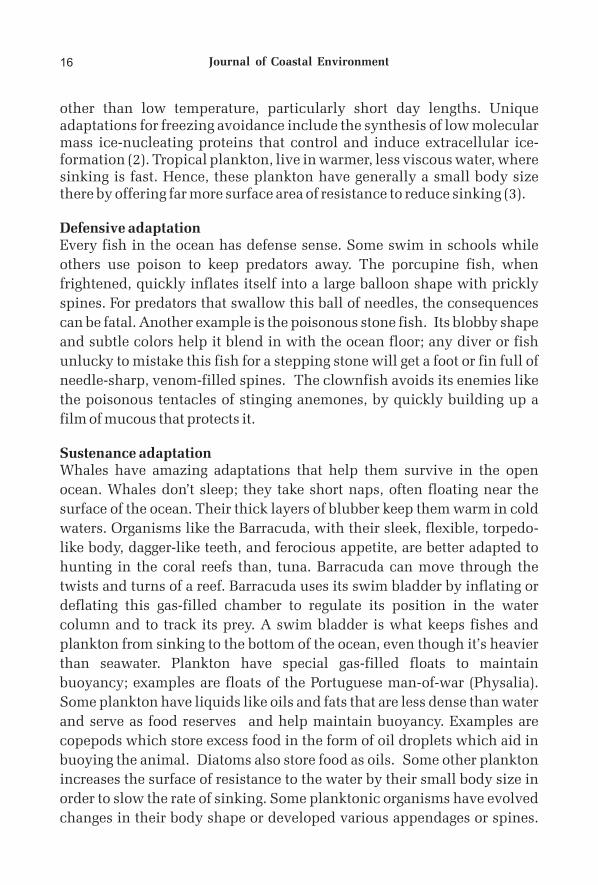
other than low temperature, particularly short day lengths. Unique adaptations for freezing avoidance include the synthesis of low molecular mass ice-nucleating proteins that control and induce extracellular ice-formation (2). Tropical plankton, live in warmer, less viscous water, where sinking is fast. Hence, these plankton have generally a small body size there by offering far more surface area of resistance to reduce sinking (3).
Defensive adaptationEvery fish in the ocean has defense sense. Some swim in schools while
others use poison to keep predators away. The porcupine fish, when
frightened, quickly inflates itself into a large balloon shape with prickly
spines. For predators that swallow this ball of needles, the consequences
can be fatal. Another example is the poisonous stone fish. Its blobby shape
and subtle colors help it blend in with the ocean floor; any diver or fish
unlucky to mistake this fish for a stepping stone will get a foot or fin full of
needle-sharp, venom-filled spines. The clownfish avoids its enemies like
the poisonous tentacles of stinging anemones, by quickly building up a
film of mucous that protects it.
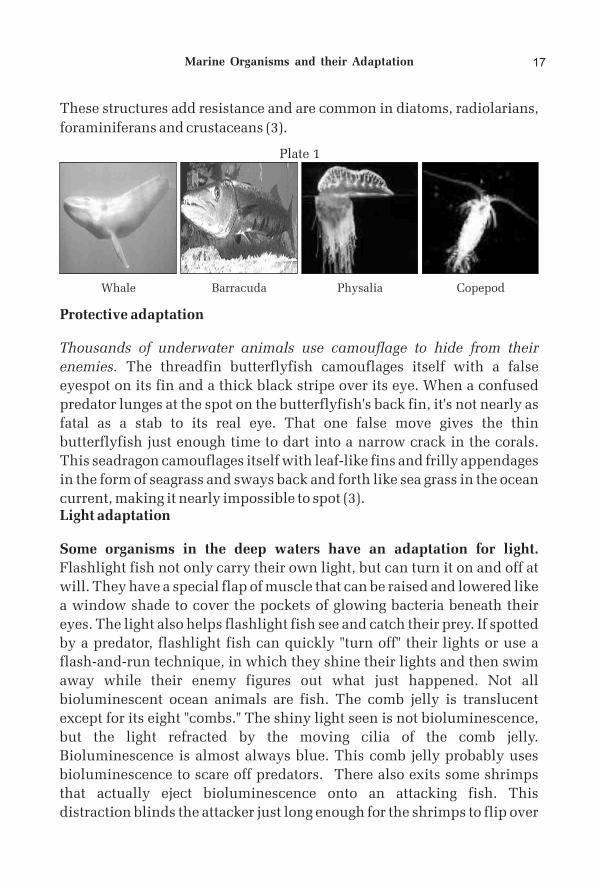
Sustenance adaptationWhales have amazing adaptations that help them survive in the open
ocean. Whales don’t sleep; they take short naps, often floating near the
surface of the ocean. Their thick layers of blubber keep them warm in cold
waters. Organisms like the Barracuda, with their sleek, flexible, torpedo-
like body, dagger-like teeth, and ferocious appetite, are better adapted to
hunting in the coral reefs than, tuna. Barracuda can move through the
twists and turns of a reef. Barracuda uses its swim bladder by inflating or
deflating this gas-filled chamber to regulate its position in the water
column and to track its prey. A swim bladder is what keeps fishes and
plankton from sinking to the bottom of the ocean, even though it’s heavier
than seawater. Plankton have special gas-filled floats to maintain
buoyancy; examples are floats of the Portuguese man-of-war (Physalia).
Some plankton have liquids like oils and fats that are less dense than water
and serve as food reserves and help maintain buoyancy. Examples are
copepods which store excess food in the form of oil droplets which aid in
buoying the animal. Diatoms also store food as oils. Some other plankton
increases the surface of resistance to the water by their small body size in
order to slow the rate of sinking. Some planktonic organisms have evolved
changes in their body shape or developed various appendages or spines.
Journal of Coastal Environment16
These structures add resistance and are common in diatoms, radiolarians,
foraminiferans and crustaceans (3).
Protective adaptation
Thousands of underwater animals use camouflage to hide from their
enemies. The threadfin butterflyfish camouflages itself with a false
eyespot on its fin and a thick black stripe over its eye. When a confused
predator lunges at the spot on the butterflyfish's back fin, it's not nearly as
fatal as a stab to its real eye. That one false move gives the thin
butterflyfish just enough time to dart into a narrow crack in the corals.
This seadragon camouflages itself with leaf-like fins and frilly appendages
in the form of seagrass and sways back and forth like sea grass in the ocean
current, making it nearly impossible to spot (3).Light adaptation
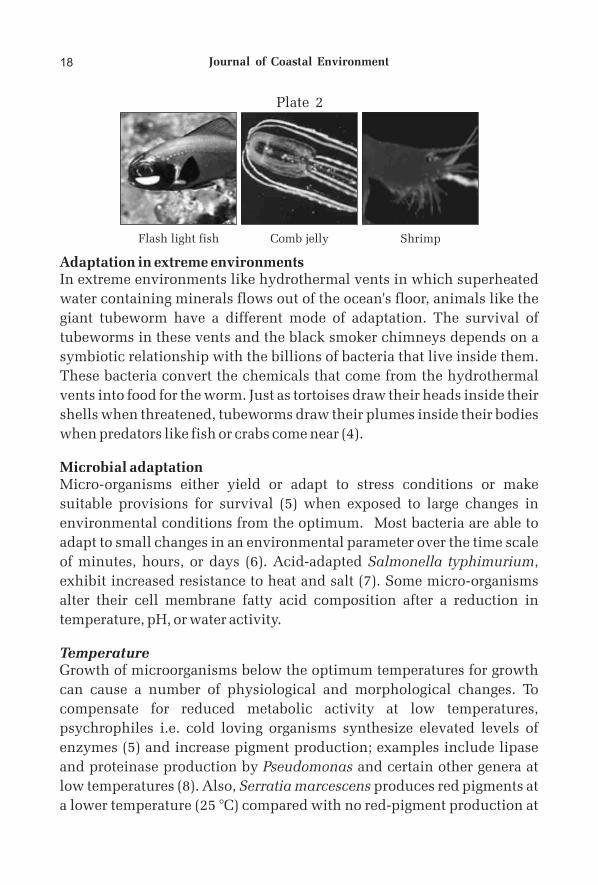
Some organisms in the deep waters have an adaptation for light.
Flashlight fish not only carry their own light, but can turn it on and off at
will. They have a special flap of muscle that can be raised and lowered like
a window shade to cover the pockets of glowing bacteria beneath their
eyes. The light also helps flashlight fish see and catch their prey. If spotted
by a predator, flashlight fish can quickly "turn off" their lights or use a
flash-and-run technique, in which they shine their lights and then swim
away while their enemy figures out what just happened. Not all
bioluminescent ocean animals are fish. The comb jelly is translucent
except for its eight "combs." The shiny light seen is not bioluminescence,
but the light refracted by the moving cilia of the comb jelly.
Bioluminescence is almost always blue. This comb jelly probably uses
bioluminescence to scare off predators. There also exits some shrimps
that actually eject bioluminescence onto an attacking fish. This
distraction blinds the attacker just long enough for the shrimps to flip over
Whale Barracuda Physalia Copepod
17
Plate 1
Marine Organisms and their Adaptation
Adaptation in extreme environmentsIn extreme environments like hydrothermal vents in which superheated
water containing minerals flows out of the ocean's floor, animals like the
giant tubeworm have a different mode of adaptation. The survival of
tubeworms in these vents and the black smoker chimneys depends on a
symbiotic relationship with the billions of bacteria that live inside them.
These bacteria convert the chemicals that come from the hydrothermal
vents into food for the worm. Just as tortoises draw their heads inside their
shells when threatened, tubeworms draw their plumes inside their bodies
when predators like fish or crabs come near (4).
Microbial adaptationMicro-organisms either yield or adapt to stress conditions or make
suitable provisions for survival (5) when exposed to large changes in
environmental conditions from the optimum. Most bacteria are able to
adapt to small changes in an environmental parameter over the time scale
of minutes, hours, or days (6). Acid-adapted Salmonella typhimurium,
exhibit increased resistance to heat and salt (7). Some micro-organisms
alter their cell membrane fatty acid composition after a reduction in
temperature, pH, or water activity.
TemperatureGrowth of microorganisms below the optimum temperatures for growth
can cause a number of physiological and morphological changes. To
compensate for reduced metabolic activity at low temperatures,
psychrophiles i.e. cold loving organisms synthesize elevated levels of
enzymes (5) and increase pigment production; examples include lipase
and proteinase production by Pseudomonas and certain other genera at
low temperatures (8). Also, Serratia marcescens produces red pigments at
a lower temperature (25 °C) compared with no red-pigment production at
Flash light fish Comb jelly Shrimp
Journal of Coastal Environment18
Plate 2
37 °C. Incubation at low temperatures can also change the lipid
composition by increasing the proportion of unsaturated fatty acids of
both bacteria and yeasts. Besides, inhibition of DNA, RNA, and protein
synthesis also occurs (9). Jones and others (10) made the initial discovery
of the cold shock response in E. coli: temperature reduction appears to
influence ribosomal activity, which leads to preferential synthesis of
proteins involved in various cellular functions from supercoiling of DNA
to initiation of translation—the cold-shock response.
PressureBacteria thrive in the deepest parts of the oceans and can withstand
pressures over 1000 times that at mean sea level (11). Some bacteria show
significant changes in the composition of their cell-membrane lipid
composition under higher pressure to maintain the cell-membrane
fluidity (12), while others change their respiratory system in response to
pressure conditions (13). Some deep-sea barophilic (pressure-loving)
bacteria have pressure-regulated genes (14).
pHTo adapt to and tolerate low pH environments, cells try to alter the external
pH value. For example, E. coli expresses carboxylase enzymes
preferentially at low pH (15). The function of such enzymes is to raise the
external pH value and contribute to induced acid tolerance in some
situations (16). Besides pH stress, efficient regulation of this gene also
affects responses to nutrient limitation, temperature shifts and osmotic
stress.
OsmoregulationBacteria also adapt to their surrounding concentration. Generally, the
internal osmotic pressure in bacterial cells is greater than that of the
surrounding environment and so pressure is exerted outward on the cell
wall; this is called turgor pressure (17). Therefore, to survive variations in
osmotic pressure, the bacterial cells raise their internal solute levels,
resulting in an increase in internal osmotic pressure and restoration of
turgor pressure.
SummaryThus, an understanding of the adaptations of marine life and the
19Marine Organisms and their Adaptation
communities of organisms we see today is intertwined with appreciation
of the immense changes in ocean structure, currents and climate that have
occurred over time. The way how marine organisms at all levels of
organization cope with and are successful in the demanding environment
of the sea is seemingly as varied as the organisms inhabiting the oceans.
Suggested Reading
C. Louden C. Elliott K. Jardine K. Dernowski. 1999. Marine and Aquatic Habitats Activities – Diversity and Adaptations.
I. A. Johnston. 1990. Cold Adaptation in Marine Organisms Philosophical Transactions of the Royal Society of London. Series B. Biological Sciences, Vol.326, 1237, pp.655-666.
Plankton and plankton communities In: Marin Biology-An Ecological Approach by J. W. Nybakken pp 446. Harper & Row Publishers, NY. 1982.
http://school.discovery.com/schooladventures/planetocean
R. A. Herbert. 1989. Microbial growth at low temperature. In: Gould GW, editor. Mechanisms of action of food preservation procedures. London: Elsevier Applied Science. pp.71–96.
C. Hill, B. O'Driscoll, I. Booth. 1995. Acid adaptation and food poisoning microorganisms. Int J Food Microbiol, Vol.28, pp.245–54.
G.J. Leyer, E. A. Johnson. Acid adaption induces cross-protection against environmental stresses in Salmonella typhimurium. Appl Environ Microbiol, Vol. 59, pp.1842–7, 1993.
J.C. Olson, P.M. 1980. Nottingham. Temperature in microbial ecology of foods volume 1: factors affecting life and death of microorganisms, International Commission on Microbiological Specifications for Foods. London: Academic Press. pp. 1–37.
N.J. Russell, R.I. Evans, P F terSteeg, J Hellemons, A Verheul and T Abee. Membranes as a target for stress adaption. Int J Food Microbiol, Vol.28, pp.255–61, 1995.
P. G. Jones, R. A. Vanbogelen, F. C. Neidhart. 1987. Induction of proteins in
response to low temperature in Escherichia coli. J Bacteriol, Vol. 169, pp.
2092–5.
Journal of Coastal Environment20
thD. H. Barlett. 2001. How bacteria adapt to high pressure. 9 international
symposium on microbial ecology Amsterdam, The Netherlands.
K. G. Zink, K. Mangelsdorf, L Toffin, G. Barbier, R. Rabus and B. Horsfield.
Membrane lipid adaptation of microorganisms to "extreme"
environmental conditions. 3rd General Assembly European Geosciences
Union (Vienna, Austria) 2006. EDOC: 8885 www.cosis.net/abs.
C Kato, M H Qureshi, K Horikoshi Pressure Response in Deep-Sea
Piezophilic Bacteria Chapter 12 Molecular Marine Microbiology Chapter
Abstracts.
www.jamstec.go.jp/jamstec-e/bio/detal/results.html.
M. H. Brown, I. R. Booth. 1991. Acidulants and low pH. In: N. J. Russell, G.
W. Gould, editors. Food preservatives. Glasgow, U.K.: Blackie. pp. 22–43.
R. J. Rowbury. 1997. Regulatory components, including integration host
factor, CysB and H-NS, that influence pH responses in Escherichia coli—a
review. Lett Appl Microbiol, Vol.24, pp.319–28.
C. Gutierrez, T. Abee and I. R. 1995. Booth. Physiology of the osmotic
stress response in microorganisms. Int J Food Microbiol, Vol.28,
pp.233–44.
P.N. All images are from http://school.discovery.com/ schooladventures/
planetocean.
21Marine Organisms and their Adaptation

Journal of Coastal Environment22
Incidence and Consequences of Mangrove Exploitation in the Sunderbans
Sharmila Chandra*
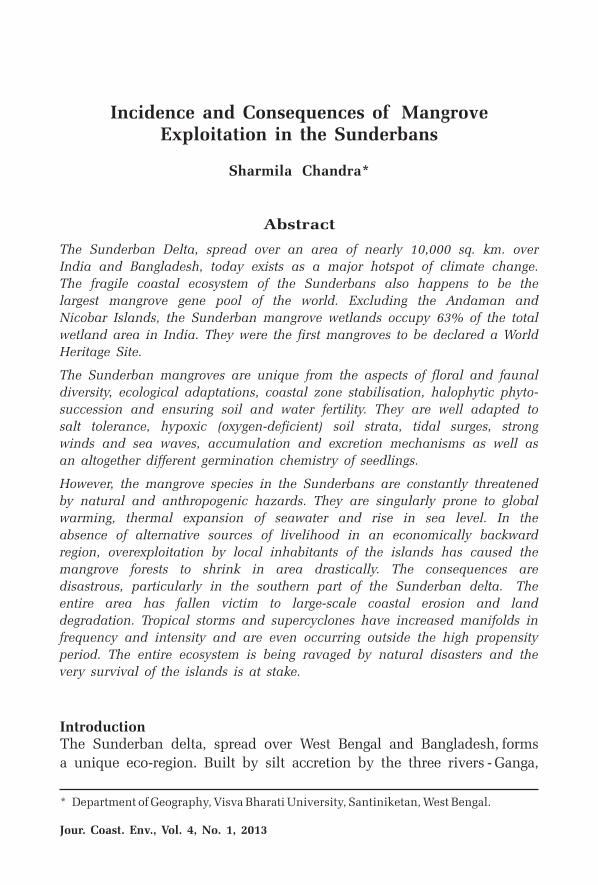
The Sunderban Delta, spread over an area of nearly 10,000 sq. km. over
India and Bangladesh, today exists as a major hotspot of climate change.
The fragile coastal ecosystem of the Sunderbans also happens to be the
largest mangrove gene pool of the world. Excluding the Andaman and
Nicobar Islands, the Sunderban mangrove wetlands occupy 63% of the total
wetland area in India. They were the first mangroves to be declared a World
Heritage Site.
The Sunderban mangroves are unique from the aspects of floral and faunal
diversity, ecological adaptations, coastal zone stabilisation, halophytic phyto-
succession and ensuring soil and water fertility. They are well adapted to
salt tolerance, hypoxic (oxygen-deficient) soil strata, tidal surges, strong
winds and sea waves, accumulation and excretion mechanisms as well as
an altogether different germination chemistry of seedlings.
However, the mangrove species in the Sunderbans are constantly threatened
by natural and anthropogenic hazards. They are singularly prone to global
warming, thermal expansion of seawater and rise in sea level. In the
absence of alternative sources of livelihood in an economically backward
region, overexploitation by local inhabitants of the islands has caused the
mangrove forests to shrink in area drastically. The consequences are
disastrous, particularly in the southern part of the Sunderban delta. The
entire area has fallen victim to large-scale coastal erosion and land
degradation. Tropical storms and supercyclones have increased manifolds in
frequency and intensity and are even occurring outside the high propensity
period. The entire ecosystem is being ravaged by natural disasters and the
very survival of the islands is at stake.
IntroductionThe Sunderban delta, spread over West Bengal and Bangladesh, forms
a unique eco-region. Built by silt accretion by the three rivers - Ganga,
* Department of Geography, Visva Bharati University, Santiniketan, West Bengal.
Jour. Coast. Env., Vol. 4, No. 1, 2013
Abstract
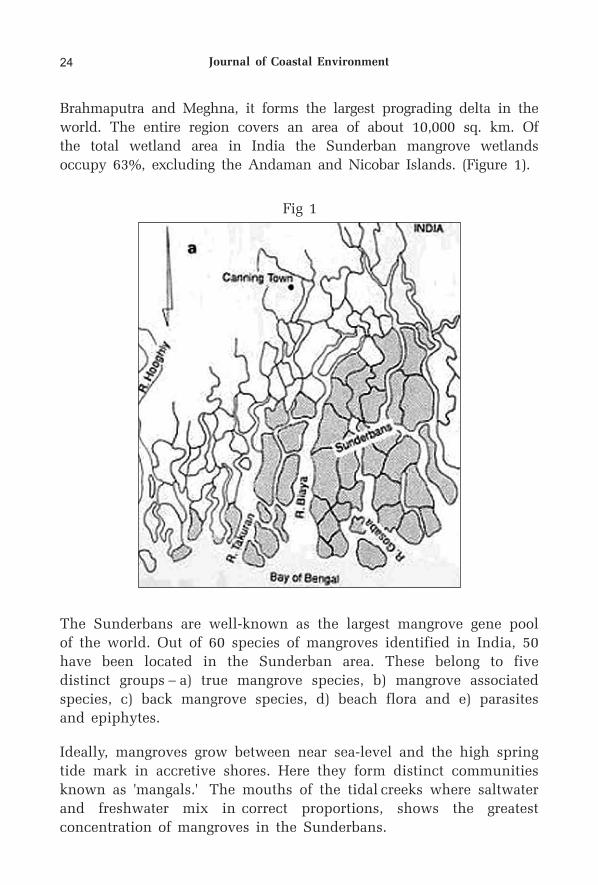
Brahmaputra and Meghna, it forms the largest prograding delta in the
world. The entire region covers an area of about 10,000 sq. km. Of
the total wetland area in India the Sunderban mangrove wetlands
occupy 63%, excluding the Andaman and Nicobar Islands. (Figure 1).
The Sunderbans are well-known as the largest mangrove gene pool
of the world. Out of 60 species of mangroves identified in India, 50
have been located in the Sunderban area. These belong to five
distinct groups – a) true mangrove species, b) mangrove associated
species, c) back mangrove species, d) beach flora and e) parasites
and epiphytes.
Ideally, mangroves grow between near sea-level and the high spring
tide mark in accretive shores. Here they form distinct communities
known as 'mangals.' The mouths of the tidal creeks where saltwater
and freshwater mix in correct proportions, shows the greatest
concentration of mangroves in the Sunderbans.
Fig 1
Journal of Coastal Environment24
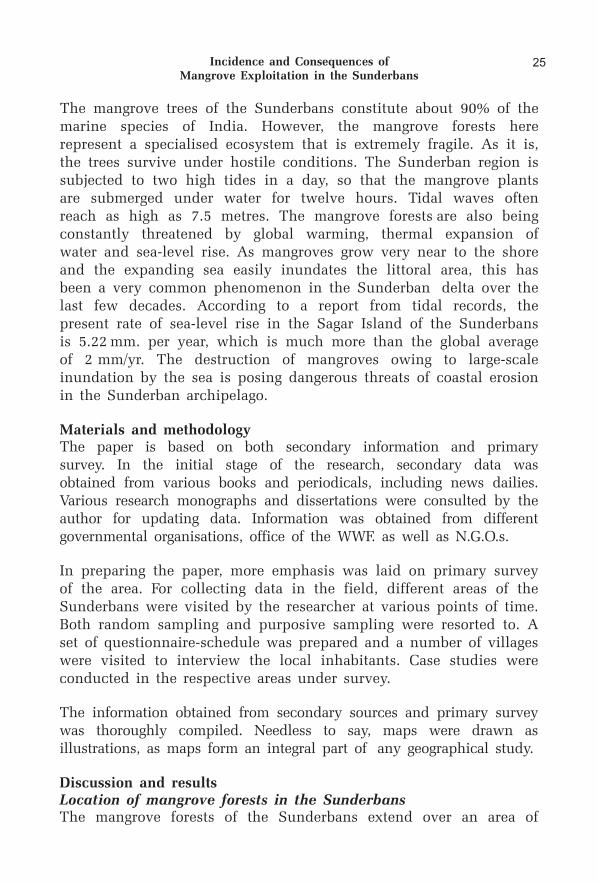
The mangrove trees of the Sunderbans constitute about 90% of the marine species of India. However, the mangrove forests here represent a specialised ecosystem that is extremely fragile. As it is, the trees survive under hostile conditions. The Sunderban region is subjected to two high tides in a day, so that the mangrove plants are submerged under water for twelve hours. Tidal waves often reach as high as 7.5 metres. The mangrove forests are also being constantly threatened by global warming, thermal expansion of water and sea-level rise. As mangroves grow very near to the shore and the expanding sea easily inundates the littoral area, this has been a very common phenomenon in the Sunderban delta over the last few decades. According to a report from tidal records, the present rate of sea-level rise in the Sagar Island of the Sunderbans is 5.22 mm. per year, which is much more than the global average of 2 mm/yr. The destruction of mangroves owing to large-scale inundation by the sea is posing dangerous threats of coastal erosion in the Sunderban archipelago.
Materials and methodologyThe paper is based on both secondary information and primary survey. In the initial stage of the research, secondary data was obtained from various books and periodicals, including news dailies. Various research monographs and dissertations were consulted by the author for updating data. Information was obtained from different governmental organisations, office of the WWF. as well as N.G.O.s.
In preparing the paper, more emphasis was laid on primary survey of the area. For collecting data in the field, different areas of the Sunderbans were visited by the researcher at various points of time. Both random sampling and purposive sampling were resorted to. A set of questionnaire-schedule was prepared and a number of villages were visited to interview the local inhabitants. Case studies were conducted in the respective areas under survey.
The information obtained from secondary sources and primary survey was thoroughly compiled. Needless to say, maps were drawn as illustrations, as maps form an integral part of any geographical study.
Discussion and resultsLocation of mangrove forests in the SunderbansThe mangrove forests of the Sunderbans extend over an area of
25Incidence and Consequences of Mangrove Exploitation in the Sunderbans
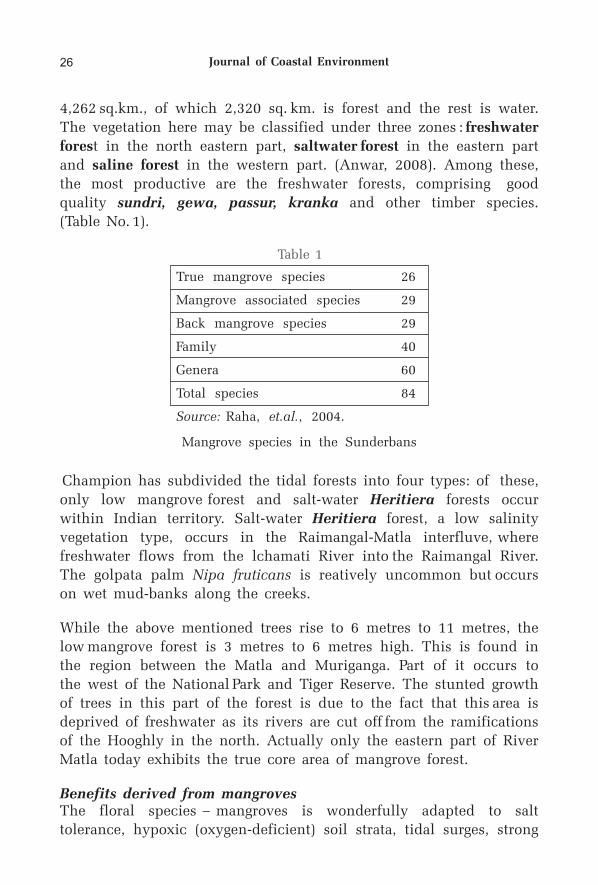
4,262 sq.km., of which 2,320 sq. km. is forest and the rest is water.
The vegetation here may be classified under three zones : freshwater
forest in the north eastern part, saltwater forest in the eastern part
and saline forest in the western part. (Anwar, 2008). Among these,
the most productive are the freshwater forests, comprising good
quality sundri, gewa, passur, kranka and other timber species.
(Table No. 1).
Champion has subdivided the tidal forests into four types: of these,
only low mangrove forest and salt-water Heritiera forests occur
within Indian territory. Salt-water Heritiera forest, a low salinity
vegetation type, occurs in the Raimangal-Matla interfluve, where
freshwater flows from the lchamati River into the Raimangal River.
The golpata palm Nipa fruticans is reatively uncommon but occurs
on wet mud-banks along the creeks.
While the above mentioned trees rise to 6 metres to 11 metres, the
low mangrove forest is 3 metres to 6 metres high. This is found in
the region between the Matla and Muriganga. Part of it occurs to
the west of the National Park and Tiger Reserve. The stunted growth
of trees in this part of the forest is due to the fact that this area is
deprived of freshwater as its rivers are cut off from the ramifications
of the Hooghly in the north. Actually only the eastern part of River
Matla today exhibits the true core area of mangrove forest.
Benefits derived from mangrovesThe floral species – mangroves is wonderfully adapted to salt
tolerance, hypoxic (oxygen-deficient) soil strata, tidal surges, strong
Table 1
Mangrove species in the Sunderbans
True mangrove species 26
Mangrove associated species 29
Back mangrove species 29
Family 40
Genera 60
Total species 84
Source: Raha, et.al., 2004.
Journal of Coastal Environment26
winds and sea waves, accumulation and excretion mechanisms as
well as an altogether different germination chemistry of seedlings.
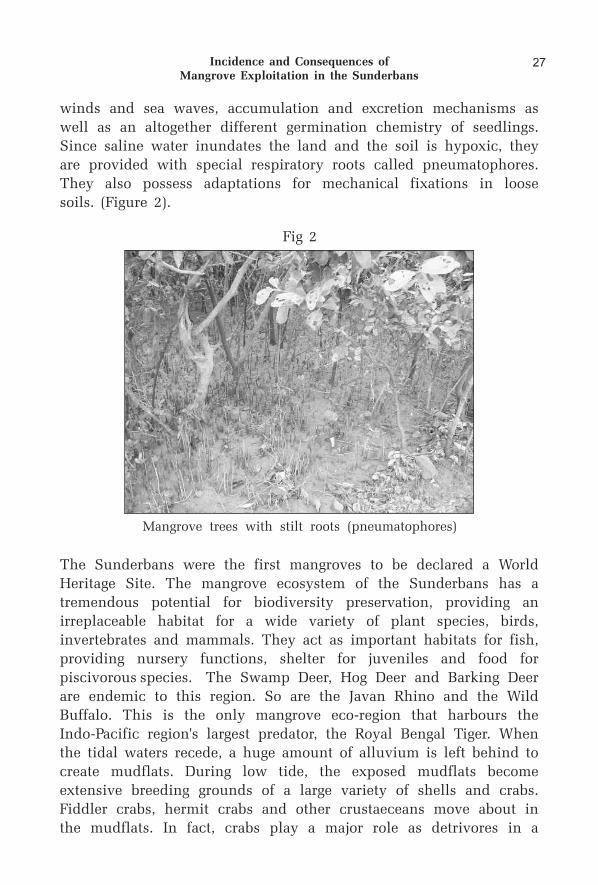
Since saline water inundates the land and the soil is hypoxic, they
are provided with special respiratory roots called pneumatophores.
They also possess adaptations for mechanical fixations in loose
soils. (Figure 2).
The Sunderbans were the first mangroves to be declared a World
Heritage Site. The mangrove ecosystem of the Sunderbans has a
tremendous potential for biodiversity preservation, providing an
irreplaceable habitat for a wide variety of plant species, birds,
invertebrates and mammals. They act as important habitats for fish,
providing nursery functions, shelter for juveniles and food for
piscivorous species. The Swamp Deer, Hog Deer and Barking Deer
are endemic to this region. So are the Javan Rhino and the Wild
Buffalo. This is the only mangrove eco-region that harbours the
Indo-Pacific region's largest predator, the Royal Bengal Tiger. When
the tidal waters recede, a huge amount of alluvium is left behind to
create mudflats. During low tide, the exposed mudflats become
extensive breeding grounds of a large variety of shells and crabs.
Fiddler crabs, hermit crabs and other crustaeceans move about in
the mudflats. In fact, crabs play a major role as detrivores in a
Fig 2
Mangrove trees with stilt roots (pneumatophores)
27Incidence and Consequences of Mangrove Exploitation in the Sunderbans
mangrove ecosystem. Other detrivores include insect larvae,
copepods, bivalves, grass shrimps, nematodes, etc. The unique river
terrapin, Batagur basaka is a native of this region. Microbial
activities on mangrove litters help in enriching the ecosystem.
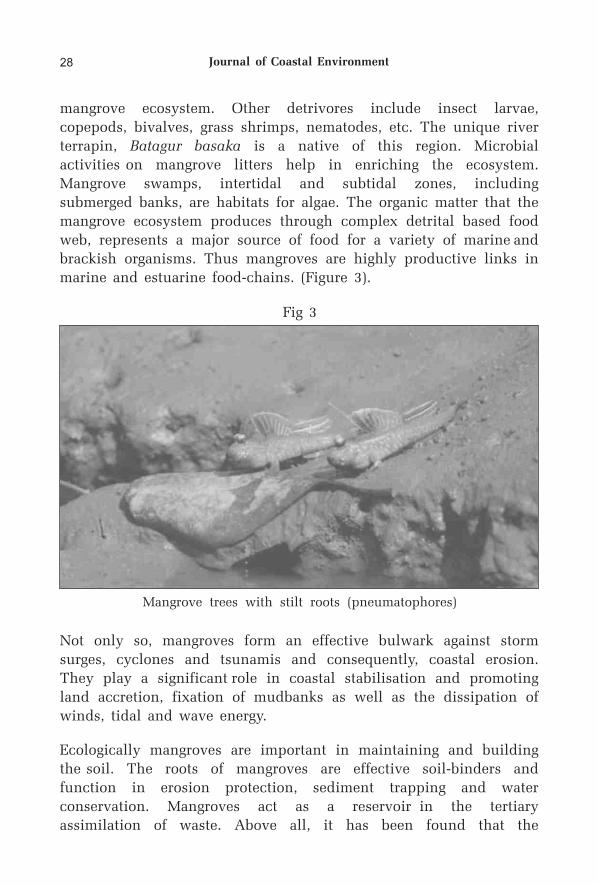
Mangrove swamps, intertidal and subtidal zones, including
submerged banks, are habitats for algae. The organic matter that the
mangrove ecosystem produces through complex detrital based food
web, represents a major source of food for a variety of marine and
brackish organisms. Thus mangroves are highly productive links in
marine and estuarine food-chains. (Figure 3).
Not only so, mangroves form an effective bulwark against storm
surges, cyclones and tsunamis and consequently, coastal erosion.
They play a significant role in coastal stabilisation and promoting
land accretion, fixation of mudbanks as well as the dissipation of
winds, tidal and wave energy.
Ecologically mangroves are important in maintaining and building
the soil. The roots of mangroves are effective soil-binders and
function in erosion protection, sediment trapping and water
conservation. Mangroves act as a reservoir in the tertiary
assimilation of waste. Above all, it has been found that the
Fig 3
Mangrove trees with stilt roots (pneumatophores)
Journal of Coastal Environment28
mangrove forests are ideal for carbon sequestration. Per hectare
mangrove forests can store four times more carbon than other
tropical forests. Hence, they can play a vital role in mitigating
climate change.
Mangrove species have special medicinal value. Decoction of
Avicennia Officinalis leaves is used to treat stomach disorders,
hernia may be cured with the leaf extract of Rhizophora Apiculata
while the leaves of Bruguiera Cylindrical appear to have tumour
inhibiting properties. Certain species such as the red mangrove can
be used as sources of tannins. This is used for dyes, leather
preservatives and furniture stains. Resin extracted from the tree is
used in producing plywood adhesives. The manufacture of chipboard
and pulpwood all depend on by-products of the red mangrove.
Although the woods split and warp when dried, the wood derived
from mangrove trees are often utilised to build carts, boat hulls,
masts and oars. The trunks of Brugiera, Rhizophora and others are
used as poles and rafters in building houses. Besides, their use as
fuel wood cannot be overlooked. The leaves are used to feed
livestock. Besides, mangroves act as a source of honey.
A recent development has been the utilisation of mangrove forests
for recreation and ecotourism.
Hazards : naural and anthropogenicThe mangrove forests of the Sunderbans have been the victims of
natural hazards as well as anthropogenic interference through the
last few decades. Over-exploitation has caused a marked decrease in
the number of species and a drastic fall in the area under
mangroves in the Sunderbans. In fact, a survey carried out by the
ODA (Overseas Developing Agency, UK) inventor in 1983, indicated
that the standing volume of sundri and gewa had declined 40 to 45
per cent respectively since the previous inventory in 1958-59.
(Anwar, 2008). The School of Oceanographic Studies, Jadavpur
University has estimated a net reduction of forest area from 2168.9
sq. km. to 2132 sq. km. within the period 2001-2008 (Hazra, Prof.
Sugata etal). The loss of forest land has taken place partly due to
coastal erosion and submergence of the islands and partly owing to
the conversion of forests into saline banks. The latter has been
more common in the case of previously degraded forests. The
29Incidence and Consequences of Mangrove Exploitation in the Sunderbans
destruction of mangroves due to inundation by waves and
anthropogenic factors has had catastrophic effects, particularly in
the southern part of the Sunderban delta. With the enormous loss
of land area, there has been a distinct reduction in the area under
mangroves. Actually only the eastern bank of River Matla today
exhibits the true core area of the mangrove forest.
As a consequence, erosion and silt accretion have commenced on an
enormous scale, so that huge deposition of silt on the river-beds
continues. This results in the occurrence of devastating floods,
leading to frequent breach of embankments. According to
Jalalluddin Shah, a local resident of Mousuni Island, in the last 15
years, embankments were breached at least 6 times. Primary survey
in the field revealed that the local people are paranoid about the
rising water-level and the breach of embankments.
Solid waste disposal from the surrounding cities as well as heavy
siltation cut the eastern rivers off from the Himalayan water
sources. The western part of the delta receives freshwater from the
Himalayan rivers, but this freshwater does not reach the central part
as the River Bidyadhari is clogged with sediments. Hence, salinity is
less in the western part of the delta, but is high in the eastern part.
It has also been found that tidal fluctuations show a significant
difference between the estuaries in the western part of the
Sunderbans and those in the east. This definitely shows that
freshwater is lacking in the eastern part. Not only so, sedimentation
and solid waste disposal have caused the rivers Matla, Haribhanga,
Saptamukhi, Thakuran and Gosaba to lose their upstream
connections with the Ganga. In this situation, increase in salinity is
posing dangerous threats to the mangrove ecosystem. Salinity leads
to high mortality of trees owing to reduction in leaf area, leaf
longevity and the production of new leaves. Net photosynthesis rate,
stomata conductance and transpiration rate of leaves decrease with
the increase of salt concentration. The most important tree species
of the Sunderbans, the Sundri, is gasping for life with the rise in
sea level and subsequent decrease in the flow of fresh water from
the rivers that feed the delta. From field survey it has been found
that a very large percentage of the mangrove species is afflicted
with Agamora or Top dying disease, particularly in the Satkhira
Range. Among these, is the Sundri tree which is on the verge of
Journal of Coastal Environment30
extinction. Since the Forest Department has not taken any preventive
measures to save the trees, the disease has been spreading, causing
many species of valuable trees to meet a tragic death. With the
increase in salinity, numerous freshwater mangroves are being
replaced by more salt-tolerant species such as Ceriops decandra
(Jhanti Goran) that are slowly colonising the saline banks.
Recently, it has been discovered that four killer plant species are
posing danger to the mangrove ecosystem. These weeds are growing
very rapidly in the area and may even affect the biodiversity of the
Sunderbans.
The Sunderban mangroves have, in particular, been affected by
anthropogenic disturbances. The fact that the mangrove ecosystem is
a major component of the livelihood of the forest dependent
population of the Sunderbans has led to its overexploitation. The
Sunderban area is one of the most backward regions of West
Bengal, housing about 4 million inhabitants. As explained earlier in
this article, it has a very fragile and limited natural resource base.
Although the largest percentage of inhabitants is engaged in
agricultural pursuits, cultivation of crops gives poor yields owing to
salinity of the soil, which prevents optimum growth of agricultural
crops. More than half of the agricultural labourers are landless.
(Singh, etal, 2010.). Hence, they are highly dependent on the forest.
The non-timber forest produce (NTFP) collected by villagers include
primarily wax and honey, besides Nypa fruticans, Phoenix paludosa,
etc. Although restrictions have been imposed on the collection of
NTFPs, some households are solely dependent on NTFPs as their
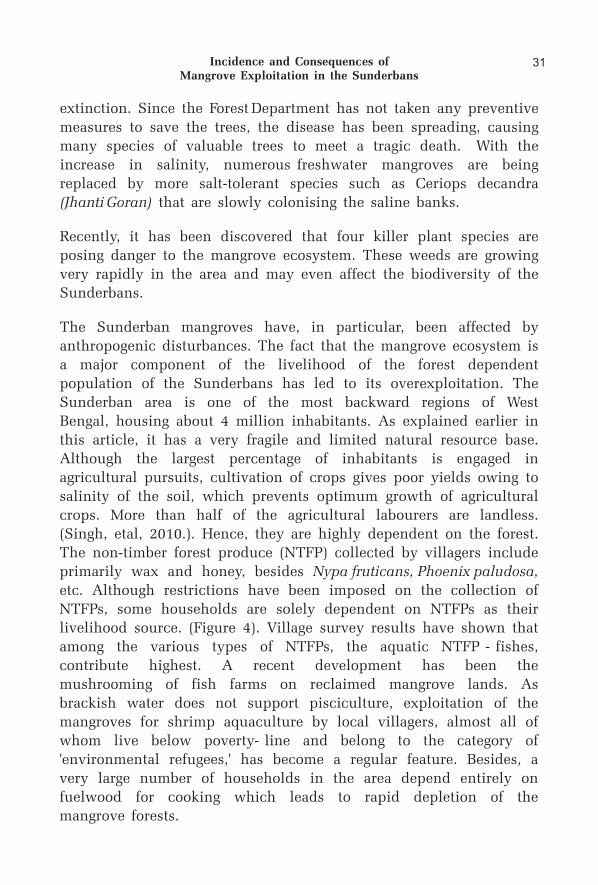
livelihood source. (Figure 4). Village survey results have shown that
among the various types of NTFPs, the aquatic NTFP - fishes,
contribute highest. A recent development has been the
mushrooming of fish farms on reclaimed mangrove lands. As
brackish water does not support pisciculture, exploitation of the
mangroves for shrimp aquaculture by local villagers, almost all of
whom live below poverty- line and belong to the category of
'environmental refugees,' has become a regular feature. Besides, a
very large number of households in the area depend entirely on
fuelwood for cooking which leads to rapid depletion of the
mangrove forests.
31Incidence and Consequences of Mangrove Exploitation in the Sunderbans
Apart from the local people, the Sunderban mangroves are also
adversely affected by an increase in pollution owing to the disposal
of ballast water, oil spills, bilge-water, shipbreaking operation,
untreated chemical and industrial waste.
Consequences of overexploitationDisturbances in the natural ecosystem due to human interference as
well as the gradual extinction of the mangroves have caused several
important fish and prawn species to decline drastically. Also, certain
species of fish that require freshwater for spawning and juvenile
feeding, have shown migration in search of sweetwater.
Mushrooming of fish farms on reclaimed mangrove lands not only
renders the area saline but also causes high salinisation of the
agricultural fields in its vicinity through seepage. Exploitation of the
mangroves for shrimp aquaculture increases the salinity of the soil
and renders it unproductive especially for paddy, the only crop of
the region.
The degradation of mangrove forests and encroachments are leading
to an alarming shrinkage of the forest resources on which the local
people are heavily dependent. This may curtail the permanent yield
of forest produce.
Apart from loss of resources, the extinction of mangrove species has
caused a phenomenal increase in the number of natural disasters
Fig 4
Dependence of local inhabitants on NTFP
Journal of Coastal Environment32
that have now become a regular feature of the region. Within a
span of three years - from 2007 to 2009, the Sunderbans of India
and Bangladesh were ravaged by four supercyclones – Nargis, Sidr,
Aila and Bijli. Tropical storms are even occurring outside the high
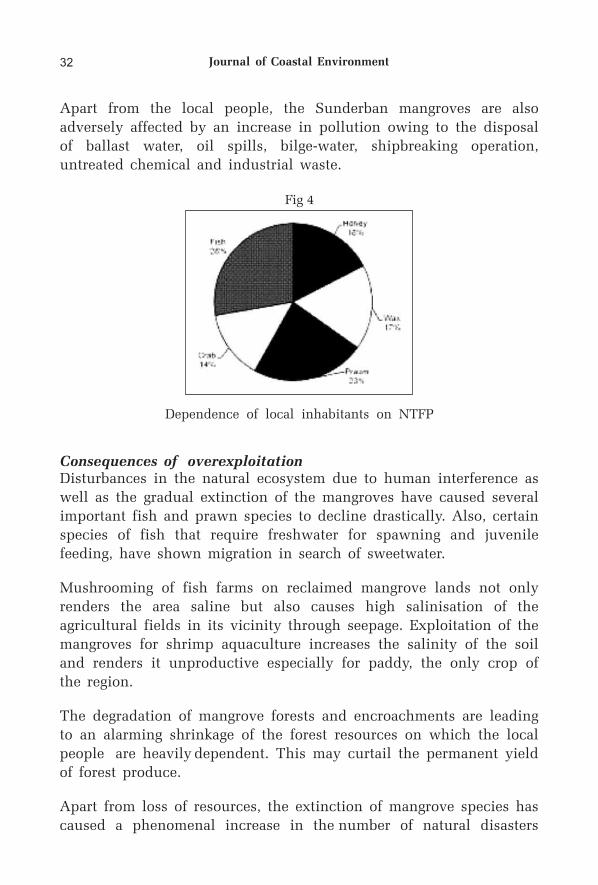
propensity period of July-September. Primary survey established the
fact that where dense mangrove forests still exist, such as in the
eastern part of the Mousuni Island, vulnerability to natural disasters
is comparatively less (Figure 5).
A large variety of fauna and flora endemic to the region has been
endangered by the overexploitation of mangroves. For instance, the
mugger crocodile is now extinct, probably as a result of past
overexploitation. Reclamation of lands once covered by mangroves
has led to the extinction of the Swamp Deer, Hog Deer and Barking
Deer from this region. The Javan Rhino and the wild buffalo have
also become extinct. Also extinct are the Indian cheetah, the golden
eagle and the pink-headed duck, all of which were once indigenous
to the Sunderban region. Two amphibians, 14 reptiles, 25 aves and
Fig 5
Island of Mousuni - remnants of once existing mangrove trees after Aila.
33Incidence and Consequences of Mangrove Exploitation in the Sunderbans
five mammals are presently endangered. Loss of habitat and
poaching have led to almost full extinction of the unique river
terrapin, Batagur basaka from the region. But the real threat of
extinction is faced by the most majestic animal of the Sunderban
Biosphere Reserve – the Royal Bengal Tiger. According to the 2011
tiger census estimates, at present, this mangrove ecosystem houses
only 270 tigers.
A unique feature of inland fishing here is the construction of bheris,
where water is impounded in naturally inundated areas bordered by
earthen dykes. These have been constructed after the destruction of
mangroves. The stagnant waters in these bheris are veritable
breeding grounds of mosquitoes that cause malaria, dengue and
other diseases.
Suggested remediesIn the light of the above discussion, it is imminent to take drastic
steps to combat the environmental degeneration faced by the
mangrove ecosystem of the Sunderbans. Development in this
backward region must take place without depleting the natural
resources. This would only ensure sustainable development in the
area. Some of the remedies for the conservation of the mangrove
ecosystem lie in-
lPreventing overexploitation of mangroves and allowing existing
mangroves to regenerate. Mangrove planting will reduce coastal
erosion and help the islands to survive longer.
lStrict legislation regarding conservation of resources and proper
vigilance.
lMinimisation of soil erosion and preservation of sand dunes by
planting trees such as casuarina. Besides, it is necessary to plant
mangroves on the barren intertidal mudflats.
lEvaluation of various uses of mangrove plants including for medicinal
purposes and as a food source.
lThe management programme of conservation, environment and
development (CED) of Sunderbans area should be planned primarily
to retain the natural ecosystem of the mangrove forest.
Journal of Coastal Environment34
l
collection and data retrieval of the resources of the Sunderban
area.
lInitiating community based coastal forestation.
lSocial forestry can be useful for eco-restoration of mangrove
vegetation through creation of employment opportunities. Initiating
community based coastal forestation.
lProviding alternative means of livelihood to the villagers so that
they do not indiscriminately exploit whatever resources lie
within their bounds.
lProper data collection and data retrieval regarding the resources
of the area and their utilisation.
lRemote sensing technique should be carried out for monitoring
the mangrove ecosystem of the Sunderbans. It is recommended
that regular mapping, at least biennially, of Sunderbans forests be
undertaken, using GIS and Remote Sensing technology, in order
to monitor the changes in this mangrove ecosystem.
For mangrove conservation and development, the Govt. of India set
up the National Mangrove Committee in 1976. The Sunderban
mangroves were the first to be placed under scientific
management.
As a preventive measure, the Forest Department cut down trees
affected by Top dying disease so that it would not spread among the
adjoining numbers. For the management of NTFPs in Sundarbans,
there exist some conservation initiatives including Global
Environmental Facility's (GEF) Biodiversity Conservation and
Livelihood, UNDP's programme on Man and Biosphere Reserve
(MAB) and the State Government's Joint Mangrove Management
(JMM) Programme, which are based on participatory mode of
planning and management of the forest resources. Funded by a
British organisation, NEWS has been able to make the locals,
especially the women, understand that depletion of mangroves,
coupled with global warming, will cause the entire Sunderbans to go
under water within a few years. This has led nearly 200 village
women in the most affected areas like Mathurakhand, Amlamethi,
Establishing databases and information systems would help in data
35Incidence and Consequences of Mangrove Exploitation in the Sunderbans
Tridibnagar, Jamespur, Sonagaon and some others to develop five
nurseries to grow lakhs of plants of Garan, Bain, Sundri, Kankra and
Hetal, all of which grow very rapidly.
AcknowledgementsAnanya Roy, Mother's International School, New Delhi. Local
inhabitants of Mousuni Island.
ReferencesAnwar, Jamal. 2008. Rainforest destruction from the Himalayas to
Bangladesh coastal plain. SOS-arsenic.net, accessed on November 10,
2008.
Bandopadhyay, Tridib 2009. Impact of anthropogenic activities on
mangrove ecosystem of the Sunderbans. National Seminar on Wealth
from Waste, Bose Institute, Kolkata, September 5-6, 2009.
Bose, Sahana. 2009. Role of Indian Sunderban mangroves in
mitigationg climate impacts : an appraisal. Climate Change : Global
Risks, Challenges and Decisions. IOP Conference Series : Earth and
Environmental Science, Volume 6.
Bose, Shivashish. Mangrove forests in Sunderbans active delta –
ecological disaster and remedies.
Danda, Anamitra Anurag. 2007. Surviving in the Sunderbans : Threats
and responses (Ph.D dissertation).
Ghosh, Dipanjan. 2011. Mangroves : The most fragile forest ecosystem.
Resonance.
Hazra, Prof. Sugata, Samanta, Kaberi, et.al. 2010. Temporal Change
Detection (2001-2008) Study of Sundarban (Final Report). School of
Oceanographic Studies, Jadavpur University, Kolkata.
Rana, S.V.S. 2009. Essentials of Ecology and Environmental Science.
PHI Learning Private Limited, New Delhi-110001.
Singh, Anshu, Vyas, Pradip. et.al. 2010. Contribution of NTFPs in
the Livelihood of Mangrove Forest Dwellers of Sundarban. Journal of
Human Ecology, Volume- 29 (3). pp-191-200.
Raha, Atanu Kumar and Saha, Bikashkanti. 2004. A Wonder that is
Sunderban. Computronics. 41, Beniatola Street, Kolkata-700005.
Journal of Coastal Environment36
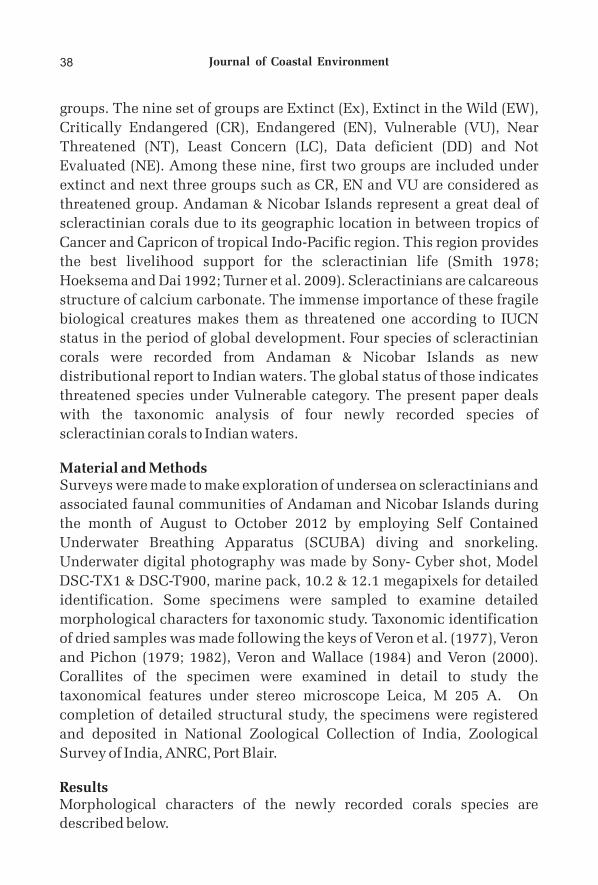
Vulnerable Scleractinians Corals from Andaman and Nicobar Islands
* * **Tamal Mondal , C. Raghunathan and K. Venkataraman
Scleractinian corals contribute the best ecosystem in marine environment.
Global threats in scleractinians categorized them in several groups under IUCN
Red List Category and Criteria. Vulnerable is one the three groups which indicate
an immense threat on their life. Four species of vulnerable corals such as
Montipora capricornis Veron (1985) and Acropora turaki Wallace (1994) belong to
family Acroporidae; Caulastrea curvata Wijsman-Best (1972) belongs to family
Faviidae; and Lobophyllia dentatus Veron (2000) under family Mussidae, among
globally reported 199 species, were recorded for the first time in Indian water
from Andaman & Nicobar Islands. The present paper dealt with these species of
scleractinian corals along with their morphological features and the existing
distributional ranges.
IntroductionThe International Union for Conservation of Nature which is popularly
known as IUCN is taking care about the conservational status of species.
The IUCN Red List of Threatened Species or the Red Data Book was
founded in 1963 to measure the biological status of organisms for their
intensive conservation. The IUCN Red List Categories and Criteria are
projected to be an easily and widely understood system for classifying
species at high risk of global extinction. The system provides an explicit
objective framework for the classification of the broadest range of species
according to their extinction risk. Rate of decline, population size, area of
geographic distribution, and degree of population and distribution
fragmentation are the basic criteria to category life forms in to nine set of
* Zoological Survey of India, Andaman and Nicobar Regional Centre, Port Blair.
** Zoological Survey of India, New Alipore, Kolkata.
Jour. Coast. Env., Vol. 4, No. 1, 2013
Abstract
groups. The nine set of groups are Extinct (Ex), Extinct in the Wild (EW),
Critically Endangered (CR), Endangered (EN), Vulnerable (VU), Near
Threatened (NT), Least Concern (LC), Data deficient (DD) and Not
Evaluated (NE). Among these nine, first two groups are included under
extinct and next three groups such as CR, EN and VU are considered as
threatened group. Andaman & Nicobar Islands represent a great deal of
scleractinian corals due to its geographic location in between tropics of
Cancer and Capricon of tropical Indo-Pacific region. This region provides
the best livelihood support for the scleractinian life (Smith 1978;
Hoeksema and Dai 1992; Turner et al. 2009). Scleractinians are calcareous
structure of calcium carbonate. The immense importance of these fragile
biological creatures makes them as threatened one according to IUCN
status in the period of global development. Four species of scleractinian
corals were recorded from Andaman & Nicobar Islands as new
distributional report to Indian waters. The global status of those indicates
threatened species under Vulnerable category. The present paper deals
with the taxonomic analysis of four newly recorded species of
scleractinian corals to Indian waters.
Material and MethodsSurveys were made to make exploration of undersea on scleractinians and
associated faunal communities of Andaman and Nicobar Islands during
the month of August to October 2012 by employing Self Contained
Underwater Breathing Apparatus (SCUBA) diving and snorkeling.
Underwater digital photography was made by Sony- Cyber shot, Model
DSC-TX1 & DSC-T900, marine pack, 10.2 & 12.1 megapixels for detailed
identification. Some specimens were sampled to examine detailed
morphological characters for taxonomic study. Taxonomic identification
of dried samples was made following the keys of Veron et al. (1977), Veron
and Pichon (1979; 1982), Veron and Wallace (1984) and Veron (2000).
Corallites of the specimen were examined in detail to study the
taxonomical features under stereo microscope Leica, M 205 A. On
completion of detailed structural study, the specimens were registered
and deposited in National Zoological Collection of India, Zoological
Survey of India, ANRC, Port Blair.
ResultsMorphological characters of the newly recorded corals species are
described below.
Journal of Coastal Environment38
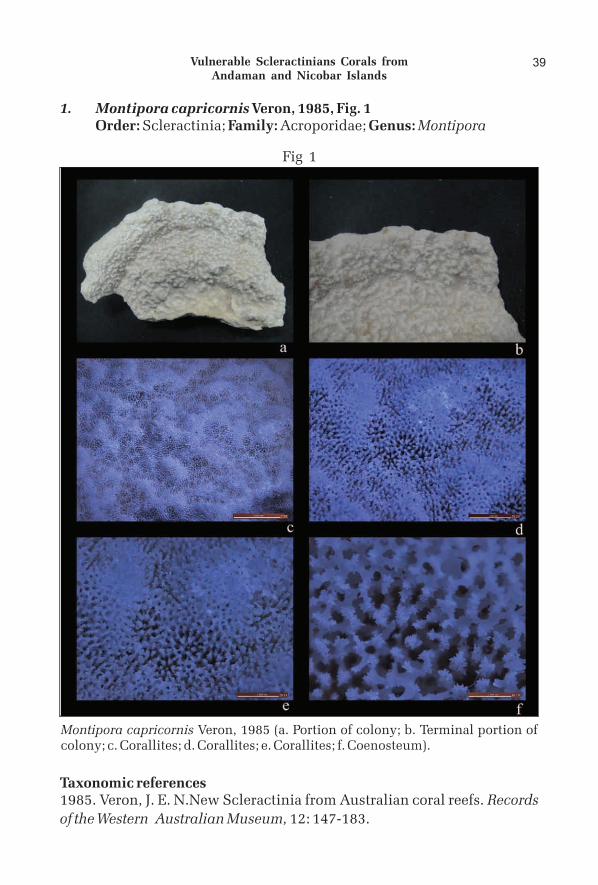
1. Montipora capricornis Veron, 1985, Fig. 1Order: Scleractinia; Family: Acroporidae; Genus: Montipora
Fig 1
Montipora capricornis Veron, 1985 (a. Portion of colony; b. Terminal portion of colony; c. Corallites; d. Corallites; e. Corallites; f. Coenosteum).
Taxonomic references1985. Veron, J. E. N.New Scleractinia from Australian coral reefs. Records
of the Western Australian Museum, 12: 147-183.
39Vulnerable Scleractinians Corals from Andaman and Nicobar Islands
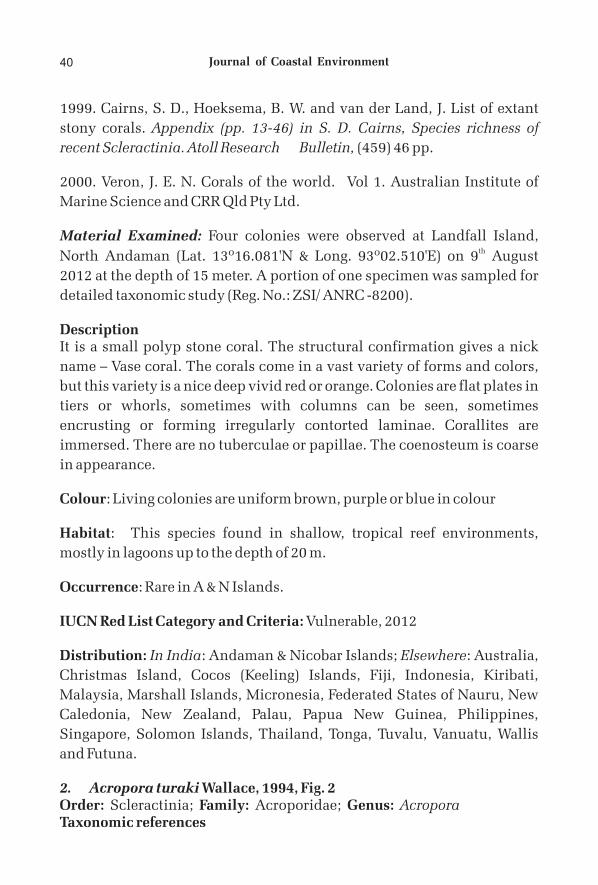
1999. Cairns, S. D., Hoeksema, B. W. and van der Land, J. List of extant
stony corals. Appendix (pp. 13-46) in S. D. Cairns, Species richness of
recent Scleractinia. Atoll Research Bulletin, (459) 46 pp.
2000. Veron, J. E. N. Corals of the world. Vol 1. Australian Institute of
Marine Science and CRR Qld Pty Ltd.
Material Examined: Four colonies were observed at Landfall Island, th
North Andaman (Lat. 13º16.081'N & Long. 93º02.510'E) on 9 August
2012 at the depth of 15 meter. A portion of one specimen was sampled for
detailed taxonomic study (Reg. No.: ZSI/ ANRC -8200).
DescriptionIt is a small polyp stone coral. The structural confirmation gives a nick
name – Vase coral. The corals come in a vast variety of forms and colors,
but this variety is a nice deep vivid red or orange. Colonies are flat plates in
tiers or whorls, sometimes with columns can be seen, sometimes
encrusting or forming irregularly contorted laminae. Corallites are
immersed. There are no tuberculae or papillae. The coenosteum is coarse
in appearance.
Colour: Living colonies are uniform brown, purple or blue in colour
Habitat: This species found in shallow, tropical reef environments,
mostly in lagoons up to the depth of 20 m.
Occurrence: Rare in A & N Islands.
IUCN Red List Category and Criteria: Vulnerable, 2012
Distribution: In India: Andaman & Nicobar Islands; Elsewhere: Australia,
Christmas Island, Cocos (Keeling) Islands, Fiji, Indonesia, Kiribati,
Malaysia, Marshall Islands, Micronesia, Federated States of Nauru, New
Caledonia, New Zealand, Palau, Papua New Guinea, Philippines,
Singapore, Solomon Islands, Thailand, Tonga, Tuvalu, Vanuatu, Wallis
and Futuna.
2. Acropora turaki Wallace, 1994, Fig. 2Order: Scleractinia; Family: Acroporidae; Genus: AcroporaTaxonomic references
Journal of Coastal Environment40
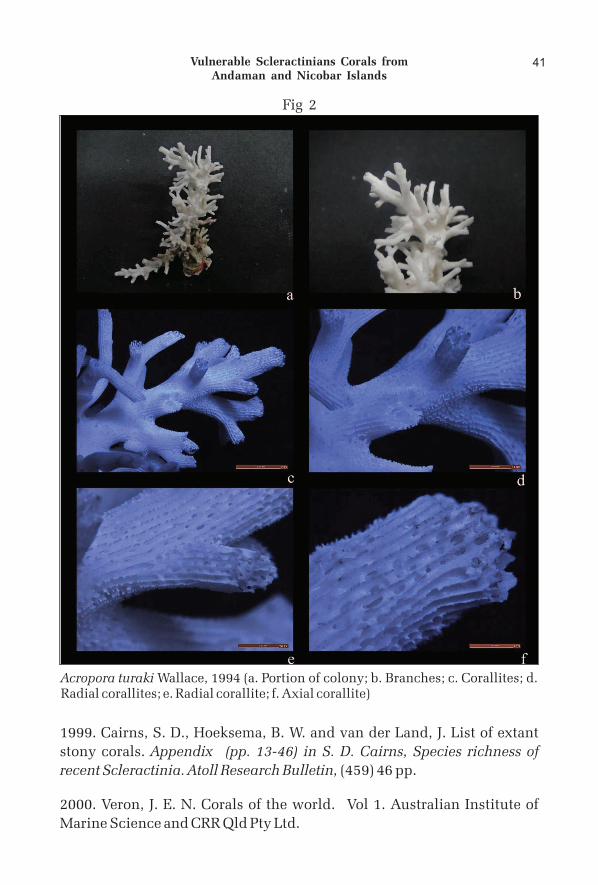
1999. Cairns, S. D., Hoeksema, B. W. and van der Land, J. List of extant
stony corals. Appendix (pp. 13-46) in S. D. Cairns, Species richness of
recent Scleractinia. Atoll Research Bulletin, (459) 46 pp.
2000. Veron, J. E. N. Corals of the world. Vol 1. Australian Institute of
Marine Science and CRR Qld Pty Ltd.
Fig 2
Acropora turaki Wallace, 1994 (a. Portion of colony; b. Branches; c. Corallites; d. Radial corallites; e. Radial corallite; f. Axial corallite)
41Vulnerable Scleractinians Corals from Andaman and Nicobar Islands
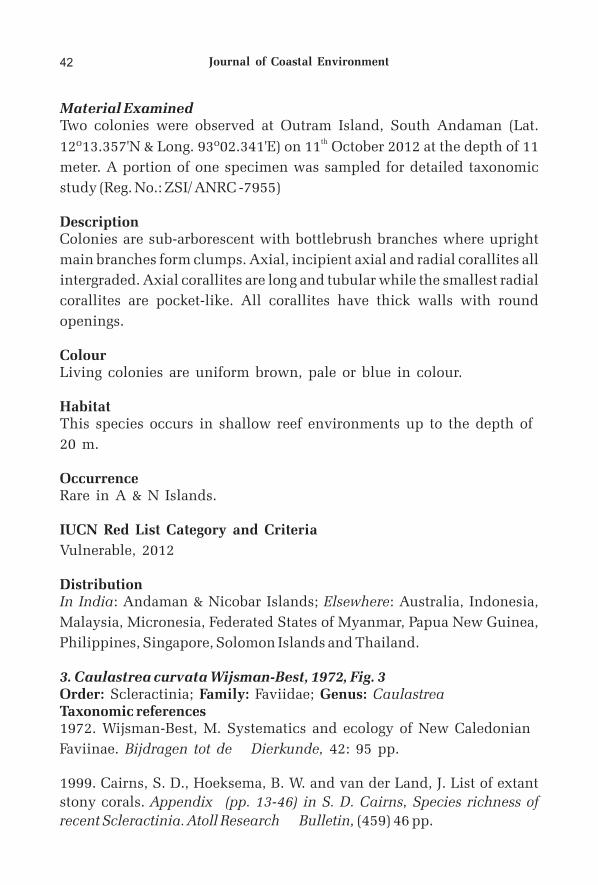
Material ExaminedTwo colonies were observed at Outram Island, South Andaman (Lat.
th12º13.357'N & Long. 93º02.341'E) on 11 October 2012 at the depth of 11
meter. A portion of one specimen was sampled for detailed taxonomic
study (Reg. No.: ZSI/ ANRC -7955)
DescriptionColonies are sub-arborescent with bottlebrush branches where upright
main branches form clumps. Axial, incipient axial and radial corallites all
intergraded. Axial corallites are long and tubular while the smallest radial
corallites are pocket-like. All corallites have thick walls with round
openings.
ColourLiving colonies are uniform brown, pale or blue in colour.
HabitatThis species occurs in shallow reef environments up to the depth of
20 m.
OccurrenceRare in A & N Islands.
IUCN Red List Category and Criteria
Vulnerable, 2012
DistributionIn India: Andaman & Nicobar Islands; Elsewhere: Australia, Indonesia,
Malaysia, Micronesia, Federated States of Myanmar, Papua New Guinea,
Philippines, Singapore, Solomon Islands and Thailand.
3. Caulastrea curvata Wijsman-Best, 1972, Fig. 3Order: Scleractinia; Family: Faviidae; Genus: CaulastreaTaxonomic references1972. Wijsman-Best, M. Systematics and ecology of New Caledonian
Faviinae. Bijdragen tot de Dierkunde, 42: 95 pp.
1999. Cairns, S. D., Hoeksema, B. W. and van der Land, J. List of extant
stony corals. Appendix (pp. 13-46) in S. D. Cairns, Species richness of
recent Scleractinia. Atoll Research Bulletin, (459) 46 pp.
Journal of Coastal Environment42
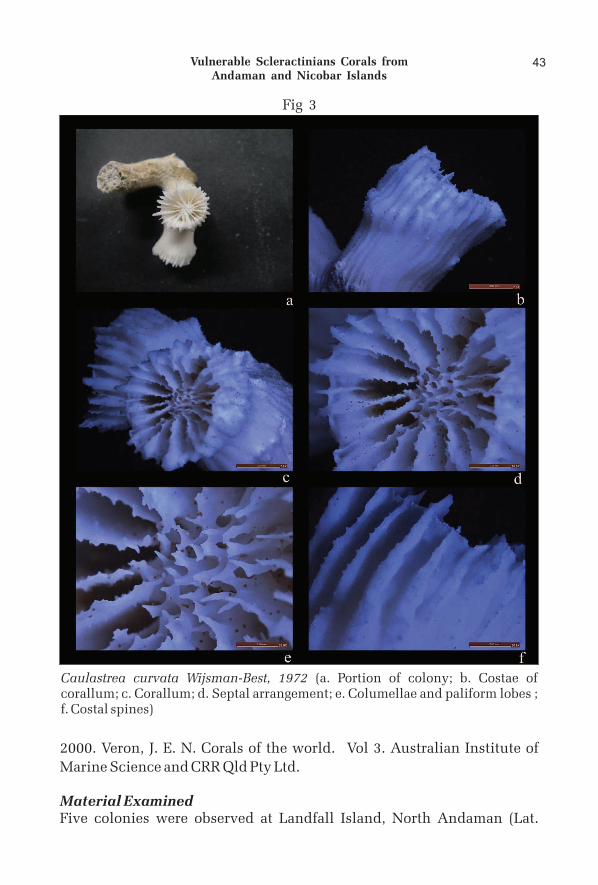
Fig 3
Caulastrea curvata Wijsman-Best, 1972 (a. Portion of colony; b. Costae of corallum; c. Corallum; d. Septal arrangement; e. Columellae and paliform lobes ; f. Costal spines)
2000. Veron, J. E. N. Corals of the world. Vol 3. Australian Institute of
Marine Science and CRR Qld Pty Ltd.
Material ExaminedFive colonies were observed at Landfall Island, North Andaman (Lat.
43Vulnerable Scleractinians Corals from Andaman and Nicobar Islands
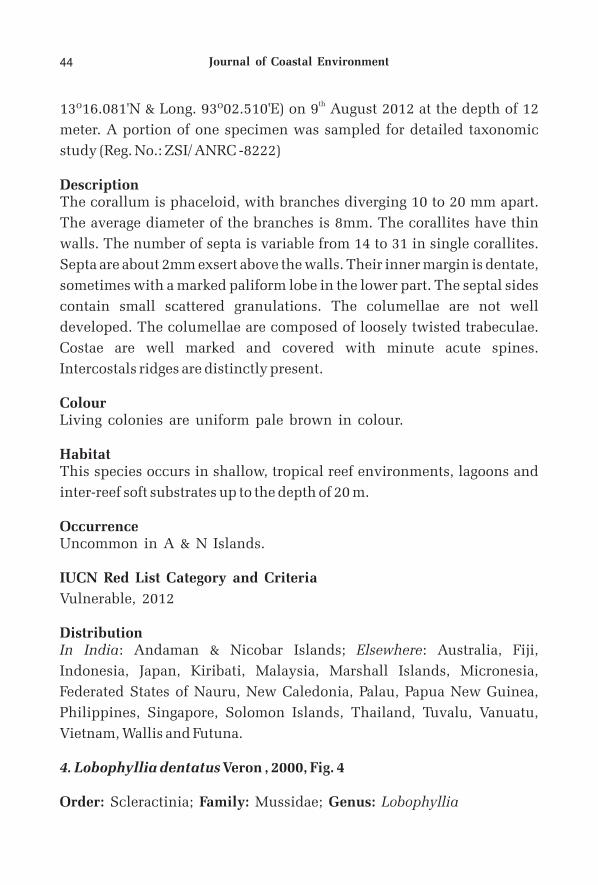
th13º16.081'N & Long. 93º02.510'E) on 9 August 2012 at the depth of 12
meter. A portion of one specimen was sampled for detailed taxonomic
study (Reg. No.: ZSI/ ANRC -8222)
DescriptionThe corallum is phaceloid, with branches diverging 10 to 20 mm apart.
The average diameter of the branches is 8mm. The corallites have thin
walls. The number of septa is variable from 14 to 31 in single corallites.
Septa are about 2mm exsert above the walls. Their inner margin is dentate,
sometimes with a marked paliform lobe in the lower part. The septal sides
contain small scattered granulations. The columellae are not well
developed. The columellae are composed of loosely twisted trabeculae.
Costae are well marked and covered with minute acute spines.
Intercostals ridges are distinctly present.
ColourLiving colonies are uniform pale brown in colour.
HabitatThis species occurs in shallow, tropical reef environments, lagoons and
inter-reef soft substrates up to the depth of 20 m.
OccurrenceUncommon in A & N Islands.
IUCN Red List Category and Criteria
Vulnerable, 2012
DistributionIn India: Andaman & Nicobar Islands; Elsewhere: Australia, Fiji,
Indonesia, Japan, Kiribati, Malaysia, Marshall Islands, Micronesia,
Federated States of Nauru, New Caledonia, Palau, Papua New Guinea,
Philippines, Singapore, Solomon Islands, Thailand, Tuvalu, Vanuatu,
Vietnam, Wallis and Futuna.
4. Lobophyllia dentatus Veron , 2000, Fig. 4
Order: Scleractinia; Family: Mussidae; Genus: Lobophyllia
Journal of Coastal Environment44
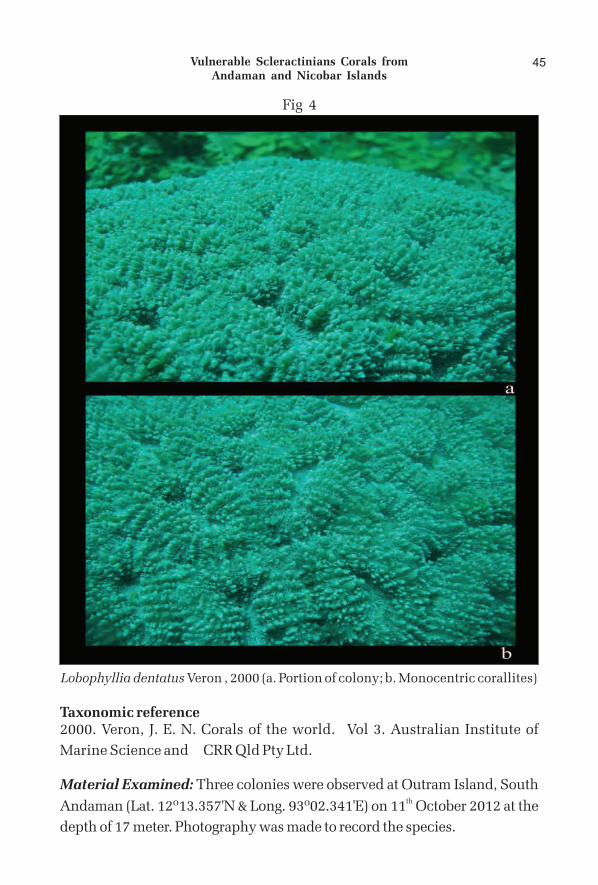
Fig 4
Lobophyllia dentatus Veron , 2000 (a. Portion of colony; b. Monocentric corallites)
Taxonomic reference2000. Veron, J. E. N. Corals of the world. Vol 3. Australian Institute of
Marine Science and CRR Qld Pty Ltd.
Material Examined: Three colonies were observed at Outram Island, South thAndaman (Lat. 12º13.357'N & Long. 93º02.341'E) on 11 October 2012 at the
depth of 17 meter. Photography was made to record the species.
45Vulnerable Scleractinians Corals from Andaman and Nicobar Islands
DescriptionColonies are flat to hemispherical and up to 2 metres across. They have
tusk-like, elongate, closely compacted monocentric corallites. Individual
corallites unite only at the base of the colony. Primary septa are very
exsert, with long teeth. The exsert primary septa have a spoke-like
appearance underwater in living state.
ColourLiving colonies are uniform grey in colour.
HabitatThis species occurs in shallow, tropical reef environments up to the depth
of 15 m. Occurrence: Uncommon in A & N Islands.
IUCN Red List Category and Criteria: Vulnerable, 2012
DistributionIn India: Andaman & Nicobar Islands; Elsewhere: Australia, Indonesia,
Malaysia, Micronesia, Federated States of Myanmar, Papua New Guinea,
Philippines, Singapore, Solomon Islands, Thailand and Vietnam.
DiscussionBeing one of the oldest animal groups, scleractinian corals can be assigned
as the flagship species as a variety of faunal communities (Licuanan
2004). Since taxonomy of scleractinian in India had started the pioneering
study of Pillai, conservational plans were initiated thereby with
consecutive surveys, explorations and monitoring of health status. As a
result of subsequent studies made by several authors increment in the
scleractinian species listing from 135 to around 500 (Pillai 1983;
Venkataraman et al. 2003; Ramakrishna et al. 2010; Tamal 2010a-c, 2011a-
g, 2012a-f). With the progressive exploration of species database in global
level, threats of scleractinian corals are also increasing in a alarming rate
due to multipurpose use of it. According to the IUCN Red List status
(2012) 199 species of scleractinian corals were included under Vulnerable
group of 4728 animals. A Vulnerable (VU) species is one which has been
categorized as likely to become Endangered (EN) unless the
circumstances threatening its survival and reproduction improve. A
taxon can be considered as Vulnerable when it is not Critically
Journal of Coastal Environment46
Endangered or Endangered but is facing a high risk of extinction in the
wild in the medium-term future. A total of four species of herd corals are
reported first time from Indian waters which are Vulnerable. Among those
four two belong to Acroporidae family in which 85 species are vulnerable
globally. Out of 22 Vulnerable species of Faviidae and 11 Vulnerable
species of Mussidae 1 species was also recorded from those each family as
new distributional record to Indian waters from Andaman & Nicobar
Islands. The inclusion of four species will increase the Indian
scleractinian database as well as it will give a call for wildlife manager to
conserve these species as they are under threat globally.
AcknowledgementAuthors are grateful to the Ministry of Environment and Forests,
Government of India for providing financial assistance to undertake the
study through the projects of National Coral Reef Research Institute,
Zoological Survey of India, Port Blair.
ReferencesHoeksema, B. and Dai, C.F. 1992. Scleractinian of Taiwan. II. Family
Fungiidae (including a new species). Bulletin of the Zoology Academia
Sinica 30: 201-226.
IUCN 2012. IUCN Red List of Threatened Species. Version 2012.2.
<www.iucnredlist.org>.
Licuanan, W.Y. 2004. New records of stony corals from the Philippines
previously known from peripheral areas of the Indo-Pacific. The Raffles
Bulletin of Zoology 52 (2): 285-288.
Pillai, C.G.S. 1983. Structure and genetic diversity of recent scleractinian
of India. J. Mar. Bio. Assoc. India 25: 78-90.
Ramakrishna, Tamal Mondal, Raghunathan, C., Raghuraman, R. and
Sivaperuman, C. 2010. New Records of Scleractinian Corals in Andaman
& Nicobar Islands. Rec. zool. Surv. India, Occ. Paper No 321: 1-143
(Published by the Director, Zool. Surv. India, Kolkata).
Smith, S.V. 1978. Coral reef area and the contribution of reefs to processes
and resources of the world oceans. Nature 273: 225-226.
47Vulnerable Scleractinians Corals from Andaman and Nicobar Islands
Tamal Mondal, C. Raghunathan and Ramakrishna. 2010a. New record of
thirteen Scleractinian Corals in Indian waters from Middle and North
Andaman. Biosystematica. 4: 75-89.
Tamal Mondal, C. Raghunathan and Ramakrishna. 2010b. New record of
nine Scleractinian Corals from Rutland Island, Andaman. Int. J. Biol. Sci.
1:155-170.
Tamal Mondal, C. Raghunathan, C. Sivaperuman, and Ramakrishna.
2010c. Identification of seven Scleractinian Corals from Andaman &
Nicobar Island as New Record to Indian Water. Proc. Zool. Soc. 63: 61-66.
Tamal Mondal, C. Raghunathan and Ramakrishna. 2011a. New record of
five Scleractinian Corals from Rutland Island, South Andaman
Archipelago. Asian J Exp Biol Sci. 2: 114-118.
Tamal Mondal, C. Raghunathan and Ramakrishna. 2011b. Notes on three
new records of scleractinian corals from Andaman Islands. Journal of
Oceanography and Marine Science. 2:122-126.
Tamal Mondal, C. Raghunathan and Ramakrishna. 2011c. Occurrence of
seven Scleractinian Corals in Ritchie's Archipelago, Andaman Islands of
India. Proc Zool Soc. 64:57-61.
Tamal Mondal, C. Raghunathan and Ramakrishna. 2011d. New Record of
Six Scleractinian Corals to Indian Water from Rani Jhansi Marine National
Park, Andaman & Nicobar Archipelago. International Journal of Science
and Nature. 2:321-326.
Tamal Mondal, C. Raghunathan and Ramakrishna. 2011e Addition of
thirteen Scleractinians as New Record to Indian Water from Rutland
Island, Andamans. Asian J Exp Biol Sci 2: 383-390.
Tamal Mondal and Raghunathan, C. 2011f. New record of two Scleractinian
Corals from Neil Island, Ritchie's Archipelago. International Journal of Plant,
Animal and Environmental Sciences. 1:76-79.
Tamal Mondal, Raghunathan, C. and Venkataraman, K. 2011g. Five
Scleractinian Corals as a new record from Andaman Islands-A New
Addition to Indian Marine Fauna. World Journal of Fish and Marine
Sciences. 3: 450-458.
Journal of Coastal Environment48
Tamal Mondal, Raghunathan, C. and Venkataraman, K.. 2012a.
Distributional record of five scleractinian corals from Andaman & Nicobar
Islands. IOSR Journal of Pharmacy. 2: 38-43.
Tamal Mondal, Raghunathan, C. and Venkataraman, K. 2012b. New
Distribution Report of Ten Scleractinian Corals to Indian Water from
Andaman & Nicobar Islands, Research J Science and Tech. 4: 152-57.
Tamal Mondal, Raghunathan, C. and K. Venkataraman. 2012c. New
Distribution Report of Eight Scleractinian Corals to Indian Water from
Andaman & Nicobar Islands, Advances in Biological Research. 6(3): 110-
120. DOI: 10.5829/idosi.abr.2012.6.3.63236
Tamal Mondal, Raghunathan, C. and K. Venkataraman. 2012d. New
Record of Five Scleractinian Corals to Indian Water from Andaman &
Nicobar Islands, International Journal of Advanced Biological Research.
2(2): 699-703.
Tamal Mondal, Raghunathan, C. and K. Venkataraman. 2012e. New
Record of five Scleractinian Corals to Indian Water from Andaman &
Nicobar Islands, Research J. Science and Tech., 4(6):278-284.
Tamal Mondal, Raghunathan, C. and K. Venkataraman. 2012f. First Report
of Dendrophylliid coral Rhizopsammia verrilli from Andaman & Nicobar
Islands. J Mar Biol Ass India., 54(2):5-7. Doi: 10.6024 /jmbai.
2012.54.2.01723-0x
Turner, J.R., Vousden, D., Klaus, R., Satyanarayana, Ch., Fenner, D.,
Venkataraman, K, Rajan, P.T., Subba Rao, N.V., Alfred, J.R.B.,
Ramakrishna & Raghunathan, C. 2009. Coral Reef ecosystem of Andaman
Islands Remote Sensing and Rapid Site Assessment Survey. Rec. zool.
Surv India, Occ Paper No., 301: 1-132.
Venkataraman, C., Ch. Satyanarayan, Alfred, J.R.B. & Wolstenholme, J.
2003. Handbook on Hard Corals of India 1-266.
Veron, J. E. N. 2000. Corals of the World. Australian Institute of Marine
Science 1-3 volumes.
Wallace, C. C. 1999. Staghorn Corals of the World. CSIRO Publications,
Melbourne, pp 421.
49Vulnerable Scleractinians Corals from Andaman and Nicobar Islands

Journal of Coastal Environment50
Socio Economic Impact of NaturalDisasters : A Case Study of Orissa
B.P. Sharma*, Manvendra Bhattacharya** and P. C. Sinha***
Orissa has a history of recurring natural disasters. While the coastal districts of
Orissa are exposed to floods and cyclones, western Orissa is prone to acute
droughts; a large section of the State is also prone to earthquakes. In addition, the
State is also affected by disasters like heat waves, epidemics, forest fire, road
accidents etc. The history of disasters substantiates the fact that about 80% of the
State is prone to one or more forms of natural disasters. Natural calamities of one
type or the other have affected Orissa from time to time incurring heavy losses to life
property and economy thus contributing to its abysmal backwardness. This also has
affected the social life of the people which has been continuously marred by
poverty, epidemics, illiteracy, and unemployment to name a few. Considering the
above aspects, this paper attempts to analyze the chronology of the natural disasters
as well as the socio economic affect it had on the life and people of Orissa.
IntroductionOrissa is more known for many wrong reasons whether it is starvation
deaths or selling of small kids or any ugly political scene by inefficient
politicians, Orissa has become a needy state on the part of international 1
organizations, a laboratory state to experiment with poverty .
Orissa is a state on the eastern seaboard of India, located between 17049 and 22036' North latitudes and between 81036' and 87018' East longitudes. It spreads over an area of 1,55,707 sq km. and is broadly divided into four geographical regions, i.e. Northern Plateau, Central River Basins, Eastern Hills and Coastal Plains. It has a 480 km coastline. Its population was 3.67crore as per the 2001 census. Administratively, the state is divided into 30 districts, 58 sub-divisions, 314 blocks (administrative units in descending order of geographical area and
* Jammu University, Jammu.** Ph.D. Scholar, CMJ University, Meghalaya. *** Senior Academic Consultant, New Delhi.
Jour. Coast. Env., Vol. 4, No. 1, 2013
Abstract
population) and 103 urban local bodies. The average density of population comes to 236 per sq km. with significantly higher density in the coastal areas compared to the interior parts.
7, 8Orissa is one of the poorest states of India. It is pre-eminently
7, 9 agricultural. The most important unit is village. Orissa has a history of recurring natural disasters. While the coastal districts of Orissa are exposed to floods and cyclones, western Orissa is prone to acute droughts; a large section of the State is also prone to earthquakes. In addition, the State is also affected by disasters like heat waves, epidemics, forest fire, road accidents etc. The history of disasters substantiates the fact that about 80% of the State is prone to one or more forms of natural disasters. For over a decade, Orissa has been teetering from one extreme weather condition to another: from heat waves to cyclones, drought to floods. The
10state has been declared disaster- affected for 95 of the last 105 years.
Disasters serve as reminders that progress is not linear and that development is characterized by discontinuities and dislocations of
3order.
Objectives and MethodologyThe climate and the topography of a region have direct bearing on the
7economic and social life of the people in that region. Natural calamities of one type or the other have affected Orissa from time to time incurring heavy losses to life property and economy thus contributing to its abysmal backwardness. This also has affected the social life of the people which has been continuously marred by poverty, epidemics, illiteracy, and unemployment to name a few. Considering the above aspects, this paper attempts to analyze the chronology of the natural disasters as well as the socio economic affect it had on the life and people of Orissa.
An estimate on the loss of related economic values associated with the calamities from 1971 onwards in the state has also been done. The study is based on secondary source of information that have been compiled through internet, newspapers, Government surveys, reports, doctoral
7thesis, scribes and books relevant to the topic.
Disaster StatisticsThe statistics of Orissa are shocking. Orissa has the highest infant mortality rate in the country. Two third of the state's population is living in abject poverty with an absolute poor health facility. Only 5 percent of the
Journal of Coastal Environment52
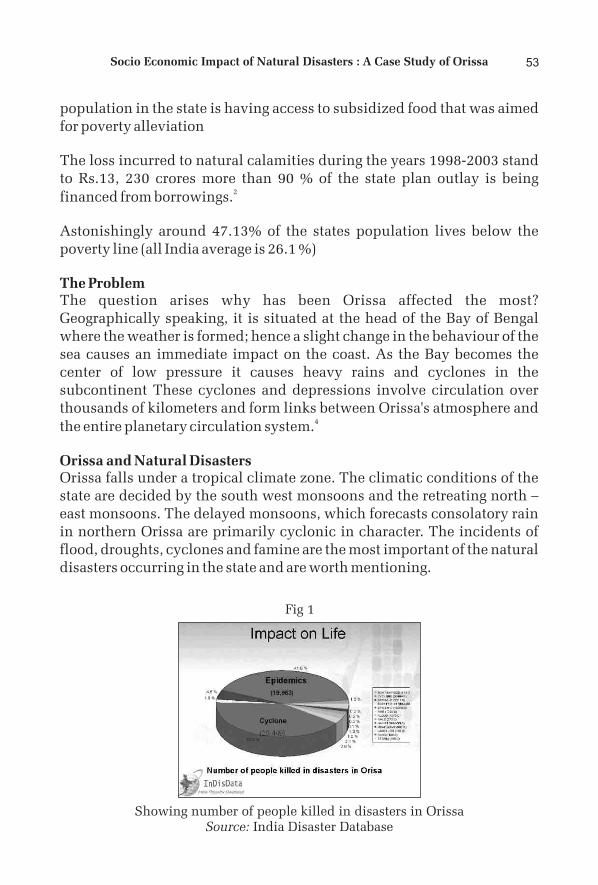
population in the state is having access to subsidized food that was aimed for poverty alleviation
The loss incurred to natural calamities during the years 1998-2003 stand to Rs.13, 230 crores more than 90 % of the state plan outlay is being
2financed from borrowings.
Astonishingly around 47.13% of the states population lives below the poverty line (all India average is 26.1 %)
The ProblemThe question arises why has been Orissa affected the most? Geographically speaking, it is situated at the head of the Bay of Bengal where the weather is formed; hence a slight change in the behaviour of the sea causes an immediate impact on the coast. As the Bay becomes the center of low pressure it causes heavy rains and cyclones in the subcontinent These cyclones and depressions involve circulation over thousands of kilometers and form links between Orissa's atmosphere and
4the entire planetary circulation system.
Orissa and Natural DisastersOrissa falls under a tropical climate zone. The climatic conditions of the state are decided by the south west monsoons and the retreating north – east monsoons. The delayed monsoons, which forecasts consolatory rain in northern Orissa are primarily cyclonic in character. The incidents of flood, droughts, cyclones and famine are the most important of the natural disasters occurring in the state and are worth mentioning.
Fig 1
Showing number of people killed in disasters in OrissaSource: India Disaster Database
53Socio Economic Impact of Natural Disasters : A Case Study of Orissa
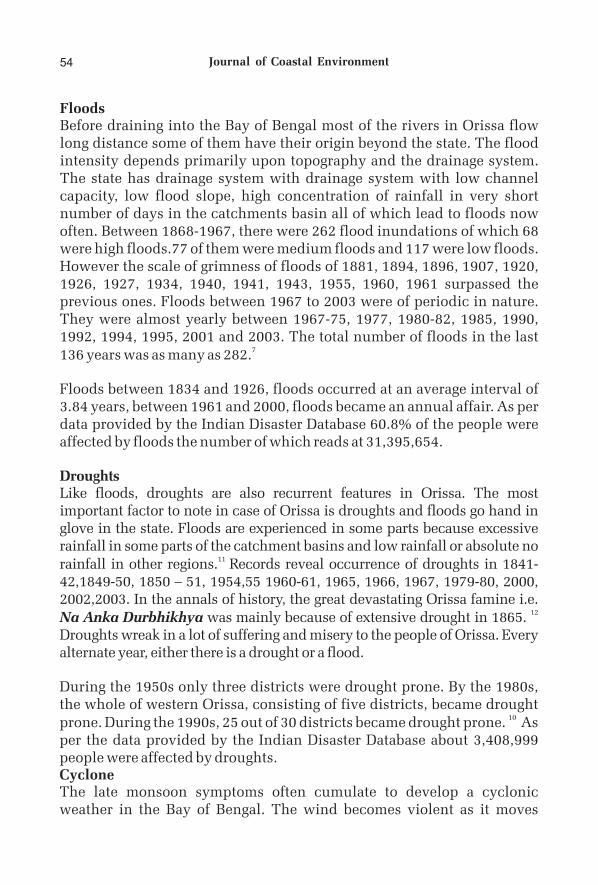
FloodsBefore draining into the Bay of Bengal most of the rivers in Orissa flow long distance some of them have their origin beyond the state. The flood intensity depends primarily upon topography and the drainage system. The state has drainage system with drainage system with low channel capacity, low flood slope, high concentration of rainfall in very short number of days in the catchments basin all of which lead to floods now often. Between 1868-1967, there were 262 flood inundations of which 68 were high floods.77 of them were medium floods and 117 were low floods. However the scale of grimness of floods of 1881, 1894, 1896, 1907, 1920, 1926, 1927, 1934, 1940, 1941, 1943, 1955, 1960, 1961 surpassed the previous ones. Floods between 1967 to 2003 were of periodic in nature. They were almost yearly between 1967-75, 1977, 1980-82, 1985, 1990, 1992, 1994, 1995, 2001 and 2003. The total number of floods in the last
7 136 years was as many as 282.
Floods between 1834 and 1926, floods occurred at an average interval of 3.84 years, between 1961 and 2000, floods became an annual affair. As per data provided by the Indian Disaster Database 60.8% of the people were affected by floods the number of which reads at 31,395,654.
DroughtsLike floods, droughts are also recurrent features in Orissa. The most important factor to note in case of Orissa is droughts and floods go hand in glove in the state. Floods are experienced in some parts because excessive rainfall in some parts of the catchment basins and low rainfall or absolute no
11 rainfall in other regions. Records reveal occurrence of droughts in 1841-42,1849-50, 1850 – 51, 1954,55 1960-61, 1965, 1966, 1967, 1979-80, 2000, 2002,2003. In the annals of history, the great devastating Orissa famine i.e.
12 Na Anka Durbhikhya was mainly because of extensive drought in 1865. Droughts wreak in a lot of suffering and misery to the people of Orissa. Every alternate year, either there is a drought or a flood.
During the 1950s only three districts were drought prone. By the 1980s, the whole of western Orissa, consisting of five districts, became drought
10 prone. During the 1990s, 25 out of 30 districts became drought prone. As per the data provided by the Indian Disaster Database about 3,408,999 people were affected by droughts.CycloneThe late monsoon symptoms often cumulate to develop a cyclonic weather in the Bay of Bengal. The wind becomes violent as it moves
Journal of Coastal Environment54
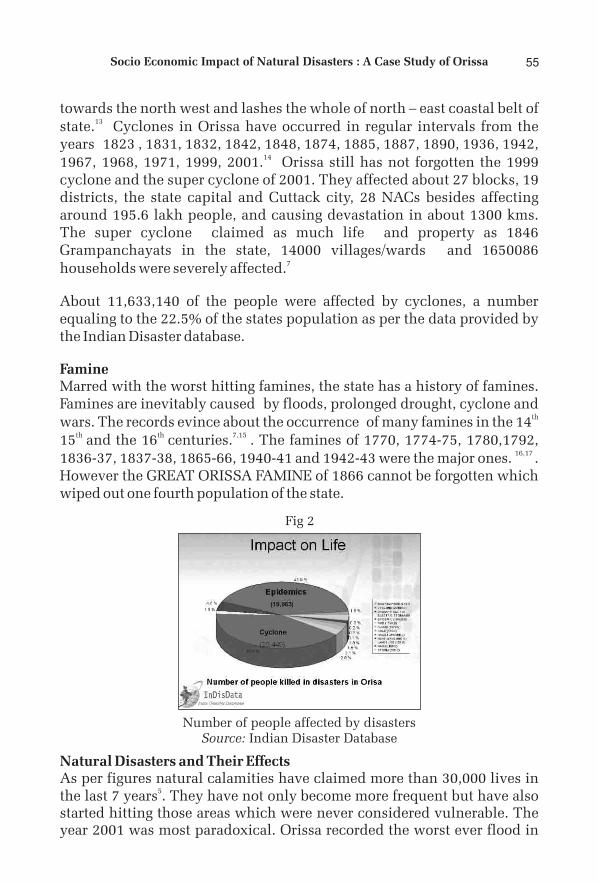
towards the north west and lashes the whole of north – east coastal belt of 13 state. Cyclones in Orissa have occurred in regular intervals from the
years 1823 , 1831, 1832, 1842, 1848, 1874, 1885, 1887, 1890, 1936, 1942, 14 1967, 1968, 1971, 1999, 2001. Orissa still has not forgotten the 1999
cyclone and the super cyclone of 2001. They affected about 27 blocks, 19 districts, the state capital and Cuttack city, 28 NACs besides affecting around 195.6 lakh people, and causing devastation in about 1300 kms. The super cyclone claimed as much life and property as 1846 Grampanchayats in the state, 14000 villages/wards and 1650086
7households were severely affected.
About 11,633,140 of the people were affected by cyclones, a number equaling to the 22.5% of the states population as per the data provided by the Indian Disaster database.
FamineMarred with the worst hitting famines, the state has a history of famines. Famines are inevitably caused by floods, prolonged drought, cyclone and
th wars. The records evince about the occurrence of many famines in the 14th th 7,15 15 and the 16 centuries. . The famines of 1770, 1774-75, 1780,1792,
16,17 1836-37, 1837-38, 1865-66, 1940-41 and 1942-43 were the major ones. . However the GREAT ORISSA FAMINE of 1866 cannot be forgotten which wiped out one fourth population of the state.
Natural Disasters and Their EffectsAs per figures natural calamities have claimed more than 30,000 lives in
5the last 7 years . They have not only become more frequent but have also started hitting those areas which were never considered vulnerable. The year 2001 was most paradoxical. Orissa recorded the worst ever flood in
Fig 2
Number of people affected by disastersSource: Indian Disaster Database
55Socio Economic Impact of Natural Disasters : A Case Study of Orissa
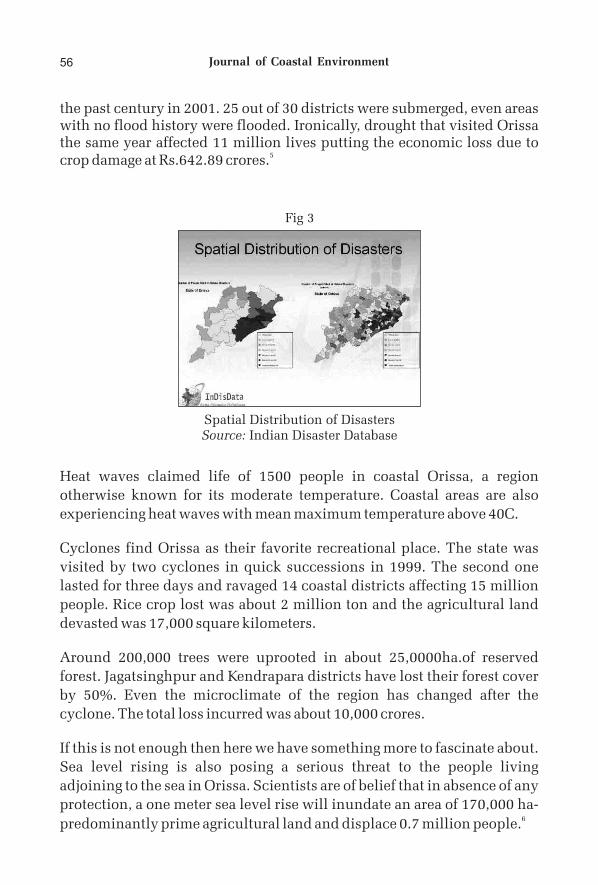
the past century in 2001. 25 out of 30 districts were submerged, even areas with no flood history were flooded. Ironically, drought that visited Orissa the same year affected 11 million lives putting the economic loss due to
5crop damage at Rs.642.89 crores.
Heat waves claimed life of 1500 people in coastal Orissa, a region
otherwise known for its moderate temperature. Coastal areas are also
experiencing heat waves with mean maximum temperature above 40C.
Cyclones find Orissa as their favorite recreational place. The state was
visited by two cyclones in quick successions in 1999. The second one
lasted for three days and ravaged 14 coastal districts affecting 15 million
people. Rice crop lost was about 2 million ton and the agricultural land
devasted was 17,000 square kilometers.
Around 200,000 trees were uprooted in about 25,0000ha.of reserved
forest. Jagatsinghpur and Kendrapara districts have lost their forest cover
by 50%. Even the microclimate of the region has changed after the
cyclone. The total loss incurred was about 10,000 crores.
If this is not enough then here we have something more to fascinate about.
Sea level rising is also posing a serious threat to the people living
adjoining to the sea in Orissa. Scientists are of belief that in absence of any
protection, a one meter sea level rise will inundate an area of 170,000 ha- 6
predominantly prime agricultural land and displace 0.7 million people.
Fig 3
Spatial Distribution of DisastersSource: Indian Disaster Database
Journal of Coastal Environment56
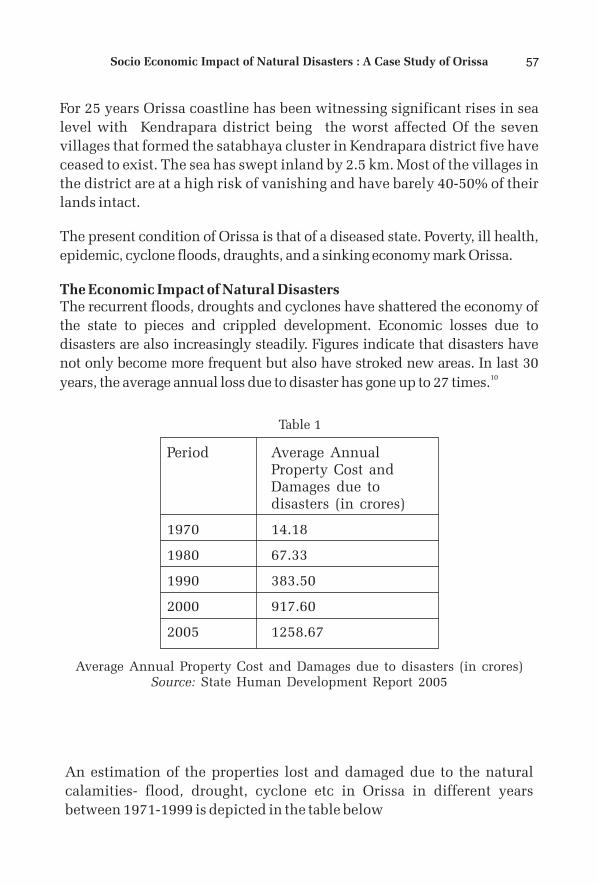
For 25 years Orissa coastline has been witnessing significant rises in sea
level with Kendrapara district being the worst affected Of the seven
villages that formed the satabhaya cluster in Kendrapara district five have
ceased to exist. The sea has swept inland by 2.5 km. Most of the villages in
the district are at a high risk of vanishing and have barely 40-50% of their
lands intact.
The present condition of Orissa is that of a diseased state. Poverty, ill health,
epidemic, cyclone floods, draughts, and a sinking economy mark Orissa.
The Economic Impact of Natural DisastersThe recurrent floods, droughts and cyclones have shattered the economy of
the state to pieces and crippled development. Economic losses due to
disasters are also increasingly steadily. Figures indicate that disasters have
not only become more frequent but also have stroked new areas. In last 30 10years, the average annual loss due to disaster has gone up to 27 times.
Table 1
Period Average Annual Property Cost and Damages due to disasters (in crores)
1970 14.18
1980 67.33
1990 383.50
2000 917.60
2005 1258.67
Average Annual Property Cost and Damages due to disasters (in crores)Source: State Human Development Report 2005
An estimation of the properties lost and damaged due to the natural
calamities- flood, drought, cyclone etc in Orissa in different years
between 1971-1999 is depicted in the table below
57Socio Economic Impact of Natural Disasters : A Case Study of Orissa
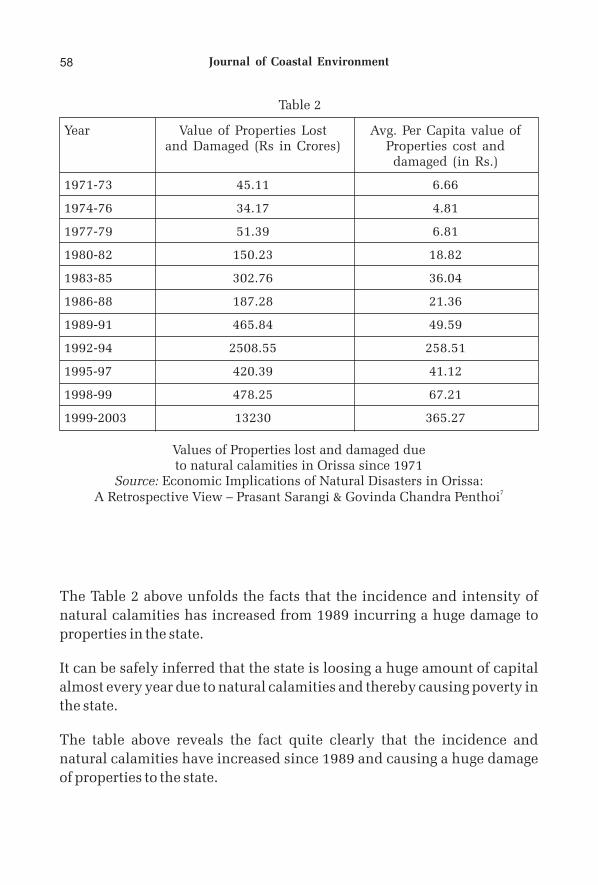
The Table 2 above unfolds the facts that the incidence and intensity of
natural calamities has increased from 1989 incurring a huge damage to
properties in the state.
It can be safely inferred that the state is loosing a huge amount of capital
almost every year due to natural calamities and thereby causing poverty in
the state.
The table above reveals the fact quite clearly that the incidence and
natural calamities have increased since 1989 and causing a huge damage
of properties to the state.
Table 2
Year Value of Properties Lost and Damaged (Rs in Crores) Properties cost and
damaged (in Rs.)
1971-73 45.11 6.66
1974-76 34.17 4.81
1977-79 51.39 6.81
1980-82 150.23 18.82
1983-85 302.76 36.04
1986-88 187.28 21.36
1989-91 465.84 49.59
1992-94 2508.55 258.51
1995-97 420.39 41.12
1998-99 478.25 67.21
1999-2003 13230 365.27
Avg. Per Capita value of
Values of Properties lost and damaged due to natural calamities in Orissa since 1971
Source: Economic Implications of Natural Disasters in Orissa: 7A Retrospective View – Prasant Sarangi & Govinda Chandra Penthoi
Journal of Coastal Environment58
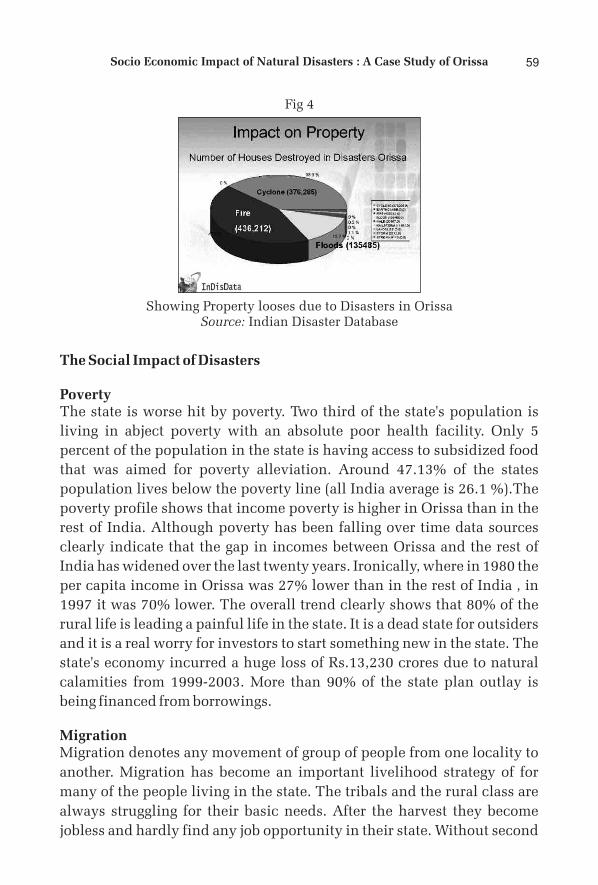
The Social Impact of Disasters
PovertyThe state is worse hit by poverty. Two third of the state's population is
living in abject poverty with an absolute poor health facility. Only 5
percent of the population in the state is having access to subsidized food
that was aimed for poverty alleviation. Around 47.13% of the states
population lives below the poverty line (all India average is 26.1 %).The
poverty profile shows that income poverty is higher in Orissa than in the
rest of India. Although poverty has been falling over time data sources
clearly indicate that the gap in incomes between Orissa and the rest of
India has widened over the last twenty years. Ironically, where in 1980 the
per capita income in Orissa was 27% lower than in the rest of India , in
1997 it was 70% lower. The overall trend clearly shows that 80% of the
rural life is leading a painful life in the state. It is a dead state for outsiders
and it is a real worry for investors to start something new in the state. The
state's economy incurred a huge loss of Rs.13,230 crores due to natural
calamities from 1999-2003. More than 90% of the state plan outlay is
being financed from borrowings.
MigrationMigration denotes any movement of group of people from one locality to
another. Migration has become an important livelihood strategy of for
many of the people living in the state. The tribals and the rural class are
always struggling for their basic needs. After the harvest they become
jobless and hardly find any job opportunity in their state. Without second
Fig 4
Showing Property looses due to Disasters in OrissaSource: Indian Disaster Database
59Socio Economic Impact of Natural Disasters : A Case Study of Orissa
thought they leave their villages and their homes in search of 'work for
food ' and start their journey to the neighbouring states for working in
construction, in weaving, in hotels, or as rickshaw or cart pullers.
Another important reason of migration is, workers are locked into a debt –
migration cycle, where earning from migration are used to repay debts
incurred at home. Moreover, absence of non farm employment, and low
agricultural production due to natural calamities has resulted in a growth 20of migration.
UnemploymentAs far as Orissa is concerned, growing educated unemployed youth is one
of the burning issues of Orissa. According to the data available at the
beginning of 2004-2005 total unemployment was 9.97 lakhs. As per the
Live register maintained by the employment exchanges in the state only
2239 were placed in jobs in 2002-03. This is only the tip of the icebergs
because not all job seekers register with these exchanges. What about
school or college dropouts who have never heard of employment 20exchanges or who are not eligible for any government job.
HIV Taking shape as an EpidemicOrissa was among seven low prevalence States, where increasing
epidemic trend was noticed by various agencies during the five-year
period. The reports of five folds increase in terms of HIV prevalence
among adults in the State between 2002 and 2006 is a matter of serious
concern. More importantly number of people living with HIV/AIDS
(PLHA) in all ages has seen a dramatic increase in Orissa. As per the study,
there was a rise of nearly five folds among numbers of PLHA from 2002 to
2006. Estimates said 8,248 people living with HIV were detected in 2002
in the State that went up to 9,717 in 2006 in the State. Further, this number
went up to 16,082 by the end of January,2010.
According to the Health & Family Welfare Department sources of
Government of Orissa, Ganjam district tops the lists of both HIV positive
cases and AIDS death cases, followed by Cuttack and Koraput. With the
number of people living with HIV/AIDS stands at 921 by February 2010,
Koraput stands second in the state. This apart, a total of 133 deaths have
been reported in Koraput during the same period. In fact, Ganjam district
happened to be the major hub of this killer virus. Ganjam again topped the
Journal of Coastal Environment60
list having 5920 in the category. Cuttack follows it with 2083 persons
affected by HIV positive. Though Orissa is not one of the high risk states,
Ganjam is one of the high risk districts in the country. While 3,359 HIV
positive cases were reported last year in the district, this year the number
has reached at 3,635 till November last year. According to latest figures
released by the Orissa State AIDS Control Society (OSACS), OSACS on the
occasion of World AIDS Day, December 2009, as many as 1,083 persons
were so far died due to AIDS in the State while Ganjam suffered highest
number of casualties with 349 deaths, followed by Koraput with 145
deaths. The deaths on account of AIDS are rising in the State where 714
people lost their lives this year compared to 133 last year and 28 in 2006.
This year's death roll is estimated to be the highest during the past seven
years. Situation is slowly becoming grim in other districts of Orissa like
Puri, Kendrapara, Angul, Bargarh, Rayagada and Jajpur.
The report published in the Indian Journal of Medical Research revealed
that an increasing epidemic trend has been noticed in seven of the low-
prevalence States such as Pudduchery, Jammu and Kashmir, Jharkhand,
Bihar, Orissa, Rajasthan and West Bengal. The assessment showed that
HIV prevalence among the adults was 0.36 per cent while the rate in high
prevalence States stood at an alarming 0.8 per cent. In the low and
moderate epidemic states like Orissa, the rate of infection stood at 0.2 per
cent. As per the data, Odisha's adult HIV prevalence rate has seen a rise
from the 0.06 per cent level in 2002 to 0.22 per cent in 2006. This also
explains why the number of people living with HIV/AIDS (PLHA) has
increased over the same time--from 9,717 to 48,248 — a 400 per cent
growth. The report further points out that Tamil Nadu is one among the
high-prevalence States to have recorded a decline in the rate, while it
remained stable in Andhra Pradesh and Karnataka.
Latest report reveals, that more than 40% of people living with HIV in
India, particularly Orissa had been refused medical treatment on the basis
of their HIV-positive status. It also found strong evidence of stigma in the
workplace, with 74% of employees not disclosing their status to their
employees for fear of discrimination. Of the 26% who did disclose their
status, 10% reported having faced prejudice as a result. by a local NGO
working with HIV/AIDS. By then, she was delirious, and infested with
ticks and worms.
61Socio Economic Impact of Natural Disasters : A Case Study of Orissa
HIV infection is on rise now in Orissa; exactly what the prevalence is, is
not really known, but it can be stated without any fear of being wrong that
infection is widespread… it is spreading rapidly into those segments that
society in the state. Sadly though, the emerging face of the HIV epidemic is
increasingly turning younger, rural and feminine. Prevailing gender
stereotypes and early marriage ensure that women remain ignorant and
unable to protect themselves, making them especially vulnerable to
infection from husbands. One of the most debilitating impacts of this
epidemic is the stigma and discrimination resulting from disclosure of
status. And AIDS widows, in particular, bear the brunt of inhuman social
ostracism. Their situation exacerbates due to loss of the earlier social
support system and source of earnings, dependent children and denial of 18
healthcare.
EpidemicsEpidemic Death has created a phobia in the interiors of Kalahandi-
Bolangir-Koraput (KBK) region. Many expert doctors and administration
teams from foreign visit Kasipur and Dasmantpur block of KBK from time
to time. Government and its officials say the situation is under control, but
the reality is something else. Until date, corpses were being carried to
cremation grounds and patients to hospitals. The situation has become so
worse that family members refuse to carry the corpses of their own kith
and kin. Superstitions and blind belief prevails that whosoever carries a
corpse shall soon become a victim himself.
According to official reports , outbreak of cholera and diarrhea and other
diseases have added to the woes of the impoverished Kasipur and
Dasmantpur block and other villages in KBK region, killing at least 250
people in the past few months and affecting hundreds who are being treated
at different hospital and medical camps. But unofficial reports had put the
death toll to over 1,000 in these areas and a large numbers of people suffered
from starvation and malnutrition in these regions. At the time of filing of this
report, the death toll continued to increase, although in a slow manner, but it
was not checked and the condition of the villagers worsened.
From mid 70s till today, almost during every monsoon season people die
in KBK area, either because of diarrhea or of bad food and hunger or other
contaminated diseases. This is a serious cause of concern for all of us.
Journal of Coastal Environment62
It needs to be noted that there is a record of history of black days to these
death. In 1979, 10 villagers died in Ranachuana, Kutakhal and Paikupakhal,
in 1981, more than 15 people died and several people affected by diarrhea in
Posapadas of Adajore village and these deaths were sources of much
political debates and differences. In 1983, in Bilamal village 13 people died.
The then collector and district magistrate (DM) took urgent steps and the
epidemic was controlled. In 1987, the starvation deaths in Kashipur were
acknowledged by the then Prime Minister, Rajiv Gandhi.
In 1990, 11 people died in Badaliguduma and Mandia Guda. In 1996, more
than 11 persons died in Khairiput, Kalimela and Motu area of Malkanagiri.
In 1998, seven persons died in Kalabedapad, Padlamput and Khamarpoto.
In 1999, nine people died in Paikupakhal of Maikanch GP. Interestingly,
these villages have been adopted by Utkal Alumina International Ltd. In
2001, once again, Bilamal was touched by epidemic death, and it was a
centre of debate.
These are some of the recorded death cases, besides every year two to five
people have been dying. In some years, the political parties and the mass
media would highlight the deaths for reasons best know to them, while
sometimes they just simply ignore these villages. But in all cases, one
reason has been highlighted that lack of food, bad food habit and
contaminated water are the real cause of such outbreak of epidemic.
Meanwhile, Tehelka investigation reveled the factors responsible for
these deaths.
All these areas have not been connected with a proper road. Every family
faces these same problems, so it is very difficult to bring a patient to the
hospital, which is more than seven to 10 km away. Snake bites are yet
another big problem in rainy days because of which villagers are reluctant
to take patients to the hospitals. On the other hand, the health workers
have not visited these villages because of unavailability of
communication facilities like road, phone, etc. Villagers used their
traditional medicines, jadi booti to cure the diseases and refuse to go to
hospitals and take medicines. Such high death toll leaves many orphans
every year and these innocent kids play cheerfully, unaware of what is
stored for them in the future. Sadly, neither the government nor the NGOs 19
have done anything for these people.
63Socio Economic Impact of Natural Disasters : A Case Study of Orissa
ConclusionsIn Orissa, 47 per cent of the population lives below the poverty line and 53
per cent is malnourished. The female literacy rate is 35 per cent and
school dropout rate for girls is high. Only 49 per cent of the population has
access to safe drinking water. These figures make it clear that in the
eventuality of a disaster, the poor are hit the most. poor public
infrastructure, poor sanitation coverage, low per capita income and
proneness to disasters. In a State where resource inequities are glaring and
land reforms non-existent, disaster mitigation and preparedness can only
be temporary solutions for long-term questions of livelihood.
ReferencesSatapathy, Sachidananda.et al. Orissa Vision-2020. Towards building a
new and Modern Orissa.
Pelli Mark, Ozerdem Alpaslan, Barakat Sulatan. The macro economic
impact of disasters.
Orissa Fact Sheet – Global Environmental Negotiations p.2
Orissa Fact Sheet – Global Environmental Negotiations p.5
Orissa Fact Sheet – Global Environmental Negotiations p.17
Orissa Fact Sheet – Global Environmental Negotiations p.23
Sarangi Prasant, Penthoi Govind Chandra. Economic Implications of
Natural Disasters in Orissa : A Retrospective View.
Sharma Archana. 2004. Floods: A Threat to Sustainable Development.
Indian Journal of Regional Science, Vol XXXVI, No1.
Haq Kazi , Md. Fazlul, Bhuiyan, Rajnan, Hussain. 2004. Delineation and
Zonation of Flood Prone Area : A case Study of Tangail District,
Bangladesh, Indian Journal Of Regional Science , Vol. XXXVI, No1.
Mahapatra, Richard. Disaster Dossier : The impact of Climate Change in
Orissa.
Mahatab, H.K., History of Orissa, Vol.II p.446.
Sinha,B.N., Geography of Orissa,p.16.
Das G.N., The Cyclones of Orissa, The Sunday Statesman(Magazine),
Feburary 6, 1972, p.1.
Pradahan, N.B., Ibid
Journal of Coastal Environment64
Drought in Orissa during 1954 and 1955, Financial Report, pp.3-6 .
Mahapatra, Devi Prasad. Migration, Unemployment in Orissa-
http://EzineArticles.com/?expert=Devi Prasad Mahapatra
Dash, K.K.HIV Epedemic spreads fast in Orissa. http://www.
orissadiary.com
Kumar, K. Outbreak of Epidemic in Orissa Tribal Regions-
merinews.com/article/outbreak-of-epidemic-in –orissa-tribals-agonised
Websiteshttp://www.infochangeindia.orghttp://www.orienvis.nic.in/disaster.asphttp://orissadiary.com http://www.osdma.org
65Socio Economic Impact of Natural Disasters : A Case Study of Orissa

Journal of Coastal Environment66
Discovery of a New Species of Clams in Coral Rubbles of Andaman and Nicobar Islands
V. Madhan Chakkaravarthy
Tapes madhaniensis Madhan Chakkaravarthy (Veneridae) is described as new
species from Malacca at Car Nicobar in Andaman and Nicobar Islands. The new
species is also providing with illustration, distribution and probable affinities of
its close allies.
IntroductionThe Andaman and Nicobar ecoregion is biologically rich in both diversity and abundance. This high biodiversity is encountered from genes to individuals to species, habitats and ecosystems. The genus Tapes Megerle von Muehlfeld., consists of about 4 species in India, out of which Tapes radiatus (Satyamurti 1956; Apte 1998) and Tapes (Ruditapes) philppinarum (Satyamurti 1956), were reported from Gulf of Mannar region and Tapes deshayes & Tapes literatus were known to occur in Andaman and Nicobar Islands, as per the updated check list by Subba Rao and Dey (2000).
As a result of research work on Bivalvia, Family Veneridae in Andaman and Nicobar Islands under the 'National Coral Reef Research Institute - Project', several field trips to the Islands were made. During a field trip to Malacca at Car Nicobar (November 2009), an interesting specimen of a species of Tapes was collected. A critical study of this specimen revealed that it is new to science and is described and illustrated here.
Systematic Account
Family: VENERIDAE Rafinesque, 1815Genus: Tapes Megerle von Muehlfeld, 1811
.* Zoological Survey of India, Andaman and Nicobar Regional Centre, National Coral Reef Research Institute, Port Blair.
Jour. Coast. Env., Vol. 4, No. 1, 2013
Abstract
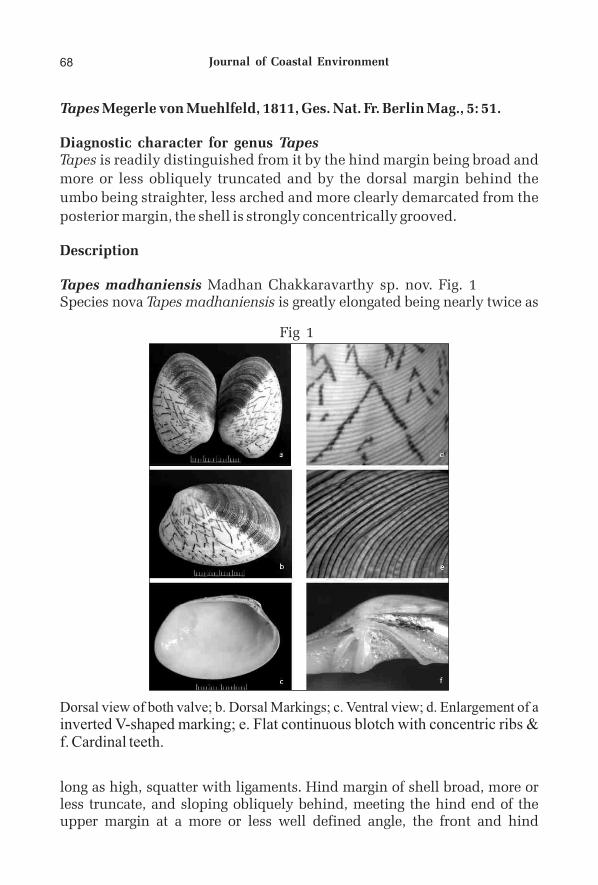
Tapes Megerle von Muehlfeld, 1811, Ges. Nat. Fr. Berlin Mag., 5: 51.
Diagnostic character for genus TapesTapes is readily distinguished from it by the hind margin being broad and
more or less obliquely truncated and by the dorsal margin behind the
umbo being straighter, less arched and more clearly demarcated from the
posterior margin, the shell is strongly concentrically grooved.
Description
Tapes madhaniensis Madhan Chakkaravarthy sp. nov. Fig. 1Species nova Tapes madhaniensis is greatly elongated being nearly twice as
Fig 1
Dorsal view of both valve; b. Dorsal Markings; c. Ventral view; d. Enlargement of a inverted V-shaped marking; e. Flat continuous blotch with concentric ribs & f. Cardinal teeth.
long as high, squatter with ligaments. Hind margin of shell broad, more or less truncate, and sloping obliquely behind, meeting the hind end of the upper margin at a more or less well defined angle, the front and hind
Journal of Coastal Environment68
margins are evenly rounded. The surface of the shell is glossy and traversed by regularly spaced concentric grooves, separated by flattened concentric ridges. The concentric grooves lose their distinctness towards the posterior margin, the posterior one-fourth part of the surface being almost smooth and devoid of any definite sculpture. The pallial sinus is U-shaped and rather small in proportion to the size of the shell. The hing bears three narrowly diverging cardinal teeth. The lunule is boarder and depressed. The shell is pale yellowish brown in colour marked throughout with pale purplish brown inverted V-shaped marking, adjacent ones of which sometime coalesce forming rhombus-shaped islets of the grand colour. The surface is more elaborately mottled with brownish angular markings which bisect the shell into two right-angled triangles. The morphological differences between the allies of Tapes madhaniensis sp. nov., T. philippinarum and T. literatus are given in Table 1.
Table 1
T. literatus
Ovate-rhomboidal, moderately compressed, thin shell with almost parallel ventral and posterior dorsal margins. Fine concentric grooves which are strongest in posterior.
~ 40 - 90 mm in length
Creamy, with fine, brown,
The shape is fairly variable, being able to see specimens more or less elongated and the posterolateral corner ligamentous more or less alive. The ligamentous margin forming an angle less with the blunt edge.
~ 32 to 40 mm in length
The coloration is extremely
Greatly elongated, nearly twice as long as high, squatter, with the ligaments.
The posterior margin is slightly broader and ventral margin is almost straight, the front and hind margins are evenly rounded.
~ 73 mm in length
The shell is pale yellowish
Sl. NameNo.
1. Shell Shape
2. Shell Size (mm)
3. Shell Colour and pattern
T. philippinarum Tapes madhaniensis sp. nov.
69Discovery of a New Species of Clams in Coral Rubbles of Andaman and Nicobar Islands
MATERIAL EXAMINEDType material: Holotype (Fig. 1), 73 × 46 × 24 mm (L × W × H). Car
Nicobar falls in between Little Andaman and Nancowry group of Island. A o
single specimen was collected by the author from Malacca (N 09 10'49.0; E o092 49'71.4) at Car Nicobar Island. The measurements of the specimen
were made by using millimeter scale. The specimen is deposited in the
National Zoological Collection, Zoological Survey of India, Andaman and
Nicobar Regional Centre, Port Blair.
Etymology: This specific epithet, madhaniensis, is from the name of the
author who revealed the species.
Distinguishing features in morphological pattern between Tapes literatus, T.
philippinarum, Tapes madhaniensis sp. nov.
zig-zag lines and irregular blotches.
Indo-Pacific, Taiwan, East Malaysia, North Borneo, Sabah, Mabul Island, Andaman and Nicobar Islands, Cebu, Philippines & Hong Kong
Moderately important.
4. Distribution
5. Commercial|
varied, reddish-brown. Sculpture is slightly different: philippinarum sculpture is even more evident in the rear, with small spinulosa at the crossing points, but smoother in the front.
This is a species native to the Pacific and also reported in Gulf of Mannar.
Moderately important.
brown in colour marked throughout with pale purplish brown inverted V-shaped marks in the dorsal surface of the shell, adjacent ones of which sometime coalesce forming rhombus-shaped islets of the grand colour.
Only known from the type locality: (Malacca at Car Nicobar) Andaman & Nicobar Islands
-Not evaluated-
Journal of Coastal Environment70
Habitat: Shallow muddy bottom of sand, coarse sand in the coral reef area.
DiscussionTapes madhaniensis is closely allied to T. literatus and T. philippinarum
species, which it mainly differs in presences of flat continuous blotch and
inverted V-shaped marking in the dorsal surface of the shell. The presence
of these morphological features has not been reported, so far. The
specimen reported from India did not reveal the presence of such features
in any of the species of Tapes. This specimen collected from coral rubbles
area of Malacca which represents a new species. As the marking and
coloration dorsally reflects the wing patterns of a butterfly, it can be
commonly named the “Malacca Butterfly Clam”.
AcknowledgementsWe thankful to the Director, ZSI, New Alipore, Kolkata, for encouragement
and Thanks are also due to Office in Charge, ANRC, Port Blair. Authors are
grateful to the Ministry of Environment and Forest (MoEF), Government of
India, for providing all facilities and funds through the project of National
Coral Reef Research Institute, Port Blair, Andaman and Nicobar Islands.
ReferencesApte, D. 1998. The Book of Indian Shells. Bombay Natural History Society.
115 pp.
Satyamurti, S.T. 1956. The Mollusca of Krusadai Island. Bull., Madras
Govt. Mus. (N.S.), N.H. I (2): 1-202.
Subba Rao, N. V. and Dey, A. 2000. Catalogue of Marine Molluscus of
Andaman and Nicobar Islands, Rec. Zool. Surv. India, Occ. Paper no. 187,
i-x, 323 pp.
71Discovery of a New Species of Clams in Coral Rubbles of Andaman and Nicobar Islands

Journal of Coastal Environment72
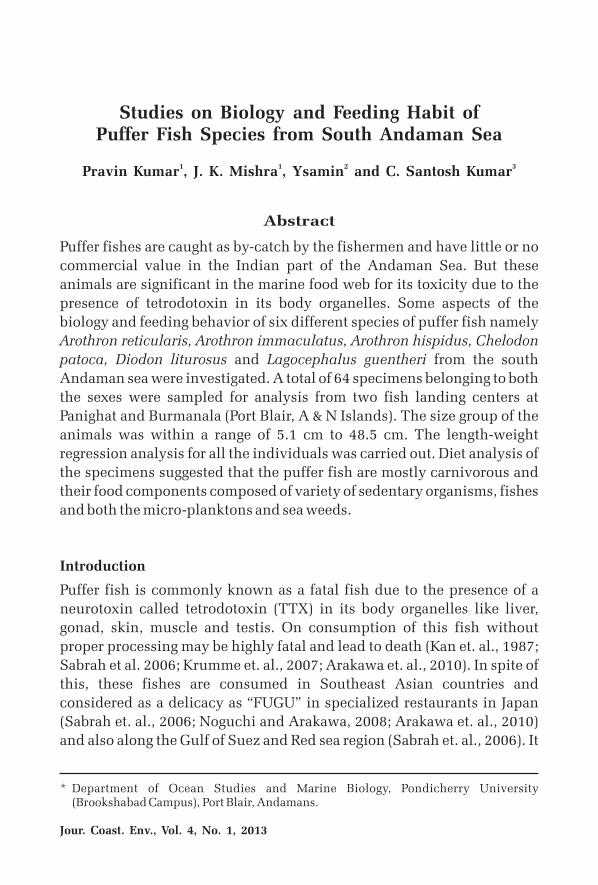
Studies on Biology and Feeding Habit of Puffer Fish Species from South Andaman Sea
1 1 2 3Pravin Kumar , J. K. Mishra , Ysamin and C. Santosh Kumar
Puffer fishes are caught as by-catch by the fishermen and have little or no
commercial value in the Indian part of the Andaman Sea. But these
animals are significant in the marine food web for its toxicity due to the
presence of tetrodotoxin in its body organelles. Some aspects of the
biology and feeding behavior of six different species of puffer fish namely
Arothron reticularis, Arothron immaculatus, Arothron hispidus, Chelodon
patoca, Diodon liturosus and Lagocephalus guentheri from the south
Andaman sea were investigated. A total of 64 specimens belonging to both
the sexes were sampled for analysis from two fish landing centers at
Panighat and Burmanala (Port Blair, A & N Islands). The size group of the
animals was within a range of 5.1 cm to 48.5 cm. The length-weight
regression analysis for all the individuals was carried out. Diet analysis of
the specimens suggested that the puffer fish are mostly carnivorous and
their food components composed of variety of sedentary organisms, fishes
and both the micro-planktons and sea weeds.
Introduction
Puffer fish is commonly known as a fatal fish due to the presence of a
neurotoxin called tetrodotoxin (TTX) in its body organelles like liver,
gonad, skin, muscle and testis. On consumption of this fish without
proper processing may be highly fatal and lead to death (Kan et. al., 1987;
Sabrah et al. 2006; Krumme et. al., 2007; Arakawa et. al., 2010). In spite of
this, these fishes are consumed in Southeast Asian countries and
considered as a delicacy as “FUGU” in specialized restaurants in Japan
(Sabrah et. al., 2006; Noguchi and Arakawa, 2008; Arakawa et. al., 2010)
and also along the Gulf of Suez and Red sea region (Sabrah et. al., 2006). It
* Department of Ocean Studies and Marine Biology, Pondicherry University (Brookshabad Campus), Port Blair, Andamans.
Jour. Coast. Env., Vol. 4, No. 1, 2013
Abstract
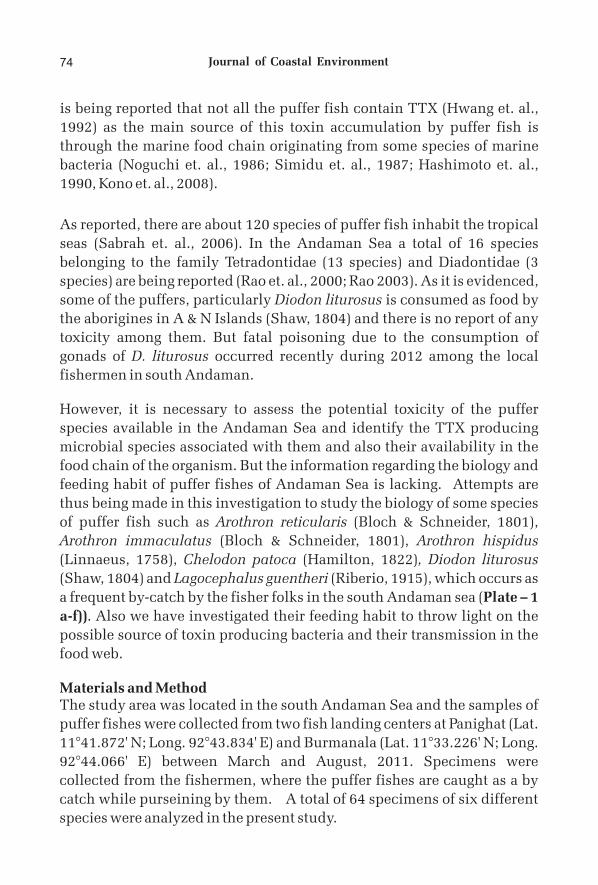
is being reported that not all the puffer fish contain TTX (Hwang et. al.,
1992) as the main source of this toxin accumulation by puffer fish is
through the marine food chain originating from some species of marine
bacteria (Noguchi et. al., 1986; Simidu et. al., 1987; Hashimoto et. al.,
1990, Kono et. al., 2008).
As reported, there are about 120 species of puffer fish inhabit the tropical
seas (Sabrah et. al., 2006). In the Andaman Sea a total of 16 species
belonging to the family Tetradontidae (13 species) and Diadontidae (3
species) are being reported (Rao et. al., 2000; Rao 2003). As it is evidenced,
some of the puffers, particularly Diodon liturosus is consumed as food by
the aborigines in A & N Islands (Shaw, 1804) and there is no report of any
toxicity among them. But fatal poisoning due to the consumption of
gonads of D. liturosus occurred recently during 2012 among the local
fishermen in south Andaman.
However, it is necessary to assess the potential toxicity of the puffer
species available in the Andaman Sea and identify the TTX producing
microbial species associated with them and also their availability in the
food chain of the organism. But the information regarding the biology and
feeding habit of puffer fishes of Andaman Sea is lacking. Attempts are
thus being made in this investigation to study the biology of some species
of puffer fish such as Arothron reticularis (Bloch & Schneider, 1801),
Arothron immaculatus (Bloch & Schneider, 1801), Arothron hispidus
(Linnaeus, 1758), Chelodon patoca (Hamilton, 1822), Diodon liturosus
(Shaw, 1804) and Lagocephalus guentheri (Riberio, 1915), which occurs as
a frequent by-catch by the fisher folks in the south Andaman sea (Plate – 1
a-f)). Also we have investigated their feeding habit to throw light on the
possible source of toxin producing bacteria and their transmission in the
food web.
Materials and MethodThe study area was located in the south Andaman Sea and the samples of
puffer fishes were collected from two fish landing centers at Panighat (Lat.
11°41.872' N; Long. 92°43.834' E) and Burmanala (Lat. 11°33.226' N; Long.
92°44.066' E) between March and August, 2011. Specimens were
collected from the fishermen, where the puffer fishes are caught as a by
catch while purseining by them. A total of 64 specimens of six different
species were analyzed in the present study.
74 Journal of Coastal Environment
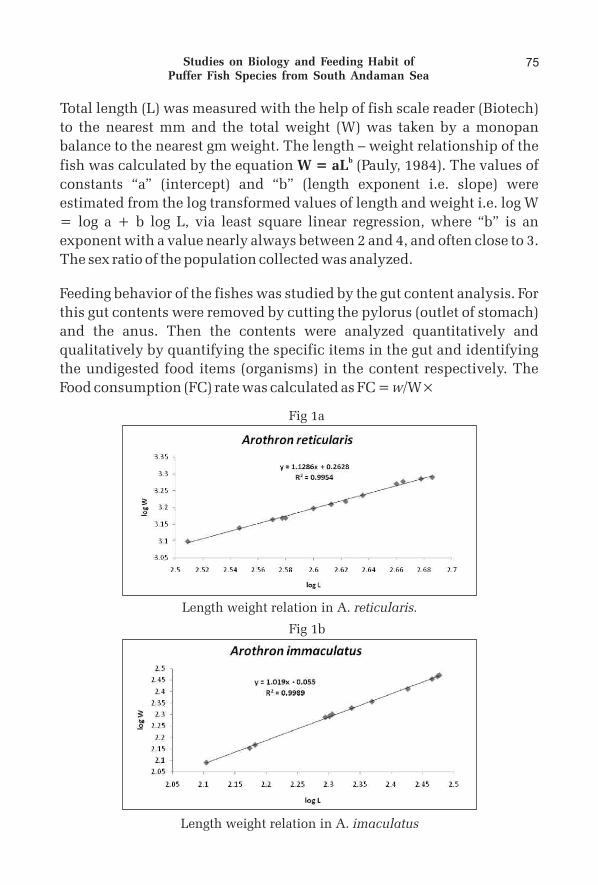
Total length (L) was measured with the help of fish scale reader (Biotech)
to the nearest mm and the total weight (W) was taken by a monopan
balance to the nearest gm weight. The length – weight relationship of the b
fish was calculated by the equation W = aL (Pauly, 1984). The values of
constants “a” (intercept) and “b” (length exponent i.e. slope) were
estimated from the log transformed values of length and weight i.e. log W
= log a + b log L, via least square linear regression, where “b” is an
exponent with a value nearly always between 2 and 4, and often close to 3.
The sex ratio of the population collected was analyzed.
Feeding behavior of the fishes was studied by the gut content analysis. For
this gut contents were removed by cutting the pylorus (outlet of stomach)
and the anus. Then the contents were analyzed quantitatively and
qualitatively by quantifying the specific items in the gut and identifying
the undigested food items (organisms) in the content respectively. The
Food consumption (FC) rate was calculated as FC = w/W×
75
Fig 1a
Fig 1b
Length weight relation in A. reticularis.
Length weight relation in A. imaculatus
Studies on Biology and Feeding Habit of Puffer Fish Species from South Andaman Sea
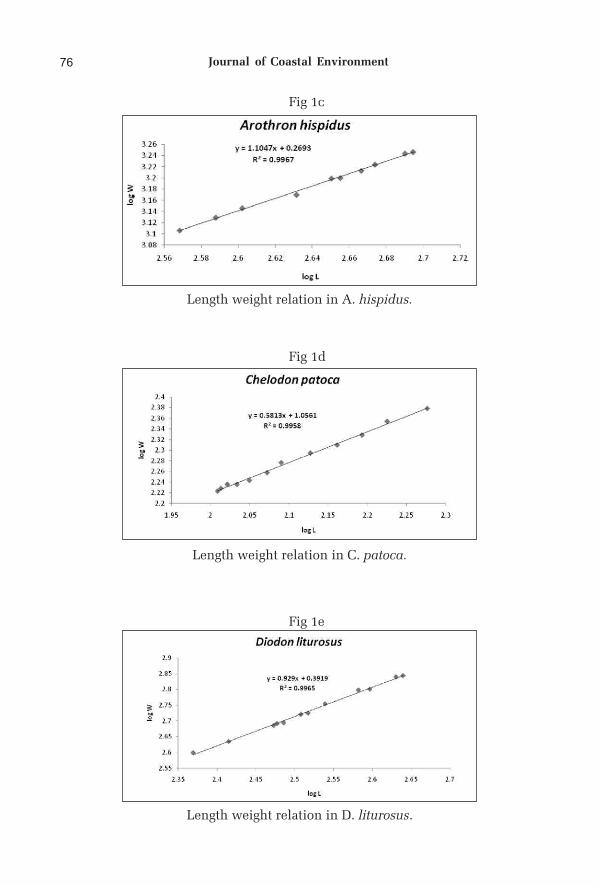
76
Fig 1c
Fig 1e
Fig 1d
Length weight relation in A. hispidus.
Length weight relation in D. liturosus.
Length weight relation in C. patoca.
Journal of Coastal Environment
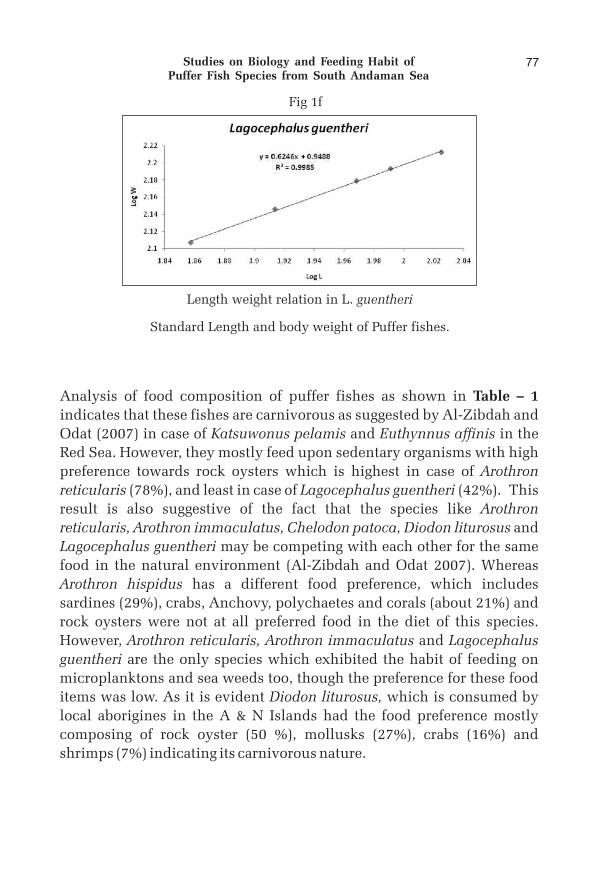
Analysis of food composition of puffer fishes as shown in Table – 1
indicates that these fishes are carnivorous as suggested by Al-Zibdah and
Odat (2007) in case of Katsuwonus pelamis and Euthynnus affinis in the
Red Sea. However, they mostly feed upon sedentary organisms with high
preference towards rock oysters which is highest in case of Arothron
reticularis (78%), and least in case of Lagocephalus guentheri (42%). This
result is also suggestive of the fact that the species like Arothron
reticularis, Arothron immaculatus, Chelodon patoca, Diodon liturosus and
Lagocephalus guentheri may be competing with each other for the same
food in the natural environment (Al-Zibdah and Odat 2007). Whereas
Arothron hispidus has a different food preference, which includes
sardines (29%), crabs, Anchovy, polychaetes and corals (about 21%) and
rock oysters were not at all preferred food in the diet of this species.
However, Arothron reticularis, Arothron immaculatus and Lagocephalus
guentheri are the only species which exhibited the habit of feeding on
microplanktons and sea weeds too, though the preference for these food
items was low. As it is evident Diodon liturosus, which is consumed by
local aborigines in the A & N Islands had the food preference mostly
composing of rock oyster (50 %), mollusks (27%), crabs (16%) and
shrimps (7%) indicating its carnivorous nature.
77
Fig 1f
Length weight relation in L. guentheri
Standard Length and body weight of Puffer fishes.
Studies on Biology and Feeding Habit of Puffer Fish Species from South Andaman Sea
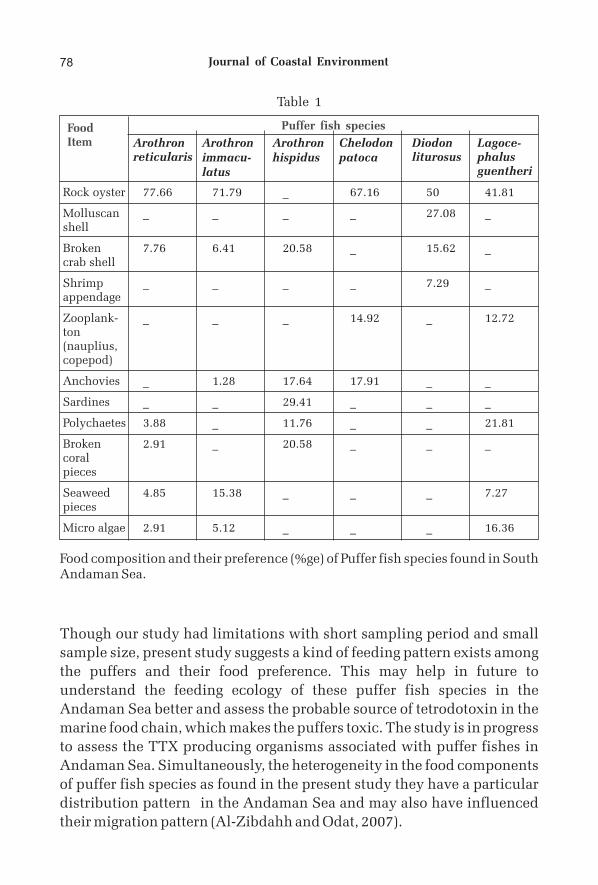
Though our study had limitations with short sampling period and small
sample size, present study suggests a kind of feeding pattern exists among
the puffers and their food preference. This may help in future to
understand the feeding ecology of these puffer fish species in the
Andaman Sea better and assess the probable source of tetrodotoxin in the
marine food chain, which makes the puffers toxic. The study is in progress
to assess the TTX producing organisms associated with puffer fishes in
Andaman Sea. Simultaneously, the heterogeneity in the food components
of puffer fish species as found in the present study they have a particular
distribution pattern in the Andaman Sea and may also have influenced
their migration pattern (Al-Zibdahh and Odat, 2007).
78
Rock oyster 77.66 71.79 _ 67.16 50 41.81
Molluscan _ _ _ _ 27.08 _shell
Broken 7.76 6.41 20.58 _ 15.62 _crab shell
Shrimp _ _ _ _ 7.29 _appendage
Zooplank- _ _ _ 14.92 _ 12.72ton(nauplius, copepod)
Anchovies _ 1.28 17.64 17.91 _ _
Sardines _ _ 29.41 _ _ _
Polychaetes 3.88 _ 11.76 _ _ 21.81
Broken 2.91 _ 20.58 _ _ _coral pieces
Seaweed 4.85 15.38 _ _ _ 7.27pieces
Micro algae 2.91 5.12 _ _ _ 16.36
Food composition and their preference (%ge) of Puffer fish species found in South Andaman Sea.
Table 1
Puffer fish speciesFood Item Arothron
reticularisArothron immacu-latus
Arothron hispidus
Chelodon patoca
Diodon liturosus
Lagoce-phalus guentheri
Journal of Coastal Environment
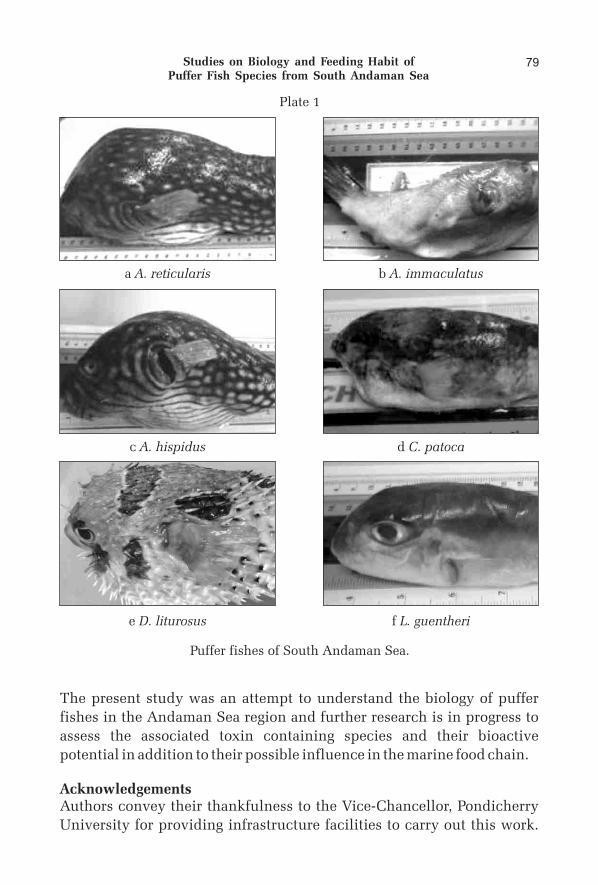
The present study was an attempt to understand the biology of puffer
fishes in the Andaman Sea region and further research is in progress to
assess the associated toxin containing species and their bioactive
potential in addition to their possible influence in the marine food chain.
AcknowledgementsAuthors convey their thankfulness to the Vice-Chancellor, Pondicherry
University for providing infrastructure facilities to carry out this work.
79
Puffer fishes of South Andaman Sea.
a A. reticularis
c A. hispidus
e D. liturosus
b A. immaculatus
d C. patoca
f L. guentheri
Plate 1
Studies on Biology and Feeding Habit of Puffer Fish Species from South Andaman Sea
Also the authors PK and CSK is thankful for availing the Pondicherry
University research fellowship.
References
Al-Zibdah, M. and Odat, N. 2007. Fishery Status, Growth, Reproduction
Biology and Feeding Habit of two Scombrid fish from the Gulf of Aqaba,
Red Sea. Lebanese Science Journal, 8 (2). Pp. 3 – 20.
Arakawa, O., Deng, H., Taniyama, S. and Takatani, T. 2010. Toxins of
Puffer fish That cause Human intoxications. In: Coastal Environmental
and Ecosystem Issues of the East China Sea, A. Ishimatsu and H. J. Lie
(Eds.) pp. 227-244.
Hashimoto K., Noguchi, T. and Watabe, S. 1990. New aspect of
tetrodotoxin. In: Microbial Toxins in Foods and Feeds, A .E. Pohland et. al.
(Eds) Plenum Pres NY. pp. 159-172.
Hwang D. F., Cao, C. F., Yang, H. C., Jeng S. S., Noguchi, T. and Hashimoto,
K. 1992. Toxicity of puffer in Taiwan. Nippon Suisan Gakkaishi. 58. Pp.
1541-1547.
Kan, S. K., Chan, M. K. and David P. 1987. Nine fatal cases of Puffer fish
poisoning in Saban, Malaysia. Medical Journal Malaysia. 42. Pp. 199-200.
Kono, M., Matsui, K., Furukawa, M., Yotsu, Y. and Yamamori, M. 2008.
Accumulation of tetrodotoxin and 4,9-anahydrotetrodotoxin in cultured
juvenile kusafugu Fugu niphobles by dietary administration of natural
toxic komonfugu Fugu poecilonotus liver. Toxicon. 51. pp. 1269-1273.
Krumme U., Keuthen H., Saint-Paul U. and Villwock W. 2007.
Contribution to the feeding ecology of the banded puffer fish Colomesus
psittacus (Tetraodontidae) in north Brazilian mangrove creeks. Braz. J.
Biol. 67(3): 383 – 392.
Noguchi, T. and Arakawa, O. 2008. Tetrodotoxin-distribution and
accumulation in aquatic organisms, and cases of human intoxication.
Marine Drugs. 6. pp. 220-242.
Noguchi, T., Jeon, J. K., Arakawa, O., Sugita H., Deguchi, Y., Shida, Y. and
Hashimoto K. 1986. Occurrence of tetrodotoxin in Vibrio sp. Isolated from
intestines of xanthid crab, Atergatis floridus. Journal of Biochemistry. 99.
Pp. 311-314.
80 Journal of Coastal Environment
Rao, D. V., Kamala Devi and Rajan, P. T. 2000. An account of Ichthyofauna
of Andaman & Nicobar islands, Bay of Bengal. Zoological Survey of India
(Publ). Paper No. 178. pp. 434.
Rao, D. V. 2003. Guide to Reef fishes of Andaman & Nicobar islands.
Zoological Survey of India (Publ). pp. 555.
Sabrah, M. M., El-Ganainy, A. A. and Zaky, M. M. 2006. Biology and
toxicity of the pufferfish Lagocephalus sceleratus (Gmelin, 1789) from the
Gulf of Suez. Egyptian Journal of aquatic Research. 32 (1). 283-297.
Simidu, U., Noguchi, T., Hwang, D. F., Shida, Y. and Hashimoto, K. 1987.
Marine bacteria which produce tetrodotoxin. Applied Environmental
Microbiology. 53. Pp. 1714-1715.
Somoro, A. N., Baloch, W. A., Jafri, S. I. H. and Suzuki, H. 2007. Studies on
length-weight and length-length relationships of a catfish
Eutropiichthyes vacha Hamilton (Schilbeidae: Siluriformes) from Indus
river, Sindh, Pakistan. Caspian J. Env. Sci. 5 (2). pp143 - 145.
81Studies on Biology and Feeding Habit of Puffer Fish Species from South Andaman Sea

82 Journal of Coastal Environment
Guidelines to Authors
Journal of Coastal Environment (JCE) is published by the Centre for Ocean and
Environmental Studies, New Delhi twice a year. The Journal promotes the study
and analyses of scientific, economic and policy issues related to the ecology of the
oceans and coasts, with far reaching impacts on the land and the atmosphere. The
emphasis is to involve a large community of scientists and scholars from India
and abroad in developing a framework of discussion and debate on conservation
and sustainable development. Book reviews, interviews, communication and
news items related to the subject are also accepted for publication.
All manuscripts are to be submitted in English in duplicate, typed double-spaced
throughout the text and should preferably be 4,000 to 5,000 words. It is requested
that manuscripts be sent by e-mail or on a CD, accompanied with a hard copy.
The paper should be in the following order: Title; Author(s); Address(es);
Abstract; Introduction; Materials and methods (if any); Results; Discussions (if
any); Acknowledgements and References.
Tables to be included should have a heading, giving the substance, and should be
typed double-spaced on separate sheets. They should also be numbered in serial
order. Figures either drawn manually or by computer should be in black ink and
the lettering on them should be large enough to stand reduction. Photographs in
colour should have sharp contrast. Legends for figures and plates should be typed
in numerical order on separate sheets, one for figures and one for plates.
References to the literature cited should list the author's name, year of publication,
title of the paper, and the Journal titles which should be cited in full (no
abbreviation) with volume, number and page number, as indicated below:
For articles in a Journal
Walsh, J.E. 2008. Climate of the Arctic Marine Environment. Ecological
Applications. 18. pp. 3-22.
For two or more authors
Bejder, L., Dawson, S.M. and Harraway, J.A. 1999. Responses by Hectors's
dolphins to boats and swimmers in Porpoise Bay, New Zealand. Marine Mammal
Science. 15. pp. 738-750.
For BooksWard, D.R. 2002. Water Wars: drought, floods, folly and politics of thirst: Riverhead Books. New York. p. 12.
Chapter in a book:Andrews, T.J., Clough, B.F. and Muller, G.J. 1984. Photosynthetic gas exchange properties and carbon isotope ratios of some mangroves in North Queensland. In: H.J. Teas (Ed.), Physiology and Management of Mangroves. W. Junk. The Hague. pp. 15-23.
From websiteNational Oceans and Atmospheric Administration (NOAA). 1995. Regional Perspectives: IndianOcean.www.ncdc.noaa.gov/paleo.outreach/coral/ sor/sor_indian.html , accessed on July 13, 2008.
While giving reference of more than two authors in the text, after, the name of the first author, et al. should be used, followed by the year of publication.
Articles are to be referred before publication. Proofs are edited in-house and may be sent back to the authors for only major changes, addition or deletion.
Copies of the Journal will be sent to the authors after publication.
Journal of Coastal Environment(Bi-Annual Journal)
SUBSCRIPTION ORDER FORM
Name:
Address:
Pin
Tel: Fax:
E-mail:
Payment Enclosed DD/Cheque No. dated drawn in favour of the Centre
for Ocean and Environmental Studies for Rs. / US$ payable
at New Delhi.
Signature Date
(Please add Rs.50/- for Outstation Cheques and allow 4 weeks for
delivery of first issue)
New Renewal
Published byCentre for Ocean and Environmental Studies
A-2, East of Kailash, New Delhi 110 065, IndiaTel.: 91-11-46078340
Website: www.coes-india.orgE-mail: [email protected]; [email protected]
SUBSCRIPTION RATES
INDIVIDUAL COPY
Inland ForeignRs. 200/- US$ 40
ANNUAL SUBSCRIPTION(2 Issues Per Year)
Individuals ForeignRs. 400/- US$ 100
InstitutionsRs.600/-
ADVERTISEMENT RATES
Full Page
Colour : Rs. 30,000.00Black/White : Rs. 20,000.00
Half Page
Colour : Rs. 15,000.00Black/White : Rs. 10,000.00
(Four weeks to be allowed after submission of advertising material)

Edited and Published by S.Z. Qasim for the Centre for Ocean and Environmental Studies, New Delhi
Typeset and Printed by DezineHut : [email protected] • 98112 38475
Journal of Coastal EnvironmentVol. 4, No. 1, 2013
C o n t e n t s
Cover page - Corals : Halt the degradation of this ecosystem.Source : www.eco-generation.org/file/corals.jpg
Enhancement of Phytoplankton Community 1
of Brackishwater System by Iron Fertilization
Sufia Zaman, Subhro Bikash Bhattacharyya,
Md. Aftab Alam, Harekrishna Jana, Mahua Roy Chowdhury, Subhasmita Sinha, Kunal Mondal and Abhijit Mitra
Marine Organisms and their Adaptation 15
Maria-Judith Gonsalves, Anindita Das
and P.A. Loka Bharathi
Incidence and Consequences of Mangrove 23
Exploitation in the Sunderbans
Sharmila Chandra
Vulnerable Scleractinians Corals from 37
Andaman and Nicobar Islands
Tamal Mondal, C. Raghunathan and K. Venkataraman
Socio Economic Impact of Natural 51
Disasters : A Case Study of Orissa
B. Ramaswamy, Manvendra Bhattacharya and P. C. Sinha
Discovery of a New Species of Clams in 67
Coral Rubbles of Andaman and Nicobar Islands
V. Madhan Chakkaravarthy
Studies on Biology and Feeding Habit of Puffer 73
Fish Species from South Andaman Sea
Pravin Kumar, J. K. Mishra, Ysamin and C. Santosh Kumar