Journal of Anatolian Environmental and Animal Sciences
105
E-ISSN 2548-0006 JAES AÇEH 781 Anadolu Çevre ve Hayvancılık Bilimleri Dergisi Journal of Anatolian Environmental and Animal Sciences Cilt/ Volume 5 • Sayı/ Number 5 • 2020 ÖZEL SAYI / SUPPLEMENT
-
Upload
khangminh22 -
Category
Documents
-
view
0 -
download
0
Transcript of Journal of Anatolian Environmental and Animal Sciences

E-ISSN 2548-0006
JAES AÇEH
781
Anadolu Çevre ve Hayvancılık
Bilimleri Dergisi
Journal of Anatolian Environmental and Animal Sciences
Cilt/Volume 5 • Sayı/Number 5 • 2020
ÖZEL SAYI / SUPPLEMENT

782
Sahibi
Prof. Dr. Bülent VEREP
Prof. Dr. Fikri BALTA
Sorumlu Yazı İşleri Müdürü Baş Editör / Editor-in Chief
Prof. Dr. Bülent VEREP
Recep Tayyip Üniversitesi, Su Ürünleri Fakültesi Temel Bilimler Bölümü, Deniz Biyolojisi Anabilim Dalı, 53100 Rize, Türkiye
Baş Editör Yardımcıları / Co-Editor in Chief
Prof. Dr. Fikri BALTA
Prof. Dr. Turan YÜKSEK Recep Tayyip Erdoğan Üniversitesi, Su Ürünleri Fakültesi, Su Ürünleri Yetiştiriciliği Bölümü, Hastalıklar Anabilim Dalı, Türkiye
Recep Tayyip Erdoğan Üniversitesi, Güzel Sanatlar Tasarım ve Mimarlık Fakültesi, Bitki Materyali ve Yetiştiriciliği Anabilim Dalı, Türkiye
Editör Yardımcıları / Co-Editors
Prof. Dr. Nüket SIVRI, İstanbul Universitesi-Cerrahpaşa, Mühendislik Fakültesi
Prof. Dr. Arzu Funda BAĞCIGİL, İstanbul Üniversitesi -Cerrahpaşa, Veterinerlik Fakültes Prof. Dr. Alper ÇİFTCİ, Ondokuz Mayıs Üniversitesi, Veteriner Fakültesi
Prof. Dr. Süleyman AKHAN, Akdeniz Üniversitesi, Su Ürünleri Fakültesi
Doç. Dr. Tamer AKKAN, Giresun Üniversitesi, Fen-Edebiyat Fakültesi Doç. Dr. Engin Derya GEZER, Karadeniz Teknik Ü, Orman Fakültesi,
Editörler Kurulu / Editorial Boards
Prof. Dr. Ahmet ALP, Kahramanmaraş Sütçü İmam Üniversitesi, Ziraat Fakültesi
Prof. Dr. Athanasios KUNGOLOS, School of Engineering, Aristotle Univ. of Thessaloniki, Greece Prof. Dr. Cemalettin ŞAHİN, Recep Tayyip Erdoğan Üniversitesi, Su Ürünleri Fakültesi Prof. Dr. Davut TURAN, Recep Tayyip Erdoğan Üniversitesi, Su Ürünleri Fakültesi Prof. Dr. Gökhan ABAY, Recep Tayyip Erdoğan Üniversitesi, Güzel San. Tas. ve Mim. Fakültesi Prof. Dr. Gülay ÇİFTCİ, Ondokuz May ıs Üniversitesi, Veteriner Fakültesi
Prof. Dr. Ilia TSACHEV, Trakia University Faculty of Veterinary Medicine Prof. Dr. İhsan AKYURT, Giresun Üniversitesi, Fen Edebiyat Fakültesi (Emekli Öğretim Üyesi) Prof. Dr. İlkay Erdoğan ORHAN, Gazi Üniversitesi, Eczacılık Fakültesi Prof. Dr. Jinho JUNG, Korea University Env. Sci. and Eco. Eng. Prof. Dr. Levent BAT, Sinop Üniversitesi, Su Ürünleri Fakültesi
Prof. Dr. Mehmet Salih ÇELİKKALE, KTÜ Deniz Bilimleri Fakültesi (Emekli Öğretim Üyesi) Prof. Dr. Muhammed TÜRKOĞLU Çanakkale 18 Mart Üniversitesi, Deniz Bil. ve Tek. Fakültesi Prof. Dr. Muhammet BORAN, Karadeniz Teknik Üniversitesi, Deniz Bilimleri Fakültesi Prof. Dr. Mustafa TÜRKMEN, Giresun Üniversitesi, Fen Edebiyat Fakültesi Prof. Dr. Nurhayat ÖZDEMİR, Recep Tayyip Erdoğan Üniversitesi, Fen-Edebiyat Fakültesi
Prof. Dr. Nadir Başçınar, Karadeniz Teknik Üniversitesi, Deniz Bilimleri Fakültesi Prof. Dr. Orhan Karslı, Recep Tayyip Erdoğan Üniversitesi, Mühendislik Fakültesi Prof. Dr. Önder YILDIRIM, Muğla Sıtkı Koçman Üniversitesi, Su Ürünleri Fakültesi Prof. Dr. Ricardo PEREZ ENRİQUEZ, Genetica Acuicola Programa de Acuicultura Centro de
Investigaciones Biologicas del Noroeste Mexico.
Prof. Dr. Semih ENGİN İzmir Kâtip Çelebi Üniversitesi, Su Ürünleri Fakültesi Prof. Dr. Şengül A. KARAOĞLU, Recep TAyyip Erdoğan Üniversitesi, Fen-Edebiyat Fakültesi Prof. Dr. Şenol AKIN, Gaziosmanpaşa Üniversitesi, Ziraat Fakültesi Prof. Dr. Şevki Kay ış Recep Tayyip Erdoğan Üniversitesi, Su Ürünleri Fakültesi Prof. Dr. Vagif ATAMOV, Recep Tayyip Erdoğan Üniversitesi, Fen Edebiyat Fakültesi
Doç. Dr. Cengiz MUTLU, Giresun Üniversitesi Fen Edebiyat Fakültesi, Biyoloj i Bölümü Doç. Dr. Emre ÇAĞLAK, Recep Tayyip Erdoğan Üniversitesi, Su Ürünleri Fakültesi Doç. Dr. Ertuğrul AĞIRBAŞ, Recep Tayyip Erdoğan Üniversitesi, Su Ürünleri Fakültesi Doç. Dr. Ertan Emek ONUK, Ondokuz May ıs Üniversitesi, Veteriner Fakültesi Doç. Dr. Ferhat KALAYCI, Recep Tayyip Erdoğan Üniversitesi, Su Ürünleri Fakültesi
Doç. Dr. Gökmen Zafer PEKMEZCİ, Ondokuz May ıs Üniversitesi, Veteriner Fakültesi Doç. Dr. Huriye Arıman Karabulut, Recep Tayyip Erdoğan Üniversitesi, Su ürünleri Fakültesi Doç. Dr. İlker Zeki KURTOĞLU, Recep Tayyip Erdoğan Üniversitesi, Su Ürünleri Fakültesi Doç. Dr. Serkan KORAL, İzmir Kâtip Çelebi Üniversitesi, Su Ürünleri Fakültesi Doç. Dr. Mehmet AYDIN, Ordu Üniversitesi, Deniz Bilimleri Fakültesi
Doç. Dr. Yusuf BEKTAŞ, Recep Tayyip Erdoğan Üniversitesi, Su Ürünleri Fakültesi Dr. Ertuğrul TERZİ, Recep Tayyip Erdoğan Üniversitesi, Su Ürünleri Fakültesi Dr. Christina EMMANOUİL, Aristotle University of Thessaloniki School of Engineering Dr. Tuba ERGÜL KALAYCI, Recep Tayyip Erdoğan Üniversitesi, Fen Edebiyat Fakültesi
Bölüm Editörleri / Section Editors Prof. Dr. Ali BİLGİN, Recep Tayyip Erdoğan Üniversitesi, Fen Edebiyat Fakültesi Prof. Dr. Ahmet Mutlu GÖZLER, Recep Tayyip Erdoğan Üniversitesi, Su Ürünleri Fakültesi
Prof. Dr. Erol ÇAPKIN, Karadeniz Teknik Üniversitesi, Deniz Bilimleri Fakültesi Prof. Dr. Fatih İSLAMOĞLU, Recep Tayyip Erdoğan Üniversitesi, Fen Edebiyat Fakültesi Prof. Dr. Nadir Başçınar, Karadeniz Teknik Üniversitesi, Deniz Bilimleri Fakültesi Prof. Dr. Ramazan SEREZLİ, İzmir Kâtip Çelebi Üniversitesi, Su Ürünleri Fakültesi Prof. Dr. Serhat KÜÇÜKALİ, Çankaya Üniversitesi, Mühendislik Fakültesi
Prof. Dr. Temel ŞAHİN, Recep Tayyip Erdoğan Üniversitesi, Denizcilik Fakültesi Doç. Dr. Aysun TÜRKMEN, Giresun Üniversitesi, Teknik Bilimler MYO Doç. Dr. Cemalettin BALTACI, Gümüşhane Üniversitesi, Gıda Bilimleri ve Mühendisliği Doç. Dr. Çoşkun ERÜZ, Karadeniz Teknik Üniversitesi, Deniz Bilimleri Fakültesi Doç. Dr. Ekrem Şanver ÇELİK, Çanakkale Onsekiz Mart Üniversitesi, Deniz Bil. ve Tek. Fakültesi
Doç. Dr. Ayşegül ÇEBi, Giresun Universitesi, Sağlık Bilimleri Fakültesi Doç. Dr. Fatih Şaban Beriş, Recep Tayyip Erdoğan Üniversitesi Fen Edebiyat Fakültesi Doç. Dr. Hacer EMİRAL Karadeniz Teknik Üniversitesi, Deniz Bilimleri Fakültesi Doç. Dr. İlhan YANDI, Recep Tayyip Erdoğan Üniversitesi, Denizcilik Fakültesi Doç. Dr. Kenan GEDİK, Recep Tayyip Erdoğan Üniversitesi, Su Ürünleri Fakültesi
Doç. Dr. M. Mustafa AKİNER Recep Tayyip Erdoğan Üniversitesi, Fen Edebiyat Fakültesi Doç. Dr. Rahşan Evren MAZLUM, , Recep Tayyip Erdoğan Üniversitesi, Su Ürünleri Fakültesi Doç. Dr. Tülay ÇAĞATAY, Akdeniz Üniversitesi, Su Ürünleri Fakültesi Doç. Dr. Ülgen AYTAN, Recep Tayyip Erdoğan Üniversitesi, Su Ürünleri Fakültesi Doç. Dr. Ahmet Raif ERYAŞAR, Recep Tayyip Erdoğan Üniversitesi, Su Ürünleri Fakültesi
Doç. Dr. Gülbin FİRİDİN GAZİ ÜNİVERSİTESİ, Fen bilimleri enstitüsü, Çevre ABD. Dr. Arzu AYDIN UNCUMUSAOĞLU, Giresun Üniversitesi, Çevre Mühendisliği Dr. Şükrü ÖNALAN, Van Yüzüncü Yıl Üniversitesi, Su Ürünleri Fakültesi Dr. Muhammed DUMAN, Uludağ Üniversitesi, Veteriner Fakültesi Dr. Erhan ÇİLOĞLU, Recep Tayyip Erdoğan Üniversitesi, Denizcilik Fakültesi
Dr. Engin Derya GEZER, Karadeniz Teknik Üniversitesi, Orman Fakültesi Dr. Fatma Delihasan SONAY, Recep Tayyip Erdoğan Üniversitesi, Su Ürünleri Fakültesi Dr. Gökhan KALAYCI, Recep Tayyip Erdoğan Üniversitesi, Su Ürünleri Fakültesi Dr. Hakan KARAOĞLU, Recep Tayyip Erdoğan Üniversitesi, Su Ürünleri Fakültesi Dr. Koray ÖZŞEKER, Karadeniz Teknik Üniversitesi, Deniz Bilimleri Enstitüsü
Dr. Oğuz KURDOĞLU, Karadeniz Teknik Üniversitesi, Orman Fakültesi Dr. Ayşe DEMİRBAŞ, Recep Tayyip Erdoğan Üniversitesi, Su Ürünleri Fakültesi Dr. Münevver ORAL, Recep Tayyip Erdoğan Üniversitesi, Su Ürünleri Fakültesi Dr. Öğ. Üyesi Salih KUMRU, Recep Tayyip Erdoğan Üniversitesi, Su Ürünleri Fakültesi Dr. Öğ. Üyesi Şafak KALINDAMAR, Ordu Üniversitesi, Fen Edebiyat Fakültesi
Dr. Ömer Lütfü ÇORBACI, Recep Tayyip Erdoğan Üniversitesi, Güzel San. Tas. ve Mim. Fakültesi Nimet Selda BAŞCINAR, Su Ürünleri Merkez Araştırma Enstitüsü
Yönetim Yeri Adres / Address Recep Tayyip Erdoğan Üniversitesi, Su Ürünleri Fakültesi, Zihni Derin Yerleşkesi, Fener Mah., 53100, Rize / Turkey.
Tel: 90 464 223 33 85-1438 ve 1436
Fax: 90 464 223 41 18 İletişim: [email protected], [email protected]
Yayın Türü: Yaygın süreli ve hakemli
Tüm hakları saklıdır. Bu Derginin tamamı ya da Dergide yer alan bil imsel çalışmaların bir kısmı ya da tamamı 5846 sayılı yasanın hükümlerine göre Anadolu Çevre ve Hayvancılık
Bilimleri Dergisi sahibi yazılı izni olmaksızın elektronik, mekanik, fotokopi ya da herhangi bir kayıt sistemiyle çoğaltılamaz, yayımlanamaz. İnternet Adreslerimiz / Web Addresses
http://dergipark.gov.tr/jaes
Journal of Anatolian Environmental and Animal Sciences
Cilt /Volume: 5, Sayı / Number: 5, Yıl / Year: 2020 (Anadolu Çevre ve Hayvancılık Bilimleri Dergisi)
Dört ayda bir yayımlanır / Published every four months. E-ISSN: 2548-0006
JAES AÇEH

783
İÇİNDEKİLER (ÖZEL SAYI) / TABLE OF CONTENTS (SUPPLEMENT)
İçindekiler/Contents
Makale/Articl
e
S/P. No
781-784
Prediction of retention level and mechanical strength of plywood treated with fire retardant chemicals by artificial neural networks.
Yangın geciktirici kimyasallarla emprenye edilmiş kontrplakların retensiyon miktarları ve mekanik dirençlerinin yapay sinir ağları ile tahmin edilmesi .
Şükrü ÖZŞAHİN, Aydın DEMİR & İsmail AYDIN
Research
Araştırma
785-792
Investigation of The Effect of Building Material Selection and Design Style on Kiln Thermal Properties in Solar Kilns.
Güneş Fırınlarında Yapı Malzemesi Seçimi ve Tasarım Stilinin Fırın Isıl Özelliklerine Etkisinin İncelenmesi.
Kemal ÜÇÜNCÜ & Aytaç AYDIN
Research
Araştırma
793-797
A scale development study to examine the application of total quality management.
Toplam kalite yönetimi uygulamalarının incelemesine yönelik bir ölçek geliştirme çalışması.
Aytaç AYDIN & Kemal ÜÇÜNCÜ
Research
Araştırma
798-801
Woodloverness As a Pathway to Civilization Connected with Nature.
Doğayla Bağlantılı Medeniyete Giden Bir Yol Olarak Ahşapseverlik.
İlker USTA
Research
Araştırma
802-806
Multicriteria evaluation of structural composite lumber products.
Yapısal kompozit kereste ürünlerinin çok kriterli değerlendirilmesi.
Hilal SİNGER & Şükrü ÖZŞAHİN
Research
Araştırma
807-813
Paper and paper products and wood and wood products sectors competition analysis: BRICS countries and Turkey .
Kağıt-kağıt ürünleri sanayi ve ahşap-ahşap ürünleri sanayi sektöründe rekabet analizi: BRICS ülkeleri ve Türkiye.
Kadri Cemil AKYÜZ & İlker AKYÜZ
Research
Araştırma
814-818
Structural Performance Analysis of Cross Laminated Timber (CLT) Produced From Pine and Spruce Grown in Turkey.
Türkiye’de Yetiştirilen Sarıçam ve Doğu Ladininden Üretilen Çapraz Lamine Ahşap (CLT) Yapısal Performans Analizi.
Abdullah Uğur BİRİNCİ, Hasan ÖZTÜRK, Cenk DEMİRKIR & Gürsel OLAKOĞLU
Research
Araştırma
819-824
The effects of polystyrene species and fiber direction on thermal conductivity of plywood.
Polistiren türü ve lif yönünün kontrplakların isıl iletkenliği üzerine etkisi.
Abdullah Uğur BİRİNCİ, Hasan ÖZTÜRK, Duygu YÜCESOY & Cenk DEMİRKIR
Research
Araştırma
825-828
Chemical changes in historical wooden structures in Rize-Fırtına Valley.
Rize- Fırtına Vadisindeki tarihi ahşap yapılardaki kimyasal değişimlerin tespiti.
Engin Derya GEZER & Büşra AYDOĞAN SELÇUK
Research
Araştırma
829-832
Emissions from drying in the wood based board industry.
Ahşap esaslı levha sektöründe kurutma kaynaklı emisyonlar.
Uğur BİLGİN, Semra ÇOLAK & Gürsel ÇOLAKOĞLU
Research
Araştırma
833-840
An Assessment of Carbon Footprint in MDF Manufacturing: A Case Study of Wood Based Panel Production in Turkey.
MDF Üretimindeki Karbon Ayak İzinin Değerlendirilmesi: Türkiye’de Odun Bazlı Levha Üretimi Üzerine Bir Örnek Çalışma.
Mehtap ERDİL & Nural YILGOR
Research
Araştırma
841-848
The Problems of Furniture Sector and Suggestions for Solutions (A Case Study of Van).
Mobilya Sektörünün Sorunları ve Çözüm Önerileri (Van İli Örneği).
Göksel ULAY
Research
Araştırma
849-857
Effect of Pre-Treatments on Wear Index of Varnished Wood Plastic Composites (WPC) With Pigmented.
P igmentli Vernikli Ahşap Plastik Kompozitlerin (WPC) Aşınma İndeksi Üzerine Ön İşlemlerin Etkisi.
Turgay ÖZDEMIR, Fatih MENGELOĞLU & Engin Derya GEZER
Research
Araştırma
858-862
Mechanical Properties of Wood Members in Santa Maria Church.
Santa Maria Kilisesindeki Ahşap Taşıyıcıların Mekanik Özellikleri.
Engin Derya GEZER, Cenk DEMİRKIR & Turgay ÖZDEMİR
Research
Araştırma
863-866
A Study on The Biomass Energy Potential of Turkey: Example of Wood Pellets.
Türkiye’nin Biyokütle Enerji Potansiyeli Üzerine Bir Araştırma: Odun Peleti Örneği.
Devlet TOKSOY & Semra ÇOLAK & Mahmut M. BAYRAMOĞLU
Research
Araştırma
867-871
Situation of Forest Carbon Projects in Carbon Markets.
Karbon Piyasalarında Ormancılık Karbon Projelerinin Durumu.
Devlet TOKSOY, Çiğdem ÖZTEKİN & Mahmut M. BAYRAMOĞLU
Research
Araştırma
872-881
Decay Resistance of Weathered Beech Wood.
Yaşlandırılmış Kayın Odununun Mantar Çürüklük Dayanımı.
Şebnem Sevil ARPACI, Merve CAMBAZOĞLU & Eylem DİZMAN TOMAK
Research
Araştırma
882-885
Journal of Anatolian Environmental and Animal Sciences
Cilt /Volume: 5, Sayı / Number: 5, Yıl / Year: 2020
(Anadolu Çevre ve Hayvancılık Bilimleri Dergisi) Dört ayda bir yayımlanır / Published every four months.
E-ISSN: 2548-0006
JAES AÇEH
Bu dergi ASOS index, Bielefeld Academic Search Engine (BASE), CiteFactor, DRJI, Google Scholar, Index Copernicus, JournalTOCs, OpenAIRE,
ProQuest, ROAD, Scientific Indexing Services, TR Dizin, Türkiye Atıf Dizini, WorldCAT indeksleri tarafından taranmaktadır.
This journal is indexed and abstracted in; ASOS index, Bielefeld Academic Search Engine (BASE), CiteFactor, DRJI, Google Scholar, Index Copernicus,
JournalTOCs, OpenAIRE, ProQuest, ROAD, Scientific Indexing Services, TR Dizin, Türkiye Atıf Dizini, WorldCAT.

784
Journal of Anatolian Environmental and Animal Sciences
Cilt /Volume: 5, Sayı / Number: 5, Yıl / Year: 2020
(Anadolu Çevre ve Hayvancılık Bilimleri Dergisi) Dört ayda bir yayımlanır / Published every four months.
E-ISSN: 2548-0006
JAES AÇEH
Cilt/Volume 5 • Sayı/Number 5 • 2020
ÖZEL SAYI / SUPPLEMENT
FOREWORD
This special issue of Journal of Anatolian Environmental and Animal Sciences contains extended versions of
selected papers of the ORENKO 2018 – International Forest Products Congress held on September 26‐29, 2018 in
Trabzon, Turkey. The congress, organized by the Department of Forest Industry Engineering at Karadeniz Technical
University, has received about 200 abstracts from all over the world including United States, Canada, Australia, Slovenia,
Slovakia, Serbia, Romania, Poland, South Korea, Italy, Iraq, Iran, Czech Republic, China, Chile, Bulgaria, Sweden,
Bangladesh and Turkey. After an initial review of the submitted abstracts, about 180 abstracts were accepted for both oral
and poster presentation.
The purpose of this congress was to provide an up‐to‐date discussion in the field of forest products in general.
ORENKO 2018 was focused on the theme "Outlining the Forefront Research in The Field of Wood Science and
Engineering". The topics that covered in the congress include wood science, technology and engineering, wood and
wood‐based products, wood anatomy, wood raw materials, wood composites, wood‐plastic composites, engineered wood
products, wood drying, biomaterials, wood constructions, physico‐mechanical properties of woo d and wood‐based
materials, nanotechnology applications in wood science, nondestructive evaluation of wood, sustainable utilization of forest
products, wood preservation, wood modification, wood biomass, wood‐inhabiting insects and fungi, marine borers,
recycle/reuse/disposal of wood and wood based materials, non‐wood forest products, wood chemistry, adhesives and
bioresins, formaldehyde and VOC emission from wood based panels, pulp and paper, advanced cellulosic products, fiber
resources from non‐woody plants, furniture design and manufacturing, wood coatings, wood finishing, archaeological
wooden structures, industry 4.0 in forest products industry, forest products economics, forest products marketing,
production management and operational research, artificial intelligence in forest product industry, forest products
ergonomics, environmental and ecological issues in forest products and occupational health and safety in forest products
industry.
We would like to thank to all person of the organizing committee who have dedicated their constant support and
countless time to organize this congress. The ORENKO 2018 is a credit to a large group of people, and everyone should be
proud of outcome. We would also like to take this opportunity to express our sincere gratitude and thanks to our congress
sponsors once again. Without their supports, it would not have been possible for us to organize this congress successfully.
Finally, we would like to specially thank to Prof. Dr. Bülent VEREP, Editor in Chief of the journ al and Co-Editors
in Chiefs Prof. Dr. Fikri BALTA and Prof. Dr. Turan YÜKSEK for providing an opportunity to bring out this special issue
which composed of some selected papers of the conference.
Assoc. Prof. Dr. Engin Derya GEZER, Section Editor of the JAES
Chair of the ORENKO 2018 Congress

Journal of Anatolian Environmental and Animal Sciences
(Anadolu Çevre ve Hayvancılık Bilimleri Dergisi) DOI: https://doi.org/10.35229/jaes.825435
JAES Year: 5, No: 5, 2020 (785-792)
AÇEH Yıl: 5, Sayı: 5, 2020 (785-792)
ARAŞTIRMA MAKALESİ RESEARCH PAPER
785
Prediction of Retention Level and Mechanical Strength of Plywood Treated with
Fire Retardant Chemicals by Artificial Neural Networks
Şükrü ÖZŞAHİN1 Aydın DEMİR2* İsmail AYDIN2 1 Karadeniz Technical University, Department of Industrial Engineering Kanuni Campus, Trabzon/Türkiye
2* Karadeniz Technical University, Department of Forest Industry Engineering Kanuni Campus, Trabzon/Türkiye
Geliş/Received: 13.11.2020 Kabul/Accepted: 25.11.2020
How to cite: Özşahin, Ş., Demir, A. & Aydın, İ. (2020). Prediction of retention level and mechanical strength of plywood treated with fire retardant chemicals
by artificial neural networks. J. Anatolian Env. and Anim. Sciences, 5(5), 785-792.
Atıf yapmak için: Özşahin, Ş., Demir, A. & Aydın, İ. (2020). Yangın geciktirici kimyasallarla emprenye edilmiş kontrplakların retensiyon miktarları ve
mekanik dirençlerinin yapay sinir ağları ile tahmin edilmesi. Anadolu Çev. ve Hay. Dergisi, 5(5), 785-792.
Abstract: The treatment with fire-retardant chemicals is the most effective process to protect wood and wood-based products from fire is. Therefore, use of fire-retardant chemicals has been increased. However, the fire-retardant chemicals have an effect on other physical, mechanical and some technological properties of the materials treated with them. In this study, firstly, the
retention level prediction model was developed with the artificial neural network (ANN) to examine the effects of wood species and concentration aqueous solution on the retention levels of veneers. Then, the effects of wood species, concentration aqueous solution and retention level on the mechanical properties of plywood were investigated with the mechanical strength prediction model developed with ANN. The prediction models with the best performance were determined by statistical and graphical comparisons. It has been observed that ANN models yielded very satisfactory results with acceptable deviations. As a result, the findings of this study could be employed effectively into the forest products industry to reduce time, energy and cost
for empirical investigations.
Keywords: Artificial Neural Network, concentration, fire-retardant, mechanical properties, plywood,
retention level.
Yangın Geciktirici Kimyasallarla Emprenye Edilmiş Kontrplakların Retensiyon
Miktarları ve Mekanik Dirençlerinin Yapay Sinir Ağları ile Tahmin Edilmesi
Öz: Yangın geciktirici kimyasallar ile emprenye işlemi, ahşap ve ahşap esaslı ürünlerin yangından korunmasında çok etkili bir işlemdir. Bu yüzden, yangın geciktirici kimyasalların kullanımı tüm dünyada artmaktadır. Ancak, yangın geciktirici kimyasallar, uygulanmış oldukları malzemelerin fiziksel, mekanik ve diğer bazı teknolojik özellikleri üzerinde bir etkiye neden olmaktadır. Bu çalışmada ilk olarak, ağaç türlerinin ve konsantrasyon miktarlarının kaplamaların retensiyon miktarları üzerindeki etkilerini incelemek için yapay sinir ağı (YSA) ile retensiyon
miktarı tahmin modeli geliştirilmiştir. Daha sonra YSA ile geliştirilen mekanik direnç tahmin modeli ile ağaç türleri, konsantrasyon miktarları ve retensiyon miktarlarının kontrplağın mekanik özelliklerine etkileri araştırılmıştır. En iyi performansa sahip tahmin modelleri, istatistiksel ve grafiksel karşılaştırmalarla belirlenmiştir. YSA modellerinin kabul edilebilir sapmalarla oldukça tatmin edici sonuçlar verdiği görülmüştür. Sonuç olarak, bu çalışmanın bulguları, deneysel araştırmalar için zaman, enerji ve maliyeti azaltmak için orman ürünleri endüstrisinde etkin bir şekilde kullanılabilecektir.
Anahtar kelimeler: Konsantrasyon, kontrplak, mekanik özellikler, retensiyon miktarı, yangın geciktirici,
yapay sinir ağları.
: https://orcid.org/0000-0001-8216-0048
* : https://orcid.org/0000-0003-4060-2578
: https://orcid.org/0000-0003-0152-7501
*Corresponding author’s:
Aydın DEMİR
Karadeniz Technical University, Department
of Industrial Engineering Kanuni Campus,
Trabzon, Turkey.
Mobile telephone: +90 (538) 790 39 34
Telephone : +90 (462) 377 15 60
Fax : +90 (462) 325 74 99
*Sorumlu yazarın:
Aydın DEMİR
Karadeniz Teknik Üniversitesi Orman
Fakültesi Orman Endüstri Mühendisliği
Bölümü, Kanuni Kampusü Trabzon, Türkiye
Cep telefonu : +90 (538) 790 39 34
Telefon : +90 (462) 377 15 60
Faks : +90 (462) 325 74 99

Özşahin et al., 5(5), 785-792, (2020) J. Anatolian Env. and Anim. Sciences, Yıl:5, No:5, (785-792), 2020
786
INTRODUCTION
Wood and wood-based panels have long used a
material in the construction industry because they have a
great durability, high strength and versatility (Stevens et
al., 2006). Plywood, being a wood-based product, one of
the most important building and furniture materials (Fateh
et al., 2013). Plywood has some advantages when
compared to solid wood and other wood panels. Physical
properties of plywood are better than other wood panels.
Bending strength and screw holding capacity of plywood
is very high, and it is resistant to deformation disorders
such as distortion or twisting. Since plywood has a
homogeneous structure, its shrinkage and expansion are
much less than solid wood. There are some unfavorable
characteristics of the plywood similar to wood and other
wood-based composite panels. It can be combusted easily,
and this is one of the undesired characteristics of plywood
(Ozkaya et al., 2007).
The flammability and combustibility properties of
such a solid material can be reduced recommended several
treatments (Fateh et al., 2013). The treatment with fire-
retardant chemicals is the most effective process to protect
wood and wood-based products from fire is. Therefore, use
of fire-retardant chemicals has been increased. It has also
risen due to awareness of environmental protection and
consumer safety, requirement standards to flame retardants
have been raised accordingly. Moreover, capability and
properties of fire-retardant chemicals such as being
harmless to human, animals, and plants and less release of
smoke and toxic gases when burned are important
parameters for consumer to select a fire-retardant chemical.
It was also shown the fire-retardant chemicals have an
effect on other physical, mechanical and some
technological properties of the materials treated with them.
Inorganic based fire-retardant chemicals are extensively
used in forest industry because they have both good
thermal stability, less release of smoke, corrosive toxic
gases and less strength loss (Yao et al., 2012; He et al.,
2014).
Determination of the optimum concentration of
aqueous solution and retention level without further loss of
mechanical strength is also very important from industrial
view point. For this aim, a lot of concentration values need
to be tested to determine the optimum values that cause the
loss of much time and energy and high costs. Therefore, it
is important to find more economic methods providing
desirable results concerning technological properties
(Demirkir et al., 2013). Artificial neural networks (ANNs)
have been widely used in the field of wood (Esteban et al.,
2011). The neural network most commonly used is the
multilayer perception, whose nature as a universal function
approximation makes it a powerful tool for modelling
complex relations between variables (Fernandez et al.,
2012). ANNs are capable of processing information in a
parallel distributed manner, learning complex cause-and-
effect relationships between input and output data, dealing
with nonlinear problems, generalizing from known tasks or
examples to unknown tasks. ANNs are good for tasks
involving incomplete data sets, fuzzy or incomplete
information, and for highly complex and ill-defined
problems, where people usually decide on an intuitional
basis. Moreover, they can be faster, cheaper and more
adaptable than traditional methods (Ceylan, 2008; Ozsahin
and Aydin, 2014).
In this study, firstly, the retention level prediction
model was developed with the artificial neural network
(ANN) to examine the effects of wood species and
concentration aqueous solution on the retention levels of
veneers. Then, the effects of wood species, concentration
aqueous solution and retention level on the mechanical
properties of plywood were investigated with the
mechanical strength prediction model developed with
ANN.
MATERIALS AND METHOD
Data Collection: In this experimental study, 2
mm-thick rotary cut veneers with the dimensions of 500
mm by 500 mm were obtained from poplar (Populus
deltoides), alder (Alnus glutinosa subsp. barbata) and Scots
pine (Pinus sylvestris L.) logs. While the alder and poplar
veneers were manufactured from freshly cut logs, Scots
pine logs were steamed for 12 h before veneer production.
The horizontal opening between knife and nosebar was
85% of the veneer thickness, and the vertical opening was
0.5 mm in rotary cutting process. The veneers were then
dried to 6-8% moisture content in a veneer dryer. After
drying, veneer sheets were treated with some fire-retardant
chemicals. For this aim, 5, 7 and 10% aqueous solutions of
zinc borate, monoammonium phosphate (MAP) and
ammonium sulphate were used. The veneers were
subjected to re-drying process at 110°C after they
immersed in the fire-retardant solutions for 20 min. The
retention level for each treatment solution was calculated
with the following equation.
R = G×C
V× 10 kg/m3 (1)
Where
R = Retention level (kg/m3)
G = treatment solution absorbed by the sample (g)
C = preservative or preservative solution in 100 g treatment solution.
V = volume of sample in cm3
Three-ply-plywood panels with 6 mm thick were
manufactured by using urea formaldehyde resin. The
veneer sheets were conditioned to approximately 5–7%

Özşahin et al., 5(5), 785-792, (2020) J. Anatolian Env. and Anim. Sciences, Yıl:5, No:5, (785-792), 2020
787
moisture content in an acclimatization chamber before
gluing. The glue mixture was applied at a rate of 160 g/m2
to the single surface of veneer by using a four-roller glue
spreader. Hot press pressure was 12 kg/cm2 for alder and 8
kg/cm2 for scots pine and poplar panels while hot pressing
time and temperature were 6 min and 110°C, respectively.
Two replicate panels were manufactured for each test
groups.
The bonding strength of plywood panels was
determined according to EN 314-1 (1998) with a universal
testing machine. Samples manufactured with UF resin
were tested after immersion in water at 20°C for 24h. The
bending strength and modulus of elasticity of plywood
panels was determined according to EN 310 (1993) with a
universal testing machine.
Artificial Neural Network (ANN) Analysis: In
this study, the retention level and mechanical strength
values of plywood were modelled by ANN approach using
the data obtained from the literature. First, the change in
retention level was modelled depending on the wood
species and concentration of aqueous solution. Then,
modelling of the change in mechanical strength values
based on wood species, concentration of aqueous solution
and retention level values was carried out. The proposed
ANN models were designed by software developed using
the MATLAB Neural Network Toolbox. The data were
obtained from the experimental study. In order to examine
the effects of related variables on retention level and
mechanical strength values; the experimental data were
randomly and homogeneously grouped as training and test
data, different data sets were created and used to train
ANNs. Among these data, 18 samples were selected for
ANN training process, while the remaining 9 samples were
used to verify the generalization capability of ANN. The
data sets used in the training and prediction models are
shown in Table 1 and Table 2. The retention level and
mechanical strength values results obtained experimentally
also presented in Table 1 and Table 2, respectively.
The obtained predicted values as a result of the
testing process were compared with the real (measured)
values. The models providing the best prediction values
with respect to the root mean-square error (RMSE) ratio,
calculated with Eq. 2, the mean absolute percentage error
(MAPE) ratio, calculated with Eq. 3 and coefficient of
determination (R2) with Eq. 4 was chosen as the prediction
models.
N
i
ii tdtN 1
21RMSE (2) (2)
1001
MAPE1
N
i i
ii
t
tdt
N (3)
(3)
N
i
i
N
i
ii
tt
tdt
1
2
1
2
)(
)(
12R (4)
In Equations 2, 3 and 4, ti is the actual output
values, tdi is the neural network predicted values, and N is
the number of objects.
Table 1. Training and testing data set and retention level prediction models results.
Training Data
Wood Species
Fire-
Retardant
Chemicals
Concentration
Aqueous
Solution
(%)
Retention Level
(kg/m3)
Actual Predicted Error (%)
Poplar Zinc Borate 5 17.118 17.113 0.028
Poplar Zinc Borate 10 30.243 30.269 -0.084
Poplar MAP 5 11.233 11.298 -0.580
Poplar MAP 7 14.219 14.041 1.254
Poplar Ammonium
Sulphate
7 11.594 11.514 0.693
Poplar Ammonium
Sulphate
10 14.660 14.833 -1.183
Alder Zinc Borate 7 20.107 20.270 -0.809
Alder Zinc Borate 10 29.053 28.967 0.294
Alder MAP 5 10.233 10.238 -0.047
Alder MAP 10 18.601 18.565 0.194
Alder
Ammonium
Sulphate
5 9.781 9.520 2.664
Alder
Ammonium
Sulphate
7 11.350 11.559 -1.844
Scots pine Zinc Borate 5 13.800 13.824 -0.175
Scots pine Zinc Borate 7 19.915 19.907 0.040
Scots pine MAP 7 18.033 17.655 2.097
Scots pine MAP 10 23.402 23.979 -2.467
Scots pine
Ammonium
Sulphate
5 11.578 11.811 -2.010
Scots pine
Ammonium
Sulphate
10 24.993 24.548 1.779
MAPE 1.014
RMSE 0.230
Testing Data
Wood Species
Fire-
Retardant
Chemicals
Concentration
Aqueous
Solution
(%)
Retention Level
(kg/m3)
Actual Predicted Error (%)
Poplar Zinc Borate 7 20.854 21.648 -3.805
Poplar MAP 10 19.514 19.553 -0.200
Poplar
Ammonium
Sulphate
5 9.705
9.248 4.707
Alder Zinc Borate 5 16.324 15.980 2.110
Alder MAP 7 14.595 13.661 6.401
Alder
Ammonium
Sulphate
10 15.254
15.741 -3.192
Scots pine Zinc Borate 10 26.420 25.938 1.825
Scots pine MAP 5 12.689 13.656 -7.618
Scots pine
Ammonium
Sulphate
7 17.553
17.397 0.886
MAPE 3.416
RMSE 0.602
Figure 1 shows the ANN models containing one
input layer, one or two hidden layers and one output layer.
The selected ANN models represent the prediction models
that produced the closest values to the measured values for
the retention level, bonding strength, bending strength and
modulus of elasticity. First, the wood species and
concentration of aqueous solution were used as the input
variables, while the retention level values were used as the
output variable in the ANN models.

Özşahin et al., 5(5), 785-792, (2020) J. Anatolian Env. and Anim. Sciences, Yıl:5, No:5, (785-792), 2020
788
Table 2. Training and testing data set and mechanical strength prediction models results.
Training Data
Wood Species Fire-Retardant
Chemicals
C. Aqueous
Solution
(%)
Retention Level
(kg/m3)
Bonding Strength
(N/mm2)
Bending Strength
(N/mm2)
Modulus of Elasticity
(N/mm2)
Actual Predicted Error
(%) Actual Predicted
Error
(%) Actual Predicted
Error
(%)
Poplar Zinc Borate 5 17.118 1.421 1.425 -0.253 70.870 71.035 -0.233 4891.00 4881.46 0.195
Poplar Zinc Borate 10 30.243 1.235 1.243 -0.637 60.710 58.914 2.958 4368.00 4367.45 0.013
Poplar MAP 5 11.233 1.270 1.283 -1.011 71.840 71.984 -0.201 4969.00 5014.80 -0.922
Poplar MAP 7 14.219 1.231 1.232 -0.078 71.310 69.919 1.950 4948.00 4890.57 1.161
Poplar A. Sulphate 7 11.594 1.186 1.192 -0.542 61.670 61.877 -0.336 4596.00 4601.34 -0.116
Poplar A. Sulphate 10 14.660 1.170 1.180 -0.816 60.180 61.988 -3.004 4584.00 4601.07 -0.372
Alder Zinc Borate 7 20.107 1.882 1.890 -0.418 87.500 89.667 -2.476 7585.00 7736.28 -1.994
Alder Zinc Borate 10 29.053 1.871 1.875 -0.213 87.880 87.302 0.657 7577.00 7550.38 0.351
Alder MAP 5 10.233 2.158 2.171 -0.598 96.040 94.782 1.310 7897.00 7812.04 1.076
Alder MAP 10 18.601 1.593 1.621 -1.766 94.500 93.358 1.209 7744.00 7727.46 0.214
Alder A. Sulphate 5 9.781 1.909 1.903 0.290 92.120 90.815 1.416 7748.00 7694.74 0.687
Alder A. Sulphate 7 11.350 1.798 1.802 -0.206 91.710 93.882 -2.368 7678.00 7708.33 -0.395
Scots pine Zinc Borate 5 13.800 1.070 1.076 -0.556 64.860 63.995 1.334 4840.00 4840.23 -0.005
Scots pine Zinc Borate 7 19.915 1.032 1.031 0.106 63.680 62.573 1.739 4820.00 4820.08 -0.002
Scots pine MAP 7 18.033 0.798 0.807 -1.183 64.300 63.440 1.337 4757.00 4757.15 -0.003
Scots pine MAP 10 23.402 0.793 0.781 1.474 56.760 58.804 -3.602 3956.00 3956.26 -0.007
Scots pine A. Sulphate 5 11.578 0.876 0.880 -0.428 61.630 63.441 -2.938 4856.00 4856.19 -0.004
Scots pine A. Sulphate 10 24.993 0.734 0.741 -0.893 59.470 58.776 1.166 4716.00 4716.33 -0.007
MAPE 0.637 1.680 0.418
RMSE 0.010 1.364 47.522
Testing Data
Wood Species Fire-Retardant
Chemicals
C. Aqueous
Solution
(%)
Retention Level
(kg/m3)
Bonding Strength
(N/mm2)
Bending Strength
(N/mm2)
Modulus of Elasticity
(N/mm2)
Actual Predicted Error
(%) Actual Predicted
Error
(%) Actual Predicted
Error
(%)
Poplar Zinc Borate 7 20.854 1.370 1.341 2.105 64.040 65.975 -3.022 4516.00 4661.80 -3.228
Poplar MAP 10 19.514 1.168 1.197 -2.479 67.980 66.898 1.592 4703.00 4603.33 2.119
Poplar A. Sulphate 5 9.705 1.256 1.207 3.872 66.150 63.965 3.303 4610.00 4582.56 0.595
Alder Zinc Borate 5 16.324 1.956 2.111 -7.930 95.680 92.758 3.054 7819.00 7782.16 0.471
Alder MAP 7 14.595 1.779 1.757 1.227 95.120 93.448 1.758 7864.00 7753.48 1.405
Alder A. Sulphate 10 15.254 1.675 1.630 2.703 90.790 92.471 -1.852 7594.00 7683.04 -1.172
Scots pine Zinc Borate 10 26.420 0.962 0.952 1.068 58.230 58.832 -1.034 4267.00 4312.14 -1.058
Scots pine MAP 5 12.689 0.833 0.863 -3.574 64.960 63.694 1.949 4654.00 4823.35 -3.639
Scots pine A. Sulphate 7 17.553 0.759 0.768 -1.193 62.480 63.331 -1.362 4857.00 4894.73 -0.777
MAPE 2.906 2.103 1.607
RMSE 0.059 1.717 97.516
The processing element numbers (neurons) of the two hidden layers were 3-3 (first layer-second layer) for the models
in Figure 1. Then, the wood species, concentration of aqueous solution and retention level were used as the input variables,
while the bonding strength, bending strength and modulus of elasticity were used as the output variable in the ANN models.
The processing element numbers (neurons) of the two hidden layers were 3-3 (first layer-second layer), 3 and 2-3 (first layer-
second layer) for the models in Figure 1.
Figure 1. The ANN architecture selected as the prediction models.

Özşahin et al., 5(5), 785-792, (2020) J. Anatolian Env. and Anim. Sciences, Yıl:5, No:5, (785-792), 2020
789
A feed forward and back propagation multilayer ANN was used for solving problems, and the network
training and testing was carried out using the MATLAB
software package. In this study, the hyperbolic tangent
sigmoid function (tansig) and the linear transfer function
(purelin) were used as the activation transfer functions, the
levenberg marquardt algorithm (trainlm) was used as the
training algorithm, the gradient descent with a momentum
back propagation algorithm (traingdm) was used as the
learning rule, and the mean square error (MSE) with Eq. 5
was used as the performance function.
N
i
ii tdtN 1
21MSE (5) (5)
Where, ti is the actual output (targeted values), tdi
is the neural network output (predicted values), and N is the
total number of training patterns. To ensure an equal
contribution of each parameter in the models, the training
and test were normalized (-1, 1 range) due to the use of the
hyperbolic tangent sigmoid function in the models and
network, which allowed the data to be translated into the
original value, with a reverse normalizing process for the
interpretation of the results. The normalization (scaling)
operations were carried out by using Eq. 6.
1XX
XX×2=X
minmax
min
norm --
- (6)
Where, Xnorm is the normalized value of a variable
X (real value of the variable), and Xmax and Xmin are the
maximum and minimum values of X, respectively.
RESULTS AND DISCUSSION
ANN models were trained and tested with the data
obtained from the experimental results of Demir et al.
(2016). Change of retention level depending on the wood
species and concentration were modelled with obtained
network parameters. The amount of error variation
depending on iteration of the selected ANN was shown in
Figure 2. In addition, changes of bonding strength, bending
strength and modulus of elasticity depending on the wood
species, concentration and retention level were modelled
with obtained network parameters. The amount of error
variation depending on iteration of the selected ANN was
shown in Figure 2. The best training performance was
0.00049989 in the 154th iteration for retention level,
0.00019427 in the 14th iteration for bonding strength,
0.004826 in the 19th iteration for bending strength,
0.00058161 in the 500th iteration for modulus of elasticity.
Figure 3 and 4 show the relationship between the
real values and calculated values obtained by the prediction
models. The comparative plots of these values are given in
Figure 5.
Retention Level Bonding strength
Bending strength Modulus of Elasticity
Figure 2. A plot of error variation depending on iteration of the
ANNs.
Figure 3. The relationship between experimental results of
retention level and ANN predicted results.
In order to assess the validity of the networks and
their accuracy, it is often useful to perform regression
analysis between the network response and the
corresponding target. The regression curves of the output
variables for the experiment and ANN data set (training
and testing) are shown in Figure 3 (retention level, training
R = 0.99931; testing R = 0.99154) and Figure 4 (bonding
strength, training R = 0.99983; testing R = 0.99081,
bending strength, training R = 0.99506; testing R =
0.99371, modulus of elasticity, training R = 0.99818;
testing R = 0.99946). As the correlation coefficients
approach 1, prediction accuracy increases and indicates
good agreement between the experimental results and the
models prediction. This value supports the applicability of
using ANNs in the present study.
Comparisons of the results between the outcomes
of ANN modelling and experimental values for the
retention level, bonding strength, bending strength and
modulus of elasticity values are plotted in Figure 5. The
results of graphic comparisons showed similarities
between the experimental study and the ANN models and
supported the reliability of the models.

Özşahin et al., 5(5), 785-792, (2020) J. Anatolian Env. and Anim. Sciences, Yıl:5, No:5, (785-792), 2020
790
Training Data Testing Data B
on
din
g S
tren
gth
Ben
din
g S
tren
gth
Mo
du
lus
of
Ela
stic
ity
Figure 4. The relationship between experimental results of
mechanical strength and ANN predicted results.
The results indicate a consistent agreement
between the outcomes of the ANN modelling and the
experimental results. MAPE was used to evaluate the
performance of the proposed ANN in the prediction
technique. The maximum absolute percentage errors
(MAPE) for retention level, bonding strength, bending
strength and modulus of elasticity were 1.014, 0.637, 1.680
and 0.418 % for training and 3.416, 2.906, 2.103 and 1.607
%for testing, respectively. These levels of error are
satisfactory for the retention level, bonding strength,
bending strength and modulus of elasticity. As seen from
the results, the ANN approach has a sufficient accuracy
rate for the prediction of retention level, bonding strength,
bending strength and modulus of elasticity values of
plywood.
The intermediate values not obtained from the
experimental study for retention level, bonding strength,
bending strength and modulus of elasticity were predicted
from the designed ANN modelling. The retention level,
bonding strength, bending strength and modulus of
elasticity values predicted by the ANN models for different
concentration of aqueous solution are shown in Figure 6, 7,
8 and 9
Figure 5. The comparison of the real and calculated values.
Figure 6. The change of retention level with increasing concentration of aqueous solution.
The retention level increased with increasing
concentration aqueous solution according to Figure 6.
Among the fire-retardant chemicals, zinc borate caused
more increase in retention levels than the other chemicals
for all of wood species. In the first model, the retention
levels estimated depending on the concentration values and
in the second model the mechanical strength values were
estimated. As can be seen Figures 7-9, generally, the
mechanical properties of the panels can be adversely

Özşahin et al., 5(5), 785-792, (2020) J. Anatolian Env. and Anim. Sciences, Yıl:5, No:5, (785-792), 2020
791
influenced by increased concentrations of fire-retardants.
In literature, it was stated that the reasons for the reduction
in mechanical strength of fire-retardant plywood could be
related to the acidity of fire-retardant could influence the
strength of the veneers; The poor compatibility between
fire-retardant and UF adhesive and the fast curing rate of
the UF adhesive, accelerated by fire-retardant, could,
theoretically, prevent a direct and effective contact
between the veneer and the UF adhesive, and hence affect
the penetration of UF adhesive into the veneer (Cheng &
Wang, 2011). The second drying process performed after
the impregnation may also contributed to decrease in shear
strength. Aydin (2004) indicated that the impregnation
material layer in the form of crystal remaining on the
veneer surface after drying affected adversely wettability
with glue and so the mechanical strength values decreased.
Among the fire-retardant chemicals, zinc borate generally
caused less decrease in bonding strength than the other
chemicals for all of wood species. MAP generally caused
less decrease in bending strength and modulus of elasticity
than the other chemicals for all of wood species. However,
the less decrease for modulus of elasticity values of Scots
pine panels was obtain from ammonium sulphate.
The different changes of mechanical properties
were determined according to concentration of fire-
retardants in the ANN models. For example, while the
bending strength values of alder plywood treated with
ammonium sulphate showed a slight increase up to 7.5%
concentration, there was a slight increase in bending
resistance up to 6% concentration in the treatment process
with MAP. It is seen that the bending strength values of
scots pine plywood remain almost constant up to 8% in the
treatment process with ammonium sulphate, 7.5% in the
treatment with MAP and 6.5% in the treatment with zinc
borate (Figure 8). The modulus of elasticity of plywood
treated with ammonium sulphate remained almost constant
at all concentration values for poplar, up to 8% for alder
and 8.5% for scots pine. Similar results to ammonium
sulphate were obtained in the treatment process with zinc
borate in scots pine plywood (Figure 9)
Figure 7. The change of bonding strength with increasing concentration of aqueous solution.
Figure 8. The change of bending strength with increasing concentration of aqueous solution.
Figure 9. The change of modulus of elasticity with increasing concentration of aqueous solution.
At ANN design, some experimental results were used
for training and some others were used for testing (Table 1
and 2). On the other hand, some data values for the poplar
samples treated at 7% concentration of aqueous solution
with zinc borate was not available in training set. However,
the strength values for this concentration and fire-retardant
chemical was available for alder samples (Table 2). It was
stated in literature that, ANNs are capable of processing
information in a parallel distributed manner, learning
complex cause and effect relationships between input and
output data, dealing with nonlinear problems, generalizing
from known tasks or examples to unknown tasks. ANNs
are good for tasks involving incomplete data sets, fuzzy or
incomplete information, and for highly complex and ill-
defined problems for which humans would usually decide
on an intuitional basis. Moreover, they can be more
adaptable than traditional methods and ANNs technology
brings completely different concepts to computing
(Ceylan, 2008). As a consequence, the knowledge of the
neural network is spread overall the links in network with
their weight values. So, the lack of some data in a trained
ANN does not significantly affect the network to produce
accurate information.

Özşahin et al., 5(5), 785-792, (2020) J. Anatolian Env. and Anim. Sciences, Yıl:5, No:5, (785-792), 2020
792
CONCLUSIONS
In this study, ANN models were developed to model
the effects of wood species and concentration values of
aqueous solutions variables on the retention level and the
effects of wood species, concentration values of aqueous
solutions and retention level variables on mechanical
strength values. As a result of the study, the retention level
increased with increasing concentration aqueous solution.
In generally, mechanical properties of the panels can be
adversely influenced by increased concentrations of fire-
retardants. The different changes of mechanical properties
were determined according to concentration of fire-
retardants in the ANN models. MAPE for retention level,
bonding strength, bending strength and modulus of
elasticity were 1.014, 0.637, 1.680 and 0.418 % for training
and 3.416, 2.906, 2.103 and 1.607 %for testing,
respectively. RMSE for retention level, bonding strength,
bending strength and modulus of elasticity were 0.230,
0.010, 1.364 and 47.52 for training and 0.602, 0.059, 1.717
and 97.516 for testing, respectively. It can be concluded
from this study that the ANN method is reasonable for the
modelling (the optimization) of retention level, bonding
strength, bending strength and modulus of elasticity at
various concentration without needing the experimental
study again and again.
ACKNOWLEDGMENTS
In this study, the experimental results obtained from the
study of Demir et al. (2016) were used. Therefore, the
authors acknowledge Dr. Aydin Demir, Dr. Ismail Aydin,
and Dr. Semra Colak for enabling data to be used. This
study was presented in ORENKO 2020 held by Karadeniz
Technical University, Trabzon.
REFERENCES
Aydin, I. (2004). Effects of Some Manufacturing Conditions
on Wettability and Bonding of Veneers Obtained
from Various Wood Species. PhD Thesis, KTU
Natural Science Institute, Trabzon.
Ceylan, I. (2008). Determination of Drying Characteristics of
Timber by Using Artificial Neural Networks and
Mathematical Models. Drying Technology, 26(12),
1469-1476.
Cheng, R. X. & Wang, Q. W., (2011). The influence of
FRW-1 fire-retardant treatment on the bonding of
plywood. Journal of Adhesion Science and
Technology, 25, 1715-1724.
Demir, A., Aydin, I. & Colak, S. (2016). Effect of various
fire-retardant chemicals in different concentrations
on mechanical properties of plywood. In Proc. 2nd
International Furniture Congress, Muğla, Turkey,
13-15 October, 411pp.
Demirkir, C., Özsahin, Ş., Aydin, I. & Colakoglu, G.,
(2013). Optimization of some panel manufacturing
parameters for the best bonding strength of plywood.
International Journal of Adhesion and Adhesives,
46, 14-20.
EN 310, (1993). Wood based panels. Determination of
modulus of elasticity in bending and of bending
strength. European Standard.
EN 314-1, (1998). Plywood–bonding quality–Part1: test
methods, European Standard.
Esteban, L.G., Fernandez, F.G. & Palacios, P., (2011).
Prediction of plywood bonding quality using an
artificial neural network. Holzforschung, 65(2),
209–214.
Fateh, T., Rogaume, T., Luche, J., Richard, F. & Jabouille,
F., (2013). Kinetic and mechanism of the thermal
degradation of a plywood by using
thermogravimetry and Fourier-transformed infrared
spectroscopy analysis in nitrogen and air
atmosphere. Fire Safety Journal, 58, 25-37.
Fernández, F.G., Esteban, L.G., Palacios, P., Navarro, N.
& Conde, M. (2008). Prediction of standard
particleboard mechanical properties utilizing an
artificial neural network and subsequent comparison
with a multivariate regression model. Investigación
agrarian. Sistemas y Recursos Forestales, 17(2),
178-187.
He, X., Li, X., Zhong, Z., Yan, Y., Mou, Q., Yao, C. &
Wang, C., (2014). The fabrication and properties
characterization of wood-based flame retardant
composites. Journal of Nanomaterials, Article ID
878357, 6p.
Ozkaya, K., Ilce, C.A., Burdurlu, E. & Aslan, S. (2007).
The effect of potassium carbonate, borax and
wolmanit on the burning characteristics of Oriented
Strand Board(OSB). Construction and Building
Materials, 1457-1462.
Ozsahin, S. & Aydin, I.,(2014). Prediction of the optimum
veneer drying temperature for good bonding in
plywood manufacturing by means of artificial neural
network. Wood science and technology, 48(1), 59-
70.
Stevens, R., Es, D.S., Bezemer, R. & Kranenbarg, A.
(2006). The structure-activity relationship of fire-
retardant phosphorus compounds in wood. Polymer
Degradation and Stability, 91, 832-841.
Yao, C.H., Wu, Y.Q. & Hu, Y.C. (2012). Flame-retardation
characteristics and mechanisms of three inorganic
magnesium compounds as fire-retardant for wood.
Journal of Central South University of Forestry and
Technology, 32(1), 18-23.

Journal of Anatolian Environmental and Animal Sciences (Anadolu Çevre ve Hayvancılık Bilimleri Dergisi)
DOI: https://doi.org/10.35229/jaes.833165
JAES Year: 5, No: 5, 2020 (793-797)
AÇEH Yıl: 5, Sayı: 5, 2020 (793-797)
ARAŞTIRMA MAKALESİ RESEARCH PAPER
793
Investigation of The Effect of Building Material Selection and Design Style on Kiln
Thermal Properties in Solar Kilns
Kemal ÜÇÜNCÜ Aytaç AYDIN* Karadeniz Technical University, Department of Forest Industry Engineering Kanuni Campus, Trabzon/Türkiye
Geliş/Received: 29.11.2020 Kabul/Accepted: 03.12.2020
How to cite: Üçüncü, K. & Aydın, A. (2020). Investigation of The Effect of Building Material Selection and Design Style on Kiln Thermal Properties in
Solar Kilns. J. Anatolian Env. and Anim. Sciences, 5(5), 793-797. Atıf yapmak için: Üçüncü, K. & Aydın, A. (2020). Güneş Fırınlarında Yapı Malzemesi Seçimi ve Tasarım Stilinin Fırın Isıl Özelliklerine Etkisinin İncelenmesi. Anadolu Çev. ve Hay. Dergisi, 5(5), 793-797.
Abstract: The negative effects of intensive energy consumption in timber drying on costs and
environmental pollution have strengthened the tendency to utilize solar energy in recent years.
Although drying of timber in flat collector solar furnaces takes more time than conventional
drying, energy costs are low and there are no negative environmental effects. In this study, the
selection of building materials and design type to be used in the design of solar furnaces was
evaluated in terms of thermal properties. Materials with different thermal capacities create
different thermal properties in different designs. Therefore, it is possible to control the course of
the temperature distribution in the solar timber drying oven throughout the day with the choice
of different building materials and design forms.
Keywords: Building material, drying, solar kiln, thermal properties.
Güneş Fırınlarında Yapı Malzemesi Seçimi ve Tasarım Stilinin Fırın Isıl
Özelliklerine Etkisinin İncelenmesi
Öz: Kereste kurutmada yoğun enerji tüketiminin maliyetlere ve çevre kirliliğine olumsuz etkileri
son yıllarda güneş enerjisinden yararlanma eğilimini güçlendirmiştir. Düz toplayıcılı güneş
fırınlarında kerestenin kurutulması klasik kurutmaya oranla fazla zaman almasına rağmen enerji
maliyetleri düşük ve olumsuz çevresel etkileri yoktur. Bu çalışmada güneş fırınlarının tasarımında
kullanılacak yapı malzemelerinin ve tasarım şeklinin seçimi ısıl özellikler bakımından
değerlendirilmiştir. Farklı ısıl kapasiteye sahip malzemeler farklı tasarım şeklinde farklı ısıl
özellik oluşturmaktadır. Dolayısıyla, farklı yapı malzemesi ve tasarım şekli seçimi ile güneş
enerjili kereste kurutma fırınında gün boyu sıcaklık dağılımının gidişinin kontrolü mümkün
olabilmektedir.
Anahtar kelimeler: Güneş fırınları, kurutma, termal özellikler, yapı malzemesi.
INTRODUCTION
Natural and technical drying methods are
generally used in drying timber. Although energy is not
consumed in natural drying, the drying period is long and
timber cannot be dried to the desired result humidity for
interiors. Although the timber can be dried to the desired
result humidity level in technical drying, drying costs are
high. 60-70% of the energy in the timber industry is spent
during the drying phase. The energy consumed depending
on the tree type and timber thickness varies between 600-
1000 kWh per 1 m3 of timber (Comstock, 1978).
In recent years, drying timber with solar energy
has been studied as an alternative drying method in order
*Corresponding author’s: Aytaç AYDIN
Karadeniz Technical University, Department
of Industrial Engineering Kanuni Campus, Trabzon, Turkey.
Mobile telephone: +90 (505) 231 91 78
Telephone : +90 (462) 377 15 13
Fax : +90 (462) 325 74 99
*Sorumlu yazarın:
Aytaç AYDIN
Karadeniz Teknik Üniversitesi Orman
Fakültesi Orman Endüstri Mühendisliği Bölümü, Kanuni Kampusü Trabzon, Türkiye
Cep telefonu : +90 (505) 231 91 78
Telefon : +90 (462) 377 15 13
Faks : +90 (462) 325 74 99
: https://orcid.org/0000-0002-6294-6112
* : https://orcid.org/0000-0001-7460-9618

Üçüncü and Aydın., 5(5), 793-797, (2020) J. Anatolian Env. and Anim. Sciences, Yıl:5, No:5, (793-797), 2020
794
to reduce energy costs in drying. For this purpose, various
types of solar-powered timber drying furnaces are designed
and drying trials are carried out. In most of these studies, it
has been concluded that solar furnaces can be used
economically if the fuel prices increase and the costs of
solar collectors can be reduced. In these studies, little
coverage has been given to the effects of wall building
materials on the temperature regime (Read et al.,1974;
Gaugh, 1977; Bois, 1977; Yang,1980; Chen, 1981;
Little,1984; Örs and Üçüncü,1992).
In terms of drying quality, drying temperatures
suitable for the properties of the dried timber should be
applied. In solar furnaces, the temperature varies according
to solar energy values and shows significant differences
throughout the day. During the sunbathing period, the
temperature first rises and decreases again after reaching
the maximum value between 12:00 - 14:00. The width of
the hourly temperature change interval negatively affects
the drying time and quality. In Figure 1, possible hourly
variations in temperature during the day are shown for a
solar furnace. The temperature of the furnace, which
decreases to the lowest level at night, reaches its maximu m
value between 13:00 and 14:00 during the day due to the
effect of solar radiation, and this temperature difference
between this temperature difference negatively affects the
drying.
Figure 1. Hourly change graph of temperature in solar furnace.
The specific heat and heat conduction coefficients
of the wall materials also have an important effect on the
change of furnace temperature. Therefore, by choosing the
wall building materials to be used, a more homogeneous
distribution of the oven temperature can be achieved.
Greenhouse type solar furnaces have been considered in
this study and these furnaces can be designed up to 10 m3
capacity. In the study, the effects of the wall designs of the
greenhouse type solar furnace with a lumber capacity of 10
m3 and a collector area of 60 m2 on the temperature regime
were examined.
MATERIALS AND METHOD
Materials: The collector area of the examined
greenhouse type solar furnace is 60 m2 and its timber
capacity is 10 m3. 34.5 m2 of the solar collector designed
in the position of the roof of the oven has a 30º and 25.5 m2
slope of 60º (Üçüncü,1995).
Figure 2. Solar furnace.
In order to examine the effects of wall designs and
materials on temperature regime, 4 types of walls were
designed (Figure 3).
A type wall:
1. 2 cm cemented particle board 2. 5 cm glass wool
3. 2 cm cemented particle board
B type wall:
1. 2 cm cemented particle board
2. 8,5 cm brick
3. 5 cm glass wool
4. 2 cm cemented particle board
C type wall:
1. 2 cm cemented particle board 2. 8,5 cm brick
3. 5 cm glass wool
4. 8,5 cm brick 5. 2 cm cemented particle board
D type wall:
1. 2 cm interior plaster 2. 8,5 cm brick
3. 5 cm glass wool
4. 8,5 cm brick 5. 2 cm interior plaster
Figure 3. Wall design and building materials

Üçüncü and Aydın., 5(5), 793-797, (2020) J. Anatolian Env. and Anim. Sciences, Yıl:5, No:5, (793-797), 2020
795
Method: The furnace temperature was calculated
using the thermal equilibrium equation (Dağsöz,1977).
𝑄𝑔 = 𝑄𝑑 + 𝑄𝑘 (1)
Here, Qg is the useful solar radiation (W) entering
the furnace, Qd is the energy stored in the furnace walls
(W), Qk is the heat lost from the furnace (W).
Useful solar radiation entering the oven
𝑄𝑔 = 𝜂 𝐴𝑐 𝐼𝑒 (2)
Here, η is collector efficiency, Ac collector field
and Ie is the instantaneous solar radiation incident on the
collector surface. Hourly solar radiation values coming to
the collector surface are calculated from Trabzon's average
irradiance values for many years and given in Table 1
(Kılıç and Öztürk,1983). The value of 45% was taken as a
basis for collector efficiency (Üçüncü,1991).
Stored heat
𝑄𝑑 = ∑ 𝑚𝐶𝑝 (𝑡𝑖 − 𝑡𝑖−1) (3)
Lost heat
𝑄𝑘 = 𝐾 𝐴𝑑 (𝑡𝑖 − 𝑡𝑜) (4)
Table 1. Hourly solar radiation coming to the collector surface in Trabzon and monthly average values of outdoor temperature, Ie (W/m2).
Months Hours
Total Tempreture
(oC) 6 7 8 9 10 11 12 13 14 15 16 17 18 19 20 21 22 23 24 1 2 3 4 5
January 0 8 112 232 310 344 344 310 232 112 8 0 0 0 0 0 0 0 0 0 0 0 0 0 2012 7,4
February 0 58 191 315 397 436 436 397 315 191 58 0 0 0 0 0 0 0 0 0 0 0 0 0 2794 7,3
March 21 116 234 336 407 437 437 407 336 234 116 21 0 0 0 0 0 0 0 0 0 0 0 0 3102 8,3
April 69 177 298 400 463 493 493 463 400 298 177 69 0 0 0 0 0 0 0 0 0 0 0 0 3800 11,4
May 102 216 334 424 487 517 517 487 424 334 216 102 0 0 0 0 0 0 0 0 0 0 0 0 4160 15,8
June 119 242 335 447 506 539 539 506 447 335 242 119 0 0 0 0 0 0 0 0 0 0 0 0 4376 20,0
July 100 213 320 401 457 482 482 457 401 320 213 100 0 0 0 0 0 0 0 0 0 0 0 0 3946 22,6
August 77 179 287 370 430 454 454 430 370 287 179 77 0 0 0 0 0 0 0 0 0 0 0 0 3594 23,1
September 36 135 249 345 406 441 441 406 345 249 135 36 0 0 0 0 0 0 0 0 0 0 0 0 3224 20,0
October 0 79 212 324 401 436 436 401 324 212 79 0 0 0 0 0 0 0 0 0 0 0 0 0 2904 16,5
November 0 19 151 273 362 396 396 362 273 151 19 0 0 0 0 0 0 0 0 0 0 0 0 0 2402 13,2
December 0 3 90 211 288 322 322 288 211 90 3 0 0 0 0 0 0 0 0 0 0 0 0 0 1828 9,7
Average 52 138 251 353 421 452 452 421 353 251 138 52 0 0 0 0 0 0 0 0 0 0 0 0 3334 16,1
Here, m wall mass (kg), specific heat of Cp wall
material (Wh / kg oC), ∑mCp sum of thermal capacities of
furnace walls (WH/oC), furnace temperature at ti i (oC), ti-1
initial furnace temperature (oC), to outdoor temperature
(oC), K is the total heat transfer coefficient of the furnace
(W/m2 oC), Ad is the furnace wall area (m2). Based on the
equations given, the following equation is obtained for the
oven temperature.
𝑡𝑖 = 𝜂 𝐴𝑐 𝐼𝑒+ ∑ 𝑚𝐶𝑝 𝑡𝑖−1 +𝐾𝐴𝑑𝑡𝑜
∑ 𝑚𝐶𝑝 +𝐾𝐴𝑑 (5)
In the calculation of the total heat transfer
coefficient, the heat transfer coefficient of the wall and the
heat losses resulting from air renewal are taken into
account. The furnace volume is approximately 150 m3 and
the rate of air regeneration in the furnace has been taken as
4, considering the required moist air requirement for
drying. Equations and equation coefficients regarding the
possible temperatures that will occur in the furnace
according to the designed walls are given below.
For wall type A:
𝑡𝑖 = 0,0250 𝐼𝑒 + 0,7868 𝑡𝑖−1 + 0,2132 𝑡𝑜 (6)
For wall type B:
𝑡𝑖 = 0,0175 𝐼𝑒 + 0,8366 𝑡𝑖−1 + 0,1634 𝑡𝑜 (7)
For type C wall:
𝑡𝑖 = 0,0118 𝐼𝑒 + 0,9026 𝑡𝑖−1 + 0,0974 𝑡𝑜 (8)
For wall type D:
𝑡𝑖 = 0,0153 𝐼𝑒 + 0,8740 𝑡𝑖−1 + 0,1260 𝑡𝑜 (9)
FINDINGS
The temperature in solar furnaces varies
significantly throughout the day due to reasons such as the
constant change of solar energy during the day, the
variation in terms of the seasons, and none at night. With
these features, drying in solar ovens can be considered
within the concept of batch drying. Although intermittent
drying does not have a direct harmful effect on drying
quality, the continuous and sudden change in temperature
may affect the drying quality as well as increase the drying
time. Wall materials also have a significant effect on the
furnace temperature in solar furnaces. In order to examine
the effect of wall materials on temperature, the annual
average hourly temperature distribution, standard
deviation, maximum, minimum and change interval values
for four types of furnace walls designed in Trabzon
climatic conditions are given in Table 2.

Üçüncü and Aydın., 5(5), 793-797, (2020) J. Anatolian Env. and Anim. Sciences, Yıl:5, No:5, (793-797), 2020
796
Table 2. Furnace temperature values according to wall types .
Wall
type
Hours t1 S1 MAX MİN CI
6 7 8 9 10 11 12 13 14 15 16 17 18 19 20 21 22 23 24 1 2 3 4 5
A 16 18 24 30 37 43 48 51 52 50 45 40 35 30 27 24 22 21 19 18 18 17 16 16 30 13 52 16 36
B 15 17 21 26 31 36 40 43 45 44 41 38 34 31 28 26 24 22 21 20 19 18 18 17 28 11 45 15 29
C 15 16 19 23 27 31 34 37 39 39 38 37 35 33 31 29 28 27 25 24 23 23 22 21 28 9 39 15 24
D 15 17 20 25 30 35 39 42 44 44 42 39 36 33 31 29 27 26 24 23 22 21 20 20 29 11 45 15 29
In Table 3, the monthly average furnace
temperature and standard deviation values for four types of
furnace walls. Here, t1 and S1 are solar furnace
temperature (oC) and standard deviation with wall type A,
t2 and S2 solar furnace temperature and standard deviation
with wall type B, t3 and S3 solar furnace temperature and
standard deviation with wall type C, t4 and S4 D-type wall
furnace temperature and standard deviation.
Table 3. Monthly average temperature and standard deviation values of furnace types .
Months A B C D
t1 S1 t1 S1 t1 S1 t1 S1
January 17,1 9,2 16,0 6,9 16,0 5,2 16,8 6,5
February 20,8 12,1 19,3 9,2 19,2 6,9 20,3 8,5
March 23,2 12,7 21,6 9,6 21,5 7,2 22,7 9,0
April 29,7 14,8 27,7 11,2 27,6 8,4 29,1 10,5
May 35,8 15,7 33,6 12,0 33,5 9,0 35,2 11,2
June 41,1 16,4 38,7 12,5 38,6 9,3 40,4 11,6
July 41,6 14,8 39,5 11,3 39,4 8,4 41,1 10,5
August 40,4 13,8 38,5 10,5 38,4 7,8 40,0 9,8
September 35,5 12,9 33,8 9,8 33,7 7,3 35,1 9,2
October 30,5 12,4 28,9 9,4 28,9 7,0 30,1 8,8
November 24,8 10,8 23,5 8,2 23,5 6,1 24,5 7,6
December 18,5 8,5 17,5 6,4 17,5 4,8 18,3 6,0
Average 29,9 12,8 28,2 9,7 28,2 7,3 29,5 9,1
Average oven temperature has the highest value
in A type oven and the lowest in C type oven. In A type
oven, the highest value of the average oven temperature
during the day (24 hours) occurred in July with 41.6 oC,
and the lowest value occurred in January with 17.1 oC. The
same values in B, C and D type furnaces, respectively;
39.5; 39.4; 40.1 °C and 16.0; 16.0; It became 16.8 oC.
Standard deviation also increases in high temperature
average values. The largest standard deviation was
observed in A type furnace with 12.8 oC, the smallest
standard deviation was observed in C type furnace with 7.3
oC. In Figure 4, the temperature changes of solar furnaces
with wall types A, B, C and D are shown by months
depending on time. In Figure 5, hourly temperature
distribution for wall types is shown. In solar furnaces, the
maximum temperature for any type of wall material is
generally reached between 14:00 and 15:00 hours. In the
solar oven for all wall types, the temperature of the oven
does not fall to the ambient temperature the next day, when
the solar radiation starts. In the furnace with a wall with a
high thermal capacity, the difference between the final
temperature and the ambient temperature is greater.
Figure 4. Monthly average temperatures.
Figure 5. Hourly temperature distribution according to wall
types.

Üçüncü and Aydın., 5(5), 793-797, (2020) J. Anatolian Env. and Anim. Sciences, Yıl:5, No:5, (793-797), 2020
797
DISCUSSION AND CONCLUS ION
Since materials with high thermal capacity will
store large amounts of heat, the furnace temperature
decreases in furnaces built of these materials. However,
despite the low temperatures that occur in the oven during
the sunbathing period, the temperature drop is less after the
sunbathing ends and at night. In furnaces built of materials
with low thermal capacity, the temperature of the furnace,
which is higher during the sunbathing period, is greater at
night. Accordingly, although the average temperature is
lower in furnaces built with materials with high thermal
capacity, the variation interval and standard deviation are
also small, so they may have more positive effects on the
drying quality. This type of furnace has more suitable
features in terms of ensuring homogeneous and high
quality drying.
In solar systems where high temperatures are
desired during the sunshine period, the selection of low
thermal capacity building materials can be recommended .
However, it would be beneficial to use materials with
higher thermal capacity in solar ovens where activity is
desired throughout the day. According to theoretical
calculations, it is seen that more stable temperature values
will be formed in solar furnaces to be built from C and D
type walls.
In terms of heat loss in solar furnaces, since the
heat losses caused by air renewal are more effective than
the thermal conductivity of wall materials, the thermal
insulation thickness of 5 cm is taken as a basis instead of
the 8 cm thermal insulation thickness recommended in the
literature. For the same reason, it is possible to use
polyurethane or styrofoam for thermal insulation.
ACKNOWLEDGMENTS
This study was presented in ORENKO 2020 held
by Karadeniz Technical University, Trabzon.
REFERENCES
Bois, P.J. (1977). Construction and operating, a small solar
heated lumber dryer. Forest Products Utilization
Technical Report. USDA, For. Service No. 7.
11pp.
Chen, P.Y.S. (1981). Design and tests of a 500 BF solar
kiln. Forest Prod. J., 31(3), 33-38.
Comstock, G.L. (1978). Energy requirement for drying of
wood products. Forest Prod. J., 28(3), 22-26.
Dağsöz, A.K. (1977). Heat transfer. ITU Faculty of
Mechanical Engineering, İstanbul.
Gaugh, D.K. (1977). The design and operating a small
solar timber kiln. Fiji Timbers and Their Uses ,
No: 67, Fiji, F. D., 17pp.
Kılıç, A. & Öztürk, A. (1983). Solar energy. ITU Faculty
of Mechanical Engineering, İstanbul.
Little, R.L. (1984). Industrial use of solar heat in lumber
drying: a long-term performance report. Forest Prod. J., 34(9), 22-26.
Örs, Y. & Üçüncü, K. (1992). Investigations on lumber
drying possibilities at 41o north parallel. TÜBİTAK Nature Magazine, 16, 22-37.
Read, W. R., Choda, A. & Cooper, P. I. (1974). A Solar timber kiln. Solar Energy. 15(4), 309-316.
Üçüncü, K. (1991). Investigation of drying possibilities of
timber (eastern spruce) with solar energy in 41o
north latitude (Trabzon) . PhD Thesis
(Unpublished), KTU Institute of Science and
Technology, Trabzon.
Üçüncü, K. (1995). Greenhouse type solar furnace design
and economic analysis for small capacity timber
cutting and furniture plants in the climat ic
conditions of the Black Sea Region. I. National
Black Sea Forestry Congress, 2. Volume,
Proceedings, Trabzon.
Yang, K.L. (1980). Solar kiln performance at a high latitude, 48oN. Forest Prod., 30(3), 37-40.

Journal of Anatolian Environmental and Animal Sciences
(Anadolu Çevre ve Hayvancılık Bilimleri Dergisi) DOI: https://doi.org/10.35229/jaes.833231
JAES Year: 5, No: 5, 2020 (798-801)
AÇEH Yıl: 5, Sayı: 5, 2020 (798-801)
ARAŞTIRMA MAKALESİ RESEARCH PAPER
798
A Scale Development Study to Examine the Application of Total Quality
Management
Aytaç AYDIN* Kemal ÜÇÜNCÜ Karadeniz Technical University, Department of Forest Industry Engineering Kanuni Campus, Trabzon/Türkiye
Geliş/Received: 29.11.2020 Kabul/Accepted: 09.12.2020
How to cite: Aydın, A. & Üçüncü K. (2020). A scale development study to examine the application of total quality management. J. Anatolian Env. and Anim. Sciences, 5(5), 798-801. Atıf yapmak için: Aydın, A. & Üçüncü K. (2020). Toplam kalite yönetimi uygulamalarının incelemesine yönelik bir ölçek geliştirme çalışması. Anadolu Çev.
ve Hay. Dergisi, 5(5), 798-801.
Abstract: The total quality management approach is a management style in which the human factor
stands out, continuous development and improvement is adopted, group work is emphasized in the
enterprise, and quality responsibility spreads to all of the employees. The goal of total quality
management is to provide continuous and excellent service to the customer with well-trained and
motivated employees. Within the scope of this study, some features (customer orientation, management
leadership, full participation, systematic process analysis and human understanding first) of total
quality management activities implemented in forest products industry are examined. For this purpose,
377 engineers and foremen working in 14 large-scale companies with ISO 9001 Quality Management
System Certificate were reached through a survey method. The questionnaire used consists of two parts.
In the first part, some demographic features of the employees were evaluated with 13 questions. In the
second part of the survey, the management system applied in the enterprises was researched with 50
questions. The survey data were evaluated with the Structural Equation Model (SEM) prepared in SP SS
and AMOS statistical package programs and the results were revealed. As a result, a statistically
acceptable scale has been put forward for researchers who want to examine the total quality
management studies in the forest products industry .
Keywords: Forest products industry, quality management system, scale development, total quality
management .
Toplam Kalite Yönetimi Uygulamalarının İncelemesine Yönelik Bir Ölçek
Geliştirme Çalışması
Ö z : Toplam kalite yönetimi yaklaşımı, insan faktörünün öne çıktığı, sürekli gelişim ve iyileştirmenin
benimsendiği, işletmede grup çalışmasına önem verildiği ve kalite sorumluluğunun tüm çalışanlara
yayıldığı bir yönetim tarzıdır. Toplam kalite yönetiminin amacı, iyi eğitimli ve motive olmuş
çalışanlarla müşteriye sürekli ve mükemmel hizmet sunmaktır. Bu çalışma kapsamında orman ürünleri
sektöründe uygulanan toplam kalite yönetimi faaliyetlerinin bazı özellikleri (müşteri odaklılık, yönetim
liderliği, tam katılım, sistematik süreç analizi ve önce insan anlayışı) incelenmiştir. Bu amaçla ISO
9001 Kalite Yönetim Sistemi Belgesine sahip 14 büyük firmada görev yapan 377 mühendis ve
ustabaşına anket yöntemi ile ulaşılmıştır. Kullanılan anket iki bölümden oluşmaktadır. İlk bölümde 13
soru ile çalışanların bazı demografik özellikleri değerlenmiş ikinci bölümünde işletmelerde uygulanan
yönetim sistemi 50 soruyla araştırılmıştır. Anket verileri SPSS ve AMOS istatistik paket
programlarında hazırlanan Yapısal Eşitlik Modeli (SEM) ile değerlendirilmiş ve sonuçlar ortaya
çıkarılmıştır. Sonuç olarak, orman ürünleri sektöründe toplam kalite yönetimi çalışmalarını incelemek
isteyen araştırmacılar için istatistiksel olarak kabul edilebilir bir ölçek ortaya koyulmuştur.
Anahtar kelimeler: Toplam kalite yönetimi, ölçek geliştirme, orman ürünleri endüstrisi, kalite
yönetim sistemi.
INTRODUCTION
The unique elements, technologies, production
and management processes of the socio-cultural and
economic structure, which differ completely from the past,
are also changing today, when the environmental
conditions change rapidly and the world takes the
globalization process. Organizations need to establish an
* : https://orcid.org/0000-0001-7460-9618
: https://orcid.org/0000-0002-6294-6112
*Corresponding author’s:
Aytaç AYDIN Karadeniz Technical University, Department
of Forest Industry Engineering Kanuni
Campus, Trabzon, Turkey. : [email protected]
Mobile telephone: +90 (505) 231 91 78
Telephone : +90 (462) 377 15 13
Fax : +90 (462) 325 74 99
*Sorumlu yazarın:
Aytaç AYDIN
Karadeniz Teknik Üniversitesi Orman Fakültesi Orman Endüstri Mühendisliği
Bölümü, Kanuni Kampusü Trabzon, Türkiye
: [email protected] Cep telefonu : +90 (505) 231 91 78
Telefon : +90 (462) 377 15 13
Faks : +90 (462) 325 74 99

Aydın and Üçüncü, 5(5), 798-801, (2020) J. Anatolian Env. and Anim. Sciences, Yıl:5, No:5, (798-801), 2020
799
effective quality system and management in order to
survive in increasingly difficult competition conditions.
Today it is the "Total Quality Management" (TQM) model
that can provide these (Kaptan, 2007).
TQM is the integration of all functions and
processes of an organization to be successful in
continuously improving the quality of its goods and
services. The goal is customer satisfaction. TQM
understanding not only increases the quality but also
increases the efficiency of the organization. Employee
satisfaction is also taken into consideration in production
and service activities that are carried out by considering
customer satisfaction (Swift, 1998).
TQM is the art of achieving perfection. It is an
effective method to achieve the ideal. Total quality
management is the set of principles and philosophy that
represent developing organizations. It is quantitative
methods and human resources application that improve all
processes within the organization. To deliver more than
current and future customer expectations. TQM is a
discipline carried out with inferential management
techniques, existing development efforts and technical
tools (Besterfield, 1999).
The basic elements of total quality management ,
in which the human factor comes to the fore, aims at
continuous development and improvement, group work is
emphasized in the enterprise, and quality responsibility is
in all business employees, are the issues that businesses
that adopt the total quality management approach should
know. Within the scope of this study, the characteristics of
total quality management activities applied in the forest
products industry (customer focus, management
leadership, full participation, systematic process analysis
and human understanding first) are examined and a scale
that can be used by researchers who will work in this field
is presented.
MATERIALS AND METHOD
Within the scope of this study, the characteristics
of total quality management activities (customer focus,
management leadership, full participation, systematic
process analysis and human understanding first) applied in
the forest products industry were examined. For this
purpose, 377 engineers and foremen working in 14 large-
scale companies holding ISO 9001 Quality Management
System Certificate were reached by survey method. In the
study, a questionnaire form prepared by compiling from
the survey studies applied on TQM and performance was
used (Eroğlu, 2003; Serin, 2004; Yağar, 2007; İnce, 2007;
Aydın, 2007). The questionnaire used consists of two parts.
In the first part, some demographic characteristics of the
employees were evaluated with 13 questions. In the second
part of the questionnaire, the management system applied
in businesses was investigated with 50 questions.
The obtained data were checked with reliability
and validity analysis. Although there are many models
used in reliability analysis, the Cronbach alpha coefficient
was used in this study. This coefficient takes values
between 0 and 1 (Kalaycı, 2009). In our study, values with
α coefficient of 0.80 and above were accepted. In our study,
factor analyzes were conducted to measure the construct
validity. At this stage, KMO (Kaiser-Meyer-Olkin) and
Bartlett tests were applied to determine the suitability of
the data for factor analysis.
After determining the suitability of the data for
factor analysis, factor analysis was started. Within the
scope of the analysis, the principal component factor
extraction method and the varimax vertical rotation method
were preferred. One of the conditions in the
implementation of structural equation models is that each
scale should consist of a single dimension and at least 3
variables belonging to that scale should be included in the
analysis (Eroğlu, 2003). Within the scope of the study, in
order to increase the reliability of the SEM, a limitation has
been introduced to be 70% and above explanatory factor
analysis. After these stages, the model prepared was
transferred to the AMOS (Analytic Moment of Structure)
package program, analyzes were performed and the results
were presented.
RESULTS AND DISCUSSION
General Information of Participants: Some
general information about the employees who participated
in our survey is given in Table 1.
Table 1. General information about the participants.
Age n % Position in business n %
20-24 19 5,0 Engineer 183 48,5
25-29 77 20,4 Foreman 152 40,3 30-34 85 22,5 Unanswered 42 11,1 35-39 50 13,3
40-44 22 5,8 Working time in the position
(years)
n %
45-49 18 4,8
>50 3 0,8 0-5 154 40,9 Unanswered 103 27,3 6-10 92 24,4 11-20 61 16,2
<21 13 3,4 Gender n. % Unanswered 57 15,1
Male 301 79,8
Female 42 11,1 Total working time (years) n %
Unanswered 34 9,0
0-5 173 45,9 6-10 101 26,8
Marital status n. % 11-20 56 14,9
married 200 53,1 >21 15 4,0 Single 98 26,0 Unanswered 32 8,5 Other 4 1,1
Unanswered 75 19,9
As seen in Table 1, 42.9% of the employees
surveyed are between the ages of 25-35, 79.8% are male,
53.1% are married. 48.5% of the participants are engineers
and 40.3% are foremen. 40.9% of them have been working
in this position for a maximum of 5 years. It was

Aydın and Üçüncü, 5(5), 798-801, (2020) J. Anatolian Env. and Anim. Sciences, Yıl:5, No:5, (798-801), 2020
800
determined that the maximum working time (45.9%) was
5 years.
Compliance with normal distribution: Kurtosis
values were used to examine the data distribution. The
purpose of kurtosis measures is to reveal how the variables
are distributed around the mean. If the kurtosis value of the
variable is between -3 and +3, it indicates that the values
of the variables come from a typical normal distribution
(Kalaycı, 2009). For this purpose, kurtosis values of each
variable are given in Table 2.
Table 2. Kurtosis values of the variables. Variables Kurtosis Variables Kurtosis Variables Kurtosis
co1 0,907 huf1 -0,477 fp7 -1,286
co2 1,374 huf2 0,306 fp8 0,939
co3 0,502 huf3 -0,432 fp9 0,842
co4 0,583 huf4 0,189 fp10 -0,147
co5 0,963 huf5 -0,459 fp11 -0,845
co6 0,206 huf6 -,0615 fp12 0,535
co7 0,359 huf7 0,117 fp13 0,762
co8 0,013 huf8 -0,505 spa1 1,134
co9 -0,508 huf9 -0,180 spa2 0,390
co10 -0,010 fp1 0,173 spa3 0,390
co11 0,694 fp2 0,634 spa4 0,448
co12 0,071 fp3 0,390 spa5 0,596
co13 -0,024 fp4 0,211 spa6 0,442
co14 0,920 fp5 1,312 spa7 0,365
co15 0,421 fp6 1,013
As seen in Table 2 kurtosis values of all variables
are within the specified limits (-3 / +3). For this reason, it
was accepted that the data had a normal distribution and
the analysis continued.
Reliability and Validity Analysis: At this stage,
the scales were analyzed for reliability and validity, and
after obtaining appropriate values, they were subjected to
factor analysis. The α coefficient for each scale and the
results of factor analysis reduced to a single scale are given
in the table.
Table 3. α coefficient for each scale and the results of factor analysis.
Scales Crocbach α Variables Explained
Variance (%)
Customer orientation 91,7 co4, co6, co7 73,372
Human understanding first 84,4 huf6, huf8, huf9 73,662
Full participation 87,5 fp1, fp2, fp3 74,402
Systematic process analysis 85,7 spa2, spa4, spa5, spa6 70,735
Management leadership 89,3 ml1, ml2, ml3, ml4 72,953
Results of the Measurement Model: After the
reliability and validity analysis of the scales, the results of
the measurement model were examined. The measurement
model is shown in Figure 1.
The goodness of fit indexes of the measurement
model shown in Figure 1 are shown in Table 4.
As seen in Table 4, the "Chi-square / degree of
freedom" of the goodness of fit indices of the measurement
model was above the acceptable limit of 2, therefore a
modification was applied to the model. Since the corrected
measurement model obtained indexes of goodness of fit are
within the limits mentioned earlier, it is accepted that the
measurement model is supported by the data.
Figure 1. Measurement model.
Table 4. The goodness of fit indexes of the measurement model
Fit indexes Measurement
model
Adjusted
measurement
model
Chi-Square statistic 242,326 212,083
Degrees of freedom 109 107
Chi-Square/Degrees of freedom 2,223 1,982
GFI 0,929 0,938
AGFI 0,901 0,911
CFI 0,964 0,972
RMR 0,034 0,033
RMSEA 0,057 0,050
NFI 0,937 0,945
IFI 0,964 0,972
By applying Confirmatory Factor Analysis (CFA)
to the improved measurement model, it was revealed to
what extent latent variables could be explained by the
observed variables. In addition, variance estimates and
reliability of the factors calculated in order to determine the
validity and reliability of the measurement model are given
in Table 5.

Aydın and Üçüncü, 5(5), 798-801, (2020) J. Anatolian Env. and Anim. Sciences, Yıl:5, No:5, (798-801), 2020
801
Table 5. CFA results for the improved measurement model. Latent
Variable
Observed
Variable
Factor
Load
Standard
Error
t-value Explained
Variance
Reliability
Customer focus
cf4 cf6
cf7
0,730 0,800
0,794
0,060 0,072
-
13,746 14,87
7 -
0,60 0,82
Human understanding
first
huf6 huf8
huf9
0,714 0,813
0,813
0,070 0,071
-
13,780
15,51
3 -
0,61 0,82
Full
participation
fp1 fp2 fp3
0,737 0,795 0,820
- 0,071 0,075
- 14,93
4 15,39
8
0,62 0,83
Systematic process analy sis
spa2 spa4
spa5 spa6
0,741 0,713
0,782 0,841
0,053
0,059 0,056
-
15,60
4 14,58
4 16,52
5
-
0,59 0,85
Management
leadership
ml1 ml2
ml3 ml4
0,820 0,889
0,744 0,684
-
0,052 0,055 0,058
-
20,008
16,694
14,14
4
0,63 0,90
Table 5 shows the factor loadings, standard errors,
t values, explained variances and reliability levels of the
variables in the measurement model. Considering the
factor loads of the variables, it is seen that they change
between 0.684 and 0.889. Therefore, except for ml4, all
other factor loads have values above the critical value of
0.70. In addition, the t values of these predictions were
found to be significant at the 0.05 significance level.
Therefore, the validity of the measurement model was
provided.
In the measurement model, two types of reliability
measures were used, namely the explained variance of the
factors and the reliability coefficients of the factors. The
explained variance estimates of the factors show the total
variance value explained by each factor in the relevant
observed variables. As seen in Table 5 the explained
variance values of the found factors are above the lower
limit (50%). Reliability coefficients of the factors, another
reliability criterion, indicate the internal reliability of the
factors. Reliability coefficients of the factors have taken
values above the lower limit of 0.70. Therefore, it can be
stated that the measurement model is reliable.
CONCLUSION
In this study, it is aimed to develop a scale to be
used to examine the applications of total quality
management in enterprises. The questionnaire form
prepared for this purpose was applied in the forest products
sector. After the necessary statistical analysis, a scale
applicable at sectoral level has been established. Scale
developments can be made on different sample groups to
examine total quality management practices .
ACKNOWLEDGMENTS
This research was supported by the Scientific
Research Projects Fund of Karadeniz Technical
University, Trabzon Turkey; Project no. 113.002.2. This
study was presented in ORENKO 2020 held by Karadeniz
Technical University, Trabzon.
REFERENCES
Aydın, S., (2007). The Role of Human Resources in Total
Quality Management. Master Thesis. Yeditepe
University Institute of Social Sciences. Istanbul.
Besterfield, H.D., (1999). Total Quality Management,
Carol Newjersey.
Eroğlu, E., (2003). Analysis of Total Quality Management
Applications with Structural Equation Model.
PhD Thesis. İ.Ü. Social Sciences Institute.
Istanbul.
İnce, C., (2007). A Research on the Effects of Total Quality
Management on Employee Satisfaction in Hotel
Businesses in Nevşehir Region. PhD Thesis, C.Ü.
Social Sciences Institute. Sivas.
Kalaycı, Ş., (2009). SPSS Applied Multivariate Statistics
Techniques. Asil Publication Distribution. ISBN:
975-9091-14-3. Ankara.
Kaptan, K.B., (2007). The Effect of Total Quality
Management Applications on the Human
Resources of the Organization, Master Thesis,
Gazi University, Institute of Social Sciences,
Ankara.
Serin, H., (2004). Total Quality Management Doctorate
Thesis in Furniture Industry Enterprises in
Organized Industrial Zones, KTU Institute of
Science, Trabzon.
Swift, J. A., Ross, J. E. & Omachonu, V. K. (1998).
Principles of Total Quality. St. Lucie Pres, Boca
Roton, Florida, Second Edition.
Yağar, H., (2007). Relationship between Total Quality
Management and Organizational Performance
and Financial Sector Practice. Master Thesis.
YTU Graduate School of Science, Istanbul.

Journal of Anatolian Environmental and Animal Sciences
(Anadolu Çevre ve Hayvancılık Bilimleri Dergisi) DOI: https://doi.org/10.35229/jaes.833383
JAES Year: 5, No: 5, 2020 (802-806)
AÇEH Yıl: 5, Sayı: 5, 2020 (802-806)
ARAŞTIRMA MAKALESİ RESEARCH PAPER
802
Woodloverness As a Pathway to Civilization Connected with Nature
İlker USTA* Hacettepe University, Department of Wood Products Industrial Engineering, Beytepe, Ankara, Turkey
Geliş/Received: 30.11.2020 Kabul/Accepted: 04.12.2020
How to cite: Usta, İ. (2020). Woodloverness As a Pathway to Civilization Connected with Nature. J. Anatolian Env. and Anim. Sciences, 5(5), 802-806.
Atıf yapmak için: Usta, İ. (2020). Doğayla Bağlantılı Medeniyete Giden Bir Yol Olarak Ahşapseverlik. Anadolu Çev. ve Hay. Dergisi, 5(5), 802-806.
Abstract: Woodloverness, although is a vast subject that has been well known throughout the world for a long time in terms of learning based on experiences that emerge with its reflections in every phase of life with its behavioural dimension that integrates attitudes and behaviours and combines feelings and thoughts, is a term that has been named and defined almost very recently in the field of wood science and technology with the focus of woodlover approach with its inherentness that complements people whose geography is far from each other by keeping them
together around the same purpose in terms of being a harmonious part of nature, and is a universal phenomenon that embraces all humanity. In a more general sense, woodloverness, in Usta’s words (Usta, 2019), is a thematic issue that contributes to the development of civilization and plays an important role in the progress of humanity and is considered in the focus of the woodlover approach that aims to integrate human with nature. Obviously, with its deep and comprehensive presence, woodloverness is an interdisciplinary phenomenon that stands out clearly in the development of civilization by integrating with nature in the company of science and technology, together with art and literature, and it is a preliminary reinforcer of the effort to
identify with nature and the environment, which constitute the essence of all humanity with its cultural dimension. In this study, woodloverness is presented as a deep and comprehensive phenomenon that provides endless benefits to humans through the integration of nature on the way to civilization, focusing on the woodlover approach.
Keywords: Civilization, human-nature interactions, wood, woodlover approach, woodloverness.
Doğayla Bağlantılı Medeniyete Giden Bir Yol Olarak Ahşapseverlik
Öz: Ahşapseverlik; deneyimlere dayalı öğrenme uyarınca hem tutum ve davranışları bütünleştiren hem de duygu ve düşünceleri birleştiren davranış boyutu ile hayatın her evresinde yansımalarıyla ortaya çıkan uzun zamandır dünya çapında bilinen geniş bir konu olmasına rağmen, ahşap bilimi ve teknolojisi alanında neredeyse çok yakın zamanda isimlendirilip tanımlanmış bir terim olup coğrafyası birbirinden uzak insanları ahşapsever yaklaşım odağında doğanın uyumlu bir parçası olma açısından aynı amaç çerçevesinde bir arada tutarak tamamlayan
doğası ile tüm insanlığı kucaklayan evrensel bir olgudur. Daha genel anlamda, Usta'nın deyimiyle (Usta, 2019), ahşapseverlik; medeniyetin gelişmesine katkı sağlayan ve insanlığın ilerlemesinde önemli rol oynayan tematik bir konudur ve insanı doğayla bütünleştirmeyi amaçlayan ahşapsever yaklaşım odağında ele alınmaktadır. Açıkçası, ahşapseverlik, derin ve kapsamlı varlığı ile bilim ve teknoloji eşliğinde, sanat ve edebiyatla birlikte doğa ile bütünleşerek medeniyetin gelişmesinde net bir şekilde öne çıkan disiplinlerarası bir kavramdır ve kültürel boyutu ile tüm insanlığın özünü oluşturan doğa ve çevre ile özdeşleşme çabasının öncelikli pekiştiricisidir. Bu çalışmada, ahşapseverlik, ahşapsever yaklaşım esas alınarak doğayla bütünleşmek suretiyle
gerçekleşen uygarlaşma sürecinde, insanlara sonsuz fayda sağlayan derin ve kapsamlı bir olgu olarak sunulmuştur. Anahtar kelimeler: Ahşap, ahşapsever yaklaşım, ahşapseverlik, insan-doğa etkileşimi, medeniyet.
* : https://orcid.org/0000-0002-0470-5839
*Corresponding author’s:
İlker USTA
Hacettepe University, Department of Wood
Products Industrial Engineering, Beytepe,
Ankara, Turkey.
Mobile telephone: +90 (536) 454 59 08
Telephone : +90 (312) 297 68 85
Fax : +90 (312) 297 68 85
*Sorumlu yazarın:
İlker USTA
Haccetepe Üniversitesi Ağaç İşleri Endüstri
Mühendisliği Bölümü, Beytepe, Ankara,
Türkiye.
Cep telefonu : +90 (536) 454 59 08
Telefon : +90 (312) 297 68 85
Faks : +90 (312) 297 68 85

Usta, 5(5), 802-806, (2020) J. Anatolian Env. and Anim. Sciences, Yıl:5, No:5, (802-806), 2020
803
INTRODUCTION
Wood, which is a natural and organic material
obtained from trees with its fibrous and porous structure, is
the oldest and widely used material in the history of
humanity with a very wide area of use in reference to its
easy processing and has played a major role in the
development of civilization and the progress of humanity.
It is clear that the use of wood alone or indirectly with other
materials in order to meet the needs and fulfill the
requirements as a sustainable natural material is closely
related to its unique material properties in terms of its
anatomical structure, chemical composition, physical
properties, and mechanical properties. At this point, despite
the fact that the breadth and depth of the presence of wood
in almost every area of life have been revealed through the
ongoing researches since a relatively long time, and
significant contributions have been made to the enrichment
of the knowledge about wood, these studies are not
sufficient in number and scope in terms of fully
recognizing wood and have not yet been completed. And
here, while the material properties of wood, as well as its
existential dimension affecting all of life, are being studied
comprehensively with an inexhaustible effort, like an
inquisitive and resourceful traveler sailing to the wind in
unstable weather conditions on the shore of a vast ocean, it
has been attempted to show how important wood is to the
communities all across the world from the past to the
present as a material and an entity, in the light of some
special facts or theories, due to its unlimited availability. In
this context, woodloverness, as a privileged theory
reinforced with the principle of causality on the basis of
woodlover approach, emerges as an important
phenomenon that clearly expresses that wood is a valuable
object embracing the whole universe and all humanity.
However, although woodloverness is a phenomenon
known to all societies since the beginning of human
history, it is still a privileged subject waiting to be defined
in detail and in depth. Therefore, in this particular study,
which is provided basically by benefiting from the articles
of Usta (2019) titled “A fact of woodloverness on the basis
of woodlover approach” and “Woodloverness”, the theory
of woodloverness is presented with annotations and
conceptual characterizations centered on the woodlover
approach to allow for understanding in a holistic and in-
depth manner. From this point of view, this study is very
highly important with its content, because the case of
“woodloverness”, which is the main reinforcement of the
subject of “woodlover approach”, will be explained in
greater detail here as a holistic and complementary new
theory by associating causality with many issues in terms
of its content that directs life and its effect that unites
people. In this regard, presenting woodloverness, which
focuses on universality with its deep and comprehensive
content, as a multi-faceted theory, will open a new horizon
in the field of wood science and technology. It is also
envisaged that the explanations made here will shed light
on all humanity as an indicator of the universality of wood.
And hence, the scope of this study is twofold: firstly, to
prepare good explanations with the intention of drawing
attention to the phenomenon of woodloverness on the basis
of woodlover approach, and to create awareness about this
special issue in the worldwide public opinion with the field
of wood science and technology, and secondly to explain
and promote in a way that will benefit everyone, which is
a global situation that makes globalization continuous.
Therefore, this study has a special content that will allow
the woodlover approach to come to the fore with a
conscious awareness with a new perspective..
THE NOTION OF WOODLOVERNESS
It is obvious that wood, which is a fascinating
component of life and an indispensable part of life with its
unlimited variety of products that integrate with daily life
practices, is the only material standing by people in the
ordinary course of life and is a valuable entity that
embraces the whole society. In this respect, it is certain that
the endless efforts that put wood into life with a wide
variety of product types are realized with the concept of
woodloverness that focuses on the woodlover approach.
Truly, considering the fact that wood is a common value of
humanity as a means of intercultural interaction that
connects the past to the present and the future with the
numerous benefits that has provided to humanity as a
material throughout history, it is clearly seen that all the
activities carried out with the concept of woodloverness on
the basis of woodlover approach are in harmony with the
essence of creativity and the mental process of innovation
and in close relationship with each other within an
integrated fiction.
Based on innovation and creativity throughout
history, the latent aspect of woodloverness, which has
always emphasized the entrepreneurial attitude and
behaviour accompanied by wood, has brought it to a very
special position that is easily perceived and immediately
noticed in the design of the unlimited variety of products
or applications that are persistently put forward with a
woodlover approach. Ultimately, woodloverness, which is
a common theory accompanied by a woodlover approach,
is a pure reality that allows the civilization process, which
facilitates life by integrating with nature, and enables
people to live comfortably, by consciously using wood,
which is a typical reflection of nature, with creative and
innovative solutions. From this perspective,
woodloverness is not only a certain term that has a

Usta, 5(5), 802-806, (2020) J. Anatolian Env. and Anim. Sciences, Yıl:5, No:5, (802-806), 2020
804
relatively long validity in the field of wood science and
technology, but also is a very special assumption that has
guided evaluation for underlying either prospective or
retrospective studies of welfare and quality of life in social
and technical literatures in order to provide scientific
evidences that can be properly acquired by experimental
and observational investigations. In this context, a fact of
woodloverness that is evaluated within the framework of
woodlover approach, which is a universal phenomenon
focused on the theme of giving importance to nature and
people by taking care of both nature and people, by using
wood supplied from trees as a sustainable and renewable
natural material correctly and effectively, includes a
progressive and enlightenment perspective that prioritizes
optimism and positive thinking in the focus of the science
and technology of wood, which has made great
contributions to the development of humanity and the
progress of civilization, because the phenomenon of
woodloverness has a detailed content that embraces all
humanity without any distinction, representing the
individual and social reality with its internality prioritizing
the individual and society, and contributing to the
development of civilization by nature and human
adaptation.
In the light of these explanations, it is an
indisputable reality that woodloverness, which focuses on
the woodlover approach, is a fundamental phenomenon
that coexists with humans, and it is undoubtedly certain
that woodloverness has a thematic content that can be
comprehensively explained by comparable definitions in
terms of its effect on the ordinary course of life by making
causality associations with all theories and practices that
are intertwined with life in one way or another. In essence,
“woodloverness” is endless efforts based on making
meaning of life and beautifying it with unlimited freedom
by overcoming difficulties by designing wood from a very
wide angle and using it in the best possible way in terms of
many different applications and various types of products
in order to improve daily life. If a broader definition is
made, “woodloverness”, which is a common attitude of
those who realize the beauty and importance of living with
an indispensable passion for wood, a natural and organic
material obtained from trees, by valuing nature as an
indicator of human dignity, is a multidimensional
phenomenon that adds value to human life and makes life
meaningful, due to the many successful and effective
solutions of wood that make daily life easier and more
enjoyable. At this point, considering the possible
marginalization of wood in the understanding and
interpretation of current discussions and suggestions for
the evaluation of wood as an important material and a
valuable entity on the basis the woodlover approach, the
phenomenon of woodloverness can be spoken as a
subjective concept that can be evaluated in detail by
directly or indirectly associating with theories or concepts
from almost all disciplines.
In fact, it is clear that woodloverness, which is an
indicator of the woodlover approach that integrates wood,
which is always in harmony with humans, as a constructive
or supportive material into life, is a significant
phenomenon that can be conceptualized with its unique
position in the development of civilization and the progress
of humanity, and is influenced by the descriptions revealed
by the knowledge about wood as a material and as an entity
due to a vast array of opportunities for sustainable solutions
what it provides for people around the world since ancient
times. Therefore, the fact that wood is a versatile and
functional material and also a valuable entity for people
from similar or different cultures throughout history has a
great effect on the comprehensive presentation of the
subject of woodloverness, which is an important and
multidimensional phenomenon that is intertwined with the
concepts of authenticity and cultural existentialism and
expressionism on the basis of woodlover approach that
focuses on universality, as a theory that has a unique
internal consistency and adequate explanatory power. Of
course, in the company of this reality, it is obvious that
activities or researches aiming to reveal wood as a material
and an entity with a woodlover approach will allow the
efforts to reconcile woodloverness with almost all existing
areas with a wider perspective.
Since it is absolute that a life without wood can
never exist, the realization of woodlover efforts with an
unprecedented enthusiasm and deep commitment that
envisage the continuous inclusion of wood into life in
terms of an unlimited variety of products and applications
will make a great contribution to the consolidation of the
notion of woodloverness. This is because woodlover
efforts are at the heart of woodloverness, which is a
dominant phenomenon in both the development and spread
of civilization in the company of nature and the progress of
humanity, and such that these indescribable efforts, which
make wood stand out with its content that directs life, both
create the common perception of all people in the focus of
a life integrated with wood and support the adoption and
internalization of woodloverness as a global phenomenon.
All these woodlover endeavors in the context of
woodloverness involve various types of causal
propositions realized with the woodlover approach that
places wood at the center of universal thought, and contain
a number of unique considerations to clarify the existence
of wood as a material and as an entity. Ultimately, as we
all get to know and learn about wood, it will become easier
and more common to associate almost any theme or subject
or concept directly or indirectly with the phenomenon of
woodloverness.

Usta, 5(5), 802-806, (2020) J. Anatolian Env. and Anim. Sciences, Yıl:5, No:5, (802-806), 2020
805
If we make an inference according to the above
explanations, it is obvious that the woodlover approach,
which forms an inseparable integrity with environmental
awareness, includes innovative and creative actions to
increase the quality of life, and hence it is essential to
constantly examine the whole existence of wood from a
multi-dimensional perspective in order to consolidate
woodloverness as a general acceptance. A lot of things can
be said about this issue, but what we particularly draw
attention to here is the necessity to unearth the content of
wood that provides countless benefits to all humanity by
examining the properties of wood as an important material
and as a valuable entity. Frankly, based on a woodlover
approach with a holistic perspective that focuses on
sustainability, wood, which is defined as a versatile and
functional material in terms of its anatomical structure,
chemical composition, physical properties and mechanical
properties, is considered to be a universal entity that affects
people’s feelings, thoughts, attitudes and behaviours as a
distinguished intercultural interaction tool. Therefore, the
introductory and informative activities foreseen on wood,
a natural and organic material used alone or in combination
with other materials to meet the various needs and different
requirements that arise in the ordinary course of daily life,
are about wood that has existed since the beginning of
human history, contains an undeniable reality that it will be
very useful in terms of creating an individual and social
consciousness and awareness and gaining strong insight.
From this viewpoint, because consciousness of
woodloverness would not shaped without awareness of the
technical, social and cultural aspects of wood that have
been brought to light with extensive experience and
scientific research methods, it is inevitable to examine the
whole possible existence of wood as an extraordinary
material and a considerable entity in depth and
comprehensively with the woodlover approach.
Since knowledge is built with science, it is
essential to demonstrate scientifically all the peculiar
properties of wood that have been noticed by experience
from past to present in order to be associated with almost
all matters related to life and to be established causality link
with all possible disciplines in terms of evaluating and
interpreting the phenomenon of woodloverness with a
broad knowledge. For this, when an assessment of the basic
assumptions about wood is made, it is obvious that the
following truths known to everyone in a definite reality are
prioritized as a final determination:
1. Wood, which is a natural and organic material
obtained from trees, is healthy with its fibrous and porous
structure and is a versatile and functional material that is
used in different ways for different purposes in daily life
with its easy processability.
2. Wood, which is a renewable natural resource
since it is obtained from trees as a reflection of nature with
sustainable forestry activities, offers almost endless
options thanks to its anatomical structure and chemical
composition, and physical properties and mechanical
properties.
3. The science and technology of wood has made
wood a considerable material used directly or indirectly in
meeting the needs and requirements that arise in the normal
course of daily life.
4. Wood is not only a material, but also a valuable
entity that influences people’s attitudes and behaviours,
feelings and thoughts, and their outlook on life, and is also
an important object that contributes to people’s
communication with each other and is of course a unique
tool in intercultural interaction.
5. Wood, which is a good and useful material that
has always stood by people since the beginning of history
with its naturalness, aesthetic appeal, characteristic feature
that is convenient to provide unlimited solutions, and
functionality, becomes strong and durable, even almost
indestructible when prepared in accordance with the
foreseen usage conditions.
6. Wood, a natural and organic material that can
be used almost everywhere with its superior material
properties, is an outstanding material that has played a
major role in the development and spread of civilization,
and therefore the contribution of wood to the progress of
humanity to the present day is an indisputable extent.
7. Wood, which is a unique material and a perfect
entity in accordance with its versatility and functionality,
is intertwined with almost all thoughts based on living as
an integral part with nature in unity and harmony, and is
integrated with almost all approaches to make sense of life
accompanied by the principles that guide life.
8. Wood is an incredible material that can be used
alone or in combination with other materials in almost all
arrangements and adaptations that make life easier, and it
is a transcendent entity that makes people behave in the
same or similar way in a positive thought.
To summarize, all the above explanations clearly
show how important the efforts made with the woodlover
approach are in evaluating woodloverness as a pathway to
civilization connected with nature, and firmly emphasize
that we should realize how much wood is actually present
in our lives as a material and an entity. As a result, the
effects of wood on our lives contain an undeniable reality,
and woodloverness, which focuses on wood, which is a
widely used material with activities carried out with a
woodlover approach, is an important phenomenon with its
multi-dimensional interiority.

Usta, 5(5), 802-806, (2020) J. Anatolian Env. and Anim. Sciences, Yıl:5, No:5, (802-806), 2020
806
CONCLUSION
It is clear that woodloverness is a deep and
comprehensive phenomenon that guides life with an
unlimited number of products and applications that are
constantly realized with the woodlover approach that
focuses on wood and can be associated with almost all
disciplines. In this regard, since wood is a universal
material that provides numerous benefits to people directly
or indirectly, either alone or in combination with other
materials, in meeting the needs and requirements that arise
in the ordinary course of daily life, and since it is an
international entity that embraces everyone by contributing
to the living in the same or similar attitudes, behaviours,
emotions and thoughts with a positive thinking, it is normal
and inevitable that the phenomenon of woodloverness,
which focuses on wood as a material and as an entity, with
its continuous and discrete quantities and features that can
be transformed into benefits, is defined in both concrete
and abstract contexts and evaluated in universal
dimensions with its unique content, referring to the
woodlover approach. In this framework, defining
woodloverness as a multi-dimensional phenomenon with a
woodlover approach is only possible by placing wood in
the center as a thematic element in terms of individual and
social awareness with its unique subjectivity.
In accordance with these explanations, it is the
basic starting point to make a common determination and
inference about wood as a material and an entity in order
to make a reconciliation between the phenomenon of
woodloverness and other possible phenomena with cause-
effect relation, and it is necessary to make this beginning
very accurately in order to successfully realize the
theoretical explanation towards woodloverness.
Accordingly, in the context of determining the
phenomenon of woodloverness in general terms, the
known determinations about wood in accordance with the
woodlover approach can be emphasized as follows:
a. Wood is an inexhaustible renewable natural
material derived from trees grown with sustainable forestry
activities as a unique reflection of nature with
extraordinary and immense beauty.
b. Wood is a universal material that provides
numerous benefits to all people directly or indirectly, either
alone or in combination with other materials, in meeting
the needs and requirements that arise in the ordinary course
of daily life.
c. Wood, which is a common material that meets
the needs and requirements of people with its versatility
and functionality, is a marvelous material that stands out
clearly in the relationship between technology and
civilization with its superior material properties.
d. Wood is an outstanding material that has a great
share in the development and spread of civilization and the
progress of humanity by reinforcing intercultural
interaction.
e. Considering globalization and cultural sharing
and empathy, wood, which is an important intercultural
interaction tool, is a valuable entity that affects people’s
feelings, thoughts, attitudes and behaviours, referring to its
natural and organic structure with its fibrous and porous
structure.
f. Wood, as a material and an entity, is fully or
partially integrated with almost all phenomena that shape
life and make sense of life with its versatile and functional
aspects.
g. Wood has a comprehensive identity, whose
properties have been continuously researched throughout
history and recognized by experience from past to present,
such that the knowledge of wood, which is a natural and
organic material that contains sustainability in its nature, is
constantly renewed by extensive experience and vast
research.
h. Wood is an excellent material that incorporates
creativity and innovative thinking and highlights an
entrepreneurial perspective, and is the most influential
entity in the entire universe that stimulates emotions.
Consequently, in order to define woodloverness
as a unique phenomenon in the focus of wood as an
extraordinary material and a wonderful entity, it is possible
to make comprehensive evaluations by looking at a broader
perspective with a woodlover approach. Lastly, it is
obvious that woodloverness is a deep-rooted phenomenon
with its holistic identity that continues its existence from
past to future with its life-guiding effect and its presence
that sheds light for all humanity.
ACKNOWLEDGMENTS
This paper was presented at the International
Forest Products Congress [ORENKO 2020] held on 23-26
September 2020, Trabzon, Turkey, and selected for
publication in the Journal of Anatolian Environmental and
Animal Sciences.
REFERENCES
Usta, I. (2019). A Fact of Woodloverness on the basis of
Woodlover Approach. Eurasian Journal of Social
and Economic Research, 6(8), 179-195.
Usta, I. (2019). Woodloverness. Mesleki Bilimler Dergisi,
8(2), 92-115.

Journal of Anatolian Environmental and Animal Sciences
(Anadolu Çevre ve Hayvancılık Bilimleri Dergisi) DOI: https://doi.org/10.35229/jaes.833750
JAES Year: 5, No: 5, 2020 (807-813)
AÇEH Yıl: 5, Sayı: 5, 2020 (807-813)
ARAŞTIRMA MAKALESİ RESEARCH PAPER
807
Multicriteria Evaluation of Structural Composite Lumber Products
Hilal SİNGER1* Şükrü ÖZŞAHİN2 1Bolu Abant Izzet Baysal University, Faculty of Engineering, Department of Industrial Engineering, Golkoy Campus, Bolu, Turkey 2Karadeniz Technical University, Faculty of Engineering, Department of Industrial Engineering, Kanuni Campus, Trabzon, Turkey
Geliş/Received: 30.11.2020 Kabul/Accepted: 14.12.2020
How to cite: Singer, H. & Özşahin, Ş. (2020). Multicriteria evaluation of structural composite lumber products. J. Anatolian Env. and Anim. Sciences, 5(5),
807-813.
Atıf yapmak için: Singer, H. & Özşahin, Ş. (2020). Yapısal kompozit kereste ürünlerinin çok kriterli değerlendirilmesi. Anadolu Çev. ve Hay. Dergisi, 5(5),
807-813.
Abstract: In this study, laminated veneer lumber, parallel strand lumber, and laminated strand lumber were evaluated via multicriteria decision-making methods. Within the model, nine evaluation criteria were defined: moisture content, density, bending strength, modulus of elasticity, compression strength parallel to grain, dynamic bending strength, tensile strength
parallel to surface, tensile strength perpendicular to surface, and screw holding capacity. The weights of the criteria were computed using the fuzzy analytic hierarchy process (FAHP). The evaluation based on distance from an average solution (EDAS) and the technique for order preference by similarity to an ideal solution (TOPSIS) were employed to determine the ranking of the alternatives. After the borda count method was used, an integrated ranking was obtained. According to the results, the first three important subcriteria were density, bending strength, and modulus of elasticity. Furthermore, laminated veneer lumber was determined as the best alternative. Consequently, this study can present a road map to evaluate wooden materials.
Keywords: EDAS, FAHP, multicriteria decision-making, structural composite lumber, TOPSIS.
Yapısal Kompozit Kereste Ürünlerinin Çok Kriterli Değerlendirilmesi
Öz: Bu çalışmada, tabakalanmış kaplama kereste, paralel şerit kereste ve tabakalanmış şerit kereste çok kriterli karar verme yöntemleri ile değerlendirilmiştir. Modelde dokuz değerlendirme kriteri belirlenmiştir: rutubet miktarı, yoğunluk, eğilme direnci, elastikiyet modülü, liflere paralel basınç direnci, dinamik eğilme direnci, yüzeye paralel yönde çekme direnci, yüzeye dik yönde çekme direnci ve vida tutma kabiliyeti. Kriterlerin ağırlıkları bulanık analitik hiyerarşi prosesi (BAHP) kullanılarak hesaplanmıştır. Alternatiflerin sıralamasını belirlemek için ortalama çözüm uzaklığına göre değerlendirme (EDAS) ve ideal çözüme benzerliğe göre tercih sıralama tekniği
(TOPSİS) kullanılmıştır. Borda sayım yöntemi kullanıldıktan sonra birleşik bir sıralama elde edilmiştir. Sonuçlara göre, ilk üç önemli alt kriter yoğunluk, eğilme direnci ve elastikiyet modülüdür. Buna ilaveten, tabakalanmış kaplama kereste en iyi alternatif olarak belirlenmiştir. Sonuç olarak, bu çalışma ahşap malzemelerin değerlendirilmesi için bir yol haritası sunabilir. Anahtar kelimeler: BAHP, çok kriterli karar verme, EDAS, TOPSİS, yapısal kompozit kereste.
INTRODUCTION
Structural composite lumber (SCL) is a family of
engineered wood products. It includes laminated veneer
lumber (LVL), parallel strand lumber (PSL), laminated
strand lumber (LSL), and oriented strand lumber (OSL)
(Bayatkashkoli and Faegh, 2014). LVL is manufactured
from wood veneers that are rotary peeled, dried, and
laminated together with parallelly oriented grains under
heat and pressure with an adhesive (Çolak et al., 2007).
PSL is manufactured by adhesively bonding long, thin, and
narrow strands of wood under high pressure (Arwade et al.,
2010). LSL consists of oriented wood flakes that are glued
and compressed to form panels up to 90 mm thick (Moses
et al., 2003). OSL is similar to LSL. The SCL products are
commonly used for rafters, headers, beams, joists, studs,
* : https://orcid.org/0000-0003-0884-2555
: https://orcid.org/0000-0001-8216-0048
*Corresponding author’s:
Hilal SİNGER
Bolu Abant Izzet Baysal University, Faculty
of Engineering, Department of Industrial
Engineering, Golkoy Campus, Bolu, Turkey.
Mobile telephone: +90 (542) 434 89 68
Telephone : +90 (374) 254 1000 / 4902
Fax : +90 (374) 253 45 58
*Sorumlu yazarın: Hilal SİNGER
Bolu Abant İzzet Baysal Üniversitesi,
Mühendislik Fakültesi, Endüstri Mühendisliği
Bölümü, Gölköy Kampüsü, Bolu, Türkiye.
Cep telefonu : +90 (542) 434 89 68
Telefon : +90 (374) 254 1000 / 4902
Faks : +90 (374) 253 45 58

Singer and Özşahin, 5(5), 807-813, (2020) J. Anatolian Env. and Anim. Sciences, Yıl:5, No:5, (807-813), 2020
808
and columns (APA, 2016). The advantages of SCL are high
strength, flexibility, high stiffness, and excellent
preservative treatability (Yazdani et al., 2004).
A large number of experimental studies have been
conducted to evaluate the various properties of the SCL
products (Ahmad & Kamke, 2011; Arwade et al., 2010;
Bal, 2016; Bayatkashkoli & Faegh, 2014; Çolak et al.,
2007; Çolak et al., 2019; Moses et al., 2003; Yazdani et al.,
2004). In light of the experimental studies, it can be said
that there are many factors that must be carefully evaluated.
Therefore, it is important to use methods providing
supportive and logical results in the evaluation process.
Multicriteria decision-making (MCDM) methods can be
used to evaluate decision elements. The fuzzy analytic
hierarchy process (FAHP), the evaluation based on
distance from an average solution (EDAS), and the
technique for order preference by similarity to an ideal
solution (TOPSIS) have been widely used to deal with
decision-making problems and obtain quite reliable results
(Chauhan & Singh, 2016; Ecer, 2018; Karakuş et al.,
2017). Therefore, in this study, these methods are used to
evaluate the SCL products.
The MCDM methods have been efficiently
applied to the various fields of wood science. Smith et al.
(1995) employed the AHP method to analyze factors
affecting the adoption of timber as a bridge material. Azizi
(2008) selected the best wood supply alternative by
employing the analytic network process (ANP) and the
BOCR approach. Lipušček et al. (2010) employed the AHP
method to classify wood products in terms of their impact
on the environment. Azizi and Modarres (2011) selected
the best construction panel by using the AHP and ANP
methods. Azizi et al. (2012) used the AHP method to select
the best medium density fiberboard (MDF) product.
Kuzman and Grošelj (2012) compared different
construction types by utilizing the AHP method. Sarfi et al.
(2013) used the AHP method to analyze factors influencing
the markets of particleboard and MDF. Karakuş et al.
(2017) employed the TOPSIS method, the multiple
attribute utility theory, and the compromise programing to
predict the optimum properties of some nanocomposites.
Singer and Özşahin (2018, 2020a, 2020b) prioritized some
factors influencing the surface roughness of wood and
wood-based materials in sawing, planing, and CNC
machining. Özşahin et al. (2019) employed AHP and
MOORA to select the best softwood species for
construction.
Consequently, the literature review has
demonstrated that there are many attempts on the use of
MCDM methods for solving various decision-making
problems in wood science. However, the literature has a
gap in evaluating the SCL products by MCDM methods.
Therefore, the objective of this study is to evaluate LVL,
PSL, and LSL by the MCDM analysis. In order to
determine the priorities of the alternatives, an evaluation
model containing FAHP, EDAS, and TOPSIS is proposed.
MATERIALS AND METHODS
Sample Preparation: The experimental data used
in this study were obtained from the literature (Özçifçi et
al., 2010; Sizüçen, 2008). The experimental process could
be briefly explained as follows. Poplar (Populus tremula
L.) veneers with the thickness of 3 mm were used to
produce LVLs. Poplar (Populus tremula L.) strands were
used to produce PSLs and LSLs. The size of strands in
PSLs was 3 mm thick by 20 mm wide by 600 mm long.
The size of strands in LSLs was 1.2 mm thick by 20 mm
wide by 300 mm long. The veneers and strands were
conditioned at a temperature of 55±2 ºC and a relative
humidity of 6±1% until they reached an average moisture
content of 3%. Phenol formaldehyde was chosen as the
adhesive. It has density, viscosity, and pH value of 1.195-
1.205 kg/m3, 250-500 MPa s, and 10.5-13, respectively.
The materials were pressed for 7 minutes at a temperature
of 180±3 ºC and a pressure of 30 kg/cm2 (ASTM D 5456,
1996). After pressing, the samples were conditioned at a
temperature of 20±2 ºC and a relative humidity of 65±5%
(TS 642/ISO 554, 1997). The moisture content and density
values of the samples were determined according to TS
2471 (1976) and TS 2472 (1976). The bending strength and
modulus of elasticity tests were carried out according to the
procedure of TS EN 310 (1999). The compression strength
parallel to grain, dynamic bending strength, screw
withdrawal, and tensile strength tests were carried out
according to TS 2595 (1977), TS 2477 (1976), ASTM D
1761 (2000), and ASTM D 1037-06a (2006), respectively.
Fuzzy Sets and Fuzzy Numbers: The fuzzy set
theory was developed by Zadeh (1965) in order to
represent the uncertainty, vagueness, and ambiguity of
judgments (Chauhan & Singh, 2016). In the classical set
theory, an element belongs or does not belong to a set. The
element of a fuzzy set naturally belongs to the set with a
membership value from the interval [0,1] (Kahraman &
Kaya, 2010). The most commonly utilized fuzzy numbers
are triangular and trapezoidal fuzzy numbers. In this study,
triangular fuzzy numbers (TFNs) will be employed owing
to their ease of use. The following equation is the
membership function of a TFN denoted as (l, m, u):
𝜇M̃(x) = { 0, x < l or x > u
(x− l) (m− l⁄ ), l ≤ x ≤ m
(u− x) (u−m),⁄ m ≤ x ≤ u
} (1)
l, m, and u indicate the lower value, the mid-value,
and the upper value, respectively. The main arithmetic
operations for two TFNs are as follows:

Singer and Özşahin, 5(5), 807-813, (2020) J. Anatolian Env. and Anim. Sciences, Yıl:5, No:5, (807-813), 2020
809
M̃1 ⊕ M̃2 = (l1 + l2,m1 + m2, u1 + u2) (2)
M̃1 ⊗ M̃2 = (l1l2,m1m2, u1u2) (3)
M̃1
-1= (1 u1⁄ , 1 m1⁄ , 1 l1⁄ ) (4)
The FAHP Method: AHP is a useful method to
solve complex MCDM problems (Saaty, 1980). In the AHP
method, the elements of the same level are compared in
pairs with respect to an element located at the higher level.
However, AHP is based on crisp judgments. In reality, it is
very hard to acquire precise data owing to uncertainties on
the judgments of decision-makers. Each decision-maker
prefers natural language expressions rather than crisp
numbers (Heo et al., 2010). Therefore, FAHP will be used
to obtain the weights of the criteria. The steps of the FAHP
method used in this study can be summarized as follows
(Chang, 1996; Somsuk & Laosirihongthong, 2014):
Step 1: The value of fuzzy synthetic extent with
respect to the ith object is computed.
Si =∑Mgi
j ⊗[∑∑Mgi
j
m
j=1
n
i=1
]
-1m
j=1
(5)
Step 2: The degree of possibility of Si =
(li,mi,ui) ≥ Sj = (lj,mj,uj) is calculated using the following
equation:
V(Si ≥ Sj) =
{
1, mi ≥ mj
0, lj ≥ ui
lj−ui
(mi−ui)−(mj−lj), otherwise
(6)
where i = 1,2,…,n, j = 1,2,…m, and i ≠ j.
Step 3: The degree of possibility of Si over all the other
fuzzy numbers is calculated.
V(Si ≥ Sj|j = 1,2,…m; i ≠ j) = minV(Si ≥ Sj|j = 1,2,…m; i ≠ j) (7)
Step 4: Compute the weight vector of a fuzzy
matrix. Assume that wi' = minV(Si ≥ Sj|j = 1,2,…m; i ≠
j).
wi =wi
'
∑ wi'n
i=1
(8)
Here, wi is a non-fuzzy value. The evaluation scale
used in this study is given in Table 1.
Table 1. The evaluation scale
Linguistic scale Triangular fuzzy scale
Equal (1,1,2)
Moderate (2,3,4)
Strong (4,5,6)
Very strong (6,7,8)
Extremely preferred (8,9,10)
The EDAS Method: EDAS is a MCDM method
that uses distances from average solutions (AV). The
evaluation of alternatives is carried out according to the
higher values of the positive distance from the average
(PDA) and the lower values of the negative distance from
the average (NDA). The EDAS procedure consists of the
following steps (Keshavarz Ghorabaee et al., 2015):
Step 1: The decision matrix D of n alternatives and
m criteria is formed.
D =
[
x11 x12⋯ x1m
x21 x22⋯ x2m
⋮
xn1
⋮
xn2
⋱
⋯
⋮
xnm]
(9)
Step 2: AV values are calculated.
AVj =∑ xij
ni=1
n (10)
Step 3: The values of PDA and NDA are
computed.
PDAij =
{
max(0,(xij − AVj))
AVj
, if j∈B
max(0,(AVj − xij))
AVj
, if j∈NB
(11)
NDAij =
{
max(0,(AVj − xij))
AVj
, if j∈B
max(0,(xij − AVj))
AVj
, if j∈NB
(12)
B and NB are associated with benefit criteria and
non-benefit criteria, respectively.
Step 4: The weighted sums of PDA and NDA are
calculated with Equations (13) and (14).
SPi =∑ (wjPDAij) (13)
m
j=1
SNi =∑ (wjNDAij)
m
j=1
(14)
Here, wj is the weight of the jth criterion.
Step 5: The normalized values of SP and SN are
determined as follows:
NSPi =SPi
maxi(SPi) (15)
NSNi = 1−SNi
maxi(SNi) (16)
Step 6: The appraisal score (AS) is calculated.

Singer and Özşahin, 5(5), 807-813, (2020) J. Anatolian Env. and Anim. Sciences, Yıl:5, No:5, (807-813), 2020
810
ASi =NSPi + NSNi
2, 0 ≤ ASi ≤ 1 (17)
The TOPSIS Method: TOPSIS is a MCDM
method that obtains a solution which is closest to the
positive ideal solution (PIS) and farthest from the negative
ideal solution (NIS). The TOPSIS procedure consists of the
following steps (Hwang & Yoon, 1981):
Step 1: The decision matrix is formed (see
Equation (9)).
Step 2: The normalized decision matrix is
obtained.
rij =xij
√∑ xij2n
i=1
𝑖 = 1,2,…,n; j = 1,2,…,m (18)
Step 3: The weighted normalized decision matrix
is obtained according to Equation (19).
Vij = wjrij (19)
Step 4: PIS and NIS are determined using
Equations (20) and (21), respectively.
A+ = {v1
+,v2+,…vn
+} = {(maxvij|j∈B), ( min vij|j∈NB )} (20)
A- = {v1
- ,v2- ,…vn
- } = {(minvij|j∈B), ( max vij|j∈NB )} (21)
Step 5: Calculate the distance of alternatives from
PIS and NIS.
di+ = √∑ (vij − vj
+)2
m
j=1
(22)
di- = √∑ (vij − vj
-)2
m
j=1
(23)
Step 6: The relative closeness to the ideal solution
(Ci) is computed.
Ci =di
-
di+ + di
- (24)
The Borda Count Method: The borda count
method can be employed to incorporate different ranking
results. An alternative gets m votes for the first-ranked
criterion, m–1 votes for the second-ranked criterion, and 1
vote for the last-ranked criterion. The alternative with the
largest sum of scores is the winner (Laukkanen et al.,
2005).
Application: In the present study, a MCDM
model is proposed to evaluate LVL, PSL, and LSL. This
model consists of the following main phases: (1)
prioritization of the criteria by FAHP, (2) prioritization of
the alternatives by EDAS and TOPSIS, and (3)
determination of the final ranking of the alternatives by
Borda. The evaluation model is shown in Figure 1.
Figure 1. The evaluation model used in the study.
In order to evaluate the alternatives, two main
criteria are defined as physical properties (PP) and
mechanical properties (MP). The subcriteria of physical
properties are moisture content (PP1) and density (PP2).
The subcriteria of mechanical properties are bending
strength (MP1), modulus of elasticity (MP2), compression
strength parallel to grain (MP3), dynamic bending strength
(MP4), tensile strength parallel to surface (MP5), tensile
strength perpendicular to surface (MP6), and screw holding
capacity (MP7). The hierarchical structure of the problem
is portrayed in Figure 2.
Figure 2. The decision hierarchy.
A decision-making team consisting of five experts
who have experience with the research topic is constructed
to evaluate each criterion. The experts use the linguistic
terms (see Table 1) to compare the criteria. The linguistic
terms are then converted to TFNs. The geometric means of

Singer and Özşahin, 5(5), 807-813, (2020) J. Anatolian Env. and Anim. Sciences, Yıl:5, No:5, (807-813), 2020
811
the fuzzy values are computed to obtain the overall results
of each evaluation matrix.
RESULTS AND DISCUSSION
The importance of each criterion is determined
using FAHP. The comparison matrices can be seen from
Tables 2-4.
Table 2. The comparison matrix of the main criteria.
Criterion PP MP
PP (1.000, 1.000, 1.000) (0.608, 0.750, 0.944)
MP (1.059, 1.332, 1.644) (1.000, 1.000, 1.000)
Table 3. The comparison matrix of the subcriteria within physical
properties. Criterion PP1 PP2
PP1 (1.000, 1.000, 1.000) (0.758, 0.903, 1.217)
PP2 (0.822, 1.108, 1.320) (1.000, 1.000, 1.000)
Table 4. The comparison matrix of the subcriteria within
mechanical properties.
Criterion MP1 MP2 MP3 MP4 MP5 MP6 MP7
MP1
(1.000,
1.000,
1.000)
(1.084,
1.185,
2.000)
(1.149,
1.380,
2.169)
(1.084, 1.
380,
1.741)
(0.871,
1.035,
1.431)
(0.871,
1.035,
1.431)
(1.320,
1.719,
2.491)
MP2
(0.500,
0.844,
0.922)
(1.000,
1.000,
1.000)
(1.246,
1.476,
2.297)
(0.922,
1.246,
1.644)
(1.059,
1.246,
1.888)
(1.059,
1.246,
1.888)
(1.320,
1.719,
2.491)
MP3
(0.461,
0.725,
0.871)
(0.435,
0.678,
0.803)
(1.000,
1.000,
1.000)
(0.803,
0.966,
1.320)
(0.699,
0.903,
1.320)
(0.699,
0.903,
1.320)
(1.000,
1.380,
1.888)
MP4
(0.574,
0.725,
0.922)
(0.608,
0.803,
1.084)
(0.758,
1.035,
1.246)
(1.000,
1.000,
1.000)
(0.944,
1.185,
1.741)
(0.944,
1.185,
1.741)
(1.084,
1.476,
2.000)
MP5
(0.699,
0.966,
1.149)
(0.530,
0.803,
0.944)
(0.758,
1.108,
1.431)
(0.574,
0.844,
1.059)
(1.000,
1.000,
1.000)
(1.000,
1.000,
2.000)
(1.431,
1.933,
2.433)
MP6
(0.699,
0.966,
1.149)
(0.530,
0.803,
0.944)
(0.758,
1.108,
1.431)
(0.574,
0.844,
1.059)
(0.500,
1.000,
1.000)
(1.000,
1.000,
1.000)
(1.431,
1.933,
2.433)
MP7
(0.401,
0.582,
0.758)
(0.401,
0.582,
0.758)
(0.530,
0.725,
1.000)
(0.500,
0.678,
0.922)
(0.411,
0.517,
0.699)
(0.411,
0.517,
0.699)
(1.000,
1.000,
1.000)
The weights are presented in Table 5. As seen in
Table 5, mechanical properties (0.734) are more important
than physical properties (0.266). The most significant
subcriterion is density (0.147). Other important subcriteria
are ranked as follows: bending strength (0.132), modulus
of elasticity (0.132), moisture content (0.119), tensile
strength parallel to surface (0.114), and tensile strength
perpendicular to surface (0.112). The lowest priority value
belongs to screw holding capacity (0.040). It is followed
by compression strength parallel to grain (0.093).
Table 5. Summary of the weights.
Main criterion Local
weight Subcriterion
Local
weight
Global
weight
Physical
properties
0.266 Moisture content 0.448 0.119
Density 0.552 0.147
Mechanical properties
0.734 Bending strength 0.180 0.132 Modulus of elasticity 0.180 0.132
Compression strength
parallel to grain 0.127 0.093
Dynamic bending strength 0.151 0.111
Tensile strength parallel to
surface 0.156 0.114
Tensile strength
perpendicular to surface 0.152 0.112
Screw holding capacity 0.054 0.040
The decision matrix is given in Table 6. The
physical and mechanical properties of the alternatives are
evaluated by EDAS and TOPSIS. The results are presented
in Tables 7 and 8. According to the results obtained by
using the FAHP-EDAS approach, the best SCL product is
LVL with an AS of 0.693. PSL with an AS of 0.597 is
positioned at the second rank, while LSL with an AS of
0.491 is placed at the third rank. According to the results
of the equal weighted EDAS analysis, the ASs of LVL,
PSL, and LSL are 0.776, 0.474 and 0.328, respectively.
These values show that the best SCL product is LVL.
Table 6. The decision matrix
PP1
(%)
PP2
(g/cm3)
MP1
(N/mm2)
MP2
(N/mm2)
MP3
(N/mm2)
MP4
(kgm/cm2)
MP5
(N/mm2)
MP6
(N/mm2)
MP7
(N/mm2)
LVL 8.13 0.40 64.51 7907.2 49.87 0.46 25.97 805.01 6.10
PSL 8.00 0.44 60.23 7864.6 43.85 0.50 25.88 796.66 5.46
LSL 8.34 0.50 61.83 8022.5 41.91 0.40 26.04 775.88 5.89
Table 7. The EDAS results FAHP−EDAS Equal weighted EDAS
SPi NSPi SNi NSNi AS Ranking SPi NSPi SNi NSNi AS Ranking
LVL 0.020 1.000 0.016 0.385 0.693 1 0.025 1.000 0.012 0.552 0.776 1
PSL 0.014 0.705 0.013 0.490 0.597 2 0.014 0.571 0.017 0.377 0.474 2
LSL 0.020 0.982 0.026 0.000 0.491 3 0.016 0.656 0.027 0.000 0.328 3
Table 8. The TOPSIS results
FAHP−TOPSIS Equal weighted TOPSIS
di+ di
- Ci Ranking di+ di
- Ci Ranking
LVL 0.020 0.014 0.419 3 0.015 0.017 0.518 1
PSL 0.015 0.016 0.528 1 0.015 0.016 0.517 2
LSL 0.018 0.019 0.520 2 0.019 0.015 0.448 3
When the results of the FAHP-TOPSIS analysis
are examined, it is seen that PSL (0.528) is the best
alternative. According to the results of the equal weighted
TOPSIS analysis, the ranking of the SCL products in
descending order with respective weights is LVL (0.518) >
PSL (0.517) > LSL (0.448). Borda is employed due to
different ranking results. Consequently, the ranking of the
alternatives is as follows: {LVL – PSL – LSL}. In light of
the results, it can be said that LVL is the best SCL product.
In Sizüçen’s work, the experimental results of
LVL, PSL, and LSL are reported. However, the ranking of
them is not reported. This shortcoming is eliminated by the
MCDM analysis.
CONCLUSION
The objective of this study is to evaluate LVL,
PSL, and LSL by taking into account their physical and
mechanical properties. In order to achieve the objective, an
evaluation model containing FAHP, EDAS, and TOPSIS
is proposed. FAHP is used to obtain the weights of the
criteria. The weights are used in EDAS and TOPSIS to
determine the ranking of the alternatives. Borda is
employed to incorporate the ranking results. According to
the results, the first three important subcriteria are density,

Singer and Özşahin, 5(5), 807-813, (2020) J. Anatolian Env. and Anim. Sciences, Yıl:5, No:5, (807-813), 2020
812
bending strength, and modulus of elasticity. Moreover, it
can be said that LVL possesses better properties when
compared with PSL and LSL. Consequently, the evaluation
model proposed in this study can provide beneficial
insights for researchers in terms of the evaluation of
wooden materials.
ACKNOWLEDGMENTS
The authors are thankful to Hamdullah Sizüçen
for providing the experimental data used in this paper. The
authors also acknowledge the experts for their
contributions to this study. This study was presented in
ORENKO 2020 held by Karadeniz Technical University,
Trabzon.
REFERENCES
Ahmad, M. & Kamke, F.A. (2011). Properties of parallel
strand lumber from Calcutta bamboo
(Dendrocalamus strictus). Wood Science and
Technology, 45(1), 63-72.
APA. (2016). Engineered wood construction guide
excerpt: structural composite lumber (SCL)
selection and specification. The Engineered
Wood Association, Washington.
Arwade, S.R., Winans, R. & Clouston, P.L. (2010). Variability of the compressive strength of parallel
strand lumber. Journal of Engineering
Mechanics, 136(4), 405-412.
ASTM D 1037-06a. (2006). Standard test methods for
evaluating properties of wood-base fiber and
particle panel materials. ASTM Standards, USA.
ASTM D 1761. (2000). Standard methods of testing
mechanical fastener in wood, staple or screw
withdrawal test. ASTM Standards, USA.
ASTM D 5456. (1996). Standard specification for evaluation of structural composite lumber
products. ASTM Standards, USA.
Azizi, M. (2008). A model of supplying poplar wood for
Iranian paper & wood factories. Journal of
Forestry Research, 19(4), 323-328.
Azizi, M. & Modarres, M. (2011). A decision making
model for investment and development of
construction panels. Journal of Forestry
Research, 22(2), 301-310.
Azizi, M., Momeni, E. & Mohebbi, N. (2012). Providing
a decision-making model for importing medium-density fiberboard product. Journal of the Indian
Academy of Wood Science, 9(2), 115-129.
Bal, B.C. (2016). Some technological properties of
laminated veneer lumber produced with fast-
growing poplar and eucalyptus. Maderas. Ciencia
y tecnología, 18(3), 413-424.
Bayatkashkoli, A. & Faegh, M. (2014). Evaluation of
mechanical properties of laminated strand lumber
and oriented strand lumber made from poplar
wood (populus deltoides) and paulownia
(paulownia fortunei) with urea formaldehyde
adhesive containing nanoclay. International Wood Products Journal, 5(4), 192-195.
Chang, D.-Y. (1996). Applications of the extent analysis
method on fuzzy AHP. European Journal of
Operational Research, 95(3), 649-655.
Chauhan, A. & Singh, A. (2016). A hybrid multi-criteria
decision making method approach for selecting a
sustainable location of healthcare waste disposal
facility. Journal of Cleaner Production, 139,
1001-1010.
Çolak, S., Çolakoğlu, G. & Aydin, I. (2007). Effects of
logs steaming, veneer drying and aging on the mechanical properties of laminated veneer lumber
(LVL). Building and Environment, 42(1), 93-98.
Çolak, S., İlhan, O. & Çolakoğlu, G. (2019). Effects of
pressing time on some technological properties of
laminated veneer lumber (LVL) produced using
polythene waste as adhesive. Journal of Anatolian
Environmental and Animal Sciences, 4(4), 662-
665.
Ecer, F. (2018). Third-party logistics (3Pls) provider
selection via fuzzy AHP and EDAS integrated
model. Technological and Economic
Development of Economy, 24(2), 615-634. Heo, E., Kim, J. & Boo, K.J. (2010). Analysis of the
assessment factors for renewable energy
dissemination program evaluation using fuzzy
AHP. Renewable and Sustainable Energy
Reviews, 14(8), 2214-2220.
Hwang, C.L. & Yoon, K. (1981). Multiple attribute
decision making: methods and applications.
Springer-Verlag, New York.
Kahraman, C. & Kaya, İ. (2010). A fuzzy multicriteria
methodology for selection among energy
alternatives. Expert Systems with Applications, 37(9), 6270-6281.
Karakuş, K., Aydemir, D., Öztel, A., Gunduz, G. &
Mengeloglu, F. (2017). Nanoboron nitride-filled
heat-treated wood polymer nanocomposites:
comparison of different multicriteria decision-
making models to predict optimum properties of
the nanocomposites. Journal of Composite
Materials, 51(30), 4205-4218.
Keshavarz Ghorabaee, M., Zavadskas, E.K., Olfat, L.
& Turskis, Z. (2015). Multi-criteria inventory
classification using a new method of evaluation
based on distance from average solution (EDAS). Informatica, 26(3), 435-451.
Kuzman, M.K. & Grošelj, P. (2012). Wood as a
construction material: comparison of different
construction types for residential building using
the analytic hierarchy process. Wood Research,
57(4), 591-600.
Laukkanen, S., Palander, T., Kangas, J. & Kangas, A.
(2005). Evaluation of the multicriteria approval
method for timber-harvesting group decision
support. Silva Fennica, 39(2), 249-264.
Lipušček, I., Bohanec, M., Oblak, L. & Stirn, L.Z. (2010). A multi-criteria decision-making model
for classifying wood products with respect to their

Singer and Özşahin, 5(5), 807-813, (2020) J. Anatolian Env. and Anim. Sciences, Yıl:5, No:5, (807-813), 2020
813
impact on environment. The International Journal of Life Cycle Assessment, 15(4), 359-367.
Moses, D.M., Prion, H.G.L., Li, H. & Boehner, W.
(2003). Composite behavior of laminated strand
lumber. Wood Science and Technology, 37(1), 59-
77.
Özçifçi, A., Uysal, B., Sizüçen, H., Yapıcı, F., Altun, S.,
Kurt, Ş. & Özbay, G. (2010). A comparative
study on some mechanical properties of structural
composite lumbers (SCL) produced from poplar
(Populus Tremula L.) papels. Technology, 13(2),
85-89.
Özşahin, Ş., Singer, H., Temiz, A. & Yıldırım, İ. (2019). Selection of softwood species for structural and
non-structural timber construction by using the
analytic hierarchy process (AHP) and the multi-
objective optimization on the basis of ratio
analysis (MOORA). Baltic Forestry, 25(2), 281-
288.
Saaty, T.L. (1980). The analytic hierarchy process:
planning, priority setting, resource allocation.
McGraw-Hill, New York.
Sarfi, F., Azizi, M. & Arian, A. (2013). A multiple criteria
analysis of factors affecting markets of engineered wood products with respect to customer
preferences: a case study of particleboard and
MDF. Forest Science and Practice, 15(1), 61-69.
Singer, H. & Özşahin, Ş. (2018). Employing an analytic
hierarchy process to prioritize factors influencing
surface roughness of wood and wood-based
materials in the sawing process. Turkish Journal
of Agriculture and Forestry, 42(5), 364-371.
Singer, H. & Özşahin, Ş. (2020a). A multiple criteria
analysis of factors influencing surface roughness
of wood and wood-based materials in the planing process. Cerne, 26(1), 58-65.
Singer, H. & Özşahin, Ş. (2020b). Prioritization of factors
affecting surface roughness of wood and wood-
based materials in CNC machining: a fuzzy
analytic hierarchy process model. Wood Material
Science & Engineering, 1-9. DOI:
10.1080/17480272.2020.1778079
Sizüçen, H. (2008). Determination of some strength
properties of laminated wood materials (LSL,
LVL, PSL) produced from poplar strands. Master
Thesis, Karabuk University, Turkey.
Smith, R.L., Bush, R.J. & Schmoldt, D.L. (1995). A hierarchical model and analysis of factors
affecting the adoption of timber as a bridge
material. Wood and Fiber Science, 27(3), 225-
238.
Somsuk, N. & Laosirihongthong, T. (2014). A fuzzy
AHP to prioritize enabling factors for strategic
management of university business incubators:
resource-based view. Technological Forecasting
& Social Change, 85, 198-210.
TS 2471. (1976). Wood, determination of moisture content
for physical and mechanical tests. Turkish Standards Institution, Ankara.
TS 2472. (1976). Wood, determination of density for physical and mechanical tests. Turkish Standards
Institution, Ankara.
TS 2477. (1976). Wood, determination of impact bending
strength. Turkish Standards Institution, Ankara.
TS 2595. (1977). Wood, determination of ultimate stress in
compression parallel to grain. Turkish Standards
Institution, Ankara.
TS 642/ISO 554. (1997). Standard atmospheres for
conditioning and/or testing; specifications.
Turkish Standards Institution, Ankara.
TS EN 310. (1999). Wood based panels, determination of modulus of elasticity in bending and of bending
strength. Turkish Standards Institution, Ankara.
Yazdani, N., Johnson, E. & Duwadi, S. (2004). Creep
effect in structural composite lumber for bridge
applications. Journal of Bridge Engineering, 9(1),
87-94.
Zadeh, L.A. (1965). Fuzzy sets. Information and Control,
8(3), 338-353.

Journal of Anatolian Environmental and Animal Sciences
(Anadolu Çevre ve Hayvancılık Bilimleri Dergisi) DOI: https://doi.org/10.35229/jaes.834199
JAES Year: 5, No: 5, 2020 (814-818)
AÇEH Yıl: 5, Sayı: 5, 2020 (814-818)
ARAŞTIRMA MAKALESİ RESEARCH PAPER
814
Paper and Paper Products and Wood and Wood Products Sectors Competition
Analysis: BRICS Countries and Turkey
Kadri Cemil AKYÜZ* İlker AKYÜZ Karadeniz Technical University, Department of Forest Industry Engineering Kanuni Campus, Trabzon/Türkiye
Geliş/Received: 01.12.2020 Kabul/Accepted: 06.12.2020
How to cite: Akyüz, K.C. & Akyüz İ. (2020). Paper and paper products and wood and wood products sectors competition analysis: BRICS countries and
Turkey. J. Anatolian Env. and Anim. Sciences, 5(5), 814-818.
Atıf yapmak için: Akyüz, K.C. & Akyüz İ. (2020). Kağıt-kağıt ürünleri sanayi ve ahşap-ahşap ürünleri sanayi sektöründe rekabet analizi: BRICS ülkeleri ve
Türkiye. Anadolu Çev. ve Hay. Dergisi, 5(5), 814-818.
Abstract: Financial crises on a world scale cause the emergence of new economic structures and powers. While the financial efficiency of developed countries decreases, developing countries are increasing their positions. BRIC (Brazil, Russia, India and China), which emerged as an
alternative economic power after the financial crisis in 2008, started to be known as BRICS countries with the addition of South Africa in 2011 and became an important economic structure. Its economic and demographic strength of thanks and wishing to take part in the active position in the world Turkey is willing to take part in the BRICS. Determination of Turkey's infrastructure sector as competitive with these countries is extremely important. In this study of the important sectoral groups of Turkey Paper and Paper Products and Wood and Wood Products Sector is intended to determine whether a location opposite of how the BRICS countries. Revealed Comparative Advantages approach was used in the study covering the years between 2010-2019.
As a result of the study, countries were compared at year level and superior sectoral structures were determined.
Keywords: BRICS, Turkey, paper-paper products, wood-wood products, revealed comparative advantages.
Kağıt-Kağıt Ürünleri Sanayi ve Ahşap-Ahşap Ürünleri Sanayi Sektöründe Rekabet
Analizi: BRICS Ülkeleri ve Türkiye
Öz: Dünya ölçeğindeki finansal krizler, yeni ekonomik yapıların ve güçlerin ortaya çıkmasına neden olmuştur. Gelişmiş ülkelerin finansal verimliliği düşerken, gelişmekte olan ülkeler
konumlarını yükseltmektedir. 2008 yılındaki finansal krizin ardından alternatif bir ekonomik güç olarak ortaya çıkan BRIC (Brezilya, Rusya, Hindistan ve Çin), 2011 yılında Güney Afrika'nın da eklenmesiyle BRICS ülkeleri olarak bilinmeye başladı ve önemli bir ekonomik yapı haline geldi. Ekonomik ve demografik gücüyle dünyada aktif pozisyonda yer almak isteyen Türkiye, BRICS'e katılmaya isteklidir. Türkiye'nin sektörel yapısının bu ülkelerle rekabet konumunun belirlenmesi son derece önemlidir. Bu çalışmada Türkiye Kağıt ve Kağıt Ürünleri ile Ağaç ve Ağaç Ürünleri Sektörünün BRICS ülkelerine karşı nasıl bir konumda olduğunun belirlenmesi amaçlanmıştır. 2010-2019 yıllarını kapsayan çalışmada Karşılaştırmalı Üstünlükler yaklaşımı kullanılmıştır. Çalışma sonucunda ülkeler yıl bazında karşılaştırılmış ve üstün sektörel yapılar tespit edilmiştir.
Anahtar kelimeler: BRICS, Türkiye, kağıt-kağıt ürünleri, ahşap-ahşap ürünleri, rekabet analizi.
INTRODUCTION
With the end of the cold war, countries in different
parts of the world began to become visible with the
economic power they caught, and they argued that an order
in which many powers would be effective, not just one
power, was adopted in the world economy (Chen, 2003;
Poyraz, 2019). The conflicts, especially due to lack of
resources, forced the formation of different economic
unions and created alternative economic power centers to
the USA and liberal economic thought. China, Russia,
Brazil, India and Turkey adopted to create alternative to the
IMF and World Bank (Ateş, 2012; Çelik, 2017).
* : https://orcid.org/0000-0003-0049-6379
: https://orcid.org/0000-0003-4241-1118
*Corresponding author’s: Kadri Cemil AKYÜZ
Karadeniz Technical University, Department
of Industrial Engineering Kanuni Campus,
Trabzon, Turkey.
Mobile telephone: +90 (533) 520 38 86
Telephone : +90 (462) 377 15 23
Fax : +90 (462) 325 74 99
*Sorumlu yazarın: Kadri Cemil AKYÜZ
Karadeniz Teknik Üniversitesi Orman
Fakültesi Orman Endüstri Mühendisliği
Bölümü, Kanuni Kampusü Trabzon, Türkiye
Cep telefonu : +90 (533) 520 38 86
Telefon : +90 (462) 377 15 23
Faks : +90 (462) 325 74 99

Akyüz and Akyüz., 5(5), 814-818, (2020) J. Anatolian Env. and Anim. Sciences, Yıl:5, No:5, (814-818), 2020
815
Established in 2006 under the name of BRIC
countries (Brazil, Russia, India, China) and later named
BRICS with the addition of South Africa in 2011, the
formation created an alternative center of attraction and
new cooperation opportunities for developing countries
(Önder, 2019). In 2001, according to the report published
by Jim o Neill, the chairman of the board of directors of
Goldman Sachs, an international investment bank, it took
its place in the economic structure (O'Neill, 2001; Sezer,
2018). In a report prepared in 2003, in less than 40 years,
BRIC countries; It has been hypothesized that France,
Germany, Italy, Japan, the UK and the USA will catch up
with the G6 countries and then these countries will become
the main engine of new demand growth and spending
power that will balance the slowing growth and population
in developed economies (Atabay Baytar, 2012). According
to the economic predictions made for the near future, it is
stated that the BRICS countries will surpass the G7
countries in 2035 (Öniş and Kutlay, 2015), and they will
be among the top 10 economies of the world in 2050
(Wilson and Purushothaman, 2003). The last 20 years have
shown that Turkey's economic success is also considered
one of the leading countries in 2050 is stated to be Turkey.
Therefore it emphasized the necessity of Turkey's inclusion
in this association and Turkey has expressed he wanted to
be a member of this mechanism in 2018.
Turkey's membership of BRICS searching for
new markets, and technological partnerships will help
support their desire to become a global actor. Therefore,
Turkey should revise the existing economic structure.
When examining the literature of Turkey and the BRICS
member countries seem to be limited studies comparing
economic performance. In this study, it is aimed to
determine the competitive position of Paper and Paper
Products Industry and Wood and Wood products industry
groups, which are sub-industrial groups of the Forest
Products Industry Sector, against BRICS countries. It is
important for the future of the country to support industrial
groups that have a high competitive position against
BRICS countries and to plan their resource use in this
direction.
Paper and Paper Products Industry and Wood
and Wood Products Industry in Foreign Trade: The
foreign trade figures of the countries within the scope of
the study in the field of paper and paper products and wood
and wood products are given in the tables below.
Table 1 show that Brazil has a significant foreign
trade surplus at both sectoral levels. When the situation is
evaluated in terms of the years analyzed, it is seen that the
foreign trade surplus in the field of paper and paper
products increased by 143%. The increase in the foreign
trade surplus in the wood and wood products industry is
around 55%. Paper and paper products industry realized
approximately 0.8% of Brazil's average exports between
2010 and 2019, while this rate is 1% for the wood and wood
products industry. A portion of 1.1% of the average paper
exports made throughout the world within the specified
years was realized by Brazil. In the field of wood and wood
products industry, approximately 2.2% of the average
export realized between 2010 and 2019 was made by
Brazil.
Table 1. Brazil's export-import level by years (1,000 dollars). Paper and Paper Products Wood and Wood Products
Years Export Imports Current
Account
Balance
Years Export Imports Current
Account
Balance
2010 2.008.555 1.540.653 467.902 2010 1.917.872 133.087 1.784.785
2011 2.187.577 1.754.203 433.374 2011 1.900.096 176.455 1.723.641
2012 1.951.228 1.606.042 345.186 2012 1.887.658 167.639 1.720.019
2013 1.970.194 1.505.819 464.375 2013 2.003.924 144.449 1.859.475 2014 1.922.181 1.441.538 480.643 2014 2.243.112 150.617 2.092.495
2015 2.020.964 957.817 1.063.147 2015 2.271.395 116.236 2.155.159
2016 1.871.020 738.456 1.132.564 2016 2.361.479 98.880 2.262.599 2017 1.013.080 838.173 1.074.907 2017 2.779.920 96.932 2.682.988
2018 2.072.495 883.457 1.189.038 2018 3.182.252 100.556 3.081.696
2019 1.986.916 846.891 1.140.025 2019 2.886.205 108.418 2.777.787
Foreign trade data of Russia can be seen in Table
2. As a result of the evaluation made, it is seen that the
foreign trade deficit in the field of paper and paper products
between 2010 and 2017 turned into a foreign trade surplus
in 2018 and 2019. This change shows that Russia is turning
into a production center in the paper and paper products
sector. When the level of exports in the field of paper and
paper products is analyzed, it corresponds to approximately
0.4% of Russia's overall export level in terms of the
average of all years. Russia realizes 1.2% of the paper
exports made worldwide. When the data of the wood and
wood products sector are examined, an increasing foreign
trade surplus of Russia in all years draws attention. The
foreign trade surplus, which increased approximately by
53% between 2010 and 2019, shows Russia's effectiveness
in this area. The wood and wood products industry sector,
which has a share of 1.7% in Russia's total foreign trade
average, constitutes 5.6% of the world's wood and wood
products exports.
Table 2. Russia’s export-import level by years (1,000 dollars).
Paper and Paper Products Wood and Wood Products
Years Export Imports Current
Account
Balance
Years Export Imports Current
Account
Balance
2010 1.457.976 3.844.758 -2.386.782 2010 6.093.699 860.844 5.232.855
2011 1.732.652 4.309.085 -2.576.433 2011 6.973.754 1.087.167 5.886.587
2012 1.924.464 3.748.744 -1.824.280 2012 6.734.568 1.450.095 5.284.473 2013 2.055.067 3.814.418 -1.759.351 2013 7.330.193 1.653.171 5.677.022
2014 2.260.193 3.542.705 -1.282.512 2014 7.763.748 1.323.914 6.439.834
2015 1.790.874 2.250.991 -460.117 2015 6.151.899 691.874 5.460.025
2016 1.899.540 2.255.626 -356.086 2016 6.523.925 601.922 5.922.003 2017 2.197.132 2.404.796 -207.664 2017 7.901.564 657.998 7.243.566
2018 2.737.863 2.653.242 84.621 2018 9.009.168 707.265 8.301.903
2019 2.491.263 2.454.115 37.148 2019 8.619.543 616.044 8.003.499
The data of India in the field of paper and paper
products industry and wood and wood products industry
are shown in Table 3. India has a significant foreign trade
deficit in both product groups (Table 3). Although the
foreign trade deficit in the field of paper and paper products

Akyüz and Akyüz., 5(5), 814-818, (2020) J. Anatolian Env. and Anim. Sciences, Yıl:5, No:5, (814-818), 2020
816
has decreased over the years, the deficit in wood and wood
products has gradually increased. In India's average export,
the paper and paper products sector is 0.4%, and the wood
and wood products sector is 0.1%. In the evaluation made
by taking into account the world export figures, it is seen
that India has a share of 0.7% in the paper and paper
products sector and 0.2% in the wood and wood products
sector.
Table 3. India’s export-import level by years (1,000 dollars). Paper and Paper Products Wood and Wood Products
Years Export Imports Current
Account
Balance
Years Export Imports Current
Account
Balance
2010 784.177 1.887.451 -1.103.274 2010 163.784 1.697.604 -1.533.820
2011 906.988 2.454.710 -1.547.722 2011 220.651 2.410.817 -2.190.166 2012 930.360 2.266.894 -1.336.534 2012 258.874 2.606.741 -2.347.867
2013 1.139.895 2.364.880 -1.224.985 2013 351.496 2.680.339 -2.328.843
2014 1.115.993 2.610.041 -1.494.048 2014 353.812 2.703.642 -2.349.830
2015 1.127.113 2.425.519 -1.298.406 2015 427.377 2.435.878 -2.008.501 2016 1.183.920 2.662.456 -1.478.536 2016 400.748 2.145.530 -1.744.782
2017 1.284.054 3.069.063 -1.785.009 2017 415.073 2.186.864 -1.771.791
2018 1.827.352 2.994.535 -1.167.183 2018 435.525 2.227.212 -1.791.687
2019 2.061.320 2.886.570 -825.250 2019 477.641 2.178.456 -1.700.805
The foreign trade figures of China at both sector
levels are shown in Table 4.
Table 4. China’s export-import level by years (1,000 dollars). Paper and Paper Products Wood and Wood Products
Years Export Imports Current
Account
Balance
Years Export Imports Current
Account
Balance
2010 9.561.194 4.611.778 4.949.416 2010 9.651.544 11.234.863 -1.583.319
2011 12.905.511 5.054.829 7.850.682 2011 11.354.387 15.857.712 -4.503.325
2012 13.721.805 4.596.226 9.125.579 2012 12.315.248 14.937.027 -2.621.779
2013 15.987.710 4.372.835 11.614.875 2013 12.748.095 18.768.839 -6.020.744 2014 17.818.529 4.308.838 13.509.691 2014 14.469.960 22.797.545 -8.327.585
2015 18.849.401 4.046.927 14.802.474 2015 14.211.187 18.627.016 -4.415.829
2016 18.172.109 3.944.806 14.227.303 2016 13.613.182 19.596.941 -5.983.759
2017 18.417.669 4.985.630 13.432.039 2017 13.693.413 23.411.325 -9.717.912 2018 19.460.630 6.201.170 13.259.460 2018 14.888.332 24.914.414 -10.026.082
2019 22.008.827 5.265.825 16.743.002 2019 13.410.436 21.976.449 -8.566.013
When the data in Table 4 are examined, it is
noteworthy that the foreign trade figures are high.
Especially in recent years, China, which has become the
production center of the world, has created trade activity at
the level of sectors. The foreign trade volume of paper and
paper products in 2010 reached 27 billion dollars in 2019
from approximately 14 billion dollars. Within the same
period, the foreign trade surplus increased approximately 4
times. On average, 0.7% of all exports made by China in
the years 2010-2019 were realized by the paper and paper
products industry sector. Considering the average of world
paper exports for the years 2010-2019, it is seen that 10%
of it was made by China. Having a foreign trade deficit in
the field of wood and wood products, China realized an
average of 10.1% of world exports. The share of wood and
wood products in China's own exports is 6% in terms of the
2010-2019 average.
South Africa's foreign trade data are shown in
Table 5. Having a negative foreign trade balance in the
paper and paper products industry for all years, South
Africa is in a position to have a foreign trade surplus in the
field of wood and wood products. The paper and paper
products industry sector has a 0.8% share in the country's
foreign trade, while the share of wood and wood products
in foreign trade is 0.5%. In the world trade, South Africa
has a share of 0.4% in paper and paper products and 0.3%
in wood and wood products.
Table 5. South Africa's export-import level by years (1,000 dollars).
Paper and Paper Products Wood and Wood Products
Years Export Imports Current
Account
Balance
Years Export Imports Current
Account
Balance
2010 910.164 992.383 -82.219 2010 513.759 334.443 179.316
2011 916.871 1.080.319 -163.448 2011 538.660 400.081 138.579
2012 809.829 1.048.274 -238.445 2012 471.249 400.126 71.123
2013 733.495 1.057.978 -324.483 2013 451.334 393.037 58.297 2014 727.116 1.043.424 -316.308 2014 510.265 396.521 113.744
2015 665.762 973.476 -307.714 2015 500.958 375.820 125.138
2016 635.106 896.427 -261.321 2016 475.342 346.874 128.468
2017 625.648 909.485 -283.837 2017 535.495 360.382 175.113 2018 706.252 1.076.186 -369.934 2018 588.922 382.758 206.164
2019 595.931 1.035.157 -439.226 2019 516.639 362.633 154.006
Turkey's foreign trade figures in Table 6 are also
shown. When the figures in Table 6 are examined, it is seen
that both sectors have a positive foreign trade trend. The
increase in exports in the paper and paper products industry
over the years has an important effect on reducing the
foreign trade deficit. Paper and paper products forming part
about 1% of Turkey's trade with Turkey has the capacity to
add to the positive change that has industrial economy.
Paper and paper products in world trade, which owns a
0.8% share at the level of Turkey holds the power industry,
this rate may increase rapidly. When the foreign trade
figures of wood and wood products are examined, it is seen
that the balance, which was negative over the years, has
moved to positive with the increase in exports. sector,
which has a weight of 0.4% in Turkey's foreign trade is a
0.5% share of world trade in general.
Table 6. Turkey’s export-import level by years (1,000 dollars). Paper and Paper Products Wood and Wood Products
Years Export Imports Current
Account
Balance
Years Export Imports Current
Account
Balance
2010 1.216.835 2.819.743 -1.602.908 2010 573.203 1.098.395 -525.195 2011 1.427.255 3.109.936 -1.682.681 2011 652.927 1.427.786 -774.860
2012 1.033.096 2.882.665 -1.849.569 2012 657.954 1.619.738 -961.783
2013 1.140.574 3.091.816 -1.951.242 2013 724.631 1.563.578 -838.948
2014 1.203.724 3.170.718 -1.966.994 2014 853.305 1.487.632 -634.328 2015 1.185.524 2.683.944 -1.498.429 2015 692.752 1.505.159 -812.407
2016 1.353.499 2.684.714 -1.330.141 2016 675.873 1.265.054 -589.131
2017 1.520.374 2.811.916 -1.291.542 2017 763.956 1.132.785 -369.895
2018 1.715.787 2.749.839 -1.034.052 2018 826.635 827.893 -1.258 2019 1.796.339 2.513.824 -717.485 2019 885.456 405.913 479.543
MATERIALS AND METHOD
BRICS countries and Turkey's Paper and Paper
Products Industry and Wood & Wood Products 2010-2019
year study of competition in the industry sector analysis of
foreign trade data are used. The data used for analysis was
obtained from the TradeMap (2020) website.
In order to measure the competitiveness of the
firm, industry and countries, it primarily uses foreign trade
data. In our study; The Revealed Comparative Advantage
(RCA) method, which was created by Liesner (1958) to

Akyüz and Akyüz., 5(5), 814-818, (2020) J. Anatolian Env. and Anim. Sciences, Yıl:5, No:5, (814-818), 2020
817
measure competitiveness and later developed by Balassa
(1965) and has been widely used until today, was used. The
Balassa index was formulated as follows:
RCAij= (xij / Xj)/ (xiw / Xw) (1)
where;
RCAij; revealed comparative advantage index for
the ith goods of the jth country.
xij : jth country’s ith exported goods
Xj : jth country's total exports
xiw : ith goods of the global exports
XW : total global exports
A value less than 1 to be obtained as a result of the
analysis made indicates that the country does not have
competitive power in terms of comparative advantages
explained at the relevant goods level, that is, it has a
disadvantage, and a value greater than 1 indicates that it is
specialized in that product group, that is, it has announced
mutual advantage.
RESULTS AND DISCUSSION
BRICS countries and Turkey Paper & Paper
Products Industry Sectors competitive analysis of the
results in Table 7 are also seen. As a result of the analysis
of the competitive power of countries, when the values in
Table 7 are examined, it is seen that all countries have
averages less than 1, which is the accepted competitive
power value indicator in terms of years average.
Table 7. BRICS countries and Turkey: Paper and Paper Products Industry
Years Brazil Russia Indian China South Africa Turkey
2010 0,896 0,330 0,320 0,545 0,992 0,962
2011 0,829 0,325 0,292 0,660 0,824 1,027
2012 0,903 0,412 0,361 0,752 0,920 0,761
2013 0,904 0,533 0,376 0,804 0,857 0,834 2014 0,938 0,428 0,386 0,835 0,862 0,839
2015 1,124 0,571 0,545 0,878 0,865 0,876
2016 1,063 0,700 0,477 0,902 0,872 0,999
2017 0,512 0,678 0,478 0,893 0,770 1,067 2018 0,954 0,673 0,623 0,862 0,819 1,129
2019 0,996 0,662 0,716 0,989 0,740 1,179
Average 0,9119 0,5312 0,4574 0,812 0,8521 0,9673
In comparison with the countries in its internal
years Turkey has the highest value in terms of average. It
is seen that it has a competitive advantage in the field of
Paper and Paper Products industry against BRICS
countries. Turkey is followed by Brazil and South Africa.
Changes occurring in the country in the years when it is
observed that increased 22.5% between the years 2010-
2019 at the level of Turkey's competitiveness. Especially
in recent years, it can be clearly seen that it has exceeded
the accepted value of 1 in 2017, 2018 and 2019 and is in an
increasing trend in this direction. With the BRICS
countries in terms of foreign trade data owned by Turkey
Paper and Paper Products are in position to compete in the
industrial area has a structure.
Brazil, which ranks second in terms of average
values, has achieved an 11% increase in competitive power
over the years. It could not maintain the competitive
advantage it had achieved in 2015 and 2016.
South Africa reduced its competitiveness value in
2010 in 2019 and showed a decline of -25% in annual
average. In general, South Africa, which does not have a
competitive value of 1 or more, shows a negative situation
in the field of Paper and Paper Products Industry.
China, which has been effective in the world
economy in recent years, has a competitive position far
from expected in the field of Paper and Paper Products
Industry. The competitive advantage it has in many
different areas is not seen in this product group.
Considering the change over the years, it can be seen that
China, which has increased by 81%, will have a say in this
field in the near future.
Russia and India share the last places in the
ranking of competitive advantage in this product group.
When it is considered that both countries showed annual
growth (in Russia 100% India 124%) between Paper and
Paper Products Industry in the BRICS countries and
Turkey is seen that there will be serious competition to the
war. Analysis results of Wood and Wood Products Industry
sectors are shown in Table 8.
When Table 8, which includes the
competitiveness of countries in the field of Wood and
Wood products industry, is examined, it is clearly seen that
Russia has a significant competitive advantage in this field
in terms of both annual average value and values in all
years. Brazil and China follow Russia.
Russia increased its competitiveness value in
2010 (2,183> 1) by 30% in 2019 (2,839> 1). During this
period, Brazil showed an increase of 33% and showed that
it was a significant power in competition..
Table 8. BRICS countries and Turkey: Wood and Wood Products
Industry. Years Brazil Russia Indian China South Africa Turkey
2010 1,351 2,183 0,105 0,870 0,884 0,715 2011 1,124 2,043 0,110 0,906 0,756 0,733
2012 1,215 2,005 0,139 0,939 0,745 0,674
2013 1,199 2,014 0,151 0,836 0,688 0,691
2014 1,365 2,136 0,152 0,846 0,754 0,741 2015 1,584 2,459 0,215 0,830 0,816 0,642
2016 1,593 2,856 0,191 0,803 0,775 0,592
2017 1,649 2,858 0,189 0,778 0,772 0,628
2018 1,745 2,638 0,176 0,785 0,814 0,640 2019 1,794 2,839 0,205 0,747 0,795 0,720
Average 1,4619 2,4031 0,1633 0,834 0,7799 0,6776
China and South Africa, which can provide an
alternative to these two countries, showed a decrease of
approximately 14% and 10% within this period and
showed that they were losing power in competition. India's
increase in this area remained far from a competitive
position.

Akyüz and Akyüz., 5(5), 814-818, (2020) J. Anatolian Env. and Anim. Sciences, Yıl:5, No:5, (814-818), 2020
818
Turkey has managed to maintain its
competitiveness although that experience increases and
decreases in the studied years. Turkey in this area who
wants to take part in the BRICS countries are quite difficult
to compete with Russia and Brazil.
CONCLUSION
Technological infrastructure and power that
Turkey has experienced production Paper and Paper
Products are qualities that can have a significant
competitive advantage the BRICS countries across the
industry. The analysis, which has adopted a position on the
standard values in some years it was increasing its strength
over the years indicate that Turkey's power in the market
may be effective in this area. Paper and paper products with
the support of Turkey will be held in the investment
industry and will have an important place in the economic
growth of the sector and will consist seems to be able to
access the production center of Turkey in the world order.
Turkey, paper and paper products are in a strong position
in the industrial area opposite the BRICS countries. Turkey
is in the paper and paper products industry can compete
with Brazil and South Africa.
In the field of wood and wood products, the
undisputed superiority of Russia and Brazil is seen in the
analysis results due to the raw material availability they
have among the BRICS countries. There is no country that
can rival these two countries within the scope of the years
examined. Turkey should act in this area and knowing the
position which should encourage rational investment
resources.
ACKNOWLEDGMENTS
This study was presented in ORENKO 2020 held
by Karadeniz Technical University, Trabzon.
REFERENCES
Atabay Baytar, R. (2012). The Determinants of Trade
Volume Between Turkey and BRIC Countries: A
Gravity Mofel Analysis, İstanbul Commerce
University. Journal of Social Sciences, 11(21),
403-424.
Ateş, D. (2012). International Organizations
Organizational Logic of States, Bursa: Dora
Publications.
Balassa, B. (1965). Trade Liberalization and Revealed
Comparative Advantage. The Manchester School
of Economic and Social Studies, 33(2), 99-123.
Chen, R. (2003). China Perceives America: Perspectives
of International Experts. Journal of
Comtemporary China, 12(35), 285-297.
Çelik, M. (2017). Sovereign Equality of States: An
International Relations Myth, Ankara: Nobel
Academic Publishing.
Liesner, H.H. (1958). The European Common Market and
British Industry. Economic Journal, 68, 302-16.
O'Neill, J. (2001). Building Better Global Economic
BRICs. Los Angeles: Goldman Sachs.
Önder, E. (2019). Some Main Index Framework in Turkey
/ BRICS Comparative Analysis. Policy Brief, 67,
1-17.
Öniş, Z. & Kutlay, M. (2015). Democratic BRICS
Countries: New Actors of Global Governance.
Analist, 20-23.
Poyraz, M. (2019). BRICS: Is it a Search For an
Alternative Order? Suleyman Demirel University
Visionary Journal, 10(24), 434-449.
Sezer, S. (2018). The Effectiveness of Orthodox and
Heterodox Economic Policies in the Elimination
of Foreing Trade Deficit: The BRICS Countries
and Turkey Comparison. Turkish Studies, 13(30),
387-420.
Trade Map. (2020). www.trademap.org , Date of Access
September 2020.
Wilson, D. & Purushothaman, R. (2003). Dreaming with
BRICs: The Path to 2050, Los Angeles: Goldman
Sachs.

Journal of Anatolian Environmental and Animal Sciences
(Anadolu Çevre ve Hayvancılık Bilimleri Dergisi) DOI: https://doi.org/10.35229/jaes.834313
JAES Year: 5, No: 5, 2020 (819-824)
AÇEH Yıl: 5, Sayı: 5, 2020 (819-824)
ARAŞTIRMA MAKALESİ RESEARCH PAPER
819
Structural Performance Analysis of Cross Laminated Timber (CLT) Produced
From Pine and Spruce Grown in Turkey
Abdullah Uğur BİRİNCİ1* Hasan ÖZTÜRK2 Cenk DEMİRKIR1 Gürsel ÇOLAKOĞLU1 1*Karadeniz Technical University, Faculty of Forestry, Department of Forest Engineering, Kanuni Campus, Trabzon, Turkey
2 Karadeniz Technical University, Arsin Vocational School, Materials and Material Processing Technologies, Trabzon, Turkey
Geliş/Received: 01.12.2020 Kabul/Accepted: 13.12.2020
How to cite: Birinci, A.U., Öztürk, H., Demirkır, C. & Çolakoğlu G. (2020). Structural Performance Analysis of Cross Laminated Timber (CLT) Produced
From Pine and Spruce Grown in Turkey. J. Anatolian Env. and Anim. Sciences, 5(5), 819-824.
Atıf yapmak için: Birinci, A.U., Öztürk, H., Demirkır, C. & Çolakoğlu G. (2020). Türkiye’de Yetiştirilen Sarıçam ve Doğu Ladininden Üretilen Çapraz
Lamine Ahşap (CLT) Yapısal Performans Analizi. Anadolu Çev. ve Hay. Dergisi, 5(5), 819-824.
Abstract: Wooden buildings with many advantages such as being lightness, durability,
earthquake resistant, healthy, insulating, and esthetic are suitable for all kinds places especially earthquake zones. Cross-laminated timber (CLT) has increasingly become a viable alternative to other structural materials, mainly because of its excellent properties related to sustainability, energy efficiency, and speed of construction. This has resulted in the recent emergence of a significant number of CLT buildings constructed around the world. This is a study on determining the properties of CLT panels manufactured from wood species grown in Turkey and investigating of the structural behaviour and seismic resistant performance of them. Lumbers of 100 mm (width) x 50 mm (thickness) x 2400 mm (length) used in CLT manufacturing were obtained from eastern spruce (Picea orientalis L.) and scots pine (Pinus slyvestris) logs. Two replicate three-
layered CLT panels of 2400 mm × 2400 mm × 150 mm in size were manufactured for each group. Density of the CLT panels was determined according to EN 323. The seismic resistant performance of the CLT shear walls was determined according to ASTM E 72 standard. CLT panels manufactured from scots pine gave higher seismic performance than those of CLT panels manufactured from spruce. The maximum load capacity of the walls increased with increasing the density values of the CLT panels.
Keywords: CLT (Cross Laminated Timber), structural behaviour performance, artificial neural network
(ANN), scots pine, spruce.
Türkiye’de Yetiştirilen Sarıçam ve Doğu Ladininden Üretilen Çapraz Lamine
Ahşap (CLT) Yapısal Performans Analizi
Öz: Hafif, dayanıklı, depreme dayanıklı, sağlıklı, yalıtkan ve estetik olması gibi pek çok avantaja sahip olan ahşap yapılar, deprem bölgeleri başta olmak üzere her türlü mekan için uygundur. Çapraz lamine ahşap (CLT), sürdürülebilir olması, enerji verimliliği ve yapım hızı ile ilgili mükemmel özellikleri nedeniyle, diğer yapısal malzemelere giderek artan bir şekilde daha uygun bir alternatif haline geldi. Bu, yakın zamanda dünya çapında inşa edilen önemli sayıda CLT binasının ortaya çıkmasıyla sonuçlanmıştır. Yapılan bu çalışma Türkiye'de yetişen ağaç türlerinden üretilen CLT panellerin özelliklerinin belirlenmesi, yapısal davranışı ve depreme dayanıklılık performanslarının incelenmesi üzerinedir. CLT imalatında kullanılan 100 mm
(genişlik) x 50 mm (kalınlık) x 2400 mm (uzunluk) ölçülerindeki keresteler, Doğu Ladini (Picea orientalis L.) ve Sarıçam (Pinus slyvestris) tomruklarından elde edilmiştir. Her bir grup için 2400 mm × 2400 mm × 150 mm boyutlarında iki adet üç tabakalı CLT paneli üretilmiştir. CLT panellerinin yoğunluğu EN 323'e göre, perde duvarların sismik dayanıklılık performansı ise ASTM E 72 standardına göre belirlenmiştir. Sarıçamdan üretilen CLT paneller, ladinden üretilen CLT panellere göre daha yüksek sismik performans sağlamıştır. CLT panellerinin yoğunluk değerleri arttıkça duvarların maksimum yük taşıma kapasitesi artmıştır. Anahtar kelimeler: CLT (Çapraz Lamine Ahşap), yapısal davranış performansı, yapay Sinir ağları, sarıçam,
doğu ladin.
* : https://orcid.org/0000-0003-3273-3615
: https://orcid.org/0000-0002-5422-7556
: https://orcid.org/0000-0003-2503-8470
: https://orcid.org/0000-0002-3795-281X
*Corresponding author’s: Abdullah Uğur Birinci
Karadeniz Technical University, Department
of Forest Industry Engineering, Kanuni
Campus, Trabzon, Turkey.
Mobile telephone: +90 (534) 250 83 87
Telephone : +90 (462) 377 15 60
Fax : +90 (462) 325 74 99
*Sorumlu yazarın: Abdullah Uğur BİRİNCİ
Karadeniz Teknik Üniversitesi Orman
Fakültesi Orman Endüstri Mühendisliği
Bölümü, Kanuni Kampusü Trabzon, Türkiye
Cep telefonu : +90 (534) 250 83 87
Telefon : +90 (462) 377 15 60
Faks : +90 (462) 325 74 99

Birinci et al., 5(5), 819-824, (2020) J. Anatolian Env. and Anim. Sciences, Yıl:5, No:5, (819-824), 2020
820
INTRODUCTION
Timber constructions have undergone a revival of
popularity over the last years; this positive trend is
associated to a combination of several factors. Firstly,
wood-based structural products generate fewer pollutants
compared to the mineral-based building materials (e.g.
steel and concrete) because are obtained from sustainable
and renewable resources. Secondly, timber structural
elements are prefabricated off-site and transported to the
building location, where they are quickly assembled.
Finally, the high strength-to-weight ratio of wood is a great
advantage for structures erected in seismic-prone areas,
because it limits the total mass of the buildings (Izzi et al.,
2018). Engineered wood products, such as glued-laminated
timber (glulam) beams and cross-laminated timber (CLT)
panels, involve adhesive bonding and/or mechanical
metallic fastening of timber to make large structural
sections and building components (e.g. beams, columns,
panels, walls, roofs) for construction applications.
Furthermore, these engineered wood products are
alternatives to common structural materials such as steel
and concrete, and are consumed in large volumes
worldwide (Sotayo et al., 2020).
CLT is a solid wood board made of timber a
structural composite sheets with an orthogonal (90°)
staggered assembly and is pressed by structural adhesives
(FPInnovations, 2011). The use of Cross Laminated
Timber (CLT) as a construction product has quickly grown
in the last 15 years (Christovasilisa et al., 2020). The
annual global volume production of CLT has seen
exponential increases from production of 50,000 m3 in the
year 2000, to 625,000 m3 in 2014 and an expected
3,000,000 m3 by 2025 (Dugmore et al., 2019). In recent
years, Cross Laminated Timber (CLT) has been widely
used for different types of buildings such as offices,
commercial buildings, public buildings and multi-story
residential complexes (Hashemi and Quenneville, 2020).
The cross lamination provides good dimensional
stability to the product, makes prefabrication of long and
wide panels possible, and provides higher splitting
resistance in connection systems (Gagnon and Pirvu,
2011). Cross laminated timber provides an alternative to
concrete and steel, with efficient structural properties and
excellent environmental attributes. It is a viable option for
multistory buildings and large-scale structures because of
its light weight relative to concrete, high strength and
stiffness relative to light-frame wood, and its ease of
assembly attributed to a high degree of prefabrication
(Hossain et al., 2016). Given that these panels are also the
main lateral load-resisting elements, the seismic
performance of the system considerably depends on their
lateral strength and stiffness. Thus, extensive research on
the seismic behavior of these structures has been initiated
by many research groups around the world to investigate
the feasibility of adopting timber panelized structures in
very seismically active areas (Hashemi et al., 2020).
CLT passed a major milestone in North America
in 2012 with the publishing of ANSI/APA PRG 320, a
recently updated standard that defined product
manufacturing and design specifications for producers and
users (ANSI/APA, 2019). According to J. Elling of the
APA - The Engineered Wood Association, Tacoma, WA.
(personal communication, August 2019), there are
currently six CLT manufacturers scattered around the U.S.;
D.R. Johnson, Freres Lumber Co., Inc., International
Beams, Katerra, SmartLam, Sterling Solutions, and
Vaagen Timbers. (Scouse et al., 2020).
The adoption of cross-laminated timber in Central
Europe, starting in Austria, has generated interest in using
local resources to create CLT panels elsewhere in Europe
(Sikora et al., 2016; Aicher et al., 2016), Asia (Okabe et al.,
2014; Lu et al., 2018; Song and Hong, 2018), Australia and
New Zealand (Iqbaì, 2015), North America
(Mohamadzadeh and Hindman, 2015; Kramer et al., 2014;
He et al., 2018; Crovella et al., 2019), and South America
(Baño, 2016). Currently, three main softwoods species
including Spruce-Pine-Fir, Southern-Pine-Fir and Douglas
fir-Larch are used as the main raw materials for
commercial production of CLT panels (FPInnovations,
2013., ANSI/APA, 2017). However, due to lack of
softwoods species in some countries, many attempts have
been focused on using local hardwood species to produce
CLT panels (Srivaro et al., 2020) Also, CLT panels are
made from different timber species that depend on local
resources such as Kiri, Katsura, Sugi, Hinoki, Buna spruce
pine (Europe and Canada) and Radiata pine (Australia and
New Zealand) (Navaratnam et al., 2020).
When the literature analysis is examined, it was
shown that every species from different locations used in
CLT manufacturing gave different mechanical
performance. Research has shown that lack of edge gluing
and gaps can have an influence on the mechanical response
of CLT (Gardner et al., 2020).
In this study the seismic performance of cross
laminated timber produced from wood species grown in
Turkey were investigated. Also, the current paper
investigated the effect of gluing methods on the
technological properties of CLT panels.
MATERIALS AND METHOD
Wood Materials and Manufacturing of CLT: In
this experimental study, lumbers of 100 mm (width) x 50
mm (thickness) x 2400 mm (length) were obtained from
eastern spruce (Picea orientalis L.) and scots pine (Pinus

Birinci et al., 5(5), 819-824, (2020) J. Anatolian Env. and Anim. Sciences, Yıl:5, No:5, (819-824), 2020
821
slyvestris) logs. The lumbers were oven-dried in a lumber
dryer until to reach 8±3% equilibrium moisture content.
All sides of the lumbers were planned to reach to the
desired thicknesses and widths before manufacturing.
Polyurethane adhesive which has high resistance
to water and temperature was used for CLT manufacturing
(KLEIBERIT PUR Adhesive 506.0). It is D4 according to
DIN/EN 204. Two different methods were applied in CLT
panels manufacturing. In one, the adhesive was only
applied to the top surfaces of the lumbers. The narrow
edges of them were not glued (non-edge-gluing). In other
method, the adhesive was applied to both of upper surfaces
and the narrow edges of lumbers (edge-gluing). Adhesive
applying processes on CLT panels are shown in Figure 1
for both methods. The adhesive was applied at a rate of 160
g/m2 by using a roller glue spreader.
Figure 1. a) Non-edge gluing, b) Edge gluing (The shaded area shows the surfaces where gluing is applied).
Hydraulic cold press which can apply vertical
clamping pressure and side clamping pressure as shown in
Figure 2 was used for pressing of CLT panels. The panels
were pressed under a vertical clamping pressure (0.8
N/mm2) and side clamping pressure (0,276 - 0,550 N/mm2)
for 40 min at ambient temperature.
Figure 2. Hydraulic cold press.
In this study, two replicate three-layered CLT
panels of 2400 mm × 2400 mm × 150 mm in size were
manufactured for each group. Then the panels were
conditioned at 65 ± 5% RH and 20 ± 2°C for 2 weeks prior
to technological testing.
Testing Procedures: The seismic resistant
performance of the CLT shear walls was determined
according to ASTM E 72 standard. Maximum load
capacity and maximum displacement were also detected
for each group. A sketch of the test set-up with a specimen
ready for testing is shown in Figure 3a (Popovski and
Karacabeyli, 2012). CLT wall during the testing is shown
in Figure 3b. CLT shear walls in platform-type
construction consist of two parts: connections and CLT
panels (Figure 3b) (Shahnewaz et al., 2019).
Figure 3. a) Sketch of the test setup used for CLT walls b) CLT wall during test.
The CLT wall analyses were carried out according
to the ASTM E72 (2014) standard for displacements under
loads of 354 kg, 712 kg and 1071 kg. After the shear wall
was loaded as specified to 354 kg, 712 kg and 1071 kg load
it again to failure or until the total displacement of the panel
becomes 100 mm. The load was then loaded up to the
maximum load that the shear wall could carry and the
displacements at maximum load were determined.
Density of CLT panels were determined
according to EN 323 (1993).
RESULTS AND DISCUSSION
The density of the panels was determined in
accordance with relevant standard. The obtained values are
given in Table 1..
Table 1. Density of CLT panels Density
(gr/cm3)
Scots pine Spruce
Non-edge gluing Edge gluing Non-edge gluing Edge gluing
X 0,471 0,456 0,467 0,443
S 0,0137 0,0214 0,0313 0,0140
According to Table 1, the density of CLT panels
manufactured from scots pine logs is the higher than
spruce.
The CLT wall groups were tested according to
ASTM E 72 (2014) and some calculations were made for
the seismic performance of the walls in the current study.

Birinci et al., 5(5), 819-824, (2020) J. Anatolian Env. and Anim. Sciences, Yıl:5, No:5, (819-824), 2020
822
Figure 4. Analysis of a load-displacement curve (Pirvu 2008).
The following properties were calculated from
this test, as illustrated in Figure 4:
• Initial stiffness, by selecting the points closest to
10% and 40% of the maximum load and fitting a straight
line to the intervening points;
• Ultimate load, as 80% of the maximum load;
• Displacement at ultimate load; was identified
based on the calculated ultimate load.
Figure 5 shows the response of the CLT walls
tested under loading. Higher maximum load
displacements at maximum load were obtained from scots
pine (non-edge gluing) CLT walls. Spruce CLT wall
groups were higher maximum load displacements values at
maximum load than those of scots pine CLT wall groups.
Figure 5. Load-displacement relationship for the test groups.
Table 2. Results of seismic resistant performance test.
Wood
Species
Gluing
Method
Max.
Load (kN)
Max.
displacement
(mm)
Stiffness
(kN/mm)
Ultimate
load (kN)
Displacement
at ultimate
load (mm)
Scots
pine
Non-edge
gluing 125.09 90.94 2.81 100.07 127.96
Edge
gluing 119.02 84,95 2.65 95.21 112.57
Spruce
Non-edge
gluing 98.35 89.33 2.72 78.68 130.4
Edge
gluing 80.09 93.78 1.25 64.07 128.99
As shown in Figure 6, the main damages were
found in the connecting elements at the end of the tests. It
is similar to the literature. Previous researches indicated
that CLT shear wall failure was mostly localized at the
connections in a combination of sliding and rocking
behavior (Shahnewaz et al. 2018; Gavric et al. 2015).
Figure 6. Failure modes of CLT shear walls.
Stiffness is one of the most important parameters
for structural panels. If the panels used for sheathing
material in a shear wall which have higher stiffness, they
will be more resistant to earthquake loads (Demirkir and
Colakoglu 2015). As shown in Table 2, CLT panels
manufactured with scots pine (non-edge-gluing) showed
the highest stiffness, whereas CLT panels manufactured
with spruce (edge-gluing) showed the lowest stiffness
value. In addition to stiffness, ductility which is defined as
the ability to deform structures especially with the effect of
the load, is also an important factor. The displacement
values at ultimate load can be compared in determining the
ductility properties of the walls. According to Table 2, CLT
panels manufactured with spruce (non-edge-gluing)
showed the highest displacement value at ultimate load,
whereas CLT panels manufactured with scots pine (edge-
gluing) showed the lowest value. Gavric et al. (2015) were
examined cyclic behavior of CLT wall systems and they
found initial and plastic stiffness values between 0.47-0.96
kN/mm, 2.82-5.77 kN/mm, respectively. In this study, the
stiffness values were found in between 1.25 and 2.81
kN/mm. Since CLT panels are rigid in comparison to their

Birinci et al., 5(5), 819-824, (2020) J. Anatolian Env. and Anim. Sciences, Yıl:5, No:5, (819-824), 2020
823
connections, the stiffness of CLT systems mostly depends
on the connections (Shahnewaz et al. 2018).
When the effect of wood species on the maximum
load carried by the walls is examined, the CLT walls
manufactured from scots pine gave higher results than CLT
walls manufactured from spruce (Table 2). The reason of
this, scots pine has the highest density values (Table 1). It
was stated that the lateral load resistance of a timber frame
system depends on the rigidity of the timber, the sheathing
material and the connecting elements used on the shear
wall (Li et al. 2007). The highest displacement value at
ultimate load was obtained from the CLT shear walls
manufactured from spruce. As can be seen from Table 2,
the maximum load values and displacement value at
ultimate load of non-edge-gluing CLT panels were higher
than those of the edge-gluing CLT panels. The lateral
resistance of shear walls is generally influenced by 4
factors which are stiffness, bending strength, resistance at
break and ductility (Demirkir et al. 2019).
The current version of ANSI/APA PRG 320
(2018), the performance standard for CLT in North
America, has no provisions for gaps in CLT, and it is the
authors’ understanding that the committee that oversees
PRG-320 is now considering a limitation on gaps. Under
the European standard (2015), gaps as large as 6 mm are
acceptable between adjacent laminations within a layer.
Since edge gluing is not required under either standard, it
is not uncommon for small gaps to occur between edge
joints during the manufacturing process (Gardner et al.,
2020).
CONCLUSION
The effects of production factors (wood species,
gluing method) of CLT panels manufactured from wood
species grown in Turkey on seismic performance of the
panels were investigated in this study. CLT panels
manufactured from scots pine gave higher maximum load
(kN) and ultimate load (kN) values than those of CLT
panels manufactured from spruce. Generally, CLT panels
manufactured from non-edge-gluing of lumbers gave
higher seismic performance than those of CLT panels
manufactured from edge gluing of lumbers. Therefore, it
can be concluded that there is no need to glue the side
surfaces which cause loss of labor, time and cost. It is
thought that the results presented in this study can provide
a basis for the use of CLT panels from wood species grown
in Turkey, resulting to widespread of CLT panel whole
Turkey.
ACKNOWLEDGMENTS
The authors acknowledge the financial support of
this study by TUBITAK (The Scientific and Technical
Research Council of Turkey) (Project No: 2170081). This
study was presented in ORENKO 2020 held by Karadeniz
Technical University, Trabzon.
REFERENCES Aicher, S., Hirsch, M. & Christian, Z. (2016). Hybrid
Cross-Laminated Timber Plates with Beech Wood
Cross-Layers. Construction and Building Materials,
124, 1007-1018.
American Society for Testing and Materials (ASTM) E72.
(2014). Standard Test Methods of Conducting Strength
Tests of Panels for Building Construction, West
Conshohocken, A, United States.
ANSI/APA PRG-320. (2017). Standard for Performance-
Rated Cross- Laminated Timber, American National
Standards Institute, USA.
ANSI/APA. (2019). Standard for performance-rated cross-
laminated timber. PRG 320-2012. Tacoma, WA: APA -
The Engineered Wood Association.
APA-The Engineered Wood Association (2018).
ANSI/APA PRG 320-2018 Standard for Performance-
Rated Cross-Laminated Timber, Tacoma, WA: APA-
The Engineered Wood Association
Baño, V., Godoy, D. & Vega, A. (2016). Experimental and
Numerical Evaluation of Cross-Laminated Timber
(CLT) Panels Produced with Pine Timber from
Thinnings in Uruguay. World Conf. Timber Eng. 2016
WCTE 2016, August 22-25.
Christovasilisa, I.P., Riparbelli, L., Rinaldin, G. &
Tamagnone, G. (2020). Methods for Practice-Oriented
Linear Analysis in Seismic Design of Cross Laminated
Timber Buildings. Soil Dynamics and Earthquake
Engineering, 128, 105869.
Crovella, P., Smith, W. & Bartczak, J. (2019). Experimental
Verification of Shear Analogy Approach to Predict
Bending Stiffness for Softwood and Hardwood Cross-
Laminated Timber Panels, Construction and Building
Materials, 229, 116895.
Demirkir, C. & Colakoglu, G. (2015). The Effect of Grain
Direction on Lateral Nail Strength and Thermal
Conductivity of Structural Plywood Panels, Maderas.
Ciencia y tecnología, 17(3), 469-478.
Demirkir, C., Colakoglu, G. & Karacabeyli, E. (2012).
Effect of Manufacturing Factors on Technological
Properties of Plywood From Northern Turkey And
Suitability of Panels for Use in Shear Walls. Journal of
structural engineering, 139(12), 04013002.
DIN/EN 204. (2001). Classification of Thermoplastic Wood
Adhesives for Non-Structural Applications. German
Institute for Standardisation (Deutsches Institut für
Normung).
Dugmore, M., Nocetti, M., Brunetti, M., Naghizadeh, Z. &
Wessels, C. B. (2019). Bonding Quality of Cross-
Laminated Timber: Evaluation of Test Methods on

Birinci et al., 5(5), 819-824, (2020) J. Anatolian Env. and Anim. Sciences, Yıl:5, No:5, (819-824), 2020
824
Eucalyptus Grandis Panels, Construction and Building
Materials, 211, 217-227.
EN 323. (1993) Wood-Based panels. Determination
ofdensity. European Standards, Brussels.
European Committee For Standardization. (2015). EN
16351: Timber structures-Cross laminated timber-
Requirements, Brusssels, BEL.
Fortune, A. & Quenneville, P. (2011). Feasibility Study of
New Zealand Radiata Pine Cross-Laminated Timber.
New Zealand Timber Design Journal, 19(3), 3-7.
FPInnovations. (2013). CLT Handbook, FPInnovations, BC.
FPInnovations. (2011). CLT Handbook: Cross-Laminated,
FPInnovations, Quebec, Canada.
Gagnon, S. & Pirvu, C. (2011). Cross laminated timber
(CLT) handbook. FPInnovations, Vancouver, Canada.
Gardner, C., Davids, W.G., Lopez-Anido, R., Herzog, B.,
Edgar, R., Nagy, E., Berube, K. & Shaler, S. (2020).
The Effect of Edge Gaps on Shear Strength and Rolling
Shear Modulus of Cross Laminated Timber Panels.
Construction and Building Materials, 259, 119710.
Gavric, I., Fragiacomo, M. & Cecotti, A. (2015c). Cyclic
Behaviour of CLT Wall Systems: Experimental Tests
and Analytical Prediction Model. Journal of structural
engineering, 141(11), 04015034.
Hashemi, A. & Quenneville, P. (2020). Large-Scale Testing
of Low Damage Rocking Cross Laminated Timber
(CLT) Wall Panels With Friction Damper. Engineering
Structures, 206, 110166.
Hashemi, A., Bagheri, H., Yousef-Beik, S.M.M., Darani,
F.M., Valadbeigi, A., Zarnani, P. & Quenneville, P.
(2020). Enhanced Seismic Performance of Timber
Structures Using Resilient Connections: Full-Scale
Testing and Design Procedure. Journal of structural
engineering, 146(9), 04020180.
He, M., Sun, X. & Li, Z. (2018). Bending and Compressive
Properties of Cross-Laminated Timber (CLT) Panels
Made From Canadian Hemlock. Construction and
Building Materials, 185.
Hossain, A., Danzig, I. & Tannert, T. (2016). Cross-
Laminated Timber Shear Connections with Double-
Angled Self-Tapping Screw Assemblies. Journal of
structural engineering, 142(11), 04016099.
Iqbaì, A., (2015). Cross-laminated Timber for Building
Structures, Branz Study Rep., SR336, 12.
Izzi, M., Casagrande, D., Bezzi, S., Pasca, D., Follesa, M.
& Tomasi, R. (2018). Seismic Behaviour of Cross
Laminated Timber Structures: A state-of-the-art review.
Engineering Structures, 170, 42-52.
Kramer, A., Barbosa, A.R. & Sinha, A. (2014). Viability of
Hybrid Poplar in ANSI Approvedcross-Laminated
Timber Applications. Journal of Materials in Civil
Engineering, 26(7), 06014009, DOI:
10.1061/(ASCE)MT.1943-5533.0000936
Li, J., Beall, F. C. & Breiner, T.A. (2007). Analysis of
racking of Structural Assemblies Using Acoustic
Emission. Advances in Acoustic Emission. AEWG, AE
Group, (6), 202.
Lu, Z., Zhou, H.Y. & Hu, L.C. (2018). Effects of Surface
Treatment and Adhesives on bond Performance and
Mechanical Properties of Cross-Laminated Timber
(CLT) Made From Small Diameter Eucalyptus Timber.
Construction and Building Materials, 161, 9-15.
Mohamadzadeh, M. & Hindman, D. (2015). Mechanical
Performance of Yellow-Poplar Cross Laminated
Timber. Rep. No. CE/VPI-ST-15-13, 44.
Navaratnam, S., Christopher, P.B., Ngo, T. & Le, T.V.
(2020). Bending and Shear Performance of Australian
Radiata Pine Cross-Laminated Timber. Construction
and Building Materials, 232, 117215.
Okabe, M., Yasumura, M., Kobayashi, K. & Fujita, K.
(2014). Prediction of Bending Stiffness and Moment
Carrying Capacityof Sugi Cross-Laminated Timber.
Journal of Wood Science, 60, 49-58.
Pirvu, C. (2008). Structural Performance of Wood
Diaphragms with Thick Panels. Canadian Forest
Service No. 13, Final report. FPInnovations Forintek,
March.
Scouse, A., Kelley, S.S., Liang, S. & Bergman, R., (2020).
Regional and Net Economic Impacts of High-Rise Mass
Timber Construction in Oregon. Sustainable Cities and
Society, 61, 102154.
Shahnewaz, M., Alam, S. & Tannert, T. (2018). Resistance
of Cross-Laminated Timber Shear Walls for Platform-
Type Construction, Journal of Structural Engineering,
ASCE ISSN, 0733-9445.
Sikora, K.S., McPolin, D.O. & Harte, A.M. (2016). Effects
of the Thickness of Cross-Laminated Timber (CLT)
Panels made from Irish Sitka Spruce on Mechanical
Performance in Bending and Shear. Construction and
Building Materials, 116, 141-150.
Song, Y.J. & Hong, S.I., (2018). Performance Evaluation of
the Bending Strength of Larch Cross-Laminated Timber,
Wood Res., 63, 105-116.
Sotayo, A., Bradley, D.F., Bather, M., Oudjene, M., El-
Houjeyri, I. & Guan, Z. (2020). Development and
Structural Behaviour of Adhesive Free Laminated
Timber Beams and Cross Laminated Panels.
Construction and Building Materials, 259, 119821.
Srivaro, S., Tomad, J., Shi, J. & Cai, J. (2020). Characterization of Coconut (Cocos Nucifera) Trunk’s Properties and Evaluation of its Suitability to be Used as
Raw Material for Cross Laminated Timber Production. Construction and Building Materials, 254, 119291.

Journal of Anatolian Environmental and Animal Sciences
(Anadolu Çevre ve Hayvancılık Bilimleri Dergisi) DOI: https://doi.org/10.35229/jaes.834382
JAES Year: 5, No: 5, 2020 (825-828)
AÇEH Yıl: 5, Sayı: 5, 2020 (825-828)
ARAŞTIRMA MAKALESİ RESEARCH PAPER
825
The Effects of Polystyrene Species and Fiber Direction on Thermal
Conductivity of Plywood
Abdullah Uğur BİRİNCİ1* Hasan ÖZTÜRK2 Duygu YÜCESOY1 Cenk DEMİRKIR1 1*Karadeniz Technical University, Faculty of Forestry, Department of Forest Engineering, Kanuni Campus, Trabzon, Turkey
2 Karadeniz Technical University, Arsin Vocational School, Materials and Material Processing Technologies, Trabzon, Turkey
Geliş/Received: 03.12.2020 Kabul/Accepted: 13.12.2020
How to cite: Birinci, A.U., Öztürk, H., Yücesoy, D. & Demirkır, C. (2020). The effects of polystyrene species and fiber direction on thermal conductivity
of plywood. J. Anatolian Env. and Anim. Sciences, 5(5), 825-828.
Atıf yapmak için: Birinci, A.U., Öztürk, H., Yücesoy, D. & Demirkır, C. (2020). Polistiren türü ve lif yönünün kontrplakların isıl iletkenliği üzerine etkisi.
Anadolu Çev. ve Hay. Dergisi, 5(5), 825-828.
Abstract: Thermal conductivity of wood material is superior to other building materials because of its porous structure. Thermal conductivity is used to estimate the ability of insulation of
material. Thermal conductivity of wood material has varied according to wood species, direction of wood fiber, specific gravity, moisture content, resin type, and addictive members used in manufacture of wood composite panels. The aim of study was to determine the effect of polystyrene species and fiber direction on thermal conductivity of plywood panels. In the study, two different wood types (black pine and spruce), two different fiber directions (parallel and perpendicular to the plywood fiber direction), two different types of insulator (expanded polystyrene-EPS and extruded polystyrene-XPS) and phenol formaldehyde glue were used as the adhesive type. Thermal conductivity of panels was determined according to ASTM C 518 & ISO
8301. As a result of the study, the lowest thermal conductivity values were obtained in the perpendicular fiber direction of the spruce plywood using XPS as insulation material. The use of XPS as an insulation material in plywood has given lower thermal conductivity values than EPS.
Keywords: Thermal conductivity, Polystyrene, Fiber direction, Black pine, Spruce.
Polistiren Türü ve Lif Yönünün Kontrplakların Isıl İletkenliği Üzerine Etkisi
Öz: Ahşap malzemenin ısı iletkenliği gözenekli yapısı nedeniyle diğer yapı malzemelerinden üstündür. Isı iletkenliği, malzemenin yalıtım kabiliyetini tahmin etmek için kullanılır. Ahşap
malzemenin ısıl iletkenliği, ağaç türü, ağaç lifinin yönü, özgül ağırlığı, nem içeriği, reçine türü ve ahşap kompozit panellerin imalatında kullanılan katkı maddelerine göre değişmektedir. Bu çalışmanın amacı, polistiren türlerinin ve lif yönünün kontrplak panellerin ısıl iletkenliği üzerindeki etkisini belirlemektir. Çalışmada, iki farklı ağaç türü (karaçam ve ladin), iki farklı lif yönü (kontrplak lif yönüne paralel ve dik), iki farklı tipte yalıtkan (genleştirilmiş polistiren-EPS ve ekstrüde polistiren-XPS) ve tutkal türü olarak fenol formaldehit tutkalı kullanılmıştır. Panellerin ısıl iletkenliği ASTM C 518 ve ISO 8301'e göre belirlenmiştir. Çalışma sonucunda, en düşük ısıl iletkenlik değerleri liflere dik yöndeki ladin kontrplaklarda izolasyon malzemesi olarak
XPS kullanılması durumunda elde edilmiştir. Kontrplaklarda izolasyon malzemesi olarak XPS kullanılması durumunda EPS ye göre daha düşük ısıl iletkenlik değerleri elde edilmiştir. Anahtar kelimeler: Isıl iletkenlik, Polistiren, Lif yönü, Karaçam, Doğu Ladin.
* : https://orcid.org/0000-0003-3273-3615
: https://orcid.org/0000-0002-5422-7556
: https://orcid.org/0000-0002-6635-8676
: https://orcid.org/0000-0003-2503-8470
*Corresponding author’s:
Abdullah Uğur Birinci
Karadeniz Technical University, Department
of Forest Industry Engineering, Kanuni
Campus, Trabzon, Turkey.
Mobile telephone: +90 (534) 250 83 87
Telephone : +90 (462) 377 15 60
Fax : +90 (462) 325 74 99
*Sorumlu yazarın:
Abdullah Uğur BİRİNCİ
Karadeniz Teknik Üniversitesi Orman
Fakültesi Orman Endüstri Mühendisliği
Bölümü, Kanuni Kampusü Trabzon, Türkiye
Cep telefonu : +90 (534) 250 83 87
Telefon : +90 (462) 377 15 60
Faks : +90 (462) 325 74 99

Birinci et al., 5(5), 825-828, (2020) J. Anatolian Env. and Anim. Sciences, Yıl:5, No:5, (825-828), 2020
826
INTRODUCTION
In order to prevent the rapid depletion of energy
resources in the world, all countries, especially developed
countries, have developed methods of controlling their
energy needs and using energy effectively. Efficient use of
energy can be achieved with thermal insulation. In
particular, it contains the building elements that separate
the interior environment of the building from the external
environment (Uysal et al., 2011). Due to the porous nature
of wooden materials, their thermal conductivity is very
good compared to other building materials. Thermal
Conductivity is an important parameter in determining the
heat transfer rate (Ozdemir et al., 2013; Gu and Zink-
Sharp, 2005). Thermal conductivity is used to determine
the insulating ability of materials. The thermal conductivity
of wood varies according to the wood type, fiber direction,
glue type and additives used in the production of wood
composite materials (Demirkır, 2014).
Reducing energy consumption of buildings is
required in order to counteract global warming induced by
carbon dioxide, and thermal insulation of a building is an
important part of this process. One of the development
concepts used in the design of insulation materials is to aim
to achieve a low thermal conductivity (k-value). An
alternative development concept is to aim to use
environmentally friendly products. One aspect of being
environmentally friendly is effective utilization of unused
resources. Using agricultural wastes, forest product wastes,
textile wastes, and so on, as the raw materials of thermal
insulation products is favorable for working towards a
sustainable society based on resource recycling (Sekino,
2016). Many types of insulation materials are available
which differ with regard to thermal properties and many
other material properties as well as cost. Current thermal
insulation materials in the construction market are
generally inorganic materials e.g. extruded polystyrene
(XPS), expanded polystyrene (EPS), polyisocyanurate and
polyurethane foam (Cetiner and Shea, 2018). Expanded
polystyrene is proved to be an excellent insulating medium
which exhibits consistent thermal performance over the
range of temperatures normally encountered in buildings
(Lakatos and Kalmar, 2012). Expanded polystyrene has a
thermal conductivity coefficient λ=0.03 w/mK, which has
led to the wide use of polystyrene panels for the
rehabilitation and thermal insulation of buildings (Claudiu
et al., 2015). Expanded polystyrene, commonly known as
styrofoam, is a polymer material present in a wide variety
of products used in daily life, ranging from disposable
goods to construction materials, due to its low cost,
durability, and light weight (Jang et al., 2018). Its
manufacture involves the heating of expandable beads of
polystyrene with steam, and the placement of these heated
expanded polystyrene beads into moulds to create
prismatic blocks of EPS (Horvath, 1994). EPS has a very
low density. An individual bead of EPS would be
approximately spher-ical and contains only about 2% of
polystyrene and about 98% of air (Dissanayake et al.,
2017). The EPS is a chemically inert material not
biodegradable, ie, it does not decompose, does not
disintegrate, does not disappear in the environment and
does not contain CFCs, consequently the EPS does not
chemically contaminate the soil, water or air. However it
can be an environmental problem if not recycled because it
is considered an eternal material and it takes up too much
space (due to its low density) (Schmidt et al., 2011.).
Hence, reuse of EPS is beneficial in terms of environmental
protection (Fernando et al., 2017). Wood–styrofoam
composite (WSC) panels may be a very suitable solution
for environmental pollution caused by styrofoam waste and
also formaldehyde released from wood based panels
(Demirkir et al., 2013).
The aim of study was to determine the effect of
polystyrene species and fiber direction on thermal
conductivity of plywood panels.
MATERIALS AND METHOD
Wood Material and Manufacturing of Plywood:
Black pine (Pinus nigra) and spruce (Picea orientalis L.)
were used in this study. The logs were steamed for 12-16
hours before veneer production. A rotary type peeler
(Valette& Garreau - Vichy, France) with a maximum
horizontal holding capacity of 800 mm was used for veneer
manufacturing and rotary cut veneer sheets with
dimensions of 1.2x2.4 m by 2 mm were clipped. Vertical
opening was 0.5 mm and horizontal opening was 85% of
the veneer thickness in veneer manufacturing process.
After rotary peeling, the veneer sheets were oven-dried at
110°C, for 5-7% moisture content in a laboratory scale jet
veneer dryer (manufactured by Hildebrand Holztechnik
GmbH).
Seven-ply plywood panels, 14 mm thick, were
manufactured by using phenol formaldehyde (PF) glue
resin with 47% solid content. Veneer sheets were
conditioned to approximately 6–7% moisture content in a
conditioning chamber before gluing. The glue was applied
at a rate of 160 g/m2 to the single surface of veneer by using
a four-roller spreader. The assembled samples were
pressed in a hot press at a pressure of 8 kg/cm2 and at 140°C
for 14 min. Two replicate plywood panels were
manufactured from each group.
Method: The thermal conductivity of the panels
were determined according to ASTM C 518 & ISO 8301
(2004). Sample size required is 300 x 300 x 14 mm. Two
specimens were used for each test group. The Lasercomp

Birinci et al., 5(5), 825-828, (2020) J. Anatolian Env. and Anim. Sciences, Yıl:5, No:5, (825-828), 2020
827
Fox-314 Heat Flow Meter shown in Fig. 1 was used for the
determination of thermal conductivity. The top and lower
layers of it was set for 20°C and 40°C for all specimens,
respectively. The panels temperature during the
measurement of the thermal conductivity was maintained
to these constant temperatures.
Figure 1. Lasercomp Fox-314 heat flow meter.
RESULTS AND DISCUSSION
The thermal conductivity coefficient values of the
plywood-insulation material combinations used within the
scope of the study are given in Figure 2 according to the
type of wood, fiber direction and insulation materials.
Figure 2. Thermal conductivity coefficients according to combination groups.
When Figure 2 is examined, it is seen that the
insulating material type and the wood type and fiber
direction of the plywood change the thermal conductivity
of the groups formed. When the tree type is examined, it
has been determined spruce plywood shows a better
insulation feature than the larch. As the reason why larch
gives higher thermal conductivity values, it can be shown
that its density is higher than spruce plywood. In a study,
pine species with different specific weights were examined
and it was found that the heat conduction coefficient
increased with the increase in density value (Krüger and
Adriazola, 2010). The reason for the increase in the heat
conduction coefficient due to the increase in density of
wood is shown to be less air-filled cell spaces (Suleiman et
al., 1999). The greater the air gap in the wood, the lower
the thermal conductivity of the wood material (Şahin Kol
et al., 2008). When the fiber directions were examined, it
was determined that the measurement made in parallel with
the fibers gave higher thermal conductivity coefficient
values than the measurement made vertically. The thermal
conductivity of the wood material varies depending on the
tree type, fiber directions in the same tree and the
anatomical structure of the tree (Demir, 2014). Thermal
conductivity value of wood material; It is also stated in the
literature that it changes in direct proportion depending on
the specific weight of the material, the amount of moisture,
the amount of extractive material and the amount of
temperature (Rice and Shepart, 2004; Aytaşkın, 2009;
Sonderegger and Niemz, 2009; Demir, 2014).
When the effect of the type of insulation materials
used in thermal conductivity measurements was examined,
as can be seen from Figure 2, plywoods used with EPS
gave the highest thermal conductivity values, while
plywoods used with XPS gave the lowest values. It is
known that the thermal conductivity coefficient of XPS
plates used in the study is 0.033 W / mK, and that of EPS
plates is 0.039 W / mK. As expected thermal conductivity
values of the plywood samples decreased with the
decreasing in thermal conductivity values of the insulation
materials. It is a desired result that XPS plates, which are
resistant to fire, transmit heat more difficultly and thus
minimize the risk of fire. Uygunoğlu et al. (2015)
determining the behavior of XPS and EPS types during
fire, it was found that XPS boards are more resistant than
other EPS types. In a study by Dikici and Kocagül (2019),
thermal conductivity coefficients of EPS and XPS boards
were compared and it was stated that the values of XPS
boards were lower. It is recommended to use materials with
low thermal conductivity coefficient values in studies
where it is desired to improve the thermal insulation of
buildings.
CONCLUSION
Today, it is a known fact that energy costs
increase with the highest energy consumption in the
building sector. For our country aiming to join the
European Union, offering different solutions to energy
efficiency is one of the most important issues. When the
structures are examined, it is seen that heat losses occur
from all directions. In a four-storey building,
approximately 60% of the average heat losses are from the
walls, 25% from the roofs, and 15% from the floors. It is
important to carry out studies on the diversity of insulation

Birinci et al., 5(5), 825-828, (2020) J. Anatolian Env. and Anim. Sciences, Yıl:5, No:5, (825-828), 2020
828
materials, which are the main issues of heat loss in building
walls, and to determine the most suitable one.
In this study, determining the type of materials
that will add insulation feature to the wall and some factors
belonging to the plywood used in coating the curtain walls
were among the main goals. Accordingly, in the thermal
conductivity coefficient measurements made within the
scope of the study, it was seen that XPS boards could be
more successful in the insulation properties of plywood.
Although EPS boards are preferred over XPS boards due
to their cheaper price, it is thought that this difference in
fees can be ignored when energy costs are considered.
ACKNOWLEDGMENTS
This study was presented in ORENKO 2020 held
by Karadeniz Technical University, Trabzon.
REFERENCES
ASTM C, 518. (2004). Methots of measuring thermal
conductivity, absolute and reference method. ASTM
International: West Conshohocken, USA.
Cetiner, I. & Shea, A.D. (2018). Wood Waste as an
Alternative Thermal Insulation For Buildings. Energy
& Buildings, 168, 374-384.
Demir, A. 2014. The effects of fire retardant chemicals on
thermal conductivity of plywood produced from
different wood species. Master Thesis, KTU Graduate
School of Natural and Applied Sciences, Trabzon, Turkey.
Demirkır, C., Colak, S. & Aydin, I. (2013). Some
Technological Properties of Wood–Styrofoam
Composite Panels, Composites: Part B, 55, 513-517.
Demirkır, M.S. (2014). The effects of pressing time and
adhesive types on technological properties of
plywood obtained from different wood species.
Master Thesis, KTU Graduate School of Natural and
Applied Sciences, Trabzon, Turkey.
Dikici, A. & Kocagül, M. (2019). Experimental
Comparison Of Eps, Xps And Stone Wool Insulation Material Used In Heat Insulation, Firat University
Journal of Engineering, 31, 1.
Dissanayake, D.M.K.W., Jayasinghe, C. & Jayasinghe,
M.T.R. (2017). Comparative Embodied Energy
Analysis of a House with Recycledexpanded
Polystyrene (EPS) Based Foam Concrete Wall
Panels. Energy and Buildings, 135, 85-94.
Fernando, P.L.N., Jayasinghe, M.T.R. & Jayasinghe, C.
(2017). Structural Feasibility of Expanded
Polystyrene (EPS) Based Lightweight Concrete
Sandwich Wall Panels. Construction and Building
Materials, 139, 45-51.
Gu H. M. & Zink-Sharp, A. (2005). Geometric model for softwood transverse thermal conductivity, Part I.
Wood and Fiber Science, 37(4), 699-711.
Jang, M., Shim, W.J., Han, G.M., Song, Y.K. & Hong,
S.H. (2018). Formation of Microplastics by
Polychaetes (Marphysa Sanguinea) Inhabiting
Expanded Polystyrene Marine Debris. Marine
Pollution Bulletin, 131, 365-369.
Kol, H. S., Özçifçi, A. & Altun, S. (2008). Effect of Some
Chemicals on Thermal Conductivity of Laminated
Veneer Lumbers Manufactured with Urea
formaldehyde and Phenol formaldehyde Adhesives. Kastamonu Univ. Journal of Forestry Faculty, 8(2),
125-130.
Krüger, E.L. & Adriazola, M. (2010). Thermal Analysis
of Wood-based test cells. Construction and Building
Materials, 24(6), 999-1007.
Lakatos, A. & Kalmar, F. (2013). Investigation of
Thickness and Density Dependence of Thermal
Conductivity of Expanded Polystyrene Insulation
Materials. Materials and Structures, 46, 1101-1105.
Özdemir, F., Tutuş, A. & Bal, B.C. (2013). Effect of fire
retardants on thermal conductivity and limited
oxygen index of high density fibreboard. SDU Faculty of Forestry Journal, 14, 121-126.
Rice, R.W. & Shepard, R. (2004). The Thermal
Conductivity of Plantation Grown White Pine (Pinus
strobus) and Red Pine (Pinus resinosa) at two
moisture content levels. Forest Products Journal,
54(1), 92-94.
Schmidta, P.N.S., Cioffia, M.O.H., Voorwalda, H.J.C.
& Silveira, J.L. (2011). Flexural Test on Recycled
Polystyrene. Procedia Engineering, 10, 930-935.
Sekino, N. (2016). Density Dependence in The Thermal
Conductivity of Cellulose Fiber Mats and Wood Shavings Mats: Investigation of The Apparent
Thermal Conductivity of Coarse Pores. J. Wood Sci.,
62, 20-26.
Sonderegger, W. & Niemz, P. (2009). Thermal
Conductivity and Water Vapour Transmission
Properties of Wood Based Materials. Europen.
Journal of Wood Products, 67, 313-321.
Suleiman, B.M., Larfeldt, J., Leckner, B. &
Gustavsson, M. (1999). Thermal Conductivity And
Diffusivity of Wood. Wood Science and Technology,
33(6), 465-473.
Uygunoğlu, T., Güneş, İ., Çaliş, M. & Özgüven, S. (2015). Investigation of Behavior of EPS and XPS
Thermal Insulation Exterior Claddings During Fire.
Journal of Polytechnic, 18(1), 21-28.
Uysal, B., Yapıcı, F., Kol H., Ş., Özcan, C., Esen, R. &
Korkmaz, M. (2011). Determination of thermal
conductivity finished on impregnated wood material.
6th International Advanced Technologies Symposium
(IATS’11).

Journal of Anatolian Environmental and Animal Sciences
(Anadolu Çevre ve Hayvancılık Bilimleri Dergisi) DOI: https://doi.org/10.35229/jaes.835279
JAES Year: 5, No: 5, 2020 (829-832)
AÇEH Yıl: 5, Sayı: 5, 2020 (829-832)
ARAŞTIRMA MAKALESİ RESEARCH PAPER
829
Chemical Changes in Historical Wooden Structures in Rize-Fırtına Valley
Engin Derya GEZER* Büşra AYDOĞAN SELÇUK Karadeniz Technical University, Forestry Faculty, Department of Forest Industry Engineering, Trabzon, Turkey
Geliş/Received: 03.12.2020 Kabul/Accepted: 16.12.2020
How to cite: Gezer, E.D. & Aydoğan Selçuk, B. (2020). Chemical changes in historical wooden structures in Rize-Fırtına Valley. J. Anatolian Env. and
Anim. Sciences, 5(5), 829-832.
Atıf yapmak için: : Gezer, E.D. & Aydoğan Selçuk, B. (2020). Rize- Fırtına Vadisindeki tarihi ahşap yapılardaki kimyasal değişimlerin tespiti. Anadolu Çev.
ve Hay. Dergisi, 5(5), 829-832.
Abstract: Studies conducted to determine the factors that cause damage in historical wooden buildings in our country are quite limited. Rize-Fırtına Valley, with a climate index higher than 65, is one of the regions with the highest rainfall in our country. The risk of decay in historical wooden buildings in this region due to the high climate index is quite high. As a result of this situation, the resistance properties of wood are negatively affected. Within the scope of the research, samples were taken from wooden mansions which are at least 150 years old in the region. Cellulose, lignin, and hemicellulose contents were determined in order to detect chemical changes occurring in the chemical structures of the wood samples. Thanks to the obtained results
from this study, intervention/restoration methods may be suggested for the protection and sustainability of wooden materials in historical buildings.
Keywords: Fırtına Valley, Historical wooden structures, Chemical analysis, Cellulose, Lignin.
Rize- Fırtına Vadisindeki Tarihi Ahşap Yapılardaki Kimyasal Değişimlerin Tespiti
Öz: Ülkemizde tarihi ahşap binalardaki zarar yapan etmenlerin belirlenmesi amacıyla yapılan çalışmalar oldukça sınırlıdır. İklim indeksi 65’ten yüksek olan Rize-Fırtına Vadisi ülkemizde en fazla yağış alan bölgelerden biridir. İklim indeksi yüksek olan bu bölgede bulunan tarihi ahşap yapılardaki çürüme riski yüksektir. Bu durumun bir sonucu olarak ahşabın direnç özellikleri olumsuz etkilenmektedir. Bu bulgudan hareketle ülkemizin doğa ve kültür turizmi açısından popüler destinasyonlarından biri olan ve bu vadide bulunan Rize ili Çamlıhemşin ilçesinde farklı yükseltilerdeki çeşitli tarihi yapılar araştırmaya dahil edilmiştir. Araştırma kapsamında söz konusu bölgede bulunan en az 150 yıllık ahşap konaklardan örnekler alınmıştır. Örnekler
üzerinde meydana gelen kimyasal değişimleri tespit etmek amacıyla selüloz, lignin ve hemiselüloz tayini yapılmıştır. Bu değişimlerin yapılardaki elemanların taşıyıcı özellikleri üzerindeki etkisine bakılmıştır. Bu sonuçlar ışığında tarihi yapılardaki ahşap malzemenin korunması ve sürdürülebilirliği noktasında müdahale yöntemleri önerilebilecektir. Anahtar kelimeler: Fırtına Vadisi, Tarihi ahşap yapılar, Kimyasal analizler, Selüloz, Lignin.
INTRODUCTION
For centuries, wood has been used for the
construction of numerous items that are now part of the
cultural heritage due to their unique properties (strength,
elasticity, thermal and sound insulation, color, odor,
durability, etc.). Accordingly, wood is one of the oldest
traditional construction materials used for religious and
civil architecture in the Black Sea Region of Turkey.
As with all wood for all time, deterioration
depends on a number of chemical and biological factors.
Losses in mechanical strength due to deterioration raise
concerns about shortening the life of wood. The
degradation of wood can be accelerated as a result of its
chemical or biological degradation, and this can be induced
or accelerated by the outdoor effect (Almkvist and
Persson,2008; Sandström et al., 2005). It is extremely
difficult to generalize the effect of degradation on the
* : https://orcid.org/0000-0001-9657-7290
: https://orcid.org/0000-0002-1893-7884
*Corresponding author’s: Engin Derya GEZER
Karadeniz Technical University, Department
of Forest Industry Engineering
61080 Trabzon, Turkey.
: [email protected] Mobile telephone: +90 (539) 365 34 10
Telephone :+90 (462) 377 15 32
Fax : +90 (462) 325 74 99
*Sorumlu yazarın: Engin Derya GEZER
Karadeniz Teknik Üniversitesi, Orman
Endüstri Mühendisliği Bölümü,
61080 Trabzon, Turkey.
Cep telefonu : +90 (539) 365 34 10
Telefon : +90 (462) 377 15 32
Faks : +90 (462) 325 74 99

Gezer & Aydoğan Selçuk, 5(5), 829-832, (2020) J. Anatolian Env. and Anim. Sciences, Yıl:5, No:5, (829-832), 2020
830
material properties of wood and this is largely dependent
on the wood. The type, age, environmental factors, rot
mechanisms and other parameters active in the wood
material, as well as the degree of exposure to oxygen, or its
contact with the soil affect the life of the place of use
(Highley, 1995; Thaler and Humar, 2013 ; Björdal, 2000).
Studies conducted to determine the factors that
cause damage in historical wooden buildings in Turkey are
quite limited. Chemical and physical change in weathering.
How fast it will be does not only depend on the durability
against rot and wood pests. It is an indication of how
effective the weather conditions on the wood material is. It
is the fiber loss caused by the deformation and the slow
wearing of the damaged surface.
The factors of the special location of Rize-Fırtına
Valley (climate, landscape and elevation) will have an
effect on the physical, mechanical and biological properties
of historical wooden structures. Climate indices was
developed by the American Weather Forecasting Office to
determine the decay risk for wood materials based on the
climatic conditions of the environment as follows.
It was reported that the risk and risk of decay is
relatively low in regions with a climate index of 35 or less,
moderate in regions between 35 and 65, and the risk of
decay of wood material in regions with a climate index of
more than 65. The risk of decay in historical wooden
buildings in this region due to the high climate index is
quite high. Rize-Fırtına Valley, with a climate index higher
than 65, is one of the regions with the highest rainfall with
a 95-climate index in Turkey (Gezer, 2003). In the scope
of this paper, two historical wooden mansions located in
rural areas of Çamlıhemşin district were studied in detail.
As high climate index results in high risks of
decay in historical wooden structures, various historical
buildings at different heights in Çamlıhemşin district of
Rize province, which is one of the popular destinations in
Turkey in terms of nature and cultural tourism and located
in this valley are included in this study.
It is important to investigate the chemistry and
structure of the material in order to detect structural
changes and deterioration in historical wooden structures
and to contribute to the protection and sustainability of
wood. For this reason, in this paper, it was aimed to
investigate the chemical changes in samples taken from
historical wooden structures located at different elevations
in the Rize-Fırtına Valley.
MATERIALS AND METHODS
Two different areas were selected in Çamlıhemşin
Rize for this study. Within the scope of the research,
samples were taken from wooden mansions which are at
least 150 years old in the region and are at different
elevations above sea level. Wood samples were taken from
the south facing exteriors of historical wooden buildings
and subjected to some chemical analysis. Those wooden
houses studied in this project were constructed from
chestnut (Castanea sativa Mill.). Chestnut is easily
obtained from the close environment. In addition, natural
durability of chestnut is very high. Therefore, it is the most
preferred material in building such mansions.
Figure 1. General view of research area (Meydanköy- area 1;
Çamlıhemşin-area 2).
Wood samples used in chemical analysis were
mechanically chipped and ground in a laboratory type
Willey mill. These samples were sieved according to the
grain size that remained in the 60-mesh sieve in accordance
with standard analysis methods. Since the samples were
taken from different elevations above sea level, they were
then placed in sealed nylon bags and stored separately.
Samples taken from each house were subjected to chemical
analysis in triplicate. The moisture content of the test
samples was determined by drying in a n oven at 103 ±
20C. Following chemical analysis were conducted.
Figure 2. Historical some wooden buildings.
Determination of moisture: Moisture
determinations of the wood samples used in the study were
made before starting the chemical analysis. Moisture
determinations were made according to TS 2471.
Accordingly, 2g of sample was weighed on a precision
scale and the first weight was determined and the sample
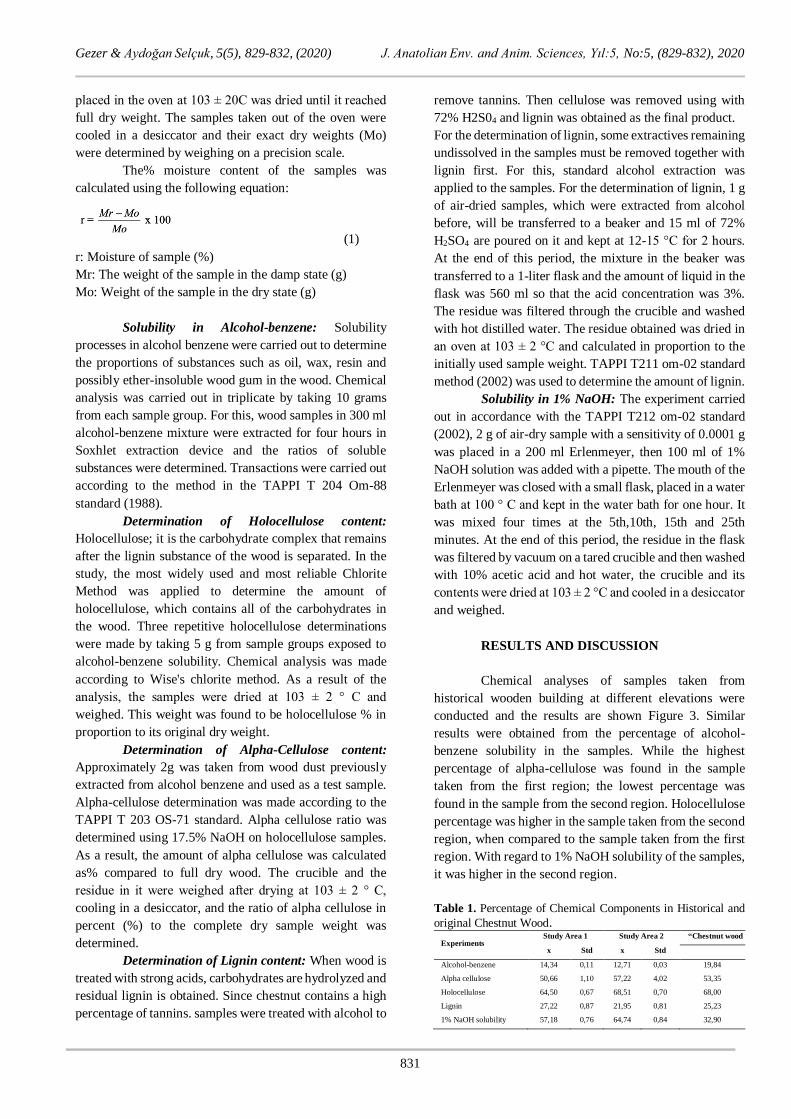
Gezer & Aydoğan Selçuk, 5(5), 829-832, (2020) J. Anatolian Env. and Anim. Sciences, Yıl:5, No:5, (829-832), 2020
831
placed in the oven at 103 ± 20C was dried until it reached
full dry weight. The samples taken out of the oven were
cooled in a desiccator and their exact dry weights (Mo)
were determined by weighing on a precision scale.
The% moisture content of the samples was
calculated using the following equation:
(1)
r: Moisture of sample (%)
Mr: The weight of the sample in the damp state (g)
Mo: Weight of the sample in the dry state (g)
Solubility in Alcohol-benzene: Solubility
processes in alcohol benzene were carried out to determine
the proportions of substances such as oil, wax, resin and
possibly ether-insoluble wood gum in the wood. Chemical
analysis was carried out in triplicate by taking 10 grams
from each sample group. For this, wood samples in 300 ml
alcohol-benzene mixture were extracted for four hours in
Soxhlet extraction device and the ratios of soluble
substances were determined. Transactions were carried out
according to the method in the TAPPI T 204 Om-88
standard (1988).
Determination of Holocellulose content:
Holocellulose; it is the carbohydrate complex that remains
after the lignin substance of the wood is separated. In the
study, the most widely used and most reliable Chlorite
Method was applied to determine the amount of
holocellulose, which contains all of the carbohydrates in
the wood. Three repetitive holocellulose determinations
were made by taking 5 g from sample groups exposed to
alcohol-benzene solubility. Chemical analysis was made
according to Wise's chlorite method. As a result of the
analysis, the samples were dried at 103 ± 2 ° C and
weighed. This weight was found to be holocellulose % in
proportion to its original dry weight.
Determination of Alpha-Cellulose content:
Approximately 2g was taken from wood dust previously
extracted from alcohol benzene and used as a test sample.
Alpha-cellulose determination was made according to the
TAPPI T 203 OS-71 standard. Alpha cellulose ratio was
determined using 17.5% NaOH on holocellulose samples.
As a result, the amount of alpha cellulose was calculated
as% compared to full dry wood. The crucible and the
residue in it were weighed after drying at 103 ± 2 ° C,
cooling in a desiccator, and the ratio of alpha cellulose in
percent (%) to the complete dry sample weight was
determined.
Determination of Lignin content: When wood is
treated with strong acids, carbohydrates are hydrolyzed and
residual lignin is obtained. Since chestnut contains a high
percentage of tannins. samples were treated with alcohol to
remove tannins. Then cellulose was removed using with
72% H2S04 and lignin was obtained as the final product.
For the determination of lignin, some extractives remaining
undissolved in the samples must be removed together with
lignin first. For this, standard alcohol extraction was
applied to the samples. For the determination of lignin, 1 g
of air-dried samples, which were extracted from alcohol
before, will be transferred to a beaker and 15 ml of 72%
H2SO4 are poured on it and kept at 12-15 °C for 2 hours.
At the end of this period, the mixture in the beaker was
transferred to a 1-liter flask and the amount of liquid in the
flask was 560 ml so that the acid concentration was 3%.
The residue was filtered through the crucible and washed
with hot distilled water. The residue obtained was dried in
an oven at 103 ± 2 °C and calculated in proportion to the
initially used sample weight. TAPPI T211 om-02 standard
method (2002) was used to determine the amount of lignin.
Solubility in 1% NaOH: The experiment carried
out in accordance with the TAPPI T212 om-02 standard
(2002), 2 g of air-dry sample with a sensitivity of 0.0001 g
was placed in a 200 ml Erlenmeyer, then 100 ml of 1%
NaOH solution was added with a pipette. The mouth of the
Erlenmeyer was closed with a small flask, placed in a water
bath at 100 ° C and kept in the water bath for one hour. It
was mixed four times at the 5th,10th, 15th and 25th
minutes. At the end of this period, the residue in the flask
was filtered by vacuum on a tared crucible and then washed
with 10% acetic acid and hot water, the crucible and its
contents were dried at 103 ± 2 °C and cooled in a desiccator
and weighed.
RESULTS AND DISCUSSION
Chemical analyses of samples taken from
historical wooden building at different elevations were
conducted and the results are shown Figure 3. Similar
results were obtained from the percentage of alcohol-
benzene solubility in the samples. While the highest
percentage of alpha-cellulose was found in the sample
taken from the first region; the lowest percentage was
found in the sample from the second region. Holocellulose
percentage was higher in the sample taken from the second
region, when compared to the sample taken from the first
region. With regard to 1% NaOH solubility of the samples,
it was higher in the second region.
Table 1. Percentage of Chemical Components in Historical and
original Chestnut Wood.
Experiments Study Area 1 Study Area 2 “Chestnut wood
x Std x Std
Alcohol-benzene 14,34 0,11 12,71 0,03 19,84
Alpha cellulose 50,66 1,10 57,22 4,02 53,35
Holocellulose 64,50 0,67 68,51 0,70 68,00
Lignin 27,22 0,87 21,95 0,81 25,23
1% NaOH solubility 57,18 0,76 64,74 0,84 32,90
Gezer & Aydoğan Selçuk, 5(5), 829-832, (2020) J. Anatolian Env. and Anim. Sciences, Yıl:5, No:5, (829-832), 2020
832
Figure 3. Percentage of Chemical Components in Chestnut Wood taken from Historical Wooden Structures.
It was reported that percentage of holocellulose,
cellulose, lignin, alcohol-benzene solubility and 1% NaOH
solubility of newly cut chestnut wood were 68%, 53.35%,
25.23%, 19.84% and 32.90%, respectively (Akgün, 2005).
The results showed that rather than main wood
components, alcohol benzene solubility and 1% NaOH
solubility dramatically changed in wood samples taken
from historical buildings regardless of their locations. The
reason for lower alcohol-benzene solubility was that
extractives might have washed out from wood due to the
rain and other climatic conditions. The reason for higher
1%NaOH solubility in wood samples taken from historical
buildings could be because of weathering, UV degradation
and insect infestation.
CONCLUSIONS
(1) The results of study area-1 showed that
percentage of cellulose, holocellulose, lignin, alcohol-
benzene solubility and 1% NaOH solubility of chestnut
wood were 50,66%, 64,50%, 27,22%, 14,34% and 57,18%,
respectively.
(2) The study area-2 results revealed that 57.22%,
68.51%, 21.95%, 19.84% and 32.90%, respectively, were
the percentage of cellulose, holocellulose, lignin, alcohol-
benzene solubility and 1% NaOH solubility of newly cut
chestnut wood.
(3) The results showed that rather than main wood
components, alcohol benzene solubility and 1% NaOH
solubility dramatically changed in wood samples taken
from historical buildings regardless of their locations. The
reason for lower alcohol-benzene solubility was that
extractives might have washed out from wood due to the
rain and other climatic conditions. The reason for higher
1%NaOH solubility in wood samples taken from historical
buildings could be because of weathering, UV degradation
and insect infestation.
ACKNOWLEDGMENTS
This work has been funded by the Scientific
Research Project Coordination Office of Karadeniz
Technical University (Project No: FBA-2019-8102). This
study was presented in ORENKO 2020 held by Karadeniz
Technical University, Trabzon.
REFERENCES
Akgün, H.C. (2005). Chemical composition of sweet
chestnut wood and suitability for pulping. Master
Thesis, Zonguldak Karaelmas University, Natural
Sciences, Zonguldak.
Almkvist, G. & Persson, I. (2008). Fenton-induced
degradation of polyethylene glycol and oak
holocellulose. A model experiment in comparison to
changes observed in conserved waterlogged wood.
Holzforschung, 62(6), 704-8. DOI:
10.1515/HF.2008.129
Björdal, C., Daniel, G. & Nilsson, T. (2000). Depth of
burial, an important factor in controlling bacterial
decay of waterlogged archaeological poles. Int
Biodeterior Biodegrad, 45, 15-26. DOI:
10.1016/S0964-8305(00)00035-4
Gezer, E.D. (2003). The Investigation on remediation of
out-of service CCA treated utility poles. PhD Thesis,
KTÜ Natural Sciences, Trabzon.
Highley, T.L. (1995). Comparative durability of untreated
wood in use above ground. Int Biodeterior
Biodegradation, 35, 409-19.
Sandström, M., Jalilehvand, F., Damian, E., Fors, Y.,
Gelius, U. & Jones, M. (2005). Sulfur accumulation
in the timbers of King Henry VIII’s warship Mary
Rose: a pathway in the sulfur cycle of conservation
concern. Proc Natl Acad Sci USA, 102, 14165-70.
DOI: 10.1073/pnas.0504490102
TAPPI T 204 om–88. (1988). Solvent Extractives of
Wood and Pulp.
TAPPI T 211 om–02. (2002). Ash in Wood, Pulp, Paper
and Paperboard, Combustion at 525°C.
TAPPI T 212 om–02. (2002). One Percent Sodium
Hydroxide Solubility of Wood and Pulp.
TAPPI T203 cm-09. (2009). Alpha-, Beta-, Gamma-
Cellulose in Pulp.
Thaler, N. & Humar, M. (2013). Performance of oak,
beech and spruce beams after more than 100 years in
service. Int Biodeterior Biodegrad, 85, 305-10. DOI:
10.1016/j.ibiod.2013.08.020
Wise, L.E. & Karl, H.L. (1962). Cellulose and
Hemicellulose in Pulp and Paper Science and
Technology, McGraw Hill Book Co, New York.
000
010
020
030
040
050
060
070
Percentage of Chemical Components in Historical Chestnut Wood
study area 1 study area 2
Journal of Anatolian Environmental and Animal Sciences
(Anadolu Çevre ve Hayvancılık Bilimleri Dergisi) DOI: https://doi.org/10.35229/jaes.835471
JAES Year: 5, No: 5, 2020 (833-840)
AÇEH Yıl: 5, Sayı: 5, 2020 (833-840)
ARAŞTIRMA MAKALESİ RESEARCH PAPER
833
Emissions from Drying in the Wood Based Board Industry
Uğur BİLGİN* Semra ÇOLAK Gürsel ÇOLAKOĞLU Karadeniz Technical University, Faculty of Forestry, Department of Forest Engineering, Kanuni Campus, Trabzon, Turkey
Geliş/Received: 03.12.2020 Kabul/Accepted: 14.12.2020
How to cite: Bilgin, U., Çolak, S. & Çolakoğlu, G. (2020). Emissions from drying in the wood based board industry. J. Anatolian Env. and Anim. Sciences,
5(5), 833-840.
Atıf yapmak için: Bilgin, U., Çolak, S. & Çolakoğlu, G. (2020). Ahşap esaslı levha sektöründe kurutma kaynaklı emisyonlar. Anadolu Çev. ve Hay. Dergisi,
5(5), 833-840.
Abstract: The reason why wood-based boards are preferred in many areas of use, especially in furniture, is that they can be produced in desired properties and are cheap. In addition, wood defects such as different work in three dimensions, differences in resistance values, internal stresses and physical changes seen in solid wood are not encountered in wood-based boards. Volatile organic compound (VOC) emissions from wood-based panels occur from the raw materials of the boards and during production stages such as gluing, storage, pressing and drying. Most of the VOCs from wood raw materials are formed during the drying process. VOCs contribute to the formation of nitrogen oxides and photo-oxidants in the presence of sunlight.
Photo-oxidants are harmful to humans as they irritate the respiratory and sensitive parts of the lungs. It also disrupts photosynthesis and damages forests and crops. The aim of this study is to evaluate the factors affecting the emissions that occur during the drying process in wood-based boards and the processes applied to reduce the emission..
Keywords: Drying process, emission of wood based panels, volatile organic compounds (VOC), wood
based panels.
Ahşap Esaslı Levha Sektöründe Kurutma Kaynaklı Emisyonlar
Öz: Ahşap esaslı levhaların başta mobilya olmak üzere birçok kullanım alanında tercih edilmesinin sebebi istenilen özelliklerde üretilebilmesi ve ucuz olmasıdır. Ayrıca masif odunda görülen üç boyutta farklı çalışma, direnç değerlerinde farklılıklar, iç gerilmeler ve fiziksel
değişimler gibi odun kusurlarına nispeten ahşap esaslı levhalarda karşılaşılmaz. Ahşap esaslı levhalardan kaynaklanan uçucu organik bileşik (VOC) emisyonları, levhaların hammaddelerinden ve tutkallama, depolama, presleme, kurutma gibi üretim aşamalarında oluşmaktadır. Odun hammaddesinden kaynaklanan VOC ların büyük kısmı kurutma işlemi sırasında oluşur. VOC lar azot oksitlerin ve güneş ışığının varlığında foto-oksidanların oluşumuna katkıda bulunur. Foto-oksidanlar solunum yollarında ve akciğerlerin hassas kısımlarında tahrişe neden oldukları için insanlar için zararlıdır. Ayrıca fotosentezi bozar, ormanlara ve ürünlere zarar verir. Bu çalışmanın amacı ahşap esaslı levhalarda kurutma işleminde
oluşan emisyonları etkileyen faktörlerin ve emisyonu düşürmek için uygulanan işlemlerin değerlendirilmesidir. Anahtar kelimeler: Ahşap esaslı paneller, ahşap esaslı panellerden kaynaklanan emisyonlar, kurutma işlemi,
uçucu organik bileşikler.
INTRODUCTION
Due to the rapid population growth, urbanization,
economic, social and cultural developments in the world,
the decrease in the availability of wood raw materials and
the increase in the demand for wooden products caused the
importance of wood-based panels products to increase.
Wood-based panels such as plywood, medium density
fiberboard (MDF), particleboard and oriented
particleboard are among the most widely used materials all
* : https://orcid.org/0000-0003-4056-7100
: https://orcid.org/0000-0003-1937-7708
: https://orcid.org/0000-0002-3795-281X
*Corresponding author’s:
Uğur BİLGİN
Karadeniz Technical University, Department
of Forest Industry Engineering, Kanuni
Campus, Trabzon, Turkey.
Mobile telephone: +90 (537) 705 13 23
Telephone : +90 (462) 377 15 60
Fax : +90 (462) 325 74 99
*Sorumlu yazarın:
Uğur BİLGİN
Karadeniz Teknik Üniversitesi Orman
Fakültesi Orman Endüstri Mühendisliği
Bölümü, Kanuni Kampusü Trabzon, Türkiye
Cep telefonu : +90 (537) 705 13 23
Telefon : +90 (462) 377 15 60
Faks : +90 (462) 325 74 99

Bilgin et al., 5(5), 833-840, (2020) J. Anatolian Env. and Anim. Sciences, Yıl:5, No:5, (833-840), 2020
834
over the world. These materials are widely used in the
construction, decoration and furnishing of homes, offices,
schools as well as other non-industrial workplaces (Bilgin,
2019; Böhm et al., 2012).
Asia-Pacific region accounted for 61 percent of
global production in 2018 (248 million m³), followed by
Europe (90 million m³, or 22 percent), Northern America
(48 million m³, or 12 percent), Latin America and the
Caribbean (19 million m³, or 4 percent) and Africa (3
million m³ or 1 percent). The four top consumers (China,
Germany, Russia, USA) of wood-based panels are the
same as the four largest producers, suggesting that the
products are mostly consumed domestically. The trends in
consumption are similar to those in production. The fifth-
largest consumer is Poland (overtaking Turkey and Japan
in 2015), where consumption increased from 9 million m³
in 2014 to 12 million m³ in 2018 (FAO, 2018).
Wood-based panel production amounts in the
world between 2014-2018 are given in Figure 1.
Turkey's fiberboard industry is the highest
production level in 2017. It is followed by particleboard,
plywood and OSB. Wood-based panels production
amounts in Turkey between the years 2010-2017 is given
in Table 1.
Figure 1. Wood based panel production in the World (FAO,
2018).
Table 1. Turkey forest product production (100 m3) (Oğuz et al., 2019).
Product/Year 2011 2012 2013 2014 2015 2016 2017
Veneers 88 85 84 85 87 270 74
Plywood 115 116 116 150 116 120 105
Particle Board 3.580 3.875 4.225 4.425 4.361 4.202 4.286
OSB 40 75 75 75 75 80 75
MDF/HDF 3.570 3.900 4.285 4.885 4.777 5.069 4.747
Other Fiber Boards 15 15 15 15 15 15 59
Wood-Water Relationship: Wood is a porous
material that contains air and water and wood cells. Wood
loses or gains moisture depending on the environmental
conditions to which it is exposed. Consequently, the weight
of a piece of wood is not constant. This relationship is
called moisture content and is expressed as the weight of
water in the cell walls and lumen as a percentage of the
weight of the oven dry (dry weight in the oven) (Walker,
2006; Rowell, 2005).
The cell wall consists of cellulosic polymers, non-
cellulosic carbohydrates (hemicellulose etc.) and a lignin
matrix that reinforces them. If water is adsorbed to
cellulose and hemicellulose in the cell wall, it is bound
water. The water in the lumen of the cells is free water. Free
water is only found when all areas in the cell wall are filled
with water; this point is called the fiber saturation point
(FSP). All water added to wood after FSP is reached is
called free water. The physical and mechanical properties
of the wood material are mostly related to the fiber
saturation point. For example, as the moisture rises below
the fiber saturation point, the strength from mechanical
properties decreases (Rowell, 2005). Free and bound water
are shown in Figure 2.
Figure 2. Water in wood (Web-1).
When drying from the green condition to the FSP
(approximately 25–30% moisture content), only free water
is lost and therefore the cell wall volume does not change.
However, when the wood is dried further, the water bound
from the cell walls is removed and the volume of the wood
begins to change (Rowell, 2005). One of the main
problems encountered is that wood shrinks as it loses
moisture and swells again as it regains moisture (Walker,
2006). In addition, the structure and arrangement of
cellulose in the cell wall, the parallel or vertical extension
of the cells to the tree axis and their symmetrical placement
within the tree trunk give the wood an anisotropic structure.
Since wood material is anisotropic, it shows shrinkage and
swelling at different rates in three main directions
(longitudinal, tangent, radial) (Nurgün and Ergin, 1997).
Wood-Based Panels: The main products
produced in the wood based panel production sector are
plywood(PW), particleboard (PB), medium density

Bilgin et al., 5(5), 833-840, (2020) J. Anatolian Env. and Anim. Sciences, Yıl:5, No:5, (833-840), 2020
835
fibreboard (MDF) and oriented particleboard (OSB).
Although some structural features such as usage areas and
strength values of particleboard, MDF and OSB products
differ from each other, they are generally produced in a
continuous process that includes the following basic
process steps (Figure 3) (Web-2). Plywood production
process is different from the others.
Figure 3. General process for PB, OSB and MDF.
The drying process is very important from the
wood panel production stages. Because drying is the
process of removing the water (moisture) in the wood that
is generally not suitable for the usage areas. The degree of
dryness required in wood depending on where it will be
used is very important (Altınok et al., 2009).
Drying in particleboard production: First trials
on particleboard production, It was held in Europe and
North America before World War II. The first
particleboard factory was established in Bremen, Germany
in 1941 during World War II and started commercial
particleboard production. Technological and scientific
studies on particleboard production have intensified after
the years of World War II and the raw material shortage
encountered by Germany was tried to be overcome in this
way (Zengin, 2009).
Particleboard according to EN 309 standard;
These are panels obtained by hot pressing of particle
obtained from wood pieces (wood pieces, particle,
sawdust, etc.) and / or lignocellulosic materials (from
lignified plants such as flax, hemp yarn, dehydrated sugar
cane pulp, etc.) (Özen and Kalaycıoğlu, 2008).
The process of drying the particle affects the
curing time of the glue, the panel being loose or bursting.
Therefore, the particles should be dried to a moisture
content of 1% - 4% in accordance with the humidity of the
panel exit from the press (Şahin, 2018).
Drying in fiberboard production: Although the
first appearance of the fiberboard industry can go back to
the early 1900s, large-scale commercial production only
emerged between the second world wars and in the United
States. The first fiberboard production factory was
established in Great Britain in 1898, followed by factories
established in New Jersey (United States of America) in
1908 and in Canada in 1909. The first equipped fiberboard
factory was established in Mississippi in 1926 (Zengin,
2009).
Fiberboard; It is a product obtained by drying or
pressing the panel draft created by using the natural
adhesion and felting properties of vegetable fibers and fiber
bundles or by using additional adhesive material. Briefly;
It is a type of panel obtained by reshaping the fiber and
fiber bundles formed by fibrillation of lignocellulosic
materials (Eroğlu and Usta, 2000).
Before the drying process, the fibers are brought
to a consistency that can be pumped with pumps with the
addition of water and resin and directed to the dryer. The
moisture of the fibers entering the dryer is around 50%, and
this moisture should decrease to a value between 6-12%. If
sufficient drying is not provided, steam exits from the panel
by explosion (Eroğlu and Usta, 2000). If the fibers are dried
for more than 7 seconds, there is a risk of fire (Önem,
2018).
Drying in OSB production: Particle board
making from oriented particles is based on the work of
Armin Elmendorf in the USA and Wilhelm Klauditz in
Germany in the late 1940s and early 1950s. Generally, two
OSB standards are used. OSB3 of these is produced for use
in exterior and moisture resistant places. OSB2, on the
other hand, is produced for use in interior and places
requiring less moisture resistance (Çakmak, 2018).
OSB; It is a panel-shaped material produced by
pressing the draft under temperature and pressure obtained
by mixing specially prepared particles with a suitable glue
and directing them in the desired direction during laying
(Akbulut et al., 2002).
The moisture content of the particles to be used
for OSB production should be around 2 - 5% after drying.
The particle moisture content affects the panel resistance
properties, panel pressing factor, glue consumption amount
and the physical properties of the panel (Doğan, 2015).
Drying in plywood production: Veneer and
plywood date back to the times of the pharaohs. It is stated
that the first wood veneer panel was produced in Egypt
3000 years ago. Plywood obtained from veneers was used
in king and prince furniture and coffins. The first machine
that will constitute the basis of today's rotary-cut veneer
machines in Europe was built in 1818 (Çolakoğlu, 2004).

Bilgin et al., 5(5), 833-840, (2020) J. Anatolian Env. and Anim. Sciences, Yıl:5, No:5, (833-840), 2020
836
Plywood according to EN 313-2; It is defined as a wood-
based panel consisting of layers that are glued on each
other with the fiber direction generally perpendicular.
Layers defined as veneer are thin boards at most 7 mm
thick obtained by peeling, cutting or sawn from wood
(Çolakoğlu, 2004). Plywood production is shown in Figure
4.
Figure 4. Plywood production (Bilgin, 2019).
Veneer drying is an important step in the
manufacture of wood-based panel products such as
plywood and laminated veneer lumber (LVL). If the wet
veneers from the peeling and cutting machines are not
dried immediately, undesirable color changes may occur
due to the effect of fungi and chemical reactions
(Çolakoğlu, 2004). The purpose of veneer drying is to
reduce the moisture content to a suitable range for bonding
plywood and other veneer-produced materials. The veneers
are dried to an average moisture content of 3% in the
manufacturing process because the moisture content of all
veneers must be below 7% before bonding. High drying
temperatures in the veneer production process are effective
on both physical and mechanical properties of plywood
(Aydin and Çolakoğlu, 2005).
VOLATILE ORGANIC COMPOUNDS (VOC)
In the recent past, both wood and wood products,
especially wood-based panels, have become environmental
problems. Volatile organic compounds (VOCs) released
from wood-based panels are harmful to humans when they
cause irritation to the respiratory tract and parts of the lungs
(Granström, 2005). In addition, wood and wood-based
panels are one of the 10 most concentrated VOCs in office
buildings, and these products cause poor air quality in
buildings (Yu et al., 2010).
VOCs can be classified into several types based
on their chemical structure (alkanes, aromatic
hydrocarbons, aldehydes, etc.), physical properties (boiling
point, vapor pressure), or potential health effects (irritant,
carcinogenic or neurotoxic), (Da Silva, 2017). The World
Health Organization (WHO) defines a VOC as any
compound with a boiling point between 50-100 ° C and
240-260 ° C and having a saturated vapor pressure of more
than 100 kPa at 25 °C ( WHO, 2010). VOCs can be found
in vapor, liquid or solid form at room temperature (Burn et
al., 1993). The World Health Organization has classified
organic pollutants according to their boiling points into
three types and summarized in Table 2.
Table 2. Classification of VOC (Da Silva, 2017). Type Boiling point (ºC)
Very Volatile Organic Compound < 0 to 50 - 100
Volatile Organic Compound 50 – 100 to 240 – 260
Semi – Volatile Organic Compound 240 – 260 to 380 - 400
Oxidation of VOCs generally results in
formaldehyde formation (WHO, 2010). Ozone can easily
oxidize naturally occurring terpenes in the air, leading to
the formation of simple aldehydes such as formaldehyde
(Stefanowski, 2018). Some reports have mentioned that
formaldehyde emission arises from wood during hot
pressing of wood-based panels, but it is considered to have
an insignificant contribution to the formaldehyde emission
level (Böhm et al., 2012). In addition, Çolakoğlu et al.
(2002) investigated the effect of waiting times of veneers
before drying on formaldehyde emission. Immediately
after the production, it has performed the drying process by
waiting 1 week, 2 weeks and 1 month. No significant
difference was found between formaldehyde emissions.
There are numerous sources of both VOCs and
formaldehyde. Volatile organic compounds (VOCs) are
found in all natural and synthetic materials, from gasoline
to flowers, water to wine. The uses of these versatile
compounds are numerous (Burn et al., 1993). Natural
materials also emit different amounts of formaldehyde; It
is known to produce meat (2–20 mg kg 1), fruits and
vegetables (6.3–35 mg kg 1) wood (0.04 mg kg 1) and even
volcanoes (WHO, 2010). It is also a product of human
metabolism and can be detected in human breath at levels
ranging from 1.2 to 72 ppb (Stefanowski, 2018).
VOC from Wood: The cell wall of wood consists
of carbohydrate (cellulose and hemicellulose), lignin and
extractive substances. A significant portion of wood
extractives are volatile organic compounds (VOCs)
consisting of terpenes, terpenoids, flavonoids, alcohols,

Bilgin et al., 5(5), 833-840, (2020) J. Anatolian Env. and Anim. Sciences, Yıl:5, No:5, (833-840), 2020
837
aldehydes and ketones. It also contains small to large
alkenes and fatty acids (Adamová et al., 2020).
Wood VOC emissions can be divided into
primary and secondary VOC emissions. Primary VOCs are
free, unbound volatile compounds, such as terpenes,
initially found in high concentrations in wood due to their
biological functions in trees. On the other hand, secondary
VOCs, including hexanal, pentanal, and acetic acid, are
composed of chemically or physically bonded compounds
released by chemical (egoxidation, hydrolysis) or physical
(eg mechanical corrosion) degradation of wood or wood
extractives (Pohleven et al. , 2019). Table 3 indicates the
most abundant VOCs emitted from different trees.
Table 3. A group of the most abundant VOCs emitted from different tree species, containing VOC concentrations emitted from sapwood / heartwood on day 31 (Adamová et al., 2020).
Extractive/Group of VOCs VOC
Terpenes α-pinene, β-pinene, Camphene, ∆3-carene, Limonene
Aldehydes Benzaldehyde, Decanal, Furfural, Hexanal, Nonanal,
Octanal, Pentanal, Formaldehyde
Acids Acetic acid
VOC emissions can be significantly affected by
the raw materials and production techniques of the panels.
VOC emission may occur as a result of oxidation,
thermolysis or evaporation in plate production stages such
as storage, drying and pressing (Çolak, 2002). Almost all
of the VOCs generated during the drying process are
caused by the wood itself. Most of the VOCs formed
during the pressing process are caused by the glue.
Drying Process: VOC emission in the drying of
the panels is caused by factors such as wood species,
drying type, dryer, temperature and time (Velic et al., 2019;
Çolak, 2002).
Wood species: VOC emissions from hardwoods
are significantly lower than softwoods because they do not
contain and emit volatile terpenes. Hardwood VOCs are
mainly degradation products resulting from the thermal
breakdown of wood tissue, including lignin, cellulose,
hemicellulose and extractives (Banerjee et al., 1995).
Mono-, di-, and sesquiterpenes are the predominant VOCs
for softwoods; In hardwoods, triterpenes and sterols are
dominant (Adamová et al., 2020).
The main emission in softwoods comes from
terpenes. These terpenes are constantly spread from wood
and during the processing of wood (Çolak, 2002; Pohleven
et al., 2019). The most important ones among these are
natural compounds such as a-pinene, b-pinene, camphene,
limonene, b-mirocene, a-terpinol and the compounds
formed as a result of the reaction of monoterpenes such as
phenicylalcohol, borneol, campphone, verbenone with
water or oxygen (Çolak, 2002). Softwood releases large
amounts of VOCs, most of which are terpenes. However,
the same VOCs originating from hardwood can be released
from the softwood as the wood texture can undergo thermal
degradation during drying of the softwood (Otwell et al.,
2000).
In general, hardwoods contain higher non-volatile
terpenes, except for some tropical species, including
monoterpenes and sesquiterpenes. In addition to acetic
acid, hardwoods emit a wide variety of carbonyl
compounds (aldehydes, carboxylic acids and ketones) and
alcohols, especially aldehyde hexanal and pentanal. Acetic
acid emission, hardwoods have more acetic acid emission
than softwoods, as hardwood hemicelluloses contain
higher amounts of acetyl groups. Hexanal is the dominant
emission (Pohleven et al., 2019).
Drying type: Drying under natural conditions or
artificially changes the profile of VOCs emitted from
wood. Because as the temperature of wood rises and dries,
VOC emission occurs in different ways (evaporation,
steam distillation and thermal decomposition) (Wilson and
Sakimoto, 2007). For example, acetic acid is formed during
the drying of wood by hydrolysis of the acetyl groups of
hemicelluloses, and furfural is formed from wood xylose
in a strong temperature-dependent reaction (Adamová et
al., 2020).
Dryer: Dryers are normally heated directly with
natural gas, but some dryers use sanding dust in a later
process step. When wood dries in dryers at high
temperatures, air emissions of particles and volatile organic
compounds (VOCs) are released. The VOC emission
during the drying process is also caused by the direct
burning of sanding dust and wood (Wilson, 2010). The
drying exhaust gas may contain substances formed by
thermal decomposition of one or more components of
wood (cellulose, ligrins, resins, and the like), various
aldehydes and acids such as formaldehyde, acetaldehyde,
acetic acid and acids. Some of these substances have a
relatively low boiling point and are also volatile in steam
(Schmidt, 1993).
Temperature and time: Sun et al. (2020)
investigated the effect of time on the TVOC and VOC
emissions of particleboards during the production stages.
The longer the exposure time of the particleboards under
all production conditions (density, thickness, resin
content), the TVOC emission decreased. The higher
density, thickness, and resin content of the particleboards
resulted in higher TVOC emission concentration at each
measurement time and showed a negative correlation on
the TVOC emission level. Increased esters, aldehydes and
ketones are most susceptible to change in production
conditions. However, terpenes exhibited a positive
increase in density and thickness, but a negative effect by
increasing the resin content. This result showed that the
terpene compounds in TVOC mostly originated from wood
particles.

Bilgin et al., 5(5), 833-840, (2020) J. Anatolian Env. and Anim. Sciences, Yıl:5, No:5, (833-840), 2020
838
He et al. (2012) stated that the emission of
formaldehyde has been decreased consecutively due to
heat treatment in the drying and hot pressing phase. He also
stated that urea formaldehyde glue contains the lowest
VOC unlike formaldehyde. He stated that wood particles
have the highest VOC content. He reported that VOC and
formaldehyde release during the drying and hot pressing
stages showed a similar trend.
The release of volatile organic compounds
(VOCs) during convective drying of particles at high
temperature has been experimentally and theoretically
investigated. The drying medium was determined as
superheated steam with a pressure of two bars. Two
different temperature levels of the drying environment, 160
and 180 ° C, and two different materials, yellow pine and
spruce, were used. It is noted that the major released
components consist of various types of monoterpenes, with
a-pinene predominant in each of the two materials. The
amount released has shown that it depends on the drying
temperature and the time of the drying process (Johansson
and Rasmuson, 1998).
Ishikawa et al. (2009) dried 3 different veneer
types at 140-180 ºC and observed that VOC and aldehyde
emissions increased with increasing temperature as a result
of HPLC, GS / MS analysis. He also stated that longer
drying time was realized for the species with high moisture
content and this increased the emissions.
Murata et al. (2013) aimed to reduce the
formaldehyde emission released from plywood without
using any chemicals. After the veneers with a humidity of
6% are dried up to 130 ° C, 3-layer plywood is produced
by heat treatment. Drying temperatures are determined as
130-150-170-190 ° C. It has been shown that heating the
veneer layers in the temperature range of 150 to 170 ° C
effectively reduces the formaldehyde emission of the
plywood without reducing the mechanical properties of the
pavement. When the coating layers were heated in the
temperature range of 150 ° C to 170 ° C, the amount of
hydrated water (monomolecular layer) was slightly
reduced and the amount of dissolved water (polymolecular
layer) remained unchanged. It is assumed that the
formaldehyde emission of plywood is related to the state of
the adsorption zone of the wood..
HEALTH AND ENVIRONMENTAL EFFECT OF VOC
In certain conditions, inhabitants of poorly
ventilated buildings are more prone to suffer from “sick
building syndrome” (SBS), which is a phenomen on
characterized by various symptoms such as headache; eye,
nose, or throat irritations; drycough; allergy reactions; dry
and itching skin; non specific hypersensitivity; insomnia;
dizziness and nausea or difficulty in concentrating;
andtiredness. The intense odors may have a negative
psychological influence as well (Adamová et al., 2020). In
addition, when VOCs such as monoterpene emit together
with NO2 and SO2, they contribute to acid accumulation
and soil acidification (Granström, 2005)
Different TVOC definitions used by different
countries make interlaboratory comparisons difficult. As
shown in Table 4, there are a number of limits given by
different regulations and specifications.
Table 4. Limit values after 28 days emissions testing in a ventilated test
chamber required by various regulations across Europe and proposed by
the WHO (Da Silva, 2017).
Organisation/Institute TVOC
(µg/m3)
Formaldehyde
(µg/m3) Product/Standard
WHO - 100 -
Belgian regulation 100 or 1* 100 Construction products
CEN/TS 16516
AgBB/DIBt (Germany) 1000 or 1* 100
Constructions products
CEN/TS16516 and ISO
16000
EMICODE
(Germany)
EC1PLUS ≤ 60 or 1* 50a
Flooring products
CEN/TS 16516 EC1 100 or 1* 50a
EC2 300 or 1* 50a
France regulation
Class A+ 1000 10
Construction products
ISO 16000
Class A 1500 60
Class B 2000 120
Class C > 2000 >120
Indoor air
comfort-
Eurofins
Standard 1000 or 1* 60 -
Gold 750 or1* 10
* For each individual carcinogenic compound.
a Emissions after 3 days stored in a ventilated environmental chamber.
The Construction Product Regulation (EU
2011/305) since 1st July 2013 defines the essential
requirements for construction materials. This Regulation
replaces the directive 89/106/EEC. Among the seven
requirements number three, already present in the old
directive, is dedicated to: hygiene, health and environment.
Then the regulation prescribes that any construction work
shall not be harmful to the health of occupants, meaning
that no dangerous particles or gases shall be emitted in the
air. The purpose of this regulation is to harmonize the
technical and healthy description of products including
also indoor emissions thus facilitating their marketing in
the EU area. The goal is that the CE label applied on
building materials and products will contain performance
classes that cover all national regulations in Europe. Then
each EU member state can specify which performance
classes a product shall fulfil for being accepted on that
national market. For indoor emissions and other types of
releases, CEN has established a technical committee (TC
351) to undertake the work of developing the harmonised
standards. A specific working group (WG 2) is dealing
with indoor air. At the moment, WG2 has produced a test
method (CEN/TS 16516) for indoor emissions based on the
ISO 16000 series of standards concerning determination of
emissions of VOCs from building products (Bulian ve
Fragasa, 2016).
Considering instrumental methods used to
determine the VOCs, gas chromatography–mass
spectrometry (GC-MS) is commonly used to separate and
identify the volatiles. For formaldehyde determination,

Bilgin et al., 5(5), 833-840, (2020) J. Anatolian Env. and Anim. Sciences, Yıl:5, No:5, (833-840), 2020
839
liquid or gas chromatography is used, often after
derivatization (Adamová et al., 2020).
CONCLUSION
Wood-based panels (plywood, fiberboard,
particle board and OSB) widely used in the world were
produced 400 million m3 in 2018. These panels are widely
used in the construction, decoration and flooring of homes,
offices, schools as well as other non-industrial workplaces.
During the production of all the panels, there is a drying
process in which water is removed from the wood. VOCs
formed during the drying process cause low air quality and
therefore various disturbances. This review will make it
easier to understand the factors affecting VOCs from wood
during drying.
Different methods are used to prevent VOC
emission from wood-based panels, which causes additional
costs. More studies should be done on the temperature and
time affecting the VOC in the drying process and a
mathematical model should be created.
ACKNOWLEDGMENTS
This study was presented in ORENKO 2020 held
by Karadeniz Technical University, Trabzon.
REFERENCES
Adamová, T., Hradecký, J. & Pánek, M. (2020). Volatile
organic compounds (VOCs) from wood and wood-
based panels: Methods for evaluation, potential health
risks, and mitigation. Polymers, 12(10), 2289.
Akbulut, T., Göker, Y. & Ayrılmış, N. (2002). Using
OSB panels instead of plywood. Journal of the
Faculty of Forestry Istanbul University, 52(1), 65-79.
Altinok, M., Küreli, İ. & Serbes, T. (2009). The
determination of the effect to some physical and mechanical properties of wood material of vacuum
and conventional drying. Journal of Polytechnic,
12(4), 271-278.
Aydin, I. & Colakoglu, G. (2005). Formaldehyde
emission, surface roughness, and some properties of
plywood as function of veneer drying temperature.
Drying Technology, 23(5), 1107-1117.
Banerjee, S., Hutten, M., Su, W., Otwell, L. & Newton,
L. (1995). Release of water and volatile organics
from wood drying. Environmental Science &
Technology, 29(4), 1135-1136. Bilgin, U. (2019). Utilization of bark and husk extracts as
filling in the production of plywood. Master's thesis,
Karadeniz Technical University, Turkey.
Böhm, M., Salem, M.Z. & Srba, J. (2012). Formaldehyde
emission monitoring from a variety of solid wood,
plywood, blockboard and flooring products
manufactured for building and furnishing materials.
Journal of Hazardous Materials, 221, 68-79.
Bulian, F. & Fragassa, C. (2016). VOC emissions from wood products and furniture: A survey about
legislation, standards and measures referred to
different materials. Fme Transactions, 44(4), 358-
364.
Burn, J., Henk, J. & Bloemen, T. (Eds.). (1993). Chemistry and analysis of volatile organic
compounds in the environment. Blackie Academic &
Professional.
Çakmak, F. (2018). Investigation of technological
characteristics of oriented strand boards (OSB).
Master's thesis, Hacettepe University, Turkey. Çolak, S. (2002). The Effect of impregnation procedure at
plywood on technological properites, formaldehyde
and acid emission of plywood. Ph.D. Thesis,
Karadeniz Technical University, Turkey.
Çolakoğlu, G. (2004). Layered wood material lecture
notes. K.T.Ü. Faculty of Forestry, Trabzon.
Çolakoğlu, G., Aydın, I. & Çolak, S. (2002). The effects
of waiting time of alder (Alnus glutinosa subsp.
barbata) veneers before drying on shear and bending
strength of plywood. Holz als Roh-und Werkstoff,
60(2), 127-129.
Da Silva, C.F.F.P. (2017). Interactions between volatile organic compounds and natural building materials.
Ph.D. Thesis, University of Bath, England.
Eroğlu, H. & Usta, M. (2000). Fiberboard production
technology. KT.Ü. Faculty of Forestry Publication,
(200/30)
Food and Agriculture Organization of the United
Nations. (2018). Global Forest Facts and Figures,
http://www.fao.org/3/ca7415en/ca7415en.pdf.
Granström, K. (2005). Emissions of volatile organic
compounds from wood (Doctoral dissertation).
Ishikawa, A., Ohira, T., Miyamoto, K., Inoue, A. & Ohkoshi, M. (2009). Emission of volatile organic
compounds during drying of veneer: Red meranti
(Shorea sect. Rubroshorea), larch (Larix sp.), and
sugi (Cryptomeria japonica D. Don). Bull. Forestry
Forest Prod. Res. Inst, 8(2), 115-125.
Johansson, A. & Rasmuson, A. (1998). The release of
monoterpenes during convective drying of wood
chips. Drying Technology, 16(7), 1395-1428.
Doğan, K. (2015). The effect on some properties of
oriented strand board (OSB) of ureaformaldehyde
resin different melamine containing and density
differences. Master Thesis, Kastamonu University, Turkey.
Murata, K., Watanabe, Y. & Nakano, T. (2013). Effect
of thermal treatment of veneer on formaldehyde
emission of poplar plywood. Materials, 6(2), 410-
420.
Kara, O., Şahin, Ö., Bekar, İ. & Kayacan, B. (2019). International Competitiveness Analysis Of Industrial
Wood And Wood Products Sector: The Case Of
Turkey. The International Journal of Economic and
Social Research, 15(1), 15-32.
Otwell, L.P., Hittmeier, M.E., Hooda, U., Yan, H., Su, W. & Banerjee, S. (2000). HAPs release from wood
drying. Environmental Science & Technology,
34(11), 2280-2283.

Bilgin et al., 5(5), 833-840, (2020) J. Anatolian Env. and Anim. Sciences, Yıl:5, No:5, (833-840), 2020
840
Önem, B. (2018). Determination some factors affecting value of deviation from plane in the production of
MDFLAM. Ph.D. Thesis, Kastamonu University,
Turkey.
Özen, R. & Kalaycıoğlu, H. (2008). Particleboard
industry lecture notes. Faculty of Forestry, Forest
Industry Engineering Department, K.T.Ü. Trabzon.
Pohleven, J., Burnard, M.D. & Kutnar, A. (2019). Volatile organic compounds emitted from untreated
and thermally modified wood-a review. Wood and
Fiber Science, 51(3), 231-254.
Rowell, R.M. (2005). Chapter 4: Handbook of wood chemistry and wood composites. CRC press.
Schmidt, A. (1993). U.S. Patent No. 5,263,266.
Washington, DC: U.S. Patent and Trademark Office.
Stefanowski, B.K. (2018). Improving Indoor Air Quality
(IAQ) Through Novel Wood-based Panel
Modifications. Ph.D. Thesis, Bangor University,
Wales.
Sun, S., Zhao, Z. & Shen, J. (2020). Effects of the
manufacturing conditions on the VOCs emissions of
particleboard. BioResources, 15(1), 1074-1084.
Şahin, F.(2018). Evaluation of rice husks in manufacture
of particleboard. Ph.D. Thesis, Kastamonu University, Turkey.
Velic, A., Soldán, M., Ház, A., Šurina, I. & Jablonský,
M. (2019). Determination of volatile organic
compounds emissions from wood processing. Wood
Research, 64(3), 461-470.
Walker, J. C. (2006). Primary wood processing: principles
and practice. Springer Science & Business Media.
Web-1:
https://www.google.com/search?q=free+and+bound
+ water+in+cell+wall&tbm= isch&ved=2ah
UKEwi76OfTxq7sAhUNixoKHXssDd4Q2-
cCegQIABAA&oq= free +and+bound+water+in+cell+wall&-
gs_lcp=CgNpbWcQAzoECAAQHjoGCAAQCB
AeUJ9GWLZhYO1iaABwAHgAgAGMAYgBnwy
SAQQwLjEzmAEAoAEBqgELZ
3dzLXdpei1pbWfAAQE&sclient=img&ei=fAiEX7
u6D42WavvYtPAN&bih=600& biw= 1360#
imgrc=pcfp-bP0gEl-gM. Access Date: 10 September
2020.
Web-2: https://webdosya.csb.gov.tr/db/sanayihavarehberi/ice
rikler//01_agac-urunler--uret-m--20200103075113.pdf. Access Date: 10 September
2020.
Wilson, J.B. (2010). Life-cycle inventory of particleboard
in terms of resources, emissions, energy and carbon.
Wood and Fiber Science, 42, 90-106.
Wilson, J.B. & Sakimoto, E.T. (2007). Gate-to-gate life-
cycle inventory of softwood plywood production.
Wood and Fiber Science, 37, 58-73.
World Health Organization. (2010). WHO guidelines for
indoor air quality selected pollutants. The WHO
European Centre for Environment and Health, Bonn
Office. Yu, C. W.F. & Kim, J.T. (2010). Building pathology,
investigation of sick buildings VOC emissions.
Indoor and Built Environment, 19(1), 30-39.
Zengin, H. (2009). Problems and Solutions on Providing
Wood Raw Material in Sheet and Plate Chip
Industries. Master Thesis, İstanbul University,
Turkey.

Journal of Anatolian Environmental and Animal Sciences
(Anadolu Çevre ve Hayvancılık Bilimleri Dergisi) DOI: https://doi.org/10.35229/jaes.836311
JAES Year: 5, No: 5, 2020 (841-848)
AÇEH Yıl: 5, Sayı: 5, 2020 (841-848)
ARAŞTIRMA MAKALESİ RESEARCH PAPER
841
An Assessment of Carbon Footprint in MDF Manufacturing: A Case Study of
Wood Based Panel Production in Turkey
Mehtap ERDİL* Nural YILGOR University of Istanbul-Cerrahpaşa, Forest Faculty, Department of Forest Industry Engineering, Istanbul, Turkey
Geliş/Received: 05.12.2020 Kabul/Accepted: 15.12.2020
How to cite: Erdil, M. & Yılgör, N. (2020). An Assessment of Carbon Footprint in MDF Manufacturing: A Case Study of Wood Based Panel Production in
Turkey. J. Anatolian Env. and Anim. Sciences, 5(5), 841-848.
Atıf yapmak için: Erdil, M. & Yılgör, N. (2020). MDF Üretimindeki Karbon Ayak İzinin Değerlendirilmesi: Türkiye’de Odun Bazlı Levha Üretimi Üzerine
Bir Örnek Çalışma. Anadolu Çev. ve Hay. Dergisi, 5(5), 841-848.
Abstract: Nowadays, carbon footprint (CF) became an important topic closely related to the ecological
production of goods and services. Energy use and subsequent emissions of greenhouse gases (GHGs)
in all human facilities affect the world’s climate in the form of global warming in recent decades. The
dominant greenhouse gas arising from human activities is carbon dioxide (CO2). Carbon footprint is
CO2 and other GHGs that are released per unit product for a specific period. The main purpose of this
study is the determination of most important critic processes about that contribute to the cf problem
during medium-density fiberboard (MDF) production with Pareto analysis method. MDF is a kind of
composite panel product which is typically containing of cellulosic fibers with the combination of
synthetic resins and additives becoming under heat and pressure. For this purpose, a wood-based panel
company is selected to examine cf for its each process. As a conclusion this study makes an important
contribution to the panel based industry to see the emission problems with the help of Pareto analysis
and help to perform an environmental oriented production for the future. Moreover, two scenarios are
built up to decrease of total carbon footprint in the selected plant. So, the analysis results are supported
with two scenarios. Also, this study shall provide a general view and perception for the importance of
the carbon footprint in the wood panel based industrial sector.
Keywords: Carbon footprint, Medium-density fiberboard (MDF), Pareto analysis, scenarios.
MDF Üretimindeki Karbon Ayak İzinin Değerlendirilmesi: Türkiye’de Odun Bazlı
Levha Üretimi Üzerine Bir Örnek Çalışma
Öz: Günümüzde karbon ayak izi, mal ve hizmetlerin ekolojik olarak üretimiyle yakından ilgili bir konu
haline gelmiştir. Son yıllarda tüm insanların faaliyetlerinde enerji kullanımı ve kullanımdan gelen sera
gazı emisyonları küresel ısınma şeklinde dünya iklimini etkilemektedir. İnsan faaliyetleri sonucunda
ortaya çıkan en baskın sera gazı karbondioksittir. Karbon ayak izi, belirli bir süre için birim ürün başına
salınan CO2 ve diğer sera gazlarıdır. Bu çalışmanın temel amacı, orta yoğunluklu lif levha (MDF)
üretimi sırasında karbon ayak izi problemine katkı sağlayan en önemli kritik süreçlerin Pareto analiz
yöntemi ile belirlenmesidir. MDF, ısı ve sıcaklık altında tipik olarak sentetik reçineler ve katkı
maddeleri kombinasyonu ile selülozik lifler içerir. Bu amaçla, karbon ayak izini her bir süreç için
incelemek üzere bir odun bazlı levha endüstrisi seçilir. Sonuç olarak bu çalışma, panel bazlı
endüstrideki emisyon sorunlarını Pareto analizi yardımıyla görmeye ve geleceğe yönelik çevre odaklı
bir üretim yapışmasına önemli katkı sağlamaktadır. Ayrıca seçilen tesiste toplam karbon ayak izini
azaltmak için iki senaryo oluşturulmuştur. Dolayısıyla analiz sonuçları iki senaryo ile
desteklenmektedir. Dahası bu çalışma, karbon ayak izinin odun panel bazlı endüstriyel sektördeki
önemi hakkında genel bir bakış açısı ve algı sağlayacaktır.
Anahtar kelimeler: Karbon ayak izi, Orta yoğunluklu liflevha (MDF), Paretö analiz, senaryolar .
INTRODUCTION
Turkish wood-based panel industry is one of the
most important industries for the country. Turkey is among
the worlds’ largest board producers in the world following
China and Germany (Yıldırım, Candan and Korkut, 2014).
Because of the high capacity of industry, energy supply and
consumption become a significant topic for the industry.
* : https://orcid.org/0000-0003-1194-7534
: https://orcid.org/0000-0002-3417-5496
*Corresponding author’s:
Mehtap ERDİL
University of Istanbul-Cerrahpaşa, Forest
Faculty, Department of Forest Industry
Engineering, 34473, Istanbul, Turkey.
Telephone :+90 (212) 338 24 00/25377
Fax : +90 (212) 338 24 24
*Sorumlu yazarın: Mehtap ERDİL
İstanbul Üniversitesi-Cerrahpaşa, Orman
Fakültesi, Orman Endüstri Mühendisliği
Bölümü, İstanbul, Türkiye.
Telefon : +90 (212) 338 24 00/25377
Faks : +90 (212) 338 24 24

Erdil and Yılgor, 5(5), 841-848, (2020) J. Anatolian Env. and Anim. Sciences, Yıl:5, No:5, (841-848), 2020
842
Besides, wood supply has a big problem for the industry
from past through today (Mahapatra and Mitchell, 1997;
Ok, 2005, Ilter and Ok, 2007; Daşdemir, 2018). The
industry runs out of substantial amounts of energy in the
forms of natural gas, biomass, and diesel fuel. So,
greenhouse gas (GHG) emissions are released in
atmosphere. Thus, increasing energy efficiency and
developing pollution reduction methods in this sector will
be important for decreasing GHG emissions in coming
decades. The most important agreement of concerning
global warming and climate change is known as Kyoto
Protocol and six greenhouse gases are defined as CO, CO2,
CH4, N2O, PFCs (per fluorocarbons), and HFCs (hydro
fluorocarbons) which cause strongly global warming and it
has been thought those gases are released by human
activities. (IPCC, 2006 ; IPCC, 2007 ; WBCSD/WRI,
2007 ; ECCM, 2008). The dominant GHG is carbon
dioxide that partly derives from diesel fuel burning (Post,
2006; ETAP, 2007; Steinfeld and Wassenaar, 2007; Da
Schio and Fagerlund, 2013).
Carbon footprint concept was originated from the
terminology of ecological footprint which was proposed by
Wackernagel and Rees in 1996 (Wackernagel and Rees,
1996; Wackernagel et al., 1999; Ercin and Hoekstra, 2012).
Carbon footprint is the total amount of CO2 and other
GHGs that occur over the full life cycle of a process or
facility and it has been described units of tones or kg
equivalent (Brenton et al., 2008; Matthewset al., 2008;
IEA, 2012; Radua et al., 2013). Some researchers explain
it as a measure of amounts of CO2 emitted from the
combustion of fossil fuels (Patel, 2006; Post, 2006; Carbon
Trust, 2007; Grubb & Ellis, 2007; Wiedmann and Minx,
2007). The footprint is divided into two groups as primary
(direct) and secondary (indirect) (Energetics, 2007;
Goodier, 2010; Atabey, 2013; Uribe et al., 2019
Moroşanu et al. (2001) studied on identifying and
evaluating of defects on oak veneer for four regions. The
researchers were used the Pareto analysis method for
developing the quality of the studied products. Pareto
analysis was also used in order to determine the important
carbon footprint problem(s) each of process in this
research. Lippke et al. (2012) investigated different uses of
wood to see their efficiency by means of carbon and energy
impacts to displace fossil energy. The researchers found
out when waste wood was consumed as a biofuel instead
of fossil fuels and so the emissions were decreased. In this
study, it is aimed to calculate CO2 emissions for each
process in a MDF industry in a plant scale of the largest
producer in Marmara region, in Turkey. The plant named
as XYZ plant afterwards in this study. This study was
prepared by the data of XYZ company which belong to the
year of 2015. The amount of annual production of MDF is
389561 m3/year in 2015. The study is also aimed to make
some suggestions to decrease the emissions fort the future.
So, two scenarios were produced and suggested. Carbon
footprint values are calculated as statistically with Tier 1
method (IPCC, 2007) during the MDF production, and
Pareto analysis is applied for determine the footprint’
problem.
MATERIALS AND METHODS
Medium-density fiberboard: XYZ is a plant
operating in forest products industry and it produces
particle board, medium density fiberboard (MDF), and
parquet as products and it is also one of the largest plant
due to its capacity in this field in Marmara region. Work
flow in concerning with MDF manufacturing is shown in
Figure 1. The MDF production follow the processes such
as chipping, screening, evaporation, refiner, gluing, drying,
laying, pressing, sizing, climatization, and sand- papering.
MDF is described as a wood based panel product
manufactured from raw fibers of wood, wood chips, and
small amount of other materials such as glues, binders, and
additives.
Figure 1. Flow chart for medium-density fiberboard panel production in XYZ plant (Erdil, 2018).
In these processes, energy is consumed in the
forms of natural gas, biomass, and diesel fuel. Considering
all the contributing factors, carbon footprints values are
calculated using the Tier 1 method according to IPCC 2006
Guidelines (IPCC, 2006). To produce 389561 m3 of the
medium-density fiberboard in 2015, it was used 10275 tons
of wood chips, 10972 tons of emery powder, 8995 tons of
edge trimming, and 7964 tons of fiber (dry) in boiler. On
the other hand, the plant used 43277505 m3
(460472653kWh) natural gas energy, 141971971 kWh
biomass energy, and 29365 liters (315673,7 kWh) of diesel
fuel for annual production in 2015. The study is carried out
in the XYZ plant considering the improvements of all of
the energy flow processes comprises of following steps:

Erdil and Yılgor, 5(5), 841-848, (2020) J. Anatolian Env. and Anim. Sciences, Yıl:5, No:5, (841-848), 2020
843
1-Design a study plan
2-Calculate of carbon footprint for each process.
3-Practising of the Pareto analysis steps
4-Drawing the Pareto diagram
5-Designate major emission problem(s) according
to 80/20 law by the help of Pareto diagram.
6-Make suggestions for the major emission
problem(s).
Energy balance: In this plant, natural gas, biomass
are consuming as the main (directly) inputs for obtaining
energy. While natural gas, and biomass are consuming in
MDF production process, diesel fuel is used by
transportation equipment (volvo, escalator, and forklift)
which are using in the field. Those inputs are primary and
direct energy sources for MDF production in process.
Figure 2. Energy balance flow chart 1 in medium density fiberboard (Erdil, 2018).
Natural gas is consuming in Turbine 1, 2, 3 and
burner. As a result of the use of natural gas, electricity
energy is producing and waste heat releases. The waste
heat is recovered in evaporation, and air-drying units as
energy sources as seen in Fig.2. Those sources are called
as indirectly energy sources. Even though the company
produces its own electricity in the plant, in some cases the
factory buys electricity from the electricity suppliers.
Figure 3. Energy balance flow chart 2 in medium density fiberboard (Erdil, 2018).
According to Fig. 3, biomass sources vary from
wood dust, wood chips, bark, emery powder, etc. It is
generally composed of process wastes. As a result of the
process, waste heat is also released. The waste heat is
recovered in evaporate as energy sources. Those sources
are called as indirectly energy sources (Erdil, 2018).
Calculation of Carbon Footprint (CF): Carbon
footprints (CF) were calculated for each process according
to the inputs’ emission factors and then Tier 1 method was
applied (IPCC, 2006; IPCC, 2007). Due to the simplicity
in application and suitability to the data available, Tier-1
method was used in this study. Process based data related
to energy and fuel consumption consumed for emission
calculations through the equation given below (Pekin,
2006; Atabey, 2013; Turanlı, 2015). Before carbon
footprint calculation, it must be known fuel consumption
and emission factor. Emission factor can be researched in
literature (Defra, 2010; Lelyveld and Woods, 2010; Cefic,
2010).
Emission is calculated according to the equation 1
is given in below and CF is calculated according to
equation 2 (IPCC, 2006; Erdil, 2017; Erdil et al., 2017;
Keskin et al., 2017; Erdil, 2018).
Emission = Energy consumption x Emission factor x Oxidation factor (1)
(Oxidation factor is taken as 1)
CF = Emissions (kg CO2e)/ Amounts of annual production (m3) (2)
Pareto Analysis: Vilfredo Pareto was an Italian
economist who lived in 19th century and evaluated
economic problems by applying mathematics and
developed a method which was maintained as his name and
it was assisted to define and classify the problems
according to the significance of the percentage values. It is
a way of assisting causes of problems to derive an effective
solution. This method uses due to 80/20 law in general. As
a result of this method diagrams are obtained which is
useful tool in defining the important problems. Pareto
diagrams assist to build a relationship in between the
problems and the reasons (Gitlow et al., 2005; Erdil, 2017;
Erdil, 2018).
Pareto diagrams are the graphical tool used in
Pareto analysis (Cravener et al.,1993; Leavengood and
Reeb, 2002). Pareto analysis is a method which is used to
distinguish causes from less significant ones. Pareto
analysis follows the procedures in below (Akın, 1996;
Akın and Oztürk, 2005; Erdil, 2017; Erdil et al., 2017; Erdil
et al., 2017; Erdil, 2018):
1. Problems should be determined and then
classified.
2. Data are classified according to the problem.
Total values which are in different categories and their
percentages are determined.
3. A bar chart was drawn. In this bar graph, while
the y-axis establishes the totals and percentages, the x-axis
presents the classified groups.
4. Pareto diagrams are carried out to notice the
biggest problem from beginning of the upper right-hand
corner of the first bar.

Erdil and Yılgor, 5(5), 841-848, (2020) J. Anatolian Env. and Anim. Sciences, Yıl:5, No:5, (841-848), 2020
844
Building up scenarios for decreasing of carbon
footprint: After calculation and exhibition of carbon and
energy footprints’ of the MDF plant, there were built up
two different scenarios for decreasing carbon footprint.
According to scenario 1, biomass usage was suggested
instead of natural gas in turbines (1, 2 and 3) as a fuel. On
the other hand, according to scenario 2, solar panel
establishment seems to help to decrease carbon footprint
instead of usage an electricity.
RESULTS AND DISCUSSION
In this study, CF values were calculated for each
process by means of primary and secondary energy
sources. Furthermore, Pareto analysis was applied to define
carbon footprint’ problem in the plant. Moreover, two
scenarios are built up to decrease of total carbon footprint
in the plant.
Carbon footprints: The distribution of carbon
footprints determined for the processes used in the plant as
primary and secondary sources are presented in Figure 4.
As can be seen, CF of Turbine 3 the highest value at 88,08
kg-CO2e/m3MDF of all other processes as primary in
Figure 4-a. CF of MDF common (it’s a general
classification for the plant) which has the highest value at
44,91 kg-CO2 e/m3MDF of all other processes as secondary
sources in Figure 4-b.
Figure 4. Carbon footprint (CF) for each effective process (a-Primary and their’ CF b-Secondary and their’ CF).
Application of Pareto analysis: In this study, CF
values were calculated for each process by means of
primary and secondary energy sources with Tier 1 method.
After then, Pareto analysis procedures are applied for
drawn Pareto diagram. Pareto chart was drawn to define
the problems which were revealed by the help of 80/20 law.
For this aim, firstly, calculated CF values of every process’
sources were enumerated as presented in Table 1.
Table 1. CF data according to effective processes in MDF
production.
Serial number Effective processes CF (kg CO2 e /m3 MDF)
1 Turbine 1 68.47
2 Turbine 2 61.69
3 Turbine 3 88.08
4 MDF Burner 0.43
5 Boiler (consumed) 5.47
6 Chipper 0.35
7 PB Chipping MDF rate 0.05
8 Woodyard other 0.45
9 Sandpapering 2.59
10 Boiler (produced) 1.43
11 Compressor 3 0.2
12 Compressor 4 0.34
13 Refiner 1 9.21
14 Glueing-1 0.05
15 Drying-1 2.79
16 Pneumatic separator-1 1.13
17 Laying-1 1.62
18 Pressing-1 3.01
19 Pressing-1 after 0.96
20 Mechanical Grinding 2.03
21 Refiner 2 6.8
22 Glueing-2 0.03
23 Drying-2 2.38
24 Pneumatic separator-2 0.78
25 Laying-2 1.89
26 Pressing-2 1.45
27 Pressing-2 after 0.87
28
Purchased electricity from
the electricity
establishment
1.52
29 Electricity transported to
other facilities 32.08
30 Turbine 1 drying process 35.45
31 Turbine 2 drying process 32.55
32 Turbine 3 drying process 2.93
33 Losses 1 40.54
34 MDF common 44.91
35 Absorption chiller 1.59
36 Losses 2 0.15
37 Transportation vehicles 0.22
Then enumerated values were ranked from high to
low and the total amount of CF was found as shown in
Table 2. Besides seen in Table 2, percentage and
cumulative percentage were calculated for every sources’
of values were took place.
Pareto chart was drawn with 3 axes. While y axes
in the left side shows CF values, y axes in the right side
shows cumulative percent and x axes defines the sources in
Fig.4.

Erdil and Yılgor, 5(5), 841-848, (2020) J. Anatolian Env. and Anim. Sciences, Yıl:5, No:5, (841-848), 2020
845
Table 2. CF data in ranked from high to low, calculated percent and cumulative percent of CF in medium-density fiberboard production.
Serial number Effective processes CF (kg CO2 e/m3
MDF)
Percent
(%)
Cumulative
percent (%)
3 Turbine 3 88.08 19.29506 19.30
1 Turbine 1 68.47 14.99923 34.29
2 Turbine 2 61.69 13.51399 47.81
34 MDF common 44.91 9.838113 57.65
33 Losses 1 40.54 8.880808 66.53
30 Turbine 1 drying
process 35.45
7.765778 74.29
31 Turbine 2 drying
process 32.55
7.130496 81.42
29 Electricity transported
to other facilities 32.08
7,027536 88.45
13 Refiner 1 9.21 2.017569 90.47
21 Refiner 2 6.8 1.489627 91.96
5 Boiler (consumed) 5.47 1.198274 93.16
18 Pressing-1 3.01 0.659379 93.82
32 Turbine 3 drying
process 2.93
0.641854 94.46
15 Drying-1 2.79 0.611185 95.07
9 Sandpapering 2.59 0.567373 95.64
23 Drying-2 2.38 0.52137 96.16
20 Mechanical Grinding 2.03 0.444698 96.60
25 Laying-2 1.89 0.414029 97.02
17 Laying-1 1.62 0.354882 97.37
35 Absorption chiller 1.59 0.34831 97.72
28
Purchased electricity
from the electricity
establishment
1.52
0.332976 98.05
26 Pressing-2 1.45 0.317641 98.37
10 Boiler (produced) 1.43 0.31326 98.68
16 Pneumatic separator-1 1.13 0.247541 98.93
19 Pressing-1 after 0.96 0.2103 99.14
27 Pressing-2 after 0,87 0.190585 99.33
24 Pneumatic separator-2 0.78 0.170869 99.50
8 Woodyard other 0.45 0.098578 99.60
4 MDF Burner 0.43 0.094197 99.70
6 Chipping 0.35 0.076672 99.77
12 Compressor 4 0.34 0.074481 99.85
37 Transportation
vehicles 0.22
0.048194 99.89
11 Compressor 3 0.2 0.043813 99.94
36 Losses 2 0.15 0.032859 99.97
7 PB Chipping MDF
rate 0.05
0.010953 99.98
14 Glueing-1 0.05 0.010953 99.99
22 Glueing-2 0.03 0.006572 100.00
TOTAL 456.49
Figure 4. Application of Pareto analysis according to relationships between effective processes and carbon footprint values.
Evaluation of scenarios to decrease of CF: As
seen in Table 3, plant's total carbon footprint was
calculated as 24.04 kg-CO2e/m3-MDFtaking into
consideration of all the processes for production according
to scenario 1. The plant's total carbon footprint, taking into
account of all the processes for production was calculated
as 158.34 kgCO2e/m3-MDF according to scenario 2.
Table 3. Carbon footprints according to scenarios.
INPUT/ OUTPUT Effective processes CF(kg CO2e/m3 MDF)
Scenario 1 Scenario 2
Primary
Turbine 1 5.55 -
Turbine 2 5.002 -
Turbine 3 7.14 -
MDF Burner 0.43 -
Boiler 5.47 -
Primary Total 23.82 -
Secondary
Chipper - 0
Particle board Chipper
MDF rate - 0
Woodyard other - 0
Sandpapering - 0
Boiler - 0
Compressor 3 - 0
Compressor 4 - 0
Refiner 1 - 0
Gluing-1 - 0
Drying-1 - 0
Pneumatic separator-1 - 0
Laying-1 - 0
Pressing-1 - 0
Pressing-1 after - 0
Mechanical Grinding - 0
Refiner 2 - 0
Gluing-2 - 0
Drying-2 - 0
Pneumatic separator-2 - 0
Laying-2 - 0
Pressing-2 - 0
Pressing-2 after - 0
Purchased electricity
from the electricity
establishment
- 0
Electricity transported to
other facilities - 0
Electricity sold to the
state - 0
Turbine 1 drying process - 35.45
Turbine 2 drying process - 32.55
Turbine 3drying process - 2.93
Losses 1 - 40.54
MDF common - 44.91
Absorption chiller - 1.59
Losses 2 - 0.15
Secondary Total - 158.12
Primary
and Secondary Transportation vehicles 0.22 0.22
Total 24.04 158.34
Gorener and Toker (2013) by using Pareto
Analysis method; calculated the firm engaged in forest
products industry which is specialized on medium-density
fiber production. They purposed to define and classify
failure modes and then make offers due to their importance
degree by Pareto analysis. They also researched the
occurrence of waste process by applying Pareto analysis.
Bergman et al. (2014) investigated the carbon effects of
wood products. This research determines how carbon
emissions savings when wood products are consumed in
constructing buildings in place of non-wood sources. Çetin
et al (2014) are used pareto analysis method on the scope
and extent of extra work caused by management and

Erdil and Yılgor, 5(5), 841-848, (2020) J. Anatolian Env. and Anim. Sciences, Yıl:5, No:5, (841-848), 2020
846
workers’ issues in Turkish furniture industry. In our
research, according to the Pareto diagram, it was clearly
seen that Turbine 3, Turbine 1, Turbine 2, MDF common,
Losses 1, and Turbine 1 drying processes are the first six
effective processes constituting 74 % of the total problem
sources (Fig. 4). While these six effective processes cause
74% of total problem, here is no problem of in remain
which is composed of 26% of 37 effective processes.
Dodoo and Gustavson (2013) developed numbers
of scenarios about the effect of wooden frame design on
the life cycle of primary energy use in buildings. So,
comparisons are made on the energy use and effects of
carbon footprint for traditional and thermal insulated
houses with those scenarios (usage of electric resistance
heaters, heat pumps, cogeneration based heaters, and
biomass based energy source heaters). Scenarios are
created to decrease of carbon footprint values. Carbon
footprint value is reduced 89 % by the use of biomass
instead of natural gas energy according to scenario 1.
According to scenario 2, solar panels are used instead of
electricity energy so the carbon footprint value is reduced
1.41 % in this case. The objective of this research is to
present and define factors that decrease of efficiency
through issues of management, production processes,
supervision of workers and aspects of the products
themselves, therefore helping enterprises acquire
necessary measures. These researches was based on
occurring cause effect diagram and evaluate the Pareto
diagram to see the reasons which cause the highest
emission problem(s).
CONCLUSION
In this study, it was demonstrated that the total
amount of 6 effective processes which take place in
sequences of 37 effective processes in the process
correspond to 74 % of total amount of the processes with
Pareto diagram by the help of 80/20 law. So primarily some
improvements can be proposed for these 6 processes which
are called Turbine 3, Turbine 1, Turbine 2, MDF common,
Losses 1, and Turbine 1 drying process. It can be suggested
that these processes may use biomass energy instead of
natural gas as an energy source. Additionally, other
renewables such as sun panels can be used as an energy
source. Some best available techniques (BAT) can also be
recommended. These techniques are explained below
(Federal Environment Agency, 2011; BAT, 2014; Erdil,
2017; Erdil, 2018):
-Staff must be trained to develop environmental
awareness periodically.
-Environmental management system must be
applied for control of procedures and carry out
responsibilities by personnel.
-Equipments’ maintenance should be supplied
regularly.
It is clear that, CF value is exhibited a very serious
decline according to scenario 1 as a result of calculations
mentioned in above. However, it seems that the biomass
waste is not enough for obtaining energy as suggested in
scenario 1. In case of being preferred scenario 1, biomass
waste should be purchased out to carry out of this scenario.
Also, it needs to be investigated in terms of cost and
availability. On the other hand, installation cost of solar
panels must be questioned for replacing the place of
consumption of the electricity energy according to scenario
2. Furthermore, if the biomass wastes can be achieved to
convert with high added-value products and high calorific
products in MDF industry, which provide largely
sustainable resources from forests, it will be achieved an
environmentally friendly production.
ACKNOWLEDGMENTS
This study was supported by the İÜ Scientific
Research Projects Corporation (İÜ BAP) (Project
Number: 23794). This study was presented in ORENKO
2020 held by Karadeniz Technical University, Trabzon.
REFERENCES
Akın, B. & Öztürk, E. (2005). İstatistiksel proses kontrol
tekniklerinin bilgisayar ortamında uygulanması.
VII. Ulusal Ekonometri ve İstatistik Sempozyumu
Bildiriler, Istanbul, 1-15.
Akın, B. (1996). Statistical Process Control Techniques in
Businesses in ISO 9000 Application, 49-50s.,
Science and Technology Publisher, İstanbul.
Atabey, T. (2013). The calculation of the carbon footprint: The city of Diyarbakir. Master Thesis, Fırat
University, Natural Sciences, Elazığ.
Bergman, R., Taylor, A., Skog, K.E. & Puettmann,
M.E. (2014). The Carbon Impacts of Wood
Products, Forests Products Journal, 64(7/8), 220-
231. DOI: 10.13073/FPJ-D-14-00047.
Best Available Techniques (BAT). (2014). Reference
Document for the Production of Wood-based
Panels.
Brenton, P., Edwards-Jones, G. & Jensen, M.F. (2008).
Carbonlabelling and low income country
exports:a look at the issues, Washington, D.C.: The World Bank, (2009), Economics, http:/ doi.
org/10.111/j.1467-76 79 . 20 09. 00445.x.
Carbon Trust. (2007). Carbon Footprint Measurement
Methodology, Version 1.1. 27 February 2007, The
Carbon Trust, London, UK, (draft)
http://www.carbontrust.co.uk.
Cefic. (2010). Guidelines for Measuring and Managing
CO2 emission from Freight Transport Operations,
2011, March.

Erdil and Yılgor, 5(5), 841-848, (2020) J. Anatolian Env. and Anim. Sciences, Yıl:5, No:5, (841-848), 2020
847
Cravener, T.L., Roush, W.B. & Jordan, H. (1993). Pareto Assessment of Quality Control in Poultry
Processing Plants. Applied Poultry Science, 2 (3),
297-302. DOI: 10.1093/japr/2.3.297
Çetin, T., Colak, M., Yılmaz S., Yılmaz, T. & Korkmaz,
Y. (2014). The scope and extent of extra work
caused by management and workers’ issues in the
Turkish furniture industry. Journal of Asian
Scientific Research, 4(12), 729-740.
Da Schio, N. & Fagerlund, B.K. (2013). The relative
carbon footprint of cities, Cahiers de recherche du
Programme Villes &territoiresn 2013-02, http:// blogs. sciences -po.fr/recherche-villes.
Daşdemir, İ. (2018). Forestry Enterprise Economics.
4thEdition,BartınUniversity, 10(6), ISBN:978-
605-60 8 8 2-8-5.
Defra. (2010). Biomass emission factors.
Dodoo, A. & Gustavsson, L. (2013). Life cycle primary
energy use and carbon footprint of wood-frame
conventional and passive houses with biomass-
based energy supply. Applied Energy, 112, 834-
842.
Energetics. (2007). The Reality of Carbon Neutrality,
London. www.energetics. com.au/file?node_ id=21228.
Ercin, A.E. & Hoekstra, A.Y. (2012). Carbon and Water
Footprints- Concepts, Methodologies and Policy
Responses. Paris: United Nations Educational,
Scientific and Cultural Organization, ISBN:978-
92-3-001095-9, France.
Erdil, M. (2017). Quality oriented process development
via statistical analysis for carbon, water, and
energy footprint: An application in textile
industry. Master Thesis, Marmara University,
Institute of Science, Environmental Engineering, Istanbul.
Erdil, M. (2018). Carbon footprints’ determination of a
factory scale in the wood-based panel industry.
Master Thesis, IIstanbul University, Institute of
Science, Forest Industry Engineering, stanbul.
Erdil, M., Yilgor, N. & Gungör, Y. (2017). Evaluation of
Carbon Footprint For Wood Based Panel Industry
in Turkey, 2nd World Conference on Technology,
Innovation and Entrepreneurship, May12-14,
İstanbul. DOI: 10. 17261 /Pressacademia. 2017.
564 PAP-WCTIE-V. 5(2),.10-18pp.
Erdil, M., Sennaroğlu, B. & Keskin, S.S. (2017). Evaluation of Energy and Carbon Footprints of
Fabric Production in Turkish Textile Industry: A
Case Study, 1th International Conference on
Energy and Thermal Engineering, 25 - 28 April
2017, İstanbul, 481-486 pp., ISBN 978-605-9546-
04-1.
ETAP. (2007). The Carbon Trust Helps UK Businesses
Reduce their Environmental Impact, Press
Release,
http://ec.europa.eu/environment/etap/pdfs/jan07_
carbon_ trust_initiative.pdf
Federal Environment Agency, Brigitte Zletlow. lichtl
Ethics& Brands. (2011). Environmental
Standards in The Textile and Shoe Sector, May
2011, https://www.umweltbundesamt.de/sites/default/fi
les/medien/publication/ long/ 4289.pdf.
Garcia, R. & Freire, F. (2013). Carbon footprint of
particleboard: a comparison between ISO/TS
14067, GHG Protocol, PAS 2050 and Climate
Declaration. Journal of Cleaner Production, 66,
199-209. DOI: 10.1016/j.jclepro.2013.11.073
Gitlow, H.S., Openheim, A.J., Oppenheim, R. &
Levine, D.M. (2005). Quality Management,
Third Edition, McGrawHill, USA (2005), pp.
366-367. Goodier, C. (2010). Carbon footprint. IN: Cohen, N. and
Robbins, P. (eds.) Green Cities: An A-to-Z Guide.
London: SAGE Publications, pp. 49 - 53.
Görener, A. & Toker, K. (2013). Quality Improvement in
Manufacturing Process to Defective Products
using Pareto Analysis and FMEA, Beykent
University Journal of Social Sciences-BUJSS,
6(2), 45-62.
Groppi, M. & Jerry Burin, P.E. 2 (2007). Meeting the
Carbon Challenge: The Role of Commercial Real
Estate Owners, Users & Managers, Chicago.
Grubb & Ellis company. Gustavson, L., & Sathre, R. (2005). Variability in energy
and carbondioxi- de balances of wood and
concrete building materials. Building and Environ
ment, 41(7), 940-951. DOı:
10.1016/j.buildenv.2005.04.008.
IEA. (2012). CO2 emissions from fuel combustion
Highlights, OECD/ International Energy Agency.
IPCC. (2006). Guidelines for National Greenhouse Gas
Inventories, Chapter 10: Emissions from livestock
and manure management, Retrieved from
http://www.ipccnggip.iges. or.jp/ public/ 2006gl/ pdf/ 4 _10_Ch10_ Livestock.pdf.
IPCC (Revised). (2007). IPCC Guideliness for National
Greenhouse Gas Inventories: Revence Manual
Intergovermental Panel on Climate Change,
Cambridge University Press, Cambridge.
Ilter, E. & Ok, K. (2007). Forestry and Forest Industry
Marketing Principles and Management, Ankara,
Turkey, ISBN:975-96967-2-X.
Keskin, S.S., Erdil, M. & Sennaroğlu, B. (2017). Determination of energy and carbon footprints in
fabric production of a textile factory, VII.
National Air Pollution and Control Symposium, Antalya, Turkey, 1-3 November 2017, 95-105pp.
Leavengood, S. & Reeb, J. (2002). Part 3: Pareto
Analysis and Check Sheets, Performance
excellence in the wood products industry
Statistical Process Control, EM 8771, January.
Lelyveld, T., Woods, P. & AECOM. (2010). Carbon
emission factors for fuels -Methodology and
values for 2013-2016, 6 October 2010.
Lippke, B., Gustafson, R., Venditti, R., Steele, P., Volk,
T.A., Oneil, E., Johnson L., Puettmann, M.E.
& Skog, K. (2012). Comparing Life-Cycle Carbon and Energy Impacts for Biofuel, Wood
Product, and Forest Management Alternatives,
Forest Products Journal Volt, 62(4), 247-257.

Erdil and Yılgor, 5(5), 841-848, (2020) J. Anatolian Env. and Anim. Sciences, Yıl:5, No:5, (841-848), 2020
848
Mahapatra, A. & Mitchell, C.P. (1997). Sustainable development of non-timber forest products:
implication for forest Management in India,
Forest Ecology and Management, 94, 15-29,
ISSN:0378-1127, Netherlands.
Matthews, H.S., Hendrickson, C.T. & Weber, C.L.
(2008). The Importance of Carbon Footprint
Estimation Boundaries. Environmental Science
Technology, 42, 5839-5842.
Moroşanu, C., Dumitraşcu, A.E. & Ciobanu, V. (2011). The Influence of Oak Raw Timber Defects on
Decorative Veneer Cutting. Bulletin of the Transilvania University of Braşov Series II
Foresty Wood Industry Agricultural Food
Engineering, 4(53), No. 2, 65-70.
Ok, K. (2005). Idea Marketing in Forestry: Some
Implications from the Turkish Forestry
Experience. Forest Policy and Economics, 7(4),
493-500. DOI: 10.1016/j.forpol.2003.07.003
Patel, J. (2006). Green sky thinking. Environment
Business, 122, 32.
Pekin , M. (2006). Greenhouse gas emissions produced by
transportation sector, Master Thesis, Mechanical
Engineering, İstanbul Technical University, Natural Sciences, İstanbul.
Post. (2006). Carbon footprint of electricity generation,
October 2006, Parliamentary Office of Science
and Technology, London, UK,
http://www.parliament.uk/documents/up load/
postp n268.pdf.
Radua, A.L., Scrieciua, M.A. & Caracotaa, D.M.
(2013). Carbon Footprint Analysis: Towards a
Projects Evaluation Model for Promoting
Sustainable Development. Procedia Economics
and Finance, 6, 353-363. DOI: 10.1016/S2212-5671(13)00149-4
Steinfeld, H. & Wassenaar, T. (2007). The role of
livestock production in carbon and nitrogen
cycles. Annual Review of Environment and
Resources, 32(1), 271-294. DOI:
10.1146/annurev.energy.32.041806.143508
Turanlı, A. (2015). Estimation of carbon footprint: A case
study for Middle East Technical University.
Mastar Thesis, Middle East Technical University.
Uribe, T.J., Ruiz, R.J.L., Milan, G.J. & Valenciano, J.d.P. (2019). Energy, Economy, and
Environment: A Worldwide Research Update.
Energies, 12(6), 1-19. DOI: 10.3390/en12061120
Wackernagel, M. & Rees, W. (1996). Urban ecological
footprints Why cities cannot be sustainable-And
why they are a key to sustainability.
Environmental Impact Assessment Review, 16(4-
6), 223-248. DOI: 10.1016/S0195-
9255(96)00022-4
Wackernagel, M., Onisto, L., Bello, P., Linares, A. C.,
Falfan, I. S. L., Garcia, J. M., Guerrero, A. I. S. & Guerrero, C. S. (1999). National natural
capital accounting with the ecological footprint
concept. Ecological Economy, 29(3), 375-390.
PII: S0921-8009(98)00063-9.
WBCSD/WRI. (2007). The Greenhouse Gas Protocol;
World Business Council for Sustainable
Development and World Resources, Institute:
Geneva, 1-116pp.
Wiedmann, T. & Minx, J. (2007). A definition of ‘Carbon
Footprint’, In: C. C. Pertsova,
EcologicalEconomics Research Trends: Chapter
1,pp.1-11, Nova Science Publishers, auppa uge NY, USA.
https://www.novapublisers.com/catalog/product_
info.php?Products_id=5999 Available from:
https://www.researchgate.net/publication/247152
314 [accessed Apr 25 2018].
Wilson, J. (2010). Life-Cycle Inventory of Medium
Density Fiberboard in Terms of Resources,
Emissions, Energy and Carbon. Wood and Fiber
Science, 42, 107-124.
Wilson, J. (2010). Life-Cycle Inventory of Particleboard
in Terms of Resources, Emissions, Energy and Carbon.Wood and Fiber Science, 42, 90-106.
Yıldırım, T., Candan, Z. & Korkut, S. (2014). Wood-
Based Panels Industry In Turkey: Future Raw
Material Challenges And Suggestions. Maderas.
Ciencia y tecnología, 16(2), 175-186. DOI:
10.4067/S0718-221X2014005000014

Journal of Anatolian Environmental and Animal Sciences
(Anadolu Çevre ve Hayvancılık Bilimleri Dergisi) DOI: https://doi.org/10.35229/jaes.836351
JAES Year: 5, No: 5, 2020 (849-857)
AÇEH Yıl: 5, Sayı: 5, 2020 (849-857)
ARAŞTIRMA MAKALESİ RESEARCH PAPER
849
The Problems of Furniture Sector and Suggestions for Solutions
(A Case Study of Van)
Göksel ULAY* Van Yuzuncu Yil University, Van Vocational School, Program of Furniture and Decoration, Van-Tuşba, 65040, Turkey
Geliş/Received: 05.12.2020 Kabul/Accepted: 16.12.2020
How to cite: Ulay, G. (2020). The Problems of Furniture Sector and Suggestions for Solutions (A Case Study of Van). J. Anatolian Env. and Anim. Sciences,
5(5), 849-857.
Atıf yapmak için: Ulay, G. (2020). Mobilya Sektörünün Sorunları ve Çözüm Önerileri (Van İli Örneği). Anadolu Çev. ve Hay. Dergisi, 5(5), 849-857.
Abstract: This study was carried out in order to determine the current situation and the problems faced by the enterprises operating in the Furniture and Carpenters Industrial Site in the city center of Van. For this purpose, 71 businesses were randomly selected from the businesses in Van furniture and carpenters industrial site. Businesses were visited and a questionnaire consisting of 12 questions was applied using face-to-face question-answer technique. With the questionnaire,
data on the defining information of the enterprises such as the establishment date, number of employees and education status, production type, machines types, sales and order method, problems experienced and supports received were collected. As a result; the problems identified by the enterprises are respectively, the use of low technology machinery (93%), website not having (85.9%), insufficient vocational training (81.9%), capital insufficiency (69%), insufficient demand (49.3%), transportation (46.5%), workplace rent (45.1%), raw material (39.4%). In addition, it is determined that the average operating time of the enterprises is 26 years and the average working personnel is 3.1 people. Recommendations on consultancy services, cooperation with vocational training institutions and increasing the level of technology use were included for
the furniture businesses within the scope of the research.
Keywords: Enterprises, Furniture, Production, Van, Woodwoorking.
Mobilya Sektörünün Sorunları ve Çözüm Önerileri
(Van İli Örneği)
Öz: Bu çalışma Van il merkezinde bulunan Mobilyacılar Sanayi Sitesi'nde faaliyet gösteren işletmelerin mevcut durumunu ve yaşadığı sorunları belirlemek amacıyla yapılmıştır. Bu amaçla Van mobilyacılar ve marangozlar sanayi sitesindeki işletmelerden rastgele 71 işletme seçilmiştir. İşletmeler ziyaret edilmiş ve yüz yüze soru-cevap tekniği kullanılarak 12 sorudan oluşan anket uygulanmıştır. Anket ile işletmelere ait kuruluş tarihi, çalışan sayısı ve eğitim durumu, üretim
türü, mevcut makineler, satış yöntemi, yaşanan sorunlar ve alınan destekler gibi işletmeyi tanımlayıcı bilgilere ilişkin veriler toplanmıştır. Sonuç olarak; işletmelere ait tespit edilen problemler sırasıyla, düşük teknolojili makine kullanımı (% 93), web sitesine sahip olmamak (% 85,9), mesleki eğitimi yetersiz personel (% 81,9), sermaye yetersizliği (% 69), talep yetersizliği (% 49,3), ulaşım (% 46,5), işyeri kirası (% 45,1), hammadde (% 39,4) ile ilgili olduğu tespit edilmiştir. Ayrıca işletmelerin ortalama faaliyet süresi 26 yıl ve işletme başına düşen ortalama personel sayısı 3,1 kişi olduğu belirlenmiştir. Araştırma kapsamındaki mobilya işletmelerine yönelik olarak danışmanlık hizmeti, mesleki eğitim kurumları ve diğer ilgili kurumlar ile iş birliği
ve teknoloji kullanım düzeyinin artırılması konusunda önerilere yer verilmiştir. Anahtar kelimeler: Ağaç işleri, İşletme, Mobilya, Üretim, Van.
* : https://orcid.org/0000-0003-4080-8816
*Corresponding author’s: Göksel ULAY
Van Yuzuncu Yil University, Van Vocational
School, Program of Furniture and Decoration,
Van-Tuşba, 65040, Turkey.
: [email protected] Mobile telephone: +90 (505) 835 78 49
Telephone :+90 (432) 444 50 65
Fax : +90 (432) 225 14 15
*Sorumlu yazarın: Göksel ULAY
Van Yüzüncü Yıl Üniversitesi, Van Meslek
Yüksekokulu, Mobilya ve Dekorasyon
Programı, Van-Tuşba
65040, Türkiye.
: [email protected] Cep telefonu : +90 (505) 835 78 49
Telefon : +90 (432) 444 50 65
Faks : +90 (432) 225 14 15

Ulay, 5(5), 849-857, (2020) J. Anatolian Env. and Anim. Sciences, Yıl:5, No:5, (849-857), 2020
850
INTRODUCTION
Furniture, which has always been a valuable item
for people in the historical process, can generally be
defined as equipment that meets needs such as resting,
storage, and sitting (Ulay, 2011). Furniture is used in
different geographical cultures of the world for purposes
such as sitting, storage and display. Today, due to the
increasing demand for furniture products, the level of
technology usage in production processes has increased.
With the creation of technological production processes,
the furniture industry has become one of the world's
advanced industries. Turkey, as the location for the
furniture production facilities in terms of access to the
necessary supply of raw materials is more advantageous as
compared to other countries (Yegin, 2020).
Turkey in the furniture industry; It is traditionally
thought to operate in the national and even local market
with low technology, insufficient capital, labor intensive
and expensive inputs. In fact, Turkey recently the furniture
industry is undergoing a rapid technological
transformation (Agras and Korkmaz, 2020) and compared
to the past is transformed into more knowledge and capital-
intensive fashion industry (TOBB, 2017). The most
important factor behind this transformation is the
competitiveness of the furniture industry and the rapid
globalization process (Gurpinar and Barca, 2007).
Furniture product is a typical example of global products
that naturally comply with the requirements of
international trade with their features such as fulfilling their
basic functions and high design input (Yeniceri, 2005).
Turkey's economy, producing value-added products and a
significant number of jobs created (Okan, 2013), but also
in the foreign trade surplus furniture industry has a special
position in the economy.
However, the furniture industry in Turkey; lack of
design (Karagoz and Sevim Korkut, 2017; Gurpinar and
Doven, 2007), funding shortage (Akyuz et al., 2020;
Malkocoglu et al. 2015; Serin and Sahin; 2020), lack of
qualified personnel (Ulay, 2011; Ulay 2015; Ulay 2020),
raw material and branding (Demirci, 2005), low
technology usage level (Gurpinar and Doven, 2007),
management deficiencies (Gurpinar and Doven, 2007),
inadequate promotion and marketing (Coskun, 2019;
Ustuner, 2010). It has been shown in many researches and
sector reports in the literature that it has very important
problems.
In general, in particular the problems of Turkey's
Van furniture industry and is thought to be similar
advantages. The province of Van has borders with Agrı in
the north, Bitlis and Siirt in the west, Iran in the east and
Sırnak and Hakkari in the south. Neighboring provinces are
behind Van province in terms of production and
infrastructure and at the same time have a market position
(Ulay, 2020a). Van province of Turkey, with a total of
1.136.757 people in 2019 in terms of population is the 19th
most populous province among 81 provinces (TUIK,
2019). The fact that the city population is over 1 million
shows the importance of the need and production amount
related to furniture consumption. Sub-Industry Fields of
Activity Operating in the TRB2 Region The localization
values (LQ) of furniture manufacturing in the years 2009-
2014 are 0.25 (Deliktas and Celik, 2019). Considering the
potential and numbers of furniture manufacturers in Van,
no scientific research was found, except for the report
prepared by DAKA (2017) for the furniture manufacturing
sector. Considering the furniture production potential in
the TRB2 Region of Van province and the surrounding
provinces, scientific research on the furniture sector is of
great importance.
According to Arslan (2018), there is also a lack of
awareness in the furniture sector regarding the necessity of
production at the quality standards required to increase the
sales amount and profit of the goods produced in TRB2 in
domestic and foreign markets. In the few studies conducted
on enterprises in the province of Van, it was emphasized
that SMEs do not receive support from professional
companies when making investment decisions and that
businesses need to develop ways to benefit from external
resources in order to become more efficient and healthy
(Kilicli, 2016; Kilicli and Aygun, 2018).
The aim of this study is; to determine the current
structure and problems of small-scale furniture enterprises
(SMEs) operating in the province of Van through the
sample. As a result, in particular in Van province and its
surroundings, usually the small-scale furniture business in
a very important furniture manufacturing industry for
Turkey's manufacturing industry (SMEs) to contribute to
the development and be a pioneer for a more
comprehensive future studies.
Turkey Furniture Industry: Turkey's furniture
industry, mainly small-scale, which lack employees and
exports by traditional methods consist of business owners
the flexibility capabilities (BAKKA, 2012; Demirci, 2005;
IMG, 2020; Sogutlu and Eroglu, 2009; Malkocoglu et al.,
2013; TOBB, 2017). Furniture exporting countries in the
world ranking of 11th. and that Turkey continued to rise in
2017 for 2.360.407 million dollars, 2.686.740 million
dollars in 2018, while in 2019 has made exports of
3.055.447 million dollars. With this figure, it has 1.6% of
the world furniture export market (IMG, 2020). Turkey
Furniture employment of the industry is the most intense
first 10 cities, respectively, Istanbul, Bursa, Kayseri,
Ankara, Izmir, Kocaeli, Antalya, Duzce, Sakarya and
Mersin (Karagoz and Sevim Korkut, 2017).

Ulay, 5(5), 849-857, (2020) J. Anatolian Env. and Anim. Sciences, Yıl:5, No:5, (849-857), 2020
851
When examined compulsorily insured
employment figures registered a total of 14.314.313
million people are working in Turkey and their 154.829
people work in the field of manufacturing of furniture and
constitute 1.08% of the total number of insured employees
(SGK, 2019). The number of registered workplaces
operating in the field of furniture manufacturing is 21.758.
The total number of registered businesses producing wood,
wood products and mushrooms is 10.161 and 60.456
insured people are employed in this sector (SGK, 2019).
When analyzed according to the number of
employees of enterprises scale furniture manufacturing
sector in Turkey, 86.6% of 1-9 people working, 81.1% of
1-6 people working, while 65.2% which runs between 1-3
people consists of businesses (SGK, 2019).
The furniture industry has some vulnerabilities to
future uncertainties and to improve its position; It is stated
that improvement should be made by focusing on concepts
such as job satisfaction and productivity (Yapar, 2005) and
strategic management (Yegin, 2020). Turkey's furniture
industry; strategic management, quality control, export,
research, design and university&industry cooperation
(Ulay and Çakicier 2020) and the industrial estates of
concepts such as discussion and adoption in business scale
and is of great importance for the future of the industry.
Van Province Furniture Industry and Its
Importance: Van province of Turkey's poorest provinces
to TRB2 maintainde in the classification and
socioeconomic development index (SEDI) ranks 75th in
the ranking of 81 cities (SEDI, 2013). It is important to
identify potential competitive sides and advantage by
analyzing the existing sectors in the TRB2 region (Deliktas
and Cekil, 2019).
According to the data of the Turkey Social
Security Institution (SGK) in 2019, the total number of
registered workplaces in the province of Van is 9440 and
the total number of employees with compulsory SGK is
94.043 (SGK, 2019). It has been determined that there are
41 workplaces producing furniture with 31 activity codes
and a total of 166 people work in these enterprises with
insurance (SSI, 2019). A total of 117 people work in 36
workplaces registered in Wood, Wood Products and
Mushroom Production with 16 activity codes, which is
another business line where wood material is used as raw
material (SGK, 2019).
According to DAKA (2017), it has been reported
that there are 350 furniture manufacturers operating in Van
registered to Van Chamber of Commerce and Industry and
the current situation research of the sector covering 199 of
these enterprises has been conducted. Similar to the general
problem of the furniture industry in Turkey; in a different
study in which all enterprises were included in the scope of
the study, regardless of the scale, financial difficulties, lack
of raw materials, insufficient demand, energy prices
(Malkocoglu et al., 2015), unfair competition, raw
materials, lack of capital, financing (Kilicli, 2016),
technology used We are faced with low capacity utilization
levels and a shortage of qualified personnel (Demirci,
2005; Ulay, 2011).
There is no scientific research other than the study
prepared by DAKA (2017) for the Van furniture industry.
The deficiency in this area should be filled with different
studies. It has been reported that the furniture sector should
be handled with a holistic perspective, taking into account
the R&D and innovation capability, product quality, taxes
and incentives, informality, demand and similar problems
(DAKA, 2017).
MATERIALS AND METHODS
In the first phase of the research, the carpenter and
furniture industry site in the center of Tusba district of Van
province was visited and the current situation of the
industrial site was observed physically. 71 businesses
registered in Van Chamber of Tradesmen and Craftsmen
and Chamber of Furniture and Carpenters, randomly
selected among the enterprises operating in the industrial
site were included in the study.
Research Approach: The business scale
classification determined by TUIK and operating in the
Carpenter and Furniture Manufacturers Industrial Site
located in the city center of Van is based on the number of
employed personnel in Table 1.
Table 1. Enterprise size according to the number of employees (Ustuner, 2010).
Number of employees Business size
1- 9 Micro-scale business
10 - 49 Small-scale business
50 - 99 Medium-scale business
100 and above Large-scale business
Method: The questionnaire consisting of 14
questions defining the basic information and current
problems of the enterprises producing furniture, wooden
doors and windows operating in the industrial site was
applied using the face-to-face interview technique.
The questionnaires were applied to the
responsible employee and / or business owner at the time
of the visit. Considering that the research population is
approximately N = 200 businesses, a sample group was
formed in the study due to its size. It was calculated that n
= 54 using the formula below. In the literature, 30 or more
sampling diameters (n) are considered sufficient for the
sampling section to be normal (web-1, 2020). For this
reason, 71 enterprises were investigated by increasing the
sample diameter above 54 as much as possible (n> 30).
Thus, the results to be obtained were tried to be more

Ulay, 5(5), 849-857, (2020) J. Anatolian Env. and Anim. Sciences, Yıl:5, No:5, (849-857), 2020
852
inclusive and reliable (Sogutlu and Eroglu, 2008;
Malkocoglu et al., 2013; 2015).
In the survey application, the sample size (n) was
calculated from below equation (Cil, 2000; Malkocoglu et
al., 2013).
𝑛 =𝑍2 ×𝑁×𝑃×𝑄
𝑁×𝐷2+𝑍2×𝑃×𝑄 (1)
Z = Confidence Coefficient (1.96 was taken for
95% confidence), N = Large mass size, P = Probability of
the property to be measured in the main mass (95%), Q =
The probability of the feature to be measured is not found
in the main mass (5%), Q = 1-P and D = indicate the
accepted sampling error (10%) (Malkocoglu et al., 2013).
Data entries of the survey results were analyzed using MS
Excel program. Tables were created by calculating the
frequency percentages (%) of the information provided by
the enterprises to the surveys, and the data were discussed
and evaluated.
RESULTS
Within the scope of this research, the answers
given by the enterprises to the questionnaire consisting of
14 questions prepared by the researcher are evaluated and
given in tables in this section.
The average number of personnel in the
enterprises participating in the survey was determined as
3.1 people.
It was determined that the operating years (age of
the enterprise) of 71 enterprises within the scope of the
research are 26 years on average.
The data on the education status of the personnel
working in the enterprise are given in Table 2.
Table 2. Education status of employees.
Graduation degree F %
University 16 7,2
Vocational High School 25 11,3
High School 55 24,9
Primary School 126 57,0
*F: Frequency
According to Table 2, 7.24% of the employed
personnel are university graduates, 11.31% vocational high
school graduates, 24.89% high school graduates and
57.01% primary education graduates. The product groups
that businesses produce are given in Table 3.
Table 3. Production types of enterprises.
Product Types F %
Furniture 62 87,3
Woodworking 41 57,8
Decoration 49 69,0
Other 15 21,1
According to Table 3, 87.3% of the enterprises
produce furniture manufacturing, 57.8% woodworking
(doors and windows etc.), 69% decoration and 21.1% other
types of products. It has emerged that some of the
businesses have a flexible structure that they can do both
furniture and joinery or decoration works together. The
data of the machine types in the enterprise are given in
Table 4.
Table 4. Machine types found in the enterprises. Machine types F % Machine types F %
CNC 5 7,0 Thickness 47 66,2
Edgebant 36 50,7 Band-saw 29 85,0
Circular-saw 61 85,9 Drilling 43 60,5
Plane 47 66,2 Milling 46 64,8
Other type 45 63,4
According to Table 5, 90.1% of the enterprises
ordered by phone, 12.7% from the internet, 5.6% from the
showroom, 97.2% from acquaintances, 90.1% by coming
to the workshop it was determined that he ordered.
In this research, it was determined that there are
businesses that use more than one and different order
taking methods. Data on the most common problems faced
by businesses are given in Table 6.
Table 6. The most common problems in enterprises. Problem type F % Problem type F %
About personnel 26 36,6 Rent 32 45,1
Lack of demand 35 49,3 Transport 33 46,5
Raw material 28 39,4 Workshop area 27 38,0
Lack of capital 49 69,0 Other 18 25,4
According to the data in Table 6, business
problems; 36.6% personnel, 49.3% lack of demand, 9.4%
raw material, 69% lack of capital, 45.1% rent, 46.4%
transportation, 38% one of them is due to workshop area
and 25.3% from other reasons.
Among the other reasons reported as; insurance
premiums, lack of qualified apprentices and journeymen,
advertising, promotions, insufficient support and
incentives. The data regarding the training requests for the
employees of the enterprises are given in Table 7.
Table 7. The status of requesting free training for employees in the business.
Sucject training F % Subject training F %
Furniture desing 35 49,3 Oparetor and maintenance 29 40,9
AutoCAD 31 43,7 Planning/organization 31 43,7
Computer 26 36,3 Work safety 39 54,9
CNC Machine 30 42,3
Training subjects requested by enterprises
according to Table 7; 49.3% furniture design, 43.7% use
AutoCAD, 36.3% computer use, 42.3% use CNC, 40.9%
operator and maintenance, 43.7% planning and
organization and 54.9% work safety. The data on the
ownership of a website by the enterprises are given in
Table 8.

Ulay, 5(5), 849-857, (2020) J. Anatolian Env. and Anim. Sciences, Yıl:5, No:5, (849-857), 2020
853
Table 8. The state of ownership of the website of enterprises.
Do you website of enterprises ? F %
Yes 10 14,1
No 61 85,9
According to Table 8, while 14.1% of the
enterprises have a website, it has been determined that
85.9% of the enterprises do not have a website. The reasons
why businesses do not have a website are given in Table 9.
Table 9. The reason for the lack of a web page belonging to businesses.
The reason for lack of web page F %
Economic reasons 28 39,4
Not needing 22 31,0
Lack of time 7 9,9
Not to find opportunities 12 16,9
Lack of information 9 12,7
According to Table 9, enterprises; It was
determined that 39.4% due to economic reasons, 31% due
to not needing, 9.9% to lack of time, 16.9% not to find
opportunities and 12.7% due to lack of information.
Cooperation status of enterprises with any educational
institution is given in Table 10.
Table 10. The cooperation of enterprises with any educational.
Type of institution F %
Vocational High School 15 21,1
University 11 15,5
Public Education Center 2 2,8
Dont Cooperation 43 60,6
According to Table 10, enterprises; It was
determined that 21.1% cooperate with vocational high
schools, 15.5% with the university, 2.8% with the public
education center, but 60.6% of the enterprises do not
cooperate with any institution. The data on whether the
business receives financial support from any institution or
not is given in Table 11.
Table 11. Whether businesses receive support from any institution.
Support status F %
Yes 16 22,5
No 55 77,5
According to Table 11, enterprises; It was
determined that 22.5% received KOSGEB project support
and 77.5% did not receive support from any institution.
Data pertaining to the need for social equipment required
for enterprise employees are given in Table 12.
Table 12. The social facilities required by employees working in enterprises.
Types of social facilities F %
Banyo-WC 45 63,4
Restaurant 46 64,8
Cafe-tee home 53 74,6
Other 41 57,8
According to Table 12, employees; It was
determined that 74.6% needed cafe-tea house, 64.8%
restaurant, 63.3% bathroom and WC, 57.8% other social
facilities in the industrial site. The demands of the working
personnel from the relevant institution for the industrial site
are given in Table 13.
Table 13. The demand of working personnel from the relevant
institution. Demand subject F % Demand subject F %
Health center 21 29,6 About financial support 20 28,2
Moque 7 9,9 Demand and promotion 15 21,1
Park 6 8,5 Fire station 2 2,8
Transportaion 10 14,1 New workshop area 5 7,0
As the general demand of enterprises in Table 13;
health center 29.6%, information on financial support
28.2%, demand and promotion 21.1%, transportation
14.1%, mosque 9.9%, park 8.5%, new workshop area 7%,
fire-station 2.8%. The data regarding the need for
showrooms where the enterprises will display their
products are given in Table 14.
Table 14. The need for a showroom for businesses to display products.
Do you need showroom ? F %
Yes 40 56,3
No 19 26,8
According to Table 14, the enterprises; 56.3%
stated that there is a need for a common showroom within
the industrial site, 26.8% stated that there is no need for a
showroom.
DISCUSSION and CONCLUSION
Within the scope of the research, it was
determined that the activity year (age of the enterprise) of
71 furniture manufacturing enterprises in the city center of
Van is 26 years on average. In the literature, according to
Kilicli and Aygun (2018), 37% of the 54 enterprises in the
Van Organized Industrial Zone (OIZ) have an average of
16 years and above. According to DAKA (2017), 56.8% of
the enterprises in the Van furniture industry have been
operating for 10 years or more, and 28.1% have been
operating for 6-10 years. It can be thought that enterprises
can have their experience in the sector and the ability to
survive against crises at different times. The relationship
between the approaches of the enterprises that have
adopted the traditional production and management style
against innovations and change and their activity durations
can be examined with different studies.
According to the education level of the working
personnel; it was determined that they graduated from
primary education (57%), high school (24.9%), vocational
high school (11.3%) and university (7.2%). It is thought
that the education level and type of training of the
employees should be suitable for manufacturing in the
technical field such as furniture and decoration (table 2).

Ulay, 5(5), 849-857, (2020) J. Anatolian Env. and Anim. Sciences, Yıl:5, No:5, (849-857), 2020
854
However, it was determined that approximately
82% of the personnel did not receive vocational training.
In the literature in Turkey furniture industry professional
trained to be in need of qualified personnel (BAKKA,
2012; Coskun, 2019; DAKA, 2017; Demirci, 2005;
Gorguc, 2008; Gurleyen et al., 2010; Malkocoglu et al.,
2013; TOBB, 2017; Ulay, 2011; Ulay, 2020) and 68% of
enterprises do not employ training staff (Gurleyen et al.,
2010). The findings of the study are consistent with the
literature. The vocational and technical training needs of
the personnel can be met through in-service or vocational
training institutions.
According to the findings, the majority of the
enterprises produce furniture (87.3%), decoration (69%)
and woodwork (57.8%) and other (21.1%) products (Table
3). It has been reported that the majority of the enterprises
are manufacturing furniture and decoration, and more than
half of them produce woodwork and related production.
It is understood that businesses keep their product
range wide rather than specializing in certain areas. This
situation is considered as an indicator of the flexibility
characteristics of SMEs. Data consistent with the literature
(DAKA, 2017; Malkocoglu et al., 2017).
The average number of employees for 71
workplaces in the Van furniture sector is 3.1 people. It is
included in the micro enterprise definition made by TUIK.
SGK (2019) argues that employ 1-3 people, 65.2% of the
furniture business in Turkey, is made up of enterprises
which employ staff while 86.6% between 1-9 people. It has
been determined that Kilicli and Aygun (2018) constitute
9.3% (5) of the 54 enterprises in Van OIZ and the rate of
those with less than 10 employees is 29.6% for all
enterprises. According to DAKA (2017), 98.5% (196) of
199 furniture businesses in Van province are micro-scale
and 1.5% are small-scale enterprises. The results of the
study are compatible with the literature. On the other hand,
it is thought that the high number of furniture enterprises
in the province of Van, the low number of employees,
working with low capacity and the increase in the number
of enterprises due to unplanned expansion in the sector.
Investment consultancy can be recommended to remedy
the deficiency in this matter.
When the data on the machine capacity of the
enterprises are examined; It has been determined that 93%
of the enterprises, that is almost all of them, use
conventional type machines. According to DAKA (2017)
in the literature, it is reported that 90% of the enterprises
use traditional machinery. It is thought that the
technological machine usage levels of the enterprises are
low and accordingly there is a deficiency in meeting their
demands and customer satisfaction.
Businesses demand from customers; It was
determined that 97.2% was done by acquaintances, 90.1%
by coming to the workshop, 90.1% by phone, 12.7% by
internet and 5.6% by showroom (Table 5). It is thought that
traditional methods are widely used for businesses to gain
new business and customers, which may cause a lack of
demand and a decrease in sales. Similar problems have
been reported in furniture businesses in different provinces
in the literature. Coskun (2019) stated that foreign
language web pages of businesses can increase their sales
and export opportunities. Ustuner (2010) stated that the
activities they did not allocate resources for promotion and
marketing were insufficient.
Common problems in businesses; lack of capital,
insufficient demand, lack of transportation, rent, raw
materials, workshop area, and qualified personnel (Table
6). The results of the study were similar to the results of the
study in the literature (Akyuz et al., 2020; DAKA; 2017;
Malkocoglu et al., 2015; Ustuner, 2010; Serin and Sahin,
2020; Kilicli, 2016) for reasons such as lack of capital,
shortage of raw materials and financing.
It is recommended to benefit from R&D and
incentive supports, focusing on products with specific
features (BAKKA, 2012) and producing innovative
products.
According to Table 8, it was determined that
85.9% of the enterprises do not have a website where they
can display their products. Businesses are considered to be
insufficient in introducing their products and services to the
market. According to DAKA (2017) in the literature, the
promotional and marketing activities of most furniture
companies in Van are carried out at a primitive level;
According to Coskun (2019), it has been reported that
businesses that do not have websites in a foreign language,
not promoting their target markets negatively affect their
export potential. According to BAKKA (2012), it has been
reported that enterprises cannot carry out promotional and
marketing activities and the content of those who have a
web page is insufficient. There are studies stating that there
is a lack of publicity and image in the furniture sector
(BAKKA, 2012; Ustuner, 2010; TOBB, 2017). For this
reason, it is thought that small and medium-sized
enterprises should improve themselves in advertising and
promotion, allocate a budget for these issues, and receive
professional support for promotion and digital marketing
activities.
According to Table 9, 39.4% of the enterprises are
due to economic reasons, 31% due to not needing, 9.9%
due to lack of time, 16.9% not to find opportunities and
12.7% due to lack of information. It has been determined
that they do not have a website. It has been reported in the
literature that advertising and marketing activities are not
carried out because the lack of qualified personnel to
prepare web pages of furniture businesses and their costs
are avoided (BAKKA, 2012; Coskun, 2019; Ustuner,

Ulay, 5(5), 849-857, (2020) J. Anatolian Env. and Anim. Sciences, Yıl:5, No:5, (849-857), 2020
855
2010). While the lack of a web page where businesses can
display their products causes a lack of promotion, this may
result in a lack of demand.
According to Table 10, 21.1% of the enterprises
cooperate with a vocational high school, 15.5% with a
university and 2.8% with a state education center.
According to DAKA (2017), organizations that produce
information with clustering, non-governmental
organizations, suppliers and educational institutions have
stated that they should be in interaction. According to
TOBB (2017), the subject of qualified labor as school,
employee, boss/employer should be considered together
and sustainable solutions should be produced. Aksin et al.
(2020) emphasizes the cooperation between universities
and enterprises with high infrastructure and technology in
order to adapt to the developments in our rapidly
developing age. It has been reported that some enterprises
have protocols for the admission of intern students to
vocational high schools. According to Ulay (2020), it has
been reported that as an academician observation, furniture
and decoration students who graduated from vocational
school are unwilling to work in this sector. It has been
observed that many businesses do not cooperate with any
educational institution. Turkey businesses operating in the
furniture industry and one of the biggest shortcomings of
professional training institutions of the co-culture is
unsettled. This situation is thought to be one of the most
important factors in development.
According to Table 11, it was determined that
22.5% of the enterprises received support from KOSGEB,
while 77.5% did not receive support from any institution.
Results of studies in the literature; In the study conducted
by DAKA (2017) for Van furniture businesses,
approximately 29% of 199 businesses benefited from
KOSGEP and DAKA supports; According to Kilicli and
Aygun (2018), it is compatible with the information that
SMEs in Van OIZ benefit the most from KOSGEB and
Halk Bank as credit source after commercial banks.
However, despite these results, it was evaluated that many
enterprises had capital shortages and did not receive any
support and could not meet the necessary conditions for the
support provided (Ulayi 2020a). Reducing bureaucratic
difficulties and sustainability should be taken into
consideration in the conditions sought in enterprises that
will receive support. In support applications, free
consultancy services can be created for enterprises within
the scope of university-industry cooperation (Ulay and
Cakicier, 2020).
According to Table 12, it has been determined that
74.6% of them need social facilities such as cafe-tee house,
64.7% restaurants, 63.3% bathrooms and wc. Söğütlü and
Eroglu (2008) found that employees in furniture businesses
do not have sufficient knowledge about the use of physical
equipment and infrastructure. It is also found in the
literature that meeting the physical needs of the employees
will provide employee motivation and job satisfaction and
affect productivity (Yapar, 2005). Ensuring employee
satisfaction is considered necessary and beneficial for
businesses and the social environment.
In Table 13, as the general demand of the
enterprises; health center, qualified personnel, lack of
demand, advertisement and promotion, transportation
facilities, mosque, park, fire station. It is thought that
deficiencies in demand issues may negatively affect
employee motivation and job satisfaction levels.
According to Yapar (2005) in the literature, he reported
that employee motivation has an effect on work efficiency.
According to Table 14, the enterprises 56.3% of
them stated that a common showroom is needed in the
industrial site, 26.8% stated that there is no need. It is
understood from these results that businesses lack
awareness about sales and marketing. Electronic
Commerce (E-Commerce) in the literature can be used in
the furniture industry as in almost every field (Kurt, 2019).
Businesses with low demand and difficulties in advertising
(Ustuner, 2010) should be aware of up-to-date solution
opportunities such as showrooms, e-showrooms and e-
fairs, online catalogs, furniture stores, and recognize
effective methods of delivering their products to
customers. Cluster models such as industrial sites are
thought to have shortcomings in sales and marketing by
store when it comes to reaching customers. Convenience in
product sales and an increase in demands can be achieved
when businesses come together and create a common
showroom or electronic commerce platform / page.
As a result, this research on the Van furniture
industry is very important for the development of the
furniture industry in terms of increasing community
employment and welfare in the province and region.
Conducting research that reveals the results of the
cooperation between qualified personnel and institutions
for the furniture sector and sharing the results with the
sector will raise awareness and encourage the parties.
Knowing the strengths and weaknesses of the Van furniture
industry, the number of businesses that will create
innovation should be increased. New research can be
conducted on strategically important issues such as
technology usage levels to improve institutionalization and
branding skills.
SUGGESTIONS
Training in the field of furniture manufacturing should
be given to those who have not received vocational
training (81.9%) in cooperation with vocational
training institutions.

Ulay, 5(5), 849-857, (2020) J. Anatolian Env. and Anim. Sciences, Yıl:5, No:5, (849-857), 2020
856
The use of machinery with CNC technology (7%),
which is inadequate, is increased and the level of
technology usage in production is improved.
Businesses that do not have a website (85.9%),
insufficient demand (49.3%) and lack of promotion /
advertising (21.1%) should update their ordering
patterns and provide accessibility with the website.
The most demanded training subjects are work safety
(54.9%), furniture design (49.3%), Autocad and
planning (43.7%), CNC machine use (42.5%), the
institutions that provide relevant vocational training
and training within the scope of the project.
The website that cannot be made due to economic
difficulties, raw material supply, rent, etc. For
situations, initiatives can be taken to get support from
KOSGEB, DAKA etc. institutions that provide
financial support and loans.
Another reason for insufficient demand may be
insufficient quality level and customer satisfaction in
products and services, so the quality level should be
increased.
Employees' physical and social needs such as tea
houses and restaurants (74.6%), bathroom-wc
(63.4%), healthcare station (29.6%) should be met and
employee satisfaction should be measured regularly.
Enterprises that do not receive any support from any
institution (77.5%) should improve their ability to
benefit from grant support. KOSGEB, DAKA, Van
TSO etc. It is recommended to carry out studies in
institutions to gain grant and fundraising skills to
micro-enterprises.
ACKNOWLEDGMENTS
This study was presented in ORENKO 2020 and
published Abstract book, held by Karadeniz Technical
University, Trabzon.
REFERENCES
Akyuz, K. C., Yildirim, I., Hamzacebioglu, O., & Ersen,
N. (2020). Financing problems and solution
suggestions of forest products industry enterprises
located in Istanbul Ikitelli organized industrial
zone. Artvin Coruh University Journal of Forestry
Faculty, 21(2), 244-250.
Arslan, O. (2018). Creating an ecosystem for the
sustainable development of prominent sectors in
Mus province. Muğla Sıtkı Koçman University
Faculty of Economics and Administrative
Sciences Journal of Economics and Management Research, 7(1), 114-166.
Askin, A., Cetin, F., & Cabuk, Y. (2020). Evaluation of
university-industry cooperation application in
terms of furniture and decoration program
graduates. Bartın Forestry Faculty Journal, 22(2), 1-1.
BAKKA. (2012). Western Black Sea Development
Agency (BAKKA), TR81 Level2 furniture and
forest products sector analysis report, Zonguldak,
Turkey, pp: 233.
Cil, B., (2014). Statistics and numerical methods,8th
edition, Detay Publishing, Ankara, Turkey, 189-
209.
Coskun, S., (2019). Increasing the export potential in the
furniture industry: Inegol example. Bursa Uludağ
University, Institute of Social Sciences. Unpublished Master's Thesis.
DAKA. (2017). Eastern Anatolia Development Agency
(DAKA),Van furniture industry and the
development of competitive cluster potential
report, Van, Turkey, pp: 63.
Dalgakiran, A. B. & Ozturkoglu, Y. (2017). Turkey
scales for the furniture industry and association
analysis. Business & Management Studies: An
International Journal, 5(1),147-161.
Deliktas, E & Celik, N. (2019). Determination of
Competitive Sectors in TRB2 Region. Izmir Katip
Celebi University Journal of the Faculty of Economics and Administrative Sciences, 2(1), 29-
44.
Demirci, S. (2005). Problems and solutions of Turkey
furniture industry, Polytechnic Journal, 8(4), 369-
379.
Gorguc, B.,(2009). Furniture industry and businessmen
association, 2008 Furniture sector report, Journal
of Furniture Decoration, 91, 96-104.
Gurleyen, L., Cakicier, N. & Ulay, G., (2010). Investigation of in-service training in furniture
sector, Journal of Furniture Decoration, 95,118-138.
Gurpinar, K & Doven, M. (2007). Analysis and
evaluation of the competitive situation of the
Turkish furniture industry from a strategic
management perspective. Afyon Kocatepe
University Journal of Economics and
Administrative Sciences, 9(1),173-190.
Gurpinar, K. & Barca, M. (2007). International
competitiveness level and reasons of Turkish
Furniture Industry. Eskişehir Osmangazi
University Journal of Economic and
Administrative Sciences, 2(2), 41-61. IGM, (2020). T.C. Ministry of Trade, (Ihracat Genel
Mudurlugu (IGM) / General Directorate of
Export), Department of Mining, Metal and
Forestry, Furniture
SectorReport.https://ticaret.gov.tr/data/5b870001
3b8761450e18d7b/Mobilya%20Sekt%C3%B6r
%20Raporu%202020.pdf , Ankara, Turkey,
(17/11/2020), pp.13.
Karagoz, T & Sevı̇m Korkut, D. (2017). Problems of the
furniture industry and solutions (Kocaeli
Province Case). Journal of Advanced Technology Sciences, 6(3), 85-92.
Kilicli, Y. & Aygun, M., (2018). Financing problems of
SMEs and solutions: A research on Van

Ulay, 5(5), 849-857, (2020) J. Anatolian Env. and Anim. Sciences, Yıl:5, No:5, (849-857), 2020
857
Organized Industrial Zone. Van Yüzüncü Yıl University Institute of Social Sciences Vankulu
Journal of Social Research, 1, 135-152.
Kilicli, Y. (2016). Financing and marketing problems of
SMEs and their solution suggestions: A research
on Van Organized Industrial Zone, M.Sc. Thesis,
Van Yuzuncu Yil University, Institute of Social
Sciences. Van, Turkey.
Kurt, R. (2019). Evaluation of e-commerce in furniture
sector with SWOT Analysis. Duzce University
Journal of Science and Technology, 7(1), 616-
627.
Malkocoglu, A., Yayli, K., Yildirim, I. & Ataseven, F.
(2015). Turkey's furniture sector small and
medium-sized businesses structural examination
of the issues and solutions. Journal of Selcuk-
Technical, 14(2),747-764.
Okan, T., (2013). Turkey Furniture sector competitiveness
level of analysis. 2th.National Furniture
Congress, 11-13 April 2013, Denizli, Turkey,
192-199.
SEDI, (2013). Socio-Economic Development Index
Ranking of Provinces and Regions SEGE - 2011,
General Directorate of Regional Development and Structural Adjustment, Ankara, Turkey,
pp:70.
SGK. (2019). Social Security Institution/Sosyal Guvenlik
Kurumu (SGK), Statistics, workplaces within the
scope of Table 1.11-4 / a and distribution of
compulsory insured by activity group (.xls),
Ankara, Turkey,
http://www.sgk.gov.tr/wps/portal/sgk/tr/calisan.
(10/11/2020).
Sogutlu C. & Eroglu F., (2008). Investigation of Physical
Conditions of Furniture Businesses in Ankara, Polytechnic Journal, 11(4),373-378.
Sogutlu, C. & Eroglu, F. (2009). Examining the factors
affecting the export status of furniture companies
in the sample of Ankara sites region. Polytechnic
Journal, 12(2),101-106.
TOBB. (2017). (Turkiye Odalar ve Borsalar
Birligi/Turkey Union of Chambers and
Commodity Exchanges),Turkey furniture
products industry council report. Ankara, Turkey,
pp.88.
TUIK. (2019). (Turkiye Istatistik Kurumu (TUIK)/Turkish
Statistical Institute), Address Based Population Registration System Results in Turkey, 2019.
https://data.tuik.gov.tr/Bulten/Index?p=Adrese-Dayali-Nufus-Kayit-Sistemi-Sonuclari-2019-
33705. (10 November 2020).
Ulay, G. (2020). Furniture decoration education in
vocational high schools and examination of the
personnel needs of the sector, Journal of
Furniture and Wood Material Research (FURAJ),
3(2),11-23.
Ulay, G. (2011). Examination of the furniture industry and
qualified personnel employment, Jorunal of
Furniture Decoration, 101,130-152.
Ulay, G. (2015). The importance of industrial internship in furniture education and an exemplary application.
Journal of Selcuk Technical, (UMK-2015, Special
Issue), 452-466.
Ulay, G. & Cakicier N. (2020). Furniture manufacturing
enterprises with a critical overview of the process
of trying to develop University&Industry
Cooperation,6th International Furniture
Congress, 2-5 November 2020, Trabzon-Turkey,
pp:1.
Ulay, G. (2020a). The problems of furniture sector and
suggestions for solutions (A Case Study of Van),
International Forest Product Congress-ORENKO2020, 23-26 September 2020, Abstract
Book, Trabzon-Turkey, pp:18.
Ustuner, A. I. (2010). Problems faced by furniture and
decoration businesses in Ankara and solutions,
Gazi University, Institute of Science,
Unpublished M.Sc. Thesis, Ankara, Turkey.
Web-1, (2020). Bio statistics, sample size
https://uroturk.org.tr/urolojiData/Uploads/files/ge
lecek-akademisyen-1210/Sunum-9.pdf ,
(10/09/2020).
Yapar, T., (2005). The effect of motivation on work productivity, Istanbul University, Institute of
Social Sciences, M.Sc. Thesis, Istanbul, Turkey.
Yegı̇n, T. (2020). Strategic analysis: a research on
furniture sector. International Journal of
Management and Administration, 4(7),100-111.
Yeniceri, B., (2005). Turkey industry exports market
research, Home and Office Furniture Industry
External Market Research Report, IGEME
Publications, Ankara, Turkey.

Journal of Anatolian Environmental and Animal Sciences
(Anadolu Çevre ve Hayvancılık Bilimleri Dergisi) DOI: https://doi.org/10.35229/jaes.836631
JAES Year: 5, No: 5, 2020 (858-862)
AÇEH Yıl: 5, Sayı: 5, 2020 (858-862)
ARAŞTIRMA MAKALESİ RESEARCH PAPER
858
Effect of Pre-Treatments on Wear Index of Varnished Wood Plastic Composites
(WPC) With Pigmented
Turgay ÖZDEMIR1* Fatih MENGELOĞLU2 Engin Derya GEZER1 1*Karadeniz Technical University, Faculty of Forestry, Forest Industry Engineering, Trabzon, Turkey
2Kahramanmaras Sütçü İmam University, Faculty of Forestry, Forest Industry Engineering, Kahramanmaraş, Turkey
Geliş/Received: 07.12.2020 Kabul/Accepted: 14.12.2020
How to cite: Özdemir, T., Mengeloğlu, F. & Gezer, E.D. (2020). Effect of Pre-Treatments on Wear Index of Varnished Wood Plastic Composites (WPC)
With Pigmented. J. Anatolian Env. and Anim. Sciences, 5(5), 858-862.
Atıf yapmak için: Özdemir, T., Mengeloğlu, F. & Gezer, E.D. (2020). Pigmentli Vernikli Ahşap Plastik Kompozitlerin (WPC) Aşınma İndeksi Üzerine Ön
İşlemlerin Etkisi. Anadolu Çev. ve Hay. Dergisi, 5(5), 858-862.
Abstract: The utilization and usage areas of the wood plastic composites (WPC) have increased over the years. In addition, the importance of wood plastic composites produced by adding
pigments has increased in terms of usage area. To be able to increase the coating ability of plastics, different pre-treatment had been used and some improvements were achieved. It is the purpose of this study to determine the wear index in abrasion of the WPC with pigmented using various coating and pre-treatments. For this purpose, it was used 2 different coating types (acrylic and cellulosic based) and 4 different pretreatments (sanding, acid treatment, UV, microwave). WPC with pigmented were manufactured and samples after various pretreatment and coating were prepared. The adhesion strength values were determined after coating. The results showed that pre-treatments used in this project affected the wear index. Acrylic based coating gave the best
results of wear index in abrasion.
Keywords: Acrylic varnish, Coating properties, Wear index, Wood plastic composites.
Pigmentli Vernikli Ahşap Plastik Kompozitlerin (WPC) Aşınma İndeksi Üzerine
Ön İşlemlerin Etkisi
Öz: Ahşap plastik kompozitlerin (WPC) kullanım ve kullanım alanları yıllar içinde artmıştır. Ayrıca pigment ilavesiyle üretilen ahşap plastik kompozitlerin kullanım alanı açısından önemi artmıştır. Plastiklerin kaplama kabiliyetini artırabilmek için farklı ön işlemler kullanılmış ve bazı iyileştirmeler yapılmıştır. Bu çalışmanın amacı, çeşitli kaplama ve ön işlemler kullanılarak WPC'nin pigmentli aşınmasındaki aşınma indeksini belirlemektir. Bu amaçla 2 farklı kaplama tipi (akrilik ve selülozik esaslı) ve 4 farklı ön işlem (kumlama, asit muamelesi, UV, mikrodalga) kullanılmıştır. Pigmentli WPC üretildi ve çeşitli ön işlem ve kaplamalardan sonra numuneler hazırlandı. Kaplama sonrası yapışma mukavemeti değerleri belirlenmiştir. Sonuçlar, bu
çalışmada kullanılan ön işlemlerin aşınma endeksini etkilediğini gösterdi. Akrilik esaslı kaplama, aşındırmada en iyi aşınma indeksi sonuçlarını vermiştir. Anahtar kelimeler: Aşınma indeksi, Ahşap plastik kompozitler, Akrilik vernik, Kaplama özellikleri.
* : https://orcid.org/0000-0002-2484-828X
: https://orcid.org/0000-0002-2614-3662
: https://orcid.org/0000-0001-9657-7290
*Corresponding author’s:
Turgay ÖZDEMİR
Karadeniz Technical University, Department
of Forest Industry Engineering
Kanuni Campus, 61080 Trabzon, Turkey.
Mobile telephone: +90 (533) 343 91 21
Telephone : +90 (462) 377 15 27
Fax : +90 (462) 325 74 99
*Sorumlu yazarın: Turgay ÖZDEMİR
Karadeniz Teknik Üniversitesi, Orman
Endüstri Mühendisliği Bölümü, Kanuni
Kampüsü, Trabzon, Türkiye
Cep telefonu : +90 (533) 343 91 21
Telefon : +90 (462) 377 15 27
Faks : +90 (462) 325 74 99

Özdemir et al., 5(5), 858-862, (2020) J. Anatolian Env. and Anim. Sciences, Yıl:5, No:5, (8858-862), 2020
859
INTRODUCTION
Plastics are widely used in all areas of our lives.
In the last century, the developments in polymer chemistry
have made polymers used in our daily life and almost every
part of the industry, depending on the reasons such as the
lifestyle consumption habits of the developing and
changing society. When the plastics are thrown away, they
remain in nature for a long time without rotting, rusting,
dissolving and biodegradable. Some plastics can remain in
nature for 700 years. It causes contamination of water and
soil. It harms the creatures in the waters and even causes
their deaths. Plastics are materials that are solid at normal
temperature and can be shaped or molded by different
methods using pressure and temperature. Polymerization is
the bonding of similar molecules that make up the polymer
chain.
The production and use of wood plastic
composites (WPC) continue to increase. One of the
important problems encountered with the use of WPC is
the color changes seen on the surfaces of the materials.
Color-changed thermoplastic parts must be replaced, or
their surfaces painted. However, it is extremely difficult to
paint thermoplastics, especially polyethylene (PE) and
polypropylene (PP) surfaces, which are called polyolefin,
due to their low surface energies. Within the scope of this
study, the dyeability of the surfaces of WPC materials,
whose usage is increasing, was investigated (Novak and
Florian, 2001).
UV lamps between 250-400nm are commonly
used to change and improve the surface properties of
polymer surfaces (Ryntz, 1998). Generally, UV treatment
is applied in the presence of oxygen and ozone in the
environment and in the presence or absence of another
photo initiator. After the energy carrier (photon) activates
the chemical species, it replaces the hydrogen atom in the
polymer chain, resulting in free radicals. Chemical species
follow two pathways of crosslinking and fragmentation
(Ryntz, 1994). Benzophenone (BP) is most commonly
used as photo initiator. This is due to the fact that BP
absorbs UV light at wavelengths at 340-360nm and
excitation / activation occurs rapidly with removal of
hydrogen from the polymer in singlet and triplet state to
form free radicals (Ranby et al., 1999). Free radicals react
with applied chemicals (paint, varnish, etc.) and provide a
better adhesion. Studies on the determination of surface
characteristics of wood plastic composites are quite
limited. Clemons et al. (1999) described the outer-middle
layer morphology that occurs in injection-pressed and
extruded wood polymer composites. It has been found that
in composites produced by injection, the direction of the
fibers in the middle layer is perpendicular and in the outer
layers the fibers are oriented parallel to the flow direction
(Clemons et al., 1999).
In addition, they found that the fiber volume ratio
in the middle layer was higher than in the outer layer (Yang
and Ranby, 1997). Processing parameters also affect the
outer-middle layer morphology. Low temperature slow
processing speed causes thick outer layer formation, high
temperature high processing speed causes thin outer layer
formation (Fu et al., 1999).
Similarly, the extrusion process leads to
differences in outer-middle layer morphology and
dehumidification properties. The surface of the wood
plastic composite produced by extrusion shows that it has
higher density and more fiber connections than the middle
layer (Barbosa and Kenny, 2000). In addition, planed wood
composites contain much more wood than wood plastic
composites produced either by extrusion or injection.
Therefore, in general, it appears that the nature of wood
plastic composites depends on processing conditions,
sampling depth, and sample preparation method.
For this purpose, it was aimed to determine the
adhesion strength values of wood plastic composites after
pre-treatment.
MATERIALS AND METHODS
In this study; High density polyethylene (YYPE_
S 0464, PETKİM) found in the laboratories of
Kahramanmaraş Sütçü İmam University, Faculty of
Forestry, Forest Industry Engineering Department was
used as polymeric material. As lignocellulosic filler, band
saw wastes were obtained from sawmills processing red
pine timber in Kahramanmaraş industry.
Waste of band saw was collected from sawmills
processing red pine timber in the Kahramanmaraş industry.
These provided red pine wastes were first grinded with the
help of the grinding machine shown in Figure 14 (a), then
they were sized with the help of a shaker sieve and passed
through a 40 mesh (0.400 mm) sieve and remained on a 60
mesh (0.250 mm) sieve. Lignocellulosic filler, red pine
wood floors were prepared by drying at 103 ± 2 0C for 24
hours before production.
The quantities of materials to be used in
thermoplastic composite production are given in Table 1.
Table 1. Trial design for the production of thermoplastic composites. Sample
Code
Polymer
Amount (%)
Lignocellulosic
Filler Amount (%)
MAPE
(%)
Zinc Sterate
(%)
Waks
(%)
Iron Oxide
(%)
TE 44 50 2 2 2 2
Production of HDPE Based Composites: The
production of HDPE-based composites was carried out
according to the scheme given in Figure 1.

Özdemir et al., 5(5), 858-862, (2020) J. Anatolian Env. and Anim. Sciences, Yıl:5, No:5, (8858-862), 2020
860
Figure 1. Composite manufacturing workflow.
Pre-Processing Samples: Before painting
processes, some pre-treatments were carried out on WPC
plates to determine their effects on their painting
performance. These pretreatments are mechanical etching,
chemical etching (diluted acid treatment), ultraviolet (UV)
light and microwave applications.
Mechanical abrasing: Sanding process was
carried out as mechanical abrasion. Examples; They were
subjected to two different sanding processes with 60 and
80 numbered sandpaper. These samples are coded Z60
(sanded with 60 nl sandpaper) and Z80 (sanded with no 80
sandpaper).
Chemical etching: Two different concentrations
of peracetic acid, 5% and 10%, were applied as chemical
etching. These samples were coded as PA5 (samples
treated with 5% concentration of peracetic acid) and PA10
(10% concentration treated samples).
Ultraviolet (UV) Light: Composite samples were
applied in two different UV applications as 10 and 20
minutes.
Microwave: Microwave application was applied
at two different times of 15 and 30 seconds. Microwave
application was carried out in the microwave oven
purchased under the project.
Painting of Pre-Treated and Unapplied WPC
Sheet Samples: In order to determine the painting
performance of WPC boards, painting processes were
carried out using different paints on pre-treated and
unprocessed surfaces. For this purpose, 4 different paint
applications which are mostly used in the literature and
industrially were selected. These paints are polyurethane
(two-component), acrylic (two-component), synthetic
(one-component) and water-based (one-component)
paints, and their application is based on the manufacturer's
mixture recommendations.
Paint applications were carried out according to
the spraying method, using a normal pressure bottom-tank
varnish gun with a spray tip opening of 1.8 mm, two layers
of filling and single layer topcoat application with 125-150
gr paint per m2. After the paint application, all samples
were kept in the air conditioning room after they were
completely dried.
Wear Index Test: In order to determine the weight
loss in abrasion, 5 samples of 100x100x7 mm of each
varnish were used and made in accordance with ASTM D
4060-10 principles. According to this; the wear index (1),
weight loss (2) and the amount of wear in each cycle (3)
were determined on the samples. For this purpose, the
weights of the samples before and after wear resistance
were determined at a sensitivity of 0.01 g.
The wear index I is calculated with the help of the
following equation:
I= (𝐴−𝐵)1000
𝐶 (1)
Here: A = Weight of sample before abrasion test, g,
B = Weight, g, of the sample after the wear test
C = Number of revolutions recorded in wear.
Coding Samples: The samples obtained were
coded as follows.
TED-Z60 60 no. Sanded
TED-Z80 80 no. Sanded
TED-UV10 UV-treated for 10 minutes
TED-UV20 UV-treated for 20 minutes
TED-MD15 15 seconds microwaved
TED-MD30 15 seconds microwaved
TED-PA5 5% peracetic acid applied
TED-PA10 5% peracetic acid applied
FINDINGS
Wear Index: Average abrasion resistance results
are given in Table 2 below according to varnish types.
Table 2. Abrasion results
TED Water based Acrylic
Control 0,6000 0,4333
MD15 0,7667 0,5667
MD30 0,9000 0,3667
UV10 0,8333 0,5000
UV20 0,5333 0,5000
PA5 0,7000 0,4667
PA10 0,6333 0,5333
Z60 0,5333 0,4667
Z80 0,7333 0,6667
Statistical Evaluation Results for Abrasion
Resistance: Variance analysis was performed for the
results obtained in the wear index values and the results of
the variance analysis are given in Table 3.
Red pine wood flour + HDPE + MAPE + Lubricant + Iron oxide
Mixing
Extrusion
Break
Drying
Injection Molding

Özdemir et al., 5(5), 858-862, (2020) J. Anatolian Env. and Anim. Sciences, Yıl:5, No:5, (8858-862), 2020
861
Table 3. Variance analysis results for wear index
Sum of
squares df
Mean
Square F
Level of
importance
Water-Based Ted
Between Groups 0,399 8 0,050 12,227 0,000
Within Groups 0,073 18 0,004
Total 0,472 26
Acrylic Ted
Between Groups 0,173 8 0,022 10,324 0,000
Within Groups 0,038 18 0,002
Total 0,211 26
The Duncan test was performed for the
homogeneity tests of the groups whose effects were
investigated according to the varnish types according to the
Duncan test results and the results are given below.
Duncan Test For Water-Based Varnish:
Pigmented (TED) Duncan test results for abrasion
resistance for synthetic varnish are given below.
Table 4. Abrasion index Duncan test results for pigmented (TED) samples for water based varnish.
GROUPS N 1 2 3 4 5 6
UV 20 3 ,5333
Z60 3 ,5333
Kontrol 3 ,6000 ,6000
PA5 3 ,6333 ,6333 ,6333
PA5 3 ,7000 ,7000 ,7000
Z80 3 ,7333 ,7333 ,7333
MD15 3 ,7667 ,7667
UV 10 3 ,8333 ,8333
MD30 3 ,9000
Level of importance ,094 ,085 ,085 ,241 ,085 ,217
According to the Duncan test results obtained, it
was determined that the wear index value was collected in
6 different groups, the highest index value was in the
samples with 30 seconds of microwave application and the
lowest index value was in the 20 minutes of UV
application. Statistically, it was determined that 15 seconds
and 30 seconds of microwave application decreased the
abrasion index value of all preliminary trials except the 80
numbered sandpaper.
Duncan Test For Water-Based Varnish:
Pigmented (TED) Duncan test results for abrasion
resistance for synthetic varnish are given below.
Table 5. Abrasion index Duncan test results on pigmented (TED) samples for acrylic varnish. GROUPS N 1 2 3 4 5
MD30 3 ,3667
Kontrol 3 ,4333 ,4333
PA5 3 ,4667 ,4667
Z60 3 ,4667 ,4667 UV 10 3 ,5000 ,5000 ,5000
UV 20 3 ,5000 ,5000 ,5000
PA5 3 ,5333 ,5333
MD15 3 ,5667 Z80 3 ,6667
Level of importance ,092 ,125 ,125 ,118 1,000
According to the results of Duncan test obtained,
it was determined that the abrasion index value was
collected in 5 different groups, the highest index value was
in the samples with 80 sanding and the lowest index value
was in the samples with 30 seconds of microwave
application. Statistically, it was determined that 10 and 20
minutes of UV, 15 seconds of microwave, 80 number of
sandpaper and 10% acid application increased the wear
index value.
CONCLUSION
Wear index values of samples are given in Figure 2.
Figure 2. Abrasion index values
When the pigmented (TED) groups were
examined, some pre-treatments increased the index value
while others decreased it. When examined according to
varnish types, the abrasion index value of acrylic varnish
was low, while the highest was obtained in water-based
varnish. It can be said that water-based varnishes wear
easily.
ACKNOWLEDGMENTS
This study was carried out within the scope of
TUBITAK 214O683 project and we thank TUBITAK for
supporting the study. This study was presented in
ORENKO 2020 held by Karadeniz Technical University,
Trabzon.
REFERENCES
ASTM D 3359-09E2. (2002). Standard guide for
evaluation of coatings applied to plastics.
American Standard of Testing of Materials.
ASTM D 4060-10. (2010). Standard test method for
abrasion resistance of organic coatings by the
taber abraser. American Standard of Testing of Materials, 2010.
Barbosa, S.E. & Kenny J. M. (2000). Processing of short‐
fiber reinforced polypropylene. I. Influence of
processing conditions on the morphology of
extruded filaments. Polymer Engineering
Science, 40, 11-25.
Clemons, C.M., Caulfield, D.F. & Giacomin, A.J.
(1999). Dynamic fracture toughness of cellulose-
0
0,2
0,4
0,6
0,8
1
Wea
r i
ndek
s val
ue
Weight loss in wear
Su bazlı akrilik

Özdemir et al., 5(5), 858-862, (2020) J. Anatolian Env. and Anim. Sciences, Yıl:5, No:5, (8858-862), 2020
862
fiber-reinforced polypropylene: Preliminary investigation of microstructural effects. Journal
of Elastomer Plastics, 31, 367-378.
Novak, I. & Florian, S. (2001). Influence of ageing on
adhesive properties of polypropylene modified by
discharge plasma. Polymer International, 50, 49-
52.
Ranby, B., Yang, W.T. & Tretinnikov, O. (1999).
Surface photografting of polymer fibers. films and
sheets. Nuclear Instruments and Methods in
Physics Research B, 151, 301-305.
Ryntz, R.A. (1998). Adhesion to plastics molding and paintability. Polymer Surfaces and Interfaces
Series, Global Press.
Ryntz, R.A. (1994). Coating adhesion to low surface free
energy substrates. Progress in Organic Coatings,
25, 73-83
Yang, W.T. & Ranby, B. (1997). Bulk surface
photografting process and its application III
photolamination of polymer films. Journal of
Applied Polymer Science, 63(13), 1723-1732.

Journal of Anatolian Environmental and Animal Sciences
(Anadolu Çevre ve Hayvancılık Bilimleri Dergisi) DOI: https://doi.org/10.35229/jaes.836874
JAES Year: 5, No: 4, 2020 (863-866)
AÇEH Yıl: 5, Sayı: 4, 2020 (863-866)
ARAŞTIRMA MAKALESİ RESEARCH PAPER
863
Mechanical Properties of Wood Members in Santa Maria Church
Engin Derya GEZER* Cenk DEMİRKIR Turgay ÖZDEMİR Karadeniz Technical University, Faculty of Forestry, Forest Industry Engineering, Trabzon, Turkey
Geliş/Received: 07.12.2020 Kabul/Accepted: 17.12.2020
How to cite: Gezer, E., Demirkır, C. & Özdemir, T. (2020). Mechanical Properties of Wood Members in Santa Maria Church. J. Anatolian Env. and Anim.
Sciences, 5(5), 863-866.
Atıf yapmak için: Gezer, E., Demirkır, C. & Özdemir, T. (2020). Santa Maria Kilisesindeki Ahşap Taşıyıcıların Mekanik Özellikleri. Anadolu Çev. ve Hay.
Dergisi, 5(5), 863-866.
Abstract: Wood is one of the oldest building materials used on earth. Wood as a building material; it has been evaluated in different ways according to the socio-economic, cultural and
natural resource structures of the countries. In addition, wood is a building material used in the construction of places of worship such as mosques and churches according to the belief structures of the societies. Our country, which has a deep-rooted culture and history, is also rich with its places of worship, houses, architecture and use of houses. It is possible to come across some of these building examples in the black sea region. One of them is the Santa Maria church, which was built between 1869-1874 in the Merkez Kemerkaya district in Trabzon, and is a religious center where foreigners who visit the city still worship. The aim of this study is to evaluate the performance of the wooden materials of the church of Santa Maria by testing them non-destructive test methods. In this way, it was aimed to determine the current bearing properties
without damaging the structural materials in a wooden structure built in our country and surviving for many years. For this purpose, the damage, defects and resistance properties of the building's bearing elements were tried to be determined with non-destructive test devices. The results obtained were compared with the values specified in the EN 338 standard. It was determined that most of the wooden elements in the structure still maintained their load-bearing properties and provide the minimum mechanical resistance properties specified in the standards. Keywords: Non-destructive tests, historical wooden structures, santa maria church, deterioration
and decay.
Santa Maria Kilisesindeki Ahşap Taşıyıcıların Mekanik Özellikleri
Öz: Ahşap, yeryüzünde kullanılan en eski yapı malzemelerinden biridir. Yapı malzemesi olarak ahşap; Ülkelerin sosyo-ekonomik, kültürel ve doğal kaynak yapılarına göre farklı şekillerde değerlendirilmiştir. Ayrıca ahşap, cemaatlerin inanç yapılarına göre cami ve kilise gibi ibadethanelerin yapımında kullanılan bir yapı malzemesidir. Köklü bir kültüre ve tarihe sahip
olan ülkemiz ibadethaneleri, evleri, mimarisi ve ev kullanımıyla da zengindir. Bu yapı örneklerinden bazılarına Karadeniz Bölgesinde rastlamak mümkündür. Bunlardan biri, Trabzon'un Merkez Kemerkaya Mahallesi'nde 1869-1874 yılları arasında inşa edilen ve şehri ziyaret eden yabancıların hala ibadet ettikleri bir dini merkez olan Santa Maria Kilisesidir. Bu çalışmanın amacı, Santa Maria Kilisesi'nin ahşap malzemelerinin performansını, hasarsız test yöntemleriyle test ederek değerlendirmektir. Bu sayede ülkemizde yapılan ve uzun yıllar ayakta kalan ahşap bir yapıda yapı malzemelerine zarar vermeden mevcut taşıyıcı özelliklerin belirlenmesi hedeflenmektedir. Bu amaçla binanın taşıyıcı elemanlarının hasar, kusur ve dayanım özellikleri hasarsız test cihazları ile belirlenmeye çalışılmıştır. Elde edilen sonuçlar EN 338
standardında belirtilen değerlerle karşılaştırılmıştır. Söz konusu yapıdaki ahşap elemanların birçoğunun halen taşıyıcı özelliklerini koruduğu tespit edilmiştir. Anahtar kelimeler: Tahribatsız testler, tarihi ahşap yapılar, santa maria kilisesi, tahribat ve çürüklük.
* : https://orcid.org/0000-0001-9657-7290
: https://orcid.org/0000-0003-2503-8470
: https://orcid.org/0000-0002-2484-828X
*Corresponding author’s:
Engin Derya GEZER
Karadeniz Technical University, Department
of Forest Industry Engineering
61080 Trabzon, Turkey.
: [email protected] Mobile telephone: +90 (539) 365 34 10
Telephone :+90 (462) 377 15 32
Fax : +90 (462) 325 74 99
*Sorumlu yazarın:
Engin Derya GEZER
Karadeniz Teknik Üniversitesi, Orman
Endüstri Mühendisliği Bölümü,
61080 Trabzon, Türkiye.
Cep telefonu : +90 (539) 365 34 10
Telefon : +90 (462) 377 15 32
Faks : +90 (462) 325 74 99

Gezer et al., 5(5), 863-866, (2020) J. Anatolian Env. and Anim. Sciences, Yıl:5, No:5, (863-866), 2020
864
INTRODUCTION
Wood is one of the oldest building materials used
on earth. Wood as a building material; It has been
evaluated in different ways according to the socio-
economic, cultural and natural resource structures of the
countries. In addition, wood is a building material used in
the construction of places of worship such as mosques and
churches according to the belief structures of the societies.
Our country, which has a deep-rooted culture and history,
is also rich with its places of worship, houses, architecture
and use of houses. It is possible to come across some of
these building examples in the Black Sea Region. One of
them is the Santa Maria Church, which was built between
1869-1874 in the Merkez Kemerkaya District in Trabzon,
and is a religious center where foreigners who visit the city
still worship.
The aim of this study was to determine the defects
and damages in Santa Maria Church through non-
destructive methods such as drilling resistance, screw
holding, shear and elasticity modulus and to develop
appropriate protection techniques that can contribute to the
solution of the problems encountered.
MATERIALS AND METHODS
In this study, Santa Maria Church (Figure 1) which
is about 150 years old was studied. The damage and defects
in the Santa Maria Church were determined by non-
destructive test devices including Resistograph and
FAKOPP Screw withdrawal resistance meter. In addition,
screw holding, shear and elasticity modulus of the wooden
beams in the structure were determined.
Figure 1. Santa Maria Church.
Resistograph: The IML-RESI F-300 instrument
is used to determine the internal decay and defects in
wooden structures, poles and beams. Possible defects are
usually foundin the interior of the wooden structures and
can’t be observed from the outside. The IML-RESI System
is based on a drilling resistance measuring method. The
variation in resistance results in increases and decreases in
the amount of torque applied to the drill shaft. A drilling
needle with a diameter of 1.5 mm to 3.0 mm penetrates into
the wooden structure with a regular advance speed, and the
drilling resistance is measured. The data is recorded on a
wax paper strip at a scale of 1:1 and also transferred to
computer for further evaluation. The wood is only
insignificantly injured, and the drilling hole closes itself
due to a special drilling angle that was customized for the
drill bit (Gezer et al., 2015).
Screw withdrawal resistance meter: The beams
in Santa Maria Church were tested using screw withdrawal
resistance meter (Figure 2). Screw withdrawal force is an
indicator of the wood material strength, density and shear
modulus. Fakopp Enterprise developed a portable screw
withdrawal force meter. The applied screw diameter is
4mm, the length of the thread is 18 mm. The screw
withdrawal force is a local parameter but selecting a
representative location on a beam it is a useful information
in wooden structure evaluation (Fakopp Enterprise, 2010).
Figure 2. The beams in Santa Maria Church were tested using
screw withdrawal resistance meter.
RESULTS AND DISCUSSION
Resistograph: The wooden beams in 15 rooms of
the Santa Maria Church were evaluated by Resistograph in
order to determine the internal defects and deteriorations
(Figure 3). Some of the Resistograph outputs obtained are
given in Figure 4. As shown in the outputs, the higher
peaks show the solid zone whereas the lower peaks indicate
the decay, cracks, splits or deteriorated zones. The
explanation of the Resistograph outputs was given on the
outputs for each beam tested.
The results showed that beams in (Figure 4a) had
partial damage, rot, cracks/voids in the interior. Rot/insect
damage and the onset of rot were detected in the inner parts
of the beam examined. As shown in the shaded area in
(Figure 4b), intensive internal cracks with rot insect
damage were detected in the inner parts of the beam. The
obtained results from Resistograph testing verified the
visual inspection observation. As a result of the

Gezer et al., 5(5), 863-866, (2020) J. Anatolian Env. and Anim. Sciences, Yıl:5, No:5, (863-866), 2020
865
investigations carried out with the Resistograph device, it
was determined that some of the beams had partial damage,
while some of them had severe damage/cracks/decay
However, some of the beams recommended to be changed
as a result of the findings obtained from both visual
inspections and examinations made with non-destructive
test devices.
Screw withdrawal resistance results: The
wooden beams in 15 rooms of the Santa Maria Church
were evaluated by Screw withdrawal resistance meter in
order to determine screw withdrawal resistance, modulus
of rupture (MOR) and shear resistance. Screw withdrawal
resistance, MOR and shear resistance of the beams are
given in Table 1.
Figure 3. Evaluation of the beams by Resistograph.
Figure 4. Some Resistograph output of the beam.

Gezer et al., 5(5), 863-866, (2020) J. Anatolian Env. and Anim. Sciences, Yıl:5, No:5, (863-866), 2020
866
Screw withdrawal resistance values of the beams
in the wooden structures examined in this study were
ranged from 1.18 to 2.18 kN. According to the results, it
was found that the beams in the room 103 and 113 had the
highest shear resistance, MOR and screw withdrawal
resistance. The lowest results were obtained from the
beams in rooms located in the second floor of the church
where the water pipeline was broken and beams got soaked
with water.
Table 1. Screw withdrawal resistance meter results. Room no Screw withd. res. kN MOR MPa Shear resistance MPa
102 1,84 61 622
102 1,80 60 613
103 2,08 70 676
103 1,62 54 574
104 1,94 65 644
105 1,98 66 653
105 1,37 45 516 105 1,46 48 536
106 1,25 41 490
106 1,43 48 531
111 1,67 56 584 111 1,73 58 597
111 1,90 63 635
112 1,64 54 576
112 2,07 69 673 112 2,06 69 670
113 2,18 73 698
113 1,74 58 601
201 2,01 67 661 201 1,85 62 624
202 1,65 55 580
203 1,23 41 485
203 1,39 46 521 204 1,29 43 498
204 1,68 56 587
204 1,55 52 558
205 1,38 46 519 205 1,61 54 571
210 1,18 39 475
210 1,74 58 600
213 1,57 52 561 214 1,51 50 549
The screw withdrawal resistance, bending and
shear strengths of the beams were calculated thanks to the
data obtained with the non-destructive test device and it
was determined that the strength properties of the beams
had the lowest resistance properties in this structure in the
resistance classes specified in the EN 338 standard.
Although these beams still had enough strength properties,
it might be recommended to replace them considering the
fatigue resistance due to the service life.
CONCLUSION
1. As a result of the investigations carried out
with the Resistograph device, it was determined that some
of the beams had partial damage, while some of them had
severe damage/cracks/decay.
2. Generally, the mechanical strength properties
of the beams examined fell into D35 and D70 classes
according to EN 338 standard and it is still possible to use
them. However, some of the beams recommended to be
changed as a result of the findings obtained from both
visual inspections and examinations made with
nondestructive test device.
3. The screw withdrawal resistance, bending and
shear strengths of the beams were calculated thanks to the
data obtained with the nondestructive test device and it was
determined that the strength properties of the beams in
rooms 106, 203 and 204 had the lowest resistance
properties in this structure in the resistance classes
specified in the EN 338 standard. Although these beams
still had enough strength properties, it might be
recommended to replace them considering the fatigue
resistance due to the service life.
4. Decay and insect damage were detected on
some of the wooden elements in the attic.
ACKNOWLEDGMENTS
This paper was presented at the International
Forest Products Congress [ORENKO 2020] held on 23-26
September 2020, Trabzon, Turkey, and selected for
publication in the Journal of Anatolian Environmental and
Animal Sciences.
REFERENCES
EN, B. 338. (2003). Structural timber–Strength classes.
Fakopp Enterprise. (2010). User's guide: Screw
withdrawal resistance meter.
https://www.fakopp.com/docs/products/withdraw
al/withdrawal_guide.pdf.
Gezer, E.D., Temiz. A. & Yüksek, T. (2015). Inspection
of wooden poles in electrical power distribution
networks in Artvin, Turkey. Advances in
Materials Science and Engineering, 2015, 1–11.
DOI: 10.1155/2015/659818

Journal of Anatolian Environmental and Animal Sciences
(Anadolu Çevre ve Hayvancılık Bilimleri Dergisi) DOI: https://doi.org/10.35229/jaes.837006
JAES Year: 5, No: 5, 2020 (867-871)
AÇEH Yıl: 5, Sayı: 5, 2020 (867-871)
ARAŞTIRMA MAKALESİ RESEARCH PAPER
867
A Study on The Biomass Energy Potential of Turkey: Example of Wood Pellets
Devlet TOKSOY1 Semra ÇOLAK2 Mahmut M. BAYRAMOĞLU1* 1*Karadeniz Technical University, Faculty of Forestry, Department of Forest Engineering, Kanuni Campus, Trabzon, Turkey
2Karadeniz Technical University, Faculty of Forestry, Department of Forest Industry Engineering, Kanuni Campus, Trabzon/Türkiye
Geliş/Received: 07.12.2020 Kabul/Accepted: 09.12.2020
How to cite: Toksoy, D., Çolak, S., Bayramoğlu M.M. (2020). A Study on The Biomass Energy Potential of Turkey: Example of Wood Pellets. J. Anatolian
Env. and Anim. Sciences, 5(5), 867-867.
Atıf yapmak için: Toksoy, D., Çolak, S., Bayramoğlu M.M. (2020). Türkiye’nin Biyokütle Enerji Potansiyeli Üzerine Bir Araştırma: Odun Peleti Örneği.
Anadolu Çev. ve Hay. Dergisi, 5(5), 867-871.
Abstract: Wood Pellet, one of the biomass fuels in renewable energy sources, stands out among all renewable energy sources with it’s ease of production technology, environmental friendliness and similar features. Wood pellets, which are fuel pellets of 6-10 mm diameter, which are obtained from the drying of wood waste, milling it into sawdust and then compressing it with high pressure, have become economically comparable with fossil fuels today. Wood pellet trade worldwide increased by more than 21% in 2018 compared to the previous year, reaching a trade
volume of 22.3 million tons. The biggest pellet exporter countries in the world since 2012 are USA, Canada, Vietnam, Latvia and Russia respectively. These countries accounted for approximately 69% of the world export volume in 2018. Except for five countries, they continue to work on alternative energy sources and especially the production, technology, use and properties of wood pellets in China. In Turkey, there are studies on the production of wood pellets and the economy. However, these studies need to be updated both in terms of production and economics. In the study, analyzed the current data with the potential that Turkey has developed proposals for the use of this potential.
Keywords: Forestry, economy, biofuel, energy demand.
Türkiye’nin Biyokütle Enerji Potansiyeli Üzerine Bir Araştırma: Odun Peleti
Örneği
Öz: Odun Peleti, üretim teknolojisi kolaylığı, çevre dostu olması ve benzeri özellikleri ile tüm
yenilenebilir enerji kaynakları içinde öne çıkmaktadır. Odun artıklarının kurutulup, öğütülerek talaş haline getirildikten sonra yüksek basınçla sıkıştırılmasından elde edilen 6-10 mm çapındaki yakıt topakları olan odun peletin ekonomik açıdan günümüzde fosil yakıtlar ile karşılaştırılabilir konuma gelmiştir. Dünya genelinde odun peleti ticareti, bir önceki yıla kıyasla 2018’de % 21'den fazla artış göstermiş olup 22.3 milyon tonluk ticaret hacmine ulaşmıştır. Dünya’da 2012 yılından itibaren en büyük pelet ihracatçısı ülkeler sırasıyla ABD, Kanada, Vietnam, Letonya ve Rusya’dır. Bu ülkeler 2018 yılında dünya ihracat hacminin yaklaşık% 69’unu oluşturmuşlardır. Beş ülke haricinde Çin’de alternatif enerji kaynakları ve özellikle odun peletinin üretimi,
teknolojisi, kullanımı ve özellikleri üzerine çalışmalarını devam ettirmektedirler. Türkiye’de ise odun peletinin üretimi ve ekonomisi üzerine çalışmalar bulunmaktadır. Ancak bu çalışmalar gerek üretim gerekse ekonomik açıdan güncellenmesi gerekmektedir. Çalışmada, Türkiye’nin sahip olduğu potansiyel güncel veriler ile analiz edilerek bu potansiyelin kullanımına yönelik öneriler geliştirilmiştir. Anahtar kelimeler: Ormancılık, ekonomi, biyo-yakıt, enerji talebi.
: https://orcid.org/0000-0002-4096-1979
: https://orcid.org/0000-0003-1937-7708
* : https://orcid.org/0000-0002-0870-5094
*Corresponding author’s: Mahmut M. BAYRAMOĞLU
Karadeniz Technical University, Department
of Forest Engineering, Kanuni Campus,
Trabzon, Turkey.
Mobile telephone: +90 (533) 559 60 93
Telephone : +90 (462) 377 41 43
Fax : +90 (462) 325 74 99
*Sorumlu yazarın: Mahmut M. BAYRAMOĞLU
Karadeniz Teknik Üniversitesi Orman
Fakültesi Orman Mühendisliği Bölümü,
Kanuni Kampusü Trabzon, Türkiye
Cep telefonu : +90 (533) 559 60 93
Telefon : +90 (462) 377 41 43
Faks : +90 (462) 325 74 99

Toksoy et al., 5(5), 867-871, (2020) J. Anatolian Env. and Anim. Sciences, Yıl:5, No:5, (867-871), 2020
868
INTRODUCTION
Renewable sources particularly biomass account
for an increasing proportion of energy generation. Efforts
to limit the use of fossil fuels and the development of
alternative energy resources are also effective in this
increase (Kaygusuz et al., 2017). Wood pellets are the most
popular and traded among biomass fuels (Jagers et al.,
2020). Wood pellets from biomass fuels have emerged as
a substitute for coal, natural gas and fuel oil both in
industry and residential heating (Junginger et al. 2019).
Wood pellet is obtained by smashing and compressing the
wood residuals such as wood chips and tree bark. Sawdust
or wood chips that are compressed under high temperature
and pressure bind together, due to their lignin content, to
form wood pellet. Wood pellet, which is a subsidiary
product obtained from sawdust as a result of wood
processing, can now also be obtained from round chocks
and battens. Wood pellet is highly preferable to other solid
biomass fuels due to its low humidity (less than 10%) and
high energy density (Junginger et al., 2011; Stewart, 2006).
Compared to wood pellets to produce 1 MWh of
energy; natural gas 3, fuel oil 5 and electric heating release
10 times as much CO2 into the atmosphere (Saraçoğlu,
2010). For this reason, the production and use of wood
pellets is increasing, especially in developed countries
Many countries have made legal regulations on the use and
trade of wood pellets in response to this interest
(Bayramoğlu & Toksoy, 2015).
The use of renewable energy sources in Turkey
has not yet reached the desired level. The use of fossil fuels
in industry and residences is quite high. The share of the
overall power generation of renewable energy sources,
despite a great potential to renewable energy sources is low
in terms of Turkey. There has been an increase in energy
production from renewable energy sources with the legal
regulations (subsidy etc.). Turkey's energy potential of
biomass is also high. However, the use and trade of this
potential is almost nonexistent. The reason for this
situation; Inadequate studies on biomass fuels (especially
wood pellets), lack of a market for biofuels produced from
wood raw materials, lack of legislation, and not
encouraging private sector investments.
Turkey's biomass potential has been demonstrated
with this study with updated data compared with other
energy sources of wood pellets. The amount of wood
pellets that can be produced and its economic value have
been calculated.
MATERIALS AND METHOD
Data Collection: In the study, many studies in the
literature on climate change, biomass energy and wood
pellet and international conventions, protocols, meeting
and conference final declarations related to the emergence
and functioning of wood pellet were also used as material.
Especially in Turkey, biomass potential and wood pellet,
use, trade, legal and institutional report prepared by the
relevant ministries for the section dealing with regulations,
national action plans and strategy documents were also
used.
Methods: Literature review method was used in
the study. Detailed information on the subject was obtained
and analyzed. The deductive method was used to form the
conceptual framework of the study. First of all, the
concepts of renewable energy, biomass energy and wood
pellet were introduced and wood pellet formed as a result
of international processes were explained. Also next to the
position of Turkey in the wood pellet market, the situation
in the international process, scientific and technical
infrastructure and legal and institutional arrangements
were discussed.
RESULTS AND DISCUSSION
Biomass Energy Potential of Turkey: Turkey has
a significant amount of biomass and bioenergy potential.
However, there are different studies regarding the total
bioenergy potential. Turkey's total bioenergy potential was
estimated Taşdemiroğlu (1986) 17 Mtoe (million tonnes of
oilequivalent), WECTNC (1996) 16.92 Mtoe, Ediger and
Kentel (1999) 17.2 Mtoe, Kaygusuz (2002) 16.9 Mtoe,
Demierbaş et al. (2006) 65 Mtoe, Toklu (2017) 17 Mtoe
and Öztürk et al. (2017) 16.92 Mtoe.
Figure 1. Turkey’s total biomass potential (MEF, 2009).
Turkey’s main biomass production is given in
Table 1. Turkey׳s main biomass production is based on
wheat straw, wood and woody materials, cocoon shell,
hazelnut shell, grain dust, crop residues and fruit tree
residues (Melikoğlu, 2013). Various agricultural residues
such as grain dust, wheat straw and hazelnut shell are
available in Turkey as the sources of biomass energy.
Approximately 2.6 x 10⁷ tonnes of wheat straw was
produced annually in Turkey. The straw is disposed of in
the fields either by burning or sometimes by ploughing it
back into the soil. Because the higher heating value of

Toksoy et al., 5(5), 867-871, (2020) J. Anatolian Env. and Anim. Sciences, Yıl:5, No:5, (867-871), 2020
869
straw is about ½ that of high-grade coal (its higher heating
value is about 28 MJ/kg), the surplus straw is equivalent to
about 1.3 x 10⁷ tonnes. The hazelnut shell is a potentially
important energy source and the amount produced annually
in Turkey is estimated to be about 3.5 x 10⁵ tonnes. The
higher heating value of the hazelnut shell is 19.2 MJ/kg and
its calorific value is equivalent to about 1.9x10⁶kWh
(Demirbaş & Şahin, 1998; Sürmen, 2002).
Table 1. Turkey’s annual biomass potential (İlleez, 2020). Amount
(tone/year)
Energy
Potential
(TEP/year)
Economical
Energy Potential
(TEP/year)
Animal wastes 193.878.079 4.385.371 1.084.506
Agricultural residues 62.206.754 6.009.049 1.462.159
City residues 32.170.975 3.373.011 485.858
Forest residues 2.739.865 859.899 -
TOTAL 290.995.673 14.627.330 3.032.523
Turkey's electricity generation in the year 2018
303.625 GWh (26 million toe) 68% of this production is
from fossil sources, 32% is produced from renewable
energy sources. However, the share of biomass in
renewable energy remained at a very low level with a share
of 2.75% and 0.88% in total electricity generation (İlleez,
2020). In 1990, the heat produced from biomass sources
worldwide was realized as 6.2 million TEP and met only
1.6% of the total heat production. In 2018, heat production
from biomass reached 7.5% with 26 million TEP. Europe
is the world leader with 87% share of heat generated
globally due to its widespread and effective use of all
biomass resources, including municipal waste, solid
biofuels and industrial waste (WEO, 2019). Turkey at the
end of 2018 the production of heat energy biomass has had
a 10.2% share by approximately 133.000 TEP (IEA, 2020;
ETKB, 2020; IRENA, 2019).
Table 2. Present and planned biomass energy production in Turkey (SSI, 1996).
Years Modern Biomass (ktoe) Classic biomass (ktoe) Total (ktoe)
1999 5 7012 7017
2000 17 6965 6982
2005 766 6494 7260
2010 1660 5754 7414
2015 2530 4790 7320
2020 3520 4000 7520
2025 4465 3345 7810
2030 4895 3310 8205
Since the early 2000s, it has prepared the biomass
energy production program in Turkey. Present and planned
biomass energy production in Turkey is given in Table 2.
According to a study by Demirbaş (2006), Turkey’s
biomass production was 7 million tonnes in 1999, and is
predicted to increase to 8.2 million tonnes in 2030.
According to the index published by Ernst & Young
(2012), Turkey is ranked 30th of 40 countries (index value
39.8) for renewable energy and 28th for biomass (index
value 35).
Wood and Woody Biomass Potential of Turkey:
Interest in forests is increasing, especially due to its role in
carbon sequestration in mitigation global climate change.
In order to reduce the greenhouse gas accumulation of
forests; It is necessary to protect forests, planting new
forest areas, reducing harvest density, increasing forest
growth and carbon storage in harvested wood products
(Bilgen, 2014).
Woody biomass (especially fuelwood), as in the
world, it is important for rural areas in Turkey because
fuelwood is very important source of energy and the major
source of energy in rural T urkey. About half of the world's
population rely on woody biomass or other biomass for
cooking and other domestic use.. About half of the total
demand for fuelwood is met through informal cutting of
State forests and other woody biomass resources in
agricultural areas (Bilgen et al., 2008). Among the biomass
energy sources, woody biomass is the most interesting.
Because it is high in Turkey's total energy production and
conversion techniques are useful to it is not necessarily
complicated. Forest biomass consumption compared to
total energy has decreased from 22% to 14% (Kaygusuz,
2010).
The latest data of the forest assets in Turkey
published in 2015. Turkey's forest area of 22,342,935
hectares have been based on these data in 2015. Turkey
forest area constitutes 29% of the 78 million hectares of the
country up to the surface. According to 2015 data, 57%
(12,704,148 ha) of forest areas are forest areas with more
than 10% canopy cover, which is qualified as productive
forest in terms of wood raw material production. The
remaining 43% of the forest areas (9,638,787 ha) consists
of hollow closed forest areas with a closure less than 10%
and called degraded or inefficient forest areas. The total
forest potential of Turkey is around 1.6 billion m3 with an
annual growth of about 45.9 million m3 in 2015 (TOD,
2019).
Table 3. Turkey's 2015-2019 industrial and firewood production. Years Industrial Wood (m3)- Firewood (Stere)
2015 16.637.598 5.022.986
2016 17.009.998 4.877.067
2017 15.521.622 4.359.646
2018 19.080.137 4.890.455
2019 22.113.248 5.589.798
Turkey has produced 22.3 million m3 industrial
wood and 5.58 million stere firewood in 2019. Turkey's
2015-2019 industrial and firewood production are given in
Table 3. In the last 5 years, it has produced an average of
18.072.520,6 m3 industrial wood and 4.947.990,4 stere
firewood.

Toksoy et al., 5(5), 867-871, (2020) J. Anatolian Env. and Anim. Sciences, Yıl:5, No:5, (867-871), 2020
870
Wood Pellet Potential of Turkey: The forestry
sector is a rising trend in Turkey. In order to meet the
demand of the sector, industrial wood production has been
increased by approximately 33% in the last 5 years.
Approximately 25% of a tree is left in the forest as
production residue at the end of the production activity
(Karayılmazlar et al., 2011). In Turkey, annually about 5
million m3 wood residues is left in the forest. These
residues are left to rot as they do not set off the
transportation costs. There are different studies on the
amount of production residues. Bayramoğlu and Toksoy
(2015) stated that approximately 4 million m3 of forest
residues could be obtained from 10 million m3 of industrial
wood production. According to General Directorate of
Forestry (GDF) estimated that there was a total of
3.528.320 stere of production residues in 27 Regional
Forest Directorates (RFD) between 2007 and 2009.
Assuming that 1 m3 is equal 0.600 tone, 5 million
m3 wood is equal to 3 million tone. Approximately 600 kg
wood pellet is produced from 1 tone wood. In this context
1.8 million tone wood pellet can be produced from 3
million tone wood which market value nearly 274 million
dollar. The energy value that can be obtained from 1.8
million tonnes of wood pellets is approximately 0.72 Mtep
which represents 0.57% of total primary energy
consumption in 2015, and 0.75% of the imported amount
of energy (95.1 mtep); 0.54% of total primary energy
consumption in 2016 and 0.74 % of imported energy (97.3
mtep); 0.49% of total primary energy consumption in 2017
and 0.65% of imported energy (110.1 mtep) of
TurkeyFrom 2015 to 2017, Turkey paid 37.8, 27.1 and 37.2
billion dollars, respectively for imported energy.
According to these calculations, if Turkey utilized wood
pellet potential, this would result in saved of 28.3 billion
dollars in 2015, 20 billion dollars in 2016 and 24.1 billion
dollars in 2017.
Economic comparison of the Turkish context
indicates that wood pellet is more advantageous than other
energy sources. One house in Turkey requires
approximately 50.2 GJ heating energy, which would
require 2 tonnes of coal, 1142 kg oil fuel, 1454 m3 natural
gas or 2.66 tonnes wood pellets.
Table 4. Compare of Energy Sources. Energy Sources Energy (kcal) Amount (kg) Unit Price ($)** Total ($)
Coal 6000 2000 0.28 560
Fuel Oil 10500 1142 0.47 541
Natural Gas 8250 1454* 0.31 450
Wood Pellet 4500 2660 0.14 371
*Amount of Consumption calculated m3 for natural gas.
**19.09.2020 date 1 $ = 7.90 TL exchange rate.
Wood pellet has lower energy value than other
energy sources because it has lower energy density (18
MJ/kg) . However, this low energy value and high rate of
usage means that wood pellet is cheaper than other energy
sources.
In 2017, approximately 23.8 million tone of wood
pellets were traded in the world. In 2023, this trading
volume is expected to be 29 million tone. The use of wood
pellets in developed countries has increased. In 2018, Japan
imported over 1 million tone, South Korea 3.4 million,
Netherlands 2.5 million and United Kingdom 1.5 million
tone of wood pellets. Unfortunately, there is not data on the
wood pellet trade in Turkey. If Turkey uses the potential of
wood pellet, it is inevitable that it will get a share of the
international market.
In this study, Turkey's wood pellet potential was
calculated at 1.8 million tone, while Bayramoğlu and
Toksoy (2015) calculated approximately 400,000 tone.
Although the value of wood pellet is calculated as $274
million, Bayramoğlu and Toksoy (2015) stated that this
value as $586 million. This difference is due to the change
in the amount of wood used in production and the dollar
rate. Besides, Bayramoğlu and Toksoy (2015) stated that
wood pellet is more economical than other energy sources.
CONCLUSION
As a result of the increase in energy prices in the
world, events in energy supply security, the development
of alternative energy sources and the legal regulations and
policies to reduce the use of fossil fuels in the combat
against climate change, the share of renewable energy
sources, especially biomass fuels, in energy production is
increasing. Wood pellet is a prominent product in biomass
fuels due to its ease of production and high raw material
potential. Although legal regulations on renewable energy
have been made in Turkey, the wood pellet has been in
lower demand than expected, especially due to high costs.
Turkey should try to raise more awareness about
its bioenergy potential. Legal arrangements must be made
to create a market for wood pellets. Private sector
investments should be encouraged, and national production
standards should be created.
ACKNOWLEDGMENTS
The authors declare that there are no conflicts of
interest. This study was presented in ORENKO 2020 held
by Karadeniz Technical University, Trabzon.
REFERENCES
Bayramoğlu, M.M. & Toksoy, D. (2015). Economic
evaluation of wood pellet as a renewable energy
source in Turkey, In: Efe, R., Curebal, İ., Bizzarri,
C. & Nyussupova, G. (Ed), Environment and
ecology at the beginning of the 21st century. 125-

Toksoy et al., 5(5), 867-871, (2020) J. Anatolian Env. and Anim. Sciences, Yıl:5, No:5, (867-871), 2020
871
137 p, St. Klıment Ohrıdskı Unıversıty Press, Sofia, Bulgaria.
Bilgen, S., Keleş, S., Kaygusuz, A., Sarı, A. & Kaygusuz,
K. (2008). Global warming and renewable energy
sources for sustainable development: A case study
in Turkey. Renew Sustain Energy Rev., 12(2),
372-396.
Bilgen, S. (2014). Structure and environmental impact of
global energy consumption. Renew Sustain
Energy Rev., 38, 890-902.
Demirbaş, A. & Şahin, A. (1998). Evaluation of biomass
residue 1. briquetting waste paper and wheat straw mixtures. Fuel Processing Technology, 55(2),
175-183.
Demirbaş, A. (2006). Turkey’s renewable energy facilities
in the near future. Energy Sources, Part A, 28(6),
527-536.
Demirbaş, A., Pehlivan, E. & Altun, T. (2006). Potential
evolution of Turkish agricultural residues as bio-
gas, bio-char and bio-oil sources. Int J Hydrog
Energy, 31, 613-620.
Ediger, V.Ş. & Kentel, E. (1999). Renewable energy
potential as an alternative to fossil fuels in Turkey.
Energy Convers Manag, 40, 743-755. Ernst. & Young. (2012). Renewable energy country
attractiveness indices. London, UK, 44p.
ETKB. (2020). Ulusal Enerji Denge Tabloları,
https://www.eigm.gov.tr/tr-TR/Denge-
Tablolari/Denge-Tablolari. (03 Mart 2020).
IEA. (2020). İstatistik Verileri. https://www.iea.org/data-
and-statistics. (03 Mart 2020).
IRENA. (2019). Renewable Energy Statistics 2019, The
International Renewable Energy Agency, Abu
Dhabi. ISBN 978-92-9260-137-9.
İlleez, B. (2020). Türkiye’de Biyokütle Enerjisi. Türkiye’nin Enerji Görünümü 2020, TMMOB
Makina Mühendisleri Odası, Ankara, 317- 344.
Jagers, J., Spayz, P., Wirtz, S. & Scherer, V. (2020). Analysis of wood pellet degradation
characteristics based on single particle impact
tests. Powder Technology (in press).
Junginger, M., Van Dame, J., Zarrilli, S., Mohamed,
F.A. Marchal, D. & Faaij A. (2011). Opportunities and Barriers For International
Bioenergy Trade. Energy Policy, 39(4), 2028-
2042.
Junginger, H.M., Mai‐Moulin, T., Daioglou, V., Fritsche, U. et al. (2019). The future of biomass
and bioenergy deployment and trade: a synthesis
of 15 years IEA Bioenergy Task 40 on sustainable
bioenergy trade. Biofuels, Bioproducts and Biorefining, 13(2), 247-266.
Stewart, A. (2006). Small-Scale Pellet Production.
Presented At: Wood Pellet Fuel Production,
Milton Keynes.
Karayılmazlar, S., Saraçoğlu, N., Çabuk, Y. & Kurt, R.
(2011). Using of biomass in energy generation in
Turkey. Bartın For. Fac. Mag., 13, 19-75.
Kaygusuz, K. (2002). Sustainable development of
hydropower and biomass energy in Turkey.
Energy Convers Manag, 43, 1099-1120.
Kaygusuz, K. (2010). Energy services and energy poverty for rural regions. Energy Sources Part B, 5, 424-
433.
Kaygusuz, K., Toksoy, D. & Bayramoğlu, M.M. (2017). Global utilization of wood pellet for residential
heating. Journal of Engineering Research and
Applied Science, 6(2), 688-697.
MEF. (2009). Forest biomass situation for renewable
energy in Turkey. Ministry of Environment and
Forestry, Ankara, 2009.
Melikoğlu, M. (2013). Vision 2023: Feasibility analysis of
Turkey׳s renewable energy projection. Renew
Energy, 50, 570-575.
Öztürk, M., Saba, N., Altay, V., Iqbal, R. et al. (2017). Biomass and bioenergy: An overview of the
development potential in Turkey and Malaysia.
Renewable and Sustainable Energy Reviews, 79,
1285-1302.
Saraçoğlu, N. (2010). Küresel İklim Değişimi, Biyoenerji
ve Enerji Ormancılığı, Efil Yayınevi, Ankara,
Türkiye, 300p.
SSI. (1996). State Statistics Institute. Environmental
Statistics. Environment Inventory for
Municipalities, Ankara, Turkey. Sürmen, Y. (2002). The necessity of biomass energy for
Turkish economy. Energy Education Science and
Technology, 10, 19-26.
Taşdemiroğlu, E. (1986). Biomass energy potential in
Turkey. Biomass, 11(1986), 81-89.
Toklu, E. (2017). Biomass energy potential and utilization
in Turkey. Renewable Energy, 107, 235-244.
WECTNC. (1996). Turkey Energy Report-1995. World
Energy Council-Turkish National Committee,
Ankara.
WEO, (2019). Global Bıoenergy Statıstıcs 2019. World
Bioenergy Association, Chicago, USA, 58p.

Journal of Anatolian Environmental and Animal Sciences
(Anadolu Çevre ve Hayvancılık Bilimleri Dergisi) DOI: https://doi.org/10.35229/jaes.837015
JAES Year: 5, No: 5, 2020 (872-881)
AÇEH Yıl: 5, Sayı: 5, 2020 (872-881)
ARAŞTIRMA MAKALESİ RESEARCH PAPER
872
Situation of Forest Carbon Projects in Carbon Markets
Devlet TOKSOY1 Çiğdem ÖZTEKİN2 Mahmut M. BAYRAMOĞLU1* 1*Karadeniz Technical University, Faculty of Forestry, Department of Forest Engineering, Kanuni Campus, Trabzon, Turkey
2 Eastern Black Sea Forestry Research Institute, Trabzon, Turkey
Geliş/Received: 07.12.2020 Kabul/Accepted: 09.12.2020
How to cite: Toksoy, D., Öztekin, Ç. & Bayramoğlu M.M. (2020). Situation of Forest Carbon Projects in Carbon Markets. J. Anatolian Env. and Anim.
Sciences, 5(5), 872-881.
Atıf yapmak için: Toksoy, D., Öztekin, Ç. & Bayramoğlu M.M. (2020). Karbon Piyasalarında Ormancılık Karbon Projelerinin Durumu. Anadolu Çev. ve
Hay. Dergisi, 5(5), 872-881.
Abstract: Global cooperation activities are being carried out within the framework of United Nations Framework Convention on Climate Change, Kyoto Protocol and Paris Agreements to stabilize the increasing greenhouse gas emissions in the atmosphere. Forests that play a key role in combating climate change are among the most important issues discussed during the climate change negotiations. There are two important pillars of the forestry sector in climate change. One is mitigation and the other is adaptation. Issues related to forestry interviewed in the scope of
mitigation are Land use, land use change and forestry (LULUCF) and REDD +. The mechanism for mitigation is carbon markets. The rate of forestry projects in carbon markets is low. Turkey is traded on the voluntary carbon market is achieving very low income according to the mandatory carbon market. However, the carbon credits that are traded are provided by the renewable energy sector. These credits are in Turkey need to combat climate change in forestry activities both actively involved in the negotiations for the benefit of the mechanisms created in this context and should maintain this attitude. Turkey must make changes in the organizational and technical infrastructure besides negotiations.
Keywords: Climate change, kyoto protocol, carbon credit, forestry.
Karbon Piyasalarında Ormancılık Karbon Projelerinin Durumu
Öz: Atmosferdeki artan sera gazı emisyonlarını stabilize etmek için Birleşmiş Milletler İklim Değişikliği Çerçeve Sözleşmesi, Kyoto Protokolü ve Paris Anlaşmaları çerçevesinde küresel
işbirliği çalışmaları yürütülmektedir. İklim Değişikliğiyle mücadele kilit rol oynayan ormanlar iklim değişikliği müzakerelerinde görüşülen en önemli konular arasında yer almaktadır. İklim değişikliğinde ormancılık sektörünün iki önemli ayağı bulunmaktadır. Bunlardan biri azaltım diğeri ise uyumdur. Azaltım kapsamında müzakerelerde görüşülen ormancılıkla ilgili hususlar Arazi kullanımı arazi kullanım değişikliği ve ormancılık (LULUCF) ve REDD konularıdır. Uyum ise; iklim değişikliğinin etkilerine yanıt olarak ekolojik, sosyal ve ekonomik sistemlerdeki düzenlemeleri ifade etmektedir ve iklim değişikliği nedeniyle ortaya çıkabilecek risklerin yönetimini kapsamaktadır. Ormancılıkta uyum iklim değişikliği odaklı sürdürülebilir orman
yönetimi anlamına gelmektedir. Azaltımla ilgili mekanizma karbon piyasalarıdır. Karbon piyasalarında ormancılık projelerinin oranı ise düşüktür. Türkiye gönüllü karbon piyasalarında işlem görmekte olup zorunlu karbon piyasalarına göre oldukça düşük gelir elde etmektedir. Bununla birlikte işlem gören karbon kredileri yenilenebilir enerji sektöründen sağlanmaktadır. Bu krediler içinde ormancılık faaliyetleri bulunmamaktadır. Bununla birlikte Türkiye, müzakereler haricinde de kurumsal ve teknik alt yapısında değişiklikler yapmak zorundadır. Anahtar kelimeler: İklim değişimi, Kyoto protokolü, karbon kredisi, ormancılık.
: https://orcid.org/0000-0002-4096-1979
: https://orcid.org/0000-0001-8643-4886
* : https://orcid.org/0000-0002-0870-5094
*Corresponding author’s: Mahmut M. BAYRAMOĞLU
Karadeniz Technical University, Department
of Forest Engineering, Kanuni Campus,
Trabzon, Turkey.
Mobile telephone: +90 (533) 559 60 93
Telephone : +90 (462) 377 41 43
Fax : +90 (462) 325 74 99
*Sorumlu yazarın: Mahmut M. BAYRAMOĞLU
Karadeniz Teknik Üniversitesi Orman
Fakültesi Orman Mühendisliği Bölümü,
Kanuni Kampusü Trabzon, Türkiye
Cep telefonu : +90 (533) 559 60 93
Telefon : +90 (462) 377 41 43
Faks : +90 (462) 325 74 99

Toksoy et al., 5(5), 872-881, (2020) J. Anatolian Env. and Anim. Sciences, Yıl:5, No:5, (872-881), 2020
873
INTRODUCTION
Climate change is a complex problem that,
although qualitatively environmental, has an impact on all
areas of humanity's life. Global problems such as poverty,
economic and sustainable development, population growth
and the management of natural resources are affected.
Therefore , it is a desired and expected situation that
solutions for climate change come from research and
development fields and all disciplines (Öztekin, 2019).
Climate change; In addition to natural climate change
observed in comparable time periods, it is defined as a
change in climate resulting from human activities that
directly or indirectly disrupt the composition of the global
atmosphere (UNFCCC, 1992). Global warming means that
the global temperature has increased by 0.5 C0 compared
to a century ago and can be explained largely by the
greenhouse effect. The greenhouse effect theory sees the
increasing concentration of certain gases (carbon dioxide,
chlorofluorocarbons, methane and nitrogen oxides) in the
atmosphere as the cause of the problem. The most effective
greenhouse gases are damp and carbon dioxide. 95% of the
total greenhouse effect consists of these gases (Serengil,
1995).
The economic growth and population growth
experienced with the industrial revolution caused the
accumulation level of carbon dioxide and other greenhouse
gases in the atmosphere to rise rapidly. Globally, economic
growth and population growth continue to be the most
important drivers of increases in carbon dioxide (CO2)
emissions from fossil fuel use (IPCC, 2014). According to
the 5th Assessment Report of the Intergovernmental Panel
on Climate Change (IPCC), the concentration of carbon
dioxide, methane and nitrogen oxide in the atmosphere has
increased unprecedentedly over the past 800,000 years.
Emissions from fossil fuel use were shown as the primary
cause of this increase, and net emissions from land use
change were shown as the secondary cause (IPCC, 2013a).
Between 1750 and 2011, about half of the total
human-induced CO2 emissions occurred in the last 40
years, and 2040 ± 310 GtCO2 total human-made CO2
emissions were added to the atmosphere. Since 1970,
cumulative CO2 emissions from burning fossil fuels,
cement production and ignition have tripled, and
cumulative CO2 emissions from forestry and other land use
have also increased by about 40%. Annual CO2 emissions
arising from fossil fuel combustion, cement production and
exacerbation in 2011 were 34.8 ± 2.9 GtCO2, while the
average annual emissions from forestry and other land use
between 2002 and 2011 were 3.3 ± 2.9 GtCO2 (IPCC,
2014).
In Turkey forests are considered to be an
important mechanism in the combat against climate change
mitigation. However, there are no forestry carbon projects
that can be subject to carbon markets until today. The
reasons for this situation are high costs of credits obtained
from forestry projects, methodology and calculation
difficulties, lack of a measurable, reportable and verifiable
system, etc. are the reasons.
In this study, the reasons for the low rate of
forestry projects in carbon markets were investigated and
the possibilities of increasing the share of forestry were
examined. Turkey's determination of its own as well as the
carbon potential, these legal and institutional arrangements
for examining solutions to do to fulfill the potential use and
obligations in international processes have been developed.
The Global Carbon Cycle and Forests: Carbon is
one of the most important elements in the world in terms
of life. Life influences the regulation of carbon content in
the atmosphere dominated by geological forces throughout
geological time periods. Earth's heat and carbon content in
the atmosphere are linked to geological time scales. Carbon
cycle processes take place between hours and millions of
years. The global carbon cycle refers to the biochemical
cycle of carbon stored in different places on our planet
between the pedosphere, hydrosphere, atmosphere,
biosphere and geosphere (Lorenz and Lal, 2010). As
carbon moves between these reservoirs, the length of stay
in each also varies significantly (Mackey et al., 2008).
One of the carbon stocks, the atmosphere contains
839 gigatons of carbon (Gt C) predominantly in the form
of carbon dioxide. The world's largest carbon stock; It is
located in the continental crust and upper mantle of the
earth (122.576.000 Gt C), most of which are formed by
sedimentary rocks formed over millions of years. The next
largest stock is ocean carbon (37,100 Gt C). More than
95% of the carbon found in the ocean is mainly in the form
of inorganic dissolved carbon. Only 900 Gt C is available
for exchange on the ocean surface. The oceans release 78.4
Gt C a year and hold 80 Gt C. Terrestrial systems, on the
other hand, emit 119 Gt C per year and keep it at 123 Gt C.
Generally, both oceans and terrestrial systems store more
carbon than they emit in a year, with 2.3 Gt C (ocean) per
year and 2.6 Gt C (land) per year net intake. Greenhouse
gas emissions caused by human activities resulting from
fossil fuel consumption and land use change are 9 GtC per
year (Janowiak et al., 2017).
In the terrestrial biosphere, carbon is stored in
living biomass (450 - 650 PgC) and in dead organic matter
(1500 - 2400 PgC) in debris and soils. Wetland soils (300
- 700 PgC) and frozen soils (1700 PgC) also contain
carbon. Carbon dioxide in the atmosphere is transported
from the atmosphere through plant photosynthesis and
stored within the plant (Gross Primary Production (GPP),
123 ± 8 PgC yr-1). The deposited carbon is used to make
plant tissues. Leaves and branches shed by the plant

Toksoy et al., 5(5), 872-881, (2020) J. Anatolian Env. and Anim. Sciences, Yıl:5, No:5, (872-881), 2020
874
decompose in the soil and stored in the soil as carbon. Plant
tissues, debris and carbon in the soil are released back to
the atmosphere by plant respiration (autotrophic
respiration), microbial soil respiration and animal
respiration (heterotrophic respiration) and natural disasters
(fire, insect, etc.) A large amount of terrestrial carbon is
transported from soils to river streams (1.7 PgC yr-1). Some
of this carbon is released into the atmosphere as CO2 by
rivers and lakes. Some of it is stored in freshwater organic
sediments, and the remaining amount (0.9 PgC yr-1) is
delivered to the coastal ocean as dissolved inorganic
carbon, dissolved organic carbon and particulate organic
carbon by rivers. Atmospheric CO2 is transported by
diffusion between the ocean surface and the atmosphere. In
the ocean, carbon is mostly found in the form of Dissolved
Inorganic Carbon (DIC, ~ 38,000 PgC), which is carbonic
acid (CO2 dissolved in water), bicarbonate and carbon ions,
but also as dissolved organic carbon (DOC, 700 PgC).
Marine biota, composed predominantly of phytoplankton
and other microorganisms, represents a small pool of
organic carbon (3 PgC). Only a small fraction (~ 0.2 PgC
yr – 1) of carbon reaches the ocean floor and is stored in
sediments (IPCC, 2013b).
According to global calculations made in the last
decade between 2007 and 2016, the difference between
human-induced emissions released into the atmosphere by
sources and removed by sinks was determined as 0.6 GtC /
yr-1. This difference in the global carbon cycle is called
stock imbalance. The emissions released into the
atmosphere are caused by fossil fuel consumption of 9.4 ±
0.5 GtC / yr-1 and industrial facilities. Emissions emitted by
land use change were determined as 1.3 ± 0.7GtC / yr-1.
When we look at the emissions removed by sinks, it is
calculated that 4.7 ± 0.5 GtC / yr-1 is stored by the
atmosphere, 3.0 ± 0.8 GtC / yr-1 by terrestrial ecosystems,
and 2.4 ± 0.5 GtC / yr-1 by the oceans (Le Quere et al.,
2018).
In this period, 88% of the emissions were caused
by fossil fuel consumption and industrial facilities, and
12% from land use change. While 44% of the total
emissions were shared between the atmosphere, 28%
between the terrestrial ecosystem and 22% between the
ocean, the remaining 5% was the stock imbalance (Le
Quere et al., 2018). The reasons for this stock imbalance
are; re-growth of forests can be explained as various
processes in plant growth, including carbon dioxide
fertilization, nitrogen storage and their interactions
(Schimel, 2006).
The world's forest area is approximately 4 billion
hectares, and this amount corresponds to 31% of the total
terrestrial area (FRA, 2010). Forests, which contain three
quarters of the terrestrial biological diversity, constitute
about half of the terrestrial carbon pools. Therefore, forests
come to the fore in regulating the world climate (FAO,
2008).
According to the Forest Resources Assessment
Report (FRA) (2010), forests at a global scale store 289 Gt
of carbon only in their biomass. Globally, forests store 650
billion tons of carbon, 44% of which is biomass, 11% of
dead wood and debris, and 45% in soil. Sustainable
management, planting and rehabilitation of forests increase
forest carbon stocks, while deforestation, forest
degradation and poor management of forests reduce this
stock. Globally, carbon stocks in forest biomass have been
estimated to decline by 0.5 Gt annually over the period
2005-2010. The main reason for this is the decrease in the
global forest area. While 16 million hectares of forest area
was destroyed annually in the 1990s, approximately 13
million hectares of forest area have been destroyed due to
changes in land use and natural reasons since the 2000s.
Emissions Trading: An Annex-I Party that has a
commitment to quantify emission limitation and reduction
within the scope of the Emission Trade, which is included
in Article 17 of the Kyoto Protocol and is a market-based
mechanism, may procure or transfer Kyoto units from
another Annex-I Party. It can use these acquired units to
meet some of their commitments in Article 3 of the
Protocol.
In other words, countries emitting less than the
committed emission amount can sell the excess emission
units they obtain to the Parties that emit more than the
committed emission amount (Dagoumas et al., 2006).
With the emission trade, the parties also include
the removal units (RMU) obtained from land use land use
change and forestry activities, certified emission reduction
units (CERs) obtained from project activities carried out
within the scope of the Clean development mechanism and
emission reduction units (ERUs) obtained from Joint
Execution projects. they can transfer within the scope of
the system.
The amount of units transferred by the Party to
other countries is limited to the commitment period reserve
of the Party. Each Party is obliged to preserve the minimum
level of units' reserve in its national register in order to
prevent Parties from being unable to meet their emission
targets by transferring excess units. Known as the
"commitment period reserve", this reserve must equal 90%
of the Party's allocated unit of quantity or 100% of the
Annex-A emissions from the most recently reviewed
inventory. This reserve, known as the commitment period
reserve, cannot be less than 90% of the allocated amount
of the Party or less than 5 times the Annex-A emissions (8
for KP2) of the last revised inventory. Whichever is the
lowest is considered (UNFCCC, 2005).
The transfer and purchase of these units are
tracked and recorded through the Kyoto Protocol

Toksoy et al., 5(5), 872-881, (2020) J. Anatolian Env. and Anim. Sciences, Yıl:5, No:5, (872-881), 2020
875
registration system. The international transaction record
(ITL) ensures that emission reduction units are securely
transferred between countries. Thus, a new commodity
subject to trade in the form of emission reduction or
removal was created. Since carbon dioxide is the main
greenhouse gas, the term carbon trade is used. Carbon is
now traced and traded like any other commodity. This is
known as the "carbon market".
MATERIALS AND METHOD
Data Collection: In the study, many studies in the
literature on climate change, carbon economy and emission
trade and international conventions, protocols, meeting and
conference final declarations related to the emergence and
functioning of carbon markets were also used as material.
Especially in Turkey, carbon markets, legal and
institutional report prepared by the relevant ministries for
the section dealing with regulations, national action plans
and strategy documents were also used.
Methods: Literature review method was used in
the study. First of all, detailed information on the subject
was obtained and analyzed. The deductive method was
used to form the conceptual framework of the study. First
of all, the concepts of global warming, carbon cycle, and
climate change were introduced and carbon markets
formed as a result of international processes were
explained. In addition, general information was given on
forests and the place of the forestry sector in the carbon
cycle. Again, subjects such as forestry projects,
certification processes and pricing within the scope of
carbon markets have been examined in detail depending on
the literature. Also next to the position of Turkey in the
carbon market, the situation in the international process,
scientific and technical infrastructure and legal and
institutional arrangements were discussed.
RESULTS AND DISCUSSION
Forest Carbon Sequestration Potential of
Turkeyy: LULUCF party Annex I countries are obliged to
submit their greenhouse gas inventory reports and common
reporting format (CRF) tables to the LULUCF Secretariat
on April 15, at the latest every year. In this context, NIR
(2019), our last national inventory report submitted to the
secretariat; The total amount of the attitude of Turkey in
the LULUCF sector is calculated as 99.907 kt CO2 eq-1.
The areas subject to calculation within the scope of the
inventory are: forest land, agricultural land, meadow and
pasture areas, wetlands, residential areas, harvested forest
products, other lands and others.
Table 1. The total emissions and removals in the LULUCF sector in Turkey. 1990 1995 2000 2005 2010 2015 2016 2017
Total (kt
CO2 eq.)
-55.765
-57.400
-61.556
-74.693
-73.492
-97.206
-95.930
-99.907
4.A
Forest
Area
-52.830 -
54.963 -
57.890 -
69.356 -
67.614 -
87.669 -
85.233 -
90.195
4.B
Farming
Area
0.69 153 38 207 453 457 344 368
4.C
Pasture
Area
0.03 262 81 211 551 929 592 640
4.D
Wetland
12 169 188 40 426 93 344 328
4.E Work
Area
NO,IE 132 145 273 426 419 406 413
4.F Other
Area
NO 181 187 310 601 764 617 653
4.G
Harvested
Wood
Product
-2.948 -3.333 -4.305 -6.379 -8.334 -
12.200
-
13.000
-
12.115
Turkey's LULUCF sector, providing a net
removal. Forests have a large share in the removal of this
sector. Within the LULUCF sector, the emission attitude
amount of forest areas has been determined as 90.195 kt
CO2 eq-1. The attitude amount provided by the harvested
wood products (HWP) sector is 12.115 kt CO2 eq-1. Other
land uses generated net emissions. LULUCF sector has
increased by 79.2% compared to 1990. In 2017, total CO2
emissions and removals in the LULUCF sector increased
by 4.1% compared to 2016.
Significant improvements have been made in the
LULUCF reporting system. With the new system,
transparency increased, integrity, accuracy and consistency
were improved. Land use definitions have been updated
with the new land monitoring system. The forest definition
used in NIR 2018 is a national legal definition with a
threshold value of 3 hectares, while in the new definition,
the forest area is divided into 2 sub-categories as fertile
forest and other forest area. The fertile forest has been
defined as the trees and shrubs larger than 1 hectare, which
grow naturally and with human influence, with more than
10% coverage. The other forest area is defined as trees and
shrubs larger than 1 hectare, which grow naturally and with
human impact, with less than 10% coverage. Inconsistency
between forestry and other land use activity data has been
corrected. Providing area, increment and other data on
forests, ENVANIS was based on the national legal
definition as a forest area. This definition did not allow the
creation of land use matrices consistent with CORINE used
as a land cover map. The new Satellite-based land cover
monitoring system provided the opportunity to monitor
every 1 hectare of land unit. In this way, since 1990,
matrixes regarding land transformations and land uses have
been developed and no duplicate calculations or skips have
been made. Ecological zones have been associated with
established climate types.

Toksoy et al., 5(5), 872-881, (2020) J. Anatolian Env. and Anim. Sciences, Yıl:5, No:5, (872-881), 2020
876
Turkey's Position in the International Process:
Turkey, the United Nations Climate Change in the
Framework Convention adopted in 1992, the Economic
Cooperation and Development Organization's Convention
on account of being a member of both Annex I and Annex
II list, has been involved with the developed countries.
Turkey since 1992, supporting the purpose and the general
principles of contract together not a party to the contract
due to the unfair position in the contract and gave a long
struggle to change that position. Made on the Moroccan
city of Marrakech in 2001 7th Conference of Parties
(COP.7), "Turkey's name to be deleted from Annex II and
the special circumstances recognized and other Annex I
will include in Annex I in a different location in the country
Became a party to the contract on 24 May 2004 following
the decision.
The Draft Law on the appropriate location of our
participation in Kyoto Protocol "05 February 2009, the
Grand National Assembly of Turkey was adopted by the
General Assembly and as of 26 August 2009 Turkey was
formally ratified the Kyoto Protocol. Turkey's first Kyoto
Protocol (2008-2012) and Second (2013-2020) Liability
Period There is no greenhouse gas emission reduction
commitments. It became a party to the Paris Agreement on
22 April 2016 and submitted the National Contribution
Declaration on 30/09/2015.
Situation in Turkey's Emissions Trading
System: The World Bank has implemented a technical
assistance program called the "Partnership for Carbon
Market Readiness (PMR)" to provide developing countries
and emerging economies with the development of the
necessary capacity to actively benefit from market
mechanisms.
Multi Donor Fund for the Grant Agreement
Carbon Market Readiness Partnership (PMR) Partnership
support program was implemented by the World Bank and
the Undersecretariat of Treasury, numbered TF010793,
made by the World Bank and the Undersecretariat of
Treasury. Fund Grant numbered TF015591 for the
Partnership for Preparation for the Carbon Market was
published in the Official Gazette numbered 28910 on 11
February 2014. With contracts, 3,350,000 dollars were
allocated to the Ministry of Environment and Urbanization.
The Ministry of Environment and Urbanization has been
designated as the Implementing Agency for the above
mentioned Grant Agreement.
A pilot study in coordination with all relevant
stakeholders for the implementation of the Regulation on
Monitoring of Greenhouse Gases (MRV) in voluntary
sectors, analytical studies, capacity building, awareness
raising and training studies to support decision-making
processes for the use of carbon market mechanisms will be
carried out within the scope of the project.
In April 2012, Turkey has adopted a new
regulatory framework for a comprehensive and
compulsory MRV system. Monitoring and reporting in
2015 (2015 emissions) started in 2016.
Turkey, since 2013, energy, cement and refinery
sectors through pilot studies in order to improve the
regulation MRV is working with PMR. A series of
workshops and analytical studies have been conducted to
explore the options for using emission trading and other
market-based tools in MRV sectors.
A synthesis report in November 2018 Climate
Change and Air Management stating that carbon markets
of policy options were presented to the Coordination
Committee for Turkey.
Turkey is a candidate at the same time EU
membership and thus aims to fulfill its environmental
obligations of EU membership (including the EU ETS
Directive) MRV Turkey MRV legislation has established a
system at the installation level for CO2 emissions for about
900 businesses. The scope of the sector includes the energy
sector (combustion fuels > 20 MW) and industrial sectors
(coke production, metals, cement, glass, ceramic products,
insulation materials, paper and pulp, chemicals according
to specified threshold sizes / production levels) ( ICAP,
2019).
Status of Forest Carbon Credits in Voluntary
and Mandatory Markets: Compared to the mandatory
markets, the forestry sector took a higher place in voluntary
markets as a transaction volume. While the value of
voluntary forest carbon offset transactions in 2016 was
74.2 million dollars, it was 551.4 million dollars when 41.9
million dollars excluding the Australian ERF in mandatory
markets were included. 2/3 of the voluntary markets in total
transaction value were obtained from forestry carbon
offsets. The transaction volume decreased by 21% in 2016
compared to 2015.
Figure 1. Transaction volume and values of forestry-based emission
reductions in voluntary and compulsory markets (Hamrick and Gallant,
2017).

Toksoy et al., 5(5), 872-881, (2020) J. Anatolian Env. and Anim. Sciences, Yıl:5, No:5, (872-881), 2020
877
The activities used to create forest carbon credits
under CDM in mandatory markets are afforestation and
reforestation. According to the latest data, only 66 of 7804
registered CDM projects are forestry projects and the share
of A / R loans in CDM loans is only 0.8%. The important
reason for this is the difficulties it faces in terms of proving
the additional contribution and effectiveness. Within the
scope of the Paris Agreement, negotiations on CDM are
continuing.
Forestry and land use projects in the voluntary
carbon market are certificated and traded within the
framework of certain standards. These standards; Verified
Carbon Standard (VCS), American Carbon Registration
Standards (ACR), Plan Vivo Standard, Gold Standard,
Climate Action Reserve (Reserve) CAR and Climate,
Community and Biodiversity Standards (CCB Standards).
82% of forestry and land use projects in the
voluntary market have the Verified Carbon Standard.
Different project types such as tree-planting, agroforestry
and advanced forest management are certified within the
scope of VCS. But the most common is REDD +. 73% of
VCS certified offsets also carry Climate Community and
Biodiversity (CCB) Standards. The CCB standard is a non-
carbon common benefit standard and is added to VCS
forest carbon projects. Historically, VCS and CCB
certified offsets have been sold at higher prices than those
approved by VCS alone, but this did not apply in 2016.
VCS certified offsets average $ 4.6 / tCO2 equivalent, VCS
+ CCB offsets 4.1 / tCO2 equivalent sold. This is probably
due to the locations of these projects; VCS + CCB Offset
prices tend to be produced in low-income countries, with
offset prices generally lower. ACR certified offsets made
up the second largest share of the market in terms of value
and volume in 2016. Most of the offsets published by the
processed ACR came from either improved forest
management or tree planting. ACR offsets are 8.9 $ / tCO2
equivalent above average prices. This is partly because
ACR certified projects are mostly found in the United
States. The Gold Standard and Plan Vivo both place great
emphasis on shared benefits and although they have no
geographic constraints, both standards approve forestry
and land use projects in small, rural communities in low-
or middle-income countries. Gold Standard accounts for
about 4% of the market volume, with these offsets traded
at an average price of $ 5.7 / tCO2 equivalent. Tree planting
constituted the main project type. Plan Vivo accounted for
2% of the market volume and these offsets were traded at
an average price of $ 8 / tCO2. Plan Vivo is forest project
types-tree planting, agro-forestry, mangrove restoration,
REDD + and advanced land and forest management. In
2016, project transactions that did not use a third-party
verification standard accounted for only 0.3% of the
market volume and were sold at the highest price (20.1 $ /
tCO2 equivalent). Offsets in the 'other' category also
accounted for the second highest price (11.5 $ / tCO2
equivalent), but they accounted for less than 1% of total
forest and land use offsets, all of which are in North
America, where prices are higher. are available. Similarly,
the Australian Carbon Agriculture Initiative offsets have
high prices (average 8.9 $ / tCO2 equivalent), making up a
very small portion of the market (2%) and were used only
in Australia. 99% of all forest carbon projects include at
least one co-benefit type (Hamrick and Gallant, 2017).
Voluntary carbon markets In 2016, more than US
$ 66 million forest carbon offset projects were processed.
These offset projects have 99% VCS standards.
Figure 2. Distribution of forestry carbon projects by project type.
When Figure 2 is examined, 26.8% of the traded
volume constitutes the forestry and land use category.
46.5% of the total value of voluntary carbon markets comes
from forestry and land use offsets. Renewable offsets sold
at an average of $ 1.4, while forestry and land use offsets
were sold at $ 5.1 (Hamrick and Gallant, 2017).
In 2016, the most traded project categories in the
voluntary carbon markets were renewable energy
resources with a transaction volume of 18.3 MtCO2
equivalent, and forestry and land use with a transaction
volume of 13.1 MtCO2.
According to the project types the transaction
volume of the forestry and land use category in the
voluntary carbon markets in 2016 was 13.1 MtCO2
equivalent. The volume of forestry project types in this
category was 12.1 MtCO2 equivalent. REDD + project type
9.7 MtCO2 equivalent, Afforestation and Reforestation (A
/ R) 1.3 MtCO2 equivalent and Advanced Forest
Management (IFM) with 1.1 MtCO2 equivalent volume
have taken place in this market. In 2016, the most
purchased and sold project type in terms of volume was 9.7
MtCO2 equivalent and wind energy followed REDD + with
8.2 MtCO2 equivalent. The average price of offsets from
the REDD + project type was $ 4.2, Afforestation and
Reforestation (A / R) offsets averaged $ 8.1, Advanced

Toksoy et al., 5(5), 872-881, (2020) J. Anatolian Env. and Anim. Sciences, Yıl:5, No:5, (872-881), 2020
878
Forest Management (IFM) offsets were traded at $ 9.5
(Hamrick and Gallant, 2017).
Approximately one-third of carbon credits in
voluntary markets are from forest carbon credits. The
majority of forest carbon credits are generated in
developing countries. Recently, the supply in the market is
high and the price of loans remains low. In forest carbon
projects, the CO2 price per tonne varies between 3 and 10
US dollars.
Carbon Market in Turkey: Turkey, although the
Kyoto Protocol does not benefit from the flexibility
mechanisms which are subject to emissions trading in
functioning independently of these mechanisms,
established within the framework of environmental and
social responsibility principles Volunteer projects for the
Carbon Market has long been developed and implemented
(NC, 2016). Voluntary Carbon Market, if we represent a
very small percentage in the World Carbon Market,
effective way to benefit from this market in Turkey offers
an important opportunity for future participation in the
carbon market. Currently, there are 348 projects that
improve the carbon presence in the Voluntary Carbon
Market. These projects are expected to achieve 26 million
CO2 equivalent greenhouse gas emissions annually (NC,
2017). 72% of voluntary carbon projects project is located
in the top five countries hosting: India (442), China (426),
United States (351), Turkey (124) and Brazil (97)
(Hamrick and Gallant, 2017).
Table 2. Industry distribution of the carbon project in Turkey
(NC, 2017).
Project Type Number of Project Annual Potential of GHG
Emission Reduction (tCO2-eq)
Hydroelectric 146 8.543.540
Wind Power 145 11.223.783
Biogas/ Waste Energy System 34 4.104.066
Geothermal 11 1.868.256
Energy Efficiency 12 268.557
TOTAL 348 26.008.202
Turkey plays a significant role in the global
voluntary carbon market and is the largest seller of
voluntary carbon credits in Europe. 2007-2015 period,
Turkey has made 35 million tonnes of CO2 equivalent
transactions with a value of over $200 million. This
transaction volume represents around 70 percent of the
total market volume in Europe so far. Turkey in 2015, 3.1
million tons, which is about half of all primary operations
in Europe are responsible for the CO2 equivalent. This is
Turkey equally with other major players, including the
United States and Kenya after Brazil, India and Indonesia
has the world's fourth largest provider of voluntary carbon
exchange. However, despite the high transaction volume,
the total value of these transactions fell from USD 18.6
million in 2013 to USD 4.3 million in 2015. Most of
Turkey's voluntary carbon transactions, wind, were
obtained from the sale of VERs generated by hydro and
landfill methane projects.
Turkey average price of $ 1.1 with traded volume
of 1.9 MtCO2 equivalent in 2016 from is stated that the
total value of $ 2M.
Carbon projects in Turkey is primarily developed
in one of the two standards. These; It is Gold Standard and
Verified Carbon Standard. As of April 2016 Turkey, has
completed 235 projects registered with the Gold Standard
which 125 of them, 110 of them are Verified Carbon
Standard. Both standards stand out as an internationally
respected framework for the development and
implementation of emission reduction projects and are
traded worldwide.
The basis of the United Nations Framework
Convention on Combating Climate Change and its
accompanying Kyoto Protocol is based on the "polluter
pays" philosophy. Parties have made emission reduction
commitments in line with this philosophy. However, for
both economic and political reasons, developed countries
with historical responsibility have taken less emission
reduction commitments than they could. While Kyoto
Protocol's first term emission reduction target was 5%, this
target was realized as 22.6% at the end of the period. This
situation reveals that especially developed countries make
less effort in combating climate change than they can.
Since the developed countries that are party to the
contracts have completed their industrialization, current
emission trends are lower than those in developing
countries that cannot complete their industrialization.
However, developed countries, which have been in a
polluting position in the historical process, do not make
enough effort and continue to contribute to their economies
by transferring technology to developing countries through
mechanisms. For example, while the Green Climate Fund,
whose establishment purpose is to provide funds to
developing countries from developed countries in
adaptation to climate change, 100 billion dollars should be
transferred until 2020, it was announced at the Lima
Conference that the amount provided for this fund was only
10 billion dollars.
Although the issue of climate change is an
environmental reality today, the economic and political
attitudes of the party countries have a negative effect on the
solution of this problem. Some of the developed countries
(Japan, Australia, Canada, Russia) that have emission
reduction and limitation targets in the first period of the
Kyoto Protocol are not included in the second period of the
Kyoto Protocol with the Doha Regulation. One of the main
factors for countries to make this decision is the avoidance
of emission reduction commitments by major economies
such as the USA, India and China. Again, since the second

Toksoy et al., 5(5), 872-881, (2020) J. Anatolian Env. and Anim. Sciences, Yıl:5, No:5, (872-881), 2020
879
period emission reduction target of the Kyoto Protocol is
18%, these countries did not take part in the second period
of the Kyoto Protocol in order to avoid the negative effects
to be experienced on their industries and thus on their
economies.
A study examining the share of sectors in KP1
emission reductions revealed that the energy sector
contributed to the highest greenhouse gas emission
reductions, with most countries achieving a limited amount
of greenhouse gas reductions from their chosen LULUCF
activities. It has been determined that LULUCF's
contribution to greenhouse gas emission reduction has a
significant but small share. This suggests that unless there
are significant changes in accounting rules, future emission
reductions will mainly result from actions to reduce fossil
fuel consumption, and the agriculture and LULUCF
sectors will continue to play a supporting role (Liua et al.,
2016).
According to 2016 data, the total volume of the
global carbon market is 6.03 GtCO2 and its monetary value
is 30.2 billion dollars. Almost all (99%) of the trading
volume of the carbon market consists of mandatory
markets. Mandatory markets have a trading volume of 5.96
GtCO2 and a monetary value of approximately $ 30 billion.
When the carbon credits obtained from forestry projects
traded in compulsory and voluntary markets are analyzed;
While the total amount of forest loans traded in the
mandatory market is 41.9 million dollars, this value is 74.2
million dollars in voluntary markets. While carbon credits
obtained from forestry projects constitute 37.1% of the
total value of voluntary markets, these credits constitute
0.14% of the compulsory market. Forests are of great
importance in efforts to combat global climate change. For
this reason, this situation has been emphasized and
continues to be done in all international processes,
especially the Kyoto Protocol. However, forestry carbon
credits cannot be traded in most of the existing mandatory
markets (limited trade in New Zealand and Canada),
especially in the European Union Emission Trading
System. The reason for this situation; countries evaluate
their forestry projects within the scope of risky investment.
Parties taken so far regarding Turkey Conference
decisions 26 / CP.7, 1 / CP.16, 2 / CP.17 1 / CP.18 and 21
/ CP.20 'dir. There has been no change in the state of
Turkey. Turkey, in a different location from the
UNFCCC's other Annex I Parties, the particular
circumstances of the well-known, not included in the
agreement's Annex II list, as defined in KP's Annex-B
binding greenhouse gas does not have any commitment to
reduce emissions. Turkey constitute the basic principles of
historical responsibility for the contract, the principle of
common but differentiated responsibilities, equity and
revise again the differences in the classification of
countries is important Annex.
Turkey has not yet ratified despite the signing of
the Paris Agreement. Turkey, the necessary arrangements
in the energy sector in reducing the use of fossil fuels 2 C
temperature increase within the confines of this agreement
is one of the declared objectives would do. However, CAT
(2019), of which Turkey is a country located in (the US,
Russia, like Saudi Arabia) at the National Contribution
Statement was found critically inadequate. Turkey's
growing energy demand planning to meet the new coal
power plants sourced from literally create a contrast with
the National Contribution Agreement under the Paris
Declaration. Turkey, 88'n% of its energy needs, according
to data of 2017, or 33% of the fossil fuel and electricity
supply (16% increase compared to 2016) have met from
the coal. In this case, the CAT (2019) to verify the report
with the revision of policy towards Turkey, especially
renewable energy sources reveals the necessity. Also, in
case the point of meeting the targets set by Treaty of Paris
that Turkey is not sufficient in forestry legislation and in
particular to continue to be considered as developed
countries needed extensive editing is in Turkey's forestry
legislation (Gencay et al., 2019).
Bouyer and Serengil (2017) in Turkey between
the years 2013- 2020 forest carbon credits that can be
obtained from 179.1 MtCO2 (nearly 22.4 MtCO2) found
equivalent. In this study, the cost per ton was found as 66.7
dollars for forest management and 86.4 dollars for
afforestation. These values indicate that only very costly
for the operation of Turkey's forests and carbon
sequestration is quite high in terms of producing only
carbon projects in terms of retention, although low
compared to other sectors.
Kuş et al. (2017) entitled, obtain carbon credits
from afforestation and reforestation projects in the
voluntary carbon market in Turkey The legal and technical
conditions have been examined. Working with Turkey
hectare basis with a small amount to be obtained A/R
carbon credits were increased disproportionately the
certification costs and a 30-year A/R project of the cycle
carbon certification cost was estimated that approximately
$ 110,000. Project design development, registration,
approval and verification processes are included in this cost
calculation and excluding afforestation cost and net present
value. In order to earn income from carbon credit sales, it
was estimated that an area of 187 hectares should be
subject to afforestation. providing reforestation carbon
certification in the private sector in the implementation of
the socio-economic responsibility program in Turkey has
observed that the economically and technically.
Turkey, the world takes its place among the few
countries that increase the presence of the forest. In

Toksoy et al., 5(5), 872-881, (2020) J. Anatolian Env. and Anim. Sciences, Yıl:5, No:5, (872-881), 2020
880
combating climate change, the forestry sector is important
in terms of mitigation and adaptation policies. One of the
ecosystem services provided by forests is that it acts as a
sink in terms of greenhouse gas emissions. Therefore, the
effect of correct and sustainable management of forests on
carbon stocks is indisputable. Turkey, however, inadequate
to the legal framework on this issue (Coskun and Gencay,
2011), the institutional embodiment there are
shortcomings. Yet rural development with forestry
activities in Turkey in the fight against climate change and
the use of tools such as agroforestry is important (Toksoy
and Bayramoglu, 2017). Positive effects can be made on
issues such as reduction of greenhouse gas emissions and
biodiversity as well as increasing the welfare levels of
regional development and rural societies through both rural
development and agricultural forestry studies (Toksoy and
Bayramoğlu, 2020).
CONCLUSION
The following recommendations are developed
alongside of climate change more effectively use the
carbon markets and forestry projects located in the struggle
with Turkey's on what to do about it.
• For the continuity of the mechanisms established
by the Kyoto Protocol, first of all, developing countries
should fulfill their economic obligations.
• Countries with similar economic indicators
should be re-evaluated and the classification should be
revised in order to correct the problems in the country
classification made as a result of international processes.
• In order to make carbon markets more effective
and efficient, besides taking into account the special
circumstances of the countries in the creation of new
market rules, practices that encourage the market should be
encouraged.
• As a carbon pricing mechanism in the fight
against climate change, regulations are made to encourage
Carbon Markets private sector solutions. Particularly with
regard to the issue of forestry forest ownership in Turkey
does not permit the private sector to take part in this
market. Must make the necessary arrangements in this
regard the relevant public institutions and organizations in
Turkey.
•Turkey's strong international position with the
change, measurable - verifiable - reportable (MRV) are
required to establish the system. For this, institutional
capacity should be developed first.
• In Turkey, the only competent authority
responsible for the management of the forests within the
General Directorate of Forestry will conduct studies on the
fight against climate change at a level sufficient (nowadays
are active in the working group level) does not have a unit.
The General Directorate of Forestry should establish a unit
at the level of departments on climate change in its current
structure, and give importance to developing its
institutional capacity and training expert teams.
ACKNOWLEDGMENTS
The authors declare that there are no conflicts of
interest. This study is derived from the master thesis
"Stiuation of Forest Carbon Projects in Carbon Markets"
conducted in the Karadeniz Technical University, Institute
of Science, Forest Engineering Department. This study was
presented in ORENKO 2020 held by Karadeniz Technical
University, Trabzon.
REFERENCES
Bouyer, O. & Serengil, Y. (2017). Cost-Benefit
Assessment of Implementing LULUCF
Accounting Rules in Turkey. In: Carbon
Management, Technologies, and Trends in
Mediterranean Ecosystems. Springer, Dordrecht,
89-129p.
CAT. (2019). Warming Projections Global Update,
London, UK, 33p.
Coşkun, A.A. & Gençay, G. (2011). Kyoto Protocol and
“Deforestation” A Legal Analysis On Turkish
Environment And Forest Legislation. Forest
Policy and Economics, 13(5), 366-377.
Dagoumas, A.S., Papagiannis, G.K. & Dokopoulos, P.S.
(2006). An economic assessment of the Kyoto
Protocol Application. Energy Policy, 34(1), 26-
39.
FAO. (2008). Strategic Framework for Forests and
Climate Change, Forest Day, Poznan, 57p.
FRA. (2010). Global Forest Resources Assessment 2010
Main Report, FAO Forestry Paper 163, Rome,
378p.
Gençay, G., Birben, Ü. & Aydın, A. (2019). To Be “A
Developed Country” Or Not To Be? The Effect
Of The Paris Agreement On Turkish Forest Law.
Environ Monit. Assess., 191(2109), 1-14.
Hamrick, K. & Gallant, M. (2017). Fertile Ground State
of Forest Carbon Finance 2017. Wahington,
USA, 88p.
ICAP. (2019). Emissions Trading Worldwide: Status
Report 2019. Berlin, Germany, 12p.
IPCC. (2013a). Summary for Policymakers. In: Climate
Change 2013: The Physical Science Basis.
Contribution of Working Group I to the Fifth
Assessment Report of the Intergovernmental
Panel on Climate Change, Cambridge University

Toksoy et al., 5(5), 872-881, (2020) J. Anatolian Env. and Anim. Sciences, Yıl:5, No:5, (872-881), 2020
881
Press, Cambridge, United Kingdom and New
York, NY, USA.
IPCC. (2013b). Carbon and Other Biogeochemical
Cycles. In: Climate Change 2013: The Physical
Science Basis. Contribution of Working Group I
to the Fifth Assessment Report of the
Intergovernmental Panel on Climate Change.
Cambridge University Press, Cambridge, United
Kingdom and New York, NY, USA.
IPCC. (2014). Climate Change 2014: Synthesis Report.
Contribution of Working Groups I, II and III to
the Fifth Assessment Report of the
Intergovernmental Panel on Climate Change.
IPCC, Geneva, Switzerland, 151p.
Janowiak, M., Connelly, W.J., Dante-Wood, K.,
Domke, G.M., Giardina, C. et al., (2017).
Considering forest and grassland carbon in land
management General Technical Report
(GTR),WO-95, USDA Forest Service,
Washington, 76p.
Kuş, M., Ülgen, H., Güneş, Y., Kırış, R., Özel, A. &
Zeydanlı, U. (2017). Carbon Certification of
Afforestation and Reforestation Areas in Turkey.
In: Erşahin, S., Kapur, S., Akça, E., Namlı, A. &
Erdoğan H.(Eds), Carbon Management,
Technologies, and Trends in Mediterranean
Ecosystems. The Anthropocene: Politik-
Economics-Society-Science 15, Springer, 159p.
Le Quéré, C., Andrew, R.M., Friedlingstein, P., Sitch,
S., Hauck, J. et al. (2018). Global Carbon Budget
2018. Earth Syst. Sci. Data, 10, 2141-2194.
Liua, S., Wilkes, A., Lia, Y., Gaoa, Q., Wana, Y., Maa,
X. & Qin, X. (2016). Contribution of different
sectors to developed countries’ fulfillment of
GHG emission reduction targets under the first
commitment period of the Kyoto Protocol.
Environmental Science & Policy, 61, 143-153.
Lorenz, K. & Lal, R. (2010). Carbon Sequestration in
Forest Ecosystems. Springer, Dordrecht, 239p.
Mackey, B.G., Keith, H. Berry, S.L. & Lindenmayer,
D.B., (2008). Green Carbon: The Role Of Natural
Forests in carbon storage. Part1. A Green Carbon
Account Of Australia’s South-Eastern Eucalypt
Forests And Policy Implications. ANU Press,
Canberra, 47p.
NC. (2016). Sixth National Communication Of Turkey.
Republic of Turkey Ministry of Environment and
Urbanization, Ankara, 155p.
NC. (2017). Seventh National Communication Of Turkey.
Republic of Turkey Ministry of Environment and
Urbanization. Ankara, 195p.
NIR. (2019). National Inventory Report. Turkish
Statistical Institute, Ankara, 567p.
Öztekin, Ç. (2019). Stiuation of forest carbon projects in
carbon markets and assessment of turkey. Master
Thesis, Natural Sciences, Karadeniz Technical
University, Trabzon, Türkiye, 128p.
Serengil, Y. (1995). Küresel Isınma ve Olası Ekolojik
Sonuçları. Journal of the Faculty of Forestry,
45(1-2), 135-152.
Schimel, D. (2006). Terrestrial Ecosystem and Carbon
Cycle. Global Change Biology, 1(1), 77-91.
Toksoy, D. & Bayramoğlu, M.M. (2017). Rural
Development and Forest Villages. KTU
Publications No:244, Trabzon, Turkey, 232p.
Toksoy, D. & Bayramoğlu, M.M. (2020). Agricultural
Forestry. Serander, Trabzon, Turkey, 200p.
UNFCCC. (1992). United Nations Framework
Convention On Climate Change.
FCCC/INFORMAL/84, GE.05-62220,(E)
200705, Rio, Brazil, 25p.
UNFCCC. (2005). Report of the Conference of the Parties serving as the meeting of the Parties to the Kyoto
Protocol on its first session, held at Montreal from
28 November to 10 December 2005, Addendum,
Part Two: Action taken by the Conference of the
Parties serving as the meeting of the Parties to the
Kyoto Protocol at its first session, 11/CMP.1
Modalities, rules and guidelines for emissions
trading under Article 17 of the Kyoto Protocol,
FCCC/KP/CMP/2005/8/Add.2.

Journal of Anatolian Environmental and Animal Sciences
(Anadolu Çevre ve Hayvancılık Bilimleri Dergisi) DOI: https://doi.org/10.35229/jaes.837653
JAES Year: 5, No: 5, 2020 (882-885)
AÇEH Yıl: 5, Sayı: 5, 2020 (882-885)
ARAŞTIRMA MAKALESİ RESEARCH PAPER
882
Decay Resistance of Weathered Beech Wood
Şebnem Sevil ARPACI* Merve CAMBAZOĞLU Eylem DİZMAN TOMAK Bursa Technical University, Faculty of Forest, Forest Industry Engineering Department, 16310, Bursa, Turkey
Geliş/Received: 08.12.2020 Kabul/Accepted: 20.12.2020
How to cite: Arpacı, Ş.S., Cambazoğlu, M. & Dizman Tomak, E. (2020). Decay Resistance of Weathered Beech Wood. J. Anatolian Env. and Anim.
Sciences, 5(5), 882-885.
Atıf yapmak için: Arpacı, Ş.S., Cambazoğlu, M. & Dizman Tomak, E. (2020). Yaşlandırılmış Kayın Odununun Mantar Çürüklük Dayanımı. Anadolu Çev.
ve Hay. Dergisi, 5(5), 882-885.
Abstract: Wood is susceptible to photo-degradation in outdoor applications, and deformations occur on its surface such as micro or macro cracks, color changes etc. Especially, cracks make wood material more vulnerable to biotic attacks. In this study, decay resistance of natural and accelerated weathered beech samples was investigated by a brown (Coniophora puteana) and white rot (Coriolus versicolor) fungi attacks. For this purpose, beech samples exposed to natural weathering (NW) for 393 days, and accelerated weathering (AW) for 1512h, and then subjected to decay test in malt extract agar medium for 2 and 4 weeks. After 2 weeks of decay testing,
weight loss of samples by C. versicolor was found to be 24.30% for controls, 13.29% for AW samples and 24.38% for NW samples. In the case of C. puteana, it was found as 21.15%, 21.49% and 30.61% for controls, AW samples and NW samples, respectively. Weight loss of samples by C. versicolor was found to be 61.82% for controls, 30.72% for AW samples and 37.62% for NW samples, after 4 weeks of decay testing. The weight loss by 4 weeks exposure of C. puteana was found to be 21.43%, 28.44% and 37.67% for controls, AW samples and NW samples, respectively. Natural weathering caused more weight loss than accelerated weathering test for both fungi species.
Keywords: White rot, brown rot, natural weathering, accelerating weathering, beech.
Yaşlandırılmış Kayın Odununun Mantar Çürüklük Dayanımı
Öz: Ahşap dış mekan uygulamalarında foto-degradasyona karşı hassas bir malzeme olup, yüzeyinde mikro veya makro çatlaklar ile renk değişiklikleri gibi deformasyonlar meydana gelmektedir. Özellikle çatlaklar, ahşap malzemeyi biyotik saldırılara karşı daha savunmasız hale getirmektedir. Bu çalışmada, doğal ve hızlandırılmış yaşlandırma testi uygulanmış kayın örneklerinin esmer (Coniophora puteana) ve beyaz çürüklük (Coriolus versicolor) mantar
saldırılarına karşı dayanımı araştırılmıştır. Bu amaçla, 393 gün boyunca doğal dış ortam testi (NW) ve 1512 saat süreyle hızlandırılmış yaşlandırma testine (AW) maruz kalan kayın örnekleri, 2 ve 4 hafta boyunca malt ekstrakt agar ortamında çürüklük testine tabi tutulmuştur. 2 hafta boyunca C. versicolor mantarının saldırısına bırakılan örneklerin ağırlık kaybı kontroller için %24,30, AW örnekleri için %13,29 ve NW örnekleri için %24,38 olarak bulunmuştur. C. puteana’ya maruz bırakılan kontrol, AW örnekleri ve NW örnekleri için ise ağırlık kaybı sırasıyla %21,15, %21,49 ve %30,61 olarak bulunmuştur. 4 hafta boyunca C. versicolor’a maruz bırakılan örneklerin ağırlık kaybı kontroller için %61,82, AW örnekleri için %30,72 ve NW örnekleri için
%37,62 olarak bulunmuştur. C. puteana’ya 4 hafta boyunca maruz bırakılan örneklerin ağırlık kaybı kontroller, AW örnekleri ve NW örnekleri için sırasıyla %21,43, %28,44 ve %37,67 olarak bulunmuştur. Doğal dış ortam testi, her iki mantar türü için hızlandırılmış yaşlandırma testinden daha fazla ağırlık kaybına neden olmuştur. Anahtar kelimeler: Beyaz çürüklük, esmer çürüklük, doğal dış ortam testi, hızlandırılmış yaşlandırma testi,
kayın.
* : https://orcid.org/0000-0002-2591-2837
: https://orcid.org/0000-0001-8001-686X
: https://orcid.org/0000-0001-8654-0005
*Corresponding author’s:
Şebnem Sevil ARPACI
Bursa Technical University, Faculty of
Forest, Forest Industry Engineering
Department, 16310, Bursa, Turkey.
: [email protected] Mobile telephone: +90 (541) 590 23 60
Telephone : +90 (224) 300 38 57
Fax : +90 (224) 300 34 29
*Sorumlu yazarın:
Şebnem Sevil ARPACI
Bursa Teknik Üniversitesi, Orman Fakültesi,
Orman Endüstri Mühendisliği Bölümü,
16310, Bursa, Türkiye.
: [email protected] Cep telefonu : +90 (541) 590 23 60
Telefon : +90 (224) 300 38 57
Faks : +90 (224) 300 34 29

Arpacı et al., 5(5), 882-885, (2020) J. Anatolian Env. and Anim. Sciences, Yıl:5, No:5, (882-885), 2020
883
INTRODUCTION
During outdoor exposure, wood may undergo
serious changes of its physical and structural properties due
to the combined effect of sunlight (UV), oxygen, moisture,
atmospheric pollutants and microorganisms. The
combination of oxygen and UV rapidly causes the
oxidation of lignin and hemicellulose, and
depolymerization of cellulose. Most of the reaction
products are water soluble, so they are easily removed from
the wood surface by rain, resulting in weight loss,
roughness and color changes (Xie et al., 2005; George et
al., 2005; Evans, 2008; Lionetto et al., 2012). Weathering
studies of wood can be both performed in laboratory and
real outdoor conditions. Laboratory weathering test also
known as artificial weathering test includes ultraviolet light
and moisture cycles, and this procedure is generally
accepted as a simulation of outdoor conditions. However,
in reality there are many other degradation factors in
outdoor such as colonization of microorganisms, aerosols,
mechanical effects of wind, human, etc. Therefore, both
experiments in laboratories and outdoor exposure tests in
ground and above ground situations are essential for
service life assessment of wood (Brischke and Meyer-
Veltrup, 2015; Metsa-Kortelainen and Viitanen, 2017;
Tomak et al., 2018).
In outdoors, wood undergoes biological decay by
white, brown and soft rot fungi. Basidiomycetes are
responsible for the most of wood decay in constructions
(Bari et al., 2015). During exposure to fungal attack,
significant changes occur in wood chemical composition,
resulting in significant weight loss, mechanical strength
loss and aesthetical defects. Weathering tests prior to decay
tests can accelerate wood degradations, and can help the
simulating of outdoor degradations in shorter time. The
combination of the weathering tests and decay tests may
become a new strategy to test wood preservatives in future.
Studies on decay test of wood and/or wood-based
composites after weathering tests showed that weathering
affected decay process. Catto et al. (2016) investigated the
effect of natural weathering and decay test by Trametes
villosa, Trametes versicolor, Pycnoporus sanguineus and
Fuscoporia ferrea. The results showed that natural
weathering accelerated fungal degradation by influencing
fungal growth. Decay resistance of weathered albizzia and
sugi wood samples was studied by Sudiyanni et al. (1996).
They found that weathered samples had higher weight loss
than control samples. In another study, oak wood was
naturally and artificially aged, and then, were inoculated
with brown and white rot fungi. In that study, brown-rot
fungi caused greater change in weight-loss in naturally
aged samples than white-rot fungi did (Chow and Bajwa,
1998). Reinprecht and Grznárik (2015) reported that the
artificial ageing decreased the decay resistance of the
modified or the modified and painted pine sapwood. Decay
test of weathered beech samples showed that samples had
darker color than that of controls due to the weight loss
after C. puteana attack (Reinprecht and Hulla, 2015).
In this study, decay resistance of natural and
accelerated weathered beech samples was investigated by
a brown (Coniophora puteana) and white rot (Coriolus
versicolor) fungi. Samples were exposed to natural
weathering (NW) for 393 days, and accelerated weathering
(AW) for 1512h, and then were subjected to decay test in
malt extract agar medium for 2 and 4 weeks. Weight loss
of samples was compared with un-weathered samples
(controls).
MATERIALS AND METHODS
Materials: Beech samples were obtained from
Sulekler Forest Industry, Bursa, Turkey. The samples were
produced industrially. Samples with dimensions of 2 mm
(radial) x 75 mm (tangential) x 150 mm (longitudinal) were
prepared for artificial and natural weathering tests. After
weathering tests, the samples were cut into 2 mm (radial)
× 5 mm (tangential) × 30 mm (longitudinal) for the decay
test. Samples without any visible defects such as cracks,
strain and knots were selected prior the experiments, and
then oven-dried. Malt extract agar sourced from Merck
(Darmstadt, Germany).
Method
Artificial weathering: Artificial weathering was
carried out in the Atlas UV Test machine (Illinois, USA)
according to ASTM G154 (2016) standard. The weathering
cycle consisting of a continuous UV (340 nm, 0.89 W/m2)
for 8 h at 60°C followed by a condensation for 4 h at 50°C
was applied for 1512 h.
Natural weathering: Samples were exposed to
outdoor conditions in south at an angle of 45° to the
horizontal in Bursa Technical University campus with an
altitude of 162 m in Bursa, Turkey for the period from
November 2018 to November 2019 according to principles
of ASTM G7 (2013) and EN 927-3 (2003) standards.
Decay test: The decay test was performed
according to EN 113 (1997) principles, with some changes
in sample size and kolle flasks. 6 replicates were used for
each group. Malt extract agar solution of 4.8%
concentration, and the samples were sterilized in an
autoclave (Tomy SX700, Japan) at a pressure of about 0.1
MPa at 120°C for 25 min. Fungi cultures of the brown rot
fungus Coniophora puteana (Schumach.) P. Karst. (Mad-
515) and white rot fungus, Coriolus versicolor (Linnaeus)
Quelet (1030) were inoculated to sterile malt extract agar
medium in the petri dishes. Samples were incubated at
20°C and 70% RH for 2 and 4 weeks. After the test, oven

Arpacı et al., 5(5), 882-885, (2020) J. Anatolian Env. and Anim. Sciences, Yıl:5, No:5, (882-885), 2020
884
dry weights of samples were determined. The weight loss
was calculated by the following equation:
Weight loss (%) = (Mint-Mend/ Mint) × 100 (1)
Where,
M is the weight of the samples and the subscripts
“int” and “end” refer to the oven-dry weight at 103°C
before and after the decay test, respectively.
RESULTS AND DISCUSSION
The weight loss of the samples is illustrated in Fig.
1 for C. versicolor, and Fig. 2 for C. puteana attack. The
weight loss of control samples showed that the decay test
was valid, and the test conditions were suitable for growth
of the fungi. Test fungi showed suitable growth and
colonization of the mycelium on all samples.
Figure 1. Weight loss of samples caused by C. versicolor attack.
After 2 weeks, natural weathering and control
samples degraded almost similarly around 24% by C.
versicolor attack. Fungal degradation was found to be less
in the artificial weathering samples (13.29%) than in the
others. This may be explained by the rapid degradation of
the chemical components of wood (especially lignin) due
to artificial degradation. Samples thickness was around
2mm, and this could accelerate the photo-degradation. At
the end of the 4 weeks, the weight loss of beech samples
was 61.82, 30.72 and 37.62% for control, artificial
weathering and natural weathering samples, respectively
(Figure 1). Panek et al. (2014) stated that artificial
weathered beech samples exhibited less weight loss than
the untreated control samples.
Artificial weathering and control samples
degraded almost similarly after 2 weeks of C. puteana
exposure. At the end of the 4 weeks, the weight loss of
beech samples was 21.43, 28.44 and 37.67% for control,
artificial weathering and natural weathering samples,
respectively. Natural weathering samples degraded more
than artificial weathering samples for both decay fungi.
Cracks and voids in the natural weathered samples could
cause an entrance for fungi mycelium, and cause an
increase in the moisture uptake during the decay test, and
therefore may create more suitable conditions for fungal
growth. Furthermore, different degradation rates of wood
components between the weathering methods could also
have an important role on the weight losses by fungi
attacks.
Figure 2. Weight loss of samples caused by C. puteana attack.
In Fig. 1, control samples showed higher weight
loss than weathered samples however in Fig. 2, weathered
samples had higher weight loss than controls. The decay
mechanism of C. versicolor and C. puteana might be the
main reason for this finding. Brown rotter’s primarily
attack the cell-wall carbohydrates, leaving a modified
lignin at the end of the decay process. Simultaneous white-
rotter’s attack all cell-wall constituents (Zabel and Morell,
1992). Weathering also causes a decrease in lignin
component. In fact, weathering is a surface phenomenon.
But in this study the thickness of the samples is quite small,
and therefore the degradation could be deeper inside the
sample. It may be concluded that the chemical components
in the control samples are higher than the weathering
samples, and thus may create a more suitable medium for
C. versicolor growth than weathered samples. In the decay
process of C. puteana, wood carbohydrates were degraded,
and lignin was previously degraded in weathered samples.
However, only carbohydrate degradations occurred during
C. puteana attack in controls. This could cause a less
weight loss in controls than weathered samples after C.
puteana attack.
CONCLUSION
This study aimed to investigate the decay
resistance of natural and accelerated weathered beech
samples against C. puteana and C. versicolor attacks. The
results showed that fungi species and weathering methods
affected the decay resistance of samples. Natural
weathering samples degraded more than artificial
weathering samples after both decay fungi exposure.
Different degradation rates of wood components between

Arpacı et al., 5(5), 882-885, (2020) J. Anatolian Env. and Anim. Sciences, Yıl:5, No:5, (882-885), 2020
885
the weathering methods probably played an important role
on the weight losses by fungi attacks. Control samples
showed higher weight loss than weathered samples after C.
versicolor exposure, however, they had lower weight loss
than weathered samples after C. puteana exposure
probably related with the decay mechanism of white and
brown rot fungi. 4 weeks of exposure to C. versicolor
caused more weight loss than C. puteana for all samples
since white rots in hardwoods are generally more severe.
More studies are needed for better understanding in decay
mechanism of weathered wood.
ACKNOWLEDGMENTS
The authors are grateful to Sulekler Forest
Industry, Bursa, Turkey for supplying the free-sample of
woods materials. Weathering tests of this study was
financially supported by Turkish Scientific and Research
Council (TUBITAK) under the project number of
118O759. This study was oral-presented in ORENKO
2020 held by Karadeniz Technical University, Trabzon..
REFERENCES
ASTM G154. (2006). Standard Practice for Operating
Fluorescent Light Apparatus for UV Exposure of
NonmetallicMaterials. American Society for
Testing and Materials.
ASTM G7. (2013). Standard Practice for Atmospheric
Environmental Exposure Testing of Nonmetallic
Materials.
Bari, E., Nazarnezhad, N., Kazemi, S. M., Ghanbary,
M. A. T., Mohebby, B., Schmidt, O. & Clausen,
C. A. (2015). Comparison between degradation
capabilities of the white rot fungi Pleurotus
ostreatus and Trametes versicolor in beech wood.
International Biodeterioration & Biodegradation,
104, 231-237.
Brischke, C. & Meyer-Veltrup, L. (2015). Moisture
content and decay of differently sized wooden
components during 5 years of outdoor exposure.
European Journal of Wood and Wood Products,
73(6), 719-728.
Catto, A.L., Montagna, L.S., Almeida, S.H., Silveira, R.
M. & Santana, R.M. (2016). Wood plastic
composites weathering: Effects of compatibilization
on biodegradation in soil and fungal decay.
International Biodeterioration & Biodegradation,
109, 11-22.
Chow, P., & Bajwa, D. S. (1998). Weathering effects on
the decay resistance of creosote-treated oak. In V:
Ninety-fourth annual meeting of the American
Wood-preservers' Association. Scottsdale, Arizona
Vol. 94.
EN 113. (1997). Wood preservatives. Test method for
determining the protective effectiveness against
wood-destroying basidiomycetes. Determination of
toxic values.
EN 927-3. (2003). Paints and varnishes - Coating materials
and coating systems for exterior wood-Part 3: Natural
weathering test.
Evans, P.D. (2008). Weathering and photo-degradation of
wood. In: Development of Wood Preservative
Systems, ACS Washington DC, USA: 69–117pp.
George, B., Suttie, E., Merlin, A. & Deglise, X. (2005).
Photodegradation and photostabilisation of wood:
The state of the art. Polym. Degrad. Stab., 88, 268-
274.
Lionetto, F., Del Sole, R., Cannoletta, D., Vasapollo, G.
& Maffezzoli, A. (2012). Monitoring wood
degradation during weathering by cellulose
crystallinity. Materials, 5(10), 1910-1922.
Metsa-Kortelainen, S. & Viitanen, H. (2017). Durability
of thermally modified sapwood and heartwood of
Scots pine and Norway spruce in the modified double
layer test. Wood Material Science & Engineering,
12(3), 129-139.
Panek, M., Reinprecht, L. & Hulla, M. (2014). Ten
essential oils for beech wood protection-Efficacy
against wood-destroying fungi and moulds, and effect
on wood discoloration. BioResources, 9(3), 5588-
5603.
Reinprecht, L. & Grznárik, T. (2015). Biological
durability of Scots pine (Pinus sylvestris L.) sapwood
modified with selected organo-silanes. Wood
Research, 60(5), 687-696.
Reinprecht, L. & Hulla, M. (2015). Colour changes of
beech wood modified with essential oils due to fungal
and ageing-fungal attacks with Coniophora puteana.
Drewno: prace naukowe, doniesienia, komunikaty,
58.
Sudiyanni, Y., Imamura, Y. & Takahashi, M. (1996).
Weathering effects on several properties of
chemically modified wood. Wood Research Institute
Kyoto University, 83, 55-58.
Tomak, E.D., Ustaomer, D., Ermeydan, M.A. & Yildiz,
S. (2018). An investigation of surface properties of
thermally modified wood during natural weathering
for 48 months. Measurement, 127, 187-197.
Xie, Y., Krause, A., Mai, C., Militz, H., Richter, K.,
Urban, K. & Evans, P.D. (2005). Weathering of
wood modified with the N-methylol compound 1,3-
dimethylol-4,5-dihydroxyethyleneurea. Polym.
Degrad. Stab., 89, 189-199.
Zabel, R.A. & Morrell, J.J. (1992). Wood microbiology
decay and its prevention. Academic Press, London.