Journal Int Hist article
24
M ONASTIC POOR RELIEF Neil S. Rushton and Wendy Sigle-Rushton Monastic Poor Relief in Sixteenth-Century England The amount of charitable provision administered by the monasteries of the later Middle Ages has long received the at- tention of historians exploring pre-industrial social-welfare sys- tems. Most nineteenth-century commentators remained skeptical about the value of monastic poor relief: “The charity distributed by the monks . . . was to a great extent unorganized and indis- criminate and did nearly as much to increase beggars as to relieve them.” 1 No systematic study of monastic charity was carried out, however, until Savine’s analysis in 1909. Using the national Church tax assessment of 1535, known as the Valor Ecclesiasticus (hereinafter Valor), Savine calculated that the average proportion of monastic national gross income spent on poor relief was c. 2.5 percent—a gure that remained in uential on historiography until as recently as 1998. Among those who revised this interpretation, Harvey outlined the provision of the sixteenth-century Westmin- ster Abbey where the monks distributed the large sum of £400 per annum—about 10 percent of the Abbey’s gross income—in Neil S. Rushton is af liated with Trinity College and the Cambridge Group for the History of Population and Social Structure, University of Cambridge. He is the author of “The Parochialisation of Sussex 1000–1086–1291,” in Kim Leslie and Brian Short (eds.), An Histori- cal Atlas of Sussex (Chichester, 1999), 36–37, 146–147; “Parochialization and Patterns of Patronage in 11 th -Century Sussex,” Sussex Archaeological Collections, CXXXVII (1999), 133– 152. Wendy Sigle-Rushton is Research Fellow, Center for Research on Child Wellbeing, Princeton University. She is co-author, with David Kertzer and Michael White, of “Aban- doned Children and Their Transitions to Adulthood in Nineteenth-Century Italy,” Journal of Family History, XXV (2000), 326–340; “Mortality Risks for Abandoned Infants in 19 th Cen- tury Bologna,” Population Studies, LIII (1999), 303–315. The authors would like to thank Richard Smith for his thoughtful comments, and par- ticipants of a seminar at the Cambridge Group for the History of Population and Social Struc- ture for suggestions and ideas. © 2001 by the Massachusetts Institute of Technology and the editors of The Journal of Interdisciplinary History. 1 Elizabeth M. Leonard, The Early History of English Poor Relief (Cambridge, 1900), 18, fol- lowed the ideas promulgated by William Ashley, An Introduction to English Economic History and Theory (London, 1925; orig. pub. 1893), II, 311–324. Journal of Interdisciplinary History, xxxii:2 (Autumn, 2001), 193–217.
-
Upload
independent -
Category
Documents
-
view
1 -
download
0
Transcript of Journal Int Hist article
MONASTIC POOR RELIEF
Neil S Rushton and Wendy Sigle-Rushton
Monastic Poor Relief in Sixteenth-CenturyEngland The amount of charitable provision administered bythe monasteries of the later Middle Ages has long received the at-tention of historians exploring pre-industrial social-welfare sys-tems Most nineteenth-century commentators remained skepticalabout the value of monastic poor relief ldquoThe charity distributedby the monks was to a great extent unorganized and indis-criminate and did nearly as much to increase beggars as to relievethemrdquo1
No systematic study of monastic charity was carried outhowever until Savinersquos analysis in 1909 Using the nationalChurch tax assessment of 1535 known as the Valor Ecclesiasticus(hereinafter Valor) Savine calculated that the average proportionof monastic national gross income spent on poor relief was c 25percentmdasha gure that remained in uential on historiography untilas recently as 1998 Among those who revised this interpretationHarvey outlined the provision of the sixteenth-century Westmin-ster Abbey where the monks distributed the large sum of pound400per annummdashabout 10 percent of the Abbeyrsquos gross incomemdashin
Neil S Rushton is af liated with Trinity College and the Cambridge Group for the Historyof Population and Social Structure University of Cambridge He is the author of ldquoTheParochialisation of Sussex 1000ndash1086ndash1291rdquo in Kim Leslie and Brian Short (eds) An Histori-cal Atlas of Sussex (Chichester 1999) 36ndash37 146ndash147 ldquoParochialization and Patterns ofPatronage in 11th-Century Sussexrdquo Sussex Archaeological Collections CXXXVII (1999) 133ndash152
Wendy Sigle-Rushton is Research Fellow Center for Research on Child WellbeingPrinceton University She is co-author with David Kertzer and Michael White of ldquoAban-doned Children and Their Transitions to Adulthood in Nineteenth-Century Italyrdquo Journal ofFamily History XXV (2000) 326ndash340 ldquoMortality Risks for Abandoned Infants in 19th Cen-tury Bolognardquo Population Studies LIII (1999) 303ndash315
The authors would like to thank Richard Smith for his thoughtful comments and par-ticipants of a seminar at the Cambridge Group for the History of Population and Social Struc-ture for suggestions and ideas
copy 2001 by the Massachusetts Institute of Technology and the editors of The Journal ofInterdisciplinary History
1 Elizabeth M Leonard The Early History of English Poor Relief (Cambridge 1900) 18 fol-lowed the ideas promulgated by William Ashley An Introduction to English Economic History andTheory (London 1925 orig pub 1893) II 311ndash324
Journal of Interdisciplinary History xxxii2 (Autumn 2001) 193ndash217
various forms of relief to the poorer inhabitants of Westminsterand London2
Several early modern historians have suggested a revision ofthe traditional view According to Slack
The dissolution of the monasteries chantries religious guilds andfraternities in the 1530s and 1540s radically reduced existing sourcesof charity The real aid which they had provided for the poor wasno doubt concentrated geographically but it was more substantialthan has often been supposed and its destruction left a real vacuumIt has been estimated that monasteries alone provided pound6500 ayear in alms before 1537 and that sum was not made good by pri-vate benefactions until after 15803
If Slack is correct and charitable relief was indeed higher thanSavinersquos estimates indicate the disruption in aid caused by theDissolution may have had profound effects on the lives and well-being of the English poor
The Valor originally consulted by Savine which contains de-tailed information about the income and expenditure of most ofthe religious houses and many of the hospitals in England andWales is an indispensable source for the economic condition ofthe religious houses on the eve of the Dissolution But it is alsoproblematic First it is incomplete Because data collected from
194 | NEIL S RUSHTON AND WENDY SIGLE-RUSHTON
2 Alexander Savine English Monasteries on the Eve of the Dissolution (Oxford 1909) 239 Da-vid Knowles The Religious Orders in England (Cambridge 1948ndash1959) III 264ndash266 Thosewriters explicitly accepting Savinersquos gure include Robert Hugh Snape Monastic Finances inthe Later Middle Ages (Cambridge 1926) 115 Sidney Webb and Beatrice Webb English PoorLaw History The Old Poor Law (London 1927 repr 1963) 17 Geoffrey Baskerville EnglishMonks and the Suppression of the Monasteries (London 1937) 31 Wilbur K Jordan Philanthropyin England 1480ndash1660 (London 1959) 59 Arthur G Dickens The English Reformation (Lon-don 1964) 56 G W O Woodward The Dissolution of the Monasteries (London 1966) 21ndash23 Christopher Haigh The Last Days of the Lancashire Monasteries and the Pilgrimage of Grace(Manchester 1969) 53ndash54 Whitney R D Jones The Tudor Commonwealth 1529ndash1559 (Lon-don 1970) 118 Joyce Youings Sixteenth-Century England (London 1984) 256 ChristopherDyer Standards of Living in the Later Middle Ages Social Change in England c 1200ndash1520 (Cam-bridge 1989 rev ed 1998) 240ndash2413 Barbara Harvey Living and Dying in England 1100ndash1540 The Monastic Experience (Oxford1993) 7ndash33 214ndash215 The early modern historians include Alan L Beier The Problem of thePoor in Tudor and Early Stuart England (London 1983) 19ndash20 Felicity Heal Hospitality in EarlyModern England (Oxford 1990) 228ndash246 Paul Slack Poverty and Policy in Tudor and StuartEngland (London 1988) 13 An extended historiographical discussion can be found inRushton ldquoMonastic Charitable Provision in Tudor England Quantifying and QualifyingPoor Relief in the Sixteenth Centuryrdquo Continuity and Change XVI (2001 forthcoming)
houses in Berkshire Cambridgeshire Essex HertfordshireNorthumberland Rutland and parts of Yorkshire do not survivein the original returns only a severely truncated accounting of thetaxable net income for these counties is available Second reli-gious houses appear to have underassessed their gross income attimes Certain houses in Lancashire were especially prone to doso Third and perhaps most important the political situation in1535 created a sociopolitical bias in the members of the commis-sions assigned to undertake the valuation
This study allows for these inaccuracies It also takes into con-sideration the effects of topographical and regional aspects ofhouse location on levels of poor relief as well as any differences bydenomination So adjusted the evidence contained in the Valorcan produce rigorous estimates of the poor relief offered by Tudormonasteries and provide support for the argument that Savinersquosestimate was too low4
This study models any potential bias in recorded poor relief asa function of the characteristics of the data collectors themselvessuch characteristics should be unrelated to the poor relief that thereligious houses actually provided We estimate the amount ofcharitable provision recorded in the Valor as a function of houseand county characteristics and our estimated bias function Usingour regression estimates we then predict what the actual charita-ble provision would have been in the absence of bias In otherwords we use our parameter estimates to predict actual poor reliefwhen our bias function is set at zero This approach also allows usto test statistically whether the sociopolitical structure of the com-missions should have made any difference in the analysis of thisdata source
social political and religious background Henry VIIIrsquosbreak with Rome entailed a suppression of the Roman Catholicmonastic network In 1535 the Crown was almost certainly welladvanced in its plans to take possession of the monasteriesrsquo goods
MONASTIC POOR RELIEF | 195
4 The Valor Ecclesiasticus is held in the Public Record Of ce London under the class markPRO E 3441ndashE 34426 The English and Welsh returns were printed by the Record Com-mission in John Caley and Joseph Hunter (eds) Valor Ecclesiasticus temp Henry VIII auctoritateregia institutis (London 1810ndash1834) 6v For under-recording in Lancashire see Savine EnglishMonasteries 45ndash47 Haigh Reformation and Resistance in Tudor Lancashire (Cambridge 1975)120ndash121
and lands Between 1536 and 1540 almost every monastery in thecountry was dissolved closely followed in the early 1540s by a ma-jority of the hospitals which had come to be seen as special typesof religious house5
The Valor was the outcome of a parliamentary bill of 1534mdashtwo years before the suppressionmdashthat procured for the Crown10 percent of all ecclesiastical income County commissioners as-signed to collect the information from the religious houses wereunder instructions to deduct from the gross income of eachhousemdashincluding its legally indentured rents stipends and pen-sionsmdashall customary or legally indentured alms The income netof charity was the sum upon which the religious houses weretaxed6
The alms recorded in the Valor represented an institution ofmonastic charity that had evolved over many centuries By theearly sixteenth century it had become an effective system of socialwelfare Distributions took place within access-controlledalmonry courtyards usually on a daily or weekly basis The recipi-ents were often speci ed as the local poormdashthat is householderswho could be identi ed as genuinely in need sometimes by to-kens that they carried to exchange for provisions The Valor alsoincludes the cost of providing indoor relief in hospitals (whetheror not administered by a monastery) and monastic almonries7
In theory this detailed document should permit a quantita-tive assessment of its value from the commissionersrsquo returned sur-veys However Savinersquos conclusion that the monasteries con-tributed up to 25 percent of their total income to charity is unre-alistic for several reasons (1) He did not reduce gross income tonet income before calculating the percentage of each housersquos poorrelief (that is he neglected rents stipends and pensions) (2) Hediscounted all of the central governmentrsquos disallowances of chari-table contributions justi able or not (3) He inexplicably omittedforty-seven alms-giving monasteries from his analysismdashtwo ofwhich were among the most generous Bury St Edmunds Abbey
196 | NEIL S RUSHTON AND WENDY SIGLE-RUSHTON
5 For the chronology of Dissolution see Knowles Religious Orders III 198ndash205 268ndash2906 A Luders T E Tomlins and J F France (eds) Statutes of the Realm (London 1810ndash1828) III 26 Henry VIII c 3 493ndash499 The instructions to the commissioners are at PRO E3441 fol 17 For the use of tokens to identify legitimate claimants of poor relief see William JCourtenay ldquoToken Coinage and the Administration of Poor Relief During the Later MiddleAgesrdquo Journal of Interdisciplinary History III (1973) 275ndash295
(pound379 1s 1d) and St Maryrsquos Abbey York (pound196 3s 5d)mdashand heincluded all of the monasteries for which no poor relief is re-corded8
This last point highlights one of the main problems with tak-ing the Valor evidence at face value The Valor lists 277 housesand hospitals as providing no charitable provision at all and afurther 69 for which no details beyond net income surviveMany of the small underendowed houses so listed probablyhad little surplus revenue available for charity after expenses butat least some of the 152 institutions with an annual net incomegreater than pound50 certainly did For example the legally bind-ing cartulary entries at Edington Priory in Wiltshire and Newn-ham Priory in Bedfordshire attest to their charitable donations asdo the internal account rolls at the large Benedictine TavistockAbbey in Devon Moreover records for some of the lesser houses(those valued at under pound200) dissolved in 1536 show thatthey made provision for sheltering the needy despite the absenceof documentation in the Valor Table 1 presents the total numberof monasteries and hospitals by net value as well the numberof these houses and hospitals that the Valor lists as giving no poorrelief9
the effect of the valor commissions on the poor-relief re-cords The commissions that were to carry out the valuationof ecclesiastical income were appointed in 1535 They usually
MONASTIC POOR RELIEF | 197
8 The Valor records only almsgiving from ordinary income It does not include any detailsabout refectory leftovers or old clothing and shoes donated to the poor which could some-times be substantial no quanti able records exist See Knowles Religious Orders III 265Harvey Living and Dying 10ndash15 Savine English Monasteries 227ndash242 This studyrsquos calcula-tions of poor relief as a percentage of income do not include the rents stipends and pensionspermitted as exemptions by the commissioners against gross income The percentage is ob-tained before subtracting the poor relief This method allows for a percentage outlay on poorrelief from the ldquorealrdquo income of the monasteries and hospitals rather than the crude gross in-come as calculated by Savine A complete analysis of the redistribution of early sixteenth-century wealth would more properly take the gross income numerator But the object of thisstudy is to arrive at a percentage of monastic poor relief to ldquoreal incomerdquo with the actualmoney totals of relief unaffected For Bury St Edmunds Abbey see Valor III 459ndash65 for StMaryrsquos Abbey York see Valor V 4ndash99 Most of the thirty-eight hospitals with small endowments probably performed some formof limited service to the poor and sick that was not registered in the Valor For BenedictineTavistock Abbey see Valor II 381ndash383 Herbert P R Finberg Tavistock Abbey A Study inthe Social and Economic History of Devon (New York 1969) 226ndash227 288 For the cartulariesand 1536 visitation see Rushton ldquoMonastic Charitable Provisionrdquo
Tab
le1
Num
ber
ofR
elig
ious
Hou
ses
and
Hos
pita
lsR
ecor
ded
inth
eV
alor
asN
otPr
ovid
ing
Cha
rity
net
valu
eto
tal
nu
mbe
ro
fre
ligi
ou
sh
ou
ses
nu
mbe
ro
fre
li-
gio
us
ho
use
sw
ith
zero
poo
rre
lief
tota
ln
um
ber
of
ho
spit
als
nu
mbe
ro
fh
os-
pita
lsw
ith
zero
poo
rre
lief
Und
erpound
5011
488
6637
pound50
-pound99
9855
72
pound10
0 -pound
149
7035
41
pound15
0 -pound
199
4518
51
pound20
0 -pound
299
6220
20
pound30
0-pound
499
4811
31
pound50
0 -pound
999
357
20
gtpound
1000
211
00
Tot
al49
323
589
42
no
teT
able
does
not
incl
ude
the
seve
nty-
thre
eho
uses
inB
erks
hire
C
ambr
idge
shir
eE
ssex
Her
tfor
dshi
reN
orth
umbe
rlan
dR
utla
nda
ndpa
rts
ofY
ork-
shir
efo
rw
hich
node
tails
ofgr
oss
inco
me
orex
pens
esar
eav
aila
ble
consisted of various members of the county gentry as well as suchlocal of cials as justices of the peace Apart from the appropriatebishop clerical personnel were conspicuous by their absence Thecommissioners owed their allegiance to the Crown and toThomas Cromwell the kingrsquos chief minister architect of the im-pending Dissolution Cromwellrsquos central government machinewas clearly keeping tight reins on the progress of the survey Al-though his letters to the commissions did not survive those writ-ten to him from the eld indicate that he was demanding constantupdates10
The commissioners were keen to assure Cromwell thateverything was being done to maximize pro ts for the Crownfrom taxation ldquoWe have labored as much as we can for the kingrsquospro t even exceeding the interpretations of the statutesrdquo Lettersfrom Thomas Tempest and George Lawson the Yorkshire com-missioners are particularly replete with such assurances This atti-tude was bound to have an effect on the valuation of almsprovision by the investigated religious houses and could well ac-count for much of their under- or nil assessments11
According to the Valor only small amounts of monastic char-ity were dispersed in the counties of Staffordshire Bedfordshireand Devon Staffordshire and Bedfordshire have only six housesbetween them (out of twenty-six) recorded as supplying some-thing albeit little and three Devon houses and one hospital (outof nineteen) are credited with small amounts However a closerinspection of the evidence from Devon suggests that the reason forthe apparent lack of monastic charitable provision in this countywas due either to a misunderstanding or a deliberate failure to ac-knowledge the instructions from the central government by theappointed commissioners William Courtenay one of the heads ofthe Devon commission was involved in a con ict with two reli-gious houses in Devon and CornwallmdashHartland Abbey andLaunceston Priorymdashduring the rst half of 1535 while the survey
MONASTIC POOR RELIEF | 199
10 For the commissions see J S Brewer James Gardiner and R H Brodie (eds) Lettersand Papers Foreign and Domestic of the Reign of Henry VIII (London 1862ndash1932) (hereinafterLetters and Papers) VIII no 149 49ndash52 For the commissions as part of the Dissolution pro-cess see Knowles Religious Orders III 268ndash290 For the letters to Cromwell see Savine Eng-lish Monasteries 5ndash811 Letters and Papers VIII no 551 208 no 945 369 IX no383 128 The amendmentsmade by the central exchequer to the returned evaluations also demonstrate the desire of thegovernment to keep charity deductions to a minimum
was in progress On Cromwellrsquos authority he received money forhis part in the deposition of both heads of these houses but wasaggravated to nd that Thomas Arundel had beaten him to agreater part of the goods and livestock of Hartland Abbey ldquoSincethe last abbot was deposed he has conveyed away the plate of thehouse by means of Sir Thomas Arundell and no corn is left Thereare not four ploughs where there were six or seven Of 1000sheep there is not 4 of 50 kine not 13 and of 100 other cattle notthreescorerdquo 12
That Humphrey Prideaux and Hugh Yeo justices of thepeace and Courtenayrsquos fellow survey commissioners were refusedentry into Hartland Abbey two months later after Arundelrsquos menhad reinstated the old abbot and garrisoned the walls indicates thelevel of antagonism that existed between the religious communityand the commission in Devon Evidently Courtenay was at-tempting to install Cromwellrsquos men as heads of houses Further-more the Devon returns display a greater degree of stringency inregard to tax exemptions (and poor relief ) than any other countyThe exact date of the evaluation of Hartland Abbey is not knownbut from a gross income of pound306 3s 2frac14d little more than pound13was allowed to be exempted none of it for poor relief Dependingon the date of the survey either Courtenayrsquos commission was tak-ing liberties against the recalcitrant abbot or CromwellrsquosCourtenayrsquos newly installed puppet-abbot was allowing the maxi-mum amount of tax to be extracted from the Abbey A similar re-fusal to allow exemptions is evident in all the Devon returns Anaverage of just over 5 percent of the gross income in Devon es-caped taxationmdasha lower proportion than for the rest of the coun-try At several of the Devon houses the only exemptionspermitted against tax were for the fees of the very commissionerswho were conducting the survey13
The implications for any assessment of the poor relief effortsof the Devon monasteries are evident Contrary to instructionsfrom the exchequer the county commissioners were not allowingtax deductions to be made for charitable provision No other
200 | NEIL S RUSHTON AND WENDY SIGLE-RUSHTON
12 Valor II 289ndash391 (Devon) III 99ndash152 (Staffordshire) IV 187ndash214 (Bedfordshire) Let-ters and Papers VIII no 569 215 Courtenay to Cromwell April 201535 For the correspon-dence concerning Launceston Priory see Letters and Papers VIII no 224 88 no 690 259ndash26013 Letters and Papers VIII no 979 387 For Newnham Priory Polsloe Priory andDunkeswell Abbey see Valor II 301ndash333
county commission was as thorough in its non-recording of mo-nastic charity though many other counties also had an unlikelynumber of houses recorded with no or with very little provisionFor example the Valor seems to indicate that certain parts ofLincolnshire in contrast to others were entirely devoid of monas-tic charity Closer inspection however reveals that the areas inquestion correspond to the deaneries that served as administrativeunits for certain members of the commissionmdashYarboroughGrimsby Walshcroft and Wraggoe Hence their apparent lack ofpoor relief is more than likely an artifact of under-recording by thesix commissioners (out of a total of thirty-one appointed for thecounty) designated to survey these deaneries Thornton Abbeyone of the wealthiest of them enjoyed a net income of pound594 17s2frac34d though according to the Valor it had no charitable obliga-tions14
Any assessment of the quantity of monastic poor relief de-rived from the Valor must rst control as much as possible for thecharacteristics of the commissions that made the evaluations Thiscaveat does not necessarily imply negative control in every in-stance The commissioners who belonged to the families whofounded monasteries and often still had relatives within themwere hardly likely to have been hostile to them In the northerncounties the Pilgrimage of Grace the only popular rebellion atleast partly inspired by the Dissolution of the lesser houses was in-stigated with the collusion of several members of the conservativegentry Ultimately however the political environment of 1535did not make for a commission sympathetic to the fair taxation ofthe religious houses15
quantifying the evidence for monastic poor relief in thev a l o r Table 2 shows the corrected analysis of the basic datafor poor relief as recorded in the Valor If the raised gure of 493percent is applied to all houses in the Valor recorded as having anet income greater than pound50 but providing no poor relief then a
MONASTIC POOR RELIEF | 201
14 The Lincolnshire entries are at Valor IV 1ndash143 For Thornton Abbey see Valor IV 73ndash7415 Knowles Religious Orders III 320ndash335 Haigh Last Days of the Lancashire Monasteries61ndash85 C S L Davies ldquoPopular Religion and the Pilgrimage of Gracerdquo in Anthony Fletcherand John Stevenson (eds) Order and Disorder in Early Modern England (Cambridge 1985) 58ndash91 A W Shaw ldquoThe Involvement of the Religious Orders in the Northern Risings of15367 Compulsion or Desirerdquo Downside Review CCCCVII (1999) 89ndash114
Tab
le2
Bas
icD
ata
Rel
evan
tto
Poor
Rel
ief
asR
ecor
ded
inth
eV
alor
C
orre
ctin
gSa
vine
rsquosA
naly
sis
reli
gio
us
ho
use
sre
cord
edas
supp
lyin
gpo
or
reli
efto
tal
poo
rre
lief
reco
rded
aver
age
poo
rre
lief
per
reli
gio
us
ho
use
aver
age
pro
port
ion
of
poo
rre
lief
per
reli
gio
us
ho
use
306
pound52
18pound
170
55
33
With
all
zero
poor
relie
fho
uses
wor
thun
der
pound50
adde
d43
1pound
5218
pound12
11
4 93
gure of pound7299 is yielded from the total monastic net incomeplus exempted poor relief of pound142 834 recorded in the Valor16
Submitting the data to these kinds of readjustment yields aproportion of monastic poor relief to income in 1535 that roughlydoubles Savinersquos estimates But these changes do not give properattention to an important concern The calculations in Table 2correct for the methodology of Savinersquos gures and attempt todeal at least to some extent with the issue of underassessment butthis correction implies that the selected sample of housesmdashthosewith non-zero poor relief or those with net incomes less thanpound50mdashhave accurate records and that the excluded ones do notAs previously noted it is likely that commissioner subjectivity hada substantial impact on the recording of all charitable exemptionsnot just on those houses that were recorded as providing zero poorrelief To address more adequately the potentially important issueof underassessment we propose a statistical methodology thatseeks to model underassessment and to correct for it
First assume that actual poor relief can be represented as
ai i= +C b e1 1i (1)
In addition assume that the value of poor relief recorded inthe Valor for each religious house can be represented as
a gi i i i= + +C Zb g b e1( ) 2 2
(2)
where the Xiare house- and county-speci c characteristics that
should be associated with the actual level of poor relief of house ithe Zi are house- and county-speci c characteristics for house ithat should be associated with the level of poor relief recorded inthe Valor but not actual poor relief The function g( ) relates thevarious Zi
variables to some measure of bias Finally the e1iand e
2i
are iid standard normal disturbances Taking expected values inequation (2) and using the fact from equation (1) that E(Xi b1
) ai we can write
E(ai ) = E(Xi b1) + E[g(Zi g)]b2 = ai + E[g(Zi g)b2
] (3)
This third equation shows that the expected value of ai is actualpoor relief ai plus a function of characteristics that should not beassociated with actual charitable provision a bias function
MONASTIC POOR RELIEF | 203
16 This calculation of total monastic net income from the Valor (inclusive of all houses) in-cludes the pound5218 in known reprised poor relief Savinersquos total monastic net income in theValor of pound136 362 excludes the income from most hospitals (English Monasteries 98)
The idea behind our estimation strategy is to model g(Zi g)and estimate the second equation If our model speci cation iscorrect Xi b should provide the expected value of actual poor re-lief for each individual religious house In other words we calcu-late an estimated value of poor relief in a situation where bias g(Zi
g) is eliminated by setting it equal to zero This estimation strategyalso provides a test of the importance of bias If the coef cient b2 isnot signi cantly different from zero we can conclude that eitherour bias function is improperly speci ed or that little systematicbias appears in the recording of poor relief in the Valor
specifying the bias function To proceed with the proposedestimation strategy we need to develop a bias function andhence both a reasonable measure of bias and a set of variables thatwould in uence recorded but not actual almsgiving From theforegoing discussion the attribution of zero poor relief in theValor is a good house-level indicator of biasmdashat least for thosehouses with a net income in excess of pound50 Moreover the internalevidence in the Valor and the recorded grant of commissions pro-vide information about the size and the structure of the county-speci c commissioning bodies that were responsible for auditingthe religious houses Unfortunately since the names of the indi-vidual commissioners who evaluated particular houses are avail-able only for Lincolnshire and a few other counties this studymust rely on general county-level measures for the characteristicsof the auditors Nevertheless it seems highly unlikely that the sizeor structure of a particular commissioning body or its tendency toundervalue other houses in the county would be at all related toactual poor relief Moreover the measures used herein should beable to capture at least some of the variation in commissionersrsquosubjectivity or their tendency to underrecord17
The rst stage is to estimate g(Zi g) as a probit function relat-ing county- and commission-speci c measures to whether or nota particular house was recorded in the Valor as giving zero poor re-lief In this probit model the dependent variable is a dichotomousindicator of zero-recorded poor relief Parameter estimates withpositive (negative) signs re ect a higher (lower) probability of zeropoor relief when the associated variable takes on larger values The
204 | NEIL S RUSHTON AND WENDY SIGLE-RUSHTON
17 The grant of commissions is recorded in Letters and Papers VIII no 149 49ndash52
regressors are only those characteristics that seem to bear no rela-tion to actual charitable provision If there were no systematic biason the part of the commissioners the parameter estimates associ-ated with the Z variablesmdashthe g vector in our notationmdashshouldbe insigni cant Table 3 presents the set of Z variables chosen forour bias function along with their de nitions means and stan-dard deviations
The variables chosen include several measures of the charac-teristics of the commissioners assigned to each county We consid-er the composition of the commissioning bodies by the positionand social class of the commissioners Given that houses were notassessed by the whole commissioning body but evaluated by teamsof four to six men a measure of the ratio of commissioners tohouses provides a rough probability of any one particularly hostileor particularly fair commissioner being assigned to assess a givenhouse An extremely hostile commissioner would have had thechance to underassess a few houses only if there were a large num-ber of commissioners to be assigned The county-level variablesare the same for all religious houses within a particular countyTwo house-level measuresmdashthe extent to which the group ofcommissioners underassessed all other religious houses in the samecounty and how much they allowed for other exemptions againsttaxation for any given housemdashare also included These two mea-sures may well be important indicators of bias because commis-sioners intent on maximizing the Crownrsquos taxable income wouldlikely have underestimated other religious houses and other cate-gories of nontaxable income The percentage of other religioushouses recorded as providing no charity may indicate the extent towhich a commission was likely to undervalue in general and theallowance of other exemptions against taxation should capture thegeneral attitude of the particular set of surveyors assigned to a par-ticular house
An important issue in the attempt to estimate this bias func-tion is the extent to which the chosen variable actually capturesunderassessment and not real poor relief The measure of exemp-tions as a percentage of gross income may be a problematicregressor in the bias function because it may somehow proxy for ahousersquos income levelmdashits ability to provide poor relief at all If thehouses with the largest percentage of gross income earning ex-emptions were on average the houses with the highest incomes
MONASTIC POOR RELIEF | 205
Tab
le3
De
nitio
ns
Mea
nsan
dSt
anda
rdD
evia
tions
ofth
eV
aria
bles
Use
din
the
Bia
sFu
nctio
n
vari
able
def
init
ion
mea
n( s
tan
dar
dd
evia
tio
n)
Dio
cesa
nbi
shop
Equ
als
1if
the
coun
tyrsquos
com
miss
ion
incl
uded
abi
shop
0
617
(04
9 )
Titl
ed(k
nigh
tsof
the
real
m)
The
num
ber
oftit
led
indi
vidu
als
inth
eco
mm
issio
n7
043
(48
9 )
Perc
ent
title
dT
hede
viat
ion
ofth
epe
rcen
tage
oftit
led
peop
lein
apa
rtic
ular
com
miss
ion
from
the
aver
age
perc
enta
gein
all
othe
rco
mm
issio
ns
001
(01
1 )
Com
miss
ione
rsT
hede
viat
ion
ofth
enu
mbe
rof
com
mis
sione
rsfr
omth
eav
erag
enu
mbe
rof
com
mis
sione
rsin
all
othe
rco
mm
issio
ns
8 09
3(1
9 90
)
Com
miss
ione
rsto
hous
esT
hera
tioof
the
num
ber
ofco
mm
issio
ners
toth
enu
mbe
rof
relig
ious
hous
esin
the
coun
ty
1 29
8(0
95 )
Perc
ent
zero
The
perc
enta
geof
othe
rho
uses
inth
eco
unty
with
zero
-rec
orde
dpo
orre
lief
0 50
0(0
23 )
Oth
erex
empt
ions
The
amou
ntof
othe
rex
empt
ions
the
hous
ew
asal
low
edas
ape
rcen
tage
ofits
gros
sin
com
e0
184
(01
6 )
it is possible that our reprisal measure is associated with high poorrelief However houses that earmarked a large percentage of theirgross income for other exemptions against taxation might nothave had much income available for charity The latter seems themore probable scenario regression analysis (results not shownherein) demonstrates that on average low-income houses had ahigher percentage of income allocated toward exemptions
Because the association between exemptions and incomelevel is negative high levels of other exemptions as a percentage ofgross incomemdashif capturing income effects in our probit speci cat-ionmdashwould appear to make the level of poor relief lower and zeropoor relief more likely Hence a positive coef cient would meanthat houses with a high percentage of gross income allotted forother expenses would have less income to spend on charity indi-cating that our measure of other exemptions is capturing ability toprovide poor relief and should not be included in the bias func-tion On the other hand if the level of exemptions is to be moreassociated with commissioner subjectivity a negative correlationbetween other exemptions and low poor relief (or zero poor re-lief as in our probit speci cation) would be more indicative of ageneral attitude on the part of the surveyors
Another important consideration involving the bias functionis that since those houses with a net value less than pound50 wereprobably unable to make charitable donations their zero assess-ments in the Valor may be valid To allow for this possibility ourbias functions are estimated with the full sample of houses and asample of only those houses with a net worth greater than pound50Results from both versions of the probit model are presented inTable 4
Notice that the coef cients are all with the exception of thebishop indicator and the average number of commissioners tohouses (which is borderline signi cant) signi cantly related atconventional levels to having been recorded in the Valor as pro-viding no poor reliefmdasha measure that we believe impliesunderassessment In order to determine whether these variablesare proxies for variations in house-level characteristics acrosscounties we estimated these probit functions using all of the com-missioner and house-level characteristics (both the Z and the Xvariables) The coef cients on the Z variables were little changedby the inclusion of variables that should in uence charitable pro-
MONASTIC POOR RELIEF | 207
vision In other words these coef cients are not likely to be pick-ing up actual variations in house-level characteristics (at thecounty level) that should be associated with actual poor relief18
In either sample those houses audited by commissions with ahigher percentage of titled members were less likely to be re-corded as zerondashpoor relief houses though this relationship isstronger when we estimate the model using the restrictedsubsample Similarly for the full sample a larger than averagenumber of commissioners is associated with a high probability ofzero- recorded poor relief and in the restricted sample the rela-tionship strengthens19
All relationships take the expected signs and remain consistentacross samples A high ratio of commissioners to houses reducesthe probability of a house having been recorded as providing nocharity As mentioned above this observation may re ect the fact
208 | NEIL S RUSHTON AND WENDY SIGLE-RUSHTON
Table 4 Parameter Estimates for the Probability of Zero Poor Relief as aFunction of Commission- and House-Speci c Characteristics That Should Notbe Associated with Actual Poor Relief
variable name full sample(n = 582)
incomes over pound50(n = 402)
Diocesan bishop 0272(187)
0294(151)
Titled (knight of the realm) 0088( 499)
0137( 471)
Percent titled 2083( 267)
3301( 272)
Commissioners 0016(546)
0020(381)
Commissioners to houses 0119( 239)
0184( 193)
Percent zero 1345(506)
1653(520)
Other exemptions 1386( 343)
1903( 336)
Log-likelihood 35897 22935
note The t-statistics are presented in parentheses Standard errors are corrected for clus-tering at the county level
18 In addition we estimated several speci cations of the bias function The results pre-sented herein are robust to both functional form and the set of regressors utilized19 For the familial ties between monasteries and society see Haigh Last Days of theLancashire Monasteries 58ndash59
that a high ratio of commissioners to religious houses reduces theprobability that extremely biased individuals were involved in theassessment of any one house Moreover the more houses within agiven county that are underassessed the higher the chances arethat another house within that county will be underassessed aswell Finally as expected those commissions that were generouswith other exemptionsmdashthat is they allowed a higher percentageof gross income to be written off as exemptions against taxationmdashwere less likely to allow no exemptions for charitable giving This nding strengthens our hypothesis that the other-exemptionsvariable is capturing commissioner subjectivity and not operatingas an income proxymdasha source of actual poor reliefmdashthat shouldbe excluded from the bias function The signi cance of thesemeasures which should in no way be related to actual charitableprovision provides convincing evidence of systematic measure-ment error in poor relief as reported in the Valor
predicting poor relief in the absence of bias The secondstage is to estimate equation (2) entering the predicted probabili-ties of zero poor relief from our probit speci cation as the g(Zi g)function We estimate equation (2) as an ordinary least squares(ols) regression in which the standard errors are corrected forclustering at the county level Once again we estimate the modelusing both the full sample and a subsample restricted to only thosehouses worth more than pound5020
At rst glance this two-stage estimation technique appearssimilar to a technique developed by Heckman to correct for sam-ple selection but it differs in two important ways First we intro-duce the predicted probability of zero alms in the second stage ofthe estimation rather than as a function of it ndash the inverse Millrsquos ra-tio suggested by Heckman Second our bias function is not meantto correct for a truncation of the error term caused by the utiliza-tion of only non-zero observations On the contrary we posit thatour predicted probability captures the level of bias on the part ofthe commissioning bodies and attempt to remove it from the esti-mated equation21
Additional house- and county-level variables thought to be
MONASTIC POOR RELIEF | 209
20 For a full discussion of the importance of these variables see Rushton ldquoMonastic Chari-table Provisionrdquo21 See James J Heckman ldquoSample Selection Bias as a Speci cation Errorrdquo EconometricaXLVII (1979) 153ndash161
associated with the actual level of charitable provision are also in-cluded in this regression and are presented along with theirde nitions means and standard deviations (for the full sample) inTable 5 Urban areas usually have larger populations requiring as-sistance and therefore face a higher demand for poor relief Be-cause houses located in urban areas during the early sixteenthcentury may also have experienced high levels of in-migrationand the resultant migrant poverty they may have had to providemore charity than houses outside the cities Similarly houses lo-cated in counties with large cities may also have attracted a sub-stantial volume of migration along with a corresponding demandfor charity22
Other characteristics of the houses themselvesmdashthe type ofreligious order its location or the gender of the inmatesmdashmayhave had an impact on how members prioritized spendingHouses with higher income should have been able to providemore poor relief than houses with lower income and the ratio ofa given housersquos income to the county average should indicateboth excess need within the county and the relative importance ofthat house Although income is undoubtedly an important deter-minant of the level of poor relief indicators are included forthe top and bottom 30 percent of the income distributions onlyThis strategy is meant to mitigate the impact of any undervalu-ing of income that may have occurred as well as the impact ofheteroskedascitymdasha problem that arises with the use of morere ned income categories
After estimating recorded poor relief as a function of thesecharacteristics and the predicted probability of having been re-corded as providing zero poor relief we estimate the value of poorrelief assuming that biasmdashthe predicted probability of no poorreliefmdashis set equal to zero Taking into account that houses ofsmall value may have been assessed correctly in the Valor we alsorun the same regression using a restricted sample of just thosehouses worth more than pound50 and predicted values from the re-stricted sample probit When we predict actual poor relief in thisrestricted speci cation we use recorded values for all excluded
210 | NEIL S RUSHTON AND WENDY SIGLE-RUSHTON
22 For urban immigration patterns before 1540 see Caroline M Barron ldquoLondon 1300ndash1540rdquo in Palliser (ed) The Cambridge Urban History of Britain I 600ndash1540 (Cambridge 2000)399ndash403 Jennifer Kermode ldquoThe Greater Towns 1300ndash1540rdquo ibid 458ndash459 ChristopherDyer ldquoSmall Towns 1270ndash1540rdquo ibid 523
Tab
le5
De
nitio
ns
Mea
ns
and
Stan
dard
Dev
iatio
nsof
Reg
ress
ors
Use
din
ols
Reg
ress
ion
ofR
ecor
ded
Poor
Rel
ief
vari
able
def
init
ion
mea
n( s
tan
dar
dd
evia
tio
n)
Urb
an=
1if
the
relig
ious
hous
eis
loca
ted
inan
urba
nen
viro
nmen
ta0
381
(04
9 )La
rge
urba
nto
wn
=1
ifth
ere
ligio
usho
use
islo
cate
din
one
ofth
e15
larg
est
urba
nar
easb
0 06
9(0
25 )
Ben
edic
tine
=1
ifth
eho
use
isB
ened
ictin
e0
249
(04
3 )Fe
mal
e=
1if
the
hous
eis
afe
mal
eho
use
0 35
9(0
48 )
Larg
ein
com
e=
1if
the
valu
eof
the
hous
eis
inth
eto
p30
of
the
dist
ribu
tion
0 30
0(0
46 )
Smal
lin
com
e=
1if
the
valu
eof
the
hous
efa
llsin
the
low
er30
of
the
dist
ribu
tion
0 31
0(0
46 )
Urb
anto
wns
inco
unty
the
num
ber
ofla
rge
tow
ns(d
ene
das
one
ofth
e40
larg
est)
inth
eco
unty
c1
321
(10
8 )N
orth
=1
ifth
eco
unty
islo
cate
din
the
nort
hof
the
coun
tryd
0 41
6(0
49 )
Tab
le5
Con
tinue
d
vari
able
def
init
ion
mea
n( s
tan
dar
dd
evia
tio
n)
Inco
me
ratio
the
ratio
ofth
eho
usersquo
sva
lue
toth
eav
erag
eva
lue
ofal
lot
her
hous
esin
the
coun
ty1
180
(20
9 )P
redi
cted
valu
eof
nopo
orre
lief
asa
func
tion
ofco
mm
issio
nch
arac
teri
stic
son
lymdash
apr
oxy
for
bias
0 48
0(0
19 )
a The
term
urba
nha
sno
dist
inct
refe
rent
atth
isda
teT
his
stud
yde
nes
urba
nen
viro
nmen
tas
any
sett
lem
ent
wit
hm
ore
than
eigh
tyta
xpay
ers
aslis
ted
inth
eLa
ySu
bsid
yta
xas
sess
men
tof1
524
25S
ettle
men
tsw
ithfe
wer
taxp
ayer
stha
tsho
wev
iden
ceof
urba
nch
arac
teri
stic
shav
eal
sobe
enta
ken
into
acco
unt
Bec
ause
tax-
paye
rsdo
not
nece
ssar
ilyre
pres
ent
all
head
sof
hous
ehol
dho
useh
old
mul
tipl
iers
usin
gsu
bsid
ylis
tsar
elia
ble
toer
ror
inte
rms
ofse
ttle
men
tsi
zean
dfu
ncti
on
Man
ylo
cati
ons
wit
hfe
wer
than
eigh
tyta
xpay
ers
mig
htha
veha
dhi
gher
popu
lati
onst
han
thos
ew
ith
mor
eth
anei
ghty
taxp
ayer
san
dal
sodi
spla
yed
urba
nch
ar-
acte
rist
ics
But
our
wor
king
de
nitio
nat
leas
tgiv
esa
viab
legr
oupi
ngof
urba
nan
dno
nurb
anse
ttle
men
tsfo
rre
ligio
usho
uses
and
hosp
ital
srec
orde
din
the
Val
or
For
the
lay
subs
idy
lists
see
John
Shea
ilT
heR
egio
nalD
istrib
utio
nof
Wea
lthin
Eng
land
asIn
dica
ted
inth
e15
24ndash2
5L
aySu
bsid
yR
etur
ns(L
ondo
n19
98)
For
the
mos
tre
cent
disc
ussi
onof
Eng
lish
tow
nsto
1540
se
eth
eva
riou
sch
apte
rsin
Dav
idM
icha
elP
allis
er(e
d)
The
Cam
brid
geU
rban
Hist
ory
ofB
ritai
nI
600ndash
1540
(Cam
-br
idge
20
00)
b Lond
onan
dth
ef
teen
larg
estp
rovi
ncia
ltow
nsb
yta
xpay
ers
inth
e15
242
5La
ySu
bsid
yal
soin
clud
ing
New
cast
lew
hich
was
noti
nth
esu
bsid
ybu
tpro
babl
yth
efo
urth
larg
est
tow
nin
the
coun
try
asw
ell
asY
ork
and
Cov
entr
yw
hich
wer
ece
rtai
nly
unde
rass
esse
dc T
hefo
rty
larg
est
tow
nsfr
omth
e15
242
5L
aySu
bsid
ypl
usN
ewca
stle
d E
ssen
tial
lyth
ehi
ghla
ndzo
ne
Der
bysh
ire
Shro
pshi
re
Lin
cons
hire
W
ales
Y
orks
hire
N
otti
ngha
msh
ire
Che
shir
eL
anca
shir
eC
umbr
ia
Wes
tmor
land
an
dD
urha
m
houses and predict poor relief for only those houses included inthe sample The full set of parameter estimates from the ols re-gression equation are presented in Appendix Table A but the pa-rameter estimates for the bias functions are presented for bothspeci cations in Table 6
The parameter estimate for the bias function is negative andsigni cant at the 1 percent level in either speci cation This pa-rameter estimate provides additional evidence that commissioncharacteristics and commissioner bias are likely to have in uencedthe recorded data In the restricted-sample speci cation our esti-mates imply that ceteris paribus a 10 percent increase in the pre-dicted probability that a house will be recorded as having zeropoor relief translates into a pound24 deduction in recorded poor reliefin the Valor Average estimated poor relief when the probability ofzero-recorded poor relief is set equal to zero and its percentage ofnet income is shown in Table 7
Notice that our choice of sample does not seem to alter ourpredicted values appreciably When the full sample is utilized av-erage charitable provision amounts to approximately pound19 perhouse This estimate drops to pound15 when low-income houses areexcluded from the analysis and their data is assumed to have beenaccurately recorded But regardless of the sample used both esti-mates of charitable provision imply that the recorded poor relief issubstantially underestimated in the Valor Recall that by simplycorrecting Savinersquos analysis charitable provision as a percentage ofmonastic income increases from 25 percent to nearly 5 percentAttempting to model and correct for systematic undervaluationincreases the estimate a further 2 to 4 percent depending on thesample used Because the lower-income houses were not likely tohave provided much charity the restricted sample estimates areprobably more accurate the full-sample results provide an upperbound rather than a realistic estimate Using these models the to-tal estimated national sum of monastichospital poor relief fromthe Valor falls between pound10630 and 1326523
Despite this ample evidence of inaccuracy in the Valorrsquos datathere are still reasons to interpret the results of this study with cau-tion First our model speci cation assumes that a record of zero
MONASTIC POOR RELIEF | 213
23 These sums are derived from the calculation 691 percent to 896 percent ofpound148052mdashpound142834 (total net monastic and hospital income) plus pound5218 (recorded poorrelief )
provision provides an adequate measure of bias and that the vari-ables selected pertain to recorded but not actual poor relief If theregressors in the bias function are somehow capturing county- orhouse-level characteristics that are associated with actual poor re-lief our model is eliminating too much bias Our choice of zero-recorded poor relief as an indicator of bias implies that houses witha higher probability of no poor relief were also subject to a higherlevel of under-recording This underlying relationship cannot beveri ed with the data at hand Given that the quality of some ofthe data has been brought into question other data in the Valormay be similarly awed The religious houses assessed in the Valorlike those in Lancashire were probably as eager to undervaluetheir incomes as the assessors were to undervalue their exemptionsagainst taxation Since this study attempts to correct for the under-valuation of almsgiving and not the undervaluation of income theestimated poor relief as a percentage of income may be biased up-ward Yet even with these caveats in mind both contextual andempirical evidence support our hypothesis of a systematic meas-urement error in the Valor data that tends to underestimate poorrelief
Previous historiography on this subject has relied too strongly onSavinersquos estimate that religious houses before the Dissolution de-voted about25 percent of their income to poor relief But Savineexcluded important houses from his analysis and he failed to use aproper measure of monastic income By including all relevant reli-gious houses and hospitals and by using the more appropriatemeasure of net income (before exemptions of poor relief ) ratherthan gross income this study roughly doubles Savinersquos calcula-
214 | NEIL S RUSHTON AND WENDY SIGLE-RUSHTON
Table 6 Parameter Estimates Associating Bias Function with Recorded PoorRelief
full sample probitand full sampleols regression
restricted sampleprobit and restrictedsample ols regression
Parameter Relating BiasFunction to RecordedPoor Relief
21874(-405)
24669(-385)
note The regression speci cation takes county-level clustering into account
tions This study also models commissioner bias and removes itfrom the estimates of charitable provision In this context bias isde ned as the predicted probability of having no poor relief re-corded in the Valor as a function of commissioner and countycharacteristics that appear to bear no relation to actual charitableprovision Estimating predicted poor relief when bias is zero is theway to achieve the greatest accuracy
Both stages of the analysis tend to con rm that bias on thepart of the commissioners in uenced the recorded levels of poorrelief The parameters in the probit equation are almost allsigni cant indicating the importance of the commissionersrsquo char-acteristics Likewise the parameter that associates bias (as a func-tion of only those characteristics believed not to be related toactual almsgiving) with recorded poor relief is negative andsigni cant at the 1 percent level indicating that bias is neither un-important nor random in these data Setting the probability ofzero poor relief to zero produces a more realistic value of reliefOur estimates suggest that actual charitable provision on the eve ofthe Dissolution amounted to about 7 percent of monastic in-comemdasha gure far higher than the one calculated by Savine andsubsequently perpetuated in the literature
This evidence of systematic underassessment of charitableprovision in the Valor is signi cant It means that the Dissolutionwas more disruptive to the lives of the English poor than Savinersquos
MONASTIC POOR RELIEF | 215
Table 7 Average Predicted Poor Relief Bias Function Set Equal to Zero and Its Pre-dicted Percentage of Monastic Income
full sample probitaverage predicted
poor relief per housefor the full sample
restricted sample probit pre-dicted poor relief per house
for the restricted sampleand recorded poor relief for
the excluded sample
Predicted average poorrelief when bias [g((Zi g)]is set equal to zero
pound1913 pound1532
Predicted poor reliefas a percentage ofmonastic income 896 718
note Predicted values include forty-eight houses with missing data on actual poor relief
gures would indicate especially since the government was un-able or unwilling to nd a substitute for this source of aid forsome time Monastic relief was by no means negligible its lossmust have been a great hardship for those who had come to relyon it
216 | NEIL S RUSHTON AND WENDY SIGLE-RUSHTON
APPENDIX PARAMETER ESTIMATES FROM THE OLS REGRES-SION OF RECORDED POOR RELIEF IN THE VALOR
regressor full samplemodel
restrictedsample model
Urban -0349(-020)
0067(-003)
Large urban town 12864(154)
13685(110)
Benedictine 2540(142)
3534(157)
Female 0319(025)
1468(-085)
Large income -2253(-060)
0294(-006)
Hospital 9889(255)
25365(239)
Small income -2385(-101)
2716(142)
Urban towns in the county 0419(060)
0342(036)
North -0148(-009)
1073(-043)
Income ratio 8370(403)
8418(369)
Predicted probability of zero relief -21874(-405)
-24669(-386)
Constant 7521(266)
3441(0906)
N 582 402
R2 049 051
note The t-statistics are reported in parentheses Standard errors are corrected for cluster-ing at the county level

Tab
le1
Num
ber
ofR
elig
ious
Hou
ses
and
Hos
pita
lsR
ecor
ded
inth
eV
alor
asN
otPr
ovid
ing
Cha
rity
net
valu
eto
tal
nu
mbe
ro
fre
ligi
ou
sh
ou
ses
nu
mbe
ro
fre
li-
gio
us
ho
use
sw
ith
zero
poo
rre
lief
tota
ln
um
ber
of
ho
spit
als
nu
mbe
ro
fh
os-
pita
lsw
ith
zero
poo
rre
lief
Und
erpound
5011
488
6637
pound50
-pound99
9855
72
pound10
0 -pound
149
7035
41
pound15
0 -pound
199
4518
51
pound20
0 -pound
299
6220
20
pound30
0-pound
499
4811
31
pound50
0 -pound
999
357
20
gtpound
1000
211
00
Tot
al49
323
589
42
no
teT
able
does
not
incl
ude
the
seve
nty-
thre
eho
uses
inB
erks
hire
C
ambr
idge
shir
eE
ssex
Her
tfor
dshi
reN
orth
umbe
rlan
dR
utla
nda
ndpa
rts
ofY
ork-
shir
efo
rw
hich
node
tails
ofgr
oss
inco
me
orex
pens
esar
eav
aila
ble
consisted of various members of the county gentry as well as suchlocal of cials as justices of the peace Apart from the appropriatebishop clerical personnel were conspicuous by their absence Thecommissioners owed their allegiance to the Crown and toThomas Cromwell the kingrsquos chief minister architect of the im-pending Dissolution Cromwellrsquos central government machinewas clearly keeping tight reins on the progress of the survey Al-though his letters to the commissions did not survive those writ-ten to him from the eld indicate that he was demanding constantupdates10
The commissioners were keen to assure Cromwell thateverything was being done to maximize pro ts for the Crownfrom taxation ldquoWe have labored as much as we can for the kingrsquospro t even exceeding the interpretations of the statutesrdquo Lettersfrom Thomas Tempest and George Lawson the Yorkshire com-missioners are particularly replete with such assurances This atti-tude was bound to have an effect on the valuation of almsprovision by the investigated religious houses and could well ac-count for much of their under- or nil assessments11
According to the Valor only small amounts of monastic char-ity were dispersed in the counties of Staffordshire Bedfordshireand Devon Staffordshire and Bedfordshire have only six housesbetween them (out of twenty-six) recorded as supplying some-thing albeit little and three Devon houses and one hospital (outof nineteen) are credited with small amounts However a closerinspection of the evidence from Devon suggests that the reason forthe apparent lack of monastic charitable provision in this countywas due either to a misunderstanding or a deliberate failure to ac-knowledge the instructions from the central government by theappointed commissioners William Courtenay one of the heads ofthe Devon commission was involved in a con ict with two reli-gious houses in Devon and CornwallmdashHartland Abbey andLaunceston Priorymdashduring the rst half of 1535 while the survey
MONASTIC POOR RELIEF | 199
10 For the commissions see J S Brewer James Gardiner and R H Brodie (eds) Lettersand Papers Foreign and Domestic of the Reign of Henry VIII (London 1862ndash1932) (hereinafterLetters and Papers) VIII no 149 49ndash52 For the commissions as part of the Dissolution pro-cess see Knowles Religious Orders III 268ndash290 For the letters to Cromwell see Savine Eng-lish Monasteries 5ndash811 Letters and Papers VIII no 551 208 no 945 369 IX no383 128 The amendmentsmade by the central exchequer to the returned evaluations also demonstrate the desire of thegovernment to keep charity deductions to a minimum
was in progress On Cromwellrsquos authority he received money forhis part in the deposition of both heads of these houses but wasaggravated to nd that Thomas Arundel had beaten him to agreater part of the goods and livestock of Hartland Abbey ldquoSincethe last abbot was deposed he has conveyed away the plate of thehouse by means of Sir Thomas Arundell and no corn is left Thereare not four ploughs where there were six or seven Of 1000sheep there is not 4 of 50 kine not 13 and of 100 other cattle notthreescorerdquo 12
That Humphrey Prideaux and Hugh Yeo justices of thepeace and Courtenayrsquos fellow survey commissioners were refusedentry into Hartland Abbey two months later after Arundelrsquos menhad reinstated the old abbot and garrisoned the walls indicates thelevel of antagonism that existed between the religious communityand the commission in Devon Evidently Courtenay was at-tempting to install Cromwellrsquos men as heads of houses Further-more the Devon returns display a greater degree of stringency inregard to tax exemptions (and poor relief ) than any other countyThe exact date of the evaluation of Hartland Abbey is not knownbut from a gross income of pound306 3s 2frac14d little more than pound13was allowed to be exempted none of it for poor relief Dependingon the date of the survey either Courtenayrsquos commission was tak-ing liberties against the recalcitrant abbot or CromwellrsquosCourtenayrsquos newly installed puppet-abbot was allowing the maxi-mum amount of tax to be extracted from the Abbey A similar re-fusal to allow exemptions is evident in all the Devon returns Anaverage of just over 5 percent of the gross income in Devon es-caped taxationmdasha lower proportion than for the rest of the coun-try At several of the Devon houses the only exemptionspermitted against tax were for the fees of the very commissionerswho were conducting the survey13
The implications for any assessment of the poor relief effortsof the Devon monasteries are evident Contrary to instructionsfrom the exchequer the county commissioners were not allowingtax deductions to be made for charitable provision No other
200 | NEIL S RUSHTON AND WENDY SIGLE-RUSHTON
12 Valor II 289ndash391 (Devon) III 99ndash152 (Staffordshire) IV 187ndash214 (Bedfordshire) Let-ters and Papers VIII no 569 215 Courtenay to Cromwell April 201535 For the correspon-dence concerning Launceston Priory see Letters and Papers VIII no 224 88 no 690 259ndash26013 Letters and Papers VIII no 979 387 For Newnham Priory Polsloe Priory andDunkeswell Abbey see Valor II 301ndash333
county commission was as thorough in its non-recording of mo-nastic charity though many other counties also had an unlikelynumber of houses recorded with no or with very little provisionFor example the Valor seems to indicate that certain parts ofLincolnshire in contrast to others were entirely devoid of monas-tic charity Closer inspection however reveals that the areas inquestion correspond to the deaneries that served as administrativeunits for certain members of the commissionmdashYarboroughGrimsby Walshcroft and Wraggoe Hence their apparent lack ofpoor relief is more than likely an artifact of under-recording by thesix commissioners (out of a total of thirty-one appointed for thecounty) designated to survey these deaneries Thornton Abbeyone of the wealthiest of them enjoyed a net income of pound594 17s2frac34d though according to the Valor it had no charitable obliga-tions14
Any assessment of the quantity of monastic poor relief de-rived from the Valor must rst control as much as possible for thecharacteristics of the commissions that made the evaluations Thiscaveat does not necessarily imply negative control in every in-stance The commissioners who belonged to the families whofounded monasteries and often still had relatives within themwere hardly likely to have been hostile to them In the northerncounties the Pilgrimage of Grace the only popular rebellion atleast partly inspired by the Dissolution of the lesser houses was in-stigated with the collusion of several members of the conservativegentry Ultimately however the political environment of 1535did not make for a commission sympathetic to the fair taxation ofthe religious houses15
quantifying the evidence for monastic poor relief in thev a l o r Table 2 shows the corrected analysis of the basic datafor poor relief as recorded in the Valor If the raised gure of 493percent is applied to all houses in the Valor recorded as having anet income greater than pound50 but providing no poor relief then a
MONASTIC POOR RELIEF | 201
14 The Lincolnshire entries are at Valor IV 1ndash143 For Thornton Abbey see Valor IV 73ndash7415 Knowles Religious Orders III 320ndash335 Haigh Last Days of the Lancashire Monasteries61ndash85 C S L Davies ldquoPopular Religion and the Pilgrimage of Gracerdquo in Anthony Fletcherand John Stevenson (eds) Order and Disorder in Early Modern England (Cambridge 1985) 58ndash91 A W Shaw ldquoThe Involvement of the Religious Orders in the Northern Risings of15367 Compulsion or Desirerdquo Downside Review CCCCVII (1999) 89ndash114
Tab
le2
Bas
icD
ata
Rel
evan
tto
Poor
Rel
ief
asR
ecor
ded
inth
eV
alor
C
orre
ctin
gSa
vine
rsquosA
naly
sis
reli
gio
us
ho
use
sre
cord
edas
supp
lyin
gpo
or
reli
efto
tal
poo
rre
lief
reco
rded
aver
age
poo
rre
lief
per
reli
gio
us
ho
use
aver
age
pro
port
ion
of
poo
rre
lief
per
reli
gio
us
ho
use
306
pound52
18pound
170
55
33
With
all
zero
poor
relie
fho
uses
wor
thun
der
pound50
adde
d43
1pound
5218
pound12
11
4 93
gure of pound7299 is yielded from the total monastic net incomeplus exempted poor relief of pound142 834 recorded in the Valor16
Submitting the data to these kinds of readjustment yields aproportion of monastic poor relief to income in 1535 that roughlydoubles Savinersquos estimates But these changes do not give properattention to an important concern The calculations in Table 2correct for the methodology of Savinersquos gures and attempt todeal at least to some extent with the issue of underassessment butthis correction implies that the selected sample of housesmdashthosewith non-zero poor relief or those with net incomes less thanpound50mdashhave accurate records and that the excluded ones do notAs previously noted it is likely that commissioner subjectivity hada substantial impact on the recording of all charitable exemptionsnot just on those houses that were recorded as providing zero poorrelief To address more adequately the potentially important issueof underassessment we propose a statistical methodology thatseeks to model underassessment and to correct for it
First assume that actual poor relief can be represented as
ai i= +C b e1 1i (1)
In addition assume that the value of poor relief recorded inthe Valor for each religious house can be represented as
a gi i i i= + +C Zb g b e1( ) 2 2
(2)
where the Xiare house- and county-speci c characteristics that
should be associated with the actual level of poor relief of house ithe Zi are house- and county-speci c characteristics for house ithat should be associated with the level of poor relief recorded inthe Valor but not actual poor relief The function g( ) relates thevarious Zi
variables to some measure of bias Finally the e1iand e
2i
are iid standard normal disturbances Taking expected values inequation (2) and using the fact from equation (1) that E(Xi b1
) ai we can write
E(ai ) = E(Xi b1) + E[g(Zi g)]b2 = ai + E[g(Zi g)b2
] (3)
This third equation shows that the expected value of ai is actualpoor relief ai plus a function of characteristics that should not beassociated with actual charitable provision a bias function
MONASTIC POOR RELIEF | 203
16 This calculation of total monastic net income from the Valor (inclusive of all houses) in-cludes the pound5218 in known reprised poor relief Savinersquos total monastic net income in theValor of pound136 362 excludes the income from most hospitals (English Monasteries 98)
The idea behind our estimation strategy is to model g(Zi g)and estimate the second equation If our model speci cation iscorrect Xi b should provide the expected value of actual poor re-lief for each individual religious house In other words we calcu-late an estimated value of poor relief in a situation where bias g(Zi
g) is eliminated by setting it equal to zero This estimation strategyalso provides a test of the importance of bias If the coef cient b2 isnot signi cantly different from zero we can conclude that eitherour bias function is improperly speci ed or that little systematicbias appears in the recording of poor relief in the Valor
specifying the bias function To proceed with the proposedestimation strategy we need to develop a bias function andhence both a reasonable measure of bias and a set of variables thatwould in uence recorded but not actual almsgiving From theforegoing discussion the attribution of zero poor relief in theValor is a good house-level indicator of biasmdashat least for thosehouses with a net income in excess of pound50 Moreover the internalevidence in the Valor and the recorded grant of commissions pro-vide information about the size and the structure of the county-speci c commissioning bodies that were responsible for auditingthe religious houses Unfortunately since the names of the indi-vidual commissioners who evaluated particular houses are avail-able only for Lincolnshire and a few other counties this studymust rely on general county-level measures for the characteristicsof the auditors Nevertheless it seems highly unlikely that the sizeor structure of a particular commissioning body or its tendency toundervalue other houses in the county would be at all related toactual poor relief Moreover the measures used herein should beable to capture at least some of the variation in commissionersrsquosubjectivity or their tendency to underrecord17
The rst stage is to estimate g(Zi g) as a probit function relat-ing county- and commission-speci c measures to whether or nota particular house was recorded in the Valor as giving zero poor re-lief In this probit model the dependent variable is a dichotomousindicator of zero-recorded poor relief Parameter estimates withpositive (negative) signs re ect a higher (lower) probability of zeropoor relief when the associated variable takes on larger values The
204 | NEIL S RUSHTON AND WENDY SIGLE-RUSHTON
17 The grant of commissions is recorded in Letters and Papers VIII no 149 49ndash52
regressors are only those characteristics that seem to bear no rela-tion to actual charitable provision If there were no systematic biason the part of the commissioners the parameter estimates associ-ated with the Z variablesmdashthe g vector in our notationmdashshouldbe insigni cant Table 3 presents the set of Z variables chosen forour bias function along with their de nitions means and stan-dard deviations
The variables chosen include several measures of the charac-teristics of the commissioners assigned to each county We consid-er the composition of the commissioning bodies by the positionand social class of the commissioners Given that houses were notassessed by the whole commissioning body but evaluated by teamsof four to six men a measure of the ratio of commissioners tohouses provides a rough probability of any one particularly hostileor particularly fair commissioner being assigned to assess a givenhouse An extremely hostile commissioner would have had thechance to underassess a few houses only if there were a large num-ber of commissioners to be assigned The county-level variablesare the same for all religious houses within a particular countyTwo house-level measuresmdashthe extent to which the group ofcommissioners underassessed all other religious houses in the samecounty and how much they allowed for other exemptions againsttaxation for any given housemdashare also included These two mea-sures may well be important indicators of bias because commis-sioners intent on maximizing the Crownrsquos taxable income wouldlikely have underestimated other religious houses and other cate-gories of nontaxable income The percentage of other religioushouses recorded as providing no charity may indicate the extent towhich a commission was likely to undervalue in general and theallowance of other exemptions against taxation should capture thegeneral attitude of the particular set of surveyors assigned to a par-ticular house
An important issue in the attempt to estimate this bias func-tion is the extent to which the chosen variable actually capturesunderassessment and not real poor relief The measure of exemp-tions as a percentage of gross income may be a problematicregressor in the bias function because it may somehow proxy for ahousersquos income levelmdashits ability to provide poor relief at all If thehouses with the largest percentage of gross income earning ex-emptions were on average the houses with the highest incomes
MONASTIC POOR RELIEF | 205
Tab
le3
De
nitio
ns
Mea
nsan
dSt
anda
rdD
evia
tions
ofth
eV
aria
bles
Use
din
the
Bia
sFu
nctio
n
vari
able
def
init
ion
mea
n( s
tan
dar
dd
evia
tio
n)
Dio
cesa
nbi
shop
Equ
als
1if
the
coun
tyrsquos
com
miss
ion
incl
uded
abi
shop
0
617
(04
9 )
Titl
ed(k
nigh
tsof
the
real
m)
The
num
ber
oftit
led
indi
vidu
als
inth
eco
mm
issio
n7
043
(48
9 )
Perc
ent
title
dT
hede
viat
ion
ofth
epe
rcen
tage
oftit
led
peop
lein
apa
rtic
ular
com
miss
ion
from
the
aver
age
perc
enta
gein
all
othe
rco
mm
issio
ns
001
(01
1 )
Com
miss
ione
rsT
hede
viat
ion
ofth
enu
mbe
rof
com
mis
sione
rsfr
omth
eav
erag
enu
mbe
rof
com
mis
sione
rsin
all
othe
rco
mm
issio
ns
8 09
3(1
9 90
)
Com
miss
ione
rsto
hous
esT
hera
tioof
the
num
ber
ofco
mm
issio
ners
toth
enu
mbe
rof
relig
ious
hous
esin
the
coun
ty
1 29
8(0
95 )
Perc
ent
zero
The
perc
enta
geof
othe
rho
uses
inth
eco
unty
with
zero
-rec
orde
dpo
orre
lief
0 50
0(0
23 )
Oth
erex
empt
ions
The
amou
ntof
othe
rex
empt
ions
the
hous
ew
asal
low
edas
ape
rcen
tage
ofits
gros
sin
com
e0
184
(01
6 )
it is possible that our reprisal measure is associated with high poorrelief However houses that earmarked a large percentage of theirgross income for other exemptions against taxation might nothave had much income available for charity The latter seems themore probable scenario regression analysis (results not shownherein) demonstrates that on average low-income houses had ahigher percentage of income allocated toward exemptions
Because the association between exemptions and incomelevel is negative high levels of other exemptions as a percentage ofgross incomemdashif capturing income effects in our probit speci cat-ionmdashwould appear to make the level of poor relief lower and zeropoor relief more likely Hence a positive coef cient would meanthat houses with a high percentage of gross income allotted forother expenses would have less income to spend on charity indi-cating that our measure of other exemptions is capturing ability toprovide poor relief and should not be included in the bias func-tion On the other hand if the level of exemptions is to be moreassociated with commissioner subjectivity a negative correlationbetween other exemptions and low poor relief (or zero poor re-lief as in our probit speci cation) would be more indicative of ageneral attitude on the part of the surveyors
Another important consideration involving the bias functionis that since those houses with a net value less than pound50 wereprobably unable to make charitable donations their zero assess-ments in the Valor may be valid To allow for this possibility ourbias functions are estimated with the full sample of houses and asample of only those houses with a net worth greater than pound50Results from both versions of the probit model are presented inTable 4
Notice that the coef cients are all with the exception of thebishop indicator and the average number of commissioners tohouses (which is borderline signi cant) signi cantly related atconventional levels to having been recorded in the Valor as pro-viding no poor reliefmdasha measure that we believe impliesunderassessment In order to determine whether these variablesare proxies for variations in house-level characteristics acrosscounties we estimated these probit functions using all of the com-missioner and house-level characteristics (both the Z and the Xvariables) The coef cients on the Z variables were little changedby the inclusion of variables that should in uence charitable pro-
MONASTIC POOR RELIEF | 207
vision In other words these coef cients are not likely to be pick-ing up actual variations in house-level characteristics (at thecounty level) that should be associated with actual poor relief18
In either sample those houses audited by commissions with ahigher percentage of titled members were less likely to be re-corded as zerondashpoor relief houses though this relationship isstronger when we estimate the model using the restrictedsubsample Similarly for the full sample a larger than averagenumber of commissioners is associated with a high probability ofzero- recorded poor relief and in the restricted sample the rela-tionship strengthens19
All relationships take the expected signs and remain consistentacross samples A high ratio of commissioners to houses reducesthe probability of a house having been recorded as providing nocharity As mentioned above this observation may re ect the fact
208 | NEIL S RUSHTON AND WENDY SIGLE-RUSHTON
Table 4 Parameter Estimates for the Probability of Zero Poor Relief as aFunction of Commission- and House-Speci c Characteristics That Should Notbe Associated with Actual Poor Relief
variable name full sample(n = 582)
incomes over pound50(n = 402)
Diocesan bishop 0272(187)
0294(151)
Titled (knight of the realm) 0088( 499)
0137( 471)
Percent titled 2083( 267)
3301( 272)
Commissioners 0016(546)
0020(381)
Commissioners to houses 0119( 239)
0184( 193)
Percent zero 1345(506)
1653(520)
Other exemptions 1386( 343)
1903( 336)
Log-likelihood 35897 22935
note The t-statistics are presented in parentheses Standard errors are corrected for clus-tering at the county level
18 In addition we estimated several speci cations of the bias function The results pre-sented herein are robust to both functional form and the set of regressors utilized19 For the familial ties between monasteries and society see Haigh Last Days of theLancashire Monasteries 58ndash59
that a high ratio of commissioners to religious houses reduces theprobability that extremely biased individuals were involved in theassessment of any one house Moreover the more houses within agiven county that are underassessed the higher the chances arethat another house within that county will be underassessed aswell Finally as expected those commissions that were generouswith other exemptionsmdashthat is they allowed a higher percentageof gross income to be written off as exemptions against taxationmdashwere less likely to allow no exemptions for charitable giving This nding strengthens our hypothesis that the other-exemptionsvariable is capturing commissioner subjectivity and not operatingas an income proxymdasha source of actual poor reliefmdashthat shouldbe excluded from the bias function The signi cance of thesemeasures which should in no way be related to actual charitableprovision provides convincing evidence of systematic measure-ment error in poor relief as reported in the Valor
predicting poor relief in the absence of bias The secondstage is to estimate equation (2) entering the predicted probabili-ties of zero poor relief from our probit speci cation as the g(Zi g)function We estimate equation (2) as an ordinary least squares(ols) regression in which the standard errors are corrected forclustering at the county level Once again we estimate the modelusing both the full sample and a subsample restricted to only thosehouses worth more than pound5020
At rst glance this two-stage estimation technique appearssimilar to a technique developed by Heckman to correct for sam-ple selection but it differs in two important ways First we intro-duce the predicted probability of zero alms in the second stage ofthe estimation rather than as a function of it ndash the inverse Millrsquos ra-tio suggested by Heckman Second our bias function is not meantto correct for a truncation of the error term caused by the utiliza-tion of only non-zero observations On the contrary we posit thatour predicted probability captures the level of bias on the part ofthe commissioning bodies and attempt to remove it from the esti-mated equation21
Additional house- and county-level variables thought to be
MONASTIC POOR RELIEF | 209
20 For a full discussion of the importance of these variables see Rushton ldquoMonastic Chari-table Provisionrdquo21 See James J Heckman ldquoSample Selection Bias as a Speci cation Errorrdquo EconometricaXLVII (1979) 153ndash161
associated with the actual level of charitable provision are also in-cluded in this regression and are presented along with theirde nitions means and standard deviations (for the full sample) inTable 5 Urban areas usually have larger populations requiring as-sistance and therefore face a higher demand for poor relief Be-cause houses located in urban areas during the early sixteenthcentury may also have experienced high levels of in-migrationand the resultant migrant poverty they may have had to providemore charity than houses outside the cities Similarly houses lo-cated in counties with large cities may also have attracted a sub-stantial volume of migration along with a corresponding demandfor charity22
Other characteristics of the houses themselvesmdashthe type ofreligious order its location or the gender of the inmatesmdashmayhave had an impact on how members prioritized spendingHouses with higher income should have been able to providemore poor relief than houses with lower income and the ratio ofa given housersquos income to the county average should indicateboth excess need within the county and the relative importance ofthat house Although income is undoubtedly an important deter-minant of the level of poor relief indicators are included forthe top and bottom 30 percent of the income distributions onlyThis strategy is meant to mitigate the impact of any undervalu-ing of income that may have occurred as well as the impact ofheteroskedascitymdasha problem that arises with the use of morere ned income categories
After estimating recorded poor relief as a function of thesecharacteristics and the predicted probability of having been re-corded as providing zero poor relief we estimate the value of poorrelief assuming that biasmdashthe predicted probability of no poorreliefmdashis set equal to zero Taking into account that houses ofsmall value may have been assessed correctly in the Valor we alsorun the same regression using a restricted sample of just thosehouses worth more than pound50 and predicted values from the re-stricted sample probit When we predict actual poor relief in thisrestricted speci cation we use recorded values for all excluded
210 | NEIL S RUSHTON AND WENDY SIGLE-RUSHTON
22 For urban immigration patterns before 1540 see Caroline M Barron ldquoLondon 1300ndash1540rdquo in Palliser (ed) The Cambridge Urban History of Britain I 600ndash1540 (Cambridge 2000)399ndash403 Jennifer Kermode ldquoThe Greater Towns 1300ndash1540rdquo ibid 458ndash459 ChristopherDyer ldquoSmall Towns 1270ndash1540rdquo ibid 523
Tab
le5
De
nitio
ns
Mea
ns
and
Stan
dard
Dev
iatio
nsof
Reg
ress
ors
Use
din
ols
Reg
ress
ion
ofR
ecor
ded
Poor
Rel
ief
vari
able
def
init
ion
mea
n( s
tan
dar
dd
evia
tio
n)
Urb
an=
1if
the
relig
ious
hous
eis
loca
ted
inan
urba
nen
viro
nmen
ta0
381
(04
9 )La
rge
urba
nto
wn
=1
ifth
ere
ligio
usho
use
islo
cate
din
one
ofth
e15
larg
est
urba
nar
easb
0 06
9(0
25 )
Ben
edic
tine
=1
ifth
eho
use
isB
ened
ictin
e0
249
(04
3 )Fe
mal
e=
1if
the
hous
eis
afe
mal
eho
use
0 35
9(0
48 )
Larg
ein
com
e=
1if
the
valu
eof
the
hous
eis
inth
eto
p30
of
the
dist
ribu
tion
0 30
0(0
46 )
Smal
lin
com
e=
1if
the
valu
eof
the
hous
efa
llsin
the
low
er30
of
the
dist
ribu
tion
0 31
0(0
46 )
Urb
anto
wns
inco
unty
the
num
ber
ofla
rge
tow
ns(d
ene
das
one
ofth
e40
larg
est)
inth
eco
unty
c1
321
(10
8 )N
orth
=1
ifth
eco
unty
islo
cate
din
the
nort
hof
the
coun
tryd
0 41
6(0
49 )
Tab
le5
Con
tinue
d
vari
able
def
init
ion
mea
n( s
tan
dar
dd
evia
tio
n)
Inco
me
ratio
the
ratio
ofth
eho
usersquo
sva
lue
toth
eav
erag
eva
lue
ofal
lot
her
hous
esin
the
coun
ty1
180
(20
9 )P
redi
cted
valu
eof
nopo
orre
lief
asa
func
tion
ofco
mm
issio
nch
arac
teri
stic
son
lymdash
apr
oxy
for
bias
0 48
0(0
19 )
a The
term
urba
nha
sno
dist
inct
refe
rent
atth
isda
teT
his
stud
yde
nes
urba
nen
viro
nmen
tas
any
sett
lem
ent
wit
hm
ore
than
eigh
tyta
xpay
ers
aslis
ted
inth
eLa
ySu
bsid
yta
xas
sess
men
tof1
524
25S
ettle
men
tsw
ithfe
wer
taxp
ayer
stha
tsho
wev
iden
ceof
urba
nch
arac
teri
stic
shav
eal
sobe
enta
ken
into
acco
unt
Bec
ause
tax-
paye
rsdo
not
nece
ssar
ilyre
pres
ent
all
head
sof
hous
ehol
dho
useh
old
mul
tipl
iers
usin
gsu
bsid
ylis
tsar
elia
ble
toer
ror
inte
rms
ofse
ttle
men
tsi
zean
dfu
ncti
on
Man
ylo
cati
ons
wit
hfe
wer
than
eigh
tyta
xpay
ers
mig
htha
veha
dhi
gher
popu
lati
onst
han
thos
ew
ith
mor
eth
anei
ghty
taxp
ayer
san
dal
sodi
spla
yed
urba
nch
ar-
acte
rist
ics
But
our
wor
king
de
nitio
nat
leas
tgiv
esa
viab
legr
oupi
ngof
urba
nan
dno
nurb
anse
ttle
men
tsfo
rre
ligio
usho
uses
and
hosp
ital
srec
orde
din
the
Val
or
For
the
lay
subs
idy
lists
see
John
Shea
ilT
heR
egio
nalD
istrib
utio
nof
Wea
lthin
Eng
land
asIn
dica
ted
inth
e15
24ndash2
5L
aySu
bsid
yR
etur
ns(L
ondo
n19
98)
For
the
mos
tre
cent
disc
ussi
onof
Eng
lish
tow
nsto
1540
se
eth
eva
riou
sch
apte
rsin
Dav
idM
icha
elP
allis
er(e
d)
The
Cam
brid
geU
rban
Hist
ory
ofB
ritai
nI
600ndash
1540
(Cam
-br
idge
20
00)
b Lond
onan
dth
ef
teen
larg
estp
rovi
ncia
ltow
nsb
yta
xpay
ers
inth
e15
242
5La
ySu
bsid
yal
soin
clud
ing
New
cast
lew
hich
was
noti
nth
esu
bsid
ybu
tpro
babl
yth
efo
urth
larg
est
tow
nin
the
coun
try
asw
ell
asY
ork
and
Cov
entr
yw
hich
wer
ece
rtai
nly
unde
rass
esse
dc T
hefo
rty
larg
est
tow
nsfr
omth
e15
242
5L
aySu
bsid
ypl
usN
ewca
stle
d E
ssen
tial
lyth
ehi
ghla
ndzo
ne
Der
bysh
ire
Shro
pshi
re
Lin
cons
hire
W
ales
Y
orks
hire
N
otti
ngha
msh
ire
Che
shir
eL
anca
shir
eC
umbr
ia
Wes
tmor
land
an
dD
urha
m
houses and predict poor relief for only those houses included inthe sample The full set of parameter estimates from the ols re-gression equation are presented in Appendix Table A but the pa-rameter estimates for the bias functions are presented for bothspeci cations in Table 6
The parameter estimate for the bias function is negative andsigni cant at the 1 percent level in either speci cation This pa-rameter estimate provides additional evidence that commissioncharacteristics and commissioner bias are likely to have in uencedthe recorded data In the restricted-sample speci cation our esti-mates imply that ceteris paribus a 10 percent increase in the pre-dicted probability that a house will be recorded as having zeropoor relief translates into a pound24 deduction in recorded poor reliefin the Valor Average estimated poor relief when the probability ofzero-recorded poor relief is set equal to zero and its percentage ofnet income is shown in Table 7
Notice that our choice of sample does not seem to alter ourpredicted values appreciably When the full sample is utilized av-erage charitable provision amounts to approximately pound19 perhouse This estimate drops to pound15 when low-income houses areexcluded from the analysis and their data is assumed to have beenaccurately recorded But regardless of the sample used both esti-mates of charitable provision imply that the recorded poor relief issubstantially underestimated in the Valor Recall that by simplycorrecting Savinersquos analysis charitable provision as a percentage ofmonastic income increases from 25 percent to nearly 5 percentAttempting to model and correct for systematic undervaluationincreases the estimate a further 2 to 4 percent depending on thesample used Because the lower-income houses were not likely tohave provided much charity the restricted sample estimates areprobably more accurate the full-sample results provide an upperbound rather than a realistic estimate Using these models the to-tal estimated national sum of monastichospital poor relief fromthe Valor falls between pound10630 and 1326523
Despite this ample evidence of inaccuracy in the Valorrsquos datathere are still reasons to interpret the results of this study with cau-tion First our model speci cation assumes that a record of zero
MONASTIC POOR RELIEF | 213
23 These sums are derived from the calculation 691 percent to 896 percent ofpound148052mdashpound142834 (total net monastic and hospital income) plus pound5218 (recorded poorrelief )
provision provides an adequate measure of bias and that the vari-ables selected pertain to recorded but not actual poor relief If theregressors in the bias function are somehow capturing county- orhouse-level characteristics that are associated with actual poor re-lief our model is eliminating too much bias Our choice of zero-recorded poor relief as an indicator of bias implies that houses witha higher probability of no poor relief were also subject to a higherlevel of under-recording This underlying relationship cannot beveri ed with the data at hand Given that the quality of some ofthe data has been brought into question other data in the Valormay be similarly awed The religious houses assessed in the Valorlike those in Lancashire were probably as eager to undervaluetheir incomes as the assessors were to undervalue their exemptionsagainst taxation Since this study attempts to correct for the under-valuation of almsgiving and not the undervaluation of income theestimated poor relief as a percentage of income may be biased up-ward Yet even with these caveats in mind both contextual andempirical evidence support our hypothesis of a systematic meas-urement error in the Valor data that tends to underestimate poorrelief
Previous historiography on this subject has relied too strongly onSavinersquos estimate that religious houses before the Dissolution de-voted about25 percent of their income to poor relief But Savineexcluded important houses from his analysis and he failed to use aproper measure of monastic income By including all relevant reli-gious houses and hospitals and by using the more appropriatemeasure of net income (before exemptions of poor relief ) ratherthan gross income this study roughly doubles Savinersquos calcula-
214 | NEIL S RUSHTON AND WENDY SIGLE-RUSHTON
Table 6 Parameter Estimates Associating Bias Function with Recorded PoorRelief
full sample probitand full sampleols regression
restricted sampleprobit and restrictedsample ols regression
Parameter Relating BiasFunction to RecordedPoor Relief
21874(-405)
24669(-385)
note The regression speci cation takes county-level clustering into account
tions This study also models commissioner bias and removes itfrom the estimates of charitable provision In this context bias isde ned as the predicted probability of having no poor relief re-corded in the Valor as a function of commissioner and countycharacteristics that appear to bear no relation to actual charitableprovision Estimating predicted poor relief when bias is zero is theway to achieve the greatest accuracy
Both stages of the analysis tend to con rm that bias on thepart of the commissioners in uenced the recorded levels of poorrelief The parameters in the probit equation are almost allsigni cant indicating the importance of the commissionersrsquo char-acteristics Likewise the parameter that associates bias (as a func-tion of only those characteristics believed not to be related toactual almsgiving) with recorded poor relief is negative andsigni cant at the 1 percent level indicating that bias is neither un-important nor random in these data Setting the probability ofzero poor relief to zero produces a more realistic value of reliefOur estimates suggest that actual charitable provision on the eve ofthe Dissolution amounted to about 7 percent of monastic in-comemdasha gure far higher than the one calculated by Savine andsubsequently perpetuated in the literature
This evidence of systematic underassessment of charitableprovision in the Valor is signi cant It means that the Dissolutionwas more disruptive to the lives of the English poor than Savinersquos
MONASTIC POOR RELIEF | 215
Table 7 Average Predicted Poor Relief Bias Function Set Equal to Zero and Its Pre-dicted Percentage of Monastic Income
full sample probitaverage predicted
poor relief per housefor the full sample
restricted sample probit pre-dicted poor relief per house
for the restricted sampleand recorded poor relief for
the excluded sample
Predicted average poorrelief when bias [g((Zi g)]is set equal to zero
pound1913 pound1532
Predicted poor reliefas a percentage ofmonastic income 896 718
note Predicted values include forty-eight houses with missing data on actual poor relief
gures would indicate especially since the government was un-able or unwilling to nd a substitute for this source of aid forsome time Monastic relief was by no means negligible its lossmust have been a great hardship for those who had come to relyon it
216 | NEIL S RUSHTON AND WENDY SIGLE-RUSHTON
APPENDIX PARAMETER ESTIMATES FROM THE OLS REGRES-SION OF RECORDED POOR RELIEF IN THE VALOR
regressor full samplemodel
restrictedsample model
Urban -0349(-020)
0067(-003)
Large urban town 12864(154)
13685(110)
Benedictine 2540(142)
3534(157)
Female 0319(025)
1468(-085)
Large income -2253(-060)
0294(-006)
Hospital 9889(255)
25365(239)
Small income -2385(-101)
2716(142)
Urban towns in the county 0419(060)
0342(036)
North -0148(-009)
1073(-043)
Income ratio 8370(403)
8418(369)
Predicted probability of zero relief -21874(-405)
-24669(-386)
Constant 7521(266)
3441(0906)
N 582 402
R2 049 051
note The t-statistics are reported in parentheses Standard errors are corrected for cluster-ing at the county level

Tab
le2
Bas
icD
ata
Rel
evan
tto
Poor
Rel
ief
asR
ecor
ded
inth
eV
alor
C
orre
ctin
gSa
vine
rsquosA
naly
sis
reli
gio
us
ho
use
sre
cord
edas
supp
lyin
gpo
or
reli
efto
tal
poo
rre
lief
reco
rded
aver
age
poo
rre
lief
per
reli
gio
us
ho
use
aver
age
pro
port
ion
of
poo
rre
lief
per
reli
gio
us
ho
use
306
pound52
18pound
170
55
33
With
all
zero
poor
relie
fho
uses
wor
thun
der
pound50
adde
d43
1pound
5218
pound12
11
4 93
gure of pound7299 is yielded from the total monastic net incomeplus exempted poor relief of pound142 834 recorded in the Valor16
Submitting the data to these kinds of readjustment yields aproportion of monastic poor relief to income in 1535 that roughlydoubles Savinersquos estimates But these changes do not give properattention to an important concern The calculations in Table 2correct for the methodology of Savinersquos gures and attempt todeal at least to some extent with the issue of underassessment butthis correction implies that the selected sample of housesmdashthosewith non-zero poor relief or those with net incomes less thanpound50mdashhave accurate records and that the excluded ones do notAs previously noted it is likely that commissioner subjectivity hada substantial impact on the recording of all charitable exemptionsnot just on those houses that were recorded as providing zero poorrelief To address more adequately the potentially important issueof underassessment we propose a statistical methodology thatseeks to model underassessment and to correct for it
First assume that actual poor relief can be represented as
ai i= +C b e1 1i (1)
In addition assume that the value of poor relief recorded inthe Valor for each religious house can be represented as
a gi i i i= + +C Zb g b e1( ) 2 2
(2)
where the Xiare house- and county-speci c characteristics that
should be associated with the actual level of poor relief of house ithe Zi are house- and county-speci c characteristics for house ithat should be associated with the level of poor relief recorded inthe Valor but not actual poor relief The function g( ) relates thevarious Zi
variables to some measure of bias Finally the e1iand e
2i
are iid standard normal disturbances Taking expected values inequation (2) and using the fact from equation (1) that E(Xi b1
) ai we can write
E(ai ) = E(Xi b1) + E[g(Zi g)]b2 = ai + E[g(Zi g)b2
] (3)
This third equation shows that the expected value of ai is actualpoor relief ai plus a function of characteristics that should not beassociated with actual charitable provision a bias function
MONASTIC POOR RELIEF | 203
16 This calculation of total monastic net income from the Valor (inclusive of all houses) in-cludes the pound5218 in known reprised poor relief Savinersquos total monastic net income in theValor of pound136 362 excludes the income from most hospitals (English Monasteries 98)
The idea behind our estimation strategy is to model g(Zi g)and estimate the second equation If our model speci cation iscorrect Xi b should provide the expected value of actual poor re-lief for each individual religious house In other words we calcu-late an estimated value of poor relief in a situation where bias g(Zi
g) is eliminated by setting it equal to zero This estimation strategyalso provides a test of the importance of bias If the coef cient b2 isnot signi cantly different from zero we can conclude that eitherour bias function is improperly speci ed or that little systematicbias appears in the recording of poor relief in the Valor
specifying the bias function To proceed with the proposedestimation strategy we need to develop a bias function andhence both a reasonable measure of bias and a set of variables thatwould in uence recorded but not actual almsgiving From theforegoing discussion the attribution of zero poor relief in theValor is a good house-level indicator of biasmdashat least for thosehouses with a net income in excess of pound50 Moreover the internalevidence in the Valor and the recorded grant of commissions pro-vide information about the size and the structure of the county-speci c commissioning bodies that were responsible for auditingthe religious houses Unfortunately since the names of the indi-vidual commissioners who evaluated particular houses are avail-able only for Lincolnshire and a few other counties this studymust rely on general county-level measures for the characteristicsof the auditors Nevertheless it seems highly unlikely that the sizeor structure of a particular commissioning body or its tendency toundervalue other houses in the county would be at all related toactual poor relief Moreover the measures used herein should beable to capture at least some of the variation in commissionersrsquosubjectivity or their tendency to underrecord17
The rst stage is to estimate g(Zi g) as a probit function relat-ing county- and commission-speci c measures to whether or nota particular house was recorded in the Valor as giving zero poor re-lief In this probit model the dependent variable is a dichotomousindicator of zero-recorded poor relief Parameter estimates withpositive (negative) signs re ect a higher (lower) probability of zeropoor relief when the associated variable takes on larger values The
204 | NEIL S RUSHTON AND WENDY SIGLE-RUSHTON
17 The grant of commissions is recorded in Letters and Papers VIII no 149 49ndash52
regressors are only those characteristics that seem to bear no rela-tion to actual charitable provision If there were no systematic biason the part of the commissioners the parameter estimates associ-ated with the Z variablesmdashthe g vector in our notationmdashshouldbe insigni cant Table 3 presents the set of Z variables chosen forour bias function along with their de nitions means and stan-dard deviations
The variables chosen include several measures of the charac-teristics of the commissioners assigned to each county We consid-er the composition of the commissioning bodies by the positionand social class of the commissioners Given that houses were notassessed by the whole commissioning body but evaluated by teamsof four to six men a measure of the ratio of commissioners tohouses provides a rough probability of any one particularly hostileor particularly fair commissioner being assigned to assess a givenhouse An extremely hostile commissioner would have had thechance to underassess a few houses only if there were a large num-ber of commissioners to be assigned The county-level variablesare the same for all religious houses within a particular countyTwo house-level measuresmdashthe extent to which the group ofcommissioners underassessed all other religious houses in the samecounty and how much they allowed for other exemptions againsttaxation for any given housemdashare also included These two mea-sures may well be important indicators of bias because commis-sioners intent on maximizing the Crownrsquos taxable income wouldlikely have underestimated other religious houses and other cate-gories of nontaxable income The percentage of other religioushouses recorded as providing no charity may indicate the extent towhich a commission was likely to undervalue in general and theallowance of other exemptions against taxation should capture thegeneral attitude of the particular set of surveyors assigned to a par-ticular house
An important issue in the attempt to estimate this bias func-tion is the extent to which the chosen variable actually capturesunderassessment and not real poor relief The measure of exemp-tions as a percentage of gross income may be a problematicregressor in the bias function because it may somehow proxy for ahousersquos income levelmdashits ability to provide poor relief at all If thehouses with the largest percentage of gross income earning ex-emptions were on average the houses with the highest incomes
MONASTIC POOR RELIEF | 205
Tab
le3
De
nitio
ns
Mea
nsan
dSt
anda
rdD
evia
tions
ofth
eV
aria
bles
Use
din
the
Bia
sFu
nctio
n
vari
able
def
init
ion
mea
n( s
tan
dar
dd
evia
tio
n)
Dio
cesa
nbi
shop
Equ
als
1if
the
coun
tyrsquos
com
miss
ion
incl
uded
abi
shop
0
617
(04
9 )
Titl
ed(k
nigh
tsof
the
real
m)
The
num
ber
oftit
led
indi
vidu
als
inth
eco
mm
issio
n7
043
(48
9 )
Perc
ent
title
dT
hede
viat
ion
ofth
epe
rcen
tage
oftit
led
peop
lein
apa
rtic
ular
com
miss
ion
from
the
aver
age
perc
enta
gein
all
othe
rco
mm
issio
ns
001
(01
1 )
Com
miss
ione
rsT
hede
viat
ion
ofth
enu
mbe
rof
com
mis
sione
rsfr
omth
eav
erag
enu
mbe
rof
com
mis
sione
rsin
all
othe
rco
mm
issio
ns
8 09
3(1
9 90
)
Com
miss
ione
rsto
hous
esT
hera
tioof
the
num
ber
ofco
mm
issio
ners
toth
enu
mbe
rof
relig
ious
hous
esin
the
coun
ty
1 29
8(0
95 )
Perc
ent
zero
The
perc
enta
geof
othe
rho
uses
inth
eco
unty
with
zero
-rec
orde
dpo
orre
lief
0 50
0(0
23 )
Oth
erex
empt
ions
The
amou
ntof
othe
rex
empt
ions
the
hous
ew
asal
low
edas
ape
rcen
tage
ofits
gros
sin
com
e0
184
(01
6 )
it is possible that our reprisal measure is associated with high poorrelief However houses that earmarked a large percentage of theirgross income for other exemptions against taxation might nothave had much income available for charity The latter seems themore probable scenario regression analysis (results not shownherein) demonstrates that on average low-income houses had ahigher percentage of income allocated toward exemptions
Because the association between exemptions and incomelevel is negative high levels of other exemptions as a percentage ofgross incomemdashif capturing income effects in our probit speci cat-ionmdashwould appear to make the level of poor relief lower and zeropoor relief more likely Hence a positive coef cient would meanthat houses with a high percentage of gross income allotted forother expenses would have less income to spend on charity indi-cating that our measure of other exemptions is capturing ability toprovide poor relief and should not be included in the bias func-tion On the other hand if the level of exemptions is to be moreassociated with commissioner subjectivity a negative correlationbetween other exemptions and low poor relief (or zero poor re-lief as in our probit speci cation) would be more indicative of ageneral attitude on the part of the surveyors
Another important consideration involving the bias functionis that since those houses with a net value less than pound50 wereprobably unable to make charitable donations their zero assess-ments in the Valor may be valid To allow for this possibility ourbias functions are estimated with the full sample of houses and asample of only those houses with a net worth greater than pound50Results from both versions of the probit model are presented inTable 4
Notice that the coef cients are all with the exception of thebishop indicator and the average number of commissioners tohouses (which is borderline signi cant) signi cantly related atconventional levels to having been recorded in the Valor as pro-viding no poor reliefmdasha measure that we believe impliesunderassessment In order to determine whether these variablesare proxies for variations in house-level characteristics acrosscounties we estimated these probit functions using all of the com-missioner and house-level characteristics (both the Z and the Xvariables) The coef cients on the Z variables were little changedby the inclusion of variables that should in uence charitable pro-
MONASTIC POOR RELIEF | 207
vision In other words these coef cients are not likely to be pick-ing up actual variations in house-level characteristics (at thecounty level) that should be associated with actual poor relief18
In either sample those houses audited by commissions with ahigher percentage of titled members were less likely to be re-corded as zerondashpoor relief houses though this relationship isstronger when we estimate the model using the restrictedsubsample Similarly for the full sample a larger than averagenumber of commissioners is associated with a high probability ofzero- recorded poor relief and in the restricted sample the rela-tionship strengthens19
All relationships take the expected signs and remain consistentacross samples A high ratio of commissioners to houses reducesthe probability of a house having been recorded as providing nocharity As mentioned above this observation may re ect the fact
208 | NEIL S RUSHTON AND WENDY SIGLE-RUSHTON
Table 4 Parameter Estimates for the Probability of Zero Poor Relief as aFunction of Commission- and House-Speci c Characteristics That Should Notbe Associated with Actual Poor Relief
variable name full sample(n = 582)
incomes over pound50(n = 402)
Diocesan bishop 0272(187)
0294(151)
Titled (knight of the realm) 0088( 499)
0137( 471)
Percent titled 2083( 267)
3301( 272)
Commissioners 0016(546)
0020(381)
Commissioners to houses 0119( 239)
0184( 193)
Percent zero 1345(506)
1653(520)
Other exemptions 1386( 343)
1903( 336)
Log-likelihood 35897 22935
note The t-statistics are presented in parentheses Standard errors are corrected for clus-tering at the county level
18 In addition we estimated several speci cations of the bias function The results pre-sented herein are robust to both functional form and the set of regressors utilized19 For the familial ties between monasteries and society see Haigh Last Days of theLancashire Monasteries 58ndash59
that a high ratio of commissioners to religious houses reduces theprobability that extremely biased individuals were involved in theassessment of any one house Moreover the more houses within agiven county that are underassessed the higher the chances arethat another house within that county will be underassessed aswell Finally as expected those commissions that were generouswith other exemptionsmdashthat is they allowed a higher percentageof gross income to be written off as exemptions against taxationmdashwere less likely to allow no exemptions for charitable giving This nding strengthens our hypothesis that the other-exemptionsvariable is capturing commissioner subjectivity and not operatingas an income proxymdasha source of actual poor reliefmdashthat shouldbe excluded from the bias function The signi cance of thesemeasures which should in no way be related to actual charitableprovision provides convincing evidence of systematic measure-ment error in poor relief as reported in the Valor
predicting poor relief in the absence of bias The secondstage is to estimate equation (2) entering the predicted probabili-ties of zero poor relief from our probit speci cation as the g(Zi g)function We estimate equation (2) as an ordinary least squares(ols) regression in which the standard errors are corrected forclustering at the county level Once again we estimate the modelusing both the full sample and a subsample restricted to only thosehouses worth more than pound5020
At rst glance this two-stage estimation technique appearssimilar to a technique developed by Heckman to correct for sam-ple selection but it differs in two important ways First we intro-duce the predicted probability of zero alms in the second stage ofthe estimation rather than as a function of it ndash the inverse Millrsquos ra-tio suggested by Heckman Second our bias function is not meantto correct for a truncation of the error term caused by the utiliza-tion of only non-zero observations On the contrary we posit thatour predicted probability captures the level of bias on the part ofthe commissioning bodies and attempt to remove it from the esti-mated equation21
Additional house- and county-level variables thought to be
MONASTIC POOR RELIEF | 209
20 For a full discussion of the importance of these variables see Rushton ldquoMonastic Chari-table Provisionrdquo21 See James J Heckman ldquoSample Selection Bias as a Speci cation Errorrdquo EconometricaXLVII (1979) 153ndash161
associated with the actual level of charitable provision are also in-cluded in this regression and are presented along with theirde nitions means and standard deviations (for the full sample) inTable 5 Urban areas usually have larger populations requiring as-sistance and therefore face a higher demand for poor relief Be-cause houses located in urban areas during the early sixteenthcentury may also have experienced high levels of in-migrationand the resultant migrant poverty they may have had to providemore charity than houses outside the cities Similarly houses lo-cated in counties with large cities may also have attracted a sub-stantial volume of migration along with a corresponding demandfor charity22
Other characteristics of the houses themselvesmdashthe type ofreligious order its location or the gender of the inmatesmdashmayhave had an impact on how members prioritized spendingHouses with higher income should have been able to providemore poor relief than houses with lower income and the ratio ofa given housersquos income to the county average should indicateboth excess need within the county and the relative importance ofthat house Although income is undoubtedly an important deter-minant of the level of poor relief indicators are included forthe top and bottom 30 percent of the income distributions onlyThis strategy is meant to mitigate the impact of any undervalu-ing of income that may have occurred as well as the impact ofheteroskedascitymdasha problem that arises with the use of morere ned income categories
After estimating recorded poor relief as a function of thesecharacteristics and the predicted probability of having been re-corded as providing zero poor relief we estimate the value of poorrelief assuming that biasmdashthe predicted probability of no poorreliefmdashis set equal to zero Taking into account that houses ofsmall value may have been assessed correctly in the Valor we alsorun the same regression using a restricted sample of just thosehouses worth more than pound50 and predicted values from the re-stricted sample probit When we predict actual poor relief in thisrestricted speci cation we use recorded values for all excluded
210 | NEIL S RUSHTON AND WENDY SIGLE-RUSHTON
22 For urban immigration patterns before 1540 see Caroline M Barron ldquoLondon 1300ndash1540rdquo in Palliser (ed) The Cambridge Urban History of Britain I 600ndash1540 (Cambridge 2000)399ndash403 Jennifer Kermode ldquoThe Greater Towns 1300ndash1540rdquo ibid 458ndash459 ChristopherDyer ldquoSmall Towns 1270ndash1540rdquo ibid 523
Tab
le5
De
nitio
ns
Mea
ns
and
Stan
dard
Dev
iatio
nsof
Reg
ress
ors
Use
din
ols
Reg
ress
ion
ofR
ecor
ded
Poor
Rel
ief
vari
able
def
init
ion
mea
n( s
tan
dar
dd
evia
tio
n)
Urb
an=
1if
the
relig
ious
hous
eis
loca
ted
inan
urba
nen
viro
nmen
ta0
381
(04
9 )La
rge
urba
nto
wn
=1
ifth
ere
ligio
usho
use
islo
cate
din
one
ofth
e15
larg
est
urba
nar
easb
0 06
9(0
25 )
Ben
edic
tine
=1
ifth
eho
use
isB
ened
ictin
e0
249
(04
3 )Fe
mal
e=
1if
the
hous
eis
afe
mal
eho
use
0 35
9(0
48 )
Larg
ein
com
e=
1if
the
valu
eof
the
hous
eis
inth
eto
p30
of
the
dist
ribu
tion
0 30
0(0
46 )
Smal
lin
com
e=
1if
the
valu
eof
the
hous
efa
llsin
the
low
er30
of
the
dist
ribu
tion
0 31
0(0
46 )
Urb
anto
wns
inco
unty
the
num
ber
ofla
rge
tow
ns(d
ene
das
one
ofth
e40
larg
est)
inth
eco
unty
c1
321
(10
8 )N
orth
=1
ifth
eco
unty
islo
cate
din
the
nort
hof
the
coun
tryd
0 41
6(0
49 )
Tab
le5
Con
tinue
d
vari
able
def
init
ion
mea
n( s
tan
dar
dd
evia
tio
n)
Inco
me
ratio
the
ratio
ofth
eho
usersquo
sva
lue
toth
eav
erag
eva
lue
ofal
lot
her
hous
esin
the
coun
ty1
180
(20
9 )P
redi
cted
valu
eof
nopo
orre
lief
asa
func
tion
ofco
mm
issio
nch
arac
teri
stic
son
lymdash
apr
oxy
for
bias
0 48
0(0
19 )
a The
term
urba
nha
sno
dist
inct
refe
rent
atth
isda
teT
his
stud
yde
nes
urba
nen
viro
nmen
tas
any
sett
lem
ent
wit
hm
ore
than
eigh
tyta
xpay
ers
aslis
ted
inth
eLa
ySu
bsid
yta
xas
sess
men
tof1
524
25S
ettle
men
tsw
ithfe
wer
taxp
ayer
stha
tsho
wev
iden
ceof
urba
nch
arac
teri
stic
shav
eal
sobe
enta
ken
into
acco
unt
Bec
ause
tax-
paye
rsdo
not
nece
ssar
ilyre
pres
ent
all
head
sof
hous
ehol
dho
useh
old
mul
tipl
iers
usin
gsu
bsid
ylis
tsar
elia
ble
toer
ror
inte
rms
ofse
ttle
men
tsi
zean
dfu
ncti
on
Man
ylo
cati
ons
wit
hfe
wer
than
eigh
tyta
xpay
ers
mig
htha
veha
dhi
gher
popu
lati
onst
han
thos
ew
ith
mor
eth
anei
ghty
taxp
ayer
san
dal
sodi
spla
yed
urba
nch
ar-
acte
rist
ics
But
our
wor
king
de
nitio
nat
leas
tgiv
esa
viab
legr
oupi
ngof
urba
nan
dno
nurb
anse
ttle
men
tsfo
rre
ligio
usho
uses
and
hosp
ital
srec
orde
din
the
Val
or
For
the
lay
subs
idy
lists
see
John
Shea
ilT
heR
egio
nalD
istrib
utio
nof
Wea
lthin
Eng
land
asIn
dica
ted
inth
e15
24ndash2
5L
aySu
bsid
yR
etur
ns(L
ondo
n19
98)
For
the
mos
tre
cent
disc
ussi
onof
Eng
lish
tow
nsto
1540
se
eth
eva
riou
sch
apte
rsin
Dav
idM
icha
elP
allis
er(e
d)
The
Cam
brid
geU
rban
Hist
ory
ofB
ritai
nI
600ndash
1540
(Cam
-br
idge
20
00)
b Lond
onan
dth
ef
teen
larg
estp
rovi
ncia
ltow
nsb
yta
xpay
ers
inth
e15
242
5La
ySu
bsid
yal
soin
clud
ing
New
cast
lew
hich
was
noti
nth
esu
bsid
ybu
tpro
babl
yth
efo
urth
larg
est
tow
nin
the
coun
try
asw
ell
asY
ork
and
Cov
entr
yw
hich
wer
ece
rtai
nly
unde
rass
esse
dc T
hefo
rty
larg
est
tow
nsfr
omth
e15
242
5L
aySu
bsid
ypl
usN
ewca
stle
d E
ssen
tial
lyth
ehi
ghla
ndzo
ne
Der
bysh
ire
Shro
pshi
re
Lin
cons
hire
W
ales
Y
orks
hire
N
otti
ngha
msh
ire
Che
shir
eL
anca
shir
eC
umbr
ia
Wes
tmor
land
an
dD
urha
m
houses and predict poor relief for only those houses included inthe sample The full set of parameter estimates from the ols re-gression equation are presented in Appendix Table A but the pa-rameter estimates for the bias functions are presented for bothspeci cations in Table 6
The parameter estimate for the bias function is negative andsigni cant at the 1 percent level in either speci cation This pa-rameter estimate provides additional evidence that commissioncharacteristics and commissioner bias are likely to have in uencedthe recorded data In the restricted-sample speci cation our esti-mates imply that ceteris paribus a 10 percent increase in the pre-dicted probability that a house will be recorded as having zeropoor relief translates into a pound24 deduction in recorded poor reliefin the Valor Average estimated poor relief when the probability ofzero-recorded poor relief is set equal to zero and its percentage ofnet income is shown in Table 7
Notice that our choice of sample does not seem to alter ourpredicted values appreciably When the full sample is utilized av-erage charitable provision amounts to approximately pound19 perhouse This estimate drops to pound15 when low-income houses areexcluded from the analysis and their data is assumed to have beenaccurately recorded But regardless of the sample used both esti-mates of charitable provision imply that the recorded poor relief issubstantially underestimated in the Valor Recall that by simplycorrecting Savinersquos analysis charitable provision as a percentage ofmonastic income increases from 25 percent to nearly 5 percentAttempting to model and correct for systematic undervaluationincreases the estimate a further 2 to 4 percent depending on thesample used Because the lower-income houses were not likely tohave provided much charity the restricted sample estimates areprobably more accurate the full-sample results provide an upperbound rather than a realistic estimate Using these models the to-tal estimated national sum of monastichospital poor relief fromthe Valor falls between pound10630 and 1326523
Despite this ample evidence of inaccuracy in the Valorrsquos datathere are still reasons to interpret the results of this study with cau-tion First our model speci cation assumes that a record of zero
MONASTIC POOR RELIEF | 213
23 These sums are derived from the calculation 691 percent to 896 percent ofpound148052mdashpound142834 (total net monastic and hospital income) plus pound5218 (recorded poorrelief )
provision provides an adequate measure of bias and that the vari-ables selected pertain to recorded but not actual poor relief If theregressors in the bias function are somehow capturing county- orhouse-level characteristics that are associated with actual poor re-lief our model is eliminating too much bias Our choice of zero-recorded poor relief as an indicator of bias implies that houses witha higher probability of no poor relief were also subject to a higherlevel of under-recording This underlying relationship cannot beveri ed with the data at hand Given that the quality of some ofthe data has been brought into question other data in the Valormay be similarly awed The religious houses assessed in the Valorlike those in Lancashire were probably as eager to undervaluetheir incomes as the assessors were to undervalue their exemptionsagainst taxation Since this study attempts to correct for the under-valuation of almsgiving and not the undervaluation of income theestimated poor relief as a percentage of income may be biased up-ward Yet even with these caveats in mind both contextual andempirical evidence support our hypothesis of a systematic meas-urement error in the Valor data that tends to underestimate poorrelief
Previous historiography on this subject has relied too strongly onSavinersquos estimate that religious houses before the Dissolution de-voted about25 percent of their income to poor relief But Savineexcluded important houses from his analysis and he failed to use aproper measure of monastic income By including all relevant reli-gious houses and hospitals and by using the more appropriatemeasure of net income (before exemptions of poor relief ) ratherthan gross income this study roughly doubles Savinersquos calcula-
214 | NEIL S RUSHTON AND WENDY SIGLE-RUSHTON
Table 6 Parameter Estimates Associating Bias Function with Recorded PoorRelief
full sample probitand full sampleols regression
restricted sampleprobit and restrictedsample ols regression
Parameter Relating BiasFunction to RecordedPoor Relief
21874(-405)
24669(-385)
note The regression speci cation takes county-level clustering into account
tions This study also models commissioner bias and removes itfrom the estimates of charitable provision In this context bias isde ned as the predicted probability of having no poor relief re-corded in the Valor as a function of commissioner and countycharacteristics that appear to bear no relation to actual charitableprovision Estimating predicted poor relief when bias is zero is theway to achieve the greatest accuracy
Both stages of the analysis tend to con rm that bias on thepart of the commissioners in uenced the recorded levels of poorrelief The parameters in the probit equation are almost allsigni cant indicating the importance of the commissionersrsquo char-acteristics Likewise the parameter that associates bias (as a func-tion of only those characteristics believed not to be related toactual almsgiving) with recorded poor relief is negative andsigni cant at the 1 percent level indicating that bias is neither un-important nor random in these data Setting the probability ofzero poor relief to zero produces a more realistic value of reliefOur estimates suggest that actual charitable provision on the eve ofthe Dissolution amounted to about 7 percent of monastic in-comemdasha gure far higher than the one calculated by Savine andsubsequently perpetuated in the literature
This evidence of systematic underassessment of charitableprovision in the Valor is signi cant It means that the Dissolutionwas more disruptive to the lives of the English poor than Savinersquos
MONASTIC POOR RELIEF | 215
Table 7 Average Predicted Poor Relief Bias Function Set Equal to Zero and Its Pre-dicted Percentage of Monastic Income
full sample probitaverage predicted
poor relief per housefor the full sample
restricted sample probit pre-dicted poor relief per house
for the restricted sampleand recorded poor relief for
the excluded sample
Predicted average poorrelief when bias [g((Zi g)]is set equal to zero
pound1913 pound1532
Predicted poor reliefas a percentage ofmonastic income 896 718
note Predicted values include forty-eight houses with missing data on actual poor relief
gures would indicate especially since the government was un-able or unwilling to nd a substitute for this source of aid forsome time Monastic relief was by no means negligible its lossmust have been a great hardship for those who had come to relyon it
216 | NEIL S RUSHTON AND WENDY SIGLE-RUSHTON
APPENDIX PARAMETER ESTIMATES FROM THE OLS REGRES-SION OF RECORDED POOR RELIEF IN THE VALOR
regressor full samplemodel
restrictedsample model
Urban -0349(-020)
0067(-003)
Large urban town 12864(154)
13685(110)
Benedictine 2540(142)
3534(157)
Female 0319(025)
1468(-085)
Large income -2253(-060)
0294(-006)
Hospital 9889(255)
25365(239)
Small income -2385(-101)
2716(142)
Urban towns in the county 0419(060)
0342(036)
North -0148(-009)
1073(-043)
Income ratio 8370(403)
8418(369)
Predicted probability of zero relief -21874(-405)
-24669(-386)
Constant 7521(266)
3441(0906)
N 582 402
R2 049 051
note The t-statistics are reported in parentheses Standard errors are corrected for cluster-ing at the county level

Tab
le3
De
nitio
ns
Mea
nsan
dSt
anda
rdD
evia
tions
ofth
eV
aria
bles
Use
din
the
Bia
sFu
nctio
n
vari
able
def
init
ion
mea
n( s
tan
dar
dd
evia
tio
n)
Dio
cesa
nbi
shop
Equ
als
1if
the
coun
tyrsquos
com
miss
ion
incl
uded
abi
shop
0
617
(04
9 )
Titl
ed(k
nigh
tsof
the
real
m)
The
num
ber
oftit
led
indi
vidu
als
inth
eco
mm
issio
n7
043
(48
9 )
Perc
ent
title
dT
hede
viat
ion
ofth
epe
rcen
tage
oftit
led
peop
lein
apa
rtic
ular
com
miss
ion
from
the
aver
age
perc
enta
gein
all
othe
rco
mm
issio
ns
001
(01
1 )
Com
miss
ione
rsT
hede
viat
ion
ofth
enu
mbe
rof
com
mis
sione
rsfr
omth
eav
erag
enu
mbe
rof
com
mis
sione
rsin
all
othe
rco
mm
issio
ns
8 09
3(1
9 90
)
Com
miss
ione
rsto
hous
esT
hera
tioof
the
num
ber
ofco
mm
issio
ners
toth
enu
mbe
rof
relig
ious
hous
esin
the
coun
ty
1 29
8(0
95 )
Perc
ent
zero
The
perc
enta
geof
othe
rho
uses
inth
eco
unty
with
zero
-rec
orde
dpo
orre
lief
0 50
0(0
23 )
Oth
erex
empt
ions
The
amou
ntof
othe
rex
empt
ions
the
hous
ew
asal
low
edas
ape
rcen
tage
ofits
gros
sin
com
e0
184
(01
6 )
it is possible that our reprisal measure is associated with high poorrelief However houses that earmarked a large percentage of theirgross income for other exemptions against taxation might nothave had much income available for charity The latter seems themore probable scenario regression analysis (results not shownherein) demonstrates that on average low-income houses had ahigher percentage of income allocated toward exemptions
Because the association between exemptions and incomelevel is negative high levels of other exemptions as a percentage ofgross incomemdashif capturing income effects in our probit speci cat-ionmdashwould appear to make the level of poor relief lower and zeropoor relief more likely Hence a positive coef cient would meanthat houses with a high percentage of gross income allotted forother expenses would have less income to spend on charity indi-cating that our measure of other exemptions is capturing ability toprovide poor relief and should not be included in the bias func-tion On the other hand if the level of exemptions is to be moreassociated with commissioner subjectivity a negative correlationbetween other exemptions and low poor relief (or zero poor re-lief as in our probit speci cation) would be more indicative of ageneral attitude on the part of the surveyors
Another important consideration involving the bias functionis that since those houses with a net value less than pound50 wereprobably unable to make charitable donations their zero assess-ments in the Valor may be valid To allow for this possibility ourbias functions are estimated with the full sample of houses and asample of only those houses with a net worth greater than pound50Results from both versions of the probit model are presented inTable 4
Notice that the coef cients are all with the exception of thebishop indicator and the average number of commissioners tohouses (which is borderline signi cant) signi cantly related atconventional levels to having been recorded in the Valor as pro-viding no poor reliefmdasha measure that we believe impliesunderassessment In order to determine whether these variablesare proxies for variations in house-level characteristics acrosscounties we estimated these probit functions using all of the com-missioner and house-level characteristics (both the Z and the Xvariables) The coef cients on the Z variables were little changedby the inclusion of variables that should in uence charitable pro-
MONASTIC POOR RELIEF | 207
vision In other words these coef cients are not likely to be pick-ing up actual variations in house-level characteristics (at thecounty level) that should be associated with actual poor relief18
In either sample those houses audited by commissions with ahigher percentage of titled members were less likely to be re-corded as zerondashpoor relief houses though this relationship isstronger when we estimate the model using the restrictedsubsample Similarly for the full sample a larger than averagenumber of commissioners is associated with a high probability ofzero- recorded poor relief and in the restricted sample the rela-tionship strengthens19
All relationships take the expected signs and remain consistentacross samples A high ratio of commissioners to houses reducesthe probability of a house having been recorded as providing nocharity As mentioned above this observation may re ect the fact
208 | NEIL S RUSHTON AND WENDY SIGLE-RUSHTON
Table 4 Parameter Estimates for the Probability of Zero Poor Relief as aFunction of Commission- and House-Speci c Characteristics That Should Notbe Associated with Actual Poor Relief
variable name full sample(n = 582)
incomes over pound50(n = 402)
Diocesan bishop 0272(187)
0294(151)
Titled (knight of the realm) 0088( 499)
0137( 471)
Percent titled 2083( 267)
3301( 272)
Commissioners 0016(546)
0020(381)
Commissioners to houses 0119( 239)
0184( 193)
Percent zero 1345(506)
1653(520)
Other exemptions 1386( 343)
1903( 336)
Log-likelihood 35897 22935
note The t-statistics are presented in parentheses Standard errors are corrected for clus-tering at the county level
18 In addition we estimated several speci cations of the bias function The results pre-sented herein are robust to both functional form and the set of regressors utilized19 For the familial ties between monasteries and society see Haigh Last Days of theLancashire Monasteries 58ndash59
that a high ratio of commissioners to religious houses reduces theprobability that extremely biased individuals were involved in theassessment of any one house Moreover the more houses within agiven county that are underassessed the higher the chances arethat another house within that county will be underassessed aswell Finally as expected those commissions that were generouswith other exemptionsmdashthat is they allowed a higher percentageof gross income to be written off as exemptions against taxationmdashwere less likely to allow no exemptions for charitable giving This nding strengthens our hypothesis that the other-exemptionsvariable is capturing commissioner subjectivity and not operatingas an income proxymdasha source of actual poor reliefmdashthat shouldbe excluded from the bias function The signi cance of thesemeasures which should in no way be related to actual charitableprovision provides convincing evidence of systematic measure-ment error in poor relief as reported in the Valor
predicting poor relief in the absence of bias The secondstage is to estimate equation (2) entering the predicted probabili-ties of zero poor relief from our probit speci cation as the g(Zi g)function We estimate equation (2) as an ordinary least squares(ols) regression in which the standard errors are corrected forclustering at the county level Once again we estimate the modelusing both the full sample and a subsample restricted to only thosehouses worth more than pound5020
At rst glance this two-stage estimation technique appearssimilar to a technique developed by Heckman to correct for sam-ple selection but it differs in two important ways First we intro-duce the predicted probability of zero alms in the second stage ofthe estimation rather than as a function of it ndash the inverse Millrsquos ra-tio suggested by Heckman Second our bias function is not meantto correct for a truncation of the error term caused by the utiliza-tion of only non-zero observations On the contrary we posit thatour predicted probability captures the level of bias on the part ofthe commissioning bodies and attempt to remove it from the esti-mated equation21
Additional house- and county-level variables thought to be
MONASTIC POOR RELIEF | 209
20 For a full discussion of the importance of these variables see Rushton ldquoMonastic Chari-table Provisionrdquo21 See James J Heckman ldquoSample Selection Bias as a Speci cation Errorrdquo EconometricaXLVII (1979) 153ndash161
associated with the actual level of charitable provision are also in-cluded in this regression and are presented along with theirde nitions means and standard deviations (for the full sample) inTable 5 Urban areas usually have larger populations requiring as-sistance and therefore face a higher demand for poor relief Be-cause houses located in urban areas during the early sixteenthcentury may also have experienced high levels of in-migrationand the resultant migrant poverty they may have had to providemore charity than houses outside the cities Similarly houses lo-cated in counties with large cities may also have attracted a sub-stantial volume of migration along with a corresponding demandfor charity22
Other characteristics of the houses themselvesmdashthe type ofreligious order its location or the gender of the inmatesmdashmayhave had an impact on how members prioritized spendingHouses with higher income should have been able to providemore poor relief than houses with lower income and the ratio ofa given housersquos income to the county average should indicateboth excess need within the county and the relative importance ofthat house Although income is undoubtedly an important deter-minant of the level of poor relief indicators are included forthe top and bottom 30 percent of the income distributions onlyThis strategy is meant to mitigate the impact of any undervalu-ing of income that may have occurred as well as the impact ofheteroskedascitymdasha problem that arises with the use of morere ned income categories
After estimating recorded poor relief as a function of thesecharacteristics and the predicted probability of having been re-corded as providing zero poor relief we estimate the value of poorrelief assuming that biasmdashthe predicted probability of no poorreliefmdashis set equal to zero Taking into account that houses ofsmall value may have been assessed correctly in the Valor we alsorun the same regression using a restricted sample of just thosehouses worth more than pound50 and predicted values from the re-stricted sample probit When we predict actual poor relief in thisrestricted speci cation we use recorded values for all excluded
210 | NEIL S RUSHTON AND WENDY SIGLE-RUSHTON
22 For urban immigration patterns before 1540 see Caroline M Barron ldquoLondon 1300ndash1540rdquo in Palliser (ed) The Cambridge Urban History of Britain I 600ndash1540 (Cambridge 2000)399ndash403 Jennifer Kermode ldquoThe Greater Towns 1300ndash1540rdquo ibid 458ndash459 ChristopherDyer ldquoSmall Towns 1270ndash1540rdquo ibid 523
Tab
le5
De
nitio
ns
Mea
ns
and
Stan
dard
Dev
iatio
nsof
Reg
ress
ors
Use
din
ols
Reg
ress
ion
ofR
ecor
ded
Poor
Rel
ief
vari
able
def
init
ion
mea
n( s
tan
dar
dd
evia
tio
n)
Urb
an=
1if
the
relig
ious
hous
eis
loca
ted
inan
urba
nen
viro
nmen
ta0
381
(04
9 )La
rge
urba
nto
wn
=1
ifth
ere
ligio
usho
use
islo
cate
din
one
ofth
e15
larg
est
urba
nar
easb
0 06
9(0
25 )
Ben
edic
tine
=1
ifth
eho
use
isB
ened
ictin
e0
249
(04
3 )Fe
mal
e=
1if
the
hous
eis
afe
mal
eho
use
0 35
9(0
48 )
Larg
ein
com
e=
1if
the
valu
eof
the
hous
eis
inth
eto
p30
of
the
dist
ribu
tion
0 30
0(0
46 )
Smal
lin
com
e=
1if
the
valu
eof
the
hous
efa
llsin
the
low
er30
of
the
dist
ribu
tion
0 31
0(0
46 )
Urb
anto
wns
inco
unty
the
num
ber
ofla
rge
tow
ns(d
ene
das
one
ofth
e40
larg
est)
inth
eco
unty
c1
321
(10
8 )N
orth
=1
ifth
eco
unty
islo
cate
din
the
nort
hof
the
coun
tryd
0 41
6(0
49 )
Tab
le5
Con
tinue
d
vari
able
def
init
ion
mea
n( s
tan
dar
dd
evia
tio
n)
Inco
me
ratio
the
ratio
ofth
eho
usersquo
sva
lue
toth
eav
erag
eva
lue
ofal
lot
her
hous
esin
the
coun
ty1
180
(20
9 )P
redi
cted
valu
eof
nopo
orre
lief
asa
func
tion
ofco
mm
issio
nch
arac
teri
stic
son
lymdash
apr
oxy
for
bias
0 48
0(0
19 )
a The
term
urba
nha
sno
dist
inct
refe
rent
atth
isda
teT
his
stud
yde
nes
urba
nen
viro
nmen
tas
any
sett
lem
ent
wit
hm
ore
than
eigh
tyta
xpay
ers
aslis
ted
inth
eLa
ySu
bsid
yta
xas
sess
men
tof1
524
25S
ettle
men
tsw
ithfe
wer
taxp
ayer
stha
tsho
wev
iden
ceof
urba
nch
arac
teri
stic
shav
eal
sobe
enta
ken
into
acco
unt
Bec
ause
tax-
paye
rsdo
not
nece
ssar
ilyre
pres
ent
all
head
sof
hous
ehol
dho
useh
old
mul
tipl
iers
usin
gsu
bsid
ylis
tsar
elia
ble
toer
ror
inte
rms
ofse
ttle
men
tsi
zean
dfu
ncti
on
Man
ylo
cati
ons
wit
hfe
wer
than
eigh
tyta
xpay
ers
mig
htha
veha
dhi
gher
popu
lati
onst
han
thos
ew
ith
mor
eth
anei
ghty
taxp
ayer
san
dal
sodi
spla
yed
urba
nch
ar-
acte
rist
ics
But
our
wor
king
de
nitio
nat
leas
tgiv
esa
viab
legr
oupi
ngof
urba
nan
dno
nurb
anse
ttle
men
tsfo
rre
ligio
usho
uses
and
hosp
ital
srec
orde
din
the
Val
or
For
the
lay
subs
idy
lists
see
John
Shea
ilT
heR
egio
nalD
istrib
utio
nof
Wea
lthin
Eng
land
asIn
dica
ted
inth
e15
24ndash2
5L
aySu
bsid
yR
etur
ns(L
ondo
n19
98)
For
the
mos
tre
cent
disc
ussi
onof
Eng
lish
tow
nsto
1540
se
eth
eva
riou
sch
apte
rsin
Dav
idM
icha
elP
allis
er(e
d)
The
Cam
brid
geU
rban
Hist
ory
ofB
ritai
nI
600ndash
1540
(Cam
-br
idge
20
00)
b Lond
onan
dth
ef
teen
larg
estp
rovi
ncia
ltow
nsb
yta
xpay
ers
inth
e15
242
5La
ySu
bsid
yal
soin
clud
ing
New
cast
lew
hich
was
noti
nth
esu
bsid
ybu
tpro
babl
yth
efo
urth
larg
est
tow
nin
the
coun
try
asw
ell
asY
ork
and
Cov
entr
yw
hich
wer
ece
rtai
nly
unde
rass
esse
dc T
hefo
rty
larg
est
tow
nsfr
omth
e15
242
5L
aySu
bsid
ypl
usN
ewca
stle
d E
ssen
tial
lyth
ehi
ghla
ndzo
ne
Der
bysh
ire
Shro
pshi
re
Lin
cons
hire
W
ales
Y
orks
hire
N
otti
ngha
msh
ire
Che
shir
eL
anca
shir
eC
umbr
ia
Wes
tmor
land
an
dD
urha
m
houses and predict poor relief for only those houses included inthe sample The full set of parameter estimates from the ols re-gression equation are presented in Appendix Table A but the pa-rameter estimates for the bias functions are presented for bothspeci cations in Table 6
The parameter estimate for the bias function is negative andsigni cant at the 1 percent level in either speci cation This pa-rameter estimate provides additional evidence that commissioncharacteristics and commissioner bias are likely to have in uencedthe recorded data In the restricted-sample speci cation our esti-mates imply that ceteris paribus a 10 percent increase in the pre-dicted probability that a house will be recorded as having zeropoor relief translates into a pound24 deduction in recorded poor reliefin the Valor Average estimated poor relief when the probability ofzero-recorded poor relief is set equal to zero and its percentage ofnet income is shown in Table 7
Notice that our choice of sample does not seem to alter ourpredicted values appreciably When the full sample is utilized av-erage charitable provision amounts to approximately pound19 perhouse This estimate drops to pound15 when low-income houses areexcluded from the analysis and their data is assumed to have beenaccurately recorded But regardless of the sample used both esti-mates of charitable provision imply that the recorded poor relief issubstantially underestimated in the Valor Recall that by simplycorrecting Savinersquos analysis charitable provision as a percentage ofmonastic income increases from 25 percent to nearly 5 percentAttempting to model and correct for systematic undervaluationincreases the estimate a further 2 to 4 percent depending on thesample used Because the lower-income houses were not likely tohave provided much charity the restricted sample estimates areprobably more accurate the full-sample results provide an upperbound rather than a realistic estimate Using these models the to-tal estimated national sum of monastichospital poor relief fromthe Valor falls between pound10630 and 1326523
Despite this ample evidence of inaccuracy in the Valorrsquos datathere are still reasons to interpret the results of this study with cau-tion First our model speci cation assumes that a record of zero
MONASTIC POOR RELIEF | 213
23 These sums are derived from the calculation 691 percent to 896 percent ofpound148052mdashpound142834 (total net monastic and hospital income) plus pound5218 (recorded poorrelief )
provision provides an adequate measure of bias and that the vari-ables selected pertain to recorded but not actual poor relief If theregressors in the bias function are somehow capturing county- orhouse-level characteristics that are associated with actual poor re-lief our model is eliminating too much bias Our choice of zero-recorded poor relief as an indicator of bias implies that houses witha higher probability of no poor relief were also subject to a higherlevel of under-recording This underlying relationship cannot beveri ed with the data at hand Given that the quality of some ofthe data has been brought into question other data in the Valormay be similarly awed The religious houses assessed in the Valorlike those in Lancashire were probably as eager to undervaluetheir incomes as the assessors were to undervalue their exemptionsagainst taxation Since this study attempts to correct for the under-valuation of almsgiving and not the undervaluation of income theestimated poor relief as a percentage of income may be biased up-ward Yet even with these caveats in mind both contextual andempirical evidence support our hypothesis of a systematic meas-urement error in the Valor data that tends to underestimate poorrelief
Previous historiography on this subject has relied too strongly onSavinersquos estimate that religious houses before the Dissolution de-voted about25 percent of their income to poor relief But Savineexcluded important houses from his analysis and he failed to use aproper measure of monastic income By including all relevant reli-gious houses and hospitals and by using the more appropriatemeasure of net income (before exemptions of poor relief ) ratherthan gross income this study roughly doubles Savinersquos calcula-
214 | NEIL S RUSHTON AND WENDY SIGLE-RUSHTON
Table 6 Parameter Estimates Associating Bias Function with Recorded PoorRelief
full sample probitand full sampleols regression
restricted sampleprobit and restrictedsample ols regression
Parameter Relating BiasFunction to RecordedPoor Relief
21874(-405)
24669(-385)
note The regression speci cation takes county-level clustering into account
tions This study also models commissioner bias and removes itfrom the estimates of charitable provision In this context bias isde ned as the predicted probability of having no poor relief re-corded in the Valor as a function of commissioner and countycharacteristics that appear to bear no relation to actual charitableprovision Estimating predicted poor relief when bias is zero is theway to achieve the greatest accuracy
Both stages of the analysis tend to con rm that bias on thepart of the commissioners in uenced the recorded levels of poorrelief The parameters in the probit equation are almost allsigni cant indicating the importance of the commissionersrsquo char-acteristics Likewise the parameter that associates bias (as a func-tion of only those characteristics believed not to be related toactual almsgiving) with recorded poor relief is negative andsigni cant at the 1 percent level indicating that bias is neither un-important nor random in these data Setting the probability ofzero poor relief to zero produces a more realistic value of reliefOur estimates suggest that actual charitable provision on the eve ofthe Dissolution amounted to about 7 percent of monastic in-comemdasha gure far higher than the one calculated by Savine andsubsequently perpetuated in the literature
This evidence of systematic underassessment of charitableprovision in the Valor is signi cant It means that the Dissolutionwas more disruptive to the lives of the English poor than Savinersquos
MONASTIC POOR RELIEF | 215
Table 7 Average Predicted Poor Relief Bias Function Set Equal to Zero and Its Pre-dicted Percentage of Monastic Income
full sample probitaverage predicted
poor relief per housefor the full sample
restricted sample probit pre-dicted poor relief per house
for the restricted sampleand recorded poor relief for
the excluded sample
Predicted average poorrelief when bias [g((Zi g)]is set equal to zero
pound1913 pound1532
Predicted poor reliefas a percentage ofmonastic income 896 718
note Predicted values include forty-eight houses with missing data on actual poor relief
gures would indicate especially since the government was un-able or unwilling to nd a substitute for this source of aid forsome time Monastic relief was by no means negligible its lossmust have been a great hardship for those who had come to relyon it
216 | NEIL S RUSHTON AND WENDY SIGLE-RUSHTON
APPENDIX PARAMETER ESTIMATES FROM THE OLS REGRES-SION OF RECORDED POOR RELIEF IN THE VALOR
regressor full samplemodel
restrictedsample model
Urban -0349(-020)
0067(-003)
Large urban town 12864(154)
13685(110)
Benedictine 2540(142)
3534(157)
Female 0319(025)
1468(-085)
Large income -2253(-060)
0294(-006)
Hospital 9889(255)
25365(239)
Small income -2385(-101)
2716(142)
Urban towns in the county 0419(060)
0342(036)
North -0148(-009)
1073(-043)
Income ratio 8370(403)
8418(369)
Predicted probability of zero relief -21874(-405)
-24669(-386)
Constant 7521(266)
3441(0906)
N 582 402
R2 049 051
note The t-statistics are reported in parentheses Standard errors are corrected for cluster-ing at the county level

Tab
le5
Con
tinue
d
vari
able
def
init
ion
mea
n( s
tan
dar
dd
evia
tio
n)
Inco
me
ratio
the
ratio
ofth
eho
usersquo
sva
lue
toth
eav
erag
eva
lue
ofal
lot
her
hous
esin
the
coun
ty1
180
(20
9 )P
redi
cted
valu
eof
nopo
orre
lief
asa
func
tion
ofco
mm
issio
nch
arac
teri
stic
son
lymdash
apr
oxy
for
bias
0 48
0(0
19 )
a The
term
urba
nha
sno
dist
inct
refe
rent
atth
isda
teT
his
stud
yde
nes
urba
nen
viro
nmen
tas
any
sett
lem
ent
wit
hm
ore
than
eigh
tyta
xpay
ers
aslis
ted
inth
eLa
ySu
bsid
yta
xas
sess
men
tof1
524
25S
ettle
men
tsw
ithfe
wer
taxp
ayer
stha
tsho
wev
iden
ceof
urba
nch
arac
teri
stic
shav
eal
sobe
enta
ken
into
acco
unt
Bec
ause
tax-
paye
rsdo
not
nece
ssar
ilyre
pres
ent
all
head
sof
hous
ehol
dho
useh
old
mul
tipl
iers
usin
gsu
bsid
ylis
tsar
elia
ble
toer
ror
inte
rms
ofse
ttle
men
tsi
zean
dfu
ncti
on
Man
ylo
cati
ons
wit
hfe
wer
than
eigh
tyta
xpay
ers
mig
htha
veha
dhi
gher
popu
lati
onst
han
thos
ew
ith
mor
eth
anei
ghty
taxp
ayer
san
dal
sodi
spla
yed
urba
nch
ar-
acte
rist
ics
But
our
wor
king
de
nitio
nat
leas
tgiv
esa
viab
legr
oupi
ngof
urba
nan
dno
nurb
anse
ttle
men
tsfo
rre
ligio
usho
uses
and
hosp
ital
srec
orde
din
the
Val
or
For
the
lay
subs
idy
lists
see
John
Shea
ilT
heR
egio
nalD
istrib
utio
nof
Wea
lthin
Eng
land
asIn
dica
ted
inth
e15
24ndash2
5L
aySu
bsid
yR
etur
ns(L
ondo
n19
98)
For
the
mos
tre
cent
disc
ussi
onof
Eng
lish
tow
nsto
1540
se
eth
eva
riou
sch
apte
rsin
Dav
idM
icha
elP
allis
er(e
d)
The
Cam
brid
geU
rban
Hist
ory
ofB
ritai
nI
600ndash
1540
(Cam
-br
idge
20
00)
b Lond
onan
dth
ef
teen
larg
estp
rovi
ncia
ltow
nsb
yta
xpay
ers
inth
e15
242
5La
ySu
bsid
yal
soin
clud
ing
New
cast
lew
hich
was
noti
nth
esu
bsid
ybu
tpro
babl
yth
efo
urth
larg
est
tow
nin
the
coun
try
asw
ell
asY
ork
and
Cov
entr
yw
hich
wer
ece
rtai
nly
unde
rass
esse
dc T
hefo
rty
larg
est
tow
nsfr
omth
e15
242
5L
aySu
bsid
ypl
usN
ewca
stle
d E
ssen
tial
lyth
ehi
ghla
ndzo
ne
Der
bysh
ire
Shro
pshi
re
Lin
cons
hire
W
ales
Y
orks
hire
N
otti
ngha
msh
ire
Che
shir
eL
anca
shir
eC
umbr
ia
Wes
tmor
land
an
dD
urha
m
houses and predict poor relief for only those houses included inthe sample The full set of parameter estimates from the ols re-gression equation are presented in Appendix Table A but the pa-rameter estimates for the bias functions are presented for bothspeci cations in Table 6
The parameter estimate for the bias function is negative andsigni cant at the 1 percent level in either speci cation This pa-rameter estimate provides additional evidence that commissioncharacteristics and commissioner bias are likely to have in uencedthe recorded data In the restricted-sample speci cation our esti-mates imply that ceteris paribus a 10 percent increase in the pre-dicted probability that a house will be recorded as having zeropoor relief translates into a pound24 deduction in recorded poor reliefin the Valor Average estimated poor relief when the probability ofzero-recorded poor relief is set equal to zero and its percentage ofnet income is shown in Table 7
Notice that our choice of sample does not seem to alter ourpredicted values appreciably When the full sample is utilized av-erage charitable provision amounts to approximately pound19 perhouse This estimate drops to pound15 when low-income houses areexcluded from the analysis and their data is assumed to have beenaccurately recorded But regardless of the sample used both esti-mates of charitable provision imply that the recorded poor relief issubstantially underestimated in the Valor Recall that by simplycorrecting Savinersquos analysis charitable provision as a percentage ofmonastic income increases from 25 percent to nearly 5 percentAttempting to model and correct for systematic undervaluationincreases the estimate a further 2 to 4 percent depending on thesample used Because the lower-income houses were not likely tohave provided much charity the restricted sample estimates areprobably more accurate the full-sample results provide an upperbound rather than a realistic estimate Using these models the to-tal estimated national sum of monastichospital poor relief fromthe Valor falls between pound10630 and 1326523
Despite this ample evidence of inaccuracy in the Valorrsquos datathere are still reasons to interpret the results of this study with cau-tion First our model speci cation assumes that a record of zero
MONASTIC POOR RELIEF | 213
23 These sums are derived from the calculation 691 percent to 896 percent ofpound148052mdashpound142834 (total net monastic and hospital income) plus pound5218 (recorded poorrelief )
provision provides an adequate measure of bias and that the vari-ables selected pertain to recorded but not actual poor relief If theregressors in the bias function are somehow capturing county- orhouse-level characteristics that are associated with actual poor re-lief our model is eliminating too much bias Our choice of zero-recorded poor relief as an indicator of bias implies that houses witha higher probability of no poor relief were also subject to a higherlevel of under-recording This underlying relationship cannot beveri ed with the data at hand Given that the quality of some ofthe data has been brought into question other data in the Valormay be similarly awed The religious houses assessed in the Valorlike those in Lancashire were probably as eager to undervaluetheir incomes as the assessors were to undervalue their exemptionsagainst taxation Since this study attempts to correct for the under-valuation of almsgiving and not the undervaluation of income theestimated poor relief as a percentage of income may be biased up-ward Yet even with these caveats in mind both contextual andempirical evidence support our hypothesis of a systematic meas-urement error in the Valor data that tends to underestimate poorrelief
Previous historiography on this subject has relied too strongly onSavinersquos estimate that religious houses before the Dissolution de-voted about25 percent of their income to poor relief But Savineexcluded important houses from his analysis and he failed to use aproper measure of monastic income By including all relevant reli-gious houses and hospitals and by using the more appropriatemeasure of net income (before exemptions of poor relief ) ratherthan gross income this study roughly doubles Savinersquos calcula-
214 | NEIL S RUSHTON AND WENDY SIGLE-RUSHTON
Table 6 Parameter Estimates Associating Bias Function with Recorded PoorRelief
full sample probitand full sampleols regression
restricted sampleprobit and restrictedsample ols regression
Parameter Relating BiasFunction to RecordedPoor Relief
21874(-405)
24669(-385)
note The regression speci cation takes county-level clustering into account
tions This study also models commissioner bias and removes itfrom the estimates of charitable provision In this context bias isde ned as the predicted probability of having no poor relief re-corded in the Valor as a function of commissioner and countycharacteristics that appear to bear no relation to actual charitableprovision Estimating predicted poor relief when bias is zero is theway to achieve the greatest accuracy
Both stages of the analysis tend to con rm that bias on thepart of the commissioners in uenced the recorded levels of poorrelief The parameters in the probit equation are almost allsigni cant indicating the importance of the commissionersrsquo char-acteristics Likewise the parameter that associates bias (as a func-tion of only those characteristics believed not to be related toactual almsgiving) with recorded poor relief is negative andsigni cant at the 1 percent level indicating that bias is neither un-important nor random in these data Setting the probability ofzero poor relief to zero produces a more realistic value of reliefOur estimates suggest that actual charitable provision on the eve ofthe Dissolution amounted to about 7 percent of monastic in-comemdasha gure far higher than the one calculated by Savine andsubsequently perpetuated in the literature
This evidence of systematic underassessment of charitableprovision in the Valor is signi cant It means that the Dissolutionwas more disruptive to the lives of the English poor than Savinersquos
MONASTIC POOR RELIEF | 215
Table 7 Average Predicted Poor Relief Bias Function Set Equal to Zero and Its Pre-dicted Percentage of Monastic Income
full sample probitaverage predicted
poor relief per housefor the full sample
restricted sample probit pre-dicted poor relief per house
for the restricted sampleand recorded poor relief for
the excluded sample
Predicted average poorrelief when bias [g((Zi g)]is set equal to zero
pound1913 pound1532
Predicted poor reliefas a percentage ofmonastic income 896 718
note Predicted values include forty-eight houses with missing data on actual poor relief
gures would indicate especially since the government was un-able or unwilling to nd a substitute for this source of aid forsome time Monastic relief was by no means negligible its lossmust have been a great hardship for those who had come to relyon it
216 | NEIL S RUSHTON AND WENDY SIGLE-RUSHTON
APPENDIX PARAMETER ESTIMATES FROM THE OLS REGRES-SION OF RECORDED POOR RELIEF IN THE VALOR
regressor full samplemodel
restrictedsample model
Urban -0349(-020)
0067(-003)
Large urban town 12864(154)
13685(110)
Benedictine 2540(142)
3534(157)
Female 0319(025)
1468(-085)
Large income -2253(-060)
0294(-006)
Hospital 9889(255)
25365(239)
Small income -2385(-101)
2716(142)
Urban towns in the county 0419(060)
0342(036)
North -0148(-009)
1073(-043)
Income ratio 8370(403)
8418(369)
Predicted probability of zero relief -21874(-405)
-24669(-386)
Constant 7521(266)
3441(0906)
N 582 402
R2 049 051
note The t-statistics are reported in parentheses Standard errors are corrected for cluster-ing at the county level
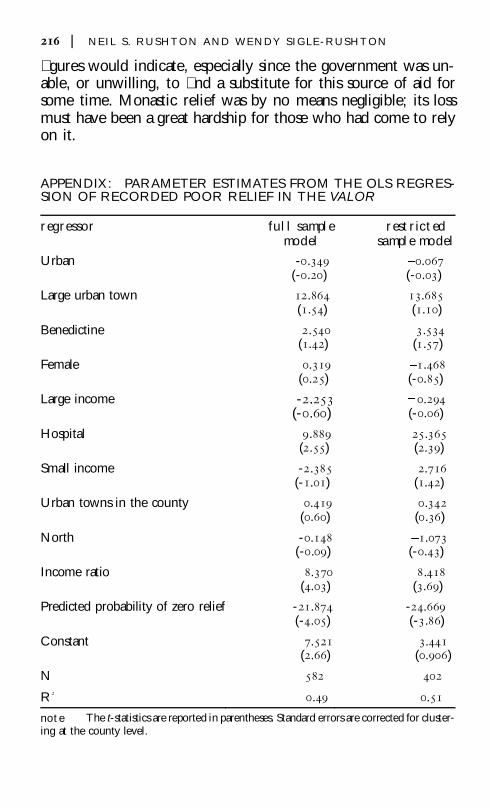