Effect of staff motivation on retention of nurses in Kenyatta ...
Upload
khangminh22Category
view
1download
0
JOMO KENYATTA UNIVERSITY OF AGRICULTURE AND
TECHNOLOGY
SCHOOL OF HUMAN RESOURCE DEVELOPMENT
PROCEEDINGS OF FIRST SHRD ANNUAL RESEARCH CONFERENCE
HELD ON
12th
and 13th
September 2013
AT
JKUAT MAIN CAMPUS
Conference Committee Members
Prof. Elegwa. Mukulu (Dean, SHRD)
Dr. Willy. Muturi (Associate Dean, SHRD)
Dr. Jane Gathenya – Department of Entrepreneurship and Procurement (Chairperson)
Dr. Kenneth Wanjau– Department of Entrepreneurship and Procurement (Associate, Chairperson)
Prof. Gregory Namusonge– Department of Entrepreneurship and Procurement
Dr. Margaret Oloko– Department of Commerce and Economics
Dr. Florence Memba– Department of Commerce and Economics
Mr. Antony Osambo– Department of Commerce and Economics
Dr. Hellen Mberia– Department of Social Sciences and Humanities
Dr. Florence Mwaura – Department of Social Sciences and Humanities
Ms. Getrude Inimah– Department of Social Sciences and Humanities

Proceedings of 1st JKUAT-SHRD Research Conference 12
th and 13
th September 2013
i
FINANCE AND ACCOUNTING
SOCIAL ACCOUNTING PRACTICES AMONG KENYAN FIRMS: AN EMPIRICAL STUDY OF
COMPANIES QUOTED AT NAIROBI SECURITIES EXCHANGE. (April 2012)
Daniel Mwasa Ishmail* &Francis N. Sira ................................................................................................ 200
DETERMINANTS OF FINANCIAL PERFORMANCE OF COMMERCIAL BANKS IN KENYA
Geoffrey Mwangi Maina* & Willy Muturi .............................................................................................. 207
THE EFFECT OF DIVIDEND POLICY ON FINANCIAL PERFORMANCE OF FIRMS LISTED IN
THE NAIROBI SECURITIES EXCHANGE (NSE).
Gwaya*, D. Kiyondi & L.A. Oyugi .......................................................................................................... 218
DETERMINANTS OF FINANCIAL SECTOR GROWTH RATE IN KENYA; 1982-2011
Joel Nzioka Muema .................................................................................................................................. 229
CAPITAL STRUCTURE AND FINANCIAL PERFORMANCE IN KENYA: EVIDENCE FROM
FIRMS LISTED AT THE NAIROBI SECURITIES EXCHANGE
Maina L.1* &Ondongo Kondongo. .......................................................................................................... 238
FACTORS AFFECTING INVESTMENT AMONGST KENYAN FOOTBALLERS: A STUDY OF
SELECTED FOOTBALLERS IN KENYA
1Oscar O. Ohaya*,
2George Misigah &
3Carolyne Kinyanjui ................................................................... 247
DERIVATIVES AS INSTRUMENTS OF RISK MANAGEMENT AMONG FIRMS LISTED AT
NAIROBI SECURITIES EXCHANGE
Salah Abdi Sheikh..................................................................................................................................... 256
THE ROLE OF EXTERNAL AUDITORS IN CORPORATE GOVERNANCE IN KENYA: THE
CASE OF UCHUMI SUPERMARKET LIMITED
Moses Wandera* & Susan Njoki Kibe, .................................................................................................... 265
EVALUATION OF FINANCIAL DISTRESS IN UCHUMI SUPERMARKET LTD
Waita, M. Gichaiya* & L.A. Oyugi .......................................................................................................... 275
MICRO-FINANCE
THE EFFECTS OF MOBILE PHONE MONEY TRANSFER SYSTEM (M-PESA) ON THE
PROFITABILITY OF MICRO AND SMALL ENTERPRISES IN BUNGOMA SOUTH SUB-
COUNTY IN KENYA
Consolata Nasimiyu Simiyu ..................................................................................................................... 285
MANAGEMENT OF OPERATIONAL RISKS AND LOAN PORTFOLIO QUALITY: A SURVEY OF
MICROFINANCE INSTITUTIONS IN KISII MUNICIPALITY

Proceedings of 1st JKUAT-SHRD Research Conference 12
th and 13
th September 2013
ii
Maobe Clecensia Kemunto* & Margaret Oloko ...................................................................................... 296
A MODEL TO ENHANCE SAVINGS AND CREDIT COOPERATIVE SOCIETIES MEMBERS’
INVESTMENT CULTURE IN KENYA
Onchangwa, Gilbert. A* & Memba, Florence, S ...................................................................................... 306

Proceedings of 1st JKUAT-SHRD Research Conference 12
th and 13
th September 2013
200
FINANCE AND ACCOUNTING
SOCIAL ACCOUNTING PRACTICES AMONG KENYAN FIRMS: AN EMPIRICAL
STUDY OF COMPANIES QUOTED AT NAIROBI SECURITIES EXCHANGE. (April
2012)
Daniel Mwasa Ishmail* &Francis N. Sira
Jomo Kenyatta University of Agriculture and Technology
Email: [email protected],
Abstract
Profit and shareholders wealth maximization have for long dictated accounting and reporting
practices, the concern for the social costs and the benefits of the business practices have given
rise to the need for environmental and social accounting. The Significance of the study was to
determine how companies are reporting positive and negative externalities to the society. The
main objectives of the study was to establish the most popular themes of social accounting in
Kenya, determine how and location for disclosure of social accounting information. The
population of the study was fifty seven companies quoted in NSE and longitudinal study was
carried from 2008-2010. Census method was used to collect data. Secondary data was collected
from published annual financial statement of all listed companies. The population of companies
is categorized into four market segment, Content analysis and descriptive analysis was used in
analyzing data. It was established in the year 2008, companies practicing social accounting
were 72%, while 2009 were 75% and in 2010 were 81%. It was also established that community
involvement and environment themes was leading in practice of social accounting. Finally, it
was established that companies prefer non-monetary form over monetary form of presentation
and also they prefer using separate location to using chairman’s report in annual reports.
Keywords: Social Accounting; Environmental Accounting; Nairobi Security Exchange
Introduction
Kenya has observed a spectacular evolution in community and investors stance towards the
environment in the past few decades. Ever-increasing sensitivity of environmental pollution,
global warming and diminishing supply of natural resources has attracted direct societal
awareness towards the environmental activities of business organizations. This concern about
the impact of enterprises on society is a global one. The expectations of consumers, employees,
investors, business partners and local communities as to the responsibility of businesses in
society are increasing. Social accounting (also known as social and environmental accounting,
corporate social reporting, corporate social responsibility reporting, non-financial reporting, or
sustainability accounting) is the process of communicating the social and environmental effects
of organizations' economic actions to particular interest groups within society and to society at
large (Gray et al 1987).
Social accounting (SA) emphasizes the notion of corporate accountability. According Adams
(2008) defines social accounting in this sense as an approach to reporting a firm’s activities
which stresses the need for the identification of socially relevant behaviour, the determination
of those to whom the company is accountable for its social performance and the development of
appropriate measures and reporting techniques.

Proceedings of 1st JKUAT-SHRD Research Conference 12
th and 13
th September 2013
201
National Environmental Management Authority (NEMA) was established under the
environmental management and coordination Act.1999, as the principal instrument of the
government in management of Kenyan environment. It’s under the Ministry of Environment
and Natural Resources (MENR). NEMA act as the watchdog of Kenyan environment and
requires companies to be environmental responsible especially in areas of waste management
and exploitation of natural resources. NEMA provides no regulations that obligate the public
companies prepare environmental reports in their annual reports. The registrar of companies
regulates companies to operate under Companies Act Cap 470, although there is no regulatory
framework that obligates public companies to report social and environmental costs to
stakeholders, but only stipulates that companies have to report on their economic issue.
Problem Statement
Iyoha (2010), state that society needs social accounting reports in much the same way that
capital markets require financial information supplied by financial accounting system. Users of
social accounting information need the data that allow them to assess whether the entity is being
socially, financially and environmentally responsible. According to Davies and Okorite (2007),
where the social activities of organizations are fairly reported in the financial statements, duly
audited and attested to and published by the organization for all to see, some of the problems
would be minimized, if not eliminated. There exist no studies that focus on social corporate
responsibility reporting, in published annual financial statement of companies quoted in Nairobi
stock exchange, in recent years.
General Objective
Assess social accounting practice in listed companies in Kenya.
Specific Objectives
(i) To determine the most popular themes of social accounting disclosed in the
annual reports of companies in Kenya.
(ii) To determine how social accounting is disclosed in the annual reports of
companies in Kenya.
(iii) Determine the location of presentation of social accounting in the annual reports
of companies in Kenya.
Justification of the Study
The increase of interest in social and environmental issues has been followed by an increase in
academic writing and publications (Mathews, 1995). Gray et al. (1996) argue that social and
environmental accounting and reporting play a relevant role in this context as tools for
analyzing the sustainability performance of the organizations and note that these have been
relevant subject in the academic literature.
In the study of Ponnu and Okoth (2009), investigating corporate social responsibility (CSR)
disclosure practices in Kenya, it focused on the disclosure practices of companies listed on the
Nairobi Stock Exchange (NSE). It looks at CSR disclosure practices in annual reports and web
sites of the companies across different industry groups to determine the relationship between
company size and CSR disclosure. The study fails to clearly point out social accounting practice
in published annual reports, but gives mixed results of both sources of disclosure. Also the

Proceedings of 1st JKUAT-SHRD Research Conference 12
th and 13
th September 2013
202
study focuses on single year 2006, thus fail to give insight on the reporting pattern of
companies.
This study establishes social accounting practices in published annual reports that are more
authentic than any other sources of disclosure (eg websites, speeches, press releases, flyers,
promotional leaflets and other documents). Also this study is a longitudinal study, focusing on
three years hence able to give more insight on reporting pattern.
Scope of the Study
This study was carried on public limited companies registered and trading in Kenya. More
specifically companies listed in Nairobi Securities Exchanges (NSE). Companies quoted in
NSE publish their annual financial statements, thus providing data that is required for carrying
this research.
Theoretical Review
The theories within the positivist group offer potential in-depth insights to explain the
underlying motivations for corporate social and environmental disclosures. Legitimacy theory
explains how an organisation wishing to maintain its license must comply with the expectations
of the community in which it operates (Deegan, 2002). Stakeholder theory suggests that an
organisation will respond to the concerns and expectations of powerful stakeholders.
Institutional theory explains how organizations embrace operating policies that are similar in
form to those embraced by powerful stakeholders (DiMaggio & Powell, 1983). Agency theory
explains that organisations will take actions to maximise management and shareholder interests
(Watts & Zimmerman, 1978). Political cost theory explains that organisations will take actions
to reduce their political costs such as those relating to increased taxes and regulation(Watts &
Zimmerman, 1978).
Hence, all of these theories seek to identify and predict the driving factors behind the
organisational disclosure decisions. While there are some similarities, agency and political cost
theory rely upon the economics-based assumptions that all action is driven by individual self-
interest (tied to wealth maximization) (Deegan, 2006). Unlike agency and political cost theory,
stakeholder, institutional and legitimacy theory do not rely on the central assumption that all
action must be driven by individual self-interest. For example, legitimacy theory relies upon the
central notion of an organisation’s social contract with society and predicts that management
will adopt particular strategies (including reporting strategies) in a bid to assure the society that
the organisation is complying with the society’s values and norms (which are predicted to
change over time) (Deegan, 2006).
Research Design and Methodology
Sample and source of data: The unit of analysis is fifty seven companies from four segment
listed at NSE for the year of study 2008-2010. These segments are Agricultural segment,
Commercial and service segment, Finance and investment segment and Industrial and Allied
segment. The study examined the social accounting practice within the financial statement of
companies using census method.
Data Analysis and Presentation: Content analysis is defined as a research technique for the
objective, systematic and qualitative description of the manifest content of communication
(O’Dwyer, 2005). It is clearly defined by Weber (1988) as a method of coding the text or the

Proceedings of 1st JKUAT-SHRD Research Conference 12
th and 13
th September 2013
203
content of a piece of writing into various groups or categories based on selected criteria (Jamil
et al., 2003). This study used content analysis to measure social accounting disclosure. This
method was chosen due to its ability to analyse different types of communication tools
including those in written code. Content analysis was used to examine written materials
contained in the annual reports. This type of analysis was used due to the fact that this study
only focuses on one document, which is the annual report. Content analysis was used in
numerous studies on social accounting disclosures (Gray et al., 1995; Jamil et al., 2003;
Kuasirikun and Sheen, 2004).
Descriptive analysis: By using content analysis, the researcher has codified the written material
in the annual reports into four (4) themes namely; human resources, environment, consumer and
product and community involvement. The data was analyzed using descriptive analysis with aid
of Statistical package for social sciences (SPSS-Ver18)
Results and Discussion
Adoption of Social Accounting
Table1 Frequency distribution table of companies that have adopted SA
2008 2009 2010
Frequency Percentage Frequency Percentage Frequency Percentage
Yes 41 72 43 75 46 81
No 16 28 14 25 11 19
From table 1 it was found that 72% of the companies trading in NSE in 2008 were practicing
social accounting, 75% in 2009 and 81% in 2010. The trend of adoption of social accounting is
above 50% and was improving from 2008 to 2010. This indicates most Kenyan firms are
embracing social accounting practice.
Social Accounting Themes
Tables 2 trend of social accounting practice
Themes 2008 (%) 2009 (%) 2010 (%)
Human resource 32 49 61
Environment 47 56 61
Consumer and
product
32 49 53
Community
involvement
56 61 70
Table 2 shows the trend of social accounting disclosures of themes. Across the period 2008-
2010 the disclosure for all themes as steadily grew every year with community involvement
leading. The analysis therefore reveals that disclosure of social and environmental activities is
specifically on the discretion of the companies.

Proceedings of 1st JKUAT-SHRD Research Conference 12
th and 13
th September 2013
204
Format of Presentation
Table 3 format social accounting disclosure in annual reports
2008(%) 2009(%) 2010(%)
Monetary form 43 43 47
Non- monetary form 57 57 53
From Table 3 shows that in 2008 43% of the companies disclose social accounting information
using monetary form and 57% disclose with Non-monetary formats. The year 2009 43% used
monetary form and 57 used non monetary format while in 2010 47% used monetary format and
53% in non-monetary form.
Table 4 Non-Monetary Form Presentation
2008(%) 2009 (%) 2010(%)
Narrative 68 65 62
Picture 29 32 36
Tables
and Graphs
3 3 3
Companies prefer narrative form disclosure to pictures and tables and graph. Many companies
were also found to have used the non monetary format to disclose human resource information
and environmental contribution primarily related to retirement benefit, training and
development and some community based projects such as adopting school, scholarships and
donations
Location of Disclosure of Social Accounting in Annual Reports
Table 5 location for social accounting disclosure in the annual reports
2008(%) 2009(%) 2010(%)
Chairman
statement
25 22 27
Separate
location
75 78 73
Table 5 shows that of the 25% companies disclose social accounting information in the
chairman’s statement in 2008, while 22% in 2009 and 27% in 2010; 75% disclose social
accounting information in the separate location in 2008 while 78% in 2009 and 73% in
2010.His result is also consistent with Mamman (2004) and Ebimobowei (2011) study that
Directors report is the most preferred location of social accounting information

Proceedings of 1st JKUAT-SHRD Research Conference 12
th and 13
th September 2013
205
Table 6 category of separate location in the annual report
2008(%) 2009(%) 2010(%)
Corporate
governance report
21 25 28
Managing director 21 23 32
Sustainability report 19 19 19
Value added
statement
4 4 4
End note 46 51 52
The paper discovers that end note is the most popular location where social accounting
information is disclosed by companies in Kenya while value added statement is least used
although it’s most explanatory.
Conclusion
It was also established that companies engage in long term project such as building school and
support of public school, scholarship programs, medical health center for employees and
community, sponsorship of sports, waste management program and continuous product
improvement.
Finally, the study found that monetary form of presentation clearly communicates information,
and more suitable for making decision that are reliable and relevant, this because non monetary
especially narrative provide qualitative data that is difficult to do analysis.
Recommendation
Firms should adopt added value statement, to report on social corporate responsibility. These
statements provide clear breakdown of costs and benefits accrued in practice of social
accounting.
The government should encourage social corporate responsibility and reporting through use of
tax incentives for companies. This would promote companies that have not adopted social
accounting adopt and practice.
Companies should adopt reporting of social and environmental accounting in separate section
particularly they should use sustainability report to give more details of company’s practice in
social corporate responsibility.
References
Adams, C. (2008). ‘A Commentary on: Corporate Social Responsibility Reporting and
Reputation Risk Management’, Accounting, Auditing, & Accountability Journal, Vol.
21, No. 3, pp. 365 -70.
Bebbington, J., Larrinaga-Gonzalez, C. & Moneva-Abadia, J. (2008) ‘Corporate Social
Responsibility Reporting and Reputation Risk Management’, Accounting, Auditing
&Accountability Journal, Vol. 21, No. 3, pp. 337- 62.
Clarkson, M. (1995). ‘Stakeholder Framework for Analysing and Evaluating Corporate Social
Performance’, Academy of Management Review, Vol. 20, pp. 92-117.

Proceedings of 1st JKUAT-SHRD Research Conference 12
th and 13
th September 2013
206
Cooper, S. & Owen, D. (2007). ‘Corporate Social Reporting and Stakeholder Accountability:
The Missing Link’, Accounting, Organizations and Society, Vol. 32, No.7-8, pp. 649
67.The Copenhagen Charter (1999). http://www.stakeholder.
Davies, N. & L. Okorite.(2007). Corporate Social Responsibility Accounting: A Wake-Up Call
to the Nigerian Accountant. Nigerian Accountant, 40(2): 44-48.
Deegan, C. (2007) Australian Financial Accounting, 5th ed., McGraw-Hill, Sydney.
Deegan, C. (2009). Financial Accounting Theory, 3rd ed., McGraw Hill, Sydney
Deegan, C. & Gordon, B. (1996).‘A Study of the Environmental Disclosure Practices of
Australian Corporations’, Accounting and Business Research, Vol. 26, No. 3, pp. 187-
99.
DiMaggio, P. & Powell, W.(1983). ‘The Iron Cage Revisited: Institutional Isomorphism and
Collective Rationality in Organizational Fields’, American Sociological Review, Vol.
48,pp.146-60.
Elkington, J. (1997). Cannibals with Forks: The Triple Bottom Line of 21st Century
Business:London, Capstone.
Ernst and Ernst. (1978). Social Responsibility Disclosure: 1978 Survey, Ernst and Ernst,
Cleveland, OH.
Jamil, C.Z.M., K. Alwi and R. Mohammed(2003).Corporate social responsibility disclosure in
the annual reports of Malaysia companies: A longitudinal study. Analysis, 10(1): 139
159.
Gray, R. (2006). "Social, environmental and sustainability reporting and organisational value
creation? Whose value? Who’s Creation?” Accounting, Auditing & Accountability
Journal, 19 (6): 793-819
Gray, R., Owen, D. and Adams, C. (1996). Accounting and Accountability. Changes and
Challenges in Corporate Social and Environmental Reporting. London: Prentice-Hall.
Van de Ven, B., (2005). ‘Human Rights a Normative Basis for Stakeholder Legitimacy’,
Corporate Governance, Vol. 5, pp. 48-59.
Watts, R. & Zimmerman. J., (1978). ‘Towards a Positive Theory of the Determination of
Accounting Standards’, The Accounting Review, Vol. 53, No 1, pp. 112-34.

Proceedings of 1st JKUAT-SHRD Research Conference 12
th and 13
th September 2013
207
DETERMINANTS OF FINANCIAL PERFORMANCE OF COMMERCIAL BANKS IN
KENYA
Geoffrey Mwangi Maina* & Willy Muturi
Jomo Kenyatta University of Agriculture and Technology
Email: [email protected]
Abstract
Kenya has experienced slowed economic growth between 2006 and 2012. The Central Bank
Rate and Repo rate, for instance, rose significantly to 18 per cent and 17.75 per cent
respectively during 2011. Under such economic conditions, most industries are expected to
register a decline in profitability. The banking industry, however, registered improved
performance raising queries on what actually determines the performance of banks in Kenya.
The objective of the study, therefore, was to investigate the impact of bank specific
characteristics on the financial performance of commercial banks in Kenya. To achieve this
objective, the study examines the financial performance of thirty-eight commercial banks in
Kenya over a seven-year period from 2006 to 2012 and tests for the factors influencing
performance. This study used secondary data from annual published financial statements and
bank supervision records at the Central Bank of Kenya (CBK). The data was analyzed using
random effects panel data analysis. Regression equations were run for both foreign and local
banks together and then each category was regressed separately to check whether both
categories had similar effects. Empirical results show that Operational efficiency and financial
structure significantly determine performance for commercial banks in Kenya when both local
and foreign banks are taken together. The same applies when the regression is run for locally
owned banks. However, for foreign banks only operational efficiency is significant. Liquidity
was not found to be a significant determinant of financial performance for commercial banks.
Keywords: Financial Performance, operational efficiency, financial structure, liquidity,
ownership structure
Introduction
The determinants of the performance of commercial banks can be broadly categorized into two:
internal factors and external factors. Internal factors, which are firm specific, are those that are
within the control of management. They are either financial (directly involve balance sheet and
income statement items) or non financial (no direct relation to financial statements). External
factors that affect bank performance are those that are considered beyond the control of the
management of a bank (Kharwish, 2011). These external factors could include inflation, gross
domestic product, competition, regulation and political stability among others. When evaluating
the financial performance of a firm, the first step is evaluating whether it has been able to
achieve the objectives its management and stockholders have chosen. In the case of banks, there
are three key objectives that need to be achieved. The first is maximizing the value of the bank
that is mainly achieved through an increase in the value of a company’s stocks (commonly
referred to as capital gains). The second objective would be to increase the bank’s profitability
that may translate to higher dividend payment to stockholders. This is evaluated using the
profitability measures/ratios. The third and critical objective of banks would be to ensure there
is a proper risk management framework to enable the bank deal with the various risk exposures
(Rose and Hudgins, 2013).Commercial banks in Kenya are licensed and regulated pursuant to
the provisions of the Banking Act and the regulations and prudential guidelines issued by the

Proceedings of 1st JKUAT-SHRD Research Conference 12
th and 13
th September 2013
208
Central Bank of Kenya (CBK). The deliberate move by the Central Bank of Kenya to encourage
the participation of small and medium banks has led to the growth of most the banking industry
over the last seven years. This implies that more Kenyans today have access to banking and
other financial services than it was the case seven years ago. In addition, there have been
several developments in the Kenyan banking industry in the recent past. First, the rollout of the
agency-banking model in May 2010 has increased accessibility to financial services. Secondly,
the introduction of Mobile financial services has made it convenient for Kenyans to transact
without having to go to banking halls. Thirdly, in a bid to reduce credit risk for financial
institutions the CBK introduced a system of Credit information sharing. Finally, the
introduction of Core banking systems has gone a long way in enhancing service delivery within
the banking industry. The core banking systems currently being usedby banks are Bankers
realm, Flexcube, T24 and Finacle (CBK, 2011).
Macroeconomic variables like inflation rose significantly from 7.6% in January 2006 to 18.3%
in January 2012 whereas the CBR also rose significantly from 9.5% to 18% during the same
period. Such a rise would have been expected to raise the cost of funds and thereby reduce the
demand for loans, which would consequently reduce the profitability of commercial banks. On
the contrary the profit before tax for the banking industry for the same period rose from Ksh.
26.38 billion in 2006 to Ksh. 106.99 billion in 2012. This raises the question as to why this
happened contrary to the expectations. To answer this question, one needs to know what
determines the financial performance of commercial banks in Kenya. Various studies have been
undertaken to investigate this but most of these studies have emphasized on the developed
markets. Researchers who have investigated this issue in Kenya, for instance Ongore and Kusa
(2013) focused on the macroeconomic variables and moderating effects of ownership structure
but ignored other critical bank specific variables. This study therefore, studies the bank specific
determinants of bank performance in Kenya between 2006 and 2012 during which there were
significant developments in the banking industry.
Objectives
The general objective of this study is to investigate the determinants of financial performance of
commercial banks in Kenya. The specific objectives of the study are:
1. To determine how the financial structure of Kenyan banks impacts on their financial
performance
2. To investigate the impact of a banks liquidity on its financial performance.
3. To investigate the impact of operational efficiency on financial performance of
commercial banks in Kenya.
4. To determine how the moderating effect of ownership structure of Kenyan banks impact
on their financial performance
Literature review
The behavior of a stock’s price is the best indicator of a bank’s financial performance because it
reflects the markets evaluation of a firm. This indicator, however, is not available for smaller
banks and other relatively small financial institutions. This is because these small firms are
either not listed or they are not actively traded in the stock exchange market. Financial analysts
therefore fall back on surrogates for market value indicators by using profitability ratios (Rose
and Hudgins, 2013). Return on assets (ROA) is an indicator of managerial efficiency and it
indicates how capable management has been converting assets into net earnings. Return on
equity (ROE) shows the rate of return that has been flowing to shareholders i.e. the benefits that

Proceedings of 1st JKUAT-SHRD Research Conference 12
th and 13
th September 2013
209
the stockholders have received from investing their capital into the firm. Both the net interest
margin (NIM) and the net operating margin are efficiency measures as well as profitability
measures indicating how well management has been able to keep the growth of revenues ahead
of rising costs. The net interest margin (NIM) measures how large a spread between interest
revenues and interest cost management has been able to achieve by close control over earning
assets and pursuit of cheaper source of funding. Many authorities prefer to use total earning
assets in the denominator of the net interest margin since the net interest income should not be
compared to all assets but to those assets that account for the majority of the income (Rose and
Hudgins, 2013).
The ownership structure can either be represented by the shares of stock owned by the various
groups of shareholders or the proportion (concentration) of each. The financial manager is
expected to act in the best interest of the stockholders by taking actions that increase the value
of the stock. However, it is not always the case that financial managers act in the interest of
stockholders. Firms will therefore incur agency costs to deal with the agency problem that may
arise. Ownership structure and board changes determine how the assets are allocated to different
uses and different management teams in response to changes in business conditions (Sarin and
David, 1998). Consequently, financial performance of the firms will be affected by the
ownership strucure. Ntaw and Laryea (2012) compared the financial performance of foreign and
local banks in Ghana for a six-year period from 2005 to 2010. Their findings showed that local
banks in Ghana were performing better than their foreign counterparts. Foreign banks in Poland
between 1997 and 2001 exhibited higher productivity of their inputs (technical efficiency) and
the choice in the right mix of inputs in light of given prices (allocative efficiency) is superior
(Havrylchyk, 2005). Berger et al (2007) showed that the “big four” state owned banks in China
are by far the least efficient; foreign owned banks are most efficient and minority foreign
ownership is associated with significantly improved efficiency. This shows that there is a
relationship between ownership structure and efficiency.
Liquidity management is a continuous process of raising new funds in the case of a deficit or
investing new excess resources when there are excess of funds. Ultimately, in liquidity
management, the benchmark remains the cash matching case, where both assets and liabilities
amortize in parallel (Bessis, 2002). Liquidity risk is the risk that a bank is unable to meet its
liabilities when they fall due. It is normally associated with the liability side of the balance sheet
when the depositors unexpectedly withdraw their financial claims. Banks can also experience
liquidity problems on the asset side of the balance sheet caused by a large number of
unexpected loan defaults. Liquidity of a bank is therefore a critical aspect of bank management
and ought to be managed carefully (Heffernan, 2005).Ongore and Kusa (2013) showed that
liquidity management had no significant effect on the performance of commercial banks in
Kenya. Performance is not about keeping high liquid assets. Liquidity therefore has lesser
effects on performance of commercial banks. The second Basel accord was designed to create
an international standard for banking regulators to control the amount of capital banks need to
put aside to guard against the risks that the banks are faced with. It was developed with a view
of strengthening global capital and liquidity regulations for the banking sector. The liquidity
coverage ratio, for instance, was designed to promote short term resilience of the liquidity risk
profile of banks by ensuring that they have sufficient high quality liquid assets to survive a
significant stress scenario lasting thirty calendar days. The net stable funding ratio was designed
to promote resilience over a longer time horizon by creating additional incentives for banks to
fund their activities with more stable sources of funding on an ongoing basis. The third Basel
accord was then developed to address the weaknesses of Basel II in relation to the capital
adequacy requirements, leverage ratio and liquidity requirements. Basel III supersedes Basel II.

Proceedings of 1st JKUAT-SHRD Research Conference 12
th and 13
th September 2013
210
One of the key internal factors that determine the banks’ profitability is operational
efficiency.In an effort to maximize profitability and the value of shareholders investment in a
financial institution, many financial firms recognize the need for greater efficiency in their
operations. This entails the reduction in the operating expenses and increasing employee
productivity. During the 2007 – 2009 global financial crises, most financial firms were under
pressure to enhance efficiency by lowering costs. Job cuts therefore became a key management
target (Rose and Hudgins, 2013). Operational efficiency shows how effectively management
utilizes a bank`s assets to generate revenue. Banks with higher non performing loan ratios have
lower operating efficiency and those with higher capital adequacy ratios have got higher
operating efficiency (Hsiao et al, 2010). Sufian (2009) investigated the determinants of bank
efficiency during unstable macroeconomic environment with empirical evidence from
Malaysia. Their findings suggest that technical efficiency is positively and significantly
associated with loans intensity suggesting that banks with higher loan to asset ratio exhibit
higher efficiency scores. He also suggested that efficient cost management is a prerequisite for
improved efficiency of the Malaysian banking system. Efficiency in cost management can be
assessed using the cost to income ratio.
Myers (1984) contrasted two ways of thinking about capital structure. The first is the static
trade-off framework, in which the firm is viewed as setting a target debt to value ratio and
gradually moving towards it, just the same way a firm adjusts dividends to move towards a
target payout ratio. Under this framework, optimal capital structure is reached when tax
advantage to borrowing (tax shield) is balanced, at the margin, by cost of financial distress. This
is contrasted against the old-fashioned pecking order framework in which the firm prefers
internal to external financing and debt to equity if it issues securities. In the pure pecking order
theory, the firm has no well-defined target to value ratio. Modigliani and Miller (1958) argued
that the firm’s overall weighted average cost of capital is not influenced by changes in capital
structure i.e. capital structure is irrelevant. Their proposition was that in the absence of tax, a
company’s capital structure would have no impact upon its weighted average cost of capital
(WACC). The ownership structure can either be represented by the shares of stock owned by
the various groups of shareholders or the proportion (concentration) of each. Euysung (2004)
show that there is a significant relationship between equity ratio and productivity performance
thereby suggesting that the use of equity financing allows greater flexibility and discretion
leading to greater innovative activities than the use of debt. Corporate ownership and capital
structure decisions may reflect the attempts to mitigate agency problems between various
stakeholders, especially shareholders and management. Corporate ownership is sometimes
organized so as to maximize firm’s value, accounting for potential conflict of interest between
controlling shareholders and minority investors. Managerial (insider) ownership has the effect
of addressing the agency problem thereby reducing the agency costs (Coles, et al, 2011).
Conceptual framework
The conceptual framework below shows the relationship between the dependent and
independent variables. The dependent variable in this study is financial performance, which is
represented by the ROA. The independent variables are financial structure (represented by debt
to equity ratio); bank liquidity; and operational efficiency (represented by the cost to income
ratio). The moderating variable in this study is ownership structure represented by the
percentage of foreign and local shareholding. The conceptual framework was developed from
the review of literature discussed above and assumes a linear relationship between the variables.
Below is a diagrammatic representation of the conceptual framework.

Proceedings of 1st JKUAT-SHRD Research Conference 12
th and 13
th September 2013
211
Financial structure (Debt: Equity)
Liquidity (Liquid Assets: Liquid
Liabilities)
Financial
Performance (ROA)
Operational Efficiency (Cost: Income)
Figure 1.1: Diagrammatic presentation of conceptual framework
Research methodology, findings and discussions
This study adopted an explanatory research design. The researcher incorporates 38 out of the 43
commercial banks operating in Kenya and focuses on the period between 2006 and 2012. This
choice of 38 banks was guided by econometric theory for panel data analysis, which advocates
for balanced panels for better regression results (Baltagi, 2005). This study relied primarily on
secondary data i.e. annual published financial statements for the banks under study as well as
bank supervision records at the Central Bank of Kenya (CBK). The researcher first analyzed
both foreign and local banks together. The data was then divided into two sets, foreign and
local, and regression analysis done on each set to eliminate the effects of the dummy variable
representing ownership structure. Ratio analysis was employed to calculate the liquidity,
efficiency and profitability measures by running the data through excel. The data was then
analyzed using normal regression analysis and random effects panel data analysis.
Model Specification
The dependent variable in this study is financial performance as recommended and used in most
studies in the commercial banking sector. Naceur (2003) used NIM and ROA as the dependant
variables to analyze the determinants of profitability of commercial banks in Tunisia. Qin and
Pastory (2012) and Munyambonera (2007) both used ROA as the dependent variables in
assessing the determinants of financial performance of commercial banks in Tunisia and Sub-
Saharan Africa respectively. The linear equation showing the relationship between the bank`s
performance and the bank specific factors is as follows:
= + )
i = 1 ……N; t = 1 …….N
Whereby represents the performance measure for bank i at time t (in this case ROA);
are the bank specific factors for bank i at time t (in this case operational efficiency,
liquidity, financial structure and ownership); and represents the error term.
In this study, the researcher uses the random effects regression model due to the utilization of a
dummy variable as defined below:
Ownership (Foreign Vs
Local)

Proceedings of 1st JKUAT-SHRD Research Conference 12
th and 13
th September 2013
212
Model 1 (combined): = + β1 + β2 + β3 + β4 + ….. (1)
Model 2 (foreign): = + β1 + β2 + β3 + ……………….... (2)
Model 3 (local): = + β1 + β2 + β3 + …………………… (3)
Where;
= Return on Assets for bank i at time t
= Intercept/constant
= Debt to equity ratio for bank i at time t
= Ownership structure for bank i at time t
= Liquidity ratio for bank i at time t
= Cost to income ratio for bank i at time t
= Error term where i is cross sectional and t is time identifier
β1- β4 = Coefficients of parameters
Diagnostic tests
The researcher first tested the suitability of the model so as to determine the reliability of the
results. The im-pesara-shin unit-root test showed that all variables are stationary at integration
level one and have a long run relationship. The variables are normally distributed and white’s
test shows no problem of heteroskedasticity and autocorrelation in the data set as shown below:
Table 2.1: Summary of Heteroskedasticity and auto-correlation test
Chi2 (9) = 84.46
Prob > Chi2 = 0.000
Source Chi2 df P
Heteroskedasticity 84.46 9 0.0000
Skewness 4.93 3 1.1771
Kurtosis 7.47 1 0.0063
Total 96.85 13 0.0000
Descriptive statistics
The mean leverage ratio was 45.16% with a standard deviation of 0.9084 whereas the mean
liquidity of the commercial banks was 0.4593 with a standard deviation of 0.1876. This implies
that the banking industry maintained an average liquidity ratio of 45.93%. The banking industry
had a mean cost to income ratio of 79.41% and a standard deviation of 1.2922. This implies that
79.41% of the income generated by the banking sector was spent on operating costs. Ownership
structure had a mean and a standard deviation of 0.2894 and 0.4543 respectively.

Proceedings of 1st JKUAT-SHRD Research Conference 12
th and 13
th September 2013
213
Table 2.2: Summary of descriptive statistics
VARIABLE OBSERVATIONS MEAN STANDARD
DEVIATION
MINIMUM MAXIMUM
LEV 266 0.4516 0.9084236 0 10.42427
LALL 266 0.4593 0.1876691 0.188 1.69
CIR 266 0.7941 1.292274 0.1530106 18.28962
OS 266 0.2894 0.454373 0 1
ROA 266 0.0207 0.0184363 -0.0706039 0.0862196
Normal regression
As shown below, the F-Value is 13.71 and the P-Value is 0.00. This means that at 5%
significant level, this model is suitable. Due to the utilization of a dummy variable, the
researcher used the random effects regression model in his study.
Table 2.3: Normal regression results
VARIABLE COEFFICIENT STD. ERROR t-VALUE P VALUE
LEV -.0043298 .0012514 -3.46 0.001
LALL -.0053833 .0058253 -0.92 0.356
CIR -.0039838 .0008655 -4.60 0.000
OS .0048141 .0024087 2.00 0.047
CONSTANT .0262712 .0028681 9.16 0.000
F (4, 261) = 13.71
P > F = 0.000
Regression results
The researcher used multiple regression analysis to investigate the relationship between ROA
and leverage, liquidity, ownership structure and the cost to income ratio for the banking
industry in KenyaThe decision whether to accept or reject the hypothesis being tested was made
based on the students t statistic (or Z value) or the P-Values. The t statistic was used for small
sample sizes whereas the Z value was used for large sample sizes.
Table 2.4: Summary of regression results for both foreign and local banks
VARIABLE COEFFICIENT STANDARD
ERROR
Z VALUE P VALUES AT 95%
C.L. LEV -0.0029674 0.0011159 -2.66 0.008
OS 0.0036197 0.0041937 0.86 0.388
LALL 0.0043303 0.0060388 0.72 0.473
CIR -0.0025709 0.0006956 -3.30 0.000
CONSTANT 0.020418 0.0034229 6.16 0.000

Proceedings of 1st JKUAT-SHRD Research Conference 12
th and 13
th September 2013
214
Table 2.5: Summary of regression results for foreign banks
VARIABLE COEFFICIENT STANDARD
ERROR
t - VALUE P VALUES AT 95%
C.L. LEV -0.0000367 0.0024058 -0.02 0.988
LALL 0.0167125 0.0096129 1.74 0.086
CIR -0.0100497 0.0026339 -3.82 0.000
CONSTANT 0.0209069 0.0057201 3.65 0.000
Table 2.6: Summary of regression results for local banks
VARIABLE COEFFICIENT STANDARD
ERROR
t - VALUE P VALUES AT 95%
C.L. LEV -0.0188768 0.0070703 -2.67 0.008
LALL -0.0034047 0.0019994 -1.70 0.090
CIR -0.0026113 0.0009391 -2.78 0.006
CONSTANT 0.0305735 0.0034366 8.90 0.000
From the regression results above, the regression models will be written as follows:
Model 1 ROA = 0.02041–0.002967LEV+0.003619OS+0.004330LALL–0.002570CIR …… (1)
Model 2 (foreign): ROA = 0.0209069–0.0000367LEV+0.016712LALL–0.010049CIR …… (2)
Model 3 (local): ROA = 0.0305735–0.0188768LEV-0.0034047LALL–0.0026113CIR …… (3)
Discussion of regression results
There is a negative relationship between ROA and leverage. This means that increasing the debt
to equity ratio in the Kenyan banking industry beyond the optimum level will negatively impact
on the ROA. This optimal level, however, is fluid and varies from one bank to another. This is
consistent with the static trade off framework, which postulates that optimal capital structure is
reached when the tax advantage to borrowing (tax shield) is balanced, at the margin, by the cost
of financial distress (Myers, 1984). This shows that high leverage significantly affects ROA of
the local banks but is not significant to foreign banks in Kenya. From the β1 coefficient in the
regression model above, a 0.296% change in leverage changes ROA by 1%. Therefore,
increasing debt for local banks beyond the optimal level by 0.3% reduces the ROA by 1%.
Although there is a positive relationship between ownership structure and ROA, it is
insignificant at a 5% confidence level. This is consistent with Ongore and Kusa (2013) findings.
This lack of significance can be explained by the recent emergence of local banks from loss
making periods in the earlier years. Local banks like Equity Bank, Kenya Commercial Bank
and Cooperative bank have in the recent past dominated the banking industry in terms of
profitability, growth as well as market share.
Liquidity is also insignificant at 5% level thus has lesser effect on the financial performance of
commercial banks in Kenya for the period under study. It is worth noting that although there is
a positive relationship between ROA and liquidity, this relationship holds only up to a certain
level beyond which it is detrimental to commercial banks. Excess liquidity is a sign that bank
lending is low and banks are holding more money for precautionary purposes (Munyambonera,
2007).

Proceedings of 1st JKUAT-SHRD Research Conference 12
th and 13
th September 2013
215
There is a negative relationship between CIR and ROA meaning that as the CIR increases, the
ROA decreases. The results are similar for the two groups of banks i.e. foreign and local. A
0.26% increase in the operating costs results to a 1% decrease in ROA. These findings are
significant at 5% confidence level in both cases. This is consistent with theory that high
operational costs negatively affect bank profitability and consequently ROA (Munyambonera,
2007). Ongore and Kusa (2013) showed that management efficiency significantly affects
financial performance of commercial banks in Kenya.
Conclusion and recommendations
The findings of this empirical study show that despite the fact that both ownership structure and
liquidity have a positive relationship with ROA, they are not significant determinants of
financial performance for commercial banks in Kenya for the time period under study.
Although liquidity management is critical in the management of banks, holding high liquid
assets does not translate to improved financial performance. This is because holding high liquid
assets means that the opportunity cost is also relatively high. There is a negative relationship
between operational efficiency and financial structure and both are significant determinants of
financial performance for commercial banks in Kenya. However, financial structure is only
significant for local banks. Banks with high operational efficiency, therefore, are more
profitable than the less efficient banks. Banks with very high debt levels are less profitable than
those with low debt levels. This however does not mean that banks should not obtain debt
financing. Reasonable levels of debt should be maintained such that they take advantage of the
tax shield.
From the analysis done, the researcher recommends thatthe banks with an ROA of less than 1%
should improve on their operational efficiency by maintaining a CIR that is lower than the mean
CIR of 79.41. These banks can manage their costs by implementing a budgetary process such as
the zero based budgeting whereby all expenses are justified at the beginning of the budgeting
process. This will assist in eliminating some of the redundancies. In addition, variance analysis
should be undertaken continuously to ensure that the costs are monitored adequately. These
banks should also embrace the use of alternate banking channels such as mobile banking
services. This approach should be based on the Kaizen principal of continuous improvement.
Unlike foreign banks, financial performance for local banks is significantly affected by
leverage. The local commercial banks should therefore design strategies to ensure that they
reduce the reliance on debt. Customer deposits are cheap sources of funds thus it will enable
banks to maximize on interest spread, which will mean higher profitability. The local banks can
also explore the possibility of borrowing from the foreign debt market which usually provides
cheaper financing than the local debt market. However, the effects of the interest rate parity
should be considered before going to the global debt market.
Future Research
This study only focuses on one measure of financial structure, liquidity management and
operational efficiency as determinants of financial performance for commercial banks in Kenya.
Future research could focus on operational efficiency alone and incorporate several measures of
operational efficiency to determine what aspect of efficiency is most significant in determining
financial performance. Further research can also be done to assess the role of liquidity
management as a risk management tool in bank management.

Proceedings of 1st JKUAT-SHRD Research Conference 12
th and 13
th September 2013
216
References
Baltagi, B.H (2005). Econometric Analysis of panel Data. John Wiley & Sons Publishers.
Chichester
Berger, A. N., Hasan, I., & Zhou. M. (2007). Bank ownership and efficiency in China: What
will happen in the world’s largest nation?Journal of Bnaking and Finance, 33, 113 –
130
Bessis, J (2002). Risk management in banking. England, John Wiley & Sons
Central Bank of Kenya (2006 – 2011). Bank Supervision Annual Reports 2006 - 2012. Central
Bank of Kenya, Nairobi.
Coles, J. L., Lemmon, M. L,. & Meschke, F. (2011). Structural Models and Endogeneity in
Corporate Finance: The Link Between Managerial Ownership and Corporate
Performance. Journal of Financial Economics.
Dimitris, M., & Maria, P. (2009). Capital Structure, Equity Ownership and Firm performance.
Journal of Banking and Finance, 34, 621 – 632
Economic Survey of Kenya (2012). Kenya National Bureau of Statistics
Euysung, K., (2004). The Impact of Family Ownership and Capital Structures on Productivity
Performance of Korean Manufacturing Firms: Corporate Governance and the
“chaebolproblem”.The Journal of Japaneese and International Economics,20,
Guisse, M. L. (2012). Financial performance of the Malaysian banking industry: Domestic vs
foreign banks. (Unpublished master's thesis).
Havrylchyk, O., (2005). Efficiency of the polish banking industry: Foreign verses domestic
banks. Journal of Banking and Finance, 30, 1975 – 1996.
Heffernan. S. (2005) Modern Banking, England. John Wiley & Sons, Ltd
Hsiao, H. C., Chang. H., Cianci, A. M, & Huang L. (2010). First financial restructuring and
operating efficiency: Evidence from Taiwaneese commercial banks. Journal of banking
and Finance,34, 1467 – 1471
Jensen, M. C., & Meckling, W.H., (1976). Theory of the Firm Managerial Behaviour, Agency
Cost and Ownership Structure. Journal of Economics, Vol. 3, 4,. 305– 360
Kenya Bankers Association (2012). Kenya Bankers Economic Bulletin. Centre for
Research and financial Markets and Policy.
Kharwish, A. H., (2011). Determinants of Commercial Bank Performance: Evidence from
Jordan. International Research journal of Finance and Economics, 81, 1450-2887.
Kothari, C. R., (2004). Research Methodology: Methods and Techniques. New Delhi. New Age
Publishers.
Proceedings of 1st JKUAT-SHRD Research Conference 12
th and 13
th September 2013
217
Megginson, L. W., Smart B. S., & Lucey, B.M., (2008). Introduction to Corporate
Finance. London, South-Western engage learning.
Modigliani, F. and Miller,M. H. (1958). The Cost of Capital, Corporate Finance and Theory of
Investment. American Economic Review. Pp. 264 – 297.
Munyambonera, E. F., (2007). Determinants of commercial bank’s profitability in Sub-
Saharan Africa.Journal of Economic Literature.
Myers, S. C (1984). Capital Structure. The Journal of Economic Perspectives. Vol. 15, No. 2,
pp. 81 - 102
Naceur,B. S., (2003). The Determinants of the Tunisian Banking Industry Profitability: Panel
Evidence.Paper presented at the Economic Research Forum 10th
Annual Conference,
Marrakesh Morocco
Ntaw, G. M., & Laryea. A. E. (2012) A Financial Performance Comparison of Foreign Vs
Local Banks in Ghana. International Journal of Business and Social Science, Vol 3, No.
21
Ongore, V.O., & Kusa. G. B., (2013). Determinants of Financial performance of Commercial
Banks in Kenya.International Journal of Economics and Finance issues, V.3, 1, 237-
252
Qin, X. & Pastory, D. (2012). Commercial Banks Profitability Position: The case ofTanzania.
International Journal of Business and Management, Vol. 7, 13.
Rose, P.S., & Hudgins, S.C., (2013). Bank Management and Financial Services. New York,
McGraw Hill
Sarin, A., & David J. (1998). Ownership and Board Structures in Publicly Traded
Corporations. Journal of Economic Literature.

Proceedings of 1st JKUAT-SHRD Research Conference 12
th and 13
th September 2013
218
THE EFFECT OF DIVIDEND POLICY ON FINANCIAL PERFORMANCE OF FIRMS
LISTED IN THE NAIROBI SECURITIES EXCHANGE (NSE).
Gwaya*, D. Kiyondi & L.A. Oyugi
Jomo Kenyatta University of Agriculture and Technology
Email:[email protected],
Abstract
Several theories have been documented on the relevance and irrelevance of dividend policy.
Many authors continue to come up with different findings from their studies on the relevance of
dividend policy. This study was set out to establish the effect of dividend policy on financial
performance of firms listed in the Nairobi Securities Exchange (NSE) of Kenya. Multiple linear
regression analysis was carried out to establish the relationship between dividend payout and
financial performance. This analysis unveils a strong positive relationship between a dividend
increase and an increase in the earnings. The findings of this study also reveal that these firms
are highly flexible in setting their dividend policy, changing it frequently. Further, with
univariate analysis the study also find support for the Lintner view, where the management only
increases the dividends when earnings are expected to increase permanently. It can be
concluded, based on the findings of this study that dividend policy is relevant and that
managers should devote adequate time in designing a dividend policy that will enhance firm
performance and therefore shareholder value.
Keywords: Dividend policy, dividend payout, financial performance.
Introduction
The patterns of corporate dividend policies not only vary over time but also across countries,
especially between developed, developing and emerging capital markets. Glen et al., (1995)
found that dividend policies in emerging markets differed from those in developed markets.
They reported that dividend payout ratios in developing countries were only about two thirds of
that of developed countries. Ramcharran (2001) observed that there are low dividend yields for
emerging markets. There has been emerging consensus that there is no single explanation of
dividends. According to Easterbrook (1984) there is no reason to believe that corporate
dividend policy is driven by a single goal. In addition, not much research has been done on the
effect of dividend policy on financial performance.
According to Black (1976), the harder we look at the dividend picture, the more it seems like a
puzzle, with pieces that do not fit together. The subject matter of dividend policy remains one of
the most controversial issues in corporate finance. Indeed the dividend policy of a company
determines what proportion of earnings is distributed to the shareholders by way of dividends,
and what proportion is ploughed back for reinvestment purposes. Since the main objective of
financial management is to maximize the market value of equity shares, one key area of study is
the effect of dividend policy on financial performance.
Although companies can change their dividend policies it is advisable that each company
establishes its own dividend policy and stick to it because frequent changes can inconvenience
existing stockholders, send unintended signals, and convey the impression of dividend
instability, all of which can have negative implications for stock prices particularly when lower
or no dividends are paid. At the same time companies must meet their debt obligations before

Proceedings of 1st JKUAT-SHRD Research Conference 12
th and 13
th September 2013
219
declaring dividends because interest on borrowed funds must be paid whether the company
makes profits or not. However, shareholders are entitled to a share as the reward for the risk
they have taken in investing in the company. The Board of Directors may balance up these two
demands on the profit, and will then recommend the size of the dividend they think is
appropriate (Chebii et al., 2011).
In light of the above, it is important to note that dividend policy has an effect on financial
performance. This study unfolds the various effects that payment or non payment of dividend
has on financial performance of firms listed in the Nairobi Securities Exchange.
Literature review
Financial performance is a subjective measure of how well a firm can use assets from its
primary mode of business to generate revenues and expand its operations (Copisarow, 2000).
Financial performance can be measured in many different ways, but all these ways should be
aggregated. Revenue from operations, operating income or cash flow from operations can be
used as well as total unit sales. According to Demsetz and Lehn (1985), financial ratios from
financial statements are a good source of data to measure financial performance. Liquidity is
one of the most outstanding financial ratios used a measure of the firm’s ability to meet
financial obligations as and when they fall due without disrupting the normal business
operations. Liquidity can be analysed both structurally and operationally.
Financial performance can also be measured in terms of net earnings which are divided into two
parts, that is, retained earnings and dividends. The retained earnings of the business may be
reinvested and treated as a source of long-term funds. The dividend should be distributed to the
shareholders in order to maximize their wealth as they have invested their money in the
expectation of being made better off financially. Nairobi Securities Exchange publication
(2010) shows that CMC Holdings limited increased their payout ratio from 27.49% in 2009 to
28.28% in 2010 thus impacting positively on the stock prices from Ksh 15.35 in 2008 to Ksh
18.85 in 2009. It also shows that CFC Stanbic Bank limited changed their payout ratio from
32.05% in 2009 to 16.16% in 2010 thus impacting negatively on the stock prices from Ksh
129.00 in 2007 to Ksh 60.00 in 2008. Therefore, dividend policy has an effect on the share
prices of NSE which in turn translates to financial performance based on shares turn over.
According to Maina (2000), there exists a relationship between dividend and investment
decisions since both compete for internally sourced funds and given that funds obtained by debt
are very expensive and not available to all firms. There are other theories that have been
proposed to explain the relevance of dividend policy and it is effect on firm performance, but no
universal agreement has been reached (Stulz, 2000; Pandey, 2003; DeAngelo et al., 2006). A
group of researchers: Amidu (2007), Lie (2005), Zhou and Ruland (2006), Howatt et al., (2009),
have come up with different findings about the relationship between dividend payout and
financial performance.
Profitability is a type of performance measure which focuses on the relationship between
revenues and expenses and on the level of profits with relative to the size of investment in the
business (Zhou and Ruland, 2006). Four most commonly noted measures of firm profitability
are: the rate of return on firm’s total assets (ROA), the rate of return on firm’s equity (ROE),
operating profit margin and net firm income. Different measures of firm performance have also
been employed to test agency cost hypothesis. It is argued that profit efficiency computed using
a profit function is a more appropriate measure to test agency cost theory because it controls for
the effects of local market prices and other exogenous factors. It also provides a reasonable

Proceedings of 1st JKUAT-SHRD Research Conference 12
th and 13
th September 2013
220
benchmark for each individual firm’s performance if agency costs were minimized. Profit
efficiency is superior to cost efficiency for evaluating the performance of managers, since it
accounts for how well managers raise revenues as well as control costs and is closer to the
concept of value maximization. Profit efficiency is measured in two different ways, that is,
standard profit efficiency and alternative profit efficiency.
According to Arnott and Asness (2003) the positive relationship between current dividend
payout and future earnings growth is based on the free cash flow theory. Low dividend resulting
in low growth may be as a result of suboptimal investment and less than ideal projects by
managers with excess free cash flows at their disposal. This is prominent for firms with limited
growth opportunities or a tendency towards over-investment. Paying substantial dividends
which in turn would require managers to raise funds from issuance of shares, may subject
management to more scrutiny, reduce conflicts of interest and thus curtail suboptimal
investment. This is based on the assumption that suboptimal investments lays the foundation for
poor earnings growth in the future whereas discipline and a minimization of conflicts will
enhance growth of future earnings through carefully chosen projects. Therefore, paying
dividends to reduce the free cash flows enhances the performance of a company since managers
will have less cash flow thus avoiding suboptimal investments.
Statement of the Problem
Managements are in a dilemma about whether to pay a large, small or zero percentage of their
earnings as dividends or to retain them for future investments. This is as a result of the need for
management to satisfy the various needs of shareholders. For instance, shareholders who need
money now for profitable investment opportunities would like to receive high dividends now.
On the other hand, shareholders who would like to invest in the future will prefer dividends to
be retained by the company and be reinvested in order to generate more returns in future
(Amidu, 2007). Due to these competing interests of shareholders, the kind of dividend policy
adopted by management may have either a positive or negative effect on financial performance
of the firm as measured by market price per share (MPS). Firms may have low dividend payout
because management is optimistic about the firm’s future and therefore wishes to retain their
earnings for further expansion. This raises the issue as to whether a high payout ratio is better
than a low payout ratio and how this is connected to investor’s perspective of the firm in its
future operations. There exist a number of studies (Arnott and Asness 2003, Farsio et al.,
2004 and Nissim and Ziv 2001) that have researched on the relationship between dividend
policy and financial performance but it still remains an unresolved issue in corporate finance.
These studies established that there exist a strong positive relationship between dividend policy
and financial performance in developed economies. A problem arises as to whether the findings
of those studies can be replicated in emerging economies or infant capital markets like Kenya.
In Kenya, a few empirical studies have been done to establish the relationship between dividend
policy and financial performance. This study sets in to fill the gap by establishing whether the
dividend policy adopted by management has an effect on financial performance in the Kenyan
scenario.
Objectives of the study
The main focus of the study was on the effect of dividend policy on financial performance of
firms listed in the Nairobi Securities Exchange.
Proceedings of 1st JKUAT-SHRD Research Conference 12
th and 13
th September 2013
221
Specific objectives
To establish the relationship between dividend payout ratio and financial performance among
firms listed in the Nairobi Securities Exchange.
To determine the effect of change of dividend policy on financial performance of firms listed in
the Nairobi Securities Exchange.
Research Questions
What relationship exists between dividend payout practices and financial performance of firms
listed in the Nairobi Securities Exchange?.
What is the relationship between change of dividend policy and financial performance of firms
listed in the Nairobi Securities Exchange?
Justification of the Study
During the past eleven years, business trends have been moving towards globalization and the
number of multinational corporations continues to grow. Newly developed information
technology allows investors around the world to trade stocks in other countries without
physically crossing borders through electronic commerce. The impact of electronic commerce is
normally described by the words “the world has become a small village” while referring to the
World Wide Web. This in turn has fostered intense competition among firms. Dividend policy
decisions are, therefore, one of the key factors that influence the financial performance for
public limited companies. Management should not ignore the effect brought about by dividend
policy on financial performance when setting policies to the investors who invest in shares, and
to the financial economists who endeavour to understand and appraise the functions of the
capital markets.
The findings of this research project report is instrumental and can help establish a dividend
policy that can be acceptable to the various stakeholders in public limited companies in Kenya.
Companies listed at the NSE also stand to benefit out of the findings of this research project
report in the same manner. A number of other beneficiaries include: the CMA who can use the
findings to assess the dividend trends in the recent past, KRA who will use the information in
assessing limitations of dividend policy on amount of revenue realized and public limited
companies in Kenya. Lastly, this study is meant to trigger aspiring researchers to explore more
dimensions in issues attached to this research project report.
Research methodology
This chapter gives a description of the research methodology employed in achieving the
objectives of this study. The chapter presents the research design, target population and
sampling procedure, data collection procedures, and data analysis and presentation.
Research Design
The research design is multiple linear regressions since it sought to establish the relationship
between dividend payout and firm performance. The data used in this research was obtained
from the annual reports of companies listed in the Nairobi Securities Exchange for a ten year
period that is, from 2002-2011. Dividend payout was measured by the actual dividends paid out
Proceedings of 1st JKUAT-SHRD Research Conference 12
th and 13
th September 2013
222
and firm performance was measured by the net profit after tax. Regression analysis was carried
out to establish the relationship between dividend policy and financial performance.
Target Population and Sampling Procedure
The population for this study consisted of the firms listed on the Nairobi Securities Exchange.
The NSE classified these companies into ten sectors. These are; agricultural, commercial and
services, telecommunication and technology, automobiles and accessories, banking, insurance,
investment, manufacturing and allied, construction and allied, energy and petroleum (NSE,
2012). The secondary data for regression analysis was gathered from twenty nine companies
listed in the Nairobi Securities Exchange. The companies were selected based on the
availability of information. Companies suspended from the Nairobi Securities Exchange were
also studied since they had the relevant data.
Data Collection
This study made use of secondary data that was obtained from the firm’s annual reports most of
which are publicly available. This was for a ten year period, that is, from the year 2002 -2011.
The data mainly comprised the financial statements, that is, income statement and statements of
financial statements. Common ratios as reported were also employed in this study.
Data Analysis and Presentation
Data analysis is the process of bringing order, structure and meaning of the mass of data
collected (Mugenda and Mugenda, 2003). The collected data was edited for completeness,
consistency and accuracy. The results of the study are presented in tables. Dividend payout ratio
was measured by dividing the actual dividends paid out by profit for the year. The independent
variables include: Dividend payout ratio (DPR) and dividend policy (DP). The study uses
accounting measures of performance such as Return on Assets (ROA) and Return on Equity
(ROE) as the dependent variables. However, as a robustness check, the study also uses Tobin’s
Q as a proxy for market based measures ratio. The “Q” is defined as the ratio of the market
value of assets (defined as the book value of assets, plus the market value of common stock,
minus the book value of common stock, minus deferred tax expense) to book value of assets.
The explanatory variables include dividend policy (POLICY) and the payout ratio (PAY) which
is given as dividend per share divided by earnings per share.
The companies selected ranged from old to newly established ones, and some companies had
erratic distribution of dividends during the study period. Therefore the number of observations
for each company is different. The general form of the regression data model can be specified
more compactly as:
Yit =α βXit eit
The subscript i represent the cross-sectional dimension and t denote the time-series dimension.
The left-hand variable Yit, represents the dependent variable in the model, which is the firm’s
financial performance. Xit, contains the set of independent variables in the estimation model, is
taken to be constant over time t and specific to the individual cross-sectional unit i. If α is taken
to be the same across all units, Ordinary Least Squares (OLS) provides a consistent and
efficient estimate of α and β. The model takes the following form:

Proceedings of 1st JKUAT-SHRD Research Conference 12
th and 13
th September 2013
223
ROAi,t =βo β1POLICYi,t β2PAYi,t β3SIZEi,t β4LEVi,t β5GROWTHi,t e
ROEi,t =βo β1POLICYi,t β2PAYi,t β3SIZEi,t β4LEVi,t β5GROWTHi,t e
Where:
ROAi,t = ratio of pre-tax profits to total assets for firm i in period t;
ROEi,t = ratio of post-tax profits to equity for firm i in period t;
TOBIN'Sqi,t = ratio of market value of assets to book value of assets for firm i in period t;
POLICYi,t = dummy variable for dividend policy for firm i in period t;
PAYi,t = dividend per share divided by earning per share for firm i in period t;
SIZEi,t = log of total assets for firm i in period t;
LEVi,t = ratio of total debt to total capital for firm i in period t;
GROWTHi,t = growth in sales for firm i in period t;
e = the error term.
Results
The study was done for the 29 companies listed in Nairobi Securities Exchange. The data for
regression analysis was drawn mainly from the financial statements for a ten year period, that is,
2002-2011.
Descriptive Statistics
Table 3.1 provides a summary of the descriptive statistics of the dependent and explanatory
variables. The mean and median of Return on Assets (ROA) measured by firm pre-tax profit
divided by total assets of sampled firms was 0.1009 and 0.0993 respectively.
Table 3.1 Descriptive statistics of companies listed in the NSE
Mean Standard
Deviation
Maximum Median Minimum
ROA 0.1009 0.2577 0.5876 0.0993 -2.9220
ROE 0.2744 0.3160 1.2800 0.2204 -0.6479
Tobin’s Q 1.0197 0.7401 3.9009 0.9810 -1.6450
POLICY 0.7283 0.4461 1.0000 1.0800 0.0000
PAY 0.3721 0.3920 3.6261 0.3388 0.0000
SIZE 3,800,000 12,480,000 94,200,000 106,400 951
LEVERAGE 0.6229 0.6123 7.8496 0.5443 0.0004
GROWTH 0.3221 0.3025 1.3597 0.2806 -0.7500
However, the average and median of Return on Equity (ROE) is 27.44% and 22.04%
respectively and the average and median of market to book value for the firms is 1.0197 and
0.9810 respectively. The mean of dividend policy is 72.83% and it has a median of 100.00%.
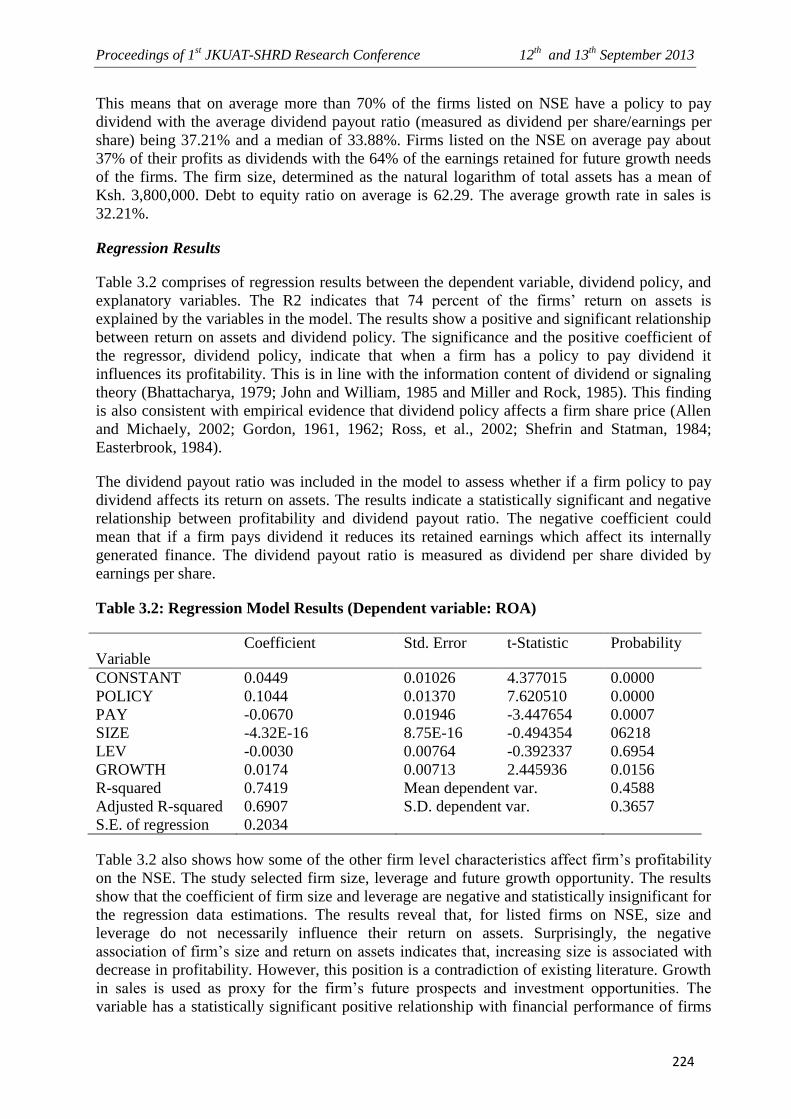
Proceedings of 1st JKUAT-SHRD Research Conference 12
th and 13
th September 2013
224
This means that on average more than 70% of the firms listed on NSE have a policy to pay
dividend with the average dividend payout ratio (measured as dividend per share/earnings per
share) being 37.21% and a median of 33.88%. Firms listed on the NSE on average pay about
37% of their profits as dividends with the 64% of the earnings retained for future growth needs
of the firms. The firm size, determined as the natural logarithm of total assets has a mean of
Ksh. 3,800,000. Debt to equity ratio on average is 62.29. The average growth rate in sales is
32.21%.
Regression Results
Table 3.2 comprises of regression results between the dependent variable, dividend policy, and
explanatory variables. The R2 indicates that 74 percent of the firms’ return on assets is
explained by the variables in the model. The results show a positive and significant relationship
between return on assets and dividend policy. The significance and the positive coefficient of
the regressor, dividend policy, indicate that when a firm has a policy to pay dividend it
influences its profitability. This is in line with the information content of dividend or signaling
theory (Bhattacharya, 1979; John and William, 1985 and Miller and Rock, 1985). This finding
is also consistent with empirical evidence that dividend policy affects a firm share price (Allen
and Michaely, 2002; Gordon, 1961, 1962; Ross, et al., 2002; Shefrin and Statman, 1984;
Easterbrook, 1984).
The dividend payout ratio was included in the model to assess whether if a firm policy to pay
dividend affects its return on assets. The results indicate a statistically significant and negative
relationship between profitability and dividend payout ratio. The negative coefficient could
mean that if a firm pays dividend it reduces its retained earnings which affect its internally
generated finance. The dividend payout ratio is measured as dividend per share divided by
earnings per share.
Table 3.2: Regression Model Results (Dependent variable: ROA)
Variable Coefficient Std. Error t-Statistic Probability
CONSTANT 0.0449 0.01026 4.377015 0.0000
POLICY 0.1044 0.01370 7.620510 0.0000
PAY -0.0670 0.01946 -3.447654 0.0007
SIZE -4.32E-16 8.75E-16 -0.494354 06218
LEV -0.0030 0.00764 -0.392337 0.6954
GROWTH 0.0174 0.00713 2.445936 0.0156
R-squared 0.7419 Mean dependent var. 0.4588
Adjusted R-squared 0.6907 S.D. dependent var. 0.3657
S.E. of regression 0.2034
Table 3.2 also shows how some of the other firm level characteristics affect firm’s profitability
on the NSE. The study selected firm size, leverage and future growth opportunity. The results
show that the coefficient of firm size and leverage are negative and statistically insignificant for
the regression data estimations. The results reveal that, for listed firms on NSE, size and
leverage do not necessarily influence their return on assets. Surprisingly, the negative
association of firm’s size and return on assets indicates that, increasing size is associated with
decrease in profitability. However, this position is a contradiction of existing literature. Growth
in sales is used as proxy for the firm’s future prospects and investment opportunities. The
variable has a statistically significant positive relationship with financial performance of firms
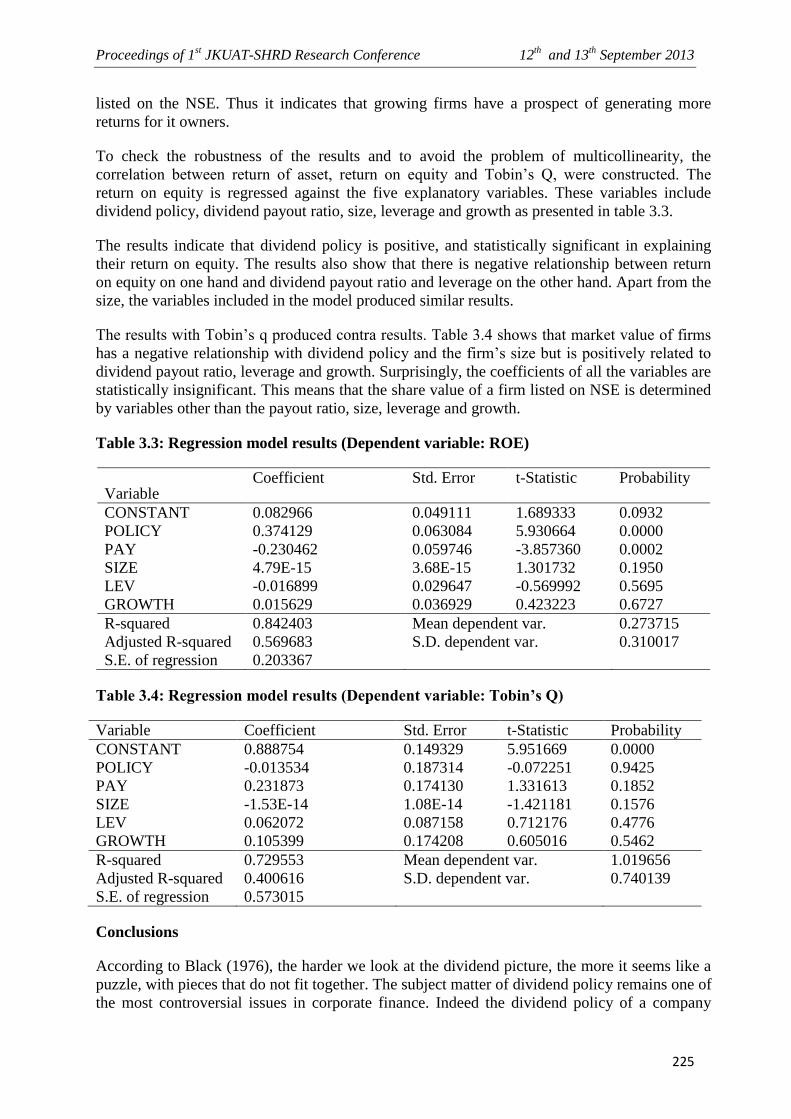
Proceedings of 1st JKUAT-SHRD Research Conference 12
th and 13
th September 2013
225
listed on the NSE. Thus it indicates that growing firms have a prospect of generating more
returns for it owners.
To check the robustness of the results and to avoid the problem of multicollinearity, the
correlation between return of asset, return on equity and Tobin’s Q, were constructed. The
return on equity is regressed against the five explanatory variables. These variables include
dividend policy, dividend payout ratio, size, leverage and growth as presented in table 3.3.
The results indicate that dividend policy is positive, and statistically significant in explaining
their return on equity. The results also show that there is negative relationship between return
on equity on one hand and dividend payout ratio and leverage on the other hand. Apart from the
size, the variables included in the model produced similar results.
The results with Tobin’s q produced contra results. Table 3.4 shows that market value of firms
has a negative relationship with dividend policy and the firm’s size but is positively related to
dividend payout ratio, leverage and growth. Surprisingly, the coefficients of all the variables are
statistically insignificant. This means that the share value of a firm listed on NSE is determined
by variables other than the payout ratio, size, leverage and growth.
Table 3.3: Regression model results (Dependent variable: ROE)
Variable Coefficient Std. Error t-Statistic Probability
CONSTANT 0.082966 0.049111 1.689333 0.0932
POLICY 0.374129 0.063084 5.930664 0.0000
PAY -0.230462 0.059746 -3.857360 0.0002
SIZE 4.79E-15 3.68E-15 1.301732 0.1950
LEV -0.016899 0.029647 -0.569992 0.5695
GROWTH 0.015629 0.036929 0.423223 0.6727
R-squared 0.842403 Mean dependent var. 0.273715
Adjusted R-squared 0.569683 S.D. dependent var. 0.310017
S.E. of regression 0.203367
Table 3.4: Regression model results (Dependent variable: Tobin’s Q)
Variable Coefficient Std. Error t-Statistic Probability
CONSTANT 0.888754 0.149329 5.951669 0.0000
POLICY -0.013534 0.187314 -0.072251 0.9425
PAY 0.231873 0.174130 1.331613 0.1852
SIZE -1.53E-14 1.08E-14 -1.421181 0.1576
LEV 0.062072 0.087158 0.712176 0.4776
GROWTH 0.105399 0.174208 0.605016 0.5462
R-squared 0.729553 Mean dependent var. 1.019656
Adjusted R-squared 0.400616 S.D. dependent var. 0.740139
S.E. of regression 0.573015
Conclusions
According to Black (1976), the harder we look at the dividend picture, the more it seems like a
puzzle, with pieces that do not fit together. The subject matter of dividend policy remains one of
the most controversial issues in corporate finance. Indeed the dividend policy of a company
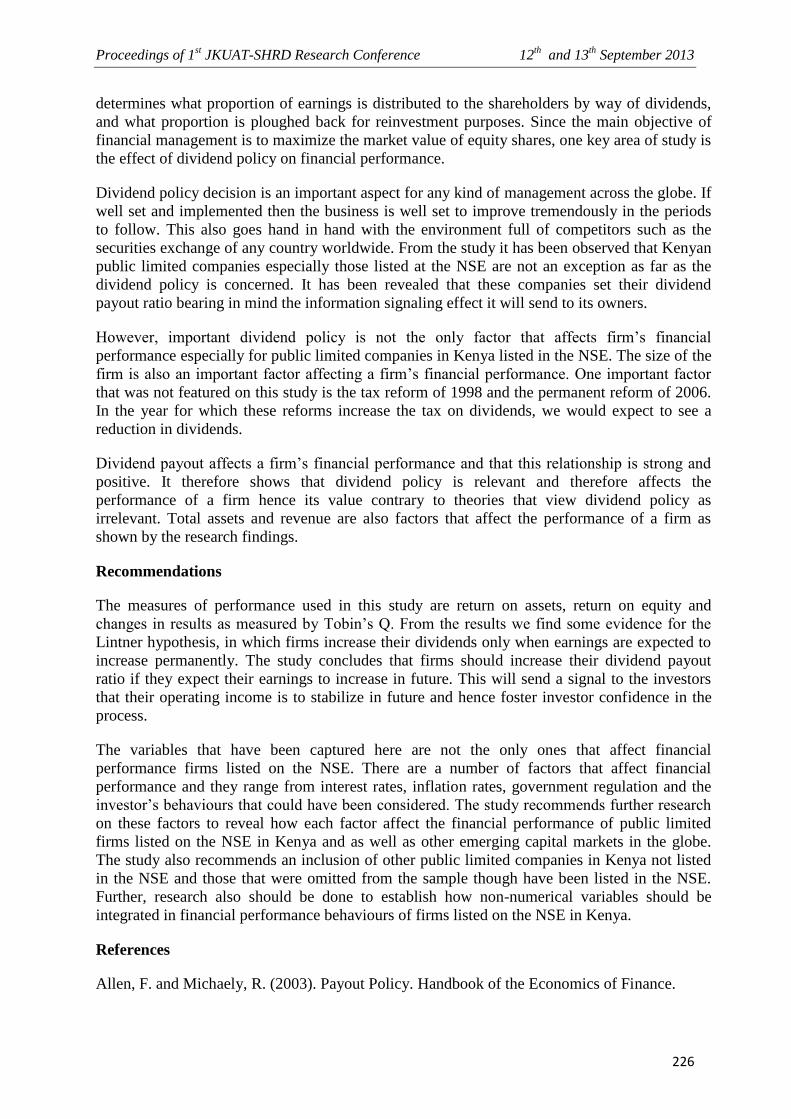
Proceedings of 1st JKUAT-SHRD Research Conference 12
th and 13
th September 2013
226
determines what proportion of earnings is distributed to the shareholders by way of dividends,
and what proportion is ploughed back for reinvestment purposes. Since the main objective of
financial management is to maximize the market value of equity shares, one key area of study is
the effect of dividend policy on financial performance.
Dividend policy decision is an important aspect for any kind of management across the globe. If
well set and implemented then the business is well set to improve tremendously in the periods
to follow. This also goes hand in hand with the environment full of competitors such as the
securities exchange of any country worldwide. From the study it has been observed that Kenyan
public limited companies especially those listed at the NSE are not an exception as far as the
dividend policy is concerned. It has been revealed that these companies set their dividend
payout ratio bearing in mind the information signaling effect it will send to its owners.
However, important dividend policy is not the only factor that affects firm’s financial
performance especially for public limited companies in Kenya listed in the NSE. The size of the
firm is also an important factor affecting a firm’s financial performance. One important factor
that was not featured on this study is the tax reform of 1998 and the permanent reform of 2006.
In the year for which these reforms increase the tax on dividends, we would expect to see a
reduction in dividends.
Dividend payout affects a firm’s financial performance and that this relationship is strong and
positive. It therefore shows that dividend policy is relevant and therefore affects the
performance of a firm hence its value contrary to theories that view dividend policy as
irrelevant. Total assets and revenue are also factors that affect the performance of a firm as
shown by the research findings.
Recommendations
The measures of performance used in this study are return on assets, return on equity and
changes in results as measured by Tobin’s Q. From the results we find some evidence for the
Lintner hypothesis, in which firms increase their dividends only when earnings are expected to
increase permanently. The study concludes that firms should increase their dividend payout
ratio if they expect their earnings to increase in future. This will send a signal to the investors
that their operating income is to stabilize in future and hence foster investor confidence in the
process.
The variables that have been captured here are not the only ones that affect financial
performance firms listed on the NSE. There are a number of factors that affect financial
performance and they range from interest rates, inflation rates, government regulation and the
investor’s behaviours that could have been considered. The study recommends further research
on these factors to reveal how each factor affect the financial performance of public limited
firms listed on the NSE in Kenya and as well as other emerging capital markets in the globe.
The study also recommends an inclusion of other public limited companies in Kenya not listed
in the NSE and those that were omitted from the sample though have been listed in the NSE.
Further, research also should be done to establish how non-numerical variables should be
integrated in financial performance behaviours of firms listed on the NSE in Kenya.
References
Allen, F. and Michaely, R. (2003). Payout Policy. Handbook of the Economics of Finance.
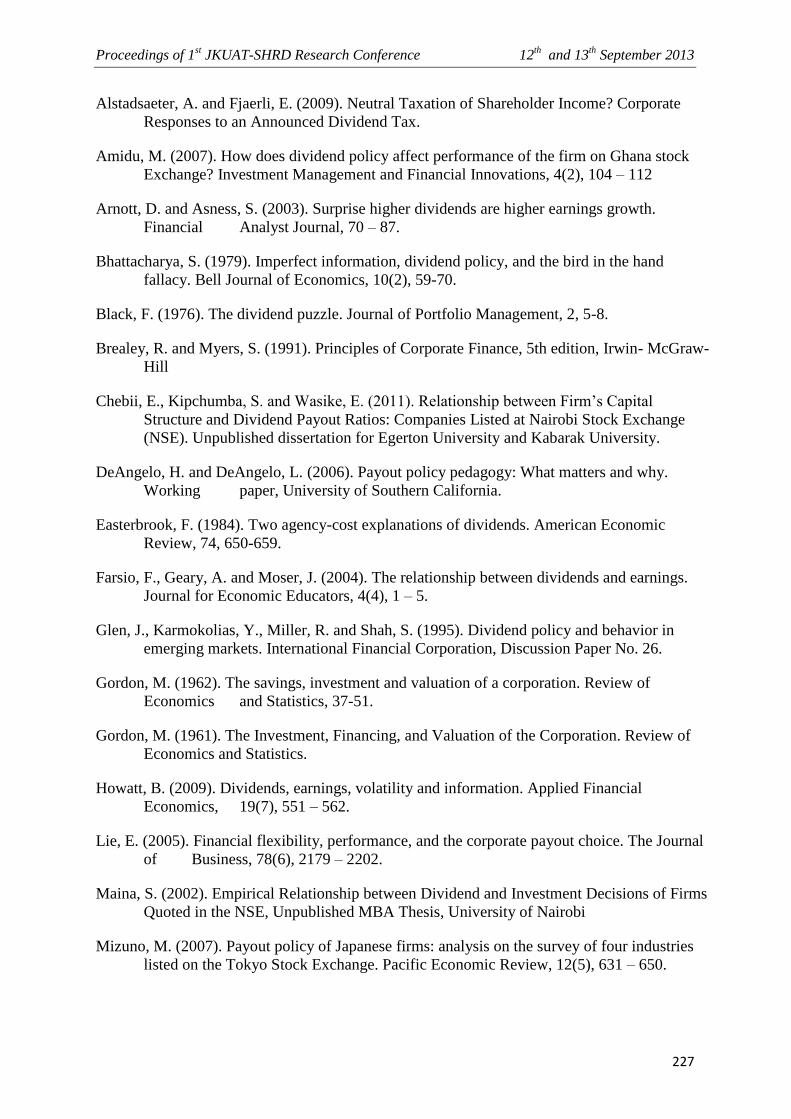
Proceedings of 1st JKUAT-SHRD Research Conference 12
th and 13
th September 2013
227
Alstadsaeter, A. and Fjaerli, E. (2009). Neutral Taxation of Shareholder Income? Corporate
Responses to an Announced Dividend Tax.
Amidu, M. (2007). How does dividend policy affect performance of the firm on Ghana stock
Exchange? Investment Management and Financial Innovations, 4(2), 104 – 112
Arnott, D. and Asness, S. (2003). Surprise higher dividends are higher earnings growth.
Financial Analyst Journal, 70 – 87.
Bhattacharya, S. (1979). Imperfect information, dividend policy, and the bird in the hand
fallacy. Bell Journal of Economics, 10(2), 59-70.
Black, F. (1976). The dividend puzzle. Journal of Portfolio Management, 2, 5-8.
Brealey, R. and Myers, S. (1991). Principles of Corporate Finance, 5th edition, Irwin- McGraw-
Hill
Chebii, E., Kipchumba, S. and Wasike, E. (2011). Relationship between Firm’s Capital
Structure and Dividend Payout Ratios: Companies Listed at Nairobi Stock Exchange
(NSE). Unpublished dissertation for Egerton University and Kabarak University.
DeAngelo, H. and DeAngelo, L. (2006). Payout policy pedagogy: What matters and why.
Working paper, University of Southern California.
Easterbrook, F. (1984). Two agency-cost explanations of dividends. American Economic
Review, 74, 650-659.
Farsio, F., Geary, A. and Moser, J. (2004). The relationship between dividends and earnings.
Journal for Economic Educators, 4(4), 1 – 5.
Glen, J., Karmokolias, Y., Miller, R. and Shah, S. (1995). Dividend policy and behavior in
emerging markets. International Financial Corporation, Discussion Paper No. 26.
Gordon, M. (1962). The savings, investment and valuation of a corporation. Review of
Economics and Statistics, 37-51.
Gordon, M. (1961). The Investment, Financing, and Valuation of the Corporation. Review of
Economics and Statistics.
Howatt, B. (2009). Dividends, earnings, volatility and information. Applied Financial
Economics, 19(7), 551 – 562.
Lie, E. (2005). Financial flexibility, performance, and the corporate payout choice. The Journal
of Business, 78(6), 2179 – 2202.
Maina, S. (2002). Empirical Relationship between Dividend and Investment Decisions of Firms
Quoted in the NSE, Unpublished MBA Thesis, University of Nairobi
Mizuno, M. (2007). Payout policy of Japanese firms: analysis on the survey of four industries
listed on the Tokyo Stock Exchange. Pacific Economic Review, 12(5), 631 – 650.

Proceedings of 1st JKUAT-SHRD Research Conference 12
th and 13
th September 2013
228
Mugenda, O. and Mugenda, A. (2003). Research Methods. Quantitative and Qualitative
Approaches. African Centre for Technology Studies (ACTS) Nairobi.
Nissim, D. and Ziv, A. (2001). Dividend Changes and Future Profitability. Journal of Finance,
56(6), 2019–65.
Pandey, M. (2003). Corporate dividend policy and behaviour the Malaysian evidence. Asian
Academy of Management Journal, 8(1), 17 – 32.
Ramcharran, H. (2001). An empirical model of dividend policy in emerging equity markets.
Emerging Markets Quarterly; 5, 39-49.
Stulz, R. (2000). Merton Miller and modern finance. Financial Management, 29(4), 119–131.
Weston, F. and Copeland, T. (1988). Financial Theory and Corporate Policy, 3rd Edition,
Wesley.
Zhou, P. and Ruland, W. (2006). Dividend payout and future earnings growth. Financial
Analysts Journal, 62(3), 58 – 69.

Proceedings of 1st JKUAT-SHRD Research Conference 12
th and 13
th September 2013
229
DETERMINANTS OF FINANCIAL SECTOR GROWTH RATE IN KENYA; 1982-2011
Joel Nzioka Muema
Jomo Kenyatta University of Agriculture and Technology/Kenya School of Monetary Studies
Emali: [email protected]
Abstract
Financial intermediation has been emphasized in developing economies to allow for
stimulation,mobilization and efficient allocation of resources.The broad objective of this study
is to investigate the factors that determine growth trends in the financial sector. This is key for
Kenya since the financial sector is expected to contribute immensely towards economic
prosperity.The study derived its results by using the Ordinary Least Squares(OLS) method
inanalyzing the time seriesannual data(1982-2011) for six variables; capital flows, interest rate,
exchange rate, GDP growth rate ,inflation and the financial sector growth rate.Results showed
that inflation and GDP growth rate are not significant in determining the financial sector
growth rate.Interest rates,Capital flows and Exchange rate were statistically significant in
determining the growth rate in the financial sector growth.Since controlling interest rate and
exchange rate could lead to adverse macroeconomic imbalances ,it’s worth noting that sound
policies ought to be adopted by the central bank in ensuring that both variables are maintained
at an optimum. Increases in exchange rates will affect the financial sector growth rate
negatively.When local currency is too strong capital inflows will increase and cause the
financial sector to grow, however this will make our exports very expensive and worsen our
trade balance.
Key Words: Financial Sector growth rate, Capital flows, GDP Growth rate, Interest rates,
Exchange rates.
Introduction
The financial sector is an essential element of economic growth in an economy Mishkin and
Eakins (2012).This sector comprises of financial institutions which exercises the responsibility
of creating a vibrant and steady financial sector. The Kenya Vision 2030 aspires to make Kenya
one of the financial centers in emerging markets by 2030.This could be achieved through
deepening of financial services and enhancing stability in the financial sector. This goal will be
achieved if there is a continued growth in the financial intermediation sector of our economy.
The financial sector is responsible for channeling funds between surplus and deficit agents
Brainard (2012). As such, a financial intermediary is a financial institution that connects surplus
and deficit agents. The classic example of a financial intermediary amongst others is a bank that
transforms its deposits into bank loans and advances. Financial intermediaries not only channel
funds from agents which have extra money to those which do not have enough money but also
handle capital flows in and out of a country.
Effective transmission of monetary policies by a Central Bank will entirely depend on a well-
developed and functioning financial sector Michael (1995); this will go a long way in
harnessing the potential of the economy from a financial perspective which is also a key frontier
in development. OoiSang (2005) points out that the effectiveness of monetary transmission
mechanism hinges on changing forms and character of financial diversity and depth of financial
markets.

Proceedings of 1st JKUAT-SHRD Research Conference 12
th and 13
th September 2013
230
Kenya’s financial sector just like the rest of Africa is relatively underdeveloped, Brinkman
(1998) and receives only a fraction of the international capital flows. Nevertheless, total
external private finance might be small compared to other regions, but it is increasingly
important and certainly large enough to trigger financial crisis in some countries Brinkman
(1998).
The banking sector, which is the main source of credit to the private sector, is an important
channel of financial intermediation through which financial resources can be mobilized for
productive investment and realization of the high economic growth Were et al, (2012).
Notwithstanding the role availability of credit plays in the economy and given that of the total
banked population, only 14.84% (Fin Access Survey, 2009) acquired loans from formal
financial institutions a lot needs to be done in this sector so as to increase availability of credit.
Statement of the problem
Several studies have been conducted on the impact of various macro-economic variables on the
financial sector. Fitzgerald (1998) discovered that short-term capital flows will have a direct
impact on credit availability in developing countries; he concludes that transmission effect on
the real economy will come about through financial institutions. Furman and Stiglitz (1998)
identify capital flows as one variable that if well understood can be reliable in predicting
financial crises, but Afari et al (2004) singles out the exchange rate management as one of the
challenging problems in the developing countries like Ghana. Afari further links continued
capital inflows as the cause of appreciation in the exchange rate. This is a contradiction with the
findings of Turner (2008) who linked the increased inflows to be as a result of development in
the financial sector. In Korea,Ahn (2008) noted that when the exchange rate was floated in
1997, the current account started witnessing surpluses immediately but the capital account
witnessed a record surplus later in 2002 which is a signal that individual countries could react
differently upon liberalization of the financial sector. According to Forbes and Warmock (2011)
1990-2000 was a decade that experienced increased capital flow volatility but in late 2001
capital dried up and surged throughout mid-2000s.This was not in line with what the other
authors have found. For instance Obiechina has shown how globalization has triggered capital
mobility whereby the final impact is felt in the financial sector. In Kenya Ngugi and Mariara
(1998), concur that even though major achievements have been made in transforming the
financial sector, there is still high levels of inefficiencies and general underdevelopment in the
sector. This observation compliments what was observed in Nigeria by Obiechina (2010) that
adoption of vigorous, appropriate and coherent policies can address the volatilities observed in
the financial sector. This paper seeks to look at how various macro-economic factors affect the
growth of the financial sector in Kenya which has been portrayed as unstable and
underdeveloped amidst increasing capital flows and liberalization of the sector. By keenly
looking at the factors at hand, the findings from this study will inform sound decision making
which will lead to a more stable and vibrant financial sector and the ultimate achievement of the
countries long term economic targets. The study investigated the factors that determine growth
trends in the financial sector by obtaining annual data for the period 1982-2011. The specific
objectives of the study were to determine the relationship between the financial sector growth
rate and:capital flows, interest rates, exchange rates, GDP growth rate and Inflation.
The financial sector in context
Krugman (1979) argued that financial crisis occurs when the continuous weakening in the
economic fundamental becomes inconsistence with an attempt to fix the exchange rate -

Proceedings of 1st JKUAT-SHRD Research Conference 12
th and 13
th September 2013
231
characteristically the persistency of money financed budget deficit and an attempt to maintain a
fixed exchange rate – this has become known as the first-generation models of balance-of-
payment crises. Krugman stated that the inconsistency can be temporarily covered if the central
bank has sufficiently large reserves, but when these reserves become inadequate, speculators
force the issue with a wave of selling.In disaggregating short-term capital by purpose and type,
Kahler(1998) advanced that pension funds and insurance company inflows tend to be relatively
stable, while private flows from mutual funds respond to interest rate differentials among
countries and are anxiously and quickly withdrawn. It is the increase in the inflow of money
that has made emerging countries more vulnerable to financial crises than in the past. Siegel
(1998) maintained that short-term investments that are easily liquidated and speculative capital
movements threaten the stability of real economies, especially in the developing world, and
force fiscal policy to be on keeping financial markets happy rather than on raising standards of
living.
Financial crisis may still occur without changes in macroeconomic fundamentals. Such are the
so called second-generation models of balance-of-payment crises. Initially there are situations
where crises occur as a consequence of pure speculation against the currency. Calvo and
Mendoza (1997) developed the model of herding behaviour which stresses that information
costs may lead foreign investors to take decisions based on limited information and, therefore,
to be more sensitive to rumours. Crises could also occur owing to the possibility of contagion
effects. That is, a situation in which the devaluation by one country leads its trading partners to
devalue in order to avoid a loss of competitiveness Gerlach and Smets (1995), and also where
crisis in one country may raise the odds of a crisis elsewhere by signalling that devaluation is
more likely as a result of the initial crisis. The signal may then lead to a self-fulfilling
speculative attack Masson, (1998).
Rationale of the study
Financial intermediation has been one of the sectors which have recorded high growth rates in
the Country. Kenya long term plan has identified this sector as a major driver and contributor in
making the country a middle income economy. Despite the much expected impact from this
sector little is known of its dynamics. Studies done so far are more focused on the
macroeconomic interactions in the financial arena. From the studies, the financial sector
responds and relates differently depending on the environment. Kenya, which is classified as
one of the countries with an underdeveloped financial sectorNgugi and Mariara, (1998), has no
study undertaken to show how the financial sector growth rate is determined by other macro-
economic factors. Were et al, (2012) acknowledges that the banking(financial) sector has a key
role in shaping the credit to private sector which could as well affect investment levels in the
country.This study therefore intends to fill the knowledge gap by determining how some macro-
economic variables determine the growth of this key sector in the Kenyan economy. Though
key but underdeveloped it will be crucial to inform policy on which variables drives this sector.
Methodology
The study used secondary data from the Kenya National Bureau of Statistics for the following
variables; GDP growth rate, capital flows, interest rate, exchange rate and inflation rates for the
period 1982-2011.This period includes the changes brought about by liberalizing the financial
sector in an effort to make it more efficient.Financial crisis has been linked to both first and
second generation models Krugman, (1979). Given the two different positions adopted by the
two models, financial experts and economists are in tandem that it’s not easy to model

Proceedings of 1st JKUAT-SHRD Research Conference 12
th and 13
th September 2013
232
qualitative features like speculation or rumour as implied by second generation models.With the
inherent problem of the Second Generation Model at hand, equation 2.1 summarises the
relationship between Financial Sector Growth rate and its probable explanatory variables:
…………………...…………...………………….2.1
Where;
Is Financial sector Growth
Is Capital flows
Is GDP Growth Rate
Is Interest rate
Is Exchange rate
Is the Inflation rate
In order to study the determinants of the financial sector growth rate, this research will estimate
equation 2.2 using Ordinary Least Squares (OLS).
Whereby; is a constant while are the respective parameters.
Analysis of results
Descriptive statistics: From table 1 it can be shown that there is a positive relationship between
financial sector growth rate and all the other variables except exchange rates.
Table 1: Correlation analysis
Financial
Sector
Growth
Capital
Flows
Exchange
Rates
GDP
Growth
Inflation Interest
Rate
Financial Sector
Capital Flows
Exchange Rates
GDP Growth
Inflation
Interest Rate
1.000000
0.057875
-
0.317627
0.079676
0.168111
0.133086
0.057875
1.000000
0.562525
0.206674
-
0.191449
-
0.222840
-0.317627
0.562525
1.000000
-0.126935
-0.228203
0.214202
0.079676
0.206674
-
0.126935
1.000000
-
0.310942
-
0.427851
0.168111
0.191449
0.228203
0.310942
1.000000
0.292005
0.133086
-
0.222840
0.214202
-
0.427851
0.292005
1.000000
Exchange rate has a negative correlation with GDP growth rate and Inflation. Capital flows and
exchange rate gives the highest level of correlation at 0.562525.The low level of correlation
between the independent variables is an indicator of the absence of multicollineality.

Proceedings of 1st JKUAT-SHRD Research Conference 12
th and 13
th September 2013
233
Table 2: Park test for autocorrelation and heteroscedasticity
Variable Coefficient Std. Error t-Statistic Prob.
Exchange Rate
GDP Growth
Inflation
Interest Rate
Ln Capital
Flows
0.342570
0.666656
0.397332
-0.550982
-9.255821
91.57759
0.526178
4.700783
0.930139
1.262842
10.02286
83.84519
0.651054
0.141818
0.427175
-0.436303
-0.923471
1.092222
0.5215
0.8885
0.6732
0.6667
0.3653
0.2860
Table 2 shows the result after testing for heteroscedasticity. All the test statistics are less than 2
implying that there is no heteroscedasticity and autocorrelation.
Unit root test: It is important to first test the data for presence of unit roots. In this regard, the
study employed the use of two tests; Philips Perron (PP) and Augmented Dickey Fuller (ADF).
The results are as shown in table 3.
Table 3: Unit root test results in levels
Variable Lags Intercept Trend ADF* Philips Perron Decision
FSW 1 2.091594 0.010470 -2.380562
(-3.5670)
-4.598264
(-3.5614)
Stationary
2 3.563198 -
0.080739
-2.347863
(-3.5731)
-4.695829
(-3.5614)
Stationary
ER 1 2.803826 0.610253 -1.849034
(-3.5670)
-1.763198
(-3.5614)
Non Stationary
1 3.338303 -
0.039605
-3.745504
(-3.5731)
-4.769257
(-3.5670)
Stationary
1st Difference
GDPR 1 2.205968 0.019250 -3.784535
(-3.5670)
-3.718926
(-3.5614)
Stationary
LCF 1 5.441175
0.118983
-2.932499
(-3.6330)
-3.048108
(-3.6027)
Non-Stationary
1 -0.092853
0.012383
-2.411297
(-3.6746)
-6.827543
(-3.6330)
Stationary
1st Difference
IR 1 3.632252 -
0.073311
-1.367659
(-3.5670)
-1.440383
(-3.5614)
Non Stationary
1 0.964135 -
0.057643
-3.095838
(-3.5731)
-5.366412
(-3.5670)
Stationary
INFR 1 11.51882
-
0.191026
-3.528601
(-3.5670)
-3.164933
(-3.5614)
Non Stationary
-1.585019 0.074065 -6.367160
(-3.5731)
-5.102778
(-3.5670)
Stationary
NB; the figure in brackets is the critical value at 5%
Financial sector growth rate and GDP growth rate were found to be stationary at the level stage.
Inflation and exchange rate, log capital flows and interest rate became stationary after the first
difference. Having established stationary, it is important to establish cointegration.
Cointegration implies that the study variables move in a divergent manner in the short term and

Proceedings of 1st JKUAT-SHRD Research Conference 12
th and 13
th September 2013
234
converge in the long-run through an error correction mechanism. If the variables are
cointegrated, then it can be said that a long-run relationship exists between them.
Co-integration test: Tests for cointergration are performed by obtaining the residual series and
testing for its significance and establish if there is stationary. Below are the results showing the
unit root test result.
Table 4: Testing cointergration
ADF Statistic 1% 5% 10%
-4.050846 -3.6661 -2.9627 -2.6200
From the ADF test illustrated in table 4,it can be concluded that there is existence of stationarity
thus presence of cointergration.
Discussion of results
Based on the results presented in table 5 the long run equation is as shown below;
FS=-10.32443-0.129300EX+0.337993GDPR+1.692296LCF+0.171007IR+
0.075656INFL.……...2.3
Table 5: Long run equation
Variable Coefficient Std. Error t-Statistic Prob.
GDPR
INFL
IR
EX
LCF
1982
2001
C
0.337993
0.075656
0.171007
-0.129300
1.692296
-13.98531
-7.941675
-10.32443
0.277643
0.055699
0.073991
0.032937
0.615176
2.206210
2.256033
5.042047
1.217368
1.358310
2.311195
-3.925643
2.750914
-6.339063
-3.520195
-2.047667
0.2370
0.1888
0.0311
0.0008
0.0120
0.0000
0.0020
0.0533
As depicted in equation 2.3, the trend of the equation is -10.32443.A percentage-point growth in
GDP leads to an increase of 0.337993 points in financial sector growth; however this factor is
not significant since the t value is 1.217368 which is less than 2. Inflation whose t value is
1.358310 is also insignificant but had a positive coefficient of 0.075656. An increase in interest
rate by a percentage point increases financial sector growth by 0.171007.Interest rate is
statistically significant in determining the growth rate in the financial sector. Increasing interest
is a major source of income for some of the financial institutions. This is similar to an
observation made by Connell et al which showed there is a consistent causality between interest
rates and exchange market pressures in impacting the financial sector. Kremmer et al (2004)
also discovered that finance corporations in Australia were found to be highly sensitive to new
shocks. The relationship between interest rates and large bank stocks was positive without
deregulation. A unit increase in exchange rate leads to the decreases in financial sector growth
by 0.129300percentage points and is statistically significant since the t value is more than 2.
This finding is similar to what was observed by Mudida et al (2012), that exchange rate was an
important tool for attempting to address persistent balance of payments and therefore contribute
to achieving an external balance.

Proceedings of 1st JKUAT-SHRD Research Conference 12
th and 13
th September 2013
235
Local capital flows affects the financial sector growth rate positively with a coefficient of
1.692296 and is also statistically significant. Similarly from a study by Forbes and
Warnock(2011) capital flows can have wide spread economic consequences such as amplifying
economic cycles, increasing financial systems vulnerabilities and aggravating overall macro-
economic instability. Kohli (2003) identified that foreign capital inflow had significant impact
on domestic money supply and stock market growth, liquidity and volatility.
The long run model is 80 percent explained by the five variables. Growth in the financial sector
cannot therefore be attributed to capital flows, GDP growth rate, exchange rate, interest rate and
inflation only. Kenya (1982) highlights how the decade started with sharp increase in oil prices,
renewed decline in coffee prices, rise in food prices and the onset of recession in some
developed countries. In order to accommodate this shock a dummy was introduced in 1982. As
for the 2000 period, the previous decade had closed having witnessed increased imports which
negatively affected the domestic industrial market as well as tight fiscal policies. The period
2000 onwards was characterised by political realignments and it was also the same time when
the donors pulled out of Kenya citing economic mismanagement thus necessitating the dummy.
Conclusion and recommendations
The study concludes by identifying capital flows, exchange rate and interest rates as the factors
affecting growth in the financial sector. GDP growth rate and inflation were found not
significant in determining the growth of financial sector growth rate.
It is recommended that the government should embark on strengthening the financial sector
which in turn will support transactions in the other sectors of the economy. The other sectors
may not be directly related to the financial sector but have a major role to play in its stability.
This is evident on how the GDP growth is impacting the financial sector. GDP growth rate
incorporates changes in all the sectors of the economy. For instance Kenya is depended on food
import which could be substituted by a vigorous Agricultural Sector. Such imports only worsen
the exchange rate and inflation situation besides introducing unbalanced competition in the
domestic economy. Lending interest rates should be controlled through monetary policy to
remain at an optimal level, high lending interest rates will attract capital and both will cause the
financial sector to grow but will make export more expensive. Very high interest rates will
trigger inflation while very low interest rates will discourage investment. Even though the
exchange rate impacts financial sector growth rate negatively, it should remain uncontrolled,
during its peak the government can redeem its foreign debt. With a broad based economy high
exchange rates will positively affect the balance of trade unlike when the country is too
depended on imports.
References
Afari, O Morrissey, O and Lloyd, T (2004),Real Exchange Rate Response to Capital Inflows: A
Dynamic Analysis for Ghana. Centre for Research in Economic Development and
International Trade, University of Nottingham
Agosin, M and Huaita, F (2007),Why should emerging Market countries (still) concern
themselves with capital Inflows, Department of Economics, Santiago: University of
Chile.
Antzoulatus, A.A (1996), Capital flows and current Account Deficits In the 1990s.Why Did
Latin America and East Asia Countries Respond Differently? Research paper No.1960.

Proceedings of 1st JKUAT-SHRD Research Conference 12
th and 13
th September 2013
236
New York, Federal Reserve Bank of New York.
Bernanke, Ben (1983), “Nonmonetary Effects of the Financial Crisis in the Propagation of the
Great Depression,” American Economic Review 73, 257-276.
Bernie.J, Caporale.G and Spagnolo.N (2009), Market, Interest Rate and Exchange Rate Risk
Effects on Financial Stock Returns: A GARCH-M Approach. Karachi, Iqra University
Press.
Caprio, G and Daniela Klingebiel (1996), “Bank Insolvencies: Cross-Country Experience,”
Policy Research Working Paper No. 1620.New York, World Bank.
Calvo, G. and Mendoza, E. G (1997).Rational Herd Behaviour and the Globalisation of
Securities Markets. Mimeo, United States of America. University of Maryland Press.
Corbo, V and Hernandez L (1994),”Macroeconomic Adjustments to Capital flows”, Research
Paper No 1337, Washington DC, World Bank.
Central Bank of Kenya (2011). Kenya’s financial sector stability report.
Dorothy, R (1987), Braking the Special Interests. Chicago, University of Chicago Press.
Evans, M.D and Hnatkovska, V (2005, International Capital Flows, Returns and World
Financial Integration. Washington, Department of Economics George town University.
Berument H and Dincer.N, (2004), Do capitals flows Improve Macroeconomic performance in
Emerging Markets? Emerging Markets Finance and Trade Vol.40 July –August 2004
Pp.20-32
Fernandez-Arias, E and Montiel P.J (1995),”The surge in Capital inflows to Developing
Countries: Prospects and Policy Response “Policy Research Working Paper No 1473,
Washington Dc. World Bank
FitzGerald, E.K. (1998),Short term Capital, the real economy and income distribution in
Developing Countries Working paper No.8 Oxford; University of Oxford International
Development Centre.
Gibson, Michael (1995), “Can Bank Health Affect Investment? Evidence from Japan,” Journal
of Business 68, Pp.281-308.
Gourinchas P.O, (2011), Capital Flows to Developing Countries: The Allocation Puzzle,
University of California at Berkeley Olivier Jeanne Johns Hopkins University
Government of Kenya (1982-2012), Economic Survey, Nairobi, Government printer.
Government of Kenya (2007), Kenya Vision 2030, Nairobi, Government printer.
Gerlach, S. and Smets, F. (1995),Contagious Speculative Attack. European Journal of Political
Economy 11 (1): Pp. 45–63
Greene, W.H., 2002, Econometric Analysis, 5th Edition, New Jersey, Prentice Hall

Proceedings of 1st JKUAT-SHRD Research Conference 12
th and 13
th September 2013
237
Kahler, M. (1998), Capital flows and Financial Crises: Theory and Reality. New York, Cornel
University Press, P. 268.
Kohli, (2003), “Capital Flows and Domestic Financial Sector in India”, Economic Political
Weekly, Feb. 22.Pp761-68.
Krugman, P. (1979), A Model of Balance of Payments Crises. Journal of Money Credit and
Banking, Vol. 11(3), Pp. 311-325.
Masson, P.R (1998), Contagion–monsoonal Effects, Spill overs and Jumps between Multiple
Equilibria. Washington, IMF.
Mishkin F. S., Eakins S. G. (2012), Financial Markets and Institutions. 7th ed., (ed).New York,
Pearson-Prentice Hall.
Ndung’u, S.N. (2001), Liberalization of the foreign exchange market in Kenya and the short-
term capital flows problem. Research paper No.109.AERC. Kenya, Africa Economics
Research Consortium.
Ngugi.R and Kabubo.J (1998), Financial sector reforms and interest rate liberalization: the
Kenya experience. Kenya, Africa Economics Research Consortium
Obiechina, M.E (2010), Capital flows and Financial Crises; Policy Issues and Challenges for
Nigeria, Economic and Financial review Vol 48/1.Pp 94-112
Odongo, T.M (2008), Short Term private Capital flows and Real exchange rate in Kenya,
Discussion Paper No.DP/86/2008.Nairobi,Kenya Institute for Public Policy Research
and Analysis (KIPPRA).
Pierre, S (2001), Money, Banking, and Financial Institutions: Canada in the Global
Environment. Toronto, McGraw-Hill Ryerson
Prasad.E, Rajan .R, and Subramanian(2006), Patterns of International Capital Flows and Their
Implications for Economic Development .New York, Research Department IMF.
Siegel, M. (1998), Control of International Capital: A Survey of Policy Options Discussion
Paper for Working Group 1 at the Friend of the Earth’s International Forum on
Globalization.
Solakoglu.M and Demir.N(2009), Exchange-Rate Exposure and the Financial Sector Journal of
Economic and Social Research 11(2)
Sumanjeet (2009), Foreign Capital Flows into India: Compositions, Regulations, Issues and
Policy Options,University of Delhi, India Working Paper No.155
Were, M., Nzomoi, J., Rutto, N. (2012), Assessing the Impact of Private Sector Credit on
Economic Performance: Evidence from Sectoral Panel Data for Kenya. International
Journal of Economics and Finance Vol. 4, No. 3; Pp. 182-190
Williamsons (2008), Macroeconomics, Third Edition, Massachusetts Pearson Boston.

Proceedings of 1st JKUAT-SHRD Research Conference 12
th and 13
th September 2013
238
CAPITAL STRUCTURE AND FINANCIAL PERFORMANCE IN KENYA: EVIDENCE
FROM FIRMS LISTED AT THE NAIROBI SECURITIES EXCHANGE
Maina L.1* &Ondongo Kondongo.
Jomo Kenyatta University of Agriculture and Technology
Abstract
Capital structure is a mix of debt and equity the firm uses to finance its operations. It is
considered important corporate financial management context and is mainly related to the
establishment of an ideal debt policy. Recently equity levels of firms listed at the NSE have
substantially risen. A random observation shows that debt equity ratios had dropped
substantially while over the same period, the returns on equity have improved substantially.
Given these observations, the main objective was to establish, the effect of capital structure on
financial performance of firms listed at the Nairobi Securities exchange. The population of
interest of this study was the firms quoted at the Nairobi securities exchange, and a census of
all firms listed at the Nairobi Security Exchange from year 2002-2011 was the sample.
Secondary data was collected from the financial statements of the firms listed at the NSE. The
study used Causal research design and Gretl statistical software to perform the panel
Regression analysis. Its output will be significant to the management of quoted companies and
government.The study concluded that debt and equity are major determinants of financial
performance of firms listed at the Nairobi Securities exchange. The study provided evidence of
a negative and significant relationship between capital structure (DE) and all measures of
performance. This implies that the more debt the firms used as a source of finance they
experienced low performance. The study also concluded that firms listed at NSE used more
short-term debts than long term.
Introduction
The theory of capital structure and its relationship with financial performance of firms has been
a controversial issue in corporate finance since the seminal work of Modigliani and Miller
(1958). The question firms are faced with is making a decision on the capital structure choice to
use. The decision is crucial given that it has an effect on the financial performance of firms. The
capital structure of a firm is generally the specific mix of debt and equity the firm uses to
finance its operations (Abor, 2005). A firm can issue a large amount of debt or a large amount
of equity; hence it’s important for a firm to deploy the appropriate mix of debt and equity that
can maximize its overall market value. Utilization of different levels of equity and debt by
managers is one strategy used by firms to improve their financial performance (Gleason et al.,
2000).
Statement of the problem
Financial Managers have a responsibility of determining the optimal mix of debt and equity that
will ensure maximization of shareholders wealth. This has led to the desire to establish whether
there is an optimal capital structure that maximizes firm’s value. Studies on the impact of
capital structure on firm performance have mostly been carried out in developed economies on
large and listed firms. In the developing economies, Chiang Yat Hung et al., (2002) concluded
that while high gearing is positively related to asset, it’s negatively related to profit margins in
Hong Kong. In Kenya, Kiogora (2000), the only study in the literature, found a positive
relationship between capital structure and value of the firm.

Proceedings of 1st JKUAT-SHRD Research Conference 12
th and 13
th September 2013
239
Since Kiogora’s (2000) study, equity levels of firms listed at the NSE have substantially risen.
A random observation shows that debt equity ratios have dropped substantially from 5.03, 1.53
and 1.89 in 2002 to 1.07, 0.64 and 1.51 in 2012 respectively for Kenya Power, BAT Kenya and
Kenya Airways. Over the same period, the returns on equity have improved substantially for the
three firms from –1.18, 0.20 and 0.17 in 2002 to 0.94, 0.31 and 0.72 in 2012 respectively for the
three companies. A similar pattern is observed for many firms listed at the NSE.
Given these observations, it would be interesting to establish, whether there is a clear linkage
between capital structure and the performance of firms listed at the Nairobi Securities
Exchange. The study proposes to investigate these issues with performance measured both in
terms of profitability and firm value.
Objectives of the study
The general objective of this study was to focus on examining the link between capital structure
and financial performance of firms listed at the NSE.
The specific objectives of this study were to:
Determine effect of equity financing on financial performance of firms listed at the Nairobi
Securities Exchange.
Determine the effect of debt financing on the financial performance of firms quoted at the
Nairobi Securities Exchange.
Literature review
This section reviews on previous studies that have been conducted related to the present study.
This research reviewed literature on the various theories related to capital structure and firm
financial performance.
Theories of capital structure
The capital structure of a firm could be explained, in general terms, by two dominant theories;
the trade-off and pecking order theories. Based on an arbitrage argument, Modigliani &Miller
(1958) ascertained that with the existence of perfect capital market, the capital structure
decisions would have no impact on the value of the firm. Arbitrage, they argued would ensure
that an individual’s exposure to risk would not change because home-made leverage was as
good as corporate leverage. However, there was a reaction from Duraud (1959) to Modigliani
and miler’s irrelevant theory. He questioned the applicability of arbitrage process and the
assumptions they made of a risk-less world that are somehow unrealistic. In response to this and
other criticisms, Modigliani and Miller (1963) modified their original hypothesis. Relaxing the
assumption of zero taxation, they argued that levered firms will be more value than unlevered
firms due to the fact that debt is a tax deductible expense.
Since Modigliani & Miller (1963) made an oversight of the impact of personal taxes, Miller
(1977) made an important contribution by correcting the 1963 contention. Relying on several
assumptions, Miller (1977) introduced a model designed to show how leverage affects a firm’s
value. When both personal and corporate taxes are taken into account, this model suggests that
in that market equilibrium, corporate tax advantage are cancelled out by the effects of personal
taxes hence capital structure irrelevance. Taggart (1980) extended Miller’s analysis to
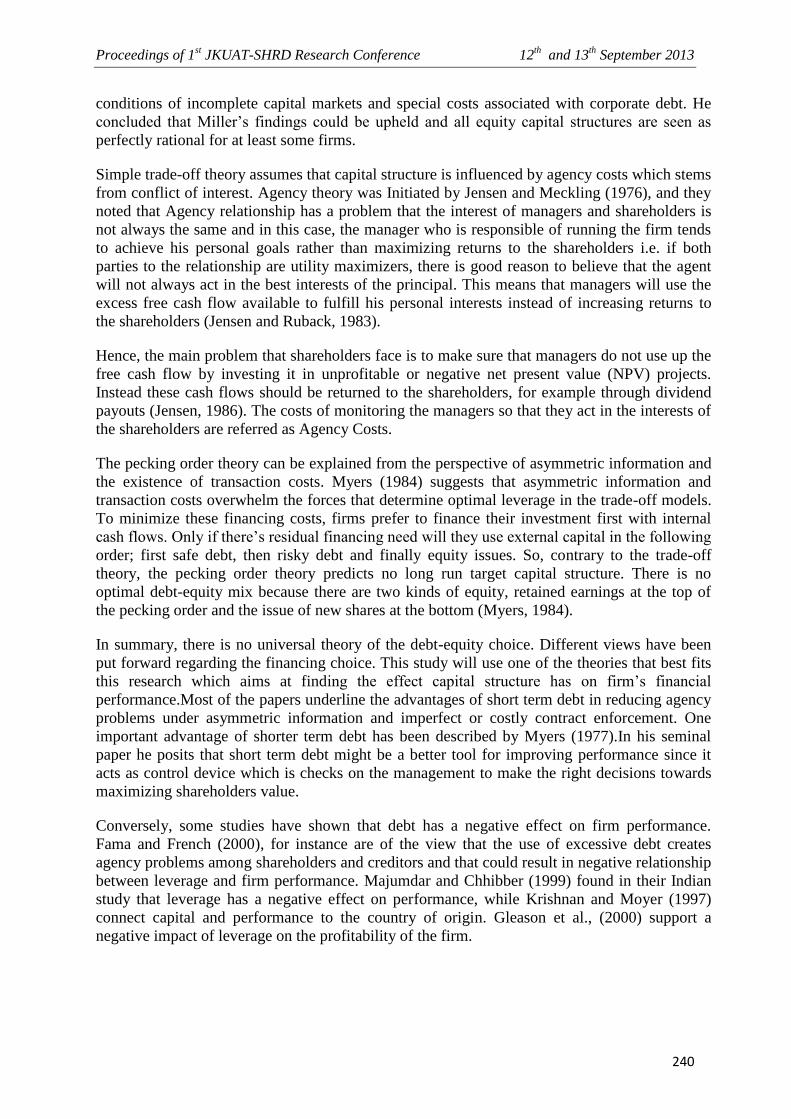
Proceedings of 1st JKUAT-SHRD Research Conference 12
th and 13
th September 2013
240
conditions of incomplete capital markets and special costs associated with corporate debt. He
concluded that Miller’s findings could be upheld and all equity capital structures are seen as
perfectly rational for at least some firms.
Simple trade-off theory assumes that capital structure is influenced by agency costs which stems
from conflict of interest. Agency theory was Initiated by Jensen and Meckling (1976), and they
noted that Agency relationship has a problem that the interest of managers and shareholders is
not always the same and in this case, the manager who is responsible of running the firm tends
to achieve his personal goals rather than maximizing returns to the shareholders i.e. if both
parties to the relationship are utility maximizers, there is good reason to believe that the agent
will not always act in the best interests of the principal. This means that managers will use the
excess free cash flow available to fulfill his personal interests instead of increasing returns to
the shareholders (Jensen and Ruback, 1983).
Hence, the main problem that shareholders face is to make sure that managers do not use up the
free cash flow by investing it in unprofitable or negative net present value (NPV) projects.
Instead these cash flows should be returned to the shareholders, for example through dividend
payouts (Jensen, 1986). The costs of monitoring the managers so that they act in the interests of
the shareholders are referred as Agency Costs.
The pecking order theory can be explained from the perspective of asymmetric information and
the existence of transaction costs. Myers (1984) suggests that asymmetric information and
transaction costs overwhelm the forces that determine optimal leverage in the trade-off models.
To minimize these financing costs, firms prefer to finance their investment first with internal
cash flows. Only if there’s residual financing need will they use external capital in the following
order; first safe debt, then risky debt and finally equity issues. So, contrary to the trade-off
theory, the pecking order theory predicts no long run target capital structure. There is no
optimal debt-equity mix because there are two kinds of equity, retained earnings at the top of
the pecking order and the issue of new shares at the bottom (Myers, 1984).
In summary, there is no universal theory of the debt-equity choice. Different views have been
put forward regarding the financing choice. This study will use one of the theories that best fits
this research which aims at finding the effect capital structure has on firm’s financial
performance.Most of the papers underline the advantages of short term debt in reducing agency
problems under asymmetric information and imperfect or costly contract enforcement. One
important advantage of shorter term debt has been described by Myers (1977).In his seminal
paper he posits that short term debt might be a better tool for improving performance since it
acts as control device which is checks on the management to make the right decisions towards
maximizing shareholders value.
Conversely, some studies have shown that debt has a negative effect on firm performance.
Fama and French (2000), for instance are of the view that the use of excessive debt creates
agency problems among shareholders and creditors and that could result in negative relationship
between leverage and firm performance. Majumdar and Chhibber (1999) found in their Indian
study that leverage has a negative effect on performance, while Krishnan and Moyer (1997)
connect capital and performance to the country of origin. Gleason et al., (2000) support a
negative impact of leverage on the profitability of the firm.
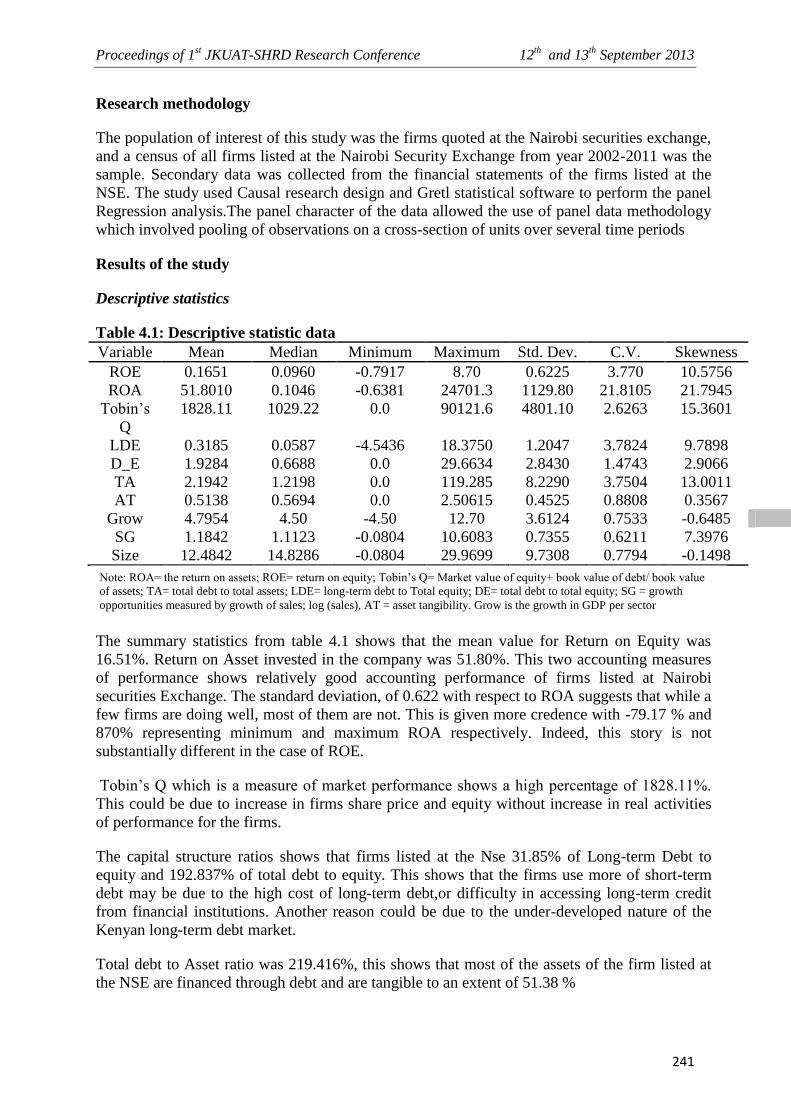
Proceedings of 1st JKUAT-SHRD Research Conference 12
th and 13
th September 2013
241
Research methodology
The population of interest of this study was the firms quoted at the Nairobi securities exchange,
and a census of all firms listed at the Nairobi Security Exchange from year 2002-2011 was the
sample. Secondary data was collected from the financial statements of the firms listed at the
NSE. The study used Causal research design and Gretl statistical software to perform the panel
Regression analysis.The panel character of the data allowed the use of panel data methodology
which involved pooling of observations on a cross-section of units over several time periods
Results of the study
Descriptive statistics
Table 4.1: Descriptive statistic data
Variable Mean Median Minimum Maximum Std. Dev. C.V. Skewness
ROE 0.1651 0.0960 -0.7917 8.70 0.6225 3.770 10.5756
ROA 51.8010 0.1046 -0.6381 24701.3 1129.80 21.8105 21.7945
Tobin’s
Q
1828.11 1029.22 0.0 90121.6 4801.10 2.6263 15.3601
LDE 0.3185 0.0587 -4.5436 18.3750 1.2047 3.7824 9.7898
D_E 1.9284 0.6688 0.0 29.6634 2.8430 1.4743 2.9066
TA 2.1942 1.2198 0.0 119.285 8.2290 3.7504 13.0011
AT 0.5138 0.5694 0.0 2.50615 0.4525 0.8808 0.3567
Grow 4.7954 4.50 -4.50 12.70 3.6124 0.7533 -0.6485
SG 1.1842 1.1123 -0.0804 10.6083 0.7355 0.6211 7.3976
Size 12.4842 14.8286 -0.0804 29.9699 9.7308 0.7794 -0.1498
The summary statistics from table 4.1 shows that the mean value for Return on Equity was
16.51%. Return on Asset invested in the company was 51.80%. This two accounting measures
of performance shows relatively good accounting performance of firms listed at Nairobi
securities Exchange. The standard deviation, of 0.622 with respect to ROA suggests that while a
few firms are doing well, most of them are not. This is given more credence with -79.17 % and
870% representing minimum and maximum ROA respectively. Indeed, this story is not
substantially different in the case of ROE.
Tobin’s Q which is a measure of market performance shows a high percentage of 1828.11%.
This could be due to increase in firms share price and equity without increase in real activities
of performance for the firms.
The capital structure ratios shows that firms listed at the Nse 31.85% of Long-term Debt to
equity and 192.837% of total debt to equity. This shows that the firms use more of short-term
debt may be due to the high cost of long-term debt,or difficulty in accessing long-term credit
from financial institutions. Another reason could be due to the under-developed nature of the
Kenyan long-term debt market.
Total debt to Asset ratio was 219.416%, this shows that most of the assets of the firm listed at
the NSE are financed through debt and are tangible to an extent of 51.38 %
Note: ROA= the return on assets; ROE= return on equity; Tobin’s Q= Market value of equity+ book value of debt/ book value
of assets; TA= total debt to total assets; LDE= long-term debt to Total equity; DE= total debt to total equity; SG = growth
opportunities measured by growth of sales; log (sales), AT = asset tangibility. Grow is the growth in GDP per sector

Proceedings of 1st JKUAT-SHRD Research Conference 12
th and 13
th September 2013
242
Correlation matrix
Table 4.2: Correlation Matrix of the Explanatory Variables, during 2002-2011
ROE ROA Tobin
Q
LDE D_E TA AT Size Grow SG
1.00
00
-
0.004
4
0.042
9
-
0.068
7
0.048
9
-
0.007
9
0.043
1
0.152
9
0.045
5
-
0.004
8
ROE
1.000
0
-
0.006
8
-
0.002
6
-
0.028
2
0.004
6
0.030
7
-
0.003
1
-
0.140
7
0.012
8
ROA
1.000
0
-
0.049
6
0.056
4
-
0.010
9
-
0.045
5
0.078
5
-
0.027
8
0.022
1
Tobin
Q
1.000
0
-
0.068
9
-
0.040
3
0.296
5
0.089
9
0.024
5
-
0.264
3
LDE
1.000
0
-
0.157
1
-
0.530
7
0.482
2
0.256
8
0.166
4
D_E
1.000
0
0.133
4
-
0.149
8
-
0.075
7
0.018
7
TA
1.000
0
0.293
9
-
0.257
2
-
0.117
6
AT
1.000
0
0.085
7
-
0.067
3
Size
1.000
0
0.116
0
1.000
0
Grow
SG
The correlation matrix for the variables reported in Table 4. 2 examine the correlation between
the explanatory variables. To address this problem the study tested for multi-co linearity by
running a correlation of one independent variable against the other(s).The results shows a
negative correlation coefficient between ROE, ROA, Tobin’s Q with LDE at -0.0687, -0.0026
and -0.0496. ROE, Tobin‘s Q also have a negative correlation coefficient with DE and TA
respectively. The correlation coefficient between the independent variables are relatively low
hence no problem of multi-collinearity in the model. The correlation coefficient lies between
zero and one, thereby measuring the linear association between the observed values.

Proceedings of 1st JKUAT-SHRD Research Conference 12
th and 13
th September 2013
243
Results for panel data model
The panel results from the models showed the following coefficients.
Model 1
Model 2
Model 3
Conclusion
In summary, the results shown in model 2 indicate that capital structure choice measured by (
LDE, DE and TA), in general terms, has no significant impact on Kenyan listed firms’
performance measured by ( ROE, ROA and Tobin’s Q).These results contradict with findings of
previous literature either in developed or transition economies which documents a significant
impact of capital structure on firm’s performance either positively (Gosh et al., 2000; Abor,
2005;Kyereboah-Coleman, 2007) or negatively (Balakrishnan and Fox, 1993; Majumdar and
Chibber, 1999; Gleason et al., 2000; Zeitun and Tian, 2007; Abor, 2007). This rejects the H1
and accepts H0 because the result shows that capital structure doesn’t affect performance of
firms listed at the NSE.

Proceedings of 1st JKUAT-SHRD Research Conference 12
th and 13
th September 2013
244
Model 1 is the only model showing a negative and significant relationship between capital
structure measured by DE and performance (ROA) hence rejecting the H0 and rejecting H1.
This may be due to agency conflicts hence companies over-leveraged themselves thus affecting
performance negatively This results are consistent with the findings of previous studies such as
Gleason, Mathur and Mathur (2000), Tzelepis and Skuras (2004), Krishnan and Moyer (1997).
Model 3 however shows a situation where capital structure measured by TA affects
performance measured by Tobin’s Q positively at 5% level of significance. This result though is
consistent with Nirajini and Priya (2013) in their study at Sri Lanka. Therefore it rejects H0 and
accepts H1
Recommendation
In line with our finding, the study recommend that firms (both highly and lowly geared) should
take into cognizance the amount of leverage incurred because it is a major determinant of firms
performance, this is obvious in both the highly geared and lowly geared firms.
The study provides evidence of a negative and significant relationship between asset tangibility
and ROA as a measure of performance in the model. The implication of this is that the firms
were not able to utilize the fixed asset composition of their total assets judiciously to impact
positively on their firms’ performance. Hence, this study recommends that asset tangibility
should be a driven factor to capital structure because firms with more tangible assets are less
likely to be financially constrained.
In addition, the government should create an enabling business friendly environment so that
businesses can thrive and thus increase firm’s performance level. This is evident in the fact that
macroeconomic variables positively affect the performances.
References
Abor, J. (2005), The effect of capital structure on profitability: empirical analysis of listed firms
in Ghana, Journal of Risk Finance, Vol. 6 No.5, pp.438-45.
Anthony, K. C. (2007), Impact of capital structure on the performance of microfinance
institutions, Journal of Risk Finance. Vol. 60 pp.187-243.
Boateng, A. (2004), Determinants of capital structure. Evidence from international joint
ventures in Ghana , International Journal of Social Economics, Vol. 31 No.1/2, pp.56-
66.
Dayson, Karl and Quach, Hao (2006), Toward a Performance Assessment of Microfinance
Institutions in Europe, Finance and the Common Good, No. 25, Autumn 2006.
Dimitris, M. and Maria, P. (2007), Capital Structure and Firm Efficiency. International Journal
of the Economics of Business, Vol. 7 No.3, pp.297-312.
Donaldson, G. (1961), "Corporate debt capacity: a study of corporate debt policy and the
determination of corporate debt capacity", Boston, MA, Harvard Graduate School of
Business Administration, Division of Research, Harvard University.

Proceedings of 1st JKUAT-SHRD Research Conference 12
th and 13
th September 2013
245
Graham, J.R., and Harvey, C. (2001), The theory and practice of corporate finance: evidence
from the field , Journal of Financial Economics, Vol. 60 pp.187-243.
Hall, G.C., Hutchinson, P.J., and Michael as, N. (2000), Industry effects on the determinants of
unquoted SMEs' capital structure, International Journal of the Economics of Business,
Vol. 7 No.3, pp.297-312.
Hadlock, C. and James, C. (2002), “Do banks provide financial slack?” Journal of Finance,
Vol. 57, pp. 1383- 420.
Fischer, E.O., Heinkel, R.and Zechner, J. (1989), ‘‘Dynamic capital structure choice: theory and
tests’’, Journal of Finance, Vol.44, pp.19-40.
Harjeet S. Bhabra, Tong Liu and Dogan Tirtiroglu. (2008), Capital structure and the firm
characteristics. Journal of Financial Management
Harris, M. and Raviv, A. (1991), The theory of capital structure, The Journal of Finance, Vol.
46 No.1, pp.297-355
Javed, H., Cindy, M., and Harry M. (2005), SME financing in the UK and in China: a
comparative perspective. Bell Journal of Economics, Vol. 8 pp.23-40.
Jensen, M. (1986), Agency costs of free cash flow, corporate finance and takeovers, American
Economic Review, Vol. 76 pp.323-9.
José, P. E., Ana P. M. G., and Mohamed A. G., (2003), Corporate debt policy of small firms: an
empirical (re)examination. Journal of Small Business and Enterprise Development.
Joshua, A. (2007), Debt policy and performance of SMEs Evidence from Ghanaian and South
African firms Journal of Risk Finance. Vol. 29 No.3, pp.37-51.
Kyereboah-Coleman, A. (2007), "The impact of capital structure on the performance of
microfinance institutions", Journal of Risk Finance, Vol. 8 pp.56-71.
Lemmon, M. L. and Zender, J .F. (2002), ‘‘Debt capacity and tests of capital structure theories’’
un published working paper, available at: www.ssrn.com.
Long, M.and Malitz ,I.(1992),‘‘The investment-financing nexus: some empirical evidence’’,in
Stern,J.AndChew,D.(Eds),TheRevolutioninCorporate Finance,
Blackwell,Oxford,pp.156-162.
Lubatkin, K. and Chatterjee, T. (1994). The dynamics of capital structure, Research in Banking
and Finance, Vol. 4 No.1, pp.275-97.
Modigliani, F., Miller, M. (1958), The cost of capital, corporation finance and the theory of
investment , American Economic Review, Vol. 48 pp.61-97.
Myers, S., and Majluf, N.S. (1984), Corporate financing and investment decisions when firms
have information that investors do not have, Journal of Financial Economics, Vol. 13
pp.187-221.

Proceedings of 1st JKUAT-SHRD Research Conference 12
th and 13
th September 2013
246
Onaolapo, A. A. and Kajola, S. O. (2010), “Capital Structure and Firm Performance: Evidence
from Nigeria”, European Journal of Economics, Finance and Administrative Sciences,
Issue, 25, pp.70-82.
Pandey, I. M. (2001), Capital structure and the firm characteristics: Evidence from an Emerging
Market. IIMA Working Paper, Indian Institute of Management Ahmedabad.
Pinegar, M and Wilbricht, L (1989): “What managers think of capital structure theory: a survey.
Financial Management, winter, pp 82- 91.
Simerly, R. and Li, M. (2000), “Environmental dynamism, financial leverage and performance:
a theoretical integration and an empirical test”, Strategic Management Journal, Vol. 21,
pp. 31-49.
Wandeto, P. (2005) an empirical investigation of the relationship between dividend changes &
earnings, cash flows & capital structure for firms listed in the NSE. Unpublished MBA
project. University of Nairobi.
Quach, M. (2005), Problems in managing internal development projects in multi-project
environments, International Journal of Project Management, Vol. 21. pp.395.
Richard, G.P. and McMahon, (2004), Ownership structure, business growth and financial
performance amongst SMEs. Jourmal of Small Business and Enterprise Development. ,
Vol. 43 pp.1-19
Richard, H. F. (2005), Agency problems and debt financing: leadership structure effects Journal
of Business Finance & Accounting. Vol. 43 pp.567-91
Robert, W. and Nick, W. (2002), Small and Medium Size Enterprise Financing: A Note on
Some of the Empirical Implications of a Pecking Order. Journal of Business and
Accounting.
Ross, S. (1977), The determination of financial structure: the incentive signaling approach , Bell
Journal of Economics, Vol. 8 pp.23-40.
Titman, S., Wessels, R. (1988), The determinants of capital structure choice, Journal of
Finance, Vol. 43 pp.1-19
Vivien, B., Alan Goodacre, Thomson, S. J. (2006), Corporate Financing Decisions: UK Survey
Evidence. Journal of Business Finance & Accounting. Vol. 46 No.1, pp.297-355

Proceedings of 1st JKUAT-SHRD Research Conference 12
th and 13
th September 2013
247
FACTORS AFFECTING INVESTMENT AMONGST KENYAN FOOTBALLERS: A
STUDY OF SELECTED FOOTBALLERS IN KENYA
1Oscar O. Ohaya*,
2George Misigah &
3Carolyne Kinyanjui
1 & 3 Jomo Kenyatta University of Agriculture And Technology
2 Egerton University
Email: [email protected]
Abstract
The main objective of the paper is to examine the factors that influence investment initiatives
amongst Kenyan footballers who are locally based. Descriptive research design was used for
the research. The population of the study comprised of the players in the Kenyan premier
league teams with players on contract. Stratification was done a simple random sample was
used to select the sample of 94 respondents. The research instrument for collection of data was
a questionnaire. The significance test was carried out using F statistics to compare the means
in various variables that yielded to no difference in the different variables tested. Coefficient of
correlation was used to test the degrees of correlation on the variables which generally resulted
to all positive correlations but with different degree. Generally, the findings were that there is
low financial literacy among the Kenyan footballers and peer and parental has a great
influence to the investment attitude of the footballers. There is need to provide extra knowledge
on financial matters to the Kenyan football players, the Kenyan football clubs and the
stakeholders. Efforts should be done to increase football players’ participation in the
management on personal finances. Immediate measure to incorporate all stakeholders and
professionals to use all available means to initiate education and training to football players in
Kenya on personal financial matters to help them invest in long term steady income generating
projects.
Key Words: Financial Literacy, Investment, Financial Management.
Introduction
Economists have been concerned for decades about the crucial role of domestic investment
mobilization in the sustenance and reinforcement of the saving-investment-growth chain in
developing economies and especially in the upcoming sectors like sports. Aghevli et al (1990)
found that the saving rate and investment in human capital are indeed closely linked to
economic growth. People have increasingly been taking individual responsibility for their
financial affairs this calls for skills that can be obtained through financial education. Over the
last several years, a great deal of attention and concern has been placed on the financial
behaviors of emerging sportsmen. The concern is stemmed from the fact that young adults often
begin their sports careers without ever having been solely responsible for their own personal
finances (Cunningham, 2000).
There is general consensus from several previous studies that young people lack basic financial
knowledge (Danes & Hira, 1987; Volpe et al, 1996). Many young adults lack the basic
knowledge and skills needed to make important personal financial decisions (Chen & Volpe,
1998). The financial decisions made early in life create habits difficult to break and affect
young adults ability to become financially secure in adulthood (Martin & Oliva, 2001). If young
people need these ‘real life’ skills to better survive in our economy today the question could be
asked, “Where do they learn these financial skills?” The home might be an ideal place yet
Proceedings of 1st JKUAT-SHRD Research Conference 12
th and 13
th September 2013
248
studies have found that most adults do not have these skills to be able to teach their children
(Moschis, 1985; Varcoe et al., 2001). Many young people learn the basic knowledge through
trial and error, yet this does not allow them to get ahead or become smart consumers in today’s
society (Lachance & Choquette, 2004).
Sportsmen sometimes neglect to take into consideration the likelihood that their career is
relatively short. A sports team is a business, and the people who run the business can decide to
replace a player at the end of a contract, injuries are also inevitable. The global problem
associated with sportsmen and their finances as many of them are dying in bankruptcy while
they made a lot of money in their hey days in sporting careers (Red Ink Inc, 2010). Football has
become an upcoming sport in terms of earnings in the world. Some of the highest earners are
indeed footballers. In Kenya sport has slowly become bread and butter for people fully engaged
in it professionally. Fondly referred to by its peers as a ‘sporting nation’, the fact of the matter
though is that much of the earnings are lop-sided with the one sport (athletics) accounting for
almost 70% of total earnings.
The paper focuses on Kenyan football players who are currently engaged or attached to the
Kenyan premier league teams. Most of the players playing for the teams in the Kenyan premier
league have period contracts, which mean they have a steady income for some time while still
attached to the clubs. Players have not invested their investment in long term income generation
investments that they can depend on after their sporting careers are over. Players invest most on
current prestigious assets for show off to their peers or to compete on social ground rather than
looking at the future.
Kenya’s economic system and society’s well being is depended on the young, energetic people
who are still working and engaging in sporting activities like football. But the rate at which our
sports men especially footballers are using their hard earned finances raises questions on their
financial investment capabilities. Challenges may be that many sportsmen do not have the
knowledge or skills to handle basic, let alone complex financial decisions. Many of them have
learned how to make money but have not been taught to manage the money they earned.
Learning how to manage money is as important as earning it. Most Kenyan footballers do not
display financial management skills in use of finances for future after they are out of active
sporting career. The paper tries to look at the factors that influence the Kenyan footballers’
investment ability on their earnings. The factors of the study were education level, income,
environmental factors and savings culture.
The significance of the study is to football managers in Kenya for decision making and
advocacy on factors to the investment initiatives. Secondly, to the government to mobilize, train
and educate the sportsmen on investment decisions as significant contributors to the (GDP).
Thirdly, to government agencies involved in the management and coordination of the youth and
sporting, for management strategy purposes. Lastly, to sponsors to gauge their contribution and
sponsorship and future.
Resource management practice systems theory
The theoretical construct predominantly used when studying financial decisions (investment) is
the resource management practice systems theory (Goldsmith, 2005). Bubolz & Sontag (1993)
discuss financial management as a concept grounded in human ecology theory and utility
theory. This research uses family resource management theory, based in systems theory, to
understand the financial management practices of players.
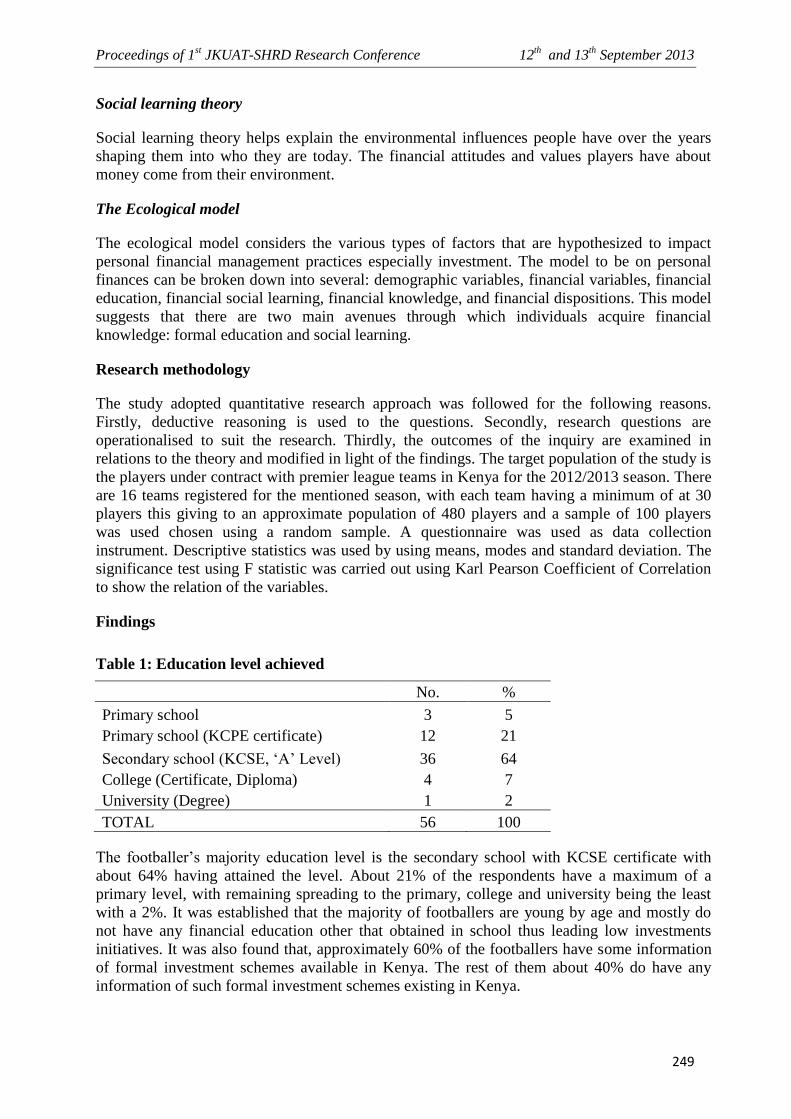
Proceedings of 1st JKUAT-SHRD Research Conference 12
th and 13
th September 2013
249
Social learning theory
Social learning theory helps explain the environmental influences people have over the years
shaping them into who they are today. The financial attitudes and values players have about
money come from their environment.
The Ecological model
The ecological model considers the various types of factors that are hypothesized to impact
personal financial management practices especially investment. The model to be on personal
finances can be broken down into several: demographic variables, financial variables, financial
education, financial social learning, financial knowledge, and financial dispositions. This model
suggests that there are two main avenues through which individuals acquire financial
knowledge: formal education and social learning.
Research methodology
The study adopted quantitative research approach was followed for the following reasons.
Firstly, deductive reasoning is used to the questions. Secondly, research questions are
operationalised to suit the research. Thirdly, the outcomes of the inquiry are examined in
relations to the theory and modified in light of the findings. The target population of the study is
the players under contract with premier league teams in Kenya for the 2012/2013 season. There
are 16 teams registered for the mentioned season, with each team having a minimum of at 30
players this giving to an approximate population of 480 players and a sample of 100 players
was used chosen using a random sample. A questionnaire was used as data collection
instrument. Descriptive statistics was used by using means, modes and standard deviation. The
significance test using F statistic was carried out using Karl Pearson Coefficient of Correlation
to show the relation of the variables.
Findings
Table 1: Education level achieved
No. %
Primary school 3 5
Primary school (KCPE certificate) 12 21
Secondary school (KCSE, ‘A’ Level) 36 64
College (Certificate, Diploma) 4 7
University (Degree) 1 2
TOTAL 56 100
The footballer’s majority education level is the secondary school with KCSE certificate with
about 64% having attained the level. About 21% of the respondents have a maximum of a
primary level, with remaining spreading to the primary, college and university being the least
with a 2%. It was established that the majority of footballers are young by age and mostly do
not have any financial education other that obtained in school thus leading low investments
initiatives. It was also found that, approximately 60% of the footballers have some information
of formal investment schemes available in Kenya. The rest of them about 40% do have any
information of such formal investment schemes existing in Kenya.

Proceedings of 1st JKUAT-SHRD Research Conference 12
th and 13
th September 2013
250
Table 2: Need for additional education on financial management matters
Strongly Disagree Neutral Agree Strongly Total
Disagree
Agree
% % % % % %
Personal education on investment 4 2 9 14 71 3.9615
Sole proprietorship management 2 7 21 54 16 2.561
Basic entrepreneurship skills 0 5 11 29 55 4.3393
Insurance and risk management
on individual matters 4 18 27 45 7 3.3393
Retirement benefits and future
preparedness 0 13 18 23 46 4.0357
Securities market information 32 27 21 7 13 2.4107
Other alternative investment
opportunities available 7 21 48 14 9 2.9643
The findings above indicate that there is need for some imparting some financial education and
skills to the footballers as portrayed in the table. 71% strongly agree that they need some
personal education on investments with the number reducing to the disagreement range. Sole
proprietorship management aspect has also a high degree of agreement for the need for such,
with 54% agreeing that they need such. The numbers also increase on the reverse side of
disagreement with none disagreeing with the fact. Approximately 27% were neutral with 45%
agreeing, but 18% had a contrary option and disagreed with the need. On the extreme end of
strongly disagreement and agreement the average was about 5% for each. Retirement matters is
a matter of concern to them since about 46% and 23% strongly agree and agrees respectively
with the need while 18% are neutral. A 13% value disagrees with the matter of retirement need
and education on the same. Security market information has a 32% strong disagreement and a
27% disagreement. On the extreme end of strong agreement is a 13% which also a significant
figure that needs attention in overall.
Table 3: Income level
No %
0 – 15,000 2 4
15,001 – 30,000 30 54
30,001 – 40,000 16 29
40,001 – 50,000 5 9
Over 50,000 3 5
Total 56 100
In the table 3 above, the results shows that the means of the different variable needs by the
footballers are all high. An average of 4.3393 need entrepreneurial skills while an average of
2.5 need security market matters. This might be a technical aspect which the footballers might
not be interested in, given low degree of financial education. It may be concluded from that
since football has started shaping up as a career and people are taking it up from a young age,
most of the players do not concentrate on the academic and financial education matters but
interested in life skills.

Proceedings of 1st JKUAT-SHRD Research Conference 12
th and 13
th September 2013
251
The average range of footballer’s earning in Kenya is the range of 15,000 – 30,000 having a
54% proportion, then a 29% in the range of 30,000 – 40,000 but others have a monthly pay of
over 50,000 with a proportion of 5% while at the bottom of the list is a range of 15,000 and
below at 4%.
About 91% of the footballers depend on income derived from football while a 9% have other
sources of income. The others sources of incomes are personal business at 50% of those having
other sources and the rest of 50% are obtained from employment. The other sources have an
extra incomes to them at a range of below 10.000 contributing a 50% while the range of 11,000
– 20,000 and 21,000 – 30,000 contributing 25% each.
Table 4: Informal groupings by footballers
No %
Informal groupings 29 52
No informal groupings 27 48
Total 56 100
Footballers also have informal groupings ‘Chamas’, of which 52% of them have participation
with, while the other 48% have no association with any informal groupings to boost their
earnings from football.
Table 5: Percentage saved by footballer
No %
0 -10% 20 36
11 - 20% 18 32
21 - 30% 12 21
31 - 40% 6 11
Above 40% 0 0
Total 56 100
From the response about 36% of them save less than 10% of their earnings while 32% saves a
range of 11 – 20% and 21% saving the range of about 21 – 30% of their earnings with a small
percentage of 11 saves between 31 – 40% from their earnings.
Table 6: Earning and investment initiative
No %
Is earning a factor in footballer’s
investment initiatives Yes 42 75
No 14 25
Total
56 100
In table 7 above, 75% of the footballers contends that their earnings is a major factor to any
investment initiative, with a 25% having a contrary opinion that earnings is not a major factor in
investment initiative to footballers.

Proceedings of 1st JKUAT-SHRD Research Conference 12
th and 13
th September 2013
252
Environmental Influence
Table 7: Family background
Variable Characteristic No. %
Family background Nuclear family 12 21
Extended family 19 34
Single parents 13 23
Orphan 8 14
Homeless 4 7
TOTAL 56 100
Most of the of the players background is from extended families with a 34% proportion, 23%
from single parents and 21% from nuclear family set up. Other are the orphaned at 4% and the
rest approximately 7% are the homeless persons.
Table 8: Advisers of footballers on financial matters
Variable
No. %
Advisers on investment matters Professionals 4 7
Relatives 16 29
Peers 14 25
None 22 39
TOTAL 56 100
From the findings it is revealed that most of the players at 39% do not seek any advice from any
person for investment matter, almost to the same proportion seek advice at about 27% from
peers and relatives respectively and a small percentage of 7% seek advice from their
professionals.
Table 9: Influence on investment initiatives
Strongly Disagree Neutral Agree Strongly
Variables Disagree
Agree Mean
Influence in
investment initiatives Parents 7 18 21 14 39 3.607
Relatives 18 25 32 14 11 2.750
Peers 41 34 11 11 4 2.018
Celebrities 32 25 14 21 7 2.464
Self 0 0 0 29 71 4.714
Parents have a high influence on the investment initiatives to the extent of 39% strongly agree
with the sentiments, 14% agreeing and 21% neutral while a significant proportion of 18% and
7% disagreeing and strongly disagreeing with the same. With relatives the result is skewed
towards disagreement that they have influence over their influence with 18% and 25% strongly
disagreeing and disagreeing respectively. A high percentage of 32% is neutral on the same
while a total of 25% agreeing. A material percentage of 32% are not strongly influenced with
celebrities with 14% being neutral while a combined total of about 30% agrees that they are
influence by celebrities. Other than oneself the next great influence is obtained from the

Proceedings of 1st JKUAT-SHRD Research Conference 12
th and 13
th September 2013
253
parental with an average mean of 3.607 which portrays a high agreement level from all
categories of respondents. Relatives also have a high mean of 2.750. This means that the
persons who appear first in the life of the footballers have a great bearing on financial matters in
their lives. The family background of the footballers have a higher influence on the investment
initiatives than the current people they are with in the day to day that is the peer although to
some considerable percentage the peer still have an influence on the investment they make.
Table 10: Savings
Strongly
Disagre
e
Neutra
l
Agre
e Strongly
Disagre
e
Agree
Mea
n
Do footballers have a poor
investment initiatives 0 0 2 29 70 4.679
Does savings have a negative
relations with investment 4 9 2 32 54 4.232
Are authorities doing enough to
instill savings in sportsmen 57 32 4 5 2 1.625
Does cultural background have
influence to investment 18 11 9 38 25 3.411
Do footballers who earn more
invest more 11 25 21 27 16 3.125
There is a highly skewed result on the overall footballers’ poor investment initiatives with 70%
strongly agreeing and 29% agree with the sentiments. A high number also strongly agrees that
savings have a negative effect to investment initiative with 54% and 32% strongly agreeing and
agreeing respectively with a total of about 15% on the other end of disagreeing. A 57%
proportion strongly disagrees that the authorities are doing enough in education aspect on
investment with 32% also agreeing with the same. A high combined percentage of about 65%
contents that cultural background influences the savings and investment initiatives. There is
almost an equal split on either side on whether footballers who earn more invests more with
21% respondents having a neutral answer, approximately 26% disagrees and agree respectively
with the extremes having almost also an equal split of about 15%. There is a very high mean
agreement rate that footballers have a poor investment initiative, this is depicted with the mean
score of almost to the maximum score of 5. Cultural background of the respondents has also a
high mean score of 3.411, meaning that the environmental setup and the surroundings greatly
influence the investment initiative. The lack of authorities concerned is not encouraging a
culture of savings in footballers rather even doing the opposite.
Table 11: Difference in players’ financial need
Characteristics No. Mean S.D d.f. F P
Nationality
Kenyan 53 3.6172 0.7414 13 0.33 0.579
Non Kenyan 3 3.3333 1.0886
The ANOVA analysis shows there is no difference on the player’s nationality – Kenyans and
non Kenyan on the different needs tested since it resulted to a P value of 0.579.

Proceedings of 1st JKUAT-SHRD Research Conference 12
th and 13
th September 2013
254
Correlation between variables
Table 12: Correlation between variables and investment initiatives
Education Income Environmental Savings
Level Level Influence factors culture
Educational Level _ 0.371 0.624 0.462
Income Level
_ 0.546 0.576
Environmental influence
factors
_ 0.481
Savings Culture
_
From table 4.3.4.1 correlation was found between the four variables studied. There is a strong
positive correlation between education level and environmental influence factors, Income level
and savings culture, at 0.624 and 0.576 respectively, a moderate positive correlation between
education level and savings culture, environmental influence factors and savings culture at
0.462 and 0.481 respectively. There exist a weak positive correlation between education level
and income level of 0.371 among footballer in Kenya.
Conclusions
Football in Kenya is played by young people from Kenya and outside Kenya. They generally
have low academic qualification and knowledge on financial matters. Most them entirely
depends on football income as a source despite having some informal groupings ‘Chamas’ and
businesses which they do and use the earnings to invest and save. The investment initiatives and
guidance comes from themselves, relatives and peers which might be a wrong approach on
investment.
Recommendations
There should be a national awareness campaigns conducted by the relevant authorities by use of
combination of measures to instill and increase financial management and investment. The use
of road shows, newsletters and brochures and publicity on the television and radio. Face to face
interactions for instance, during league matches can be used as promotional campaigns. KFWA,
FKF and KPL should lobby professional and corporates to sensitize players on financial
matters. They can target use of specially made newsletters on finance and investments issues
written and circulated to different clubs in the country. They should also seek partnerships with
interested parties (universities, colleges, sponsors and NGOs) on the provision of finance and
investment literacy programs and to deal with training (including training of trainers).
Since most of the footballers depend on football as a source of income there should be a
harmonized way of their pay according to some benchmarks. Other means to generate income
to footballers should be put in place through formal and informal ways. Use of the television
(sports channels) for publicity can be a popular media of communication to the players and so
its use should be maximized. Interactive sessions with audiences can be hosted on TV to
encourage participation. Social networking websites such as face book and twitter are quite
effective in reaching a majority of the players.
The football organizations should liaise with the government to seek ways of raising funds to
support finance and investment programs. These funds can be channeled through training

Proceedings of 1st JKUAT-SHRD Research Conference 12
th and 13
th September 2013
255
institutions (partnership agreements with KFWA) to subsidize the programs. In conclusion
Kenya should have a national sportsmen strategy that should include retirement planning. The
strategy should aim to equip players with lifelong understanding of finance matters and should
be made in consultation with all the relevant stakeholders.
Reference
Aghevli, B., Boughton, J., Montiel, P., Villanueva, D., & Woglom, G. (1990). “The Role of
National Saving in the World Economy: Recent Trends and Prospects.” IMF Occasional
Paper No. 67.
Bubolz, M. M., & Sontag, M. S. (1993). Human ecology theory. In P. G. Boss, W. J. Doherty,
R.
Chen, H., & Volpe, R. P. (1998). An analysis of personal financial literacy among college
students. Financial Services Review, 7(2): 107-128.
Cunningham, J. (2000). College student credit card usage and the need for on-campus financial
counseling and planning. Undergraduate Research Journal for the Human Sciences.
Available; http://www.kon.org/urc/cunningham.html. (Retrieved 20 February, 2012).
Danes, S. M., & Hira, T. K. (1987). Money management knowledge of college students.
Journal of Student Financial Aid, 17(1): 4-16.
Goldsmith, E. (2005). Resource management for individuals and families. Belmont, CA:
Wadsworth.
Lachance, M. J., & Choquette-Bernier, N. (2004). College students' consumer competence: A
qualitative exploration. International Journal of Consumer Studies, 28, 433-442.
Martin, A., & Oliva, J. C. (2001). Teaching children about money: Applications of social
learning and cognitive learning developmental theories. Journal of Family and Consumer
Sciences, 93(2), 26-29.
Moschis, G. P. (1985). The role of family communication in consumer socialization of children
and adolescents. Journal of Consumer Research, 11, 898-913.
Red Ink Inc (2010). Seven rich sportsmen who lost their fortunes. Available:
www.elitetrader.com/vb/index.php. (Retrieved February 20, 2012)
Varcoe, K. P., Peterson, S., Garrett, C., Marten, A., Rene, P., & Costello, C. (2001). What teens
want to know about financial management. Journal of Family and Consumer Sciences,
93(2): 30-34.
Volpe, R. P., Chen, H., & Pavlicko, J. J. (1996). Personal investment literacy among college
students: A survey. Financial Practice and Education, 6(2): 86-94.

Proceedings of 1st JKUAT-SHRD Research Conference 12
th and 13
th September 2013
256
DERIVATIVES AS INSTRUMENTS OF RISK MANAGEMENT AMONG FIRMS
LISTED AT NAIROBI SECURITIES EXCHANGE
Salah Abdi Sheikh
Jomo Kenyatta University of Agriculture and Technology
Abstract
The objective of this study is to explore the usage of derivatives as instruments of financial risk
management among quoted firms in Kenya. Data for this study was obtained through analysis
of disclosures in annual reports of all firms quoted at the Nairobi Securities Exchange for the
year 2011. Univariate and multivariate analysis were applied on variables obtained through
analysis of past literature. The basic hypothesis of the study was to test whether there is
statistical significance to support leverage, firm size, financing cost and growth opportunities
as proxies for firm value. None of these variables was found to be statistically significant. This
study concludes that 14% of companies listed at the Nairobi Securities Exchange use
derivatives. Forward contracts are the most important derivatives used by Kenyan firms; 75%
of the derivative users employ OTC forward contracts. The use of derivatives is not related to
leverage, size, financing cost and growth opportunities. For companies quoted at the Nairobi
Securities Exchange hedging does not increase firm value. This paper contributes to the debate
on the introduction of derivative trading in the Kenyan Financial Markets.
Key words: Derivatives, forward contracts, firm value, financing costs, financial distress,
growth opportunities
Introduction
Risk is an inherent component of business which leads to volatility of expected future
cashflows. Businesses are exposed to risks from their operations and environment. Financial
risk emanates from everyday transactions of a business is engaged and introduce uncertainty
into the receipt and magnitude of future expected cashflows. There are three main forms of
financial risk that a company can be exposed to from external sources; interest rate risk, foreign
exchange risk and commodity prices risk (Froot, Scharfastein and Stein, 1994).
Corporate management entails the management of risks using various tools. Traditional tools of
risk management includes establishing branches approach, leading and lagging were prevalent
in the past. New tools were developed in the 1970s in the form of derivatives. A derivative is a
financial contract that derives its value from an underlying financial asset, instrument or an
economic good (Stulz, 2004). Derivatives are a significant component of the global economy,
with notional market size exceeding $700 trillion (Bartram, Brown and Fehle, 2009.) The
principle working of derivatives is that they transfer risk from those who do not want to bear it
to those who want to be exposed to the risk. The basic types of derivatives also called plain
vanilla derivatives are forward contracts, futures, options and swaps. Financial engineering has
come with numerous variations of these derivatives.
While there has been an explosion of derivative use in the developed world, sub-Saharan Africa
has not experienced the emergence and growth of a derivative exchange except in South Africa.
In Kenya OTC derivative contracts are transacted through local banks. Currency forwards deals
Proceedings of 1st JKUAT-SHRD Research Conference 12
th and 13
th September 2013
257
are common among commercial banks on the overnight borrowing window. The Nairobi
Securities Exchange has been implementing a demutualization drive which will among others
lay down the necessary regulatory framework for the introduction of exchange-traded
derivative.
This study looks in the usage of derivatives as financial risk management instruments among
firms listed at the Nairobi Securities Exchange. Data for this study is collected form publicly
available annual records. It is a regulatory requirement that firms disclose their risk exposure
and risk management strategies including financial instruments held in their financial reporting.
Extensive review of existing literature incorporating the latest papers available on the subject
reveals the various variables that can be tested by appropriate hypotheses. The study employs
both univariate employing independent t-test of means and multivariate analysis using logistic
regression.
This study contributes to the existing body of knowledge on derivative usage and tests the
known variables under the environment of the Kenyan markets. The study provides a point of
reference for further research into hedging and derivatives among firms at the Nairobi Securities
Exchange. The study also provides a definitive answer to the question of usage derivatives in
the Kenyan market by providing the evidence of usage of such instruments.
Statement of the problem
According to ISDA, 94% of large companies globally use derivatives. With the exception of
South Africa, there is dearth of published reports on derivative use in Africa. A survey by
Holman, Correia and Jahrescog (2012) in South Africa targeting large listed South African non-
financial firms found that 90% of respondents used derivatives. Kenya is an important financial
hub where a futures market is on course to start operation. Over-The-Counter derivative
contracts with banks are fairly common in Kenya (Tanui 2008).
Major studies on derivatives in Kenya have avoided the extent and motive of usage of
derivatives by Kenyan companies focusing mainly on factors influencing the development of
financial derivatives (Ngugi et al 2013). There is therefore a latent gap in research to establish
the use of derivatives as risk management tools among companies listed at the Nairobi
Securities Exchange and if the use of derivatives has any relation with firm characteristics vital
for making risk management decisions.
Objectives of the study
The objective of the study is to establish to what extent are derivatives used by firms listed at
the Nairobi Securities Exchange as tools of financial risk management. The specific objectives
include:
To establish the extent to which firms use of derivatives is motivated by cost of financial
distress
To describe the effect of firm size on use of derivative for hedging
To illustrate the effect on cost of financing on firm’s use of derivatives for hedging.
To establish the extent to which firm’s growth opportunities motivate use of derivatives for
hedging

Proceedings of 1st JKUAT-SHRD Research Conference 12
th and 13
th September 2013
258
Hypothesis
The hypothesis developed can only generalized for firms listed at the Nairobi Securities
Exchange. The following null hypotheses were developed for this study:
H01: Derivatives can significantly reduce the value of the firm by increasing cost of financial
distress
H02: The use of derivatives is negatively related to firm size
H03: Derivatives can significantly reduce the value of the firm by increasing cost of financing
H04: Firms with higher growth opportunities are less likely to use derivatives as instruments of
risk management.
Theoretical review
MM theory holds that it is irrelevant the way the firm is financed (Modigliani and Miller, 1958).
Investors in a perfect market, with symmetrical access to information and no transaction costs
can engage in diversification to eliminate unsystematic risk. The only relevant risk however is
the systematic risk. In developed markets where tools of risk management are exchange traded
investors will not attach premium to any hedging activities that management may engage in
(Sharpe, 1964; Linter, 1965; Mossin, 1966).
Finance theory holds that firms use derivatives in risk management to increase shareholder
value (Froot , Scharfsten and Stein,1993). There are two competing theories attempting to
explain the rationale for use of financial derivatives. The first theory suggests that hedging is
aimed at and leads to maximization shareholder wealth. The second theory contends that
hedging has no effect on shareholder wealth and is purely done for managerial utility function
(Jin and Jurion, 2007).
The proponents of the first theory maintain that maximization of shareholder wealth can be
achieved through tax reduction, reducing costs of financing and financial distress and reduction
of agency costs and reduction of the underinvestment problem. The overall result is reduction of
cashflow volatility and enhancement of PV of future cashflows hence maximization of
shareholder wealth (Stulz, 1984; Smith and Stulz, 1985).
In convex tax regimes, derivatives when combined with creative ownership structures reduce
taxes by generating non-economic losses and offer alternative tax treatments of similar
transactions (Donohoe, 2012a). Derivatives enhance debt capacity of the firm; hedging and
leverage have a positive relationship (Dolde, 1995; Haushalter, 2000; Graham and Rogers,
2002). The enhanced debt capacity leads to a higher debt tax-shield (Myers, 1984; 1993). This
seems to be a common practice by large by a large American banks who were accused by
Congress of cooking up over 100 Billion derivative tax dodging in 2008 (Warner, 2008).
Hedging is aimed at reducing underinvestment problem; inability to undertake existing
profitable investment opportunities due to shortage of cash. Companies would rather use their
internal funds to fund existing opportunities. When has profitable investments and is facing
high cost of debt, the firm would rather hedge its own cashflows saving itself the need to take
up a costly debt (Gay and Nam, 1998; Froot et.al., 1993; Haushalter, 2000).

Proceedings of 1st JKUAT-SHRD Research Conference 12
th and 13
th September 2013
259
Proponents of the second theory contend that available evidence does not support the
maximization of shareholder wealth but supports the managerial utility function. Research has
shown that managers will engage in hedging using derivatives if their own personal wealth and
interest are at stake and engaging in personal hedging activity outside the firm is impossible
(Tufano, 1996; Jin and Jurion, 2007)
Empirical evidence
Empirical evidence is inconclusive on the ability of management to engage in derivates usage to
enhance firm’s value. Bartram, Gregory and Conrad (2011), carried out an extensive research
using a large sample of 6888 non-financial firms in 47 countries and concluded that hedging
reduces both total risk and systematic risk. Allayannis and Weston (2001) studying 720 large
US non-financial firms between 1990 and 1995 find a positive relation between firm value and
use of foreign exchange derivatives. Using Tobin Q ratio as proxy for firm value, the
researchers find that firms that use foreign exchange derivatives for hedging have 4.87%
premium over firms that do not. This is economically and statistically significant.
Studies have found a positive relation between firm size and derivatives use. Economies of
scale in hedging and transaction cost of hedging which include cost of trading and informational
systems enabling costs favour larger firms than smaller firms (Haushalter 2000; Geczy, Minton
and Schrand, 1997; Dolde, 1995 and Nance Smith and Smithson, 1993). However, one study by
Ang, Chua and McConnel (1982) found that small companies have higher probability of facing
financial distress and going bankrupt and therefore more likely to hedge.
Hedging with financial derivatives may lower the deadweight cost of financial distress (Mayers
and Smith, 1982; Smith and Stulz, 1985). Financial distress is related to debt. Higher total debt
to total equity ratio leads to higher chances of facing financial distress. Companies with high
level of debt are more likely to hedge than companies with a lower level of debt (Dolde, 1995;
Guay, 1999; Graham and Rogers, 1999). Empirical evidence on tax avoidance schemes using
derivatives was recently provided by Donohoe (2012b). This study shows that using derivatives
a company can reduce its current taxes and cash paid by 1.7 and 4.0 percent respectively.
However this is limited to regimes with convex tax systems.
Campello, Lin, Ma, and Zou (2011) intimate that hedging firms pay lower interest spreads and
are less likely to have capital expenditure restrictions in loan agreements. These favorable
financing terms, in turn, allow hedgers to invest more by alleviating the problem of
underinvestment. The problem of underinvestment has received sufficient attention and has
been explored in many studies. Studies show that companies with higher profitable
opportunities are likely to hedge more (Gay and Nam, 1998; Froot et. al., 1993; Haushalter,
2000; Allayannis and Ofek, 2001; Geczy, Minton and Schrand, 1997). However, Chiorean,
Donohoe, and Sougiannis (2012) believe that they have brought to an end the debate on firm’s
engaging in derivatives usage to alleviate the underinvestment problem. According to this latest
research, “firms neither implement derivatives to reduce underinvestment nor alter their
investment behavior after beginning to use derivatives”.
Guay and Kothari (2003) demonstrate that the relationship between firm value and hedging is
spurious and makes no economic sense. The gains postulated in hedging are too minute for
large companies. Tufano (1996) states that “little empirical support for the predictive power of
theories that view risk management as a means to maximize shareholder value”. Similar studies
by Jin and Jorion (2007) using Tobin Q as proxy for firm’s value for 44 North American Gold
Mining firms from 1991 to 2000, could not find any positive relationship between hedging

Proceedings of 1st JKUAT-SHRD Research Conference 12
th and 13
th September 2013
260
activities and firm value. Jin and Jorion (2007) conclude that since commodity price exposure is
transparent and available to all investors, it is not rational to expect that hedging against
commodity prices should lead to higher firm value.
Tufano (1996) finds support for management utility function theory suggesting managers who
hold more options did not engage in hedging while firms whose managers hold more stock
actively hedged their position. This suggests that managerial risk aversion informs firm’s risk
management programs. Graham and Rogers (2002) also reach a similar conclusion that
managers’ equity holdings affect their inclination to hedge.
The debate as to the effect of derivative usage and firm’s value is yet to be settled. There are
numerous papers that find a relationship between firm value and hedging using derivatives
(Batram et. al., 2011; Allayannis and Weston, 2001; Graham and Rogers, 2002; Adam and
Fernando 2003; Campelo et. al., 2011). However there exists a mountain of literature that find
no relationship between hedging with derivatives and firm value (Mian, 1996; Tufano, 1996;
Guay and Kothari, 2003; Bartran, Brown and Conrad, 2007; Jin and Jorion 2006; Callahan
2002). The difference in view cans be explained by different samples, different timelines and
different proxies for the same variables.
In the African context the most basic derivatives; Forwards, Futures, Options and Swaps are yet
to take root. South Africa is the only major market where Exchange-traded derivatives are
available to investors. According to Tanui (2008), 56.8% of motor vehicle dealers in Kenya use
forward contracts to hedge against foreign exchange rate. Mwangi (2007), suggests that lack of
derivatives at the Nairobi Securities Exchange contributes to the slow pace of financial
innovations in the African continent. No study has been undertaken on the extent and motive of
the use of OTC derivatives as risk management among public companies in Kenya.
Methodology
Data collection: Data for this study was collected from 2011 annual reports of companies listed
at the Nairobi Securities Exchange. There are 58 companies listed at the Nairobi Securities
Exchange (Ngugi et. al., 2013). Financial Institutions and Investment companies totaling 20
were excluded from the sample. Banks and Insurance take are on the supply side of the
derivative contracts and are the market makers. Investment companies are engaged in
ownership of equity and debt positions in other listed companies and will have high correlations
with the companies they own.
The sample selected for further study was reduced to 23 firms because information for several
companies was missing from the public records. The sample obtained is 40% of the firms listed
at the Nairobi Securities Exchange which is considered sufficient for the purpose of the study.
Public companies are required by IFRS 7 and IAS 39 to disclose their risk exposures and risk
management tools.
Data analysis methods: The data was analyzed using both univariate and multivariate analysis.
Univariate analysis is used where the data being analyzed is parametric, unrelated and small. A
t-test finds out if there is a significant difference in average means of one continuous or
dichotomous group versus another and finds the significance of that relationship. In this case the
date presented the data obtained is mainly ratio in nature and a t-test is found to be a suitable
measure. To compliment the t-test a correlation test was carried out using Pearson’s correlation
coefficient.

Proceedings of 1st JKUAT-SHRD Research Conference 12
th and 13
th September 2013
261
Multivariate Analysis was used because the data is in binary dependent variables form with two
dichotomous categories: Either a firm is a derivative user (1) or not a derivative use (0).
Logistic regression is used here because normal OLS regression will not apply; the data is
limited, discrete and non-continuous.
Variables description: The dependent variable is a binary, dichotomous measure which was
coded “1” for firms that engage in hedging with derivatives and “0” for firms that do not engage
in derivative use (Ahmed and Haris, 2012; Sprcic, 2007; Géczy, Minton and Schrand, 1997;
Allayannis and Weston, 200; Smith and Smithson, 1993).
The hypothesis developed so far shows that financial distress, firm size, cost of financing and
growth opportunities are the independent variables. The proxy for leverage (Financial Distress)
is the ratio of book value of long-term debt to book value of assets (Géczy, Minton and
Schrand, 1997). The proxy for firm size is book value of assets (Ahmed and Haris, 2012;
Allayannis and Weston, 2001; Mian, 1996). The proxy for cost of financing is the interest cover
ratio (Sprcic, 2007). Growth opportunities are related to growth of assets and investments. A
good measure of growth opportunities is the ratio of investment expenditures to book value of
assets (Sprcic, 2007; Haushalter, 2000; Géczy, Minton and Schrand, 1997; Smith and Stulz,
1985).
Results
Descriptive statistics
14% of the companies listed at the Nairobi Securities Exchange engage in hedging using
derivatives. Forward contracts are the most popular derivatives used by the companies listed at
the Nairobi Securities Exchange with over 75% of the derivative users. Only one firm among
the derivative users has disclosed to using more than one type of derivative in risk management.
Table 1: Correlation Matrix
Constant V1 V2 V3 V4
Step 1 Constant 1.000 -0.249 -0.470 -0.452 -0.227
V1 -0.249 1.000 -0.193 0.071 -0.072
V2 -0.470 -0.193 1.000 0.090 -0.108
V3 -0.452 0.071 0.090 1.000 0.017
V4 -0.227 -0.072 -0.108 0.017 1.000
The variables tested have very low correlation as shown in table 1. The analysis therefore does
not suffer from multicolinearity. However the sample is small and this may affect the robustness
of the analysis. On the basis of independent T-test we fail to find any difference in means of the
two samples. The p-values for Leverage, Firm Size, Financing Costs and Growth Opportunities
are not statistically significant. This means the variables analyzed do not explain the hypothesis
being tested.
Multivariate analysis
In the logistic regression shown in table 2 below Leverage, Firm Size, Cost of Financing and
Growth opportunities were regressed. The p values highlighted shows that none exhibits
statistical significance. This suggests that these variables are not explanatory in the firm’s

Proceedings of 1st JKUAT-SHRD Research Conference 12
th and 13
th September 2013
262
decision to use derivatives as tools of risk management. However, Firm size shows a level of
marginal effect on the use of derivatives. For every 1% increase in firm size, the likelihood of a
firm using derivatives increases by 3.6%.
Table 2: Variables in the Equation
B S.E. Wald df Sig. Exp(B)
95.0% C.I.for
EXP(B)
Lower Upper
Step
1(a)
V1 -
1.127 1.978 0.325 1 0.569 0.324 0.007 15.627
V2 1.280 1.181 1.174 1 0.279 3.596 0.355 36.411
V3 -
0.014 0.023 0.346 1 0.556 0.986 0.942 1.033
V4 0.192 0.612 0.098 1 0.754 1.211 0.365 4.016
Constant -
0.500 0.755 0.439 1 0.508 0.606
a. Variable(s) entered on step 1: V1, V2, V3, V4.
Conclusion
This study explores the usage of derivatives as tools of financial risk management among
companies listed at the Nairobi Securities Exchange. Using the analysis above, 14% of
companies listed at the Nairobi Securities Exchange use derivatives as tools of risk
management. Forward contracts are the most important derivative instruments used by the
companies quoted at the Nairobi Securities Exchange. This is a revelation because there have
been no studies in this area that confirmed the existence of derivative usage among companies
listed at the Nairobi Securities exchange.
This study fails to support the hypothesis that hedging with derivatives increases firm value.
The dependent variables; Leverage, Firm Size, Financing Cost and Growth opportunities, do not
explain the motives for usage of derivatives by these firms. This conclusion is in line with past
studies (Jin and Jorion, 2006; Tufano, 1996). Using the repeated evidence showing that
derivative usage does not increase firm value, it can be concluded derivatives are not
necessarily for enhancement of firm value but rather for stabilization of firm value. Usage of
derivatives locks in future currency rates, commodity prices or interest rates. This means the
firm benefits from hedging if future expected outcome would have led to a loss due financial
risk, otherwise the firm does not benefit at all. In this case therefore hedging creates a stable
environment for wealth protection rather than wealth creation. This points to different direction
from the anticipated and much discussed position that hedging increases shareholder value.
References
Ahmed, N. and Haris, B. (2012). Factors for Using Derivatives: Evidence from Malaysian Non-
Financial Companies. Research Journal of Finance and Accounting, Vol 3, No 9.
Allayannis, G. and Ofek, E. (2001). Exchange rate exposure, hedging, and the use of foreign
currency derivatives. Journal of International Money and Finance, 20: 273-296.
Proceedings of 1st JKUAT-SHRD Research Conference 12
th and 13
th September 2013
263
Allayannis, G. and Weston, J. (2001). The use of foreign currency derivatives and firm market
value. Review of Financial Studies 14, 243–276.
Campello M., Lin C., Ma Y., and Zou H. (2011). The Real and Financial Implications
ofCorporate Hedging. Journal of Finance, 5, LXVI, 1615-1647.
Chiorean R., Donohoe M., and Sougiannis T. (2012). Why do firms use derivatives? Revisiting
the underinvestment hypothesis. Working Paper, University of Illinois at Urbana-
Champaign
Dolde, W. (1995). Hedging, leverage, and primitive risk. Journal of Financial Engineering 4:
187-216.
Donohoe, M. (2012a). Financial derivatives in corporate tax avoidance: Why, how, and who?.
Working paper, Unversity of Illinois at Urbana-Champaign.
_____. (2012b). Financial derivatives in corporate tax avoidance: Outcomes and determinants.
Working paper, University of Illinois at Urbana-Champaign.
Froot, K., Scharfstein D., and Stein J. (1993). Risk management: coordinating corporate
investment and financing policies. The Journal of Finance 48: 1629-1658.
Gay, G. D., and Nam J. (1998). The underinvestment problem and corporate derivatives use.
Financial Management 27(4): 53-69.
Géczy, C., Minton B., and Schrand C. (1997). Why firms use currency derivatives. Journal of
Finance 52: 1323-1354.
Graham, J. and Rogers D. (2002). Do firms hedge in response to tax incentives?. Journal of
Finance 57: 815-839.
Haushalter, D. (2000). Financing policy, basis risk, and corporate hedging: Evidence from oil
and gas producers. The Journal of Finance 55: 107-152.
Jin, Y. and Jorion P. (2006). Firm value and hedging: Evidence from U.S. oil and gas
producers. Journal of Finance 66, 893–919.
Mayers, D. and Smith C. (1982). On the corporate demand for insurance. Journal of Business
55: 281-296.
Minton, B. and Schrand C. (1999). The impact of cash flow volatility on discretionary
investment and the costs of debt and equity financing. Journal of Financial Economics,
54: 423-460.
Modigliani, F. and Miller M. (1958). The cost of capital, corporate finance and the theory of
investment. American Economic Review, 48: 261–297. 30
Mwangi, M. (2007). Factors influencing financial innovations in Kenyan securities: a Survey of
firms listed at NSE. Unpublished MBA Thesis, University of Nairobi
Myers, S.C. (1977). The determinants of corporate borrowing. Journal of Financial
Management (November), 147-175.

Proceedings of 1st JKUAT-SHRD Research Conference 12
th and 13
th September 2013
264
Nance, D. R., Smith C. W., and Smithson C. W. (1993). On the determinants of corporate
hedging. The journal of Finance, 48(1): 267-284.
Smith, C.W. and Stulz R.M. (1985). The determinants of firms’ hedging policies. Journal of
Financial and Quantitative Analysis, 20: 391-405.
Sprčić, D. M. (2007). The Derivatives as Financial Risk Management Instruments: The Case of
Croatian and Slovenian Non-financial Companies. Financial Theory and Practice, 31 (4)
395-420
Tanui, D. (2008). Foreign Exchange risk management practices: A survey of Motor Vehicle
Industry in Kenya. Unpublished MBA Thesis, University of Nairobi.
Tufano, P. (1996). Who manages risk? An empirical examination of risk management practices
in the gold mining industry. Journal of Finance 51(4): 1097-1137.
Proceedings of 1st JKUAT-SHRD Research Conference 12
th and 13
th September 2013
265
THE ROLE OF EXTERNAL AUDITORS IN CORPORATE GOVERNANCE IN
KENYA: THE CASE OF UCHUMI SUPERMARKET LIMITED
Moses Wandera* & Susan Njoki Kibe,
Jomo Kenyatta University of Agriculture and Technology
Email: [email protected]
Abstract
Public outcry and widespread need for disclosures due to corporate frauds has resulted in
greater responsibility being thrust upon on internal and external auditors for the prevention
and detection of corporate irregularities. Globally, irregularities in companies such as Enron,
Worldcom and Satyam have been publicized. Africa and in Kenya has had no exception. The
audit opinion issued during the period of reported irregularities for any company in question
becomes unqualified, yet, users of audited financial statements generally expect external
auditors to detect issues of fraud and mismanagement which affect the integrity of financial
reports. External auditors, however, are more concerned with material misstatements in the
audited financial statements. This study sought to clarify the role of external auditors in
corporate governance in Kenya under the existing regulatory framework. The objective was to
establish if there is a need for increased regulations that place specific responsibility on
external auditors in the detection and reporting of corporate irregularities and fraud, to
safeguard the interests of users who place reliance on audited financial statements, while
enhancing the credibility of the audit profession. Lessons learnt in the United States; the
Sabarnes-Oxley Act which was enacted in 2002 to enhance auditors’ effectiveness in
discharging their roles in detection and prevention of corporate frauds was a case in mind. The
theories used for the study are the agency theory, stewardship theory, stakeholder theory and
the resource dependency theory, however stakeholder and agency theories were the main ones
used. The target population comprised financial statement users, accountants as preparers of
financial statements, external auditors and the accountants’ professional regulatory body.
Convenience sampling and simple random were used on the accessible population members
from whom to obtain information. A sample size was chosen on the basis of representation of
financial statement users due to geographical spread of the large population size. Both primary
and secondary data were utilized, with published media and internet sources being secondary
data, while questionnaires were administered to obtain primary data. The study was descriptive
in nature; therefore analysis was done through tabulations and pie charts. A confidentiality
clause will be included in the questionnaire to protect the identity of respondents. The results
indicated that the external auditor was exonerated from any blame while the public and
shareholders relied on external auditor, therefore auditors should be accountable to the users
of the financial statements and the entire public who rely on audit opinion. Further research
should be on the extend of management responsibility towards detection of fraud and error and
how external auditors should be able to detect and report issues of corporate governance
internal and external factors.
Key words: Corporate governance, External Auditors, Uchumi Supermarket Limited
Introduction and background of the study
Corporate governance refers to the set of systems, principles and processes by which a company
is governed. They provide the guidelines as to how the company can be directed or controlled
such that it can fulfill its goals and objectives in a manner that adds to the value of the company

Proceedings of 1st JKUAT-SHRD Research Conference 12
th and 13
th September 2013
266
and is also beneficial for all stakeholders in the long term. Stakeholders in this case would
include everyone ranging from the board of directors, management, shareholders to customers,
employees and society. The management of the company hence assumes the role of a trustee for
all the others. (Thomson, 2009).
Global cases of corporate fraud
The Enron scandal, revealed in October 2001, eventually led to the bankruptcy of the Enron
Corporation, an American energy company based in Houston, Texas, and the de facto
dissolution of Arthur Andersen, which was one of the five largest audit and accountancy
partnerships in the world. In addition to being the largest bankruptcy reorganization in
American history at that time, Enron was attributed as the biggest audit failure. Senior staff
executives used accounting loopholes, special purpose entities, and poor financial reporting to
hide billions of dollars in debt from failed deals and projects. The Chief Financial Officer, then
and other executives not only misled Enron's board of directors and audit committee on high-
risk accounting practices, but also pressured Andersen to ignore the issues. (Healy, Krishna G,
2003).
Local case of corporate fraud
Uchumi Supermarkets Limited was founded in 1975, as a public limited liability company, by
three Kenyan parastatal companies, namely Industrial Commercial & Development Corporation
(ICDC), Kenya Wine Agencies Limited (KWAL) and Kenya National Trading Corporation
(KNTC). The main objective at the time was to create outlets for the equitable distribution of
commodities and to create retail outlets for Kenyan manufactures. The shares of the company
stock were listed on the Nairobi Stock Exchange (NSE) in 1992. Uchumi Supermarket chain
was suspended in 2006 from trading at the Nairobi Securities Exchange following its collapse
over accrued debts.
Effects of corporate fraud and audited financial statements
In the wake of these scandals, many of these companies saw their equity values plummet
dramatically and experienced a decline in the credit ratings of their debt issues, often to junk
status. Many of these firms were forced to file for bankruptcy protection from creditors.
Accounting problems are widely cited as a reason for the stock market slump that followed
these scandals. (Agrawal, Chadha, 2005). Delisting from a stock exchange, or material asset
sales are other effects of corporate fraud. (Alexei Romanenko, 2011). The board of directors or
top executives may be fired by the shareholders, as was the case in Uchumi Supermarkets
Limited. Court cases may be filed against the fraud perpetrator, resulting in negative publicity
for the organization, and decline of share values. Where external auditors fail to report on
evident corporate misdeeds, audit firms have been barred from practicing, as was the case with
Arthur Anderson. Locally, the corporate misdeeds of Uchumi Supermarkets saw several of its
chains close down, resulting to loss of jobs for its workforce, and investigation of the then
auditor, Price water house Coopers. (Wahome, 2006) Similarly, Audited Financial Statements
regardless of the type of entity, whether in the public or private sector, or whether profit or not,
all entities use economic resources to pursue their goals. Financial statements enable an entity’s
management to provide useful information about its financial position at a particular point in
time and the results of its operations and its changes in financial position for a particular period
of time. External financial reporting for these entities is directed toward the common interest of
various users. Financial statements provide owners with information about the stewardship of
management. They also provide a basis for investors’ decisions about whether to buy or sell

Proceedings of 1st JKUAT-SHRD Research Conference 12
th and 13
th September 2013
267
securities, for credit rating services decisions about the credit worthiness of entities; for
bankers’ decisions about whether to lend money, and for decisions of other creditors, regulators,
and others outside of the entity. (Chartered Accountants Auditing and Assurance Handbook,
2008).
Statement of the problem
During the audit, the auditor collects evidence to obtain reasonable assurance that the amounts
and disclosures in the financial statements are free of material misstatement or accounting
fraud. However, the characteristics of evaluating evidence on a test basis, the fact that
accounting estimates are inherently imprecise, and the difficulties associated with detecting
misstatements hidden by collusion and careful forgery, prevent the auditor from finding every
error or irregularity that may affect a user’s decision. Auditors are not trained to detect
forgeries, nor will customary audit procedures detect conspiracies. As a result, a properly
designed and executed audit may not detect material fraud. Therefore, audits can only provide
reasonable assurance that financial statements are free of material misstatements and cannot
absolutely guarantee the accuracy of financial statements. External auditors are not and should
not be expected to provide absolute assurance regarding reliability of financial statements, but
the public expectations concerning external auditors performance are high. Users of audited
financial statements generally expect external auditors to detect financial statement fraud and
employees’ illegal acts and fraud, which affect the integrity of financial reports. External
auditors, however, are more concerned with material misstatements in the audited financial
statements. (Rezaee Z, 2009). Auditors are not trained investigators. However, the audit
methodology is normally carried out on test basis due to the large number of transactions, hence
even a thorough audit may fail to uncover frauds.
Objectives
Main objective
This study seeks to clarify the role of external auditors in corporate governance in Kenya as a
means of addressing expectations of financial statement users.
Specific objectives
The specific objectives of this study are;
To determine whether there is an expectations gap between external auditors and financial
statement users understanding of the role of external auditors in corporate governance.
To establish adequacy of existing audit obligations and determine if there is need for increased
legislation or regulation that place specific responsibility on external auditors in the detection
and reporting of corporate irregularities and fraud.
To safeguard interests of users of financial statements by ensuring they have an understanding
of the extent to which they can place reliance on the auditors’ opinion in as far as detection and
reporting of corporate fraud.
To safeguard the image of external auditors as independent third parties to financial statement
users by clarifying their professional obligations in as far as detection and reporting of corporate
fraud.

Proceedings of 1st JKUAT-SHRD Research Conference 12
th and 13
th September 2013
268
Theoretical review
Agency theory: The theory is conceptually a simple theory that reduces the corporation to two
participants of managers and shareholders. Second, agency theory suggests that employees or
managers in organizations can be self-interested. In agency theory shareholders expect the
agents to act and make decisions in the principal’s interest.
Stakeholder theory: Stakeholder theory can be defined as “any group or individual who can
affect or is affected by the achievement of the organization’s objectives”. Unlike agency theory
in which the managers are working and serving for the stakeholders, stakeholder theorists
suggest that managers in organizations have a network of relationships to serve – this include
the suppliers, employees and business partners.
Dependency theory: Whilst the stakeholder theory focuses on relationships with many groups
for individual benefits, resource dependency theory concentrates on the role of board of
directors in providing access to resources needed by the firm. However, other related theories
and political theory are; stewardship theory, transaction cost theory and political theory.
Role of external auditor and the audited reports: An external auditor performs independent,
third-party reviews of all the financial records of a company or corporation. He evaluates all
accounting, payroll and purchasing records, as well as any documents related to investments,
stocks or loans. His job is to provide an accurate, unbiased analysis of the company’s financial
condition.
Audited reports: The auditor expresses his assurance on the financial statements in an auditor’s
report. The report, which contains standard words and phrases that have a specific meaning,
conveys the auditor’s opinion related to whether the financial statements fairly present the
entity’s financial position and results of operations. If the auditor has reservations about
amounts or disclosures in the statements, he modifies the report to describe the reservations.
The auditor’s report and management’s financial statements are only useful to those who make
the effort to understand them. (Alexei Romanenko, 2011). Further in the case of Sarbanes-
Oxley Act of 2002 of U.S, Hailed as the most significant change to securities laws since the
1934 Securities Exchange Act, a new penal law commonly known as the Sarbanes-Oxley Act of
2002, was signed into law by George W. Bush and became effective on July 30, 2002.The Act
contains sweeping reforms for issuers of publicly traded securities, auditors, corporate board
members, and lawyers. It adopts tough new provisions intended to deter and punish corporate
and accounting fraud and corruption, threatening severe penalties for wrongdoers, and
protecting the interests of workers and shareholders.
Literature review
An exploratory study of auditors’ responsibility for fraud detection in Barbados (Alleyne and
Howard, 2005), indicated that the expectation gap is wide, as auditors felt that the detection of
fraud is management's responsibility, while users and management disagreed.
A paper by the Zabihollah Rezaee (2009) defined financial statement fraud as the deliberate
misstatements or omissions of amounts or disclosures of financial statements to deceive
financial statement users, particularly investors and creditors. The Committee of Sponsoring
Organizations of the Treadway Commission (COSO) study (2010) on fraudulent financial
reporting in US Public Companies, reported 347 cases of fraudulent financial reporting from

Proceedings of 1st JKUAT-SHRD Research Conference 12
th and 13
th September 2013
269
1998 to 2007, where the most common technique involved improper revenue recognition,
followed by overstatement of existing assets and capitalization of expenses. (Rezaee, 2009).
Anup Agrawal and Sahiba Shadha (2005) examined whether certain corporate governance
mechanisms are related to the probability of a company restating its earnings. A company
typically reveals serious accounting problems via a restatement of its financial reports. Findings
indicate therefore that several key governance characteristics are unrelated to the probability of
a company restating earnings. However, inefficiencies in the processes of accounting may
amount to a professional scandal. (Noahankomah, 2011).
Research gaps
Kenya has had its’ own share of corporate frauds, more recently the highly publicized corporate
mismanagement of Uchumi Supermarkets and CMC Motors. The public questioned the audit
process as both companies had previously received unqualified audit reports. Auditors of the
companies were put to task on their failure to detect and report the mismanagement evident in
the companies. A study on financial statement users expectations in regards to the roles and
responsibility of auditors in detection and prevention of fraud is yet to be conducted in Kenya.
Methodology
A research design is simply the framework or plan for a study, used as a guide in collecting and
analyzing data. The critical tenet of research is that the design of the investigation should stem
from the problem. (Churchill, Iacaobucci, 2002). This study was in the form of descriptive case
research design. Case study was preferred in this research because of the sensitive nature of the
study. The target population was selected to capture parties affected by the corporate fraud of
Uchumi Supermakets which took place in the year 2005. The respondents therefore comprise
users of Uchumi Supermarkets financial statements for the year 2005, accountants, auditors, and
the audit firm that issued unqualified audit report for the period. As well, the regulatory body
and watchdog for the accountancy profession in Kenya, the Institute of Certified Accountants of
Kenya (ICPAK).
Instruments
Primary data was obtained through self administered surveys. Secondary data was obtained
from previously published media reports as well as internet and other social media. The opinion
of financial statement was first hand as it is collated from what is posted to the internet by the
users themselves.
Data analysis
Gender
From the analysis, it occurred that, 52% of the respondents who participated in the study were
female while 48% of the respondents were male. This implies that, women are beginning to get
a number of significant appointments in the corporate sector and are involved in day to day
decision making in the corporate scene.

Proceedings of 1st JKUAT-SHRD Research Conference 12
th and 13
th September 2013
270
Profession
From the analysis, it occurred that, 57% of the respondents who participated in the study were
auditors, 29% of the respondents were accountants, while 14% were in other professions such
as marketing, the business community, and a senior official in a public entity. This confirms the
reliability of the findings and data since more than 80% of the respondents are users of the
financial information.
Corporate fraud as a major concern for business in Kenya
Here, 48% of the respondents who participated in the study were in agreement that corporate
fraud is a major concern for business in Kenya, 33% of the respondents strongly agreed that
corporate fraud is a major concern for business in Kenya, 9% of the respondents were neutral
and 5% disagreed that corporate fraud is a major concern for business in Kenya and another 5%
strongly disagreed that corporate fraud is a major concern for business in Kenya. This implies
that, 81% of the respondents agreed that corporate fraud is a major concern for business in
Kenya; hence corporate governance awareness in Kenya is increasing as is globally.
Additionally, corporate fraud does dent the public image of organizations; hence organizations
must give adequate attention to issues of good corporate governance.
Discovery of fraudulent activity having negative impact on the users of financial statement
From the findings, 48% of the respondents who participated in the study strongly agreed that
discovery of fraudulent activity would have negative impact on users of financial statement,
38% of the respondents who participated in the study agreed that discovery of fraudulent
activity would have negative impact on users of financial statement, 9% were neutral and 5% of
the respondents who participated in the study disagreed that discovery of fraudulent activity
would have negative impact on users of financial statement. It is imperative to note that
cumulatively 86% of the respondents who participated in the study agreed that discovery of
fraudulent activity would have negative impact on users of financial statement.
The role in external auditors in a specific duty to identify and report the corporate fraud
From the findings, 43% of the respondents who participated in the study strongly agreed that
external auditors have a specific duty to identify and report corporate fraud, 28% of the
respondents who participated in the study agreed while 24% disagree and 5% of the respondents
who participated in the study strongly disagree. The results indicated a situation where users of
financial statements believe external auditors have specific duty to identify and report corporate
fraud therefore their opinion is highly relied on in decision making.
As to whether the auditor’s report on financial statements can be relied on as a true
reflection of the integrity of financial statement?
Here, 43% of the respondents who participated in the study were in agreement that auditor’s
report on financial statements can be relied on as a true reflection of the integrity of financial
statement, 14% of the respondents strongly agreed, 29% were neutral while 14% of the
respondents were in disagreement. The responses indicated that investors and any other
stakeholder in the organization accept as true the auditor’s opinion.

Proceedings of 1st JKUAT-SHRD Research Conference 12
th and 13
th September 2013
271
Legislation that places specific responsibility on external auditors to identify and report
corporate fraud
47% of the respondents who participated in the study strongly agreed that there should be
legislation that places specific responsibility on external auditors to identify and report
corporate fraud, 43% of the respondents agreed that there should be legislation that places
specific responsibility on external auditors to identify and report corporate fraud, 5% of the
respondents were neutral while another 5% were in disagreement that legislation that places
specific responsibility on external auditors to identify and report corporate fraud. The study
therefore indicated need for specific legislation to ensure auditors can be held accountable for
their opinions published in the financial statements of corporate organizations.
Have the recent corporate governance irregularities impacted negatively on the credibility of
auditors as trustworthy and independent professionals who add integrity to financial
statements
43% of the respondents who participated in the study were in agreement that the recent
corporate governance irregularities have impacted negatively on the credibility of auditors as
trustworthy and independent professionals who add integrity to financial statements, a further
29% of the respondents who participated in the study strongly agree, 19% of the respondents
were neutral while 9% of the respondents disagreed that the recent corporate governance
irregularities have impacted negatively on the credibility of auditors as trustworthy and
independent professionals who add integrity to financial statements.
Situational Analysis
On if the auditors of Uchumi supermarkets achieved the audit objective of responding
appropriately to fraud or suspected fraud identified during the period of reported corporate
governance irregularities
From the findings, 38% respondents who participated in the study agreed that the auditors of
Uchumi supermarket achieved the audit objective of responding to fraud or suspected fraud,
however, 33% of the respondents who participated in the study disagreed that the auditors
achieved the objective of the audit objective of responding to fraud or suspected fraud, 14% of
the respondents were neutral and did not comment on the issue, while 10% strongly agreed that
the auditors achieved the objective of the audit objective of responding to fraud or suspected
fraud and 5% of the respondents strongly disagreed that the auditors achieved the objective of
the audit objective of responding to fraud or suspected fraud. From these findings it implied that
this is a contentious issue.
If ICPAK was justified in clearing the auditors of professional negligence in the audit of
Uchumi Supermarket after unqualified (clean) opinion was issued despite the bad corporate
practices later reported
From the analysis, 33% of the respondents were in agreement that ICPAK was justified in
clearing the auditors of professional negligence in the audit of Uchumi after issuing unqualified
opinion despite the bad corporate practices later reported, 29% of the respondents disagreed that
ICPAK was justified in clearing the auditors of professional negligence in the audit of Uchumi
after issuing unqualified opinion despite the bad corporate practices later reported, 9% of the
respondents strongly agreed with ICPAK decision, 10% of the respondents strongly disagreed
with ICPAK action while 19% of the respondents were neutral and non committal to ICPAK

Proceedings of 1st JKUAT-SHRD Research Conference 12
th and 13
th September 2013
272
decision of clearing the auditors of professional negligence in the audit of Uchumi after issuing
unqualified opinion despite the bad corporate practices later reported. The results therefore
indicate that half of the respondents were in agreement with ICPAK while approximately the
same numbers were in disagreement with ICPAK.
From the analysis of secondary data
As if Uchumi's was a case of corporate crime: from an investor opinion
Representing users of financial statements, specifically investors, the opinion of a commissioner
at the Kenya National Commission on Human Rights posed in the East African Standard (2012)
is cited.
He states, “This wide coverage and dynamic notion of ethical conduct on the part of a company
appears to say that legal compliance alone is not enough. There is a whole realm of duties that
relate to the area that current discourse on social responsibility refers to as 'beyond compliance.'
There exists a difference between direct abuse and complicity. It is against this background that
the Uchumi Supermarkets make an excellent case study that may just start Kenya's own version
of Sarbanes-Oxley Act.” This is also the name given to an Act that was sponsored by US
Senator Paul Sarbanes and Congressman Michael G. Oxley following the corporate scandals of
Enron, WorldCom and others in the US.
Institute of certified public accountants of Kenya (ICPAK) investigations
An investigation by the Institute of Certified Public Accountants of Kenya (ICPAK), on
whether the auditors’ opinions were in step with set accountancy professional standards,
absolved them from accusations that it did not raise the alarm that the supermarket chain was
crumbling under debt. The auditors were found to have operated above board and cleared of any
malpractice in the lead up to the collapse of Uchumi Supermarkets. (Capital FM Business,
2008).
As to shareholders opinion on Uchumi; and the role of external auditors
The following was published in “Analyses of issues at the Nairobi Stock Exchange and other
matters” in 2006.
In the last Uchumi AGM, there was a heated discussion with some minority shareholders on
one side and the board on the other regarding the continuation of Price waterhousecoopers as
external auditors of the company. The shareholders argued that that PWC did not raise a red
flag when Uchumi was going under. This issue was not clearly resolved with the board
promising to take the views of the shareholders into consideration. This question cannot be
more relevant than today. The CMA should consult widely and seek to enact a law to define the
roles of auditors and other parties on matters of corporate governance; this was also similar to
USA opinion.
Opinion from member of public (2006) surveyed in the daily papers had said that the CEO of
price Waterhouse Coopers Kenya who were Uchumi auditors were supposed to be arrested just
like the CEO of Capital markets Authority, Nairobi Securities and Central Depositories and
Settlement Corporation.

Proceedings of 1st JKUAT-SHRD Research Conference 12
th and 13
th September 2013
273
Summary and conclusion of the key findings
PWC, the external auditors, exonerated themselves from responsibility in the identifying and
reporting of corporate mismanagement in the Uchumi scandal. Investigation by their regulatory
body, ICPAK, also demonstrated that the auditor is not placed with this responsibility in the
normal course of their work. The public and shareholders on the other hand seem to place
reliance on external auditors to identify and report issues of governance and fraud.
The role of auditors must be clarified to users of financial statements. While in US there was a
tightening of regulations to place more responsibility on auditors, such a regulation has not been
passed in Kenya. However, auditors remain accountable to users of financial statements as the
public places reliance on the auditors’ opinion. In conclusion the findings indicate that the
expectation gap is wide, as auditors feel that the detection of fraud is management's
responsibility, while users disagree.
Recommendations
The study reveals a gap in expectations which can be addressed by educating the public on the
duties and scope of work of external auditors in Kenya. This can be spearheaded by the Institute
of Certified Public Accountants of Kenya. Given the impact of corporate governance issues on
investors and the public as a whole, and the increasing public demand both locally and globally
for greater transparency and accountability, a law similar to Sarbanes-Oxley Act passed in the
US would give assurance and increase confidence of financial statements users in the work of
external auditors in matters corporate governance. A study on the impact that Sarbanes-Oxley
Act has had on corporate governance in the US would serve as a guide on whether such
legislation could benefit Kenya.
References
Agrawal A, Chadha S, (2005). Corporate Governance & Accounting Scandals, Journal of Law
& Economics, New York
Alleyne P, Howard M, (2005). An exploratory study of auditors’ responsibility for fraud
detection in Barbados, West Indies, Emerald Group Publishing Limited.
Becker L, DeFond L, Jiambalvo J, et al. (1998). The Effect of Audit Quality on Earnings
Management, Contemporary Accounting Research.
Broadley D, (2006). Auditing and its Role in Corporate Governance, Munich University,
Germany.
Carcello J.; Hermanson R, et al, (2000). Jr. Board Characteristics and Audit Fees, Working
paper, University of Tennessee.
Cooper D, Puxty T, Robson K , et al, (1992). The Ideology of Professional Regulation and the
Markets for Accounting Labour: Three Episodes in the recent history of the UK
Accounting Profession.
Daily, C.M., Dalton, D.R. and Canella, A.A. (2003) “Corporate Governance: Decades of
Dialogue and Data”. Academy of Management Review, Vol. 28, No. 3, pp. 371-382
Proceedings of 1st JKUAT-SHRD Research Conference 12
th and 13
th September 2013
274
Davis, J.H., Schoorman, F.D. and Donaldson, L. (1997) “Toward a Stewardship Theory of
Management”. Academy of Management Review, Vol. 22, pp. 20-47.
DeFond, J.; Francis J.; et al, (2000)., Auditor Industry Specialization and Market
Segmentation:Evidence from Hong Kong. Auditing: A Journal of Practice and Theory
19: 49–66.
Eichenseher. W., Shields D,1989, Corporate Capital Structure and Auditor ‘Fit.’ Advances in
Accounting (Supplement 1989): 39–56.
Fan, H., Wong J, (2002). Corporate Ownership Structure and the Informativeness of
Accounting Earnings in East Asia. Journal of Accounting and Economics 33: 401–
26.DOI:
Francis, J. (1984). The Effect of Audit Firm Size and Audit Prices. Journal of Accounting and
Economics 6 : 133–52.DOI:
Gazette Notice Number 3362, The Capital Markets Act, Guidelines on Corporate Governance
Practices on Public Listed Companies in Kenya.
Hawley, J.P. and Williams, A.T. (1996) “Corporate Governance in the United States: The Rise
Of Fiduciary Capitalism”. Working Paper, Saint Mary's College of California, School of
Economics and Business Administration
Johnson, S.; Boone P.; et al, (2000), Corporate Governance in the Asian Financial Crisis.
Journal of Financial Economics 58 : 141–86.
Kilonzo D, (2011). Business Daily: Kenya: Uchumi Case Sheds Light On Corporate
Governance Gaps in Public Companies.
La Porta R.; Lopez-de-Silanes F.; et al, (1999). Corporate Ownership Around the World.
Journal of Finance 5): 471–518.
La Porta, R.; Lopez-de-Silanes F.; et al, (2002). Investor Protection and Corporate Valuation.
Journal of Finance Lutzenberger Tom , (2009). Role of an External Auditor in Corporate
Governance, Demand Media, CaliforniaLincoln, YS. & Guba, EG. (1985). Naturalistic
Inquiry. Newbury Park, CA: Sage Publications.
Miles, MB. & Huberman, AM. (1994). Qualitative Data Analysis (2nd edition). Thousand
Oaks, CA: Sage Publications.
Merriam, S. (1988). Case study research in education: A qualitative approach. San Francisco,
CA: Jossey-Bass.
Private Sector Initiative for Corporate Governance, Nairobi.
Williamson, O. (1996) “The Mechanisms of Governance”. Oxford University Press, Oxford

Proceedings of 1st JKUAT-SHRD Research Conference 12
th and 13
th September 2013
275
EVALUATION OF FINANCIAL DISTRESS IN UCHUMI SUPERMARKET LTD
Waita, M. Gichaiya* & L.A. Oyugi
Jomo Kenyatta University of Agriculture and Technology, Kenya.
Email: [email protected]
Abstract
There exists no conclusive agreement on which financial ratio(s) are most appropriate to assess
the likelihood of financial distress and the successful turnaround strategies of recovering firms.
This study evaluates financial health in Uchumi supermarket limited by testing whether
Altman’s Z score model is accurate in predicting corporate financial distress for a study period
of 2003 to 2012. The research also assesses the success of turnaround strategies. The company
was selected because of its historical record of financial difficulties in the mid 2000s that led to
its receivership in June 2006 and its current recovery to profitability. Analytical formulas in
Altman’s model were applied on the financial statements and questionnaires were administered.
Stratified random sampling was used to select a sample size. The results reveal that the model is
accurate with Z values reflecting a distress zone especially in the period under receivership and
a grey zone in 2012 which is an alarming matter that may lead to corporate bankruptcy in near
future unless corrective measures are undertaken. The study also highlights that successful
recovery is not a function of a single strategy but a combination of various tactics within the
four main restructuring activities.
Keywords: Financial distress, Altman, Turnaround strategies.
Introduction
According to Glen (2005) financial distress is a situation whereby a firm does not meet
creditors’ obligations or are met with difficulties. Financially distressed firms have problems in
meeting and/or paying off their due or overdue financial obligations to its creditors. Wruck
(1990) defines financial distress as a situation where a firm’s operating cash-flow are not
sufficient to satisfy current obligations and the firm is forced to take corrective action.
Financially distressed firms face possible conflicts that can either be described as a cash
shortage on the assets side of the balance sheet, or as an overdue obligation or debt in liabilities.
This marks the genesis of cash flow insufficiency to settle current obligations. Most distressed
firms resolve the situation by raising capital to fund their restructuring although very few are
liable to trust this risky investment owing to the fact that a financial boost does not guarantee a
lasting solution to the problems at hand. Previous studies show that financial distress arises
mainly due to unwise use of debt financing. Arnold (2005) states that one of the cheapest ways
to finance a company is through debt but firms tend to run into financial distress, induced by
payment of interest regardless of the cash flow of the business. If the firms hit a rough patch in
its business activities it may have trouble paying its bond holders, bankers and other creditors
their entitlement. Firms that hit a rough patch in business fail to meet creditors’ entitlement.
Debt is highly emphasized as the main cause of financial distress yet with this information it’s
still inevitable.
Outecheva (2007) concluded that resolution from financial distress provides unsatisfying results
varying from 10% to 34%. This shows a low interrelation between financial distress and

Proceedings of 1st JKUAT-SHRD Research Conference 12
th and 13
th September 2013
276
recovery that needs constant results. McCarthy (2011) found out that apart from demographic
and economic variables leading to financial difficulties, behavioural factors also matter.
Argyrou (2006) argued that financial distress occurs when a company’s shareholders’ equity
falls below 40% of the company’s share capital. Evidently, financial difficulties in companies
have been a chronic problem and appropriate actions should be incorporated. The motivation of
this study emanates from the arguments that there is no conclusive agreement on which ratio(s)
are most appropriate to assess the likelihood of financial distress and assess the success of
turnaround strategies of distressed firms. The study determines the accuracy of Altman’s model
and appropriate measures that enhance recovery of financially distressed firms.
There have been severe cases of financial distress in Kenya such as: Uchumi supermarket, Bulk
medical limited, E. A. Packaging industries limited among others. Firms deal with financial
distress in several ways such as selling off major assets, merging with other firms, reducing
capital spending, research and development, issuing new securities, negotiating debts with its
banks and other creditors, exchanging debt for equity and filing for bankruptcy. This means that
firms should plan and evaluate their financial condition in such a manner that the risk of
financial distress is minimized at all costs for sound performance of the business. Despite
various theories in existence, firms are experiencing financial distress, some in ultimate distress
that is bankruptcy, while some have collapsed already. In light to the above it is important to
note and conclude that business firms and in particular public companies have a role to play in
the entire management. Large financial failures in the recent years have pointed to the need for
extensive research on financial distress.
Uchumi supermarket is the only publicly quoted supermarket in Kenya. The headquarters is in
Kenya and it has various branches throughout the country and also retail outlets in East Africa.
The company came into existence in 1975 as a public limited liability company that was formed
by three state owned companies namely; Industrial Commercial & Development Corporation
(ICDC), Kenya Wine Agencies Limited (KWAL) and Kenya National Trading Corporation
(KNTC). The main objective initially was to trade in commodities for Kenyan manufacturers. In
1976, the shareholders to the company signed a management contract with an Italian
supermarket to train Kenyans to run the new business enterprise. The company’s shares were
listed on the Nairobi Stock Exchange currently known as the Nairobi Securities Exchange
(NSE) in 1992. In the early 2000s, the company encountered severe financial constraints and
went into receivership in June 2006. This state led to de-listing of the company from the NSE.
Later on the company resumed trading under an interim management. Since January 2011,
Uchumi supermarket has managed to regain profitability. The company was re-listed on NSE in
May, 2011.
Literature review
Beaver (1966) holds the pioneering efforts of the current state of literature in financial distress
prediction and management. Beaver (1968) conducted the first cornerstone study on distress
prediction, which allowed researchers to comprehend how firms enter a failure path. Much
research work on financial distress has been carried out over several years more so in the
industrially developed countries. Almeida and Philippon (2000) analyzed risk adjusted cost of
financial distress of public companies in the United States which have issued corporate bonds
and have difficulties to pay coupon and its bond. Fitzpatrick (2004) conducted an empirical
study on the dynamic of financial distress of public companies in the United States whereas
Gennaiola and Rossi (2006) explored the optimal solution of financial distress in Sweden.

Proceedings of 1st JKUAT-SHRD Research Conference 12
th and 13
th September 2013
277
Intensive research also extends to Outtecheva (2007) who analysed the probability of financial
distress and the different avenues to avoid it in New York Stock Exchange (NYSE).
It is worth noting that few studies have been conducted in most developing countries. Hui and
Jhao (2008) explored the dynamics of financial distress of 193 companies which have
experienced financial distress in China in between the years 2000-2006. Ugurlu and Hakan
(2006) conducted a research to predict corporate financial distress for the manufacturing
companies listed in Istanbul stock exchange for the period, 1996-2003. Bemmann (2005) argues
that the Z scores, developed by Professor Edward I. Altman is perhaps the most widely
recognized and applied model for predicting financial distress. Altman (1968) uses multiple
discriminate analysis that is also applied in this study. Since the establishment of Altman’s
financial distress prediction model, several studies pertaining to the model have been conducted
including, Deakin (1972), Taffler (1983), Goudie (1987), Agarwal and Taffler (2007).
According to Scherrer (2003), for the turnaround to be successful, business decline must be
acted upon as soon as warning signals are identified and key elements such as competent
management, cooperation of firm stakeholders and sufficient bridge capital to carry out the
turnaround plan must be present. A company that is experiencing financial distress has several
turnaround or exit options. Selection is done depending on the appropriateness of an option or
the expected benefits to an organization. There exist four main generic strategies that can be
adopted by a financially distressed firm for survival as a going concern.
According to Lasfer and Remer (2010), operational restructuring is generally the first broad
strategy undertaken by companies. This includes strategies to boost revenue generation, and
improve efficiency. The ultimate aim of this restructuring is to typically conserve or generate
more cash inflows to the business and can include; reducing Capital Spending on Research and
Development, cutback action and/ or layoffs. Lasfer and Remer (2010) acknowledge that asset
restructuring is the second and it typically generates much needed cash quickly but it is
considered to be a drastic option. It involves; disposing of real property and/ or merging with
other firms. The third strategy is financial restructuring that involves debt and/or equity
restructuring and can either generate or conserve cash. Gilson et al. (1990) defines debt
restructuring as a transaction in which existing debt is replaced by a new contract which either:
reduces interest or capital, extends maturity or swaps debt for equity. The strategy here
includes; issuing new shares, negotiating with creditors, cutting and/ or omitting dividends.
Lastly is management restructuring that involves changes in the management of the company
and it does not directly involve cash (Lasfer and Remer, 2010). In an extensive study on
financial distress and corporate turnaround Loui and Smith (2007), conclude that previous
studies identify the top management change as a pre-requisite for any successful recovery.
Reorganization handles all the people issues in the business and it entails restructuring, re-
staffing, re-skilling and change of leadership with an objective of improving the organizational
management, structure, alignment and culture. Previous studies which include; Lasfer and
Remer (2010), Collard (2010), Outecheva (2007) and Situma (2006) have failed to clearly
highlight the appropriate turnaround strategies that can be adopted to rectify shortcomings of a
distressed firm.
Many empirical studies have been done concerning financial distress but most companies still
suffer from financial problems heading to the extreme exit option of liquidation and bankruptcy.
This is alarming, not because of the collapse of individual firms but also enormous for the entire
financial system. A research gap exists in that despite several attempts to predict business
failure and bankruptcy, an unambiguous conclusion has not been achieved on which

Proceedings of 1st JKUAT-SHRD Research Conference 12
th and 13
th September 2013
278
combination of ratios would derive the most appropriate model for financial distress prediction.
Much of the research carried out also fails to clearly explain how to successfully turnaround a
distressed firm. This study seeks to close the gap by evaluating accuracy of Altman’s revised
model and determine if it is necessary to develop a more up to date model of predicting
financial distress in Kenya and how to successfully revive collapsing firms.
Methodology
The study relied on both primary data that was collected through questionnaires issued to the
managerial staff members in Uchumi supermarket and secondary data which involved
evaluating financial statements using Altman’s model for a span of 10 years from 2003 to 2012.
Descriptive research design was applied which involved examining the adopted turnaround
strategies to give a description of the state of affairs as it exists. Stratified random sampling was
used to select a sample size. The first objective was analysed by computing ratios for X1, X2,
X3 and X4 so as to determine the Z score in the model. Variance analysis was used to compare
the zones of discrimination in the multiple discriminant analysis model. A likert’s scale was
used for the second objective with a scale of 1 to 5 where 1 and 2 gave an average of positivity,
3 being the average for neutral or uncertain responses and lastly 4 and 5 gave the average for
negativity.
Econometric specification of Altman model: Bemmann (2005) argues that the Z scores,
developed by Professor Edward I. Altman, is perhaps the most widely recognized and applied
model for predicting financial distress. According to Altman (1968), he formulated the Z-score
formula for predicting the probability of a firm to face financial distress or go into bankruptcy
by using multiple corporate income and balance sheet values to measure the financial health of
a company. Z-score is a linear combination of four or five common business ratios, weighted by
coefficients that were estimated by identifying a set of firms which had declared bankruptcy and
then collecting a matched sample of firms which had survived, with matching by industry and
approximate size (assets). Altman applied the statistical method of discriminant analysis to a
dataset of publicly held manufacturers. The estimation was originally based on data from
publicly held manufacturers, but has since been re-estimated based on other datasets for private
manufacturing.
The Z-score estimated for non-manufacturing industrial and emerging market credits is a linear
combination of four ratios hence applicable for predicting financial distress in Uchumi
supermarket since it’s a non-manufacturing organizations. It applies the following ratios;
Z = 6.56X1 + 3.26X2 + 6.72X3 + 1.05X4 where;
X1 = Working Capital
Total Assets
X2 = Retained Earnings
Total Assets
X3 = Earnings Before Interest and Taxes
Total Assets
X4 = Book Value of Equity
Total Liabilities
Zones of Discrimination: Z > 2.6; - Safe zone
1.1 < Z < 2.6; - Grey zone
Z < 1.1; - Distress zone

Proceedings of 1st JKUAT-SHRD Research Conference 12
th and 13
th September 2013
279
Results and discussion
Table 1 clearly illustrates computed ratios in the Altman’s model with their respective Z scores
on a yearly basis for a period of 10 years (2003 - 2012).
Table 1: Prediction of Financial Distress
Financial Year T1 T2 T3 T4 Z Score
2003 – 0.338 0.049 – 0.049 0.257 –
2.12 2004 – 0.406 – 0.149 – 0.193 0.035 –
4.41 2005 – 0.885 – 0.918 – 0.581 – 0.375 –
13.10 2006 – 0.521 0.00 – 0.406 – 0.328 – 6.49
2007 – 0.019 0.00 – 0.069 – 0.386 –
0.99 2008 – 0.200 0.00 0.178 – 0.339 –
0.47 2009 – 0.305 0.00 0.133 – 0.068 –
1.18 2010 – 0.032 0.203 0.170 0.953
2.59 2011 – 0.036 0.238 0.129 1.321
2.79
2012 – 0.123 0.269 0.087 1.164
1.88
The organization was in a distress zone during the 2003 financial year implying that it was
susceptible to financial distress in the near future estimated to be after two succeeding years
from the base year. This model proves to be accurate in a local Kenyan scenario since in the
succeeding years the Z score tabulated continuously remained to be less than 1.1 showing the
company was deteriorating financially. This is also supported by the fact that Uchumi
supermarket further landed into receivership in years 2006, 2007, 2008, 2009 and partly 2010.
The study is in accordance with Altman (1968) discriminant ratio model that proved to be
accurate in predicting financial distress in 94% of firms studied in U.K and 95% of all firms in
bankrupt and non bankrupt groups of classification.
The ratios in Altman’s model have been used as yardsticks for evaluating the financial health of
Uchumi supermarket from 2003 to 2012. Working capital in the total assets is used as a measure
of a firm’s underlying operational efficiency. A decrease or negative working capital may
portray the idea that a copy is operating in an efficient way since cash held up in inventory or
debtors cannot be used to pay off any of the company's obligations. However if a company
extends for long with a negative working capital, it implies that the firm may face a bankruptcy
or serious financial trouble.
The working capital in Uchumi supermarket remained to be negative in the years under study
signaling possibility of an underlying problem in the company's operations more so if the
accounts payables over shadow accounts receivable and inventories. The study reports a
fluctuating negative X1 (Working Capital/ Total Assets) over the years being a red flag that
Proceedings of 1st JKUAT-SHRD Research Conference 12
th and 13
th September 2013
280
calls for corrective measures to be put in place to avoid shortage of liquid funds causing stock
outs.
X2 (Retained Earnings to Total Assets) measures a firm’s reinvestment level that reflects its
ability to accumulate earnings using its assets. If 1:1 retained earnings to total assets ratio is
achieved, it indicates 100% growth financed through profits and not increased debt whereas a
low ratio shows unsustainable growth financed from increasing debt. The study shows a
negative ratio in the earlier years that shifts to a zero. A ratio of 0.203 is achieved in year 2010
that gradually increases in the other two years. This implies that the company is in a position to
generate adequate reserves for future growth.
X3 (Earnings Before Interest and Taxes to Total Assets) measures a firms effectiveness in
generating earnings using its assets before contractual obligations are met. The ratio is used by
investors to determine the return attributable to profits pulled from its assets and the higher the
ratio the more the effectiveness. The EBIT to total assets ratio remained negative in the initial
years reflecting the company’s consistent loses. In 2008 a positive ratio of 0.178 was reported
with fluctuations prevailing to year 2012. Year 2012 record a decline to 0.087 which is not good
sign. The management should exercise caution to enhance the ratio.
X4 (Book Value of Equity to Total Liabilities) ratio measures the extent to which a company is
financed by debt. The result indicates a low ratio in initially then translates to a negative in the
years under receivership. However, from year 2010 it becomes positive but still minimal
indicating that the proportion of debt and equity had an impact on the financial performance.
According to Ray (2011) those businesses with ratios above 200 percent are safest.
The computed Z scores also prove that by year 2010 the company was moderately resuming its
commercial activities because it shifted from a distress zone to a grey zone with a computed Z
score of 2.59 as demonstrated on table 4.13. According to Uchumi supermarket limited and
subsidiary annual report (2011) it documented that lending financial institutions lifted the
company’s receivership in 2010 and the supermarket group was successfully re-listed in the
Nairobi Securities Exchange on 31st May 2011. The results further reveal the accuracy of the
model by upholding that by year 2011 the company had regained profitability and it shifted
from a computed Z score of 2.59 in year 2010 to 2.79 in year 2011 implying a transition to a
safe zone free from susceptibility to financial distress in the future period. In the financial year
ending 30th June 2012, there was a drop in the Z score which reduced to 1.88 showing a draw
back to the grey zone. The results can be attributed to the restructuring of the company on
implementation of turnaround strategies and expansion of the business into a wider branch
network. A grey zone implies a moderate degree of risk to financial failure which is an alarming
matter that may lead to corporate bankruptcy in near future unless corrective measures are
undertaken.
The sample group administered with questionnaires by the researcher consisted of sixty five
members of staff in Uchumi supermarket and only fifty one questionnaires were valid and
returned accounting for 78% responsive rate. The study reveals that a combination of strategies
was put in place and the various respondents determined the extent of their effectiveness. Table
2 reveals that majority of the respondents admit that reduction of capital spending on research
and development had a positive effect with a mean of 2.0.
On laying off staff most respondents argued there was no effect with a mean of 3.4. Cost cutting
measures had a positive effect according to a majority response with a mean of 1.9. The results
illustrate that under operational restructuring; cost cutting strategies are most effective with the

Proceedings of 1st JKUAT-SHRD Research Conference 12
th and 13
th September 2013
281
minimal coefficient of variation indicating it is less variable hence more stable. The strategy is
successful for the supermarket and the study is in line with a research by Zimmerman (1989) on
managing a successful turnaround where it was found that recovered companies are diligent and
maintain their costs low. On asset restructuring, disposal of real property was considered to
have a positive effect with a mean of 3.7. Gilson et al. (1990) argued that although disposal of
real property is common for obtaining cash while in distress, the sales may not be optimal since
financially distressed firms may get a bad price for their assets. This strategy was not effective
hence unsuccessful and can be attributed to the above fact.
Table 2: Turnaround Strategies
Mean S.D C.V
Operational Restructuring
a) Reduced capital spending on research and dev. 2.0 0.96 0.48
b) Staff lay off 3.4 1.25 0.36
c) Cost cutting (cost reduction and asset reduction) 1.9 0.64
0.34
Asset Restructuring d) Disposal of real property 3.7 1.01 0.27
e) Merged with another company 0.0 0.0 0.0
Financial Restructuring
f) Negotiation with creditors on payment mode 2.5 1.22 0.49
g) Float of new shares to the public for subscription 2.2 1.05 0.48
h) Omitted or cut dividend payment 3.9 1.25
0.32
Management Restructuring
i) Change of management after financial distress 1.7 0.63 0.37
j) Reorganization of staff members 2.2 1.15 0.52
The research displays that under financial restructuring, float of new shares to the public for
subscription was the most effective strategy with a mean of 2.2 and a coefficient of variation of
0.48 as shown on table 4.12. Negotiation with creditors on mode of payment was the second
effective strategy in the category with a mean of 2.5. Most of the respondents (mean of 3.9)
claimed that omitted/ cut dividend payment had a negative or no effect. Strategies under
financial restructuring entail debt and/or equity restructuring with an objective of either
generating or conserving cash. The results imply that floatation of new shares generated cash
for resolutions and expansion hence a high degree of success. According to Gilson et al. (1990)
debt restructuring is characterized by one or more of the following; interest or principal
reduction, debt maturity extension and/ or debt is swapped for equity. The study conforms to
Datta and Iskandar (1995) who found out that 50% of companies that undertake financial
restructuring are successful in renegotiating the terms of their debt contracts. Dividend
omission/ cut can lead to negative signaling and taint the corporate image.
Management restructuring was successful to reinstate the organization back to its roots. A high
number of the respondents with a mean of 1.7 attested to the effectiveness of change of
management after financial distress. The coefficient of variation was also minimal (0.37)
indicating uniform results. Reorganization of staff members was also considered effective with
a mean of 2.2 from the respondents. Improvement in industry economic condition is a
significant determinant of recovery for companies in economic distress but not for those that

Proceedings of 1st JKUAT-SHRD Research Conference 12
th and 13
th September 2013
282
were historically poorly managed (Whitaker, 1999). The results imply that sound management
is very crucial to sustain stability of a recovery firm.
Summary and conclusions
This study examines the outcome of various financial ratios with the aid of Multiple
Discriminate Analysis (MDA). Altman’s Z score model proves to be accurate in predicting
corporate financial distress in a Kenyan scenario based on the study. The study conforms to the
financial situation experienced by Uchumi supermarket over the period under study hence can
be relied upon in predicting the future financial health of a business. The model is useful in
discovering financially troubled firms that may face bankruptcy. In year 2012 the supermarket
lies on a grey zone which is alarming matter in that it implies the possibility of corporate
bankruptcy in near future unless corrective measures are undertaken. The management and
investors of various companies can apply the model for financial planning with the empirical
evidence of providing a warning signal.
Advanced prediction of the future terrible financial status of a company would help rectify it
before landing to the ultimate bankruptcy through remedial turnaround action such as
operational, asset, financial or management restructuring to avoid potential bankruptcy costs. It
is evident that successful recovery of a company is not a function of a single strategy but is a
combination various degrees of the four main restructuring activities.
Research shortcomings
This research focused on a case study exposing it to a risk that the results might have been
affected with regards to the sample size thus a similar study can be conducted for other business
organizations to find out if similar results would be realized. This would facilitate comparison
and comprehensive results on findings.
References
Agarwal, V. and Taffler, R. (2007). Comparing the Performance of Market Based and
Accounting Based Bankruptcy Prediction Models :http://ssrn.com/abstract=968252.
Accessed on 8th August, 2013.
Altman, E. I. (1968). Financial ratios, discriminant analysis and the prediction of corporate
bankruptcy. Journal of Finance, 23(4), 589-609.
Almeida, H. and Philippon, T. (2000). The Risk Adjusted Cost of Financial Distress, The Stern
School of Business, New York University, USA.
Argyrou, A. (2006). Predicting Financial Distress using Neural Networks: Another Episode to
the Serial? Unpublished Masters Thesis. Hanken Swedish School of Economics and
Business Administration.
Arnold, G. (2005). Corporate Financial Management. Pearson Education Limited, London.
Beaver, W. H. (1966). Financial Ratios as Predictors of Failure. Journal of Accounting
Research (supplement), 4: 71-102.

Proceedings of 1st JKUAT-SHRD Research Conference 12
th and 13
th September 2013
283
Beaver, W. (1968). The Information Content of Annual Earnings Announcement, Journal of
Accounting Research, 6: 67-92.
Bemmann, M. (2005). Improving the Comparability of insolvency Predictions. Dresden
Economics Discussion Paper Series No. 08/2005. http://ssrn.com/abstract=731644
Accessed on 23rd July, 2013.
Collard, J. M. (2010). Recovery Value: Turnaround Management and Distressed Investing
Strategies, Strategic Management Partner, Inc.
Datta, S. and Iskandar, D. M. (1995). Reorganisation and Financial Distress: An Empirical
Investigation, Journal of Financial Research, 18 (1): 15-32.
Fitzpatrick, (2004). An Empirical Investigation of Dynamics of Financial Distress, A
Dissertation Doctor of Philosophy, Faculty of the Graduate School of the State
University of Buffalo, USA.
Gennaiola and Rossi, (2006). Optimum Resolution of Financial Distress by Contract, IIES,
Stockholm University and Stockholm School of Economics.
Glen, A. (2005). Corporate Financial Management. Prentice Hall, London.
Gilson, S., John, K. and Lang, L. (1990). Troubled Debt Restructurings: An Empirical Study of
Private Reorganization of Firms in Default, Journal of Financial Economics, 27: 315-
353.
Goudie, A.W. (1987), Forecasting Corporate Failure: Discriminant Analysis within a
Disaggregated Model of the Corporate Sector, Journal of the Royal Statistical Society,
150(1): 69-81.
Hui, H. and Jhao, J. (2008). Relationship between Corporate Governance and Financial
Distress: An Empirical Analysis of the Distressed Companies in China, International
Journal of Management, 25: 32-38.
Lasfer, M. and Remer, L. S. (2010). Corporate Financial Distress and Recovery: The UK
Evidence. JEL Classification: G33, K22, G21 working paper series, Cass Business
School, City University, London, UK.
Loui, D. and Smith, M. (2007). Financial distress and Corporate Turnaround: A review of
literature and agenda for research, Working paper, Edith Cowan University, Western
Australia
McCarthy, Y. (2011). Behavioural Characteristics and Financial Distress.
http://ssrn.com/abstract_id=1761570. Accessed on 10th
January, 2013.
Outecheva, N. (2007). Corporate Financial Distress: An Empirical Analysis of Distress Risk.
Unpublished Dissertation, University of St.Gallen Graduate School of Business
Administration.
Scherrer, P. S. (2003). Management Turnarounds: Diagnosing Business Ailments. Corporate
Governance, 3(4): 52. Doi10.1108/14720700310497122.

Proceedings of 1st JKUAT-SHRD Research Conference 12
th and 13
th September 2013
284
Situma, S. (2006). A Study of the Turnaround Strategy Adopted at the Kenya Commercial
Bank, Research Thesis for MBA University of Nairobi.
Taffler, R. J. (1983). The Assessment of Company Solvency and Performance using a Statistical
Model, Accounting and Business Research, 15(52): 295-308.
Ugurlu, M. and Hakan, A. (2006). Prediction of Corporate Financial Distress in an Emerging
Market: Turkey, Cross Cultural Management: An International Journal, 13(4): 277-96.
Whitaker, R. (1999). The Early Stages of Financial Distress, Journal of Economics and
Finance, 23(2): 123-133.
Wruck, D. (1990). Financial Management. Pearson Education Limited, London.
Zimmerman, F. (1989). Managing a Successful Turnaround. Long Range Planning, 22(3):105-
124.

Proceedings of 1st JKUAT-SHRD Research Conference 12
th and 13
th September 2013
285
MICRO-FINANCE
THE EFFECTS OF MOBILE PHONE MONEY TRANSFER SYSTEM (M-PESA) ON
THE PROFITABILITY OF MICRO AND SMALL ENTERPRISES IN BUNGOMA
SOUTH SUB- COUNTY IN KENYA
Consolata Nasimiyu Simiyu
Kibabii University College, Masinde Muliro University of Science and Technology
E-mail: [email protected]
Abstract
There have been relatively few studies focusing directly on the way mobile payments are used to
enhance the quality of the services of MSEs especially those in rural areas and therefore
increasing their profitability. The main objectives of the study were to determine the effect of
cost reduction, sales revenue and market share by use of mobile phone money transfer services
on the profitability of MSEs. Descriptive research design was used to obtain information about
the existing phenomenon by use of questionnaires. The target population was Micro and Small
Enterprises. The sampling technique used was multi-stage random sampling where a total of 57
sample size was yielded. Excel Computer Package was used to analyse data which was
descriptive and presented in form of graphs, pie-charts and percentage tables. Some of the
major findings included that almost each business own or have used a mobile phone in their
business at 98% which signifies that the high penetration of the mobile phone among the MSEs
in rural areas can serve to help the high percentage of unbanked small businesses access
financial services through M-pesa which helps them to increase their profits and as a result, the
mobile phone industry can be seen as an ideal partner to offer mobile services to MSEs in rural
areas. The government should assist in bringing down the cost of m-pesa transactions so as to
induce MSEs in using mobile money transfer services.
Key words: Micro and Small Enterprises, Mobile money, Profitability.
Introduction
Lack of employment alternatives has pushed many people into self employment activities which
largely form the micro and small enterprises sector in the country. A micro enterprise is one
having not more than ten employees including the owner, while a small enterprise is the one
having eleven to fifty employees (Stevenson, 2005). So far, there has been no clear insight into
the role that mobile phone money transfer system play in the development of micro-business.
This implies that technology providers, government agencies and development partners may not
address the required interventions and there is therefore a need to examine the contribution of
mobile payment technology on micro businesses and the effect on their business profitability.
The micro business operator also needs to fully understand the entrepreneurial effect of this new
technology on their business so as to cope with the increasing developments in the mobile
payment services on one hand, and the challenges of the micro business operating environment,
on the other hand.
Statement of the Research Problem
There is significant potential for a mobile phone to increase profitability of MSEs but current
supporting evidence is scarce, methodologically heterogeneous and economically unreliable

Proceedings of 1st JKUAT-SHRD Research Conference 12
th and 13
th September 2013
286
(Donner and Escabori, 2009). There have been relatively few studies focusing directly on the
way mobile phones are used in enhancing productivity among the users in the developing
world, some businesses also lacks the awareness regarding the potentials that exist in the use of
mobile phones and ICTs. MSEs from the rural areas were also facing problems in settling their
day to day transactions as they had to visit banks to settle their obligations (Donner, 2005).
General Objective
The main research objective was to determine the effects of mobile phone-money transfer
system (M-PESA) on the profitability of Micro and Small Enterprises in Bungoma South sub
county.
Specific Objectives
1. To determine the effect of cost reduction by use of mobile phone money transfer system
on the profitability of Micro and Small Enterprises.
2. To determine the effect of sales revenue by use of mobile phone money transfer system
on the profitability of Micro and Small Enterprises.
3. To determine the effect of market share by use of mobile phone money transfer
system on the profitability of Micro and Small Enterprises.
Research Questions
1. What is the effect of cost reduction by use of mobile phone money transfer system
on the profitability of Micro and Small Enterprises?
2. What is the effect of sales revenue by use of mobile phone money transfer system
on the profitability of Micro and Small Enterprises?
3. What is the effect of market share or growth by use of mobile phone money transfer system
on the profitability of Micro and Small Enterprises?
Justification of the study
The study may benefit a number of groups, among them the MSEs owners to understand the
benefits of the mobile-based money transfer system in their businesses. The government too
under the Ministries of Trade and National Planning and vision 2030 will find the study
appropriate for strategic reasons, crafting appropriate policies to ensure MSEs utilizes benefits
accrued by the mobile base money transfer system (M-PESA).
Literature Review
Morawczynski and Pickens (2009), made a study to show how M-PESA can be beneficial to
businesses. The study shows how the transaction costs have reduced due to the technology
simplicity, quickness and reliability. The introduction of mobile phone on marketing in Indian
fisheries led to increased arbitrage among local fish markets leading to reduced price

Proceedings of 1st JKUAT-SHRD Research Conference 12
th and 13
th September 2013
287
dispersions (Jensen, 2007). Using micro-level survey data, he elicited that the adoption of
mobiles by fishermen and wholesalers led to reduced price dispersion, elimination of dead
weight loss, the near-perfect adherence to the Law of One Price, and ultimately the
improvement in the welfare of wholesalers. Arunga and Kahora (2007), concluded that sole
proprietors and small businesses in Kenya benefited hugely from the mobile phone revolution
as they are able to make savings and gain access to more customers and new services.The
micro-business operators are able to transact payments directly with their customers and
suppliers through a mobile phone in the palm of their hands without necessarily going through a
bank) and without having to leave their business premises (Anuradi et al., 2009).
Independent Variables Dependent Variable
Figure 2.1 Conceptual framework
Research Methodology
Research Design: The researcher employed a descriptive or survey research design. Descriptive
research involves surveys, a fact finding enquires of different kinds. It attempts to describe and
explain conditions of the present by using many subjects and questionnaires to fully describe a
phenomenon.
Target Population: The total target population of Micro and small businesses for the entire
Bungoma County was 8,074 (Business Register-County Council of Bungoma, 2012) that of
Bungoma South was 2,557 (Bumula constituency had 861 businesses while Kanduyi
constituency had 1,696 businesses). The research involved businesses such as retail shops,
tailoring, chemists, hardware’s, carpentry, metal workers, hair salons, repair services and
butcheries.
Sampling Technique: Multi-stage random sampling technique was used where a sample was
prepared in stages and sampling was ideally random at each stage.
Sample size: The total target population of the studied wards was 570. The researcher studied
only 57 MSEs out of the total 570. This sample is enough for conclusive generalization of the
whole population as it constitutes 10% of the target population (Kothari, 2006).
Sales Revenue
MSEs PROFITABILITY
Market Share
Cost Reduction

Proceedings of 1st JKUAT-SHRD Research Conference 12
th and 13
th September 2013
288
Data Collection Procedures and Instruments: The main primary data collection instrument
that was used was the questionnaire. Closed-ended questions in the long run were used to
collect data.
Data Analysis and Presentation: Analysis of data in this study was descriptive. Nachmias and
Nachmias (2004) noted that descriptive statistics enables the researcher to summarize and
organize data in an effective and meaningful way. Microsoft Excel was used in the processing
of data and the information generated was presented in the form of graphs, pie charts, frequency
and percentage tables.
Findings and Discussions
Ownership of Mobile Phone by Businesses
According to the findings, 92% of Micro and small business owners own a mobile phone while
a further 6% can access one through family or friends. The study also found out that in totality,
therefore, 98% of Micro and Small businesses in Bungoma South Sub-County can access
mobile phone money transfer services through M-PESA if they wanted while 2% of Micro and
Small businesses cannot access M-PESA services. It can be seen therefore that the high
penetration of the mobile phone among the MSEs in rural areas can serve to help the high
percentage of unbanked small business access financial services through M-pesa which helps
them to reduce costs. The mobile phone industry can therefore be seen as an ideal partner to
offer mobile services to MSEs in rural areas.
Figure 4. 1 Ownership of mobile phones
Nature of phone used in a business
Mobile phones were the ones mostly used in a business and had the highest perceived impacts
on their MSEs at 96% of the respondents while only 4% of the respondents used simu ya jamii
in their business. However, most respondents felt that fax machines and fixed lines were not
used in their businesses. This was contributed by the fact that most of the micro entrepreneurs

Proceedings of 1st JKUAT-SHRD Research Conference 12
th and 13
th September 2013
289
had no access to fixed lined and faxes machines and hence felt no impact about them on their
businesses. The mobile phones were the mostly available tool and effective communication
channel for conducting businesses transactions with the micro entrepreneurs’ due to their easy
accessibility to persons with limited resources and semi permanent structures as in the case of
jua kali /MSEs.
Figure 4. 2 Nature of phones used in a business
Education Level
The results are evidence that those running the Micro and Small business are High school
leavers at 73% followed by tertiary college at 13%, primary school level at 10% and only 4%
with university education level. It is evident that most of the entrepreneurs (83%) had secondary
education and below. Lack of school fees and formal employment could have been one of the
reasons that pushed these entrepreneurs into venturing into different types of businesses. Those
with little education are yet to realize the better side of running businesses due to lack of
information and adequate knowledge on how to run and sustain the MSEs to maturity.
Therefore, education matters a lot in running a small enterprise. University graduates holds only
at 4% who are involved in running small enterprises but not micro.
Education level has an effect on running the business and hence the profitability of that
business. Businessmen with different education levels perceive the importance of Mobile
Money Transfer services on their businesses in different ways. The higher the levels of
education, the better for the entrepreneurs’ to take advantage of different business changes.
There is a challenge posed to education level and skills training by the large numbers employed
in micro and small enterprises particularly on the advantages of the current technology by use of
mobile phones to help them reduce costs and increase profitability.

Proceedings of 1st JKUAT-SHRD Research Conference 12
th and 13
th September 2013
290
Comparison of mobile money transfer services, traditional banking and money transfer
companies
The study reveals that mobile money transfer services forms the highest percentage of banking
usage among the respondents at 86% as opposed to the traditional banking hall set up and
money transfer companies at 10% and 4% respectively. Respondents prefer using this mode of
service compared to traditional banking halls and money transfer companies because Mobile
Money Transfer Services holds the prospect of offering a low cost, accessible transaction
banking platform for currently unbanked customers in Kenya (Info DEV, 2006).
Additionally, the flexible operating hours of the M-pesa agents leaves them with greater
opportunities to satisfy banking requirements that may arise at any time. On the contrary,
Kenyan banks operate for an average of seven hours per day. The supplementary Automated
Teller Machines (ATMs) do not have a sufficient outreach since they are only available in
major towns. While money transfers companies are expensive, not reliable and takes more time
to deliver the service.
Figure 4.4 comparison of mobile money transfer services, traditional banking, money
transfer companies
Effect of M-PESA on sales revenue
The research revealed that 77% of the respondents interviewed agreed that mobile money
transfer services has an effect on sales revenue while 13% did not agree and a further 10% were
not aware whether MMTs has any effect on sales revenue. Most respondents felt that the use of
mobile phone money transfer services increases their sales revenue in the sense that customers
do not have to go to the bank to withdraw money so as to purchase goods and services as they

Proceedings of 1st JKUAT-SHRD Research Conference 12
th and 13
th September 2013
291
already have a mobile bank with them and can make purchases anytime, anywhere as they so
wish.
Figure 4.5 Effect of M-PESA on sales revenue
Respondents opinion if M-PESA has reduced costs and increased profitability
The research revealed that 77% of the respondents felt that M-PESA services reduces costs and
hence increases profits of a business, while 15% felt that it does not reduce costs and 8% do not
know. Mobile Money Transfer (MMT) services dramatically reduce the cost of delivering
financial services this is aptly demonstrated by the 77% score of the respondents interviewed.
CBK (2007), statistics put the average monthly cost of operating a current account with a
Kenyan commercial bank at over Ksh 900 ($13). M-pesa reduces the cost of basic banking
services to customers with over 60 percent from what it would cost through traditional channels.
The electronically managed transactions result in huge cost savings, the benefits of which are
transferred to the users. This is explained by the absence of charges at the time of registration. It
can be deduced that majority of MSEs seeking MMT attach a high consideration to the
monetary consequence of enrolling into a banking facility. Thus the absence of opening account
balance boosts their preference for the service.
Cost cutting techniques used in a business
From the survey conducted 75% of the respondents rated a mobile phone as the main cost
cutting technique used in their business followed by training at 10%, others at 7%, hiring
outside analyst at 6% and use of face book and twitter at 2% for marketing. Most MSEs use
mobile phones because majority of them own or have access to a mobile phone. Due to lack of
enough capital and knowledge majority of them cannot afford training in order to enhance their
business management skills and also hire outside analyst as majority do not even have
accounting books. They also lack knowledge or enough stock to use face book and twitter for
marketing purposes.

Proceedings of 1st JKUAT-SHRD Research Conference 12
th and 13
th September 2013
292
Category in which business uses M-PESA frequently
Mobile phone money transfer services are mainly used by MSEs for money transfer in their
business. The 48% consensus in response expresses this reality as a product like mobile money,
provides a faster, safer, traceable, long distance way to pay people (that doesn’t require change).
A further 42% uses the facility for social services such as making calls to say hello to friends
and relatives, watching TV, listening to radio, accessing internet, receiving sms from other
mobile operators and it is used as a way for workers in urban settings to send money home and
support their family. The 6% and 4% are used on political purposes and others respectively.
Small business owners and entrepreneurs in rural areas are also getting in the action of using
mobile money as a key part of their business. Many of them reported time and cost savings in
making mobile payments, and considerable efficiency improvements in their logistics and
customer service stemming from this medium.
Techniques applied in business to increase market share
The researcher noted that most MSEs in rural areas use a mobile phone in their businesses to
increase market share since they form a total of 82%. This is an indication that there is a need
for the businesses to diverse other better methods to increase their market share so that they
may not be competed out of the business
Rating of Mobile Money Transfer Services
According to the data collected the researcher noted that most respondents rated mobile money
transfer service as above average at 58%, excellent at 19%, average at 11%, satisfactory at 8%
and good at 4%. This shows that most of the MSEs have confidence and satisfaction in the
services provided by Safaricom providers.
Figure 4.10 Rating of Mobile Money Transfer Services

Proceedings of 1st JKUAT-SHRD Research Conference 12
th and 13
th September 2013
293
Recommendation of M-PESA to other people
The Research showed that a high percentage of respondents would recommend M-PESA
services to other people at 92% compared to those who would not at 8%. This shows how
effective and efficient the service is among the users who are satisfied with the success factors
attributable to its usage such as reduction in transaction costs, convenience, security, support
from the mobile payments provider and good relationship with the regulator and other banks.
How M-PESA has influenced the profitability of micro and small businesses
The research reveals that many of the business owners felt that by use of the mobile phone
money transfer system has helped their businesses to cut costs and hence increase their
profitability. Thus, 86% of the respondents agreed that it has made a tremendous positive
change in different sectors or areas of operation within the business. Only 14% of those who
own and transact using the service felt it was yet to bring about a positive change in terms of
cost savings and safety.
How M-PESA has influenced the profitability of micro and small businesses
The 86% of those who felt the system has helped their businesses increase their profitability
highlighted that it has helped their business save on cost, reduced number of times of going to
the bank i.e. time saving on queuing, it left individuals with more time to run and monitor their
businesses one on one, transaction fees were lower than those charged by most banks, it’s easier
to use it when paying for clients and customers in their rural areas, they used it to pay for the
goods and services like water , It reduced their transport cost and risks when sending cash
compared to other means.
Figure 4.13 How M-PESA has influenced the profitability of micro and small businesses
Conclusions
There are high chances for all the people in the rural areas to own a mobile phone and thus there
will be increased use of the Mobile Money Transfer services among the MSEs in rural areas.
Most of the MSEs are literate people due to current unemployment in formal sectors and
therefore institutions should come up with lessons to teach mobile phone usage technology
which is transforming the lives for better in the informal sector and train the public on business
benefits of mobile money transfer services. Based on the research model and research findings,
the government and the mobile service providers can enhance the micro business operators’ use

Proceedings of 1st JKUAT-SHRD Research Conference 12
th and 13
th September 2013
294
of the mobile payments and the digital technology by: Providing infrastructure that minimizes
congestion periods within the mobile network and enhance security measures.
This study identified that mobile money transfer service increases market share as more and
more people are increasingly using the mobile payment services and a more extensive research
should be conducted to bring out those factors that are necessary to ensure that the micro
businesses embrace the digital technology in the conduct of their business and enhance their
business performance not necessary for social network.
Mobile payment technology is increasingly being used by micro business enterprises in Kenya
as most respondents agreed to recommend MMTs to other people. These findings provide
evidence to support that the mobile payments users consider the technology to be convenient,
well supported and that perceived advantages will influence the behavior to use the technology.
There is evidence that the entrepreneurs have accepted the use of the technology and hence the
governments should provide appropriate policies to facilitate the use of the mobile technologies
in the MSEs and explore the viability of mobile commerce in the informal sectors. The policy
makers, ministry of finance, ministry of labor and human resource development and mobile
service providers should educate the masses more about the benefits of integrating and using
mobile technologies to enhance small businesses and also the need to enhance technical
capabilities of entrepreneurs to allow widespread use of emerging technologies in MSEs.
Recommendations
Studies that have been done so far on information and communication technologies (ICTs) in
the informal sector have focused on the internet and computer usage rather than on applications
of a mobile phone, and yet the mobile phones are wide used in the informal sector for business
transactions. The researcher recommends that institutions should come up with policies to
educate individuals on the importance of ICTs also focusing on mobile payments by use of
phones but not only computers. The training should not only concentrate on computer studies
but on information and communication technologies. There is need to popularize the connection
between computers and other ICTs, in particular, the mobile phone which is widely used.
Research work for this report showed that rural people are entrepreneurs; what might be lacking
is exposure, and the right business environment and infrastructure.
Policies to encourage innovation among the MSEs should be formulated so as to create jobs
within the sector, as stipulated in Kenyan Vision 2030. The people who publicly demonstrate
new inventions in mobile phone applications should be identified and facilitated so as to
continue with their inventions.
It is commendable that the Kenyan government has removed tax from mobile handsets making
mobile phones affordable by many people. Nevertheless, it should also assist in bringing down
the cost of airtime further so as to induce most of the MSEs in using the mobile money transfer
services. Internet enabled mobile phones are already on the Kenyan market and most MSEs in
rural areas do not use these service therefore training is required to enlighten rural people as the
internet is important for the import or export of goods, and MSEs that would like to participate
in global markets should be given a chance to make informed market choices by being
enlightened on.

Proceedings of 1st JKUAT-SHRD Research Conference 12
th and 13
th September 2013
295
REFERENCES
Aker, J.C. (2008). Does digital divide or provide? The impacts of cell phones on grain Markets
in Niger. Working paper 154. New York: Center for Global Development
Anuradi, S., Tyagi, R. and Raddi, S. (2009). “Mobile Payment 2.0: The Next-Generation
Model,” in HSBC”s Guide to cash, Supply Chain and Treasury Management in Asia
Pacific.Ed.178 183.
Arunga, J.and Kahora, B. (2007). Cell phone Revolution in Kenya. International Policy
Network.
Bungoma District website: <http://www.bungomadistrict.co.ke> Accessed on 25th October,
2011.
Communications Commission of Kenya, (2008/09). Communications Statistics Report.
Donner, J. (2005). Research Approaches to Mobile Phone Use in Developing world: A Review
of literature. The Information Society, 24, 140-159.
Donner, J. and Escobari, B. (2009). A Review of the Research on Mobile Use by Micro and
Small Scale Enterprises (MSEs). A paper presented at international conference on
Information Communication Technologies and Development, IEEE, Doha Qatar.
Accessed on October 12, 2011 from http://ictd2009.org/
Kothari, C.R. (2004). Research Methodology and Techniques. Second edition, new age
international (p) limited publisher.
Morawczynski, O. (2008). Surviving in the ‘dual system’: How M-PESA is fostering urban-to-
rural remittances in a Kenyan Slum. Pretoria: International for Information
Processing.
Morawczynski, O. and Pickens, M. (2009). Poor people using mobile financial services:
Observations
Nachmias, C.F. and Nachmias, D. (2004). Research methods in Social Sciences. London:
Stevenson, L. (2005). Support for Growth-Oriented Women Entrepreneurs in Ethiopia, Kenya
and Tanzania, an Overview report, International Labour office, Geneva.

Proceedings of 1st JKUAT-SHRD Research Conference 12
th and 13
th September 2013
296
MANAGEMENT OF OPERATIONAL RISKS AND LOAN PORTFOLIO QUALITY: A
SURVEY OF MICROFINANCE INSTITUTIONS IN KISII MUNICIPALITY
Maobe Clecensia Kemunto* & Margaret Oloko
Jomo Kenyatta University of Agriculture and Technology
Abstract
Microfinance institutions are exposed to risks for which most of them lack the capacity to
effectively manage hence impacting negatively on their portfolio quality. The risks rage from
financial, through operational to strategic risks. For most MFIs, operational risks are the most
important because it is this area that a MFI stands to lose most. This study focused on two
methods of managing operational risks. These are investment in human resources which is used
to manage human resource risk and standardization of internal policies which is used to mange
strategic risks. The general objective of this study was to establish how MFIs manage
operational risks and how this influences their portfolio quality. The specific objectives were: to
determine the influence of investment in human resources on loan portfolio quality and to
establish the influence of standardization of internal policies on loan portfolio quality. The
researcher used a descriptive research design. From a target population of 59 composed of
credit officers and managers of eight MFIs, a sample of 50 respondents was selected through
stratified purposeful sampling. Using questionnaires, quantitative information was collected
and organised in tables and analysed using percentages and frequencies while qualitative data
was presented through narrations. From the results, investment in human resources has
enabled MFIs to improve portfolio quality up to 61% and most MFIs strictly implement their
integrated policies up to 73%. It is evident that internal policies contributed more to better
portfolio quality than investment in human resources. The findings of this study will provide the
managers of MFIs with more effective techniques of managing risks and be able to isolate
specific areas for capacity building for enhancing their portfolio quality thereby improve the
quality of investment for investors. The researcher recommended employment of enough staff,
offering competitive compensation and incentive schemes to retain key staff and use optimum
policies for better portfolio quality. Two areas suggested for further research are, the influence
of organizational structure on MFIs portfolio quality and optimal policies for maximization of
portfolio quality.
Key words: Microfinance institutions, operational risks, risk management, portfolio quality,
portfolio at risk and internal policies.
Background of the Study
Microfinance institutions (hereafter MFIs) are organisations that lend small loans to the poor
and small entrepreneurs who cannot access mainstream bank loans due to lack of collateral and
unreliable sources of income. The mission of most MFIs is to incorporate the lowest sector of
productive labour force into the formal financial system and thereby expand the financial sector
reach (Maria, 1998).
Kumar (2011) states that MFI’s role as financial intermediaries offering small, short-term and
unsecured credit, makes microfinance business risky. Furthermore as (Anderson, 2009) notes,
MFI’s dependence on subsidised funds, their a large clientele , lack of good MIS, and pressure
to cut costs expose MFIs to several risks for which they lack proper systems to manage.
According to (Khan, 2010), the risks range from financial, through operational; to strategic
Proceedings of 1st JKUAT-SHRD Research Conference 12
th and 13
th September 2013
297
risks. For many microfinance institutions, operational risk is the most relevant because it is this
area that MFIs stands to lose the most (Sabetta, Isem,Joyce,Leman,Brandy,Mc Cord, and Sbana
2003). The Rural Financial Learning Centre (RFLC) (2010) categorised operational risks into:
human resource risk and transaction risk among many others.
Techniques used to manage them are tailored to fit an MFI’s unique circumstance (Khan, 2000).
Allesi (2012) who was reporting for the Basel committee and Biswas (2010) concurred with
same opinion. These risks are growing putting MFI’s ability to handle them to the test Anderson
(2009). This is because MFIs have been slow to react to their changing environment (Lasclles,
2012) and have not integrated risk management concepts into their day to day activities
(Ruchmer et al 2012).
In India Kumar (2011) explains that operational risks are mitigated using the techniques like,
setting cash retention limits for branches and giving each branch a risk score to establish
branches with poor portfolio quality. In Cambodia, Naim, (2009), and Saleh, (2010) reporting
for the IFC conference, argued that the rise in portfolio at risk and NPLs was attributed to the
risk management systems of the MFIs. The proceedings recommended the following risk
management techniques: Comprehensive information systems to reduce over-lending; Strong
financial literacy and education; responsible ethical collection practices; and robust internal
control systems.In Nigeria according to Kieanyibe (2009) recommends the following techniques
in managing this risk: acquisition of qualified personnel for MFIs; developing the skill and
abilities of personnel; motivating staff to high levels of performance; and maintaining their
commitments to the MFIs. K-Rep bank is the oldest of the formal microfinance
institutions operating in Kenya (Karugu, 2007). This model MFI in Kenya’s microfinance
sector manages its operational risks through educational campaign; Training to increase
manager’s capacity ; Random operational checks; Enforcing human resource policies ;
Establishing a good relationship with the regulatory authorities through open communication ;
And ,using simple standardized cash transaction procedure.
Statement of the problem
Microfinance information exchange Market report (2010) show that while MFIs in Kenya are
able to maintain low financial and operational expenses, they register high Portfolio at Risk
(PAR). As contained in a Central Bank of Kenya report (2010), it is reported that the banking
industry had been registering high Non Performing Loans (NPLs) in the last three years.
According to the report there was a decrease in NPLs between 2009 and 2012. It is shown that
in 2009/2010, NPLs were 61.5 billion (7.4%).In 2010/2011, NPLs were 58.3 billion (5.4%). In
2011/2012, the NPLs were 57.5 billion (4.5%). Though there has been some decrease in NPLs,
the figures still remain high.Therefore this research sought to establish the extent MFIs have
implemented the techniques and how they influence loan portfolio quality in microfinance
institutions in kisii municipality.
General objective
The general objective of the study was to examine how MFIs in Kisii municipality manage
operational risks and how this influences the quality of their loan portfolio.
The specific objectives
1. To determine the influence of investment in human resources on loan portfolio quality.

Proceedings of 1st JKUAT-SHRD Research Conference 12
th and 13
th September 2013
298
2. To establish the influence of standardisation of internal policies on loan portfolio quality
Research questions
1. What is the influence of investing in human resources on MFI’s portfolio quality?
2. How does standardisation of internal policies influence MFI’s portfolio quality?
Justification
The findings of the study will be beneficial to the management of MFIs who will learn new and
more effective risk management techniques. They may also help them to isolate specific areas
for capacity building and technical assistance for enhancing the portfolio quality of MFIs.
Investors will benefit from improved quality of their investment. Employees may enjoy job
security as a result of reduced loan losses as the money saved may be used to improve their
compensation.
Literature review
Investing in human resources
In this section the review will focus on how the use of major human resource principles
including recruitment, compensation, training and motivation by microfinance to manage the
human resource risk.
Human resource risk is the risk that a MFI hires incompetent staff and management or fails to
retain them leading to inefficiencies and ineffectiveness and consequently losses (Allesi, 2010).
MFIs handle many small loans which require large staff that are expected to manage cash using
either manual or computerised methods yet most microfinance employees are of limited
educational qualification or computer skills which enhance operational risks. If there is
continuous and large turnover of key management and staff, it will certainly affect performance
of a MFI (UNH- SMDP, 2010).
The quality of human resource plays a key role in the success or failure of a MFI. Good human
resource can meet most challenges while weak human resource enhances operational risks
(Allesi, 2010). Therefore its quality needs to be assured right from the recruitment stage.
Human resources are the MFIs staff and managers that execute or oversee processes
(Arunachalum, 2011). Arunachalum explains that personnel should be qualified and competent
and perform as expected. They should understand the MFI’s mission, values, policies, and
processes. MFIs should design compensation programs to attract, develop, and retain qualified
personnel. In addition, compensation programs should be structured in such a manner that
encourages strong risk management practices. This involves activities like training and capacity
building, competitive remuneration and motivation.
As Ross (2010) notes, the private sector has shown time and again that the organisations that
“get” the people side of things are more successful than those that don’t. As far as training is
concerned, human capital is one area that is often overlooked, though it was one of the causes of
India’s Andhra Pradesh microfinance unrest as Ross wrote.
According to Grammling and Holtmann (2007) short term individual staff incentives can
produce significant positive effects on loan officer productivity and loan portfolio quality. An

Proceedings of 1st JKUAT-SHRD Research Conference 12
th and 13
th September 2013
299
MFI can dramatically reduce its vulnerability to most risks if it has well trained and motivated
employees. In his hand book, Churchill (2001) explained that this can be accomplished through
a three pronged strategy: Hiring staff with the right values, training and rewarding. Norell
(2001) in his study of the Georgian credit fund, recommend training and rewarding staff to keep
them motivated and enthusiastic about their work.
Standardisation of internal policies
The review in this section is aimed at finding out the internal policies proposed by other
scholars in the management of transaction risk faced by MFIs. These guide microfinance
employees to work towards a common goal and thus maintain the institution’s portfolio quality.
Transaction risks refer to risks that affect all products and services on a daily basis in a MFI as
transactions are processed. They are particularly high for MFI because they handle many small
short-term loans on a daily basis which create opportunity for errors and fraud. Examples of
transaction risks include skipped or wrongly documented or posted figures (Allesi, 2010).
According to Arunachalum (2011), policies often define the limits for various actions and set
standards (on risk tolerance, for example) and should be consistent with a MFI’s underlying
mission, values and principles. According to Norell (2001), the policies should be crafted by the
board of directors and dully understood by credit officers. One of the actions where policy is
necessary is loan restructuring and loan refinancing as most restructured loans end up not being
paid MABS (2005). MFIs need a policy to regulate and track cash movement against collection
for MFIs operating in remote areas can be defrauded. Kumar (2011) argues that setting cash
retention limits for branches with deviations approved and recorded can improve portfolio
quality by reducing fraud risk.
However for the policies to work properly Mbeba (2007) cautions MFIs that there should be
delegation and segregation of duties to assist a MFI to avoid fictitious loans which raise the
value of NPLs and for staff to be responsible. To reinforce separation of duties and MFI needs a
transparency policy to ensure policies are followed (Eliane, 2012). According to Norell through
policies, it is better to prevent risk than treating it. Clients should understand from the onset that
arrears will not be tolerated and each credit officer’s portfolio record should be tracked. In a
survey carried out by the Pakistan microfinance network, Haq and Khalid (2011) found out that
most microfinance recognised that fraud especially at loan staff level caused dire implication as
it encouraged wilful default at client level.
The survey findings recommended that fraud can be managed by: ensuring the existence of
robust risk mitigation strategies and internal control measures; and reviewing staff incentive and
salary structure. Mosin and Sharon (2009) have given various policies like loan approval
policies; loan provisioning policies; and loan write-off policies.
In their study on the role of various factors on portfolio quality, Gonzalez and Javoy (2011)
came up with findings that policies used should be strict in order to achieve high loan
performance. In their study on performance of MFIs in Meru, Moti, Masinde, Mugenda and
Sindani, M.(2012) found out that microfinance institutions should adopt stringent policy as a
method of collecting loans as compared to lenient policy.

Proceedings of 1st JKUAT-SHRD Research Conference 12
th and 13
th September 2013
300
Loan Portfolio quality
Portfolio quality also called loan repayment, according to Rosenberg (2009), and CGAP (2006),
is the indicator used to measure financial performance of microfinance. It measures how well
the lender is collecting its loans. It is measured using Portfolio at Risk (PAR) Tainytsky (2011)
using the following formula.
Principal balance of loans with missed payment one day or month
PAR =
Total principal loan balance
Poor Loan portfolio quality means lack of microfinance sustainability and failure.
Figure 1: Conceptual Framework
Figure 2.1 Conceptual framework model which was used to illustrate the relationship between the
independent variable (x) and dependent variable (y).The arrows show the direction of influence of
human resources and internal policies on portfolio quality.
Methodology
Research design: In this research, descriptive research design which Sounders (2009) define as
one that portrays an accurate profile of persons, events or situations. The research portrayed the
risk management methods as they are used by MFI and explored how they influence their
portfolio quality.
Target Population: According to Mugenda and Abel (2004), target population is the population
to which a researcher wants to generalize the results of the study. It is obtained from the
population which Malage (2009) defines as the entire group under study. The target population
of this study consisted of eight institutions offering microfinance within Kisii municipality. The
target population therefore consisted of a total of 59 employees.
Sample and Sampling technique: Sampling is the procedure by which some members of a
given population are selected as representatives of the entire population (Malage, 2009). From
the population of 59, a representative sample was calculated using the formula by Glenn D. I
(2012): n= N / [1+N (e) ²] where n is the sample size, N is the population size and e is the
precision level (5%). Based on the formula, the sample size was therefore 50. The number of
respondents sampled from the credit officers was obtained using the formula while all the eight
managers were included. This sample generated information on the risk management techniques
Investing In Human
Resource
Portfolio Quality
Internal Policies

Proceedings of 1st JKUAT-SHRD Research Conference 12
th and 13
th September 2013
301
used, the people responsible for their implementation and their impact on the value of the MFIs’
loan portfolio quality.
Data collection instruments: The instrument consisted of questionnaires which were
administered to the loan officers and risk managers after a successful pilot study. The
questionnaires were designed with both closed and open ended questions derived from the
research questions. It was delivered to the respondents who were requested to fill them up in a
period of two weeks, and then they were picked later.
Reliability and validity of the instrument: Reliability is the ability of the research instrument to
give the same results after repeated tests in a research (Mugenda and Mugenda 2003). The
reliability of the instrument for this study was determined during the pilot study which was
carried out on non-sampled population of similar institutions and workers in Nyamira town. On
analysis, it was established that the responses were answering the research questions, indicating
that the instrument was reliable. As for validity, the researcher relied on the experts’ judgement
by the supervisors and lecturers of the university. Then necessary adjustments were made to the
instrument before administering it for the main study.
Data collection procedure: Data was collected from the sampled credit officers and managers
of the various MFI’s after a brief introduction to the respondents with the aim of establishing
rapport, obtaining permission and informed consent. This included explaining the nature and
importance of the study to the respondents. Filled up instruments were picked later.
Data processing and analysis: The data collected was analysed using quantitative measures,
that is, frequencies and percentages. Then interpretations on the impact of the individual
techniques on the portfolio quality as well as generalisation were made. The information was
presented using frequency tables.
Results and discussions
Study Response Rate
The researcher issued 59 questionnaires to the respondents. On collection 42 of them were
received. This reflected a response rate of 84%.
Employee’s Demographics
The Study captured relevant characteristics of bank workers including employees’ designation,
work experience and departmental staff size. Results indicated that 90% of respondents were
credit officers and that 81% respondents had worked for less than five years. Fifty nine percent
of respondents felt their staff size was small.
The influence of investing in human resources on a MFI’s loan portfolio quality
The effect of investing in human resource and its influence on the portfolio quality was tested
using various questionnaire items as discussed bellow. The results were summarized in the table
below.

Proceedings of 1st JKUAT-SHRD Research Conference 12
th and 13
th September 2013
302
Table 4.4 Influence of investment in human resources on loan portfolio quality
Area investment percentage of MFIs
Advertising 83%
Networking 64%
Staff size 68%
Information on recruitments 71%
Training 83%
Orientation 78%
Compensation 59%
Incentive 67%
The results indicate that advertising is used more by 83% of MFIs to recruit the right staff.That
71% of them recruit with enough information. Training is emphasized by 83% of the
institutions too together with orientation of employee. However, 68% institutions have
inadequate staff. It is also evident that the level of compensation is low for 59% of the
respondents. Motivation for employees is satisfactory for only 67% of the institutions.
Influence of standardization of internal policies on loan portfolio quality
Table 4.5 Influence of standardization of internal policies on loan portfolio quality
Policy Percentage of respondents
Approval of loan restructuring and refinancing 95%
Setting cash limits for branches 47%
Dual signature for all transactions 100%
Assigning clear responsibilities to staff 88%
Compulsory leave for errant staff 47%
Separation of duties 83%
Loan write-off 36%
Review of policies 71%
The results show that the dual signature policy is full adhered to, followed by approval of loan
restructuring and refinancing policy at 95% and assignment of clear responsibilities for835 of
MFIs. The other policies are not strictly followed. This contributes inefficiencies in loan
tracking and monitoring. This could be the reason why the policies are reviewed any time it
Proceedings of 1st JKUAT-SHRD Research Conference 12
th and 13
th September 2013
303
becomes necessary. Generally 73% of respondents agreed that policies do influence their
portfolio quality.
Conclusions
The major aim of this research was to establish how MFIs institutions manage their operational
risks and how this influences their portfolio quality. What emerged is that the portfolio quality
is a function of investment in human resources, internal policies and information system
security. From the findings, the two operational risk management methods depicted strong
influence on the MFIs portfolio quality. Internal policies ranked first at 73% and investment in
human resources second at 61%. This implies that human resource remains the most
challenging to the institution’s performance. Some of the human resource areas that raised
concern include the small staff size, low compensation level, employee’s short work experience
and unsatisfactory motivation of employees which prevented the MFIs from achieving optimum
performance.
While most of the policies are strictly applied, some like the separation of duties, loan write-off
policy and compulsory leave for errant employees are not strictly adhered to. This explains why
some MFIs experience poor portfolio quality. On the antifraud policy the cash limits are
sometimes exceeded, while some MFIs do not design clear responsibilities for their managers.
This lowers the portfolio quality because they encourage malpractices like kickbacks in return
for camouflaging a loan to be a defaulted loan or allowing a client to take more loans even
without ability to pay. This survey was subject to certain limitations neutral responses, which
represented a blind sport in the data, differing interpretations of questions and the interest of
respondents which could have distorted the influence of the risk management methods on
portfolio quality. The small geographical area covered makes generalization of conclusions to
be done with caution.
It is hoped that research on operational risk management in MFIs will be extended to widen the
microfinance industry’s understanding of the importance of operational risk management.
Otherwise from the research results, use of the two operational risk management methods has
enabled MFIs to register good portfolio quality for.
Recommendations
Microfinance can "get the people side" by sticking to the professional recruitment of employees.
Given the many weaknesses of networking as a recruitment method, the researcher recommends
the use of advertisement of vacancies to get the right people. More investment to increase staff
size and revision of their compensation and incentive schemes to make MFIs more competitive
and to retain employee for longer periods is also recommended. According to the findings it
seems policies are not strictly adhered to due to issues surrounding the microfinance
institution’s human resources and technological issue. The researcher recommends the use of
optimum policies that can work for a MFI unique circumstances. MFIs should ensure that every
credit officer has all the technological facilities to prevent unauthorised access to information.
References
Allesi, C. (2011). The Basel Committee on banking supervision: Principles for sound
Management of operational risks, June 2011. Bank for international settlements.

Proceedings of 1st JKUAT-SHRD Research Conference 12
th and 13
th September 2013
304
Anderson, J. (2009). Commercialization of microfinance: Portfolio aspects of turning Banker to
the poor. Microfinance Technologies Case Study. MicroREPORT#USAID Publication.
Biswas. (2010).India’s microfinance suicide epidemic: BBC News, Medack, Andhra Pradesh.
CGAP (2013).Microfinance. Gateway.
Eliane, A. (2012). Best practices for financial transparency in microfinance. PlaNet Finance
Guide.
Glenn, D. (2012). Determining sample size: PEOD6, Agricultural Education and
Communication Department, Florida Cooperative Extensio Services, Institute of food
and agricultural sciences. University of Florida.
Gonzalez, A., & Javoy, E. (2011). Microfinance and the role of Policies and Procedure in
Saturated Markets and During Periods of Fast Growth Microfinance Information
Exchange and Planet Rating, September 2011.
Grammling, M., &Holtmann, M. (2007).What are the most effective incentive Scheme? :
Results from two global surveys. CGAP Microfinance Gateway.
Khan, S. (2010). Risk management in microfinance institutions: The ASA Experience, ASA
International Nigeria.
Karugu, W., & Kanyagia, D.(2007). K-REP Bank: Alleviating poverty through Micro- Finance.
United Nations Development Programme.
Kieanyibe, O.(2009). Human Resource Management for Sustainable Microfinance Institutions
in Nigeria: Global Journal of social science, Vol.8, 2009:119-134; Bachudo science co.
LTD, Nigeria.
Kumar, G. (2011). Managing Risk in Microfinance: IFMR capital, February 16 Th,
2011. The
Hindu Business Line.
MABS (2005). Microfinance loan restructuring policies and procedures.
Mix Market (2010) Microfinance in Kenya: Country Briefing. Washington D C: July 2010, 12
Mosin, S.(2009). Sample Credit Policies and Procedures Manual. Microfinance Institutions
(MFIs) Upgrading and Rating Initiative of the Development Bank of Austria (OeEB) in
East Africa. October 2009.
Moti, H.,Masinde,J., Mugenda, N.&Sindani,M.(2012). International Journal of
BusinessHumanities and Technology. Vol.2 No.6; October 2012.
Mugenda,O. & Mugenda, G. (1999). Research Methods; Quantitative and Qualitative
Approaches. Acts Press Nairobi.
Naim, A. (2009). Working in the context of today’s crisis, managing the risk and Challenges,
Cambodia’s microfinance amid the global finance crisis. Conference proceedings,
Phnom Penh Conference August 19-20 2009, IFC Advisory services.

Proceedings of 1st JKUAT-SHRD Research Conference 12
th and 13
th September 2013
305
Rosenberg, R. (2009). Measuring Results of Microfinance Institutions: Minimum Indicators
That Donors and Investors Should Track. CGAP.
Ruchmer, C. (2012). Risk management seminar.
RFLC (2010). Lessons for microfinance: Lesson 10 Managing Arrears and Defaults.
Sahid, A. M.(2008).Human Resource Development in Microfinance Institutions. Sept 2008.
Sabetta, J., Isem J., Joyce, Lehman, Brandy H., McCord M., Sbana B. (2003).Operationa risk
management for microfinance – CGAP. Promotion of Microfinance. 02 Feb 2009
McroSave Market-led Solutions for Financial Services research paper.
UNH-SMDP (2010) Nuts and Bolts of Microfinance-Risk Managements

Proceedings of 1st JKUAT-SHRD Research Conference 12
th and 13
th September 2013
306
A MODEL TO ENHANCE SAVINGS AND CREDIT COOPERATIVE SOCIETIES
MEMBERS’ INVESTMENT CULTURE IN KENYA
Onchangwa, Gilbert. A* & Memba, Florence, S
Jomo Kenyatta University of Agriculture and Technology
E-mail: [email protected]
Abstract
A high saving economy accumulates assets faster and thus grows faster than a low saving
economy. The investment culture is very low in Kenya. Kenya’s vision 2030 for financial
services is to create a successful and globally competitive financial sector that promotes high
levels of saving and financing for Kenya’s investment needs. This vision can be fully
achieved if cooperative societies in Kenya can improve the investment culture of their
members. This study, therefore, sought to establish a model that can enhance cooperatives
members’ investment culture in Kenya. The study adopted descriptive research design. A
population of 25145 members of all the 8 registered Savings and Credit Cooperative
Societies (SACCOs) in Gucha district was targeted. Simple random sampling was used to
select a random sample of 379 respondents from a population of 25145 SACCO members.
Both closed and open ended questionnaires were used to collect primary data. Secondary
data was obtained from periodicals, internet and published SACCO reports. Data was
analyzed using statistical techniques with the help of Excel computer software. Multiple
linear regression was used to model the relationship between the study variables. The
findings in this study showed that saving in SACCOs influence the investment culture of their
members. Moreover, consumption was found to reduce investment. The regression model
connecting investment (dependent variable), savings and consumption (independent
variables) was found to be Ŷ = 7543.415 + 0.9683X1 – 0.7653X2. The study concluded that
savings and credit cooperative societies improved the investment culture of their members.
The model Ŷ = 7543.415 + 0.9683X1 – 0.7653X2 was developed to enhance cooperatives
members’ investment culture. Based on the above findings, the following recommendations
were proposed: the government should mobilize the formation, strengthening and
restructuring of SACCOs with the aim of enhancing investment in order to achieve vision
2030 on financial services; in the same vein members’ consumption should be minimized as
it was found by the study to reduce investment; the government, donors and other
stakeholders should assist SACCOs to undertake member education about SACCOs
operations, credit, shares and investment.
Key Words: investment, savings, consumption, culture
Introduction
Through investment a country can sustain its growth and development. High rates of
investments depend on high rates of saving (Pelrine & Kabatalya, 2005). Many scholars have
written on investment but little effort has been made in establishing a model that can enhance
cooperatives members’ investment culture in Kenya. According to Lipsey and Chrystal
(1995) a high saving economy accumulates assets faster and thus grows faster than a low
saving economy. SACCOs link borrowers and savers (Tache, 2006). The savers pool their
money as savings and shares against which they borrow in form of loans. SACCOs are not-
for- profit- organizations as their basic purpose is to help members save (Kyendo, 2011).
Bailey (2001) defines SACCOs as cooperatives which provide their members with

Proceedings of 1st JKUAT-SHRD Research Conference 12
th and 13
th September 2013
307
convenient and secure means of saving money and obtaining credit at affordable interest
rates.
According to Tache (2006) SACCOs were invented in south Germany in 1846 by two
community business leaders: Freidrich and Herman. The two are the founding fathers of
SACCO movement. In Italy, Luigi Luzzatti established saving and credit cooperatives which
combined the principles established by the two business leaders. The SACCO movement
spread all over Europe, Northern America, Latin America, and Asia from 1900 to 1930 and
thereafter to Ghana by a catholic Bishop. Towards the end of 1950s African farmers
promoted and registered cooperatives for cash crops like pyrethrum and coffee. Mudibo
(2005) suggests that cooperatives have played a prime role in the development of the
economies of Kenya, Uganda and Tanzania.
According to the Republic of Uganda (2008) cooperative movement in Uganda was started in
1913 to involve Ugandans in domestic and export marketing. SACCOs emerged in Kenya in
the years 1965-1970 (Chao-Beroff, et.al, 2000). The SACCOs came as a result of the credit
systems of the farming cooperatives. In these cooperatives farmers would access financial
services through the union’s banking sections. In the cooperatives’ banking sections farmers
saved and obtained advances that were serviced from income earned from the harvest. The
SACCOs’ banking services are provided even today in Kenya with already 219 SACCOs that
offer banking services spread all over the country (Kyendo, 2011). The first co-operative
society in Kenya was Lumbwa cooperative society (Bottleberge & Agevi, 2010). In 1908 the
European Farmers made this cooperative formal. Its main objective was marketing and
purchasing of farm inputs. According to KUSCCO report of 2011 cooperatives in Kenya
have led to the development in agriculture, storage, housing, fishing and credit. The Ministry
of Cooperative Development and Marketing (MCDM) conference report of 2010 indicates
that there are currently over 5200 registered SACCOs with over 5.6 million registered
members in Kenya.
Like in most African countries, cooperatives in Kenya have developed through two main
eras, that is, the era of state control and the era of liberalization (Wanyama, 2009). According
to Wanyama, the first era made cooperatives platforms for implementing socio-economic
policies to the extent that failure of state policies expressed themselves in the cooperative
movement. The failures saw the need for the liberalization of the cooperative movement in
early 1990s (Porvali, 1993). Wanyama (2009) argues that the new economic environment
that Africa experienced in the 1990s steered Kenya to formulate new policy and legislation
framework in 1997 in order to liberalize cooperatives.
The Government of Kenya recognizes cooperatives as the major contributor to national
development with the total population of Kenya estimated at 37.2 million people (Republic
of Kenya [RoK], 2008a). The ministry of cooperative development and marketing [MCDM],
2008) estimates that 63 % of Kenya’s population participates directly or indirectly in
cooperative based enterprises. Thus, the remaining Kenyans which constitute 37% do not
take part in cooperatives.
The policy governing cooperatives in Kenya is provided by sessional paper number 6 of 1997
(RoK, 1997a). The policy is on cooperatives in a liberalized economic environment (RoK,
1997b). This policy was formulated when the state withdrew control over cooperative
movement following the liberalization of the economy. The policy made cooperatives
autonomous and changed the government’s role from that of control to that of regulation.

Proceedings of 1st JKUAT-SHRD Research Conference 12
th and 13
th September 2013
308
However, the 1997 policy did not provide for the government’s supportive role of
development of cooperatives and was also silent on the cooperative societies Act of 2004.
This prompted the MCDM to formulate a revised policy framework called Kenya
Cooperative Development Policy 2008 which addresses restructuring, strengthening and
transforming cooperatives into successful economic entities.
In legislation, the Cooperative Societies Act of 2004 (RoK, 2004) guides the formation and
management of cooperatives in Kenya. The Act enhances state regulation of the cooperative
movement through the office of the commissioner for cooperative development. In addition
to this legislation there is the SACCO Societies Act of 2008 (RoK, 2008b) that provides for
the licensing, regulation, supervision and promotion of SACCOs by the SACCO Societies
Regulatory Authority (SASRA). SASRA licenses SACCOs to carry out deposit- taking
businesses called Front Office Service Activity (FOSA) and can also intervene in the
management of SACCOs that are mismanaged. SASRA is a Government agency under the
MCDM. For example, in intervening in management of mismanaged SACCOs the MCDM
has suspended senior managers and tellers of Ogembo tea SACCO in Gucha district over Ksh
20 million fraud (Moraa & Ambala, 2012). Mishkin and Eakins (2007) have shown that
SACCOs have characteristics that differentiate them from other financial institutions. The
characteristics include non- profit motive, tax exempt status, common bond membership and
mutual ownership.
Kenya’s vision 2030 for financial services is to create a successful and globally competitive
financial sector capable of promoting high levels of saving and financing for Kenya’s
investment needs (Adam, Collier & Ndungu, 2011). The county’s vision 2030 recognizes the
role of financial services in mediating between borrowing and investment. However, access
to financial services is a stumbling block which has led to low investment culture in Kenya.
This is confirmed by the world council of credit unions [WOCCU], 2008) that 38.3% of the
Kenyans are still not included in financial services and use. Kenya’s deteriorating
infrastructure and rising costs has made many foreign investors to divest or consolidate their
activities outside Kenya (United Nations Conference on Trade and Development
[UNCTAD], 2005). Moreover, the World Bank’s World Business Environment Survey
[WBES], 2000) indicates that investors rated the infrastructure quality very poorly, especially
roads, water and telecommunications. The vision 2030 for financial services in Kenya can be
fully achieved if SACCO members can transform their savings into viable investments.
Hence, this study sought to investigate into the influence of consumption and saving in
cooperatives on members’ investment culture in Kenya.
Statement of the problem
Investment can enhance income and promote productivity with the intention to break through
the vicious cycle of poverty (Keynes, 1936). However, the levels of domestic savings and
investment in Kenya have been very low (Lawrence, et al., 2009). The deterioration of public
infrastructure, governance problems and insecurity have discouraged private investment in
Kenya (UNCTAD, 2005). Moreover, some of the installed capacity has deteriorated due to
lack of investment or maintenance. World Bank (2003) approximates capacity utilization in
Kenya at 63%. Kenya’s vision 2030 for financial services is to create a successful and
globally competitive sector that drives savings and investments in the country. However, the
vision 2030 argues that access to financial services still remains low (Adam et al., 2011).
WOCCU (2008) has shown that 38.3% of Kenyans are not included in financial services and
use. All these indicate low levels of investment in Kenya. The problem of low savings and

Proceedings of 1st JKUAT-SHRD Research Conference 12
th and 13
th September 2013
309
investment comes at a time when African Confederation of Co-operative Savings and Credit
Association [ACCOSCA], 2011) workshop has classified SACCOs as vehicles for economic
growth. Moreover, the government of Kenya recognizes cooperatives as the major
contributor to national development with the country’s population approximately 37.2
million (RoK, 2008). Kyendo (2011) confirms that most SACCOs have been lending at 12%
per annum, which is lower than what banks have offered. The basic function of SACCOs is
to provide credit facilities at low cost (Saunders & Cornet, 2007). This is done through
pooling together members’ savings. SACCOs have been pooling together members’ savings
until 1990s when sector liberalization enabled them to diversify their financing sources
through offering of FOSA services (Owen, 2007). According to Landi and Venturelli (2002),
diversification of financing sources improves the performance of the diversifying institution.
The improved performance of SACCOs is assumed to translate into improved service
delivery to members including affordable loans that hopefully should enhance the investment
culture which is low in Kenya (Lawrence et al., 2009). This study therefore, sought to
develop a model that can enhance cooperatives members’ investment culture in Kenya
Objective
To develop a model that can enhance cooperatives members’ investment culture in Kenya.
Research hypotheses
Ho1: Savings and consumption do not influence members’ investment culture
HA1: Savings and consumption do influence members’ investment culture
The study variables were believed to obey the model I= f(S, C), that is Y = β0 + β1X1 + β2X2
+ µ where,
I = Y = investment
S = X1 = saving
C = X2 = consumption
β0 = the intercept term
β1 and β2 are the slope coefficients
µ = the disturbance
Methodology
The study was carried out using a descriptive research design. Simple random sampling was
used to select a ran the help of dom of 379 respondents from a population of 25145 SACCO
members. Both closed and open ended questionnaires were used to collect primary data.
Secondary data was obtained from periodicals and published SACCO reports. Editing and
sorting of data was done with the help of Excel computer software. Multiple linear
regression was used to model the relationship between investment, savings and consumption.
The study variables were believed to obey the model Y = β0 + β1X1+ β2X2 + µ where: Y =

Proceedings of 1st JKUAT-SHRD Research Conference 12
th and 13
th September 2013
310
investment, X1 = saving, X2 = consumption, β0 = the intercept term, β1 and β2 are the slope
coefficients and µ = the disturbance
Results and discussion
The study sought to establish a model that can enhance cooperatives members’ investment
culture. The researcher used the loans advanced by SACCOs to members to represent the
SACCOs influence on members’ investment culture. It is from the loans that the members
invested in various business activities. The Excel output for the data on investment, savings
and consumption was shown in table 1.
Table 1:Summary output
Regression Statistics
output
Multiple R 0.991371
R Square 0.982817
Adjusted R
Square 0.982689
Standard Error 39911.89
Observations 272
ANOVA
Significance df SS MS F F
Regression 2
2.45E+
13
1.23
E+1
3
769
3.05
4
4.2E-
238
Residual 269
4.29E+
11
1.59
E+0
9
Total 271
2.49E+
13
Coefficients
Standar
d Error
t
Stat
P-
valu
e
Lowe
r
95%
Uppe
r
95%
Lower
95.0%
Upper
95.0%
Intercept 7698.435
3109.9
71
2.47
5404
0.01
392
5
1575.
456
1382
1.41
1575.4
56
13821.
41
X1 0.967898
0.0094
14
102.
8176
6E-
218
0.949
364
0.986
432
0.9493
64
0.9864
32
X2 -0.75767
0.0744
8
-
10.1
729
8.87
E-
21
-
0.904
31
-
0.611
03
-
0.9043
1
-
0.6110
3
From the Excel output table 1, Ŷ = 7698.44 + 0.9679X1 – 0.7577X2.
Se = (3109.97) (0.0094) (0.0745) , t = (2.4754) (102.8176) (10.1729)
p = (0.0139) (0.0000) (0.0000), R2 = 0.9828
Proceedings of 1st JKUAT-SHRD Research Conference 12
th and 13
th September 2013
311
From table 1, β1 obtained is 0.9679. The positive coefficient indicate that holding the
influence of consumption constant, an increase in savings by khs.1, on average, increases
investment by about 0.97 cents. The findings were in line with Balassa (1989)’s study on
regression analysis who established a relationship between savings and investment. However,
the results contradicted Agu (1988) who concluded that the relationship between savings and
investment is insignificant.
However, the value of β2 obtained is negative. This shows that, holding the influence of
saving in SACCOs constant, an increase in consumption by khs.1, on average, decreases
investment by about 0.76cents. Moreover, the value of β0 obtained implies that when both
consumption and savings are zero investment is about kshs.7698 which is of less physical
meaning.
The values of t and p obtained shows that the parameters estimated are significant. This is
because t>2 and p<0.05. That is, t = 102.8176>2 for β1 and t = 10.1729>2 for β2. Similarly,
p = 0.000 for β1 and β2, showing that the parameter estimates, β1 and β2 are significant.
Moreover, the R2 obtained was 98.28% implying that about 98% of the variation in
investment is explained by both saving and consumption. Hence the remaining percentage of
about 2% of variation in investment is explained by other factors (µ) that affect investment
but are not taken into account explicitly by the model. This showed that the model was a
good fit and that the regression results make sense.
Since the value of t observed for β1 is greater than 2, that is, t = 102.8176>2 the null
hypothesis that SACCOs do not influence the investment culture of their members was
rejected. Moreover, the value of t observed for β2 is greater than 2, that is, t = 10.1729>2.
This led to the rejection of the null hypothesis that consumption does not affect investment
made by SACCO members.
Conclusions
From the foregoing, it follows that SACCOs influence members’ investment culture.
The study developed the model Ŷ = 7698.44 + 0.9679X1 – 0.7577X2, connecting
investment, savings and consumption that can guide the investment decision making of
SACCO members. The study further concluded that consumption reduces investment.
References
Adam, C., Collier, P., & Ndungu, N. (2011). Kenya. Policies for Prosperity. Oxford: Oxford
University Press.
ACCOSCA (2011). Attaining Sustainable SACCO Growth Using Regulation Framework.
June 15th
-17th
.
Bailey, T. (2001). Applying International Best Practices to South Africa’s SACCOs:
Published Dissertation. South Africa: De Mont Fort University.
Chao- Beroff, R., Cao, T.H.H., Vandenbrroucke, J.P., Musinga, M., Tiaro, E. &
Chinn, M.D., & Ito, H. (2007). Current Account Balances, Financial Development and
Institutions: Assaying the World “Saving Glut.” Journal of International Money and
Finance 26, pp.546-569.

Proceedings of 1st JKUAT-SHRD Research Conference 12
th and 13
th September 2013
312
Keynes, J.M. (1936). The General Theory of Employment, Interest and Money. London:
Macmillan.
Kyendo, M. (2011). The Growing Power of Savings and Credit Co-operative Societies in
Kenya (http://www. Investmentnewskenya.com/the- growing-power-of –saving- and
– cooperative- societies- in – Kenya/
Lipsey, R.G., & chrystal, K.A., (1995). An Introduction to Positive Economics, 8th
Edition.
Oxford: Oxford University Press.
Lawrence, K. K., Benjamin, K. M., Desterio, E. O., Shem, A. O., & George, O. (2009).
Determinants of Household Saving: Case Study of Smallholder Farmers,
Entrepreneurs and Teachers in Rural Areas of Kenya. Journal of Development and
Agricultural Economics vol 1 (7), pp. 137- 143.
Mudibo, K. E. (2005 November). Corporate Governance in Cooperatives: the East African
Experience. Report Presented at the 3rd
Pan- Afric Consultative Forum on Corporate
Governance, Dakar: Senegal.
Pelrine, R., & Kabatalya, O. (2005). Savings Habits, Needs and Priorities in Rural Uganda.
Kampala: USAID/ Rural SPEED.
Saunders, A., & Cornett, M.M. (2007). Financial Markets and Institutions: An Introduction
to a Risk Management Approach. 3rd
Ed. New Delhi: Tata McGraw-Hill Publishing
Company.
Copyright © 2022 FDOKUMEN