Job Tenure in Australia and Britain: Individual Versus Workplace effects
41
Discussion Papers in Economics Department of Economics and Related Studies University of York Heslington York, YO10 5DD No. 2000/16 Job Tenure in Australia and Britain: Individual Versus Workplace effects by Karen Mumford and Peter N Smith
Transcript of Job Tenure in Australia and Britain: Individual Versus Workplace effects

Discussion Papers in Economics
No. 2000/62
Dynamics of Output Growth, Consumption and Physical Capital in Two-Sector Models of Endogenous Growth
by
Farhad Nili
Department of Economics and Related Studies University of York
Heslington York, YO10 5DD
No. 2000/16
Job Tenure in Australia and Britain:
Individual Versus Workplace effects
by
Karen Mumford and Peter N Smith
1
JOB TENURE IN AUSTRALIA AND BRITAIN: INDIVIDUALVERSUS WORKPLACE EFFECTS*
Karen Mumford and Peter N. Smith
Department of EconomicsUniversity of [email protected]
March 2000.
Abstract JEL # J2The distribution of individual job tenure is a revealing measure of job stability. We considerdifferences in individual job tenure between Australia and Britain. We employ linked data forindividual employee and workplace characteristics. This enables us to distinguish between theeffects of demographic, education, job characteristics, occupation and work environment for theindividual, as well as of the workplace in which they work. Whilst, the various individualcharacteristics are, as a group, found to be essentially uncorrelated with the workplace effect, thisis not true for women and non-white employees. We find that the lower tenure rates associatedwith membership of these groups is predominantly captured by workplace effects suggesting somedegree of labour market segmentation, especially so in Britain. We also find union membershipto be strongly related to longer tenure in both countries, supporting the union-voice literature.
Key words: job tenure, individual, fixed-effects, voice, segmentation.
AcknowledgementsThis paper is based on the preliminary release of the WERS98 datasets. We thank the WERS98sponsors - the Department of Trade and Industry, the Economic and Social Research Council, theAdvisory, Conciliation and Arbitration Service and the Policy Studies Institute - for allowing earlyaccess to the data. They are not responsible for any of the findings or claims made in the paper.We would like to thank participants of the WERS98 workshops, especially Willy Brown, AlexBryson, John Forth, Andrew Hildreth, Paul Latreille, Ben Knight, Steve Machin, PaulMarginson, Keith Whitfield and Stephen Wood.

2
1Gross and net worker turnover are also identified in Mumford and Smith (2000) as measures of employmentchange which can be meaningfully compared.
1. Introduction
The issue of the stability of jobs has increasingly become a question of public and professional
interest over the last two decades. A recent focus of this interest has been on the possible changes
in the distribution of worker’s tenure. In particular, authors have examined the question of
whether jobs are less long lasting than they used to be. Whilst the results from these papers are
far from uniform, they do suggest that in the US there has been some decrease in tenure (albeit
modest) amongst those white males who had previously had relatively long tenure, amongst
blacks and amongst young adults (Neumark et al, 1999). Similarly, the UK has seen some fall
in the average male tenure (Gregg and Wadsworth, 1995), especially so amongst the lower paid
(Burgess and Rees, 1996), although again these changes are not dramatic (Nickell, 1999). None
of these papers, however, consider the cross-sectional distribution of tenure and it’s
determination. This is the focus of our paper.
Tenure is one of a number of measures of job stability. We could alternatively identify quit
rates or total separations1. An advantage of tenure as a measure of stability is that it captures
longer run, more permanent behaviour. A drawback, as Freeman (1980) notes, is that the job-
related information we have from survey data relates primarily to current job conditions rather
than to earlier periods of the relationship between worker and firm. This may especially affect the
interpretation of the influence of attitudinal questions.
Much of the existing literature on job tenure has concentrated on the extent to which the
presence of trade unions increases individual job tenure by providing a ‘voice’ for grievances as
well as increased wages, both resulting in lower quit rates. The analysis in this literature, initiated
by Freeman (1980) and Freeman and Medoff (1984) was restricted by the nature of the available
datasets which provided little demographic and job-related information in addition to measures
of individual tenure. In particular, none of the existing studies employ any substantive workplace
information. In contrast, our paper employs datasets which are built on linked employee-
workplace survey information.
In this paper we compare and explore the determinants of the distribution of job tenure
amongst employees in both Britain and Australia. In so doing, we will consider differences in the

3
nature of the workplaces; the characteristics of the employees; and (to a limited extent) the nature
of the regulatory systems across the two countries. This study is possible due to recently produced
linked surveys of workplaces and their employees in the two countries (the Australian Workplace
Industrial Relations Survey 1995, AWIRS95, and the British Workplace Employee Relations
Survey 1998, WERS98). Whilst such a detailed study of tenure has not been carried out for these
countries before, our paper follows a small but nevertheless important literature of previous
comparisons and contrasts between the two countries’ economic and industrial relations systems.
A more complete explanation of the distribution of individual and workplace tenure
contains both labour supply and demand elements. Thus, the inclusion of workplace effects in
addition to the labour supply determinants that feature in the work following Freeman (1980) may
play an important role. We will explicitly consider the role of changes in workplace labour demand
on job tenure by incorporating features of the Cabellero and Hammour (1994) model of job
reallocation into our analysis at the workplace level. There is an obvious link between higher job
reallocation rates and lower average tenure in a workplace since anything which increases new
hires will decrease average tenure ceteris paribus as will anything which increases separations.
Mumford and Smith (2000) explored this relationship more fully by considering job reallocation
and average tenure as alternative dependent variables for Australia. They found that, with the
exclusion of training, variables which were found to have a significant effect on job reallocation
had a significant and opposite effect on average tenure.
In this study, we propose to extend these earlier papers by concentrating on the
determination of individual worker tenure given knowledge of the average tenure and
characteristics of the workplace where they are employed. In particular, we are interested in
discovering if low tenure individuals are concentrated in workplaces which have low average
tenure (and vice versa) and if this is true in both Australia and Britain. In so doing, we will
explicitly consider the industrial relations practices within workplaces and the implications of these
practices on tenure rates. We also want to know whether there are identifiable characteristics of
individual employees which makes them more likely to have shorter tenure than their workplace
average (and vice versa). We find that individual and workplace effects explain, on the margin,
about equal amounts of the variation of individual tenure in both Britain and Australia. This result
emphasises the importance of allowing for workplace effects. Furthermore, the two sets of
variables are essentially uncorrelated with one another.

4
An important related issue is that of labour market segmentation. For example, it is
possible that the labour market is in some ways divided into workplaces which offer better
working conditions, are more attractive places of employment and are associated with longer
tenure, and those that are not (Doeringer and Piore, 1971, and Taubman and Wachter, 1986). It
has previously been shown that females and non-white employees have shorter tenure (Burgess
1998, and Neumark et al, 1999). Here we show that in our datasets this result is predominantly
due to the nature of the workplace they are employed in. Important differences between Australia
and Britain are clear here too. We find that the apparent segmentation of females and non-whites
into workplaces characterised by shorter tenure is significantly stronger in Britain than in
Australia. Indeed, in Britain the shorter individual tenure effects of females and non-whites
disappear once workplace effects are allowed for.
In section 2 of the paper we examine and contrast the industrial relations environment in
Britain and Australia. Having described the data sets in section 3, we go on to discuss the
determination on individual and workplace tenure job tenure in section 4. Section 5 discusses
econometric issues whilst section 6 evaluates the estimation results. We conclude in section 7.
2. The industrial relations environment in Britain and Australia.
Australia has a highly legalised and central system of industrial relations (including compulsory
third party arbitration) which has been in place since the Conciliation and Arbitration Act of 1904.
This Act encouraged the growth of large national based unions; agreements between the parties
are ratified by the court as awards and are fully legal documents; and collective agreements have
historically been fully facilitated by the system. In contrast, since the Trade Disputes Act of 1906,
Britain has encouraged a non-legalistic industrial relations environment: parties could not claim
damages resulted from disputes; agreements were rarely formalised in written contracts; there is
not sweeping compulsory arbitration; and collective agreements have reflected union and
management strategy rather than the structure of the system itself (Whitfield et al, 1994). Whilst
both countries have seen recent changes in their political environments which have resulted in less
collective action in Australia and greater legalism in Britain (Miller and Mulvey, 1991 and
Whitfield et al 1994), the two systems are nevertheless poles apart.
Early empirical comparisons of the relative impact of the differing regulatory systems in
Australia and Britain typically involved macro comparisons across countries and/or time. These

5
studies generated contradictory results depending on the labour market outcome being
investigated. For example, Norris (1980) concluded that the Australian system does not affect
the wage structure because the latter was found to be similar to the British wage structure,
whereas Kuhn (1966), Iremonger et al (1973) and Mumford (1993) found that the regulatory
system does impact on strike behaviour since Australian strikes are more frequent but are of
shorter duration. These studies are inherently subject to criticism of their imprecision, however,
predominantly due to aggregation and lack of control variables.
A more recent study comparing the impact of the industrial relations regulatory system
on labour market outcomes in Britain and Australia avoided many of these difficulties by using
cross section surveys of workplaces (but not employees) which were carried out in the two
countries prior to those surveys examined in this paper. Whitfield et al (1994) found that the
respective regulatory regimes led to differences in the levels of industrial action and the presence
of a specialist manager consistent with their hypotheses. They also found significant dissimilarities
in the behaviour of union density and voluntary labour turnover in the two countries, although
the relationship between these variables and the regulatory system was not as they predicted. In
particular, the measure of voluntary labour turnover in Australia was much higher than they
expected.
There have been a series of studies of total labour turnover using the same, earlier,
workplace industrial relations surveys which have documented the nature of job reallocation in
Britain (Konings, 1995), in Australia (Mumford and Smith, 1996 and 2000) and comparing the
two (Blanchflower and Burgess, 1998). It has been consistently found that the rate of job
reallocation is greater in Australia than in Britain (OECD, 1994). Typically these studies have
found that for both countries there are lower job reallocation rates in those workplaces which are
older, larger, offering higher wages, facing greater competition in the product market, more
labour intensive or using older technology. However, these studies made little of the different
industrial relations regimes in the two countries nor did they explicitly consider tenure or
dissimilarities in the individual characteristics of employees.
There have also been studies exploring average tenure as a measure of labour turnover,
although these are surprisingly few for Britain and nonexistent for Australia (Burgess, 1998).
Furthermore, none of these studies have used the workplace industrial relations surveys: most of

6
2Department of Trade and Industry (1999). Workplace Employee Relations Survey: Cross-Section, 1998 (computerfile). 4th ed. Colchester: The Data Archive (distributor), 22 December 1999. SN: 3955.
them are more aggregated and employ a severely limited array of explanatory variables leaving
them open to aggregation bias, low fit and an inability to distinguish between important
determinants of the distribution of tenure (Bromars and Famulari, 1997, and Bingley and
Westergaad-Nielsen, 1998).
3. Data.
The data used in this study are drawn from the Australian WorkPlace Relations Survey 1995
(AWIRS95) and the British Workplace Employee Relations Survey 1998 (WERS98)2. The
Australian survey was based on the British predecessor to WERS98 (the WIRS series, discussed
below) so that AWIRS95 and WER98 have many overlapping questions and a very similar
surveying approach. The extension AWIRS95 made (in common with WERS98) was to include
a linked survey of employees. The two new surveys collect an extensive range of information on
both employees and their workplaces, covering standard economic and industrial relations issues
raised above.
AWIRS95 is the second in a series of large-scale surveys of workplaces in Australia (the
first survey, AWIRS90, was carried out in 1990). Both AWIRS surveys were undertaken by what
is now the Australian Commonwealth Department of Industrial Relations. Our study will
concentrate on AWIRS95. Surveying for AWIRS95 was conducted between August 1995 and
January 1996 (Morehead et al, 1997). The respondents were from 2001 workplaces which
employed 20 or more employees. From each of these workplaces, the general manager, employee
relations manager and trade union delegate (from the union with most members at the workplace)
were asked to complete separate face-to-face surveys. The results from each of these three
surveys are fully linkable. Furthermore, individual employees from these workplaces were also
surveyed for a vast range of information including their personal characteristics, individual job
characteristics, work environment, etc. This survey of individuals included 19,155 employees
and is also fully linkable to the main surveys.

7
3‘The senior lay representative of the recognised union with the most members at the workplace or if there wereno recognised unions, but a joint consultative committee operated, the senior employee representative on thatcommittee’ (Cully, 1998;9).
The British Workplace Employee Relations Survey 1998 (WERS98) is the largest,
currently available, survey of its type and was conducted between October 1997 and June 1998
(Cully et al, 1998). It is the fourth in an on-going series of surveys: the first was the Workplace
Industrial Relations Survey 1980 (WIRS80), the second and third were carried out in 1984 and
1990 (WIRS84 and WIRS90). The WERS98 is very similar in construction to AWIRS95:
interviews were conducted with a manager (with day-to-day responsibility for employee relations)
and with a worker representative3 (if nominated) at 2191 workplaces (all of which had more than
10 employees). Employees in these workplaces were also randomly sampled (a sample size of
28,215). All of these surveys are all fully linkable.
The AWIRS95 was released in late 1997, the WERS98 was released in February, 1999
so there has been little time for studies to be undertaken using both data sets. There have been a
limited number of comparative studies using earlier versions of these data sets (Millward et al,
1998). However, the linkable employee surveys add a major, and very valuable, component to
existing studies of tenure: providing for the possibility of separating out individual from workplace
effects on tenure.
4. Modelling job tenure.
At the individual level, the decision to seek and continue market employment has been well
documented in the labour supply literature (Killingsworth, 1983). A useful set of organising
principles for the analysis of individual worker tenure is laid out in Freeman (1980) in his
discussion of the union-exit voice issue. These are the pecuniary and non-pecuniary benefits of
the current job and, in addition, the personal characteristics affecting the transactions costs of job
mobility.
The pecuniary benefits of the current job are clearly dominated by the wage. However,
this is obviously endogenous in the determination of tenure. Freeman and numbers of other

8
authors have subsequently attempted to adjust for the simultaneity of the wage in tenure
regressions (Freeman and Medoff, 1984 and Miller and Mulvey, 1991). The workplace fixed
effects that we allow for could influence wages and tenure, so we simplify the analysis by
estimating a reduced form and leave the exit voice issue for further work.
Non-pecuniary work benefits are hard to identify but we extend the range of variables used
in the exit voice tenure studies by including variables that identify job characteristics, occupation,
and work environment. We expect that measures of education and occupation may be correlated
with the value of outside opportunities. Finally, demographic information which includes family
circumstances will be highly correlated with the transactions costs of job mobility. Each of the
groups of variables is described in more detail below.
The most important difference between our estimates and the existing literature is the
addition of workplace fixed effects. In terms of the classification above, we can anticipate that
these workplace effects predominantly influence the pecuniary and non-pecuniary benefits of the
current job and will be much less correlated with outside opportunities. To the extent that we find
these fixed effects to be of statistical significance, this strengthens our belief in the relative
importance of current-job-related information. In particular, this also raises the possible
importance of the labour demand or firm initiated determinants of tenure. As discussed by
Mumford and Smith (1996 and 2000), dynamic models of labour demand (such as that outlined
by Cabellero and Hammour, 1994) can provide predictions of the likely impact of shocks to the
demand for the firm’s output. For example, if subject to a negative demand shock, the firm may
choose to reduce tenure by increasing the rate of layoff whilst leaving the hiring rate unchanged.
The costs of hiring and firing will play an important role here. In the current study, labour demand
effects on individual tenure will be captured predominantly by the workplace fixed effects.
We essentially have data from surveys at two different levels: the individual employee, and
the workplace. We will address these in turn.

9
4.1. At the individual level.
The individual employee survey asked respondents for demographic information about themselves
(such as age, education, number of children), factual information about their jobs (hours worked,
employer provided training, et cetera) and to a lesser degree attitudinal questions about their job
and their work environment. The overlap between these categories, especially between job
characteristics and work environment, is major and is accentuated by the attitudinal nature of
many of the survey questions (such as the extent of job effort and/or insecurity). We have
accordingly, somewhat arbitrarily, blocked the summary statistics for variables for British and
Australian employees in Table 1a into demographic attributes; job characteristics; and attitudes
to the work environment (with education and occupation controls listed separately).
Considering Table 1a in more detail, column one presents the name of the variable,
columns two to seven present summary statistics and column eight provides the variable
definition. The summary statistics for the British data (presented in columns 2 through 5) are for
the entire data set (for workplaces of 10 or more employees). However, since the Australian data
only includes workplaces with 20 or more employees, columns 6 and 7 provide the means and
standard deviations for the British data excluding workplaces with less than 20 employees. The
data have been weighted by inverse sampling probabilities and thus represent the sampling
population.
It becomes immediately obvious that whilst the AWIRS95 and WERS98 are similar
surveys, they are not identical. For example, with respect to tenure AWIRS95 asked for actual
years at workplace, the longest period of tenure (tenure total) was 45 years with a mean value
of 6.1 years. The WERS98 asked respondents to choose a band (5 available bands) with a
maximum value of 10 years or more. If this latter band is coded at 10 years, the average tenure
in Britain (tenure) is 5.3 years (5.38 at larger workplaces). Treating the Australian data similarly
leads to a lower average tenure (tenure) of 4.8 years. It may also be insightful to consider tenure
as a proportion of working life, especially in a new world country such as Australia where 23%
of the workforce are foreign born (foreign) and may not have been resident in the country for all
10
4This calculation treats vocational training in Australia equivalent to secondary education.
of their working life. When we carry out this calculation (ppnten) we see that the average tenure
value is now higher in Australia than Britain (22% of working life compared to some 18%). We
will return to consider the implications of these alternative measures of tenure in the estimation
below.
The demographic variables suggest that proportionally the Australian workforce is slightly
younger, with fewer females, a similar distribution of children and more disabled members. The
race variables are not very comparable. The Australian data does not provide information on race
other than for Aborigines and Torres Strait Islanders (race). It does tell us, if people were born
out of the country (foreign) , what country they were born. However, this is not necessarily
revealing of race. We also know if English is usually spoken at home (english). We would expect
from the literature on discrimination (Cain, 1986, Mumford, 1989 and Joshi and Paci, 1998) and
segmented labour markets (Doeringer and Piore, 1971) that, if these variables did have an impact
on tenure then being young, female (especially with children), disabled, non-white, foreign born
and not natively english speaking would all lead to shorter tenure.
The education classifications also differ across the countries but 62% of both populations
did not proceed with formal education beyond a maximum of the end of secondary school4. A
very similar proportion did degrees in the two countries, whilst Australia has more post-graduates
and England has many more ‘others’ probably quite a few of whom did not progress beyond
primary education. The expected relationship between education and tenure is non-linear: poorer
educated individuals may be clustered into low quality, short tenure employment; more highly
educated individuals face a greater range of employment opportunities and are typically more
mobile, both resulting in shorter tenure.
Considering job characteristics, the gross hourly pay in both countries is included in Table
1a mainly for information purposes (since, as discussed previously, it is not exogenous to tenure
and it would not be valid to include it amongst the explanatory variables in regression analysis,

11
Brown 1989). Given the exchange rates and inflation in the time period being considered, the
average wage in Australia is some 12% higher. The variance amongst Australian employees is
about 20% higher that that of Britain. An increasing tendency towards wage inequality in
Australia has been discussed by Borland (1998). Its impact on relative tenure is multi-faceted,
nevertheless, it may at least reflect a change in the types of employment individuals face. For this
reason we include a range of variables which reflect the non-pecuniary quality of the job: fixed
term contract, maternity/paternity leave available and if there is employer subsidised childcare. We
believe that permanent jobs with parental leave and childcare would be more attractive to
employees and be associated with longer tenure. Australians are three times more likely to be on
fixed term contracts than Britons (9% versus 3%), although almost one in two Australians have
maternity/paternity leave available compared to roughly one in four Britons, and the relatively rare
provision of employer subsidised childcare in Australia (3%) is virtually unheard of in Britain
(0.004%).
We also include variables measuring whether the individual is employed part time, their
total hours worked and if they would would prefer to work more hours. Labour supply theory
suggests that working generates disutility for the employee, thus the more hours demanded by the
job the more likely the worker is to be discontent and to leave, resulting in shorter tenure
(Killingsworth, 1983). This prediction needs to be tempered, however, by the constraints part-
time contracts put on the labour supply choices of individuals. In total, Australian and British
employees on average work much the same number of hours per week (39 in Australia compared
to 37 in Britain) but there are substantially more part-time employees in Britain (25% relative to
18%). This is reflected in 29% of the British labour market wanting to work more hours whereas
only 9% of Australians do so. The proportions of individuals receiving employer provided training
are very similar across the two countries and are substantial at around 60%. Training funded in
this way would be predominantly job specific in nature and is typically associated with longer
tenure (Becker, 1975).
Occupational choice, at an individual level, is often treated in much the same way as

12
5Unions may obviously also provide a range of other services to their members which would increase relative jobsatisfaction and lower the quit rate. One such service which has been found to have a significant positive impacton average tenure in the UK, but for which we do not have data, is the provision of a pension scheme (Shah, 1985and Henley et al, 1994).
educational outcome since they both reflect a range of variables, especially individual ability and
opportunity (Filer, 1986). Our data sets only cover those currently employed so these
occupational choices may be also somewhat constrained. The relative size of occupational
groupings across the two countries in our study are much the same, although Australia has larger
numbers in the sales and professional categories and Britain has many more in the ‘other’ group
(many of whom are probably labourers). We do not have strong priors concerning the impact of
occupation on tenure. In general, we would expect less skilled occupations to be associated with
shorter tenure. The occupation dummies will be included predominantly as control variables in
the regression analysis and they may also help us to understand the impact of the variables
capturing the work environment.
The work environment variables can be considered in three clusters: job related;
management related; and trade union oriented. With the exception of whether the individual is a
union member or an ex-member, these variables are all strongly attitudinal. More Australians
report that their jobs are stressful (40% versus 23%), require a lot of effort (89% versus 76%)
and feel insecure about the future of their job (29% versus 19%).
Union membership is substantially higher in Australia (50%) than in Britain (39% or 41%
at larger workplaces) and this difference has largely arisen in the lifetime of the workforces since
the proportion of individuals who are or have been a member are essentially the same (58% versus
59%). Once again we find that Australians are much more critical than are their British
counterparts with 39% being satisfied with the union compared to 69% of the British. In terms
of the impact of unionism on the individual, we would expect that the union would provide a
voice mechanism for the individual thereby leading to less quits and longer tenure (Freeman,
1980)5. This voice effect would be hampered if the union was primarily providing a legal service
external to the workplace, however, which may be indicated by the lower satisfaction levels in
13
Australia.
4.2. At the workplace level.
At the aggregate, or macro, level of the workplace we believe that the main economic process
determinating average tenure is one of varying labour demand which can be captured by the
creative-destructive model of Cabellero and Hamour (1984). This model has been applied in a
series of job reallocation papers (Blanchflower and Burgess, 1996, Mumford and Smith, 1996)
and to job reallocation and tenure in Australia (Mumford and Smith, 2000). The latter paper
develops the model and related arguments at length, a further more detailed exposition is available
in an appendix from the authors.
Cabellero and Hamour (1984) argue that the processes of job creation and destruction
are profit maximising responses of firms facing continuously advancing technology and exogenous
changes in the demand for their output. Firms are assumed to introduce new technology by
creating a new production unit (a new job) which is a bonding of a suitable worker, capital and
state-of-the-art technology. New workers are more productive and output will be accordingly
higher. Once created, the technological level of a job is fixed, consequently a gap between the
worker’s productivity and that of new employees emerges over time. If firms do not introduce
new jobs, their production processes will eventually become outdated as the skills of the longer
tenured members of the labour force become relatively obsolete. When a recession hits, the
derived demand for the firm’s employees falls. The firm can reduce the size of its labour force by
either decreasing job creation or increasing job destruction. If it adjusts entirely via less creation,
the incumbent employees are, at least partially, insulated from the recession and average tenure
in the workplace will rise.
The course chosen by the firm will depend on the nature of the costs involved in creation
and the necessity to smooth this flow over time. This analysis suggests that average tenure is
asymmetrically related to expected changes in demand for the output of the workplace; falls in
demand have a positive impact which is larger than the negative impact of increases in demand

14
6The size of the alpha tenure measures (the dependent variables to be used in our final stage of estimation) do nothave an obvious intuitive interpretation, they are derived from our first stage of estimation and will be discussedfurther below.
on tenure (and vice versa for employment growth). Furthermore, tenure will be longer in
workplaces that are larger, more capital intensive, and running training programs for their
employees. These relationships will be discussed in more detail below.
The summary statistics for the workplace data are presented in Table 1b. Once again the
data are clustered for descriptive purposes, this time into market (or economic) variables;
workforce demographic variables; and industrial relations indicators. The data have again been
weighted by inverse sampling probabilities and thus represent the sampling population. As with
Table 1a, the summary statistics for the British data (presented in columns 2 through 5) are for
the entire data set (for workplaces of 10 or more employees). However, since the Australian data
only includes workplaces with 20 or more employees, columns 6 and 7 provide the means and
standard deviations for the British data excluding workplaces with less than 20 employees.
Considering market characteristics6, the two countries were at similar positions in the
business cycles at the time of being surveyed. They had moved out of recession and were
experiencing similar relative growth rates; each growing at 1% above their average rates for the
period since 1980. Our data sets reveal a range of similarities and differences across the two
countries: more Australian workplaces were experiencing either an increase or a decrease in the
demand for their product; British workplaces are much likely to have a formal training program
in operation (76% versus 64%); and labour costs as a proportion of total costs are slightly higher
in Australia (50% compared to 47%).
The workplace characteristics reveal much more substantial differences: the vast majority
of British workplaces are predominantly or totally domestically owned (94% of all, 91% of larger
workplaces compared to 79% in Australia); there are many more multiple workplaces in Australia
(83% compared to 70%); and Australian workplaces typically have twice as many employees
(166.5 relative to 87).

15
In the Cabellero and Hammour (1994) framework a larger workplace would facilitate
potential alternative job opportunities for worker’s whose jobs had become redundant, thereby
lowering actual changes in the workforce but having little effect on average job tenure. The
literature on labour market segmentation (Doeringer and Piore, 1971), however, suggests that
larger workplaces have greater opportunity to develop internal job ladders and establish a system
of workplace industrial relations (including grievance procedures) that increase job satisfaction
and lead to lower quits, thereby increasing average tenure (Rebitzer, 1986). Furthermore, in terms
of both the models, any institutional arrangement which would increase the provision of
workplace training (such as internal job markets) would lower job destruction and increase
average job tenure.
The workplace hours measures are not very comparable, in Australia they measure weekly
operating hours at the workplace, in Britain they are the average hours worked by an employee
in a week. The average full time wage is again similar across the two countries although the
variances are now also similar: it would seem that the relative wage inequalities in Australia occur
predominantly within (rather than across) workplaces.
On the basis of the predictions generated by the Cabellero and Hammour (1984) model
it is not clear which of the two countries will in aggregate have longer tenure since neither country
has a stronger uniform set of market and workplace characteristics which are positively predicted
to be associated with tenure. We will, therefore, consider the application of the model to each
country in the results section below.
The workforce demographics again capture the trends that we found with the individual
data. These demographic indicators are included in both stages of estimation (discussed below)
so that we can attempt to address effects such as being an employee of a minority group from the
overall characteristics of the workforce (for example, is the tenure outcome of a female in a male
dominated workplace going to be different than for a female in a female dominated workplace).

16
7 Two recent studies of linked datasets on wages, tenure and employment dynamics (Bromars and Famulari, 1997,and Bingley and Westergaad-Nielsen, 1998) also have very limited workplace information.
The industrial relations measures are also commensurate with the individual data: the level
of union recognition is considerably higher in Australia (87%) than in Britain (37%). It is
arguable that recognition is a better measure of workplace unionism (than, for example, union
density) impacting as it does on the union’s ability to provide an aggregate voice in negotiations
with management. Having a written grievance procedure is much more common in Australian
workplaces (77% versus 50%) as was industrial action in the previous 12 months (27%
compared to 5%). Whilst both of these last two findings may merely reflect a more formal and
legalistic approach to industrial relations in Australia than Britain, it may also be that Australian
workplaces are displaying greater levels of conflict which are symptomatic of more fundamental
industrial relations problems.
5. Estimation.
The presence of linked employee and employer workplace information allows us to estimate
models of tenure differentials across workplaces, conditional on characteristics of individual
workers. The linked nature of the datasets to be employed can thus be used to good effect.
Typically individual-based datasets, whilst they may include some workplace information, do not
identify where more than one individual in the data is employed in any given workplace.
Individual-based datasets also, typically, have limited workplace information.7 The model to be
estimated is:
(1)Iik'"k%Xik$i%µ ik
where the tenure of worker i in workplace k (Tik) is explained by a set of individual characteristics
(Xik) and a workplace fixed effect ("k), µ ik is an iid error term. As Bromars and Famulari (1997),
Bingley and Westergaad-Nielsen (1998), and Abowd et al (1999) show, this equation can be
estimated with the within estimator employed usually in panel data problems (see Greene, 1997).
Workplace and individual effects are not assumed to be uncorrelated and it is possible to recover
the proportional contributions of the two types of effect. We expect both types of effect to be
important.

17
8The methods we employ could therefore be extended at a later date if, and when, another wave of WERS and/orAWIRS become available.
If one is prepared to go a step further and assume that the determinants of the workplace
fixed effects and the individual characteristics are uncorrelated, it is possible to estimate the
determination of the workplace fixed effects. Estimation of:
(2)"̂k'a%ZkK%,k
where the are generated from equation (1), Zk are workplace characteristics and ,k is an iid error"̂k
term.
It is not possible with our datasets with single cross-sections of linked worker and
workplace information to allow for completely general, unconstrained estimation employing
individual and workplace characteristics. Abowd et al (1999) show that under some quite
restrictive assumptions, more progress can be made if the dataset has a panel format (ie., at least
two cross-sections over time).8
In evaluating the estimation results we will measure the relative explanatory contribution
of individual and workplace effects. We can also compare estimates which omit the workplace
fixed effects (entitled OLS in the tables) and the full estimates (entitled fixed effects or FE). An
issue that we can address by this comparison is that of segmentation.
Among our demographic and occupational groupings we have groups who, in variety of
different papers, have been identified as more likely to be in a different labour market segmented
from the remainder (such as females and non-whites, see Doeringer and Piore, 1971, Taubman
and Wachter, 1986, and Joshi and Paci, 1998). A test of this idea can be carried out by
comparison of the coefficients between the OLS and the fixed effects results. If a demographic
identifier is significant in the OLS estimates but not in the fixed effect estimates, then we can
attribute the impact of membership of that demographic group to the workplace rather that to the
worker’s individual characteristic. This would be evidence suggesting segmentation.

18
The form of tenure model we use here is linear in the individual characteristics and
workplace fixed effects. In common with Freeman (1980) and subsequent authors, we adopt this
first-order Taylor approximation to a more complicated hazard function. Freeman (1980) provides
evidence in favour of this approach relative to a constant hazard model.
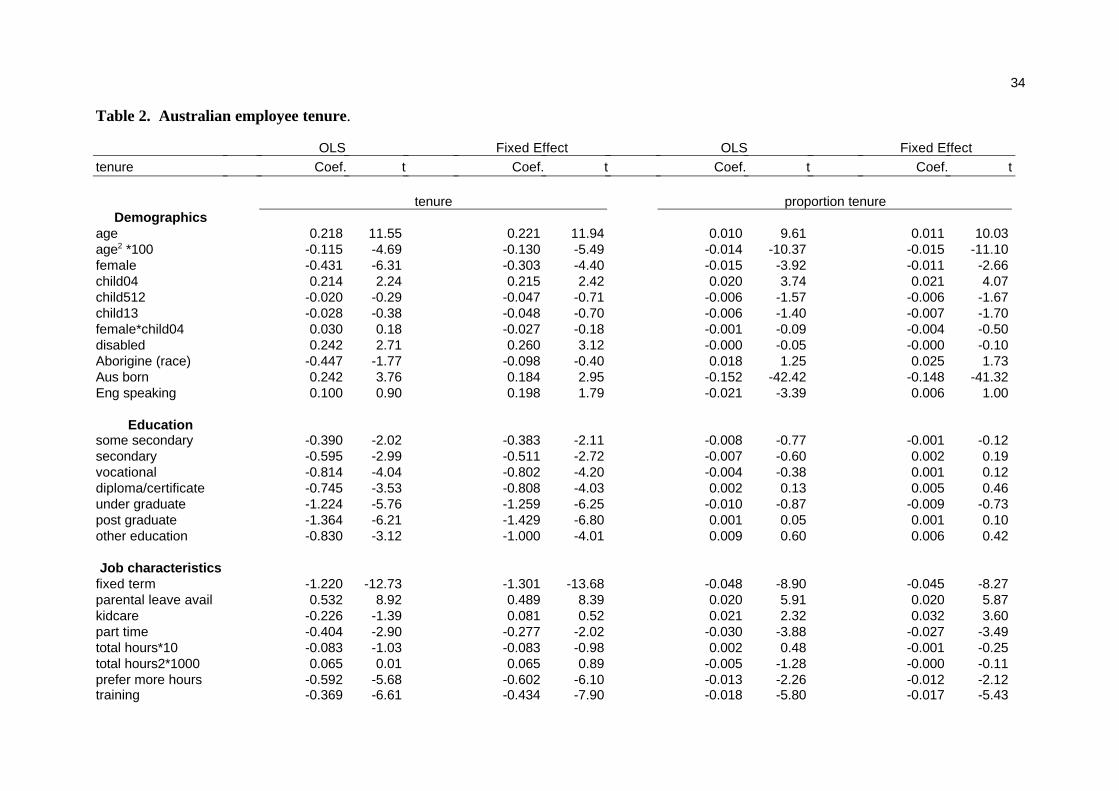
6. Estimation Results
The estimation results for models of individual worker tenure and tenure as a proportion of
working life are given in Tables 2 and 3. For each country there are four sets of estimates. The
first set, in columns 1 to 4 of Tables 2 and 3 are for raw job tenure. Columns 1 and 3 contain the
basic results. These are estimates using OLS allowing for the individuals effects (demographic,
job characteristics, workforce environment, occupation and education) in column 1 and
additionally allowing for fixed workplace effects in column 3. The Australian results are given in
Table 2, those for Britain in Table 3.
Analysis of the fit of these models is given in summary at the bottom of Tables 2 and 3.
A more detailed analysis of variance is carried out in Table 4. Comparison of columns 1 and 2 in
both Tables 2 and 3 shows that both individuals’ and workplace effects are important in
explaining the variation in individual worker tenure. Table 4 shows us that, for Australia the two
sets explain 43.9% of the variation in tenure. Individuals’ characteristics explain 26.6% by
themselves and workplace effects 27.7%. On the margin the two sets explain roughly equal
amounts; 16.2 and 17.3%, respectively. Comparison with the results for Britain in Table 3
indicates a remarkable similarity in the overall level of fit and the relative contribution, both on
average and on the margin, of the two groups of characteristics. If anything, the relative
importance of workplace effects is a little greater in Britain than in Australia.
In the worker tenure regressions we have identified distinctions between individual
human capital and demographic characteristics; features of the particular job that the worker has;
and their work environment. Previous studies (eg Bromars and Famulari, 1997) have only had
access to demographics. All three groups of variables can be seen to be important in explaining

19
job tenure. Education, gender and race are all significant as are occupation, full or part-time
status, hours worked and a number of job related and work environment related attitudinal
variables. All three groups of explanatory variables interact with the impact of the workplace in
which the worker is.
The education effects demonstrate that educational attainment is broadly negatively related
to tenure. The impact of gender and race on tenure provides an interesting comparison between
the OLS and fixed effects results. The OLS results for both Australia and Britain indicate a
significant negative female gender effect on tenure. They also show shorter tenure for those from
a non-Australian or Aboriginal and Torres Straight Island background for Australia and non-
white background for Britain. Part-time workers also have shorter tenure. These effects are all
much reduced in size and significance in the fixed effects results. Controlling for the workplace
fixed effects shows that analysis of data on individuals alone would mistakenly attribute the
negative impact of the type of workplace where any member of either of these groups works to
their gender or racial background or whether they are part-time. Indeed, for those with an
Aboriginal and Torres Straight Islands background, the impact of racial background is
insignificant once the workplace fixed effect is included. Similar arguments could be made for the
impact of some occupational groupings. These results provide some support for the idea of
segmented labour markets discussed above.
As with any analysis of a specific regression model, questions of robustness arise. The first
concerns worker age. There is a strong relationship in the estimation results between tenure and
age (this is commonly found in the literature, see Burgess 1998). The coefficients over-estimate
the behavioural impact of age given the obvious direct functional relationship between the two.
In addition, this effect is further confused for those who have shorter tenure solely because they
were adult migrants into the country concerned. This is of most importance for Australia where
23% of the sample were not born in the country. We attempt to allow for these two effects by
defining a new dependent variable which is current job tenure as a proportion of working life
beyond the age of 15 or arrival as a migrant. Results for our OLS and fixed-effects regression

20
9The degrees of freedom of these two regressions are very similar making them comparable.
models are given in columns 5 and 7 in Tables 2 and 3 with analysis of variance in Table 4. Many
of the results are similar to those for the raw definition of tenure. A strong positive relationship
with age remains, suggesting that it is behavioural. Also the impact of race and origin are of
similar orders of magnitude and significance.
Considering Table 4, which contains further analysis of variance, in more detail. The
results for the two measures of tenure are examined for each of the two countries. In each case
we distinguish between the contributions of worker and job characteristics on the one hand, and
workplace effects, on the other. For Australia, the fixed effects estimation results show that some
44% of the variation in raw job tenure across workers is explained by worker and job
characteristics and workplace effects together. This falls to 33% for the measure of tenure as a
proportion of working life. The individual contributions to the overall fit of these two groups are
similar for the raw measure of tenure at about 27%. They are also similar on the margin at around
17%.9 The similarity of these figures with the results for Britain is striking. Of a slightly lower
overall level of fit, the workplace fixed effects are a little more important for Britain.
Unsurprisingly, the fit of the equations for the alternative measure of tenure are lower than for the
raw measure as we have offset much of the impact of the individual’s age. The relative importance
of the workplace fixed effects is increased, although more for Britain than for Australia.
Comparison with results for the US in Bromars and Famulari (1997) shows a somewhat greater
relative contribution of worker characteristics. However, they only have a sample of 240
establishments which may explain the reduced relative role of establishment fixed effects in their
results.
According to our results in Table 4, tenure is positively correlated across workers in any
given workplace, conditional on the individual characteristics of the workers and the jobs they are
in. Also, conditional differences in tenure across workplaces are quite large. In Australia (Britain)
workplaces with average tenure one standard deviation above the overall mean, conditional on
worker characteristics, have tenure rates 1.7 (1.6) years longer than the average of 4.8 (5.3) years.
21
10For the British results, increased demand means that the workplaces financial performance was better or a lotbetter than average. For the Australian results, increased demand means demand for wp main product isexpanding. Whilst not identical, these variables both capture changes in workplace product market performance.
There does not, however, appear to be significant evidence that long tenure workers sort
themselves into long tenure workplaces in either country. The simple correlation between
workplace average worker and job characteristics and workplaces fixed effects is 0.082 for the
raw measure of tenure in Australia and 0.195 in Britain. These figures are much smaller than that
found for the US by Bromars and Famulari of 0.221. The largest correlations between individual
worker and job characteristics and workplace fixed effects are those for gender, racial
background, and some occupations. These results indicate some labour market segmentation.
Next we consider models of the workplace fixed-effects, that is average tenure in the
workplace conditioning on the demographic and job characteristics of the workers concerned. The
estimates are given in Table 5. The determination of the workplace fixed effects show interesting
differences to the estimates for raw average tenure. As we would expect, many of the workforce-
specific variables are much less significant. However, the corollary of the results in Table 3 for
individual workers tenure is that workplaces with higher numbers of female, foreign born, younger
or part-time workers have shorter average tenure.
Output demand effects have a significant impact on workplace average tenure10.
Conditional and unconditional estimates of these effects are very similar, for both countries. In
all results, the impact of positive demand changes is to reduce average tenure. As the model
evaluated by Mumford and Smith (2000) shows; positive demand shocks will result in reduced
average tenure if workplaces predominantly choose to adjust the level of labour demand upwards
by increasing hiring rather than reducing hiring.
Conversely, it appears from our results that reduced demand also results in lower average
tenure in Britain whilst having no significant effect in Australia. This suggests that in downturns,
workplaces employ both reduced hiring and increased firing in both countries with some evidence
that insulation of the incumbent workers is greater in Australia than in Britain. This is consistent

22
11F-tests for the exclusion of industry effects for Australia (15) and Britain (11) across the column of Table 5 are:2.78, 11.43, 4.97, all distributed F(15, 1036) and 3.17, 4.47, 4.60 all distributed F(11, 1254). All are signficantat the 1% level.
with the view that the industrial relations systems in Australia places a higher cost on firing than
the more heavily reformed system in Britain.
Our results show that larger more capital intensive workplaces have longer tenure,
although size has a less significant impact on average tenure in British workplaces. This may be
related to the size distribution of workplaces in the respective datasets. If the positive impact of
size on tenure only appears above a given size, the larger average size of the Australian
workplaces in the sample may allow this effect to be significant in the Australian data.
Union activity is an important feature of workplace average tenure. Without conditioning
on worker characteristics such as union membership, union recognition adds significantly to
average tenure as does the existence of workplace grievance procedures. Again, these effects are
much reduced in size in the conditional workplace tenure results (especially for Australia) but they
remain significant for Britain. This results suggests that the union voice mechanism works to
increase tenure at both the worker and workplace level in Britain. In Australia, the voice effect
is strong at the worker level but not impacting at the workplace level perhaps due to the more
legalistic industrial relations process replacing the role of the union at this level.
Finally, in common with Bromars and Fumulari (1997), we find that workplace average
tenure (both conditional and unconditional) is significantly affected by the industry in which the
workplace operates. From Table 5 it can be seen that there are some country differences between
sectors11. In Australia, some industries have significantly longer tenure than the missing public
sector category: in particular, manufacturing, education, electricity and gas, and the retail sectors.
In Britain, however, several industries have significantly lower tenure than the missing public
sector category. Workplaces in the transport and health sectors have the lowest average tenure,
whilst non are significantly higher than the public sector

23
7. Conclusion
This paper has examined the determination of individual and workplace tenure employing two
new datasets. These datasets provide linked employee-workplace data which has allowed for a
much more complete analysis of the determinants of job tenure.
Using a fixed effects estimator, we find that a range of demographic and educational, job
related, occupation and work environment variables are important for explaining individual job
tenure. In addition, workplace fixed effects explain as much of the variation in individual tenure
as the individual characteristics. These two groups of variables are essentially uncorrelated.
However, we do find that the negative impact of gender and race on tenure that is well
documented in the existing literature and appears strongly significant in OLS estimates excluding
workplace effects, is offset when workplace effects are included. We interpret this as evidence in
favour of job segmentation.
We find that there are important differences between Britain and Australia in this regard.
Whilst the impact of both gender and race on tenure are fully offset in the British fixed effects
results, this is not true in the Australian results. Despite the much larger gender and race effects
on tenure found in the Australian OLS results, these are only partially offset by the workplace
effects. This result may be related to continuing differences in the respective industrial relations
systems. The more formal and legalistic Australian system may have limited the extent of the
segmentation which appears to occur in Britain.
We find strong evidence of a positive impact of union membership on individual job
tenure. This is consistent with the union voice literature, although our approach is different to
those studies. Analysis of average workplace tenure unconditionally and conditional on the
individual effects in the individual tenure models (ie the fixed effects) suggests that the impact of
unions is predominantly through individual membership. Our unconditional results show
significant effects from union recognition and the existence of written grievance procedures.
These effects reduce in size and significance in the conditional analysis. This is true for Australia

24
and Britain, although there is a remaining effect of union recognition in Britain, again reflecting
differences in the industrial relations systems.
Our results also demonstrate the extent of the missing variable problem in the initial
analyses of individual job tenure exemplified by the union voice literature. The impacts of gender
and race being the most important effects incorrectly estimated. Equally, however, the apparent
near orthogonality of the remaining variables with the firm fixed effects means that the impact of
the remaining individual variables is not altered. In particular, the union membership effect is
robust which suggests support for the union voice effects on job tenure. A structural estimation
of this model using linked data is clearly an avenue for future research.
References.Abowd, J.M., F. Kramarz, and D.N. Margolis, D.N., 1999. High wage workers and high wage
firms. Econometrica 67(2), 251-334. Becker, G.,1975. Human Capital 2nd Edition. University of Chicago Press, Chicago.Bingley, P., and N. Westergaad-Nielsen, N., 1998, Establishment tenure and worker turnover.
Mimeo Aarhus Business School. Borland, J., 1998, Earnings inequality in Australia: Changes, causes and consequences.
Centre for Economic Policy Research Discussion Paper 390, Australian NationalUniversity.
Bromars, S.G. and M. Famulari, 1997, Wage, tenure and wage growth variation within andacross establishments. Journal of Labor Economics 15(2), 285-317.
Blanchflower, D. G. and S.M. Burgess., 1996. Job creation and job destruction in GreatBritain in the 1980s. Industrial and Labor Relations Review 50(1),17-38.
----- 1998. New technology and jobs: Comparative evidence from a two country study.’Economics of Innovation and New Technology 52(4), 109-138.
Brown, J., 1989. Why do wages increase with tenure. American Economic Review 79, 971-999.
Burgess, S., 1998. ‘The reallocation of labour: An international comparison using job tenuredata.’ Mimeo, Department of Economics, University of Bristol.
Burgess, S. and Rees, H., 1996. ‘Job tenure in Britain, 1975-1992.’ Economic Journal
106(435), 809-816.Caballero, R.J. and Hammour, M.L. (1994). ‘The cleansing effect of recessions.’ American
Economic Review 84(5); 1075-1084.Cain, G. C., 1986. The economic analysis of labor market discrimination: A survey.’ in
Ashenfelter, Orley and Layard, Richard (editors). Handbook of Labor Economics.(North Holland, Amsterdam), 693-785.

25
Coutrot, T., 1998. How do institutional frameworks affect industrial-relations outcomes? Amicro-statistical comparison of France and Britain. European Journal of Industrial
Relations 4(2), 177-205.Cully, M. 1998. ‘A survey in transition: The design of the 1998 Workplace Employee
Relations Survey.’ Mimeo, Department of Trade and Industry, July.Cully, M., A. O’Reilly, N. Millward, J. Forth, S. Woodland, G. Dix, and A. Bryson, 1998. The
1998 workplace employee relations survey: first findings. Department of Trade andIndustry.
Department of Trade and Industry (1999) Workplace Employee Relations Survey:
Cross-Section, 1998 (computer file). 4th ed. Colchester: The Data Archive(distributor), 22 December 1999. SN: 3955.
Doeringer, P. B. and M.J. Piore, 1971. Internal labor markets and manpower analysis.D.C.Heath, Massachusetts, USA.
Filer, R., 1986. The role of personality and tastes in determining occupational structure.’Industrial and Labor Relations Review 39, 412-424.
Freeman, R., 1980. The exit-voice tradeoff in the labor market: Unionism, job tenure, quitsand separations. Quarterly Journal of Economics 94(4), 643-674.
Freeman, R., and J. Medoff. 1984. What do unions do? Basic Books, New York.Greene,. W.H., 1997. Econometric analysis. Third edition. Prentice Hall International, New
Jersey.Gregg, P. and J. Wadsworth, 1995. ‘A short history of labour turnover, job tenure and job
security, 1975-1993.’ Oxford Review of Economic Policy 11(1), 73-90.Henley, A., R. Disney, and A. Carruth, 1994. ‘Job tenure and asset holdings.’ Economic
Journal 104(423), 338-349. Iremonger, J., J. Merritt, and G. Osborne, 1973. Strikes: Studies in twentieth century social
history. Angus and Robertson, Sydney.Joshi, H., and P. Paci, 1998. Unequal pay for men and women. MIT Press, Cambridge
Massachusetts.Killingsworth, M., 1983. Labour supply. Cambridge University Press, Cambridge UK.Konings, J., 1995. Job creation and job destruction in the U.K. manufacturing sector. Oxford
Bulletin of Economics and Statistics 57, 5-24.Kuhn, J.W., 1966. Grievance machinery and strikes in Australia. in Northup, H. Compulsory
arbitration and government intervention in labor disputes. Labor Policy AssociationInc., Washington.
Miller, P. and Mulvey, C., 1991. Australian evidence on the exit/voice model of the labormarket. Industrial and Labor Relations Review 45(1), 44-57.
Millward, N. Woodland, S. Bryson, A. Forth, J. and Kirby, S. 1999. ‘A bibliography ofresearch based on the British Workplace Industrial Relations Survey Series.’ Mimeo,
National Institute for Economic and Social Research, November.Morehead, A., M. Steele, M. Alexander, K. Stephen, and L. Duffin, 1997. Changes at work:
The 1995 Australian workplace industrial relations survey. Addison Wesley -

26
Longman, Sydney.Nickell, S.,T. Jones, and G. Quintini. 1999. ‘A picture of the job insecurity facing British men.’
Mimeo, Centre for Economic Performance, London School of Economics.Mumford, K.A., 1988. Women working: Economics and reality. Allen and Unwin, Sydney.----- 1993. "A critical comparison of models of strike activity." Oxford Bulletin of Economics
and Statistics, 55(3); 285-312, August 1993. ----- 1994. ‘Possibilities for the future of arbitration in Australia: Learning from international
experience. Economic Papers 13(3), 91-103. Mumford, K. and P.N. Smith, 1996. Job reallocation: Theory and workplace evidence.’
University of York, Discussion Papers in Economics 96/46.----- 2000. Job reallocation and average job tenure: Theory and workplace evidence from
Australia. University of York, Discussion Papers in Economics 2000/01.Norris, Keith, 1980. 'Compulsory arbitration and the wage structure in Australia. Journal of
Industrial Relations 22(3), 249-263.Neumark, D., Polsky, D. and Hansen, D, 1999. ‘Has job stability declined yet? New evidence
for the 1990s.’ Journal of Labour Economics 17(4), S29-S64.Rebitzer, J.B., 1986. ‘Establishment size and tenure.’ Industrial Relations 25(3), 292-302. Shah, A. 1985. ‘Are wage incentives and unionism important determinants of job tenure.’
Oxford Economic Papers 37, 643-658.Taubman, P., and Wachter, M. 1986. ‘Segmented Labor Markets.’ in Ashenfelter, O., and
Layard, R. (Editors). Handbook of Labor Economics Volume 2. North-Holland,Amsterdam.
Whitfield, K,. P. Marginson, and W. Brown, 1994. Workplace industrial relations underdifferent regulatory systems: A survey-based comparison of Australia and Britain.’British Journal of Industrial Relations 32(3), 319-339.

27
Table 1a. Summary statistics for the employee data.
Variable Mean Std. Dev. Min Max Definition
Dependent Variable >19 employeesAustraliantenure total 6.12 6.23 0.50 45.00 total years at workplaceppnten total 0.25 0.24 0.01 1.00 total tenure as proportion of working life
tenure 4.84 3.64 0.5 10 years at workplace, max 10 yearsppnten 0.22 0.19 0.01 1.00 tenure (max 10) as proportion of working life
Britishtenure 5.32 3.64 0.5 10 5.38 3.63 years at workplace (mid points 5 bands) max 10 yearsppnten 0.18 0.13 0.01 1.00 0.19 0.13 tenure as proportion of working life
DemographicsAustralianage 37.37 11.41 17.5 57.5 midpoints of individuals age bands (9 bands)female 0.45 0.5 0.00 1.00 femalechild04 0.14 0.35 0.00 1.00 dep child aged 0-4child512 0.21 0.41 0.00 1.00 dep child aged 5-12child13 0.19 0.39 0.00 1.00 dep child aged13-18disabled 0.1 0.31 0.00 1.00 health problem or disability likely to last more 6 monthsrace 0.02 0.13 0.00 1.00 Aboriginal or Torres Strait Islanderforeign 0.23 0.42 0.00 1.00 not born in AustraliaEnglish speaking 0.94 0.24 0.00 1.00 English language usually spoken at home
Britishage 39.64 11.63 20 60 39.72 11.55 midpoints of individuals age bands (7 bands)female 0.49 0.5 0.00 1.00 0.49 0.5 femalechild04 0.14 0.35 0.00 1.00 0.14 0.35 dep child aged 0-4child511 0.2 0.39 0.00 1.00 0.2 0.4 dep child aged 5-11child12 0.19 0.4 0.00 1.00 0.19 0.4 dep child aged12-18disabled 0.06 0.24 0.00 1.00 0.06 0.24 long standing health problem or disabilityrace 0.04 0.2 0.00 1.00 0.04 0.2 not white

28
Table 1a. Summary statistics for the employee data.
Variable Mean Std. Dev. Min Max Definition
Education >19 employeesAustralian primary 0.03 0.16 0.00 1.00 primary school, highest education level attained ...some secondary 0.28 0.45 0.00 1.00 some secondary school educationsecondary 0.19 0.39 0.00 1.00 completed secondary schoolvocational 0.15 0.36 0.00 1.00 skilled or basic vocational qualificationsdiploma/certificate 0.09 0.29 0.00 1.00 assoc diploma or advanced certificatedegree 0.14 0.35 0.00 1.00 undergrad degree/diploma,post grad 0.11 0.31 0.00 1.00 postgrad degree or diplomaother educ 0.02 0.15 0.00 1.00 have other educ qual
BritishCSE 0.12 0.33 0.00 1.00 0.12 0.33 CSE or equiv, GCSE (grades D-G), highest education ...O-level 0.26 0.44 0.00 1.00 0.26 0.44 O level or equiv, GCSE (grades A-C)A-level 0.15 0.35 0.00 1.00 0.15 0.35 A level or equivdegree 0.16 0.36 0.00 1.00 0.16 0.36 degree or equivpost grad 0.05 0.23 0.00 1.00 0.05 0.23 post grad degree or equivother educ 0.26 0.44 0.00 1.00 0.26 0.44 have other educ qual
Job characteristicsAustralianghpay 15.82 15.39 0.53 875 gross hourly pay (23 bands)fixed term 0.09 0.28 0.00 1.00 on a fixed term contractmatern/patern avail 0.48 0.5 0.00 1.00 maternity or paternity leave availablekidcare 0.03 0.17 0.00 1.00 employer subsidised childcare availablepart time 0.18 0.38 0.00 1.00 work < 30 hours per weektotal hours 0.39 13.75 0.5 168 total hours worked in norm week, incl overtimeprefer more hours 0.09 0.29 0.00 1.00 prefer more hoursemployer job train 0.61 0.49 0.00 1.00 employer has provided job training
Britishghpay 7.26 7.17 0.83 610.01 7.03 7.18 gross hourly pay (12 bands)fixed term 0.03 0.02 0.00 1.00 0.03 0.18 job is fixed term

29
Table 1a. Summary statistics for the employee data.
Variable Mean Std. Dev. Min Max Definition
>19 employeesmatern/patern avail 0.27 0.44 0.00 1.00 0.28 0.45 parental leave availablekidcare 0.004 0.06 0.00 1.00 0.004 0.06 wp nursery or employer subsidised childcare availablepart time 0.26 0.44 0.00 1.00 0.25 0.43 work < 30 hours per weektotal hours 36.59 12.92 0.5 125 36.98 12.65 total hours worked in norm week, incl overtimeprefer more hours 0.28 0.45 0.00 1.00 0.29 0.45 work extra hours because enjoy or need moneyemployer job train 0.59 0.49 0.00 1.00 0.6 0.49 employer paid for or organised job training
OccupationAustralianlabourer 0.16 0.35 0.00 1.00 labourer and related workersoperator 0.08 0.27 0.00 1.00 plant & machine operator and driverssales 0.14 0.35 0.00 1.00 sales and personal service workersclerk 0.18 0.38 0.00 1.00 clerical and secretarialtrades 0.08 0.27 0.00 1.00 tradespersons and apprenticesassoc profs 0.11 0.32 0.00 1.00 para (associate) professionalprofs 0.17 0.38 0.00 1.00 professionalsmanagers 0.07 0.26 0.00 1.00 managersother occup 0.01 0.09 0.00 1.00 other occupational groups
Britishoperative 0.13 0.34 0.00 1.00 0.14 0.35 operative and assemblysales 0.1 0.3 0.00 1.00 0.09 0.29 sales operator, sales assistantpersonal 0.08 0.28 0.00 1.00 0.08 0.27 personal and protective servicescraft 0.1 0.31 0.00 1.00 0.1 0.3 craft and skilled serviceclerk 0.16 0.37 0.00 1.00 0.16 0.36 clerical and secretarialassoc prof 0.09 0.29 0.00 1.00 0.09 0.29 associate professional and technicalprofs 0.13 0.34 0.00 1.00 0.13 0.34 professionalsmanagers 0.09 0.28 0.00 1.00 0.08 0.28 managers and senior administratorsother occup 0.12 0.33 0.00 1.00 0.12 0.33 other occupational group

30
Table 1a. Summary statistics for the employee data.
Variable Mean Std. Dev. Min Max Definition
Work environment >19 employees
Australianjob stress 0.4 0.49 0.00 1.00 job is very stressfuljob effort 0.89 0.32 0.00 1.00 put a lot of effort into jobjob insecurity 0.29 0.45 0.00 1.00 feel insecure about future at this workplaceunion member 0.5 0.5 0.00 1.00 still a union member at this wpexunion 0.08 0.26 0.00 1.00 was a union member at this wpsatunion 0.39 0.49 0.00 1.00 overall satisfied with the service union provides at this wp
Britishjob stress 0.23 0.42 0.00 1.00 0.23 0.42 worry a lot about job outside working hoursjob effort 0.76 0.43 0.00 1.00 0.76 0.43 job requires respondent to work very hardjob insecurity 0.19 0.4 0.00 1.00 0.2 0.4 feel job is insecure at this wpunion member 0.39 0.49 0.00 1.00 0.41 0.49 is a union (or staff association) memberexunion 0.18 0.39 0.00 1.00 0.18 0.39 has previously been a union membersatunion 0.69 0.46 0.00 1.00 0.69 0.46 union makes a difference to what it is like to work here
no. of observations British 28215 Aus 19155 British 26927 weighted by inverse sampling probabilities.

31
Table 1b. Summary statistics for the workplace data.
Variable Mean S.Dev. Min Max Mean S.Dev. Definition
>19 employeesDependent variablesAustralianalpha tenure -1.63 1.71 -7.71 5.06 from the fixed effect tenure regressionalpha ppnten 0.15 0.09 -0.12 0.89 from the fixed effect ppn tenure regress
Britishalpha tenure -3.17 1.55 -7.79 1.12 -3.17 1.55 from the fixed effect tenure regressionalpha ppnten 0.17 0.07 -0.01 0.38 0.17 0.06 from the fixed effect ppn tenure regress
Market characteristicsAustralianinc demand 0.53 0.50 0.00 1.00 demand for wp main product expandingdec demand 0.11 0.32 1 0.00 demand for wp main product contractingtraining 0.64 0.48 0.00 1.00 formal training scheme operateslabour cost 0.50 0.26 0.10 0.90 labour costs as proportion of total costs
Britishinc demand 0.49 0.50 0.00 1.00 0.51 0.50 wp financial performance better/a lot better than avedec demand 0.02 0.14 1 0.00 0.03 0.16 wp financial performance worse/a lot worse than avetraining 0.76 0.43 0.00 1.00 0.81 0.40 formal training scheme operateslabour cost 0.46 0.28 0.13 0.88 0.47 0.28 labour costs as proportion of total costs (4bands)
WP characteristicsAustralianAus own 0.79 0.41 0.00 1.00 predominantly or totally Australian ownedmulti wp 0.83 0.38 0.00 1.00 wp is one of multiple wps in enterprisewp size 166.53 304.47 6.00 3979.00 employees on pay 12 months previouslywp hours 81.96 50.01 17.50 168.00 hours per week wp operatesave full time wage 33816.20 11039.12 13000 104000 average annual full time wp earnings
BritishUK owned 0.94 0.24 0.00 1.00 0.91 0.28 predominantly or totally UK ownedmulti wp 0.68 0.47 0.00 1.00 0.70 0.46 wp is one of multiple wps in enterprise

32
Table 1b. Summary statistics for the workplace data.
Variable Mean S.Dev. Min Max Mean S.Dev. Definition
>19 employees
wp size 60.49 233.61 10 30995 87.15 289.95 employees on pay 12 months previouslywp hours 38.52 8.51 1.00 97.00 38.67 8.44 total normal weekly hours workedave full time wage 16116 7734 2600 35361 16221 7725 average annual full time wp earnings
DemographicsAustralianfemale 0.45 0.28 0.00 1 proportion of the workforce femalerace 0.02 0.05 0.00 0.75 proportion of the workforce aboriginal or TSIno eng 0.12 0.18 0.00 0.75 proportion not speaking English at homepart 0.27 0.31 0.00 1 proportion of the workforce part timedisabled 0.03 0.06 0.00 0.75 proportion of the workforce disabledyouth 0.10 0.16 0.00 0.75 proportion of the workforce below 21old 0.14 0.17 0.00 0.75 proportion of the workforce over 50
Britishfemale 0.54 0.31 0.00 1.00 0.53 0.30 proportion of the workforce femaleethnic 0.04 0.10 0.00 0.89 0.05 0.11 proportion of the workforce ethnicpart 0.32 0.30 0.00 1.00 0.31 0.29 proportion of the workforce part timedisabled 0.01 0.02 0.00 0.86 0.01 0.02 proportion of the workforce disabledyouth 0.08 0.14 0.00 0.89 0.08 0.13 proportion of the workforce below 21old 0.15 0.12 0.00 0.86 0.14 0.11 proportion of the workforce over 50
IR measuresAustralianunion recognised 0.87 0.34 0.00 1.00 union recognised in negotiationgrievance procedure 0.77 0.42 0.00 1.00 written grievance procedureindustrial action 0.27 0.44 0.00 1.00 industrial action in previous 12 months
Britishunion recognised 0.39 0.49 0.00 1.00 0.43 0.5 union recognised in negotiationgrievance procedure 0.50 0.50 0.00 1.00 0.54 0.50 written grievance procedureindustrial action 0.05 0.22 0.00 1.00 0.05 0.22 industrial action in previous 12 months

33
Table 1b. Summary statistics for the workplace data.
Variable Mean S.Dev. Min Max Mean S.Dev. Definition
>19 employeesIndustry
Australianmining 0.01 0.12 0.00 1.00 miningmanufacturing 0.17 0.37 0.00 1.00 manufacturingelectrical 0.01 0.11 0.00 1.00 electrical gasconstruction 0.03 0.16 0.00 1.00 constructionwholesale 0.04 0.20 0.00 1.00 wholesaleretail 0.13 0.33 0.00 1.00 retailaccommodation 0.08 0.27 0.00 1.00 accommodationtransport 0.04 0.19 0.00 1.00 transportcommunications 0.02 0.14 0.00 1.00 communicationsfinance 0.04 0.19 0.00 1.00 financeproperty 0.08 0.27 0.00 1.00 propertygovernment 0.10 0.30 0.00 1.00 government serviceseduc 0.11 0.31 0.00 1.00 educationhealth 0.09 0.29 0.00 1.00 healthsport 0.03 0.17 0.00 1.00 sport and recreationpers 0.03 0.17 0.00 1 personal services
Britishmanufacturing 0.13 0.34 0.00 1.00 0.15 0.36 manufacturingconstruction 0.04 0.20 0.00 1.00 0.03 0.18 constructionelectrical 0.01 0.05 0 1 0.00 0.06 electricalwholesale 0.19 0.39 0.00 1.00 0.19 0.40 wholesalehotels 0.08 0.27 0.00 1.00 0.07 0.26 hotelstransport 0.05 0.21 0.00 1.00 0.05 0.22 transportfinance 0.03 0.17 0.00 1.00 0.03 0.17 financeother business 0.11 0.32 0.00 1.00 0.10 0.29 other businesseducation 0.13 0.34 0.00 1.00 0.14 0.34 educationpublic 0.05 0.21 0 1 0.05 0.22 public serviceshealth 0.14 0.35 0.00 1.00 0.14 0.34 healthother 0.05 0.22 0.00 1.00 0.04 0.2 other
no. of observations British 2192 Aus 2001 British 2016 data weighted by inverse sampling probabilities.
34
Table 2. Australian employee tenure.
OLS Fixed Effect OLS Fixed Effecttenure Coef. t Coef. t Coef. t Coef. t
tenure proportion tenureDemographics
age 0.218 11.55 0.221 11.94 0.010 9.61 0.011 10.03 age2 *100 -0.115 -4.69 -0.130 -5.49 -0.014 -10.37 -0.015 -11.10 female -0.431 -6.31 -0.303 -4.40 -0.015 -3.92 -0.011 -2.66 child04 0.214 2.24 0.215 2.42 0.020 3.74 0.021 4.07 child512 -0.020 -0.29 -0.047 -0.71 -0.006 -1.57 -0.006 -1.67 child13 -0.028 -0.38 -0.048 -0.70 -0.006 -1.40 -0.007 -1.70 female*child04 0.030 0.18 -0.027 -0.18 -0.001 -0.09 -0.004 -0.50 disabled 0.242 2.71 0.260 3.12 -0.000 -0.05 -0.000 -0.10 Aborigine (race) -0.447 -1.77 -0.098 -0.40 0.018 1.25 0.025 1.73 Aus born 0.242 3.76 0.184 2.95 -0.152 -42.42 -0.148 -41.32 Eng speaking 0.100 0.90 0.198 1.79 -0.021 -3.39 0.006 1.00
Educationsome secondary -0.390 -2.02 -0.383 -2.11 -0.008 -0.77 -0.001 -0.12 secondary -0.595 -2.99 -0.511 -2.72 -0.007 -0.60 0.002 0.19 vocational -0.814 -4.04 -0.802 -4.20 -0.004 -0.38 0.001 0.12 diploma/certificate -0.745 -3.53 -0.808 -4.03 0.002 0.13 0.005 0.46 under graduate -1.224 -5.76 -1.259 -6.25 -0.010 -0.87 -0.009 -0.73 post graduate -1.364 -6.21 -1.429 -6.80 0.001 0.05 0.001 0.10 other education -0.830 -3.12 -1.000 -4.01 0.009 0.60 0.006 0.42
Job characteristicsfixed term -1.220 -12.73 -1.301 -13.68 -0.048 -8.90 -0.045 -8.27 parental leave avail 0.532 8.92 0.489 8.39 0.020 5.91 0.020 5.87 kidcare -0.226 -1.39 0.081 0.52 0.021 2.32 0.032 3.60 part time -0.404 -2.90 -0.277 -2.02 -0.030 -3.88 -0.027 -3.49 total hours*10 -0.083 -1.03 -0.083 -0.98 0.002 0.48 -0.001 -0.25 total hours2*1000 0.065 0.01 0.065 0.89 -0.005 -1.28 -0.000 -0.11 prefer more hours -0.592 -5.68 -0.602 -6.10 -0.013 -2.26 -0.012 -2.12 training -0.369 -6.61 -0.434 -7.90 -0.018 -5.80 -0.017 -5.43

35
Table 2. Australian employee tenure.
OLS Fixed Effect OLS Fixed Effecttenure Coef. t Coef. t Coef. t Coef. t
tenure proportion tenure
Occupationoperator 0.401 3.36 0.189 1.56 0.008 1.24 0.006 0.90 sales 0.067 0.60 0.153 1.27 -0.007 -1.17 -0.002 -0.22 clerk 0.197 1.90 0.298 2.71 -0.007 -1.26 0.001 0.23 trades 0.978 7.65 0.874 6.70 0.032 4.46 0.035 4.65 assoc professional 0.429 3.70 0.630 5.13 -0.002 -0.35 0.013 1.80 professional 0.415 3.22 0.407 3.08 -0.019 -2.62 -0.009 -1.15 managers 0.370 2.75 0.586 4.38 -0.007 -0.93 0.007 0.96 other occupation 0.079 0.25 0.120 0.40 0.001 0.05 0.012 0.72
Work environmentjob stress 0.486 8.57 0.534 9.90 0.019 5.97 0.022 7.04 job effort -0.116 -1.38 -0.047 -0.60 -0.012 -2.53 -0.009 -2.04 insecure 0.103 1.72 -0.035 -0.61 0.002 0.51 -0.004 -1.05 union member 1.026 18.13 0.923 14.34 0.032 10.05 0.034 9.06
constant -1.405 -3.14 0.198 7.92
Number of obs 15742 15742 15742 15742 F( 38, 15703) 149.40 F( 38, 13885) 104.92 F( 38, 15703) 85.62 F( 38, 13885) 66.01
Prob > F 0.00 0.00 0.00 0.00 R-squared 0.27 0.44 0.17 0.33 Adj R-squared 0.26 0.37 0.17 0.24 Root MSE 3.30 2.89 0.18 0.17

36
Table 3. British employee tenure.
tenure OLS Fixed Effect OLS Fixed EffectCoef. t Coef. t Coef. t Coef. t
tenure proportional tenureDemographics
age 0.321 18.03 0.303 17.84 0.004 5.17 0.003 4.16 age2 *100 -0.256 -11.64 -0.245 -11.72 -0.007 -8.13 -0.007 -7.80 female -0.111 -1.94 0.043 0.74 -0.004 -1.80 0.001 0.22 child04 -0.003 -0.04 -0.021 -0.25 0.005 1.42 0.003 1.02 child512 -0.047 -0.75 -0.058 -0.98 -0.002 -0.95 -0.003 -1.36 child13 -0.293 -4.71 -0.316 -5.40 -0.012 -4.79 -0.013 -5.37 female*child04 0.467 3.50 0.492 3.94 0.021 3.95 0.022 4.43 disabled 0.257 2.50 0.227 2.36 0.007 1.84 0.005 1.31 race -0.486 -3.94 -0.174 -1.42 -0.026 -5.33 -0.012 -2.51
Educationolevel -0.121 -1.42 -0.118 -1.48 -0.006 -1.89 -0.006 -1.96 alevel -0.315 -3.36 -0.310 -3.50 -0.014 -3.68 -0.013 -3.68 degree -1.003 -10.12 -0.932 -9.80 -0.047 -11.96 -0.043 -11.34 postgrad -1.479 -11.73 -1.367 -11.23 -0.062 -12.49 -0.056 -11.63 other education 0.012 0.13 0.001 0.01 -0.007 -1.90 -0.007 -2.08
Job characteristicsfixed term -1.447 -10.76 -1.624 -12.34 -0.058 -10.93 -0.066 -12.53 parental leave avail 0.688 2.19 0.563 1.86 0.024 1.91 0.019 1.56 kidcare 0.185 3.53 0.114 2.24 0.007 3.55 0.005 2.24 part time -0.466 -6.42 -0.380 -5.28 -0.019 -6.56 -0.016 -5.52 total hours*10 0.163 2.42 -0.067 -0.96 0.006 2.33 -0.002 -0.80 total hours2*1000 -0.199 -2.18 0.121 1.30 -0.009 -2.45 0.004 1.00 prefer more hours 0.065 1.12 -0.002 -0.04 0.002 0.91 -0.001 -0.24 training -0.370 -7.18 -0.392 -7.58 -0.015 -7.56 -0.016 -7.84

37
Table 3. British employee tenure.
tenure OLS Fixed Effect OLS Fixed EffectCoef. t Coef. t Coef. t Coef. t
tenure proportional tenureOccupation
sales -0.167 -1.33 0.230 1.50 -0.011 -2.25 0.004 0.63 personal services -0.567 -4.52 0.165 1.09 -0.024 -4.75 0.002 0.31 skilled/crafts 0.572 5.01 0.593 4.83 0.022 4.81 0.021 4.31 clerk 0.034 0.32 0.491 4.12 0.004 0.86 0.018 3.76 assoc professional 0.303 2.63 0.669 5.24 0.011 2.36 0.023 4.50 professional 0.512 4.31 0.877 6.78 0.017 3.61 0.029 5.56 manager 0.144 1.21 0.771 6.13 0.007 1.51 0.028 5.69 other occupation -0.405 -3.54 0.040 0.32 -0.015 -3.23 0.000 0.08
Work environmentjob stress 0.192 3.49 0.302 5.84 0.007 3.12 0.012 5.75 job effort 0.169 2.95 0.166 3.06 0.005 2.32 0.005 2.33 insecure 0.056 0.98 -0.006 -0.10 0.003 1.38 0.000 0.01 union member 1.356 27.16 1.206 20.31 0.049 24.75 0.044 18.50
constant -3.327 -9.01 0.161 11.04
Number of obs 20554 20554 20554 20554 F( 34, 20519) 192.74 F( 34, 18898) 128.54 F( 34, 20519) 75.11 F( 34, 18898) 58.79
Prob > F 0.00 0.00 0.00 0.00 R-squared 0.24 0.4 0.11 0.27 Adj R-squared 0.24 0.34 0.11 0.21 Root MSE 3.28 2.93 0.13 0.12

38
Table 4. Variance decomposition.
Tenure Proportion Tenure
Aus Britain Aus Britain
Fraction of variance explained
worker and job characteristicsand workplace fixed effects
0.439 0.395 0.328 0.274
worker and job characteristics 0.266 0.242 0.172 0.111
(number) 38 34 38 34
workplace effects 0.277 0.255 0.206 0.198
(number) 1819 1622 1819 1622
Marginal fraction of variance explained
worker and job characteristics 0.162 0.14 0.122 0.076
workplace fixed effects 0.173 0.153 0.156 0.163
Standard deviations
worker and job characteristics
across workers across workplaces
0.980 1.110
0.8590.942
0.0370.043
0.0200.021
workplace fixed effects 1.74 1.53 0.09 0.059
Correlations
worker and job characteristics across workplaces and workplace fixed effects
0.082 0.195 0.05 0.015

39
Table 5. Workplace tenureAustralian Britain
OLS tenure FE tenure FE Ppn tenure OLS tenure FE tenure FE Ppn tenureCoeff. t Coeff. t Coeff. t Coeff. t Coeff. t Coeff. t
Market characteristicsincreasing demand -0.258 -1.53 -0.239 -2.11 -0.014 -2.57 -0.387 -3.99 -0.345 -4.11 -0.016 -4.77 decreasing demand -0.352 -1.3 0.069 0.38 0 -0.26 -0.618 -1.96 -0.589 -2.16 -0.026 -2.36 training -0.044 -0.27 0.183 1.66 0.011 2.14 -0.158 -1.21 -0.033 -0.29 0.001 0.17 labour cost 0.618 1.61 -0.334 -1.29 -0.028 -2.23 -0.002 -0.84 -0.004 -1.85 -0.000 -1.39
WP characteristicsforeign owned -0.168 -0.62 0.097 0.54 -0.003 -0.36 -0.141 -0.77 0.015 0.10 -0.000 -0.07 multiple workplaces -0.032 -0.12 0.053 0.29 -0.001 -0.11 0.112 0.96 0.038 0.38 -0.002 -0.39 workplace size*1000 -0.063 -0.25 0.478 2.83 0.020 2.40 0.253 1.56 0.252 1.79 0.009 1.61 wp hours *100 0.164 0.86 0.049 0.38 0.009 1.36 0.009 1.56 0.006 1.12 0.000 1.17
Demographicsppn female -1.391 -3.10 -0.574 -1.90 -0.010 -0.65 0.256 0.90 0.038 0.16 0.017 1.69 race -2.214 -1.48 -3.180 -3.16 -0.097 -1.99 -2.072 -4.52 -1.612 -4.07 -0.080 -5.05 no English at home 0.085 0.18 0.317 0.99 0.054 3.49 ppn part time -0.648 -1.48 -0.137 -0.47 -0.001 -0.07 -0.920 -3.26 -0.376 -1.54 -0.020 -2.06 ppn disabled 6.332 3.80 2.469 2.20 0.059 1.09 -0.572 -0.32 0.640 0.41 0.038 0.61 ppn < 20 -5.906 -7.32 -1.235 -2.27 -0.066 -2.51 -1.843 -3.86 1.024 2.48 0.029 1.76 ppn > 50 4.164 7.25 0.662 1.71 0.036 1.92 5.489 12.03 2.866 7.27 0.133 8.44
Industrial relationsunion recognition 0.504 2.27 -0.152 -1.02 -0.006 -0.83 0.847 6.37 0.275 2.39 0.009 1.87 grievance procedure 0.518 2.34 0.112 0.75 -0.008 -1.05 0.445 4.00 0.233 2.43 0.011 2.95 industrial action 0.499 2.84 -0.048 -0.40 -0.006 -1.02 0.558 2.66 0.432 2.39 0.014 1.87

40
Table 5. Workplace tenureAustralian Britain
OLS tenure FE tenure FE Ppn tenure OLS tenure FE tenure FE Ppn tenureCoeff. t Coeff. t Coeff. t Coeff. t Coeff. t Coeff. t
Industrymanufacturing 0.885 2.57 0.529 2.29 0.030 2.69 0.087 0.31 0.111 0.46 -0.004 -0.36 construction 0.838 1.60 -0.567 -1.61 -0.022 -1.30 -0.020 -0.06 0.018 0.06 -0.001 -0.05 electrical 2.391 3.93 1.349 3.30 0.053 2.65 0.132 0.14 0.219 0.27 -0.001 -0.04 wholesale -0.013 -0.02 -0.182 -0.51 0.008 0.48 -0.163 -0.58 -0.079 -0.32 -0.011 -1.16 transport -0.005 -0.01 -0.422 -1.36 -0.014 -0.90 -0.660 -2.03 -0.714 -2.54 -0.038 -3.34 finance -0.279 -0.66 -0.412 -1.45 -0.012 -0.87 -0.023 -0.07 -0.012 -0.04 -0.008 -0.68 education 0.239 0.70 0.472 2.06 0.005 0.48 0.138 0.54 0.075 0.34 -0.012 -1.34 health -0.003 -0.01 0.398 1.40 0.011 0.78 -0.724 -2.72 -0.738 -3.21 -0.038 -4.10 hotels -0.314 -0.97 -0.255 -0.91 -0.027 -2.44 other business -0.399 -1.40 -0.242 -0.98 -0.020 -1.98 UK other 0.111 0.33 0.287 0.99 0.001 0.06 retail 0.770 1.68 0.818 2.66 0.033 2.21 accommodation -0.162 -0.33 -0.564 -1.70 -0.042 -2.63 communications 0.513 1.08 -0.935 -2.92 -0.037 -2.37 property -0.351 -0.85 0.080 0.29 0.024 1.79 sport and recreation 0.485 0.90 0.219 0.61 0.011 0.64 personal services -0.702 -1.51 -0.308 -0.98 -0.018 -1.18 mining 0.490 0.69 0.717 1.50 0.016 0.70 constant 5.289 10.22 -1.513 -4.34 0.154 9.10 3.949 9.12 -3.494 -9.33 0.159 10.61
No. of obs 1070 1070 1070 1283 1283 1283 F( 33, 1036) 11.17 F( 33, 1036) 5.12 F( 33, 1036) 5.46 F( 28, 1254) 23.37 F( 28, 1254) 7.84 F( 28, 1254) 8.86
Prob > F 0.00 0.00 0.00 0.00 0.00 0.00 R-squared 0.26 0.14 0.15 0.34 0.15 0.17 Adj R2 0.24 0.11 0.12 0.33 0.13 0.15 Root MSE 2.42 1.63 0.08 1.65 1.43 0.06