jir? ^ - National Institute of Educational Planning and ...
787
GOVERNMENT OF PUNJAB (INDIA) >jir? ^ wraf^c? RttMa'd ya’a rracf’^ gstao _^ONOMIC ADVISER TO GOVERNMENT PUNJAB CHANDIGARH
-
Upload
khangminh22 -
Category
Documents
-
view
0 -
download
0
Transcript of jir? ^ - National Institute of Educational Planning and ...

GOVERNMENT OF PUNJAB (INDIA)
> jir ? ^
wraf c? RttMa'd ya’a rracf’ gstao
_ ^ O N O M IC ADVISER TO GOVERNMENT PUNJABCHANDIGARH
naorrg (5 3 3 ) GOVERNMENT OF PUNJAB (INDIA)
»rag >H3 wfeT T Har3?5 ECONOMIC AND STATISTICAL ORGANISATION
X icTB Z H: 623 PUBLICATION NO. 623
STATISTICAL ABSTRACT
OF
PUNJAB
1989
NIEPA DC
D06011
0 3 :
> H T cf^ i f e m rfSoTB
Issued by ;ECONOMIC ADVISER TO GOVERNMENT PUNJAB

*> •? T • ■ ■ i " • t
N -•' or L 'h \ c ^ i i o n i i \» ' ■ - : i’" ■■■ ' ; ■ ’Oilr - > . 'o VTar- -;y-JKK)J4
'H i * ........ ________________

Hbf OT
grfT ^ RtHW ijoPH S » F H § 3 § fH U H T tT § fe c rw ^ 3^ § sn it ?n ^ t >H§ T O f e w f%H Oh 5ft^ 5 1 ira ^ § g 'tTdjtOjof•H§ IjHiHftoT ^ t ftPJTO u t UftW ^ ^ nfsf^r y Tg J gr^f ^ {jj3sra^ HH"" tF ^ ?ivlf sfer W Hfe>vf 1
VMBTT Ffrg ^ ^ FTO ¥3^^ U ^ »fTBfe f l5 ^ § 3H3T3>^ >Hoffg>HiudH'‘g ’''^ 5 1 fen ^ » r a f e »ferfw 3 " fen r^ ^ ^ ^ g t>HT w%^ H O T HH^T 5 I » m >H§ 55UraUT F T ^ Hrg^t>HT ^ H O T § fH ^ »?3 3 oT ^ ^
^ d » f§ 1 5 H^^St»fT HTHf5 sra^ U § ? ? HWtMT § ^ ^ I
H", »rnfcr H^'dd?TH UTFH H c f^ »f§ fH t »f^H^ Bt stH ^ HSW S f ^ Ut ^Mt >H3 3"5T§ M5ife>HT ^ feH IJofTHcS f HH" fH3 Oh ofter ^ I
: §. >>iH.8, 1990. offHHHH » f§ HoTdd,
UtTO H^oFg, I
FOREWORD
Statistical Abstract of Punjab is an annual publication of the Economic & Statistical Organisation. Normally it is brought out as one of the State Budget documents and presented to the Legislative Assembly every year. However, in view of the changed political and administrative set up in the State, the usual procedure of issuing it at the time of the presentation of the State Budget could not be followed.
The information presented in the Statistical Abstract covers almost the entire gamut of socio-economic achievements made in the state by providing comparable series of statistics at one place. In addition to data on the state’s economy this volum e gives information about selected items relating to other states of the country. The Economic and Statistical Organisation has updated most of the tables, added some new and deleted the obsolete ones,
I compliment the Economic Adviser to Government Punjab and team of his officers who have been able to present this exhaustive and up-to-date volume of Statistical data well in time.
Chandigarh : A. S. CHATHADated the Sth May, 1990. Financial Commissioner and
Secretary to Government Punjab, Department of
Planning.

CPFPg ^ Fre fsr FFH 1989 HtlT3 d, feH ^ 3 2 ^ 0 Ife n Ijo P H S ^ ^ FTO H H if e M § i f f u ^ t § " § f ^ R W I ? t f e r Q |
H tfH 3 HVT » fe g ^ ^ ^ tf f o t a ^ H" >H§ ^ H fC f^ B " fH ^ >H3 H5f sra ^
^fHH ^ I ^ h3t § Htf u^ s^sHTfHsr ^?t>Ht FF3^t»n hthh
of^nW 3 T ^ U31 M feH iT O ^ unq y a g ^ 'ut ^ c iY a s fs r fe s T w g ^ ^ H d R i^ l
3 1 ^ ^ I MoT^T jqra lir r a ^ » r a t e 3 T ^ ? tf ^ y i;foH»fT n g q t st§ h itu i » f t f e n w w r i i r o ^ -
srgT »f§ i jp w ^ ^ »fOTg ^ »f§ § f e e ^ 5 f , iHui M§ fn ^ ^ 3 wfeMT ^feoT d I
H", ^ ^ yy>>r m§ ftrff ht w ^ >M5fi 5 f^ »f§ t f f sira r R fe l^ T f e T 5 Is
h ; g i r ^ M§ fe y s hh3t^ fe^far, # ^ a if »f§ ^ >hh5 ^ ^ c^^'til tp ^fen § HH" fRH g us I
f e j FTH i j ?ramb f™ , ^ 'fe l^33 f u t e s ^UTFg ^ ^ bu >h§ » e ^ w ite fenra sftHT fep>fT I Frg ^ >>rag mh Fr»ido/id, ^ a fe g fnwj^i7 »f?Hu, gTf^feg m s g§TH fRaisr, fRm, w rg 5TH^»f, fRUf, i(oto swu,F T ^ fRU/, » ft 5 ^ ^ fRf ?Hr^, R§R >H§ fefe'H' ^3 5 U ^ sfeT § h RHTOIt
& I RTH f ^ § W S , >H giHT^ R so t RTyr s f e r tt'^ o l'd l W ^RRt T3UI
9 {
i fl. >HR. oTUg2, 1990 M T^sr H»'3biid, O frg r^ ' b >
PREFACE
The current issue of the Statistical Abstract of Punjab relates to the year 1989 and is the 32nd in the series of this publication. The data coverage is extensive and touches almost all the socio-economic aspects of the State. Efforts have been made to make it as up-to-date as possible within the limited time available for collection of the information from, all parts of the State and several other sources in the country. A number of useful tables have been added to meet the requirements of the users. For the latest year not only have the information been given at the state level but information disaggregated at the district level has also been presented. The Statistical Abstract presents reliable and comprehensive statistics pertaining to various aspects of the economy of Punjab needed by State planners and administrators and serves as a store house of authentic, reliable and up-to-date statistics of the State.
I am grateful to the various Heads of Departments and District Statistical Offices for their valuable co-operation in the collection and supply of information.
My thanks are due to the Controller, Printing and Stationery, Chandigarh Administration and his staff who extended whole-hearted co-operation in printing such a large volume in time.
The Abstract has been prepared under the supervision and guidance of Shri Jagjit Singh, Director Field Operations, Punjab. Acknowledgement is made of the useful work done by Sarvshri K. K. Verma, Deputy Economic and Statistical Adviser, Joqinder Singh, Research Officer, Rajinder Lai Kalra, Subhash Singla, Harjinder Singh, Rakesh Kumar Kalia, Dharam Singh, Om Parkash Kapoor, Sandeep Singh and Sarvsmt. Joginder Kaur, Uma Kumari, Sudesh Kumari and Divya Rattan Paul in preparation of the Abstract and acknowledgement is also made of the useful work done by the A rt Section for designing the title and preparing charts and graphs given in the Abstract.
Chandigarh : J. S. KAPOORMay 2, 1990. Economic Adviser to G ovt, Punjab.
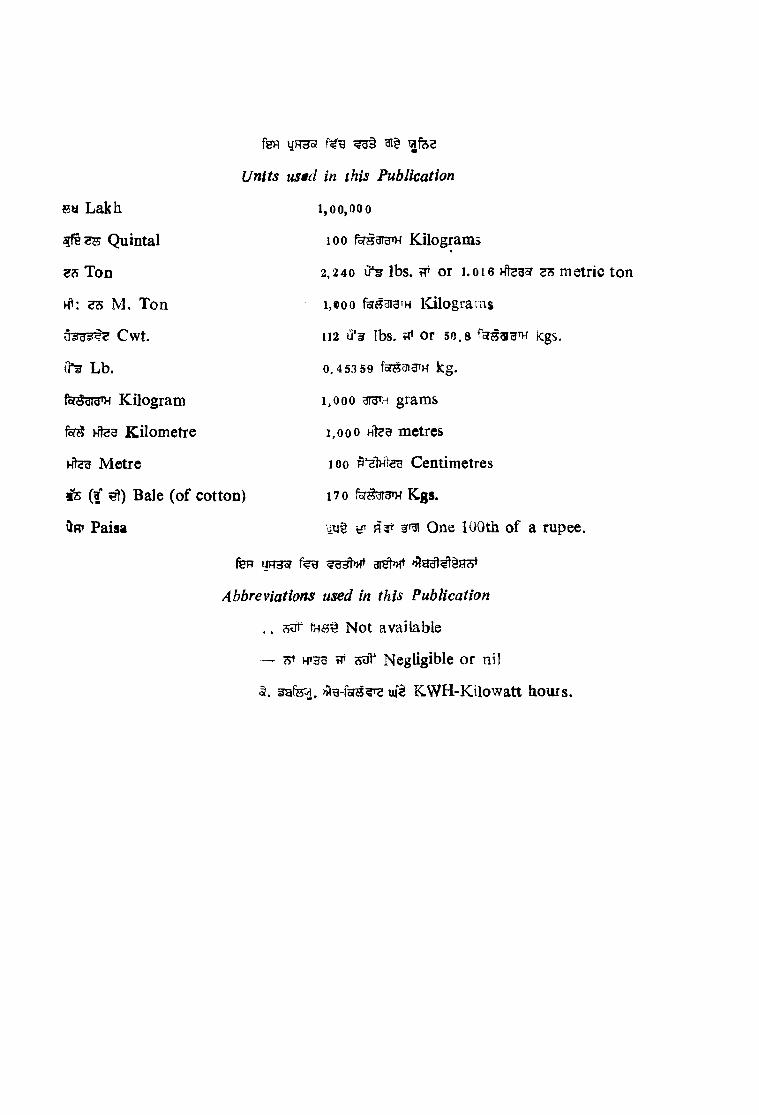
fOT URHof ^ git lafeS
Units us§d in this Publication
«« L a k h 1,00,000
Q u in ta l 100 K ilo g ram s
T o n 2,2 40 lbs. w o r 1.016 Hlgasr z e m e t
K : M . T o n i,«oo IC ilogram s
C w t. 112 u*3 lbs. o r 50.8 kgS.
0 ^ L b . 0.4 53 59 foTHaigTH kg .
fcrdWH K ilo g ra m 1,000 dfd'H g ram s
foidJ Hteg K ilo m e tre 1,000 Htea m etres
^ M e tre 100 C en tim e tre s
i s (€ B ale (o f c o tto n ) 170 K gs.
P a isa oug ^ ^ O n e 100th o f a ru p ee .
fen UH3o? »AH §acS
Abbreviations used in this Publication
. . N o t av a ilab le
— ^ KT3 o w su? N eg lig ib le o r n il
u ji K W H -K ilo w a tt h o u rs .
i ^ AcreI
i Square Mile1 33iHts Sq. Mile 1 gra Square Yardi3cR»f3 Hectare1 Ml<Jd
Square Kilometre 1 Hteg
Sq. Kilometre 1 Hteg Sq. Metre
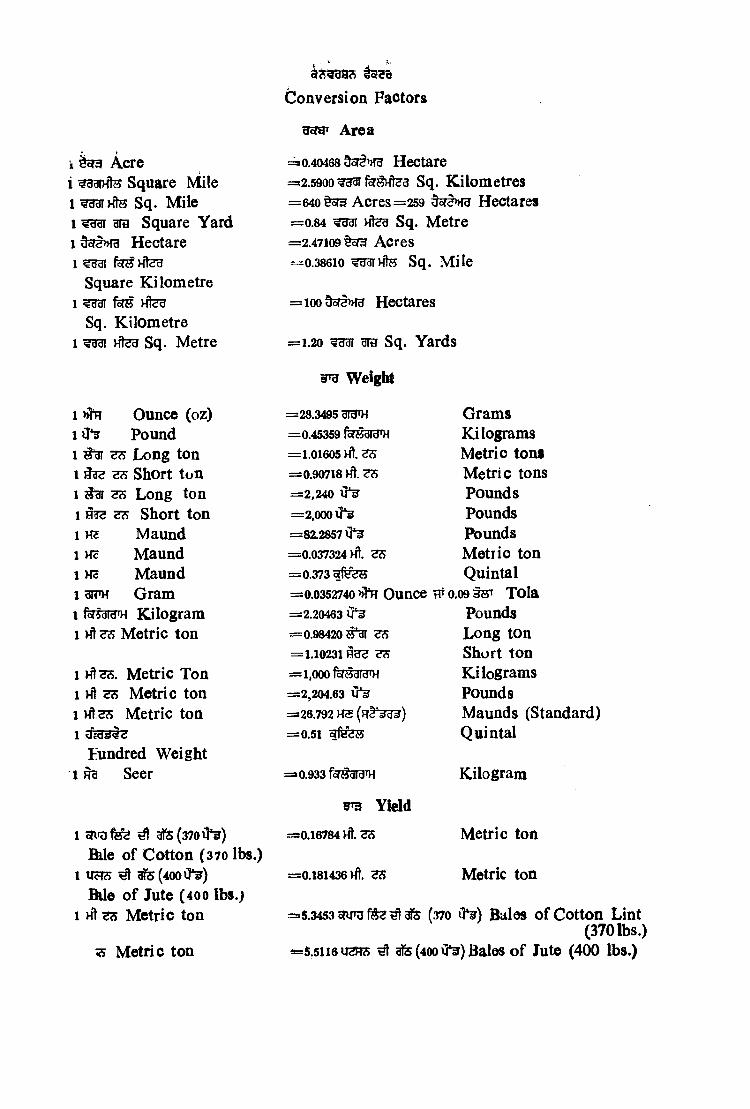
Conversion Factors
Area
=i0.40468 55T »f3 Hectare =*2.5900 ^ Sq. Kilometres= 6 4 0 §oT3 Acres—259 dof§»ra Hectares =0.84 Hte3 Sq. Metre =2.47109 §0^3 Acres =0.38610 ?33iHte Sq. Mile
=ioo55r§»ra Hectares
= 1.20 331 gra Sq. Yards
Weight
1 >jfH Ounce (o z ) =28.3495 dfd'H Grams1 i?*? Pound =0.45359 fsTKaraTH Kilograms1 ^ ^ Long ton =1.01605 Ht. e s Metric tont1 Short tun =0.90718 Ht.e?5 Metric tons1 j 'di Long ton =2,240 ^ Pounds1 z?> Short ton =2,000 Pounds1 m Maund =82.2857 Pounds1 He Maund =0.037324 hI. Metric ton1 Hs Maund =0.373 Quintal1 gR»H Gram =0.0352740 >j?TR Ounce tp 0.09 d tt ' Tola1 fcJidid'H Kilogram =2.20463 Pounds1 Hi <;«s Metric ton =0.98420?^ es Long ton
=1.10231 ^ Short ton1 Ht s. Metric Ton =1,000 Kilograms1 hI Metric ton =2,204.63 ^ Pounds1 Metric ton =26.792 HS Maunds (Standard)1 =0.51 Quintal
hundred Weight1 ^ Seer =0.933 rofi?drdn4
9 3 Yield
Kilogram
1 oTl'Uf ^ afe(37oi?3) =ia0.16784 Ht. HS Metric ton&le of Cotton (370 lbs.)
1 UcTS ^ ^(400iJ*?) =0.181436 35 Metric tonRle of Jute (4 0 0 Ibs.j
1 Ht Metric ton
Metric ton
:5.3453 onm ^ afe (370 iJ* ) Bales of Cotton Lint(370 lbs.)
=s.5li6U2Fr5 ^ afe (400 u*3) Bales of Jute (400 lbs.)

I Lakh 1 Crore 1 fHst»RS Million 1 Million
1 fng Inch 1 ^ Yard 1 Kte Mile1 fHst Millimetre 1 Centimetre1 Metre 1 Kilometre
1 ws 3IH Cubic Yard 1 lUc? Hteu Cubic Metre
1
Imperial Gallon 1 steg Litre
Nnmberid
: 1,00,000 TT or o . i t e t e =10,000,000 or lofMste =10 m Lakh =0.1 srts Crore
MillionMillion
55^ Length
--25A fM n te u =0.9144a.61 fsrs Hte3 =0.04= 0.3937 feg =1.09 gra =0.62
Volame
MillimetresMetreKilometresInchInchYardsMile
=0.7646 Hteu Cubic Metre=1.3079 ara Cubic Yards=35.3133 ^ Oubic feet
FwggT Capacity
=4.55 Litres
= 0.22 feHutgte imperial Gallon
For conversion of temperature in Centigrade (C®j to Fahrenheit (F'"> the relation is F*=9/5 (C°)+32.

Hglc o n t e n t s
UR *5: sjTable Particulars Pag eNo. N o .
--- 1PART—I
1— w I—Administrative Structare
M gTfl|UT75 3Names of Governor and Administrative Secretaries
1.2 »f§ ... 10 Names of Judges of the Punjab and Haryana High Court
1.3 rtsr H?T ufe»fW^ ^ 12Members of Punjab Public Service Commission, Patiala
1.4 ... 13Universities of Punjab and their Vice-Chancellors
1.5 \ i m ^ ^ ^ W'HH 1985 ... 14Names of Elected Members of Vidhan Sabha in Punjab, 1985
1.6 UtTO gftrftet ... 22Tehsils and Blocks of Punjab, Districtwise
2— WT3
II—Basic Statistics
2.1 ^ ^ 29Basic Statistics relating to some Important Sectors of Punjab
3— Uorgr
III—^Area and popnlation
3.1 U?TO ^ feUT^, J# I^ M§ f m »T5FnB 1981 .. 3 9Rural, Urban and Sex-wise Population of Punjab, Tehsil-wise, 1981
3.2 1951 § ' ... 42Increase in Population since 1951 by Districts
3.3 U"tTO fyU'dl »T§ 1981 ... 4 3Rural and Urban Population in Punjab, Districtwise, 1981
3.4 liWH fen ftfer § o?F|fH>H* ^ H fW : 1971 M§ 1981 . . . » 4 4Number of Villages and Towns in Punjab, 1971 and 1981
3.5 fecrfeRfI HoTO* ^ jffW : 1981 ... 45Number of Residential Houses : 1981
3.6 1981 ^ HgHH W TO UtTO ^ ^ ^ fU^ ... 46Villages classified by various Population Ranges in Punjab : 1981
3.7 u'tTO MOTg ^ »[§ >HTgT 1981 ... 8District-wise and Sex-wise Population, Area and Density of Population, 1981
Tabic Particulars PagjeNo. No.
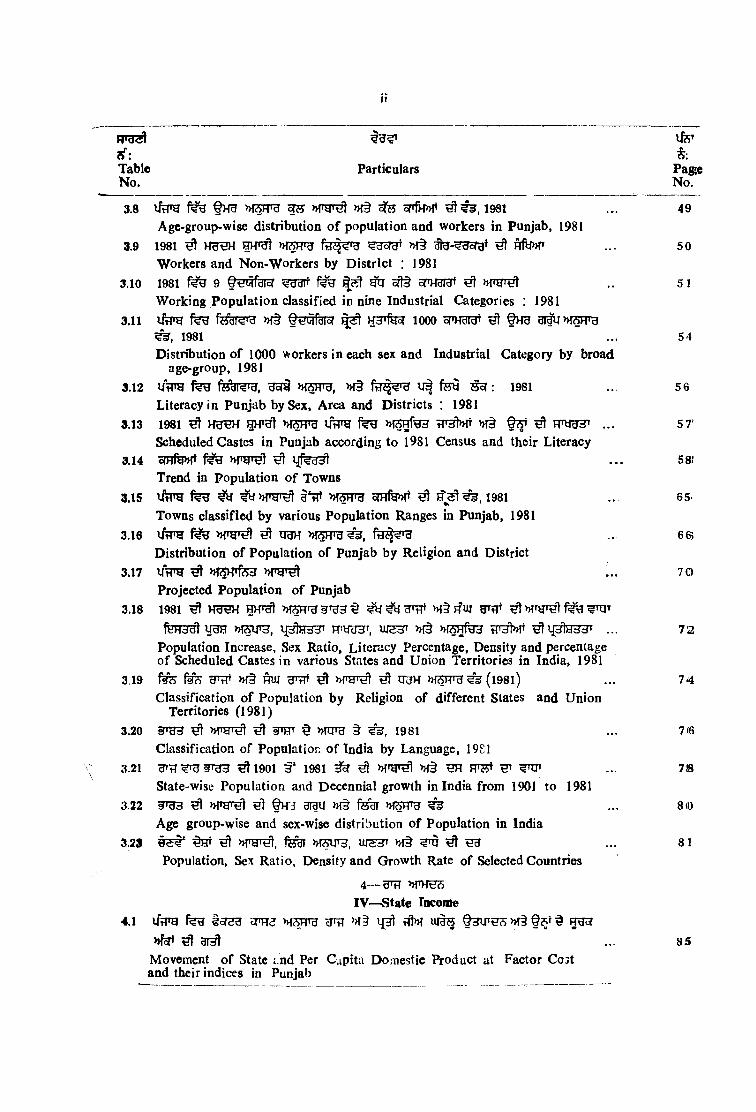
3.8 lirre fHU W TB »THr^ >H§ ^ cTfH»ft ^ # 3 , 1981 ... 49Agc-group-wise distribution o f population and workers in Punjab, 1981
3.9 1981 ^ m m W TH »T§ ^ HfW ... 50Workers and Non-Workers by District : 1981
3.10 1981 ^ 9 ^ ofit STH^r ^ »THT^ .. 5 1Working Population classified in nine Industrial Categories : 1981
3.11 >»f§ ^ 1000 cPHgigr fHU 3TWMOTB1981 ... 54
Distribution of 1000 workers in each sex and Industrial Category by broad age-group, 1981
3.12 i/Vnn feu f s t e g , Ucfg HRFPg, »f§ u f fey 1981 .. 56Literacy in Punjab by Sex, Area and Districts : 1981
3.13 1981 ^ W TO iffng >H5RfH3 >H§ ^ Fryggr ... 57'Scheduled Castes in Punjab according to 1981 Census and their Literacy
3.14 sm fW ^ . . . 58!Trend in population of Towns
3.15 UtTO ^ nfSFPg smfW h1 1981 .. 65'Towns classified by various Population Ranges in Punjab, 1981
3.16 ^ ugH ... 66?Distribution of Population of Punjab by Religion and District
3.17 iAth ^ » f5 K fe ... 70Projected Population of Punjab
3.18 1981 ^ W TO grgg f ^ »f§ g"uj gr rtfeH3cll irae W PH, »{§ »ISHfe3 tTHtW ^Ijc /lay jr ... 72
Population Increase, Sex Ratio, Literacy Percentage, Density and percentage of Scheduled Castes in various States and Union Territories in India, 1981
3.19 ^ »f§ HW ^ ^ »{?SFTO^(l98l) ... 74Classification of Population by Religion of different States and Union
Territories (1981)3.20 ^ ^ t WTO § 1981
Classification of Population of India by Language, 19813.21 ^1901 H" 1981 ^ ^ »f§ ^ HW ^
State-wise Population and Decennial growth in India from 1901 to 19813.22 ^ tH*j gray >H§ ^
Age group-wise and sex-wise distribution of Population in India3.23 ^ ^ >ym^. fe ^ >HWT3, ufSHT ^ ^
Population, Sex Ratio, Density and Growth Rate of Selected Countries
7(6
7S
8(0
81
4—^IV—state Income
4.1 U fpg ta r e g s m e gnq iflM u e s
^ 3T^ 85Movement of State :.nd Per Capita Domestic Product at Factor Cost and their indices in Punjab
Ill
Table Particulars PageNo. No.
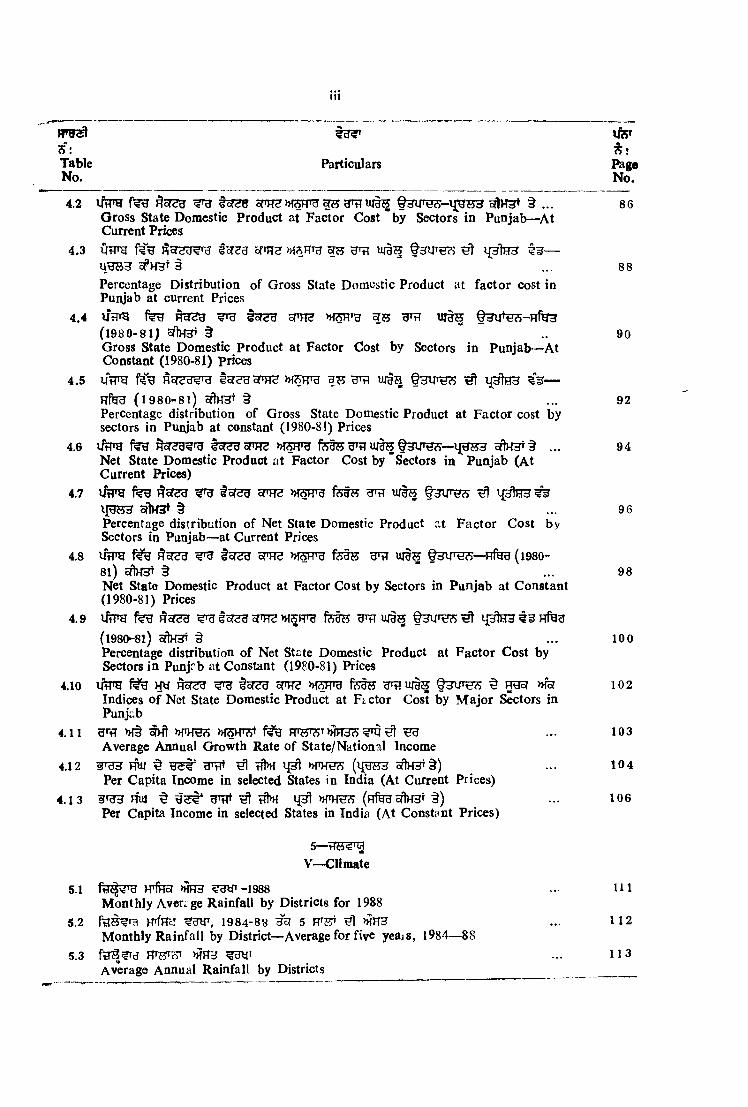
4.2 ifiTO ^ oTIHH* § ... 86Gross State Domestic Product at Factor Cost "by Sectors in Punjab— AtCurrent Prices
4.3 Otth ^oT^d^id loreg strpj^ u j is i{ 3 te #3 —UTO3 5pHHT3 " ... 88Percentage Distribution of Gross State Domestic Product at factor cost inPunjab at current Prices
4.4 UtTrg feg nfOT'H UltH(1980-81) § " .. 90Gross State Domestic Product at Factor Cost by Sectors in Punjab—At Constant (1980-81) Prices
4.5 iftTH tor?HcrHH >H3HTg a?j § huth?5 ^ i j p t e —Hfeg (1980-81) oftH T § ... 92Percentage distribution of Gross State Domestic Product at Factor cost by sectors in Punjab at constant (1980-81) Prices
4.6 l i ^ fen »f5Frg fetW grt? UHS cffH3r^ ... 94Net State Domestic Product at Factor Cost by “Sectors in Punjab (AtCurrent Prices)
4.7 fee onrrs w r e fefw ^ ^ ’-intHH ^oiTh3» t ' ... 96
Percentage distribution of Net State Domestic Product at Factor Cost bySectors in Punjab—at Current Prices
4.8 litTO ^ I c r e g c t h ? n w a f e § s ^ u r t^ t H i r e s — n f e g ( i 98o -8l) o te r § * ... 98Net State Domestic Product at Factor Cost by Sectors in Punjab at Constant (1980-81) Prices
4.9 x rm fee ^ oTTO feUH UlSs ^ Fffes(l980-8l) o t o § ... 100Percentage distribution of Net State Domestic Product at Factor Cost by Sectors in Punjrb at Constant (1980-81) Prices
4.10 UtTH fee w ^ oPHH »f5FTO feg?? ^ TOoj nfe 102Indices of Net State Domestic Product at Fictor Cost by M ajor Actors in Punjab
4.11 HTti >H§ ^ n W ^ »f5>TOt Fr^5T75T>HH3S^^ ^Average Annual Growth Rate of State/National Income
4.12 ^ ^ tTt>H »fW£S oftHHr §)Per Capita Income in selected States in India (At Current Prices)
4.1 3 nuj ^ ^ tTt>H »THH?> (Hfeu oftH3T §)Per Capita Income in selected States in India (At Constant Prices)
5—tfW€'0jV—Climate
5.1 >HH3 ^Uyr-1988 .. I l lMonthly Aver^^ge Rainfall by Districts for 1988
5.2 1984-88 HEJ 5 FTH ^1 MHH ... 112Monthly Rainfall by District—Average for five yeajs, 1984—88
5.3 ... H 3Average Annual Rainfall by Districts
103
104
106

HTggjl tuV7fl 71Tablo Particulars IPage
No. INo.
5.4 1988 ^ T B f^ »!§ ITOHS ... 1114Rainfall at Selected Stations— Actual and Normal in 1988
5.5 FTS 1988 g s t" ^§03^ § 3 W 3 (r") .. 1 I 5Temperature (O )at Selected Stations during 1988
5.6 >Hf>13nu qu ^ ... 1116Hours of Bright Sunshine at Amritsar
5.7 Urrg nfe^T >jjH3 1117Mean Wind Speed recorded at selected Stations in Punjab
5.8 1988 § >HH3 fns . . . 1118Mean Relative Humidity at Selected Stations in Punjab, 1988
VI—^Agricalture6.1 ^ . . . 1124
Classifies tion of Area in Punjab6.2 Hi 198 5-86 . . . 1126
Total Area ^.nd Clr.ssification of Area in India, 1985-866.3 imm f ^ qntj ^ gggr »,§ H2 8
Area and Production of Principal Crops in Punjab6.4 HT’R i'ci . . . 1130
Area under Principal Crops in India by States6.5 ^ f im . . . 1134
Production of Principal Crops in India by StPtes6.6 m j ^ . . . 1:38
Yield of important Crops in India by States6.7 UTTg ffg Hy g^rgr, . . . 114 0
Districtwise Area, Production and Yield per hectare of important crops inPunjab
6.8 m ra 9^3 ^ Hy ;gH?5t gcfgr . . . 1:50Area under High Yielding Varieties c f major Crops in Punjab
6.9 >H§ gsfgr ... H51Atca under Food and non-food Crops in Punjab
6.10 ^ 5TT . . . 1152Per Hectare yield of High Yielding Varieties of crops by States
6.11 w g . . . 1153Area under Fruits in Punjab
6.12 Utl^ ^ _ . . 1 : 5 4production o f Fruits in Punjab
6.13 RgrflM w t e i .s eArea under vegetables in Punjab
6.14 y3 fHB afi?’ m§ y^ . . . i-s?Cane crushed and Sugar production in the Sugar Mills of Punjab
6.15 yHTg f ^ ijny ^ . . . i ;5 sPercentage Distribution of Principal Orops in Punjab—District-wise
6.16 uV g . . . K60Number of Operational Holdings in Punjab
6.17 1980-81 »fy§B3?5 f3I^^ ... I (62Statiwise number of Op rational Holdings in 1980-81
IV

ifSTjs:
Table ParticularsNo. No.
6.18 1980-81 g w H »nraHSH ^ qnlwcJdT State-wise Operational Holdings 1980-81—Percentages
163
8 .19 19 8 0- 81 >H35|fe HtW ^Hofgr >H§ >HH3 >HoTO ... 166Statewise number of operational Holdings, Operated area and average size per holding of Scheduled Castes and Schedule Tribes in 1980-81.
6.20 les Statewise and size Groupwise number of operational Holdings of ScheduleCastes and Sheduled Tribes in 1980-81
6.21 W g ^ »Te? .. . 170Index Numbers of Agricultural Production in Punjab
6.22 UTpg § ynfgrgt >H .. . 172Agricultural Index Numbers in Punjab
6.23 >M3 ... 174Agricultural Jndex Numbers of Production in India
6.24 UflTg gHTfeOsar ire t W 3 . . . 177Consumption of Chemical Fertilizers in Punjab
6.25 UflTg g g s tThMt ojrfjWt ^ ijfH tTgrfe^ ofTH
M3T3 ■3^ ^ ’ .. . 178Percentage of Workers engaged in Agriculture to Total Workers and
Cultivable Area per Agricultural Worker in Punjab6.26 fi?g ify 5 ^ » ig >HFI3 5TT3 ... 179
Average yield per Hectare of Important Orops in India and other Countries
6.27 imrg Hi ^ fum . . . ig oPercentage contribution of Agriculture to total State Income in Punjab
6.28 UtlTg FTHT i RBcI >HS? . . . 181Indices of Parity in Punjab
6.29 UflTg Htj 3H3* rgtl^srt »!§ ... 182Sowing and Harvesting periods of important crops in Punjab
7,VII—Marketing and Storage
7,1 hVI'h* ^ . . . l a s
Number of Principal Agricultural Markets
•>,2 H^»|t »l§ » 1 ^ . . . 1 8 6
Regulated Markets and Sub-Yards7.3 ^ isijHet . . . i 8 7
Capacity of State Owned Warehouses7.4 ^ .. . 188
Di8trict>wise Market Arrivals of Important Crops
Vi
iu3t
Table Particalars PageNo. No.
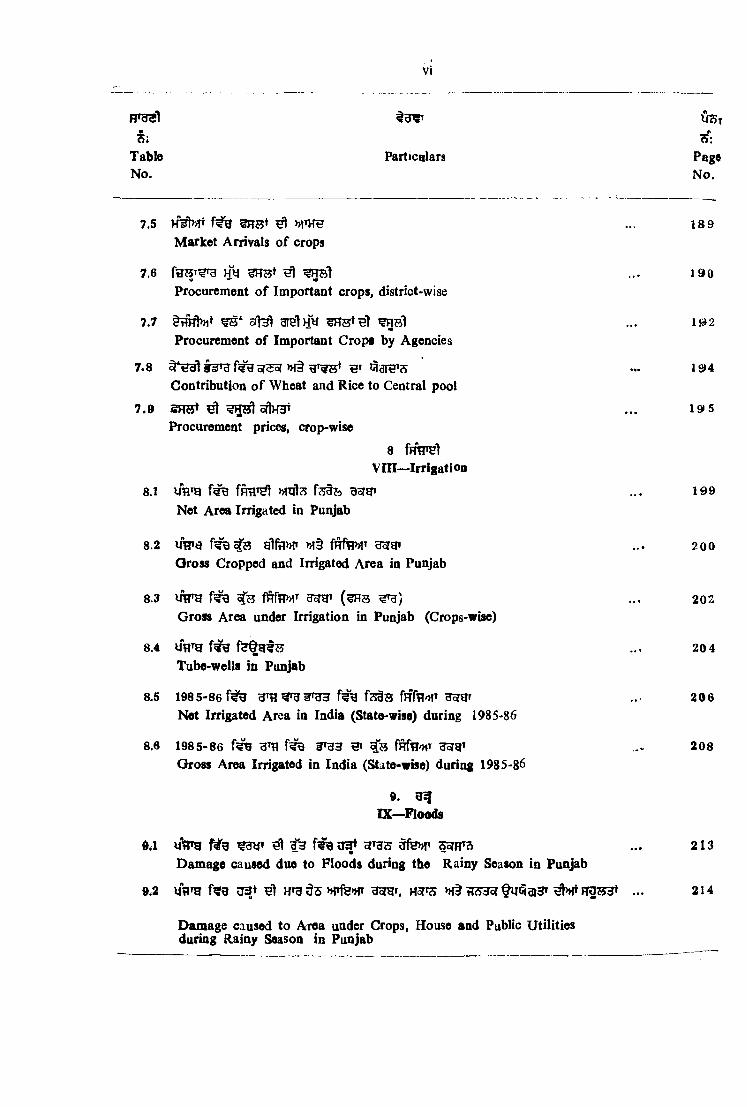
7.5 M lMt f€g ^35* ^ ... 189Market Arrivals o f crops
7.6 fg S T ^ Hy Hi ... 190Procurement o f Important crops, district-wise
7.7 §tfFft»i* aielHy ... 192Procurement of Important Cropf by Agencies
7.8 5T^ »f§ fare’s — 19>4Contribution o f Wheat and Rice to Central pool
7.9 gRH* ^ ^R?5t oTtH3t ... 19>5Procurement prices, crop-wise
8 fmfH!V m —Irrigation
8.1 uV g f#9 fpmT^ »fql 5 aorgr ... 199Net Area Irrigated in Punjab
8.2 lirr >h§ fRfiWT Hsrg* ... 200Oross Cropped and Irrigated Area in Punjab
8.3 fRf?T»lT g^gT 202Gross Area under Irrigation in Punjab (Crops-wise)
8.4 u V g 204 Tube-wells in Punjab
8.5 1985-86 ^ f ;^ f^gg HoTHr 206Net Irrigated Area in India (State-wise) during 1985-86
8.6 1985-86 208Gross Area Irrigated in India (State-wise) during 1985-86
9. ggIX—Floods
da ^ €3 ... 213Damage caused due to Floods during the Rainy Season in Punjab
9.2 W g 03t ^ HTH ^ 3 K5T3 >Ht #»{♦ ... 214
Damage caused to Area under Crops, House and Public Utilities during Rainy Season in Punjab
VI1
Table Particulars PageNo. No.
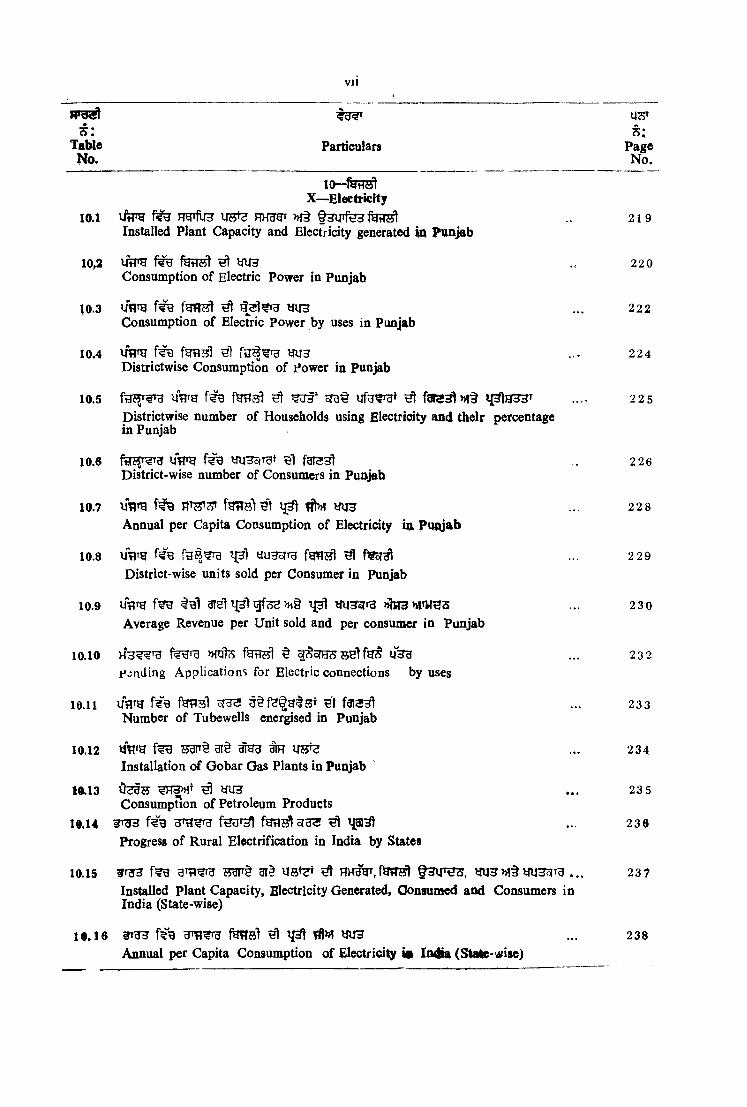
10—feiWtX—Eleefricity
10.1 imni Ifg^ HHggr >»[§ 219Installed Plant Capacity and Electricity generated to Punjab
10.2 2 2 0Consumption of Electric Power in Punjab
10.3 UTITg ^ UU3 ... 222Consumption of Electric Power by uses in Punjab
10.4 U?rg yiJ3 . , . 2 2 4Districtwise Consumption of Power in Punjab
10.5 liVjTg ^ ^ f3T33l »!§ 22 5Districtwise number of Households using Electricity and their percentage in Punjab
10.6 MTTg yUH TUf f3i3^ 2 26District-wise number of Consumers in Punjab
10.7 yu3 ... 22sAnnual per Capita Consumption of Electricity in Punjab
10.8 u V a yugsfTu fg^sl ^ ... 229District-wise units sold per Consumer in Punjab
10.9 w g t g l 3T5l g f e » i§ ... 230Average Revenue per Unit sold and per consumer in Punjab
10.10 iThu ... 23 2t*,;ading Applications for Electric connections by uses
10.11 u V g fgnsl 3§ f ^ § g t s t '1 ... 233Number of Tubewells energised in Punjab
10.12 3I§ ^ tR ... 234Installation of Gobar Gas Plants in Punjab
t«.13 0^35 ^ yU3 ... 23 5Consumption of Petroleum Products
10.14 ^ ... 236Progress of Rural Electrification in India by States
10.15 ar^ ^ » ! ^ ... 2 3 ^Installed Plant Capacity, Electricity Generated, Oonsumed and Consumers in India (State-wise)
ie .1 6 3T33 f#9 f ^ s l s i m 3 ... 238Annual per Capita Consumption of Electrici^ mi Indibi (State-wise)

Viii
5": s":Table Particulars Page
_ N o . ______________________ ________________________________________________ No.
11. ^XI—Forests
11.1 unrg 244Area under Forests in Punjab
11.2 ^ sftt ... 246Plants planted and supplied by the Forest Department
11.3 ^ 3" Hy tUH ... 247Major Forest Produce in Punjab
11.4 UTirg § 3^ f 0 fu fl ... 247Minor Forest Produce in Punjab
11.5 »i3I ^ “e a s gs^ai 2485Area Protected from Fire and Cattle-Grazing
11.6 Utirg Hy ^ ... 24 0Plantation of Important Species in Punjab
11.7 ... 249Employment of Forestry in Punjab
12 ire q?i, UHXII—Livestock, Animal Husbandry and Dairying
12.1 Mg UH q s 1977 ... 253Livestock and Poultry in Punjab: 1977
12.2 li’tTH ar§M»:1977 ... 254Cattle in Punjab: 1977
12.3 imrg 1977 § H5r» .. 255Buffaloes in Punjab: 1977
12.4 imrg uJ3 »t§ z z : 1977 .. 25 6Horses and Ponies in Punjab: 1977
12.5 W g »1§ yHa»: 1977 ... 2 5 7Donkeys and Mules in Punjab: 1977
12.6 uVg f€g : 1977 ' , ... 25 8Sheep in Punjab: 1977
12.7 MtJTg »!§ H3:1977 ... 259Goats, Camels and Pigs in Punjab: 1977
12.8 UtJTH ^ y f , »f§ u a U S ^ :1 9 7 7 ... 2 60Fowls, Ducks, and Other Poultry in Punjab: 1977 _

PTTHrt3 5
Table Particulars PageNo. No.
12.9 ^ f y gmt UHUS, STth" »ft ygg[ H^gft»fi R fW : 1977 ... 2 62Number of Live-stock, Working Cattle and Poultry in the States of In d ia ; 1977
12.10 imrg ira fgfsrHFP ... 2 64Veterinary Institutions and their Staff (District-wise) in Punjab
12.11 m >n§ vra h w t e n M w i wft?> uh »f§ .. 265Average Number of Livestock Units and Area and Units served per Institution and Veternarian
12.12 Ufltg ira hToTHHt STH ... 26 6Work done in the Veterinary Institutions in Punjab (District-wise)
12.13 UrIfH HFT hI ^ g f W ... 2 68Livestock and Artificial Insemination Development Centres in Punjab (District-wise)
12.14 Ut?53 f^ojm ... 2 69Fisheries Development in Punjab
12.15 ITFrg 3 ‘ § 3 1 ^ ^ ... 270Fish-Seed Farms/Nurseries ar.d their production in Punjab
12.16 ifTTH fH?5 »1§ .. 2 71Milk Plants and Milk Chilling Centres in Punjab
l:i.l7 uVg ^ >H§ fH55 ... 2 72Estimated Milk Production and per capita availability of Milk in Punjab
12.18 urrg <fH3 FTfy> T ... 273Number of Recognised Slaughter Houses in Punjab
12.19 f 3 t s UT§75 fUHT ... 2 74Share of Livestock in Net State Domestic Product
13. 0 ^ f^THXIII—^Raral Development
13.1 Vf3 IJ3I3TH § ... 2 78Government Expenditure on Rural Development Programme
13.2 unm ^ 0 ^ iragrsTH b w ^ n fn i^ ... 2soPeople’s Contribution in the Rural Development Programme
13.3 f t r ^ ^ ^ fgrSHl .. 2S1District-wise Number of Blocks
13.4 >H (f^ T ^ ) , 1986-8 7 ... 282Districtwise Selected Economic Indicators (Rural Area), 1986-87
13.5 w g ^ 1986-87 ... 286Focal Point in Punjab by District as on 1986-87
IX

TableNo.
Particulars PageNd.
14.XIV^CooptfatioD
14.1Selected Statistics of All Oo-operative Societies in Punjab
299
14.2 UtTH t*c?, 1987-88 Cooperative Societies and Banks in Punjab by Districts, 1987-88
290
14.3 i/rtTg f ifrl s r ^ tSelected Statistics of Primary Agricultural Credit Societies in Punjab
291
14.4 U??Tg oTHin ^ <5^-Selected Statistics of Primary Non-Agricultural Credit Societies in Punjab
292
14.5is elected Statistics of State Land Development Bank
293
14.6 lAra T{rfHH »ffer3 Selected Statistics of Primary Land Development Banks in Punjab
2 94
14,7 |*cTt ^ »,sr^Selected Statistics of Central Co-operative Banks in Punjab
295
14.8 t/TTg tSelected Statistics of StHte Co-6perfttive Banks in Punjab
29S
14.9 liflTH ^ »,ucm © ^<5^' H fe Selected Statistics of Apex Marketing Federation, Punjab
297
14.10 lirrg fg?jT g^r f^sr^ ^Selected Statistics of District Wholesale Societies in Punjab
298
14.11Selected Statistics of Prlmftry Matketing-cum-Processing Societies in Punjab
299
14.12 lirrg ^ r-^u s tSelected Statistics of Central Consumer Stores in Punjab
300
14.13 liHTg R^^t tSelected Statistics of Primary Stores in Punjab
301
14.14 urrg ’QSelected Statistics of Joint Collective Farming Societies in Punjab
302
14.15 vfFrg » t to r^ 3 c ? g 3 r ^ ^ § m 3Selected Statistics of L^ibour and Construction Societies in Punjab
303
X I
Table Particulars PageNo No
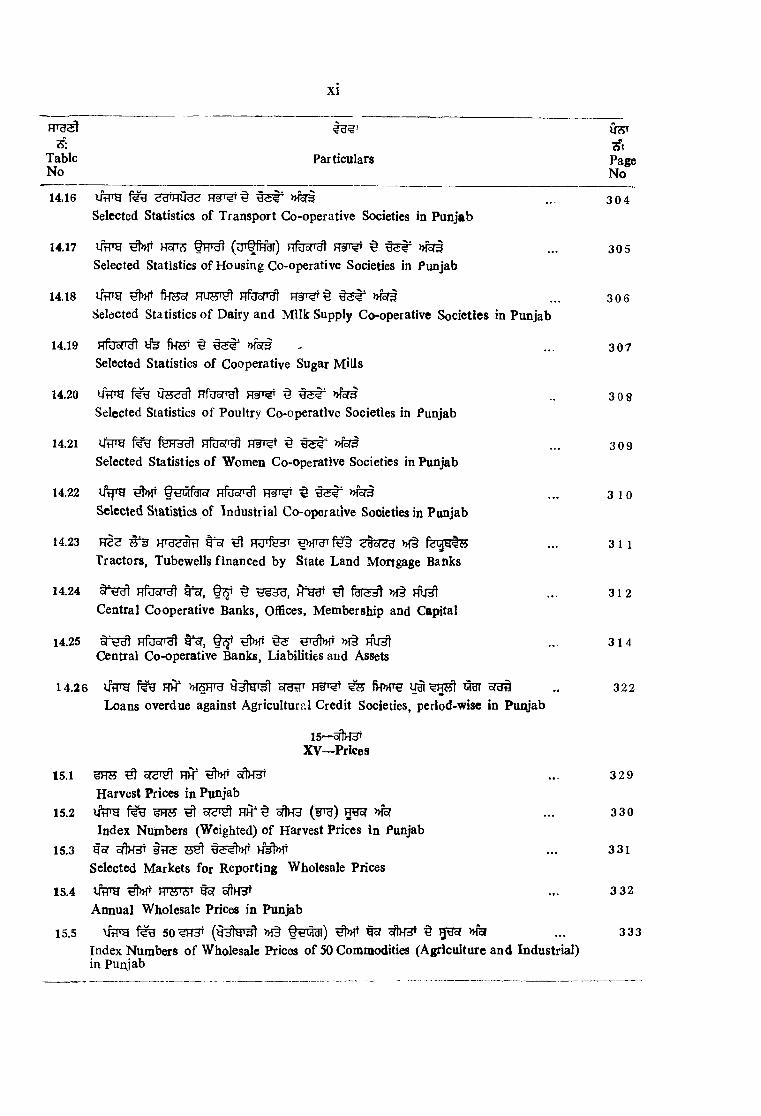
14.16 iftro w r i ... 304Selected Statistics of Transport Co-operative Societies in Punjab
14.17 ^ HSTO (uW df) HfaofT ^ nferi ... 305Selected Statistics of Housing Co-operative Societies in Punjab
14.18 ^ t e s r HfaoT' 1 ... 306Selected Statistics of Dairy and Mllfc Supply Co-operative Societies in Punjab
14.19 HfOoT tfe t o ^ ... 307Selected Statistics of Cooperative Sugar Mills
14.20 iftTO ^ #5#^ m i .. 308Selected Statistics of Poultry Co-operative Societies in Punjab
14.21 RfOof'-cfl ^ 309Selected Statistics of Women Co-operative Societies in Punjab
14.22 litjra ^ t e q f e FrfuoTdl ^ »feri ... 3 1 0Selected Statistics of Industrial Co-operative Societies in Punjab
14.23 ^ ^ RnrfEHT >H§ fegglu? ... 311Tractors, Tubewells financed by State Land Mortgage Banks
14.24 HfUoT t o ^ H W ^ ... 312Central Cooperative Banks, Offices, Membership and Capital
14.25 ^ >H§ ... 314Central Co-operative Banks, Liabilities and Assets
14.26 UiTO HH* MOTU ST^t ^ jH»TO ^ 322Loans overdue against Agriculturr.l Credit Societies, period-wise in Punjab
15- oflH3»XV—Prices
15.1 ^H55 ^ HH" o f to ... 329Harvest Prices in Punjab
15.2 litra ^ hh"^ oftHH h w m ... 330Index Numbers (Weighted) of Harvest Prices in Punjab
15.3 gsr of}H3T itTS ^ ... 331Selected Markets for Reporting Wholesale Prices
15.4 i j ^ HWc^ ^ oftHgt ... 3 32Annual Wholesale Prices in Punjab
15.5 MtTO 5o^H3T »i§ ^ ^ cftH3 ^ »fer ... 333Index Numbers of Wholesale Prices of 50 Commodities (Agriculture and Industrial)in Puruab
S::Table Particulars PagcieNo. No#.
X i l
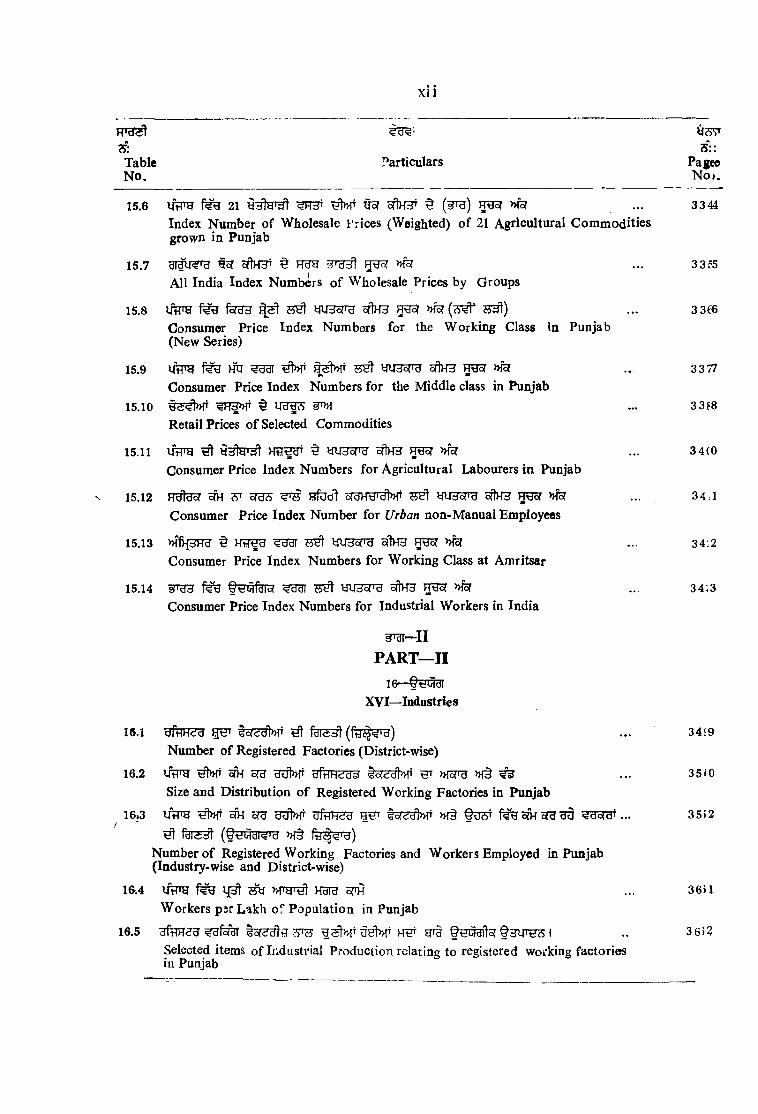
15.6 litTO 21 ^t»T gs? ofbfHT t (grg) ^ »{ ... 3344Index Number of Wholesale Frices (Weighted) of 21 Agricultural Commodities grown in Punjab
15.7 gsr cftn^ ^ ... 3355All India Index Numbers of Wholesale Prices by Groups
15.8 yifHsfTu > vfer(^ ... 3366Consumer Price Index Numbers for the Working Class in Punjab (New Series)
15.9 ifFTO w ^!»r yiBsru sftHH »fer ... 3377Consumer Price Index Numbers for the Middle class in Punjab
15.10 ^ U H ^ W»\ ... 3 368Retail Prices of Selected Commodities
15.11 ifFTO ^ t tfUHSnU 5ftH3 ... 34(0Consumer Price Index Numbers for Agricultural Labourers in Punjab
15.12 H^tgsr olH oTUS ^ HfUdl 5raHW|>Ht W35TO oftHH >>fer ... 34.1Consumer Price Index Number for Urban non-Manual Employees
15.13 nffrjHTO ^ 75^ WHSTO SiThH HW ... 34:2Consumer Price Index Numbers for Working Class at Amritsar
15.14 WH5T^ sftHH »fer ... 34;3Consumer Price Index Numbers for Industrial Workers in India
^ —11
PART—II16—
XVI—Industries
16.1 t o T 3 ^ ^ ... 3459Number of Registered Factories (District-wise)
16.2 i f ^ ^t»{t 5W ofU UUt>HT 'cfTd'HcJdsi ^ >H§ ^ ... 3510Size and Distribution of Registered Working Factories in Punjab
16.3 utTO oiK ora uulw f ^ o j H ^ n d ^^sraT... 35>2
Number of Registered Working Factories and Workers Employed in Punjab (Industiy-wise and District-wise)
16.4 Kara sth ... 36UWorkers psr Lakh of Population in Punjab
16.5 hw ^ i .. 3 652Selected items of Industrial Production relating to registered working factories in Punjab

X ll l
5"UST3*
fableNo.
Particulars PageNo.
16.6 UHTH feg HTS UgS hV § § ^ 7 ^ 1987-88 ... Selected Information relating to registered working factories in Punjab 1987-88
364
16.7 ^ Ot!Qfeo[ § w g §Industrial informition on the basis of Annual Survey of Industries in Punjab
366
16.8 grgH O^qfdiof TOly<s ^
Industrial information on the basis of Annual survey of Industries in India (State-wise)
368
16.9 fAW^’3HoT W ItTdR Production and Employment of Manufacturing Industries in Punjab
372
16.10 QtjMfdrc ^ t^fersT Qaru'^A' # w utra § Index of Industrial production according to industrial classification
374
16.11 iftTO >H§Production and employment of selected Industries ia Punjab
376
16.12 4 Wa owi ^ t e r , RflfeHi? §Cotton Textile Mills, Spindles aad Looms in Punjab
379
16.13 ifrTH ^ H ^ o r U S ’ fHMT oTUi >h9 U'd'l W fSH fey>TOOTF3..,Production of cotton and yarn and average daily employment in Ootton Textile Mills in Punjab
380
16.14 UtTH onra€l»f^ afer fn^ra oM ht Cotton pressed in Punjab
381
16.15 *tT HO'fed' oT<J, 1935 MUlS Qtl ifcflof UPac;' ^ oflJl dl l fec/1 HU'fed' . . .Financial Assistance granted to Industrial Units under the State Aid to Industries
Act, 1935
382
16.16 uti'y feg (y ^ ) HT Q3i4T^»f§Production and Value of Cotton (Khadi) in Punjab
383
16.17 feoTdl Sale of Khadi
383
16.18 ^ QyCi’di' 2 tf€t >h9 'draTH Qt crar yus ^ 'd ' f^ il uisl y r a e t brdd...Amount of Grants and Loans Disbursed to various Industries in Punjab by Khadi and Village Industries Board
384
16.19 UtTO t ^ ^ >h§ h h w h
Production, Sale and Employment in different Village Industries in Punjab385
16.20 UfPH ioTS U»Pfe3H gjsfgrArea and Plots in Focal Points of Punjab
387
uJ jS : m'Table Particulars P^geNo. Nio.
XIV
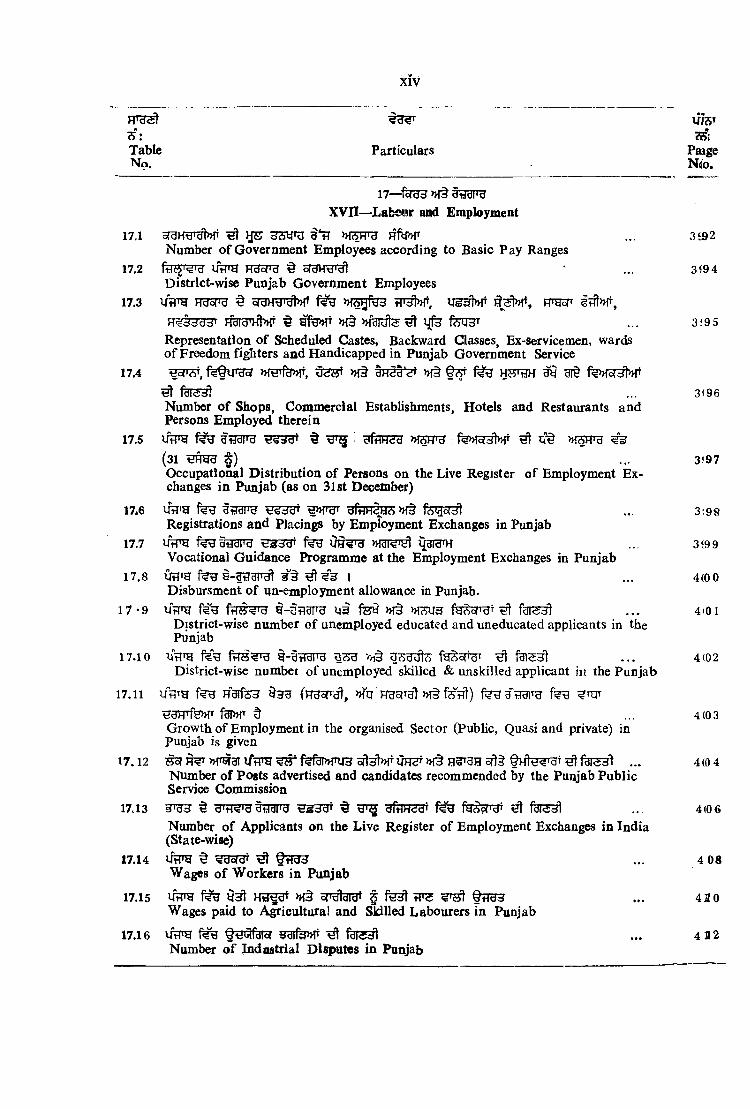
17— »{§ HHunu XVn—Labear and Employment
17.1 ^ ^ 331TU MOTU h I w ... 3 ‘92Number of Government Employees according to Basic Pay Ranges
17.2 Ut o HHSTO ^ s r a H ^ • ... 3 ‘94District«wise Punjab Government Employees
17.3 Utpw prasTO § fphst
H^3333T H UTHhKT ^ »fgnfte ^ Ijfe feg^T 3 f95Representation of Scheduled Castes, Backward Glasses, Ex-servicemen, wards of Freedom fighters and Handicapped in Punjab Government Service
17.4 ^ofW , f% §U W » f t dR5d*^I »f§ t o W fe>H5r3]»ft
^ ... 3(96Number of Shops, Commercial Establishments, Hotels and Restaurants and Persons Employed therein
17.5 ^ »TOTH ^ M55TO ^(31 § ) ... 3197Occupational Distribution of Persons on the Live Register of Employment Exchanges in Punjab (as on 31st December)
17.6 UH'H feg ^trara crfHJT cS' »T§ feqST^ ... 3:98Registrations and Placings by Employment Exchanges in Punjab
17.7 UTTH feu » e ^ ... 3 99Vocational Guidance Programme at the Employment Exchanges in Punjab
17.8 ifflTg ^ I 4(0 0Disbursment of im-employment allowance in Punjab.
17 *9 iTTra i-GflUITU U3 fSW »1§ ^ . . . 4 , 0 1District-wise number of unemployed educated and uneducated applicants in the Punjab
17.10 lAlTg Mg fFTS^Tg »i§ ^ . . . 4(02District-wise numbei of unemployed skilled & unskilled applicant i]i the Punjab
17.11 U>H R3lfe3 WI Hao?Tgt »f§ ^njrHOTTfHMT t ... 4(03Growth of Employment in the organised Sector (Public, Quasi and private) in Punjab is given
17.12 ^ ^ >>m3T iftTO ^ fefuI»fnjH B f t i f l w > H § H5T3H 5fl§ ^ ... 4(0 4Number of Posts advertised and candidates recommended by the Punjab PublicService Commission
17.13 Sgngr ^ g rg ^ .. 4(06Number of Applicants on the Live Register of Employment Exchanges in India (State-wise)
17.14 ^ t?T33 ... 4 08Wages of Workers in Punjab
17.15 >H§ oTcftera* § ^ ... 4110Wages paid to Agricultural and Sldlled Labourers in Punjab
17.16 ifhTO ^ ... 4 32Number o f ^dustrla l Disputes in Punjab
XV
75:TableNo.
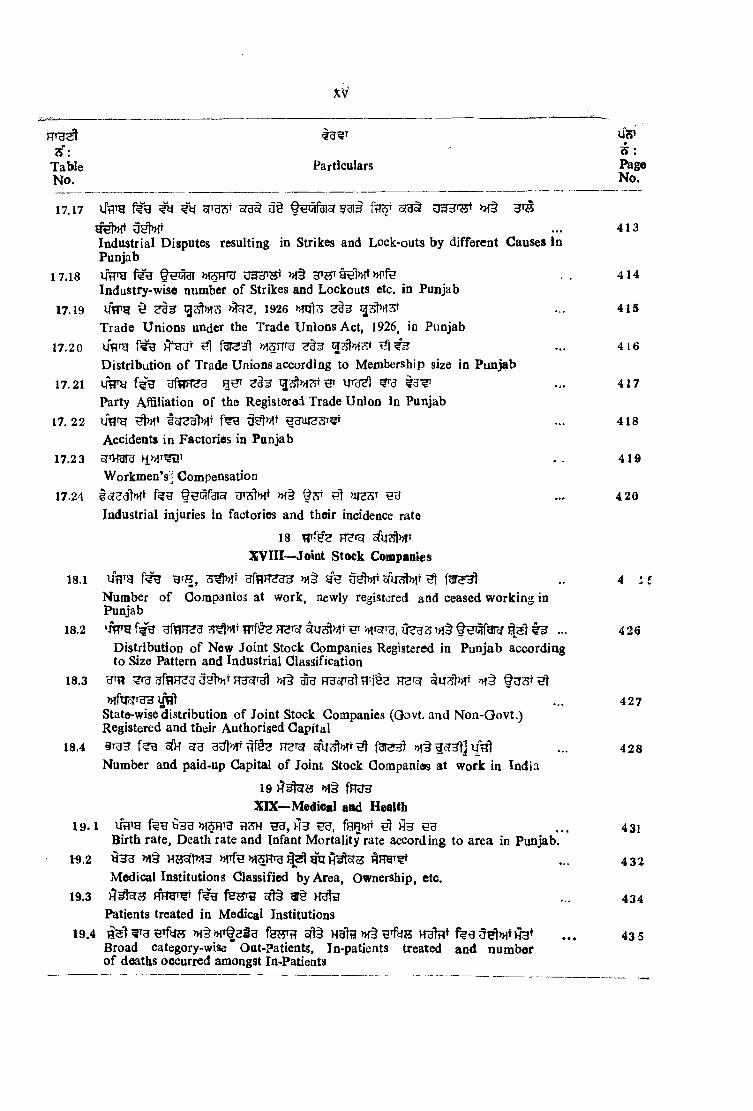
17.17
17.18
17.19
17.20
17.21
17. 22
17.2 3
17.24
Particulars
US'5:PageNo.
18.1
18.2
18.3
18.4
19.1
W.2
19.3
19.4
^ ^ U33W >jf§
Industrial Disputes resulting in Strikes and Lock-outs by different Causes i PunjabVj^ U3HW »l§Industry-wise number of Strikes and Lockouts etc. in Punjab uVg § >>tee, i926
Trade Unions under the Trade Unions Act, 1926, in Punjab uflfg m m iDistribution of Trade Unions according to Membership size in Punjab iftT^ ‘dfTin^a a^T ^3 ^ uigel ^Party Affiliation of the Registered Trade Union in Punjab
tsr33>>»i gguiHSTStAccidents in Factories in Punjab
Workmen’s Compensation»{§ t o s i uie?»T
Industrial injuries in factories and their incidence rate18 H?TcT oTif MT
XVIII—Joint Stock Companies
Number of Companies at work, newly registered and ceased working in PunjabuVg TTfe? ifegs -
Distribution of New Joint Stock Companies Registered in Punjab accordingto Size Pattern and Industrial Classification
^ >h Frasrfal tiffse nsrs? oi§ )>!flI TB3 Uflt
State-wise distribution of Joint Stock Companies (Qovt. and Non-Qovt.) Registered and their Authorised Capital
sfH TTemNumber and paid-up Capital of Joint Stock Companios at work in India
19 H ^ S fnU3XIX—Medical and Health
Ifflig HH feHW ^ H3Birth rate, Death rate and Infant Mortality rate according to area in Punjab.
Medical Institutions Classified by Area, Ownership, etc.fsjjrH 5t1§
Patients treated in Medical Institutions>Ht>HT§2iu fSHTfl 5ft§ >H§ f%0U^>ntH3t
Broad category-wise Out-Patients, In-patients treated and number of deaths occurred amongst In-Patients
413
414
415
416
417
418
419
420
4 I i
426
427
428
431
432
434
43 5

XVI
iS : 5;Table Particulars PageNo, No.
19.5 a3r?>! RFfg»?r 436Ayurvedic, Unani and Homoeopathic Institutions
19.6 ... 437Beds in Medical Institutions
19.7 »!§ Out 433Registered Medical and Para-Medical Personnel
19.8 H^^T-5 »1§ ElM 1T^ )>1TyT 439Population served per Medical and Para-Medical Personnel
19.9 »!TgT lj[^ hW , >H§ipt . . . 44 0Population served per Institution, Bed
19.10 orfe»!i^ uarurH uel . . . 441Achievements of Family Welfare Programme in Punjab
1 9 .1 1 fOTTi3 ^ 3 w . . . 442^ lJ3le33T
Percentage of eligible couples effectively Protected under different methods of Family Planning
19.12 oViTW feg 3g §f3TUT§ grg >H§3ra§ gr)>fH^ faisst ... 443
Number of Medical termination of Pregnancies and Number since inception in Punjab.
19 . 1 3 yrrg araw ^Number of Births averted since inception in Punjab.
19.14 imrg § futasSterilisation Operations in Punjab
\
19.15 W 3 U5Jfe3 ^ ^ fUSTfl HiProgress of Prophy-laxis against Nutritional anaemia
444
445
446
19.16 u frg 33IT ^ ^ tjpr^ . . . 447Progress of Immunisation Programme in Punjab
19.17 ifte miJJTHl fu% . . . 448Villages covered under Drinking Water Supply Scheme
20—fnfwXX—Edocati(Hi
20.1 f?e ^ .. . 452District-wise Number of recognised Institutions in Punjab
XVII
<33JS" : ?S :Table Particulars PageNo. No-
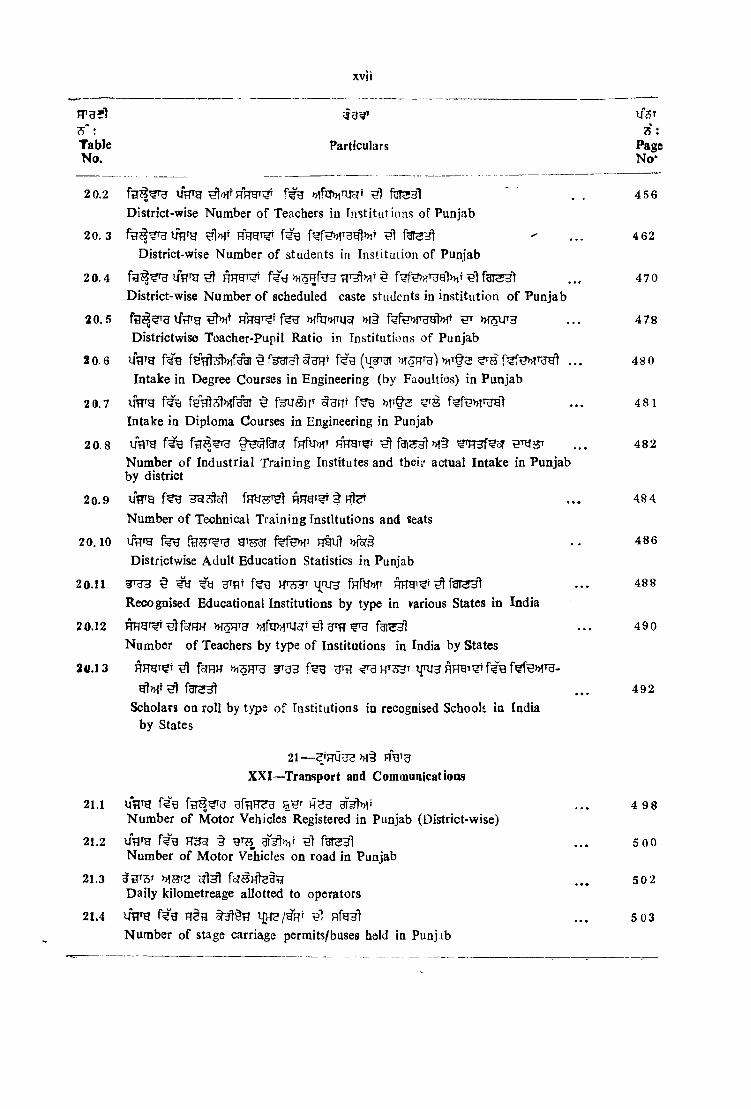
20.2 uVg fgT33l * . . 456District-wise Number of Teachers in rnstitutions of Punjab
20.3 HHgT f€g t e n t ^ ... 4 62District-wise Number of students in Institution of Punjab
20 .4 ^ HJTgr fgT33t ... 470District-wise Number of scheduled caste students in institution of Punjab
20.5 ftT^^g iftTTg HFTgTT ^ » f ^ 3 . . . 478Districtwise Teacher-Pupil Ratio in Institutions of Punjab
20.6 uVg (W3I ’MWg) >>lT§3 .. . 48 0Intake in Degree Courses in Engineering (by Faoultios) in Punjab
20.7 . . . 481Intake in Diploma Courses in Engineering in Punjab
2 0.8 uflTg t ^ f t r s r f n f w nngT^f ^Tysr . . . 482Number of Industrial Training Institutes and their actual Intake in Punjab by district
20.9 UTTa § hI^ . . . 48 4Number of Technical Training Institutions and seats
20.10 ifrfTg f ^ t e w HT553T nggt . . 486Districtwise Adult Education Statistics in Punjab
20.11 ^ €y fnfw ... 488Recognised Educational Institutions by type in various States in India
20.12 >H5HTcr n fxiMnJST ^ .. . 490Number of Teachers by type of Institutions in India by States
20.13 Angr^t ^ fgpiH grff <frgHT33T qU]3f3T3^ . . . 492
Scholars on roll by type of Institutions in recognised Schools, in India by States
21— Fra^gXXI—^Transport and Communications
21.1 uVg f?9 w 3r »ii ... 4 98Number of Motor Vehicles Registered in Punjab (District-wise)
21.2 UtlTg gr^nit fgT3H) . . . 5 00Number of Motor Vehicles on road in Punjab
21.3 srtnl . . . 50 2Daily kilometreage allotted to operators
21.4 w g f? g H??5 - 1 Rfgnt . . . 503Number of stage carriage permits/buses held in Punj ib
H'gsl usTs : 7f:
Table Particulars PageNo. No-
jrvfji
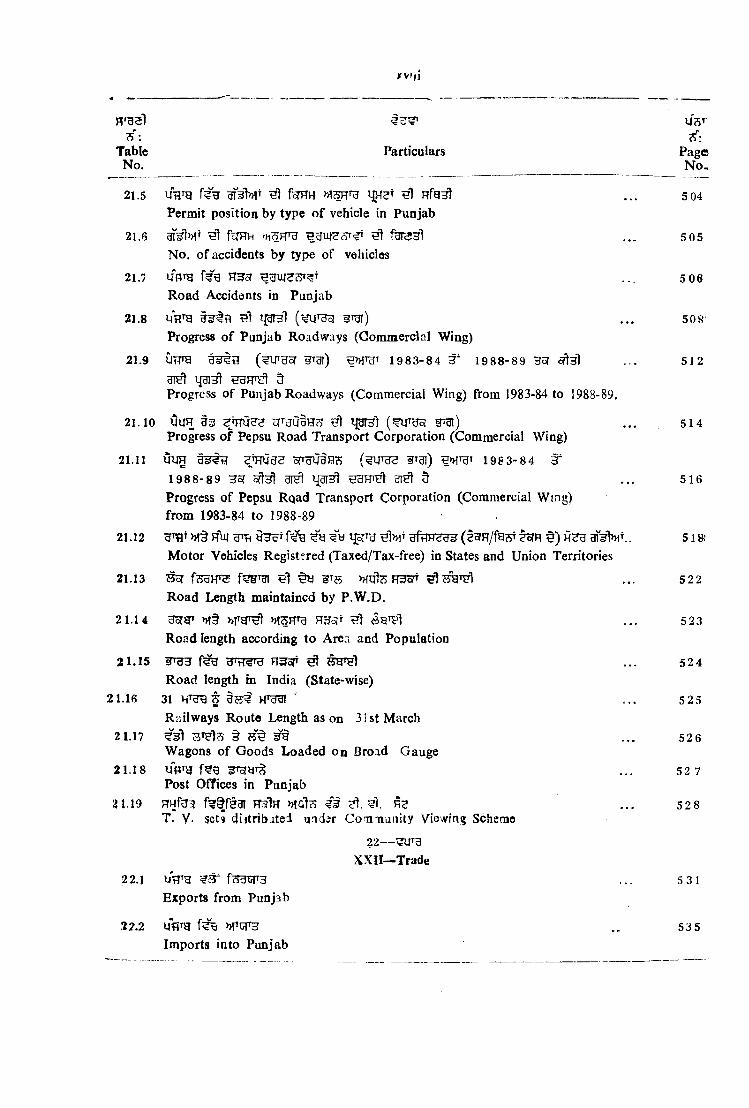
21.5 uV g Hi fOTH Hi . . . 504Permit position by type of vehicle in Punjab
21.6 Hi fETFTh h1 f ^ H l 5 05No. of accidents by type of vehicles
21.7 uV g r^g tt ot _ 5 osRoad Accidents in Punjab
21.8 Hi ljpT3l 3igr) . . . 508'Progress of Punjab Roadways (Gommercial Wing)
21.9 iiWB (w g s r ^Tgj) )) TgT 1983-84 3" 1988-89 35? aft^l ... 512H9nr^ 5
Progress of Punjab Roadways (Commercial Wing) from 1983-84 to 1988-89.
21.10 iiun 33 'dTgUaH?) Hi I J ^ l grgi) 514Progress of Pepsu Road Transport Corporation (Commercial Wing)
21.11 Oug oTdyBHH ¥T3l) H>H T 1983-84 ^1988-89 35f ar^ ij^inl hsht^ 5 . . . 5 i6Progress of Pepsu Rqad Transport Corporation (Commercial Wing) from 1983-84 to 1988-89
21.12 Jfu; tjcJTg hIhi BftTRZ^ (fcJR/fg^r ?ofR § ) a f ^ t , . 518;Motor Vehicles Registered (Taxed/Tax-free) in States and Union Territories
21.13 ^ f3UHT gr^ MqIcS h1 S g ^ ... 5 22Road Length maintained by P.W.D.
21.14 M3FFg H36jt Hi ... 5 23Road length according to Area and Population
21.15 ^ s:gTHl ... 524Road length in India (State-wise)
21.16 31 ' ... 525 Railways Route Length as on 31st March
21.17 ^Sl BT^lS § ^ .. . 52 6Wagons of Goods Loaded on Broad Gauge
21.18 w g ... 52 7Post Offices in Punjab
21.19 FTHf 3 f^^r§3l PT Ih M01?5 ?1. ^1. RS . . . 528T- V. 5cti d iftrib itei uid^r CoTiTiuiiity Viewing Scheme
22—XXII—Trade
22.1 w g ^ 3 ' f3gCT3 ... 5 31Exports from Punjab
.22.2 Ufim 53 5Imports into Punjab

3: rt:Tablo Particulars PageNo. No.
22.3 urrg 3*t€qfeT5f ^R3T § feUGTT3 3 gigg) ^ . . . 5 39Value of Export (out of India) Industrial goods from Punjab (District wise)
22.4 W ig #>T W ( W ^ 3 ' 540Principal Export (out of India) items of Punjab.
2 3—tfsrai
XXIIT—Banking
23.1 UflTg f€'0 f^Tp 543Banking Development in Punjab
23.2 fgr^^ ... 544Districtwise Banking Offices in Punjab
23.3 W hI »i^Tg gr^T § HSlgq §'for^ ^SHd . . . 54 5Banking Offices classified according to Populstion in various places in Punjab
2 3.4 €ta fu if3T33l . . . 54 6
Number of Scheduled Commercial Banking offices in various Stites per thousand square Kilometres of Area i.nd Per Lakh of Population
2 3.5 W g ^TfHo? f ^ r S . 548Year-wise Dejwsits and Advances Ratio of Scheduled Commercial Banks in Punjab
23.6 gsfTfsv farg^T 550State-wise classification of out-standing Credit of Scheduled CommercialBanks accordings to Sanction and utilisation
23.7 ^ ]>nt »^§ . . . 554State*wls3 Distribitio I of Djposit^ a id Advances of Scheduled C>niii3rcial Banks according to Population group
23.8 3Tg3 . . . 555State-wise DiUribution of B ink Offices iu India
23.9 Uflig ^ ’rU5?g"-o!»^5‘ ar^ Qgg . . . 55 8Scheduled Commercial Banks* advances to agriculture in Punjab
23.10 f tT ^ ^ >H§ fsr^^g ^ g fe>HT ora^ w . . . 560District-wise and occupation-wise classification of outstanding credit ofScheduled Commercial Banks.
XIX
XX
: ^ !Table Particulars PageNo. No.
24— f i sXXIV—Pablic Finance
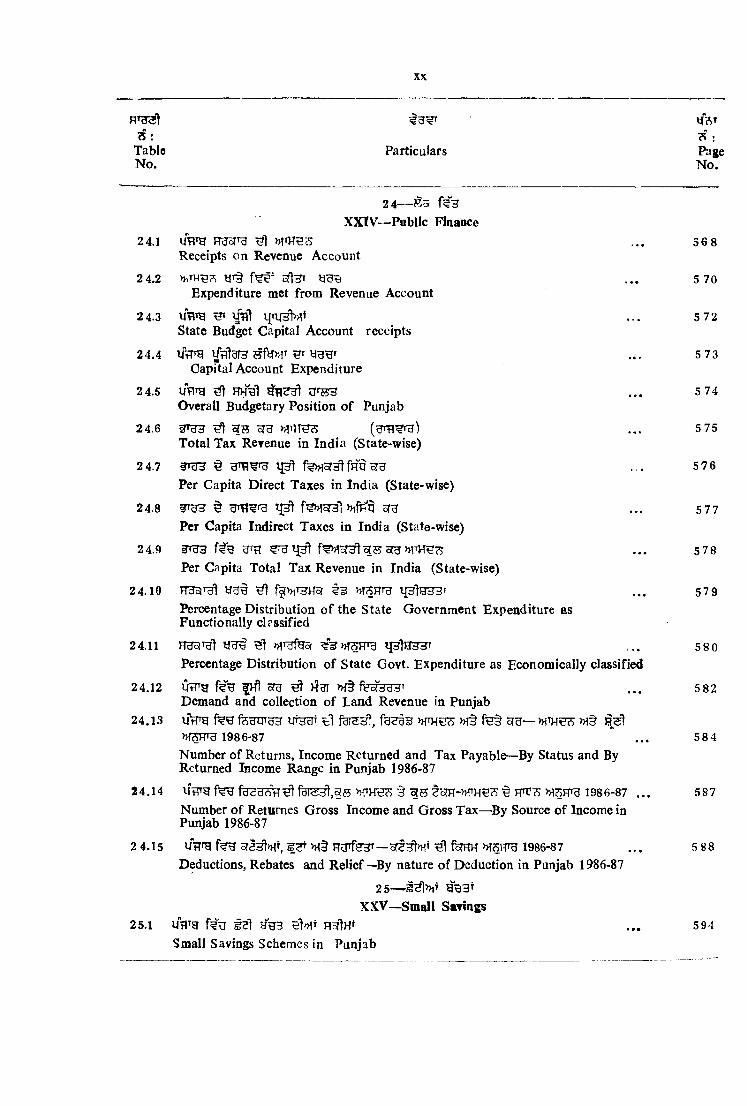
24.1Receipts on Revenue Account
568
2 4.2 oflHTExpenditure met from Revenue Account
5 70
2 4.3State Budget Capital Account receipts
572
24.4Capital Account Expenditure
573
2 4.5 UTITH ^ nnglOverall Budgetary Position of Punjab
574
24.6 r-<?3Total Tax Reyenue in India (State-wise)
575
2 4.7 f ^ s r ^ f m sruPer Capita Direct Taxes in India (State-wise)
576
24.8 y'cjd ^ oTHPer Capita Indirect Taxes in India (State-wise)
577
24.9Per Capita Total Tax Revenue in India (State-wise)
578
2 4.10Percentage Distribution of the State Government Expenditure as Functionally clrssified
579
24.11 HdcjTHl iplH33TPercentage Distribution of State Govt. Expenditure as Economically classified
580
24.12 fJfl cm ^ HUI >H§r^o/yddT Demand and collection of Land Revenue in Punjab
582
24.13 UtTTg feguiy-j uthht » it f^§1986-87 584
Number of Returns, Income Returned and Tax Payable—By Status and ByReturned Income Range in Punjab 1986-87
24.14 ifTfTH 1986-87 ...Number of Returnes Gross Income and Gross Tax—'By Source of Income in Punjab 1986-87
587
2 4.15 UtTfg f^H fsrHH MSHtB 1986-87 Deductions, Rebates and Relief—By nature of Deduction in Punjab 1986-87
25— 9B3T XXV—Small Savings
588
25.1 w g f?% i? l 594Small Savings Schemes in Punjab
xki
II3Ts : SrTable Particulars PageNo. No.
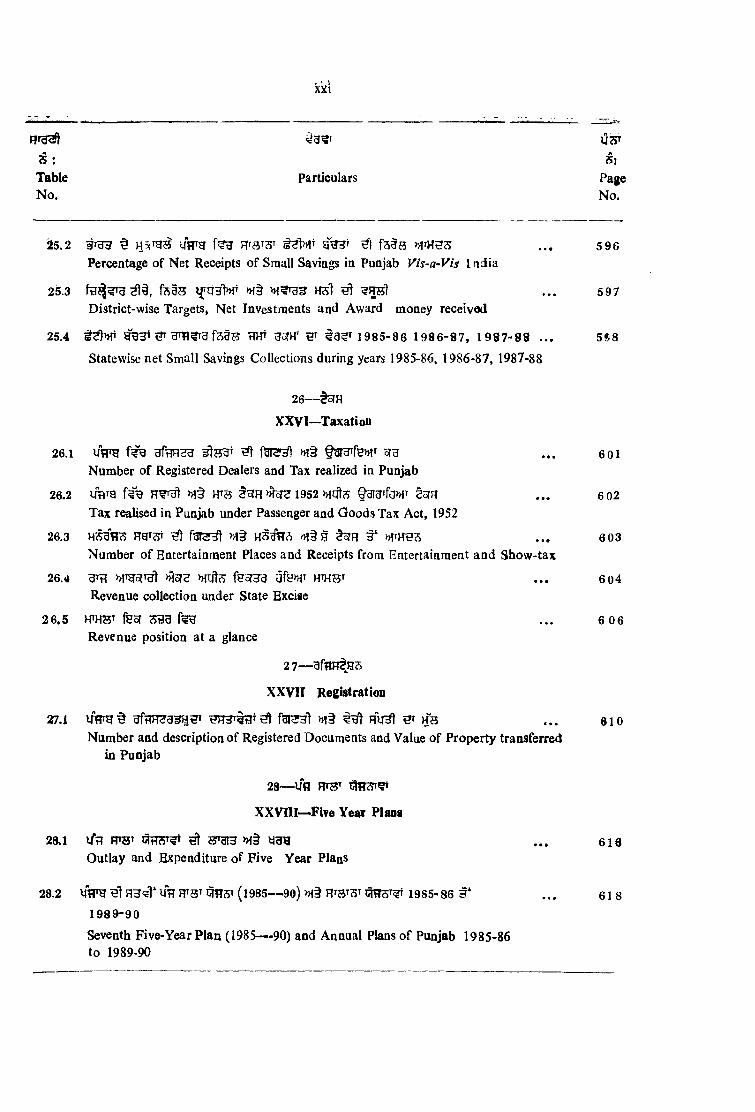
25.2 ^ HSi'rgS uVh ^ . . . 5 96Percentage of Net Receipts of Small Savings in Punjab Vis-a-Vis I ndia
25.3 f^as l{ftT3t»fT »f§ ^ ?Rh1 . . . 597District-wise Targets, Net Investments and Award money received
25.4 flHT gsfH' #3?^ 1985-86 1986-87, 1987-88 .. . 5S8Statewise net Small Savings Collections during years 1985-86, 1986-87, 1987-88
2 6 ~ ts fR
XX VI—Taxation
26.1 UTTg f#3 ^ »^§ Q-did'fs tT srn Number of Registered Dealers and Tax realized in Punjab
• • • 601
26.2 uV a HTs 1952 §3i3»fa>HTTax realised in Punjab under Passenger and Goods Tax Act, 1952
... 6 02
26.3 Hgr^T ^ fynsjl Mt tc?n §*Number of Entertainment Places and Receipts from Entertainment and Show-tax
603
26.4 >H5r? fesr^a Revenue collection under State Excise
• • • 604
26.5 fee?Revenue position at a glance
27— afl1H^J35
XXVII Registration
6 06
27.1 U frg§ »!§ HU^ h s Number and description of Registered Documents and Value of Property transferred
in Punjab
610
28— Ufl mST
XXVIlI-^Five Year Plans
28vl i/t? FPHT ^ >H§ ygg Outlay and Expenditure of Five Year Plans
... 616
28.2 hVh n Wt* UTI Ht^t (1985— 90) >H§ 1985-86 5* 1989-90
.. . 618
Seventh Five-Year Plan (1985— 90) and Annual Plans of Punjab 1985-86 to 1989-90

XXll
S : Table No.
Particulars
ifTS?<s;i
PaigeN(o.
29—X X lX -Local Bodies
29.1 fir?f ST Qhh, f e i ^ , »!TjTgs Mt
Area, Population Number, Income and Expenditure of Zila Parishads in Punjab
62J9
29.2
Income of Zila Parishads and its Percentage in Punjab
630
29.3 UfTH f3W ygg >h§Expenditure of 21ila Parishads and its Percentage in Punjab
6 332
29.4 uflTg 5arg iT??3rr5^/op^BS' farajl. ^ . . . Number,] Population, Area, Constitution, Income and Expenditure of
MunicipalCommittees/Corporations in Punjab
634
29.5 25ar^5?5rt:?r/syTgCftg^ ^ f t r ^ ^Income of Municipal Oommittees/G orporations (District-wise)
64i0
29.6 cSdid ir?55r^/5rgu3H<5* w tragExpenditure of Municipal Committees/Corporations (District-wise)
6-^2
29.7 iftiTg § ^arg Hirg »>fTH 3 »r§ ^Constitution, Income and Expenditure of Improvement Trusts in Punjab
6415
29.8 Ufl'g HITH ^ »iTHH3 Income of Improvement Trusts in Punjab
64 6
29.9 t csaiu Hqrg ^ tjgg Expenditure o f Improvement Trusts in Punjab
64,8
29.10 «BTfe3* HWitStatistics relating to Panchayats
30— ^€3* ^ nfeg
XXX—Electoral Statistics
65 1
30.1 uVb m HgT § m r ^Number of Electors In Lok Sabha and Vidhan Sabha in Punjab
655
30.2 iffTTg f?qT( H3T Bt»fT g^T ^ 1985Valid votes polled in Punjab Vidhan Sabha Elections by Parties and
Dtstrict—Sept., 85,
65(6
xAiii
i-. h-.Table Particulars PagoI o. No.
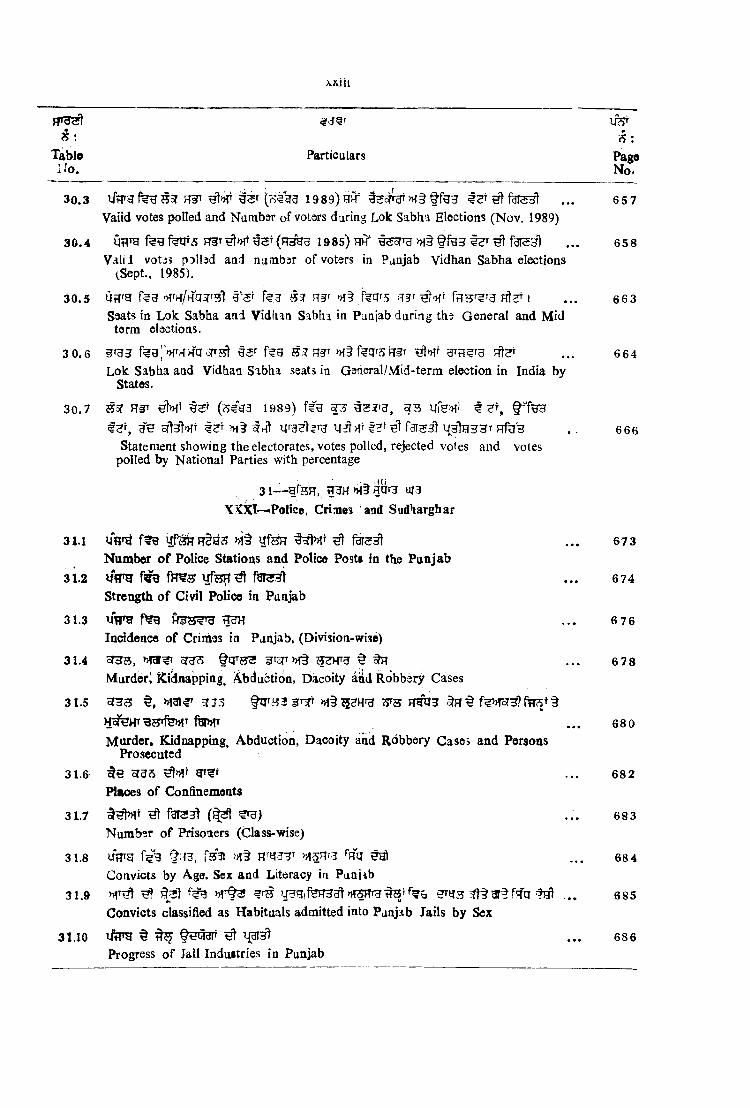
30.3 U > g f e n ^ > > T 1989)5?)^ 657Vaiid votes polled and Number of voters during Lok Sabha Elections (Nov. 1989)
30.4 0?|Ta 1985) hh" ... 658Valid votji pDlled and nunibdr of voters in Panjab Vidhan Sabha elections
(Sept, 1985).
30.5 Ufffg f€3 §’’5f ssr Rfr f?ar5 | ... g63Seats in Lok Sabha and Vidiian Sabha in Panjab during th3 General and Mid
terra elections.
3 0.6 %e|VHHa<?T5^ ear f^g sir rr r pft t 564Lok Sabha and Vidhan Sabha seats in General/Mid-term election in India by
States.
30.7 S5f H§T (pj^gg iggg) ffg ^ 3 ^ 3 Ufe ir f e t, § - f ^fe f , gn »1§ Uf■3 1 Tg n^>ir . . 6 66
Statement showing the electorates, votes polled, rejected votes and votes polled by National Parties with percentage
.i-.Ui31— grsH,, M3 Rar3 UJ3
X7<Xt—Police, Crime? and Sudharghar
31.1 UHf »i§ UfHH ^ . . . 673Number of Police Stations and Police Posts in the Punjab
3L2 W g fH^{5 ^1331 . . . 674Strength of Civil Police in Punjab
31.3 W H ^ . . . 6 76Incidence of Crimes in Panjab, (Division-wise)
31.4 ^ 3 , §CT32 >H§ t tH . . . 678Murdeirl fCicinapping Abduction, Dacoity aiid Robbery Cases
31.5 ^ 3 3 »!31^ 7?E m J 3 ^ §H5rSHTg?JTfe>MT f^ T 680Murder, Kidnapping, Abduction, Dacoity and Robbery Cases and Persons
Prosecuted31.6 ^9 ^35 ... 682
Places of Confinements
31.7 f3T3^ ( ^ 1 . . . 683Number of Prisoners (Class-wise)
31.8 uVg rs3l »!§ » ,5nf3 fmj . . . 68 4Convicts by Age, Sex and Literacy in Punjib
31.9 ^ ?rH U^g,fHFTH STt fmi ^ ... 685Convicts classified as Habituals admitted into Punjab Jails by Sex
31.10 ^ ^ ^ . . . 686Progress of Jail Industries in Punjab

XXIV
Table Particulars PagteNo. No.
3 2 -g W ^ ijoTWX X X Il—PrintiDg Presses and Pablications
32.1 UtTH feg gnj . . . 689Printing Presses in Punjab
32.2 IJoTOH UFtW UHHoTt, »f§ gTTO f . . . 689Books, Newspapers and Periodicals Published
32.3 >H§ l j ^ 3 14HHc7t ^ . . . 690Number of Books Published in different Indian and other Languages
33~-H3cT^X X X m —Public Undertakings
33.1 l i ^ T T g J ' o ? B f e W >H§ » f 3 ^ ^ ^ . . . 6941Classification of Loans and Advances by Punjab Financial Corporation
33.2 ^ sraH>n§ ^ |f|; ... 6 965Classification of Loans and Advances by the Financial Corporation by ranges
33.3 VtTO Hfe§H3 5THe ^ »T§ §5TTO . . . 6 97^
Loans advanced by the Punjab Scheduled Castes I^nd Development and Fii\andal Corpcration te the Scheduled in Punjab
33.4 lirro U’§frfel fs k s iS te oTTO »ft tn rg HoT . . . 6 98?Lx>an8 received and Houses constructed by the Punjab Housing Development
Board33.5 r<lOy5tf oPHUteWBT ... 6 99>
Tubewells Installed by the Punjab State Tubewell Corporation33.6 5 n g 0 tH (S Ijn jH tW .. . 7 00)
A chievements of the Panjab Agro-Industries Corporation33.7 UrPg ferR >M§ 1% ofrijfe f e t 5f >MT >H§
^ ^ I ... 7011Classification of Loans advanced by Punjab Backward classes Land Develop
ment and Finance Corporation,
34~13crHXXXlV—MiscellaneODS .
34.1 » m t u H 7055Number of enterprises and persons usually working
3 4 .2 aiU W3l >M US y i§ ^ f e g l yy f^RH .. . 7 0 6Number of Non-agricultural own account by major activity groups
3 4 .3 fgi?5^ »1§ ^^7)' WH 3 ^ § sTh>H3 7077
Number of enterprises and persons usually working-All-India and Punjab State J 54.4 »iHTfeMT farsHt »f§ ‘000’
fits ... 708State wise Number of enterprises and persons usually working per *000’
population

TaUe Particulars PageNo. No.
34.5 HTfegt >H§ >HTH § ofH o [ ^ f?»for^ 1977gi^^T >n 1980 ’HTgfesrgiOT >hsh^ ... 709
Number of Non-agricultural establishments and persons usually working as in 1977 Economic Census and 1980—Economic Census.
34.6] fe?5T c T ^ >H§ ^ ^ . . . 710District Red Cross Branches and their Membership
34.7 ofU>H ^ ygg >H§ »r>re^ I I . . . 712Income and Expenditure of Red Cross Societies
34.8 U?TO f t3 HcTO HcflHi W c?h| ... 713Working of the various Housing Schemes in P^unjab
34.9 uwH ura >Ht ggrs ... 714Rest-Houses and Dak Bungalows in Punjab
34.10 €^1313 »f§ § U c ^ t§ oft^ ... 715Plots sold and Construction Activities at Chandigarh
34.11 otbV , fH§ § ttoI ^ »f§tRT^T ^ . . . 716Flying clubs, planes and No. of Licenses issued to the trained persons in Punjab.
34.12 ^ ofTO f3T>HT ^ I ... 717Quarterly and annual construction cost Index for Patiala Centre.
3 5 ~ H ^XXXV—All India Indicators
35.1 Hnjof ... 721Money Stock Measures
35.2 ^ ... 722India’s Foreign Trade by years
*35.5 W F F 5 ^ " ... 723
India's Foreign Exchange Reserves by years
35.4 cWi ^ Ijfe P... 724Per Capita Availability of Cloth in India by years
35.5 WW feB ^ ^ W EW 1{^ iffM 1975,1980 >H§ 1983 f l9 8 5 ... 726Per Capita Earnings of Employees in Manufacturing Industries by selected States from 1975, 1980 and 1983 to 1985
35.6 OdUftTcS' ^ m S ^ ’ilsT ... 7 30Index Numbers of Industrial Production by years in India
35.7 3Tg3 ^ ^ t TOST ... 732Statewise Indicators on different Aspects in India
XXV

Haas 1
Uixfoft
1.1 Ufrg ^ FtTlTH >H§ Hgqsrl R ^ g t ^ 0 I
HTU 1.2 V?rg »T§ ufe*HT5T UT ^ tftlf ^ f # § 3I§ 0 3 (
RT32 1.3 fe e Sof crfHI?5 UTT g, ufe»HfS» t § st§ ‘ f e t US I
1.4 Wrg qc^?3H^)Ht >K§ § ?Te|F[-HrH{53T § ^gj:|r§ gig ^ |
RTget 1.5 UfTO feefeCTTS % H^3T § ^ h3FT§ gf§ |
RTH^ 1.6 fee t e g 3W 55t >H§ gsfo* fg s ^ fe-§ gi§ u s I
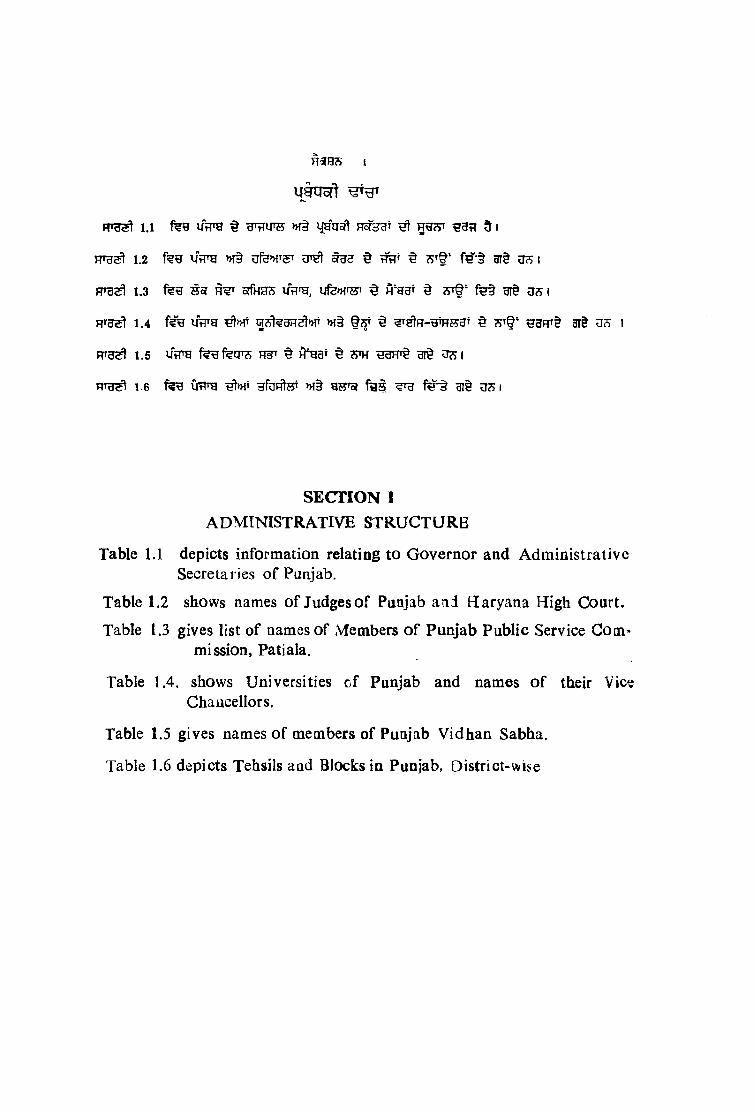
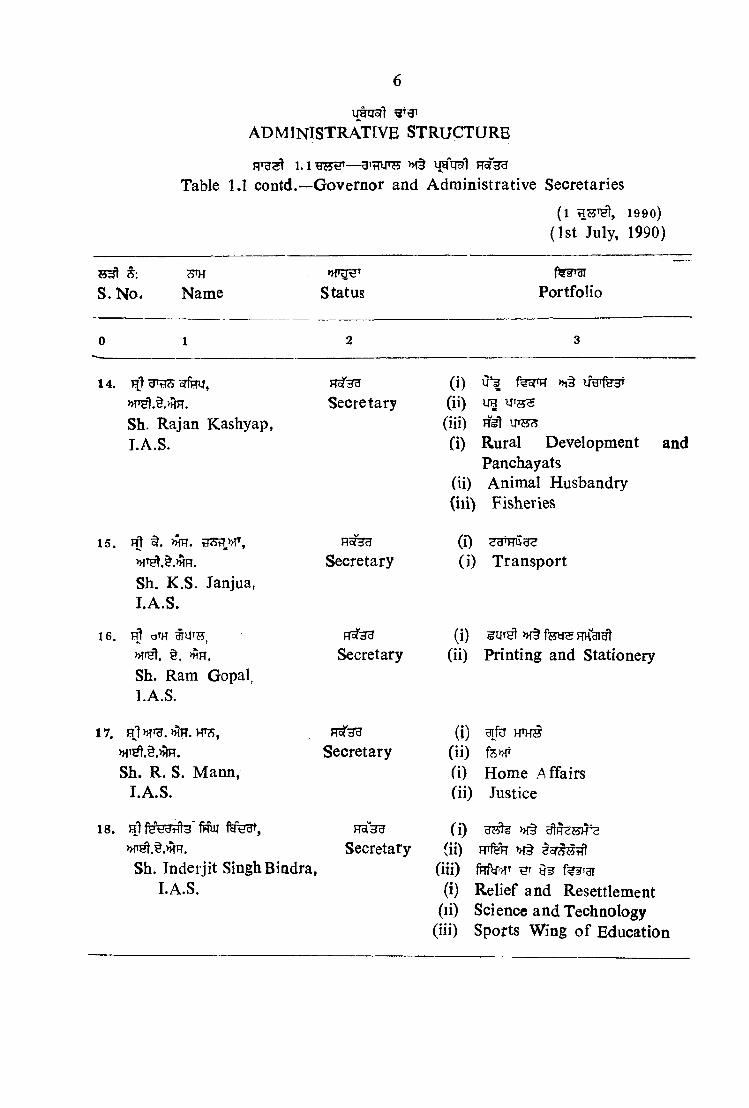
SECTION IADMINISTRATIVE STRUCTURE
Table 1.1 depicts information relating to Governor and Administrative Secretaries of Punjab.
Table 1.2 shows names of Judges of Punjab and Haryana High Court.
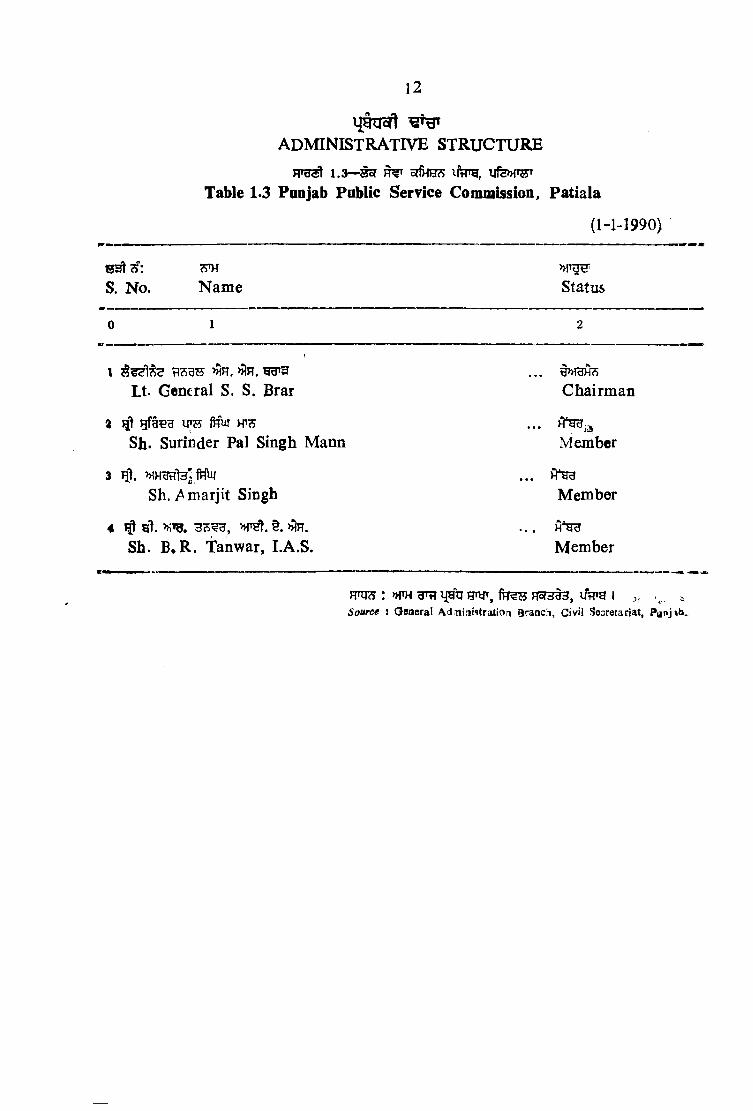
Table 1.3 gives list of names of Members of Punjab Public Service Commission, Patiala.
Table 1.4. shows Universities cf Punjab and names of their Vic« Chancellors.
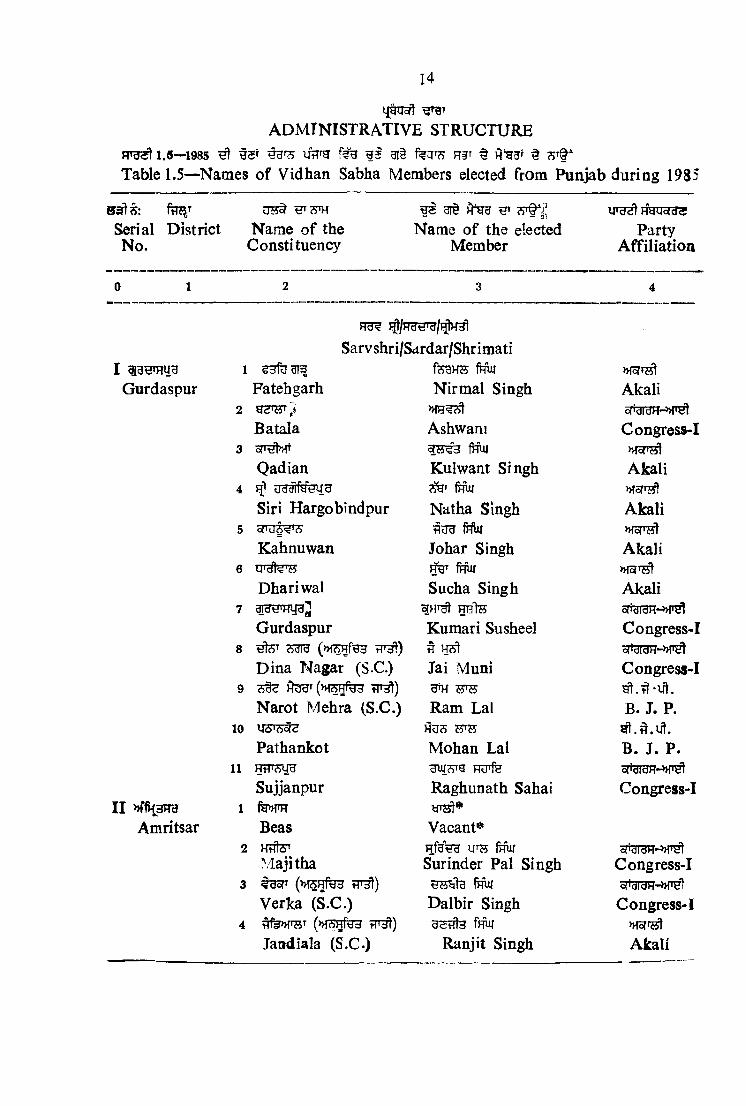
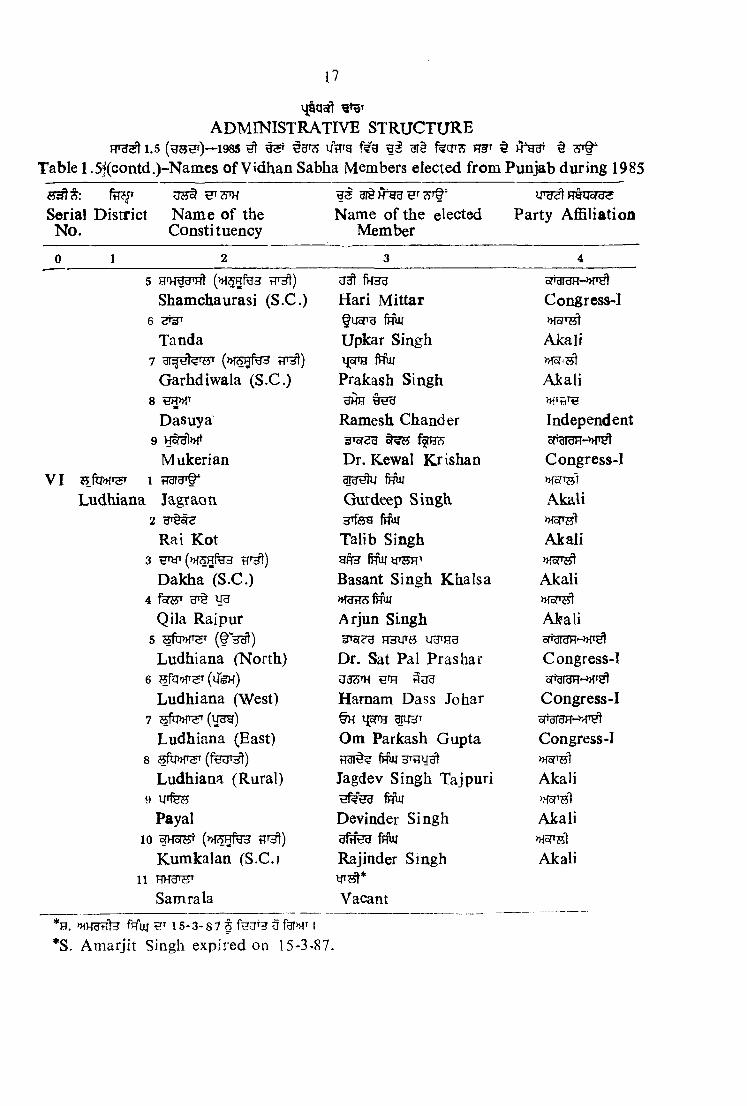
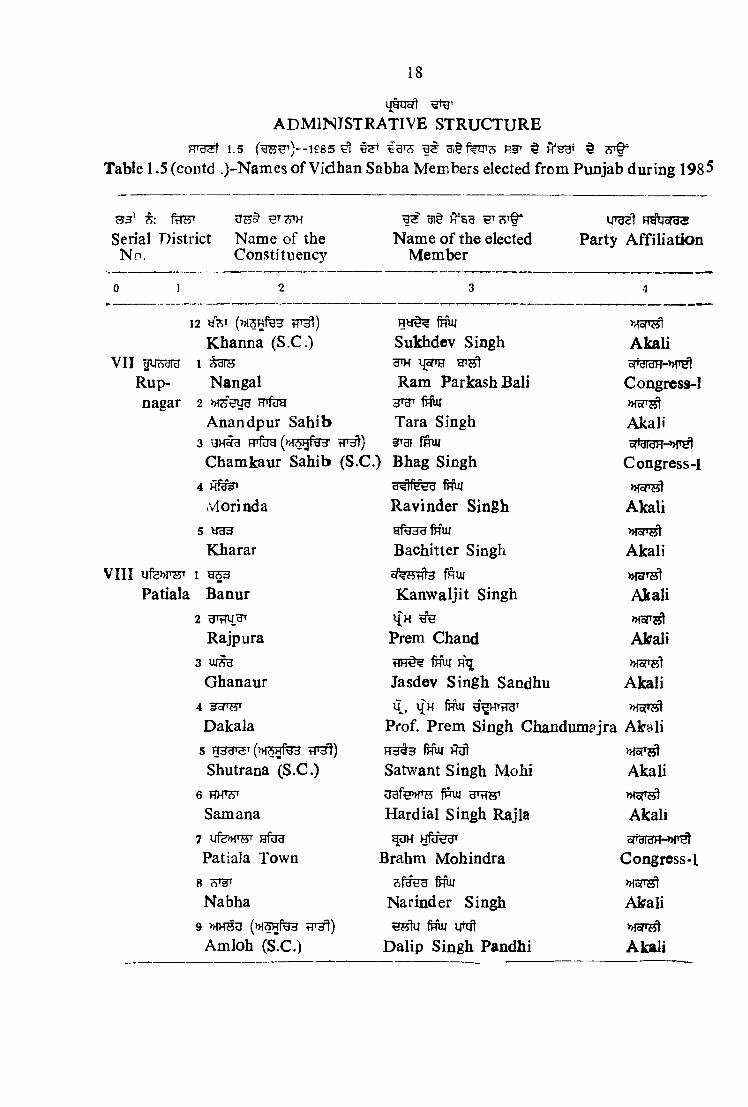
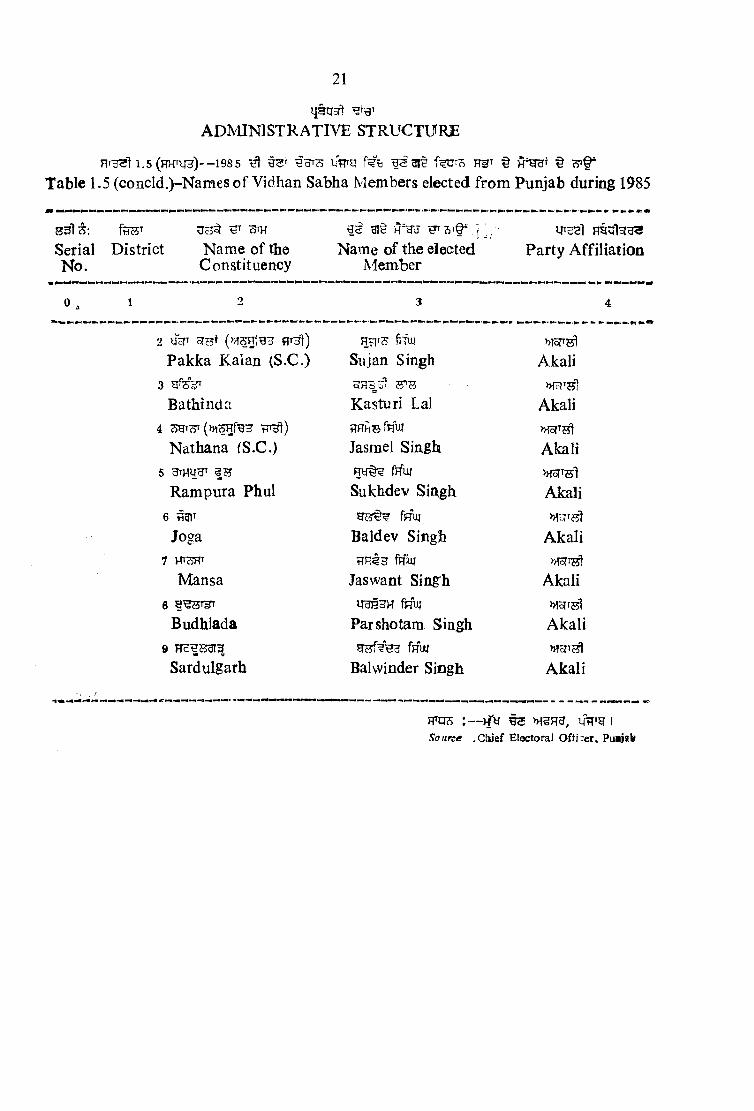
Table 1.5 gives names of members of Punjab Vidhan Sabha.
Table 1.6 depicts Tehsils and Blocks in Punjab, District-wise

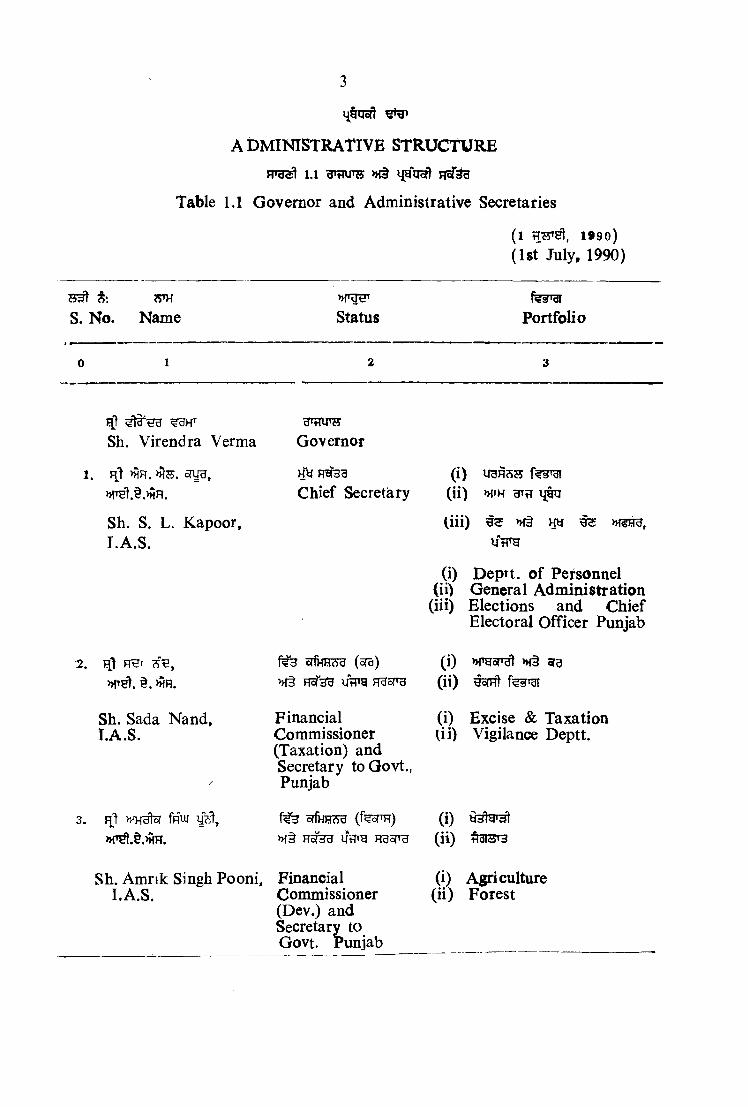
ADMINISTRATIVE STRUCTURE1.1 3 W H »f§ Ml qort fIcT^
Table 1.1 Governor and Administrative Secretaries
(l 1990)(1st July, 1990)
fesJfdiS. No. Name Status Portfolio
0 1 2 3
d'«insSh. Virendra Verma Governor
1. >HH. >HS. (i) l^RSSChief Secretary (ii) >HTH grfl
Sh. S. L. Kapoor, iiii) >Ht W €5 >H?Rd,I.A.S. U'rl>53
(i) Deprt. of Personnel(ii) General Administration
(iii) Elections and Chief Electoral Officer Punjab
2. 7 RHr orfHR (^ ) (i) »TOon ag§. >HR. >Ht RoTsB UtPg Hbl'd (ii) rJo{Hl f Tgi
Sh. Sada Nand, I.A.S.
/
Financial Commissioner (Taxation) and Secretary toQovt., Punjab
(i) Excise & Taxation(ii) Vigilance Deptt.
3. Fj} fRW offHRcsg (ferTT) (i)»f§ R 3 uVg RgsrH (ii)
Sh. Amrik Singh Pooni, I.A.S.
Financial Commissioner (Dev.) and Secretary to Govt. Punjab
(i) Agriculture(ii) Forest

ADMINISTRATIVE STRUCTURE1 ,1 ngxToft HoT a
Table 1.1 oontd.—Governor and Administrative Secretaries(l g S ’Ht, 1990)(1st July, 1990)f??Tg[
S. No. Name Status Portfolio
Q 1 2 3
4. ftrW, srfHHS-d (KT75) (i)(ii)
Sh. Hardial Singh, (i) RevenueI.A.S. Financial
Commissioner (Revenue) and Secretary to Govt. Punjab
(ii) Rehabilitation
5. Sill 3Ht Hth, uprfefegr e???? tsfH,
Sh. Hari Ram, PresidingI.A.S. Officer Sales Tax
Collage andSchool Tribunal Govt. Punjab
6. pft Mdld fRUj orfHH?)3 (i)H53g, U tTTH (ii)
Sh. Ajit Singh Chatha, (iii) § 20I.A.S. »T§
Financial (i) Planning DepartmentCommissioner (ii) Palanning TVlonitoringand Secretary to (iii) Economic CoordinationGovt. Punjab and 20 Point Programme
and advisory Council
7. 7^ s t. r< d (i) H cST SB HUgsr»i§ CfTiTg (ii) ^ hI §5T3‘ »f§ ferft3T »??>
T. K. A. Nair, H WT.A.S. Financial Commis (i) Information and Public
sioner (Industry) Relationand Secretary to (ii) National IntegrationGovt. Punjab Council and Emigration
Affairs

S. No.
ADMINISTRATIVE STRUCTURE1.1 gr iiTO >H§ l|9IJof| HoTH
Table l.l contd.—Governor and Administrative Secretaries( 1 1990)
(1st July. 1990)
7^Name Status Portfolio
8. hJ MR. >HH.
Sh. S.S. Boparai, I.A.S.
9. hJM tU. 3m37,
Sh. R. N. Gupta, I.A.S.
1 0. Pj}
Sh. Darshan Kumar,I.A.S.
11.
R. R. Bhardwaj, I.A.S.
12.
Smt. Shyama Mann. I.A.S.
13. fnX
Sh. Rajinder Singh, I.A.S.
HoIdHSecretary
Secretary
(i) »f§ H5T3t(i) Irrigation and Power
(i) m(ii) H'H3, STHHt(i) Finance
(ii) Member, of Pay Anomalies Committee
(i) >>f§ ;g}(ii) >H3Hfe3 »4t
(i) Social & Women’s Welfare(ii) Welfare of Scheduled
Castes & Backward Classes
MSTH mnu (i) fis»ft I'sr
(i) Director Institutional Finance and Banking Bureau of Enterprises
Haf3BSecretary
Ex Officio Secretary
HoTH9Secretary
F7oT3gSecretar
(i) »ft huht(i) Food and Supplies
(i) fHfy»n fHftW 3*fH §)
(i) Education (Excluding Primary Education)
a d m in is t r a t iv e s t r u c t u r e
—31TWTH »f§ ipirsfl HoThh Table 1.1 contd.—Governor and Administrative Secretaries
6
( l 1990)(1st July, 1990)
S. No. Name Statusf ST-dr
Portfolio
0 1 2 3
14. Up y'?TA'oTfwi,
Sh. Raj an Kashyap, I.A.S.
HoTcMSecretary
(i) 0^ fesTH >h§(ii) UH(iii) Hkl(i) Rural Development and
Panchayats(ii) Animal Husbandry(iii) Fisheries
15. Hi m .
Sh. K.S. Janjua, I.A.S.
HoiggSecretary
(1)(i) Transport
16. hJ dTH§. >MR.
Sh. Ram Gopal, I.A.S.
Secretary(i) surnt »f§ feys
(ii) Printing and Stationery
17. VTO,
Sh. R. S. Mann, I.A.S.
HoTdSecretary
(i)(ii) fe»r(i) Home A ffairs(ii) Justice
18. Mu»T .§.W.Sh. Inderjit Singh Bindra.
I.A.S.
FTolHSecretary
(i) »f§(ii) H'Fot
(iii) fHftr>TT f wiuT(i) Relief and Resettlement
(li) Science and Technology (iii) Sports Wing of Education

ADMINISTRATIVE STRUCTURE1.1 HWS »ft Iffeft F?of
Table 1.1 contd.—Governor and Administrative Secretaries
( l 1990)
(1st Jul>, 1990)
ssftOlS. No. Name Status Portfolio
0 1 2 3
19. e l §.
Sh. A. K. Kundra, LA.S.
20. >>fe.
Sh. C. L. Bains, I.A.S.
Rof3HSecretary
Secretary
(i) fife(i) Health ar\d
WelfareFamily
(i)(ii) f »ra! f spH(i) Cooperation(ii) Dairy Development
21. jJin. 5T,§. m .
Sh. S. K. Naik, LA.S.
22. >>m. Urggr,
Sh. Y. S. Ratra,I.A.S.
23, 3IHferBU ,
Smt. Gurbinder Chahal, LA.S.
(l) H35TB >H§ fFn^Secretary »f§ fern >h§ w »i
HRf5 i oTH(i) Local Government and
Housing and Urban Development and inAddition Officer on Special Duty, Urban Development Authority
HoThH (i) 5BTFn595 fegrgi ^ ItmSecretary (i) Civil Aviation wing of
Transport Department
HcT33 (i) foToB tOTBSecretary (i) Labour and Employment

FT»3 1.1 — HTtTUTH »{§ l|gqc?t HofSB
Table 1.1 contd.—Governor and Administrative Secretaries
8
ADMINISTRATIVE STRUCTURE
(1 1990)(1st July, 1990)
fisl'dlS. No. Name Status Portfolio
0 1 2 3
24. #tft, (i)Secretary (ii) HthH.
Smt. Daljit Jaijee, (iii) fRfy>HT ^ f¥giI.A.S. (iv)
(v) fU5r »{§ oTT”-
(i) Tourism(ii) Cultural Affairs
(iii) Archives Wing of the Dep tt . of Education
(iv) Chairman, Punjab, T our ism Development Corporation
(v) Chairman Films & News; Corporation.
25. H. IhW,
S. Narajan Singh I.A.S.
(i)Secretary (i) Department of Planning
26. H. fHW,>HTS. Surjit SinghI.A.S.
Ffo^Secretary
(i) SoT(i) Public Works.
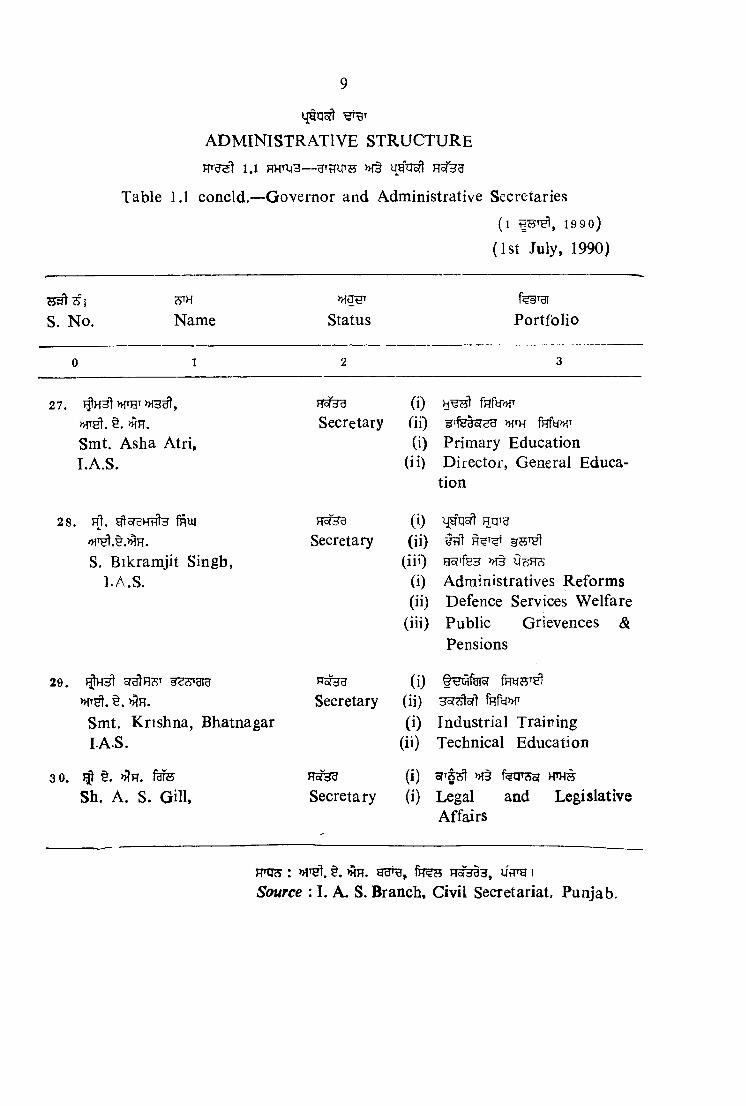
ADMINISTRATIVE STRUCTURE1.1 HHTU3— »i§ ujgnoft hsTh^
Table 1.1 concld.—Governor and Administrative Secretaries( l 19 90)
(1st July, 1990)
STHS. No. Name Status Portfolio
0 1 2 3
27. HoTdd (i)»fT8l. §. >HR. Secretary fii)Smt. Asha Atri, (i) Primary EducationI.A.S. (ii) Director, General Educa
tion
28. hJ. (i) ijgqort Rq»HSecretary (ii)
S. Bikramjit Singb, (iii) H3fife3 >H3I.A.S. (i)
(ii)(iii)
Administratives Reforms Defence Services Welfare Public Grievences <& Pensions
29. WoTdd (i)»fT . t. >HH. Secretary (ii)Smt. Krishna, Bhatnagar (i) Industrial TrairingLAS. (ii) Technical Education
3 0. §. MR. fefe RoT33 (i) M§Sh. A. S. Gill, Secretary (i) Legal and Legislative
Affairs
wm : MH. rr^3, iSource : I. A. S. Branch, Civil Secretariat, Punjab.

1.2 UtTg >H§ ^ ^
Table 1,2 Judges of the Punjab and Haryana High Court (31-3-1990)
10
ADMINISTRATIVE STRUCTURE
7i: cT'H
S. No. Name Status
0 1 2
1 . 53J oTHtdWO h^Sh. J. V. Gupta Acting Chief Justice
2. fH3?5 fc torrg
Sh. Ookal Chand Mittal Justice
3. 17: fsafHT?? fnujS. Iqbal Singh Tiwana Justice
4. MR. Hti) fc Tofig
Sh. S. S. Sodhi Justice
5. >HH. MdlcSl33 fe>H T3Sh. M. R. Agnihotri Justice
6.Sh. K. S. Bhalla Justice

11
64 J1 cff c HS. No. Name Status
0 1 2
7. > lH.
Sh. M. S. Liberhan8. >ng. MR.
Sh. H. S. Rai9. >HH. HflTtT
Sh. s. D. Bajaj10. f( frfur Hy"
Sh. Jai Singh Sekhon1 1 . nffwB
Sh. Amrit Lai Bahri12 . ^ I?33 rft3 fRUI
Sh. Sharnjit Singh Grewal13. et >HTO u5 »o
Sh. Anand Parka sh Choudhri14.
Sh. Gurbax Rai Majithia15. ^
Sh. Naresh Chander Jain16. JjJ nTHUrfe
Sh. Amarjit Chaudhary17. t . ift.
Sh. K. P. Bhandari18. H. d <m\
Sh. J. B. Garg
Justice
Justicefe»TBfTg
Justicefe>H^Tg
Justicefe>>f5r»g
Justice
Justice
JusticefWorTg
Justicefe»f<onu
Justice
Justice
Justicefe»{T5|T3
Justice
Source:—Punjab and Haryana High Court.
4 ]EitioflADMINISTRATIVE STRUCTURE
1.3—^ orfHHS ufe»f®TTable 1.3 Panjab Public Service Commission, Patiala
12
(1-M990)
S. No. Name Status
0 1 2
1 W. >>}R. 53 3Lt. General S. S. Brar Chairman
a qt efg^g wb frw W7i ...Sh. Surinder Pal Singh Mann Member
3 Ij. ...Sh. i^marjit Singh Member
4 ^ 33^, m. ... nyy
Sh. B ,R . tanwar, I.A.S. Member
Frnjc? : »TH g n i I p q HoTHgH, if trg I ,i S5Source I General Aduitiistration Branch, Civil Secretariat, Punj»b^

13
y(sT« 'dH^V >h§ W5$g Table 1.4 —^Universities of Panjab and their Vice Chancellors
ADMINISTRATIVE STRUCTURE
(1-1-1990)
gHSr. No. Name of the V.C
McSl fHcOUniversity
1. > 1 tfl. >HR.Sh. G. S. Randhawa
7P?i3t THcSteafR t, ,Guru Nanak Dev University, Amritsar
fHUfDr. H.K. Manmohan Singh
9 h frw Mh Dr. Khem Singh Gill
3T. />rg. irt. gtgr^Dr. R. P. Bambah
Punjabi University, Patiala
Punjab Agricultural University, Ludhiana.
Panjab University, Chandigarh.
RHjs : MTH ^ ijgq an4T fP? ?5 HoTcJBJ, ifRTg I
Source : General Administration branch. Civil Secretariat, Punjab
14
F T ^ 1.5—1985 ^ UH g f#3 1 5 3T§ f ;}‘g3r § *
Table 1.5—^Names of Vidhan Sabha Members elected from Punjab during 1985
ADMINISTRATIVE STRUCTURE
cH§ yiSerial District Name of the Name of the elected PartyNo. Constituency Member Affiliation
0 1 2 3 4
HcT<Sarvshri/Scirdar/Shrimati
I 1 sHfegTf fcS>R5 fW >HcrqGurdaspur Fatehgarh Nirmal Singh Akali
2 ji ofidIdH-»>rBatala Ashwani Congress-I
3 orr tMT frjW >Hor»wlQadian Kulwant Singh Akali
4 JddliytiUH fNWSiri Hargobindpur Natha Singh Akali
frfuiKahnuwan Johar Singh Akali
6 i tj' fmuDhariwal Sucha Singh Akali
Hete orryraH->»nGurdaspur Kumari Susheel Congress-I
8 ^ (VgraDina Nagar (S.C.) Jai Muni Congress-I
HtH tt'64Narot Mehra (S.C.) Ram Lai B. J. P.
10 U(5'<S ^ HU(5 W'WPathankot Mohan Lai B. J. P.
11 HH'cS\ra’ ?jTg HO'fy cpgrgH-»>fSujjanpur Raghunath Sahai Congress-I
II »ff43TO 1 fWRAmritsar Beas Vacant*
2 HHl4> UTS fHuiMajitha Surinder Pal Singh Congress-I
3 asfT (»T5nfe3 iqrdl) fnWVerka (S.C.) Dalbir Singh Congress-I
4 (>Hc?Hfe3 rT ) d<itfl3 frWJandiala (S.C.) Ranjit Singh Akali

15
qgxjoft ^ADMINISTRATIVE STRUCTURE
1.5 ( ^ ^ 0-^1985 ^ UTt t
Table 1.5. (contd,)-Names ofVidhan Sabha Members elected from Punjab during 19855^ fi: ftlST ^Serial District Name of the No. Constituency
i s UI§ A'ggName of the elected
MemberParty Affiliation
0 1 2 3 4
gfdri |HcS” HugTAmritsar North Brij Bhushan Mehra Congress-I
6 »ffH3Fra USHt urn oPciraH-»HiAmritsar West Sewa Ram Congress-I
7 »H>13Ra oTidigH-»rAmritsar Central Darbari Lai Congress-I
iHA3'Amritsar South Kirpal Singh Janata
9 t (STWr jjcs fnuiAjnala Rattan Singh Akali
10 BTTt h'hI m UTS frfWRaja Sansi Shash Pal Singh Akali
11 (>K5Rf WfHl) >nor»Attari (S.C.) Tara Singh Akali
12 <S' Qh fnWTarn Taran Prem Singh Lalpura Akali
13 H'foy (*h3rI%h w^) d'd' frMKhadoor Sahib (S.C.) Tara Singh Akali
14 <5efOU' lff»f d'dsfrlcS frnWNaushehra Pannuan Harbhajan Singh Sandhu Akali
15Patti Naranjan Singh Akali
16 HHU fiw 0Q5 >Ho{'i4TValtoha Major Singh Uboke Akali
III TTHTO 1 HHrfte fnw >Hyr65lJalandhar Adampur Surjit Singh Akali
Jalandhar Cantt. Indira Congress-I3 WSXTd ttd Gh l{ofiH ^
Jalandhar North Vaid Om Parkash Dutt B. J. P.4 HOTd
Jalandhar Central Vacant• l |t H3 ViU3 ^ 2 - 6-86 J 0 I• Sh. Manmohan Ralia expired on 2-6-86.

16
a d m in is t r a t iv e s t r u c t u r e
1.5 1985 ijVng UI§ ^ A W t 7 i^Table 1.5(contd.)-Names of Vidhan Sabha Members elected from Punjab during 1985
fm j diS W U'dcil HyUofcfSerial District Name of the Name of the elected PartyNo. Constituency Member Affiliation
0 1 2 3 4
HfU fiW ^Jalandhar South (S.C.) Mohinder Singh Kaypee Congress-I
b ofdd'dyd Vl' ) tfdlrfld frW ■ofiyidH“»r^Kartarpur (S.C.) Jagjit Singh Congress-I
7 , frfWLohian Balwant Singh A kali
8 (SoTtfH frfui >HofT?5tNakodar Kuldip Singh Wadala Akali
9 SUHfUH Rfdtld IJTZ5 fiwNur Mahal Surinderpal Singh Akali
10 W (»r<OTfBd r|Tyl) fiW nibr'wlBanga (S.C.) Balwant Singh Akali
11 <7 eftra ftrww fm briardH-»rNawanshehr Dilbagh Singh Congress-I
12 Hd« * fmPhillaur "(S.C.) Sarwan Singh Akali
IV 1 1?^ HtlfflVd frfWKapurthala Bholath Sukhjinder Singh Akali
2 oruuw feHirs fiw cTdrdH-^Kapurthala Kirpal Singh Congress-I
ytJA fiwSultanpur Bachan Singh Akali
flfdfyd fRuj ■ofTdldH-MPhagwara (S.C.) Joginder Singh Congress-I
1 y»'t)dHoshiarpur Balachaur Ram Kishan Independent
2 ‘drSHofd Hd<<i: ^ brdI'dH-»fGarhshankar Sarwan Ram Congress-I
t 3re1H >Ho('WlMahilpur (S.C.) Jagdish Kaur Akali
4 ofy’vrauH Congress-IHoshiarpur Mohan Lai origraR-»>r
17
vi UortADMINISTRATIVE STRUCTURE
F T ^ 1.5 (gSHf)-^1985 ^ UtTTg 13 pf r ^ ^Table 1.5f(contd.)-Names ofVidhan Sabha Members elected from Punjab during 1985
Serial District Name of the No. Constituency
Name of the elected Member
u^^Hyqoras Party Affiliation
0 1 2 3 4of'dldR-»r
Shamchaurasi (S.C.) Hari Mittar Congress-16 ^ f Uopg friW
Tanda Upkar Singh Akali7 H' 1) IJoJiH frfuj
Garhdiwala (S.C.) Prakash Singh Akali8
Dasuya Ramesh Chander Independent9 3Tor?g f HcS
Mukerian Dr. K-ewal Krishan Congress-1VI 1 frargrf*
Ludhiana Jagraoti Gurdeep Singh Akali2 d'fey
Rai Kot Talib Singh Akali3 tF )
D alia (S.C.) Basant Singh Khalsa Akali4 fsrsT d'9 uH »rafrsfHW
Qila Raipur Arjun Singh Akali5 {Qj-S) c<?-d R314TSLudhiana (North) Dr. Sat Pal Prashar Congress-1
6Ludhiana (West) Hamam Dass Johar Congress-I
7 Ijof'H m3^Ludhiana (East) Om Parkash Gupta Congress-I
8 SftW'ii' (fejT ) fHUI3THyLudhiana (Rural) Jagdev Singh Tajpuri Akali
9 frfw nf relPayal Devinder Singh Akali
10 HoTHT tl^) fiiW w s lKumkalan (S.C.) Rajinder Singh Akali
11 RHd'WSamrala Vacant
*e. fRUi W 15-3-87 f U fgiMf I*S. Amarjit Singh expired on 15-3-87.
ijpqof!ADMINISTRATIVE STRUCTURE
1.5 1P85 Rirr ^ H H T ^Table 1.5 (contd ,)-Names of Vidhan Sabha Members elected from Punjab during 1985
18
553' 7>: te ' gi§Serial District Name of the Name of the elected Party AffiliationNo. Constituency Member
0 1 2 3 4
12 W (»\3Rrtld frfu/Khanna (S.C.) Sukhdev Singh Akali
VII ^3TU 1 6 65 ^ Mof'H ofrdl'dH-WtRup- Nangal Ram ParkashBali Congress-]nagar 2 mfjy >Ho<'sl
Anandpur Sahib Tara Singh Akali3 vJHd tT ) §Tgr fRW
Chamkaur Sahib (S.C.) Bhag Singh Congress-I4 Hfd ' aWlftTtfd IhW
iVlorinda Ravinder Singh Akali5 yd;i yfvJdd frfui >H5r«w1
Kharar Bachitter Singh AkaliIII Ufe»TOT 1 ofeHtflH fRUj >Hon
Patiala Banur Kanwaljit Singh Akali2 d'HUHT tdV »foPHl
Rajpura Prem Chand Akali3 W(Sd fiW Fi\ »ionst
Ghanaur Jasdev Singh Sandhu Akali4 i{H fnWDakala Prof. Prem Singh Chandumajra Aknli
H3#3 fm HUt »{5r25tShutrana (S.C.) Satwant Singh Mo hi Akali
6 HHW dMH'Sam ana Hardial Singh Rajla Akali
7 Ufe>HW Hfdd ^ HfaW or'didH-»rPatiala Town Brahm Mohindra Congress-I
8 cS-'sl'Nabha Narinder Singh Akali
9 nfTOU (>H fe3 tlT ) fnuj iMAmloh (S.C.) Dalip Singh Pandhi Akali

19
ipqcft ^ADMINISTRATIVE STRUCTURE
1.5 ('B75Ht)~1985 ^ iftTg ^ gi§ t A W t
T able 1.5 (contd.)-Names of Vidhan Sabha Members elected from Punjab during 1985
Serial District No.
Name of the Constituency
IS 31§Name of the elected
Member
H ofTOParty
Affiliatioa
0 1 2 3 4
10 HdfJtJ feyrs friWSirbind Kirpal Singh Akali
IX H3TU 1 ^ Hf^fNW Mof'tflSangrur Dhuri Surinder Singh Akali
2 HSU c«;e4' “*HddMaler Kotla Nusrat AH Khan Akali
3 H'dUd (>H<52fed ?T ) MoHHtSherpur (S.C.) Go bind Singh Akali
Rgtfte frw ggswBarnala Surjit Singji Bamala Akali
5 ^ 3 fjTyl) ttiA'Bhadaur (S.C.) Kundan Singh Akali
6 UcStt' dify tnufDhanaula Gobind Singh Longowal Alsali
7 H3T3U fWUSangrur Ranjit Singh Akali
s frftu >Hor'75tDirba Baldev Singh Akali
9 Hft'HSunam Sukhdev Singh Akali
10 wfucf> frjui >HorTHLehra Inderjit Singh Akali
11 (»T5gfecf trnt) UH ^ o{'drdH->HBalluana (S.C.) Hans Raj Arya Congress-I
X fegmra 1 wijy »rat<A frfUl u!.Firozpur Abohar Arjan Singh B.J.P.
2 grfiji5or' dTU' offgJ3?5Fazilka Radha Kiishan B. J. P.
3 friui H». u).Jalalabad Mehtab Singh C.P. I.
4 ^ UH fR\»Guru Har Sahai Sajwar Singh Independent

ADMINISTRATIVE STRUCTURE
1.5 1985 ^ ^3t?5 Uf?TH gf§ § H*ggt § 31Table 1.5 (contd)-Names of Vidhan Sabha Members elected from^Punjab during 1985
20
urg2l HtHcTUSSerial District Name of the Name of the elected PartyNo. Constituency Member Affiliation
0 1 2 3 4
5 ^ H ofH 5?i TcrHFirozpur Bal Mukand Congrjss-I
Firozpur Cantt. Mohinder Singh Akali7 tftdT fpfuj
Zira Hari Singh AkalifHuifafe
Dharamkot (S.O.) Gurdev Singh Gill Congress-1XI 1 HW fpmi
Faridkot Moga Gurcharan Singh Congress-I2 HniT HHSftMH fpfiil fqq
Bagha Purana Malkiat Singh Sidhu Akali3 fcS’UTj fnuj fFTi4 >MS(Tst
Nihal Singh AVala (S.C.) Zora Singh Akalifnuj gr^s
Panjgrain (S.C.) Gurdev Singh Badal Akali'5 Hfang flRuj
Kot Kapura Mohinder Singh Brar Akali6
Faridkot Karnail Singh Doad Independent7 H'dTHHd
Muktsar Gurbinder Kaur Congress-I8 fFW gfS®
Gidderbaha Parkash Singh Badal Akalife? ge
Malout (S.O.) Shiv Chand Ooagress-I10 TofT?
Lambi Hardeepinder Singh AkaliXII gfeVi 1 33#^ MH3fee3 fR'iJ
Bathinda Talwaadi Sabo Atnrinder Singh Akali
21
ADMINISTRATIVE STRUCTURE
1.5 (HHtih) - - 198 5 ^ I S § H^ggt §
Table 1.5 (concld.)~Namesof Vidhan Sabha Members elected from Punjab during 1985
55313: fd«' Uot ^Serial District Name of the No. Constituency
Name of the elected Member
Party Affiliation
0 , 1 2 3 4
2 uV flTHl) fpfuiPakka Kalan (S.C.) Sujan Singh Akali
3 HfeVBathinda Kasturi Lai Akali
Nathana fS.C.) Jasmel Singh Akali5 fjfu
Rampura Phul Sukhdev Sin.gh Akali6Joga Baldev Singh Akali
7 HT?JHT tTR#3 fpfiiiMansa Jaswant Singh Akali
6 a T T ygHHH fiRUfBudhlada Parshotam Singh Akali
9 HHH553T3 fRuiSardulgarh Balwinder Singb Akali
H'UcS :—)fy So urce . Cllief
§5 Utl'g 1 Electoral Officer. Puqjteb

22
ADMINISTRATIVE STRUCTURE1.6—ITFTO dfjHlW' >H§
Table 1.6—TehsUs and Blocks of Punjab (Districtwise)Feb., 1989)
fiJW' Ffg-3faHtWSerial District Sub-Tehsil BlockNo. Tehsil/
Sub-Division
0 1 2 3 4
(§) fisqg H33 (A) Jalandhar Division
1 13HT7UgGurdaspur
2 »f1kHyra Amritsar
(l) IHHTRUB Gurdaspur
(2)Pathankot
{3)Batala
(1) Kalanaur
WETCTT Dhar Kalan fnuf
Narot Jaimal Singh(4) HfHws Bamyal
(5) Qadian
(e)Dera Baba Nanafc
(1)Amritsar
(2) WW H5TZJT Baba bakala
(3) Patti(1) yHsrac Khem Karan
TarnTaran (2) yfu H>fegKhadurSahib
(3) 5HT5 Jhabhal
{4)
(1) iHHTRug Gurdaspur(2) Kalanaur(3) Dhariwal(4) ^ 6'drd Dina Nagar(5) o?Tn§?i?j Kahnuwan
(l) Pathankot(2) irg Dhar kalan(3) Ti^Z Narot Jamal
frfuj Singh(4) Bamyal
(1) Batala(2) UT5 Fatehgarh
Churian(3) igrgrgT Dera Baba
6'rfof Nanak(4) Htuu^BSri Har
yu Gobindpurfl) idol' Verka(2) Majitha(3) Jandiala(1) Tarsi ka(2) Rayya
(1) Patti(2) m Bhikhi Wind(3) Vaitoha
(1) Tarn Taran(2) H ug Khadur
Sahib(3) feT Gandiwind

23
l.eg j^ T —IfflTH Ht>HT HfUFfter »ft
Table 1.6 TehsUs and Blocks of Punjab DistrictwiseFeb., 19 9O)
ADMINISTRATIVE STRUCTURE
Serial District No.
jfuHlw/ng-si- lidcsTehsil/Sub~Division
RW-3fUHteSub Tehsil
f%6?TRBlock
0 1 2 3 4
(4) Naushehrav/nU3»T Punnuan
(5) tujjT H'foy Chohla Sahib(5) »wj^wAjnala (1) >MdcSW Ajnala
(2) ddl'< ' Chogawan
3 onr?yw' (1) KapurthalaKapurthala Kapurthala (1) Bholath f2) Nadala
(2) (2) Dhilwan (1) PhagwaraPhagwara
(3) iiul (1) Htt'J'cS'yU SultanpurSultanpur Lodki tiul Lodhi
4 tiiiUd (1) (1) Kartarpur (1) TT^HtHsJalandharEasJalandhar Jalandhar (2) tTsnrafH Jalandhar
West(2) diuH Bhogpur (3) diyu Bhogpur
u) Adampu r(2) (1 HtTd Nawan Shehar
Nawan Shehar(3) Banga (2) ydi' Banga(3) >ite Aur
(3) MtTdNakodar (1) Nairodar(4) H'o <; Shahkot (2) t s Shahkot
(4) Phillaur (1) Phillaur(5) OTHfeNur Mahal[ 2) *3 Hfciw Nur Mahal
(3) ofWt Rurka Kalan
(1) (1) Jdi' Bhunga (i)orH»rmrH"I Hoshiarpur IHoshiarpur Hoshiarpur (2) ufH'MTuya-II Hoshiarpur-II
(3) dl' Bhunga(2) tdH HTDasuya (1) Dasuya
(2) Hdl»fT Mukerian (2) Mukerian"(3) Talwara (3) Talwara(4) - of' Tanda (4) Tanda
(3) dfi Hofcf (1) BT Hora Garh ShankarGarhshankar (2) H'fjtf UU Mahilpur
(4) yw'i d (1) BalachaurBalachaur (2) Hd»T Saroya

24
1.6 lIHTg t>Ht .sfuRtet 5^513Table 1.6 contd.—Tehsils and Blocks of Punjab Districtwise Feb., 1990)
ADMINISTRATIVE STRUCTURE
f[H t oSerial District No.
5fuFfte/Rg-5wteTehsil/Sub-
DivisionSub-Tehsil
fern tfe Block
6Rupnagar
7Ludhiana
8 HdlgcJSangrur
9 ufenw Patiala
(>h) ufeJHiST h3?5 (b) Patiala Division
(1) iu33ra Rupnagar
(2) tm^Kharar
(1) RTfUi?Chamkaur Sahib
(3) MSWa FTfog (2)Anandpur Nurpur Bedi
Sahib(1) (1)
Ludhiana Malaud(2) tfeT Khanna (2) xrfm Payal
(3) HHTfyr Samrala
(4) tTdTHTf" Jagraon
(1)Sangrur
(2)Barnala
(3)ylalerkotla
(4) TOm Siinam
(1)Patiala
(3) cfi9<5c! Raikot
(1) w Rupnagar(2)
Chamkaur Sahib(1) Kharar(2) fR»rsgT
Sialba Majri(1) Nurpur Bedi(2) RTfua
Anandpur Sahib(1) Hftr>H -I Ludhiana-I 2) #3MTST-II Ludhiana-II(1) Doraha(2) iuH' Dehlon(3) w^Pakhowal1) HH3T75T Samrala2) HTgkr T Machhiwara
(1) Hdra>0* Jagraon(2) Sidhwan Bet(3) Sudhar
(1) 3?T^teBhawanigarh(i) Sangrur(2) Longowal (2) Bhawanigarh
(3) Tappa(4) Bhadaur(5) Ahmedgarh(6) Dhuri
(7) Moonak(s) ( todC'dr
Lehragaga
(1) ^ FTOTDhudan Sadhan
(2) ^3fU3If FTftjg Fatehgarh Sahib
(3) w Nabha (2) >hh;ot Amloh
(1) Barnala(2) Sehna(3) Mahal Kalam(1) Malerkotla(2) » f fu H ^ fA h m e d g a rh(3) cgt Dhuri(1) H?^Sunam(2) uTw Lehragaga
(1) ife fw Patiala(2) BhunerHeri
(1) u s w B a s s i Pathaaa(2) Fraftfe Sirhind (1) w Nabha

25
ijgqoflADMINISTRATIVE STRUCTURE
1.6 3fUJ%t >H§ aSTor (fei^rg)T able 1.6 concid,—Tehsils and Blocks of Punjab Districtwise Feb., i39o)7i:
Serial District N o.
Tehsil/Sub-Division
Hg-3fUJTteSub-Tehsil Block
0 1 2 3 4
10 feumig Firozpur
11Bathinda
12Faridkot
(3) iw gRDera Bassi
(5) HHT Tgamana (4) inngf Pattran
\2) Dera Bassi(3) u[^ Ghanaur
Samana
(1)Firozpur (1) IfUUFRFfe
Guru Harsahai
(?) f53i3ug HS?5 (c) Firozpur Division(1) fejtWH Firozpur(2) Guru Har Sahai(3) ura Ghall Khurd(1) Faziika
tT5?fHW Jalalabad (2) Jalalabad( 1) Abohar(2) y^ R g^ K hu ian Sarwa*1) Zira2) cran ^ Dharam Kot1) gfeV Bathinda2) Nathana
(3) HTg Talwandi Sabo R3T3 Sangat HcSHT iViansa l^ ^ B u d h lad a
(3) Jhunir(1) THyBT Rampura(2) fH Phul(1) Faridkot2 sru T K.ot Kapura1) HHHHH Muktsar2) ^ 5^ Kot Bhai(3) Malout(4) Lambi(1) OT-I -vjOga-I(2) OT-II .vloga-ll
(5) fera fnW (3) feui NihalNihal Singh Wala Singh Wala
__________________ (4) gw^jgrgrBagba Purana:— hth fergr, 1
Source: —Revenue Department, Punjab.
(2) Faziika(2)
(3) >H^ Abohar
(4) tflHT Zira (4)Dharamkot
(1) gfeV Bathinda(1) 39^ Nathana
(2)Talwandi Sabo
(3) HW (2)Mansa Sardulgarh
(3)(4) 1 5 Budhlada
Rampura Phul(1)
Faridkot(2) 'H5r3H3
Muktsar
(1) ^ Jaito
(2)Giddarbaha
(3) HE-B Malout h) Lambi
(h) Fpg (d) Summary [1) Divisions 312) Districts 12[3j tU “>fes Sub-Divisions 46(4) Hfenter Tehsils 46[5) feoTH y k Blocks 118(e) H9-3fbHte Sub-Tehsils 48
>H§ T>HtUR hS IN ote The boundaries o f Tehsils, Sub-tehsils and Blocks are not co-term inus.


> if9 i
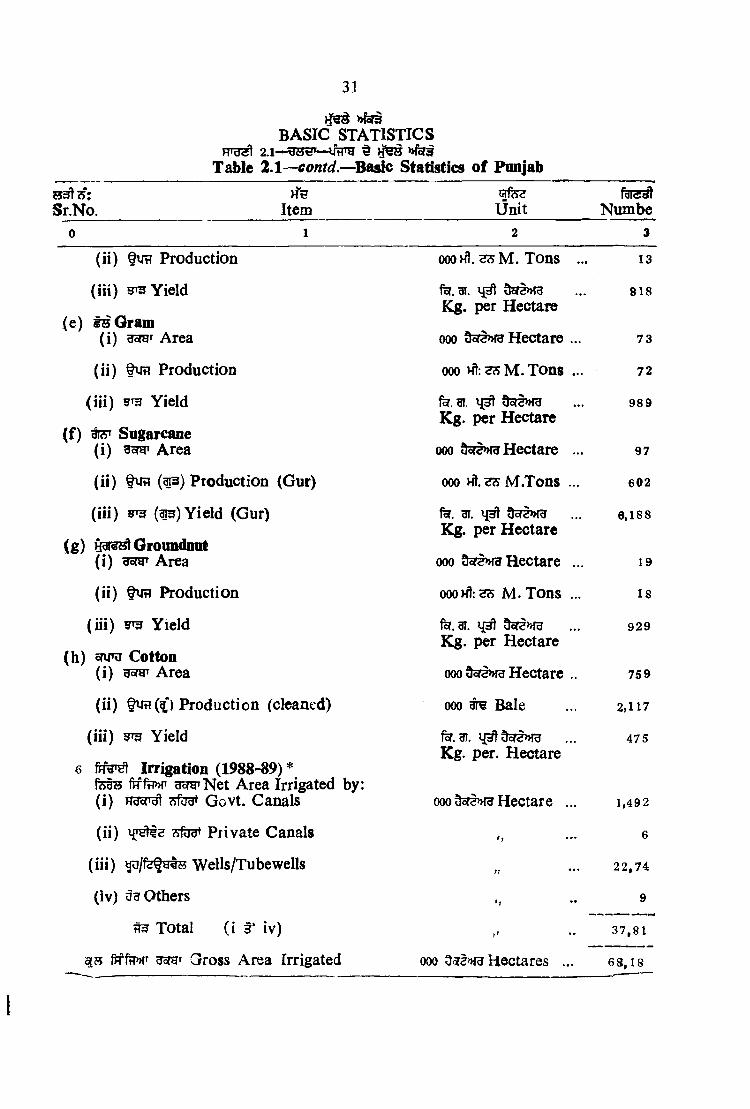
2.1 ^ g g H 3 3 ^ Qbut r M >H ai
fti3 3T§ UH I
SECTION II
BASIC STATISTICS
Table 2.1. Shows the Basic statistics relating to some important sectors of Punjab.
27
2


29
H 5 S >K5r3 B A S I C S T A T I S T r C S
2 .1 — VtT'g ^ l | e 5 M5T3 T a b le 2 . 1 — B a sic Statistics o f P u a ja b
S r . N o . ItemGLfeS
U n itfdT5^
N u m b e r
0 1 2 3
1 Horgr 4 re a ( i9 8 i census) S q . K m . .. 50,362
srWiiis D iv is io n s S :N o .
D istricts S :N O . 12
S u b D iv is io n s N O . 46
T e h sils N o . 46
R3 Hfaf^jy’fS u b T e h sils NO. 48
vf? B lo c k s S: N o . 118 ‘
omg T o w n s <S:N0. 129
T f e C it ie s £ 5 : N o . 5
fUV In h ab ite d villag es S :N o . 12,342
2 )»rg»el Popalation (1981)< M T o ta l P o p u la tio n m L a k h 167.89
R u r a l P o p u la tio n m L a k h 121.41
f s ut i{3tg33T Percentage to total % 72.3
efu^ U rb a n P o p u la t io n L a k h 46.48
^ Percentage to total % 27.7
D e n s ity
u t feyf?>Hcr3 l L iterate an d Ed u cated Perso ns
L ite ra c y
Kt33 . .
P er Sq. K m .3: N o .
M^H3 %
333
68,60,343
40.86
3 Frg*sc? Local Bodies (1988-89)f e f iJ h h Z i la P a rish a d s ^ "N o . 10
fHfHUH xVfunicipal C o m m itte e s S :N o . 108
7 ^ Hnrg Im p ro vem ent T ru s ts ^ :N 0 . 2 7
4 Climate (1988)>HFB A verag e R a in fa ll M iU im e tfe 1122.7

BASIC STATISTICSP T ^ IfFPH % »feri
30
S i.N o . Item U n itfgi33it
N u m b e r
0 1 2 3
5 Agriculture (1988-89)*fiS6M gsra’ N e t A r e a Sow n 000 Dof2>nu H e cta re ... 4 ,205
fe r 3 ‘ €q dotyTArea Sow n m ore 000 H e cta re ... 3 ,18 2th an once
SHHt C r o p p in g In te n sity % 1 76
H75* Production of Crops
( i ) ^ > H ^ t i T o ta l C e re a ls 0 0 0 Hi. M. Tons ... 16,93 8
( i i ) ^ T o ta l P u lse s II ••• 12:7
(a) ^ ^ T o t a l Fo o d g ra in s (i & i i ) If 17,06i5
(b) # 5 T o t a l O il seeds ft ... 1359
w »mte gorar, Qxj » i§ 573 A re a , p ro d u ctio nand y ie ld o f selected crops
(a ) Rice( i ) yoW' A re a 000 9c?i»raH ectare ... 1,77 8
( l i ) § ira P ro d u c tio n 000Ht. 23 M. Tons .. 4.92J3
( i i i ) y'd Y ie ld fofii'drd*H tlofSWHKgs. per Hectare
2 ,7 7 2
(b ) ofio( Wheat( i) usTiT A re a 000 9o^t»ra H e cta re 3 ,15 7
( ii) f iff l P ro d u c tio n 000 Ht. M . Tons1 1 1 ,5 7 8
( i i i) y'd Y ie ld fo?. 31. lj[^ oTSMSTK g s . per H e cta re
3, 66 8
(c) Maize( i) do yi A re a 000 5or2»ra H e cta re 24 9
( ii) f JtT P ro d u ctio n 000 Ht. 23 M . Tons 2 9 3
( i i i) y';i Y ie ld fe.3T. Oor2>»ra Kg. per H e cta re
l,17t6
(d ) gTTgrQajra
( i) dofyi A re a 000 5c?§»fg H e cta re 1 6
31
BASIC STATISTICS2.1— VfTH ^ y | ^ >»fe3
Table 2.1— Basic Statistics of Punjab
Sr.No. Itemcrfe?Unit Numbe
0 1 2 3(ii) futT Production 000kI. Tons ... 13
(Hi) grg Yield fif. 31. 9cT5Wg K . per Hectare
818
(e) tsGram(i) Area 000 5crt»ra Hectare ... 73
(ii) flit? Production 000 Ht:?sM.Tons ... 72
(ill) 9 3 Yield fe. 31. Dot<;>>ra Kg. per Hectare
989
(f) t o Sugarcane(i) HcW’ Area 000 9or§»ra Hectare ... 97
(ii) (^3) Production (Gur) 000 Ht.?s M.Tons ... 602
(iii) (^ ) Yield (Gur) fe. 3T. Do(<;>>f3Kg. per Hectare
6.188
(g) Groundnut(i) gsrar Area 000 Hectare ... 19
(ii) flit? Production oooHt:25 JVl. Tons ... 18
(iii) y'd Yield fe.3i. OoT§»ra Kg. per Hectare
929
(h) snnu Cotton(i) defy Area 000 9or§»ra Hectare .. 759
(ii) Production (cleaned) 000 ^ Bale 2,117
(iii) y'd Yield ur.Kg. per. Hectare
475
6 fR ^ Irrigation (1988-89) *feg?5 ftfftiMT gw N et Area Irrigated by:(i) Wofigl Govt. Canals 000 Hectare ... 1,492
(ii) s t o Private Canals 6
(iii) Wells/Tubewells t) ••• 22,74
(iv) 0 Others 9
^ Total (i 3‘ iv) 37,81
Gross Area Irrigated 000 0^>>ra Hectares ... 68,18

32
»»fe3BASIC STATISTICS2.1 § > 1^ m i
Table 2.1 eonid,— Basic Statistics of Punjabq.fc
Sr,No. Item Unit Number0 1 2 37 qg w m Animal Husbandry (1988-89)
qjj gfersRT Veterinary Hospitals
PermanentOutlying Dispensaries & insminallin Units
fFftTS Artificial InseminationCent res
Hofgr r?iRf?e Area stockedwithfish
t s ug qs Total Live Stock
^ Total Poultry
8 Energy (1987-88)*^fufi Generation of Electricity
^ WB Consumption of Electricity
Per Capita Consumptionof Electricity
9 Forests (1988-89)?3 T HBrgr Area under Forests
10 §e<H3T Industries (1988)Regd. Working Factories
11
Average No. of workers employed in Regd. Working Factories
^^55 »r§ fHU3 Medical and Health (1-4-1989) HoT?5 RRgT Medical Institutions:—3RU51W Hospitals feHihT^ Di spensari es
§55^ R ^ P .H .C .S »ngg|fe5r Ayurvedic andUnani Institutions
^:N0. 846
No. 1,033
^:N0. 46
H e c ta -e ... 15,83
utFH thousand ... 8,99 6t t
od'd thousand ... 5 ,539ff
uf? ... 12,207.79Million K W H .
forS?r^ uj§ ... 9390.6Million K W H .
f5T^?reuf?KW H. ... 510.»
rarforsHtsa Sq. K m ..„ 2,842
^:No. 10,419
Nu. 3,36,050
3; No. 26 5^:N0. 1,567^:N0. 365^:No. 525
____ .

BASIC STATISTICS, 2.1 utTTg ^ )fg^ »feri
Tabie 2.1 concld.—Basic Statistics of Punjab
33
3 : HH fdI33lS.No. Item Unit Number
1
RHgT?' H o m o e o p a th ic In s t itu t io n s s : N o . .. 85Beds insta lled in s :N o . ... 23,910
M e d ic a l In st itu tio n s12 fiffyMT Education (30-9-1988)
Universities S:No.
* P ro v is io n a l.@ 31 1988 ^ R fg^ I@ As on 31st Dec., 1988
3l5r 1977 Hi 9 ItfRelates’ to Live Stock Census* 1977.£ 1.25 3tl § €q£ C it ie s h a v in g p o p -ila t io n m o re th a n 1.25 la k h ,
3
» T3 5TTHOT, UKHTfeFJ)H§ RrfeH S :N o . ... 17 1A rts , C o m m e rce , H o m e Scie n ce & Science C o lle g e s
H ig h /S e n io r S e co n d a ry s :N o . ... 2,740S c h o o lstH^ FRH M id d le S ch o o ls s; N o . ... i,4i3
P r im a ry Scho ols ft: N o . ... 12,357
13 Co-operation (1987-88)C o -o p e ra t iv e S o c ie t ie s s :N o . ... 27, 0 4 i
H'gg feu Membership m Lakh ... 36.84
UtTl Working Capital RsCrore ... 2,343 38
Primary Agricultural No. ... 4 6 3 oC r e d it Societies
14 Banking (31st Dec., 1988)t ‘5T Scheduled Banks S: No. ... 2,068
N o n Scheduled B a n k s s ;N o . ... 1
16 fssrs Miscellaneous (1988-89)Post O ffice s S ;N o . ... 3,7 82
ufeH u e P o lice S ta t io n s/P o lic e Posts 3: N o . ... 322 @urTH f?aT?s H§T Htsr Seats in P u n ja b s: N o . ... 117
V id h a n Sab ha-m HsTT L o k S ab h a Seats in P u n ja b s: N o . .. 13


R5nEHs 3 D^6.01L... ... . . . . .....
)^ § >HTHTd)
feR ^ »f5Frg ^ § ^sra »K§»rgi5?! Rgat te3311 TO I 1931 Ht "f7t3 fijf55»ff »f§ ^ » r Rgdfe'f?e ^ srei
§ Or sf >HT feu RT-ffW ftmro e i ^ ^ i i98i ^ ^"rs rA" hM§ l^^fRT^ ^gifW 3 1 ^ f ^ t ^ ^ f ^ ^
:
w feR t » r g f^ tT tH irfeof f w fgPHT ^ w ^fm t R ^ s?fferWH W U Rof T 01
>)?J-orH :
f u OD? U^ H RTH yfe r 183 rT feR 3* »T gf^H i 'I s I
HT^tf!^ SfTV :
^ c?D gR? ftTJJT ^ RTH H» Vftf ftjRT ^ oftH gHfcf 183 f^?P 3^ ufe ftlR ^ RH* SS'T
t u ^ UTS ^ RTH SUT offer |
u f ^ g :
^ ^ f u 5 feo?5 u s »f§ fe^ € k § f ^ y ^ u s ^ ta§ 3H t UW3 »f UT eras f OT I
fey :
feg u f ^ fe fW K^y ^ W ^ gTHT J RH9 U3 >H§ fey R TO’ 0 I
3.1 —Iftrg ^ 3fURte?’3 feUTHl »f§ Rfu^ >H§ f?5^ nf^R^ n fg r^ 315! 11
RTU^3. 2— fugfe»f H U rfw % » f w ! f%"U %»fT ^ i
RTU^ 3.3— ^ UfTO ^ feUT t »{§ e f ^ t » f w t ^UtT d I
RTUe 3.4— RTS 1971 1981 H U ^ R t >H3RtU Ifflrg fuV >h§ Rfuu ^ fgi33leURT^ ^
R^U^ 3.5— VfflTg 1981 ^ feurfe^ HoTO ^ >H§ feU^Rl MoTO BcT ^ >»iR3»{§ U f u ^ ^ ^R T §*^ 5 1
FTU^ 3.6— ifarg 198J Z5F1 ^ ^ >HTgr ^ §*tn >H?SR ^^ •
35
3.7— uVg uI u/^ ht nf^ ffj F 3i
FTg^l 3.8— u> g §HB nj^gT I m§ bjs snfnM’ el #3, i98i i
FTH513.9 »f^ 3.10~f#3 1981 »{§ UTTH M§ 5JifH>H' ^i3 d:a-5?irH>H elfUT^l »1§ 5FfH>HT W T O f ^ l 31^ 9 I
Rf3 5 l 3 . i i — u > g f s a i 1,000 § k u o t u i 3 .
1981 I
Rfg^3.12— uV gf^^ ??57gT_ fjygy »^§ f n s ^ HTteH^ 1981 I
R’>3 5l 3 13— uVg FT75 1981 25 1 >H5Rfg3 1 ^Tgr^l >H RTy jT pgRT@"el9 I
RT?T^l3.14— ^Hry l H3HHiHTgl MSJTO UtTf^ ^ B fF ffw 1 l { f ^ 3 l ^ u l 5 I
3.15— R H 1981 #y nfrgr^l ^ S"W »fc5RTU 5?Rfu»{f h1 R s l- t^giul9 I
R’g ^ l 3.16— UTTH f # 3 »THT e1 HHH # 3 , 19.81 UTHI 5 1
R T ^ l 3. 17— R^5 3 , u fp g >HTgT f^Mrg s f ^ gi^l ^ » n w f e » |T g^ l
eUTT 5 1
3.18 >H§ 3 .19;— f ^ WB3 ^ ^ >H§ RU| »{TgT '] ^ ^rgt Jg% | >^314^5,
RTtra^ >H i { 3 t e n f ^ f e n trH t» r » f t n frg r^ ^ g g H » n 5 R ^ grel 9 1
RTg^ 3.20;— WW § »fXJTg § J971 1
RT3^ 3.21:— h1 M W l 1901 W 1981 HR-ER RT5 W ^ fe > faPH 3 ( .
Rig^ 3.22:— f?e >>fTgrg| h1 §H3 UT3U MSR^ #3, 1961, 1971 >H§ 1981 I
R'3sl 3.23--” ^ §a^ h1 »r3^el, »f3u^ >h% ui h 3i 1 5 1
SECTION 3
AREA AND POPULATION
This section provider data relating to area and p">pu1ation of th3 stats aixording to different censuses. There have been changes in the administrative boundaries of various districts and tehsils on dnu Tiber ofoQ^asi^ri'.. All the chaig^j have be^i taken into account in the presentation of dati during1981 census. Concepts and definitions used in 1981 census are given below:—
Work:—Work was defined as participation in any economically productive activity. Such participation was physical or mental in nature.
Main Workers:—Main Workers ;were those who had worked for the major part of the year i.e. who were engaged in any economically productive activity for 183 days or more during the year.
Marginal Workers:—Marginal workers were those who worked any time at all in the year but did not worV for a major part of the year, i.e. those who worked for less than 183 days,
? 6
iNon-Workers:—Non-workers were those who had not storked any time at all in the year.
Hoasehold:—A household is a group of persons who commonly live together and take their meals from a common kitchen unless the exigencies of work prevented any of them from doing so.
Literates:—A person who can both read and write with understanding in any language.
Table 3 *1: Gives tehsil-wise, area-wise and sex-wise population in Punjab, 1981.
Table 3 *2 : Gives district-wise growth of population in Punjab daring the last three decades.
Table 3 *3 : Gives district-wise rural and urban population of Punjab.
Table 3 *4 : Shows district-wise number of villages and towns of Punjab in 1981 Census.
Table 3 *5 : Exhibits number of residential houses and persons per occupied house and household in Punjab for 1981.
Table 3 ’6 : Shows district-wise classification of villages by various population ranges in Punjab for 1981.
Table 3 *7 : Gives district-wise area and density of population and sex-wise population, 1981.
Table 3 *8 : Age group-wise distribution of population and workers in Punjab, 1981.
Tables 3 *9 and 3 -10 : Present sex-wise and district-wise workers and non-workers and classification of working population into nine industrial categories in Punjab for 1981.
Table 3-11 : Distribution of 1,000 workers in each sex and industrial category by broad agegroups, 1981.
Table 3 *12 : Shows literacy, sex-wise and area-wise in the districts of Punjab for 1981.
Table 3 *13 : Gives district-wise literacy and population of scheduled castes for 1981 in Punjab.
Table 3 *14 : Contains information regarding trend of population in the towns of Punjab for the latestCensus.
Table 3 *15 : Shows classification of towns by various ranges of population in Punjab for 1981.
Table 3 *16 : Presents classification of population by religion, 1981.
Table 3 *17 : Gives projected population of Punjab worked out by the Economic and Statistical Organisation, Punjab.
Tables 3 *18 and 3 *19 : Give increase in population, sex ratio, literacy, percentage of scheduled castes and distribution of population by religion in different states and Union Territories, 1981.
Table 3 *20 : Depicts classification of population by Language, in India.
Table 3 *21 : Depicts decennial growth of population in India from 1901 to 1981.
Table 3 *22: Gives age-group-wise distribution of population in India, for the year 1961, 1971 and198J.
Table 3 *23 : Shows population, sex-ratio and density of selected countries.
37
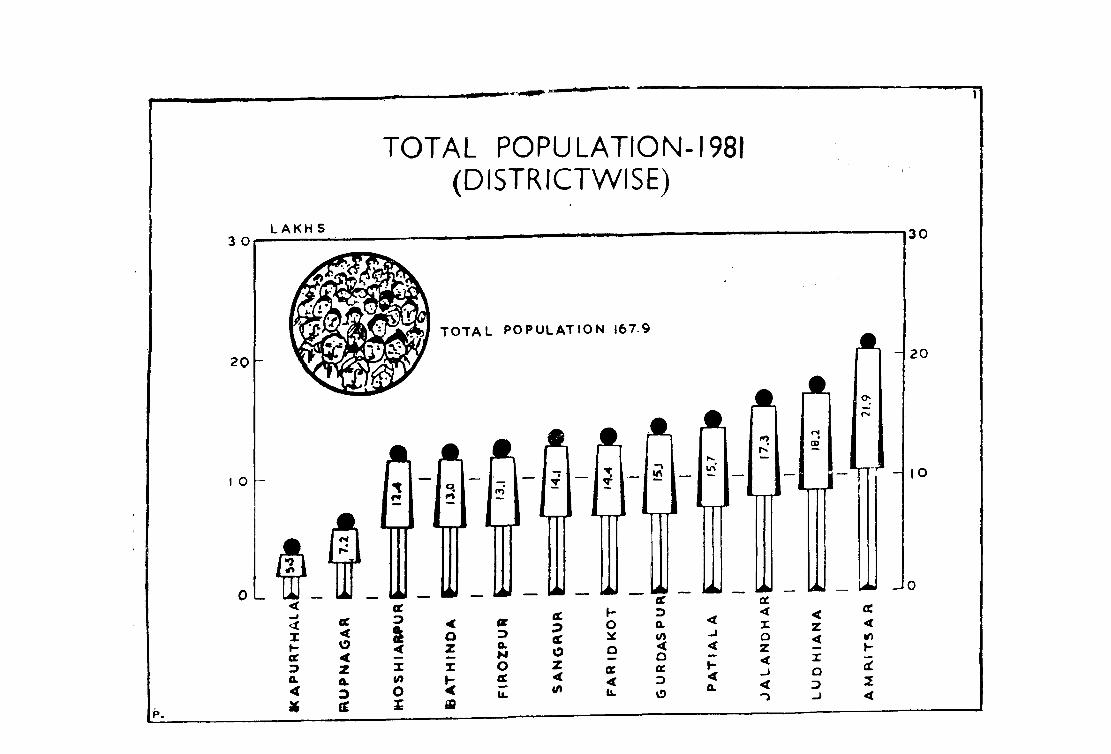
TOTAL POPULATION-1981 (DISTRICTWISE)
3 OLAKH S 30
20
TOTAL POPULATION 167.920
I O
S \l l
<I
ocDa<
ec<O<za.3
UN__
A
OlrO
-
<>fN
10
J o
It
(taz<
hoocr<ti.
flCDa<OcrDO
»-<a
<Xoz<<
<z<XaD
(£<10H52<
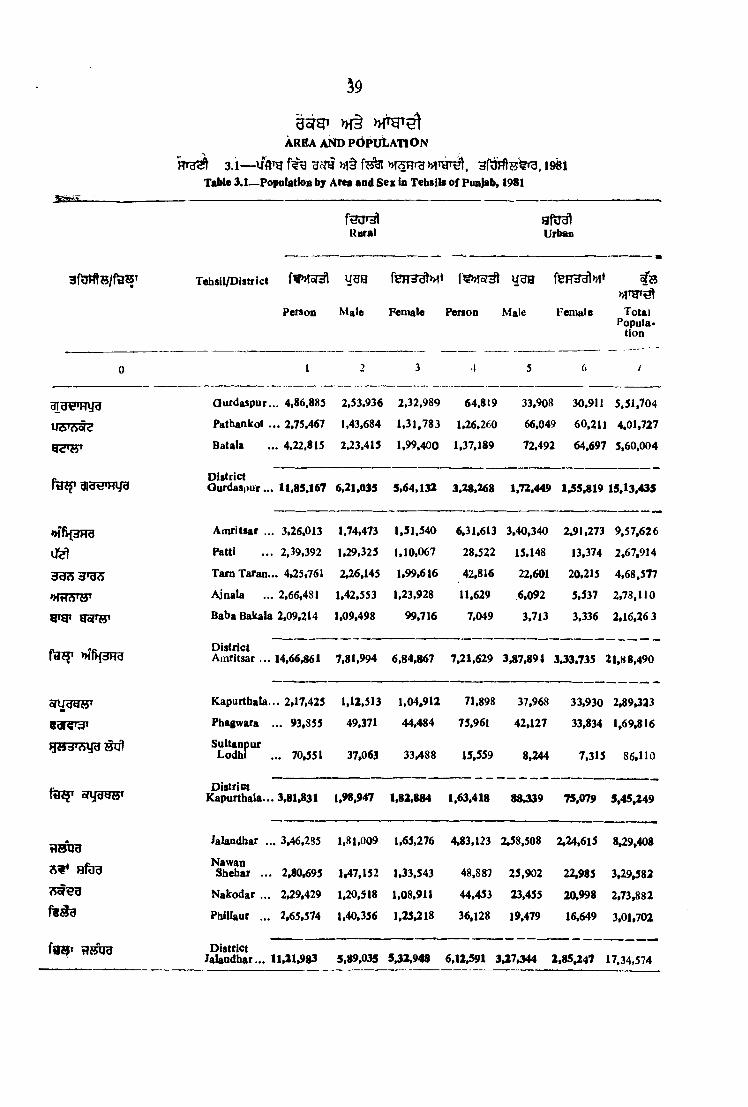
39
g g g i >h§
»ef ^ 'mgsfl 3.1— uflTg gsw im
Table 3.1— PopnlatioD by Area and Sex in Tehsili of Punjab, 1981
AREA AND p 6 p u LATION
Rural Urban
T ehsil/D istricl f«»!olcA u g g U3H
------— m
Person Male Fem ale Person Male Fem ale TotalPopula*
tion
0 1 2 3 -» 5 6 /
^ d « 'H y g G urdaspur... 4.86,883 2.53.936 2.32,989 64.819 33,908 30.911 5,51.704
ua'A oid Pathankot . . . 2.75.467 1,43.684 1 .31 ,783 1.26.260 66.049 60.211 4,01,727
Batala . .. 4.22.815 2.23.415 1.99,400 1.37.189 72.492: 64.697 5,60.004
DistrictO urdaspur... 11,85.167 6.21.035 5,64.132 3.28.268 1,72,449 1,55,819 15,13,435
♦HfitJHd Ainritsar ... 3.26.013 1.74,473 1,51.540 6.31.613 3,40,340 2,91,273 9 .57 ,626
U5^ Patti . . . 2.39,392 1.29.325 1.10.067 28.522 15,148 13,374 2,67,914
3cTS3^ T am T aran... 4,25,761 2,26,145 1,99,616 42,816 22,601 20.215 4,68.577
Ajnala ... 2,66,481 1.42.553 1.23.928 11,629 6,092 5.537 2,78.110
WW yo('H' Baba Bakala 2,09,214 1.09,498 99,716 7,049 3,713 3.336 2,16,26 3
>HfttdKdDistrictAmritsar . . . 14.66.861 7.81.994 6,84.867 7,21.629 3.87.894 3.33,735 21,88,490
K apurthata... 2,17,425 1,12.513 1.04,912 71.898 37,968 33,930 2,89,323
earn 'd ' Phagwara ... 93,855 49.371 44,484 75.961 42,127 33,834 1,69,816
y t fd 'A y d tf if) SultanpurLodhi . .. 70,551 37,063 33.488 15.559 8,244 7,315 86,110
sryggsTDistrict
K apurthata... 3,81,831 1.98,947 1.82.884 1.63.418 88439 75,079 5,45,249
Jalandhar ... 3,46,235 1.81.009 1,65.276 4.83.123 2,58,508 2,24,615 8 3 ,4 0 8
a f e dNawan
Shehar . . . 2,80,695 1,47.152 1.33.543 48.887 25.902 22,985 3 3 . 5 8 2
Nakodar . .. 2,29,429 1.20,518 1.08.911 44.453 23.455 20,998 2,73,882
Phillaur ... 2,65,574 1.40,356 1.25,218 36,128 19,479 16.649 3,01,702
tisira DistrictJalandhar... 11.11,983 5.89.035 5.32.948 6.12.591 3.27J44 2,85,247 17.34.574
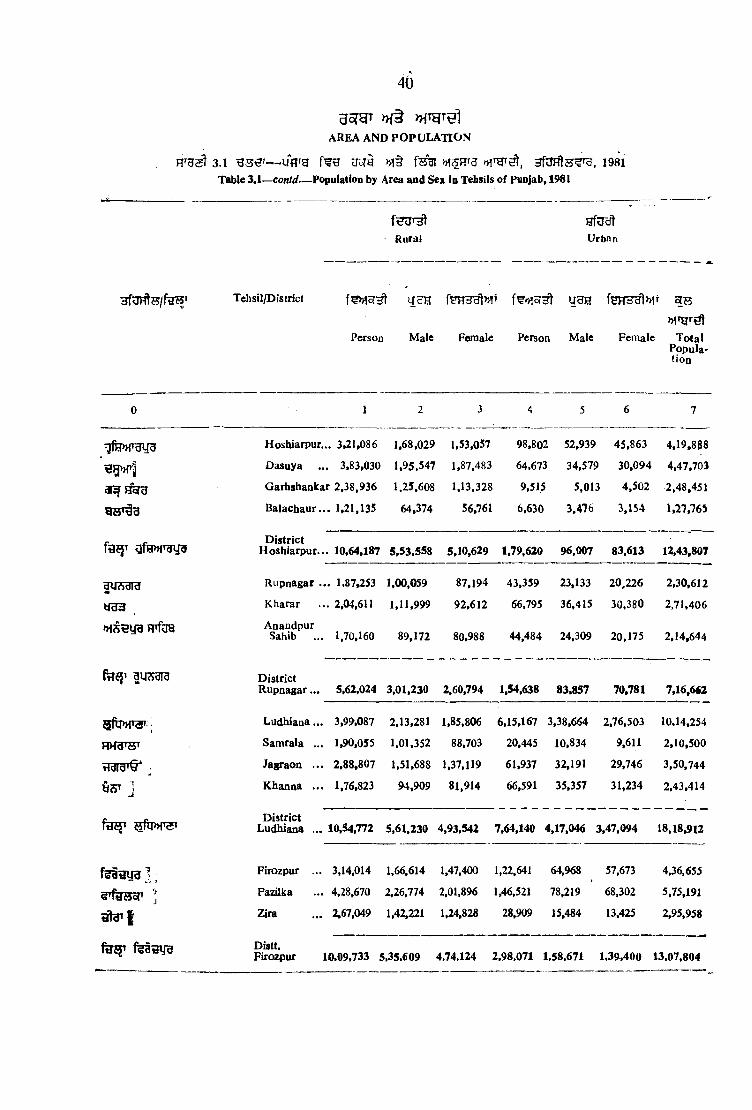
40
gsfg r o f§ >HigTsl AREA AND PO PU L A T IO N
HTggl 3.1 — uflfg v)i§ f sai ^ 50^3 i98iTable 3.1— con/</._PopuIation by Area and Sex in Tebsils o f Punjab, 1961
fi3Ur3lRural
afucjtUrbnn
3f^ B f/ftr75T Tehsil/District 1
Person Male Female Person Male Female T otalPopula'tion
0 1 2 3 4 5 6 7
Hoshiarpur., 3,21,086 1,68,029 1,53,057 98,802 52,939 45,863 4,19*888
« g» fi Dasuya . 3,83,030 1.95,547 1,87,483 64,673 34,579 30,094 4,47,703
a if j t e Garbshankar 2,38 ,936 1.25,608 1,13,328 9,515 5,013 4,502 2,48,451
B alacbaur.. . 1,21,135 64,374 56,761 6,630 3.476 3,154 1,27,765
D istrictH oshiarpur.. . 10,64,187 5,53,558 5,10,629 1,79,620 96,007 83,613 12,43,807
fVIAdld Rupnagar . . . 1,87,253 1,00,059 87,194 43,359 23,133 20.226 2,30,612
Kharar . 2,04,611 1,11,999 92,612 66,795 36,415 30,380 2,71,406
>Hs^yg wfuQ AnandpurSahib 1,70,160 89,172 80,988 44,484 24,309 20,175 2,14,644
ftTiJ’ 3l4Adld D istrict R upnagar... 5,62,024 3,01,230 2,60,794 1.54,638 83,857 70,781 7,16.662
^rU»T3P:; L udhiana... 3,99,087 2,13,281 1,85,806 6,15,167 3,38,664 2,76,503 10.14,254
HHi3W Samrala ... 1,90,055 1,01,352 88,703 20,445 10,834 9,611 2,10,500
ildld'Q* j Jagraon . . . 2,88.807 1,51,688 1,37,119 61,937 32,191 29,746 3,50,744
yST j Khanna . . . 1,76,823 94,909 81,914 66,591 35,357 31,234 2,43,414
District Ludhiana ... 10,54,772 5,61,230 4,93,542 7,64,140 4,17,046 3,47,094 18,18.912
fe a m ig ] .Firozpur ... 3,14,014 1,66,614 1,47,400 1,22,641 64,968 57,673 436,655
5^dao(» ' Fazilka 4,28,670 2,26,774 2,01,896 1,46,521 78,219 68,302 5,75,191
Zira 2,67,049 1,42,221 1,24,828 28,909 15,484 13,425 2,95,958
Distt.Firozpur 10.09,733 5,35.609 4.74.124 2,98,071 1,58.671 1.39 ,400 13,07.804

41
a e jg i )n §AREA AND POPULATION
3.1 RHTa3— u f r g >h§ f s a i o r g r ^ , l a g iTable 3 *1—concld.—Population by Area aad Sex in Tehsiis o f Punjab, 1981
Rural Urban
d f d H la / f a ^ Tehsil/District UdH
Person Male Female Person Male
feR3^>WT 4 9
>n'y't!lFemale Total
Population
0 1 2 3 4 5 6 7
Faridkot g2,51,247 1,34,054 1,17,193 ,1,16,034 61,381 54,653 3,67.281
Muktsar S4,10,408 ,2,18,366 1,92,042 1,32,974 69,894 63,080 5,43,382
w ar jMoga ^4,31,004 2,29,405 2,01,599 94.561 50,076 44,485 ,5.25.565
gfj53^ V, j
Distt. Faridkot 10,92,659 5,81,825 5,10.834 3,43,569 1,81,351 ; 1,62,218 14,36,228
Bathiada 2,58,270 1,37,692 1,20,578 1,51»611 83,031 *,68,580 4,09,881
H T S IT l iM a m i4,22,S57 2,26,151 6S.1SI i 36^18 32,533 4,91,608
U W ig r f K j
3 S ^
Rampura Phul
Talwandi Sabo
1,78,964
1,48,638
96,134
79,751
82,830
68,887
31,890
43,625
16,974
. 23,258
^14,916
20,367
2,10,854
1,92,263
Hdl^d ;
D istt. Bathinda 10,08,729 5,40,334 4,68,395 295,877 1,59,481 1,36,396 13,04,606
Saogrur 1,78,505 96,471 82,034 68,008 36,063 31,945 2,46,513
yar<5Ttf ; BamaU Si2,97,007 1,59,472 1,37,535 82,023 43,748 38,275 3,79,030
Malerkotla 3,37,940 1,81,469 1,56,471 1,09,730 58,262 51,468 4,47,670
R?PHSunara 2,75,157 1,49,758 1,25,399 61,880 32,815 29,065 3,37,037
fe^ T J t o d j i DistrictSaogrur 10,88.699 5,87,170 5,01,439 3,21,641 4,7J,888 1,50,753 14.H),250
uf?»»rs» Patiala t2 ,43,747 1,30,643 1,13,164 2,19,888 1,16,874 1,03,014 4,63,633
FatehgarhSahib i l , 67,693 90,234 77,459 47,052 25,465 21,587 2,14,745
z sr r Nabha S2,02,616 1,09,436 93,180 79,656 44,034 35,622 2,82.272
R^pura 23,21,085 1,71,794 1,49,291 73,519 39,779 33,740 3,94,604
RMW Satnaoa 1,69,462 90,390 79,072 44,180 23,267 20,913 2,13,642
U fe»T S» Distt. Patiala] 11,04,603 5,92.497 5,12,10^ 4,64,295 2,49,419 2,14,876 15,68,898
Uh *« Punjab i ; z M U 5 8 64,44,464 56,96,694 46-,47,757 24,92,746 .21,55,011 l,6 7 ,8 i,9 1 5
HTCRj ?Tjfetof2B. Hira UtTaiSource i Director, Census Operation, Punjab,

42>
TIBXjgOftWdUUgij sgra , ^n>>r^
HdlgdUfe»fT5 r
l/ilTg
aoTHT )^ 3 M ig ii^ARft/C a n d p o p u l a t i o n
R T g ^ 3 .2 — 1951 3 ‘ f a ^ a
Table 3 *2T-rj[ncrease in Populatioatsince.1951 by Districts
District
>>rgT »FgT^ »{tht^ feg ?tqi Percentage Increase In;'
PoBuJgtion Population Population P;QPula^on.. - PopiiIetii^ik^H 1981 1971 1961 1951 ^
1971— 81 1961—71 1 9 5 1 -6 1
0 . J 2 ", 4 .,5 6 7
G urdaspur... 15,13,435 ' 12,29,464 9,80,879 8,47,034 23-10 25 -34 15*80
Amritsar ... 21,88,490 '"18,35,500 15.34,162 13,66,555 19-28 19-64 1F 26
kapurthala... 5,45,249 4,29,514 ' "3,^3,778 2 ,9 5 ,0 7 f 26-95 24-94 16*51
Jalandhar ... 14,54,501 12,26,182 10,55,349 19 -26 18 -62 16*19
Hoshiarpur... 12,V3,8b7 10,51,074 8,71,130 7,94,393 18-34 20-66 9 -§ 6
Rupnagar ... 7.16,662 5,49,33: 4,76,357 3,87,182^ 30 -46 15-32 23 -03
L'ldhiana ... 18,18,912 14,20,055 11,07,310 8,54,032 28 -09 28 24 2 9 -6 7
Firozpur ... 13,07,804 10,44,936 8,79,599 7,20,511 . 25-16 18-80 2: - 0 8
Faridkot ... 14,36,228 11,53,760 9,76,247 7,29,862 24-48 18*18 33 76
Bathinda ... 13,04,606 10,25,271 8,30,064 6,21,251 27 -24 23 -52 33 *61
Sangrur ... 14,10,250 11,46,650 9,54,307 7,62,677 22-99 20*16 /5 ‘'-l 3
Patiala 15,68,898 15,11,(X)3 '■ V 9,55,054 7,23,338 -29 -55 26 -80 32 -03
Punjab 1,67,88,915 1,35,51,060 1,11,35,069 91,57,255.' 23 -89 21 -70•* -_
RTCfs : — ^ut es , iTFrg i Source :—Director Census Operation, Punjab.
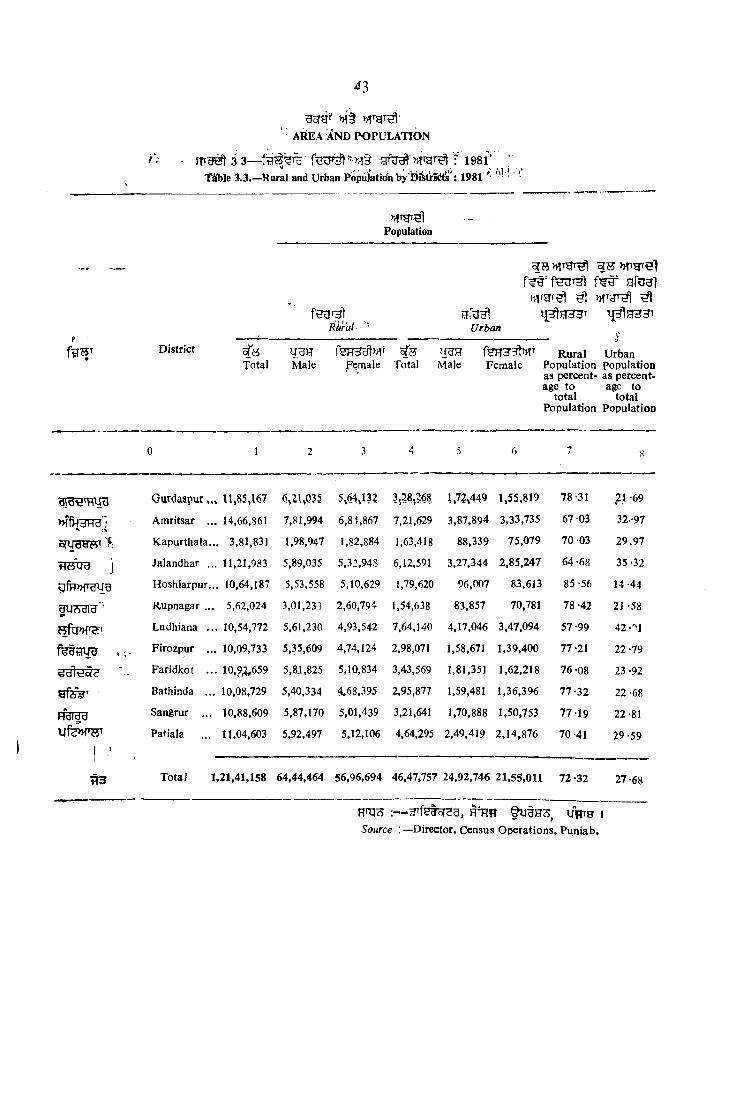
^3
f ■
fi- 3, 3— f 1981'- ' ; ^ TiWe 3.3.—Rural and Urban PbpuIatio'nby’OistrlBidts': 1981 '>V t
' AREA And popu latio n
District
Population
f^THlRtir'al
efug]f lTgr » TgT ^
Urban
^ 3 u g j? feFTHHlMf f s Rural UrbanTotal Male peraale Total Male Fem ale Population population
as percent- as percentage to age to
total totalPopulation Population
0 1 2 3 4 5 6 7
Gurdaspur IU85»167 6»ZU035 5,64,132 3;28.,?68^ i >7^,449 1,55,819 78 -31 21-69
Amritsar ... 14,66,861 7,81,994 6,81,867 7,21,629 3,87,894 3,33,735 67 03 32.-97
oH jayw' ' ■ Kapurthala... 3,81,831 1,98,947 1,82,884 1,63,418 88,339 75,079 70 03 29 .97
iTCiira j Jalandhar ... 11,21,983 5,89,035 5,32,948 6,12,591 3,27,344 2,85,247 64-68 35-32
ufH>>ffgug Hoshiarpur... 10,64,187 5,53,558 5,10,629 1,79,620 96,007 83,613 85-56 14-44
D<
Rupnagar ... 5,62,024 3,01,233 2,60,794 1,54,638 83,857 70,781 78 -42 21 -58
K fq>>r^ Ludhiana . . . 10,54,772 5,61,230 4,93,542 7,64,140 4,17,046 3,47,094 57-99 42-01
. ; .Firozpur ... 10.09,733 5,35,609 4,74,124 2,98,071 1,58,671 1,39,400 77 -21 22 -79
Faridkot . . . 10,9^659 5,8J,825 5,10,834 3,43,569 1,81,351 1,62,218 76 -08 23 -92
Bathinda ... 10,08,729 5,40,334 4.68,395 2,95,877 1,59,481 1,36,396 77-32 22-68
HdldH Sanfirur ... 10,88,609 5,87,170 5,01,439 3,21,641 1,70,888 1,50,753 77-19 22 -81
U f^ H W
!
Patiala 11,04,603 5,92,497 5,12,106 4,64,295 2,49,419 2,14,876 70 -41 29-59
Total 1,21,41,158 64,44,464 56,96,694 46,47,757 24,92,746 21,55,011 72-32 27-68
HH33 :— HTl f l W e I
Source ;—Director, Census O perations, Punjab,

44
3.4— 1971 » !§ 1981 ^ hT^Rrg i/V ro ^ >n§
Table 3*4— ^Villages and Towns in Punjab in 1971 and 1981 Census
AREA AND POPULATION
(Num ber)
1981 1971
V illages
»TfU5rT3y^ oTRt
fuVDistrict Villages Uninha- Inhabited Towns Inhabited Towns
borne on bited Villagesthe juris- Villages diction list
0 1 2 3 4 5 6
Gurdaspur • •• 1,631 80 1,551 11 1,527 10
Amritsar . . . 1,242 51 1,191 11 1,181 s
oTUd*3fcb' Kapurthala . . . 693 91 602 8 SS6 3
t^MUd Jalandhar . . . 1,260 34 1,226 16 1,209 12
dfH»fTWg Hoshiarpur • • • 1,617 33 1,584 10 1.574 9
gcTff-di'd] Rupnagar . . . 919 26 893 9 871 7
ttru»T^T Ludhiana . . . 984 26 958 10 975 6
Firozpur . . . 1,166 47 1,119 9 1,084 10
Faridkot . . . 578 13 565 11 565 7
Bathinda . . . 527 7 520 12 518 11
RdlddStSangrur . . . 717 10 707 14 709 12
tjrci>MT^ Patiala . . . 1,461 35 1,426 13 1,419 12
Total . . . 12,795 453 12,342 134 12,188 108
HTH3; — - ^ 1971 »<§ 1981 »Source .^C easm o f India, 1971 and 19$1.
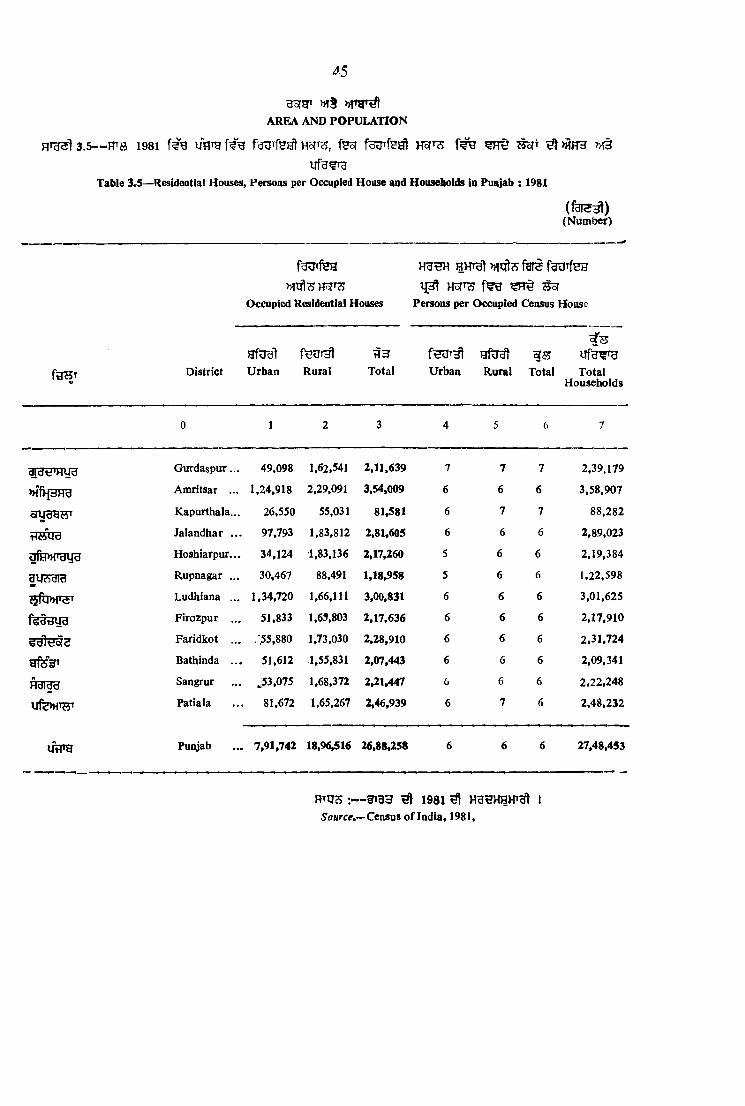
AREA AND POPULATIO N
3.5— 1981 im^g fgu^fSHt H'ofT??, fS5f Hoft^ ^ >i?H3 >13
Table 3 .5—Residential Houses, Persons per Occupied House and Houseliolds in Punjab : 1981
(Num ber)
-^5
fOTrfeH»TTfl3
Occupied Residential Houses
HKrg) fgrS faUTfHH
Persons per Occupied Census House
ftTHT District
jjfualUrban Rural Total Urban Rural Total Total
H ouseholds
0 1 2 3 4 5 6 7
arat^mira G urdaspur... 49,098 1,62,541 2,11,639 7 7 7 2,39,179
Amritsar ... 1,24,918 2,29,091 3,54.009 6 6 6 3,58,907
c^dt^W Kapurthala... 26,550 55,031 81,581 6 7 7 88,282
HttUd Jalandhar . . . 97,793 1,83,812 2,81,605 6 6 6 2,89,023
ofH»TOyu Hoshiarpur... 34,124 1,83,136 2,17,260 5 6 6 2,19,384
UUAdia Rupnagar ... 30,467 88,491 1,18,958 5 6 6 1,22,598
«4ru»fT5T Ludhiana ... 1,34,720 1,66,111 3,00,831 6 6 6 3,01,625
f< id ijyg Firozpur ... 51,833 1,65,803 2,17,636 6 6 6 2,17,910
Faridkot ... ,55 ,880 1,73,030 2,28,910 6 6 6 2,31,724
y f 6 ^ Bathinda . . . 51,612 1,55,831 2,07,443 6 6 6 2,09,341
Hdldy Sangrur J53.075 1,68,372 2,21,447 6 6 6 2 ,22 ,248
Patiala 81,672 1,65,267 2,46,939 6 7 6 2 ,48 ,232
ut^'y Put\jab 7,91,742 18,96,516 26,88,258 6 6 6 27,48,453
R iq ^ ^ 1931 ^ I
Source,— Census o f India. 1981,

46
District
3.6— ^ §#>J!3Frr3Table 3.6—Villages Classified by Various Population
AREA AND
200 3 ‘ ufe Less than 200 200—499
fyV
TotalNumber
6 fInhabited
Villages
TotalRutalPot>ura-tion
N o. PopulationHTy»iT
N o. Population
1
ojyeraBT'
lusgra
fetaua
H ddd
Gurdaspur.............. 1,551 11,85,167 - 228 23.967 465 1.62,555
Amxitsar 1,191 14,66,861 111 11,107 180 63.940
K apurthala. 602 3,81,831 169 13,120 166 57.719
Jalandhar 1,226 11,21,983 171 15.639 260 93,695
Hoshiarpur 1,584 10,64,18*7 272 27,383 515 1,80,463
Rupnagar m 5,62,024 ». 169 17,203 294 1,02,092
Ludhiana 958 10,54,772 ^85 9,104 201 68,842
Firozpur 1,119 10,09,733 189 ■ 18,346 276 94,709
Faridkot 565 10,92,659 16 1,317 28 10,057
Bathinda 520 10,08,729 2 368 23 8,704
Sangrur m i 10,88,609 r 29>V■' 2,688 62 23,633
Patiala 1,426 11,04,603 130 14.801 393 1,40,871
TotalPercentage
12,342 (100 00)
1.21,41,158 (100 00)
1,571 (12 -73)
1,55,043 (1 -28)
2,863 (23 -20)
10,07280(8 .30)
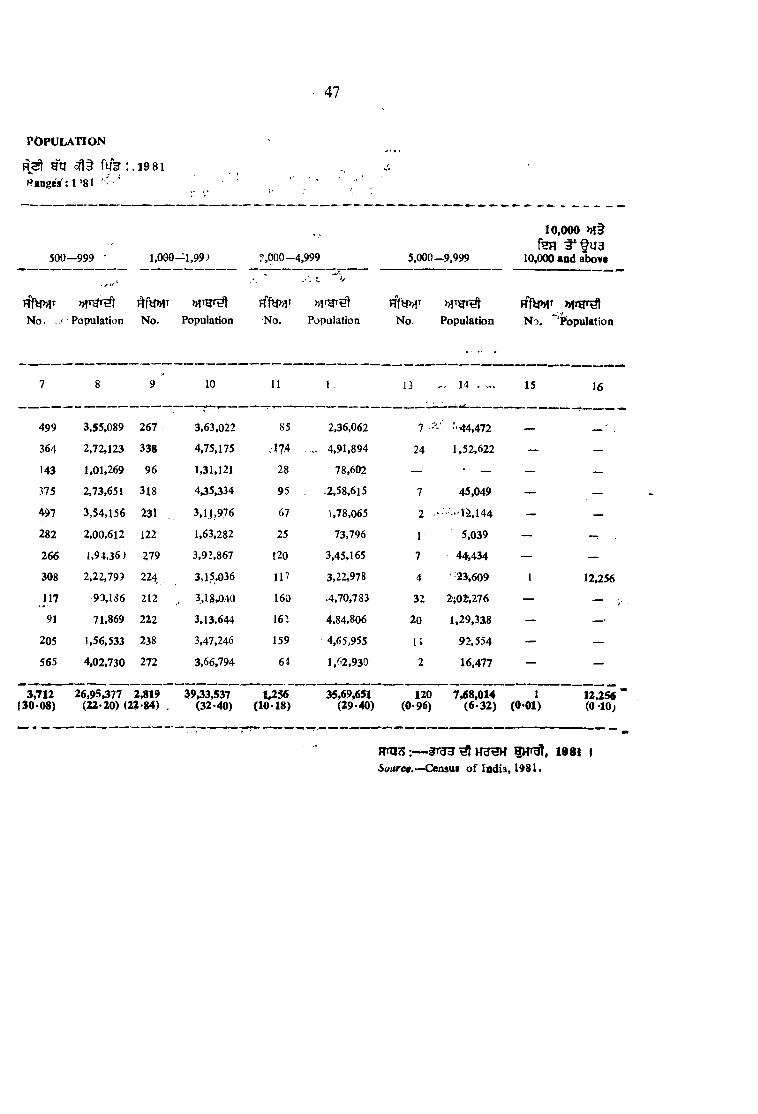
47
PO PULA TIO N
g q fu % : .1 9 8 1 s.i BDgeV: l ' 8 t '
:: " ; ■ :
500-- 9 9 9 ' 1,000 - 1 ,9 9 ; 2 ,0 0 0 - 4,999 5,000--9 ,9 9 9
10,(M)0 » !§fHH
10,000 and above
Hfy»!T M'ytH
c V
H f WN o . ..! Population N o. Population •No. Population N o. Population N o. Population
7 8 9 10 11 I ; 13 14 . ... 15 16
499 3,55,089 267 3,63,022 85 2,36,062 7 ’’-44,472 — — ^
364 2,72,123 338 4,75,175 .174 ..... 4,91,894 24 1,52,622 — ■ —
143 1,01,269 96 1,31,121 28 78,602 — • — — —375 2,73,651 318 4,35,334 95 . .2,58,615 7 45,049 — —
497 3,54,156 231 3,11,976 67 1,78,065 2 • — —
282 2,00,612 122 1,63,282 25 73,796 1 5,039 —266 1,94.36) 279 3,92,867 120 3,45,165 7 44,434 — —308 2,22,799 224, 3,15.036 117 3,22,978 4 ' 23,609 I 12,256
117 93,186 212 ,, 3.18,040 .160 .4.70,783 32 2j02v276 —91 71,869 222 3,13,644 162 4,84.806 20 1,29,3318 —
205 1,56,533 238 3,47,246 159 4,65.955 U 92.554 — —565 4,02,730 272 3,66,794 64 1,62,930 2 16,477 ~ —
3,712 {30-08)
26,95,377 2,819 (22*20) (22*84) .
3933,537(32-40)
1^ 56(10-18)
35,69,651(29-40)
120(0-96)
7,68,014(6-32)
1(0-01)
12.256 “ (0 -10;
Rnic5 ;— ^ 1981 ISoaree .'-C sasw o f India, 1981.

48
» f r w ]AREA A N D PO PU LA TIO N
3.7-»«u?!Tg fH3T M SRfg ^5? u ? g i , u i s ^ f s a r >h su t3 , i 981Table X 7 —District-wise Area, Sexwise Population, Deaslty and Sex Ratio in Punjab,1981
^ d t
35?g‘
^ 3 1 0 \
^ d ai
1 0 0 0Ugi3^
fuS
ftTBi District Area in Square
Kilometres
TotalPopulation
Male Female DensityPerSqJCm.
Females Per 000 Males ^
0 1 2 3 4 5 6
Gurdaspur ... 3,562 15,13,435 7,93,484 7,19,951 425 907
Amritsar . . . 5,087 21,88,490 11,69,888 10,18,602 430 871V.
S fW S .1Kapurthala . . . 1,633 5,45,249 2,87,286 2,57,963 334 898
T )S ^ Jalandhar ... 3,401 17.34,574 9,16,379 8,18,195 510 893
gf0>ifayg Hosiiiarpur ... 3,881 12,43,807 6,49,565 5,94,242 320 915
auTjgraRupnagar ... 2,085 7,16,662 3,85,087 3,31,575 344 861
Ludhiana ... 3,857 18,18,912 9,78,276 8,40,636 472 859
fsa a u g Firozpur ... 5,874 13,07,804 6,94,280 6,13,524 223 884
Faridkot . . . 5,740 14,36,228 7,63,176 6,73,052 250 882
s f3 ^Bathinda ... 5,551 13,04,606 6,99,815 6,04,791 235 864
Sangrur ... 5,107 14,10,250 7,58,058 6,52,192 276 860Patiala 4,584 15,68,898 8,41,916 7,26,982 342 863
d'H 5tate . . . 5 0 3 6 2 1,67,88,915 89^7,210 78,51,705 333 879
wrjz ;— 3Tf^l^r^g, UfTH ISource .'— Director, Census Operation, Punjab.
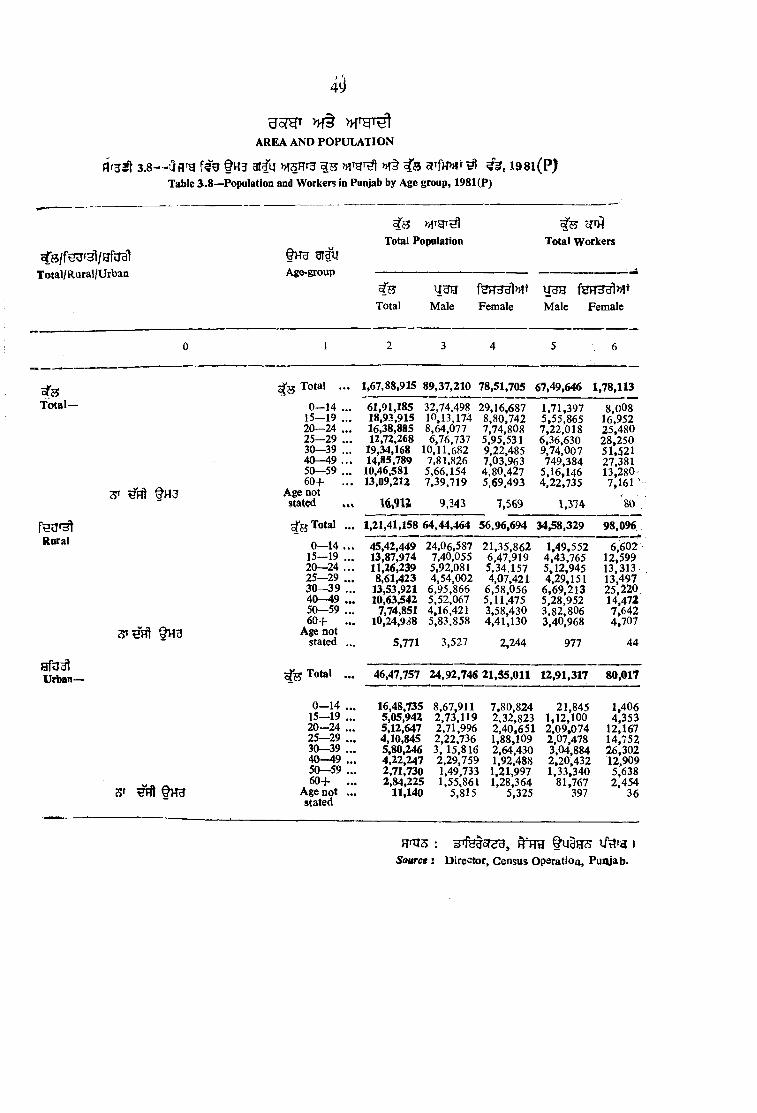
4 )
3.8—ua g arfu msFfrg 3 3 m§ Cs sfTfH»» i98i(P)Table S .8 —Population and Workers in Punjab by Age group, 1981(P)
AREA AND POPULATION
Total/Rural/Urban
fHu grtiiAge-group
^Tgr^ Total Population Total Workers
oTsT otal—
Rural
STHnl fHB
^55 Total ...
0—14 ... 15—19 ... 20—24 ... 25-29 ... 30—39 ... 40—49 ... 50—59 ... 60+ ...
Age not stated
^ j5 Total ...
0—14 ... 15—19 ... 20—24 ... 25—29 ... 30—39 ... 40-49 ... 50—59 ... 60-f- ...
Age not stated ...
Urban- Total
Total Male Female M ale Female
2 3 4 5 6
1,67.88,915 89,37,210 78,51,705 67,49,646 1,78,113
61,91,18518,93,91516,38,88512,72,268
19,34,16814,85,789
10,46,58113,09,212
32,74.49810,13,1748,64,0776,76.737
10.11,6827,81,8265,66,1547,39,719
29,16,6878,80,7427,74,8085,95,5319,22,4857,03,9634,80,4275.69,493
1.71,3975,55,8657,22,0186,36,6309,74,007749,384
5.16,1464.22,735
8.008 16.952 25,480 28,250 51,521 27,381 13,280 7,161 ‘
IM U 9,34a 7,569 1.374 * 80 .
1,21,41,158 64,44,464 56,96,694 34,58.329 98,096
45,42,44913,87,97411,26,2398,61,423
13,53,92110,63,542
7,74,85110,24,938
24.06,5877,40.0555,92,0814,54.002
6,95.8665,52,0674,16,4215,83,858
21,35,8626,47,9195,34.1574,07.421
6,58,0565,11,4753,58,4304,41,130
1,49,5524,43,7655.12,9454.29,151
6 ,69 .2135.28,9523 .82,8063.40.968
6.60212,59913,31313,49725,22014,4727,6424,707
5,771 3,527 2,244 977 44
46,47,757 24,92,746 21,S5,011 12,91,317 80,017
0— 14 15— 19 2 0 - 2 4 25—29 30—39 4 0 - 4 9 50—59 6 0 +
Age not stated
16,48,7355,05,9425,12,6474,10,8455.80.2464.22.247 2,71,730 2,84,225
11,140
8,67,9112.73.1192,71,996 2,22.736 3, 15.816 2,29,7591,49.7331,55,861
5,815
7,80.8242.32,8232 .40,6511,88,1092,64,4301,92,4881,21,9971,28,364
5,325
21,8451,12,1002 .09 ,0742.07.4783,04,8842,20.4321,33,340
81,767397
1,4064,353
12,16714,75226,30212.9095,6382,454
36
Source I Director, Census Operatioa, Punjab*

AREA A N D POPULATIO i^
I TOI 3.9.— ^ f ^ »!§ f 3 S ^ 1981
dtd-ffdcra
Main W orka's Marginal Workers Non-TV orkers
y c H M cS
<55H<5
TcH3cfI»?t t ig
f S B ’ District Male Female Total M ale Female Total MaL' Fem ale TotalM ain
workers as percentage to Total
Population
0 J 2 3 4 5 6 7 8 9 10
a i3 t ! W d Gurdaspur ... 3,89,586 12,513 4,02,099 4,614 10,527 15,141 3,99,284 6,96,911 10,96,195 26-57
»ffHdHd Amritsar . . . 6,25.667 23,076 6,< 8,743 5,753 23,083 28,836 5,38,468 9,72,443 15,10,911 29 >64
K apurthala... 1,49,601 6,170 1,55,771 9C6 5,034 5,940 1,36,779 2,46,759 3,83,538 28 -57
Jalandhar . . . [4,64,899 20,574 4,85,473 4,382 18,259 22,641 4,47,098 7.79,362 12,26,460 27 -99
g f a » f 3 u a H oshiarpur... 3,14,490 13,724 3 3 ,2 1 4 9,175 27,372 36,547 3,25,900 5,53,146 8,79,046 26-39
f u s a r a Rupnagar . .. 1,97,670 8.892 2,06,562 2,162 9,827 11,989 1,85,255 3,12,856 4,98,111 28-82
srq»f»5T Ludhiana 5,31,674 21,091 5,52,765 2,937 21,208 24,145 4,43,665 7,98,337 12,42,002 30-35
f e t a y g Firozpur ... 3,83,757 15,085 3,98,842 5,570 32,608 38,178 3,04,953 5,65,831 8,70.784 30-50
Faridkot . . . 4,19,435 14,435 4,33,871 4,561 44,956 49,517 3,39,179 6,13,661 9,52,840 30 -21
yr5jj» Bathinda ... 3,90,117 12,285 4,02,402 6,325 53,071 59,396 3,03,373 5,39,435 8,42,808 30 -84
H 3 r |3 Sangrur 4,33,437 12,429 4,43,866 5,204 43,343 48,547 3,21,417 5,96,420 9,17,837 31 -47
Patiala 4,51,312 17,839 4,69,151 3,109 16,166 19,275 3,87,495 6,92,977 10,80,472 29 -90
T otal ... 47,49,646 1,78,113 49,27,759 54,698 3,05,454 3,60,152 41,32,866 73,68,138 1,15,01,004 29 35
U)o
H T O :— snfSdc^eu, HTTrT §U^BRJS, Source.—Director, Census Operations, Puniab.

>HfAR E A AND PO PU L A T IO N
3.10— 1981 M g qTable 3.10—W orking Population by Nine Industrial Catsgories ; 1981
District
(I)
As Cultivators As
(II)
Agricultural Labourers
I
M a e Female Total Male Fem ale T otal
0 1 3 4 5 6
< urdaspur 1,31,199 461 1,31,660 90,750 2,545 93,295
Amritsar 2,03,378 753 2,04,131 1,37,988 6,266 1,44,254
oTUggST Kapurthala 54,777 233 55,010 26,873 1,380 28,258
TfiiU'd Jalandhar 1,24,87(0 646 1,25,516 94,834 6,387 1.01,221
u fa M ^ u g Hosfaiarpur 1,17,083 1,068 1,18,149 66,221 3,978 70,199
g u Rupnagar 71,689 930 72,619 32,736 1,094 33,830
Ludhiana 1,44,650 560 1,45,210 93,756 3,389 97,145
Firozpur 1,77,363 2,229 1,79,592 92,210 5.467 97.677
Faridkot 1,77,771 988 1,78,759 1,16,163 4,332 1.20,495
gfS3T Bathinda 185,536 679 1,86,215 87,794 3,388 91,182
Sangrur 2,04,394 \ 3 2 7 2,05,721 1,05,777 3,576 1,09,353
Ufe»rrST i Patiala 1,64,071 633 1.64.704 1,02,068 3,248 1,05.316
Tota) • • • 17,56,779 10,507 17,67,286 10,47,175 45,050 10,92,225

>K§AREA AND PO PU L A T IO N
3.10 (m ru3)-—1981 s f€g § ^ g u srTHar^T 'tTable 3.10 (Ccncld.)—^Working Population by Nine Icdiistrial Categories ; 1981
(Va)Household Industry
»>T§ HW3TMsnufacturing, Processing,
Serricing and Repairs
III,V(bX VI o I X
UH 3fTH
Other Workers
(1 to IX )
Total Main Workers
ofH HS
District u u a
M alefeR 33 l»1t
Female
^ 3
TotalU3HMale Female Total M ale Female
^ 3Total
0 7 8 9 10 11 12 13 14 15
Gurdaspur ... 8,489 637 9,126 1,59,148 8,870 1,68,018 3,89,586 12,513 4,02,099
>nfHdHd Amritsar ... 14,718 1,230 15,948 2,69,583 14,827 2,84,410 6,25,667 23,076 6,48,743
ofiragjjT Kapurthala 2,898 313 3,211 65,048 4,244 69,292 1,49,601 6,170 1,55,771
tJ^qu Jalandhar 15,609 930 16,539 2,29,586 12,611 2,42,197 4,64,899 20,574 4,85,473
gfH»TO\ra Hoshiarpur 11,265 874 12,139 1,19,923 7,804 1,27,727 3,14,490 13,724 3,28,214
3ir cSdid Rupnagar 6,621 321 69.42 86,624 6,547 93,171 1,97,670 8,892 2,06.562
s f t w w Ludhiana ... 19,214 1,295 20,509 2,74,054 15,847 2,89,901 5,31,674 21,091 5,52,765
'fe’d^iira Firozpur 6,728 500 7,228 1,07,456 6,889 1,14,345 3,83,757 15,085 3,98.842
Faridkot 8,234 613 8,847 1,17,268 8,502 1,25,770 4,19,436 14,435 4,33,871
Bathinda ... 7,914 646 8,560 1,08,873 7,572 1,16,445 3,90,117 12,285 4,02,402
H3I|3 Sangrur ... 11,348 794 12,142 1,09,918 6,732 1,16,650 4,31,437 12,429 4,43,866
U fe»T Sf Patiala ... 5,496 499 5,995 1,79,677 13,459 1,93.136 4,51,312 17,839 4,69,151
... 1,18,534 8,652 1,27.186 18,27,158 1,13,904 19,41,062 47,49,646 1,78,113 49,27,759
Fni3 :— Hi l H iftpgSource :— Director, Census Operations. Puidab.
u%to

AREA AND POPULATION
53

54
a sfg r » f3
AREA A N D
3. 11— >n§ ^ H H tfga
Table 3 <11—Distrlbation of 1,000 Workers in eacb S ex and
Total 0— 14 1 5 - 1 9 2 0 - 2 4
Industrial Categories
PUM
fs u fH y rs f? u feF P M F P M F P M F
0 4 5 6 7 9 10 11 t >
^ cTH
(i) ofTgddiTg(ii) rid'fydl
(iii) m u ^ ,ITJra, fHsra,
yTdiyr*)R t o owt fee
(iv) ug3 yw(v) imfiM »{§
WHHT— "
(§) feg
(»f) 3"
(vi) fPPJl(vii) >H§
(viii) t i»f^. >H§
(ix) og fee
Total W orkers
A s cultivators
A s Agricultural Labourers
1,0<00 1,000 1,000 36 36 45 116 117 95 152 152 143
l,0i00 1,000 1,000 37 36 67 125 125 130 146147 132
1,000 1,000 1,000 73 72 92 169 169 172 149 150 1 23
Livestock, Forestry,Fishery, Hunting and Plantation, Orchardsand Allied A ctiv ities... 1,0-00 1,000 1,000 105 106 70 119 120 96 133 134 104
M ining and Quarying... 1,0*00 1,000 1,000 9 10 — 62 63 — 144 142 1 67
M anufacturing, Processing and Repairs—
(A ) In H ousehold Industry
(B) In M anufacturing other than H ousehold
1,0G0 1,000 1,000 30 26 74 103 98 177 140 139 157
Industry 1 ,000 1,000 1,000 23 21 94 121 120 164 198 199 152
In Construction 1,000 1,000 1,000 14 12 74 79 79 103 150 150 196
In Trade and Commerce 1,000 1,000 1,000 14 13 18 82 83 74 164 164 177
In Transport, Storage and C om m unication... 1 ,000 1,000 1,000 6 6 6 64 64 77 157 157 230
In other Ssrvicjs 1 ,000 1,000 1,000 9 9 8 42 44 32 128 126 U 6
N :Negligible P : P.'rsjns
U : U33M : Male F : Female

55
PO PULA TIO N
1,000 ^THairgt ^ H 3 g ilU M Snrg ”5 19 81 (P)
Industrial Category by broad Age Groups, 1981(F)
(fa ia il)
fNum ber)
60’>I§ St 3"60 and above
Age BOt stated
25—29 301-34 35-39 40-49 50 - 5 9
11 fH U If fs q. r? U 4 f2 U feP M F P M F P M F P M F P M F P M F P M F
13 14 15 16 17 18 19 20 21 22 23 24 25 26 27 28 29 30 31 32 33
135 134 159 114 112 164 94 93 125 158 158 154 108 109 75 81' 89 40 — ,
115 115 110 96 96 104 81 81 87 153 153 165 123 123 110 124 124 95 , _
119 119 115 102 101 115 82 81 96 13S 138 153 94 95 85 74 75 48 - • — 1
1 13 114 96 102 102 106 88 86 114 15:5 1.54 V .l m 102 i l l ,82, 82 91 — - —
186 183 300 198 199 167 96 95 107 141 141 167 120 123 — 44 44 — — 3
118 119 106 98 99 94 89 88 99 162 163 152 130 133 83 J30 :135 58 — ' —
162 163 127 120 120 105 94 94 104 145 144 147 82 83 74 54 55 33 1 1 —
148 148 173 135 135 132 112 112 98 188 188 153 111 112 55 62 64 15 — — 1
16(0 160 173 122 122 135 96 95 lOS 161 161 161 113 113 88 88 88 61 — — —
173 171 194 143 143 146 118 118 123 192 193 124 112 ll3 76 35 35 24 — — -
171 168 197 169 160 220 141 139 152 198 205 154 97 102 63 44 47 28
HTt rS; — I
Source ;— D irecto r , Census O peration, Punjab

g s rg i >»rgT^l
AREA AND POPUIAIION
3 . 1 2 — Sera >5T3HtU R i ^ ^ , 1981
Table 3 .12—Literacy by Sex , Areaftnd Districts, 1981
D istrict Persons
Rural Urban
Num ber
uuaM ale Female
Rural Urban Rural Urban Rural
i j p t e HTlfgHT ,
Percentage Literacy
afo^ IBUrban Total
UUaM ale Fem ale
0 1 2 3 4 5 6 7 8 9 10 11
Gurdaspur ... 4,74,260 1,83,952 2,92,438 1,06,628 1,81,822 77,324 40-02 56-04 43 -49 50-29 35-99
MfHdHd Amritsar ... 4,89,722 4,08,586 3,11,093 2,36,775 1,78,629 1,71.811 33-39 56-62 41-05 46*83 34-40
Kapurthala ... 1,53,689 90,871 92,985 52,863 60,704 38,008 40-25 55-61 44 85 50-77 38-27
tie&ud Jalandhar ... 4,94,758 3,58,257 2.98,645 2,06,990 1,96,113 1.51,267 44-10 58 -48 49-18 55-18 42-46
<lfHJ>rayg Hoshiarpur ... 5,13,923 1,09,161 3,13,757 64,560 2,00,166 44,601 48 -29 60-77 50 09 58 -24 41-19
^ A d ld Rupnagar ... 2,46,078 98,462 1,57,147 58,262 88,931 40,200 43-78 63 -67 48 08 55-94 38-94
§fcr»rsT Ludhiana ... 4,60,863 4,59,583 2,79,792 2,69,544 1,81,071 1,90,039 43 -69 60 14 50 60 56-15 44-15
f s d ij u e Firozpur ... 2,66 ,255 1,55,984 1,81,178 92,783 85,077 63,201 26 -37 52-33 32-29 39-46 24-17
Faridkot ... 3,15,135 1,67,123 , 2,02,036 99,343 1,13,099 67,780 28-84 48-64 33 -58 39 -49 26-87
Bathinda ... 2 ,21 ,883 1,39,727 1,52,926 85,986 .6 8 ,9 5 7 53,741 22-00 47 -22 2 7 -7 2 34-14 20 -29
R3F9B Sangrur ... 2,80 ,398 1,37,075 J ,8 5 ,8 0 5 83,758 94,593 53.317 25-76 42-62 2 9 60 35-56 22-68
ufe>>rB^ Patiala ... 3,57,862 2,76,742 2,33,121 1,56,463 1,24,741 1,20,279 32-40 59-60 40-45 46-27 33-70
a t p gPunjab ... 42,74,826 25,85,523 27,00,923 15,13,955 15,73,903 10,71,568 35-21 55 63 40-86 47-16 33-69
n n i 3 t u u H S t T , y f ir g i
Source :—D irector, Census Operations, Punjab.

gefgT )X§
^ Hrg^ 3.13 »TOTf^ !T^»T^ ^ : 1981Table 3.l3-~Sdiedaled Castes and their Literacy Rate by Districts : 1981
AREA and population /
District
Scheduled Castes
Number
Literate Scheduled Castes and their Percentage
fcIfS^Number
jpm sT Percentage L iteracyrcn;em age jLriterac;
Scheduled Castes as
M ale Fem ale Totalto Total
0 1 2 3population
4Gurdaspur 1.89.834 1,68,706 3,58,54<I 23-69Amritsar — 3,08,353 2,65,041 5,73,394 26-20
^ydfclBT Kapurthala . . . 77,898 69,253 l,4 7 ,lS il 25-98diiU cf Jalandhar 3.34,612 2,94,685 6,29,29»7 36-27
Hoshiarpur 2,02,618 1,80,905 3,83,523 30-83|U Adid Rupnagar ••• 94,878 79,851 1,74,729 24-38sftp>rsT Ludhiana ••• 2,46,671 2,11,341 4,58,012 2 5 18f e a d y g Firozpur • •• 1,46,535 1,26,793 2,73,328 20-89
Faridkot . . . 2,44,192 2,10,687 4,54,879 31 -67Bathinda 1,89,659 1,62,830 3,52,489 27 01
J^dldd Sangrur 1.94,034 1.65,225 3,59,259 25 -47Mfe»TOT Patiala ••• 1,86,619 1.60.483 3,47,102 22-12
Punjab 24,15,903 20,95,800 45,11,703 26-87
Persons M ale Feoiale Total Male Fem ale
5 6 7 8 9 101,05,819 71.599 34.220 29 -51 37-71 20-28
1,00,289 72,585 27,704 17-49 23 -53 10-4542,039 28,156 13,883 2 8 -56 36-14 20-04
2,24,598 1,48,442 76,156 35-69 44-36 25-841,59,438 1,04,604 54,834 41 -57 51 -62 30-31
61,568 42,485 19,083 35-23 44-77 23*891,41,918 96,549 45,369 30-98 39-14 21 *46
33,008 25,705 7,303 12-07 17-54 5*7555,911 42,435 13,476 12 29 17*37 6*39
32,611 25,605 7,006 9*25 13*50 4 -3049,035 38,279 10,756 13-64 19'72 6*5070,081 51,553 18,528 20 19 27 -62 11*54
10,76^15 7,47.997 3.28.318 23-85 30*96 15 *<6
FTOS : ^ >raSH iHT^. 1 981Source • Census o f India, 1981.

?fsrfr »f§ARBA AND POPUIAHON
3. 14— 1901 3" 1981 Table 3.14— Population of Towns, 1901 to 1981
first M T ^Population
Town District1981 1971 1961 1951 1941 1921 1901
---------------------------- 0 1 2 3 4 5 6 7 8
f l a i l (1 ,0 0 ,0 0 0 >hS # 1 ) Class I (1,00,000 and above)—
1. >nfH3Fra Amritsar Amritsar . .. 5,94,844 4,34,951 3,76,295 3,25,747 3,91,010 1,60,218 1,62,24
2. Ludhiana Ludhiana . .. 6„07,052 4,01,176 2,44,072 1,53,795 1,11,639 51,880 48,649
3. tR5ira Jalandhar d iiU d Jaandhar . . . 4 ,08 ,196 2,96,106 2,22,569 1,68,816 1,10,969 59,085 54,455
4. ufe>H W Patiala Patiala 2,06,254 1,51,041 1,25,234 97,869 69,850 47,531 53,545
5. U £ '< S ^ Pathankot Gurdaspur . .. 1,10,039 78,192 54.810 32,415 12,354 7,353 6,091
6. Batala dIdti'H yS G urdaspur... 1,01,966 76,488 51,300 55,850 44,458 26,122 27,365
7 . y f 6 V , Bathinda Bathinda ... 1,27,363 65,318 52,253 34,991 24,833 20,154 13,185
^ n iClass II (50,000_-9 9 ,9 9 9 )— /
1. H3TM oga Faridkot . .. 80,272 61,625 47,779 36,598 27,785 14,145 6,725
2. >HyUdAbohar fed^ryg Firozpur . .. 86,334 58,925 46,863 25,476 21,222 8,916
3. 3 f a » r a v gHoshiarpur Hoshiarpur... 85,648 57,691 50,739 45,291 35,345 21,285 17,549
4 . fe3 ttU 9Firozpur feddOH Firozpur . . . 61,162 51,090 47,060 40,703 41,190 29,695 23,475
5,Phagwara oTUgg?5T Kapurthala... 75,961 55,012 37,929 25,591 !16,194 11,395 14,108
6.Malerkotla Hdidd Sangrur 65,756 48,859 39,543 32,575 29,321 24,564 21,122
7. ViojdHdMuktsar ^dltdbi<; Faridkot . .. 50,941 39,403 30,765 22,097 20,651 10,539 6,389
8 . d'dUarRajpura u f e » f w Patiala 58,645 14,840 11,211 23,310 4,735 •• ••
9. ^Khanna Ludhiana . .. 53,761 34.820 24,416 12,646 7,941 •• 3,838
10. ofU39H»K apurthala Kapurthala... 50,300 35,482 29,334 26,947 26,067 16,242 18,519‘
Class III (20,00—49,999)—
1.Fazilka Firozpur . .. 43,548 36,281 32,015 25,934 28,262 13,829 8,505
2 . f e a i w a g ’Q ^tFirozpur Gantt.
f e r a y gFirozpur . .. 44,678 L 41,571 46,327 38,784 41,312 24,656 25,866
c/i00
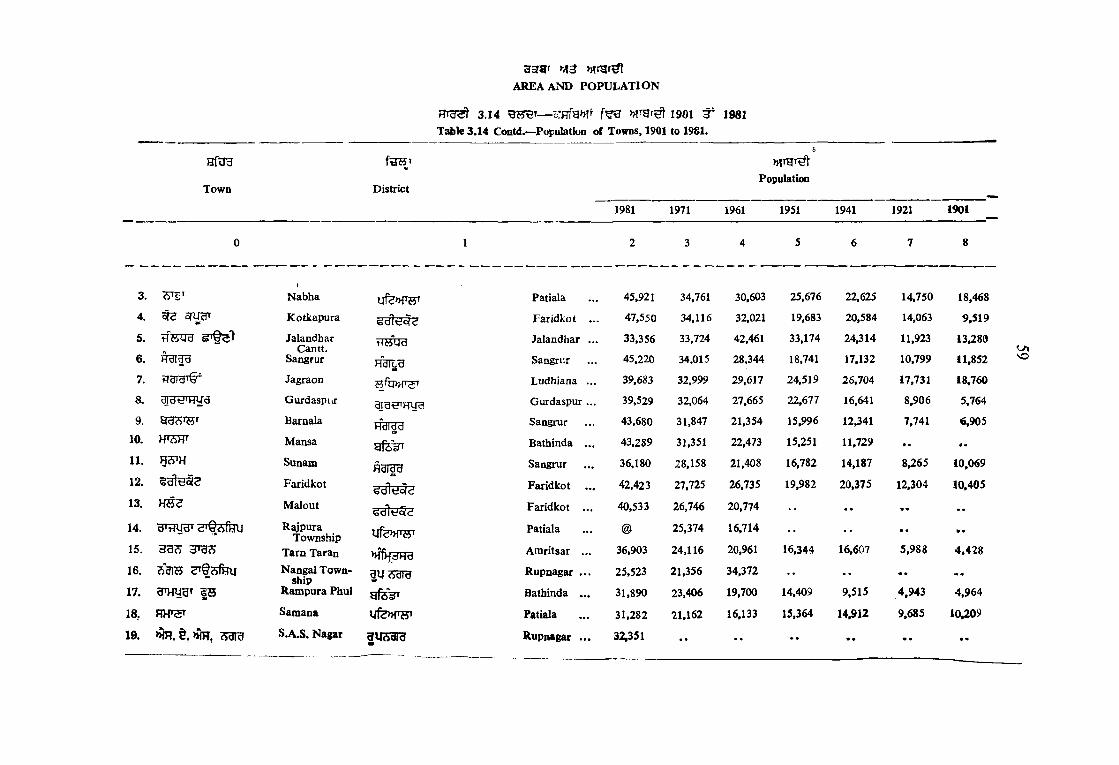
M3AREA AND PO PU LA TIO N
3 .1 4 g??;5T— -crrrTg r 1901 t ' i 9 8 i
Table 3 .14 Contd.—Population o f Towns, 1901 to 1981.
HfUH ftJ44T »lTgTHt
Town DistrictPopulation
1981 1971 1961 1951 1941 1921 1901
0 1 2 3 4 5 6 7 8
3.1
Nabha Patiala 45.921 34.761 30,603 25,676 22,625 14.750 18,468
4. ^ cJUSF9K Kotkapura Faridkot ... 47,550 34,116 32,021 19,683 20,584 14,063 9,519
5.
6.
tJEVU S ^ ' f
Hdidd
JalandharCantt.
SangrurtHWUd
HdloB
Jalandhar ...
Sangrur
33,356
45,220
33,724
34,015
42,461
28,344
33,174
18,741
24,314
17,132
11,923
10,799
13,280
11,852
7. ??did'G Jagraon Ludhiana ... 39,683 32,999 29,617 24,519 26,704 17,731 18,760
8. Gurdaspiir Gurdaspur ... 39,529 32,064 27,665 22,677 16,641 8,906 5.764
9. Baroaia Hdidd Sangrur 43.680 31,847 21,354 15,996 12,341 7,741 «,905
10. Mansa Bathinda ... 43,289 31,351 22,473 15,251 11,729 . .
11. Sunam Haidd Sangrur 36,180 28,158 21,408 16,782 14,187 8,265 10,069
12. Faridkota
Faridkot 42,423 27.725 26,735 19,982 20,375 12,304 10,405
13. M alout Faridkot ... 40.533 26,746 20,774 . . . .
14. RajpuraTownship u f e » iW Patiala @ 25,374 16,714 •• •• « •
15. 3 ^ 3 3T 9S Tarn Taran >% dH d Amritsar ... 36,903 24,116 20,961 16,344 16,607 5,988 4 ,4 2 8
16. S r § 3 f e y Nangal Township g i[ *dld Rupnagar . . . 25.523 21,356 34.372 •• •• •• • m «
17. BTWgT | H Rampura Phul Bathinda ... 31,890 23,406 19,700 14,409 9.515 4,943 4 ,964
18. HVT^T Samana Patiala 31.282 21,162 16,133 15,364 14,912 9,685 10,209
19. sg r a S.A.S. Nagar BU?5dP3 Rupnagar ... 32,351 •• •• • • • • m • • «
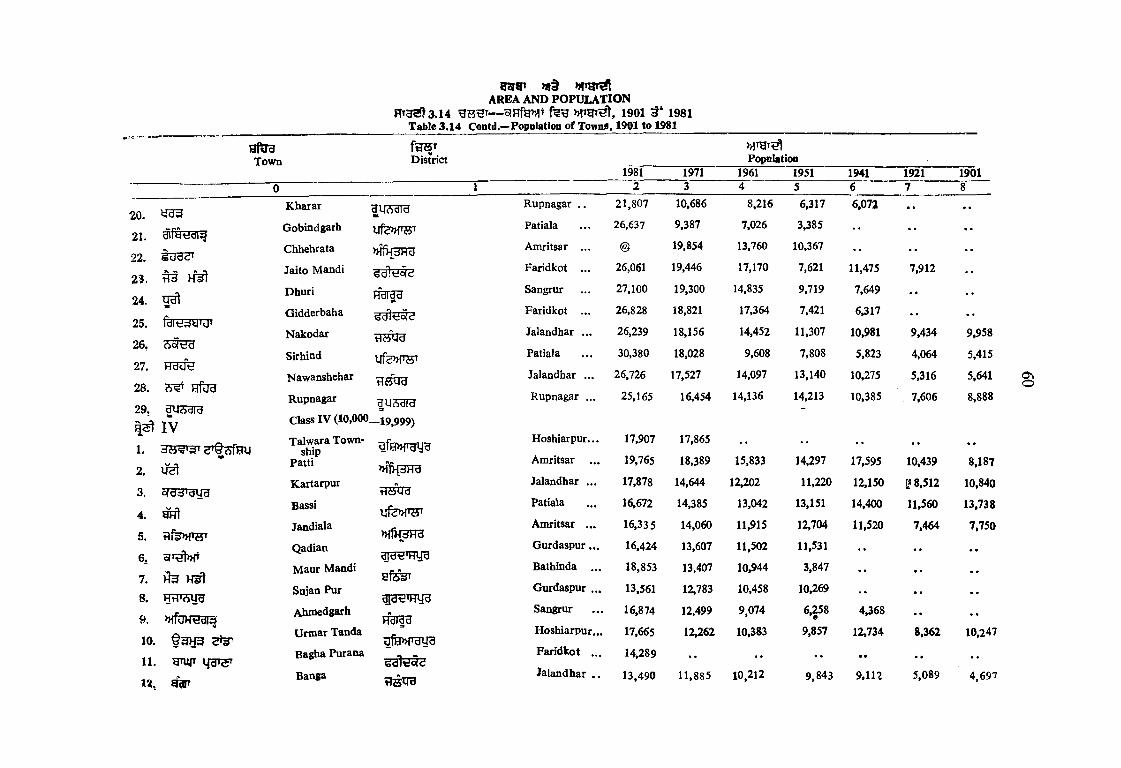
AREA AND POPULATION ^B€T— o!Hfg»1T >HTHT , 1901 3* 1981
Table 3.14 Contd.— Popnlation of Torritf, 1901 to 1981
aftnrTown
fUSTDistrict Popnlation
Kharar
Gobindgarh
Chhehrata
Jaito Mandi
Dhuri
Gidderbaha
Nakodar
Sirhind
Nawanshehar
Rupnagar
U fe » fW
n f iH ^
Hdldddl<do(<d
UfeMW?T5OT3
HusuraClass IV (1 0 ,0 0 0 _ i9 999J
T dw araT ow n- g f i ; p ^ g
>HfH3HgPatti
Kartarpur
Bassi
Jandiala
Qadian
Maur Mandi
Sujan Pur
Ahmedgarh
Urmar Tanda
Bagha Purana
Banga
ufe>HW>Hfipra
s f ^313^ w gHdl§3UftP>f3U3
1981 1971 1961 1951 1941 1921 19012 3 4 5 6 7 8
Rupnagar . . 21,807 10,686 8,216 6,317 6.072 . . . .
Patiala 26,637 9,387 7,026 3,385
Amritsar ... @ 19,854 13,760 10,367
Faridkot ... 26,061 19,446 17,170 7,621 11,475 7,912 . .
Sangrur 27.100 19,300 14,835 9,719 7,649
Faridkot ... 26,828 18,821 17,364 7,421 6,317 . .
Jalandhar ... 26,239 18,156 14,452 11,307 10,981 9,434 9,958
Patiala 30,380 18,028 9,608 7,808 5,823 4,064 5,415
Jalandhar ... 26,726 17,527 14,097 13,140 10,275 5,316 5,641
Rupnagar ... 25,165 16,454 14,136 14,213 10,385 7,606 8,888
Hoshiarpur... 17,907 17,865 • • • • . .
Amritsar . .. 19,765 18,389 15,833 14,297 17,595 10,439 8.187
Jalandhar ... 17,878 14,644 12,202 11,220 12,150 i 8,512 10,840
Patiala 16,672 14,385 13,042 13,151 14,400 11,560 13.738
Amritsar . .. 16,335 14,060 11,915 12,704 11,520 7,464 7,750
G iirdaspur... 16,424 13,607 11,502 11,531 . . • •
Bathinda ... 18,853 13,407 10,944 3,847 . . • •
Gurdaspur ... 13,561 12,783 10,458 10,269 ..
Sangrur 16,874 12,499 9,074 6,258 4,368
H oshiarpur... 17,665 12,262 10383 9,857 12,734 8.362 10,247
Faridkot ... 14,289 . . . . • # . .
Jalandhar . . 13,490 11,885 10,212 9,843 9,112 5,089 4,697
0\O

13.
14.
15. ^
16. g w
17.18.
19. s W h
21.22. ^ara
23.
24.SK
25. SBFH26. tPoit Tg:
27. ^grgft28. Hfugr grw
29. H f^30. tflgr
31. 5T«5n'6V13 SCf}32. HUT
33. »fn5HUH34. HH3W
35. Tm
36. n ifK ^
V
1. 3 ^ ^
2.3. ^ Hfos4 LidHotd
5. gfeiJdl^ g3t>v’
Dhaoaula <
Budhlada
Raikot
Raman Mandi
Phillaur
Sanaur
Longowa 1
Jalalabad j
Mukerian ’
D ina Nagar
Bhadaur
Dasuya
N aya Nangal
Dhariwa!
Kurali
Lehra Gaga
M oriada
Zira
■ Frai
HdW3fetHuarufi?>>ruy3graEiRUHHdjdd
gfrp>raug | u S3ra ^raf^nryg
praifu
fe§i3iraSultanpur Lodhi
HcirpAdampur
Samrala
Talwandt Sabo
Amritsar Cantt.
Class V—(5,000—9,999)
Bareta Mandi
Majitha
Nur Mahal
Dharam K oi
FatehgarbChwi»“
feagya
31
Sangrur 13,885 11,877 11,238 <»,S50 6,887 7 ,448
Bathinda ... 15.968 11,713 8,620 7,077
Ludhiana ... 17,106 11,709 11,239 10,153 13,777 8,379 10,131
Bathinda ... 14,318 11,574 9,507 6,446 * »
Jalandhar ... 17,650 11,543 11,058 9,484 9,011 4,696 6,986
Patiala 13,634 11,217 9,007 7,948 8,426 6,532 8,580
Sangrur 12,971 11,209 9,269 6,543 6,848 « • • •
Firozpur ... 16,639 11,032 7,723 6,283 7,134 3,833
Hoshiarpur... 14,454 10,937 8,676 7,493 . . • • 3,589
G urdaspur... 13,078 10,607 9,599 9,617 6,968 4,047 5,191
Sangrur 13,350 10,428 9,407 7,277 7,862 5,577 7,710
H oshiarpur... ) 4,657 10,363 8,721 7,895 9,206 6,404
Rupnagar . . . 10,390 9.997 7,987 , ,
G urdaspur... 12,212 9,985 9,601 7.731 7,388
Rupnagar ... 12,637 9,776 6,390 • •
Sangrur 12,241 9,531 ; 7,847 3,616 • •
Rupnagar ... 13,502 9,326 f 7,540 6,068 5,837 • •
Firozpur 19,581 i 9,264 K 8,118 0 6»389 t 5.963 4,622 4,001
Kapurthala . .. 12,143 9,176 7,661 17,733 10,168 8,141 9,004
Sangrur 11,108 8,467 6,220 n 4,671 • • • •
Jalandhar . . . 10,960 8,105 5,177 . . • •
Ludhiana 10.824 7,554 5,439 4,734 • • • •
Bathinda 10,454 . . • • • •
Amritsar 11,040 3,224 7,992 • • .. • •
Bathinda . . 9,494 8,313 7,041 5,317 ... • •
Amritsar . . 9 ,394 8,225 6,973 7,368 9 ,004 5 ,6 6 4 6,403
Jalandhar ... 9,676 8,135 6.995 6 ,7 9 i 8.324 6 ,845 8.706
Firozpur . . 9.328 7.720 6,443 6,845 8,360 5 ,9 5 0 6,731
Gurdasuur . . 9 ,372 7,590 6.439 4.151 , ,
0\

lo w o
6.7.
8*
10.11.
a.l4 (bB ^ ) : ofHfgMT 1901 3* 1981Table 3.14 (Cootd.)— Population o f Towns 1901 to 1981
AREA AND POPULATION
f3®T
DistrictPopulation
1981 1971 1961 1951 1941 1921
yH 5T33
gt3
3 J '
tgTHHt
12. 3 3 ? ^13. aaTfsn^T
14.
15. H3316. H3l17. FPftJS18. Fra^t19. »iHOT
ig r gtgi st^
^5T» ^ S l
^0.21 .22.
24.
Khemkaran
Garhshankar
Bhawanigarh
Rahon
Dera Bassi
G oniana M andi
Talwandi Bhai
Goraya
Doraha
Banur
Bhucho M andi
Anandpur Sahib
Guru Har Sahai
>hTh3 fb ■'
tIEVB
Amloh
Dera Baba Nanak
Aiawal Pur
Hariana
Tankanwali
Machhiwara
Ufe»lTSrT
fRstruq.fj?»!Tgug
Amritsar ...
H oshiarpur...
Sangrur
Jalandhar ...
Patiala
Bathinda ...
Firozpur ...
Jalandhar ...
Ludhiana ...
Patiala
Bathinda ...
Rupnagar ...
Firozpur ...
Patiala
Gurdaspur ...
Jalandhar ...
Hoshiarpur...
Firozpur ...
Ludhiana ...
8,757
9,515
9,817
8,671
7,421
8,596
9,117
8,802
7,606
7,453
7,820
8,576
7,684
7,098
6,212
5,851
5,633
@9,621
8,329
6,882
6,706
6,607
5,807
6,408
6,018
6,000
5,804
5,459
2,945
5,000
4,601
4,848
5,338
4,732
5,002
5,048
7,142
5,976
5,437
6,316
4,051
8,054
4,886
4,602
4,308
2,277
4,189
4,293
3,582
5,288
4,539
4,468
4,545
7,069
5,495
4,253
6,541
3,651
3,948
3,062
3,468
1,624
4,266
3,128
2,863
2,868
4,452
4,725
2,800
8,023 6,152
6,885
8.065 5,947
5,070 3,890
2,311
2,184 1.543
5,872 4,333
6,417 5.205
1901
8
fid a 6,083
5,803
8,651
4,641
5,610
5,028
5,118
4.4236.0C5
ONts:>
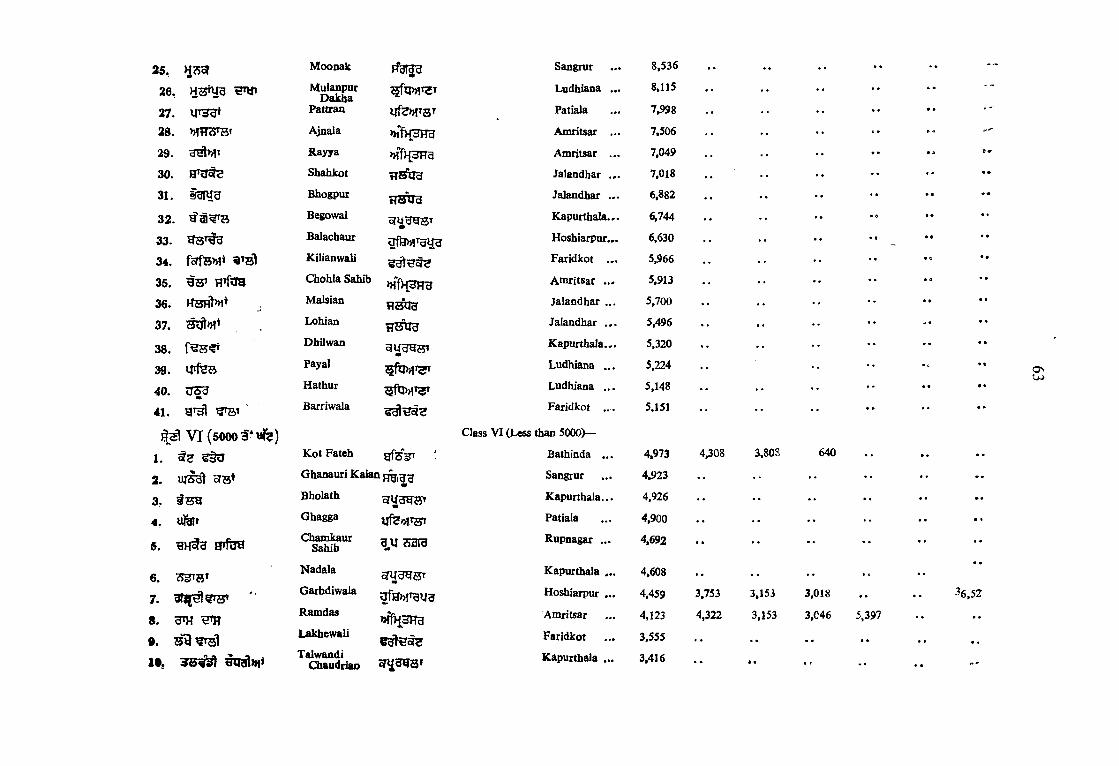
2 5 , ) i« sr M oonak Sangrur 8,536 •• • • » • *
2 6 , MulanpurDakha
Ludhiana ... 8.115 ••
27 . Pattran Patiala 7.998 •• # « r -
2 8 , >>ltJ3TB» Ajnala >hf>idH-d Amritsar . .. 7,506 ••
29 . Rayya nff>i3Ha Amritsar . . . 7,049 •• • » i
30 . H'3<5^ Shahkot t i s i i g Jalandhar . . . 7.018 •• . . f ^
31. Bhogpur HM lId Jalandhar .«. 6,882 •• • • * A
3 2 . Begowal sr y n g sT K apurthala... 6,744 •• * • • ft « • • •
33 . 9 3 ^ ^ Balachaur Hoshiarpur... 6.630 •• . . • • • •
3 4 . foTfBb!* V S l Kilianwali Faridkot . , . 5,966 •• • c *•
3 5 . H B ’ Chohla Sahib Am ritsar . . . 5,913 •• • a • •
3 6 . j Malsian HBOH Jalandhar . .. 5,700 •• . .
37 . Lohian Jalandhar . , . 5.496 •• . .
3 8 .Dhilwan
9 U ^ B T Kapurthala.*. 5,320 . . • • * *
3 9 . i n f e s Payal Ludhiana . . . 5,224 •• . .
4 0 . X36d Hathur Ludhiana . . . 5.148 •• •• . . • • • t
4 1 . a ' J Barriwala 6 d i t/o iS Faridkot . . . 5,151 •• •• . . • • *
VI (5 0 0 0 ^ * w fe ) Class VI (Less than 5000)—
1. -^§0 K ot Fateh Bathinda . . . 4.973 4,308 3.808 640 • • • *
2 . Ghanauri Kalan Sangrur 4.923 •• •• . . . .
3 . f B ^ Bholath W O T B ' K apurthala... 4.926 •• •• • • « •
4 . Ghagga IjfeiHTBi Patiala 4.900 • • •• . . • • « »
5 . g r fa yChamkaur
Sahib AkJld Rupnagar ... 4.692 •• •• • • • •
6 , ?5^B »Nadala cfUg^BT Kapurthala . . . 4.608 • • . . • • • B
• •
7. a r f^ ? T B » ': Garbdiwaia n fH ^ T g y g Hoshiarpur . . . 4.459 3.753 3.153 3.018 36,52
8 . urn t»'HRamdas Amritsar 4,123 4,322 3.153 3.C46 5,397 . .
» .Lakhewali Faridkot 3,555 •• . . . . • • *1
1 » , 3 8 ^ ^ 1 } H <Talwandi
ChaudriaoKapurthala . . . 3.416 . . . . . . • • ^
OJ

AREA AND POPULATION
Brgrafl 3.14 (roWIH) omfe>H» »rHr^ 1901 t* 1981 Table 3.14 (OmciiL).~Popiil8tion of Toims 1901 to 1981
ftjH’P<9nlat>on
AVWU
1981 1971 1961 1951 1941 1921 1901
0 1 2 3 4 5 6 7 8
Hi Sri Hargobind- pur
Gurdaspur... 3,215 2,430 2,341 3,049
»»
13.
14
m3^
Sham Chanrasi
Sangat
Narot Jaimal Singh
Hoshiarpur...
Bathinda ...
Gurdaspur...
3,062
2.859
2,660
2,468
3,531
2,470
2,874
2,988
933
• •
4^
: grfgtc?eg, R*HH tu g a ^ , VflTg iSource : Director, Census Operation, Punjab
@ 1981 ^ Bsaras» Hif‘ 2T^sfau, 5^3^^ »|§ § crgH^g > n fH ^HTHS srg f ^ T f^»iT ^ i
@RiUPura Township, Chhehrta and Tankawali were merged with Rajpura. Amritsar and Firozpur respectively in 1981 Census.
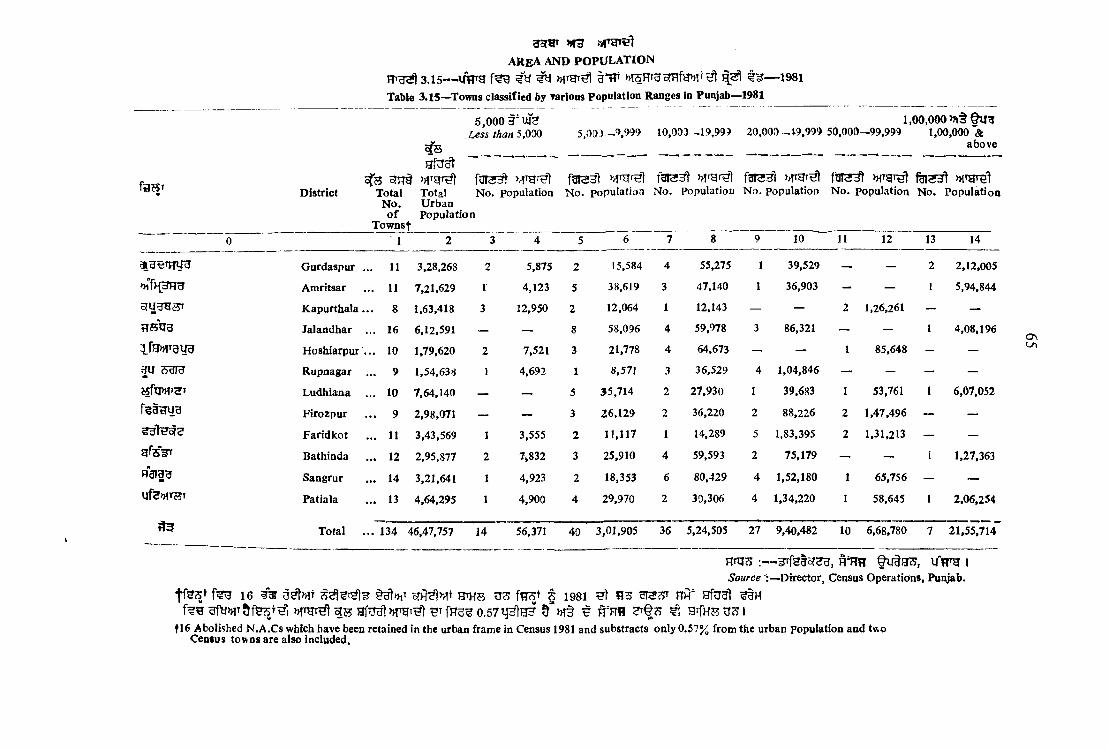
a r e a a n d p o p u l a t i o n
F T > ^ 3 .15— i n r g ^ >HTgr^ ^ — 1981
Table 3 .1 5 —Towns classified 6y Tarloas Population Ranges in Punjab—1981
5 ,0 0 0 Less than 5,090
1,00,0005.003 -9 ,9 9 9 10,003-^19,99? 2 0 ,0 0 0 -1 9 ,9 9 9 50,000—99,999 1,00,000 &
above
District
__ ______ ________ _______________ _____________ _____________ ______ _______
o f s fgygHl fara^ l MTgr^l fg T 3 ^ >HTgT^ >nTgT lTotal Total N o . population N o . population N o . Populatiorj N o . population N o . population N o . Population
N o . Urban o f population
T ow n sf__________________ ______________________________________________________________ ______ ____________________________2 3 4 5 6 7 81 10 11 12 13 14
Gurdaspur ... 11 3,28,268 2 5,875 2 15,584 4 55,275 1 39,529 — — 2 2,12,005
Amritsar 11 7,21,629 r 4,123 5 38,619 3 47,140 1 36,903 - — 1 5,94,844
E fU ^jyr K apurthala . . . 8 1,63,418 3 12,950 2 12,064 I 12,143 — — 2 1,26,261 — —
Jalandhar ... 16 6,12,591 — — 8 58,096 4 59,978 3 86,321 — — 1 4,08,196
q.f3>>!Tai|g H oshiarpur’. . . 10 1,79,620 2 7,521 3 21,778 4 64,673 — — I 85,648 - —
Rupnagar ... 9 1,54,638 1 4,692 1 8,571 3 36,529 4 1,04,846 — — — —
jsftpH’eT Ludhiana ... 10 7,64,140 — — 5 35,714 2 27,930 1 39,683 1 53,761 1 6,07,052
Firozpur 9 2,98,071 — — 3 256,129 2 36,220 2 88,226 2 1,47,496 — —
Farid kot 11 3,43,569 1 3,555 2 11,117 1 14,289 5 1,83,395 2 1,31,213 — —
a f s V Bathinda 12 2,95,877 2 7*832 3 25,910 4 59,593 2 75,179 — — 1 1,27,363H3I33 Sangrur 14 3,21,641 1 4,923 2 18,353 6 80,429 4 1,52,180 1 65,756 — —
Patiala 13 4,64,295 1 4,900 4 29,970 2 39,306 4 1,34,220 1 58,645 1 2,06,254
^ 3 Total 134 46,47,757 14 56,371 40 3,01,905 36 5,24,505 27 9,40,482 10 6,68,780 7 21,55,714
m u s :— H ^ t ! u '’T T g |Source ;—Director, Census Operatidns, Punjab.
f t e * 16 oT)^^>}Tt HTHS § 1931 RH" JJfUUt
»!TgT O.STtplHH t H'HH e^§?> HrfHE aJ? If 16 Abolished N .A .C s which have been retained in the urban frame in Census 1981 and substracts only 0.57% from the urban population and two
Census tov^ns are also included.
a s(-/I
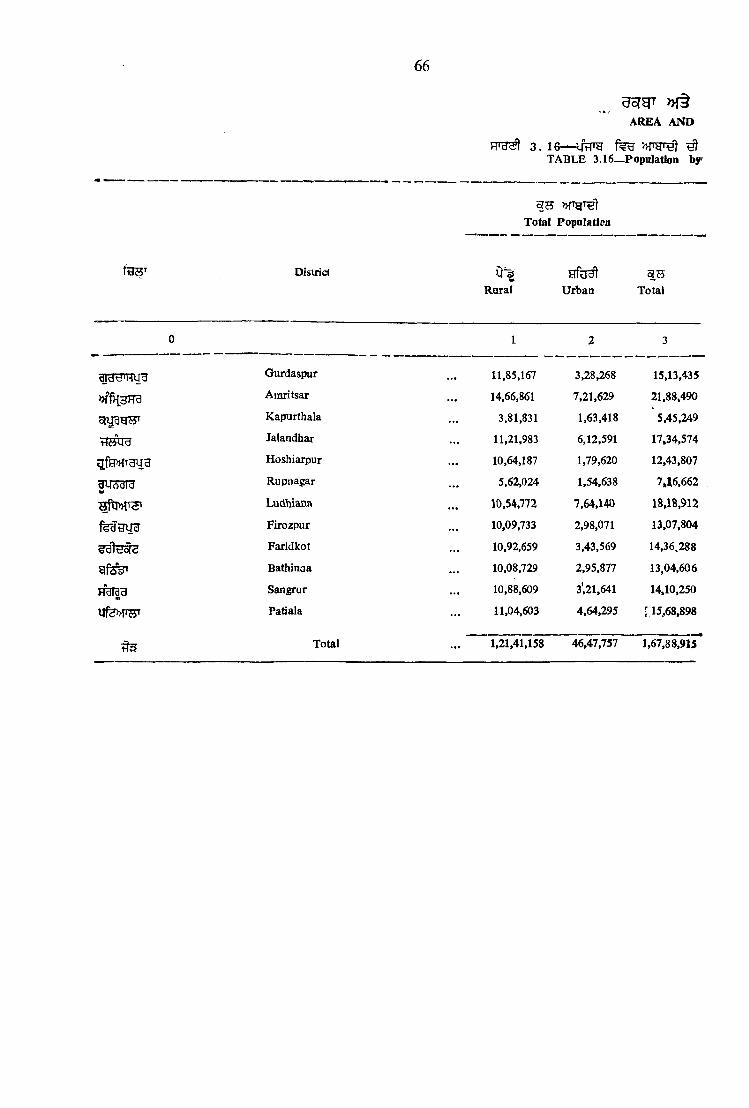
6 6
>}f§ AREA A N D
3 . 16 — ifp r g ^TABLE 3 .16_P op n la tion bjr
District
T otal Popalatico
0 ^ H fu ^ Rural Urban Total
0 1 2 3
Ourdaspur ... 11,85,167 3,28,268 15,13,435
Amritsar ... 14,66,861 7,21,629 21,88,490
siy g m s' Kapurthala 3,81,831 1,63,418 5,45,249
Jalandhar 11,21,983 6,12,591 17,34,574
afHMTHUH Hoshiarpur 10,64,187 1,79,620 12,43,807
^ c^ d f3 Rupnagar 5,62,024 1,54,638 7,16,662
Ludhiana 10,54,772 7,64,140 18,18,912
frdfcT ie Firozpur 10,09,733 2,98,071 13,07,804
Faridkot 10,92,659 3,43,569 14,36.288
Bathinaa 10,08,729 2,95,877 13,04,606
jfdTgU Sangrur 10,88,609 3',21,641 14.10,250
ufe»rrsT Patiala 11,04,603 4,64,295 [15,68,898
Total ... 1,21.41,158 46,47,757 1,67,88,915

->HTgT^P O P U L A T IO N
q^H 1 9 8 1Religion and Disb'ict in Panfab, 1981
67
Hinda
msuch
a ‘3mRural Urban Total
ftT5
Percentage in the District
0 " iRural Urban Total Percentage
in the District
4 5 6 7 8 9 10 11
4,76,531 2,51,831 7,28,362 48*13 ’ 6,09,380 66,020 6,75,400 44-63
95,937 3,96,215 4,92,152 22-49 13,40,258 3,14,947 16,55,205 75-63
1,04,987 1,06,614 2,11,601 38-81 2,73,070 55,075 3,28.145 60-18
5,09,318 4,60,102 9,69,420 55-89 6.00,666 1,42,700 7,43,366 4 2 -86
6,03,892 1,35,337 7,39,229 59 -43 4,45,807 41,240 4,87,047 39-16
2,05,743 94,025 2,99,768 41 -83 3,48,477 57,013 4,05,490 56-58
1,14,722 4,71,801 5,86,523 32-25 9,31,420 2,78,566 12,09,986 66-52
3,50,397 2,29,262 5,79,659 44-32 6,48,165 61.406 7,09,571 54-26
98,506 1,97,618 2,96,124 20-62 9,87,591 \A 2 ,n Q 11,30,361 78-70
1,17,322 1,82,718 3,00,040 23 -00 8,84,594 1,10,271 9,94,865 76-26
1,72,803 1,60,808 3,33,611 23 -66 8,72,500 1,09,440 9,81,940 69-63
3,68,233 2,95,473 6,63,706 42 -30 7,14,590 1,63,175 8,77,765 55 -96
32,18,391 29,81,804 62,00,195 36-93 86,56,518 15,42,623 1,01,99.141 60-75
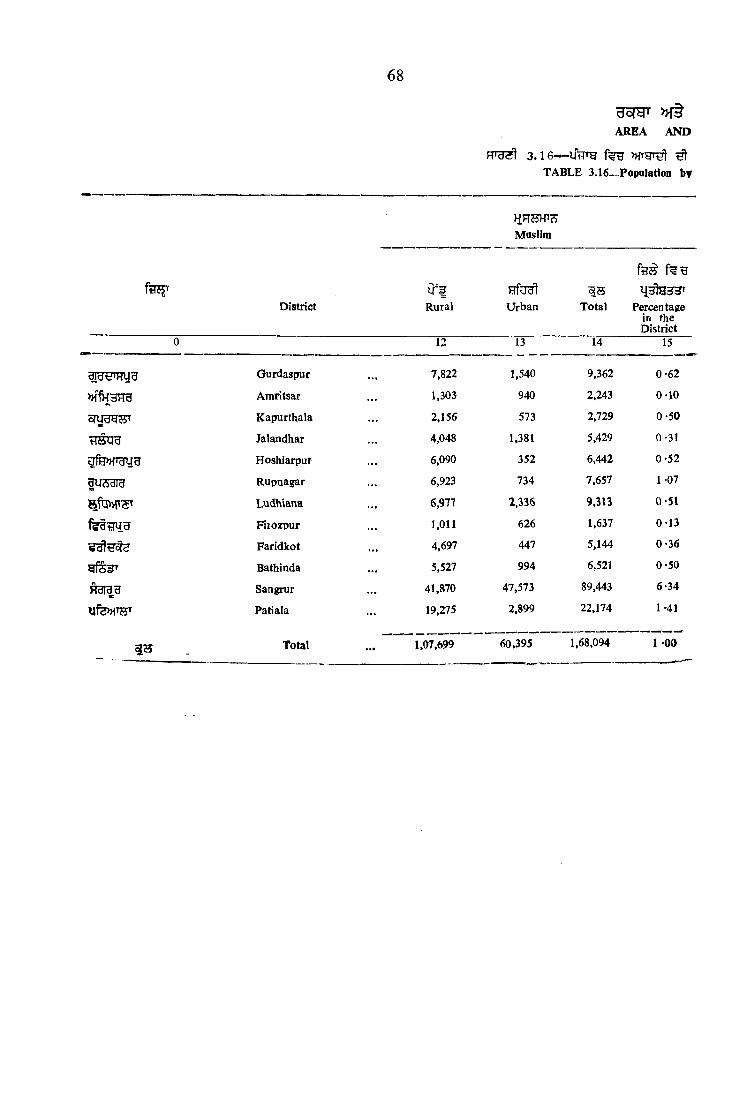
68
3 . 1 6 — ^
TABLE 3.16—PopaIation by
AREA AND
District
HRHH^Masiim
U'fRural
hTu^Urban Total Percentage
in the District
0 12 13 14 15
Gurdaspuf 7,822 1,540 9,362 0-62
Amritsar 1,303 940 2,243 0-10
cfuggsT Kapurthala 2,156 573 2,729 0-50
Jalandhar 4,048 1,381 5,429 0-31gfH iTgyg Hoshiarpur 6,090 352 6,442 0-52
fUAdld Rupnagar 6,923 734 7,657 1-07
Ludhiana 6,977 2,336 9,313 0-51
Fiiozpur 1,011 626 1,637 0-13
Faridkot • • •4,697 447 5,144 0-36
Bathinda • • • 5,527 994 6,521 0-50
nsiBU Sangrur 41,870 47,573 89,443 6-34
Ufe>HTj5T Patiala 19,275 2,899 22,174 1-41
1 3 Total 1,07,699 60,395 1,68,094 1 -00
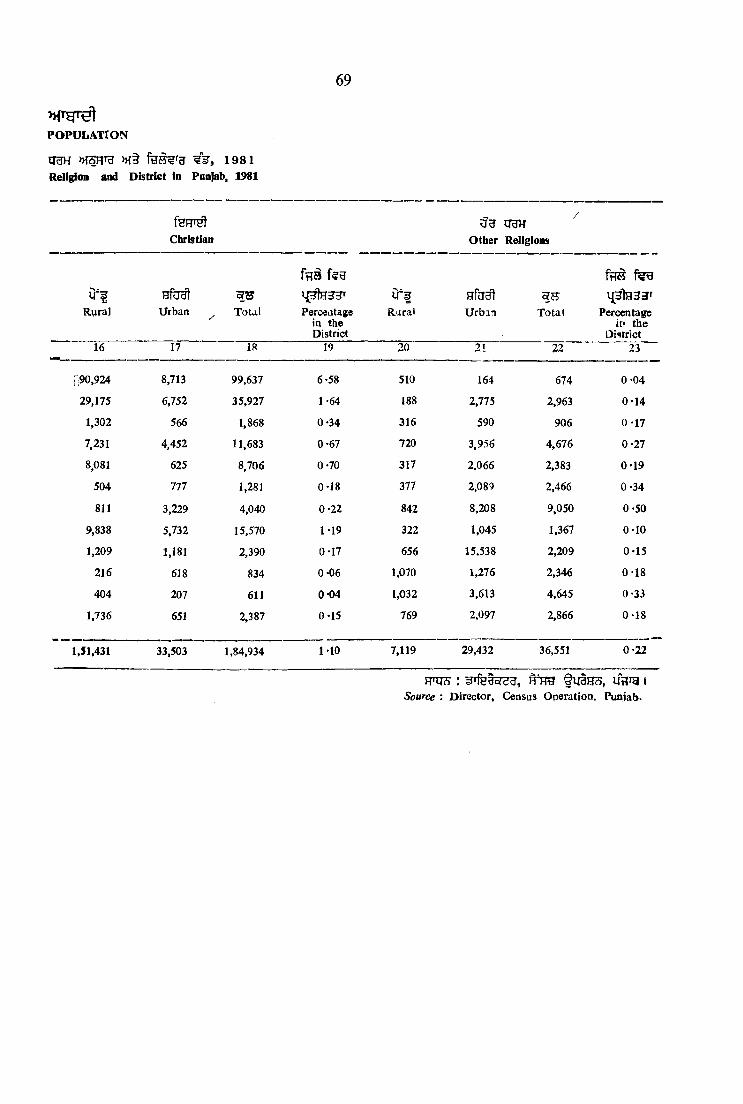
69
PO P U L A T IO N
UgH >H§ 1 9 8 1 Religion and District in Pan}ab» 1981
Christian o th er Religions
Rural Urban ^ Total
f a s
Perosatage in the District
U ^fRatal Urbaa Total
f t fS
Percentage in the
District16 17 18 19 20 21 22 23
1^90,924 8,713 99,637 6-58 510 164 674 0 -0 4
29.175 6,752 35,927 1-64 188 2,775 2,963 0-14
1,302 566 1,868 0-34 316 590 906 0 -1 7
7,231 4,452 11,683 0-67 720 3,956 4,676 0-27
8,081 625 8,706 0*70 317 2,066 2,383 0-19
504 777 1,281 0-18 377 2,089 2,466 0 -3 4
811 3,229 4,040 0-22 842 8,208 9,050 0 -5 0
9,838 5,732 15,570 1*19 322 1,045 1,367 0-10
1,209 1,181 2,390 0-17 656 15,538 2,209 0-15
216 618 834 0-06 1,070 1,276 2,346 0 -1 8
404 207 611 0-04 1,032 3,613 4,645 0-33
1,736 651 2,387 0-15 769 2,097 2,866 0 -1 8
1,51,431 33,503 1,84,934 M O 7,119 29,432 36,551 0 -2 2
RHJ?) : 1Source : Director, Census Operation. Punjab.
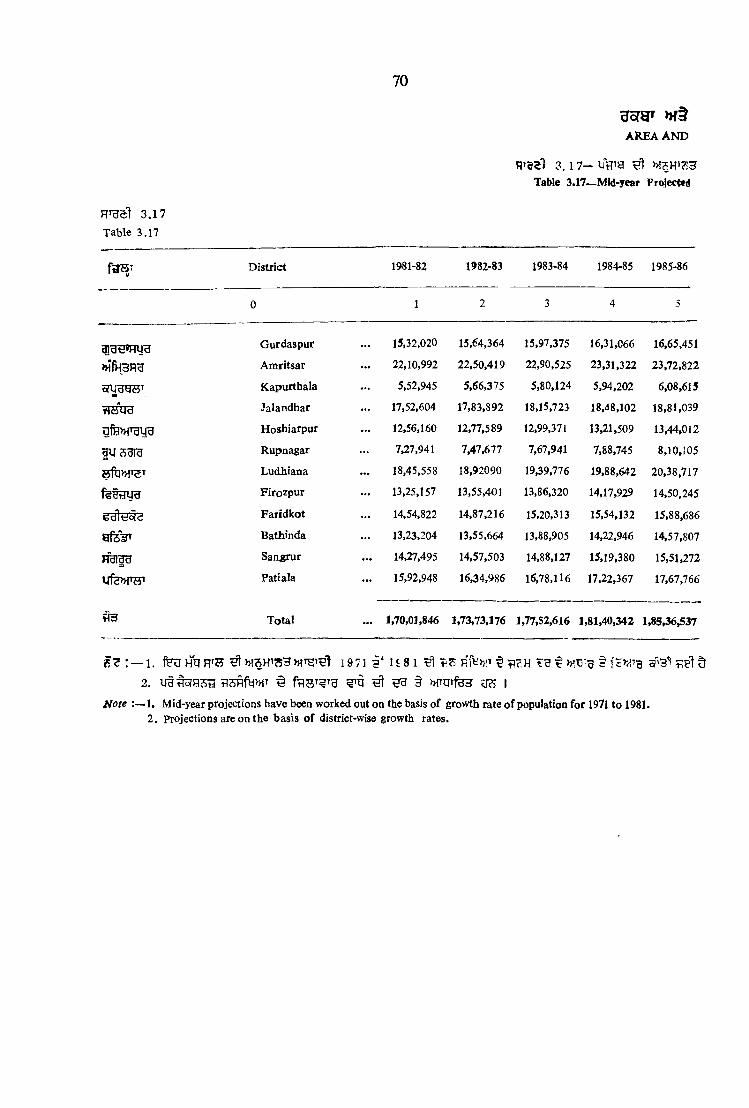
70
g s ra f w tAREA A N D
3 . 1 7 - W g e l MS HI 3
Table 3.17— Mid-year Projected
RTUsl 3 .1 7
Table 3 .17
D istrict 1981-82 1982-83 1983-84 1984-85 1985-86
0 1 2 3 4 5
I 3 s m i i u Gurdaspur 15,32,020 15,64,364 15,97,375 16,31,066 16,65,451
>HfH3Rg Amritsar 22,10,992 22,50,419 22,90,525 23,31,322 23,72,822
Kapurthala 5,52,945 5,66,375 5,80,124 5,94,202 6,08,615
flH ira Jalandhar 17,52,604 17,83,892 18,15,723 18,48,102 18,81,039
gfe>n^ vig Hoshiatpur 12,56,160 12,77,589 12,99,371 13,21,509 13,44,012
Rupnagar 7,27,941 7,47,677 7,67.941 7,88,745 8,10,105
Ludhiana 18,45,558 18,92090 19,39,776 19,88,642 20,38,717
f<^atiug Firozpur 13,25,157 13,55,401 13,86,320 14,17,929 14,50,245
Faridkot 14,54,822 14,87,216 15,20,313 15,54,132 15,88,686
Bathinda 13,23,204 13,55,664 13,88,905 14,22,946 14,57,807
Hdidd Sangrur 14,27,495 14,57,503 14,88,127 15,19,380 15,51,272
yfe>H W Patiala 15,92,948 16,34,986 16,78,116 17,22,367 17,67,766
T otal ... 1,70,01,846 1,73,73,176 1,77,52,616 1,81,40,342 1,85,36,537
1. feu Hg ^ 1971 u 8 1 ^ t??.H t § f s w g alB"! d2. tl5Flfy>MT ^ fRST^^g e l ^ § »TOtfg3 03 I
Ifo te :— 1. Mid-year projections have been worked out on the basis o f growth rate o f population for 1971 to 1981.2 . Projections are on the basis o f district-wise growth rates.
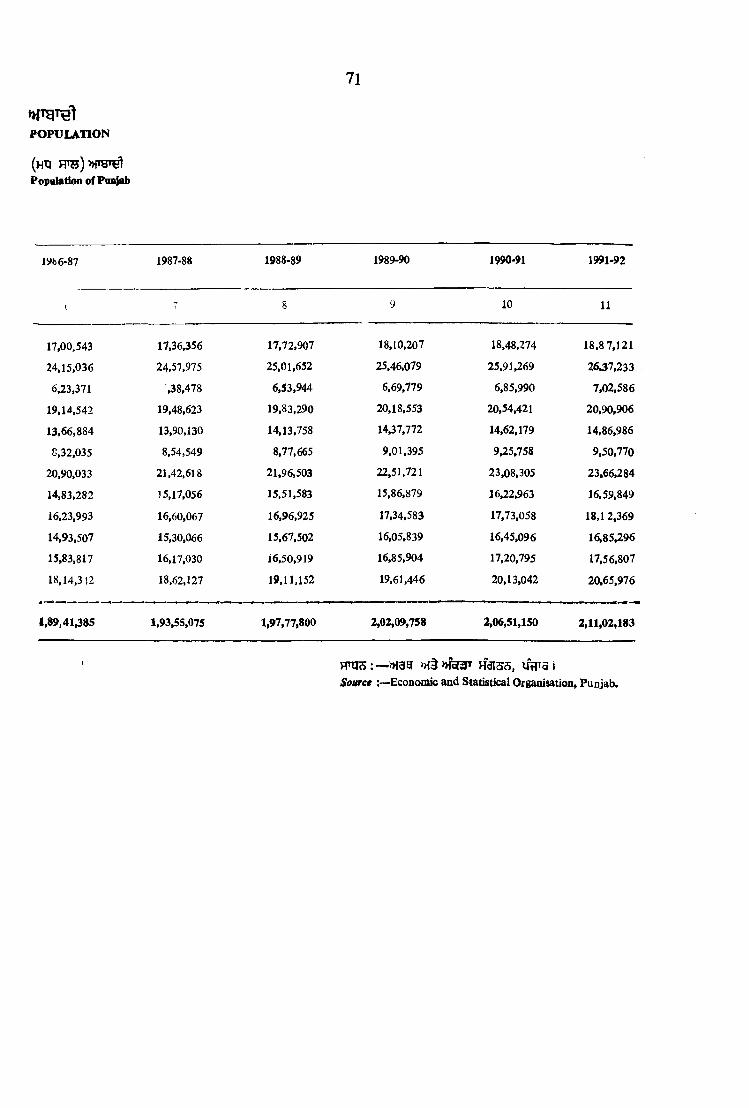
PO PU L A T IO N
(hH HTs)>HTai^ Population of Punjab
71
iyb6-87 1987-88 1988-89 1989-90 1990-91 1991-92
10 11
17,00,543 17,36,356 17,72,907 18,10,207 18,48,274 18,8 7,121
24,15.036 24.57,975 25,01,652 25,46,079 25,91,269 26,37,2336,23,371 ,38,478 6,53,944 6,69,779 6,85,990 7,02,586
19,14,542 19,48,623 19,83,290 20,18,553 20,54,421 20,90,906
13,66,884 13,90,130 14,13,758 14,37,772 14,62,179 14,86,986
8,32,035 8,54,549 8,77,665 9,01,395 9,25,758 9,50,77020,90,033 21,42,618 21,96,503 22,51,721 23,08,305 23,66,284
14,83,282 15,17,056 15,51,583 15,86.879 16,22,963 16,59,84916,23,993 16,60,067 16,96,925 17,34,583 17,73,058 18,1 2,36914,93,507 15,30,066 15,67,502 16.05,839 16,45,096 16,85,296
15,83,817 16,17,030 16,50,919 16,85,904 17,20,795 17,56,80718,14,3 }2 18,62,127 19,11.152 19,61,446 20,13,042 20,65,976
1,89,41,385 1,93,55,075 1,97,77,800 2,02,09,758 2,06,51,150 2,11,02,183
»Tcfg H3I35, UtTra 1Source Economic and Statistical Organisation, Punjab.

3 . 1 8 — l 9 8 l ^ m r B t »WFTO WT33 ^ ^ Ht UUH n^-^lF3, I J h W FTOg3»,u ra ^ >H§ »T5Rfe 7 P ^ ^
Table 3.18— Population Increase, Sex Katio, Density, Literacy Rates and Percentage of Schedaled Castes In India by States, 1981
AREA AND POPULATION
States
f ^ g s ra r1981 1971
Area in v) Squared
Kilometres
Population1981
Population1971
1 9 7 1 - 8 1
^TJT-unZT
Variatioa' in popula
tion 1971-81
1 9 8 l f ^ » f H ^ h M RTbraHT » f ^ f ? g g
l ^ H 3 3 T 1 ,0 0 0 ^ l J 3 t e W ^ l
1971-81 ^ ( 1 9 8 1 ) ^ ^ ^ *m 3 fSTKHteH TJ3fte3T
( l 9 8 i ) ( l 9 8 l )
Percentage increase 1971-81
Femalesper
1,000M ales1981
Populationper
Square K ilometre
(1981)
Percentage percent-o f age
Urban (1981)Popula
tion (1981)
( l 9 8 l ) Literacy Percent
age o f Schedul
ed Castes/ Tribes to total Popula
tion (1981)
0 1 2 3 4 5 6 7 8 9 10
§ t3 3 India* 32,08,823 68,51,84,692 54,81,59,652 13,70,25,040 25 00 934 214 23 01 36-23 22-82
( § )
>rtiqdi
(a) State
Andhra Pradesh 2.75,068 5,35,49,673 4,35,02,708 1,00,46,965 23 -10 975 195 23 -32 29*94 20*80
*>nHTH A ssam — 1,98,96,843® 1,46,25,152 52,71,691® 36 -05@ . . . .
f g a 'y Bihar 1t n
Gujarat
1,73,877 6,99,14,734 5,63,53,369 1,35,61,365 24 06 946 402 12-47 26-20 22-82
aL?iHT3 1,96,024 3,40,85,799 2,66,97,475 73,88,324 2 7 -67 942 174 31-10 43-70 2 1-38
Ofe>HT3rr H aryana ^ 44,212 1,29,22,618 1,00,36,808 28,85,810 28-75 870 292 21 -88 36-14 19*07
^ >n§ Jam m u and Kashm ir 2,22,236 59,87,389 46,16,632 13,70,757 2 9-69 892 27 21 -96 26-67 8-31
Karnataka 1,91,791 3,71,35,714 2,92,99,014 78,36,700 26 -75 963 194 28 -89 38-46 19*98
Kerala 38,863 2,54,53,680 2,13,47,375 :"41,06,305 19-24 1,032 655 18-74 70-42 1 1 .0 4
>ii3 Madhya Pradesh 4,43,446 5,21,78,844 4,16,54,119 1,05,24,725 25-27 941 118 20-29 27-87 37*08
Maharashtra 3,07,690 6,27,84,171 5,04,12,235 1,23,71,936 24-54 937 204 35-03 47-18 16*33
io
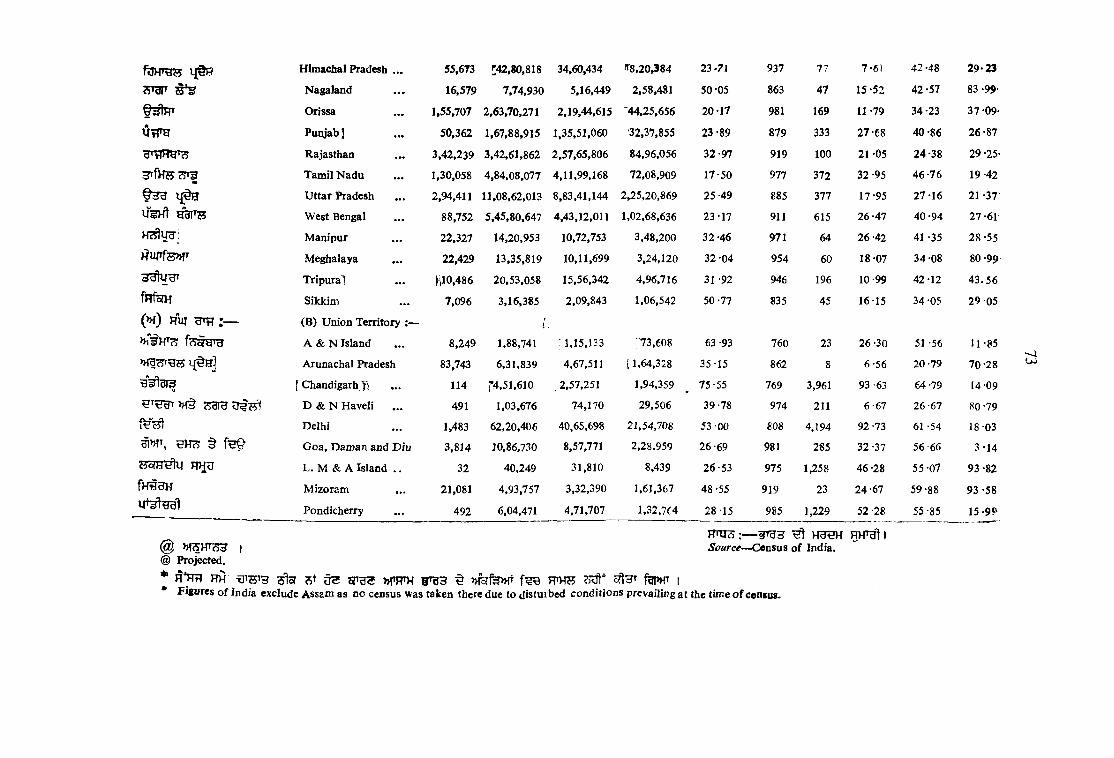
UtTH
cTT3
f n g
USHt
H7?lyu:
l^UirfzP)jy
3 ^ t u ^
fHfoTH
(» f ) HUI UT 7 .
?5W ^
»T5HTSH I Projected
Himachal Pradesh ... 55,673 ^42,80,818 34,60,434 8,20,384 23-71 937 77 7-61 42-48 29-23
Nagaland . . . 16,579 7.74,930 5,16,449 2,58,481 50-05 863 47 15*52 42-57 8 3 -99-
Orissa . .. 1,55,707 2,63,70,271 2,19,44,615 '44,25,656 20-17 981 169 11-79 34-23 3 7 09-
PunjabJ ... 50,362 1,67,88,915 1,35,51,060 32,37,855 23-89 879 333 27-68 40-86 26-87
Rajasthan . .. 3 ,42,239 3,42,61,862 2,57,65,806 84,96,056 32-97 919 100 21-05 24-38 29-25>
Tamil N adu ... 1,30,058 4,84.08,077 4,11,99,168 72,08,909 17-50 977 372 32-95 46-76 19-42
Uttar Pradesh . .. 2,94,411 11,08,62,013 8,83,41,144 2,25,20,869 25 -49 885 377 17-95 27-16 2 1 -37
W est Bengal . .. 88,752 5,45,80,647 4,43,12,011 1,02,68,636 23-17 911 615 26-47 40-94 27-61
Manipur ... 22,327 14,20,953 10,72,753 3,48,200 32 46 971 64 26-42 41-35 28*55
Meghalaya . . . 22,429 13,35,819 10,11,699 3,24,120 32-04 954 60 18-07 34-08 80-99
Tripura] . .. ^10,486 20,53,058 15,56,342 4,96,716 31-92 946 196 10-99 42-12 4 3 .5 6
Sikkim . . . 7,096 3,16,385 2,09,843 1,06,542 50-77 835 45 16-15 34-05 29-05
(B) Union Territory ;— f
»r^HTc5 A & N Island 8,249 1,88,741 : 1,15,133 ;,73,608 63 -93 760 23 26 -30 51 -56 11-85
Arunachal Pradesh 83,743 6,31,839 4,67,511 [1,64,328 35-15 862 8 6-56 20 -79 70-28
f Chandigarh 71 114 [*4,51,610 2,57,251 1,94,359 75-55 769 3,961 93-63 64-79 1 4 0 9
c^dld D & N Haveli . .. 491 1,03,676 74,170 29,506 39-78 974 211 6-67 26-67 80 -79
Delhi 1,483 62,20,406 40.65,698 21,54,708 53 00 808 4,194 92-73 61 -54 18-03
G oa, Dam an and D iu 3,814 10,86,730 8,57,771 2,28.959 26-69 981 285 32-37 56-66 3 -14
HHu L. M & A Island . . 32 40,249 31,810 8,439 26-53 975 1,258 46 -28 55-07 93 -82
M izoram 21,081 4,93,757 3,32,390 1,61,367 48-55 919 23 24-67 59-88 93 -58
Pondicherry 492 6,04,471 4,71,707 1.32,764 28-15 985 1,229 52 -28 55-85 1 5 -9»
^ ITiV/JVWl U.
H*RtT RH s lo f ^ FPHH I* Figures o f India exclude Assam as no census was taken there due to distuvbed conditions prevailing at
m i 3 : — ^ Source—iCensus o f India.
the time o f cengus.
La
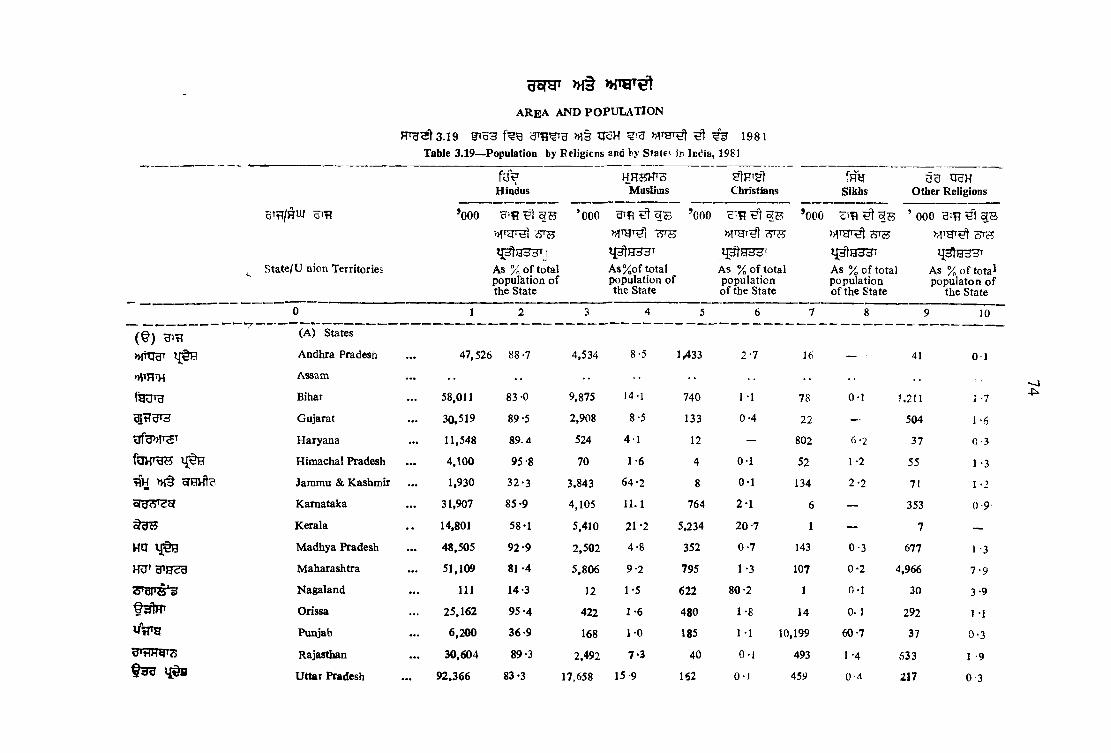
a r e a a n d p o p u l a t i o n
Hth^ 3 . 1 9 »1§ tJ cH i g g i
Table 3.19—Population by Ecligicns and by Slates in ludia, 1981
f o pHindus
H H O T 3Muslims Christians
fHUSikhs
TOH Other Religions
3TtT/HUi oTfl ’ooo
As % o f total population o f the State
’coo ’coo c^TI
As % o f total population o f the State
’OOG ’ 000 giT?
As % o f tota* populaton o f
the State
^ State/U nion Territories As% of total population o f the State
As % o f total population o f the State
0 1 2 3 4 5 6 7 8 9 10
( § ) HTTf (A ) States
Andhra Pradesh 47,526 88-7 4,534 8-5 M 3 3 2 -7 16 41 0 1
Assam
Bihar 58,011 83 *0 9,875 J4-1 740 1 -1 78 0-1 1.211 1-7^ tT d 'd Gujarat 30,519 89 -5 2,908 8-5 133 0-4 22 — 504 1-6
UfUMT^T Haryana 11,548 89.4 524 4-1 12 — 802 6-2 37 0 -3
H im achal Pradesh 4 ,100 95 -8 70 1-6 4 0-1 52 1-2 55 1-3
flH >M§ Jammu & Kashmir 1,930 32*3 3,843 6 4-2 8 0-1 134 2-2 71 1 -2
Karnataka 31,907 85 -9 4,105 11.1 764 2-1 6 — 353 0 -9
Kerala 14,801 58-1 5,410 21 -2 5.234 20-7 1 — 7 —
m M adhya Pradesh 48,505 9 2 -9 2,502 4-8 352 0 -7 143 0 -3 677 1 -3
a^wciy Maharashtra 51,109 81 -4 5,806 9 -2 795 1-3 107 0 -2 4,966 7 -9
S^bl^Ja s N agaland 111 14-3 12 1-5 622 80 -2 1 0-1 30 3-9/~v -W3lH' Orissa 25,162 95*4 422 1-6 480 1-8 14 0. 1 292 1 -I
lAra Punjab 6,200 36-9 168 1-0 185 1 -1 10,199 60-7 37 0-3Rajasthan 30,604 89*3 2,492 7*3 40 0-1 493 1-4 633 i -9
Q 'dy i j ^ Uttar Pradesh 92.366 83-3 17,658 15-9 162 0-) 459 0-4 217 0 3

u g
H d tu g ’
THfeH
(» i) n u i gTp
Tamil Nadu
West Bengal
Manipu:
Tripiffa
M eghalaya
Sikkim
< B) Union Territories
43,017 88*9 2,520 5-2 2,798 — 09 0.142,007 76-9 11,743 21 -6 320 0 ’6 49 0-1 462 0-8
853 60-0 99 7-0 422 29-8 1 — 46 3-21,834 89-3 139 6-8 25 1-2 t — 55 2-7
241 18*0 41 3-1 703 52 -6 2 0-1 349 26 *2213 67 -4 3 0-9 7 2-2 t — 93 29-5
A & N Island ... 122 64-9 16 8-5 48 25-6 1 0-5 1 0-5
l f 9 «Arunachal Pradesh 185 29-3 5 0-8 27 4-3 1 0-2 413 65 -4
tf^dT 3Chandigarh ... 340 75*2 9 2 0 4 0-9 95 21 -2 3 0-7D . & N . Haveli ... 99 95 -2 2 1 -9 2 1-9 t — 1 1 -0Delhi ... 5.200 83 -6 4S2 7-7 62 1 .0 394 6-4 83 1 -3
^»fr, ^ G oa., Dam an & D iu ... 716 65 -9 48 ,1 .4 318 29-4 1 — 2 0-3
HHU L .M . & A . Island 2 5-0 38 95 -0 t — — — t —
Pondicherry ... 517 85 -6 37 61 50 8-3 t — 1 —
Th ^ hhM izoram •• 35 7-1 2 0-4 414 83-9 t — 42 8-b
Indii ... 5,49,780 82*6 75,513 11-4 16,165 2-4 13,078 2 0 10,752 1*6
*MTHm B th t f e n RTfHS 7 ^ U 3 f g W
UST3 7)'' 1 9 8 1 U
HSrt I♦ Excludes Assam where Census could not beheld owing to
disturbed Conditions prevailing thsre.
t 500 u fe t L m than 500
Fj rqo: — 1981 <Source : —Census o f India, 1 9*t.
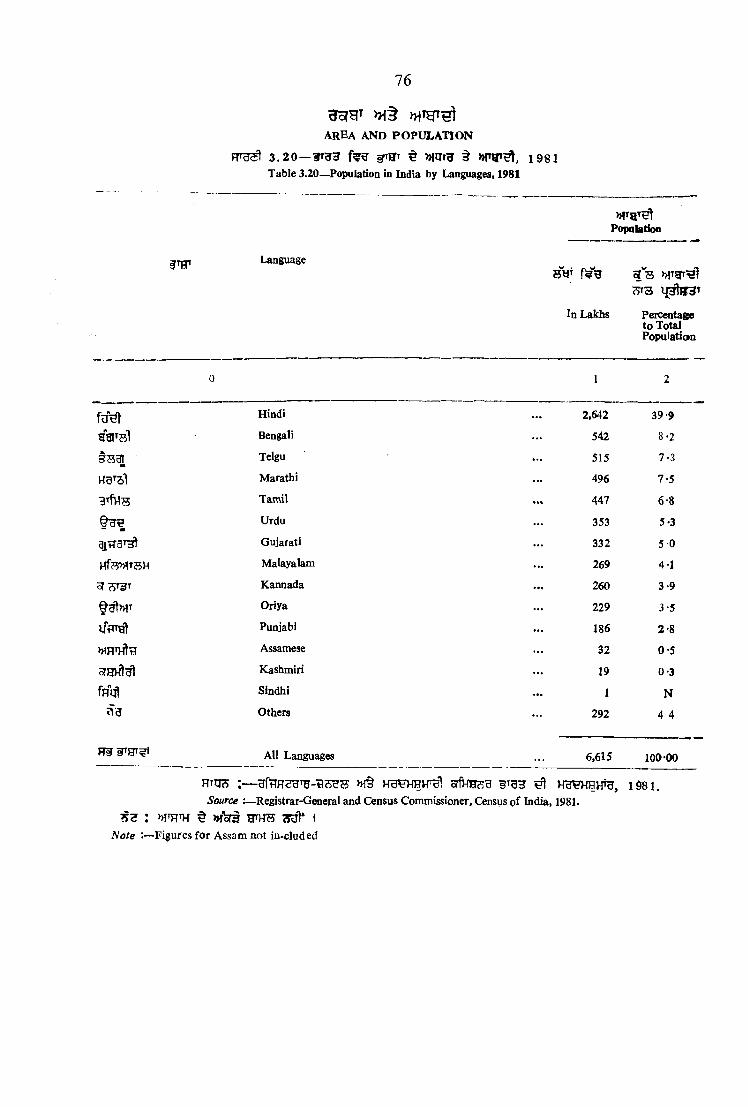
a r e a a n d p o p u l a t i o n
Frg^ 3.20 —r g g ^ )HgTH § 1981Table 3.20—Population in India by Languages, 1981
76
L ^guage
»fT5T^Popaktioo
In Lakhs Percentage to Total Population
0 1 2
fu"et Hindi ... 2.642 39-9
a3TTsl Bengali ... 542 8-2
3 B ^ Telgu ... 515 7-3
H3Tsl Marathi ... 496 7-5
Tamil %«% 447 6-8
Urdu ... 353 5-3
3j[tT a^ Gujarati ... 332 5 0
Hfe-b^TSH Malayalam ... 269 4-1
Kannada ... 260 3-9
^^»1T Oriya ... 229 3-5
UfTTgt Punjabi ... 186 2-8
WRTHttJ Assamese ... 32 0*5
Kashnuri ... 19 0*3
fm ft Sindhi ... 1 N
Others ... 292 4 4
All Languages ... 6,615 100-00
HtUS ;— yy^ )WHHVTO! S f f t e B ^ H B ^ V T O , 1 $ 8 1 .
Source :—Registrar-General and Census Commissioner, Census o f India, 1931.
: M W ^ > H ^ ?rat* I
N ote :—Figures for A ssam not in-cluded
POPULATION IN INDIA
77

g sfsr ^ »»lTgT^AREA A N D p o p u l a t i o n
3 . 2 1 — ^ 1 9 0 1 ^ 1 9 8 1 ^ ^ » f § 1 0 H W H T ? ^Table 3J>1— States-wise Popalation and Decemnial Orowtb in India from 1901 to 1981
( § ) ^ 1.
(A ) States
Andhra Pradesh
2. Assam
3. Bihar
4 . dJVIcTH Gujarat
5 . Haryana
6. Himachal Pradesh
7 . ^ Jammu and Kashmv
8. Karnataka
9. Kerala
10. HQ M adhya Pradesh
U . Maharashtra
12. Manipur
X3. Meghalaya
1 4 .Nagalani'
Oc'ssa
(fH2^>HS M Ulions))
s. N o .State/Union Twritories 1901 1911 1921 1931 1941 1951 1961 1971 1981
0 1 2 3 4 5 6 7 8 9
19-07 21 -45 21 -42 24-20 27-29 31 -12 35-98 43-50 53 -54(+ 1 2 -4 9 ) ( _ 0 -13) (+ 1 2 -9 9 ) (+ 1 2 -7 5 ) + 1 4 -0 2 (+ 1 5 -6 5 ) (+ 2 0 -9 0 ) ( + 2 3 -10)
3-37 3-94 4-74 5 -68 6-85 8-23 11-10 14-96 199(+ 1 6 -8 4 ) ( + 2 0 19) (+ 2 0 -0 5 ) (+ 2 0 -4 5 ) (+ 2 0 -1 2 ) (+ 3 4 -9 9 ) ( + 3 4 -71) ( + 3 6 -05)
27-31 28 -31 28 -13) 31 -35 35 17 38 -78 46-45 56 -25 69-91( + 3 -67) ( - 0 - 6 6 (+ 1 1 -4 5 ) (+ 1 2 -2 0 ) (+ 1 0 -2 7 ) (+ 1 9 -7 6 ) (+ 2 1 -33) (+ 2 4 -0 6 )
9-10 9-80 10 -8 11 -49 13 -70 16-26 20-63 26-70 34 -09(+ 7 -7 9 ) ( + 3 -79) (+ 1 2 -9 2 ) ^ (+ 19-25) ( + 1 8 -69) (+ 2 6 -8 8 ) (+ 2 9 -39) ( + 2 7 - 6 7 )
4-62 4-17 4-26 4-56 5-27 5-67 7-59 10 -04 12-92( - 9 -70) ( + 1 -95) ( + 7 14) ( + 15-63) (+ 7 -6 0 ) (+ 3 3 -79) (+ 3 2 -2 3 ) ( + 2 8 -75)
1-92 1-90 1-93 2-023 2-26 2-39 2-81 3-46 4-28( - 1 -22) ( + 1 -65) (+ 5 -2 3 ) 11*54) (+ 5 -4 2 ) (+ 1 7 -8 7 ) ( + 2 3 -04) (+ 2 3 -71)
2 -14 2-29 2-42 2 -67 2 -95 3-25 3-56 4-62 5-99(+ 7 -1 6 ) (+ 5 -7 5 ) (+ 1 0 -1 4 ) (+ 1 0 -3 6 ) (+ 1 0 -4 2 ) (+ 9 -4 4 ) ( + 2 9 -65) ( + 2 9 -69)
13 06 13-53 13-38 14-63 16-26 19-40 23 -39 29-30 37-14( + 3 -6 0 ) (— 1*09) ( + 9 -3 8 ) (+ 1 1 -0 9 ) (+ 1 9 -3 6 ) (+ 2 1 -5 7 ) ( + 2 4 -2 2 ) (+ 2 6 -7 5 )
6 -4 0
16-86
19-39
7*15 7-80 9-51 11-03 13-55 16-90 21-35(+ 1 1 -7 5 ) ( + 9 -1 6 ) (21-85) (+ 1 6 -0 4 ) (+ 2 2 -3 2 ) (+ 2 4 -7 6 ) (+ 2 6 -2 9 )
19-44 19-17 21-36 23-99 26-07 32-37 41-65(+ 1 5 -3 0 ) (— 1-38) (+ 1 1 -3 9 ) (+ 1 2 -3 4 ) (+ 8 -6 7 ) (+ 2 4 -1 7 ) (+ 2 8 -6 7 )
21 -47 20 -83 23 -96 26. 83 32 -00 39 -55 50-41
2 5 -4 5(+ 1 9 - 2 4 )
52-18 ( + 2 5 -27)
62-78(+ 1 0 -7 4 ) (— 2-91) (+ 1 4 -9 1 ) (+ 1 1 -9 9 ) (+ 1 9 -2 7 ) (+ 2 3 -6 0 ) (+ 2 7 -4 5 ) (+ 2 4 -5 4 )
0-28 0-35 0-38 0-44 0-51 0 -58 0 -78 1 07 1-42(+ 2 1 -7 1 ) (+ 1 0 -9 2 ) (+ 1 6 -0 4 ) ( + 14-92) ( + 12-80) (+ 3 5 -0 4 ) (+ 3 7 -5 3 ) ( + 3 2 -4 6 )
0 -34 0-39 0 -42 0-48 0-56 0 -61 0 -77 1 -01 1-34(+ 1 5 -7 1 ) (+ 7 -2 1 ) + 13-83) ( + 15-59J (+ 8 -9 7 ) (+ 2 7 -0 3 ) (+ 3 1 -5 0 ) ( f 32 -44)
0 -10 0-15 0 -1 6 0-19 0 -21 0 -21 0 -37 0 -52 0 -77(+ 4 6 -7 6 ) 1 + 6-55) ' + 12-62) ( + 6-04) (+ 8 -6 0 ) (+ 4 -0 7 ) (+ 3 9 -8 8 ) ( + 5 0 -05)
10-30 11 -38 11-16 12-49 13-77 14- 65 17 -55 21 -94 26 -37(+ 1 0 -4 4 ) (*^1 94) ( + 11 -94) (+ 1 0 -2 2 ) ( + 6 -3 8 ) (+ 1 9 -8 2 ) (+ 2 5 -0 5 ) ( + 2 0 -17)
- 4oo
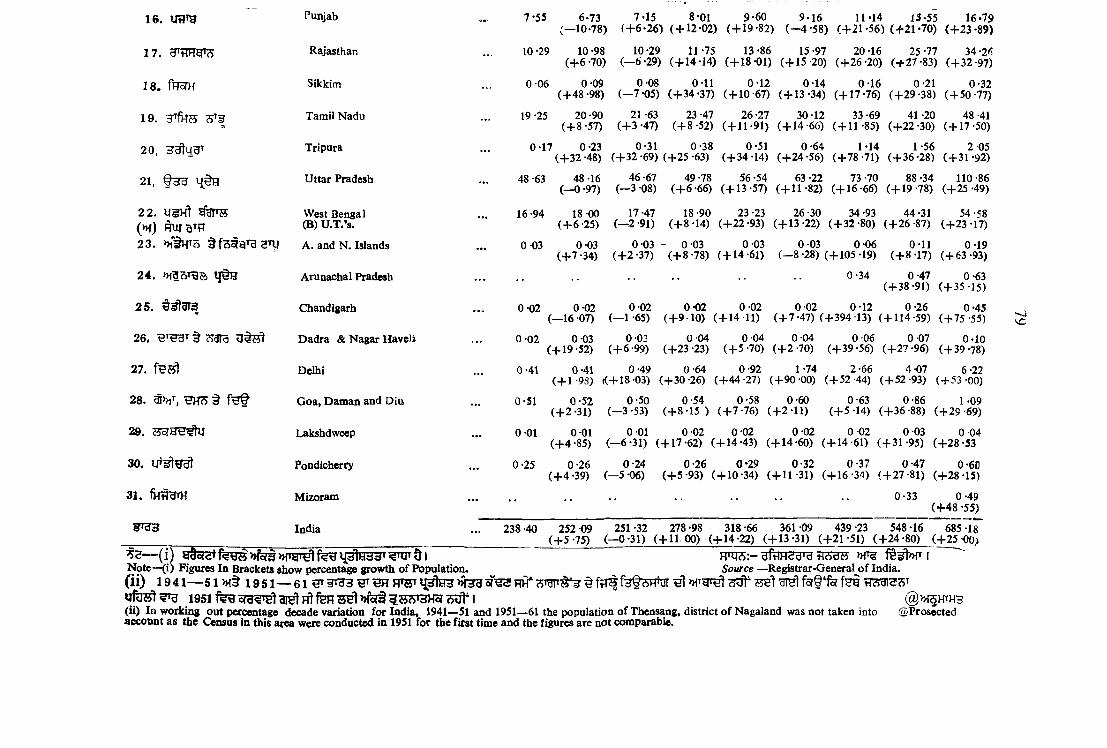
1 6 . UtJTg
1 7 .
1 8 . fRSTH
1 9 .
20 .21,
2 2 . UgH t gaTTS (» f ) RUJB^tT23. »f^T?i
24. tf§H
25. #^3T3
26.
27. f?J?t
2 8 . § f e t
29.
30.
31. f H l ^
3 1 ^ 3
Punjab 7-55 6-73( — 10-78)
7-15 8-01 (+ 6 -2 6 ) ( + 12-02)
9*60(+ 1 9 -8 2 )
9*16 (—4 -58)
11-14 13-55 (+ 2 1 -5 6 ) (+ 2 1 -7 0 )
16*79(+ 2 3 -8 9 )
Rajasthan 10*29 10 -98 ( + 6 -70)
10-29( - 6 - 2 9 )
11-75(+ 1 4 -1 4 )
13-86(+ 1 8 -0 1 )
15-97(+ 1 5 -2 0 )
20-16 (+ 2 6 -20)
25 -77 (+ 2 7 -8 3 )
34 -26 (+ 3 2 -9 7 )
Sikkim 0 06 0-09 (+ 4 8 -98)
0-08( -7 * 0 5 )
0-11(+ 3 4 -3 7 )
0-12(+ 1 0 -6 7 )
0-14(+ 1 3 -3 4 )
0-16(+ 1 7 -7 6 )
0-21(+ 2 9 -3 8 )
0-32 ( + 50 -77)
Tamil Nadu 19-25 20-90 ( + 8 -57)
21 -63 ( + 3 -47)
23 -47 (+ 8 -5 2 )
26 -27 (+ 1 1 -9 1 )
30-12(+ 1 4 -6 6 )
33-69 ( + 11-85)
41 -20 (+ 2 2 -3 0 )
48 -41 (+ 1 7 -5 0 )
Tripura 0-17 0-23(+ 3 2 -4 8 )
0-31 0-38 (+ 3 2 -69) (+ 2 5 -63)
0-51(+ 3 4 -1 4 )
0-64(+ 2 4 -5 6 )
1-14 (+ 7 8 -71)
1-56(+ 3 6 -2 8 )
2 05 (+ 3 1 -92)
Uttar Pradesh 48 -63 48 -16 ( - 0 -97)
46-67 ( - 3 -08)
49-78(+ 6 -6 6 )
56-54(+ 1 3 -5 7 )
63-22(+ 1 1 -8 2 )
73 -70 (+ 1 6 -6 6 )
88 -34 (+ 1 9 -78)
110-86 (+ 2 5 -49)
West Bengal (B) U .T .’s.
16-94 18-00(+ 6 -2 5 )
17-47( - 2 - 9 1 )
18-90 ( + 8 -14)
23 -23 (+ 2 2 -93)
26-30(+ 1 3 -2 2 )
34 -93 (+ 3 2 -80)
44-31 (+ 2 6 -87)
54-58 (+ 2 3 -17)
A. and N . Islands 0 -03 0-03(+ 7 -3 4 )
0-03 - (+ 2 -3 7 )
- 0-03 (+ 8 -7 8 )
0 03 (+ 1 4 -6 1 )
0 -03 0 -06 (—8-28) (+ 1 0 5 -1 9 )
0-11(+ 8 -1 7 )
0-19 (+ 6 3 -93)
Arunachal Pradesh ................... -• 0 -34 0-47(+ 3 8 -9 1 )
0-63 (+ 3 5 -15)
Chandigarh
Dadra & Nagar Havels
Delhi
G oa, Dam an and D iu
Lakshdweep
Pondicherry
Mizoram
India
— ( i ) «3 o « ;f >n'y 1^1 ^ 3 t e d » dN ote—<i) Figures In Brackets show percentage growth o f Pc
0-02 0-02 0-02 0-02 0-02 0-02 0-12 0-26 0-45(— 16 -07) (— 1 -65) ( + 9 10) (+ 1 4 11) (+ 7 -4 7 ) (+ 3 9 4 13) (+ 1 1 4 -5 9 ) (+ 7 5 -55)
0 -02 0-03 0-03 0 04 0 04 0 04 0 06 0 07 0-10(+ 1 9 -5 2 ) (+ 6 -9 9 ) (+ 2 3 -23) ( + 5 -70) ( + 2 -70) (+ 3 9 -5 6 ) (+ 2 7 -9 6 ) (+ 3 9 -78)
0-41 0-41 0-49 0-64 0-92 1-74 2-66 4-07 6-22(+ 1 -93) ((+18-03) (+ 3 0 -2 6 ) (+ 4 4 -27) (+ 9 0 -0 0 ) ( + 5 2 -44) (+ 5 2 -9 3 ) (+ 5 3 -00)
0-51 0 -52 0-50 0-54 0-58 0-60 0-63 0-86 1 -09(+ 2 -3 1 ) ( - 3 -53) (+ 8 -1 5 ) ( + 7 -76) (+ 2 -1 1 ) (+ 5 -1 4 ) (+ 3 6 -8 8 ) (+ 2 9 '69)
0-01 0-01 0-01 0 02 0-02 0-02 0-02 0 03 0 04(+ 4 -8 5 ) ( - 6 - 3 1 ) (+ 1 7 -6 2 ) (+ 1 4 -4 3 ) (+ 1 4 -6 0 ) (+ 1 4 -6 1 ) (+ 3 1 -9 5 ) (+ 2 8 -53
0-25 0-26 0-24 0-26 0-29 0-32 0-37 0-47 0-60(+ 4 -3 9 ) ( - 5 -06) (+ 5 -9 3 ) (+ 1 0 -3 4 ) (+ 1 1 -3 1 ) (+ 1 6 -3 4 ) (+ 2 7 -8 1 ) (+ 2 8 -1 5 )
0-33 0-49 ( + 4 8 -55)
238-40 252 09 251*32 278-98 318-66 361-09 439-23 548-16 685-18( + 5 -75) ( - 0 - 3 1 ) (+ 1 1 00) (+ 1 4 -2 2 ) (+ 1 3 -3 1 ) (+ 2 1 -5 1 ) ( + 2 4 -80) (+ 2 5 00)
o f Population. Source —Registrar-General o f India.( ii) 1941— 51 >H§ 1951— 61 ^ ^ 3 FTOt 4 3 ^ 3 0^23 HH* ^ f;lSf3^AH^dr ^ ^
1951 f e B c r a ^ S l ^ H t f e n l H 3 i 3 H o f I (ii) lo working out percentage decade variation for India, 1941— 51 and 1951— 61 the population o f Thensang, district o f Nagaland was not taken into @Prosected account as the Ctnsus in this area were conducted in 1951 for the first time and the figures are not comparable.
■nc
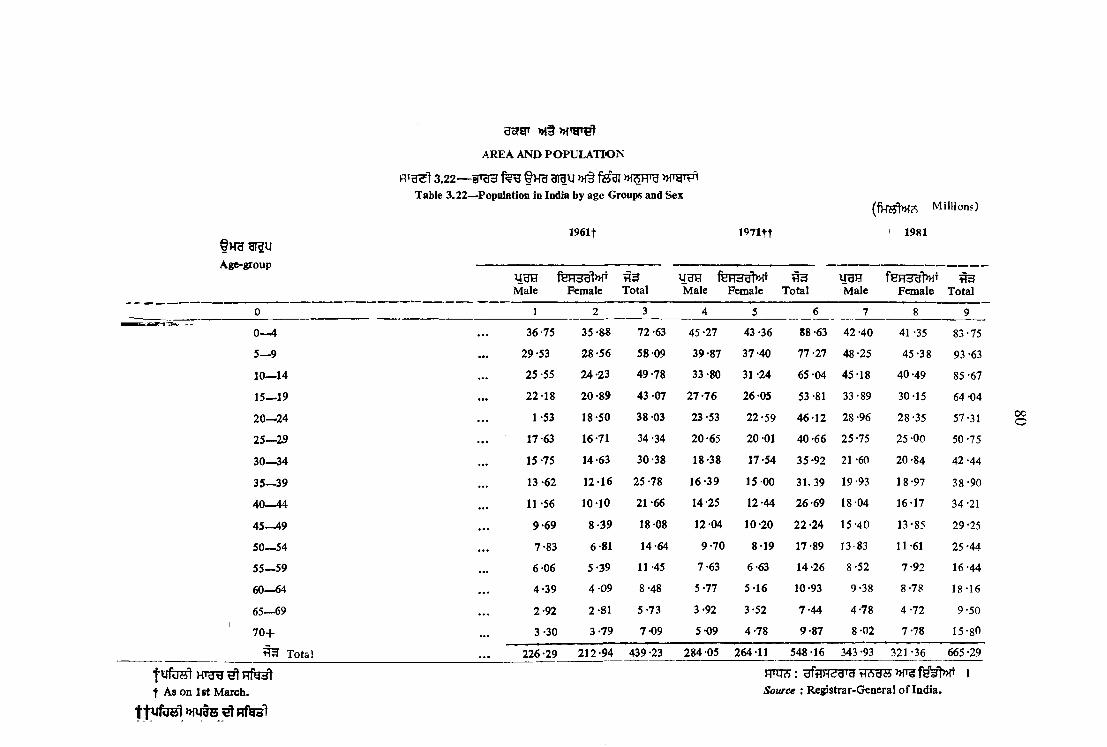
§ H g ^ u
Age-group
t A s on 1st March.
W i t s ^ H t e t
AREA AND PO PU L A T IO N
3 .2 2 — STO3 f n g m n » f t fe"gi w t bTable 3 .22—Population in India by age Groups and Sex
1961t 1971tt
(fH H t»R MilHon.O
' 1981
feHddl>3ff M ale Female Total
UjdE feH3g1>HT M ale Fem ale Total M ale Fem ale Total
93mx-0 —4 36-75 35 -88 72 -63 45 -27 43-36 88 -63 42 -40 41 -35 83-75
5—9 29 -53 28 -56 58-09 39-87 37-40 77-27 48-25 45-38 93 -63
10— 14 25 -55 24-23 49-78 33 -80 31-24 65-04 45-18 40 -49 85 -67
15— 19 22-18 2 0 -8 9 43 -07 2 7 -7 6 26-05 53 -81 33-89 30-15 64 -04
20—24 1-53 18-50 38-03 23-53 22-59 46-12 28 -96 28-35 57-31
25—29 17-63 16-71 34-34 20-65 20-01 40 -66 25-75 25-00 50-75
30— 34 15 -75 14-63 30-38 18-38 17-54 35-92 21 -60 20-84 42 -44
35—39 13 -62 12-16 25 -78 16 -39 15-00 31 .39 19-93 18-97 38-90
40— 44 11 -56 10-10 21 -66 14-25 12-44 26-69 18 04 16-17 34-21
45—49 9-69 8 -3 9 18-08 12-04 10-20 2 2 -2 4 15-40 13-85 29 -25
50— 54 7-83 6-81 14-64 9 -7 0 8-19 17-89 13-83 11-61 25 -44
55— 59 6-06 5-39 11 -45 7-63 6-63 14-26 8-52 7-92 16-44
60— 64 4 -3 9 4 -0 9 8-48 5-77 5-16 10-93 9-38 8-78 18-16
65— 69 2-92 2-81 5-73 3-92 3-52 7-44 4-78 4 -72 9-50
7 0 + 3 -30 3 -79 7-09 5-09 4-78 9-87 8-02 7-78 15-80
Total 226-29 212-94 439 -23 284-05 264-11 548-16 343 -93 321-36 665 -29
PTHT : ■dfdH^arrg f8¥t>HT
Source : Registrar-General o f India.
oco

^ > H o ?
gsrar >Ht>HTgT^
AREA AND POPULATION
F T 3 ^ 3 .2 3 — FPTO § VRfe? ^ ^ «fS3T >H§ fS 3I
Table 3.23—Population, Sex Ratio, and Density o f Selected Countries.
81
3 T S ^ ht<5 f tr s H te g( 0 0 0 ) U |5 3 t
Nam e o f Country Census Total popula- Sex Density o f Popula-Year tion (000) Ratio* tion per Sq. K m .
1
1. »TTT3§s1>nT** Australia** 1981 14,576tt 1,006 2
2 . HHHtBurma 1983 35,314 1,016 52
3 . o iX y' Canada 1981 24,343 1,017 2
4 . J j & V Srilanka 1981 14,848 962 226
5 (of) China (Mainland) 1982 10,31,883 N ,A . 108
6 . (13.§.»1T3) Egypt (U .A .R .) 1976 36,626 964 37
7 . France 1982 54,335 N .A . 97
8 ( oT) (V 3H ) (a) Germany (East) 1981 16,706 1,128 154
( y ) (b) Germany (West) 1970 ^60,651 1,101 244
9 . S 'd d India 1981 6,85,185 933 216
1 0 . Japan 1980 1,17,060 1,033 310
11 UTf^H3T3 Pakistan 1981 84,254 905 106
1 2 fe g r d * 3 U .K . 1981 53,678 1,060 228
1 3 »w^5rT U .S ..A . 1980 2 ,26 ,546 1,059 74
1 4 gr? U .S .S .R . 1979 2,62,436 1,145 12
RHjs: 3"3for)HT irus»j?jHtfeFrf35rR btk HiTS IndiaSource', Hand o f Population Statistics C e n su s o f India.
*1000 fui trST?5t>HtFem ales per 1000 males
t f
N A N o t avilable
>HTUTft
Provisional
^ 5 3 ,7 8 ,6 2 7 »I§ >Torg ^ » T g i ^ ^ I
T he to la l population o f China ind udes a population o f 53,78,627 for H ongkong and M acau.

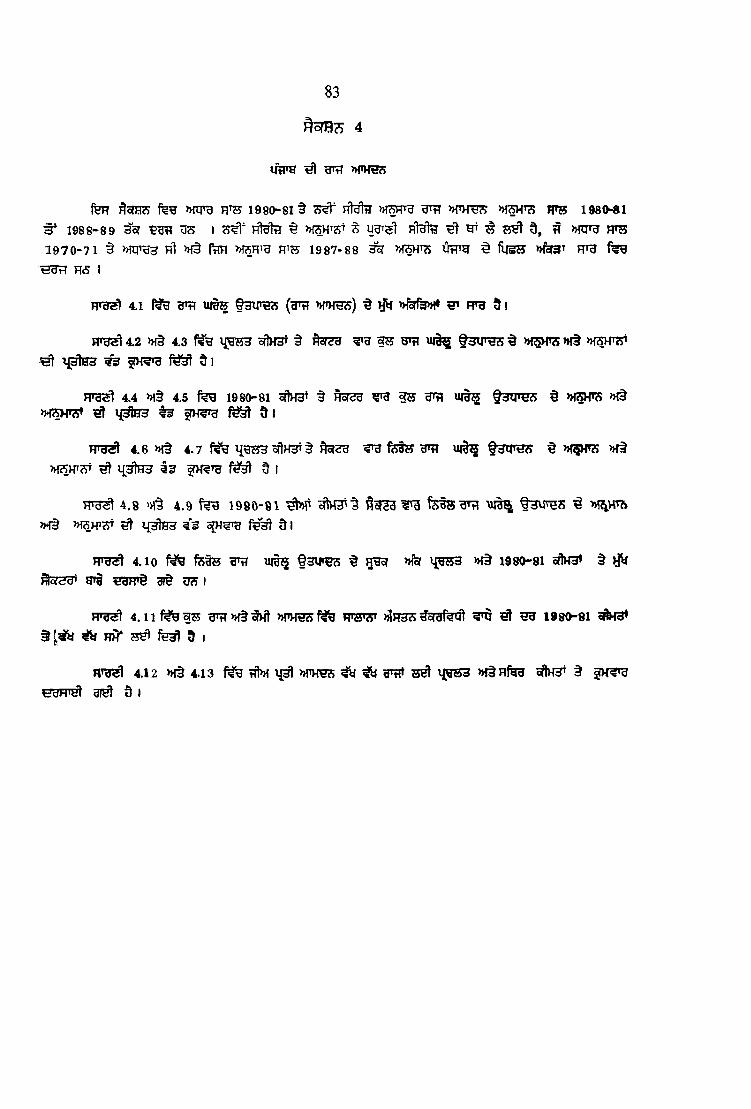
l i m ^ ^ »r>rej5
fen i980-8i§ ^ rMtr »fSH ^ »f vp frs i980-«i^ 1988-89 3"cr ^3 I ^ ^ nlgte ^ ^ ^ d , ^ WJ^h rth
1970-71 § h1 M§ fRH H’75 1987-88 ^ IfflTg ^ fyg^5 )>f^T
HUtT H6 I
FHB< 4.1 9^ Uife §3ire?5 (g t? »T>f5S) ^ rfi| >HSrfg>Ht FTO I
H»g^ 4.2 >nt 4.3 1{BB3 of)H3» § § S UiH ^ »fSH»<5 >H§^ ^J3lH3 ^ 1 1
4.4 >H§ 4.5 1980-81 o f to § ^ ^ HRf? U j|^ fHlTCS § »f5H»?5 >H§^ # 5 d l
4.6 >H§ 4.7 ^ ^ feSs g»t? Ult t >H5H»S >HtMc5K'<^ ^ liHtHH 4 3 0 |
HTH^ 4.8 4.9 1980-81 ^ ^ \ « ^ f3VF575 ^>H§ ^ MHh33 5 I
4.10 ftSBH ura §3X1^ § nfer {3H3 1980-81 oftH3< t ^^5T3^ g»0 B3H»§ clf§ US I
4.11 gr;?M§^ »f*H^f^ m m >)iH33€oraf ^ ^ ^ 1980-81 sflH3*^ 9 I
4.12 >H§ 4.13 tfl>H »W3?5 ^ ^ MJ3S3 »ftHfeg31^ 5 I
83
4

SECTION IV
STATE INCOME OF PUNJAB
The estimates of St^te Income given in this section pertain to New Series with base year 1980-81 and for the years 1980-81 to 1988-89. The New Series thus replaces the estimates as per existing series with base year 1970-71 available upto to the year 1987-88 and given in the earlier Statistical Abstracts of Punjal).
Table 4.1 shows the summary results of the State Domestic Product (State Income).
Table 4.2 and 4.3 show sector-wise estimates of Gross State Domestic Product at current prices and their pwcentage distribution respectively.
Table 4.4 and 4.5 show sector-wise estimates of Gross State Domestic Product at 1980-81 prices and their percentage distribution respectively.
Table 4.6 and 4.7 show sector-wise estimates of Net State Domestic Product at current prices and their percentage distribution respectively.
Tabla 4.8 and 4.9 show sector-wise estimates of Net State Domestic Product at 1980-81 prices and their percentage distribution respectively.
Table 4.10 shows the indices o f Net State Domestic Product by major sectors at current and at 1980-81 [prices.
T&We 4.11 shows the average animal compound growth rate of Gross State/National Income at 1980-81 prices for different periods.
Table 4.12 and 4.13 show Per Capita Income of various States of the country at current and at constant prices respectively.
84

PER CAPITA STATE INCOME AT CURRENT PRICES
8000
6000 -
4000 -
2000
(P ) « PROVISIONAL (Q)=»QUICK
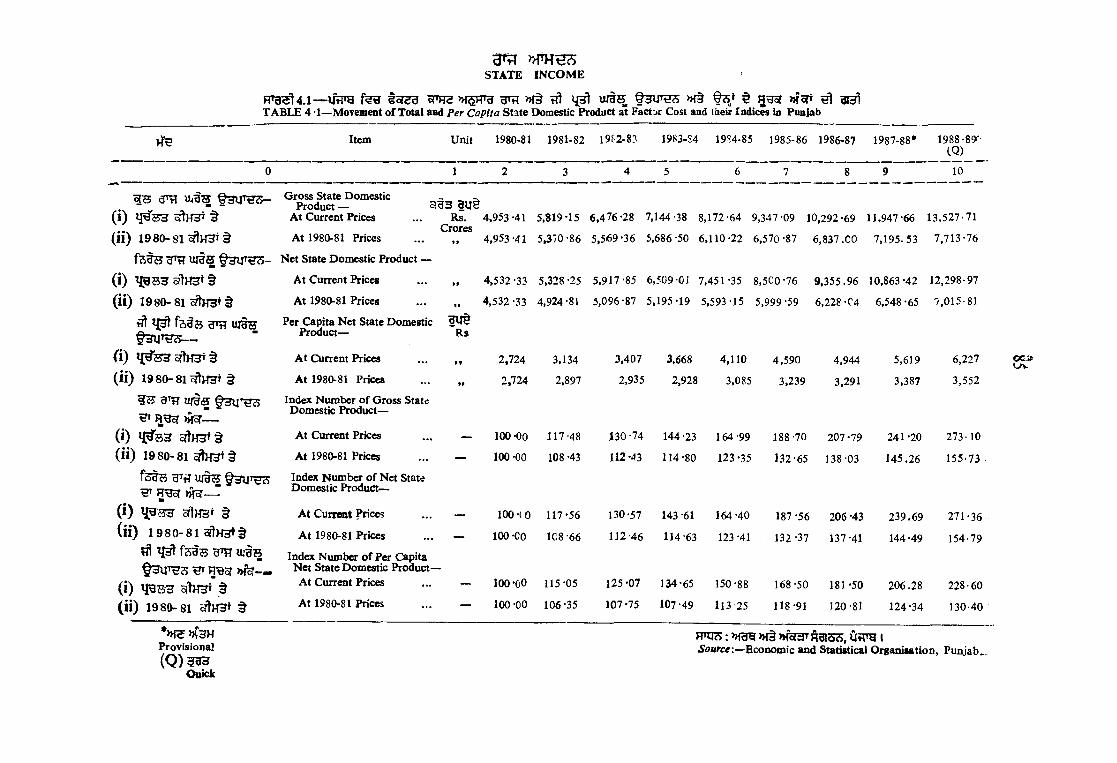
T OSTATE IN C O M E
R T a ^ 4 .1 — -UrFa o i r o >H5Pra gr;i » f§ tfl w i t s f a u r ^ >K§ f?5* ^ ?>fc(T ^TABLE 4 -1— Movement o f Total and Per Capita State Domestic Product at Factor Cost and their Indices b Punjab
Item U nit 1980-81 1981-82 19J-2-83 1983-84 1954-85 1985-86 1986-87
1 8
1987-88*
~ 9
1988-89^-_CQ)_ _
10
Gross State Dom estic Product —
( l ) STTH T 3 A t Current Prices
( i i ) 1 9 8 0 -8 1 oflHHT§ At 1980-81 Prices
u j t s f 3 i r ^ - N et State Dom estic Product
(i)(ii) 1980-81 ^H3+§
flt ^§3U T H 3—
(i) ^.^5)3 §( ii) 1980-81 oftHHt §
IS ? e u l ir a s
Hr —
(i) ^ H 3 ^ t(ii) 1980-81
fS 3 B U|§?5 Index Number o f N et StateBT Dom estic P ro d u d t-
g t 3 BU§Rs. 4,953-41 5,819*15 6 ,476-28 7,144-38 8,172-64 9,347-09 10,292*69 11,947-66 13,527-71
Crores4,953-41 5.370-86 5,569*36 5,686-50 6 ,110-22 6 ,570-87 6 ,8 3 7 .CO 7 ,1 9 5 .5 3 7 ,713-76
A t Current Prices
A t 1980-81 Prices
Per Capita N et State Dom estic Product—
A t Current Prices
At 1980-81 Prices
Index Number o f Gross State Dom estic Product—
At Current Prices
At 1980-81 Prices
4.532-33 5,328-25 5 ,917-85 6 ,509-0] 7 ,451-35 8.5C0-76
4.532-33 4,924-81 5,096-87 5.195-19 5,593-15 5,999-59
9 ,3 5 5 .9 6 10,863-42 12,298-97
6 ,228-04 6,548-65 7,015-81
Rs
(i) c^H5T §
( i i ) 1980-81 o?}H3#§
Hr » f e — .
( i) glHHT §( i i ) 1980-81 sftHHT §
Provisional(Q )3 9 3
Quick
A t Current Prices
A t 1980-81 Prices
Index Number o f Per Capita N et State Dom estic Product—
At Current Prices
At 1980-81 Prices
2.724
2.724
100*00
100 -00
100*10
100-00
100 *00
100-00
3,134
2,897
117-48
108 -43
117*56
108-66
115*05
106*35
3,407
2,935
130 -74
112*43
130-57
112-46
125*07
107*75
3,668
2,928
144 -23
114-80
143 -61
114-63
134-65
107-49
4,1103,085
164-99
123*35
164-40
123 -41
150-88
113 25
4 ,590
3,239
188-70
132-65
187-56
132 -37
168-50
118-91
4,944
3,291
207 *79
138-03
206 -43
137-41
181*50
120-81
5,619
3,387
241 *20
145.26
239 .69
144*49
206 .28
124*34
6,227
3,552
273-10
155-73
271-36
154-79
228-60
130-40
FTO3: >Mcra » {§ nfoJcJ' Hdl6A, OflTO ISource:—Econom ic and Statistical Organisation, Punjab.
OC-i»
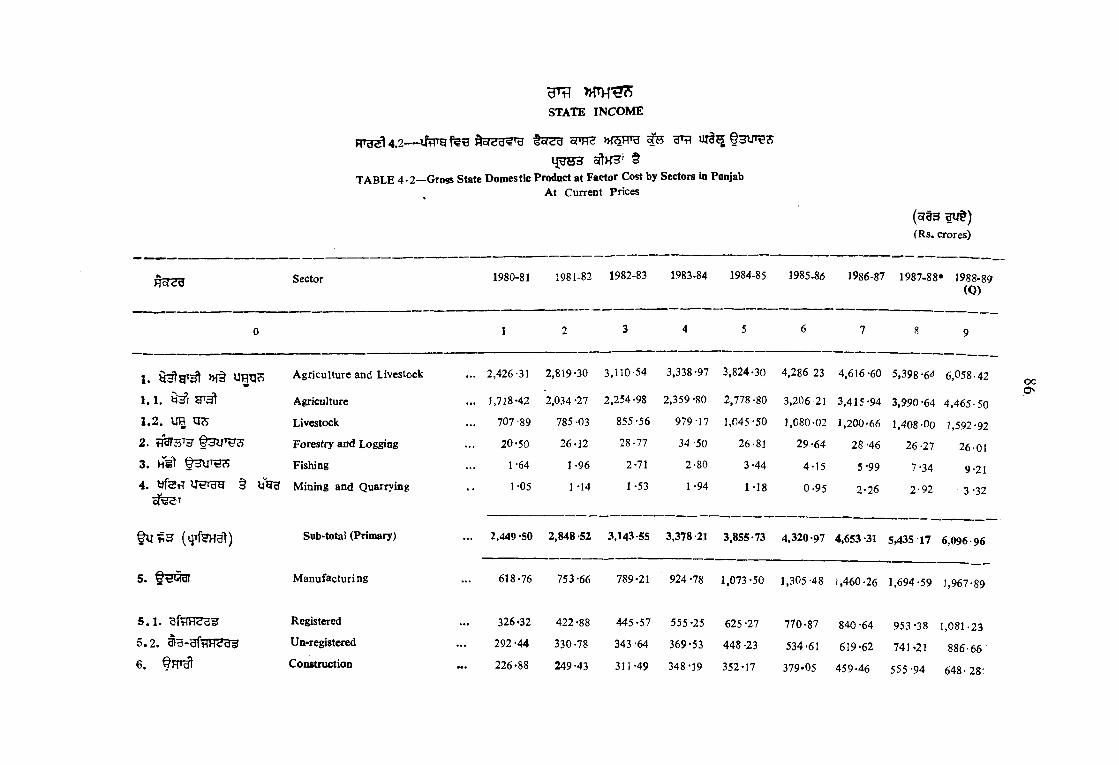
STATE IN CO M E
F Tg ^ 4 . 2 — t STe U 5fTO ^ 3 ^ J1T§?5
TABLE 4 -2 —Gross State Dom estic Product at Factor Cost by Sectors In PonjabAt Current Prices
(Rs. crores)
Sector 1980-81 1981-82 1982-83 1983-84 1984-85 1985^6 1986-87 1987-88* 1988-89 ( 0 )
0 1 2 3 4 5 6 7 8 9
1. >H§ m v R i Agriculture and Livestock ... 2,426-31 2,819-30 3,110-54 3,338-97 3,824-30 4,286 23 4,616-60 5,398 -64 6,058-42
1 .1 . Agriculture ... ],7 ]8 -42 2,034 -27 2,254-98 2,359 -80 2,778-80 3,206 21 3,415-94 3,990 -64 4 ,465-50
1 .2 . IW ViTi Livestock 707 -89 785 -03 855-56 979-17 1,045-50 1,080-02 1,200-66 1,408-00 1,592-92
2. Forestry and Logging 20-50 26-12 28-77 34 -50 26-81 29-64 28-46 26-27 26-013 . Hg^ Fishing 1 -64 1-96 2-71 2-80 3-44 4-15 5-99 7-34 9-214 . § l ik u M ining and Quarrying 1-05 1 -14 1 -53 1 -94 1-18 0-95 2-26 2-92 3-32
(qT feH al) Sub'tota! (Primary) ... 2,449-50 2,848-52 3,143-55 3,378 -21 3,855-73 4,320-97 4,653 -31 5,435 17 6 ,096-96
5 . 9 ^ ^ M anufacturi ng 618-76 753-66 789-21 924-78 1,073-50 1,305 -48 1,460-26 1,694-59 1,967-89
5 . 1 . Registered 326*32 422-88 445-57 555-25 625 -27 770-87 840 -64 953 -38 1,081-235 , 2 . 3)U-3fVlH<?dsJ Un*registered 292-44 330-78 343 -64 369*53 448 -23 534-61 619-62 741.21 886-666 . f r r ^ Construction 226 -88 249-43 311-49 348-19 352-17 379*05 459-46 555-94 648- 28:
ocO,

7 . Electritity, G as and Water Supply . 133-04 142-07 165 -28 188 -69 220 -77 287 -26 308.10 366 -03 413-17
^ HH Sub-Total (Secondary) 978 *68 1,145-16 1.265-98 1,461 -66 1,646 '44 1.971 79 2,227-82 2,616 -56 3,029-34
8 .a a r g
Transport, Storage ana Communication 128-46 158-97 189-47 208 54 219-27 263-13 308-28 373 -26 444-55
9. ^ ’3 , » !§ Trade, Hotels and Restaurants 658 -44 823 -25 907 -35 1,011-67 1.206 -43 1,446-89 1,599-17 1.804 -26 2,014-82
{ § )HHrg 7>j§
(a) Sub-Total ; Transport, Communication and Trade 786 .9 0 982 -22 1,096-82 1,220-21 1.425 -70 1,710 -02 1.907 -45 2.177-52 2,459-37
1 0 . Banking and Insurance 115-7] 161-94 212-60 235-78 286-52 283-31 341 -23 385-81 436-20
1 1 . ? 'H 3 r^ h \i^ , Uid» ^ » i§
Real Estate, Ownership o f Dwellings and Business Services 227-32 246-51 263-01 279 -41 298 -73 320-78 343 -32 368-19 394-85
<»f) » f§ (b) Sub-Total: Finance and Real E state 343 -03 408 -45 475 61 515 -19 585 -25 604 09 684 -55 754-00 831-05
1 2 . ^ ^ S ? > Public Administration 142 -95 148 -57 170-00 190 -C6 233 40 264-87 306-03 369-17 445-33
1 3 . O'd » i§V
Other Services and Sanitary Services.,. 252-35 286-23 324 -32 379-05 426-12 475-35 513-53 595-24 665-66
(^ ) : RHUSf >H§ (c) Sub-Total ; Community and Personal Services 395 -30, 434 -80 494-32 569 11 659 -52 740 -22 819 -56 964-41 1,110 99
( @ + » I+ S )
1 4 . : 1?5 H TT U4§« tnuTH s
Sub-Total (Tertiary) (a-hb-i-c)
1,525 -23 1,825 -47 2,066-75 2,304 -51 2,670 -47 3.054 -33 3,411 -56 3 ,895-93 4,401-41
T ota l; Gross State Domestic Product 4.953 -41 5,819 15 6,476 -28 7,144*38 8,172 -64 9.347-09 10,292-69 11.947-66 13,527-71
^ »for3T f r t s s , i
Provisional Source : Economic and Statistical Organisation, Punjab.
(Q)Quick
oo'-j

STA TE i n c o m e
4.3— UVfTg loT^g oTTHe ^,'S W w a s @HUT^ ^ 5Tt>i3t ^
TABLE 4.3 —Percentage Distribution o f Gross State Dom estic Product at Factor Cost by Sectors in PunjabAt Current Prices
( > f ^ 3 )
(Per cent)
Sector 1980-81 1981-82 1982-83 1983-84 1984-85 1985-86 1986-87 1987-88* 1988-89(Q)
0 1 2 3 4 5 6 7 8 9
I. Agriculture and Livestock 48 -98 48 -45 48 -03 46 -73 46-79 45 -86 44-85 45-19 44-79
1.1. Agriculture 34 -69 34 -96 34 -82 33 -03 3 4 -CO 34-30 33-19 33 -40 33-01
1.2 . URlj*- Livestock 14 -29 13-49 13-21 13-70 12-79 11 -56 11 -66 11-79 11-78
.2. ^ 3 1 ® ^ Forestry and Logging 0-42 0-45 0-45 0-48 0-33 . 0-32 0-28 0-22 0-19
.3. Fishing 0 03 0 03 0-04 0 -04 0-04 0-04 0-06 0-06 0-07
•4. U tJ'dy § M ining and Quarrying 0 02 0 -02 0-02 0-03 0-02 0-01 0-02 0-02 0-02
§ u (H'fenal) Sub-Total (Primary) 49 45 48 95 48 54 47-28 47-18 46-23 45 21 45 49 45 07
5. Manufacturing 12-49 12 -95 12-19 12-94 13-14 13-97 14-19 14-19 14-55
5.1 . Registered 6-59 7-27 6-88 7-77 7-65 8-25 8-17 7-99 7-99
5.2. ^«3-gfFrH2g^ Unregistered 5-90 5-68 5-31 5-17 5-49 5-72 6 02 6-20 6-56
6. § H T ^ Construction 4-58 4 -2 9 4-81 4-88 - 4-31 4-06 4 -46 4-65 4-79
7. » {§ TT^l{^q Electricity, G as and W ater Supply 2-69 2-4 4 2 -55 2*64 2 -7 0 3-07 2 -99 3-06 3-05
§ U ( R 3 ^ ) Sub-Total (Secondary) 19-76 19 -68 19 55 20 -46 20-15 21-10 21 64 21 -90 22-39
>8. <id'HU^, Mt Transport. Storage and Communication 2-59 2-73 2-93 2-92 2-68 2-81 3 -00 3-13 3-29
9. »T§ Inside/r\\ zrs - .
Trade, H otels and Restaurants 13-29 14-15 14-01 14-16 14-76 15-48 15-54 15-10 14-89
(Vj §u-fl3 : (a) S u b -T o ta l: Transport, Communication andAtJ'd »!§ Trade 15-88 16 88 16 -94 17 -08 17 -44 18-29 18 -54 18 -23 18-18
oa00

1 0 . )}f§ gtH '
u . A u ^ , uraT
Banking and Insurance
Real Estate, Ownership o f D w elling and Business Services
'2 - 3 4
4 -5 9
2 -78
4 -2 4
3-28
4 -06
3-30
3-91
3-51
3-65
3-03
3*43
3-32
3-33
3-23
3-08
3-23
2-92
(>h) fb) Sub-Total : Finance and Real Estate 6 93 7 02 7-34 7-21 '^■16 6-46 6 65 6-31 6 15
<;S'Hdl*cO! HMcSl
12 .
13.
Public Administration
Other Services and Sanitary Services
2-89
5-09
2 -5 5
4 -9 2
2-62
5-01
2-66
5-31
2-86
5-21
2-83
5-09
2-97
4.993-09
4 -98
3-29
4-92
( e ) § U - f l3 : HHfUor >H§
fStTt(c) Sub-Total : Community and Personal
Services7 -98 7 .4'r 7 63 7-97 8 07 7 -92 7 -96 8 -07 8 21
§14■ ( § + m + h )
14. : %75 dM UIBH
©3UTH5
Sub-Total : Tertiary (a -t-b+ c) 30 -79 31 -37 31-91 32 26 32-67 32-67 33 15 32 61 32-54
Total : Gross State Domestic Product 100 00 100 OD 100 00 100 00 100 -00 100-00 100-00 100 -00 100-00
♦ » 1S >M3H : »>fug >H§ >H5r3T RdlicS'
Provisional.
(Q) 333Quick
Source : Econom ic and Statistical Organisation, Punjab.

STATE IN CO M E
R T g ^ 4 .4 — UtTO ^ c r 3 g ^ t o f 5 U c P R 2 » f 5 H T U g H t 5 t r e s
F j f^ ( l 9 8 0 - 8 l ) o f t H ^ t TABLE 4 -4 —Gross State Domestic Product at Factor Cost by Sectors in Pnnjab
At Constant (1980-81) Prices(3Tt3 g u § ) (Rs. Crores)
Sector 1980-81 1981-82 1982-83 1983-84 1984-85 1985-86 1986-87 1987-88* 1988-89(Q )
I. y3^ UHTJ5 Agriculture and Livestock 2,426-31 2 ,695-02 2,781*98 2,758-89 3,071-39 3,326-69 3,316-30 3,467-25 3,731-63
1.1 y 'd l Agriculture ... 1,718-42 1,930 -40 1,992 -07 1,921-97 2,198 -75 2,389-05 2,319-48 2,428-69 2 ,627-04
1.2 Livestock ... 707-89 764-62 7 8 9 -9j 836-92 872 -64 937-64 996 -82 1,038-56 1,104-59
2. Forestry and Logging ... 20-50 20 -23 18-79 19-27 18-17 16-37 15-38 12-15 10-63
3. Fishing 1 -64 1 -67 1 -81 1-84 1-79 1-89 2-23 2-83 3-12
4. tffe^ ru tJ 'd y t i l f g g Mining and Quarrying 1 -05 1 -14 1 -53 1.94 1-16 0-94 2-25 2-80 3 0 8
t u Sub-Total (Primary) ... 2,449-50 2,718 -06 2,894 -11 2,781 -94 3,092 -51 3,345 -89 3,336 -16 3,485-03 3,748-46
5. M anufacturing 618-76 706 -06 730 -80 785-84 856 -02 967 -49 1,043-63 1,121-42 1,206-42
5.1 Registered ... 326-32 400-10 418-70 482 -32 510-78 583-87 616-74 644-68 673-88
5.2 Un-registered ... 292-44 305-96 312 10 303 -52 345 -24 383-62 426 -89 476 -74 532-54
Construction ... 226-88 223-16 218-62 229-19 210-16 215-82 236-68 255-16 272-31
7 . ^ Electricity, Gas and Water Supply ... 133-04 142-88 159 08 175-36 178-30 211 -55 247 -03 257-04 283-34
(HifsSdl) Sub-Total (Secondary) 978 -68 1 ,072-10 1 ,108-50 1,190-39 1,244 -48 1,394-86 1,527 -34 1 ,633-62 1,762 07
VOO

8 . 2a»HUg<;, >h5 Transport, Storage and Communication 128 *46 140-77 146 -80 156*13 159*88 173*75 185-87 199-63 2 1 3 -98"
hV ( 5
9 . J c fg » f§ §Hg'd*^ Trade, Hotels and Restaurants ... 658 *44 684*01 711-77 738*21 742-10 751*12 813*55 839-89 888*10
( § ) (a) Sub-Total : Transport Communica- 786 -90 tion and Trade.
824-78 858 -57 894 -34 901 -98 924 -87 999 42 1,039 *52 1,102-08
10. Banking and Insurance . .. 115*71 132*48 152-78 159-72 175-95 179-60 221 -92 242 *90 265-85
11. U[gf ^
>H§
Real Estate, Ownership o f Dwellings andBusiness Services . .. 227 *32 234-11 241*10 248 -36 255-94 263-81 271 -97 280 *43 289-15
(>H) f ^ » f § (b) Sub-Total : Finance and Real 343 03 Estate
366-59 393 -88 408 08 431-89 443 41 493 -89 523 -33 555 00
12. Public Administration ... 142*95 132*20 139-56 139-47 160-17 174-07 187.45 213-96 238-79
13. ^ »f§ F T ^ R ^ T
( 8 ) >>f§
fe tf t
Other Services and Sanitary Services 252*35 257*13 264 -74 272*28 279-19 287 -77 292 *74 300 *07 307-36
(c) Sub-Total : Community 395 *30 and Personal Services
389 *33 404-30 411*75 439 -36 461 -84 480 -19 514 *03 546-15
§ y (<:dwut) ( § + » f + u )
Sub-Total (Tertiary) ... 1,525 -23( a + b + c )
1,580 *70 1,656-75 1,714 -17 1 ,773 -23 1,830 -12 1,973 *50 2,076 *88 2,203-23
14. ^ T otal: Gross State Domestic Prodact... 4,953-41 5,370 *86 5,569 >36 5,686 -50 6,110*22 6,570 -87 6,837 -00 7,195-53 7,713-76
»f3H FTOcS: — I
Provisional Source :—Economic and Statistical Organisation, Punjab;(Q) 333
Quick

m j
4.5— utTH is r?g sroa »bhth t o w is § 3 W ^ ^ ijsfnj iw Frfgg (1980- 81) sftHHt§TABLE : 4.5— Percenfa Distribatkm of Gross State Domestic Product at Factor Cost by Sectors in Punjab
At Constant (1980-81) Prices rPp.r
STATE INCOME
(Per cent)
1980-81 1981-82 1982-83 1983-84 1984-85 1985-86 1986-87 1987-88* 1988-89Sector (Q )
1. »1§ UBTI?; Agriculture and Livestock
1.1. W3t Agriculture
1.2. URTIS Livestock
2. fl3I?5TH § J 3 U ^ Forestry and Logging
3 . § 3 U T ^ Fishing
4. yfeiFT U trrgg » 1§ M ining and Quarrying u-uz u uz x.' ' ' ' ' ' vr
---------------------- — — —----------------------------- vrrs --------------------------- ta *o(^<5'Sub-Total (Primary)
5. §H^cfT Manufacturing
5.1 UfW^^US Registered
5.2. Un-registered
6 . @ FP^ Construction
7 . »T§ Electricity, Gas and Water Supply
§.U-fl3 (h^=3^) Sub-Total (Secondary)
8 . >H§ HHrg Transport, Storage and Communication
9 . U e S » f§ l R ^ ^ Trade, H otels and Restaurants
( ^ ) Sub-Total : Transport, Communication and
1 2 3 4 5 6 7 8 9
48-98 50-18 49-95 48-52 50-26 50-63 48-51 4 8 -19 48-38
34-69 35-94 35-77 33-80 35-98 36-36 33-93 33-75 34 -06
14*29 14-24 14-18 14-72 14-28 14-27 14*58 14-44 14-32
0-42 0 -38 0-34 0-34 0-30 0-25 0-23 0 -17 0 -14
0-03 0-03 0-03 0-03 0-03 0-03 0-03 0 -0 4 0 -0 4
0-02 0-02 0-03 0-03 0-02 O-OI 0-03 0 -0 4 0 -0 4
49-45 50-61 50-35 48-92 50-61 50-92 48-80 48-44 4 8 -60
12-49 13-15 13-12 13-82 14-01 14-73 15-26 15-58 15-64
6-59 7-45 7-52 8-48 8-36 8-89 9-02 8-96 8 -74
5-90 5-70 5-60 5-34 5-65 5-84 6-24 6-62 6 -9 0
4-58 4*15 3-93 4-03 3-44 3-28 3-46 3 ’55 3-53
2-69 2 -6 6 2-85 3-08 2-92 3-22 3-62 3-57 3 -6 7
. 19-76 19-96 19-90 20-93 20-37 21-23 22-34 2 2 -7C1 22-84
2 -59 2-61 2-64 2-75 2 -62 2 -6 4 2-72 2-77 2 -7 7
13-29 12-74 12-78 12-98 12-15 11-43 11-90 11-67 l l - 5 1 t
~
!. 15-88 15-35 15-42 15-73 14 -77 14-07 14-62 14-44 14-28C

1 0 .
11.^ H ?Joft»e » f t ^ T g o f
(>H) § U - S 3 , f ^ 3 >H§ ?n7?fS or R U ^
12. Hof
13.
(h ) § u - f l 5 : H)^Kisr f e n t
§ U - B 3 (2 U H ^ )( § + ^ h + f )
14. § 3 -
B a n k in g ^ l Insurance 2*34 2-47 2-74 2-81 2-88 2-73 3-24 V -3 8 3-45T
Real Estate Ownership o f Dwellings and Business Services 4*59 4-36 4-33 4 -3 7 4 -19 4*02 3-98 3-90 3-75
(b) Sub-Total : Finance and Real Estate 6-93 6*83 7 -0 7 7 18 7 -07 6 -75 7 -22 7 -2 8 7 -2 0
Public Administration 2 -89 2-46 2-51 2-45 2-62 2-65 2-74 2 -9 7 3 -1 0
Other Services and Sanitary Services 5-09 4 -7 9 4-75 4-79 4 -5 6 4 -3 8 4 -28 4 -1 7 3-98
(c) Sub-Total : Commuiity and Personal Services . . 7*98 7-25 7-26 7-24 7-18 7-03 7-02 7-1 4 7 -0 8
Sub-Total ; Tertiary (a f b + c ) 30-79 29 -43 29-75 30 15 29-02 27-85 28 -86 28 -86 28-56
Total : Gross State Domestic Product 100 00 100 00 100-00 100-00 100-00 100-00 100-00 100-00 100-00
: M u g » i§ jjfor^T RcRcScS UTfTH ?
*>HS >H3H Source : Economic and Statistical Organisation, Punjab. ^Provisional
(Q) 3^3Quick
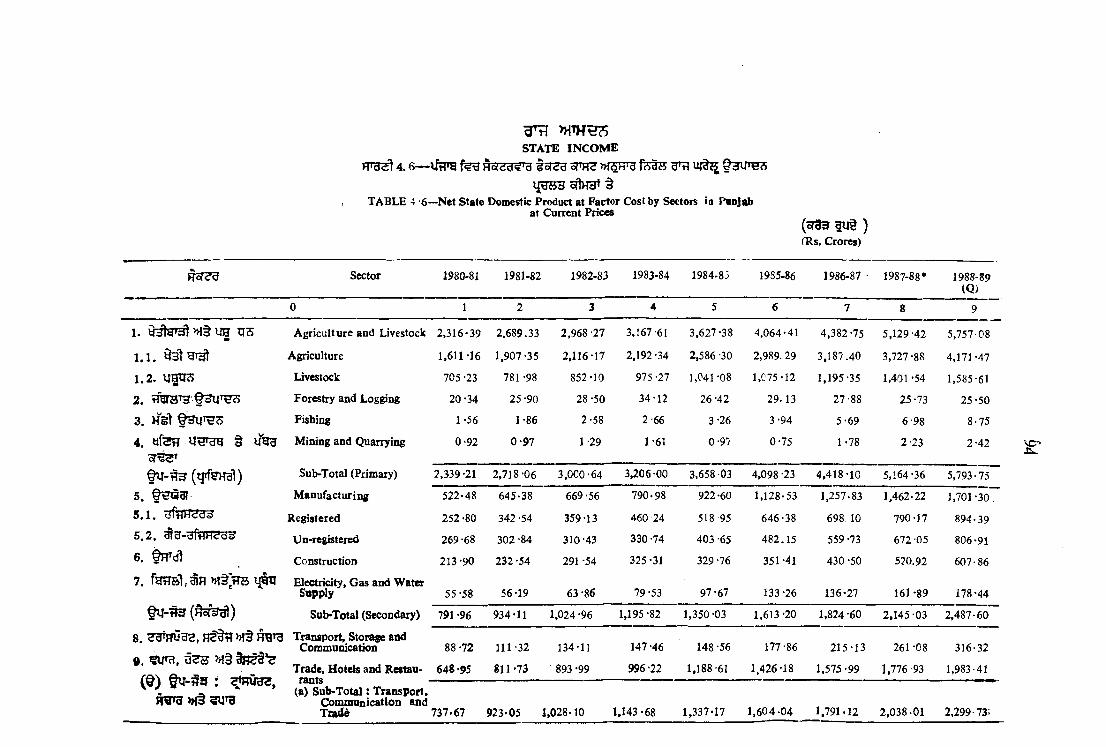
STATE IN C O M E
4.6— VfTS iof^^ oTH3 »TOT3 f e t s ^
TABLE A -6—Net State Domestic Product at Factor Cost by Sectors in Pnnjabat Current Prices
( o i ^ ) (Rs. Crores)
Ror?g Sector 1980-81 1981-82 1982-83 1983-84 1984-83 19S5-86 1986-87 1987-88* 1988-89(Q>
0 1 2 3 4 5 6 7 8 9
1. Q 3 ty T 3 !> H § u a xj7i Agriculture and Livestock 2 ,316-39 2.689.33 2.968 -27 3,167 -61 3,627-38 4,064-41 4,382 -75 5,129-42 5,757-08
1 .1 . Agriculture 1,611-16 1,907-35 2,116-17 2,192-34 2,586 -30 2,989. 29 3,187 .40 3,727-88 4,171-47
1 .2 . UHHV> Livestock 705 -23 781 -98 852-10 975 -27 1,041 -08 1,C75-12 1,195-35 1,401 -54 1,585-61
2 . t T ^ T 3 ' f 3 u ' 5 * ‘ Forestry and Logging 20 *34 25-90 28 -50 34-12 26 -42 29 .13 27-88 25-73 25-50
3 . § m i ‘t?6- Fishing 1-56 1-86 2-58 2-66 3-26 3-94 5-69 6-98 8-75
4 . t lfe r l Mining and Quarrying 0-92 0 -9 7 1-29 1-61 0-97 0-75 1 -78 2-23 2-42
Sub-Total (Primary) 2 3 3 9 -21 2 ,718-06 3.0C0-64 3,206-00 3,658 03 4,098 -23 4 ,418-10 5,164-36 5,793-75
5 . M anufacturing 522-48 645-38 669 -56 790-98 922-60 1,128-53 1,257.83 1,462-22 1.701-30,
5 . 1 . '3 ftiH ? g 5 Registered 252 -80 342 -54 359-13 460 24 518 95 646-38 698. 10 790-17 894-395 .2 . Un-registered 269-68 302 -84 310-43 330 -74 403 -65 482 .15 559 -73 672 05 806-91
6 . Construction 213-90 232 -54 291 -54 325-31 329 -76 351-41 430 -50 520.92 607-86
7 . f r r T s i , i n » !§ ,tr 5 ^|lxj Electricity, G as and Water Supply 55-58 56-19 63-86 79 -53 97-67 133-26 136-27 161-89 178-44
Sub-Total (Secondary) 791 -96 934-11 1,024 -96 1,195-82 1,350 -03 1,613-20 1,824 -60 2,145-03 2,487-60
8 . <;d'rTUU2, H ^3rl Transport, Storage and Communication
9 . ^ ,Trade. H otels and Restau-
/ * 90««4a
88-72
648*95
111 -32
811-73
134-11
893 -99
147 -46
996-22
148 -56
1,188 -61
177-86
1,426-18
215-13
1,575-99
261 -08
1,776 93
316-32
1,983-41\\S J . ^'nMOC,
fiRna > k § ^ t h
A9UA%9(a) S u b -T o ta l: Transport,
C om m unication and Tiatfe 737-67 923-05 1,028-10 1,143 -68 1,337-17 1 ,6 0 4 -0 4 1,791-12 2,038-01 2,299-73’.
S ’

1 0 . § T a 3 i ) > ,§ ^ m
1 1 . u u *
^ »1§ ^ IJ T ^
'{»!) f i r - ^ : f 9 3 » f t
i l 2 . S g iiJ 3 T I3
1 3 . ^
< e ) ; RHUcl » !§
fe fft
f u - i a ^ ( ? 3 H ^ )
( ^ + M + H )
Banking and Insurance 113*52 159-19 209 06 231*45 281*13 277*32 333 70 377*20 426-39
Real Estate, Ownership ot Dwellings and Business Services 182 -27 190 -57 197*18 204 -48 215*42 228-48 238*11 255-36 273-85
(b) S u b -T o ta l: Financeand Real Estate 295 -79 349 -76 406-24 435 *93 496 -55 505-80 571-81 632-56 700-24
Public Administration 125 -27 129*17 147. 34 164*55 202 08 226 -53 262 -22 319-11 388-34
Other Services and San itary Services 242 -43 274 -10 310*57 363 *03 407 -49 452 -96 488 -11 564 .35 629-31
(c) S u b -T ota l; Communityand Personal Services 367 -70 403-27 457-91 527-58 609-57 679-49 750 -33 883-46 1,017-65
Sub-Total (Tertiary) 1,401 •! 6 ( a + b + c )
1.676-08 1,892 *25 2,107*19 2,443 -29 2,789 33 3,113-26 3 ,554 .03 4,017-62
Total : N et State D om estic Product 4,532 -33 5,328 -25 5,917-85 6,509 -01 7,451*35 8,500 -76 9,355 -96 10,863 .42 12,298-97
Per Capita N et State Dom estic Product—
(Per Capita N et Income) R s 2,724 3.134 3,407 3,668 4,110 4,590 4,944 5,619 6,227
■otyt
*>H^>Jf3H R T g s;— M 5r3rH 3I5S, UrFg IProvisional. Source . —Economic and Statistical Organisation, Punjab.
( Q ) u u sQuick*
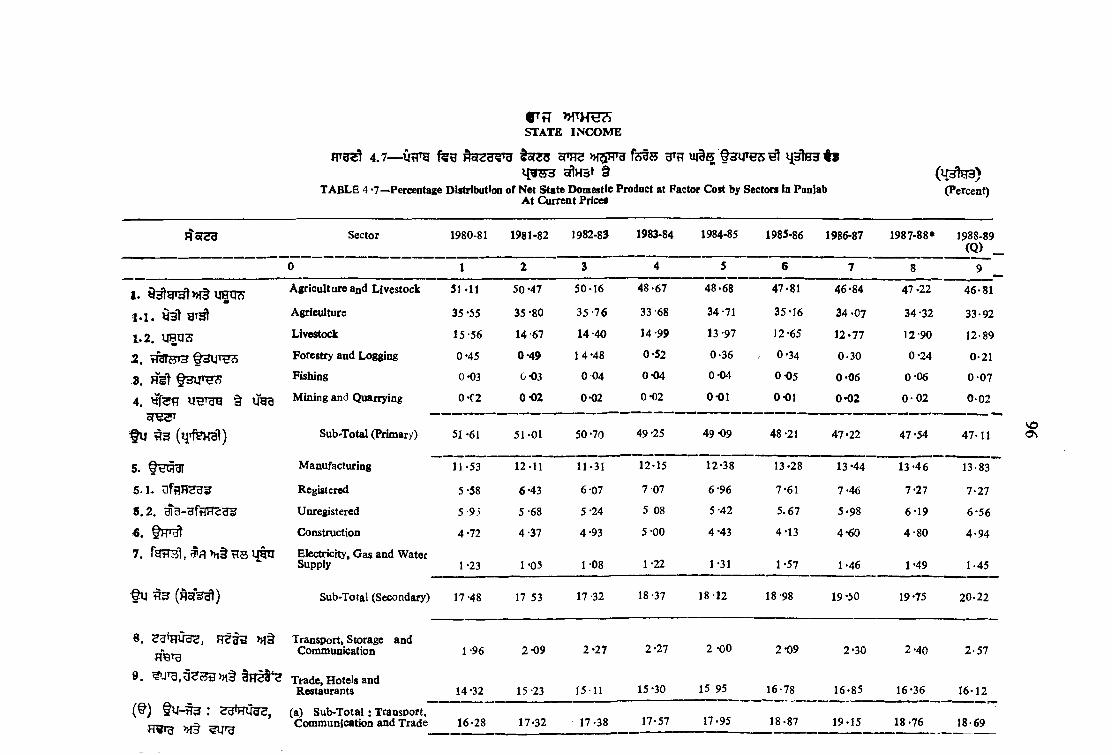
r f iSTATE IN C O M E
4 .7 — urTSf f?g m r z >n^Fra f e t s u j l^ f g i r g s ^ i j5 te 3 t»l ( ^ H 3 oflHSt §
TABLE 4 *7—Percentage Distrtbution o f Net State Domestic Product at Factor Cost by Sectors in PanlabA t Current Price*
( U ^ )
p ercen t)
H y 2 a Sector 1980-81 1981-82 1982-83 1983-84 1984-85 1985-86 1986-87 1987-88* 1988-89 (Q ) _
0 1 2 3 4 5 6 7 8 9 _
1. ir a q ^ Agriculture and Livestock 51-11 50 *47 50-16 4 8 -67 48-68 47-81 46-84 47 -22 46-81
1 .1 . Agriculture 35 *55 35 *80 3 5 -7 6 33 68 34 -71 35-16 3 4 -0 7 34 *32 33-92
1 .2 . UHQS Livestock 15-56 14-67 14 -40 14-99 13-97 12-65 12-77 12-90 12-89
2 . rl3Tyfi3 Forestry and Logging 0-45 0*49 1 4 -4 8 0-52 0-36 0 *34 0 -3 0 0 -24 0-21
8 . H gt fg iT H ? ? Fishing 0*03 G-03 0 04 0-04 0-04 0-05 0 -0 6 0*06 0 -0 7
4 . § 14%3 M ining and Quarrying 0-C2 0 -0 2 0-02 0-02 0-01 0-01 0 -0 2 0 - 0 2 0 -0 2
f u Sub-Total (Primary) 51 -61 51-01 50 -70 49*25 49-09 48 -21 47-22 47 -54 47-11
5. Manufacturing 11 -53 12-11 11-31 12-15 12-38 13-28 13-44 1 3-46 13-83
5 .1 . Registered 5-58 6-43 6-07 7 07 6-96 7-61 7-46 7*27 7-27
5 . 2 . Unregistered 5-93 5 -68 5-24 5 08 5-42 5 .6 7 5-98 6*19 6 -5 6
6 . QH'd) Construction 4-72 4-37 4-93 5 -0 0 4-43 4-13 4-60 4 -8 0 4 -9 4
7 . t o s l , >M§ tiB Electricity, G as and Water Supply 1-23 1-05 1-08 1-22 1-31 1*57 1-46 1*49 1*45
©U (H ci% ^) Sub-Total (Secondary) 17-48 17 53 17-32 18-37 18-12 18-98 19*50 19*75 20-22
8 . R e g s »!§HQTg
Transport, Storage and Conununication 1-96 2 -0 9 2 -2 7 I'll 2 -00 2*09 2-30 2-40 2 -57
9. >Ht Ttade, H otels and Restaurants 14-32 15-23 1 5 1 1 15-30 15 95 16-78 16-85 16-36 16-12
( § )
H«Tg >H§(a) S u b -T o ta l; Transport, Com m unication and Trade 16-28 17*32 17-38 17-57 17-95 18-87 19-15 18-76 18-69
VOOS

i 0 . >Ht
1 2 . SoT ijHm?;
1 3 . 5 g
i 's ) f u - ^ 3 : FTH
fSrft
( § - j - > H + E )
1 4 . t f 3 : ^
Banking and Insurance 2 -5 0 2-99 3-53 3*56 3 -7 7 3-26 3 -5 7 3 -47 3 -4 7
Real Estate, Ownership o l Dwellings and Business Sovioes
4-02 3 -5 8 3*33 3*14 2-89 2-69 2 -5 4 2*35 2-23
(b) Sub-Tota! : Finance and R eal Estate 6 -52 6-57 6 -8 6 6-70 6 -66 5-95 6-11 5 -8 2 5-70
Public Administration 2-76 2-42 2-49 2-53 1 2-71 2 -6 6 2*80 ; 2 -94 3-16
Other Services and Sanitary Services
5-35 5-15 5-25 5-58 5.47 5-33 5-22 5-19 5-12
(c) S u b -T o ta l: Community and Personal Services 8 - n 7 .5 7 7-74 - 8-11 8-18 7.99 8-02 8 .13 8-28
Sab>Total (Tertiary) ( a + b + c ) 30 91 31-46 31-9* 32-38 32-79 32-81 33-28 32-71 32-67
Total ; N et State Domestic Product 100 00 too -00 1.00 -09 100 -00 100 00 100-00 100-00 100 -03 100-00
»f3H O fp g IProvisional. Source : Econom ic and Statistical Organisation, Puiyab.
< Q ) 3 3 3 Quick,
VO--a
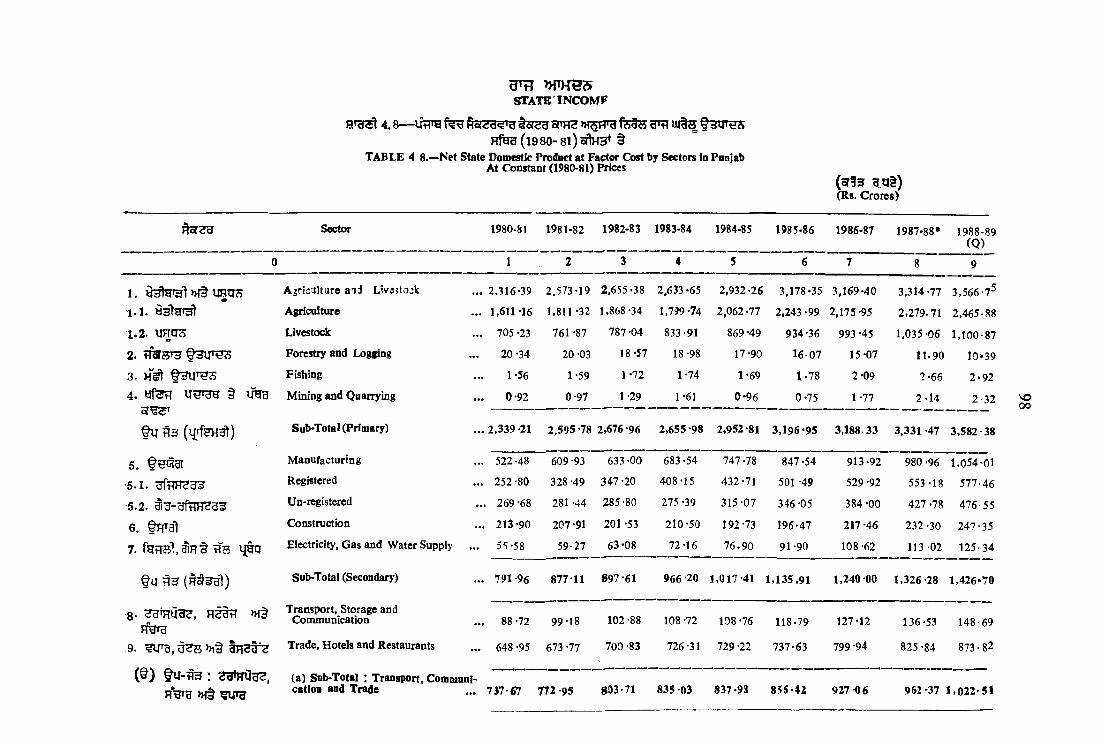
SfTATE'INCOMF
4.8—Ut4*y Osy Ho(CcJ«S 5o«id o[‘H fs Hi cTO Uits Q?iU*tdARf^(l980-8l)ortH3* §
TABLE 4 8.—Net State Domestic Prodoct at Factor Cost by Sectors in Panjab At Constant (1980-81) Prices
( ot! 3 g q § ) (Rs. Crores)
Sector 1980-81 1981-82 1982-83 1983-84 1984-85 1985-86 1986-87 1987-88* 1988-89(Q )
0 1 2 3 4 5 6 7 8 9
1. A jricalture a id LivestojV 2,316-39 2.573-19 2,655-38 2,633-65 2,932-26 3,178-35 3,169-40 3,314 -77 3,566-7^
1 .1 . « 3 t ^ Agriculture 1,611-16 1,811 *32 1,868 -34 1,799 -74 2,062-77 2,243-99 2,175-95 2 ,279.71 2,465-88
1 .2 . UHCr^ Livestock: 705 -23 761 -87 787 -04 833-91 869 -49 934-36 993 -45 1 ,035-06 1,100-87
2 . t fa r s r s Forestry and Logging 20-34 20 -03 18-57 18-98 17-90 16-07 15-07 11-90 10*39
3 . f n u ' t ! * Fishing 1-56 1-59 1-72 1-74 1-69 1-78 2-09 2-66 2 -9 2
4 . y f3 r l
tU H3
M ining and Quarrying 0-92 0-97 1-29 1'61 0 -9 6 0-75 1-77 2 -1 4 2-32
Sub-Total (Primary) 2 ,339 -21 2,595-78 2,676-96 2,655 -98 2,952-81 3 .1 9 6 -9 5 3,188. 33 3,331 -47 3 ,582-38
5. Manufacturing 522-48 609 -93 633-00 683-54 747-78 847-54 913-92 980 -96 1,054-01
■5.1. UftlH<?U3’ Registered 252 -80 328 -49 347 -20 408-15 432-71 501 -49 529 -92 553-18 577-46
•5.2. Un-registered 269 -68 281 -44 285-80 275 -39 315-07 346 -05 384 -00 427 -78 476-55
6 . Construction 213-90 207-91 201 -53 210-50 192 '73 196-47 217-46 232-30 247-35
7. Electricity, G as and Water Supply 55-58 59-27 63*08 72-16 7 6 .9 0 91-90 108 -62 113 02 125-34
t U { M ^ ^ ) Sub-Total (Secondary) 791 -96 877 11 897 -61 966 -20 1 ,017 -41 1 ,1 3 5 .9 1 1,240 -00 1 ,326-28 1,426*70
8 . H ^ tT >H§ H^rg
Transport, Storage and Communication 88 *72 99-18 102-88 108 -72 108 -76 118-79 127-12 136-53 148-69
9. t n s t ^
( § ) f u - ^ 3 : ^ ^ g ^ ,H%th b f§
Trade, Hotels and Restaurants 648 -95 673 -77 700 -83 726 -31 729 -22 737-63 799 -94 825 -84 873-82
(a) Sab-Total : Transport, Commanl- cation and Trade 7J7-67 772 -95 g03-71 835 -03 837-93 85S-42 9 2 7 -0 6 962*37 1 ,0 2 2 -5 1
00

1 0 .
1 1 . ^
H8orlM 3 >Ji§ ?irgc»'
(m ) i
1 2 . S5?
1 3 . d g »T§ H grel
( e ) f U - H 3 ; H H t e » f§
fe tft
( § + » f + 5 )
Banking and Insurance 113-52 130 -03 149-86 156-36 172-01 175-63 217-23 237. 75 260-22-
Real Estate, Ownership o f Dwellings and Business Services 182-27 187-80 193.56 200 -35 206 -94 213 .75 220-80 227 -67 234-75^
(b) Sab-T otal ; Fiaaoce andReal E)state . .. 295*79 317 -83 343-42 356-71 378-95 389 -38 438-03 465 -42 494 *97
Public Administration , 125 -27 114-80 121-50 120 -71 139-27 14 6 .5 4 155 -99 178-01 197-74
Other Services and Sanitary Services . . 242 -43 246 -34 253 -67 260-56 266 -73 274-39 278-63 285-10 2 9 1 -5 1
(c) Sub'Total : Commimity and Personal Services . 367-70 361 -14 375 -17 381-27 406-00 420-93 434 62 463 11 489 -25
Sub*Total (Tertiary) ( a + b + c )
1,401 16 1,451 -92 1 ,522-30 1 ,573 01 1,6 22 -93 1,666 -73 1,799 -71 1,890 90 2 ,0 0 6 73
Total: N et S tate Dom estic Product 4 ,532 -33 4,924 81 5 ,096 -87 5,195 19 5,593 -15 5,999 -59 6,228 04 '6 ,548 -65 7,015 81
Per Capita N et State Dom estic Product (Per Capita N et Incom e) Rs. 2,724 2.897 2,935 2,928 3,085 3,239 3,291 3,387 3,552
*>H 5»f3H H^TS: » fg g » f§ >H5f3T p f t e s , U tT g IProvisionaV So«rc«^E conom ic and Statistical Organisation, Punjab.
VC.
(Q )1 3 3Quick

— i f f l r a f < ^ t j o m s m p P B f e t s ^ u / ^Fifeg (1980-81) o f t o §
TABLE 4.9^Perceiitage Distribatioii o f N et S tate Dom estic Product at Factor Cost by Sectors la PanfabA t Constant (1980-8l> Prices
STATE INCOME
(Percent)
(U3te)
Sector 1980-81 1981-82 1982-83 1983-84 1984-85 1985-86 1986-87 1987-88* 1988-89(Q)
— 0 1 2 3 4 5 6 7 8 9
1 . y3tet3l»f§uin?5 Agriculture and Livestock 51-11 52 '25 52-10 50-69 52-42 52-97 50-89 50-62 50-84
' 1 ,1 . ^ Agriculture 35 *55 36 -78 36-66 34-64 36-88 37 -40 34 -94 34-81 35-15
1 .2 . Livestock 15-56 15-47 15-44 16 -05 15-54 15-57 15-95 15-81 15-69
2 , TTdlBTH Forestry and Logging 0-45 0 '41 0-36 0-37 0-32 0*28 0-24 0 -18 0 1 5
3 . HSl f ishing 0 03 0*03 0-03 0-03 0-03 0-03 0 03 0 -04 0 04
4 . y f s t? M ining and Quarrying 0-02 0 02 0-03 0 03 0 02 0-01 0-03 0-03 0 0 3
t u S 3 Sob-Total (Primary) 51 -61 52-71 52*52 51-12 52-79 53 -29 5 1 1 9 50 -87 51 06
5 . Q ^ 'd l M anufacturing 11-53 12-39 12-42 13-16 13-37 14-13 14-68 14-98 15-02
5 . 1 . g f t iH s a ^ Registered 5-58 6-67 6-81 7-86 7-74 8-36 8-51 8-45 8-23
5 . 2 . 3 iy -U frlH 339 U n -r^ stered 5-95 5-72 5-61 5-30 5-63 5-77 6-17 6-53 6 -79
6 .Constructitm 4 -72 4-22 3-95 4-05 3-45 3-27 3-49 3-55 3-53
7 . IfH n i t tTS Electricity»G as and Water Supply . .. 1 -23 1 -20 1-24 1-39 1*37 1-53 1-74 1-73 1-79
t u Sub-Total (Sec(»idflry) 17-48 17-81 17-61 18-60 18 19 18 -93 19 91 20-26 2 0 -3 4
Transport, Storage and Communication 1-96 2 -02 2-02 2-09 1-94 1 -98 2-04 2-08 2 -1 2
9, H B fS*2 Trade, HoteU and Restaurants 14 -32 13-68 13-75 13-98 13-04 12 -30 12. 84 12-61 1 2 -4 5
(^ ) (a) SBb>Total: Transport,CoauniuicatiOD and Trade 16-28 15-70 15 -77 16-07 14-98 14-28 14-88 14-69 14-57
oG>

1 0 . g l 5 3 r » j§ ^
11,H75of))>I3 M§ ^ingof
(>H) f y - H 3 : » i§FfU^
1 2 .
1 3 . 3 g >H§
(H ) tu - iR S f : Hlifeot >Ht
fS tft
© U -H 3 (H 3 H ^ )
Banking and iBsurancc: 2 -5 0 2-6 4 2 -9 4 3-01 3-08 2 -93 3 -49 3 63 3* 7 t
R eal Estate Ownership o f Dwellings and Business Services 4 -02 3-81 3-80 3-86 3 -7 0 3-56 3-55 3-48 3-35
(b ) Sab Total : Finance and Real 6 -52 6 45 6 74 6-87 6 -7 8 6-49 7 -0 4 7 -1 1 7 -0 6
public Adm inistration
Other Services «nd sanitary Services
2-76
5-35
2 -3 3
5 -00
2-38
4-98
2-32
5-02
2 -49
4 -7 7
2-44
4 -5 7
2-51
4 -4 7
2 -7 2 2-82
4 -3 5 4 -1 5
(c) Sub T ota l; Community and Personal Services 8 -11 7 -3 3 7 -3 6 7 -3 4 7 -2 6 7 01 6 98 7 07 6 97
Sub-Total ; Tertiary(a + b + c ) 30-91 29-48 29-87 30-28 29 02 27-78 28-90 28-87 28-60
Total; N et S tate D om estic Product 100 00 10 0 -0 0 100 00 100-00 100-00 100-00 10 0 -0 0 100-00 100-00
1 iTrra 1
* >H^ >»(3H Source ' Economic and Statistical Organisation, Punjab-P rovisional
( Q ) 3 ^QuiCk

STATE INCO M E
4 .1 0 — lltP g y ' y I s r ^ g oT>H2 >H SHT3 f e t s § H IF € S »Tg
TABLE 4.10—Indices o f Net State Domestic Product at Factor Cost by Major Sectors in Panjab
Particulars 1980-81 1981-82 1982-83 1983-84 1984-85 1985-86 1986-87 1987-88* 1988-89(Q)
f53?5 ^ § 3
»?of)—
(I) of[H3T §(II) 1980-81 5ftH3T §
(I) M?H3oftH3T§(II) 1980-81 5flHHT§
HoJcJcJ—
(I)(II) 1980'81 dflHHt §
(I) {9 53 §(II) 1980-815f H3t§
§ 3 ir e ? 5 —
(I)(II) 1 9 8 0 -8 1 5f[H 3T§
N et State Dom estic Product (Index)—
At Current Prices
At 1980-81 Prices
Primary Sector—
A t Current Prices
At 1980-81 Prices
Secondary Sector—
A t Current Prices
A t 1980-81 Prices—
Tertiary Sector—
At Current Prices
A t 1980-81 Prices
Per Capita N et State Dom estic Product-
A t C u r r ^ Prices
A t 1980-81 Prices
100 .00 117-56 130-57 143-61
100-00 108-66 112-46 114-63
100-00 116-20 128-28 137-05
100-00 110-97 114-44 113-54
100-00 117-95 129-42 150 .99
100-00 110*75 113-34 122-00
100-00 119-62 135-05 150-39
100-00 103-62 108-65 112-26
100-00 115-05 125-07 134-65
100-00 106-35 107-75 107-49
164-40
123 -41
187 -56
132-37
206-43
137-41
239-69 271-36
144-49 154-79
156-38 175-20 188-87 220-77 247-68
126-23 136-67 136-30 142-42 153-14
170-47 203-70 230-39 270-85 31^-H
128-47 143-43 156 *57 167-47 18 0 -]5
174-38 199-07 222-19 253*65 286-74
115-83 118-95 128-44 134-95 143-22
150-88 168-50 181-50 206-28 228-60
113-25 118-91 120-81 124-34 130-40
Provisional
( 0 ) 3 9 3Quick
FFTJ^:— >>R3T |
Source : —Econom ic and Statistical Orgam'sation,
g

4.11— W >K§ ^ nWHS ^ fee RTffTcST >HRHS ^ H3t a b l e 4 ‘l l —Average Annual Compound Growth Rate of Gross State/National Income
STATE INCOME
n e HProvisional
( 0 ) 1 ^ 3Quick,
(v {^ FTTH(Per cent per annum)
1 9 8 0 -8 1 5ftH3T§ At 1980-8 1 Prices
Hcfdd Sector
1980-813"to
1987-88
6th Plan
1980-813"to
1984-85
1985-86
R 3 ^7th Plan Period
1986-87 1987-88* 1988-89 (Q )
0 1 2 3 4 5 6
u '^rg-- PUNJA B—
Primary 4-96 5-51 8-19 ( —)0 -29 4-46 7-56
Secondary 6-62 4-93 12-08 9 -50 6 -96 7-86
Tertiary 5*21 5-09 3 -21 7-83 5-24 6 0 8
Overall State Income 5-40 5-28 7-54 4 05 5 -24 7 -20
3TUB— IN D IA —
Primary 3-39 5-59 0 -5 4 (—)1 -58 0-56 16-87
R olV el Secondary 6-27 6 04 8-45 8-24 3*35 7-67
^g?33't Tertiary 6-01 5-51 7-32 6-22 7 -04 6 -9 4
^ 5J3T H ?al » »P H ^ Overall N ationallncom e ... 5*5 5-67 5-07 3-96 3-82 10-41
R n ? ? i » f g g » f§ U trg I
Source :—Economic and Statistical Organisation, Punjab.
O
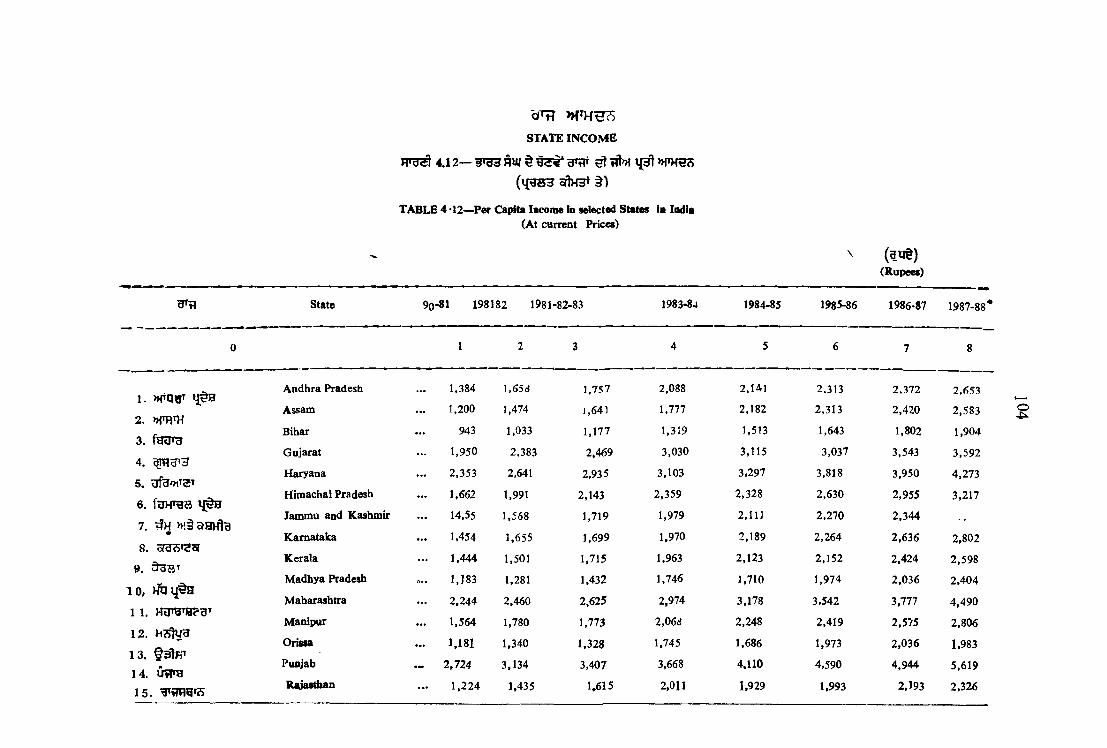
F T ^ 4 . 1 2 — ^ ift»f »THe?7
( l f 3 H 3 oflHH^ § )
TABLE 4 *12—Per Capita locom e in selected States ia India(At current Priccs)
STATE INCOME
^ ( l ^ ) (R u p ea )
State 90-81 198182 1981-82-83 1983-84 1984-85 1985-86 1986-87 1987-88'
1. »rq»T
2 . »TRm
3. fgurg
4 . ^ ^ 3
5.
6 . fUHT^S
7. »!^ a a jftB
8. oT33n2Br
9.
1 0 ,
1 1 .
12 .
1 3 . ^3lHT
1 4 . UtTH
1 5 .
Andhra Pradesb ... 1,384 1.658 1,757 2,088 2,141 2.313 2.372 2.653
Assam ... 1,200 ],474 J,641 1,777 2,182 2,313 2,420 2,583
Bihar ... 943 1,033 1,177 1,319 1,513 1,643 1,802 1,904
Gujarat ... 1,950 2,383 2,469 3,030 3,115 3,037 3,543 3,592
Haryana ... 2,353 2.641 2,935 3,103 3.297 3,818 3,950 4,273
H im achal Pradesh ... 1,662 1,991 2,143 2 ,359 2,328 2,630 2,955 3,217
Jammu and Kashmir ... 14,55 1,568 1,719 1,979 2,111 2,270 2,344
Karnataka ... 1.454 1,655 1,699 1,970 2,189 2,264 2,636 2,802
Kerala ... 1,444 1,501 1,715 1,963 2,123 2,152 2,424 2 ,598
M adhya Pradesb o.. 1,183 1,281 1,432 1,746 1,710 1,974 2,036 2 ,404
Maharashtra ... 2.244 2,460 2,625 2,974 3,178 3.542 3,777 4,490
Manipur ... 1,564 1,780 1,773 2,06<J 2,248 2,419 2,575 2,806
Orissa ... 1,181 1,340 1,328 1,745 1,686 1,973 2,036 1,983
Pui^ab 2,724 3,134 3,407 3,668 4.110 4,590 4,944 5,619
lU iasthan ... 1 ,224 1.435 1,615 2,011 1,929 1,993 2,193 2,326
S

1 6 . Tamil Nadu ... 1,498 1,776 1,777 2,024 2,341 2,674 2,921 3,163
1 7 . ^ Uttar Pradesh ... 1,332 1.389 1,584 1,718 1,853 2,072 2.269 2,488
1 8 . West Bengal ... 1,643 1,723 1,860 2,237 2.576 2,712 2 .864 3,193
All-India ... 1.627 1,851 1,993 2,288 2,494 2,734 2 ,974 3 ,286
»fof3T >H§ H t. MH. §T g3 H3o<id 1
N ot A vailable
>H3HPiovicional
Source State Statistical Bureaas and C .S .O ., G ovt o f India.
a

(Rp33 ollHJf §) ofrqrg; 1989-81
table 4 *]3— Per Capita Income in s«iect«d States in India (At constaQt prices) Base : 1980-81
STATE INCOME
(?ut)(Rupees)
State 1980-81 1981-82 1982-83 1983-84 1984-85 1985-86 1986-87 1987-88*
0 1 2 3 4 5 6 7 8
1. » i n j g T t j ^ Andhra Pradesh 1,384 1,562 1.549 1.583 1,506 1,553 1,452 1,495
2 . HTOm Assam ... 1,200 1,307 1.367 1,375 1,457 1,483 1,474 1,516
3 . fSO 'd Bihar@ 441 445 426 454 467 477 482 472
4, Gujarat 1,950 2,106 2,019 2,248 2,206 1,976 2,124 1,948
5. nf7f»HT?T Haryana 2,353 2.365 2.449 2.440 2,463 2,753 2,630 2,572
6. fo H rg a Himachal Pradesh ... 1,662 1.768 1,696 1,740 1,617 1,749 1,869 1,822
7. oTHHtU Jammu and Kashm ii @ 642 638 633 673 674 681 684
8. Karnataka @ ... 687 718 700 731 772 756 799 116
9. Kerala 1,444 1,403 1,407 1,317 1,378 1,391 1,384 1,386
10* M adhya Pradesh @ 517 529 536 612 581 618 590 633
11* HuTdTHecTT M aharashtra® 957 983 1,002 1,025 1,011 1,042 1,036 1,159
12. HjftUg Manipur 1,564 1,599 1.560 1,651 1,660 1,686 1,655 1,705
13. Orissa @ 477 477 443 541 483 548 538 498
14, ITFTH Puivab 2,724 2,897 2.935 2,928 3,085 3,239 3,291 3,387
O0 \
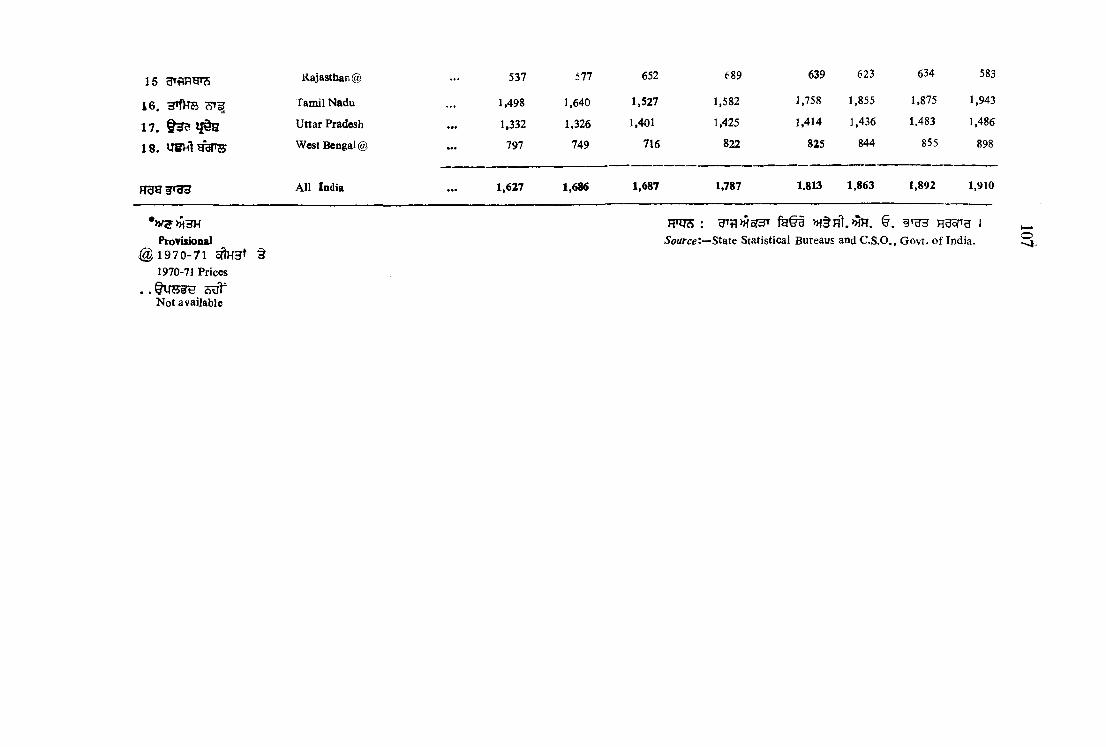
15 Kajastban @ ... 537 577 652 689 639 623 634 583
1 6 . 3Tf^S Tamil Nadu ... 1,498 1,640 1,527 1,582 1,758 1,855 1,875 1,943
1 7 . ^ 3 ? ^ i§ a Uttar Pradesh ... 1,332 1.326 1,401 1,425 1,414 1,436 1.483 1,486
1 8 . UBV^lydl'S West Bengal @ ... 797 749 716 822 825 844 855 898
TOW sf'dd A ll India ... 1,627 1,686 1,687 1,787 1.813 1,863 1,892 1,910
Provisional@ 1 9 7 0 - 7 1 §
1970-71 Prices
. . 5 #N o t available
Source’.—State Statistical Bureaus and C .S .O ., G ovt. o f India. O*>4


fS H ^ HRH Rgij} M5T3, Ufff^ § ^ 3 # " PT3W § ? 3 ^ ' >H§ M H 3
^ ^ ui9 >H§ fes, §3#" f%Q g^^rg >h§ >hH3 F rW -fe ,^7i 1
J T O ^ 5.1 1988 § >HFt3 ^ n f ^ t O S I
Rrg;^ 5.2 H f e t >H5?3 ftr UH (l98 4— 8S) ^ WT3 0^ I
5.3 m s ^ ^ I
R T ^ 5.4 f ^ t?T ^ T 5^”crt d i cTH w e H§H^7 § criar ^ } '^ H 3 fe ?
^ g y r f e o T ^ 9 I f e n f e V u f ^ ^ g y r R ^ t ^ r e Ff0H3t O T
H t e d » i § fe u fe s ^ s n ^ HHH 7 ^ 5 fl§ rT^ T O W # 3 ^ U 3 3 t T
jforfen offer f e w 9 1 u fe M W § e% ftr t ftr h § i w ^ t? T ^ i j ^ 5 ,
Hn? ^ Hnj5f H SES* ^ t § t W 'tU H U S I f8U cSTUHH 1940 ^ »fe 3of
u f e w s §" g ^ , f t r i feu HVP 1945 f 1950 351 5 , « t q 3 H § H ^ § f e ^ 5Tt§ l { ^ ^ t s ^
fe^JTO oft^ 31^ u s I
FTU^ 5.5 t ^ 3 W S gUST ^ d I f e u ^ f e ^ 5 P ^ )1h H ^ U
r l ^ 5?t§ tTT 3iTW ifeUT § M a f e U S M § H T 3 U 5 e fe lH nfSH’U
08.30 ^ feoITg^ o T t t r f ^ U S I ^ 3 " € n » f § u f e 3 " u f e 3 ^ ^ , )-fUt^ ^ fe ^ f e s t # 3
3* ^ >M§ life 3" HnjJTO U S ! > t e Hnjjf?5 ^ HU^s fe'JUS 5ft§ g i t ^ ^
3 ^ 1 ^ ^ ^ > t e tD f u fe 3^ u fe 3 n j i ^ ^ >HH3 € t » fo ^ I
FPH ^ 5.6 ^ f ^ Ufe>vT 9 1 T J ^ 3?5 § f u U T O ^ d tT T RHtT
fe g sT q u ^ § a a s ^ ' W u s i feu »ffH3Fra f ^ H § w 5 c i H t ? 5 f e s r w fg ^ T ^ g
cf}3^ d I
5.7 U?T ^ U ? 3 r j Hgqt H T O ^ t \ feU t ? r t RSHSr U I
R>U^ 5.8 f e e 6 1 5 # ' r Ih S ^ § >HH3 H O N -fH ^ B 9 R r ^ U 5l d I HfUy-fPT^ § H H S -? th U ^ fHorera
HOf ^ d feU3^ 3 3 3 9 U 5 s e t 3 3 R ^ fHofgrg ^ y sfr g ^ U?r f? U H ^ S U # I
SECTION V
CLIMATE
Meteorological data given ia this section relate to rainfall and temperature at selected stations in Punjab, average rainfall (district-wise),hours and days of bright sun-shine, wind speed at selected centres and mean relative humidity.
Table 5.1 gives distict-wise monthly rainfall figujes for 1988,
Table 5.2. shows district-wise montiily rainfall figures, aveage of five years (1984—88).
Table 5.3 shows annual average rainfall by districts.
Table 5.4 depicts the data about rainfall. The actual rainfall is recorded for each day.
109
5
noat selected stations throughout the State. Rainfall data given in this table relate to 6 selected stations and have been compiled from the daily statements issued by the Regional Meteorological Center, New Delhi. Normal rainfall figures are based on data of State laingauge stations, except for Patiala where data of observatory stations only aie available. These normals r re calulatcd from the available data collecsed at the respective stations upto ti e end of 1940, except for Patiala where the period is 1945 (c 1950.
Table 5.5 gives information regarding temperature. These figures are also based on the daily statements issued by Regional Meteorological Centre, New Delhi, and are recorded at 08.30 hours, India Standard Time. Highest and lowest temperatures are the highest and the lowest temperatures on a particular day in a month. Mean temperature is one-half of the average maximum plus average minimum temperature recorded during the month.
Table 5.6 contains data regarding sunshine. Sunshine is the condition at the earth’s surface when the sun casts a well-defind shadow. It is recorded at Amritsar by StandardCompbell StocR recorders.
Table 5.7 gives information in respect of windspeed. These data are given for selected stations of Punjab.
TaWe 5.8 shows mean relative humidity at 6 selected stations. Relative humidity is the measure of the amount ol water vapours present in the atmosphere relative to tbe coiresponding amount for saturation.

CUMATB
5.1— HTfHSrwte ^«T : 1988 Table 5.1— Monthly Average Rainfall by Districts : 1988
(M illimetres)
tT c ^ ^ HHlDistrict January February March April May
» ! ^ H » i5 f3 g a e sJune July August Septem- Octo- Novem - Decem - Total
ber ber ber ber
10 11 12 13
Gurdaspur 25 -0 13-8 117-7 5 1 0-5 35*5 • 527-5 235-3 492-4 — 0-5 34-1 1487-4
Amritsar 12-4 9*8 72-2 11-2 — 35*8 291-5 152-4 347-0 1-1 — 4 8 -9 982 -3
Kapurthala — 4 6 -0 33 0 — — — 302-5 52-0 245-0 — — 11 -0 689-5
x V S ^ J^andhar 3-2 44-3 49 -0 0*9 4-2 74-1 438-3 240 -0 638-4 — — 47-4 1539-8
3 tfe w H y ? Hoshiarpur 7 -4 47*7 58 -0 5 -8 10*3 6 3 .9 681 -1 312-5 722 -8 — — 48 -7 1958 -2
Rupnagar 10-9 19-6 20-2 — 8-0 51 -9 633-5 290-0 390 -0 — — 92-3 1516-4
Ludbdana 3 -8 12-5 26-2 — 5 -4 60-4 367-3 248 -2 488-9 — — 32 *5 1242-2
f e S g y u Firozpur 6 -2 18-9 52-5 — 1-7 3-8 129 -5 93 -9 417 -3 2-5 4 -0 9-9 540 -2
SSteoTS Faridkot 0 -5 23-3 35*2 0-3 2-0 17*9 119 -2 135 -9 2 6 0 .6 — 1 -6 18-4 614-9
g f e V Bathinda 0 -4 4 -2 4-5 — — 11-5 130-3 83 -7 288 -2 — — 4 -3 527-1
jfarau Sangrur — 15-2 13*0 0 -3 — 2 8 -7 1 9 0 0 179-0 392-6 — — 2 5 -6 844-4
iife » r sT Patiala 2 1 9*5 13-3 0 -6 1-5 78 *0 659-0 241-9 483-4 ~ — 40-2 1529 -5
u a r g ()iiH 3 ) PuAjab (Average) 6 0 2 0 .9 41*2 2 -0 2-8 38-5 372-5 188 -7 413*6 0-3 0.5 34-4 1122-7
RTg^ : OtTrg i
Source : —Director o f Land Records, Punjab.
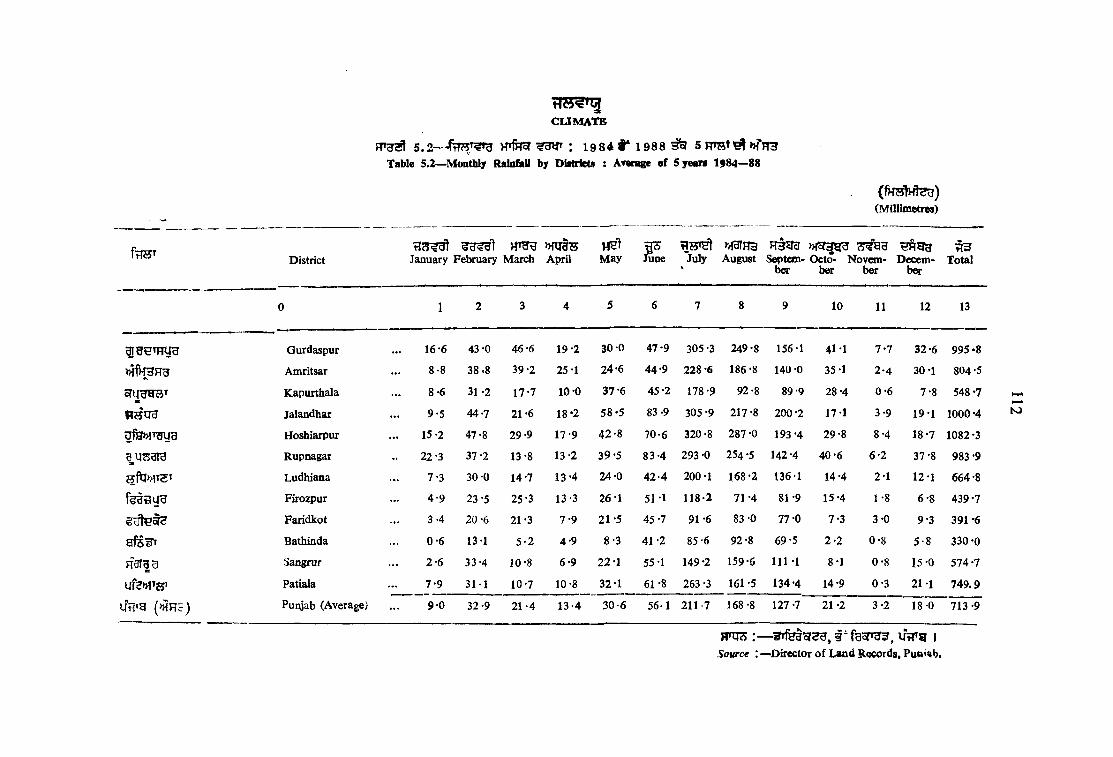
District
CLIM ATE
5 . 2 — Hr t e ; 19 3 4 t * 1 9 8 8 ^ 5 F T O t^ »>rFr3
Table 5.2-<Monthly RainfiiU by Districts : AT«rage o f 5 yea n 1984—88
( f k s M e g )(M illimetres)
»W§?5January February March April
HSt ^ »(cITH3 > H ^ r ^ ^M ay June July August S ^ tem - Octo- Novem - Decern- Total
' bCT ber ber b «
10 11 12 13
Gurdaspur 16-6 43 -0 46-6 19*2 30 0 47-9 305 -3 249-8 156-1 41-1 7 -7 32-6 9 9 5-8
Amritsar 8-8 3 8 .8 39-2 25*1 24-6 44-9 228-6 186-8 140 -0 35-1 2 -4 30-1 804-5
Kapurthala 8 -6 31 -2 17-7 10-0 37 -6 45-2 178-9 92-8 89-9 28-4 0 -6 7-8 548 -7
n s T jg Jalandhar 9 -5 44-7 21 -6 18-2 58*5 83 -9 305-9 217-8 200-2 17-1 3-9 19-1 1000-4
U f ^ T g y g Hoshiarpur 1 5 ’2 47-8 29-9 17-9 4 2 -8 7 0-6 320-8 287 -0 193 -4 29-8 8-4 18-7 1082-3
Rupnagar 22-3 37 -2 13-8 13-2 39-5 8 3-4 293 -0 254-5 142-4 4 0 -6 6 -2 37-8 983 -9
Ludhiana 7-3 30 -0 14-7 13*4 24-0 4 2 -4 200-1 168 -2 136-1 14 -4 2-1 12-1 664 -8
f e d t ia u Firozpur 4*9 23-5 25-3 13-3 26 1 51-1 118-2 7 1-4 81-9 15-4 1-8 6-8 439-7
Faridkot 3 -4 20 -6 21 -3 7 -9 21 -5 45 -7 91 -6 83 -0 77-0 7-3 3-0 9-3 391*6
a fs3 ^ Bathinda 0 -6 13-1 5 -2 4-9 8-3 41 -2 85*6 92-8 69-5 2 -2 0-8 5 -8 330 -0
R 3T |g Sangrur 2 -6 33-4 10-8 6-9 22-1 55 -1 149-2 159-6 111 -1 8-1 0 -8 15-0 574-7
ufe»TT®» Patiala 7-9 31-1 10*7 10-8 32*1 61 -8 263 -3 161 -5 134-4 14-9 0 -3 21 -1 749.9
y > g (M H 5) Puryab (Average) 9-0 32-9 2 1 -4 13*4 3 0-6 56-1 211-7 168 -8 127-7 21 -2 3 -2 18-0 713-9
jT crs : -Source :•
-3TfetEJSg,i^fgcnH5, lftT9 I ^Director o f Land Records, Puni^b,
t o
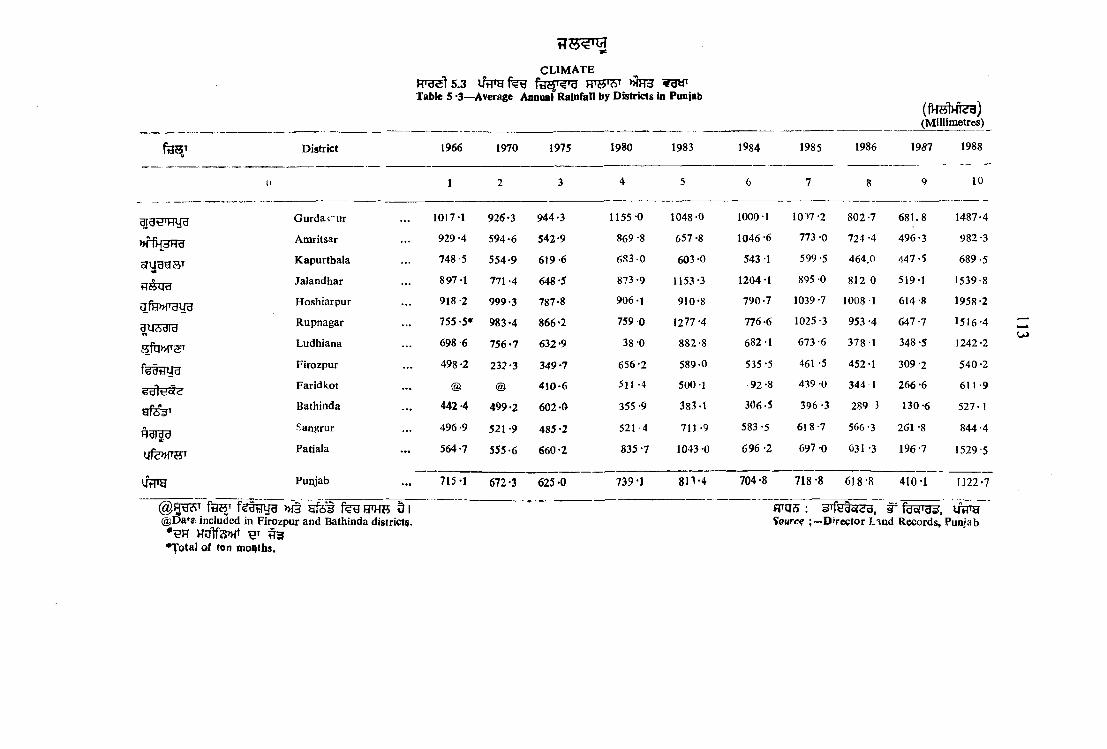
>»rfH3Fra
ofuggaT
tIttUd
3ftp> rau u
|u ?jara
ftodtiyn
g f e r
Rdidd
lffe>MTHT
vitiTg
District
Gurda>"ur
Amritsar
Kapurtbala
Jalandhar
Hoshiarpur
Rupnagar
Ludhiana
Firozpur
Faridkot
Bathinda
-angrur
Patiala
Punjab
CLIMATEFTO ^t5.3 UtTOf% g >j?H3Table 5 *3—Average Annual Rainfall by Districts in Punjab
(Millimetres)
1966 1970 1975 1980 1983 1984 1985 1986 1957 1988
10
@ 5 ^ >Ht g f e t HTHS 5 I@Da*ff. included in Firozpur and Bathinda district^.
•Jotal ot ton moqtbs.
1017-1 926*3 944*3 1155 0 1048-0 1000-1 10 >7 -2 802-7 681 .8 1487*4
929-4 594*6 542*9 869 -8 657*8 1046 -6 773 -0 724-4 496-3 982-3
748 -5 554*9 619-6 683 0 603 *0 543-1 599 -5 464.0 447-5 689-5
897-1 771 -4 648 *5 873 -9 1153*3 1204-1 895 0 812 0 519-1 1539-8
918-2 999-3 787*8 906-1 910*8 790-7 1039 -7 1008 1 614-8 1958*2
755-5* 983-4 866 *2 759 -0 1277 -4 776-6 1025-3 953 -4 647-7 1516-4
698 -6 756-7 632 *9 38-0 882*8 682-1 673-6 378 1 348 -5 1242*2
498 -2 23? *3 349 *7 656-2 589*0 535 -5 461 -5 452-1 309-2 540*2
@ @ 410*6 511 -4 500-1 92-8 439 -0 344 1 266 -6 611 -9
442 -4 499*2 602*0 355 -9 383-1 306-5 395-3 289 3 130-6 527*1
496 -9 521 -9 485 *2 521-4 711 *9 583-5 618-7 566-3 261 -8 844-4
564 -7 555*6 660*2 835*7 1043 *0 696 -2 697 *0 631 -3 196-7 1529-5
715*1 672*3 625 *0 739*1 813*4 704*8 718-8 618-8 410*1 I122-7
f r a s : g r fe to f^ g , wSource ; —D'reptor L m d
fdb/TdsJ, i/? n a R ords, Punfab
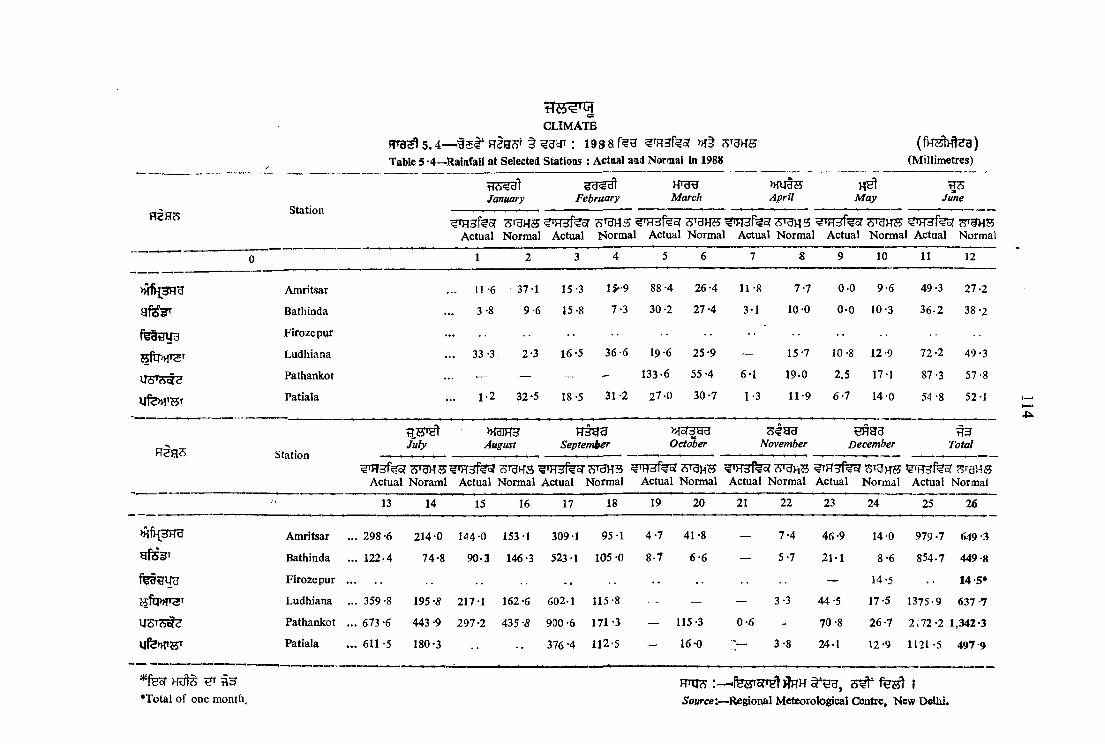
CLIMATE
5 . 4 — : 1 9 8 8 0?^
Table 5 *4—Raiafall at Selected Statioas : Actoal and Normal in 1988 (M illimetres)
H6<«d^January
^d<«d1February
HT3BMarch
» w t sApril
HHtM ay June
Station
Actual Norm al Actual H orm al Actual Norm al Actual Norm al Actual N orm al Actual Normal
0 1 2 3 4 5 6 7 S 9 10 11 12
Amritsar . .. 11 -6 37-1 15-3 1^-9 88-4 26 -4 11 -8 7*7 0-0 9-6 49 -3 27-2
g f e V Bathinda 3 -8 9-6 15-8 7-3 30 -2 27 -4 3-1 10 0 0 -0 10-3 3 6-2 38-2
f e g d y g Firozepur ................ •• ••
Ludhiana . . . 33 -3 2-3 16-5 36-6 19-6 25-9 — 15-7 10-8 12-9 72 -2 49-3
u s» H cfe Pathankot — — ~ — 133-6 55 -4 6-1 19-0 2.5 17 1 87-3 57-8
Ufe^T^T Patiala ... 1-2 32-5 18-5 31-2 2 7 -0 30-7 1-3 11-9 6-7 14-0 54-8 52-1 ^
StationJuly August
F B gHSeptember O c t^ e r November December
tT3Total
oTU)43 ?)TaHSActual Noram l Actual Norm al Actual Norm al Actual Normal Actual Norm al Actual Norm al Actual Normal
! 13 14 15 16 17 18 19 20 21 22 23 24 25 26
Amritsar . .. 298-6 214-0 144-0 153 1 309-1 95-1 4 -7 41 -8 — 7 -4 46 *9 14-0 979 -7 649 -3
g fs3 T Bathinda ... 122-4 74-8 90-3 146-3 523-1 105 -0 8 -7 6 -6 — 5-7 21-1 8 -6 854-7 449-8
fe§tIUcJ Firozepur .............. -- — 14-5 14 5*
sftr>ir3^ Ludhiana ... 359-8 195 '8 217-1 162 -6 602-1 115-8 — — — 3-3 44-5 17-5 1375-9 637 -7
USTTSgS Pathankot ... 673 -6 443 -9 297-2 435-5 900-6 171 *3 — 115-3 0 -6 — 70-8 26-7 2172-2 1,342-3
Patiala . . . 611 -5 180-3 . . 376-4 112-5 — 16-0 3-8 24-1 12-9 1121 -5 497 9
' fesr A 3
•T otal o f one month.TVTJ7> fejyrSfTHlflFTH |
5ource ;>^Regional M eteorological Centre, N ew Delia.

R§e?5
CLIMATE
5 . 5 - — I 9 8 8 f e g §3njKT?>Table 5.5—Temperature (Centigrade) at Selected Stations daring 1988
Station January FebruaryHTggMarch
m mApril
HHtMay
H?5June
0 1 2 3 4 5 6 7 4 9 10 11 12 13 14 15 16 17 18
H L M H L M H L M H L M H L M H L M
Amritsar ... 24-0 0 -9 12*3 26-9 0 -0 14*7 31 -8 5-1 18-0 41 -7 7-7 25 -7 41 -2 1 5 -S 31 -2 43-8 19-1 32 "3
gf5"3^ Bathinda ... 2 5 -2 1-4 13-7 28-8 2 -4 16-2 34-2 7 -4 19-9 42-2 12-0 28-8 47-7 20-0 34-6 4 6 .7 24-0 34-5
fe'dtryu Firozpur
Ludhiana ... 21-8 1 .2 12-9 26 6 2-8 15-0 31-6 7-0 19-3 41-4 10-8 27 -8 46 -6 18-7 32-3 4 4 -2 2 0 -2 32-7
Pathankot .......... 31-4 6-0 18-3 40-8 9 -4 26-1 4 7 .6 15-3 3 2 .1 4 4 .4 19-5 32 .6
ufe>H W Patiala ... 23-1 3-7 14-3 26-4 5-4 14-4 3 2-5 lO-l 19-3 41-5 12-6 28-7 46 -3 21 1 3 2-9 43 -9 22 -4 33-2
>Hc/39dOctoberRSH3 Station July August September November
tdH^dDecem ber
0 19 20 21 22 23 24 25 26 27 28 29 30 31 32 33 34 35 36
Amritsar
Bathinda
Firozepur
Ludhiana
USTS^cJ Pathankot
l4fe»TO» Patiala
H3 9 .0
40-6
L M H L M H L M H L M H L M H L M 22-0 29-0 36-7 19-2 33*9 38*1 18-9 28-3 3 3 -6 11*4 23*2 30*6 1-7 17*8 25-1 1-2 12*9
24 0 31-4 38-0 21-0 30*4 39-5 2 0 -4 29-2 3 4 -6 13-8 23-2 32-0 5 -2 19-7 26-6 3 -2 14*2
35-5 22-2 29-4 34-7 21-4 28*6 3 6-0 18-0 27-5 33*4 13-2 24-4 29*5 5*4 19*1 2 5 -0 4 -2 15 0
38-5 2 2 -5 2 8 -7 35-6 22-4 2 8 -7 36-6 18-0 2 6 -9 3 4 -0 11-6 2 2 -8 30-2 4 -3 18-3 2 5 -4 3 -4 14*3
35-5 22-4 29-4 34-7 2 3 -0 28-2 37-5 21-3 28-3 33*1 14*4 22*7 2 9-7 5*4 19-5 25-9 5*1 15*0
H — fSTR ^ Rf}‘ 3* f g I
M — 1/2 hQs ofter i* TIHt >HR3<S uie) IH —Highest at any point o f time in a ooontb.
L—^Lowest at any point o f time in a month.^ — ^12 (average maximum/>/«j average minimum temperatures reported during ibe m onth).
: fesT orret h r h - ^ f e ^ l i
S'owrce:—Regional M eteorological Centre, New Delhi.
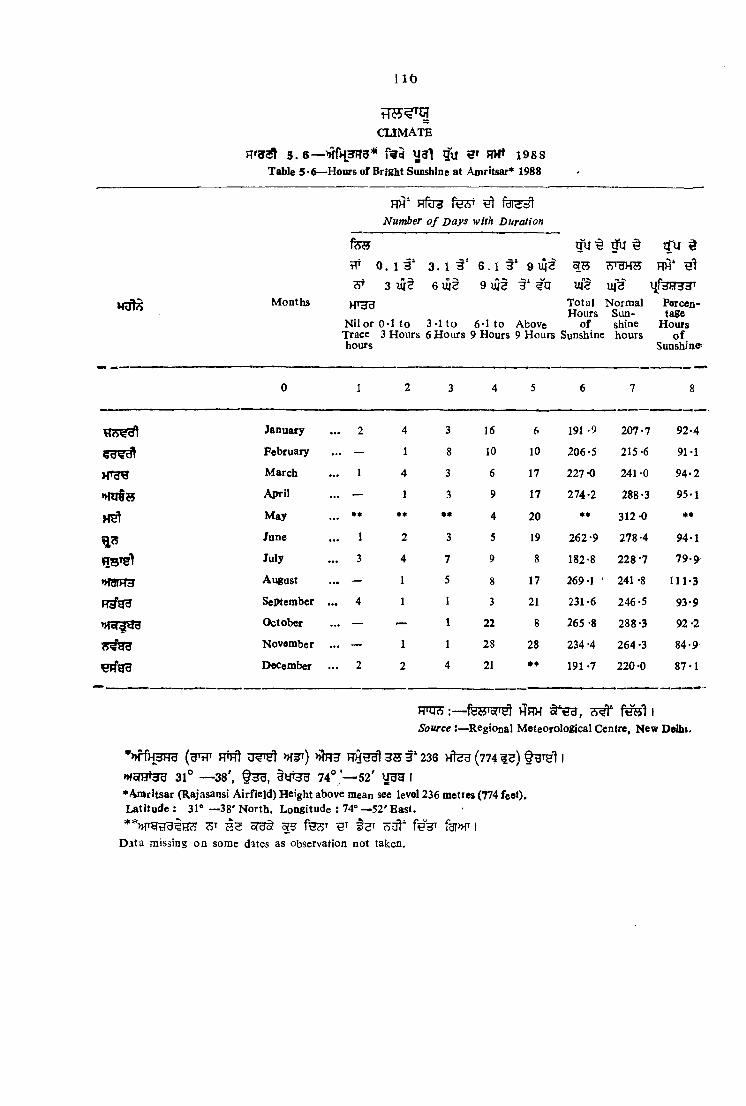
110
c u m a t e
5.6— gu HH* 1988 Table 5*6— Hours o f Bright Sunshine at Amritsar* 1988
MUts
HH' HfU3 ^Number o f D ays with Duration
M onths
f e S
^ 0 . 1 3 '
7P 3 U |t
HTgg
3 . 1 3 ' 6 . 1 9 u i^
6 l i i? 9 lii§ # 3
q l l ^ ^ ^
u f? u f^T otal Normal Hours Sun-
o f shineN i lo r O ’l t o 3*1 to 6*1 to Above Trace 3 H ours 6 H ours 9 Hours 9 Hours Sunshine hours hours
I f H #
HH‘
Parcen-tage
Hourso f
Sunshine;
0 1 2 3 4 5 6 7 8
January ... 2 4 3 16 6 191 -9 207-7 9 2 -4
February ... — 1 8 10 10 206-5 215-6 91-1
M arch ... 1 4 3 6 17 227 -0 241 -0 94*2
»>m Ss April ... — 1 3 9 17 274-2 288-3 95-1
Met M ay *• •* *« 4 20 ** 312-0 **
June ... 1 2 3 5 19 262-9 278 -4 94-1
July . .. 3 4 7 9 8 182-8 2 2 8 -7 7 9 -9
♦»WfFr3 August ... — 1 5 8 17 269-1 ' 241 -8 111-3
HSfad September ... 4 1 1 3 21 231-6 246-5 93-9
October ... — — 1 22 8 265 -8 288-3 9 2 -2
Novem ber ... — 1 1 28 28 234 -4 264 -3 8 4 -9
Decem ber ... 2 2 4 21 ** 191-7 220-0 8 7-1
H'UA -fs s 'o f iy l HRH 1S o u r c e Regional M eteorological Cenire, N ew Delbt.
(H ttt FpHt >;?Fr3 H S t ' 236 H feg (774 i s )
3 1 ° — 3 8 ', § 3 3 , 7 4 ° ’— 52' ^ I
♦Am ritsar (Rajasansi A irfield) H eight above mean see level 236 metres (774 feet). L atitude : 31“ — 38' N orth . Longitude : 74» — 52' E ast.
* t s r feV fgr»f iD ita missing on some dates as observation not taken.

117
CLIMATE
5 . 7 — FT2HHT f%y ^ >HH3 1 9 8 8
Table 5.7— Average W iad Speed Recorded at selected Stations in Puiyab, 1988
(f^ , H\,: ufer)(Km . Per hoiir)
Stations
M onths »rfip F ra g f ^ T f e g ij y u U 3T 5^ e ufeW55T ^yfqnrST
Amritsar Batbinda Firozepur Pathankot Patiala Ludhiana
0 1 2 3 4 5 6
January 1-2 — 6-1 4*9
February 1 -7 - 3*5 5*6
March . . . 2-7 — 4 -0 —
April 1 -8 — 7-6 -
h h I May 2*4 4 -5
June 3-1 7 -8
July 1-6 4 -4
>K31H3 August 1 -4
Septem ber 1 -6 4 -9
October 0. 9 3-9
2 5 ^ Novem ber ... 0-5 3-0
Decem ber . . . 0*8 4 -3
H'UA: fettTojTy] hhH <S^T 1
Source'.—Regional M eteorological Centre, N ew D ^ h i ,
TiZl hA* »I5FTO 08.30 ^ 24 uffe>HT e t >i?H3 d € d 'd 1
N jte .— Avjrage W ia i speed for 24 hours from 08.30 hours I.S.T.
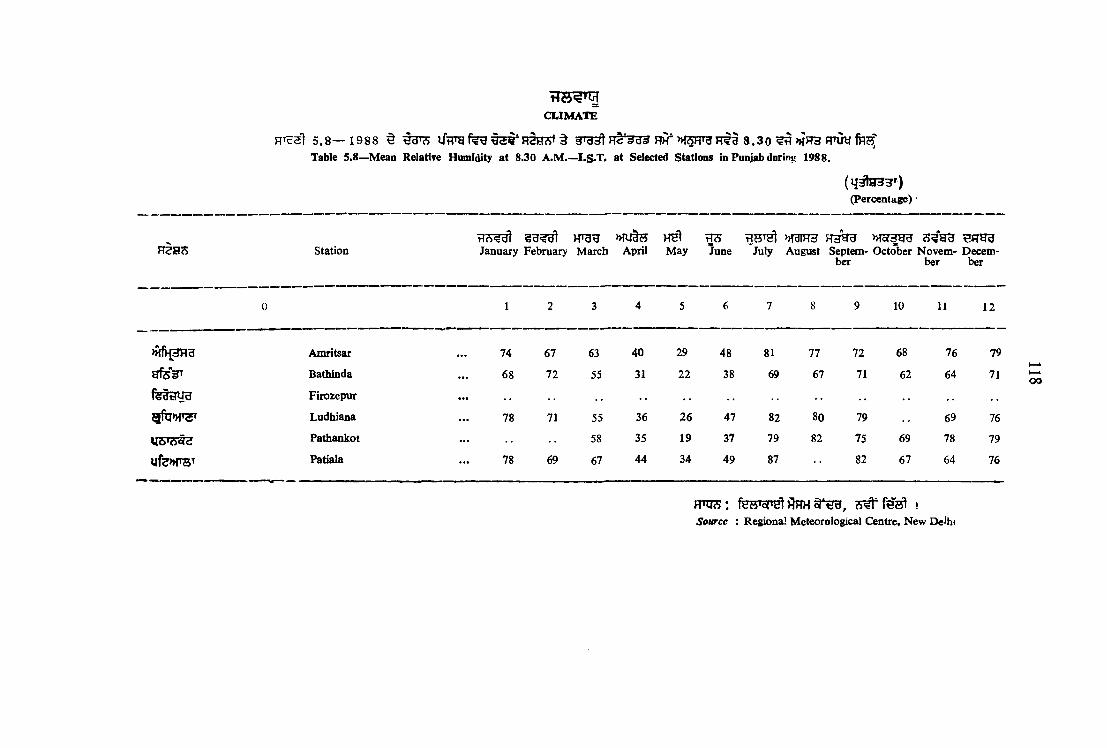
FT?H?5
CLIMATE
RTd^l 5 . 8 — 1 9 8 8 § R>r >>fSHTg H i t 8 . 3 0 ^ >HH3 R n w frjS'
Table 5.8—Mean Relative Homidity at 8.30 A.M .—I.S«T. at Selected Stations in Punjab during 1988.
Station
(Percentage)
r l ? 5 ^ HTBg >HUl?5 m MUTRH ^JT^gJanuary February March April May June July August Septem- October N ovem - Decem
ber ber ber
0 1 2 3 4 5 6 7 8 9 10 11 12
Amritsar 74 67 63 40 29 48 81 77 72 68 76 79
g f e V Bathinda 68 72 55 31 22 38 69 67 71 62 64 71
fe a m r a Firozepur ...gfq>HT5T Ludhiana 78 71 55 36 26 47 82 80 79 69 76
y s T S ^ Pathankot 58 35 19 37 79 82 75 69 78 79
ufe»TBT Patiala 78 69 67 44 34 49 87 82 67 64 76
oo
m a s : i^h h tSource : Regional Meteorological Centre, New De^hi

1 960-61 , 1 9 7 0 - 7 1 ,1 9 7 5 - 7 6 , 1 9 8 0 -8 1 >>i§ 1 9 8 3 - 8 4 3 ' 1 9 8 8 - 8 9 3'^ 3T1 SH I
q w r 3 » H § FTS 198 8 - 8 9 3T§ vJ5l
HWe 3 Tq r^lS^Tg §u§J?^SS f ^ 3 3 l ^1 f ? g gTHl 9 I f^O f^HH Sf^d
3 ifs§ 5 r ? g , f - y > g §" q^U3 3T?) 9 » i§ t2 T \jfu c5 t t " ^
3 0 35( U3H y n t g r ^ ni?5 FTSfOH 5 I
f u 3 ^ s r r g r a u ^ f »f5qTH g ? r r ; fusT t aT O -uH H T )>i^Fr^ fef?5jir
h " 3 ^ SH I fu V § H>HTgT fH> Tg ^ fHHiTfu^t f § »1TJTfg3 ^ f y f^ d 3 S 7 -H U t g jjjji
8T3H § HHt>«a l»fTHT f3»|Tg sfl^ i fgy>},T ^ i f e t >nVf3MT ^ l» ft t f^HH^ ^ 9 fcTf*f^
H oTtht ^ a ^ MU3T§ 3T§ U 3 I
HSrg»: f e n gsfgr 5 ^ ^ folR c?t§S
5<l3T fgiMT q t ^ ijg q gfy>j^T fgrn r o t i HUEJT t W I j j e l t e f ^ S f ^
u # , UU f e n HHt3 HT ^r^T )>!f?7aT hth b CTT 9 TtTH ^ ^ I
» fq lS Horgr, ^ ^»^TgT f ^ t ^->>Tc7ST ^ R t§ S ' S feR h S
yr^T fc?^* H HHlc^ M g ^ ^ ^ 71
r f H ^ W , imTH S ?>uT farfe»!T I
?Dlt?? Sr»H3 S 5 l l{Ty5 S» u # : fUR R ^ S 5 F STra »T§
fsr UUT3, RT?g^ yj^rf f ^ § f g gBTHy^^ 5^^ fg^T 5?tj?3 n ^ l s fe>;ireT fii U # «
n* ^ fSHTHHt, H3c?t, g ^ t >J § OT3: > fe l iqt ^ f H STTH3 BHt fp 3 H u t I
H>0 ?J 3* ^ g -5 T O 3 m ite T : f^R hth:^ ^ 5 x533
< fU 3 f e a fs?^ cTT foTR cTTH3 ^Tg3 >jitf|7; 31 fs»rtHt>>!t fl s k grel»!* U S
>J!§ fHR £?TJ^ iSgr yr;^) tTH)^, »)^§ HR
9V ^3^5t>},T ^rHl?jt gTHE I
9^5 : fSR »!fTrul»iT ^Tjn^qgi ^ h ? 5 t ^ ' 'T ^ § 3 ^ B" HH RH*
s H l m g g s : M t § y3^1'>iT gT5 ^^13* u?? »^§ ^ R^k ^
»!tft^^ 3T fS>;it^1 o!t g s § ?5^»lt a t9 |
g lfti» i» f e l s ; f s g MfTTUT u ^ g t 9 fiTR ^ 3 ^ f>rg s R a grnl u € m § g3?a
RTQ § f e ? 3 ' ^ ?R75 g M 3T^ § R f Ul f3Tf >HT Q i
5HB*)»rah5 3 3 3 5 3 » : f?R SEfg^ R T O S f f lR f^ '9 O TcS ?R H g lff l SlS l
^ RT - ^ o T ? ife ^ gHt?J gRBT gie])>it 3 3 ^ g t f j q
tftBT t I
6.1 y ^ g i f S 3 UflTg sh T R'B 1 9 6 0 -6 1 ,1 9 7 0 -7 1 1 9 7 5 - 7 6 , 1 9 8 0 - 8 1 >H§ 1 9 8 3 - 8 4
3 ' 1 9 8 8 - 8 9 3 5 J ~ ^ d 3 ‘ >:;ql3 ^ 3 3 h1 R ^ l? ^ 9 I
6.2 ^ y ^ y RTS 1 9 8 5 -8 6 B S l 3SfS l | s l 3 B oT3HoT R fy s l 5 I
119
6
6 .3 u V g F!r3 1 9 6 0 -6 1 , 1 9 7 0 -7 1 , 1 9 7 5 - 7 6 , 1 9 8 0 - 8 1 1 9 8 3 - 8 4 §*
1 9 8 8 - 8 9 ? ? l{ij^ 5R55' 5 I
6.4,6.5 6.6 ffg f y ^tjr qny ^R?5* »>it ^ 3grel 9 I
6 .7 H fS 19 6 0 -6 1 , 1 9 7 0 -7 1 , 1 9 7 5 -7 6 , 1 9 8 0 - 8 1 1 9 8 4 - 8 5 3* 1 9 8 8 - 8 9 H ^ O T 9
HTfl ijH y g ;7 sr § garg , ^ a n na'Tt h j a 9 »j! § f e a Hq
5 § i n'd^T 6.8, 6 .9 , 6 . 1 0 , 6.1 1 , 6 . 1 2 6 . 1 3 F^e ?Q 3 ^3 SfTi?'
36?gr, >)^ ^ 4 Wt3 § 3 3 ^ 3 * S '
55r8»10 n g g t w 'dS^W >H§ ^ 9 I 0^331 6 .1 4
ufiTg yVfM55M'?e ^ m § y? § 3 u ^ ^? } ^ r fe # g ? r ^ | e .1 5 yy s f t j ?
iS\ ffiST^Tg U5Ti » f§ OHf^'3^ Ht 5 I ^ T lig g ^ B ^1 Rg^T R t ^ I 6 .1 6
*»!§ 6.17 f 6.20 3> ^ 3 3 9 feU »1§ §R ^1 9^9^31 3133 1980-81 §>hnrf^ § I
HTsr^ 6 .2 i * h ^ 6 .2 2 f?% R^B' 1 9 6 0 -6 1 , 1970-71^ 1 9 7 5 -7 6 , 1 9 8 0 - 8 1 >>i§ 1 9 8 3 - 8 4 3* 1 9 8 8 -8 9
3 ^ i n r g ^ ^ f s ^ § fo fR » it § R^cf m ar§ U 3 1 r t u s ! 6 .2 3 fi% BTg3
1 9 6 0 -6 1 , 1 9 7 0 -7 1 , 1 9 7 5 -7 6 , 1 9 8 0 - 8 1 >M§ 1 9 8 3 - 8 4 3* 1 9 8 7 - 8 8 3BT f i m RHol >HSJ U S I
R ^ l 6 .2 4 U flTg URTf^Ssr yT^t y u ^ J^T^51 9 6 0 -6 1 ,1 9 7 0 -7 1 , 1 9 7 5 -7 6 , 1 9 8 0 - 8 1 » i§ 1983-84 3"
1 9 8 8 -8 9 3 ^ 5 R ^ * ) 6 .2 5 vW^g f ^ H cfr fe^ s n f w * ^ 3 r S I i 3 t e 3 f » f^ » |f3
oTH H 3ig 5 rR 3 IM f ^ ftT»T & I Rt ^ I 6 .2 6 R^S 1 9 8 5 TJHI » i§ ^
f ? g );f^ SR B t >)?R3 9T3 f w 9 • HTa 3 6 ,2 7 ^ g i f | »nTHHa
Q3l5fT^ ST tjfHR3f?JhT O03T f t I RTU31 6 .2 8 uVfTg R H t^3t RgS} H g q U 3 I 6 .2 9 ^
5RB» ^ » !§ RRT fg^T fui>HT t I
FFB 1 9 6 0 -6 1 3* gf3c7, S H , g r q g i. HcO » f§ H3r^5^ ^ 4:^ >H§
n g 5 ( 3 if f lm R n j s 3Tfafg>nt 3" t { ^ 3 3 § fRf?»!T » in iT f ^ TO 3l"^
§ 19 6 5 -6 6 , R^H^ 3iBi>flcT, 3c~>>^i, >y.^ § 1 9 7 3-74 »1§ BJU'^ § 1&74-75 3" fE W f3;»i’
f l I t 1960-61 3 " fE»lT rT U 3 1 9 6 9 -7 0 3* ^ | ^ ^"^3
3flgfg>MT B S l UftJBT fHcT ^ Ugsr 3r{]R lB RiUB ^ 3 9 3
5 1 fe R ^ ' ^ 3 f?R 3U t t e ^ y 3 t Ht fBR 3 ^ t ^ 5 f |^ ^ 9 » f§ f ^ 3 g r^
gr§ 0 3 fHc{ y B i e fSR 3 ^ t c M 9 1 <J31 5 c i t » ! g f t 3 ^ 3 y v ft3 r u h t? *
^RH M 5R^3 HTfH»n fwH^ 5 I
SECTION VI
AGRICULTURE
Agricultural aStistics for 1S6C-61, 197C-71, i975-76,I9^C*81 and frcm jS82*f4 to 398f*89 regaidirg classification of arch, prccucticn of principal crops ard yield per hcctare of irajor crops for the Stale as a vhcle ard dislrict-wise fcr ihe jear IS8C-SS are pic^ectcd in this sccticn. The data in letpect of number of cj-eialicral tcldirgs fci iLe Stale as a v^lxle ard di5trict-\vif e are ako given. 7 te Ecvrce of Efon:£iicn is n.'irJy Lii<ctci cf l ir d Fcccics ard Diicctcr, Agiiculttre, Punjfb ard the data elate to agiic-ultuial year which starts from 1st July and ends on 30th June.
Arec acccrdirg to Village Parers : It is according to \illa^ e papers and is ^8sed on rUurns of area
170

prepared by village staff for revenue purposes ia the districts whereas area by professional survey is worked out by the Surveyor-General of India. There is some difference in the two sets of figures, because of different methods adopted by them.
Area under Forests: This includes actually forested areas on the lands, classed or administered as forests uniar any legal enactment dealing with forest whether State-owned or Private except in areas not cadastrally surveyed. Area under forests given in this section does not tally with that of the Forest Department, shown in the section on forest statistics owing to the fact that certain lands though no wooded, are taken as forest by the Forest Department while these are not treated as such by th© Director of Land Records, Punjab.
Land not available for Cultivation: This includes absolutely barren and unculturable land like mountains, deserts etc., which cannot be brought under plough except at exhorbitant cost or land covered by buildings, roads and railways and water or otherwise appropriated for non-agricultural purposes.
Other Uncultivated Land excluding Fallow Lands: This denotes land available for cultivation either not taken up for cultivation or abandoned later on for one reason or the other and includes culd turable waste, parminent pastures and other grazing land and lands under miscellaneous tree crops an- g roves.
Fallow Lands: It denotes cultivable land which after abandonment remains uncultivated over along period called “old fallow”, those kept uncultivated during the current year are called “current fallows.
Net Area Sown : It is the’net area sown under crops, the areas sown more than once during the year being counted once only.
Total Cropped Area : It includes total area covered with crops during the year. In case different crops are raised on the same land during the year, the same area is counted more than once.
Table 6.1 gives classification] of area of Punjab by land use for 1960-61, 1970-71, 1975-76, 1980-81 and 1983-84 to 1988-89.
Table 6.2. shows comparative posititon of various states in this regard for the year 1985-86.
Table 6.3 presents data regarding area and production of principal crops in the Punjab for the years 1960-61, 1970-71, 1975-76, 1980-81 and 1983-84 to 1988-89.
Table 6.4, 6.5 and 6.6 show comparative position of various states in regard to the area, pro duction and yields of principal crops.
Table 6.7 presents distirct-wise data regarding area, production and yield per hectare of principal crops of the Punjab State for the years, 1960-61, 1970-71, 1975-76, 1980-81 and ^rom 1983-84 to 1988-89. Area under High Yielding Varieties, are under Food andnon-food crops, per hectare yield of H.Y.V. for different states and area under fruitsand Vegetables and Pi oduction of fruits has been given in table 6.8, 6.9, 6.10 6.11, 6.12 and 6.13 Table 6.14 shows the crushing capacity, cane crushed and sugar production in the Sugar Mills of Punjab. District-wise percentages of principal ciops etc. are given in table 6.15. The irfoimaticn on operational holdings for Punjab arc shown in table 6.16 and for India in tables 6.17 to 6.20 and it is based on the Agricultural Census of 1980-81.
Table 6.21 and 6.22 indicate the iwdcx ciimbeis of agricultural production and its components in Punjal: for the years 1960-61, 1970-71, 1975-76, 19SC-81 aEd;H^<-?5to 198C-8? srd Irdiccs ofAgricultural Production in India are given for the year, 1960-61, 1970-71, 1975-76 1980-81 and 1983-84 to 1987-88 in table 6.23
Table 6.24 gives the consumption of chemical fertilizers in Punjab for the years 1960-61, 1970-71 975-76, 158C-81 snd lSl?-f4 io 198r-8 whereas The tabic 6.25 shovs agricuHural workers as percentage
121
of total workers and cultivable area per agricultural worker by Districts in Punjab. Table 6.26 shows the average yield per hectare of important crops in India and selected countries for the year 1986. Table 6.27 shows percentage contribution of Agriculture to total State Income in Punjab. Indices of parity in Punjab are given in table 6.28. Table 6.29 shows Sowing and Harvesting periods of important crops in Punjab.
From the year 1960-61 the yield per hectare and out-turn of rice, wheat, gram, barley, bajra, maiz*? and groundnut are based on the results obtained from crop cutting experiments by random sampling mefthod. Sugarcane has been covered since 1965-65, rape aid mustard since 1973-74 and cotton iince 1974-75. Jowar was covered under the experiment since 1960-61 but has been excluded sines 1969-70 Crop cutting experiments consist of selection of a few villages in each tehsil of a district by random sampling method, selection of a few fields in each selected village randomly and consequently selection of a plot in each selected field at rando.a. The yield per hectare is estimated from the crop harvested on such plots.
122
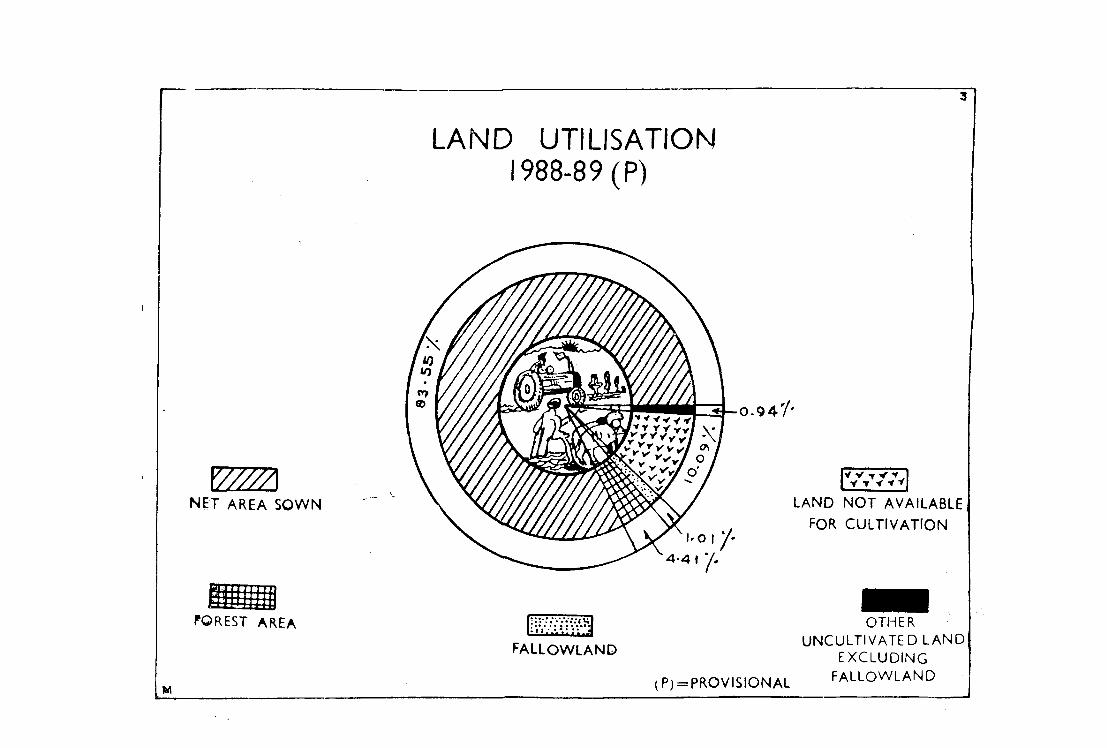
LAND UTILISATION 988-89 (P)
net area s o w n
IV y V V f .1 L y t V t t |
LAND NOT AVAILABLEFOR CULTIVATION
FOREST AREAw m m
FALLOWLAND
(P)=PROVISIONAL
OTHER UNCULTIVATED LAND
EXCLUDING FALLOWLAND

AREA UNDER MAJOR CROPS
(000 HECTARES)
7000
5600TOTAL OILSEEDS
m SUGARCANE
+200 -
2600
1400
rrK TOTAL FOODGRAINS n \ COTTON
1970- 75- 80'71 "6 81
83-
8484-
8*5
8 5 '
8686 '
8787-88
R .(P)=PR0VIS10NAL
89(P )
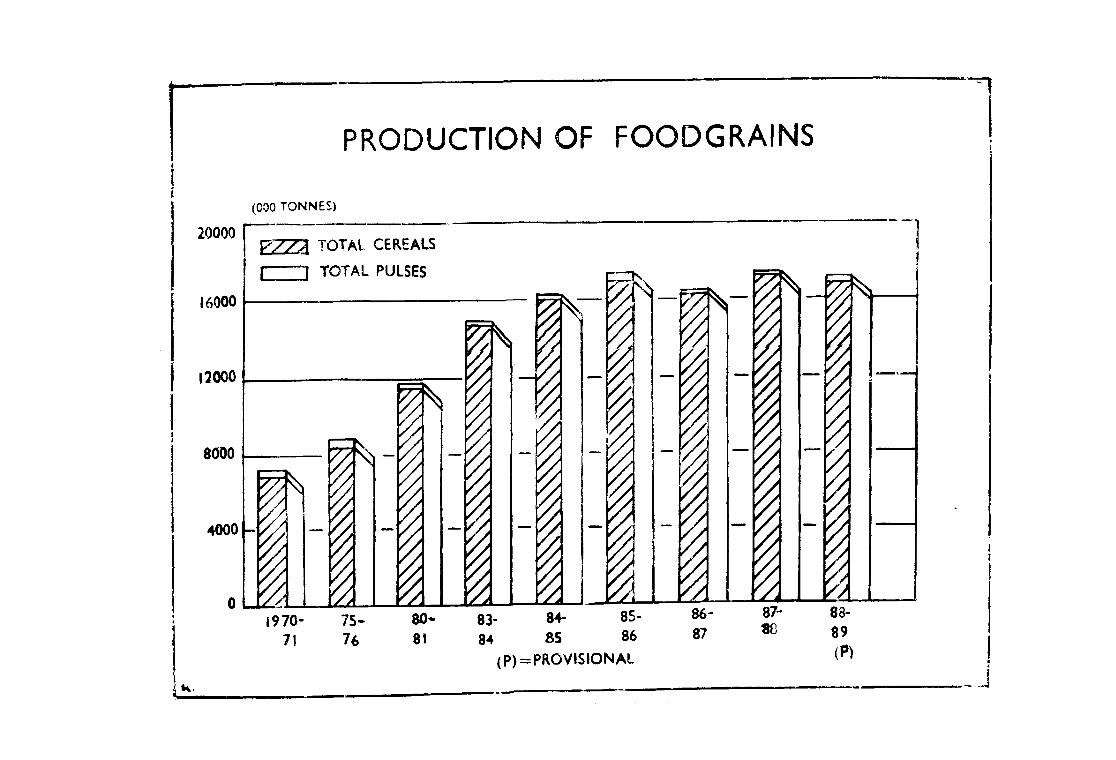
PRODUCTION OF FOODGRAINS
(0 0 0 T O N N E S )
20000
16000
laooo
8000
4000 -
y Z T T i TOTAL CEREALS I--------i TOTAL PULSES
m
80^
8183-84
i
r
( P ) =
84- 85- 86-8S 86 87
PROVISIONAL
87-«G
5
. a .88-
89(P)

PRODUCTION OF SUGARCANE, OILSEEDSAND COTTON
000 t o n n e s /b a l e s
R .
7f 76 81 84 85 36
(P )^ PROVISIONAL
87 88 89( P )


U r T H g s r a ^
CLASSIFICATION OF AREA IN PUNJAB
123
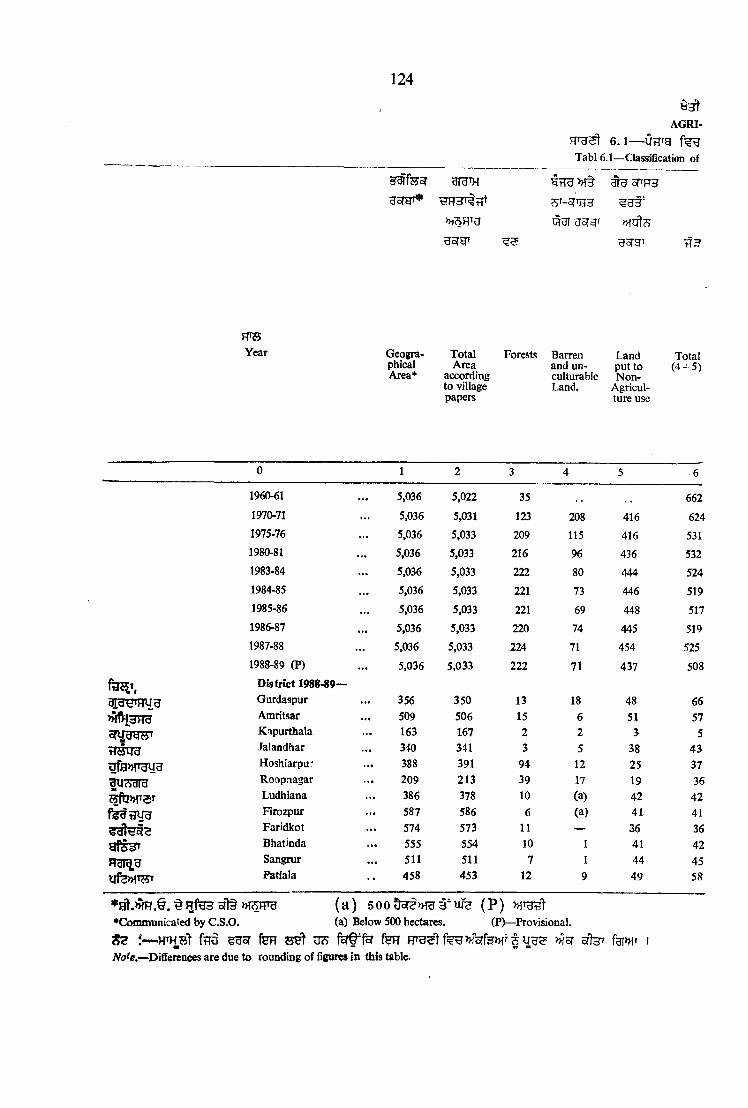
124
AGRI-
6 . 1 — Oi7Tg Tabl 6.1— Classification of
sT^fesr
HSTHT*
niSRTU nfOt?)
usrgT
H'HYear Geogra Total Forests Barren Land Total
phical Area and un- put to (4 + 5 )Area* according culturablc Non-
to village Land. Agriculpapers ture use
0 1 2 3 4 5 6
1960-61 5,036 5,022 35 . . 662
1970-71 5,036 5,031 123 208 416 624
1975-76 5,036 5,033 209 115 416 5311980-81 5,036 5,033 216 96 436 532
1983-84 5,036 5,033 222 80 444 524
1984-85 5,036 5,033 221 73 446 519
1985-86 5,036 5,033 221 69 448 517
1986-87 5,036 5,033 220 74 445 519
1987-88 5,036 5,033 224 71 454 525
1988-89 (?) 5,036 5,033 222 71 437 508
< 3 ^ ', District 1988-89—Gurdaspur 356 350 13 18 48 66Amritsar 509 506 15 6 51 57Kapurthala 163 167 2 2 3 5Jalandhar 340 341 3 5 38 43
ufa»THyH Hoshiarpu" 388 391 94 12 25 37Roopnagar 209 213 39 17 19 36Ludhiana 386 378 10 (a) 42 42Firozpur 587 586 6 (a) 41 41Faridkot 574 573 11 — 36 36Bhatinda 555 554 10 1 41 42Sangrur 511 511 7 1 44 45Patiala 458 453 12 9 49 58
*Hft.>HF?.§. Rteofl§»T5JTO (a) 500^Mg3"ufe (P)•Communicated by C.S.O. (a) Below 500 hectares. (P)—Provisional.
HTHst fnei ggsr fen set to fen HTU5tf >Horfe»{T Juu? >h57 iAto/g.—Differences are due to rounding of figures in this table.

m
CULTURE
Area in Ponjab (Thousand Hectares)
BSfgr
Cultur*ablewaste
r fp R i^ fsr
gsra
sfts l ur?t
§ U ^ ^ J c S
TT3
f"
f e u s f e g s fes? 3^ ^FTSt
^fTPHT ^ ^TH
^sf^T g s r g r ^ ^frrni’T
u sm 0^3^
Permanent
Pastures and other grazing Land
Land under Misc.
tree crops and
groves not included in net area sown
Total(7+8+9)
Currentfallow
FallowLandotherthancurrentfallow
Total(11+ 12)
NetAreaSown
Net Area
Sown as percentage to Total Area
AreaSown
morethanonce
TotalCroppedArea(14+16)
7 8 9 10 11 12 13 14 15 16 17
255 313 313 3,15T 15 915 4,13283 5 4 92 139 — 139 4,053 81 1,625 5,67861 4 3 68 66 1 67 4,158 83 2,097 6,25541 4 4 49t 45 (a) 45 4,191 83 2,572 6,76333 4 5 42 29 4 33 4,212 84 2,765 6,97741 4 4 49 52 3 55 4,189 83 2,824 7,01339 4 4 47 51 (a) 51 4,197 83 2,961 7,15840 3 1 44 48 — 48 4,202 83 3,015 7,21740 4 5 49 78 (a) 78 4,157 83 3,l69t 7,32638 4 3 47 51 (a) 51 4,205 84 3,182 7,387
— _ — ___ ■ 271 77 193 4644 — (a) 4 2 — 2 428 85 347 7757 — — 7 2 — 2 151 90 94 245
(a) — — (a) — — - — 295 86 213 5081 2 4 7 1 — 1 252 64 144 3966 2 — 8 11 — 11 119 56 78 197
— — — — — — — 326 86 273 59919 — (a) 19 19 — 19 501 85 421 922— — — — (a) — (a) 526 92 371 897(a) — 1 (a) (a) — (a) 502 91 333 835
1 — 1 2 6 — 6 451 88 394 845— — — — 10 (a) 10 383 83 321 704
t TO
fRevlsed
HtTO W OhtH ISource : Director Land Records, Punjab.
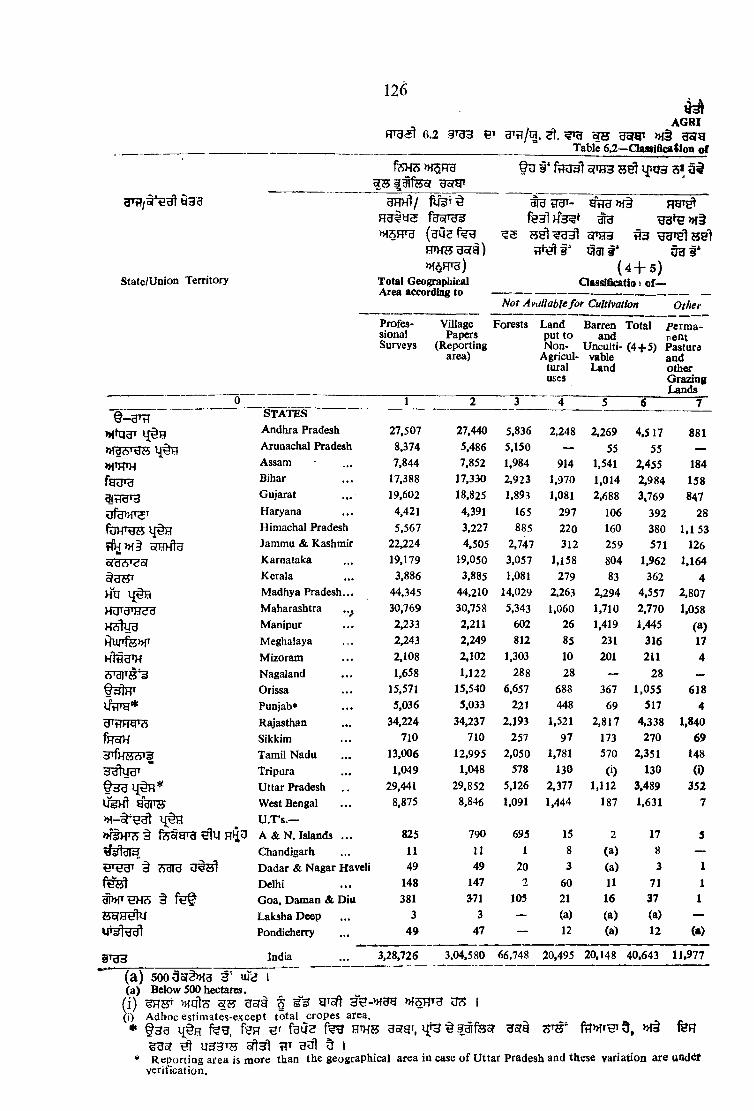
126
AGRI6 .2 §TU3 a^»7/g. ^ gcjgr » f§ g g g
fcSH3 t U i * ofiHH 3 ^ l£*q3 5* 3 #
y ^ 3
State/Union Territory
3HH1/
MSH'd
>HAFrc{)Total Geographical Area accord!^ to
^ trar- g n g >nt RHT^
f e 3 l ^ >H§ ^ 5 cPH3 H 3
f l M §' tS3I f* u g r ( 4 - f 5 )
Classificatio) of—
A or Available fo r Cultivation Other
Profes- Village sional Papers Surveys (Reporting
area)
Forests Land Barren Total perm a- put to and rent Non- Unculti- (4 + 5 ) Pasture
Agricul- vable and tural Land other uses Grazing
Lands■■ ' 0 1 2 3 4 5 6 7§-UTtT
>Htq3TSTATES
Andhra Pradesh 27,507 27,440 5,836 2,248 2,269 4,517 881>H3'A’'eH 1{§H Arunachal Pradesh 8,374 5,486 5,150 — 55 55 —
»HTHTH Assam 7,844 7,852 1,984 914 1,541 2,455 184f e r e Bihar 17,388 17,330 2,923 1,970 1,014 2,984 1583i?raT3 Gujarat 19,602 18,825 1,893 1,081 2,688 3,769 847
Haryana 4,421 4,391 165 297 106 392 28fUVfBB Himachal Pradesh 5,567 3,227 885 220 160 380 1,153fm>H§ srmflu Jammu & Kashmir 22,224 4,505 2,747 312 259 571 126c<dcS'<Jof Karnataka 19,179 19,050 3,057 1.158 804 1,962 1,164
Kerala 3,886 3,885 1,081 279 83 362 4Madhya Pradesh... 44,345 44,210 14,029 2,263 2,294 4,557 2,807
HO'cJ'HcJc) Maharashtra ..^ 30,769 30,758 5,343 1,060 1,710 2,770 1,058Hc^tya Manipur 2,233 2,211 602 26 1,419 1,445 (a)iRurfe>>fT Meghalaya 2,243 2,249 812 85 231 316 17
Mizoram 2,108 2,102 1,303 10 201 211 4JSraflTtf s{ Nagaland 1,658 1,122 288 28 — 28 —
tSf^RT Orissa 15,571 15,540 6,657 688 367 1,055 618{ fn iy * Punjab* 5,036 5,033 221 448 69 517 4
Rajasthan 34,224 34,237 2,193 1,521 2,817 4,338 1,840fR57H Sikkim 710 710 257 97 173 270 69
Tamil Nadu 13,006 12,995 2,050 1,781 570 2,351 148d d ly g r Tripura 1,049 1,048 578 130 (i) 130 (i)
Q d 3 Uttar Pradesh 29,441 29,852 5,126 2,377 1,112 3,489 352ydi'w West Bengal 8,875 8,846 1,091 1,444 187 1,631 7
U .T s .—A & N . Islands . . . 825 790 695 15 2 11 5
^1313 Chandigarh 11 11 1 8 (a) 8 —^ r g g r § *cj|d Dadar & Nagar Haveli 49 49 20 3 (a) 3 1f t f e l Delhi 148 147 2 60 11 71 1
G oa, Dam an & Diu 381 371 105 21 16 37 1H o f B ^ Laksha Deep 3 3 — (a) (a) (a) —
Pondicherry 49 47 — 12 (a) 12 ( • )
§rgH India 3,28,726 3,04,580 66,748 20,495 20,148 40,643 11,977(a) 5oo3ot 3 3' uTe i(a ) Below 500 hectares.
(i) ^55 garg f ^ I(i) Adhoc estimates-except total cropes area. a* § 3 3 l^§e f^g, fHH fgif3 m i E ^ f^feST Hofi STJ' 9 , m feFT
^ U 33T H 5 ft3 l W 5 I* R eportiog atea is m ore than the geographical area in case o f Uttar Pradesh and these variation are und^t
verification.
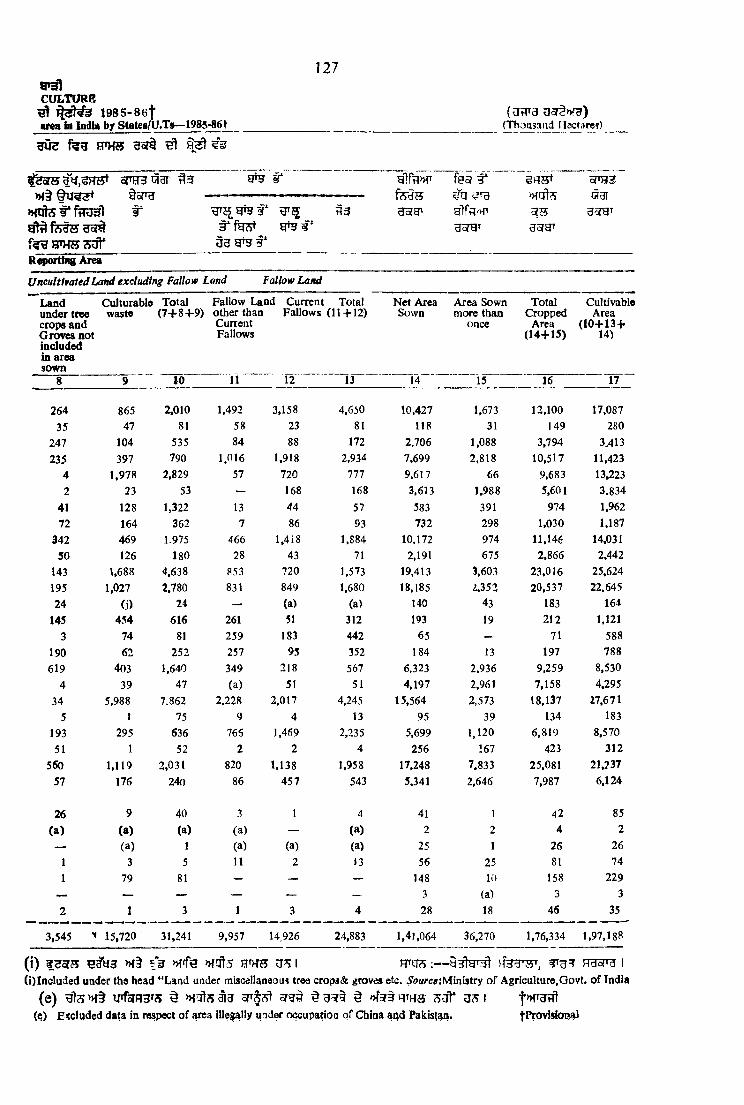
127
CULTURE^ 198 5-setarea in India by States/U .Ts— 1985-86t
H ite w m ^
(a ? p g U 5f^»f?) (Thousand Hectare?)
r
fey??^ 5 * 5(3
dy,<oH4i^
W t e f*fe§ 7 5 3cJ^
o<'H3031
U 3 W B i '
^ 3
Reporting Area
UnculthatedLand excluding Fallow Land Fallow Land
Land Culturabieunder tree wastecrops andG roves notincludedin areasown
Total( 7 + 8 + 9 )
Fallow Land Current Total other than Fallows (11+12) Current Fallows
N et Area Sown
Area Sown more than
once
TotalCropped
Area(1 4 + 1 5 )
CultivableArea
(1 0 + 1 3 +14)
8 9 10 11 12 13 14 15 16 17
264 865 2,010 1,492 3,158 4,650 10,427 1,673 12,100 17,087
35 47 81 58 23 81 118 31 149 280
247 104 535 84 88 172 2,706 1,088 3,794 3.413
235 397 790 1.016 1,918 2,934 7.699 2,818 10,517 11,4234 1,978 2,829 57 720 111 9,617 66 9.683 13,2232 23 53 — 168 168 3,613 1,988 5,601 3.834
41 128 1,322 13 44 57 583 391 974 1,962
72 164 362 7 86 93 732 298 1,030 1,187
342 469 1.975 466 1,418 1,884 10.172 974 11,146 14,03150 126 180 28 43 71 2,191 675 2,866 2,442
143 1,688 4,638 853 720 1,573 19,413 3.603 23,016 25,624
195 1,027 2,780 831 849 1.680 18,185 i.352 20,537 22,645
24 (i) 24 — (a) (a) 140 43 183 164
145 454 616 261 51 312 193 19 212 1,121
3 74 81 259 183 442 65 — 71 588
190 62 252 257 95 352 184 13 197 788
619 403 1,640 349 218 567 6,323 2,936 9,259 8,530
4 39 47 (a) 51 51 4,197 2,961 7,158 4,295
34 5,988 7.862 2,228 2,017 4,245 15,564 2,573 18,137 27,671
5 1 75 9 4 13 95 39 134 183
193 295 636 765 1,4S9 2,235 5,699 1.120 6,819 8,570
51 1 52 2 2 4 256 167 423 312
560 1,119 2,031 820 1,138 1,958 17,248 7.833 25,081 21,237
57 176 240 86 457 543 5,341 2,646 7,987 6,124
26 9 40 3 1 4 41 1 42 85
(a ) (a ) (a) (a) — (a) 2 2 4 2
— (a) 1 (a) (a) (a) 25 1 26 26
I 3 5 11 2 13 56 25 81 74
1 79 81 — — — 148 10 158 229— — — — — — 3 (a) 3 3
2 I 3 1 3 4 28 18 46 35
3,545 15,720' 31,241 9,957 14 926 24,883 1,4J,064 36,270 1,76,334 1,97,188
(i) fHoj's »ft fsT »fffe i wu?;:— vfggw, rhoT3 i(i)Iadu ded uader the head “ Laad under miscellanaou? tree crops& groves etc. ^o«rce:Ministry o f Agriculture,Govt, o f India
(e) yrfsfFiys § MOts 3 § »f53 qrH{5 ;SOt* US I(?) Excluded data in respect o f 5 -ea illes^lly under occupatioa of China and Pakistatn. |ProvI*ional

1 2 8
6 .3 i t e m Table 6 .3—Area and Production o f
AGRl
R lg h x s
H^H/Year
yr^yr
Kharif Cereals
orac? ^
Rabi Cereals OtherCereals
W t lTotal
CerealsRice Jowar Bajra M aize Wheat Barley
0 1 2 3 4 5 6 7 8
Uoigr !ter§»ra)
Area (Thousand H ectares) 1960-61 227 6 123 327 1,400 66 11 2,160
1970-71 390 5 207 555 2,299 57 1 3,514
1975-76 567 5 182 577 2,439 120 1 3,891
1980-81 1,183 1 69 382 2,812 65 1 4 3 1 3
1983-84 1,481 2 45 294 3,124 60 (a) 5,006
1984-85 1,644 1 59 304 3,094 49 1 5,1521985-86 1,714 1 32 260 3,112 50 (a) 5,169
1986-87 1,786 (a) 24 261 3,185 39 4 5.299
1987-88 1,720 1 13 233 3,131 39 1 5,138
1988-89 (p) 1,778 3 16 249 3,157 49 1 5,253§ i m (O d 'd H f ^ ^ Production (Thousand M etric
1960-61Tons)
229 (M ) 58 371 1,742 52 i 2,453
1970-71 688 i 243 861 5,145 57 ^»rt 6,997
1975-76 1,447 3 189 846 5,788 152 8,425
1980-81 3,233 1 86 612 7,677 108 (» •) 11,717
1983-84 4,536 3 55 539 9,422 94 (M ) 14,649
1984-85 5.052 1 60 576 10,176 83 (M ) 15,948
1985-86 5,485 1 28 412 10,988 109 (M) 17,023
1986-87 5,949 (M ) 28 528 9,447 80 f w ) 16,032
1987-88 5,442 1 13 365 11,084 89 ( m > 16,994
1988-89 (p) 4,923 3 13 293 11,578 128 ( v ) 16,938
ff lt" TO?7 )iV t » f§ W fgr §?yf § ^ ) ) ( f ^ HTg H tc i3 ) j j ^ I3THS ^ ITO; ( l ) f U t T 1 3 ^ g ir fwH 9 I
(2) H 3 I ^ f e s l RftiH M 5 I( 3 ) cflTU FTg ^ d >H§ 170 fsr. 3JT: ^ r^ t» ft fecT 0^ gfe^ t^dK^gl 5 »(>k) 500 >fl: ^ l ife I ( p ) >K ig^(>K) B elow 500 M . Tons. (p) Provisional( a ) 500 t T o ? ^ ^ u fe * h i5(a) hactares *Revi8ed.
**Final Forecast

129
CULTUREgoigT f ira
Principal Crops in Punjab
la fdW
d'dTHfe’
>h b h I era afer
y»*4'Poises
>XA'H( 8 + 1 1 )
nU'U
Gram Otherpulses
Total Total Ground- pulses 1 food- nut
grains (8 + 1 1 )
Sesamum Rapeand
mustard
Linseed Total oil seedsf
Cotton Sugarcane Potatoes
9 10 11 12 13 14 15 16 17 18 19 20
go?H» {UiJrg
Area (Thousand Hectares)838 65 903 [3,0<»3 67 8 107 3 185 447 133 $
358 56 414 3,928 174 15 103 3 295 397 128 17
381 60 441 4,332 168 23 122 2 315 580 114 27
258 83 341 4,854 83 17 136 2 238 649 71 40
98 102 200 5,206 58 14 83 1 156 650 84 30
102 101 203 5,355 45 14 138 1 198 472 79 34
108 117 225 5^94 45 14 w \ 211 559 78 43
114 114 228 5,527 40 13 106 1 160 567 97 28
66 92* 158*J 5,296* 32 11 158* 1* 202* 621 106 33
73 92 165 5,418 19
f U t? (UtTO Z7i)^ od uctiu n (Thousand Metric Tons)
20 114 2 155 759 97 31
681 28 709 3,162 62 3 54 2 121 709 486 12!>
284 24 308 7,305 169 6 57 I 233 818 527 216
376 26 402 8,827 176 « 78 1 263 1,235 613 445
150 54 204 11,921 104 5 77 1 187 1,178 392 767
58 78 136 14,785 42 5 72 (>K) 119 707 553 588
60 90 150 16,098 45 5 148 1 199 1,241 492 669
98 105 203 17,226 43 5 153 1 202 1,403 504 427
82 101 183 16,215 40 6 93 1 140 1,691 611 252**
29 69 98 17,092 23 4 160* 1* 188* 1,863* 582 642
72 55 127 17,065 18 6 114 1 139 2,117 602 626
FTt o ; ^ ’fpfcT c^ , f ‘ U tp g I
Source : Director o f Land Records/Agriculture, PuQjab
tD o e s not include figure relating to other edible like sunflower and non-edible oil seeds, e.g. Castor seeds. ffote>—(1) Production o f sugarcane is in terms o f gur
(iO Groundnut is nuts in shell.(|ii) Cotton is cleaned cotton and is in terms o f thousand bales o f 170 kgs. each

F T ^ 6 . 4 - § T O ^ 3 <jy d Tjjly SH B t l 9 8 8 - 8 9 f
Table 6.4— Area aoder Principal Crops in India by States/UTs.— 1988<89t
AGRICULTURE
( u s ^(Thousand Hectares)
yTH-yuTor Food grains
Cereals Poises
Kharif Rab!
^ tT /g .Z l . S ta tes/U .ls . Hoft ■c Sof i s u gti'W t W - W g
Rice Jowar Bajra Maize Wheat Barley OtherCereals
TotalCereals Gram
OtherPulses
Total Total Pulses Foodgrains
(9 + 1 0 ) (8 + 1 1 )
0 1 2 3 4 5 6 7 8 9 10 11 12
§ - a ' ^ A-STATES
Andhra Pradesh ... 4 ,107 -4 1,396-6 295*7 292-1 1] -1 — 417-5 ^ 6,520 4 54 4 1,437 -7 1,495-1 8,015-5
»h1?5TH5 Arunachal Pradesh 116-5 — — 30-5 5-9 — 26-2 179 1 — — — 179 -1
»HWH Assam 2.301 -3 — — 16-9 106-3 — 10-5 2,435 -0 3 -5 118 -3 121 8 2,556-8
fe u r g Bihar 5,349-6 4 -7 9 -7 692-3 2 ,112-2 59 7 184 -4 8 ,412-6 147 7 985-2 1,132-9 9,545 -5
Goa 53*6 — — — — — 3-5 57-1 — — — 57-1
®t]cjr3 Gujarat 535-6 780 -8 1,489-1 337 -2 648 -8 6 -7 141 -0 3,939 -2 107-5 664 0 771-5 4,710-7
Uf3»TST Haryana 599 -0 154 -0 786 0 44 -0 1,820 -0 65 0 — 3,468 -0 645 0 86-6 725 6 4,193-6
fUHT^S Himachal Pradesh... 8 6-6 0 -2 — 320-8 373-0 28-3 23 8 832 -7 5 8 35-6 41 -4 874-1
AH >H§ oTHHtg Jammu and Kashmir 264 0 — 14-5 292 -2 242 -7 9-1 16 -8 839 -3 1 -1 43-1 44 -2 883-5
Karnataka 1,185-1 2 ,089-1 452-5 256 -0 235-3 - 1,354 -6 5,572 -6 190-9 1,425 0 1,615-9 7,188 -5
o
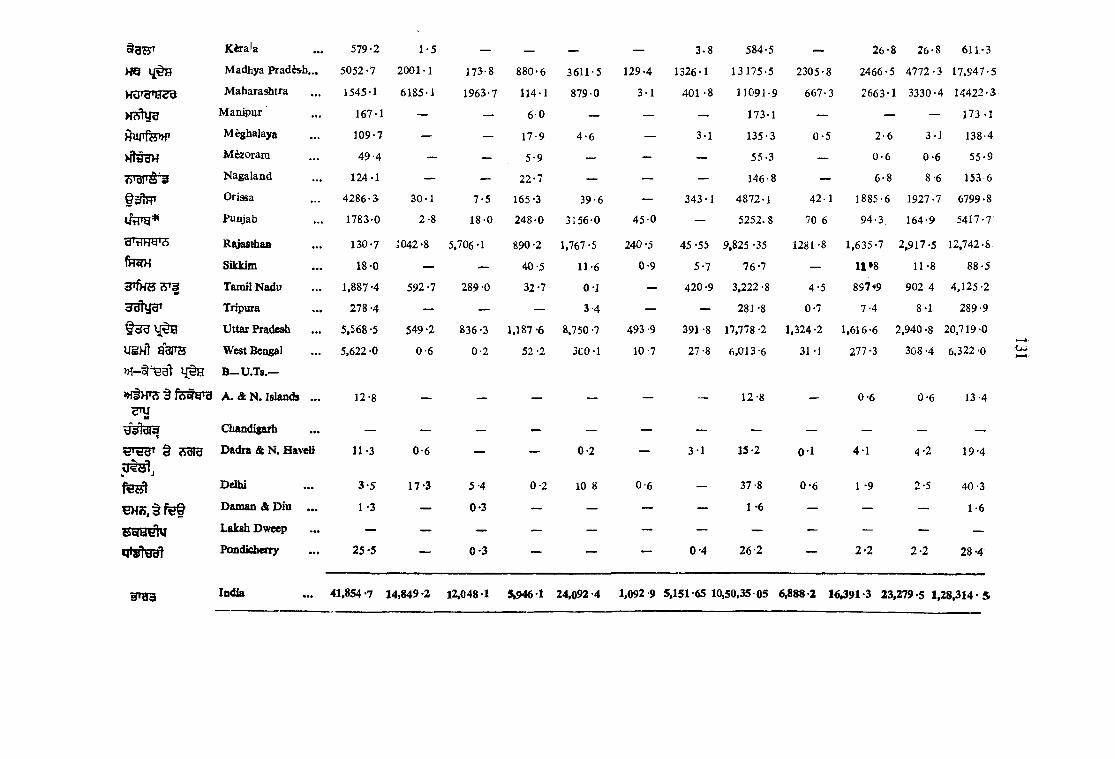
m
Mh33H
gT fn w cs
fHcTH
3 T f i ^ S T |
y g ) f l a a r o
*H3>f?5 § f e f y ’d
W t m g
t ?raravT I ^ ,
g g g e fa
Kira la
Madhya P ra d ^ b ...
M aharashtra
Manipur
M eghalaya
M ^ oram
N agaland
Orissa
Punjab
Rajasthaa
Sikkim
Tamil Nadu
Tripura
Uttar Pradesh
West Benga]
B-U.Ts.—
A. & N. Islands ...
Chandigarh
Dadra & N. Haveb
Delhi
Daman & Diu ...
Laksh Dweep
Pondidierry
India
579-2
5052*7
1545-1
167-1
109-7
4 9 -4
124-1
42 8 6 -S
1783-0
130-7
18-0
1.887-4
278 -4
5.568-5
5,622 -0
12-8
11-3
3*5
1 -3
2 5 -5
1 -5
2001-1
6185-1
173-8
1963-7
30-12 -8
1042 -8
592-7
549-2
0-6
0-6
17-3
7-5
1 8 0
5,706-1
289-0
836-3
0-2
5 -4
0-3
0 -3
88 0 -6
114-1
6 0
17-9
5 -9
22-7
165-3
248-0
890 -2
40-5
32-7
1,187 -6
52 -2
0 -2
— — 3-8 584-5 — 2 6-8 26-8 611-3
3611-5 129-4 1326-1 13 1 7 5 -5 2305-8 2466-5 4 7 7 2 -3 I7 .S47-5
879-0 3-1 401 -8 n 0 9 1 - 9 667-3 2663-1 3330-4 14422-3
— — — 173-1 — — — 173 -1
4 -6 — 3-1 135-3 0 -5 2 -6 3-1 138-4
— — — 55-3 — 0 -6 0 -6 5 5 -9
— — — 146-8 — 6-8 8-6 153 6
39-6 — 343-1 4872-1 42-1 3885-6 1927-7 6799-8
3156-0 4 5 -0 — 525 2 .8 70 6 94-3 . 164-9 5417-7
1,767 -5 240-5 45 -55 9,825 -35 1281 -8 1,635-7 2,917-5 12,742-8.
11-6 0-9 5-7 7 6-7 — U » 8 11-8 88-5
0-1 — 420 -9 3,222 -8 4-5 897^9 902 4 4,125 -2
3-4 — — 281-8 0-7 7-4 8-1 289-9
8.750 -? 493-9 391 -8 17.778 -2 1,324 -2 1,616-6 2 ,940-8 20,719-0
3C0-1 10 -7 27-8 6,013-6 31 -1 277 -3 308-4 6,322 -0
— — — 12-8 — 0-6 0-6 13-4
0 -2 — 3-1 15 -2 0-1 4-1 4-2 19-4
10 8 0-6 — 37-8 0 -6 1 -9 2-5 40-3
— — 1 -6 — — — 1-6
— — 0-4 26-2 -— 2 -2 2-2 2 8-4
Ca
41,854 -7 14,849 -2 12.048 -1 5»946 -l 24,092 -4 1,092 9 5,151-65 10,50.35 05 6,888 -2 16391-3 23,279-5 1,28,314 • S
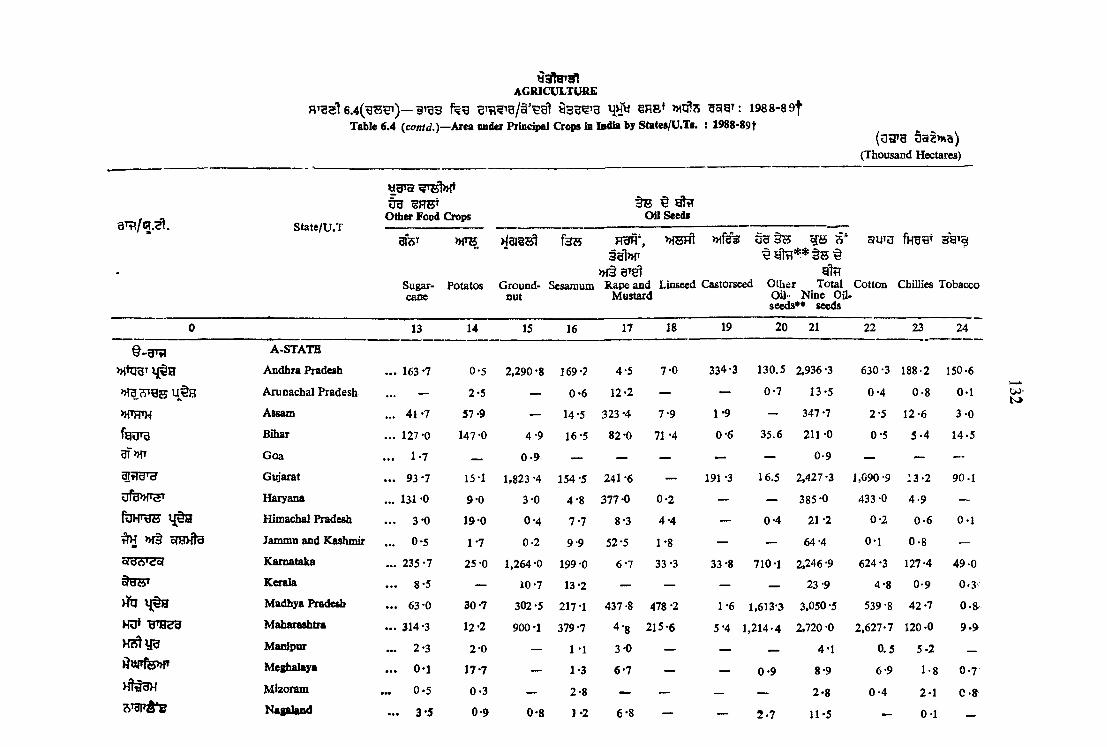
6 .4 ( ^ ® ^ ) — 3^ 3 3 : 198 8 -8 9 fTable 6.4 {contd.)—^ ^ under Principal Crops in lodia by States/U.Ti. : 1988-89t
AGRICULTURE
(U3^H 5ai> H B ) (Thousand Hectares)
State/U .TOther Food Crops
§ B ^ ^ O il Seeds
gfeT
Sugarcane
ts
Potatos
HaiSHl
Groundnut
f e w
Sesamum
3 g 1 » r » ( § 9 T ^
Rape and Mustard
>HlSFft >Hfe¥ g S S*
ylHLinseed Castorseed Other Total
Oil N ine Oil- s e ^ * * seeds
ofqTO
Cotton Chillies Tobacco
0 13 14 15 16 17 18 19 20 21 22 23 24
§ - e r ; i
» i ^ T
A-STATO
Andhra Pradesh . . . 163 -7 0*5 2,290 *8 169*2 4*5 7*0 334*3 130 .5 2,936*3 630 -3 188-2 150-6
Arunachal Pradesh — 2*5 — 0 -6 12*2 — — 0*7 13-5 0 -4 0 -8 0-1
>H'H H Assam ... 4 1 -7 5 7-9 — 14*5 323*4 7*9 1-9 — 347 *7 2-5 1 2-6 3 -0
fg o ra Bihar . . . 127-0 147*0 4 -9 16*5 82 *0 71 *4 0 -6 3 5 .6 211 *0 0*5 5*4 1 4-5
gr»fT G oa . . . 1*7 — 0 - 9 — — — — — 0 -9 — — —
Gujarat . . . 9 3 -7 15-1 1,823 *4 154 *5 241*6 — 191 *3 16.5 2,427*3 1,090 -9 1 3 -2 90-1
ufB>»r5T Haryana ... 131 *0 9*0 3*0 4*8 377*0 0 -2 — — 385*0 433-0 4 -9 —
Himachal Pradesh . . . 3*0 19-0 0*4 7*7 8*3 4*4 — 0 -4 21 -2 0 -2 0 -6 0-1
^ » f§ olHHte Jamniii and K azim ir . .. 0 -5 1*7 0 -2 9-9 52 *5 1-8 — — 64-4 0*1 0 -8 —
^ 6 ' e d Karnataka . .. 235*7 25 -0 1,264*0 199 -0 6*7 33 *3 33 *8 710-1 2,246 -9 624 *3 127-4 49 0
Kerala . . . 8*5 — 10*7 13*2 — — — — 23 -9 4-8 0 -9 0 .3
>?XI 1{^H Madhya Pradeib . . . 63-0 30 *7 302*5 217*1 437 *8 478 *2 1-6 1,613-3 3,050-5 539-8 42 *7 0 . 8
Maharaditra . . . 314*3 12*2 900*1 379*7 4*8 215-6 5*4 1 ,2 1 4 -4 2.720 -0 2,627*7 120-0 9 .9
H jy iy g Manipur . . . 2 *3 2*0 — 1 *1 3-0 — — 4-1 0 .5 5 .2 _
M eghalaya . . . 0*1 17*7 — 1*3 6 -7 _ 0*9 8-9 6*9 1-8 0 -7>#3UH M izoram 0 -5 0*3 — 2 -8 _ — _ __ 2*8 0 -4 2 1 C-8? > w S * s Nagaland . . . 3 -5 0*9 0*8 1*2 6 -8 — — 2 -7 11*5 0-1
w -

9 = ^ Orissa 47 -0 8*7 376 -6 292 *9 135-5 35-8 32 -8 203 -2 1,076 -8 6 -6 77 0 1 4 -0
UtTO* Punjab* . . . 9 8 -0 24-9 2 0-0 1 8 '4 159 -0 0-1 — — 197-5 758 0 3 .5 —
3TRH5T5 Rajasthan 16-1 2 -2 234 -5 322*3 1,^27-3 61 -5 7-7 I l l -8 2,265 -1 299-4 33-1 2 -4
THoIH Sikkim — 5-5 — — 7-8 — — 4 -6 12-4 — — —
BTfHS Tamil Nadu . . . 2 2 0 '9 4 -6 1,044 -1 159-4 0 -6 — 25 -5 2 3 -8 1,253 -4 243 -7 5 0 -0 5 -8
dalUBT Tripura 1 -9 3 -0 1-6 3*4 5-4 — — — 10-4 1-0 1-3 0 -6
Uttar Pradesh ... 1,779-3 359-3 128 -6 373 '2 1,079 -2 247 -6 0*1 19-2 1,847 -9 24 -2 2 0-9 1 4-7
USHt gBTH West Bengal ... 16-4 188-6 2 0-6 6 9 -3 378 -5 16 8 0-1 7 -6 492 -9 0-3 46-5 17-9
B.—U T.s—
A & N Islands ... 0-1 — — — — — — — — — — —
Chandigarh — — — — _ — — — — — — —
Dadra & Nagar Haveli — — — — — — — 0 -5 0*5 — — —
Delhi — 0 1 — — 4 -4 — — — 4 -4 — — —
^ f e f Dam an and Diu - — — — — — — — — — — —
Kb!HiSllI iw tr Laksh Dweep — — — — — — — — — — — —
U^slg'cjl Pondicherry 2 -9 ~ 2 -6 0-5 — — — ~~ 3-1 1-0 — —
d 'd d India ... 3 ,372-6 9 3 8 -4 8 ,430-3 2,432 -5 4,865 0 1 ,181-6 635-1 4,095 -8 21,640 -3 7,296. 5 759 0 375 -3
H T O: — 0921^91 Source : Ministry o f Agriculture, Government o f India,
)H3H t »nT Pfe3 U S >H§ HOSWai !(Vo/e.— Figures are based on final estimates and are subject to revision
»feH § »ftnfe3 crat 6.3 >Ht 6.7 feB fp§ Wffe’HT ^ ^ \•Figures are based on final forecast and hence will not tally with the figures given in table 6.3 and 6.7.
^ fetTHFfte, g g H H y l » I§ H tK S ft I♦♦Other Oilseeds includes Safflower* Nigerseed, Sunflower and Soyabean.
t>M3HfF ioal Forecast. ,
u>U)

AGRICULTURE
9 3 3 ^ ^ 3 ^ gUfT : 1 9 8 8 -8 9 f
Table 6 .5—Production o f Principal Crops in India by States and U .T s .: 1988*89tH tegsr ? » )
(Thousand Metric Tons)
Foodgrains
Statc/U . T .>H?5TtlCereals Pulses
F n f s l
Kharif
y'ddT HS?t
Rabi
3 ^
Other Total Cereals Cereals
(1 to 7)
Gram
U 3
OtherPulses
^T5T
TotalPulses(9 + 1 0 )
y g r g
TotalF oodgrains(8 + 1 1 )
*Rice Jowar Bajra Maize Wheat Barley
0 1 2 3 4 5 6 7 8 9 10 11 12
t — ASTATESAndhra Pradesh . . . 1 ,05 ,58-8 7,48-7 2 ,05 -2 5 ,19-7 7-5 280 -0 :1,23,19-9 24 -5 647 -3 671 -8 1,29,91 -7
> K 1 3 T ^ Arunachal Pradesh 134 -0 — — 3 6-6 9*0 — 14-4 1 ,9 4 -0 — — — 194-0
W T O Assam 24,39 '3 — — 10-5 1.22 -3 — 5-2 25,77 -3 1 -7 49-4 51-1 26,28 -4
f e P B Biha^ 61,18*8 2-6 6-5 10.73 -9 35,57-0 4 7 -6 110-5 10,916-9 128-8 5,60 1 6,88 9 1,16,05 -8
^>HT G oa 1,29-1 — — — — — 0 -9 1,30 -0 — — — 130 -0
Gujarat 8 ,66 -0 4,25 -1 14,87 -5 4 5 5 -9 15,12-5 6 -8 87 -7 4.841 -5 65 -5 4,24 -2 4 ,8 9 -7 53,31 -2
Haryana 14,37 -0 39 0 9,58 -0 43-0 61,99-0 130 -0 — 88,06 -0 604 -0 68 -2 672-2 9,78 -2
Himachal Pradesh... 89 -8 — — 4,83 -1 5 ,12 -5 34 -4 8-2 11,28 -0 2-8 4-5 7-3 11,35-3» i§ oidHfe Jammu & Kashmir 5,79-6 — 5-4 4,41 -8 2 .45-6 6-1 6-9 12,85 -4 0 -4 4-6 5-0 12,90-0
Karnataka 24,10 -8 15,11-1 2 .07 -2 6,77 -7 1.61 -7 — 12,34 -1 62,02 -6 62-9 4,53 -5 5 ,16-4 67,19-0
Kerala 10,13-7 0 -8 — — — — 3 -2 10,17-7 19-7 19-7 10,37-4W Madhya Pradesh ... 48 ,80-0 18,81 -0 1.57-9 12,56-8 46,33 -8 1,02 -6 3.07 -7 13,219-8 15,02 -3 11.78-4 26,80-7 1,59,00-5
Maharashtra 26.52-1 42,77-9 9 ,00 -5 1,40-3 10,43 -2 2 -6 3.31 -5 93.48 -1 407 -7 13.22 -0 17.29-7 1,10,77-6
Manipur 319-7 — — 1 2 -2 — — 331-9 — — — 331-9
OJ
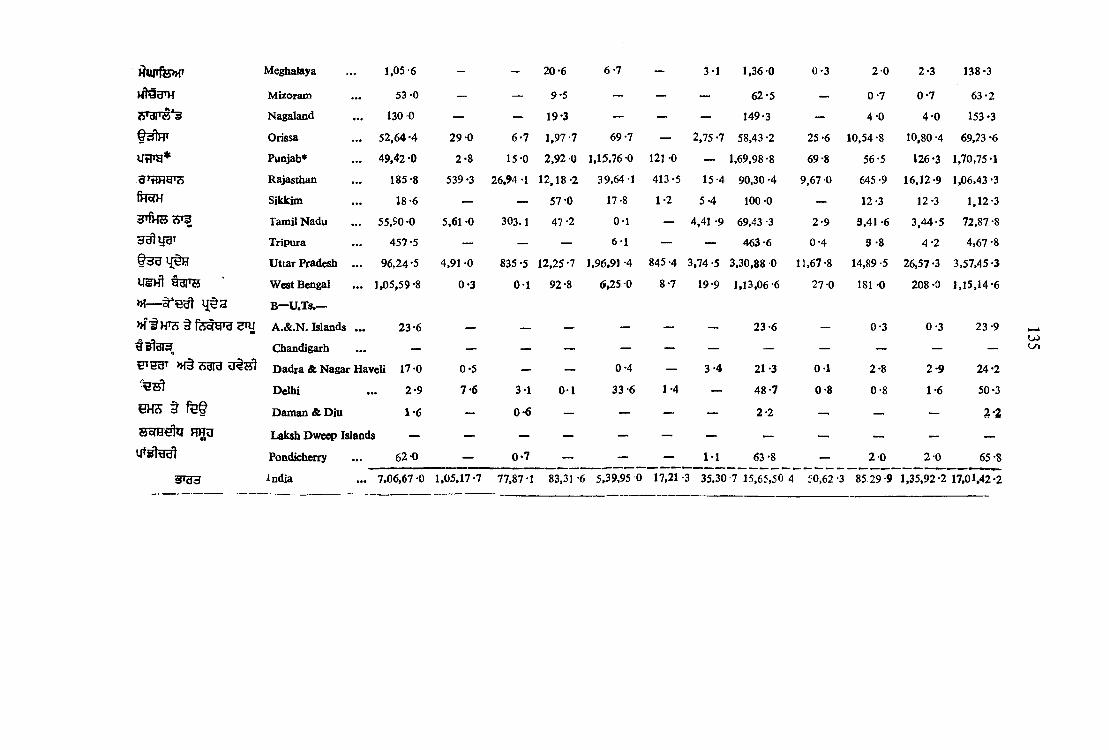
J^UPfe»T Meghalaya . .. 1 ,05-6 - - 20-6 6 -7 - 3*1 1,36 0 0 -3 2-0 2-3 138*3
M laanf Mizoram 53 -0 — — 9*5 — — — 6 2 -5 — 0 -7 0*7 63*2
Nagaland 130 0 — — 19*3 — — — 149-3 — 4-0 4 -0 153 *3
Orissa 52 ,6 4 -4 2 9 -0 6-7 1,97 -7 69 -7 — 2,75 *7 58,43 -2 25 -6 10,54 -8 10,80 -4 69,23 *6
UtTO* Punjab* 49,42 -0 2*8 15-0 2,92 0 1,15,76 -0 121 -0 — 1,69,98 -8 69-8 56-5 126*3 1,70,75*1
Rajasthan 185*8 539 *3 26,94 -1 12,18*2 39.64-1 413-5 15-4 90,30 -4 9,67 0 645 -9 16,12-9 1,06,43 -3
fHo?H Sikkim 18-6 — — 57-0 17-8 1 *2 5 -4 100 -0 — 12-3 12-3 1,12 -3
3 4 ( 5 3^ 3 Tamil Nadu 55.90-0 5,61 *0 303.1 47 -2 0-1 — 4,41 -9 69,43 -3 2 -9 3,41 -6 3 ,4 4 -5 72,87 -8
3 ^ y g T Tripura 457 *5 — — — 6-1 — — 463-6 0 -4 3 -8 4 -2 4,67 -8
Uttar Pradesh 96,24-5 4,91 -0 835 -5 12,25-7 1,96,91 -4 845-4 3 .74-5 3,30,88 0 11,67 -8 14,89 -5 26,57-3 3,57,45 -3
U 5 )^ 9 d l ^ W est Bengal 1,05,59*8 0*3 0 1 92 -8 6,25 -0 8 -7 19 -9 1,13,06 -6 27 -0 181 -0 208 *0 1,15,14-6
»H— l { t 3
» f i ) T O § f e O T H S T U
B —U.Ts.—
A .& .N . Islands . .. 23 -6 23 -6 0 -3 0 -3 23-9
esH airf Chandigarh — — — — — — — — — — — —
5^531 >h9 Sara Dadra & Nagar Haveli 17 *0 0*5 — — 0 -4 - 3 -4 21 -3 0-1 2-8 2*9 24*2
D elhi . .. 2 -9 7 -6 3*1 0-1 33-6 1-4 — 4 8 -7 0*8 0-8 1-6 50 *3
€ H 5 § f e § Dam an & D iu 1*6 — 0*6 — — — — 2-2 —1 — .— a -2
S o n id ir HHu Laksh Dw eep Islands — — ■— — — — — — — — —
Pondicherry 62-0 — 0*7 — — — 1 1 63 -8 — 2 0 2 0 65 -8
ai'dd ^ndia 7,06,67 0 1,05,17-7 77,87 -1 83,31 -6 5,39,95 0 17,21-3 35.30 7 15,65,50 4 i:0 ,62-3 85 29-9 1,35,92-2 17,01,42*2

6 .5 Table 6.5
A G R C IT T U F E(h ts )— y g g STOT ^ flit? 198 8-8 9f
Principal Crops Id India l)3f Slaks/U.Ts— 1988-89t(5Ii3»^ H teg 3 3 ) (Thousand M etric Tons)
S ta te /U . T.
Other Food Crops
§75 t ^
OU Seeds
cn^T » T 5 y g r e s t RUH^,3T3»- »R5Ht oWru i f o f M 3 g r ^t ^ '§ g ltT f i i g ^
» I§ U T ^Sugarcane Potato Ground- Sesa- Rape and Linseed Castor Other** Total N ine Cotton Dry Tobacco
nut mum Mustard seed o i l seeds Oil seeds ChiUies
13 14 IS 16 17 18 19 20 21 22 23 24
A — STATES
Andhra Pradesh 11,636*6 3-6 2,200*6 17*8 0-8 0 -9 67*9 35-5 2,323 *5 542*7 2 7 2 -4 184-1
n § e Arunachal Pradesh . . . — 2 0-9 , — 0 -4 13*8 — — 1*3 15*5 3*3 1-0 0-1
>>fTRTH Assam 1,864 -4 345 -9 — 7*4 154*5 3*8 0*8 — 166*5 1*1 7 -7 1-7
fsrara Bihar 5,483 0 1,472 -0 5*0 4*4 6 3 0 32 *3 0 -4 14*1 119* 2 1*5 3 -7 17-3
iS»r G oa 64-2 — 1-4 — — -> — — 1-4 — — —
p r id 'd Gujarat 7,907-1 3,145*0 2,875 *0 8 8-8 329*1 — 289*0 12-3 3,593 -8 1 ,469-9 15-5 151-0
lfe>HTST Haryana 6,580-0 142 0 2*2 1*6 477*0 0-1 — — 480*9 845-0 5-7 —
fuH T gs Himachal Pradesh 20-1 110-0 0 1 0*9 2*2 1*6 — 0 1 4*9 0-1 0-1 —
Jammu and K ashm ir... 21 *6 2 -8 0*1 2*1 25 *8 0 -5 — — 28 *5 0 -1 0 -5 —
Karnataka 18,446 -0 217*3 1,009-6 9 0 -0 1*9 5*5 26 *9 317-8 1,451 *7 873*2 37-6 39-7
Kerala 561 -5 — 4*7 3-0 — — — — 7*7 7-9 0 -9 0 -6
M adhya Pradesh 2,293 -0 352-5 335*6 58 *2 392*9 125 *7 0*6 1,298-8 2,211 *8 333*4 9 -9 0 -4HU»gTH2g Maharashtra 25,499 *6 50-9 1,005 *9 77*5 1*2 55*7 2*2 560-1 1,695-6 1,373-3 6 4 -2 8 -5
H s ty g Manipur 9 5 -3 11*4 — 0*6 1*4 — — — 2*0 0*2 3 0 —
v i u r f w Meghalaya 4 -0 71-1 — 0-7 3*4 — — 0 -9 5*0 4*2 1-1 0 -5
M izonun 6 -5 2 -2 — 2*0 — — — — 2*0 1-2 2 -0 0*7
u>Os

Nagaland . . . l29-t> 5-0 0-6 U-9 3*5 — — 1-6 6-6 - 0-3 —
Orissa 3,200 -0 78 -7 562-7 139 -2 71*5 14-8 17-3 86-6 892-1 8-6 58-1 6-3
VH'g* Punjab* 5,513-0 513-8 19-0 5-6 160 -0 0-1 — — 184-7 2,118-0 5-1 —
Rajasthan 686-2 28-2 260 0 61-6 1,439-7 24-9 3-1 124 *5 1,913 8 600-8 37-9 3 4
ffToW Sikkim . . . — 31 -6 — — 7-0 — — 5-8 12-8 — — —
Tamil Nadu . . . 23,767 -6 104 -6 1,104 -4 46-6 0-2 — 8-1 12-9 1,172 -2 476 *2 32-6 7-3
ddlU^T Tripura . . . 72 *5 54 -4 1 *4 1-4 4-0 — — — 6-8 1 -1 0-6 0-2
©ad Uttar Pradesh . . . 89,371 -2 6,612-8 123-4 16-1 931 -5 77-1 0-1 24-0 1,172 -2 20-4 16-4 49-7
USHt yd!'« West Bengal . . . 1.162-5 4,345-9 27-4 39 -4 327-1 6-4 0-1 2-3 402 -7 0*6 32-7 19-9»f— B—U.Ts.
A. & N. Islands . . . 0-6 — — — — — — — — — — -
Chandigarh . . . — — — — — — - — ~ — — —
tJ'tid ' ^ cSdId Dadra & Nagar Haveli — — — — — — — 0*2 0-2 — — —
felsrt Delhi . . . — 0-4 — — 0-7 — — — 0-7 - — —
§ fg § Daman & Diu . . . — — — — — — — — — — — —
5fc?H^U Hyu Lakshdweep . . . — — — — — — — — — — —
u-fifW Pondicherry . . . 239-9 — 4-6 0-4 — — — — 5-0 3-0 — —
3 ^ India . . . 2,04,625 -5 14,892 *5 9,543 -7 666 -6 4.412-2 349 -4 416-5 2,498-8 17,887 -2 8,685-8 609-0 491-4
Source.— Ministry o f Agriculture, Government o f India.( i ) H u r ^ n f u 3 d i
( 2 ) ^ H ^Frgt 5 afeT 5 h h fsr a f s 17 0 f e s a ig r n u s r
>HHH »T3HW § »TCnfe3 U5 6.3 >H§ 6.7 fe§ MorfeMT TPS INote—(i) Groundnut is nuts in shell.
(ii) Production o f Cotton is in Cleaned Cotton and is in terms o f thousand bales o f 170 kgs. each.•Figures are based on final forecast and hence will not tally with the figures given in table 6.3 and 6.7.
^ glriT fe^rarft^, RUtDiut h k s d i•♦other Oilseeds includes Safflower, Nigerseed, Sunflower and Soyabeep
t >H3H »I5HT75 tF io a l forecast
U)

6.6— ^ 3 f g . S l ^ 5 ^ 5 : 1 9 8 8 - 8 9Table 6.6—Yield of Important Crops in India by States/U.T.s. : 1988-89
AGRICULTURE
(f^;^3]rH 5or?»T3)(Kilograms per Hectare)
State/U.T. Ricet 7 ^
JowarW 3 TBajra
HoftMaize
wWheat Barley
S55 dlcS'Gram Sugarcane Potato
^ 0
(t)Cotton(Cleaned)
0 1 2 3 4 5 6 7 9 10
'd ^ A—STATES
W d ' Andhra Pradesh 2,571 536 694 1,779 676 — 427 71,172 7,200 146Arunachal Pradesh 1,150 — ,l “ 1,200 1,525 — — — 8,360 140
»TFnH Assam 1,060 — — 621 1,150 — 486 44,710 59,74 75Bihar 1,144 553 670 1,116 1,685 797 872 43,173 10,014 51Goa 2,409 — — — — ~ — 37,771 — —
3lt^d'd Gujarat 1,617 544 999 1,352 2,331 1,015 609 84,387 20,828 229
Ord>M»5T Haryana 2,399 253 1,219 977 3.406 2,000 936 50,229 15,778 332Himachal Pradesh 1,037 — — 1,506 1,374 1,216 483 67,000 57,89 85
»f§ o<H>^ Jammu and Kashmir ... 2,195 — 372 1,512 1,020 670 364 43,200 1647 170/ Karnataka ... 2,034 723 458 2,647 687 — 329 78,260 8,692 238
Kerala ... 1,750 533 — — — — — 66,059 — 280
Htl Madhya Pradseh 966 940 908 1,427 1,283 793 652 36,397 11,482 105
H JTd'Wdd Maharashtra 1,716 692 459 11,230 1,187 839 611 81,131 4,172 89
H5tU3 Manipur 1,913 — 2,033 — — — 41.435 15,700 68
)?upfe»r Meghalaya 963 — — 1,151 1,456 — 600 40,000 4.017 16 3
UJoc-
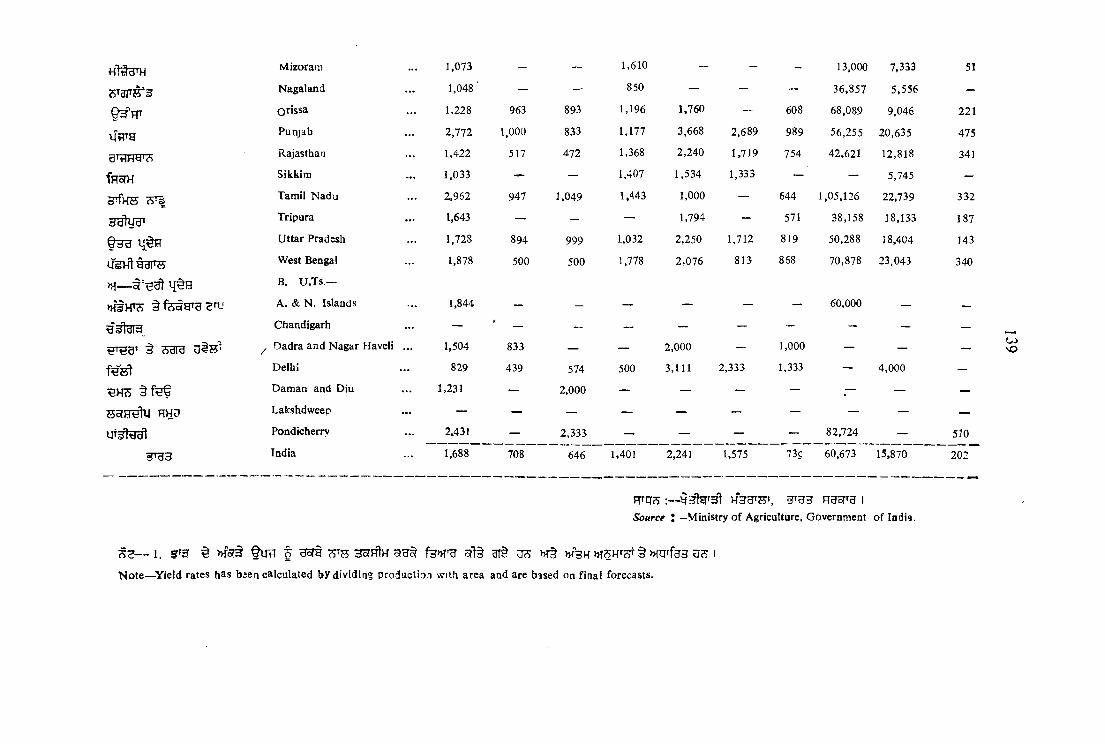
KiggTH Mizoram 1,073 — -- 1,610 — - - 13,000 7,333 51
<S 3FB 3 Nagaland 1,048 — — 850 — - — 36,857 5,556Orissa 1,228 963 893 1,196 1,760 — 608 68,089 9,046 221
ilflTg Punjab 2,772 1,000 833 1,177 3,668 2.689 989 56,255 20,635 475
UMHCi'cS Rajasthan 1,422 517 472 1,368 2,240 1,719 754 42,621 12,818 341
fHoTH Sikkim 1,033 — — 1,407 1,534 1,333 — — 5,745 —
3^^fH cS'^ Tamil Nadu 2,962 947 1.049 1,443 1,000 — 644 1,05,126 22,739 332
adlugi Tripura 1,643 — — — 1,794 — 571 38,158 18,133 187
e-d'd Uttar Pradesh 1,728 894 999 1,032 2,250 1.712 819 50,288 18,404 143West Bengal 1,878 500 500 1,778 2,076 813 868 70,878 23.043 340B. U.Ts.—
»?§HTcS A. & N. Islands i,844 — — — — — — 60,000 — —Chandigarh — — — — — - — — —
§ <sgra ^ Dadra and Nagar Maveli 1,504 833 — — 2,000 — 1,000 — — —Delhi 829 439 574 500 3,111 2,333 1,333 — 4,000 —
§TtiG Daman and Diu 1,231 — 2,000 — — — — — — —
S^H^VJ RH? Lakshdweep — — — — — — — — —
UJjt^gT Pondicherry 2.431 — 2,333 — — — — 82,724 — 510
-J'd3 India 1,688 708 646 1,401 2,241 ][,575 73s 60,673 15,870 202
eJ'dH RgofTg 1
OJMD
Source ! —Ministry of Agriculture. Government of Iadl9.
1. ^ M’ofH f HSrt 3T§ V 3 H »T5HT?>t ^ U?>
Note—Yield rates has bsen calculated by dividing production with area and are based on final forecasts.
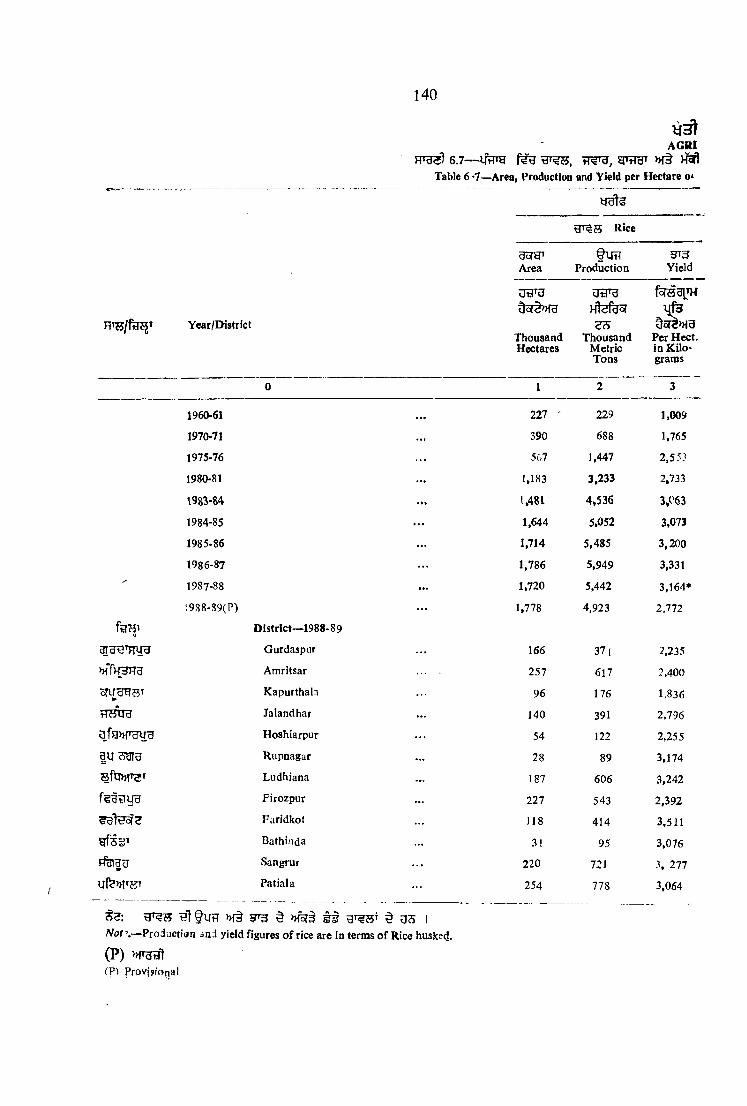
1 4 0
AGRI6. 7— g w » f t w r l
Table 6 *7—Area, Production and Yield per Hectare o*
bfafe
Rice
Area Production9T3
Yield
Year/DistrictThousandHectares
dd'dHldPdoiS3
ThousandMetricTons
fe-SUlTH
Per Hect. in Kilograms
0 1 2 3
1960-61 ... 227 ' 229 1,009
1970-71 ... 390 688 1,765
1975-76 ... 567 1,447 2,55?
1980-81 ... 1,183 3,233
1983-84 ... 1,481 4,536 3.C63
1984-85 ... 1,644 5,052 3,073
1985-86 ... 1,714 5,485 3,200
1986-87 ... 1,786 5,949 3,331
1987-88 ... 1,720 5,442 3,164*
;988-S9(P) ... 1,778 4,923 2,772fi3Hi Distrlct-1988-89
Gurdaspur ... 166 37 [ 2.235Amritsar 257 617 2.400
oTuugsT Kapurthab ... 96 176 1,836Jalandhar ... 140 391 2.796
ofa>>nmf-3 Hoshiarpur 54 122 2,255|u Rupnagar ... 28 89 3,174BfUMT T Ludhiana ... 187 606 3,242r^Btiyu Firozpur ... 227 543 2,392
Faridkot ]18 414 3,511gfss^ Bathinda ... .31 95 3,076
Sangrur ... 220 721 277Uf MTKT Patiala ... 254 778 3,064
S 3 : » f§ 9^3 § I
— Production and yield figures o f rice are in terms o f Rice husked.
(P) »fT^(P Prpvjsrooal
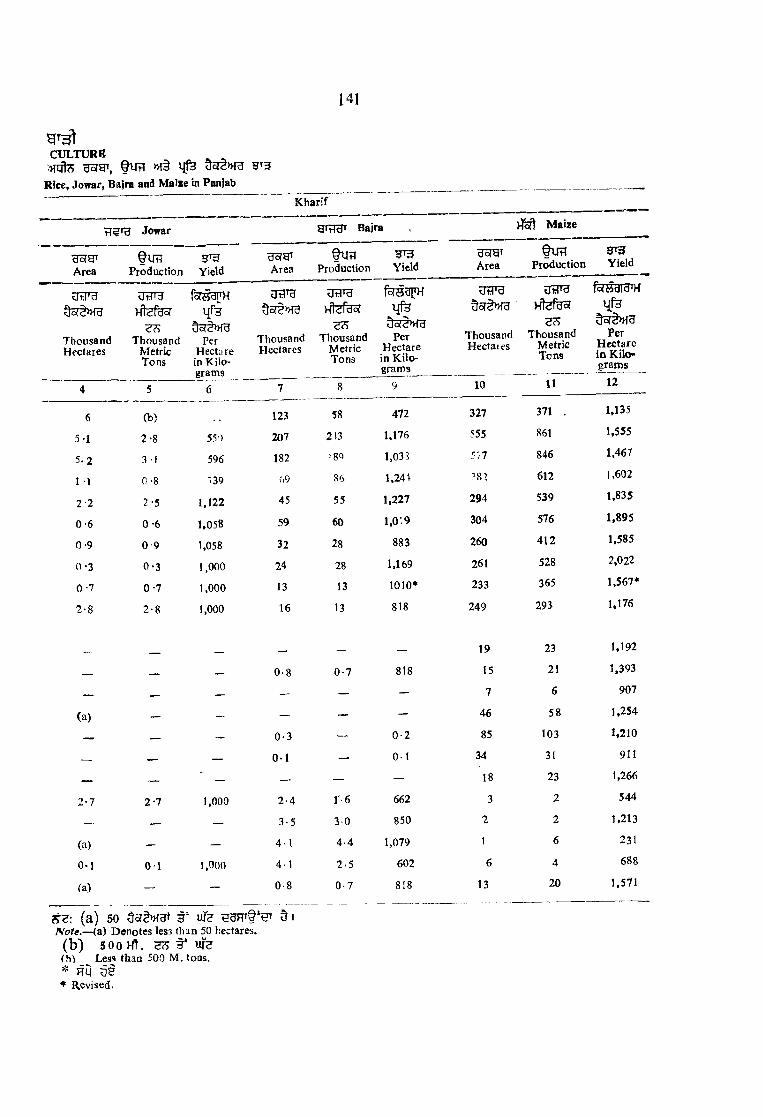
HI
5 ' ^CULTURE•KOte f i m q fe FT3
Rfce, Jowar, Bajra and M alce in Pnn}ab
K harif
Jowar grtTBT Bajra M aize
fun 9^Area Production Yield Area
fUTTProduction Yield Area
f u ? iProduction
5T3Yield
UHirg UtlTg UtTO
(a) 50 ufe 5 ISote.—(a) Denotes less than 50 hectares.(b) 500 Ht. ??> H* UR
Less than 500 M. toos.* h O♦ R,evised.
ThousandHectares
Htefcjsr
ThousandMetricTons
lf-3 C|5(2^
Per Hectare in Kilograms
ThousandHectares
Hl<;rdof
ThousandMetricTons
W
PerHectare in Kilograms
ThousandHectares
Hiemof
ThousandMetricTons
Per Hectare in Kilograms
4 5 6 7 8 9 10 11 12
6 (b) 123 58 472 327 371 . 1,135
5 1 2-8 550 207 2i3 1,176 555 861 1,555
5-2 3-1 596 182 189 1,033 5/7 846 1,467
1 1 0-8 '39 w9 86 l,24t ^8’ 612 1,602
2-2 2-5 1,122 45 55 1.227 294 539 1,835
0-6 0-6 1,058 59 60 1,0.9 304 576 1,895
0-9 0 9 1,058 32 28 883 260 412 1,585
0-3 0-3 1,000 24 28 1,169 261 528 2.022
0 -7 0-7 1,000 13 13 1010* 233 365 1,567*
2*8 2-8 1,000 16 13 818 249 293 1.176
__ _ __ 19 23 1.192
_ __ — 0-8 0-7 818 15 21 1,393
_ _ — — — — 7 6 907
(a) — — — — — 46 58 1,254
_ _ — 0-3 — 0-2 85 103 1,210
_ __ — 0-1 — 0 1 34 31 911
_ — — — — — 18 23 1,266
2-7 2-7 1,000 2-4 1-6 662 3 2 544
— — — 3-5 30 850 2 2 1,213
(a) — — 4-1 4-4 1,079 1 6 231
0-1 01 1,000 4 1 2-5 602 6 4 688
fa) — ~ 0-8 0-7 818 13 20 1,571

142
AGRI-
6.7— Uflrg >H§Table 6.7—Area, Production and Yield per Hectare of
o(<io| Wheat
dc<y« ^ 3Area Production Yield
U tra Od'd foTsgrHH te f^
Year/District- Thousand
HectaresThousand-
M etri: Tons
Per H ectare in K iio- gr<ms
0 1 2 i
1960-61 1.400 1,742 1,244
1970-71 2,299 5,145 2,238
1975-76 2,439 5,78 i 2.373
; 980-81 2.812 7.677 2,730
1983-84 3,124 9.422 ?,015
1984-85 3,094 10.176 3,289
1985-86 3,112 10.988 3.531
1986-87 3.185 9,447 2,966
1987-''8 3.131 11,084 3,540
1988-89(P) 3,157 11,578 3,668
fg ? f— D istrict— 1988-89
Gurdaspur 197 652 3,310
nffHHHg Amritsar 333 1,257 3,774
Kapurthala 109 406 3,725
Jalandhar 215 807 3,752
qftj»rguB Hoshiarpur 163 460 2,825
3VJ331B Rupnagar 78 244 3,127
S f W ^ T Ludhiana 261 1,123 4,303
fedtjyg Firozpur 384 1,430 3,724
^dly<b?2 Farldkot 386 1,325 3,433
a fss f' Bathinda 329 1,040 3,160
Hdidd Sangruf 381 1,585 4.160
(P)(P) Pro»isional

c u l t u r e
»HT3l?5 » f§ i{3 t\ |h e a t . Barley, Gram and Mash in Punjab
Rabi
^ Barley S 3 Gram Mash
B '3 §UT?Area Product! )ii Yield Area Pro luctioti Yicid Area Pro uctlon
u^rd UtTO foTSBPH dd'd dd'd UtTOKtsfesf 10]
cTS S3ThousandHectares
ThousandMetricTons
PerHe :t'.rein Kilograms
ThousandHectares
ThousandMetricTons
PerHectare in Kilograms
T'lousandHectares
ThousandMetricTons
4 5 (' 7 8 9 10 11
66 52 798 838 681 813 19-3 7-057 57 1,022 358 284 797 25.9 11 8
12) 15 1,267 ?81 376 ?■! 23-9 10*165 1)8 1»640 258 150 582 21 >5 »*660 94 1,568 98 58 596 14-4 7-249 83 1,684 102 60 5 1 12 0 7 150 109 2,199 108 98 911 12-9 7 639 80 2,058 114 82 720 U -55 6-639 89 22,28* 66 29 435 9-29 4-5*49 128 2.684 73 72 989 11-24 4-5
0-4 — — 0-8 0-8 989 5-81 2-40-1 — — 0-4 — — 0*82 0-30-1 — — (H) — — 013 0-1(a) — — 0-1 — — 0.62 0-2
1 (a) — — 3-4 3-1 924 1-24 0*51-4 4 2.684 3-4 3-1 922 1-05 0-43-1 7 2,396 01 — — 0-40 0.29-6 20 2.118 10-1 8-5 839 0.74 0*3
11-9 33 2.797 10-4 11-6 1112 008 —
12-4 30 2,418 39*5 40-5 1,025 — —
7-7 26 3,359 3-5 2-9 816 0-03 —
2-8 8 2,916 1*5 1-2 813 0.32 0-1

144
U H t
AGRICUL
6 .7— ygi, w r a , §Table 6 -7—Area, Production and Yield per Hectare of Moong,
Year/District
0
Arharm
MoongHR3
Massar
Area
ThousandHectares
1
tUH Uoigr Q\j[^ ^ g i Production Area Production Area Production
enjTg g g r g
Ht?UH H tefeof Htefuar
Thousand Tiiousand Thousand Thousand Thousand M etric Hectares Metric Hectares Metric Tons Tons Tons
2 3 4 5 6
1960-61 5-8 1 -8 29-80 17.1
1970-71 6-9 3 -9 13-27 5-3
1975-76 5*9 3-0 15-76 6*3
1980-81 21-3 22-5 15 1 11-1 19-76 8-8
1983-84 39-6 3 6 .3 33 -4 26-2 7-91 3-4
1984-85 42-5 46-3 34 -4 29-1 6*71 3-7
1985-86 40 0 4 3 .7 46 *4 41 -3 11-67 7 .5
1986-87 31-4 3 M 52 -1 47-0 13-10 9-6
1987-88 30*5 25-8 36-75 27-4 9-85 6-1*
1988-89(P) 25-6 17.3 44-59 24 -7 10-36 7 6
f g ^ D istrict— 1988-89
Gurdaspur (a) - 0-09 0 1 1 -13 0-8
Amritsar 1 3 0 -9 0 -14 0 .1 1 08 0-8
Kapurthaia 0*1 0-1 0 05 (a) 0 08 O j
Jalandliar 1-3 0 -9 0-34 0 -2 0-39 0-3
ufEPHWa Hoshiarpur 0 .8 0-5 0 -4 (0 3-35 2-5
9USaT3 Rupnagar 3-5 2-3 0 0 2 (a) 1-22 1 0
sfti»r5T Ludhiana 8-9 6-0 7-62 4 -0 0-05 (a)
feg?rira Flrozpur 1 .0 0 -7 12-17 6 -4 0-19 0 -1
Faridlcot 1 -0 0*7 16-20 18-6 0-11 0-1
Bathinda 0 1 0-1 2-15 2 -2 0-19 0-1
H9iy9 Sangrur 2 -5 1-7 5. 60 3 0 0-05 (a)
Patiala 5*1 3-4 0-17 0 1 2 -52 1-8
(P) >>p^(P) Provisional
* f l 9 a S
• Revised
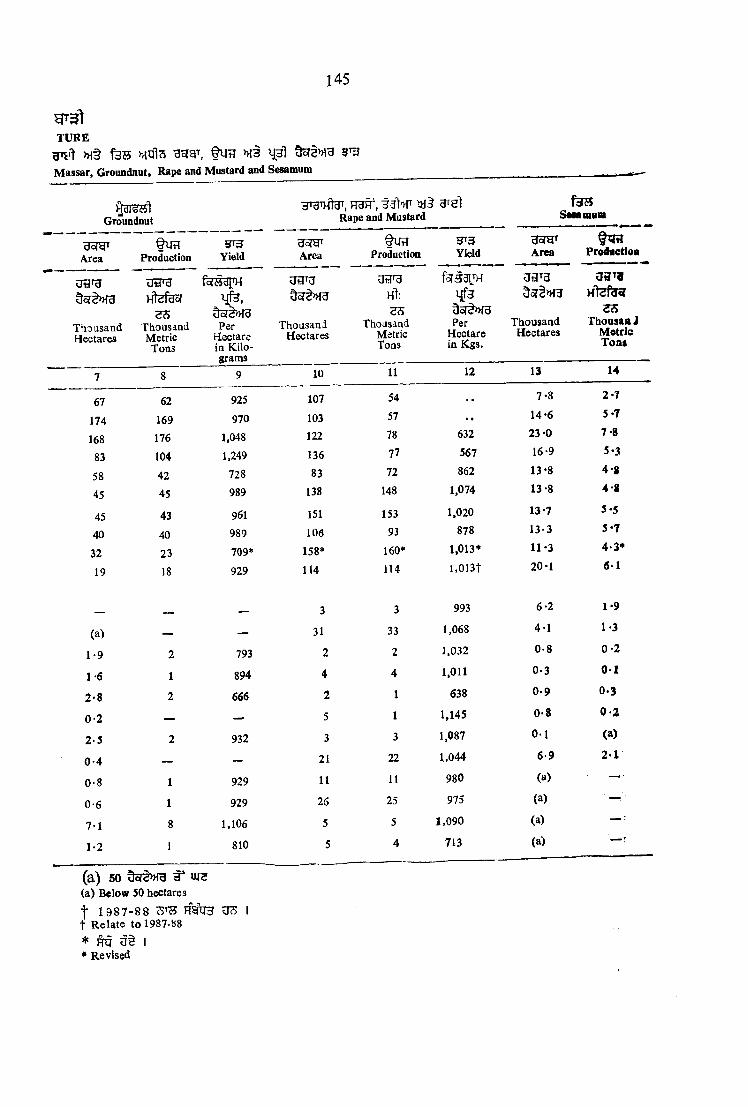
1 4 5
TURE» i t f e s
M assar, Groondnuti Rape and
, f y t i » !3Mustard and
^3 ^ 3T3 Sesamum
Hdl^64lGroundnut
HdH , t i t M f 3^81 Rape and Mustard
f36iSam nivia
Uo{yfArea Production Yield
do(y^Area Production
^ 3Yield
dc<y'Area
t^ r aPr^BCtioB
'
H\:3 5
ThousaadMetricTons
PerHectare in Kgs.
ThousandHectares
T housaa i M etric T ons
d tlfddc??>>ra
ThoasaadHectares
UH'dntdfdof
ThousandMetric
Tons
PerHectare ia K ilograms
ThousaodHectares
7 8 9 10 11 12 13 14
67 62 925 107 54 7-8 2-7
174 169 970 103 SI • • 14-6 5 -7
168 176 1,048 122 78 632 23 *0 7-8
83 104 1,249 136 77 567 16-9 5-3
58 42 728 83 72 862 13-8 4 -8
45 45 989 138 148 1.074 13-8 4 -8
45 43 961 151 153 1,020 13-7 5*5
40 40 989 106 93 878 13-3 5*7
32 23 709* 158* 160* 1,013* 11-3 4-3*
19 18 929 114 114 l,0 1 3 t 20-1 fl-1
3 3 993 6-2 1-9
(a) __ --- 31 33 1,068 4-1 1-3
1-9 2 793 2 2 1,032 0 -8 0 -2
1 6 1 894 4 4 1,011 0.3 0 1
2*8 2 666 2 1 638 0.9 0.3
0-2 _ —. 5 1 1,145 0 -8 0 - 2
2-5 2 932 3 3 1,087 0-1 (a)
0 -4 __ — 21 22 1.044 6 -9 2 1
0 -8 1 929 11 11 980 (a)
0 6 1 929 26 25 975 (a) ' —r ■
7-1 8 1.106 5 5 1 ,090 (a) — •
1-2 1 810 5 4 713 (a)
(a) 50 3"(a) B elow 50 hectares
f 1 9 8 7 - 8 8 HgUH 0?> I t R e la te to l9 8 7 -S 8
* TO I• Revised
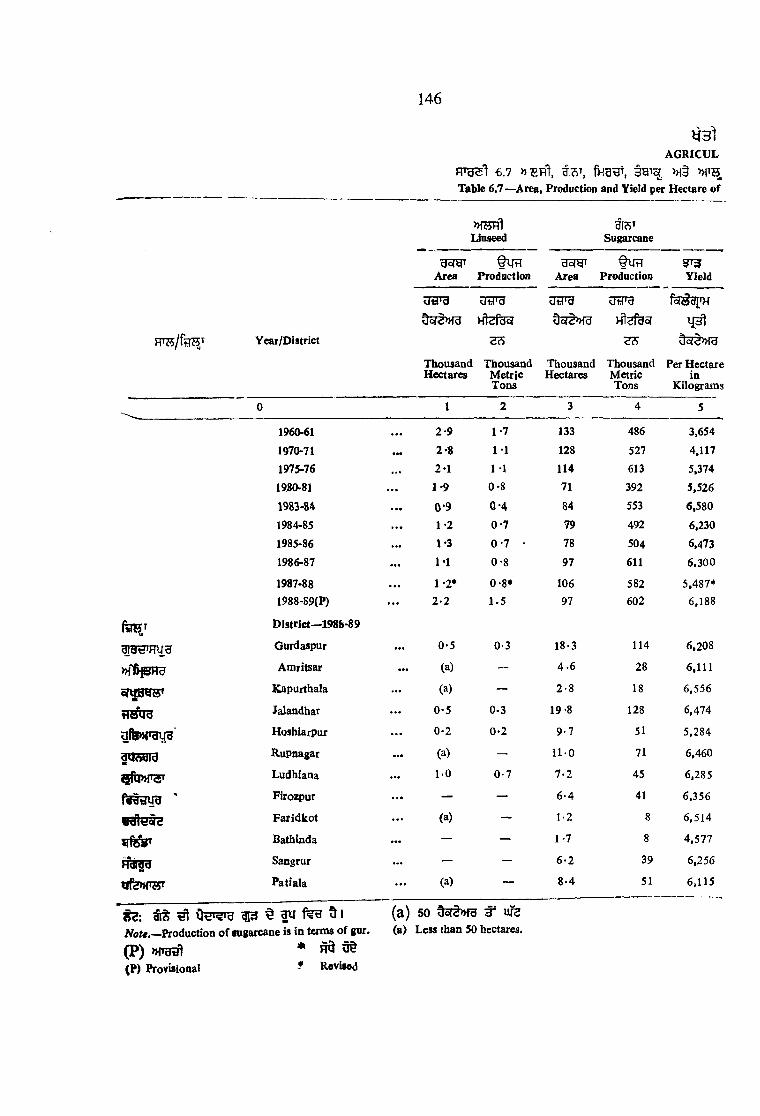
1 4 6
€ .7 fh-QW, 3 9 ' 'g >H§Table 6.7 —Area, Production and Yield per Hectare of
AGRICUL
Year/District
»fHH^Linseed
3T3TSugarcane
gsrar §1[H Area Production
§U H Area Production
9^3Yield
UHT3 U tP g
STS
Thousand Thousand H ectares M etric
T ons
^TtPU TJWd f5Wai»H
95f$»ra Htefgo?
dsrsnra
Thousand Thousand Per Hectare Hectares Metric in
Tons Kilograms
0 1 2 3 4 5
1960-61 . . . 2-9 1-7 133 486 3,654
1970-71 • • • 2-8 1 1 128 527 4,117
1975-76 . . . 2-1 1 1 114 613 5,374
1980<81 . . . 1-9 0-8 71 392 5,526
1983-84 . . . 0 -9 0 -4 84 553 6,580
1984-85 . . . 1-2 0 -7 79 492 6,230
1985-86 . . . 1*3 0 -7 ' 78 504 6,473
1986-87 . . . 1-1 0-8 97 611 6.300
1987-88 . . . 1-2* O-S* 106 582 5,487*
1988-89(P) . . . 2-2 1 .5 97 602 6,188
D istrict—198&-89
Gurdaspur . . . 0-5 0-3 18-3 114 6,208
Amritsar • • • (a) — 4*6 28 6,111K^purthala . . . (a) — 2-8 18 6.556
t i s ^ Jalandhar . . . 0-5 0-3 19-8 128 6,474
uftP)T3lfH Hoshiarpur . . . 0*2 0 -2 9-7 51 5,284
d O ^ ld Rupnagar • • • (a) — 11-0 71 6.460
^tj»T3r Ludhiana . . . 1-0 0-7 7-2 45 6,285
f^Rtiug Flrozpur . . . — — 6 -4 41 6,356
Faridkot . . . (a) — 1-2 8 6,514
Bathinda • • • — — 1-7 8 4,577
F f ^ Sangrur . . . — — 6 -2 39 6,256
Patiala . . . (a) — 8-4 51 6,115
( a ) 50 Oort»fa 3' ufeJVo/#.—Production o f tugarcane is in terms o f gur. (a) Less than 50 hectares.
(P)(P ) Provisional
* ^
f Revised

147
w j t e §vit7 i j f e
Linseed, Sugarcane, Chillies, Tobacco and Potato
TURE
H o iV Dry ChilUes
3JT<iTobacco Potato
do|y' H5T3T fU tT r 5Area Production Area Production Area Production Y ield
Utirg UiJrg foTffauH
Hfefdof 0of3>Hg HldPdcf
5of^»ra
Thousand Thousand Hectares Metric Tons Thousand Thousand Pm- HectareHectares Metric Tons Hectares Metric Tons In Kilograms
6 7 8 9 10 11 12
. . • • , , 8-7 128 -8 14,803
17-20 13 00 123 200 16-9 216 0 12,752
21 -57 19-6 100 200 26-7 444-5 1«,648
12-69 11-5 70 117 39 -7 767 -4 19,287
8-28 9-5 35 59 32-7 635 0 19.419
9*31 9-7 4 2 30 1 587 -6 19.505
5-00 4 -9 36 60 34 ‘3 668 *6 19,493
7-36 8-1 34 58 43-3 427-3 9,868
7-54 8-6 7 12 28-3 251 -5t I0 ,224t
4 -4 0 4 -8 7* — 33-4 641-8 19,249
3-81 4-8 — — 3 0 .9 626-3 20,0911
— — _ __ 0 -2 4 -4 22,000
1-41 2-1 — — 1 1 27 0 24,508
0 -10 0-1 — — 2 -0 48 0 24,000
0-47 0-4 — — 10-5 231 -3 22,026
— — — — 7 -7 128 -3 16,658
0 0 3 — — — 1-3 27-3 21,000
0 0 2 — — — 3-5 61 -8 17,869
0*83 0-7 — — 0 -5 n o 22,000
(a) — — — 0 -8 15-2 19,000
0*11 0-1 — — 0 -3 5-4 18,000
0 -20 0-3 — — 0 -4 6 0 20,000
0-61 1-1 — — 2-7 60 0 22,437
t »feHt Final Forecasf

148
AORICU-H 'cisl 6 .7 ofU' J (>HHd1c?5 >H§ M ) w t S
Table 6.7,—Area, Production and yield per
Year/Districtd e fyArea
Od'd
ThousandHectares
oflTO » f H ^ Cotton Ameriaui
Production Yield
foT5 giJH
Thousand Thousand Per Hectare Bales Metric Tons in K ilograns
0 1 2 3 4
1960-61 245 388 65 -79 269
1970-71 212 471 84-78 399
1975-76 363 863 146-92 404
1980-81 502 969 164-73 329
1983-84 .556 632 107 -44 193
1984-85 409 1,136 193-12 4711985-86 471 1.253 213-85 452
1986-87 496 1,555 264-37 533
1987-88 565 1,765* 300 -05* 531
1988-89 (P) 702 2,030 345-31 492
ftTBTtt DIrtrlct—1988-89
Gurdaspur — — —
Amritsar 2 -0 6 0-98 492
Kapurthala — — — —
a d ir a Jalandhar 0 -9 2 0-44 492
g ftiH ra y g Hoshiarpur (a) — — —
^UA"dra Rupnagar — — — —
Ludhiana ... 17-4 39 6-58 378
f e r o y u Firozpur ... 115-1 334 56-86 494
g a V 5 < f Faridfcot . .. 203-0 696 M 8-35 583
Bathinda ... 2 5 7-6 700 1 1 9 0 1 462
nd id? Sangrur ... 98-3 236 40-11 408
u fe n n ir Patiala 7 -5 17 2-98 398
Bales o f 170 K gs. each.
(!i) ^ >H§ 9^ ^ ofl^u^ I0 0 Production and yield are in terms o f cleaned cotton.
(lii) ?Bor »fefe>HT f >Hor-yg5 ojg to i(iii) The minor differences are due to rounding ol figures.

149
CULTURE
Hofgr, n f§
Hectare o f Cotton (American and Desi)
oOrU ^ Cotton DesI
Uorar
Area
ThousandHectares
f i r aProduction
u t r gafet
ThousandBales
Thousand Metric Tons
5T3
Yield
Per Hectare in KiloRrams
8
202185
217
147
94
63
88
71
56
57
321
347
372
209
75
105
150
136
98*
87
54 -51
62*53
63-19
35-53
12-75
17-89
25-46
23-15
16-66*
14-88
270
338
292
241
136
287
288
326
29V 265
0-2
I -6
O .l
1 -4
0-9
0-4
5*2
8-3
9-3
14-7
12-7
1-8
(a) 50(a) Below 50 hectares.
(P)(P) Provisional.
2
1
6
16
20
24
13
3
0 -4 2
0-3 7
0 .2 4
0 94
2-76
3-38
4 -14
2-15
0-48
265
265
265
180
332
363
282
169
265
w m : o ife lo id d i* y iqTg j
5 o a r « : Director o f . Land Records/Agriculture, Punjab-
♦Revised

1 5 0
AGRICULTURE
H *dil b.8 ^f5}>HT Jfy W H ) ?R?5T W t e HSrar Table 6.8— Area under High Yielding Varieties o f Major Food Crops in Punjab
(Ji:(rd doT^»f3)- '• in. ------- — ------- ---- / *AAr» TT«-*»----\
Hf2y/ftT3T Year/District
Rice
Crops
M aizey'rid 'Bajra Wh«at
0 1 2 3 ir
1967-68 17 29 51 621
1970-71 130 49 126 1589
1975-76 517 100 40 2195
1980-81 1095 127 34 2757
1983-84 1414 127 30 3107
1984-S5 1584 149 21 3090
1985-86 1623 127 17 3110
1986-87 1698 141 !4 3176
1987-88 1527 110 7 3116
fflHT
1988-89 (P)
District 1988-89
1671 142 10 3151
Gurdaspur 116 19 197>hTh 3 h b Amritsar 222 5 1 33 3
4 Kapurthala 93 7 — 109?r«xrd Jalandhar 137 21 _ 215
afH»!T3yH Hoshiarpuf 50 55 _ 161HU^dld Rupnagar 27 13 __ 76
Ludhiana 187 10 __ 261
Firozpur 225 2 1 384
Faridkot 118 1 2 385Bhatinda 31 1 2 329
Sangnir 219 3 3 381
Ufe»fTBT Patiala 246 5 1 320
(P)(P) Provisional
Frqjj : 9 3 l 8 ’3 l , iSoiffce,— Director o f AgricuUure, Puninb.

151
m a s t e . 9 — >ns » f§ ^ 3 ->h^ g^rgiTable 6.9— Area under Food and Non-food Crops in Punjab
AGRICULTURE
(Thousand Hectares)
H d Kharif Crops
^ ? 5 t
Rabi Crops Total Crops
Year/District F ood N onfood
I BTotal Food N o n
foodT otal F ood N o n
foodT ota l
0 1 2 3 4 5 6 7 8 9
1960-61 . . . .
1970-71 1,356 1,160 2,516 2,773 389 3,162 4,129 1,549 5,6781975-76 1,538 1,312 2,850 3,005 400 3,405 4,543 1,712 6,2551980-81 1,827 1,324 ^3,151 3,204 408 3,612 5,031 1,732 6,7631983-84 2,057 . 1,235 3,292 3,333 352 3,685 5,390 1,587 6,9771984-85 r 2,227 i|l,075 ' 3,302 .3,307 404 3,711 5,534 1,479 7,0131985-86 2,253 1,127 3,380 3,328 450 3,778 5,581 1,577 7,158
1986-87 2,338 1,147 3,485 3,387 345 3,732 5,725 1,492 7,217
1987-88 (P) 2,187 1,269 3,456 3,316 554 3,870 5,503 1,823 7,325
1988-89 (P)
District 1988-89—
2,122 1,264 3,386 3,294 707 4,001 5,416 1,971 7,326*
Gurdaspur 191 21 212 199 53 252 390 74 464
>AfHBHn*Amritsar 275 67 342 335 98 433 610 165 775
Kapurthala 100 34 134 109 2 111 209 36 245
Jalandhar 188 62 250 219 39 258 407 101 508
Hoshiarpur 141 56 197 170 29 199 3 U 85 396
Rupnagar 66 34 100 84 13 97 150 47 197
€ d l t!o(2
Ludhiana 222 36 258 264 77 341 486 113 599
Firozpur 249 175 424 404 94 498 653 269 922
Faridkot 141 254 395 408 94 502 549 348 897
a fs ^ T Bhatinda 38 306 344 381 110 491 419 416 835>-f 1 W O'
n m a gSangrur 238 156 394 393 58 451 631 214 845
Patiala 273 63 336 328 40 368 601 103 704
(P) IProvisional.
* H g u §
♦R evised
HTII3 t »Source :—Director, Land Records, Puniab.

1 5 2
6 .1 0— ^ ^ SH B t to [§ » ra 5^3 ( f^ . 31.) 1 9 8 6 -8 7
Table 6.10— Per Hectare yield (Kgs.) of High Yielding Varieties o f major Crops by Sta<es/U.Ts. 1986-87
AGRICULTURE
w ig T
feOT3
^ » f § 3TH>flB
5 a ^ c 7
^ S T
HTI ^
> iu rfs» p
iftTO
grtw gT S
^ fH H 7>^
i f e n l ^ T ^
>»f—
f e ^
§ fH |
State
A —States
Andhra Pradesh
Assam
Bihar
Gujarat
Haryana
Hiroachal Pradesh
Jammu & K ashm ir
Karnataka
Kerala
Madhya Pradesh
Maharashtra
M eghalaya
Orissa
Punjab
Rajasthan
Tamil Nadu
Uttar Pradesh
W est Bengal
B —U .T s.
Dadra and Nagar Ha veil
Delhi
G oa, Dam an & Dlu
Pondicherry
W ^ * T f ^ * Rice* Jowar*
m wBajra
N.W.
1,408
1,639
1,862
N.W.
N.A.
2,585
2,536
1,910
1,667
1,373
N.A.
1,709
3,332
2,107
2,896
N.W.
N.A.
1,883
2,425
1.632
2,141
N-W.
651
N.W.
1,644
@
N.W.
N.A.
N.A.
1,528
N .W .
N.W.
756
N.W.
571
@
N.W.
310
1,484
313
1,655
N.W.
747
m .A .
N.W.
@
1,432
1,787
N.W.
N.W.
2,001
2,884
@
N.W.
N.W.
@
475
2,456
N.A.
@
N .W .
N .A .
N.A.
Maize* W heat
®
1 .056
1 ,70 7
2 .0 5 7
N .W ,
N .W .
970
1,301
@
2 ,2 4 2
855
iW,
914
2 ,972
2 ,1 2 5
@
N .W .
N .A .
2 ,9 01
1,988
*%«lates to Kharif/Suraraer crop
@@ Not'Applicable
N . A i IN .A . Inform ation not availab ls/received.
N.W. IN .W . N o t worked out.
ir n jS : — H3 3 TJ5I, g r g g 1735^3 |
S o u r c e Ministry o f Agrioulture, Govt, o f In d ia .
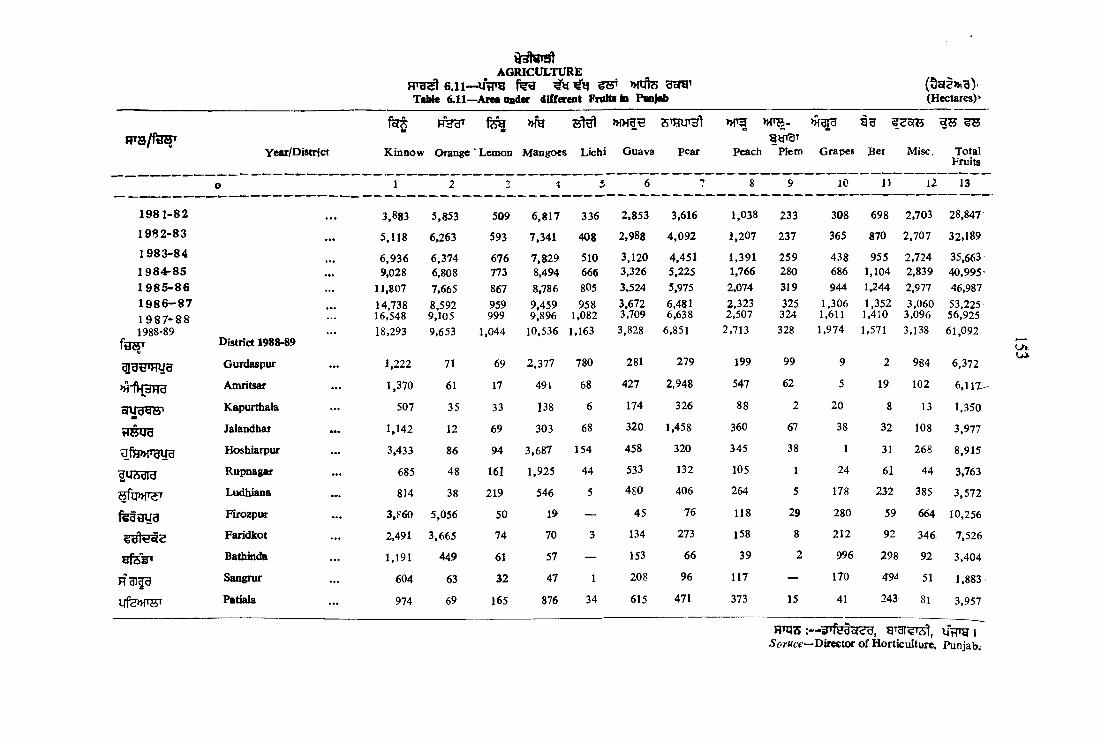
6. 11— ^ wi f eTaUe 6.11—Arctt imdcr different Fhiitsin Punjab
AGRICULTURE( 9 g |» i 3 ) '(Hectares)*
HHd' »fe ttlWl >HH1€ » f 3 ^c!o(l4
J T s / f a s tYear/District K innow Orange Lemon M angoes Lichi Guava pear Peach
g y i g iPlem Grapes Ber M isc. Total
Fruits
o I 2 •3 4 5 6 n g 9 JO 1) 12 13
1 9 8 1 - 8 2 . . . 3,883 5,853 509 6 ,817 336 2,853 3,616 1,038 233 308 698 2,703 28,847
1 9 8 2 - 8 3 ... 5,118 6,263 593 7,341 408 2,988 4 ,0 9 2 1,207 237 365 870 2,707 32,189
1 9 8 3 - 8 4 6 ,936 6,374 676 7,829 510 3,120 4,451 1,391 259 438 955 2,724 35,6631 9 8 4 r 8 5 ... 9,028 6,808 773 8.494 666 3,326 5,225 1,766 280 686 1,104 2,839 40 ,9 9 5 ’1 9 8 5 - 8 6 11,807 7,665 867 8,786 805 3,524 5,975 2,074 319 944 1,244 2,977 46,9871 9 8 6 - 8 71 9 8 7 - 8 8
... 14,73816,548
8,5929,105
959999
9,4599,896
9581,082
3,6723,709
6,4816,638
2,3232.507
325324
1,3061,611
1,3521,410
3,0603,096
53.22556.925
1988-89fa > District 1988-89
. . . 18,293 9.653 1,044 10,536 1,163 3,828 6,851 2.713 328 1.974 1.571 3.138 61,092
^■dti*HU9 Gurdaspur ... 1,222 71 69 2,377 780 281 279 199 99 9 2 984 6,372
Amritsar ... 1,370 61 17 491 68 427 2,948 547 62 5 19 102 6,11Z-
ofUg^ Kapurthala ... 507 35 33 138 6 174 326 88 2 20 8 13 1.350
t 5ug Jalandhar ••• 1,142 12 69 303 68 320 1,458 360 67 38 32 108 3,977
Hoshiarpur 3,433 86 94 3,687 154 458 320 345 38 1 31 268 8,915
ItfA dId Rupnagar ... 685 48 161 1,925 44 533 132 105 1 24 61 44 3,763
Ludhiana ... 814 38 219 546 5 480 406 264 5 178 232 385 3,572
fefgya F irozpw ... 3,860 5,056 50 19 — 45 76 118 29 280 59 664 10,256
Faridkot ... 2,491 3,665 74 70 3 134 273 158 8 212 92 346 7,526
Bathinda ... 1,191 449 61 57 — 153 66 39 2 996 298 92 3,404
H didd Sangrur ... 604 63 32 47 1 208 96 117 — 170 49^ 51 1,883
Patiala ... 974 69 165 876 34 615 471 373 15 41 243 81 3,957
u>
a n j 5 ;— 3Tfedy<j'd, i f tp g i-SorMce—Director o f Horticulture. Punjab.

ISA
AGRI6 . 1 2 - UtTfg
tab le 6 .12—Production of different
1
ffTHT
District K innow Orange Lemon M angoes
Lichi
0 1 2 3 4 5
1985-86 • •• 72,912 37,864 4,270 54,252 4,970
1986-87 91.0C5 42,444 4,740 58,407 5,917
1987-88 ... 1,03,427 45,522 4,994 61,852 6,762
1988-89 ... 1 ,70,600 48,265 5,208 65,849 7,267
fSHT District 1988-89
Gurdaspur ... 12,220 355 344 14,856 4,875
Amritsar • •• 1,370 305 85 3,069 425
Kapurthala ... 5,070 175 165 862 37
tTSUB Jalandhar ... 11,420 60 344 1,894 425
ufe»iTByg , Hoshiarpur ... 34,330 430 469 23,044 962
|U * d ld Rupnagar ... 6 ,850 240 803 12,031 275
Ludhiana ... 8 ,140 190 1,093 3,412 31
fe d d y g Firozpur ... 38.600 25,280 249 119 —
Faridkot ... 24,910 18,325 369 437 19
« f 6 V Bathinda ... n , 9 i o 2,245 304 356 —
H a i|3 Sangrur ... 6 ,040 315 l60 294 6
Patiala ... 9,740 345 823 5,475 212

155
fruits In Punjab
CULTURE
(33)(Tonnes)
Guava Pear Peach Plum Grapes Ber M isc . Totalfruits
10 II 12 13
21,757 1,47,580 51,240 1,970 11,660 15,365 7,352 4,31,226
22,675 1.60,080 57,380 2,010 16,135 16,695 7,556 4,85,044
23,182 1,65 ,960 62,670 2,025 20,140 17,625 7,738 5,21,897
38,280 1,02,765 42,359 2,049 24,673 18,495 7,843 5,33,653
2,810
4,270
1,740
3,200
4,580
5,330
4,800
450
1,340
1,530
2,080
6,150
4,185
44,220
4.890
21,870
4,800
1,980
6.090
1,140
4,095
990
1,440
7,065
2,987 619 112 23 2.460 45,846
8,210 387 62 224 255 62,882
1,321 12 250 ' 94 32 14,648
5.404 419 475 377 270 46,158
5,178 238 12 365 670 75.078
1,576 6 300 719 110 30,220
5,599 31 2,225 2,733 962 35.306
1,772 181 3,500 695 1,660 73,646
2,372 50 2,650 1,084 865 56.516
585 12 12,450 3,510 230 34.122
1,756 — 2,125 5,819 127 20,162
5.599 94 512 2,852 202 39,069
W U 6:— 5>fy3o(<;d, Ud'Si 1
Source :—Director o f Horticulture, Punjab.
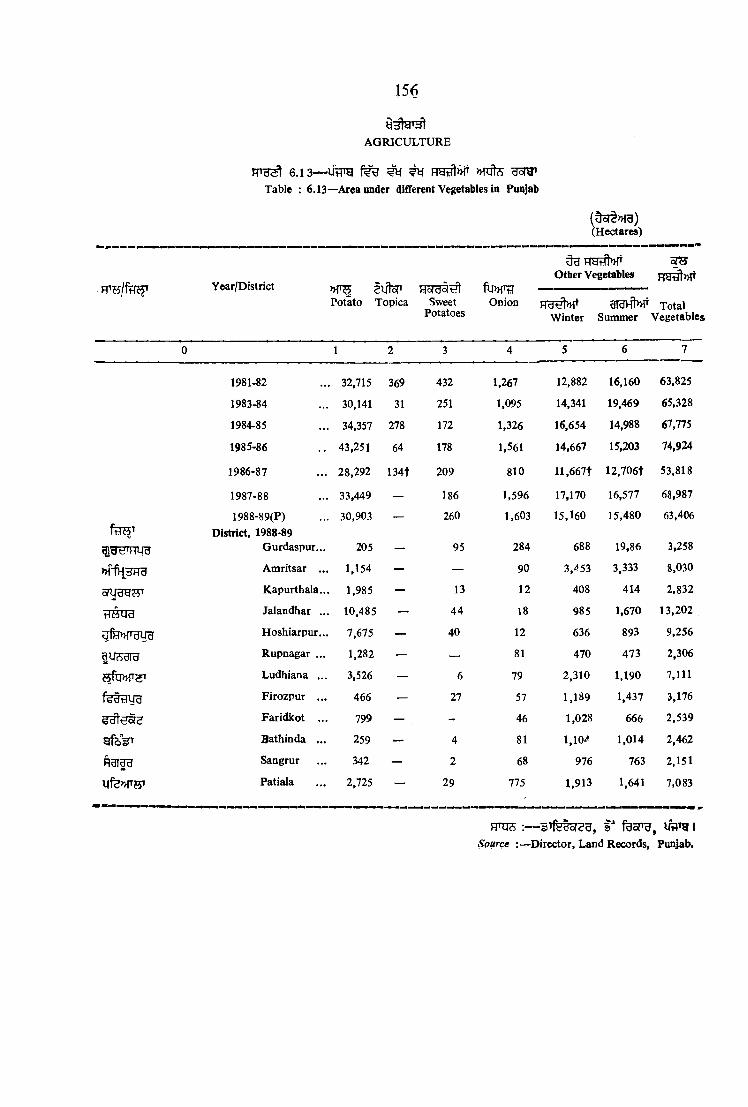
AGRICULTURE
6, 13— ^ »rateTable : 6.13—Area under different Vegetables in Punjab
156
(Hectares)
^ FT9iEft»f
Year/DistrictPotato T Onion
Other Vegetables
TotalV egetables
UM'opica
Ho(cJo(tdlSweet
PotatoesH dtdW
Winterd l d ) ^
Summer
0 1 2 3 4 5 6 7
1981-82 . 32,715 369 432 1,267 12,882 16,160 63,825
1983-84 30,141 31 251 1,095 14,341 19,469 65,328
1984-85 , 34,357 278 172 1,326 16,654 14,988 67,775
1985-86 43,251 64 178 1,561 14,667 15,203 74,924
1986-87 28,292 134t 209 810 l l ,6 6 7 t 12,706t 53,818
1987-88 33,449 — 186 1,596 17,170 16,577 68,987
1988-89(P) , 30,903 — 260 1,603 15,160 15,480 63,406
District, 1988-89Gurdaspur... 205 — 95 284 688 19,86 3,258
»rfHHRU Amritsar ... 1,154 — — 90 3,^53 3,333 8,030
sTuggsT Kapurthala... 1.985 — 13 12 408 414 2,832
iHWUd Jalandhar ..., 10,485 — 44 18 985 1,670 13,202
Hoshiarpur... 7,675 — 40 12 636 893 9,256
Rupnagar ... 1,282 — — 81 470 473 2,306
s f w ^ T Ludhiana ... 3,526 — 6 79 2,310 1,190 7,111
f^ddUU Firozpur ... 466 — 27 57 1,189 1,437 3,176
Faridkot ... 799 — - 46 1,028 666 2,539
Bathinda ... 259 — 4 81 1,10^ 1,014 2,462
R 3 1 ^ Sangrur 342 — 2 68 976 763 2,151
UfeMTHT Patiala 2,725 — 29 775 1,913 1,641 7,083
m j is :— sT fetofSU , feoT ^ , liflTg |
Spftrce :— Director, Land Records, Punjab.

157
6 .1 4 ITfrg i M » f§ § 3 1 T H STable 6 .14—Cane Crashed and Sugar Produced by Mills in Punjab
AGRICULTURE
Year/Mill
Numbero f
SugarMiUs
life?? ^ ^
H W (U tF ^ HHT
( e ^ ) - ^ ) ( f e )Daily Cane
Crushing CrushedCapacity (000(Tonnes) tonnes)
Sugar Re- N o . o f Produc- covery Days
tioa (000 Per- worked tonnes) centage in a year
0 1 4
1960-611970-711975-761980-811983-841984-851985-861986-871987-881988-89
66S88
10111313
2950—3200 490 *759 5 0 -6 2 0 0 560*85950—6500 962-7
10000— 10250 585-910250— 10500 1 396-0 10250— 10500 1339-2 12750-13000 1501-7
14000 2415.518100225fO
2075 -3 2547 -5
43-2 48 -6 82-7 51 -9
149-4 146 0 147-9 236-0 213-4 248-1
8-68-58-7
10-4 10 -69-8 9-7
10-189-61
178115162
82142129135 191136 147
f u r u u 1 Ltd>, Bhogpur 1000 188-0 19-2 9-78 172
2 . HfvjoiMl y 's tH 5
f e H f e ? H fd^' 1
M orinda Co-operative Sugar Mill Ltd., Morinda 3,000 264-3 24-9 9-31 140
3 . R fbST ^ t a Batala Co-operative Sugar M ills Ltd.,Batala 1,500 237-3 24 -2 10-14 169
4. Doaba Co-operative Sugar Mill Ltd., Nawanshehar 2,500 2 1 0 0 20-3 9-39 147
5 .( t f e ^Tgi) ^gi^rgr
Oswal Agro M ills Ltd.,(Sugar D ivision) Phagwara 1,000 180 -7 17-5 9-49 156
5.fe fk fe c f , Hdl
Bhagwanpura Sugar Mill Ltd. Dhuri 2,500 94-3 9-1 9-37 96
7 . UTra QtioidI fSHr<5sJ, Punjab Khand Udyog Ltd.,Gurdaspur 2,000 288 -2 29 0 10 01 166
8. Zira Co-Opera tive Sugar M ills Ltd., Zira 1,250 189 0 17-2 9 01 135
9. yfe>H W
f e f e n f e ^ , By^TPatiala Co-operative Sugar
M ills Ltd., Rakhra 1,250 206-0 20-1 9-71 151
1 0 . J fe fT g l y V t a Fazilka Co-operative Sugar M ills L td ., Fazilka 1,250 130-4 1 2-4 9-41 128
1 1. y ^ fn;^ Budhewal Co-oPerative Sugar Mills L td ., Budhewal 1,250 229-8 2 2-4 9-74 163
1 2 .
fj-TS fe T n fe ^ d d 6 '3^d6 I 3 . fH55
Tarn Taran Co-op. Sugaf M ills Ltd. Tarn Taran
Nakodar Co-op. Sugar M ills Ltd. Nakodar
1.250
1.250
139-8
189-5
13-3
18-4
9-49
9 -66
141
148
j r n i s : — ^ ErfHH?5H, y tirg iSoiree : -Cane Com m issioner, Pimjab

6.15—UtTO 1988-89* Ij3b33^Table 6.15—Percentage Distribution of Principal Crops in Punjab, 1988-89*
AGRICULTURE
District
^ f e 3 < 5 5
^ ortfH65T^3
goTs ^
M * 5 3 T
Rice
r T ^
Jowar
& S '
I " ®? te u rx3
Percen- Percen- Percen- Percentage o f tage o f tage o f tage c f
districtwise districtwise net area Rice area to net area irrigated area inState sown to to State Statetotal State net Areaarea net irrigated
sown Area
%
rc
c^i
Ir
t)t)JS
%
&,15 %
Percentage to State Production
rsD
Percentage to Jowar area in State Area
T)IT
Percentage to State Production
Percen- Percentage to tage toBajra Statearea ia Produc-State tionArea
0 1 2 3 4 5 6 7 8 9
Gurdaspur . . . 6-95 6-06 5.04 9-31 7-52 — — 11-11 13-33
Amritsar . . . 10-05 10-18 11-05 14-41 12-48 — — 5-55 6-69
sruggHT Kapurthala . . . 3-32 3-25 3-44 5-38 3-56 — — — —
Jalandhar ... 6-78 6-93 7-37 7-85 7-93 — — — —
ufH>H»dUS Hoshiarpur . . . I ' l l 6-06 3-75 3-02 2-47 — — — ~~
Rupnagar ... 4-23 3-15 2-09 1 -57 1-80 — — — —
Ludhiana . . . 7-57 7-79 8-50 10-49 12 -26 — — - —
fe3rW3 Firozpur ... 11 -65 11 -79 12-72 12-73 10 -99 96 -43 96 -43 11 -11 6-67
Faridkot - 11-38 12 -65 13-21 6-90 8-74 — — 22 -22 26 -67
g f s ^ Bathinda 11 01 12 05 11 -96 1 -74 1 -92 — — 22 -22 26 -67
Ffdidd Sangrur . . . 10-15 10-92 11.88 12-34 14 -59 3-57 3-57 22-22 13-33
Ufe»{'75» Patiata . . . 9-20 9-17 8-99 14-25 15-74 — — 5-55 6-67
po

F r a s l6 ,1 5 (RHtiIH) ITR^ 1 9 8 8 - 8 9 * ^ M W ^ ljf3H 33TTable 6.15.—(co/ic/</).--Percentage Districtwise Distrilnition of Principal Crops in Punjab, 1988-89*
AGRICULTURE
HeftMaiie
oTgcrWheat Barley
5 HGram Sugarcane OU*seeds
m mCotton
District
%
<D>.
ri i
“0T)&O
Percent- Percent- Percent- Percent- Percent- Percent-Percent- Percentage to age to age to age to age to age to age to age toM aize State Wheat State Barley State Gram Statearea in pro- area in Pro- area in Pro- area in prostate duction State duction State duction State duction
Percent- Percent- Percent- Percent- Percent- Percent- age to age to age to age to age to age toSugarcane State Oilseeds State Cotton Statearea in pro- area in pro- area in Pro-State duction State duction State duction
0 10 11 12 13 14 15 16 17 18 19 20 21 22 23
Gurdaspur 7-66 7-88 6-24 5-63 — — 1-41 1 -43 18-37 18-48 6-26 3-74 — —
Amritsar 6 -05 7-19 10-58 10-88 — — — — 5-10 5-11 22-60 24-68 0 -53 0-42
srijOTsr Kapurthala 2 -82 2-05 3-48 3-93 — — — — 3-06 3 -30 3-03 3-2 — —
tI5 Q 9 Jalandhar 2 . . . 18-55 19-86 6-81 6-97 — — — — 20-41 21-29 4-13 3-88 0-26 0-24
q.fB>Mfgug Hoshiarpttr . .. 34 -27 35-27 5-10 3-54 — — 2-82 2 -86 10-20 8 -75 3-81 2-52 0-13 0-09
iu?5319 Rapnagar . .. 13-71 10-62 2-44 2-08 2-22 2 -4 8 2-82 2-86 11 -22 11-72 1-29 0-86 — —Lodhiana 6-85 7-55 8-27 9-70 6-6 7 5 -78 — — 7-14 7-26 4-26 4 -1 0 3-03 2-12
fg tayg Fiioq)ur^ 1-21 0-68 12*17 12 -35 13-33 10-74 15-49 12-86 7-14 7-26 18-26 17-34 16-23 16-41
Faridkot 0-81 0 -68 12-23 11-45 26-67 27-27 14 -08 15-71 1-02 0-99 7-61 8-63 27-96 34 -23
Bathioda 0 -40 — 10-42 8 -97 26-67 23-97 56-34 58-57 2 -04 1-48 17-16 18-70 36-02 34 -28
H9I93 Sangrur 2 -48 1-37 12-07 13-69 17-77 22-31 5 -73 4 -2 9 6-12 6-27 7-81 9-35 14-64 11-71
Patiala 5 -24 6-85 10-17 10-79 6-67 20-00 1 -41 1-43 8-16 8-09 4 -00 3 -60 1-19 0 -9 0
VO
^FtovWofuO.
RHJJ5nfigTgof »f§ fofgr ngiss, litTO I Source Eonomic and Statktical Organisatioii. Punjtb.

160
AGRICUI,
w>y<2j| 6 .1 6 — u f r y fjj’a uraniTH >h'5 to t
Table 6 .16—Number of Operational holdings by size groups and district
fd t} ' Difltt'ict Below 0-5
3 * Ufe
0-5— 1 -00
1 -00— 2-00
2 -0 '" -3-00
01 2 4
Gurdaspur 14,194 16,092 23,939 15,702
»ffk3RB Amritsar 11,184 12,344 21,940 24,257
5nia«i5' Kapurthala 15,15 2,754 7,320 8,278
Jalandhar 7.315 8,078 12,641 14,633
ufH»fTgiia Hoflhiarpur 12.675 13,3^1 20,362 18,831
^ViAdld Rupnagar 6,651 8,589 12,382 7,513
Ludhiana 4,425 6,151 12,602 13,743
ftW i3\|g Firozpur 5,144 11,537 22,684 21,779
Faridkot 2.417 15,540 26,481 11,054
gfeV Bathinda 4,875 6,441 12,513 12.37J
H3!^g Sangrur 4,456 7,231 14,042 14,609
Patiala 6,718 7,656 12,462 13,655
State 1980-81 . . . 81.569 a -94)
1,15,754(11-27)
1,99,368(19*41)
1,76,427(17-18)
State 1970-71 . . . 3,10.049 (22-54)
2,07,519(15-09)
2,60,083(18-91)
1,69,826(12-35)

161
TURE
1980-81 in Punjab,—1980-81
3 00-4 00
4 00—5 00
5-00— 10 00
10-00— 20 00
20 -00-30-00
30-00—40-00
(»forrg gray doT^)>rat
(S ize group in hectares)
40-00— 50 00
SO -00 and above
Total
10 11 12 13
10,93?
13,38y
4,011
9,479
9,184
5,160
5,650
10,716
4,156
7,373
8,187
3,909
10.375
: 14,939
[5,220
11.375
8,457
4,119
[2,869
4,821
11,868
3,502
2,475
1,091
151
763
188
411
179
82
12
218
40
80
70
89
20
60
40
20
30
99,917(9-73)
1,14,698(11*17)
35,350(3-44)
74,927(7-29)
93,851(9-14)
49,496(4-82)
8,745 10,138 13,467 3,768 478 49 -- -- 73,566(7-16>
13,527 10,228 15,875 7,639 1,800 323 211 218 1,10,965(10-80)
8,641 11,171 26,273 10,077 1,818 475 143 203 I.14,2R3 (11 13)
9,640 12,001 21,050 10,129 1,566 182 126 19 90,915(8-85)
10,239 12,169 18,810 7,402 602 102 50 IS) 89,731(8-74)
8,050 9,234 14,180 6,039 1,060 275 50 39 79,418 (7 -73)
1,10,996(10-81)
1,04,932 (10 <22)
1,64,140 (15 -98)
61,680(6-00)
9,098(0-88)
1,826(0-18)
749(0-07)
588(0-06)
10,27,127(100-00)
1,11,277(8-09)
79,021(5-75)
1,68,734(12-27)
58,498(4-25)
7,631(0-55)
1,801(0-13)
652(0-05)
301(0-02)
13,75,392(100-00)
B T O T , O iTrg, 1980-81
Source :—Agricultural Census, Punjab, 1980-81.
( i ) srtorst
Note^— {^) Figures within brackets are percentages.
(}i) M 1960-81 9 I( i i) , Agricultural Cctsus of 1980-81 is based on ten per cent Sample Survey.
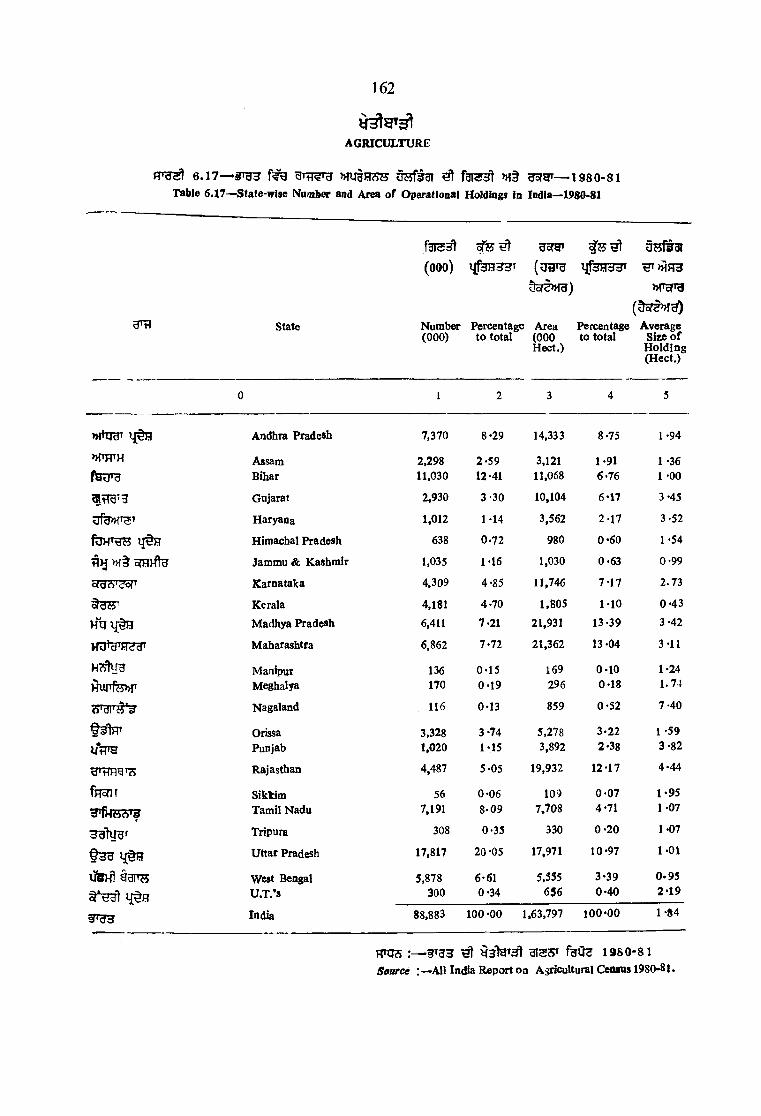
162
6.17— wraR^ OHfiar ^ m§ gsrgr—isso-siTable 6 .1 7 —State-wise Namber and Area o f Operational Holdings In India— 1980-81
AGRICULTURE
f3 I S ^
(o o o ) (u a T g
9of<W 3)
^ > H H 3
State Number(000)
Percentage to total
Area(000H ect.)
Percentage to total
Average Size o f
H old in g (H ect.)
0 1 2 3 4 5
nitqHT Andhra PradeSh 7,370 8-29 14,333 8-75 1 -94
»THth Assam 2,298 2-59 3,121 1-91 1 -36f y g i y Bihar 11.030 12-41 11,068 6-76 1 -00
^ - ^ ‘3 Gujarat 2,930 3 -30 10,104 6-17 3-45
Haryana 1,012 1 1 4 3,562 2-17 3-52
Himachal Pradesh 638 0-72 980 0 -6 0 1-54
Jammu A Kashmir 1,035 1-16 1,030 0-63 0-99
bTd?) <?bf' Karnataka 4.309 4-85 11,746 7 -17 2 .7 3
Kerala 4.181 4-70 1,805 1-10 0 -4 3
M adhya Pradesh 6,411 7-21 21,931 13-39 3-42
HURTOfcF Maharashtra 6,862 7-72 21,362 13-04 3-11
Manipur 136 0-15 169 0 -10 1-24
MWTfe»f Meghalya 170 0-19 296 0-18 1.74
STdl'i^'y Nagaland 116 0-13 859 0 -5 2 7-40
t^ lF P Orissa 3,328 3-74 5.278 3-22 1 -59
Vt^'y Punjab 1,020 1*15 3,892 2-38 3 -82
Rajasthan 4,487 5-05 19,932 12-17 4 -44
fHsnr Sikkim 56 0-06 109 0 -0 7 1-95
Tamil Nadu 7,191 8 -09 7,708 4-71 1-07
Tripura 308 0-35 330 0 -2 0 1-07
Q 3 d Uttar Pradesh 17,817 20-05 17,971 10*97 l-O l
O W t a r o West Bengal 5,878 6-61 5.555 3-39 0 .9 5
^ V d l q t e
d ’W3
U .T .’s 300 0-34 656 0 -4 0 2*19
India 88,883 1 0 0-00 1,63,797 100*00 1-84
m q s ^ Q g la T sl hi3 S t f g u e l a s o - s i
Source ’. — Ail India Report on Agricultural Genius 1980-81.
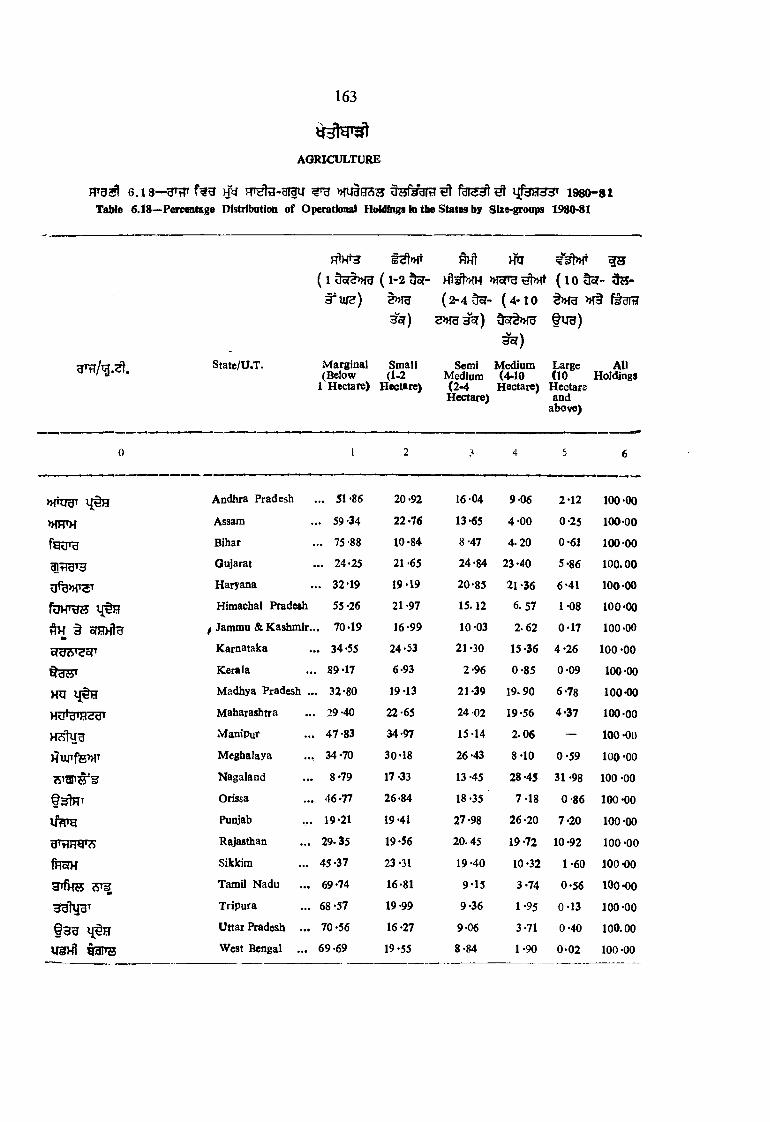
AGRICULTURE
6.18-"3T^Tt w FF^-griU ^ >Hyl5333 Utff/dfa ^ ljf3H33» 1980-81Table 6.18—P a^tsge Distribotion of Operational Htrfdings io tbe States by Size-groaps 1980^1
16 3
State/U .T .
( 1 3c($»ra ( 1 - 2
3 ^ u r? ) §»Tg
M arginal Small (Below (1-2
1 Hectare) Hectare)
^ HU
( 2 - 4 ^ - ( 4 - 1 0
s » r a 3 5 f ) 9 ’ori»rar
3 ^ )
Semi Medium Medium (4-10 (2 -4 Hectare) Hectare)
I S
( 1 0 T O -
f U H )
Large AH (10 Holdings
Hectare and
above)
0 1 2 3 4 5 6
» r q g ’ Andhra Pradesh ... 51-86 20*92 16-04 9 06 2*12 100*00
>HHTH Assam .. 59-34 22-76 13*65 4 -0 0 0-25 100*00
fy u 'd Bihar ... 75-88 10*84 8-47 4 .2 0 0-61 100-00
Gujarat ... 24*25 21 -65 24*84 23 *40 5*86 100 .0 0
Haryana .. 32-19 19*19 20-85 21 *36 6*41 100*00
Himachal Pradesh 55 -26 21-97 15.12 6. 57 1-08 100-00
S h § oihhIu f Jammu & Kashmir..,. 70-19 16-99 10-03 2 .6 2 0*17 100*00
s r a ^ c T Karnataka .. 34*55 24*53 21*30 15*36 4*26 100 *00
Qb w Kerala . 89-17 6*93 2-96 0*85 0*09 100*00
HU Madhya Pradesh ... 32*80 19*13 21*39 19 .90 6*78 100*00
Ho^d'fclcJd' Maharashtra , 29 -40 22-65 24 02 19*56 4-37 100*00
ManiPut 47-83 34-97 15*14 2 .0 6 — 100*00
)?UITffe>MT M eghalaya ... 34*70 30*18 26 -43 8-10 0 -5 9 100*00
7 5 ig p ^ 5 Nagaland 8*79 17*33 13*45 28*45 31 *98 100 -00
t ^ T Orissa 46-77 26*84 18*35 7*18 0 -86 100-00
Pufljab 19*21 19 *41 27*98 26*20 7-20 100*00
Rajasthan 29 .35 19*56 20 .45 19*72 10*92 100 *00
Thc h Sikkim 45*37 23 *31 19*40 10*32 1*60 100 *00
y f H S <9^ Tamil Nadu 69*74 16*81 9*15 3*74 0*56 100-00
sg tv B T Tripura 68*57 19-99 9*36 1*95 0*13 100*00
f 3 U Uttar Pradesh ... 70*56 16*27 9-06 3*71 0*40 100.00
ugH t I a n s West Bengal ... 69-69 19*55 8*84 1*90 0 -02 100-00

164
6 . 18 (FTHHra) FT iil USf^gTiH ^ ^ Mf3H3J« 1980-»1 ^Table 6 ‘18 (Conc/^.)—Percentage Distribution of Operational Holdings in tbe State by SlEC-groaps 1980^1
AGRICULTURE
HtH3 f s
(id o r e a (1 -2 doT- HM»W ( 1 0 ^ - 'a s r f ^ i3^ UI2) ( 2 - 4
a's?)(4 -1 0
mf ir a )
<5nf7/g.^j State/U.T. Marginal (Below 1 Hectare]
Small (1-2
1 Hectare)
Semi Medium Latg^ Medium (4*10 (10
(2-4 Hectare) Hectare Hectare) & Above)
AllHoldingd
0 1 2 3 4 5 6
Union Territories
nfsHTS »(§ fe<5y»g A A N Islands ... 13 '58 18*52 35*80 30*86 1*24 100 oo-
HtH Arunaobal Pradesh... 16*54 20*73 28-12 28 *12 6*49 100*00
■felaicf Chandigarh ... 65 *22 17-39 13-04 4-35 — 100-00^
i3»H3’ >H§ 35»aiH
fent
Dadra ft Nagar Havdi ... 40*68
Dehli ... 44*7033*0519-21
16*9518-87
6*78 14 *57
2*542-65
100 oo> 100*00
W >Ht f e t Qoa Daman &Diu... 78 *23 13-30 5-44 2*30 0-73 100-oa
aswtflu Lakshadweep ... 87*76 8-16 4*08 — — 10Q*Oa
Mizoram ... 33 *69 40-99 22*32 3-00 — lOO-Oo
U»3te3^ Pondichvty ... 72*48 14*79 7*99 3*8 5 0-8S> IOOOq,
r ? 3 India ... 56*58 18-01 13*96 9-04 2-41 lOO-tll
wni s : — ^ gife—1980-815bi^0f.—A ll India Report on Agricultural Census— 1980-^1

AGRICULTURE
165

AGRICUL
6 . 1 9 — ^ 3 3 » f ^ R f ^ tT r ^ /> H ^ y T H ofgtfeMT H !» rTable 6 *19 State>wise number o f operational holdiags, operated area and average size
166
Scb^ul«d
( 0 0 0 ) ^J^ta33» ( UiJTH dofSM U)Number (Percentage Area
(000) to total) (OOOHect.)
0 1 2 3
Andfara Pradesh . . . 930 9 -25 984
»!Hth Assam 108 1 -07 128
fe^T9 Bihar 900 8-95 499
Gujarat 119 1*18 311
Haryana • • • 22 0*22 46
fUVTTO Himachal Pradesh • • • 156 1.55 114
^ >H§ g r w !g Jammu & Kashmir * • • 72 0-72 76
o r a s ^ o p Karnataka . . . 366 3*64 703
Kerala • • • 357 3-55 44
HU Madhya PradeA • • • 824 8-20 1,729
HU»3fFR!g Maharaditra 467 4*65 956
Manipur • • • 2 0-02 6
d u r f w Meghalaya — — —
Nagaland • • • — — —
Orissa • • • 403 4-03 415
U tl’9 Punjab • • • 51 0-51 99
9'H H g*S R^asthan • • • 640 6*37 2;i55
fR5H Sikkim • • • 1 0-01 2
3^fHS RTf Tamil Nadu • • • 564 5-61 379
331^ 3^ Tripura • • • 45 0*4. ! 35
t 3 3 Uttar Pradesh . . . 2,631 26*17 1,661
USh I tdl'M West Bengal • • • 1386 13-79 1,076
U nion Territories • • • 6 0 -0 6 3
r 3 3 India • • • 10.052 100 -00 11.521

167
TURE
gofgr »f§ lj[ ^3 >T13 MoPg 1980-81 per holding o f Scheduled Castes and Scheduled Tribes, 1980-81
tT T ^ TCastes Scheduled Tribes
(Percentage to total)
I # ^
>i?H3 M araAverage size per Holding
f a i s ^
( o o o )Number
(000) <
dc<yT
d o | ^ )
(Percentage to Area total) (000 Hect.)
^ 3 ^
M3tPr33T(Percentage to
total)
>Mbrtd (dor2»ra)Average size per Holding
(H ect.)
4 5 6 7 8 9 10
8-54 1 0 6 473 6-90 902 5-40 1-91
1-11 1-19 289 4*22 432 2-59 1-49
4-33 0-55 832 12 14 1.798 10-76 2-16
2*70 2-60 320 4-67 813 4-87 2 -54
0-40 2-09 — — — - —
0-99 0-73 27 0-39 32 0-li^ 1*18
0-66 1-05 — - — — —
6-10 1-92 160 2-34 407 2-44 2 -54-
0-38 0-12 41 0-60 27- 0-16 0<-66
15 01 2-10 l'i610 23-49 5,448 32-62 3 -38-
8-30 2-05 413 6-03 1*299 7 .7 8 3 f l4
0 05 3 -00 53 0-77 7 i 0-43 1-36
~ — 170 2-48 296 1-77 1 -74-
— — 116 1-69 859 5-14 7-41v
3-60 1 0 2 918 13-39 1,57S 9-45 l '7 2 r
0-86 1-95 — — — — —
19-57 3-52 689 10-05 1,665 9-97 2-42
0-02 2 -0 0 17 0-25 41 0-25 2-41
3-29 0-67 48 0-70 78 0-47 1-62
0-30 0-78 95 1-39 123 0-74 1-29
14-42 0-63 29 0-42 50 0-30 1-75
9-34 0-78 416 6-07 366 2-19 0-83
0-03 0-50 138 2-01 418 2-50 3-03
100-00 1 1 5 6,854 100-00 16.704 100-00 2-44
FTOS— gi5c? feite 1980-81 Source :—^All*India Report on Agricultural Census, 1980-81.
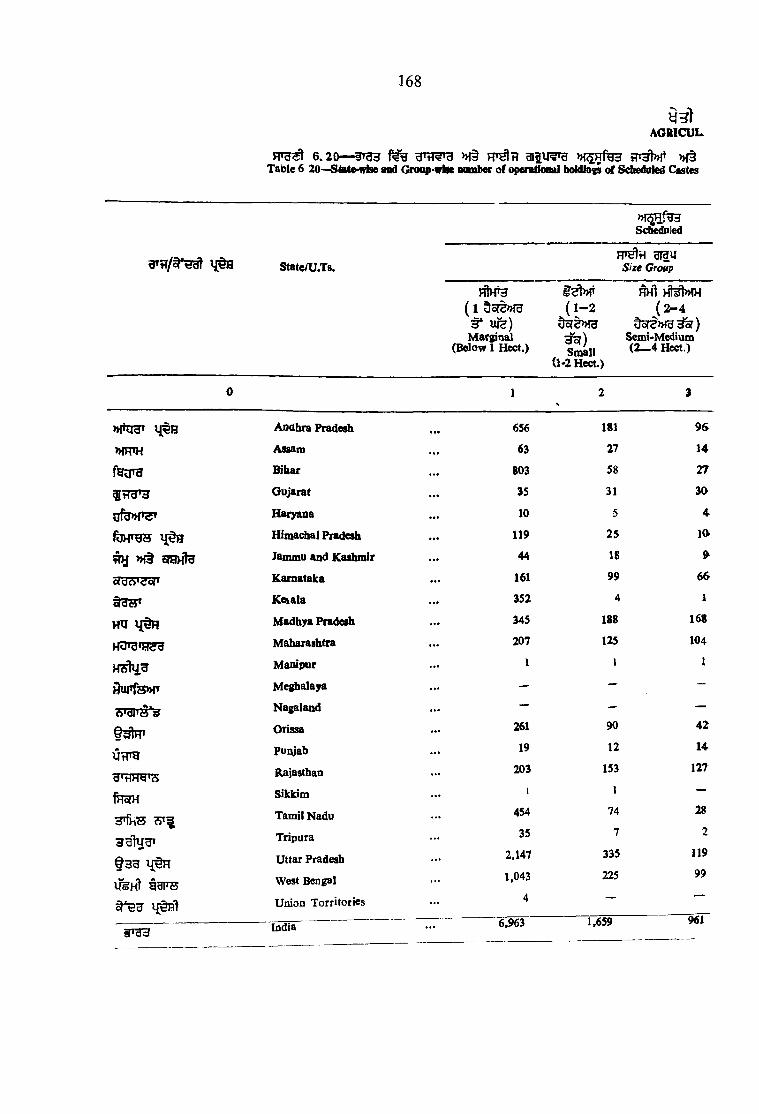
y ? )AGRlCUl^
6 . 2 0 — §T33 d»rl?’3 M § f P ^ » |§Table 6 20^tet»>wise and Group-wise ooaiber of operational holdio^ ot Sdiedoled Castes
168
ScbedoJed
Statcyu.Ts.FT^ti grgu Size Group
h Ih ^( l
3* u fe ) Marginal
(Below 1 H ect.)
f e V
j * - " yof?>>T3
3 ^ ) Small
(1*2 Hect.)
M > M » W( 2 - 4
dST2>HU^o?) SemioMedium (2— 4 Hect.)
0 1N
2 3
Andhra Pradesh 656 181 9 ^
Assam 63 27 14
Bihar . . . 803 58 2T
5 ? ? ^ '3 Oujarat 35 31 30
Haryana 10 5 4
lf§J3 H im adial Pradesh 119 25 10
^ >H§ sraH te Jammu and Kashmir 44 18 9
Karnataka 161 99 6&
K eiala 352 4 1
HU M]§F? M adhya Pradesh . . . 345 188 168
Maharashtra . . . 207 125 104
Manipur 1 I I
f ju i'fe n r M eghalaya . . . — — —
A Ol'CJ 9 N a ^ la itd — — —
Orissa 261 90 4 2
u t r g pui\)ab 19 12 14
iUjasthan . . . 203 153 127
fHoTH Sikkim 1 1 “ “
Tamil Nadu . . .454 74 28
3^1U^T Tripura 35 7 2
f a g Uttar Pradesh . . . 2.147 335 119
ifen ^ tU FH West Bengal 1,043 225 99
Union TorrUoties 4“
India . . . 6,963 1,659 9ol
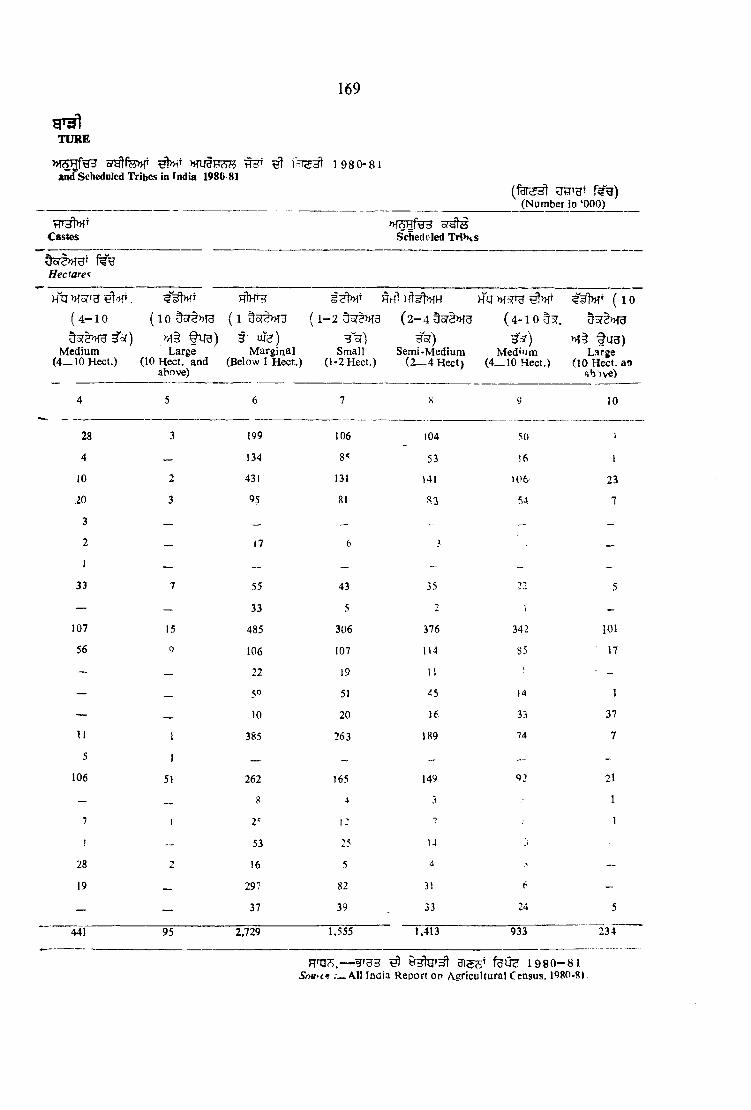
169
TXJRE
and Scheduled Tribes in fndia 198G-81^ ^ 1 9 8 0 -8 1
Castes
(f9T S^(Number in ‘000)
»T5HfeH o T ^ Schedv'led Trih«s
Hectare'!
HI3 MSrrg PflH^ g ^ t )-ft '^>fH HQ ( 1 0
( 4 - 1 0 (10 {1 ( 1 - 2 5 3 t^ 3 ( 2 - 4 ( 4-10 53r. 53rs»f35 3 r iW 3 5 f ) >n§ ^ ) t U{?) 3 -^ ) H3f)3 -^ ) H3T) 3 ^ )
Medium Large Marginal Small Semi-Medium Med»'im(4—10 Hect.) (lOHect. and (Below 1 Hect.) (l-2Hect.) (2_4Hect) (4_10 Hect.)
above)
28
4
10
20
3
2
J
33
107
56
II
5
106
!
28
19
441
159
1
51
95
199
134431
95
17
55
33
485
10622
50
10
385
2628
2'
53
!6
297
37
2,729
106
131
81
435
306
107
19
51
20
263
1654
i :
25
5
82
39
1.555
104
53141
8.3
50
16
lOfy
54
35
2
376
114
11
45
16
189
1493
14
4
31
33
342
85
14
33
74
6
24
1,413 933
t u a )Large
(10 Hect. an qbive)
10
1
23
7
101
17
1
37
7
21
1
5
"23 r
FTT3? .— ^ a rs s ’ felfe 1980-81Sf>u>tn .— All Inaia Report o p A.gricultural Census, 1980-81.
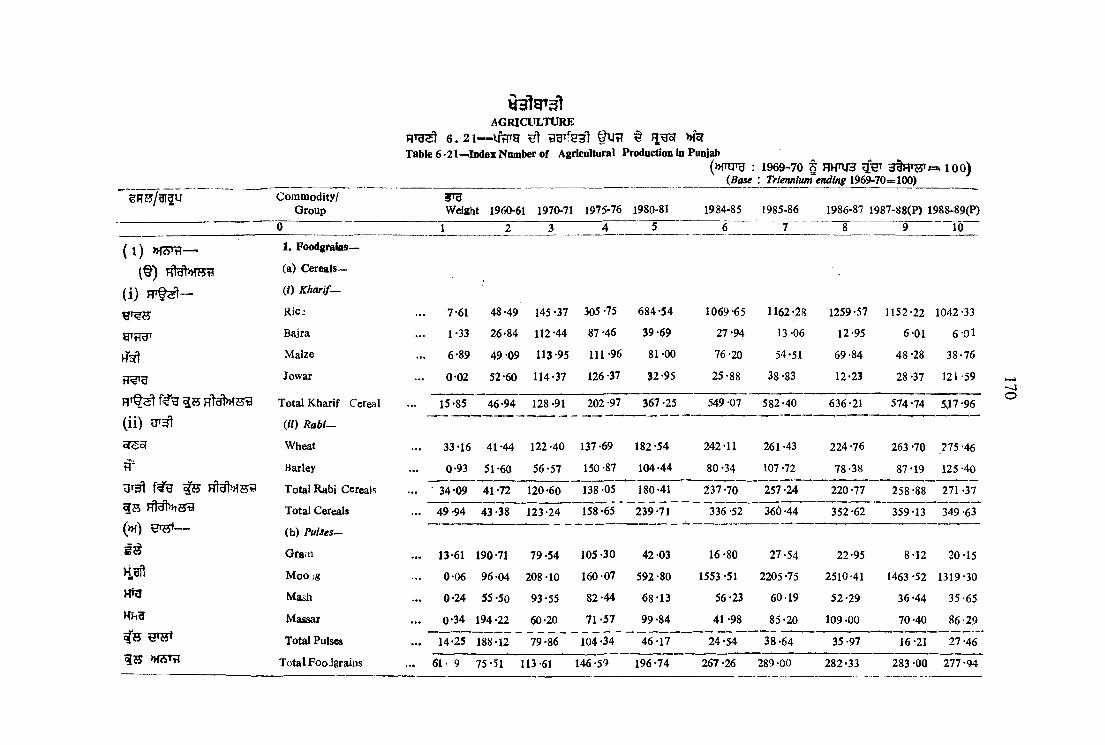
AGRICULTURE 6 . 2 1 — IfflTg BHTf53l » f e
Table 6 '21—>lDdez Number of Agricultural Production to Punjab(»TOTB ; 1969-70 § HHnjH 3 f R T ^ « lO O )
lOiCO «7A 1A/\\{Base : Triemium ending 1969-70=100)
?Rf5/3T2U Com m odity/Group Weight 1960-61 1970-71 1975-76 1980-81 1984-85 1985-86 1986-87 1987-88(P) 1988-89(P)
0 1 2 3 4 5 6 7 8 9 10
( l )
( § )
( i ) F T t ^ —
1. Foodgrains—
(a) Cereals—
CO Kharif—
RiCi 7-61
1
48*49 145 -37 305 -75 684*54 1069 -65 1162-28 1259-57 1152*22 1042 -33
^ t^ d ' Bajra 1*33 26*84 112*44 87 '46 39*69 27*94 13-06 12*95 6*01 6 01
M Maize 6-89 49 09 113-95 111 -96 81 *00 76-20 54-51 69*84 48-28 38*76
Jowar 0 0 2 52*60 114-37 126 -37 32*95 25*88 38 *83 12-23 28 -37 121-59
hM > h h 3 Total Kharif Cereal 15*85 46*94 128*91 202 -97 367 *25 549 -07 582*40 636-21 574 *74 5,17 *96
( i i ) (« ) R a b i-
^<io( Wheat 33-16 41*44 122*40 137*69 182*54 242-11 261*43 224-76 263 *70 275 *46
Barley 0-93 51*60 56*57 150 -87 104*44 80 -34 107-72 78*38 87-19 125*40
t B H ldlniS?) Total Rabi Cereals 34*09 41*72 120-60 138*05 180*41 237-70 257 -24 220 *77 258-88 271 -37
?55 Hldl»TSg Total Cereals ... 49 *94 43*38 123*24 158 *65 "'239 *71 336 -52 360 -44 352 *62 359-13 349 -63
(>H) — (b) Pulses—
i d Gram ... 13*61 190*71 79-54 105 *30 42*03 16-80 27-54 22-95 8-12 20*15
>iclft M oo ig 0*06 96*04 208 -10 160*07 592-80 1553 -51 2205-75 2510*41 1463 *52 1319*30
Mash 0*24 55*50 93-55 82*44 68-13 56 -23 60-19 52*29 36*44 35-65
Massar 0-34 194*22 60-20 71 -57 99-84 41 -98 85-20 109 -00 70 *40 86-29
Total Pulses ... 14*25 188-12 79-86 104 -34 46-17 24~-54 38-64 35*97 16*21 27 -46
q s >H2S»t? T otal F oo jgrains ... 61- 9 75*51 ]113-61 146*59 196-74 267 *26 289-00 282-33 283 *00 277-94
O
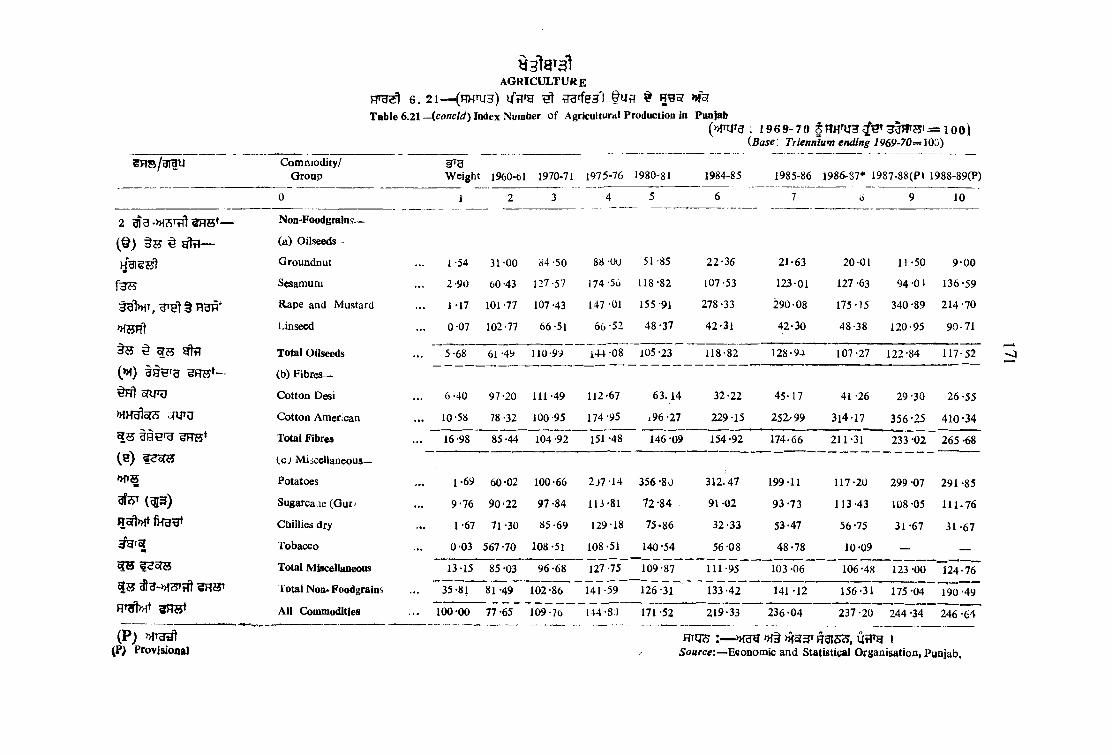
a g r i c u l t u r e
6 . 2 1 — (HHTU3) ^ ^raffen') ^Table 6.21 —(concld) Index Number o f Agricultural Production in Punjab
(»|Tyf3 : 1 9 6 9 - 7 0 lO O i{Base . Triennium ending i969-70«=100)
Comniodity/Group Weight 1960-61 1970-71 1975-76 1980-81 1984-85 1985-86 1986-87* 1987-88(PI 1988-89(P)
0 1 2 3 4 5 6 7 6 9 10
Non-Foodgrains—
(©) ^ (a) Oilseeds—
Groundnut 1 -54 31 00 84-50 88 -Ou 51 -85 22-36 21-63 20 -01 11 *50 9-00
Sesamum 2-90 60 -43 127-57 174 -56 118-82 107-53 123-01 127 -63 94 -01 136-59
Rape and Mustard 1-17 101-77 107-43 147 -01 155-91 278 -33 290-08 175-15 340 -89 214-70
m nl Linseed 0 07 102-77 66-51 66-52 48-37 42-31 42-30 48-38 120-95 90-71
^ y )« Total Oilseeds 5-68 61 -49 110-99 144 -08 105-23 118-82 128-94 107-27 122-84 117-52
(» f) d H S » - (b) Fibres—
§Fft 5RT3 Cotton Desi 6-40 97-20 111-49 112-67 6 3 .14 32-22 45-17 41 -26 29-30 26-55
»!H ^ 5rs Cotton American ... 10-58 78-32 100 -95 174 '95 i96-27 229 -15 252/99 314-17 356-25 410*34
Total Fibres 16-98 85 -44 104 -92 151 -48 146 -09 154 -92 174-66 211-31 233 -02 265 *68
( e ) ?^or^5 (.cj Miscellaneous—
»H15 Potatoes 1 -69 60-02 100-66 2J7-14 356*80 312.47 199-11 117-20 299 *07 291 *85
afsT (^ s f ) Sugarcane (Gur^ 9-76 90-22 97 -84 113'81 72-84 91 -02 93 -73 113-43 108 -05 111 .76
HolW ft 3 Cbillies dry 1 -67 71 -30 85-69 129-18 75-86 32-33 53-47 56*75 31 *67 31 -67
Tobacco 0 0 3 567 -70 108 -51 108-51 140-54 56 -08 48*78 10*09 — —
^55 5R5T
Total Miscellaneous 13-15 85-03 96-68 127-75 109-87 111-95 103 -06 106*48 123 *00 124-76
lotai Non* Foodgrains' 35-81 81-49 102 -86 141.-59 126-31 133-42 141 -12 156-31 175*04 190 -49
All Commodities . . . 100-00 77 -65 10 9 -7b 144-8J 171 -52 219-33 236-04 237-20 244 *34 246 -64
(Pj H«Jc5 :— » e g »{§ MoT^T Hgis<5, Ut4iy 1Source:— Economic aad Statistical Organisatioa» Punjab.
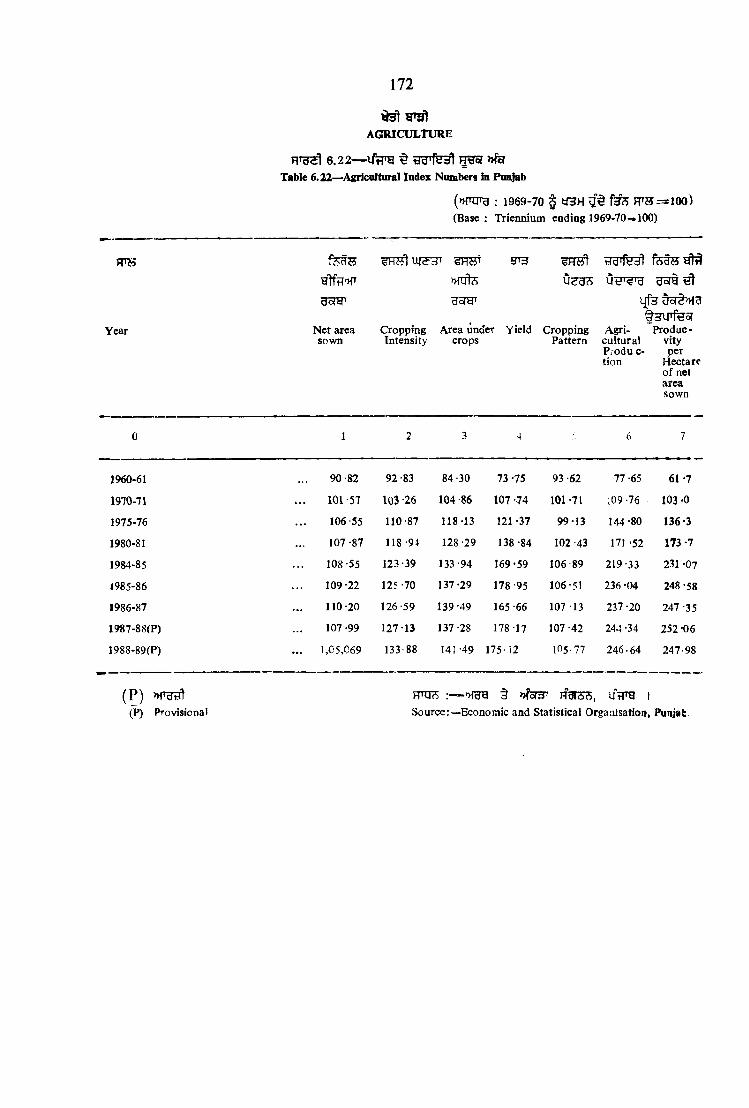
172
Year
6 . 2 2 — ^ d d ' f e a l » f eTable 6 .22—^Agricnltural Index Numbers in Punjab
AGRICULTURE
N et area sown
(>WTCrg : 1969-70 3 y 3 H F T S— lOO)
(Base : Triennium ending 1969-70=1100)
w f t e
dojyi
^ y d 'fe d !
ijfed sr ^ M af3UTfH5J
Cropping Area under Yield Cropping Agri- Produc- Intensity crops Pattern cultural vity
Pi odu c- pertion Hectare
o f net area sown
0 1 2 3 4 6 7
1960-61 90-82 92-83 84-30 73 -75 93 -62 77 -65 61 -7
1970-71 101 -57 103-26 104 -86 107 -74 101 -71 ;09-76 103 -0
1975-76 . . . 106-55 110-87 118-13 121 -37 99 13 144-80 136-3
1980-81 107 -87 118 -94 128 -29 138-84 102 -43 171 -52 173-7
1984-85 108-55 123-39 133-94 169-59 106 89 219-33 231 -07
1985-86 109-22 125-70 137 -29 178-95 106-51 236-04 248 -58
1986-87 110 *20 126-59 139-49 165 -66 107-13 237 -20 247 -35
1987-88(P) 107 -99 127-13 137 -28 178-17 107 -42 244 -34 252 -06
1988-89(P) 1,05,069 133-88 H i -49 175-12 105-77 246-64 247-98
(P) » T ^(P) Provisional
RHJ?: .>>fgg § »for^ H3T5S, \ J w ^ I
Source:—Economic and Statistical OrgauisatioK, Fuaiab

AORICULTURE
173
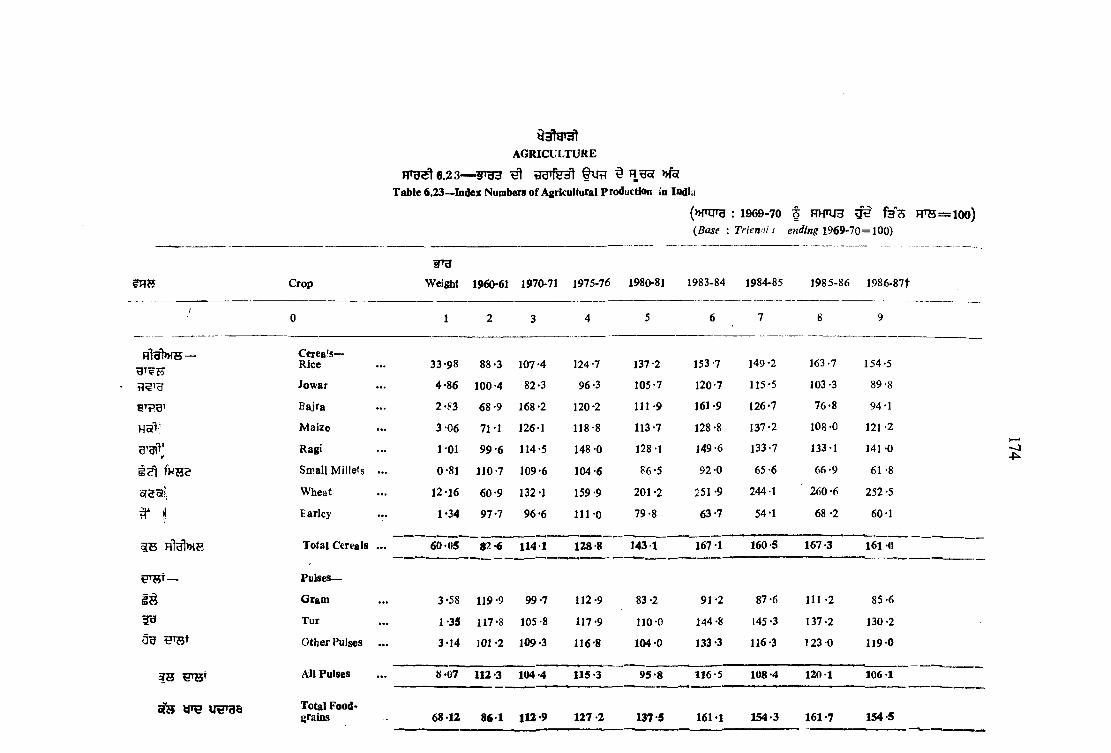
HTcra^6. 23— ^ tld>fy3l ^ n fe
Table 6.23->Indez Numbers of Agricultural Production in India
(>>TOTh ; 1969-70 f HHnjH ^ f37 i FTO=100)(Base : Trienni i ending 1969-10=100)
AGRICULTURE
Crop Weight 1960-61 1970-71 1975-76 1980-81 1983-84 1984-85 1985-86 1986-87t
/0 1 2 3 4 5 6 7 8 9
h1^>h s — Cereals— Rice 33-98 88 -3 107-4 124 -7 137*2 153-7 149 -2 163-7 154*5
Jowar 4-86 100-4 82-3 96-3 105-7 120-7 115*5 103 -3 89-8
Bajra 2*83 68 -9 168 -2 120 -2 111 -9 161 *9 126*7 76-8 94-1
M aize 3 06 71-1 126-1 118-8 113-7 128 -8 137-2 108-0 121 -2
Ragi 1 0 1 99 -6 114-5 148 -0 128-1 149-6 133-7 133*1 141 -0
i e l fwHS Small M illets ... 0-81 110-7 109-6 104 -6 86-5 92-0 65-6 66-9 61 -8
Wheat 12-16 60-9 132-1 159 -9 201-2 251 -9 244-1 260-6 252-5
Earley 1-34 97-7 96-6 111-0 79-8 63 -7 54-1 68 -2 60-1
I B Total Cereals ... 60-05 82-6 114 1 128-8 143 1 167-1 160-5 167-3 161 0
^ w — Pulses—
Gram 3-58 119-9 99-7 112-9 83 -2 91-2 87 -6 111 -2 85-6
Tur 1-35 117-8 105-8 117-9 110-0 144 -8 145 *3 137*2 130-2
a g tJ'Bt Other Pulses ... 3-14 101 -2 109*3 116-8 104*0 133-3 116-3 123 0 119-0
All Pulses 8-07 112-3 104 -4 115-3 95-8 116-5 108 -4 120 1 106 -1
irerga Total Food- grains 68-12 86-1 112*9 127 -2 137-5 161 *1 154*3 161 -7 154*5
'-J41

A a isB t
oil S e e d s -
Groundnu; 4-82 91-0 118-4 130-9 97 -0 l37 -4 124-8 99 -3 i»7 5
SesaP uni 0-62 72 -9 128-2 , 109'] 101 -4 127 -0 118-3 113-8 JOO-7
R3R" tH t»T >H§ Rape and Mustard 1-73 90-2 132 -3 129-6 153-8 173 -9 204 -9 178-7 175 -7
Linseed 0-43 95 9 114-9 145- 102-6 107 -7 94-3 91 -2 83 -2
Castor Seed O i l 120 3 113-4 119 0 170-2 336-8 391 -1 256-7 197-0
Safflower 0 -09 71-0 147-1 225-9 317-8 475-0 488-6 329-9 315-4
Nigerseed 0-10 97-6 134-3 158-0 153.3 183-9 154-4 200-6 137-8
Coconut 1 -87 84-7 108-9 104-5 102 -6 104-2 124-0 121 -4 114-9
Cotton (Seed) ... 1 -19 97*1 85-3 106-6 126-1 114-3 152-2 156-1 125-5
^ f s gt^i Total O il Seeds... 10-96 89-8 116 1 123 8 113-6 138-5 144-6 126-7 127 -4
(3§ — Fibres— ^
( i ) Cotton (Lint) 3'01 -2 85-1 106 -2 125-1 114-0 151-8 155-8 125 -2
U<!H* Jute 0-81 83 -2 99 -6 89-5 131 -2 127-4 131-6 219-3 148 -3
HHd' Mesta 0-15 100-9 113-7 127 -0 142-2 120-4 108-1 151-6 109-5
H S Sunnhemp 0-06 117-0 94-6 91'2 78-3 67-4 81-1 82-9 75-8
aR Total Fibres 4-03 S6-3 89 -3 103-4 126-3 116-2 145-1 167-3 128 -5
u B ^ c S Plantation Crops—
Tea 1-85 81-6 l06 -4 123 -7 144-7 147-7 162 -5 166 -6 158-6
‘ o r ^ Coffee 0*24 86-1 170 1 129 ■(> 182-9 161 -9 301 -9t 188-6 294-5
3 9 3 Rubber 0-19 36-7 127 1 190 -2 211-4 :42 -0 257-5 276-8 303-1
S B ^ B ’Total Pli^ntation Crops 2-28 78-3 114-8 129 '9 154-3 157-1 1 8 5 - lt J78 -1 184 -9

a g r i c u l t u r e
6 .2 3 w n j 3 — ^ §VJTI ^ I^gc? >K5r
la h le 6.23 (concluded)—l^des Number o f Agricultural Prodoction in IntSia(n ro rg :
S H 5 ’ —
g fe ’ (a j3 )
>>ff5
oTO! f H ^
B ’B fH3V( j
(R5?')
FOI^^
q B ^
?H?5T
Crop
M isceliare us Cro s_
Sugarc tie (Gur)
Tobacco
Potato
Pepper(Black)Chi I c (Dry)
Ginger (.Dry
Turmeric Arecanut Coriand J; Cardamom
Tapioca Sweet Potato Banana Cashew nut Guarseed
T otal N on- Foodgrains
AJl Com m odities
1969-70 t HHTU3 f e s JT O ralO o) (Base : Triemium ending 1 9 6 9 -7 0 1 0 0 )
•Provisional
Weight 1960-61 1970-71
1 3
1975-76
■
1980-81
' ' 5
1983-84 1984-85 1985-86 1986-87*
7-Oi 9 4 1 106-4 118-2 129-4 146 0 142-8 143-1 153 -0
1 14 84-5 101 -8 98 -4 135-1 138-3 136-4 123-9 128 -2
1-41 66 -9 112'v 176-0 2 1-9 291-2 301 -2 249 -7 305-0
0-08 132-3 94-6 102-4 127-4 98-1 78-7 146-9 141 -9
1 11 <8-9 120-6 100 1 117-4 130-7 145-5 202-5 180 -0
0 07 90-5 151-9 227-5 315-7 428-8 473 -2 487-9 448 -9
0-3 80*8 130-3 93-8 J50-5 147-4 179-8 254-6 194-6
0-60 73-3 102-5 113-9 139-5 135-0 55-8 154-0 149*2
0 01 145-2 134-4 93-3 137*7 101 -0 98-6 140-7
0 1 3 104-2 100-0 167-7 n i - 1 268-2 280-3 302-0 293*3
0-81 40-8 106-2 133-1 122-2 122-6 117-9 101-7 74-4
0-43 71-0 97-5 104-5 U ’l 91-5 93-9 81-2 83-8
1 -11 S7-6 91-5 101-6 141-4 146-5 165-4 169-9 145-2
0-21 68-6 108-9 138-3 158-7 180-6 189-5 189-5* 189-5
0-18 ]1 7 '3 160-9 184-4 140-2 250-6 173-2 96-2 89-2
31 88 88 1 !08 6 120 -5 130-5 146-4 155 -3 150 9 148-4
DO 00 86-7 111 -5 125 1 i35-3 156-4 154-6 158-3 152-6
§ »for3' R65faoT5, W S J 1
- J
Houn #— Ecooom ic and Statistical A -viser Government o f India.
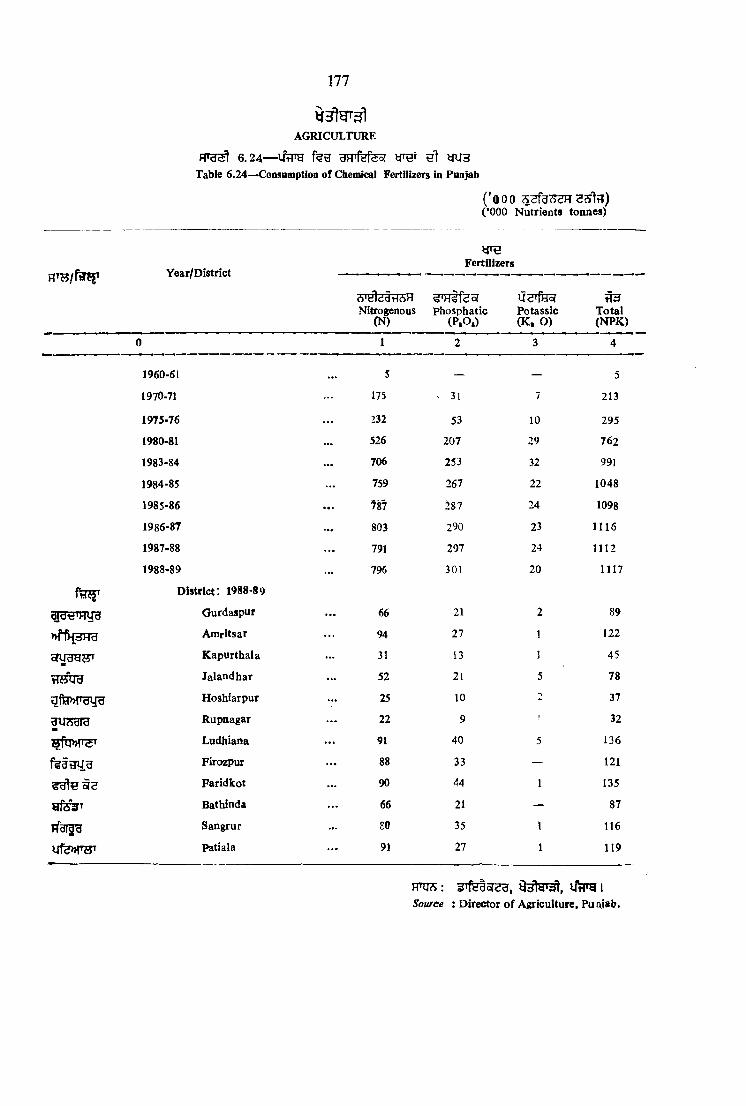
177
6 . 2 4 — gRj f ef esr hT tru 3
Table 6 .24—Consumption o f Chemical Fertilizers in Punjab
AGRICULTURE
Year/District
('OOO SSlfC )( ’000 Nutrients tonnes)
Fertilizers
SryVdflcSH U ^ r f ^Nitrogenous phosphatic P otassic T otal
(N) (P .O .) (K . O) (N PK )
areREmyu
oW dyf^'
u fe> »ruyg
3u?5ura
s f q » n ^
u f e » r ? r
0
1960-61
1970-71
1975-76
1980-81
1983-84
1984-85
1985-86
1986-87
1987-88
1988-89
D istrict; 1988-89
Ourdaspur
Amritsar
K apurthala
Jalandhar
Hoshiarpur
Rupnagar
Ludhiana
Firozpur
Faridkot
Bathinda
Sangrur
Patiala
1
5
175
232
526
706
759
78^
803791
796
66
94
31
52
25
22
91
88
90
66
80
91
31
53
207
253
267
287
290
297
301
21
27
13
21
10
9
40
33
44
21
35
27
/
10
29
32
22
24
23
24
20
2
1
1
5
5
213
295
762
991
1048
1098
1116
1112
1117
89
122
45
78
37
32
136
121
135
87
116
119
M Stgr^ , UrP^ I Source : Director o f Agriculture, Puaiab.

AGRICULTURE
UtTSr ^ T O oTfHMT iJd^fec/l oPfHMT ^ i j fe lH g r >H§ i j f e giH
HaraoPHH ^ UoT3T
TABLE 6 -25—Agricultural Ww-kers as Percentage o f Total p o rk ers and Cultivable Area per Agricultural Worker in districts o f Punjab
178
District
^ l J * 3 3 T oTH cT133dofy* (3'of<!>>raf)
Percentage o f Agricultural W(HiEers
1961 1971 1981
Cultivable area per Agriculture Worker (Hectares)
1961 1971 1981
0 1 2 3 4 5 6
Gurdaspur 49 18 58 -85 55 -95 1-79 1-49 1-15
Amritsar 46 00 55 -85 53 -70 2-06 1-45 1-23
SW 3«i5’ Kapurthala 54 *75 61 -47 53 -46 2-63 1 -84 1-78
iJttUd Jalandhar 42-44 50-69 46-70 1-94 1-48 1-31
Hoshiarpur 57*24 61 -51 57 -39 1-72 1-53 1-38
uuftara Rupnagar 56 -59 62-65 51-53 1-54 1-35 1 -32
^rir>HTST Ludhiana 45-18 50-80 43-84 2-32 1-55 1-36
ftfd d y ^ Firozpur 66-55 73 -48 69-52 2-44 2-35 1-93
Faridkot 65-35 74-57 68 -97 2-67 2-02 1 -7«
Bathinda 72-92 76-42 68 -94 2-54 2-11 1-81
Hdlda Sangrur 67-07 71 -48 70-98 2-23 1-82 1-47
uf?»r?5^ Patiala 53 -54 63 -23 57 -56 2-61 1 -80 1 -47
u d 'y Punjab . . . 55 -89 62-67 58 -03 2-23 1-75 1-50
HH33 :—»Tof3cr >H§ ijnrg |Source \ —Economic and Statistical Organisation, Punjab.
^:~ 1971 feu oPH ^ 5 1 1961 1% fe>Hor 5fH» 3^1" feoTIjfe f e 3 Fft Z RHf5»T TT^t pft | vjg 1971 f | 3 1 RHfSW^
fclTMT ^ oP r lj[fe ^ H3?i m> IThe definition o f a worker has undergone a change in 1971. In 1961, persons economically active even for hour a day were treated as workers but in 1971 they were treated as such only if this activity them daily for a period sufficient to make them gainful.

JTcT 6i26— >H§ ^ ^ Ijfe > ite 1985TABLE 6.26— ATerage Yield of Principal Crops in India and Stlectad Coantrles—1985
(fe:3T: \ f 3 f i s i b i a ) (Kg. per Hectare)
179
AGRICULTURE
Countries
^H64Crop
( ^ )
Rice(Paddy)
Wheat M ake(
( a f ^ ^
SugarcaneC intBm uof
Cane)
0 1 2 3 4
»»ratn!5 Argentina ... 1,605 3,603 55,000
AvwtcaUa •• 1.384 • • 79,479
y g ' ^ H Brazil . . . 1,698 •• 1,866 63,846
China 5,346 2,951 . . 70,006
Canada 1,746 6 .179 . .
63*H France ... . . 6 ,008 6,372 . .
9 * 9 3 India 2,179 1,873 1,207 59,845
Italy ... . . 2 ,808 ^6.979 . .
i n r o Japan 6.225 • • . .
Pakistan ... 2,250 1,589 1,272 35,553
HcJofl Turkey 1.892 [3 ,279 . .
TJ. »TH. U .A .R . • • • • • • . .
U .K . •• 6,151 • • . .
U .S.A. 6,095 2,519 7,406 82,036
>>Ih . >>Ih . »fTg, U.S.S.R. ... 3,898 1,647 2,906 ••
FTOS HHargT, RTOrg I
5oorc«:— Ministry o f Agriculture, G ovem oieat o f India.

AGRICULTURE
6 .2 7 — U tP g ^ g t f i »fT)fg3 f%g ^
Table 6 .27^PeroM tage cootribntloii o f Agriculture to total State Income in Punjab
180
Year
State IncomeoR5 g r n »fTHHS
Gross State Income
At Current A t Constant At Current At Constant prices (1980-81) prices (1980-81)
IM-Ices prices
0 1 2 3 4
1980-81 35 -55 35-55 34-69 34-69
1981-82 . . . 35. 80 36-78 34-96 35 -94
1982-83 •«# 35 -76 36-66 34-82 3 5 77
1983-84 33-68 3 4 -6 4 33-03 33-80
1984-85 •«% 34 -71 36-88 34 -00 35-98
1985-86 • • • 35-16 37-40 34 -30 36-36
1986-87 34 -20 35-12 33-19 33 -93
1987-88 • • • 33.46 3 5 .0 0 33-40 33-75
1988-89CQ) • • • 34 -07 35-28 33-01 34-06
FTOS : W g » f§ »f5r3T rf3T5S, ISource : Economic and Statistical Organisation, Punjab.
Q Qu’ck
:^ § i[u sr 3 y y i^ r ^ j M t ? (w r » g i 9 8 o - 8 i ) ^ W ti m a t
Ht#i3 (MqTB 197 0-7 1) ^ ^ U3 I
/Vo/e The above estim ates relate to N ew -Series (with base 1980-81) and replace the existing series (with base 1970-71) given in the earlier Statistical Abstracts o f Punjab.

AGRICULTURE
t 1 ^ 6 . 2 8 — HHTS3T q g g
Table 6 .2 8 -J n d ices o f Parity ia Poiifab
(»PXrg Ba^ : 1059-60^0 196i-62-ld6j
l§ i
n » sYear
HT g ^ c jIndex of Index of Index of
prices received prices paid parity by the farmers by the farmeirs
0 I 2
1965-66 146 01 137-41 106 -26
1970-71 203 17 214 -80 94-39
1975-76 311 05 316-01 98 -43
1976-77 336.63 363 -38 92-64
1977-78 353 00 356-26 99 08
1978-79 383 -73 361 -82 106 -06
1979-80 394-61 399-02 98 -S9
1980-81 521-17 477-16 109-22
a n i s ; » f§ >»f^y F f^ 3 5 , i
Source : Economic and Statistical Organisation Ihinjab,

182
t f 3 T 9 ' 3 lAG ilC U . l URE
H ^ 6 . 2 9 - - l / F F g ^ >h§ srer^ ^ HH*
Table 6.29— Sowing and Harvesting periods o f important crops in Punjab
g fI SCr jp
RKt
Sovvrag Period
o f e s W HHT H arvesting period
0 1 2
R lcj M ay—July Sept mber—Novem ber
Jowar June-July H d y d - 3 ^ Sept ember—N o vember
Bajra gs->H diH a June— August H d y d - 7 S ^ Sep'ember—November
M aize June-July Fldyd-^Holdyd September—October
W h.at »{or3gu-dH yd October— December A p ril— May
Barley >Ko(dyd— tJHWd O ctob ,r— D ece Tiber W Jd H -H ^ April— May
Gram » f s r f g 3 - s ¥ a g October-Novem ber M arch—A pril
H^) M as A June-July » r a ^ 'g 3 -* ‘|y d O cto 'cc— November
n a i M ooag June-July ^o(dyd-A<c"y3 O ctober—Novem ber
Arhar May.June October-November
HBg Massar Oct ob jr- N 0 vember Marcli—April
Sugarcanc ^d«^d1-HTUB Febru iry-March — H'dtJ Deo-m ber— M arch
M mm P otato 3^"gg-V !6^'^ n f§ n f u t s - H e l
Septem ier-O ctober and December- January
Novem ber—January and A pril—May
Groundnut May—July >H oi3gg-«^g-d October-November
f y « Sesamu.n June-July October
Toria H dyd ;-j September A < ^ 3 -« R g d November-Devember
HdH* Sarson October-Novem ber HTgg->w9M March-April
>x h h 1 Linseed » fb < 3 y d -5 ^ g d October-Movember H 'd r J -» w fe March-April
jjijTia Cotton April— June September— Decem ber
ST H fH 36 C hillies H 'd tJ -» w t5 » f§ »rai H3— >H§ ^ 3 ^
M arch-April and June-July August—Novem ber and Novem ber—February
ijfu »r3T 1
Source : Punjab Agricultural University, Ludhiana.

H a f s i f e l l R ? fiq
7.1— H'fT 31 1989 3 > H U 5 ? a 3 3 5 ’ >H§ fg iS 3 t3 I
R ig^ l 7 . 2 ~ l ^ « f e ^ H3t>HT >HUf§ >H I{dfl H 3l fU l ^ 35jgT «aR T g*t't 3 I
7.3—3m ^ ^ R H ^ 5 I
7.4— f e ^ ^ § ^ f ^ ^ 5 I
7.5—VRTH fi9BT?Tg yi^ ygT j § n a t »iin^ ’5BF.i§ 'b1 5 I
r ib s ') 7.6“-^ T rg ^ gRf5T e l f ^ 3 l u ? l 5 1
R '3 ^ 7.7— ^ ??T 3T^ Ifi 3R5T 3^
7. 8— tlTg )tf§ T qgrei3 1
R’g^l 7.9— SHHt ?Rh1 I
SECTION VII
MARKETING AND STORAGE
Tabic 7.1 Indicates the names and number of principal agricultural markets in the State as on31st March, 1989.
Fable 7.2 Shows the distribution of regulated markets and sub-yards attached to such markets atwell as average number of villages and area served per mirket.
lable 7.3 Indicates capacity of State owned storages in the State,
Table 7.4 Gives market arrivals of important crops by districts and years.
Table 7.5 Exhibits distribution of market arrivals of foodgrains and non-foodgrains by districts and years in Punjab.
Table 7,6 Shows procurement of important crops in Punjab by districts.
Table 7.7 Procurement of important corps by agencies.
Table 7.8 Contribution of Wheat and Rice to Central Popl,Tabic 7,9 Procurement prices cropwi^e.
183
7

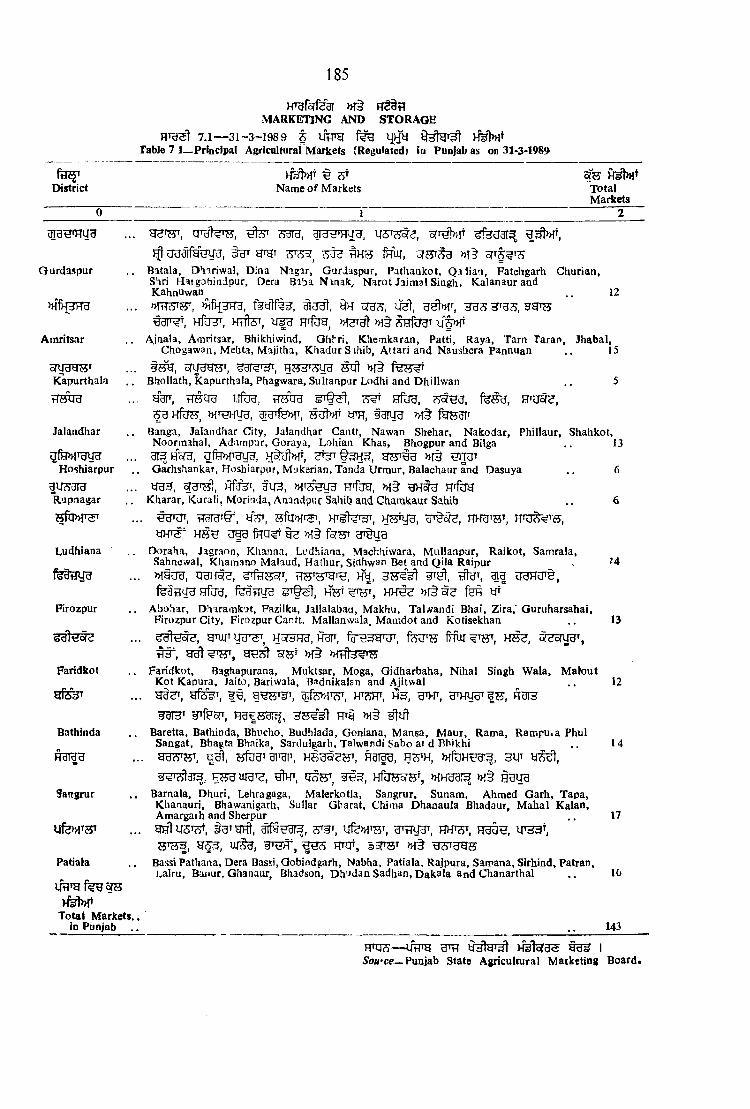
185
District
0
7 . i ~ 3 i - 3 “-i9 8 9 f i{Hy )M >htTable 7 l_P rlncip aI Agricultural Markets (Regulated) iu Punjab as on 31-3-1989
MARKETING AND STORAGE
Name of Markets TotalMarkets
1
Ourdaspur
Amritsar
oTydtfS^Kapurthala
Jalandhar
Hoshiarpur
Rupriagar
Ludhiana
fe§ tjira
Firozpur
Faridkot
Bathinda
Sangrur
Ufe>HW
Patiala
Total Markets, io Punjab
^ srolniT ^ a 3 T 3
3UT grgi ^H c5 fJM, >H^
Batala, Dh^riwal, Dina Nigar, Ourdaspur, Pathankot, Qalian, Fatehgarh Churian,S'lri Haigobiadpur, Dera Biba Nxnak, Narot Jaimal Singh, KalanaurandKahnUwan , . 12
>vif^3Fra, t o l , W ^ ? 5 ,HHteT RTfbg >h§ i f w
Ajnala, Amritsar, Bhikhiwind, Giihri, Khemkaran, Patti, Raya, Tarn Tarap, Jhabal, Chogawan, Mebta, Majitha, Khadur Sihib, Attari and Naushcra pannuan .. 15
#OT, 5TUgg 5f, dT<€'3r, ^Bhollath, Kapurthala, Phagwara, SuTtanpar Lodhi and Dhillwan .. 5
W , tTSCra E f e , ^ H T U ^,H te , grarf^T^ yiH, fgruH »j§
Banga, Jalandhar City, Jalandhar Cantf, Nawan Shehar, Nakodar, Phillaur, Shahkot, Noormahal, Adampur, Goraya, Lohian Khas, Bhogpur and Bilga .. 13gT3H15fH, HHUtGarhshankar, Hoshiarpur, Miikerian, Tanda Urmur, Balachaur and Dasuya .. 6y U 3 , H f^ f , gU 3 , W fm , » I§ HfftiH
Kharar, Kurali, Morinda, Anandpuc Sahib aad Chacukaur Sahib .. 6irgraT§", ^7^, hhutst,
U |g f n q ^ t eDoraha, Jagraon, Khanna, Lt’dhiana, Machhiwara, Mullanpur, Raikot, Samrala, Sahnewal, Kharanno Malaud, Halhur, Siclhwac Bet and Qila RaipurW U g , Hy, # d ^ UUHO ^,feaH O U H fog, feStTUU H H ^ feH
Abohar, Dharamkot, Fazilka, Jallalabaa, Makhu, Talwandi Bhai, Zira, Guruharsahai, Firozpur City, Firozpur Cartt. Mallanwala, Mamdot and FCotisekhan^ ^ ' c 5 , gnjlTT H3F,
» i§Faridkot, Baghapurana, Muktsar, Moga, Gldharbaha, Nihal Singh Wala, Malout
Kot Kapura, Jaito, Bariwala, Bsdnikalan and Ajitwal H§?T, Hf^T^ HTOT, H^, gTHT, eTHy^T|^^
§BT3T grf^T^ 3S^ "3t >H§
Baretta, Bathinda, Bhucho, Budblada, Goniana, Mansa, Maur, Rama, Rampu»a Phul Sangat, Bhagta Bhaika, Sardulgarh, Talwandi Sabo ai d Bhikhi
. a g l , ??fedTgiTgii, H s g ^ e s \ n a ifu ,
sr^ < 3T 5 , TOHuraT^, ^HT. ^ 3 , Hfa?55fST, §3113
Barnala, Dhuri, Lehragaga, Malerkotla, Sangrur, Sunam, Ahmed Garh, Tapa, Khanauri, Bhawanigarh, Sullar Gharat, Chima Dhanaula Bhadaur, Mahal Kalan, Amargaih and SherpurH hIuSW ^ U fen iW , g w u r , HdtiH, W 33^,
i w , i w , ^ 5 H n r, s s r s T n f§Bassi Pathana, Dera Basi5i,Gobindgarh, Nabha, Patiala, Rajpura, Samana, Sirhind, Patrao, Lalru, Baxiur. Ghanaur, Bhadson, Dh’Jdan Sadhan, Dakala and Chanarthal .. 10
f4
13
12
U
17
143
FTO3— l i ^ u rT iSotf'ce^Punjab State Agriculiural Matketing Board.
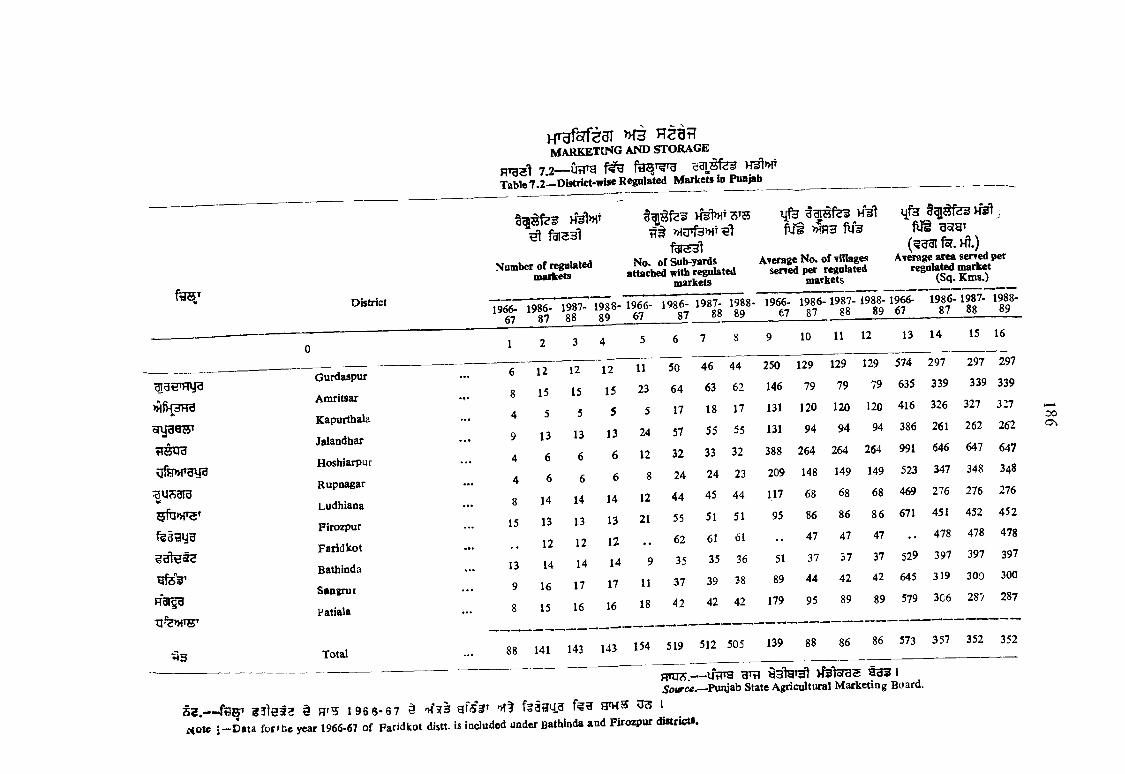
^u?)3ra
^ > > r 3 ^
f s a g y a
g f e V
R a i^
XffS>HW
^ 3
District
Gurdaspur
Amritsar
Kapurthala
Jalandhar
Hoshiarpur
Rupnagar
Ludhiaoa
Firozpur
Faridkot
Bathioda
Sangrur
Patiala
Total
H ^ g f a r f j a r > H 3 H e a nMARKETING AND STORAGE
7.2— O rra c a r ^ B fe h ^ > ht
Table 7 .2 — District'Wise Regulated M arkets in Punjab
Number o f regulated markets
>feT»1T i j f e>HUTf3»ii e l f U t >Jf?3
No. of Sub-yards attached ^itb regulated
markets
Average No. o f villages served per regulated
markets
f U i(^ g g i f e . Ht.)
Average area served per regulated market
(Sq. Kms.)
1966-67
1986-87
1987-88
1988-89
1966-67
1986-87
1987-88
1988-89
1966-67
1986-87
1987-88
1988-89
1966-67
1986- 1987- 87 88
1988-89
1 2 3 4 5 6 7 8 9 10 11 12 13 14 15 16
6 12 12 12 11 50 46 44 250 129 129 129 574 297 297 297
8 15 15 15 23 64 63 62 146 79 79 79 635 339 339 339
4 5 5 5 5 17 18 17 131 120 120 120 416 326 327 327
9 13 13 13 24 57 55 55 131 94 94 94 386 261 262 262
4 6 6 6 12 32 33 32 388 264 264 264 991 646 647 647
4 6 6 6 8 24 24 23 209 148 149 149 523 347 348 348
8 14 14 14 12 44 45 44 117 68 68 68 469 276 276 276
15 13 13 13 21 55 51 51 95 86 86 86 671 451 452 452
12 12 12 . . 62 61 61 .• 47 47 47 •• 478 478 478
13 14 14 14 9 35 35 36 51 37 37 37 529 397 397 397
9 16 17 17 11 37 39 38 89 44 42 42 645 319 300 300
8 15 16 16 18 42 42 42 179 95 89 89 579 3C6 287 287
__ . —-- ---------------- - ------------------ ------- ------ ---------
88 141 143 143 154 519 512 505 139 88 86 86 573 357 352 352
Source.—Punjab State Agricultural M arketing Board.
S ? . — 3 3 l S 3 2 § 1 9 6 6 - 6 7 §ciotc Data fo r the year 1966-67 o f Faridkot distt.
g f s V ^ iis included under Bathinda and Firo:q>ur district*.
00a \

187
H ' ^ 2 3 1 M 3 fT S T O
M \RKETING AND STORAGE
7 . 3 - l f f P g f # 3 R g s r ^Table 7 .3—State Owned Storage Capacity* in Punjab
Hti 3 5 )
(Lakb M . Toni>
^ Name o f Agency 1975-76 1980-81 1983-84 1984-85 1985-86 1986-87 1987-88 1988-8 9
0 I 2 3 4 5 6 7 8
1. F ood Corporation o f India 10-81 51-80 41-22 45-12 45 -99 57-36 5 9 -43 58 .3 5
2 . f ^ B H U H ^ Civil Supplies Department 5 07 26 07 13-03 18 08 2 2-20 16 -99 11-29 7-13
3 . UtTH Markfed Punjab 7-84 12-83 15.74 12-44 17-97 14-12 11 03 18-36
4 .fR3I
State W arehousing Corporation 5*41 8-60 10-97 10. 80 14 -20 15-60 15-21 11-8]
5. 2J*ycjl O’Q- THdi
Central W arehousing Corporation 0 81 4*05 4-80 4 -87 5-52 3-50 2-77 2-11
6.HU75»^ 'd 'dU -
Puftj&b St&UCWU Supply Corporation ••• 0-81 8-38 9.01 9 77 11-75 18 -11 15-32 8 -0 5
7. M arketing Board — — — — — 2-41 2-41 2 - 4 ^
Total 30.75 111-73 94-77 101. 08 117-63 128-09 117-46 10 8 -8 8
Source—Food and CivilSupplies Departm ent.
§ H § » f§ y?? ^ ^ h t k s i
^Includes hired storage capacity and open capacity.
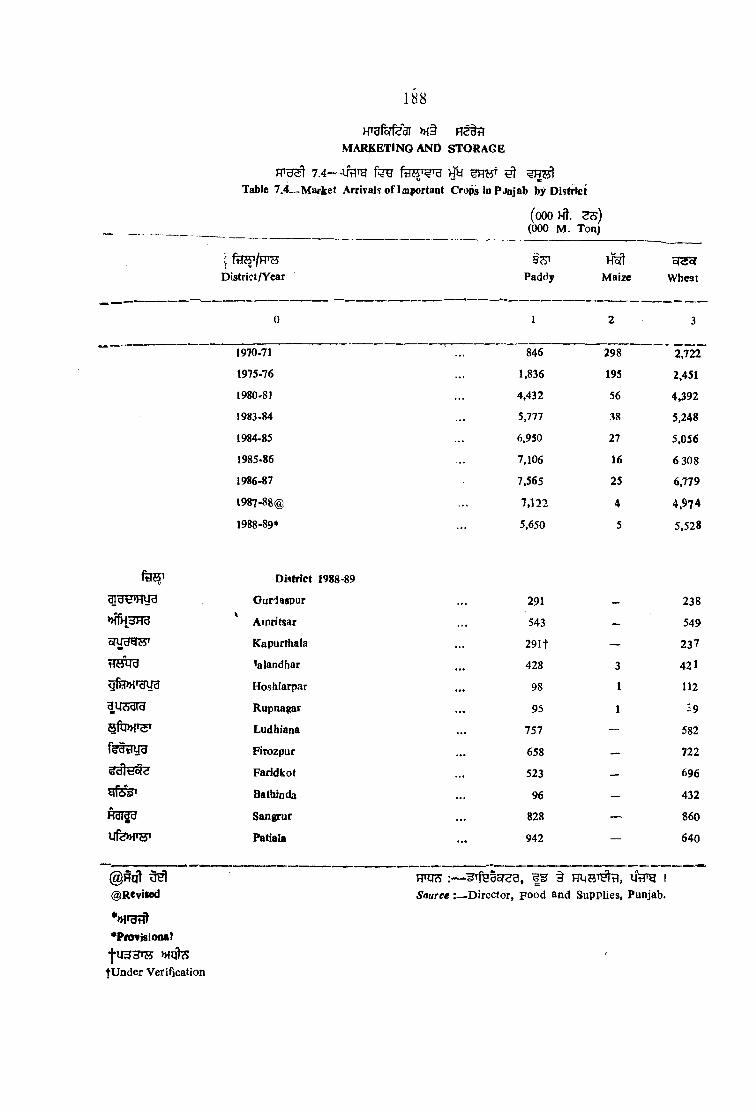
mHTgfefeai >H§
MARKETING AND STO RAGE
•> H > ^^Provisional
•|*U33t75 »{q t5
tU n der Verification
FTO^ 7 .4— i r a ^ y y ^
Table 7.4— Market Arrivals o f Important Crops in Punjab by District
(oOOHt.(000 M . Ton)
t f^ /F P Z 5 District/Year
B7?Paddy i
Hoft
Maize Wheat
0 1 2 3
1970-71 846 298 ' l i m
1975-76 1,836 195 2,451
1980.81 4,432 56 4,392
1983-84 5,777 38 5,248
1984-85 6,950 27 5,056
1985-86 7.106 16 6 308
1986-87 7,565 25 6,779
l987-88@ 7,122 4 4 ,974
1988-89* 5,650 5 5,528
District 1988 89
Ourdaspur 291 238
MfkcfHd Aiontsar 543 — 549
o T U H ^ Kapurthala 291f ~ 237
tIMUd talandliar 428 3 421
Hoshiarpar 98 1 112
g u sd rd R u pn a^ r 95 1 39
5 f t f» T ^ Ludhiana 757 — 582
feS tiira Firozpur 658 __ 722
^ d ^ yg^ Faridkot 523 _ 696
y f iy * Bathioda 96 — 432
Hdr^d Sangrur 828 — 860
ufe»n® » Patiala 942 — 640
@ H o t M@ Re vised
HTq^ ^Tfsaor<f9, UrPg 1
Source :— D irector, p o o d and Supplies, Punjab.

MARKElENG AND STORAGE
^ Wti? >H§ SHSVel (ooo iflBHS)Table 73-^DiStribation Qjf Market ^ riv^ ls of Foodgrakis and Non-fgodgrains in Punjab (000 g ts .)
189
f t # D*stribt
Tota! Market arrivals
1975-76 1980-81 1983-84 1984-85 1985-86 1986-87 1987-88 1988-8
* ■■ ,»» *,
0 1 2 3 4 5 6 7 8
^clti*HU3 Ji ' ' Gurdaspur ... 4.266 5.975 6,474 6,234 8,034 8,310 5,423 5,601
5»flH ^ra Amritsar : . . . 7.061 9,942 11,282 12,990 14.550 16,072 11,313 11,182
5fUd9tt' Kaparthala . . . 2.938 4.785. 7,962 12,250 13,354 7,418 6.289 4,286*
Jalandhar ... 4.944 8,847 5,730 9,901 1 1 3 0 12,597 10,116 9,632
q.f »ra\ra Hoshiarpur ... 1.959 2,505 2,103 4,575 3,505 4,068 2,379 3,031
9U Tidty Rupnagar 869 1,520 3,571 1,765 1.915 2,223 1,812 2,430
Ludiiana . .. 7,00) 12,90:? 15,374 14,366 16,716 19,191 17,825 17,121
ferovja Firozput ... J .7 1 S 12,SS4 26,S18 \% ,m \S ,260 22,SS9 18,757 17,947
FariJkot ... 7,662 11,456 16,413 15,646 17,216 20,386 17,192 17,956
yrsoJi Bathinda ... 3,516 5,580 14,871 8,924 7,774 11,001 9,361 9,066
n m j d Sangrur ... 5,822 13,104 18,359 12,378 19,93^ 21,436 20,057 19,963
Patiala ... 6,828 13,836 17,184 16,381 18,4^1 19,904 17,985 17,091
* U 3 3 t?5•U nder V arification
Total 60.690 1,03,310 1.45,841 1,32.400 1,50,893 1.65,495 1.38,509 1,35,306
Rnni : — g g s iSource Pu liab State Agricultural M arketing, f?oard.

190
H > 3 o f f 2 3 t >H § m arketing a n d st o r a g e
7.6—UrTH ^ ^ ^Table 7.6—Distiict-w'se Prodoction and Procurement of Important CrolM in Punjab ^
(000 onv)
»iTh 3 H h
qfa>HTguH
District/YearPaddy M aize
ireojWheat
^ §U t?Productioa Procure- Productii.n Procure
ment mcnt
f i mTroduction Procure-
H3«at
1
1970-71 1,302 637 861 205 4,865 2,375
1975-76 2,175 1,836 846 195 ' 5,788 2,364
1980-81 4,850 4,432 1,612 40 7,677 4.277
1983-84 6.804 5,777 539 38 9,422 5,248
1984-85 7,581 6,950 577 27 10,176 5,056
1985-86 8,225 7.106 412 16 10,988 6 .308
1986-87 8,877 7,565 528 25 9,447 6,779
1987 88 8.122 7 ,1 2 2 t 365 4 t 11,084 4 ,974f
1988.89* 7,347 5,650 293 5 n ,5 7 8 5 ,528
D istrict 1988-89* Gurdaspur 554 291 23 — 652 238
Amritsar 921 543 21 — 1.257 549
Kapurtbala 263 291 6 — 406 237
Jalandhar 583 428 58 3 807 421
Hoshiarpur 182 98 103 1 460 112
Rupnagar 133 95 31 1 244 39
Ludhiana 904 757 23 — 1,123 582
Firozpur 810 658 2 — 1.430 722
Faridkot 618 523 2 — 1,325 696
Bathinda 142 96 @ - - 1.040 432
Sangrur 1,076 928 4 — 1,585 seoPatiala 1,161 942 20 — 1,249 640
FTUR: 5»fe3ib^^d >n§ H u s » ^ >H§ i?»f8goRrg f * f e o p g s , u iT O i
iiource :— L irector Food ar,d Supplies Lepaitn ei.t and D ireclcr 1 ant Kett tds, Fui ab.
;-oiEa naci > o(B fee? r>b fug § iNot« — W heat production data relates to rrcceeding year,
•PrOvisiona!
t HQ ^ 11 R evised ,

> T 3 f o f f 2 3 l >H §
Marketing and Storage
191

192
Hrgfoifeai >H§
M ARKETING A N D
« . 7 .7— ^Table N o . 7.7—Procurement o f
H yIm portant
Paddy
District
grfl >;te. Ht. HTgoftF U25HU
H3oTg »fT^.
State F.C.I. Markfed Punsup Traders TotalGovernment
0 1 2 3 4 5 6
Gurdaspui • •• — — — — 291 291
Amritsar^ S r i
9 — — 534 543
Kapurthala — 1 — 290 291
Jalandhar 12 5 — 410 428
?jfH»F3yg Hoshiarpur . . . — 2 2 — 94 98
9U Adiy Rupnagar ••• — — — — 95 95
Ludhiana . . . — 1 9 — 747 757
fSH W B Firozpur . . . 2 37 1 — 618 658
Farldkot . . . __ — 5 — 518 523
s f 6 3 ' Bathinda . . . — — ~ — 96 96
RoflfH Sangrur . . . 3 2 — — 923 928
Patiala . . . — — — — 942 942
o 'f l State . . . 6 63 23 — 5,558 5,650
*Prpvi»|on9)
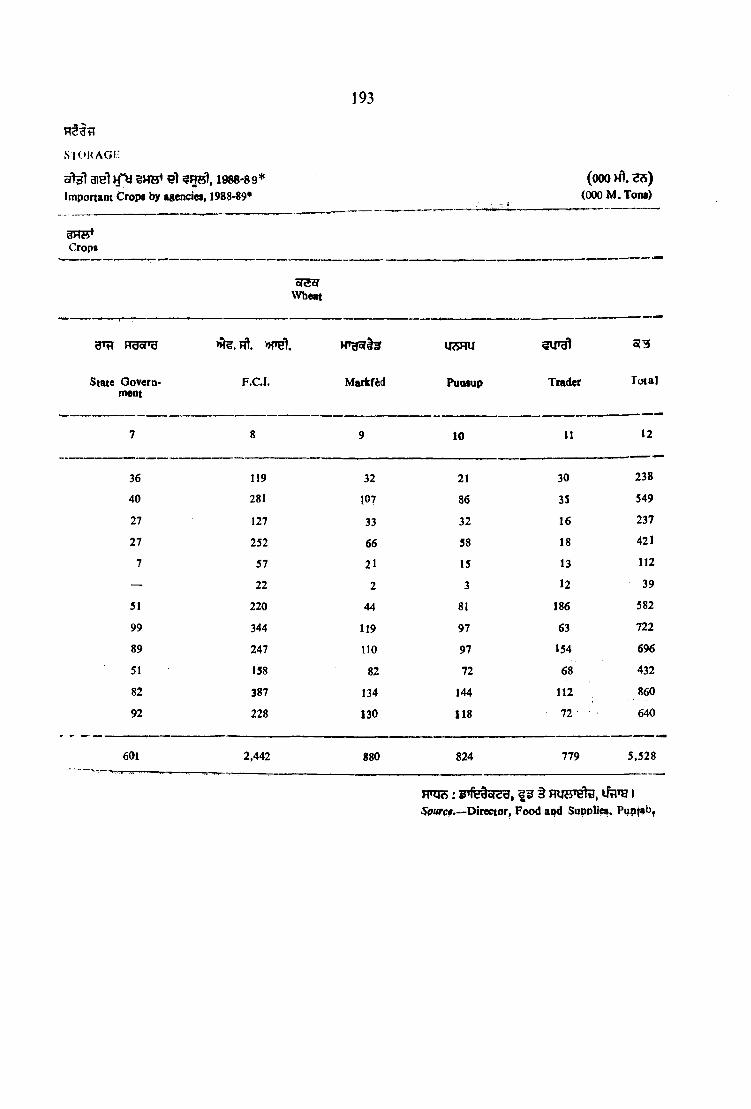
SI OKAGf:
a l g l 3is1 H“y e l 1 9 8 8-89*
Important Crops by agcncies, 1988*89*
Crops
193
(ooo H\ 25)(000 M . T oot)
o?3crWheat
Fraopg
State Oovcrn- meat
Rt.
F .C I. Markfid
USHU
PUQSUP Trader T otal
7 8 9 10 11 12
36 119 32 21 30 238
40 281 107 86 3S 549
27 127 33 32 16 237
27 252 66 58 18 421
7 57 21 15 13 112
— 22 2 3 12 39
51 220 44 81 186 582
99 344 119 97 63 722
89 247 110 97 154 696
51 158 82 72 68 432
82 387 134 144 112 860
92 228 130 118 72 ^ 640
601 2,442 880 824 779 5,528
m i T i : § H U 5 ^ , I^puTfr .—Director, F ood aod Supplier. Pupfab^
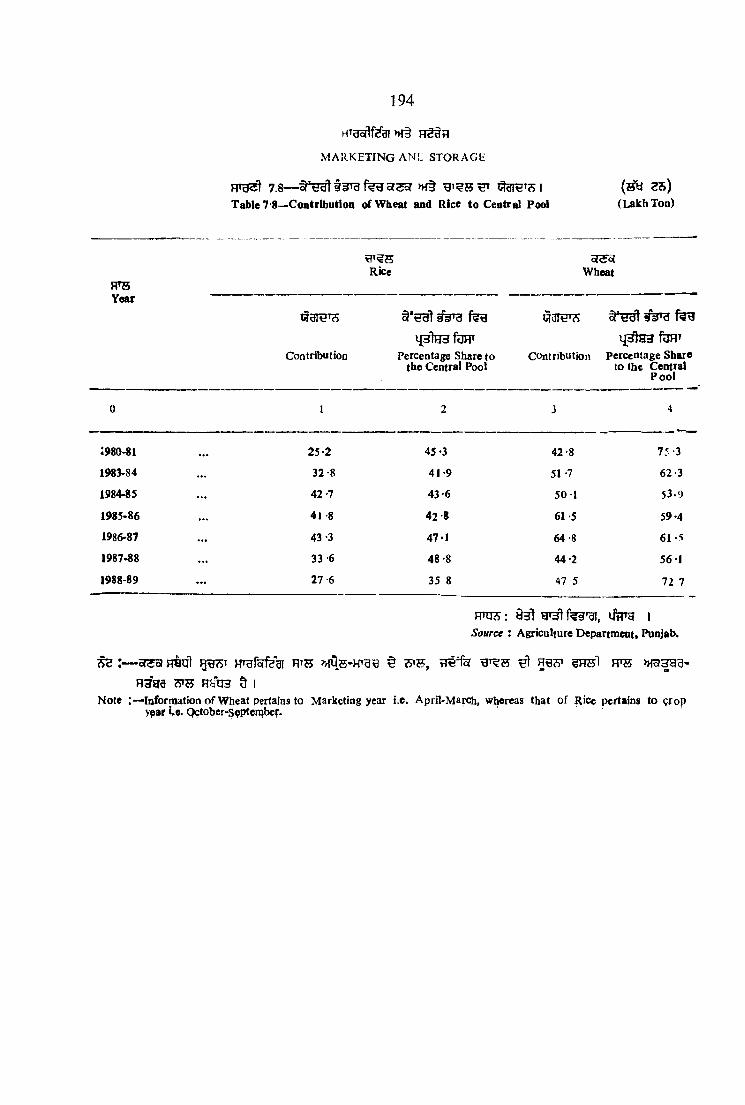
HTgof1fe''cli n f§
M ARKETING ANL STORAGE
7. 8— cj ssr » f§ ^ i
Table 7*8—Contribution o f W heat and Rice to Central Pool
194
(Lakh Ton)
W ERice
oT55lWheat
Year
q d W * 9 t id l sJcJ'd C?dW?)
Contribution431H 3 fOHT
Percentage Share to the Central Pool
contribution
fORT
Percentage Share to the Central
P o o l
0 I 2 3 4
:980-81 • • • 25-2 45 -3 42-8 7 5-3
1983-84 32*8 4 1-9 51-7 62-3
1984-85 4 2-7 43 *6 50 1 53 .9
1985-86 41 -8 4 2-8 61 -5 59-4
1986-87 43 -3 47-1 64-8 6 1-5
1987-88 3 3-6 4 8-8 44-2 56-1
1988-89 . . . 27 6 35 8 47 5 72 7
H nj(S: 9 3 1 i f t r a ISource : Agriculture Departm rat. Punjab.
^ :— o?3a RSTj! g ^ T HTufefegi ^ 7 ? ^ , ire 'fef e n s l f t o > H o i^ a -
H 3 g 0 9 IN ote :— Inforrnation o f Wheat pertains to Marketing year i.e. Aprll-March, whereas that o f Rice pertains to 9rop
ypar i.e. Qctober-S?pten?ber.
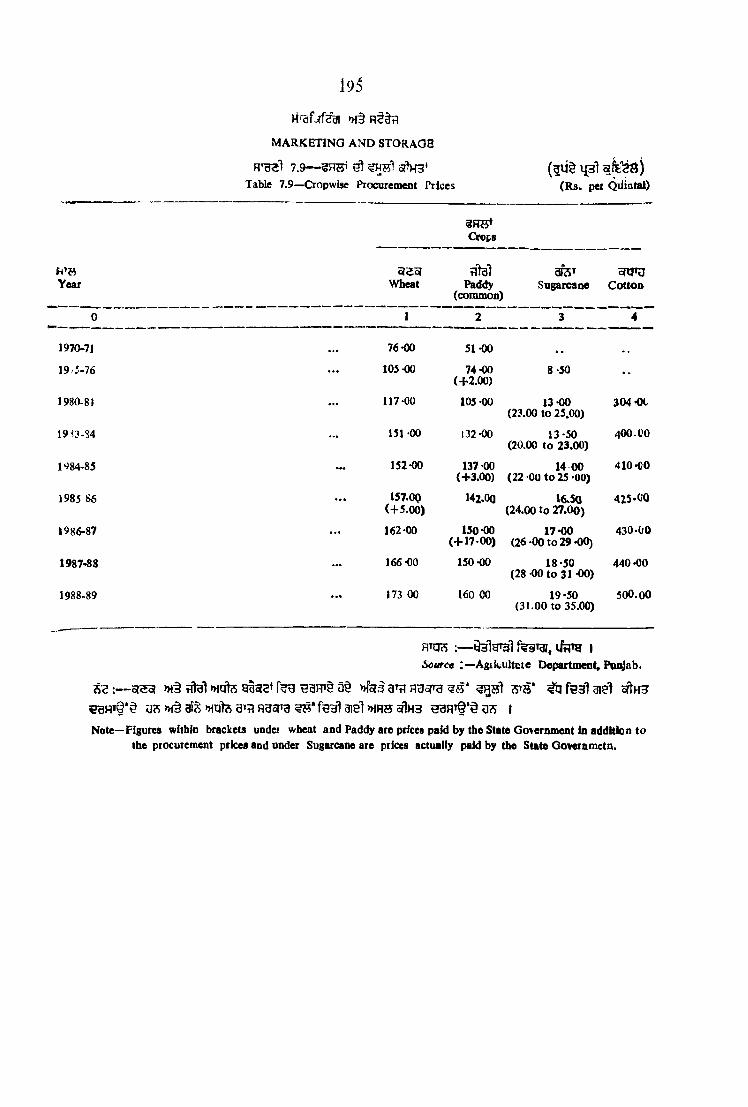
\9i
Year
FTBSl 7. 9— ^ 5 ^ ’
Table 7.9—Cropwisc Procurement Trices
MARKETING AND STORAGE
3HH*Orops
Wheat Paddy(common)
( 3 l i § l{3 l a f e j d ) (R a. pel Qiiiatal)
afeT oratuSugarcane C ottou
1970-71 . . . 76-00 51-00 . . • •
19 5-76 . . . 105-00 74-00(+ 2 .0 0 )
8 ‘50 •-
1980-81 . . . 117-00 105-00 13-00 (23.00 to 25.00)
304*00
19^?-S4 . . . 151 00 132 -00 13-50 (20.00 to 23.00)
400.00
l ‘ 84-85 152-00 137 00 (+ 3 .0 0 )
14 00(22 00 to 25 -00)
410*00
1985 86 . . . 157.00(+ 5 .0 0 )
142.00 16.30(24.00 to 27 .00 )
425*00
1986-87 . . . 162-00 150-00(+ 1 7 -0 0 )
17-00(26-00 to 29 *00)
43 0-00
1987-88 . . . 166-00 150-00 18-50 (28 -00 to 31 00)
440 *00
1988-89 . . . 173 00 160 00 19*50 (31 .00 to 35.00)
500 .0 0
:— ^ 3lgT 3l f^§T3i^ I
Scarce A giicu ltc ie Department, Piiq}ab.
SS >M§ >Hqte R35PB ^S* 7>m" ^ 3I8l sftH3u^>X§ai^ >HqfeaiflRg5rg^?^fe3l3iel>HHHaf!H3 I
Note—Figures within brackets under wheat and Faddy are prices paid by the State Government in addition to the procurement prices and under Sugarcane are prices actually paid by the State Goveram etn.


197
R5TH?J 8
8.1 fiHB gTfl fyet »^§ i g g s - s e s e l M 5H »3fF rs'H l
»nq ts f? 5 e s H sri o a g t w r s u § a s i
JT^U3l8.2 >H§ 8.3 W g i^S glfeoi’ >H§ 35?Ht, gfT3 MUlS TH ^"^53 o t t e ! 3 B g srg 7?E q ^ 0 3 3 T » i§ M f r e l ucf^T €HFrfe»)'.Tdrs»i'' tJi
n»32l8,4 f i h fe § g tsT ^ faT 53l H3FTel 3151 9 I ^^9:1 8.5 198 5-86 SSl grfj^rg f s g srH'ffl>H^ n f w gsraT eU H TfW ti 8.6 f n m " gF B ?ru fH fTI»>!T ofC U 5Q 4€ 3t f3 [» ijt I
SECTION v m
IRRIGATION
Table 8.1 shows data concerning net area under irrigation according to different modes, for the State as a whole and district-wise for 1988-89.
Tables 8.2 and 8.3 present total oroppsd aid irrigated area, perceataga of gross irri^ites} ar >» (c total cropped area and gross area under irrigation (crop-wise) in Punjab, respectively.
Table 8.4 shows the number of tube-wells in Punjab. Table 8.5 gives State-wise net area irrigated during 1985-86 whereas the table 8.6 gives gross area irrigated cropwise for the same period.

NET AREA IRRIGATED BY SOURCE
TUBEWELLS AND WELLS
4000
OTHER SOURCES (000 HECTARES)
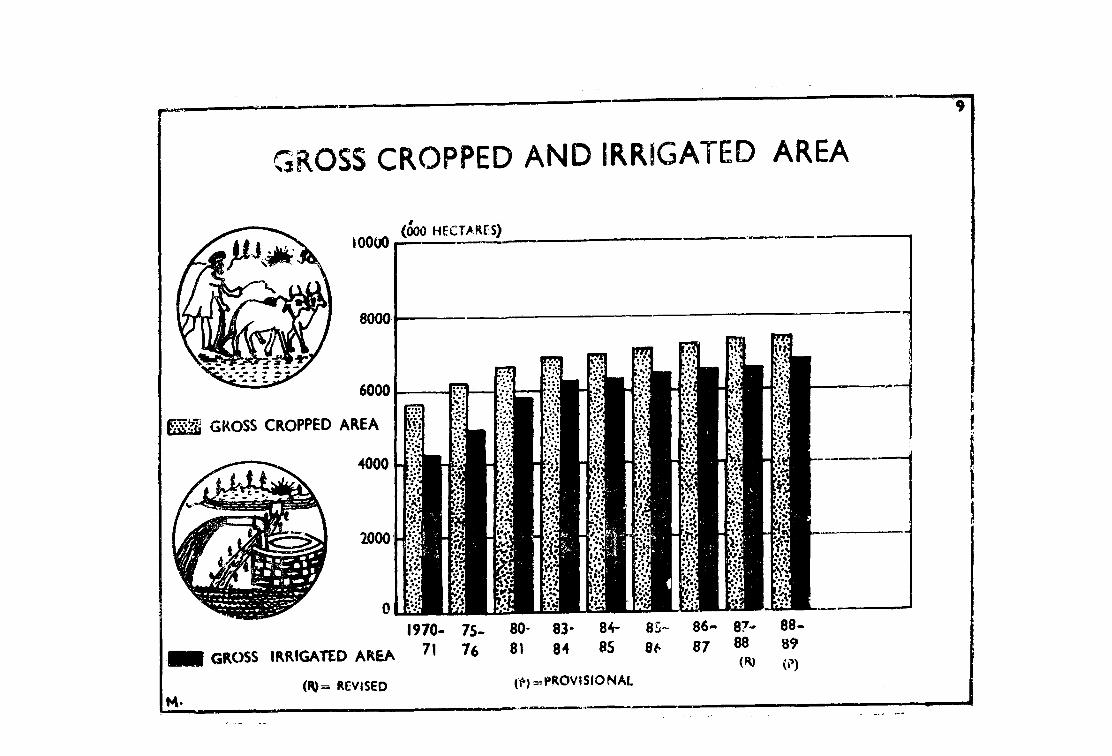
GROSS CROPPED AND IRRIGATED AREA
10000
8000
6000
m m GKOSS CROPPED AREA
4000
2000 H
(000 HECTAHfS)
M .
1970- 75-g r o ss IRRIGATED AREA
(R)= REVISED ((V )= .p K O V IS (O N A L
86- 87- 88.8 7 8 8 8 9
{?)

199
nSTJU
wr
Bfu»i>2» p
f s a s u B
HfeST
RBTJB
UfS»TJ5T
fHiTTeliRRIGATIOxN
RTH2^8. 1— f Ht T^ »rate Table 8.1 —N et Irrigated Area in Punjab by Source
Year/Di$trict
0
1960^1
1970-71
1975-76
1980-81
1983-84
1984-85
1985-86
1986-87
1987-88 (R )1988-89 (P)
District 1988-89 OurdaspuT
Amritsar
Kapurthala
Jalandhar
Hoshiarpur
Rupnagar
Ludhiana
Firozpur
Faridkot
Bathinda
Sangrur
Patiala
(P) »Tcr(P) Provisional.( R ) Revised
( @ ) 5 O 0 5 r c » lH 3 U fe
(Thousand Hectares)
Net Area Irrigated
K 3cT ^
HTUf
Government
Canals
f e O y lw '
Private Tubewells Oilier Canals and Wells Sources
fHH fe§3
Percentageo f
Total N et Area Irrigated
to Net Area Sown
1
1,173
1.286
1,366
1,430
1,478
1.399
1,412
1,440
1,4091,492
57-1
217-1
0-8
3 3 0
14.1
3*6
14-2
247*4
347-6
354 -3
150-9
51-4
66
6-3
829
1,591
1,742
1.939
2,123
2,212
2,274
2.274
2,3072.274
1 3 5 0
202-5
147-6
252-2
126-5
75-5
310-2
231-9
137-8
73 -4
292-3
285*5
11
5
7
13
8
10
4
3
7
9
0 -3
6-2
0*5
(@ )
0-1
2-0
2,020
2,888
3,119
3,382
3,609
3,621
3,690
3,717
3,724
3,781
l° 8 -3
4 25-8
148-4
289-2
141-1
79-1
321 .4
4 7 9 -4
4 8 5 -4
4 2 7 -7
443 -2
338-9
54
;l
75
f?l
86
86
88
88
8989
73-3
99-5
98-3
94 6
5 6-0
66-5
9 9 -5
9 5 -7
9 2-3
85-2
98 3
8 8-5
R T C R i * {fflTg i
Source,—^Director o f Land Records. Punjab.
(@)Below 50 Hectares.
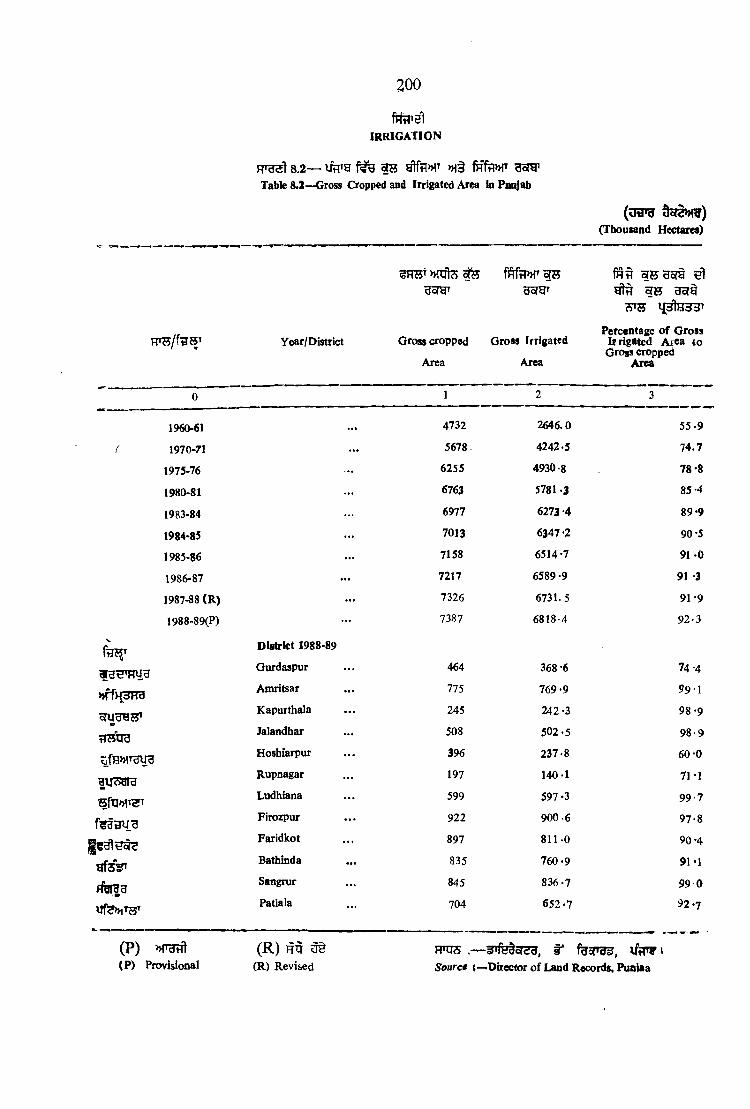
8 .2 — iffrai 1 3 >H§ fRfflMTTable 8.2—Gross Cropped and Irrigated Area in Punjab
2 0 0
IRRIGATION
(Thousand Hectares)
fn tn n r
0
Uf^»lTST
1960-61
1970-71
1975-76
1980-81
1983-84
1984-85
1985-86
1986-87
1987-88 (R )
1988-89(P)
a a s w j g
B
SfH»1THUg
au ^ a ra
Sfq»iT3T
Year/District Gross cropped G ross Irrigated
Area Area
District 1988-89
Gurdaspur
Amritsar
Kapurthala
Jalandhar
Hoshiarpur
Rupnagar
Ludhiana
Pirozpur
Faridkot
Bathinda
Sangrur
Patiala
fR fl I B H c r a e l
^ I S
Percentage o f G ross Irrigated A ica io Gross cropped
Area
1
4732
5678
6255
6763
6977
7013
7158
7217
7326
7387
464
775
245
508
396
197
599
922
897
835
845
704
2646.0
4242-5
4930-8
5781 .3
6273 *4
6347-2
6514-7
6589-9
6731. 5
6818-4
368 -6
7 69-9
242 -3
5 02-5
237-8
140-1
597-3
900-6
811-0
7 6 0-9
836-7
65 2 -7
5 5 -9
74 .7
78 -8
85 -4
89*9
90-5
91 -0
91 -3
9 1-9
9 2 -3
74-4
99-1
9 8 -9
9 8 -9
6 0 -0
71-1
9 9 -7
9 7 -8
9 0 -4
91-1
99 0
92 -7
(P) »T^(P ) Provisional
(R) HU(R) Revised
RTII3 r iftT P ISource t—Ditec(or o f Land Records, Puniaa

IRRIGATION
201
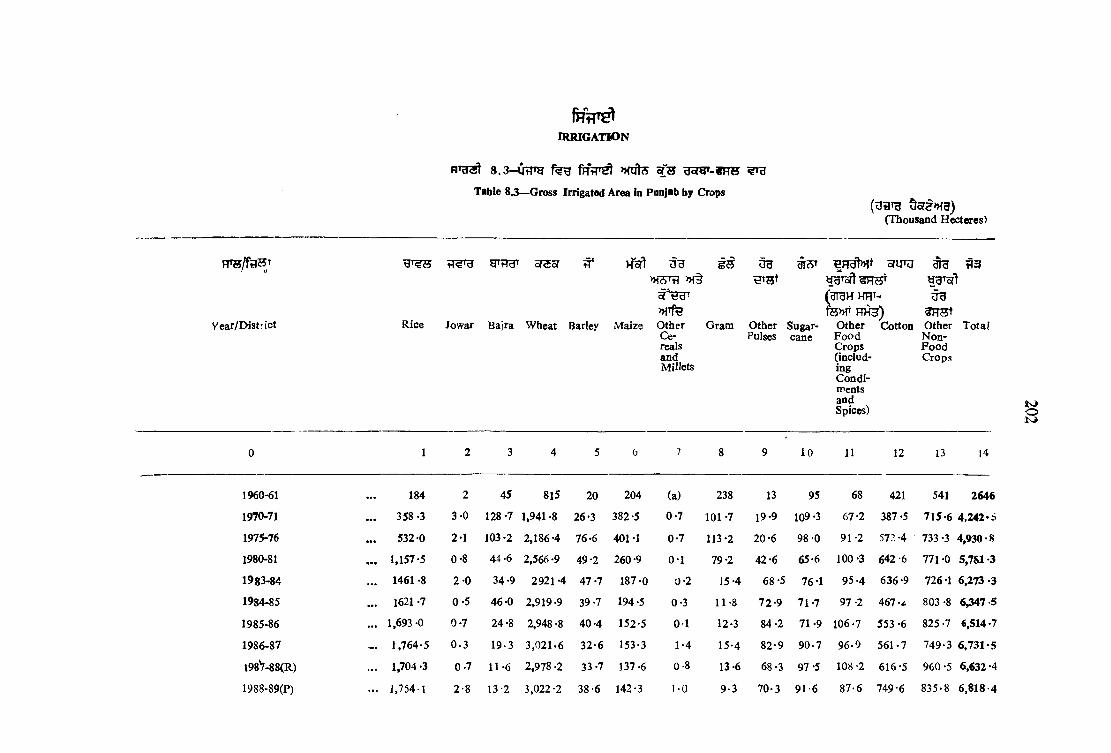
Ih ^IR RlG A TiO N
8.3-U tT T g fR tT ^ ^
Table 8 3 —Gross Irrigated Area in Punjab by Crops(HiiTg 5 o73>H3)
(Thousand Hecteres)
F T S/faH i
Year/District
Hoft UB i s
»fTfHJowar Bajra Wheat Barley IVfaize Other
Cereals and Millets
Rice
^ ^5T cJUTU H 3
(g ra n HRT- u gfe>HT ^yT55t
Gram Other Sugar- Other Cotton Other TotalPulses cane F ood N on-
Crops F ood(includ- CropsingCondimentsandSpices)
0 1 2 3 4 5 6 7 8 9 10 11 12 13 14
1960-61 184 2 45 815 20 204 (a) 238 13 95 68 421 541 2646
1970-71 ... 358 -3 3 -0 128 -7 1,941 -8 26-3 382-5 0-7 101 -7 19-9 109-3 67-2 387 -5 715-6 4 ,2 4 2 -5
1975-76 532-0 2-1 103-2 2,186-4 76-6 401 -1 0-7 113-2 20 -6 98-0 91-2 572-4 733-3 4,930-8
1980-81 . .. 1,157-5 0-8 44 -6 2,566-9 49-2 260-9 0-1 79-2 42-6 65-6 100-3 642-6 771 -0 5,781 -3
1983-84 ... 1461 -8 2 -0 34-9 2921 -4 47 -7 187-0 0-2 15-4 68-5 76-1 95 -4 636-9 726-1 6 ,273-3
1984-85 ... 1621 -7 0 -5 46-0 2,919 -9 39-7 194-5 0-3 11-8 7 2-9 71-7 97 -2 467--6 803 -8 6,347 5
1985-86 ... 1,693-0 0-7 24-8 2,948 -8 40-4 152-5 0 1 12-3 84 -2 71-9 106-7 553 -6 825-7 6,514-7
1986-87 - . 1 ,764-5 0 .3 19-3 3 ,0 2 1 .6 32-6 153-3 1-4 15-4 82-9 9 0 .7 96-9 561-7 749-3 6 .731-5
198V-88(R) ... 1,704 -3 0 -7 11-6 2,978 -2 33-7 137-6 0-8 13-6 68 -3 97-5 108 -2 616-5 960 -5 6,632-4
1988“89(P) ... 1,754-1 2-8 13-2 3,022-2 38-6 142-3 1-0 9-3 70-3 91-6 87-6 749-6 835-8 6 ,818-4
oiK»

'cU?.UlB
f
f 3 l ? 3 S
S f j f e ’
ufe>H W
Gurdaspur
Amritsar
Kapurthala ...
Jalandhar
Hoshiarpur
Rupnagar
Ludhiana
Firozpur
Faridkot
Bathinda
Sangrur
P atia la
District 1988-89
152-1
2 5 5 -9
9 5 -7
140-2
50 -0
22-6
186-6
226 -7
118-0
31-4
220-3
251-0
— 0*7
0-1
2 6
(a)
0-1
(a)
(a)
(a)
2-3
3-2
2-7
3-7
0 .6
152-1 (a) 3-3 (a) (a) 0-7 15-3 3-1 0-1 41 9 368-6
326-1 0-1 13-6 0-1 0-5 2-5 4 -6 2 -7 3-6 157-5 767-9
108-6 — 7-4 — (a) 0-3 2*8 2-1 0-1 25 *3 242*3
213-8 (a) 4 5-3 (a) 0-1 2-8 19-7 10-9 2-3 67-4 502 -5
115-2 (a) 30-6 — (a) 1-9 8 6 10 -2 0 -2 21 0 237-8
61 -4 0-5 6 -2 — 0-1 0-8 10-0 2 -4 0-2 32-3 140-1
260 -7 3-1 1 7-6 — 0-1 18-0 7-2 8-2 17-4 78 *4 597-3
383-1 4 -6 3 -0 0 1 4 -0 13-5 6-3 18-8 123 -2 112-3 9 0 0 -6
381-8 9-9 1 -5 — 1-1 14-4 1-2 11-8 211-9 56-2 811-0
328 -9 10-5 1-2 (a) 2-0 2 -6 1-7 6 -2 270 '4 103 -3 760'-9
381-1 7-6 6 -4 0 -6 1 0 8-9 6-2 3-2 110-9 86-5 83 6-7
309-4 2-3 6 -2 __ 0 -4 3-9 8-0 8 -0 9-2 53 -7 652 -7
m j s :— feo T W , litTO ! Source’.—Director o f Land Records, Punjab.
(p) »fgt!t(p) Provisional
(a) 50 3ort»ra s' ufe(a) Below 50 hectares.
— (1) m eras'], 5 5 , fe e n fwB^, ophc^ (hbe , t o i
(2) wai URB >vi3 3B
(3) yBToft fHBBT, »reBof, >H3 H W I
(4) RS , >nfe5 ^ glrT, »-;s1h, ^FIBT grsl H B T ^,
fe®, R3% 3 b1>HT § >H§ >MSHt >H ^ HTHS 975 IN o te s .— 1. Other cereals and millets indude Ragi, K angni, K odo, little m illets, common millets, other cereals etc.
2. Other pulses Include M oong. Tur (^ h a r ) M ash, Kulthi, Massar and other pulses3. Other food crops include M oon g , Potato, Chillies, Ginger, Pepper, Turmeric, Cardamum, other food crops, fruits and vegetables.4 . Other non>food crops include , Jute, Sanhemp, Castor-seed, Rubber, Tobacco, Coffee, Tea, Opium, Fodder crops, other non- 1
Seasm um , Rape & M ustard, Linseed etc.■foodcrops Groandnut, Coconut,

f e V n lIRRIGATION
8 .4 — O fPg f e ^ t ®
Table 8.4— Tube-wells in Punjab
2 0 4
m(Lakhs)
FR5
Year
Number o f Tubewells
B553Diesel
operated
- ^ 3Electricoperated
^ 3
Total
1970-71 1 '01 0-91 1-92
1975-76 3-04 1*46 4.50
1980-81 3 -20 2-80 6 -0 0
1983-84 2-57 3*80 6 -37
1984-85 2-47 4 .0 0 6-4?
1985-86 2-21 4*41 6 -6 2
1986-87 1-83 4 -9 0 6*73
1987-88 1-73 5-10 6»P?
1988-89 2-07 5-36 7-42
, OrT3 1
5ourc0.—Director, Agrk:ulture, Pimjab.

IRRIGATION
205

8 . 5 — W h 3 f t ? ^ >H 1 ? 3 9 ? t0 M Ots f e t R HofeT 1 9 8 5 - 8 6 *Table 8 .5 .—Net Area Irrigated ia ladia by]States and UTs, 1985-86*
IRRIGATION
State/U .T.
(U a^g 5oT^)H«) (Thousand Hectarei)
SfUBt
Canals WeUs
35J»a f e § g t K ^ ^ ^ f e g s ^ g g lS t o jsfoax Fpq75 ^ Ijf j fU d d '
Govern- Private Tanks Tubewell Other Other Total Percentage m ent Canals W ells Sources to N et
CsiQ&ls Aic&Sown
Andhra Pradesh ... 1,783 (e) 786 183 673 113 3,538 33 -9
»ra3Tgsrij^^K ( j ) Arunchal Pradesh (j) ... — — — — — 22 22 18-6
»hhth ( b ) Assam (b) ... 71 291 “ — 210 572 21 1
feipg Bihar ... 973 — 121 933 113 668 2,808 35 *5
dj^d'3 (c ) Oujarat ( j ) ... 489 — 41 305 1,432 4 2,271 23 -6
Haryana ••• 1,181 — 1 1,038 9 7 2,236 6 1 -9
Himachal Pradesh ••• 7 — (a) 4 — 85 96 16 -5
tw torante Jammu & Kashmir ••• 122 167 3 2 2 14 310 42-3
ora?5T2b(T Karnataka 735 — 242 42 439 217 1,675 16-5
Kerala «. 96 4 44 38 ( 0 114 296 13-5
kftjljQH M adhya Pradesh ... 1,294 2 145 84 1,213 249 1,987 15-4
HgTaiw^d (d) Maharashtra (d) ... 389 24 281 — 1,063 127 1,881 10-3
( e ) Manipur (e) ... — — — — — 65 65 46 *4
( u ) Meghalaya (u) ... — — — — — 50 50 25 *9
( g ) M izoram (g) — — — — — 8 8 12-3
s w Nagaland ... — — — -- 51 51 27-7
t oOOn

OrissaPunjab
Rajasthan
fF?ofH Sikkim
Tamil Nadu
( g ) Tripura (g)
Uttar Pradesh (j)
ug>fl ( j ) West Bengal (j)
>H§ Andaman and Nicobar Isian ds
Chandigarh
2 u i s t Dadar and Nagar Have li
Delhi
3i»r, f e t G oa, Daman and Diu
64o(H ^ ( u ) Lakshadweep (u)
Pondicherry
India
•Provisional.
(a) 500 3 life I(a) Less than SOO hectares.
( b ) 1 9 53-54 % m s I (b) Relates to 1953—54
( d ) 1 9 7 4 -7 5 t m i I(d) Relates to 1974— 75
( e ) I (e ) A d-hoc Estim ates,
( j ) 1 9 8 3 - 8 4 ^(jj Relates to 1983-84
(u) 1 9 8 1 - 8 2 ^ I
(u ) Relates to 1981—82.
( g ) 1 9 7 7 - 7 8 ^ >Hor3 (g) R elates to the year 1977-78
853
1,412
J.154
774
3,330
717
(a)
234
84
672
152
263
2,229
170
5,467
689
31
14
360 — 1,673 26-545 4 3,690 87 -9
1,681 20 3,109 20 0
— 16 16 16*8
942 25 2,501 43 -9
— 29 29 11-3
614 316 ^ 9,879 57-3
23 219 1,911 35 *8
(a) ___ 1 50-01 (a) 1 4-0
11 (a) 47 83 -9
— 13 13 8*8— (aj (a) —_ _ 24 24 85 -7
15,391 488 3,070 11,544 8,621 2,646 41,760 29-6
FTnj s :— >n§ r w u s p u , y d ly ’d l > q [ w , Fraepg iSource.—Economic and Statistical Adviser, Ministry o f Agriculture.
Government o f India.
K)O'-J
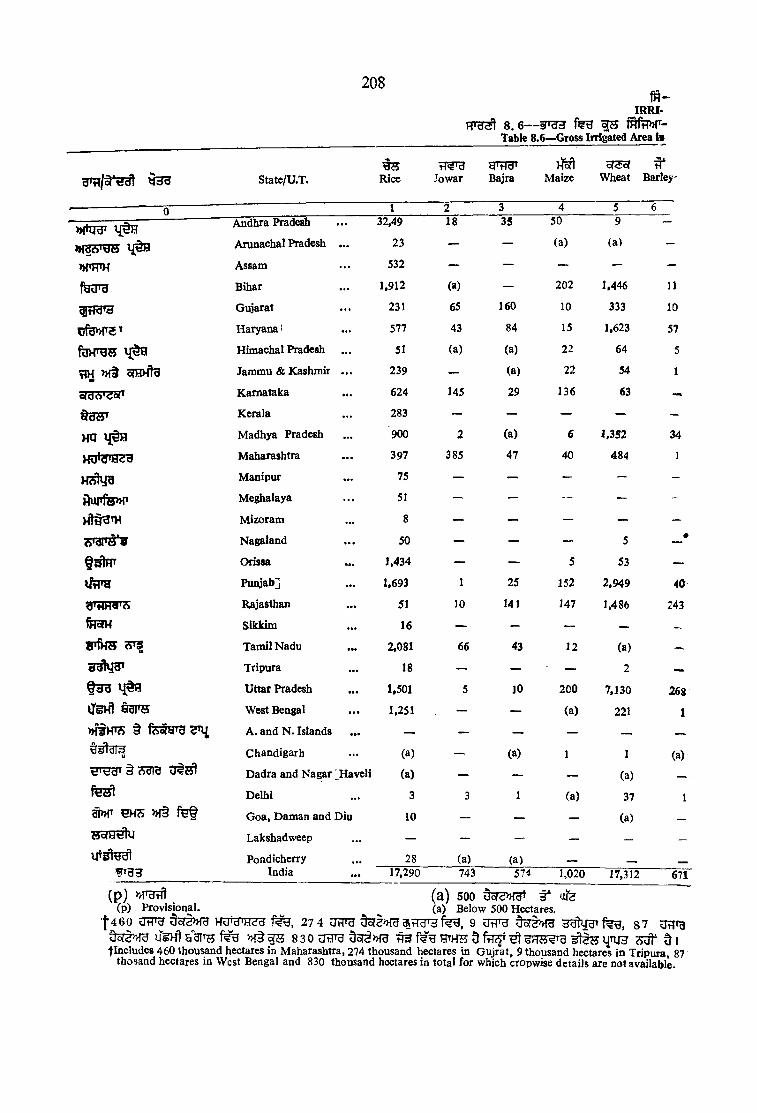
208f R -
IRRI-8 . 6 — ^ f ^ f W -
Table 8.6—Gross Irrigated Area i s
State/U.T.^J5
RicetT?T3
Jowar BajraH5ft
Maizec73of
Wheat Barley'
1
JHiqgT Andhra Pradesh . . . 32.49 18 35 50 9 —•
Arunachal Pradesh • •• 23 — — (a) (a) —
nOFTH Assam ... 532 — — — — —
Bihar ... 1,912 (a) — 202 1,446 11
ajtTd^ Gujarat . . . 231 65 160 10 333 10
H aryana! ... 577 43 84 15 1,623 57
Himachal Pradesh ... 51 (a) (a) 22 64 5
f ly oiHHtg Jammu & Kashmir . . . 239 — (a) 22 54 1
oldA’^ ar Karnataka ... 624 145 29 136 63 —
Kerala ... 283 — — — — -
Htl Madhya Pradesh ... 900 2 (a) 6 1,352 34
HUlaiKRH Maharashtra . . . 397 385 47 40 484 1
Manipur ... 75 — — — — -
fiu rf® » r Meghalaya . . . 51 — — — -
Ht§HTH M izoram ... 8 — — — — -
Nagaland . . . 50 — — — 5 4
Orissa 1,434 — — 5 53 —
Puiyabj ... 1,693 1 25 152 2,949 40
Rajasthan • •• 51 10 141 147 1,486 243
fHSW Sikkim 16 — — — —
BTIHH Tamil Nadu • •• 2,081 66 43 12 (a) —
H3^ycP Tripura ... 18 — — ' ~ 2 —
f n g Uttar Pradesh ••• 1,501 5 10 200 7,130 268
iJgHt S3H S West Bengal • •• 1,251 — ~ (a) 221 1
A . and N . Islands ••• — — — — — —
u Chandigarh ... (a) — (a) 1 1 (a)§ 3313 3 ^ 2 ^ Dadra and Nagar Haveli (a) — — __ (a)
Delhi ■ *« 3 3 1 (a) 37 1^ HH?5 » f§ rt!@ G oa, Dam an and Diu 10 __ __ „ (a)
Lakshadweep • •• — — — — __ _
ITsnddl Pondicherry 28 (a) (a) _ __India 17,290 743 574 1,020 17,312 671
( p )(p) Provisional.
500 3* Ufea) Below 500 Hectares,
|'460 dH*d Uors>>fSr HvJ'd‘HCd 27 4 UtTO aTT^ra 9 U rF^ 5oTt>>ra fe g , 8 7 UvlTgdoT3»ra iTgHt 8 3 0 dor^»fU ^ HTH3? 5 ^ i i l s 4TUH 7 ^ 5 Iflncludes 460 thousand hectares in Maharashtra, 274 thousand hectares \n Gujrat, 9 thousand hectares in Tripura, 87
thosand hectares in West Bengal and 830 thousand hectares in total for which cropwise details are not available.
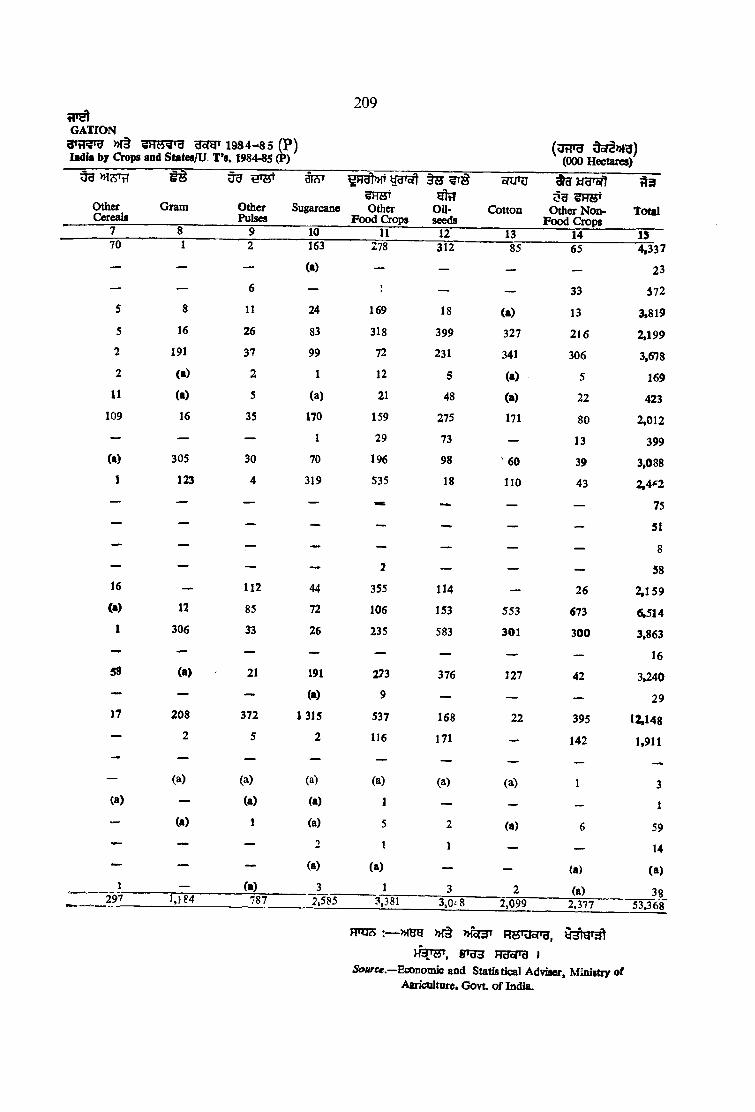
3 W 9 » f§ Bomr 1 9 8 4 - 8 5 (P)Lidia by Crops and States/U. T*s. 1984^5 (P)
CATION
209
(000 Hectares)
OtherCereals
70
5
5
2
2
11
109
(•)
I
Gram
81
8
16
191
(a)(a)16
305
123
OtherPulses
oWTU 5HST sf]tT
Sugarcane Other Oil> Cotton ____________ ^Food Crops seeds
10 11
u g 5H5TOther N on - Total
F ood Crops12 13 14
6
11
26
37
2
5
35
30
4
163
(a)
24
83
99
1
(a)170
1
70
319
S78
169
318
72
12
21
159
29
196
535
312
18
399
231
5
48
275
73
98
18
85
(a)327
341
(a)(a)171
' 60
110
65
33
13
21 6
306
5
22
80
13
39
43
134 ,337
23
572
3,819
2 ,199
3,678
169
423
2,012
399
3,088
2,4<^2
75
51
— — — — — 8— — — — 2 — — 5816 — 112 44 355 114 — 26 2 ,1 5 9
(a) 12 85 72 106 153 553 673 6,514I 306 33 26 235 583 301 3 0 0 3,863
— — — — — — — — 1658 (a) 21 191 223 376 127 42 3,240— — — (a) 9 — — — 2917 208 372 1 315 537 168 22 395 12,148— 2 5 2 116 171 — 142 1,911— — — — — — — — _
— (a) (a) (a) (a) (a) (a) 1 3(a) — (a) (a) 1 — — — 1— (a) 1 (a) 5 2 (a) 6 59
— — 2 1 1 — 14— — (a) (a) — — (a) (a)
1 — (a) 3 1 3 2 (a) 38297 JJS4 787 2,585 3,381 3,0^'8 2.099 2,377 53,368
HTUS : ~ » m
H ^ . g r g g h BcTB I
Source.—Economic and Statistical Advian*, Ministry o f Agriculture. G o v t o f India.


3Tf
fHH ^ >nt ggi gr^* oTSl ^ ^liat<nt 5 m 5* t U3fH»!T ^ s r r r s HuHtfeMT ^ i fu B t § fq n r »!H g, f g r ^ ^ l c > h*
§ UU2 »!5HtU & f
HTH31 9.1 HT5 I960, 19 7 0, 1975,1980 Mt 198 2 3* 1987 ?5S) »!§ 1987DfT ^ 750e fgT2! , H^yt H3* »lt ScIFT^ »i1'g H3irti3§ 051
H t g 3 l9 .2 F|T3 1 9 6 0 , 1 9 7 0 ,1 9 7 5 , 1 9 8 0 » !§ 1 9 8 2 3* 1 9 8 7 ^ F P S ^ fr?5 1 9 8 7 3 ^
9 3 g f ^ T H o r? )t> > ^ § ^ |3 3 5 r flR 3 g r3 T ^ T H g s3 ^ §
SECTION IX
FLOODS
The section of floods gives information regarding the area and population affected by ‘floods and damage caused by floods to various typos of proper^ and crops. Information relatmg to villages affected by ‘floods’ is as reported at the time of girdawari by the Deputy Commissioners of Punjab.
Table 9.1 gives [the figures about the damage caused by floods to cattle heads, human Uves lost, and Number of villages, towns affected etc., for the years 1960,1970, 1975,1980 and 1982 to 1987 year wise and for the year 1987 district-wise.
Table 9.2 depicts the damage caused by floods to crops, houses and public utilities during rainy season for the years 1960, 1970, 1975, 1980 and 1982 to 1987 year-wise and for the year 1987 on district-wise basis.
2 1 1
9

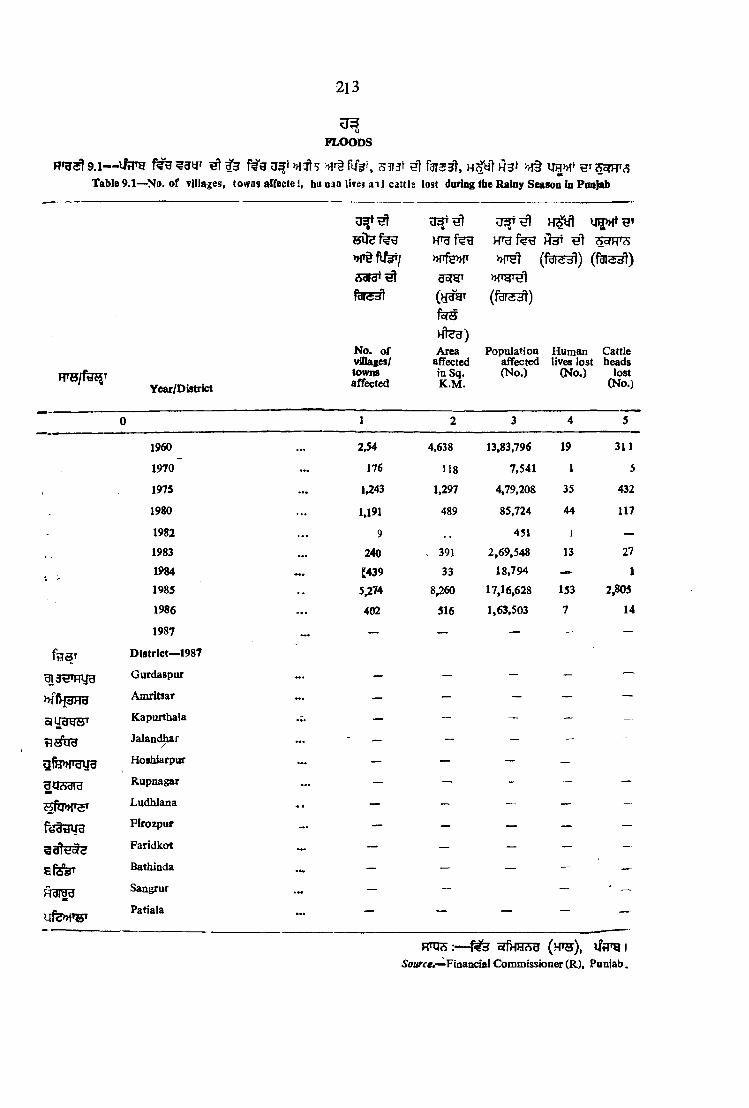
213
FLOODS
9.1— ^ ^ u?f >H7t5 ^1 fara^, H syl H3f ub>h SgtftsTable 9.1—^No. o f villages, towas affectel, hii nan lives a i l cattle lost during the Rainy Season in Ponjab
H C tefed H3t So/HTcS»n§fifeT/ »Ffe>HT (fgiS3l)53ra* ^ d o iy
fofiiH t3g)
(r d le d l)
N o. o f Area Population Human Cattlevillages/ affected affected lives lost heads
Year/Districttownsaffected
in Sq. K.M.
(N o.) (N o .) lost(N o.)
0 1 2 3 4 5
1960 ... 2.54 4,638 13,83,796 19 311
1970 ••• 176 118 7,541 1 5
1975 ... 1 43 1,297 4,79,208 35 432
1980 ... 1.191 489 85,724 44 117
1982 ... 9 451 i ~1983 • •• 240 , 391 2,69,548 13 271984 ■M. [439 33 18,794 — 11985 • • 5^74 8^60 17,16,628 153 2,8051986 402 516 1,63,503 7 14
1987 — — — - —
fi?S» District—1987
^3H»F?yg Gurdaspur — — — — —
>HfH3Hd Amritsar ... — — — — —
3 U d H tt' Kapurthala — " — — -Jalandhar
/ — — - - -
Hoshiarpur — — — —
aqcSdld Rupnagar ••• — — — — —
Ludhiana — — — — —
fi»3tdU8 Firozpur ... — — — — —
Faridkot ... — — — — -
8 fa s ’ Bathinda — — — — —
H3ITO Sangrur ... — - — ■ —
ufe>H»BTPatiala ... — — — — —
FFo?5:— oifmnB (w e ), ifflraiS’oarce.‘- “FinanciaI Commissioner (R), Punjab.
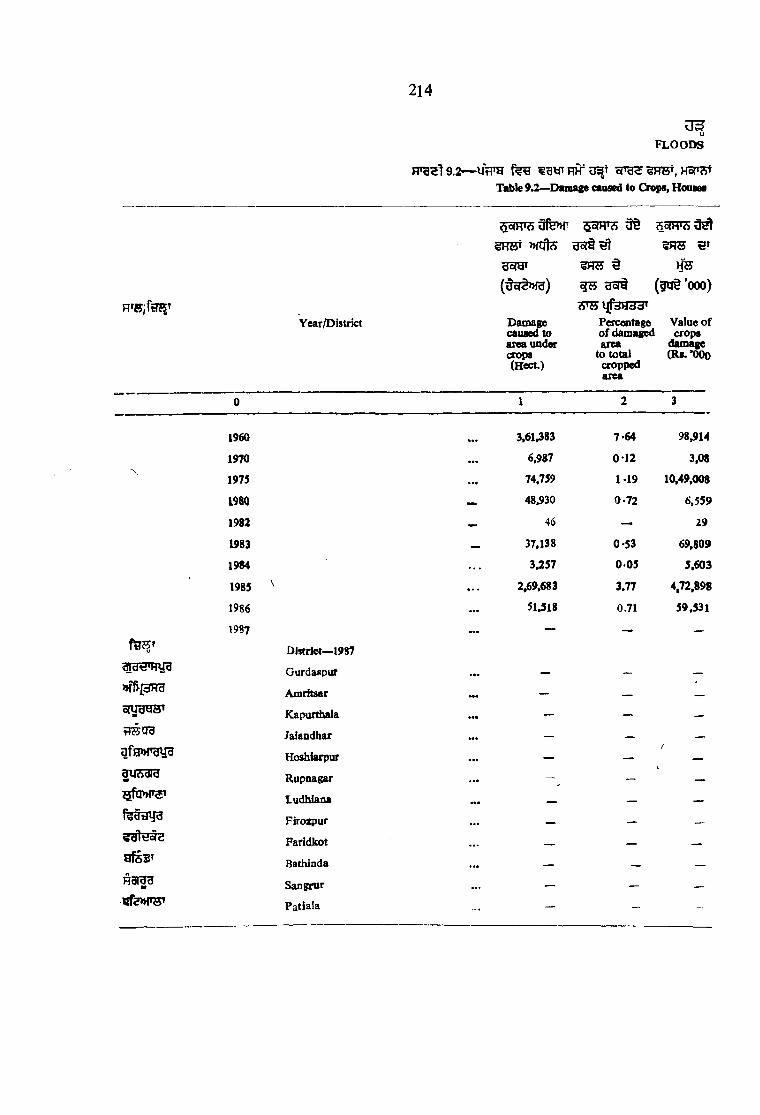
214
FLO O DS
FT O 519.2--v itT O o p ^ ?T O t,Table 9.2>-Damage caused to Crops, Houses
Year/District
ojyi
(3ci^)
Damage caused to area under cxops (Hect.)
3o(H*A
(5U§ ’goo)
Value of 1 crops
damage (RS.’OOO
3c<Q
?5^ ljTciMc5'Pox;eotage of damagec area to total oropped area
0 1 2 3
I960 ... 3.6M83 7-64 98 14
1970 ... 6.987 0 12 3,08
1975 ... 74,759 1-19 10,49,008
1980 — 48»930 0.72 6,559
1982 46 — 29
1983 — 37.138 0-53 69,809
1984 ... 3,257 0 05 5,603
1985 \ ... 2.69,683 3.77 4,72,898
1986 ... 51.518 0.71 59.531
1987 ••• —
f 55» District— 1987
Gurdaspur ••• _ _ _
’>ff>]3Hd Amritsar *«• — — _
fCapurtfaala ••• — — -flS03 Jalandhar ••• _ __ _
afa»rgy3 Ho iarpar • •• _/
UUAdid Rupnagar — -
ludhiaoa ••• . _
feByU9 Firo*pur _ _
Faridkot _gfs3T Bathinda _ _
Hdidd SangruT • •• — -
ufenrs^ Patiala — - -

215
»H§ tR 539 ^ 5 W T 3aad PaUk ntOttkf daring Rainy S«Mon in Pnjab.
■6aH»J5 v| Hsr?5 ( < f ^ )
Houses damaged (Private)
H2S35rttm3T
('000 Hf§)
Damage to puMic utilities
3ns*. )«§ t!253»
< oW’A- (*000 TOt)
Total damage to crops, hon sei and public utilities
(R*. ’000)(Col. 3+5+6)
No.H s (ooo;3ir§)
Vahie (Re. *000)
(K*. *0uQ)
4 5 S 7
42.098 2 3 ^1.811 430 .. ..
30;!79 11.954 ..
31,940 4.391 201 11,15116 69 — 98
16,953 7,858 2.123 79,79015,712 5.791 — 1U943.07,023 14.02,627 10.20,869 28.96,3949.653 20,013 •• ••
— — — —
_ — — —
— — — —
— — — —
— — — —
— — — —
— — — —
— — — __
— — - —
— — —
- — — —
— — — —
— — —
i r a S : — OH' i 1Sdurca.—Fiaaacial Coaan'm ioasr (R .\ PaajaH.


217
R o T H ^ 1 0
feu uVg ngrfuH HHW, §311^^3 , »lTf ^ >Hoff3» t 0803 0 1
F}T^110.1 f€g i^mw »i§ fgqsl fnuTg^ ^g?7 tJ i
HTggft 10.2 #y grsl 9 i
HT^tio.aM'^ uV h fy hhI fgtiHt naql gr§ u^i
HTg t 10.4 uV g yiiH hbhihI m"] 9 1
FTTH t 10 .5 w g ^ ^ 3 ' l ifu ^ o T Hi fgT33^ lj[^J333T ^ |
10 .6 w g f € ^ f g n s l ^ y y n ^ T g t tj31 h3 3 t
10.7 f?B w g f€g €y €y H st y^3 f^3l gml 5 I
RTg l 10.8 utf'9 ^ 1 yy35(^ f y i fHHst f ^ a l 1
10.9 (1) qnt gr§ Rfc?? (2) yu35ng f § fegyrfg^ >i?R3 )MTHe3^ % \
H ^ l 10.10 f^grg y§ Hi [313^ H3Fr5l gisft 9 I
10.11 uVa f#a orgg u t f?^gt?5T H tte n l nun 9 1
FT ^l 10.12 w g f?% %! fgj3^ f ^ gj^ ^ |
10.13 uHTg feg OsTO ^ 3 >ht ^ yii3 gr^ 3 i
mgallO.U fgnTHl fg???5t ofH3 31^ ^ i
H^gjl 10.15 ( ^ ^ ) m rfqn y s ^ hh^ t, fgrf?5l, yy3 5 ^ >h§yyHHTgi grel 9 i
HT331 10.16 3t 3 fgtisl Ht HTBT3T qsl h1»1 yy3 H3HT81 gisl d »
SECTION X
ENERGY
This section deals with the statistics relating to the installed capacity, generation,consumption etc. of electricity in the State of Punjab.
Table 10.1 depicts figures of installed plant capacity and electricity generated.
Table 10.2 shows sale of electric pow^r for different uses.
Table 10.3 shows consumption of electricity in Punjab for different years.
Table 10.4 gives district-wise consumption of Power in Punjab.
Table 10.5 depicts district-wise number of households using electricity and their percentage.
Table 10.6 gives district-wise number of consumers of electric power and their percentage in Punjab.
Table 10.7 gives annual per capita consumption of electricity in Punjab.Table 10.8 shows distric-wise units sold per consumer in Punjab.
Table 10.9 depicts the cverage revenue assessed per annum of (i) per unit sold and (ii) per consumer.
Table 10.10 gives the number of applications lying pending
Table 10.11 contains information on tubewells energised in PunjaD.
Table 10.12 gives the number of installation of Gobar Gas Plants in Punjab.
Tahle 10.13 shows the consumption of Petroleum Products in Punjab.
Table 10.14 shows the progress of rural electrification in India (State-wise). Table 10.15 shows installed plant capacity, electricity generated, consumed and number of
consumers in India (State-wise).
Table 10.16 depicts annual per capita (State-wise) consumption of electricity in India.
218

\ o
INSTALLED PLANT CAPACITY AND ELECTRICITY GENERATED
3000
2400
(M.W.S.) INSTALLED CAPACITY
1800
1200
600
(MILLION K.W.H.) 200001
GENERATED
10000
5000
00GO
I S -00 OO CO
IH ,(P)=PRdVISIONAL (R ) : REVISED

H
PER CAPITA CONSUMPTION OF ELECTRICITY
SIO
1970-71
80- 83- 84- 85-81 84 66 86
^P)_ p r o v i s io n a l
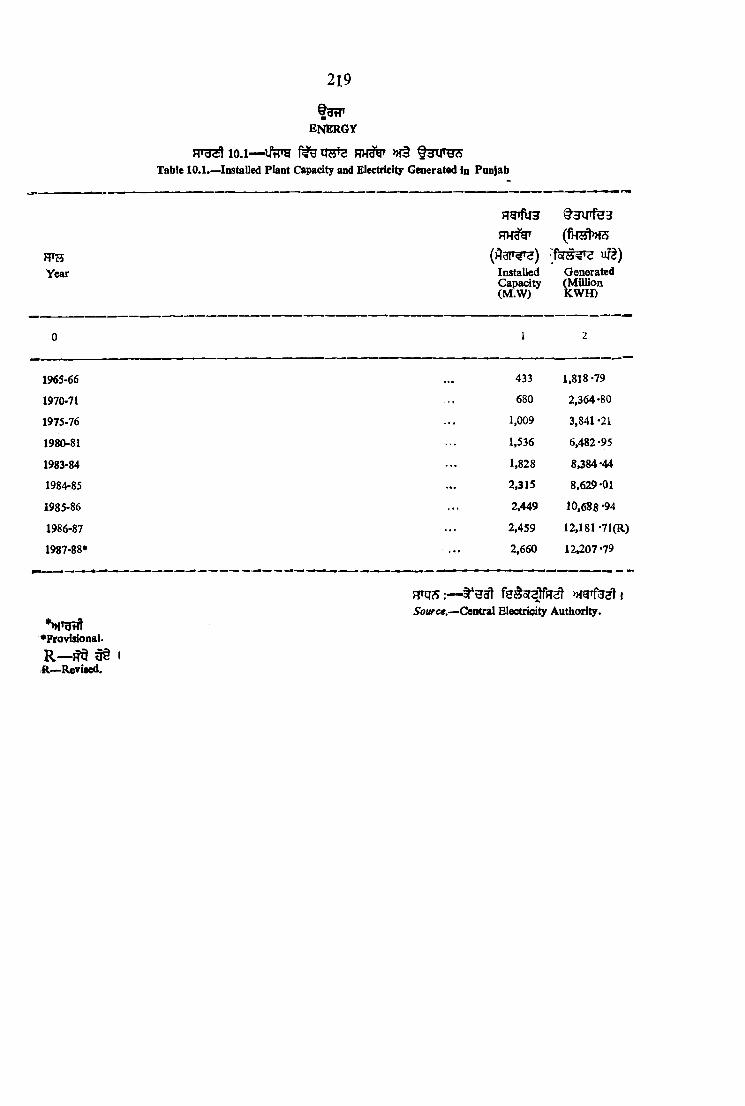
e n e r g y
219
HT33n 10. 1— tf55»S » f§ t 3 W S Table 10.1.—^Installed Plant Capacity and Electricity G ^erated in Punjab
W EYear
R H ^
( A c i r ^ )InstalledCapacity(M .W )
Generated(M illionK W H)
0 1 2
1965-66 • •• 433 1,818-79
1970-71 ... 680 2,364-80
1975-76 . . . 1,009 3,841-21
1980-81 1,536 6,482-95
1983-84 1,828 8,384-44
1984-85 ... 2,315 8,629-01
1985-86 . . . 2,449 10,688 *94
1986-87 . . . 2 ,459 12,181 -71(R)
1987-88* 2,660 12,207-79
•ProvW onal.
R — ^ n § IR — Revised.
Source.— Central Electricity Authority.

10.2— if j r g ^ y u 3
Table 10.2~Consamption of Electric-Power In Punjab by uses
ENERGY
(MiUion KW H)
u i t sDomestic Commercia!
Otjuirdio*industrial
m sYear
y d l» T
RHTS
» f§l l9
UI2 f g * R35Tgt y u 3
Heat, Small Power,
Lights and Fans
Heat, Small Power,
Lights and Fans
LowMediumVolt.
High*Medium
Volt.
PublicLighting
Agricultural
TotalConsumption
0 1 2 3 4 5 6 7
1970-71 137-67 107-62 261-23 1,125 -09 6-94 477 -80 2,116 -35
1975-76 250-18 155 *51 350 -69 1,697-67 9-49 916-24 3,379 -78
198C-81 497-28 139-30 318-42 2,037 -00 18-10 1,987 -3 9 tt 4 W -49
1983-R4 716-83 174-79 720 -23 2,278 -75 17*38 2,383 -04 6,291 82
1984-85 713-08 158 -62 729 -03 2,137-16 19-10 2,599 -61 6,356-60
1985-86 840 -07 188 -99 852-42 2,777-34 19-83 3,024-42 7,703 -07
1986-87 979-32 212-56 862 -83 2,971 -30 21 -42 3,883 -38 8,930*81
l987-88t 1,052-25 227-14 931 -08 3,214-44 23 '26 4 ,242 .42 96,90-59
10.3 ?5»® Vte 5 ^ fsrt*^ FPqS ^ OSI WlTi:( i i ) u fe o<§ f g H3fH>>f^ t S 3 f # 3 t i ^ a l ^ f e g t IJthh 5 I Source. ~C«atral
*U ^f»af ^Uo?R, ifftfai ^ feoral ^ feoT ^ H W TO INote.— (i) Information does not tally with Table 10.3 as the source is different.
(II) Sales o f Nangal Fertilizers included in Low and High M edium Volt.• I h e figures for sale to Punjab water works. Sewerage, pumping and Miscellaneous are included in H igh M edium Volt.
t Provisional.g»tT f H t is l g g ? § u g fe s r ^ w i 3 5 1
tfln c lu d e consumption o f Public W iter Works o fP .S .E .B .
Electricity /V'Jthority.
Is)O

ENERGY
2 2 1

222
§ 3
e n k
Rrgsl 10.3—Fable 10 -3— Consumption of Electric
1970-71 1975-76 1980-81
V V 3
V feJ333»j
g n y u 3 e l y u 3 ^
ij3kr33T
Category o f consurrjptioD
Con-Jumption
Percent-^age to
total
Consumption
Percentage to Total
Consumption
Percent.age to Total
0 1 2 3 4 5 6
1 .
2 .
3 . f e c i f c i iyW 1
D om estic
Commercial
Industrial
Public lighting and bulk
II9 -I
63-7
. . . 4 3 8 -es
9 -77
5-22
35*96
247-6
111-0
736-0
11-89
5-33
35-35
497-39
139 -29
1.613-40
11-74
3 -29
38-09
4 , W . . . 134*7 11 -05 88-9 4-27 136-51 3-2 2
Agriculture . . . 463 -4 38 00 898 -6 43-16 1,849-75 43-66
Total . . . 1,219-5 100 00 2,062 -1 100-00 4.236-34 10 0-00
^ :— §oJ3 gra 3* 9TUgS >H§ o!TH3l(H WJBopgi ^ HtHH ?5Uf IKS IVo/<—The figures for Ex-State and Common ‘'Pool** consumers are not included in the above table.
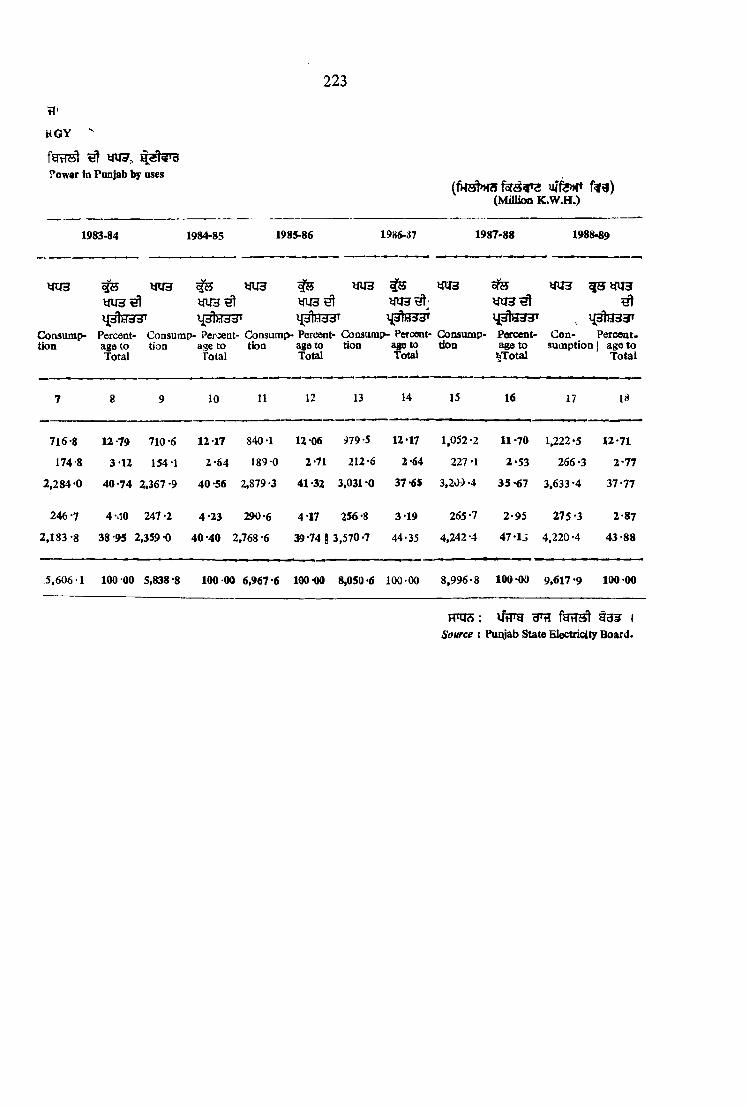
223
ti'
KGY ^
Power in Punjab by oses
(M illioa K .W .H .)
1983-84 1984-85 1985-86 1986-37 1987-88 1988^9
m 3
Consumption
m s W 3
Consiunp-tioa
o fe
C on- Percent- sumption ] age to
Total
IJdlWdfdT 4dlHdd> ^dlWdd'Percent- Consump- Percent- Coosumr)- Percent- Consump- Percentage to tion age to tion age to tion age to Total Total Total Total
Percentage to p o t a l
7 8 9 10 11 12 13 14 15 16 17 18
716-8 12-79 710-6 12-17 840-1 12 *06 979 -5 12-17 1,052-2 11 *70 1,222-5 12-71
174-8 3-12 154-1 2 -6 4 189-0 2-71 212*6 2-64 227*1 2-53 266 -3 2*77
2,284 -0 4 0-74 2.367-9 40 -56 2,S19‘3 41-32 3,031 *0 37*6$ 3,209 *4 35*67 3,633*4 37-77
246-7 4-.10 247-2 4 -23 290-6 4 17 256 -8 3*19 265*7 2*95 275*3 2-87
2 ,1 8 3 -8 38-95 2,359-0 40 -40 2,768 *6 39-74 8 3,570-7 44*35 4,242-4 47*1J 4,220*4 43 -8 8
5 ,606-1 100 00 5,838 -8 100 -00 6,967'6 100-00 8,050*6 100-00 8 ,996-8 100*00 9,617 *9 100-00
FTO5; xffng ^ t g ? ISoia^ce t Puiyab State Electrici^ Board.
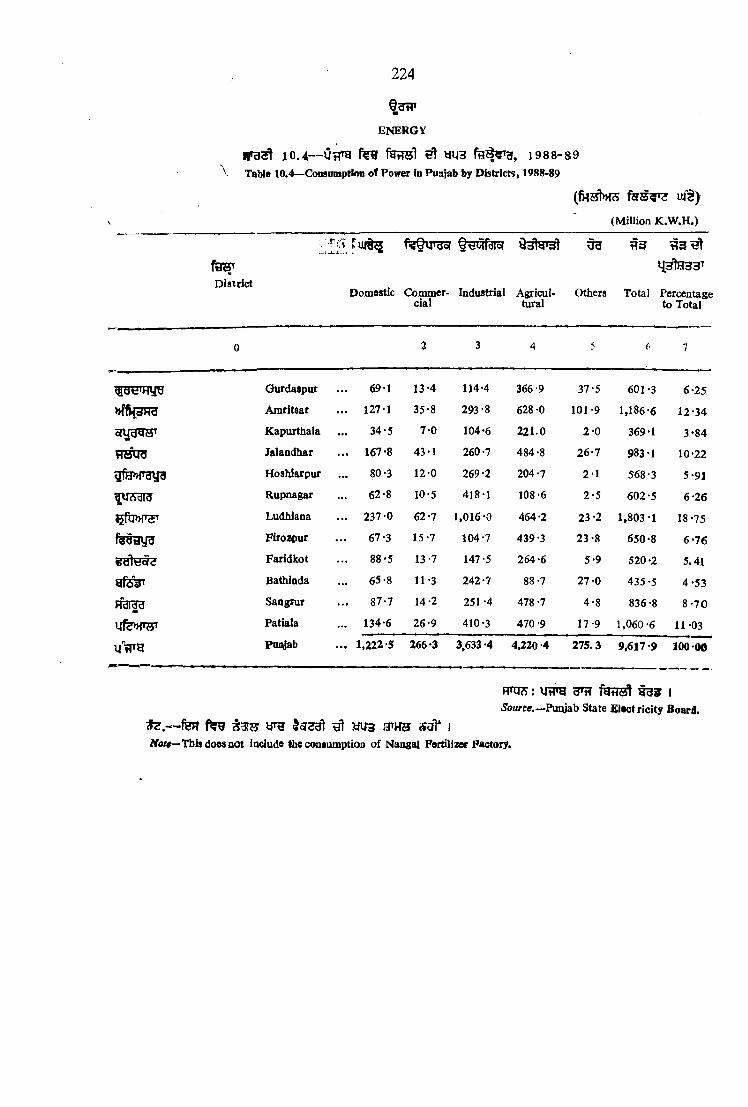
\
© a » r
ENERGY
i r a ^ i o . 4 - - y ? i ^ fetra;! s'! y u 3 j 9 8 8 - 8 9
224
Table 10.4— Consumption of Power in Punjab by Districts, 1988-89
f a r s ^
(MiUion K .W .H .)
r u i ^ f e ^ ir g s r Q g tg r ^ u g ^ 31 |3 !i533T
D istrictDom estic Commcr- Industrial Agricul-
cial turalOthers Total Percentage
to Total
0 2 3 4 5 7
Ourdaspur 69-1 13-4 114*4 366-9 37-5 601-3 6 -2 5
Amritsar . . . 1 2 7 1 35-8 293*8 628 -0 101-9 1,186-6 12-34
Kapurthala 34-5 7-0 104-6 2 2 1 .0 2 -0 369-1 3-84
H ttu a Jalandhar . . . 167-8 43-1 260-7 484-8 2 6-7 983-1 10-22
yfH>>r3yg Hoshfarpur 80-3 12-0 269-2 204-7 2-1 568-3 5-91
^'JAdlO Rupnagar 62-8 10-5 418-1 108-6 2 -5 602-5 6 -26
Ludhiana . . . 237-0 62-7 1 ,016-0 464-2 23 -2 1 ,803-1 18*75
feaavra Firoapur 67-3 15-7 104-7 439-3 23-8 650-8 6 -7 6
Faridkot 88*5 13-7 147-5 264-6 5-9 520-2 5.41
Bathinda 65-8 11-3 242 -7 88-7 27 -0 435-5 4 -5 3
Hdi^a Sangcur 87-7 14-2 251 -4 478-7 4 -8 836-8 8 -7 0
Ufe»TOT Patiala ... 134-6 2 6-9 410-3 470 -9 17-9 1,060 -6 11-03
u '» r g Piiq}ab ... 1,222-5 266-3 3,633-4 4,220-4 275.3 9,617-9 100-00
F T O s: in7»g g n ? 5 3 5 1 5o«fCtf.--Pimjab State E ltcfric ity Board.
f e n t r a lo r ? ^ ^ h p h 3 s a i* 1iVo/#--Tbis does not include (he consumption o f Nangal Pertilizer Factory.

ENERGY
1 0 .5 — IfFPg ^ 5 T ^ L [ f U ^ ,
Table 10.5—^DUtr^ctwise Number of Households using Eliectricity in Punjab
^25
( s : )District/Year Total Households
(N o.)
Households using Electricity
(N o .)
Percentage
0 1 2 3
1975-76 25,18,164 9,60,306 38-14
1980-81 27,48,453 15,53,629 56*53
1983-84 28,9(6,613 19,61,650 67*72
1984-85 29.47754 20,71,433 70*27
1985-86 21 ,86,526 72*89
1986-87 ... 30,52,761 23,05,344 75-52
1987-88 31,09,861 24,18,684 77*77
1988-89 31,65,233 25,49,137 80*54
t o ' District 1988-89
Gurdaspur 2,10,IM 1 ,95 ,624 72*24
>Hf)ldHd Amritsar 4,07,473 3,08,833 75*79
Kapurthala . . . 1,04,470 90,077 86*22
rT5iU3 Jalandhar 3,17,591 3,16,726 99.73
Hoshiarpur . . . 2,45,196 2,05,326 83*74
m j*did Rupnagar 1,49,674 1,21,284 81*03
Ludhiana 3,50,262 3,44,572 98 .3 8
Firozpur 2,42,292 1,50,077 61*94
paridkot 2,32,258 2,00 ,800 7 0 .8 9
Bathinda 2,53,941 1,63,587 64*42
HdfdU Sangrur . . . 2,53,721 2,06,214 8 1 .28
Patiala 2,86,571 2,46,017 85 .8 5
s s :— >H5H f e UcS >H§ l 971— 8 1^ ^ § »TOTfHH TO I
Note : — Total households are projectea and are based upon 1971—81 growth rate o f populatiop.
Finq^ :— ( l ) U f im HTtrfHtT??} |
( 2) >H§ w aists , u V g 1
Source :— (1) Punjab State Electricity Board.(2) Economic acd Statistical Organisattoo,
Punjab.

mENERGY
1 0 . 6 —Table 10.6—Number of Consumers in Punjlab
( f e 3 l )(Number)
h u3 o:t ^ e s tCategory o f CoRSUjntrs
Year/District
Domestic Commercial | Industrial§ ywo(
Public Lighting and Bulk
Agricultural Ti Ti-1
0 1 2 3 4 5 6
1965-66 . . . 4,20,655 (73 -84)
1,03,852 (18 -23)
19,123(3-36)
282 (0. 05)
25,724(4-52)
5,69,636(100-00)
1970-71 6,98,533 (73 13)
1.36,915 (14 -33)
27,971(2-93)
385 (0 04)
91,410(9-57)
9,55,234(100-00)
1975-76 9,60,306(70-97)
2,01,694(14-91)
42,832(3-16)
555(0-04)
1,47,690(10-92)
13,53,077(100-00)
1980^81 . . . 15,53,629 (71 -87)
2,66,733(12-34)
62,547(2-89)
770 (0 -03)
2,78,184(12-87)
21,61,863(100*00)
1983-84 19,61,650(71-79)
3,12,094 (11 -42)
75,004(2-75)
898 (0 03)
3.82,893(14-01)
27,32,539 (100 00>
1984-85 20,71,433 (71 -69)
3,26,413 (11 *30)
79^15(2*77)
954(0-03)
4,10,519(14-21)
28,89,234 (100 -00)
1985-86 . . . 21,86,526 (71 -44)
3,42,694 (11 -20)
84,255(2-75)
983(0*03)
4,46,219(14*58)
30,60,677(100*00)
1986-87 23.05,344 (70 *85)
3.59,127 (11 0 4 )
90,653(2*79)
958(0-03)
4,97,714(15*29)
32,53,796 (1 0 0 -00>
19S7-88 . . . 24,18,684(70-88)
3,76,628 (11 *04)
94,939 (2 -78)
988(0*03)
5,20,915 ( 5 -27)
34,12,154(100-00)
1988-89 25,49,137( i 7 .0 3 )
3.96,523(11-05)
99 *229 (2-76)
1,079(0-03)
5,42,946(15*13)
35,88,914 (100-00)
toboO.

■feJT District—1988-89
Gurdaspur 1,95.624 (70 -30)
27,652 (9 *44)
7,707 (2 77)
74 (0 -03)
47,196 (16 '96)
2,7S,253 (100 -00)
Amritsar 3,08833(64*26)
68.588(14*27)
22,254(4-63)
138(0-37)
80,789(16*81)
4,80,602(100*00)
s f u g w Kapurthala 90,077 (66 -97)
12,798 (9 -52)
3,173(2-36)
32(0-02)
28,432(21-13)
1,34.512 (100 *00)
rfwud Jalandhar 3,16,726 (71 '13)
53,772 (12 08)
12,231(2-75)
129(0 03)
62,372(14*01)
4,45,230 (100 *00)
Hoshiarpur 2.05.326 (78 -86)
24,871(9*55)
3,797 (1 -46)
22(0-01)
26,341 (10 *12)
2,60,357 (100 '00)
aUcSdid Rupnagar 1,21,2«4 (79 •7.5)
14,409 (9-47)
2,370 (1 -56)
51(0-03)
13,958(9*19)
1.52.082 (100 -00)
»ra>>fT5T Ludhiana 3,44,5/2 (69 '9'2)
66,205(13-43)
22.083(4-48)
222(0-05)
59,713(12*12)
4,92,795 (100 -00)
Firozpur 1,50.077 (64 *42)
22,204(9'54)
4,138(1 -78)
46 (0 -01)
56,513 (24 *25)
2,32,978 (ICO -00)
Faridkot 2,00,80'i) (76.19)
23,450 (S -89)
5,228 (1 -98)
41 (0-02)
34,045 (12 -92)
2,63,564 (100 -00)
Bathinda 1.63,587 (83 1$)
17,784 (9 04)
3,900 (1*98)
53 (0 -03)
11,404(5-80)
1,96,728 (100 -GO)
ffcfidd Sangrur 2.06,214(6i.89>)
26.025 (5 -69)
5,421(I '81)
77(0-03)
61,590 (20 -58)
2,99.327(100-00)
Patiala Z,46,0\7 (69. 80 )
387.65(11-00)
6.927 (1 -96)
194 (0 -06)
60,583(17*18)
3,52,486(100-UU)
— ( i ) i
( i i ) W 3^i^3t ^ pfTg^ 1 0 .1 5 ??i? H?5 bft^ f# 5 0^5 IN ote.—{}) Figures ia brackets iadicate perceatages.
(ii) Information of Consumers does not taly with Table No. 10.15 as the Source is different.
:— C^Tg g rn g g ^ |
Source : Punjab State Electricity Boar 1.
lOK>*-4

228
§3tTT
ENERGY
R’cjSl 10.7— UtTH ^ H'6*A' ^Jjfe rftM W 3
Table 10 -7 —Annual Per Capita Consumption o f Electricity in Punjab
u f^ )(K W H )
Ot!Mfdlo( Hdcsl^dl
»i§H V nH frlH
HH’W ir<?d
•^dolH
FTHH U S
Year Dom estic Light and
Small Power
Commercial Light and Small Power
Industrial including Traction and
Water Works
PublicLighting
Agricultural T - t i l
0 1 2 3 4 5 0
\9no -i\ • •• 10-31 8-06 104-90 0-52 34-73 158 -52
1975-76 ... 17-06 10-61 141 -00 0-65 61-19 230 -51
1980-81 30-10 8-43 150 -91 1-10 111 -97 302 -51
1983-84 40-43 9 -86 180 -20 0-98 123-55 355 02
1984-85 39-46 8-78 171-64 1 -06 130-84 351 -78
1985-86 45-69 10-28 211-27 1-08 150-56 ' 418-88
1986-87 52-37 11 -37 221 -74 1 -15 190 -95 477 -58
1987-88* ... 55 -47 11 -97 218-53 1-23 223 -64 5 1 0 -8 4
tZ : ({) ^ 3 HTHH ^ I( i i ) f e n m E t r e 5 1
N ote~{\) Non-utilities not included in T otal.(ii 1 Conn^^wption o f Naagal Fertiliser Factory » iocla<Jf4'
♦PrQvjsioc^i
FTOS : iSource ; Central Electricity Authorit|r.

ENERGY
FraS^ 10.8— P T 3 1 9 8 8 - 8 9 f e g i f f l^Table 10 -8—Sale of Electricity per Consamer In Panjab by Districts 1988<89
(Units)
f e f ir g o f lf9tl5of
District Domestic Commercial Industrial Agricultural Bulk PublicLighting
Average
0 1 2 3 4 5 6 7
Gurdaspur ... 353 4-87 14,848 7,773 12,09,491 27,373 2,161
•+>ffH3H3 Amritsar ... 412 521 13,204 7,773 11.10,553 84,123 2,469
o f i j g g s ’ Kapurttiala 383 543 32,961 7,773 1,06.588 38,527 2,744
Jalandhar 530 SOI 21.310 7,773 8,86,492 27,287 2,208
afe>>i’3 \f3 Hoshiarpur ... 391 483 70.8,8 7,773 1,65.470 56,456 2,183
3113313 Rupnagar 518 11% 1,76,421 i,m 1.28.3S9 29,927 3,961
Ludhiana ... 688 9^1 46,012 i,m 4.80,637 26,717 3,659
f s j g i r a ; Firozpur ... 449 705 25.311 7,773 10.70.019 54,515 2,794
Faridko t ... 441 583 28.209 7,773 5,35.090 47,948 1,974
'gfisjT Bathinda ... 402 631 62.215 1,713 28.71.410 26,926 2,213
Ffaiag Sangrur ... 425 544 46.373 7,773 3,96.920 18.210 2.796
Patiala\
547 693 59,232 5,10.607 18,528 3,009
■^t? >HH3 State Average ... 480 671 36,617 i .m 8.71.238 30,822 2,680
RTITS :— iftT g 3 ’ t? fatlM l H d 3 1
t ot oVO
Stfufcr.'-Punjab State Electricity Board.

2 3 0
E N E
10 .9 — ifa r g f # g g ig l i j f e q f e s
i able 10 '9.-_Average Revenue per U ait i9ld
¥ « 3Category o f Consumer;
A?er ge Reyenoe per Unit s^H (In pai se)
1970-71
197576
1980- 1983- 1984- W 85- 1986 1987- 81 84 85 86 87 88
0 1 2 3 4 5 6 7 8
1 . u i § s Dom estic 22-69 27-61 32-7 51-00 58-15 59-05 6 5 -57 6 7 -9 0
2 . Commercial 19-26 43 -80 51-8 79 00 88-18 91-22 104-23 95 -4 6
3 . Industrial—
( l ) UI? >Ht (1) Low and MediumV oltagi
( i ) S S ) (i) Small 11*71 21-16 28-81 43-00 51-22 56-44 67 -08 72*54
( i i ) (ii) M ediun 11 -96 20-41 25-4 46-00 46-93 52-73 66-47 68«80
( 2 ) ^ t s t t T (2) Large High Voi- tag i 8*89 16-04 22 1 4 2 -00 44-25 4 8 -9 2 52*55 6 1 -6 9
4. FigSfrul Public Ligliting 8-82 25 -92 10-2 80 00 59-05 6 1 .30 79-62 8 5 -5 0
6. Agrcultural 9 -5 0 14-:8 20-4 14-00 15-94 13-69 10-80 14*79
6 . g s c ? Bulk Distribution
7, Licen 'sirt the State >nd M .E.S. e 11 -4 9 13-36 20'8 30 00 32-43 42 19 59-27 5 7 -8 9
»?HH Average 11-50 18-50 n - 1 3 2 -6 0 35-20 3 7 -3 2 39-90 46*19
« 2 : “ ~ t a r 3 f # 3 3 ‘ g»uaf5 » f§ 'or^Hs \ [ h ’ >JU3oftg^ ^ nfo^i hthj? s u f a s i
V<(>/e.--.The figures for Ex-State and ‘Common Pool’ Consumers are not included in the above Table.

231
fii
«G Y
q f3 W 5of<i3 >H»M55 •nJ per Consumei in Pi nj ib
H W ST ij fe W H cTS >iiH3
Average Aooual Revenue per Consomer d o Rs.)
1988-89 1970-71 1975-76 1980-81 1983-84 1984-85 1985-86 1986-87 1987-88 1988-89
9 10 11 12 13 14 15 IS 17 13
75-79 38-51 67 SO 9% -9 178-12 1 9 1 1 5 218-34 269-48 291 -01 352 .40
J12-95 94*95 227-13 267-3 434-46 4 H 0 4 504'52 621 -14 711-77 765-14
69 33 750-53 l.O U -21 '1,674-2 2.447-94 25,28-C3 2,988 -39 3,541 -50 3,866 *09 3 ,820-67
90-88 5,562-06 9,327 -75 136,24-9 25,151*64 25.700 07 32.162-86 3^.703-13 42,306-93 54.086*03
58-12 47.790-05 1,20 342-14 2,15,111-2 4,99,113.69 5.49,567 60 7,27,685-14 9 ,0 i ,3 f 6 - ‘9 9,35,428.80 9,05,905*76
88-44 3.43T-50 4,472-56 5.529-0 17,909*77 13,934 75 14,831-72 19.533-69 22,788 89 23,482-97
8 .48 434*31 893 678-5 774-44 ^16-05 7Vi-61 l,20<j-87 658*79
65-00 1,20,000 -CO 1,85,931*31 3,54,680-2 6*24,706.52 6.30,430.00 8,71,339.71 10,59.120 37 10.69.569.11 11,92,680-45
38-83 141*33 307-63 394-7 701-40 748-74 890-64 1,0 43-32 1 ,446-09 12,88*15
RTO3 :— lif lr g fg^qg^ g g g ,
Source i— Punjab State Electricity Board.

ENERGY
10. 10— >H§ »ra te f ^ n s l t h s 1 f e s i f e ^
Table 10.10 — Yearwise Pending Applications for Electric Connectioas by uses( f S 5 3 l )
(N u m beii)
Year
WHlg^gl f lg
Dom estic Commercial Industiial AgriculturaJ Total
0 1 2 3 4 5
1966-67 14,210 2,377 3,055 24,636 44,278
1975-76 1,07,683 10,623 12,304 97,130 2,27,800
1980-81 81,556 9,353 8,358 1,28,625 2,27 ,892
1983-84 ... 52,103 8,584 12,428 1,30,590 2,03 ,705
1984-85 40,437 6,387 12,590 1,29,750 1,89,164
1985-86 ... 54,680 9,391 11,089 1,22,692 1,97 ,852
1985-87 54,625 9,909 6,445 1,80,665 2,5^,644
1987-88 47,175 8,587 3,880 1,63,873 2,23,515
1988-89 ... 41,129 7,511 3,177 1,71,304 2,23,.121
FTtRS:— U w g gT^ ,
•S’mtcc.—Punjab State Electricity fiottrd.
K>-U)KJj
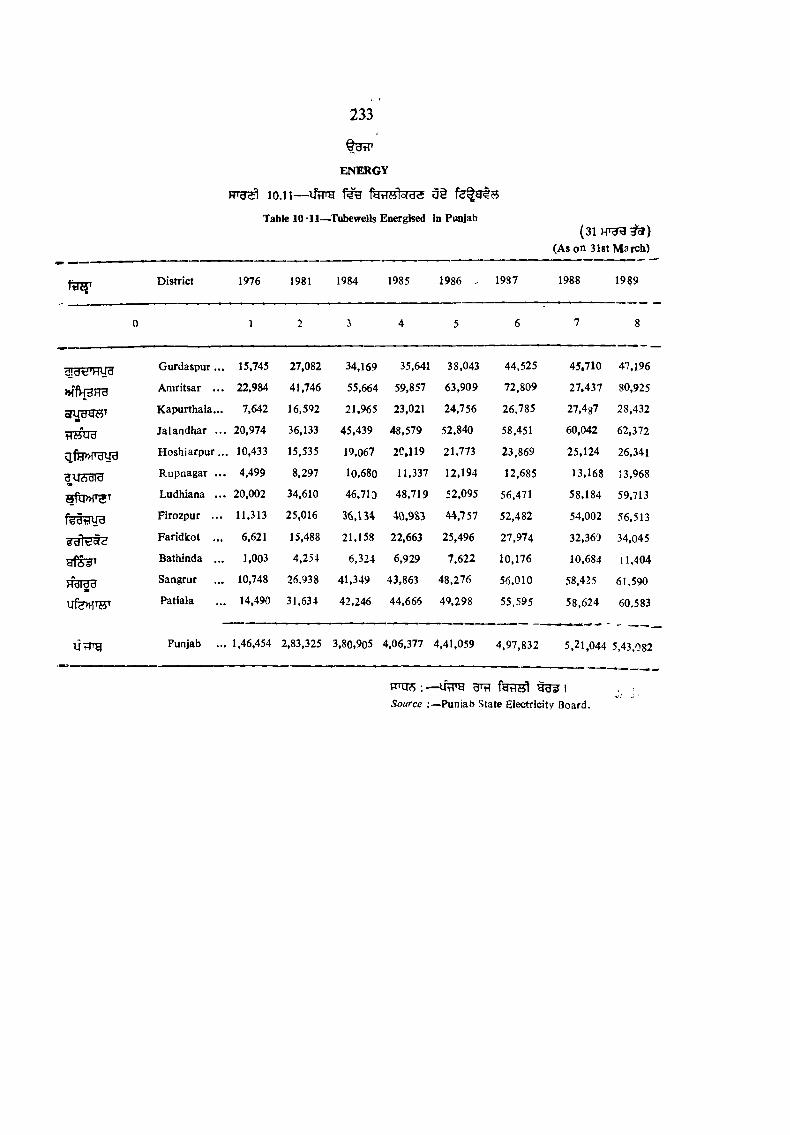
ENERGY
10.11— f e i n t s
Table 10 -11—^Tubewells Energised in Punjab
233
(31(As on 31st M arch)
District 1976 1981 1984 1985 1986 1987 1988 1989
d j d t f w g Gurdaspur ... 15,745 27,082 34,169 35,641 38,043 44,525 45,710 47,196
Amritsar . . . 22,984 41,746 55,664 59,857 63,909 72,809 27,437 80,925
Kapurthala... 7,642 16,592 21.965 23,021 24,756 26.785 27,48? 28,432
tlttU d Jalandhar . . . 20,974 36,133 45,439 48,579 52,840 58,451 60,042 62,372
q.fH>vraue H oshiarpur... 10,433 15,535 19,067 2C,119 21,773 23,869 25,124 26.341
g y A d id Rupnagar . . . 4,499 8,297 10,680 11,337 12.194 12,685 13,168 13,968
afipvr;?’ Ludhiana . . . 20,002 34,610 46,710 48,719 52,095 56,471 58,184 59,713
Firozpur . . . 11,313 25,016 36,134 40,9S3 44,757 52,482 54,002 56,513
Faridkot ... 6,621 15,488 21,158 22,663 25,496 27,974 32,369 34,045
gfSsfT Bathinda ... 1,003 4,254 6,324 6,929 7,622 10,176 10,684 11,404
Hdl'dd Sangrur 10,748 26,938 41,349 43,863 48,276 56,010 58,425 61,590
U fe M W Patiala 14,490 31,634 42,246 44,666 49,298 55,595 58,624 60,583
Punjab 1,46,454 2,83,325 3,80,905 4,06,377 4,41,059 4,97,832 5,21,044 5.43,082
RTCrs f g ^ ^ I
Source :— Punjab State Electricity Board.

ENERGY
234
1 0 .1 2 — i w e 3 i§ ^g-d diH
Table 10'12—Inslallation of Gobar Gas Plants in Punjab
(fd l< 5^ )(Num ber)
P!»H
yiWH 2 / 1y ea r Target Achievements Percentage
C ol. 2/1
0 I 2 3
1981-82 700 486 69-43
1983-84 1,250 1.228 98-24
1984-85 1,500 1,868 124-53
ll#85-86 1,600 1,752 109-50
1986-87 1,600 2,445 152.81
1987-88 1.3C0 1,384 106 -46
1988-89 2,500 2,009 80-36
vRTSf 1
Source : — Director Agriculture, Punjab.
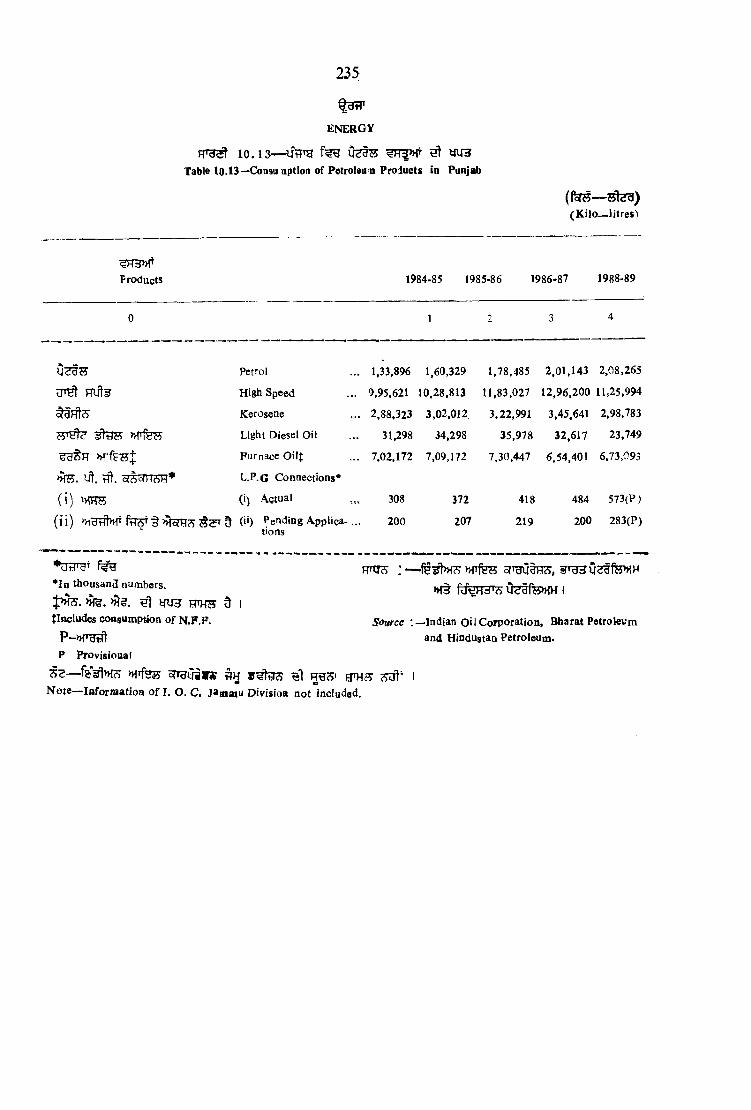
235
Products
ENERGY
FTBst 1 0 . 1 3 — 0^t ^F ^ y u 3Table lQ.13—Consu option of Petroleun Products in Punjab
1984-85 1985-86
( f ^ — s t e g )(K ilo — litres)
1986-87 1988-89
n te . ut. ETSormsR*
( i ) m E
Petrol
High Speed
Keroseae
Light Diesel Oil
Farnace OilJ
L.P.G Connections*
(i) Actual
1,33,896 1,60,329 1,78,485 2 ,01 ,143 2,08,265
9,95,621 10,28,813 11,83,027 1 2 ,96 ,200 11,25,994
2,88,323 3,02,012 3,22,991 3,45,641 2,98,783
35,978 32,617 23,749
7,30,447 6,54,401 6,73,093
31,298 34,298
7.02,172 7,09,172
308
200
372
207
418
219
484 573(P )
200 283(F)
♦In thousand numbers.
>Hg. ^ t f i a 5 I tincludes consumption o f N .F.F .
P Provisioaal
nfTfegf o r r g y i iy f ly
N o te — laforaaatioa o f I. O. C, J#amiu D ivistoa not included.
httj?) : — » r fe H
Hf§ CteSfehW I
Source Indian Oil Corporation, Bbarat Petroleum and Hindustan Petroleum.
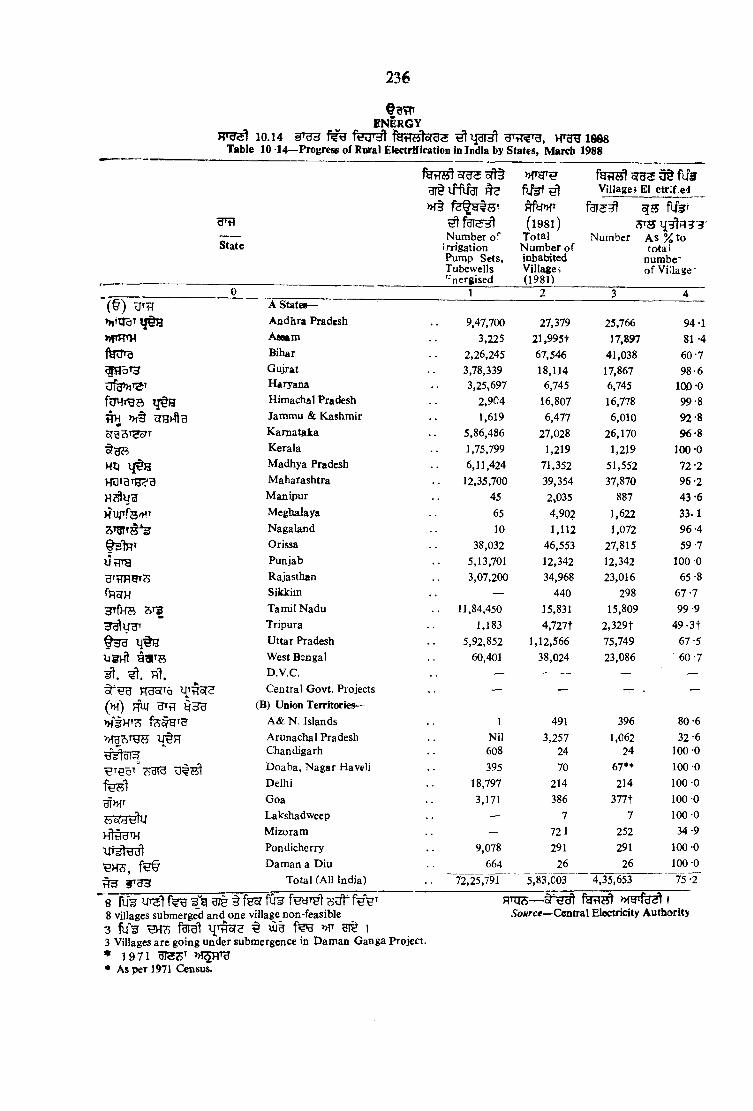
236
E N E R G Y10.14 5 ^ f e r o t o r a s gr^r^rg, v r g g i s s s
Table 10 14—Progress of Rural ElectrificatioD in India by States, March 1988
State
( § ) Uf?f»»»Ti9H |§a
MTRTH
uTg»>iT3'
w » i§
HijH 3TBTHc'3
HUrfS')*’
UfTOu^tmerc^
fngHHTfHB
xjgHi aaiTB
i \ . n t .HBofTa
(» f) fN HTf? y 3 g
f e s ' t
^»fT
) ^ th
^H?J,^ r 3 3
A State»-Andhra PradeshAssamBiharGujratHaryanaHimachal Pradesh Jammu & Kashmir Karnataka KeralaMadhya PradeshMaharashtraManipurMeghalayaNagalandOrissaPunjabRajasthanSikkimTamil NaduTripuraUttar PradeshWest BengalD.V.C.Central Govt. Projects
(B) Union Territories—
fetTJFt o T ^ o ftt
Number of* irrigation Pump Sets, Tubewells '^nergised
f lfe f ^R f W
(1981) Total
Number of inhabited Village i (1981)
f e iT ^ o{d<S ^ fU 3 Villages E)l ctrif ed
Number
^55OT55
A s % to total
numbe' of Village-
1 2 3 4
9,47,700 27,379 25,766 94-13,225 21,9951 17,897 81 -4
2,26,245 67,546 41,038 60-73,78,339 18,114 17,867 98-63,25,697 6,745 6,745 100 0
2,904 16,807 16,778 99-81,619 6,477 6,010 92-8
5,86,486 27,028 26,170 96 -81,75,799 1,219 1,219 100-06,11,424 71,352 51,552 72-2
12,35,700 39,354 37,870 96 -245 2,035 887 43-665 4,902 1,622 33.110 1,112 1,072 96 -4
38,032 46,553 27,815 59 -75,13,701 12,342 12,342 100 03,07,200 34,968 23,016 65 -8
— 440 298 67-711,84,450 15,831 15,809 99 -9
1,183 4,727t 2,329t 4 9 -3t5,92,852 1,12,566 75,749 67 -5
60,401 38,024 23,086 60 -7
A & N. Islands 1 491 396 80 -6Arunachal Pradesh N il 3,257 1,062 32-6Chandigarh 608 24 24 100 0Doaba, Nagar Haveli 395 70 67** 100 0Delhi 18,797 214 214 100 0Goa 3,171 386 377t 100 0Lakshadweep — 7 7 100 -0Mizoram — 721 252 34 -9Pondicherry 9,078 291 291 100 -0Daman a D iu 664 26 26 100 0
Total (All India) 72,25,791 5,83,003 4,35,653 75 -2
^8 fU s 3 5 gr§ § feoT fO^8 villages submerged and one village non-feasible 3 f u 3 t e l ^ Ulg I3 Villages are going under submergence in Daman Ganga Project.♦ 1971• As per 1971 Census.
HTq?5— n f g r f ^ | Source— Central Electricity Authority

ENERGY
1 0 .15— 1 9 8 7 -8 8Table 10 • IS—.Electricity Statistics in India by States 1987-88
( § ) b t r
>nmTHfeU 'd
tTH oJHh !^o(d<S*<io(T
!{§HKO^cTH^HH ^ iy gftunfe>vn
taflHTVfFFg
HUHrar
^{§H
(» f) H W g T tiy 3 3» i i > p s - f e w g» r a ? 5 ^ i { § H
S 5 n j ^
U^altJdl m ( § t 9 3 )
State/U.Ts.
0
WHofTgrHHHgT ^
( h3t w ) ( f ^ s ^ u f l ) f g r s ^ tInstalled Gross* Consum ption* N um ber Capacity G enerated (M illion K wh) o f (M .W .) (M illion K w h.) C onsum ersf
(A) States
Andhra PradeshAssamBiharGujratHaryanaHimachal Pradesh Jammu & Kashmir Karnataka Kerala
Madhya PracieshMaharashtraManipur
MeghalayaNagalanaOrissaPunjabRajasthanSikkimTamil NaauTripuraUttar Pradesh
West BengalD.V.C.Central Govt. Budget
(B) Union Terr tories A. & N . Islands Arunachal Praaesh Chandigarh Dadra Nagar Haveli D elhiGoa, Daman & Diu
Lakshadweep Mizoram Pondicherry
Total (A1 Inaia)
1
3,614-44 507-19
1,549 -43 3,862-93 1,569 -32
153-57 209 -54
2,529 -80 1,476-50 3,042 -16 7,272 -22
9-81
133-76 5-37
1,394-42 2,660 -34 1,211-76
17-79 3,300 -05
32-15 4,886 -79 2,619-38
1,841-50 97,76 -01
15-7620-432-00
416-60
4 05 20-10
54,155-17
13,360 -20 11.608-53 41,21,8891,165-00 1,250-31 30,54574,083 -21 6,645-55 10,94,50215,125-98 13,418-68 44,62,1026,023 -06 4,445-58 17,27,346
517-81 780 -38 7,00,2701,025-23 1,130-53 4,56,327
436-64 8,174-99 37,72,3174,104-06 3,611 -15 24,37,598
12,651 -03 10,418-90 31,94,98825,654-11 24,081-90 74,66,591
— 100-85 41,790462-07 134-82 53,603
— 62 -29 60,3852,973 -00 4,327 -42 7,78,58612,207 -79 9,690 -59 30,61,7965,159-53 5,885-58 20,87,675
— 25-81* 13,1939,345-80 12,600-50 64,11,325
— 84*14 59,40216,581 -44 14,377-10 27,55,887
3,582 -99 7,728 -30 15,44,426
__— 44
__ 25-24 24,682- 35-36 28,035— 308-14 1,06,976— 50-35 4,139— 4,475-70 13,89,438— 401 -40 1,93,581— 5-47 9,204— 26*47 20,976— 293-78 87,388
14,458-95 1,46,205-81 4,84,68,918
f m 1 9 8 5 - 8 6 9 Iflnform ation relates to the year 1985-S6.
•Provisional
R rq3 : feS oT fefH ^ I
Source :—Central Electricity Authority.
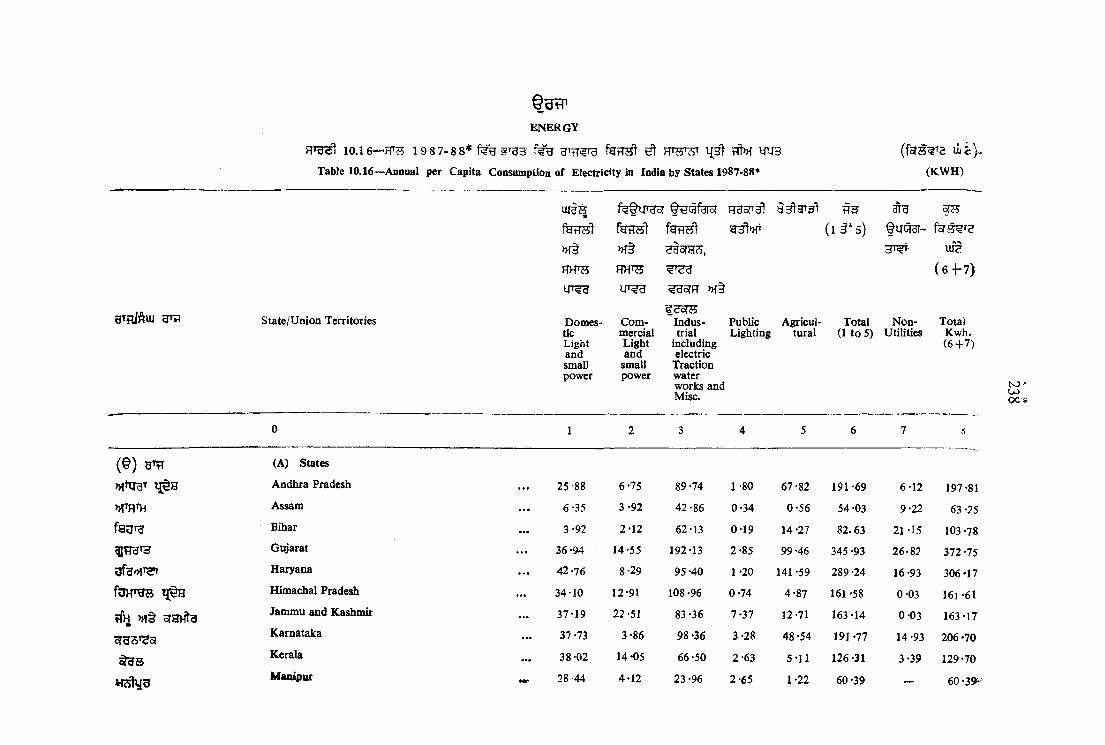
@ g T T
e n e r g y
1 0 .1 6— FT^ 1 9 8 7 - 8 8 * ^ l{3 t fft>H W 3
Table 10.16—Annual per Capita ConsumpUoa of Electricity in India by States 1987-88* (K W H)
svd a
fg r r st ( 1 3 ' 5) fu iS gT -
>H§ » f§ 3'^T- m ?
HHTH RHTH ^'<id ( 6 f 7)
•^dofR
gTflinuj State/Union Territories D om esticLightandsmallpower
CommercialLightand
smallpower
l<JoT65Industrial
including electric
Traction water works and Misc.
PublicLighting
Agricultural
Total (1 to 5)
N on-Utilities
TotalKwh.( 6 + 7 )
0 1 2 3 4 5 6 7
( § ) urn (A) States
>HTxraT T|§B Andhra Pradesh 25-88 6-75 89-74 1 *80 67*82 191-69 6*12 197*81
m rth Assam 6-35 3 -92 42-86 0*34 0*56 54 *03 9*22 63 *75
Bihar 3 -92 2-12 62-13 0*19 14*27 82. 63 21 *15 103 *78
Gujarat 36*94 14-55 192*13 2*85 99 *46 345 *93 26*82 372 *75
Haryana 42-76 8*29 95 -40 1 *20 141 *59 289 *24 16*93 306-17
Himachal Pradesh 34-10 12-91 108-96 0*74 4*87 161 -58 0*03 I61 -61
tfn » !§ oTi3Htg Jammu and Kashmir 37-19 22 -51 83 *36 7*37 12*71 163*14 0*03 163-17
Karnataka 37 -73 3-86 98 *36 3*28 48 -54 191 -77 14*93 206 -70
Kerala 38 -02 14-05 66-50 2*63 5*11 126*31 3*39 129-70
Maaipur ^ 28-44 4-12 23*96 2*65 1-22 60*39 — 60 *39^
NJ'OJOC-;
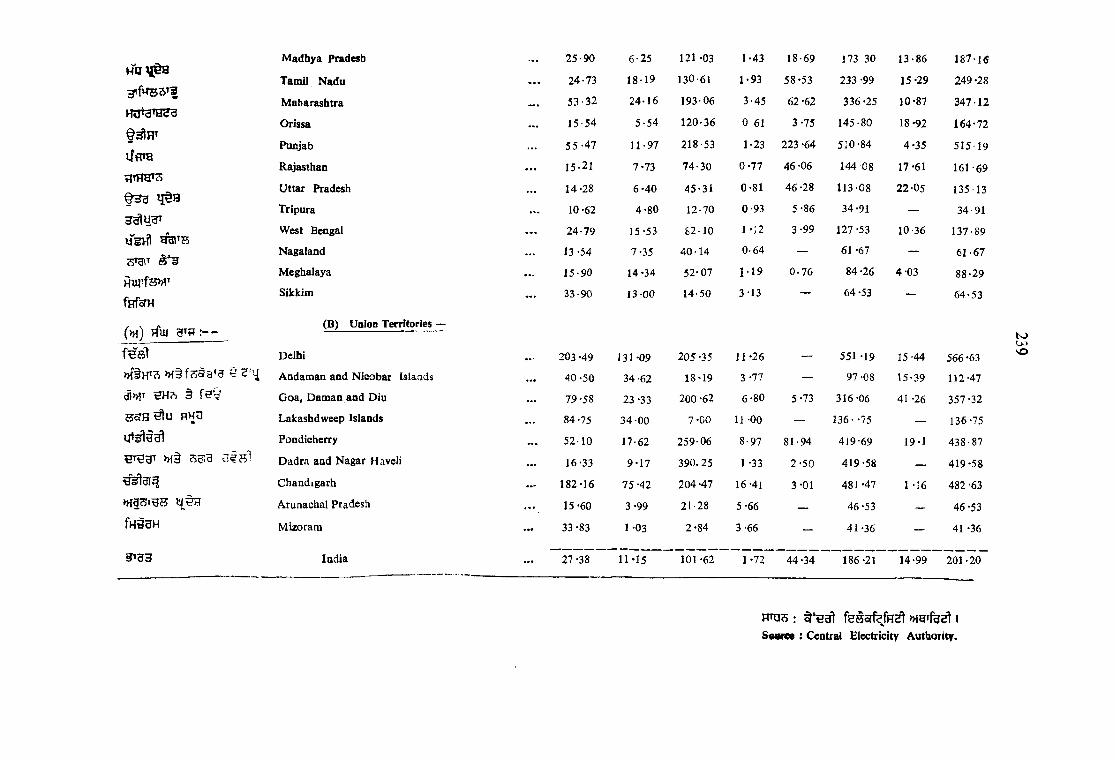
i f f r a
rlTnHT3
f H 3
S ^ T &*^
fHfoTH
( m ) tfui
>H§HT?> M § fc ^ a ^ d F 3^U
di>HT HH?) §
S 5 ? e ^ U RH3
» f§ 5dlB CIIh '
fHSUH
m s
Madhya Pradesh
Tanail Nadu
Maharashtra
Orissa
Punjab
Rajasthan
Uttar Pradesh
Tripura
West Bengal
Nagaland
Meghalaya
Sikkim
(B) Union Territories —
Delhi
Andaman and Nicobar Islaads
G oa, Dam an and Diu
Lakashdweep Islands
Pondicherry
Dadra and Nagar Haveli
Chandigarh
Arunachal Pradesh
Mizoram
India
25-90 6-25 121 *03 1-43 18-69 173 30 13-86 187-16
24-73 18-19 130-61 1-93 58-53 233 -99 15-29 249-28
53-32 24-16 193 06 3-45 62 -62 336-25 10-87 347 12
15-54 5-54 120-36 0 61 3-75 145-80 18-92 164-72
55-47 11-97 218 53 1-23 223 -64 510-84 4-35 51519
15-21 7-73 74-30 0-77 46-06 144 08 17-61 161-69
14 -28 6*40 45-31 0-81 46 -28 113-08 22 -05 13513
10-62 4-80 12-70 0-93 5-86 34-91 — 34 91
24-79 15-53 82-10 1 -12 3-99 127 -53 10 36 137-89
13 -54 7-35 40-14 0-64 — 61 -67 — 61-67
15-90 14-34 52-07 1-19 0-76 84 -26 4-03 88-29
33-90 13-00 14-50 3-13 64-53 -- 64-53
203 -49 131 -09 205 -35 11-26 _ 551 -19 15-44 566 -63
40-50 34 -62 18-19 3 -77 — 97 -08 15-39 112-47
79 -58 23 -33 200 -62 6-80 5-73 316-06 41 -26 357-32
84-75 34-00 7-00 11 -00 — 136- -75 — 136-75
52-10 17-62 259-06 8-97 81-94 419-69 19-1 438-87
16-33 9-17 390.25 1-33 2-50 419-58 — 419-58
182-16 75 -42 204 -47 16-41 3-01 481-47 1 -16 482 -63
15-60 3-99 21-28 5-66 — 46-53 — 46-53
33 *83 1-03 2*84 3-66 — 41-36 — 41 -36
27 -38 11-15 101 -62 1-72 44-34 186 -21 14-99 201-20
t oLtJVO
Sow ce : Central Electricity Authority.

R ra^l 5 : 1 1 . 1 Uorg t p e m ^ 3 ^ >h§ 1 1 . 2 a i§ »f§
RU55 3T§ i?fe»r ^ far^^ tpts rqcth d »f§ e s t §Ufi
S»B R t 0 3 ^ I S: 11.5 »f3I Ug-Jff § H 3 S ^ g ^ f t l ^ ojt^ 35?g R g o l >H§ § ^ 3 S
U oft R io t fT^cTcft 5 1 R T gjt n . e u > g f ? e Ht»>r s r s >na!5 aarg
R&lfl tT ^ oT ^ fe " ^ 5 I Rf3c^ fi: 11.7 R to t f e e l 5 I
SECTION XI
FORESTS
Table 11.1 deals with the area under forests, 11.2 gives information regarding saplings planted and supplied by the Forest Department in Punjab. The next two tables relate to the out-turn of forest produce, and table 11.5 gives information regarding area of forests protected from fire and cattle grazing and area closed and open for grazing. Table 11.6 gives information about plantation of important species in Punjab. Table 11.7 gives information routing to position of employment of labour in forestry.
241
11


FOREST
243

244
F O R E
H’B S l 11.1 ^Table l i •!—Area of Forests under the
Hoof'd} ^
State Forest(a>
FTO
Year Reserved I’rotectedm
Unclassed Total
0 1 2 3 4
1965-66 39 649 60 7481970-71 40 654 198 8921975-76 44 744 211 9991980-81 '44 994 262 1,3001983-84 44 1,046 253 1,3431984-85 44 1,083 220 1.3471985-86 44 1.085 221 1,3501986-87 44 1,092 212 1,3481987-88 44 1,092 212 1,3481988-89 ... 44 1,092 212 1,348
District 1988-89
Gurdaspur ... 1 187 18 206
Amritsar ... 11) 89 48 147
Kapiuthala ... — 7 !0 17
tT s^ a Jalandhar ... 1 26 25 52
Hoshiarpur 27 161 25 213
§ y s 9 r e i Rupnagar — 55 9 64
Ludhiana I 77 25 103
Firozpur ... 4 85 16 105
i Faridkot — 108 — 108
Bathinda — 93 8 101^____ ‘ »R 3 I ^ !. Sangrur ... — 68 2 70
Ufe»*TO» Patiala ... — 136 26 162
(a) »ffed ^ ^ f%§rgr »f§ ^ H355oft))f3 OS I(a) Forests owned by Forest Department and Civil Aufliority.
(b) ^ feaiHH AhW »f§ HSofh>f3 TO IIW Fprests owned by Corporate Bodies and Private Individuals.
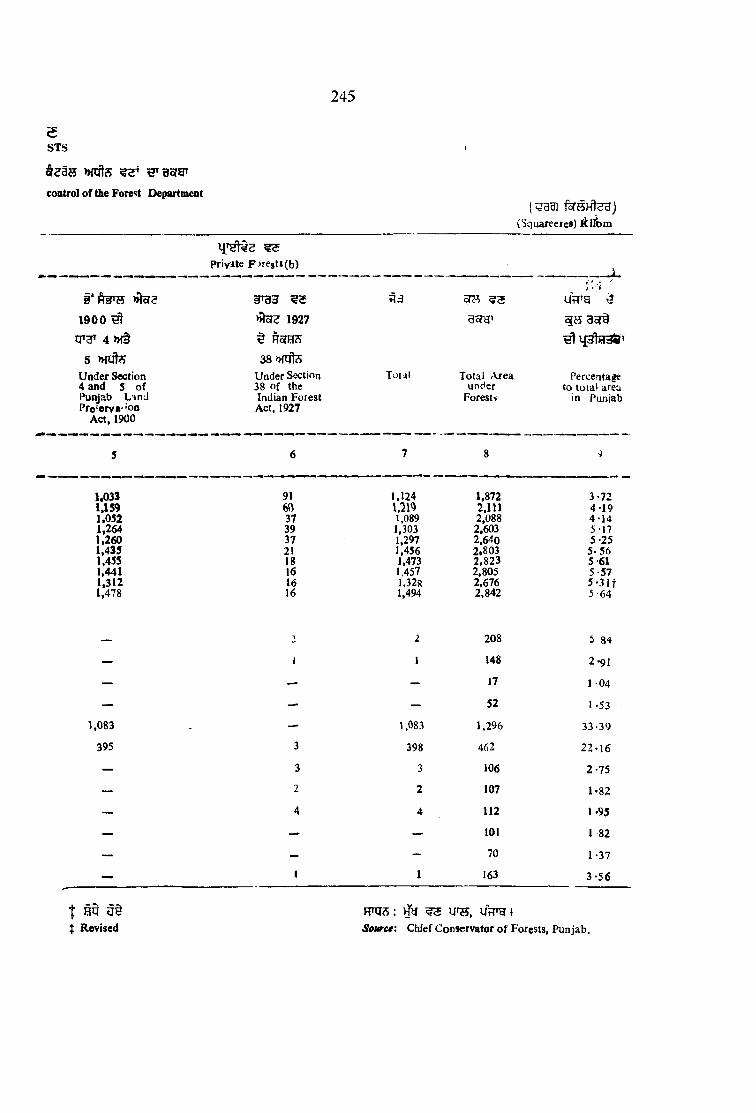
245
5STS
w f t s ^
control o f the Forest Department(?391
(Squarcere*) k ifc m
Priyite F>re8t*{b)
1 9 0 0 ^
IT3T 4 » f§
5 MUtSUnder Section 4 and 5 o f Punjab Land Pre^erv**'on
Act, 1900
§ r g 3 ^
^cj<f 1927
t Rore3
38 w t eUnder Section 38 of the Indian Forest Act, 1927
^;3
Total
5TS
Total Area under
Forests
/ - i
^ q a la sS S ’
Perceatage to total area
in Punjab
5 6 7 8 9
1.033 91 1,124 1,872 3-721,159 60 \ . m 2,111 4-191.052 37 1,089 2,088 4 1 41.264 39 1,303 2,603 5-171,260 37 J,297 2,640 5-251,435 21 1,456 2.803 5 .5 61,455 18 1,473 2,823 5 611,441 16 1,457 2.805 5-571,312 16 1,328 2,676 5 0 1 t1,478 16 1,494 2,842 5 64
__ ") 2 208 5 84
— i 1 148 2-91
— — 17 1 04
— — — 52 1-53
1,083 — 1,083 1,296 33-39
395 3 398 462 2 2 -1 6
— 3 3 106 2 -7 5
— 2 2 107 1-82
— 4 4 112 1-95
— — — 101 1 82
— — - 70 1-37
— 1 1 163 3 -5 6
t e q 0 §;{; Revised
RH IS: ^ iffT ^ I
Source: Chief Conservator o f Forests, Punjab.

246
Year
f o r e s t s
S: 1 1 .2 . »r§ H W H t of[§ g i§ i} §
Table N o . 11.2 Plants planted so supplied bj the Fcrest DepartneiK iii Pun>b
RTS
( E ^ m(in U k h )
C!^ § H 3 n f s HU-
5ft§ i7 §Saplings planted by Plants supplied totb eF o iest Depart- public by F oiestluent Departm ent
3T§ i3^
Total Saplings planted in Punjab
1970-71 31-86 24 -60 56-46
1975-76 60 00 29-83 89*831980-81 108 00 67 -12 175 12
1983-84 195 -37 475 -00 670-37
1984-85 199-52 355 -85 555 -37
1985-86 238-96 351 32 590*281986-87 219 10 355-95 575 -05
1987-88 185 -001 277 -78 495 -52
1988-89
32-74*J
292 02 261 *07 253 -09
RTq<s: ^ ytpg 1Source'. Chief Conservator of Forests, Puiuab
•U € T fe3 f«53Tgr ^ § O T t clT§ I♦Panted by Panchayat D eptt. on Panchayat Lands.

247
Year
FORESTS
11.3 ^ '^Ufl
Tab?* 11-3— Major Forests Produce in Punja'j (State Forests only)
3")
msreTg ‘ooo’ ^yfao?quantit / fa *000 7u‘ i j metres
feHT'<33i] 9 ^ 3 5 5Ta H 3
Timber Firew.io I Totalf ^ )
Tota' V a’us (Tbousand
RuprC4;
1965-66m o -7 11975-761980-811983-841984-85 19S5-861986-871987-8R !9i>8 89
17 16 33 1 5 3441 39 80 6,22241 35 76 9,51399 40 139 37,77860 28 88 43,9"669 10 79 36,3W65 8 73 32 69754 8 62 32,96048 6 54 30,73946 4 50 22,150
F fq S : H.y ? a jn f5 , Uff^g iSource'.— Chief Conservator o f Forests, i’unjab
FORESTS
FPHSl 11.4 i r a ^ ^ ^ ^
H gsrg! ^Table 11 *4—Minor Forest Produce In Punjab
(State Forest 9 only)(v fe(Value in Rupees)
Year
>>f§
Bamboos and Canes
» f§
u ru
>H§
0 3
Fodder and Gums and OthersGrasses Rosins
Toat
1
1965-66 15.380 2,94.298 46.5001970-71 26,835 4,02,486 ! 59,8121975-76 2,07,675 4,54,515 82,8151980-81 92,875 13,73,060 ____
1983-84 ____ 14,21,905 1,8001984-85 ... 2,59,712 14,37,898 —
1983-86 ____ 14,46,3951986-87 — 16,44,593 4,66.1751987-88 — 18,89.618 7,49,4001988-89 — 22,21,375 3.76,721
2.10.1522,45,6573,28,331
13,95,58378.14,182
1,19.08,91290,84,19797,53,50074,29.460
•29.91,064
5,66,3307,34,790
10,73,3SS28,61,51892,37,887
1,16,06,5221,05,30,5921,18,64,2681,00.68.478
55,89,157
WHS: ^ m s , UtlTg jChief Conservator o f Forests. Puniah

248
FORESTS
11.5— »r3I » f§ Ug>H» § 3*R 3ft4M 3
Table 11* 5—Area Protected a:’ainst Fire and Cattle Grazing
^ 95?gt
(? 3 cn f s r s
>>feProtection against Fire
g g fw » f3
nrate
H !^3) a ^ g r (^ gar f e g
f e a n t e g ) H tea )
Total Forest Area (sq . kUo-
Attempted Protected(S q .K ilo - (Sq. K ilo metres) metres)
_ >H» 3 ' J=T’3 § m s ^ ^ B
g c j g f e ^ g g s s H i
^ ^ ^ H gdt s h I ug>n» ^
R^y>H 3 >HT gc?gT #fy>>raor3T
(5?33f ( ^ f a s 3fti'H T3a9T
4f3J333» (? : ) fgj5Hte?r ( ^ 3 T f ^f ^ )
Percentage o f Forests
under Fire
Cost o fFire Conservancy
Areaclosed to Crazing
Area open tc Gracing
Areaopen to g axing
metres) Protection to total
Forest Area
Operations(R s.)
(Sq . K ilometres)
througi out the year (Sq. KUo.
m etres)
for p aft o f the year (Sq. KUo-
m etret)
0 I 2 3 4 5 6 7 8
1965-6G 1,872 1,872 1,863 99-5 18.469 766 921 1851070-71 2.1 U 2,111 2,062 98 -0 81,846 I ,I I I 811 1891975-76 • •• 2,088 2,088 2,075 9 8 -0 36,710 1,203 352 5331980-81 2,603 2,603 2,592 99-6 9,528 1,656 815 1321983-84 2,640 2 ,640 2,640 100-0 — 1,852 667 1211984-85 2,803 2,803 2,780 99-2 — 1 ,717 965 1211985-86 2,823 2,823 2,818 9 9-8 — 1,761 941 1211986-87 • •• 2,805 2,805 2,804 99-9 — 1,718 995 921987-88 • •• 2,676 2,676 2,671* 99-8 — 1,801 783 921988-89 • •• 2,842 2,842 2,720 95-7 2,116 634 92
* R g u §♦Revised
F rq 5 i--]y [w \Source:—C hief Consorvator o f Forests, Punjab.
FORESTS
R * H 3ftii.0 --iiW »g 0% »f* ^ 7>m^ ^ RTarj^T »o^tfeHTable 11 *6— Annual Forests Pfamting at Major Spedes in Pai ab
(Squar* Kllometret)
FTH HtHH 0 9 u f ^ H 3Year Euclyptus Shisham Kikar Khair Mulberry Chil Miscellaneous Total
0 1 2 3 4 5 6 7 8
1965-66 1970-71 1975-76 1980-8 i1983-841984-851985-861986-871987-881988-89
9 .6 0 3-52 2-14 0-58 0-32 0*128-10 5-98 14-10 1-60 0-54 0-336-98 4-69 23 -98 8-53 1-60 0-60
69-74 1-51 19-85 20-14 1-33 _
68-29 0-72 2 0 -5 8 62 -68 0 -2 7 1-5946-96 0 -7 8 31-28 95-81 0 -8 2 0-0342-66 1 .17 50-53 85-12 1-80 0 -0 637-78 0 -95 57-23 8 3 -0 3 1-60 0 -3 836-89 1-36 43-18 7 2 -10 1-013 4 .2 9 1-26 4 0 1 3 67 02 0 -9 3 —
0-16 0-07 2*37 3-25
37-05 11*89 28 *06 15-37 43-21 20-67
16 .44 3 0 .7 2 48 .7S
115-82 191 .17 187*57 209-40 196-34 176-75 164-30
R n n s ;— >iw WZ U»H. i f t r o i
S o u fw —C hief Conservator of Porettt, PuQjftb.

249
F O R E ST S
1 1 .7 u q » g ^ }^,BTflH3
Table 11.7-^Employmeat la Forestry ia P 3 i jab
(f-Iumber)
W E
Year Managementand
Productioo*
Extraction©
t l3 1 S ^Forestry
T otalBmployment
0 1 2 3
I%5-66 ... 2,734 2,754
1970.71 5,088 ' 3,341 8,429
1975-76 ... 5,272 1,017 5,28^
19«V81 9,352 3.609 11,991
1 9 8 3 ^ ... 16,665 4,453 21,118
1984>8S 1?,729 4^80 22,009
1983^6 20,055 4,169 24.224
1986-87 ... 20,877 2,62 s 23,505
1987-88 18,890 2,309 21,199
1988-89 22,343 2,460 24,803
; )^y ^ q»® , w g i
Souret :—-Chief Conservator o f Forests, Puafafr,
sfH § w a ^ g i•Labour employed by the Forest Departm ent.
»^§ f e g ’Hll B'B § B o!5 B5? B ’t Ult f
©Estimated ^abour em ployed by Pilvate Contiacters and Forest Department for explotation o f Forest product, '


HoTgJS 1 2
UH q s , UH u r s 3
fear ^71!^ f^g ug aa uefgf3f3fi ^Ffgr^ »iTfg ^ >hh^ hM>H§ fBfof3R» J^Rgx^ f f g sTm c?t?? Rgql HBSt gTM 3T^ 3 I fSR a tg f^ g U ^JJafgrt
^ Ci3 H es^H B 17 3 l 3 t 3ISl d i u a a^g H e s> fi9 7 7 s fM U S F i w u g g n r a l § § » !» a if33 5 iT
^ 3 3 2 3 , f ‘ f33fTg^, UflT3 €>HT3f ST3?T^ gT2?tHll UH q S H^5T f S n t a l f S S T f ^ n f U ^ H »3 §?fHt
fS3Tfoi»^T n g r ^ )J,H^ €>)lT3Tf5cfeT oft3i fai>HT 9 I
HT3 3 ! 12.1 3 ' 12.8 3 3 ^ l» it Uffrg ^ g s n ^ q l » i3 ^ 1977 ^ 148 U?>
HHT^t >5F»^T a a ^ OS I 3 3 ^ f3 H :? »lfa>>{5 m s 1 9 7 2 1 9 6 6 3 S l R tg 313 ^ i i H 3 ^
R 'datw * eg?? ofl3T fgi)H» 9 i
H»B3l 12.9 3^ 3 3 ^ ^ gt^it y n q ^ , f lg q t , c?g^ ^»B ua>M»
f 3 I ^ >H3 ^ t g ^ g t jqgq) 3 3 ^ t3H 3 Rfg3> ^ g q 9 l fSD >M33 1 9 7 7 ^ U’5 8 4 ^ 3 1 ^ 'H’q f 3 3 0 5 f
RT33) 1 2 .1 0 ^ 12 .13 q g q ^ s a f?§Tgi FiBaigHlm* >H3aT3 ufl^a q g r b q i i ^
>HTfe f g i3 3 l >y§ § 3 » fgi33'^ » i§ q 3 lH B q T fijg y i | q s q f e ^ , u g q s f ^ m ^ 3 * ^
UH >Ht HR3S] §*93*f«3 3HITO* f3T33f 93FPf*9l>H» OS I
R T S l 12.14 HVt q T 3 3 ngg!gMl»i^ 51^ H ^ 3 '5 3 T I 0
W d ^ 12.15 fee<fR»q 1989 rfst-03? 3 ‘ qgi f ^ q ^ s a I
RTc^^. 1 2 .1 6 fW /dt t t i ^ K l-^^ ^ \
H^c2l 12.17 ;^ q t 3 q ^ ? ^ 9^3 1^3'^ 9 »
RTg^l 12 ,18 f? H Ht:S3t q g iy B q ^ s 5 i
12.19 fS B S UJBS M e qH q ^ BT fgH ’ 9BRifa)H^ f3:»i> 5 I
SECTION x nLIVESTOCK, ANIMAL HUSBANDRY AND DAIRYIN3
In this section information is presented relating to Livestock Veterinary Institutions and tlieir staff and work done ini^eterinary institutions. Some information in respect of Fisheries has also baen included In this chapter. The information in rcspect of livestock is based oo Quinqaennial Livestock jCanaos, 1977 c o o d acted by the Director, Land Records, Punjab. In the rural areas the primary livestock data are
collected by the revenue agency and in the urban areas by the staff of local bodies.Tat ies l lA to 12.8 In aU these tables data have besa given for livestock in the Punjab according
to 1977 Livestock Census. For the sake of comparison, the State totals for the years, 1972 and 1966 have also been shown in all tables.
Table 12.9 indicates the comparative position in respect of livestock and p nUry and number of working cattle in vairous States of India. The "data are according to 1977 Livestock Census.
Tables 12.10 to 12.13 show the activities of Animal Husbandry Department i. e, number of veterri- aiy institutions and their staff in Punjab, Livestoclc units and area served per institution. The position of Livestock Development Centres, work done in Veterinary Institutions and aumber of Bulls kept Artificial Insemination Centres.Tabie 12.14 depicts data on Fisheries in Punjab.Table 12.15 depicts Fish-Seed Farms/Nurseries aad their Production for thd year 1989 in Punjab.Table 12.16 depicts data on Milk Plants i jd Chilling Centres in Punjab.Fcble 12.17 gives Milk Statistics in Punjab.Tuble 12.18 depicts recognised Slaughter Houses.Tchle 12.19 depicts data relating to tie shara of Livjsto^k ia t'ls nst State Domestic Product.
251


@ 5 0 3* m s
© below 5o
U H T I 5 , U H t » f l ¥ 3 Iss * ssLIVESTOCK, ANIM AL H USBA NDR Y AND DAIRYING
12,1—imrg ug » r f e : 1977Table 12.1—Livestock anrt Poultry la Punjab ; 1977
{TSWd)(Thousand)
D istrict Cattle Buffaloes
t
Horses Don> and keys
Ponies
f y i § ' 6
Mules Sheep G oats Camels
Wd
Pigs Others Total Poultry
0 1 2 3 4 5 6 7 8 9 10 11 12
ar^tirHUH Gurdaspur 358-6 286-7 11-7 3 -0 2 -7 2 5-9 34 1 0 1 5-4 — 728 -2 430 -7
Amritsar 309-5 451 -6 13 -7 15*6 1 -3 36-2 35-5 3-3 11 -1 ^ 8 7 7-8 1,173 -9
Kapurthala 140-2 157 -9 1-7 0 -5 0-1 2 -0 13-7 @ 1 -4 — 317-5 117-6
Jalandhar 270 -2 443 -1 9 -9 7 -6 2 -2 12-4 58 -9 0 -2 8-1 812-6 4 0 5 -9
Hoshiarpur 280-1 332-6 4 -0 3-1 l O 2 -5 88 -0 0 -2 1 -8 — 713-3 694-5
flTA'drd Rupnagar 101 -6 179-6 10-0 3 -6 0 -4 4 -6 44-1 0-4 9-9 — 354 -2 508-9
s f o n r s T Ludhiana 265-1 419-1 3 -8 5 -4 1 -5 40-2 67-3 0 -9 30-1 — 833 -4 631 9
Firozpur 326-5 376-9 3 1 4 -0 0 -2 64-4 65 -1 6 4 2*4 — 849 -0 309 -8
R rldkot 260 -7 378-7 4 -2 4 -0 0-5 69-1 85 -5 13-7 2 '6 — 819-0 319-3
Br hinda 245 -3 273 -9 7 -6 4 -8 0 -5 129 -9 108-1 37-7 4 -2 — 812-0 175 -3
Sangrur 412-2 430-3 3 -2 5 -8 2 -2 66-5 66 -2 11 -1 18-3 — 1,015-8 256-0
Uf^W SPPatiala 341'8 379-6 3 -0 3 -5 2 -2 43 -8 55-6 0 -4 33-4 - 863 -3 515-4
Total 1977 ... 3,311 *8 4,110-0 75-9 60-9 14-8 497-5 722-1 74-4 128 7 — 8,996-1 5,539-2
^ 3 Total 1972 ... 3,389 *8 3,795 -5 49 -7 64-7 9-3 387-7 801 -2 102-3 46 1 — 8,646-3 3,017 -3
Total 1966 ... 3 ,161-8 2,983-3 36-3 66 -4 4 -5 444-0 621 -4 118-5 44 -9 7,481-1 1,680-1
RTIJS ; F T fe g ^ , r f3cT3^, w g ISource ; Director, Land Records, Punjab.
tou»
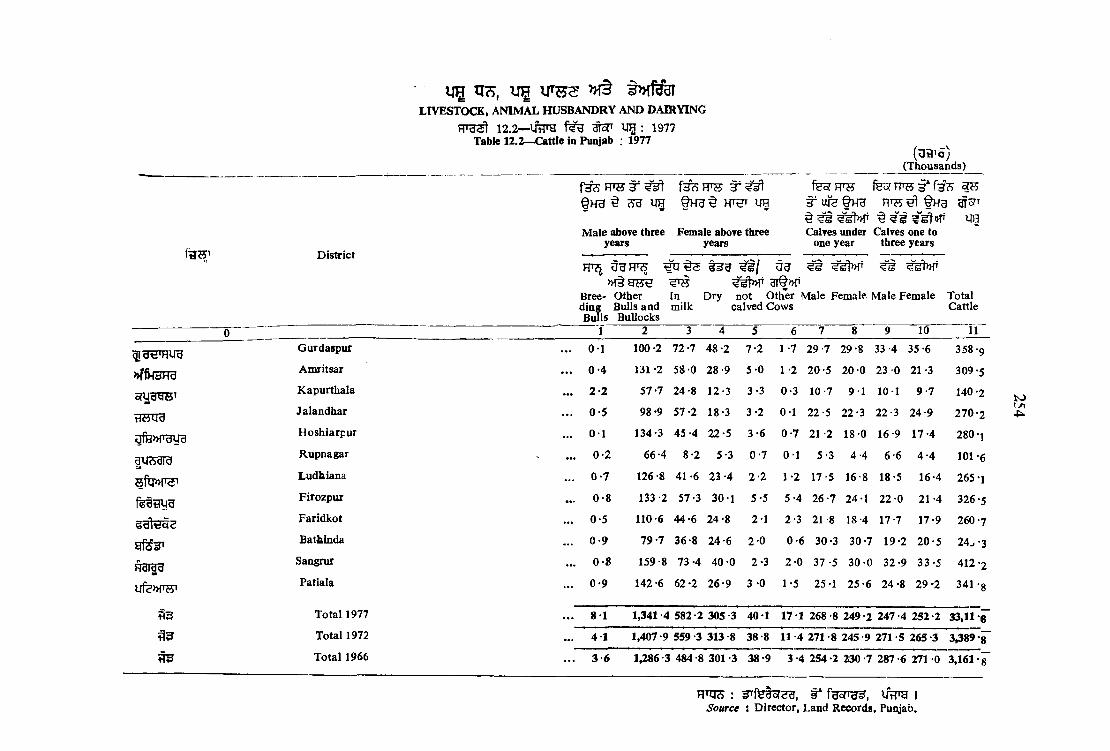
District
y g u s , u g ^ i > « f ^
LIVESTOCK, ANIM AL H USBANDRY AND DAIRYING
12.2— iffFH y g : 1977Table 12.2— Cattle in Punjab ; 1977
§H H ^ UH UH
M ale above three Female above three years years
(U B ’d )__ (Thousands)
f Ufe HT?5 ^ t H gu g
Calves under Calves one to one year three years
FP? UHiTO t i / u g t i» f§ ^ ^ s t » f 3 i f » r
Bree- Other In Dry not Other Male Fem ale M ale Fem ale Totalding Bulls and milk Bulls Bullocks
calved Cows Cattle
0 1 2 3 4 5 6 7 8 9 10 11
Gurdaspur . . . 0 1 100-2 7 2-7 48 -2 7-2 1 -7 29 -7 2 9-8 33 -4 35 -6 358-9
»ffH3HdAmritsar . . . 0 -4 131 -2 58-0 2 8-9 5 -0 1 -2 2 0 -5 2 0 -0 23 0 21 -3 309-5
K apurthala . .. 2 -2 57-7 2 4-8 12-3 3-3 0 -3 10-7 9 1 1 0 1 9 -7 140-2
HttUUJalandhar . . . 0 -5 98 -9 57-2 18*3 3 -2 0-1 22-5 22-3 22-3 2 4-9 2 7 0 -2
g fH » rg y gH oshiarpur ... 0 1 134-3 45 -4 2 2-5 3*6 0 -7 21 -2 18-0 16-9 17-4 280-]
Rupnagar ' ... 0 -2 66-4 8-2 5-3 0 -7 0 1 5-3 4 -4 6-6 4 -4 101-6
SftP>l'<5'Ludhiana ... 0 -7 126-8 41 -6 23 -4 2 -2 1-2 17-5 16-8 18-5 16-4 265-1
Firozpur ... 0 -8 133 -2 57-3 30-1 5-5 5 -4 2 6 -7 24-1 2 2-0 21 -4 326-5
SdltJ^CFaridkot ... 0 -5 110-6 44-6 2 4-8 2-1 2-3 21 -8 18-4 17-7 17-9 260-7
y f^ F fBathinda ... 0 -9 7 9-7 36-8 2 4-6 2-0 0 -6 30-3 30-7 19-2 2 0 -5 24^-3
HdiddSangrur ... 0 -8 159-8 73 -4 4 0 -0 2-3 2 -0 3 7 -5 3 0 -0 3 2-9 3 3 -5 412-2
i[fe»r?!n Patiala . .. 0 -9 142 -6 62-2 26-9 3 -0 1-5 25-1 2 5 -6 24 -8 29 -2 341 -8
S 3 T otal 1977 ... 8 1 1,341-4 582 -2 305 -3 40*1 17-1 268 -8 249 -2 247 -4 252-2 33,11-rT otal 1972 ... 4 1 1,407 -9 559 -3 313 -8 38-8 11 -4 271-8 245-9 271-5 265 -3 3,389-^T otal 1966 . . . 3 6 1,286-3 484 8 301 -3 38-9 3 -4 254-2 230 -7 287-6 271-0 3,161-i"
RTq : Tfetoreg, r fgcr^ , uhth iSource : Director, Land Records, Puiyab.
to4^
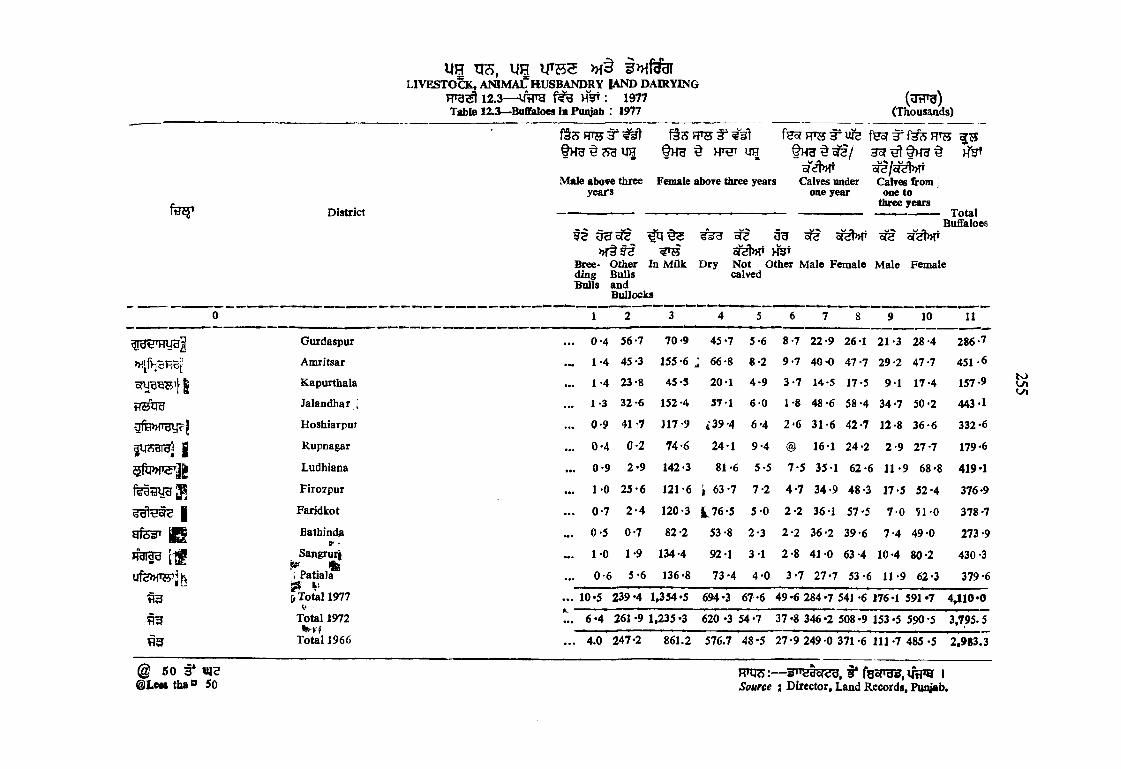
@ 5 0 ^ » I2 @ Lew thac> 50
yg T3S, UHLIVESTOCK, ANIM AL HUSBANDRY |A N D DAIRYING
12.3— W H hV : 1977Table 12.S—Baffaloes in PuiUab : 1977
(U tT ^ )(Thousands)
f H 5 ? F r s ^ u f e
f H g § UH5T<%t orf/o f^ > ft
M ale above three Fonale above three years Calves underone yearyears
D istrict
Calves from (me to
three years
^ Sf? 5T? ^ ofet»ff» r t f ^ ^ o f ^ HST
Bree- Other In M ilk Dry N ot Other M ale Fem ale M ale Female ding Bulls calvedBulls and
BuUoclcs
TotalBuffaloes
0 1 2 3 4 5 6 7 8 9 10 11
Gurdaspur . . . 0 -4 56-7 70 -9 4 5-7 5 -6 8 -7 22*9 26-1 2 1 -3 2 8 -4 286*7
Amritsar ... 1 -4 45-3 155 -6 : 66-8 8 -2 9 -7 4 0 -0 4 7 -7 2 9 -2 47-7 451 *6
1 Kapurthala ... 1 -4 23-8 45 *5 20 1 4 -9 3*7 14-5 17-5 9 1 17*4 157*9
Jalandhar i ... 1 -3 3 2 -6 152 -4 57-1 6 0 1*8 4 8 -6 5 8 -4 3 4 -7 5 0 -2 443*1
9fe>>Fgyr| Hoshiarpur 0 -9 41*7 J17-9 i'39-4 6 '4 2 -6 3 1 -6 4 2 -7 12-8 3 6 -6 332 -6
1 Rupnagar ... 0 -4 0*2 7 4 -6 24-1 9 -4 @ 16-1 2 4 -2 2 -9 2 7 -7 179*6
Ludhiana . .. 0 -9 2 ’9 142-3 81 *6 5-5 7 -5 35-1 6 2 -6 11 -9 68-8 419*1
fe B i3 ir a ^ Firozpur . .. 1 -0 2 5 -6 121*6 i 6 3 -7 7 -2 4*7 3 4 -9 4 8 -3 17-5 5 2 -4 376-9
1 Faridkot . . . 0 -7 2*4 120-3 L 7 6 -5 5 -0 2*2 36-1 57*5 7 -0 9 1 0 378*7
yfesf» g Bathinda 0 -5 0-7 82 *2 53 -8 2 -3 2 -2 3 6 -2 3 9 -6 7 -4 4 9 -0 273 *9
Hdldd [ - JbT t
SangrurSN" m
1 0 1-9 134-4 92-1 3-1 2 -8 4 1 -0 63 *4 10-4 80-2 430 *3
[ P a t ia ir ^ 1'
... 0 -6 5-6 136-8 73-4 4-0 3 -7 2 7 -7 53 -6 11-9 62-3 379-6
tid & Total 1977 . . . 10-5 239-4 1,354*5 694-3 67-6 49*6 284*7 541 -6 176*1 591 «7 4,110*0
S 3 Total 1972 ... 6-4 261 -9 1,235*3 620 -3 5 4 -7 37*8 346*2 508 *9 153*5 590*5 3,795.5
f lS T otal 1966 ... 4.0 247-2 861.2 576.7 48-5 27 *9 249*0 371*6 111-7 485-5 2,983.3
H nj75:---5T T g|cr2g, iSource j D irector, Land Records, Puiyab.
t o\ j \KJ\

f in ?District
u g v g i m e w
LIVESTOCK. ANIM AL HUSBANDRY A N D DAIRYING
1 2 .4 ~ l i t T O U |3 » f§ ^ : 1977Table 12.4— ^Horseand Ponies la Punjab : 1977
fear PfT5535r 't §H3
Upto 033 year
(u a » 3 ) (Thoasands)
feof HfSJ f 3 S Fr'55 fH Sff H 3 § §
O ne to three years 0 ? e r three yearsG ra a d
H 3 3 3 Hr^f S 3Male Pe.niTe Total ivlale F e m ls Total Male Fem ale T otal Total
@50 3* wfe T( Lets than 5G
0 1 2 3 4 5 6 7 8 9 10
Gurdaspur 0-8 0 -7 1*5 1 -8 1 -6 3-4 3 -9 2 -9 6-8 11*75
Amritsar . . . 0 -5 0 -7 1 - 2 1-0 1-5 2 -5 2 -9 7 1 10-0 13-7
^apurthala @ 0-1 0 1 0-2 0 1 0-3 0-5 0-8 1-3 1-7
oHJdytt'
t^UUd
Jilandhar 0 -4 1 1 1-5 1 1 0 -9 2-0 2 -7 3*7 6 -4 9 -9
H<i)8hiarpur 0-1 0-3 0 -4 0*2 0 -7 0*9 1-4 1-3 2*7 4 0
3 U*dldRilpaagar . . . 0 1 @ 0 1 0-1 0-2 0-3 2-2 7-4 9 -6 10-0
Ludhiana 0-1 0-2 0 -3 0 -3 0 -3 0-6 0-8 2-1 2*9 3 -8
Firozpur 0 1 0 1 0-2 0-2 0-3 0 -5 1 0 1-4 2 -4 3 1
Faridkot 0-1 0«2 0*3 0*2 0 -4 0-6 1-0 2*3 3-3 4 -2
Bathinda 0 1 0-1 0-2 @ 0*2 0-2 1*7 5 -5 7-2 7-6
H3RT9Sangrur 0*1 0-2 0-3 0-2 0-3 0 -5 0-6 1-8 2 -4 3*2
Patiala 0-3 0*3 0-6 0 ’5 0 -4 0 -9 0-6 0*9 1-5 3iO
S 3 T otal 1977 2 -7 4 -0 6*7 5 -8 6 -9 12-7 19-3 3 7-2 56*5 7 5-9
T otal 1972 ... 2-2 2-3 4 -5 3*6 4 -7 8*3 14 -5 22 -4 3 6-9 49.7
^ 3 T otal 1966 1 *7 1-7 3 -4 3-7 3 -4 7 -1 9 -7 16-1 2 5 -8 36-3
RTtiS: ^ f e d o f 2 y , i * faoTHsf, iAt o i
Source : Director, Land Records, Punjab.
K)0 \
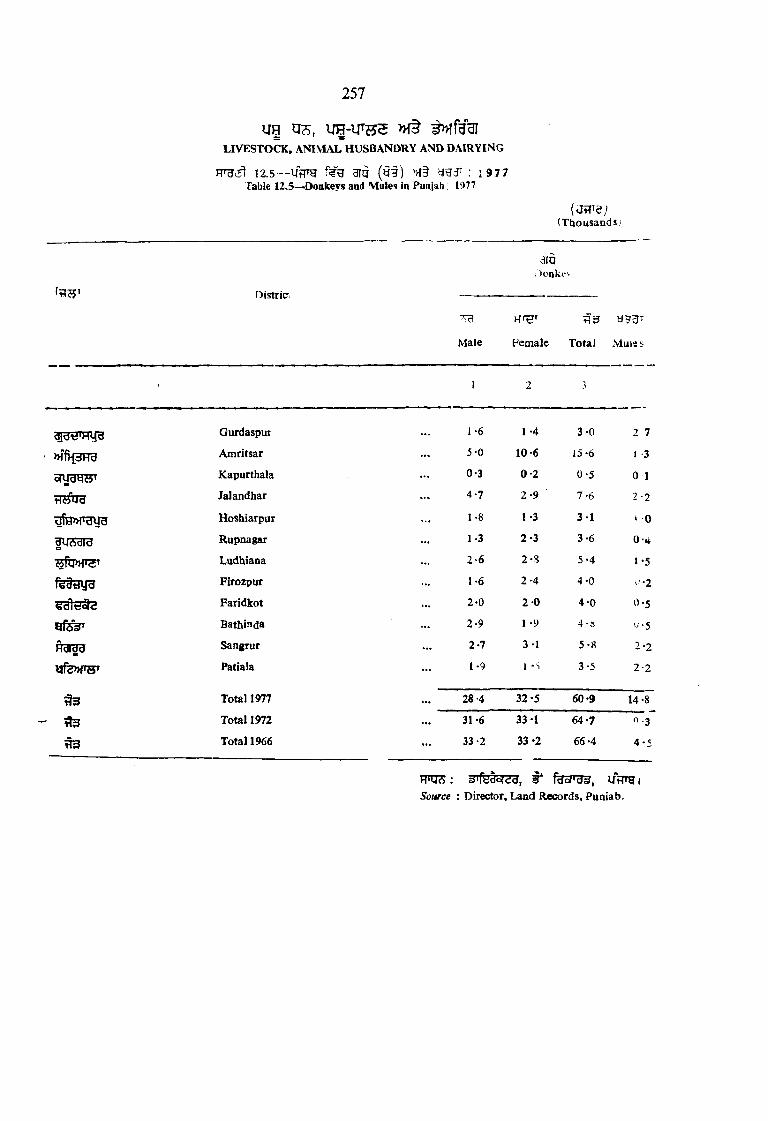
u g u e - i r ? 5 S
LIVESTOCK. ANIMAL HUSBANDRY AND DAIRYING
12 .5 — u fp g Biq ( y § ) : 1 9 7 7Table 12.5-^Doakeys and Mules in Punjab 1977
257
Districr
(T housands;
dTQ:)onkfv
Male Fem ale T otal M uies
) 1 2 3
dJdtTHyB Gurdaspur . . . 1 -6 1 -4 3 -0 2 7
Amritsar 5-0 10-6 15-6 1 -3
oW dtl»' Kapurthala 0-3 0 -2 0-5 0 1
t^ttUd Jalandhar 4-7 2 -9 7-6 2-2
Hoshiarpur 1-8 I -3 3 1 ' 0
^ A d ld Rupnagar . . . 1 3 2*3 3 -6 0 -4
w fq»T ^t Ludhiana 2 -6 2-S 5 '4 1-5
f e s t iy B Flrozpur 1-6 2*4 4*0 v>-2
Faridkot 2 -0 2 0 4 -0 0-5
QfSsT Bathinda 2-9 1 -9 4*« '-■•5
Hdrad Sangrur 2-7 3 -1 5 -8 2-2
Patiala 1-9 1 *S 3-5 2 -2
Total 1977 28-4 3 2 -5 60-9 14 -8
- Total 1972 31-6 33-1 64*7 n-3
Total 1966 . . . 33-2 33 -2 66-4 4 -5
PTO s: FTfelEr^g, fjoTH s;, u frrg i Source : Director, Land Records, Punjab,

u e q s , U H - i m s 3 » l f ^
LIVESTOCK, ANIM AL HUSBANDRY AND DAIRYING
12.6 f e u # 3 ^ : 1977Table 1 2 .6 -^ h e ep in Punjab. 1977
258
(UST3)(Thousands?
District
fee? F R 5 ^
Over one year
SB
Male Female
?T3
Total
f s ^ m s
i s ? ’
Upto Total one year Sheep
Gurdaspur 3-7 10-8 14-5 11-4 -9
Amtitsiu 6-7 16-7 23 -4 12-8 36-2
Kapurthala 0 -8 0 -9 1-7 0*3 2-J
Jalaadhar 1-4 5-3 6-7 5-7 !2 -4
Hoshiarpur 0-4 1 *2 1 *6 0 -9 2 0
l u <5ara Rupnagar 0-5 2-2 2-7 1 '9 4 .6
Ludhiana 6-6 18-9 25-5 14-7 40-2
r<^dgyg Firozpur 7*7 33 -7 41 -4 23 -0 6 i - 4
iod1t!o(C Faridkot 6*6 42*4 49-0 20-1 6^-1
Bathinda 22 0 69 *4 91 -4 38-5 129.9
Sangrur 6 -5 35*6 42-1 24-4 66-5
Patiala 6 -7 2 2 -2 28 -9 14-9 43 -8
Total 1977 69 *6 259-3 328 -9 168 -6 497-5
Total 1972 42 -8 214-7 257-5 130 -2 387*5
^ 3 Total 1966 43 -2 267-6 310-8 133-2 444-0
H'US , i * feo T W , 1
Source Director, Land Records . Puaiab,

u g q s , U H u ’H S > n §LlVi^STOCK ANIM AL H USbANO fiY AND DAIRYING
1 2 .7 — UvPg ^ HH; 1977Table 12.7—G ats, Camels and Pi s in i'unjdb 977
( 3 t r 3 i(Thousands''
<^50 t " Ui?(g Lest tbaa So.
District
9 o f d l^Goats
§ ' 3Ca’mels
f5^7 T O f " # 7 Ov r one year
3" f i r aOve’ four years
f e f W S JTO35? >HT
7 ^ HT^T h t^ t,.1ale l ema* Total Upto Total Male Fema- Total
l-i one Goats leyear
fth r b u a
F|T?5 ^ ^ " 5§ fSH
Four Total Pigs Othersyears Camelsandundjr
0 1 2 3 4 5 6 7 8 9 10 11 12
Gurdaspur ... 5-2 13-6 18 -8 15-3 34 1 0 1 @ 0-1 @ 0 1 5-4 —
Amritsar 18-') 22-3 12-7 35- 1 *5 0-8 2 3 I >0 3-3 11 *1 -
Kapurthiila ... 1 -0 6-9 7-9 5 8 13 7 (( ■‘J ■<u I -4 —
Jalandhar ... 4 -9 29 -8 34-7 2 4 -i 58-9 0 1 0 1 0 -2 0 -2 8 I -
Hoshiarpur ... 4*6 47-6 52-2 35-8 88-0 0-1 0 1 0-1 0*7. : -8 -
|u?5aT-a Rupnagat ... 2-1 25 -5 27*6 16-5 44 1 0-3 0-3 0-1 0*4 9-9 —
Ludhiana ... 3-1 35-8 38 -9 28-4 67-3 0-6 0-2 0*8 0*1 0-9 30 1 —
Firozpur ... 6-3 34 -4 40-7 24 -4 65 -1 2-7 2-3 5 *0 1*4 6-4 2 ' \ -
Faridkot ... 4-2 53-1 57*3 28-2 85 *5 7-5 2-6 10 1 3-6 13-7 2-6 —
9 f 3 5 ’ Bathinda ... 5-8 62-0 67-8 40-3. 108-1 17-8 8-4 26*2 11-5 37-7 4-2 -
H 3isa Sangrur ... 3-1 36-4 39-5 26-7 66-2 4-9 2-6 7 -5 3-6 11 1 18-3 -
Patiala .. 3-3 31*3 34 -6 21 -0 55-6 0-2 0-1 0-3 0-1 0*4 33 -4 —
f l3 Total 1977 , 47 -5 395 -3 442 8 279 -3 722 1 35 8 17 1 52-9 21 -5 74-4 128-7 —
f[3 Total 1972 . 1 9 456 9 498 -8 302 4 801 -2 56 1 22*3 78-4 23 -9 102 *3 4 d l —
^ 3 Total 1966 ... 30 -6 335 -4 366*0 255 4 621 4 71-4 22 -8 94 2 24-3 118*5 44-9 _r
H ^ a s ;- -3 ife a ^ r e g , § f^ o r g ^ , u ^ 9 iSat^ct :—Director Laud Records, Punjab.
K)VO

u g T O , U H I T H S » ( §LIVESTOCK, ANIM AL HUSBANDRY AN D DAIRYING
12.8 w g ^ >h§ O h s ^ : 1977Table 12.»—Fowls, Ducks amA other poultry iq Punjab ; l? 7 7
( u s ^ )(Thousands)
Distrid
H9i3I—H99fh>T Fowls
H g i
Hens
Docks
g sy T H n g n ^ Hiy
Cocks Chickens Total Ducks Dra- Duck- Totalkes lings
-Others Grand Total
1 10
Gurdaspur . .. 241 -8 39-8 147-1 428-7 1 -1 0-2 0-7 2 -0 @ 430-7
Amritsar . .. 825 -9 72-8 260-3 1159 -0 8-2 - 4 -0 12 -2 2-7 1173 9
Kapurthala 65-0 20 -0 31 -0 116-0 0-7 0-8 0-1 1 6 @ 117-6
Jalandhar . .. 325 -3 32 1 32 -5 390 -5 0-3 — (a) 0-3 15-1 405 -9
gfH»i^9v,e Hoshiarpur . .. 462-4 96-1 135-8 694-3 0-2 @ @ 0-2 — 694-5
giJtsgici Rupnagar . .. 434-6 14-2 60 -0 508 -8 0-1 — @ 0-1 — 508-9
Ludhiana . .. 317-4 39 -4 273 -3 630-1 0-4 1 -1 0-2 1-7 0-1 63 1-9
fea iiijB Firozpur ... 126-7 44-9 136-8 308 -4 1 -0 @ 0-3 1-3 0-1 309-2
Faridkot . .. 174-5 53-1 91-2 318 -8 0-4 0 1 @ 0-5 @ 319-3
Bathinda 86-0 31 -5 56 -2 173-7 0-3 0-9 @ 1 2 0-4 175-3
Sangrur . .. 145 -8 21 -6 86 -7 254-1 1 -7 (& 0-2 1 9 — 256*0
uf?W ?5’ Patiala . .. 231-9 42-1 237 -0 511-0 2-2 0-2 0-5 2-9 1 5 515-4
Total 1977
Total 197.
Total 11966
3437-3 508-2 1547 9 5493-4 16-6 3 -3 6 -0 25-9 19*9 5539-2
1 6 8 1 3 519-4 985 7 2986-4 17 3 1 -9 4-7 23 9 7 -0 3017 3
650*9 187-5 770-6 1609-O 9 -6 4 -9 4 -2 18-7 5 2 -4 1680-1
5 » 3 ' Wd(5 Les than *>'.)
FTO^: 5Tf5tET5F, r fecn^F.iftTOl•'ource : Director. Land Records, Punjab,
K>

LIVESTOCK, ANIMAL HUSBANDRY AND DAIRYING
2 6 1

gTt?/HUratfl
§
»TFnH
^713^3
u | o s , u | i / T H s » r a t> » r fO T
U V E STOCK, ANIM AL HUSBANDRY AND DAIRYING
12.S—§^31 gw ue tj3, sh 533 ^ ue >h§ : 1977Table 12 *9—Number of Livestock, f orking Cattle and Poultry in Various States of India ; 1977
(U B T U )(Thousands)
State/U .T.
arar OH
Cattle Buffaloes Sheep Goats
l u j u s
Horses Other Total Poultry and Livestock Livestock Ponies
e r a s e s UH
^5fT UR, hV ^
( 00 ’)Cattle Buffaloes Four
Wheeled Tractor (00*'
1 10
A . State Andhra Pradesh .
Assam
Bihar
Gujarat
Haryana j
Himachal Pradesh
12,041
6,603
15,162
6,006
2,442
2406
7,163
730
4,463
3,473
2,940
560
7,064
59
1,150
M 92
542
1,055
4,364
1,657
9,925
3,084
519
1,035
27
18
110
76
27
15
813
515
947
175
420
24
31,472
9,582
31,757
14,406
6,890
4,795
21,609
10,450
14,076
3,426
1,403
330
5,412
2,533
7,477
2,858
944
820
1,227
296
823
29
87
9
111
6
105
112
304
5
>H§ oraHtg Jammu and Kashmir 2,138 5 0 0 , l a i c 692 69 44 4,659 2,040 760 42 8
Karnataka 10,27? 3,278 4,536 3,388 27 349 21,800 9,696 4,033 287 83
Q 3K ' Kerala ••• 3,006 454 3 1,683 @ 173 5,319 13,389 367 220 17
Hcr Madhya Pradesh ••• 26,253 5,845 968 6,725 118 420 40,329 7,156 9,753 1,122 151
HJ'diHcIcJ Maharashtra • •• 15,218 3,899 2,636 7563 49 278 29,643 18,751 6,255 313 125
Hui«rM»r M eghalaya ••• 477 40 20 119 6 151 813 1,073 147 10 •*
Orissa . . . 12,120 1,359 1,431 3,417 4 295 18,626 9,490 4,893 602 14
UH’y Punjab ••• 3,312 4,110 498 722 76 279 8,997 5.540 1,323 262 667
Manipur • •• 294 52 2 16 1 142 507 938 146 23 —
gfflRera: Rajasthan • •• 12,896 5,072 9,938 12,307 49 1,097 41,359 1,590 3,950 176 247
^ 3 3 Uttar Pradesh . . . 25,773 13,965 2,059 8,462 204 1,881 52,344 5,497 13,530 1,822 m
t oOn
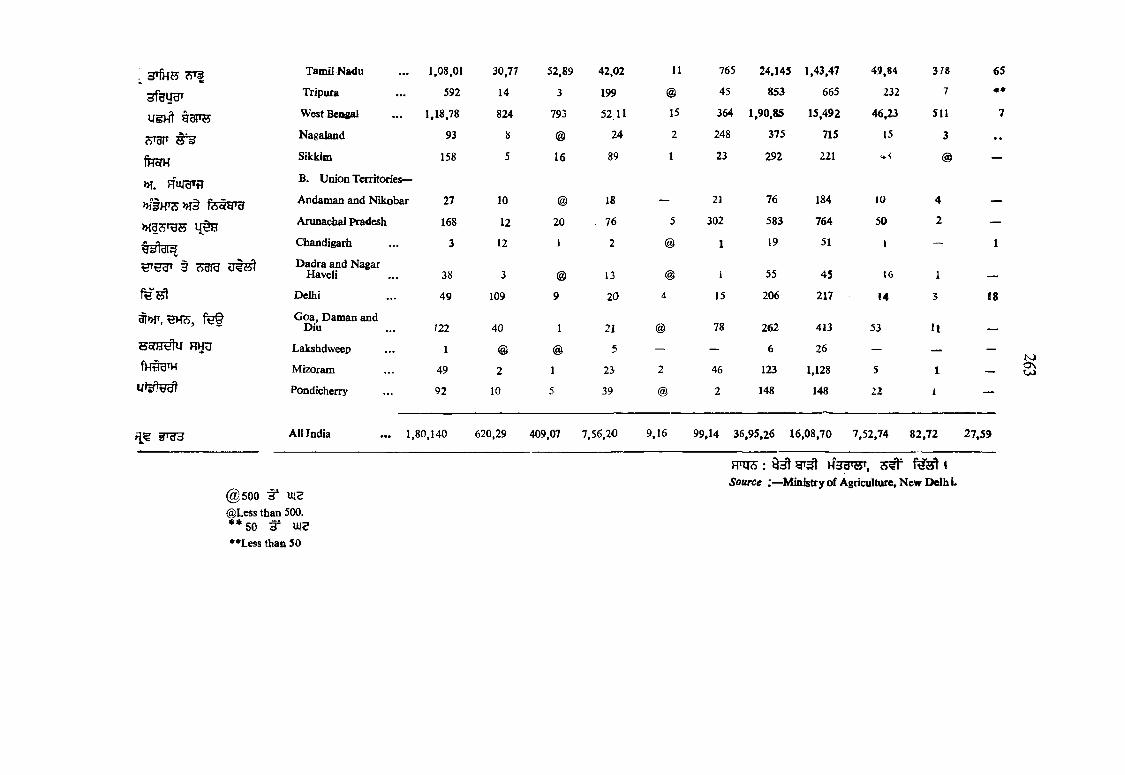
UgHt H 3F S
fHoTH>H. HiVaifl
»ftH TcS»f§
> H 1 ^ S
w t g r s
^ » |T ,H H S , f e §
5 5 r e ^ H i^
f H ^ H
U ^ c f t
Tamil Nadu 1,08,01 30,77 52,89 42,02 11 765 24,145 1,43,47 49,84 3 78 65
Tripura 592 14 3 199 @ 45 853 665 232 7 ♦*
West Bengal 1,18,78 824 793 52 11 15 364 1,90,85 15,492 46,23 511 7
Nagaland 93 8 @ 24 2 248 375 715 15 3 . .
Sikkim 158 5 16 89 1 23 292 221 m —
B. Union Territories—
Andaman and Nikobar 27 10 @ 18 — 21 76 184 10 4 —
Arunachal Pradesh 168 12 20 . 76 5 302 583 764 50 2 —
Chandigarh 3 12 1 2 @ 1 19 51 1 — 1
Dadra and Nagar Haveli 38 3 @ 13 @ 1 55 45 16 1
Delhi 49 109 9 20 4 15 206 217 14 3 18
G oa, Daman and Diu 322 40 1 21 @ 78 262 413 53 11 _
Lakshdweep 1 @ @ 5 — — 6 26 — — —
Mizoram 49 2 1 23 2 46 123 1,128 5 1 —
Pondicherry 92 10 5 39 @ 2 148 148 22 1 —
AU India . . . 1,80,140 620,29 409,07 7,56,20 9,16 99,14 36,95,26 16,08,70 7,52,74 82,72 27,59
K)OSOJ
@ 5 0 0 ^ u je © Less than 500. * * 5 0 ^ W ••L ess than 50
HTJS : ^ H 3 H W , I
Source ;— ^Ministry o f Agriculture, N ew D elh L
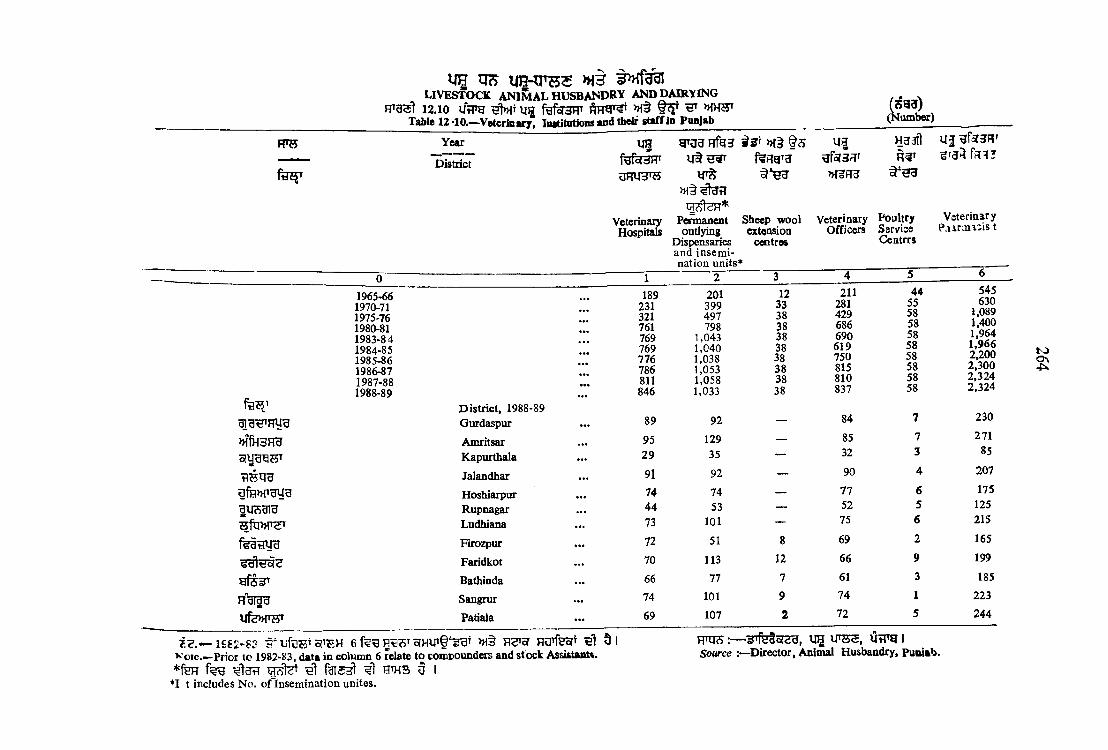
VHT T O M 3LIVESTOCK ANIMAL h u s b a n d r y ANDDAm\ING 12.10 l ir r g y n ^ ^
Table 12 *10.—Veterinarj, Inititiitions and their staff In Pnojab( 5 3 ? ) (Number)
FPH Year
District
01965-661970-711975-761980-811983-841984-851985-861986-871987-881988-89
UHfgfET3FP
VeterinaryHospitals
Pem anent outlying
Dispensaries and in sem ination units*
Sheep w ool extension
centres
q g H33ll
Veterinary Poultry Officers Ssrvice
Ceatrrs
U 3 3FI' fP llI
Vsterinary P .nrtn i3is t
D istrict, 1988-89Gurdaspur
>HfH3RU AmritsarKapurthala
Jalandhar
3fe>nTgyg HoshiarpurRupnagarLudhiana
fe g m r a Firozpur
€ ‘dlt!o(S Faridkot
Bathinda
R-dfd-d Sangrur
UfeM'M' Patiala
Z ? ,— 1£82-8S S ' g i E H 6 jq^oT RU^goft 5 IV o te__ Prior to 1982-S3, data in column 6 relate to compounders and stock Assistaata.* feR ^ ^ H^HS U I
♦I t includes N o . o fln sem in ation unites.
189 201 12 211 44 545231 399 33 281 55 630
••• 321 497 38 429 58 1,089• ••
761 798 38 686 58 1,400769 1,043 38 690 58 1,964769 1,040 38 619 58 1,966
••• 776 1,038 38 750 58 2,200• • •
786 1,053 38 815 58 2,300• • •
811 1,058 38 810 58 2,324•••846 1,033 38 837 58 2,324
89 92 — 84 7 230
95 129 — 85 7 271
. . . 29 35 — 32 3 85
• • • 91 92 — 90 4 207
74 74 — 77 6 175
44 53 — 52 5 125
• • • 73 101 — 75 6 215
. . . 72 51 8 69 2 165
. . . 70 113 12 66 9 199
• • • 66 77 7 61 3 185
. . . 74 101 9 74 1 223
. . . 69 107 2 72 5 244
RTTO 3Tfetor5H , q g UT5^, M W 9 I Sowce -.—Director, Animal Husbandry, Puii|ab>
t oo^4^
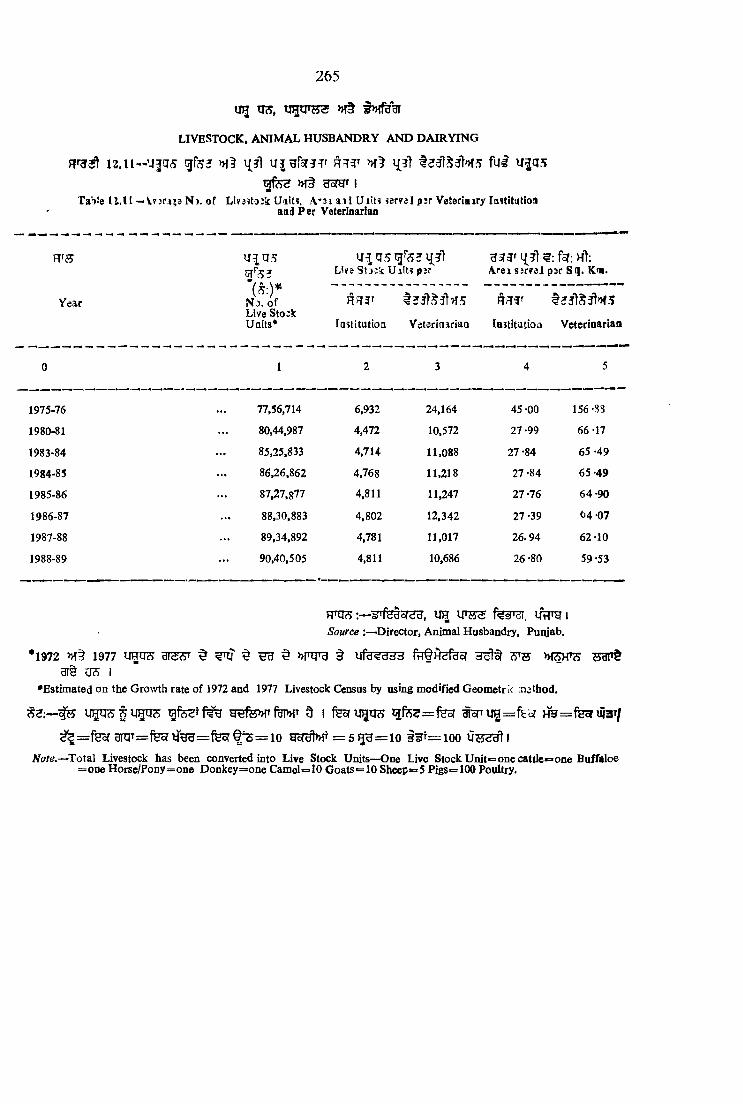
trg ITS, in ffn g r
LIVESTOCK, AN IM AL H U SB A N D R Y A N D D A IR Y IN G
12.U--’43a5 gfe? »f l{7l U?Hf5r? r l{3t ful U a5g f e ? M § UoTHT I
Ta’>le l l . U — V7jri;3 N i, o f Liv3^to:k Uait?, \ ' 3 i a i l U iUs «r?d l psr Veteriniry la^titatioaand Per Veterinarian
265
Yearm *
N j . o f Live Sto;k Uoits*
LW3 St*:k UiUs pjrgsr^f 1{?1 ?; far; Hi:Arei sirreJ pjr Sq[. Km .
iQstitutioa Veteriaarian lastitatioa Veterinarian
0 1 2 3 4 5
1975-76 . . . 77,56,714 6,932 24,164 45 -00 156 -83
1980-81 . . . 80,44,987 4,472 10,572 27-99 66 -17
1983-84 85,25.833 4,714 11,088 27-84 65 -49
1984-85 86,26,862 4,768 11,218 27 -84 6 5 -49
1985-86 87,27,877 4,811 11,247 27 -76 6 4-90
1986-87 88,30,883 4,802 12,342 27 -39 6 4 -07
1987-88 89,34,892 4,781 11,017 26 .94 62-10
1988-89 . . . 90,40,505 4,811 10,686 26 -80 59 *53
:— ^'fedy<53, UH IT^5^ ifflTH I
Source :—^Director, Animal Husbandry, Punjab.
*1972 1977 UHII?? ^ ^ ^ ^ § U fe ^ B 3 3 fe fH S fe o ? 3 ^ ^ 7PB3T§ 0 5 I
•Estim ated on the Growth rate o f 1972 and 1977 Livestock Census by using m odified Geometric n^thod.
3 2 : — UOTFj f 5 | y e n ? ) f o r T u g = f s c r w = f e o r u i 3 » /
^ = f e o r a T H T = f e 5 ? y ^ = : f e o r § ^ = i o g o r ^ = 5 H u = i o lo o
Note.—Total Livestock has been converted into Live Stock Units—One Live Stock U n it= o n e cattle*= one Buffaloe = o n e H orse/Pony= one D on k ey= on e C am el=10 G o a ts= 1 0 S h eep= 5 P igs= 100 Poultry.

5 7 5 ^
gftp > ro y g
|U 5 3 r a
u g TJ?>, U H » f 3 3 ' » f f ^
LIVESTOCK, ANIM AL H USBANDRY AN D DAIRYING
F T ^ 12.12— U?TH UH-^fSTHFT » T fe cft^r ^
Table 12*12— Work done in Veterinary Institutioos ia Panjab by Districts( t e ^ )(Numberj
Year/District
fgfjTtT o i!§ y ^
Cases Castrations Treated performed
Vaccination Performed
^ 3 IT ^ 3 f r fRtTSf e n s ^31 ^31 <5 55
Animals coyeredthroogb A .I. CaJres born
methods by A .I. method
R.P. a s . B.Q. R.K:. F . & M . Others Cows Buffaloes Cows Buffaloes
0 1 2 3 4
1965-66 17.16,656 1,45,565 11.18,398 11,70,861
1970-71 16,29,506 94,895 9,66,638 13.13,149
1975-76 14.66,242 37,197 9.58,707 14,25,456
1980-81 20.87.833 24.984 14,97.268 19,90,724
1983-84 26,48,375 22.872 6,99,793 30.23,188
1984-85 27.20,162 24,152 13,23,430 33,10,938
1985-86 ... 28,80,570 22,924 10,33.014 36,74,602
1986-87 27.74.565 23,530 22.79.676 38.79,335
1987-88 26.36.271 19,24,0 15,92,725 34,38.588
1988-89 ... 28,15,629 17,254 7,83,144 45.08,855
Distt., 1988-89
Gurdaspur 2,41,208 570 75,250 5.15.240
Amritsar 3,04,394 459 83.812 4.75,618
Kapurthala... 2,04,494 1,834 49,529 2,28.688
Jalandhar ... 2,41.332 944 11,724 3,43,028
Hoshiarpur... 1,95,057 1,293 52,470 3,07.352
Rupnagar ... 1*01,250 661 45,760 2,18.634
8 10 11 12
16^52 2,63,969 20,773 •• 58,661 60,768 4,243 8,507
40.361 1,47.501 10,259 1,06,430 85,696 5,713 11,321
36,000 6.58.826 35,892 3,31.958 1,97,570 64,605 887 5,224
20.770 3.22.120 1,81.346 86,285 4,44,971 1,11,622 1,17,318 32,934
1.17.010 151t 2,25,380 18,540 5,61,214 1,41,433 1,62,932 45,887
18,862 51.815 2,86,149 30,502 50,21,696 5,92,732 1,73,975 48,915
33.614 10,500 4,53,933 1,103 6,40,476 1,41,433 1,96.281 53,453
61.688 — 6.60,239 13 6,79,257 2.06,847 2,00,825 61,467
26.356 —. 6,14,839 — 7,09,016 2,21,322 2,18,551 72.442
21,430 — 5,17.062 — 7,29,602 2,26.629 2i,31,644 79,693
8,760 38,100 — 86,994 8,453 13,616 1,825
-- - 35,122 - - 96,720 3,439 21,356 142
245 _ 25,812 — 36,680 8,777 11,466 3,069
- , _ 45,122 — 93,311 29,343 30.776 10,870
_ 49,020 — 73.157 21,768 23,957 7,570
— 14,061 — 16,395 9,373 5,738 3,113
K)o \o \
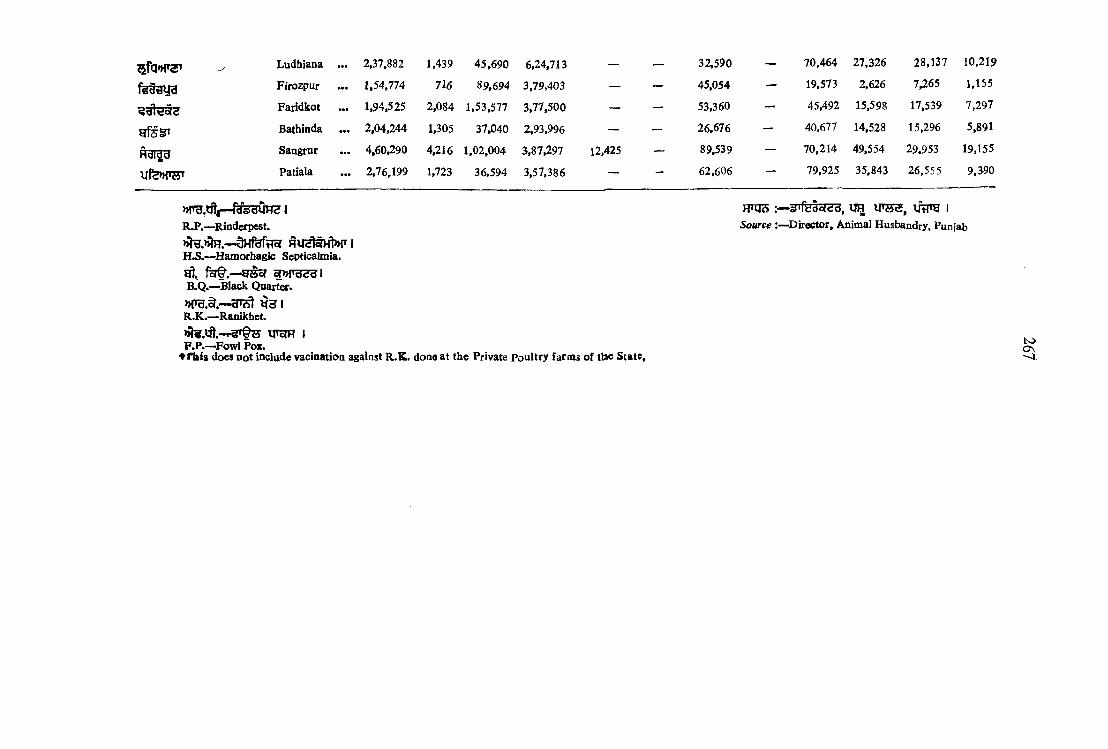
Ludhiana • • • 2,37,882 1,439 45 ,690 6,24,713 — — 32,590 — 70,464 27.326 28.137 10,219
Firozpur • • • 1,54,774 7 l6 89,694 3,79,403 — — 45.054 — 19,573 2,626 7,265 1,155
Faridkot • • • 1,94.525 2,084 1,53,577 3,77,500 _ — 53,360 — 45,492 15,598 17,539 7,297
Bathinda • • • 2,04,244 1,305 37,040 2,93,996 — — 26,676 — 40,677 14,528 15,296 5,891
Sangrur • • • 4,60,290 4,216 1,02,004 3.87,297 12.425 — 89,539 — 70,214 49,554 29.953 19,155
Patiala • • • 2,76„199 1,723 36,594 3.57,386 — — 62,606 — 79,925 35,843 26,555 9,390
>>rH ,dt|~f^3H un2f IR.P.— RindMpest.
>>hg.i>b=F.—^HfeftiorH.S.— ^Hamorhagic Septicalmia.
B.Q.—-Black Q u arts.
^ 3 I R.K .— Ranikhet.
P .P .— ^Fowl Pox.♦ r b is does not include vacination against R .K . doae at the Private Poultry farms o f the State,
RTqs :— o5'rydy<fd, q e IT H S , ijrnH I
Source Director, Animal Husbandry, Punjab
K>ON>-4
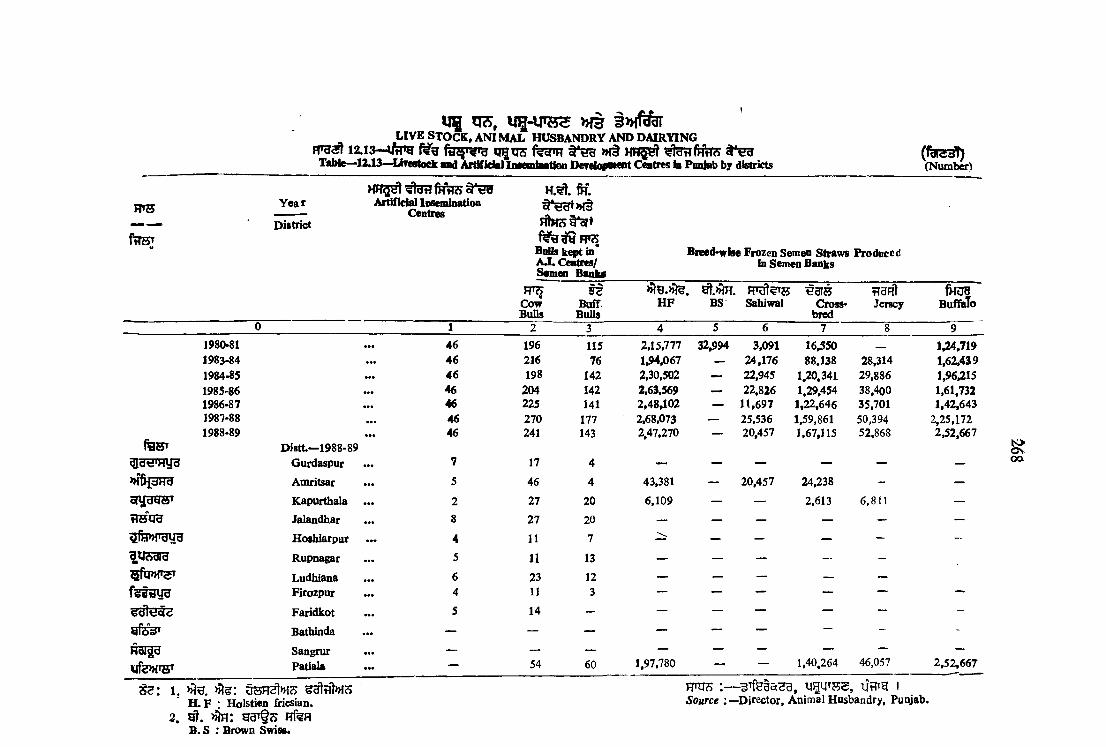
FTS
filST
TO , V g - V B S » t3LIV E St o c k , a n im a l h u s b a n d r y a n d d a ir y in g
fTTja 12.13—VtTO qgU5 feoFR >«§Table—12.13—livestock and Artificial InMmiMitiQn DardofDMOt Centres b Pmiab by districts
Year
Diftrict
M R 5^ ^tetT fN tlSA ^ icia l IflSendnatioD
Centres
frf.
Boils Icept in A J, Centres/ S«QMn Banktf
Breed>wise Frozen Semen Straws Frodoced in Semen Banks
CowBuUs
BuffBuUs
H F BS Sahiwal^ a r s
Crossbred
trgprtJersey
(Number)
fHOTBuffalo
1980>81 . . . 46 196 115 2.15.777 32,994 3,091 16,550 __ 1,24,7191983-84 • •• 46 216 76 1,94,067 — 24,176 88.138 28,314 1,62,4391984-85 ••• 46 198 142 2,30,502 — 22,945 1,20,341 29,886 1,96,215198S>86 ••• 46 204 142 2,63,569 — 22,826 1,29,454 38,400 1,61.7321986-87 ••• 46 225 141 2.48.102 — U .697 1,22,646 35,701 1.42.6431987-88 ••• 46 270 177 2,68,073 — 25,536 1.59,861 50,394 2,25,1721988-89 46 241 143 2,47,270 — 20,457 1,67,115 52,868 2,52,667
D istt.— 1988-89^dtS'HUU Gurdaspur • •• 7 17 4 — — — — — —
JJffiidHd Amritsar • •• 5 46 4 43,381 — 20,457 24,238 - —oiyggB T Kapurthala • •• 2 27 20 6,109 — — 2,613 6,811 —tTSQH Jalandhar • •• 8 27 20 — — — — — —
Hoshiarpur • •• 4 11 7 — — — — — -
W<S-dld Rupnagar • •• 5 11 13 — — — — —
Ludhiana ... 6 23 12 — — — —
f s ? 3 y 3 Firozpur ... 4 11 3 — — — — — —
Faridkot 5 14 — — — — — — -
Bathinda • •• — — — — — — — -
Hdl^d Sangrur • •• — — — — — — — —
Patiala ••• — 54 60 1,97,780 — 1,40,264 46,057 2 ,52 ,667
1 , >HH. S 3 M > rtsH. F : Holstien friesian.
2. nfeaB. S : Bfowd Swiss*
Osoo
HTU3 :— ^31535^^a, VHUTS2, ifHTg i Source D irector, Anim al Husbandry, Punjab.

u e UH UTJ55 » f§
LIVESTOCK, ANIM AL HUSBANDRY AND DAIRYING
12.14— f e t Uf555 M5T3
Table 12.14— Fisheries Statistics in Punjab
269
U5rgT
fHR ugr H T■o? H ^ » ff 5l"3rfgi>Ki
(ooo’)
(3or^ »fg)
} T ^ t H ^ r t o g j f j a
H *^?5 H ^ t 5t3T
3T ?5RH ('ooo 1U§) ^ ^ (3f^<f ^ )
IT 5F /f^ ^ Year/District Area N o. of where Fish finger-
Stocked lings in (000’)
(Hectares)
FishingLicences
Issued
Total Number ( Receipts o f cases
from detected Fisheries o f Fishing (*000 Rs) without
Licence
Compensation
Realised(R s.)
0 1 2 3 4 5 6
1965-66 237 376 437 109 900
1970-71 187 389 729 322 1,891
1975-76 267 1,041 911 490 5 ,0 6 4
1980-81 343 925 1.537 523 9 ,749
1983-84 771 370 1,941 452 6 ,0 3 0
1984-85 993 156 1,906 349 4 ,28 5
1985-86 ... 1,060-67 6,510 141 1.794 181 3,328
1986-87 ... 1,521-51 92,21,135 238 1,720 75 3 ,176
1987-88 . . . 1 ,572*17 10 ,598 ,900 219 2,420 202 6,010
1988-89 ... 1,582-65 1,4),40 ,420 ' 250 4,017 97 2,215District I988-89
Gurdaspur 213 .61 12,83,900 — 322 18 330
» f^ 3 F ra Amritsar 199.35 12.66,650 12 337 13 210
Kapurthala 4 2 .0 0 2,42 ,100 72 1,078 34 770
Jalandhar 127-22 9,64,050 30 254 — —
3fH »fTgyg Hoshiarpur 5 1 .1 0 2,14,650 — 446 9 315
Rupnagar 38-31 3.41,050 38 134 10 440
Ludhiana 381-14 46,67,000 8 578 — —
f<^dijyd Firozpur 58-95 5,23,100 — 454 — —
g d lti< S s Faridkot 5 0 .8 0 3 ,03,000 — 0 -3 0 — —
Bathinda 109-03 8,39,500 — 0 -8 4 2 40
H3T29 Sangrur 187-60 19,14,650 77 151 — —
Ufe»T3T Patiala 123-54 14,83,770 13 149 11 1 10
FRTS :— 3 ^ s to ? 5 d M § ^ 3 5 IT H ^ f e T R v flr g |
Source.— DinctoT aad Warden o f Fisheries, P u ii a b.

L IV E ST O C K , ANIM AL HUSBANDRY A N D DAIRYING
1 2 . 1 5 . — FP75 1 9 8 9 H g tu g T lw y ? )U H ^ > H t 3 ' H ^ U gT § 3 1 4 ^ ^
Table 12 -1 5 .— Fish Seed Farms/Nurseries and their Production for the year 1989 in Punjab
270
H gt lldlFish Seed Farms Fish-Seed Nurseries
District
fdl<id1
Num ber Production (N o, in lakhs)
Number Production (N o. in lakhs)
0 1 2 3 4
dIdtJ'HVS Gurdaspur 1 19-73 ■) 0 -53
>H^dHd Amritsar 1 n - 7 1 2 0 2 3
Kapurthala 1 18-87 1 0 -0 5
Jalandhar 1 0-86 3 0 -96
otH>HT3ira Hoshiarpur 2 8 78 — —
iUAdId Rupnagar 1 9-13 4 1-18
<*5ru>HT? Ludhiana 1 5-99 5 4 97
Firozpur - — 5 0 -54
Faridkoi — 3 0-35
Bathinda 1 0-94 2 0-45
Sangrur 1 6-63 4 0-86
Patiala 8-19 3 1-32
ik3 Total 12 90-83 30 15-44
httjes f e w , l i w a I
Source :— D irector and Warden o f Fisheries, Punjab.
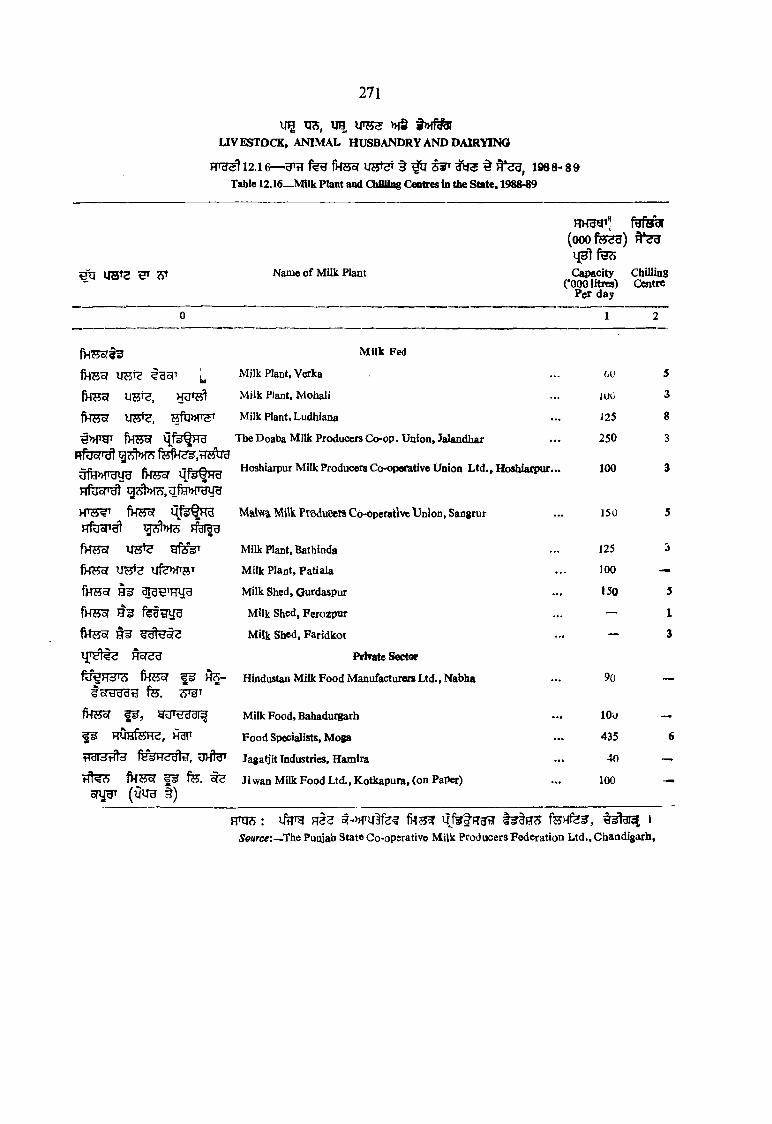
271
u e I3H, UH >H§ § » f f ^
U V ESTO C K , ANIMAL HUSBANDRY AN D DAIRYING
RT3 12.16— 1988-89 Table 12.16—MQk Plant and ChUUne Cwtres in the State. 1988-89
Name o f Milk Plant
RK3gT] f^ r»dl
(000f65< i3) t o
Capacity Chilling (*000 litres) Centre
Per day
0 1 2
M ilk Fed
i^ 5 i i Milk Plant, Verka bV 5
fHHSf Milk PJant, Mohali 100 3
fHHSr U75^, Milk Plant. Ludhiana 125 8
fH S g The Doaba Milk Producers Co-op. Union, Jalandhar 250 3
HfObT^ g ^ }M 3 fe lH ^ .r lr i l id
u f H W m J irsfQ wHoshiarpur Milk Producers Co-operative Union L td ., Hoshian?ur... 100 3
H fooF ^ g ^ t » n s ,o f H » r iy g
Malwa MUk PTOdxiecTS Co-operailve U nion, Sangrur 150 5ycs^nf?>
fHMbf Milk Plant, Bathinda 125 3
fHWoT U fW S T Milk Plant, Patiala 100 —
fHSoT Milk Shed, Qurdaspur 150 5
fHttoT f e g g y u Milk Shed, Ferozpur — 1
Milk Shed, Faridkot — 3
ijthIQs Hbreu Private Sector
fd'dHd'A f k S ^ ^ H ^ - Hindustan Milk Food Manufacturers Ltd., Nabha 90 _
to ftJd d iJ f e .
fH « y go?, yjTtiddij^ Milk Foodf Bahadurgarh lOu —
RV[HfeH5, Food Specialists, Moga 435 6
u h ! ^ Jagatjit Industries, Hamira 40 —
fMHSr f e . ^ Ji wan Milk Food Ltd., Kotkapura, (on PaPer) 100o r y ^ ({J y g § )
FTCR : t -» T ir 3 fe ? # ^ § 3 ^ f e K f e ? , ISource:—The Puajab State Go-opsrative M ilk Producers Federation Ltd., Ciiandigarb,
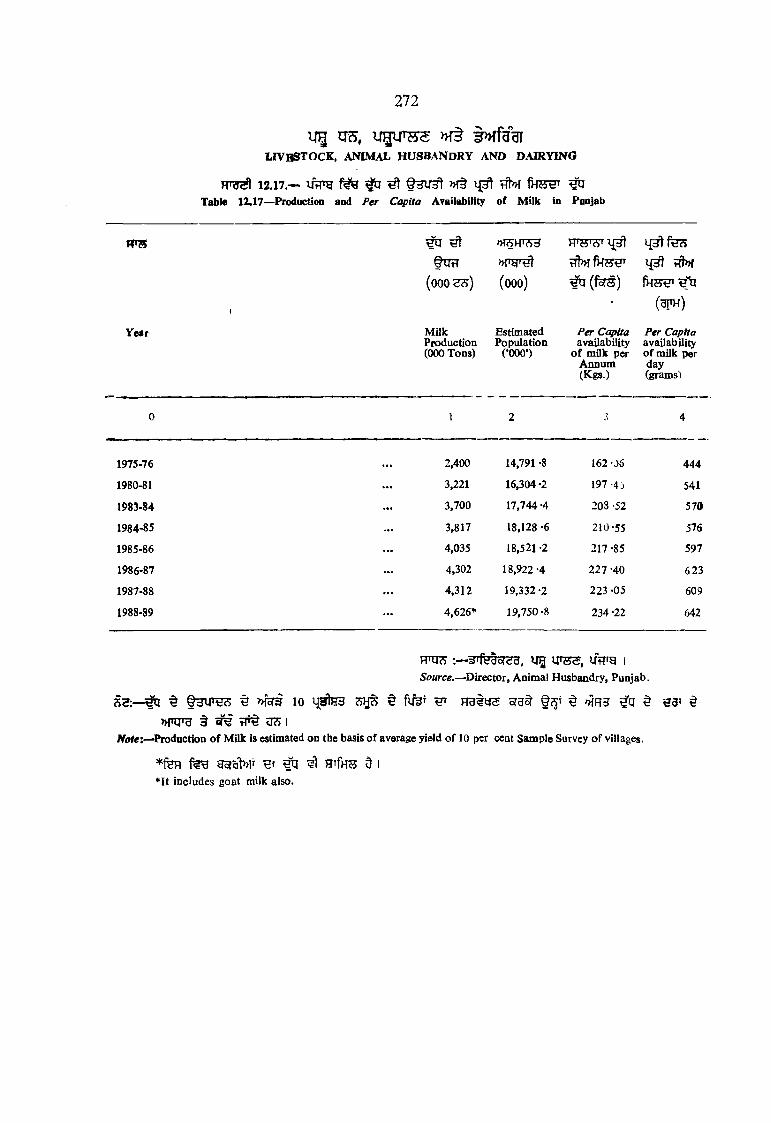
272
U H m , u g i j f H S » f §
u v b s t o c k , a n i m a l h u s b a n d r y a n d d a i r y i n g
12.17.— iT frg ^ ^ ^ H ir ^ » f t tTtM f H S ^
Table 12,17—Production and Per Capita Availability o f M ilk in Punjab
FTO ITO'cS'
§tTt7 >H'y'tn t jh i
(oooe^s)
i
(ooo) ^ (fsr»‘)(3TH)
Year Milk Estimated Per Capita Per CapitaProduction Population availability availability(000 Tons) (‘000*) o f milk per
Annum (Kgs.)
o f milk per day(grams'!
0 1 2 4
1975-76 2,400 14,791 -8 162 0 6 444
1980-81 3,221 16,304 -2 197 -4j 541
1983-84 3,700 17.744 -4 208 -52 570
1984-85 3,817 18,128 -6 210-55 576
1985-86 4,035 18,521 -2 217 -85 597
1986-87 4,302 18,922 -4 227 -40 623
1987-88 4.312 19,332 -2 223 -05 609
1988-89 4,626* 19,750 -8 234 -22 642
W T j T i wrfuBor^g, u g ifR fg i
5’oHrce.—Director, Animal Husbandry, Punjab.
s ? ; — ^ t O cW ^cS ^ 10 mhIh3 (Sy^ § fij^T ^ ^ ^ ^
§ crW T O iAfote;—Production o f Milk is estimated on the basis o f average yield o f 10 per cent Sample Survey o f villages.
*fHH gofcjN f s q i \ HTfHS 5 I ♦It includes goat milk also.

273
lie tl?5, via
UVES'^OCK, ANIMAL HUSBANDRY A N D DAIRYING
F r a ^ l2 .1 8 .--H T S 3 T § 3 3 U2»fTHl
Table 12.18—Number of RecogaUed Slaughter Houses and Animals Slaughtered therein
Y e a r /D i^ c t
5 ^ o n t HH
Animals SlaughteredHr^HT ----------------
>H§
Number o f recognised slaughter houses
Sheep and goats
5 ^
Pigs
t?3
Total
» ffk 3 ira
oWdtj66'
3fiiP>TOyu
H ftm rsT
H3TUH
Ufe>HTST
1965-66
1970-71
1975-76
1980-81
1983-84
1984-85
1985-86
1986-87
1987-88
1988-89
District— 1988-89 Gurdaspur
Amritsar
Kapurthala
Jalandhar
Hoshiarpur
Rupnagar
Ludhiana
Firozpur
Fan'dkot
Bathinda
Sangrur
Patiala
77 2,72,802 4,923 2,77,725
79 4,62,443 11,629 4,74,072
84 4,53,964 11,442 4,65.406
89 4,47,296 14,563 4,61,859
91 4,21,771 22,493 4.44,264
91 4,71,441 22,747 4,94,188
91 4,89,918 22,754 5,12,672
91 4,57,650 23,762 4,81,412
91 3,82,844 23,892 4,06,736
91 3,73,903 25,611 3,99,514
11 22,580 2,705 25,285
7 88,283 135 88,418
3 13,339 532 13,871
7 13,701 126 13,827
9 15,570 614 16,184
4 8,847 2,608 10,915
6 87,972 6,512 94,484
7 26,445 1,545 27,990
7 30,156 2,309 32,465
i i 28,394 2.294 30,688
9 20,973 1,593 22,566
10 17,643 5,198 22,821
RTU^: — u g yflTg ,
5<>«rCff:—D irector, Anim al Husbandry, P uaia b.

274
Year
U H > H § 1 ^ 1
LIVESTOCK, ANIM AL H USBANDRY AND DAIRYING
HTg s ] i 2 . 1 9 — ^ feFT Table 12.19 — Sbare of Livestock in the Net State Domestic Product, Poojab
w i n UH q?;
Percentage share o f Live-Stock in the Net State Domestic Product
At Current Prices
19 8 0 -8 1
At 1980-81 Prices
0 1 2
1980-81 15-56 15-56
1981*82 14-67 15-47
\9M-H3 14-40 15-44
1983-84 14*99 16.05
1984-85 13 -97 J5-54
1985-86 12-65 15-57
1986-87 12-77 15-95
1987*88 . . . 12-90 15-811988-89 . . . 12-89 15 69
RTTO »fer3T H g i3 ^ U tF 3 I
Source:—Econonuc and Statistical Orgamsation, Pimiab*
§l.'9c'3 ]9 £ C -8 l) ^ pfrgrfe§ hIhI T (>H’UTg 1970-71) t ^
Note :—Two above estimates relate to new series with base (1980.81) and replaces the existing series with base (1970.71) given in the earlier statistical Abstract of Punjab.
t Quick Estimates
argTH f^cjTH
fen uf sl>)iT ujamTH ^ w3 33 3* i988- 89 ifs[ imtg fggy e i c ’H § «^E R co ^ c l tJc^ >>!§ Sort ^ F ftC B l | 13,3 f ^
f^ n nsTiH >«tilc5 >ni$ bb:h » i§ »»§ f s n r sHh 3* ^ 3 t§ 3 » |T gT ^^ ^
f3i3^ 9 l 13.4 Htb 1987-88 iftlTg H3Ht cll03 I 13.5 un rf^H gi§ u s i
SECTION x m
RURAL DEVELOPMENT
The first two tables in this w ection give information regarding Government expenditure incurred on the Rural I>cvelopiiient Programme in the Punjab and People’s contribution since the inception of t he programme up to 31-3-89. Table 13.3 shows the number of blocks functionmg, area and village covered and the population served in the Punjab district-wise. Table 13.4 shows the district-wise stlecttd Economic Indicators for the year 1987-88. Table 13.5 shows the district-wise number o i Focal Points in the State.
275
13


fesT H
RURAL DEVELOPMENT
m
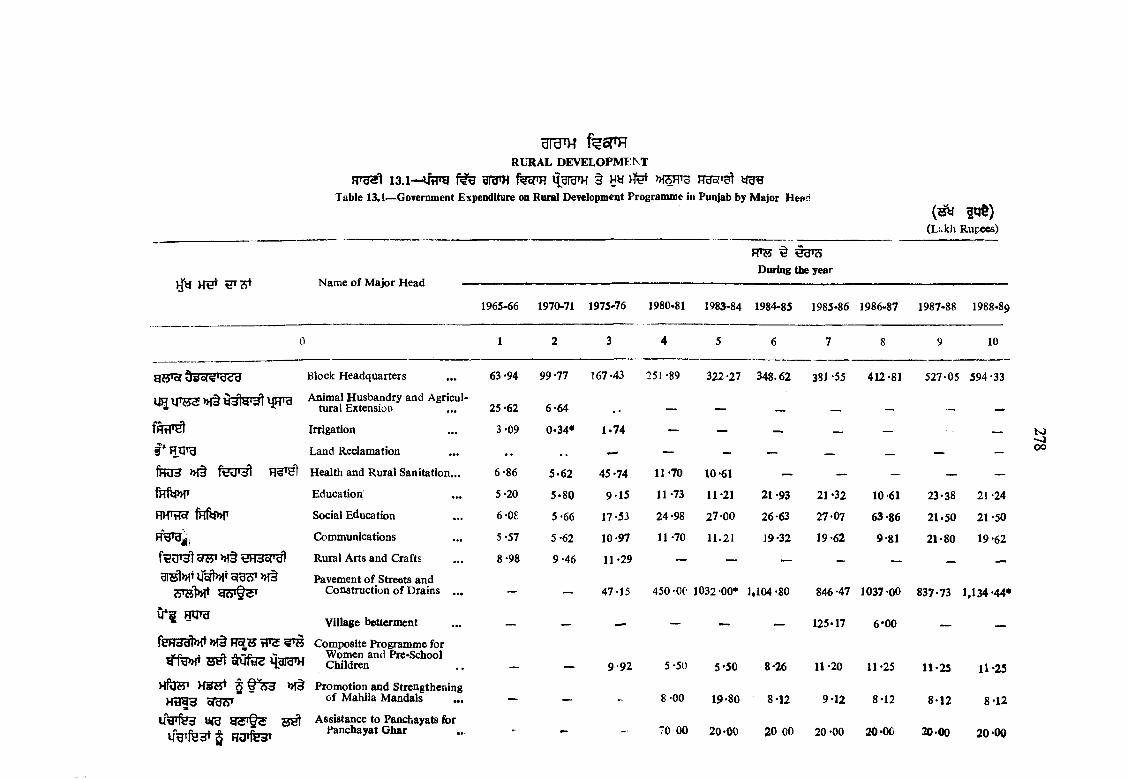
a r a m f e o p H
RURAL DEVELOPM ENT
13.1— UtTO 3ram feoTH § W > ET yy r ngsfi yggTable 13.1— Government Expenditure on Rural Development Programme in Punjab by Major Head
(Lakh Rupees)
During flie yearm
Nam e o f Major Head —
1965-66 1970-71 1975-76 1980-81 1983-84 1984-85 1985-86 1986-87 1987-88 1988-89
0 1 2 3 4 5 6 7 8 9 10
Block Headquarters 63 -94 99 -77 167 -43 251 -89 322 -27 348.62 381 -55 412-81 527-05 594-33
u i UTH3 »{§ Animal Husbandry and Agricultural Extension 25 -62 6-64 __
fHtpyl Irrigation 3-09 0*34* 1.74 — — — — — —
§ * H trg Land Reclamation — — — — — __ — —
fHUii >h9 f € ( F ^ Health and Rural Sanitation... 6-86 5*62 45-74 11-70 10 -61 — — — —
fF r iw Education 5-20 5*80 9-15 11 -73 11-21 2! -93 21 *32 10'61 23-38 21 -24
HH'Hof t n f t w Social Education 6-08 5-66 17*53 24 -98 27-00 26-63 27-07 63 -86 21-50 21 -50
Communications 5-57 5-62 10-97 11 -70 11.21 19-32 19-62 9-81 21-80 19-62
yw> >H§ SR35fTg! Rural Arts and Crafts 8-98 9-46 11 -29 — — _ —
3i^»iTirofi»|Tsra?r>H§ Pavement o f Streets and Construction o f Drains . .. ~ — 47-15 450 -OC 1032-00* 1*104 -80 846 -47 1037 -00 837-73 1,134-44*
0 * f HU»dV illage betterment - __ ■MM 125-17 6*00
feHdy)>Ht >H§ t r s ^
^ufd<i M ara^
Com posite Programme for W omen and Pre-School Children 9 -9 2 5-50 5-50 8-26 11-20 11-25 11-25 11-25
HfO«' » !§ Prom otion and Strengthening H H 53 bfg[<S* M ahila M andals . .. --- __ 8-00 19-80 8-12 9-12 8-12 8 -1 2 8-12
u w f e 3 ura y % ife 3 * 5 H orfear
Assistance to Panchayats for Panchayat Gbar - - 70 GO 20-00 20 00 20-00 20-00 20-00 2 0 -0 0
TO
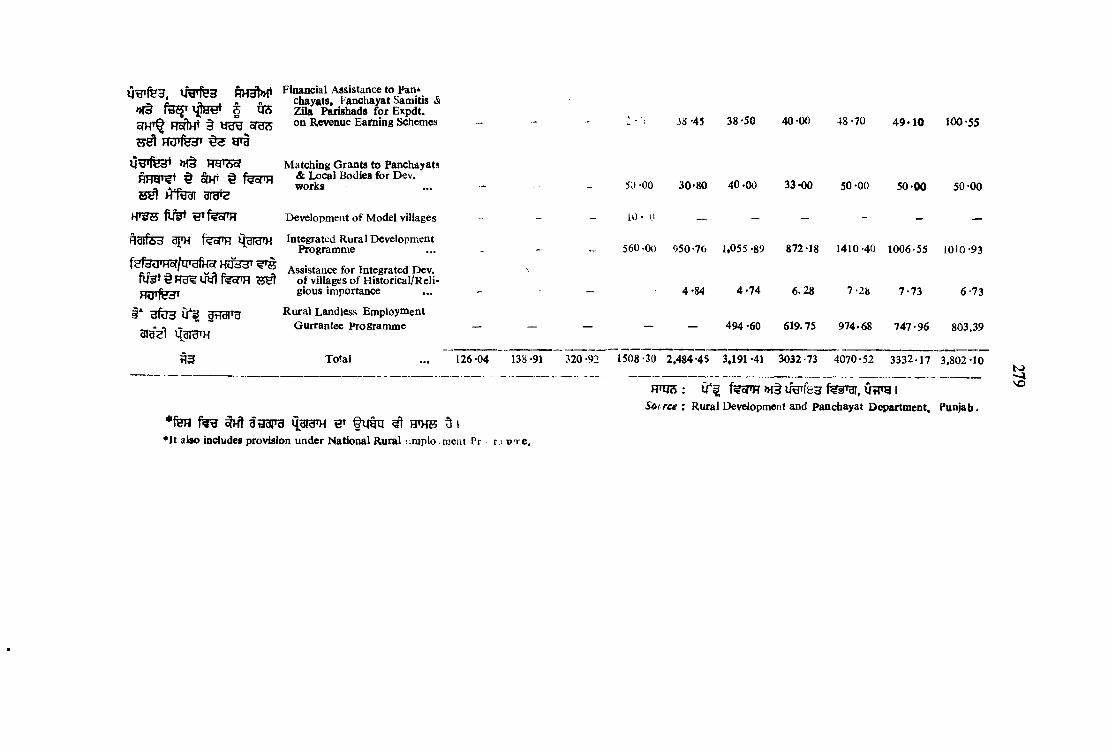
nvn^tort Financial Assistance to Pan*^ r chayats, Fanchayat Samitis &>Hd i 5 ^ S TO Zila Parishads for Expdt.oTH^ § yU U oTg S on Revenue Earning Schemes - - - • 3 8 - 4 5 38*50 40-00 48-70 4 9 * 1 0 100-55
lit i f fe d ' Matching Grants to Panchayatsflo Hia t d ^rur d f e r m & Local Bodies for Dev.
^ 40-00 33*00 50-00 5 0 -00 50-00
H J3S fife* BTfeoPH Development o f Model villages — - - 10 • 0 — — — - _ —
^ 3 lfe 3 3PH fecPH QgTHTH Integrated Rural Development ^ Programme ... - _ _ 5 6 0 -Od 050-76 1,055-89 872-18 1410-40 1006-55 1010-93
Assistance for Integrated Dev. ^H rsfof'H o f villages o f Historical/Reli-
gious importance . .. - - — 4-84 4*74 6-28 7 -28 7 -7 3 6 -73
i* 3 fU 3 gnaiTar Landless Employmento ~ Gurrantee Programme __ _ _ _ _ 494-60 619-75 974-68 747-96 803,39
o l 9 o Udld'H
t?3 Total . .. 126-04 138-91 320-92 1508-30 2.484-45 3,191-41 3032-73 4070-52 3332-17 3.802-10
f p m : f ? o r H » f § i i^ f e 3 f ? 3 T g r , 0 ? T ^ iSitirce : Rural Development and Panchayat Department, Punjab*
* fe R ^ ^ jjth h 5 ,
•It also includes provision under National Rural uraplo meat Pr r i x?Te.
VO
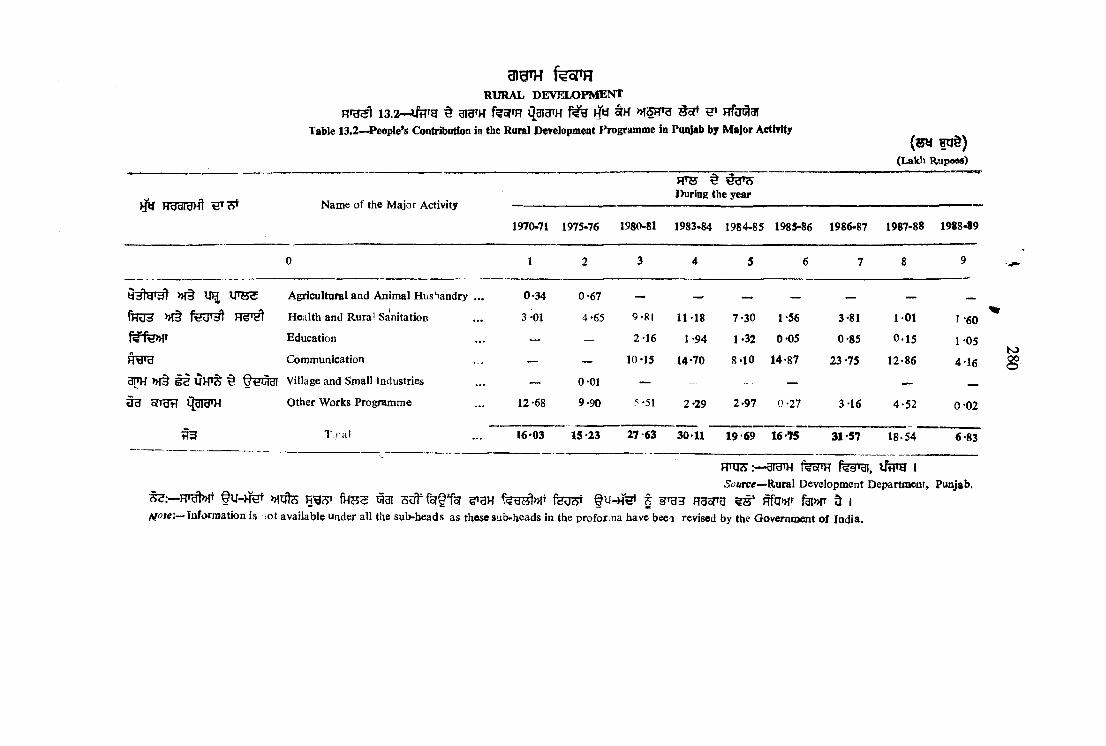
a i g n r f e g n i
RURAL DEVELOPM ENT
^ ffofTR »f§prcr RfoiSgr
Table 13.2—People’s Contribution in the Roral Development Programme in Pqqjab by Major ActivityH U §)
(Lakh Rupees)
yj^ Hgara>fl Nam e o f the Major Activity
r m ^During the year
1970-71 1975-76 1980-81 1983-84 1984-85 1985-86 1986-87 1987-88 1988-89
0 1 2 3 4 5 6 7 8 9
» f§ u e u 'w e Agricultural and Anim al Husbandry ... 0-34 0-67 — — — — —
f t o » f§ f y ^ Health and Rural Sanitation 3-01 4*65 9-81 11-18 7-30 1-56 3-81 1-01 J -60
f«Sf€>HT Education — — 2 16 1-94 1-32 0-05 0-85 0-15 1-05
HW 3 Communication — — 10-15 14-70 8-10 14-87 23 -75 12-86 4-16
3 W ^ ^ Village and Small Industries __ 0-01 — - — —
g g oTrgH iJdfd'H Other Works Programme 12-68 9-90 5*51 2-29 2-97 0-27 3-16 4 -52 0-02
T j a l 16-03 IS 23 27 63 30 11 19*69 16-75 31-57 18-54 6-83
FfnjS3THTH |Source—Rural Developm ent Department, Punjab.
fU -H €t fH?55 1331 fV -yfei | gfH3 Ff3c?T3 ^q>Hr f3I»T d IInformation is ot available under all the sub-heads as these sub-beads in the profor na have b ee i revised by the Government o f India.
ls>00O
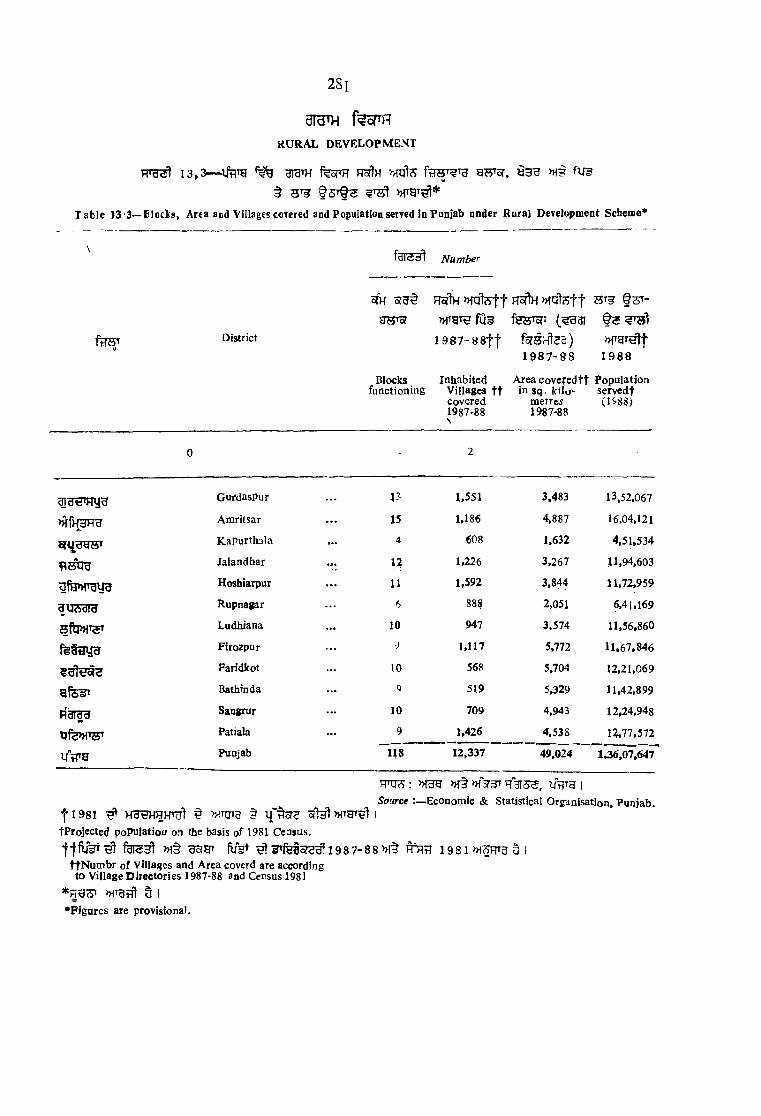
3 r a n i f e p H
RURAI. DEVELOPM ENT
1 3 . 3 — gi gi H feoTR HcftH fU ^' a§ § 3 T f s » f g T ^ *
T ab le 13 3—Blocis, Area and Villages coTered and Population served in Punjab nnder Rural Development Scheme*
28i
fdl<id! Number
ff?ST District
olH Ho/Ih n fq f e f t § 3 ^ -
gHToT » p g T H f0 5 f e s T ^ ( ^ 3 1
1 9 8 7- 8 8 f t f^SHt^d ) »fgT^-|-1987-88 1988
Blocks Inhabited A rea co v e fed tt Populationfunctioning V illages f t in s q .k ila * servedf
covered m etres (15'88)1987-88 1987-88
0 i 2
GurdasPur . . . V> 1,551 3,483 13,52.067
Amritsar . . . 15 1,186 4,887 16.04,121
oT i£H W KaPurthala . . . 4 608 1,632 4,51,534
n tt ir a Jalandhar 1.226 3,267 11,94,603
Hoshiarpur . . . 11 1,592 3,844 11,72,959
3u?>dia Rupnagar . . . 6 888 2,051 6,41,169
5ftp>nST Ludhiana . . . 10 947 3,574 11,56,860
Firozpur . . . 9 1,117 5,772 11.67,846
Faridkot . . . 10 568 5,704 12,21,069
8f5d> Bathinda . . . g 519 5,329 11.42,899
Rdidd Sangrur . . . 10 709 4,943 12,24.948
c f e n i w Patiala . . . 9 1,426 4,538 12.77,572
Punjab 118 12,337 49.024 1 3 6 ,0 7 ,6 4 7
: M O T > H § » T3 ?3 T |
Source Economic & Statistical Organisation, Punjab.f 1 981 ^ ^ MnjTg § w g r ^ l I
tProjected poPuIatiou on the basis of 1981 Census.
fiisT ^ l 3 ^ f e S o f e ^ l9 8 7 - 8 8 » 1 § 1 9 8 l» < 3 H T g 5 ]tfN u m br o f Villages and Area coverd are according to Village D irectories 1987-88 and Cersus 1981
♦Figures are provisional.
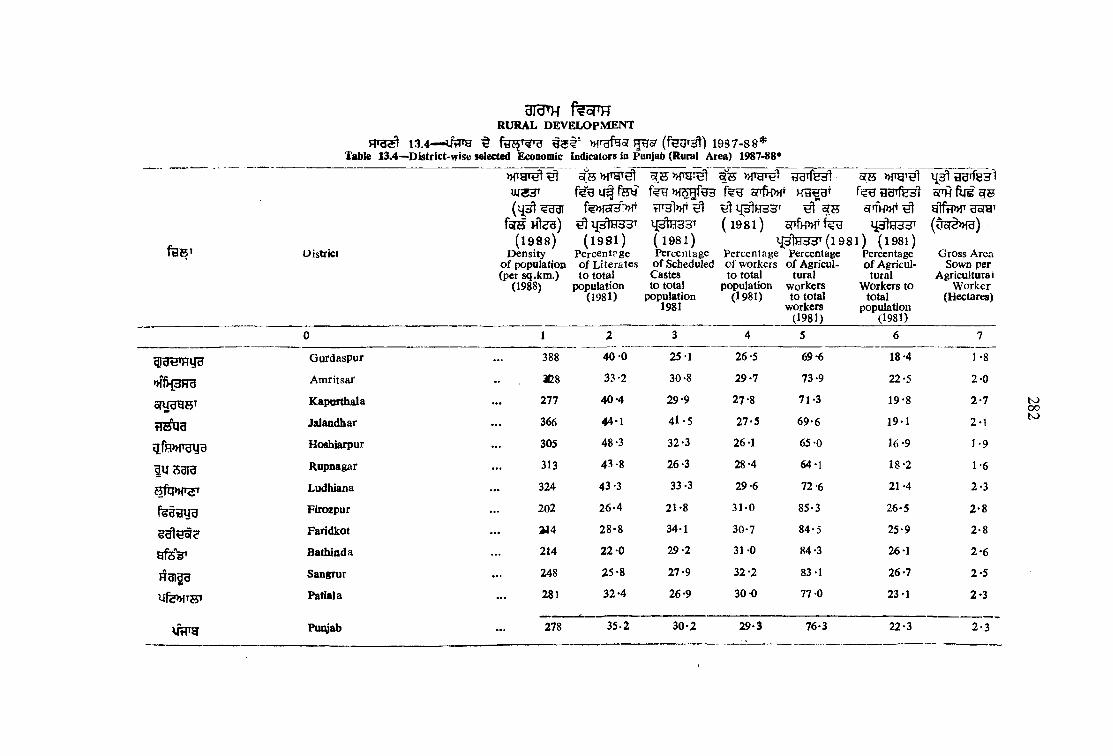
f a s ’
f e P HRURAL DEVELOPM ENT
13. 4— ^ »T ^ g5? HB5T (feU T ^ ) 1 9 S 7 - 8 8 *Table 13 .4~D istrict-w ise selected Economic Indicators in Punjab (Rural Area) 1987-88*
District
t ld 'fe d l
4 3 t e 3 T
UI33T u f f e y onfH»fT HtreBT( 43^^931 feMoTHtw tr a l,v fT ^
foJH H t2g) IJSlWdd’ ( l 9 8 l ) o n fH » T f^( 1 9 8 8 ) ( 1 9 8 1 ) ( l 9 8 l ) ^j[3lH33T ( l 9 8 1 ) ( l 9 8 l )
D ensity Percent? ge Percentage Percentage Percentage Percentage o f population o f L iterates o f Scheduled c f workers o f Agricul- o f Agricul- (per sq .km.) to total Castes to total tural tural
(1988) population to total population workers Workers to (1981) population (1981) to total total
1981 workers population(1981) (1981)
v{5f1 ir a if e n l o T H fu g g © g l f t w B o r a ’ ( 3 ^ ^ )
Gross Area Sown per
AgriculturaJ W orker
(Hectares)
0 1 2 3 4 5 6 7
G ufdaspur . . . 388 40 0 25 1 26 -5 69-6 18-4 1 -8
Am ritsaf m 33-2 30-8 29-7 73 -9 22-5 2-0
Kapnrthala 277 40-4 29-9 27 -8 71-3 19-8 2 -7
tiifU d Jalandhar 366 44-1 4 1 -5 2 7-5 69-6 19-1 2-1
Hoshlarpur . . . 305 48 -3 32-3 26 -1 65-0 16-9 1 *9
lujsara Rupnagar . . . 313 43 -8 26 -3 28-4 64-1 18-2 1*6
Ludhiana 324 43 -3 33-3 29 -6 72*6 21 -4 2*3
f e g g y g Fircapur 202 2 6-4 21*8 31-0 85-3 26-5 2 -8
Faridkot 214 2 8 -8 34-1 30-7 84-5 25-9 2-8
Bathinda 214 2 2 -0 2 9-2 31-0 84-3 26*1 2 -6
R 3 I |^ Sangrur 248 2 5-8 27 -9 32 -2 83-1 16-1 2 -5
Ufe>HTHt Patiala . . . 281 3 2-4 26-9 30 0 77 -0 23-1 2*3
UH'y Puiyab . . . in 3 5 .2 30*2 2 9-3 76-3 22*3 2 -3
K)oot o
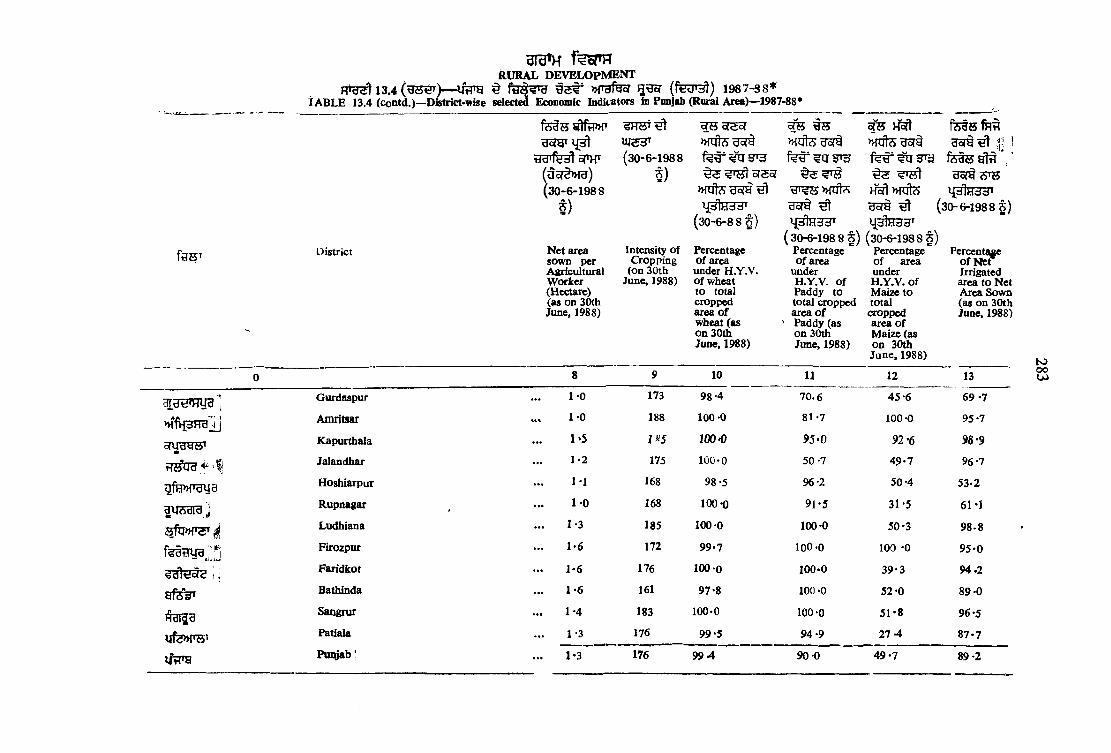
lABLE
RURAL DEVELOPMENT13.4 ^ » r a f g ^ g g g ( f e n ^ ) i 9 8 7 - s 8 *
13.4 (contd.)—District-wise selected Eoooomic Indicators in Punjab (Rural Area)—198'1987-88*
District
fcs j s ¥tftP>f
iH r fe ^ E p > r(uqr^»ra)(3 0 -6 -1 9 8 8
S)
Net area sown per Agricultural Worker (Hectare) (as on 30th June, 1988)
(3 0 -6 -1 9 8 8
S)
Intensity o f Cropping
(on 30th June, 1988)
^ jlw d dT ( 3 0 - 6 - 8 8 t )
Percentage o f area
under H.Y.V. o f wheat to total cropped area o f wheat (as on 30th June. 1988)
^ B 3
y r ^ » n i h s
(3 0 -6 -1 9 8 8 § ) Percentage o f area
under H.Y.V. o f Paddy to total cropped area o f
' Paddy (as on 30th June, 1988)
fe ts y fr lr l
lj5tH33T
USra ^ (3 0 -6 -1 9 8 8 5 )l { 3 t e d T
(3 0 -6 -1 9 8 8 § ) Percentage ~ of area under H.Y.V. o f Maize to total
cropped area o f Maize (as on 30th June, 1988)
Percentage o f N e r Irrigated
area to Net Area Sown (as on 30th June, 1988)
0 8 9 10 11 12 13
Gurdaspur 1 *0 173 98 -4 7 0 .6 45 -6 69 *7
mlVldHdXiAmritsar 1 *0 188 100-0 81*7 100-0 95 -7
Kapurthala 1 *5 100*0 95*0 9 2 ’6 9 8 ’9
iTS'Ud t '1 Jalandhar 1 -2 175 100*0 50 -7 4 9-7 96-7
Hoshiarpur 1 *1 168 98 -5 96-2 50*4 53-2
fU A d ld J Rupnagar ^ 1 0 168 100-0 91-5 31-5 61-1
Ludhiana 1 -3 185 100 0 100-0 50-3 98-8
Firozpur 1-6 172 99-7 100 -0 100 *0 9 5 -0
i-i Faridkot 1-6 176 100-0 100-0 39*3 9 4 .2
Bathinda 1 -6 161 97-8 100 -0 52-0 89 -0
Sangrur 1 -4 183 100-0 100-0 5 1 -8 96-5
Patiala 1 -3 176 9 9-5 9 4-9 2 7 -4 8 7-7
i f f r a Puiy'ab' 1-3 176 9 9 4 9 0-0 4 9 -7 8 9-2
tooou>
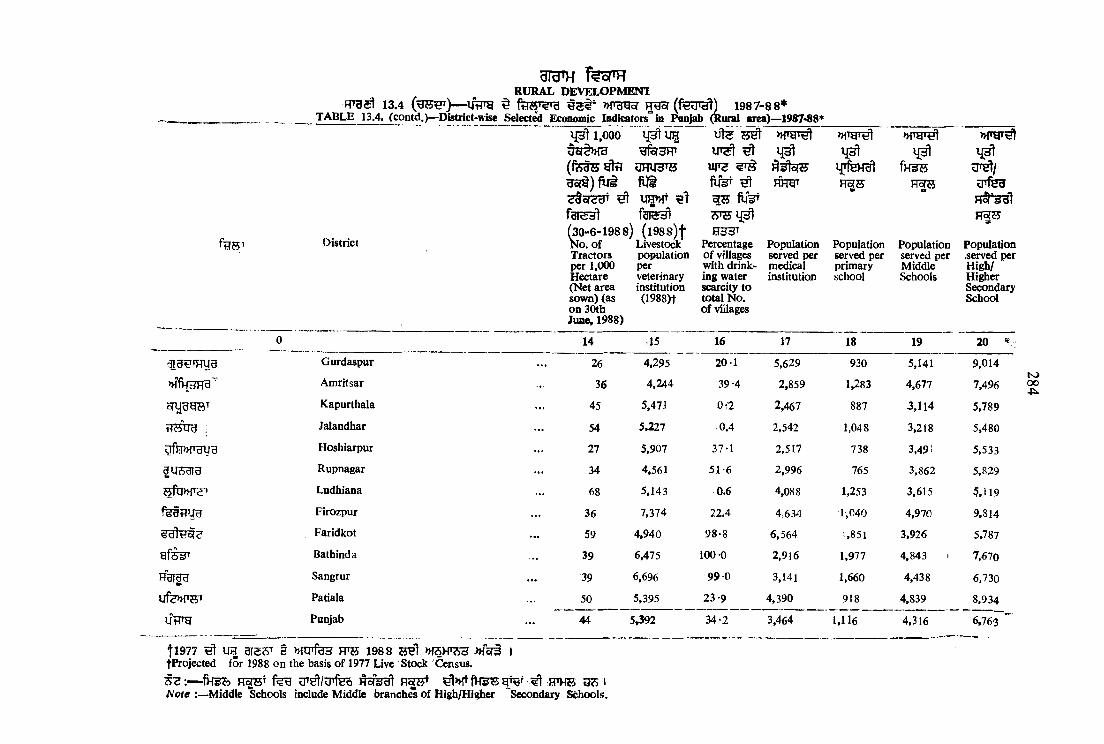
p p a d 13.4 ^TABLE 13.4. (contd.)— D istrict-wise S e lec t^ Economic Indicators'^ in Punjab
I p 1 ,000 UH^5?^ A sm( f^ d tt Wlfl iJHUd'fii
m
(30-6-1988) ( l9 8 s ) fOistricf N o. o f L vestock
g r a m f e mRURAL DEVELOPMENl
1987-88* ural area)—1987-88*
Tractors per 1,000 Hectare (Net area sown) (as on 30tb June, 1988)
populationperveterinaryinstitution(1988)t
HsHoTttflfer ^ HHy'
H53TPercentage Populationof villages served perwith drink medicaling water institutionscarcity tototal N o.Of villages
FTSH
Population served per primary school
U s e
» fig T ^
U ^ /
H ^ 3 g 1R 5fS
Population Population served per served perMiddleSchools
High/ Higher Secondary Sdiool
0 14 ,15 16 17 18 19 20
Gurdaspur 26 4,295 20 1 5,629 930 5,141 9,014
Amritsar 36 4,244 39 -4 2,859 1,283 4.677 7,496
Kapurthala 45 5,471 0-2 2,467 887 3,114 5,789
f i s n g ; Jalandhar 54 5,227 0.4 2,542 1,048 3,218 5,480
o fH w u ijg Hoshiarpur 27 5,907 37-1 2,517 738 3,491 5,533
a u s g j g Rupnagar . . . 34 4,561 51-6 2,996 765 3,862 5,829
Ludhiana 68 5,143 0.6 4,088 1,253 3,615 5,119
Firozpur 36 7,374 22.4 4,634 1,040 4,970 9,814
Faridkot 59 4,940 98-8 6,564 1,851 3,926 5,787
Bathinda 39 6,475 100-0 2,916 1,977 4,843 t 7,670
Sangrur . . . 39 6,696 99 0 3,141 1,660 4,438 6,730
ufe>KT?F» Patiala . . . 50 5,395 23-9 4,390 918 4,839 8,934
Ur<'y Punjab 44 5.592 34-2 3,464 1,116 4,316 6,763
f l9 7 7 u e FF5 1 9 8 8 HHI >H5HtS 3 W r a ItProjected for 1988 on the basis o f 1977 Live Stock Census.
R ^ T Hof%^ ^>HT ^ m \ B 3 3 tN ote :—Middle Schools include Middle branch^ o f High/Higher Secondary Schools.
N>00

13.4 TABLE 13
(HHnjH)— ^ fg^T^«g »T9fg5r (fgur^)— 1987-88*.4 (concld.)—‘District'Wtee selected Economic Indicators in Punjab (Rural area)—1987-88*
3rgn fe r'BKURAL DEVELOPMENT
D istrict
0 21 22 23
Gurdaspur 100-0 14 15,023
»ffkdH d Amritsar 99-3 95 8.624
oTifgyid' Kapurthala 90-3 157 10,501
fiHcra Jalandhar 100-0 222 10.860
^ifH>»TOy3 Hoshiarpur 97-7 204 11.278
fu sa T b Rupnagaf 97-1 170 13,358
i§ru>nTar Ludhiana 99-3 227 10,237
fS d t iy 3 Firozpur 85-1 82 15,167
Faridkot 100-0 132 9,181
Bathinda 100-0 125 11,205
PP3IB3 Sangnir 100-0 236 10.840
Patiala 9 9-2 97 13,737
OrlTg Punjab 97-4 117 11,227
♦>HS >H3H (fR?T§ snZJH 2 3" 6 H’U6 >H§ »Tc♦provisional (Except col. 2 to 6) Source :—Econom ic and 1
H3oTt Urgcf
Mfgfetf’ig g ‘or fu i
(31-3-88)
(30-6-88 J)Percentage o f Members o f Population villages Co-operative served perlinked with Societies Commercialpucca roads per 1,000 o f Bank (as
population on(as on 30-6-88) 31-3-88)
HTUfsr?
oTK t fa i
(€ 3 3 1 far: fH O
Area served per Market Committee
(sq. K .M .)
Population served per Post OfBce
24 25
53 -6
4 7 -0
,48 -0
46-0
48-7
102-3
45-8
6 7-9
67-1
79-5
41 -9
58 -2
5 4 -4
4.778
3,526
3.202
2,703
2,7993,542
3.474
4,055
3,706
5,772
4,9595,603
3,839
rsio o

286
RURAL DEVELOPMENT
1 3 .5 - 1 9 8 8 - 8 9 5 fsTH W f e e TABLE 13 -5—Focal Points In Punjab by Districts in 1988-89
District rdi<*3]Number
0 1
Gurdaspur 37
»ff}i3T O Amritsar 46
oTuyy^s’ Kapurthala 12
tTMUy Jalandhar 34
UfB»TOUU Hoshiarpur 47
^ (sy i'd Rupnagar 18
srq>HT^T Ludhiana 28
Firozpur 27
Faridkot 30
53f6^' B athind) 27
H'dldd Sangrur 30
qfe>H'W' Patiala 26
Total 362
f^oPH i/^|Tg |
Source Rural Development Departmeat, Punjab.

287
A H
r?R I?TU3fj>>TT H W T y q r H f ^ »HltS ^ H f9^ 3 r^ 5 I
HTH31 14.1 ifflTg h HU HfU5?Tu] H ^ ? t ^ fgrS H T SfT3f[ iJtTt ^HTf€ H 3 R r ^ ^ 9 !
Rth^ 14.2 RTJ5 198 7- 88 qgTHt ^ T T 5 I
14 3 14.4 yH lgr^ t FT^T f U.ua; RH??t ^iJTT'f**
g1>HT ?T§'f5f HTUel^T 14,5 »^§ 14 6 H $ e Hr3?3IiR H g^l I
F|ru3l»)ir 14.7 H .g 3ra nf^Jifrgt g^c?t ^7 RHJjr § g g ^ l UTf"^>:TT UJ? I
HTU31MT 14.9 H" 14.21 ^ f^HH HfUSfT^I f f l i ' f ^ . R S HRrfHSlg
»1ff5 UT§^et»lT I RTg^l 14,22 f^iSfaTor M ^ » ! *
§ 9 I
R t g ^ 14.23 R ^ 3 ^ R^rfeHr J?rj5 ^ 1
Rrg^T'H’ 14 .24 >H§ 14.25 ^ 5 ^ 1 Rfn^rgl g ^ t § y n l , TTRt gSfRi, J>1§HIJ^
HURTfH»iT fgi^T 9 i
RTU5!l 14.26 Hh " niOTrg yH lgr^ l 'cJott # 8 fH>>!Te ^Rf5l ^ >H5rf3>HT ?5T?f
RgijH 5 I
fOT Rsrg^? M ori RftrsrTgl r t ^ ( i 1 751 1 t 30 ^ sr) R g g n U 3 1
SECTION XIV
CO-OPERATION
The tables in this section show the working of the Co-operative movement in Punjab.
Table 14.1 gives the number, membership and working capital etc., of all Co-operative Societies in Punjab.
Table 14.2 shows the district-wise distribution of Co-operative Societies and Banks for the year, 1987-88.
Tables 14.3 and 14.4 depict the important information regarding Primary Agricultural and No of Agricultural Credit Societies whereas the information contained in tables 14.5 and 14.6 is related to State and Primary Land Development Banks in the State.
Tables 14.7 and 14.8 reflect information regarding Central and State Co-operative B inks.
Tables 14.9 to 14.21 throw light on the important activities of the different types of the Co-operativj S ocieties in the State such as Marketing Federation, District Wholesale Societies, etc.
Table 14.22 shows the selected indicators relating to Industrial Co-operatives.
Table 14.23 depicts the riiimber of Tractors and Tube-wells financed by the State Land Development Bank.
Tables 14.24 and 14.25 give description of Central Co-operative Bank Offices, Membership Capital, Deposits, Liabilities and Assets.
Table 14.26 relates to the Statistical Information relating to loans over-due against Agricultural Credit Societies (Periodwise).
Tbfl data in this section relate} to tlie Co-operative yeir, trona 1st July to 3Jth June

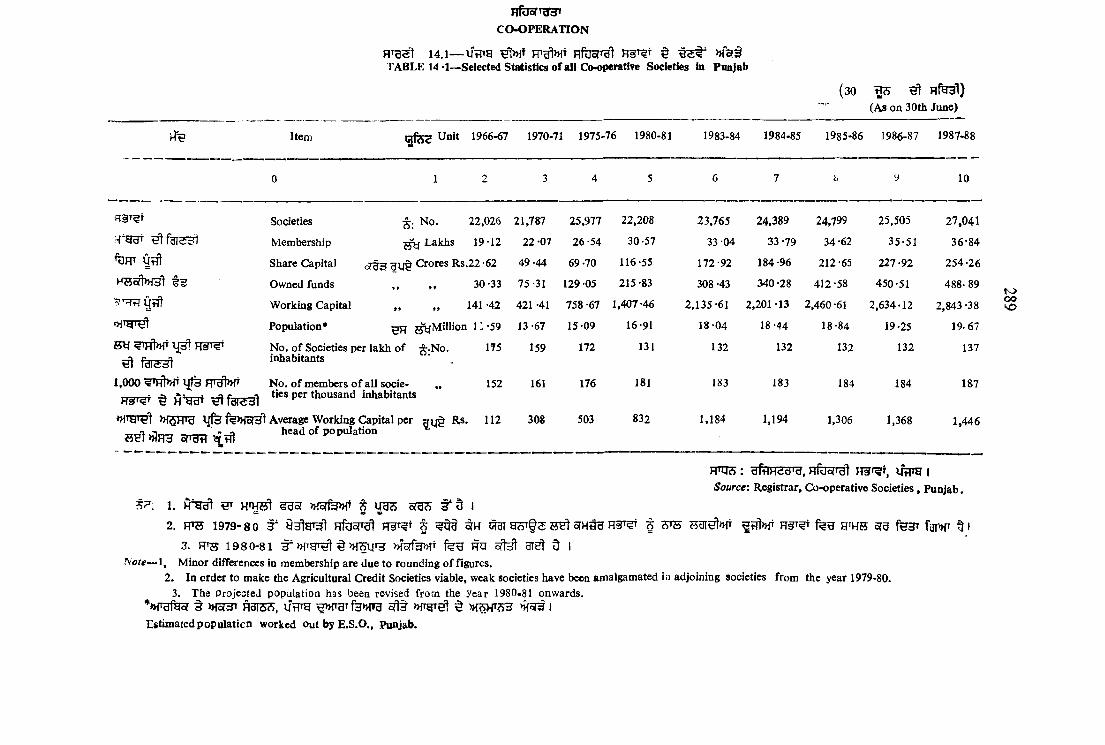
Item
HfUofT^gr
CO -O PERATIO N
14.1— U > g F f e r g l h ^ t t § >h"o}3TABLE 14 *1— Selected Statistics o f all Co<operati?e Societies in Paojab
(30 ^ ^ n fg 3 l)(As on 30th June)
Unit 1966-67 1970-71 1975-76 1980-81 1983-84 1984-85 1985-86 1986-87 1987-?
10
R§T^T Societies N o . 22.026 21,787 25,977 22,208 23,765 24,389 24,799 25,505 27 ,041
H y d ' Membership Lakhs 19-12 22 -07 26-54 30-57 33-04 33 -79 34-62 35-51 36*84
Share Capital Crores R s.22 -62 49 -44 69 -70 116-55 172-92 184 -96 212-65 227 -92 254 -26
Owned funds , , , , 30-33 75 -31 129 -05 215 -83 308 -43 340 -28 412 -58 450-51 488-89
ytTt Working Capital , , , , 141-42 421 -41 758 -67 1,407-46 2,135 -61 2,201 -13 2,460 -61 2,634-12 2,843 -38
Population* ^ j^ M illio n 12-59 13-67 15-09 16-91 18-04 18-44 18-84 19-25 19.67
^ fdlS'Sl
N o . o f Societies per lakh o f ^ -N o . inhabitants
175 159 172 131 132 132 132 132 137
1,000 RTgt>HT N o. o f members o f a ll socie- ,, ties per thousand inhabitants
152 161 176 181 183 183 184 184 187
^jfe Average Working Capital per Rs. head o f population
112 308 503 832 1,184 1,194 1,306 1,368 1,446
: ufkH3d'^, HfUcPut Ifflrg ISource: Registrar, Co-operative S o c ieties, Punjab.
5?: 1. ^ ^ 0? >»foffe>HT ^ U gs Ien s s
2. W B 1 9 7 9 -8 0 ^ HfooTT^ Pfgr^i § ^ s d SfHSH f 3 t S R § t ^ f e g h^hB sra f e g r fgj»fT
3. RT^ 1 9 8 0 - 8 1 T ^ f e g Rci Bfe”! a r ^ 5 i
^o te— 1, Minor differences in membership are due to rounding o f figures.2. In order to maice the Agricultural Credit Societies viable, weak societies have been amalgamated in adjoining societies from the year 1979-80.
3. The Projected population has been revised frotn the year 1980.81 onwards.§ » fo r^ R 3I3S, U tirg H>HT3TfH>HTa »fTgT^ § >H5r3 I
Estimated population worked out by E.S.O ., Punjab.
K>o o
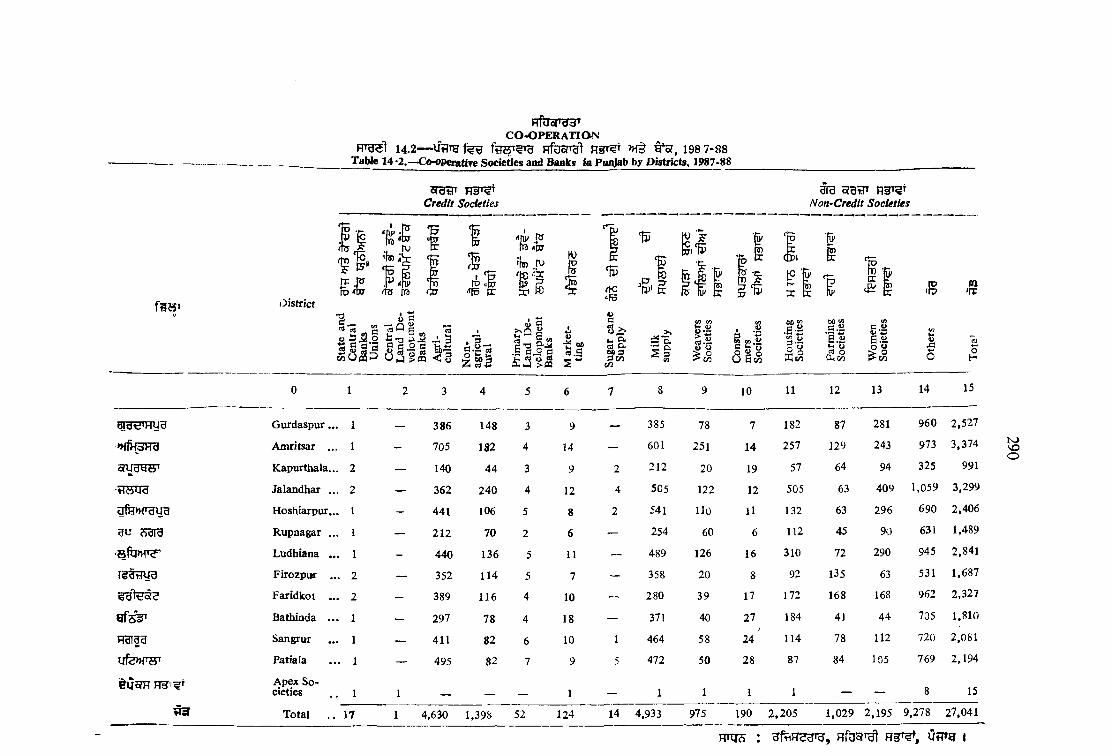
H fU oT W C O -O P E R A T ia N
14.2-~U H T g H fooral M § i* o f, 198 7 -8 8Table 14*2.~Co-oi>eBatire Societies and Banks io Punjab by Districts, 1987-88
cratnCredtt Societies
Uig ojgtIT Noti'Credit Societies
District
no
§ <».s5 S 36
CtDi e
\ 9 ft~*r
X tr O'
60.S -- C.S
S .«bca o few
1d: S'
^ fi)
c,s>BS. o o > o l^cn
'[?
J3o
m'rr
0 1 2 3 4 5 6 7 8 9 10 11 12 13 14 15
G urdaspur... 1 — 386 148 3 9 — 385 78 7 182 87 281 960 2,527
♦HfHdHd Amritsar . .. 1 - 705 182 4 14 — 601 251 14 257 129 243 973 3,374
oTUdtltt’ Kapurthala... 2 — 140 44 3 9 2 212 20 19 57 64 94 325 991
•t<i5Ud Jalandhar ... 2 — 362 240 4 12 4 505 122 12 505 63 409 1,059 3,299
Hoshiarpur... 1 - 441 106 5 8 2 541 n o 11 132 63 296 690 2 ,406
3U Adld Rupnagar ... 1 — 212 70 2 6 — 254 60 6 112 45 90 631 1,489
Ludhiana . .. 1 - 440 136 5 11 — 489 126 16 310 72 290 945 2,841
Firozpur . .. 2 — 352 114 5 7 — 358 20 8 92 135 63 531 1,687
Faridkot . . . 2 — 389 116 4 10 — 280 39 17 172 168 168 962 2,327
o f ; ^ Bathinda . . . 1 — 297 78 4 18 — 371 40 27 184 41 44 705 1,810
R3133 Sangrur . .. 1 — 411 82 6 10 1 464 58 24 114 78 112 720 2,081
y fe » fw Patiala . . . i — 495 82 7 9 5 472 50 28 87 84 105 769 2.194
§ y cm RgT^t Apex Societies . . 1 1 __ --- __ 1 — 1 1 1 1 — — 8 15
T otal . . 17 1 4,630 1,398 52 124 14 4,933 975 190 2 ,2 0 5 1,029 2,195 9,278 27,041
\ oo
RTIJS : UH»g I

H f b o T Wc o - o p e r a t i o n
F T ^ 1 4 . 3 — o T ^ ^Table 14.3.—Selected statistics of Primary AgricHltural Credit gometiee in Punjab
( 3 0 ^(As on 30th June)
Item ^r<yd Unit 1970-fl 1975-76 1980-81 1963-84 1984-85 1985-86 1986-87 1987-880 1 2 3 4 5 6 7 8 9
Societies N®. 10,932 10,976 4,266 4,270 4,240 4,235 4,235 4,630
M em bership Lakhsi 14-64 16-23 17-84 18-78 18 -84 18-96 19-30 19-47
y tf l Share Capital sTy 3 U § Lakh Rs.
1,120-08 1,745 -34 3,517 -45 4658 -29 5,017-47 5,229 -33 5,544-66 5,671 -56
Owned Funds 1,856-32 3,040-26 5,646-00 8,172-38 9,119-23 11,536 07 11,526-31 11,881 -54
of'dtl Utft W orking Capital 7,650-3-2 ;10,942-17 23,124-37 37,894-14 36,556 -09 40,248 -24 47,028-72 49,771 -27
t7HT BoTHT D eposits t> •« 1,786 -88 2,338 -81 2,463 -27 2,926-14 3,198-77 3,429 -33 3,812-07 4,326 -83
gsfTfH»r § q T g Borrowing out-standing ... 3,968 -01 5,152-20 15,362 -81 26,142-12 23,451 -26 25,072-75 30,169-68 31,628-49
RTS ^ BHT3 fgPHT
ofdlJf ^ ^ 5 5fl3 5 ? ^
Loans advanced during the year
Loans recovered f» >>
5,726-59
5,633 -02
7.497 -57
7.497 -47
19,920 -65
16,323 -54
29,724-14
22,215-18
36,531 -55
36,360-59
31,219-50 31,044-49 35,231-89
30,248-63 26,495-33 33,452-72
H'K ^ » f3 § gs|TfH>HT ofdtl
1 . >H35U
Loans outstanding at the end o f the year
Short term
9* 9*
9» 99
5,197-32
4,297-116
6,754-18
6,024 -43
14,625 -88
14,025 -25
26,618 -89
25,015 -88
24,789 -85
23,299-15
25,760-72 30,309-88 32,089-05
23,408 -61*24,207 -8j 33,978 -02
2 . HH s r a l M edium term 900 16 729 -75 600 -63 1,603-01 1,498 -70 1,381 -24* 1,552-91 1,253 -87
H '» ^ M 3 § fHMT^ ofdH
Giai c(dij ^ HoTfe>HT srafe>HT cS-TS y n tesH T
Over-dues at the end o f the year
Over dues as percentage o f outstanding loan
Societies showing profit ...
99 99
99 99
N o.
2,213-52
43
8,254
3,990-96
59
6,632
5,033 -33
35
2,268
7,62] -34
29
2,206
10,065-10
41
2,298
12,502-44 13,923.8*
-‘.-j
2,236 2,088
14,173 -53
44
2,275
HcS'ijd ^ A m ount o f profit•" Pc
165 -27 233-91 344 -98 761 -39 1,351 -36 877-54 7 1 4 -S5 1,040 -94
Societies showing loss H: N o . 2.001 3,321 1,022 897 751 941 1 ,38a
^ H5?H Am ount o f lossRs.
36 -44 112-62 196 -97 312-41 180-76 320-34 448 480-
\C
Hrqcs : H fe o n ^ w g iSource .—Registrar, Co-operative SocieUes. Punjab.

a f e o p g a ’
C O -O fE ATION
14. 4— sr^t P » W 3Table 14-4.— S e h ' .d S:atatics ;'J Vimary Non-Ai;ricultural Credit Societies in Punjab
(30 ^ Hfl3^)(As on 30th June)
Itemc f e
Unit 1966-67 1970-71 1975-76 1980-81 1983-84 1984-85 1985-86 1986-87 1987-88
10
=3
c H ^ i t f l
?THT cjagr
f^>hT oTTOt
s f t e r j ^ T syggT
gopfeHT Q[HgT
TTOI E?3^ ^ gBTTf^t sruftWT cTO
^ H 3 3 t
y s r t
UTS R 3T ^
'JtfTs" ^ g o ? H
Societies
Membership
Share Capital
Owned Funds
Working Capital
Dq>osits
Loans advanced
Loans Recovered
Loans out-standing
Overdues
Overdues as percentage o f out-standing %
t :
S «
Societies showing lo ss 3 .
Am ount c^Loss
Societies show ing profitAm ount o f profit
U tr a
N o . 1,325 1,363 1,40.) 1,396 1,398 1,400 1,401 1,402 1,398
rhousands 76-56 80*94 90 -8 ) 100 -98 106 *35 108 -49 113-50 116-11 117-10
Lakh Rs. 45-45 f5 *73 73 -78 90-79 115*83 142 -55 202 *80 158-17 173 *49
*» 70-61 86-00 116-60 151-34 189 *25 232-85 306 *58 272 -78 311-39
99 182 -61 225 -29 315 -66 393 *54 557-69 778 -21 904-60 962 -92 1,190 -91
f» 37-01 59 *83 97*71 164-03 289 -58 440 -75 541*96 593-80 755 *37
9f 88 -89 96-27 124*47 100 *52 132 -26 412-80 384-38 605 -20 571 -40
ff 79*66 88 ‘99 108 *84 127 *70 99*71 273 -52 489-80 518 -07 454. 67
»» 146 12 175*01 229* 1 280 -53 418-43 557-75 593 -80 675 -80 792 -53
99 53 *91 80*29 123 *62 162-57 62 -69 1 0 0 2 184-95 300 -93 378 -72
% 36 -89 45-88 53 -91 58 -90 14-98 1 -79 31-15 44-53 4 7 -0 0
N o. 838 685 500 482 130 477 211 369 410
Lakh Rs 3-65 5*16 6*73 7-05 4 -34 16-84 8*11 21-36 29 -28
N o . 393 291 506 102 36 57 102 267 81
Lakh Rs. 1-34 1-35 3*25 5*47 0-35 1 *25 1*02 2-07 2*45
: g f tm s u r g , HfUorTgl FigT^^ |
Source > Registrar, Co-operative Societies. PuD|»t<,
MDt o

HfUoTTHBT
CO -O PER AW O N
14.5 g itl ^ 5 " " ^ 1*37 t >Ho[3Table 14 -5—Selected Statistics of State Land Development Bank
(30 ^7i(As on 30th June)
Item Unit 1966-67 1970-71 1975-76 1980-81 1983-84 1984-85 1985-86 1986-87 1987-88
10
fifeT
1. HaoTT^ ftjHT
2. 3^
UflIJ
FTS fE 3 T fgi>>iT Loans advanced during the year „
^ c7l3 T Loans recovered darin; the year „
r*T-™ ^ V.,"-, F r ^ , ^ Loans outstanding at the end FT55 H >H3 o 5i3 c?U3’ o f the year . .. „
Membership
Share Capital
Held by Government
Held by others
Owned funds \
Working Capital
S ; N o. 25 34
s y g y § Lakhs K s 43 66 277 02
18-14
42
378 -95
80-14 105-14
196-88 273-81
44 45 46 50 52 54
517-81 783-61 878-48 894-03 950-00 969-18
107-14 162-58 111-14 111-14 111-14 61-14
10-67 621-03 767-34 782-89 838*86 908-04
Amouixt o f profit
53-13 291-73 653-23 1,424-43 2,295-01 2,782-36 3,295-66 3,334-72 4,232-68
551-64 5.699-82 11,725-71 17,253 *47 26,644-16 28,997-96 g29,792-58 31,704-20 35,636*19
157-54 1,800*75 1,456-89 3,601-51 4,857-95 4,511-50 4,660.71 5,717-62 6,018-86
160-49 367 30 1,317-61 1,584 98 1,940-50 4,310-45 ,3 ,409-21 3,227-04 5,204-43
437-19 4,584-97 6,257-01 10.810-45 18,376-48 1 8,577-53 1 9,829-03 22,219 . 6 1 23,034-04
2*95 17-43 94-69 217-20 425-07 496-39 591-04 473*96 569-16
RTIJ3: g fe n e g T g , U fl’a I
Source:— Registrar, C>operativa Societies, Punja^.
t o
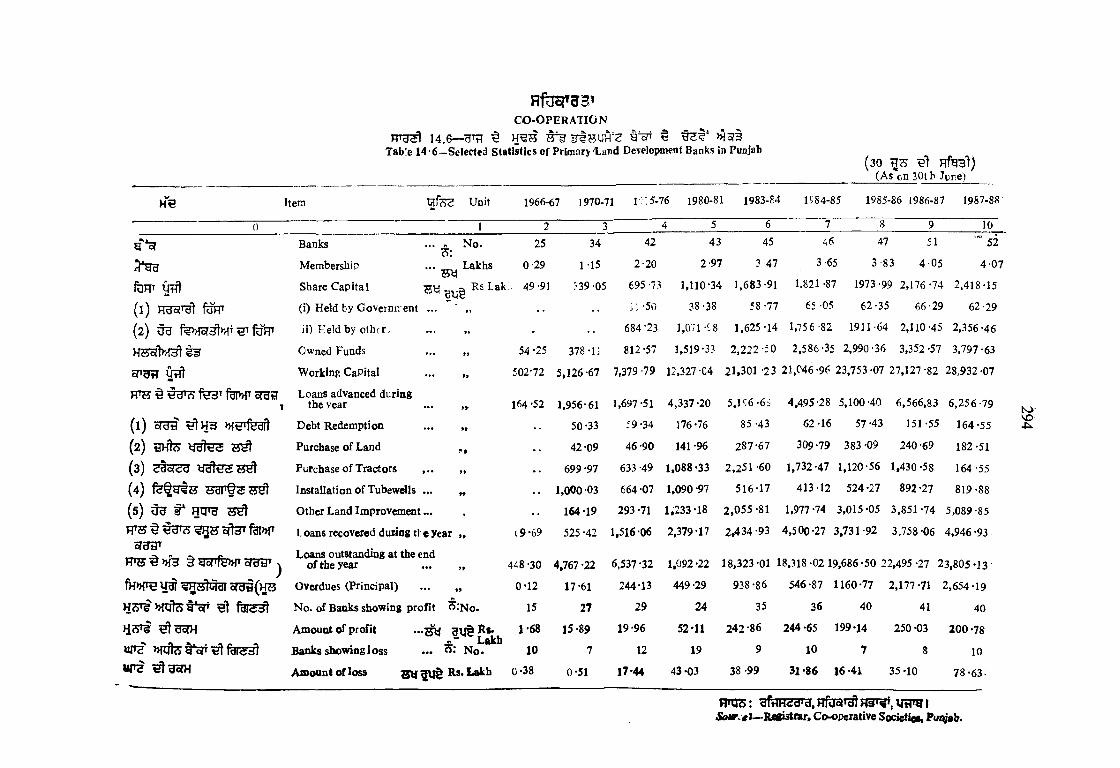
R f t r e r 3 3 '
C O -O PER ATIO N
14.6— ^ ^ >H iTab:e 14 -6—Selected Statistics o f Primary 'Land Development Banks in Punjab
(30 Hfg3^)(As on 30t b Jure)
Item Unit 1966-67 1970-71 i::5 -7 6 1980-81 1983-84 1584-85 1985-86 1986-87 1987-88
0 1 2 3 4 5 6 7 8 9 10
Banks ... N o . 25 34 42 43 45 46 47 51 “ 52
Membership . . . ^ U k h s 0-29 1 1 5 2-20 2-97 3-47 3-65 3-83 4 -05 4 07
fORT M Share Capital :: 49'91 .'39 -05 695 -731 1,110-34 1,683 -91 1.821-87 1973-99 2 ,176-74 2.418-15
( i ) pra5?Tg feHT (i) Held by Governn ent . . i: -50 38-38 58-77 65-05 62-35 66-29 62-29
( 2 ) u u fuHT ii) Held by other, •• • r> 684-23 1,071 -C8 1,625-14 1,75 6-82 1911-64 2,110-45 2 ,356-46
H 5jg l»eT Owned Funds • •• ff 54 -25 378-1] 812-57 1,519-33 2 ,222 ;0 2,586-35 2,990-36 3,352-57 3,797-63
cT9t? Otft Working CaPital • •• »» 502-72 5,126 -67 7,379 -79 12,327 -C4 21,301 -23 21,046-96 23,753-07 27,127-82 28.932-07
JTO ^ fS'c! fdP>fT crag Loans advanced during5 .U 6 -6 3 4,495-28 5,100-40 6,566,83
T the year 99- 164 *52 1,956-61 1,697 -51 4,337 -20 6 ,2 56-79
( 1 ) oTira >Hg^feaft Debt Redemption ••• P9 50 -33 59-34 176-76 85-43 62-16 57-43 151-55 164 -55
( 2 ) ydTtra Purchase o f Land 42-09 46-90 141-96 287-67 309-79 383-09 240-69 182 -51
( 3 ) Purchase o f Tractors • •• ft 699 *97 633 -49 1,088-33 2,251 -60 1,732-47 1,120-56 1,430-58 164-55
( 4 ) f e ^ g t s Installation o f Tubewells ••• tf 1,000-03 664 -07 1,090-97 516-17 413-12 524-27 892-27 819-88
( 5 ) u d f* giTH Other Land Improvement • • • 9 164 19 293 -71 1,233-18 2 ,0 5 5 -8 1 1,977*74 3,015-05 3 ,851-74 5,089-85
JTS § offs^ f e w Loans recovered during tl e year „ t9 -69 525 -42 1,516-06 2,379-17 2,434 -93 4 ,500-27 3,731-92 3,758-06 4,946 -93oTUH’’
RTJ5 § /h3 9 gcrfe»fT orasT
fH>>Fe s r a i ( H s
Loans outstanding at the end o f the year . . . „ 4A8 30 4,767 -22 6,537-32 1,092-22 18,323-01 18,118-02 19,686-50 22,495-27 23 ,805-13
Overdues (Principal) ••• ft 0-12 17-61 244-13 449-29 938-86 546-87 1160-77 2,177-71 2 ,654-19
H S T # » n ite t* c r N o . o f Banks shovring profit o .'N o. 15 27 29 24 35 36 40 41 40
Am ount o f profit g q § R « . 1-68 15-89 19-96 52-11 242 -86 244-65 199-14 250-03 2 0 0 -7 8
UTS B a i^ s showing lo ss« - Lakh
. . . or N o . 10 7 12 19 9 10 7 8 10
u r e ^ g o w A m ount o f lo ss ^ Rs. Lakh 0-38 0-51 17-44 43 -03 38 -99 31 -86 16 -41 35 -10 78-63;
K>VO:
yTT33: d fd H gg^d , H f O o t T ^ \f f fr q t &Mff’. «t_lugistnu’, Co-operative Societies, Puiyab.
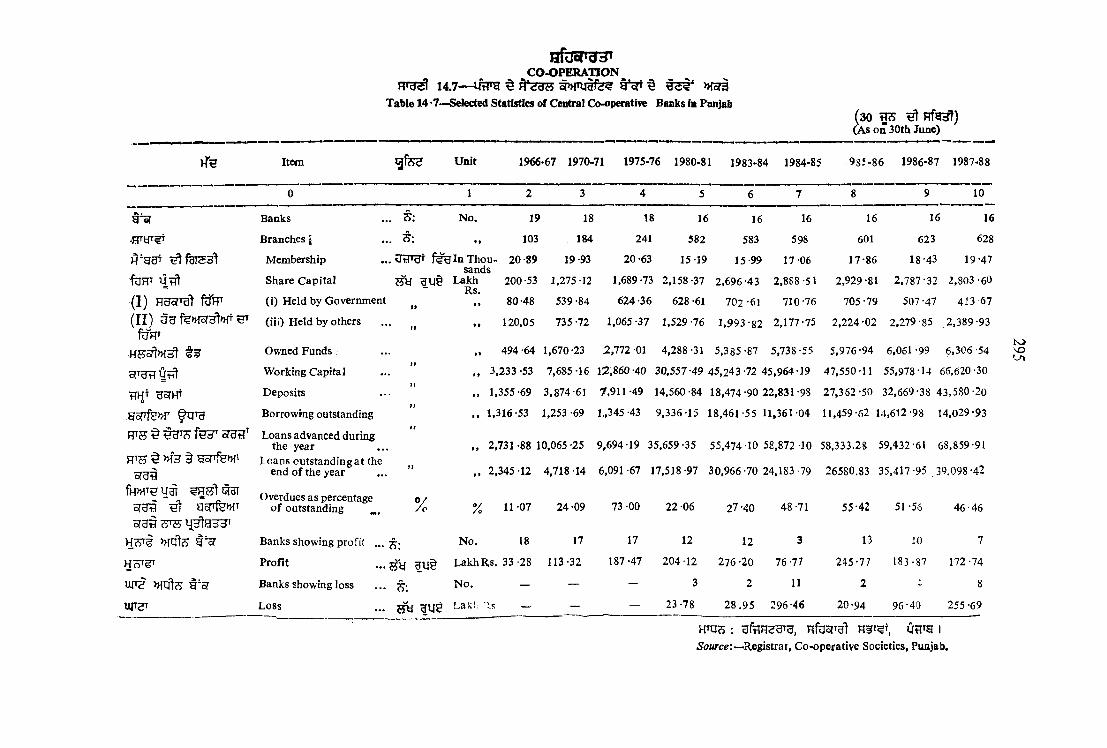
g T ^ w a J 'CO -O PERATIO N
14.7— irara § ^ >HGra
Table 14 *7-<Selected Statistics of Central Co-operative Banks in Punjab(30 ^ ^ H fg ^ )(As on 30th June)
Item Unit 1966-67 1970-71 1975-761 1980-81 1983-84 1984-85 935-86 1986-87 1987-88
0 1 2 3 4 5 6 7 8 9 10
Banks ... N o . 19 18 18 16 16 16 16 16 16
Branches | . .. >» 103 184 241 582 583 598 601 623 628
Membership . .. UtHUr In Thou-CO nrlo 20-89 19-93 20-63 15-19 15 99 17-06 17-86 18-43 19-47
fURT Share C apital Lakh Rs.
• 1
200-53 1.275-12 1,689 -73 2.158 -37 2.696-43 2,888-51 2,929 -81 2,787-32 2,803-60
(I) fUFT (i) H eld by Government 80-48 539 -84 624 -36 628-61 702 -61 710-76 705-79 507 -47 413 67
(II) U g J1»T ^ f e V
(iii) H eld by others tt 120.05 735 -72 1,065 -37 1,529 -76 1 .993-82 2.177-75 2,224 -02 2,279-85 _2,389-93
Owned Funds *> 494-64 1,670-23 2,112 01 4,288 -31 5,385-87 5,738 -55 5,976-94 6,061-99 6.306 54
oTHT
^ 5 T fe » f
W E ^
w s ^ M 3 § o r g i
fn>MT€ yar qar
Working Capital
D eposits
Borrowing outstanding
Loans advanced during the year
L eans outstanding at the end o f the year
STHS ^ g5TTfe>HTwvwiuucB ao pciL-cmagc
o f outstanding % % 11 -07 24-09 73 -00 22-06 27-40
Banks showing profit ... N o . 18 17 17 12 12
Profit H tf L akhR s. 33 -28 113-32 187 -47 204-12 2 76-20
u r e m q I?? t"5T Banks showing loss N o . — — — 3 2
Loss Lakh :',s — — — 23-78 2 8 .9 5
,, 3,233-53 7,685-16 12.860-40 30,557-49 45,243-72 45,964-19 47,550-11 55,978-14 65,620-30
„ 1,355-69 3,874-61 7.9U -49 14.560-84 18,474-90 22,831-98 27,362-50 32,669-38 43 .580-20
,, 1,316-53 1,253-69 1.,345-43 9,336-15 18,461-55 11,361-04 11,459-62 14.612-98 14.029-93
, , 2,731-88 10,065-25 9,694-19 35,659-35 55,474-10 58,872 10 58.333.2S 59.432-61 68.859-91
, , 2,345-12 4,718-14 6,091-67 17,518-97 30,966-70 24.183-79
48 -71
3
76 -77
11
26580.83 35.417-95 39.098-42
55-42 51-56 46 '46
13 10 7
245-77 183-87 172 -74
2 - 8
20-94 96-40 255 -69
K>Ui
HTgs ; nftioiTel i
5<?ttrce:—Registrar, Co-operative Societies, Punjab,

C O -O PER A TIO N
14.8— UtFH §Table 14 -8—Selected Statistics o f State Co-operative Banks in Punjab
(30 ^ R f ^ )(As on 30th June)
Item U nit 1966-67 1970-71 1975-76 1980-81 1983-84 1984-85 1985-86 1986-87 1987-J
'0
1 2 3 4 5 6 7 8 9 10
Membership ... N o . 1,647 1,645 29 29 34 35 36 36 39
fURT ss Share Capital ... H U^Lakh 156 -70 473 -25 501 -45 678-15 1,107-81 1,178-75 1,181 -75 1,166-29 1.184-24
( i ) ( i) H eld by Government „KS
13 -94 157 -58 62-68 162 -58 162 -58 162 -58 162-58 146-72 163-80
( 2 ) u u f^5r^>H T^TftjRT (ii) H eld by others . .. „ „ 142 -76 315-67 438 -77 515.57 945-23 1,016-17 1.019-17 1,019-57 1,020-44
t s r Owned Funds ... „ „ 205 05 681 -79 997-64 1,574-74 2,295-01 2,204-14 2,310-27 2 ,375-72 2,450-13
c<'dd UHt Working Capital . .. u „ 1,780-60 3,800 -59 6,505 -34 16,236 -94 28,644-16 20,447-85 21,743 -64 24,734-42 32,396-80
tTHT D eposits ... M „ 502-95 1,516-49 4,437 -68 9,384 -34 11,928-18 14,541-99 15,679-57 13,828-72 24,696-00
FT»?? § >H3 t g3frfe»nQ^q^dj
Borrowing outstanding n at the end o f the y e a r .. . , 1,071-58 1,679-63 785 -10 4,845 -26 13,809-18 2,807-56 3,002 -61 7.836 25 4 ,177-24
'HTJ5 § f<ed' fdI>HTofHflT
Loans advanced during the year . . . ” . 1 ,608-54 10,060 -60 17,739-88 36,025-13 57,078-10 69,227-54 64,529-61 59,744-29 60 ,668-23]
fU B § HUT-*- ^ ofd fT
Loans recovered during the year ... .• , , 1,955-0 9 10,603-12 18,196-65 29,565-22 49,118-97 75,673-23 65,113-65 55,273-7] 53 ,713-12
m s § » f3 § gcTfe>MT c fy y i L oans outstanding at the end o f the year . . . /. 1,346-90 2,697 -86 3,133 -25 11,693-73 20,674-64 14,228-98 13,644-91 18,115-49 16,955-11
U3TTOverdues . . . „ 2-05 — >_ 17-00 85-92 19-17 4 0-19 116-58 128-89
^HTgT Profit9f 10-03 76 -97 92 -28 80-90 1 3 6 -3 0 ( - ) 9 4 / 0 3 ( )149-52 ( - ) 4 6 - 7 0 ( + ) 4 - 1 2
Source \ — Co-operative Societies, Punjab.
t oVOo s
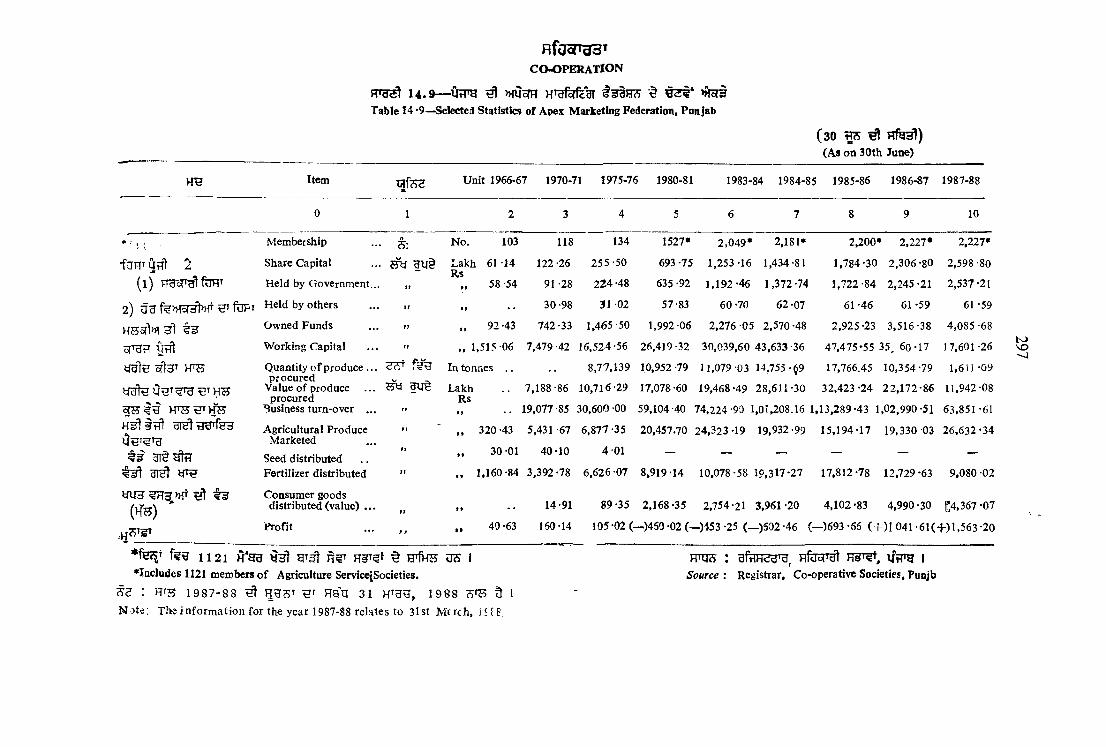
f l f O o r t g B ’
CO -O PER A TIO N
1 4 .9 — OtTO ^ >>to?iTable 14 -9—Selected Statistics of Apex Marketing Federation, Punjab
( 3 0 TO ^ n f e ^ )(As on 30th June)
Item Unit 1966-67 1970-71 1975-76 1980-81 1983-84 1984-85 1985-86 1986-87 1987-88
1 8 10
fORf 2
Membership
Share Capital
( l ) Held by Governm ent...
2 ) fo p i H eld by others
HS5flii=f 3I
Lakh 61 14 Rs
58 -54
y g l c Bffer W B
h h
Owned Funds ... ». , , 92 -43
Working Capital . . . ” ,, 1,515-06« 1/
Quantity o f produce . . . <ih'' In tonnes . .procured
3 T § ^W
y U 3 ^ 3 >H ^(HS) ‘
_________________
Value o f produce procured
’business turn-over ..
Agricultural Produce Marketed
Seed distributed Fertilizer distributed
Consumer goods distributed (value) . .
Profit
N o . 103 118 134
122-26 2 5 5-50
91-28 224-48
30-98 31-02
742-33 1,465-50
7,479-42 16.524-56
8,77,139
7,188-86 10,716-29
19,077-85 30,600 -00
320-43 5,431-67 6 ,877-35
30-01 40-10 4-01
1,160-84 3 ,392-78 6 ,626-07
14-91 89-35
40-63 150-14 105-02 (-
1527* 2 ,0 4 9 * 2,181*
693-75 1,253-16 1,434-81
635-92 1 ,1 92-46 1,372-74
57-83 60-70 62-07
1,992-06 2 ,2 76-05 2,570-48
26,419 -32 30,039,60 43,633 -36
10,952-79 11,079-03 14,755-^9
2,200* 2,227* 2,227*
1,784-30 2 ,306-80 2,598-80
1 ,722-84 2 ,245-21 2,537-21
61*46 61-59 61-59
2,925-23 3,516-38 4 ,085-68
47,475-55 35, 60-17 17,601-26
17,766.45 10,354-79 1,611-09
LakhRs
17,078-60 19,468-49 28,611-30 3 2 ,423-24 2 2 ,1 7 2 -8 6 11,942-08
59,104-40 74 ,224-90 1,01,208.16 1 ,13.289-43 1,02,990-51 63,851-61
20,457.70 24 ,323-19 19,932-99 15 ,194-17 19,330 03 2 6 ,632-34
8,919-14 10,078-58 19,317-27 17,812-78 12,729-63 9 ,080-02
2 ,168-35 2,754-21 3 ,961-20 4,102*83 4 ,990-30 ^4,367-07
-> 4 5 0 -0 2 (^ )4 5 3 -2 5 (_ )5 0 2 -4 6 (—)6 9 3 -66 ( + ) 1 0 4 1 -6 1 (- i-) l ,5 6 3 -20
H 2 1 H*Era M I*Iacludes 1121 members o f Agriculture Service|Societies.
1 9 8 7 - 8 8 ^ H a n 3 1 m U H , 1 9 8 8 5
N o te ; The in fo rm a tio n for the year 1987-88 rela tes to 3 ls t M trch , H J8
JTOS ; l/tTO ISource : Registrar, Co-operative Societies, Puojb
t o

H f b o t w
CO -O PERATIO N
H Tg^i4.io— >HcT3Table 14 *10—Selected Statistics of District Wholesale Societies in Punjab
(30 ^ ^ Frfe3t)(As on 30th June)
Item Unit 1966-67 1970-71 1975-76 1980-81 1983-84 1984-85 1985-86 1986-87 1987-88
0 1 2 3 4 5 6 7 8 9 10
D istrict W holesale Service Societies... 7i: N o . 12 12 13 13 13 13 13 13 13
H’y d
fOH' M
gTgrf
Membership
Share Capital . . .
Owned Funds . . .
Working C apital...
U tp g tf^
if
InThousands
Lakh Rs.
»»
99
5 -24
14-73
31*29
134-54
5-1 2 5 -48 4 -8 7
15-05 16-46 18-93
61-06 70-21 80-09
591-87 1,436-51 1,299-12
4-86 4 -86
19-16 19-16
80-25 188-14
1,454-34 1,207-79
4 -8 6
19-53
181-21
1,281-15
4 -86
19 -34
179-86
1,278-56
4-86
21 -23
84 -29
1,257-58
Societies in Profit N o . 11 8 6 3 4 6 5 5 7
Profit ^ l u t Lakh Rs. 6-11 2-61 1-91 0-39 0-11 2 -27 1-44 1 -97 1-79
UT^ >HT3fe H ¥ t Societies in lo ss...7i:
N o . — 3 5 6 6 4 5 5 3
M(Tct Losss y
Lakh RS. — 0 -8 2 4-00 0 -28 6*73 1-56 1-23 0-80 2 -Cl
rrnKJ: H fb cP ^ H 3T^, u f r a ISource : Registrar, Co-operative Societies, Punjab.
t oVO00

afag»33»CO -O PER ATIO N
R»U2ft 1 4 .1 1 -A f tr g ^ H g lonj g » (§ h SIhw ^Table 14*11—Selected Statistics o f Primary Marketlng-cum-Proces»ing Societies in Punjab
(30(As on 30th June)
vre Item g f e s Unit 1966-67 1970-71 1975-76 1980-81 1983-84 1984-85 1985-86 1986-87 1987-88
0 1 2 3 4 5 6 7 8 9 10
Societies1 .1 ij .
N o- 105 In thousands
114 123
76-37
123
84 -25
123
85-15
123
85-55
123
85-73
123
86-28
123
H*5H Membership »> 39*24 53 -37 86*40
fURT 0 Share Capital Lakh R s. 61 -84 75-7!9 124-68 165-12 161-07 160 -64 166 -20 167-34 170-48
Hdol'dl feFT ( 2 ) ^
foH»
(1) H eld by Govern* ment
(2) H eld by others
If
It
»» 26 -60
3 5 .2 4
32-53
4 3 .2 6
68*65
56-03
94-97
70-15
97*18
63 *89
90-22
70 *42
95-73
70*47
96 -38
70-96
101-77
68*71
Owned Funds fif » 118-32 294-43 449*48 582-77 704-79 652 *52 679-16 737-70 754-75
c/»3tTyi?ftf e y i t f t
f u a
W orking Capital
Value o f Agricultural Produce Marketed
II
IIP9
I*
409-64 1,514-33
1 ,291-20 10,177-99
2,980 ‘49
9,182 -81
3,307*07
7,920-32
3,316-79 3,307-62 3,298-71 4.015-93 3,114-25
8,493 *08 8,083 *95 12,114 *73 9,189 *98 9,226 -32
» f t y u 3 o r ig
d HV4?5^1 >HTfeSupply including Fertilizer,
Consumer G oods etc. 99 • » 1,329-43 3,636-16 14,741 -84 8,774-15 4,782 -54 4.903 ’58 8,911 -82 6,945 -88 9 ,131 .27
H S o f k n l a i3»t?5 G odowns owned S : N o . 237 488 567 688 538 538 538 537
fc!d‘9 § ? 5 § 3 r 5 T ts G odowns Hired II99 866 3,567 2,076 686 338 328 328 164 289
Societies showing profit II99 86 84 46 45 59 52 60 66 66
M «'^' Profit L a k liR s . 26-65 2 8 -8 9 1 5 ‘32 20-54 29 -64 31 -86 42-17 28*92 41 -12u n § Fi§T^ Societies showing loss . . . t : N o . 5 18 55 38 40 43 33 30 32U|i^r L oss L a k h R s , 3-5* 6 -66 30-35 22-70 23 28 10*62 9*50 18-36
FHXIS : q y p g |
Source : Registrar, Co^^perative Societies, Punjab.
t oVC

CO-OPERATION
14.12—CitTO t o r a :^ Htat ^Table 14*12—Sdected Statistics of Ceatral Consamer Stores ia Punjab
(30(As on 30th June)
> fe Item U nit 1966-67 1970-71 1975-76 1980-81 1983-84 1984-85 1985-86 1986-87 1987-g
fOHT
(1) TTdofTj) ftJlRF(2) 3HfW>Hor5W ^
w i w i f e H fg
IMT T
Societies
Membership
Owned Fund
Share Capital
(i) H eld by Govern ment
(ii) H eld by others
vVorking Capital
Value o f Sales
Stores showing Profit
Profit
Stores showing loss
L oss
?5: N o .
naT gt f s n In ots (3 thousands
14
81 -91
.Lakh R s. 36 *34
30-87
18-81
12 06
127-07
637-82
N o . 9
L a k h R s. 5*10
S I N o . 4
S y L a k h R s. 2 -1 0
16
101 -66
59-56
47-69
33-49
14-20
138 -62
16
112 *82
83 -93
66-97
51 -36
15-61
175 -57
524 *58 363 -36
2 10
0 *90 0 -42
14 6
9 -72 2-61
10
16 16 16 16 16 16
111-65 112-17 112-17 112-17 112-17 112-17
103-00 128-22 133-87 144*73 106*60 106-21
81-38 86-17 84*29 83-86 83*91 83*91
65-67 70-19 68-58 68-13 68*18 68*18
15-71 15-98 15-71 17-73 15*73 15*73
215-99 221-99 192-30 168*62 1 93-03 229*01
375-43 269-33 202-08 245-52 239*19 236-54
4 — 2 1 1 3
1*21 — 1-87 0*02 0 -2 2 0*23
11 12 12 11 12 10
9-88 18*19 8-43 1 0 -0 0 8*57 8*5?
UJ •oo
Frnj3 : R§T^Sosa-ce : Registrar, Co-operative Societies.
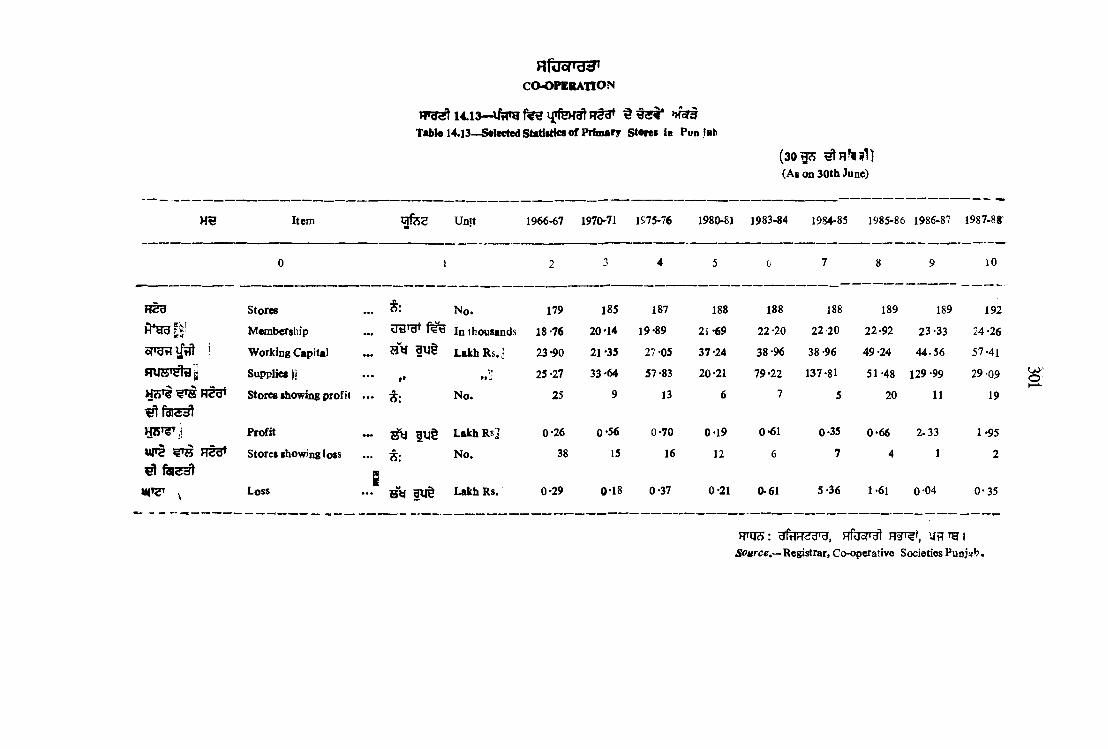
H50 Item
n r o d ' d g 'COOPERATION
Table 14.13—S«lccted Statistics of Primary Stores io Pun fab
C jfe s Unit
( 3 0 ^(As on 30th June)
1966-67 1970-71 1975-76 1980-81 1983-84 1984-85 1985-86 1986-87 1987-88
10
Stores . . . N o . 179 185 187 188 188 188 189 189 192
Membership . . . In thousands 18-76 20'14 19-89 21 -69 22-20 22-20 22-92 23-33 24-26
ori'dti 1 Working Capital . . . Lakh R s .: 23 -90 21*35 27 -05 37-24 38-96 38-96 49 -24 4 4 .5 6 57-41
Supplies 25-27 33 *64 57 -83 20-21 79-22 137-81 51-48 129 -99 29-09
Stores showing profit — N o . 25 9 13 6 7 5 20 11 19
Profit . . . ^ g i l t Lakh Rs2 0-26 0-56 0-70 0-19 0-61 0-35 0 -66 2 .3 3 1-95
w r e ^ H fy» Stores showing loss
^ ^ — s y § i i§
N o . 38 15 16 12 6 7 4 1 2
V Loss Lakh Rs. 0-29 0-18 0-37 0-21 0-61 5-36 1-61 0-04 0 -3 5
W ^^>: HTOoT y vl TH IiSi0tfrce.-> Registrar, Co-operative Societies Pusj^*?.
U>'O

CO-OPERATION
14.14: ~l/i7Tg ^ ^ S S ffe? SfgfH3I ^ ^ 3 # ' >Hc?3Table 14.14—Selected Statistics of Joint Collectlye Farming Societies in Punjab
(30 flcS HfeBt)(As on 30th June)
MU Items g f e g Unit 1966-67 1970-71 1975-76 1980-81 1983-84 1984-85 1985-86 1986-87 1987-88
0 1 2 3 4 5 6 7 8 9 10
Societies . . . N o . 935 991 1,009 1,029 1,029 1,029 1,029 1,029 1,027•k • rH'y-cJ Membership . . . 3i3TgT In thousands 14 -63 1 5-08 15 *41 15-66 15-68 15-68 16 -58 16 -58 16-54
Owned Fund . . . s y l u ^ , Lakh Rs. 64-02 82 -87 75 -24 75 -34 75 -02 76-26 75 .48 76-25
Orft W orking Capital fl »» 194 -77 258-16 219-26 229 -76 217-57 207-13 212 -44 203 -04 213-10
RgT^T >nq^5 Command Area ... vJtl>'d , t o ^ » r a
ThousandH ea a re
30-67 30-46 28-85 28-46 28-46 25 -00 14 -41 18-09 12-90
HETon>H3l Godowns Owned . . . 3 : N o . 201 250 266 266 265 205 265 290 291c r a T ^ § H § g i3 T -
Q?i'^ ^ fdltfdlGodowns Hired . . . N o. 23 50 73 78 53 53 54 54
H 3T ^ ^ fd ied l^
Societies in Profit . . . S : N o . 363 283 242 103 2 2 — — 1
H75'^' j Profit H i t Lakh Rs. 1-89 7 -41 1-69 0-49 0-60 0-15 — — 0 -6 9
UTC Societies in Loss . . . S : N o . 2S6 285 275 32 14 49 22 27 12
L oss . . . g i l t Lakh Rs. 4-91 5 -56 4-17 0-16 0-72 0-44 0-92 0 -49 0-91
OJ-O
t m a : FifeoTOl H 3T^, V Fre I
Source. -R egistrar, C o-operati'c Societies. Puyj%'j^

CO-OPERATION
14.15--t/57Tg >Ht o(6R3ai=nJSTable 14.15—Selected Statistics of Labour aod Construction Societies
(30 g s ^ R fg ^ )As on 30th June)
Item g f e S Unit 1966-67 1^70-71 1975*76 1980-Si 1983-84 1984-85 1985-86 1986-87 1987-88
10
Societies ... S: N o. 676 704 811 1,144 1,250 1,260 1,262 1,313 1,319
Membership . . . U grgi n thousands 55 *85 58-81 6.0 98 78 -67 87-75 88-55 89-35 92 -03 93 -56
O.v ^cd Fu ds . .. B y Rs. Lakh 26-71 28 -92 36 *60 53-03 67 -48 71-86 77-22 85-71 50-76
Working Capital ii „ 160-00 128 -61 161-39 194-69 198 -28 206 -60 203 -25 258 -97 407 -56
oft§ ^ )Ib Valu o f Work d o n ; ••• ft »> 83*59 167 -32 376-09 786-85 923 06 1,097-98 1,325 -24 1,531-75 2,253-63
Societie; in Pro i ... o. 241 184 310 4 )7 472 485 475 488 496
^ fd lS ^
Profit . . . {W 9UB R?:. Lakh 1-05 0-86 6-07 4-73 1-22 9-16 9-86 12-15 16-81
U(T§ H3T^’ Societ in L .. 35: o. 276 317 168 227 270 276 330 346 243
Loss ... g u § Rs Lakh 7-24 3-55 3-71 5-17 3-17 4-59 9-18 16-00 7-42
f l r a s : Rfasrrgl 0^ 1 3 1Source. -Re*istra% Co-operat ve Societie*, Puiyab.
O

H f o c P W
C O -O PER A TIO N
14.16— vffPB ?3THirae ^ *>ra3Table 14.16—Selected Statistics of Transport Co-operative Societies in Punjab
(30 ^(Ai on 30th June)
y fs Item Unit 1966-67 1970-7 1 1975-76 l93')-8 1983-84 1934 85 1985-86 1986-87 1987-88
0 1 2 3 4 5 6 7 8 0 10
S o cetiesA7i: N o U3 163 169 168 168 170 170 173 175
Membership Thousands 4-57 4-55 5-45 5-70 5-70 5-60 5-85 6-13 6 I 3
Owned Funds Rs. Lakh 45-34 58-06 76-11 97-32 144-25 134-01 138 -02 173-69 179-64
ei'3H ^ W o-king Capital tt *> 113-68 164-95 243 -3 J 335-41 361 -00 361-00 399-51 529-02 612-02
FPH ^ » f e § goTfe>»f O q ig
Borrowing outstanding at ttie end o f the year . . . • ) •* :4-23 44-57 50-23 86 09 78-22 102 -69 154-24 211-84 238*77
HHQrt>H^ TP fa S 'S § Vehicles vvned or Hired fi: N o. 216 207 222 319 224 229 246 166 167
Societies in Proflt f • 36 33 16 29 17 21 34 45 57
fto f it
Societies in o»s
ftRs. Lakh
N o .
5-11
22
1-56
31
4-14
41
33-92
28
1-41
40
3-41
18
6-32
22
7 -34
14
7 -4 4
22
HfffT Loss 7XH Tmd Rs. Lakh 1-44 1-81 4-28 2-76 15-77 7-97 15-68 33-99 4 5 -3
w m : gfim ^grg, RfoBPcft h 3 t^ , i r t o i5ourc*.<-Registrar, Co-op ;rative Societies, Punjab.
'Sji2

H U d (» c fd »
C O -O P E R A n O N
14.17— Ht »T H5TO (O Ttfifai) g fo S T ^
Table 14.17— Selectei Statistics of Housing Co-operative Societies, Punja'>
(30 e l(As on 30th June)
H e Itom UjnSd Unit 1966-67 197,)-71 1975-75 1930-81 1983-84 I9?4-85 1985-86 1936-87 1987-88
0 1 2 3 4 5 6 7 a 9 10
'■ocieties N o. 201 280 1,165 1,817 2,047 2,071 2,004 2,102 2,204
Membership ra'cjT In Thousands S-26 12-81 35-77 57-53 66-51 68-82 70 -53 76-27 80 -65
Owned Funds ^ i u § Lakh Rs. 30-16 78-66 164-88 208-5: 348-36 370-26 388 -95 413-63 460 -87
Offt Working Capital If *» 127*73 237-02 681-30 1,129-35 2,218-18 ’,715-78 3,246-77 3.949-25 4,921 -43
» f3 3 5 f^ ® H 5 r S ^
^ fR T ^Houses Constructed by
the end o f the year ... 7i: N 3,014 3,385 5,451 • 8.184 13,052 13,626 15,311 15,977 16,118
w f t s H3»^’ Societies in ProfitII 99 53 70 311 481 534 604 586 948 816
Profit s y l U t Lakh Rs. 1-49 0-44 0-83 - -41 10-01 4-26 5-55 15-46 15-58
UT^ >HUlcSR§T?T Societies in loss 5 : N o. 76 76 189 194 159 107 240 242 277
MiT Loss Lakh Rs 0*79 0-38 0-3> i -11 0-47 1-47 1-30 36-81 3-44
H^Q5 : ^dH cJd'd , nrOot'dl R § ^ , UtTW I |
5o«rctf.—Registrar, Co-oporativ» Societiot. Punjab,
-OJoO b
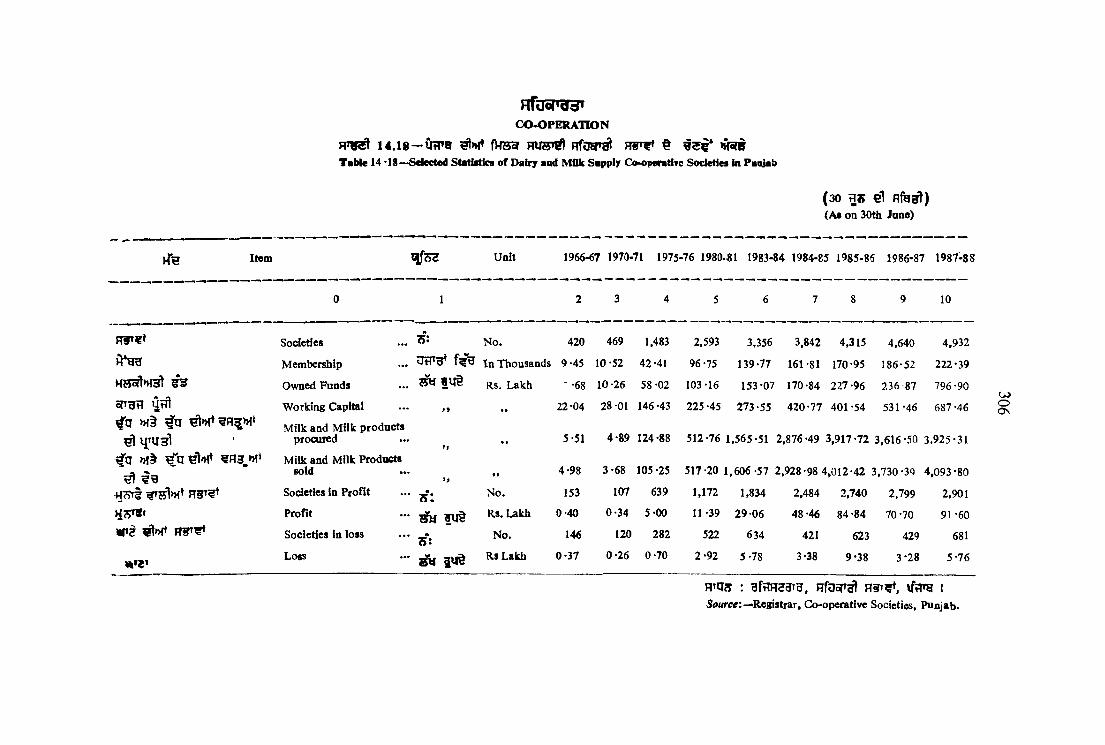
CX>^PERATION
1 4 . l 8 - 0 t T 8 ?^»f» fHHof HUS»^ R firer^ t »HWTaMc 14 *18—Selected Statistics of Dairy and Mfllc Sapply Co-opcratiTe Societies in Puojab
(3 0 e l flfeEft)(As on 30th June)
Item Unit 1966-67 1970-71 1975-76 1980.81 1983-84 1984-85 1985-86 1986-87 1987-88
0 1 2 3 4 5 6 7 8 9 10
Rf»¥> Societies • •• H: N o . 420 469 1,483 2,593 3,356 3,842 4,315 4,640 4,932
Membership . . . In Thousands 9-45 10*52 42*41 96*75 139-77 161-81 170 -95 186-52 222-39
Owned Funds . . . m € i4 § Rs. Lakh ■ *68 10*26 58 *02 103-16 153-07 170-84 227 *96 236 87 796*90
srrgfr Worldng Capital . . . >9 ft 22-04 28*01 146-43 225 *45 273-55 420-77 401 -54 531-46 687 *464X3 » f^ Millc and M ilk products
procured . . .
ft • > 5-51 4-89 124-88 512-76 1,565-51 2,876-49 3,917-72 3,616-50 3 .925-31
Millc and Millc Productssold • •• • • 4-98 3 -68 105-25 517*20 1 ,606-57 2,928-98 4 ,012-42 3,730-39 4,093-80
H<9r| Societies In Profit . . . «s : N o. 153 107 639 1,172 1,834 2,484 2,740 2,799 2,901
Profit . . . ^ ? u § Rs. Lakh 0-40 0-34 5-00 11 -39 29*06 48-46 84 -84 70-70 91 -60
i r ? Societies in loss . . . N o. 146 120 282 522 634 421 623 429 681
Loss . . .
i U § Rs Lakh 0 -37 0-26 0-70 2-92 5-78 3-38 9-38 3*28 5-76
OJoON
RTqS : BftlH23Tg, RfOoT^ ISiDurctf:—Registrar, Co-operative Societies, Punjab.
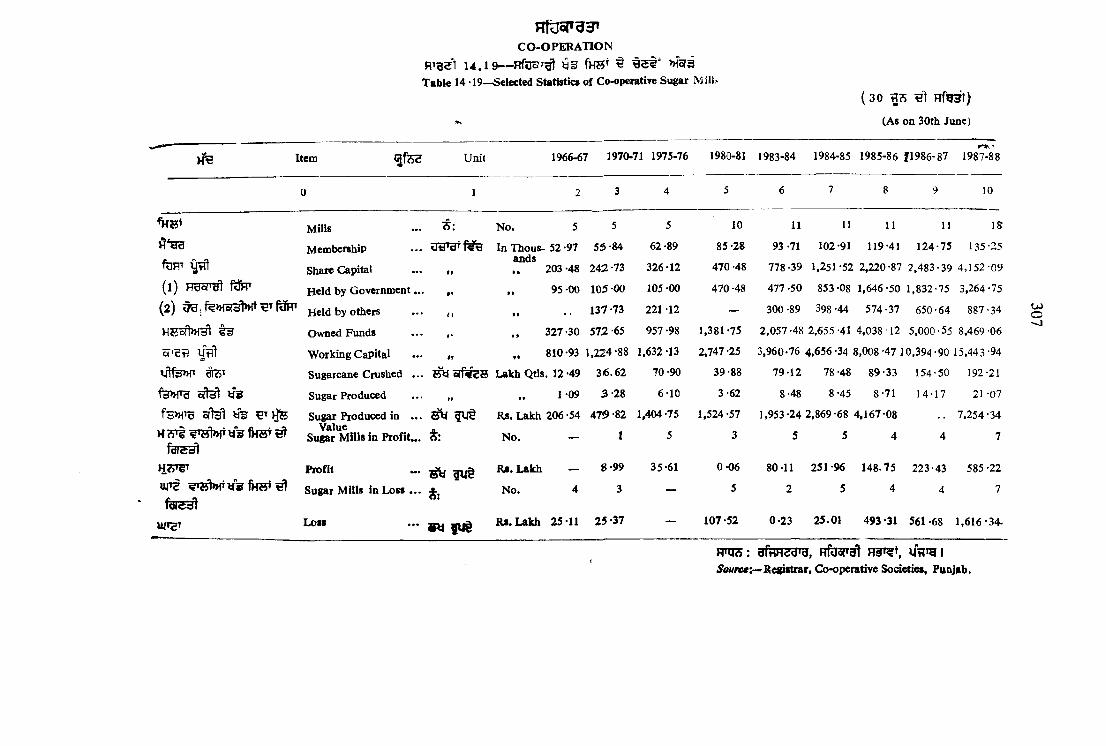
C O -O PE R A T IO N
Racist 1 4 .1 9 — nfOoTT^ t l 5 f 3 # ' » r a sTabie 14 19—Selected Statistics of Co-operative Sugar
( 3 0 HfTOl)
(As on 30th June)
Item Unit 1966-67 1970-71 1975-76 1980-81 1983-84 1984-85 1985-86 |1986-87 1987-88
8 10
> 1 ^
feFTf
( l ) ITOon^ ftJFT
{2 )
tftfb>HT yi?)»
1 W 9 o ft^ ¥ 5
o f e l ’ETltfe
fdfiESl
H W
U|TS
UJ»ST
M ills
Membership
Share Capital
H eld by G overnm ent.
Held by others
Owned Funds
W orking Capital
Sugarcane Crushed .
Sugar Produced
Sugar Produced in ..Value
Sugar M ills in Profit..
Profit
Sugar M ills in Loss . .
Loss
N o . 5 5 5
In Thous- 52 -97 55 84 62 -89ands
„ „ 203-48 242-73 326-12
„ „ 95-00 105-00 105-00
. . 137-73 221-12
327-30 572-65 957-98
„ „ 810-93 1,224-88 1,632-13
o r f ^ B Lakh Qtls. 12 -49 3 6 .6 2 70 -90
1-09 3 -2 8 6-10
Rs. Lakh 206-54 4719 -82 1.404 -75
t \ N o . — 1 5
^ R4.L a k h - 8*99 35*61
No. 4 3 —
10 11 11 11 11 Ig
85-28 93-71 102-91 119-41 124-75 135-25
470-48 778-39 1,251-52 2,220-87 2 ,483-39 4 ,1 5 2 -0 9
470-48 477-50 853-08 1,646-50 1,832-75 3,264-75
— 300-89 398-44 574-37 650-64 887-34
1,381-75 2 ,057-48 2,655-41 4,038 12 5,000-55 8.469-06
2,747-25 3,960*76 4,656-34 8,008-47 10.394-90 15,443-94
39-88 79-12 78-48 89-33 154-50 192-21
3-62 8-48 8-45 8-71 14-17 21 07
1,524-57 1,953-24 2,869-68 4,167-08 7,254-34
3 5 5 4 4 7
0 -06 80-11 251-96 148-75 223-43 585-22
5 2 5 4 4 7
S l j { U t ^^-L akh 25-11 25*37 — 107*52 0 -23 25.01 493*31 561-68 1 ,616-34 .
m i s : nfbsfrgt |
5 ’(0i/rc«:-'Begistrar, Co-operative Societies, Punjab.
U)o•<1
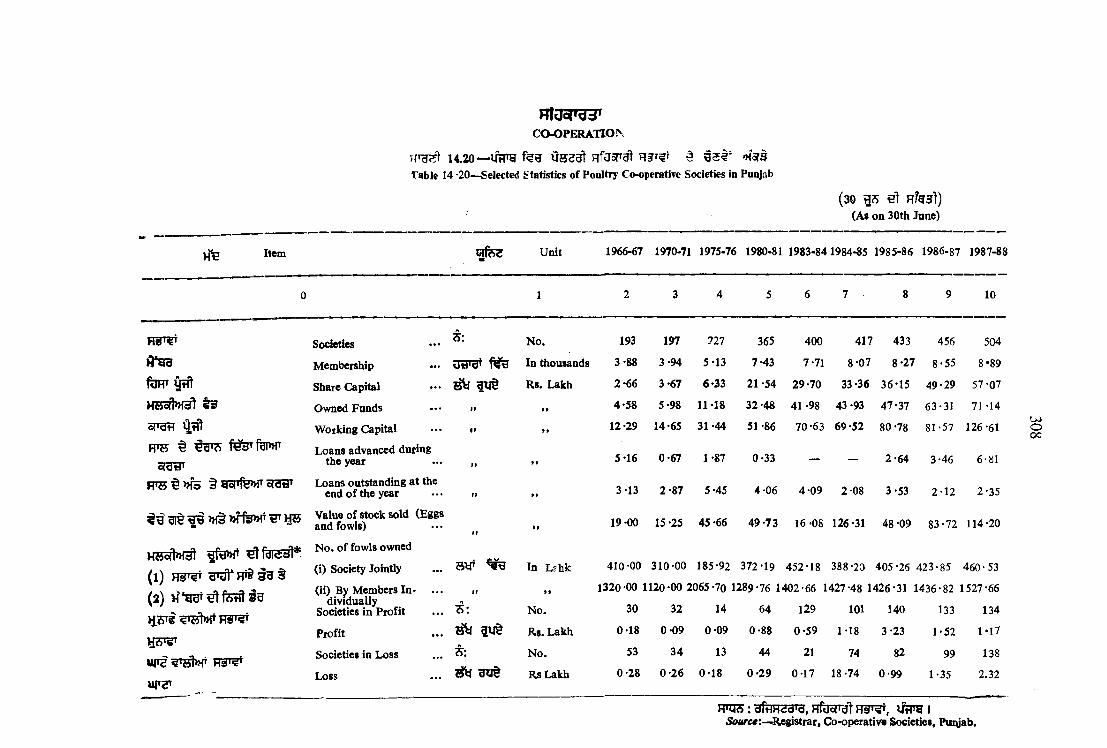
CO-OPERATlO><
14. 20— Uf 5 2 ^ RfaafT^ ^ MS(STable 14 *20—Selected s tatistics of Poultry Co-operative Societies in Panjab
(30 3 5 e t H fg3])(As on 30th June)
Item Unit 1966-67 1970-71 1975-76 1980-81 1983-841984-85 1985-86 1986-87 1987-8!
0 1 2 3 4 5 6 7 8 9 10
Societies N o . 193 197 ?27 365 400 417 433 456 504
Membership ^jya* i^tr In thousands 3-88 3-94 5-13 7-43 7-71 8-07 8-27 8-55 8*89
ftlHT ^ Share Capital ^ 1 « § R s. Lakh 2-66 3-67 6*33 21 -54 29-70 33 -36 36-15 49-29 57-07
HBofhHcft Owned Funds ir 99 4-58 5-98 11-18 32 -48 41 -98 43 -93 47*37 63-31 71 -14
ol'dtl Utft W oiking Capital 99 99 12-29 14-65 31-44 51 -86 70-63 69 -52 80*78 81-57 126 -61
W E t
b iy y iLoans advanced during
the year If 99 5-16 0-67 1-87 0-33 — — 2*64 3-46 6-81
R T H § » f e t s o n f w o r a a r Loans outstanding at the end o f the year . fl 99 3-13 2-87 5-45 4 06 4-09 2-08 3*53 2-12 2-35
^ >H§ ’EfT H 5 Value o f stock sold (Eggs and fowls) If 99 19-00 15-25 45-66 49-73 16-08 126 -31 48 *09 83-72 114-20
( 1 ) g r ^ F p t i g t
(2)
Mre^Tj5t)HT n g rg t
une^
N o . o f fowls owned
(!) Society Jointly
(ii) By Members In-
S i r In Lchk 410*00 310-00 185-92 372-19 452-18 388-20 405-26 423-85 460-53
1320-00 1120-00 2065-70 1289-76 1402-66 1427-48 1426-31 1436-82 1527-66diviauaiiy
Societies in Profit . . . ^5: N o . 30 32 14 64 129 101 140 133 134
Profit . . . ^ R s. Lakh 0*18 0*09 0*09 0-88 0 -5 9 1-18 3-23 1*52 1*17
Societies in Loss . . . N o . 53 34 13 44 21 74 82 99 138
Loss . . . ^ R sL akh 0*28 0*26 0*18 0*29 0-17 18-74 0 -99 1-35 2.32
w m a : dfHWijarg, H foordt h ^ , v i t r o i 5bi(ree:-~Registrar, Co-operative Societies, Pimjab.
Ooc

c o -o p e r a t i o n
14,21—UtTQ feg feHSBt HfooT H§^ ^Table 14-21—Selected Statistics of W omen Co-operative Societies in Punjab
(30 ^ e lH f e s t )(as on 30t’n June)
Item Unit 1966-67 1970-71 1975-76 1980-81 1983-84 1984-85 1985-86 i 986-87 1987-8g
0 I 2 3 4 5 6 7 8 9 10
Societies •••S :
N o . 1,055 1,315 1,364 1,474 1,592 1,609 1,614 1,636 2,195
Membership •••d ti'd '
~s In thousand 36 -70 49-42 61 -55 83-81 99-18 103-54 107-39 110-69 129-40
fOHT ijtft Share Capital • • •m Rs. Lakh 18 *50 38-05 70-75 117 -52 165-30 178-65 193-85 206-51 228 -16
K?55ft»f^ Owned Funds ••• II »» 18-38 38-77 72-21 119-81 168-35 182-72 198-65 212-40 249 -83
c/icid Working Capital . . . $i »* 18-62 39 -08 72-61 120-12 168-95 183-57 204-95 212-92 280 -51
RTS f e 3 i orggr Loans advanced during the year
. . . jf »» 0-09 0-17 0-27 0-39 1-02 1 -11 1-02 0-94 —
H T { 5 t» f3 § g5rfe>HT
of-dtd'
Loans outstanding at the end o f the year
.. . It>» 0-34 0-29 0-33 0-24 0 -4 4 0 -66 0 -73 0-78 0 69
)l^T g ^ 5 ^ H §T^ Societies in Profit ••• t : N o. 952 1,217 1,293 l1,348 1,490 1,445 1,502 1.517 1,973
H^TgT Profit ••• Rs. Lakb 0-50 1-08 2-51 4-06 5-55 5 -60 5 -46 5-90 3-99
il|TS H§T^ Societies in Loss • •• S : N o . 22 5 1 — — — — — —
U T T Loss Rs. Lakh 0-01 1-59 — --- --- --- --- — —•
S'o^rce :—Registrar, Co-operative Societies, Paajab,
u>oVO
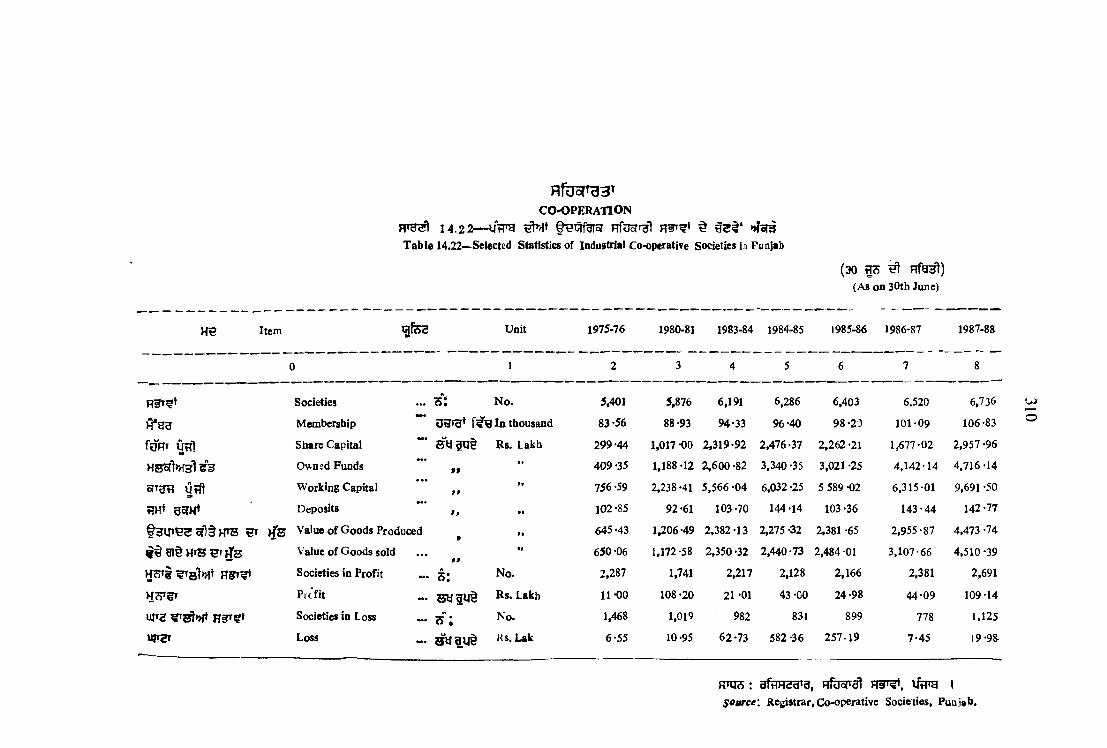
H f e o J T g g i
CO -O PER ATIO N
1 4 .2 2 — yfP H ^ € 3 f t ‘ *Hcf^T able 14.22—Selected Statistics of Indastrial Co*operatiTe Societies in Punjab
(30 ^ ^ H t e t )(As on 30th June)
H e Item Unit 1975-76 1980-81 1983-84 1984-85 1985-86 1986*87 1987-88
R?T?t Societies ... 5*. N o . 5,401 5,876 6,191 6,286 6,403 6.520 6,736
Membership In thousand 83-56 88-93 94-33 96-40 98-20 101-09 106 -83
fu m OtTl Share Capital 5 « g t [ § Rs. Lakh 299-44 1,017 -00 2,319-92 2,476-37 2,262-21 1,677-02 2,957 -96
H S 5 t » f 3 l5 3 Owned Fuads•••
f tft 409 -35 1,188 -12 2,600 -82 3,340 -35 3,021 -25 4,142-14 4,716 -14
5fTg?I y tit Working Capital...
9$ 756 -59 2,238-41 5,566 -04 6,032-25 5 589 -02 6,315-01 9,691 -50
tIHT Deposits•••
9 f102 *85 92-61 103-70 144 -14 103 -36 143-44 142 -77
t3 U T ^ 3 cr1 § H T B ) £ s Value o f G oods Produced 9 • » 645 -43 1,206 -49 2,382-13 2,275 -32 2,381 *65 2,955-87 4,473 -74
Value o f G oods sold ... 99 650 -06 1,172 -58 2,350 -32 2,440-73 2,484 01 3,107-66 4,510 -39
Societies in Profit ••• s ; N o . 2,287 1,741 2,217 2,128 2,166 2,381 2,691
Prcfit s y i u § Rs. Lakh 11-00 108-20 21 -01 43 -00 24-98 44-09 109-14
UJTZ u g r ^ t Societies in Loss ... 3 " ; N o. 1,468 1,019 982 831 899 778 1,125
UlTgT Loss ... ^ 3 1 1 ^ Rs. Lak 6-55 10-95 62-73 582 -36 257.19 7-45 19-98^
RTqjs: 3fiiH 2aT3, RfoofT^ u W a I
source: Registrar, Co-operative Societies, Puoj»b.
u>
O

H fijc P a S T '
CO -O PERATIO N
H 'g s l 1 4 . 2 3 — RES H*3 ^ 3 1 I H " S ^ ^ ^ ^ a >H§
( 3 0 H s Hi R fg n l)fa b le i 4.J3— K •<'1''* and Tube vel.s Financed by State Land Development Banks
(as un 30th Jane)
^Number)
s l e o i u
( 1 ) HI?5 ^
( 2 ) n » s ^ >H3 5 a
f 2 t 3 9 i B
( 1 ) ^TH # €^^^5
( 2 ) ^ >H3 ^ C S
Description
0Tractors—
I) During the year
(ii) I p to year
1 u be-wells—( ) Duiing the year (ii Up to year
1975-75 193^81 1983-84 1984-85 1985-86 1986-87 1987-88
2 ,000 3,238 2.980 1,955 984 1,084
14,100 26,727 38.344 40,299 41,283 42,367
9,0010 11,343 7,399 6,711 7.358 8,264
l,34,OOP 2,02,293 2 ,16 ,295 2,23,006 2 ,30,364 2,38,628
1.664
44,031
4 ,364
2,42.992
: affTR^grg^ Rfasr^^ 1
Source — Rejistrar, Co-»?3rative S a d etiss P a a itb .

H f U o T U H 'CO-OPERATION
14 .24— URTg ^ H W ^ <313^, Oh J § TTHtTable 14.24—Central Co-operative Banks, Offices, Membership, Capital and Deposits in Piuuab
Namber of O ffices*Number o f Membws
Hfuo?T^
>H§ H ^ > H t Central and Primary Societies
C e o W Co-operative — “ J — — , 53.34 1 , 84.85 1985-86I 986-87 1987-88 1W -7 S 1980-81 1983-84 1984-85 1985-86 1986-87 g l9 8 7 -8 8
>H 1 3Tra
9 5 W
fe a tiy ^
gftm ro ira
HWUd
cTira^T
H3F
eftjB
ufe>H W
| u jsgra
Hdlc^
g g s 3th?
0
Amritsar
Batala
Bathinda
Faridkot
Fazilka
Firozpur
Gurdaspur
Hoshiarpur
Jalandhar
Kapurthala
Ludhiana
M oga
Nawanshehar
Patiala
Rupnagar
Sangrur
T am Taran
1 10 91 12 13 14
17 84@
9 Merged
16
10
8
11
13
21
206
32
10
8
23
12
17
47
32
23
24
48
57
52
20
52
19
19
43
26
51
8 Mergedf
* H y n H 3 iIncluding Head Office. M arged with Gurdaspur.
84 84 85 88 88 1.275 1,370 1,530 1,607 1,650 1,729 1,932
Merged Merged Merged M eiged Marged 830 Merged Merged Merged Merged Merged Merged
47 47 46 47 48 1,074 759 851 1,104 1,177 1,295 1,081
32 32 31 31 32 1,089 1,004 1,063 1,085 1,098 1,106 1,156
23 23 22 23 24 698 584 598 603 608 610 637
24 24 25 25 25 1,290 990 1,065 1,652 1,661 1,766 1.139
48 48 47 47 47 1,322 1,329 1,529 1,552 2,044 2,126 1,698
57 57 57 57 59 2,014 1,368 1,435 1,491 1,593 1,704 1.412
53 53 53 53 55 2,069 1,327 1,336 1,334 1,335 1,342 1,395
20 20 20 20 22 806 656 656 659 694 706 647
52 52 52 52 52 1,982 1,638 1.654 1.664 1,670 1,696 1,745
20 20 21 30 30 566 501 504 503 494 489 513
19 19 20 20 20 530 398 404 403 405 403 413
43 43 46 46 48 1,593 1,271 1,301 1,309 1,316 1,335 1,355
26 26 26 27 27 1,177 783 801 817 817 828 851
51 51 50 55 56 1,420 1,173 1,226 1,240 1,261 1,262 1,337
Merged Merged Merged Merged Merged 858 Merged Merged Merged Merged Merged M erged
THH cO§ 1
u>
to
Marged with Amritsar.

R i g ^ 14.2 4 — {fflrg RfuSfTgl g ‘s?, fgrSH^, ^rft § tTH gSTH’
Table 14.24—Central Co-operative Banks, Offices, Memberships, Capital and Deposits in Punjab
c o -o p e r a t i o n
a*aCentral Co-operative
Bank
U tfl ( ’OOO Paid up Capital (000 Rs.)
( ’ O O O l f w f ^ g ) Deposits (’000 Rs.)
a f ^
STfesioTT
fe lt f ir a
dJd^'HUg
gfH » ro y g
tiB ira
H3F
?5^ e f e g
y fe > n w
§U <S3I9
33?5 3Tg?5
Amritsar
Batala
Bathinda
Faridkot
Fazilka
Firozpur
Gurdaspur
Hoshiarpur
Jalandhar
Kapurthala
Ludhiana
M oga
Nawanshehar
Patiala
Rupnagar
Sangrur
Tarn Taran
1975-76 1980-81 1983-84 1984-85 1985-86 1986-87 1987-88 1975-76 1980-81 1983-84 1984-85 1985-86 1986-87 1987-88
1815 16 17 19 20 21 22 23 24 25 26 27 28
10,716 22,273 27,833 : 29,067 29,441 29,730 30,093 46,352 1,28,356 1 ,91 ,554 2.32,818 2,94,101 3,03,309 4 ,93 ,636
5,486 Merged Merged Merged M erged M erged Merged 24,721 Merged Merged Merged M erged M erged Merged
10,443 16,023 19,993 22,272 22,371 21,227 18,507 26,799 53,847 58,745 83,884 1,09,684 1,34.893 2 ,38,271
7,708 12,806 18,307 19,184 19,403 18,379 18.585 21,386 70,697 47,457 80,152 92,287 96,455 1,83,088
7,284 9,148 12,072 12,892 12,904 14,033 14,992 13,452 25,363 33,576 38,414 46,700 55,166 90,531
9,905 14,889 20,430 22,465 23,587 24,116 19,891 31,957 43,286 48,869 67,838 78,354 83,907 1,49,839
6,605 13,422 16,401 17,726 18,620 18,790 19,842 37,095 86,713 1 ,20 ,654 1,47,978 1,65,826 1,71,639 2 ,41 ,134
7,508 9,278 11,606 11,752 11,970 12,300 J2,894 75,526 1,51,859 2 ,19 ,942 2,43,552 2,94,083 2,88,358 4 ,08 .344
8,471 11,081 15,143 16,437 15,764 15,758 16.218 1,09,852 1,82,786 2 ,24 ,743 2,74,865 3,39,926 3,02,336 4,91,850
5,417 6,725 9 ,005 9,997 10,170 9,015 9.015 45,794 1,10,674 1,50,326 1,76,253 2 ,08,192 2,21,207 3,21,975
24,690 27,647 30,187 31,846 32,588 25,364 26,355 1,02,410 1,54,109 1 ,6 5 ,3 9 3 2,21,843 2,60,765 2,43,288 3,88 ,077
9,725 12,051 14,144 15,331 15,403 12,950 10,827 24,910 52,724 72,682 87,160 1,09,779 1,22,808 1,77,023
3,268 3,693 3,693 3,803 3,903 3,903 4 ,066 70,831 1,57,122 2,25 ,^76 2,63,455 2,98,774 2,69,870 4 ,02 ,626
19,366 25,335 34,195 38,839 38,943 36,239 39,845 62,385 1,08,674 1 ,14 ,545 1,52,087 1,82,969 2,11,847 3,06 ,208
5,135 7,666 10.038 10,240 11,481 10,979 12,603 30,980 57,339 84,961 96,047 1,15,613 1,29,369 1,79.206
19,229 23,794 26,590 26,997 26,427 25,878 26,621 42,575 72,501 88,342 1,16.852 1,39,163 1,63,256 2,83.808
8,011 Merged Merged Merged Merged M erged Merged 24,090 Merged Merged Merged M erged M erged M erged
HftjoTcrt H y r n g I Source R^atar, Co-operative Societies, PuAiab.
u»

n fu o p ^ t*oT
314
R f o
CO .
14.2 5— i4;rg nfuor^ fu s *Table 14.25—Central Co-operathe Banks,
Central Co-operativeBank
Liabilities
Working Capital
1975-76 1980-81 1933-81 1934-85 1985-86 1986-87 1987-88
Amritsar ... 79,127 3,67,454((p,
Merged
5 ,2 4 ,2 1 9 5,03,574 5,52,482 6,65,021 8 .42 ,216
Batata . . . 44,948 Merged Merged M erged M erged Merged
Bathinda . . . 50,617 1,58,123 2 ,8 3 ,1 6 8 2,15,475 2.29,557 2.97,130 3.43,762
Faridkot . . . 44,622 1,71,731 2 ,82 ,790 2,51,302 2,65,574 3,13,467 3.02.555
Fazilka ... 29,634 1,02,236 1,56,304 1.29,536 1 ,35 ,630 1,72,191 2 ,14 .916
r^dijyg Firozpur ... 61.566 1,78,053 2,50,747 2,51,562 2,62,031 2,97,386 3.67.068
dIdti'HUB Gurdaspur ... 58,325 2,00,878 3 .3 3 ,0 0 9 3,28,912 3,74,375 4,41,100 4,87,413
vJrH»TBy3 Hoshiarpur ...1 ,0 8 ,3 0 5 2,00,521 2,75.025 2,90,573 3,46,158 3,97,834 4.60.671
'•R&UiJ Jalandhar ...1 ,43 ,462 2,93,147 3 ,08 ,880 3,39,573 4,08,425 4.63,848 5,61.388
oTUdy^ * Kapurthala ... 59 ,39 ) 1,37,004 1,83,309 2,11,162 2,45,888 2,91,345 3,63,404
wru>>r5» Ludhiana ...1 ,71 ,554 3,14,581 4,71,846 4.32,527 4,27,742 4,64,960 5.93.163
Krar Moga ... 42,880 1,01,356 1,80.115 1,43,512 1,52,138 1,96,654 2.57.104
Nawanshehar... 85,358 1,92,114 2 ,84 ,514 3,29.323 3,73,603 4,31,009 4.99.134
u fe» rsT Patiala . . . 97,736 2,87,336 4.16,793 3,86,656 4,66,653 5,26,514 6.28.705
9UAdI? Rupoagar . . . 44,329 1,14,365 2.06,939 1,63,589 1,85,079 2,42,770 2.64,955
Hdidd Sangrur ...1 ,10 ,010 2,38,423 3,66 ,584 2.99,861 3,29,646 3,96,395 4.69,847
3 3 6 d 'd S Tam Taran ... 63,833 Mergedt Merged Merged Merged M erged Merged
S ? : — ( i ) 1 9 7 1 §* SHHTI UtT^—
( i i) 1983-84 3" »4Tfg<»He >H§ ^ I
(i) Since 1971 the Workiog Capital^*Total Assets and(ii) Since 1933-SU working capita! =»AU item? appearin’ io liibilities side ot the balanca sheet
exdudiag contra items and commulative loss.
@ hth h oft§ i
@ Merged with Gurdaspur.
t »>ffH3Fra H 'fH S It Merged with Amritsar.

^ >H§tbeir Liabilities and Assets
OPERATION
5l 5
LiabiUties
(u a r g(Thousand Rupees)
All other Liabilities
m s - 1 6 1983-81 1983-84 1984-85 ■985-86 1986-87 1987-88
10 11 12 13 14
5.537 14.814 15,172 11.409 16,4l5 92,061 12.444
1,503 Merged Merged Merged Merged Merged Merged
3,518 6,557 8,769 2,572 2,615 4,455 7,285
4,173 9,422 7.979 3,771 1,820 10,799 3.836
3,148 3 .2 3 9 3,471 2.4M 4,013 1,849 l ,6 8 i
2.323 11,640 17,281 10,707 14,041 8,271 6,165
1,555 12,408 16,635 14.268 17,1.21 16,944 10.792
6,451 10,321 20,932 9.534 10,599 14,069 18,439
4,785 14,511 22 ,504 8.S3S 9.125 12,524 11,150
2,306 4,007 3,070 4.003 3,225 3,562 2.598
8,267 19,585 25.497 14,884 17,779 9,724 15.347
1,176 8,837 3.979 1,940 2,397 2,898 8 ,049
2.106 8,524 5,395 5.951 5 .61) 5,7^5 6.597
7.627 17,142 23,625 20,456 2 5 .3 U 25,753 29,925
]4 ,i2 l 6,019 8,935 4.583 4.431 5.697 4,530
6,501 35.7U 2 5 ,UO 18,5)3 20, U l 20.288 23,681
7,174 M ergsi V lsfia i Me(*g3i Margad ie r g e j

316
HfoCC
14. 25— 1*51,Table 14.25—Central Co-operative Bankti*
Liabiities
CentralCo-operative
Bank
i7 3Total Cash-
1975-76 1980-81 1983-84 1984-85 1985-86 1986-87 1987-88 1975-76
0 15 16 17 18 19 20 21 22
Amritsar 74,785 3,67,251 5,27.873 5,03,578 5,52,482 6,65,021 8,42,216 6,371
Batala • •• 43,359 Merged Merged Merged Merged Merged Merged 3,168
Bathinda • •• 49,779 1,58,790 2,83,168 2,15,475 2,30,914 2,98,931 3,47 ,095 5,408
Faridkot • •• 42,145 1,71,309 2^1,784 2.51,302 2,64,964 3,12,619 3,01,981 2,503
e»fg3c?t Pazilka • •• 29,418 1,00,918 1,56,319 1.31,046 1,36,635 1,71,612 2 ,14,209 2 ,6 2 )
fe a a y a Firozpur • •• 59,766 1,75,718 2,98.743 2 ,4 ) ,558 2,63,239 2,98.628 3,67,984 5,039
iia tjn qya Qurdaspur . . . 57,372 1,95,731 J,30,009 3,28,912 3,68,672 4,44,411 4 ,93,750 3,673
3 ftn »r3y3 Hoshlarpur • •• 1,04,950 1,98,493 2,72,720 2,93,222 3,45,927 3,97,894 4,69,417 6.092
HriUd Jalaadbar • • • 1,35,709 2,72,354 3,05,421 3,39,573 4,0 4,40 J 4,64,312 5,56,807 9,951
sryOTs» Kapurthila 57,958 1,33,169 1,80,755 2.10,556 2,42,064 , 2,35,063 3,57,463 3,105
Ludhiana 1,62,670 2,92,60? 4,61,797 4,31,798 4,25,571 4,64.610 5,91.071 24,388
flar Moga • • • 40,674 1,00,522 1.76,895 1.14,212 1,50,173 1,93,651 2,53,453 3,362
?Rf» a f b i Nawaaihehar... 81,214 1,86,360 2,56,022 3,06,688 3,57,316 4,04,848 4,63.137 2,405
Patiala • •• 95,804 2,88,186 4,24,184 3,94,047 4,78,679 5,38,288 6 ,43 .256 3.830
|Q Adid Rupaagar • •• 42,728 1,13,453 2,09,162 1,66,163 1,87,647 2,45,360 2,71,438 1,709
fraifg Sangrur • •• 1,08,692 2,63,048 3,65,584 3,05,850 3,3>,63> 4,03,562 4,83,901 5,153
3 3 S d 'd A Tara Taraa • •4. 62,419 Merged M erg il M ifg e l M erged \fe f g e j Merge i 3 ,436
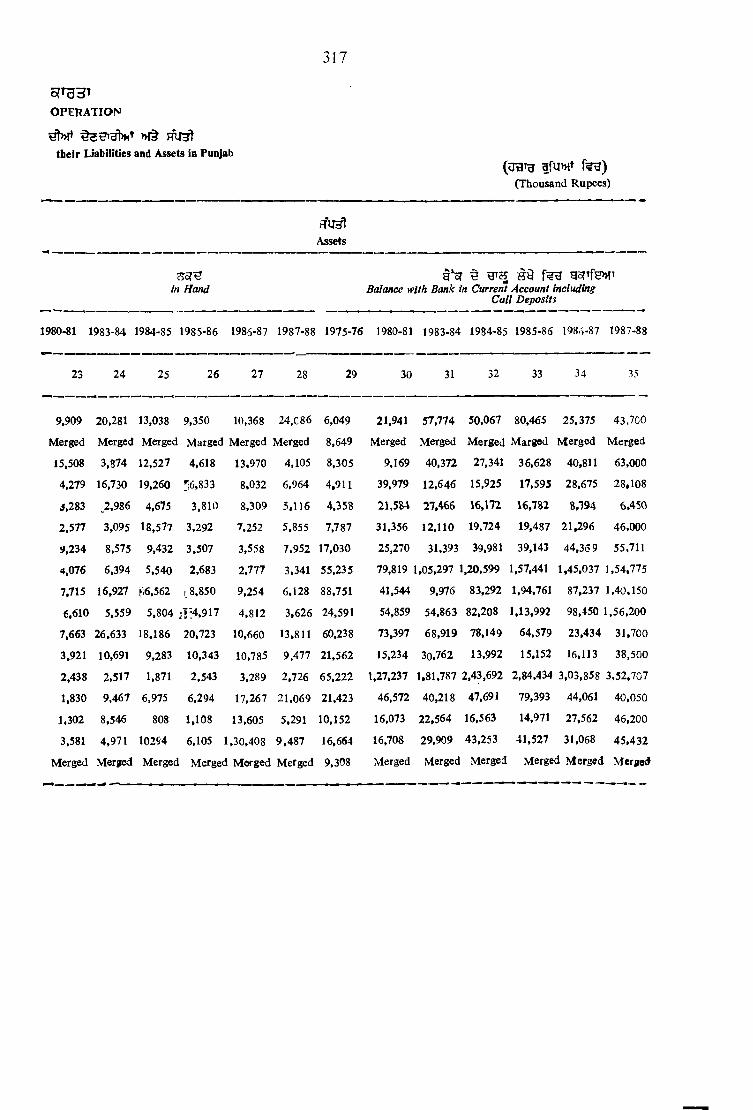
317
o^T^HT
O PERATIO N
>H§tbeir Liabilities and Assets in Punjab
(UtlTH f ^ )(Thousand Rupees)
F T ^Assets
in Hand Balance with Bank in Current Account including Call Deposits
1980-81 1983-84 1984-85 1985-86 1986-87 1987-88 1975-76 1980-81 1983-84 1984-85 1985-86 l98r,-87 1987-88
23 24 25 26 27 28 29 30 31 32 33 34 35
9,909 20,281 13,038 9,350 10,368 24.C86 6,049 21,941 57,774 50,067 80,465 25,375 43,700
Merged Merged Merged Marged M erged Merged 8,649 Merged Merged M erged Margod M erged M erged
15,508 3,874 12,527 4,618 13.970 4.105 8,305 9,169 40,372 27,341 36,628 40,811 63,000
4,279 16,730 19,260 % 833 8.032 6,964 4.911 39.979 12,646 15.925 17,595 28,675 28,108
3,283 _2,986 4,675 3,810 8.309 5,116 4,358 21.5S4 27,466 16,172 16,782 8,194 6,450
2,577 3,095 18,577 3,292 7,252 5,855 7,787 31,356 12,110 19,724 19,487 21,296 46,000
9,234 8.575 9,432 3,507 3,558 7.952 17,030 25.270 31,393 39,981 39,143 44,369 55,711
4,076 6,394 5,540 2,683 2,777 3,341 55,235 79.819 1,05,297 1,20,599 1,57,441 1,45,037 1,54.775
7,715 16,927 ti6,562 r 8,850 9,254 6.128 88,751 41,544 9,976 83,292 1,94,761 87,237 1.40.150
6,610 5,559 5,804 ;!l:4 .917 4,812 3,626 24,591 54,859 54,863 82,208 1,13,992 98,450 1,56 ,200
7,663 26,633 18,186 20,723 10,660 13,811 60,238 73,397 68,919 78,149 64.579 23,434 31,700
3,921 10,691 9,283 10,343 10,785 9,477 21,562 15,234 30.762 13,992 15,152 16,113 38,500
2,438 2,517 1,871 2,543 3,289 2,726 65,222 1,27,237 1.81,787 2,43,692 2,84,434 3,03,858 3,52,707
1,830 9.467 6,975 6,294 17,267 21,069 21,423 46,572 40,218 47,691 79,393 44,061 40,050
1*302 8,546 808 1,108 13.605 5.291 10,152 16,073 22,564 16,563 14,971 27,562 46,200
3,581 4,971 10294 6,105 1,30,408 9 ,487 16,664 16,708 29.909 43,253 41,527 31,068 45 ,432
Merged Merged Merged Merged Merged Merged 9,308 Merged Merged Merged Merged Merged Merged
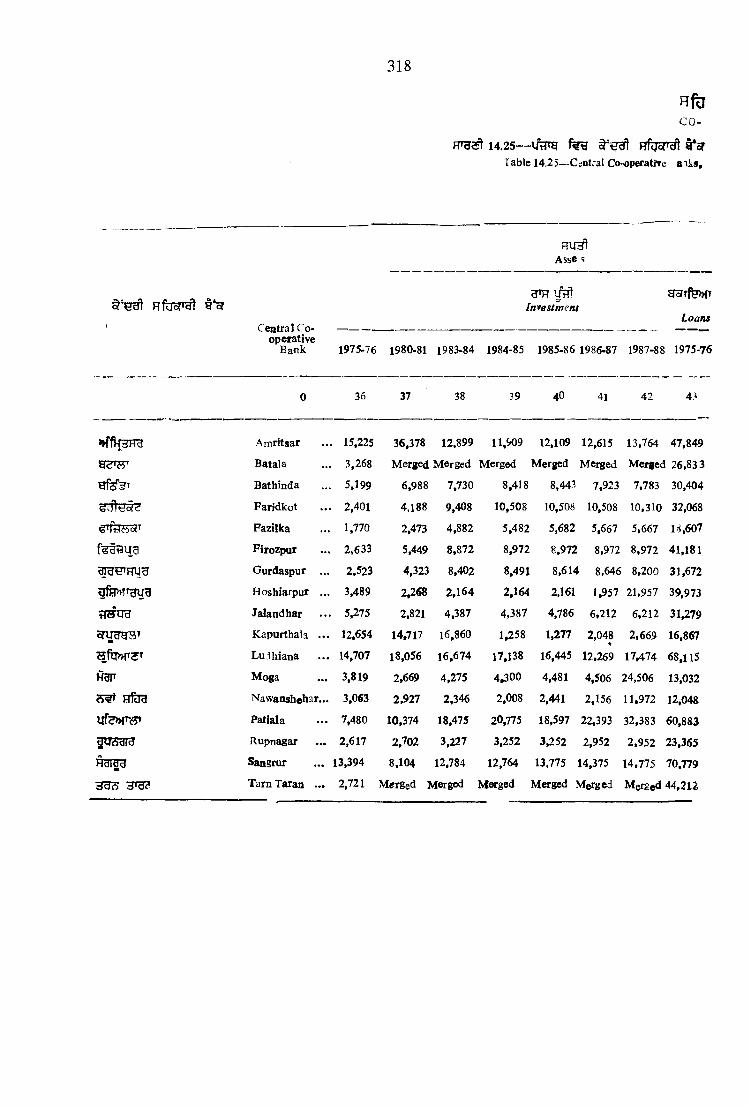
318
co-
14. 25— t*6rTable 14.25—Central CO'>operatite a iks.
R f e s n ^ g*cT
f?U ^Asse
^ ^ t f ^ TInvest me ni
LoansCentral Co- -------------------------------------------------------------------------------------------------- ------------—
operativeBank 1975-76 1980-81 1983-84 1984-85 1985-86 1986-87 1987-88 1975-76
36 37 38 39 40 41 42 43
Amritsar . . . 15,225 36,378 12,899 11,909 12,109 12,615 13,764 47,849
y<J'64» Batala ... 3,268 Merged M erged Merged Merged Merged Merged 26,833
Bathinda ... 5,199 6,988 7,730 8,418 8,443 7.923 7,783 30,404
Faridkot . . . 2,401 4,188 9,408 10,508 10,508 10.508 10,310 32,068
Fazilka ... 1,770 2,473 4,882 5.482 5,682 5.667 5,667 18,607
Firozpur ... 2,633 5,449 8,872 8.972 8,972 8,972 8,972 41,181
Gurdaspur ... 2,523 4,323 8,402 8.491 8,614■ 8,646 8,200 31,672
JpHMTHyg Hoshiarpur ... 3,489 2.268 2,164 2.164 2,161 1.957 21,957 39,973
Jalandhar . . . 5,275 2,821 4,387 4,387 4,786 6,212 6,212 31^79
Kapurthala . . . 12,654 14,717 16,860 1.258 1,277 2,048 2,669 16,867
Ludhiana . . . 14,707 18,056 16.674 17.138 16,445 12.269 17,474 68.115
H3F M oga ... 3,819 2,669 4,275 4,300 4,481 4.506 24,506 13,032
wrod Nawanshehar... 3,063 2.927 2,346 2,008 2,441 2.156 11,972 12,048
Ufe>HT^ Patiala . . . 7,480 10,374 18,475 20.775 18,597 22.393 32,383 60,883
UUSdl? Rupnagar ... 2,617 2,702 3,227 3,252 3,252 2.952 2,952 23,365
H dird Sangrur ... 13,394 8,104 12,784 12.764 13,775 14,375 14,775 70,779
HfH? TarnTaran ... 2,721 Merged Merged Merged Merged ^Merged Merged 44.212

319
(heir Liabilities and Assets in Pnniab
o p e r a t io n
Assets
(O T’^ 0 1lusand Rupees)
orat?Outstanding
2 5Interest
1980-81 1983-84 1984-85 1985-86 1986-87 1987-88 1975-76 1980-81 1983-84 1984-85 1985-86 1986-87 1987-88
44 45 46 47 48 49 50 51 52 53 54 55 56
2.59,444
Merged
82,723
94,051
59,808
1,00,448
1,19,664
65,405
63,076
57,132
1,54,717
49,691 1.00,585
18,663 41.562
2,00,170
46,856
1,63,877
3,53,816 3.45,587 3,45,480 4,98,950 5,54,851 2,244 10,190
Merged M erged M erged Merged Merged 2,702 Merged
2.16,733 1,46,769 1,19,538 2,03,889 2,00,774 791 2,277
2»07,907 1,72,288 1,56,050 2,50460 2,16.417 2,189 3,971
1,13,444 88,341 80.532 1,30557 1,65.156 1,856 4,186
1.88,969 1,62,869 1,73,530 2,17,024 2,36,147 4,236 10,492
2,07,659 2,16,762 2,32,144 3,46,828 3.60.096 2,627 8,437
1,25,575 1,28,805 1,23,909 1,86.610 1,96,771 1,863 3,081
1,32,784 1,39,842 1,24,694 2,33,412 2.32,569 3.080 5,049
44,109 93,988 79,199 1,23,478 1,18,278 1,803 2,999
3,23,272 2,57,041 2,42,258 3.24,591 5,06.621 2,828 6,922
82,453 '85,879 1,35,473 1,44,719 187 527
49,512 41,488 68,156 70,652 243 3,973
2,28,324 2,59,237 2,65,577 3,80,013 4,45,737 2,317 8,665
72,175 85,185 85,137 1,66,519 1,69,734 2,191 5,942
2,71,305 l,76.9S0 2,71,151 2,75,835 2.85.555 3,209 10.285
Merged Merged M erged Merged Merged Merged 3,496 'Merged
14,795 ’ 18,811 21,971* 24,557 25.61 7
Merged M erged Merged Merged Merged
3,303 3,975 4,594 5,383 6,222
5,105 5,395 5.803 7,107 3,380
4,850 5,168 5,577 5,747 5,929
13,967 15,059 15,771 16,512 17,022
19,013 21,298 24,084 27,701 29.407
4,890 5,110 5.881 7,634 7,854
6.870 6.913 7.734 6.980 6,399
946 831 965 936 1,036
8,915 10,920 11,112 4,250 13,868
1,069 1,052 1,244 1,502 1,036
7,816 635 862 957 1,092
13,563 14,932 16,H 2 17,902 19,614
9,590 10,977 10,750 11.908 15,458
21,830 24,978 27,963 30,083 33,321
Merged Merged M erged Merged Merged
Revised

320
f i f e
CO-
1 4 . 2 5 ~ l i ^ HfjofTdl ^*oT, f u s t
Table 14.25— Central Co-ope'ative Banks* the|»
A S. tS
FrfborgI t*oT Central Co-operative Bank All other Assets
1975-76 1980-81 1983-84 1984-85 1985-86 1986-87 1987-88
0 57 58 59 60 61 62 63
Amritsar 1,389 4,530 3,151 2,739 2,723 3,293 9.958
Batala 328 Merged M erged M erged Merged Merged M erged
Bathinda 510 3,383 1,446 1,890 1,844 2,555 4.283
Faridkot 550 1,932 1.S21 2,404 2,552 3 ,268 4.275
iaiiVka 414 689 979 749 917 1,063 1 ,945
Firozpur 690 1,963 1.621 1,607 2,151 2 ,809 3.855
Curdatpur 800 1.899 1.920 1,895 2.149 2,553 2 ,636
«jfHMTgyg Hoshiarpur . . . 1,648 6,405 : 6 ,192 6,734 8,754 ^,265 14,340
tlWUd Jalandhar 5,126 11,893 8,087 7,945 6,646 10,644 21.337
ofUHWST Karxirthala 370 687 3,297 4,111 5,190 6,081 9,802
Ludhiana 1,278 1,532 3,131 2,917 2,942 1,832 1.625
Mar Moga 918 2,062 1,904 1,828 2.062 2,942 4,091
?r€' H fjg Nawanshehar . . . 2,377 1,030 1,202 6,995 7,373 7,939 7.971nfe>HT3T Patiala . . . 1,803 9,916 4,683 11,771 6,354 4,931 6.700
Rupnagar 4,295 3,523 1,780 1,924 6,244 3,908 2.309
Sangrur 811 1.200 3,397 2,144 1.797 2,077 2.742
3 3 3 3^ 3 3 Tarn Taran . . 660 Merged Merged M erged Merged M erged M erged

niftLiabflltiw A n ^ In l toUab
OPERATION
321
Aaets
Tbtal
( u i r g i f W t ^ )( T h o i ^ d R u pe^ ;
1975-76 1980^1 1983-84 1984-85 1985-86 1986-87 1987-88
64 65 66 67 68 69
19,127 3,67/454 5.24319 4,94324 5,42,972 6,54309 8.27.775
44,948 Merged Merged Merged Merged Merged Merged
50,617 1,58,123 2.83,168 2.14,118 2,29,113 235,598 3,39,375
44,622 1,71,731 2,»2,790 2.50,051 2,65,574 3,13,4« 3,02.555
29,634 1,01,136 1.56,303 1.29,535 135,630 1.71,181 2,14,915
L61,566 1,78,053 2,50,747 2,50,148 2,62,031 2,97386 3.67.968
58,325 2,00,878 3.33,038 3,26389 3,67326 4,41,100 5.(6,701
1,08,305 2,00,849 2,75,025 2,93,161 3,46,157 3,96.253 4.67.449
1,43,462 2,74.793 3.08,889 338,189 4,07,041 4,70,455 5.62.950
59,3M 137,094 1,81.309 2.11.162 2,45.888 2,91345 3,63.404
1,71,554 3,14,581 4,71,846 432,527 4,27,742 4,64,960 5,93,163
42,880 1,01356 1,83,115 1.43312 132,138 1,96,654 2,57,114
85,358 1,92,114 2,84,515 3 29323 3,73,603 431,009 4«99,134
97,736 2,87,336 4.16,793 3,88,678 4,66,653 536,514 6,28,702
44,329 1,13338 2,06,939 1,63314 1,85,079 2,42388 2,64,955
1,10,010 2,65,990 3,67,691 3,00334 3,27,993 3,93,621 4,69.846
63,833 Mcf ed Merged Merged Merged Merged Merged
WQS ;— 3ftlR?3Td HfOcT^ liW»3 IS n v w .—R^;istzar, C oopenU ive Societies, Punjab.

322
Hf3co-
14.28— ml* W5RT3 T aU e 14 *26-L oans Oyordoe against Agricultaral Credit
Period for overdue
1970-71 1975-76
goW lj3tH 33T g i w
Am ount Percent- Amount Percentage age
*>»iaUoPB! >H§ oJT^ ora^
•Short and Medium Term I cans.
0 1 2 3 4
FTO 3* ufe Less than one year ... 1,392-28 62-90 1.860-18 46-60
1 - 2 IT S 3cT 1-2 year ••• 443-67 20-04 822-78 20-62
2 - 3 FT® 3of 2-3 years ' 242-04 10-94 632-03 15-84
3 RTS nf§ fuu 3 years and above ... 135*53 6-12 675-91 16-94
TO Total • •• 2»213-52 100-00 3.990-96 100-Oo

323
-sragr U3t o f a i *
Societies (PcriDd irtoe) InPmiab*
OPERATION
(Rs. i s laldis)
1980-81 1983;«4 1984^ 1985-86 1986-87 1987 88
gow ijyrwd^Amount f Percent
age
dc?H qyiHcJd' UoWAmount Percoit-;] Amount
“ age
dotH iidlkidd*Percent- Amount; Peicait- age age
(Jewjimount jPeroenl- Amount Proo^«
age age
5 6 7 8 9 10 11 12 13 14 l15 16
2,530-25 50-27 2,879-00 37-78 5,065-36 50-33 6^97-89 50-37 3,875*25 27*83 7,673*58 54*14999-25 19-85 2,043*81 26-88 2,669-97 26-53 3^94-73 26*35 3,153*84 22*65 3,692*00 26*05
763-71 15.17 1,220-15 16-01 1,318*10 13-09 1,530*76 12*25 1,386*74 9*96 1,267*65 8*94740-12 14-71 1,473-38 19-33 1,011-67 10-05 1,379-06 11‘03 5,508 *00 39*56 1.540-30 10*87
J.033-33 100-00 7,621 -34 100-00 10,065 00 100 00 12.502-44 100-00 13,923*83 100*00 ]E4.173-53 100*00
Hnij? I— Ut TO iSmrea—'. Riefijstrar, Co-operative Sodeties, Puiua)».

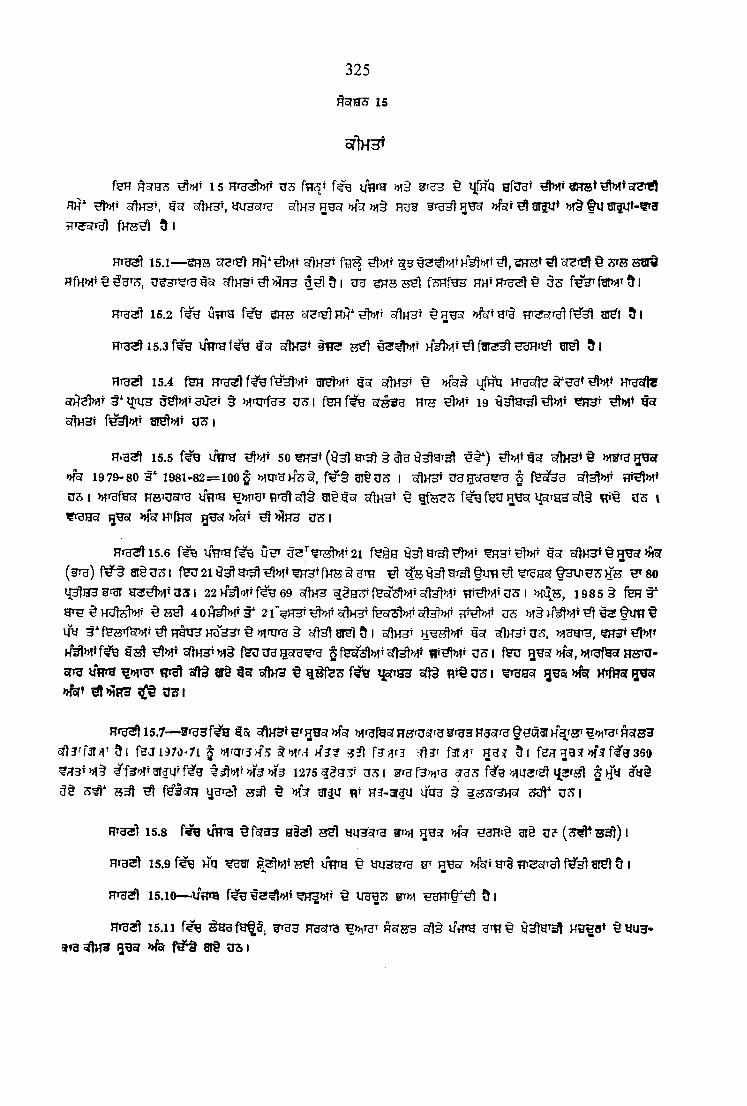
325
f l 3 3 3 IS
SflH3*
1 5 H r g ^ t ^ 3 y f lr g >;i§ § qfRQ g f o g t g H g t ^ t oreifft
hh* o^lH3^ gs? srlHHt, mjHSTTu sH hh h h st m » i§ nuw STgnt n fe t ^ grjy* » ! t f u
m g ^l 15.1— SRS cT^T^ nH‘ ^»Tt srlHHi
f7fHMt§^UT3^ 4^1 9 I UH ^ S ??h1 f?JHfH3 FTH^HtUSI^ 0S f ^ V f w f t l
nrg^t 15.2 f ^ O tra 3H ^ HH‘ ^Tmt ^IhHt »fetH r§ gy^j ft I
H T u ^ i 5 . 3 f ^ iH F r g f ^ gsT ^ r t e t § t r ! ?5h1 hW ^ h u h i^ I stsI 5 i
HTg^ 15.4 fOT nrg^t gr^)>^t gsr 5?lH3» § m i ijfJTO Hrusffe
oTHSW 3 * l | i i i3 § >jinjTfg3 3^51 f H H f ^ S ? s3 g HtB 19 y^ H r^ l ^ t ^>,^1 f g
sftH 3i f^ > H T ar^M t g ? j |
15.5 im tg 50 (^ 3] HT^ § ts? s r te * t»>fe 1979-80 3 ‘ 1981-82 = 100 § f # § ai§U 3 I BT1h3 t f f e ^ 3 t T ^ tvl^ I MTBfgoT ITRTH ^>^131 fligt ofl§ g ittS T ^ HHof IJc^thh o^§ {
^ H S ? 5^ >HsrHTfHor ^>j?H3 0 5 1
H T H 3tl5 .6 y t T m f ^ U ^ f^ e O y 3 l g T ^ t ^ » l ' ^ 3 T ^>nt gsr o T W HHoT >Mcr
( ^ ) f^-§ ar§ U3 1 fHU 21 ^ gi^ ^ i b ynl ^ v\ f 3 Vr^^ ) b ^ so2 2 > f^ o ltf^ g 69 srtHH U3 I >>mj55, 1985 § fSH §*
40H^!>HT3" 2r^H 3T^!>>ft of^ H H T fe^r^ 5M >H T M § ^ ^ f i m §
u y 3 * f^ 'T f ^ M t^ F r a r i3 H Q 3 3 T § > ) ^ n r g § o f t ^ g r ^ J t l srlHHT H ^ > )T t gsr g lH 3 T U 3 , »1HgT3,
| g g sr m , H O T -
ofTu y ifp g i»JiTgt HT^ s f t t ar§ ^ h 3 § % -^7 > f # 3 i^THH cO§ ? j i § u s j g g p i m H T fw sr g ^
»fet ^>«lT3r u s I
15. 7— r ^ g gc i 5 f g ’35f >Hor JJir^fgar Hfjraajru ^ r g s Hgafrg f €(H3r H^rjjr ^»,THr ^ 5 3 3
^73ff3T)1' 9 l f3J197i)-7l § ^ W A K ?? ^3ft r3}fr3 S7l ? r H 37 ^ \ f?»7 »f5r 360?i73Tb!^ grJlT’f #?l>)!f»f3»l3 1275 ^^U 5f US I »!ir3 rHl Ijarjjl J j f y gtr§
3 ^ ?5^" ^ fsisTff y g is t ?53t ^ M3T gr^U n t H3-3r3U UOH § 3SSr3H5r u s I
HTU3 t 15 .8 im ^ g §f5T33 a § 3 l yi|^5?TU gr»f »f5j H 3 R i§ aT§ U ? I
H ig ^ ! 15 .9 f?>B Hq jjH t IfTPg § W 3 ^ th 3 t »fo?T g rg TTtS c tuI f ^ 3 l 3 1 ^ & |
m u s l 15 ,10— X Jtm ^ gr>n 9 I
HTU31 15.11 f? g ^ 3 HUc?Tg B>hTUT R6rB3 ifflTH y3lHT^ H3^5* § « U 3 -
3 »a 5 ^cf » fe ar§ u s i

15.12 RHofTU H ^B3 5T1§ nffHHHg b f t R3SgiB H ^ R a tJ of]j-3 R^c! >viWi F litll fl^^5:icl f t ' s l g 't ] 5 1
15.13 s g u f g ^ , ^ U 3 HUoTTU^MTgr Ho?s 3 oT1§ »f*fH3HH BSt HBBH ^ W3ofTg
sftHH » fe t H ttj! TreBTTUl g r ^ ^ |
15.14— ^ 3 § H33 Hrg ^ ^ 5 § S t HtTH3 iM »1 t Hri5 US ft?3T 5§ HlitUUS SrTBl»T§ § U3I f?JlR3 HHt ^ rn t US fafe ^»iT^Tf3j3g3sf]§ ^ ^ H H t^
fU3l [H£r>>iH3Hire^HSl§ UJcJ y y n ^ sftHH Hgtil I
QTi t ^H3- iftTHVMg U?J, Mcg^Hydi^r, »1§ ^U3 »!§ »i^f?,»^§ i (3 R gTqll )>f^_ gygy hV ^T H tt3 3 oflHH H! 3 ) fe 3
»j?H3 ^1 ^^f?Jfug>HFr3 HtT^UeSl U a ^ ^ t § c7|§ I r7?5HB^5f SHI, gravjT UU fHSf § >3 H3 HSi >HTdT cft§ tO >«Fr3
»iSHTg fgcfst ))iH3 Tfttl ^ I fsruT^ § » k i HTc'tnit f ^ h t »fe s h rh^ h" oflg} arel u ^ b
§ » T TUH G3I ^H3T »!§ ^»iTfoR yrH HHHf?^ ^>"4^ STIhHt ftJHrg 3U? BTf^»lTfar>} T I nfEJi w g fsVi>}iT ^ w ortt 1
3^;— fHR m »i^7i i ^ u n m ^ r tb >h3Hth f # § gi§ U31s e l u iu^T gfy>,it »fef3»^t H s y t § i
SECTION XV
PRICES
This section consists of sixteen tables containing information on harvest prices, wholesale prices consumer price index numbers etc., for important towns of Punjab and India and All-India Index num bers of wholesale prices by groups and sub-groups.
Table 15.1.—Harvest prices are the averages of weekly wholesale prices in certain selected markets of the districts during the periods, closely following the harvesting of various crops. The period pres* cribed for each crop is shown below the table.
Table 15.2.—Shows Harvest Price Index Numbers in Punjab.
Tab/e 15.3.—Shows information regarding wholesale price reporting markets in Punjab.
Tab/e 15.4.—Statistics of wholesale prices given in this table are based mainly on reports received from market committees of the impartaat mirket centres. Wholesale prices of 19 agricaltural commodities during calendar years have been given.
’r; Table 15.5.— Shows the index numbers (unweighted) of wholesale prices of 50 commodities (both agricultural and non-agricultural) in Punjab witK 1979-80 to 1981-82=100 as the base. Where The prices are collected on each Friday. These index numbers are published in the wholesale price bulletins issued by the Economic Adviser to Government, Punjab. Annual Index Numbers are the averages of th monthly index numbers.
Table 15.6.—Index numbers (weighted new series) of wholesale prices of 21 important agricultural commodities grown in Punjab are contained in this table. These 21 agricultural commodities to-- gather form about 80 per cent of annual value df total agricultural production of the State, 69 price quotations dispersed over 22 markets are collected. Prices of 21 agriculture commodities are now collected from 40 market committees since April, 1985. The selection of markets has been made on the basis of relative importance o f areas from production' point of view. The prices are the primary wholesale prices, i.e., mandi auction prices of the commodities and are collected on each Friday. These Index numbers are alr.o published in the monthly wholesale price bulletins issued by the Economic Advise to Govetcinent, Punjab. The annual index numbers are the average o f the monthly index numbergf
326

Table ISn.^Index Number o f Wholesale Prices in India.—This Index is compiled by the Economic Adviser to the Government o f India, Ministry of Industry. It is a general purpose Index with year 1970-71=8100 as base. This Index includes 360 commodities and 1,275 individual quotations divided into main groups. It is a weighted arithmetic mean of price relatives. In view of the difference in methodology adopted in compiling the weight system of the revised series and the old series, it is not possible to draw any comparison with the old series at group/sub-group level.
Table 15.8.—Gives Consumer Price Index Numbers for the working class in Punjab (New Series).
Table 15.9.—Gives Consumer Price Index Numbers for the Middle Class in Punjab.
Table 15.10.—Gives retail prices of selected commodities in Punjab.
Table 15.11.—Consumer Price Index Numbers for Agricultural Labourers in the Punjab State as compiled by the Labour Bureau, Government of India have been shown in this table.
Table 15.12.—Gives information relating to Consumer Price Index Numbers for urban non- manual employees in respect of Chandigarh, Amritsar and All-India compiled by the Central Statistical Organisation, Government of India.
Table 15.13.—Gives information regarding Consumer Price Index Numbers for the Working Class at Amritsar compiled by the Labour Bureau, Government of India.
Table 15.14.— The figures for various centresia India rehte only to working class families,thf?e heads of which are in full timj and regular employmsit. They represent the changes in the cost of i givjn schedule of goods and services coasum^d by an average working class household in each centre as determined by periodical field enquiries. (The items on the list of articles are grouped under five heads, viz., food, fuel and lighting, clothing and beddings etc., house rent and miscellaneous. The index for any group is the weighted arithmetic average of the price relatives of the several items o f the g oup, the weights being proportionated to the expenditure of an average working class family on those tems. To arrive at the general Index, the group indices are averaged together after being weighted by percentages of total expenditure devoted to each of these groups by an average working class family. Rent, figures in all cases are obtained from enquiries held at long intervals. No account is taken o f the seaonality in prices of commodities and services included. Annual indices are arithmetic mean of monthly indices). The data are collected from the Reserve Bank of India Bulletins.
Note,— The data have been added for the financial years instead of calendar year in most of the tables. Data are not comparable with the data published in the earlier years.
327


iv
CONSUMER PRICE INDICES FOR THE WORKING CLASS ( base 1976«I00)
250200ISO
100
500
NANGAL
Si ^ ® o2® 59 ®o SP 00 COo <yv
250200ISO
100
50
0
DHARIWAL As
\259
m sx>S ® 00^ cv
0000 00o s OS
250200
150
1 0 0
500
ABOHAR11---------- 1r - ■ V-----— I
«N m00 Op 00 2?<yH os
OO'
OS00Os
250200150
(00
500
LUDHIANA
OssoOOOs
^S.00
00OO
250200ISO
100
500
gOS
PATIALA“f "■ t .... . 1........."'»■
w>OD
sO00Os
OOO s
<» sOO 2?OS ^
.y - p y # i » i C M O tlT W S O W U V
250200150
1 0 0
500
PHAGWARA
(>* lAOO 00O^ Os
" 1.............11 — '
'O 22GO CO 00oT OS Os
Os

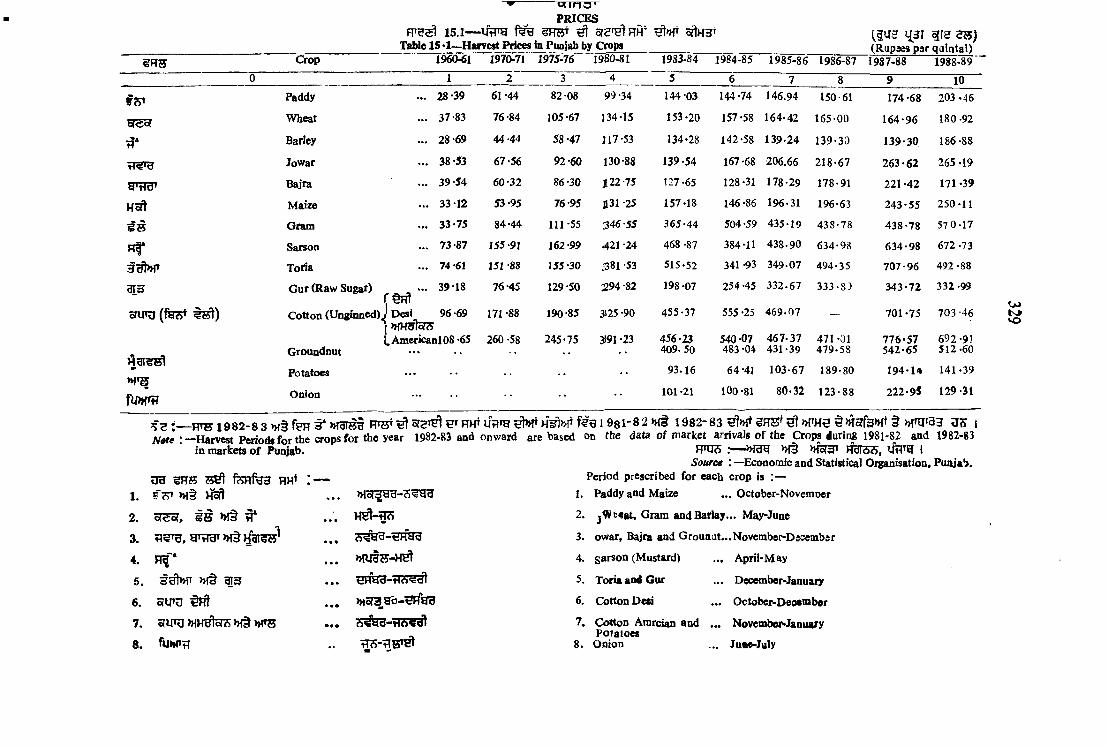
Crop
PRICES15.1—Utra mB* ^ oftHH'
Table 15 *1—Harvest Prices in Paojab by Crops1983-84 1984-'85 1985-86 1986-87 1987-1960-61 1970-71 197S-76 1980-81
{.BUS 113J W S Z B ) (Rup39i p3f qg igta l)
1988-89
1
WSS(
u w
Hoft
3 ^
cm iu (fe?5* i ? ^ )
10
Paddy
Wheat
Barley
Jowar
Bajra
Maize
Gram
SarsoD
Toria
Gur (Raw Suga^)
28-39
37-83
28-69
38-53
39-54
33-12
33-75
73-87
74-61
39-18
96 -69f § R t
Cotton (Unginned) J Desi
L AmericanlOS -65
61 -44
76-84
44-44
67-56
60-32
53-95
84-44
155-91
151 -88
76-45
171 -88
260 -58
fLPHm
Groundnut
Potatoes
Onion
82-08
105-67
58-47
92-60
86-30
76-95
111 -55
162 99
155-30
129 -SO
190-85
245-75
99-34
134-15
117-53
130-88
t l l - l S
1131-25
346-55
421 -24
381 -53
2 9 4 -82
3525 -90
3591 -23
144-03 144-74 146.94 150-61 174-68 203-46
153-20 157-58 164-42 165-00 164*96 180 -92
134-28 142-58 139-24 139-30 139*30 186 -88
139-54 167-68 206.66 218*67 26 3 -6 2 265 -19
127-65 128 -31 178-29 178-91 221-42 171 -39
157-18 146 -86 196-31 196*63 243-55 250-11
365-44 504 -59 435-19 438-78 438*78 57 0 .1 7
468 -87 384-11 438-90 634*98 6 3 4-98 672 -73
515-52 341 -93 349-07 494-35 7 0 7-96 492 -88
198-07 254 -45 332-67 333-8J 343-72 332 -99
455-37 555 -25 469-07 — 701-75 703-46
456-23 409 .50
540*07 483 -04
467-37431-39
471-01479-58
776-57542-65
692 *91 512 .60
93.16 64*41 103-67 189-80 194-1« 141-39
101-21 lOo *81 80-32 123-88 222-95 129*31
— F P5 1 9 8 2 - 8 3 f e n 5* WSTSg F T W ^ BT RH* M 9 1 981" 8 2 >>f§ 1 9 8 2 “ 8 3 «JS {N »u ; —Harvest Period* for the crops for the year 1982-83 and onward are based on the data o f market arrivals o f the Crops during l9 8 l-8 ^ _ a n d 1982-83
in markets o f Puiyab.
3H 5 H S SH I f e n f e FIH
HHj cs :— >H§ >H5raT l e r g iSource : —^Economic and Statistical Organisation, Punjab.
Period prescribed for each crop is :—
1. f7 ^ >H§ . . . 1. Paddy and Maize . .. October-Novemoer
2. srsof, g s hft ^ . . . 2. Gram andB arlay... May-June
3. . . . 3. owar, Bajra and G rounat...Novem ber-Dscem bsr
4. 4. garson (Mustard) . .. April-M ay
5. 3yl»r M§ m3 . . . 5. Toria and Gur ... December-January
6. c?ytu ^n1 . . . )«oR jab -iS H «y 6. Cotton D esi . . . October-Decembor
7.
8.
e?iTO n m
fuwt?
. . . 7.
8 .
Cotton Amrcian and . . . NovemberJanuary Pofaioes
Onion ... Ju«e-July
t s iVO

cTlH H *
PRICES
330
1 5 , 2 — 1 9 8 8 - 3 9 ^ ^ 3 gH^ ^'>f^ 2 1 gsT ^ ^^5? >A - -Iff 15,2 — V ji'iteJ I ila « a U f of air?ejt(>Viw'.<jnle)IVices of 21 AjrlcuHaral C am a)lU ies In Paajab daring 193^*89.
(M ’U'd : 1 9 7 9 - 8 0 3 * 1 9 8 1 - 8 2 = » 1 0 0 )(Base : 1979-80 to 1931*82=100)
?52rt 3 t
Sr. NO. Commodity CommodityWeight
fs io H ICommodityIndex
1 2 3 4
1 . oTSof Wheat 3820 144-7
2. jTsft Maize 58 183*7
3. Bajra 14 147-4
4 . V<S» Paddy 3700 196-0
5. g ® Gram 120 193-6
6 . H T IVfOODg 10 172*2
7. HTU Mash 3 255-3
8 . H 3 Moth 1 205-5
9 . HHg Massar 3 210*5
1 0 . HS SarsoD 128 - 170-4
1 1 . §cft>HT Toria 100 142-0
1 2 . Taramira ... 9 176-2
1 3 . Cotton Seed 13 m - 8
M . tfa reB l Groundnut 94 174*6
1 5 . cW*a JHMdlor j Cotton American 1360 165-4
1 6 . o T U T O ^ Cotton Desi 214 192-4
1 7 . Potatoes 100 193*9
1 8 . Onion Dry 69 113*3
1 9 . Chillies Dry 32 366-6
2 0 . Gur 133 127-2
2 1 . Khandsari 19 130*0
H Adtt fe io rH General Index 169*9
R H j s : l i ^ i
Source : Economic and Statistical Organisation, Punjab.

PRICES
33l
15.3— u flfg gar # H 5 s a l > ^ > h* Table I f 'S— Setocted M arkets for Reporting Wholesale Prices in Punjab
(Number)
Disiriet Markets
0. ______—. ... .— ■ , -------------- -------------------- *— ---------- ---------- -—----------------
1
dld^'HUU Gurdaspur 2
»fl)13Kd Amritsar 3
srydytf* KapurthalaJ 1
HKMU Jalandhar 2
3fH » rg ira Hoshiarpur 2
^ y s y r d Rupnagar i
Ludhiana 4
Fkozpur 4
Faridkot 5
Bathinda 7
FTdldg Sangrur 4
ufe>>rHT Patiala 5
ITotal 40
F T as » f3 g M § >Hcr3T 1^325^ ,
Source;—Economic & Statistical O rsaaisatioa. PuiUat*

i s
HSft
1 3
33l»f» I
» F 5
^ c W r u (» f5 i5 ^ )
^ oTU^ ( t ^ U ^ )
5UHT (> H S ife» fT )
sawT ( t fe » iT )
Commodity
PRICES
JTO^ 15.4— UtTH feu tsr oftH^lU ile 15 *4—A n n g e Wholesale Prices in Panjab
1961 1971 1975 1980
1
Wheat
Gram
Barley
Rice (H us ed
Maize
Bajra
Jawar
Gur
GrOudnut
Toria
Sarshaf (Sarson)
Potato
Onion
Chillies dry
Cotton Desi (Unginned) ...
Cotton D esi (Ginned) . ..
Cotton American(Unginned).
Cotton American (G inned)...
Cotton Seed
40-25 79-66
37*91 86-56
29 -31
52-07
35.77
36-69
36-28
44-18
78-05
77-74
46-53
94*59
55-25
53-34
70-57
107-04
160-60
172-91
86-44 161-06
190-66 340*42
102-11 260*55
247-17 516-50
41-60 89-13
113-60
l9 i -50
87-25
168-05
118 -85
154-80
126-70
178-65
196*95
219-65
212-30
452-30
263 -60
636 *80
144 *10
(Rupees per Quinta
1983 1984 1985 1986 1987 1988 1989
8 10 11
12S-53
298-80
117-70
182-14
128-09
132-84
158 -66
348-72
276-19
400-27
428 -81
106-65
81 -33
621 -10
298 *43
630-09
360*89
799-14
190-38
163 -54
300-30
128 -48
289 -74
177-80
149-58
183*78
210-43
344*29
438 -53
467-63
110-97
150-71
1063 -35
451 -90
1063 -63
430-74
975-00
241 -08
158-94 166*24 173-08 180-88 216-60 221-25
430*83 513-14 444-72 4 3 5-43 621-82 '7 1 2 -4 6
134*76 157-90 145-13 155-59 189-30 174-89
266-27 315-75 340-61 323-99 360-54 395-75
158*20 190-09 222-97 217-83 259-95 256-54
139-87 150-22 186*69 198-09 250-86 207-17
204-73 226-84 238-40 256-21 240*98
357-51 346-15 317-59 357*44 45 4 -8 0
488*27 435-75 453-51 505-59 537-75 554-85
465-27 363-76 463-96 740-85 607*93 5 3 4-08
382-96 487.81 751-22 669-69 578-12
81-75 205-13 137-80 130-53 111-68
117-82 142-24 247-91 207-28 166-75
1049-13 1,370-48 1,024-27 1051-82 2016-50 2 ,047-44
543-02 509-24 410-15 592 09 705-46 674-98
1216*60 1,175-50 1,025-11 1108-00 1527-05 1,469-27
554*75 506-03 438-57 566-31 777*48 723-38
939-38 1,185-51 1,112-30 1231-93 1777*33 1,670-33
284*95 314-75 314-43 446 13 505*97 466-22
180-48
251 *26
496-97
85*41
112-56
t o
Source :—Economic and Statistical Org lisation , PuAjab
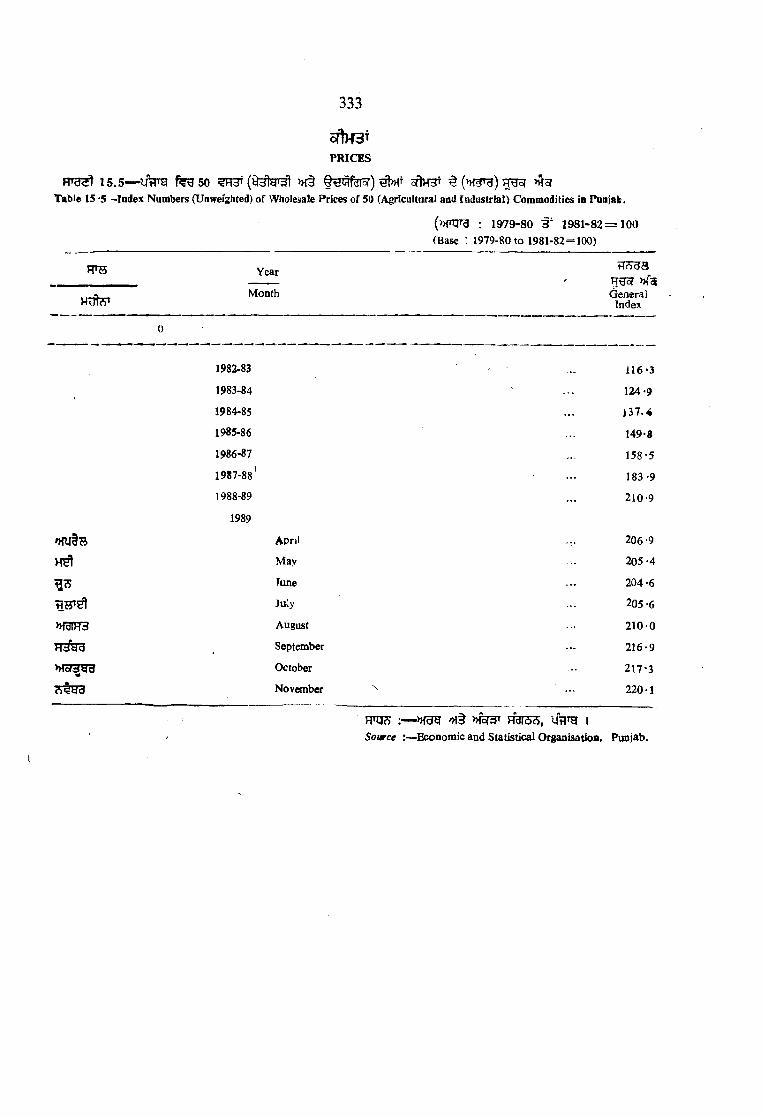
333
o f b f 3 T
PRICES
15.5— fee 50 {^3\sp^ >H§ ^ ggo[ fofTable 15 -5 -Index Numbers (Unweighted) of Wholesale Prices of 50 (Agricalturai and Industrial) Commodities in Punjafc,
(»fnjTg : 1979-80 W 1981-82 = 100 (Base : 1979-80 to 1981-82=100)
W B Year
Month» f3
GeneralIndex
^■5
»RTH3
W 3 g g
1982-83
1983-84
1984-85
1985-86
1986-87
1987-88'
1988-89
1989
AprilMay
TuneJuly
August
September
October
November
116*3
124 -9
1 3 7 .4
149-8
158-5
183 -9
210-9
206-9
2 0 5 -4
204-6
205 *6
210-0
216-9
217-3
220-1
HTUcS :— ni t H t e , ISource :—'Economic and Statistical Organisatioia. Punjab.
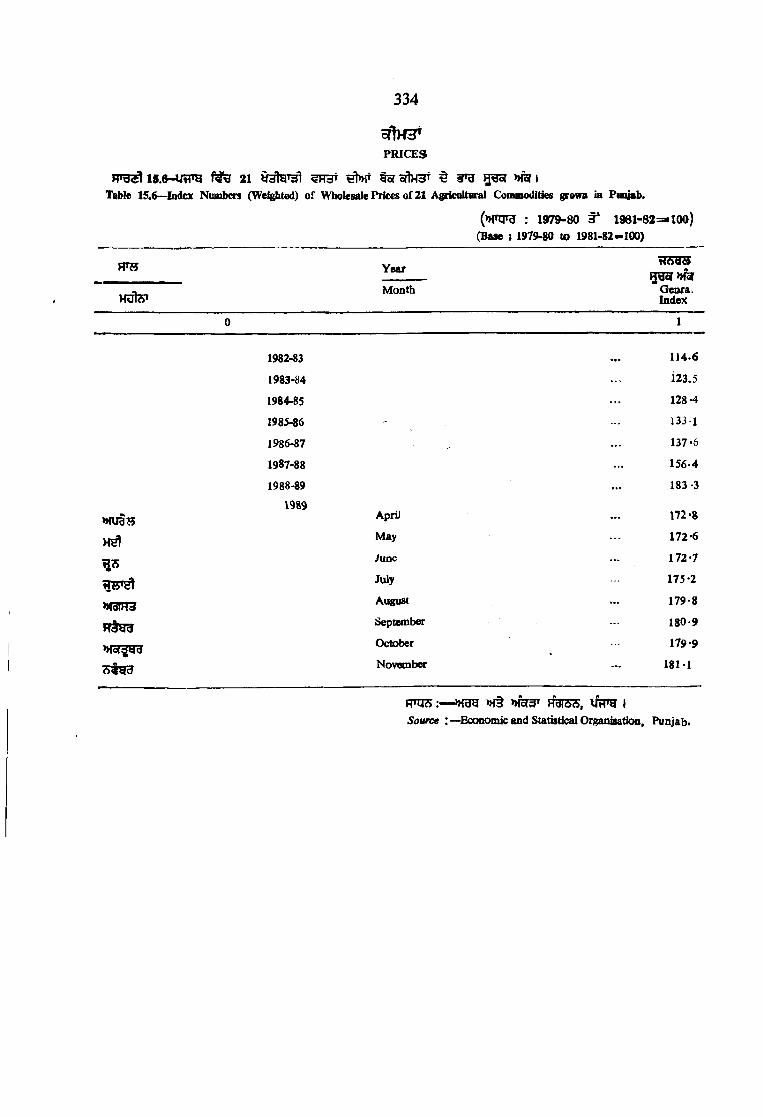
334
stTh h *
PR IC E S
i5 .« - 4 j t r a 21 ydha^dl ^ o jb e r t 3^3 gB of >tm iTable 15.6—Index Numbers (Weighted) of Wholesale Prices of 21 Agricultural Coounodlties grown in Pmijab.
(»rtrg : 1979-80 3* 1981-82=»100) (Base a 1979-80 to 1981>82-100)
i=rs Yeart l 3 9 5
y w w rGeora.IndexMute»
Month
0 1
1982-83 114 .6
1983-84 i2 3 .5
1984-85 128-4
1985-86 ' 133-1
1986-87 137-6
1987-88 1 5 6 .4
1988-89 183 -3
1989»»wg?5 April m * 8
May 172*6
June 172-7
July 175*2
»»RM3August 179-8
Septanber 180-9
October 179-9
6 ^ d November 181-1
j m s :— » f t i f t r o i
Source : —^Ec(»omic and Statistical OrganisatiQa, Punjabt

PRICES
15.7— tc? 5ftK3* R33 ^33l m lable 15.7-AU'IodUi fades Nooibers of Wholesale Price
o f t H ?
(>nnjTa: 1970-71 =»ioo\(Base : 1970-71-100)
B i n Groap 1971-72 1975-76 1980-81 1983-84 1984-85 1985-86 1986-87 1987-88 11988-89
0 I 2 3 4 5 6 7.
9
A— Primary Articles 100 *9 165 *5 237*5 304-0 324-4 331 *0 348 *5 382*6 411 *1
1 . ^H»or siHd* Food Articles 101 1 163*9 207*9 283 *1 297-4 317-7 338 -7 367 *3 408 -0
2 . Non-Food Articles 98-6 139*9 217*7 281*6 319 -6 287 *0 305 -4 385 *6 380*1
3. y fe^ Minerals 115*4 428*1 1110*2 994*0 1015*1 1030*2 948 •& 720 -5 748 -7
•H-VHa, tHsI >h§
§H
B—F uel, Power Light and ... Lubricants
105 -9 219*2 354*3 494-8 518-4 579-9 619*2 642*0 677 *4
C ^ ' 4 i i ifastureJ Produots ... 109*5 171 *2 257 *3 295*8 319-5 342-6 359*4 384*4 414*4
9 ® All Commodities 105*6 172-9 25T-3 316-0 336*4 357-8 376 *8 4 05-4 435 *3
R*qs : — » r e f e ^ T 1Source I— Reserve Bamk o f India BuiUain.
U)u>

336
PRICES
H T ^ 1 5 . 8 — u n » g f i ^ oTfHW yuH oT^ g g sr »raTable 15.8—Consumer Price Index for the Working Class in Punjab (New Series)
(n m r g : 1 9 7 6 = 1 0 0 ) (Base : 1976-100)
Centre
^ f e f cm
Food Groupt T ^ S
General Index
V©
VO00o\ 000\
00VOooo\
r~ooo>
0 1 2 3 4 5 6 7 8 9 10 11 12 13 14
Nangal . .. 138 167 173 185 200 216 246 134 171 180 189 206 219 239
Dhariwal ... 135 171 176 182 193 217 250 133 176 184 198 208 225 250
» !^ a u Abohar ... 142 175 176 185 202 228 254 137 172 176 185 200 219 237
L udhiana... 140 172 176 183 195 213 — 137 173 179 187 197 211 —
Patiala 137 169 179 189 199 212 236 132 162 173 184 195 207 226
Phagwara ... 145 176 182 190 201 220 248 139 171 177 185 194 210 234
>»fH3 Average ... 140 172 177 186 198 218 247@ 135 171 178 188 200 216 237@
R rg s : — »?or^ R^ISS.U ^^rg |
Source Ecoaomic and Statistical Organisation, Punjab.
@ g »ia5SfB 1988 3^ HSIU f g f § , RHoTU ^ u id T 3 ^
» R , t ”! (M TITB 1 9 8 2 = 10 0 ) a ^ s r ^ f5 H f U^ITg
HtgItT 1S 88 § ' t]^T f S 3 T f ^ T 5 I
@ As the Ludhiana centre o f the state series has been included by Labour Bureau, Govt, o f India, Shimla in the new series of Conumer Price Index Numbrrs for the working class (Base 1982=100) so the same has been excluded from the state series w.e.f. October 1988.

PRICES
337
15.9— rfq yu3org Table 15.9—Consumer Price Index Number for the Middle Class in Punjab
(Base :: 1966=»10e)1966=100)
HT5Year Patiala Ludhiana
F ood Index 1 General Index Food Index General Index
0 1 2 3 4
1969-70 . . . 130 121 132 125
1970-71 . . . 134 126 137 130
1975-76 . . . 206 201 21.) 198
I9mt 277 262 297 274
198 83 320 304 335 317
1983-84 . . . 343 324 351 334
19S4-85 • »» 366 345 364 351
1985-85 383 369 393 369
1986-87 » » • 417 395 406 387
1987-88 • • • 436 420 435 410
HTTIJ5 : » f t vgftST hbt3 3 , l i r o i
Source t B coo(anic and Statistica] Organ! satioo. Punjat).

PRICES
1 5 . 1 0 — ?f73»>fr § l { 3 5
Table 15.10—Average Retail Prices of selecteJ Confltnodities in Punjab by Districts
(srtHiff 3fU>Hr r # e a s 5 3 ^ ^ 5?^ f^ 3 i
(Prices are in Rupees per FCg. where otherwise msntloned)
fiJST
Year
District
W T ^ ujt
Wheat Wheat Rice M oong Mash Gram Massar Ghee @Vanas- **Tea Potatoes Onion o u r K, O ilfAtta Desi pati
Ghee
0 1 2 3 4 5 6 7 8 9 10 11 12 13 14 15
1973 0 -92 1 *09 1 -41 2-94 2-73 1-84 2-12 16-57 16-87 6-38 1-50 0-85 0-91 2-;)7 0 -75
1974 1*30 1-51 1-81 2-85 2-63 2*59 2-68 22-98 20-26 7-30 2-04 0-96 0-91 2-10 I -09
1975 I *31 1 -48 2-02 2-95 2-86 2-38 2-67 23-15 23-36 9-16 2-28 0-77 1 -12 1 -97 1 *21
1980 1*43 1-62 2 03 4*92 4-05 3-57 4-16 26-14 27 -51 12-14 2-53 1 -43 1 -26 4-37 1 -63
1982 1*70 1-98 2-69 4-81 4-69 3-78 4-79 36-85 34 -94 13-09 3-10 1 -22 1 -7v3 3 -)5 1 -94
1984 1-78 2-13 3-41 6-19 6-53 5-00 5-67 43-15 3 8-96 20-16 3-57 1 -46 1-75 3 -U 2 -1 0
1985 1-83 2-17 3-43 7*12 7-00 6-32 6-25 40-58 40 -97 21 -36 3-70 1 -83 1 -87 4-V7 2 -29
1986 1-86 2 -24 3*44 6 -62 6-88 5-89 6 -59 42 -66 44-75 19-99 3-91 3-00 2 -1 8 4-61 2-45
1937 1-98 2 -38 3 -6 9 6 '83 7-11 5-39 6 -73 51 -94 54 -36 21 -76 3 -93 2-05 3 -49 4-23 2 -4 9
1988 2 -3 2 2 -80 4 -39 10-15 8 -56 7-58 8-38 56-35 56-08 21 -20 4 -50 2-08 2 -98 4 -8 0 2 -5 0
1989 2 -4 5 2 -9 8 4 -59 10-49 9-34 9-31 ' 9 -7 7 5 9 -0 5 58-83 24 97 5 -14 2 -0 2 2-67 6-05 2-51
Gurdaspur 2 -46 2-93 4 -3 2 9*53 8-71 9-35 9-56 6 0 -0 0 60-10 24-68 5 -0 0 2-16 2 -8 2 5 -50 2-53
MfHdHd Amritsar 2 -3 4 3-35 3 -84 10-82 10-11 9-08 10-17 55-13 60 01 24-69 5-15 1-90 2-48 6 -12 2-60
Kapurthala 2 -3 8 2*74 4 -5 9 10-39 .1 0 -05 9-62 9-55 55-44 59-08 23-42 5-18 1-78 2-41 5 -8 2 2-50
HiiUd Jalandhar 2 -5 9 3-14 4 -9 0 10-16 10-19 9-89 10-15 56-78 59-19 24-74 5 -43 2-21 2 -94 6-21 2-51
Hoshiarpur 2 -2 7 3*20 4 -7 6 10-82 10-39 9 -46 8* 14 60-72 58-25 28-60 5 -77 1-74 2-43 6 04 2-64
U)oo
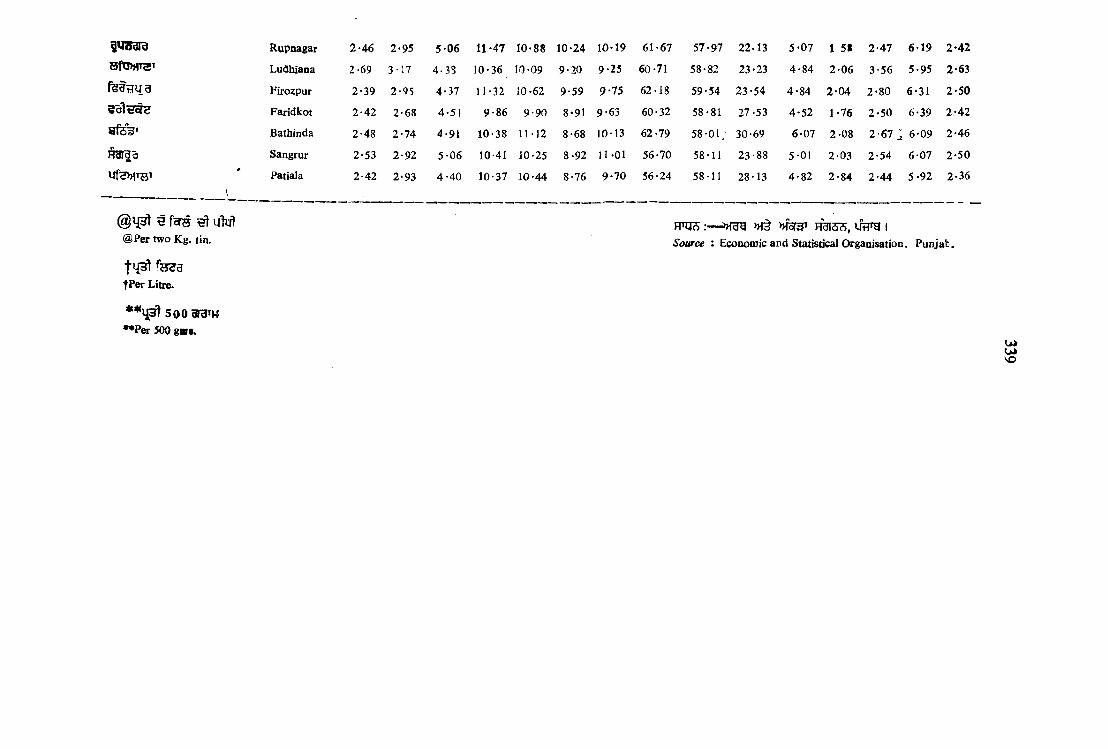
Frai3d
uf<f»iTs’
^ foTH ^ u M @Per two Kg. tin.
t 4 3 t
fPer Litre.
s o o g r g m
••P er 500 govs.
Rupnagar 2 -4 6 2 -95 5 -0 6 11-47 10-88 10-24 10-19 61-67 57 -97 2 2 .13 5 -0 7 1 5 t 2 -47 6 -1 9 2 -4 2
Ludhiana 2-69 3-17 4-38 10*36 10-09 9-20 9 -25 60-71 58-82 23-23 4 -8 4 2 -0 6 3-56 5-95 2-63
Firozpur 2-39 2*95 4-37 11-32 10-62 9-59 9 -7 5 62-18 59-54 2 3 -5 4 4 -8 4 2 -0 4 2-8 0 6-31 2 -5 0
Faridkot 2 -4 2 2 -6 8 4*51 9 -8 6 9 -90 8*91 9-63 60-32 58-81 27-53 4 -52 1-76 2 -5 0 6-39 2 -4 2
Bathinda 2-48 2 -7 4 4-91 10-38 11-12 8-68 10-13 62-79 58-01^ 30-69 6 -07 2-08 2 -6 7 1 6 -09 2 -46
Sangrur 2-53 2 -9 2 5 -0 6 10-41 10-25 8-92 11 -01 56-70 58-11 2 3 -8 8 5-01 2-03 2-54 6 -07 2 -5 0
Patiala 2 -42 2-93 4 -4 0 10-37 10-44 8-76 9 -7 0 56-24 58-11 28-13 4 -8 2 2 -8 4 2 -4 4 5 -9 2 2 -36
F T O s:— » ra g » f ^ T Frairo, uhth i
Source : Economic and Statistical Organisation. Punjab.
UiU lVO
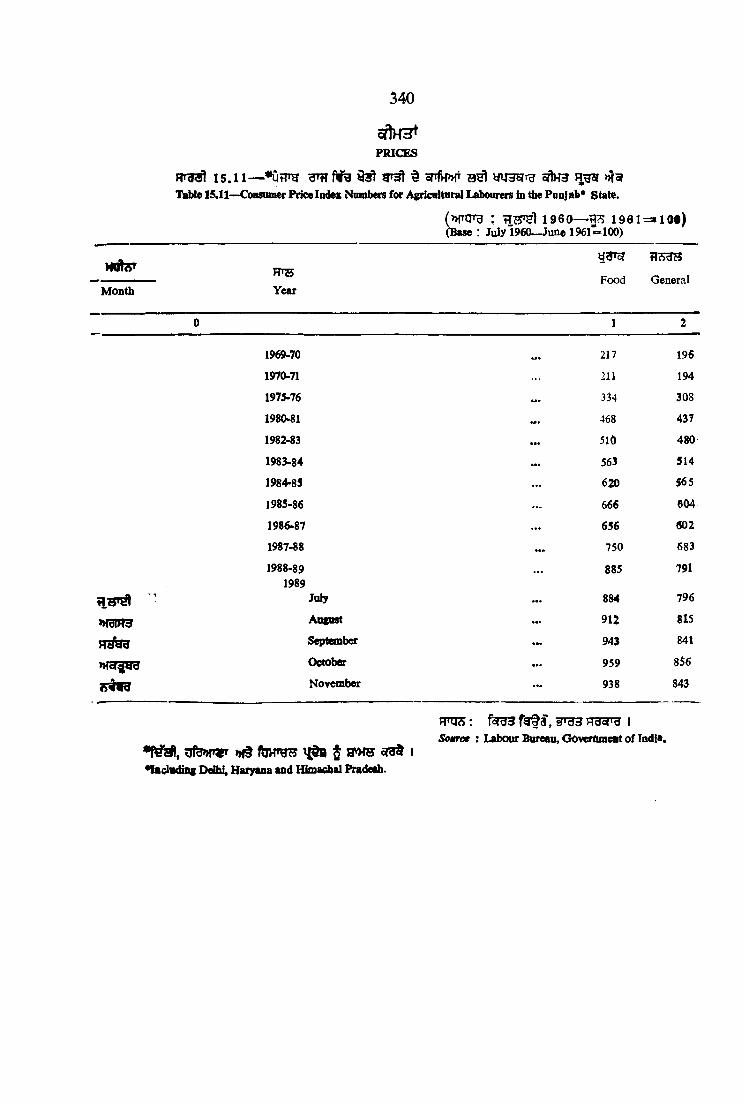
340
PRICES
15.11— gr?? 93! ^ onfrr>»r oflH3 R-gzj1U}le 15.11—CoBsnmw Price Index Nmnbers for Agricaltnral Labourm in the Punjab* State.
(»ptng : hstoI i960— 1961 (Base : July l960^ u n e 1961=100)
1 0 « )
w h r FrrS
Year
y^jtsr
Food GeneralMonth
0 1 2
1969-70 217 196
1970-71 211 194
1975-76 334 308
1980-81 468 437
1982-83 . . . 510 48 0
1983-84 • • • 563 514
1984-85 . . . 620 565
1985-86 — 666 604
1986-87 . . . 656 602
1987-88 750 683
1988-89 . . . 885 7911989
July • • • 884 796
M3IR3 August • • • 912 815
T T ^ September • • • 943 841
♦HcT^yy Octobcr • • • 959 8$6
Noyember . . . 938 843
»H§ ^ ^ I•laclvdiiig Ddhi, Haryana and Himacbal Pradesh.
JTnjS: ISmtree : Labour Bureau, Govertunett of India.
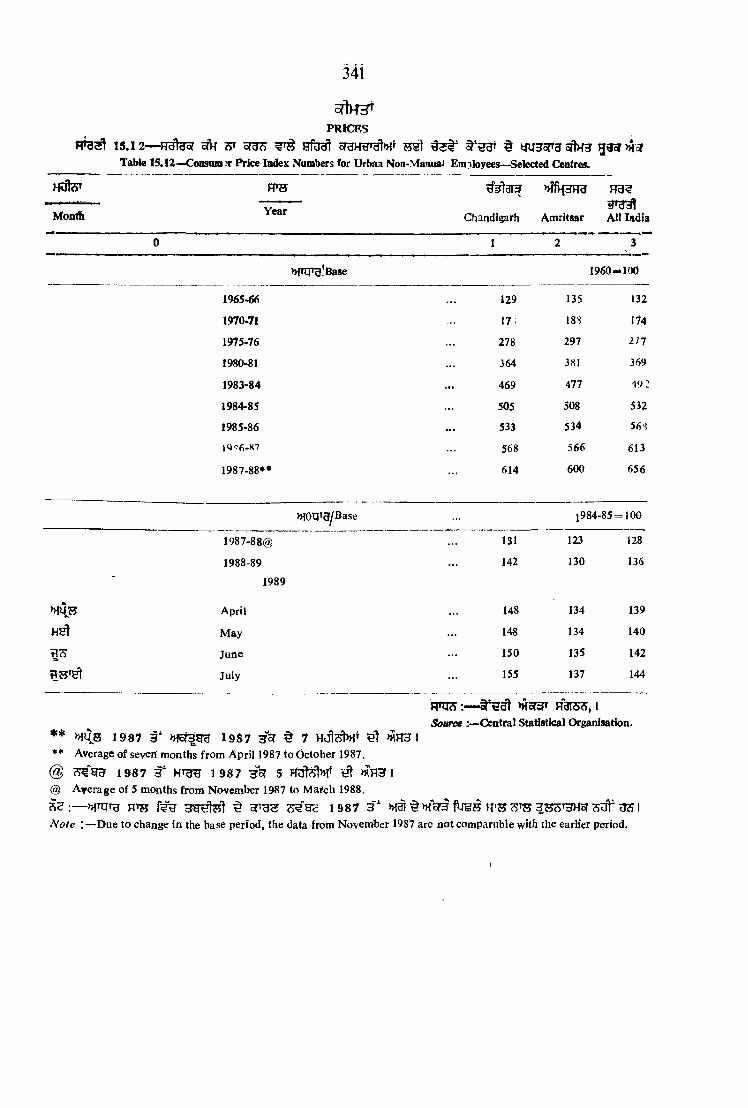
341
c r t H ?
PRICES
15.12— oW eras ^ ufb ?5Sl ^‘53 § trUHopgoftHH g^njcfTable 15.12—ConsoniTr Price Index Numbers for Urban Noo-Manuai Employees—Selected Centres.
HOter
MonUi
W B
YearChandigarh
»ff>PFra FT3?
Amritsar All India
0 1 2 3
>)fin^!Base 1960- i 100
1965-66 129 135 132
1970-71 17; 18S 174
1975-76 . . . 278 297 2 /7
1980-81 . . . 364 381 369
1983-84 . . . 469 477 492
1984-85 . . . 505 508 532
1985-86 . . . 533 534 56S
IQ'^6.87 . . . 568 566 613
1987-88** 614 600 656
W q^ g/B ase 1984-85 = = 100
1987-88® 131 123 128
1988-89 . . . 142 130 136
1989
April 148 134 139
M ay 148 134 140
^7> June 150 135 142
July . . . 155 137 144
F i n i s :— >Hor3T j fa r s s , |
Soiave :-X ^ntral Statistical Organisation.* * 1 9 8 7 3" »f5f3H g 1 9 8 7 35T § 7 HCflcfbH* S t >MH3 I** Average of sev«ii month’s from April 1987 to October 1987.
@ 1 & 87 3" 1 9 8 7 Hof 5 ^ >i?H3 i@ A verage of 5 m onths from Novem ber 1987 to M afch 1988.
% ofT gs 1 9 8 7 3 ^ ^ FI'S HSStSHoT 3 # IN ote :— D u e to change in the base period, the data from Novem ber 1987 are not comparuble with the earlier period.

PRICES
34l
RTg^i 1 5 .1 3— >Hfjl3nB ?331 ( f e i^ d lo f o|tfk»ff) WHofTg SftH3 gtTof i
Table 15.13—Consumer Price Index Number for the Industrial Workers at A atlts»r
h J Ia ' H'tt yd'oj m s B___ - Food GeneralMonth Year
0 1 2
>HTrrTg/Base 1960== 100
1966-67 . . . 180 145
1970-71 Hi 192
1975-76 346 324
1980-81 441* 417
1983-84 . . . 576 538
1984-85 . . . 613 578
1985-86 . . . 651 617
1986-87 659
1987-88 . . . 741
1988-89© • • • 816 792
;ase 1982 = 100
»HU3H1989
April 169 166
May 162 163
tiTT June 160 162
July 164 165
»TdIH3 August 168 168
September 182 175
HUtfe»fT ^ )j?R3 ^ H § o r ^ g , f5T?3 fjJHST |
•Average o f 10 raoaths. Source : Director, Labour Bureau, Simla.
:— 1982 § y \ r3 ^ r s RBSf >H3I ^ SSl »fcr3gu 1988 3" H3 of!^ aist >H§ feH§ 1960 f h s ^ f3»|Tg ^ o f 5T3 fe§ 9T§ I
Note :—The new series of index^numbers with the base 1982 is introduced from October 1988 and with that thecompilation of index numbers with the base year 1960 has been discontinued.
1 9 8 8 3 " 1 9 8 8 3 5 ? 6 H O f e W ^ >WH3
©Average of six months from APril 1988 to September 1988@ @ > H ^ 3 g U 1 9 8 8 3 " 1 9 8 9 35T g ^
@@Average of six months from October 1988 to March I989

MfUHHTgrg
gHTBH
sf «c ridfd
fe a r a ^
g r ^ T » f g
d 'e u r g r y
t w e ^ u
H.ujIh
H.^ToTH
5»grira
RUT^jsyu
H s t y g
SflH H TPRICES
15 1 4 — 0?TfH»fi S ^ t fU 3 c T O oftHH g ^ c l nfoTI( R 3 ? >H§ u § § ^ )
Table 15.14 onsamer Price Index Nambers for the Industrial Workers (All-India and Selected Centres)
Centre
AU India*
Ahmedabad
AlwayeAsansol
Baaglore
Bhavoagar
Bombay
Calcutta
Delhi
Digboi
Gwalior
Howrah
Hyderabad
Jamshedpur
Monghyr
Mundakayam
Nagpur
Saharanpur
Sholapur
1960=100 1982=1001970-71
1
1975-76
2
1980-81
3
1983-84
4
1984-85
5
1985-86
6
1986-87
7
1987-S8 1988-89@ 1988-89@ @
8 9 10
186 313 401 547 582 620 674 736 786 166
176 293 376 544 570 599 657 724 763 163
198 358 407 589 634 664 730 767 804 162
189 317 411 529 572 616 657 710 752 164
186 332 434 605 642 682 736 809 871 159
186 315 407 556 579 653 723 787 805 162
182 300 400 564 609 654 717 791 856 171
182 287 382 511 576 610 671 715 783 172
199 333 426 551 597 648 707 788 852 177
189 317 414 528 588 615 659 716 784 803
191 324 427 545 581 628 670 727 779 851
186 290 370 489 531 570 626 655 702 177
189 316 406 545 588 624 690 752 816 162
183 293 383 513 528 580 639 689 74? 162
203 325 430 576 581 621 676 755 839 165
197 346 396 556 591 603 664 729 748 168
187 326 398 558 601 632 673 726 802 170
186 313 409 543 574 623 661 714 768 162
185 342 411 579 612 647 697 747 789 173
FTOS :— >HTSource :— ^Reserve Bank o f Indi?» Bnlletip.
5 f t o f T g ? , MoTHgU 1 9 8 8 3 " ^ u f t lS nH3T MoTt oTM 7 " H 5 T ^ 5 I® ® change in base period and introduc ion of new series, the index number from Oc^obet 1988 are not comparable with the earlier period.
h rx r r y - m i T r - i ^ . -5 . _.i _ a .•"_____ /—n _______ ___ ______________ _ * - ____ a_A. .• _3. . ’i_____
U>
»fy 3" H3gg 1 988 35T i ^ >HH3 IAverage of siemonths from April 1988 to September 1988.
nfsr^gB 1 988 3^ 1 9 8 9 3oT i ^ >HH3Average of six months from October 1988 to March 1989.

16.1 Isredt 'HST?, 194S H) qf^f 2 MH (i >H§ ii) »r§85 >nqtS3ftTRS3 toT2^ift,^ 9 g f t iR e g >h§ fmn\^ 5 i
U gr 2 ) H > f5HTg Isr?^ w ^ MftT ufefflHT »f§ lfel35T ^ .__
(i) ^ rT fen 3" # J ^sra sfH 5T3 TO UStT 12 HUtfeW fsTRfSSTO >H§ ftTTO ftjR 14 ^ <STH feHHTS ^ t >hh?5 B H feo r
U t TTt RTqi Jg §g § » l t o ^ fTH
( i i ) f e n ^ ?!i f e n 3 ' # 3 ^ u sra % f sth t o ^ i z H u t f w f%g f e n
fe s OTH T O U S > H § f ^ ^ f ^ f i j H f ^ ^ feST feHH^S ^ >HHSo€ HT H'U'UA 3H § >HfHir ^ >H§ fee feg oTOt M5T2, 1923 »Wte
TO tT 3??# ^H^fe^T T I^ FTO HPWJ otT I
tF9T 85 >>fijt(S d'tJ hdof'd § >HfUo^^ 5 ^ ^ <J3 ?> fSTH 3 feR
5§* »n ftig fe3 sra R ^ ^ d I
16.2 ^ l o f Z ^ ^ W 3i^ ^ ^ ^ \ fe j ^ «^»rgT g f l 3T§ f § W fife ? 5 » f t f e u UH UUt»fT RT >HT g rg <^of ^ |
Rfcf t 16.3 ^ TOt»T RT »X umRTO ^oT^yy^ ^ fdl3^ >K§ ^ofgr g)H 2‘3 g 3 §H^3f3Iof ^ MSRiB f? R 3 fe 3 ^ 3 I feR RT^d fe U H??nTIH W ^3org» ^
f e lS ^ to^eg>HT W H T ^R?'fe>HT ^ hB [fE 3 cfl3 l 3 1^ 5 I >niT^zfki § R^TJ ^
HHTtIH3 t »f5HTS RH(S t fe H c ^ RrtW t W |Tg f ^ i g c{H > H ^ 3 U3^ SHt? sft^T
9 , Mdl'9 3T$ ’. — ■
( i) S: 2 UfHRiRS >H§ HfER^R W'£ Sf?>»r§ 55Sft fe§ aT§ U33»li?3TO ;
( i i ) ^ft? ^ f5T33 fe^fai § feR u sreg l Re^g ort§ g r § f u g s H »i»fe^!
( i i i ) lo T S ^ T § f y g s R W grg 1
R ^ 16.4 f ioT »f^Hf Hgru oTH fe§ U3 I
RT^^ 16.5 HfffR?H3 lore^H 7?E ueW w i ^cqfarsr § 3 u t^ s i
RTg^} 1 6 .6 u"h »h fe B ^rfTReg^ i 5 f ^ ^ ^ ^ » f He^ § §
1985-86 I
RTg2 16.7M§ 16.8 RT TO GtWbf RH#tf5 >HSR R^t HHt R ^ uV «B e l n f§ §»TO ? 5 ^ ^ R ^ gfet 5 1
R T ^ 16.9 t5?rg )£y § ^ g i t ^ »!§ f^ T fgr»fT 5 |
F.»H 16.10 >HOTT3 t^y faw §3U T^ ^ RW »f5f f e t 9T§ TO I
345

H fHst 16.11 f e g cfTfi ^ u § 3?jaif3 fgyinr 5 1
R f3 5 t 16.12 g? 7 ^ u i 3 5 |r§ g i§ >H y ^ » » f
a H t» r TJ ) I
16.13 5TU3f f H ^ ^ U 5 » f § M § fSR
9 O T B f e 3 f ftlPHT 5 I
H T g^ 16.14 U ln s f t ^ oTiru f e ^ t 31^ 9 i
W 3 ^ 16.15 li?TO H U 'fey MSRT, 1935 W t e m p fe g r ^ f j r e la i^ d I
ITO^t»fT 16.16 3^ 16 .19 H l l t M M § gTH H fS W a T t fesTiH 7P1S U 3 I
16 .20 grsft l i t r g ^ t o r s w f e ^ n ujyr^r ^ » f§
gsra HP§ 5 I
SECTION XVI
INDUSTRIES
Table 16*1 shows year-wise and districtwise break up o f total registered factories, registered workiag factories and workers employed therein under sections 2m (i and ii) and 85 of the Factories Act, 1948. Under section 2m factory means any premises including the precincts thereof:
(i) wherein ten or more workers are working or were working on any day of the preceding twelvemonths, and in any part of which manufacturing process is being carried oa with the aid of power or is ordinarily so carried on.
(ii) wherein twenty or more workers are working or were working on any day of the precedingtwelve months, and in any part of which a manufacturing process is being carried on without the aid ofpower, or is so carried on and does not include a mine subject to ths operations of the Indian Mines Act, 1923, or a railway running school.
Under Section 85, the State Government is empowered to notify any factory not covered under t he above two sections.
Talf/e 16'2 gives the size and distribution of registered working factories. This is based on the returns submitted by the factories and does not relate to all the working factories.
Tab/e 16*3 gives detailed information about the number of all registered working factories and workers employed therein by the Standard Industrial Classification. In this table, the number of workers employed has been compiled from the returns submitted by the factories. The estimates of employment for factories not submitting returns have been worked out from the following sources of information mentioned in order of preference : —
(i) Employment data given in Form No. 2 for the application of registration and grant orrenewal of licenses.
(ii) Recent inspections by the inspectorate staff of the State Labour Department.
(ill) Last year’s employment data of the factories.
Table 16 *4 shows workers per lakh of population in registered working factories.
Tables 16.5 Selected items of In'^ustrial Production relating to registered working factories j r Punjab.
Tab! s 16.6 Selected Information relating to registered working factories in Punjab I985-S6.
346

i6 *7 and i6 *8 givnnformation on important items of Industries for Punjab and Indik (iSiate>wise) according to Annual Survey of Industries.
Table 16 *9 shows the production and etnpioynient of major industry groups in the State.
Table 16*10 shows the index of industrial production according to industrial classification.
Table 16 *11 shows the production and employment of selected industries in Punjab.
Tobh 16 *12 shows the number of cotton textile mills and spindles and lo jms installed therein.
Table 16 *13 shows the production of cotton and yarn ?nd average daily employment in cotton textile mills in Punjab.
Table 16.14 gives the quantity o f cotton pressed in the Punjab.
Table 16*15 shows financial assistance granted under the Punjab State Aid to Industries Act, 1935.
Tables 16 *16 to 16 *19 relate to the development of khadi and village industries in the State.
Table 16 *20 gives information about the number of plots and area acquire in the Focal Points cf Punjab.
347
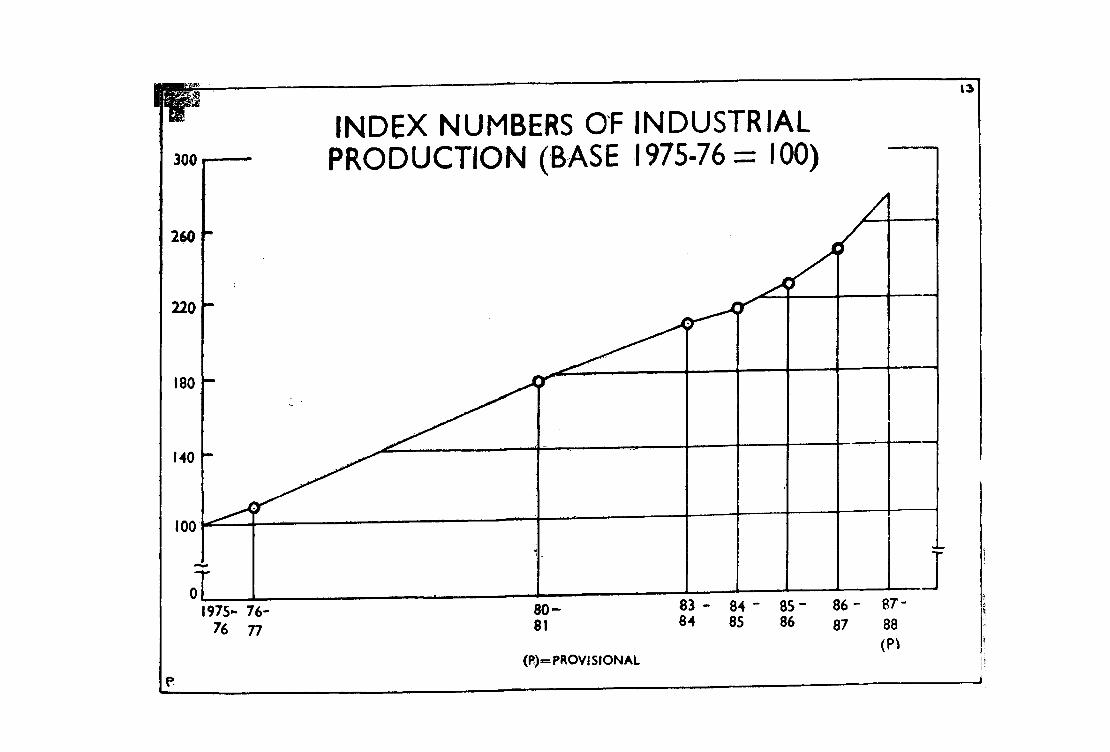
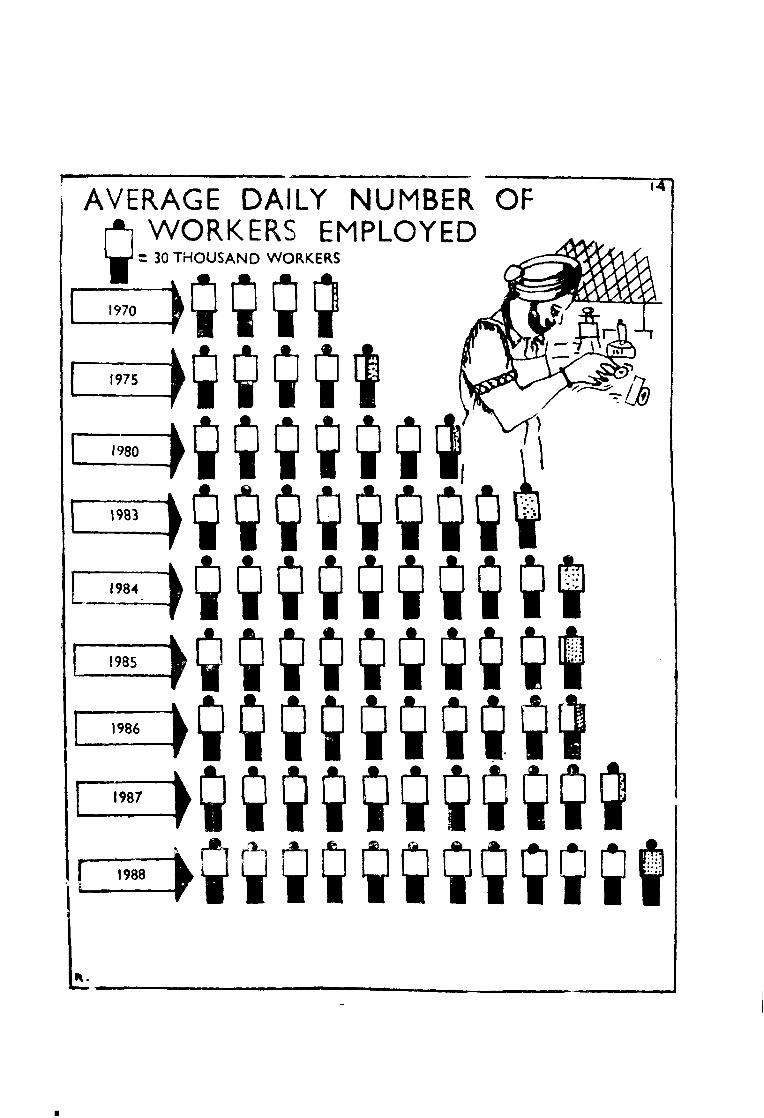
AVERAGE DAILY NUMBER OF WORKERS EMPLOYED
= 30 THOUSAND WORKERS
TT
1970
1975
1980
n 1984
1985
1986
1 T I T I I I I T ¥
f V T T l Y V V I
^ I V T f V l V V T1987
f V I T T T V ¥ 1 V V l
1988
V V T V V V T V V

District Year
IN DUSTRIES
1 6 4 — f e e lor2^»>ft >H§ fegoT 3 oT lTable 16 *1—Factw ies and Workers Employed in P a i ^
349
u fiiH S 3 ^ ^ f a i 5 ^Number o f R ^ stered Factories
^sn??72 >HH(i &ii) w n ? )
^oTHJS 85
Under Section 85
Under section 2m (i & ii)
Hof:/! HoT^ ^i f e t o
With W ithout Power Power
Total
oTH
R egist^ed W orkersWorkingFactories
H S ^ H *» m 3
Num ber Average number o f
workersemployed
1970 3,920 852 2 4,850 4,501 1,16,806
1975 4,155 1,270 — 5,525 5,279 1,36,280
1980 5,606 1,676 — 7,397 7.053 2,01,735
1983 6,840 2,342 — 8.882 8,535 2,43 ,008
1984 7,317 2,222 — 9,539 9,184 2,73,932
1985 7,468 2,098 _ _ 9,566 9,271 2,82,214
1986 7,840 2,20 4 — 10,044 9,754 2,98,503
1987 8,193 2,282 - 10,472 10,255 3,26,722
1988 8326 2,343 10,669 10,419 3,36.050fi3HT D istt., 1987
fgHTRyar Gurdaspur 441 233 — 674 651 14,167
Amritsar 1,320 283 — 1,603 1,543 35,196
Kapurthala 264 63 - 327 318 13,330B
Jalandhar 1,134 239 — 1,373 1,344 35,884
H oshiarpur 148 211 359 354 15,479
B u s g r g Rupnagar 233 78 — 311 307 19,385
Ludhiana 2,861 359 — 3,220 3,164 106,881
fetiJlTH Firozpur 273 1 55 — 428 410 10,668
Faridkot 321 207 — 528 515 13,437
yr6s}T Bathinda 263 225 — 488 484 15,987
Sangrur 377 150 — 527 520 19,898
afe>HTSfPatiala 691 140 — 831 809 35,738
HTq^;-Source
- f t r a n orfH esg, i f t r g iLabour Com m issioner, Punjabi

350
1 6 .2 - if f l ig f i g oTh ofH a d a fa R S B s Table 16.2—Registered workfaig
INDUS
> W iJK T ^ > t e f3 T 3 ^ Average number o f workers 1966 1970
A B A B
- 1 2 3 4
10 3 " u fe Less than 10 626 3,987 1,087 6,429
I 0 i i ^ # 7 u a r 2 0 ^ u f e 10 o r m ore but less than 20 1.092 14,208 1.176 15.115
2 0 tlT ^ g 1 ^ 5 0 3 * ^20 o r m ore but less than 50 568 17,701 546 16,930
s o t i ^ ^ y n i o o ^ u fe 5 ) o r m ore but less than 100 178 13,030 182 13,054
l O O r l t ^ i e 500 3^ Ufe 100 o r m ore but less than 500 89 17,"92 90 16,831
500 r l t ^ i r a 1,000 500 o r mo re but less than 1,000 12 8,325 15 9,462
1,000 5 ,0 0 0 ^ 1000 o r m ore but !ess than 5,000 7 12.700 6 11,995
1 ,0 0 0 ^ ^5000 o r m ore — — — —
Total 2,572 87,943 3,102 89,816
(A) I(A) D enotes number o f factories.
(B) onHgigt’e1>HR5fgi53!yafnf^di(B) D enotes average numbei'’o f w ofkers.
t z f oj’c y ’f?,»i* z m 3 »♦§ c s a s : l e . i 7>vs Tsg? i/Vo/e—laforaation relates to factories submittiag returns aad is not oomparable with Table 16 *1.

351
IHIESR^TFactories and workers employed there in Pm»iab
^ u m b « )
1975 1980 19S3 1984 1985 1986 1987 1988
A B A 6 A B A B A B A B A B A 3
5 6 7 8 9 10 11 12 13 14 15 16 17 18 19 20
1,176 7,044 722 4,669 484 3,128 411 2,672 448 2,835 533 3,151 434 2,550 597 3,353
1,031 13,596 845 11,288 595 7,908 507 6,497 526 7,124 656 9»790 572 7,717 626 3,182
641 19,819 595 18,408 459 13,204 353 10,774 359 11,829 405 13 ,274 380 11,162 402 15,102
172 11,711 159 11,175 144 9,401 133 8,760 134 10,005 135 9»128 127 8,703 139 9,383
107 20,885 120 23,422 107 21,846 102 23.143 98 24,441 125 28,434 148 32,379 109 21,470
12 8,013 15 9,593 18 12,240 19 13,954 20 14,677 21 14,806 524 16,475 25 17,301
9 18,084 16 31,909 13 18,356 13 26,774 13 29,668 17 31,308 19 33,191 14 22,527
— — — — 1 5,084 1 5,238 1 5,822 1 5 ,178 1 5,231 — —
1,148 99,152 2,472 1,10,464 1,821 91,167 1,539 97,812 1,599 1,06,401 1895 1.15,069 1.711 1,17,408 1,912 97,318
I f ir a a i r f i c s a , t f i r o i
Sount: Labour CommigdoiMr, Poaiab.
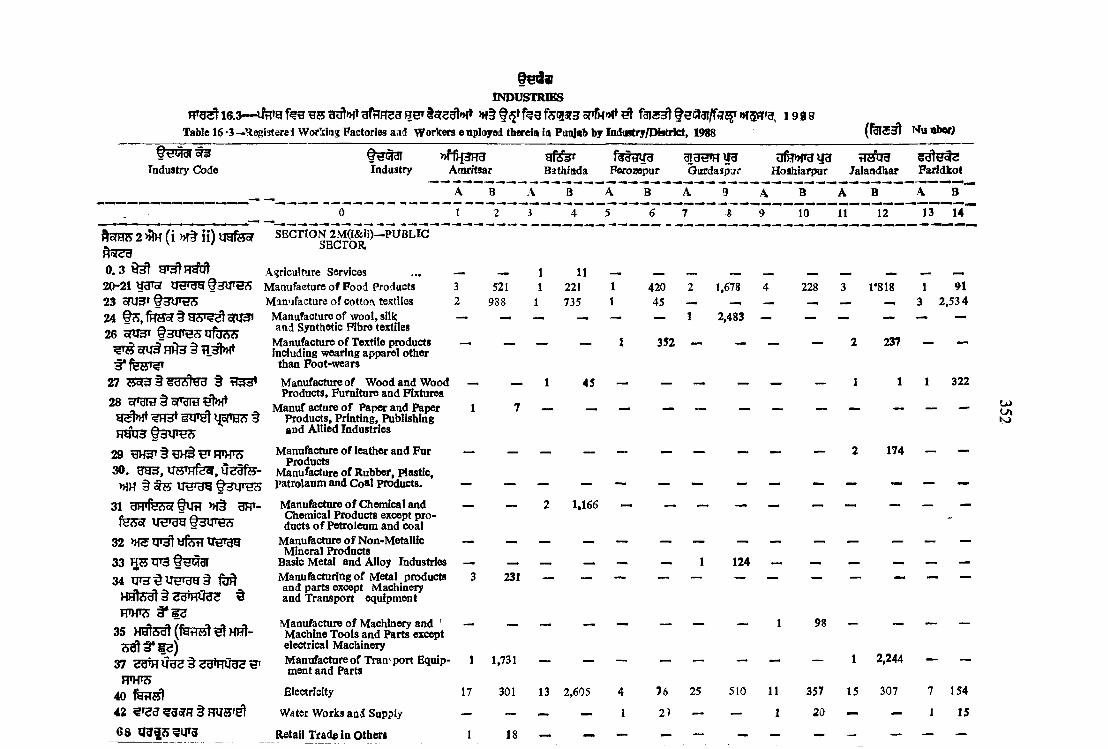
f e v v
INDUSTRIES
16.3— ifiFrg f e e tsr2^»H» >h§ f e a fe g a r ? sttTm'jI ^ f a i ^ ^ »K5f|fg, 1 9 9 s
Table 16 •S—Hegisterel WorWns Factories aacl W otIcots enployed therein in PuQ}ab by Ind«rtry/Di«trict, 1988 NuTib«f)
Industry Codef e wIndustry
3 f 3 » f » 3 ^ tTJPHAmritsar Bathiada Ferozepur Otirdaspur Hoahiarpur Jalandhar Farldkot
oTHW 2 »5Ih (i »it ii) irafeof^5T2B0.3
2 0 - 2 1 ^ lT 3»5W t3U T SS2 3 srtr^r f 3 i r e ? s24 fs , t e r § gsT?2l oru3» 26
27 HoTSt dAltra § tl33»28
? H 3 t s q r ^ IJ^[TBS t H5"q3 0 3 l F t ' S
29 i3H5P § ^ Rnro30. gg5,uwfear,059fe-
m U H ^ f n i n g ^
31 BPPfeScr UH BFP- feSoT t T F g g § 3 W 5
32 >HSqT^yfetTUS»gg33 T3 OtilSdl34 fu
H H t e g t S ^ g t f l t e r ^
Fn>T5 ^ 1 5
357 5 ^ ^ 1 2 )
37H W S
4042 ?^55?gon7§HaS»5t
3 A
' f
B A
' T
A
' n
B
12 13 14
6 8 O T ^ S ^ O rg
S B C n O N 2M (i& ii)—PUBLIC SBCrOR.
Ag^icul^a^e ServicesManufacture o f Food ProductsManufacture o f cotto!\ textiles
Manufacture o f w ool, silk and Synthetic Fibre textiles
Manufacture o f Textile products including wearing apparel other
than Foot-wears
Manufacture o f W ood and W ood Products, Furniture and Fixtures
M anuf acture o f Paper and Paper Products, Printing, Publishing «Qd A llied Industries
Manxifacture o f leather and Fur Products
Manufacture o f Rubber, plastic, patrolaum and C oal products.
Manufacture o f Chemical and Chenaical Products except products o f Petroleum and coal
Manufacture o f N on-M etallic M ineral Products
Basic Metal and Alloy IndustriesManufacturing o f Metal products and parts except M adiinery and Transport equipment
Manufacture o f Machinery and ' M achine T ools and Parts except electrical MachineryManufacture o f Transport Equipment and Parts
Electricity
Water Works a n l Supply
Retail Trade in o th e r i
17
521988
11
221735
42045
1,678 4
2,483 -
228 1*818 1 913 2 ,5 3 4
352 — - - - 237 - —
322
u t
174 - —
1,166
124231
1 1,731
301 13 2,605 762 )
25 510 11 357
20
15
2,244
307 154
15
18

74 H 2 ^ t1 » f§ t» r a Storage aad W areiousiag91 Saiitary Sirvlcss66 fe ff t Persoaa) Services
97 y g H 3 Repair Services
18
749 432 1 136 446 421 316 5 418
t l3
2 HoT^g
020320-212 2 §
23 c!lf3T24 t S , f H ^ § 3 c 9 ^
o O r S T f^ u T ^26 cfUST f 3 \ | r 5 3
» f§
2728 srgra § srara
W ^ 3 T gyr^'t IjoTH^ §
e f e fH UTE^29 ^ H 3 T § B H 5 ^ R H T cS
(HHH3 3 m-B)30 B 9 5 USrpffeBT, Oeafe>HH
31 gsqfer §iFT I dH'fyfesT UU rgg ^ U ^ B cS '
32 >HS TJT t tffe^ y ^ g
33 y[5 a?3§^31
§ HHT S335 HSfe' (fern5Jt HHt-
36 IW 5 l H 3 n t H U ^ l
37 ^ u iH C r a ^ te g r R u g s ^
Total
Section 2ni(i and ii)—Prirate Sector
39 4,566 24 5,215 9 1,049 33 5,241 22 1124 26 5,097 18 3 ,5 34
Live-stock Productions s . , . 3 46Agricultural Services ] .;'. __ _ __ MM _Manufacture o f Food, Products 198 3,688 84 2,334 182 3,508 106 3,255 23 296 65 1,358 135 3 ,938
Manufacture o f B e v ^ g e s , Tobacco and Tobaccd P n^ u cts
4 894 — — — — — 1 50 2 248 2 56
Manufacture o f Cottoa Textiles 26 631 87 4,750 24 4,233 __ __ 5 3,029 4 294 59 2,376Manufacture o f W ool/ Silk and
Synthetic Fibre Textiles
Manufacture o f Textiles Products (including Wearing Apparel other than Foot-wears)
598 15,002
38 1.054
1 18 2 94
1 24
5
1
2,167
45
1
5
10
196
1 45
M anufact^e o f Wood and Wood Products, Furniture and Fixtures
19 111 3 11 — — 16 156 2 5 18 234 4 14
Manufacture o f Paper and Paper Products, Printing, Publishing and Allied Industries
29 569 5 195 9 150 3 355 19 2,384 37 839 10 820
Manufacture o f Leather and Fur Products (excepf Repairs),
Manufacture o f Rubber, Plastic, Petroleum and Coal Products
2
23
625
620 9 177 •— — 3 47 8 145
12
150
1.138
3,079
Manufacturing Chemicals and Chemical Products (except Products o f Petroleum)
53 1,304 11 647 6 428 2 150 15 2,108 12 234 7 160
Manufacture o f Non-Metallic Mineral Products
7 160 6 726 — — 9 183 6 214 17 532 4 146
Basic Metal and Alloy Industry 31 859 6 203 — 60 940 8 2,268 51 1,730 13 461Manufacture o f Metal Products and Parts except Machinery and Transport fiquipment
69 948 4 30 5 51 23 776 30 132 334 8,424 17 251
Manufacture of Machinery, Machine T ools and Parts except Electrical Machinery
89 1,509 10 220 7 98 173 2,004 8 424 168 3,323 32 438
Manufacture o f Electrical Machine Apparatus, Appliances,
Supplies and Parts j
31 397 7 151 ■“ — 2 28 3 27 42 1,798 — —
Manufacture o f Transport Equipment and Pa rt s
21 755 1 8 — — 1 13 2 27 116 3,322 4 55
u>

f e w
PP95l l 6 . 3— t o?23>HT >H§ >H?ITO-1987Table 16.3 co77r</.—Registered ^Vorking Factories and ncrkers Emplosred therein In Punjab I j Iriustrj /Disiriri— 1S17
INDUSTRIES
( f e l5 ^ ) (Number)
IndustryC ode
Industry» f ^ n 3Amritsar
A B
Bathinda
A B
Ferozpurg j g w y gGurdaspur Hoshiarpur Jalandhar Faridkot
B
0
B
lo’A
11
B
12
A
13
B
14
38 ^ Qt!o]di 41 iFT§64
6874 t»raU^fH3l
96 %t?t97 H t e99 HW3 fRU^ f e t ^
7 ^ " -H'S!
Hc?H7S 85 »Wte Hfo3
Other Manufacturing Industries . ..
Gas and Steam
W holesale Trade o f Miaoellaneom Manufacturing
Retail Trade in others
Storage & Ware Housing
PersonaJ Services
Repair Services
R epair not elsewhere classified
Total
U n d e r s e c t i o n 85 w i t hPOWER
2 0 -21 ir e r g g F ood Products
23 srust
26 s a r i w ^(ufb?55 onJ§ HH3
27 B5?3 eBHtgg § tI33t
28
3 1 BFpfefesr § UFT- fe fe o f UB’9 9
Sfr* o f C otton Textile
M anufactuie o f Textile Prodoc (including wearing appsrd otl than foot-wears)
)Manufacture o f W ood and W ood Products, Furniture and Fixtures
Manufacture o f Paper and Pa|»er Products Printing, Publishing and allied industries
Manufacture o f Chemteal and chemical Products (except Products o f Petroleum and coal)
84
6
44
18
34
1
2,385 1. 20
21 — -
7 —
31 —
30 —
172 4
22 198 20 —
— 4
50 14 — —
45
1C8
5
1
1
20
82 2 24
15 — —
16 — —
526 3 38
i;260 29,566 238 9,520 258 8,774 401 4,951 126 13,536 1,096 29,804 294 8,842
16
2
120 4
14 —
33 31 212 13 no 11 85 59 49
198 721 184 945 111 630 198 841 187 669 193 700 188 939
15 IS 33
28
Or
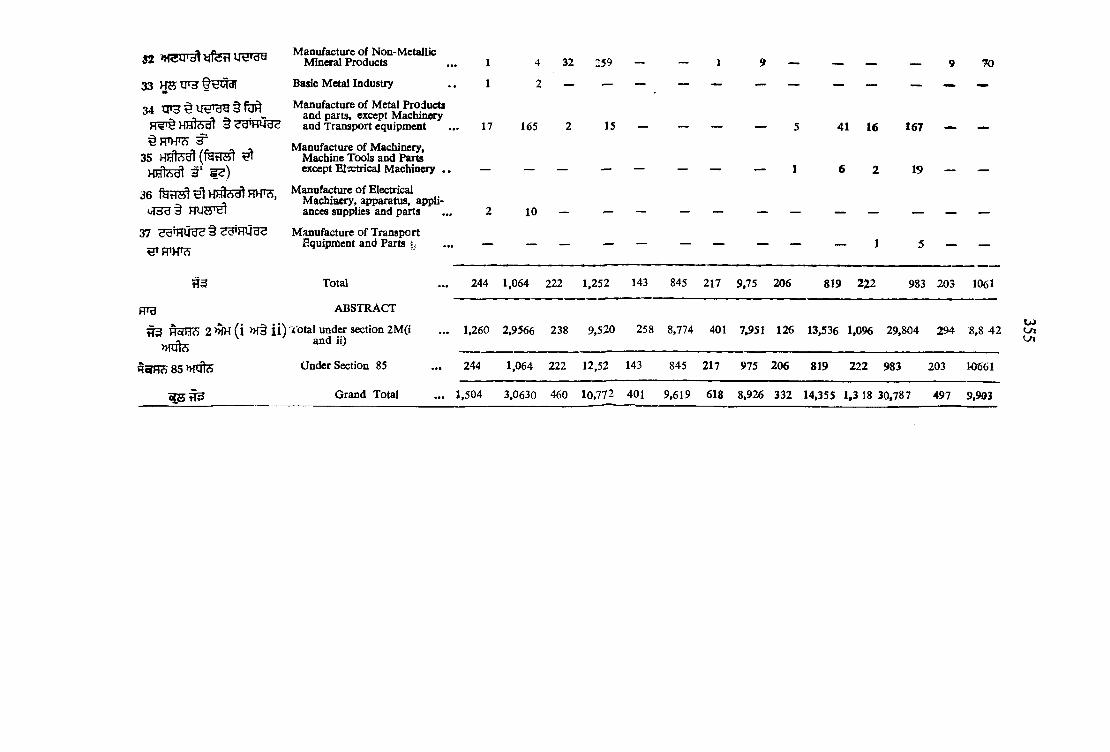
32Manufacture o f Non-M etallic
Mineral Products . .. 1 4 32 259 _ — 1 9 — — — — 9 70
33 Basic Metal Industry . . 1 2
34 T T H ^U tJidy H ^'9 HwlcSdl § <fd‘H yg^
Manufactiure o f Metal Products and parts, except Machinery and Transport equipment . .. 17 165 2 15 5 41 16 167
§FTHTS ^35 H H te ^ (fy d tt1 ^
3 3 ^ )
Manufacture o f Machinery,Machine Tools and Partsexcept EI%trical Machinery . . — 1 6 2 19
36 fyiHwl HhO cSdl H>TO,
o i d d t
Manufacture o f Electrical Machinery, apparatus, appliances supplies and parts . .. 2 10
37 ^ a m lra ^ § Manufacture o f Transport Equipment and Parts . .. — — — — — — — — — — 1 5 — —
Total . .. 244 1,064 222 1,252 143 845 217 9,75 206 819 222 983 203 1061
ABSTRACT
^ H5fH?> 2 W ( i >H§ i i ) lo ta l under section 2M (i . .. 1,260
» n ife
2,9566 238 9,520 258 8,774 401 7,951 126 13,536 1,096 29,804 294 8 ,8 4 2
qasR s 85 »ra fe (Jnder Section 85 . .. 244 1,064 222 12,52 143 845 217 975 206 819 222 983 203 10661
Grand Total . .. 1,504 3,0630 460 10,772 401 9,619 618 8,926 332 14,355 1,3 18 30.787 497 9,903
u>Cfi
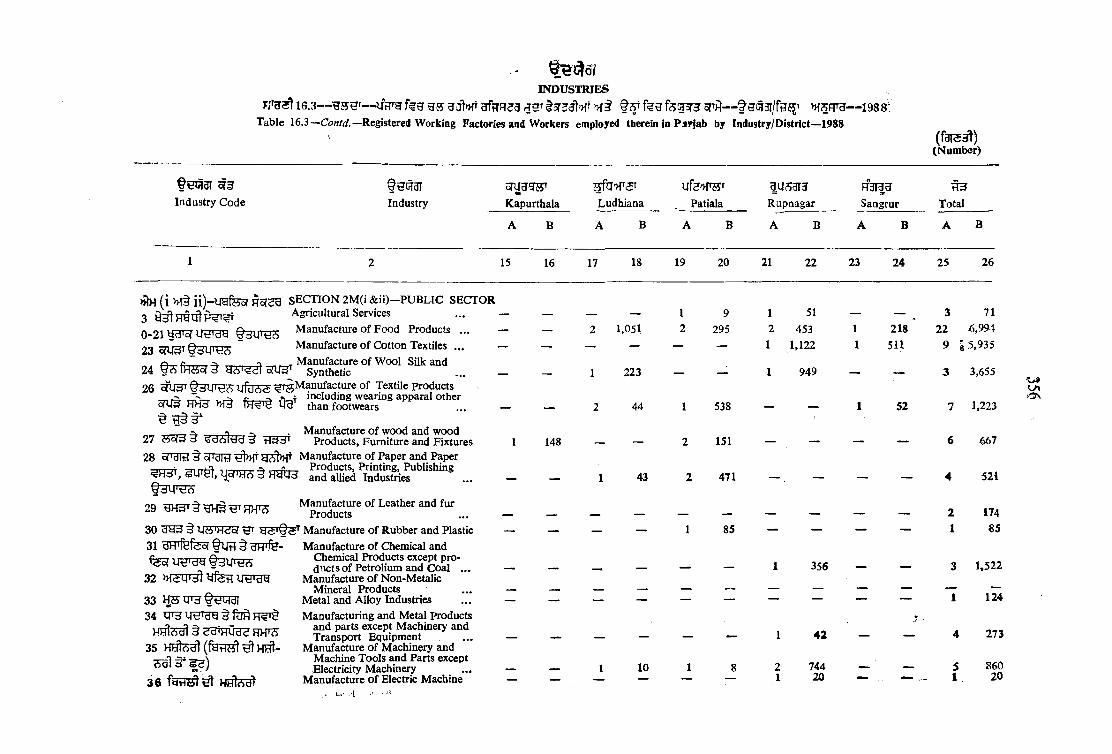
INDUSTRIES
16.3— f?g gs gaW gfHF733 /js tor at f >>{i fegsr? ortj — msft^—i9 8 s -Table 16.3—Conte/.—Registered Working Factories and Workers employed therein in P j? |ab by Industry/District—1988
f eiSaiIndustry Code Industry Kapurthala
A B
Ludhiana
A B
Ufe^rST |U 5 3 I 3Patiala Rupnagar
B B
H 3 I|3Sangrur
B
(fcU5^)(Number)
tT3Total
15 16 17 IS 19 20 21 22 23 24 25 26
s e c t i o n 2M (i & ii)-? U B L IC SECTOR 3 Agricultural Services
0- 2 iy g T 5f i ; g T ^ t 3 l F ^ Manufacture o f Food Products ...23 Manufacture o f Cotton Textiles ...^ , A-r- rT . ^ , , , n Manufacture o f W ool Silk and24 ^ lH6o{ d yA*<^dl ofU3^ Synthetic26 U fu ? ^ ^ M a n u fa c tu r e o f Textile products
f - __ » T including wearing apparal Other^ HHH >H§ 14^' than footwears§
^ n ^ . Manufacture o f wood and wood27 S o to d sdcSitId d iH^d' Products, Furniture and Fixtures28 o|T(j|y § SfTdld Manufacture o f Paper and Paper
Products, Printing, Publishing ^HdT, sy icT , 3 Hy<Jd and allied Industries
29 gHg'tgHS^HHTS ...30 9 9 3 ^ y «>'Hc:o( Manufacture o f Rubber and Plastic31 dH'fefeoj § BFPfS- Manufacture o f Chemical and
Chemical Products except products o f Petrolium and Coal ...
Manufacture o f Non-M etalic Mineral Products
Metal and Alloy Industries
51 — — 71
32 y f e f f
3334
35
3 6
Manufacturing and Metal Products and parts except Machinery and Transport Equipment
Manufacture o f Machinery and Machine Tools and Parts except Electricity Machinery
Manufacture o f Electric Machine
— — 2 1,051 2 295 2 453 1 218 22 6,994
— — — — — — 1 1,122 1 5 U 9 i 5.935
— — 1 223 — — 1 949 — — 3 3,655
— — 2 44 1 538 — — 1 52 7 1,223
1 148 — — 2 151 — — — — 6 667
— — I 43 2 471 — . — — — 4 521
_ _ _ __ _ __ __ __ 2 174
— — — — 1 85 — — — — 1 65
— — — — — — 1 356 — — 3 1,522
■ __ __ __ _ _ —1 124
— — — — — — 1 4 2 — — 4 273
1 10 1 8 2 744 _ 5 860__ __ 1 20 — I 20
!0»
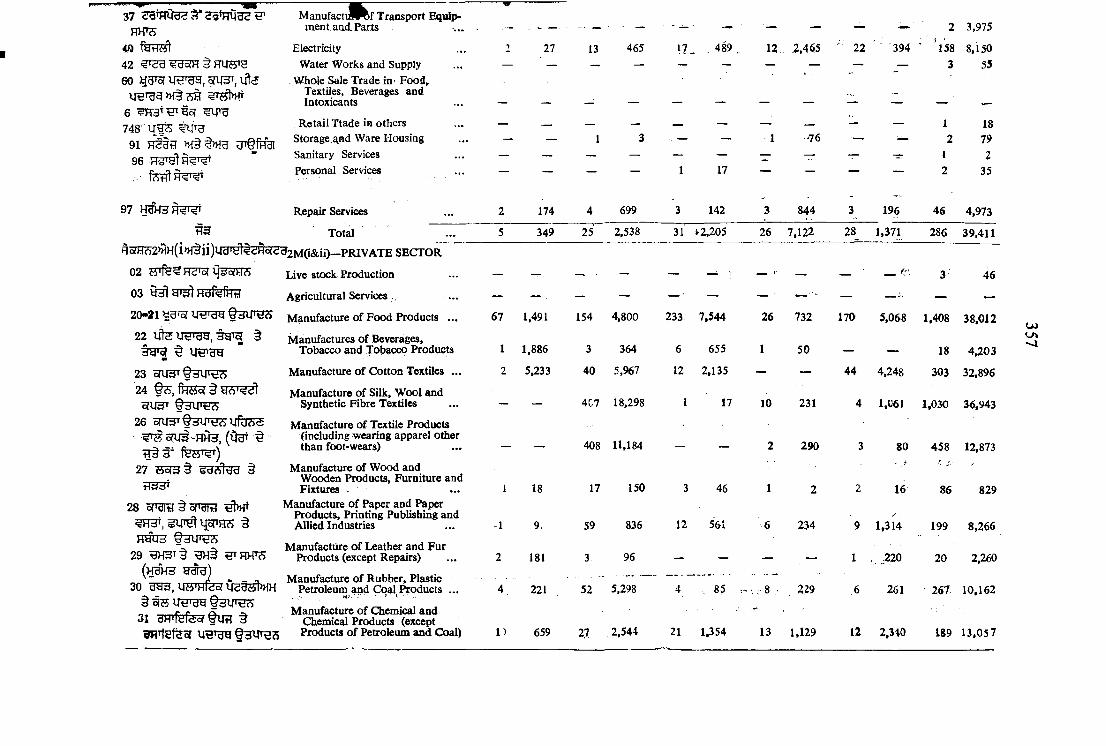
37
<0 fetTSft42 § FTUH^60 y 3 ^ U H ^ ,o r u 3 ^ ,u t 5
if€ T ^ g M § 3 H 6 ^H BT^rgsr 748 U J ^ ?UTg
91 >H§t>Hg UT§fH3196
97
02 7 5 T fe ^ H ^ U 5 o |H S
03 y ^ ^ g ^ H s f e f r r a
20-21 i4H T ^ ^ 3 i r e ? j
22 U te U 5 T ^ > 3 g r ^ §
23 5 n 4 3 T § 3 V F ^
24 f 3 , t e 5 r § g ^ s T ^ c?u3T
26 o r U S r f3 i;T :e H y fU ^ • ^ o r U ^ -HHH, ( ife t t
f e s ^ )27 H o ? 3 § §
i T ^
28 sro re § srara
^H3T, IjoPH^S § HatiH f n i r e ^
29 ^ H S T § g H 3 HTHHT5 (h b h 3 g m g )
30 Ua3,U?5^Hfef023?5t>MH ^ UtJ'd^ Q siPB ??
TOTtefeoT
M anufactil^ ^ f Transport Eqitip- m e n ta a d Parts ... - - .......... ^ ■ - ^ ■ ■■__■ ' 2 3,975
Electricity 27 13 465 17 . . 489 ^ 12 2,465 22 394 ’ l58 8,150Water Works and Supply — — — — — — — — — — 3 55
W hole Sale Trade in Food^ Textiles, Beverages and Intoxicants
... -
, R etail Ttade in others — __ — . — __ — — ' _ — 1 18Storage a,nd Ware Housing — — 1 3 — — 1 76 — 2 79Sanitary Services 1 2Personal Services — — — — 1 17 — — — — 2 35
Repair Services 2 174 4 699 3 142 3 844 3 196 46 4,973
Total 5 349 25 2,538 31 > 2,205 26 7,122 28_ 1,371 286 39.411
■^2M(i&ii)—PRIVATE SECTOR
Live stock Production — — ■ — — — ■' — '■ — — __ 3 46
Agricultural Services , — — - — — — ■ — — — — —
Manufacture o f Food Products ... 67 1,491 154 4,800 233 7,544 26 732 170 5,068 1,408 38,012
Manufactures o f Beverages, Tobacco and Tobacco Products 1 1,886 3 364 6 655 1 50 — __ 18 4,203
Manufacture o f Cotton Textiles ... 2 5,233 40 5,967 12 2.135 — — 44 4,248 303 32,896
Manufacture o f Silk, W ool and Synthetic Fibre Textiles — — 4C7 18,298 1 17 10 231 4 1,061 1,030 36,943
Manufacture o f Textile Products (including wearing apparel other than foot-virears) ■ 408 11,184 _ _ 2 290 3 80 458 12,873
Manufacture o f W ood and W ooden Products, Furniture and Fixtures 1 18 17 150 3 46 1 2 2 16 86 829
Manufacture o f Paper and Paper Products, Printing Publishing and Allied Industries 1 9. 59 836 12 561 6 234 9 1,314 199 8,266
Manufacture o f Leather and Fur Products (except Repairs) 2 181 3 96 — — — — 1 .220 20 2,260
Manufacture o f Rubber, Plastic Petroleum and Coal Products .... : >it:' r ' ■ ■ > 1. ■ ■ 4 221 52 5,298 4 85 ;■ 8 ,, 2.29 6 261 267. 10,162
Manufacture o f Chemical and Chemical Products (except
; Products o f Petroleum and Coal) 1) 659 27 2,544 21 1.354 13 1,129 12 2,340 1S9 13 ,057
u>

16. 3— U H g u t » f 9 ^ 3 9 JJHT fegoTH cpA § € q 3 f /f ij (5 f >H^nTg 193
Table 16 *3 Coatd.—Regist^ed Working Factories and Workers Employed therein Piw}ab by Industries/Districts, 1987
INDUSTRIES
( f e 3 \ )(Number)
cTB oHOTSTK a i^ h a la
s f a » r s TLudhiana Patiala Rupnagar
R 3 I ^Sangrur
. tT 3 - Total
Code Industry —A B A B A B A B A B A B
0 15 16 17 18 19 20 21 22 23 24 25 26
32 y fe R Manufacture o f N on-M etallic Mineral Products 11 365 11 408 19 584 10 462 4 155 104 3,935
33 Basic Metal and Alloy Industries 9 152 210 9,525 214 11,179 11 571 25 1,520 638 29,408
34 13^3 UBTB9 ftlH H^T§
§ ?giHCraS 3*
35
36 ^ HVTO
M anufacfure o f Metal Products and Parts except Machinery ard Transport equipment
Manufacture o f M achinwy, Machine Tools and Parts except Machinery
Manufacture o f electrical machinery apparatus, appliances and parts
11
69
37
133
1,007
911
220
380
40
5,415
7,307
1,290
22
42
10
838
2,463
628
15
54
35
357
3,106
3,966
19
23
1
354
455
29
749
1,055
208
17,709
22,352
9,225
37 § ^ U iF lijg^ Manufacture o f Transport equipment and pai;t .......... 24 388 720 27.472 25 3,816 7 217 20 511 941 36,:^84
38 ^ O'^^cfT Other Manufacturing Industries ... — — 15 671 2 13 3 286 1 37 62 3,540
41 ^ H § § T ^ G as and Steam — — 6 144 8 553 1 15 1 66 19 823
64 ^ gS7 W holesale trade o f Miscellaneous Manufacturing — — 1 10 1 10
64 ira UB^cSRetail Trade in others — — 1 18 1 9 — — — — 34 358
74 H ^ ^ T § i> H UStorage and W arehousing 1 20 — — — — — — — — S H i
92 Education Scientific and Research Services — — — — 1 100 — — — — 1 100
94 Community Services — — 1 68 — — — — — — i 68
96 ferf] Personal Services — — 1 17 — — 1 48 - — 5 111
97 f e w g Repair Services 1 20 10 250 4 107 3 60 — — 58 1.345
99?irl"
Services not elsewhere classified 2 31 — — 1 31 — — - - — 3 62
TT5 Total 253 12,725 2,786 1.02,132 641 32,718 207 11,985 345 17,735 7,905 2 .85 ,288
OJ00
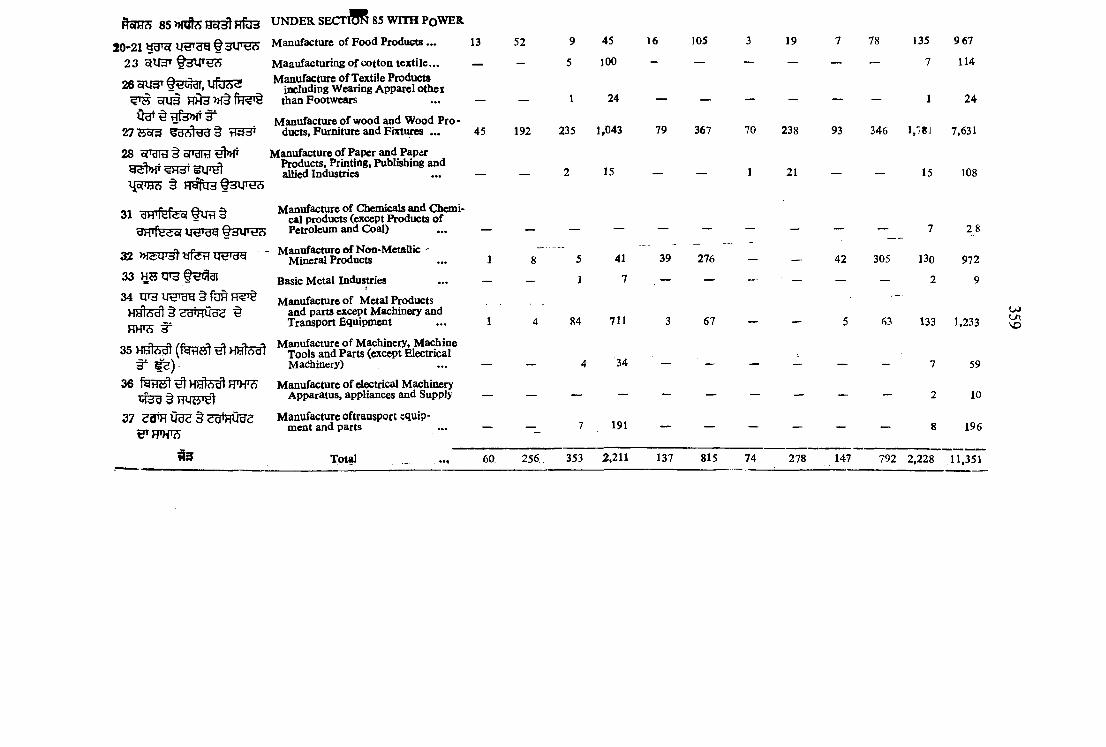
85 Wite HoTSft HfU3JO-21 f 3 i n ^
232 6 ^ lI3 T fH T O T ,llfb 3 3
^ ohS H H 3 M § f F I ^
2 7 S o f^ r133T
28 oTUratolTO^W
MolTO § H g fg 3 § 3 lT € ? >
U N D E R SECtJBR 85 WITH Pq WER
Manufacture o f Food Products . ..
M aaufacturing o f cotton te x tile ...Manufacture o f Textile Products
including Wearing Apparel o th et than Footwears
Manufacture o f wood and W ood P roducts, Furniture and Fixtures . ..
Manufacture o f Paper and Paper Products, Printing, Publishing and allied Industries
13
32 ■3334
3"
36 ^ HWlSdl HWJ
37 UatfTW tsglHUU^
^ 3
Manufacture o f Chemicals and C h«ni- cal products (except Products o f Petroleum and Coal)
Manufacture N o n -M eta llic - Mineral Products
Basic M etal IndustriestManufacture o f Metal Products
and parts except Machinery and Transport Equipment
Manufacture o f Machinery, M achine T ools and Parts (except Electrical Machinery)
Manufacture o f electrical Machinery Apparatus, appliances and Supply
Manufacture oftraasport equipment and parts
45
52 9 45
5 JOO
1 24
15
41
7
84 711
34
16 105 19
192 235 1,043 79 367 70 238
39 276
3 67 -
78
7 114
135 9 67
— — 1 24
93 346 1.781 7,631
1 21 — - 15 108
28
7 191 _ _
42 305 130 972
— — 2 9
5 63 133 1,233
7 59
2 10
8 196
u»'O
Total 60. 2 5 6 . 353 2,211 137 815 74 278 147 792 2,228 11,351
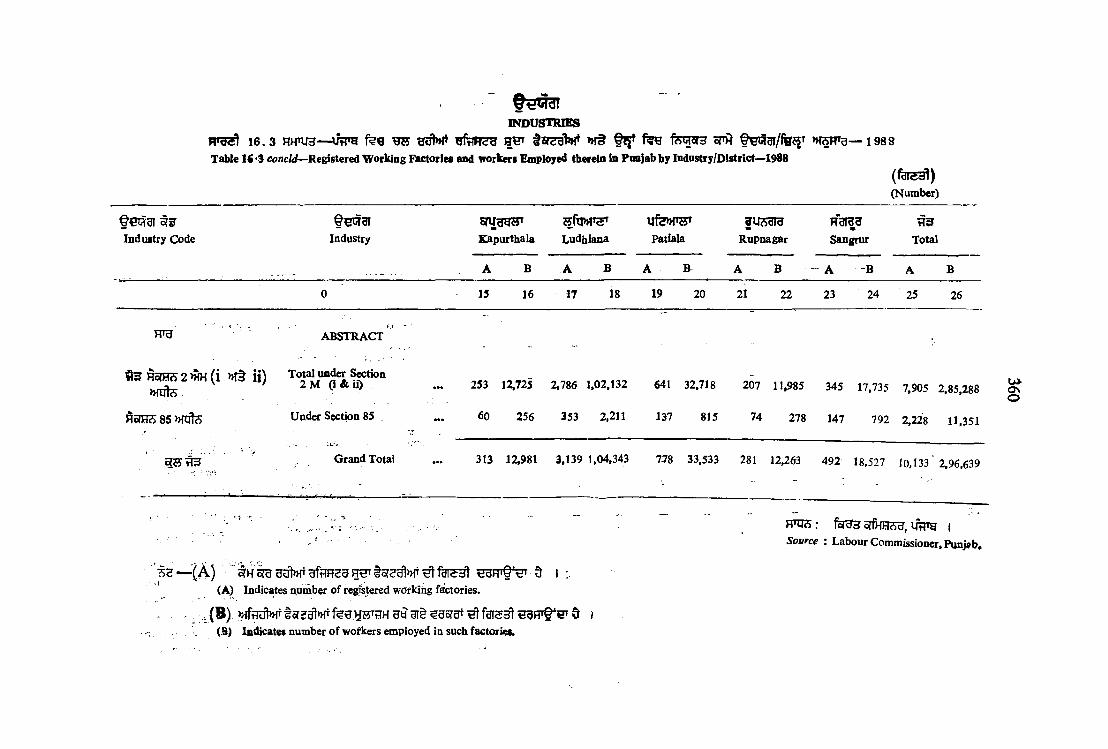
1 6 .3 w g g s g u M g frff?yd BW fo r ? g V >H§ f ! f feu feqzfd f ^ a i / f e ^ T >H5RTg—- ig g sTable 1< *3 co/icW—Registered Working Factories and workers Employed therein in Punjab by Indastry/District—1988
INDUSTRIES
(Number)
Industry Code Industry
BWHgHT
Kapurthala
H f W c ?Ludhiana
u fe»r?5’Patiala
fu?53ra
Rupnagar Sangrur Total
A B A B A B A B ~ A -B A B
0 15 16 17 18 19 20 21 22 23 24 25 26
H«d ABSTRACT
S 3 Horais 2 w ( i >H§ i i ) >Hy1*
85 W t e
Total under Section 2 M ( i& i j )
Under Section 85
253 12,725
60 256
2.786 1,02,132
353 2.211
641 32,718
137 815
207 11,985
74 278
345 17,735
147 792
7,905 2,85,288
2,228 11,351
Grand Total 313 12,981 3,139 1,04,343 778 33,533 281 12,263 492 18,527 10,133' 2,96,639
- -H'UA :
— ( A ) " i r a udt>HT ^ d i :.(A) Indicates niumb^r o f regfstered wafkiag f^ tor ies.
Source : Labour Commissioner, Punjab,
,, { B ) . ^ r id t » r for ?^»fT u y gt ^ § i(S ) Indicates number o f wofkers employed la such factories.
s
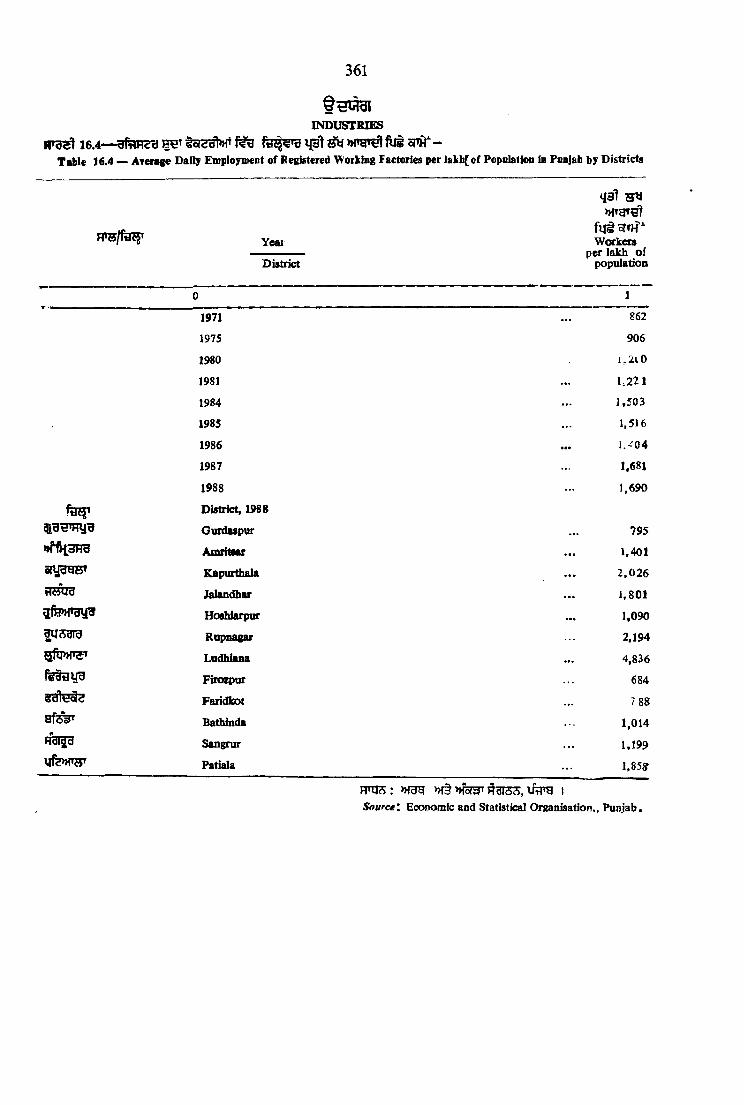
361
i r g ^ i 6 . 4 — f e ^ ^ i j 3 l ^ > H i Q i ^ f U i o n > r -Table 16.4 — Avmige Daily Empioymeot of Registered Working Factories per l&fcb[of Popolatloo in Poojab by Districts
INDUSTRIES
HTS/fe gr Year
<i3l ^5^
f u i srf>f" Workers
per lakh of populationDistrict
0 1
1971 . . . 862
1975 906
1980 I,2t0
1981 . . . 1,221
1984 . . . 1,503
1985 . . . 1,516
1986 • • • 1.404
1987 . . . 1,681
1988 . . . 1,690
District, 1988
Gurdaspiff • • • 795>»f1ii3Fra AmritMT . . . 1.401
Kaptirthala • • • 2,026tIHUB Jalandhar • • • 1,801
Hoshiarpur • • • 1,090wq^gra Rupnasar 2.194
Ludhiana . . . 4,836ferouH Firozpur . . . 684
Faridbot . . . 7 88a f ^ Bathinda 1,014Rgil'd Sangrur • • • 1,199Hfe>HW Patiala . . . 1,85?
H H H : » rag >H§ »fe?3T HUTS3, UfPH ISource: Economic and Statistica] Organisation,. Punjab.
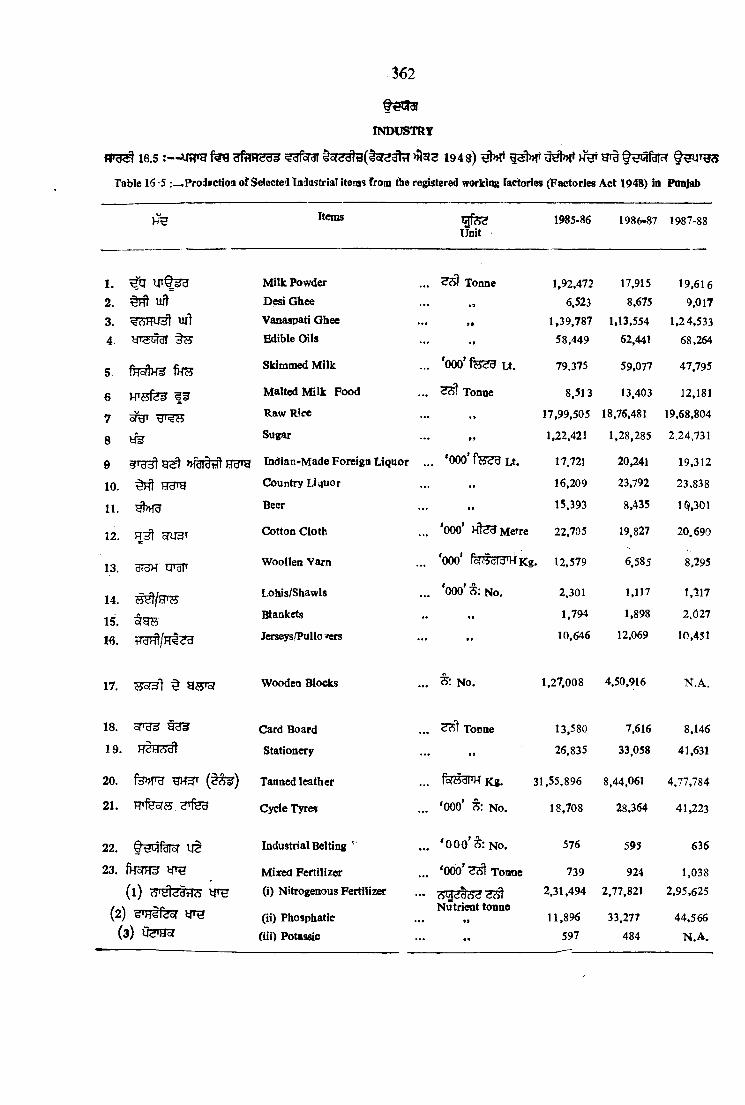
362
16.5 UtTH l c f 2 ^ ( t Q r < ? ^ >>J312 1 9 4 8 ) h Imt U # )!* § m iT H 5
Table 16 -5 r^ P roioctioa o f Selectei In iastrialltenis from tlie re^ tered working Tactoiies (Factories A ct 1948) iil POttjab
INDUSTRY
Items g f e 3Unit
1985-86 1986-87 1987-S
1.
2. ^ Uft3. ml4.
5. fH 5
6 HTfjfer
7 ^
8 t f e
9 sl'dJl ^dldijl Hd'y
10. ^11. HhHU
12. cTU3T
13. 3T^ lOT
14. ^ /liT O15.16.
M ilk Powder ... Tonne
D esi G hee ... „
Vanaspati G hee ... „
Edible Oils
Skimmed M ilk
Malted M ilk Food
Raw Rice
Sugar
Indian-M ade Foreign Liquor
Country Liijuor
Beer
Cotton Cloth
W oollen Y am
Lohis/Shawls . .. *000 S ; N o.
Blankets ... „
Jerseys/Pullo/ers
W f e ^ ^ U .
Tonne
»>
*000* f s e g Lt.
99
*000* Hl<?d Metre
1,92,472
6,523
1,39 ,787
58,449
79,375
8,513
17,99,505
1,22,421
17.721
16,209
15.393
22,705
17.915
8,675
1,13,554
62,441
59.077
13,403
18,76,481
1,28,285
20,241
23,792
8,435
19.827
2,301
1,794
10,646
1,117
1,898
12,069
19,616
9,017
1,24,533
68,264
47,795
12,181
19,68,804
2,24.731
19,312
23,838
10,301
20.690
*000* fc^SdrcJTH Kg. 12,579 6,585 8,295
1,117
2 .027
10,451
W ooden Blocks N o . 1,27,008 4,50,916 N .A .
18. 5TH^
1 9 .
20. fe» rH ( t ^ )
21 . F p f e r s
22. ut
23. fksHT^ IPH
( 1 ) cTHteStTc? T O
( 2) T O
(3) ifenjoT
Card Board
Stationery
Tanned leather
Cycle Tyres
Industrial Belting '
M ixed Fertilizer
(i) Nitrogenous Fertilizer
(ii) Phosphatie
(ill) Potassic
Toone 13,580
26,835
f^rjfgPHKg.
OOO’ N o .
* 0 0 0 * ^ : N o .
000’ Toane
Nutrient tonne
576
7,616
330 5 8
31,55,896 8,44,061
18,708 28,364
595
739 924
2,31,494 2,77,821
11,896
597
33,277
484
8,146
41,631
4,77,784
41,223
636
1,038
2,95,625
44,566
N .A .

Table 16.5 i—{concld.) Productioo of greeted
<363
Q ti^ d lIN D U ST R Y
€ ^ d i I c f e ^ g Q j i p t i sIndustrial items from the registered working factories in Pm jab
v fe Items
Unit 1985-86 1986-87 1987-88
2 4 . Paints/Vam ishes ... *000* 9 ^ Rs. 49,329 5,064 4.720
2 5 . M edicines • • • tf 1,00,770 2,95,985 3,31,947
36. H 'y s Soap ... Tonne 38,787 32,704 34,619
27. R ice (Bran) Oi! . . . 45,153 56.906 69,921
28. 2 d o ^ d Tractors ... N o . 8,052 8,385 10,950
29. y ld W fetTS D iesel Engines ffr N .A 1,07^ 945
30. 0 S 3 Rice Shelier • • • 99 61 202 57
31 . N uts & Bolts ... Tonne 20,852 16,262 15,037
3 2 . HHte Sewing M achine ... N o . 2 ,84 ,300 5,60,154 2,04,272
33 . fn a ra e hhT< Cigarette Machine • • • 99 28 9 6
34. TI<^d<Id Generators •** 99 N .A . 94 10
35. HT'cS Switchgeara • • • %V 15,96,977 3,57,930 1,79,137
36. Transformers 99 2,272 1,846 3.811
37. H 'ylofS Bicycles ... 'ooo' N 6. 3,476 2,970 1,400
38. ^ s m § C ecils & Valves • * « 9# 4,643 3,314 3,684
89. l)9 Electric Fans 99 35 46 16
4 0 . hO ¥ Mopeds . . . 98 76 69
41. HT HHTcS Sports goods . .. * 0 0 0 * 3 U § R s. 1,39,647 1,12,919 1,38,372
4 2 . » f§ ^ (n d l» r ) Bar & Rods . . . *000* TonneR 493 579 476
43. crw O ?cr Micro Computer . . . S : N o . 2 ,506 3,353 2,259
44. Transmitter set ... 3 : N o . N .A . 53 N .A .
45. cidWdlHl-^d Trans-receivers • • • , 99 4,747 5,568 2,717
r r r q^:— wr s T ngrs;^, im »3 iSovrce :— Econom ic and Statistical OrganisaticMji, Punjab*
^ : » f ^ § . » r ^ . t ? ^ 1 5 - 1 2 - 8 7 ^ y»lJ3 ^ I
JVote :'Figures are based on returns under Annual Survey o f Industries ( A .S .I .) received upto 15-12-87.*fH<^ ^ I♦Includes mini Generators-
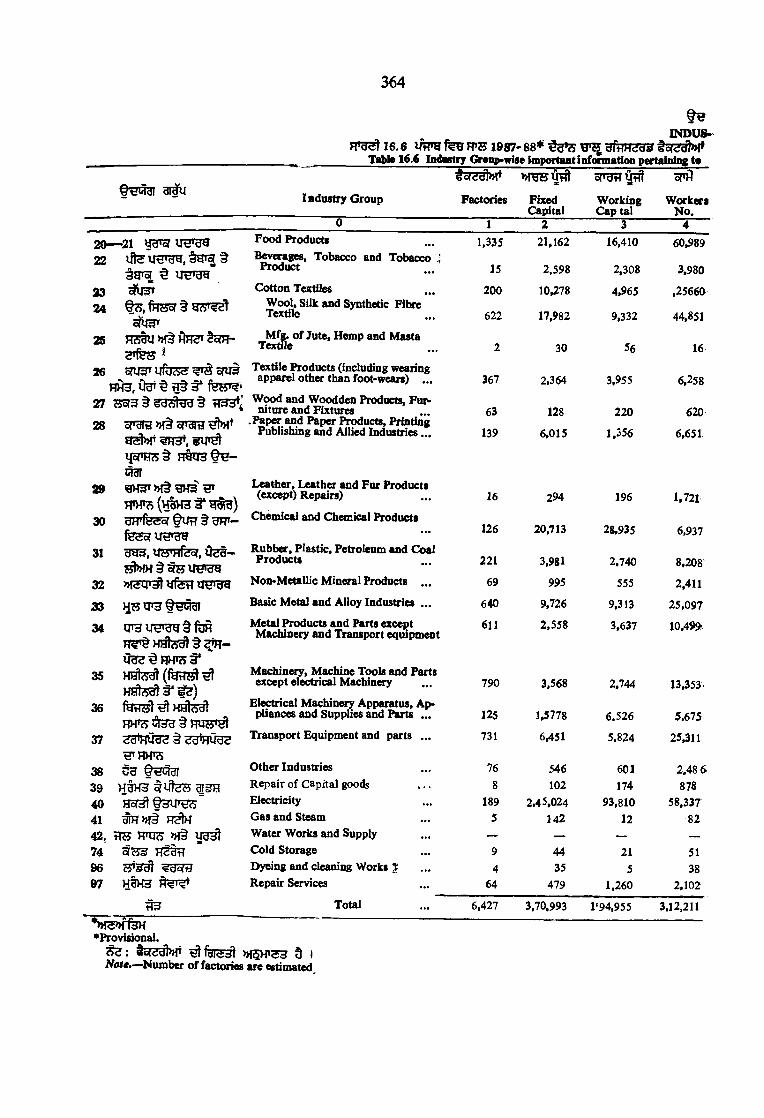
364
INDUS-^
^ *- ^ _____s_»_____ ____________^ ____________ A-
f ^ a r Industry Group
t5rrdt»f'
Factories
n r a s M
FixedCapital
■oFdtT 0 tfl
WorkingCaptal
sni)
WorkersNo.
0 1 2 3 42 0 — 21 y c n g r u H * w
22
t7? .fH 555r§ c t o f
JTOIu >Ht Ah^ t lo fH -
s w ^ y f e 5 ^ 5 w i H A 3 ,v fe T t f e s » ^ '
27 tl33*;s r r o » f§ opgra ^ T
i^ oni3^ § H t e f € - 1331g H 3 T » r§ g H 3 ^
d H 'f e o f fu tT § g y r -
fe 5 o r ir e » 3 g g g ^ , u w H fe y , Oh h -
2324
25
26
28
29
30
31
32
33
34
35
36
37
U*y Qt^Wdi
^ t R H > ? 5 3 * HHic5^ (fefR Si ^
FPTO y d cj ^ r w w ’^ <?d*MUU3 ^ cfd 'H U ^
38 uu39 H#H3 t v t e4041 ^ > H §42, HS HH33 >H§749 6 2 ? ^97
^ _________ __
" S r p h I s h*Proviaonal.
: »{5H »S3 t INole.^Mumber of factories are estimated.
Food ProductsBeverages, Tobacco and Tobacco i Product
1,335
15
21,162
2,598
16,410
2,308
60,989
3,980
Cotton Textiles Wool^Silk and Synthetic Fllwe
200
622
10,278
17,982
4,965
9,332
,25660
44,851
T ^ ^ of Jute, Hemp and Masta2 30 56 16
Textile Products (including wearing apparel other than foot-wears) ... 367 2,364 3,955 6,258
Wood and Woodden Products, Furniture and Fixtum
.Paper and Paper Products, Printing Publishing and Allied Industries...
63
139
128
6.015
220
1,356
620
6,651
Leather, Leather and Fur Products (except) Repairs) 16 294 196 1.721
Chemical and Chonical Products126 20,713 28,935 6.937
Rubber, Plastic, Petroleum and Coal Products 221 3.981 2,740 8.208
Non-Metallic Mineral Products ... 69 995 555 2,411
Basic Metal and Alloy Industries ... 640 9,726 9,313 25.097
Metal Products and Parts except Machinery and Transport equipment
611 2,558 3,637 10,49»
Machinery, Machine Tools and Parts except electncal Madiinery 790 3.568 2,744 13,353
Electrical Machinoy Apparatus, Appliances and Supplies and Parts ... 125 1,5778 6.526 5,675
Transport Equipment and parts ... 731 6,451 5.824 25,311
Other Industries R epair o f Capital goods Electricity Gas and Steam Water Works and Supply Cold StorageDyeing and cleaning Works | Repair Services
76
8
1895
9
464
546102
2,45,024142
4435
479
601174
93,810
12
21
51.260
2.48 6
878 58,337
82
5138
2,102
Total 6,427 3,70,993 1‘94.955 3.12,211

365
TRYiaiflf licJa’ H>Jt ^
© rfdd'
Wages
5
Em ployees(N o .)
6 '
Emolu*ments
7 ~ -
Hb(d}Fuel
consum e!
HHdldlMateria?consumed
y?nf7i a z
TotalInput
V
Totaloutput
11
' -’''I*:'. ; «.s. in
Depricia-tion
lacsj
-s'qf N et Value added
138 9 104.262 72.734 5,434 5,662 1,82,137 2,00,922 2.22,623 4,246 17,455
416 4,834 562 834 8,694 11,246 15 229 599 3,3842,059 28,925 2,591 1,720 34,392 37,980 45,281 1,746 5,5552,947 54.465 3,867 3,672 39.804 47,800 58,409 2,846 7,763
1 23 1 1 24 26 19 3 (— )10
801 7,563 980 311 13,667 17,025 19,925 564 2 ,336
54 703 65 29 478 534 714 34 146628 8.037 881 1,420 4,921 6,610 8,548 779 1,159
132 2.053 183 61 2,438 2,603 3.137 92 442
1,251 10,293 2,414 11,729 24,104 41,676 54,982 4 ,539 8 ,767
772 9,954 1,070 1,200 19,724 22,111 26,352 653 3,588180 2,823 239 632 1,132 1,871 2,437 280 , 286
.2399 29,996 3.100 10.119 91,522 1,04,875 11,4857 1.921 8,061866 12,099 1,114 1,179 12,338 14,686 18.019 553 2 ,7 8 0
1.251 16.123 1.805 1,400 19,176 22,160 26,506 760 3,586
598 8,137 1.172 465 13,914 15,821 20,428 1,155 3,4522.180 30,625 3.156 2,500 41,611 47,409 57,289 1,518 8,362
199 2,909 274 129 2,370 2,734 3,573 97 742161 925 175 27 431 465 612 6 141
9,809 86,874 16,426 24,058 43,492 72,751 1,24,868 5,747l*f A
46,3707 140 15 29 62 123 188 27 38
3 68 5 22 3 31 48 8 93 58 5 6 62 74 91 16 I
303 2,662 409 57 590 939 1,661 51 67131.282 3,93,023 45,943 67.262 5,57,0b6 6,72,472 8,25,796 28.240 1,25,084
» f ^ M § >>R3T H^fST),
5owrce—Economic and Statistical Organisation. Pttnjab.
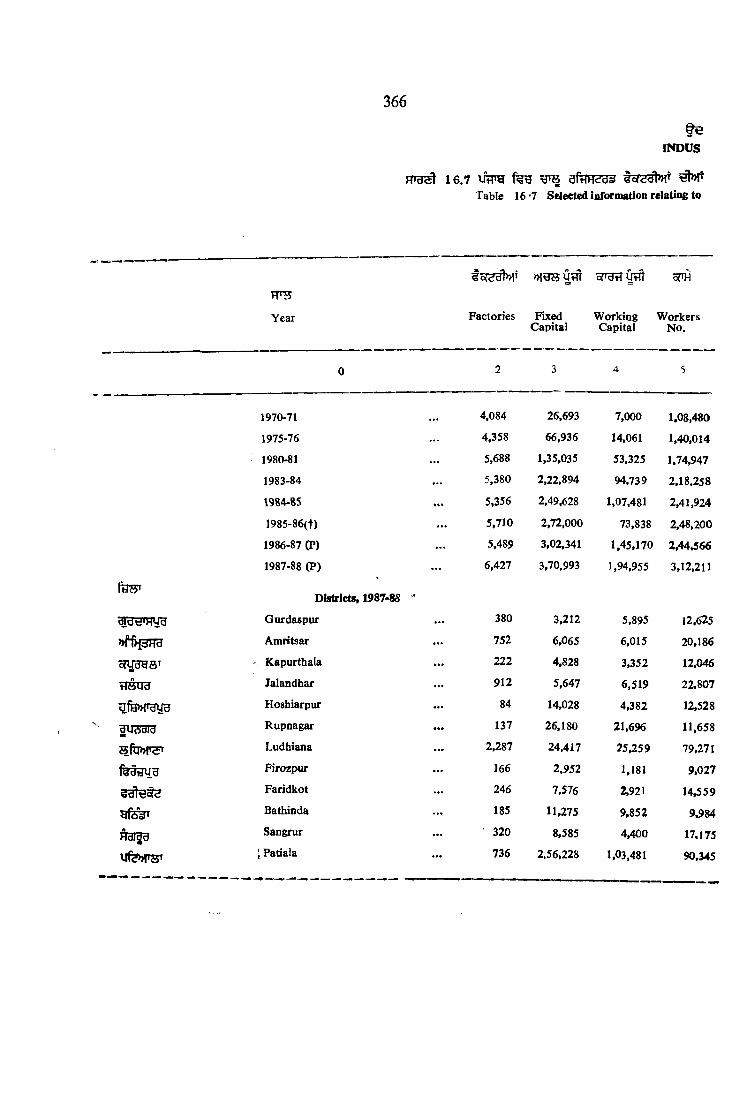
366
INDUS
1 6 .7 aftff7?<35 t o f ^ ^ ^Table 16 ’7 Sh eeted information relating to
TTH
Year
»ig?5UtTl orHt?yrft oPh
Factories Fixed W orking W orkersCapital Capital N o .
t o
*>f1)-pTT3
t 7 ^
Uftp>I'UU3
W A dld
8dltJ«5<5
Agrgu
ufe>>rsT
1970-71
1975-76
1980-81
1983-84
1984-85
1985-86(t)
1986-87 (P)
1987-88 (P)
Districts, 1987-85
Gurdaspur
Amritsar
Kapurthala
Jalandhar
Hoshiarpur
Rupnagar
Ludhiana
Firozpiu-
Faridkot
Bathinda
Sangrur
[ Patiala
4,084
4,358
5,688
5,380
5,356
5,710
5.489
6,427
380
752
222
912
84
137
2,287
166
246
185
' 320
736
26,693
66,936
1,35,035
2,22,894
2,49,628
2,72,000
3,02,341
3»10,993
3,212
6,065
4,828
5,647
14,028
26,180
24.417
2 .952
7.576
11,275
8,585
2.56,228
7,000
14,061
53,325
94,739
1.07.481
73,838
1,45,170
1,94,955
5,895
6,015
3,352
6,519
4,382
21,696
25,259
1,181
2,921
9.852
4,400
1.03.481
1,08,480
1.40,014
1.74,947
2,18.258
2,41,924
2,48,200
2,44.566
3,12,211
12,625
20,186
12,046
22.807
12,528
11.658
79,27t
9 .027
14.559
9.984
17.175
90.345

367
T R Y -
M ug^yucs § § HgsTH egistered working factories in Punjab
(h« ^ §fu>H*r4W)(V alue in lakh rupees)
T UT^t ^
Wages Employees Emoluments Fuelconsumed
Materialconsum ed
Totalinput
Totaloutput
Depreciation
N et Value added
6 7 8 9 10 11 12 13 14
2.541 1,39,084 3,400 1,106 32,936 35,780 44,185 1,301 7,104
4,680 1,38,600 6,942 3,705 63,799 82,285 1,01,194 1,976 16,933
8240 2,35,141 15,195 13,717 1,57,012 2,02,141 2,49,106 1,358 38,607
16,353 2,75,421 24,637 28,978 2,50.288 3,00,535 3,68,200 13,183 54,482
20,250 3.08,865 31,268 35,504 2,86,486 3.46,089 4,22,691 14,857 61,745
22.697 M l . S l i 34.4S0 45,953 3,48.141 4,23.180 5.15,473 n ,4 8 4 74,809
23 149 3,08,448 33,912 53,200 3,65,334 4,53,401 5,62,235 18,217 90,617
31,282 3,93,023 45,943 67,262 5,57,086 6,72,472 8,25,796 28,240 1,25,084
1,147 14,721 1,185 1,185 14,694 16,756 20,127 477 2,894
1,664 24,057 2,185 2,405 36,459 41,887 47,473 1,339 4 ,247
1,072 13,808 1,369 1,992 20,264 24,645 30,682 839 5,198
2,068 27,688 2,784 2,791 34,247 39,982 47,255 1,196 6,077
1,074 15,339 1,642 2,182 16,936 20,872 28,794 1,491 6,431
1,756 16,144 3,259 6,970 63.703 74,806 84,909 3,204 6,899
6,261 96,225 8,268 11,050 1,53,243 1,78,210 2,02,921 5,168 19,543
637 10,552 802 480 12,815 14,348 16,777 631 1,798
1,167 16,634 t,5J7 1,391 35,645 38,679 44,765 1 ,369 4.717
881 11,976 1,400 5.524 37,647 46,261 54,874 3,127 5,486
1,115 20.356 1.434 1,754 35,108 41,563 47.173 1,392 4,218
12,4401
1,25,523 20,103 i 29.538 195,325 1,34.453 : 2 ,00,046 8,007 57,576
P >H3 »ffHH )»!§ H3I3J5, 1
P Provisional
f ^ U §
t Revised
S ^ : R th 1970-71 , 1975-76
<Vow ; D a^eforthoysars 1970
Source —Econom ic and Statistical Organisation, Punjab.
» i t 1980-81» 19 8 3 - 8 4 1 9 8 4 -8 5 ^ ^“oTi t* g ^ /» fo r3 T HaT55 a s r fs a ^ I S I
•71, 1975-76 1980-81,1983-84 and 1984-85 were compiled by C S .O .
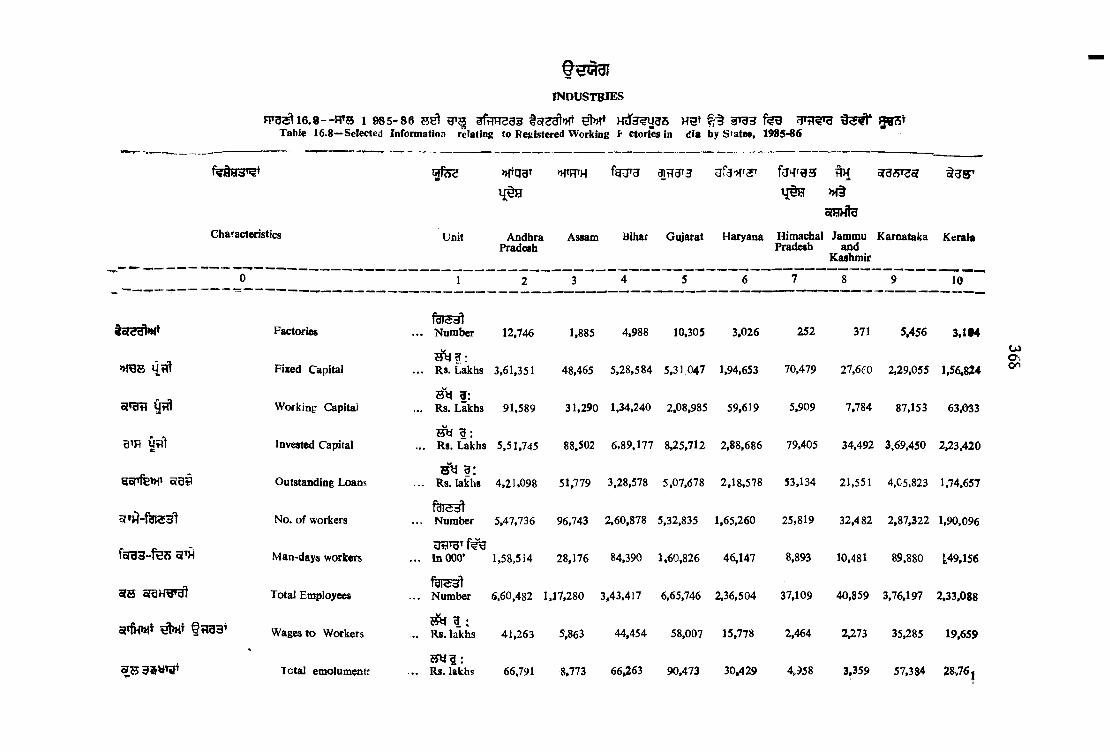
FJT3 16.8—FHS 1 985-86 5^ ^ Hd'HUcTS HW3Table 16.8—Selected Information relating to Registered Working F ctoriM in dia by States, 1985-86
INDUSTBIES
g f e i ; »>rggT W H faK f^jy
>H§
Characteristics Unit AndhraPradesh
Assam Bihar Gujarat Haryana HimachalPradesh
Jammuand
Kashmir
Karnataka Kerala
0 1 2 3 4 5 6 7 8 9 10
FactoriesTdraj^
. . . Number 12,746 1,885 4,988 10,305 3,026 252 371 5.456 3.104
»T0S u?i! Fixed Capital . . . Rs. Lakhs 3,61,351 48,465 5,28,584 5,31.047 1,94,653 70,479 27,6f0 2,29,055 1,56,824
a»gt? ^ Working Capitals y ? :
... Rs. Lakhs 91,589 31,290 1,34,240 2,08,985 59,619 5,909 7,784 87,153 63,033
B’R ytO Invested Capital1 :
... Rs. Lakhs 5,51,745 88,502 6»89,177 8,25,712 2,88,686 79,405 34,492 3,69.450 2,23.420
goj^»>p ojQB Outstanding Loansi :
Rs. lakhs 4,21,098 51,779 3,28,578 5,07,678 2,18,578 53,134 21,551 4.05,823 1.74.657
3»K -f3153^ No. o f workers . . . Number 5,47,736 96,743 2,60,878 5,32,835 1,65,260 25,819 32,482 2,87,322 1.90,096
fora3-fe75 q[TH M an-days workers . . . In 000’ 1,58,514 28,176 84,390 1,60,826 46,147 8,893 10,481 89.880 L49.156
3 B Total Employeesfdl<i3l
. . . Number 6.60,482 1.17,280 3,43.417 6,65,746 2,36,504 37,109 40,859 3,76,197 2.33.088
g»fH>Mt f t i a a ’ Wages to Workers^ B ;
... Rs. lakhs 41,263 5,863 44,454 58,007 15,778 2,464 2,273 35,285 19,659
Total emolumeotFH y g :
.. Rs. Ukhs 66.791 8,773 66,263 90,473 30,429 4,958 3,359 57,384 28,76j
U>OSon
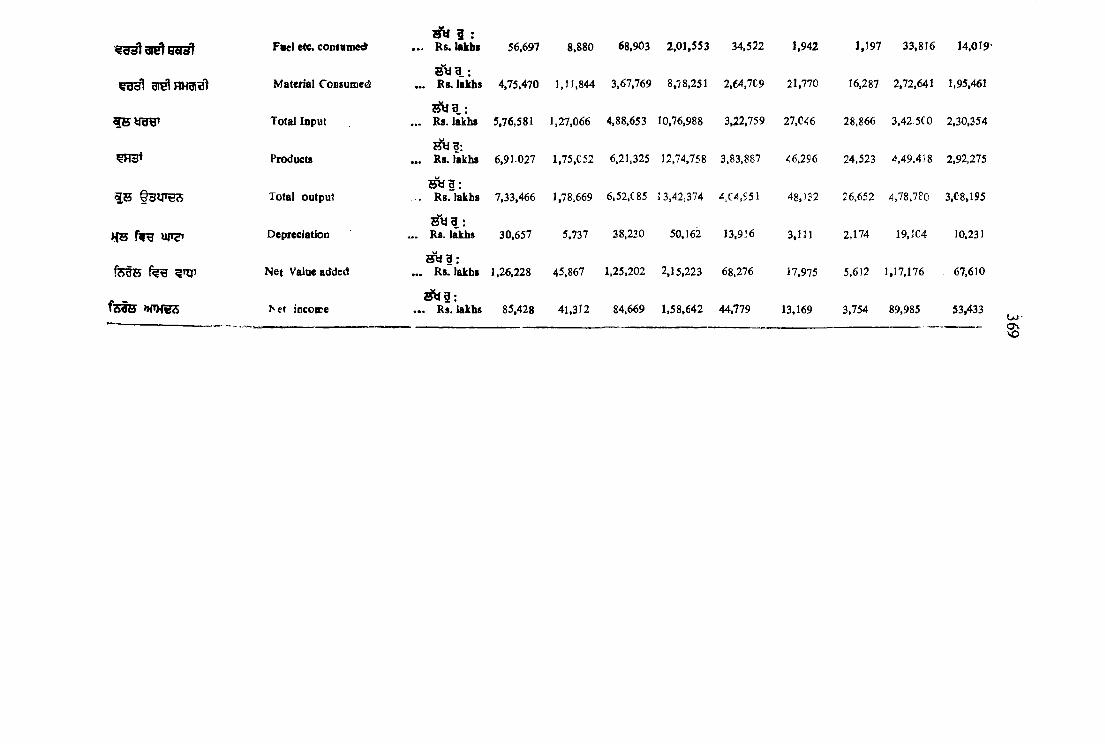
F ie l etc. cooiem«<t^ 3 :
. . . Rs. lakbt 56,697 8,880 68,903 2,01,553 34.522 1,942 1,197 33,816 14,019‘
Material Coosum edg _ :
. . . Rs. lakhs 4,75.470 1.1J.844 3.67,769 8,78.251 2.64.7C9 21,770 16.287 2,72,641 1,95,461
Total Input . .. Rs. lakhs 5,76,581 1,27,066 4,88,653 10,76,988 3,22,759 27.C46 28,866 3,42.500 2,30,354
Productsb'm ?:Rs. lakhs 6,91-027 1,75,G52 6,21.325 12.74,758 3.83.887 <6.296 24.523 4,49.418 2,92.275
Total output^ 3 :
. . R s. lakhs 7,33,466 1,78,669 6,52,C 85 3 3,42:374 4,C4,951 48,132 26,652 4,78.780 3,C8,195
v r s f i g u n s ' Depreciation:
. . . Rs. lakhs 30,657 5.737 38.230 50,162 13.916 3,111 2,174 19,104 10.231
f e f s i n p N et Value added^ 1 :
. . . Rs. lakhs 1,26,228 45,867 1,25,202 2,15,223 68.276 17,975 5,612 1,17,176 67,610
M a » n H « 3 Net inccice^ 1 :
. . . Rs. lakhs 85,428 41,312 84.669 1,58,642 44,779 13,169 3,754 89,985 53,433OJ-OvVO
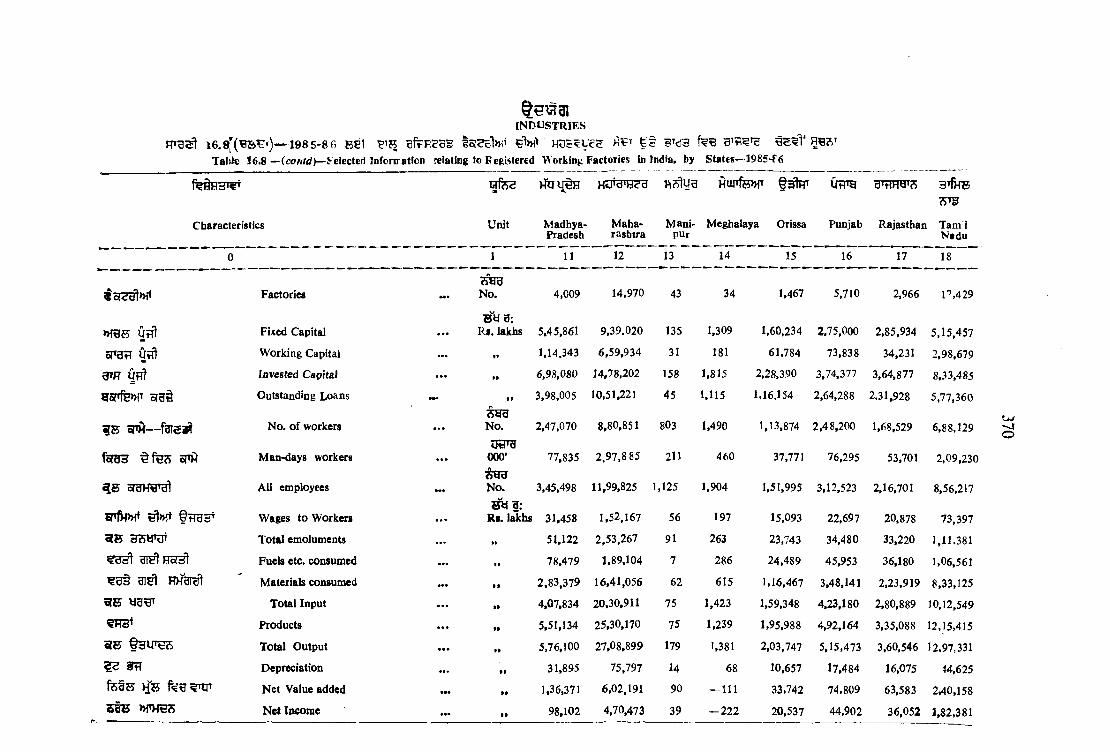
t e w a iINDUSTRIES
— 1985-86 BCl ^ ’5 #>h' fe'S 5V3
Table 16.8 — {C O e l e c t e d Inforn atfon relating to R eglstered 'V\ orking Factories in India, by S ta tes--198546. f*
3TfHBw f e s U d 'y d'rlHtj'A
Characteristics Unit Madhya-Pradesh
Maharashtra
M anipur
Meghalaya Orissa Punjab Rajasthan T am l Nadu
0 1 11 12 13 14 15 16 17 18
??0(<!y1>H* Factories M * N o. 4,009 14.970 43 34 1,467 5,710 2,966 P .4 2 9
nfg{5 uff) Fixed Capital R«. lakhs 5.45.861 9,39.020 135 1,309 1,60,234 2,75,000 2,85,934 5,15,457
Sf efrT Ufl) Working Capital . . . 1.14,343 6 ,59 ,934 31 181 61,784 73,838 34,231 2,98,679
6TR Urff Invested Capital a • • *» 6,9S,080 14,78,202 158 1,815 2,28,390 3,74,377 3,64,877 8,33.485
g5fTfe»nT o res Outstanding Loans f t 3,98,005 10,51,221 45 1,115 1,16,154 2,64,288 2,31,928 5,77,360
jgB N o. o f workers » • •
6 ^ dN o. 2,47,070 8,80,851 803 1,490 1,13,874 2,48,200 1,68,529 6,88,129
fsra 3 ^ f e « oT^
^ 5 s r a H ^ ^
Man*days workers
AU employees
. . .
gyTg000’
N o .
77,835
3,45,498
2 .97,8 85
11,99,825
211
1,125
460
1,904
37,771
1,51,995
76,295
3,12,523
53,701
2,16,701
2,09,230
8,56,217
snftPM d>Ht §?ra3^ Wages to Workers^ 1 :
Rs. lakhs 31.458 1,52,167 56 197 15,093 22,697 20.878 73,397
cTR d?>y*o* Total emoluments . . . »» 51,122 2,53,267 91 263 23,743 34,480 33,220 1,11,381
Fuels etc. consumed • • 78,479 1,89,104 7 286 24,489 45,953 36,180 1,06,561
^ g § 3 ie t Materials consumed • • 2,83 ,379 16,41,056 62 615 1,16,467 3,48,141 2,23,919 8,33,125
WE ya^T Total Input . . . » • 4,07,834 20,30,911 75 1,423 1,59,348 4.23,180 2,80,889 10,12,549
<^H3’ Products . . . »» 5,51,134 25,30,170 75 1,239 1,95,988 4,92,164 3,35,088 12,15.415
9 K Total Output • • • 5,76,100 27,08,899 179 1,381 2,03,747 5,15,473 3,60,546 12,97,331
3Tf Depreciation 9 f 31,895 75,797 14 68 10,657 17,484 16,075 44,625
f e t S ) iE N et Value added • • • t » 1.36,371 6,02,191 90 — 111 33,742 74,809 63,583 2,40,158
‘6 ’d ti » W e R N et Income • • • • » 98,102 4,70,473 39 — 222 20,537 44,902 36,052 1,82,381
--JrO
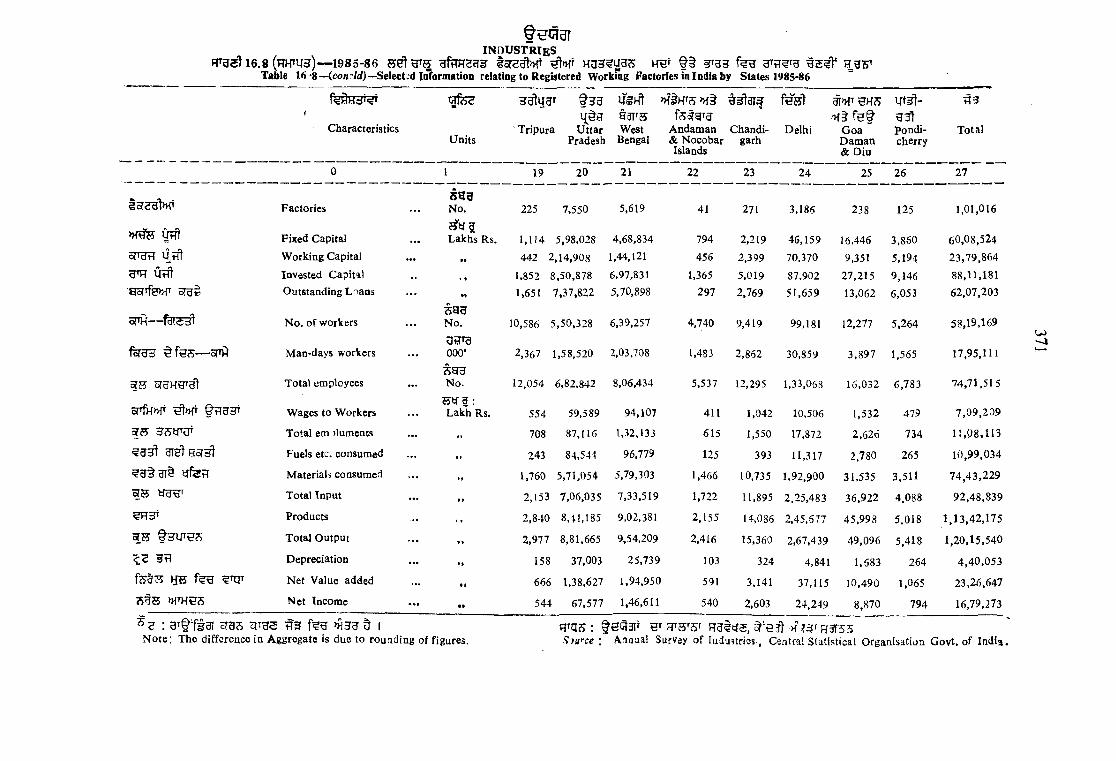
f e i a a ri n d u s t r i e s
1 6 .8 (hHtUH)— 1 9 8 5 -8 6 Ha3?UcTS W BB H 35^Table 1 6 ‘8 —(co/ir/^J—Selected Information relating to Registered Working Factories in India by States 1985-86
tCharacteristics
UnitsTripura Uttar
Pradesh
>K§531^55 f e t g f g West Andaman Chandi- Bengal & Nocobar garh
Islands
Delhif g f
Goa Daman & Diu
u t ? t -
Pondicherry
^ 3
Total
0 1 19 20 21 22 23 24 25 26 27
Factories
Fixed Capital
. . .S 9 3No.
Lakhs Rs.
225 7,550
1,114 5,98.028
5,619
4,68,834
41
794
271
2,219
3.186
46,159
238
16,446
125
3.860
1.01,016
60,08,524Sfrgtl Working Capital • •• 99 442 2,14,908 1,44,121 456 2,399 70.370 9.351 5,194 23,79,864
UiTt Invested Capital , , 1.852 8.50,878 6,97.831 1,365 5,019 87.902 27,215 9,146 88,11,1815fge Outstanding Loans . . . *» 1,651 7,37,822 5,70,898 297 2,769 51,659 13,062 6,053 62,07,203
SHH— No. of worktsrs • • •s a gNo. 10,586 5,50,328 6,39,257 4,740 9,419 99.181 12,277 5,264 58,19.169
Man-days workers • • •J d 'd000’ 2,367 1,58,520 2,03.708 1,483 2,862 30.859 3,897 1,565 17,95,111
Total employees . .. No. 12,054 6.82,842 8,06.434 5,537 12,295 1.33,068 16,032 6,783 74,71.515
orfH W ^ y y i T Wages to Workers . . .HfcT5: Lal^ Rs. 554 59.589 94,107 411 1,042 10.506 1,532 479 7,09,209
HcSifUT Total emoluments ... »> 708 87,116 1,32,133 615 1,550 17,872 2,626 734 11,08.113u isftes fg } Fuels etc. consumed ... f f 243 84,544 96,779 125 393 11,317 2.780 265 10,99,034
? g § g r § y f e n Materials consumed . .. 9 t 1,760 5,71,054 5,79,103 1,466 10,735 1.92,900 31,535 3,511 74,43,229Total Input . .. 9 » 2,153 7,06,035 7,33,519 1,722 11,895 2.25,483 36,922 4.088 92,48,839Products ... . . 2,840 8.41.185 9.02.381 2,155 14.086 2,45.677 45,998 5.018 1,13,42,175
^ _ E §3UT55S Total Output . . . >> 2,977 8,81,665 9,54.209 2,416 15,360 2,67,439 49,096 5,418 1,20,15,540Depreciation ... f t 158 37,003 25,739 103 324 4.841 1,683 264 4,40,053
f e a ^ y ? j Net Value added ... f 1 666 1,38,627 1,94,950 591 3.141 37,115 10,490 1,065 23,26,647«SH5 >HTHtfS Net Income . . . t* 544 67,577 1,46,611 540 2,603 24,249 8,870 794 16,79,273
; 3T §Y i91 ^ 3 5 >H53 d 1 WQE : ^ H R3T55
u>
Note; The difference in Aggregate is due to rounding of figures. G ovt, of India,
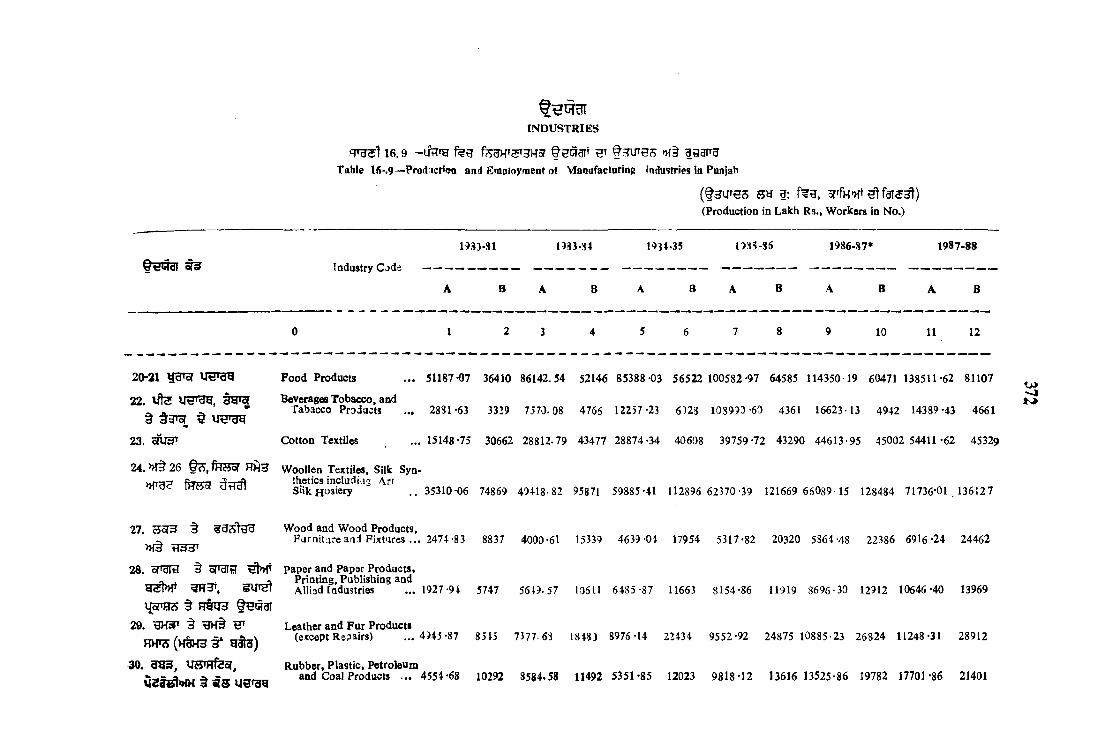
1 6 .9 — t ei Hart w g a a n ?
Table 15-.9— Prod icHen and Employ?nent ot Vfanufacturing (ndustries in Punjab
INDUSTRIES
Industry Coda
( t n u r g s s y H: f ^ e , f a i s ^ )(Production in Lakh Rs., Workers in N o.)
1933*81 nS3-34 i m - i S 1986-87* 1987-88
10 11 12
20-21 W of Food Products . . . 51187-07 36410 86142.54 52146 85388-03 56522 100582-97 64585 114350 19 60471 138511-62 81107 ^
22. Vte Sgrgf Beverages Tobacco, and- „ ^ ■ Tabacco Products ... 2881 -63 3329 7570-08 4765 12257 -23 6 )23 10S993 60 4361 16623 13 4942 14389-43 46613 3 3 ^ ¥
23. olUgT Cotton Textiles ... 15148-75 30662 28812-79 43477 28874-34 40608 39759-72 43290 44613-95 45002 54411-62 45329
24. 26 O a , HH3 W oollen Textiles, Silk Syn-rum-;? thetics includi.ig A.rt
<7100 iHWQi UHdi Siik Hosiery . .3 5 3 1 0 -0 6 74869 49418-82 95871 59885-41 112896 62370-39 121669 66089-15 128484 71736'Oi . 136127
27. ^ W ood and W ood Products,^ F u rn ita rea a l Fixtures . . . 2474-83 8837 4000-61 15339 4639-04 17954 5317-82 20320 5364-48 22386 6916-24 24462
>H3
28. oT3ra § oT9ItF paper and Paper Products,T 1 t ; n Printing, Publishing and
gST»r gU»HT AUiad Industries . .. 1927-94 5747 5649-57 105U 6435-37 11663 8154-86 11919 8696-30 12912 10646-40 13969ijpTHS § H t e tB iS a r
29. '3HjT § Leather and Fur Productsg lr a ) (except Repairs) . .. 4)45-87 8515 7377 63 18483 8976-14 22434 9552-92 24875 10885-23 26824 11248-31 28912
3 0 . g g a f, US'H feof Rubber, Plastic, Petroleumand Coal Products . . . 4554-68 10292 8584.58 11492 5351-85 12023 9818-12 13616 13525-86 19782 17701-86 21401

31^ dH'fe<fof f U f f §
c3H'r«<So<
Chemicals and Chemical Products (except Products of Petroleum) . . . 17728-68 12856 46229 -31 15990 47801-95 18581 56292-07 21451 72059-52 23156 88548-81 24248
32. y fetT Soa-M etallic Minsral Products . .. 2667 -59 8459 3970-16 12036 4343 -86 13394 4931-08 14236 5493•28 15729 6742-18 17195
33. KW UTd•8 “
Basic Metal and Alloy Industry . . . 24579-05 28425 39357-33 35515 41309-53 33736 5 2 4 0 5 1 6 36033 67613-15 37493 75652-85 38724
34. W 3 ^ Metal Products . .. 12081-95 47491 16896-46 58201 23600 -12 66005 20746-35 69200 23692 -90 73553 27146 -71 76560
35. fgrrw^ d H H lsa l y ’ Machinery except electrical machinery ... 16250-32 29707 20095-29 37047 20625 -72 38917 24495-29 40835 26066-13 42698 28718-84 48650
3 6 . B t H ljfeg ) Electrical Machine Apparatus Appliances Supplies and Parts . . . 7876-24 9932 8242-72 12512 10228-05 14419 11203 -71 16583 18565-38 18524 22050 -96 21510
37. ScPFlira^ § Transport Equipment and 21752 -16 parts
49038 35101 -88 55567 33137-81 61222 40173-73 58950 47354-95 62064 56331-78 65940
38. u g OtJiifdr Other Industries . . . 3594-41 5746 6423 -67 10100 6818-28 11454 7804-37 12603 75962 -26 13322 8511-56 14246
96-97. HUH3 » !§ Repair and personal Services 489 -70 4291 2490-67 14415 3211 -67 18003 4044-26 22457 5246-51 28436 6641 -14 33718
■toTotal ... 225950-93 374636 377874-16 503665 402934-90 555859 468551-88 596983 554336-43 645778 645906*32 696759 ^
(A) I rrqjy: rfeior a ifiT'3 i(A) Indicates Production. Source: Director o f Industries, Punjab.
(B) BTA BgRTt 5 1(B) Indicates W orkm .
•Revised

16.10 19 70 fHiSfaraf >HH (Mnjrg 1975-76=«100)Table 16.10—Index of Industrial Production according to Industrial Classification 1970 (Ba^e 1975-76«-100)
INDUSTRIES
Divisbn/Major Group Description Weight
»for
Index
flrS B FPS
Percentage increase(+) or decrease^—) over
Previous year
1976-77 1980-81 1983-84 1984-85 1985-86 1986-87 1987-88*
23Hy3Tf»4 ( § )
20-2122 u t s 3 9 ^ 3 §
-23
■24 fn555? §
2 6 UfecSS ^ oTUi RH 3 §
3 ‘27 S573 § §
H33^28 5TrgiaHl»fj
g ^ » f f ^F^3^
i{orTH?) § R ig H t^ ^ 3 T29 HKi>H§30 H33 us^Fffeam^-
u e r g g3 1 gR^fgfecT t U R » I §
3RTfef56i u H fe g
Manufacturing
(a) Major Groups (A)
Food Products
Beverages, Tobacco and Tobacco Products
Cotton Textiles
W ool, Silk and Synthetic Fibre Textiles
Textile Products, including wearings... apparel other than Footwears
W ood and Wood Products, Furniture, and Flstnre
Paper and paper Products, P r in tin g ,. Publishing and Allied Industries
Leather and Fur Products
Rubber P lastic.Petroleuu and Coal Products
Chemical and Chsnaical Products except Products o f Petroleum and Coal
805-91 108 -68 176-66 203 -06 207-13 214-76 229 -90 244 -09 + 6-17.
145-46 100 -51 135-37 188-17 199-69 233-11 240 -72 260 -46 .+ 8-20
13-94 132 -81 102-66 166-30 98-55 238-76 187-83 191-16 + 1-77
77 -01 78-94 100 -89 137-25 117-52 120-65 137-16 139-97 + 2-05
107-11 118-26 174-20 154-87 152 -04 180-05 168 -19 176 -37 + 4 -8 6
37-19 103-61 168-86 118 -59 265-35 188-05 203 -73 166 -37 ( - ) 1 8 - 3 4
2-25 106-55 226 -23 312-41 83 -91 61-33 86*62 67-70 (_.)21 -84
5-96 107 09 156-37 1,240-23 1326-37 1347-08 1526-12 1852-70 + 21-40
1-34 117-45 246-65 74-38 296 -90 793-96 319-52 230 -06 ( - ) 2 8 -00
12-15 103-96 188-25 308-03 335*20 276-55 329 -21 366-91 + 11 -45
89 09 97*44 185-14 187-28 164-59 163.00 204-06 245 -99 + 20 55
OJ
4^

Non-Metalllc MineralProductg 1 .30 137-38 161 .69 500 .1 5 540-11 4 8 4 -SV 979-81 1171-94 + 19-61Basic Metal Alloy Industries 82-99 103-80 192*41 232-78 224.30 217.08 225-11 262 -72 -f 16-71
Metal Products and Parts except Machinery and Transport equipment
30-90 138-17 174- 27 159-60 186-26 209-28 1 8 7 -7 ^ 155-85 ( - ) 1 6 - 9 8
Machinery and Machine Tools and Parts except Electrical Machinery’ 70-84 139 -09 326-38 233-14 250-36 224 -64 283 -44 278 -93 ( - ) l - 5 9
Electricity Machinery, Appratus Appliances and Suppllies and Partsr*
32-80 114.17 225. 71 205-64 i73 04 170.30 211-38 300-46 ( f ) 4 2 - 1 4
4Transport E uispment and Parts 86-70 110-65 164-00 276-69 275 -87 283-27 285-81 262-01 ( - ) 8 - 3 0
Other Industrie 8-88 142-33 190-89 175 -61 188-40 218-19 230-36 219-26 ( - ) 4 - 8 2
Electricity (B) 194 09 116*05 181-36 2 2 9 .49 251 43 287-43 314-49 405-08 + 2 8 -6 4
General Indxe 100-00 110-11 177-57 208-12 215573 228 -86 246-32 275 -34 + 11-78
32
33 QtiQdf
3 4 tTB i r e ^ ^ f i c m
T W ? )3 ‘ 4 ^ '35 H P te^ ^
HHh^') §" 1 ^ )3 6 farr?5t ^
RHT^ i f e g § H U 5 5 ^37 € » f ^ HTB HHTS
38
40 H5T^ f 3 i n ^ (>H)
r f ^ H felorH
* » f g ^*ProvisionaJ..
^ :— (i) f3»TB 0?gis BSl 3liH § WB3 f(ii) >H3r t. >AH. >viT. ^ tHT § >HTCpf33 33 I
Note ;—(1) Weights used for preparation of indices are based on the gross value added. (H) The indices are based oo A.S.I. data.
r h 3 ^ : »raw »{§ >H3(w m s ^ , uTT»g iSource : —EconoTiie and Statistical Organisation, Putijab.

376
R fij s ’ 16. 11— u § w M t ig a i r glabie 16.1i~-Prodaction and Employment in Selected fndustries ia Puajat^
( § 3 i r e s s y 1: oT H(Production in lakhs R s. and Workers ia N u m ix i)
INDUSTRIES
Sugar (2060—72)p p s k s t u g e
Cycle and Cycle Parts
i w e T h h Is ' ^
Sewing Machine and parts (3591—98)
diddl'd O d i r e S lidtff'd Bi33T3Year Produc
tionEmploy
mentProduction
Employment
Production
Employment
0 1 2 3 4 5 6
1980-81 • • • 2.166-12 5,178 15,963 -17 33,040 1.236 -19 4.948
19t{1.82 5.303 *29 60,81 18,696-11 34,907 1,212-23 5.016
1983-^4 5,626 19 5,757 43 ,275-57 37,694 1.390-83 5,310
1984-85 5,077*64 5.477 25.245 -55 41,835 1517-93 5,318
1985-86 . . . 5,943-67 6,537 29,482-83 39,662 1,594-83 5,579
1986-87* . . . 9,656-49 6,543 34,004-37 40,289 1655-48 5.814
1987-88t . . . 11,874-42 8,399 36,843 -68 42,000 1,823 -54 9,795

377
RTS
Year
16.1 I - ( B HH t)— I S § B IT B S » f§Table 16.11—(contd.)—Production and employment o f Selected Industries in Punjab
INDUSTRIES
Hand tools
Hdrllbttt G tJw ^ ( 3 8 0 1 - 3 8 0 2 )
Scientific and Surgical Industries
RHTS
Sportsgoods(3851)
Production
Employ*ment
Production
Employment
^ I T € Afto d u c-
tionEmployment
1 7 8 9 10 11 12
1980-81 2 ,575-95 6,527 825-77 1,980 3,447 *40 4,242
1981-8: 3,033 *64 6,836 783 -61 2.248 4,133 -50 4,826
1983-84 3 ,262-60 7,111 870*50 2,294 5,274-74 6,233
1984^85 3.375*96 7,488 91,20*45 2,390 5,401-30 6,523
1985-86 6,365 -01 8,364 15,74-12 2,490 5,540 *24 7,273
1986-87* 4 ,9 9 1 -8 5 8 ,768 13,48-68 2,567 5,637 18 76,28
1987-88f 4 ,510-40 8,465 13,81 *54 2.583 5,954 -63 8,092
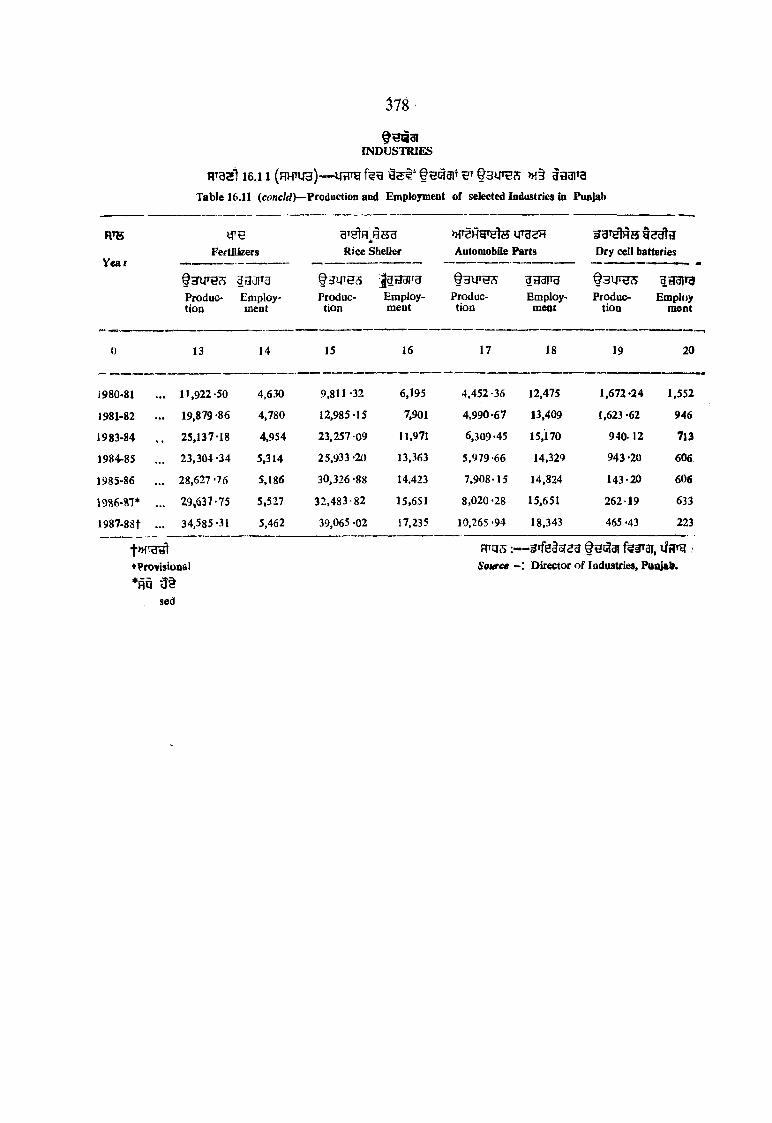
378
R»B
Vear
16 ,11 (HH^ira)— MtTO g s ? ' §HlH3n f 3141^ ^ »{§ 333113
Table 16.11 {concld)— Production and Employment o f selected Industries in Punjab
INDUSTRIES
t r eFertilizers Rice Sheller
» T 2 )^ 'te M T 3 2 H
Automobile Parts Dry cell batteries
Production
3331T3
Employ*roent
Production
;j3??gFT3Employment
§3U 'tlA 'Produc
tion
ItJdl'dEmploy
mentProduc
tionEmploy
ment
0 13 14 15 16 17 18 19 20
j 980-81 11,922 -50 4,630 9.811 *32 6,195 4,452 -36 12,475 1,672-24 1,552
J981-82 . 19,879 -86 4,780 12.985-15 7,901 4,990-67 13,409 1,623 -62 946
1983-84 . 25,137-18 4,954 23,257 09 11,971 6,309-45 15,170 940 .12 713
1984-85 . 23,304 -34 5,314 25,933 -20 13,363 5.979-66 14,329 943-20 606
1985-86 . 28,627 ’76 5,186 30,326 -88 14,423 7,908-15 14,824 143-20 606
1986-S7* . 29»637-75 5,527 3 2 ,483-82 15,651 8,020 -28 15,651 262-19 633
1987-8 8 t . 34,585-31 5,462 39,065 -02 17.235 10.265 -94 18,343 465 -43 223
♦Provisional
* Wsed
R r q s :— fe g ia i, iltTfg
Source Director o f Industries, Pimjalb.

379
1 6 .12— U tp g f e e fHJ5T, R f u ^ s >H§
Table 16 12— Cotton Textile Mills, Spindles and Looms in Punjab
INDUSTRIES
( f a i 5 ^ )( Num bet)
A t the beginning o f the year
5f3Tgl
Spinningmills
cW ftlSfj-fer
Compositemills
75Un§ H3TSl>HT
RfU?55 3 1 ^(ooo)
Spindles Loom sInstalled Installed
(000)
0 1 2 3 4
1961 2 2 62 1,058
1970 6 2 156 1,288
1975 6 2 169 1.299
1980 7 2 262 1.240
1981 9 2 270 1,240
1983 11 2 388 1,240
1984 13 2 405 1,240
1985 18 2 522 1,245
1986 18 2 532 1,2,45
1987 19 2 548 1,245
1988 19 2 573 1,245
Spurce ;—^Textiles Commissioner, Bombay.

380
R^ 3 l l 6 . 1 3 — ^ M § f S H f a W
>HHH 3tid l'd ITable 16 *13—Productioa of Yarn and Cloth and Arerage Daily Employment in Cotton Textile Mills in Pai||ftb
INDUSTRIES
V S
Year
^ U « d 7(ooofsT^apH )
Total Y am (000 K gs.)
c W ^ (OOO Hl<!d)
Total Cloth (000 metres)
a^di^a
Average D aily Employment
(N o .)
0 1 2
1975 30,714 42,167 9,902
1980 43,441 43,486 16 ,84$
1981 46,570 42,227 19,362
1983 62,676 37,792 24,659
1984 79,523 25,294
1985 73,575 33,822
1986 83,550 34,826
1987 97,161 36,508
1988 95,088 36.746
Source —Textile Coramissioaer, Bombay.

381
INDUSTRIES
16.14—Table 16 -14—Cotton Pressed in Punjab (Number)
Year
1960-611970-711975-761980-811983-841984-851985-861986-871987-881988-89?
FP 5/Year, 1988-8fiSqg ofinu
oflTOo(\J^
ojinu6 d lt i ^ 0(\ru eisWltJA
Jalandhar Cotton Division
Amritsar Cotton Division
Fitoxpur Cotton Division
Patiala Cotton Division
Faridkot Cotton Division
(l7 0
(Bales of 170 Kgs. each)
4,46,212*4,93.624*3,33,926*10.58,1116.39,718
10,61,10912,81,66316.43.00025.34.000
23,96,500
25,00
3»95,001,77,00
17,99,50
P — IP —Provisional
— (l) c?iru-HT?5 UfesT 3 ’ 31 >H3TH3 ^ 1Note.—(1) Cotton year is from 1st September to 31st August.
•These are based on Cotton Bulletin and a bale is of 170 K g .W n fe UcS n it 313 170 feS I
w m : imrg iSource : Director of Agriculture, Punjab.
fCotton divisions include the following districts
SllTU HPHH frlttCotton Division Districts Included
T istra , o f u u w , Jaland.ur Jalandiiar, Ludhiana, Kapurthala Hoshiarpur
>H‘f)i3Fig »rfti3Fig, Amritsar Amritsar, Gurdaspur
fg a s y u fe d d y s Firozpur Firozpur
R U ip , o il Patiala Patiala, Sangrur, Rupnagar
i a i e a ? Faridkot Bathinda, Faridkot

382
16.15-FT5 19 8 8^8 9 ^ ifHTg g§ t f €(331 % We\ Ufirg HU fe3»M5TS, 1935 >HOte HOTfe^T ( f e s ^ )
Tabis 16 15—Finaacial Assistance grauted under the Punjab State Aid to Industries Act, 1935, for the Developnttct ofSmall Scale Industries in Punjab by districts 1988-889
INDUSTRIES
HUTfH3T (gTfRjl
Subsidies (State & Centre)
District
fdleJlNumber
ofParties
goiM('ooo
Amount COOO Rs.)
0 1 2
Gurdaspur 49 2,967» N k 3 H g Amritsar 284 20,114oWdy»’ Kapurthala 4 232
Jalandliar 4 60gfH>>TOUg Hoshiarpur 25 2,842HU Adid Rupnagar 22 7,566q>HT5T Ludhiana 4 1.294
f<^ddyg Firozepur 168 10,482g'dle Faridkot 72 5,0^5yPdsJ' Bathinda 68 4,374HaiBd Sangrur 111 6,722yfe»iw Patiala . . . 15 3,824
Total . . . 826 65,492
Source ; Director of Industries, Pi|Q|^b.
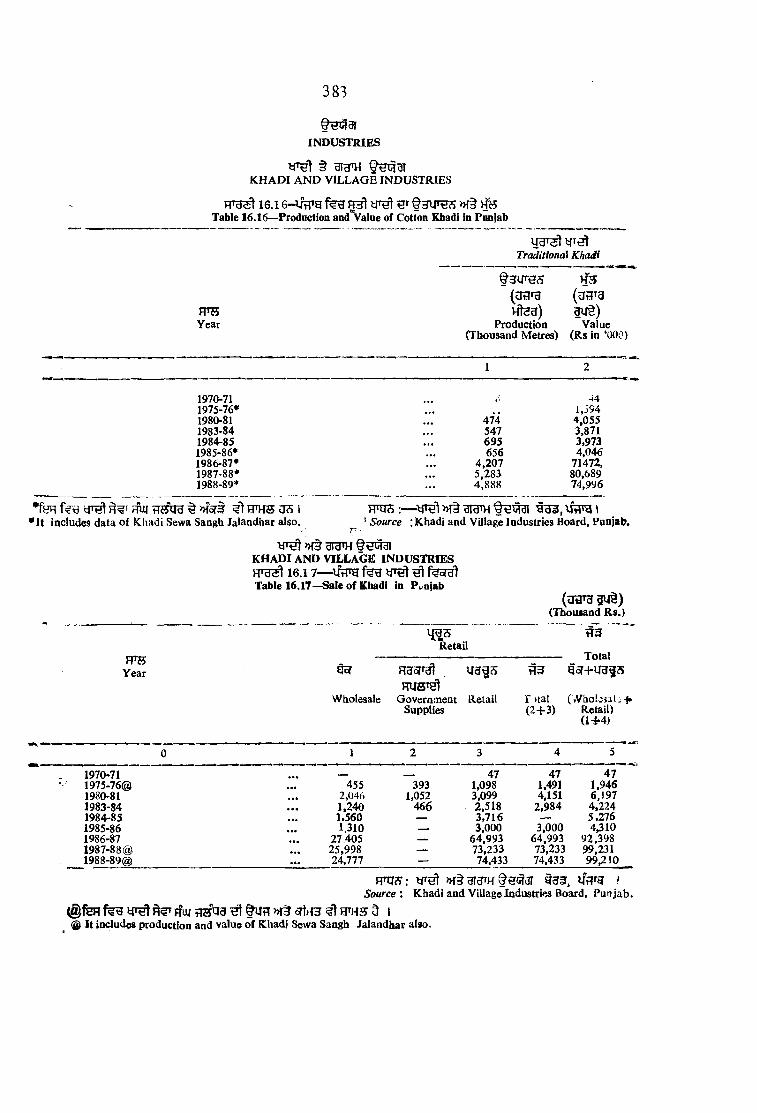
383
K H A D I A N D V IL L A G E IN D U S T R IE S
1 6 J6 -V ra rg f^ g ^ t^ ^ T f3 ijT ^ > H § ]h fe Table 16.16—Production and'Value of Cotfon Khadi in Punjab
INDUSTRIES
Traditional Khadi
ITOYear
(UHT3Hten)
Production
H3(3 i3 '33U§)
Value(Thousand Metres) (R s in ‘000)
1 2
1970-71 V 441975-76* • •• , 1,3941980-81 474 4,0551983-84 547 3,8711984-85 • •• 695 3,9731985-86* 656 4,0461986-87* • •• 4,207 71472,1987-88* 5,28a 80,6891988-89* . . . 4,888 74,996
•fen rW HHtra ^ M sri ^ h t h s u s i• It includes data of Khadi Sewa Sangh Jalandhar also. ‘ Source Khadi and Village Industries Board, Punjab.
»f§ BTUTHK H A D I A N D V IL L A G E IN D U S T R IE S
16.1 7— ^UFra fe n ^Table 16.17—Sale of Khadi in PKajab
Year
WRetaO
Wholesale Governmeat Retail Supplies
(Thousand R s.)
t!3
r )tal (2+3 )
t73
Totali5f+U3^S
( vViiob?al ■ + Retail) (1+4)
1970-71 _ — 47 47 471975-76® * •* 455 393 1,098 1,491 1,9461980-81 2,046 1,052 3,099 4,151 6,1971983-84 • • • 1,240 466 2.518 2,984 4,2241984-85 «* • 1.560 ____ 3,716 — 5,2761985-86 • • • 1.310 — 3,000 3,000 4,3101986-87 • • • 27.405 — 64,993 64,993 92,3981987-88® . . . 25,998 — 73,233 73,233 99,2311988-89® • • • 24,777 — 74,433 74,433 99,210
RHjs: »f^ gicTH *Source
( g fe H g"u| H5f^3 H i >H^ 6TIK3 ^ W H S 5 IIt includes production and value of Khadi Sewa Sangh Jalandhar also.
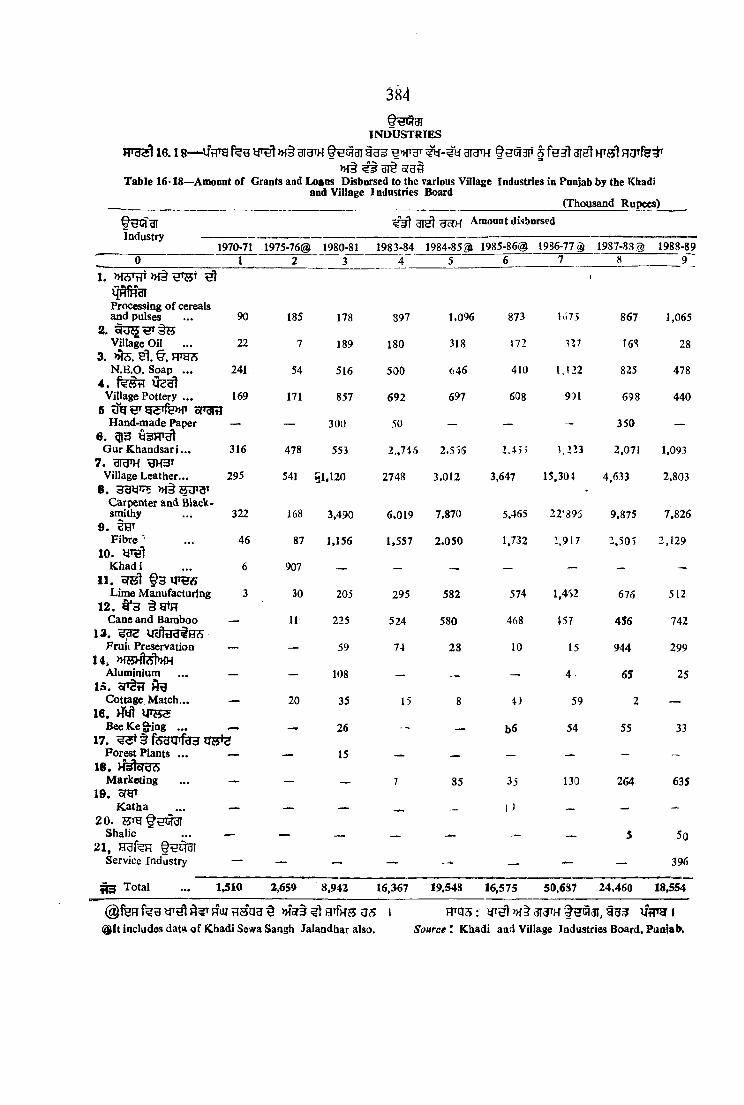
384
16.18— fee »f§ aT3TH 313^ §giH3P § f e j t 3I5t HTfft Ra fS^T»f§ 3T
Table 16> 18—Amount of Grants and Loaas Disbursed to the various Village Industries in Punjab by the Khadiand Village I ndastries Board
_________________________________________ __________________________________ (Thousand Rupees)
INDUSTRIES
^aft disbursed
1970-71 1975-76® 1980-81 1983-84 1984-8531 1985-86® 1986-773 1988-890 1 2 3 4 5 6 7 8 9
1. )H§ - 1H^fRdlProcessing of cereals and pulses 90 185 178 897 1,096 873
1
1675 867 1,0652 . tIT 5 h
Village Oil 22 7 189 180 318 172 337 16S 283. >>te. H i § . FlTg<S
N .E.O . Soap ... 241 54 516 500 646 410 1,122 825 4784 . fe sti ijsal
Village Pottery ... 169 171 857 692 697 608 951 698 4406 ojtgra
Hand-made Paper 300 50 3506. ^3
G ur Kh and sari... 316 478 553 2..7I5 2.5)6 2.4)) 2.071 1,0937. 31d'H
Village Leather... 295 541 51.120 2748 3,012 3.647 15,304 4,633 2,8038.
Carpenter and Black- smithy 322 168 3,490 6,019 7,870 5,465 22*895 9,875 7,826
9.Fibre ' 46 87 1,156 1,557 2,050 1,732 ’ ,917 2,505 2,129
10.K h a d i 6 907
11. oittl f3 T O « Lime Manufacturing 3 30 205 295 582 574 1,452 676 512
12. § E P fj C ane and Bamboo 11 225 524 580 468 t57 456 742
U . ^d<J Fru ii Preservation 59 74 28 10 15 944 299
14Aluminium 108 4 65 25
15. cr»3tCottage Match... 20 35 15 8 4J 59 2
16. y*BS Bee K e g-ing ... 26 b6 54 55 33
17.Forest Plants ... — 15
18. HsAsfd*Marketing 7 85 35 130 264 635
19. o<Hi K ath a D
20.Shalic 5 5o
21,Service Industry — — — — — — 396
^ Total ... 1,510 2.6S9 8,942 16,367 19.54S 16,575 50.6S7 24,460 18,554
>H5r3 a t e U5 (^It includes dat« of Khadi Sewa Sangh Jalandhar also.
m a s : yTut >H iSource t Khadi and Village Industries Board, Puaiab,

RTS
Year
f| fC* Quintals
§ ^ 3 TINDUSTRIES
»f§ gram §^iaaiKHADI AND VILLAGE INDUSTRIES
16. 19— gram § 3 i n ^ , >k§ fa a reTable 16.1 Production, Sale and Em^oyment in Village Industries in Pan|ab
>H?5 >H§ ua«HfHai
Processing of Cereals and Pulses
3ramun?^§HO'OTdl
Villaie GhaniOU Industry
>>te. bI § .
N.E.O. Soap Industry
Village Pottery Industry
f 3 i n ^ ^trei^ §3VTO?5(onra (faiss!)BIJ$) in § )
Produc- Sale Employ- Production (’000 Rs) ment tion
(’000 Rs) (No.) (’000 Rs)
feoral atrarra Qhitos BtrarB f n i r ^(UtlTg (fai5^) (Utira (UtTg (f3T53l) (uflrg ( f ^ ^ )
l u t ) Hl4t) 1U§)Sale Employ- ProCi'C-
(’000 Rs) ment tJpDment (’OOO Rs)
gi4^)Sale
(’000 Rs)Employ- Produc- ment tion (No.) (’000 Rs)
3li§)Sale Employ • (’OOORs) ment
(No.)
0 1 2 3 4 5 6 7 8 9 10 11 12
I970-7J . . . 385tt 203ft 128 17tt 43tt "31 118tt 115tt 627 1*327 1.431 4781975-76 . . . 5.913 6.725 373 2 44 286 40 5,167 5,730 291 5,606 5,835 2,2361980-81 . . . 12,780 14,568 1.105 895 1034 63 19,542 21,098 523 7,057 9,065 ?,37g1983>84 . . . 17,781 21,175 1.631 1.703 1,891 69 19,788 23,615 714 \4,95l n a i4 2,9571984*85 . . . 14.729 17.301 1,311 2,165 2.340 91 13.091 13 043 437 18,121 20,852 3,3501985-86 14,940 18.475 1.530 2,813 3,123 105 10,622 11,103 346 22,595 27,826 3,443
> 86-87 . . . 15.455 18.457 1.597 3,051 4,351 101 12,014 14,727 317 22,398 26,703 3.510l')S7*88 . . . 27.597 33.402 2.087 8.611 10 735 124 17.215 10,461 337 34,802 37,105 4,5021988-89 . . . 31,940 37,16% 2,231 8,276 8920 88 20,277 22,959 376 3 9,879 47,489 4,405
oo
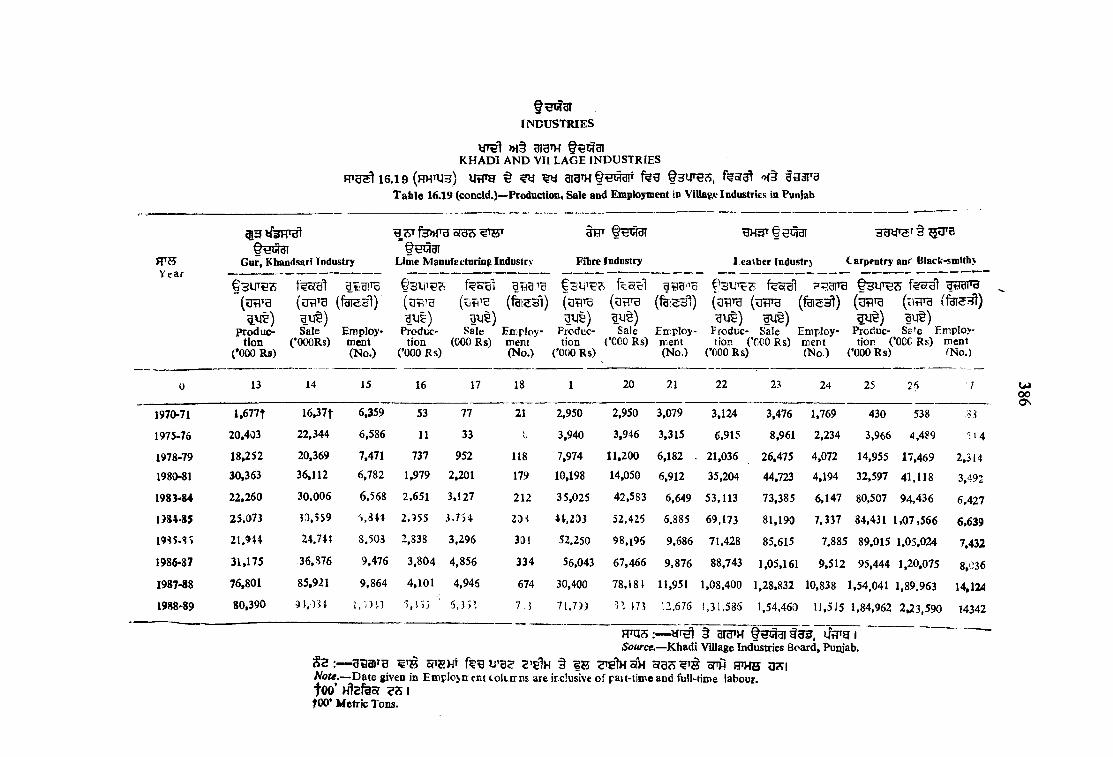
Year
>H§ §^1331K H A D I A N D V IL L A G E IN D U S T R IE S
FP3^ 16.19 (Hwnj3) HtTO # ^ gigiHQeOT fe g §3U T ^. 9331^9Table 16.19 (concld.)—Production, Sale and Employment in Village Industries in Punlab
INDUSTRIES
OtdUidlGur, Kbandsari Industry Lime Manufecturing Industry Fibre Industry 1 eatber Industry
3 g if5 T § ^ B
C arpentry an«.' Black-smitbj
fSUTBS feoio'i gSHna § 3 1 4 ^ gtigi’H( f e s l ) ' (3ri’9 (oin'S (fesst) (3TTO (fessl) (3r1TU ( ItTO (l\WB (1^5^)
l u t ) iv it) lU t) ^VJ§) g\j$) gu^) gy§)produc- Sale Employ* Produc- Sale Eirp loy- Produc- Sale Eir.ploy- Froduc- Sale Employ- Produc- Ss’e Emplo>'
(’OOORs) ment tion (000 Rs) ment tion (’CCORs) meet lion (’€00 R s) mert tion (’CCC Rs) mcnttion (*000 Rs) (No.) (’000 Rs) (No.) ('000 Rs) (No.) (’000 Rs) (No.) (’OOORs) CNo.)
0 13 14 15 16 17 18 1 20 21 22 23 24 25 2 : 7
1970-71 l,677t 16,37f 6,359 53 77 21 2,950 2,950 3,079 3,124 3,476 1,769 430 538 ■Si
1975-76 20,403 22,344 6,586 11 33 b 3,940 3,946 3,315 6,915 8,961 2,234 3,966 4,489 ^141978-79 18,252 20,369 7,471 737 952 118 7,974 11,200 6,182 . 21,036 26,475 4,072 14,955 17,469 2,3141980-81 30,363 36,112 6,782 1,979 2,201 179 10,198 14,050 6,912 35,204 44,723 4,194 32,597 41,118 3,4921983-84 22,260 30.006 6.568 2,651 3,127 212 35,025 42,583 6,649 53,113 73,385 6,147 80,507 94,436 6.4271934-3S 25.073 33,559 2,955 3.754 23 S 41.233 52.425 6,885 69,173 81,190 7,337 84,431 1.07,566 6,63919 5.1^ 21.9U 24.741 8.503 2,838 3,296 301 52.250 98.196 9,686 71.428 85.615 7.885 89,015 1.05,024 7,4321986-37 31,175 36,376 9,476 3,804 4,856 334 56,043 67,466 9,876 88,743 1,05,161 9,512 95,444 1,20,075 8,0361987-88 76,801 85,921 9,864 4,101 4,946 674 30,400 78,181 11,951 1,08,400 1,28,832 10,838 1,54,041 1,89.963 14,1241988-89 80,390 1, in ? ■), 5) i 6,3 S’! 7:} 71.799 3’ \ n 12,675 1,31,586 1,54.460 11,515 1,84,962 2,23,590 14342
gaajTB 515 fegNote.— Date given in Employirect to o ’ HlsfeoT I too* Metric Tons.
Source.—Khadi Village Industries Board, Puiyab.§ IB STglHSH oTA a^HS
cokcTDs are ir.dvssive of pait-time and full-time labour.
u»00Os

387
srast 16.2 0 -3 1 -1 2 -1 9 8 8 €o( goTH u » r » ^ gojgT >h w g
Table 16.20—Area aad P lits in iadustriai Focal Poiats ia Punjab up to 31-12-1989
INDUSTRIES
Focal points
ljnJ3 cffeT #orar
(f3 3 ) Area
Acquired
Industria] Plots
(Acres) f3»pg5ft§ »fS^5ft§ t r s l Developed Allotted Vacaat
1
1. Dhandari Kalaa 877-00 1,098 1.056 42
2. (Sdld 449.72 607 381 226
3. Q^T! UBT Rajpura 4-44 25 23 2
4, VLB Hoshiarpur 82.40 83 73 10
5. eerRT fiatala 103 -85 123 87 36
p. 3B?) Tarn Taran 52 -60 95 85 10
7. Nwan StichM 50 *55 111 55 56
8. kf?5’ Kbanna 110 00 124 123 1
9. Nabh* 52 .52 104 23 8110. O T Moga 108 -28 201 194 711. g g a w g r Kotkapura 53-35 111 100 1112. jfafigg Sangmr 56-60 128 87 4113. Bhatinda (old and New) 90 -98 148 125 2314. trarog Jalandhar 105-56 140 14015. m ra?H cwyBoTH.tTHqg Sports Co Tjplex, Jalandhar 74 -00 197 160 3716. »f1){dHd Amritsar 94*05 232 210 22
Total ... 2365 *90 3527 2.922 605^
fm is : RHm R ts ^ >>f57mra2
Source : Punjab Small Iodustriaa»Export Corparatioa Ltd.


HoTHS 17 »f§ §OT3
17.1 y s 35- ''3 31 1939 § ijfffg TtT f%H oIH oTgjJgref ^ i
Fff3^ 17.2 Pfjif'j § or3^3fjtMf ^ H5FT^ gfgtVRFU^ 17.3 UtTrg % STgHg^gW >H5gre3 tF5l»r, Ug »HT H^»r, HTgsrr
R#3^33T H3TgTHt>HT § gTe*HT »f§ >>i3T S ^ qfefeqgrFTO^,17.4 HofTSt, f?^qrg5f U3f?T >H§ iRSl'ei fee HfJTtlH W aT§ ^95?^ HgRT§ 91 U5 IRTU2 17.5 t 17.7 f?e iftTfg 3ftT ^ ^ fW rF^r t? r H9RTfe>HT f w 5 1R'Ugt 17.8 f#e UtTg f€g g§ST3TfH ^3 ^ § e3RTfe»iT U I tlti3Trg! ^3^ ^ W fsCTH 5
§HH 17 3‘ 40 TRtb, 5 ( I - 4-80 T feu 093 Uf?T ^ j Rrg ETOfe^^etu)>- § sfe>HT HH* ^ I BTg 5 5 ?tj5 ^ e | )>,th^ 7^Y ^ W lj\^ I §H ^tfe q 'H t l ( v f c ^ ’B V 3 l fiT KT3T fUHT »-:§ of^H ^ § § R t fe g§ B
JH’HF rjs) 5C0 o: Hrl^ 3*' l ( 1 .4.81 3" UIHt ^ 300 g: ^3\ Hut3 ofgf^3' 9iSl Cf 1) 5!?5H ^ ?»S> M ^ HcSTjU f?fe*Mor, SofSts?! >H§ utHSS HRqr fefe>HTe^ ' ?]T o^T ^ o l^ t I §^j Rt-ai?3iTg ? j# gTo|e» 1 ngajt^ w foTHt ugf25or »{HTg ^,^sr^ 3’ fefs^q 5faHgr^ fT fsfR ^ fsfRH ^ H^Ttfsg qgr gan ^ 3 3 s # 1
R»g^ 17. 9 UflTg f#g t-tf731^g u | fey ^'t f^^3l HHRt^ aiL 9 1Rf^^t 17.10 ufif i ffi5^f3 t - l a j f f j g53 »f^ 3^3 a ls fg^srrat h1 ^ 3! HgRrst gr^ d 1Rigsl 17.11 f^g Raife? ^33 (H3ofrgt, )Hq Ha<5fTUl M3 f?f?ft) gif3TTU
aRTf?>HT ftlMT 5 IR^3^ 17,12 f?H BoT R?r > t 3t v/Vg f?fgiH!»U3 yR?» R^UH oft§
^ fai«^ ^3RT^ ar^ tl IR ^ 17.13 §TB3 § ^ H Rt )w OrW ^S t gy^t ^hftgr gggpg ^ BJ
3ff?R?BT feg fe;s lT3gT ^ SBR^ 9 IRTu^ 17.14— Isre^ ?Horgr ^ >>f§ oTHT Rgcf! »fc?i fHU3 »{€Tfegft >Hors, 1936 >Hdtj
oft§ 3I§ U?J I feR ^ fu g q §5??^ >>(5r2 ^ qrgt 2 H (i) >H§ 2 H (ii) grfi gftTRHg8t?. RTgW tor2al»HT f § 3 5 I feR 3 feS^^r qrgr 2 R (ii) ^ y% (§), (r), (o) »f§( ^ ) ^ R cft§ 3I§ ^ la fe lc f SF ' ^ ^ I tcfT Otiqfdlor >H€Tfe>Hf
gie ig^T 143^ f § >HTqTfg3 d 1RT32 17.15 feg .URTg § Q^gr^t srrH TJt >H§ (UURt) § h\2^ cfl^
gisl f rig3 UI fe u l^ ^ uicT H om f e f e oflHT WW 5 >H3 Rasfrg § ^ rgfeof RSrUope
5>HTaT of]3T d IRTB^ 17.16 § t ^ c ? aife HT ^ fgi5^ W% Rfg^ €URT^ 31^ 5
R ^ 17.17 >H§ 17.18 §eiHrai5r 93lf3»IT W § § W 9 fS \ feo f n i^ o f 53T3^ g e , 1947 MCftjS UffT § fo7g3 f?ff3I H'Hfgf feofsr cftjf fai ff 9 I U33TH HT nmg ^ rg r^ HET35f>H R"3Tfe3 § uirR3 sft?! 5 1 3^5^507 MK 3 9 § fe^ o ft B»r9T ofH ^ srgjsfui^cft3t Rtgt 9 I Faii R5CI3 ^d5f3‘f h1 >HrRUt 3 t f t ?gii W fRq^ MfRq' 33 § MR3 fU-Hf u t I
R f g ^ 17.19 3" 17.21 f ? g e l 5 Msre, 1923 »nit5 e l ? w i t ? T f t w fe gf RffeR M§ R gq >H5Rfg *H3Rrfe'>{r fdl^ff ^1Rrg^ 17.22 ts rs^ ^oT?, 1948 >HatS »fft''^>f^ iyr35r Rt ^-U T3c? ^ U f 2 5 ^
h1 fais^ HafT oft^ 3ret 5 1W E^ 17.23-”orrH3I3 H>Hf?af oTcT, 1923 MOls 1031^3 fee S3T ^3573 § oTgs
53ft>H ftT f orf3oH3 U u t >H3 ^^5^3# (u^ W ^^3?? §3 §) U 3IEt 5 t, J H »f^T »}pTfpgrt^31 u V 9, ua R33 feu ^ foffea r3^ 'tfffTa ^3^3^ § >rtfU5 sr^a orras s # n i t
Rfait 17.2 4 —fee f«?e fe^g isr uTj >Ht m§ §?^t uiss» ^ ^brtuI ^ 5 i
389
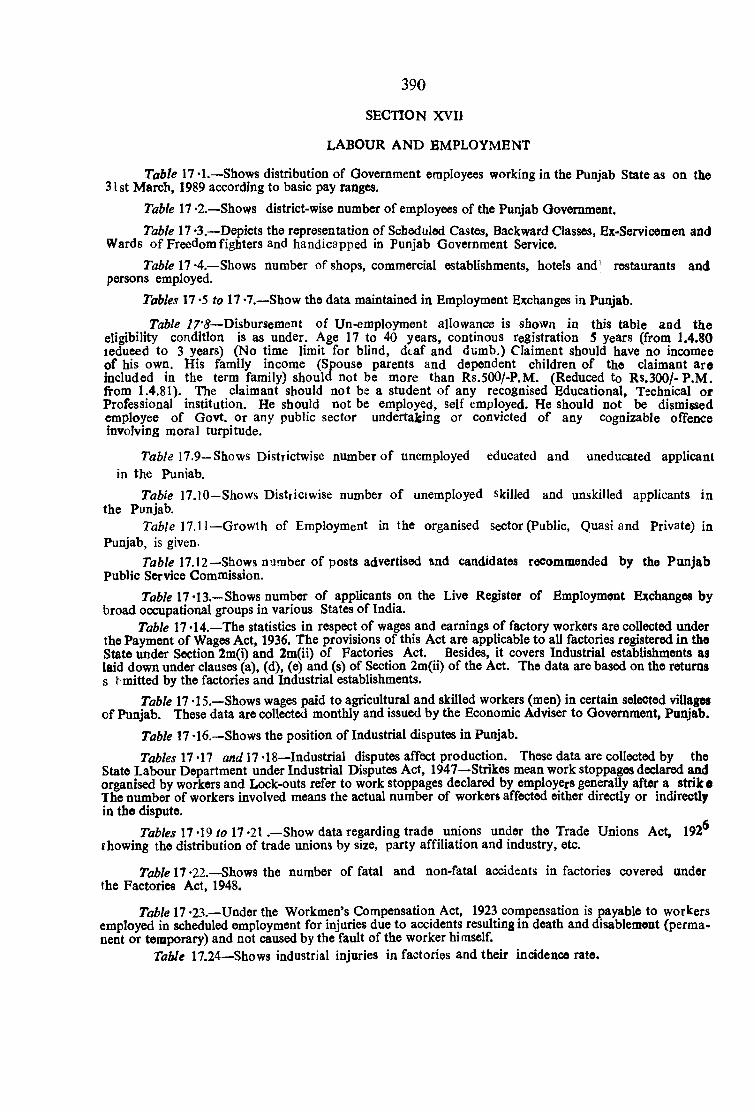
Table 17*1.—Shows distribution of Qovemment employees working in the Punjab State as on the 31st March, 1989 according to basic pay ranges.
Table 17 -2.—Shows district-wise number of employees of the Punjab Oovemment.
Table 17 *3.—Depicts the representation of Scheduled Castes, Backward Classes, Ex-Servicemen and Wards o f Freedom fighters and handicapped in Punjab Government Service.
TflWe 17 *4.—Shows number of shops, commercial establishments, hotels and' restaurants and persons employed.
Tables 17 *5 ro 17 *7.—Show the data maintained in Employment Exchanges in Punjab.
Table 17'8—Disbursement of Un-employment allowance is shown in this table and the eligibility condition is as under. Age 17 to 40 years, continous registration 5 years (from 1.4.80 ledueed to 3 years) (No time limit for blind, deaf and dumb.) Claimant should have no incomee of his own. His family income (Spouse parents and dependent children o f the claimant are included in the term family) should not be more than Rs.500/-P.M. (Reduced to RS.300/-P.M . from 1.4.81). The claimant should not be a student o f any recognised Educational, Technical or Professional institution. He should not be employed, self employed. He should not be dismissed employee of Govt, or any public sector undertalfling or convicted o f any cognizable offence involving moral turpitude.
Tafc/e 17.9—Shows Districtwise number of unemployed educated and uneducated applicant in the Punjab.
Table 17.10—Shows Distiictwise number of unemployed skilled and unskilled applicants in the Punjab.
TVzWe 17.11—Growth of Employment in the organised sector (Public, Quasi and Private) in Punjab, is given.
Table 17.12—Shows number o f posts advertised and candidates recommended by the Punjab Public Service Commission.
ToWe 17-13.—Shows number of applicants on the Live Register of Employment Exchanges by broad occupational groups in various States of India.
Table 17*14.—The statistics in respect of wages and earnings of factory workers are collected under the Payment of Wages Act, 1936. The provisions of this Act are applicable to all factories registered in the State under Section 2m(i) and 2m(ii) of Factories Act. Besides, it covers Industrial establishments as laid down under clauses (a), (d), (e) and (s) of Section 2m(ii) of the Act. The data are based on the returns s E mitted by the factories and Industrial establishments.
Table 17 *15.—Shows wages paid to agricultural and skilled workers (men) in certain selected villages of Punjab. These data are collected monthly and issued by the Economic Adviser to Government, Punjab.
Table 17 *16 .-Shows the position of Industrial disputes in Punjab.
Tables \ 1 ‘\1 one? 17‘IS—Industrial disputes affect production. These data are collected by the State Labour Department under Industrial Disputes Act, 1947—Strikes mean work stoppages declared and organised by workers and Lock-outs refer to work stoppages declared by employers generally after a strike The number of workers involved means the actual number of workers affected either directly or indirectly in the dispute.
rafcfej 17-19 ro 17-21 .—Show data regarding trade unions under the Trade Unions Act, 192® showing the distribution of trade unions by size, party affiliation and industry, etc.
Table 17 -22.—Shows the number of fatal and non-fatal accidents in factories covered under fhe Factories Act, 1948.
Table 17 -23.—Under the Workmen’s Compensation Act, 1923 compensation is payable to workers employed in scheduled employment for injuries due to accidents resulting in death and disablement (permanent or temporary) and not caused by the fault of the worker himself.
Table 17.24—Shows industrial injuries in factories and their incidence rate.
390
SECTION XVII
l a b o u r a n d e m p l o y m e n t
» f t t t r a r g
LABOUR AND EMPLOYMENT
391

far33 ta a roLABOUR AND EMPLOYMENT
iraift 17,1— ^Jtre 31 VfOT, 1989 (p ) $ Haopgl o r a M F ^ ^ >1® 3SVU #*tT »H5FTO
Table 17 '1—Gofcmmcnt Employees in Pmtjab as on 31st Mardh* 1989 (p) according to Basic Pay Ranges
(SSar Number)
(aoS)Basic Pay Range
(Rupees)
arafe?
Gazetted
3b arafes
Non-Gazetted
Class I Class II| s n i
C U ta ttl Class IVf W
»fMS»»f§
>HH5T
onw-
ip teafT
im ^ 0^ 5T€ m§( on§ y § oTdPerma- Tempo- Perma- Tempo- Perma- Tempo- Perma- Tempo- Contin- Total Percentage
nent rary nent rary nent rary netrt rary gency to totalpaid and Emplo-worlt- yeescharged
U3VOto
10 11
1. 7 5 0 ^ 750
2. 7 5 0 tF 9 5 0 ^ ufe 750 or more but less than950
3. 9 5 0 i 3 T ^ i j i s o ^ u f e 950 or more but less than 1,150
4. 1,150 ,350 1,150 or more but less than 1,350
5. 1,350 r?T ^ 1,410 wfe 1»350 or more but less than l,4 i0
.. 2* 2* — — 4 264 1,390 1,450 10,830 13,942 4-40
— 1,652 649 14,774 19.199 6.144 42,418 13-38
— 12,920 15.702 *11,660 6,936 2,144 49,363 15-57
— 16,465 14,181 2,393 1,024 1,016 35,079 11-06
— 16,857 12,641 176 49 278 30.001 9.46

6. 1,410 1,680 3* ufe
7. 1,680 tit 1,880 ^ ufe
8. 1,880 2,100 §* life9. 2,100?rt^n2,700 3"W3
10. 2,700 W 'cr 2,850 3* ufe11. 2,850 TTt 3 400 3 ufe
12. 3,400 W 3,700 3" life 1 3. 3,700 tTT 4'tJI 4,125 3" ufe14. 4,125 tit #5 4,625 3" life15. 4,625 tIT 5,450 3^16. 5,450 t|t 6,100 3^ ufe
17. 6,100 tit 6,700 3" Ulfe18. 6,700 BU§ rF
1,410 or more but Ik s than 1,680
1,680 or more but less than 1,880
1,880 or more but less than 2,100
2.100 or mote but less than 2.700
2.700 or more but less than 2,850
2,850 or more but less than 3,400
3,400 or more but less thau 3,700
3.700 or more but less than 4,125
4,125 or more but less than 4,625
4,625 or more but less than 5,450
5,450 or more but less than 6,100
6.100 or more but less than 6,700
6.700 or More
Total
263
158
384
339
357
175
195
88
74
27
— 332
114 1,500
109 1,109
154 1,651
— 34,618
— 27,224
523 18,223
1,336 13,639
186
124'
57
47
20
16
25
825
258
127
35
1
3
846
716
205
77
3,976
1,356
209
40
15,32?
9,202
5,928
2,861
56i
297
812
71 19 120
1 —
50,156 15 -82'
36,426 11 -49
25,006 7-89
19,713 6 -2 2 '
6,759 2-13
4,558 1 -44
1,845 0-58
858 0 -27
367 0-12
279 0-09
109 0 -03
94 0-03
53 0-02
... 2,063 854 5.842 3,714 1,47,183 77,697 30,464 28,677 20,532 3,17,026 100-00
VOu>
P»f5>H3H P Provisional
» f § » f e T F f e s , IfflTg I l i
Source : —Economic and Statistical Organisatio d . Punj ab.
*f3cS Ukrg, orSTjq J »T3 feST I rf?>gsHora>3t TO I
♦Three classl Posts o f Gurudwara Tribunal Punjab, one class I post of Administrative General and Official Trustee and one class I Post of Additional Advocate General are bonourary.
’6 Z : — 19 89 f e 'g 3”t i U T O ^HtH3 H I § HJSl I I 91^33 » I§ e j s l I I I HTHS OT
f e § 31^ INote I In 1989 according to third Punjab Pay Commission Recommendations, information of class I I I Gazetted has been merged Partly in class I I GazettM and p a rtly -
class I I I non Gazetted. '

m3 cJid*3Td l a b o u r a n d e m p lo y m e n t
17.2— Ur Pa H 3 5 p g ^Table 17.2—District-Wise Pan]«b GoTemment Employees
Nuaiber )
District
31 HTUH 788
As on 31st March
1967 1971 1976 1980 1983 1984 1985 1986 1987 1988 1989**
10 11
ajdti'Huu Gurdaspur 13,002 14,491 17,753 21,359 22,725 22,795 23,317 23,774 25,420 26,093 32,754
Amritsar 18,927 21,665 27,741 30,892 31,213 31,084 31,164 31.809 32,367 32,951 33,972
o w g w Kapurthala 4,506 5,232 7,144 8,186 8,660 8,695 9,092 8,909 9,017 9,268 9,453
tlJJUdT Jalandhar 18,914 20,137 24,463 27,448 30,099 30,367 30,447 30.920 31,231 32,637 32,736
afe>HTgya Hoshiarpur 8,909 12,069 18,229 20,762 21,633 21,743 22,070 21,902 22,460 23,883 24,263
fU Sd ld Rupnagar 5,193 6,451 9,472 12,552 13,81? 14,221 15,134 15,872 16,682 16,953 17,350
Ludhiana 13,296 14,913 19,519 23,562 30.600 32,082 30,637 30,781 27,690 28,871 26,589
fedidW Firozpur 16,742 19,612 15,738 17,135 18,661 18,902 18,799 19,540 20,632 21,083 21,542
^d1tdi5d Faridkot • * 15,449 18,473 20.136 20,481 20,759 22,167 22,643 23.141 23,912
9fe3Ti Bathinda 11,458 13,303 14,657 15,301 17,489 18,456 19,006 19,281 19,304 19,874t 20,235
Sangrur 9.662 12,521 18,734 18,318 19,283 19,441 19,168 19,290 20,630 20,678 20,906
Patiala 18,650 21,153 26,945 30,149 32,335 32,715 33,507 33,861 34,693 34,746 34,926
Chandigarh 8,016 1 U 56 13,856 15,669 16,943 16,403 18,568 16,755 17,027 17,248t 18,388
Total 1,47^75 1,72,803 2,29,700 2,59,801 2,83,596 2,87,385 2,91,668 2,94,861 2,99,796 3,07,426t 3,17,026
•Included in Bathinda and Firozpur.
**Provittoaal
tRevisedFTO :— »f§ »for3t H3r3^, iftrrg i Source ; —>Economi« and Statistical Or^nisation, Puiyab;
VO
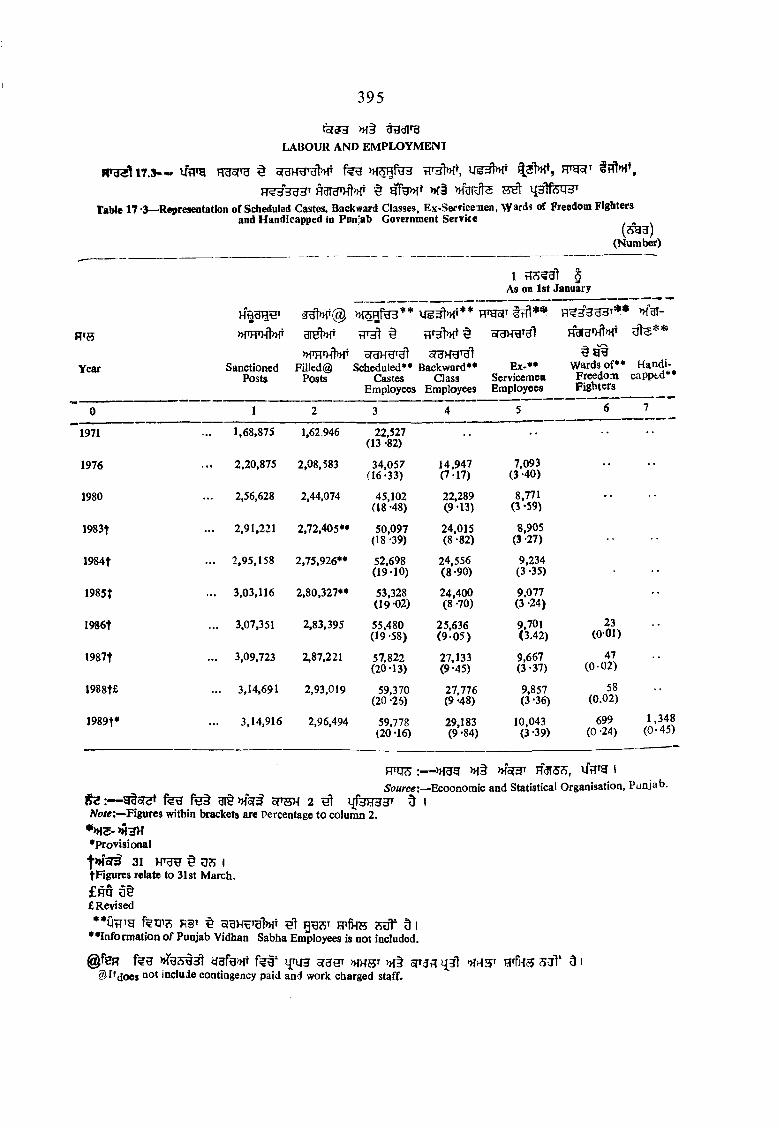
395
»f§LA B O U R A N D E M P LO Y M E N T
Vfn g jq oPH ^ HrgsjT^ >»f§ 75H| lj[3tfeTJ3T
Table 17-3—R^reseotation of Scheduled Castes, Backward Classes, Ex-Sem'ceuen, Wards of Freedom Fighters and Handicapped in Panjab GoTernment Service
( ^ 3 )(Number)
1 TT?5?al § As on 1st January
W E t^'dl §
U g ^ * * FraoiT tT ft* * ’ >Hgr-
Year SanctionedPosts
»fn=rHtnfTF ille d ®
PostsScheduled** Backward**
Castes Class Employees Employees
Ex-**ServicemenEmployees
-V V/-\wards of**
Freedom Fighters
Handi-capptd**
0 1 2 3 4 5 6 7
1971 1,68,875 1,62.946 22,527 (13 -82)
-- ••
1976 2,20,875 2,08,583 34,057(16-33)
14,947(7-17)
7,093 (3 *40)
--
1980 2.56,628 2,44,074 45,102 (18 *48)
22,289(9*13)
8,771(5-59)
1983t 2,91,221 2,72,405** 50,097(18-39)
24,015 (8 -82)
8,905 (3 -27)
1984f ... 2,95,158 2,75,926** 52.698(19-10)
24,556(8-90)
9,234 (3 -35)
1985t ... 3,03,116 2,80,327** 53,328(19-02)
24,400 (8 -70)
9,077 (3 -24)
1986t ... 3.07,351 2,83,395 55,480 (19’58)
25,636(9-05)
9,70!(3.42)
23(001)
I987t ... 3,09,723 2,87,221 57,822(20-13)
27,133(9-45)
9,667 (3 -37)
47(0 02)
1988t£ ... 3,14,691 2,93,019 59,370 (20 -26)
27,776(9-48)
9,857(3-36)
58(0.02)
1989t* 3,14,916 2,96,494 59,778 (20 -16)
29,183(9-84)
10,043 (3 -39)
699 (0 -24)
1,348(0-45)
>H§ H3ISJS, iSource:— Bcoonomxc and Statistical Organisation. Punjab.
t z :— gi t >Hor3 5TSH 2 ^ IjfHHHJT 5 I Figures within brackets are Percentage to column 2.
•provisional
f >Hoi3 31 vrgn § US I fFigures relate to 31st March.
£ r5 3§£ Revised
••Information of Punjab Vidhan Sabha Employees is not included.
@feiR fee f^w ijnjH 5f35T >HKs oPcja i{3\ effHfj 0 1^ redoes include contingency paid and work charged staff.

f^33 >H§ diJd'd LABOUR AND EMPLOYMENT
17.4— »f§ ^ HOTJH 3T§Table 17 -4—Shops, Commerdal Establishments, Hotels and Restaurants and Persons Employed there-in
(cSW3 Number)
396
31
As on 31st December
Shops
Number of Townsf
••CommercialEstablishments
Hotels and Restaurants
Total
fdl<id)Number Employee
TdlddlNumber Employee Number
fdid'diEmployee Number Employee
(2+4+6) (3+5+?:
0 1 2 3 4 5 6 7 8 !r
1966 . . . 92 98,087 35,601 30,458 43,311 4,679 7,250 1,33,224 86,162
1971 69 1,31,274 45,577 38,911 52,507 5,150 8,089 1,75,335 1,06,173
1975 . . . 90 1,15,729 40,484 30,217 54,499 7,454 13,066 1,53,400 1,08,049
1980 . . . 124 1,72,831 42,764 40,736 83,063 10,773 15,546 2,24,340 1,43,371
1983 125 2,08.738 50,898 48,214 90,878 11,382 17,107 2,68,334 1,58,883
1984 125 2,14,452 50,541 48,845 92,103 11,498 17,320 2,74,795 1,59,964
1985 . . . 125 2,19,749 51,585 49.570 92,908 11,664 17,577 2,80,983 1,62,070
1986 125 2,26,318 56,738 49,979 99,978 11,754 16,762 2.88,051 1.73,478
1987 . . . 125 2,31.172 58,322 50,951 1,03,505 11.909 16,702 2,94,032 1,78,52 9
1988 125 2,32,194 59,821 54,07 J 1,05,565 12,249 17,234 2,98,514 1,82,620
Rnj s :— iSource:—Chief Inspector of Shops, Punjab.
•f UTTH 1940 >H§ ^ 5 ^ 1 f^iTUof >H5r , 1958 W fe » r t ^ ItCovered under the Punjab Trade Employees Act, 1940 and Punjab Shops and Commercia] Establishments Act, 1958.
**fen 3?51**IlKludes Cinema and theatres.
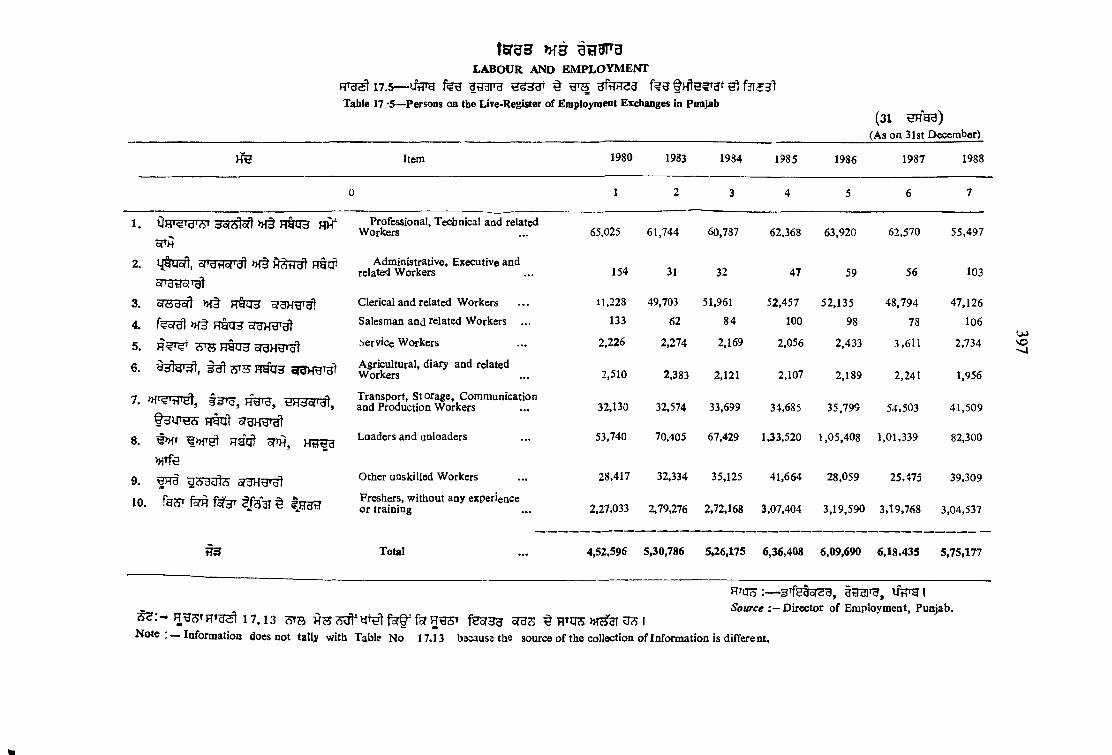
tBrars m s a a a r 'aL A B O U R A N D E M P L O Y M E N T
17.5— iffrg gegfrg f ^Table 17 *5—Persons on the Live>Register of Employment Exchanges in Punjab
(31 €Hgg)
wItem 1980 1983 1984 1985 1986 1987 1988
0 1 2 3 4 5 6 7
1. O ar^ Tgr^ »f§ H 9 a 3 RH'
oTH
Professional, Technical and related Workers 65,025 61,744 60,787 62,368 63,920 62,570 55,497
2. 5fTgt^o<Tdi >h9 Fraot
ol'ddof'^1
Administrative, Executive and related Workers 154 31 32 47 59 56 103
3. S^Sdo/1 »f§ SPgHgrgt Clerical and related Workers 11,228 49,703 51,961 52,457 52,135 48,794 47,126
4. » ft H y u j Salesman and related Workers ... 133 62 84 100 98 78 106
5. Service Workers 2,226 2,274 2,169 2,056 2,433 3,611 2,734
6. Agricultural, diary and related Workers 2,510 2,383 2,121 2,107 2,189 2,241 1,956
7. TO IU, HHciorr^, Transport, Storage, Communication and Production Workers 32,130 32,574 33,699 34,685 35,799 54,503 41,509
8. ^ ^ »re i Raof Hiirea >M»fe
Loaders and unloaders 53,740 70,405 67,429 1,33,520 1,05,408 1,01,339 82,300
9. Other unskilled Workers 28.417 32,334 35,125 41,664 28,059 25,475 39,309
10,, fgsT fern ^Jcfgr t I j ju i? Freshers, without any experience or training 2,27,033 2,79,276 2,72,168 3,07,404 3,19,590 3,19,768 3,04,537
Total 4,52,596 5,30,786 5,26,175 6,36,408 6,09,690 6,18,435 5,75,177
Frrq?S 3Tf53orS3, liTFHISource :—Director of Employment, Punjab.
1 7 .1 3 S T S H35 fsT f' foT fHoTHH ofUS ^ »l^f3T TO INote ; — Information does not tally with Table No 17.13 because ths source of the collection of Information is different.
u>VO

17.6— ^ 3 3 ^ »(TgT ^flgegHcS >H§ feqoTHlw Table 17 '6—Registrations and Placings by Employment Exchanges
fsraa »f§ 3 O T 3LABOUR AND EMPLOYMENT
(Number)(31 t3Hy<3 § A s on 31st December )
Item 1966 1971 1975 1980 1983 1984 1985 1986 1987 1988
0 1 2 3 4 5 6 7 8 9 10
§ U gg g irg ^fd is a l
Employment Exchanges including Suboffices ... 24 28 34 49* 51* 51* 51* 51* 51* 51*
gftTHS^eS Registrations 1,45,487 1,97,943 2,33,086 2,62,725 2,23,957 2,00,805 3.03,866 2,31,179 2,23,573 1,95,817
fe y c T y W Placings 24,905 34,874 27,751 17,998 15,168 12,918 9,850 8,305 8,995 9,918
»TFnHt>HT V acancies notified 40,342 53,098 '45,687 36,121 33,515 23,754 25,911 25,265 24,887 21,646
>h 'h «h W Vacancies filled 125,648 33,485 . 27,697 :17,914 15,561 12,934 10,883 7,639 9,060 10,341
5oTfe»fT Vacancies outstanding 4,960 8,361 12,725 14,648 18,209 9,684 6,803 11,635 11,292 10,366
«M>H' m y i^ Submissions made 1,48,074 3,09,894 3,47,209 3,56,519 3,51,874 2,52,358 2,30,073 2,21,876 2,08,505 1,99,092
dfi4H<dd g -t i3 3 F d ^ f3Ic5^
Number of the unemployed persons on the live register 50,578 1,20,741 2,99,882 4,52,596 5,30,786 5,26,175 6,36,408 6,09,690 6,18,435 5,75,177
tsaiTU t a o f d l - 3 T3 T ^ f3 I3 ^
Employers using the Employment Exchanges 9,054 11,358 11,291 6,280 4,874 2,965 3,337 2,901 2,708 2,644
u>VOoo
•llO*! FPHS UJ5 t*lBcludes 11 Rural Manpower units.
w m :— gygnn, iDirector of Employment, Puiyab.

» f g i ^ CgreTHTable 17 *7—Vocational Guidance Programme at the Employment Exchanges
ftra3 >Ht fg3i»gLABOUR AND EMPLOYMENT
(Number)( 31 § As on 31st December )
Item 1966 1971 1975 1980 1983 1984 1985 1986 1987 1988
0 1 2 3 4 5 6 7 8 9 10
1. lJ^^TgTj5T)>fd|.^Tyl ig fe iii
2. feScP gf^ Tdiedl
N um b» of Vocational Guidance Units
Number of applicants guided in Groups
10
12,043
13
18,954
16
21,155
16
16,542
17
20,471
17
16,004
17
17,510
16
20,197
16
17,285
16
17,288
3. fe»fo?3l3ld § 3 § >H3ra^1 fe5o<id> rjt fa i3 3 l
Number of applicants guided individually 884 1,449 4,359 : 3,173 2,972 2,922 2,620 2,722 2,381 2,355
4. f%»{pf3Tyid d d § g f r d cit§ 31$ feSoJid' e l
Number of applicants given information individually 3,63o 5,644 9,013 9,553 21,515 21,001 23,318 29,771 20,576 34,717
5. a rt 3I3U » ra isr^ i j g r a m ^Tdiddl
Number of group guidance Programmes conducted 1,838 3,207 4,036 2,980 3,531 3,023 3,245 3,538 2,649 2,944
6. f iW S T ^ fH fy » fT 3 ^ 5
5 « ! 3f§ fa r a ^
Number of applicants forwarded to the Training Institutions for apprenticeship 385 352 2.564 2,001 2,24U 1,935 2,229 1,826 2.571 1,914
7* f i w s ^ nH9T/^€cifdw »ftrfe>>rf5?g ^ f e ^ T g r ^
Number of applications placed in Training Institute/Industrial Establishments for apprenticeship 46 123 43 6 35 37 8 16 152 58
8, 3 o r^ § H 3F^ dl§ » f d F ^ »rate feSePgr ^
Number of guided applicants placed in jobs 111 100 248 45 13 17 7 3 9 1
Frq3 :— gOTg, xjw^ iDirector of Employment, Punitb.
UJ>-VOVO'

>fe
Item
: 17.8— Uti»3 a-gggndt § § ^ ^Table No. 17.8—Disbursement of Un-employment Allowance in Pmijab
BU§ (Rs. in lacs)
m s
Year No. of beneficiaries
»fOT f e 7P^ § ^
^ (oTfSH 4 ora3T ^(oHSH
»reTfegftu<3HcrfHH HfW)
Amount Paid (including money order Commission)
Male Female Total
No. of4 r< \j HTHH)
No. ofScheduled Backward
Caste Classbenefi beneficiaries ciaries
(included (includedin Col. 4) in Col. 4)
HHja
A llCategories
»fSRf33
olUHT ( oTOH (oTOH7 THB) 7
Scheduled BackwardCaste Class
benefi- beneficiaries ciaries
(included (includedin Col. 7) in Col. 7)
0 1 2 3 4 5 6 7 R 9
f e s H ‘tt UtiioRrs ^ 1980-81 8,571 5,558 14,129 1,157 976 3^-64 2-78 2-84
With 3 years Registration condition 1983-84 4,920 3,194 8,114 1,710 755 57-60 11-83 5-77
1984-85 5,721 3,304 9,025 2,269 720 63 03 15-40^ 5-11
1985-86 5,656 3,197 8,853 2,316 582 66-09 16-47 3-42
1986-87 5,926 3,304 9,230 2,842 388 69-11 18-77 2^35
1987-8 S 6,805 3,514 10,319 3,020 303 60-37 17 -07 1 -581988-89 5,796 4,482 10,278 3,634 281 67-50 23 -40 1 ‘72
N ote.—Rate of Allowance :—
1. Matriculate/Under Graduates»f§ fu g
2. Graduates and above
1 -4 -7 8 3 * 3 1 -3 -8 1 ^ From 1-4-78 to 31-3-81 4o/-g: Huter
R S .4 0 P . M.50/-5: HUt3TRs. 50 P. M.
l-4-813*»I3TOH^ From 1-4-81 onwards
80/-a:Rs. 80 P. M.100/-g: HUfer
Rs. 100 P. M.
HTCIS: —SrfelcrSH UiqrgSource :—-Director Employment, Punjab.
Oo -
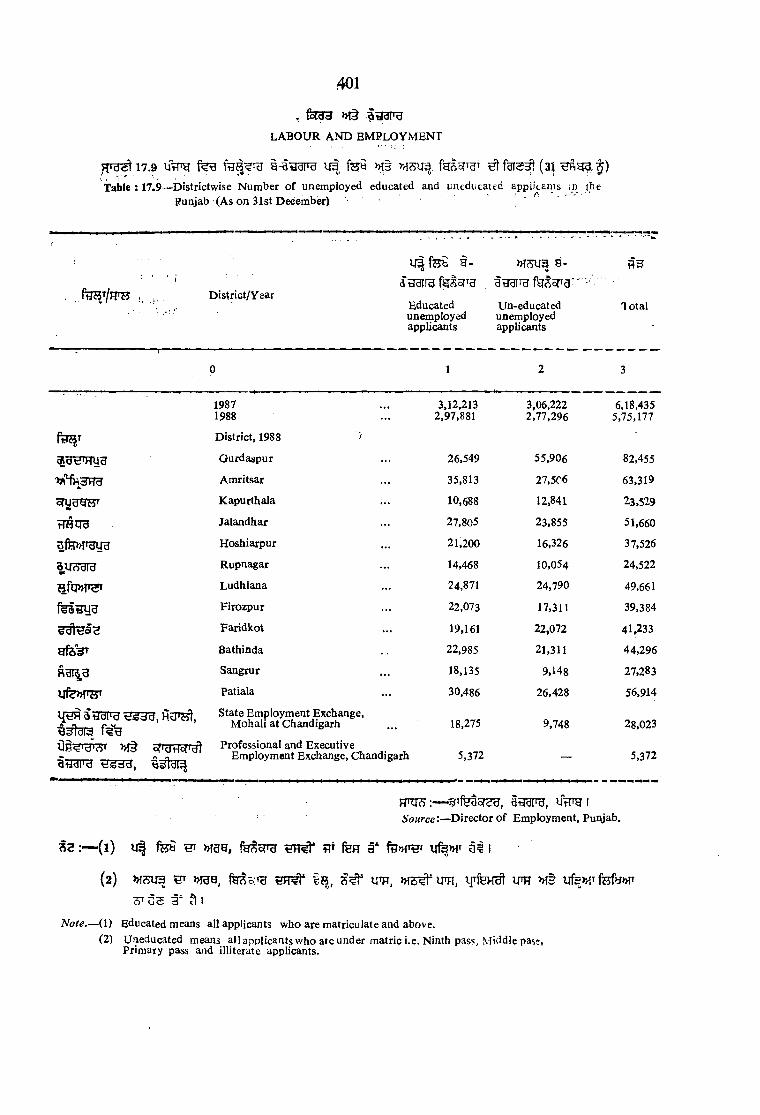
401
LABOUR A ND EMPLOYMENT
ypg^i7.9 lirrg g-aiiBro ira fey ^ 3 ^ f g r s ^ (aiTable : 17.9—Districtwise Number of unemployed educated aad uneducated applicams in the
Punjab (As on 31st December)
to /F T H , , District/Year
l 4 f e b g- aijgirg
9-
Educated Un-educatedunemployed unemployedapplicants applicants
Total
0 1 2 3
1987 3,12,213 3,06,222 6,18,435
ftRJT
a a v iH u g
1988
District, 1988
Gurdaspur
2,97,881
26,549
2,77,296
55,906
5,75,177
82,455
Amritsar 35,813 27,506 63,319
B w d y w Kapurthala 10,688 12»841 23,529
rra u u Jalandhar 27.805 23,855 51,660
Hoshiarpur 21,200 16,326 37,526
au<s‘d[d Rupnagar 14,468 10,054 24,522
Ludhiana 24,871 24,790 49,661
Firozpur 22,073 17,311 39,384
Faridkot 19,161 22,072 41.233
Bathinda 22,985 21,311 44,296
Sangrur 18.135 9,148 27,283
Patiala 30,486 26,428 56,914
l{5 n €]g3d, H State Employment Exchange, Mohali at Chandigarh 18,275 9,748 28,023
>}{§g iia F d
ST'dfTof'dl Professional and Executive Employment Exchange, Chandigarh 5,372 — 5,372
(1 ) i l | f e S ^
di33Fd, ^ H T y i 5o«rce:—Director of Employment, Punjab.
»T35r, feSoTTU w fe e 3 “ ufe>HT 1
(2) >H?7U3 HT »TU0, UTT, >H5^ ira , IPH »T§ UfewfefyJHT3" ft I
N ote.— (1) Educated means all applicants who are matriculate and above.(2) Uneducated means all applicants who aie under matric i.e. Ninth pass. Middle pa^?,
Primary pass and illiterate applicants.
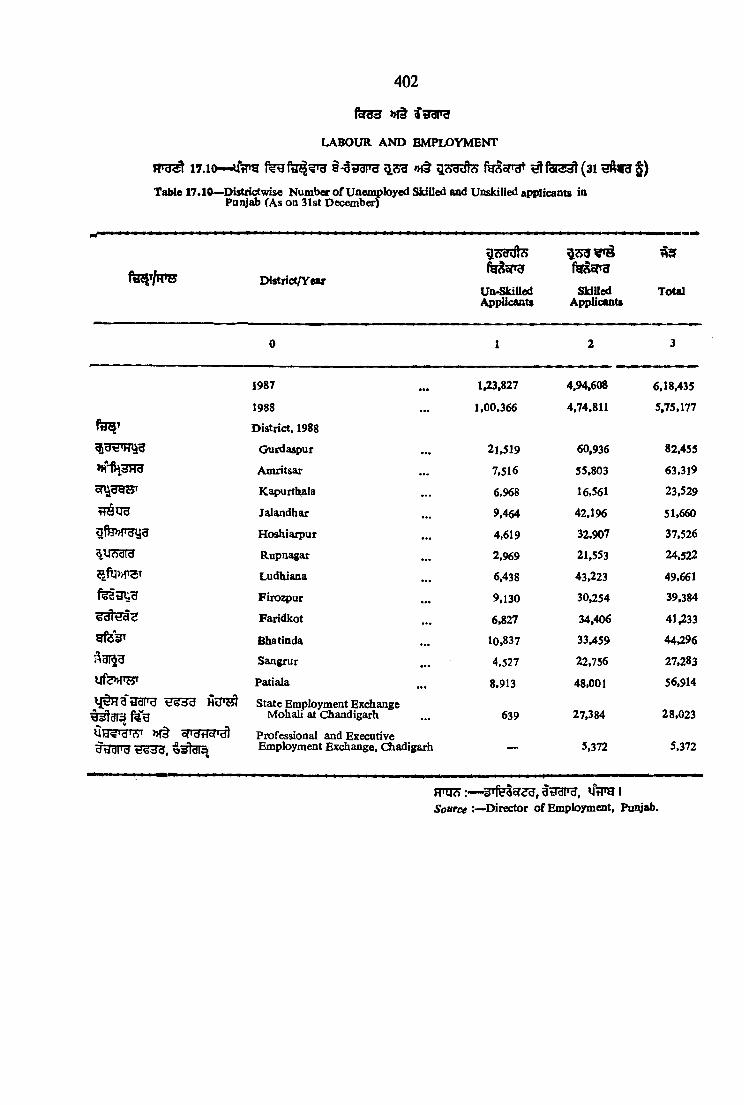
feT33 i'tJdJ'd
L A B O U R A N D E M P L O Y M E N T
8-3i3aTO 3?5g 3??3Uh5 feSon^ ^ f t r a ^ (3 1
Table 17.1&->I>istrictwise N um bw of Uooaoployed Skilled and Unskilled applicants in Paiyab (A s on 31st December)
402
District/YearUn-SkiUedApplicants
M oTOSkiUed
ApplicantsTotal
1987 ... i;Z3,827 4,94,608
1988 ... 1,00,366 4,74,811
D istrict, 1988
Gurdaspur ... 2 i,5 l9 60,936
Am ritsar ... 7,516 55,803
Kapurthala ... 6>968 1 6.561
Jalandhar ... 9,464 42,196
Hoshiarpur ... 4,619 32,907
Rupnagar ... 2,969 21,553
Ludhiana ... 6,438 43,223
F ir o ^ u r ... 9,130 30,254
Faridkot ... 6,827 34,406
Bhatinda ... 10,837 33,459
Sangrur ... 4,527 22,756
Patiala ... 8,913 48.001
State Employment Exchange Mohali at Chandigarh ... 639 27,384
Professional and ExecutiveEmployment Exchange, Chadigarii - - 5,372
Ufe»TW
»f§ cfidtfcfiJl^tfdl'd
6,18,435
5,75,177
82,455
63,319
23,529
51.660
37,526
24,522
49.661
39.384
41,233
44,296
27,283
56,914
28,023
5,372
S’oKfce Director o f Employment, Pui^ab.

17.11.— ^lirnq ftg ifen ^ 3 3 (R 3 o n ^ , > w fen t) aiJBpu fe g ?»ti» (31 h » o t j )Table 17.11.—Growth of Employment in the organised Sector (Public, Quasi and Private) hi Punjab (As (m 31st March)
fora3 BOTHLABOUR AP«) EMPLOYMENT
Sector Years
1981 1982 1983 1984 1985 1986 1987 1988 1989
0 1 2 3 4 5 6 7 8 9
1. $ 3 3 1. Public Sector
H d RgsfTg Central Government 67,460 (10 -62)
67,021(10-21)
65,440(9-70)
66,193(?-48)
68,010(9-65)
67,711(9-38)
69,234(9-42)
71,505(9-47)
69,667(9-11)
3»tl J State Government 2,55,505(40-23)
2,59,097 (39 -47)
2,67,566(39-66)
2,76,331(39-60)
2,76,145(39-19)
2.78.520(38-59)
2,78,244(37-87)
2,78,937(36-96)
2,81,064(36-75)
»Tq HgofT^ I ! ( t ' ^ t H»fl)
Quasi Government (Central and State)
1,16,606(18-36)
1,25,150 (19 06)
1,34,058(19*87)
1,39,717(20 -02)
1,43.753(20-40)
1,51,544 CM-99)
1,59.779 6 1 -74)
1,63,981 (21-72)
1,65,931 (21 -69)
W O T
^ - ...-
Local Government 28,244(4-44)
29,118(4*44)
30,364(4-50)
30,619(4-39)
31,223(4-43)
31,971(4-43)
32,667(4-45)
33,223(4-40)
33.596(4-39)
0 A 3 1 Total 1 4,67,795 (73 -65)
4,80,386(73-18)
4,97,428(73-73)
5,12,860 (73 -49)
5,19,131(73-67)
5,29,746 (73 -39)
5,39,924(73-48)
5,47,646(72-55)
5,50.258(71-94)
2 . fS ffI ^ 3 3 Private Sector 1,67.340(26-35)
1,76,080(26-82)
1,77,235(26-27)
1,85,024(26-51)
1,85,478(26-33)
1,92,040(26-61)
1.94,881(26-52)
2,07,016(27-45)
2,14,618a s -06)
( 1+ 2 ) Grand Total ( l- f 2) 6,35,135 (100 00)
6,56,466(100-00)
6,74,663(100-00)
6,97,884(100-00)
7,04,609(100-00)
7,21,786(100-00)
7,34,805(100-00)
7,54,662(100-00)
7,64,876(100-00)
§
H»q?7 : yftr3c(<;g, aggng,Sourct: JDirector of Emtdoyment, P to ^ .

MH d tid i 'd, L A B O U R A N D E M P LO Y M E N T '
17.12. iT'fi’S 'fefeTlJc o(''b1>) t fel53l >H§ Rf^30 ^ 3I§Table 17 12. Number of posts ad?ertieds and c£itic£tcs rcccn n crtcc l> il t rmjafc Piiblic Service Commissko
404
R§Tgg^ . OH t ^ ,- 5ft§31§
Posts Number of Caadidates (?aadida tag Advertised Applicants Intiervlewed Recunini<>
■ " , aed
1970-71 . . . 661 4,617 3,799 564
1975-76 . . . 269 J,,965 1,577 2 l61980-81 . . . 1,174 4^77 2,345 7711982-83 . . . U 5 8 14,038 4,228 6001983-84 f • • 386 1,310 534 1851984-85 . . . 1,551 11,016 1,491 7541985-86 . . . kl48 1,967 227 811986-87 . . . 546 3,015 2,337 2741987-88 • »* 789 15,084 1.841 6121988-89 . . . 682 9,493 1,991 64q
FF03 : ScJ ^ UffTg ISource s Punjab Public Service Commission.
M 3 BiJgiTB
LABOUR AND EMPLOYMENT
405

f s r 3 3 » f § O T 3 F 3LA B O U R A N D e m p l o y m e n t
5 f ! § ^ f g ^ U (31 HRgU, 1985 f )lable 17 03. —Applicants on the Live Register of Employment Exchanges Classified by Broad Occnpational Groups in States
(As on December 31 1985)
17. 13. — t 3331^3 g g g g § W E gffTR33 grfa'f
(fgi53l)(Number)
grfi
RUigTfl 933
State
Union Territory
3 5 ? ^ orgtTorr^ >H§ >H§
n t e fe3i3iHT>HT«^do|d
Profes Adminissional, trative,technical Executive
and andrelated manageworkers rial
workers
srsgart fsFTs, fuH foT§}4i§,fa5T^, >H§nfT?r-
HSW3 SoTSDTg TP 5ft§'" cJoJd R9TJ3 ^ <cdo d ^
< do[dClerical Sales Service Farmers, Production Workers
and workers workers Fishermen, and related notrelated Hunters, workers, classified
workers Loggers Transport by occu-and related equipment pationworkers operators
and labourers
Total
0 1 2 3 4 5 6 7 8 9
§ , g rfl A . S T A T E
Andhra Pradesh 1,23,16) 1,128 77,297 126 27,092 3,463 1,46,244 19,50,329 23,28,839
»fHTH Assam 5,547 95 5,228 42 4,503 6,429 29,843 5,51,692 6,03,379
t o g Bihar 99,432 347 1,07,130 2,158 60,937 9,491 4,52,172 18,17,803 25,49,470
Gujarat 37,477 223 16,228 61 8,645 1,138 29,440 6,36,617 7,29,829
ufgW $T Haryana 38,258 80 37,671 126 29,087 4,054 42,397 3,27,553 4,79,226
Himachal Pradesh 25,534 108 22,663 232 18,899 2,688 43,796 2,00,531 3,14,451
% >H§ oJHHto Jammu and Kashmir 1.390 20 1,826 7 2,743 58 10,503 57,378 73,925
Karnataka 75,370 345 39,350 21 7,218 1,396 33,018 7,70,053 9^6,771
Kerala 1,00,388 2,921 1,80,718 265 63.070 15,523 1,69,147 20,41,458 25,73,490

H fWHO’-d'Kreu
ifiTO
3TfH3 cS I3ukraT
§3g i j teusmT
sw S ^5 >H. Hm g t? fH^H
>?13HTS§ foggrg ^Tijfihu
al>HT, § f e f
<3 7cfiyfe s )Sofa^lu H3? §t33
Madiiya Pradeib
Maharashtra
Manipvir
Orissa
Punjab
Rajastha
Tamil Na d
Tripura
Uttar Pradesh
West Bengal
Meghalaya
Nagaland
B. U N IO N T E R R IT O R IE S
Mizoram
Andaman and Nicobai Islands
Goa, Daman and D iu
F ondicheny
Chandigarh
Delhi
l^akshdeep
A ll India
35,551 152 42,966 58 26,683 2,578 54,033 12,66,968 14,28,989
1,01,547 1,080 1,57,766 151 32,946 4,604 1,34,062 19,91,700 24,23,856
3,299 58 1,320 3 86 98 13,252 2,01,320 2,19,436
32,258 63 25,551 11 12,485 676 90,649 5,58,777 7,20,470
61,227 33 54.475 101 32,435 2,640 1,73,180 3,08,552 6,32,643
52,353 538 2,487 33 13,555 571 19,252 5,88,989 6,77.778
1,05,253 276 1,33,716 551 47,977 9,340 1,82,726 15,99,176 20.79.015904 199 501 — 110 184 3,099 95,167 1,00,164
1,28,072 302 53,067 263 61,362 4,967 1,91,323 21,24,980 25,64,3361,03,826 286 1,35,779 575 49,449 3,908 1,57,412 35,08,989 39,60,224
249 — 126 — 515 53 629 15,683 17,255
16 — 161 — 69 — 331 16,306 16,883
29 — 70 — — — 693 22.818 23,610747 9 389 — 508 124 1,801 8,781 12.359
1,3623,928
10.911
66.911 197
11
308
15
142
7,024 3,259
J 5*809
74,530 126
91
SI5i6188
1,392609
9,429
21,055
16 7,586560 3,706945 22,269
1,026 50,545
294 2,758
33,147 50,547
63,197 15J6S51,672 1,12,151
3.54,487 5,69,212
2,499 6,06212,15,196 8,759 11,98,233 5,579 5,32,859 76,824 20,65,866 2,11.66,622 2,62,69,938
R T O : >Ht 3i33F3 R3ofTg ISource : Ministry of Labour and Employment, Government of In d ii.
?5e.— 1. fHo?H »f§ €ti3iTg s s g g 5 I2. »f§ sBiu aH sra fen s u f ufe»fT .3 . U iTtg g r s f^ofrn 1 7 .5 5 T S H S o [ ^ # Htqc^ TI7i I
N ote.— I. There is no Employment Exchange in Sikkim and Arunachal Pradesh.2. One Employment ]^change is functioning in Dadra and Nagar Haveli, but datas are not being received.
3. Information of Punjab State does not tally with Table No. 17.5 because the source of the collection of information is different.

feB H ^ d T dL A B O U R A N D E M P L O Y M E N T
17.14— 400/1000f HUfer 3^ufe PraTjjT 1 31 >Mt snWt* (§TT33 »fgTHgft > t e , 1936 »fcte)
Table 17 *14~Per Capita Annual Earnings* of Workers in Pnnjab earning less than Rs 400/1000 f P. M.(Under tlie Payment of Wage Act, 1936)
(5^ Rupees)
9F t : ^Code No. Industry 1966 1971 1975 1980 1983 1984 1985 1986 1987(F)_ | _ ^ ^ ^ ^ ^ ^
20-21 tra^ST Manufacture o f food products ... 1,415 2,457 3,318 6,682 8,297 10,202 9,698 10,927 9,833
9? lihF UCT?ra -jgra S Manufactxire o f Beverages, Tobacco and TobaccoZ2. M]<t products ... 1,255 1,809 3,553 4,182 7,196 7,964 8,927 9,041 11,088
23. 5?U3 T Manufacture of Cotton Textiles ... 1,663 1,874 3,049 4,534 5,495 5,952 6,643 6,804 7,209
24. § ??3, f e n l >H§ UU Manufacture of Wool, S ilk and Synthetic Fibre»T^fe TextUes
26. 5rvfe»i^ ^H 3 T Manufacture of Textile, Products (including?1 B 5Wfe«|i H t e f e ' g Q gi ^ Wearing apparel other than footwear)
27. TJoral § Manufacture of wood and wood products, fum i- _ture and fixture ... 1,245 2,063 2,834 4,474 6,127 5,966 6,631 7,460 8,996 §
28. UU9 § Qira ^ 3 T Manufacture o f Paper and paper products andPrinting Publishing and allied industjes ... 1,251
29. ^ Manufacture of Leather, Leather and Fur Pro-( H f e 3^ f e t ) ^ ducts (except Repair) ... 1,498
30. lR5^Rfeof >H§ ^ Manufacture of Rubber, Plastic, Petroleum and
31. BHTfess? I BFPfess? Manufacture of Chemical and Chemical Products^ products of Petroleum and Coal) ... 1,562
32. y f e n ManuactureofNon-MetaUic Mineral Products... 1,112
33. i r e Basic Metal and Alloys Industries ... 1,550
34. Q’3 ^ Manufacture o f Metal Products and Parts ... 1,393
35. HBted! T O § fvJH Manufacture o f Machinery, Machine Tools andf e t ^ ^ except electrical machinery ... 1,533
36. ^ H>TO, Manufacture of electrical machinery Appar atus,g Appliances Supplies and Parts ... 1,433
2,342 3,442 4,537 6,489 7,347 7,373 7,908 8.654
2,919 3,203 5,061 7,903 8,362 8,129 12,583 12,436
2,063 2,834 4,474 6,127 5,966 6,631 7,460 8,996
2,281 2,181 4,617 5,714 6,535 7,044 9,217 7,305
2,311 2,621 3,558 5,123 6,380 6,760 7,196 7,848
1,677 2,653 4,091 5,796 5,767 6,188 6,257 6,056
2,742 3,054 8,825 9,447 7,459 11,394 14,119 10,7041,936 2,500 4,010 4,975 5,076 6,143 6,786 6,5052,125 2,400 4,825 6,147 7,785 7,751 9,132 7,1622,049 3,335 4,675 6,255 7,056 8,015 7,650 9,925
2,138 3005 4,927 6,794 7.147 8.587 8.715 8,952
1,782 3,349 4,728 6,457 7.473 9,144 16,120 8.91?
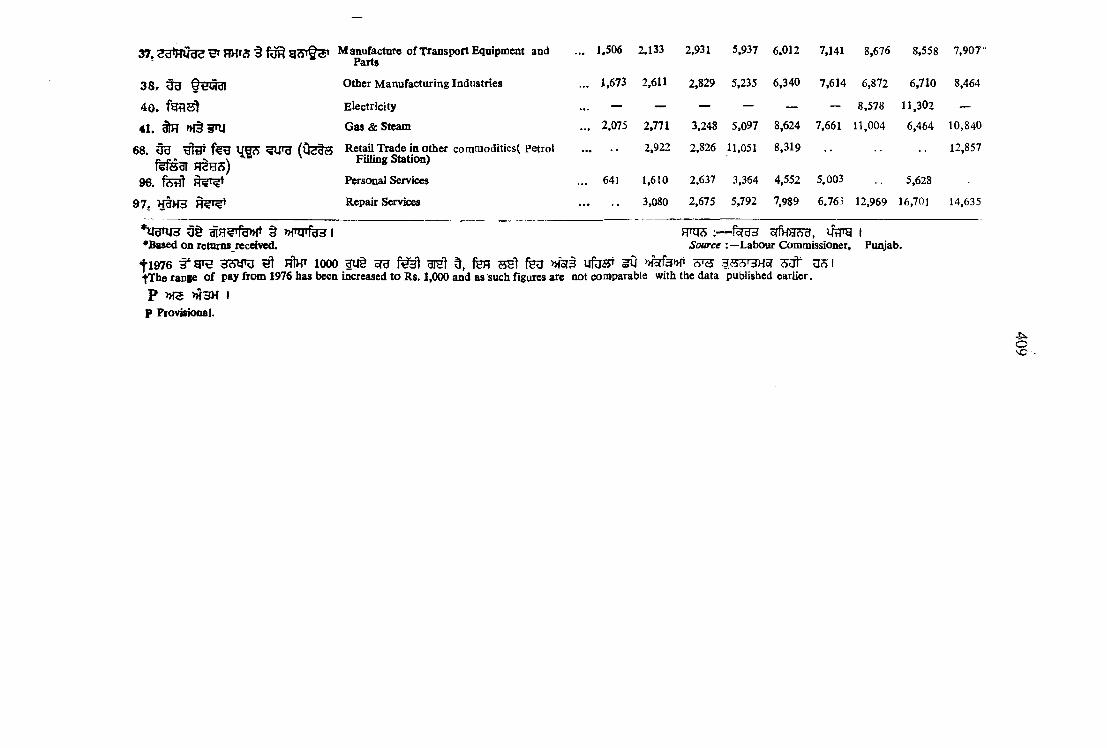
40.
41. 3fH >H§3nj68. ^ ^ feg
fef«3I RSHS) 96. fetft
97. H&H3
38, uu few ai
Manufacture of Transport Equipment and Parts
... 1.506 2.133 2,931 5,937 6.012 7,141 8,676 8,558 7,907'
Other Manufacturing Industries ... 1,673 2,611 2,829 5,235 6,340 7,614 6,872 6,710 8,464
Electricity — — — — — — 8,578 11,302 —
Gas & Steam ... 2,075 2,771 3,248 5,097 8,624 7.661 11,004 6,464 10,840
Retail Trade in other coramodities( Petrol Filling Station)
............. 2,922 2,826 11,051 8,319 •• 12,857
Personal Services ... 641 1,610 2,637 3,364 4,552 5,003 5,628 -
Repair Services 3,080 2,675 5,792 7,989 6.763 12,969 16,70] 14,635
*irarii3 u§ fH?rfe»{t § m jr fs 3 1 htos :— ifpra I*Based on returns received. Source : —Labour Commissioner, Punjab.
f l9 7 6 3 S y rU ^ h Iht 1000 S B d , feH feU U f e r s O ^ U 5 ItThe ranie of pay from 1976 has been increased to Rs. 1,000 and as such figures are not comparable with the data published earlier.
P »I5 >H3M I P Piovkional.
oVC'

i7.i5-*-ufng f?e »f§ sr^iaigt (yggt) |Table 17 *15—Wages paid to Agrlcoltoral and Skilled Laboarers (Men) in Pan jab
fa o 3 g^igirgLABOUR AND EMPLOYMENi’
(gyg)(Rupees)
District30 § HoTSt W BYea"ending 30th June
Agricultural Labour5?Tgtarg
Skilled Labour
cfB<S
ForPlough
ing
For For
Bfiru*^dl<i
9 ^ § ttO'd ddy^ar
ForHarvest
ing
For* Picking of cotton
ForotherAgricultural
Operations
Blacksmith
Carpenter
8
2-59 2-00 2*49 4-24 4*41
7*94 3-48 6*46 12.31 12-31
10*34 5-44 8*60 14.68 14*68
13*47 8*25 10*96 23 *23 23*23
16-04 9*93 14 -06 29*65 29*86
18-03 14*25 15*76 35-87 35 *74
21*42 15-10 18*59 40*77 40 -62'
25-57 15-55 19*43 44 *02 43 -01
26 *25 16-53 21-54 47-95 47-90
27 -97 20-25 23-74 56-95 52 -20
32-41 24-05 28-00 57 -67 57*78
35-00 — 26*11 55*00 55 *00
33-50 — 34 *67 63 *25 63*25
1
2-50
6-62
8'43
10-95
13-87
15.9]
17*33
20 -04
21 -91
23 -87
28-86
26*11
35*33
3
2-65
6-55
8-48
10 -86
13 -24
15'39
17*54
19-38
21 *33
23 '64
26-83
26-25
34 -75
O
>«fH 3H3
1961
1971
1975
1980
198S
1984
1985
1985
1987
1988
1989District, 1989 Gordaspur
Amritsai
2-49
6. 62
8-58
11*03
13-86
16*24
18-70
20-20
22*18
25 -19
28 07
27-50
30 00
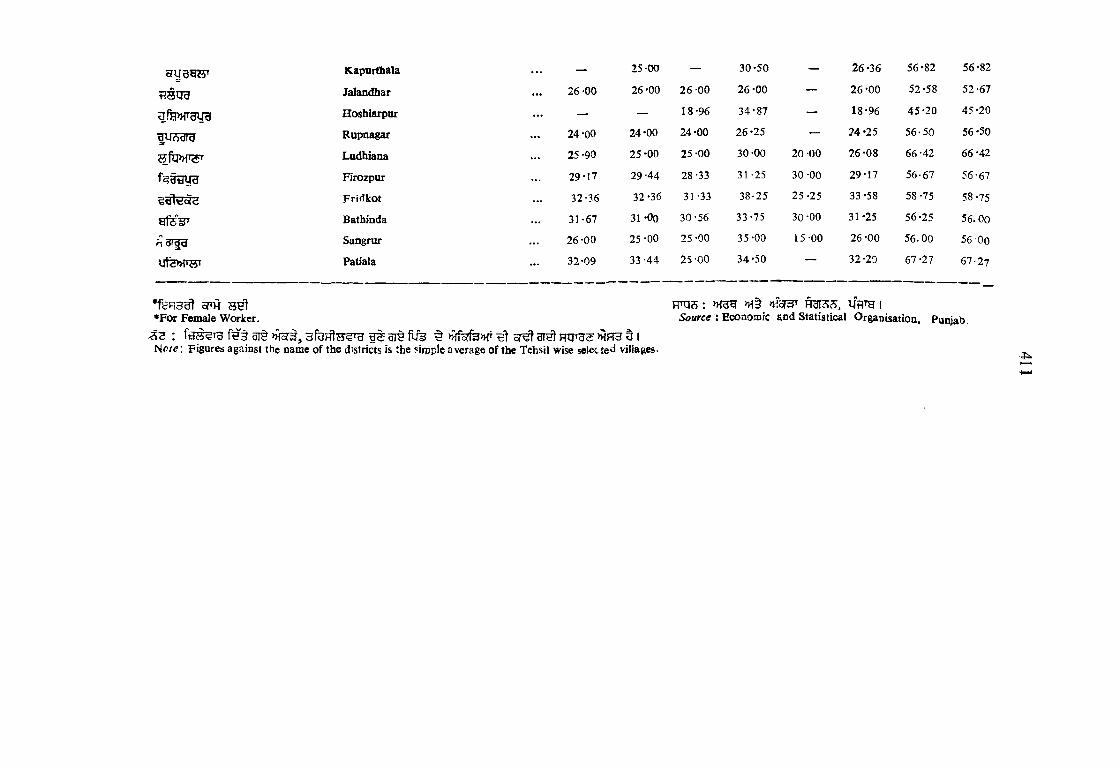
BU33T5
st^:5T H 3?^ Ut2»iW
Kapurthala
Jalandhar
Hoshiarpor
Rupnagar
Ludhiana
Firozpur
Fridkot
Bathinda
SangruT
Patiala
— 25-00 — 30-50 — 26 -36 56-82 56-82
26 -00 26-00 26-00 26-00 — 26-00 52-58 52-67
— — 18-96 34-87 — 18-96 45-20 45-20
24-00 24 -00 24-00 26 -25 — 24 -25 56-50 56*50
25 -90 25-00 25-00 30-00 20-00 26-08 66-42 66-42
29-17 29 -44 28-33 31-25 30 -00 29-17 56-67 56-67
32-36 32-36 31 -33 38-25 25-25 33-58 58-75 58-7531-67 31 -Co 30-56 33-75 30-00 31-25 56-25 56.0026-00 25-00 25-00 35-00 15 00 26 -00 56.00 56 0032*09 33'44 25-00 34-50 — 32-20 67-27 67-27
*feF53^ oPH •For Female Worker,
z z : ar^ fife ^ >nforfe»r >HPf3 & iN<^re: Figures against the name of the districts is the simple average of the Tehsi] wise selected villages.
FFqs: >H§ niof^ RgiSS. UflTg |Source : Economic end Statistical Organisation. Punjab
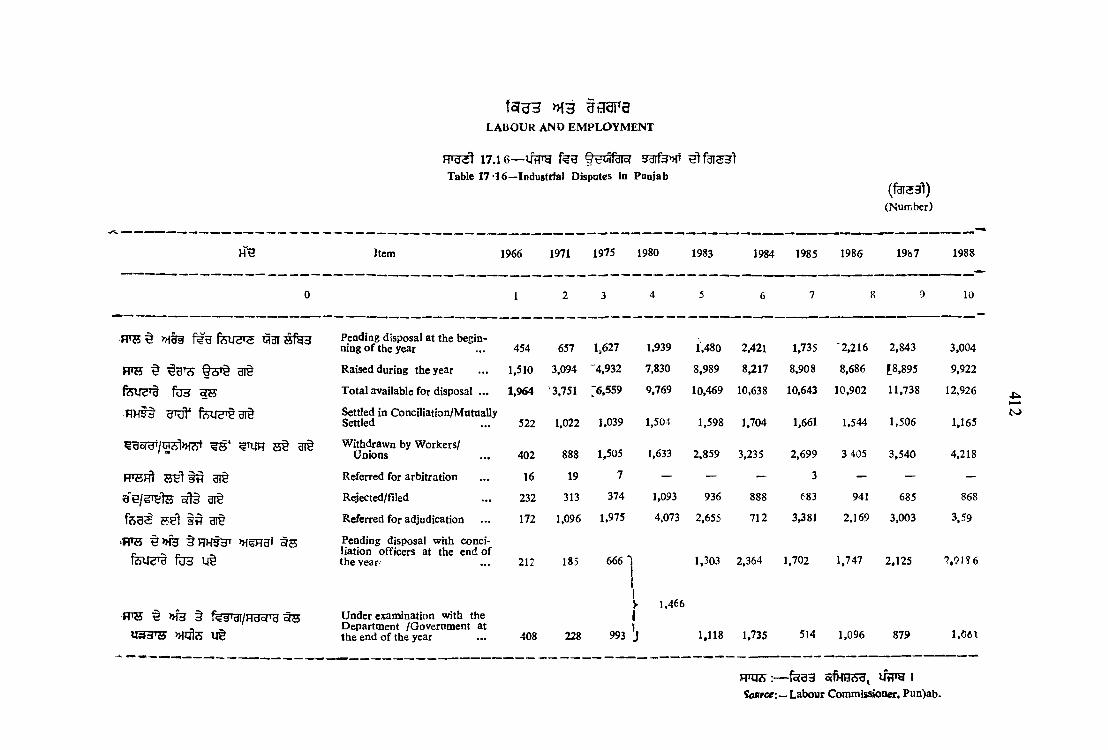
17.16— IWH fee Qtll^dfo? ^ 3 » T Table 17*16—Industrial Dispates in Punjab
f a g s » i 3 3 O T a
LABOUR AND EMPLOYMENT
(Number)
HH Item 1966 1971 1975 1980 1983 1984 1985 1986 1987 1988
0 1 2 3 4 5 6 7 8 9 10
q a i s f e Peading disposal at the beginning of the year 454 657 1,627 1,939 1,480 2,421 1,735 '2,216 2,843 3,004
m s § g it Raised during the year 1,510 3,094 “4,932 7,830 8,989 8,217 8,908 8,686 18,895 9,922
fo y Total available for disposal ... 1,964 3,751 76,559 9,769 10,469 10,638 10,643 10,902 11,738 12,926
f e u s i t g i t Settled in Conciliation/Mutually Settled 522 1,022 1,039 1,504 1,598 1,704 1,661 1,544 1,506 1,165
^n jH ^ 3I§ Withdrawn by Workers/ Unions 402 888 1,505 1,633 2,859 3,235 2,699 3 405 3,540 4,218
FTOHt d it Referred for arbitration 16 19 7 — — — 3 — — —
« e / e ^ c<T5 3 it Rejected/filed 232 313 374 1,093 936 888 683 941 685 868
Referred for adjudication 172 1,096 1,975 4,073 2,655 712 3,381 2,169 3,003 3,59
>H«tt § » f e § H H ^ M gH3ifel;^Tg f^3
Pending disposal with conciliation officers at the end of the year- 212 185 666 *
11,303 2,364 1,702 1,747 2,125 ?.91?6
H'tt ^ »fe § feirgj/jqgsiid ^ Under examination with the Department /Government at the end of the year 408 228
1
y 1,466 1 1
993 J 1,118 1.735 514 1,096 879 1,061
m iis :— ISoBfC«:—Labour Commission^, Pun)ab.
K>

413
17.17—^ ^ 5TH5T ^ te^fdisr ?ai3 ft?Si Sfgt 053^55 3T33^>niTable 17 -17—Industrial Disputes Resulting in Strikes and Lock-outs by different Causes
LABOUR AND EM PLOYM ENT
(Nunabor)
PT?5 § 3 3 3 >H§ U3 H 3
Year Wages aod Allowances
Bonus Personnel Leave and Holidays
Retrenchment
Other Total
n 1 2 3 4 5 6 7
1966 16 — — _ 1 4 21
1971 9 1 — — 1 4 15
1975 6 — 5 1 1 8 21
19^0 38 7 23 — 5 16 89
1983 22 4 24 1 5 15 71
1984 13 3 14 — — 8 38
1985 11 1 15 — — 19 46
1986 16 3 15 1 2 19 56
1987 14 5 11 3 1 16 50
1988 I I 4 19 — —i 10 44
w m :^ f3 [ ^ 3 sffneOT,Source i —Labour Commissioner, Punjab*

414
>K§ a i j g r eLA B O U R A N D E M P L O Y M E N T
17.18— M3HTU U33W »f§ >H§ f e i ^1988
Table No. 17.18—Industry-wise workers involved and man-days lost In Strikes and Lock-outs in Punjab ; 1988
(Number)
Code Industry
HTHH^ fdledl "cdoid^ ^
Number of Number of works workers stoppages involved
foran
SofRTS Number o f
Man-day lost
00 Agriculture Production 1 35 560
20-21 W o t U H ^ y t g r Manufacture of Food products ... 2 539 2,43022. l i f e ^ H 3 t, >H§
23. g 3 ^ * o n i^ gcS’Qe'T24. §csl I h H ^
y A 't ^ T
Manufacture of Bewerages, Tobacco and Tobacco Production
Manufacture of Cotton Textiles ...Manufacture of Wool S ilk and
Synthetic Fibre Textiles
18
6
1626,629
451
1,8661,20,183
3,330
26. H?TTt3T Manufacture of Textile Products... 1 129 12928. SfTgy § sngm SU^el Manufacture of Paper and
paper product, printing, and allied industry 2 680 5,736
30. ng3 u s § s >n§ ^ Manufacturing of Rubber Plastic Petroleium and Coal Products ... 3 713 77.825
31. UFFfe >H§ Utl'dg^ ^ f iq ^ § US^E^m >H§ ^
iitJ'dy 1
Manufacture of Chemical and Chemical Products (except products of Petroleum and coal) ..c 1 112 28
32. ^ U'H yfetl Manufacture of Non-Metallic Mineral Products — ____ —
33. MS qiB f*€Gic31 Basic Metal and Alloys Industry ... 4 303 16,917
34. »f§ fon HHlft§gr >H§ RH ?) fHc T
35. H t o l , HRt?) m >H-§ feR ^fH^ig fgvi?^ e1 ^
Manufacturing Metal Products and Parts except Machinery and Transport equipmentManufacture of Machinery,
Machine Tools and parts except electrical Machinery
2
3
889
69
18,024
1,246.
36. fgt 64 Hi HRIh^ § §RU5Tst Hc Tg T
Manufacture of Electrical Machinery, Apparatus, Appliance and Supplies 3 439 8,437
37. Ri>f?> >H§ fd'lR>>i Manufacturing of Transport equipment and parts 3 44 772
41. >H§ sfTU Gas and steam — — ____
65. u te , ^ T ^ » T , ^R3T ^ ^yig
Retail Trade in Food Articles, Bewerages, Tobacco and intoxicants 1 40 191
70. Land Transport 2 10,159 12,.^59
99. UH R€T^^ Services not elsewheie classified 1 17 867
R3Total 44 21,410 2,71,100
RTtrs: faraj ^HRS3, ufiTg iSource : Labour Commissioner, Punjab.

415
foB H M 3L A B O U R A N D E M P L O Y M E N T
17, 19— 1926 »fCft?>Table 17.19—Trade Unions under the Trade Unions Act, 1926
R t h Mffrdt»T § )jf3
(3 U § ) (1U%) (3U §) § (nffH Hldl<5dl
Year
Total number
of Unions standing registered at the end of the year
di9NumberofUnionswhichsubmittedreturns
Number Opening* of Balance
Members* (Rs.)
Income*(Rs.)
Expenditure*(Rs.)
Closing* Balance
at the end of the
year) (R s.
0 1 2 3 4 5 6 7
1966 473 288 73,980 1,41,416 3,64,200 3,05,937 1,99,688
1971 470 365 1,25,187 3,60,338 16,43,624 ; 14,94,791 5,09,221
1975 731 464 2,05,871 9,85,665 17,51,540 15,61,739 11,75,466
1980 1.070 409 2,25,592 10,81,215 18,73,295 16,20,890 13,33,620
1983 1,222 469 3,33,628 14,31.781 34,65,839 29,43,966 19,53,654
1984 1,296 416 2,75,037 30,73,447 28,79,923 25,56,244 33,97,126
1985 1,376 457 3,16,888 13,74,530 45,31,405 45,24,707 13,81,228
1986 1,429 491 3,41,766 30,26,907 50,00,546 51,18,882 32,08,571
1987 1.520 484 3,16,297 22,46,462 40,58,919 40,97,068 22,08,313
1988 1,635 456 3,93,863 57,76,792 55,92,285 87,(^9J87 25,99,890
R H JS :— f s r ^ 5ffH353, I Source ;—Labour Commissioner, Puojab.
f § >HTqf33, fafl >h »ffen w^'] h s ?>u? yt§ |*dased oa the returns received only and as such difference occurs in the opening /closing balances.

f o T 3 3 d i J d l '3
LA B O U R A N D E iv lP L O Y M E N T1 7 .2 0 — FF^5 1988 3 ^ h W f t e t JHSTTB ■ ^ 3 ^
Table 17.20^Distribation of Trade Uoions according to their Membership site for the year 1988
4i6
Group of members Number of TradeUnioos submitting returns
;gl
Membership
1
50 § ‘ dst
Below SO
50 f5H H* f i r a ira 100 Ufe
50 or above but below 100
100 flT fen §* ira 300 3* uT
100 or above but below 300
300 tT fen 3* ^ ira 500 uT?
JOOor above but below 500
500 tT* fey? §* ^ IW 1,000 3* ufe
500 or above but below 1,000
1.000 fen 3^ vra 2,000 §* uTa
IjOOO or above but below 2,000
2.000 ^ fen 3 ‘ f ira uu 5,000 3 *
2.000 or above but below 5,000
5*000 tT feR t u g ira 10,000 H* U|^
5.000 or above but below 10,000
10 0 00 tP fSR t y s
10.000 or above
lo ta l
60
74
141
42
55
32
30
15
456
1,685
4,609
21,387
13,479
31,893
34,948
1.05,765
96,191
83,906
3.93,863
FTfiis ftraa orfHBRfa, Otto iSourct Labour Commissioner, Puqiab.

417
feT3H M3 tHgi'3L A B O U R A N D EM PT O Yn tE N T
17. 21— 1988 ufflR^STS WTable 17.21—Party Affiliation of the Registered Trade Unions in Pi^r'jt.h f«r tbc "sar
R H g' C ’ ftf ftlH ?PE Hsra 9 Nfme of the Cpntr«1 vvVnm "f^*!'-^cd
f :^?T% ^ q ;s
e l
fgid'c/1r .. ofunions ,submittingreturns
Me^bjraaiP
0 1 2
SHS75 2 ^ 5 oH^dldH Indian National Trade Union Congress 44 27,509
<;9a o(idldH A ll India Trade Union Congress • •• 53 45.179
8»aa) H ti^ a ^fihartiya MazdoOT Sangh _ 167 1,36,566
Hind MazdoraSangb 10 15.623
ftfe i f e ^ H Hind Mazdocv Panchayat ... _
>HTS fSsf1>HT Cwitre o f India Trade Union 65 55.835
UtTO vra^d \ iB Punjab Mazdoor Dai I 1.094
<5b
Others • •• 116 1,12,057
A 3Total 456 3,93.863
RnjS:— c?fHe?J3,Source :—Labour Commissioner, Puajab.
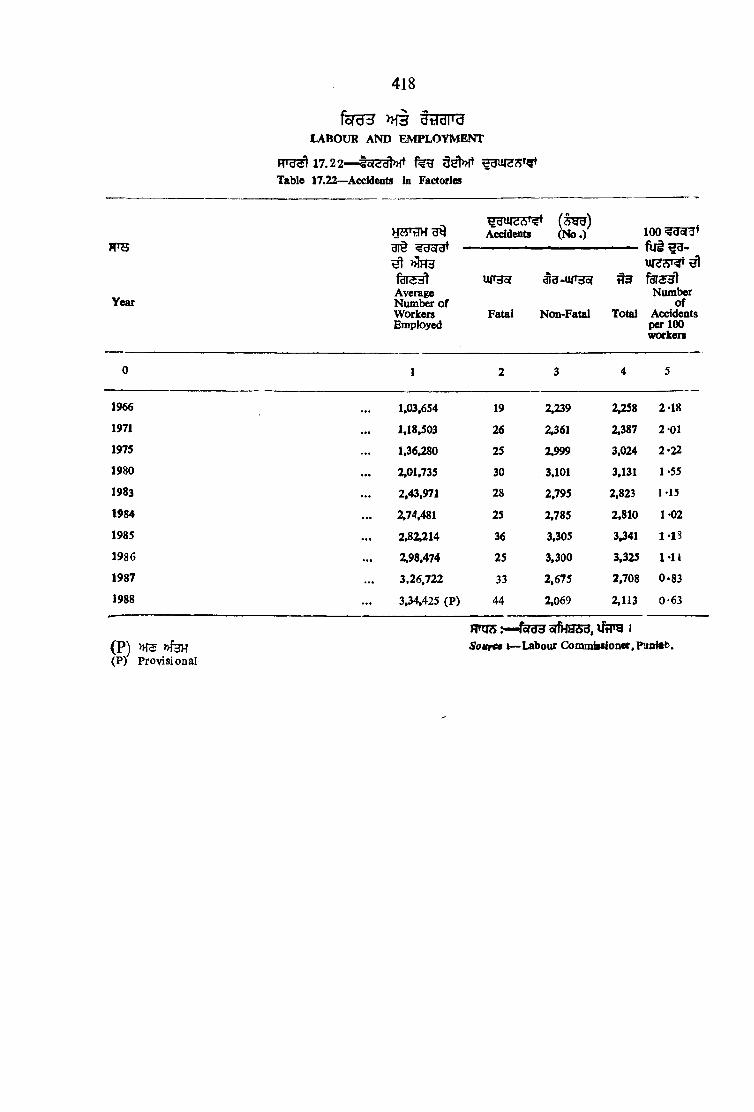
418
f e d H >>fH d d d l'dLABOUR AND EMPLOYMENT
17.22—Table 17.22— Accidrats in Factories
H'W
Year
Accidents (No.) 100 « dc<rit
rdl<id)Average Number of Workers Employed
UiW
Fatal Non-Fatal
uie<sf^ ^
Numberof
Total Accidents per 100 workers
0 1 2 3 4 5
1966 . . . 1.03,654 19 2,239 2,258 2-18
1971 1,18,503 26 2,361 2,387 2 *011975 1,36,280 25 2,999 3,024 2 -22
1980 2,01,735 30 3,101 3,131 1 -55
1983 2,43,971 28 2,795 2,823 1*15
1984 2,74,481 25 2,785 2,810 1 -02
1985 . . . 2,82,214 36 3,305 3,341 1 18
1986 2,98,474 25 3,300 3,325 1 *11
1987 . . . 3,26,722 33 2.675 2,708 0.83
1988 . . . 3,34,425 (P) 44 2,069 2,113 0-63
( P ) >H%H (P ) Provisional
«n3S: — i Source i—Labour Commistionw. Pinritt.

419
« f§ f t r a RL A B O U R A N D E M P L O Y M E N T
TT^ 17 . 23— (5TK3T3 >>55, 1923 WftcS oft3t y » r ^ )Table 17.23—Worker’s Compensation (Compensation paid in lieu of Accidents nnd^ Workmen's Compensation
Act, 1923)
Item1 9 6 6 1971 1 9 7 5 1 9 8 0 1 9 8 3 198 4 1 9 8 5 1 9 8 6 1 9 8 7 1 9 8 8
0 10
>Hof
Nomber of accidents reported by the employers under the Act
(i) ujTofFatal
(ii) *To<idnj5 Permanent Disability ...
(iii)Temporary Disability ...
Total
12 11
20 I I
175 162
7 4
4 3
11 14
66 58 26 5 33 27
237 184 70 37 12 12 35 30 ^6
H ^ go?H (ll4^)Amount of Compensation paid (R s )
(i) UTHo?Fatal ... 28,000 7,000 25,000 1.90,200 j 84,000 55,700 3,63,120 1,43,512 1,32,472 9,90,589
(ii)Permaaeat Disability ... 19,096 17,557 9.770 ’ 30,225 — 27,342 39,690 — 61,103 31,812
(iii)Temporary Disability ... 17,405 13,717 9,486 150,170 19,575 348 - 11,425 2,732 —
Total ... :;:64,502 38,274 '44,256 2,70.595 1,03,575.33,390 4,02.810 1,54,937 1,96,30710,22,401
HHTS:— orfkasg, UtTHI Source Labour Commissioaer, Pnqjab*
5 2 :— feR »feH H » T ^ cfH
fed* f3PH 5 JkNou~-T\i9 iaforciatioa ia this tabls relatst to tliDss accidsiit} far wbish final conpensatioa has bsea paid by tbs employers

420
fo ra 3 >H§LABOUR AND EMPLOYMENT
17.24— lofS yW >H§ ^Table 17.24—Indostrkd injuries in Factories and their incidence rate
Year/State
ofHFatal Non>Fatal Total
S ; S ? f :
oT3HH^3t>HTf U i) m ) fU t)
No. Incidence No. Incidence No. Incidencerate (per 1000 rate (per 1000 rate (per lOOO
workers workers workersemployed) employed) employed )
0 1 2 3 4 5 6
1961 . . . 474 0-14 159,222 45-53 159,696 45 -67
1971 . . . 635 0-15 324,545 75 -52 325,180 75-67
1975 . . . 660 0-14 241,663 50 -72 242,323 50 -86
1979 . . . 830 0'16 317.438 61 *74 318,268 61 -90
198C* . . . 774 0-15 333,108 65*14 333,882 65-29
1982* . . . 599 0.12 301,669 64.06 302,268 64.18
m i* . . . m 0-15 291,554 59 *07 292.2J4 59-22
1984* . . . 305 0-10 108,625 36-62 108.930 36-72
1985* . . . 630 0-15 217,328 51-74 217,958 51-89
1986* . . . 619 0 1 6 236,311 54 -95 236,990 55-11
•d't! state 1986
>K»qgT i{ ^ a Andhra Pradesh . . . 67 0-18 7,772 20-09 7,839 20-27
>Hnw Assam . . . 11 0-14 926 12-31 937 12 *45
Bihar . . . 52 0-11 6,n90 13-47 6,142 13-58
at^g'3 Gujarat . . . 95 0-20 36.820 76-51 36,915 76-71
Haryana . . . 24 0-15 3,125 21 -79 3,149 21-94
Himachal Pradesh . . . • • • • • • • • • •
t?H>H§ sraiHls Jammu & Kashmir . . . . .
ddei^Sol^ Karnataka . . . • • . . . .
Kerala . . . 9 0-05 4,561 25-19 4,570 25 *24
Madhya Pradesh . . .
Hd’d'asa Maharashtra . . . 186 0*18 57,282 54-97 57,468 55-15
Manipur — — — — — -
H u n f^ Meghalaya . . .
Orissa . . . 16 0-17 3,275 34-47 3,291 34-64Punjab . . . 24 0*20 3,300 28-23 3,324 28-43
g w fgrs Rajasthan . . . 24 0.20 7,399 61-55 7,423 61 -75
3»fMS <5 5 Tamil Nadu • • • 106 0-16 18,624 28-46 18.730 28-62
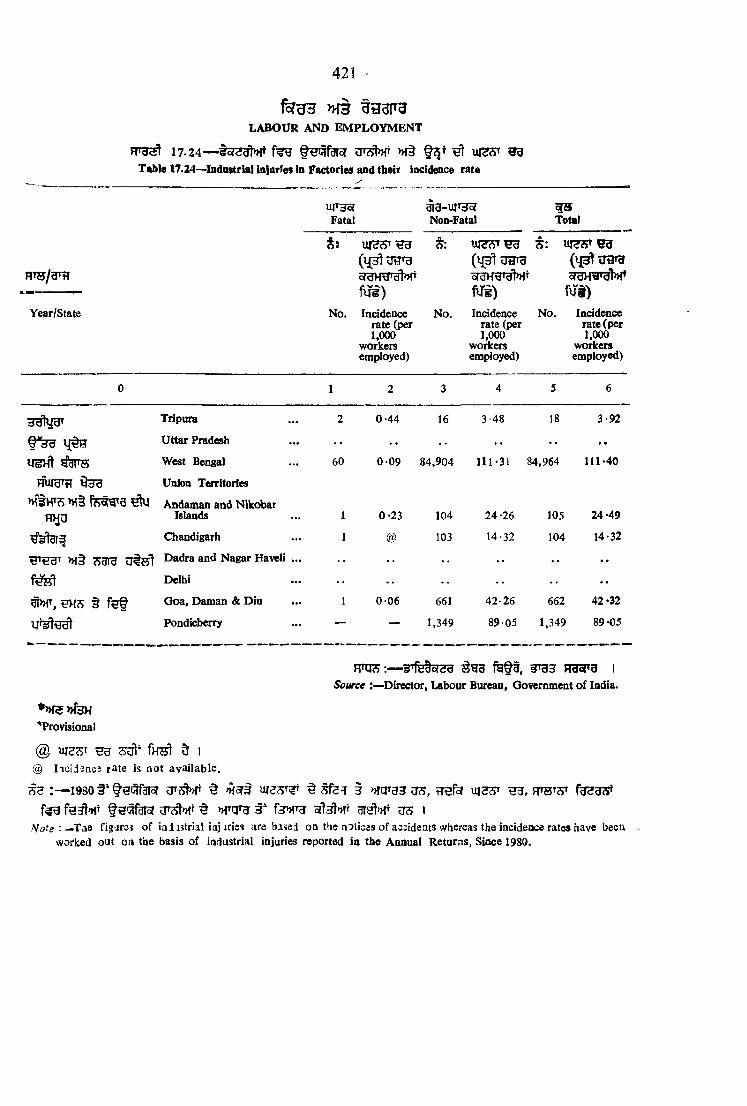
421
17.24— tcf?gh>ft »f§ ^ g gTable 17.24—Industrial lalurfes in Factories aad their incidence rate
>«3 tH3I»3LABOUR AND EMPLOYMENT
Fatal3ig-UJ»do<Non-Fatal Total
W E fW ri oraHVJ'dl'H^m )
uie-<5TSd( i j ^ dijTd
m )
ora>fErgt>H*m )
Year/State No. Incidence rate (per 1,000
workers employed)
No. Incidence rate (per 1,000
workers employed)
No. Incidence rate (per 1,000
workers employed)
0 1 2 3 4 5 6
Tripura 2 0-44 16 3-48 18 3-92
1{§B Uttar Pradesh •• •• •• •• •• ••
u s h ! y d l'ii West Bengal 60 0-09 84.904 111-31 84,964 111-40
Fftud'ti Union Territories
>H§ f e ^ ’a ^R y u
Andaman and Ntkobar Islands 1 0-23 104 24 -26 105 24-49
Chandigarh 1 @ 103 14-32 104 14-32
ti'tddf >H§ u t s l Dadra and Nagar Haveli ... •• •• .. .. . . • •
Delhi •• •• •• .. .. ••
§ f e t Goa, Daman & Diu 1 0-06 661 42-26 662 42 -32
Pondicherry --- — 1,349 89-05 1,349 89-05
FTOS;— ^Tfetoraa s g g f e f t , ^ 3 0 ^ 3 1
Source :~D irector, Labour Bureau, Oovernment of India.
■'Provisional
@ ure?jT ^ fnst !f i @ Iic i i^ a c J rate is not available.
1980 § ‘ t9>3r3r5r ^ *HSr ^ § W 3 3 tT^f UI^ 9^ »rcraf 3 o?> 1
N ote Tae figarsj of ia lis tr ia l iaj iriss are based on the notices of asiideats whereas the incidence rates have been worked out oa the basis of industrial injuries reported in the Annual Returns, Since 1980.

Ufest F P U ^ o f lR ^ ^ f e l ^ , » lt ygfecf fewfe^, oIH§ UftlHSHHHT>nftra!»i oftj?yt>Ht ^ ^ ifFTg feg ^ ^ erg fe3T j y g R i f ^ fi i
W b^ 18.2 1988-89 § ^e^lftTH fHUfeS UTft cW J^, »To(iB >H§g^Mfdfof #3 >HOTg trafR'^>rtt g i ^ U3 I
rrgst 18.3 feg 1988-89 T ife H 'of oWSt>H' (ngofr^ »f§ Hgofr^)»HfqofTg3 ^ Hgi? 5 \
FT O ^ 18.4 f e g oW c B HOhnt oW2 ^ 5 I
SECTION x v n i
JOINT STOCK COMPANIES
The first table shows number of Companies, Private and Public Limited at work, companies registered and companies ceased working in Punjab.
Table 18.2 gives the distribution o f new Joint Stock Companies registered in Punjab during 1988-89 according to size and industrial classification.
Table 18.3 depicts Statewise distribution o f jo in t stock companies (Q ovt. & non Govt.) and their authorised capital during 1988-89.
Table 18.4 shows the number of companies at work in India.
423
1 8
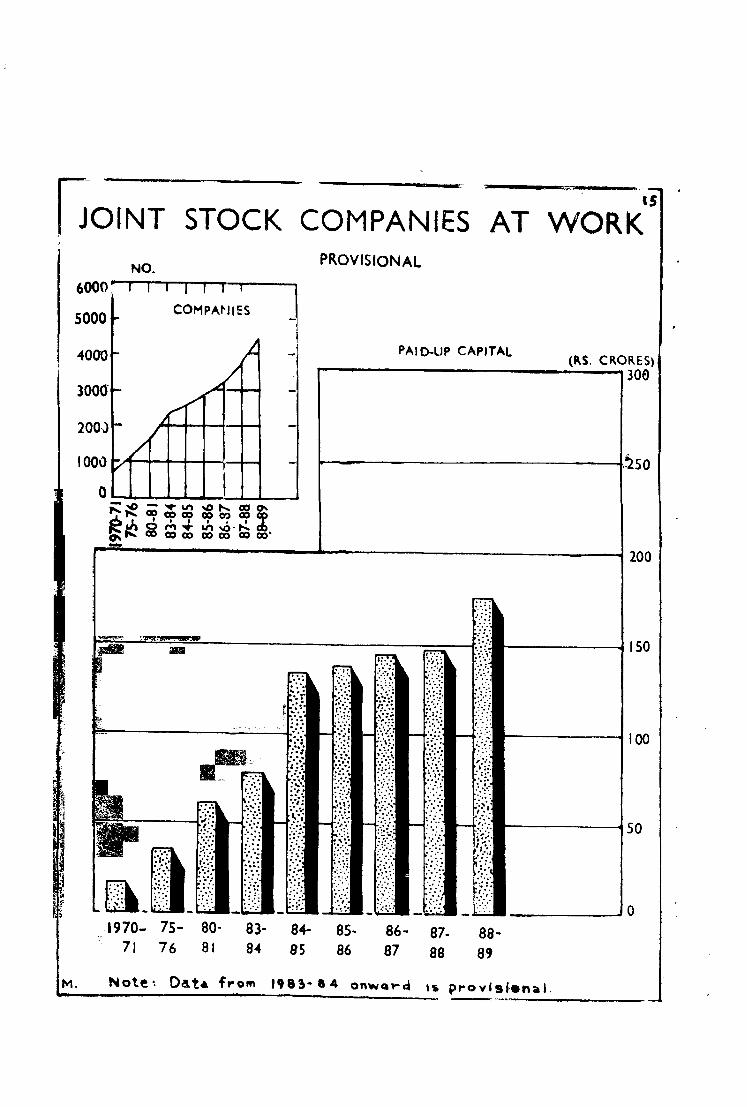
JOINT STOCK COMPANIES AT WORKNO.
6000' I I I I I I

JO IN T S T O C K C O M P A N IE S
18.1— uVg ofH 5T3 gd!»ff oW oT3So f u ^ ^
Table 18.1—No. of Companies at work, Companies Registered and ceased working in Punjab
425
on 31st March
^ sra Hdh>T
Companies at work
JTO §g e ofHs
cfU c^Companies registered Companies ceased working
daring tlie year daring the year
f3T5^
No.
»f5' 5Tt3t
Paid up capital
(Rs. crores)
fars^
No.
>nrgcrrg3
(? ^ iu§ )Authorised
Capital (Rs. in lakhs)
No.
yal1U§)
Paid up Capital
(Rs. in iakh i)
0 1 2 3 4 5 6
1957 581 12-5 47 126 35 17
1971 751 15*9 59 244 11 4
1976 1,167 34-5 56 272 1 -1981 1,621 60-9 214 1,813 10 8
1984* 2,349 78 *4 240 2,880 8 3
1985* 2,581 134 -0 233 3.014 1 —
1986* 2,930 137 -8 356 4,812 7 9
1987* 3,282 145-9 358 3,441 6 5
1938* 3.800 148 *6 519 3,996 — —
1989* 4,401 175-6 601 4,818 — —
^t33 FraoTO \Source : —Department of Company Affairs, Government of India.
♦Provisional.
s e :— 1. fbu ihhhIhhst ^ to a ^ to iNote 1. These figures do not indicate number of Association not for profit.

T trfe? orLfstWJO IN T S T O C K C O M PA N IES
Hf3^18.2— 1988-89 S Hf§3 »{fQ3^33 ypft >H5f7 3 »fTcrfM§ ^
Table 13.2—Distribution of Joint Stock Companies Registered in Punjab during 1988-89 according to the size Group of Authorised Capital and Industrial Classification
426
Mfq5rT33 yfft Size Group According to Authorised Capital
Industrial Classification
fesr m feo TsU 5 m 10 m 25
HU§ T 3'4§
ufe 5 S t f ia?5tf 25 m § R H"B ' 3 ' 1U § T # 3
ufeBelow R s . l R s.5 R s. 10 Rs. 25R s . l lakh but lakh but lakh but lakh andlakh under under under above
R s.5 Rs. 10 R s.25lakh lakh lakh
Total
0. »T RgUH cTugrg
1. »f§ HTofH
2. yrs»{§ § '
» lt feUHT^3. TTHT »T§
>H§^ UrIr^ §
4. >HfFr^T^:^ URfe^ f e H H ^ frlcS‘ § fofUd UU cftHTfePHT I
5. Qh^S >h§ §iragi3T6. STHUR (^ITU >H§ f%3)
7. >HTtTT?l »it
8. RyfUoT >H§
9. fetft »f§ Ug R^T
H3
Agriculture and Allied Activities
Mining and Quarrying
Processing and Manufacture of Food stuffs.
2 12— 2
Products thereof 1 25 37 5i 12 126
Processing and Manufacture of Metals and Chemicals and Products thereof 56 88 52 >6 212
Piocessing and Manufacture not elsewhere classified — 1 1 1 — 3
Construction and Utilities... — 4 7 3 — 14
Commerce (Trade and Finance) — 8 14 12 2 36
Transport, Communication and Storage — 9 4 6 — 19
Community and Business Services 2 102 41 19 5 169
Personal and other Services — 2 2 3 1 8
Total 3 209 199 152 38 601
R ^ :— oWtSW R ^ l grgn RBoTO ISource \—Departirent of Coirpany Affairs, Govt ot India.

427
giisTnfJO IN T S T O C K C O M PA N IES
18.3— 1988-89 § UfRH<i3 U5tMT rTfH UT^T^d # 3 >H§ »iftlo?Tg3( H ^ t^ m
Table 18*3—State-wfse Distribution of Joint Stock Companies Registered in 1988-89 anJ their Authorised Capital(Go vi and Non .Govt.) _____________
HUigTH
>H WmuH
qtIUT3
u fw sT
o(cJrt*Co(
i j ta HU d W<Jd
Ut?rgHTtlRgrs
ijjSaUsHtg s t e
HHS >H§ fe §
fb v n ^ i{§H
3utucnHunfe>»iT
>HiH^>H§ f e g wbtg^snasH w r »f§ u t s li>HTftRH
State U. T .
afHR^a a ^ » f ofu?jt»rNumber o f Companies Registered_______
nffqsrgg ^ ( S t f
Rd6p ^ ^ 3 iflPHTfeg)Authorised
Public Private Total Capital(LakhRupees)
0Andhra Pradesh
Assam
Bihar
Gujarat
Haryana
Jammu and Kashmir
Karnataka
Kerla
Madhya Pradesh
Maharashtra
Orissa Punjab Rajasthan Tamil Nadu Uttar Pradesh West Bengal Chandigarh DelhiDaman & Dm ManipurHimachal PradeshPondicherryTripuraMeghalayaMizoramNagalandAndaman and Nicobar Arunachal Pradesh Dadar and Nagar HaveiiGoaSikkamLakshdweep
Total
184
38
25
40
22
4
27
30
22
112
2548
199867
201
27182
1456 1 1
1
1,220
196
420
1,465
269
63
931
295
651
4,237
198553501
1,4971,0502,318
2184,346
823
118422
143
11
97
127
1,304
234
445
1,505
291
67
958
325
673
4,349
223601520
1,595
18,003
4,813
5,215
14,308
5,785
3,294
9,271
4,527
6,411
31,421
2,254 4,818 3.322
23,180 1,117 1,37,021
2,519 35,2644,460
60.016 171
1,306 1,01.086
908
2454,528
927
12348
3153
12
97
136
85342160319
131116
1,503
1099 20,792 21,891 4,79.510
Source i—^Department of Company Affairs^, Government of India
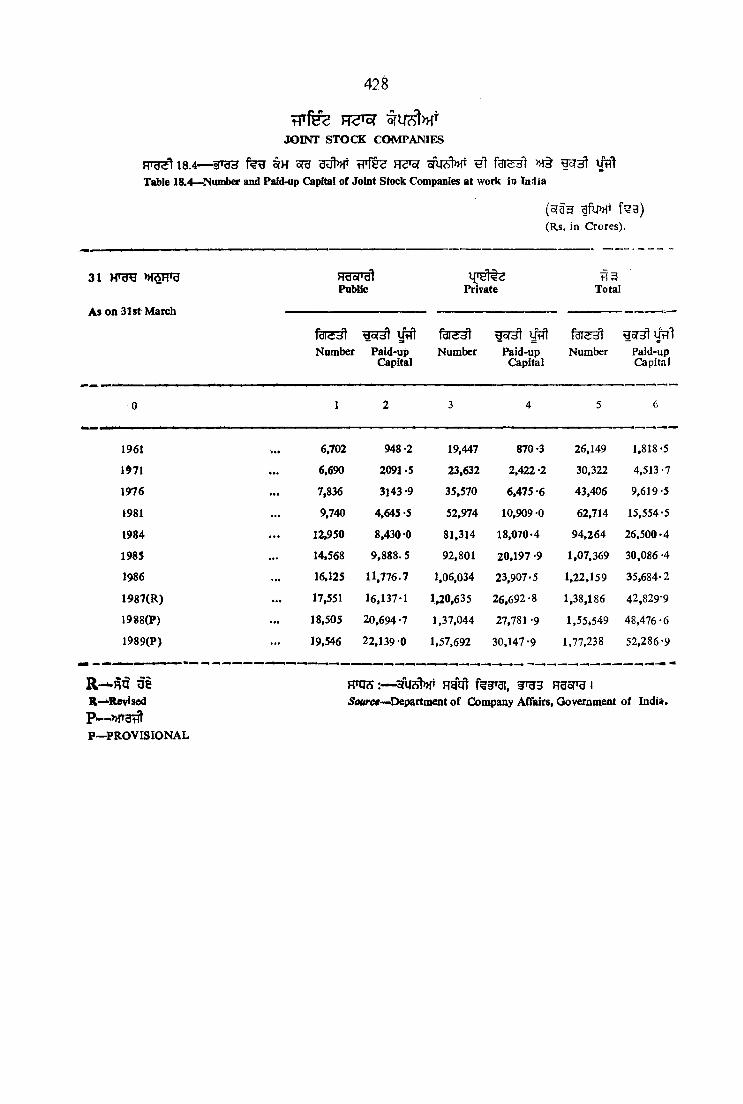
JOINT STOCK COMPANIES
18.4— r 9 3 WH ora H rsf oW?jt>Ht >H§ UtftTable 18.4— Number and Paid-up Capital of Joint Stock Companies at work in In4ia
(5rf3 f?3)(Rs. in Crores).
428
31 >H3FTO
As on 31st March
WddTcrtPabUc
Paid-upCapital
Private
Numberrdi<5dlNumber Paid-up
Capital
H5Total
Number Paid-up Capital
0 1 2 3 4 5 6
1961 6,702 948 -2 19,447 870-3 26,149 1.818-5
1^71 6,690 2091.5 23,632 2,422 -2 30,322 4.513-7
1976 7,836 3143-9 35,570 6,475 -6 43,406 9.619-5
1981 9.740 4,645 -5 52,974 10,909 -0 62,714 15,554-5
1984 12,950 8,430-0 81,314 18.070-4 94,264 26,500-4
1985 14,568 9,888.5 92,801 20,197 -9 1,07.369 30,086 -4
1986 16,125 11,776.7 1,06,034 23,907-5 1,22.159 35,684-2
1987(R) 17,551 16,137-1 1,20,635 26,692 -8 1,38,186 42,829-9
19«8(P) 18,505 20,694 -7 1.37,044 27.781 -9 1.55,549 48.476-6
1989(P) 19,546 22,139-0 1,57,692 30,147 -9 1,77.238 52,286-9
R-^Revised
P—PROVISIONAL
Hgcrt ferai, ¥ ^ 3 praorra 15Miree—Department of Company Affairs, Government of India.

429
HoTH?? 19
>H§ fRU3
19.1 iftTO >>i;sFru m tnsH H 3 ^ g fen^H*
fe§ gi§ IR T g ^ 19.2 iftTO ;gt»fT HHyr^r ^ f^»^T ^|
19.3 M b UHIT3TBT f e H U * H ^ ^ M HUH U ^ l
FTHSt 19.4 H f y a M § >H f§?t3 f855Tfr oTtt H lt t l »f§ H3^ ^ g w 0 5
i r g ^ 19.5 f l B W B t f e s ? , o fH §O fg^ HHy-^f UUtT TO I
F T ^ 19.6 f f H fi?^, f S E ^ f m »i5RTg H ^tsfS H R gi^ i 1 ^ ^eUtl U 5 I
F T ^ 19.7 W H M s r s M § O g ^ -M s f^ f e t g i§ TO I
19.8 liviTsr >Mt 0 ^ H ^ t e oranuT^ w t e > h t ^ ^ u h d i
J T ^ 19.9 HHgT, »^§ FiRgT >nifte »ft tJtTTg v Tgr 'tfUi t s Hsilfl HTOT HUH t \
19.1 0 3" 19.14 ^ srfe»TS ??fTO ^ m ) 9 I
F f T ^ 19.15 f % UHfe^ ^ UTZ o P ^ s f t t tT S ^ ^ BHTg t
gr^ d 1
R rg ^ 19.16 W ^ f of giH ^ l { ^ HHH ^ I
19.17 f ^ u ^ ifte^ iT^ h ''h >Mqte flfet Ht H fw gret 5 I
SEC nO N XIX
MEDICAL AND HEALTH
Table 19 *1 Presents biith rate, death rate and infant mortality rate per thousand by area.
Tables 19 *2 gives details of medical institutions in Punjab.
I ’able 19-3 shows the patients treated in hospitals, dispensaries etc.
Table 19.4 gives broad category-wise out-patients, in-patients ^ treated and number of deaths occurred amongst in-patients.
Fable 19 *5 gives information relating to Ayurvedic, Unani and Homoeopathic institutions.
Table 19 ’6 shows beds installed in medical institutions sex-wise and district-wise.
Table 19 -7 depicts registered medical and para-medical personnel in Punjab.
Table 19 *8 indicates population served per medical and para-medical personnel in Punjab.
Table 19 *9 shows population served per institution, bed, doctor and area covered per institution and bed.
Tables 19 *10 to 19 *14 shows the progress of the family welfare movement in the State.
Table 19 *15 indicates the Progress of Prophylaxies against Nutritional anaemia in Punjab.
Table 19 *16 shows the Progress of Immunization programme in Punjab.
Table 19*17 indicates the villages covered under drinking water supply scheme district-wise ia the State.

16
MEDICAL INSTITUTIONSAS ON 1ST APRIL
NO.3000
2400
1800
1200
600
1970 1975 1980 1982 1984 1985 1986 1987 ( 988 1989
M
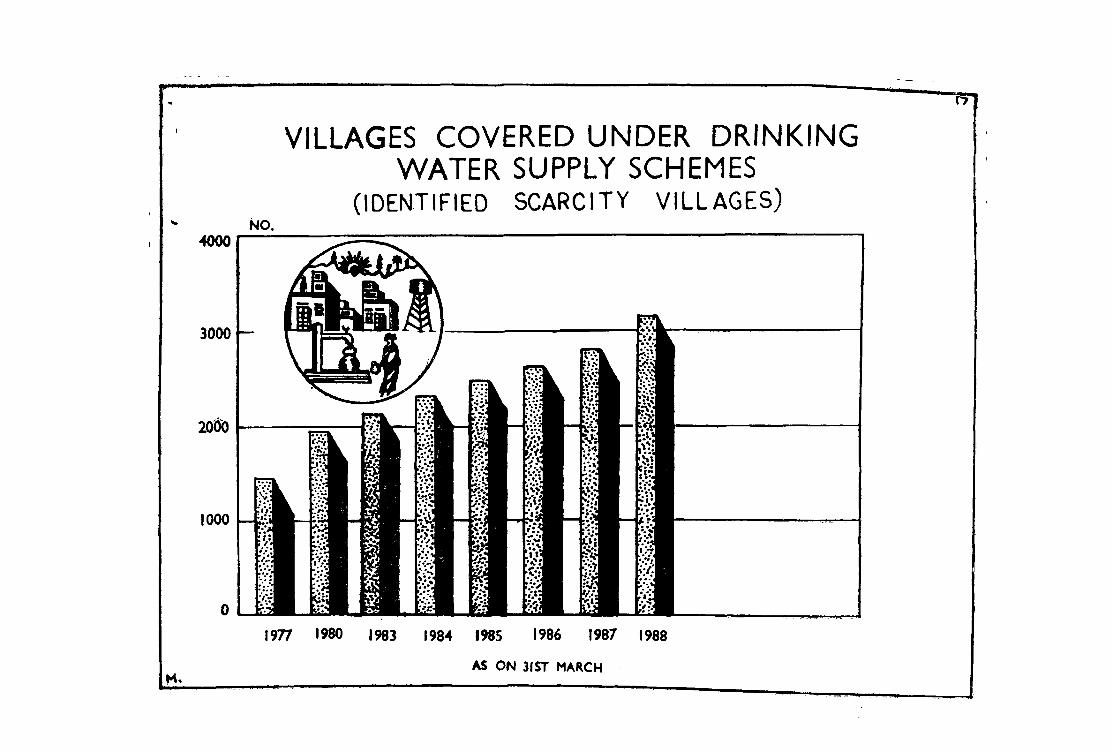
ly
VILLAGES COVERED UNDER DRINKING WATER SUPPLY SCHEMES
(IDENTIFIED SCARCITY VILLAGES)NO.
4000
3000
2000
1000
1977 1980 1983 1984 1985 1986 1987 1988
AS ON 3IST MARCH
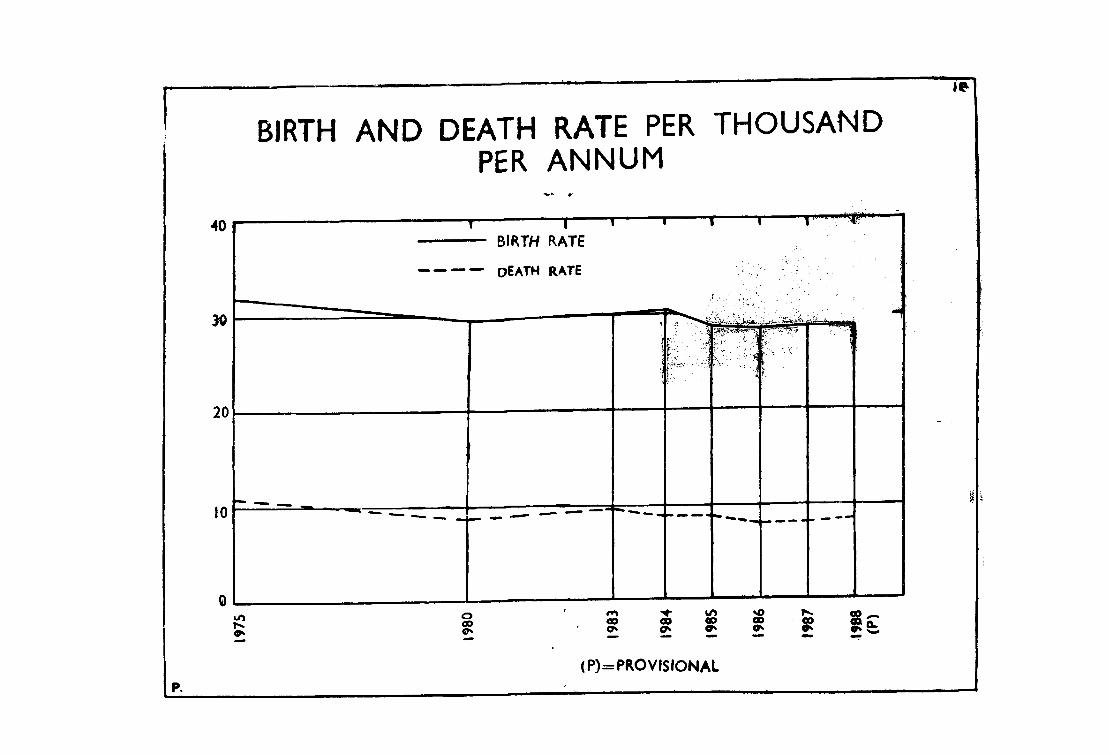
1^
BIRTH AND DEATH RATE PER THOUSANDPER ANNUM
40
20
1.............I » • 1— BIRTH RATE
1-------- 1------- .....
— death RATE
<«!
'i
r..
10
vO<9
OCO0S
CO^ tn00 opCh
>o00 00
(P)=PR0VISI0NAL
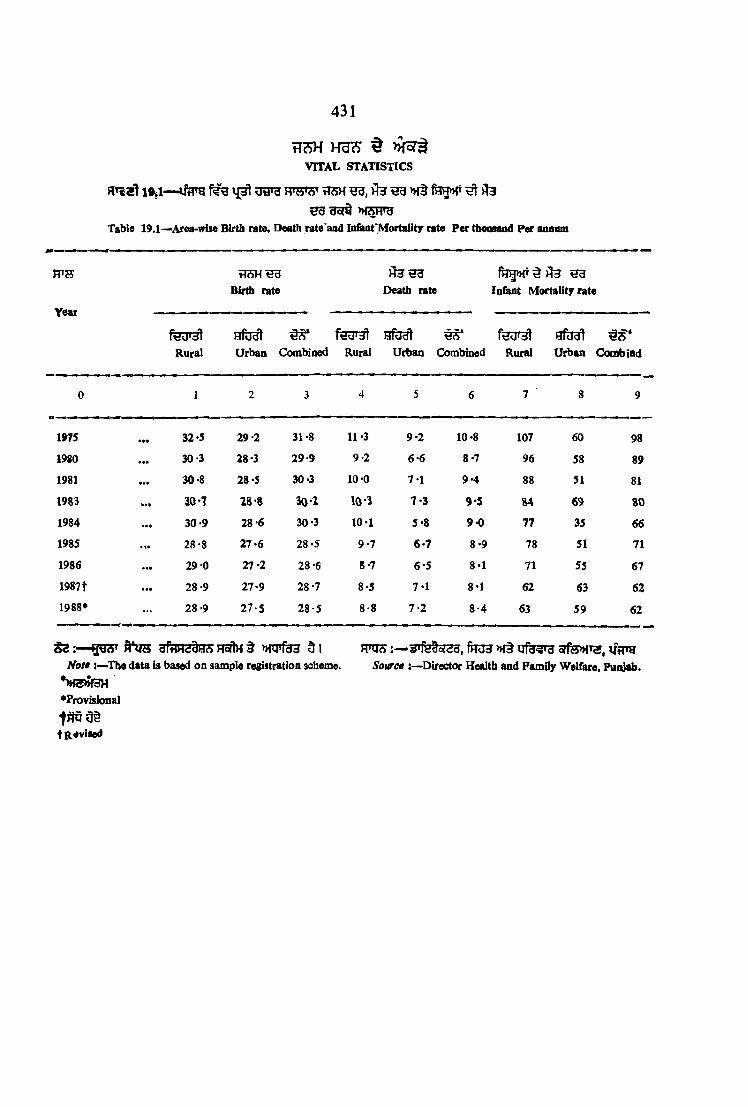
431
HOT HTO tVITAL STATISTICS
l«il— iTfra gwg FTSW t725H >H§ >H3ITO
Table 19.1—Area*wise Birth rate. Death rate'and In&nt'Mortality rate Per thoannd Ptf annam
Birth rate Death rateH3
In&at Mortality rate
ic»riT j
RuralWd^dlRural
MiOdlUrban
dcSCombioed
fdUiJlRural
HkidlUrban
ti<SCombined
HiJdlUrban Combiad
0 1 2 3 4 5 6 7 8 9
1975 ••• 32-5 29-2 31 *8 11-3 9-2 10‘8 107 60 98
1980 • •• 30-3 28*3 29-9 9-2 6-6 8-7 96 58 89
1981 • •• 30-8 28-5 30-3 10-0 7-1 9-4 88 51 81
1983 30-7 28*8 30-2 10-3 7-3 9-5 U 69 SO
1984 • •• 30-9 28 ’6 30 -3 10-1 5-8 9-0 77 35 66
1985 28-8 27-6 28*5 9-7 6-7 8-9 78 51 71
1986 • •• 29-0 27-2 28*6 8-7 6-5 8*1 71 55 67
1987t • •• 28-9 27-9 28 -7 8-5 7*1 8-1 62 63 621988* ... 28 -9 27-5 28-5 8*8 7*2 8-4 63 59 62
g e y a*qs dfHH<i a(S ro t »fqfer d i ftcts :^¥Tfetor53, fgo3 >k§ffott :-«Th9 data is based on sample registratioa scheme. Source {—Director Health and Family Welfare, Punjab.
•Provisional
tR«viied
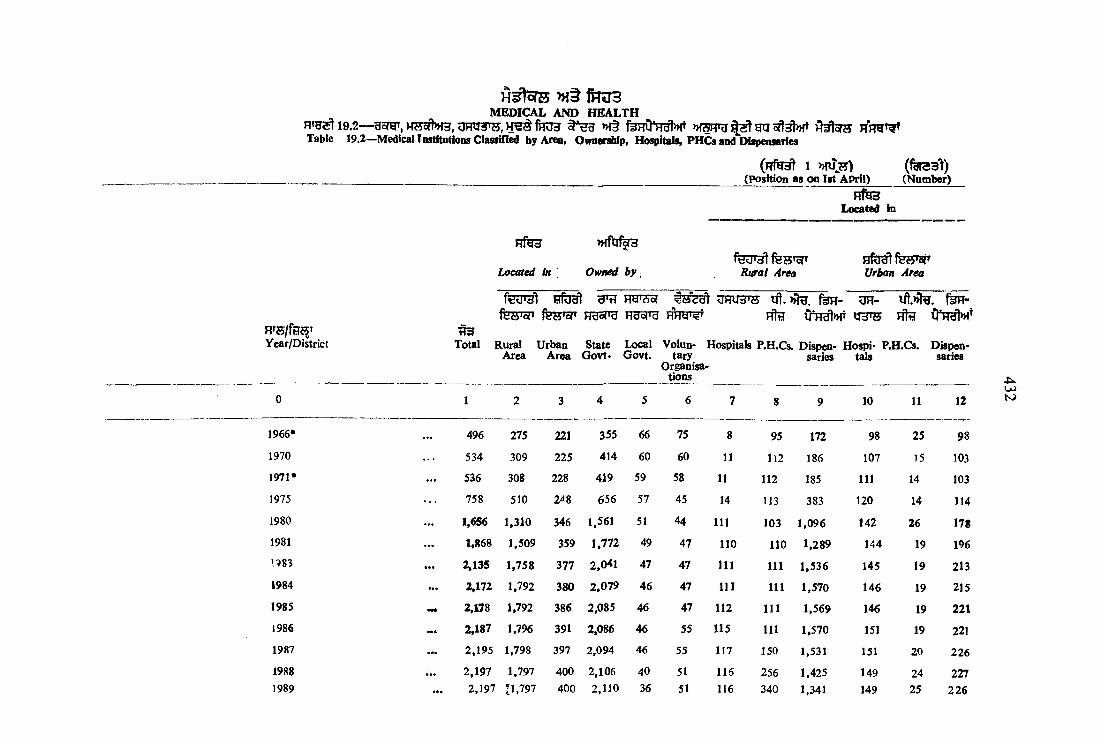
H^toTS f im 3MEDICAL AND HEALTH
>Ht feH 0*J7^ MSRTg gn Table 19.2—Medical Instftations Classified by Area, Ownership, Hospitals, P H C s and IHfpensaries
( l ? f ^ 1 W ts ) (1 ^3 ^ )________________________________________ _______ _________________________(position as on 1st April) (Number)
Located in
Rfen
Loaaed in 1 Owned by | Rural Area Urban Area
HfU^ ^ TW7^ OTT3TS ift. >J|g. feH- UR- Ut.>>Jg. feH-feHToP fe»ofT Hgsre Frasro h5 to^ pffe OiT^nr ^31 5 nfe
WSjf^EJ ^Year/District Total Rural Urban State Local Volun- Hospitals P.H.Cs. Dispen- Hospi- P.H.CTs. Dispen*
Area Area Govt* Govt. tary saries tals sariesOrganisa
tions
0 1 2 3 4 5 6 7 8 9 10 11 12
1966* . . . 496 275 221 355 66 75 8 95 172 98 25 98
1970 . . . 534 309 225 414 60 60 11 112 186 107 15 103
1971* . . . 536 308 228 419 59 58 11 112 185 111 14 103
1975 . . . 758 510 2^8 656 57 45 14 113 383 120 14 114
1980 . . . 1,656 1,310 346 1,561 51 44 111 103 1,096 142 26 1781981 . . . 1,868 1,509 359 1,772 49 47 110 110 1,289 144 19 196
• • • 2,135 1,758 377 2,041 47 47 111 111 1,536 145 19 213
1984 . . . 2,172 1,792 380 2,079 46 47 111 111 1,570 146 19 215
1983 • • • 2,178 1,792 386 2,085 46 47 112 111 1,569 146 19 221
1986 2,187 1,796 391 2,086 46 55 115 111 1,570 151 19 221
1987 . . . 2,195 1,798 397 2,094 46 55 117 150 1,531 151 20 226
1988 . . . 2,197 1,797 400 2,106 40 51 116 256 1,425 149 24 2271989 • • • 2,197 [1J9 7 400 2,110 36 51 116 340 1,341 149 25 226
4iOJN)
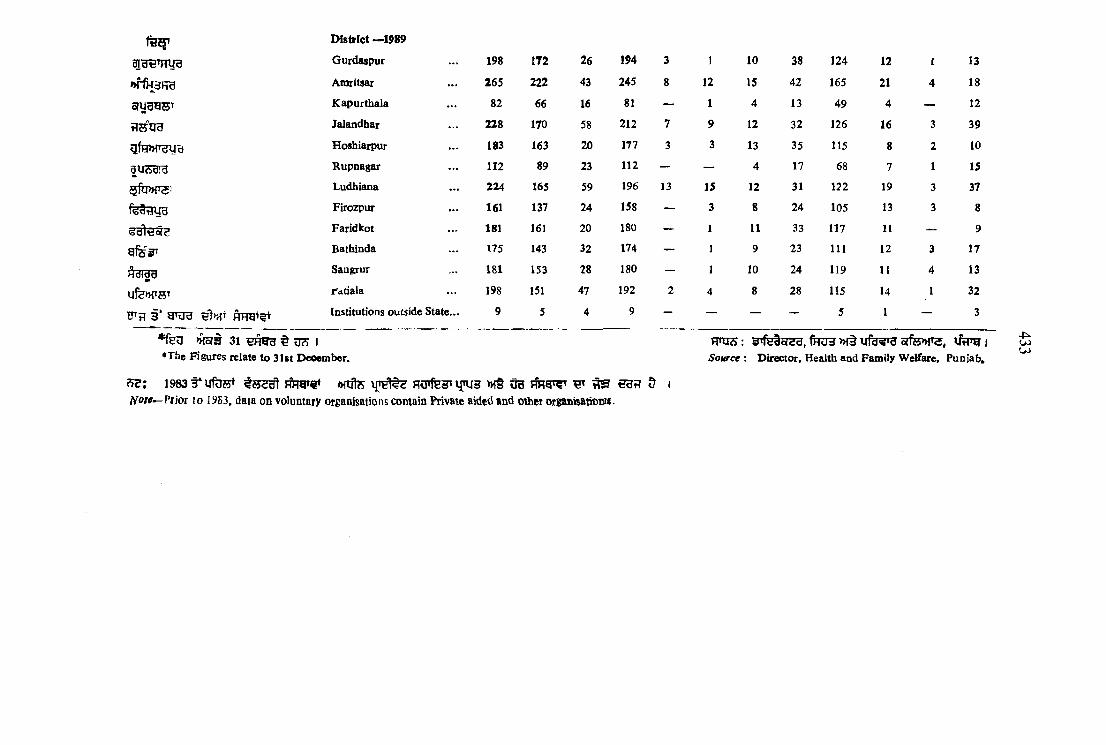
>>rfi43Rra
fTHiragfHwgyc)3U?53r3SftPHT ’
gfeV
ufe^THT3* g rg g e>/TT RJTO^?t
District —1989Gurdaspur
Amritsar
Kapurthala
Jalandhar
Hoshiarpur
Rupnagar
Ludhiana
Firozpur
Faridkot
Bathinda
Sangrur
r<tdala
Institutions outside State
*feO >){ori 31 ^ TO I•The Figures relate to 31st December.
198 172 26 194 3 1 10 38 124 12 1 13265 222 43 245 8 12 15 42 165 21 4 1882 66 16 81 — 1 4 13 49 4 — 12
228 170 58 212 7 9 12 32 126 16 3 39183 163 20 177 3 3 13 35 115 8 2 10112 89 23 112 — — 4 17 68 7 1 15224 165 59 196 13 15 12 31 122 19 3 37161 137 24 158 — 3 8 24 105 13 3 8181 161 20 180 — 1 11 33 117 11 — 9175 143 32 174 — 1 9 23 111 12 3 17181 153 28 180 — 1 10 24 119 11 4 13198 151 47 192 2 4 8 28 115 14 1 32
9 5 4 9 — — ___ ___ 5 1 ____ 3
H*urt : ¥*fB§creB, fHU3 »f^ n fd ^ '9 5ffe>>r5, U tTg | Source : Director. Health and Family Welfare, Punjab,
4U>UJ
1983t*yfU5^ # 5 ? ^ FftWT w te gcnfeST IJTU3 »H§ ug ^ ^ €g;7 5 IK0u~-^?t\0T to 1983, data on voluntary organisations contain Private aided and other organisatiOBif.

4 3 ^
HSTs t s fH03M E D IC A L A N D H E A L T H
P F 3 3 t l9 .3 — ^ A 5 t 5 r S F f r r a r ^ f % g f e 3 T f lo f t §Table 19.3—Patients Treated in Medical Institutions of Punjab
rrsjYear
Person
In-Patient Out-Patient
Malc^ Female Person MalefeR33l>H*Female
0 1 2 3 4 5 6
1966 1,95,570 1,04,089 91,481 48,80,274 26,12,694 22,67,580
1971 2,32,921 1,15,348 1,17,573 60,50,942 31,84,356 28,66,586
1975 2,80,825 1,35,935 1,44,890 88,60,626 45,72,455 42,88,171
1980 3,78,233 1,90,504 1,87,729 1,32,37,447 67,31,637 65,05,810
1981 4,16,009 2,02,490 2,13,519 1,49,08,369 77,79,275 71,29,094
1982 4,41,401 2,07,342 2,34,059 1,31,17,743 68,57,784 62,59,959
1983 4,42,278 2,05,438 2,36,840 1,35,39,568 68,94,144 66,45,424
1984 4,43,448 2,11,241 2,32,207 1,35,69,873 69,50,171 66,19,7021985 4,43,386 2,16,782 2,26,604 1,23,48,146 62,66,963 60,81,183
1986 4,30,530 2,08,757 2,21,773 1,16,73,837 59,21,422 57,52,415
1 987 4,41,360 2,07,759 2,33,601 1,30,18,779 64,71,168 65,47,6111988 5,26,191 2,47,465 2,78,726 1,21,28,441 61,76,681 59,51,760
FTq^: ^TfetoT^H frra3nf§l|fe^irf?P>r3, l/nrg JSom ee : Director Health and Family Welfare, Punjab.

435
MSlcJ?5 >H§ fO T 3M E D IC A L A N D H E A L T H
19.4— 1983T A B L E 19.4—Broad Category-wlae Oot-Patieots, In>pati«nts treated and nomlMr of deatbs occnntd amongst
IiHwtieiits during 1988
S. Name of DiseaseNo.
Out-patient In-patient Death
1 Infectious and ParasiticDiseases
2 Neo Plasms
3 Endocrine, Nutritionaland Metabolic Disea* ses and immunity disorders
4 Diseases of Blood andBlood forming Organs
5 Mental Disorders
6 Diseases of the NervousSystem and Sense Organs
7 Diseases of the Circulatory System
8 Diseases of the Respiratory System
9 Diseases of the Digestive System
10 Diseases of Genitourinary System
11 Complications of Pregnancy, Child-birth and the Puerperium
12 Diseases of the Skioand Subcutaneous Tissue
13 Diseases of the Musculoskeletal System and connective tissue
14 Congenital Anomalies
15 Certain ConditionsOriginating in the Period
16 Symptoms, Signs and illdefin- ed conditions
17 Injury and Poisoning
23.61,836
49,884
2.86,145
10,57,627
1,13,735
10,30,707
2,52,349
21,81,416
10,87,652
3,04,936
2,66,543
11.03.764
3,80,215
10.659
20,967
7,09.028
9,10,978
1,04,965
10,377
21,648
22,640
4,897
46,442
22,637
34,945
24,874
31,282
82,330
4,550
4,696
2,837
7,342
31,270
68,459
3,636
532
434
238
7S
316
3,560
1,239
745
339
230
12
111
105
516
903
2,463
Grand Total : 1,21,28,441 5,26,191 15,457
h t t o : » f§ 3 fe » i» 3 , O i r g iSource ; ->Directoc Health and FamUyWelfare, Fuqjab.
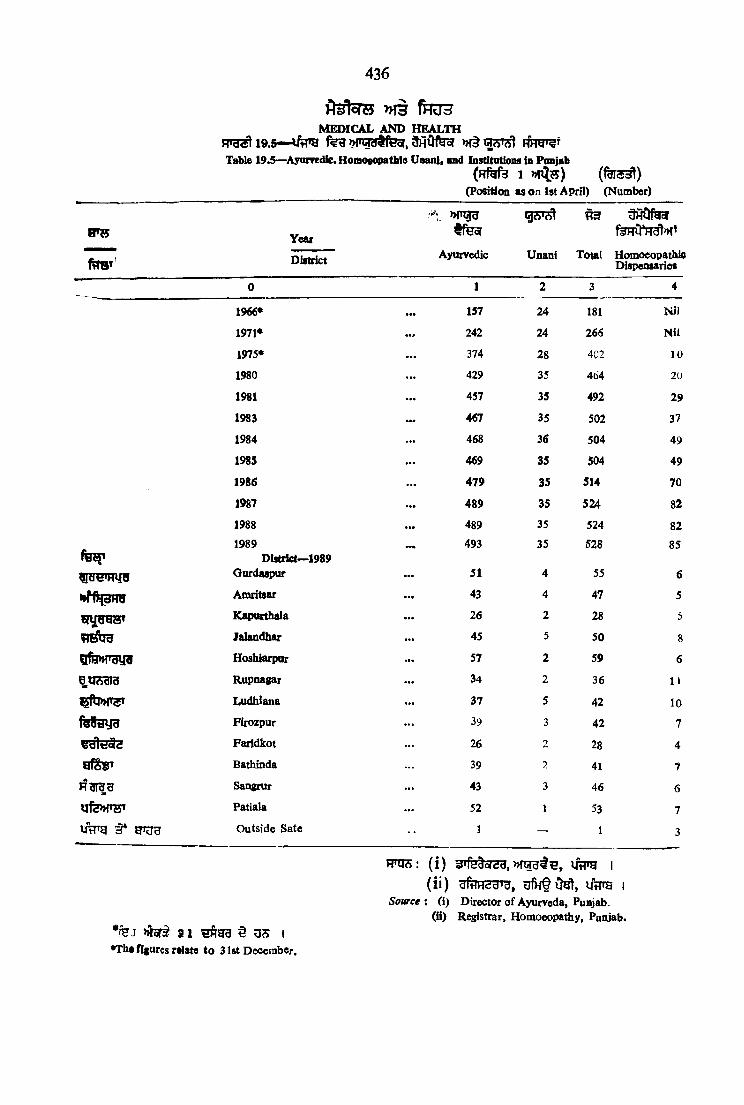
W tiM E D IC A L A N D H E A L T H
19.5— ^ItTO >>jnTOtfeor» » f tTable 19.5—Ayum dic. HomogcqMitliie Unani, and Institatioiis in Pinijab
(Rfefe 1 (fara^)(Position as on 1st April) (Number)
436
Year
District
»ngu«fe3
Ayurvedic
TO ^HOftrsr
Unani Total HomoeopathicDispeosariet
0 1 2 3 4
1966* • • • 157 24 181 N il
1971* 242 24 266 N il
1975* . . . 374 28 4C2 10
1980 429 35 464 20
1981 . . . 457 35 492 29
1983 467 35 502 37
1984 . . . 468 36 504 49
1985 . . . 469 35 504 49
1986 . . . 479 35 514 70
1987 • • • 489 35 524 82
1988 • • • 489 35 524 82
1989 493 35 528 85District—1989
ig B T P P jB Qurdaspur • • • 51 4 55 6
Amritsar 43 4 47 5
Kapurthala 26 2 28 5
Jalandhar 45 5 50 8
SfH w ray® Hoshiupur . . . 57 2 59 6
BU Adia Rupnagar 34 2 36 11
Ludhiana 37 5 42 10
f e t e y g Firozpur 39 3 42 7
Faiidkot 26 2 28 4
Q fS S ’ Bathinda 39 2 41 7
H31^B Sangrur 43 3 46 6
Ufe»T5T Patiala 52 1 53 7
w g §* Outside Sate 1 — 1 3
•fej nrer# s i ^ u s «•Ths figures relate to 31st December.
FRJS: (i) arfstoTSg, Miggts, IRTH I( i i ) gffTH2g»U, UtTO I
Source : (i) Director of Ayurveda, Punjab.(ii) Registrar, Homoeopatliy, Punjab.
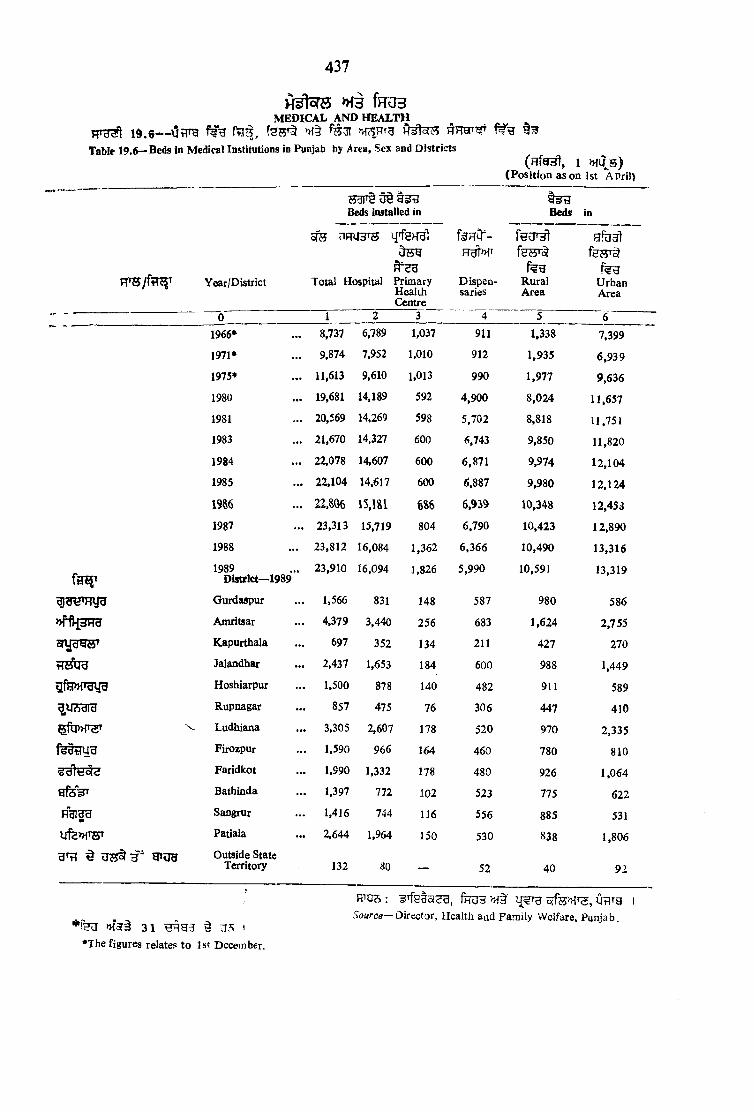
437
H s lo rs » f3 f n o 3M E D IC A L AND H E A L T H
l^.S— l3; Tg fHH, f^3T Mc HTg HH3t
Table 19.6—Beds in Medical Institutions in Punjab by Area, Sex and Districts(Rfgnl, 1
(Position as on 1st April)
F T H / ftT ^ Year/District
*>rf 3IT3afifgw
gfH»TOVJ3
^u?sgra
fegiTUH
Hfesnr
Ufe>HW
1966*
1971*
1975*
1980
1981
1983
1984
1985
1986
1987
1988
1989 District—1989
Gurdaspur
Amritsar
Kapurthala
Jalandhar
Hoshiarpur
Rupnagar
Ludhiana
Firozpur
Faridkot
Bathinda
Sangrur
Patiala
Outside State Territory
6dl'9 ^ 9F9 Beds installed in
d®g
Total Hospital Primary Health Centre
Beds in
feRO"-
Dispensaries
RuralArea
18,737
9,874
11,613
19,681
6,789
7,952
9,610
14,189
20,569 14,269
21,670 14,327
22,078 14,607
22,104 14,617
22,80623,313
15,181
15,719
23,812 16,084
23,910 16.094
1,566
4,379
697
2,437
1,500
857
3,305
1,590
1,990
1,397
1,416
2,644
132
831
3,440
352
1,653
878
475
2,607
966
1,332
772
744
1,964
1,037
1,010
1,013
592
598
600
600
600
686
804
1,362
1,826
148
256
134
184
140
76
178
164
178
102
116
150
80 —
911
912
990
4,900
5,702
6,743
6,871
6,887
6,939
6,790
6,366
5,990
587
683
211600
482
306
520
460
480
523
556
530
52
1,338
1,935
1,977
8,024
8,818
9.850
9,974
9,980
10,348
10,423
10,490
10,591
980
1,624
427
988
911
447
970
780
926
775
885
838
40
efbat
feeUrbanArea
7,399
6,939
9,636
11,657
11,751
11,820
12,104
12,124
12,453
12,890
13,316
13,319
586
2,755
270
1,449
589
410
2,335
810
1,064
622
531
1,806
92
31 )•The figures relate? to Isc December.
HiUcS: 5(fe>HTS, Ofltg■Soarcfl—Director, Health aad Family Welfare, Punjab.

438
MEDICAL AND HEALTH
Table 19 -7—R^stered Medical and Para-medical Personnel in Punjab
(f3P53l)(Number)
^csjdd fH3 cSdH
Doctor Midwife Nurse D ai• 1
Year
District
0 1 “ i
1966 ... 4,413 1,499 1,561 8,793
1971 ... 5,239 2,138 2,603 10,563
1975 ... 6,765 2,587 3,530 11,506
1980 ... 8,809 4,384 4,557 15,913
1981 ... 9,307 4,624 4,712 17,535
1983 ... 10,182 5,749 5,252 24,267
1984 ... 10,569 6,107 5,436 26,019
1985 ... 11,006 6,886 5,672 28,266
1986 ... 11,340 7,868 5,952 29,829
1987 ... 11,719 9,050 6,572 30,960
1988 12,144 9,832 6,840 31,880
fftR5T District 1988Gurdaspur ... 566 1,310 828 3,805
hrf>j3H9 Amritsar ... 2,591 1,164 995 5,505
o(i{gw Kapurthala ... 270 277 88 1.398
flttUd Jalandhar ... 1,424 766 712 3,100
3fH»Tsryg Hoshiarpur ... 615 1,271 375 2,913
eUAdld Rupnagar ... 211 477 184 1,384
CftPHT PT Ludhiana ... 2,117 1,779 1,709 3,318Firozepur ... 429 661 668 3.192Faridkot ... 627 620 295 872
yf6s^ Battiinda ... 552 379 68 2,136
Sangrur ... 612 435 194 1,774
qfe»f5r Patiala ... 2,130 693 724 2^83
HHJS : fRUB »f§ 3fe»T3, Uflrg iS!9ifre«:—Director, Health and Family Wslfare, Pimjab.

439
H^toTS >H3 fR 0 3M E D IC A L A N D H E A L T H
19.8— UHTg H^<5T5 H^c/44 o(dHtl'ci1 ‘HUlcS »f'yTe|Table 19 S—Population Served per Medical and Pura-Medical Personnel in Paqjab
3iw<;d
Year Doctor Midwife Nurse
District
t /
1966 2.758 8,119 7,797
1971 ... 2,585 6,338 5,203
1975 ... 2.198 5,749 4,213
1980 ... 1,894 3,807 3,662
1981 ... 1.806 3,635 3,567
1983 ... 1,733 3,039 3.360
1984 ... 1.715 2,967 3,334
1985 ... 1,687 2,696 3,273
1986 ... 1,716 2,474 3.270
1987 1.642 2,126 2,927
- 1988 ... 1,622 2,004 2,880
District—1988
Gurdaspur ... 3,120 1,348 2,133
Amritsar ... 959 2,135 2.498
cwawEF Kapurthala 2,417 2,356 7,415
tTstra Jalandhar ... )l,383 2,571 2,767
^fspwyg Hoshiarpur ... 2,607 1,261 4,275
gy*dicj Rupnagar ... 4,188 1,977 4,803
SftPH^T Ludhiana ... 1,035 1,232 i,283
fetayu Firozpur 3,602 2,338 2,313
Faridkot ... 2,701 2,732 5.741
ef^sT Bathinda ... 2.827 4,118 22,953
Kdl{|d Sangrux ... 2,686 3,780 8,475
Patiala ... 893 2.746 2,629
Hnj S: — I Source 2—>DirecUv. HoaUh & Family Welfare, Paajab*

440
19,9—Table 19 i l —Popabition Served l
WE
H 3 te ® fHU3MEDICAL AND HEALTH ^
FnTOT>M§ I f >H§ w t e B W , ’OOO fu SMr Institatkm, and Bed and Area covered per Institution and teds per *000 Population in Punjab
Position as on 1st Aprii1
Year
District
PopnfaitI(» Served per
Institution Bed
>HR3» f ^
f%»TH
(foTSHtea^f% g)
Average Radius
(in icms) served ^ r Institution
»fTgT^
f i j i
Beds per 000
population
etiu«*ny3
*>rfr|dHcJ
t T ^
a u sa ra
f^tavra
8 f ^
v^cjiyci
uf?>nw
1966*
1971*
1975*
1980
1981
1983
19841985
1986
1987
19881989District 1989
Gurdaspur
Amritsar
Kapurthala
Jalandliar
Hosbiarpur
Rupnagar
Ludhiana
Firozpur
Faridkot
Bathinda
Sangrur
Patiala
24^38 a U 9 3 5*768 0*7179
25^69 [1,372 5-468 0*7290
19,619 Sl,2«0 4-597 0 *7809
10,077 848 3-111 0*8
8,997 817 2-929 0*8
8,291 817 2-740 1-2
8,344 821 2-726 0*8
8,524 840 2-712 0*8
8.724 838 l . l i l 0*8
8,905 840 2-707 0-89,110 837 2-706 0-89,291 854 2-706 0-8
9,230 1,167 2-392 1 *2
9,647 584 2-471 0-6
8.281 974 2-517 1-0
8,886 832 2-178 0*8
7,875 961 2-597 1-0
8,265 1,080 2-433 1-1
10,199 691 2-340 0*7
9.959 1,008 3-407 1 0
9,705 883 3*176 0-9
9,280 1,163 3-136 1 -2
9,398 1,201 2-996 1 *2
10,033 751 2*714 0-7
•feaf »T613 31 ^ D?5 I*The figures relates to 31st December.
FTO3 :— ^ ’felo<<;d. fRU3 » f t U f e ^ U ^ iSource:— Director, Health and Family Welfare, Punjab.

f i= ra 3
MEDICAL AND HEALTH
19.10— 1988- 8 9 5rfs>>{T5 MOfe u d ^ l{31^Table 19 'lO^Progress of Family Welfare Programme la Puajab 1988-89 by Districts
441
District
feST g t y y s f U3B5Voluntary Sterilisatloa
Operations
» T ^ . t \ .LU.D.»s
^ ^Le v^ of Achievement Level of Achieve-
Performance Performance ment
0 i 2 3
Gurdaspur ... 11,304 8,728 28,472 29,130
^rf^j3FT3 Amritsar ... 14.348 11,696 32,891 39,936
cfijo y ® ' Kapurthala ... 3,913 3,133 6,872 7,837
Jalandhar ... 13,044 10,553 30,437 31,201
gfH »T3lI3 Hoshiarpur ... 8,695 6,670 18,763 21,920
gu?5ara^ R u p n a ^ f •• 5,218 4,002 13,255 14,919
Ludhiana • •• 13,044 12,512 26,509 32,123
feUUVB Firozpur — 8,695 7,564 21,600 20,813
Faridkot ... 10,870 8,641 23.563 30,264
Bathinda ... 8,695 7,585 19,145 20,984
H 3 If9 Sangrur ... 11,304 7,141 25,529 35,924
Patiala • •• 10,870 8,369 23,564 29,259
Total ... 1,20,000 9,6594 2,70,000 3,14,310
w m :— 3Tfe|ofe3, frran 5ffe/>F5, UftTgSource:—^Director, Health & Family Welfare, Punjab,
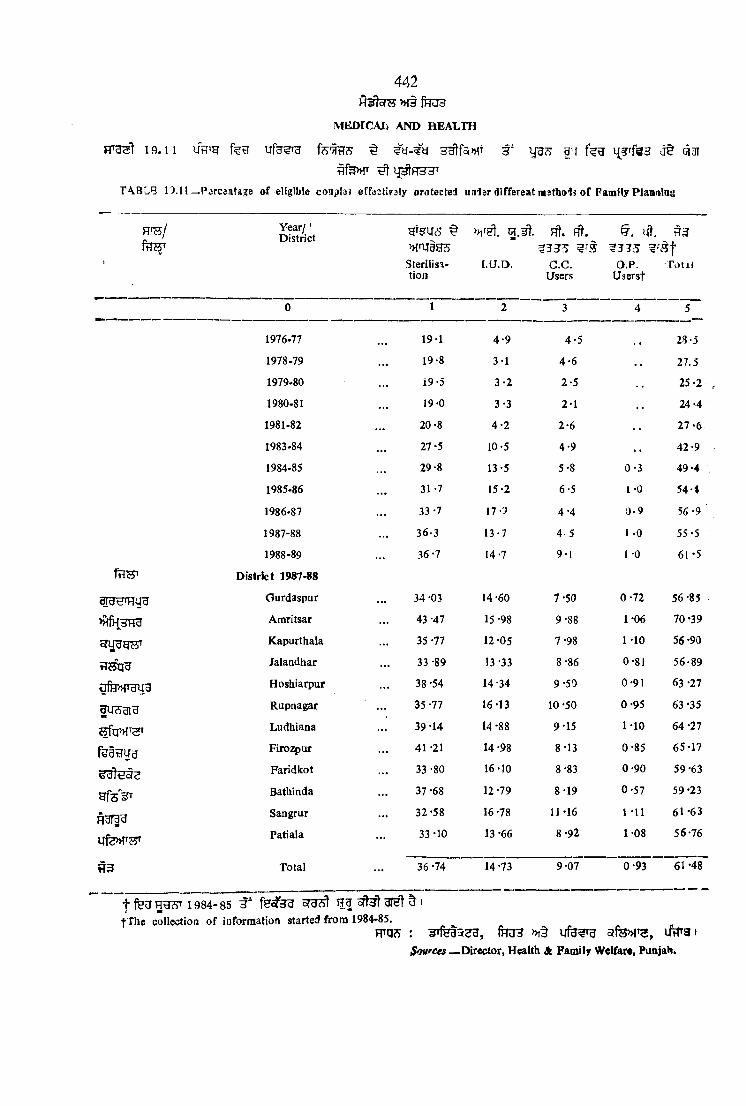
442
MEDICAL AND HEALTH
F r a s t 19.11
T A B L E 15.11
uVfrg ddlfSiMT 3 ‘ y n s f f l{? rf3 3 j § q3l
—Porceataga of eligible couple? effectlvaly protected unisr different methols of Family Plannla'j
H'W/t o
J
Year/ ' District
M f U t eSterilisation
» if^ . Hi. Fft.
I.a .D . G .C.Users
§ . lit.
O.P. T o til Usefst
0 1 2 3 4 5
1976-77 19-1 4-9 4-5 .. 28-5
1978-79 19*8 3-1 4 -6 27.5
1979-80 19-5 3-2 2-5 25 -2
1980-81 19-0 3-3 2-1 24'4
1981-82 20-8 4-2 2*6 27-6
1983-84 27*5 10-5 4-9 42 -9
1984-85 29-8 13-5 5-8 0-3 49*4
1985-86 31-7 15-2 6-5 i-0 54-4
1986-87 33-7 17-9 4-4 0-9 56 -9
1987-88 36-3 13-7 4-5 1 -0 55-5
1988-89 36-7 14-7 9-1 1 -0 61 *5
ftlW District 1987-88
dJdtJ'HU^ Ourdaspur 34 -03 14-60 7-50 0-72 56-85
Amritsar 43*47 15-98 9-88 1-06 70 -39
Kapurthala 35 -77 12 -05 7-98 1 -10 56 -90
tTStjU Jalandhar 33-89 13-33 8-86 0-81 56-89
OrHMT^yU Hoshiarpur 38 -54 14-34 9-50 0-91 63-27
HUcsaiu Rupnagar 35 *77 16*13 10-50 0-95 63 -35
^ g » f ^ Ludhiana 39-14 14 -88 9-15 1-10 64 -27
fe a tiu g Firozpur 41-21 14 -98 8-13 0-85 65-17
Faridkot 33-80 16-10 8-83 0-90 59-63
g f s V Bathinda 37 -68 12 -79 8-19 0-57 59-23
H3r33 Sangrur 32-58 16-78 11-16 1 -11 61*63
Ufe>HT;55T Patiala 33-10 13-66 8-92 1-08 56*76
Total 36-74 14 -73 9-07 0-93 61 *48
f 1984-85 3 " ^ c S t H | 31^f The collection of information started from 1984-85.
R rg s : frnjH »i§ 5|fe»!T3, i/?T3Sources — Director, Health A Family Welfar*, PuajaH.

44.^
»»!§ f t e
M E D IC A L A N D H E A L T H
T A B L E 19.12—Number of Medical termination of pregenancies and Number since Inception In Punjab.
Year/DistrictH '« /
fH iJ' fdld'9 3 ^No. of
M .T.P.
did si CF33 T
Sinceinception
0 1 2
1976-77 7,584 14,403
1978-79 8,991 30,837
1979-80 9.616 40,453
1980-81 12,434 52,887
1982-83 25,485 1,01,195
1983-84 25,538 1,26,733
1984-85 24,953 1,51,686
1985-86 21,656 1,73,342
1986-87 21,488 1,94,830
1987-88 20,793 2,15,623
1988-89 15.831 2,31,454
District 1988-89
Gurdaspur 361 16,452
Amritsar 1,974 28,414
Kapurthala 570 14,947
t7(5 Ud Jalandhar 1.919 33,756
Hoshiarpur 1,317 17,516
Rupnagar 856 11,004
Ludhiana 3,014 25,888
Firozpur 579 10.420
Faridkot 745 10,338
Bathinda 934 16,192
mSangrur 1,278 19,178
Ufe>hW Patiala 2.2H :7.349
n n jjj : ^Tfefor^u, f t e >H §ufB ^iu uiRTg jFofircfs pirector Health & Family Welfare, Punjab.

M EDICAL AND HEALTH
19.13--- iffl’H ^ ^ fgj53\T A B L E 19.13—Number of Birflis averted siace incepiiM fa PnMab.
444
sran XTTO 3*
H'W tTSH 3T^
Year Births No. sinceaverted inception
0 1 2
1976-77 1,07.977 8,82,0T7
1978-79 1,16,362 11,24,54^8
1979-80 1,12,580 12,37.1218
1980-81 1,11,430 13,48,558
1981-82 1,18,452 14.67,010
1983-84 1,88,709 17,94,921
1984-85 2,39.241 20,34,162
1985-86 2,84,984 23,19,146
1986-87 3,30,691 26,49,83 7
1987-88 3,85,648 30,35,484
1988-89 4,19,142 34,54,626
RH]77 : g Tfeg s ig g , fTO 3 > H § u f e ^ orf75»r5,Source :—Director, Health & Family Welfare, Punjab.
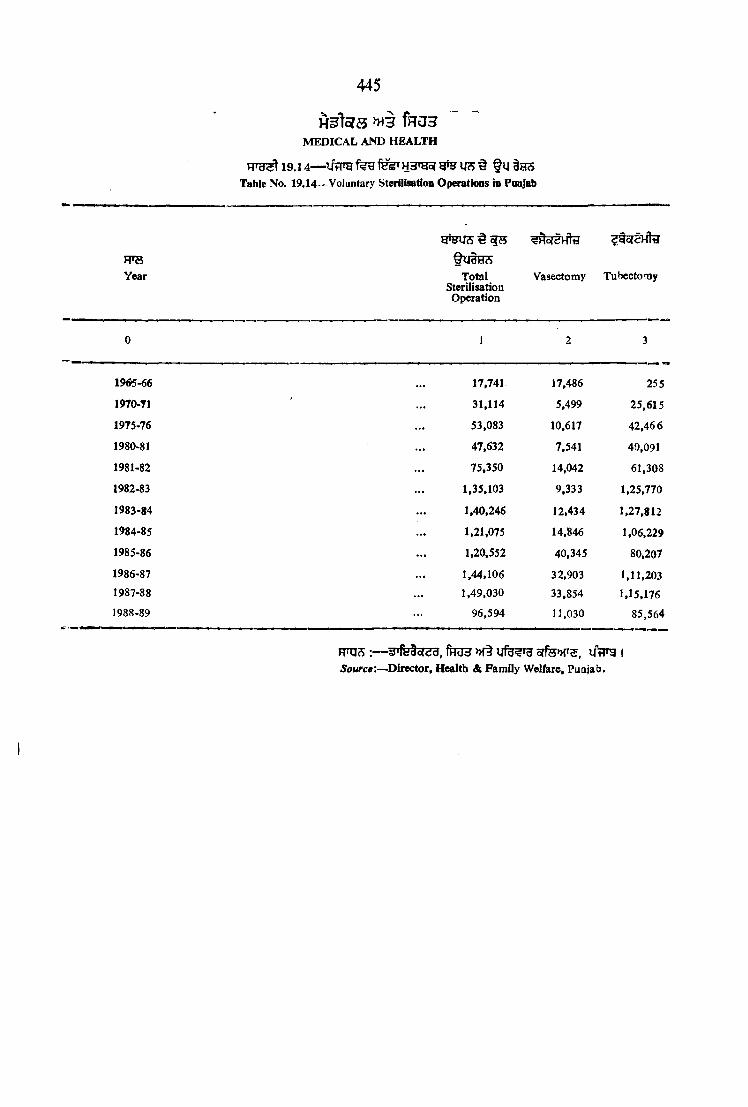
445
» ) 3 f n a 3M E D IC A L AND H E A L T H
19.14— ^UrlTg # t u Table No. 19,14—Voluntary Sterilisation Operations in Paqjab
FTSYear Total Vasectomy
Sterilisation Operation
Tubectomy
0 J 2 3
19«5-66 17,741 17,486 255
1970-Tl 31,114 5,499 25,615
1975-76 53,083 10,617 42,466
1980-81 47,632 7,541 40,091
1981-82 75,350 14,042 61,308
1982-83 1,35,103 9,333 1,25,770
1983-84 1,40,246 12,434 1,27,812
1984-85 1,21,075 14,846 1,06,229
1985-86 1,20,552 40,345 80,207
1986-87 1,44,106 32,903 1,11,2031987-88 1,49,030 33,854 1,15,176
1988-89 96,594 11,030 85,564
H ’Q S oJ'fe3ct<;d, fH03f Ufd'^'d o f f e r s , U rT3 I Source:—^Director, Health & Fam ily Welfare, Puajab.
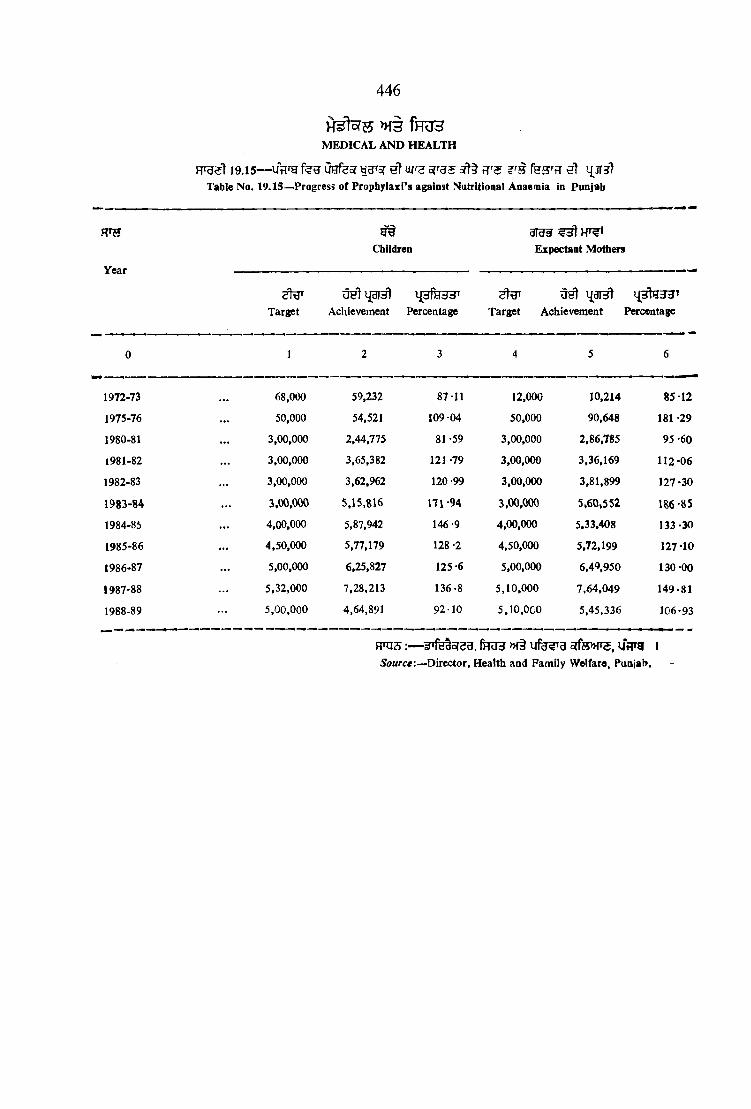
>H3 fHU3M E D IC A L A N D H E A L T H
19.15— uefea? ygrsr ^ u/r^ 5ft^ r s fe^^fr e t Table No. 19.15—Progress of Prophylaxi’s against Nutritional Anaemia in Punjab
446
RTH
Year
Cliiidren
Target Achievement Percentage
Expectant Motliers
Target Achievement Percentage
0 1 2 3 4 5 6
1972-73 ••• 68,000 59,232 87*11 12,000 10,214 85-12
1975-76 .. . 50,000 54,521 109-04 50,000 90,648 181 -29
1980-81 . . . 3,00,000 2,44,775 81 -59 3,00,000 2,86,785 95 -60
1981-82 . . . 3,00,000 3,65,382 121 -79 3,00,000 3,36,169 112-06
1982-83 . .. 3,00,000 3,62,962 120 -99 3,00,000 3,81,899 127-30
1983-84 . . . 3,00,000 5,15,816 171 -94 3,00,000 5,60»552 186-85
1984-85 . . . 4,00,000 5,87.942 146-9 4,00,000 5,33.408 133-30
1985-86 . . . 4,50,000 5,77,179 128 -2 4,50,000 5,72,199 127 -10
1986-87 . . . 5,00,000 6,25,827 125-6 5,00,000 6,49,950 130 -00
!987-88 .. . 5,32,000 7,28,213 136-8 5,10,000 7,64,049 149-81
1988-89 ... 5,00,000 4,64,891 92-10 5,10,0c0 5,45,336 106-93
F p g s :— f ^ 3 >H§ u fe ? rg 5jfe»T5, U tFa I Source:—Director, Health and Family Welfare, Punjab.
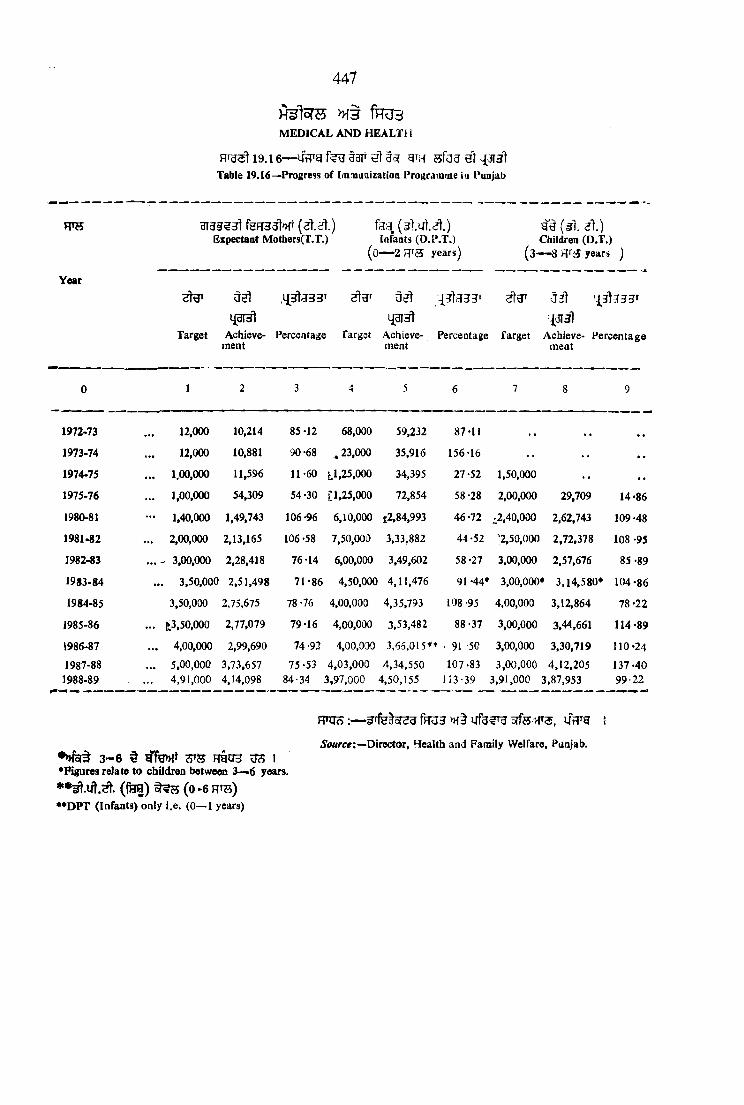
f e l o T S M 3 f e j 3M E D IC A L AN D H E A L T H
H f ^ d l9 .1 6 — UtTg t3 F h I t5? 3 fa 3 9 ] i{3T3lTable 19.16—Progress of (fn:nuaizatioa Prograoinie in Punjab
447
W B
Year
fefR ^lo fr ( e l d . ) Expectant Mothers(T.T.) lafaats (D.P.T.)
(o-— 2 FT55 years)
( ^ l 3 l ) Chiidrea (D.T.)
(3— 8Rr<3years )
431^ 431^ >^3I3lTarget Achieve- Perceotage Target Achieve- Percentage Target Achieve- Percentage
raent ment meat
0 1 2 3 4 5 6 7 8 9
1972-73 12,000 10,214 85 -12 68,000 59,232 87 -11 . .
1973-74 12,000 10,881 90-68 . 23,000 35,916 156-16 • .
1974-75 ... 1,00,000 11,596 11-60 L l,25,000 34,395 27-52 1,50,000 4 ,
1975-76 ... 1,00,000 54,309 54-30 [1,25,000 72,854 58-28 2,00,000 29,709 14-86
1980-81 - 1,40,000 1,49,743 106-96 6,10,000 j;2,84,993 46-72 ^2,40,000 2,62,743 109 -48
1981-82 ... 2,00,000 2,13,165 106 -58 7,50,000 3,33,882 44-52 '2,50,000 2,72,378 108 -95
1982-83 ... 3,00,000 2,28,418 76-14 6,00,000 3,49,602 58-27 3,00,000 2,57,676 85-89
1983-84 ... 3,50,000 2,51,498 71-86 4,50,000 4,11,476 91 -44* 3,00,000* 3,14,580* 104-86
1984-85 3,50,000 2,75,675 78-76 4,00,000 4,35,793 108 -95 4,00,000 3,12,864 78 -22
1985-86 ... ^3,50,000 2,77,079 79-16 4,00,000 3,53,482 88-37 3,00,000 3,44,661 114 -89
1986-87 ... 4,00,000 2,99,690 74-93 4,00,030 3,65,015** . 91 -50 3,00,000 3,30,719 110-241987-88 ... 5,00,000 3,73,657 75-53 4,03,000 4,34,550 107-83 3,00,000 4,12,205 137 -40
1988-89 ... 4,91,000 4,14,098 84-34 3,97,000 4,50,155 H3-39 3,91,000 3,87,953 99-22
• » ra ^ 3 - 6 § R g 0 3 TO I•Figures relate to chiidrea between 3— 6 years.
(fe a ) (o *6 RTs)•♦DPT (Infaats) only I.e. (0— 1 years)
Rn jcs;— r r f e l r a f r o g >H§ l i f g ^ E f fo iT s , y f r g i
ilottrce;~Director, Health and Family Welfare, Puajab.

448
H ^5fH >H3 fTO 3M E D IC A L AN D H E A L T H
1 9 .1 7— UtTO lit^ 5?^^ faff»f ITable 19.17—Villages covered under Rural Drinking Water Supply Schemes in Punjab.
Year/District
fU V ^Number of villages
fife*
No, of Villages*
oft§fife
IdentifiedwaterScarcityVillages
fife, f ^
Scarcity Villages
where water suTply
Schemes Commissioned®
o rt§ 3 ltf i f e f ^ T
Balance of scarcity
villages where water supply
schemes still to be initiated©
cPSH3/2
%ageCol
3/2
fTTHT
aidtd’HUB
o w g w
tre ijB
gfe>nT3U^
WtSdId
g f q n r ^
f^rttw g
g f ^
t o g
Hf2>HW
1977
1980
1981
1983
1984
19851986
1987
1988District 1988
Gurdaspur
Amritsar
Kapurthala
Jalandhar
Hoshiarpur
Rupnagar
Ludhiana]
Firozpur
Faridkot
Bathinda
Sangrur
Patiala
12,188
12>188
12,188
12.342
12.34212.342 12342
12.342
12.342
1,551
1,191
602
1,226
1,584
893
958
1,119
565
520
707
1,426
3,799
3.712
3.712
3.712
3.712
3.7123.712
3.712
6,287
398
564
71
312
1,037
575
204
718
539
517
624
728
1,472
1,945
2,025
2,152
2,317
2,4822,652
2,8323,140
154
92
1
4
509
435
5
303
461
448
367
361
2,327
1.767
1,687
1,560
1,395
1,2301,060
880
3,147
244
472
70
308
528
140
199
415
78
69
257
367
38 -7
52-4
54-5
58 -0
62-4
66-9 71 -4
76.3
49*9
38-69
16-31
1-41
1*28
49*08
75-65
2-45
42-20
85*53
86-65
58-81
49-59
•fu9* ^ fgi^gft JT O 1971 t 1981 ^ T IM 3 3 T § » p q T f^ ^ 1FTOs:— fHtftshng, lit. ^ 5 . i
•No. of Village are Based on 1971 & 1981 S o u n ei—CY\t>i Engineer Public Health (PW D), Punjab,@ 3 1 H f ^® As on 31st March

i b . l ^ f g i 5 ^ I
2 0 .2 u f r g »!fg>>niHt ^ h 3 rt^ a r^ 9 i
R T g ^ 2 0 .3 U t^ g RRgf?^ M € >H Tg^^T ^ fgj^gt H 3 R f^ 31^ d !
R ^ 2 0 .4 OtTTg f e s ^ fe n t i T ^ ^ M g n ru g t egR^H g-i§ u s i
RTg^ 2 0 .5 fe^^Tg >Hfg>HTi[or >>T§ >H?5Ut3 H3R'fe>HT fai H' & :
RT32^ 2 0 .6 »f§ 2 0 .7 t fStflfe»HftaT ^ fe3T^ § feU SRT t ^ R t ^ Fftet H3Rf^>HT 3 3 i
R i ^ 2 0 .8 t t j T S t e >»{§ t<5T ^ R H ^ ^ H R T 5 t 3 T^ 9 I
R ^ 2 0 . 9 f R y s r ^ R R g T ^ ^ f3 T 5 ^ § Rfer *€URT^>Ht O S I
RTU2^ 2 0 .1 0 U tT ^ fe g g»53T R ^ MoT# 3T§ U S I
RTU3^ 2 0 . 1 1 3 * 2 0 . 1 3 f ^ g r jit g r g g § RH Ilt 31^ U S I
H e m 20
SEcnoK XX
EDUCATION
Table 20.1 Gives number of recognised Institutions in IHinjab-
Table 20.2 Shows districtwise number of teachers in institutions of Punjab.
Table 20.3 Depicts districtwise number o f students in institutions o f Punjab.
Table 20.4 Depicts district-wise number of Scheduled Caste students in Punjab.
Table 20.5 Depicts district-wise teacher-pupil ratio.
Table 20.6 And 20.7 Depict the intake capacity in Degree and Diploma Courses itEngineering in Punjab-
Table 20.8 Shows the numbsr of Industrial Training Institutions and thsir intake capacity.
Table 20.9 Show* the number of Technical Training Institutions and seats in thsse.
Table 20-10 Shows District-wise Adult Educatioa Statistics in Paajab.
Tables 20.11 to 20.13 Give education statistics in India by States.


f H f y W
EDUCATIONAL INSTITUTIONS
451

452
mE D U C A
20.1— tfflrg HTjsgiTtble 20.1—District-wise Nambcr of
Year/District
T Y P E O F
»fT3SH, fe fe in re , m m >Ht
^ RTf§Fi oPHt?
University Arts, Science,Commerce and Home
Science Colleges
>nTgcrt to ra a
Engineering, Teclinolog; and Architecture
College
753^ 753oft»{t ^ H3o(>HT 1R3Boys G irls Total Boys G irls Total
1971* . . . 3 85 37 122 2 — 2
1975* .. . 3 107 47 154 7 - 2
1980 . . . 3 110 52 162 3 — 3
1983 . .. 3 112 53 165 3 — 3
1984 . . . 3 113 53 166 3 — 3
1985 .. . 3 113 53 166 3 — 31986 . .. 3 116 53 169 3 - 31987 . . . 3 117 53 170 3 - 31988 . . . 3 118 53 171 3 — 3
District, 1988
Gurdaspur ... — 10 4 14 — - -
>>ffH3Fra Amritsar ... I 10 6 16 - — -
Kapurthala ... — 9 4\
13 — - -J alandhar ... — 13 9 22 — — -
ofHwgyg Hoshiarpur ... — 13 — 13 — - -
gucSdid Rupnagar ... — 6 2 8 — - -
Ludhiana ... 1 13 12 25 2 - 2
Firczpur ... — 7 3 10 — - -
Faridkot ... — 11 5 16 — — -Bathinda ... — 6 3 9 — — -
Agi'du Sangrur ... — 9 3 12 — - -
Patiala ... 1 11 2 13 1 — 1
M ete.~~C o\t. and Non-Government (Recogniced) Institutions.

453
TION
Recognised Institutions in Punjab.(30 ^ H f ^ )
(As on 30th September)
feHHIN S T IT U T IO N S
Medical Colleges (Allopathic only)
Teachers Training College (B.Ed.)
(104-2 R o T ^
(u grsT
Higher Secondary/ Higher/ Senior School (10+2 Secondary Secon-
Pattern) School dary (O ld School
Pattern)
High/PostBasicSchool
755^ 753oft>HT Boys Girls Total Boys G irls Total Boys G irls Total Boys Girls Total
10 11
12
12
12
12
12
12
12
12
12
12 13 14 15 16 17 18 n
17 179 73 252 854 217 1,071
17 174 70 214 1,035 241 1,276
18 90 67 157 1,637 275 1,912
18 193 66 259 1,935 304 2,239
18 194 66 260 1,958 307 2,265
18 194 66 260 1,976 307 2,283
18 218 62 280 1,962 310 . 2,272
18 257 67 324 2,096 309 2,405
18 313 74 387 2,049 304 2.353
-- — — — — — 26 4 30 162 22 1841 — 1 1 1 2 39 10 49 213 50 263
— — — 1 1 2 12 3 15 73 11 84— — — 3 — 3 36 9 45 220 60 280— — — 1 — 1 32 7 39 189 13 202— — — — — — 23 1 24 106 15 121
2 — 2 1 2 3 31 9 40 239 43 282— — — 1 1 2 19 6 25 132 14 146
1 — 1 3 1 4 25 10 35 203 24 227— — — — — — 21 3 24 147 20 167
— 18 3 21 195 15 2101 — 1 1 — 1 31 9 40 170 17 187

454
fWfuE D U C A
20.1 (RHnj3) vitlTg W^WTable 20.1 {concld.)—District-wise Namber of
FPH /ftWYear/Disirict
Middle/Senior Basic School
T Y P E O F
HcTH
Primary/Junior Basic School
Boys Girls Total Boys G irls Total
20 21 22 23 24 25
1971* . . . 886 174 1,060 7,133 125 7,258
1975* 1,247 150 1,397 9,229 106 9.335
1980 . . . 1.416 82 1,498 12,219 164 12,383
1983 . .. 1.365 56 1,421 12»239 157 12,396
1984 . . . 1.375 55 1,430 12,172 159 12,331
1985 . . . 1,379 55 1,434 12,170 161 12,331
1986 . . . 1,389 55 1,444 12,158 164 12,322
1987 . . . 1,343 52 1,395 12,158 164 12,322
1988 . . . 1,362 51 1,413 12,192 165 12,357
District, 1988
Gurdaspur .. . 125 9 134 1,303 25 1,328
Amritsar . .. 167 8 175 1,393 47 1,440
o W H W Kapurthala . . . 63 2 65 481 4 485
dAUd Jalandhar 151 5 156 1.133 43 1,176
Hoshiarpur . . . 126 3 129 1,422 4 1,426
^ r t d ld Rupnagar ... 67 — 67 844 4 848
Ludhiana . . . 116 3 119 1,C05 19 1.024
fe d e yu Firozpur . . . 129 10 139 1,121 14 1,135
Farldkot .. . 102 5 107 731 4 735
yr^oJ' Bathinda 98 2 ICO 661 — 661
HdlddSangrur .. . 97 ^ — 97 828 1 829
Patiala .... 121 4 125 1.270 — 1,270
ffe U feS-Fraf^RtThese schools designated as Inservice Training Centre,
31 HTg ^•Information relates to 31st March.

455
TION
Recognised Institutions in Punjab(3 0 ^(As on 30th September)
feRHIN S T IT U T IO N S
Pre-Primat y/Pre-Basic School
fs?>HcrteecS'
PolytechnicInstitutions
TedA
F R S(H .
Teachers Training School ( J .B .T .)
w d z
Imical Industrial rt Craft School
Boys Girls Total Boys Girls Total Boys Girls Total353^Boys Girls Total
26 27 28 29 30 31 32 33 34 35 36 37
2 1 3 5 2 7 8 — 8 36 1 37
2 — 2 10 — 10 8 1 9 36 1 37
2 — 2 10 — 10 8 1 9 49 60 109
2 — 2 10 — 10 8 I 9 53 58 i l l
2 — 2 10 — 10 9 1 10 53 58 111
2 — 2 10 — lo t 9 1 10 54 52 106
2 — 2 — — — 9 1 10 53 53 106
2 — 2 — — — 9 1 10 53 52 105
2 — 2 — — — 9 1 10 53 53 106
_ _ _ __ 1 — 1 5 6 11
_ — — — — — 1 — 1 8 3 11
— — — — — — 1 - 1 3 4 7
— — — — — — 1 1 2 6 8 14
— — — — — 1 - 1 5 1 6
— — — _ _ — — — — 2 6 8
— — — _ _ — 1 — 1 6 3 9
— — — _ _ _ — — — 2 3 5
1 — 1 — — — 1 — 1 4 7 11
— — — _ _ _ 1 — 1 3 3 <j
1 — 1 _ _ _ — — — 2 5 7
— — — _ _ — 1 — 1 7 4 11
Source.— D irec to r o f Public Instruction, Punjab.
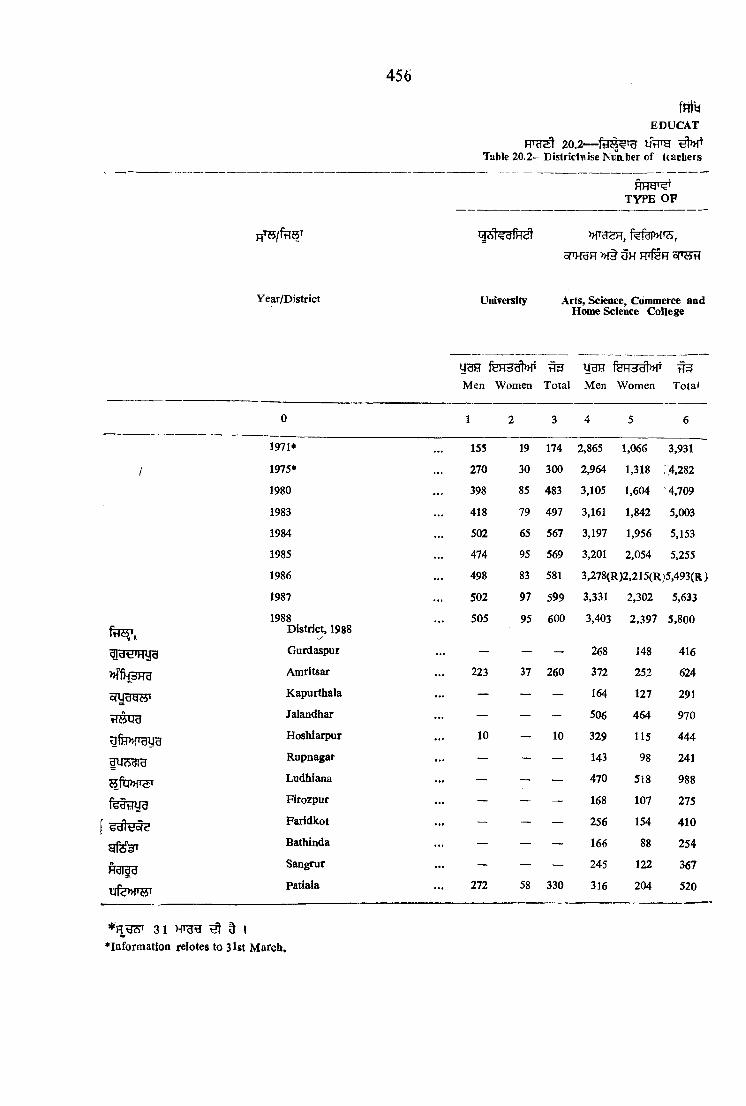
456
fnftiEDUCAT
20.2—Table 20 .2- Districtvise Niiirber of teachers
T Y P K O F
Pf^/ftT5^ W diiH , fefdTWS,
oPK3R OH FpfeR o PSn
Year/District University Arts, Science. Commerce andHome Science College
y d a d d fyH adl^FMen Women Total Men Women Total
0 1 2 3 4 5 6
1971* 155 19 174 2,865 1,066 3,931
1 1975* 270 30 300 2,964 1,318 :4,282
1980 398 85 483 3,105 1,604 4,709
1983 418 79 497 3,161 1,842 5,003
1984 502 65 567 3,197 1,956 5,153
1985 474 95 569 3,201 2,054 5,255
1986 498 83 581 3,278(R)2,215(Rj5,493(R)
1987 502 97 599 3,331 2,302 5,633
1988 505 95 600 3,403 2,397 5,800District, 1988
/Gurdaspur — — — 268 148 416
Amritsar 223 37 260 372 252 624
o fU B W Kapurthala — — — 164 127 291
VlWUd Jalandhar — — — 506 464 970
ufj!P>rBira Hoshlarpur 10 — 10 329 115 444
|l|*dld Rupnagar — — — 143 98 241
H f w ^ T Ludhiana — — — 470 518 988
fedWUU Firozpur — — — 168 107 275
Faridkot — — — 256 154 410
gfssrr Bathinda — — — 166 88 254
Hdl^d Sangrur — — — 245 122 367
Patiala 272 58 330 316 204 520
31 Hrgg ^ ^ I *Iafofmatioa relotes to sUt March.

457
cfFrg:^f JHfa'H'trsrf hT in lastitutfons of Punjab
ION
( 3 0 R fg ^ )(As on 30th September)
foTRHIN S T rrO T IO N S
^ 6 - S T lt
Eaglneeriag, Technology, and Architecture College
>>Ir )
Medical College (M .B.B.S, only)
<f*d!
Teachers Training CB.Ed.)
R 3( l0 + 2 U ? U JS ) P f| S
u a u is )College Higher/ H igher / Senior
Secondary Secondary Secon* School School dary
(10+2 School Pattern) (O ld Pattern)
u g e S 3 U3H f5F73^»Hf H 3 U3RMen Women Total 1VIen Women Total Msa Women Total Men Women Total
7 8 9 10 11 12 13 14 15 16 17 18
158 2 160 363 90 453 167 100 267 4,830 3.632 8,462
157 2 159 436 158 594 157 102 259 4,846 4,072 8,918
241 4 245 m m m 154 U S 272 5,210 3,918 9,128
216 4 220 677 228 905 144 134 278 5.070 4,135 9,205
218 3 221 696 247 943 143 134 277 5,079 4,174 9,253
218 3 221 762 269 1,031 144 128 272 5,022 4,297 9,319
197 13 210 813 259 1,072 144 133 277 5,335 4,407 9,742
196 13 209 811 255 1,066 138 130 268 5,715 4.878 10.593
205 15 220 830 258 1,088 136 129 265 6,637 5,545 12,182
— — — — — — >_ — — 571 323 894
— — — 229 55 284 11 16 27 875 705 1,580
— — — — — — 12 16 28 250 215 465
— — — — — 30 18 48 734 587 1.321
— — — — — — 12 6 18 828 4? 9 1,257
— — — — — — — — — 435 377 812
133 4 137 232 86 318 18 24 42 772 637 1.409
— — — — — — 10 19 29 310 420 730
— — — 98 32 130 25 21 46 495 542 1,037
— — — — — — — — — 341 347 638
— — — — — — _ — — 431 213 644
72 11 83 271 85 356 18 9 27 595 750 1,345

458
fHfwE D U C A
2 0 .2 l/ tT ^Table 20.2 Districtwise Number of Teachers
R F f g ^ T Y P E O F
m s / f ^ wYear/District High/Post Basic School
vraeMen Women Total
0 19 20 21
1971* 11,775 7,121 18,896
1975* .. . 15,215 10,569 25,784
1980 . . . 18,536 11,580 30,116
1983 . . . 20,547 14,362 34,909
1984 .. . 20,781 14,921 35,702
1985 .. . 20,845 15,677 36,522
1986 .. . 20,472 15,637 36,109
1987 . . . 20,719 15,756 36,475
1988 . . . 20,090 15,598 35,688
fa sT , District, 1988
Gurdaspur . . . 1,977 1,172 3,149
Amritsar . . . 2,076 1,938 4,014
sm d ysT Kapurthala .. . 729 485 1,214
Jalandhar .. . 2,131 2,045 4,176
ufB>>rgira Hoshiarpur . . . 2,034 885 2,919
^ cSd ld Rupnagar . . . 948 1,111 2,059
ttru»r;5T Ludhiana . . . 2,019 2,494 4.513
r^driUB Firozpur . . . 1,156 889 2.045
yd”tt3ci<; Faridkot . .. 2,001 1,071 3,072
yfosji Bathinda 1,365 1,008 2,373
Adidd Sangrur .. . 2,142 1,019 3,161
Patiala . . . 1,512 1,481 2,993

459
H F r a ^ » r f w i io r ^in Institutioiis of Punjab
TION
(30 ^(As on 30th September)
feRMIN S T IT U T IO N S
fH ^ S /H h stw QPnot H< d4
Middle/Senior Basic School
yfHol
Primary/Junior Basic Sdiool
ifH o I
Pr»>Frimary/Fre*Basic School
ydHMen Women Total
ydHMen Women Total Men
fS R H d WWomen Total
22 23 24 25 26 27 28 29 30
6,364 4,556 10,920 13,367 9,429 22,796 2 5 7
8,517 7,191 15,708 16,865 14,102 30,967 1 7 8
5,067 4,359 10,426 22,665 25,237 47,902 2 4 6
5,663 4,204 9,867 22,220 25,435 47,655 2 4 6
5,793 4,217 10,010 22,039 25,463 47,502 2 4 6
5,822 4,190 10,012 21,921 25,610 47,531 2 4 6
5,769 4,226 9,995 21,866 25,400 47,266 2 4 e
5.503 4,085 9,588 21,801 24,971 46,772 1 4 5
5,518 4,321 9,839 21,965 25,528 47,493 1 4 5
538 372 910 2,342 2,386 4,728 _ _
730 793 1,523 3,094 3,458 6,552 — — —
237 145 382 826 866 1,692 — — —
519 496 1,015 1,743 2,932 4,675 — — —
602 317 919 2,104 2,393 4,497 — —
221 267 488 1,130 - 1,307 2,437 — —
392 404 796 1,915 2,651 4,566 — —
514 488 1,002 1,557 1,912 3,469 — — -
381 203 584 2.052 1,982 4,034 — 4 4370 295 665 1,709 1,369 3,078 — — —
420 144 564 1,776 1,573 3,349 1 — 1
594 397 991 1,717 2,699 4,416 — — —
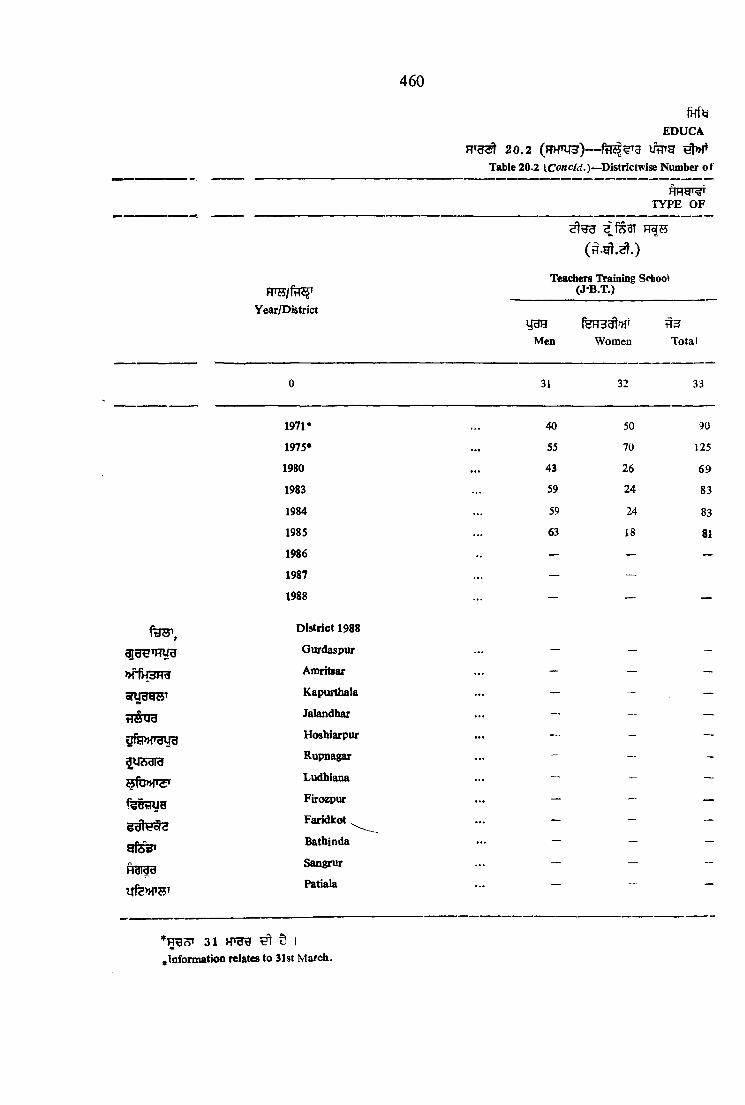
460
*HB?n 31 5 I^Information relates to 31st March.
E D U C A20.2 (J7Hnf5)— fiFTS^Tg
Table 20.2 (Concld.)~Districtmse Number o f
T Y P E O F
Teachers Training SiAoot (J-B .T .)
Year/Districty g e
MenfeR3dt»ff
Women^ 3
Total
0 31 32 33
1971* 40 50 90
1975* 55 70 125
1980 43 26 69
1983 59 24 83
1984 59 24 S3
1985 .. . 63 18 81
1986 — — —
1987 — —
1988 — — —
t o ,District 1988
dlcJtJ'HyB Gurdaspur — — -
v IH3H^ Amritsar — — —
oWd<Si4' Kapurthala ... — - —
t lS ^ d Jalandhar — — —
3fSP»fgUH Hoshiarpur ... — - —
ai46dld Rupnagar — - —
Ludhiana - - — —
Firozpur — — —
Faridkot — — —
Hf6a»Bathinda — — —
HdiddSangrur — — —
Patiala
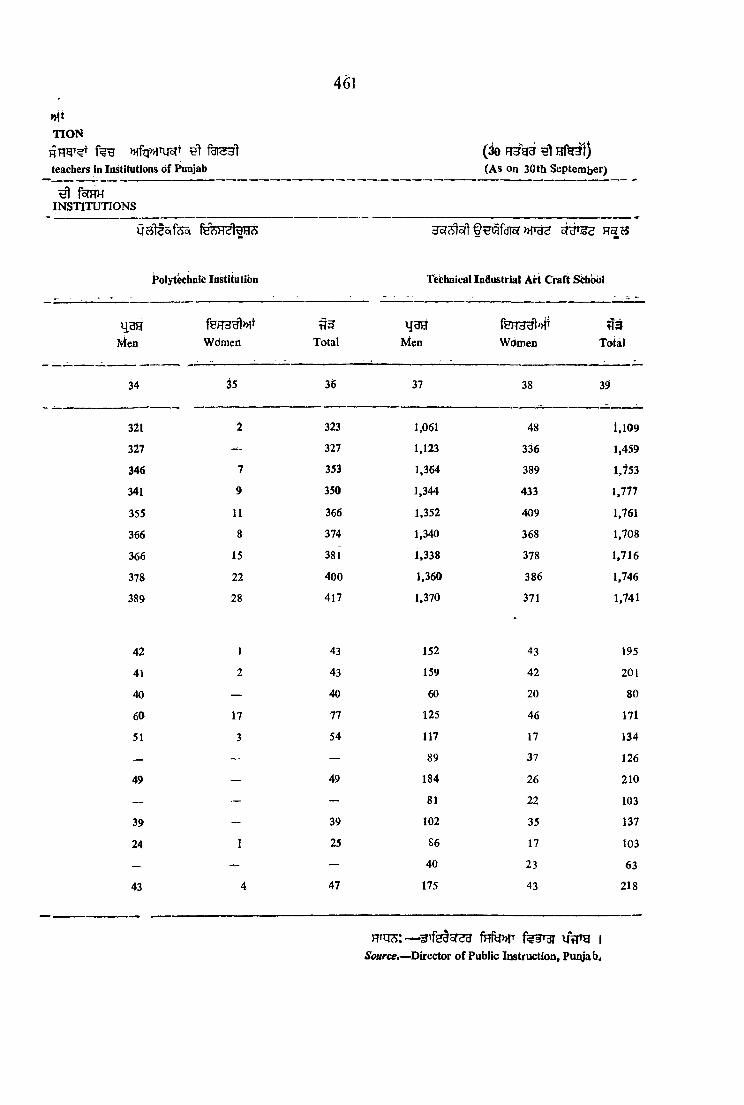
4^1
nftT IO N
teachers in Institutions of Punjab(io R3g3 HfdT!(As On 30th September)
^ fofHH IN S T IT U T IO N S
u s lt s i f s s ifv n ^
jPoIyt^bnic Institutibn Tkbnicfll InSustrial Art Craft Sbbobl
143H m
ivien Wdmeil Tbtal Meri Women Total
34 i s 36 37 38 39
321 2 323 1,061 48 1,109
327 327 1,123 336 1,459
346 7 353 1,364 389 1,753
341 9 350 1,344 433 1,777
355 11 366 1,352 409 1,761
366 8 374 1,340 368 1,708
366 15 381 1,338 378 1,716
378 22 400 1,360 386 1,746
389 28 417 1,370 371 1,741
42 1 43 152 43 195
41 2 43 159 42 201
40 — 40 60 20 80
60 17 77 125 46 171
51 3 54 117 17 134
— — — 89 37 126
49 — 49 184 26 210
~ — — 81 22 103
39 — 39 102 35 137
24 1 25 86 17 103
— — — 40 23 63
43 4 47 175 43 218
F T ^ s: — frffyMT u V h I Source.—^Director of Public Instruction, Pum’ab<

462
E D U
20. 3— Ut r a s I ’Ht
Table 20.3—Di^rictwise Number ol
FTS/feST u l m , >>1h . fe 5 @Year/Dlsirict P h .D .© M. Phil.@
S3ort)>{t ^ 3Boys Girls Total Boys Girls Total
0 1 2 3 4 5 6
1971* . .. 12 1 13 —
1975* . .. 16 5 21 — — -
1980 . .. 56 4b 102 138 140 278
1983 ... 149 121 270 163 257 420
1984 ... 137 91 228 159 270 429
1985 ... 65 57 122 156 266 422
1986 ... 113 77 190 155 290 445
1987 • •• 100 120 220 194 318 5J2
1988 ... 80 96 176 207 345 552
ftra?' District. 1988
a iS ti'H u g Gurdaspur ... — — — - — —
Amritsar ... 27 49 76 95 167 262
ofU9QiSP Kapurthaia ... — — — - - —
t^6yd Jalandhar J ... — — — — — —
gfe» ra\ra Hoshiarpur . .. — — - — — —
gUAdld Rupnagar . .. — — - — - —
Ludhiana . .. — 15 15 - — —
f^ d tiy g Flrozpur ... — - - — — —
Faridlcot ... — — - — — -
yfesf' Bathinda ... — — - — — —
ftdlda Sangrur . .. — — - — — —
u fe n fw Patiala ... 53 32 85 112 178 290
31 ^ 5•Information relates to 31st March.
>H§ tTcSBH M w ?ST5 H§XI3 ©Relates to Arts and General Education

463
CATION
Students ia lastitutjoas of Punjab(30 R fg ^ )
(As on 30th September)
>> H. § M.A.
>>Ih . Rt.
M .Sc.>Ah . oph
M. Com.
M3ol
Boys?5don>>f
Girls Total Boys5r5oft>>fr
Girls Total253^Boys G irls Tota l
7 8 9 10 11 12 13 14 15
2,602 1,510 4,112 244 115 359 3 33,446 2,095 5,541 212 88 300 47 I 48
2,852 2,985 5,837 338 319 657 22 5 272,604 3,410 6,014 401 410 811 94 20 1142,552 3,439 5,991 432 455 887 61 30 912,800 3,775 6,575 494 497 991 124 40 1642,780 3,995 6,775 531 568 1099 90 47 1373,407 4,382 7,789 541 608 1,149 74 54 1283,697 4,779 8,476 614 m 1,281 59 70 129
124 96 220 _
419 778 1,19? 131 157 288 28 15 43113 63 176 — — _
1,136 1,489 2.625 210 145 355 _ _
332 379 711 — — ■
101 76 177 — _ _
368 978 1,346 73 167 240 11 29 4182 138 220 — — _
112 33 145 — — _
109 24 133 — — _
147 46 193 — — _
654 679 1,333 200 198 398 19 26 45

464
WE D U
2 0 . 3Table 20.3 (contd.)—Districtwise Number of
Year /District
§ ./ ^ . §.
B.A./B.A. (Hons.)
>HR. W . Ff\
B.Sc./B.Sc. (Hons. )
Boys Girls Total Boys
Hdoflmr
G irls
^ 3Total
0 16 17 18 19 20 21
1971* 34,220 16,480 50,700 10,467 2,316 12,783
1975* 40,001 22,788 62,789 7,335 2,120 9,455
1980 33,436 27,635 61,071 7,780 3,395 11,175
1983 35,244 31,151 66,395 9,305 4,018 13,323
1984 36,119 34,196 70,315 9,606 4,535 14.141
1985 38,066 35,367 73,433 9,948 5,103 15,051
1986 41.412 37,898 79,310 10,551 5,526 16,077
1987* 26,646 24,675 51,321 5.059 3,548 8 607
1988 25,257 23,311 48,568 5,270 3,769 9,039
District, 1988
Gurdaspur 2,671 1,722 4,393 772 281 1,053
Amritsar 2,333 2,606 4,939 628 443 1,071
oWdywT Kapurthala 1,412 1,432 2,844 145 55 200
Jalandhar 5,075 5,056 10,131 1,033 550 1,583
Hoshiarpur 2,659 1,508 4,167 465 193 658
lUcSdId Rupnagar 984 519 1,503 149 83 232
Ludhiana 2,433 4,651 7,084 572 1,061 1,633
Firozpur 858 1,105 1,963 265 266 531
Faridkot 1,831 1,232 3,063 266 271 537
Bathinda 1,399 887 2,286 243 119 362
Rdldd£= Sangrur 1,443 895 2,338 314 121 435
Patiala 2,159 1,698 3,857 418 326 744
♦ f e f w r ^ A'WI' 1 0 + 2 fHR?H H | ^ |♦Enrolment is decreasing due to ths Introduction of new policy of eiaDitioa i, e. 10+2 system-
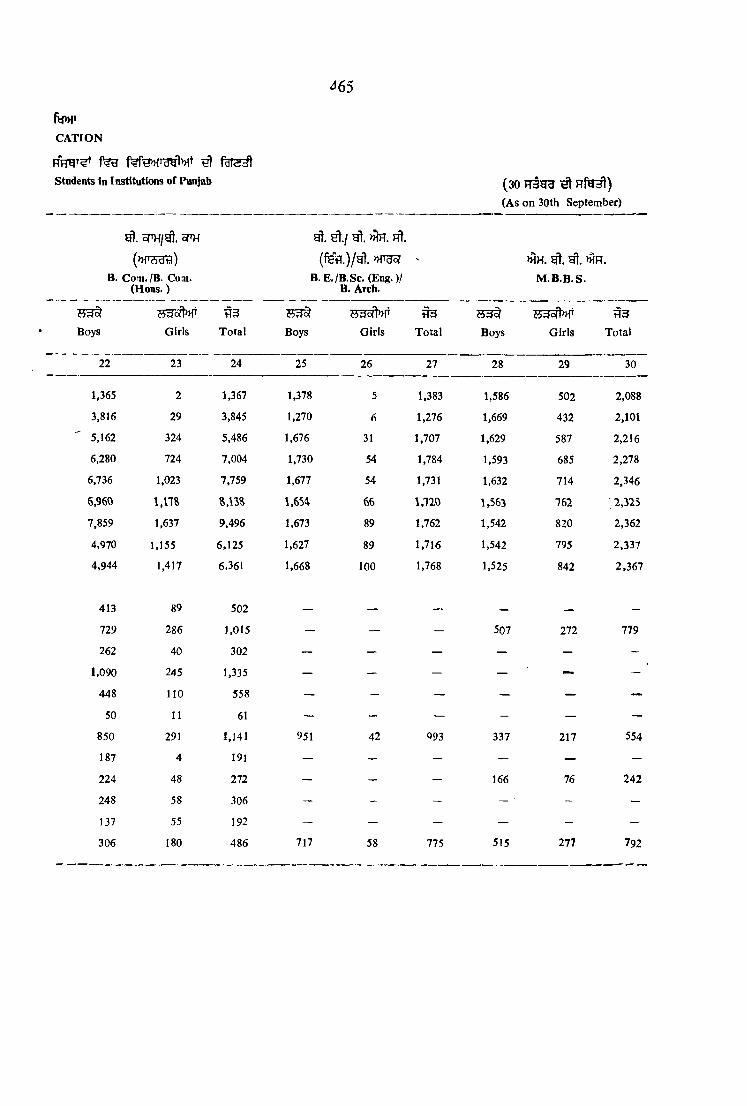
^65
CATION
faT3^Students in Institutions of Punjab
5TH/^. 5TH
B. Coiti./B. Com. (Hons.)
^ ./ m . Rt.
( fe f l.)/ ^ .B. E./B.SC. (Eng.)/
B. AtcIi.
(30 ^ H f ^ )(As on 30th September)
>HH. >HH.
M .B .B .S .
?53^Boys
.
Total
.
Total
■N^ 3
TotalGirls
64do|
Boys Girls Boys Girls
22 23 24 25 26 27 28 29 30
1,365 2 1,367 1,378 5 1,383 1,586 502 2,088
3,816 29 3,845 1,270 6 1,276 1,669 432 2,101
5,162 324 5,486 1,676 31 1,707 1,629 587 2,216
6,280 724 7,004 1,730 54 1,784 1,593 685 2,278
6,736 1,023 7,759 1,677 54 1,731 1,632 714 2,346
6,960 \ , m 1,654 66 \,120 1,563 162 2,325
7,859 1,637 9,496 1,673 89 1,762 1,542 820 2,362
4,970 1,155 6,125 1,627 89 1,716 1,542 795 2,337
4,944 1,417 6,361 1,668 100 1,768 1,525 842 2,367
413 89 502 — — — --- —
729 286 1,015 — — — 507 111 779
262 40 302 — — — — — -
1,090 245 1,335 — — — — — —
448 110 558 — - — — —
50 11 61 — - — - — —
850 291 1,141 951 42 993 337 217 554
187 4 191 — — — — — —
224 48 272 — — — 166 76 242
248 58 306 — - - - - —
137 55 192 — — — — - —
306 180 486 717 58 775 515 277 792

466
EDUf
FTOSt 2 0 .3 ( ^ ^ 0 — iftTTg
Table 20.3 (co/jrrf.)—Districtwiffe Number of
IT O / f iWYear/District
B . Ed.
RoiEJdl H o f^ ^ ( l0 + 2 U d d c S ) FT5S T m s
U ddA)Higlier/ Higher/ Senior
Secondary Secondary Sec«Hidary School School School (10t 2 (O ld Pattern) Pattern)
Boys5ra off>HT
GirlsrI3
Total Boys G irlst73
Total
0 31 32 33 34 35 36
1971* ... 1,243 1,896 3,139 1,76,159 93,717 2,69,876
1975* ... 1.138 2,164 3,302 1,59,150 5<4,565 2,13,715
1980 ... 1»009 1,689 2,698 1,46,182 85,116 2,31,298
1983 ... 825 2,490 3,315 1,52,529 93,826 2.46,355
1984 ... 838 2,546 3,384 1,51,798 91,683 2,43,481
1985 ... 754 2,336 3,090 1,53,410 93,315 2,46,725
1986 ... 686 2,383 3,069 1,57,161 94,773 2,51,934
1987 ... 802 2,392 3,194 1,91,933 1,13,376 3,05,309
1988 ... 790 2,401 3,191 2,33,703 1,43,268 3,76,971
I f e l District, 1988
Id t J 'H U H Gurdaspur ... — — — 22,322 12,889 35,211
Amritsar ... 59 280 339 32,625 19.098 51,723
srydyw ' Kapurthala ... 70 225 295 6,286 5,242 11,528
t^ttUd Jalandhar ... 160 295 455 28,375 11,545 39,920
Hoshiarpur ... 91 254 345 19,417 13,828 33,245
guA did Rupnagar ... — — — 15,786 6,586 22,312
Ludhiana ... 107 500 607 28,784 16,360 45,144Firozpur ... 71 347 418 12,758 9,975 22,733Faridkot ... 191 358 549 18,114 14,258 32,372
a f e V Bhatinda ... — — — 13,244 8,116 21,360Hdidd Sangrur ... — — — 9,926 7,052 16,978
U f W S T Patiala ••• 41 142 183 26,066 18,319 44,385

467
CATION
Students id Institutions of Punjab (3 0 P f^ g 3 ^ H f ^ )
(A s on 30th September)
High/Post Basic Middle/Senior Basicl/igstnfa ^ 5 ?
Pdmary/Junior Basic
5 3 ^Boys G irls Total
753^Boys Girls
H 3Total
5 3 tBoys
5Borh>pG irls Total
37
3.70»816
3,49,672
4,20,410
54,62,275
24,62,432
4,79,359
S'4,90,726
5,00,137
5,08,945
38 39 40 41 42 43 44
2,26,409
2,20,833
2,80,234
3,32,240
i^3,42,225
3,62,309
3,73,174
3,89,375
4,03,252
5,97,225
5,70,505
7,00,644
7,94,515
8,04,657
8,41,668
8,63,900
8,89,512
9,12,197
1,94,189
2,46.958
1,10,035
94,116
99,247
99,865
1,02,179
98,318
1,04,017
1,27,939
1,76,981
76,167
68,874
67,865
71,731
74,023
72,015
80,657
3,22,128
4,23,939
1,86,202
1,62,990
1,67,112
1,71,596
1,76,202
1,70,333
1,84,674
5,22,589
6,07,'/71
10,70,225
9,76,582
9,97,772
10,18,317
9,87,982
10,02,025
10,29,515
3,49,001
4,45.C^5
8,73,285
8,01,950
8,21,993
8,47,366
8,32,979
8,50,724
8,73,840
45
8,71,590
10,52,S16
19,43,510
17,78,532
18,19,765
18,65,683
18,20,961
18,52,749
19,03,335
52,060 39,360 91,420 11,322 10,242 21,564 92,629 81,738 1,74,367
53,592 48,382 1,01,974 15,330 14,021 29,351 1,49.728 1,25,073 2,74,801
17,468 14,407 31,875 3,565 3,292 6,857 28,758 25,439 54,197
56,650 55,300 1,11,950 11,500 9,19o 20,690 98,547 90,729 1,89,276
46,389 34,457 80,846 6,553 6,040 12,593 79,242 73,589 1,52,831
26,388 22,693 49,081 5,158 3,577 8,735 42,553 38,291 80,844
61,230 58,531 1,19,761 9,629 8,035 17,664 93,807 82,746 1,76,553
34,567 19,738 54,305 12,290 7,943 20,233 89,739 69,122 1,58,861
35,492 26,495 61,987 6,917 4,293 11,210 1,02,684 83,874 1,86,558
35,851 23,899 59,750 6,892 4,498 11,390 76,926 60,399 1,37,325
44,794 28,805 73,599 5,054 2,874 8,378 79.219 62,041 1,41,260
4i,464 31,185 75,649 9,357 6,652 16,009 95,683 80,799 1,76.482

468
faED U
FrTg^20.3(HHTU3)— W gTdble 20.3( concld.)—.Districtwise Number df
Pre-Primary/Pre-Basic
FPH/ftiJJTYear/District
H s s rtwBoys O irls Total
0 46 47 48
1971* ... 79 54 133
1975* ... 102 56 158
1980 ... 82 69 151
1983 .*• 144 105 249
1984 .t. 84 77 161
1985 ... 99 77 176
1986 ... 26 22 48
1987 78 43 121
1988 ... 63 47 110
fr lij' D istr ic t- 1988
Gurdaspur ... — — -
Amritsar , ... — — -
o j y a w Kapurthala1 ... — - ~
tfdU d1
Jalandhar ... — — -
gft3»fBU 3 Hoshlarpur ... — - -
f u * y id Rupnagar 1 ... — - -
»fu»F5T Ludhiana ... — — -
Firozpur ... — — -
Faridlcot ... 60 40 100
gfesJ' Bathinda - ~ -
naidd Sangrur ... 3 7 10
Uf2>H»tt' Patiala --- —

460
fa iiiiCATION
^ f3T2# Stadeats ia lutHutioBS Punjab
(30 H3gg ^ « f g ^ )(As on 30th September)
teacher Training School
USitoffeof
Polytechnic Institutions
35?^5f} >H"3H f S
Teclinlcal Indiutrial Art and Craft School
83o|Boys G ir ls !
«A
Totalt ts 3
BoysS3o|>HTGirls Total Boys G irls Total
49 SO 51 52 53 54 55 56 57
843 1,210 2,053 1,470 _ 1,470 6,939 1.172 8,111
569 533 1,102 2,915 1 2.916 9.835 4.441 14.276
447 555 1,002 3.295 179 3.474 13.051 5.735 18,786
— — 3.680 248 3»928 n , 9 n 5,960 18,937
— — 3,715 219 3.934 12,999 5.648 18.647
— — — 3.627 261 3.888 12,923 5,555 18.478
— — 3.760 271 4,031 13.050 5,540 18.590
— — — 3,959 284 4.243 12.717 5,526 18.243
— — ~ 4.183 392 4,575 11.866 5,591 17.457
_ - 341 __ 341 1,463 615 2,078
— 681 3 684 1.331 552 1,883
— -i. 352 — 352 422 244 666
499 277 776 1.123 784 1.907
620 56 676 1,127 289 1,416
_ — — _ — 768 645 1,413
—— _ 776 — 776 1,502 467 l,i^69
.. _ — — — 729 309 1,038
— 318 — 318 869 543 1,412
. --P _ 187 23 210 790 254 1,044
— — — — 353 293 646
— — — 409 33 442 1.389 596 1.985
Fpq^:— 5{«fedo|g g f i f f w ifflpg ISource: Director of Public Instructions, Punjab.
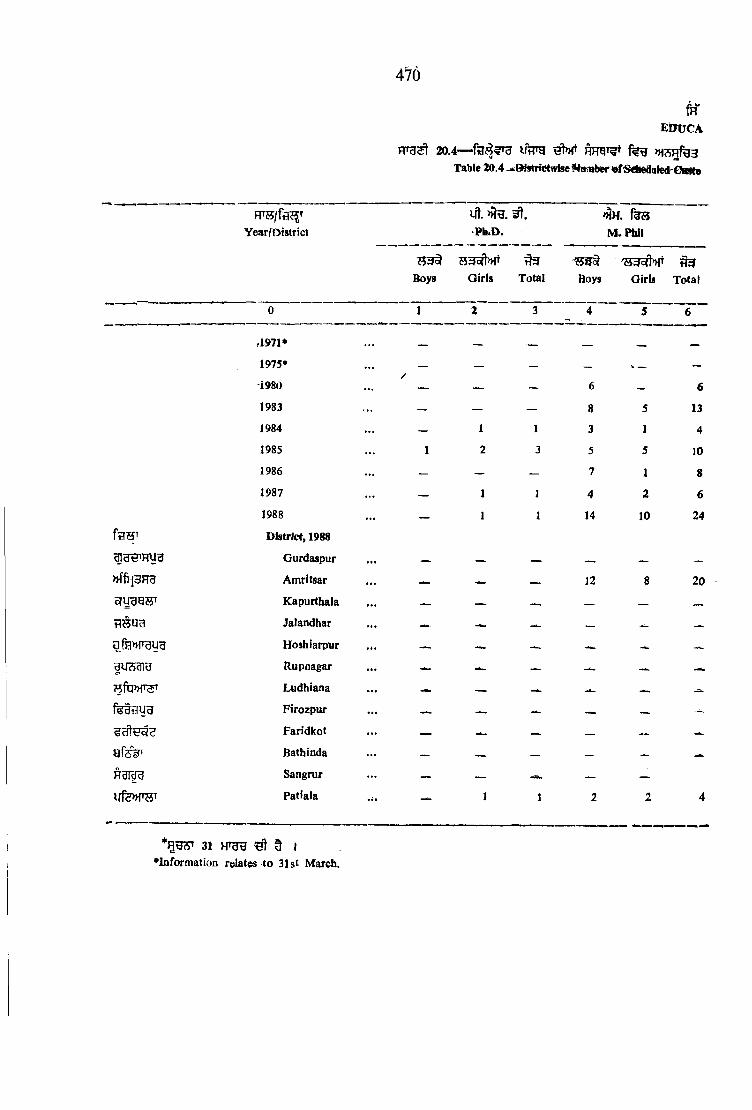
fRE D U C A
20.4— fe n >H75Rfe3 Table 20.4 mstrhitwlse f^iraber iofSdieaaled-Ctefte
470
Year/DistrictIft. >>Jh .
Ph.D.
Boys G irls Total^^cfhHT ^
Boys Girls Total
0 1 2 3 4 5 6
,1971* ... _ _ __ _ _ _
1975* .../
— — — —
■i980 ... — — — 6 - 6
1983 ... — — — 8 5 13
1984 ... — 1 1 3 1 4
1985 ... 1 2 3 5 5 10
1986 ... — — — 7 1 8
1987 ... — 1 1 4 2 6
1988 ... __ 1 1 14 10 24
District, 1988
^ d d 'FW g Gurdaspur
>Hf)l3HU Amritsar
oTUgqBT Kapurthala
Jalandhar
Hoshiarpur
3U(S31U Rupoagar
HftPH'd' Ludhiana
fed s u e Firozpur
Faridkot
Bathinda
Sangrur
Patiala
*Rd<S» 31 HTgg 5 1
12 20
•Information relates to 31st March.
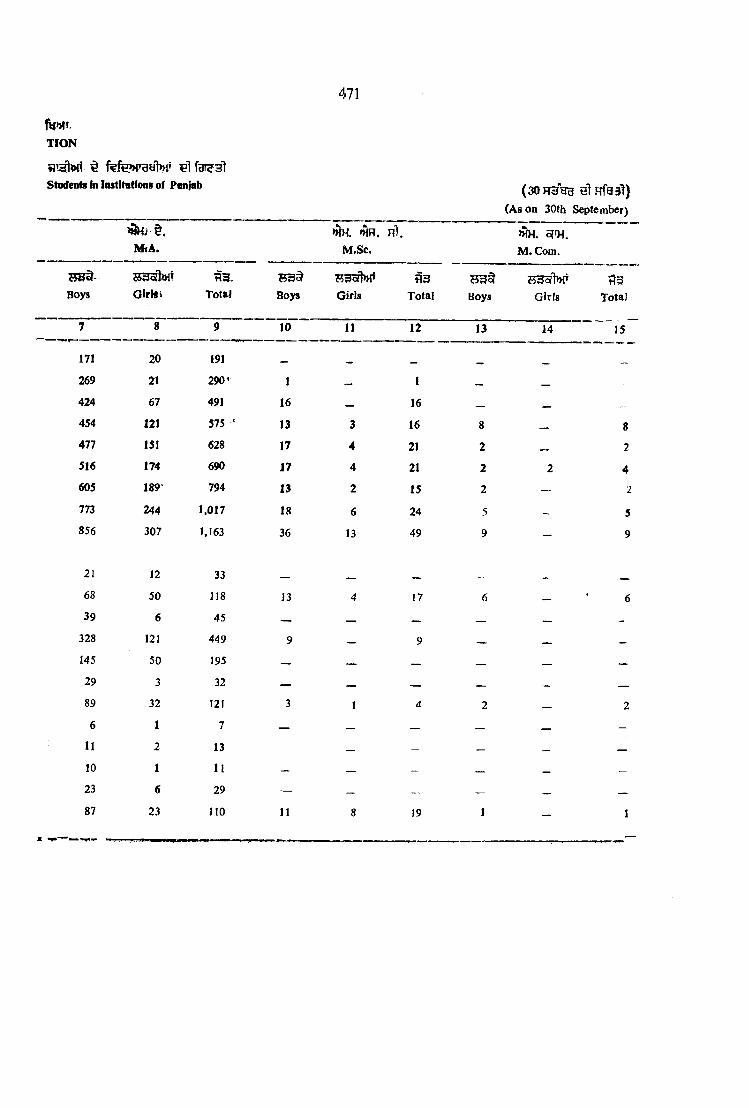
471
ftfni*.T IO N
Stndents in Institations of Panjab (30FT3gB e l Hf93t)(As 00 30th September)
>3Hi § .M (A.
W4. >HH. r1. M.Sc.
>>Ih .M . Com.
?53^-Boys
s s g J w tGfrHt
fl3 -Total Boys
75^0(1^Girls Total Boys G irls
f igTotal
7 8 9 10 11 12 13 14 15
171 20 191 _
269 21 290’ 1 — 1 _
424 67 491 16 — 16 _ —
454 121 575 ’ 13 3 16 8 _ 8
477 151 628 17 4 21 2 — 2
516 174 690 17 4 21 2 2 4605 189- 794 13 2 15 2 — 2
773 244 1,017 18 6 24 5 — 5
856 307 1,163 36 13 49 9 - 9
21 12 33 ■ _ _ _
68 50 1J8 13 4 17 6 — 6
39 6 45 — — — — —
328 12J 449 9 — 9 — _ —
145 50 195 — — — — — —
29 3 32 — — — __ — —
89 32 121 3 I d 2 — 2
6 1 7 — — — — — -
11 2 13 — — — _ —
10 1 11 — — — — — —
23 6 29 — — -- — — —
87 23 110 11 8 19 1 — 1
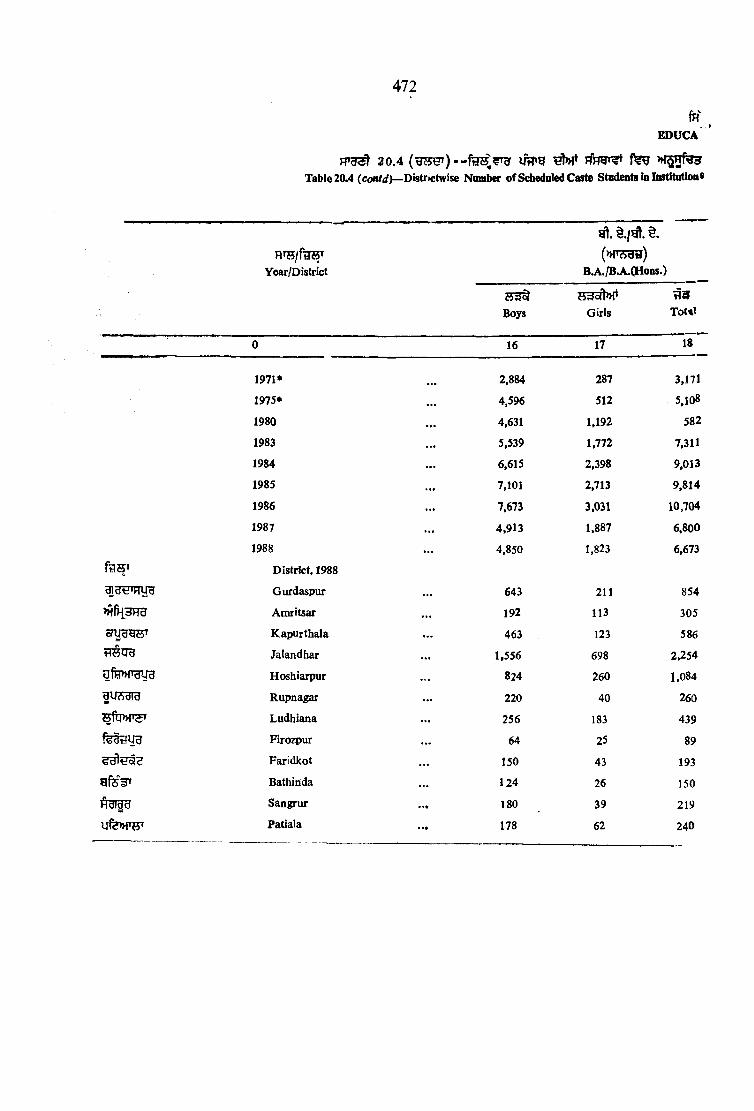
472
fHEIDUCA
Table 20.4 {eontd )—Districtwise Number of Scheduled Caste Stadents in InrtitutionS
n m i f m 'Year/District
(»n3TO )B.A./B.A.CHons.)
Boys Girls^ 9
Tot»l
0 16 17 18
1971* 2,884 287 3,171
1975* . . . 4,596 512 5,108
1980 . . . 4,631 1,192 582
1983 . . . 5,539 1,772 7,311
1984 . . . 6,615 2,398 9,013
1985 . . . 7,101 2,713 9,814
1986 . . . 7,673 3,031 10,704
1987 . . . 4,913 1,887 6.800
1988 . . . 4,850 1.823 6,673
District, 1988
Gurdaspur . . . 643 211 854
Anaritsar . . . 192 113 305
Kapurthala . . . 463 123 586
tTRcry Jalandhar 1,556 698 2.254
aftpHTgira Hoshiarpur . . . 824 260 1,084
gii* d id Rupnagar . . . 220 40 260
ttru » T ^ Ludhiana . . . 256 183 439
Firo2pur . . . 64 25 89
Faridkot . . . 150 43 193
g f e V Bathinda . . . 124 26 150
A biu u Sangrur 180 39 219
ufe>HW Patiala 178 62 240
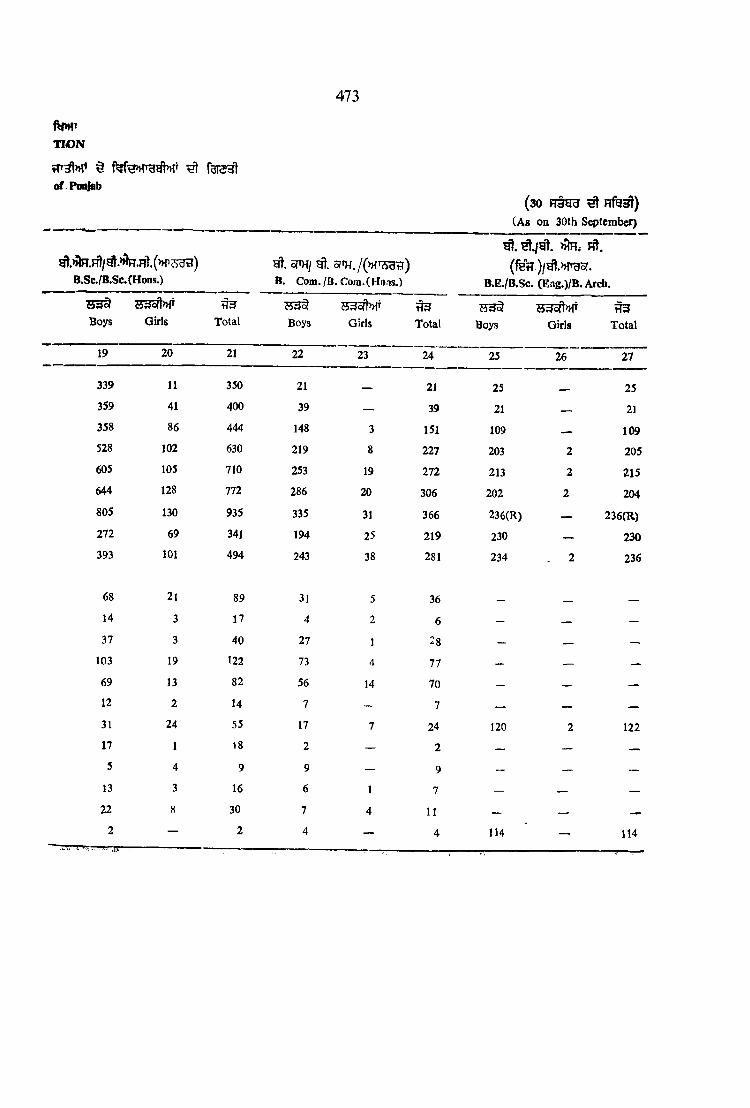
473
fVH>WON
Poolab(30 Fragg ^ H fe ^ )
(As on 30th September)
B.Sc./B.Sc.(Hons.)5PH/ 5?th./(>HT^??)
B. Com. IQ. Com. ( Ho.is.)
^ . ^ . / ^ . >>lH, Ht.
(fe fl.)/^ .» r3 Sr. B.E./B.SC. (Eng.)/B. Arch.
Total TotalBoys Girls
ij 1 Wdc<Boys Girls Boys Girls
HcJTotal
19 20 21 22 23 24 25 26 27
339 11 350 21 _ 21 25 25359 41 400 39 — 39 21 __ 21358 86 444 148 3 151 109 —. 109528 102 630 219 8 227 203 2 205605 105 710 253 19 272 213 2 215644 128 772 286 20 306 202 2 204805 130 935 335 31 366 236(R) — 236(R)272 69 341 194 25 219 230 — 230393 101 494 243 38 281 234 , 2 236
68 21 89 31 5 36 _ _
14 3 17 4 2 6 — — —
37 3 40 27 1 28 — — —
103 19 122 73 4 77 — — —
69 13 82 56 14 70 — — —
12 2 14 7 — 7 — — —
31 24 55 17 7 24 120 2 12217 1 18 2 — 2 — — —
5 4 9 9 — 9 — — _
13 3 16 6 1 7 — — —
22 8 30 7 4 11 — — —
2 — 2 4 — 4 114 — 114•I

474
fREDUGA
RTgst 20.4 »i?5gf03 Table 20.4(co/t/c/.)~l^istiictwise Number of Scheduled Caste Students in JastitulioQs
Year/District>>b . MR
M .B .B .S .g'r. >HsrB. Ed.
Boys Girls Total;
BoysflcJ-
G irls Total
0 28 29 30 31 32 33
1971* 81 20 101 96 25 121
1975* 206 20 226 198 87 285
1980 333 47 380 274 121 395
1983 371 80 451 162 177 339
1984 379 91 470 153 179 332
1985 393 112 505 151 170 321
1986 400 107 507 169 m 337
1987 388 130 518 208 162 370
1988 359 136 495 216 193 409
District, 1988
3 jd € 'H yg Gurdaspur — — — — — -
Amritsar 99 62 161 10 20 30
cTUdyS'S3 Kapurthala — _ — 17 27 44
dttUd Jalandhar — — — 68 34 102
g t a r g i r a Hoshiarpur — — — 21 14 35
I^ A d ld Rupnagar — — — — — —
Bathlnda
Sangrur
Patiala
Ludhiana 64 13 77 23 45 68
Firozpur — _ — 18 20 38
Faridkot 45 15 60 47 23 70
151 46 197 12 10 22

475
T IC N
of Ponjab.
3Tfe3 H 5 f ^ ( l0 + 2 O3 3 3 )/
U # 3 H § 3 ^ ( U ^ )
O ^ g s )/ F M n r a n t ^ f r ^Higher Secondary (10+2 Pattern)/ Higher Secondary (Old Pattern)/
Senior Secondary School
Boys Girls
34
24,846
1,08,599
24.224
25,434
23,582
23,428
25,606
32,198
37.225
35
6,926
41,413
8,234
9,940
9,505
9,956
10,607
14,189
18,435
Total
36
31,772
1,50,012
32,458
35,374
33,087
33,384
36,213
46.387
55,660
Boys
High/Post-3aslc
Qlrls
(30 n t o ^ Frfggl)(As on 30th September)
fH33/Ht5l>H3 gfFT5( Middle/Senior Basic
173Total Boys Girls
37 38 39 40
57,040
@
83.140
96,886
96,006
99,528
1,00,729(R)
1,04,5^7
1,07,741
17,534 74,574
38,472 1,21,612
52jllO 1,48,996
53,509 1,49,515
57,219 1,56,747
59.473(R) 1,60,202(R)
64,692 1,69,219
70,123 1,77,864
28,015
51,188
24^289
21,587
21,654
20,752
22,835(R)
22.108
23,476
41
13,010
28,261
11,235
11,170
11,570
12,801
13,184
12,508
14.576
Total
42
41,025
79,449
35,524
32,757
33,224
33,553
36,019(R>
34,616
38',0'52
4,622 2,072 6,694 12,155 7,637 19,792 2,458 2,079 4,537
3,499 2,533 6,032 8,868 5,242 14,110 2,326 1.291 3,617
1,305 1,064 2,369 4,463 2 , m 7,265 1,254 862 2.096
5,920 1.505 7,425 18,396 14.546 32.942 4,570 3.^60 7,830
4.867 3,078 7,945 12,249 n.495 23.744 2,309 1.516 3.825
2.717 971 3.688 5,937 4.207 10,144 1,132 675 1.807
4.467 1.426 5,893 14,060 10.493 24.553 2,823 1.850 4.673
1.177 759 1,936 4,359 1,^00 5,659 1,: 95 844 2.239
^090 1,916 5,006 4,853 2.678 7,531 911 484 1,395
l,75g 890 2.648 5,736 2.354 8,090 1,261 647 1.908
1,595 741 2,336 7.806 . 3.092 10,898 1.270 402 1.672
2,-208 1,480 3.688 8,859 4.277 13,136 1.787 666 2,453
( g e g ^ R o ? 3 g ]/ F f }^ ^ H o f3 ^ FTfs^ H m s ^ I (^lafonnation included in Higher Secondary/Senior Secondary Schools.

476
ffl-BDUCA
20.4 (R H n H ) U rTH »f2iHfg3Table No. 20.4 (Concld) Districtwise Number of Scheduled Castes Students fn
W B f f r ^Year/District Primary /Junior Basic Pre-Prlmary/Pre-Basic
Boys G irlstI3
Total Boys?53aft>>fTGirlg Total
0 1 43 44 45 46 47 4>
1971* ... 1,08,348 512,265 6,20,613 _ —
1975* ... 1,65,297 99,066 2,64,363 4 3 7
1980 ... 3,41,763 2.54,758 5,96,521 10 10 20
1983 ... 3,22,240 2,34,535 5,56.775 18 7 25
1984 ... 3,37,176 2,46,571 5,83,747 8 3 11
1985 ... 3,46,680 2,58,526 6,05,206 5 5 10
1986 ... 3,43,185 2,58,279 6,01.464 V. tvl .
^1987 3,61,150 2,79,300 6,40,450 — 1
rt48j;; 1988I? ... 3,78,707 2,93,118 6,71,825 1 __ 1
D istrict—1988
Gurdaspur 30,947 25,008 55,955
;s Amritsar ... 56,222 43,185 99,407 — — -
5TUHHHT Kapurthala 11,957 10,026 21,983 — — —
tfSU B Jalandhar 51,776 45,436 97,212 — —
3fifP>T3ira Hoshiarpur 32,899 29.436 62,335 — -* —
fUAclia Rupnagar 14,806 12,389 27,195 — —
8ru»T3T Ludhiana 40,067 33,439 73.506 — —
Firozpur 22,411 14,630 37.041 —. —,
Faridlcot 40,584 27.660 68,244 — —
Bathinda 23,278 15,130 38,408 — —
ftbiyu Sangrur 23,864 14,910 38,774 1 — 1
vrfe>H ^ Patiala 29,896 21.869 51,765 __ - __

477
^ f g ,5 ^
Institutiions of Panjab.
TION
( 3 0 H fga!)
(As on 30th September)
sfeBI Ho[5ssTeachers Training School
USlioir?)-(SPolytechnic Institutions
do<rtlo(1j OtflHfelof,
Technical, Industrial, Art and Craft School
Boys G irls Total BoysH 3 o fW
Girls Total Boys G irls Total
49 50 51 52 53 54 55 56 57
30 23 53 92 _ 92 1,366 159 1,525
197 128 325 314 — 314 1,766 540 2,306
233 252 485 659 34 693 2,457 602 3,059
— — — 711 55 766 2,909 849 3,758
— — 751 50 801 2,935 896 3,831
— — — 733 61 794 2»987 949 3,936
— — — 810 60 870 '3,071(R) 930(R) 4,001(R)
— — — 833 61 894 3.079 1,010 4,089
— — — 959 93 1,052 2,985 1,046 4,031
— — — 90 — 90 356 104 460
— — — 127 l27 285 95 380
— — — 90 — 90 99 62 161
— — — 107 69 176 264 162 426— — — 144 17 161 393 61 454
— — — — — 208 96 304
— — — 171 1 172 368 87 455
— — — — — 151 48 199
— — — 88 — 88 246 104 350
— — 43 2 45 232 32 264
- - - - - — 86 93 179
— 99 4 103 297 102 399
R — 1 '^'fedoT<;d, f%^3T, UHTgiR — Revised» Source— Director of Public Instructions, Punjab,

47S
fR*ED U C A
20.5—Table 20.5—District-wise Teachers—Pupil
R TSifeST Year/District
RFrar^Type
ferlcSl^Hfddl,
sra??
Engineering 5 Technology and Architecture College
0 11971* 9
1915* 8
1980 7
1983 8
1984 8
1985 8
1986 8
1987 1 8
1988 8k - ^ District, 1988
Gurdaspur»ffH3Fra*s Amritsaro TU B W KapurthalarIttUd Jalandhargfe>HT3ug HoshiarpurgUScJId Rupnagara f w ^ Ludhiana 1f^ddU B
^ d l€ ^ 2Firozpur
Faridkot «i.
Bathinda
Hdidd Sangrur
Patiala 9
31 HTUB ^ 9 •Information relates to 31st March

479
f wn o N
»!^UT3Ratio in Tnstitntions of Punjab
(30(As on 30th September)
^ fSTRH of Institutions
1 oj1o/w o('64iH cfltJd ^PacJI U*fed/ 0*fed 0* 1UH3
^.>>}h.) w . ) PWtf yrwbf ( fo + 2 (y5r-<vT eo{»
nhslMB
FT375Medical Teachers Highet Higher High/ College Training Secondary Secondary Post
(M .B.B.S. College School School Basic only) (B.Ed.) (10+2 (Old School
Pattern) Pattern)/SeniorSecondarySchool
fHsJS/HlcSl*>ragfHol
Middle/SeniorBasicSchool
ijjfeHa!/
ifRSTm Es
Primary/JuniorBasic
School
Pre-Primary/Pre-Basic
School
I B S
Teacher Polytech* Training nic School Insti-
(J.B .T .) tution
HoTcStoTt
Technical Industrial A rt Craft
School
2 3 4 5 6 7 8 9 10 115 12 32 32 29 38 19 23 5 7
4 13 24 21 n 34 20 9 9 10
3 10 25 23 18 41 25 15 10 11
3 12 27 23 17 37 41 - 11 11
2 12 26 23 17 38 27 — 11 ! l
2 11 26 23 17 39 29 — 10 11
2 11 26 24 18 39 8 — 11 10
2 12 29 24 18 40 24 — l l 10
2 12 31 26 19 40 22 — 11 10
— — 39 29 24 37 — — 10 11
— 13 33 25 19 42 — — 16 9
— 11 25 26 18 32 — — 9 8
— 9 30 27 20 40 — — 10 11
— 19 26 28 14 34 — — 13 11
— — 28 24 18 33 — — — 11
2 14 32 27 22 39 ~ — 16 9
— 14 31 27 20 46 — - - 10
2 12 31 20 19 46 25 - 8 10
— — 31 25 17 45 — — 8 10
— — 26 23 15 42 10 - — lo
2 7 33 25 16 40 — 9 9
m jT i:— ^'ryaojdd, itfph iSource : Director of Public Instructions, Putiiab

8 — UtTrg fS T ft^ W fg i § f^3igt >H5Rrg) »|t§ 5 f%fe))fTgg|
Table 20 *6—Intake in Degree Coarsss in Eagiaeering (by Faculties) in Poniab
480
EDUCATION
m T O s r fefft^>Hr33I ofTHtT,
Guru Nanak EnginmiDg College, Ludhiana
>>i^ lffe»TH i
Thapar Institute of Engineering and Techoaology, Patiala
W E
Yearw | 1
I f
ao*K)^5 to «I a
JQ1c iJ ' g S
g |S I tn
! .-T3 >
t € ' "r?y
c*— » etff V . y hr t j a E r §
'R 3 8 c f I X3
1
E w .S t JtC c}
S rt «» j : f l «j
0 1 2 3 4 5 6 7 8 9 10 11 12 13
196(>.61 60 60 60 — __ 180 60 30 30 — — — 120
1970-71 . . . 60 60 60 — — 180 60 60 60 - — — 180
1975-76 . . . 60 60 60 — — 180 60 60 60 — - - 180
1980-81 .. . 60 60 60 — 180 60 45 60 15 — — 180
1983-84 ••• 60 45 60 15 — 180 60 30 45 15 15 15 180
1984-85 . . . 60 45 60 15 — 180 60 30 45 15 15 15 180
l!#85-86 . . . 60 45 60 15 — 180 60 30 45 15 15 15 180
1986-87 . . . 60 45 45 15 15 180 60 30 45 15 15 15 180
1987-88 . . . 60 45 45 15 15 180 60 30 45 15 15 15 180
1988 89 • •• 60 45 45 15 15 180 60 30 45 15 15 15 180
F T O :— O t^g ^
Source:—E ngin ^nn s Colleges of Punjat.

EDUCATION
F T ^ 2 0 .7 —Table 2q,7— Intake in Diploma Courses In Engineering in Punjab
Name of the Polytechnic 1960-61 1970-71 1975-76 1980-81 1983-84 1984-85 1985-86 1986-87 1987-88 1988-89
9 10I 8
1. UHltarfeor, Government Polytechnic,63
2.
>hT K 3 TO
urafHS Uttlsbifosf,
Amritsar
Government Polytechnic, Guru
1G3 18S 133 120 207 210 210 210
3.
Teg Bahadur. Faridkot
J.R . Government Polytechnic,
62 59 137 120 120 112 120 120 120
4.tdfcSo^, ufeMTUUH
d ld ffe
Hoshiarpur
Government Polytechnic,
120 128 172 253 !85 166 196 210 255 255
5. H^jg weBatala
Mehar Chand Polytechnic
81 106 211 210 181 168 210 210 210
6.HHUd Jalandhar
Guru Nanak Polytechnic,
120 129 183 136 189 158 166 165 205 205
Ludhiana 120 119£ 178£ 271 306 207 273 270 270 270
7. ysteoffecT, Thapar Polytechnic, Patiala ...
Ramgarhia Polytechnic,
119 68 138 198 180 190 153 150 150 150
8.
Qstlsffesr,
Phagwara
Government Polytechnic
180 90 137 131 139 133 120 120 120 120
9. Bathinda 15 15 60 90 120 120
BTfT State 659 780 1,036 1,525 1,479 1,290 1,455 1.545 1,660 1,660
H g r f e ^ feuSH T feH W H B 5 Iilocludes Post Graduate Diploma course in Automobile Engineering.
PRj?? :— fHfy>MT >ji§ u?TTg iSource.—Director, Technical Education and Industrial Training, Punjab.
-fs-oa
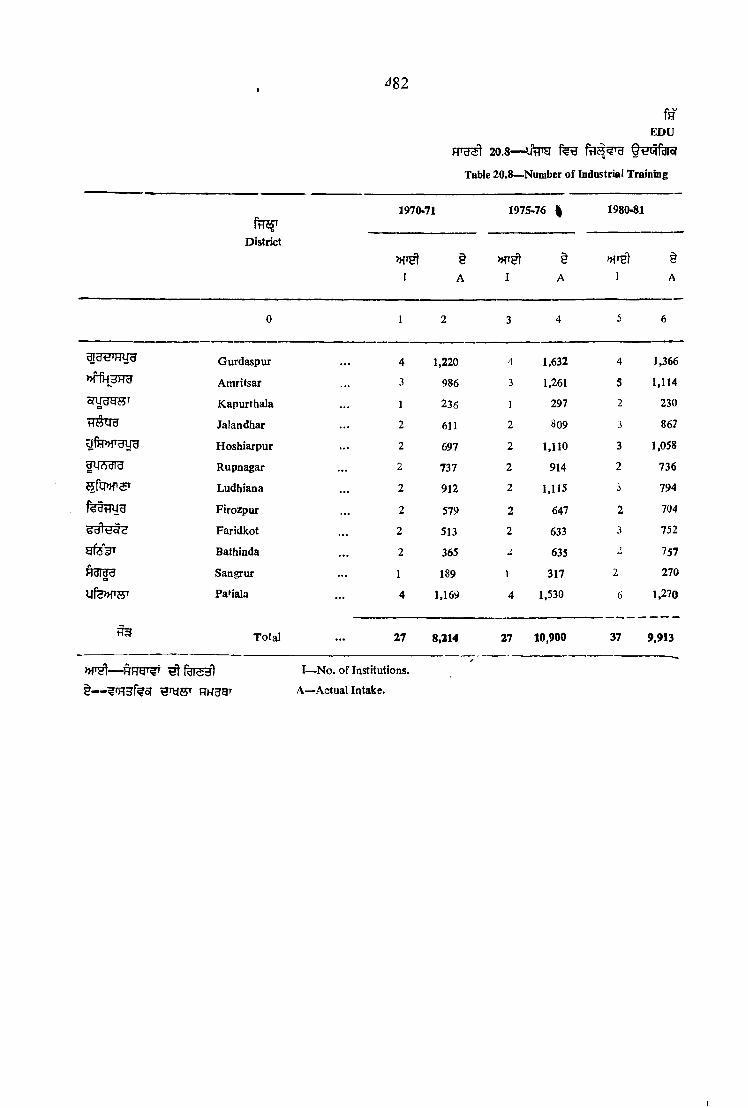
^82
f t i j fDistrict
feED U
20. 8— Oeqf dr a
Table 20.8—Number of Industriei Training
1970-71 1975-76 I
I§A I
I—No. of Institutions.
A —Actual Intake.
1980-81
I§A
0 1 2 3 4 5 6
Gurdaspur 4 1,220 4 1,632 4 1,366
»N H dH a Amritsar .. . 3 986 3 1,261 5 1,114
Kapurthala . . . 1 236 1 297 2 230
tHWUd Jalandhar . . . 2 611 2 809 3 862
g f t w u ir a Hoshiarpur .. . 2 697 2 1,110 3 1,058
fUcSdld Rupnagar . . . 2 737 2 914 2 736
Ludhiana . . . 2 912 2 1,115 3 794
r^dnuu Firozpur .. . 2 579 2 647 2 704
Faridkot . . . 2 513 2 633 3 752
Bathinda . . . 2 365 ) 635 - 757
Hdida Sangrur . . . 1 189 1 317 2 270
Ufe»TH^ Patiala . . . 4 1,169 4 1,530 6 1.270
Total . . . 27 8,214 27 10,900 37 9,913
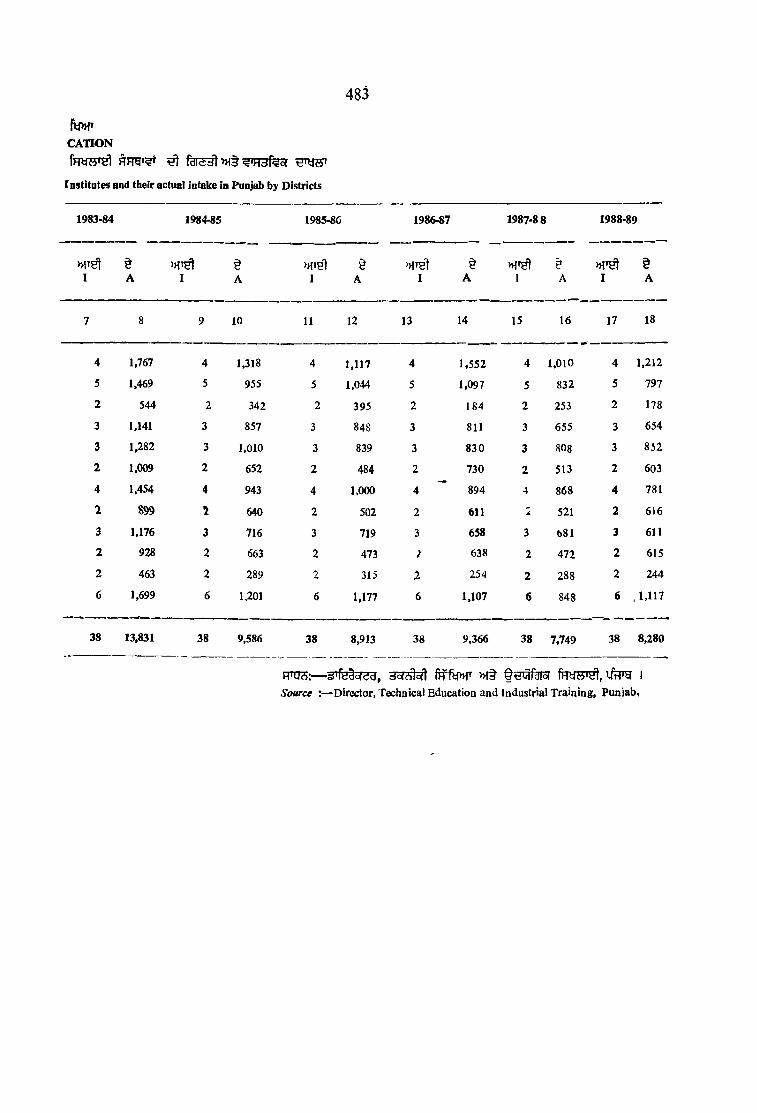
483
( wC A T IO N
^ >H§ ^ Hgfeo<
Institutes and their actual intake in Punjab by Districts
1983-84 1984-85 1985-8C 1986«7 1987-88 1988-89
I§A I I I I I
§A
7 8 9 10 11 12 13 14 15 16 17 18
4 1,767 4 1,318 4 1,117 4 1,552 4 1,010 4 1,212
5 1,469 5 955 5 1,044 5 1,097 5 832 5 797
2 544 2 342 2 395 2 184 2 253 2 178
3 1,141 3 857 3 848 3 811 3 655 3 654
3 1,282 3 1,010 3 839 3 830 3 808 3 852
2 1,009 2 652 2 484 2 730 2 513 2 603
4 1.454 4 943 4 1,000 4 894 4 868 4 781
2 899 2 640 2 502 2 611 1 521 2 616
3 1,176 3 716 3 719 3 658 3 681 3 611
2 928 2 663 2 473 1 638 2 472 2 615
2 463 2 289 2 315 2 254 2 288 2 244
6 1,699 6 1,201 6 1,177 6 1,107 6 848 6 , 1,117
38 13,831 38 9,586 38 8,913 38 9,366 38 7,749 38 8,280
RHJ3:— sjrfe^ofdd, jorcsloil f r f f tW >H§ 1Source “Director, Technical Education and Industrial Training, Punjab,

484
fR-^EDU
20.9— O tPg Table 2Q.9>~Nuint:er aod Seats.in T#jf|u)«cal
1970-71 1975-76 i m h s i
HFra»^T Name of the fnsMtUiion>H’S l >MR >JIh
I S I S 1 S
0 1 2 3 4 5 6
1. ^ fa o ? HHgr^T Speci al Trade Institutes 5 694 6 970 6 895
2. >H6Rfe3 tH Scheduled Castes Welfare Training Centres 5 288 5 352 5 380
3. ®3o|l>H' a e l H36JTdl
U S t ^ fe o f
Government Polytechnics for Women 1 60 I 180 1 180
4. 253fcr»{T H 5 l @€TSfaT3r Industria' Schools for Boys 1 96 1 64 1 136
5. Bdbn»>r ^Hirifdic? Industrie 1 Schoo's for G ills 37 2.380 40 3,294 44 4 070
Hdtt6. 53or>Mr iiH l Private Affiliated Schools for G irls 15 720 15 m 15 iOJ
H925
fcdSHl1—Number of Institutions.
MR—S —Number of seats.

485
nf§Trainiog Institutions in Punjab
CATION
1983-84 1984-85 1985-86 1986-87 1987-88 1988-89
m >HH >HH mnI s I S I S I s I s I s
7 8 9 10 11 12 13 14 15 16 17 IS
6 931 6 931 6 931 6 931 0 931 6 931
5 380 5 380 51
380 5 380 5 380 5 380
1 250 1 250 1 250 1 250 1 250 1 250
1 136 1 136 1 136 i 136 1 136 1 236
44 3.864 44 3,864 44 3,968 44 3,968 4 4.414 45 4,270
13 704 12 656 336 7 352 8 429 8 418
ITOcS;— 5{‘fed<2/^d, S o aI oH f H f w »f§ u " |Source :— Director, Technical Education and Industrial Training, Punjab.

486
f H f W
ED U C A T IO N
2 0 .1 0 : — f F T ^ T ^ fe fe » r FTirat M5T3
Table 20.10—^Districtwise Adult Education Statistics in Punjab.
•V Ik* •H ^ / f ^
Year/District
tJW cJO H ^ d ' td[ ldie?JI No. of Centra In opmtion
^ 5 5 y'Mdl' ^ TdraHT No. of Adolts admitted 1
Male Female%
TotalU3HMale Female Total
0 1 2 3 4 5 6
1985-86 255 2,219 2,474 9,446 79,876 89,322
1986-87 325 2,168 2,493 13,262 86,003 99,265
1987-88 469 2,765 3,234 18,002 1,02,391 1,20,393
ftTJp
1988-89
Districts 1988-89
608 2,920 3,528 20,179 99,389 1,19,568
Gurdaspur 6 294 300 220 10,261 10.481
Amritsar — 300 300 — 12,000 12,000
Kapurthala 86 158 244 2,868 6,316 9,184
flttU d Jalandhar 31 269 300 980 8,361 9,341
Hoshiarpur 35 265 300 2,122 7,775 9,897
3UAdld Rupnagar . 84 216 300 2,537 6,442 8,979
ttru»T5t Ludhiana 3 288 291 90 8,982 9,072
fed rflia Firozpur 107 191 298 3,481 6,781 10,262
^ a it d ^ Faridkot 68 232 300 2,687 8,116 10,803
g f3 3 ’ Bathinda 118 179 297 3,200 8,680 11,880
Saagrur 55 245 300 1,715 7,811 9,526V
Patiala 15 283 298 279 7,864 8,143
RTos:— BTfeloRry, f n f w u o t i
Source Director of Public Instruction, Punjab.

EDUCATfONAL INSTITUTIONS
487

488
E D U C A20. 11— ^ ^ ^ ^ W 7 ^
_______Table 20.11—Rec<^ised Edocational Institatioiis by type iof i t t W Ah W
Number of
State/U.Ts.
hWfcTB JTfegF T f ^ n f §olKUH »f§ 3oT- )>}H. 5THH R ^ ( l O + 5JT5H J^ o TTH ?? 2?teTO )
University Arts, Science and
CommerceCollege
Engineering and Technical
College
Medical Teachers Higher College Training Secon.
College(M .B.B. S. only)
dary School (10+2Pattern ^
0 1 2 3 4 5 6( § ) ^ (A) States
1. Andhra Pradesh 12 36] 27 10 48 482. »THm Assam 3 160 3 3 9 3653. fy iP g Bihar 9 405 6 10 15 1774. dlHdf3 Gujarat 9 218 10 6 39 1,2985. Haryana 3 114 2 1 18 1976. fU H T ^ Himachal Pradesh ... 3 37 j 1 2 1237. ^ »f§ ora>ftg Janmiu and Kashmir 4 27 4 2 3 1908. o(d<S'<icJ« Karnataka 8 372 50 18 60 9,050
9. Kerala 6 142 7 5 19 21
10. Hq 4 Qh Madhya Pradesh ... 12 375 11 6 19 2.26311. HU^3‘H2d Maharashtra 11 548 74 16 81 1,350
12. Manipur 1 23 — 1 3 30
13. Meghalya 1 23 — — 1 —
14. ^ 9 1 ^ ^ Nagaland — 16 1 _ / 1 -
15. Orissa 5 182 3 3 34 —
16. UH'y Punjab 4@ 170 3 5 18 324
17. Rajasthan 6 138 5 33 14
18. Sikkim — 1 — — — —19. W fH B 7FS Tamil Nadu 10 203 37 13 22 1,710
20. ddlug^ Tripura 1 11 1 — 1 126
21. f 3B Uttar Pradesh 20 403 3 8 13 —
22. iadl'tt West Bengal 8 302 10 43 1,147
23. W Goa 1 n 2 1 1 27
2.4 Arunachal Pradesh 1 3 ~ — ' -- 38
25. Mizoram — 12 — 1 —
(>h ) nut dM 1. »HSHT3 §
(B ) Union Territories1A . & N . Islands ... — — 1 ^8
2. Chandigarh — 12 2 10n
3. § ?S3ig Dadra and Nagar Haveli — -- — 3
4. f e s t Delhi ... 3 52 2 4 697
5 § ftdG Daman and Diu — 1 —- — 2
6. Lakshadweep —1 1 22Pondicherry 1 6 —
7.India 142 4,329 262 129 485 1,115
m Includes under Graduate'College of Teachers Training also.
©Include Punjab Uniyeristy, Chandigarh,* ^HUftT2 ofTHfl 1* Composite Junior College.T HHST U S^orfeof gifWH ^ 1t I^orm ation Includes in Polytechnic Institutions.
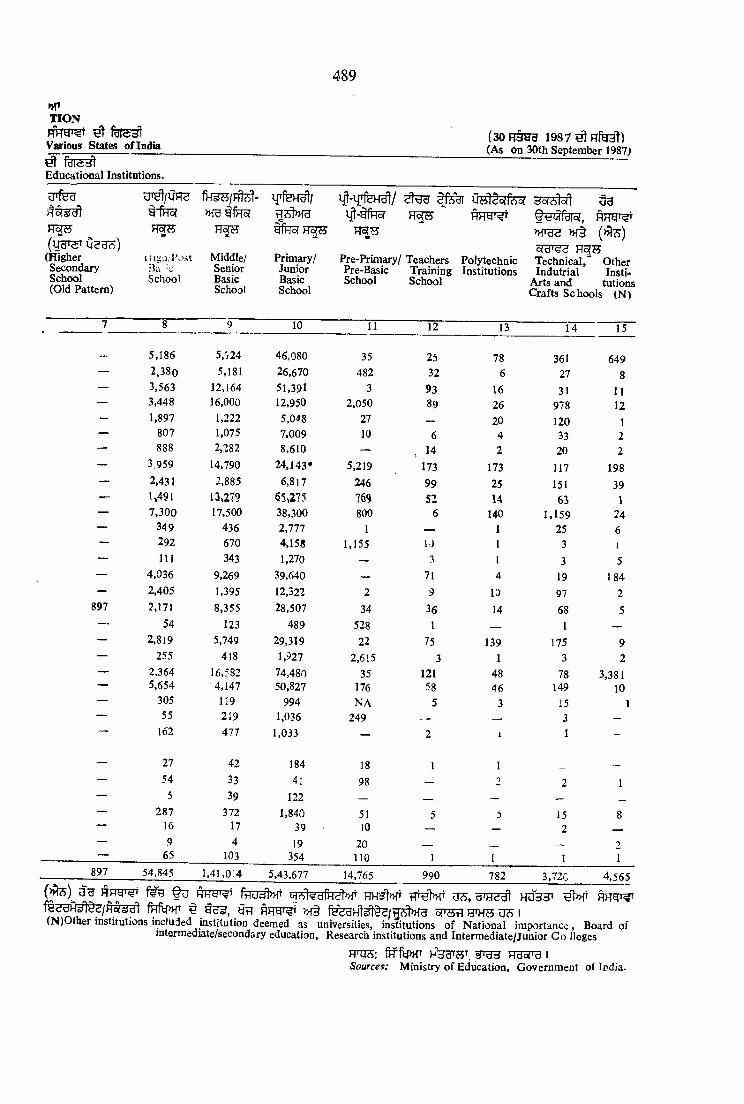
489
Various States of India
TION
^ fdlctJ]Educational Institutions.
(30H§gg 1987^Rfe3t)(As on 30th September 1987)
( U ^ 0 ? B 3 ) (Higher Secondary School (Old Pattern)
g if e fHo?^
r-nga/Post Ba :c School
» ra g lH ^
Middle/SeniorBasicSchool
Prhnary/JuniorBasicSchool
^ LtetSorfe^r H H W
Pre-Primary/ Teachers Pre-Basic TrainingSchool School
PolytechnicInstitutions
3 3
»f§o(6«S<iTechnical,' Other Indutrial Insti-
Arts and tutionsCrafts Schools (N)
10
897
5,1862.38o3,5633,4481,897
807888
3,9592.4311,4917,300
349292111
4,0362,405?,171
54 2,819
2552,3645,654
30555
162
27545
287169
65
5,',24 5,181
12,164 16,000
1,222 1,075 2,282
14,790 2,885
13,279 17,500
436 670 343
9,269 1,395 8,355
123 5,749
418 16,582 4,147 119 219 477
423339
372174
103
46.08026,67051,39112,9505,0487,0098,610
24,143*6,817
65>275
38,3002,7774,1581,270
39,64012,32228,507
48929,3191.92774,48050,827
9941,036
1,033
18441
1221,840
3919
354
11 12 13 14 15
35 23 78 361 649482 32 6 27 8
3 93 16 31 112.050 89 26 978 12
27 — 20 120 110 6 4 33 2— , 14 2 20 2
5,219 173 173 117 198246 99 25 151 39
52 14 63 \800 6 140 1,159 24
1 — 1 25 61,155 IJ 1 3 1
— 3 1 3 5— 71 4 19 1842 9 10 97 2
34 36 14 68 5528 1 — 1 —22 75 139 175 9
2.615 3 1 3 235 121 48 78 3,381
176 58 46 149 10N A 5 3 15 1
249 — — 3 -— 2 1 1 -
18 1 1 —
98 — 2 2 1
5110
20110
897 54,845 1,41,0:4 5,43.677 14,765 990 782
152
3,12c 4,565
f n f W ^ y n R H W >H§ STHH I(N)Other institutions included institution deemed as universities, institutions of National importance, Board of
intermediate/secondary education. Research institutions and Intermediate/Junior C o lieges
Fnns: f r f f w n g s ro iSources: Ministry of Education, Government o flrd ia .

490fn
E D U20. 12— ^ n rw re f% g
________Table No. 20.12—Number of Teachers by
States/U.Ts. T E A
Ufeg H^sidi R ^ ( l 0 + 2 Urfeg H ^ (U 3 r 5 T Higher S ^ n d a ry School Higher Secondary School
___________a o + 2 Pattern) (Old Pattern)U3HMen
feHddlMTWomen Total Men
feH5dl>HT Women Total
1. >H’qcJT Andhra Pradesh 5,455 2,747 8,202 — _
2. W W Assam 8,360 1,7 41 10,101 — — —
3. Bihar 3,631 1,441 5,072 — — —
f 4, Gujarat 26,000 7,500 33,500 — —
5. U fe W T Haryana 3,870 2,(55 6,725 — __ —
6. Himachal Pradesh 2,298 1,068 3,366 — «« _
7. ^ »t9 ofHHla Jammu and Kashm ir... 3,391 1,311 4,702 — - _
8. oraS^cic^T Karnataka 12,285 14,054 16,339 — - —
9. Kerala 494 1,508 2,002 — __ _
10. Hq Madhya Pradesh 23.994 7,431 31,425 — _ —
11. HUT a w H Maharashtra 42,000 16,500 58,500 - _
12. HfSlyg Manipur 740 290 1,030 - -
13. HUjTfe^f Meghalaya — — — - -
14. Nagaland 18 5 23 — _
15. Orissa — — — — _
16. l i ^ g Punjab 5,715 4,878 10,593 — — —
17. Raasthan ~ — — 4,96,824 1,37,538 6,34,362
18. fnfeH Sikkim 381 222 603 — — —
19. 3 T f H ^ ^ Tam il Nadu 41,218 27,379 68,5 97 — _ _
20. d d ly g r Tripura 2,654 1,209 3,863 — -
21. Uttar Pradesh 1,04,597 20,562 1,25,159 — — -
22. UgHt yaJ'W West Bengal 28.582 8,478 37,060 _ — —23 Goa 316 232 548 __ — —24. Arunachal Pradesh ... 745 130 875 _ —25.
(»f) W dMMizoram
(B ) Union Territories
7 1 8 — — —
1. 3 l*o<yid2. tIcndW
A . & N . Islands 665 407 1,072 — _ —
Chandigarh 161 346 507 — — —
3. tJ'tid ' d cSdId 0 ^ 8 1 Dadra and Nagar Havel i 62 25 87 — —4, ftdttl Delhi 11,945 17,670 29,615 — — —
5. § fe G Daman & D iu 21 4 25 — —
6 Lakshadweep 30 2 32 — — **
7. Pondicherry 476 263 729 — — —
^ 3 India 3.33.111 1,20,249 4.63,3S0 4,95,824 1,37,538 6,34,36 2
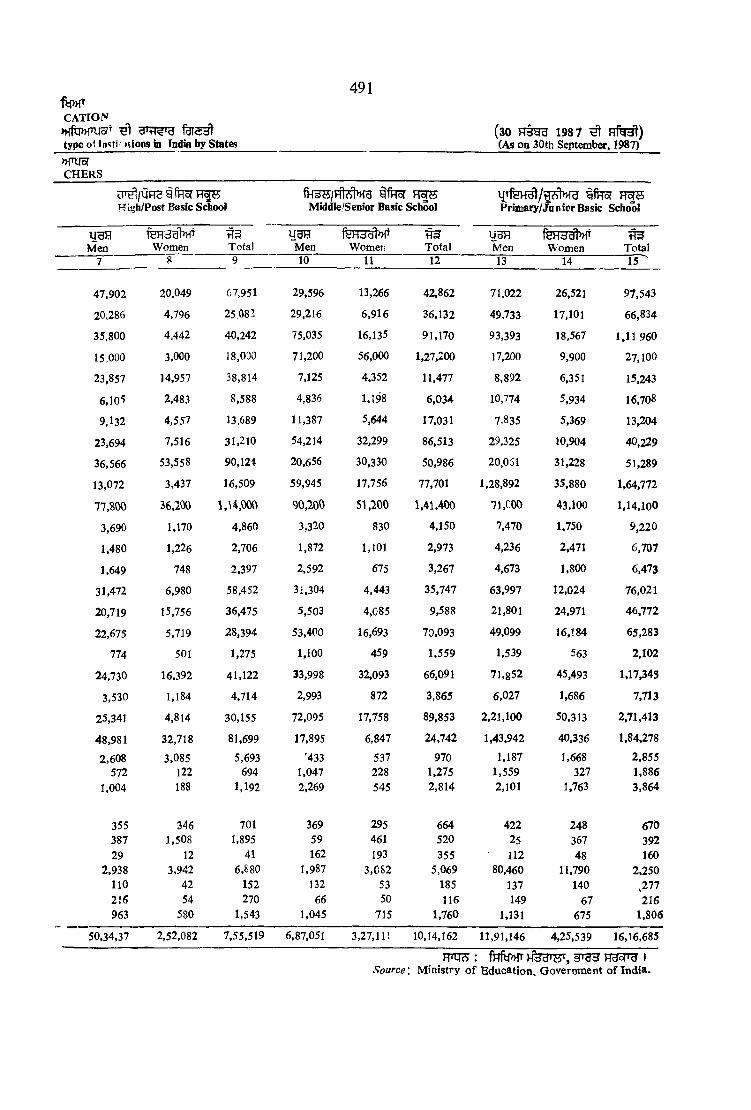
type q1 Instit jcions fa Inda by States»TOorC H E R S
CATION
491
(30 H3H3 1987 ^ H f ^ )(As on 30th September, 1987)
nigh/Post Basic School Middle/Senior Basic S c h ^ l Priniary/.niRicr Basic School
yu HMen
fe H 3 g WWomen
TT3Total Men Womer;
tT^Total
UBHMen
felHifdlWWomen
10 11 12 13 14Total15
47,902
20,286
35.800
15.000
23,857
6,105
9,132
23,694
36,566
13,072
77,S003,690
1,480
1,649
31,472
20,719
22,675
774
24.730
3,530
25,341
48,981
2,608572
1,004
20.049
4,796
4,442
3,000
14,957
2,483
4,557
7,516
53,558
3.437
36,2001,170
1,226
748
6,980
15,756
5,fl9
501
16,392
1,184
4,814
32,718
3,085122188
67,951
25.082
40,242
18,030
38,814
8,588
13,689
31,21090,12^
16,509
1,\4,0004,860
2,706
2,397
58,452
36,475
28,394
1,275
41,1224,714
30,155
81,699
5,693694
1,192
29,596
29,216
75,035
71.200
7,125
4,836
11,387
54,214
20,656
59,945
90.200 3,320
1,872
2,592
31,304
5,503
53,400
1,100
33,998
2,993
72,095
17,895
4331,0472,269
13,266
6,916
16,135
56,000
4,352
1,198
5,644
32,299
30,330
17,756
51,200830
1,101
675
4,443
4,085
16,693
459
32,093
872
17,758
6,847
537228545
42,862
36,132
91,170
1,27,200
11,477
6,034
17,031
86,513
50,986
77,701
1,41.400
4,150
2,973
3,267
35,747
9,588
70,093
1,559
66,091
3,865
89,853
24,742
9701,2752,814
71,022
49,733
93,393
17,200
8,892
10,774
7,835
29,325
20,051
1,28,892
71,COD
7,470
4,236
4,673
63,997
21,801
49,099
1,539
71,852
6,027
2,21,100
1,43,942
1,187 1,559 2,101
26,521
17,101
18,567
9,900
6,351
5,934
5,369
10,904
31,228
35,880
43,100
1,750
2,471
1,800
12,024
24,971
16,184
563
45,493
1,686
50,313
40,336
1,668327
1,763
97,543
66,834
1,11 960
27,100
15,243
16,708
13,204
40.229
51,289
1,64,772
1.14,100
9,220
6,707
6.473
76,021
46,772
65,283
2.102
1,17,345
7,713
2,71,413
1,84,278
2,8551,8863,864
355 346 701 369 295 664 422 248 670387 1,508 1,895 59 461 520 25 367 39229 12 41 162 193 355 112 48 160
2,938 3.942 6,S80 1,987 3,082 5,069 80,460 11,790 2,250110 42 152 132 53 185 137 140 ,277216 54 270 66 50 116 149 67 216963 580 1,543 1,045 715 1,760 1,131 675 1,806
50,34,37 2,52,082 7,55,519 6,87,051 3,27,111 10,14,162 11,91,146 4,25,539 16,16,685
H33THT, tS o u r c e Ministry o f Education, Government of India.

firE D U
20. 13— d H« 'dTable 20.13—Scholars on Roll by type of
492
States/U.Ts.U f e ( l0 + 2 T O S (\ra r^
Higher Secondary School Higher Secondary School(1 0 + 2 Pattern) (Old Pattern)
Boys G irlst75
Total Boys G irls Total
( t ) ^ (A) States 1 2 3 4 5 6
I. »roaT Andhra Pradesh 1,94,217 81,186 2,75,403 — — —
2. m m Assam 1,36,839 56,720 1,93,559 — - —
3, fyd'd Bihar 1,45,462 41,695 1,87,157 - -■
4, ^ d d ’d Gujarat 5,81,000 3,19,000 9,00,000 — - -
5. Haryana 135,687 50,194 1,85,881 — — —
6, i{§ a Himachal Pradesh 40,277 24,681 64,958 — — —
7. tiH § crawtg Jammu and K a sh m ir... 57,584 32,792 90,376 — - -
8. orar^soP Karnataka 1,16,394 35,772 1,52,166 — - -
9. ^ d tt' Kerala 23,305 16,693 39,998 — - _
10. HU Madhya Pradesh 3,05,372 98,869 4,04,241 - - — —
11. H iT d 'a^ d Maharashtra 13.42,000 6,85,000 20,27,000 — - - -
12. Manipur 10,150 7,950 18,100 — - —
13. HUJifo»T Meghalaya - — — - - —
14. ^ W 5 * 5 Nagaland 287 117 404 — — —
15. Orissa* _ _ — — — —
16. Punjab 1,91,933 1,13,376 3,05,309 — — —17. 'd '^ H y A
18.19. 3 i H S 3 T520. d d ly g r
21. § 3 3 lj[fe
Rajasthan
Sikkim
Tam il Nadu Tripura
5,339
12.74,17055,496
4,061
^,12,71438,882
9,400
20,86,88494,378
4,96,824 1,37,538 6,34,362'
Uttar Pradesh 33.54,747 10,58,195 44,12,942 — - -22 IJSHt t 9 F S West Bengal 7,75,469 3,83,102 11,58,571 _ -2 3 . W2 4 . W A '^ 6i
25. HtagTH
(>H) W d ' r l /
1.
Goa
Arunachal Pradesh ...
Mizoram
(B ) Union Territories Andaman and Nicobar
Islands
9,193
12,182
37
11,825
6,523
6,660
27
9,529
16,716
18,842
64
21,354
-
-
-
2. Chandigarh 6,994 5,989 12,983 — — —
3. Hi'tid' ^ ^Sdld U i? jt Dadra and Nagar Haveli ■J,358 812 2,170 — - -
4. Delhi 3,85,200 3,27,600 7,12,800 — — —
5. § f e § Daman & Diu 489 193 682 — — —6 . Lakshadweep 14 ] 15 — — -7. lI'silTdUl Pondicherry 15,053 9,056 24,109 — — —
^ 'd d India 91,88,073 42,28,389 1,34,16,462 4,S6,824 1,37,538 6,34,362
•No teacher has been appointed for + 2 StAg-3, existing teaching staff of colleges mm^ger the work o f 10+2 Stage.
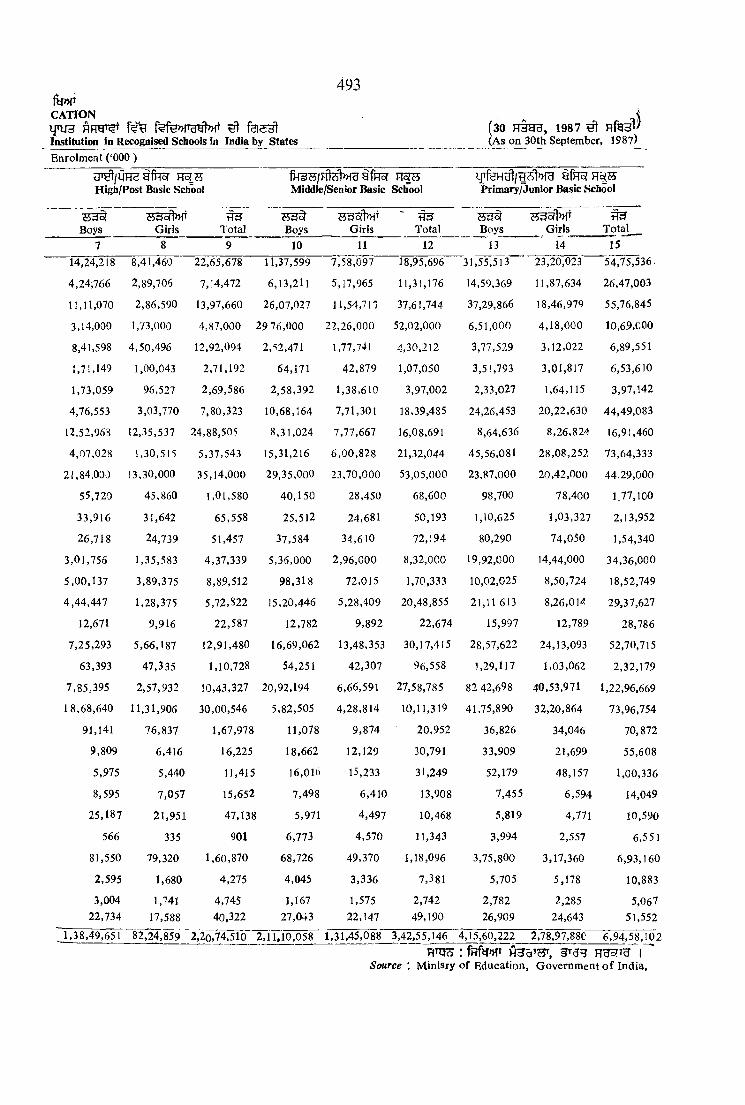
CATIONijo iH f%fe»TOTt»fT ^Institution in Recognised Schools in India by StatesEnrolment (‘000 )
493
(30 1987 ^(As on 30th September, 198?)
UT /UH gfHof m jsHigh/Post Basic School Middle/Senior Basic Sc^o!
afH5?H'c^s Primary/Junior Basic School
Boys753of1»ff
Girlst?5
lo ta l Boys Girls Total9 10 11 12
Boys Girls __ Total^13 14 is '^
14.24,218
4,24,766
11,11,070
3,14,000
8,41,598
1,71,149
1,73,059
4,76,553
12.52,963
4,07,028
21,84,030
55,720
33,916
26,718
3,01,756
5,00,137
4,44,447
12,671
7,25,293
63,393
7,85,395
18,68,640
8,41,460
2,89,706
2,86,590
1.73.000
4,50,496
1,00,043
96,527
3,03,770
12,35,537
1,30,515
13.30.000
45,860
31,642
24,739
1,35,583
3.89.375
1.28.375
9,916
5,66,187
47,335
2,57,932
11,31,906
22,65,678 11,37,599
7,14,472 6,13,211
13,97,660 26,07,027
4,87,000 29 76,000
12,92,094 2,52,471
2,71,192
2,69,586
7,80,323
24,88,505
5,37,543
35,14,000
1,01,580
65,558
51,457
4,37,339
8,89,512
5,72,822
22,587
12,91,480
1,10,728
64,171
2,58,392
10,68,164
8,31,024
15,31,216
29.35.000
40,150
25,512
37,584
5.36.000
98,318
15,20,446
12,782
16.69,062
54,251
10,43,327 20,92,194
30,00,546 5,82,505
7,58,097
5,17,965
11,54,717
22,26,000
1,77,741
42,879
1,38,610
7,71,301
7,77,667
6,00,828
23.70.000
28,450
24,681
34,610
2.96.000
72,015
5,28,409
9,892
13,48,353
42,307
6,66,591
4,28,814
18,95,696
11,31,176
37,61,744
52,02,000
4,30,212
1,07,050
3,97,002
18,39,485
16,08,691
21,32,044
53.05,000
68,600
50.193
72.194
8,32,000
1,70,333
20,48,855
22,674
30,17,415
96,558
27,58,785
10,11,319
31,55,513
14,59,369
37,29,866
6.51.000
3,77,529
3,51,793
2,33,027
24,26,453
8,64,636
45,56,081
23.87.000
98,700
1,10,625
80,290
19.92.000
10,02,025
21,11 613
15,997
28,57,622
1,29,117
82 42,698
41.75,890
23,20,023
11,87,634
18,46,979
4,18,000
3,12,022
3,01,817
1,64,115
20,22,630
8,26,824
28,08,252
20.42.000
78,400
1,03,327
74,050
14.44.000
8,50,724
8,26,0M
12,789
24,13,093
1,03,062
40,53,971
32,20,864
54,75,536.
26,47,003
55,76.845
lO,69,COO
6,89,551
6,53,610
3,97,142
44,49,083
16,91,460
73,64,333
44.29.000
1.77,100
2,13,952
1,54,340
34.36.000
18,52,749
29,37,627
28,786
52,70,715
2,32,179
1,22,96,669
73,96,754
91,141 76,837 1,67,978 11,078 9,874 20,952 36,826 34,046 70,872
9,809 6,416 16,225 18,662 12,129 30,791 33,909 21,699 55,608
5,975 5,440 11,415 16,016 15,233 31,249 52,179 48,157 1,00,336
8,595 7,057 15,652 7,498 6,410 13,908 7,455 6,594 14,049
25,187 21,951 47,138 5,971 4,497 10,468 5,819 4,771 10,590
566 335 901 6,773 4,570 11,343 3,994 2,557 6,551
81,550 79,320 1,60,870 68,726 49,370 1,18,096 3,75,800 3,17,360 6,93,160
2,595 1,680 4,275 4,045 3,336 7,381 5,705 5,178 10,883
3,004 1,741 4,745 1,167 1,575 2,742 2,782 2,285 5,06722,734 17,588 40,322 27,043 22,147 49,190 26,909 24,643 51,552
1,38,49,651 82,24,859 2,20,74,510 2,11,10,058 r ,31,45,088 3,42,55,146 4,15,60,222 2,78,97,880 6,94,58,102: fRfy>HT Ah o W , 1
Source ; Minisry of Education, Government o f India.


495
R s n js 21
HtJ'd
H^ar^ 21.1 fe g ^ fe n ^ t y ^ 3 t ^ >h§ 1 9 8 8 -8 9
P ? JT ^Ut7 t \
n ^ 21.2 I^BlffTO f ^ s i l ^ H W » f § 1 9 8 8 - 8 9 S S t g islw
^ 5 l
21.3 giJf ST > m ^ oft^ BHTT 0 I
R ^ 2 i . 4 litTO ^ » n ra ?u t ^ ^ i j h 2
H^TT 9 I
FTHSl 21.5 iftTH ^fsTHH T O F 3 ^ Fffe^ d I
R T g ^ 21.6 ^ f ^ ^ feRH ^ H O T 9 I
R T g ^ 2 1 . 7 f ^ ^ ^ FTH^ U H rg fe ^ U§ U^HR >H§ 198 8 5?^ »feri HUFr§
U S I
F T B ^ 21.8 litTO ( ^ I f ^ ^ ) 1988-89 oft^ l|3T^ 9 !^ 5 I
P T B ^ 21.9 UfPSf (^ITBSr gTgj) 1983*S4 3 ' 1988-8 9 3 ^ S fM 1{3T^ ^cTR fgl t I
w ^ 21.10 O u r ^ r n u § H ? ? ( t i iw 51^ ) ^ ^ ^ 1988- 8 9 % ^ o f t ^ i p ^
d i
21.11 f^gOu R 2jRUgs SfTUuie? (^ t^ o T grgj) >> 1 7 1983-84 ^ 1988-89 Hof
giHt '
R ^ 21.12 ^ ^ feHH ^ aft?R2g^ (torR/^oTR fe?5t)
itfcS'cWoT b l M s n g R ' f ^ 9 I
R T g ^ 21.13 iffFH ^ fcTRH Ht>HT R55T ^ § y ^ f^ irg j
^g»THT ^ W t I 1 9 8 8 -8 9 R^H ^ R^^^ f e ? 5 ^ yUH'U! 31^ t l
R T g ^ 21.14 R 3 c r 100 ^H3T f^TSHfeB § fesf ^ f i f i >H§ R ^
31$ flfer ^ H H R ^ 5 I
21.15 31 H W , 1984 3 H cTIr ^ »f§ >H3Rg|R5 R3ort ^
g i ^ d i
R f g ^ 21.16 ^ Hf^ar fe s n te g 9 1 § ? ? i ^rggi rh " i ^ » f T w
§ ut feife»r fTHT 5 1
R T H ^ 21.17 f H § >Hc?i ^ j y r f e § ^R3^ ^ c § # T O § W R r f ^ U 5 I
R ^ 21.18 ^ ^ W f e » f T fTScffd l 3T^ 5 I
21.19 ife rg R H f ^ f ^ ^ f e g i R oHh >HT3te ^ ^ R^nt
% "3! 31^ ft '

TRANSPORT AND COMMUNICATIONS
Table 21.1 shows the number of different types of vehicles registered in the Paijab State ovjr a number of years and district-wise data for the year 1988-89.
Table 21.2 :Shows the number of different types of vehicles on the road in the Punjab State over number of years and district-wise for the year 1988-89.
Table 21.3 shows daily kilometreage allotted to different citegorias ofopsrators,
Table 21.4 shows number of stage carriage permits/buses held by different categories of opsri n Punjab.
Table 21.5 shows the permit position by category of vehicle in Punjab.
Table 21.6 shows number of accidents according to class of vehicles in Punjab.
Table 21.7 shows road accidents in Punjab in different years anl districtwise data for the yeir1988.
Table 21.8 presents the progress achievaj by the Paijib R oiiv iys (Cjnne-oial \Viaj) djrif 1988-89.
Table 21.9 depicts the progress of Punjab Roadways (Commsrcial Wing) from 1983-84 to 1988-8 Table 21.10 presents the progress achieved by the Pepsu Road Transport Corporation (Commeroia
Wing) during 1988-S9.Table 21.11 depicts the progress of Pep>i Road Tria;porl Corporation (C:>nri;n;rcial Wing
1983-84 to 1988-89.Table 21.12 denotes comparative position in respect of number of various types of registered
(Taxed/Tax-free) vehicles in use in the States of India.
Tables 21.13 show road length of different types maintained by the Public Works Depart neat in Punjab. District-wise data have been shown for the year 1988-89.
Table 21.14 shows road length per 100 square kilometres of area and per lakh of population anJ number of villages linked with roads. ;
Table 21.15 shows surfaced and unsurfaced road length in India (State-wise) as on 31st Mirc'i,1984.
Table 2L16 shows route kilometres of the railways. In calculating route kilo netres doable or triple lines are counted only once.
Table 21.17 presents the figures regarding number of wagons loaded with important commodities.
Tables 21*18 give data about Post Offices in Punjab.
Table 21.19 gives number of T. V. Sets distributed under the Comnunity Viewing Scheme in Puniab.
496
SECTION XXI

ROAD LENGTH
THOUSANDS KILOMETRES 0 10 20
1988-89
1987-88
19
1970-71
r
0 10 20 30 HONOTE ROADS MAINTAINED BY P.W.D. (B. 4 R.) PB.
P.


> H § r f e r g
TRANSPORT AND COMMUNICATIONS
497
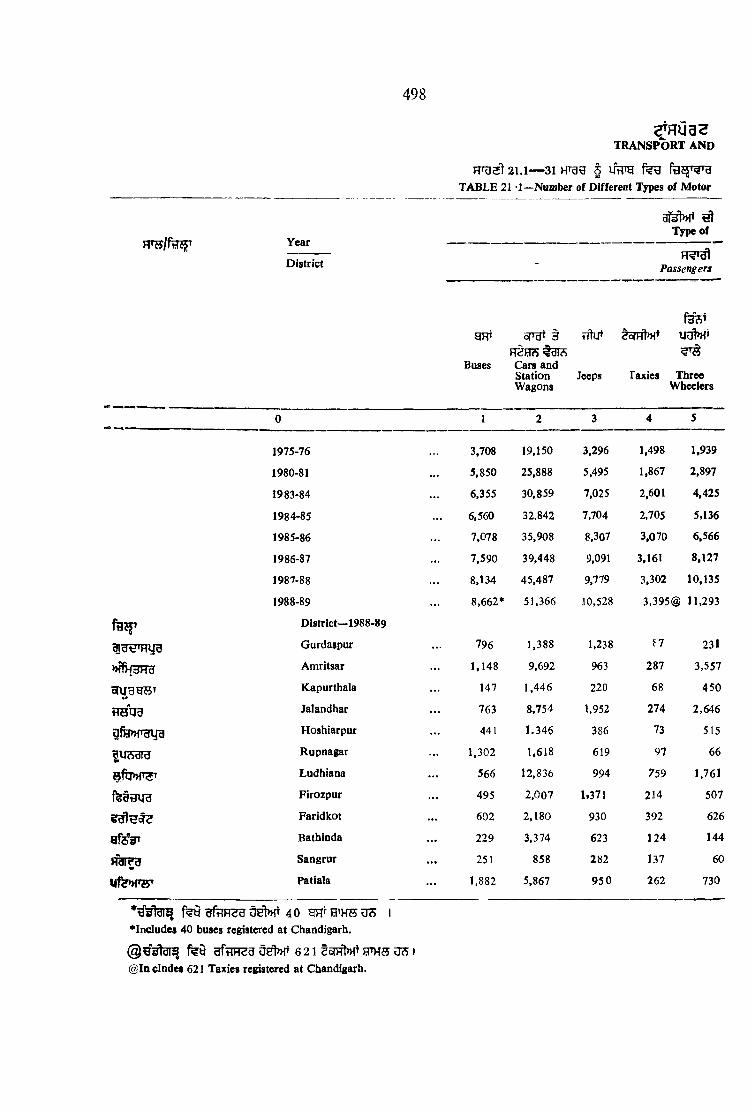
498
c J T g u g sT R A N S P O R T A N D
21.1— 31 HTgg § l ir r g T A B L E 21 •!—Number of Different Types of Motor
dl5n»f* ^
n 's / f i j j j ' V^arType of
District - Passengers
f3A*§
RcJMtS
udtnfj
Buses Cars andStationWagons
Jeeps Taxies ThreeWheelers
0 1 2 3 4 5
1975-76 3,708 19,150 3,296 1,498 1,939
1980-81 ... 5,850 25,888 5,495 1,867 2,897
1983-84 ... 6,355 30,859 7,025 2.601 4.425
1984-85 ... 6,560 32,842 7,704 2.705 5,136
1985-86 ... 7,078 35,908 8.307 3.070 6.566
1986-87 ... 7,590 39,448 9,091 3,161 8.127
1987-88 8,134 45,487 9,779 3,302 10,135
1988-89 ... 8,662* 51,366 10,528 3,395@ 11,293
f a y District—1988-89
Gurdaspur ... 796 1,388 1,238 n 231
Amritsar ... 1,148 9,692 963 287 3,557
e iu g g sTC5 Kapurthala ... 147 1,446 220 68 450
HiSUd Jalandhar ... 763 8,754 1,952 274 2,646
Hoshiarpur ... 441 1.346 386 73 515
BUAdld Rupnagar ... 1,302 1,618 619 97 66
BftpJTST Ludhiana ... 566 12,836 994 759 1,761
Firozpur ... 495 2,007 1.371 214 507
Faridkot ... 602 2,180 930 392 626
Bathinda ... 229 3,374 623 124 144
H3f^ Sangrur ... 251 858 282 137 60
UfS»PW Patiala ... 1,882 5,867 95 0 262 730
^Includes 40 buses registered at Chandigarh.
@ B 5 ta r^ 6 21 fPWS U3 I@ lDclndet 621 Taxies registered at Chandigarh.
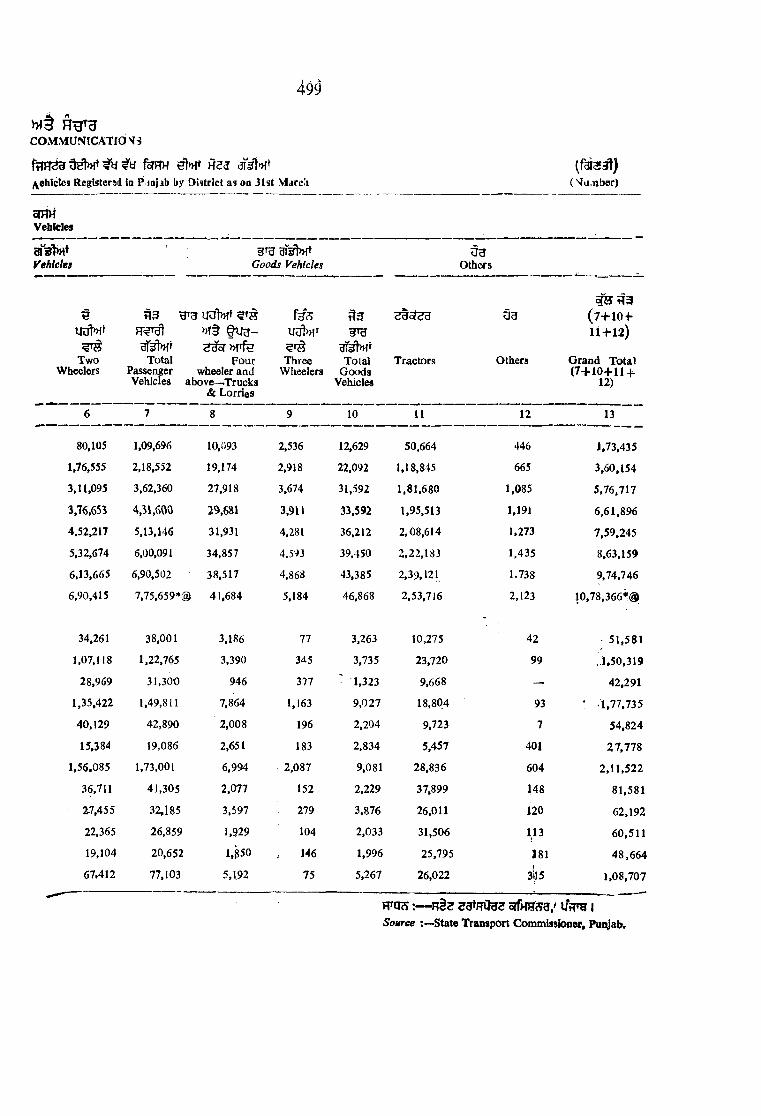
49^
w i H g r gCO M M U N tC A TIO V S
foTPTH a f^ W/vehicles Registered ia Pja}4b by District as oa 31st MarcU
oTFftVehicles
aT3l>H*Vehicles Goods Vehicles
u gOthers
(fasa!)( ''fuixiber)
BUUt»fT
TwoWheelers
^ UOtMt
Total Four Passenger wheeler and Vehicles above— Trucks
& Lorries
ThreeWheelers
^ 3d'd
TotalGoods
Vehicles
ddojc;d
Tractors
3 3
Others
(7+10-1-11+12)
Grand Total (7+1 0 +1 1 +
12)
6 7 8 9 10 11 12 13
80,105 1,09,696 10,093 2,536 12,629 50.664 446 1,73,435
1,76.555 2,18,552 19,174 2,918 22.092 1,18,845 665 3,60,154
3,11,095 3,62,360 27,918 3,674 31,592 1,81,680 1,085 5,76,717
3,76,65S 4,31,600 29,681 3,9U 33.592 1,95,513 1,191 6,61,896
4.52,217 5,13,146 31,931 4,281 36,212 2,08,614 1,273 7,59,245
5,32,674 6,00,091 34,857 4.59J 39.450 2.22,183 1.435 8,63,159
6,13,665 6,90,502 38,517 4,868 43,385 2,39,121 1.738 9.74.746
6,90,415 7,75,659*® 41,684 5,184 46,868 2,53,716 2,123 10,78,366»(3i
34,261 38,001 3,186 77 3,263 10,275 42 • 51,581
1,07,118 1,22,765 3,390 345 3,735 23,720 99 .1,50,319
28,969 31,300 946 377 ' 1.323 9,668 — 42,291
1,35,422 1,49,811 7,864 1,163 9,027 18.804 93 • -1,77,735
40,129 42,890 2,008 196 2,204 9,723 7 54,824
15,384 19,086 2,651 183 2,834 5,457 401 27,778
1.56.085 1,73,001 6,994 2,087 9,081 28,836 604 2,11,522
36,711 41,305 2,077 152 2,229 37,899 148 81,581
2.7,455 32,185 3,597 279 3,876 26.011 120 62,192
22,365 26.859 1.929 104 2,033 31,506 113 60,511
19,104 20,652 U 5 0 146 1,996 25,795 a s i 48,664
67.412 77,103 5,192 75 5,267 26,022 s b 1,08,707
m a s :— cf fHJJS5/ U*iTO |Source ‘.—State Transport Commissioner, Puqjab.
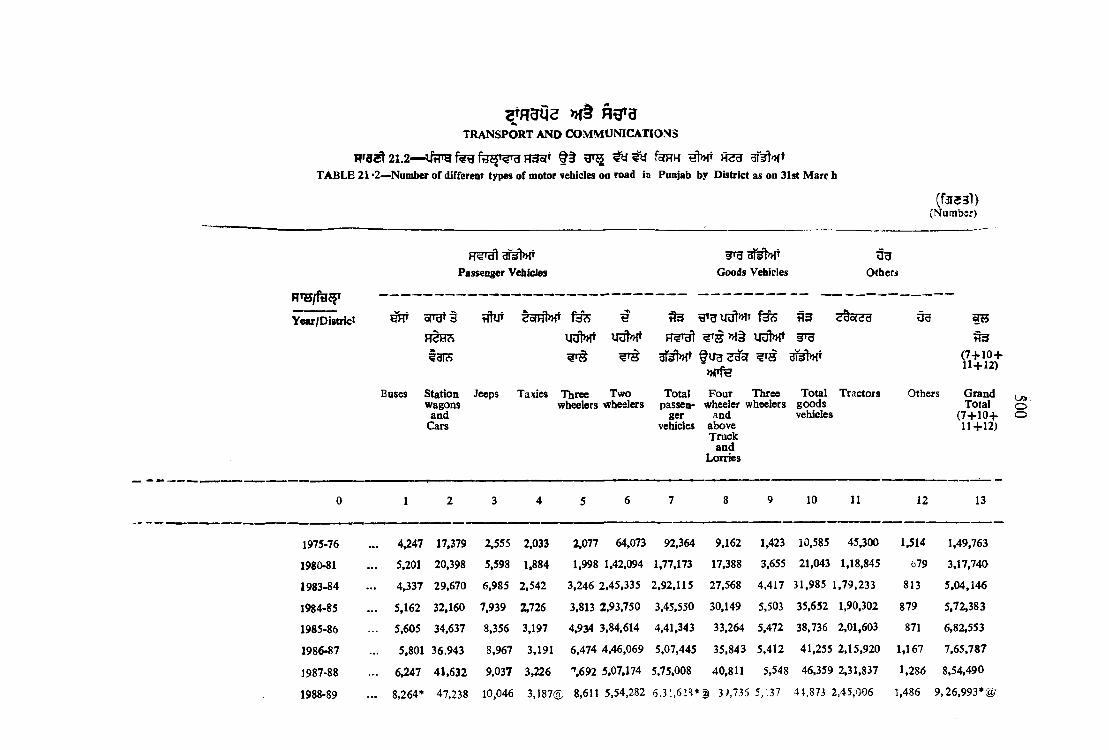
>k S
T R A N S P O R T A N D C O M M U N IC A TIO N S
H»3^^21. 2— H35ft foTHH ^ H ?3TABLE 21 *2— Number of differenr types of motor vehicles oo road in Panjab by District as on 31st Marc h
(fa ia a l)(Numbsr)
Year/District
Passenger Vehicles Goods Vehicles
3 ^ o p g t§ Htyr t o iH M ^ ^
H^HcS udt»ft UUt»fT ^
^ f l J 3 3H5r ^ r s 3T3t»f
Others
Buses Station Jeeps Taxies Three Twowagons wheelers wheelers
and Cars
Total Four Three Total Tractorspassen- wheeler wheelers goods
ger and vehiclesvehicles above
Truck and
Lorries
Others
(7 + 1 0 +11+12)
GrandTotal O
(7 + 1 0 + o11+12)
0 1 2 3 4 5 6 7 8 9 10 11 12 13
1975-76 ... 4^47 17,379 2,555 2,033 2,077 64,073 92,364 9,162 1,423 10,585 45,300 1,514 1,49,763
1980-81 ... 5,201 20,398 5,598 1,884 1,998 1,42,094 1,77,173 17,388 3,655 21,043 1,18,845 679 3,17,740
1983-84 ... 4,337 29,670 6,985 2,542 3,246 2,45,335 2,92,115 27,568 4,417 31,985 1,79.233 813 5,04,146
1984-85 ... 5,162 32,160 7,939 2,726 3,813 2,93,750 3,45,550 30,149 5,503 35,652 1,90,302 879 5,72,383
1985-86 ... 5,605 34,637 8,356 3,197 4,934 3,84,614 4,41,343 33,264 5,472 38,736 2,01,603 871 6,82,553
1986-87 ... 5,801 36,943 8,967 3,191 6,474 4,46,069 5,07.445 35.843 5,412 41,255 2.15,920 1,167 7,65,787
1987-88 ... 6,247 41,632 9.037 3,226 *',692 5,07.174 5,75.008 40,811 5,548 46,359 2,31,837 1,286 8,54,490
1988-89 ... 8,264* 47,238 10,046 3,187@ 8,611 5,54,282 6.31,613* g 39,735 5,!37 4t,873 2,45,006 1,486 9,26,993* @

-HtHBRB
«K
h s q g
Oistrict 1988-89
Gurdaspur
A.ODritsar
Kapurtbala ..
Jalandhat
241 1,472 261 132 239 3 0.846 33,191 2,632 187 2,819
483 2,947 683 227 1,528 lM 8 2 22,350 1,905 136 2,041
n o 2,188 283 53 397 19,342 22,373 633 345 978
811 11,857 2,706 297 2,763 1,45,807 1,64,241 7,958 1,478 9,436
8,600
23,720
9,668
19,038
41
18
97
44,651
48,129
33,019
1,92,812
Hoshiarpur 190 1,117 279 J49 382 30,080 32,197 2,1 13 236 2,349 9,621 - 44,167
fu sg ia Rupnagar 3,147 1,756 472 47 53 12,486 17,961 J.894 127 2,021 4,779 5 i l 25.303
Ludhiana 327 30,927 1,138 590 1.399 1.37,040 1,51,421 6,09J2 1,925 8,017 25,199 117 1,84,754
Firozpur 339 2,650 1,172 204 464 39,481 44,310 2,442 33 2,475 38,546 157 85,488
Farldkot 226 2,025 1,142 369 449 17,850 22,061 3,407 221 3,628 26,749 35 52,*473
Bathinda 232 3,473 637 125 158 22,538 27,163 1.929 104 2,033 30,007 110 59,313
R a ? ^ Sangrur 259 615 262 237 49 1 3,205 14,627 3,596 270 3,866 23,057 19 41,569
Patiala ... 1,871 6,211 1,011 262 730 69,125 79,210 5,135 75 5,210 26,022 3 50 1,10,792
RTO S: Iiource I—State Transport Commissioner, PuajtV.
Htf 28 9Ht w m *•lnclu<ies 28 buses on road at Chandigarh Headquarters.
'a 4 5 ^ 3 H« 495(a Includes 495 taxieg on road at Chandigarh Headquarters.
O

502
W 3 A g f gT R A N S P O R T A N D C O M M U N IC A TIO N S
21.3 : gpi w m ' f >HHT3 fsrew teg 31 ^ Pffg^tTable 21.3. Daily Kilometre allotted to bus operators as on 31st March
HTB
Year
vid 'y oft§ foTSHtes f Kilometreage allotted in Punjab
OUH ft'dia fe3IH ^ 3
fcTSHteg
PunjabRoadways
Pepsu Road Transport ,
Corporatioa
MunicipalCorporationTransport
PrivateOperator
T o ta l. Kilometres of Punjab buses in other States
Kilometres of Other StatM
buses in Punjab
0 1 Z i 4 1 o
1975-76 ... 3,62,545 1,72,430 — 2,70,610 8,05,585
1980-81 ... 4,48,878 2,37,828 26,116 3,43,490 10,56,312 61,283 63,039
1983-84 ... 5,08,(15 2.58,674 26,116 3,54,411 11,47,316 77,455 79,335
1984-85 .« 5,36,548 2,72,431 26,116 3,56,641 11,91,736 77,455 79,333
1985-86 ... 5,36,658 2,77,514 26,116 3,70,265 12,10,553 82,150 83,035
1986-87 ... 5,21,965 2,67,272 26,116 3,86,053 12,01,406 82,103 83,055
1987-88 ... 5,23,837 2,67,776 26,116 3,86,323 12,04.052 82,103 83,035
1988-89 ... 5,51,182 2,79,377 26,558 4,30,724 12,87,841 96,202 1,01,333
Soirc* t— Stute Transport Commissicnm. Punjab.

503
Provisional
M 3T R A N S P O R T A N D C O M M U N IC A TIO N S
21.4 ^ 4fH 3 »f§ gJT^ ^Table 21.4 Stage carriage permits/Buses held by diiTcreat category of Operators In Punjab
Punjab Roadways P E P SU Road Transoprt
Corporation
MunicipalCorporation
Transport
Private Operator
?T3
Total
Year 4H5Permits Buses Permits Buses Permits Buses
q n ePermits
gfnBuses Permits Buses
0 1 2 3 4 5 6 7 o 9 10
1975-76 ... 1,745 1,870 800 774 — 1,383 1,482 3,928 4,126
1980-81 ... 2,329 2,248 1,214 930 137 152 2,219 1,649 5,899 4,979
1983-84 ... 2.560 2,342 1,?.95 1,035 137 132 2,651 1,460 6,643 4,969
1984-85 , 2,596 2,364 1,302 1,042 137 128 2,649 1,492 6,684 5,026
1985-86 ... 2,619 2,410 1,324 1.369 137 113 2,746 1,539 6.826 5,431
1986-87 ... 2,633 2,348 1.338 1,074 137 117 2.825 1,566 6,933 5,105
1987-88 ... 2,640 2,367 1,285 1,023 137 117 2,890 1,696 6,952 5,203
1988.89 ... 2,717 2,356t 1,310 1,030 137 117 3,112 1,902 7,276 5,405
Source :-4ltate Transport Commiuioner. Punjab.
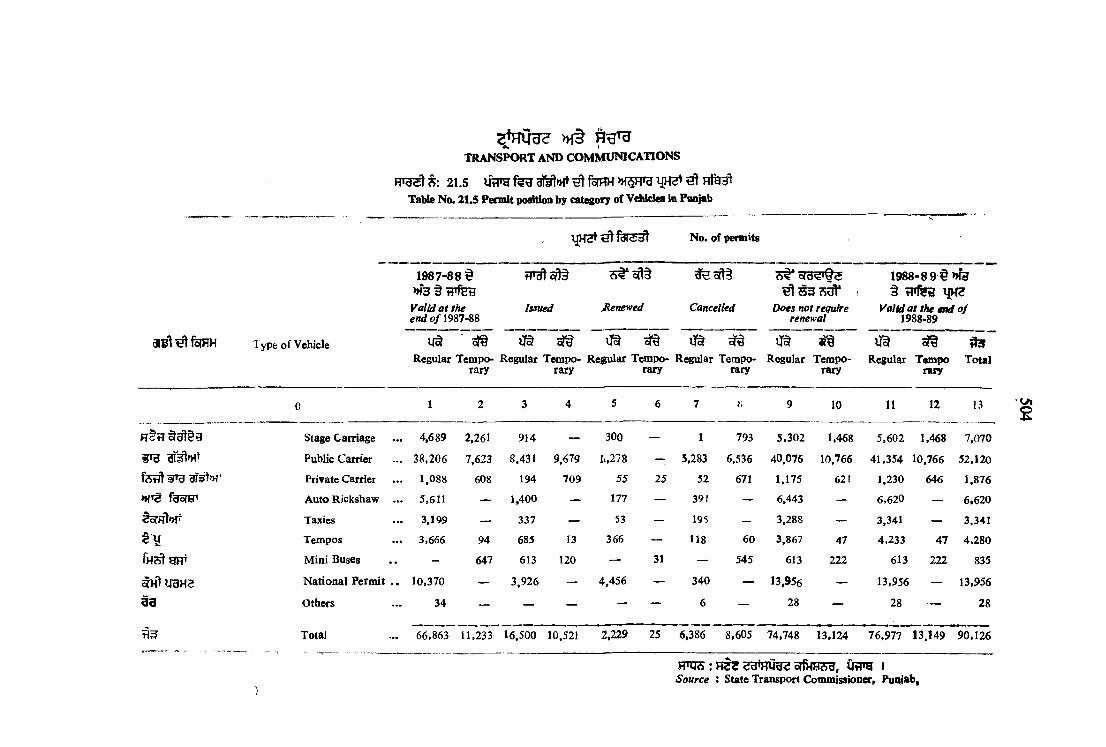
> H § f t g ’ HTRANSPORT AND COMMUNICATIONS
RTi3< S: 21.5TaUe No. 21.5 Pennit position by catesory of Vdikles in Pnnjab
No. of pmnits
1987-881> > e t tPfeBValid a t the end 0/1987-88
Issued jRenewed Cancelled
o|d«S*Qe
Does not require renewal
1988-89 t>»fe§ tnf5ra MH?
Valid a t the end o f 1988-89
Type of VehicleRegular Tempo- Regular Tempo
rary rary
^Regular Tempo- Regular Tempo
rary raryRegular Tempo
raryRegular Ttsmpo
rw yTotal
0 1 2 3 4 5 6 7 9 10 11 12 13
R*i7 Stage Carriage . 4,689 2,261 914 — 300 — 1 793 5,302 1,468 5,602 1,468 7,070
g»a Public Carrier . 38,206 7,623 8,431 9,679 I l,278 — 5,283 6,536 40.076 10,766 41,354 10,766 52,120
fetft WT3 Private Carrier . 1.088 608 194 709 55 25 52 671 1,175 621 1,230 646 1,876
w f3ofJ=n Auto Rickshaw . 5,611 — 1,400 — 177 — 39J — 6,443 — 6,620 — 6,620
Taxies 3,199 — 337 — 53 — 195 — 3,288 — 3,341 — 3,341
Tempos . 3,666 94 685 13 366 — 118 60 3,867 47 4,233 47 4,280
Mini Buses “ 647 613 120 — 31 — 545 613 222 613 222 835
National Permit 10,370 — 3,926 — 4,456 — 340 — 13,956 — 13,956 — 13,956
a a Others 34 — — — — — 6 — 28 — 28 — 28
Total 66,863 11,233 16,500 10.521 2,229 25 6,386 8,605 74,748 13,124 76.977 13.149 90,126
FTOJ5 : F IS? ^ 3 n w g ^ giMHSH, UtTO I Source : State Transport Commissioner, Punjab,
•u»g

505
» i 3T R A N S P O R T A N D C O M M U N IC A TIO N S
R ^ 2 i . 6 fonw ^Table 21.6 Number of accidents according to Class of Vehicle involved
m s
Year
^ feHH Type of Vehicle
t w oTO H ly g R ^ t3r^ gfecJHT '
7 P 3Two Auto- Car Jeep Bus Truck Tractor Tempo Station Tractor Others Total
Wheelers Rick- Wagons withshaw Trailors
0 1 2 3 4 5 6 7 8 91
10 11 12
1975 , , , . , . 752
1980 55 16 68 31 286 259 89 3 17 6 180 1,010
1983 44 6 75 2S 232 225 61 19 3 — 378 1,071
1984 32 12 86 29 210 320 42 — — — 260 991
1985 59 6 104 28 277 327 55 — — — 304 1,160
1986 47 9 100 50 301 446 89 — — — 204 1,246
1987 56 86 54 10 314 392 78 — 38 — 348 1,376
1988 69 21 126 74 350 360 59 32 — — 391 1,482
R ^ : H u r f ^ fe M U sr^ g H s g s yf55H (y ^ 5 r ) lA r g iSource :—Assistant Inspector-General of Police (Traffic), Punjab.
S 2 ^ ggg ^ig afel ^ t IN otfv—i f two vehicles are involved, class of vehicle primarily involved is taken.

506
>H HT R A N S P O R T A N D C O M M U N IC A T IO N S
RTgat 2 1 .7 — 0 ? r g H 3 3T A B L E 21.7—Road Accidents in Paniab
( f a 3 3 l )(Number)
H T S/m H i Year/District Accidents VehiclesInvolved
HT§ U ltf«»i33r}
Persons Persons Killed lAlured
u 1 2 3
1970* 677 747 331 557
1975 752 359
1980 1,010 1,064 472 83 5
1983 1,071 1,071 652 928
1984 99i 991 504 811
1985 1,160 1,160 710 799
1986 1.246 1,146 763 789
1987 1,376 1,376 819 884
1988 1,482 1,482 908 1,058
DIftrlct—1988
Gudaspur 75 75 42 109
M fiidHaAmritsar 76 76 40 65
o flJdyii'Kapurthala 55 55 40 69
fljs lraJalandhar 146 146 88 58
orw »rgyg Hoshiarpur 67 67 39 72
Hyftdld Rupnagar 134 134 92 85
Ludhiana 258 258 158 151
fefrlUlB Firozpur 101 lO l 62 71
Faridkot 104 104 63 52
Bathinda 88 88 53 110
Rarau Sangrur 98 98 63 67
iife»r?5T Patiala 280 280 168 149
•Informatioa relates to financial year.
FT u s ;— f s Rus r s a u rir^ iSourre ;—Assistant Inspector General of Police (Traffic) Punjab.
3 3 . — H ai3^>HT ^ e srg ^ § iNote,— two vehicles are involved, closs of vehicles primarily involved is taken.

TRANSPORT AND COMMUNICATIONS
507

508
T R A N S P O R T
2 1 .8 — 1 9 8 8 -8 9 U tT gT A B L E 21.8—Progress of Punjab Roadways
f m
W T
RHHT y g g r
S fe lW ^ ^ 3 '
W S >HHHT
g?T?ST ^ )iRnfg+
Total Fleet
Effective Kilometre*
Total Receipt*
Total Expenditure
Total Loss
Overall Receipts
Overall Expenditure
Overall Lost
Fleet utilization
D aily vehicle utilizatioa
Kilometres
Break-downs
Accidents
Total Staff
Daily Passengers carried
Oh i j [ ^
fe rsH fe g
Number
Lakh
RupeesLakh
RupeesLakh
RupeesLakh
Paise per Kilometre
Paise per Kilometre
Paise per Kilometre
Percentage
fe S H te g Kilometre
4 ^ ^ 3 3 P e rU tr ,
lo .o o o fe ^ Per 10,000 Hi<r9^'fUs Kilometres
s y fs?SHteU fllg
No.
2 ^ Lakh
Per one U k h K m .
136
106-25
342 -34
476 -45
134-11
322
448
126
97 -7
224
4-22
0*32
0-24
747
0-35
u tf 'y
TO q f e s I I I
Item Unit Amritsar i Amritsar 11
0 1 2 3
12 8
103-15
304-13
437 -40
133 -27
295
424
129
95-3
221
4-11
0-76
0-06
669
0-39
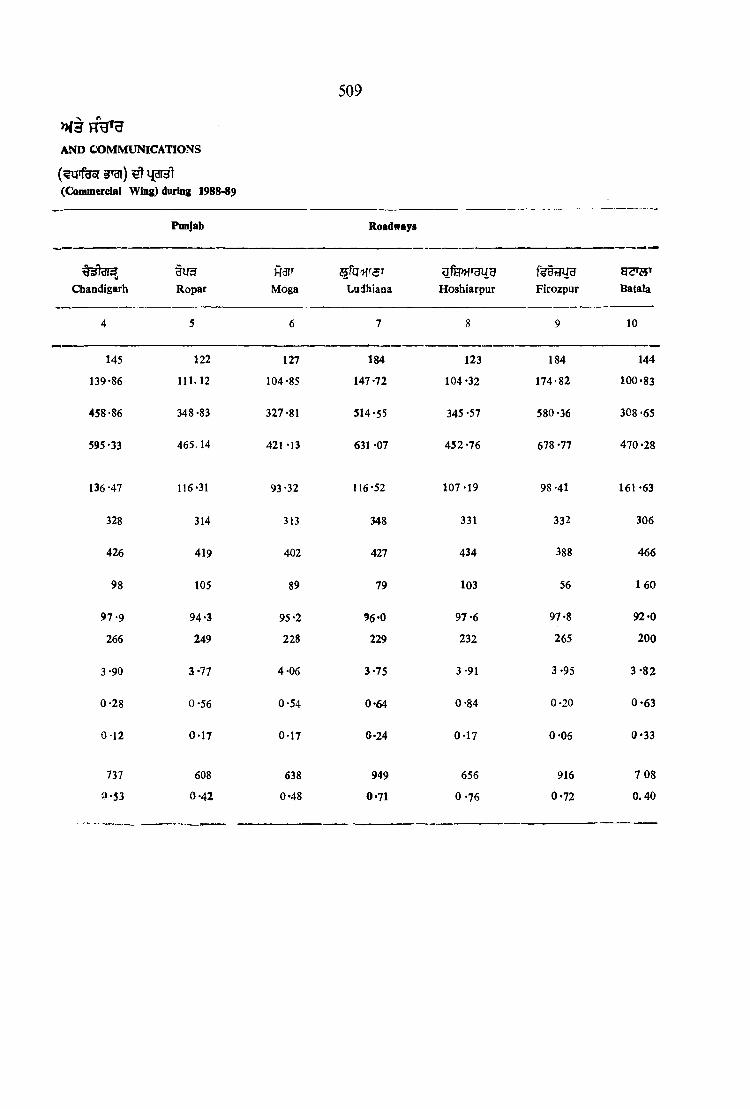
509
> H 3 h W
AN D C O M M U N IC A TIO N S
(Commercial Wing) daring 1988-89
Punjab Roadways
Ciiandigarhd imRopar Moga Ludhiaaa Hoshiarpur
fe d d y gFirozpur Batala
4 5 6 7 8 9 10
145 122 127 184 123 184 144
139-86 111.12 104-85 147-72 104 -32 174-82 100*83
458*86 348-83 327-81 514-55 345 -57 580-36 308 -65
595 *33 465.14 421 -13 631 -07 452 -76 678 -77 470 -28
136-47 116-31 93-32 116 -52 107-19 98 -41 161 -63
328 314 313 348 331 332 306
426 419 402 427 434 388 466
98 105 89 79 103 56 160
97-9 94-3 95 -2 96-0 97 -6 97-8 92-0
266 249 228 229 232 265 200
3-90 3-77 4-06 3-75 3-91 3-95 3*82
0-28 0-56 0-54 0-64 0-84 0-20 0-63
0-12 0-17 0-17 0*24 0-17 0-06 0*33
737 608 638 949 656 916 7 08
a -53 0-42 0-48 0*71 0 -76 0-72 0.40
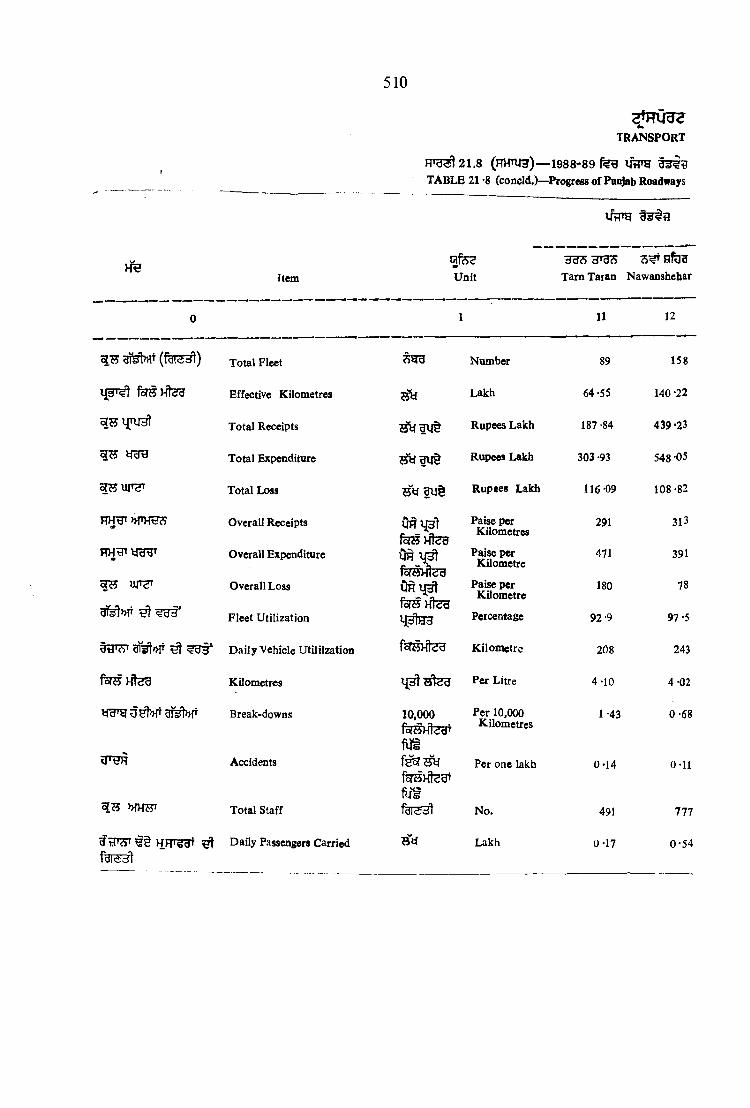
510
Item
5 H U T 3 T
F T H ^ > > rH ^
^ ursT
3 T ^ » r ^
dtl'cS'' 3T^<>F ^ ^53*
fsTB Hteg
w g u ? M 3 i¥ t > > r
IF H R
»TH?7T
Total Fleet
Effective Kilometres
Total Receipts
Total Expenditure
Total Loss
Overall Receipts
Overall Expenditure
Overall Loss
Fleet Utilization
D a ily Vehicle Utililzatioa
Kilometres
Break-downs
Accidents
Total Staff
TR A N SP O R T
R ^ 2 1 . 8 (HHTira)— 1988-89 fe g ^ 5 T A B L E 21 *8 (concld.)—Progress of Punjab Roadways
i/ rra
Unit3g?5 3 ^ Hfgg
Tam Taran Nawanshehar
H F T ^ ^ Daily Passengers Carried
7 m
m § u §
f ^ v i t e gOh
foTSHteu
f e s H t e g
f s r s ) ^
10,000fsnsHtegr
m
f ^ H t e g t
rdl<e:d1
11 12
Number 89 158
Lakh 64 -55 140 -22
Rupees Lakh 187 -84 439 *23
Rupees Lakh 303 -93 548 -05
Rupees Lakh 116 09 108-82
Paise per Kilometres
291 313
Paise per Kilometre
471 391
Paise per Kilometre
180 78
Percentage 92 -9 97*5
Kilometre 208 243
Per Litre 4-10 4-02
Per 10,000 Kilometres
1 -43 0 -68
Per one lakh 0-14 0-11
No. 491 777
Lakh 0-17 0*54

511
(Commtfclal Wing) during 1988>89
Punjab
AND COMMUNICATIONS
Roadways
13
?sa is )joraH? usT?5or2Nangal Muktsar Pathankot Patti Jalaodhar-I Jaiandhar-II Jagraon
14 15 16 17 18 19
Total
20
96 104 177 84 135 125 95 2356
74-40 87-37 147 -87 62-41 127 -44 113-81 81-47 1992 -46
239*70 269-86 464-21 174 *34 39Q -56 375-33 243-24 6,324 -41
.319-62 404-32 660-21 286-53 544 -27 485 -13 320-90 8502 -29
79-92 134-46 196 -50 112-19 145 -21 109 -80 77-66 2 \ n -88
322 309 314 279 314 330 299 317
430 463 447 459 427 426 394 426
108 154 133 180 113 96 95 109
94-6 95-1 93*8 95 -1 98 -5 98 -4 95-8 96-0
219 232 228 208 260 251 235 23 5
3-75 3-77 3-97 3-95 4-06 3-91 4-12 3 -95
M 4 0-49 0-45 0-80 0-41 0-47 0-43 0-56
0-17 0-19 0-16 0-18 U-26 0-10 0-09 0-16
435 552 923 447 686 678 461 12,078
0-29 0-38 0-62 0-24 0*46 0-43 0-21 8 -10
FTq5 33^30^2, 15oar<»:—.Director, State Transport, Puruab,
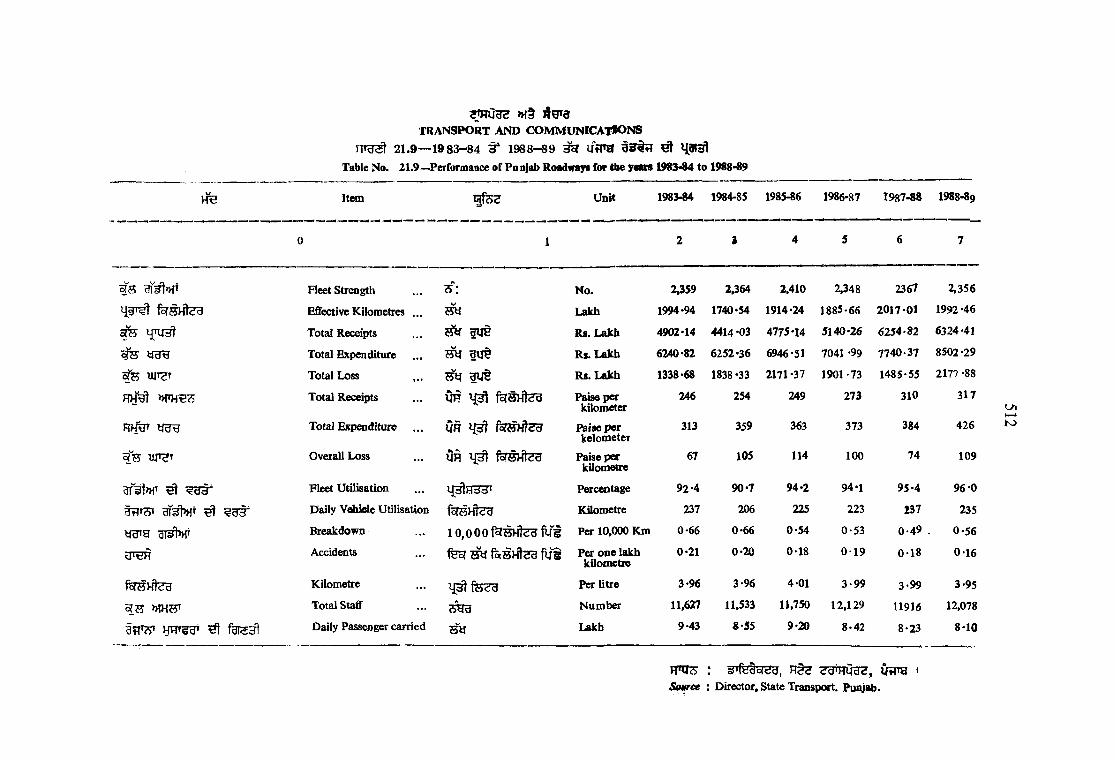
>H§TRANSPORT AND COMMUNlCATiONS
21.9-1983-84 §* 1988-89 ^ UtTO ^Table No. 21.9— Performance of Pa njab Roadways for the yaars 1983-84 to 1988-89
Item UnK 1983-84 1984-85 1985-86 1986-87 1987-88 1988-89
0 1 2 i 4 5 6 7
I S Fleet strength s : No. 2,359 2,364 2,410 2348 2367 2,356
Effective Kilometres ... m Lakh 1994*94 1740-54 1914*24 1885-66 2017 01 1992-46
Total Receipts ^ gtr§ Rs. I^ k h 4902*14 4414-03 4775*14 5140^26 6254-82 6324-41
^ ydtd Total Expenditure ... m g ii§ R s .L a k h 6240-82 6252*36 6946-51 7041 -99 7740-37 8502 -29
UlT^T Total Loss ,.. gut Rs. Lakh 1338-68 1838 *33 2171 *37 1901-73 1485-55 2177 -88
Total Receipts Oh Paiseperkilometer
246 254 249 273 310 317
Total Expenditure Oh ^ paisepcrkelometer
313 359 363 373 384 426
"5 WT Overall Loss Or foTHHteg Paise per kyometre
67 105 114 100 74 109
^ «cT5 Fleet Utilisation M ^H33T Percentage 92-4 90*7 94*2 94*1 95-4 96-0
^ , cTd Daily Vohielc Utilisation for5Hl<id Kilometre 237 206 225 223 237 235
gfsfl r Breakdown lO .O O O fcT H H te u fir i Per 10,000 Km 0-66 0*66 0-54 0-53 0-49 , 0-56
J 't iH Accidents fy'of m fe H H tsa f l i i Per one lakh kilometre
0-21 0-20 0-18 0 1 9 0-18 0-16
feH H te g Kilometre fo<id Per litre 3-96 3-96 4 01 3-99 3*99 3-95
Total Staff AWd Number 11,627 11,533 11,750 12,129 11916 12,078
D aily Passenger carried Lakh 9-43 «-55 9-20 8-42 8-23 8-10
t—k K )
0 ? ra >Source : Director. State Transp<»t, Pim|ab.
iferg
TRANSPORT AND COMMUNICATIONS
513
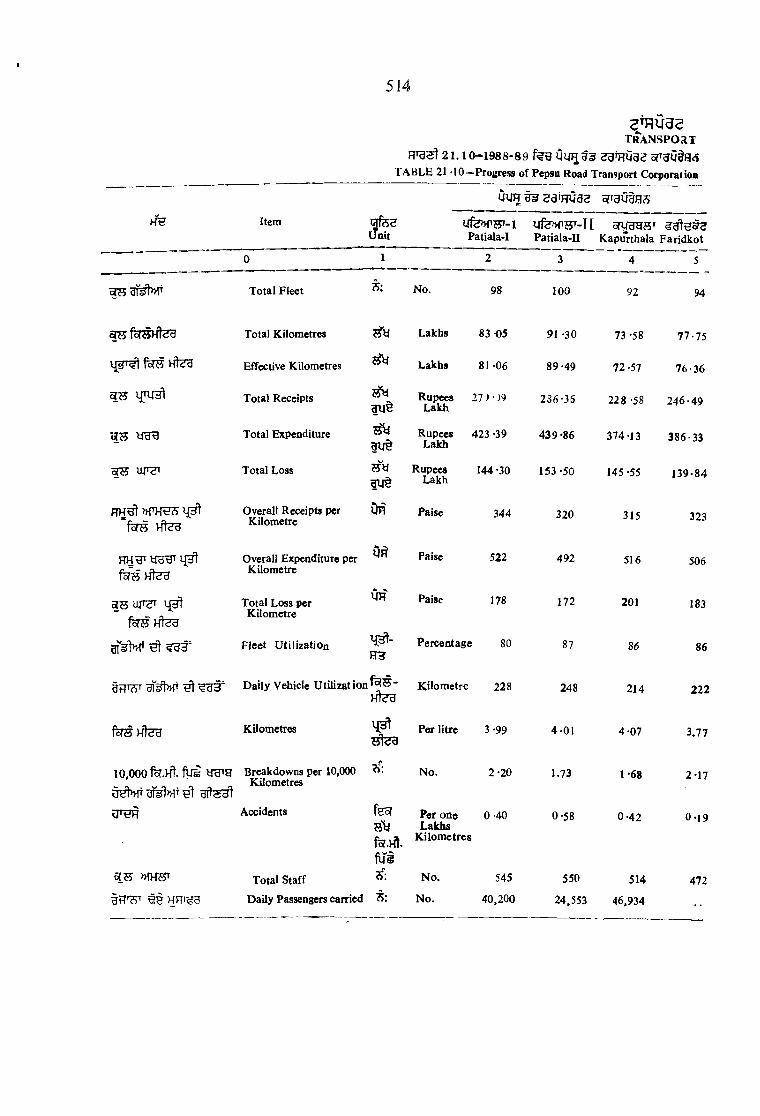
514
T R A N S P O a T2 1 .1 0 -1 9 8 8 -8 9 OUH ^ 3 2 g W 3 2 5r3U 3BS
TABLE 21 10—Progress of Pepsu Road Transport Corporation
Ou r ^ 2a*RU32
ItemUnit Patiala-I
u fe » T S T -nPatiala-II Kapurthala Faridkot
0 1 2 3 4 5
oTf5 Total Fleet S : No. 98 100 92 94
Total Kilometres Lakhs 83 -05 91 -30 73 *58 77-75
Effective Kilometres Lakhs 81 -06 89-49 72 -57 76-36
Total Receipts RupeesLakh
2 7)-J9 236-36 228 -58 246-49
yd tJ Total Expenditure - m RupeesLakh
423 -39 439-86 374 -13 386-33
T O UJi^i Total Loss s y RupeesLakh
144 -30 153-50 145 -55 139-84
f r o Wl^dOverall Receipts per
KilometreQw Paise 344 320 315 323
Overall Expenditure per Kilometre
0 ^ Paise 522 492 516 506
a?5UJ'<;'
foTH h Is U
Total Loss per Kilometre
Ol7 Paise 178 172 201 183
ai'V'tM* H i 4 d d ' Fleet Utilization 1 0 - Percentage 80 87 86 86
3 TO T ^ ^B3* D aily Vehicle U t il iz a t io n ^ ^ " Hl^d
Kilometre 228 248 214 222
fcfs Hteu Kilometres Pa: litre 3-99 4-01 4-07 3.77
10,000 fe.Ht. fy g tra^H Breakdowns per 10,000 Kilometres
No. 2-20 1.73 1 -68 2-17dy1»ft gtW)>HT ^
O'tJH Accidents fg3ts y
m
Per one 0 -40 Lakhs
Kilometres
0-58 0-42 0-19
cTS >HHHT Total Staff No. 545 550 514 472
g f r w HRT^g Daily Passengers carried 7i: No. 40.200 24,553 46.934 ••
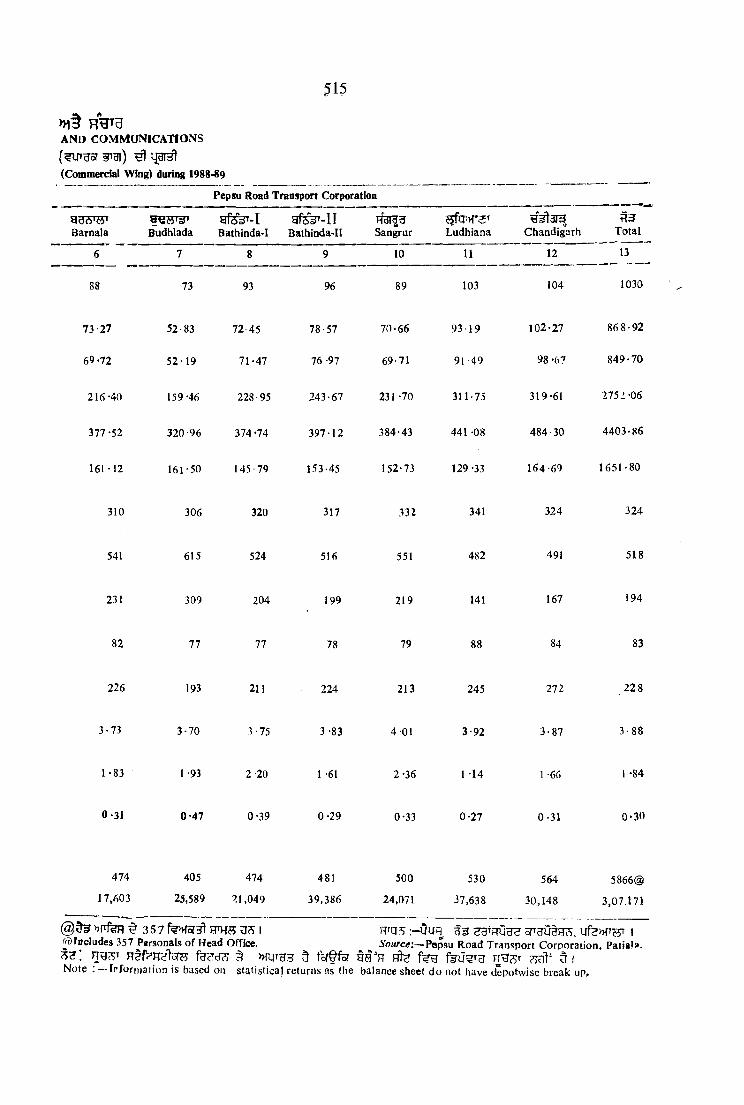
515
AND COMMUNICATIONS
(Commercial Wing) during 1988-89
9 d A 't i’Barnala
Pepsu Road Transport Corporation
g f e '^ - irBudhlada Bathinda-I Bathinda-II Saagrur Ludhiana Chandigarh
73 93
10 11
96 89 103
12
104
Total
13
1030
73-27
69-72
52-83 72-45
52 19 71-47
78-57 70-66 9319
76-97 69-71 9| 49
102-27 868-92
98-67 849-70
216-40
377 -52
161-12
159-46 228-95 243-67 231-70
320-96 374*74
311-75
397-12 384-43 441-08
161-50 145-79 153-45 152*73 129*33
319*61 2752*06
484-30 4403-86
164*69 1651-80
310 306 320 317 332 341 324 324
541 615 524 516 551 482 491 518
231 309 204 199 219 141 167 194
82 77 77 78 79 84 83
226 193 211 224 213 245 272 228
3-73 3-70 3-75 3 -83 4-01 3-92 3-87 3-88
1-83 1 *93 2 -20 1 -61 2*36 1-14 1 -66 \ *84
0-31 0*47 0*39 0*29 0 *33 0 *27 0-31 0*30
474
17,603405 474 481 5C0 530
25,589 21,049 39,386 24,071 37,638564
30,1485866®
3,07.171
>5frfeF| ^ 357 fTHS US i :-OuR 33 STHUHFTS, I^^Fffcludes 357 Psrsonals of Head Office. Source:—Pepsu Road Transport Corporation, Patialf,
Note ; — Irforrr»3fion is based on statistical returns as the balance sheet do not have depotvvisc break up,

T R A N S P O R T AN D C O M M U N IC A T IO N S 21.11— 1983-64 3" 198 8 -8 9 ^ yVJH c T ^ u f e ^
H B Item Unit 1983-84 1984-85i 1985-86 1986-87 1987-88 1988-89t
0 1 2 3 4 5 6 7
Fleet Strength Number 1,035 1,041 1.057 1,057 1,023 1,030
EflFective Kilometres ... I^ k h 826-19 778-15 813-05 787 -04 861*94 849 -70
Total Receipts ^ g u § R s .L a k h 2059-06 2030-89 2.132-79 2,262-60 27,35-44* 2.638.11
y g t j Total Expenditure 3U§ R s .L a k h 3249-01 3369-97 3,595-47 3,928-91 4,206-18* 4,902 -61
Total Loss R s .La k h 1189.95 1339-08 1,462-68 1,666 -31 1,470-74* 2.148-48
Total Receipts Oh ^ Paise per kilometre
249 261 262 287 317* 324
Total Expenditure Oh ^ Paise pCT kilometre
393 433 442 499 488* 577
IW T Overall Loss
Fleet Utilisation
Or Paise per kilometre
Percentage
144
0*7
172
90
180
90
212
90
171*
OA
553
83diofw* ^ <'cJd 0 / o9Daily Vehicle Utilisation 10,000 f u i Per 10,000
kilometre226 220 217 210 229 228
Breakdown Kilometre 1-02 1-05 1-08 1-14 1-92 1-84
Accidents f e o i Per one lakh kilometre
0-32 0-24 0-34 0-32 0-32 0-36
Kilometre Per litre 3-92 3*91 3-93 3-93 3-93 3-88
>HH?5T Total Stafif *VcJ Number 6,028 6,032 59.42 6,159 6.116 5,866
HtTOT HHrggr ^ f g i ^ Daily Passenger carried s “y la k h — — 3-60 3 -19 3-30 3-07
♦HQ Revised.
^ 21.10 H S ^ fS \
tlnformation based on provisional balance sheet that’s why it does not tally with figures of table 21 -10.
H n js : s r w in ? ? , ufe»r25» iSource : Pepsu Road Transport Corporatioii, Patiala.
\ o \
TRANSPORT AND COMMUNICATIONS
5l7

>H§
R T i ^ 21. 12— ^ » ft FW ^ 3 ^ t^TH) 3T^t»T— 1984-85Table 21.12—Total Registered Vebides (Taxed/Tax Exempted) in India by States and UniM Territories—1984-H5
TRANSPORT AND COMMUNICATIONS
(Number)
t o/'d' ?ftut 9RT ddo<^3
StateTwo
Wheelers•Threewheelers
Cars Jeeps Taxies Buses Trucks Tractors Trailers Others TotalUnion Territory
0 1 2 3 4 5 0 7 8 9 10 IJ
lj[§e (P)A —ST A T E S
Andhra Pradesh (P) 3,66,436 18,072(E) 40,137 15,456 3,093 12,198 52,629 22,701 15,333 2,272 5,48,327(E)
»KWH Assam 40,339 988 18,471 9,014 1,838 3,391 26,293 6,304 4,903 1,752 1.13,293
Bihar 1,64,320 5,329 31,892 16,528 7,884 11,073 37,069 16,913 10,156 5,643 3,06,807
Gujarat 5,66,812(P) 82,615 69,914 22,110 6,354 19,478 59,183 61,400 50,853 2,026 9,40,745 (P)
Haryana 99,953 3,341 7,534 3,842 329 3,349 20,966 70,368 617 2,10,299
fUHTe?? 1{§B (2) Himachal Pradesh (2) 15,827 (A) 3,269 3,271 160 2,954 8,785 2,756 (A) 763 37,785
Ah »f 5n?Htg Jammu & Kashmir 19,508 2,336 7,040^ 3,575 2,772 4,918 10,231 2,017 168 591 53,156
^dA'do?fCurnataka 4,17,374 30,389 85,638 14,721 6,443 16,869 44,107 26,736 26,978 7,504 6,76,759
(P)Kerala (P) 78,660 21,486 67,983(E) 9,541 24,501 14,fl3(E) 28,880 4,061 361 3,528 2,53,914(E)
HQ (2) Madhya Pradesh (2) 2.25.763 (A) 49,386 (A ) 12,030 14,760 45,152 33,637 (A) 14,999 3,95,727
oo
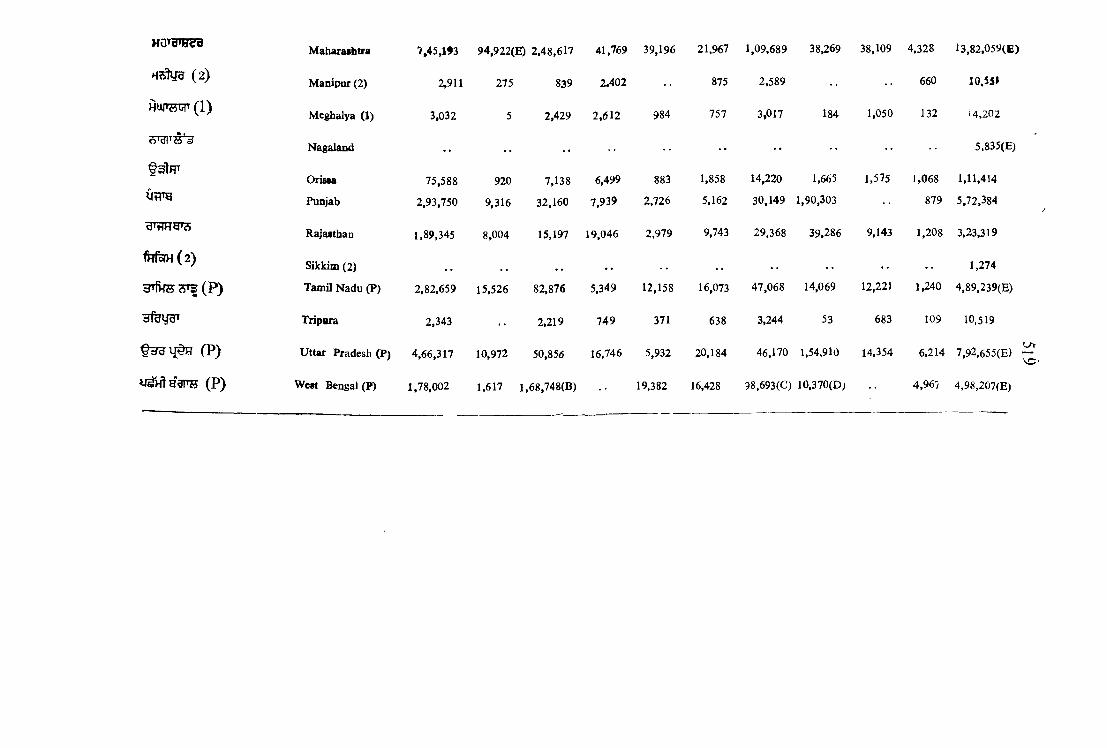
Maharashtra 7.45,193 94.922(E) 2,48,617 41,769 39,196 21,967 1,09,689 38,269 38,109 4,328 I3,82,059(E]
( 2) Manipur (2) 2,911 275 839 2.402 875 2,589 660 10.55)
HUI'MWT ( 1)Meghalya (1) 3,032 5 2,429 2 ,612 984 757 3,017 184 1,050 132 14,202
Nagaland •• •• •• •• •• 5.835(E)
t^ lFfTOrissa 75,588 920 7,138 6,499 883 1,858 14,220 1,665 1,575 1,068 1,11,414
CfH'y Punjab 2,93,750 9,316 32,160 7,939 2,126 5,162 30,149 1,90,303 879 5,72,384
^TtmfQ73Rajasthan 1,89,345 8,004 15,197 19,046 2,979 9,743 29,368 39,286 9,143 1,208 3.23,319
fH fo W (2)Sikkim (2) . . , , 1,274
3TfHS ^ i| (P ) Tamil Nadu (P) 2,82,659 15,526 82,876 5,349 12,158 16,073 47,068 14,069 12,221 1,240 4,89,239(E)
5feyoP Tripura 2,343 •• 2,219 749 371 638 3,244 53 683 109 10,519
§ i# c jii§ e (P ) Uttar Pradesh (P) 4,66,317 10,972 50,856 16,746 5,932 20,184 46,170 1,54,910 14,354 6,214 7,92,655(E)
(P) West Bengal (P) 1,78,002 1,617 1,68,748(8) 19,382 16,428 98,693(C) 10,370(D; 4,967 4,98,207(E)
'sD'

»f§ n V a
21.1 2 (HHnjH)— - 3 ^ % UTfli >k§ FRU gTff §55 HfF7HH33 i^ T l) g i^ » r 1 9 8 4 -8 5T A B L E 21.12 (Co/ic/</)—Total Registered Vehicles (Taxed/Tax Exempted) in use in India by State/Union Territories 1984-85
TRANSPORT AND COMMUNICATIONS
( f e ^ )(Number)
H U ig T H 9 3 ^ State
Union Territory
Twowheelers
oTHT
Wlvittdd*Three Cars
wheeler**Jeeps Taxies Buses Trucks Tractors Trailers Others Total
0 1 2 3 4 6 7 5 > 10 11
B—U N IO N T E R R IT O R IE S
Delhi 5,09,435 28,044 1,44,355(3) 8,334 12,35 2 47,627(0 7,50,147
^sHdl^ Chandigarh 71,940 1,658 12,690 •• •• 497 3,240 1,037 46 91 91,199(F)
>»f§JTO§f«o(yTd > A>&N. Islands 1,440 3 172 178 93 115 566 120 J1 138 2 856
v » t jy '^ ? 5 ;a r a u # ^ ( 2 ) Dadra and Nagar (2) 253 Haveli
4 124 24 — i7 31 14 i 510
» r a < s w 4 ^ H ( i ) Arunachal Pradesh (1) 179 — 114 (G) (G) 18 191 — — - 502
§ f e § Goa, Daman and D iu
30,595 575 7,765 — 1,283 1,167 7,621 334 — 1,433 50,773
Lakshadweep — — — — — — — — — - -
( i ) Pondicherry (1) 25,869 1,058 5,536 172 400 284 799 780 528 201 35,62?
MltldH Mizoram •• •• •• •• •• •• •• 4,189
(P)(K)1982-83 35,11,868
2.94.6892.94.689 2,30,081
11.03.09011.03.090 10,60,742
1.78.7951.78.795
1,54,459
1.42.4261.42.426
1,36,009
1.95.8071.95.807 1,77,768
7.19.2697.19.269
6,47.633
6.40.7276.40.727
5,77,324
1.72.6261.72.626
1,58,650
59.81459.814
58,463
77.59.35177.59.351 67,18,539(T)
1980-81 25,28,364 1979-80 21,15,254
1,80,268 • •
8,98,143 1,18,549 1,00,009 1,53,7571,40,346
5,26,6084,72,093
4,28,111 1,24,755 1,14,449 . . 17,86,293
51,73,01345,13,986
O

1975-76 10,57^0 . . . . . . . . 1,14,934 3,50,393 .. 11,77,031 26^9,598
1970-71 5.75,893 36,765 5 39,473 82.584 60.446 93,90? 3,42,577 .. .. 1.33.668 18,65,315
1960-61 88,360 6,235 2,56,243 31.670 21,663 56,792 1,67.649 .. . . 35,863 6,64,475
FPUS :— gTyr) , H3eITa ISource :—Ministry of Tranport (Transport Wing), Government of India.
( P ) - — Provisional
( E ) nf5H^?53 Estimated.
(K) HUrrfe»fr, »f§ ^ ^ ^ t(K ) Total will not tally with the breakup as the breakup in respect of Meghalaya, S ikk im and Mizoram are not available.
(1 ) 3 1 - 3 - 8 3 ^ I D ata relates to 31-3-83.
( 2 ) 3 1 -3 -7 9 ^ Data relates to 31-3-79.
(A) f# 3 5 I included in other.
( B ) rlH r ^ <JcS } Includes Jeeps.
( C ) UftPHT Wrg ^ 3 ^ ^ OB I Includes goods three wheelers.
( D ) H T O THi I Includes Trailers.
(F) 3' gflB Excluding Taxies.
( G ) e esit f e g HtHh I included in trucks.
(H) 3 0 - 6 - 8 4 ^ Hfgnt I Data relates to 30-6-84,

522
t r a n s p o r t a n d c o m m u n i c a t i o n s21.1 3 -S o f § HSoff) ^ H3oft H)arel
T A B L E 21.13— Road Lengtb Maintained by Public Works Department (B & R ) in Pnnjab(fsrs Hl29)
(Kilometres)
d'hlcicjl ridc^tt1^R3oi* National Highnays
^ P H o?Provincial Highways
H35?tTotal Roads
V T S j f ^Year/District
nCl?i
'V3a9 fN
+w
- tp s s i «^FS„ g |
T3ao*« e + * « s ,
H f» ^ S ,rv *3y <iRy c8 ea tn «
O.I h
"a
r d00 OCk + ; t
oi
0
1965-66
1970-71
1975-76
1980-81
1983-84
1984-85
1985-86
1986-87
1987-88
1988-89
1
S(^
964
964
964
964
964
964
974
SC4
964
964
964
964
964
964
974
23,405
30,181
31,522
32,323
33,047
34.253
34,850
34,995
1,336 24,741
1,301 31,482
648 32,170
510 32,833
690 33,737
284 34,537
150 35,000
— 34,995
24,369 1,336
31,145 1,301
32,486 648
33,287 570
34,011 690
35,217 284
35,814 150
35,969 —
9
9 , i i r
13.859
25,705
32,446
33,134
33,797
34,701
35,501
35,964
35,969District 1988-89 :
u
argtU'Hug Gurdaspur 108 — 108 2,927 — 2,927 3,035 — 3,035
nffJidHd Amritsar 166 ~ 166 3,167 - 3,167 3,333 — 3,333
sruHMW Kapurthala 34 — 34 1,225 — 1,225 1,259 — 1,259
Jalandhar 81 — 81 3,059 — 3,059 3,140 — 3,140
OfR>HTgyg Hoshiarpur 51 51 3,132 — 3,132 3,183 — 3,183
giicsdid Rupnagar 77 — 77 1,822 — 1,822 1,899 — 1,899
«ru»F5T Ludhiana 59 — 59 3,322 — 3,322 3,381 — 3.381
r ^ d a w Firozpur 149 — 149 3,552 — 3,552 3,701 — 3,701Faridkot 124 — 124 3,014 — 3,014 3,138 — 3,138
yf65T Bathinda 46 — 46 :,737 — 2,737 2,783 — 2,783
Hcffd^ Sangrur — — — 3,252 — 3,252 3,252 — 3,252
y f e ^ f wPatiala 79 — 79 3,786 — 3,786 3,865 3,865
-Htf fenlrtl^HU, fegV TS f%wrg[ Uf(TSI I* *> « Source Chief Engineer, P.W .D, (B. & R .), Punjab.
RSoT ^ 7P75 IJoiT f e s r ^frfg[T |ultimately be finished as balck tops roads.
cS2 — 9^*' 1965-66 >>1§ 1970-71 fs 3 T jqr^ RgT^Sf RRg^+ Ht ^ TOR 3 g r ^ R5S^
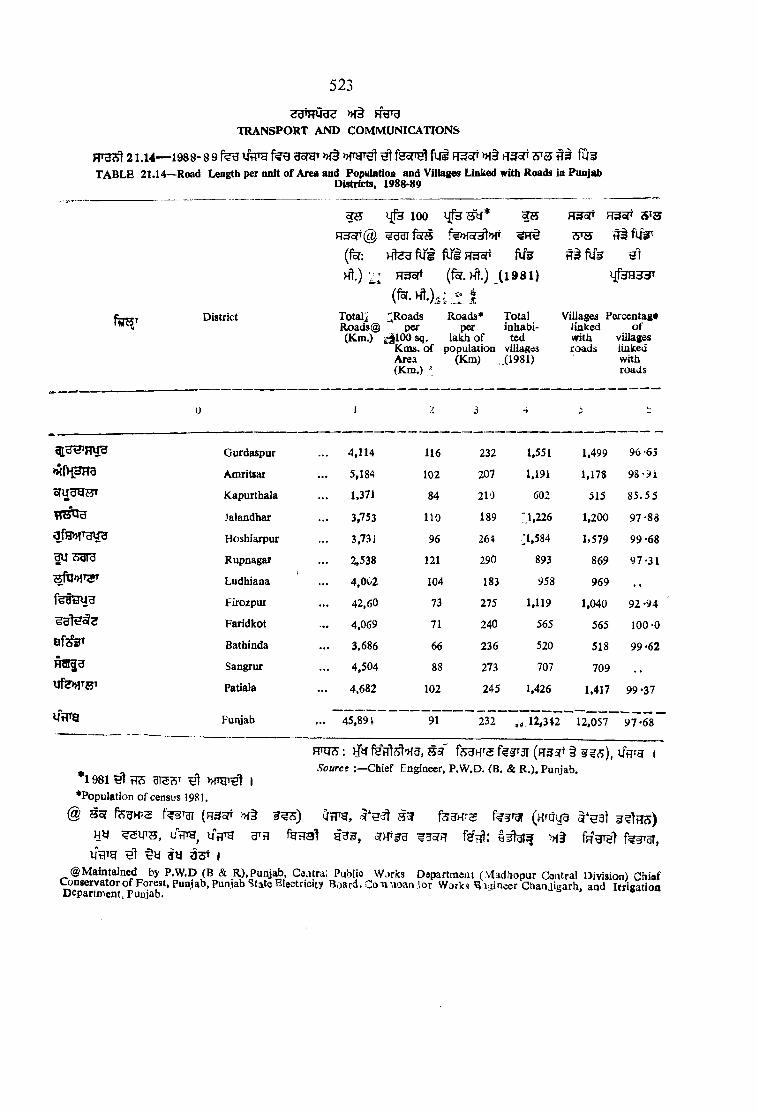
523
TRANSPORT AND COMMUNICATIONS
T A B L E 21.14—Road Length per nnit of Area and Population and V illage Linked with Roads in PunjabDistricts, 1988-89
21.14— 1988- 8 9 ^ fe s P e l fUS H55T >H§ fl35P fU3
Hfe 100 H3dP 5^3
R ^ d r@ f^ o {d l» ft A 'i i
( f e fife H I
Hrfofi ( fe .K f .) (1 9 8 1 )
District Totalj Roads @ (Km.)
;^Roads per
^1 0 0 sq. Kms. of Area (Km .) ’
Roads* per
lakh of population
(Km ) ,
Totalinhabi
tedvillages
.(1981)
Villages Percentage linked of with villages roads linked
with roads
0 J 2 3 4
a id t i'H y u Gurdaspur ... 4,114 116 232 1.551 1,499 96 -63
Amritsar ... 5,184 102 207 1.191 1,178 98-91
Kapurthaia 1,371 84 210 602 515 85.5 5
Jalandhar 3,753 110 189 11.226 1.200 97-88
Hoshiarpur 3,73i 96 264 :i,584 1.579 99*68ni] 33T9 Rupnagar 2,538 121 290 893 869 97-31
Ludhiana 4,002 104 183 958 969
Firozpur 42,60 73 275 1.119 1,040 92-94
Faridkot 4,069 71 240 565 565 100-0
Bathinda 3,686 66 236 520 518 99 *62
Sangrur 4,504 88 273 707 709
Patiala 4,682 102 245 1,426 1,417 99 -37
iffTO Punjab ... 45,891 91 232 12<342 12,057 97-68
*1981 e l rm 3T53T ^ I•Population of census 1981.
Source Chief Engineer, P.W.D. (B. & R .), Punjab.
@ f e w s f^ T g r ( H 3 ^ 5 ^ ) (H r c j^
m UHT3, UflTg f g n s l g 3 F , fs f f i: T r V ^ I fegrai,
ui3^g e l § y j y 3 3 1©Maintained by P.W .D (B & R),Punjab, Central Publio W:>rlcs Departrneat (Madliopur Central Division) Chiaf
(^nservator of Forest, Punjab, Punjab State Electricity Board, C o n n o aa lor Works ^a.»ineer Chanjigarh. and Irrigation Department. Punjab.
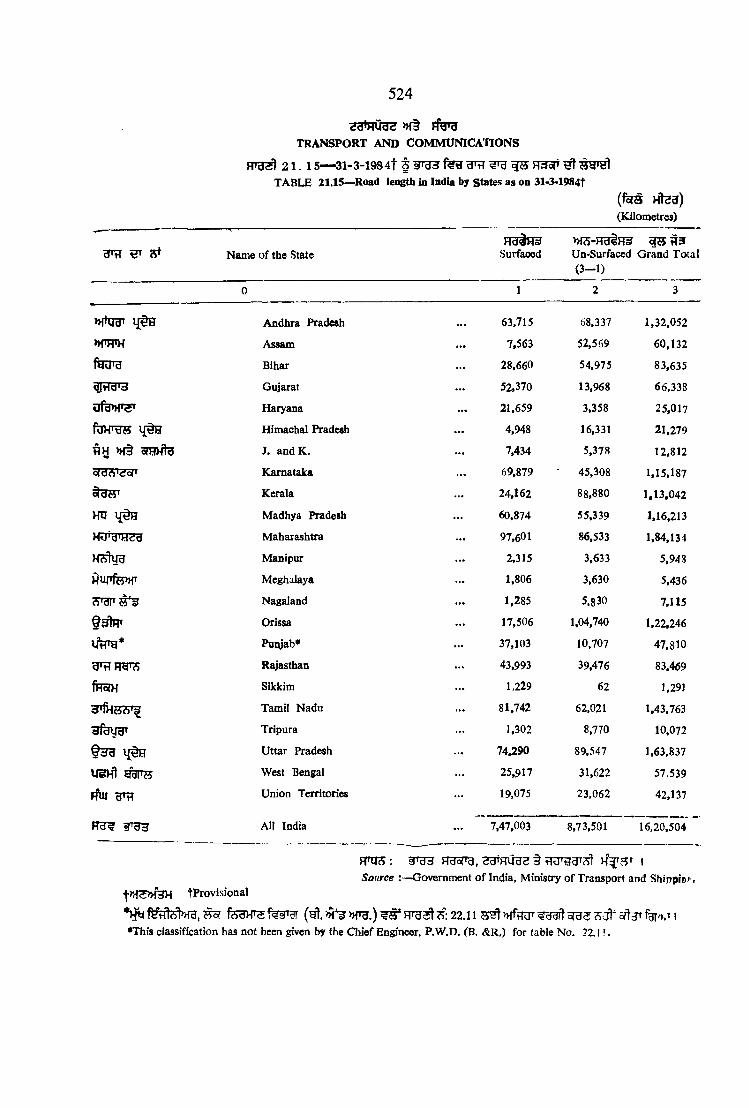
524
M §T R A N S P O R T A N D C O M M U N IC A TIO N S
2 1 . 1 5 — 31-3-1984t J W B 3 ^ ^ ^ H3oT ^ 643'^T A B L E 21.15—^Road length in India by States as on 31-3-1984t
( ft r s H tea)(Kilometres)
»HWH
aragrg
ftlHTTO 1{§H
f l y >H§ srantg
33<Si<;o{i
HU
HUfTfe»f
Uflrg*
frfofH
3^25?|Tg
3fe\ra^
f n g ^{§e
u g K t g f e
riW g r^
Name of the State
Andhra Pradesh
Assam
Bihar
Gujarat
Haryana
Himachal Pradesh
J. a n d K .
Karnataka
Kerala
Madhya Pradesh
Maharashtra
Manipur
Meghalaya
Nagaland
Orissa
Pum'ab*
Rajasthan
Sikkim
Tamil Nadu
Tripura
Uttar Pradesh
West Bengal
Union Territories
A ll India
» Ts-Fra iH ^ ^Surfaoed Un-Surfaced Grand Total
(3 -1 )
1
63.715
7,563
28,660
52.370
21.659
4,948
7,434
69,879
24,162
60,874
97,601
2,315
1,806
1,285
17,506
37,103
43,993
1.229
81,742
1,302
74,290
25,917
19,075
68,337
52,569
54,975
13,968
3,358
16,331
5,378
45,308
88,880
55,339
86,533
3,633
3,630
5.830
1,04,740
10,707
39,476
62
62.021
8,770
89,547
31,622
23,062
7,47,003 8,73,501
1,32,052
60,132
83,635
66,338
25,017
21,279
12,812
1,15,187
1,13,042
1,16,213
1,84,134
5,948
5,436
7,115
1,22,246
47.810
83.469
1,291
1,43.763
10.072
1,63,837
57,539
42,137
16,20,504
FTOS : H^oTg, ISource :—Government of India, Ministry of Transport and Shippiof^,
tProvisional
f5W »re, ^ (^ . »frg.) ^ 22.11 5^5 ?>d ' 5ft3T t•This classification has not been given by the Chief Engineer, P.W.D. (B. &R.) for fable No. 22./ f .

525
TRANSPORT AND COMMUNICATION 552 1 .1 6 — 31 HT33I*
Table 21 -16—Railway Route as on 31st March*
(Kilometres)
^ 35 '— 6' 2 '— 6*'
>>f 2 — 0*
Division/Year Total Broad Gauge 5'— 6'
Narrow Gauge 2 —6* anc
2"— 0 "
0 1 2 3
1971
A. Delhi
1,592*50 1,496 *93 93 -j 71975 . . 1,597 -64 1,502 -07 95 -571980 1,734 *09 1,638 *52 95 *571983 . . 1.852*76 1,757*19 95 *571984 1,864 *76 1,769 19 95 *571985 . . . 1,864*76 1,769*19 95-571986 • • • 1864 *76 1769 -19 95 -571987 . . . 1864*76 1769*19 95 -571988 . . . 1,093 -53 1,093 *53 —
19^9 • • 1,190-79 1,190*79 —
1971
B. Firozpur
1,698 *75 1,534-74 163 *991975 . . . 1,774*76 1,610 -77 163 -991980 . . 1,777 *28 1,613 -29 163 *991983 1,777 *28 1,613 -29 163 -991984 . . . 1,765 *28 1,601 *29 163 *991985 . . . 1,765 -28 1,601 *29 163 -991986 . . . 1765 -28 1601 -29 163 -991987 . . . 1765 *28 1601 *29 163 -99
1988 1,771 -43 1,607 -44 163 -991989 . . . 1,464 -80 1,300-11 163 99
5. Jjfg rst C . Arabala . . . 771.23 675-66 95*57
1888 . . . — — —
1989 . . . 980-60 885-03 95 *57( § + M + H )
1971
Total ( A + B + C )
3,291 *23 3,031 *67 259*561975 3,372*40 3,112*84 259 -561980 . 4 . 3,511 *37 3,251 *81 259 *561983 . . . :3,630 *04 3,370 *48 259 *561984 . . . 3,630-04 3,370 -48 259 -561985 3,630 *04 3,370 *48 259 *561986 . . . 3630*04 3370 -48 259 -561987 . . . 3630-04 3370 *48 259 *561988 . . . 3.636 *19 3.376-(53 259 561989 . . . 3.636*19 3.376 -63 259 *56
Note
FPir?) ISource :—General Manager (Statistics) Northern Railways. New Delh*.
fHR yTT^g t j. ^ ^ f e B H m U 5 i
Includes route kilometres of Punjab, Haryana, Himachal Pradesh and Union Territory of Chandigarh in the respective divisions.

Items/Division
{ § )
fe f ii ir a
(»f) § H ^ ^
fe ftf ira
(e) *
JH grSr
(a) Foodgrains—
Delhi
Firozpur
Am bala
(b) Oilseeds—
Delhi
Firozpur
Ambala
(c) Sugar—
Delhi
Firozpur
Ambala
21. 17— ^Table No. 21.17—Wagons Loaded with Important Commodities on Broad Gaii^c
TRANSPORT AND COMMUNICATIONS
(Number)
1965-66 1970-71 1975-76 1980-81 1983-84 1984-85 1985-86 1986-87 1987-? 1988-88
10
34,892 90,724 78,844 2,05,140 1,92,230 1,65,739 2,07,989 2,73,44g 1,69.311 99,505
22,568 85,197 96,206 1,92,022 2,02,687 1,73,523 2,44,003 2,91,487 3,15,341 2,28,128
— — _ — _ _ _ _ 1,24,037 1,46,379
6,816
2,748
3,446
1,401
1,518
3,123
233 131
1,217 1,186
188
1,499
135
1,864
140
1,870
67
1,187
146
65
59 0
14 0
4,697 4,768 9,853
1 325
3,271 5,851 i»,549 4,464 4,534 7,532 7,894
65 99 64 2 1
— — - - — 1,447 331
m j? i TRraH f - 3 ^ ^ I
Sow ce .‘—General Manager (Statistics) Northern Railways. New D elh i

2a*HU3E »f§
T R A N S P O R T AN D C O M M U N IC A TfO N S
FPH 5^21.18— liw a fe g 3iof y i^
Tabic No. 21.18—Post Offices in Puniat*
Item Unit 1966-67 1970-71 1980-81^ 1983-84^ 1984-85 1985-86 1986-87 1987.88 1988-89
0 1 2 3 4 5 6 7 8 9 10
Post Offices ... No. 2,532 2,736 3,708 3,724 3,718 3,710 3,736 3.774 37,82Telegraph Offices ... 5 ,N o . 369 257 579
Telephone Exchange ^ .N o . 126 112 230 ' . . . .
uafeoT Public Cali Offices*...^. No. 572 348 867
tiigdd*
yo^H Letter Boxes ... No. 6,091 7,716 15,212 14,922 15,054 14,855 14.813 15,007 15,112
4% U dd' UR3
yrgRHT »f§ 05T?‘
No. of Letters, Post Cards, News Papers, parcels and packets
delivered ... Lakhs 1,496 -00 791 -91
/
5,347 -93 401-52* 337 -74* 337 94*
d ir iJ l
H*d1 o?t§
>K§ y ^ R ]
No. of Inland and Foreign Monev Orders issued . . .T h o u
sand1.732 *00 2,011 -46 • 6,656 -79 \ 51A 11* 1,874 08*
11,884 -OO*
f i
* U iT O FfgofS
•Relates to Punjab Circle.
Provisional
No. of value payable articles sent ... Thou
sand515-00 404*10 803 138-98 150-25» J,5 1 -25*
to
t g . ^ . ^ ^ h th H § I
t Includes information of U .T ., Chandigarh.
R^gS. — jR 5 H fR ? 3 H S 3 S U flfg H55fS |
Sou'ce : —Postmasrjr Gensra!, i-*aajab C>rc/e
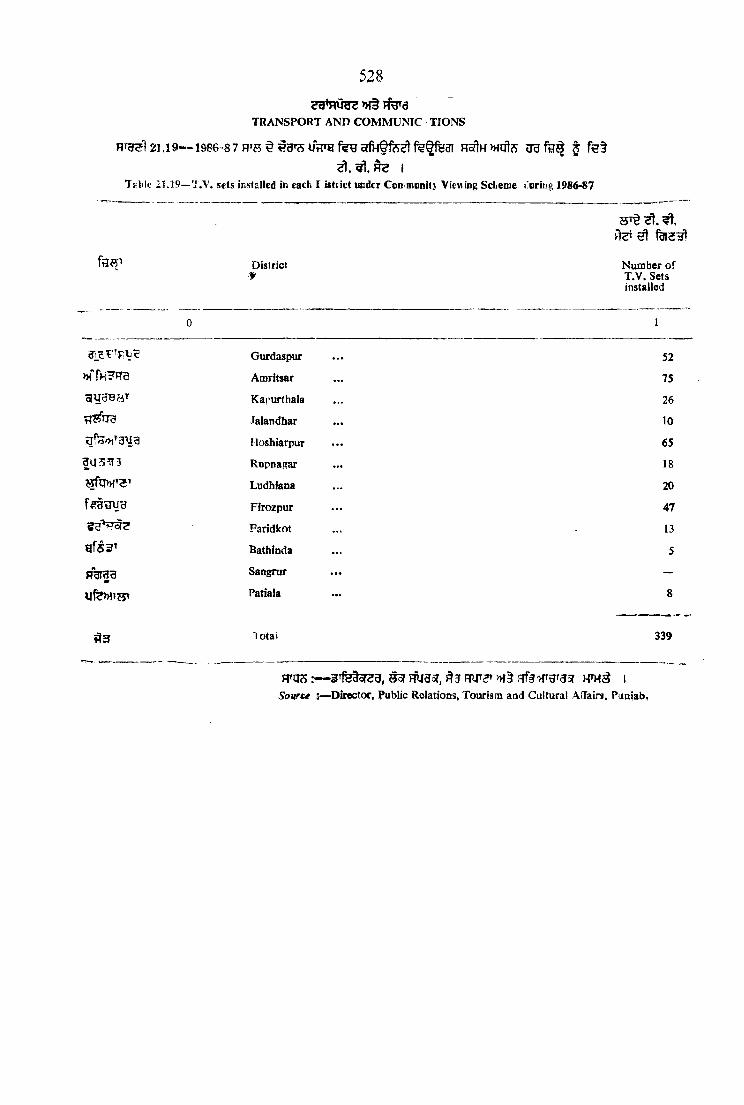
528
TR A N SP O R T A N D C O M M U N IC T IO N S
RTcf5l2l.l9--1986’87RTH^^gTSUiHrafegoffH§fe^f%§fe3I HSftHMCfts 3 fe§TO I
Table i1 J 9 —T.V. sets icslsllcd ii> each T i*tiict ucdtr Ccn munit} Viewing ScLeme s’urhig 1986-87
Districtli-
Number of T .V . Sets installed
Gurdaspur . . . 52
>HTH?r?3 Amritsar . . . 75
oiy3B«T Kapurthala • • • 26
Jalandhar • • • 10
Hoshiarpur . . . 65
Rupnagar • • • 18
Ludhiana 20
Firozpur 47
Faridkot 13
a f s r Bathinda 5
RgiHg Sangrur —
Ufe>HW
^ 3
Patiala
lotai
8
339
J T O S :-Source ;— Director, Public Relations, Tourism aod Cultural AfTairs, Punjab,

H H r ^ » f T f # g ifHrg ^ rq i § fsg C fiB c?l3l»jT ^
r a ? ^ HT rr 3" U^rg f^ g > rGfr3 §3?1»ff fff- f H^al 3T 1 ?5 i
^ :2 2 .1 »1§ 2 2 .2 §?? t |f§ ^>4r3 H ^q3 5 I f^ a o ' H Hr :^>>! f^ g
ygrof >HT ug-qs, ug U3 fuTiT, f hb cfgl>Ht >h§fSgHT3 »1§ uB fS^HTT* Tif- 3 3 5 I
22.3 ?J73t g* g i ^ ) h^ fSTH 3 I
FT^ 22.4 ^ t^feisr 93^ 3" f53UiT5 (§tH3 3" ^^b 'I U Hi yy H3t |
SECTION XXU
TRADE
The first two tables in this Section contain inforraation on exports from and imports into Punjab of the selected commodities from other States of Jndia. The information incorporated in Table Nos. 22.1 and 22.2 relates to raiV &or«e fra /e. The data in these two tables relate to food articles, livestock %nd livestock products, oilseeds and their products, industrial raw materials and semi-manufactures and manufactures.
Table No. 22.3 depicts value of Export (Oat of M ia ) of Industrial goods from Puujab. (District-wise)
Table No 22.4 depicts value of Export (Out o f India) of pricipal items from indusrrial sector in Puniab.
529
22

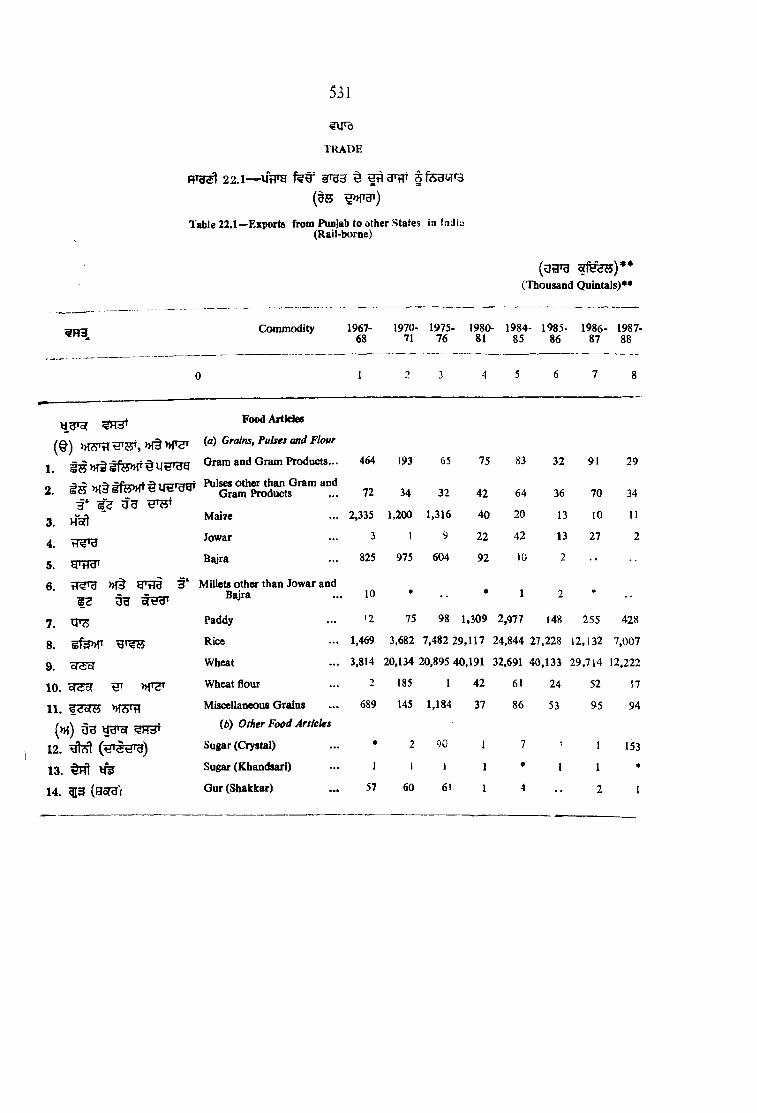
T R A D E
22. 1— §f egei T3
( t s ^»fTgt)
Table 22.1—Exports from Punjab to other States in fndiii (Rail-borne)
531
( u i r g(Thousand Quintals)**
^ H 3 Commodity 1967-68
1970-71
1975-76
1980- 1984- 81 85
1985-86
1986-87
1987-88
0 1 2 3 4 5 6 7 8
Food Artides
( § ) W )TtTHf?5T,»r§»reT (a) Grains, Pulses and Flour
1. i® > H t g f e » r ^ U H T g g Gram and Gram Products... 464 193 65 75 83 32 91 29
r f ? u g e w
3. > sft
Pulses other than Gram and Gram Products
Maize
72
2,335
34
1,200
32
1,316
42
40
64
20
36
13
70
10
34
11
4. t i^ 'y Jowar 3 1 9 22 42 13 27 2
5. HM d' Bajra 825 975 604 92 10 2 ••
6. »f§s e ^ ^ t id '
Millets other than Jowar and Bajra 10 •• « 1 2
7. ^ Paddy 12 75 98 U309 2,977 148 255 428
8. Rice 1,469 3,682 7,482 29,117 24,844 27,228 12,132 7,007
9. ofdol Wheat 3,814 20,134 20,895 40,191 32,691 40,133 29,714 12.222
10. oTibf HT W T Wheat flour 2 185 1 42 61 24 52 17
11. 13oR5 M S'tl Miscellaneous Grains 689 145 1,184 37 86 53 95 94
(>M) U g y'd’y ?3H3T (6) Other Food Articles
12. g'te'l Sugar (Crystal) * 2 90 1 7 1 I 153
13. 5§h1 ^ Sugar (Khandsari) 1 1 1 1 « 1 1 «
14. 1 3 (asrg j Gur (Shakkar) 57 60 61 1 4 •• 2 1

532
T R A D E
RT33 I 22.1— (H2y3T)— U trg t gT^t § f e g c r s
( b s ^ g r )
Table 22.1—(con/</.)—Exports from Punjab to other States in India(Rail-bome)
(U arg
(Thousand Quintals)**
Commodity 11967- 1970" 68 71
1975-76
1980-81
1984'85
1985-86
1986-87
1987-88
0 1 2 3 4 5 6 7 8
15. Hid' MTfe Molasses, etc. 6 * 1 * « ■* *
16. Tea 23 40 22 27 •• •• *
17. ^ ( ^ ) Fruits (dried) 2 5 2 4 * * *
18. Salt 7 10 10 10 5 5 16 5
19. ^II. ira
( § ) U H -g ^
20. 55<'»f§
Coffee
livestock and U^estodt Products
U vestock
Cattle excluding Sheep and Goats
3 10 6 9 1 « 13 18
g-dr^»T H T O ^ ujs (OTTg Ht f% ^)
(»f) ug-UcS U tJ'dy
(Thousand Number)
Livestock Products
66 65 80 24 172 181 250 247
21. J s f W Bones 46 41 63 66 41 49 49 6522. ^ (o fy i) Hides (raw) 20 17 37 37 41 21 46 3223. ( c f ^ ) Skins (raw) 11 13 7 « 1 7 1 724. o T K T ^ H75t.
nf§ ^Tanned Hides^ Sldos, and Leathers... 6 4 5 2 5 10 2 2
25. Ult Ghee « « •• •• — — — —
26. (9^)III §?5 § ylH
Wool (raw)
Oilseeds and their Products
7 4 4 1 3 5 4 12
^
27. Uf95 § ^ Castor seed « * 1 * * ..
28. Cotton seed 262 188 385 245 179 97 172 181
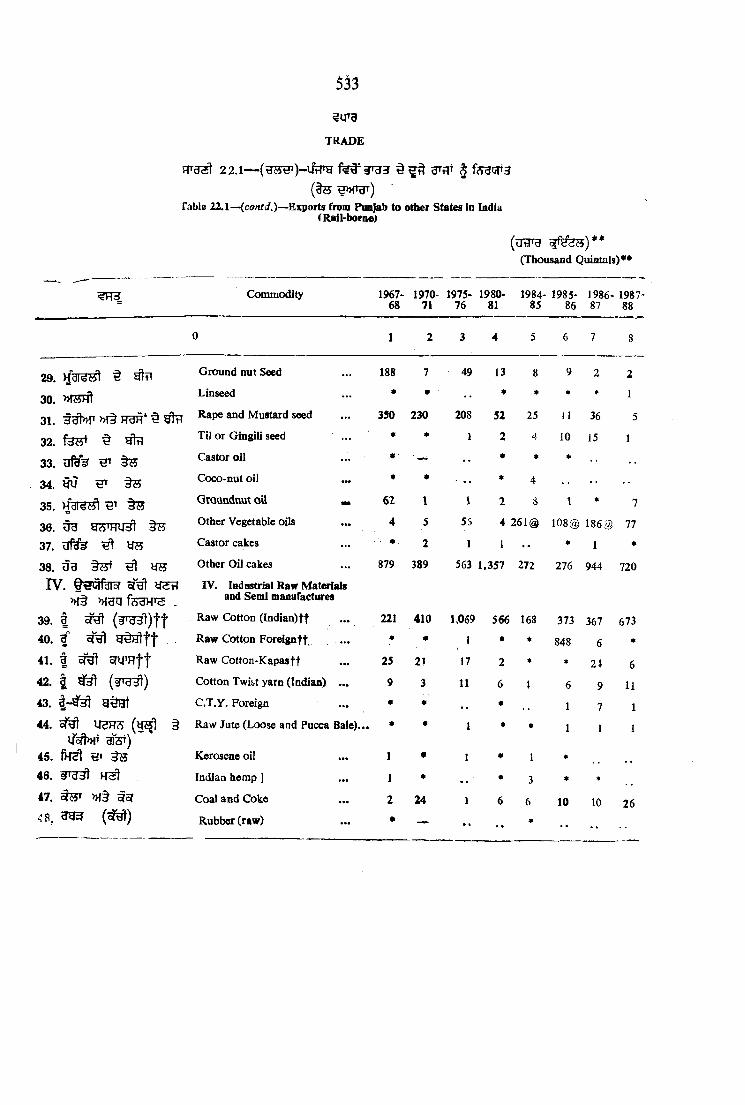
533
T R A D E
Table 22.1—(co/i/i.)—Exports from Punjab to other States in India (Rail-borne)
(Thousand Quintals)**
«; Hd Commodity 1967-68
1970-71
1975-76
1980-81
1984-85
1985*86
1986-87
198788
0 1 2 3 4 5 6 7 8
29. )fdl^w1 t Ground nut Seed 188 7 49 13 8 9 2 2
30. »T«h1 Linseed • « : •• * * * * 1
31. » f t HUH" ^ gtff Rape and Mustard seed 350 230 208 52 25 11 36 5
32. fe«T § ^ TiJ or Gingili seed ... « • 1 2 4 10 15 1
33. W § H Castor oil '* ■ ■ — •• « * * ••
34. W ^ 9W Coco-nut oil * • * 4
35. ^ Groundaut o il «• 62 1 1 2 S 1 * 7
36. UB ^tSTHU^ Other Vegetable oils 4 5 55 4 261@ 108@ 186^ 77
37. dfdsJ ^ m Castor cakes • - . 2 1 •• * 1 *
38. u g 9^* ^ y?5 Other Oil cakes 879 389 563 1,357 272 276 944 720
rv. Q^yfdiof y t j l t f s f l» i§ » fg g fe g H T 3 .
39. 1 oH I ( 5 T g ^ ) t t
IV . Indiistrial Raw Materials and Semi manufactures
Raw Cotton (Indian)tt 221 410 1,069 566 168 373 367 673
40. 1 o f^ g M f t Raw Cotton Fo re ign ft, ... • « 1 « * 848 6 *
41. I o?i|TH|t Raw Cotton-Kapasff 25 2J 17 2 * ♦ 24 642. 3 y d l Cotton Twist yarn (Indian) ... 9 3 11 6 4 6 9 1143. C .T .Y . Foreign « « « 1 7 1
44. O^il U ^H S ( ^ 1 § Raw Jute (Loose and Pucca Bale)... • « 1 * * 1 1 1U5rt»|T gfsT)
45. f k d t E Kerosene oil 1 * 1 « 1 *
46. S j'd j) Indian hemp ] 1 • • 3 * ♦
47. 3 3 T »f§ Coal and Coke 2 24 1 6 6 10 10 26<8, ( ^ ) Rubber (raw) • — 9 • ••
«

534
TRADE
22.1— (FW nj3)-U tITg ^ gtfp ^
(§ H « » ( ^ )table 22.1—{concld)—Exportft franr Pmjiib to other States in India
(RaU-bornc)(o a rg ^ f e a s ) * *
(Thousand Quintals)**
Commodity 1967-68 1970- 1975- 71 76
1980-81
1984*85
1985-861986- 1987- 87 88
0 1 2 3 4 5 6 7 8
49. §gT (oTti') Tobacco (raw) 0 * •• • •• 1 ••
50. FrdI« 'A ^ 75oT Teakwood • • • ••
51. 5oT^
V — fe'dHT
Other Timber
V— Maotifaclaies
457 377 274 210 222 228 119 70
52. Cotton Piece Goods (Indian) ... 5 4 16 8 1 * 2 *
53. K3\ Cotton Piece Goods (Fwelgn)... • • .. « * 4 * 154. HlJiT Glass 3 5 5 4 3 7 5 655. u<:h6
oTU T
56. HUT
Gunny Bags and Cloth
Iron & Steel bars. Sheets. Girders and other Comnaercial forms of
3 8 18 10 21 21 31 9
t J ' t J O ' , O l ' O e J O , V JO
?ir or ItTt
Iron and Stee] ... 1,024 983 954 269 210 234 208 201
57. hIPh^ Cement 6 14 25 1 5 36 58 101
RTq?5 :— af«§ot2d-tR53H, »ft >»f33T ^rgg ggoTg |Source Director-Oeoeral of Qxnmecdal Inteffigence and Statistics, OovcraoaMt of India.
* 500 §* Ufe I
* * g a ^ ;5g?r srter fep»fT o f |
% »feri w ms »f3iH3 ms Ff#T3 3» iw §35 w m 9 1
• lesG than 500.••Except where stated otherwise.ttFigures relate to Cotton year i .e. S^tember to Augoil.©Includes Mustard Oil.

TRADE22.2— ^ ^ 3 § f ^ ^ l n p C T g
Tilblo 22.2~lmports into Poi abTrom otb«r- States in India (Rail-borae)
535
(Thousand Quintals)*-
<^Hd Commodity 19^768
1970-71
1975-76
1980 ■ 81
■ 1934- 85
1985-?6
1986-87
1987-88
0 1 2 j 4 5 6 / 8
Food Articles
( § ) ’OTst >K§ » r? ' (a) Grains^ Pulses am! Flour
1. Gram and Gram Products ... 74 51 23 29 24 23 29 93
2. s s " » f§ g fe » r^ U H T H ^ Pubes other than Gram and ji* -a- Gram Product*3^ ^ u g B W
94 113 60 67 17 30 28 116
3. Hsft Maize 98 14 2 114 174 246 85 171
4. Jowar 83 60 38 85 81 139 253 916
5. Bajra S 2 1 i 5 15 87 20
6. »{§ gr;Tg
S Z
Millets other than Jowar and Bajra 3 J 2 5 *
7. Paddy 41 1 I 8 62 52 39 38
8. gfefJT Rioe 136 15 23 6 180 67 5 79. 5r?or Wheat 1754 28 49 13 7 28 34 105
10. € ’ M’er Wheaf-flour 19 6 1 10 1 5 611. >HcST?{ Miscellaneous grains 91 67 66 132 114 16S 360 187
( m ) u g ?H3» (ft) Other Food Articles
12. t/lrtl ( t T d ^ y ) Sugar (cr>’8tal) 482 440 149 221 101 2531 483 66613. ( t n ! ) Sugar (Khandsari) 10 13 18 51 13 84 14 914. ( a n y ) Gur(Sfaakkar) 89 150 186 242 132 i n J15 10515. 13I 3 T Molasses 51 56 I I * 116. y ' j Tea 62 164 134 115 4 15 3 *
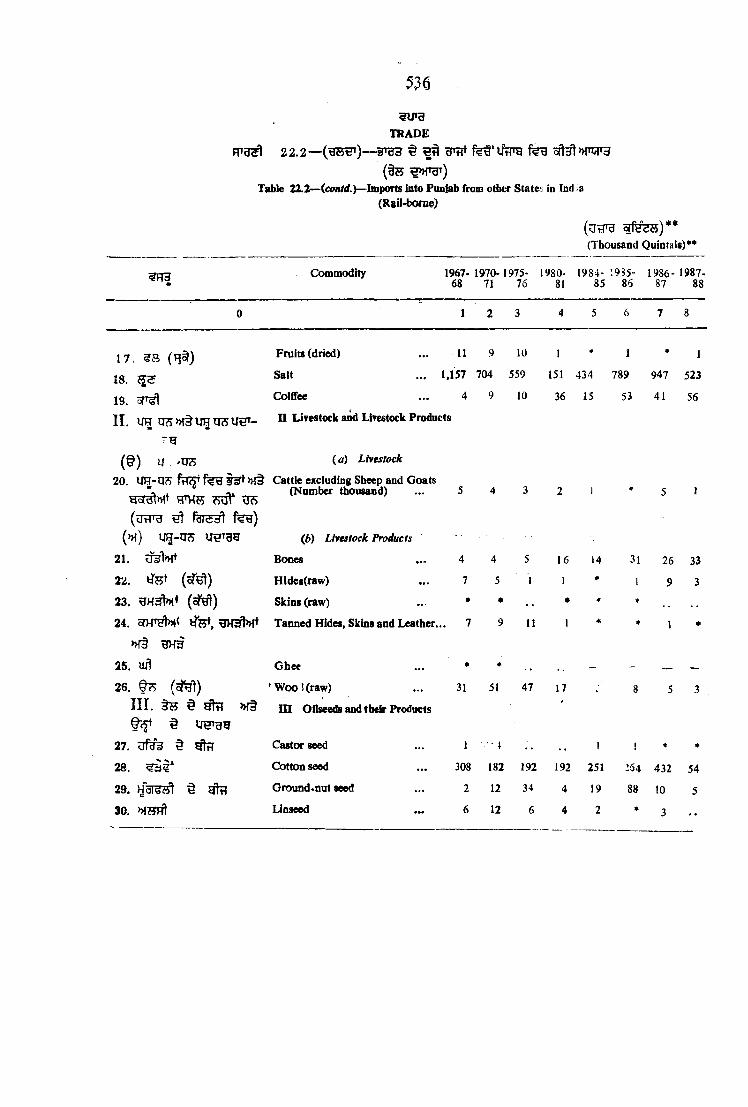
m
?u»aT R A D E
( i s ^ ’H ^ )Table 21.2—(cotttd.)—Imports into Punjab from other States in Ind >9
(RaO-bonie}
(u g rg(Thousand Quintals)**
Commodity 1967- 1970- 1975- 1980- 68 71 76 81
1984- 1955- 85 86
1986-1987- 87 88
0 1 2 3 4 5 6 7 8
17 3 8 ( q ^ ) Fruits (dried) ... 11 9 10 l • 1
jg Salt ... 1,157 704 559 151 434 789
19 Colffec ... 4 9 10 36 15 53
I I , UH q?J >H§ U g CR5 U ^ - ° Livestock and Livestock Products
(&)■ g
u ( a) Livestock
947
41
1
523
56
20. IfH-n?) ftT?^ >H^ Cattle excluding Sheep and Goats(Number thousand)
w m ?j^3T vi?)5 4 3 2 1 5 1
(>h ) u g - o s U ^Tgg (b) Livestock Products
21. Bones 4 4 5 16 14 31 26 33
22. (o T ^ ) HidesCraw) 7 5 1 1 1 9 3
23. (o^gl) Skins (raw) • • • « ■f
24. ife t , Tanned Hides, Skins and Leather... 7 9 11 1 « * 1 *
»f§
25. W! Ghee - - — —
26. (c?%1)
I I I . ^ ^ >Ht
W ool (raw)
i n Oilseeds and their Products
31 51 47 17 8 5 3
QcS' ^
27. dfdoJ § ^ Castor seed 1 i 1 1 * «
28. ^ 1 * Cotton seed 308 182 192 192 251 254 432 54
29. S ytt? Ground-nut seed 2 12 34 4 19 88 to 5
30. Linseed 6 12 6 4 2 « 3 ••

537
T R A D E
22. 2— grfft f^ g
( t s ^PHt t)
Table m r - i c o n td y —lia^orts into Punjab from other States in India(B&il-b<?ro§)
(U trg
(Thousand Quintals'' • '
Commodity 11967-68
1970-71
1975-76
1980-81
1984-85
1985-86
m e -87
. 1987-88
0 1 2 3 4 5 6 7 8
31. 3gl-»|T >H§ H B R -§ ^ Rape and Mustard jeed 14 26 94 112 103 135 97 80
32. ^ T il or Gingili Seed 12 10 9 3 2 19 7 7
33. U fS s W t S Castor oil 1 3 19 14 13 I 1 5
34. W HT §75 Coconut oil 6 3 4 7 * 35 64 I
35. §«; Groundnut oil 3 39 25 1 13 1 *
36. Other Vegetable oils 137 84 57 667 1276^ 4,867® 3571 @ 7242
37. ■3f9‘3 ^ Castor «ike 2 6 * I 2 1
38. U g 9W» \SE Other Oil cakes 420 978 773 856 981 2,461 2,845 1,339
IV. Otitiirdio? cTt/1 tr^ »f§ »raq
rv —Industrial Raw Materials and Semi-Manufactures
39. 1 ^ ( ’Hc/l)tt Raw Cotton (Indian)ft 37 44 35 86 714 79 140 52
40. 1 o?%l (W§et) f t Raw Cotton (Foreign)ff ... 1 1 . . • *
41. 1 ( oTITh ) f f Raw Cotton (Kapas)tt 19 8 9 * 1 * 2 ♦
42. R 3 ^ ^ ? w n w ( s n 'd c / t ) Cotton Twist Yarn (Indian)... 15 12 13 4 2 3 1 1
43. H 3 ^ ? fe » r ir g T T (g M ) C T .Y . (Foreign) 1 * 1 * • # 2 54
44. cra^ USTO (y^5l §i ToT afeO
Raw Jute (Loose and Pucca Bales) 4 7 27 26 1 1 1 37
45. ^ §75 Kerosene oil 328 U 7 0 1,092 1,041 3,887 35,741 19,593 7,150
46. »f§ ^ t a Indian hemp^ 3 5 2 • 2 1 « 1
47. ^75T »f§ ^ Coal and coke ; ... 13,245 14,517 27,798 20,502 49,270 63,320 75,809 88,638
48. 3 5 3 (5?^) Rubber (raw); 14 18 4 4 6 9 5 649. (of%r) Tobacco (raw) 16 15 10 8 1 * * *

538
T R A D E
2 2 .2 — ( R H n j3 ) — ^ f ^ >^TCr3
( t s H»TTBt)Table 22.2— {concld.)— Imports into Punjab Trom other States in India
(Rail-bom c)
(u g rg
(Thousand Quintals) ••
?H 3 Commodity 1967- 1970- 68 71
1975-76
1980-81
198485
1985-86
1986-87
1987-88
0 1 2 3 4 5 6 7 8
50. ^ Wofril Teak Wook 3 6 5 13 10 23 45 47
51. Other Timber 939 800 683 543 186 296 480 465
V — V —Manufacture
52. ?H3T (^Tdc/l) Cotton piece Goods (Indian)... 41 20 21 8 1 ? 4 1
53. ?H'3’ C.P.G (Foreign) • * •• •• ♦ 9 7 54
54. hI h ' Glass 100 83 72 77 41 57 64 36
55. ueTO yd]»ft Gunny Bags and Cloth 108 437 556 808 693 1,175 855 689
56. M § Iron and Steel Bars, Sheets,>>{:§ Girders and other Commercial
^ >>f§
57. R ifH S Cement
forms of Iron and Steel 4,816 5,819 8,626 4,755 5,827 5,134 7,855 7,629
4,103 7,311 9,673 5,132 6,456 17,068 11,643 11,503
w m :— ?T^5) g ? »f§ iSource .—Director General of Commercial Intelligence and Statistics, Government ol Indi?
’ 500 3" uTe
* feg UH ofer fgp>{T 5 Itfs JV T u § 3^ »raiH3 7 m r # i 3 u s i
^ § ? 5 Ht h s 9 I
•Less than 500••Except where stated otherwise.ttFigures relate to Cotton year i.e. September to August ^Includes Mustard oil.
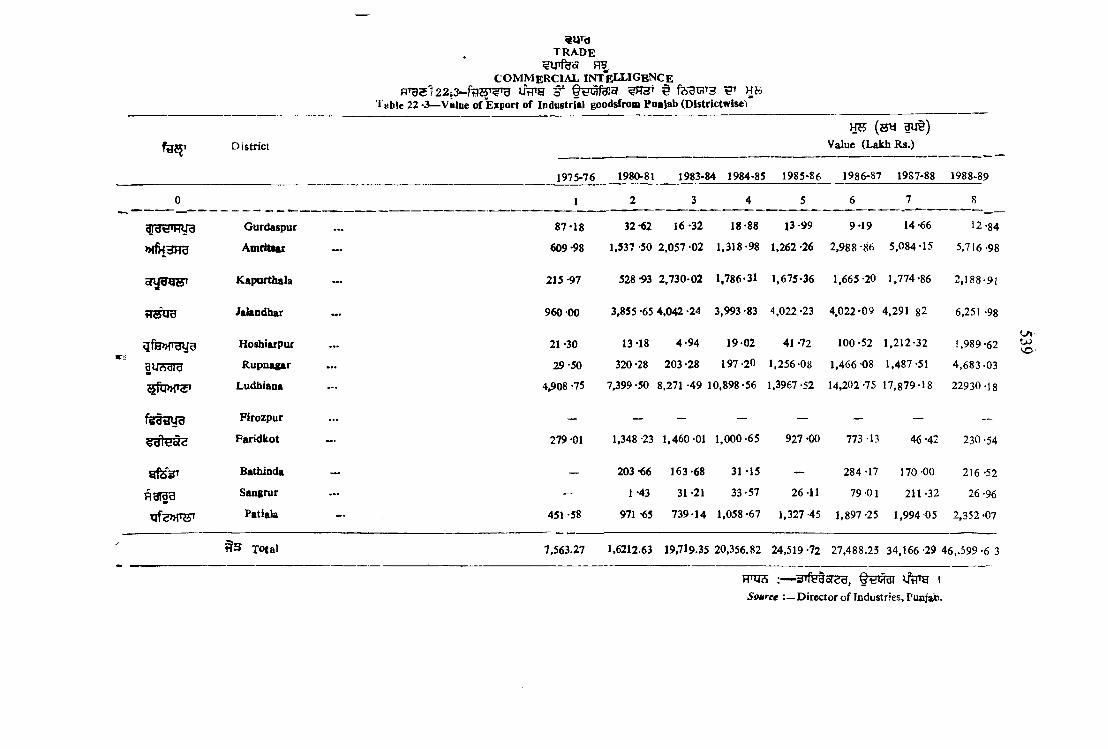
t r a d e
c o m m e r c ia l in t e l l ig e n c eiffTB ^ §€031^ ?H3t :§ f?i^ZJi3 W HB
1 able 22 -3—Value of Export of Industrial goodsfrom Poa}ab (Districtwise'i
H s ( s n a u t )
District Value (Lakh Rs.) __ _
1975-76 1980-81 1983-84 1984-85 1985-86 1986-87 1987-88 1988-89
0 1 2 3 4 5 6 7 8
diiTtimyg Gurdaspur ... 87-18 32*62 16*32 18-88 13-99 9-19 14*66 12-84
>HfH3H3 Amritsar - 609*98 1.537 -50 2,057 *02 1,318*98 1,262 *26 2,988-86 5,084*15 5,716-98
ory^Q^ Kapurthala ... 215 -97 528*93 2,730-02 1.786-31 1,675-36 1,665*20 1,774*86 2,188-91
H sue Jalandhar 960 00 3,855 *65 4,042 *24 3,993 *83 4,022 *23 4,022*09 4,291 82 6.251 -98
^fe>>ruy9 HoshiarPur ... 21 -30 13*18 4*94 19-02 41 -72 100*52 1,212-32 1,989*62
giiiSdiy Rupnasar ... 29*50 320 -28 203 *28 197-20 1,256 08 1,466-08 1,487*51 4,683-03
Ludhiana ... 4»908 *75 7,399 *50 8,271 -49 10,898*56 1,3967 -52 14,202-75 17,879-18 22930-18
fettfUB Firozpur ... — — — — — _ _ ~
6dltJoi<d Faridkot - 279 *01 1,348 -23 1,460*01 1,000 -65 927*00 773-13 46 -42 230 -54
gfeV Bathinda ... — 203*66 163*68 31 *15 — 284*17 170-00 216*52
Sangrur ... — 1 *43 31 *21 33*57 26 -11 79*01 211-32 26 -96
Patiala — 451 *58 971 -65 739-14 1,058-67 1,327 -45 1,897-25 1,994-05 2,352 -07
S3 Total 7,563.27 1,6212.63 19,719.35 20,356.82 24,519 *72 27,488.23 34,166-29 46,.599 *6 3
U iU)VO'
PnJS ;— 3ffedo<<Jd, Q'tfTOl VfTO I Source :—Director of Industries, Punja,t).
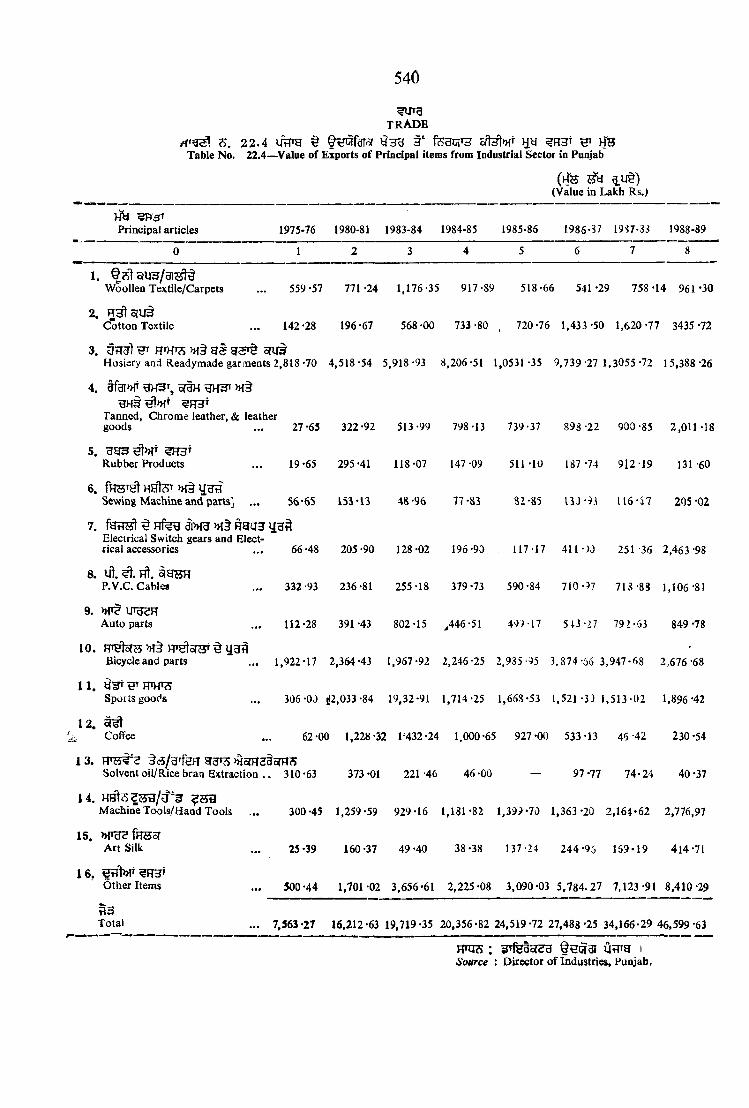
t r a d e
s . 2 2 .4 iTFrg § § ‘ )|5$Table No. 22.4—^Value of Exports of Principal items from Industrial Sector in Punjab
( ) % m i u § )(Value in Lakh Rs.)
Principal articles 1975-76 1980-81 1983-84 1984-85 1985-86 1986-37 19^7-3.? 1988-89
0 1 2 3 4 5 6 7 8
1. § < s t 9 U ^ / 3 I< ^Woollen Textile/Carpets ... 559-57 771-24 1,176-35 917-89 518-66 541‘29 758-14 961*30
2.Cotton Textile ... 142-28 196-67 568-00 733-80 , 720-76 1,433-50 1,620-77 3435-72
3. WHosiery and Readymade garments 2,818-70 4,518-54 5,918-93 8,206-51 1,0531-35 9,739-27 1.3055-72 15,388-26
4. tfai»T srtH
Tanned, Chrome leather, & leather
540
goods 27-65 322-92 513-99 798-13 739-37 898 -22 900 -85 2,011 -18
5.Rubber Products 19-65 295 -41 118-07 147-09 511 -10 187 -74 912-19 131 -60
6.Sewing Machine and parts] ... 56-65 153-13 48 -96 77-83 82-85 U J -93 116-57 205 -02
7. t ap>ra »f§ R g a 3Electrical Switch gears and Electrical accessories ... 66 -48 205-90 128 -02 196-90 117-17 411 - W 251 36 2,463 -98
8. u \. Ht. m mP.V.C. Cable# 332 -93 236 -81 255-18 379 -73 590 -84 710-97 713-8? 1,106 -81
9. >HT? U'd^H Auto parts 112-28 391-43 802-15 ^446-51 49;>-l7 5+3-27 19l>63 849 -78
10.Bicycle and parts 1,922-17 2,364-43 1,967-92 2,246-25 2,935-95 3.874-56 3,947-68 2,676 -68
11. FWTS Sports gooc^s 306 -OJ |I2,033 -84 19,32-91 1,714-25 1,663 -53 1,521 ’Z) 1,513-02 1.896 *42
12./ Coffee ... 62-00 1,228-32 1432-24 1.000-65 927-OC1 533 -13 46 -42 230 -54
13. tc5/gf857 >H5rH2§Qm5 Solvent oil/Rice bran Extraction . . 310 - 63 373 -01 221 -46 46 -00 — 97*77 74-24 40 -37
14.Machine Tools/Hand Tools 300-45 1,259 -59 929-16 1,181-82 1,399-70 1,363 -20 2,164*62 2,776,97
15.Art Silk 25-39 160 -37 49 -40 38-38 137-24 244-95 169-19 414 -71
16.Other Items 500-44 1,701 -02 3,656*61 2,225 -08 3,090-03 5,784.27 7,123 -91 8,410 -29
Total 7,563-27 16,212-63 19,719-35 20,356-82 24,519-72 27,488*25 34,166-29 46,599*63
:Source
t H q a i •: Director of industries, Punjab,

23
tW cIT
23.1 H w h ' t n 33 ^ ? ti-€ tf f ^ H t t"5p Hgqt rthji srtalare^ 5 I
2 3 .2 i 's i i ^ 5 1
HTU^ 2 3 .3 a*tF § ilftrg § t^fcfai ^
& IH 'g^l 2 3 .4 7 ^ ^ fe f5 f^ t -^ggi fsrsH lsg M§ fS5? h ! >nm»^ f u i hthi
RTg^ 2 3.5 t"ofT ^»{t HHt HSfH >H§ feHH3 ^ |
HT^sl 23.6 f^g ^ ^ r g s f g"^t § gSfrfe fT gr ^ggftsTU^, U3 icS:aft § flR 3t3T
»WR^U n^3T 3iel ^ I
0^3^! 23.7 f f g tI?;-H fW ^ »iqTg § »{O TfH 3tV tTHT )>!§ MHTfe3ff)H g m H W et^T
315V I
23.8 1 ^ ^ gT^r^rg ^ g j^ 5 I
23 .9 t v ^ ?53l fH§3T§ 3!§ ?JcS I
23 .1 0 )>f§ fo r§^»f5H f9H ^ITgoTl^f § 5fgfi3)>r €3HTfe»f ftT>HT 3 I
s e c t i o n XXIII
b a n k i n g
Table 23.1 incorporates Information on different types o f banks functioning'injthe State ov^r a umber'of years.
Table 23.2 shows district-wise banking offices in Punjab.
Table 23.3 shows banking offices in various places of Punjab by population ranges.
Table 23.4 gives the number of banking offices in various states; per thousand square kilomaters of area and per lakh of population.
Table 23.5 shows the year-wise deposits and advances ratio of scheduled commercial bailks.
Table 23.6 shows the state wise classification of outstanding credit of scheduled commercial banks according to sanction and utilisation.
Table 23.7 shows [the state-wise distribution of deposits and advances of scheduled commercial banks according to population groups.
Table 23.8 shows the state-wise distribution of banking offices.
Table 23.9 shows the advances of Agriciiltare Sector by scheduled banks in Punjab.
Table 23.10 indicates the District-wise and Occupation-wise classification of outstaadiitg credit of scheduled commerial banks.
54i


§ 1 ^B A N K IN G
23.1— UtTH g ‘5r f%oTH ( 3 1 e r h h J )Table 23.1—Banking Deyelopment ia Punjab as on 31st December
Type of BankNnmber of Offices
I.
II.III. HfoofialI V .
t ^ T o fS foTHHT
Indian Commercial Banks
(a) Indian Scheduled Banks
(b) Indian Non-Scheduled Banks
Foreign Banks
Co-operative Banks*
Post OflBce Saving Bank(s)
A ll Types of Banks
1965 1970-71 1975 1980 1983 1984 1985 1986 1987 1988
1 2 3 4 5 6 7 8 9 10
249 530 1,057 1,563 1.821 1,928 1995 2,005 2.044 2,069
241 523 1,056 1,562 1,820 1,927 1,994 2,004 2,043 2,068
8 7 1 1 1 1 1 1 1 1
3 3 3 3 3 3 3 3 3 3
92 158 238 590® 609(A) 617(A) 619(A) 631(A) 639(A) 637(A)
1,240 1,192 1,384@ 1,828 3,751 3,766 3,746 3,736 3,778 3,779
1,584 1,883 2,682 3,761 6,184 6,314 6,363 6,375 6,464 6,488
FFUcS ;— ^ f e s f ofSource Stetistical Tables relating to Banks in India, —^Reserve Bank of India.
^ ^ U 3, >h§ ^ ( § ) y n t >x§ > h h s i s w h th >h t3 5 s y3 ' U4 (»f) 1956 ^ qr^T 3 I j f a W s o flt >H5Fr^ s f U ^ ^ ^ gt W
f e l H H 3 o T U S t ’^ f U ^ , f e n H R g r ^ > H § ( h ) f e j B R 5 y c f t ^ 3 § ' U 5 f § H T
gSfH rPjT <Sd‘Q e ^ fOB ^ ^ ^ S fH ijg ? 1934 ^ ^ HTHS 5(t3T WHcrer t >H fen HTHS SjIht iqrf 3 »fSHf33 fsfUT ?p;ga ^ I
H f t r a T g l > H t ^ f e t » r S » F 3 T g a 5 f t § M S R T g f e R H ^ g s t » f 5 R f % 3 R H f 3 » { T f a i M T 5 I
@ fe u 31 H T^, ^ Cl IZ Z .— ( i ) H g33T f ^ Htf H § 3 3 , S § 3 3 , § U MSrfeait
ga snfHS u?; iA = H i t i 3 f e s T > A 5 r 5 '^ ^ ,C [ t 7 T g
Scheduled Banks.—Which carry on the business of Banking in India and which (a) have paid-up capital and reserves of an aggregate real or exchangeable value of not lass than Rs. 5 lakhs, (b) are either companies as defined in section 3 of the Companies Act, 1956 Corporations or Companies incorporated by as under any law in force in any pleaceoutsidelndiaorlnstitutionsnotifiedbyCentralGovernmentonthisbehalf and (c) satisfy the Reserve Bank that their affairs are not being conducted in a manner deterimental to the interests of their deposits are eligible for inclusion in the Second Schedule to the Reserve Bank of India, Act,1934, and when so included are known as
“ Scheduled Banks” .♦Punjab Cooperative Bank, Amritsar has been considered as Scheduled Bank in this table as classified by Reserve Bank of India.@As on 31st March.
h o te : - - ( i) Banking Offices include Registered Office, Head Offices, Central Office, Branch, Sub*Branch, Pay Offices, Sub-Pay Offices. Treasury Pay Offices, Cash O Sce .A » Source District Statistical Offices of Punjab.
c/»U>
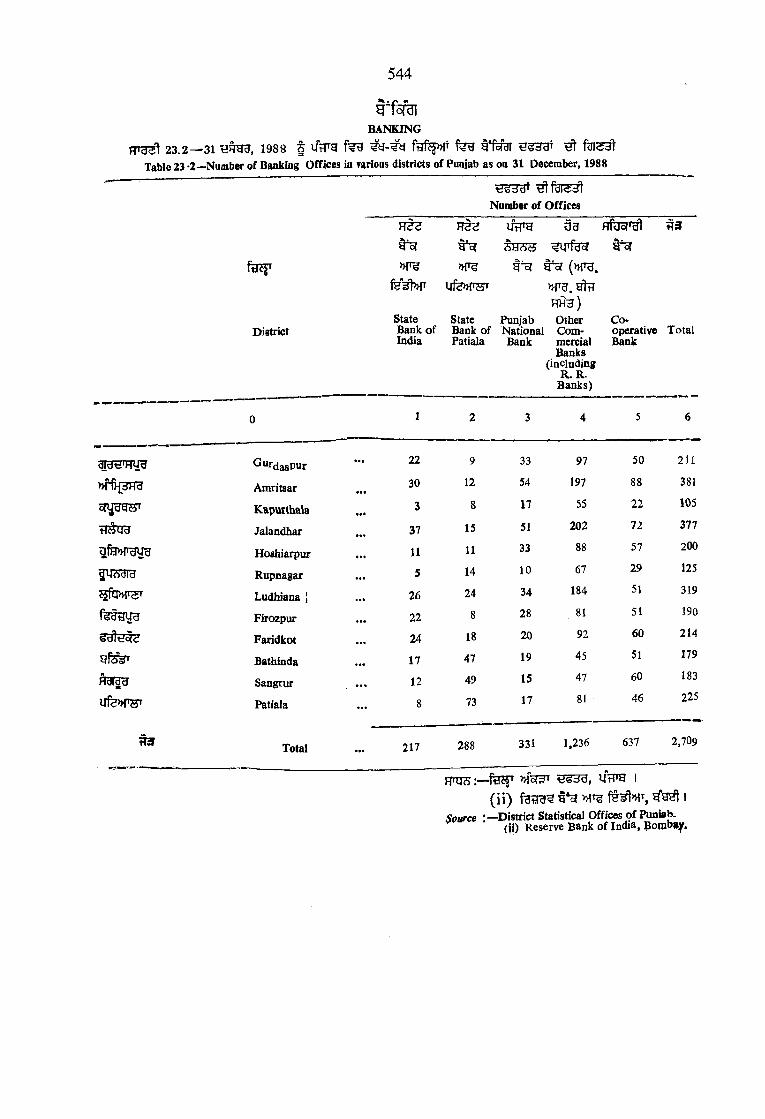
544
B A N K IN G
23.2—31 1988 f UVpg ^Table 23 -2—Number of Banking Offices in varions districts of Punjab as on 31 December, 1988
fcir^c/1 Number of Offices
T jie 3 3
^ * fd o fAHcSei
f>{^
Ufe>H'W'
y bi ( n f g .
W 3 )
DistrictState Bank of India
State Bank of Patiala
Punjab Other National Com- Bank mercial
Banks (including
R . R . Banks)
CooperativeBank
Total
0 1 2 3 4 5 6
^ “^dasPur • •• 22 9 33 97 50 211
Amritsar • ••30 12 54 197 88 381
Kapurthala 3 8 17 55 22 105
HeJUd Jalandliar • •• 37 15 51 202 72 377
3fa>>rHUH Hoshiarpur 11 11 33 88 57 200
Rupnagar • •• 5 14 10 67 29 125
Ludhiana [ • •• 26 24 34 184 51 319
Firozpur • •• 22 8 28 81 51 190
Faridkot ... 24 18 20 92 60 214
Bathinda • •• 17 47 19 45 51 179
H’dTdU Sangrur 12 49 15 47 60 183
u fe )> r^ Patiala ... 8 73 17 81 46 225
% Total ... 217 288 331 1,236 637 2,709
FTO3: — »i5r5T viVro I
(ii) §*0? iSource :—-District Statistical Offices o f Puiiiab.
(il) Reserve Bank of India, Bomb#y,

B A N KIN G
H T U st2 3 .3 31 H R g g § § ^ ‘ tT € y H g 3 3 t* ^ f a r ^ ^ iT«Ue 23 *3—Number of Banking office^* in various places of Punjab by Population Ranges as on 31st December
545
Rural Semi Urban Urban
0*^
9,9 99 "m 10,000 § ‘ ? u u a 3
9 9 ,9 9 9 r u f e
1,00,000 3" ^
10,00,000
3* Ui2Upto 9,999 Above 10,000 but
below 99,999Above 1,00,000 but
below 10,00,000, |Total
f r s tie d d ' tJjSdd'
f3r<if3lYear Number
ofOffices
Numberof
Offices
Numberof
Offices
Numberof
Offices
0 1 2 3 4
1965-66 97 155 92 341
1970-71 326 230 13j 691
1975 506 312 228 1,045
1980 808 439 319 1,566
1983 1,002 465 357 1.824
1984 1,078 470 383 1.931
1985 1,077 469 452 l,99J
1986 1,082 471 455 2,008
1987 1,119 474 454 2,047
1988 1,133 476 4 64 2,072
m r o : — t"of >HT^Source : Reserve Bank of India, Bombay.
RfOoIidl t"of )>{§ |-5f ^ HTHJ5 TO 1
•Baokiog offices include Co-operative Banks aad Foreign Banks a'so.

546
B A N K IN G23.4—31 HRH3 19 88 § ^ 3 1 U5?t f u i >H§fsW m
Table 23 *4—Number of Commercial Banking Offices in various States per thousand Square Kilometres of Area and per Lakh of Population as on 31st December, 1988
State/U.T.
» f 5 H f e UoigT feoT l j3 l
g^ofT § ^ddr f y s fe s H te u » rg T ^ l
^ f u s (o iJTg) fd ii'd ) t-ftrai
fdr<£c/fNumber of Area in Number of Popula- Banking thousand Banking tion per Offices Square offices Bank
kilometre per thou- Office sand square (Thou* Kilometres sand)
of Area0 1 2 3 4
Andhra Pradesh ... 4.397 277 16 12
W H Assam 1,073 79 13 18
Bihar 4,443 174 25 15
djtfd'd Gujarat ... 3,243 196 16 10
ufe>>r;sT Haryana 1,239 44 28 10
fUVP^S Himachal Pradesh 651 56 11 6
^ M § oTHHte Jammu and Kashmir 738 222 3 8
■ordA*f<ro? Karnataka ... 4,116 192 21 8
^d65' Kerala 2,789 39 71 9
Madhya Pradesh ... 4,054 443 9 13
Ho^dna^yr Maharashtra 5,276 308 17 12
H?jtyg Manipur ... 67 22 3 21
Meghalaya 140 22 6 9
Nagaland 68 17 4 11
Orissa 1.857 156 12 14
Punjab ... 2.072 50 'U 8
g T -f iw * Rajasthan 2,840 342 8 12
fHSTH Sikkim 26 7 4 12
H t e 6 '^ Tamil Nadu 4,149 130 32 12
cTdly^ Tripura 155 10 15 13
§ J U Uttar Pradesh 7,945 294 27 14
yd f'5 West Bengal 3,790 88 4} 14
^ ■stu Andaman and Nicobar Islands 17 8 2 10
»T3cS'TtJ« l|§0 Arunachal Pradesh 57 84 — 10
^oJldl;^ Chandigarh 108 **« 4
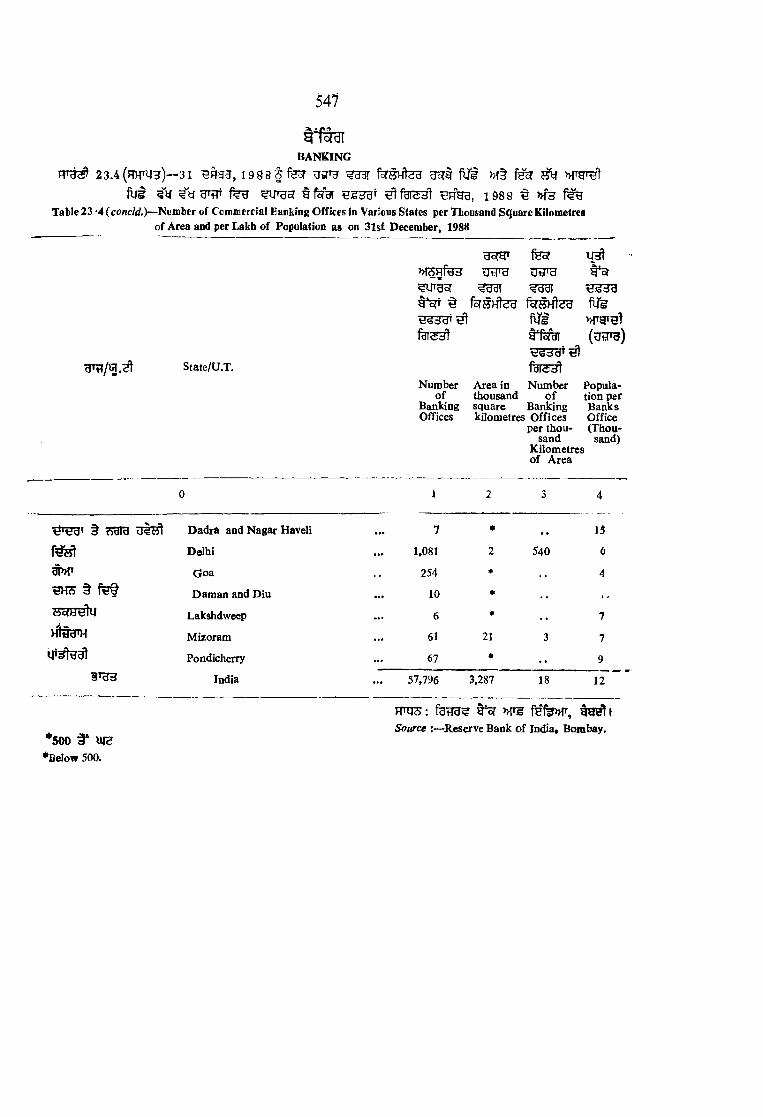
547
llO TB A N K IN G
23.4(hhtU3)—31 BFfg?, i 9 8 8 j f e r ^ g^rt f u i M§ fssr ^ w n tf u i ^ y g r fT f g ^ f e s t S H g g , 1 9 8 8 ^ >H3
Table 23 -4 (concW.)—Numfcer of CcmiEercial Banking Offices in Various States per Thousand Square Kilometres of Area and per Lakh of Population as on 31st December, 1988
*500 §* MfB
*BeIow 500.
?gBTt^oTT t forsHteu ftrsH te g
ti.<o3'6fu gv>rgTg^
( u i r g )
State/U.T.Number Area in Number Popula-
of thousand o f tion per Banking square Banking Banks Offices kilometres Offices Office
per thou- (Thousand sand)
Kilometres of Area
0 1 2 3 4
§ ?)-um Dadra and Nagar Haveli 7 « , , 15
Delhi 1.081 2 540 6
# > r Goa 254 * , , 4§ f e t Daman and D iu 10 * . . , ,
Lakshdweep 6 * 7n ltiy 'H Mizoram 61 21 3 7
Pondicherry 67 * . . 9
India 57.796 3,287 18 12
HTTO : fetT3? f5 % » r , ISource :—Reserve Bank of India, Bombay.

B A N K IN G
23. 5— ^yr gor t*^r ^ t HoTHt >H§ oraftlMf fc^FRHTable 23 -5—Year-wiie Deposits and Advances Ratio of Scheduled Commercial Banks—Punjab
( IW 1 U § ) (Rs. lakh)
548
F T S Hofd<«'d) rT^jTgsrHt M H ^ a ftn r 5rufe»f*«1
oTHH tfl^rgoW*
Year (Last Friday of June) Deposits Advances Percoutage o f Avcnces to Deposits
0 2 3
1970* 27,3 5) 9,586 35.04
1975* 66,945 25,478 38.06
1980 1,75,394 67,653 38 '57
1983 2,95,707 1,21,904 41 22
1984 3,48,750 1,52,468 43-72
1985 4,13,110 1,84,108 44 57
1986 4,93,397 2,09,228 42-41
1987* 6,32,537 2.74,315 43-37
1988* 7,63.718 3,14,402 41 *17
Source : Banking Statistics Division* R.B.T.,Bombay.
•As on the last Friday of December.

BANKING
549

550
DANK2 3 .6 — »fSHf%3 ?i|T3or to?* 9T gonfe»f» sra# ^ ^agfforg^ ira-^Tcsgrl ^
Table 23.6—State*wbe Clasiificatton ot outstaading Credit of Scheduled(As on the last Friday of
H H H g, 1985 December, 1985
Regkm/State
I y 3 1.2.3. >Kt oTHHtU
4. ITFPg
5.
6.7.
II ^1. W H "
2. H uMw
3. H c^g
4.
5.
6.7. Hi gn8 . fH5?H i; ,
III ^L fe tn s
2. t ^ F T ^
3. ygHt 931^3"'"'.H4. ^
B ln RHU ^ 3
I. Northern Regioa—
1. Haryana
2. Himachal Pradetb
3. Jammu & Kashmir
4. PuAjab
5. Rajasthan
6. Chandigarh
7. DeJhi
Total
II. Nortb-Eafltorn Region—
1. Assam
2. Meghalaya
3. Manipur
4. Nagaland
5. Tripura
6. Arunachal Pradesh
7. Mi/oram
8. Siickim
Total
III. Eastern Rcftioa—
1. Bihar
2. Orissa
3. West Bengal
1. Andaman/Nicobar Islands
Total
§ > > r c r 3 tAccording to sanction
Numberof
Accounts
aoTHAmount
1 2
7.00,343 1,00,950
2,44,888 21,427
1,98,440 29,416
10,08.700 2,02,887
]2,61,875 1,45,242
44,527 86.332
3,94,929 4,24,219
38,53,702 10,10,472
3,95.690 48,627
43,174 3,197
18,814 2,302
14,164 2,766
2,04,073 6,256
4,824 656
6.618 809
11,262 713
6,98,619 65,327
22,65,496 1,40,107
18,18,950 84,483
20,89,736 4,48,304
5,209 691
61.79,391 6,73,585

55]
IN G^ >MnjTg t ^ § )Commercial Baaks according to Sanction and UtilisationDeoember)
1 9 8 5 December, 1985
1 9 8 6 December, i986
According to utilisation^ » r q T g t
According to Sanction
(^oTH(Amount in lakh of Rupees)
e f g g , 198 6December, 1986
>>nrTB t According to tni^isation
Nu nbsr of AccouatsgoiH
Arnaunt Nu.ubsr of Accounti A TiDuntss y
Nu Ti'ior o'" Accounts
Amount
j •* 5 6 7 8
7.01.693 1,34,721 8,20.259 1,15.025 8,21,867 1,59,860
2.44,824 22,174 2,71,918 24,567 2,72,009 26,290
1,98.635 29.810 2.07,485 35,395 2.07,766 36,475
\ \ 'V ) .s n I M \4S U.53,955 2,33,2\7 n,55,\92 2,5^,91S
12.63.071 1,49,957 13,99.669 1,57,700 14,01,039 1.66.568
4i.8l5 32,703 51,784 79,616 51,125 40,731
?,92,189 3,86,4 >7 4,12,927 4,65.012 4,10,030 4,12,571
38,53,732 10,07,939 43,17,997 11,10,532 43,19,028 11,01,413
3 95,690 48,627 4,73,936 50,191 4,79.834 67,550
43.174 3.197 46.966 5,472 47,841 6,456
18,814 2,3)2 2 ,261 3,571 25,230 3,580
14,164 2.766 15,337 4,019 15,558 4,979
2.04.073 6.256 2,37,175 8,549 2,37,197 8,710
4.824 656 6,737 2,167 6,789 2,570
6,618 809 9.716 1,512 11,152 2,898
11,262 713 11,488 790 11,490 1,269
6.98,619 65,327 8,26.616 76,272 8,35,141 98,013
22,65.496 1.40,107 27,77.998 1,59,201 27,71,537 1,64,289
18,18,950 84,483 20,20,223 98 887 20,20,198 i ,05,754
20,89.736 4,48,304 25,14,083 5,30.558 25,13,447 4,94.085
5,209 691 7,707 945 7,712 974
61.79,391 6J3.5S5 73,20,011 7,89.591 73.12.894 7.65,102
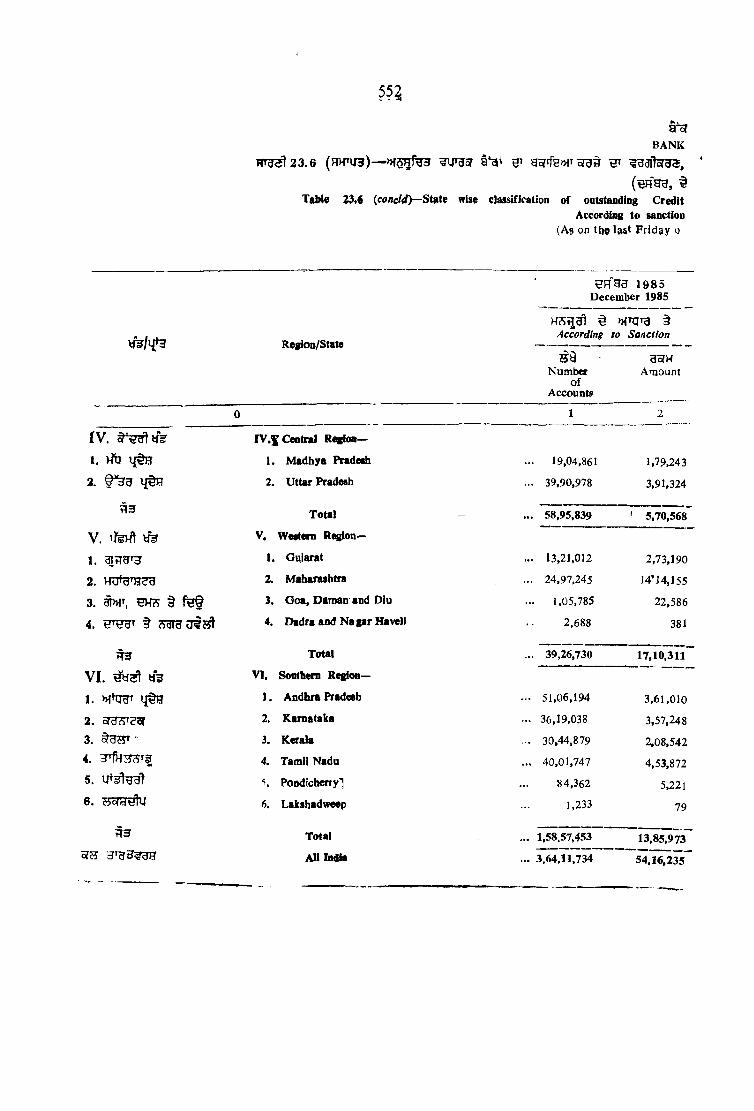
a'otBANK
(^ F ig U , ^Tabl« 23t6 iconcl4)— SUit? wise classification of outstandlog Credit
According to sanction(As on tb© last Frid ay o
RTg;^23.6 ( W t /3 ) — W g ffe>HT *
1985 December 1985
Region/StateAccording
>HTgTg ^ to Sanction
Numberof
Accounts
Anaouot
0 1 2
I V . IV .S C e n tn il Regioo—
I . > tl 1. Madhya Pradcth ... 19,04,861 1,79,243
2. 2. Uttar Pradesh ... 39,90,978 3,91,324
Total ... 58,95,839 ' 5,70,568
V. V, Weetern Region—
1. 1. Gujarat ... 13,21,012 2,73,190
2. 2. Maharashtra ... 24,97,245 14’ ]4,155
3. §M ^ m ? s § f e t 3. Goa, Daman and Diu ... 1,05.785 22,586
4. § A' fcJ 4. Dadra and Nagar Haveli 2,688 381
% Total ... 39,26,730 17,10,311
V I. VT. Sonthem Regloa—
1. i j t e 1. Andhra Pradesh - 51,06,194 3,61,010
2. org?>re3r 2. Karnataka ... 36,19,038 3,57,248
3. ■ 3. Kerala — 30,44.879 2,08,5424. HT^3ySi| 4. Tamii Nadu ... 40,01,747 4,53,8725. Pondicheny'] 84,362 5,2216. ?5orHt?ki 6. Lakshadweep ],233 79
^ 3 Total ... 1,58.57,453 13,85,973oT?5 3 ' 3 3 ^ 3 A ll India ... 3.64,11,734 54,16,235

553
fojaiIN G
cra?r?73fl § ^ >HqTg 3
M 3H § )Scheduled Commercial Banks and Utiliaatlon
December)
HFTH3, 1985 December, 1985
^ m F d § According to Utilisation
Number of Accounts
Amount
HFIHU, 1 9 8 6 December, 1986
According to Sanction
Number of Accounts
Amount
(gsTH w f?% )(Amount in lakh o f Rupees)
1 9 8 6December, 1986
According to Utilisation
Number of Accounts
Amount
19,04,453
39,90,282
1,85,257
3,98,491
22,44,424
41,64,146
2,18,559
4,12,16222,44,591
41,65,2272,23,717
4,35,558
58,94,73s 5,83,747 64,08.570 6,30,722 64,09,818 6,59,276
13,22,596 2,95,422 14,90,292 3,44,799 14,84,832 3,68,184
24,95,006 13,64,294 28,07,081 14,39,710 28,07,915 13,79,4251 .05,708 23.011 1,12,049 25,583 1,11,983 26,39 5
2,748 609 3,203 506 3,263 739
39,26,058 16,83,335 44,12,625 18,10,598 44,07,993 17,74,743
51,05,654 3,64,469 57,67,709 4,54,054 57,68,038 4,60,89036,18,959 3,63,477 42,74,267 4,27,729 42,74,682 4.39,11830,44,998 2,12,242 35,12,718 2,49,420 35,12,746 2,53,06640,01,803 4.49,806 46,97,883 5,56.809 46,98,037 5,53,796
84,377 5,765 95,232 7,598 95,247 7,9021,235 71 1,698 111 1,702 120
1,58,57,026 13,95,831 1,83,49,507 16,95,722 1,83,50,452 17,14,893
3,64,11,734 54,16,235 4,16,35,326 61,13,436 4,16,35,326 61,13,436
nrq^^: 3Tofel 3 ^ 5 ,S'pwrce:—Banking Statistics Division. R .B J . Bombay
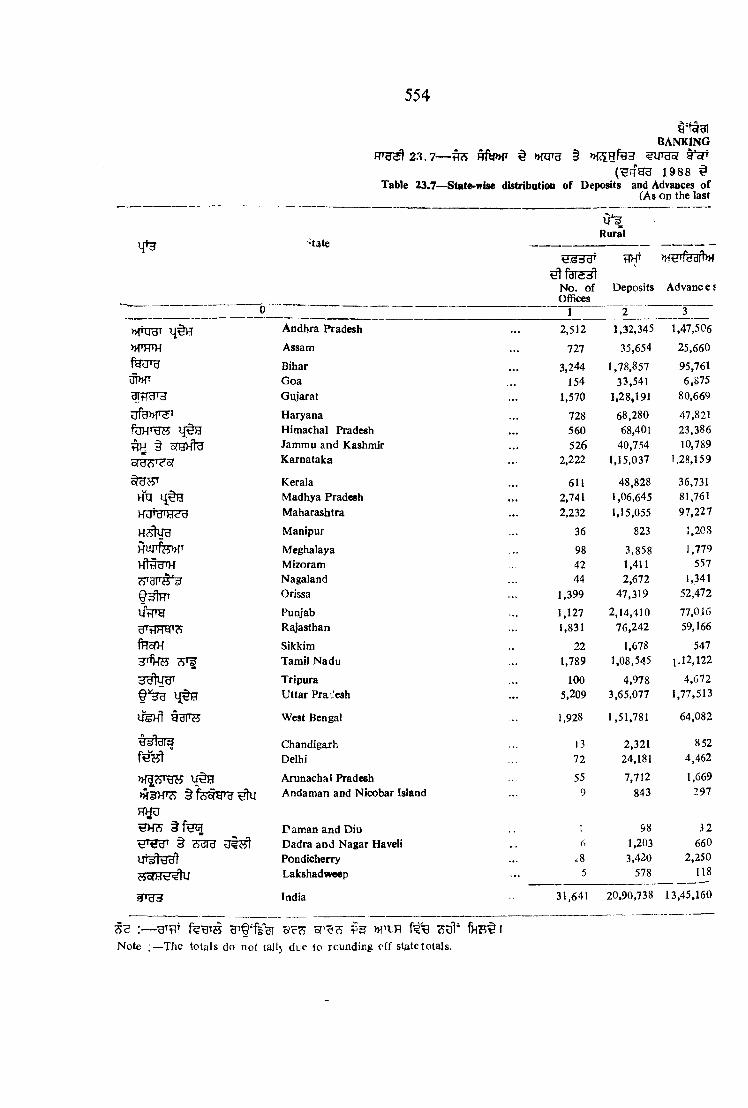
554
B A N KIN GF r g ^ 2 3 . 7 — ^ R f W ^ W g § » f3 R fe 3 t V
( ^ q g u 1 988 ^Table 23.7—State-wise distribation of Deposits and Advances of
(As on the last
Rural>tate
^ fd iad lfTvr
No. of Deposits Advanc e sOffices
0 1 2 3Andhra Pradesh 2,512 1,32,345 1,47,506
MTRTH Assam 111 35,654 25,660fHUT'd Bihar 3,244 1,78,857 95,761
Goa 154 33,541 6,875Gujarat 1,570 1,28,191 80,669
Haryana 728 68.280 47,821Himachal Pradesh 560 68,401 23,386
§ sthhI^ Jammu and Kashmir 526 40,754 10,789Karnataka 2,222 1,15,037 1,28,159
Kerala 611 48,828 36,731Hq 4 ^ Madhya Pradesh 2,741 1,06,645 81,761
Maharashtra 2,232 1,15,055 97,227
Manipur 36 823 1,208
HUrfe»{T Meghalaya 98 3,858 1,779Mizoram 42 1,411 557Nagaland 44 2,672 1,341Orissa 1,399 47,319 52,472
U H 'y Punjab 1,127 2,14,410 77,016Rajasthan 1,831 76,242 59,166
fHcm Sikkim 22 1,678 547Tamil Nadu 1,789 1,08,545 1.12,122
yyluH T Tripura 100 4,978 4,672Uttar Pra Jesh 5,209 3,65,077 1,77,513
US>fl SfBF75 West Bengal 1,928 1,51,781 64,082
Chandigarh 13 2,321 852Delhi 72 24,181 4,462
»racST-gH Arunachal Pradesh 55 7,712 1,669
>H3TTO § fcS'yjP'd ^ Andaman and Nicobar Island 9 843 297
RHUDaman and Diu ; 98 32
■tTOcT § iS-dfd Dadra and Nagar Haveli f, 1,203 660Pondicherry ^8 3,420 2,250Lakshadweep 5 578 118
s('d=# India 31,641 20,90,738 13,45,160
5^ :— gi f ^f sgr 3c7) c? ‘97 M’t'HNote The totals do not tallj due lo rounding off st^tctotals.

555
% HHTfe3ft»r e l ^gsrd'^'3 § )
Scheduled Cottiniercial Banks according to Population GroupsFriday of DJctnber, 1988) (Amount in lakhs of Rupees)
»icr-H fu^Semi Urban Urban/Metropolitan Total Percentpge
oft?) tTHT
No. of Deposits offices
914
2 2 )
683100706
2437864
779
1,734648807
Mgrfpgft^r
Advances No. of Deposits Advances offices
h !fgT5?t
No. of offices
flHf ^Jvaiices' to
Deposits AdvancesDeposits
8 10 112 ,08,006
63,213
2,10,19175,499
2,53,076
94,27932,11215,774
1,43,408
3,32,1421,59,0981,74,806
1,53,46625,562
68,25228,988
1,13,353
50,58711,0055,606
1,12,131
1,74,54082,704
1,05,342
951
106
470
934
265
1411,086
447592
2»t56
4,17,39264,501
2.87,507
4,65,116
1,18,041
78,4304,14,830
1,63,9412,89,422
22J5»9Q5
3,40,733
37,910
97,543
2,99,637
73,509
44,9733,91,409
1,36,204 1,89,822
16,46,5S0
4,377
1,053
4,397254
3,210
1,236638731
4,087
2,7923,9815,195
7,57,742
1,63,367
6,76,5551,09,0408,46,384
2,80,6011,00,5131,34,958
6,73,275
5,44,9095,55,167
25,65.766
12 ___6,41,705
89,134
2,61,55735,864
4,93,659
1,71,91534,39061,369
6,31,699
3,47,475 3,54,286
18,49,09 V
84-6854-56
38-6632-8958-32
61-2634-2145-4793-82
63-7763-8272-07
9 1,041 1,001 18 5,161 2,176 63 7,027 4,384 62-39
12 4,415 884 28 16,719 2,728 138 24,992 5,390 21-578 4,154 1,063 — — — 50 5,566 1,619 29-09
24 12,116 4,865 — — — 68 14,787 6,207 41-98252 52,436 33,495 199 83,123 67,524 1,850 1,82,878 1,53,490 83-93
476 2,50,707 1,02,618 464 2,98,599 1,34,768 2,067 7,63,718 3,14,402 41-17548 1,14,888 60,968 457 1,88,993 1,09,512 2,836 3,80.121 2,29,646 60-41
4 5,550 1.702 — — — 26 7,228 2,249 31-121,048 2,09,139 1,59,510 1,311 5,86,787 5,81,738 4,148 9,04,472 8,53,371 94-35
23 3,912 2,617 25 10,710 4,059 148 19,600 11,347 57-891,166 3,67,675 1,55,636 1,471 7,34,608 3,04,322 7,846 14,67,359 6,37,472 43-44
594 2,04,604 50,769 1,216 10,64,266 6,00,368 3,738 14,20,652 7,15,221 50-34
5 1,967 321 92 1,04,571 75,943 110 1,08,858 77,116 70-846 5,484 756 1,005 13,95.766 7,68,572 1,083 14,25,431 7,73,791 54-281 189 18 — — — 56 7,901 1,687 21.358 3,130 1,083 — — — 17 3,974 1,380 34-73
9 3,836 841 10 3,933 873 22-20— — — — — — 6 1,203 660 54-b610 4,475 1,301 28 15,843 8,445 66 23,737 11,996 50-54— — — — — — 5 578 118 20-42
11,179 30,11.322 15,10,984 13,462 90,80,231 59,18,425 56,282 1,41,82^292 87,74,571 61-87~*
m a s :— tt^3T FrIfeRfesfH. 5 ^ 3 5 , >^^3. gt. 9 3 9 1 1 •foUTiv:—Banking Statistics Division, BomlMy.
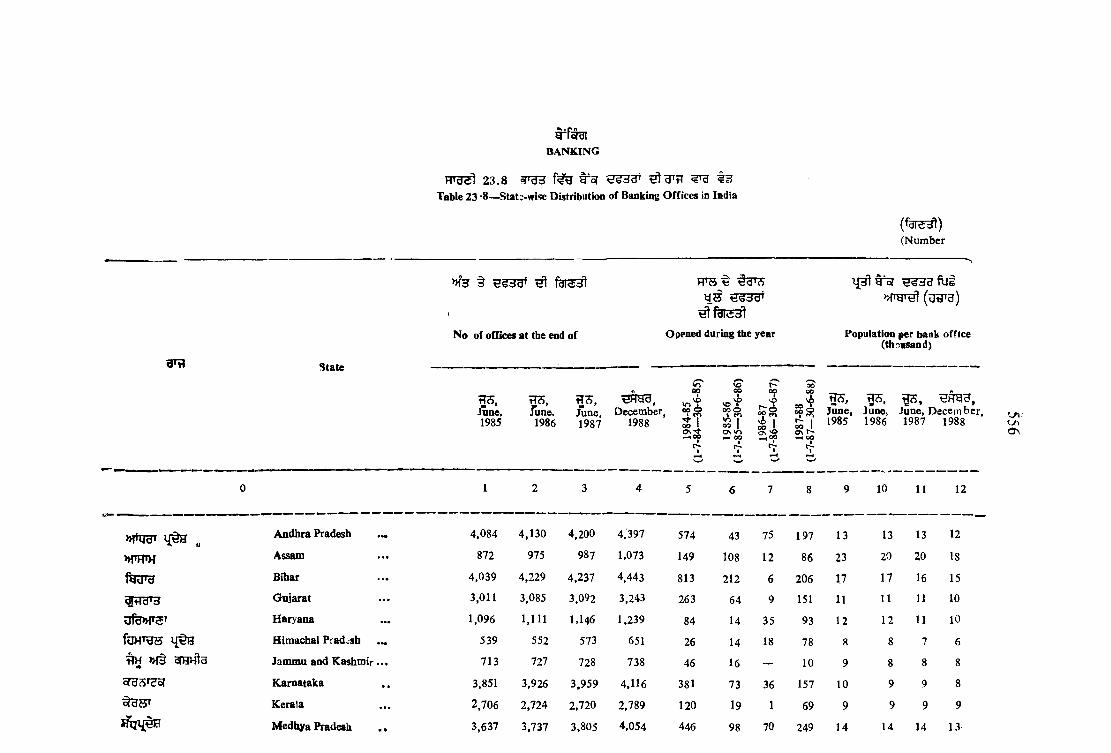
banking
23.8 ^ # sJTable 23 '8—^Stat?-wise Distribution of Banking Offices in India
State
No of offices at the end of
F T S ^
^ fd led l
Opened during tbe year
( f ^ )(Number
H 3 , H S , H 3 ,June. June. June. December,1985 1986 1987 1988
00 (ooo 00•^4
1oo 1
ve'fooo00 ION <n 1—1 oo
vi 1 oo '-H op
5 6 7
S 700 I os—I oo
Population per bank office (thoH^nd)
June, June, June, December, 1985 1986 1987 1988
10 11 12
O n
Andhra Pradesh 4,084 4,130 4,200 4.397 574 43 75 197 13 13 13 12
»fTHTH Assam 872 975 987 1,073 149 108 12 86 23 20 20 18
t o u Bihar 4,039 4,229 4,237 4,443 813 212 6 206 17 17 16 15
4 ? ra 'a Gujarat 3,011 3,085 3,092 3,243 263 64 9 151 11 11 11 10
Haryana 1,096 1,111 1,146 1.239 84 14 35 93 12 12 11 10
f o H T ^ i { t e Himachal Pradesh 539 552 573 651 26 14 18 78 8 8 7 6
^ >H§ ajHHta Jammu and Kash m ir... 713 727 728 738 46 16 — 10 9 8 8 8
oTHS'r^of Karnataka 3,851 3,926 3,959 4,116 381 73 36 157 10 9 9 8
tH S T Kerala 2,706 2,724 2,720 2,789 120 19 1 69 9 9 9 9
Medhya Pradesh . . 3,637 3,737 3,805 4,054 446 98 70 249 14 14 14 13

MUpfe»r
vfflTH
H t e J ^
ifew t tu H H
>HiHT3 § f e t r g
^ HH3
Maharashtra
Manipur
Meghalaya
Nagaland
Orissa
Punjab
Rajasthan
Tamil Nadu
Tripura
Uttar Pradesh
West Bengal
Andaman & Nicobar Islands
4.814 4,919 4,957 5,276 411 103 4J 329 13 n 13 12*
67 67 67 67 15 6 — — 24 21 21 21
125 130 133 140 25 5 3 7 11 10 10 9
64 66 67 68 9 2 — I 12 12 t 11
1,691 1.735 1,764 1,857 207 42 21 93 16 15 15 14
1,992 2,004 2,035 2,072 146 9 32 37 8 8 8 8
2,616 2,681 2,711 2,840 446 69 31 129 13 13 13 12
3,909 3,930 3,932 4,149 288 29 11 217 12 12 12 12
136 136 137 155 16 13 1 18 15 15 15 13
7,200 7.345 7,475 7,145 1,192 lf>8 133 470 15 15 15 14
3,210 3,418 I M l 3.790 467 192 44 313 17 16 15 14
13 14 14 17 _ 1 _ 3 14 13 13 10
Aruuachal Pradesh 48 54 56 57 11 6 2 1 13 12 11 11
Chandigarh ..h. 105 107 K07 108 6 2 — 1 4 4 4 4
Dadra and NagarHaveliDelhi;
6
1,042
6
1,059
6
i,o;5?
7
1,081 48 16 4
I
24
17
6
17
4
17
6
15
6
Goa, Daman and D iu ... 260 260 2(61 264 3 — 1 3 4 4 4 4
Lakshadweep 5 5 5 b — — — 1 8 8 8 7
Mizoram 45 51 50 61 26 5 — 11 11 10 10 7
cnsAtJcft Pondicherry 63 63 63 67 4 — - - 4 10 10 10 9
fHoTH Sikkim 19 19 19 26 — — — 7 17 17 17 12
Total 51,978 53,265 53,840 56,796 6,222 1,266 587 2,956 13 13 13 12
HlfenfeoTR » re .^ .» P ^ * , g s f ^ J.5oi<rce:—Banking Statistics Division, R .B .L , Bombay.
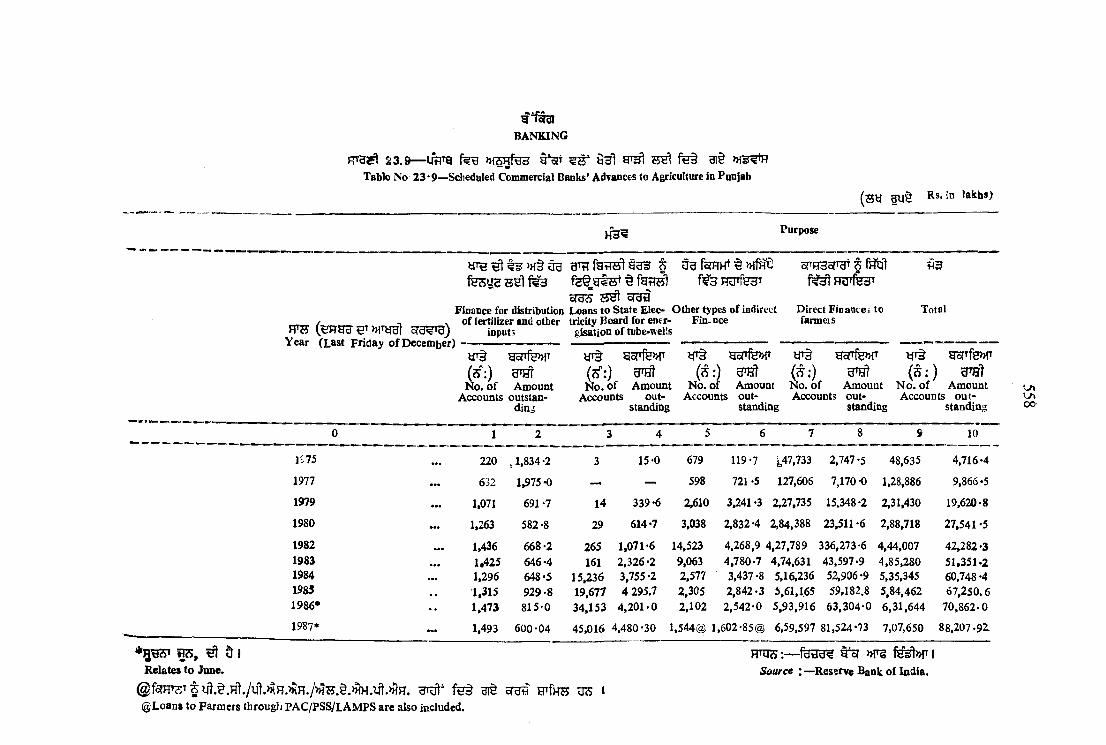
B A N K IN G
2 3 .9 — “IfflTg t 'o T fe § 9I§ >H 5?^Tabic No 23*9—^Scheduled Commercial Banks' Advances to Agriculture in Punjab
( s y lakhs)
Purpose
fe3 U 2 fe § g i ^ t t e s t M b F R rfesry'd6' Wtil b(did
Fioance for distribution Loans to State Elec- Other types of indirect. /.__ __ _a \ of fertilizer and other tricity Board for ener- Finance
FTH (,^1753’ oTcf^^J inputs gisation of tube-wellsYear (Last Friday of December)
STHHoT^ § f M f ^ R U i f e r
Direct Financei to farmeis
?(3
Total
HcrTfe>HT
fo. of Amount Accounts outstan
ding
.s'O&
gorfe»iT g^fe>HT( s ; ) grJJt
No. of Amount No. of Amount l^o. of Amount N o . of AmountAccounts out- Accounts out- Accounts out- Accounts out
standing standing standing standing
y i t 9orrfe>HT ( s : )
y r t gorfe»fT yr§
( f f : ) orat ( ^ ; )
0 1 2 2i 4 5 6 7 8 9 10
1S75 . . . 220 J,834-2 3 15-0 679 119-7 L47.733 2,747-5 48,635 4,716-4
1977 • •• 632 1,975-0 — — 598 721 -5 127,606 7,170-0 1,28,886 9,866-5
1979 • •• 1,071 691 -7 14 339-6 2,610 3,241 -3 2,27,735 15.348-2 2,31,430 19,620-8
1980 ••• 1,263 582-8 29 614-7 3,038 2,832-4 2,84,388 23,511 -6 2,88,718 27,541-5
1982 1,436 668-2 265 1,071-6 14,523 4.268,9 4,27,789 336,273-6 4,44,007 42,282-31983 • •• M 2 5 646-4 161 2,326-2 9,063 4,780-7 4,74,631 43,597-9 4,85,280 51,351-21984 ••• 1,296 648-5 15,236 3,755-2 2,577 3,437-8 5,16,236 52,906-9 5,35,345 60,748 -41985 , * 1,315 929-8 19,677 4 295.7 2,305 2,842-3 5,61,165 59,182.8 5,84,462 67,250.61986* • • 1,473 815-0 34,153 4,201-0 2,102 2,542-0 5,93,916 63,304-0 6,31,644 70,862-0
19«7* — 1,493 600-04 45,016 4.480-30 1,544@ 1,602-85® 6,59,597 81,524-73 7,07,650 88.207.92.
^ d I Relates to June.
@Loans to Farmers through PA C/PSS/LA M PS are also included.
H T q s :— fe n g ? » rgSource : —Ressrv© Bank of India.
oo

gTsfaiBANKING
559
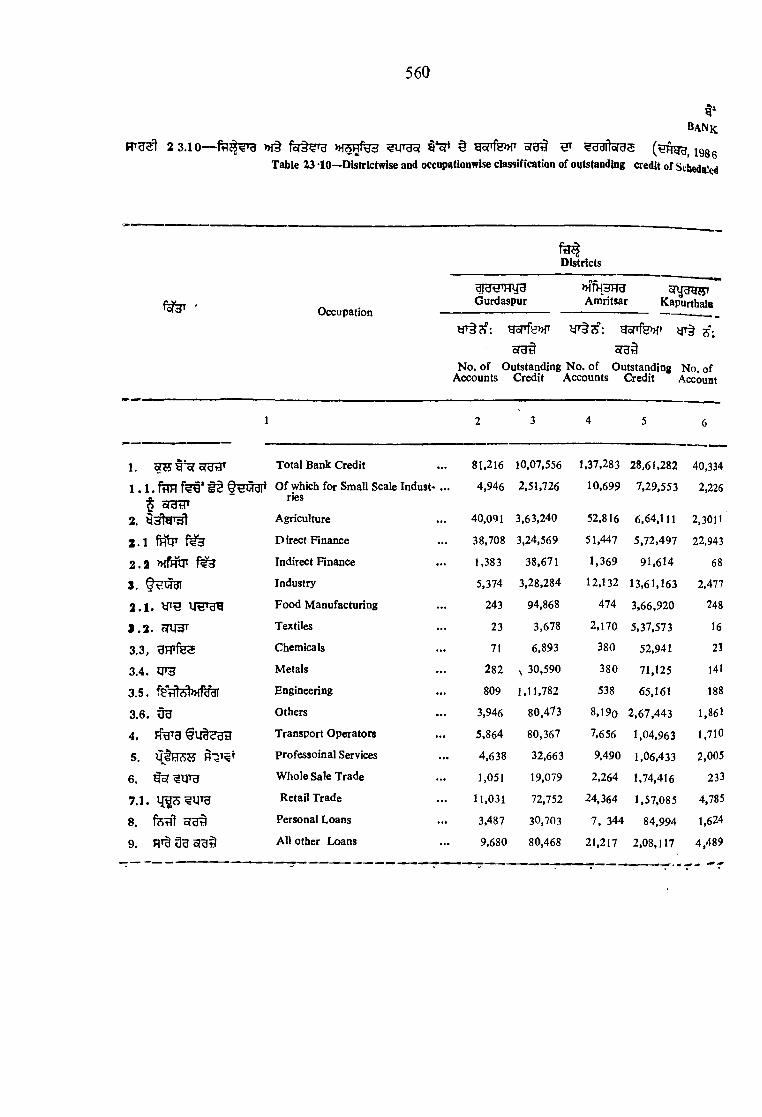
t*Bank
2 3. 10— >H§ » fS H ^ § g5rfe»T ofgna aailo/ds (^Hwg, igggTable 23 -10—Dlstrlctwise and occupatlonwise classification of outstanding credit of Sc{»edaled
560
Occupation
Districts
ddt!'Hy3Gurdaspur
»iTH3TOAmritsar Kapurthala
y r t s ; HoTfe»r yT§75: HoTfevH' yr§o [ ^ sra^
No. of Outstanding No. of Outstanding No. of Accounts Credit Accounts Credit Account
1. gfii y o( o(d# Total Bank Credit 81,216 10,07,556 1,37,283 28,61,282 40,334
1 ,1 . ^ Of wliich for Small Scale Indust- ... 4,946 2,51,726 10,699 7,29,553 2,226rics
2. Sdlsi'di Agriculture 40,091 3,63,240 52,816 6,64,111 2,3011
2.1 fHV Direct Finance 38,708 3,24,569 51,447 5,72,497 22,943
2 .2 » f f ^ Indirect Finance 1,383 38,671 1,369 91,614 68
S. t^ w a i Industry 5,374 3,28,284 12,132 13,61,163 2,477
2 .1 . u ti'ay Food Manufacturing 243 94,868 474 3,66,920 248
J .2 . 5W3T Textiles 23 3,678 2,170 5,37,573 16
3.3, HFTfe Chemicals 71 6,893 380 52,941 21
3.4. U'3 Metals 282 30,590 380 71,125 141
3.5. f8dlA l»if^ Engineering 809 1,11,782 538 65,161 188
3.6. UU Others 3,946 80,473 8,l9o 2,67,443 1,861
4 , RW9 Transport Operators 5,864 80,367 7,656 1,04,963 1,710
5. uJH cSW professoinal Services 4,638 32,663 9,490 1,06,433 2,005
6. 114TH Whole Sale Trade 1,051 19,079 2,264 1,74,416 233
7.1. Retail Trade 11.031 72,752 24,364 1,57,085 4,785
8. Personal Loans 3,487 30,703 7, 344 84.994 1,624
9. oig^ All other Loans 9,680 80,468 21,217 2,08,117 4,489
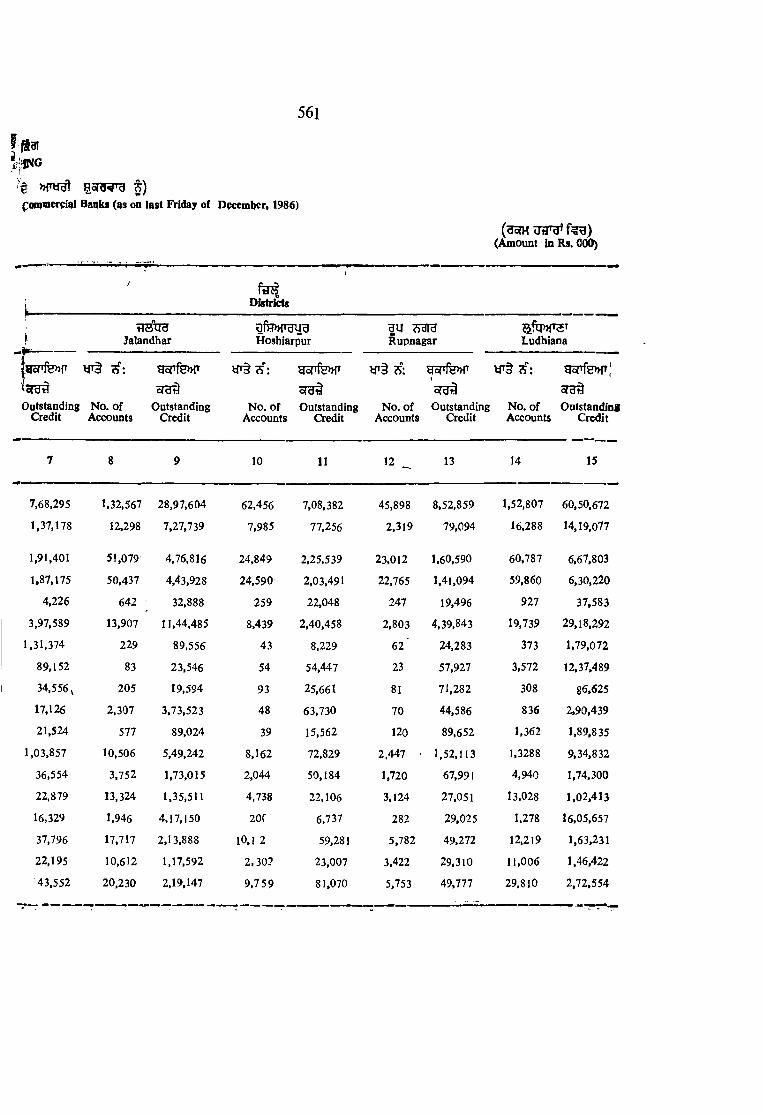
561
. . MIflNG
‘kpODHderpia]
f )Baqks (us on last Friday of December, 1986)
(now irara^f^)(Amount inRs.000)
i .
/ftii?
Dlstrkts
1
t^ttUd 6U1. Jalandhar Hoshiarpur Rupnagar Ludhiana
|5yir«»F yc?'ry>KT 7i: g5pfe>>r 3:o(cJt) oldti
Outstanding No. of Outstanding No. of Outstanding No. of Outstanding No. of OutstandingCredit Accounts Credit Accounts Credit Accounts Credit Accounts Credit
7 8 9 10 11 12 ^ 13 14 15
7,68,295 1,32,567 28,97,604 62,456 7,08,382 45,898 8,52,859 1,52,807 60,50.672
1,37,178 12,298 7,27,739 7,985 77,256 2,319 79,094 16,288 14.19,077
1,91,401 51,079 4,76,816 24,849 2,25,539 23,012 1,60,590 60,787 6,67,803
1,87,175 50.437 4.43,928 24.590 2.03.491 22,765 1,41,094 59,860 6,30.220
4,226 642 32,888 259 22,048 247 19,496 927 37,5833,97,589 13,907 11,44,485 8,439 2,40,458 2,803 4,39,843 19,739 29,18,292
1,31,374 229 89.556 43 8,229 62 24,283 373 1,79,07289,152 83 23,546 54 54,447 23 57,927 3,572 12,37,489
34,556^ 205 19,594 93 25,661 81 71,282 308 86,62517,126 2,307 3,73,523 48 63,730 70 44,586 836 2,90.43921,524 577 89,024 39 15,562 120 89,652 1,362 1.89,835
1,03,857 10,506 5,49,242 8,162 72,829 2.447 ' 1.52,113 1,3288 9,34.83236,554 3,752 1,73,015 2,044 50,184 1,720 67,991 4,940 1,74,300
22.879 13,324 1,35,511 4.738 22,106 3,124 27,051 13,028 1,02,41316,329 1,946 4,17,150 20f 6,737 282 29,025 1,278 16,05,657
37,796 17,717 2,13,888 10,1 2 59,281 5,782 49,272 12,219 1,63,231
22.195 10,612 1,17,592 2,302 23,007 3,422 29,310 11,006 1,46,42243.552 20.230 2,19,147 9,7 59 81,070 5,753 49,777 29,810 2,72,554

562
g -UAiNK-
FTg^ 23.10— f i§<r9 t*ofr ^ girfe)>r (o t 3, 198 sTable 23-lo—Districtwise and occapatiou nvise cl'4ssifiQatiuo of outstanding cr dU Qf S^^dulet?
Occupation
feuijyuFitozpur
Districts
FaridkotgfeV
Bathinda
tfT§ h: g5rfe)HT tfT§?f; ao|TfH»fT yr§?f;
No. of Outstanding No. of Outstanding No. of Accounts Credit Accounts Credit Accounts
16 17 18 20
1. sragr Total Bank Credit 96,065 15,02530 1,02,859 16,23,189 1,03,959
1.1 Of whicV\ for Small Scale Induitries 1,780 1,51,323 2,641 1,81,082 3;657oJdiJT
2. 9 3 ^ 3 ^ Agriculture 69,088 8,36,380 70,865 8,69 043 71,083
2.1 Direct Finance 67,308 7,98,532 70,439 7,66,875 69,848
2 .2 Indirect Finance ],780 37,848 426 1.02,168 1,235
S. t ^ g r Industry 2,]20 3,18,917 3,069 2,79,138 4,092
3.1 yr^UH'dy Food Manufacturing 315 2,24,425 291 1„28178 103
3 .2 Textiles 25 52,261 46 41,571 97
3.3 HHTfes Chemicals 24 8,643 44 9,660 45
3.4 qT3 Metals 11 519 59 10,869 45
3.5 Engineering 100 4,912 183 19,335 80
3.6 Others 1,645 28,157 2,446 69,525 3,722
4. Transport operators 2,685 55,304 2,919 96.890 2,084
5. u j e ^ professional Services 3,710 20,084 4,044 38,941 4,131
6. ^UTU Wholesale Trade 819 1,07,283 610 1,08,C83 1,482
6.1 Of which Retail Trade 8,380 64,823 8,349 78,164 V 9,5327. oragr Personal Loans 2,530 24,5i4 4,344 35,512 3,317
8. RT ol^i All Others Loans 6,733 75,225 8,659 1,17,418 8,238

563
fofaiING
Comiuercial Baaks (as oa last Friday of Decejnber, 1986)
f ^ ) (Amount in Rs. 000)
Districts
OutstandingCredit
FididdSangrur
yr§ t : gsrfenr
OutstandingNo. of Accounts Credit
Ufe>HTS?TPatiala Chandigarh* Total
S; 9irfe>HT
No. of Outstanding No. of Outstanding No. of Outstanding Accounts Credit Accounts Credit Accounts Credit
7i: goFfe»Teras
21 22 23 24 25 26 27 28 29
19,06,129 1,03,292 13,79,247 98,265 27,61,098 191 15,47,841 11,55,192 2,58,66,684
90,792 5,352 1,88,292 4,361 5,27,150 94 127,328 74,646 47,87,590
12,95.028 69,099 7,70,266 51,071 9,96.622 21 50.952 6.06,872 75,67,7917,44,?29 68,648 6,61,536 50.484 5,53.304 16 4,338 5,97,493 60,31,7885,50,799 451 1.08,730 587 4,43,318 5 46.614 9,379 15,36.0031.85,124 5,811 3.47.009 5,549 11,55,176 132 1,65,309 85,644 92,80,787
41,946 245 1,36,154 528 3,71,040 4 550 3,158 17,96,5951 62,525 48 43,216 21 22,971 5 322 6,183 22,26.67810,702 81 31,648 136 48,852 25 18,912 1,516 4*25,969r 4,982 187 37,349 553 2,39.486 15 55,343 4,934 12*39,66716,838 58 8,233 231 1,21,840 51 51,478 4,336 8,05,17648.131 5,192 90,409 4,080 3,50,987 32 38,704 65,517 27,86,702
79.244 2,286 57,239 3,531 1,45,547 10 1,208 41,201 11,22,80630,451 5,392 30,737 6,172 59,94/ '2 174 73,798 6,29,390
1,19,910 609 11,547 887 68,942 5 13,28,729 11,666 40,12,88783,703 8,165 64,364 10,122 1,06,609 7 625 1,30,578 11,51,59334,563 3,892 33,584 6,885 1,05,126 10 446 60,775 6,87,968
78,106 8,038 64,501 12.048 1,23,129 4 398 1,44,658 14,13,462
HHjs; 1*0? n rs fg^»fT|: Reserve Bank of India.
♦feu HtjB ori§ 31$ 05 fejf ^ oft^ aiet d >Ht faa
’ {adicatd the ciredit sanstioned in Chaadigarh but utilised ia Puajab for which district-wise break ups art not available.

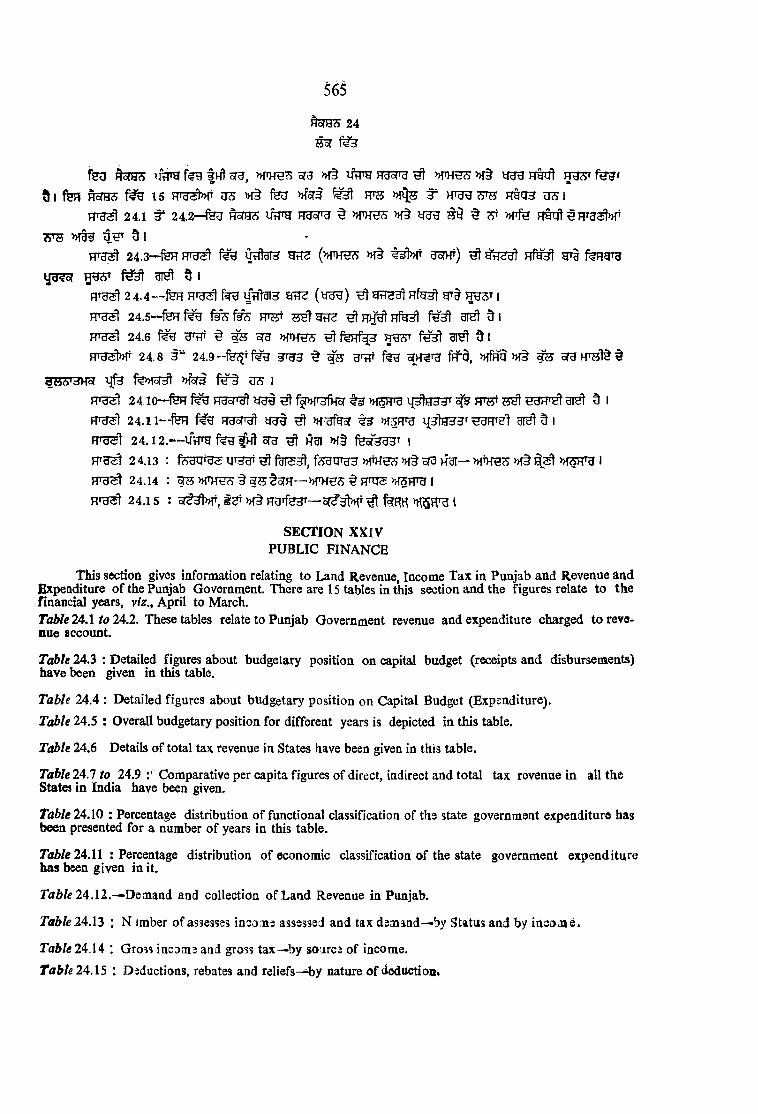
fso #Ht 5TU, ^3 >H§ lf?FH FBsrcf ^ »PHHS »f§ ^ hM5 1 feT? H5THS 15 03 M§ fe l ^ mS » % 3" OT5 I# J 3 TO I
F T ^ 24.1 3" 24.2—feu H^HJS ^ M§ »Tfe hM
<5^ 0 ^ IFFB^ 24.3—fen FTH^ M3T3 HtT3 (»THgS »f§ ^ R f ^ grg f^ g rg
yU?or ^ ^ IRTH 2 4.4—fen f ^ uH^3i3 (yH^) ^1 grreutnfer^ i
24.5“ feR f ^ HW ?55t ^ ^ HH^ Hfe^ 3T^ ^ IfTB^l 24.6 HnPF ^ ^ sra »THH3 HBcSr ^ ^ \F T ^ ^ 2 4 .8 3 ‘' 2 4 . 9 - - f e ^ t f ^ feH oIK ^ tH f ^ , >HfRq »f§ ^ SfH HT?5t§ §
3 W (S> ^ MIh fe » R ^ »fer3 U3 IR i ^ 24,10*—feR HUSTcff tfHU ^ nfSRrg hW ^ H3FT^ 5 IR ^ 24.11“ -feR R ^ i^ ^ »f3fer MOT'H 43te3TH3RTS'^ grsl d I RTHSl 24. 12. — ofg ^ Rgi M§ feor333T |RTH 2 4.13 : f e a H ^ IF3^ ^ fSHTFHH >HiM M§ 5T3 H3T— >H^?> »f§ MSR^ I R»nc 24.14 : ^ >>rH^ § ??5 tsTR— »THHS t R^nS M^R^ I RTH^ 24.15 : srM>HT, g^T »|§ ROTfeHT— o t ^ ^ t ^ \
SECTION XXIV PUBLIC FINANCE
This section gives information relating to Land Revenue, Income Tax in Punjab and Revenue and Bxpeaditure of the Punjab Government. There are 15 tables in this section and the figures relate to the jfinancial years, viz., April to March.Table 24.1 to 24.2. These tables relate to Punjab Government revenue and expenditure charged to revenue account.
Table 24.3 : Detailed figures about budgetary position on capital budget (receipts and disbursements) have been given in this table.
Table 24.4 : Detailed figures about budgetary position on Capital Budget (Expsnditure).Table 24.5 : Overall budgetary position for different years is depicted in this table.
T<^le 24.6 Details of total tax revenue in States have been given in this table.
Table 24.7 to 24.9 :‘ Comparative per capita figures of direct, indirect and total tax revenue in all the States in India have been given.
TablelAA^ : Percentage distribution of functional classification of the state government expenditure has been presented for a number of years in this table.
Table 24.11 : Percentage distribution of economic classification of the state government expenditure has been given in it.
rad/€ 24.12.—Demand and collection of Land Revenue in Punjab.
Ttfd/e 24.13 : N jmber of assesses income assessed and tax dsmiad—by Status and by income.
Table 24.1 A : Gross income and gross tax-^by sourcs of income.Table 24.15 ; Diductions, rebates and reliefs—by nature of deduction*
565
24

PUBLIC FINANCE
5§r
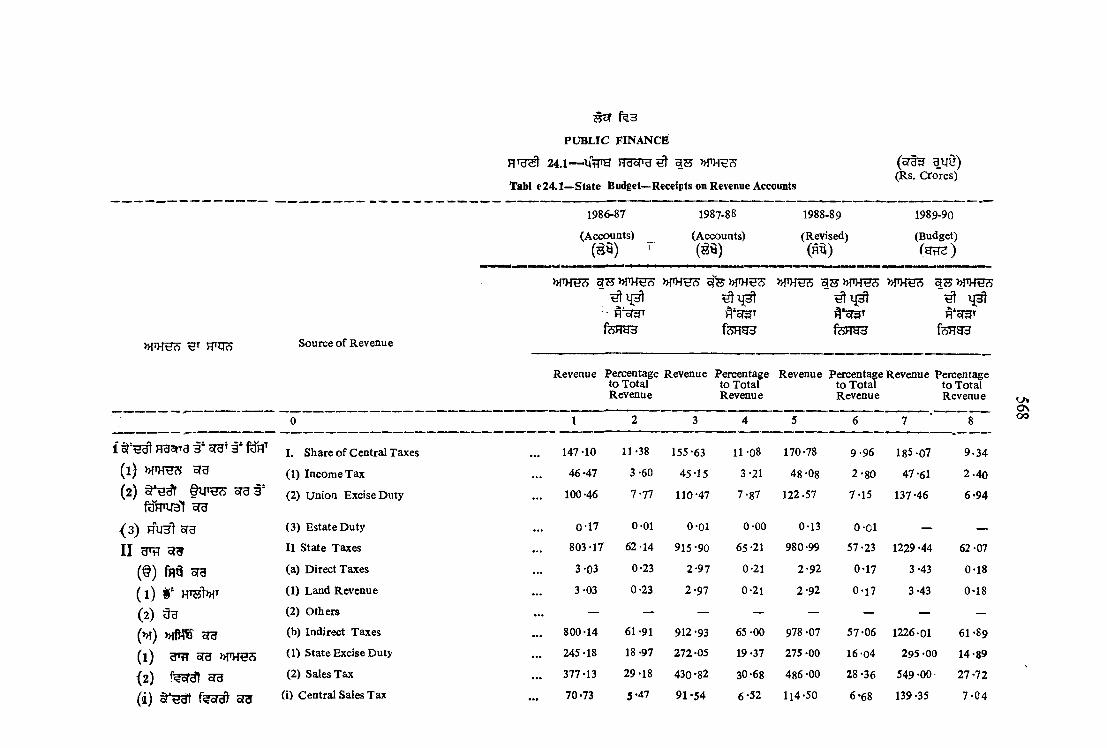
PUBUC FINANCE
24.1— »f H^3
Tabl e 24. In sta te Budget—Receipts on Revenue Accounts
Source of Revenue
1986-87
(Accounts)(gS)
1987-88
(Accounts)(b S)
1988-89(Revised)(h3)
(5T^ giru)(^s. Cfores)
1989-90(Budget)(HrTe)
qB »T H ^ »TH ^ 9^5^
n*orgTfeR53 fc HH3 feHH3
Revenue Percentage Revenue Percentage Revenue Percentage Revenue Percentage to Total to Total to Total to TotalRevenue Revenue Revenue Revenue
0 1 2 3 4 5 6 7 8
i ngarta 3 - oRt 3- I. Share of Central Taxes 147-10 11-38 155-63 11-08 170-78 9-96 185-07 9.34(1) (1) Income Tax 46*47 3-60 45-15 3-21 48-08 2-80 47-61 2-40( 2 ) era 3 '
ftmiBl ora(2) Union Excise Duty 100-46 7-77 110-47 7-87 122.57 7-15 137-46 6-94
( 3) r u h ! 5rg (3) Estate Duty 0-17 0-01 0-01 0-00 0-13 0-01 — —
II U'H II State Taxes 803-17 62-14 915-90 65 -21 980-99 57-23 1229 -44 62-07
(§) M Bra (a) Direct Taxes 3 *03 0-23 2-97 0-21 2-92 0-17 3-43 0-18
( 1) i* (1) Land Revenue 3 -03 0-23 2-97 0-21 2-92 0-17 3-43 0-18
( 2) (2) Others — — — — — — — —
(m ) ora (b) Indirect Taxes 800-14 61 -91 912 -93 65-00 978 -07 57-06 1226-01 61-89
(1) ^ 5ra >)fH€5 (1) State Excise Duty 245 -18 18 -97 272-05 19-37 275-00 16-04 295 -00 14-89
( 2) f^sr^ ora (2) Sales Tax 377-13 29-18 430-82 30-68 486-00 28 *36 549 -00 27-72
,(i) f?or^ sra (i) Central Sales Tax 70-73 5-47 91-54 6-52 114-50 6-68 139 -35 7-C4
ONoo
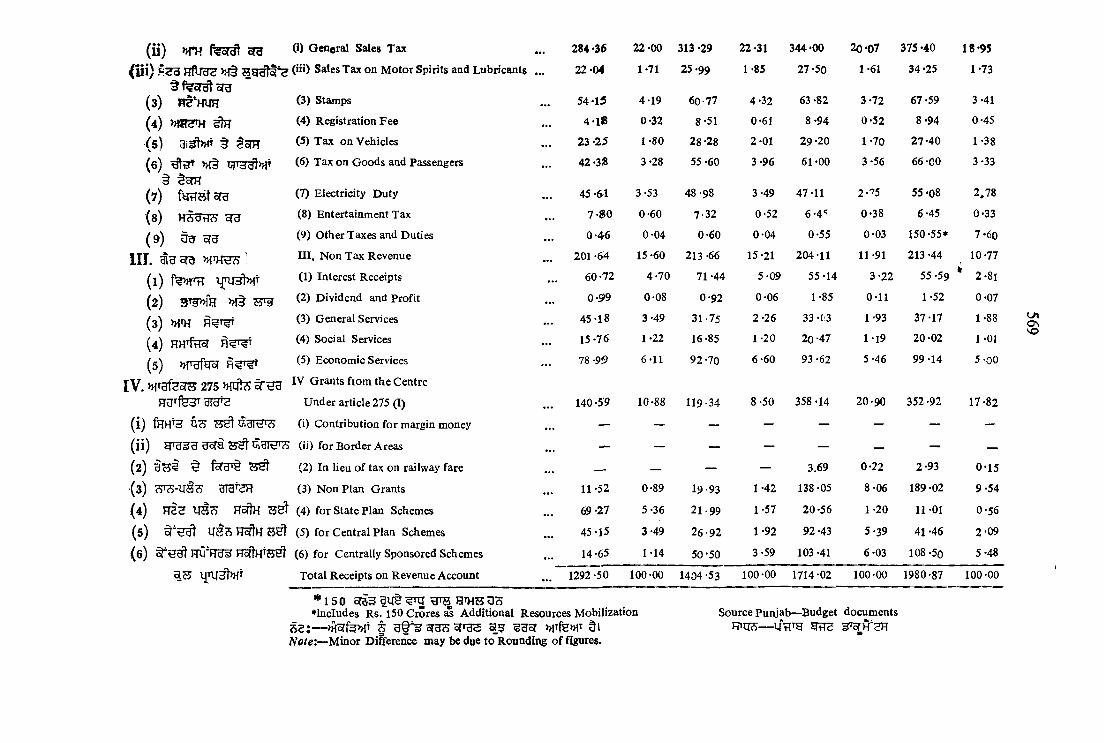
( i i ) »TH te cA sra (i) General Sales Tax 284-36 22 -00 313 -29 22-31 344-00 20-07 375-40 18-95
/ ii i ) »l§ Sates Tax on Motor Spirits and Lubricants ... 22-04 1-71 25-99 1-85 27-50 1-61 34-25 1-73
( 3) n t ‘HUR (3) Stamps 54*15 4-19 60-77 4-32 63 -82 3-72 67-59 3-41
(4) sIh (4) Registration Fee 4-1J8 0-32 8-51 0-61 8-94 0-52 8-94 0-45
( 5) 3i t>HT t SoTH (5) Tax on Vehicles 23-25 1-80 28-28 2-01 29 -20 1-70 27-40 1 -38
(e) (6) Tax on Goods and Passengers 42-3« 3-28 55 -60 3-96 61-00 3-56 66 -00 3-33§ §3rH
(7) f ^ 8 t oTH (7) Electricity Duty 45-61 3-53 48-98 3-49 47-11 2-75 55 -08 2,78
(s) cTU (8) Entertainment Tax 7-80 0-60 7-32 0-52 6-4* 0-38 6-45 0-33
(9) u g erg (9) Other Taxes and Duties 0-46 0-04 0-60 0-04 0-55 0-03 150-55* 7-60
III. sra III. Non Tax Revenue 201 ’64 15-60 213 -66 15-21 204-11 11-91 213 -44 10-77
(1) (1) Interest Receipts 60-72 4-70 71-44 5-09 55-14 3-22 55 -59 * 2-81
(2) »f§ W'sl (2) Dividend and Profit 0-99 0-08 0-92 0-06 1-85 0-11 1-52 0-07
( 3) WH (3) General Services 45-18 3-49 31-75 2-26 33-G3 1-93 37-17 1-88
(4) HHTfHcI (4) Social Services 15-76 1-22 16-85 1-20 20 -47 1-19 20-02 1-01
(5) (5) Economic Sen'ices 78 -919 6-11 92-70 6-60 93 -62 5-46 99-14 5-00
IV. »> Taf 5rs 275 »idte sre a IV Grants from the Centre
i7a fH3T Under article275 (I) 140-5'9 10-88 119-34 8-50 358-14 20-90 352 -92 17-82
(i) fHHT3 (i) Contribution for margin money — — — — — — — —
(ii) J 'dsSd defy (ii) for Border Areas — — — — — — —
( 2) §55i ^ (2) In lieu of tax on railway fare — — — — 3.69 0-22 2-93 0-15
(3) •A'l'cs'-us ara^R (3) Non Plan Grants 11-52 0-89 19-93 1-42 138 -05 8-06 189 -02 9-54
( 4) h S s HsftH '^bI (4) for State Plan Schemes 69-27 5-36 21-99 1-57 20-56 1-20 11-01 0-56
(5) (5) for Central Plan Schemes 45-15 3-49 26-92 1-92 92 -43 5-39 41 -46 2-09
(s) 5 t! FruTra (6) for Centrally Sponsored Schemes 14-65 1-14 50-50 3-59 103 -41 6-03 108 -50 5-48
Total Receipts on Revenue Account 1292 -50 100-00 1404 -53 100-00 1714-02 100-00 1980-87 100-00
* 150 sra^ lH^ H'WS 33♦lucludes Rs. 150 Crores ^ Additional Resources Mobilization
52: — § g t^ c rg ^ o f ig s a ? sus? >HTfe*HT di Note'.—Minor Difference may be due to Rounding of figures.
UlosVO
Source Punjab— Budget documents

PUBLIC FINANCE24.2— feB‘
TABLE 24.2—Expenditure met from Revenue in Punjab(5f§3 1U§) (Rs. Crore)
Type of ExpenditureExpendi*
ture
1986-87(s«)
(Accounts)
fepran
1987-88( h3)
(Accounts)
1989-90(gH2)
(Budget)
il3\ feHHH
Percentage Expend!- Percentage Expendi- Percentage Expendi- Percentage to total ture to total ture to total ture to total
Expenditure Expenditure Expenditure Expenditure
1988-89U§)
(Revised)
fengs feHH3
0 1 2 3 4 5 (' 7 8
I I General Services 418-33 34-84 432 -27 26-46 561 06 28-18 . 763-97 37-42i. d'rT^>?fUr i. Organs of State 12-21 1 -01 13-89 0-85 19-14 0-96 8- 7 0-89
ii . HT?^ ii. Fiscal Services 17-26 1-44 22-J2 1-35 27 -55 1.38 29-91 1-47, i i i . f w r r » { § t e
iV.
iii. Interest payments and Servicing Debt Services
iv. Administration Services
174 -54
146 -98
14-52
12-23
161-19
170 -28
9-87
10-42
201 -37
224-0110-12
11 -25243-95
367-7611-9518-01
I I HH ?TV. Pension and Miscellaneous General
Services II Social Services
67 *34
454 -46
5-60
37 -80
64-79 707-45
3-97
43 -3188-99
98 i -52
4-47
, 49-31104-18824-48
5-10
40-38(i) fHfy»fT, y 8 5re?T »f§ (i) Education, Sports, Art andCulture 250-60 20-85 331 -78 20-31 450-27 22-62 462 ■■77 22-67
( i i ) §U ^T g (ii) Health and Family Welfare 89-98 7-48 106-44 6-52 145-83 7-33 '145-86 7-14
( i i i ) T O ' m ^ -5 § Hfb^
(iii) Water Supply, Sanitation, Housing and Urban Development 32-99 2-74 37 -68 2-31 123-86 . 6-22 ,68-80 3.37
( i v ) Htjcs;» (iv) Information and Broadcasting 2-76 0-23 3^59 •0-22 " 3.87 ' 0^19 ' 4-68 0-23
o

( v ) >h^ -
Hfg3 ofglfew § uu yg^^T
( v i ) fc fg ^ ^ .,(vii) HHm § w g,
( v i i i ) U 3 I I I ^>{Tum(i) ^ Hw( i i ) f e F H l f ^ ^ H .
( i i i ) y 3 3 U 3 T ^
(iv) fnWt ( v) H5T(vi)(vii)(viii) f?feT»TO,
(ix) MiH HTOfgsr
(v) Welfare of Schedufed Castes Schedule Tribe and Other Backward CIa»es
(vi) Labour and Labour WelfareI w
(yii) Social Welfare apd Nutrition
(viii) Others
HI Economic Services(i) Agricultureand Allied Activities
(ii) Rural Development
(iii) Special Area Programme
(iv) Irrigation and Flood Control(v) Energy
(vi) Industry and Minerals(vii) Transport
(viii) Science, Technology and Environment
(ix) General Economic Services
IV Grants-in-Aid Contribution
Total
... 17*02•■rr f > ’ ^ ... 1,;42 , 19-44 ,,1-19 o r^3-60 31-89 1-56
10-46 ' 0 ‘87 - 13.55 0-83 16-38 -0 -82 17-75 0-87C,.. 49-29^ '' A -to 393-25 ' 11 -83 ,215-37 • 10-82 90-36 4-42i.. 1-36 ''0 -11 1 -72 -0-10 : 2-34 .0-12 2-37 0-12... 318 -99 I 26-54 483-12 29 -58 428 -78 21 -54 437-49 21-43
... . 75 •86-i
' 6-31 91-58 5-61 111 -63 5-61 130-30 6-3834 -55 2-88 30-84 1 -89 43 -98 2-21 43-94 2-15
— — — ___ __83-98 6-99 106-76 6-53 128-03 6*43 98-54 4-83
— — 125-72 7-70 090 0-04 1 10 0-0516-29 1-36 12-93 0-79 15-73 0-79 14-32 0-70
103-42 8-60 108 -92 6-67 114-24 5-74 119-68 5-860-16 0 01 0-17 0-01 0-18 0 -01 0-36 0-024 -73 0-39 6-20 0-38 14-09 0 -71 29-25 t-44
10-31 0-86 10-70 0-65 19-29 0-97 15-63 0-77
... 1,202 09 100-00 1633-54 100 -00 1990 65 100-00 2941-57 100-00
N ote —Minor Differences may be due to rounding of figuresn^uTi :
Punjab Budget, Docuraents^
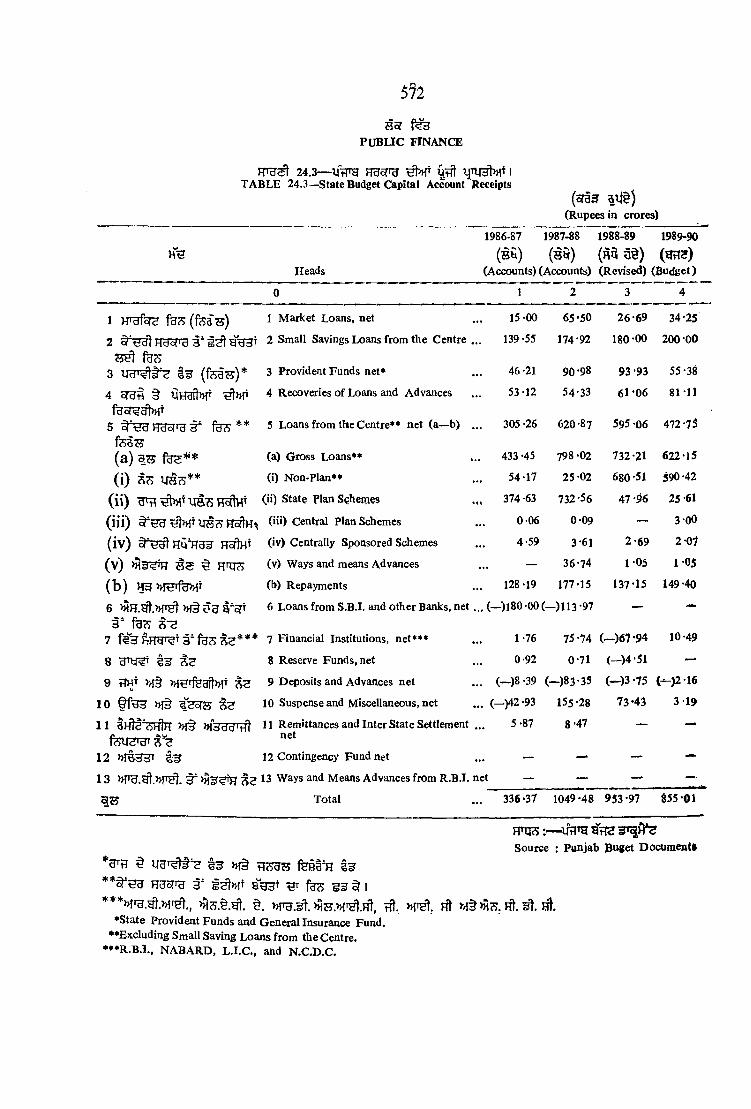
5 7 2
PUBLIC FINANCE
24.3— y tTO Frasra Otft IJpV^T ITABLE 24.3—State Budget Capital Account Receipts
(eras aii§)(Rupees in crores)
1986 87 1987-88 1988-89 1989-90
m ( s 9 ) 5§) (an ? )Heads (Accounts) (Accounts) (Revised) (Budget)
0 1 2 3 4
1 HrnfoTH feis ( f e a s ) I Market Loans, net 15-00 65-50 26-69 34-25
2 Hijyi-g d ' a e l ytJ3> 2 Small Savings Loans from the Centre 139-55 174*92 180 -00 200-00S hI fdcS'
3 (fea?5)* 3 Provident Funds net^ 46 -21 90*98 93 -93 55-38
4 sras § T4H3T|)>iT ^>HT 4 Recoveries of Loans and Advances 53-12 54-33 61‘06 81 -11■
5 fe s ** 5 Loans from the Centre* ♦ net (a—b) 305 -26 620 -8? 595-06 472-75feSH( a ) g s (a) Gross Loans*^ ... 433 -45 798 -02 732-21 622-15
( i ) ira c s * * (i) Non.plan*^ 54-17 25-02 680-51 590-42
( i i ) ^ (ii) State Plan Schemes 374-63 732*56 47 ‘06 25-61
( i i i ) ^ » fT (iii) Central Plan Schemes 0 06 0-09 — 3-00
( i v ) cl t J j l HSflHT (iv) Centrally Sponsored Schemes 4-59 3-61 2-69 2-07
( v ) S S 0 (v) Ways and means Advances — 36-74 1-05 1-05
( b ) (b) Repayments 128-19 177-15 137-15 149-40
6 >H§Dcr9^5rT 6 Loans from S.B.I. and other Banks, net ...(-)l80-00(-)ll3 -97 — —3 ‘ fecS 5-3
7 Financial Institutions, net*** 1 -76 75-74 (—)67-94 10-49
8 g r t f ^ 8 Reserve Funds, net 0-92 0-71 (-)4-51 —
9 TTHT 9 Deposits and Advances net ... (-)8-39 (-)83-35 (->3-75 (^)2 16
10 f t e M§ S3 10 Suspense and Miscellaneous, net ... (_)42-93 155-28 73-4^ 3-19
11 BHIc c'hJh ^ddd^tfl 11 Remittances and Inter State Settlement 5 -87 8*47 —net
12 12 Contingency Fund net — —
13 13 Ways and Means Advances from R.B.I. net — — — -■
Total ... 336-37 1049 *48 953-97 855 -01
HHJSiff lTg wSource : Punjab Buget Documenti
'*'3Tfr ^ i n tTOTs fenl'HHgBTTU 3‘ i^>HT ^ ^ I
>H^.§.gl §. M’U.St. rf! >H§ >?i( .. Ht, lift.♦State Provident Funds and General Insurance Fund.
♦♦Excluding Small Saving Loans from the Centre.♦♦♦R.B.I., NABARD, L.LC., and N.C.D.C.

5 7 3
Eo(PUBLIC FINANCE
HTUSt 24.4— UTftgi5 « f w TABLE 24.4—State Budget—Capital Account Expenditure
(Rs. in crores)
1986-87 1987-88 1988-89 1989-90
( s y )Head (Accounts)
(B ^) ( r q 3§) ( m e )(Accounts) (Revised) (Eiidget)
0 1 2 3 4
A—Capital Outlay 3-85 (—)12-01 199-57 246-54(1) Capital Acco'int of General Services ,. 4-91 6-48 9-30 20-41
(2)j7HTfl ^ Htfr (2) Capital Account of Social Services 23 -40 26-79 34-40 42-49
( 3)M’ a f e r R-^T^T -^T (3) Capital Account of Economic Services ., (_)24 -46 (—)45 -28 155-87 183-64
( i ) y 3 k i ^ § Ha I B H H - dldHhHT UHt'dT3 H tT
( l i ) f e j T ^ f%or>H 4 4 id id
(i) Capital Account of Agriculture andAllied Activities , ^(_)142-48 (— )1?2-48
(ii) Capital Account of Rural Development... — —22-23 12-56
0-17
W (*'*) Capital Account of other Special Area ^ o i -V Programme
yt4 ld eOv^fUHTSft U3 935^5 ^ Capital Account of Irrigation and Flood n_; - “ ControlytTtgra
( v ) R o [ ^ W U?ftBT3 W (v) Capital Account of energy
70 -35
5-41
1 3 - 2 A 69-30 70-34
( v i ) ©HlS'dl § y fe r l UTftgiB a y i
(v ii)< T H u u e w jHtaTH
(vi) Capital Account of Industry and minerals 12-82 26-53 18-42 28-39
(vii) Capital Account of Transport 28-38 25-85 42-41 67-83
(v iii)M g TM T?) do(<ssTft t
(ix )> 3 rH R ^T^gr^tflyrd a y f
B -5 T ^ §
(viii) Capital Account of Science Technology and environment
(ix) Capital Account of General Economic Services
B—Loans and Advances
0-54
0-52
482 -54
1 -05
0-53805-87
1*16
2-35
477 -78
2-60
1 -75
547-77
(i) Wofdl ^ uflsre (i) Power Projects 377 -95 520 -56 384-76 465 -04
( i i ) (ii) Others 104-59 285-31 93 -02 82-73
^ 3 ( A + B ) Total Capital Expenditure (A+B) ... 486 -39 793 -86 677-35 794-31
Source :—Punjab Budget Documents.
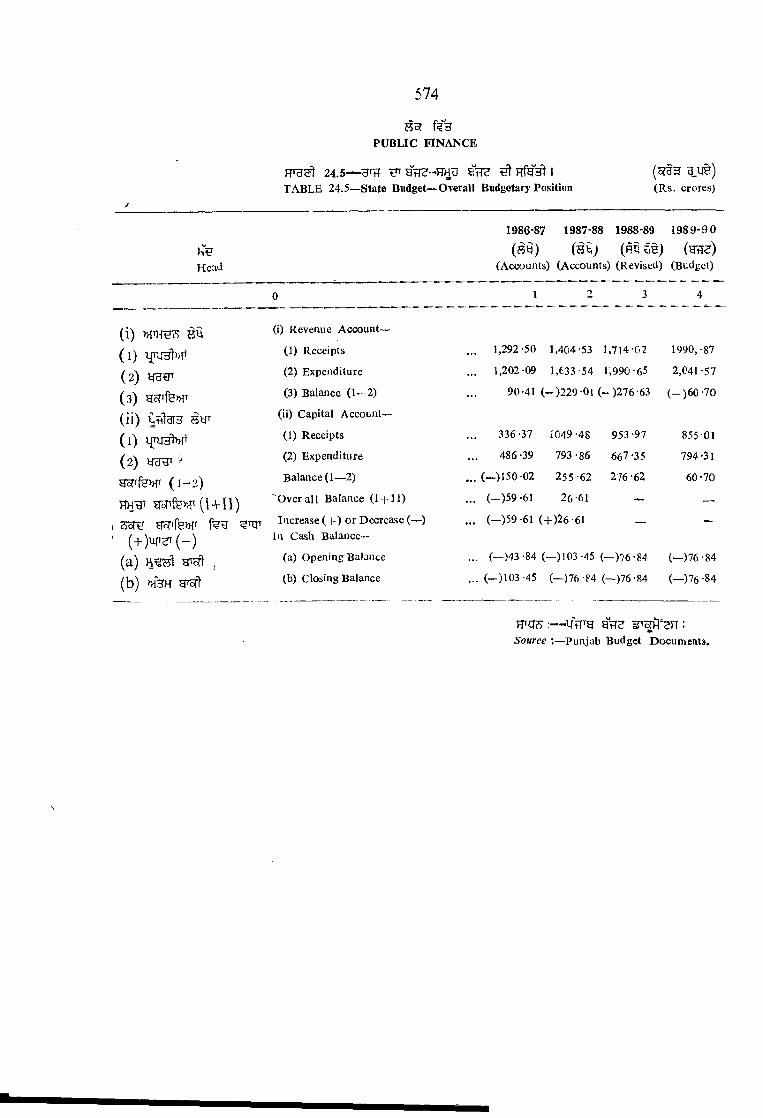
574
PUBLIC FINANCE
24.5— s hh ^ Hfgst iTABLE 24.5—State Budget— O T e r a ll Budgetary Position
(ofg3 ivj^) (Rs. crores)
Head
1986-87 1987-88 1988-89 1989-90(fly) (gtre)
(Accounts) (Accounts) (Revised) (Budget)
1
(1) M ( l)( 2)( 3)( i i ) C t n t e HMT
( 1)
( 2)( 1- 2)
(1+11)Sore gcrife»IT
(+)U T2'(-)(a ) j
(b) ^
(i) Revenue Account—
(1) Receipts ... 1,292-50 1,404-53 1,714-02 1990,-87
(2) Expenditure ... 1,202-09 1,633-54 r,990-65 2,041 -57
(3) Balance (1—2) 90-41 (—)229-0l(—)276-63 (_)60-70
(ii) Capital Account—
(1) Receipts 336-37 1C49-48 953 -97 855 01
(2) Expenditure 486-39 793-86 667 -35 794 -31
Balance (1—2) (_)I50-02 255-62 276 -62 60-70
Overall Balance (1 + 11) ... (-)59-61 26-61 — —.
Increase ( f ) or Decrease (— ) ... (—)59-61 (+)26-6l _ —In Cash Balance—
(a) Opening Balance ... (—)43 -84 (—)103 -45 (—)?6 -84 (—)76-84
(b) Closing Balance ... (_)l03 -45 (—)76 -84 (—)76-84 (—)76 -84
Source :—Punjab Budget Documcats.
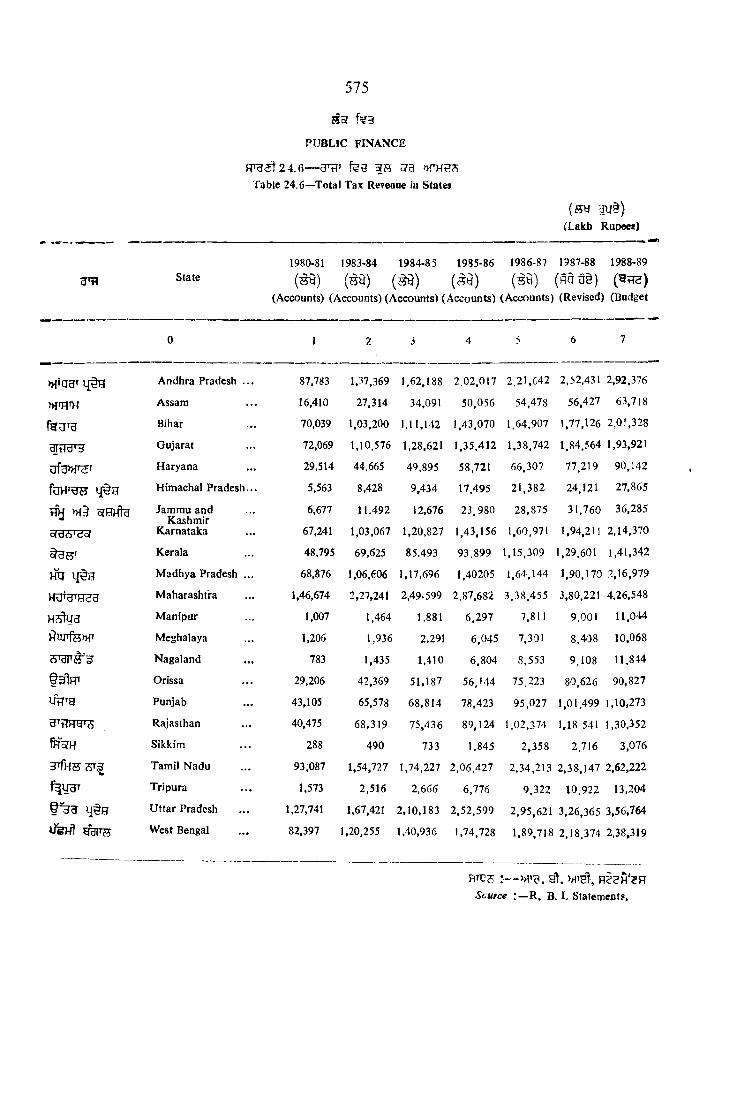
f^3
PUBLIC FINANCE
H ^ ^ 2 4 .6 — cFFff fee I S ST3 Table 24.6—Total Tax Reveoue in States
575
( sy uif§)(Lakb Rupoec)
State1980-81 1983-84 1984-85 1985-86 1986-8? 1987-88 1988-89( ^ ) ( ^ ) ( ^ ) (^9 ) (s9 ) (nq u§)
CAccounts) (Accounts) (Accounts) (Accounts) (Accounts) (Revised) (Budget
nffFTH
»{§ ofHHte o<d*'<Jo(
Hq l{tFT
Hj^yapiuTfe»r
f^FTUt7fg
tH5?H
guFB'
Andhra Pradesh
Assam
Bihar
Gujarat
Haryana
Himachal Prades
Jammu and Kashmir
Karnataka
Kerala
Madhya Pradesh
Maharashtra
Manipur
Meghalaya
Nagaland
Orissa
Punjab
Rajasthan
Sikkim
Tamil Nadu
Tripura
Uttar Pradesh
West Bengal
87,783
16,410
70,039
72,069
29,514
5,563
6,677
67,241
48,795
68,876
1,46,674
1,007
1,206
783
29.206
43,105
40,475
288
93,087
1,573
1,27,741
82,397
1,37.369
27.314
1.03,2001,10.576
44.665
8,428
11.492
1,03,067
69,625
1,06,606
2,27.241
1.464
1,936
1,435
42,369
65,578
68,319490
1,54,727
2,516
1,67,421
1,20,255
1,62,188
34,091
1,11,142
1,28,621
49.895
9,434
12,676
1,20,827
85,493
1,17.696
2,49.599
1,881
2,291
1,41051,187
68,814
75.436
733
1,74,227
2,666
2,10,183
1,40,936
2.02,017
50.056
1,43.070
1,35,412
58,721
17,495 23,980
1.43,156
93,899
1.40205
2.87.682
6.297
6,045
6,804
56,144
78,423
89,124
1,845
2,06.427
6,776
2,52,599
!,74,728
2,21.642
54,4781,64,907
1,38.742
66,30?
21,382
28,875
1,60,971
1,15,309
1.64,144
3,38.455
7,811
7,301
8,553
75,223
95,027
1,02,374
2,358
2,34,213
9,322
2.95,621
1,89,718
2,52,431 56.427
1,77.126
1.84,564
77,219
24,121
31,760
1,94,211
1,29.601
1,90,170
3,80.221
9.001
8.408
9,108
80,626
1,01.499
1,18 541
2,716
2,38,147
10.922
3.26.365
2.18,374
2,92,376
63,718
2,01,328
1,93,921
90,142
27,865
36,285
2,14,370
1,41,342
.2,16,9794,26,548
11,044
10,068
11.844
90,827
1,10,273
1,30,352
3,076
2,62,222
13,204
3,56,764
2,38.319
Scarce R, B. I. Stateoicots,

576
PUBLIC nNANCE FTHc^24.7— l{^ ora
Table 24.7--State-wise Per Capita Direct Taxes
State
0
^Htqgr
»fm it o g
UfeWT
tm >Ht ilHHk ofW ?^
HJ‘d'HddU3
PuiTfe>HT
VTirSi
STflHgr?;fHoTH
3TfHHS^f
f " 3 ^
V3H! ^ ’55
Andhra Pradesh
Assam
Bfhar
Gujarat
Haryana
Himachal Pradesh
Jammu and Kashmir
Karnataka
Kerala
Madhya Pradesh
Maharashtra
Manipur
Meghalaya
Nagaland
Orissa
Punjab
Rajasthan
Sikkim
Tamil Nadu
Tripura
Uttar Pradesh
West Bengal
(g«t)(Rupees)
1980-81 1983-84 1984-85 1985-86* 1986-87 1987-88 1988-89(ay) (^y) ( ^ ) (sy ) (sy) (to u§) ( ^ )
(Accounts) (Accounts) (Accounts) (Accounts) (Accounts) (Revised) (Budget)
1 2 3 4 5 6 7
22 -22 20-49 21 -82 30-24 32-47 38-07 44 -06
21 -75 21.08 32 10 54-48 58-14 45 45 58-63
15-58 18-4f 18-22 32.19 41 •]! V 35-56 42 -49
24 -62 26.94 30 -42 31-74 20 87 37 -80 43-18
18-50 19.41 19 75 16-42 17-21 17 99 20 -03
15-39 16 59 17-21 30 08 26*34 30-83 33-3]
16-12 16-45 17-01 18-98 48-25 33-14 36-04
22 -40 23 -36 22 -84 30 00 32-83 39-74 40-52
21 -04 23 -80 27-63 25 86 46 19 39-82 46-51
16-26 19-52 19-61 2^-67 35 -32 41-71 52-72
26-14 32-68 34-98 35-85 42-35 48-74 51-93
14-05 14-78 1 8 -73 30-69 37-47 35-9o 41 -12
15-26 16-36 16-51 24-70 28-90 31-57 33 93
15-42 18-48 1815 22 -39 24 -79 24-10 28-83
16-20 18-45 21-17 32-79 38-48 4G -82 47-69
18-81 21.02 22 -71 15-20 26-68 25-49 28 12
16-28 20-56 19-29 26-56 30-56 35-04 38-24
14-00 40 -00 40 -00 52-97 79-74 56-'/5 55 -12
17-92 22 -20 28 -68 34 -29 35-72 4] -05 44-66
14-53 21 -77 18-44 26-51 30 -77 34-27 36-69
16-72 19-31 19 04 29-64 33-65 33-31 38-89
18-39 28 -97 40 -41 54-42 59-79 72-47 77-28
hI oTUrI >H§ f e ^91-21 9 87-88 § HQ-FJ^ bJ ^§ § HftjMT fm r I
♦Revised on the basis of mid-year Populaton as given in RBI Report on Currency and Finance Volume—II 1987-88.
Source :—R.B.I. Stateoums.
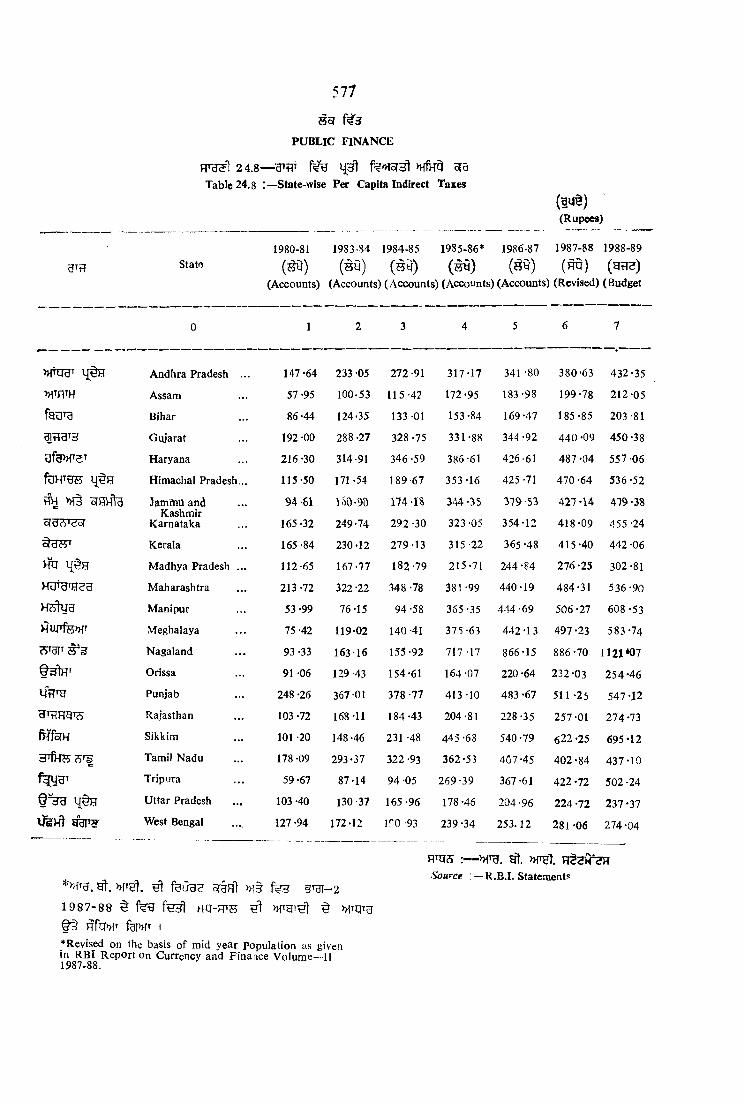
So? Ms PUBLIC FINANCE
577
H ths! 2 4 .8 — W W n ftw 5T0Table 24.8 :—State-wise Per Capita Indirect Taxes
(ay§)(Rupees)
Stato1980-81
(s 9 )(Accounts)
1983-34 1984-85 1985-86* 1986-87 1987-88(s y ) (^ y ) ( m ) ( s y ) ( m )
(Accounts) (Accounts) (Accounts) (Accounts) (Revised)
1988-89( w )
(Budget
0 1 2 3 4 5 6 7
Andhra Pradesh ... 147 -64 233 -05 272 -91 317-17 341 -80 380-63 432-35>HTf1TH Assam 57 -95 100-53 115-42 111'95 183-98 199-78 212-05
Bihar 86 -44 124-35 133 01 153-84 169 -47 185-85 203-81
Gujarat 192 -00 288-27 328 -75 331-88 344 -92 440 -09 450 -38
Haryana 216-30 314-91 346 -59 386 -61 426-61 487 -04 557-06fe w w Himachal Pradesh... 115-50 171 -54 189-67 353-16 425 -71 470 -64 536-52
vTH 3ammu and 94-61 150-90 174 -IS 344 -35 379 53 427 -14 479 -38u?> c!cf
KashmirKarnataka 165 -32 249-74 292 -30 323-05 354-12 418-09 455 -24
Kerala 165 -84 230-12 279-13 315 -22 365 -48 415-40 442 -06m i{§H Madhya Pradesh ... 112-65 167-77 182-79 215-71 244 -84 276 -25 302-81
H d 'd w g Maharashtra 213 -72 322 -22 348 -78 381-99 440-19 484-31 536-90Manipur 53 -99 76-15 94 -58 365-35 4-44-69 506 -27 608 -53Meghalaya 75 -42 119-02 140 -41 315-63 442-13 497 -23 583-74Nagaland 93 -33 163-16 155 -92 717-17 866-15 886-70 112J»07Orissa 91 -06 129 -43 154-61 164 -07 220 -64 232-03 254-46
UtTTg Punjab 248 -26 367 01 378 -77 413-10 483 -67 511 -25 547-J2Rajasthan 103 -72 168 -11 184 -43 204-81 228-35 257-01 274-73
fHfsfH Sikkim 101 -20 148 -46 231 -48 445 -68 540-79 622 -25 695*12Tamil Nadu 178 -09 293-37 322 -93 362-53 407 -45 402 -84 437-10
f ^ T Tripura 59 -67 87-14 94 -05 269-39 367 -61 422 -72 502 -24f dd 1{§H Uttar Pradesh 103 -40 130 -37 165-96 178 -46 204 -96 224 -72 237*37
West Bengal 127 -94 172-12 iro 93 239-34 253.12 281 -06 274 -04
gt. >HTet. ^ feuue EfgFft »{§ 5Tgr_21 9 8 7 - 8 8 § fe g riU-RTS H Miq^B^ Hfa HT fgiMT I*Revised on the basis of mid year Population as given in RBI Report on Currency and Finance Volume—II 1987-88.
RTcriS :-“ »{Tg. »fT5l. R2S>r?F| Source :— K.B.I. Statement?

578
S'ofPUBLIC HNANCE
F re ^ 24. 9— a ® oja Table 24.9—State-wise Per Capita Total Tax Revenue
{9ug)(Rupees)
State1980-81 1983-84 1984-85 1985-86* 1986-87 1987-88 1988-89(o t) (<^) (§y) (By) ( ^ ) (to) (a?ie)
(Accounts) (Accounts) (Accounts) (Accounts) (Accounts) (Revised) (Budget)
»rnTH
^ o(Hv g oT3c9^
KUtgrnr^g
H u rfw
M rt
UHTg3TH5W?
f3 J ^i{§e
Andhra Pradesh
Assam
Bihar
Gujarat
Haryana
Himachal Pradesh
Jammu and Kashmir
Karnataka
Kerala
Madhya Pradesh
Maharashtra
Manipur
Meghalaya
Nagaland
Orissa
Punjab
Rajasthan
Sikkim
Tamil Nadu
Tripura
Uttar Pradesh
West Bengal
1 2 3 4 5 6 7
169 -86 253. 54 294 -73 347-41 374-27 418-70 476-41
79 -70 121.61 147 -52 227-43 242-13 245 -23 270-68
102 -20 142-76 151 -23 186-63 210-58 221 -41 246 -30
216-62 314.31 359-17 363 -62 365 -79 477-89 493 -56
234 -80 334-32 365 -34 403 -03 443 -82 505 -03 577 -09
130-89 188-13 206-88 376 -24 452-05 501 -47 569-83
110-73 177. 35 191-19 363 -33 427-78 460 -28 515 -42
187 -71 273-10 315-14 351 05 386-95 457 -83 495 -76
186 -98 253 -92 306-76 341 -08 411-67 455-22 488-57
128 -91 187-29 202 -40 244-38 280-16 317-96 355 -53
239 -86 354-90 383 -76 417-84 482-54 533-05 588 -83
68 -04 90 -93 113-31 396 -04 482-16 542-23 649-65
90 -68 135 -38 156-92 400 -33 4/1 -63 528-80 617-67
108 -75 181-64 174 -07 739-56 890 -94 910-80 1149-90
107 -26 147-88 175 -78 196-86 259-12 272-85 302-15
267 -07 388-03 401 -48 428-30 510-350 536 -74 575 *24
120 -00 188-67 203 -72 231-37 258-91 292-05 312-97
115-20 183-46 271 -48 498-65 620 -53 679-00 750 -24196 -01 315-57 351-61 396-82 443-17 443 -89 481.7674 -20 108 -91 112-49 295 -90 398-38 456 -99 538 -93
120-12 149-68 185-00 208 -10 238-61 258-03 276 '26
146 -33 201-09 231 -34 293 -76 312-9! 353-53 351-32
»1T . h7 5?HH! »f§ 5fUT-219 8 7 -8 8 § W-RTJ5 ^7 ^ W ’U
HfUMT fdT»T i*Revised on the basis of mid-year Population as given in RBI Report on Currency and Finance Volume—II 1987-88.
! -Source : -R.B.I. Statemeats.

579
PUBLIC FINANCE 24. 10— ^ ^ ^ ^ 3 %'S
TABLE 24'10—Functional Classification—Percentage Distribution of Expenditure
HH Heads 1986-87(s-a)
(Accounts)
1987-88 (Rq U§)(Revised)
1988-89(a n j)
(Budget)0 1 2 3
1. General Public Stirvices 9-63 8-51 13-601.1 n^rii ijHfFTS, ^ >H§ General Administration, Public
Order and Safety 9-54 8 43 13-53
1.2 HTiTHs y?r General Research 0-09 0-08 0-07
2. fH??5 f^'FT Civil Defencc 0-41 021 0-10
3. fnfy>HT Education 16-33 16 68 13-45
3.1 fejJiHH, >H§ W Administration, Regulation and Research 0-30 0-29 0-23
3.2 ^ 36 fnfy»iT
University School and Other Educational Facilities 16-03 16*39 13-22
4. fFRiH Health 4-12 3-77 3-30
4.1 qRfRS, feC«H3 >H§ y T 4.2. >H§ ug
fTOH
Administration Regulation and Research
HospitaU Clinics and Health Services
0-13
3-99
0-11
3-66
')-ll
3-19
5. HHTftTSr fHfy»iT Social Security and Welfare Services... 3-29 2-89 2-59
6. »T§ w Housing and Community Amenities.. 1 -03 0*77 0-51
7. H«§TT3 »^§ Culture, Recreational and Religious Services 0-54 0-58 0-50
8. ^Tgfgsf, Economic Services 34 -43 40-61 32 -72
8.1 qPfTH feClHHT >H§ General Administration, Regulation and Research 0-13 0-12 0-07
8.3 fF rg t >H§ fegHT^
8.4 J?c(^
Agriculture, Forest, Fishery and Hunting
Mining, Manufacture and Construction
Electricity Gas, Steam, and Power ...
31 -81
3-48
2-06
33-48
2-40
6 '66
23-311-90
1-35
8.5 Hsr^S3 Atomic Energy — — —
8.6 Wgsr Transport and Communication 3*15 2-98 2-82
8.7 Other Economic Services 6-20 (-)5-03 3-27
9. H3? Other Purposes 30-22 25-98 33-23
9.1 HU'fe^T STOt? Relief Operation 1 -87 7-62 0-46
9.2 Interest 8-12 6-00 7*11
9.3 ^ 5fHH Public Debt 20-23 12-36 25-66
Total 100 00 100-00 100-00
FTTO: UtT g gfT3S’otfrcg;—Puniab Budget. Documents
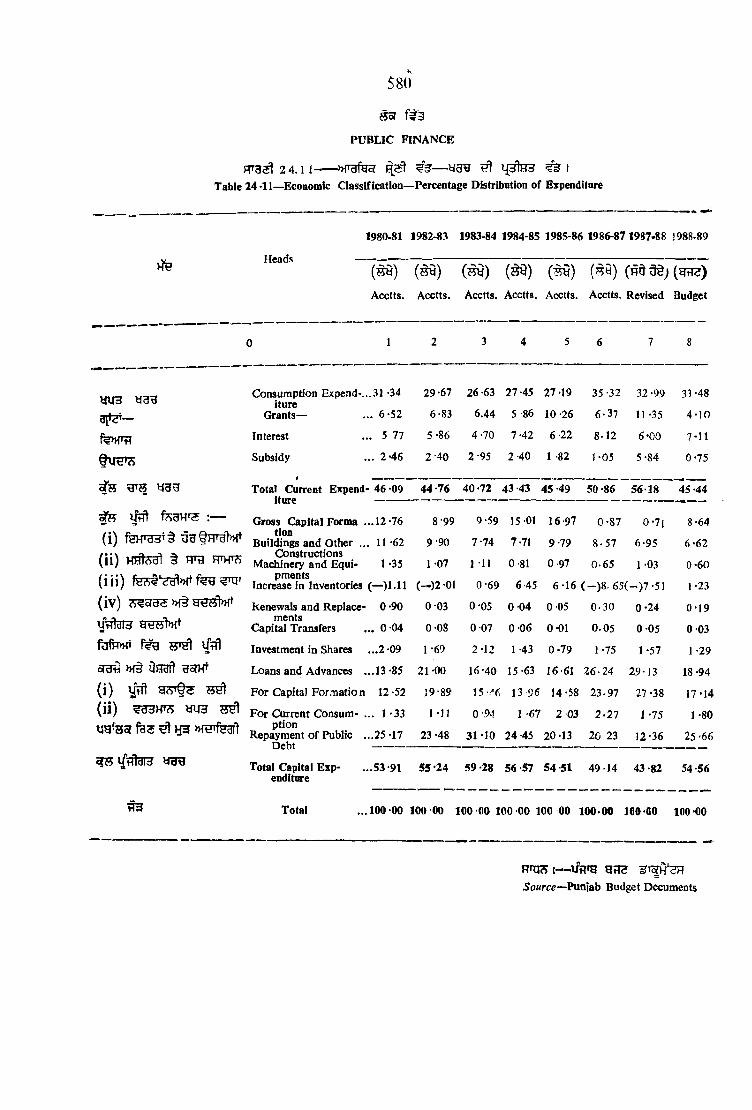
m f?3
PUBLIC FINANCE
FT3^ 2 4.1 1------^ ^ ^ ITable 24-11—Economic Classification—Percentage Distribution of Expenditure
580
vfef-TAarfc -
1980-81 1982-83 1983-M 1984-8S 1985-8e 1986-87 1987-88 1988-89
nCaUS(gQ)
Acctts.m
Acctts.
(h «)
Acctts.m
Acctts.
(®3)
Acctts. Acctts. Revised Budget
0 1 2 3 4 5 6 7 8
Consumption Expend-, iture
..31 -34 29-67 26 -63 27-45 27 -19 35-32 32 -99 33-48
Grants— .. 6-52 6-83 6.44 5 -86 10-26 6-37 11-35 4-10
fe>HTtT Interest .. 5 77 5 -86 4-70 7-42 6-22 8-12 6-00 7*11Subsidy ... 2-46 2-40 2-95 2-40 1 -82 1-05 5-84 0-75
W E trag Total Current Expend iture
- 46 09 44-76 40-72 43 43 45-49 50-86 56 18 45-44
Gross Capital Forma ...12-76 8-99 9-59 15 01 16-97 0-87 0-7i 8-64(i) feH'ddT§ tion
Buildings and Other ... 11 -62 9-90 7-74 7-71 9-79 8-57 6-95 6-62(ii) § m i WW7i
Constructions Machinery and Equi- 1 -35 1 -07 1 11 0 81 0-97 0-65 1 -03 0-60
( i i i ) praen tsIncrease in Inventories (—)1.11 (-)2-01 0-69 6-45 6-16 (-)8.65( -^)7-51 1-23
(iv) Ai*«old<5 Renewals and Replace- 0 -90 0-03 0-05 0 04 0-05 0-30 0-24 0-19Uirtgi5 ytdttW ments
Capital Transfers ... 0 04 0-08 0-07 0 06 0-01 0.05 0-05 0-03fofpw Utfl Investment in Shares ...2 -09 1-69 2-12 1 -43 0-79 1-75 1 -57 1-29ddi^ m Oeaft gsi>F Loans and Advances ...13-85 21-00 16-40 15-63 16-61 26-24 29-J3 18-94( i) Vi^ 75^ For Capital Formation 12 -52 J9-89 15-. 6 13 96 14-58 23-97 27 -38 17-14(ii) m 3 For Current Consum- ... 1 *33 1 -n 0 94 1 -67 2 03 2.27 1 -75 1-80
ptionRepayment of Public ...25 -17
Debt23 -48 31-10 24-45 20-13 20 23 12-36 25 ‘66
Total Capital Exp- ...53 *91 enditure
55-24 59 -28 56-57 54 51 49 14 43-82 54-56
Total ...100 00 100 00 100 00 100 00 100 00 100*00 160 00 100-00
HH33 1— URfH BffE Source—fun \ab Budget Decuments

S5( Mh PUBLIC FINANCE
581
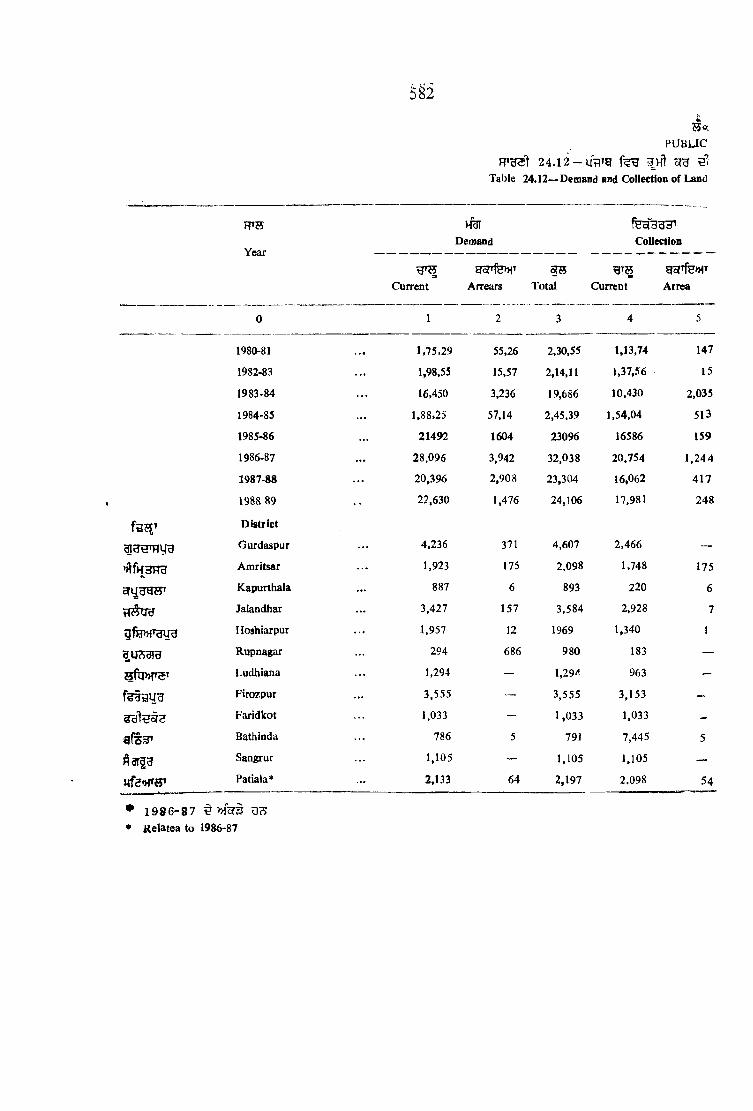
5 ^ 2
ISff
PUBLIC
2 4 .l2 ~ u V g Table 24.12—Demand and Collection of Land
rth
Year
Current
Demand
Arrears Total
Collection
Current Arrea
0 1 2 3 4 5
1980-81 1,75.29 55,26 2,30,55 1,13,74 147
1982-83 1,98,55 15,57 2,14,11 1,37,56 15
1983-84 16.450 3.236 19,686 10,430 2,035
1984-85 1,88.25 57,14 2,45,39 1,54,04 513
1985-86 21492 1604 23096 16586 159
1986-87 28.096 3,942 32,038 20.754 1,24 4
1987-88 20,396 2,908 23,304 16,062 417
1988 89
District
22,630 1,476 24,106 17,981 248
aiaHTfiyB Gurdaspur 4.236 371 4,607 2,466 —Amritsar 1,923 175 2.098 1,748 175
orijgg?F» Kapurthala 887 6 893 220 6Jalandhar 3.427 157 3,584 2,928 7Hoshiarpur 1,957 12 1969 1,340 1Rupnagar 294 686 980 183 —
sfq»T5T Ludhiana 1,294 — 1,29^ 963 -Firozpur 3.555 — 3,555 3,153Faridkot 1,033 — 1,033 1,033 -
9 f s ^ Bathinda 786 5 791 7,445 5
A3f§3 Sangrur 1,105 — 1,105 1,105 —
yfe*>r«5T Patiala* 2,133 64 2,197 2.098 54
• 1986-87• Relatea to
^ »f5ri 1986-87

f^3FINANCE
MaiRevenue ia Ponjab
583
(Urirg gif?) (000* Rs.)
Written offW3i\
Balance
t sTotal Current Arrears Total Curre:.f Arrearj Total
6 7 8 9 10 11 12
11,522 5,141 3,279 8,420 1.335 1,335 2.67013.771 5.393 899 6.282 436 170 60s
12,4 5 4,091 310 4,401 1,929 891 2,82r
15,917 3,322 537 3,859 1,551 3,212 4,76316745 3668 773 4441 1238 672 1910
21,998 4.479 1,462 5,941 2,863 1,236 4,09916.4?9 3.187 1,491 4.678 1,147 1,000 2.14718,219 3,738 96 3,834 911 l,\32 2,043
2,466 1,190 18 1,208 580 ?53 9331,923 35 — 35 140 -- 140
226 665 — 665 2 ... 22,935 471 67 538 28 83 1111,341 612 n 623 5 — 5
183 — — — 111 686 797963 331 - 331 — - -
3,153 392 — 392 10 - 101,033 “ — — — -
749 42 — 42 — —1,105 — — — @ - @2,152 -- @ ~ 35 10 45
@ 500 3* uT 1S figures below 500 Source district Statistical Officers, Puojib,
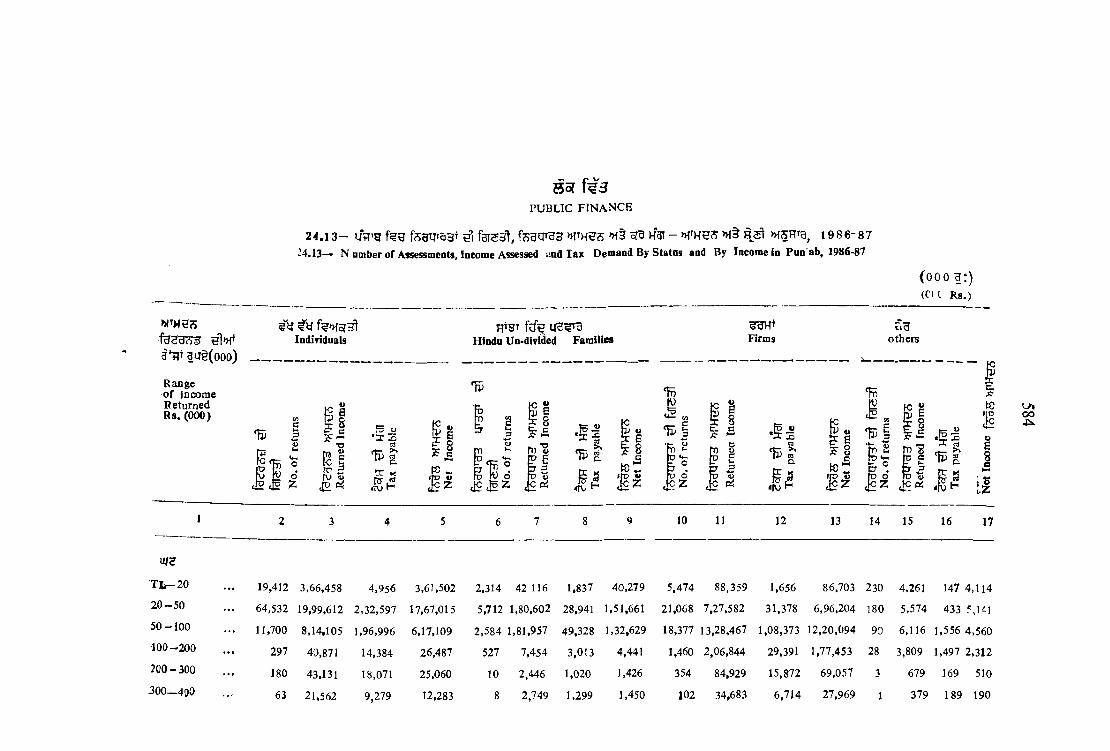
PUBLIC FINANCE
3*;r au§(ooo)
2 4 .1 3 - lf> g f?JUqra3T Si fgT53t, n iin es »H§ ^3 K3T - >H§ R.^ 1 9 8 6 -8 7M.13— N umber of Assessments. Income Assessed and lax Demand By Statas and By Income in Pun ab, 1986-87
Individualsfus
Hindu Un-div ded Families Firms
(000 §:) (tU Rs.)
others
Range of income Returned Rs. (000)
oZ
g i? oQ
r |5 fv w42
F5 o •X Srt
nr X r?r<rv HtcitV
, c :
%
VV &
D ,' o 'Z
fc « V S ? 8
ri) 'Zp fi & 3
• I 2% a
<v ^
cV uS S
b ::: g z
c/3c I I5 £ Fd «
•ic sf>n<U vy■ S gO
6Z
1 s
c i <rvj H
'K
I?V U^ i ? ot e f
tr V5 E ? 8 I £m "S P •-6 3,fc
‘g ^X rtrtTv g.
ifS H
I 2 3 4 5 6 7 8 9 10 11 12 13 14 15 16 17
UJS
TL-20 19,412 3,66,458 4,956 3,61,502 2,314 42 116 1,837 40,279 5,474 88,359 1,656 86,703 230 4,261 147 4,11420-50 64,532 19,99,612 2,32,597 17,67,015 5,712 1,80,602 28,941 1,51,661 21,068 7,27,582 31,378 6,96,204 180 5,574 433 5,14150 -100 11,700 8,14.105 1,96,996 6,17,109 2,584 1,81,957 49,328 1,32,629 18,377 13,28,467 1,08,373 12,20,094 90 6,116 1,556 4,560100 -200 297 40,871 14,384 26,487 527 7,454 3,013 4,441 1,460 2,06,844 29,391 1,77,453 28 3,809 1,497 2,312200 - 300 180 43.131 18,071 25,060 10 2,446 1,020 1,426 354 84,929 15,872 69,057 3 679 169 510300—4D0 63 21,562 9,279 12,283 8 2,749 1,299 1,450 102 34,683 6,714 27,969 1 379 189 190
Utoo

^%-500500—1000
1000
Total
9 3.950 1,809 2,141 — — — — 78 34,709 7,191 27,518 1 486 224 26236 22,805 9,547 13,258 - — — — 32 21,280 4,635 16,645 1 578 259 31918 33,154 15,136 18,018 8- 20,007 10,86S 9,139 38 82,834 19,192 63,642 2 3,883 1,098 2,785
96,247 33,45,648 5,02,775 28,42,873 10,638 4,37,331 96,306 3,41,025 46,983 26,,09,687 2,,24,402 23,,85,285 536 25,765 5,572 20,193
CO

m fPUBLIC FINANCE
^4.13— urrg f33cS'3 l 198 6-87 24.13.—Number of Returns, Income Returned and Tax payable—By Status and Returned Income range in Punjab, 1986-87
(000 gu§)(000 Rs.’)
3-f|t 5 u t (qoo)
CompanyFS
All Status -
g dcs■tfMTHtlcS
^ H31 ^ HBT
Range of Income Assessed Rs. (000)
No. of Returns Returned
incomeTax
Payable
NetIncome No. of
returnsReturnsincome
TaxPayable
NetIncome
1 18 19 20 21 22 23 24 25
T, L. 68 451 262 189 27,498 5,01,645 8,858 4,92,7972 0 - 5 0 81 2.7J6 1,498 ],2J8 91,573 29,16,C86 2,94,847 26,2J,23950—100 57 4,063 2,173 1,890 32,808 23,34,708 3,58,426 19,76,282
100-200 36 5,583 3.058 2,525 1,873 2.64,561 51,343 2,13,2182 00—300 24 5,795 3,406 2,389 571 1,36.980 38,538 98,442
300-400 14 4,740 2,710 2.C3C 188 €4,113 20,191 ^3,922
400—500 8 3,5C8 2,070 1,438 96 42,653 11,294 31,359
500-1000 32 2,444 13,009 (-)10,565 101 47,107 27,450 19,6571000 32 4,12,645 2,24,562 1,88,083 98 5,52,523 2,70,856 2,81,667
Total 352 4,41.945 2,52,748 1,89,197 1,54,806 68,60,376 10,81,803 57,78,573
' 1. fefH >nTH^=fHeg?f^ ^ tigiNote,— I, Net Income = Returned iccocae—Tax Payable
oo0\
FPt R. — ^ 1986-875<?«rc«—State-wise IncoGoe-tax Statistics, 19?6-87

587
S 5PUBLIC FINANCE
24.14—f3e3c^^lf3133l t ^ MSntg 24.14.—Number of Ret'inis, Gross [acome aad Gross Tax—By Source of Income is
, *1086-87 Punjab, *1986-87
(oo© gq§)(000 Rs.)
HTUS
Source of Income^ fdle3^
No. of Net Returns
GrossIncome
tsmGrossTax
0 I 2' ~
1. Salaries—
1.1. Central Government 7,366 2,77,153 30,432
BT f pTdcTB 1.2. State Government 10,936 4,26.714 47,017
03 1.3. Others 20,574 7,37,488 90,566
Total 38,876 14,41,355 1,68,015
2. Interest on Securities 4,603 57,275 8,887
3. House Property 23,104 1,77,048 33,586
^ f ^ i 4. Business or Profession 1,11,757 55,20,893 9,15,769
5. Capital Gains 8,715 1,59,445 26,562
RnjcS 6. Other Sources
\
30,914 5,45,027 1,10,639
oJH Total 1,54,806 79,01,043 12,63,458
flH SiFlHta ^ >>i<5c3 JJiHH OH 1 ♦Includes Jammu and Kashmir, Himachal Pradesh and Chandigarh.
>nf«ir3 % Hm?) us^ fuisnl ^ ,Note.—T(«0 <otanl umber of returns shown above under each seurce of income is the net number of returns,
»HTHUcS m »fcf# 1986-87 I Source :—State-wi»e Income-Tax Statistic*, 1986-87.
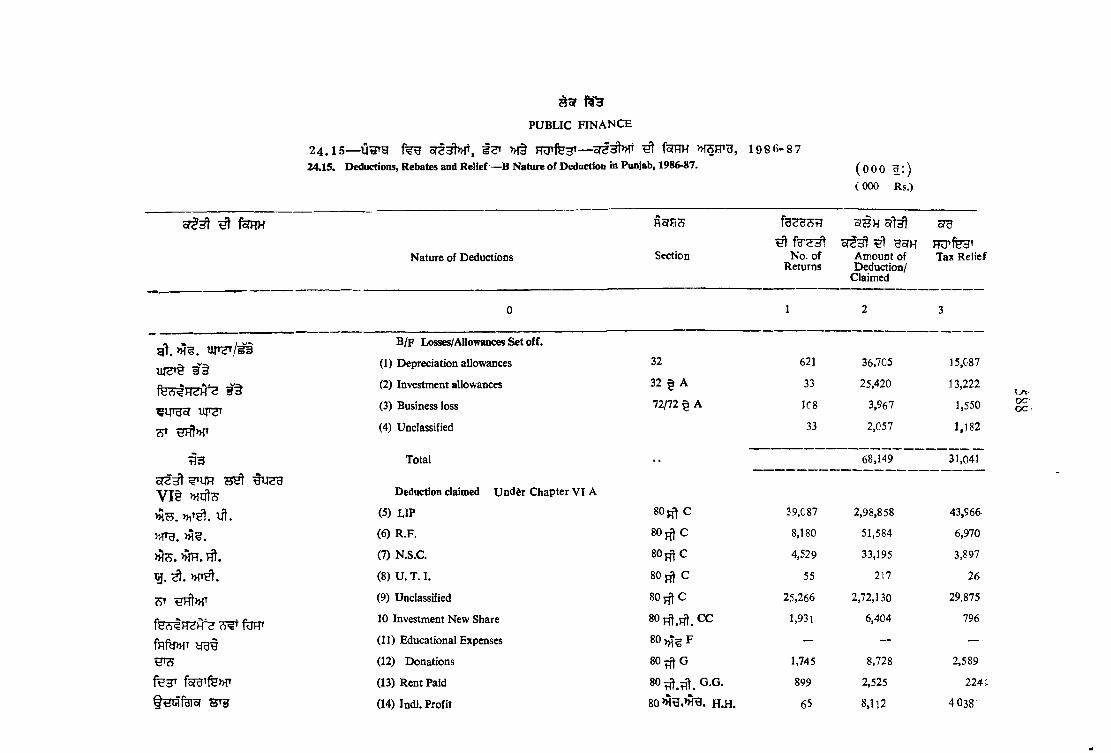
PUBLIC FINAT^CE
24 .1 5 — uijrg isT >H§ Hu^fen^— or^^»r ^ f^nn »wi;rB, 24.15. Deductions, Rebates and Relief—B Nature of Deduction in Punjab, 1986-87.
1986-87( o o o a ;)(000 Rs.)
^ foTRH
Nature of Deductions Section No. of Returns
SHHBofH
Amount of Deduction/
Claimed
cTUHU’feHT Tax Relief
0 1 2 3
gl. >H . u r 3 » /^B/f Losses/AHowances Set off.
(1) Depreciation allowances 32 621 36,705 15,C87
(2) Investment allowances 32 § A 33 25,420 13,222
^irgsr uir^T (3) Business loss 72/72 ^ A 1C8 3,967 1,550
3T ^>HT (4) Unclassified 33 2,C57 1,182
Total 68,149 31,041
^UH 75^V I § MTjtcS Deduction claimed Unddr Chapter VI A
»>iS. lit. (5) LIP 8 0 ^ C 39,C87 2,98,858 43,966
>H . (6) R.F. 80gtC 8,180 51,584 6,970
>H3. MH. hI. (7) N.S.C. s o ^ t c 4,529 33,195 3,897
Cf. (8) U. T. I. 8 0 ^ C 55 217 26
?? (9) Unclassified 80h^C 25,266 2,72,130 29,875
7 ^ ftlHT 10 Investment New Share SOF^.Ht.CC 1.931 6,404 796
(11) Educational Expenses 80 »Ts F — — — -
y><9 (12) Donations 8 0 ^ G 1,745 8,728 2,589
foraifeMT (13) Rent Paid SO^.Tit.G.G. 899 2,525 224;
(14) Indl. Profit H.H. 65 8,112 4 038
oc-oc

IjWZH fefB>MT3 ^ Z37)
t^ fg io fUHUc^I^f3T5? W l^ i'3
?y
fHHU ^5^31 ofu^l ^
f6!3Tgt ^ g in ^ 3^ 25Tg,
SH3TR 3"
feeg?)tr
ol75 tI3
(15) S.S.I. Industrial Profits
(16) Profits-Foreign Projects(17) Export Turn over
(18) Industrial Profits(19) Profits Livestock(20) Ind./Dividends(21) Dividends
(22) Interest(23) Unclassified
(24) Inter Corp. Dividends
(25) Royalty Indian cos.
(26) Dividends from foreign Cos.
(27) Pmfits book Publications(28) Profits India lamgs
(29) Foreign Remun profons etc.
(30) Foreign Return Services
Grand Total
8 363 128
»o 2 93 13
80 H.H.C. 87 20,554 6,463
80 I 238 7,904 3.265
80^.:^. 2 1.929 1,113
80 ^ K . — — —
80>;|^ L 8,932 35,615 6 450
16,828 59,367 8,754
80>H75 ^389 629 48
80 36 3,333 2,047
on
9 —
80fe§.1^§.Q-Q 80fe§ .fg t.^ . Q-Q-A.
80 >HTg. R-
80
953
10,40,667
17
1
Utft (31) Capital Gains 80 a T. 622 5,198 860
(32) Physical Disability 80cL-^*296 1,242 221
Others 5,111 1.55,440 2S.002
t?3 Total 9,72,518 1,49,803
1,80.844
>y{tws^ cfg >Aor§ 198 6 -87 Sbwrces—Statewise Income Tax Statistics 1986-87.
ooVO


591
Hsms 2S
fe a H3ia3 ^»^TgT y'Viig 5?l3l>Ht g?| W B 5 I f5H
^^33 4 Frg3l»i» ^3 >H§ feu ^ 3 1
RTUSI 2 5.1 s^l»1^ 5%3i »igt3 liflig ^BFI’ET 3151 ft I
2 5.2 wrg3§ H^rg^ uV ^ Sg3t ^1 f^UB ti3lB33'‘gm)
2 5 .3 r?,-g?} UJU3V >Ht R’H yTyg >H Tg>H5I3 ^ F T f ^ 5 I
25.4 5^3^ feaSflHT H’B 1984-85, 1986-87,1987-88 >Ht J988-89 I
SECTION XXV
SMALL SAVINGS
This scctm gi\es infoiroation lelating to Sma\l Savings Schemes intioduced in Punjab by the Government of India. There are four tables in this section and the figures relate tc the financial year.
Table 25.1 Shows the net receipts of Small Savings in Punjab.
1 able 25.2 Shows the percentage of net receipts of Small Savings in Punjab vis-a-vis India.
Table 25.3 Shows District wise Targets, Net Collection and Award Money received during the year.
Table 25.4 Shows Statewise net Small Savings collections during ihe years 1985-86,1986-87, 1987-88 and 1988- !9.

SMALL SAVINGS
593

Rofh4 Scheme
SMALL SAVINGS HTg^2 5.1— HsftHt
Table 25.1—Small Savings Schemes in Punjab
1983-84 1984-85 1985-86 1986-87
gut)(Rupees thousand)
1987-88 1988-89
}. ^ uia m 3 goTHT-
( i )( i i )
( i i i ) f e t s2. 10 RW HHT f f e tnf
(i) ol_?5»WE^
( ii) tn
(iii) fe 5 s » rH ^
3. U t lH W ^ u r a ^ igoTHT—(i) »fH^5
(ii)
( iii) f e ts » f hhs
4. 3 5? fPJTHifK»—(i) ^(ii) te
“ lift 2W S f ^(i)(ii) tHora^
(iii)f?jH5
Post Office Savings
Bank Deposits—
Gross Receipts
Encashment
Net Receipts
10 Year Cumulative Time Deposits-
Gross Receipts
Encashment
Net Receipts
Five Year Post Office Recurring Deposits—
Gross ReceiptsEnacashment
Net Receipts
Post Office Time Deposits—
Gross Receipts Encashment Net Receipts
National Savings Certificates—II to V issue
Gross ReceiptsEncashment Net Receipts
7,32,258
6,85,059
47,199
6,92,470
7,91,418
(—)98,948
7,55,188
7,18,199
36,989
8,40,987
8,42,370
(-)13,83
9,94,683
9,36,714
57,969
11,03,229
10,73,609
29,620
36,747 33,885 33,974 29,916 25,999 23,456
30,440 30,001 30,575 32,328 34,257 49,217
6,307 3,884 3,399 (~)2,412 (—)8,258 (—;25,76l
70,538 95,710 1,25,359 1,61,644 2,01,264 2,63,09340.238 54,711 66,460 95,012 1,13,621 1,41.52330,300 40,999 58,899 66,632 87,643 1,21,570
1.12,376 1,44,100 1,54,871 1,65,376 2,12,896 1,84,2901.21,076 1,35,100 1,42,730 1,29,623 1,28,347 1,82,908(--)8,700 9,000 12,141 35,753 84,549 1,382
8,007 4,728 8,993 6,188 6,718 7,2044,107 4,292 4,718 3,181 5,598 7,5033,900 436 4,275 3,007 1,120 (-)299
VO
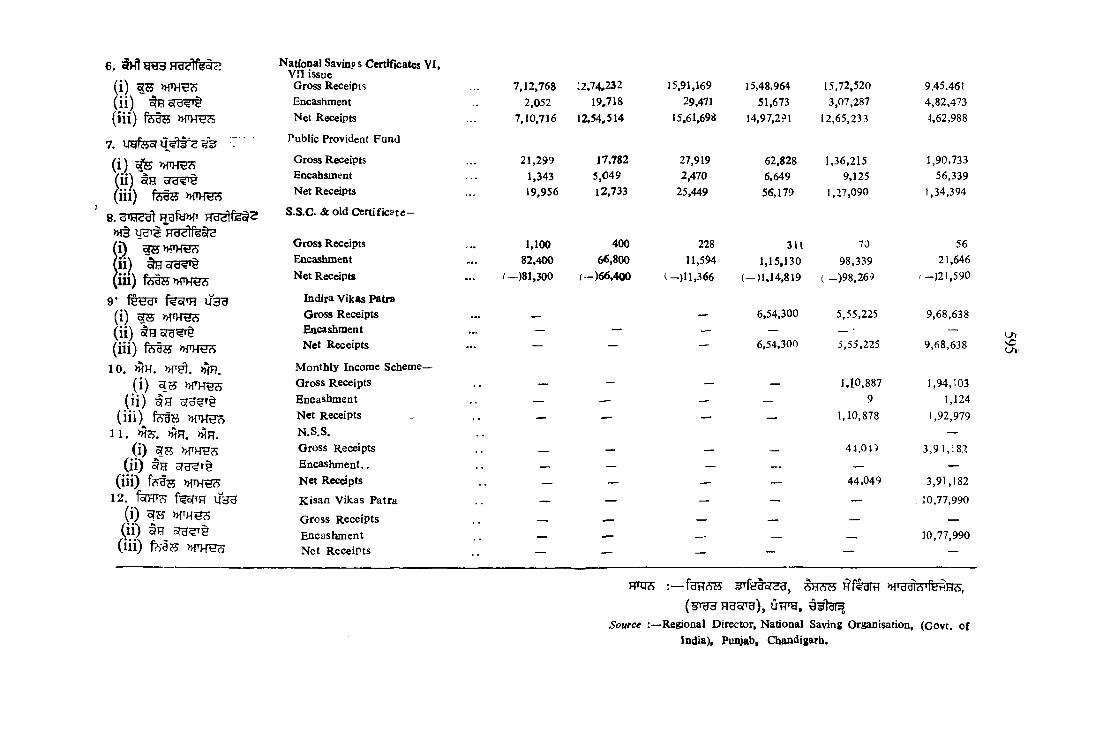
6. ^ HgytfeQe
ii)(iii) fefH
7. T '(ij ^(ii) tn o('d« 9 (iil) feB75 »fH^
8. H w ut Hgfy»nHdcJlfe^d
(ii)(iii) tesnw es
9* fHOT fesfTH U3B( i ) ^ »THB3(ii) tHora^(iii) fetH »fH^
10. MH. >)fH.( i) »TH^cS
( ii)
( i i i ) ^ fe §B »iTHH?>11. >WH. > H.
( i ) ??5( i i ) i n
( i i i ) >HT>re(S12. feHT fe iH ygg
( i ) oTS MTHH?)( i i ) 5fU^T§( i i i ) f e a s
National Savings Certificates VI,VII issue Gross ReceiptsEncashmentNet Receipts
Public Provident Fund
Gross Receipts Encabsment Net Receipts
S.S.C. & old Certificate-
Gross Receipts Encashment Net Receipts
Indira Vikas Patra Gross Receipts Encashment Net Receipts
Monthly Income Scheme-Gross ReceiptsEncashmentNet ReceiptsN.S.S.Gross Receipts Encashment..Net Receipts Kisan Vikas Patra Gross Receipts Encashment Net Receipts
7.12,768 12.74,232 15,91,169 15,48,964 15,72,520 9.45.4612,052 19,718 29,471 51,673 3,07,287 4,82,473
7,10,716 12,54,514 15,61,698 I4,97,2?l 12,65,233 4,62,988
21,299 17,782 27,919 62,828 1,36,215 1,90,7331,343 5,049 2,470 6,649 9,125 56,33919,956 12,733 25,449 56,179 1,27,090 1,34,394
1,100 400 228 3U 70 5682,400 66,800 11,594 1,15,130 98,339 21,646
-)81,300 f-)66,400 (-)11,366 (_)1,14,819 ( _)98,269 --)2!,590
— — 6,54,300 5,55,225 9,68,638
— — — 6,54,300 5,55,225 9,68,638
_ — _ _ 1,10,887 1,94,103--- — — — 9 1,124— — — — 1,10,878 J,92,979
— — — — 4-t,049 3,9 1,182
_ — __ — 44.049 3,91,182— — — — — 10,77,990
— —— — —
10,77,990
Hdbi’d ), Uti^y,
<c
Source :—Regional Director, National Saving Organisation, (Govt, of India), Puiyab, Chandigarh.

SMALL SAVINGS
25. 2— ^ ) i w m l i^ g feg FrarsT fen g m^hhs iTable 25 *2—Aanaal Net Receipts of Small Savings in Punjab vis-a-vis India
f R s . Crore)
596
HT» 51W4(2)
ij3te33»Vear India Punjab Percentage
Col.(2)foCol.(l)
0 1 2 3
1970-71 '88-36 1114 5-91
1975-76 416*13 1-67 0 -401980-81 954-70 29-08 3-05
1983-84 2410.36 80 -92 3-361984-85 3536-96 124-08 3-501985-86 4174-56 168-20 4-031986-87 - 3122 -70 219-53 7-031987-88 3828-82 222-72 5-811988-89 5048 -24 333-31 6-60
H qs:— s a w gggr, u frg iS’oi/rctf;—Director,Stnalf SaWngs, Puojait.

597
SMALL SAVINGS
25.3— feS W d ■fetS >K§ ^Table 25.3-~District wise Targets, Net InTestmeat and Award Money received
Year/District Targets
(d: s ’tft f^e) (Rs. in lacs)
RT'.S § 4nj^)>ft fg§
^ fe?)TH ^ a^HAward money received
during theyear
Netcollection
fajj'
>>rf>pHUofUdtJtt*
aucsgra** /
fettiyg
Praia g ufe^rs’
1980-8] 2,000 4046.81 33-38
1983-84 5,000 8,092.00 47-351984-85 7,800 12,408 00 102-281985-86 16,200 16,820 00 117.881986-87 20,000 21,953.00 190.751987-88 26,400 22,272 *29 102-821988-89 28,000 33,3330-90 123-84District 1988-89Gurdaspur 1,800 2,201-99 7.84
Amritsar 4,200 4,627.86 15-24
Kapurthala 1,000 1,217.09 4-15
Jalandhar 3,800 4,327-25 15-32
Hoshiarpur 2,000 2,111-92 8-12
Rupnagar 1,300 1,573-61 12 99Ludhiana ... 5,600 7,990-11 20 -06Firozpur 1,200 1,415-32 4‘56Faridkot 1,650 1,858-51 5-98Bathinda 1,650 1,737-76 6-60Sangrur 1,300 1,566-Ol 12-02Patiala 2,500 " 2,703 -47 10-96
prqc^: g^'>l» ^^5 ', uV a tSource: Director, Small Savings. Puaiab,
HT55 1 988-89 fey iRHT2 5 ST93’ HU '
Note It contain 25 Crores deposited by Unit Trust of India at Ludhiana in the year 1988-89.

598
SMALL SAVINGSFirg^ 2 5 .4 i ^ t » f TiHTgsrHTHT 1 9 8 5 -8 6 , 1 9 8 6 - 8 7 ,
1 9 8 7 - 8 8 M3 1 9 8 8 -8 9Table 25.4 Statement showing State-wise net Small Savings Collections during the years 1985-86, 1986-87
1987-88 and 1988-89(§.
(Rs. in Crore
gr?r ht 3Name of State
It?
I ' E i ' l
1 ' ^ ^ 'cc ^ 00 » «]j3
5:
VO T300 C.A«00 [T'IQD.cU
*o‘£2W c
I f S■M » b^ u Oiz-sS:
ro3: X'h) S^ XS ^^ K to ‘Ptc
tw ^
VO CO
-i p ^ ru5:
\o.
S 5 « 3. g o~ eo5 S 2 o §< a £
i s & ®.2c S «- « *-* o» r~S ► -PS B-ono 2 ®oO m! C " £;= 60 3- ^ I S S^ 2 = £ S
K. 5: K“I g i f
1
• . b i : i
S g S |2 fDcfc- fo
00 fTR 00 no jw? Dr ?
p: 8oo O 00
.1 5 2
n g-5 *-iC O o *- **T% ftj r*I s ?8=3 =
<J5 rt=*00 cjw^ m ^’-' 112 ?fp%no00 IT IIT : ® tG
ry
6CX!00^ ;H “ oI 3 £~cE cH-- ft
cC/3Q Q ^ Os^ Q^ in ^« 8 g ”
f e s . i
^ pM o ^
>HTqUT Andhra Pradesh»pj7T>f Assam
Arunachal Pradesh fgtJTg Bihar
G^jrat Goa
ufu>>r^ HaryanaHimachal Pradesh
?TH cTHHte Jammu and Kashmir oTBcT o? Karnataka
KeralaHfq>J T Madhya PradeshH<3 Maharashtra
Ug ManipurPujTfeMT MeghalyaHhaHTH Mezoram
188.0871.93
360.203^.73
105.6739.67
26.03250.1257,85
174.37832-17
1.244-31
149.07 64.98
152.52399,44
107.4043.07 35*86
150-7884.19
114.65476.57
1.055-35
149-04 70-76
1.50 263 -57 445-61
16-61
150-23 65-98 45-18
245-63 116-36
173-57 523-33
1 -93 5-76 0.79
246.23105.65
1.47132.04644.98
25.86240.20
85.7658.52
291.72158.78226.01769-06
2.497-801.02
Nagaland 133 1-32 2-17 2.34Orris a 62.24 48.34 70-53 106.22
litTTH Punjab 175-34 209-46 202.62 265-63
Rajasthan 161.26 90.63 146-24 210.87
flHH Sikkim 0-10 0-30 0-57 M 8
Tamil Nadu 166-42 81.09 100 -79' 157*58
Tripura 4-82 5.97 9-43 19-95
Uttar Pradesh 505.94 50(^65 686-22 686-22
vgH! sfgTH West Bengal 470-78 394.01 334-40 600-66
Total 4024.60 3122-70 3828.82 5048-24
RTCf ; — i Source :—Director, Small Savings, Punjab.
l^efH 3-26
tcTH
fgn f? g lit? HTU3V US I 26.1 fg i5 ^ >«§ (gU 3 Htt FTSTeB’s) § uigig oiu ^ ^ d i i r g ^ 26.2 fee 3f#HT t gfriR^g^ b w hthst^ ^ M tH^>g]»i§ H»S5T3>H5f3, 1952 Mcfts ^ f3THTU 5T3 h I ^35t H3Rt 31^ 5 I 26 .3
H 9W ^ » f t e t^F? 3^ MTHHS 31^ 5 I
H'35t 26. 4 U^? M 33rTaf> 5?3 >H^? F<3533 uf3»ff H'HS’ f f t f fe » r f3I»T 5 I HT3^ 2 0 .5 FPS
1 9 9 7 -8 8 >H§ 1 9 8 8 -8 9 § HthH H3FF§^ d i
SECTION XXVI TAXATION
Tbii section contains five tables. Table 26.1 shows the number of registered dealers and sales tax realised over a number of years. Table 26.2 shows the number of registered owners of vehicles and tax collected under Passengers and Qoods Tax Act, 1952. Table 26.3shows number of entertainmeat plicss and receipts from '^entertainment and show tax.Table 26.4 shows revenue collection uadar state excise. Table 26.5 shows the revenueposition at a glance for the year 1987-88 and 1988-89.
599


Year
601
2 6.1— UTTTg ^ »f^ tgTgrfo»f 3raTable 26.1—Number of Ragistered Dealers and Tax Realised in Punjab
TAXATION
District
31
Number of Ragistered Dealers as i 31 St March
5T3 5?3>M5rS, 1948 M5TS, 1953
Punjab General Sales Tax Act, 1948
Central Sales Tax Act, 1956
5?3 He3 yffuf33('OOJdU^)
a Tax Realfeed ^939(‘000 Rs) - ^
_________ _____W S5?R
^ 3 f?5rgl 5T3^5??, 1948 M5T3, 1956(000 i : )
Tax collected Punjab Central under Motor
General Sales Tax Spirit SalesSales Tax Act, 1956 T ' Act,Act, 1948 1939
(‘000 Rs.)
( ‘0 30 JU§) (^ ’BH3+ 4+ 5)
Total Sales Tax (‘000 Rs.)
(Cols 3+4+5)
1970-71
1975-761980-81
1983-84
1984-85
1985*86
1986-87
1987-88
1988-89
District—1988-89
* HQ d§ • Revised
50,955 38,503 2,62,620 88,197 21,992 3.72,30970,643 63,255 5,06,074 1,69,953 55,537 7,31,56494,592 81,493 11,38,376 3,41,412 79,520 15.59,308
1,06,609* 91,462* 19,17,929 5,29,163 1,06,182 25,53,2741,02,707 90.897 19,62,951* 5,52,700* 1,20»999* 26,36.650*1,06,698 94.122 23,36 948 6,61,168 1,30,272 31,28,388
1,09,916 97,718 27,64,047 7,81,695 2.26,907 37,72,6491,07, 941* 96,354 31,34,301 9,17,380 2,59,717 43,11.3931,12,600 1,02,681 33,23,260 11,33,205 2,84,283 47,40,748
Gurdaspur 6,733 6,715 85,049 31,532 - 1,16,581
•HftidHd Amritsar 16,074 14,266 3,55,137 85,416 — 4,40,553
Kapurtbala 3,852 3,028 62,526 35,589 — 98,115
HSnS Jalandhar ... 15,149 13,541 4,45,250 1,69,617 2,30,000 8,44,867
Hoshiarpur ... 2,842 2,478 67,920 13,710 — 81,630
fVRura Rupnagar 3,559 3,433 1,84,312 1,13,941 - 2,98,253
5ftj»nsT Ludhiana 26,453 25,834 6,24,752 3,11,594 — 9,36,346
Firozpur 5,741 4,888 1,35,683 40,507 — 1,76,190
Faridkot 6,909 6,349 2,01,113 40,467 — 2,41,580
r<Ss{' Bathinda 7,026 6,314 1,94,427 1,15,757 — 3,10,184
H dl^ Sangrur 6,570 5,512 1,86,148 29,385 — 2,15,533
Patiala 11,692 10,323 7,80,943 1.45,690 54,283 9,80,916
: 9 c?3 5ffHTf5cl, Utrg 1Source: Excise and Taxation Comnaissionor, Puqjak.

602
f r d ^ 2 6 2— fegOFFra »f§ h m toTFT >?fer3, 1952 w f e 3a[RTable 26.2—>Tax Realised in PuQjab uoder Passenger and Goods fax Act, 1952.
TAXATION
m sYear
District
drHHdd^
t e n t
Registered Owners of vehicles
HT25n^ars, 1952wifetararftpHT
( ‘ooo 1 :)Tax ooUflcted under passen
ger and Goods Tax Act. 19S2
(*000 Rs)
1970-71 • • • 10.904 73,5921975-76 . . . 22.513 1,45,401
1980-81 . . . 34,857 2,63,495
1983*84 . . . 46.369 3,62,276
1984-85 . . . 50.076 3.42.320
1985-86 . . . 55,542* 3,72,042*
1986-87 • • • 62.829 4,82,078
1987-88 69,338 5,54,189
1988-89 • • • 75,265 6,10,418®
>HfH^oTvragHT
IJcSdld
H^ddUfe»TST
* revised
District—1988-89
Gurdaspur 6,306 44,610
Amritsar 9,418 56,220
Kapurthala ( 1,288 19,070
Jalandhar 13.209 74,913
tioshiarpur 4,055 27,474Rupnagar 3,099 77,312
Ludhiana 9,739 68,310
Firozpur 3,842 32,975
Faridkot 7,190 54,164
Bathinda 4,016 42,342
Saagrur 4,516 40,445
Patiala 8.587 70,297
So /fce: Exdse and Taxation Conamissiow ^ feoT oft^ U5TH HTfHH cS# ofM 9T
TyTB HS /Rd To u a >sands received at H
. w o <u y witft State total.

603
lofHTAXATION
h»a^26.3— imrg ^ f3T5^ »ft M§ >H§ 3 tsfR 3" nPWSTiTaU* 26.3^Mu!Hber of EatertainoMot Places and Receipts frotn EntertaiiuMiit and Show Tax ia Pi«iab
5ir§) Receipts (*000 tia,)
«»5Yev
HS' tTS ^
District ( fd r a i l ) KS RFfcS §oTR a&itortain>
naoat places (Number)
Entertainment Tax
Show Tax
i i z 3 ^
1970-71 113 20,198 69O
ins-16 143 58.553 4,09^
19S0SI 159 87,821 6,043
1983-84 167 90,578 7.044
19844S 169 73.259 4,565*
1985-86 173* 86.011 5.432
\986-87 174* 77,623 4,973
1987-88 173* 73,798 4,754
1988-89 167 59.743 4,100
f® 5 ' District—1988-89
Ourdaspur 8 2,298 162
Amritsar 26 5.482 374
oiijciy»‘ Kapurthala 3 1,078 85
TO ira Jalandhar 22 9,806 594
Hotiiiarpur 10 2,586 255
?H6dld Rupna^r 6 1.849 123
5ftP)f3T Ludhiana 28 17.905 935
f e f t i y g Firo^pur 15 3.530 243
Faridkot 20 3.813 268
Bathinda 10 2,790 196
Fraria Sangnir lO 4,142 292
Ufe>HW Patiala 9 4,464 573
— »rgQrcrt » ft sra iffFg iSourett Excise and Taxation Commiasionar, Puqjab.
•ifQ•Revised

604
TAX26.4-3^3 ^S[d
Table 26.4—Reveaae coliectioo
feold'd 9fe>HT HTHHT (O 00 iy § )
H^<2fWo(d,m Rfuf32
RTSYear
DistrictCountry Foreign Malt
Spirit Liquor and Liquor,Spirit Beer
0 1 2 3
1970-71 1,76,149 23,960 6,740
1975-76 3,37,198 1,01,514 8,380
1980-81 7,02,155 1,91,101 13,943
1983-84 11,58,818 2,52.863 44,303
1984-85 11,59,043 4,38480 13,149
1985-86 11,67,407 7,27.733 19,698
1986-87 15,53,703 8,64,609 20,096
1987-88 17,80,790 8,83,250 35,612
1988-89(P) 22,29,961 9,83,275 34,082
fi3W» District—1988^9
Gurdaspur 1,05.799 82,713 1,264Amritsar 1.41,420 90,101 1.109
oTUTOJ? Kapurthala 85,239 18.945
tTscra Jalandhar 2.76,532 2,54,124 5,457Hoshiarpur 1,59,286 42,980 241
§USdl3 Rupnagar 1,17,638 35,509 60Ludhiana 3,37,153 1,89,509 13,612
feBFTUg Firozpur 1,05,228 28,064 164Faridkot«» 2,32,334 50.408 256
gfz>y Bathinda 2,16,848 77.353 1,215
Hgrag Sangrur 2,34,530 34,753 131Ufe>HTST Patiala 2,17.954 78,816 10,573
P —M3 »ff3H P—Provisional

605
anATION
>»TOte feofeg 3fe>>r understate Excise
Revenue Collection (Rs. 000)
#31 ^ 3
Commercialised
DenaturedMedicated
Wines
Medical and Toilet
PrepMations
Opium, Hemp and other Drugs
OtherReceipts
Tovil
4 5 6 7 8
1,606 52 168 19,632 2,28,3071,617 19 164 6,095 4.54.9876,745 156 1,610 15,534 9,31,2447.377 11,042 18,825 2,686 14,95.914
40,288 - 140 1,61020 18,12,32J
4,644 81 489 40,986 19,61,0384,677 J«5 211 8,690 24,52,1717,719 172 72 10,439 27,18,0544,197 506 909 17,561 32,70. 591
122 19 _ 431 J.90 348427 4 1,704 2,34,765103 — -r 9,588 1,13,875370 — 863 471 5,37^817631 453 1 610 2,04,202849 — 8 489 lt54.553822 30 17 1,562 5.42,7p5159 — 5 225 1,33,845)86 — 4 248 2.83,43649 __ — 303 2.95.76860 — 4 1,108 2,70 586
519 -- 7 822 3.08.691
FTOs:>HTgor^»i§33cffHa?5g, utT»aSource : Excise and Taxation Coaunissiooer, Puniab,

TAXATION
26.5— feo? StIU f?B Table 26.5—Reyerne position at a glance |
606
( 0 0 0 ’(000’ Rs.)
HTSjYear
ItemH ,;1987-88 1988-89
sra SaleaTax(§ ) (a) Amount ' ... 43,11,398 47,40,748(>H) ftJSH Fn?5 (b) Perc enlage ircreaff/decfef se over previousyear ... 14-3 lO-O
^ -ra Taxes on goods and PassengersCT’do'M' o ofcJ(§ ) 9 ^ Amount * ... 5,54,189 6,10,418
(>H) fUS^ FTO 3 ^ (b) Percentage increase/dccrefse over previous year ... 15*0 10-2
era EnteitafninentTax
{§) (a) Amount ... 73,798 59,743
{>H) fUS^ FT<3 ^jptE5 (b) Percen tage increasf/decreese over previous year ... (—)4*9 (—)19*1^/UIT^T
B Show Tax
( ^ ) 3 ’J?I (a) Amount ... 4,754 4,100
{>H) fW S 4 ^ 0 d (b) Percent age increase/decrease over previous year ... (—)4-4 (—)l3-8^rur/ixn^T
fS@^ State Excise Duty
(§ ) H h! (a) Amount ... 27,18,096 32,89,671{>H) (b) Percent age increase/decrease over previous year ... 6-5 21 0
M’HHS Total Revenue
(§ ) (a) Amount ... 76,62,225 87,04,680
(>H) fUSH Fn?5 l^Rrar (b) Percentage increase/decrease over previous year ... i2 -9 H -4
Source : Excise and Taxation Commissioner, Punjab. w m : »!»gor^ >Ht sra o7fHH?5gf, i f a r g I

fUH 3fTrr3§H5 0l f3T3^, ^>>ft g1 faT3^, jPW^ I S)]B 1965-e6,197<f-7l, 1975-76, 1980-81 1983-84 §'1988-89 ^of M§
a»HB UJ51 »ny^ h>h >h3^ ^ J
»rf^ § § g^y»!3 s a l ^ t sras ^31 Jw ra^fw 9 I fSH t* fen ^ ^ »fTH^ gr feof HTCRJ ^ & I
SECTION x x v n
REGISTRATION
This section contains data on the namber of Registration otBces, number of registrations of property, aggregate value of property transferred and the total receipts there from to the Ooverooient for1965-66, 1970-71, 1975-76,1980-81 and 1983-84 to 1988-89. This data for the latest year have been given districtwise.
Registration of property is a legal msasure deviseiby the State to ensure inviolability of right To propeity, etc. Besides, it is a source of income to the State.
607
21
6fft7!T?§H3 '


REGISTRATION
6dd

3ffTH ?§H SREGISTRATION
2 7.1— gfflHSd) 3(T§ far^a'^ § % ^ fy » r >h^ u V a fiu3 b ^Tabfe 27*1—Namber and Description of Registered Documents and ^alne of Property Transfeited in Punjab
ruh! fgi<5^Number of Registrations of Property
HU3l gg (*o00 a:)A®?regate Value of Property Transferred
(000 Rs.)
Year/District >HBSImmovable Property
-----------------^ W f3-
f 3 I ^Number of Registration Offices
»fT^
Compul Optional Total sory (2+3)
USn i j# HH3
»T§ f ^ t e ^ 3Hcst»raw
MovableProperty Wi 11 s inclu
ding Cancel, lation and Grand
Authority to Total
arc5
>Hg5
Immovable
Adopt (4+5+6) Property
MovableProperty
1}TU3
( ’ooo ? : )!
Total(8+9)
Total Amount Receipts
(Rs. ’000)
0 1 2 3 4 5 6 7 8 9 10 11
1965-66 ... 61 1^,598 455 135,053 8,983 5,91,808 3.657 5,95,465 3,9351970-71 ... 79 2,07,071 65 2,07,136 9,041 1,57,891 993 138.884 164291975-76 ... 90 2,35,808 198 2,36,006 13,184 14,272 2,63,462 29,69,516 1,958 29,71,474 24407’1980-81 ... 108 3,21,828 58 3,21,886 8.464 20,043 330393 46.33,649 23 46,33,672 30,108
1983-84 ... 106 3,03,914 1,194 3,05,108 24,843 21,499 3,51.450 49,06,435 2.200 49,08,635 36,702
1984-S5 ... 106 2,52,849 36 2,52,885 21,650 19,889 2,94,424 45,97,749 1,894 45.99,643 31,134-
1985-86 ... 106 3,13,643 16 3,13,659 26,664 21,065 3,613*8 53.63,085 2,403 55,65,488 38,647
1986-87 106 3,31.584 19 3,31.603 29.127 21,630 3,82,360 75.01.994 1,376 75,03.374 40.889
1987-88106 3,46,024 30 3^6,054 31,469 24,242 4,01,765 68,07.467* 1,308 68,08,775 49,171
1988-89 • •• 106 3,54,680 14 3,54,694 37,907 25,443 4,18,044 95,06.750 2,745 95,09,495 59,027’
21'-
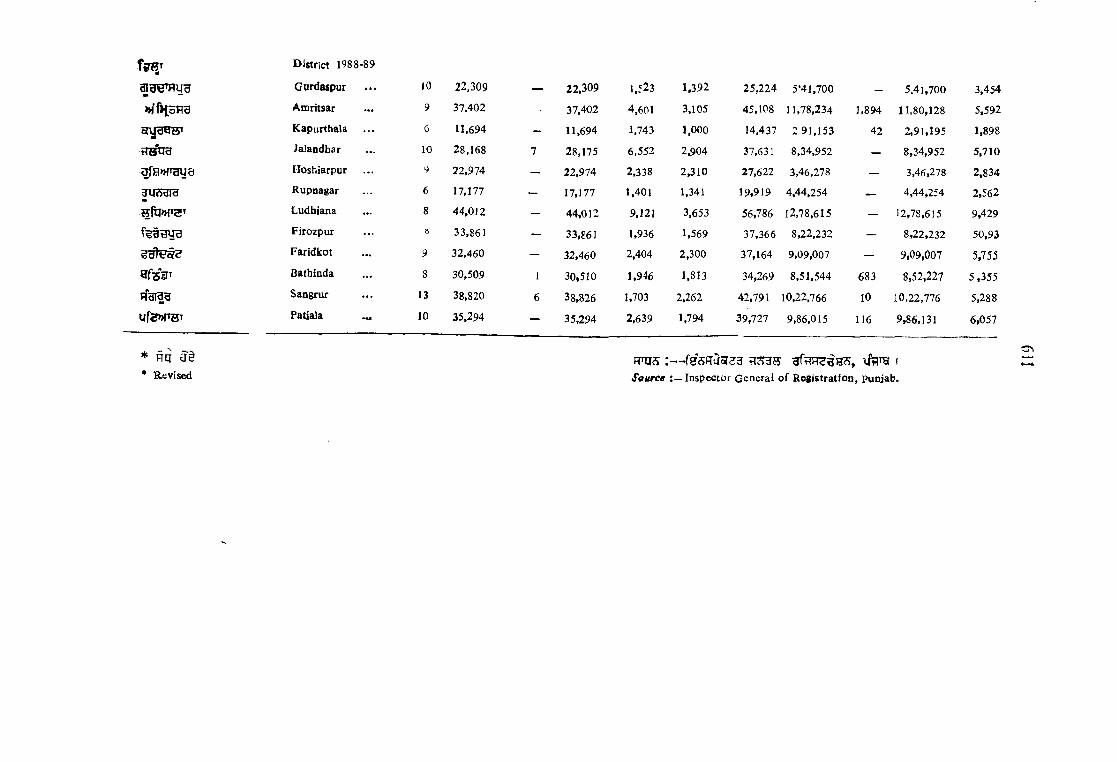
3fHW3U93U33I3m
Hftl>HT2!T
fggmra
Ute»»fTHT
* Hq ij§* Revised
District 1988-89
Gurdaspur Amritsar Kapurthala
JaJandbar Hoshiarpur Rupnagar Ludhiana
Firozpur Faridkot
Batbiada
Sangrur
Patiala
10
9
6
10 9 6
8
s
9
8
13
10
22.30937.402
11.694
28,16822,97417,177
44,012
33,86132,460
30,509
38,820
35,294
22,309 1.523 1,392 25,224 5*41,700 - 5,41,700 3.45437.402 4,601 3,105 45,108 11,78,234 1,894 11,80,128 5,59211,694 1,743 1.000 14,437 2 91,153 42 2,91,195 1,898
28,175 6,552 2,904 37,631 8,34,952 — 8,34,952 5,71022,974 2.338 2,310 27,622 3.46,278 — 3,46,278 2.83417,177 1,401 1,341 19,919 4,44,254 — 4,44,254 2,56244,012 9,121 3,653 56,786 12,78,615 — 12,78,615 9,429
33,861 1,936 1,569 37,366 8,22,232 — 8,22,232 50,9332,460 2,404 2,300 37,164 9,09,007 — 9,09,007 5,75530,510 1,946 1,813 34,269 8,51,544 683 8,52,227 5,355
38,826 1,703 2,262 42,791 10,22.766 10 10,22,776 5,288
35.294 2,639 1,794 39,727 9,86,015 116 9,86,131 6,057
F r a s :Source Inspector General of Registratioa, Punjab.


R5?aS 28
iRrg uV fts’
28.1— wfl-RT?r ^ ?5TgrH »i§ d i
28.U— im-PtW IHtTST ( l 985— 90) » ft H5T<S* 1985-86 3* 1 9 9 0 -9 1 h1H»gT3 fi I
SECTION XXVIII
FIVE-YEAR PLANS OF PUNJAB
TaZ / 28.1—Shows outlay and Expendituie of Five-Year Plans.
28.2—Shows the outlay for tho Seventh Five-Year Plan (1985-90) and Annual Plans 1985*86 to J990-9U
6 1 3

FIVE-YEAR PLANS
615
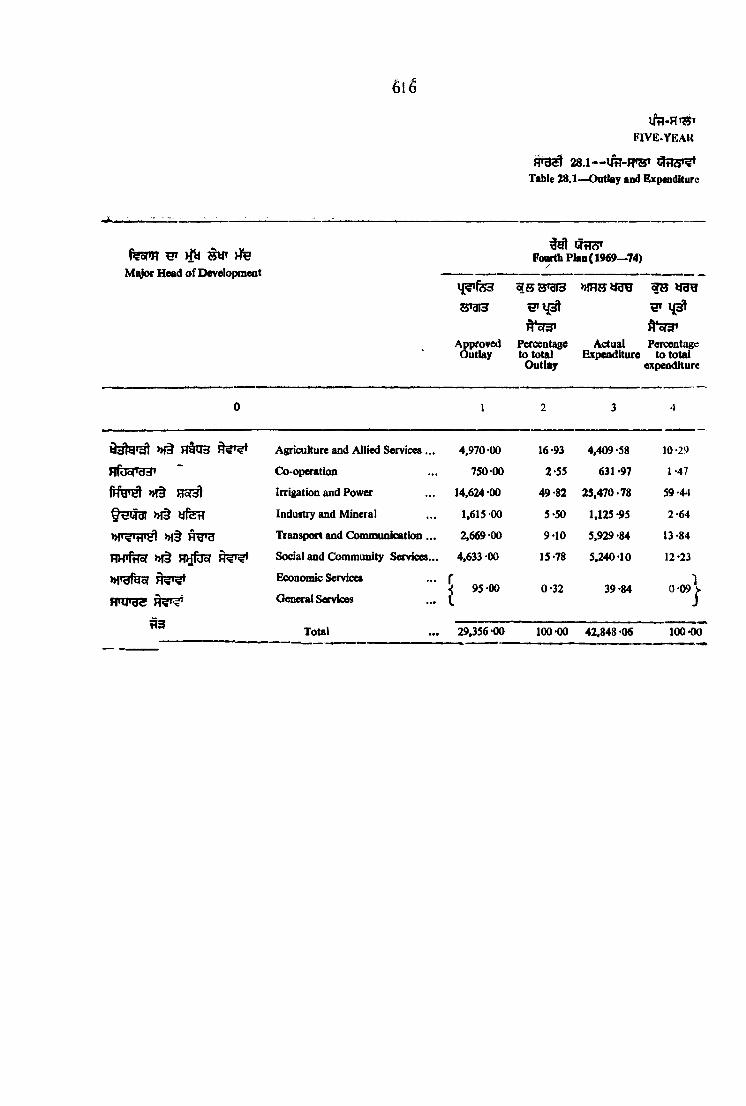
ifn-rtT^TFIVE-YEAR
28.1— iStTZS Table 28.1—Outlay and Expenditure
M^or Head of DevelopmentFourth PlaB(1969—74)
Approved Percentage Outlay to total
Outlay
Actual Percentage Expenditure to total
expenditure
0 1 2 3 4
9 ^ * ^ >H§ FWra F l ^ Agriculture and Allied Services ... 4.970-00 16-93 4,409-58 10-29
HfyoTdd» Co-operation 750 00 2-55 631 -97 1-47
f N ^ »!§ Irrigation and Power 14.624 00 49-82 25,470.78 59 -44
»f§ yfeti Industry and Mineral 1,615 00 5*50 1,125-95 2-64
>h9 Transport and Communication... 2.669 00 9 10 5.929 -84 13-84
m r t e >n§ H>ifbEr h^ ' i Sodal and Community Services... 4,633 00 15-78 5,240-10 12-23
hrofesr
rnirae
H3
Economic Services
Oenout Services^ 95*00 0-32 39-84 0-09J.
Total 29,356 00 100-00 42.848-06 100-00

PLANS
^ ?5Tgr§ >H§ yggof Five-Year Plans
617
5U§) (Lakh Rupees ^
Fifth Plan (1974—78)
Approv ed Outlay
Percentage to Actual total Outlay Expenditure
Percentage to total
Expenditure
Sixth Plan (1980—85)
Approved Percentage to Actual PercentageOutlay total Expenditure to total
Outlay Expend itufe
5 6 7 8 9 10 11 12
12,623 -03 12-25 8,433 -72 11-73 25,476-00 13-02 20,217-51 10*691,585-41 1-54 879-13 1 -22 4,150 -00 2-12 3,957 -47 2-09
48,661-27 47 -23 37,204 -46 51-73 1,08,123 -00 55-25 1.13.900-43 60 256,615-78 6*42 3,755-12 5-22 8,13?-03 4-13 7,413-93 3-938.742-19 8-49 6,326 -2S 8-3) ll.}l5-0) 5-7) 6*03
22,774-74 22-11 14,657-24 20-38 35,901 -00 13-86 30,7H-2l 15. 21
63.93 0-06 36*40 0-05 135-00 0-05 64 98 0-0 31.958*88 1 -90 623-85 0-87 1,407-00 0-72 1,405 -25 0 74
1,03.025 -23 100-00 71,917 -21 100-00 1,95,700-00 100-00 1,89,086-47 100-00
n n i s T O 5 T 1975-76, 1979-80 >HtarSTl, 1986-87
Source : Annual Plan 1975-76, 1979-80 and Budget-at-a 01aa.:s, 1986-87.
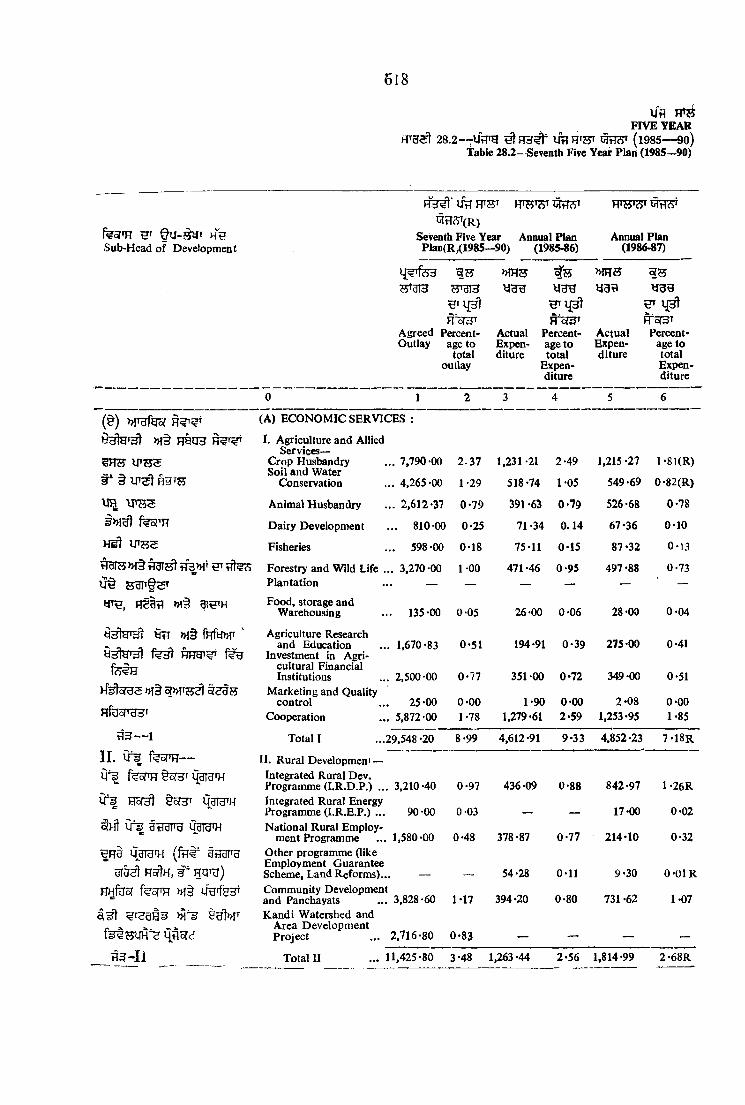
518
FIVE YEAR28.2— U frg (1985~ « o)
Table 28.2—Seventh Five Year Plan (1985—90)
%5rTi uf Ht?Sub-Head of Development
R 3^‘ UH FTHT RT^W ^ 7 PqtIST(R)
Seventh Five Year Annual Plan Plan(R/1985—90) (1985-86)
Annual Plan (1986-87)
<5 3T3 H*'dI3 H iip t R'orSJ H"cf3T
Agreed Percent- Actual Percent- Outiay age to Expen- age to
total diture totaloutlay Expen
diture
>HHS
ActualExpenditure
ygg
^cT3TPercent
age to total Expenditure
9 ^ ' ^ >H§ HSQH
t* § R5TJ5
m vj'BS
HUR5 >H§ ^ rft?S
^ >H§ fnftW’ '
fe te»i§ i(^iE
RfeoTO3
1II. CT¥ f oTH—
0 " | qargiH
^Ht ggaro
^Ha' ygrafH (fe t ' naTTu a T&l HsffH, f " m ^ )
HHfeor feofiH »i§
fl3 -Il
0 1 2 3 4 5 6
(A) ECONOMIC SERVICES :
I, Agriculture and Allied Services—
Crop Husbandry ...7,790*00 Soil and Water
Conservation ... 4,265-00
2.37
1-29
1,231-21
518-74
2-49
1-05
1,215 -27 549-69
l-Bl(R)0-82(R)
Animal Husbandry ... 2,612 *37 0-79 391-63 0-79 526-68 0-78
Dairy Development ... 810-00 0-25 71 -34 0.14 67*36 0-10
Fisheries ... 598-00 0-18 75-11 0-15 87-32 0-13
Forestry and Wild Life ... 3,270-00 1-00 471 -46 0-95 497 -88 0-73Plantation ... — — — — — —Food, storage and
Warehousing ... 135-00 0-05 26-00 0-06 28-00 0-04
Agriculture Research and Education ... 1,670-83
Investment in Agricultural Financial Institutions ... 2,500-00
0-51
0*77
194-91
351-00
0-39
0*72
275-00
349-00
0-41
0-51Marketing and Quality
control ... 25-00 0-00 1-90 0-00 2-08 0-00Cooperation ... 5,872-00 1-78 1.279-61 2-59 1,253-95 1-85
Total I ...29,548-20 8-99 4,612-91 9*33 4,852-23 7-18R
II. Rural Developmeni —Integrated Rural Dev.Programme (I.R.D.P.) ... 3,210-40 0-97 436-09 0-88 842-97 1-26RIntegrated Rural Energy Programme (I.R.E.P.) ... 90-00 0-03 _ 17-00 0-02National Rural Employ
ment Programme ... 1,580-00 0-48 378 -87 0-77 214-10 0-32Other programme (like Employment Guarantee Scheme, Land Reforms)... — 54-28 0-11 9-30 0-OlRCommunity Developmentand Panchayats ... 3,828-60 1*17 394-20 0-80 731 -62 1-07Kandi Watershed and
Area Development Project ... 2,716-80 0-83 _ — _ _-
Total II ... 11,425-80 3-48 1,263 *44 2-56 1,814-99 2-68R

6 1 9
PLANS>H§ FTHST 1985-86 H* 1989-90and Annua! Plans of Punjab 1985-86 to 1989-90
LTfT??'
{Hy 114^) (Lakh Rupees )
Annual Plan (1987-88)
Annual Plan (1989-89)
Anuua! Plan (1989-90)
Anual Plan (1990-91)
ActualsExpenditure
lji3l
Percentage Actual to total Expenditure
Expenditure
percentage to totalExpenditure
H'of^TApproved Percentage Approved
outlay to total outlay
fH?5T m d I K S J W t" 55^3
R"sf3^Devulu- Total Percent-tion outlay age to
of funds . Totalto districts ‘ Outlay
3^313(3 'f)
Outlay
7 8 9 10 11 12 13 14 15 16
1,058 -17 1 -33 2,217-93 3-12 2,589-CO 3-28 2,758-10 384-20 3,142-30 3-47
510*20 0-64 309-52 0.43 1,278 -00 1-62 25 00 1,311-00 1,336-00 1-48
502-25 0-63 801-45 1-13 806-00 1-03 315-70 657-30 973-00 1-08
79-95 0-10 143-92 0-20 85-50 0-24 265 -50 72-50 338-00 0-37
100-55 0-13 136 88 0.19 136-00 0-17 30 00 178-00 20»-00 0-23
616-40 0-78 625-01 0.88 685-00 0-87 171 -70 358-30 530 00 0-59
28 -00 0-04 27-77 0-04 5 OU 0-06 0-10 — 0-10 0-00
351-80R 0-44R 260-86 0 37 415-OU 0 53 335-00 — 335-00 0-37
325 -00 0-42 391--00 0-55 450-00 0-57 460-00 — 460 00 0-51
2-93 0-00 3-19 0.004 6-40 ' 0-087 — 8-00 8-00 0-00
1,391-11 1*77 1,314-85 1.85 1,671-50 2-12 1,720-00 — 1,720-00 1 -90
4,966 -36 6-28R 6,235-38 8.74 8,227 -40 10-43 6,081-10 2,969-30 9,050-40 10-00
526-32 0-66 534.81 0-75 257-81 0-33 11 00 570 -50 581-50 0-64
25-00 0-04 25-00 0-03 30-00 0-04 30-00 — 30 -00 0-04
252 -86 0-32 499 79 0.70 345-11 0-44 — — — —
_ — 1-00 0 00 — 353-90 353-90 0-39
328 -40 0-66 589-92 0.83 561-53 0-71 3-66 4,006-34 4,01000 4-43
458-67 0-58 485-48 0-68 615-50 0-78 700-00 — 700-00 0-77
1,791-25 2-26 2,13500 3-00 1,810-95 2-30 744-60 4,930-14 5,675-40 6-27

620
FIVE YEARfTU^V28.2 imRTjjr ( l9 8 5 — -90)
Table 28.2 (contd.)—Seventh Five Year Plan (1985-90)
Seventh Five Year Plan (R) (1985—90)
cm?)’
Annual Plan (1985-86)
Annual Plan (1986-87)
f€5f'H S’ Ktff HP gub-He^d pf Develppment RT313 yuH yyy
H
^75
W d
AgreedOutlay
Percentage to total Outlay
Actual Percent- Expendi- age to
ture totalEJtpenditure
Actual Percent- Expendi- age to
ture totalExpenditure
0 1 2 3 4 5 6
I I I . »1§ssrgTH
^ »i§
III. Irrigation and Flood Control—
Major and medium Irrigation 26,888 -00 8-19 4,031 -94 8-16 4.716-12 6-98
i l U H ^-^ rHg'y) Minor IrrigationCommand Area
Development
4,812-00
1,600-00
1-46
0-49
543-98
600-00
1-10
1-21
577-38
900-00
0-86R
1-33Flood Control Project ... 3,700-00 1-13 873-41 1-77 1,025-21 1-51
H 3 - I I I Total n i .. 37,000-00 11*27 6.049-33 12-24 7,218-71 10*68R
I V . IV. Energy—
H'HS 5)
PowerNon-conventional
source of energy (including Bio Gas) ...
1.63,800 00
400 -00
49-86
0-12
26,985 -00
4-41
54-60
0 01
39,400 -48
(1 -70R
58 -31R
0-08R
I V Total IV 1,64,200 -00 49 -98 26,989 -41 54 -61 39,462 18R 58 -39R
V . ^OTay>H§yfeH
i r ^ »T§§ElSgT (0'S>H§Hly
§HP3T H'fec^)
V. Industry and Minerals—Village and Small Industries
Industries (other village and Small
Industries
3,603 -00
8,831 -00
1*10
2-68
487 -21
1,419 CO
0-99
2-87
539 -84
2,855 -27
0-81R
4-22R
H'U >M§ BT5
Mining, Weights and Measures
40-00 0 01 — — 4-40 0 00
V Total V . 12.474 -00 3-79 1,906 -21 3-86 3,399 -51 5 03R
V I . Transport— /
Civil and Aviation 120.00 0-04 11 -60 0-02 15-00 0-02
H3BfT >H§ US Roads andi Bridge 9,800 -00 2-98 1,343 -49 2-72 1,396-27 2-06
Road Transport .. 8,300 00 2*53 1,195 -29 2-42 1,223 -47R I -81R
S3 V I Total VI 18,220-00 5-55 2,550-38 5-16 2,634 -74R 3 -89R
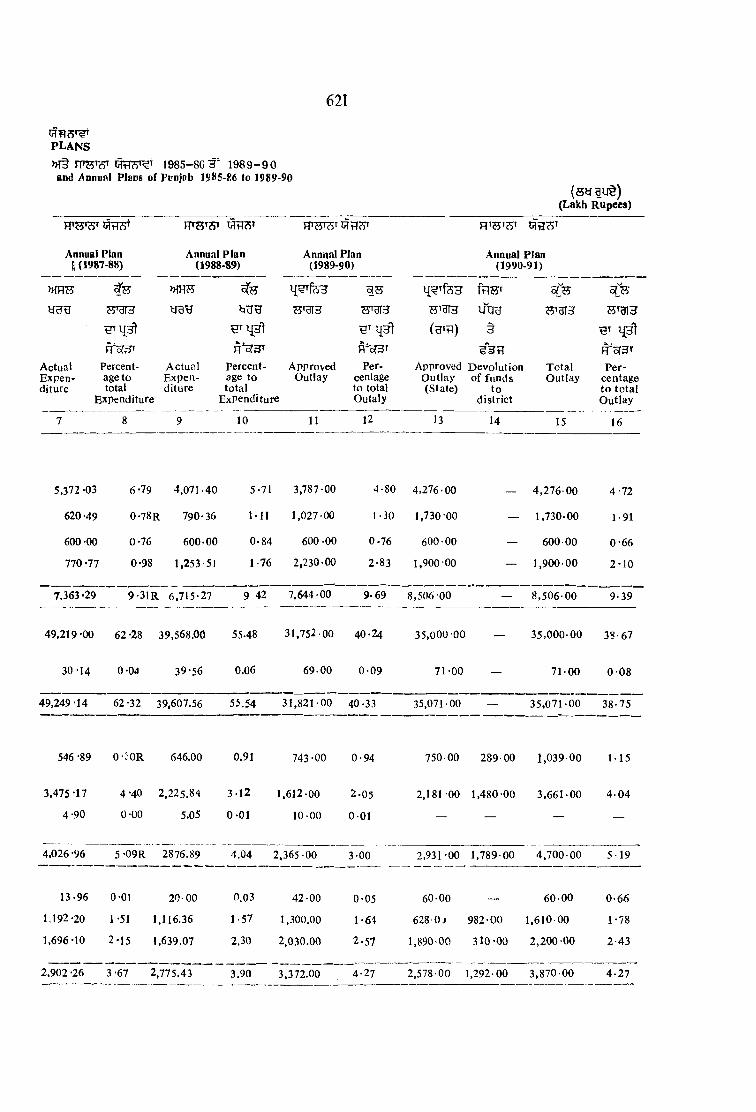
621
p l a n s
»T§ JTOW 1985-86 3" 1 9 8 9 -9 0and ^iinu»] Plans of Pvnjeb 19S5-86 to 1989-90
{ m a u § )(Lakh Rupees)
Annual Plan 1 (1987-88)
Annual Plan (1988-89)
Annnal Plan (1989-90)
Annual Plan (1990-91)
MHH
yuB S^dld UqH 55^313
§
R'sraTActual Percent- Expen* age to diture total
Expenditure
Actual Percent- Approved Expen- age to Outlay diture total
Expenditure
Per-centage to total Outaly
ApprovedOutlay(Slate)
Devolution of funds
to district
TotalOutlay
Percentage to total Outlay
7 8 9 10 11 12 13 14 15 16
5,372 -03 6-79 4,071.40 5-71 3,787-00 4-80 4,276-00 4,276 00 4-72
620-49 0-78R 790-36 M l 1,027-00 1 -30 1,730 00 — 1,730-00 1-91
600-00 0-76 600-00 0-84 600 -00 0-76 600 00 — 600 00 0-66
770 -77 0-98 1,253 51 1-76 2,230 00 2-83 1,900 00 — 1,900-00 2-10
7.363-29 9-3IR 6.715-27 9 42 7.644 00 9.69 8,506 00 — 8,506-00 9-39
49,219-00 62-28 39,568.00 55.48 31,752-00 40-24 35,000 -00 — 35,000-00 38-67
30-14 o-oa 39-56 0.C6 69-00 0-09 71-00 — 71-00 0 0 8
49.249 -14 62 -32 39,607.56 55.54 31,821 -00 40-33 35,071-00 — 35,071-00 38-75
546 -89 o-:oR 646.00 0.91 743-00 0-94 750 00 289-00 1,039 00 1-15
3,475-17 4-40 2,225.84 3-12 1,612-00 2.05 2,181 -00 1,480 00 3,661-00 4-04
4-90 0-00 5.05 0-01 1 0 0 0 0 0 1 — — — —
4.026 -96 5-09R 2876.89 4.04 2.365-00 3-00 2,931-00 1,789-00 4,700 00 5 1 9
13-96 0-01 20-00 0.03 42-00 0-05 60 00 60 00 0-66
1.192-20 1-51 1,116.36 1-57 1,300,00 1-64 628-Oj 982-00 1 ,61000 1-78
1,696*10 2-15 1,639.07 2.30 2,030.00 2-57 1,890-00 310-00 2,200 00 2-43
2,902 -26 3 -67 2,775.43 3.90 3,372.00 4-27 2,578-00 1,292-00 3,870-00 4-27
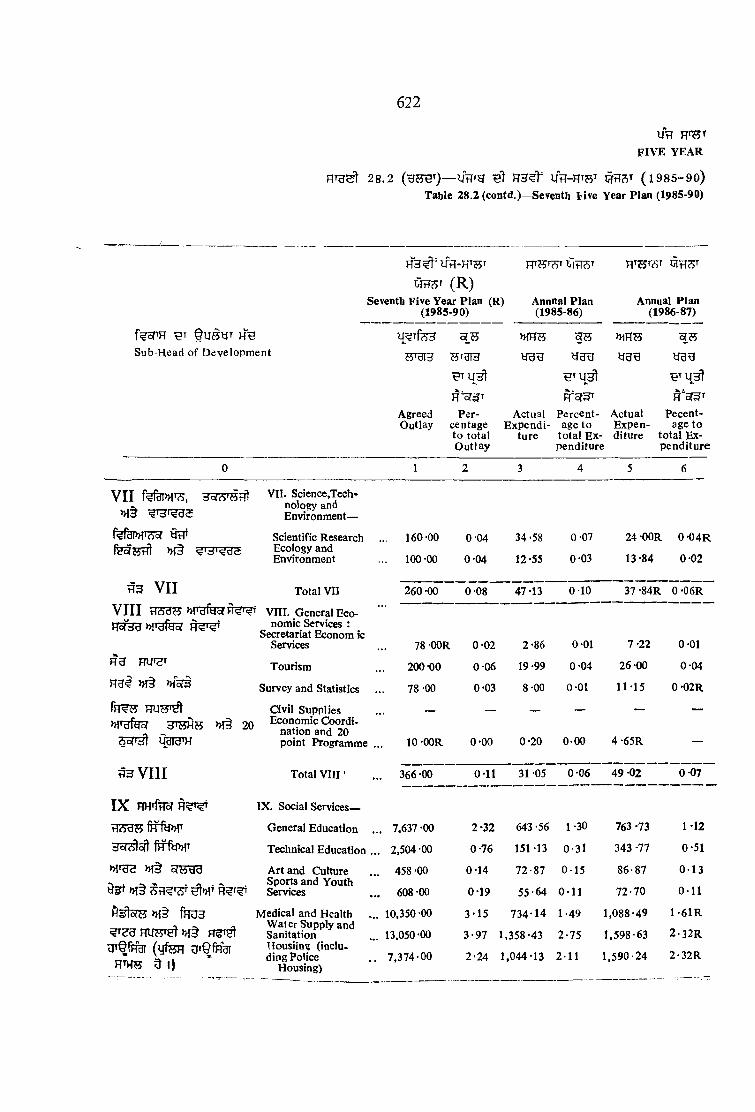
6 2 2
Ut?f i v e y e a r
R T g^ 2 8 .2 i Th -H tST ( i 9 8 5 - 9 0 )
Table 28.2 (contd.)—Seventh Five Year Plan (1985-90)
( R )Seventh Five Year Plan (R)
(1985-90)Annnal Plan (1985-86)
Annual Plan (1986-87)
f?oTH § u s y T h H m T S
Sub-Head of Development 64'dl3 E r d i d y g g y g g
^ r i f ^
AgreedOutlay
Percentage to total Outlay
ActualExpendi
ture
Percentage to
total Expenditure
ActualExpenditure
Pecent- age to
total Expenditure
0 1 2 3 4 5 6
V I I fefgr>H^, » l§
VII. Science,Tech- nology and Environment—
Scientific Research Ecology and Environment
.. 160-00
100-00
0-04
0-04
34-58
12-55
0-07
0-03
2 4 -OOR 0-0 4R
13-84 0-02
V I I Total Vn 260-00 0-08 47-13 0-10 37-84R 0-06R
V I I I HSdHHofcfd>M'dfey
VIIT. General Economic Services :
Secretariat Econom ic Services 78-OOR 0-02 2-86 0-01 I ' l l 0-01
R U Tourism 200-00 0-06 19 -99 0-04 26-00 0-04
H u i >H§ >nyd Survey and Statistics 78-00 0-03 8-00 0-01 11-15 0-02R
m'dPyof >H§ 20Civil Supplies Economic Coordi
nation and 20 point Programme ... 10 -OOR 0-00 0-20 0-00 4-65R —
f l a v i n Total V III' 366 -00 O i l 31 05 0-06 49 -02 0-07
I X HH’ftlof IX. Social Services—
General Education ... 7,637 -00 2-32 643-56 1 -30 763 -73 1-12
HoT^sft firfy>H» Technical Education ... 2,504 -00 0-76 151-13 0-31 343 -77 0-51
»!§ o<J5Hd
>H§
Art and Culture Sports and Youth Services
458-00
608-00
0-14
0*19
72-87
55-64
0-15
0-11
86-87
72-70
0-13
0-11
HsilolW >rt fTO3 ? ^ ? g n u s T ^ » i§
Ur^Rbr (ufeH U>§fH3T H m s D Ij
Medical and Health Water Supply and Sanitation Housiins (inclu- ding Police
Housing)
10,350 00
13.050-00
7,374-00
3-15
3-97
2-24
734-14
1.358-43
1,044-13
1-49 1,088-49
2-75 1,598-63
2-11 1,590-24
1-61R
2-32R
2-32R

623
PLAN
»l§ 1 9 8 5 -8 6 § ' 1 9 8 9 -9 0and Annual Plans of Punjab 1985-86 to 1989-90
GTTI?>T
(sT y(Lakh Rupees)
Annual Plan (1987-88)
ActualExpenditure
y o g
Percentage to
total Expenditure
Annual Plan (1988-89)
ActualExp.
Annual Plan (1989-90)
Annual Plan (1990-91)
ftfST
y g g WdlH Uqu ??Td|d
( ^ t f ) §
W 'd [ ; i r
Percentage to
total Exp.
Approved
Outlay
Percentage to
total Outlay
ApprovedOutlay(State)
Devalu- tion of funds to district
TotalOutlay
Percentage to
Total Outlay
10 11 12 13 14 15 16
28 *00 0-03 32.34 0.04 55.00 0-06 99-00 — 99 00 O i l
31 -00 0-04 40.25 0.06 47.00 0-06 45-50 12-00 57-50 0-06
59 -00 0-07R 72.59 O.lO 102.00 0-12 144-50 12-00 156-50 0 1 7
21 -98R 0-02 632.18 0.89 2,100.50 2-66 167-00 2 ,423-00 2 ,5 9 0 0 0 2-86
48 -00 0-07 80.00 0.11 113.00 0-14 150-00 — 150-00 0 -l7
11 15 0-01 13.08 0.02 24.50 0-03 15-87 — 15-87 0-01
— — — — 1.00 0-0012 2 00 — 2-00 0 0 1
0-58R 0-00 12.36 0.02 1.00 0 0012 4 -00 — 4-00 0 0 0
81 -71 0-10 737.62 1.04 2,240.00 2-84 338-87 2,423 00 2,761-87 3-05
1,080-43 1-36 1,765.68 2.47 2,129.26 2-69 4 1 6 0 0 1,231-50 1.647-50 1-82
334 *64 0-42 440.73 0.62 525.00 0-66 1,000-00 — 1,000-Oo 1-10
105-15 0-13 88.78 0.12 190.00 0-24 339-00 — 339 00 20-37
161-65 0-20 451.83 0.63 703-42 0-89 106-14 823*86 930-00 1-03
1 ,1 3 3 1 2 1-43 1,254,25 1.76 2,100.00 2-66 834 05 1,147-45 1,981-50 2-19
1.748-29 2-21 2,017.25 2.83 2,550.00 3-23 — 3,225-00 3,225-00 3-56
11,4 37-80 1-81 1,070.96 1.50 9,070.00 11-49 2,590-56 503-00 3,093-56 23-42
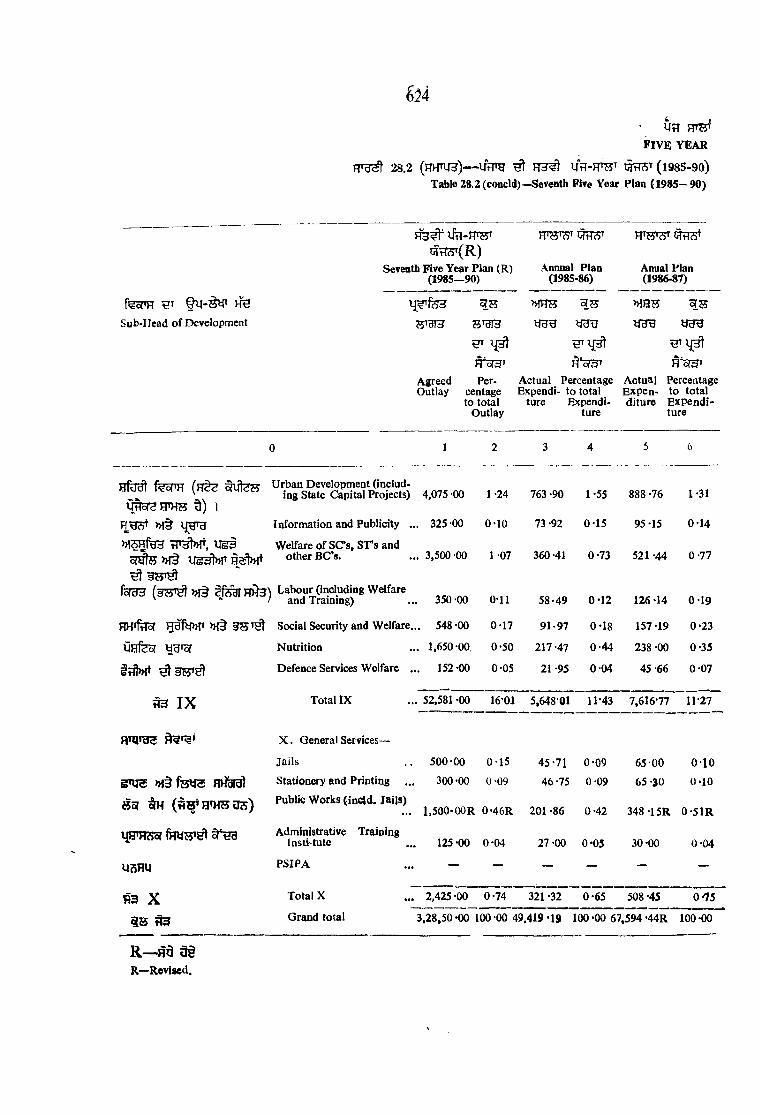
• 5tT
FIVE y e a r
28.2 (HHnjH)— ^ H 3 ^ i f t l - H W ( i 9 8 5 -9 0 )Table 28.2 (concld)^S8Venth Five Year Plan (1985— 90)
^54
R 3 # IW-JTOT
^ S tW (R )Seventh Five Year Plan (R)
(1985—90)
F T H W ’t t W
Annual Plan (1985-86)
Anual Plan (1986-87)
feoTO HH >HHW
Sub-Head o f Development ?5Tgj3 5 'd fd y j t j
H Hc^d'
Agreed Per- Outlay centage
to total Outlay
Actual Percentage Expendi- to total
ture Expenditure
Actual Percentage Expen- to total diture Expendi
ture
0 1 2 3 4 5 6
hM feajTH e l i t e s
1
Urban Development (includ- ing State Capital Projects) 4.075 -00 1 2 4 763 -90 1*55 888 -76 1-31
>H§ IJRTU Information and Publicity . .. 325-00 0-10 73-92 0-15 95-15 0-14
, U g i Welfare o f S C s . ST’s and S W t e » l§ U g ^ e ^ other BC s.
^ s jw y lfsrUH HH3) Labour (including Welfare
' *• / and Training)
.. 3,500-00
.. 350 -00
1-07
0-11
360 -41 0 *73
58-49 0 -12
521 -44
126 -14
0-77
0-19
HH«rtT'6f >H§ Social Security and Welfare. .. 548 -00 0-17 91-97 0-18 157-19 0-23
UHfecf yU ’o? Nutrition .. 1,650-00 0-50 217 -47 0 -44 238 -00 0-35
i t f M Defence Services Welfare . 152 -00 0-05 21-95 0-04 45-66 0-07
^ IX Total IX 52,581 -00 16-01 5,64801 11*43 7,616-77 11-27
HTQjg® X . General Services—
Jails 500-00 0-15 45-71 0-09 65 00 0-1 0
enjg »H§f3Ws Stationery and Printing .. 300-00 0-09 46 -75 0 -09 65 -30 0-10
Ho( (fi a*H75U3) Public Works (incld . ja ils)1 ,500-OCR 0-46R 201*86 0-42 348 -15R 0-51R
IJHTISc? Administrative Training Institute 125 -00 0*04 27-00 0-03 30-00 0-04
usw PSIPA — — — — —
W3 X Total X , 2,425 *00 0-74 321-32 0-65 508-45 0-75
5s ^ Grand total 3,28,50 -00 100 -00 49,419 *19 100 -00 67.594 -44R 100-00
R —R—Revised.
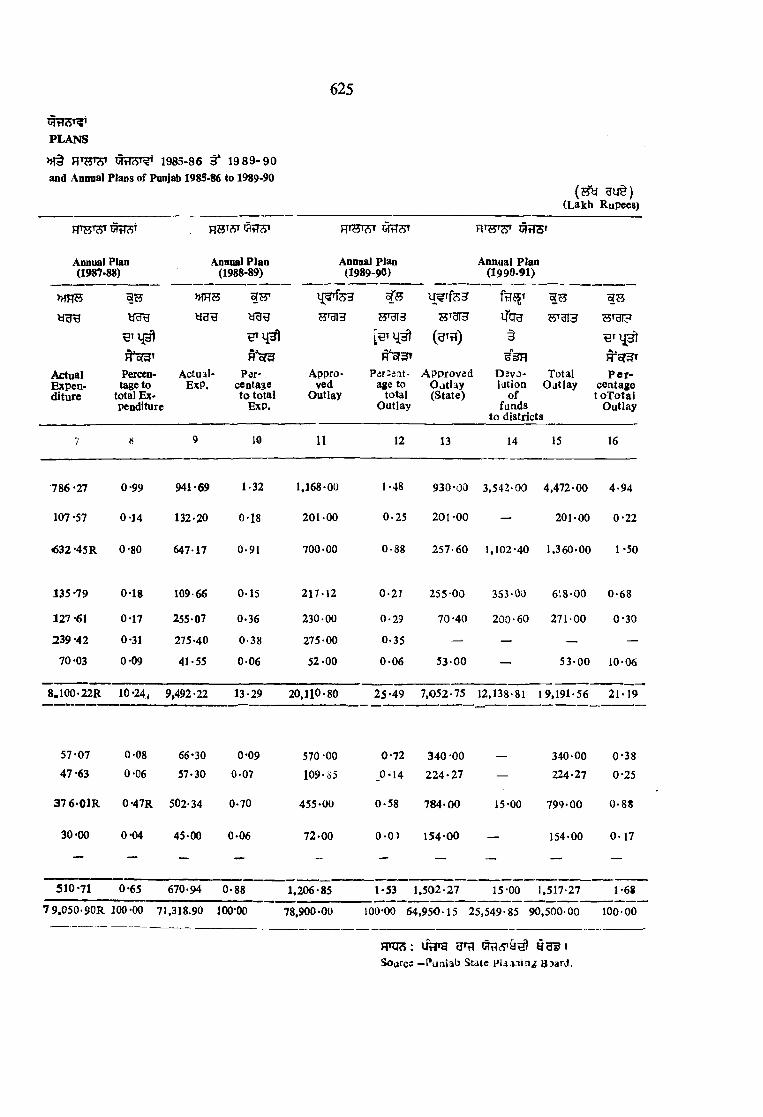
6 2 5
PLANS
» !§ 1985-86 ^ 1 9 8 9 -9 0and Annual Plans of Punjab 1985-86 to 1989-90
( 5 jy g u t )(Lakh Rupees)
FTSW^TIcST H H W ^i73T
Annual Plan (1987-88)
Annual Plan (1988-89)
Annual Plan (1989-90)
Annual Plan (1990-91)
» m s >HHS fH{5^
y a g y u g J5'dl3 HT'dId
(3 'H ) §
t a 3 >
ActualExpenditure
Percentage to
total Expenditure
ActualExP.
Percentage to total
Exp.
Approved
Outlay
Par33it’ age to
total Outlay
A pprovedO atlay(State)
D3V0- lution
o f funds
to districts
TotalO atlay
P e r centage
t o T o ta l O utlay
7 9 10 11 12 13 14 15 16
786 -27 0-99 941-69 1-32 1,168-00 1-48 930-00 3 .542-00 4 ,472-00 4 -94
107 -57 0-14 132-20 0-18 201-00 0 -2 5 2 0 1 -0 0 — 201-00 0 -2 2
« 3 2 -45R 0-80 647-17 0-91 700-00 0 -88 2 5 7-60 1 ,102-40 1 ,360-00 1-50
135 -79 0-18 109-66 0-15 217-12 0-27 2 5 5 -0 0 353-00 618-00 0 -6 8
327 -61 0-17 255-07 0-36 230-00 0 -29 70-40 2 0 0 •6 0 271-00 0 -3 0
239 -42 0-31 275-40 0-38 275-00 0-35 — — — —
70*03 0-09 41-55 0 -06 52-00 0 -0 6 5 3 -0 0 — 5 3 -0 0 10-06
8 .1 0 0 -22R 10 -24, 9,492-22 13-29 20,110-80 2 5 -4 9 7 ,0 5 2 -7 5 12,138-81 19 ,191-56 2 1 -1 9
5 7 -07 0-08 66-30 0-09 570 -00 0 -72 3 4 0 00 340-00 0 -3 8
47 *63 0-06 57-30 0-07 109-85 ^0-14 2 2 4 -2 7 — 224-27 0-25
37 6 01R 0-47R 502-34 0-70 455-00 0 -5 8 7 8 4 -0 0 15-00 7 9 9 -0 0 0 -8 8
30-00 0-04 45-00 0-06 72-00 0 - 0 ) 1 5 4-00 — 154-00 0 -1 7
510-71 0-65 670-94 0-88 1 ,206-85 1*53 1 ,5 0 2 -2 7 15-00 1,517-27 1-68
7 9 .050-90R 100-00 71,318.90 100-00 78,900-00 100-00 64 ,9 5 0 -1 5 25 ,549-85 90 ,500-00 100-00
F rq3 ; UH»a IS ojrcs -P u n ia b Stale P la i .i ia i BJard.


f e u »!SiTgi # fg sT »^§ s a i^ in f s o ? !^ § a a t , g ^ 3 3 , 7m
ntfOH & I f^ T ter fpB MSFT & I
fl»33l 29.1 1965.66 1970_71 197 5. 7 0 1980-81 >Ht 1983-84 3* 1988-89 ^9w 3 3 3 1 , » i t o t h b 9 i
FT331 29.2 »!§ 29.3 FTS* t MTOS, M§ qfe ft*5r3» fSIW3^ n fg ^ 3 S I
FT^^ 29.4 FPS 1960-61, 1970-71,1975-76, 1980-85 1 »)it 1983- 8 4 198 8-89 3a[ MtT«^ » n * sa ra irfasfT ?* ? h ‘ , gsrar, »i ^ h s >h^ y g t j h h ?? u i?? j
29.5 » it 29.6 RTg 1988-89 3Sl SarJUffS^r^ gl f ^ 0 Tg *>!§ a s I
FT»33! 29.7, 29.8 >H§ 29.9 Ffrs 1988-89 SS1 liTTS t 3aT3 q5T3 2J7S* ^ 9339 , »fHHS >n § ft I
29.10 ^3* g»g arel \
SECTION XXIX
LOCAL BODIES
This sectiott deals with statistics of area, populatioa, coastjitution, iicooie aad expeaditure of Zila Parishads and Muaicipal Corainittees in Punjab. Data are giwen according to financial year.
Table 29.1 depicts area, population, number, income and expenditure of Zila Parishads for 1965-66, 1970-71, 1975-76, 1980-81 and from 1983-84 to 1988-89.
Table 29.2 and 29.3 show incomej expenditure and its percenitage under different heads over a number o f years.
Table 29.4 shows population, area constitution, income and expenditure of Municipal Oommitteei in the Punjab for 1960-61, 1970-71, 1975-76, 1980-81 and from 1983-84 to 1988-89.
Tables 29.5 and 29.6 show the income and expenditure of Muinicipal Committees during 1988-89 !n detail and district-wise.
Tables 29.7, 29.8 and 29.9 giva constitution, income and expemditure, position of active Improvement Trusts in Punjab for the year 1988-89.
Table 29.10 gives the information relating to Panchayat Electioaia.
627
» > ! 5 ^ 2 9

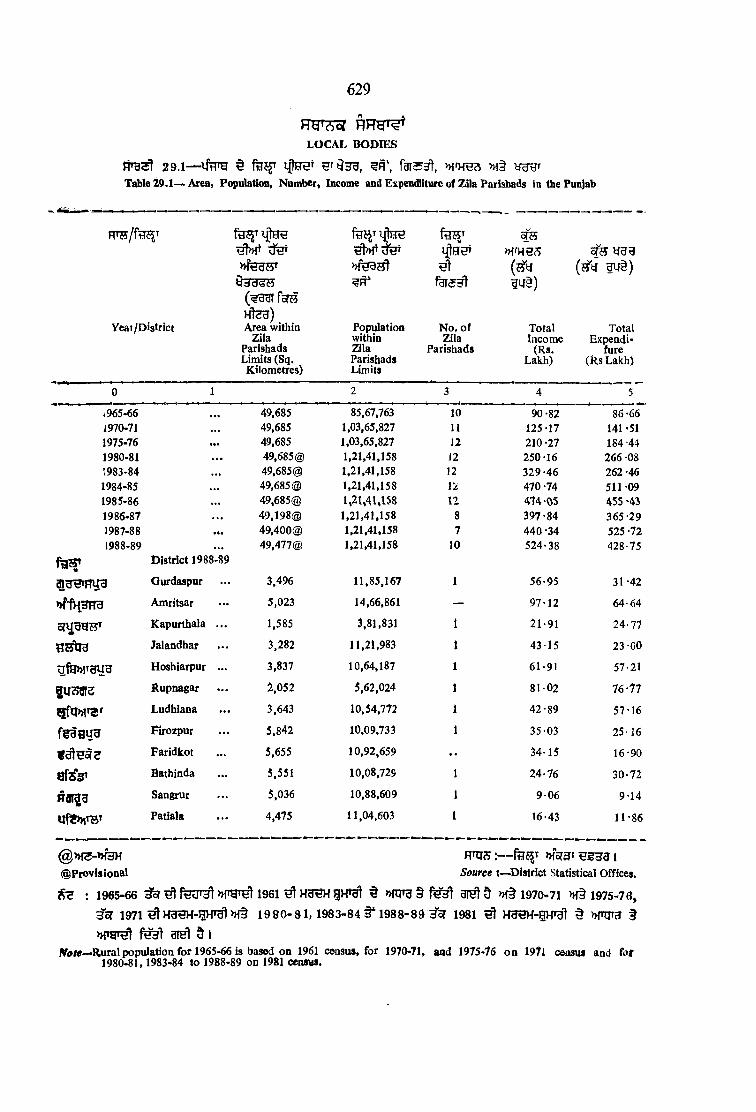
R W c ?
LOCAL BO DIES
2 9 .1 -— UtTO fe2fT »ff>fe^ m §
ta b le 29.1— Area, Population, Namber, Income and Expenditure of ZUa Parishads ia the Punjab
629
ITO /fiTSi
Year/Distfict
(< ^ 3 i fofH H teu)Area within
Zila Parishads Limits (Sq.
Kilometres)
PopulationwithinZilaParishadsLimits
H i
N o . of Zila
Parishads
g a § )
TotalIncome
(Rs.Lakh)
Total Expeadi-
fure (R s Lakh)
0
*965-661970-71
49.68549.685
85,67,7631,03,65,827
1011
90-82125-17
86 -66 141*51
1975-76 49,685 1,03,65,827 12 210-27 184 -441980-81 . . . 49,685@ 1,21,41,158 J2 250-16 266 -081983-84 • •• 49,685@ 1,21,41,158 12 329-46 262 -461984-85 49,685 @ 1,21,41,158 12 470 -74 511-091985-86 49,685@ 1»2U4U158 12 414-05 455 *431986-87 49,198@ 1,21,41,158 8 397-84 365 -291987-88 • •• 49 ,400® 1,21,41,158 7 440 -34 525 -721988-89 49,477® 1,21,41,158 10 524*38 428-75
District 1988-89
Gurdaspur 3,496 11,85,167 1 56-95 31-42
Amritsar 5,023 14,66,861 — 97-12 64-64
Kapurthala . . . 1,585 3,81,831 1 21-91 24-77
t I 2 ^ 3 Jalandhar 3,282 11,21,983 1 43-15 23-00
Hoshiarpur ... 3,837 10,64,187 1 61-91 57-21
g u s a r s Rupnagar i ,0 5 2 5,62,024 1 81 02 76-77
Ludhiana 3,643 10,54,772 1 42-89 57-16
f e g e y g Firozpur 5.842 10,09,733 1 35-03 25-16
Faridkot 5,655 10,92,659 • • 34-15 16-90
a f s V Bathinda 5,551 10,08,729 1 24-76 30-72
Sangrur 5,036 10,88,609 1 9-06 9-14
Patiala 4,475 11,04,603 1 16-43 11-86
@ >H 5-»i3M H n j s : - >jfor3t Hi&33 1© P rovisional Source t—.District Statistical Offices.
: 1965-66 ^ ^ 1961 H91?H gHt^ % 31^ 5 1970-71 »ft 1975-73oT 1971 ^Vra^-HVf^>H§ 19 8 0-81,1983-84 3^1988-89 35? 1981 ^ H3^-gHrgt % W ? t
» r a T ^ 3 1 ^ d IfV’ /^^H.ural population for 1965-66 is based on 1961 ceosus, for 1970-71, and \91S-16 o n 1 9 tl census and fof
1980-81, 1983-84 to 1988-89 on 1981 census.

6 3 0
LOCAL
29 .2— in r a i^ a e 'Table 29.2 —Income o f Zila Parishads
FTO/ftT55T
Year/District
Income from
era TPS c S ^
M 3 t e ^Local %age to Taxes %age toRate Total Total
incom e Income
Fees
1 ( ^ 3 3 ' H r f e ^ e 4 3 t e 3 T
%age to Board’s %age to Edu- Total propelty T otal cation Income Income
0 1 2 3 4 5 C 7 8 9
1965-6ft ... 33 -82 37 -2 — 0-57 0 -9 2-95 3-3 —
1970-71 51 -03 40 -8 — ~ 0-75 0*5 8-51 6-8 -
1975-76 54 66 26-0 0-4;5 0-2 0-69 0-3 5-79 2-7 —
1980-81 ... 48-53 19 4 2 -31 0*9 0-79 0-3 12-60 5 1 —
1983-84 49 07 14-9 — . — 0-92 0 -3 23 ‘75 7 -2 —
1984-85 . . . 48 -54 10-3 — — 0-94 0-2 31 -52 6-7 1 -97
19g5-86 43 -30 9-1 — — 6-75 1-4 30 -36 6*4 8-41
1986-87 .i. 51 -33 12-90 — — 0 -89 0 -2 2 38-48 9-67 17-27
1987-88 •i. 44-50 10 -11 — — 0 -89 0-20 58-80 13 35 11 -48
1988-89 . . . 48-00 9-15 0 0)9 0-02 0-81 0-15 66-85 12-75 0-19
D istrict 1988^89
3LB€TRyg Gurdaspur ... 6 -1 9 10-87 — — 0 -05 0 -09 1 2 2 8 21-56 ~
Amritsar 7-91 8-14 — — 0-07 0 -0 7 3-22 3-32 -
onjuQRT Kapurthala ... 1-41 6 -44 — — — — 0 -22 1-00 —
' f j m u Jalaodhar ... 3-10 7 -18 — — 0-27 0-63 — — —
qfHMTgyg H oshiarpui ... 3 -13 5-06 — ~ 0 1 7 0 -2 7 2-69 4-35 '
fU A d ie Rupnagar ... 2 -74 3-38 — — 0 -0 4 0-05 7-24 8 ‘94
Ludhiana ... 4-11 9-58 0- 09 0-21 — — 2 3 -96 55-86 -
Firozpur ... 6 0 8 17-36 — — 0*16 0 -46 5-48 15-64 -
Faridkot 8-02 23-48 — — 0 -0 5 0 -15 — —
Bathinda 2 -3 0 9-29 — — — — 3-44 13-89 -i-
R 3i^g Sangrur 1 -23 13-58 — — — — 3-42 37-75 —
Ufe>H^5T Patiala 1'78 10-83 — — — — 4 -90 29-82 0 -0 9
@ 500 3" lifebelow Rs 500
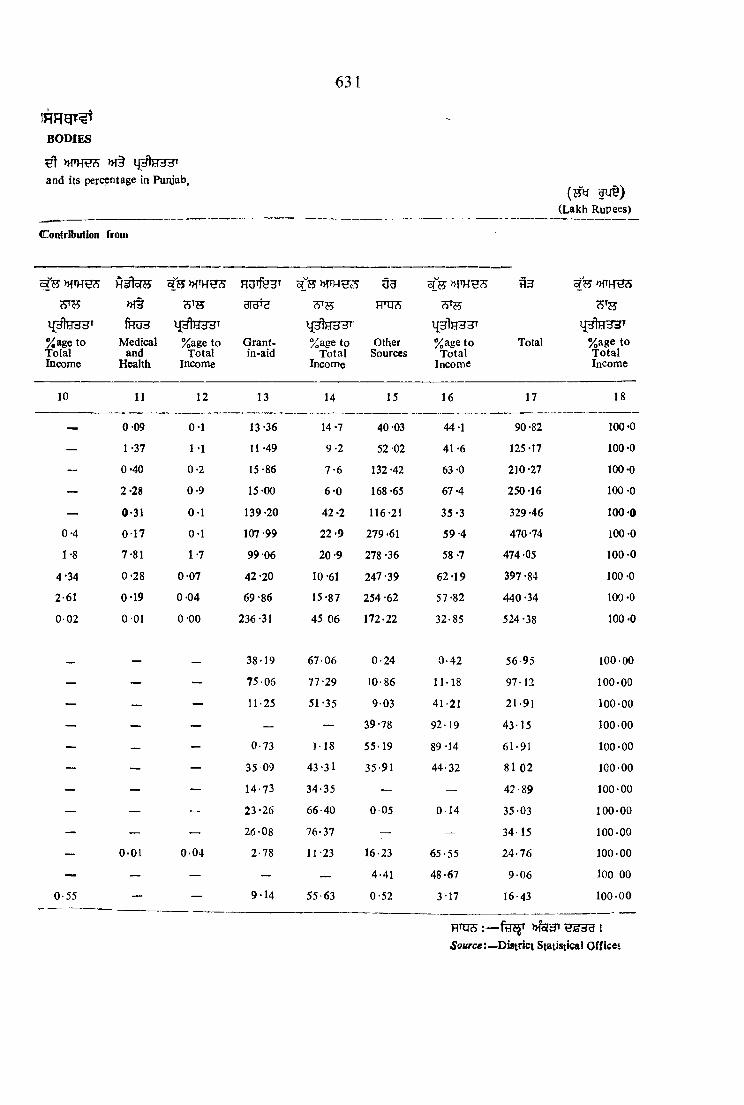
6 3 1
BODIES
and its percentage In Punjab,
(Lakh Rupees)
(Contribution I'roni
MHteH3T
%age to T otal Income
lJ 3 te H T
%age toTolalIncome
^3\E3^3^%age to
Total Income
dld'ci
Grant-in-aid
u e
H'UcS
OtlierSources
■ElB
%age to Total
Income
Total
fWOd
Medicaland
Health
%age to T otal
Income
10 11 12 13 14 15 16 17 18
— 0-09 0-1 13-36 14*7 40 -03 44-1 90-82 100 *0
— 1-37 1 1 11-49 9-2 52 -02 41-6 125-17 100-0
— 0-40 0-2 15-86 7 -6 132 -42 63 -0 210-27 100-0
— 2-28 0-9 15-00 6 -0 168 -65 67-4 250-16 100-0
— 0-31 0-1 139-20 42 -2 116-21 3 5-3 329-46 100-0
0-4 0 1 7 0-1 107-99 2 2-9 279 -61 5 9-4 470-74 100-0
1-8 7-81 1*7 99 06 20-9 278 -36 58 -7 474 -05 100-0
4-34 0-28 0 -07 42 -20 10-61 247 -39 62-19 397 -84 100-0
2-61 0-19 0 -04 69-86 15-87 254 -62 57-82 440-34 100 -0
0 0 2 0 01 0 00 236 -31 45 06 172-22 32-85 524-38 100-0
_ — _ 38-19 67 06 0 -2 4 0 -4 2 56-95 100-00
— — — 75 06 77-29 10-86 11-18 97-12 100-00
— — — 11-25 51-35 9-03 41-21 21-91 100-00
— — — — — 39-78 92-19 43-15 100-00
— — 0-73 1-18 55-19 89-14 61-91 100-00
— — — 35 09 43-31 35-91 44-32 81 02 100-00
— — — 14-73 34-35 — — 42-89 100-00
— — — 23*26 66-40 0 0 5 0 -1 4 35-03 10 0-00
— — — 26-08 76-37 — — 34-15 100-00
— 0 0 1 0 -0 4 2-78 11-23 16-23 65-55 2 4 -76 100-00
— — — — — 4-41 48-67 9 -0 6 100 00
0-55 — — 9 -14 55-63 0-52 3-17 16-43 100-00
•Sofirce:—District Statistioal Offices

632
R g r ^ o f
LOCAL
2 9 .3 - ^ i i ’t r g
Table 29.3-'Expenditure of Zila Parishads
HrfcC
% agetototalExpt.
i m w
%age to total
Expt.
Year/District Establishment
iTjhjdsJT
%age to totat Expt.
Roads Education
0 1 2 3 4 5 6
1965-66 21 -72 25 -0 20-36 23-5 0-63 0-8
1970-71 42-30 29-9 25 -77 18-2 2-09 1-5
1975-76 56-00 30 -4 13-14 7-1 0-05 —
1980-81 81 -90 30 -8 2 -J6 0-8 0-27 0-1
1983-84 122 -67 46-7 2-92 1-1 0-10 0-1
1984-85 119-83 23-4 1 -94 0-4 4-40 0-9
1985-86 134-51 29-6 2-28 0-5 9-96 2 -2
1986-87 130 -08 35-61 6-67 1 -83 33 -14 9-07
1987-88 157-93 30 -04 21-04 4 -OO 35 -03 6-66
1988-89 180-69 42-14 2-44 0-57 20-21 4 71
f ^ r District 1988-89
Gurdaspur 21-47 68-33
Amritsar 41-48 64-17 — — — —
3-42 13-81 — — — —
Jalandhar 20-25 88-04 — — — —
ilftpiTUira Hoshlarpur 6-11 10-68 2 -1 6 3-78 — —
fU Rupnagar 12-37 1 6 -U — — — —•
Ludhiana 26-65 46-62 0 -23 0 -40 8-87 15-52
f e u tw g Firozpur 21-15 84-06 — — — —
Fandkot
Bathinda
10-90
4 -70
64-50
15-30 I6 -0 0
5-34
3 5 -5 0
17-38
Rgfug Sangmr 5-31 58-10 — — — —
ufe)j!THT Patiala 6-88 58-01 0 -0 5 0-42 — —

B O D IES
^ )H§
and it9 percentage in Panjab,
633
( 5^ 9 y § )(Lakh Rupees)
>H§
fHU3M edical
andHealth
lj5tH53T
%age to total Expt.
m ,
Veterinary %ag(j to total Expt.
OthersExpendi
ture
%ag to total Expt.
TotaJ
10 11 12 13
l j 3 b 3 3 T
%age to total Expt.
14
6-83 7.9 7-15 8-2 29 -97 34-6 86-66 100-0
4-65 3*2 6-45 4 -6 60 -25 42-6 141*51 100 -0
5-26 2*8 7-66 4-2 102 *33 55-5 184*44 100 -0
9*60 3*6 12-05 4-5 160-10 60-2 266 -08 100-0
5-06 1-9 10*30 3-9 121 -41 46-3 262-46 100*0
4*26 0-8 5-97 1 -2 374-69 73 -3 511 -09 100 -0
5-02 1 -1 7-30 1 *6 296 -36 65 -0 455 -43 100-0
6 '65 1 -82 5*13 1-40 183-62 50 -27 365 -29 100-00
4 -83 0'92 4 -9 7 0-95 301 -92 57 -43 525 -72 100 -OfJ
3 -7 9 0-88 5-17 1 -21 216-45 50*49 428 -75 100-00
0'20 0-64 0*04 0-13 9-71 30-90 31-42 100*00
D -09 0 -14 0 -06 0 -0 9 23*01 35-60 64-64 100*00
— — — ~ 21-35 8 6 1 9 24-77 100*00
— — — — 2-75 11*96 23 00 100*00
3 -3 9 5-93 5 06 8 8 4 40 49 70-77 57*21 100*00
— — — 64-40 83-89 76-77 100-00
— — — — 21-41 37-46 57-16 100-00
0 0 5 0-20 — - 3-96 15*74 25-16 100-00
— — — — — — 16-90 100*00
0 -0 6 0-20 0 0 1 0 03 20 61 67-09 30-72 100-00
— — — — 3-83 41*90 9-14 100*00
— — — — 4-93 41-57 11-86 100-00
H S 3 B 1
.S'f7«rc«t—District Statistical Offloei.

LOCAL BODIES
29.4—UtTO Uofgr, H^BfeU, WH^S »!§ ^3^Table 29.4— Number, Population, Area,, Membership, Income and Expenditure of Municipal Committees/Corpora'
tions in Punjab.
634
W E jfiJW
Ycar/Districi Niumberof
Muinicipalcomimittees
N am e o f Muinicipal Connmittee
cS'dId- Sdld- i r f e s r in??5p
PopUla- tion .
within (^9BTMunicipal f^f. hV. ) Commit- ' .tee limits Areii within
Municipal .^Comm ittee
limits
N uraber of MembersRBoPcfi 3T3
Official Nonofficial
(Sq. Kms.)
Total
y ^ 3(OOO I :) (OOO B:) Income Expendi-
(000 Rs) ture (000 Rs)
1960-61 ... 103 24,42,344 7 773 780 41,828 38,635
1970-71 103 31,17,882 16 1,123 1,139 1,04,693 1,02,139
1975-76 . . . 103 31,17,882 41 1,283 1,324 2,53,096 2,53,915
1980-81 105 43,08,150 115 1,512 1.627 5,06,184 5,27,717
1983-84 . . . 105 43,32,079 443 1,032 1,475 8,70,580 8,73,407
1984-85 106 43,79,318 326 1,176 1,502 9,67,631 9,47,607
1985-86 . . . 106 43.85,747 1.123-20 — 19 19 11,71,303 11,45,525
1986-87 108 44,04,152 11 ,64-10 19 48 67 12,87,987 12,83,344
1987-88 108 44,02,871 ]11,99-80 10 58 68 13,40,684 13,53,076
1988-89 . . . 108 44,02,871 n , 99-80 22 48 70 23,24,361 22,62,543
<jld€'Hy^ 1. u iH H w ra Gurdaspuir .. 39,529 10-85 — — — 11,301 10,838
Gurdaspur 2. Patbankot .. 1,10,039 20-98 — — — 20,060 19,929
3. D in a N a g a r .. 13,078 10-36 — — — 2.603 2,572
4. Batala .. 1,01,966 8-75 — — — 16,294 15,633
5. o i '^ W Qadian . 16,424 9-06 — — — 1,646 1,614
6 . Ht4'(SUe Sujanpur ... 13,095 0-31 — — — 726 684
7. U'dl€^H Dhariwall .. 12,212 3-29 — — — 2,363 1,993
8. Shri Har/gobindpur. 3,215 0 -52 —- — — 226 232
9. Fatehgarh Churian. .. 9,372 1 .50 — — — 2,008 1,729
10. D era Batoa N anak . 6,212 0-78 — — — 927 534
Total .. 3,25.142 66-40 — — — 58,154 55,758
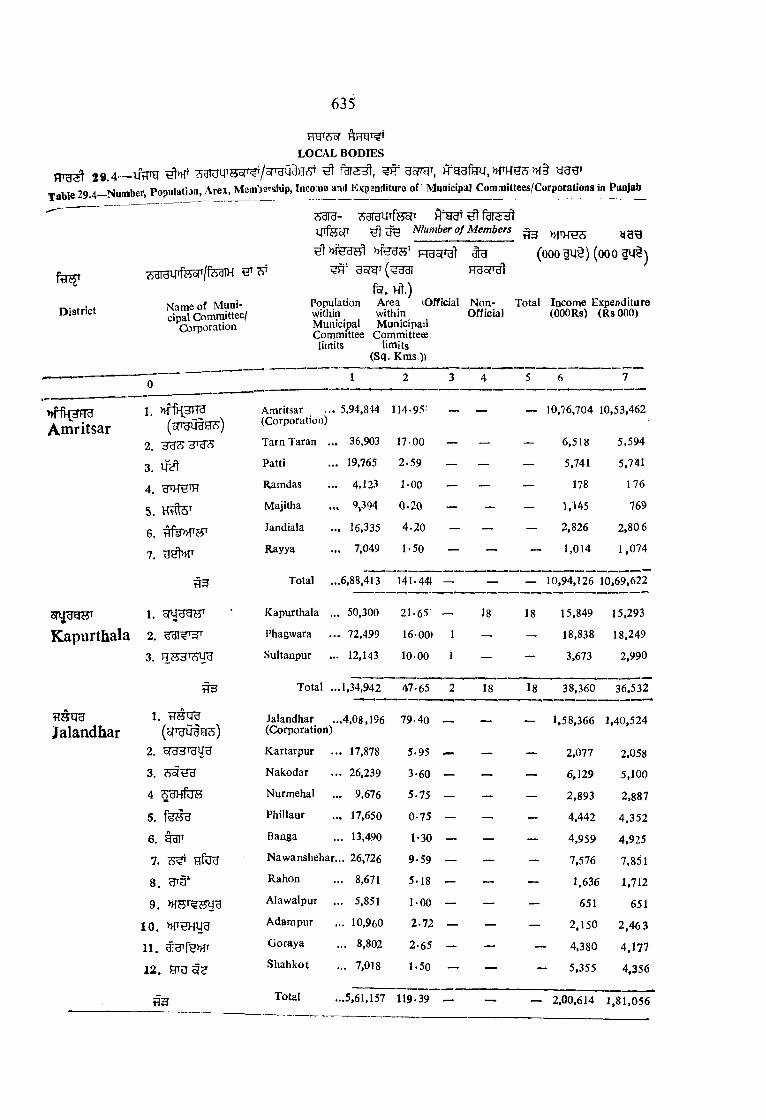
6 3 5
LOCAL BODIES
2 9 , 4 — UTTg f S T ^ , )T ggfeU , »THH5Table 29 4—Number, Populatian, Area, Membevship, Income and Expenditure of Municipal Committees/Corporations in Punjab
^ ^3TU- 33Taifffe5fT H W ^ f a i ^yrfesfT NIumber oj Members ^ » | t h ^
Rasral (oooiy§) (oooaut\H35fTUt
fsf. Ht.)Population Area (Official N on- Total Income Expenditure
District
?jgrairfe5r/fe3TH
Amritsar
Name of Municipal Committee/
Corporation
ZrUdtjrfi
Kapurthala
Jalandhar
1 .(oFgUHH??)
2.3.4.
5.
6.
7.
1.
2.
3.
1. TISqH (sfrguta??)
2. oraHTHUg
3.4
5. feSU6. O T
7. Hfeg
8.9. >HHT??5yB
10 .1 1 .12.
within within Municipal Municipal! Committee Committees
limits limits
Official (OOORs) (RsOOO)
(Sq. Kms.))
1 2 3 4 5 6 7
Amritsar(Corporation)
5,94,844 114-95: — — — 10,76,704 10,53.462
Tarn Taran ... 36,903 17-00 — — — 6,518 5,594
Patti 19,765 2.59 — — — 5,741 5,741
Ramdas 4,123 1-00 — — — 178 176
Majitha > V 9 4 0*20 — — — 1,145 769
Jandiala . 16,335 4.20 — -* — 2,826 2 ,8 0 6
Rayya . 7,049 1-50 — — — 1,014 1 ,074
Total .. .6,88,413 141.441 — — — 10,94,126 10,69,622
Kapurthala . 50,300 21-65 —. 18 18 15.849 15,293
Phagwara . 72,499 16-001 1 — — 18,838 18,249
Sultanpur 12,143 1 0 0 0 1 — — 3,673 2,990
Total .. .1.34,942 47-65 2 18 I s 38,360 36,532
Jalandhar(Corporation)
..4,08,196 79 40 — — 1,58,366 1,40,524
Kartarpur . 17,878 5.95 — — — 2,077 2,058
Nakodar . 26,239 3-60 •— — — 6,129 5,100
Nurmehal ,. 9,676 5.75 — — —■ 2,893 2,887
Phillaur . 17,650 0-75 — - - 4.442 4 ,3 5 2
Banga .. 13,490 1-30 — — - - 4,959 4,925
Nawanshehar. .. 26,726 9-59 — — — 7,576 7,851
Rahon .. 8,671 5 .18 — — — 1,636 1,712
Alawalpur .. 5,851 1-00 — — — 651 651
Adampur .. 10,960 2-72 — — — 2,150 2 ,46 3
Goraya ... 8,802 2-65 — — 4,380 4.177Shahkot ... 7.018 1.50 — — 5,355 4.356
Total ..5,61,157 119-39 —- — — 2,00,614 1 ,81 .056
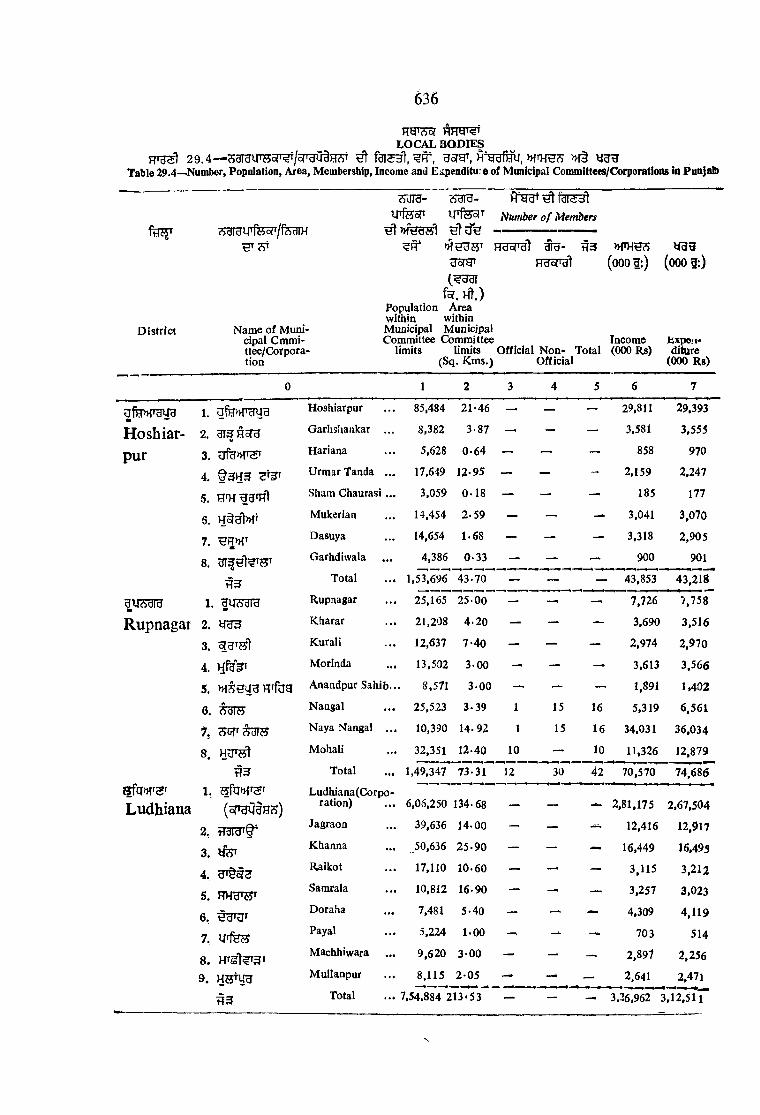
LOCAL BO D IES2 9 .4 — Hgrairgf^T^/oPHU^HcS^ ^ UoT , H tJdfMU, >H§
Table 29.4—Number, Population, Area, Meuabership, Income and £:^penditu;e of Municipal Committees/Corporations in Pun]al)
6 3 6
(S^THirfesr/fegrH^ 7 ?
Number o f Members
D istrict Nam e o f Municipal Cmmi- ttee/Corpora- tion
irfeoTT l|Tfe5jT
Hdo<'dlUofW Hdoi'dl(^ 391
f^ . H t.)Population Area within within Municipal Municipal
( o o o l : ) ( o o o i : )
lacomeCommittee Committee limits limits Official N on- Total (000 Rs)
(Sq. K m s.) Officialditure
(000 Rs)
0 1 2 3 4 5 6 7
1. q fn » r n y 3 Hoshiarpur 85,484 21-46 — — — 29,811 29,393
Hoshiar- 2. Garhsliankar 8,382 3-87 — — — 3,581 3,555
p u r 3. Hariana 5,628 0 -6 4 — — — 858 970
4. Urmar Tanda 17,649 12-95 — - 2,159 2,247
5. Sham Chaurasi 3,059 0 -1 8 — _ — 185 177
s. Mukerian 14,454 2 .5 9 — — — 3,041 3,070
7. Dasuya 14,654 1-68 — — — 3,318 2,905
8. Garhdiwala 4,386 0-33 — — — 900 901
Total 1,53,696 43-70 — — 43,853 43,21^
gucs-di'dm 1. l u s g r a Rupnagar 25,165 2 5 -00 — — — 7,726 7,758
Rupnagat 2. y d d Kharar 21,208 4 -2 0 — — — 3,690 3,516
3. q g f S t Kurali 12,637 7 -40 — — — 2,974 2 ,970
4. Morinda 13,502 3-00 — — — 3,613 3 ,566
5. » is:tra g Ffffag Anandpur Sahi 8,571 3 -0 0 — — — 1,891 1,402
6. Adlii' Naagal 25,523 3-39 1 15 16 5,319 6,561
7j c^cr c!>dr25 Naya Nangal 10,390 14-92 1 15 16 34.031 36,034
8 . Mohali 32,351 12-40 10 — JO 11,326 12,879
Total 1,49,347 73-31 12 30 42 70,570 74,686
1. Ludhiana(Corp
Ludhiana ( c c a u t j js ) ration) 6,06,250 134-68 — — 2,81.175 2.67,504
2 , traiHTf"Jagraon 39,636 14-00 — — 12,416 12,917
3. Khanna J 0 ,6 3 6 2 5 -9 0 — — — 16,449 16,495
4. cJ’9 o(2Raikot 17,110 10-60 — — — 3,115 3,212
5. Samrala 10,812 16-90 — — — 3,257 3,023
6. Doraha 7,481 5-40 — — — 4,309 4,119
7, U f e Payal 5,224 1‘00 — — — 703 514
8 .Machhiwara 9 ,620 3 -0 0 — — — 2,897 2.256
9. H«Tyg Mullaopur 8 ,115 2 -0 5 — — — 2,641 2,471
H 3 Total 7.54.884 21 3 ‘ 53 — — — 3,26.962 3,12,511

6 3 7
HFigr^t
2 9 .4 — IfRTg f%e ^ f3I5?t, gs?gr^ H ^ ggfeu , M fH gST able 29.4—Number, Population, Area, Membership, Income an! Ficpanjitura of Municipal Committees/Corporatioas ia Punjab
?>gT^UTfe5fT
District Name of MunicipalCommi ttee
?)3igi4feorr S3T3a% 5fr H^g^T
^ JH Number o f Members>>fH3c5f --------------------------------H5rgf H 3ofr^ i g ^ 3 ( o d o i : ) (090 3 :)
(^^^Tfsr.H t.)Population Area Income Expendi
within within Municipal MunicipalCommittes Committee Official N on - Total
limits limits o fficia l(Sq. K m s.)
(000 Rs) ture(000 Rs)
0 1
IfeUlJUB 1.
Firozpur 2. ^ 3 .
4.
5. acfHOffe
6. r R ? W W
7.
8. §1^1
Faridkot
Bathinda
Firozpur
Zira
Fazilka
Abohar
Ouru Har Sahai.
Jalalabad
Dhaiamkot
Talwandi Bhai .
.61,162
. 19,581
..43,548
. 86,334
.. 7,684
.. 16.639
. . % m
.. 9,117
11.33
19-42
5.44
14.17
1.50
2 -84
i .iO
2-00
Total .2,53,393 57-80
1. Faridkot ... 42,423 15.00
2. ^ cryBT Kotkapura ... 47,550 14-50
3 . ^ Jaitu ... 26,061 9 -06
4. Hgp Moga ... 80,272 16.10
5. HofyHy Muktsar ... 50,941 13-80
6. Malout ... 40,533 4 .5 0
7 . Giddarbaha ... 26,828 5.75
8. g w y g r j T Bagha Purana ... 14,289 6 -00
Total ...3,28,897 84-71
1. Bathinda ...1,27,363 97-00
2. ^ Kot Fattah . . . 4,973 1-60
3. Bhucho Mandi ... 7,820 2-204. grnygT Rampura Phul ... 31,890 13-10
5. H'A-HT Mansa ... 43,289 28-806. #6-»TOT Goniana ... 8,596 3-00
7. Raman Mandi ... 14,318 2 .36
8. AdlcJ Sangaf . . . 2,859 1-28
3 4 5 6 7
I — 1 17,321 17,261
1 — 1 5,749 5,927
1 — 1 11,077 10,976
1 — 1 21,410 21,692
1 — 1 3,453 3,194
1 — 1 5,248 5,337
1 — 1 1,407 1,397
1 — 1 3,224 3,665
8 — 8 68,889 69,449
— — __ 7,369 7,322
— — — 28,025 27,410
— — — 7,270 6,248
— — — 26,053 25,905
— — — 8,508 7,941
— — — 14,685 14,628
— — — 6,427 6,511
— — — 2,609 2,554
1,00,946 9 8 ,5 1 9
66,401 72,100
506 438
2,647 2,602
6,931 6,885
12,193 12,005
2,923 2,943
4,424 4,484
477 474

6 3 8
LOCAL BODIES
q r g ^ 2 9 . 4 — rtdldU'WoCS'/onBijdHA' ^ fd ied l, H ydfWU, >vf ITFraTable 29.4—Number, Population, Area, Membership, Income, Expenditure of Municipal Committees/Corporations io Pu^jaib
District Name of Municipal Commi
ttee
sgrmjTfesfT
^ > ) f e ^ ^ U% Number oj Members^ >}feusT ------------------------------ >> rH ^ y g ^
Hcjb|T (oooiu§) (ooom §)RUc^iJl
Popula- Area tion within
within M unicipal Municipal Committee Committee lim its Official Non- Total
limits 7 (Sq. K m s.) Official
Income Expendf- (000 Rs) tuf e
(000 Rs)
g f ^ - ( y 3 H ) 9. Baretta 9,494 4 -0 0 — — — 2,611 1,828
Bathinda-• 10. Budhlada 15,968 3-60 _ _ — 5,661 5,229
( c o n c l d . ) 11. H 3 Maur Mandi ... 18,853 4 .8 0 — — — 4,127 4,149
Total 2,85.423 161.74 — — — 1,08,901 1.13,137
1. Sangrur 45,220 13 .90 — — .— 11,983 12,042
Sangrur 2. HOT Malerkotla ... 65,756 4-25 - — — 15,859 16,034
3. Ahmedgarh ... 16,874 3 .08 — — — 6,004 5,928
4. u y l Dhuri 27,100 5 .0 0 — — — 5,787 5.877
5.
6. ^
fiarnala
Tappa - ...
43,680
11,108
16-79 ~ —
2 .4 7 — —
— 13,564
2,424
13,810
2,078
7. sitid Bbadour 13,350 6 00 — - ' — 801 833
8. Uc5«' Dhanaula 13,885 5 .0 0 — — — I,13l 872
9. Sunam 36,180 1 3 .0 0 — — — 7,244 7,328
10. wfodT g r w Lehragaga ... 12,241 5 .8 0 — — — 3,126 2,777
11. 'dW Bhiwanigarh . . . 9,817 2-59 — — — 2,228 2,367
12. 6 dt'^'45 Longowal . . . 12,971 3 .2 5 - — — 1,201 1,027
Total .. 3,08,182 81-13 — — 71,352 70,973
1. Pailala ... 2,06,254 3 1 .20 — _ — 53,546 52,653
Patiala 2 . RH'5' Samana ... 31,282 5-50 — — - 5.372 5,385
3. Rajpura ... 58,645 14-00 — — - 23,040 23 ,j09
4 . >hh; ^ Amloh ... 7,098 2 .6 9 - — - 1,200 1,247
5 . H u fa e Sirhind ... 30,380 11-50 — — - 7,494 7,248
6. d if^ d ld ^ Gobindgarh ... 26,637 9 -0 0 — — — 28,988 27,287
— — — — . 7 . 9 d ' a n t Dera Bassi . . . 7,421 3 .0 6 — — - 1,605 1,630
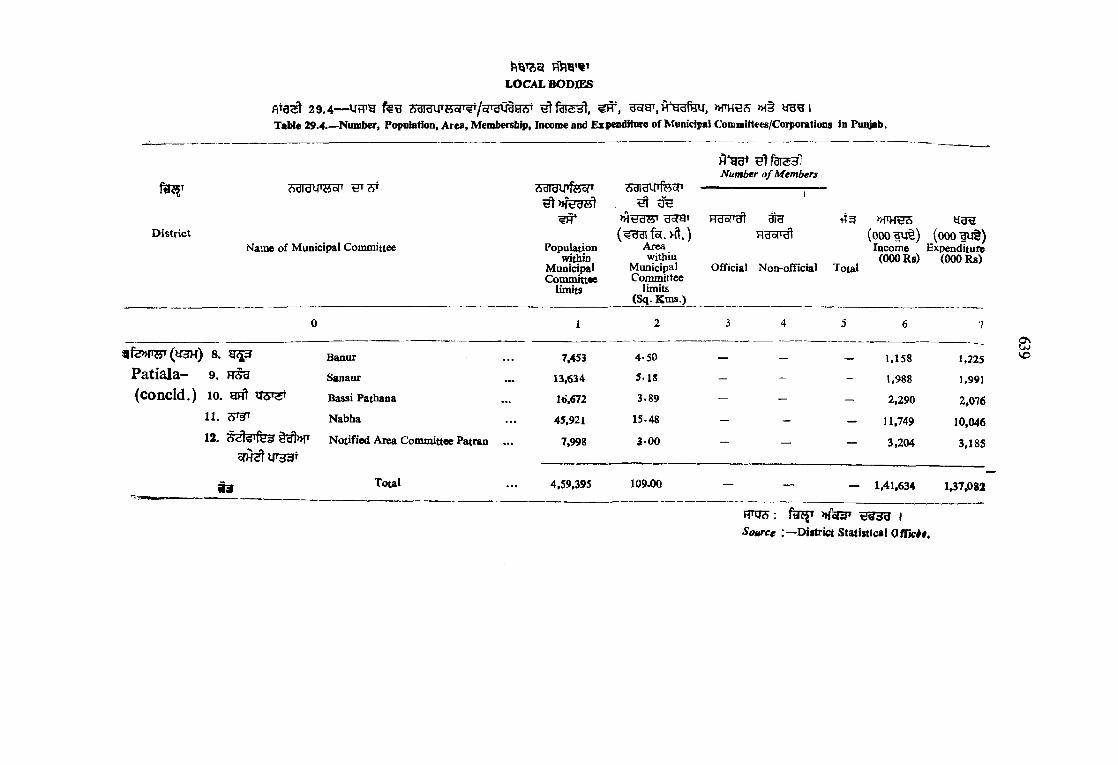
29.4— UtTH ^3raUT?5or /5nuiraHST »FHe5 »H§ yg^ lTable 29.4.—Number, Population, Area, Membership, Income and Expenditure of Municipal Committees/Corporations in Punjab.
LOCAL BODIES
D istrict
AdldU'iiol' SBrgipfscTT
H*ggtNumber o f Members
Rdo/'dl
Hgo(T^Mame o f Municipal Committee Population
withinMunicipalCommittee
limits
Area within
Municipal Committee
limits (Sq. K m s.)
Official Non-official Total
Income (000 Rs)
Expenditure (000 R s)
0 1 2 3 4 5 6 7
i f e » f w ( y 3 H ) 8. Banur 7,453 4-50 _ _ __ 1,158 1.225P a t i a l a - 9 . H(§y Sanaiir 13,634 5 .1 8 — - - 1,988 1,991(c o n c ld .) 10. gnt irs»^ Bassi Pathana lb',672 3.89 — — — 2,290 2,076
11. A-' ' Nabha 45,921 15.48 — — — 11,749 10,04612. N otified Area Committee Patran ... 7,998 3 -0 0 _ __ __ 3,204 3,185
oTH;^ir33T
Total 4,59,395 109.00 — — — 1,41,634 1,37.082
FTO5: >H33T I
Source :—District Statistics! O ftict§,
o \OJVO

H W o r LO CAL BODIES
29.5— m s ITBor^/oPgOtHST 1988-89Table 29.5—Income of Monidpalities/Coiporatimis in Punjab by Districts 1988-89
(ooo(000 lU)
Source o f Income
f U - S f o - fe§tTUg
ira RH W \ [ 3 3313Gurdas- Amrit- Kapur- Jalan- Hoshiar- Rup- Ludhi- Firoz-
pur sar tbala <&ar pur nagar ana purFarid- Bathin- Sangrur Patiala
kot da
6 10 11 12
cSdl'dtl'i^of' ^ ^"3 A . M unicipal Rates and Taxes—
( l ) dd ll Octroi- 33,227 75,675 16,748 1,22,134 22,470 29,121 1,84,008 26,621 63,270 51,658 34,267 89,283
( i i ) u^T i w t e § era Tax on houses and lands 4,299 13,362 3,128 16.773 3,504 4,693 36, 621 5,440 5,515 7,132 6,230 10,569
( i i i ) 9T¥t>HT S Ere Tax on animals and vehicles 26 503 12 535 13 292 49 351 119 171 100 21®
( i v ) < cJs!* » f§ ^ Tax on professional and trades . .. 17 17 147 763 30 1,331 1,895 3^ — 178 115 961
( v ) § Tolls on roads and ferries — 1,284 — 49 — 268 — — — 58 162 50
( v i ) '<t\ Water rates 2,551 22,534 2,778 0,024 2,034 354 16,999 3,422 3,756 2,632 3, 502 7,652
( v i i ) L ightm grate — 1,97,702 — — 1 — 245 — - — — —
( v ii i) dw ^ Conservancy rate 385 6,770 598 190 — 6 197 3 1,057 45 820 18
(ix) uu sre Other taxes 686 67,760 539 17,693 272 1,596 2,752 2,206 820 267 1,514 2,131
Total 4 1 , l 9 l 3,85,607 23,950 1,65,161 28,324 37,661 2,42,766 38,077 74,537 62,141 46,710 1,10,874*H. MoT? » flfte
Qbrd’dl>HTB. Realisation under Special Acts—
er^ori, oTcfTQ t/i>KT af^>KT 5 ’feHH, » f§
From pounds, hackney carriages Licences. Licences for sales o f spirits and drugs etc. 586 — 84 175 145 21 30 93 140 6 40 361
C. Other sources o f revenue
( l ) W q^HJiTOT Rents o f Lands, houses, p ra is.4 ~ ^ * ®st houses, dak bangalows e tc ....
fSM t » r f e § o T ^ |
2,199 717 764 4,326 1220 641 4,804 4,480 3,987 4,786 3,260 4,062
0 \o
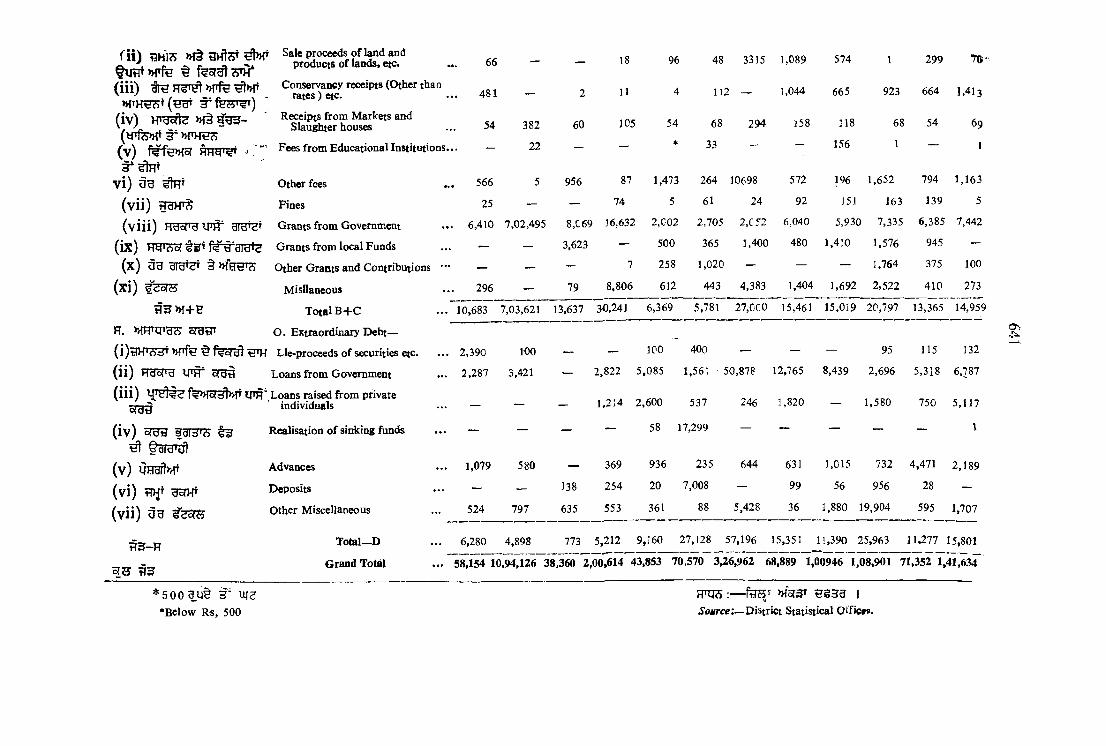
Conservancy receipts (Other than rates ) etc.
Receipts from Markets and Slaughter houses
Fees from Educational Institutions.
C ii) a n l s Sale proceeds o f l^ d and
(iii)
(iv)( y f e » r § -
(v) hhW
vi) og Other fees
(vii) Fines
(viii) Grams from Government
(ix) Frer^of f^ 'y'y iyf;» Grants from local Funds
(x) clf'd*^’ § Other Grants and Contributions
(xi) M isllaneous
M +H Total B + C
R. sraHT O . Extraordinary D ebt—
(i)iW TO3T »{Tf^ ^ f^oT^ Lle-proceeds o f securities etc.
( i i ) FraoTO w s r a i Loans from Government
(iii) tTH' Loans raised from private
(iv)^ f a f d 'o )
(v) Orf»rt(vi) gsTHT(vii) uu ?sors
tT 3-H
^ 5
individuals
Realisation o f sinking funds
Advances
Deposits
Other M iscellaneous
Total—D
Grand Total
66 — — 18 96 48 3315 1,089 574 1 299 7©-
481 — 2 11 4 112 — 1,044 665 923 664 1,413
54 382 60 105 54 68 294 J58 118 68 54 69
— 22 — — * 33 — — 156 1 — 1
566 5 956 87 1,473 264 10698 572 196 1,652 794 1,163
25 — — 14 5 61 24 92 151 163 139 5
6,410 1,02A95 8,C691 16,632 2,002 2,705 2,C52 6,040 5,930 7,335 6,385 7,442
— — 3,623 — 500 365 1,400 480 1,410 1,576 945 —
— — — 7 258 1,020 — — — 1,764 375 100
296 — 79 8,806 612 443 4,383 1,404 1,692 2,522 410 273
10,683 7,03,621 13,637 30,241 6,369 5,781 27.0C0 15,461 15,019 20,797 13,365 14,959
2,390 1<X) _ _ ICO 400 __ __ __ 95 115 132
2,287 3,421 — 2,822 5,,085 1,561 :50,878 12,765 8,439 2,696 5,318 6.787
— — — 1,214 2,,600 537 246 1,820 — 1,580 750 5,117
— — — — 58 17,299 — — — — — 1
1,079 580 — 369 936 235 644 631 1,015 732 4,471 2,189— — 138 254 20 7,008 — 99 56 956 28 —
524 797 635 553 361 88 5,428 36 1,880 19,904 595 1,707
6,280 4,898 773 5,212 9,,j60 ;27,128 57,196 15,351 11,390 25,963 11,277 15,801
58,154 10.94,126 38,360 2,,00,614 43,,853 70,570 3,26,962 68,889 1,00946 1,,08,901 71,352 1,41,634
ON
* 5 0 0 3 ' u ie
*Below Rs, 500W ^ 7 i ;— feS T »f5f3T H g 3 3 I
5o«rce:—District Statistical Otficw.

LOCAL BODIES2 9 . 6 * - U ^ ^3raufer?T/oPUCj^H3T 1 9 8 8 -8 9 .
Table 29.6.—Expenditure of Municipalities/Corporations in Puajab by Districts 1988-89.( ’OOO 1:)(♦000 Rs.)
Item o f Expenditure/ District
dldtJ')-!-
Gurdas*pur
RU
Amritsar
5 ? ^ -W
Kapur-thala
Ufe>HTU-u g
Jalan- Hoshiar- dhar pur
g u -Adld
Rup-nagar
UH
Ludhi- Firoz- ana pur
Farid- Bathinda kot
R3T|3 ’
Sangrur Patiala
0 1 2 3 4 5 6 7 8 9 10 11 12
§ . »fm ijgqFraii A— General Administration Charges 8,319 6,711 4,809 12,098 9,478 7,222 12,047 11,337 1J.842 12,579 14,^178 26,073
( i )
B —Public Safety—
Lighting 2,486 5,746 1,520 7,483 1,541 4.462 12,699 2,001 3,135 2,972 3,381 9,961
(ii) Fire 2,414 — 718 2,795 472 — 3,648 1.872 2,347 1,905 448 1,613
(iii) 125R? Miscellaneous 5,700 3.470 467 413 633 859 2092 1,272 1,110 853 359 8^ 36
Total A + B 18,919 15,927 7,514 22.789 12,124 12,543 30,486 16,482 18,434 18,309 18,366 45,883
e. ^ fH33, HS » l t
( i ) tT S H U 3 5 ^ (R H 3
C— Public Health, WatCT Supply and Convenience—
Water supply (including Capital Outlay)^ 8,518 58,928 4,758 27,928 6,396 5,421 63,392 15,156 6, 563 17,694 9,561 19,999
( ii) v > T ^ ( fih3 u s ) ' | i D rainage (including Capita Outlay) 3,336 !.429 980 4,246 3,072 928 40,277 4,487 8,486 4,790 2,314 1 ,966
( i i i) 3T5 Conservancy 4,583 996 5,392 6,903 5,336 1,958 41,422 11,748 10,803 16,117 12,402 16,546'{iv) 3 H U 3 T H feR {r-
R ^ » f t <0^Hospitals/Dispensaries a n !
Vaccinations 595 39,558 41 639 213 6 1,693 25Q 31 75 206
o .t o
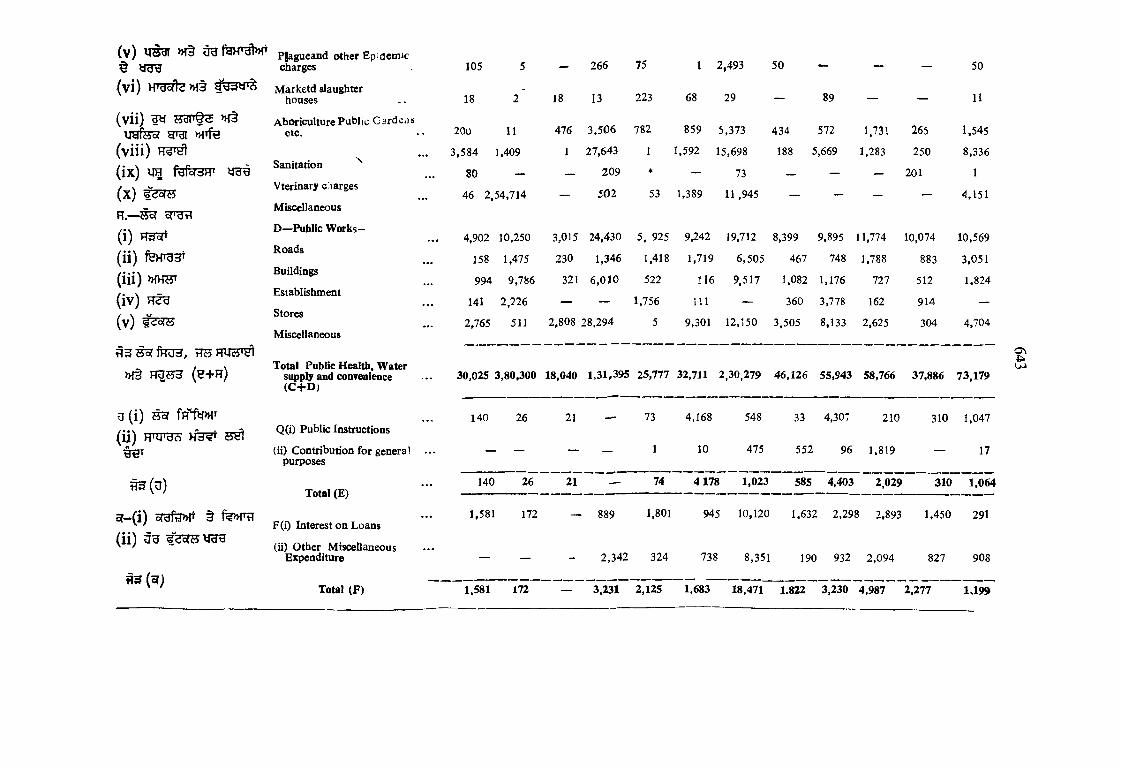
(v)
(vi) hW s >H§
( v i i ) l yy j f e ? grgi iH ife
(viii)(ix) ue feferr tra( x )
( i )
( i i ) feHTg^T
(iii) »m75T( i v )
(v)
» f§ H q??3 ( h + h )
{j (i) ^ fHitPH*( ii) WWdTi H 3^
S 3 ( 3 )
5f-(i) ^gfH»r § f?>HTtT
( i i )
« 3 ( g j
P|agueand other Epidemic charges
Marketd slaughter houses
Aboriculture Public Gardens etc.
Sanitation ^
Vterinary charges
Miscellaneous
D —Public W ork s-
Roads
Buildings
Establishment
Stores
Miscellaneous
Total Public Health, Water supply and convenience (C + D )
Q(i) Public Instructions
(ii) Contribution for general purposes
Total (E)
F(i) Interest on Loans
(ii) Other Miscellaneous Expenditure
Total (F)
105 5 — 266 75 1 2 ,493 50 — — — 50
18 l ' 18 13 223 68 29 — 89 — — 11
200 11 476 3 ,506 782 859 5 ,373 434 572 1,731 265 1,545
3,584 1,409 1 27,643 1 1,592 15,698 188 5,669 1,283 250 8,336
80 — — 209 * — 73 — — — 201 1
46 2, 54,714 — 502 53 1,389 11 ,945 — — — — 4,151
4,902 10,250 3,015 24,430 5. 925 9,242 19,712 8,399 9,895 11,774 10,074 10,569
158 1,475 230 1,346 1,418 1,719 6,505 467 748 1,788 883 3,051
994 9,786 321 6 ,010 522 116 9,517 1,082 1,176 727 512 1,824
141 2,226 — — 1,756 i n — 360 3,778 162 914 —
2,765 511 2,808 28,294 5 9,301 12,150 3,505 8,133 2,625 304 4,704
30.025 3,80,300 18,040 1,31,395 25,777 32,711 2 ,30.279 46,126 55,943 58,766 37,886 73,179
140 26 21 — 73 4,168 548 33 4,307 210 310 1,047
- . _ — — 1 10 475 552 96 1.819 — 17
140 26 21 — 74 4 1 7 8 1,023 585 4,403 2,029 310 1,064
1,581 172 ■ 889 1,801 945 10,120 1,632 2,298 2.893 1,450 291
— — - 2,342 324 738 8,351 190 932 2,094 827 908
1,581 172 — 3,231 2,125 1,683 18,471 1.822 3,230 4,987 2,277 1 J 9 9
<y\OJ

LOCAL BODIES
29 .6 ---- 1988-89 s W fej r^Tg y g g i ,Table 29.6—Expenditure of Municipalities/Corporations in Punjab by Districts, 1988-89.
(ooo 1 U§)(000 Rupees)
' | U - fe d d - g f e V H B ip u feb iT B T
Item o f Expenditure/Districi
mGurdas- Amrit-
pur sarKapur- Jalan- thala dhar
Hoshiar-pur
cbd'.dRup-nagar
Ludhiana
Firoz-pur
Farid- Bathinda Sangrur Patiau kot
1 1 3 4 5 6 7 8 9 10 11 12
y~MRTqTgpj G — Extraordinary Debt—
( i ) ^ y n t Investment - 6,69,639 _ 4.0C0 — 20,852 — — 88 21,700 — -
( i i ) 5?3i3 ^ Hi>>iti‘rfcdn
Payment to sinking funJ 1,668 — — — — 362 — — — — — 255
. ( i i i ) c<driJ»fT METfeuft
Repayment o f loans 2,006 1.676 6,045 17,266 1,432 661 18,442 4,230 10,467 4.821 6,340 9,404
( v i ) iT H d ilw Advances — 387 — 1,833 973 206 5,555 138 152 332 1,033 2,636
( v ) tD f g w Deposits — — 4,418 — 3 56 — 66 — 837 4 —
(vi) u u f s c r e Other Miscellaneous 1,419 1,495 494 2 710 634 8,255 — 5,802 1.356 4,757 3,461
■H3 (H ) Total (G) 5,093 6,73.197 10,957 23,101 3,118 23.571 32,252 4,434 16,509 29,046 12,134 15,757
Grand Total 55.758 10,69,622 36,532 1,81,056 -13,218 74.686 3,12,511 69,449 98,519 1,13,137 70,973 1,37.082
* 5 0 0 3 U § ^ u f e
‘Below Rs. 500RTQ(S :— >Hold' ^ .^ d d I Source :— District Statistical Cffices

645
LOCAL BODIES
« T f ^ 2 9 .7 — i m ^ g § ^313 gcrrg <idH<if ^ y ^ e — 1 9 8 8 - 8 9 ( P )
Table No. 29.7—^Membership Incone and Expenditure o f Improyemeot Trusts in Punjab—1988*89 (P)
7S3»^Name o f
Jmprovement Trust
HMd Members
»THH^('OOO U:) ( 0 0 0 'd;)
Total Income Expenditura (000 Rs.) (000 R s.)
Hdof'd Hdci'dI
Ex-officio Nominated Number Other by the o f Officials
Government
0 1 2 3 4 5 0 7
1. »>{fH3Hg Amritsar 8 — — — 8 87,239 82,884
2 . Jalandhar 3 6 1 — 10 10,763 10,687
Patiala 7 — — 7 5.260 5,280
4 . U6'rto<<J Pathankot 6 3 — — 9 3,2 >9 2.035
5 . Bathinda 1 6 — 7 16.385 14,805
6 . Mansa 3 — „ 3 104 73
7. Malerkotla 1 3 3 _ 7 2,606 2,665
8 . g g s w Barnala 1 — 7 7 15 4,230 4,209
9. Batala 1 — 4 — 5 5,431 4,828
1 0 . LudWana — % — — 8 2 ),3 2 2
1 1 . 3U(SdId Rupnagar — 6 5 1 12 3,783 3,270
1 2 . Faridkot 1 8 — - 9 409 427
1 3- ^ Koi Kapura 1 8 _ _ 9 1,005 393
1 4 . HHl' Moga 1 6 _ _ 7 1,177 1,028
1 5 . Sangrur 1 7 7 — n 3,426 3,398
1 6 . Hoshiarpur — 12 15 — 27 1,199 2,063
1 7 . y S ’ Khanna 6 — — - 6 3.018 3.388
1 8 . 5{V4Ug?5i Kapurthala 5 — — — 5 7,486 7,244
1 9 . 5 3 1 ? ^ Phagwara 6 2 — — 8 2,353 2,963
2 0 . ^>{§03 Abohar 1 — 5 - 6 401 421
2 1 . didtl'HyB Gufdaspur — — 5 - 5 3,045 3,151
2 2 . Nabha — 7 — — 7 1,300 77
2 3 . Rajpura — — — — — 469 90
2 4 . Fazilka — 1 2 3 48 47
2 5 . Firoxpur — 7 6 - 13 430 396
2 6 . Malaut 1 4 — — 5 3 5
2 7 . HSfHFra Muktsar 1 8 — — 9 1,016 73
(U^) M3H RTq^ - 1
(P) Provisional s:cmrce\~•District Statistical O ffices.
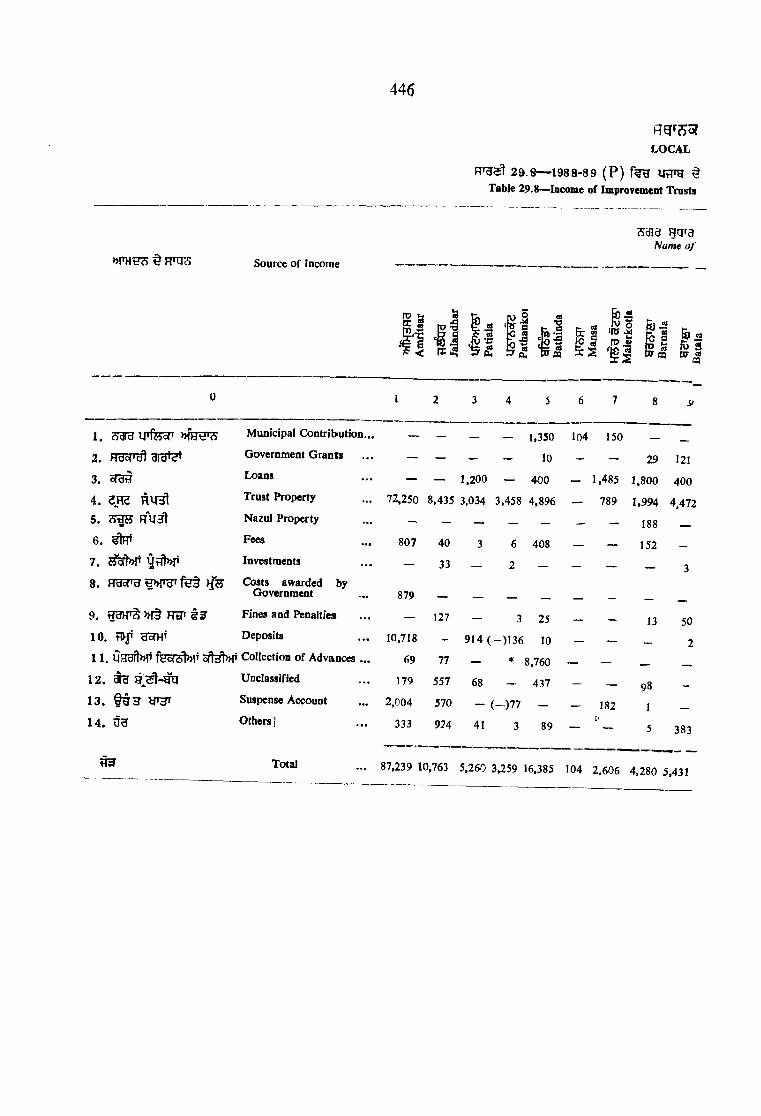
446
Source o f Income
LOCAL
2 9 .8 — 1 9 8 8 -8 9 (P) UtTg §Table 29.8—Income o f Improvement Trusts
S d ia g q 'dName o f
Municipal Contribution...
Government Grants
Loans
Trust Property
Nazul Property
Fees
Investments
1.
2 . Hy<^Tcj)
3. cO ti
4. R U ^
5. R U ^
6. ^7 . y tft»T
8 . Frasrar f e t i f s c o sts awarded byGovernment
9 . Fines and Penalties
1 0 . tD f goTHT Deposits
1 1 . feor5 t>>lt Collection o f Advances . ..
1 2 . i B Unclassified
1 3 . ^ 3 Suspense Account
1 4 . UH Others]
[V 5
fc |S n 'II :1 &a
S S I05
I 5
% Total
— - - — 1,350 104 150
— — 1,200 — 400 — 1,485
72,250 8,435 3,034 3,458 4,896 — 789
807 40 3 6 408 — —
_ 33 _ 2 — - —
29 121
1,800 400
1,994 4,472
188 —
152
— 3
879
— 127 — 3 25 -
10,718 - 9 I 4 ( - ) 1 3 6 10
69 77 — * 8,760 —
179 557 68 - 437 -
2,004 570 - (—)77 -
333 924 41 3 89
— 182
87,239 10,763 5,260 3,259 16,385 104 2,606
13 50
- 2
1 —
5 383
4,280 5,431

6 4 7
SSraH U'd ^ >>PHF?iin Punjab during 1988-89 (P).
BODIES
<5dH<; ^ 7PImprovement Trusts
(0 0 0(000 Rupees)
IV srn o .r Ci m 2
to*II13
« a a •- os■fiil I I f | -1.1 - I I S*|
It). 2 fo ft>
•o 2 ' I S l t v l g f ' 1 ? -S f f -=1 ‘CE '3 'p 2 rc' o f c ; z b ^ f u > ( 2 « l ! £ E x 4 l
10 11 12 13 14 15 16 17 18 19 2(0 21 22 23 24 25 26 27
— — 94 50
—
— — — — 600 — — — 1,800 — — 2,932 1,300 450 — - 1 ,000
23,529 1.560 308 809 499 1,809 376 1,161 4,608 2,339 256 89 — — - 419 - —
— 36 10 2 — — — - — - — — — - — — - —
3,954 12 12 — 5 45 232 2 2 495 * — — — — - - —
— — — 54 8 — 28 7 183 335 — - _ - - - -
— — — — 1 — — — — „ — — — _ _ —
564 203 « 3 5 54 16 - 14 24 — _ _ - - __
17 — 57 12 5 — 463 1,779 - (— )868 2 — — 12 _ 10 — -
239 — 4 21 ~ 7 - — — 4 57
392 1,^00 16 — 4 9 92 53 20 4 24
627 172 2 2 — 12 3 — - ( - ) 1 2 17 24 — — — 1 __ __
— — — 8 — 540 5 — 873 42 21 — - 7 — - — 16
29,322 3,783 409 1,005 1,177 3,426 1,199 3,018 7,486 2,353 401 3,045 1,300 469 48 430 3 1,016
• 5 0 0 31J§ •*11elow Rs. SCO.
(P ) M S >H3H(P) Provisional,
m r o : — ftT2f > n ^ i
Source;—District Statistical Officeg.
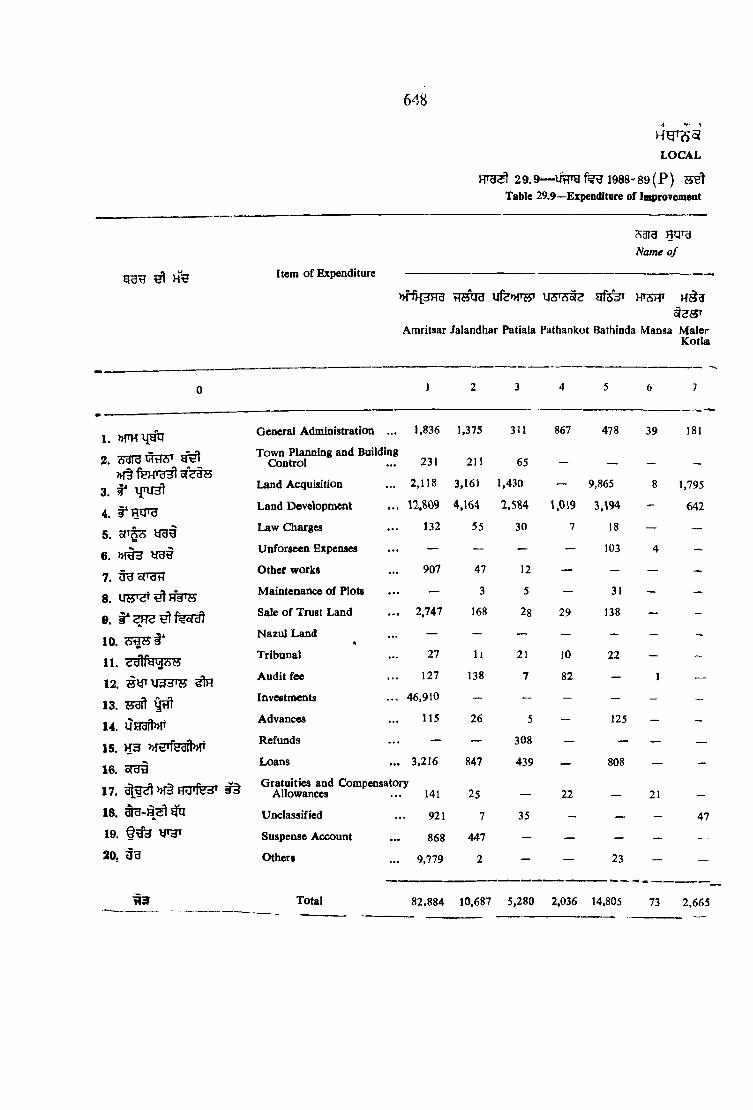
Item o f Expenditure
648
LOCAL
F F ^ 2 9 .9 — im r g f e ^ 1 9 8 8 -8 9 ( P ) ?58! Table 29.9—Expenditnre of ImproTement
S3I3 gq ra
Name o f
u f e » f w htsft
Amritsar Jalandhar Patiala Pathankot Bathinda Mansa M alerK otla
1.2. ?)3T9
3. t
4. t*RXpg5. ofT§cS
6.7. U oTO T
8.
B,
10.11.12. <o1h
13. HBft y n t
14. uHraft»n15. H3 MHTfeaftnr
16. STHH17. >H§ FRPfeBT18.19. yr T20 .
) 2 3 4 5 6 7
General Administration ... 1,836 1,375 311 867 478 39 181
Town Planning and Building Control 231 211 65 — ___ — —
Land Acquisition 2,118 3.161 1,430 — 9,865 8 1,795
Land Developm ent n .8 0 9 4,164 2 ,584 1.019 3,194 - 642
Law Charges 132 55 30 7 18 — —
U nforseen Expenses — — — — 103 4 -
Other works 907 47 12 — — —
M aintenance o f Plots — 3 5 — 31 — -
Sale o f Trust Land 2,747 168 28 29 138 — -
N azul Land — — — — - —
Tribunal 27 11 21 10 22 — -
Audit fee 127 138 7 82 — 1 —
Investments 46,910 — ~ ~ — — —
Advances 115 26 5 — 125 — -
Refunds — — 308 — — — —
Loans 3,216 847 439 — 808 — -
Gratuities and Compensatory Allowances . . . 141 25 — 22 ___ 21 ___
Unclassified 921 7 35 - — — 47
Suspense Account 868 447 — — — — —
Others 9,779 2 — — 23 — —
Total 82,884 10,687 5,280 2,036 14,805 73 2,665
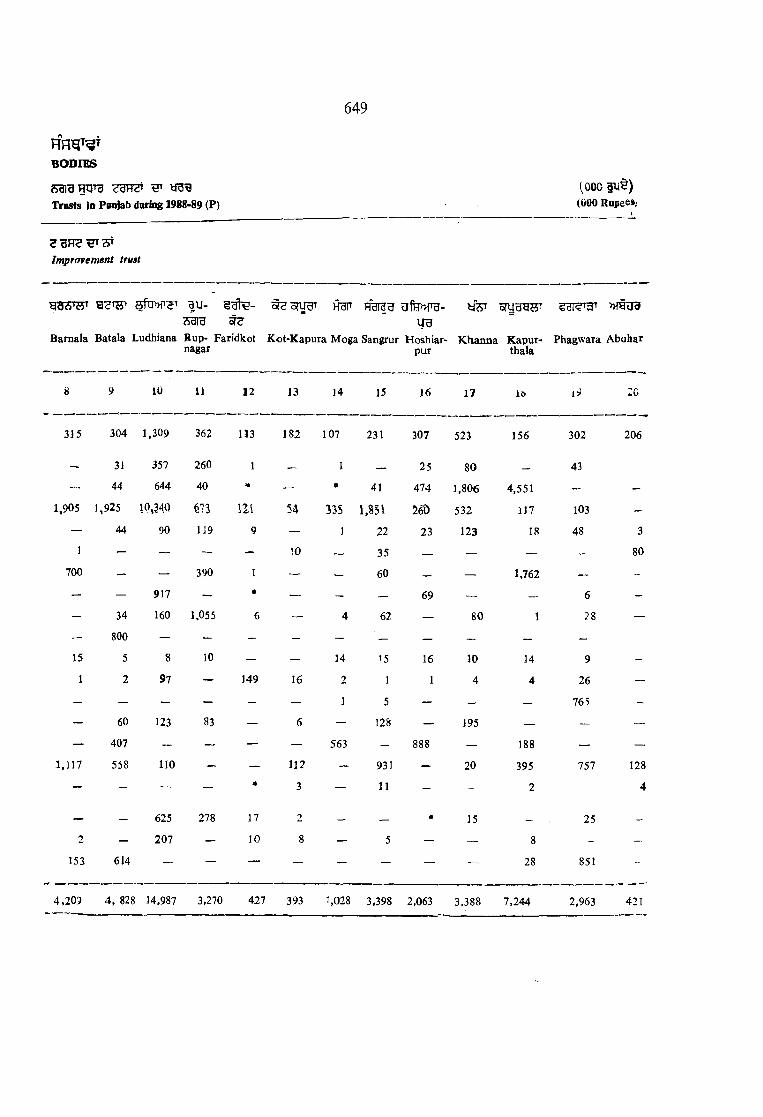
( o o o w ^ )
6 4 9
BODIES
Tnists in Poniab daring 1988-89 (P) (000 Rupee»;
SgH ?H T?5T
Improvement trust
-y g A ’w d u - e d i « -
*did t zBaraala Batala Ludhiana Rup- Faridkot
nagar
Hgrr OTH>>fU-
u gKot-Kapura Moga Sangrur Hoshiar-
purKhanna Kapur-
thalaPhagwara Abohar
8 9 10 11 12 13 14 15 16 17 16 20
315 304 1.309 362 113 182 107 231 307 523 156 302 206
— 31 357 260 1 — 1 — 25 80 _ 43
— 44 644 40 — « 41 474 1,806 4,551 — -1,905 1,925 10,340 m 111 54 335 1,S51 i m 532 117 103 —
— 44 90 119 9 — 1 22 23 123 18 48 3
1 — ~ — — 10 — 35 — — — — 80
700 — — 390 1 — — 60 — — 1,762 — ~
— — 917 — * — — — 69 — — 6 -
— 34 160 1,055 6 — 4 62 — 80 1 28 —
— 800 — — - - — — — — — -15 5 8 10 — — 14 15 16 10 14 9 -
1 2 97 — 149 16 2 1 1 4 4 26 —
— — — — - — 1 5 — — — 765
— 60 123 83 — 6 — 128 — 195 — — —— 407 — — — 563 — 888 — 188 — —
3,117 558 110 — 112 — 931 — 20 395 757 128— - — — « 3 — 11 - - 2 4
— — 625 278 17 2 — — * 15 — 25 —
2 — 207 — 10 8 5 — — 8 -
153 614 — — — — — — — — 28 851 -
4 ,209 4, 828 14,987 3.2701 427 393 1,028 3,398 2.063 3.388 7,244 2,963 421

6 5 0
2 9 . 9 ( R K 0 / 3 ) — 1 9 8 8 - 8 9 ( P ) KcTT R tF g
Table 29.9 (concld.)—^Expenditure o f Improvement Trusts in Punjab during 1988-89 (P)
LOCAL BODIES
Hi H e
(000 3U ^ )
(000 Rupees )
Item o f Expenditure3 3ra RqTg ^
Name o f Improvement trust
to
F5*0
21 22 23 24 25 26 27
1. »1th
2.
3.4. I ‘5 .
6.
7. 5fT3t78. ^9. i'' SH? ^
10.11 . 2 ^ 3 1 3 5 B
1 2 . U 33T B ^
13. JJgfl Urft14. 0H3ft»T1 5 . 1£3 nm rfegftW
i« . orga
17.
1 8 . g q
19. f t 3 ^
20. ^
General Administration
Town Planning and Buildin Control
Land Acquisition
Land D evelopm ent
Law Charges
Un for seen Expenses
Other works
M aintenance of Plots
Sale o f Trust Land
Nazul Land
Tribunal
Audit fee
Investments
Advances
Refunds
Loans
Gratuities and Compensator Allowances
Unclassified
Suspenses Account
Others
Total
. 77
3,013
56
3 38
1
46 100 5 64
7
13
6
— 128 —
— 67 52 —
... 3,151 77 90 47 396 5 73
* 5 0 0 g u t 3 ' I •Below Rs.500.
(P) >viS »f3H 1 (P) provisional.
Fmas:— fi?sr I
Source ; —District Statistical Offices.
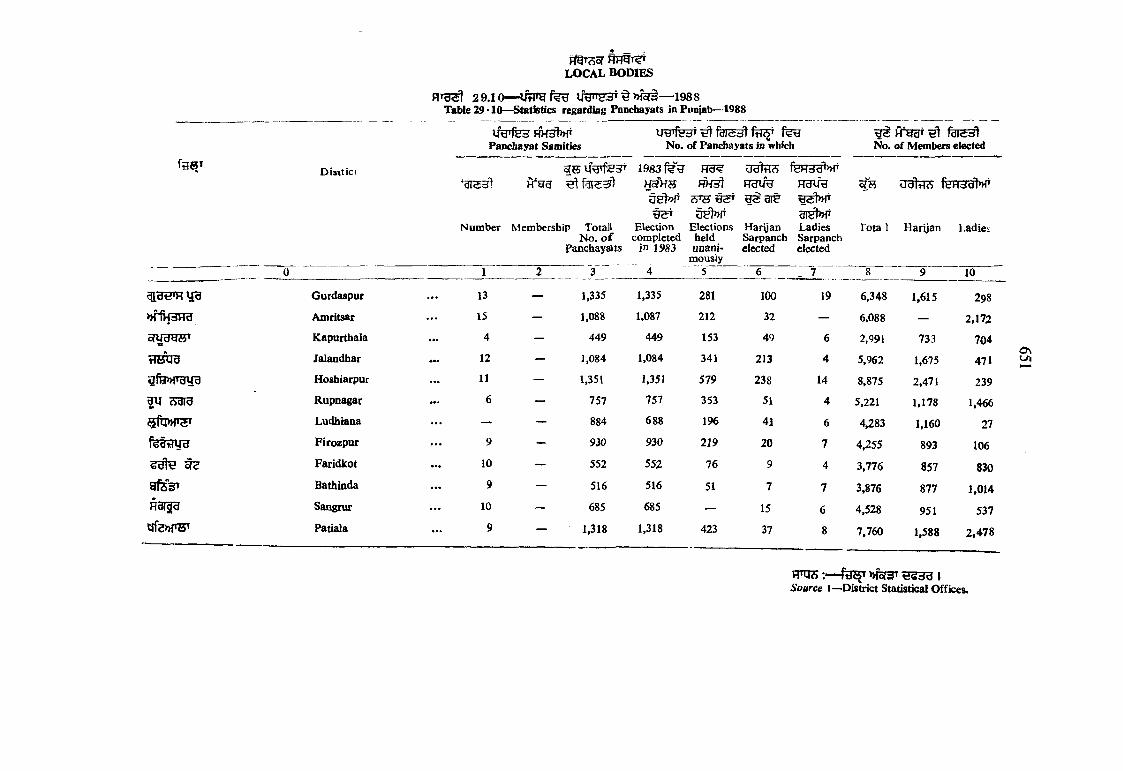
LOCAL BODIES
2 9 .1 0 — UtTOfeH iftFyHT ^ »fer3— 1988Table 29 *10—Statistics regarding Panchayats ia Poniab—1988
Disxticf
IfgrfeHPancfaayat Samities
^ Tdl^dl fHc^No. o f Panchayats in which
1 9 8 3 R U W feR 3^»T* a i5 3 l f r g g s i m n s
u s l» p B s a i t^ 3 1 ^
Number Membership Totall Election Elections Harijan LadiesN o. o f completed held Sarpanch Sarpanch
Panchayats in 1983 unani- elected electedmously
1 2 y ~ 4 5 6 7
No. of Members elected
cfH O B t e feHSratW
Tota 1 Harijan Ladies
10
Gurdaspur . . . 13 — 1,335 1,335 281 100 19 6,348 1,615 298
Amritsar . . . 15 — 1,088 1,087 212 32 — 6,088 — 2,172
oWUgBT* Kapurthala . .. 4 — 449 449 153 49 6 2,991 733 704
t iy y d Jalandhar «•* 12 — 1,084 1,084 341 213 4 5,962 1,675 471
<3fi5p>royB Hoshiarpur . .. 11 — 1,351 1,351 519 238 14 8,875 2,471 239
| l l Adid Rupnagar ••• 6 — 757 757 353 51 4 5,221 1,178 1,466
Ludhiana . . . — — 884 688 196 41 6 4,283 1,160 27
fsdtrJUH Firozpur . . . 9 — 930 930 219 20 7 4,255 893 106
Faridkot . .. 10 — 552 552 76 9 4 3,776 857 830g f e V Bathinda . .. 9 — 516 516 51 7 7 3,876 877 1,014
H3?s[3 Sangrur . . . 10 685 685 — 15 6 4,528 951 537
Ufe>»iW Patiala . .. 9 — 1,318 1,318 423 37 8 7,760 1,588 2,478
f m 5 :— I Source »—District Statistical Offices.

3 0.1 fee Mm/Htr Sfigt ^ ftI^?Tg ^ HT § feqr^ H r t f oTH 1
3 3 .2 u > g H r HH" f f ^ ^ urg^ ^ >»f§ (H § g a ,
1985) I
30.3 iffTO f%g ^ H T ( S ^ , 1 9 8 9 ) HK* »ft f f ^ ^ ^ i
RTg^ 30.4 y> g fee felTO H?T (H3gg, i s s s ) RH^g^oTg IH§
RTg^ 30.5 litrH feg m i / H Q ^ ^ f%U ^ RT »f§ feXTO H3t ^ Pffer !
FTU^ 30.6 §rgH m t l m ST75 ^ H?t >,{§ ^ ^fetj
RT^^t 30.7 Sof rr T ^nft (H3HU 1989) ^ U^»lt ^ c t , f f e te^,)>f§ ^ hT ?th itbV s i I
SECTION XXX
ELECTORAL STATISTICS
Table 30.1 depicts voters for Lok Sabha and Vidhan Sahha Elections in Puiyab for a number df years.
Table 30.2 shows number o valid votes polled for Vidhan Sabha elections by various parties in September, 1985.
Table 30.3 depicts vaild votes polled and number o f voters in Lok Sabha election (November, 1989)
Table 30.4 depicts vaild votes polled and number of voters in Punjab Vidhan Sabha Election (September, 1985).
Table 30.5 shows number of seats for Lok Sabha and Vidhan Sabha for genoral/mid-term elections in Punjab
Table 30.6 shows state>wise Loir Sabha and Vidhan Sabha seats in India.
Table 30.7 shows Electorates, votes Polled rejected votes and votes Polled by National Parties with percentage in Lok Sabha Elections (November, 1989).
65^
30


^ 5 ^ P > H o f5ELECTORAL STATISTICS
3 0 .1 — U trm f^ ^ ssr ngr » §Table 30 *1— Voters for Lok SaUia and Vidhan Sabha General and Mid-Term Ejections in Punjab by Districts
District
( s g g )(Num bw)
S cIH3t 153 Ffgr f^qrR fecPTI FWLok Sabha Vidhan Lok Sabha Vidhan Lok Sabha Vidhan Lok Sabha V idhui L ok Sabha
Sabha Sabha Sabha SaMw1971 1972 1977 1977 1980 1980 1985 1985 1989
1 2 3 4 5 6 7 8 9 ”
Gurdaspur 5,94,692 6,11,935 5,63,497 7,75,783 6,83,185 8,47,484 7,54,117 9,33,607 94,85,24
Amritsar 9,65,550^ 10,13,782 13,15,421« 12.70,763 15,33,164* 13,69,822 16,68,486* 14,71,524 19,36,662*
c?^|3qa^
tTBTJg
Kapurthala 2,22,442® 2,29,960 6,49,304® 2,70,891 7,76,522® 2,97,265 8,40,382© 3,37,794 10,10,117®
Jalandhar | 7,39,282 7,75,891 5,92,262 9,22,414 7,25,205 10,59,724 7,57,112 10,81,333 93,78,92
g fa » T H y gHoshiarpur 5,57,927 5,83,919 6,26,330 6,55,202 7,32,020 7,52,852 7,80,453 8,07,326 94 ,63 ,68
Rupnagar 2,83,034 2,94,431 6,37,090 3,61,193 7,64,571 4,03,011 8,64,560 4,58,129 10,43,186
® f q » r ^Ludhiana 7,41,736 7,86,450 6,65,954 9,63,540 8,28,069 10,80,828 9,16,364 11,80,200 11,35,916
Firozpur 10,19,971 1048,600 6,31,895 6,53,878 7,55,567 7,66,350 8,44,964 8,44,964 10,37,784
Bathinda 6,59,850 6,83,836 6,07,613 6,30,814 7,08,507 7,16,373 8,42,005 8,42,005 9,89,706
Sangrur 5,76,469 6,01,882 6,22,238 7,15,801 7,25,096 8,18,399 7,93,493 8,86 ,007 9,43,992
Patiala 5,86,746 6,15,644 6,06,187 7,75,127 7,36,383 8,75,411 8,24,586 9,59,518 10,17,093
Faridkot — — 6,46,094 7,67,902 7 ,72 ,846 8,69,751 8,48.893 9,33,546 10,00,795
Total 69,47,699 72 ,46330 81,63,885 87,63,308 97,41.135 9837 ,270 1,07,35,415 1,0735,953 1,29,48,035
H ? :— h w h ) >h§ d'Ht w »ri4H g H t n g q d iN o te .~ T h e boundaries o f districts and Parliamentary Constituencies are not CO'terminus
So, Rgr t 5*Includes T am Taran Parliament Constituency.
9 i© R elates to Pbillur Parliament Constituency.
Source : Chief Electoral Officer, Punjab.
On

§ > , j ^
ELECTORAL STATISTICS
30 .2— iiW felP?? R?T >»ff J,H* ^ 3 ^ vrg^^ig »f^ R ^ , 1985Table 30 '2 .-.V tIM Votes Polled in Pmja'i Vidbu Sabba Electioa by Parties and Districts—September, 198S
__________________________________________ ______________________ ______________ (Numbers)
Parries
656
t f ^ »!cr^Rl.lft.nrnt. »TT .
—■
UTB^cf'dran(>Sh)
m s (^H)ftTH District Total
ValidVotes
IndianNationalCongreis
ShiromaniAkallDal
B.J.P. JantaParty
C.P.I. C.P.I. Congress Inde. (M) (S) pendent
0 1 2 3 4 5 6 7 8 9
Gurdaspur 6^4,103 2,37,894 1,96,569 93.135 — 21,953 5,974 — 48,578
Amritsar 8,33,880 3,26,492 3.07,745 39.550 28.482 43,602 19,612 — 68,397
omdHa* Kapurthala 2,21,351 95,448 68,584 4,598 21,424 1,442 — — 29,855
wHua Jalandhar 7,18,946 2,94,872 2,12,606 56,249 4,862 11,779 23,998 211 1,14,369
afe>vr3yg Hoshiarpur 5.13,133 2,09,230 1,15,313 14,495 691 22,474 11,965 — 1,38,965
§U 6613 RupDagar 3.04.990 1,15,753 1,21.587 15,489 — 11,208 — — 40,953
Ludhiana 7,45,516 2,97.759 3,47.279 25,108 — 18,829 17,729 — 38,812
Firozpur 5,48,657 1,97,468 1,18,376 84,270 — 49,686 2,147 — 96.710
g■d‘fe5 ^ Faridkot 5,76.587 2,15.334 2.48.390 — 19,848 20,102 3,548 — 69,365
Bathinda 5,65,172 1,88,433 2.46.219 1.757 — 54,666 3,418 — 70,679
Hd dd Sangnir 6,22,094 1,98,985 3.30.398 — — 21,539 27,691 — 43,481
Ufe>HW Patiala 6,66,289 2,50^392 3.17.404 ri8.754 — 16,646 11,787 — 51,306
^ 3 Total 69,20,718* 26,28,060 26.30,470 3,53,405 75,307 2,93,926 1,27,869 211 8,11.470
(100 00) (37-97) (38.01) ^5-11) (1-09) (4-25) f t -85) (0.00) (11-72)
f ? a »for^ i { 3 t u a r y ^ a s i
Y ot0— Figures in brackets an peroentages
♦5 4 — 1 7 ^|W»r f ^ OS I ^Including 17 missjrs votes io R«ikot Assen^y Goostitveocy*
RitlTJ ^ ITETBI
Soared i-~C hief Blectoral Officer. Punjab.

657
^ § W i tELECTORAL STATISTICS
3 0 .3 — UrTH #>T ^ 1989) RH* »?§ f f g 3 2+ T a U « 3 9 ’3— Valid Votes Polled and Number o f Voters la Lok Sabha Electloos (Novem ber, 1989)
(?W ^ Num ber)
Coostit uency U3HM ale
t2 ? o r3
Total Votan
Fem ale Total
t f 3 3
f a r ^
ValidVotes
Polled
Gurdaspur 4,89,198 4,59.326 9 ,48 ,524 5 ,44 ,817
WfHHHd Amritsar 5,41,129 4,53,371 9 ,94 ,500 5.79,222
fc a s H iy * ' Tarantaran 4,95,070 4 ,47 ,092 9 ,4? , 162 5,91.883y •
Jalandhar 4,87,566 4,50 ,326 93.78 ,92 5,44,737
■ f S ^ rTift) P h illa u t(S .C .) . . 5 ,26 ,644 4 ,83 ,473 10,10,117 5.93,391
gfH »»Tg\ig Hoshiarpur 5,19,885 4,26 ,483 9,46 ,368 5.47,821
'|gU?5tnB ? P 3 t) Rupnagar (S .C .) .. . 5,77,955 4,65,231 10,43,186 7,02,261
Ludhiana 6,18,082 5,17,834 11,35,916 6,68,207
Firozpur 5 ,61 ,284 4,76,500 10,37,787 6,54,561
Faridkot 5 ,48 ,470 4,52,325 10,00,795 6,28 ,226
(M 5 R % 3 Bathinda (S.C .) 5,32 ,104 4 ,76,500 9,89,706 5 ,9 6 ,0 4 5
Sangrur 5,11,708 4 ,32 ,284 9,43 ,992 6,60,238
Wfe»T5?T Patiala 5,53,973 4,63,120 10,17,093 6,31,418
1Total 69 ,63 ,068 59,84,967 1,29,48,035 79,42,827
ITO?5 MgF?g, UtTH I
Source :—Chief Blot^oral Officer, PuOjab.

658
ELECTORAL STATISTICS
3 0 . 4 — U tirg f?qT5 Pf5T yti»?Tf<*;T (H 3 y a , 1 9 8 5 ) HH’ t s a f r g f » f t
t f t B f ^
Table 3 0 ’4—Valid votes polled and number of voters in Punjab Vidhan Sabha Elections (September, 1985.)
Number)
Sr.
N o gfjoT Constituency
Total Voters
VaildVotes
PolledUUHM ale T otal
feFr3lf^>f♦Female
0 1 2 3 4
1. <^r3aaT3 Fatehgarh 45,026 41,807 86,833 59.248
2 . Batala ... 53,100 47,314 100,414 6,7.756
3 . Qadian 50,165 46^83 96,548 61,734
4. U e S tH U H Shri Hargobind pur 44,562 41,331 85,893 50,494
5 . 5i«A!^«cS Kahnuwan ... 42,001 39,071 81,072 44,472
6. Dhariwal 44,059 39,317 83,376 53,507
7 . 9THyiHU9 Gurdaspur 48,264 44,909 93,173 59,453
8 . yte»A-dTd D ina nagar 45,041 41,790 86,831 56,116
9 . 6 ^ d Narot Mehra 38,480 34,826 73,306 49,799
1 0 , U6*ao(? Pathankot 41,372 35,398 76,770 53,913
1 1 . R tlT ^yg Sujan pur 37,022 32,369 69,391 48,111
1 2 . Bcas 51,025 46,407 97,432 57,708
1 3 , Ht7te» Majltha 48339 39,908 88,747 51,705
1 4 . ^dof* Verka ... 58,945 41,301 100,246 47,965
1 5 . ^>>r(55» Jandiaia 52,759 42,401 95,160 51,403
1 6 . iM fM 3Fra(§3H ) Amritsar (North) 47,654 42,221 89,875 51,858
1 7 . »rfH 3H g(ygH ) Amritsar (West) 60,181 53,498 113,679 64,252
18. Amritsar (Centra!) 38,768 33,656 72,424 43,709
19. >H l)i3T 7g(e«S) Amritsar (South) 48,263 46,572 94,835 56,845
2 0 . Ajnala ... 52,788 47.801 100,589 62,272
n . g»t!T Raja Sansi ... 43,323 37,499 80,822 53,327
2 2 . » ! e r ^ Attari ... 40,678 36,052 76,730 40,991
2 3 . 3g?S T am Taran 52,328 46,347 98,675 54,173
2 4 . RTftw Khadoor Sahib ... 48,320 39,176 87,496 38,279
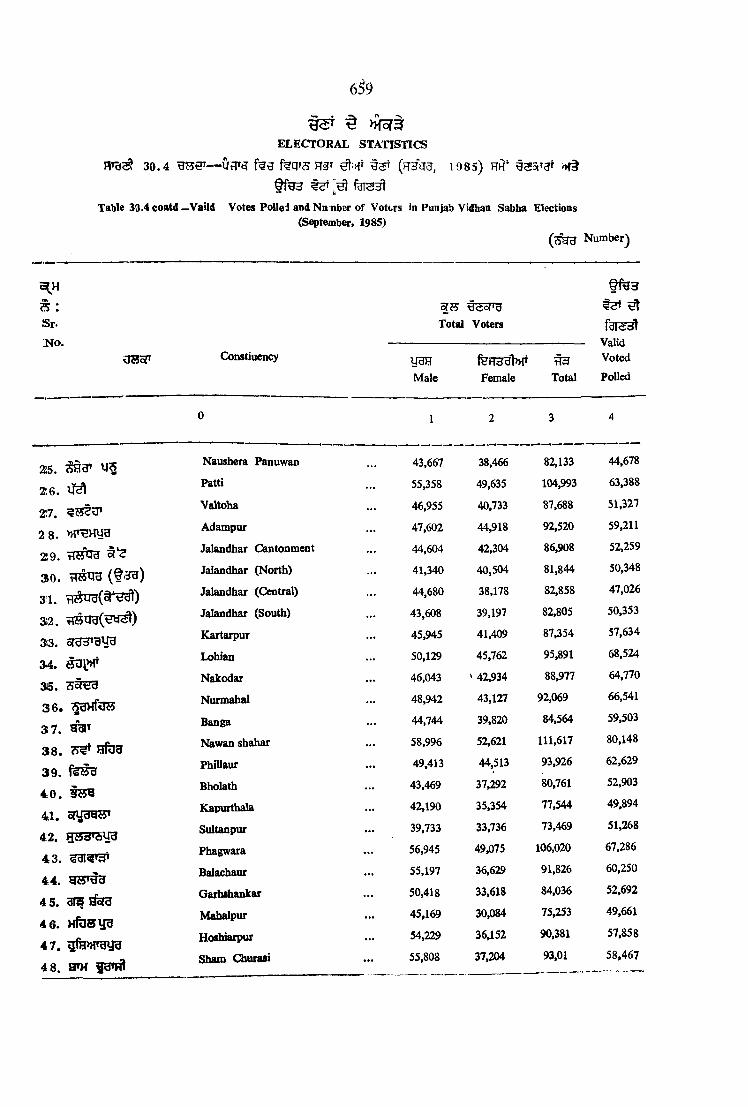
ELECTORAL STATISTICS
3 0 .4 — U fp g t S f (17555, 1985) gSotTgf
#ST •• 6>
Table 30.4 cotttd—Vaild Votes Polled and Nnnber of Voters in Punjab Vidhan Sabha Elections(S^tem ber, 1985)
6 ^ 9
Num ber)
c^H
^ : S r.
2^0.
o B s r Constiuency
Total Voters
U3HM ale
^ 3
------------------- ------------- Valid
Female Total Polled
2 5 .
2! 6 .
2*7.
2 8 . »T^H>4H
2 9 .
30. ( t ' ^ )3 1 . T i H n g ( t ^ )
312.
313. 5fg3»gy3 34. S3li?>r 315.36 . ?J3HftR5
37.38. 7!^ Hfeg39.4 0 . i s i41. cr»i3gH»42. gZ53’SU3
43.44.
4 S.
4 6. HfOS\I347 . gfeniTgyg
48. am €3»Fft
Naushera Panuwan
Patti
Valtoha
Adampur
Jalandhar Cantonment
Jalandhar (North)
Jalandhar (Central)
Jalandhar (South)
Kartarpur
Lohian
Nakodar
Nunnahal
Banga
Nawan shahar
Phillaur
Bholath
Kapurthala
Sultanpur
Phagwara
Baladiaur
Garhshankar
Mahalpur
Hoshiarpur
Sham Churasi
1 2 3 4
43,667 38,466 82,133 44,678
55,358 49,635 104,993 63,388
46,955 40,733 87,688 51,327
47,602 44,918 92,520 59,211
44,604 42,304 86,908 52,259
41,340 40,504 81,844 50,348
44,680 38,178 82,858 47,026
43,608 39,197 82,805 50,353
45,945 41,409 87,354 57,634
50,129 45,762 95,891 68,524
46,043 ‘ 42,934 88,977 64,770
48,942 43,127 92,069 66,541
44,744 39,820 84,564 59,503
58,996 52,621 111,617 80,148
49,413 44,513 93,926 62,629
43,469 37,292 80,761 52,903
42,190 35,354 77,544 49,894
39,733 33,736 73,469 51,268
56,945 49,075 106,020 67,286
55,197 36,629 91,826 60,250
50,418 33,618 84,036 52,692
45,169 30,084 75,253 49,661
54,229 36,152 90,381 57,858
55,808 37,204 93,01 58,467

t m 3ELECTORAL STATISTICS
H’33t 30.4 Ifiqra yjgr ^»jf 1985) HH' »f§
^ f 3 I ^
Table 30.4 coQtd.— Valid Votes Polled aad Nuaber of Voters ia Paajab Vidhaa Sabha E lections(Septenber, 1985)
N u m b er)
660
OSoT Const ituoDcy
Total Voters
IB H feH33l>Ht ^M ale Fem ale T otal
f3T33! Valid
_ V otes y P olled
4 9 .
5 0 . 3Tj?ti1^ST
51.52.
5 3 . rT3raT§^
5 4 .
5 5 . ’BTtr
5 6 .
5 7 . ( ^ 3 u t )
5 8 . S_ftl>H»^T (O kH t)
5 9 .
6 0 . ( y " f )
61. UTfe6 2 .
6 3 . R H 3 W
6 4 .
6 5 .
6 6 . > K ^ J 3 m f e a — 0 U 3
6 7 .
6 8 . Hfe"3»
6 9 . y g s
7 0 .
71.7 2 .
Tanda
Gardhiwala
Dasuya
Mukerian
Jagraon
Raikot
Dakha
Kila Rai Par
Ludhiana (North)
Ludhiana (West)
Ludhiana (East)
Ludhiana (Rural)
Payal
Kum Kalan
Sam rala!
Khanna
Nangal
Anandpur Sahib—Ropar
Chamkaur Sahib
Morinda
Kharar
Banur
Rajpura
Ghanaur
54,615
53,753
53,823
62,061
53,556
46,097
60,302
49,665
51,131
50,965
44,678
82,313
50,935
49,816
44,385
49,762
49,700
51,749
49,413
59,361
65,288
51,494
55.419
45,300
36,468
35,834
34,960
41,304
50,878
43,858
53,599
43,718
41,999
41,954
41,895
62,523
43,100
43,337
37,051
42,683
33,597
34,458
32,425
38,973
43,165
40,502
40,679
37,940
91,083
89,587
88,783
103,365
104,434
89,955
113,901
93,383
93,130
92,919
86,573
144,836
94,035
93,153
81,436
92,445
^83.297
i^86,207
81,838
98,334
108,453
91,996
96,098
83,240
59,139
54,316
51,483
69,267
62,642
53,342*
69,924
55,252
59,625
51,563
53,087
78,771
72,009
62,256
60,698
66,347
53,660
56,035
56,069
69,^57
69»869
64,292
63,364
59,200
* 17 ^ jjrH S I
*lncluding the 17 m lssiog vo tes.
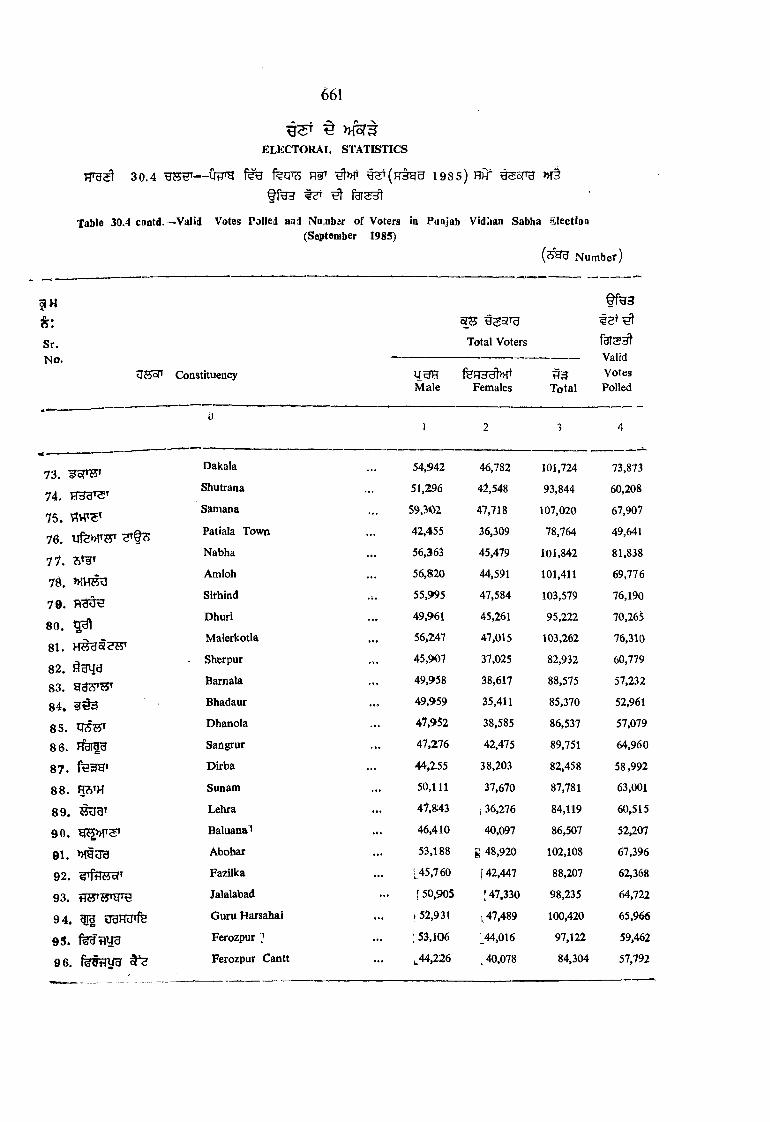
ELECTORAL STATISTICS
30.4 fecPTJ 198S) Hh" »f§§f%H t e r ^
Table 30.4 contd.—Valid Votes Polled an3 Na,nbar of Voters in Punjab Vidaan Sabha Election(September 1985)
N um ber)
661
Sr.N o .
0 7 5 ^ Constituency
Total Voters
UHHM ale
fHFT3^>HTFemales
t f H 3
f a r s ^----------- Valid
Votes Total Polled
73. ofT<55T
74.
75.76. ufem w
71.7^ . »H Usa
79.
80.
81.82. §gU383.84.
85. tnssT8 6 . FfelfH
87.8 8 . R?>th
89.90.
91.92. gifeoTT
93.
94. ^ UdTJipf
93.
96. f e ^ y g r
Dakala
Shutrana
S^mana
Patiala Towd
Nabha
Amloh
Slfhind
Dhuri
Malerkotla
Sherpur
Bam ala
Bhadaur
Dhanola
Sangrur
Dirba
Sunam
Lehra
Baluana"5
Abohar
Fazilka
Jalalabad
Guru Harsahai
Ferozpur ^
Ferozpur Cantt
54,942 46,782 101,724 73.873
51,296 42,548 93,844 60,208
59,302 47,718 107,020 67,907
42,455 36,309 78,764 49,641
56,363 45,479 101,842 81,838
56,820 44,591 101,411 69,776
55,995 47,584 103,579 76,190
49,961 45,261 95,222 70,26$
56>247 47,015 103,262 76,310
45,9K)7 37,025 82,932 60,779
49,958 38,617 88,575 57,232
49,959 35,411 85,370 52,961
47,952 38,585 86,537 57,079
47,276 42,475 89,751 64,960
44,2.55 38,203 82,458 58,992
50,111 37,670 87,781 63,001
47,8;43 i 36,276 84,119 60,515
46,410 40,097 86,507 52,207
53,188 g 48,920 102,108 67,396
i45 ,760 j 42,447 88,207 62,368
[ 50,905 f 47.330 98,235 64,722
1 52,931 L 47,489 100,420 65,966
53,106 ^44,016 97,122 59,462
^44,226 , 40,078 84,304 57,792
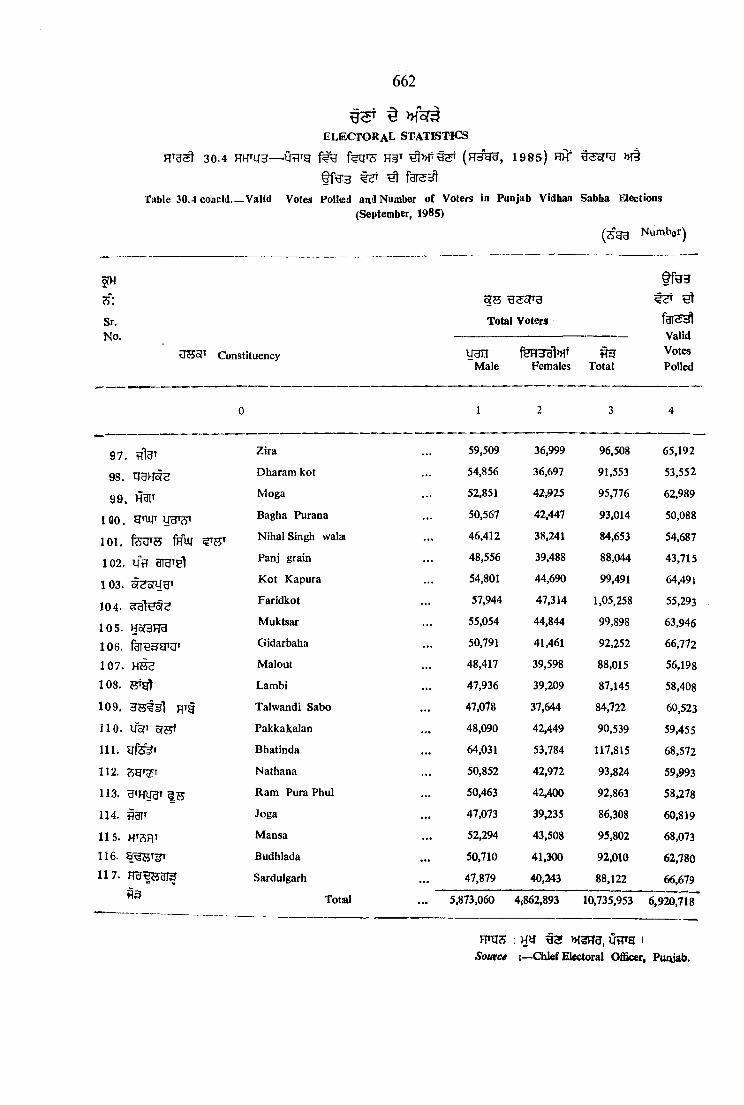
e l e c t o r a l s t a t i s t i c s
30.4 HHTU3— w g n§T ( H ^ , 1985) H) » f |
tP a'H ^ ^
Table 30.4 concid__ Valid Votes Polled and Number o f Voters in Punjab Vidhan Sabba Elections(September, 1985)
( S g g Num ber)
662
Sr.N o.
Constituency
Total Voters
u u e feH3a1>HT ^Male Females Total
§ f e 3
ValidVotesPolled
9 7 .
98.
9 9 . O T
1 0 0 . yHf?5T
10 1 . fjfui 5TJ5T
1 0 2 . iff l
103. ^^oTUg’
104-1 0 5 . Hof3H3
106.1 0 7 .
10 8 .
109. 3?5#s!l RTg1 1 0 . U V 5f25f
111.112.113. ^HUBTlTF114.
115.116.
117. HUfSaifm
Zira 59,509 36,999 96,508 65,192
Dharam kot 54,856 36,697 91,553 53,552
Moga 52,851 42,925 95,776 62,989
Bagha Purana 50,567 42,447 93,014 50,088
Nihal Singh wala 46,412 38,241 84,653 54,687
Panj grain 48,556 39,488 88,044 43,715
K ot Kapura 54,801 44,690 99,491 64,491
Faridkot 57,944 47,314 1,05,258 55,293
Muktsar 55,054 44,844 99,898 63,946
Gidarbaha 50,791 41,461 92,252 66,772
M alout 48,417 39,598 88,015 56,198
Lambi 47,936 39,209 87,145 58,408
Talwandi Sabo 47,078 37,644 84,722 60,523
Pakkakalan 48,090 42,449 90,539 59,455
Bhatinda 64,031 53,784 117,815 68,572
Nathana 50,852 42,972 93,824 59,993
Ram PuraPhul 50,463 42,400 92,863 58,278
Joga 47,073 39,235 86,308 60,819
Mansa 52,294 43,508 95,802 68,073
Budhlada 50,710 41,300 92,010 62,780
Sardulgarh 47,879 40,243 88,122 66,679
T otal 5,873,060 4i862,893 10,735,953 6,920,718
HTQS ; H y f S 1
Source :— Chief Electoral Officer, Puruab.

ELECTORAL STATISTICS
3 0 . 5 — ut^rg Soj >»f§ n r lg|»^T fiI st
Table 30 -5.—Seats ia Lok Sabha and Vidban Sabba in Puajab during the General and Mid-term Electionsby Districts
663
^
No. o f Seats in Vidhan Sabba District -----------------------------------------------------
So? RWT g fe r ^ farag't
No. o f Parliament Seats
^7 i H 3 9 3 H 3 a 3March June May Sep. March March January Sep. N ov.
1972 1977 1980 19>85 1971 1977 1980 1985 1989
Gurdaspur 11 11 11 1 1 i 1
Amritsar 14 16 16 16 2 2 2
srv4H^?5^ Kapurthala a 4 42 J. 2
tTtfqa Jalandhar j 12 12 H2
Hoshiarpur 8 9 9 9 J i 1 1
^IRTdlU Rupnagar 5 5 5 5 1 1 1 1
Ludhiana 10 12 12 112 1 1 1 1
Firozpur 15 9 9 9 2 2 1 1
Bathinda 10 9 9 9 1 I t 1
Sangrur 9 10 10 BO 1 I 1
Patiala 9 10 10 no 1 1 1 1
Faridkot — 10 10 no — - 1 1
Total 104 117 117 117 n 13 13 13 13
F p q s : Htf UTfTg i
So>iirce Chief Electoral Officer, Punjab.
— P fR ^ U ?5t » f t >hti4H 3 5 t ^ 3 ? ^ 1
N o te .— The lx)uodaries o f districts and ParlianiShtary Constituencies are not co-terminu5,
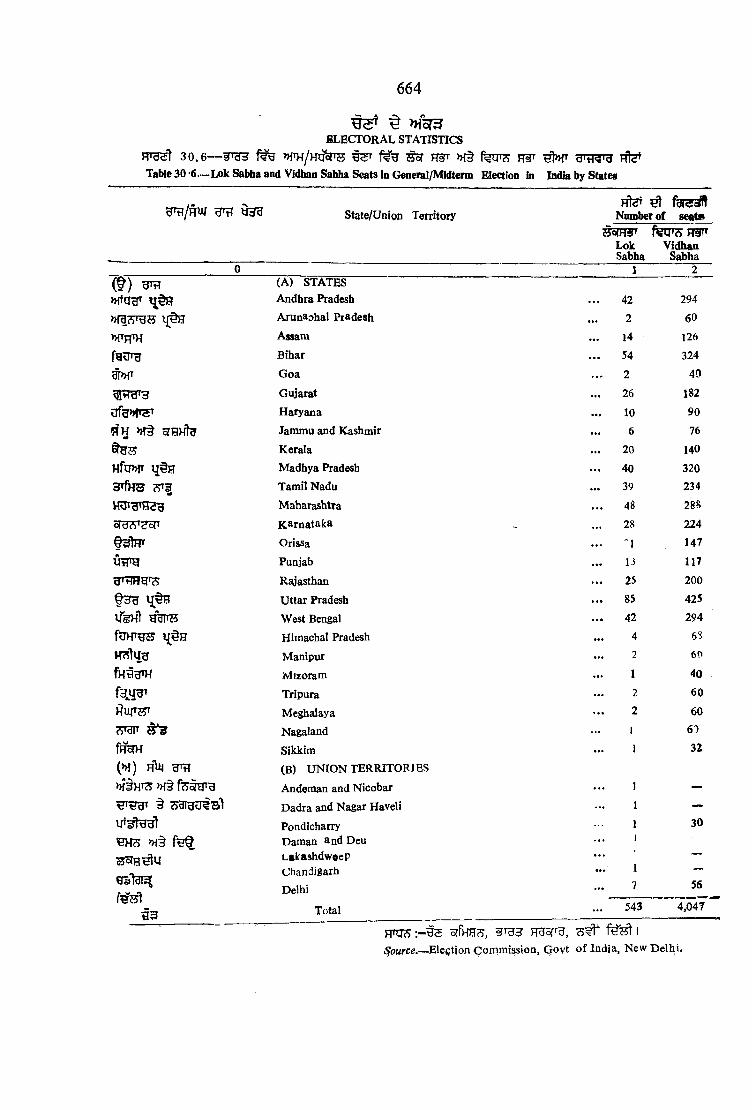
664
^ ^ » ) c r 3M .ECTORAL STATISTICS
3 0 . 6 — ^ » {§ f%gr^ Ht»ff
Table 30 -6— Lok Sabba and Vidhan Sabba Seats in General/MIdtenn Election in India by States
State/Union Territory Number o f sea tsSoTH^T
Lok VidhanSabha Sabha
1( f ) ^ (A) STATES
>Htq^ Andhra Pradesh . . . 42 294
Arunaohai Pradesh . . . 2 60
>HTn^ Assam . . . 14 126
fgoTH Bihar . . . 54 324
a w G oa . . . 2 40
Gujarat « •* 26 182ufg»PST Haryana 10 90
5TH >H§ oTHHt^ Jammu and Kashmir . . . 6 76
Kerala . . . 20 140
HfiPUT M adhya Pradesh . . . 40 320
3TfHS Tamil Nadu . . . 39 234
Maharashtra . . . 48 288
o?dcS’Ho{> Karnataka - 28 224
t s l m Orissa . . . "1 147
0 ? r g Punjab . . . 13 117
Rajasthan . . . 25 200fH B Uttar Pradesh . . . 85 425
likH t West Bengal . . . 42 294
Himachal Pradesh . . . 4 6S
W 5lug Manipur . . . 2 60
fH SgW Mizoram . . . 1 40
Tripura . . . 2 60
Meghalaya . . . 2 60
■< 'd|i ^ Nagaland . . . 1 69
fRBTH Sikkim . . . I 32
(>H) HUM yiH CB) U N IO N TERRITORIES
» f§ Andeman and Nicobar . . . 1 —
Dadra and Nagar Haveli . . . 1 —
Pondicharry 1 30
^H?5 » f§ Daman and Deu . . . J
Latashdw oeP . . .
1
7
---
Chandigarh
D elhi . . . 56
543 4,0473 3 Total . . .
F T T O i-H S ^ ^ 3 TOSfrg,
Source__ Election C om m ission, Q ovt
Io f India, N ew D elh i.
■ m H r e V i 9 8 9
LOK SABHA e l e c t i o n . 1989
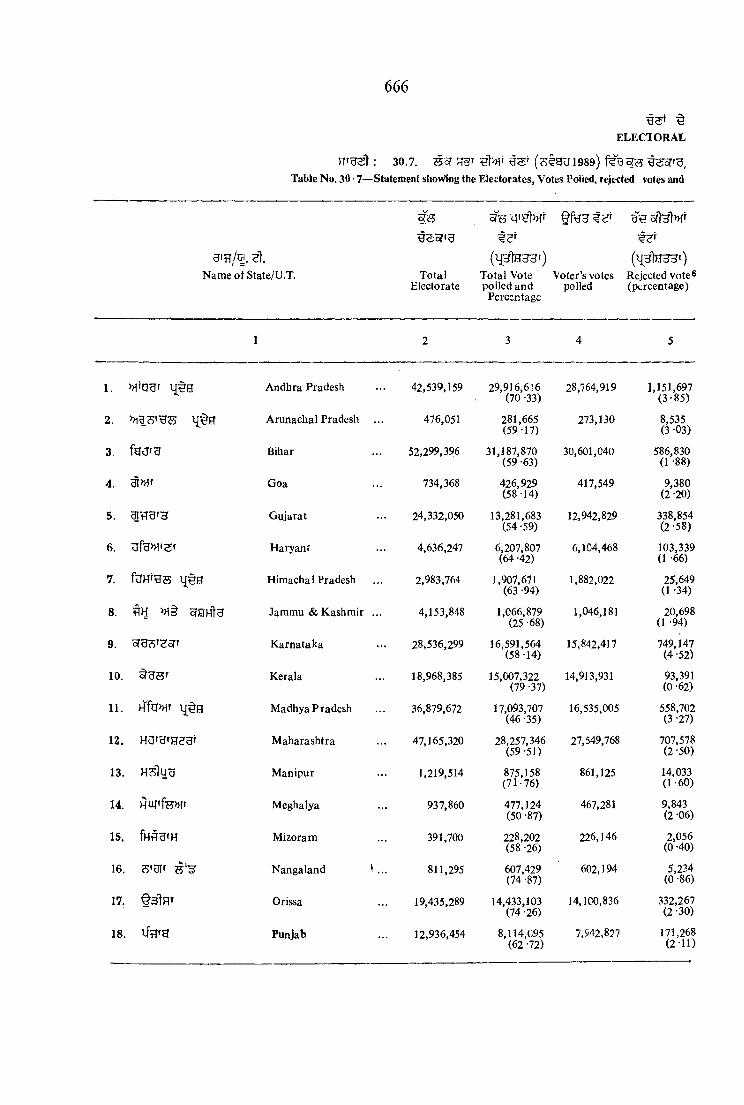
6 6 6
ELECTORAL
: 30.7. ( c ^ lg g i9 8 9 )
Table No. 30 7—Statement shoWkig the Electorates, Votes Poiied, rejected votes and
g 'r7 /» . e l
N am eof State/U.T. TotalElectorate
Total Vote polled and
Percentage
f Hf
Voter’s votes polled
Rejected vote® (percentage)
1 2 3 4 5
1. Andhra Pradesh 42,539,159 29,916,616 (70 -33)
28,764,919 1,151,697(3 -85)
2. Arunachal Pradesh ... 476,051 281,665(59-17)
273,130 8,535 (3 03)
3 Bihar 52,299.396 31,187,870 (59 -63)
30,601,040 586,830 (1 -88)
4. Goa 734.368 426,929 (58 -14)
417,549 9,380 (2 -20)
5. l ? r e f 3 Gujarat 24,332,050 13,281,683 (54 -59)
12,942,829 338,854(2 -58)
6. Haryanf 4,636,247 6,207,807 (64 -42)
6,104,468 103,339 (1 -66)
7. Himachal Pradesh 2,983,764 1,907,671 (63 -94)
1,882,022 25,649 (1 -34)
8. m SfaHtU Jammu & Kashmir ... 4,153,848 1,066,879 (25 -68)
1,046,181 20,698 (1 -94)
9. Karnataka 28,536,299 16,591,564 (58 -14)
15,842,417 749,147 (4 -52)
10. Kerala 18,968,385 15,007,322 (79 -37)
14,913,931 93,391 (0 -62)
11. Madhya Pradesh 36,879,672 17,093,707 (46 -35)
16,535,005 558,702 (3 -27)
12. HOfUfHeuT Maharashtra 47,165,320 28,257,346 (59 -5])
27,549,768. 707,578 (2 -50)
13. H?)luu Manipur 1,219,514 875,158(71-76)
861,125 14,033(1-60)
14. HU|ffe)>ir Meghalya 937,860 477,124 (50 -87)
467,281 9,843 (2 -06)
15. fHflU'H Mizoram 391,700 228,202 (58 -26)
226,146 2,056 (0 -40)
16. cS'UIf Nangaland ' ... 811,295 607,429 (74 -87)
602,194 5,234 (0 -86)
17. Orissa 19,435,289 14,433,103 (74 -26)
14,100,836 332,267 (2 -30)
18. llt7»g Punjab 12,936,454 8,114,095 (62 -72)
7,942,827 171,268(2-11)
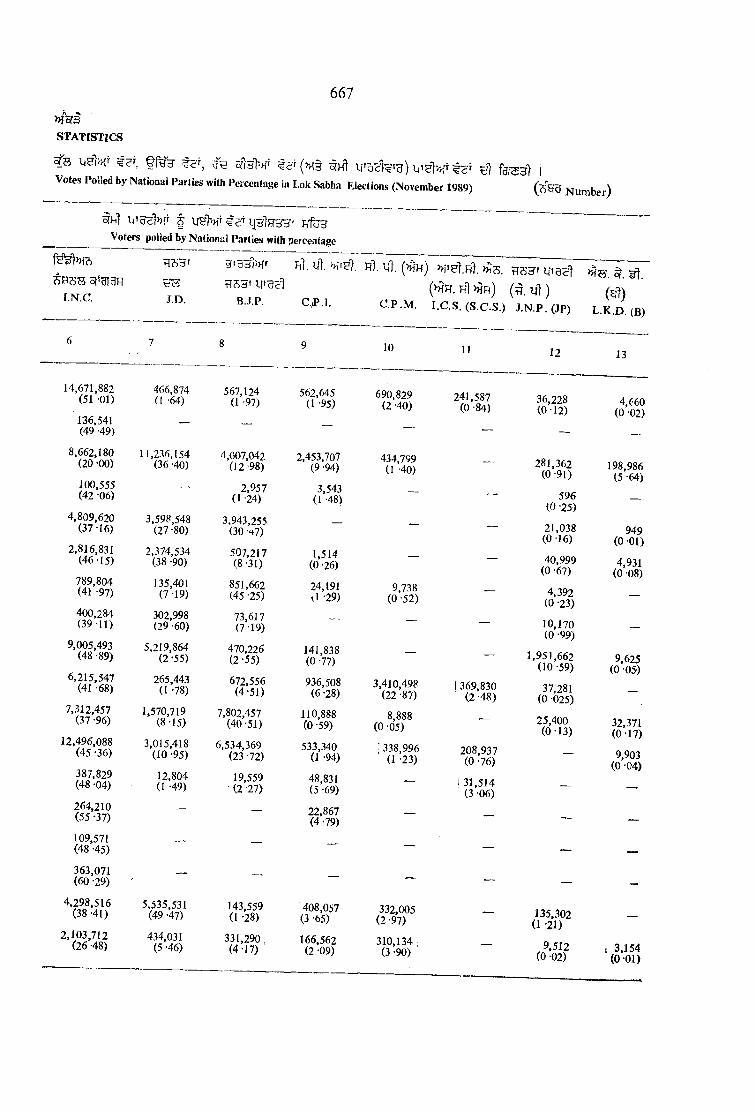
667
f tc% t e r ( h{§ ^ hI Ij'acl^Tg) H f e s ] IVotes Polled by National Parties with Percentage in I-ok Sabha Elections (November 1989) (?fSiB Number)
STATISTICS
f U H l# PilUHVoters polled by National Parties with percentage
5?’gi3HI N C . J.D.
9r'g5l»ff r I ul. H i 111. (MH) >hK UtdSi
rTSSfU’Sc'} (>HH. HI>HR) (H. U] ) (^ ])
B.J.P. C.,P.l. C.P.M . I.C.S. (S.C.S.) J.N .P.(JP) L.K.D. (B)
6 7 8 9 10 11
14,671,882 (51 -01)
466.874 (I '64)
567,124 (1 -97)
562.645 (1 -95)
690.829 (2 -40)
241,587 (0 -84)
136,541 (49 -49)
— — — — —
8.662,180 (20 -00)
11,236,154 (36 -40)
4,007,042(12-98)
2,453,707 (9 94)
434,799 (1 40)
—
100.555 (42 -06)
— 2,957 (1 -24)
3,543 (1 ^S)
— —
4,809,620(37-16)
3.598.548(27-80)
3,943,255 (30 -<+7)
— — —
2,816,831(46-15)
2,374.534 (38 -90)
507,217 (8 -31)
1,514 (0 -26)
— —
789,804 (41 -97)
135,401 (7 -19)
851,662 (45 -25)
24.191 a -29)
9,738 (0 -52)
—
400,284 (39 11)
302,998 (29 -60)
73,617(7-19)
— — —
9,005,493 (48 -89)
5,219,864 (2 -55)
470,226 (2 -55)
141.838 (0 -77)
— —
6,215,547 (41 -68)
265,443 (1 -78)
672,556(4-51)
936.508 (6 -28)
3.410,498 (22 -87)
(369,830 (2 -48)
7,312,457 (37 -96)
1,570,719(8-15)
7,802,457(40-51)
110,888 (0 -59)
8,888 (0 05)
—
12,496.088 (45 -36)
3,015,418 (10 -95)
6,534,369 (23 -72)
533,340 (1 -94)
338.996 (1 -23)
208,937 (0 -76)
387,829(48-04)
12,804 (1 -49)
19,559 (2 -27)
48,831 (5 -69)
— 1 31,514 (3 -06)
264,210 (55 -37)
— — 22,867 (4 -79)
— —
109,571 (48 -45)
— — — — —
363,071 (60 -29)
— — — — —
4,298,516 (38 '41)
5,535,531 (49 -47)
143,559 (1 -28)
408,057 (3 -65)
332,005 (2 -97)
—
2.103,712 (26 -48)
434.031 (5 -46)
331,290,(4-17)
166,562 (2 -09)
310,134 , (3 -90)
—
12
36,228 (0 12)
281.362(0-91)
596 (0 -25)
21,038 (0 16)
40,999 (0 -67)
4,392 (0 -23)
10,170 (0 -99)
1,951,662 (10 59)
37,281 (0 025)
25,400( 0J 3)
135,302 (1 -21)
9,512 (0 02)
13
4,660 (0 02)
198,986 (5 -64)
949 (0 01)4,931
(0 08)
9,625 (0 05)
32,371 (0 17)
9,903 (0 -04)
, 3.154(0 01)
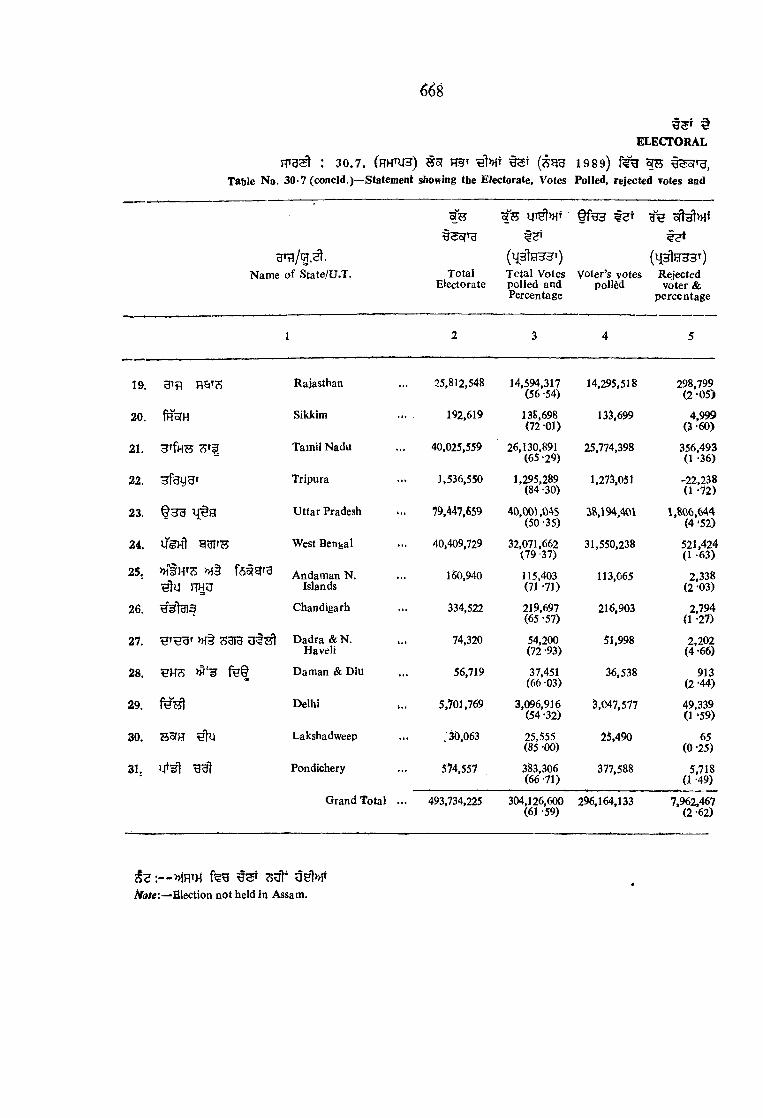
6 6 8
ELECTORAL
F P 3 ^ : 3 0 .7 . (RH^IB) » 5 f H§r 19 9 9 ) §^5?rg^
Table N o. 30-7 (concld .)— Statement showing the Electorate, Votes Polled, rejected Totes and
fS T
i e t
Nam e o f State/U .T . TotalElectorate
T ctal Votes polled and Percentage
vo ter ’s votes pollM
Rejected voter &
percentage
1 2 3 4 5
19. Rajasthan 25,812,548 14,594,317 (56 -54)
14,295,518 298,799 (2 -05)
20. fHSTH Sikkim 192,619 138,698 (72 01)
133,699 4.999 (3 *60)
21 . Tamil Nadu 40,025.559 26,130.891 (65-29)
25,774,398 356,493 (1 -36)
22. n fgyuT Tripura 1,536,550 1,295,289 (84 -30)
1,273,051 '22,238(1 -72)
23. Oc^d Uttar Pradesh 19,447,659 40,001,04S 38,194,401 1,E06,644(50 -35) (4 -52)
24. ifeH l g g t 'S W estBenfeal 40,409,729 32,071,662 (79 -37)
31,550,238 521,424 (1 -6 3 )
25. »5§ Andaman N. Islands
160,940 115,403 (71 -71)
113,065 2,338 (2 -03)
26. Chandigarh 334,522 219,697 (65 -57)
216,903 2,794 (1 -27)
27. T im U t s i Dadra & N .Haveli
74,320 54,200 (72 -93)
51,998 2,202 (4 -66)
28. Dam an & DiU 56,719 37,451 (66 03)
36,538 913(2-44)
29. Delhi 5,701,769 3,096,916 (54 -32)
3,047,577 49,339 (1 ‘59)
30. 55fH Lakshadweep : 30,063 25.555 (85 00)
25,490 65 (0 -25)
31, Pondichery 574,557 383,306 (66 -71)
377,588 5,718 (1 *49)
Grand Total ... 493,734,225 304,126,600 (61 -59)
296,164,133 7,962,467(2 -62)
UHlni*
M»/e:— Election not held in Assam.
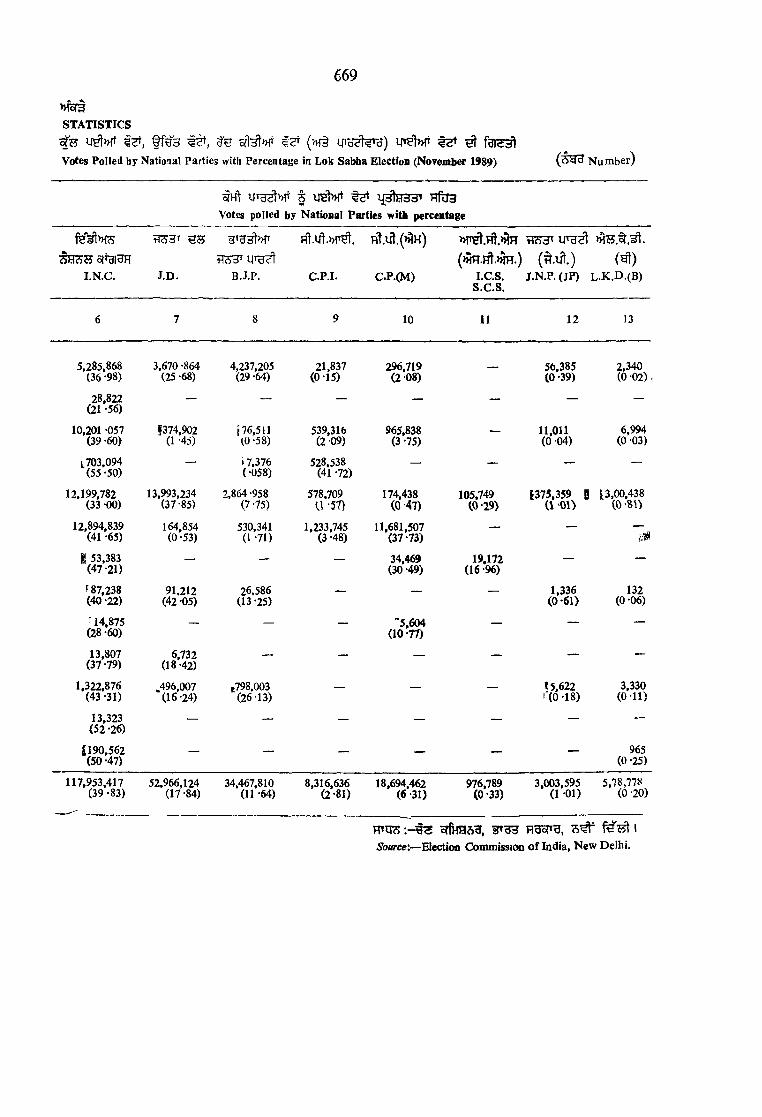
669
»fer3
STATISTICSo f l^ » f 1 st UIq^ th) utsl)>rt ^ ^ f g i ^
Votes Polled by National Parties witli Percentage in Lok Sabha Election (November 1989) (* y H Number)
o{Hl <Sd' qdlW dd’ HTU3
Votes polled by National Parties nvith percentage
Fil.iit.M’yl.^ 5 5iTgiUH (S - u t .) ( ^ )
I.N .C . J.D . B.J.P. C.P.I. C.P.(M ) I.C.S.s.c.s.
J.N .P .(JP ) L .K .D .(B )
6 7 8 9 10 11 12 13
5.285.868 (36 -98)
3,670 -864 (25 -68)
4,237.205(29-64)
21,837(0-15)
296,719(2-08)
— 56.385 (0 -39)
2.340 (0 02) !
28,822 (21 -56)
— — — — — — —
10,201 -057 (39 -60)
1374,902 (1 -45)
{76.511 (0 -58)
539,316 (2 09)
965,838 (3 -75)
— 11,011 (0 04)
6.994 (0 03)
L703.094 (55 -50)
— ^7.376(-058)
528,538 (41 -72)
— — — —
12.199.782 (33 -00)
13,993.234(37-85)
2.864 -958 (7-75)
578,709 a -57)
174,438(0-47)
105,749 CO-29)
E375.359 gU - o i )
1.3.00.438(0 M >
12.894,839 (41 *65)
164,854 (0 -53)
530.341 (1 -71)
1,233,745(3-48)
11,681,507(37-73)
— —m
I 53.383 (47*21)
— — — 34,469 (30 -49)
19.172 (16 -96)
— —
f 87,238 (40-22)
91,212 (42 -05)
26,586 (13 -25)
— — — 1,336(0 -61)
132 (0 -06)
14,875(28-60)
— — — "5,604(10-77)
— — —
13,807 (37 -79)
6,732(18-42)
— — — — — —
1,322,876 (43 -31)
,496.007(16-24)
b798,003 (26 -13)
— — — ! 5.622 ' (0 -18)
3,330( O i l )
13,323(52-26)
— — — — — — —
1190,562 (50 -47)
— — — —• — — 965(0-25)
117,953,417 (39 -83)
52.966.124(17-84)
34,467,810 (11 -64)
8,316,636(2-81)
18,694.462(6-31)
976,789 (0 -33)
3,003,595 (1 01)
5,78,778 (0 -20)
__
H»q?> ir»g3 n g ^ B , \Source'.— Election Commission o f India, N ew D elhi.

f e n u t o , h h h § HqT^u;^^ ^ ^ i fn n ^ g r RT^gsl^Mt
f e g r t 3 T Frt-f^'HTfif)!H 9 f e a rr^ T g § f^grgrf 3 s iIh t fgr^^t ^ 1
R T gsl ?5: 31 .1 31 1 9 8 8 § o/h Sf^ STf^^r » ,§ ufgrH ( f t T W ^ ) HHqt
?rr3olTgl g r^ 9 I
Rfg.^1 S : 31.2 § ' 31.S BT FT3il u V h Ufem r3T33l § €v[ fsTRH ^ 9 I
S": 3 1 .6 3 ‘ 31.10UnTH % qiTH UI^t § FT Sfe, frm €Bf! M §
g § a i§ ^ fgr33rl u s i
SECTION XXXI
POLICE, CRIMES AND SUDHARGHAR
This section contains information relating to the administration of Police, Crimes and Sudharghar The data shown in the tables of this section are self-explanatory and have been compiled from the data received from the concerned offices of the State Government.
Table 31.1, gives information relating to number Qf Police StalioQS and Police Posts (District- wise) as on 31st December, 1988.
Table 31.2 to 31.5. Information relating to the strength of Punjab Police and different types of crimes is given in these tables.
Tables 31.6 to 31.10. Number of prisoners convicted and released relating to all sudharghar? and judicial lock-ups in the State of Punjab have been shown in these tables.
671
31

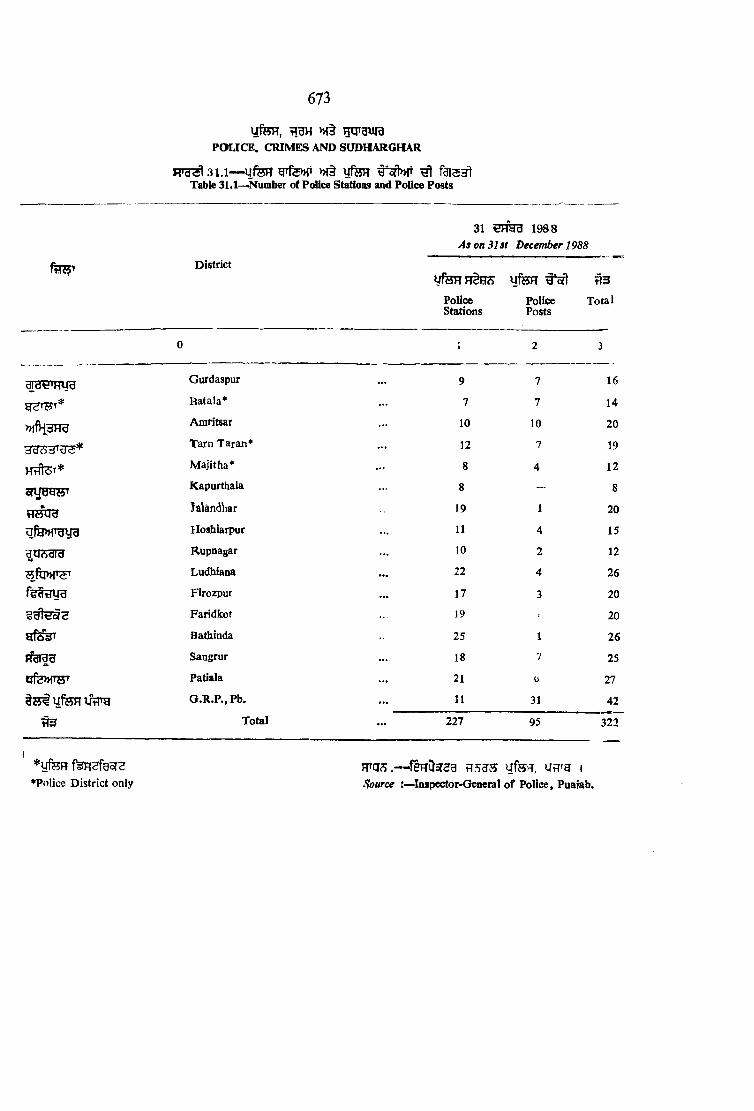
673
U feH , HqrguraPOLICE, CRIMES AND SUDHARGHAR
i T ^ 3 i . i — u fe H g 'fe » F » f§ y f e n ^Table 31.1—Number of Police Stations and Police Posts
District
31 1 9 8 8As on 31 at December 1988
PoliceStations
PolicePosts
t?3
T otal
0 1 2 3
grerem uuGurdaspur . . . 9 7 16
geT^5T* Batala* . . . 7 7 14
Amritsar 10 10 20
Tarn Taran* . . . 12 7 19
HtiiiT* Majitha* 8 4 12
sryBETPKapurthala 8 8
HttUd Jalandliar 19 1 20
ufe>H»aira Hoshiarpur . . . 11 4 15
^tlAdld Rupnagar 10 2 12
Ludhiana 22 4 26
fec ftiy u Firozpur 17 3 20
Faridkot 19 ■ 20
Bathinda 25 1 26
Sangrur . . . 18 7 25
tlfe>H W Patiala 21 6 27
u f« H I4 > y G .R .P .,P b . 11 31 42
Total . . . 227 95 322
*ufep^•Police D istrict only
RTCJS.— ^^Pri)5r2g UR^Sf ISource Iaspector*General o f P olice, Puaiab.

u fe H ^ >Ht HUT3 ura P O U C E , CRIM E AND.SUDHARGHAR
RT U^ 3 1 . 2 — (h ^ V feH ^Table 31.2—Strength o f CI?U Police by Categories
( f ^ ^ )(NumbCT^
Items 1967 1970 1975 1980 1984 1985 1986 1987 1988 1989
0 1 2 3 4 5 6 7 8 9 10
m Qs J u fe R ^ ^
fa i5 3 l
f8j5H 0or?3 t r a s s , f e s H -
OorS9 tTdTO >H§ feOTOoTSg
Sanctioned Strength of Police Forces as on 1st April
Inspector-Generals, Additional Inspector Generals, and Deputy Inspector-Generals 7 7 7 7 14 24 25 25 25 27
FRPfeoT >H§
a u 3 ^
Superintendents, Assistant Superintendents and Deputy Superintendents 125 134 169 196 232 337 318 334 340 394
fHSHOoTSa >Ht Fra-fenO o^sg RH^fe
>H§ >n1viwt‘2 HH-feSHOora^
Inspectors and Sub-Inspectors Sergeants and Assistant Sub- Inspectors 2,195 2,007 2,404 3,025 3,261 3,871 3,982 4,050 4,157 5,573
fH 2f f e g W 3 H< 'd TO
\M^ H ^'d JW dt
Head Constables including Mounted Head Constables . . .
M ounted Constables
3,151 2,667
184
3,291
184
4,664
184
5.689
184
6,428
184
6,321
184
6,410
184
6,400
184
8,292
184
fn ir u l Foot Constables 17,919 15,232 18,494 20,777 23,475 24,311 24,558 24,795 24,909 37,363
Total . .. :23,397 20,231 24,549 28,853 32,855 35,155 35,388 35,798 36,015 51,833“
Fnt R5: — y f e n , i j t r a i
SMirc*:-~Inspector Oeoeral o f Police, Punjaq.
Os4:

yfeR, 13H vjg
POLICE, CRIMES AND SUDHARGHAR
675

y fe H , H tra mP O U C E , CR IM ES AND SUDHARGHAR
3 1 ,3 — f e g of!§ a i§ ^Table 91.3—'Incidence of Crimes in Ponjab by D ivision
(fej33l)Number)
D istrictHTB/Yeai
19701975198019841985198619871988
o(3B 3Ton H S 53HT3 >>{31? H 3T ^ 3 ^ 9 1 W E ^ y f e H §
H S y fHoT ]
u f3»T
Murder Dacoity Burglary Theft Robbery Kidnap- Riots Culpable Counter- M iscel- Totalping Homicide fiet laneous Cognizi-
Coining ableCrimes
1 2 3 4 5 6 7 8 9 10 11
574 _ 1,554 2,854 28 301 44 198 6,925 12,478638 3 1,553 2,807 48 295 91 169 2 6,754 12,360620 1 1,207 2,299 21 256 17 147 3 7,108 11,679744 11 905 1,447 103 168 83 174 6 9,187 12,828646 10 1.003 1,477 110 164 58 142 9 7,566 11,185
1.101 51 1,363 1,939 361 172 91 159 1 7,986 13,2241,388 151 1,464 2,304 592 182 160 137 9 8,630 15,0171,761 112 1,500 2 4 3 0 582 193 32 112 3 7,851 M ,276
O s- a
District/DlTision 1988
HBU'd JalandharDivision
Jalandhar }>-Jalandhar R ange
Hoshiarpur
867
281
69 350
20 354
446
542
249
126
61
43
15 -
21
2,053 4,117
— 1,399 2,794
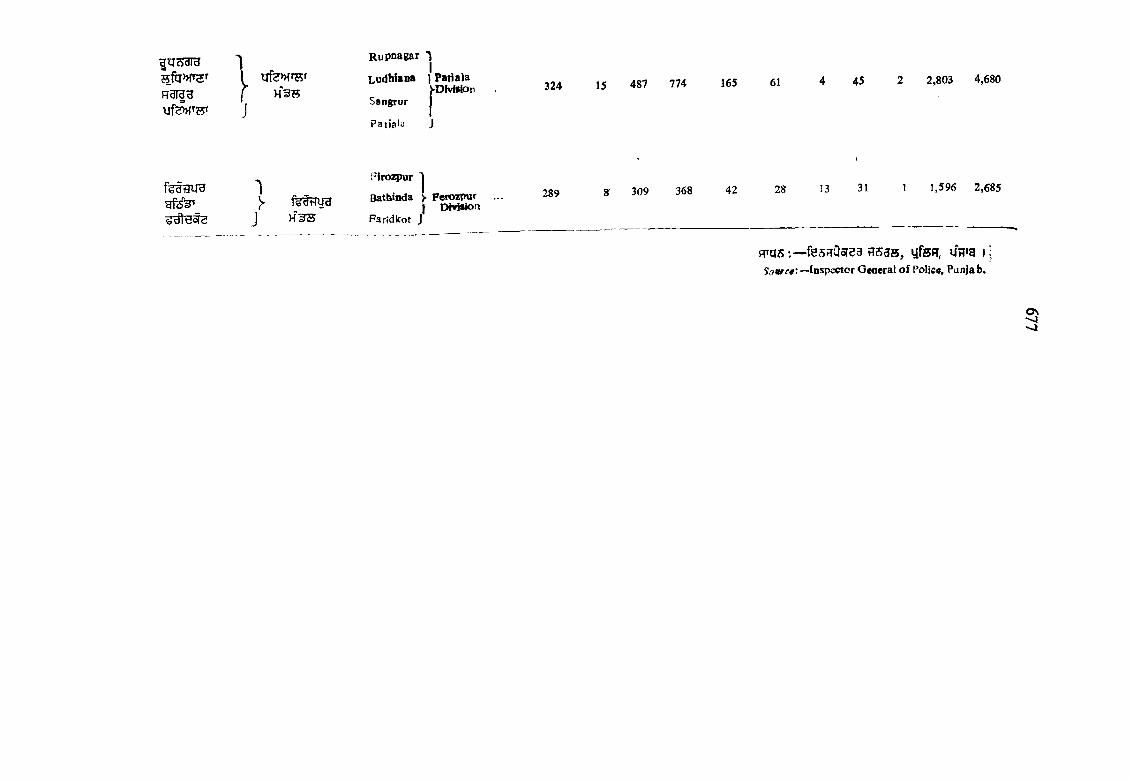
R 3 I |g f HS?5
J
Rupnagar
Ludhiana ) Patiala ^Division
Sangrur |
Patia?a J
324 15 487 774 165 61 4 45 2 2,803 4,680
J
FitoJ5>ur
f e im m Bathinda >• Ferozpurj Division
Fan'dkot J
289 g 309 368 42 28 13 31 1 1,596 2,685
H»a5 tT 5 3 S , UfSR, U > 9
Softrce'.—Inspector General o f Police, Punjab.
S J- J

U feH ,POLICE, CRIM E AND SUDHARGHAR
3 1 .4 — ora®, >>rai^ora?5,Table 3 1 .4 —Marder» Kidnapping and Abduction. O acoity and Robbery Cases
of3®Murder
o jg s >n§ Kidnapping and abdaction
Items1970 1975 1980 1984 1985 1986 1987 1988 1970 1975 1980 1984 1985 1986 ^ 1 987 1988
0 1 2 3 4 5 6 7 8 9 10 11 12 13 14 15 16
1. f u g s Rf?5* 3 ' % a f d t H
2 . H'tt ^a i9 ^
Cases pending from last year*
Cases reported during the year
470**
574
' 559
638
357
620
125
744
287
646
258
1101
451
1,388
665
1761
351
301
376
296
307
256
95
168
80
164
99
172
77
182
118
193
3 . Q rt tH fdT<i3T H | S oTT*<S e l 3 1 5 ^ S s
H ^ 5 3 W<5\ o<a«'d
N o . o f cases declared false, mistake o f law or non-cogni- zable 16 12 10 7 7 9 15 90 98 52 41 36 47 22
f ^ § cU^4. ti)
H H i f e t T ^ 5
Pending investigation or trial; 533J 427 154 287 258 45J 665 1174 479J 367 84 80 99 77 118 132
5. Qh y a ’ ^t^ Cases not detected 49 56 32 118 63 205 469 387 54 57 41 57 36 48 43 40f e HftWT
6. ^ fi^-T f e t l HH'fen HSfHS d y l ( 7 + 8 )
7.
Cases in which trial was completed (7 + 8 )
Cases acquitted or discharged
461
156
540t
279
495
201
445
204
420
264
739
343
591
318
582
340
119
79
134tt
112
166
109
76
45
72
31
86
40
36
27
75
54
8 . frra « h1 ^ Cases convicted ... 305 419 294 241 156 396 273 242 40 46 57 31 41 46 9 21
9 . fira h b W § y o p g s f e g H ofeP 3 i t
A*o{^ fe H 9 3
( H 3 ^ W A d ld ')
Percentage o f cases convicted to cases tried (result o f trial) 66-2 77 -6 59-3 54-2 37 14 5 4-0 46-0 41 -7 33 -6 33-2 34-3 40*8 56-9 53-0 2 5 -0 28-0
On
oo

y fe H ,POLICE, C B IM E A N D SUDHARGHAR
3 1 .4 (R H ^ U 3 )— ol3H , >H§ STt >h§
Table 31.4 (concid)— Murder, Kidinppfaig and Abduction, D acotty an<1 Robbery Cases
Items3»opr
Dacoity Robbery
1970 1975 1980 1984 1985 19»6 1987 1988 1970 1975 1980 1984 1985 1986 1987 1988
17 18 19 20 21 22 23 24 25 26 27 28 29 30 31
^91 ftl9 3IH
felTO3{HSmW <S^rlT)
9H 3 € ^ e su T fwfe>H» § R’B ^ U<5 I^'ote .— Cases in which trial wa& completed plus cases not detected are total cases.
*fe<S' ^ HiHS U3 I♦Includes cases pending from previous year in the Courts.
f g t a»HS 3S I oflt BiHS US I p >H§4 ^ I h ^ t h i h s 5 Itlncluding dropped C cn r ovr dtd. JlncUitks infrrn aticn of 3 & 4 itcn s.
felS 3^ » ,ig >>3 2 cFj ^ 3 h V I r B o t i♦♦Three cases received from other beads acd two esses transferred to othe* heads..
H’U S :— yf SH, ITRiS
Source : Inspe(^or-General o f Police, Punjab,
32
Cases pending from last year 5 14 3 4 8 7 43 69 25 86 55 42 40 81 223 301
Cases reported during the year — 3 1 11 10 51 151 112 28 48 21 103 110 361 592 582
N o . o f cases declared false, mistake o f law or non- congnizable P — 4 — — — 1 — — 4 1 5 — 2 4 3
Pending investigation or trial ^ 4J 10 1 8 7 43 69 83 39J 80 42 40 81 223 301 448
Cases not detected — — — 2 1 9 87 21 3 16 8 36 18 102 302 132
Cases in which trial was completed (7 + 8 ) 1 6t _ 3 8 9 12 19 11 32f 25 22 38 57 75 110
Cases acquitted or discharged — 2 — — 3 3 9 17 5 12 11 9 12 21 63 88
Cases convicted 1 5 — 3 5 6 3 2 6 22 14 13 26 36 12 22
Percentage o f cases con- 1 victed to cases tried ' (result o f trial) 100 0 83 -3 62 -5 6 7 -0 25 -0 10-5 54 -5 68 -8 56 -0 59 -1 68-42 63*0 16 2 0-0
3VO
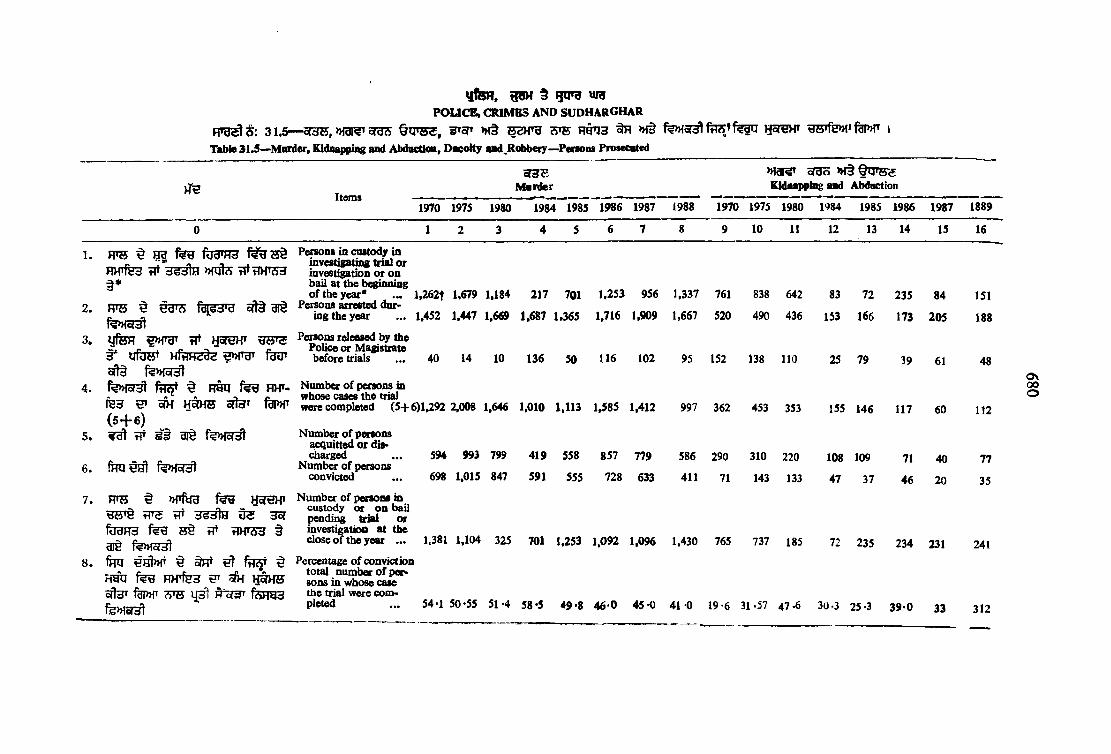
qftSH, 5 mP O U C E , CRIM BS AND SUDHARGHAR
R»3^S: 31.5— »rai eras §q»SS, 3»cT» >H§ ^ Rgijg ^ >H§ ^5Tfg>H»kTable 31.5—-Morder, Kidnapping and Abductioa, DacoHy and^Robbery—Pflrsons Prosecuted
9 3 EM irder
M3RT cTSRi >H§ KIdoappfaig and Abdoction
itoms1970 1975 1980 1984 1985 1986 1987 1988 1970 1975 1980 1984 1985 1986 1987 1889
0 1 2 3 4 5 6 7 8 9 10 11 12 13 14 15 16
P en on t in o u to d y in investigating trial or investigation or on bail at the b^ iim ingo f the year* ... l ,2 6 2 t 1.679 1,184 217 701 1,253 956 1,337 761 838 642 83 72 235 84
Persons arrested during the year . .. 1,452 1,447 1.669 1,687 1,365 1.716 1,909 1,667 520 490 436 153 166 173 205
1 . flTOi ^ I*etJ (od 'rtJ f e u 3 dR H f e W 3 ^ ^ t?HTJ53§ *
2 . w s ^
3. yfeH f»fTgT ?it H355HT3" u t o w g r feg r
4 . ^ ^ FT&q R >f-f e 3 ^ oW iofer( 5 + 6 )
5 . ^ w e i a id f?>Hor^
6 . f T O s e ! f e » fo i^
7 .
8 .
ms t >HTftf3 feg y g wtT 3 ^ ^ ^ 3oT
fOTR3 ^ t?lTO3 §aref fe n fo f^fHQ ^ ^ §Frau R > ffe3 W ^ IjfiM Scfl3T ^ ijg l f e q g 3
fe>H a^
Persons released by the Police or Magistratebefore trials . .. 40 14 10 136 50 1 16 102 95 152 138 110 25 79 39 61
Number o f persons in whose cases the trialwere completed (5 + 6)1,292 2.008 1,646 1,010 1,113 1,585 1,412 997 362 453 353 155 146 117 60
Number o f persons acquitted or dis*charged ... 594 993 799 419 558 857 779 586 290 310 220 108 109 71 40
Number o f personsconvicted . .. 698 1,015 847 591 555 728 633 411 71 143 133 47 37 46 20
Number o f persons in custody or o n bail pending teial or investigatioa at theclose o f the year . .. 1,381 1,104 325 701 1,253 1,092 1,096 1,430 765 737 185 72 235 234 231
Percentage o f conviction total number o f per- sons in whose case the trial were completed ... 54*1 50-55 51*4 58-5 49*8 4 6 -0 45*0 41 0 19-6 31.57 47.6 30-3 25-3 3 9 -0 33
151
188
48
112
77
35
241
312
0 \00O

P O U C E , CRIMES A N D SUDHARGHAR
3 1 .5 — ( h H ^ 3 ) cf3H , »13T^T5ra^ >K§ 5 ^ HtH S»75 ^ >H§ f t w H3reH» fuPHnTable 31.5— (Concld.) Murder, Kidnappiag and Abdiictioa, D acoity and Robbery—Perswis Prosecuted
ItemsDacoity Robbery
1970 1975 1980 1984 1985 1986 1987 1988 1970 1975 1980 1984 1985 1986 1987
17 18 19 20 21 22 23 24 25 26 27 28 29 30 31
1. ^ Persons in custody in investigating trial or
W "dioJlH W ite flT HHTcra investigation or onbail at the beginning
® o f the year*2. HTs t m
f e . | 3 3 l3, u fS R Hc?EH* Persons released by the
3 ' ufUHt H>HTgiSrt§f%»f5r3t
4, ^ R g q RH»~ Number o f persons whoser * n r cases the trial were comp-f e 3 cW HofHH 5n3» fgWT le te d (5 + 6 )(5+6)
5 g # 3I§ Number o f persons acqui-' tted or discharged
6 firo fe>M5r3 Number o f persons convicted
7. W B ^ w v r a fe 'e Hsfevn Number o f persons inp. • o - " custody or on bail
W 3S3TH O S pending trial or investi-fe^e tTT gation at the close o f the
§ aig <*'8. fFR ^ ^ frfST ^ Percentage o f conviction
R t a t e g R w fg 3 S ' S h h w b t o w h S r ^ r t f S T5feT fgi>HT IST® H'E?3f r?JHg3 were completed
15 67
10
14
7
4
39
26
43
45
73
65
250
82 66
47
202
67
97
33
40
169
74
151
163
304
201527
100-0 40-0 — 85-7 66-7 3 9 -0 30*0 25 0 57-2 61-78 42-8 28-3 25-6 2 5 -0 2 5 -0
* f u g ^ R T ^ 3" ^ UU tRT R g q ^ Rth?5•Includes persons involved in cases pending from previous year in the Courts.
: few O H T sg y f m , Url^g ISource : Inspector General o f Police, Punjab.
1988
32
304
387
— — — 3 --- 1 4 5 ““ 3 8 22 25 —
3 40 — 14 39 31 40 47 34 89 49 60 90 102 155 216
— 24 - 2 13 19 28 35 21 34 23 43 1 67 77 116 184
3 16 — 12 26 12 12 12 13 55 21 17 23 25 39 32
8 37 7 26 45 39 138 127 66 175 81 74 163 235 471 627
15-0
OSoo
f feR 4 f?>Hor^ u g U 3 2tFour Persons received from other heads and two transferred to other haads.

U feH , >H§ uugPOLICE, CRJMESfAND SUDHAR GHAR
3 1 .6 — W g o?g?5 g r ^Table 31 .6—Places of Confinement
6 8 2
WS/Year
sra?5Places oj confinement
^ sj55 ftiH /r W ^ iuh R u ^ u r a
H w u r aCentral District OpenSudhar-ghar
Sudhar-ghar
Air. Sudhar-
ghar
m lT iRqTg
uraSubordinate
Sudhar-ghar
Judicial Total Lock-ups
------ --------------- -----
1971 3 7 1 1 10 35
1975 ... 3 7 1 i 10 35
1980 ... 5 5 1 1 10 35
1983 ... 8 5 i 1 10 37
1984 9 5 2 1 ' 10 37
1985 ... 7 6 1 1 10 36
1986 ... 7 6 2 I 10 36
1987 ... 7 t> 1 10 36
1988 ... 7 6 2 11 10 36
ftJHT
1989
Districts : 1989
... 7 6 2 1 10 36
Gurdaspur ... 1 — — 1 3
Amritsar ... 1 — — 1 3
^vjciyw' Kapurthala ... — 1 1 — 3
tIteUd Jalandhar 1 — — — 2
O fn»frgyg. Hoshiarpur ... — 1 — — 2
|U*cllcJ Rupnagar ... — — — — 1
Ludhiana ... 1 1@ — 2 4
firamru Firozpur ... 1 — — 1 ' 3
Faridkot ... _ 1 — 1 3
Bathinda ... 1 — — 1 3
R3ra3 Sangrur ... — 1 — 2 4
y f e » f w Patiala ... 1 1 1 1 5
RTq^ :— ^fesnOoj^u 1TSBZ5 w a 1
Source ;—Inspector-General o f Prisons, Punjab.
@ §BFr5BH FrgT i © B orstal Institution.

Yeax
UfBH, HIPU uraPOUCE, CRIMES AND SUDHARGHAR
F TO^ 3 i . 7 — f a i ^ Table 31.7—Number of Prison^s in Punjab by Class
At the beginning oj the year
FTO § 5EUT3 feR tfd T f o ftt FTO § § grsft
Received during the year Discharged during the year Remaining at the end o f the year Total daily average prisonersduring the year
{Col. 4 to 6)
frmw f t e
Convicted Under trial
Ih u
Civil Convictedw t eUnderTrial
Civil Convictedw t e
Under Civil Trial
f m
Convicted UnderTrial
CivilHHft w i t s _
Convicted Under —Trial >
0 1 2 3 4 5 6 7 8 J 10 11 12 13 14 15
1970 4,482 2,721 11 15,411 45,776 362 15,352 45,818 347 4,541 2,679 26 42 89 1
J975 4,667 3,068 24 16,413 44,406 3,064 16,441 43,690 2,913 4,639 3,784 175 45 122 8
1980 4,901 2,010 231 12,598 35,832 1,853 13,018 34,933 2,052 4,481 2,909 32 35 98 5
1984 4,516 3,462 272 13,625 1,58,125 5,942 13,406 1,43,657 5,547 4,705 7,930 667 37 433 16
1985-86 ... 4,798 7,210 120 14,415 55,051 9,572 15,228 58,925 9,608 3,985 3,336 84 25 151 26
1986-87 ... 3,985 3,336 84 10,897 40,893 243 11,169 40,177 322 3,713 40,52 5 30 112
1987-88 ... 3,314 4,882 3 6,769 35,838 491 7,450 36.545 488 2,633 4,175 6 19 98
f 1 ^ ^31? 5 IA'ote : — 1 1 's table iiculdes pr'soDers in Jails, Sub-Jails and Judicial lock-ups.
FTOS:—
Source:—Inipector-General o f Prisons, Punjab.
ONooUJ

f p h
U fB H , HtPB w g POUCE, CRIMES AND SUDHARGHAR
FTOSt 3 1 . 8 — IRTO f e g fsiw M §Table 31 '8—Convicts by Age, Sex and Literacy in Panjab
RT® ^
3T§Total Convicts" imprisoned
^ t H 3 Age o f Convicts Edncational Qualification among Convicts
Year
Guruig me year
22 Hitt T uJeUnder 22 years
2 2 ^ 40 ITO 22 /o 40 years
4 1 3 ‘ 60 H 'tt 41 to 60 years
60 RHSH* Above 60 years
u i f e yLiterate Illiterate
y g eMale Female Total
U 9SM ale
feH 3 jFemale
ugH
Male Female
U5HMale Female
y g aMale
feRsrJ
FemaleUHHMale Female
fyw aj
Male Female
0 1 2 3 4 5 6 7 8 9 10 11 12 13 14 15
1970 9,956 61 10,017 1,180 9 6,733 43 1,739 7 304 2 5,414 21 4,542 40
1975 10,379 3,139 13,518 1,675 16 6,798 114 1.402 9 504 — 6,459 49 3,920 90
1980 8,638 166 8,804 819 24 6,432 90 1,150 48 295 4 6,403 98 2,293 68
1984 8,505 155 8,660 1,277 46 5,407 93 1,220 7 601 9 4,462 50 4,043 105
1985-86 ... 9,120 166 9,286 1,248 34 6.226 126 1,265 5 381 1 4,610 60 4,510 106
1986-87 ... 4,186 62 4,248 263 3 2,768 54 1,056 5 99 — 2,790 36 1,396 26
1987-88 ... 5,142 62 5,209 530 1 3,206 39 1,248 25 158 2 3,245 24 1,896 44
F r a s f e ? 5 H it e u « 7 i3 g s U tr g iSource : -Inspector-G eneral o f Prisoqs, Punjab,
Osoo

y t s H ,g g H » r t m r g urnPOLICE, CRIMES AND SUDHARGHAR
^ s f H g B B t f?ra^ o ft§ a i§Table 31J>—Coniricts Classified as **Habitoals** Admitted into Poojab Jails
TO Items 1970 1975 1980 1982 1983 1984 1985-86 1986-87 1987-88'
0 1 2 3 4 5 6 7 8 9
J
1. ITO t oft§ Convicts admitted dor* ing the year 10,017 10.518 8,804 9,353 9.337 8,660 9,286 5,955 5,209
I I , aHni53 »> g a 3
^ ^ g i t
tO fd ldS t—
( § ) ^
Num ber imprisoned in default o f furnishing security and classiHed as habituals—
(A ) F or the first time 58 92 7
>
(>k) u t o e a t <!>1bd^ 3 i t — (B) Convicted previously—
( i ) feoT «T0 Once 55 29 2 — — — - - —
( i i ) t ^ Twice 2 5 21 2 — — ~ —
( i i i ) ^ 3* ^ ^ M ore than twiccs 13 6 1 — — — — —
tA n ^ t r » r t s
?TH H y ( ^ + > h)
Total Convicts classified as Habituals (A + B ) 151 148 12 — — — — —
o^^oo»V/»;
H Tus: fesR 0 5 r^ ^ tT S 9 5 , u V g I
Source ;—Iaspector<5eneral o f Prisons, Punjab.

686
P O U C E , CRIMES A N D SUDHARGHAR
R T g^ 3 1 .1 0 — if t r a t ^ OiJliidI* ^Table 31.10—Progress of Jail Industries in Punjab
Year/Industry
1970197519801981198219831984198519861987-881988-89
lU ^ ) Value o f Articles
Produced (Lakh Rupees)
1
3 « .3 36 -8 61 -4 71 1 83 -2
108-4 87-8 159-6 124-9
164-01 173-63
t y y d l« ^ 'd - l9 8 8 - 8 9 Industry-wise—1988-89
1. d d t r ^ s w Carpentry 44-21
2. oTugi Textile . . . 39 87
3. Leather 0 -72;
4. tid l» r Durries ... l-5 2 i
5. yddl ^ cm Tailoring . . . 4-43i
Munj . . . —
7 . r o i Bamboo Curtains • •• —
8. tjWl Atta Chakki 0-99)
9. Tents . . . 63 455 (
10. of? dItt'H Cut Glass ... —
11. ETTB >H§ gfe»Tc|T 5fH Smithy ... 0 - 4 2
12. Niwar -■ 0 8 4
13. Blanket —
14. Chalks . . . —
\ f . w oTh Embroidery . . . —
16. Phenyl . . . 2.9*9
17, Soap 2-9)8
18. H33ft i r S S Poultry 2-9)2
19. Daying 0 -3 7
2 0 . Miscellaneous ... 7-9)2
FPUS :— Ui ffTH |
Source Inspector-General o f Prisons, Punjab.

687
t e s 32
gfOtfT >>f gui>Mt 1 faT33l Haot RTeargl fe^ aiet5 1
3 2 .1 liflrg ^ ^ 0 yrf^/>it Bt 5 I
RT'd^t 3 2 .2 f # 9 U > g § » i W 3 ^ gm feM T » ,§ ^ l> H t U R ^ gt juggt f^ H ’ f3T»i 9 I 5 ^ ^ ’
q-dfTg^ UHH3<T § f^sr ^ g r ^ l , B w H 3_-^hth1 grauT f ^ ' 1 1
HT3 3 I 3 2 .3 5 ^ 3 ^‘|»1T f ^ g r ^ f ^ T|t33^S1
fH 3 t giHl 5 I
SECTION XXXll
PRINTING PRESSES AND PUBLICATIONS
In this sectioa information has been given about the iiucnbsr of printing presses an i of ns v spapeis, periodicals and books published.
ra6/e 32.1 shows the number of printing presses in the Punjab.
Table 32.2 Presents data regarding number of newspapers, periodicals and books published in the State. The books published in different languages have been grouped as uni-lingual, bi-lingual or multi-lingual.
Table 32.3 glv«? information about the unilingual books published in different Indian and otjier (\sian 'languages.


689
Year
grO y r g >H§ lJ[crHS PRINTING PRESSES AN D P U B U C A T IO N S
3% .l— g n) yr^Tie 321—Printing Presses io Punjab
fg i3 3 lNumber
1965-66 5341970-71 1,124
1,4901975-76 ...1980-81 1,9501981-82 2,0321983-84 2,2931984-85 2,0341985-86 2,2691986-87 ... 2,2611987-88* 2,4441988-89 ... 2,711
OH♦Revised.
HTq?9: grfU ifffTg I
Source Home E>epartment, Punjab.
g » 0 y r^ n f§PRINTING PRESSES AN D PUBLICATIO NS
3 2 . 2 - l f ^ M W g t gpfTH >H yR^oTTTable 32.2—News Papers, Periodicals and Books Published in Punjab.
(Number*)
Books
FTSYear
>H§3HT^Newspapers Vnl’llngual Bi-Ungual or Multilingual Total
auu — Preiodicals » f a p sJ*dd1
>H§UcrM d U t e
» f§
In English In Indian Purely in Mfaced (2-J-3-I-4+5)and other and other Indian and LanguagesEuropean Asian other Asian (Asian andLanguages Languages Languages European)
0 1 2 3 4 5 6
1965 511 216 264 3 123 6061970 477 77 208 6 42 3331975 528 211 528 2 94 8351980 800 59 135 I 22 2171982 609 9 14 10 9 491983 661 36 66 _ 28 1301984 992 ___ — — —
1985 651 15 126 2 7 1501986 868 77 204 — 3 2841987 946 209 495 3 4 7111988 820 31 440 1 5 4791989 966 64 230 — 5 299
3Tfo f ? § ^ ,Source Home Departmeot, Punjab
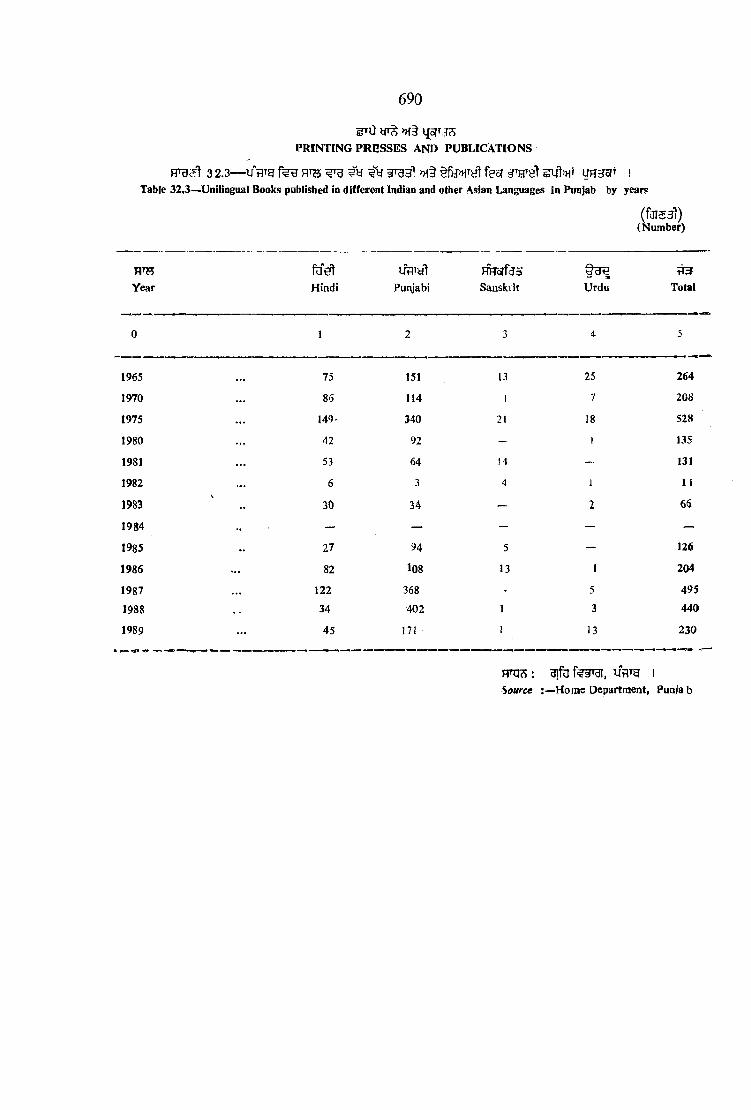
^ 0 » f§PRINTING PRESSES AND PUBLICATIONS
FF35I 3 2.3— U h^H §^33] >h§ !Table 32,3—Unilingual Books published in different Indian and other Asian Languages in Punjab by years
6 9 0
(fai$3i)(Number)
Year Hindi Punjabi Sauskiit Urdu Total
0 1 2 3 4 5
1965 75 151 13 25 264
1970 86 114 1 7 208
1975 149- 340 21 18 528
1980 42 92 - 1 135
1981 53 64 14 — 131
1982 6 3 4 ] I i
1983V
30 34 — 2 6^
1984 — — — — —
1985 .. 27 94 5 — 126
1986 . . . 82 IO8 13 1 204
1987 122 368 — 5 495
1988 34 402 1 3 440
1989 . . . 45 171 I 13 230
m i7 i : 3 lfu f^ a 'd l, ifflTg 11
Source Home Departraent, Punja b
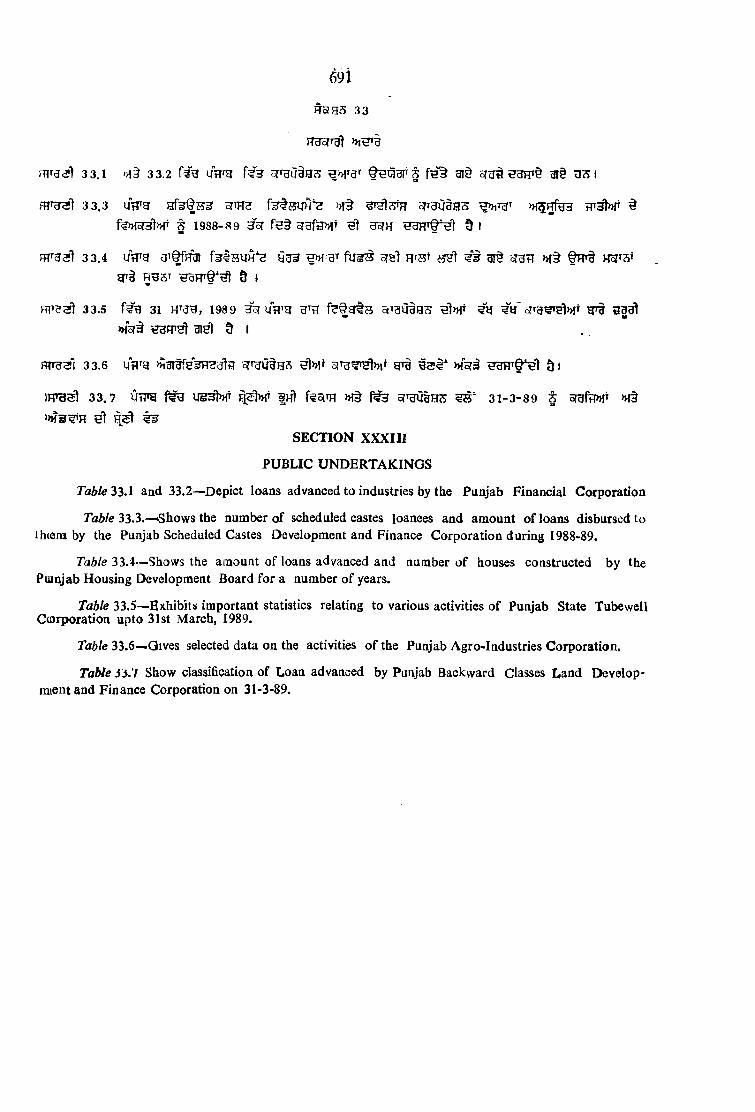
3 3 .3 y n r g 5 3 f 3 § S 3 » l t H>>iT3» >H5R%3 tTTaftnT §
fe)H5r3t»f § 1 9 8 8 -8 9 3"sT f s t crgfH»fi ^ n T § ^ l 9 I
3 3.4 im^g a^^Frai s>M-gT f y g s srsi Frst sh I »i§ Hg»5»
gT§ r b s t S d F r f ' ^ 9 j
Pn»B3l 3 3 .5 f ? g 31 HT^'3, 198 9 35? u V g otTaQgg^ ^1>Ht ? V 5 ? T g ^ l» f i g i§ g g ^
tjgF T ^ a ie l 9 I
Wdm 3 3 .6 w g >A gT tfe^ eu t?I g T g ^ » i i g rg )H5r^ 9 j
3 3 . 7 UTTO |K t k s n i M § 3 1 - 3 - 8 9 § 5 r a f ^ » >H§
» H 3 ^ H g t ^ %3
SECTION XXXIII
PUBLIC UNDERTAKINGS
Table 33A and 33.2—Depict loans advanced to iadustries by the Punjab Financial Corporation
Table 33.3.—Shows the number of scheduled castes loanees and amount of loans disbursed to ih(em by the Punjab Scheduled Castes Development and Finance Corporation during 1988-89.
Table 33.4—Shows the anaouiit of loans advanced and number of houses constructed by the Puinjab Housing Development Board for a number of years.
Table 33.5—Exhibits important statistics relating to various activities of Punjab State Tubewell Corporation upto 31st March, 1989.
Table 33.6—-Gives selected data on the activities of the Punjab Agro-Industries Corporation.
Tabie 5X1 Show classification of Loan advanced by Punjab Backward Classes Land Develop- nuent and Finance Corporation on 31-3-89.
691
3 3
3 3.1 3 3 .2 a V g STt B O S H W § fH § g i§ 31^ I

R d o f i ^
PUBLIC UNDERTAKINGS
693

Sr.N o.
33.1— uVfTg 5fTBlJ§H S 31laMe No. 33.1—Indusfry-wlse classification ot'Ioans sanctioned/disbursed
( s t f gi4§_____________________________________________________________(Rs. in
Smail Scale Units
6 9 4
PUBLIC
^ feHH Type of Industry
5rt3! '3o(Tf2WAmount sanctioned gsTH HSfH
131^31 (1 H ) ■
N o. o f loans
Sanctioned (gross)
^ 5gross
etfective
Amountdisbursed
Amountoutstand
ing
—0 1 1 2 3 4 5
1M etal Products 54 457-49 353 -50 345 -80 1,006-74
2 . tf^Tsr ,^Hd‘ Food manufacturing Industries . . 41 260 -35 174 -00 342 -31 1.112-21
3 . UHTfes Q ^'rdcS Chemical Products 60 590-36 513-67 473 -80 1,640-17
4 . 5 (U i Textiles 30 397-36 280 *01 351 -67 1,230 -50
5 . H otel Industries — — — — —
6 . HTHT5 Transport equipments 28 320 -85 229-67 225 -98 645 -31
7 . % z m Miscellaneous 35 354 -54 354 -54 153 -26 534 -21
8 . Machinery except electrical Machinery 46 233 -48 169 -49 164-97 438 -73
9.h v bthI oT^cSt
Electrical machinery Apparatus, appliances and Supplies 28 269 -07 215 -25 202 -97 475-81
10. d;^^T>HTfs Stone Quarrying clay and sand pits — — 1.65 17.11
1 1 . 5?TUTH >H§ STBTS Q^U' tdcS Paper and paper Products 6 65.36 54.39 143.00 463.41
1 2 . fufrsT Cotton ginning 26 354.24 340.18 216.95 414.61
1 3 . U d d i Hosiery 16 190.27 136.29 85.19 220 .66
1 4 . <^Hd' Rubber Products 19 282.30 267.36 194.37 482,69
1 5 . » f§ ^ RSnt <^Hd' Footwear & Other wearing apparel 6 98,35 82.33 46 81 100.74
1 6 . W T 3 tr fe ti Non-metallic Mineral Product 5 109,90 95.94 103,13 354.33
1 7 . Basic metal Industries 20 395.70 375,37 322.69 693.98
1 8 . ira fe fesT M § tfT Printing and publishing and allied Industries 6 25.70 22.98 101.81 79.92
1 9 . » f§ «^d^ Cold Storage and ice Plants 9 51.77 42.64 37.54 517.30
2 0 .
2 1 .<id'HU^S 6ic3(ri1 >H3 ofTUof
Transport operators
W ood and Cork Furniture
513
6
678.52
19.16
565.61
16.14
421,76
38.11
781.90
33.20
2 2 .
fH?T$ gu?^l^d
fe ir o l m »T§HgT^
Electricity, gas water and sanitary Services — — — 77.35
2 3 . u t e Beverage — — ( - ) 4 .7 4 4.11 16.94
2 4 . ^ s l ' d d t f e r B B U Furniture and fixtures 10 8.44 ( - ) 1 1 .9 3 4.75 15.44
2 5 . Leather and Fur Products 5 32.82 (—)29.49 66.77 131.94
2 6 . 0 ^ ^ M 3 <^Hd>>f Petroleum and Coal ftt>ducts ' — — (- )1 1 .5 8 15.69 118.93
Total 969 5,202.03 4,294.23 4 ,065 .09 11,604.33
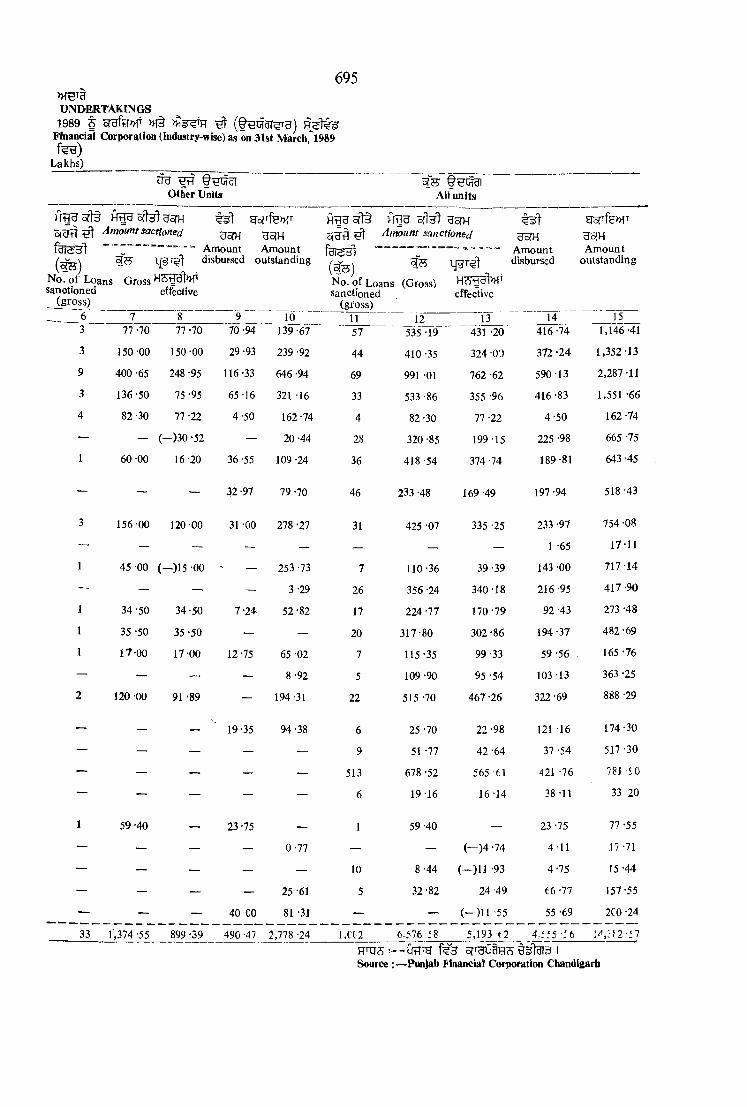
695
UNDERTAKINGS1989 f ^
Financial Corporation (Industry-wise) as on 31st Marcb. l^S^ f ^ )
Lakhs)
Other Units AU units
) ^ o r t § H ^ o fM H o r H o(OT ^ Amount sactioned
Sro|Tfe»fT
H5fH U5IHH ^oT T h HflU 5fl5r7 U5TH ofUH ^ Amount sanctioned gSTH
gofTfe>HT
H5JH
( ^ )No. ol” Loans Sanctioned
(gross)
???Gross
Amount Amount disbutsed outstanding
effective
(Vh )No. of Loans (Gross) Sanctioned
(gross)effective
Amountdisbursed
Amountoutstanding
_ 6 7 8 9 10 11 12 13 14 15'^3 77 -70 77 *70 70-94 139-67 57 535 -19 431 -20 416 -74 1,146 -413 150 -00 150-00 29-93 239 -92 44 410 -35 324 -GO 372 -24 1,352-139 400 -65 248 -95 116-33 646 -94 69 991 -01 762 -62 590-13 2,287-113 136 50 75 -95 65 -16 321 -16 33 533 -86 355 -96 416-83 1,551 -664 82-30 77-22 4-50 162-74 4 82-30 77 -22 4-50 162 -74
— — (-)30 -52 — 20 -44 28 320 -85 199-15 225 -98 665 -751 60 00 16-20 36-55 109 -24 36 418 -54 374 -74 189-81 643 -45
— — — 32-97 79-70 46 233 -48 169 -49 197 -94 518 -43
3 156 00 120-00 31 -00 278 -27 31 425 -07 335 -25 233 -97 754 -08
— — — — — — — — 1 -65 17-111 45 00 (-)15 '00 — 253 -73 7 110-36 39-39 143 -00 717-14
— — — — 3-29 26 356 -24 340-18 216 -95 417-90
1 34-50 34-50 7-24, 52 -82 17 224 -77 170-79 92-43 273 -48
1 35 -50 35 -50 — — 20 317-80 302-86 194 -37 482-691 17-00 17-00 12-75 65 -02 7 115-35 99-33 59-56 165-76
— — — — 8-92 5 109 -90 95 -54 103 -13 363 *25
2 120 00 91 -89 — 194 -31 22 515 -70 467 -26 322 -69 888 -29
— — — 19-35 94-38 6 25-70 22-98 121 -16 174-30
— — — — — 9 51 -77 42-64 37 -54 517-30
— — — — — 513 678 -52 565 61 421 -76 781 SO
— — — — — 6 19-16 16-14 38 -11 33 -20
1 59 -40 — 23 -75 — 1 59-40 _ 23-75 77-55
— — — — 0-77 — — (-)4 -74 4-11 17 -71
— — — — — 10 8-44 (—)11 -93 4-75 15-44
— — — — 25 -61 5 32-82 24'49 66-77 157-55
— — — 40 00 81 -31 — >- ( - ) l l -55 55 -69 2C0 -24
33 1,374 -55 899 -59 490 -47 2,778 -24 1 ,CC2 6-576 i 8 5,193 (2 4:f55 -r6 \^ ;a i 11
Source:- u v i ' y 5r'uii3H?j 1 — Punjab Financial Corporation Chandigarh

696
HcJot'dl
P U B U C UNDERTAKINGS
33. 2— of T gut HS W U T ^ ^fS F T^ s ftt ^ o ^ f w » f §
Table No. 33.2__ CbssificatioD o f Loans and Advances (sanctioned) by the Punjab Financial Corporation by Ranges
^H>Hor Serial N o. Rangs
31}T O ^, 1989
Total amount sanctioned since the inception of
Corporation upto 31st March, 1989
l> H U ls , 1 9 8 8 3 * 3 1 HT3^, 1 9 8 9 3of
Sanctioned Fh>m 1st A pril, 1988
to 31st March, 1989
i n f e r ^ofH q f e s H ^
( m - ^ ) ” ( ? W 3 q § )Units Amount Unhs Amount
(Lakh R i.) (Lakh R t)
1. 50,000 3U§3oT ^oT3^
2 . 50,000 H u t §* ^ ira fes? h V g i i§ 3oT ^ orara
3. l u t 3* ^ 3c? t
4. 2 ? W 3 * # IU g 5 5 5 y H U t 3o? t ora^
5. 5 iu § 3* ^ >H§ 10 2W 3oT ^ oraB
6 . 10 ? W l V f § 3 ' ^ ira 30 5^ 3of ^ oidtl
7 . ira6 0 3 ^ ^ o r a i
Loans not exceeding R». 50,000 2.581 743-13 228 82-74
Loans exceeding Rs.50,000 but not exceeding Rs. one lakh
Loans exceeding Rs. one lakh but not exceeding Rs. 2 lakh
Loans exceeding Rs. 2 lakhs but not exceeding Rs. 5 lakh
Loans exceeding Rs. 5 lakh but not exoeeding Rs. 10 lakh
Loans exceeding Rs, 10 lakh but not exoeeding Rs. 30 lakh
Loans exceeding Rs. 30 lakh but not exceeding Rs. 60 lakh
1,149 839-60 74 35*74
1,644 2.689-97 130 197-80
1,789 5,647-96 305 856-36
828 6,070-11 93 695-56
750 14,851-90 121 2,565-33
158 7,449-05 51 2,443.05
Total 8,889 38,291 -72 1,C02 6,576-58
FTOTi:— gVl ai f I Source Punjab Financial Corporation, Chandigarh.
— fe n § >Ho?3 R 5C 3 33.1 » o|fe>HT WS 753? I
N o te —Figures in this table relate to total apsount sanctioned and will cot tally with those o f table 33.1
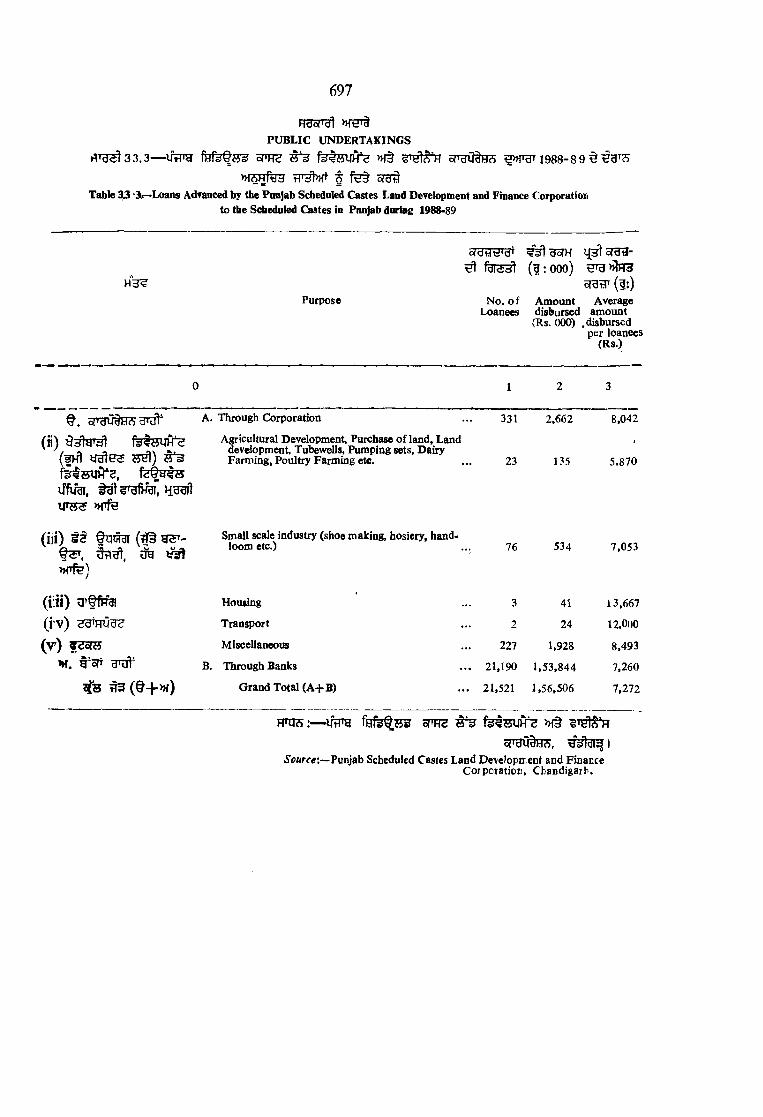
»f3T§
PUBLIC UNDERTAKINGS
f l T ^ 3 3 . 3 — VfPH oPH^ ^ f e t s U H ^ >Ht 5 T B U ^ H»fUT 1 9 8 8 -8 9 § H 3 t?J
t T T ^ J ora#
Table 33 *3k-Loans Advanced by the Punjab Scheduled Castes Land Developinent and Finance Corporation to the Scheduled Castes fn Punjab daring 1988-89
697
Purpose
o<3iHt!'d' ijp to r a g -^ ( g : 0 0 0 ) HTUWT3
(H:)
N o. o f Amount Average Loanees disbursed amount
(Rs. 000) .disbursed per loanees
(Rs.)
0 1 2 3
STHVtHSHrdt' A. Through Corporation 331 2,662 8,042
( i i ) fa J tsU H ^
ifHrai,
Agricultural Development, Purchase o f land. Land development, Tubewells, Pumping sets, Dairy Farming, Poultry Farming etc. 23 135 5.870
( i i i ) t i 5 5 ^ - U t \^ , ^
» r f e )
Small scale industry (shoe making, hosiery, hand- loom etc.) ... 76 534 7,053
( i : i i ) vT§frrai Housing 3 41 13,667
(i'V ) Transport 2 24 12,000
( v ) ?<;oR5 Miscellaneous 227 1,928 8,493
W. t'oTT d'Ol' B. Through Banks 21,190 1,53 ,844 7,260
^ 3 H 3 ( § - | - n f ) Grand Total (A + B ) 21,521 1,56,506 7,272
W T J T i ifRTg oTTO ^ f e f 5 1 0 ^
o r g y f e .5'o«rfe:--Punjab Scheduled Casies Land Devclopn ent and Finance
Corporatico, Cbandigaih.
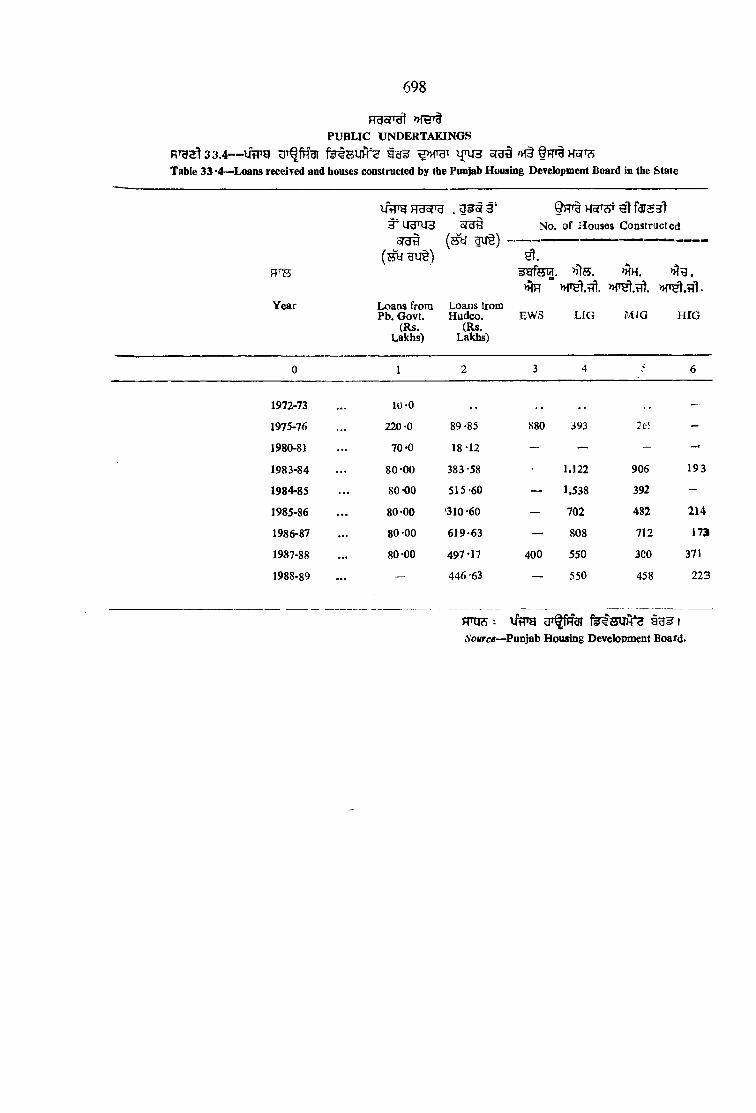
698
HcJo(>dl PUBLIC UNDERTAKINGS
R ^ g s l3 3 .4 — IfflTg f e l s i n r e § F R H5TOTable 33*4—>Loans received and houses constructed by the Punjab Housing Development Board in the State
Hdof'd . d § F r t K 5 r ^ ^ 't f a i5 3 ' tojdt!
1U §)No. o f H ouses Constructed
, >HS. >HH. >>?g.
Year Loans from Pb. Govt.
(Rs. Lakhs)
Loans trom Hudco.
(Rs.Lakhs)
EWS LIG MIG H IG
0 1 2 3 4 : 6
1972-73 10-0 .. .. —
1975-76 220-0 89 -85 880 393 265 -
1980-81 70-0 18-12 — — -
1983-84 8 0-00 383 -58 - 1.122 906 193
1984-85 80 -00 515-60 — 1,538 392 -
1985-86 80-00 '310-60 — 702 482 214
1986-87 80 -00 619-63 — 808 712 173
1987-88 80-00 497 *17 400 550 300 371
1988-89 - 446 -63 — 550 458 223
n 'M. n r. >.H'U* •-A’o«rc«—Punjab Housing Development Board.

6 9 9
PUBLIC UNDERTAKINGS
3 3 , 5 - - W g H t e Bofrgr 3 1 - 3 - 8 9 35T ^ 5 ^ ^ f e f g t S
Table 33 -5—Tubewells Installed by the Punjab State Tabewell Corporation as on 31-3,-89
m Item
( ^ ) ^
( l ) HoJH?5 0(19
(ii) ^ oft§(iii)(iv) ^(v) fnfiw m s uorar
( m ) W g yf^»|T
c [ ^
(i) qofW yw
(ii) ^ifeToryiHoj^(iii) i)^ywj5ij5 ^
f e s t i n ^
(A ) Installation o f Tubewells
Tubewells completed
Ttibewells energised
Potential created
Potential utilised
Actual area irrigated
(B) Luining o f water courses :
Length o f water courses completed
Additional potential created
Additional Water saved by lining of water courses
Hectares
786
763
2,250
59.250
27,109
fer. Ht Kms. 27 ,865-80
Hectares 2 ,22 ,926-40
v p te B Percentage 21*58
F F O S i f F T g o T u O ^ , I
Source:—Punjab State Tubewell Corporation, Chandigarh.
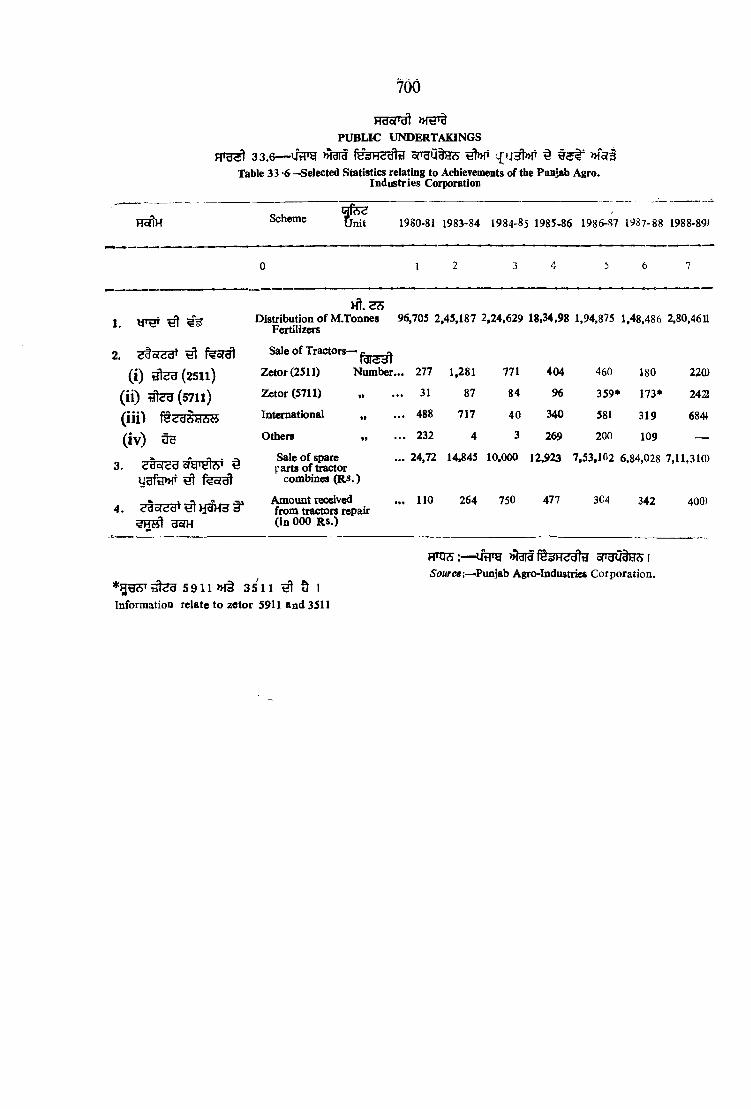
700
HgopBtPUBLIC UNDERTAKINGS
33.6— ijrTg Mara t >H5?3Table 33 *6^Selected Statistics relating to Achieyements of the Punjab Agro.
Industries Corporation
HdflH Scheme 1980-81 1983-84 1984-85 1985-86 1986-87 1987-88 1988-89)
0 1 2 3 4 5 6 7
1. ^
H t .3 SDistribution o f M.Tonnes
Fertilizers96,705 2,45,187 2,24,629 18,34,98 1,94,875 1,48.486 2.80,46U
2. ^ feofdl S a l e o f T r a c t o r , - ^
( i ) d l< id (2 5 1 l) Zetor (2511) Number.... 277 1,281 771 404 460 180 220)
( i i ) t f l^ d ( 5 7 1 l ) Zetor (5711) .. 31 87 84 96 359* 173* 2422
( i i i ) f e s u i t e s International „ ... 488 717 40 340 581 319 684+
( i v ) OB Others *» . . . 232 4 3 269 200 109 —
3. o f g T ^ i ^Sale o f spare parts o f tractor
combines (R s.)
. .. 24,72 14,845 10,000 12,923 7,53,102 6,84,028 7,11.31©
4 . til ) i ^ 3^ 3oTH
Amount received from tractors repair (In 000 RS.)
. .. 110 264 750 477 3C4 342 400)
5 9 1 1 >H§ 3 5 1 1 ^ 5 I InformatioQ relate to zetor S911 and 3S11
>»brSf^3H ?gt5 E pgudH Si S o u r c e P u n ja b Agro-Industries Corporation.
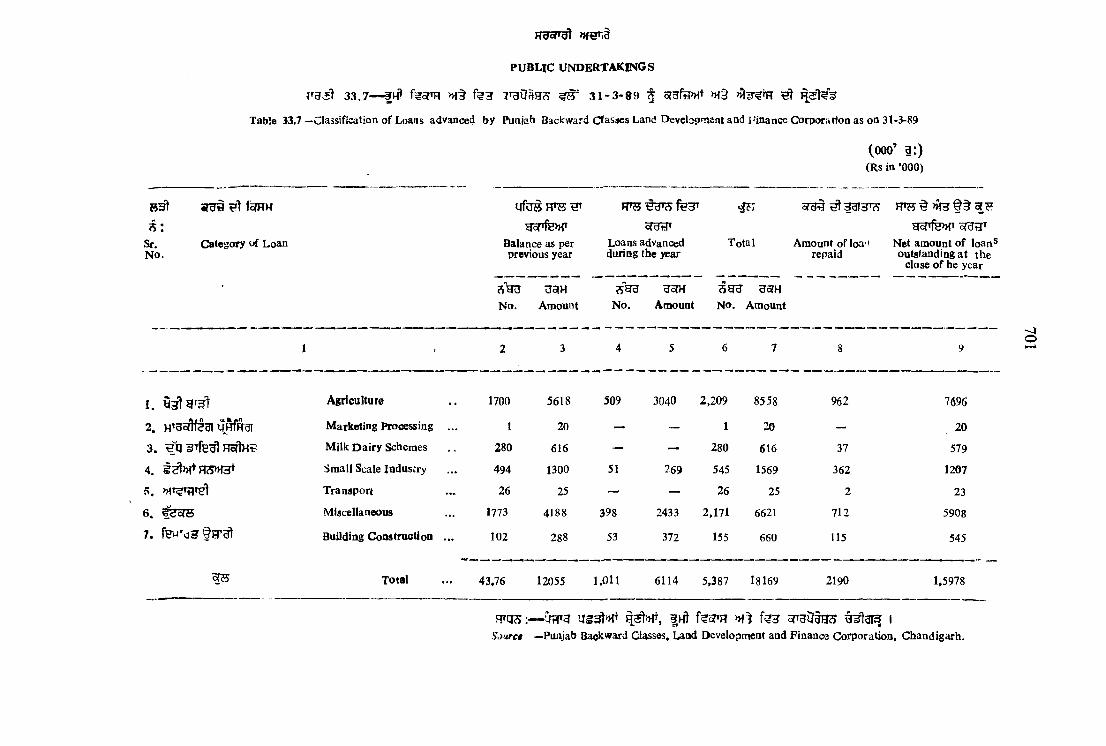
1^351 3 3 .7 — f^fl n|§ f ^ 3 3 1 - 3 - 8 9 f 5??fe»fT i>f§ ^
Table 33 .7 —Classification o f Lo^ns advanced by Punjab Backward C lasses Land Developnsent and Pinance Corporation as on 31-3-89
(ooo’ 3:)(Rs in ’000)
PUBLIC UNDERTAKINGS
H 3l
s :Sr.N o .
;iTTO F t fSfWH
Category of Loan
U fU 5 FTS ^
H oPfe»rBalance as per previous year
r r o feafT <^7
Loans advanced Tota 1during the year
ora^
Amount o f loa'i repaid
g3frfe>HT
N et amount o f loan® outstanding at the
close o f he year
S H 3 H9H N o, Amount
HoTH N o. Amount
go?HNO. Am ount
1.
2 . w f f lg r
3. Ho?te
4.
5.
6 .
7. fSw^dHtET^
of??
1 2 3 4 5 6 7 8 9
Agriculture 1700 5618 509 3040 2,209 8558 962 7696
Marketing Processing ... 1 20 — — 1 20 — 20
Milic D airy Schemes 280 616 — — 280 616 37 579
Sm all Scale Industry 494 1300 51 269 545 1569 362 1207
Transport 26 25 — — 26 25 2 23
M iscellaneous 1773 4188 398 2433 2,171 6621 712 5908
Building Construction ... 102 288 53 372 155 660 115 545
Total 43,76 12055 1,011 6114 5,387 18169 2190 1,5978
RTgS:Si>^rce
:— '4flTg Ug^>HT |K t f^STR » f^ ^ ^ 3 1 3 1 —Punjab Backward Glasses, Land Development and Finance Corporation, Chandigarh,

fOT 5 : —
34.1 ^ f3T^ »f§ »TH ^ § OW S5f I
34.2 -3 »{IU5 l r§ ^ yy gfgy ^
Hrgs) 34.3 3 f3T33> »{§ t 5W qTJ f^»{3r^ Fra^-§Tg3tU t7^ ^ I
34.4 fJTr3 >H3 ff3 T ^ fgyj^ )j|§ , rH § 3 j § oT3§ IJ^ ‘OOO*nTHT^l fU i I
RTg^ 3 4 5 HHTfeft »reTfe>HT ^ fgRfHf >Ht 3 ^ t ^ ^ f^HfoTSft fof 1977St 3 ! ^ »ft 1980 ^ 3T5^ I
Hr^3t 34.6 3 ‘ 3 4 .7 :— r?5^ f ? 9 R^r^f f g s r ^ H33T3>fl»1» f € ^ » i t ST^>H*
OS I Ufg? ^ ThHt §3 cTHTH gjgt »,§ § H*ggt ^ fgi33\ §3 c rn aRU >H§ »!§ fua*5§ H*ggt g] f3T33l >H§ ! ? 5JJFT g3r3l?>!T ig^ HnTfeHT tc7t»it ggifl 3 3 I F T ^34.7 »TH€3 »i§ yarg ^ f tr s» ^ ay^ f^ r far>HT ^ i
f t ^ T 34.8 f ^ h ^ t -5 j^ iH t t cfn Rg??»
34.9 wgt § roT ggrfsoft ^ fgi3^ arel 9 1
F rg ^ l 34.10 » !§ H35?Tg ^»|rjT 3 1 H T 3 g i9 8 9 ^ >H3 3 3 »!atcS
>)i§ HoThs 3I§ UflT T jqggl gist 9 I
34.11 W g 5 353 , rRbf55f5t 5Tt§ f?>>{c7it4r fSf^RV »f§ HO fr Hi f3T53! R^al =H5T3 31 U?5 I
TTS i 34.12 ^'53 H' >H R^SW oTfR2 fslorR f3I»Hf 5 I
SECTION XXXIV
MISCELLANEOUS
Information contained in this section is as follows *—
Table 34.1 gives information regarding number of enterprises end persons usually working.
Table 34.2 gives information regarding number of Non-agricultural own account eater prises by major activity groups.
Table 34.3 give? information regarding number of enterprises and persons usually working — All India and Punjab State.
Tahle 34.4 gives infor*natioa regariiaf state-wise number of enterprises and persons usually working per ‘000* population.
Table 34.5 gives iafor.aitioo regarding number of Non-agricultural establishments aad periions usually workiog as in 1977 Economic Census and 1980 Econoinic Census.
703
^ 5 3 3 3 4

Table 34.6 to 34.7.~District-wise activities of the Red Cross Societies have been described in these tables. In the first table an account of District Red Cross Branches and their membership, Junior Red Cross Groups and their membership and First-aid Posts run by Red Cross Society, Punjab have been given. Table 34.7 gives district-wise data in respect of Income and Expenditure of Red Cross Societies,
Table 34.8. gives information regarding working of various Housing Schemes, in Punjab,
Table 34.9. gives information regarding the number of Rest Houses and Dak Bungalows in Punjab.
TaWe 34.10. ©ves information relating to plots sold, under construction and completed both by the private persons and the Government upto the end of 31th March, 1989.
Table 34.11. shows data concerning flying clubs, planes and No. of Licenses issued to the trained persons in Punjab.
Table 34.12 shows quarterly and annual construction Cost Index for Patiala Centre.
704

„ M ISCELLANEOUS3 4 .1 — 1 9 8 O f % H » T 0 f w ^ f e ^ >H§ nPH ^ q( I
Table : 34.1 Number o f enterprises and persons usually working, 1980
705
Type o f enterprisesRural Urban
jS9B ^d lh ldd' cSyd ^dlwdd^Number Percen- Number Percen
tage tage
3 3
Total
^ f u f l >H§ ^
( § ) m
(i) ir§(ii) >H^
(m ) § 5fH 5fcr§
( i) H3
( ii) t 5TH
2 . f g ^ % » f ^
( § ) ^ I
(i) yr§j(ii) MHT3T(>h) » f H § 3 § ^
fe>H5rat
( i ) ^ I
(ii) HTi^^oTi^
^ fs? §14T7 >H§ a § 3"
( § ) ^ »rg»3(i) »Rfs tr§(ii) >H^( § )
(i) ^(i) § 5TH
Agricultural activities o thw than Crop production and plantation—
(a) Total enterprises
(i) Own account
(ii) Establishments
(b) Persons usually working in enterprises
(i) Total
(ii) Hired workers
Non-Agricultural activities :
(a) Total . .. 1.93^35
(i) Own account ... |1 ,45,675
(ii) Establishment . .. '47,860
(b) Persons usually working In enterprises :
(i) Total . . . £4,00,869
(ii) Hired Workers . .. ; 1,97,733
Agricultural and Non-Agricultural |g activities other than crop production and plantation :
2 3 4 5 6
18,111 64-36 4491 35 -64 12,602
1.6,586 70-63 2.738 29-37 9,324
11.525 46-52 1,753 53 -54 3,278
114,040 51 -69 ,13 ,124 48 -31 27,164
13,044 43-49 [3,955 56-51 ,6,999
(a) Total enterprises]
(i) Own account
(ii) Establishments
... 12,01,646
. . . £1.52,261j
...1 ,49,385
(b) Persons usually workingj in enterprises :
(i) Total . .. 4,14,909
(ii) Hired Workwa ... 2,00,777
42-96 2,56,995
45-67 i 1,73,271
36-37 [83,724
30-63 [9.07,876
26-06 [5,61,075
43-54 i.2,61,486
46-38 J J 6 ,0 0 9
36-62 85,477
31-06 [9,21.000
26-22 .5 ,65,030
57-04 .4 ,50,530
54 -33 3,18.946
63*63 U ,31,584
69-37 ; 13,08,745
73-94 7,58,808
56-46
53 -62
63-38
4,63,132
3,28,270
1,34,862
68-94 .13,35,909
73 -78 7,65,80y
RTU3 :— »T3 fgor ar$5» is soSource : Econom ic Census, 1980.
^ 35.1 3" 35.5 ^ 3* ^H3t W^ §3ire^ tp fyigrsfT 3* 3it»f usi feu i r a t i 3"fu H FW ui R^finsrH, iths >h§ feoT aras feaS B ftw u s ! t u ^ § t3 U T H S tp i f § w ^ US;3 T ^ , 1980 ^ n ra ts^ su f 3I§ I 9T5f| FT^>»r c?U UU S ^ 3
f e » r ^ INotet (far table 35.1 to 35.5)—An enterprise taken in the Economic Census is defined as an undertaking engaged
in production or distribution o f goods, services not for the solepurpose o f own consumption. An Agricultural enterprise for the purpose o f Economic census is defined as one engaged in live stock production'Agricultural Service, thunting trapping and game propagation, forestry and logging and fishing. Enterprises engaged inacitvities pertaining to agricultural production and plantation were not covered under the Bcano.nic Ceusus 1980. Enterprises engaged in all other activities were termed as an njn-agricultural enterprises.

$5oT S
vnSCECLANEOUS
5: 3 4 .2 — 1 9 8 0 fsTPTH STfdU xJig M 'U S IT § ^ fa i5 3 lTable : 34>2^Number of non>agricultaral O'wn account enterprises by major actirity groups, 1980
706
w fonu>H ^M ajor activity ^ o u p
RuralefucftUrban
TT3Total
Number Percentage
S: i j n t e n 3 :Number Percen- Number Percen
tage tage
1 2 3 4 5 6 7
1. HfeFf ^ o lS 5 '
Minning and Quarryintg 43 0 03 8 0 00 51 0 02
2. Manufacturing and Repair services 56,836 39 01 47,790 2 7 .58 10.46,26 32 80
3. tira& l i n >H§ Electricity gas and wat(er Services 109 0 07 99 0 06 208 0-07
4. fFT B l Construction 1,352 0-93 1,138 0-66 2,490 0-78
5. m >nt ^ W hole sale and retail trade 63,908 43 -87 87,565 50-54 1,51,473 47 -49
6. Restaurants and Hotelis 3,042 2*09 7,620 4-40 10,662 3. 34
7. Transport 3,319 2-28 7,243 4-18 10,562 3-32
8. HSaH >H§ dlt!‘H Storage and Warehousing ............... 215 0-15 1,549 0*89 1,764 0-55
9. HtJ'd Communications — — — — — —
10. fs la Financing and etc. Seirvices 614 0-42 [4,277 2-47 4,891 1-53
11. Hy^sr,f?Sft
Community, Social amd ^ r so n a l Services .... 16,237 11-15 15,982 9 -22 32,219 10-10
12. Others — — — — — —
Immwm*j r a M foird>Hf^ A ll Activities 1,45,675 100 -00 1,73,271 100 00 3,18,946 100 -00
3IS5T 1980 Source : Economic Census. 1980.
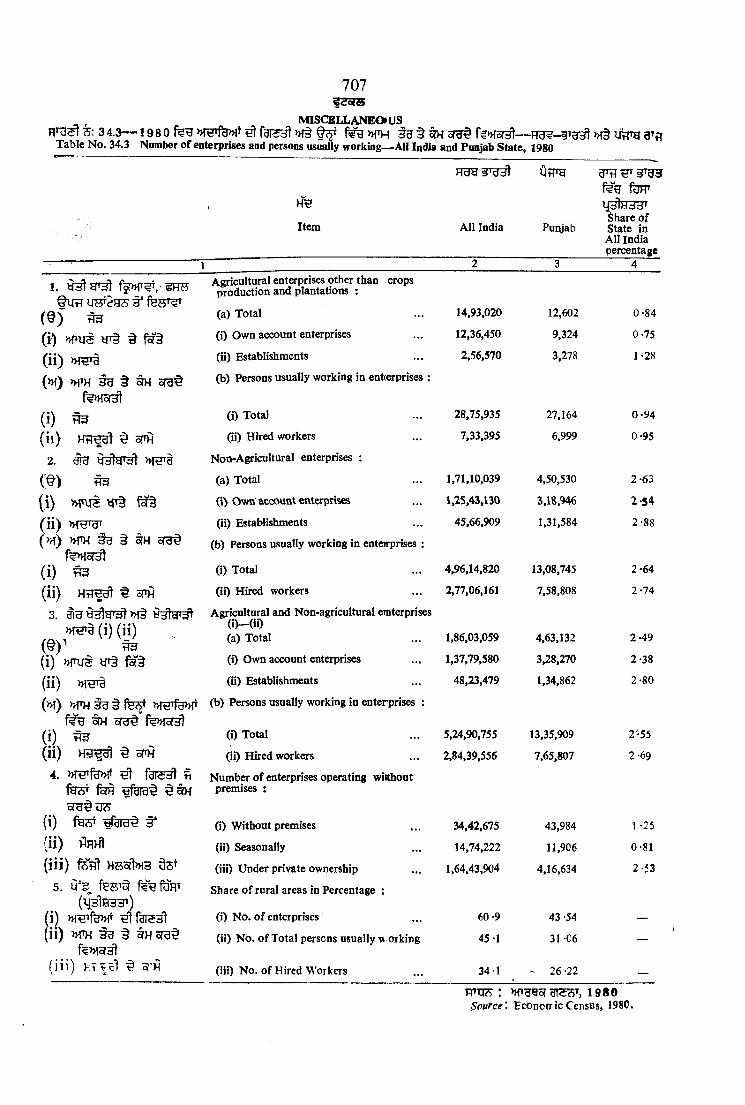
707? 2 o f 5
m i s c e l l a n e o u s3 4 ,3 — 1 9 8 0 ^ >j|§ i g § o T ^ )>f§ irpfrg g tq
T able N o . 34.3 Number o f enterprises and persons usually working— All India and Punjab State, 1980
K dy s|Tdd] OtFH
Item A ll India Punjab
1.
( § ) ^
( i ) y r § § f ^ §
( i i ) »T3Tg
(>H) >H’H t #H 5T3^
(i)( i i )
2.
(i)
HlTfSft § oTH
3?H >>{9^9
(ii)( m) »th § u § crg^
(i) fl3
(ii) ^ 5HH3. »f§ y^tgr^
»f0Tg(i) (ii)( § ) 1 ^(i) »m§ fg§(ii) »iHT3(m) » T H 3 g § fe f >HHTfe>HT
(i) ^(ii) § oTH
4. ^ fdl<id) w feisT feH B fera#
(i) fe T §*(ii) ) hh!(iii) 33T
5 . o x(H31H33^)
(i)(ii) m i ^ ^
( i i i ) l - ; T t c 1 ^ 5 j'H
f%"tJ fumM3fH33T
Share o f State in All India percentage
Agricultural enterprises other than crops production and plantations :
(a) Total ... 14,93,020 12,602 0 -84
(i) Own account enterprises ... 12,36,450 9,324 0-75
(ii) Establishments ... 2,56,570 3,278 1 *28
(b) Persons usually working in ent(erprises :
(i) Total ... 28,75,935 27,164 0 -94
(ii) Hired workers ... 7,33,395 6,999 0-95
Non-Agricultural enterprises :
(a) Total ... 1,71,10,039 4,50,530 2 -63
(1) Ovm account enterprises ... 1,25,43,130 3,18,946 2 -54
(ii) Establishments ... 45,66,909 1,31,584 2 -88
(b) Persons usually working in enterprises :
(i) Total ... 4,96,14,820 13,08,745 2-64
(ii) Hired workers . .. 2,77,06,161 7,58,808 2 -74
Agricultural and Non-agricultural emterprises ( i ) - ( i i )(a) Total ... 1,86,03,059 4,63,132 2 -49
(i) Own account enterprises ... 1,37,79,580 3,28,270 2-38
(ii) Establishments ... 48,23,479 1,34,862 2 -80
(b) Persons usually working in enterprises :
(i) Total . .. 5,24,90,755 13,35,909 2 -55
(ii) Hired workers . .. 2,84,39,556 7,65,807 2 -69
Number o f enterprises operating witthout premises :
(i) W ithout premises . .. 34,42,675 43,984 1-25
(ii) Seasonally ... 14,74,222 11,906 0 -81
(iii) Under private ownership ... 1,64,43,904 4,16,634 2 -53
Share o f rural areas in Percentage :
(i) N o . o f enterprises ... 60-9 43 -54 —
(ii) N o . o f Total persons usually \ orking 45-1 31 C6 —
(iii) N o . o f Hired Workers ... 34 1 " 26 -22 —
1 9 8 0^pijrce'. Econonric Census, 1980.

708
MISCELLANEOUSHTg^34.4— 1980f%B ^ f e y t »f§ »1TH ^ ^ 5?^ f%WT5t (OOO) »TgT^filt
Talile 34.4— Statewise number of enterprises and persfms osaally workiog per 000’ population, 1980
5tate/U.T.fdTcidI
Total Number o f enterprises
" ‘OGO’ M'y'tJl fu g
Enterprises per ‘000’
population
» fH ^ Ui?Tg
^ ofdQ‘goo f%»iofdl
N o. o f N o. o f persons persons Usually working working per ‘000* ‘000’ population
1 2 3 4 5Andhra Pradesh 16,14,160 30-14 47,121 87 -99
»TTTrH Assam •• •• • -
Bihar 10,45,604 14-96 26,095 37 -33
3lt^d'd Gujarat 11,88,409 34 -86 36,523 107-14
dfd^vT^ H aryana’” 3,19,679 24-74 9,740 75 -39
Him achal Pradesh 1,39,342 32 -56 3,443 80-44
f w » f§ srawte Jammu and Kashmir 1,96,525 32 -81 4,890 81 -64
b fd * '^ y Karnataka 13,74,971 37 -02 38,661 104-10
Kerala 9,22,922 36 -26 25,353 99 -62
*Ti3 M adhya Pradesh 13,41,70s 25 -71 32,932 63-11
Hd’d'HddT M aharashtra 18,39,393 29 -30 67,504 107 -52
M anipur 34,745 24-47 1,049 73 -87
HUJTfeW M eghalaya 32,370 24-16 1,085 80 -97
^TaiT75"5 Nagaland 15,689 20-38 746 96 -88
Orissa 8,03,662 30-48 19,486 73-89
Utth Punjab 4,63,132 27-58 13,360 79-57
d^flHy^S Rajasthan 9,63,623 28-13 23,170 67-63
fHoTH Sikkim 8,254 25 -79 305 95 -31
3 T t e Tam il Nadu 17,67,481 36-51 51,458 106-30
ddlyu^ Tripura 53,641 26-17 ^ ,3 4 4 65 -56
U ttar Pradesh ? 21,65,915 19-54 57,391 51 -77
Ugwt ydl'75 W est Bengal ’ 17,03,901 31-22 53,428 97 -89
*H3>TO § fcSoJyTy ^ tu Andam an and Nicobar Islands 7,192 37-85 378 198 -95
Arunachal Pradesh 10,974 17-42 440 69-84
Chandigarh 15,843 35-21 '1,210 268 -89
>H§ csgra D adra and Nagar Haveli 1,876 18-76 72 72 -00
f e s t D elhi 2,89,893 46-61 14,710 236-50
a w f e § G oa, Dam an and Diu 52,410 48 -08 2,523 231 -47
Lakshadweep 4,693 117-32 139 347 -50
fH^idH M izoram 13,498 27-55 459 93 -67
v jT iM Pondicherry 22,837 38 06 813 135 -50
^ i- Total 1,84,14,339 ' 26-88 5,35,828 78 -20
gi^tST, 1980 Source : Economic Census. 1980
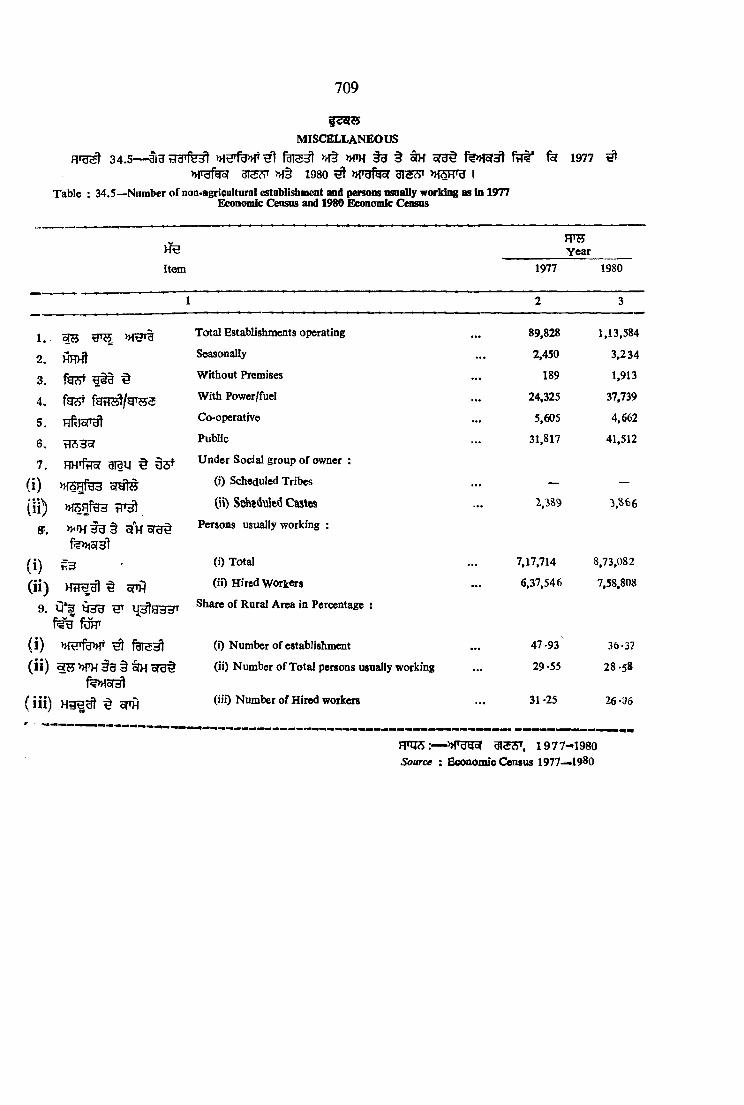
709
M ISCELLANEOUS
3 4 .5 — ara »f^ »0H § 3 t ^ o rg§ f%>Hor^ >H'drHbj gT5?TT nr§ 1980 ^ »Tgfgaf grss’ •
Table : 34.5—Number o f noa<agricuItaral establishment and persons nsaally working as in 1977Economic Census and 1980 Economic Census
1977 ^
m sYear
Item 1977 1980
2 3
1, ’>rgTg Total Establishments operating 89,828 1,13,584
2 , hh h! Seasonally 2,450 3 ,234
3 . fe?jT Big ^ W ithout Premises 189 1,913
4 , With Power/fuel 24,325 y j ,m
5 . nftiof'dl Co-operative 5,605 4,662
6.. Public 31,817 41,512
7 . HH'fdy arau ^ 35^ Under Social group o f owner :
( i ) MSRftJd «?ytH (i) Scheduled Tribes — —
(ii) » T 5 H te VI'd) (ii) S ftdviied Castes 2.3S9 3 ,866
9 . clH of'd' Persons usually working :
f?>Hc?3t
( i ) S 3 (i) Total 7,17,714 8,73,082
( i i ) Htld^ ^ oHH (iO Hired Workers 6,37,546 7,58,808
9. Share of Rural Area in Percentage :
fURT
( i ) rHjrd»T ^ (0 Number o f establishment 47 -93 36-3?
( i i ) § ;&H s r a t (ii) Number o f Total persons usually working 29-55 28 .58fe>Hor^
( i i i ) ^ cPH (iii) Number o f Hired workers 31*25 26-as
FTOS: — gi 5ST, 1 9 7 7 - 1 9 8 0 Source : Ecwomic Census 1977-«19S0

f ? s r s
m i s c e l l a n e o u ;
ED CROSS SOCIET13S
3 4 . 6 — 1 5 a p r w § 3 »>f§ f o s r ^
^ s^ »ra »T§ # 3 ojjR m u » !§ ^ >T*£r3ftw R u ifeg t gcrt»i*
Table 34.6__District Red Cross Branches and flieir Membership, Junior and Senior Red Cross group > and their Menbership andFirst Aid Posts ru i by Red Cross S ;ciety, Poijab
C Number)
Year
Ff!^^»ra ^ ^ ^ 5TH grau H^HUfeU
Senior Red Cross Junior Red 'Cross Groups Membership
-First aidPostsBranches Members Boys Girls Co-educa- Boys Girls
tion
0 1 2 3 4 5 6 7 8
1963 10 4^1.238 7,930 1,190 11,36,044 6,08,789 , ,
1970 11 1,85.652 8.472 810 . . 12,65,951 7,22,350 335
1975 12 45,69,503 11,346 U T l 16.14,989 10,65.135 819
1980 13 59,57,502 15,987 448 16,77,867 12.57,110 865
1983 13 1,10,21.136 2,681 493 13,545 15.64,051 11,99,116 115
1984 13 1,30,70,616 2,419 480 13,763 16,08.516 12,45,173 9 30
1985 13 1,07,29,378 2,619 487 1 \5 4 6 17.23,870 12,71.696 941
1986 13 66,64,6 0 2,704 483 13,660 16,796.*2 13,18,437 9 6 6
1987 13 56,65,503 1,597 480 13,694 17.31,253 13,64.429 809
1988 13 65,83,872 3^.54 462 12,912 17,0,2,971 13,60,852 827
H-Ur
O

a y B s s ’
g f e » r e y 0
3U S3ras
fv d s y B
a fO T
HargH
qfe>H W
g iH g ry i
ftis j Dlstrict-.19S8
Gurdatpur
Amritsar
Kapurthala
Jalandhar
Hosbiarpur
Rupnagar
Ludhiana
Firo^)ur
Pari(9cot
Batbinda
Sangrur
Patiala
State Branch
81,853 260 30 1,500 1,46,609 1.15.975 102
44,708 365 69 1,400 2,43.791 1,96,294 235
2.82,578 10 17 1 670 [52 .805 45,051 31
10,60,097 444 95 1,164 1,76,125 1,56,7S1 50
3,59,267 339 23 1,420 1,36,015 1,18,466 109
61,142 6 19 1,017 87,211 69.145 —
7.30,767 491 78 852 1,79,618 1,52.974 83
5,79,456 13 13 1,466 1.39,514 98,520 56
10,20,391 293 27 743 1,44,218 1,08,769 93
10,40,201 7 43 858 1.17,420 85,621 2 0
10.59,730 839 13 295 1,27,868 93,759 36
2,63,682 287 35 1,527 1.51.777 1,19,497 12
— — — — — — —
FTOS I— HoTdd, § 3 ISource : —Secretary, Punjab Red Cross Branch, Chandiyarb

712
se o T s\fISCBLLANBOUS
R ED CROSS SOCIETIES
3 4 .7 — i f ir a 1 9 8 8 H T g ^ rg /fg ^ ^rg 3 9
Table 34 *7-.Iaeoffle and Bxpeoditure o f Red Cross Societies In Paajab by year and Districts I 988
Year District
(gu§)(R s.)
OoeniagBalance
»T K €5lacom e
>H3K HTsrl Expenditure C losing
B alance
/
196S . . . 1U 6„620 12,12,59 10,08,356 13,40,3.23
1970 • • • 12,23,540 14.67,247 14,17,668 12,73,119
1975 • • • 30,35,523 7?,38,728 53,42,716 49 ,31,533
1980 97,56,873 2,16,03,960 1.71,42,945 1,42.17.888
1983 • • • 14,59,46,95 2,52,86,977 2,49.33,460 1.49,49.012:
1984 1,50.62,321 2.75,83.889 2.56,45,908 1,70,00,302
1985 ««« l»73^3,518 2,59,45,483 3,06,23,663 1.26,45,338
1986 • • • 2.26,71.378 3.05.40,264 3,12,17,437 1 , 19,94,205:
1987 • • t 1.16,97.456 2,89,57,432 2,75,07,933 1.31.46,955
1988 • • • 1,40.75,029 3,61,06.395 3,36,30,874 1,55,50,549'
Dfalrktf—1988
Ourdaspur ••• 3.34,647 10,19,671 10,70,18^ 2,84,1341
mtWdH'dj Amritsar • •• 16,34,027 34.66.124 25,65,102 25 ,35,049
Kapurthala . .. 2,52,957 12,31,078 8,38,292 6,4 5,7433
Jalandhar ... 30,39,469 29,98,662 27,42,196 32,95,935!
5fia>>rciyB Hoshiaipur - 12,18,366 21 ,92 ,308 24.57.032 9,53.6421
Ruimagar ... 17,55,227 19,43,187 17,17,710 9,80,704^
Ludhiana ••• 6,63,914 37,41,323 37»41,38I 6 ,63,856>
f e r o y g Firo^ur • •t 17 ,19,080 22 ,90 ,606 18,91,413 21,18.273;
Faridkot ••• 3.93 ,272 36,80,675 34.95.259 5,78.688-
Bathinda ••• 1.80,251 1,00.79,858 98,39,884 4,20, 225;
SaBgrur ••• 4,62 .247 12,48,988 9,13,151 7 ,98 .084-
Patiala ... 24^1.571 22,13,915 33,59,270 22 ,76 .216
H » q s! ^ i
Source Secretary, Puiyab Red Croa* Brandi, Chandigarh.
52 !—>H3H § g'ofi goTH* ^ >Ho?f3»ft § »fTfe5/)>rl32 0$ d \V<7/«.-.Differeaces io clogfog /apetdat baUoM t uiB due to hudited/uoaudited figurei.

MISCEIXANEOUSHoT?7 )jfor3
HOUSING STATISTICS 3 4 .8 — l/tTm H»?5^ 9V
Table 34 *8—Working of the various Housing Sdiemes in Punjab by years
?5t ( '0 0 0 * 5 U § ) HoTHh H3»?5Expenditure (‘000 rupees) House* completed
Nam e o f Scheme
1970- 1975-76 1980-81 1983- 1984- 1985- 1986- 1987- 1988- 1970- 1975- 1980- 1983- 1984- 1985- 1986- 1987- 1988-71 84 85 86 87 88 89 71 76 • 81 84 85 86 87 88 89
5 6 7 8 9 10 11 12 13 14 15 16 17 18
1 . ^
arau §r»h^ hhIhM iddle Income Group H ousing 1,714 ~ 3.100 23*491 15,495 18,026 22,124 17,989 33,577 124 269 — 906 392 482 712 300 458
Scheme
2 . uT^ ^ cUBUHcTO f RT^ RcT'bi
LOW Income Group Housing 4,508 6,195 3,000 25,029 24,729 14,837 12,659 8,021 15,304 645 393 — 1,122 1.53S 702 8C8 550 550Scheme
3. feHSiCt t ^ q a r HETc
Subsidized Industrial H ousing 144 8,848 200 187 — 58 77 — 49 24 — — 84 — _ _ _ _Scheme
4. ^R ^ RoftH
Rental H ousing Scheme 3,510 2,029 3,000 31,366 288 3,940 6,985 9,097 14,725 13 ^ — 84 210 72 — - 144
5 . HErns f R ’^ l ,Rural*Hojsing _ _ _ y^^Sl 104 2,671 217 604 774 — — 9,919 1,678 929 157 — — —
e . r >H§ fesim rbtI h
Land Acquisition and Develop- 500 53,982 47,797 — 56,600 326 3,990 423 — — — _ - — _ __ _ment Scheme
r *t3?5 RoTng, Uti^a iSource Secretary, Housing Department, Punjab.
->1u>

714
ecbfii'
M ISC ELLANE O U S
H fg^ ! 3 4 . 9 — U tr g f ^ e f%ad»H uja' >h § ygrfe>xt ^ fa ra ^ t, i 9 S 9
Table 34 .9—M umbo'of Rest Hoa^es/Oak Bangalows ia Paajab by D istr icts, 1989
U{33T g g g iK
t o R-ast H o\iss/ O ak Bungalows
1 2
Gurdaspur 41
Amritsar 45
Kapurtliala 8
TTSqB Jalandhar 22
u f a » r g y g Hoshiarpur 25
9U 5 a ra Rupnagar 2^
sfq»I»3T Ludhiana 29
Firoxpur 3 5
Faridicot/
47
Bathinda > 51
Sangrur 43
ufe»)r?r Patiala 42
A 3 Total 416
R n i5 >Hor3T h « 3 3 , i
5 o iir te:— District Statistical O ffices, Punjab.

715
i^ c IHM ISCELLANEOUS
C H A N D IG A R H U N IO N TERRITORY
3 4 .1 0 — 3 1 HTH^ 1 9 8 9 3of inSTHM § § 0 ^ ^ § s M Table 34 -lO ^PIots sold aod construction activity upto 31st M arch, 1989
Numbo* o f Plots
f H'di HoTHH ^ W 4 ^
U6i'<; oft§
W fte ATtf
f i T ^ ^ fo i m Type o f Construction Plotssold
Completed Underconstruc
tion
Total o f completed and under
construo* tion plots
Peroent- a t t o f
column 4 toColumn 1
0 1 2 3 4 5
Residential . .. 20.081 12,911 1,669 14,580 72-61
W 3 i 7 Commercial ... 4.636 2.235 236 2,471 53-30
Industrial . .. 1,843 384 57 441 23 -93
»H§ f%fe»ior 1
Religious, Cultural and Educat i o n . .. 307 87 55 14 2 46*25
Total . .. 26,867 15,617 2,017 17,634 65-63
FTHIS > > f ^ , g?5t>>f?5 g I
Source I— Estate Officer, Union Territory Administration, Chandigarh.
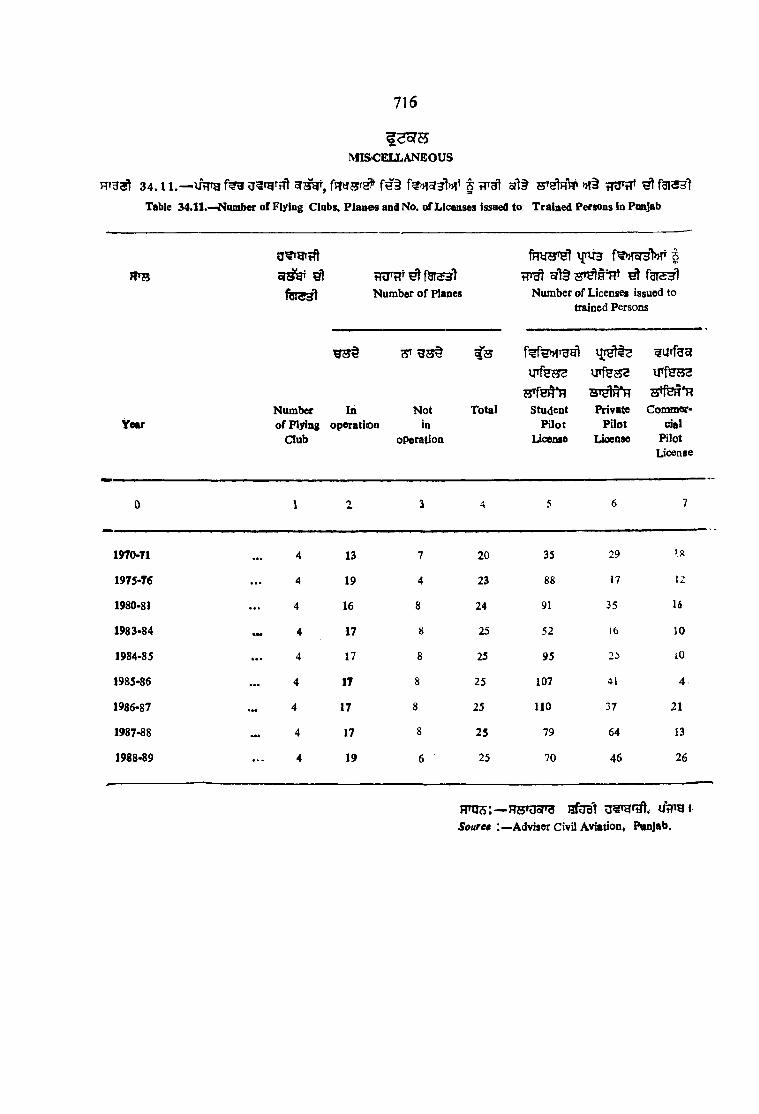
M ISC E IX A N E O U S
3 4 . 1 1 . — UHTg U ^ ^ H t sr s^ r , f u t j a r # f € § S ^ R J T » !§ tnTtT^ ^ f a f 3 3 l
Table 34.11.—Cam ber o f Flying Clubs, P la n es and No. o f Lic«nses issaed to Trained Persons in Punjab
716
f t r a g l Num ber o f Planes^ f a i5 3 l
Number o f Licenses issued to trained Persons
YearNumber o f Flying
Club
?ST
In N ot operation in
operation
^35
Total student Private P ilo t P ilot
License License
^ a r fg g
Commercial
PilotLicense
0 1 2 I 4 5 6 7
1970-71 • •• “ 13 7 20 35 29 18
1975-76 • • • H 19 4 23 88 17 12
1980-81 • • • 4 16 8 24 91 35 16
1983-84 « . 4 17 8 25 52 16 10
1984-85 17 8 25 95 2t> 10
1985-86 • •• “ 17 8 25 107 41 4
1986-87 • •• “ 17 8 25 110 37 21
1987-88 17 8 25 79 64 13
1988-89 • • • ^ 19 6 25 70 46 26
FTOs:— Rs»3or aftra'tS'ource ;— Adviser Civil Aviation, Pnnjab.
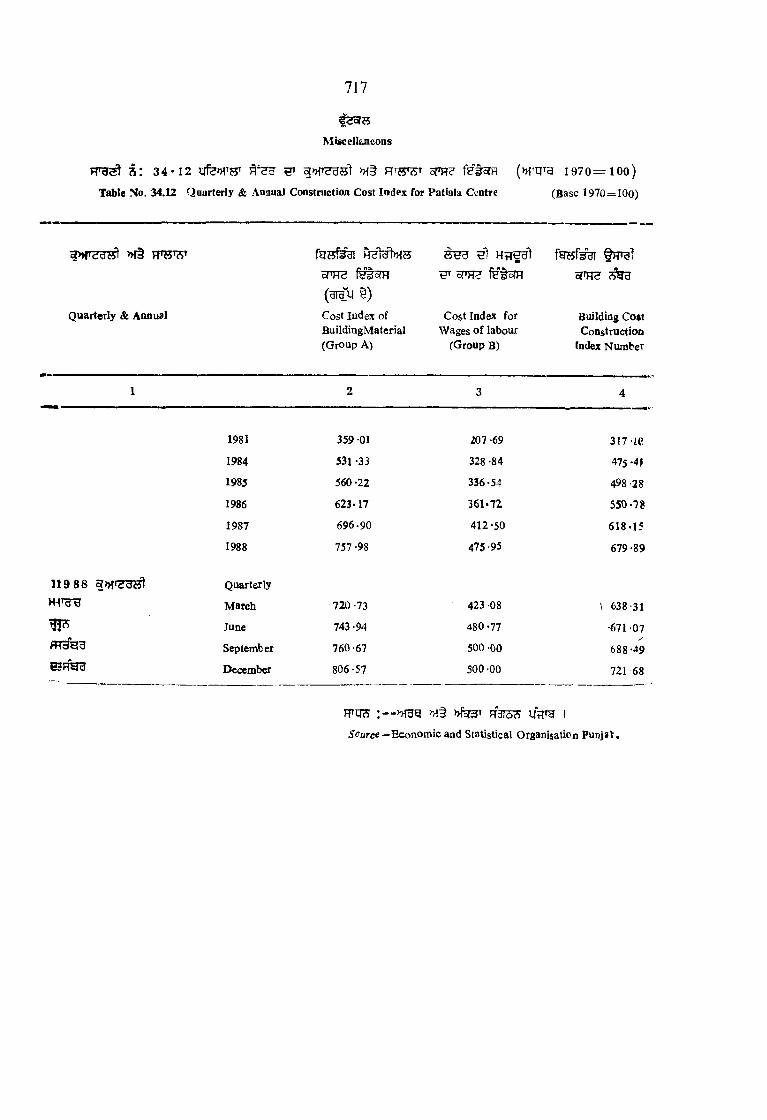
717
M iscellaneons
a : 3 4 *
Table No. 34.12
12 i f f e > n w ^ H'dyf^T o t h s f e t s fR 19 7 0 = 10 0 )
Quarterly & AnnaaJ Construction Cost Index for Patiala Centre (Base 197 0 = 1 0 0 )
oCOf'cTdWI
Quarterly & Annual
oPH? fstSTH
(grC^ § )
Cost Index of BuildingMaterial (Group A)
Cost Index for Wages o f labour
(Group B)
* ^ 3
Building Co»t Construction
Index Number
1 2 3 4
1981 359 01 207 -69 3 1 7 -iC
1984 531 -33 328 -84 475 -4f
1985 560 -22 336-54 498 -28
1986 623-17 361 .72 550 0 8
1987 696-90 412-50 61 8 .1 5
1988 757 *98 475 95 679 -89
119 8 8 Quarterly
H -r r g March 720 -73 423-08 \ 638-31
June 743-94 480 -77 •671 07
September 760 67 500 -00 688-49
December 806-57 500 -00 721 68
r r q ^ >H§ pfarscs uViTg i
S<?urce—Econom ic and Statistical Organisation PunjsV,

^ 0133 f e a l TiTe^Tgl fsH?- 9 : —
1 331 35.1 r€g ufag.^i i^3 3l H3J Frlgl Hf33fT3l re3l gisl 5i
1^331 35.2 r^ 3 ^ 31T fginf 5 I
R’^ 1 35.3 r ^ 3 § HH3T f?3T 5 |
FT331 35.4 ^ 3 c»U3 ^ qt>H 4 ^ fHS3 tjaT3T 5 I
IT33t 35.5 f<fg f53HT3 ^ i^ g r j i^ FTtBTSt tll>H1975,1980 »Ht 1983 3 ‘ 1985 ^3 3l fH3l arsi 9 1
BfTg l 35.6 f?g feiH faiat3ure5 ^ ggs jhqj ai§ a s
fT3«1 3 5 .7 f ? 9 9 T 3 g f ^ a ^ l j f^H h1 S 3 M^gTSl g ) 1433^^^33 m l33»,
f8 ^ 3 ‘ ^Q 35?t S t f s t a 3T 3 q ^ a 3 3 » , fjW S ^ ^ f e t s a l^
S^S q^333r, I0rt 33 »1tHHS § a§ 3^ |
SECTION XXXXV
ALL INDIA INDICATORS
laformatioo coataioed ia this sectioa is as follows :—
Table 35.1.—Coataias iaformationregardiag Moaey Stook Measures.
Table 35.2.—Gives aa account of ladia’s Foreign Trade.
Table 35.3.—Data peresented in this table are regarding India’s Foreign Exchange Reserves.
Table 35.4.—Gives per Capita Availability of Cloth in India.
Table 35.5.—Contains per Capita Annual Earnings of Employees in Manufacturing Industrias by Selected States during 1975, 1980, and 1983 to 1935.
Table 35.6.—Gives Index Numbers of Industrial Production.
ra6/e 35.7.—Gives State-wise Indicators of Density of population per square km.; percentage of literacy ; percentage of area sown more than once to net area sown ; percentage of net area irrigated to net area sown ; and per capita total tax revenue.
719
35


721
W tg B ^ H cren^rg Last Friday
A I X I N D U INDICATORS
T?rg^ 35, 1— H UB?
Table 35.1 — Money Stock Measures
Currency with the Public
{ct%a(Rs. Croret)
TIHTg^WiJ^TTS^ 5 2 lH fef»n ^
Notes in Circula* Circula- Cash on Total D eposit M oneycircula- tion o f tion o f Hand ( 1 + 2 + 3 ) M oney supply
tion R u jw small with — 4) o f the (5 + 6 )Coins Coins Banks Public
0 1 2 3 4 5 6 7
1970-71 4,169 247 137 186 4,367 2,954 7,32
1975-76 6,492 331 224 343 6,704 6,439 13,143
1980-81 13,688 333 286 844 13,463 9,747 23.210
1983-84 19,888 386 333 U054 19.553 13,513 33,066
1984-85 23,088 426 351 1,202 22,664 16,985 396,49
1985-86 25,519 531 409 1,291 25,168 18,431 43,599
1986-87 28,762 709 483 1,369 28,585 22,592 51,177
l987-88t 33,812 839 541 1,542 33,650 24,152 57,802
1988-89* 38,728 893 571 1,700 38,492 27,988 66,480 /
April, 1989* 40,503 896 571 1,736 40,235 28.497 68,732
May. 1989* 42.141 901 571 1,834 41,779 28,363 70,142
June, 1989* 41,639 904 571 1,985 41,129 29,613 70,742
July, 1989* 40,675 904 571 1,921 40,229 30,029 70,258
»K3H• ’Provisional
1 m u§!lt Revised
f t t t o : » r g fe^ H T g s f e ( h ^ , 1989) »5o«rctf.—Reserve Bank o f India Bulletin, (September, 19889)

FTST? 3 ^ 3 ^ALL INDLW IN DIC ATO RS
y T 3 ^ 35.2— 3 ^ 3 3 ^TABLE 3S.2— India's Foreign Trade
I l l
( o r a s i t i t )(R s. Croret)
RHTPeriod
goPfe>HrImports Exports Balance
(— ) ( + ) Trade
1
1960-61 ... 1,122 642 ( — )480
1970-71 ... 1,634 1,535 ( - ) 9 9
1975-76 ... 5,265 4,042 ( - ) I ^ 3
1980-81 ... 12,549 6,711 ( - ) 5 ,8 3 8
1983-84 ... 15.831 9,771 ( — )6,060
1984-85 ... , U .134 11,744 (— )5,390
1985-86 19.658 10,895 (— )8,763
1986-87t ... 20,096 12,452 (— )7,644
1987-88t ... 21,399 15,741 (— )6,658
1988-89 27,693 20,281 (— )7,412
April 1989* ... 2,318 1,960 (— )358
May 1989* ••• 2.694 2,074 ( - ) 6 2 0
June 1989* ... 2,670 1,980 (~ )6 9 0
July 1989* ... 2,383 2,011 ( - ) 3 7 2
fH d U§
tRevised
♦Provisional
rrnj s :— nf g g s f e s (R^gu, i989) iSouirce—Rsserve Baak o f India BuUetin^(September, 1989).
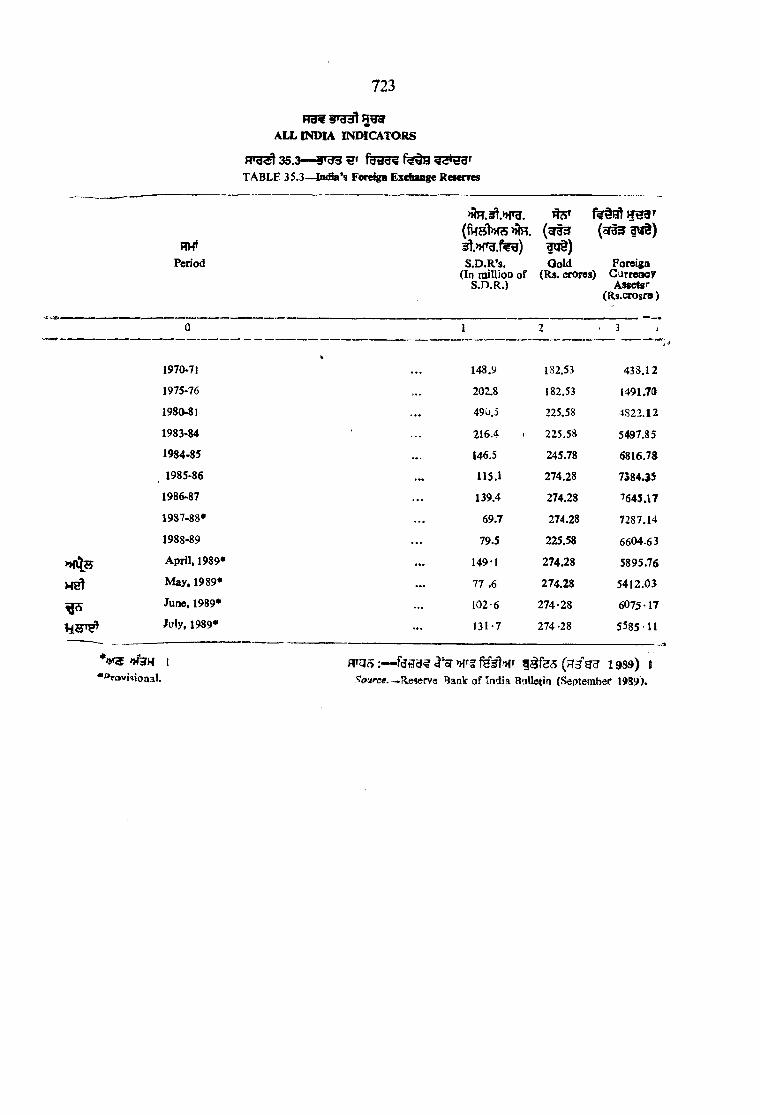
723
H 3 ^ 9 'd d l ALL INDIA INDICATORS
f l » g ^3 5 . 3 — ^2 * 5 3 ^TABLE 3S.3—^&idia*s ForeigH Exchange R esm es
Period
(fH S b x S n lR .
S .D .R ’s.(la miUioo of
S.D .R .)
JJH3"(or§3 (cJ3:J 1 ^ ) 1 U § )O oid Foreiga
(Rs. crores) Curreooy Asset«r
(Rs.crosr0 )
0 1 2 < 3 M
1970-71 148.9 182.53 433.12
1975-76 202.8 182,53 1491.70
1980-81 490,5 225.58 4822.12
1983-84 216.4 225.58 5497.35
1984-85 146.5 245.78 6816.7*
1985-86 115.1 274.28 7384.35
1986-87 139.4 274.28 7645.17
1987-88* 69.7 274.28 7287.14
1988-89 79.5 225.58 6604.63
April, 1989* 149-1 274.28 5895.76
HEft M ay, 1989* 77 .6 274.28 5412.03
June, 1989* 102-6 274-28 6075-17
July, 1989* 131-7 274 -28 5585 11
■ *rowi<»ioaa!.I'o f »ff§ f § f e 5 ( H 3 ’g ^ 1 9 8 9 ) I
'^aurce— Reserve Bank o f India Bulletin (September 1989).

724
H>rPeriod
TO ?
ALL IN D IA IN DIC ATO RS
H 'd c l 35 .4— s^'dd oW 3 ^ tft>H fH H S Hdld'TABLE 3 S .4 _ P e r Capita Ayailability o f O otb in India
WT
( M » r sf i g )
Estimatedmid-yearpopulation(m illions)
A vtdlaW ity fo r home consun^tion (rriUion metres)
Cottond o th
oM3T
Blendedd o th
tihH ^3T3» (H te 5 )Per Capita avaUability (Metres)
Man-madefabrics
5W3T
Cottondoth
oW3T 83ife)HT
Blended M an-made doth fabrics
0 1 2 3 4 5 6 7
1961 442-4 6,527 — 509 14-75 — 1-15
1971 551 -3 6,825 246 948 12-38 0-45 1-72
1975 603 -5 7,513 367 821 12-47 0-61 1-36
1980 675-2 7,463 1,227 1,312 11-05 1-82 1 *94
1983 721 -8 7 ,8 1 8 1,332 1,529 10-83 1-85 2*12
1984 738 -0 7,823 1,255 1,638 10-60 1-70 2 -2 2
1985 75 4 0 8.173 1,221 1,795 1 0 .84 1 '62 2 -38
1986 7 7 1 0 8,191 1,318 2,057 10-63 1-71 2 -6 7
1987 781-4 8,196 1,332 1,985 10-49 1-70 2 '5 4
1988 800 , b,088 1,168 2,464 10-11 1-46 3-08
f f n j g :— o f t e s u , i
Sow>ee :—Textile Commissioner, Govemmeot o f India.

ALL INDIA IPTOICATORS
725

726
ALL INDIAF rg g ] 3 5 .5 -
Tahle 3 5 .5 -r<sdH»2 ^ c r e r § Efgw ercftw ^ g r g s §
-Per Capita Aoooal iElamings o f E'nployees ia
1975>Hor2
>hu1a
UtPrt*
W T3
Q 3 o State/Union Teirftory
,j^ f f e f t
Number o f Factories Covered under the
Act
dddl^d( odd)
Averagedaily
Em ployment(000)
»TH t;5
Per capita Annuals Earning (Rs.)
0 1 2 3
>HTUa'
States
Andhra Pradesh 2,263 132 2 ,824
»fW H Assam , 490 13 2,627Bihar 2,745 129 2 ,1 5 8
dj'rid^ Gujarat 6,825 190 2 ,749
Uf3»fTiiT Haryana 1,396 54 3.371H im achal Pradesh 146 3 2,'»45Jammu & Kashmi 250 9 2 ,843
cra?)Ts-6r Karnataka . . . *.4,235 108 2,893Kerala ... r 1,881 34 2,947Madhya Pradesh U .666 46 3 , ^ 2Maharashtra i ' 9,707 222 3 ,459Orissa 446 39 4 ,1 9 4
^ ,1 ..Punjab 3,697 64 3 ,089
a n w y w , R ^asthan 1,468 42 3,325Tam il Nadu 4,760 204 2 ,543
d d ly a r Tripura 29 @ 2,453O d d i f § a ^ Uttar Pradesh 3,706 178 3,054ygHt ydiris . W est Bengal 4,457 342 3 ,966
M anipur • •• _
Nagaland _
F W U th 9 3 3
>H^T3>H§f5or-
Union Territcxles
A . & N . Islands 34 lO E3.300
3 ,2 3 9
5elu HHU f ^ l Delhi 2,230 46
G oa , Dam an & D iu 93 4 3,792Pondicharry 81 1 2,615
si'd d India . . . . 52,904 1,870 3 ,158

727
Fn d i c a t o r s
P IT ^ I W H H S, 1 9 7 5 , 1 9 8 0 1 9 8 3 3^ 1 9 8 5Maaufactaring Industries in India by Selected States during 1975, 1980 and 1983 to 1985
1980
ts
% '§ Jtv w -to § g
«fu> fc-o . 1 WK V ^ S ^ te «*<[P (flU) ©60
K> ^ ^ = 3
P 5i s »r5 m
rotC T3 o
a s0 g H
l < i
tP
1 § a
««•
^ 3 |[? aI- ii ry 11 w K CIh w
4 5 6 7
3*182 1 994 191 5,186
1,792 238 18 4,494
3,025 2,907 216 5,584
9,485 4,981 438 8,544
2.474 840 105 6.401
174 44 3 4,745
276 176 10 4,0o9
5.565 247 31 4.903
2,164 1,303 73 7,146
2,332 297 ' 75 7,964
11.949 9.321 996 7,190
975 296 21 6,728
4.614 2.093 , 92 5,196
2,312 786 69 6,698
6,593 5,482 459 6,477
176 24 1 7,937
4,083 2,029 211 6,376
5,244 3,187 541 7,977
31 18 4 4,096
3,339 3,560 79 6.228
i81 105 5 5.211
108 84 12 8.066
70,074 38,012 3,649 6,997

728
3 5 . 5 ( HK^a g ) — f 5iH3r ^ ^ ______ Table 35.5 (cnocId)— P&r Capita Annual Earnings o f Employees in
ALL IN D IA
cHtl/Riy g i t T y g g
1983
State/Union Territory
fv>
■ i
S '®
1 S. ^
Bxj3COs?
o o '
l i s ^ s
2 « S Seu 3
•H- «fa- Ofc £<ivi o S { 5 ' g Og*
fQ, ^ Z-C
o® *Lo ^IP §•B S
'to i>
E l f
' ? l § t? s s g
, ! S 5 s
fC _ fP -I § ^ <jF
' g . l a:: U .S - § S-
0 8 9 10 11
StatesAndhra Pradesh 6,262 3 J 5 6 207 7,518
>HTHth " Assam 623 283 19 6,340Bihar 13,784 13,430 296 7,892
^ 3 ^ 3 Gujarat 13.59J 6,289 384 9,198Haryana 3,775 649 91 8,293Himachal Pradesh 89 33 3 7,146Jammu & Kashmir 443 249 12 5,226
936*<fo{» Karnataka . .Kerala 8,652 3,507 89 7,986
h‘q Madhya Pradesh 2.418 610 121 8,545Maharashtra 29,926 15.558 820 8,376Orissa 1,084 251 22 10,210
IPFI’H Punjab 7,432 1.422 59 9,407Rajasthan 6,113 878 78 8,683Tamil Nadu 8,887 7,411 536 7,831
H ahjg* * Tripura 501 83 3 2,447
t 3 B Uttar Pradeshu s h I t g r s West Bengal 6,340 2,184 336 10,323
H^^yB Manipur 11 6
S'di'^*3 Nagaland 4 1 17,698
e m 3 ’t7 y 3 B Union Territories
»fiH TS>M §rc5^H ^ ^ U H H n A. * N . Islands 57 35 s 4,411
Delhi 6,041 1,637 76 5,842Goa, Daman & Diu 300 229 12 7,894Pondicharry 447 287 8 7.700
«i33 India 1,16,780 58,792 3,187 8.411
^ : — 1. 1 9 7 5 ^ 5 g 3 T 4 0 0 W § 3 ‘ u f e l J ^ 1 9 8 0 ^ 1 0 0 0 g U §
§‘uT3 1983 1600 3* life ^ I2. HT® 1982 >H5ri tofedi >?ra , 1948 ^ HofH?; 2(M) ioreu!>HT TP's rb i
f ^ 1 0 r?T cfiM >H§ 2 0 >M§ giH fg?St 3H o?g^ 3 3 I
1 9 8 3 3 " W U f g F|o?a?5 8 5 w i s H’fH S ofl3T fgi>Hi 9 I1. Information for the yeer 1975 relates to w o ik eis eain irg less than B s. <C0 per n c n h and fcr the year ISfc®
relates to svorkers drawing less than Rs. 1 ,C00 per ir onth and fcr 1983 relates to workers earnirg less than R s. 1.60C per m onth.
2. Statistics upto the year 1982 relates to factories registered under sccticn 2(^^) c f the factories Act, 3S48 i.e. factories em ploying 10 or ircrc workers with the aid c f pcwcr and 20 cr m ere w cr ltr s w iih ctl ti e aid c f
pow er, From 1983 onwards statistics o f establisbinect covered under the Section 85 o f Factories Act, 1943 have also been iocludpd.

729
irNDICATORSirrjTOT 1975, 1 9 8 0 ^ 1 9 8 3 § * 1 9 8 5
Mfanufacturing Industries in India by Selected States during 1975, 1980 and 19«3 to 19851984(F) 1985 (P)
»H5r^
^ Td(<i-^
Number o f Factories Covered under the
Act
^ fdrs^)Number o f Factories Submitting returns
’Here ):>!qT3 g o fc fd W
31 r ">
Num ber o f F actories
Subm itting returns
> ) t e
Per capita A nnual
Earnings (R s.)
^ iJ'cS' H’rf'A'
d iJd!'2( 000)AveragedailyEmployment
(000)
»T^re7;
Per capita AnnualEarningsCRs.)
Numbe^r o f F actories Covered
under the Act
( 0 0 0 )A verage
dailyE m ploym ent
(000)
12 13 14 15 16 17 18 19
7.254 4,226 232 6,660 7,751 4,261 279 8,409653 264 18 7,545 601 243 14 30,566
5.025 4,779 238 7,214 15,~39 14,550 283 6,88013.595 6,043 309 9,482 13,702 5,681 826 3,760
4.162 906 95 8,713 4,319 1.213 120 10,827
89 33 3 7,146 53 30 3 7.146
461 264 12 5.429 422 263 12 5,429
8{,900 4,197 99 9.322 9,299 4,586 103 9 ,\4 9
^.521 348 81 10,750 2,710 485 95 12,618
1(6,411 12.851 737 10,671 16,963 13,018 665 12,73011.053 305 27 10,281 1,190 309 34 12,283
77,884 1,239 57 7^ 00 7,846 1,225 69 9,2616-.390 1,062 82 8,816 7,005 967 82 11,117
^,433 7.889 548 9,627 9,051 7,289 540 9,482552 47 I 4.476 467 47 I 4,476
6,592 2,187 343 11,606 6,810 1,860 367 12,09325 8 3 5,719 29 4 2 1,783
4 2 1 13,208 2 2 1 9,847
32 25 4 10,060 34 22 5 13,236
4,178 1,256 66 10,485 4,353 1,494 64 9,335
167 134 6 11,224 169 111 6 11,067446 164 8 10,827 ^90 255 9 9,225
95,827 48,229 2,976 9,594 1,09,257 57,915 3,58C 8,885
s s : S 3 * 3 3 3 s r ^ 5 1K ote D iffetecces in the totals are due to ro\iodiog of the figures,
@500 3 ' UR Less than 500 (P) )»<5 »H3H Piovisional. (R) Hq Revised.
f e t a , 3 T 3 3 ngoTO 1 Source :— Labour Bureau, G overnm ent o f lo d i? .

ALL-INDIA INDICATORS
3 5 . 6 - - ^ 3 f e u t m @Table 35.6—^Index Numbers o f Industrial Production in India @
730
(» fn jT g : 19 8 0 - 8 1 =»ilOO) (Base 1 1980-81 =-100)
Sector
y ' S >H§
M iningand
Quartying
M anufacturing
f g t i s t
Electricity
»TTH
G enerf 11 (crude)
^ ^ /w e ig t’t 11 -46 77-11 11-43 100 00
P ^ s/y ea r1981-82 117*7 107 -9 110 -2 1 0 9 -S
1982-83 132-3 109 -4 116-5 112-ffi
1983-83 147 -8 115-6 125-4 120-41
1984-85 160-8 124 -8 140 4 130 -7'
1985-86 167-5 136*9 152 -4 1 4 2 -U
1985-87 177-9 149-7 168-1 155* 1
1987-88 184-6 161-5 181-0 166 *4
1988-09 199-0 175*8 198-1 181 *(0
January, 1989 • 2 2 9-0 182-8 215-3 191 ->8
F ebuary, 1989* 219-0 178 -4 2 0 0-9 1 8 5 -»6
H'dtJ M arch, 1989* 247-0 200 -5 220-0 208 ..1
nfUJB A pril, 1989* 207-0 165-0 209-3 1 7 4 -9
^ » ra > » f3 H @Pro visional
r r o s : f e a u ? iS 8 9')Source: Reserve Bank o f India Bullelins (June 1989)

STATEWISE ALL INDIA INDICATORST O o r
731
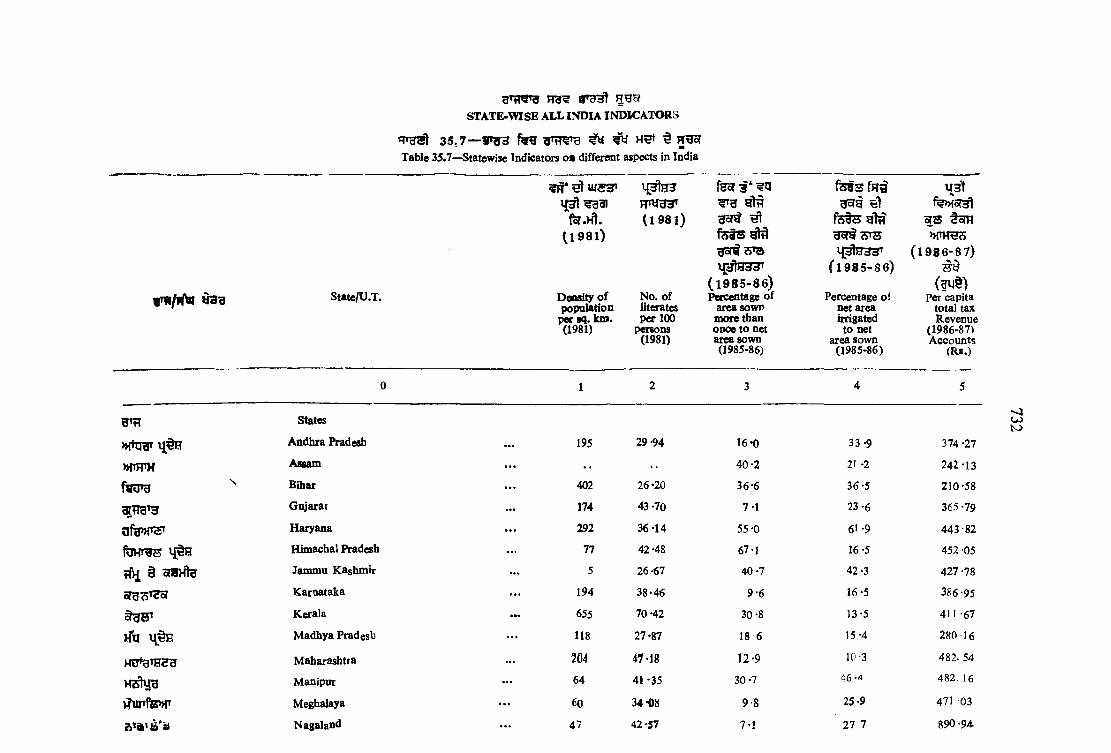
STATE-W ISE ALL IN D IA INDICATO RS
*=ng^ 3 5 , 7 — 5»?y3 ^ w g ^Table 35.7—Statewise Indicators o a differ«it aspects in India
State/U.T.
( 1 9 8 1 )
0 ^ 8 1 )
D en si^ o f N o. o f popukUion literates
per sq. km . per 100 (1981) persons
(1981)
? th g tnHojil ^
( 1 9 8 5 - 8 6 ) Percentage o f
area sown noorethan once to net area sown (1985-86)
f e t s g l i ?
( ' 1 9 8 5 - 8 6 )
Percentage o! net area irrigated
to net area sown
(1985-86)
H31
5 oih
( 1 9 8 6 - 8 7 )
(a v i§ )Per capita
total tax Revenue
(1986-87) Accounts
(R s.)
0 1 2 3 4 5
States
i|«gH Andhra Pradesh 195 29-94 16-0 33-9 374 -27
nfTHTH Assam 40 -2 21 -2 242-13
Bihar 402 26 -20 36-6 36-5 210-58
Gujarat 174 43-70 7-1 23 -6 365 -79
a fe w ^ T Haryana 292 36 -14 55-0 61 -9 443-82
Himachal Pradesh 77 42-48 67-1 16 -5 452 -05
§ offlrHtB Jaminu Kashmir ... 5 26-67 40-7 42 -3 427 -78
s r g 3 ^ Karnataka ... 194 38-46 9-6 16-5 386-95
Kerala 655 70 -42 30 -8 13-5 411-67
rfq M adhya Pradesb 118 27-87 18 6 15-4 280 16
HO^anren Maharashtra 204 4 7 -i8 12-9 10-3 482. 54
Manipur ... 64 41 -35 30 -7 46*4 4 8 2 .1 6
>?unffe>»p M ^ a la y a ... 60 34*08 9-8 25 -9 471 03
3 19 1 £ * 3 Nagaland ... 47 42-57 7-1 27 7 890 -94.
U)K>
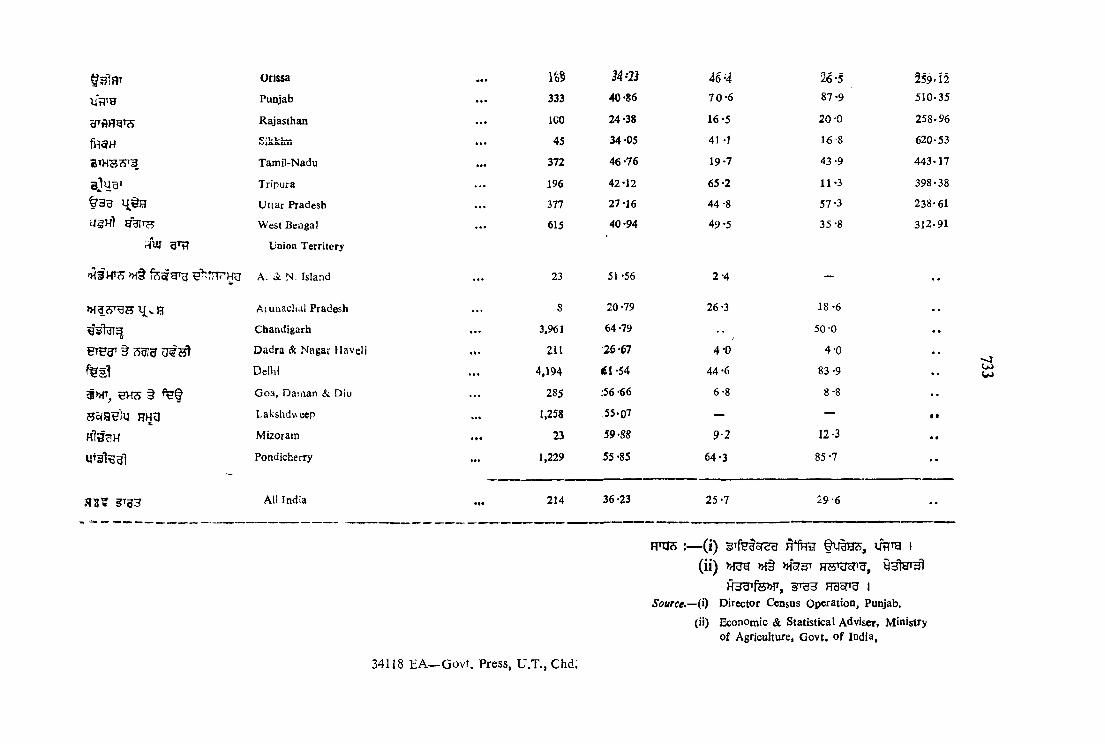
Orissa
Punjab
Rajasthan
fH9H c < : u u i ^
Tamil-Nadu
Tripura
Uttar PradeshagH) ggiTH West Bengal
rjUJ Union Territory
' A t A . ii N. Island
» f3 S ^ ^ B lJ[vH
BTFar ^ 5Ufg u f
t e l
SKcS §
B ^ a ^ iU HHU
Hlg;3H
H I ? §Tg3
Aluaachal Pradesh
Chandigarh
Dadra & Nagar HaveJj
Delhi
Goa, Daman & Diu
Lakshdweep
Mizoram
Pondicherry
All India
1 65
333
ICO
45
372
196
377
615
23
8
3.961
211
4.194
285
1,258
23
1,229
214
34
40-86
24-38
34 -05
46-76
42-12
27 -16
40-94
51-56
20 -79
64-79
26-67 <1-54
:56 -66
55-07
59-88
55-85
36-23
46^4
7 0 -6
16-5
41 -1
19-7
65-2
44 -8
49-5
2 -4
26 -3
4 -0
44 -6
6-8
9-2
64-3
25 -7
26-5
87 -9
20 -0
16'8
43 -9
11-3
57-3
35-8
18-6
50-0
4-0
83 -9
12 -3
85 -7
2 9-6
259*i2
510-35
258 .9 6
620-53
4 4 3 .1 7
398-38
238-61
312-91
Rni5 :—(i) rIhh f y f e , UHTg i(ii) »f§ WT3T HSWH,
Frasrrg I
Source.— ii) Director Census Operation, Punjab.
(ii) Economic & Statistical Advisett Ministry o f Agriculture, G ovt, o f India,
34118 EA—Govf. Press, U.T., Chd.

ERRATA
Page Table Col/Line
55 3.11 21/358 3.14 8/178 3.2i 4;4;5 :9 /6 ;l4 ;l4 ;l381 3.23 0;2;2 /i;i;2103 4.11 1/8104 4.12 Year111 5.1 9/8113 5.3 6/11120 Write-up Para Ill/F irst120 Write-up Para IV/Fhird121 Write-up Para XII/Third125 6.1 9;9/20;l0134 6.5 12/7141 6.7 11/20143 6.7 5;6;9/3;9;3144 6.7 3/15145 6.7 iO/J6151 6.9 9;9/9;l0172 6.22 1/9199 8.1 6/10
:200 8.2 3/11:202 8.3 14/8■204 8-4 1/9
.206 8.5 7/1120 7 8.5 6/15213 9.1 1/1
214 9.2 3:3/2; 3,226 10.6 1/10231 10.9 16/8233 10.11 7:7/2:3235 10.13 Heading235 10.13 Heading236 10.14 Foot Note237 10.15 4/26239 10.16 1;7/6;17246 11.2 3/10278 13.1 10/10279 13.1 4/1291 14.3 8/14293 14.5 5/4297 14.9 9/6357 16.3 25:25/13;14381 16.14 1/14412 17.16 10;10/8;9441 19.10 3/5467 20.3 40/20
484 20.9 6/1485 20.9 15/5488 20.11 6/8489 20.11 10/1490 20.12 2/3492 20.13 2/23493 20.13 Heading500 21.2 13/8511 21.8 17/4516 21.11 6; 7/11:8525 21.16 2/20526 21.17 10;10/4;8527 21.18 9;9;10;10/1;5;1,5
536 22.2 5/10545 23.3 2/10569 24.1 3/30570 24.2 2/1
B S}For
143Read
11416,2242.023:0.19:0.21; +32.44 Australia**l4576tt; 353145.5 90-81417.3 583-5 1984-85 1987-88 1987-88 l ;3
978.2615,2228*;87 0.457325;73261.05,0698974.46731.5 2*07
198724254
308;104900817.0310591203727437;274g7BlankBlank; Col. 4
2803515.21;19.1253.091134.44*
Blank10*673 5 6 0 1 71408;181799503,59;20186187635054
895490504608021556523Enrolment (000’) 926993 544.27 1.92;553
1300.11 65:13774;15.007;3782;15112
Blank476
34 .84
14416,2490.03;0.18;0.19; + 3 2 .0 4 Australia; 14576;35314P 5.15 1980-81217.3 583-6 19o3-84 1986-871986-87
- 59478.2 b152:2282*:9870.0417326;7387105.609079.46589.92*06
2987(a)2549
3088:10490871.031059120.37 77284;274371987-88 0 ) 1 .4 ; Col. 5
2503515.22 ,19 .18553.091134.4442.80 46
410.6735260-171443;2017995003596:2018181635504
89645905*4608628557523Enrolm ent i N o s.)922993544.771.29;253
1,300.8166:133 7 7 4 t;1 5 0 0 7 t;3 7 8 2 t;l5 1 1 2 t
2475
34.80
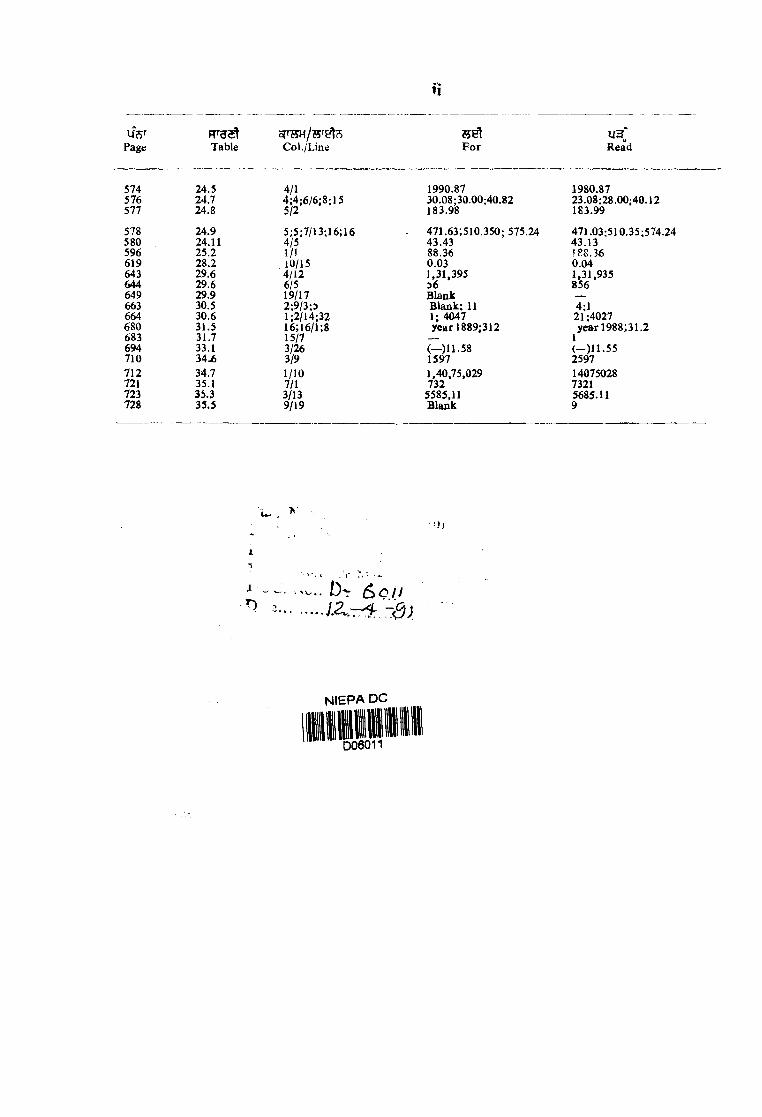
U7)^Page Table Col./Line For Read
574 24,5 4/1 1990.87 1980.87576 24.7 4;4;6/6;8;15 30.08;30.00;40.82 23.08:28.00;40.12577 24.8 5/2 183.98 183.99
578 24.9 5;5;7/13;16;16 471.63;510.350; 575.24 471.03:51 0.35;574.24580 24.11 4/5 43.43 43.13596 25.2 1/1 88.36 1SS.36619 28.2 10/15 0.03 0.04643 29.6 4/12 1,31,395 1,31,935644 29.6 6/5 56 856649 29.9 19/17 Blank —
663 30.5 2;9/3;5 Blank; 11 4;1664 30.6 1;2/14;32 1; 4047 21 ;4027680 31.5 16;16/1;8 year1889;312 yearl988;31 .2683 31.7 15/7 — 1694 33.1 3/26 (— )11.58 ( - ) 1 1 .5 5710 34^6 3/9 1597 2597712 34.7 1/10 1,40,75,029 14075028721 35.1 7/1 732 7321723 35.3 3/13 5585,11 5685.11728 35.5 9/19 Blank 9