J+ .fJ '~·
28
J+ .fJ THE PI: FOR RELEASE APR. 4, A. M. BUREAU OF AGRICULTURAL ECONOMICS UNITED STATES DEPARTMENT OF AGRICULTURE _c_s_- 1_3_9---------,------ __ __,. _____ J_A_N_. -_M_A_R_._1_9_5_2_ //.,,_ PER CAPITA CO TION OF COTTON, RAYON, AND ALL FIBERS POUNDS 30 20 10 0 1920 1925 1930 1935 .· .. ·.· }}}}}} ? 1940 1945 1950 1955 *"OTHERS" INCLUDE WOOL, FLAX, SILK FOR ALL YEARS AND •oTHER MAN-MADE" FIBERS FOR 1940 TO DATE U.S. DEPARTMENT OF AGRICULTURE NEG. 48485-XX BUREAU OF AGRICULTURAL ECONOMICS Per capita consumption of fiber in the United States has been more than a third higher during years than prewar. The shift has been due to a higher level of economic activity. Con- sumptJon of rayon has increased steadily since 1920. Cotton consumption has also increased recently but not as much as rayon. Consumption of other fibers, has increased slightly in recent years, due primarily to the consumption of more non-cellulose synthetics. (See table .. 17.)
-
Upload
khangminh22 -
Category
Documents
-
view
0 -
download
0
Transcript of J+ .fJ '~·

J+ .fJ
THE PI:
'~· FOR RELEASE
APR. 4, A. M.
BUREAU OF AGRICULTURAL ECONOMICS
UNITED STATES DEPARTMENT OF AGRICULTURE
_c_s_-1_3_9---------,------«~ B,~..__ __ __,. _____ J_A_N_. -_M_A_R_._1_9_5_2_ //.,,_
PER CAPITA CO TION OF COTTON, RAYON, AND ALL FIBERS
POUNDS so~----~----~----~----~~~-----4----~
40~----+-----+-----+-----~~~~~~~----~
30
20
10
0 1920 1925 1930 1935
.· .. ·.·
./~ f~~~{{f)~~~ }}}}}} ?
1940 1945 1950 1955 *"OTHERS" INCLUDE WOOL, FLAX, SILK FOR ALL YEARS AND •oTHER MAN-MADE" FIBERS FOR 1940 TO DATE
U.S. DEPARTMENT OF AGRICULTURE NEG. 48485-XX BUREAU OF AGRICULTURAL ECONOMICS
Per capita consumption of fiber in the United States has been more than a third higher during re~ent. years than prewar. The shift has been due Prtma~tly to a higher level of economic activity. ConsumptJon of rayon has increased steadily since 1920.
Cotton consumption has also increased recently but not as much as rayon. Consumption of other fibers, has increased slightly in recent years, due primarily to the consumption of more non-cellulose synthetics. (See table .. 17.)

Cotton Situation at a Glance
1950 1951 1952 Item Unit December January February December January February y
Prices received by farmers (mid-month) ••••••••••••. Pari t.y price ••••••••••••••••••••••••••••••••• , •••• : Farm price ae a percentage of parity ••••••••••••••• : Average 10 spot market price Middling 15/16 inch •• : Average price for 17 constructions, grey goods •••• : Average price cotton used in 17 constructions ••••• : Mill margine for 17 constructions ••••••••••••••••• :
BLS wholesale price index All commodi tiee ••••••••••••••••••••••••••••••••• : Cotton broad woven goode •••••••••••••••••••••••• :
. Index of industrial production OVeral.l . , •••••.•••••• o •••••••••••••••••••••••••• :
Textiles and Products ••••••••••••••••••••••••••••
Cents Cents
Percent Cents Cents Cents Cents
1947-49 = 100
1935-39 "' 100
Personal income payments ••••••••••••••••••••••••••: Billion dollars Department store sales (adjusted and revised) ••••• : Million dollars
Mill consumption of all kinds of cotton!/ •••••••• : Mill consumption, daily rate ••••••••••••••••••••••: Index of spindle actiVity ••••••••••••·•·••••••••••: Spindles in place end of month in cotton system ••• :
Spindles consuming 100 percent cotton ••••••••••• : Spindles idle ••••••••••••••••••••••••••••••••••• :
Grose hourly earnings in broad woven goode I/ ..... :
Exports of cotton ••••••••••••••••••••••••••••••••• : Exports of cotton since August 1 ••••••••••••••••••: Imports of' cotton ........•........... , ............ : Imports of cotton since August 1 .••••••••••••••••• : Mill stocks end of month •••••••••••••••••••••••••• : Stocke, public storage, etc • •••••••••••••••••••••• :
Linters prices §./ Grade 2 ••••••••.•.••••••••••••••••••••..••••••••. Grad.e 4 •••••••.•..••••.••••••••• , ., •••••••••••.•• : Gre.de 6 ..................•............. , ....... , :
Rayon pricea Viscose yarn, 150 denier •••••••••••••••••••••••• : Sta~le fiber. viscose; 1! denier •••••••••••••••• : Acetate yarn, 150 denier •••••••••••••••••••..••• :
Compiled from official sources.
11 000 bales 1,000 bales
P./ Thousand Thousand Thousand
Cents
1,ooo bales 1,000 bales
Bales Bales
11 000 bales 1,000 bales
Cents Cents Cents
Cents Cents Cents
40.34 32.36
125 42.59 92.88 42.67 50.21
112.1 117.7
218 194
244.4 955
784.6 41.3
141.3 23,1119 20,730 1,065 127.9
448.6 1832.8 6,407
37,245 2033.8 6656.5
24.35 18.96 15.13
77 40 76
111.38 32.98
125 411.20 94.41 44.29 50.12
115.0 118.7
221 194
243.6 1058
2/1,047.3 42.7
145.9 23,201 20,900
909 128.3
316.6 2149.4 2,342
39,587 2256.0 4964.9
25.35 19.75 15.11
78 40 76
42.31 33.11
128 g}
95.55 gj y
116.5 119.1
221 194
243.3 948
899.0 45.7
152.0 23,143 20,085
922 128.4
428.6 2578.0 93,800
151,018 2335.7 4627.4
25.92 20.33 16.00
78 40 76
40.34 34.10
118 42.23 72.15 42.20 29.95
113.5 101.1
218 152
258.6 917
672.7 35.4
118.4 23,152 20,264 1,636 129.0
979.8 2873.2 2,214
14,981 1575.6 5691.2
12.48 8.75 7.08
78 40 76
38.70 34.35
113 41.88 70.91 41.87 29.04
113.2 100.5
219 159
257.3 910
2/922.6 37.7
125.8 23,118 20,102 1,758
676.4 3549.6 15,453 30,434 1674.4 5636.3
1/ Pre~iminary. gj Markets cl.oeed, 3./ Not avail.abl.e. lz./ 4-week period except as noted. 2/ 5-week period. §/ 80-hour week = 100 percent. 1./ Cotton, silk am e~thetic :fibers. ?d Average prioee at Memphis, Da.l.l.ae end Atlanta.
37.25 34.47
108 40.56 69.03 40.58 28.45
~ ~ ~
768.9 39.1
127.3 23,110 19,854 1,984
~ ~
1681.3 4453.4
~ > z
~ . ~ )3
1\)
I

CC-13'J - 3-
gilt .... et'> - - ...... _ - - - .. - - - ..... -
T H E C 0 ~ T 0 N S I T U A T I 0 N·
--~----------------Approved by 'the 9~\t:J..ook and Situation Board, March 24~ 1952
Su"MMARY .
Disappearance of cotton in the United States during the 1951-52 crop year will probably be about 15.5 million bales, 5 percent larger than jn 195r)-5lo This includes an &stimated consumption by domestic mills of approximately 9.5 million bales and exports of about 6.0 million bales.
During February~ the average daily rate of consumption was·up 3.7 percent over that for· January, somewhat more than the usual seasonal increase. Since August 1, domestic consumption has been running at an annual rate of about 9. 5 million bales. Consumption for the year as a "VThole may vary as much as 300 thousand bales from this figure.·
Exports from August through January were 65 percent larger than for the same peri~d of 1950-51 and 47 percent larger than for this period in 1949-50. E..xports during the remainder of the marketing year will not be as large as during the first half of the season. Hol'lE::ver, exports for the entire season will probably be substantially larger than they l'Tere for .the 1950-51 crop year.
The supply of cottcn in the United States for the 1951-52 marketing season is estimated at 17.4 million bales. This includes gir~ngs from the 1931 crop estimated at 15,050 thousand bales, imports of 100 thousand, and a beginning carry-over of 2.3 million. The estimates of supply and distribution indicate that the United States carry-over on Au~ust 1, 1952 may be smaller than the 2,278 thousand bales on A~sust 1, 1951, the smallest· in 26 years~
World production of cotton is now estimated at about 34.5 million bales compared with 27.7 million last year. The United States accounted for 5.1 million bales of this increase, communist eountries about 1.1 million and all other countries 600 thousand.
qonsumption of cotton in non-commynist countries will probably be l to 2 million bales smaller than in the 1950-51 marketing season. Most o:r_ this decrea.se is occurring in the United. States and Canada. Repo.rts in1icate that consumption in the communist countries will be somewhat higher than last year. In this event, world consumption will be around 32 million bales.
The world carry-ov~r on August 1~ 1952 is expected to increase roughly.2 to 3.million bales over a year earlier, and to total between 13 and 14 miliion bales.
- . The supply of linters in the United States is estimated at 2.0 mil-lion bales~ ·This includes a carry-over on August 1, 1951 of 264 thousand bale~ estimated prod~ctio~·of 1,6?0 thousand and estimated imports of 100 thousand.

JAN;; MAR. 1952 - 4 -
Disappearance of lj.nters for the current crop year is estimated at approximately 1.6 million bales> compared with 1.5 million in 1950-51~ The gain is due to an estimated increase of about 133~4 thousand bales in exports over the 9196 thousand exported la~t_yearG However, consumption in 1951-52 will probably be about the same as in 1950-51, 1 ... 4 million bales& Carry-over on August 1, 1952 will probably be about 400 thousand bales., approxjmately 50 percent larger than a yeat• earlier.
RECENT DEVELOPMENTS
12!sappearan_£e of Cotl£!! ,!1~ Last Season
Disappearance of cotton in the United States from August 1 through January was 8.4 million bales, 10 percent larger than for the same period last season and the largest for this period since the end of vlorld War IIo The gain over last ~ar was due to a sharp increase in exports which more than counterbalanced a sharp decline in mill consumption.,
Domestic consumption from August 1 through March 1 was about 776 thou sand bales smaller than for approximately the same period in the 1950-51 crop year ... From August 1, 1951 to March 1, 1952 it was about 5,572 thousand bales. The average daily rate of consumption during February was up 3, 7 percent over that for January, The average seasonal increase since 1920 was about 2.3 percent. The average daily rate of consumption for the current marketing season through February has been 37.3 thousand bales. If mill activity follows the usual seasonal pattern for the remainder of the current marketing year, consumption will total about 9.5 million bales, although it may vary as much as 300 thousand bales from this figure.
Exports through January were at a post-war high of 3.5 million bales. This was 47 and 65 percent larger than exports in the same periods of the 1949-50 and 1950..,51 crop years. Exports during the remainder of the marketing year will probably not be as large as during the first half of the season. r. However, exports.for the entire season will be large. ·
Much of the money made available by the u. s. government for the purchase of cotton by foreign countries has not been spent. Stocks of cotton in many of the importing countries especially in Europe, were abnormally small on August 11 1951 and. a de~ire to have larger stocks on August 1, 1952 will probably encourage continued importation of cotton~ Total exports for the 1951-52 crop year will probably be about 6 million balesG
Supply of Cotton in ~ United States Estimated ~ ~ Million Bales
The supply of cotton in the United States for the 1951-52 crop year 1 is estimated at 17.4 million running bales compared to 16.9 million in 195~5 and the 1941-42 to 1950-51 average of 19.8 million. This season's supplY includes a carry-over at the beginning of the year of 2a3 million bales, ginnings as reported by the Bureau of the Census on March 20 of 15 1050 thous .. and bales and imports of about 100 thousand bales.
Production in 1951 was well above the average of approximately 12.5 million bales for the 1915 to 1950 period. There are only 7 crops on record which have been largern

Cfl-139 - 5-
Imports have been running at an abnormally low rate• Thnough January 30.4 thousand bale6. had been imported as compared with 107a6 and 39.6 thousand jn the same period of the 194~~50 ani 1950-51 crop years. Unless the rate of importation shows a sharp increase over the next 5 months, imports by the United States will not greatly exceed 100 thousand bales.
~cr~oo:~v:.er sm Au.&llL'f! 1, 1252 Exp~i&J! to ~ Small
The above estimat~s of supply and distribution indicate that the carry~over of cotton at the end of the current crop year may be smaller than the carry-over of 2,278 thousand bales at the beginning of the year. This \..ras the smallest carry-over since August l, 1925eo
Qu~bti..Y S.Ughtl;v ~~ !2,.~ ~
The quality of ginnings and of the total supply of upland cotton carry~over plus ginnings in the 1951-52 season are slighly lower than in 1950-51, as shown below:
Year befinnin,g ~~index, (M White. =100) Average staEle len~th Au,ernst L_ Qinnings §ypply .Qinnin_B~ St:.;QPll
)2ds 32ds of en inch· of an inch
1950 94.7 95e3 32 .. 6 32.8
1951 94.0 94o2 32$4 32a5
About 21., 5 percent of the e:r.r:.~eilt suppl:y is 15/16 inch in staple length and shorter compared.with 17e2 percent last season~ Approximately 31.6 percent of Low middling and below in 1951L·52 as compared with 28.1 percent tn 1950-51. In other words, a larger proportion of the supply falls into the lower grades and the shorter staple lengths thia season than last season, (See tables 6 and 7)c
Erica of .Qillp.,n ~tuates
The average 10 spot market price for Middling 1;/16 inch cotton declined to 39e52 ce~ s ~ pyund on February 181 compared with a monthly aver~ age of 42e23 cents in Decembero This decline probab:t_y was caused by a slow demand for grey goods which was reflected in .the slow demand for raw cotton by domestic mills. However; by March 24, the price had increased to 1.1.·42 cents., ·
The average price received by farmers for cotton on February 15 was 37.25 cents per poundo This was 3.75 cents lower than the season high of. 41.00 cents on December 15~ The'parity price in m!d~February was. 34.47 cents,
·Up 0 .12. cents from: ,Ta.nuary, ·

~TAN.-~MAR. 1952 ..... 6 ~ .
The m:! ll margins for 17 constructions of grey good.s have been much lower for the -past four months thaL for the same months last season, as shown oeJ Oil:
Price of cloth, cotton and mill mar8ins, 2.'( constructi..ons, United States, 1950-51 to date,
---·-Year beginning - ---··- ---·---· ------ --~-------. . _ August 1 Jan, Aug. . Sept. · Oct,. Nov. · Dec. • :F'eb, . . .
Cents-Cents -Cents Cents-Cen ts-_,C_e_n_t_I3.........;._C_e_n_t_s_
1950 1951
1950 1951
1950 1951
t I • •' I •
.... ('f.,
.. 0 ,, '
..... ' .
·-- ---· ---Cloth y· --81.43 89,24 $9.16----90,67 92.88 72.47 68.83 68.04 70.12 72.15
37.85 40,55 3l1 .85 34.95
43.58 48.69 37.62 33.88
· Cotton 2/ 39.80-42.28 36.84 41,40
·Margins · 4/ 49.36 48.-39 31.20 28.72
42.67 42.20
50,21 29.95
94.41 70.91
44.29 41.87
50.12 29.04
95.55 69.03
3.1 28,45
~Value of approximate qu~tity of cloth obtainable from a pound of cotton with ad~ustments for salable waste. gj Average price at the 10 STJOt markets for the q_uality of cotton assumed to be used in each kind of c~o~h. '3/ Markets closed. :!£/Difference between prices of cotton and cloth. Cotton :Branch, :?roductj_on and Marketing Administration.
In Februar3r the mill margj_ns were the low·est since July 1949, These low margins reflect the low price of gray goods in the past four months coupled with the relatively high cost of cotton.
Loan Rat!!!_.!'£!: l95g_ -Crop Cotton Anu6~
On February 21, the De-partment of Agricu1t·1Jre ahnouneed that the loan rate for 1952 crop cotton would. average not less than 30.91 cents per pound for Middling, 7/.8 inch, This is 90 percent of the January 15 parHy price, If the parity price on August 1 is higher than that of JanLary, the loan rate will be increased accordingly.
The purchas~ ~rice by the Commodity Credit Corpuration for 1952 crop Amsak and Pima 32 varieties of American Egyptian cotton will average 107.10 cents per pound for Grade No.2, l-1/2 inches in staple length. This is 3.10 cents higher than that of last season,

cs ... l39 -7 ...
The amount of u~land cotton· from the 1951 crop held under Commodity credit Corporation loe.ns declined from November 21 to Fabruary 28. On the latter data loans on 407,871 bales were outstanding~ Since February 28, the number of bales covered by outstanding loans have been increasing and on ~.arch 13, 412,939 bales were held under these loans. More of thi s increase is reported to be lo"ir quality cotton. Although the market price of the better quality cotton has been increasing recently, the price of low quality cotton has remained fairly constant, as illustrated below:
Midd.ling, : 41.89 1-1/32 inch:
Strict Geed Ordinary 7/8 inch . 32.13 .
jJ Ten spot m~rket average.
ExPort.fi 2f Cotton Cloth ~ease
41.13 40.89
32.24. 32.00
Exports of cotton cloth in 1951, 802.5 million square yards, were 44 percent larger than in 1950, but, they were smaller than in apy other year s:tnce 1946. (See table 9.). About 68 percent of the exports in 1951 went to Canada, Indonesia, Phillipine Re~ublic, Uhion of South Africa, Cuba, Venezuela, and Iran. Exports to other countries were less than 25 million square yards each. (See table 10.)
Con~~~pti<E:!, of Cott~?£ in Non-Communist Countries Declines
Consumption in countries outside the iron curtain will probably be 1 to 2 million bales smaller in 1951-52 than in 1950-51. Most of tnis reduction in consumption will occur in the United States and Canada which had consumed 837 thousand bales less through February tnan during the same period in the 1.950-51 marketing season. Consumption in Japan and India is expected to be larger than last year, but it will probably be smaller in some of the Western European countries. Reports indicate that consumption in the communist qountries will be somewhat higher than last year. In this event, world consumption will be about 32 million bales.
Total world consumption of cotton in 1950-51 is estimated at about 33 million bales, This includes an estimate of about 6.5 million bales for communist countries, the reliability of which is difficult to assess,
~2r~ Suppl~ of Cotton Increases
Cotton supply outside the iron curtain is estimated at 37.5 million bales for 1951-52, slightly larger than in 1950-51. This is composed of carry-over of about 9,9 million bales and production of about 27.6 million

JAN. -MAR. 1952 - 8 -
If the carry--over and production in communist countries, 1.1 and 6.9 mil~ion bales, are added to the supply in the other countries, the world supply is estima";:.ed at a·bout 45.5 million bales, including a carry-over of 11,0 million and production of 34.5 million.
This supply will lea7e a carry-over on August 1, 1952 in nonComlliUnist countries of about 12 million bales. Total world carry-over is estimated at about 13.5 million ba:.es. !r! other words, the world carry-over of cotton at the end of the 1951-52 marketing season will probably be 2 to 3 million bales larger than at the end of the 1950-51 season.
Prices of som.e foreign cotton are the lowest since the beginning of the curre:.~t crop year. (See table 12.) For example, Middling 15/16 inch cotton at Torreon, Mexico on March-20 was quoted at 28.28 cents per pound, 30 percent below ita peak of early December, and Type 5 at Sao Paulo, Brazil was 28 percent telow :ts peak of early November. Pakistan growths hav-e sho..-...'D similar price movements, These price declines have pro· bably been assoc:!.at.ed wj_~h the prospectiYe-·decrease in world consumption and the increased quantity of 1Jr:i ted States cotton available for export,
Supply Qf. 1_in~~ Decreases
The sup!)ly of lint.ers d<Iring the l95l-52 erop year· in· the· Unit~d States is estimated at 2,0 million bales compared Nitn 2.4 million in 1950-51. Included in the cur~ent supply are a carry-over of 264 thousand bales, estimated production of 1,670 thousand bales, and estimated imports of about ~00 thousand bales. Of this total, i~ is estimated that approxima~ely 1,2 million bales will be chemical linters and 0.8 million will be fel~ing linters.
Disappearanoe of Linters Increases
Disappearance of linters for the 1951-52 seasor: is estimated at 1.6 million bales 7 compared with 1.5 million in 1950-51, The gain is due to an increase in estimated exports.
Exports of raw linters from August 1, 1951 through July 31, 1952, are expected to be about 225 t~ousand bales. This would be 145 percent larger than during the 1950-51 year when exports were restricted by allocation. Expo~ts of lin~ers from August 1, 1951 th~oug~ January 1952 were 104,2 thousand bales. However, through Marcn 3, export licenses had been issued for 198,561 bales and these licenses did not cover exports to Canada which amoun~ed to 4,829 bales ~hrough January.
Consumption will probably be about 1.4 million bales, approximately the same as in the 1950-51 season. From August l through February, linters consumption was 822,6 thousand bales compared with 857.6 thousand during the same period in 1950-51. It is interesting to note that consumption by

CS-139 - 9 -
bleachers for this period in 1951-52, 524.7 -~housand bales, was 7.6 percent larger than_for the same period last season whi1e consumption by other users, 297.9 thousand bales, was 19 .. 4 percent smaller.
These estimates indicate a carry-over of linters on August 1, 1952 of about 400 _thousand bales. This will be more than 50 percent larger than the carry-over on August 1, 1951.
Pric·es o:[ linters ~t~~.Qi
The prices of linters have shown very little movement for the past 3 months. On March 18, the price of Grade 2 at ~Emphis was 13 to li cents per pound and Grade~ was 7.5 to 7,0 cents. Although Grade 2ts have fluctuated around this level since November 3, Grade 6 1 s have been quoted at the same price since November 20c
Linters PulE Pri~ Decline
Linters pulp prices have been declining since July 1951. In that month the price was 27,70 cents per pound> but by Decem~er the price had declined 43 percent to 15.80 cents and remained there during January. This parallelled a decline of 34 percent in the price of Grade 6 linters over the same period.
At the same time that linters pulp prices declined, dissolving woodpulp prices held stoady. For example, standard viscose grade pulp bas been selling for 9.25 cents per pound since January 1951.
World production of rayon and acetate during 1951 v.as the largest on record, This output was about 13 percent larger than in 1950, 3,960, and 3,494 million pound""·' respectively. The 1951 world output was equivalent to 9,3 million bales of cotton. However, rayon and acetate compete with other ~ibers as well as cotton,
The U:1ited States produced about 33 percent of the world total in 1951, compared -.;ri th 36 percent in the preceding year. The decline -in the proportion produced in the U. S. emphasizes the fact that U. S. production increased only slightly over 1950; about 2.8 percent to 1,294 million pounds, while production in the rest of the world increased about 19 percent to 2,666 million pounds.
U. S. Rayon Stocks 1IQ_
At ~~e end of February 1, rayon and acetate stocks in the United States held by producers were 115,2 million pound.s> the larg~st on record. Stocks have been accumulating since the end of June 1951. At the end of Docember, they were about 8 percent of the 1951 production and trade reports indicate that the output of rayon and acetate has been reduced in recent months.

JAN. -:t<!AR. 1952 - 10 -
Tablel .-Cotton exports from the United States, by country of destination ru1d staple length, November 1951 1/
Country Pima Year beginning August 1
1-1/8 :1-1/16 in-:15/16 inch: of and inches ches to to Under .
deetine,tion Sea and l-1/8 1-1/16 15 '16 : Total 1Uc .
[email protected]__: _over inches inches . . ---Running Running Running Rlli"'lning Running Running bales __ bales bales bales bales bales
Euro~ - -~----~
United Kingdom.,, •. : 0 8,984 18,922 62,482 8,455 98,843 A us tria o ••••• o t •••• : 0 527 1,907 1,408 3,842 Belgium and
Luxembourg ••...•. : 0 2,134 l8j082 39,375 1,132 60,723 Czechoslovakia,,,,,: 0 0 0 0 0 0 Denmark • . , ., • (' 4 ;l " ••• : 0 0 0 5,283 0 5,283 Eire . ... , ......... ~ : 0 0 0 850 0 850 Finland. , " ......... : 0 0 0 6,125 0 6,125 France, .......... o •• ~ 0 5,314 7,872 41;861 414 55,461 Germany . ........... ; 0 3;338 18,936 12,219 160 34,653 Greece ..... , ...... t : 0 0 0 0 0 0 Hungary •• , • , • , . , • , • : 0 0 0 0 0 0 Italy •..••.•..••••• : 0 3,577 18,119 15,427 1,605 38,728 Netherlands •••••••• : 0 4,279 8,810 11,362 0 24,451 Norway.~ .. , ...... ,.: 0 157 375 3;093 0 3,625 Poland and Danzig •• : 0 0 0 0 0 0 Portugal •..•.•.•..• : 0 0 1,152 2,181 0 3,333 Spain , . i1 • • • • , , o • • • • : 0 585 1,449 37,499 230 39,763 Sweden . ... , .... o •• o : 0 0 0 17' 352 17,352 Switzerland •••••••. : 0 7,157 5,651 13,214 448 26,470 Trieste ..... o ;t o ••••• o • : 0 0 0 254 0 254 u.s.s.R. tttttt.t"<tOt 0 0 0 0 0 0 Yugoslavia ••.•••.•• : 0 500 4,381 8,936 0 13,817 Otter Europe ••••.•. : 0 0 0 0 0 0 Total Europe< ..•..• : 0 36,552 105,656 278,921 12,444 433,573
Other countries Canada. " ...... ., . ¢ •• : 0 1,523 11,728 32,661 1,023 46,935 Mexico .•••••..••... : 0 0 0 0 0 0 Cuba •• D •••• ~ ••••••• : 0 0 0 3,250 0 3,250 Colombia'> ....•..••. : 0 0 5,123 lj334 0 6,457 I 11C!. 1 a , (" . . . . o • • • • • & • : 0 121,237 3,394 1,624 0 126,275 Cl1:L:ua, ••••.•••• ~~ ••• : 0 0 0 0 0 0 Japan., •••.•• OJ •••• o • : 0 605 34,483 93,921 26' 254 1551263 Hong Kong .••••••.•• : 0 0 0 0 0 0 Korea . .. " .... e ••••• : 0 0 0 0 0 0 Palestine and Israel: 0 100 0 0 0 100 Philippine Repv.'blic : 0 0 0 0 0 0 Australia~ ... ~". (I •• : 0 50 1;147 14,327 0 15,524 Other countries., .. : 0 1,842 4,677 3,694 6 010 16,223 World total •••.••.• : 0 161,909 166,208 429,732 45; 731 803,58° ---Compiled from reports of the Bureau of the Census. 1/ Preliminary.
s-139 - 11 -
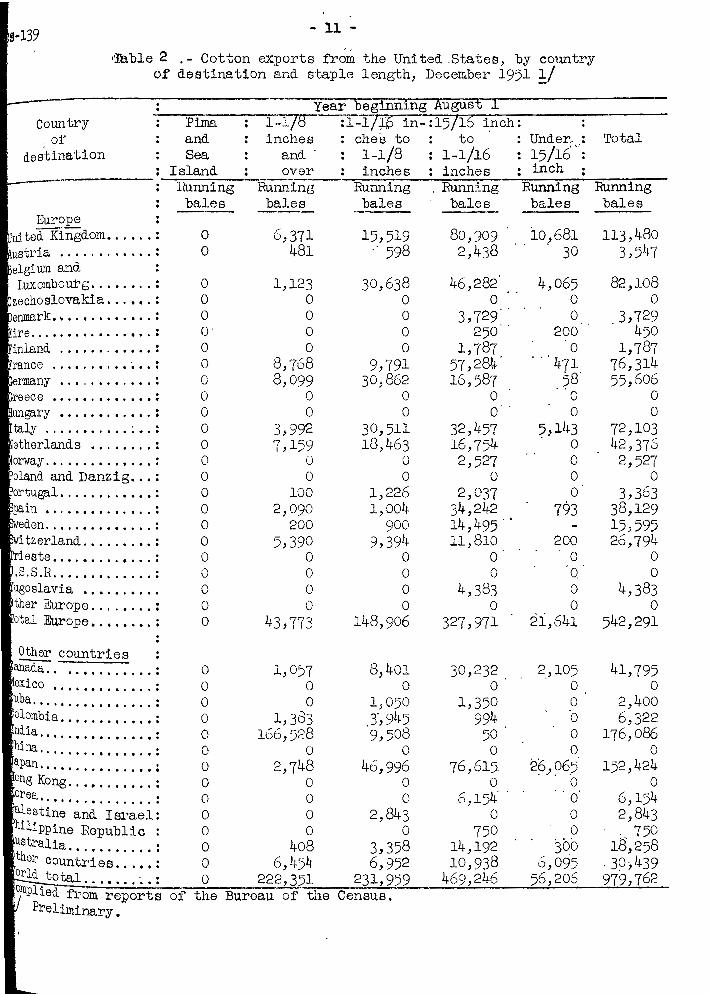
•Table 2 - Cotton exports fr~m the United .States, by country 6f destination and staple length, December 1951 !/
cow1try of
destination
Europe : ni ted Kingdom •..... : ustria ............ : elgium and Luxembourg ...•.•.. :
zechoslovakia ...••. :
rmany ............ . reece ........•.... : ungary ••...•.•..•. : taly .....•..... : •. : etherlands ........ : orway .•. .•..•..•.•. : oland and Danzig •.. : o:rtuea,l ........•... : pain .........•.... : eden . ........•.... : · tzerland ........• : ieste . ........•... :
: .S.S.R ....•.•...... : ugoslavia . , •.•... , . ther Europe. , ...... : otal Europe •...•.•. :
Other countries : ---1anada.. . .......... : exico .............. . uba .•. .•..•••••.•.. : olombia. , , .. , ...•.• : nd.ia • hina: . ' · · · ' · • · · · · · · : ............... a :pan . ..••...••...•• : ong Kong., .•.. ,,, .. : orea, . alestt~~ '~~d · j ~~.~~i; hilippine Republic : Ust:ralia . the:r cou~t;i~~: : : : :; orld total. ..•.....• : 0/!Uplied from reports
Preliminary.
Year begtnriing August I Pima 1-.l/8 :1-lj.:US in- :15/16 inch: and inches ches to : to Under. : Total Sea and· l-l/8 : 1-l/16 15/16·":
Island over inches : inches inch Hunn-1=-n-g-~RUnning --.::Ru~nn--=-in-g--. -===Ru~nn-l"""· n-g---==R:-uruu--=-· n-g--:::Ru:--nn--:-in_g_ bales bales bales bales bales bales
0 0
0 0 0 o· 0 0 0 0 0 0 0 0 0 0 0 0 0 0 0 0 0 0
6,371 481
1,123 0 0 0 0
8,768 8,099
0 0
3,992 7,159
0 0
100 2,090
200 5,390
0 0 0 0
43,773
0 1,057 0 0 0 0 0 1,383 0 166,528 0 0 0 2,748 0 0 0 0 0 0 0 0 0 408 0 6,454 0 222,351
of the Bureau of the
15,519 ,' 598
30,638 0 0 0 0
9,791 30,862
0 0
30,511 18,463
0 0
1,226 1,004
900 9,394
0 0 0 0
148,906
8,401 0
1,050 ,J, 945 9,508
0 46,996
0 0
2,843 0
3,358 6,952
231,959 Census.
80,909 2,438
46,282 0
3,729 250
1,787 57,284' 16,58'7
0 0
32,457 16,754 2,527
0 2,037
34,242 14,495'. 11,810
0 0
4,383 0
327,971
30,232 0
1,350 994 50
0 76,615.
0 0:154' .
0 750
14,192 10,938
469,2l~6
io,681 . 30
4,065 0 0
200 0
... 471 sa·
. . 0
0 5,143 . 0
0 0 0
793
200 0
0. 0 0
21,641
2,,105 0 0 ·o 0 0
26,065 . .. 0 0 0 0
}00 6,095
56,206
113,480 3,547
82,108 0
3,729 450
1,787 76,314 55,606
0 0
72,103 42,376 2,527
0 3,363
38,129 15,595 26,794
0 0
4,383 0
542,291
41,795 0
2,400 6,322
176,086 0
152,424 0
6,154 2,843 . 750
18,258 '30·,439 979,762

JAN. -MAR. 1952 - l2 -
Table 3 .-Cotton exports from the United States, by country of destination and staple length, August-December 1951
------- ---- -·-·-- --·-------- __ Y~ar. o~sinning__~~)!lt 1 ----- ·--~--
Country Pima 1-1re-:1-l716 in-:15;16 inch; Under~ of and inches : ches to : to : 1 r:,/l6 ~ T t 1
dea~vination Sea ar.ti 1-1/8 1-1/16 : .. _, t 0 a I 1 d . . . , inch ----- _____ :_ !3 an over 1ncnes 1ncnes : : RunnJng Running Running RUJ.""lni~g Runnj ng -Running-bales bales baba bales sales bales
Europe United Kingdom .• ".,; A us tria D • • • , • •• • • • • , :
Belgiu.rn and Luxembourg •.. , ..• :
Czechoslovakia ••••. : Denmark, .... (.) • o • " •• :
Eire .. " ..... .:) u • a ••• =
Finland •• " • ., •.. , , , " : France . .. ~ a. •••••••• ~ Germany . ••.. o • o n ••• :
Greece, ~ e ••• ., $ • ,.. •• ., ;
Hungary •• , , ...•••• , : Italy. , . 1o ., ..... "' (\ ••• ~
Netherlands •..•• ,,.~ Norway • .... ~ .. , .... , ~
Poland and Danzig •• : Portugal ••.....•... : Spain. , ., i •• f'> c • ~ •••• :
Sweden t , ••••• , ••••• !
Trieste ........ e ••• ~
U.S .s .R., , " •• (: •• o h • ~ :
Yugoslavia •• , •. ,,., : Other Europe ...•..• : Total Europe ...• , •• :
Qther countries Canada. , • ~ ..... ~ t ••• :
Mexico . .. , ....•...•. : Cuba. :t I) • , ••• " ~ • # n •• :
Colombia., .. o••••••: India . . , ~ " (, , ... " ... : China, . ~ e .... ., ••• , .... , :
JaiJan •••••.•• ~ ~ •••• : Hong Kong .•••.• , ••• : Korea . .. e •••••• o ••• :
Palestine and Israel Philippine Republic: Australia ..•••..••• : Other countriese,••: World total ••..•... :
0 0
0 0 0 0 0 0 0 0 0 0 0 0 0 0 0 0 0 0 0 0 0 0
0 0 0 0 0 0 0 0 0 0 0 0 0 0
22,298 1,216
41357 0
315 0 0
17,564 24:093
0 0
7,699 16,222
0 0
100 4,825 2,216
16,315 0 0
1,200 0
118,420
4,831 0 0
2,108 355,982
0 3,853
0 0
100 0
458 15,979
501,731
76,781 3,190
287,547 6,463
80,517 135,8'72 0 0
10 18;882 0 2}290
510 11,060 25y919 154,928
106,953 57,128 0 0 0 0
56,647 49,548 38,301 42,230
150 9,889 0 0
4,206 6,120 8,277 125,549 2' 87 4 4 3' 3 61+
27,286 41,720 274 345
0 0 21,074 28,534
0 0 452,969 1~021,469
31,658 108,844 0 0
1,050 7,639 18,517 5,101 13,600 1,674
0 0 127,017 332,33)
0 0 0 6,154
3,240 0 0 750
5,473 29,819 23,326 27,026
676,850 1,540,811
Compiled from reports of the Bureau of the Census.
-----....--30,413 417,039
30 10,899
5,372 226,118 0 0
0 19,207 200 2,490
0 11,570 1,125 199,536
238 188,412 0 0 0 0
6, 748 120;642 0 96,753 0 10,039 0 0 0 10,426
1,173 139,824 0 48,454
650 85,971 0 619 0 0 0 50,808 0 0
45' 949 1, 638,807
7, 746 153,079 0 0 0 8}689 0 25' 726 0 371)256 0 0
72,875 536,080 0 0 0 6;154 0 3,340 0 750
300 36,050 22,974 89,305
149' 841~ 2' 869,236
------l/ Preliminary, a Bureau of Agricultural Economics, Division of Statistical and Historical Rese~
- 13 -·
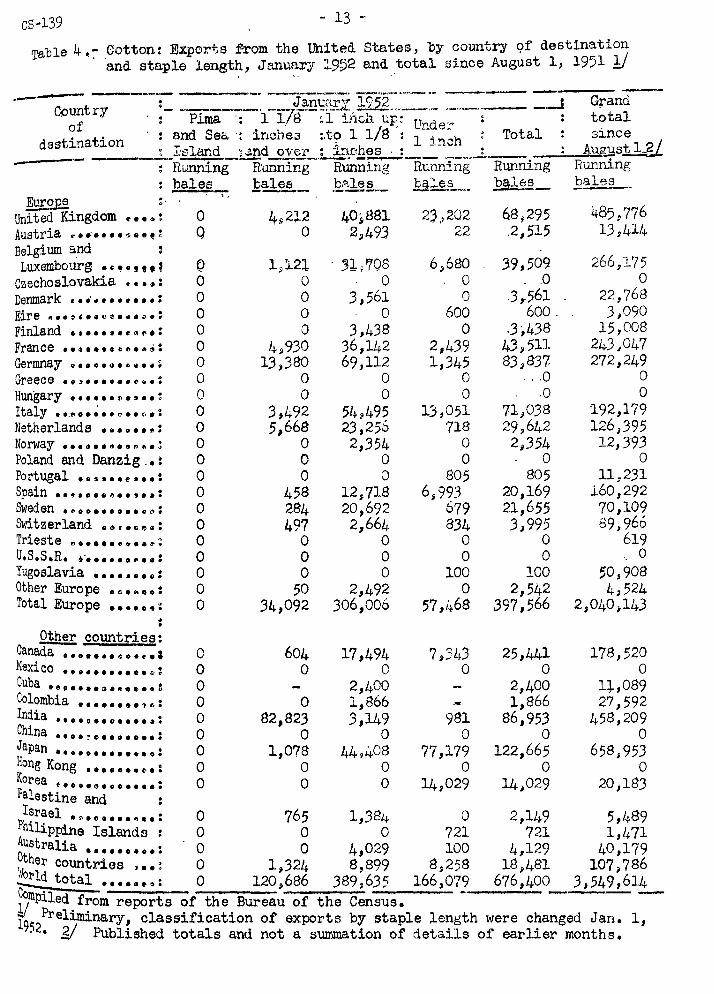
Table 4~~ .cotton: Export.s from the United States, by country 9f destination and staple length, Janu~r-J ::..9J2 and . .total since August 1, 1951 Y
EurC!.,Ee Uni t;d Kingdom
:·
Austria " ••. • • • o '~- o .. , ~ Belgium and Luxembourg • c , • , , , '
Czechoslovakia ~ s •• :
Denmark •• • •• • • " • •• : tire ~··~•··~~···~·= Finland ••••• " • ., " " • : France •• ~ ••• ~c .... ":
Germnay ~ •• o .......... ~
~eece ••3•••••·~~.: Hungary •••••• ., ••• o ~
Italy ..... o • ~ •• ., •• ,, • :
Netherlands ... o g .... :
Norway o •• .,. •,. o.., ... ~
Poland and Danzig .• : Portugal oo s ••• ., .... : Spain ••••••• " •• , • ., : ~eden •~••••eo••~o: Smtzerland oo .... .,.,:
~ieste & ........... ~~ u.s.s.R. ~·· •••• o .... :
Yugoslavia ••••••• o: Other Europe • e • .. o .. :
Total Europe o • o ••• :
0 0
Q 0 0 0 0 0 0 0 0 0 0 0 0 0 0 0 0 0 0 0 0 0
l,l2l. 0 0 0 0
4!)930 13,380
0 0
3,492 5,668
0 0 0
45S 284 497
0 0 0
50 .34,092
40i881 2~493
.3lf7Q8 0
3,561 0
3,438 36,142 69,112
0 0
54"495 23,256 2,354
0 0
12;718 20,692 2,664
0 0 0
2,492 306,006
6,600 0 0
600 0
2,439 1,345
0 0
13,051 718
0 0
805 6~993
679 834
0 0
100 0
57,468
68,295 .2,515
39,509 .0
.3 ,.561 600.
.3:,438 43:;511 83)837
... o .o
71,038 29,642 2i354
0 805
20,169 21,655 31995
0 0
100 2,542
397,566
485,776 13,414
266,175 0
22,768 31090
15,008 243)047 272,249
0 0
192,179 126~395 12,393
0 11,.231
160,292 70,109 89,966
619 0
50,908 4,524
2,040;143
Other countries: ~an~da::' ••••• u u.: 0 604 17,494 7/343 25,441 178,520 ex1co • • •• • • •• • .... : 0 0 0 0 0 0
Cuba •u ... u ... uoo t 0 2 1 400 2,400 1+,089 Colombia •••••uo?r.: 0 0 1,866 1,866 27 1 592 Ind · la ••••e••••o•••= 0 82,823 31149 981 86,953 458,209 China •••• ,. ••••••• : 0 0 0 0 0 0 Japan •••••••••••••= 0 1,078 44~*08 77,179 122,665 658~953 Hong Kong .......... : 0 0 0 0 0 0 Korea • 0 Palest!~; • ~d .. •• • • · 0 0 14,029 14,029 20 1183
Israel •~oooooooae: 0 765 1,384 0 2,149 5,489 Philippine Islands : 0 0 0 721 721 1,471 ~ustra.lia ••••••••• : 0 0 4,029 100 4,129 40,179 W~~~~ countries u. ~ 0 1,324 8,899 8,258 18,481 107,786 --- total ••••••~= 0 120,686 389,635 166,079 676,400 3,549,614 trnpiled from reports of the Bureau of the Census. - -19~2Pre;~nary, classification of exports by staple length were changed Jan. 1,
· • ~ Published totals and not a summation of details of earlier months.
JAN. -MAR o 1952 - 14 -
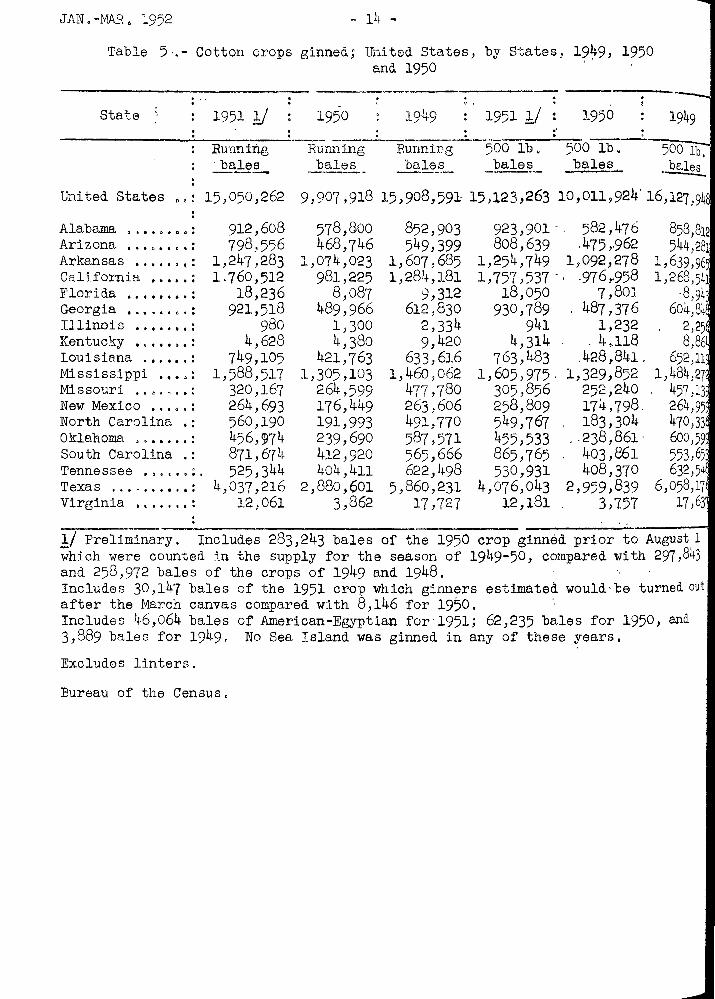
Table 5 .. - Cotton crops ginned; Unitod States, by States, 1~~9, 1950 and 1950
------------- --------~-------- ----------... . State
Alabama , .••.••• : Arizona •.. , •••• : Arkansas .
t • I I I:) 111: I
California ••••. : Florida ...••.•. : Georgia •.•... ,.: Illinois ........ Kentucky ,, .•• ,.: Louisiana .•..•. : Mississippi . . . . .,). . Missouri .. " . "' ... New Mexico ••.•. : North Carolina .: Oklahoma ...•.•. : South Carolina .: Tennessee • , .ll t ••••
Texas I II I _.. I I I • I t I
Virginia . ~ ......
1951 11 Runnil'lg ~le.§._
912,608 798,5'56
1,247,283 l, 760,512
18,236 921,518
980 4,628
749,105 1,588,517
320,167 264,693 560,190 456,gJ74 871,674 525,344
4,037,216 12,061
1950 19!~9 -
1950 1951 1./ . . •' . . R-unning--Runnir:g~---5oo lb • )00 lb. 500 lb-:--.J?.~es . bale~~- _pale~- bales bales -
578,800 852,903 923,901 .. 582,476 858,812 468 '746 549,399 808,639 .475,-962 544,281
1,074,023 1,607,685 1,254,749 1,092,278 1,639,965 981,225 1,284,181 1,757;537 .. -976r958 1,268,541
8,087 9,312 18,050 7,80] ·8,94) 489,966 612,830 930,789 ' 487,376 6o4-,84t
1,300 2,334 941 1,232 2,25t 4,380 9,420 4,314 . 4,118 8,86
421,763 633,616 763,483 .428,841. 652,11\ 1,305,103 1,460,062 1,605,975· 1,329,852 1' 484 ,27~
264,599 477 '780 305,856 252,240 457,139. 176,449 263,606 258,809 174,798. 264,95\ 191,993 491,770 549 '767 183,304 470 ,33t, 239,690 587,571 455,533 .. 238,861' 600,59\ 412,920 565,666 865 '765 403,861 553,65 404,411 622, 1+98 530,931 408,370 632,54
2,880,601 5,860,231 4,076,043 2,959,839 6,058,17 3,862 17,7'27 12,181 3,757 17,63
1/ Preliminary. Includes 283,243 bales of the 1950 crop ginned prior to August 1 ;hich were counted in the supply for the season of 1949-50, compared with 297,843 and 258,972 bales of the crops of 1949 and 1948. Includes 30,147 bales of the 1951 crop which ginners estimated. would· be turned out after the March canvas compared with 8,146 for 1950. Includes 46,064 bales of American-Egyptian for'l951; 62,235 bales for 1950, and 3,889 bales for 1949, No Sea Island was ginned in any of these years.
Excludes linters.
Bureau of the Census,
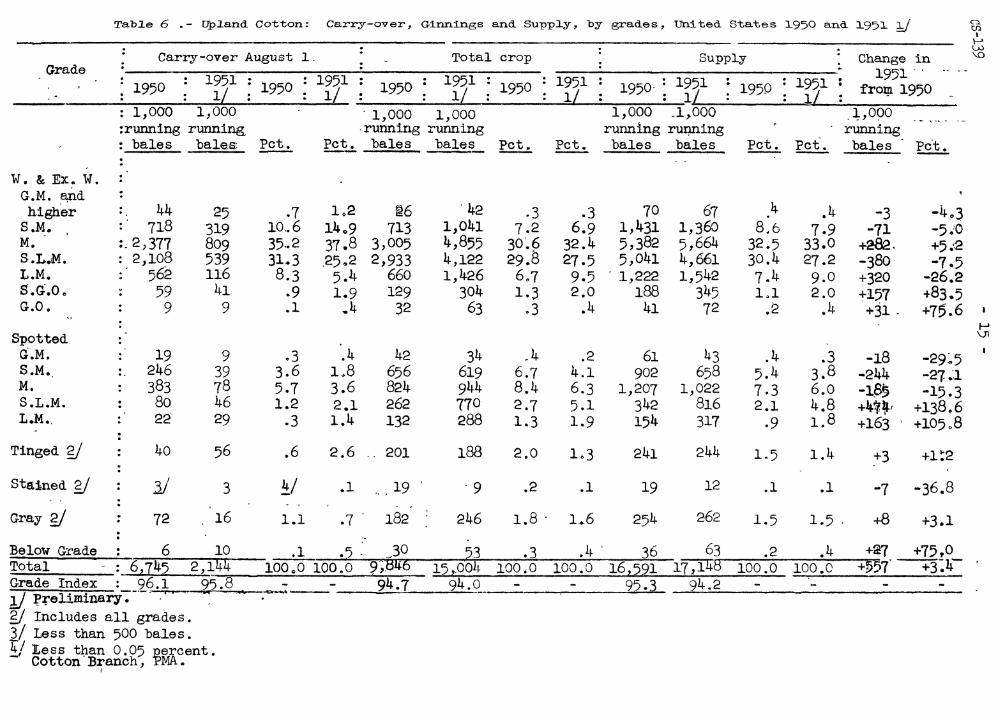
Tab~e 6 .- vp~and Cotton; Carry-over, Ginnings and Supply, by grades, United States 1950 and 1951 1J
Carry-over August l Total crop Supply : Change in Grade
: 1950 : 1951 : 1950 : 1951 : 1950 : 1951 : 1950 : 1951 ; 1950· : 1951 : 1950 : 1951 ; f 195i9'5•0 : : 1/ : : 1/ : : 1/ : : 1/ : : 1/ : . : 1/ • TOI!l
W.&Ex.W. G.M. El:nd higher
S.M. M. -S.L.M. L.M. S .G.O. G.O.
Spotted G.M. S.M. M. S .L.M. L.M •.
Tinged g)
Sta.:lned g)
Gray g)
: 1,000 1,000 . 1,000 1,000 1,000 _1,000 :running running_ -running running running rut)Iling : bales bales; Pet. Pet. bales bales Pet. Pet. bales bales Pet. Pet.
44 718
:. 2, 377 : 2,108 . 562
. .
59 9
19 246 383 80 22
40
J)
72
25 319 809 539 116
41 9
9 39 78 46 29
56
3
16
--- ---- ---
.7 10 .. 6 35 .. 2 31.3 8.3
.9
.1
.3 3.6 5.7 1.2
.3
.6
lj_/
1.1
1.2 14o9 37.8 .25,2
5.4 1.9
..4
.4 1.8 3.6 2.1 1.4
~6 713
3,005 2,933
660 129
32
42 656 824 262 132
2.6 -. 201
.1 ... 19
.7 182
. 42 1,041 4,855 4,122 1,426
304 63
34 619 944 (70 288
188
'9
246
.3 7.2
30'.6 29.8 6.7 1.3
.3
.4 6.7 8.4 2.7 1.3
2.0
.2
.3 6.9
32.4 27.5 9.5 2.0
.4
.2 4.1 6.3 5.1 1.9
1.3
.1
1.8 · L.6
70 1,431 5,382 5,041
. 1,222 188
41
61 902
1,207 342 154
241
19
254
67 1,360 5,664 4,661 1,542
345 72
43 658
1,022 816 317
244
12
262
4 . 8.6
32.5 30.4 7.4 Ll
.2
.4 5.4 7.3 2.1
.9
1.5
.1
1.5
.4 7-9
33.0 27.2 9.0 2.0
.4
.3 3.8 6.0 4.8 1.8
1.4
.1
1.5 .
.:1:,000 running bales
-3 -71
+282. -38o +320 +157 +31-
-18 -244 -1$!} +41 .. 1
+163
Pet.
-4~3 -5.;0 +5.·2 -7.5
-26.2 +83.5 +75 .. 6
-29~5 -27.1. -15.3
+138.6 +105.8
+3 +1~2
-7 -36.8
+8 +3.1
Below Grade : 6 10 .1 .5 .· ~30 53 .3 .4 · 36 63 .2 .4 +27 +75~0 Total - : 6,745 2,~4~- lOOgO 100.0 9;.846 15,.00h 100,0 100,0 16,591 Grade Index : 96.1 95.8 - - 94.7 94.0 - - 95.3 J) ~:rellminary -:-·--~ . . ..... ----- -
gj Includes all grades. 3/ Less than 500 bales. Y ][..ess than 0.05 "Qercent.
Cotton· Branch, PMA. I
1~8 100.0 100.0 +~57·~~4-94.2
0 Ul
l ~ LU '-0
1-' \.)1

Table 7 • - UplS:nd Cotton: Carry-over, ginnings, and supply, by lengths, United States g; 1950 and 1951 21 .
I
Carry-over August 1 : Total crop : Supply ; Change in ~
Staple . • : . : . . 1iJ1 ~ 1950 ~ 1iJ1 ~19516~!y1950 length . : 1951 . 1950: 1951 : 1950 : 1951 : 1950 : 1951 : . I-'
. 1950 . 1950 : \()
1/ : 1/ \J1 : . . 1/ . . • 1/ . 1\) . . . . . . . 1,000 1,000 1,000 1,000 1,000 1,000 1,000
:running running running running running running running bales bales Pet. Pet. bales bales Pet. Pet. bales bales ~ Pet. bales Pet.
: 13/16" and
54 14 .8 288 1.8 1.8 shorter : .. 7 175 1.9 229 392 l.lJ. +7~ +31.9 7/8" : 263 63 3.9 2.9 644 1,052 6.5 7.0 907 1,115 5.5 6.5 +20 +22.9 29/32" : 249 42 3.7 2.0 430 1,017 4.4 6.8 679 1,059 4.1 6.2 +380 +56 .. 0
: 15/16tl : 424 1ID4 6.3 4 .. 9 609 1,086 6.2 7.2 1,033 1,190 6.2 6.9 +157 +15.2
31/32" : 280 87 . 4.2 ·4.1 483 527 4.9 3-5 763 614 4.6 3.6 -149 -19.5 I-' 1" .. 848 231 12.6 10.8 909 1,419 9.2 9.5 1,757 1,650 10.6 9.6 -107 -6.1 0\
1-1/32" : 1,503 438 22.3 20.4 2,093 3,674 21.3 24.5 3,596 4,112 21.7 24.0 +516 +14.3 I
1-1/16" : 1,853 587 27.4 27.4 3,197 4,285 . 32.4 28.5 5,050 4,872 . 30.4 28.4 -178 -3.5 1-3/32" : 898 262 13.3 . 12.2 1,016 1,287 . 10.3 8.6 1,914 1,549 11.5 9.0 -365 -19.1 1-1/8" : 236 179 3.5 8.3 161 218 1.6 1.5 397 397 2.4 2.3 l-5/32" : 61 67 .9 3.1 45 "'86 c; .6 106 153 .6 .9 +47" +44.3 •..;
1-3/16" : 27 28 .4 1.3 37 49 .4 .3 64 77 .4 .4 +13 *-20.3 l-7/32" : 23 20 .3 .9 30 10 .3 .1 53 30 .3 .2 -23 '1-43 .. 4 1-1/4'"' and
longer ; 26 22 .4 1.0 17 6 .2 g) 43 23 -3 .2 -15 -34o9
Total : 6,745 2,144 100.0 100.0 9,846 15,004 100.0 100.0 -16,-591 17,148 1o<Y.o- 100 .o +557 -- ---+3 D4 Ave. length (32nd in.) : 33.0 33.5 - - 32.6 32.4 - - 32.8 32.5 ~ .. 1./ Preliminary. - ·--
gj Less than 0.05 ~ercent.
Cotton. Bra:n.ch, "PMA..

cs-139 -· - 17 -
Table 8 .-· Cotton under Commodity Credit Corporation, United States 1949, 1950 and 195:1 cro-ps.
~-·-·,··-·--·-----· ..... ~---~- .. ------.~~-- .-----:----~-· ---- --------------· ---: . _ ' Season beginning August l . -----------~-.. ----.....:- -·------·-~-------
' .. . 1949
Dat~ .~/ : · : ____ ... ___ ... : ______ :Out -: -- ·- .T - ~
: P1aced :Repay- stand-: P1aced:Repay-: . in :monts . : ing_. ·: in ·:ments ; loan ?/: · 'J/ :loan ?) : . . . . . . .
---;------: 1, oo·..,.o---=1, 666- :i., Cic)o-1-, ooo----1, ooo , _. :runnin~ r~l)Jfing running runnj_ng running · _;_ ~t:les..: _.'ba_·J,._ef!_ ____ b_a_1e_s __ ba_l_es_· __ b_a·l_efL
S~pt. . '
Oct.
Nov,
Dec,.
JSrn·.
Feb~
Ma:r.
• . . 1 : 2.2 6' : 4.5
13 ' 21 .. 0 2q.•
.. 37.4 :
2:( 69.1 4 121.4
11 .. ·234.-5 . 18 3'17 .5 2) 522.6
1 710.5 8 : -864.9
15 ;1., 028.'4 .:1, 225 .'i~ 1;1
29- ':1, 501.2 6 :J,, 743.2
13 :2,\.i10.2 20 :2,200~0 27 ~2,383.4 3 .:2, 48'7 .o
10 ;2,'6::;2.3 17 !2', 784.3 2h ;:2, 877.2 31 :2,967.8 7 ::3,029.8
14 ;3,073.0 21 :3,101.3 28. .~3, 115.4 s :3,129.6
13 :3, 141.·6 20 :3,:L55.8
27 : 3,160. 0
So a. son . •
Total 3,,190.2 : •'
1.4 2,7 '( e 5
14.9 4o.s 61+.9 1.1
·0:1 123.0 1.6 ,9 238.1 ., c
.L,O
1.7 372.5 2.2 3.6 527.7 2.8 6.0 q62_.2· 3.0
10.6 797.0 ·_3.6 ci.l l5.i 9fit .9 lt.l ,1 21.4 1,191.6 4.4 .l 25.$ _1,38'( .1 !.~.3 l ·-l-33 ;·4 l ,·-0)1 -:,:} ' 5.3 l
'0~'-p. -·~ •-'-
'42 .. 4 1,880.3' 5.9 ,2 52.4 2,066.1+ :.2 .2 59.9. 2,244.3 . . u .. 6 ?
•..)
73 .;2 2~~9~.>.4 . 6.9 .j 93'!9 . 2;5.51.3 ·?.5 .6
122.0 2,6:52.7 7.5 ,7
-150 .. 4- 2,719.8 .· 7.8 .8 '199.8 2-,757 ,0_ r• 0
I • _;} LJ 249.5 2,783.0 "(.9 1.1 285.7 2,779.7 7.9 1.1 389.8 2, 708.7 7.9 1.2 490.6 2,632.0 7·9 1 "i . ~·
·582;B' 2' 552. 9_ {.9 1.5 672.2 2;4Tr .2· 7'-9 2.0 767.3 2,388.2 7 Q
I • _. 2 .l+
3,]00.5 89.7 8.0 5,'1
' -' '.
1951
Out Ou~
stand-: Placed :Repay- ·:stand-ing · in :men ts ·: ing 1/ loan gj: 'jj .
1 ,·ooo-1~ ooo running ru..'IDing bales bales
28.8 . 75.2 175.1 282.1
0.6 369.8 1-.1. 1;.66 .8 1.4 549.3 1.8 628.2 2.0 694.5 2.5 742,7 2.9 T75.9 3.h 789.8 3.8 805.0 J.9 815.1 1+. 7 32-0.3 5.3 . 827.6 5.6 834.7 5.9 846.4
. 6·.3 B57.9 ~ ,..
871.4 •).o s:r 877.2 6.6 884.2 6.8- .B89 .4 6.9 895.5 6.8 906.8 6.8 920,1 6.4 931.9 8,4 944,0 5.9 ') F. ~·J
2.9
1,000 1,000 running running bales bales
49.0 0.1 ·104.9
..., ·.) 154.0 .4 :237.2 .9 342.2
1.4 461.1 2,9 -563.1 5.2 646.1
16 .'8 . ·695. 9 . 'l
.2 3, r( .721, 7 57 .9· -720.6
113 •. 4 :680.8 173.2 64'5 .3 221-.9 :603-.7 266.:1 ;564 .1 308.-3 528.6 342.0 -511.5 38L4 ,486.5 412,2 ·463.1 435.;i. ·446 .8 455.0 '431.2 475.1~ .:417.5 488. d . ;413 . 2
. 499. d ' ~407. 9 506.-4 409.9 5l4. 4. 412.9
.. ..
~~----=-- '"-------l?O!'ts of Commodity Credit Corporation. ·. , _ - Dates refer to end of business on Thursdays for 1951 and correspo,~ding. ~Ul'sd.ay? in p:t·eceding ;years. In. 6!'ise of·.ho1i<;l~:~.y :on 'J:'hursda~· data. ar~ for: ed.nesda~'. ?_/ Includes.cotton ":i,.n p~ocess, '!. ·'}/ ,Excludes q_uantit,J" "in process."

Table 9·- Exports of cotton cloths, by months, United States, 1920-1951 l/
---ye~-===~any~J.~bruarl : Ma~£h . .:.L.!Eill : May : June· ...L....!!ll;!;t--l.A..u.fL~t-l~~r:Octob~Noy~m12.~~b~!2t~jl 2/ · ~Million. Million Million Million Million Million Million Million Million Million Million Million· Million ~.~~~h sq.,yds.
lO:.yr ... av.: 1920.··29 : 43 .. 4 40.8
1930 1931 1932 1933 1934 1935 1936 1937 1938 1939
. . ~ 39"4 : 31.7 : 28 .. 4 ~ 34-4 : 'I7,l
15./1 15 .. 7 15<;5
: 25G7 21.,7
10-yr .. av. : 1930-39 : 24·5 . . 1940 1941 1942
: 33 .. 9 • ?&; '7 .• J_, 0.
1943 .. ·:· ..... : 1944 1945 1946 194? l9k.8 : 19~9 : 10-yr~ av.: 1940-...49 ':
• .
47 .. 5 l}2 ... 3 34.2 5, ,.,.
....... ~a
~2.8 89.0 93.9
102.3
59 .. 3
32 .. 2 25.3 31.0 34.:.3 20.3 16 .. 0 15 .. 5 16.6 24 .. 5 28.1
24.,4
34r..l 34.7 .;o .... 2 37.5 42.0 51.7
. 66.2 88~)-82.4 88.2
57r,5
sg .,yds.. sg .. yd~!. ..§.9 ... yds.:;.
49 .. 2
36.4 33.,5 38r.2 39 .. 6 22.7 18 .. 9 21.9 21.5 36<>5 34.5
30.4
35Q9 40~2
. 36 .. 0 51..8
. 46~0 59 •. 0 71 .. 5
126 .. 5 75,.6 93.5
63 .. 6
49.6
37 .. 0 31.0 44 .. 2 28 .. 2 23.8 16.5 19.9 17.9 28.9 30.6
27 .. 8
35<>5 39e2 31.S 44;,8 43 .. 3 52 .. 8 65.,2
:138.2 80.1 79-4
61.0
SOo9
38.7 31.1 39.8 27.4. 22.9 16e6 19 .. 0 '18 .. 6 26o1 24 .. 2
26.4
29.9 46 .. 9 29 .. 3 49o7 48.7 51~4 73.1
146.7 79.9 74.3
63.,0
sg.yds.. B£tiY<J.s.
48.6 47.9
36.1 34~6 30.0 J0 .. 4 21~4 13 .. 8 17.0 16 .. 5 22 .. 2 28 .. 3
25.0
24~8 39 .. 6 25.6 40.0 5lo6 56 .. 7 68 .. 3
125.2 73 .. 1 81.1
;8.;6.
35.6 35.4 33 .. 9 28 .. 3 15.7 14.6 18.7 16.1 21.,0 29 .. 4
24.9
. 26.8 41 .. 5 29.1 40.1 63 .. 2 62.9
. 57.5 129.3 71.9 65o9
58.8
!!9.::yds, B.,yds.
46.1 47.0
34 .• 4 30.5 24.3 18.4 14 .. 6 13.9 24-5 17.5 22.0 22a5
22 .. 3
25.0 51..3 48.1 48.9 63 .. 4 57~0 59 .. 9
140.7 63.,7 60 .. 0
6lo8
32.7 25.9 25 .. 3 .· 13.9 17.5 14.3 13~6 19c5 26 .. 3 30:.8
22<.0
24 .. 6 .47 .. 3 29 .. 7 51..4 58.8 58.0 hl.6
130.7 62~5 66.4
57ol
sg.yds. sg .. yds .. !!_q.yds.,
50.9
35.0 . 30.0 24~1 13.3 16.6 .. 15 .. 7 15 .. 6 27.8 27.9. 41 .. 6.
24.8
28 .. 1 . 77"'8 36·4 39-.0 55.0
. 49.0 42.6
135e3 83.3
''60.4
60 .. 7
46.8
29.3 27.4 25c5 14 .. 8 17.1 1?.0 13.1 25.5 28~5 36 .. 7
23 .. 5
42.2
29.5 30.9 30.7 18-.1 16.;6 12n5 6.0
23.,7 30 .. 0 39 .. 0
23~7
30.,8 28~5 63.6 J./69 .. 0 35-7 J/48.4 49.2 3/43 .. 8 77.2 J/54.6
. 68,.3. l/52.8 70-.3 '1/96QO
122.7 l/95. 7 58~,0 116oO 52 .. 8 55 .. 9
62.9 66 .. 1
~~
563 .. 3
416.3 367.0 375<>4 302 .. 0 226.3 185 .. 6 200.5 236 .. 3 319,.(> 367.5
299 .. 7 . .
35'7,.9 ~ 586.7 .~ 447.8 538.5 '638.1 672.8 774.9
1,468.0 940 .. 4
.880,.2
730o;
19)0 : 36 .. 5 35.0-- ' 49u3 52 .. 7 48o7 52,.3 35_e9 45.,q 51.0 50.2 -45-;4 ,2/53 .. 8 556.,3 1~:,_:__27.:i2.:._::..57,_6 -~7_9_ej:__,_73,_9_ __ __13:._li .. _71._..,8 ...... ·-63.1 __ 6.2_:,2 __ .__~5~1~---~--~53!7 64 .. 1 77 .. 4 802.!2.._ C?mpiled. fro~Jn Monthly SlliiliilB.ry of :Foreign Comni.erce o.f the United States, and reports of the Bureau of the Census. 1/ Includes ·d1,lck, tire fabrics, all other cotton cloths, b.leached, oobleached, yarn dYJ3d and coloreds,~ and lfiixtures made largely of cotton Y'S.rns. y Totals were made be.fore . .figures were rounded to millionsll and are not always summation o:f monthly j da·ta owing ·to revisions and adjustments. 2./: Arbitrary adjustments to calendar years ·!;otals., iJ/ Preli.m:i.nary. J

Tabl.e J.O.- Cotton cl.oth: Exports from United States, by countries, 1920 to date 1/
Cal.endar • United • • : Central : : : :Philippine' Other year : Kin&dom : Canada : CUba :Ar~entine Colombia Haiti America ; China : E~t : Indonesia: Islands :countries: Total. y ------~;~Mi~llion Million Million Million Y~llion Million Million Million Million Million Million Million . Million
1920 'JI 19211/ 1922 1923 1924 1925 1926 1927 1928 1929
1930 1931 1932 1933 1934 1935 1936 19.37 19.38 1939
1940 1941 1942 1943 1944 1945 1946 1947 1948 1949
: square : yards
5.1 2.7 4.0 1.9 2.2 4o3 .3.6 7.7 9.3
10.7
s.s 5o6 .2 .1 ·5 ·4 .J .5
1.1 1.1
.3.6 1.5 1.9
31.5 3 • .3 7.7
o5 42.1 27.0 23.2
square yards
66.3 43.1 50.1 35.5 33·4 38.1 46.2 63.1 69.8 75.6
58 • .3 37.1 26.7 17.1 12.5 12.0 16.2 20.4 25.5 43·5
91.7 115.7 174o2 189.4 218.7 191.1 203.0 278.3 160.4 173.7
square square squane square yards X!rds I!_rds yards
160.7 22.5 48.8 86.9 80.9 66.4 70.0 so.o 70.7 76.6
64.4 54.3 50.2 45o1 67.6 55o4 59.7 65.8 48·4 63.4
44.3 62.0 47.7 27.9 31.2 32.4 33.5 43·4 .39.8 44o2
46.3 24-9 40.6 21.5 21.2 22.9 19.3 24.8 24.2 23.9
16.3 14o5 15.8 9.6 1.2 ·4 .1 ·4 .6
21 .1 ·4
4-9 .5 .8
1.0 2.2
59.9 15.6
2.0
83.2 14.1 34.7 22.9 32.3 43o9 .33.7 29.5 33.9 26.0
21.6 26.4 27.9 25.6 16.0 8.8
16.7 16.7 14.2 23.5
16.5 33.3 4-7 4-9 4o4 2.7 3.7 7.0
10.7 6.8
21.7 20.8 22.6 22.3 2.3.2 31.1 17.5 27.3 25.4 14.5
20.0 14o7 19 • .3 13.1 2.6 4·9
10.6 9.2
15.2 19.4
15.7 17.6 13.1 12.6 15.1 11.9 11.0 19.9 9.6
15.0
square yards
58.0 72.3 62.0 51.8 62.7 63.2 53.0 60.4 49·5 60.5
40.9 44·7 47o4 44·4 33o5 21.4 21.3 17.7 36.8 45o8
36.9 51.3 34o4 25.1 26.3 19.6 23.2 56.3 49.8 44.9
square square yards yards
28.4 24-5 15.7 1.6 1.6 7.4 1.4 1.0 1.3 1.0
·5 1.1 1.4
.6
.3
.3
.1 ·4 .2
1.4
·1 4·7 2.5
~ 23.6 18.0 18.8 0.3 21
~ ~ ~ ~ fj
~ ~ ~ y
.1
.l
.l
1.7 23.1 16.1
.1 1.2 3o5 .7
2.2
~
square yarr!.s
~ ~ ~ ~ fj
~ ~ ~ y 1.6 1.1 4·.3
11.3 48o9 6.8
0 0
4o2 70.7 33.2 17.9 38.3
square yarrts
63.1 53.6 93.4 73.8 67.5 79.8
101.1 88.0 93.8 81.3
48.6 61.6
116.7 88.1 47o9 47.1 4lo5 66.7
125.5 107.5
74.2 88.3
0 0 0
2.5 85.2 90.8 83.0
112.7
square yards
286.0 273.0 215.6 146 • .3 152.8 186.2 167.5 183.2 168.9 194.3
136.9 107.0 69.8 58.3 44.2 34-9 34o0 36.8 50.9 57.5
61.2 1.39.9 141.5 246.5 337.1 372.6 323.2 316.2 526.3 419·4
square yards
818.8 551.5 587.5 464.5 477.8 543·3 51.3.3 565.0 546.8 564.4
416.3 367.0 ' J75o4 302.0 226.3 185.6 200.5 236.3 319.6 367.5
357.9 586.7 447.8 538.5 638.1 672.8 774.9
1,468.0 940.4 880.2
1950 6/ : 0.2 148.3 65 • .3 4/ 9.7 18.7 45o9 W W 77o2 43o4 147o6 556o3 1951 6/ : 4,7 143.0 44•6 6.1 7.2 14•8 40.6 0 O.l 103.3 120.1 318.0 802.5 Compiled from Monthly Summary of Forei~ Commerce of the United States and reports of the Bureau of the Census. !/ Includes duck, tire fabrics, all other cotton cloths, bleached. unbleached, yarn dyed and colored, and mixtures made 1ar~ely of cotton yarns. 2) Totals were made before ti~es were rounded to millions. 2/ Linear yards. W It any included in other countries. W Less than 50,000 square yards. Y Preliminary.
~ I t; -D
~ I

20
Table 11,- Cotton clutlls: :D:X:ports :fl·om UnHed States, by country of destin.a·c:ton, calendR:c years, 1939, 1947 t,) date I:./
Ccuntr~r----=------ _,... __ . -..-.- -· ·------;----~--·--;---~---:-~-----·-~~-. . . . of 1939 1950 ?):
destination : : : -------------l-Mi"'""''llion-1vTITITor1-:~aiilon Million--··-M-,.i"""l,_l.,...ion
Grand total )../
Canada Mexico Guatomala El Sal va.dor Honduras Nicaragua Costa Rtca Panama Republic Cuba Haiti Dominican Republic Colombia Venezuela Surinam Ecuador Bolivia Paraguay Sweden Nonray United Kingdom Belgium Iraq Iran Israel and Palest:ire: Saud1 Arabi'=l. Pakistan Ceylon Thailand Bri t.i sh .l:1alaya Indonesia Phili::;>ydne Republic: Hong .Kong French Morocco French West Africa Belgian Congo Ethiopia Madag3.scar Union of South Ah~
sq. yds. sq. 2fds. sq. yds. sq. y<is. sq. yds. ~7 .~- i-;4-m:o -§Ii.oT ---srro.2 556.3 -
43.5 3.8
lJ-/ 12-:-9 4.1
12.0 lJ-.1
2.5 63.4 19.4-
).5 23.5 8.1 0. 3
.8
.1 4/
2:1 iJ
l.l .1 4/ ~I
\) ,-., u
0
~/ ·)
.9 4- .J
lG'f .:) 1.3 4/ -0
4/ -0
lt/ 3-:6
278.3 6.9 '). 3
13.7 10.5
U . ...)
8.) 5.3
4-3.8 19.8 15.0 6.8
27.0 4.6 h.) 2.7 1.8
29.0 18.7 l:.2 • () 9.3
lL}. U 10.1 3.9 9.6
1+/ 17-:-G 6.2
47.5 33.2 96.9 3.1 ).9
25.9 30.7 11.4
-3.6
160. !.j. 8.2 7-7
li+ .6 5.Lc. 8.5 7.1 5.1
39.8 9.~
11. () 10.7 38.9 3 )JG.G LJ- .1 0.2 2.3 3.9
26.9 3.9 6.5
l~G .h
9.1 4,2
23.3 h.4-
l06.o 17.9 83.0 l.l (.5 7.8
26.3 8,6 c; • E3
98.0
1'(3.7 ).7 8.7 6.5 9.7 5.1 8.6 5.5
1~4 .2 15.0 10.8 6.8
28.2 2.4 '· '7 '+. :
6.7 3.5 1.1 5.2
23·.2 2 5 7.2
109.2 3.9 lt.4
lh.2 21.3 19.0 10. '( 38.3
112.7 4-.5
11.7 ::>.6
18.1 3.'5 l.O
~j)+ • 8
llt8.3 3.7 8.8 6.8 7.1 7.5
10.3 5.5
65.3 18.7 lh.5 9.7
22.8 2.0 6,5 3.4 1.4 1.8 3.8 0.2 1.7 1.6
12.0 l.l
.7 ,...
.o h/
1o:h 2.7
T( .2 43.4 6.0 3.6 l.l 7.8
.5
.7 13.0
1951 g/ Millionsq. yds. 't302.5-
143.0 5.0 7.2 7.5 6.7 5.9 7.2 5.2
LJ-4 .6 14.8 11.8 7.2
3!~ '7 1.4 5.7 7.3 0.8 2.3 5.8 LJ .• 7 4,0
3.5 29.6 o.S l~. 6 0.5
12.6 1'( .4 11.2
103.3 120.1
2.1 4.5 0.2
14.5 2.6 0.3
72.5
Other countries h2.6 484o7 110.7 62.6 2!~.4 69.A.-Compiled from reports of the Bureau-of the Census. --------· 1/ Includes duck, tire fabr1cs, all other cotton cloths, and mixtures made largely of' cotton ;yarns. 2/ l'reliminary. 3/ Totals were made before data were rounded to millions. ·-!±_/ Less than 50,000 yarcls.

Tab~e ~2.- pr1ces of cotton 1n spec1fied foreign markets, averages l935-39 to date 0 en
Year Egypt : India ; Pakistan : Arf!entina : Peru : Brazil. : Mexico ' : ...... begin- : Alexandria : Eomba;r : Karachi :Buenos Aires: Lima :Sao Paul.o:Torreon I..Al
ning :Ashmouni: Karnak : Jarilla :4 F Punjab:2B9 F Sind:289 F Punjab: Type B : Tanguis : Type 5 ·:Middling Aug. 1 : Good . Good : Fine : S G Fine : S G Fine: S G Fine : : Type 5 : ~15/16 inch .
Average : Cents Cents Cents Cents Cents Cents Cehts Cents Cents ~ 1935-39 : 1/12.54 gj 8.31 Y. gj- gj 12.81 10 .. 99 10.33 .11.52 1940-44 : 1/18 .• 31 . Y. '. ' 'll 9..90 . y y [I 13.98 12.82 10.73 16.23 1945 : ~28.29 ~31.38 16.43 g) gj y 20.43 18.22 , 17 .93'' ·- ~9.41 1946 : -~35.95 35.28 16.81 y 6/21.19 '§/24.02 30.14 24.93 25.88 28.34 1947 : . 51. 7' 6~.38. ?1.47 y' -· 1/25.60 7/28.52 37.53 28.40 28.44 30.o8 1948 : . 42.10 : 67·.94 23.43 30.14 33.54 - 36.00 46.80 .§/31.43 33.05 '2./25.25 1949 : L/45 ·96 9/47· .14 . 17.57 . 27.87 29.11 30.08 41.03 :2/)0.41 32.35 25.30 1950 : 67.13 -82.88 20.17 .42~48 44.43 •46.96 54.55 'Y_37.ao 58.79 44.61 Aug. :.!Q/41:96 50.64 16.50 32.31 33.48 34.44 41.77 .±2/28.36 43.27 31.30. Sept. : 48.54 54.98 20.50 37.63 39.46 40.60 39.69 30.99 45.66 35 .. 15 Oct. : 63.36 65.68 - 20.50 44.73' !1/45 .. 64 11/47.48 46.82 J::E}32.9o 54.89 40.53 Nov .. : 66~32 69.38 20.50 40.49 J:Y42.41 gj_42.77 41.28 37-98 6o.92 lY.44.31 Dec. : 71.91 73.29 20.50 36.78 37.99 38.59 41.28 D) 64.08 gj44.88 Jan. . 78.05 90.65 . 20 .. 50 40.65' 42.30 '43.95 41.28 ~ 69.71 48.76 . Feb. . 81.'96 100.40 20.50 48.50 50.21 53.35 41.28 71.78 60.43 . ill Mar. : 76.94 102.87 20.50 54.30 57.09 63.03 69.13 lY53.10 71.57 63.95' 1951 . . ~ug. : 72.29 10l.65 20.50 36.99 39.49 40.25 72.58 31.48 46.53 28.86 Sept. . 43.85 61.64 21.83 32.59 33.59 35.20 73.26 31.92 50.92 30.09 . Oct. : 51.63 70.32 21.83. 30.89 31.99 35.02 74.16 3J.l9 52.36 32.07 Nov. " . 58.43' 9.3-74 21.83 39.82 42.86 44.95 75.12 36.71 61.96 35.25 . Dec. : 57-73 93.20 21.60 46.24 46.47 48.35 76.20 1Q/38.57 57.10 36.92 Jan. : 54.25 94.04 21.52 44.99 .45.17 47.44 77.11 J§}J6.63 56.83 33-70 Feb. .. 52.~1 89.79 21.33 .!Y38~36 ll/39.11 12/40.45 76.66 32.89 47.34 29.33 Mar. Compiled from reports of the State Department ~nd converted to cents per pound at current rates of exchange as reported by the Federal Reserve Board. Based on prices on one day in each week. Ceiling prices for Jerilla fine in :Bombay since Sept. 1950. !) Price of Asmouni, Fully Good Fair. g} Comparable data not readily available. J./ Average for 3 years. 4/ Quotation for one month. '2./ Average for 10 months. 6/ Average for 7 months. 1.} Average for 9 months fJ/ Average for-8 months. 2} Average for 11 months. 10/ Average of 2 quotations. ]d/ One quotation .•. W Average of 3 quotations. 13/ No quotatiqn_ . -- · · · ..
"'
~ I '

JAN ... f.!J\R • 1952 - 22 -
Table 13 • - Cotton linters: Wee.k1y price renge per pound at Me mph is, May 29 , 1951 to de to
- -·---- --·--- --· -·----Grade -----·----- 6-;--; 1 : 2 3 4 5 . 11- 1/ : ]j_ -
Cents Cents_ Q _ _ent§_ ge~ Cents Cents Cents --.- -- ----.;.
May 29 g) 25.50-22.25 21.50-19 18.50-17.50 17 -16 16 -16 1~-16 June 5 y 24 -21 20 -18 17.50-16.50 16 -16 16 -16 16-.16
12 gj 22 -20.50 19 -18 17.00-16.50 16 -16 16 -16 16-16 19 g) 21 -19 18.50-17 16 -15.50 14.50-12.50 12.50-12 12-12 26 ~ 20 -'18 '17 -15.50 15 -14 13 -12.50 12.50-12 12-12
July 3 20 -18 17 -15.50 15 -14 13 -12.50 12.50-12 12-12 10 gj 18.50-16.50 16 -14.50 14 --13 13 -12.50 12.50-12 12-12 17 gj 16 -14 13.50-13 12 ··11 11 -10.50 10 -10 10 .. 10 24 y 16 -13.50 13.25-11 11 -10.50 10.50-10 10 -10 10-10 31 y 16 -13.50 13,25-11 11 -10.50 10.50-10 10 -10 10-10
Aug. 7 gj 15 -13 ·12. 75-11 11 -10.50 10.50-10 10 -10 10·10 14 gj 15 -13 12. 75"-11 . 11 -10.50 10.50-10 10 -10 10-10 21 gj 14 -13 12.75 .. 11 11 -10 10.50-10 . 9 - 9 9- 9 28 y 13.75-13 12.75-11 10.50- 9.75 9.50- 8.50 8 - 8 8- 8
Sept. 4 y 13.50-12.50 12.25-11 10.00- 9.50 9.00- 8.50 8 - 8 8- 8 11 . y ·. 13. 50 -12. 50 12,25-11 10.00- 9.50 9.00- 8.50 8 - 8 8- 8 18. ; g) 13.50-12,25 11.75-10.50 10.00- 9.00 8.75- 8.50 8 - 8 8- 8 25 2/ 13.50-12.00 11,50-lO.DO 9.75- 9.00 8.75'- 8.50 8 - 8 8- 8
Oct. 2 y 13.50-12.00 11.50-10.00 9-75- 9.00 8.75- 8.50 8 - 8 8- 8 9 y 13.50-12.00 11.50-10.00 9.75- 9.00 8.75- 8.50 8 - 8 8- 8
16 y 13.00-11.50 11.25-10.00 9-75- 9.00 8.75- 8.50 8 -· ~ 8- 8 23 Y· 13.00-11.50 11,00- 9.75 9.50- 9.00 8.75- 8.50 8 - 8 8·- 8 30 ; ?-] 13.00-11.50 10.75- 9.50 9.25- 8.75. 8.50- 8.25 8 - 8 . 8- 8
Nov. · 6·: y 13.00-11.50 10.75- 9.50 9.25- 8.75 8.50- 8.25 8 - s· 8- 8 13 . : y 13.00-11,00 10.50- 9.50 9.25- 8.75 8,50- 8.25 8 - 8 8- 8 20 g) 13.00-10.75 10,25- 9.00 8.75- 8.25 8.25- 7.75 7. 50- 7 7-. 7 27 gj 13. 50-ll. 00 10.50- 9.00 8.75- 8.25 8.25- 7.75 7.50- 7 '7- 7
Dec. 4 gj 13.75-11.25 10.75- 9.25 9.00- 8.50 8.25- 7.75 7.50- 7 7• 7 11 gj 13.75-11.25 11.00- 9. 50 9.00- 8.50 8. 25- ~(. 75 7.50- 7 . 7· 7 18 gj 13.75-11.25 11.00- 9 .)0 9.00- 8.50 8.25- 7.75 7.50- 7 . 7- 7 26 ?} 13.75-11.2:) 11,00- 9.50 9.00- 8.50 8.25- 7.75 '7. 50- 7 7- 7
Jan. 3 ?} 14.00-11.75 11.25- 9.50 9.00- 8.50 8.25- 7.75 7.50- 7 . 7- 7 8 ?} 14.00-11.75 11.25- 9.50 9.00- 8.50 8.25- 7.75 7. 50- 7 7- 7 15 ?} 14.00-11.75 11.25:- 9. 50, 9.00- 8.50 8.25- 7.75 7.50- 7 7- 7 22 y 14.50-12.00 11.50- 9.75 9.25- 8.50 8.25- 7-75 7.50- 7 7- 7 29 ?} 14.50-12.00 11.50- 9.75 9.25- 8.50 8.25- 7.75 7.50- 7' 7·· 7
Feb. 5 g; 14.50-12.00 11.50- 9.75 9.25- 8.50 8.25- 7.75 7.50- 7 7- 7 12 g; 14.50-12.00 11.50- 9.75 9.25- 8.50 8.25- 7-75 7.50- 7 7• 7 19 y. 14.50-12.00 11.50- 9.75 9.25:. 8,)0' 8.25- 7.75 :1.50- 7 '7~ 7 26 gj 14.00-12.00 11.50- 9.75 9.25- 8.50' 8.25- 7-75 7.50- 7 7- 7
Mar. 4 gj 14.00-12.00 11.50- 9. 75 9.25- 8.50 8.25- 7.75 7.50·· 7 7- 7 11 . y 14,00-12,00 11.25- 9.50 9,00- 8.25 8.00- 7.75 7.50- 7 7• 7 . -
7• 7 18 £1 13.00-11.00 ].0,75- 9.25 9.00- 8.25· 8.oo,. 7.75· 7.50- 7 25 : -------Cotton :Branch, Production and Marketing Administration. . 1 l/ Prices for these grades are based on 73 percent cellulose with a differentla
for each unit of cellulose up or down. gj No ~uotation.

cs·l93 - 2~ -9
Table 14,- Rayon production, United States, 1930-1951
calendar: Filament yarn Staple fiber Total
:Viscose:A tat : T t 1 :Viscose:A t t : T t 1 :Viscose:A t t : Total : l/ : ce e: o a •: l/ : ce a e: o a : l/ : ce a e: :Million Million Million Million Million Million Million Million Million :pounds pounds_ pounds pounds pounds pounds pounds pounds pounds
1930 : 117.5 9.8 127.3 0.4 0 0.4 117.9 9.8 127.7 1931 : 135.2 15.6 150.8 .9 0 .9 136.1 15.6 151.7 1932 : 116.4 18.3 134.7 1.1 0 1.1 117.5 18.3 135.8 1933 : 172.4 41.1 213.5 2.1 0 2.1 174.5 41.1 215.6 1934 : 170.3 38.0 208.3 2.2 0 2,2 172.5 38.0 210.5 1935 : 202.0 55.5 257.5 4.3 0.3 4.6 206.3 55.8 262.1 1936 214.9 62.7 277.6 9.8 2.5 12.3 224.7 65.2 289.9 1937 238.2 82.4 320.6 16.6 3.6 20.2 254.8 86.0 340.8 1938 181.5 76.1 257.6 26.4 3.5 29.9 207.9 79.6 287.5 1939 231.3 97.3 328.6 45.3 6.0 51.3 276.6 103.3 379-9
1940 257.1 133.0 390.1 70.6 10.5 81.1 327.7 143.5 471.2 1941 287.5 163.7 451,2 105.3 16.7 122.0 392.8 180.4 573.! 1942 310.5 168.8 479.3 127.6 25.7 153.3 438.1 194.5 632.6 1943 338.5 162.6 501.1 129.6 32.4 162.0 468.1 195.0 663.1 1944 383.5 171.7 555.2 128.4 40.3 168.7 511.9 212.0 723.9 1945 448.8 174.9 623.7 129.1 39.3 168.4 577.9 214.2 792.1 1946 491.2 186.3 677.5 132.7 43.7 176.4 623.9 230.0 853.9 1947 525,2 221.5 746.7 198.2 60.2 228.4 693.4 281.7 975.1 1948 562.3 293.8 856.1 184.5 83.7 268.2 746.8 377.5 1,124.3 1949 544.3 256.3 800.6 129.8 65.3 195.1 674.1 321.6 995.7 1950 627.3 326,6 953.9 188.5 11'7.0 305.5 815.8 443.6 1,259.4 1951 658.1 300.1 958.2 207.3 :J-28.7 336.0 865.4 428.8 1,294.2
1950 1st. quarter: 152.6 So.o 232.6 45.8 27.3 73.1 198.4 107.3 305.7 2nd, : quarter: 150.3 80.1 230.4 47.3 28,8 76.1 197.6 108.9 306.5 3rd. . . quarter: 159.0 4th. :
82,5 241.5 47.1 29.0 76.1 206.1 111.5 317.6
quarter : 165, 4 84.0 249.4 48.3 31.9 80.2 213.7 115.9 329.6
1951 1st, . . quarter: 163.4 81.7 245.1 50.2 30.8 81.0 213.6 112.5 326.1 2nd, • • quarter: 166.5 87.2 253.7 49.6 34.1 83.7 216.1 121.3 337.4 3rd, : quarter: 168,7 81.4 250.1 52.6 34.6 87.2 221.3 116,0 337.3 4th . . . quarter: 159.5 49.8 209.3 54.9 29.2 84.1 214~4 79.0 293.4 . . .
Iixtile Organon, a publication of the Textile Economics Bureau, Inc. \d Includes rayqn yarn produced by the viscose, cupramoniu~, and nitrocellu~ose
iscontinued in 1934)' processes.

.m:N .~-~ • 1952 - :i!4 -
Table 15- Rayon yarn and staple fiber: Production in United States and-world total, 1909 to 1951
Calendar: World total United States Foreign countries _zear . I,oao · I,ood 1,000 ' - I,ooo r,ooo I,ooo-
.·P9Unds: · balss 1/' · J20Unds . ' bales· Y . ,;EOUnds ~11 ~--. :: ..
1909. . 16,500· 39 ~~ ~ 16,500 39 . 1.910 .. 17,600 41 .17;600 41 1911 ... 18,700 44 365 1 18,335 43 .
. 1912 . ·:. ,: 19,-800 47 1,110 3 18,6go: 44 1913 ., - 25,-195 59 i,815 4· 23,380: 55 . 1914 .. ;
19;700 46 2,420 6 17,280· 40 .. 1915 '. :' 18,500 44 3,885 9 14,615 35 1916 23,400 55 5,750 14 17,620 41 1917 24;200 57 6,545 15' 17,655 42 1918 25,900 61 5,845 14 20,055 47 1919 27,800 65 8,280 19 19,520 46
1920 33,100 78 10,125 24 22,975 54 1921 48,200 113 .. 14,985 35 33,215 78 1922 76,590 180 24,065 57 52,525 123 1923. 102,990 242 34,960 82 68,030 160 1924. 138}285 325. 36,330 85' 101,955 240 1925. 185,290 436. 51,050 120 134)240 316 1926 ~ 211,735 498 62,695 148 149-,040 '350 1927 ' ' 295,095 694. 178 219,540 516 . 75,555 . 1928 3.60,550 848 97,400 229 263,150 619 .'1929' o' 441;400 1,039 121,900 287 319,500 752 .
' 776 '1930' 457,370 1,076 127,~85 300 329,685 1931' .. 5o:-r;68o . 1,195 151,760 357 355,920 838 . 1932 534,165 1,257 135,770 319 -398,395 938 1933 694,320 1,6]4 215,600 507 478,720 1,127 1934 . 823,280 1,937 210,520 495 612,760 1,442 . 1935' :- 1,074;315 2,5~~8 262,155 617 812,160 1,911 1936 1,321,105 3,:1.08 289,940 ' 682 1,·031,165 2,426 1937 1,822,395 4,28$ 340,800 802 1,481,595 .3,486 1938 1,928,110 4,537 287,485 676 1,640,625' 3,861 1939 2,240,400 r 5,272 379,940 894 1,860,460 4,378
. 1940 2,462,695 5,795 471,170 1,109 1,991,525 4,686 1941 2,786,355 6,556 573,230 . 1, 3"49 2,213,125, 5,207 1942 2,649,390 6,2]4 632,615 1,488 2,016,775 4,746 1943 2,544,005 5,986 663,145 1,560 l,88o,86o 4,426 194:4 2,087,975 4,913 723,955 1,703 1,364,020 3,210 1945 1,405,650 3,307 '792 ,035 1,864 .613, 615 1,443 1946 1,691,105 3,97.9 853,915 2,009 837,190 1,970 1947 1,978,385 4,6)5 975,145 2,294 1,003,240. 2,361 1948 2,45l+,66o 5,776 1!124,330 2}6~5 1,330,330 . ' 3,131 1949 2,701;,807 6,357 995.700 2,343 1, 706,J.07 ' 4,014
1950 3,494,170 8,222 1",259 ,400 2,964 ~,23.4,77.0 5,258 1951 3, 960, ooo 9, 318 . · ·1 ;294! 200 3, oL.s 2,665, Boo . 6:£11-.
Compiled from T8Xtile Organon,, a puhlioation of the Textile Economics Bureau' rnc. 1/ Calculated by assuming 425 pounds of rayon equivalent to 500-pound bales of cotton, g/ Negligible. ·

JAN, -MAR" 1952
·rable 16 .- Rayon and cotton.; Actual prices of yarT, and equivalent :prices of raw fiber, Urdted States; average 1930-34, 1935-39 and 1940 to date
-~·---·--- -------·-------·-·--·--- -·· · · "··------·---~ t ios ; Actual prices ; Equivalent -prices :per : Rayon : per pound : pound of usa·o1e fiber ~ Rayon : staple : Rayo~u:----:Rayon-:~~=··coj?-ton!.±F--·~; yarn to:fiber to
; Rayon : staple :fiber to
Year beginning Aug.
:filament: Cotter. : staple :Middling: S. M. cotton :Htcldling ~ S. M. : yarn yarn 2/: fiber : 15!16 : 1-1;'16 yarn : 15/16 . 1-1/16
I - I ' : 1 31 _ ]_ inc!!_ _ _: inches -~-= _ ~nq_h __ : ili<j.]:.~_s _ --. : Cem:;s Cez::tts Cent?. Ce!2_ts Q~ Average 1930-34 1935-39
1940 1941 1942 1943 1944 1945 1946 1941 1948 1949 1950
1950 Aug, Sept, Oct, Nov, Dec, Jan. Feb. Mar, Apr, May
·.June July
1951 Aug, Sept. Oct, Nov. Dec, Jan,
Jeb, :
67 56
53 55 55 55 55 55 63 71 76 71 77
74 75.5 76.0 76.0 77.0 78.0 78.0 78,0 78,0 78.0 78.0 78.0
78.0 78.0 78.0 78.0 78,0
3.., .. J :
36
39 50 52 52 56 62 83
102 86 81
112
92.5 100.7 107.2 114.7 116.6 117.2 117,6 117.6 117.6 117.6 112.7 105.8
96.8 92.6 91.1 94.8 96.0
46.83 28.56
26.25 26,25 26.25 2!:),20 26,25 26.2~ 30.58 36.33 38.43 36.75 40.95
38.85 38,85 38.85 38.85 42.00 42,00 42,00 42,00 42.00 42.00 42.00 42.00
42,00 42.00 42.00 42,00 42.00
11.68 13.37
13.71 22.33 24.55 25.07 26.47 3L26 l+L83 41.39 38.90 38.55
'515Ll8 _,
46.02 49 .. 01 48.21 51.14 51.21 53.12
6' _I 54.21 54.22 54,16 53.96 47,63
42.31 42.29 44.47 49 .. 62 50,75 50.38
13.54 14.95
15.34 25.01 27.45 27.97 28,97 33 .. 15 h3.44 44.f)7 41.58 42.42
2/54.53
49.55 52.23 52.01 55.02 55o06 57,01
6/ 57.32 57.33 57.27 56.34 49.99
44.55: 44.32 46.68 51.95 53.16 53.,11
Percent
181 156
136 110 106 106
98 89 76 70 88 88 69
80 75 71 66 66 67 66 66 66 66 69 74
81 84 86 82 81
401 214
191 118 107 101
99 84 78 88 99 95 eo
84 79 81 76 82 79 0
77 77 78 78 88
99 99 94 85 83
Pe:;:cent ~·--
346 191
171 105 96 90 91 79 70 81 92 87. 75
78 74 75 71 76 74
0 73 73 73 75 84
94 95 90 81 79
Compiled from data from Bureau of Labor Statistics and Cotton Branch, Production and Marketing Administration. 1/ Wholesale price of Viscose 150 denier. 2/ \..Jholesale price of Single ~-0 1 s carded untn July 1946: August 1946-December 1951 twisted. cardad: January 1952 to dat~ carded, Knitting, 30/1, on cones or tubes. 3./ Wholesale price of Viscosa, 1-1/2 denier, Assumes net waste multiplier of 1.05~ J:./ Price of Memphis Territory ~r/owth~landed Group B mill points and assuming net waste multiplier of 1.15. - Average for 11 months.

Table 17.- Cotton, Wool, Silk, Flax, Rayon and Other Synthetics, Conaumption in United States, 1913 to date
Cotton ?J Wool :J Silk!;/ Flax '2f Rayon§/ Other Synthetics 1./ Total
Calendar Year
Population
on Jul.,y l
!I
Per- Per- : Per- : Per- ; Per- Per ... Total Per cent Total Per cent Total Per • cent : Total Per cent Total Per : cent Total Per cent All fibers : Per capita
oap1 ta of oapi ta of oap1 ta of ; capita of cap! ta: of oap1 to. of : total total total; total : total total __ L
Mil.
98.o 99.9
101.3
- 1,000-lb; J:.h -PcC-IUf~ lb. J<h--~ 1 1000 lb. Lb. Pet. Mil. lb. J<h ~ Mil. lb. Lb. ~ Mil. lb. Lb. ~ I.O<XJI'D.---- --l<l.:.
1913 1914 1915 1916 1917 1918 1919
1920 1921 1922 1923 1924 1925 1926 1927 1928 1929
1930 1931 1932 1933 1934 1935 1936 1937 1938 1939
1940 1941 1942 191>3 1~ 19115 1946 l9lo7 191>8 191>9
1950 1951 !Q} 1952 1953 19511
102.8 101>.2 105.4 10,.9
107.3 109.3 ll0.9 112.7 114.9 116.6 118,2 119.8 121.3 122.6
123.8 124.8 125.6 126.3 127.1 128.0 128.9 129.6 130.7 131.7
133.0 131>.2 135.7 137.6 139.3 140.8 142.3 145.0 147.5 150.0
152.6 155·2
2, 709,31>7 27.65 2,640,499 26.1>3 2,911,654 28.74 3,197,362 31.10 3,280,980 31.49 2,975.371 28.23 2,859,656 27 .oo
2,822,779 26.31 2,600,580 23.79 2,911,265 26.25 3,122,571 27.71 2,636,532 22.95 3,075,267 26.37 3,213,543 27.19 3.590,055 29.97 3,187,019 26.27 3,425,251 27.94-
2,616,697 21.14 2,654,929 21.27 2,463,719 19.62 3,050,709 24.15 2,659,450 20.92 2,755,360 21.53 3,471,364 26.93 3,646,642 28.14 2,918,315 22.33 3,628,580 27.55
3.959.071 29-77 5,192,075 38.69 5,633,145 41.51 5,270,634 38.30 4,790,406 34.39 4,515,838 32.07 4,809,128 33.80 4,665,560 32.18 4,463,480 30.26 3,839,127 25.59
1>,682,722 30.69 4,851,374 31.26
90.3 88.9 88.2 88.3 88.8 86.3 87.6
88.3 86.0 85.3 85.4 85.4 86.1 86.6 86.7 85.6 84.8
84.5 82.5 84.0 83.2 84.2 78.3 81.1 82.7 81.2 79-7
80.6 80.1 81.6 79.7 77.5 75.1> 73.9 72.8 69.8 70.6
68.5 71.0
228.5 271.7 336.8 362.1 345.0 399.3 329.1
314.2 343.4 406.5 422.4 342.2 349.9 342.7 354.1 333.2 368.1
263.2 311.0 230.1 317.1 229.7 417.5 406.1 380.8 284.5 396.5
407.9 648.0 603.6 636.2 622.8 645.1 7_37-5 698.2 693.1 ,OO.Io
631>.8 479.0
2.33 2.72 3.32 3.52 3.31 3.79 3.11
2.93 3.14 3.67 3-75 2.98 3.00 2.90 2.96 2.75 3.00
2.13 2.49 1.83 2.51 1.81 3.26 3.15 2.94 2.18 3.01
3.07 4.83 ll.lo5 4.62 4.47 4.58 5.18 4.82 4.70 3.34
4.16 3.09
7.6 9.1
10.2 10.0 9.3
11.6 10.1
9.8 11.4 11.9 11.6 11.1 9.8 9.2 8.6 9.0 9.1
8.5 9.7 7.9 8.7 7-3
11.9 9.5 8.6 ·1·9 8.7
8.3 10.0 8.7 9.6
10.1 10.8 11.3 10.9 10.8 9.2
9.3 7.0
33.996 30,600 36,958 40,406 42,971 1>8,163 55,035
38,798 51,846 57,827 61,511 59,626 76,003 76,870 S,,036 87,172 96.848
80,581 87,540 74,841 70,361 60,447 72,361 67,541 64,169 57,050 55.271.
47,600 25,639
207 11
~' 13,515 3,182 7,361 3,986
10,538 7,181
0.35 0.31
.36 -39 .~1 .46 .52
.36
.47
.52 -55 .52 .65 .65 .71 .72 -79
.65
.70
.60
.56
.1>8 -57 .52 .50 .44 .lo2
.36
.19
~ 2/
.01
.10 ,02 .05 .03
.07
.05
1.1 1.0 1.1 1.1 1.2 1,4 1.7
1~
1~ 1~ 1~ 18 2.1 2.1 2~ 2.3 2~ '
2.6 2.7 2.6 1.9 1.9 2.1 1.6 1.5 1.6 1.2
1.0 0,4
.2
.1
.1
.2
.1
8/ 25.9 8/ 23.1 ~/ 10.6 ~/ 15.6 w 18.2
!8.7 10.1
13.3 8.8
12.2 15.4 8.5
12.6 16.2 11.4 13.6 111.0
15.6 7.2 7.8
10.2 10.9 12.6 13.1 14.2
3.9 14.4
12.1 9.7
23.0 13.6 9.5 7.4
12.6 8.8 5.5 6.0
10.5 10.7
0.26 .23 .10 .15 .17 .18 .10
.12
.oB
.11
.14
.07
.11
.14
.10 .11 .11
.13
.06
.06
.oB
.09
.10
.10
.11
.03
.11
.09
.07
.17
.10
.07 .05 .09 .o6 .oil .ol>
.07
.07
0.9 .8 .3 .4 .5 .5 .3
·" .3 .4 .4 .3 .4 ·5 .3 .4 ·3
4.0 5-l 6.6 6.6 6.8 6.0 9-3
8.7 19.8 24.7 32.5 42.2 58.2 60.6
100.0 100.5 133.4
-5 118.8 .2 158.9 ·3 155-3 .3 217.2 .4 196.9 .II 259.1 -3 322.4 ·3 304.7 .1 329.4 ·3 458.8
.2 1>82.0
.2 591.8
.3 620.8
.2 656.1
.2 704.8 .1 769.9 .2 875.5 .1 987.9 .1 1,11>9.6 .1 993.1>
.2
.2 1,351.4 1,276.2
0.04 .05 .06 .06 .07 .06 .09
.08
.18
.22
.29
.37
.50
.51
.84
.83 1.09
.96 1.27 1.24 1.72 1.55 2.02 2.50 2.35 2.52 3.1>8
3.62 4,41 4.57 4.77 5.06 5.47 6.15 6.81 7.79 6.62
8.86 8.22
0.1 .2 .2 .2 .2 .2 .3
.3
.6
.7
.9 1.3 1.6 1.6 2.4 2.7 3-3
3.9 11.9 5-3 5.9 6.2 7-3 7.5 6.9 9.2
.10.1
9.8 9.1 9.0 9.9
11.4 12.8 13.5 15.4 18.0 18.3
19.7 18.6
tnCiudeB sOiie- io8Vieione ofpreV1ous fi.gttl'es- becaUie- 0?- -reV1e8d -popula.t10it -e-8-timat-ee and- bS.ie w81ght8-8.D.ddd1 ti0n.B.ld.Rt8011 -synthet1C-fTiiers since~.
5.0 13.0 26.0 39.0 49.0 52.0 56.0 50.0 75.0
·92.0
145.0 210.0
0,04 .10 .19 .28 .35 .37 .39 .34 .51 .61
.95 1.35
0~ ~ .4. ~ ~ 8 8 ~ 1~ 1~
2~ 3~
3,001,743 2,970,999 3,302,612 3,622,068 3,693,951 3,4117,534 3,263,191
3,197,777 3,024,4e6 3,412,492 3,654,382 3,o8g,058 3,571,970 3.709,913 4,140,591 3,721,491 4,037.599
3,094, 788 3,219,569 2,931, 760 3,665.570 3,157.397 3,516,921 4,280,505 4,410,511 3,593,165 4,553.551
4,913,671 6,480,214 6,906,752 6,615,545 6,176,539 5,991,192 6,504,2113 6,1113,61!2 6,394,041 5,434,913
6,!!34,960 6,!!34,455
30.63 29.74 32.58 35.22 35.45 32.72 30.82
29.80 27.66 30.77 32.44 26.8g 30.63 31.39 34.58 30.68 32.93
25.01 25.79 23.35 29.02 24.85 27.1>8 33.20 34.04 27.50 34.57
36.95 1>8.29 50.8g 1>8.07 41>.34 42.55 45.71 411.23 43.35 36.23
41>.80 411.04
~ Population of continental United States ae of July 1. including armed forcee overaese. Adjusted. for under-enumeration of children under 5 ::year1 of age. (:Bureau of' the Cenne). 2 Mill consumption ao reported by the Bureau of the Census, For American cotton tare, 22 pounds, was deducted from the grooo weight of bale produced through 1923: eince 1924 the tare ao reported by the
rop Reporting Board hae been deducted: for foreign cotton 3 percent (15 poundo) was deducted. 31 lncludee apparel and, carpet vool on a scoured basis. Data through 1917 were based on production plus net imports. Since 191g data are from Wocl Consumption reports of the :Bures.u of the Cttneue. TIJllureau of the Ceneue. Net importe through 1933, Since 19)4 importe for consumption, 5_/ "Bureau of the Census a..nd 'Bureau of Plant Industry. Imports and eatimated production. [/ Textile Organon, publication of the Textile Ec~nomice :Bureau Inc. Include filament and ateple :f'ibere.. Data are based on production, domestic: eb!pmenta, Rtoeka and tre.de. lJ ~ext1.1.e Orge.non, include orl.on, glass fiber, etc. S I Year beginning July ~. !J Leu. than. 0.005 pound.t1. !Q.['P't"el.i.ll:!.in..ary.
'-< ,. z ·, ~ ~ ~
"
" "" I

U. s~ Department of Agriculture 1.Vashington 25, n~c~
OFFICIAL BUSINESS
BAE-CS-139 -3/52~ 2900 Permit No. 1001
N. Y. STATE LIBRARY 9-29-47 FNS-5
Penalty for private use to avoid payment of postage
$300
COLLEGE Of AGi.