
IT TAKES A VILLAGE - NRDC
76
JANUARY 2021 REPORT IT TAKES A VILLAGE ADVANCING HARIYALI CLEAN ENERGY SOLUTIONS IN RURAL INDIA
-
Upload
khangminh22 -
Category
Documents
-
view
3 -
download
0
Transcript of IT TAKES A VILLAGE - NRDC

JANUARY 2021REPORTIT TAKES A VILLAGE
ADVANCING HARIYALI CLEAN ENERGY SOLUTIONS IN RURAL INDIA

PAGE ii IT TAKES A VILLAGE: ADVANCING HARIYALI CLEAN ENERGY SOLUTIONS IN RURAL INDIA
About the Report The overall objective of this report It Takes A Village: Advancing Hariyali Clean Energy Solutions In Rural India is to create a framework for comprehensive policy and market solutions to improve clean energy access in rural India. The report has six main components. First, the report lays out the objectives and methodology followed by a summary of the clean energy village-level interventions. Second, the report provides a review of select government programs and policies at the national and state-level (Gujarat and Rajasthan). Third, it highlights key findings from the household survey conducted in the two pilot villages – Nagano Math and Beraniya – to determine the critical energy uses for domestic and productive uses in the villages. Fourth, the report discusses the survey results and identifies interventions for increasing clean energy use for household and livelihood activities. Fifth, the report proposes village-level energy plans. Sixth, the report concludes by analyzing potential impacts of suggested interventions.
About NRDC The Natural Resources Defense Council (NRDC) is an international environmental organization with more than 3 million members and online supporters. Since 1970, our scientists, lawyers and other environmental specialists have worked to protect the world’s natural resources, public health, and the environment. NRDC works in the United States, China, India, Canada, Latin America, as well as on global initiatives to address climate change, protect nature, and promote healthy people and thriving communities. In India, NRDC works with local partners on transformative solutions to advance clean energy and climate resilience. For more information, visit www.nrdc.org.
About SEWA Self Employed Women’s Association (SEWA) is a member-based organization of poor, self-employed women workers in India. SEWA is spread across 14 states of India with deep penetration at grassroots level in villages. SEWA also works in Afghanistan, Nepal, Sri Lanka, and Myanmar. SEWA has membership reach of 1.7 million globally. SEWA organizes the women into self-help groups and cooperatives based on their respective trades and then channelizes information, awareness, health interventions, trainings for skill development, financial support (e.g. savings, insurance, credit, and pension), and market linkages to enable members to become self-sustainable in their trades, including salt production. SEWA’s twin goals are “Full Employment” and “Self-Reliance.” “Full employment” includes work security, income security, food security and social security (at least healthcare, childcare, nutrition, shelter) whereas “self-reliance” means making members autonomous economically and in decision-making. For more information, visit www.sewa.org.
Project Team NRDC Team: Madhura Joshi, Sameer Kwatra, and Poonam Sandhu Project Director: Anjali Jaiswal
SEWA Team: Chhaya Bhavsar, Naimisha Joshi, Devesh Shah, Neha Patel, and Bharti Bhavsar Project Director: Reema Nanavaty
Report authors: Madhura Joshi, Sameer Kwatra, Anjali Jaiswal, Chhaya Bhavsar, and Devesh Shah
Acknowledgements We thank officials of the Ministry of New and Renewable Energy, the Governments of Gujarat and Rajasthan for their advice and implementation support for the Hariyali Green Village Plans. We would also like to thank EESL Ltd. For partnering with us on implementing efficient appliances for rural households. The project has also benefited from discussions with clean energy companies, financiers, and other stakeholders in the access space. We particularly thank the Association of Renewable Energy Agencies of States; National Institute of Solar Energy; Electronics Sector Skill Council; Skill Council for Green Jobs; and the Clean Energy Access Network for their insights. We are grateful to SEWA’s village and field teams – Bhanuben, Jyotiben, Menaben, Dharmishtaben, Veenaben, Bhavnaben, Sangeetaben, Rinkuben, Hiralben Krishnaben, Bhupendra bhai, Neha Patel, and Sagar Junagade from SEWA for constant support with field work, research, and implementation. The research team is thankful for the warm hospitality of SEWA’s field staff in both Gujarat and Rajasthan.
We sincerely appreciate the valuable contributions and review comments of the NRDC team – Sagarika Subramanian, Poonam Sandhu, Kim Knowlton, and Marie McNamara. We thank our reviewers – Anubha Prasad, United Nations Environment Program; Nikhil Goveas, Koan Advisory; Sasmita Patnaik, Council on Energy Environment and Water; Anuj Xess, Clean Energy Access Network; Ananya Saini, Clean Energy Access Network; Dr. Vijay Limaye, NRDC, and Prima Madan, NRDC. Lastly, we would like to thank our funders for their constant support of our work.
Photo Credits Photos in the report are credited to Madhura Joshi, NRDC, and Neha Patel, Veenaben, and Jyotiben, SEWA, unless otherwise stated.

PAGE iiiIT TAKES A VILLAGE: ADVANCING HARIYALI CLEAN ENERGY SOLUTIONS IN RURAL INDIA
Table of Contents
Executive Summary 1
I. Objective 5
II. Methodology 5
III. Government Programs and Opportunities 7A. Highlighted National Level Programs 7B. Highlighted Gujarat State Programs 9C. Highlighted Rajasthan State Programs 9D. Market Transformation Through CSR Initiatives 10
IV. Village Profiles and Key Findings 10A. Nagano Math 10B. Beraniya 14
V. Discussion and Proposed Interventions – Potential for reducing drudgery, energy expense, and introducing clean and energy efficient measures 18A. Lighting 18B. Cooling 21C. Agriculture 24D. Cooking 28
VI. Potential Impact of Green Village Plans 31
VII. Summary Green Village Implementation Plan 32
VIII. Appendices 34A. Appendix: Survey Questionnaire 34B. Appendix: Survey Analyses 39C. Appendix: Summary Table of Clean Energy and Energy Efficient Solutions 66
Endnotes 69

PAGE iv IT TAKES A VILLAGE: ADVANCING HARIYALI CLEAN ENERGY SOLUTIONS IN RURAL INDIA

PAGE 1IT TAKES A VILLAGE: ADVANCING HARIYALI CLEAN ENERGY SOLUTIONS IN RURAL INDIA
Over half of India’s population – over 870 million people – lives in villages.1 India has made considerable progress in lifting people out of poverty – 271 million people between 2005 and 2016 as per a 2018 study – and providing electricity connections for all.2 Yet, many of India’s villages have yet to be fully included in the clean energy transition benefits which include affordable energy, cleaner environment, and jobs.
Major challenges exist in providing sufficient, reliable, affordable, and clean energy for the 66% of India’s population that lives in rural areas. For instance, the Ministry of Power reports that average daily electricity supply in rural areas is 12-16 hours; however, power outages and voltage fluctuations are frequent.3 Use of polluting diesel and traditional solid fuels, such as dung cakes, in rural areas is also high, with nearly 80% of rural households relying on biomass for cooking in many Indian states.4
The COVID-19 pandemic induced economic crisis poses a major threat to India’s progress on poverty alleviation. The health and economic effects are already exacerbating inequities, threatening rural livelihoods, and limiting opportunities for clean energy adoption by rural communities. In this context, government programs that create sustainable livelihood opportunities, invest in clean energy solutions, and build resilience at the village level are critical. Recent policies, which build on past efforts to advance clean energy solutions in rural India, are encouraging and can benefit from greater impetus.
The overall objective of the “Hariyali Green Villages – Advancing Clean and Energy Efficient Solutions to Improve Livelihoods” project is to accelerate the uptake of clean energy by implementing policy and market solutions to reduce energy poverty in rural India. Working with partners, the Self Employed Women’s Association (SEWA) and the Natural Resources Defense Council (NRDC) are designing and implementing effective interventions through the Green Village Energy Plans, starting with two villages – Nagano Math in Arvalli District, Gujarat, and Beraniya in Dungarpur District, Rajasthan. The goal is to expand these plans initially to 10 villages by 2025 and potentially more in the future. The Hariyali project, engages women throughout the process: decision-making regarding energy choices, financing, implementation, and skill development for operations and maintenance of solutions.
The project’s guiding considerations are increasing affordability, enhancing energy supply for household and livelihood activities, expanding clean energy, improving living conditions, and reducing drudgery while improving health, air quality, and environmental quality by reducing emissions. The ultimate goals of the Green Village Energy Plans are to work towards a policy, market, technology, financial, and social framework led by women that reduces energy poverty and enhances traditional livelihoods through climate solutions.
Executive Summary

PAGE 2 IT TAKES A VILLAGE: ADVANCING HARIYALI CLEAN ENERGY SOLUTIONS IN RURAL INDIA
Key Findings from Surveyed Households
Low annual income: Both villages reported modest annual incomes with 92% of Nagano Math households making less than `120,000 ($1,700) per year and 61% of Beraniya households making less than `90,000 ($1,280).
Meager savings: Both villages reported limited annual savings with 79% of Nagano Math households saving less than `7,000 ($100) and 13% of Beraniya households saving less than `2,200 ($30).
High electricity expenses: Both villages reported spending high portion of income for electricity expenses for household and agricultural purposes for electricity bills and diesel purchases with Nagano Math households spending `700 to `3,500 ($10 to $50) per year in electricity expenses and Beraniya households spending `2,000 to `8,000 ($30 to $120) per year in electricity expenses.
High energy expenses: Excluding expense on diesel and electricity for agriculture, both villages had high energy expenses with 26% of households in Nagano Math spending more than `12,000 ($171) on their energy needs annually and 9% of households using kerosene for lighting purposes; and about half the households in Beraniya spending more than `6000 ($80) to meet their annual energy needs, while 16% spend more than `12,000 ($171)/year. Of surveyed households in Beraniya, 44% reported using kerosene for lighting purposes spending an average of `960 ($14) per year.
Significant time and effort spent on fuel collection: Both villages spend a significant time in collecting fuel, such as firewood and dung cakes with a majority of surveyed Nagano Math households (61%) spending between 11 to 31 hours every week on procuring fuel and with a vast majority of surveyed Beraniya households (71%) spending up to 15 hours every week on collecting or procuring fuel to meet their energy needs.
Limited appliance ownership: Both villages have limited appliance ownership with all of the surveyed households in Nagano Math owning at least one cooling and lighting solutions – 90% own ceiling fans, 48% own table fans, and 24% own refrigerators, 86% own at least one LED bulb, 68% own incandescent bulbs, and 59% own solar lamps; and in Beraniya, cooling solutions are not universal – about 63% of the surveyed households own a ceiling fan, 13% portable table fans, 31% have no cooling device – and for lighting – 22% have incandescent bulbs, 86% have at least one LED bulb.
Mixed sources of irrigation: Both villages rely on rainfall, or electricity- or diesel-run water pumps, or purchase water for irrigation with most Nagano Math farmers relying on electricity (66%), followed by another 11% using diesel pumps, and 24% purchasing water; and with 25% of farmers in Beraniya depending on rainfall, 35% using water pumps running on electricity, 16% using diesel-pumps, and about a third (34%) purchasing water to meet irrigation needs.
Five Interventions for Hariyali Green Villages
Based on energy analysis of the pilot villages, examining government programs and expert discussions, the following five interventions for the village clean energy plans were developed. In developing the plans, technical compatibility, financial viability, and skill development were main considerations.
1. Lighting: expand LED bulbs, solar lamps, and voltage stabilizers in both villages • Increase use of LED bulbs to reduce the use of use of incandescent bulb in both villages.
• Ensure quality solar lamps are more accessible to reduce reliance on kerosene for lighting and to provide night-time illumination for outdoor activities.
• Explore voltage stabilizers as an option for interested households, particularly those who wish to invest in larger appliances in both villages.
2. Cooling: increase efficient fans and cool roofs in both villages. • Introduce efficient fans to improve the efficiency of household energy use, reduce expense on electricity, and provide
better indoor cooling/circulation.
• Promote cool roofs for households with cement or tin roofs to help improve indoor thermal comfort.
3. Irrigation: switch to invidual and community-owned solar water pumps and micro-irrigation practices for agriculture • Switch to solar irrigation pumps with individual and joint ownership models to reduce energy expenses.
• Explore micro-irrigation technologies to improve water-use efficiency and reduce energy demand.
4. Household Cooking and Key Livelihood Opportunities: explore cleaner cooking options, solar operated livelihood appliances, and electric vehicles
• Explore household-level biogas digesters for cooking.
• Explore ways in which the use of LPG cylinder and indcution stoves for cooking can be enhanced in villages.

PAGE 3IT TAKES A VILLAGE: ADVANCING HARIYALI CLEAN ENERGY SOLUTIONS IN RURAL INDIA
• Test the potential of other livelihood appliances such as solar flourmills, solar oil mill, solar milk chillers and expanding income sources.
• Explore electric three-wheelers to improve last-mile connectivity and provide livelihood options.
5. Community-Level Interventions: engage schools and health care centers in clean energy transformation • Upgrade government schools to use clean energy solutions and increase awareness through rooftop solar, LED bulbs,
efficient fans, cool roofs, solar pumps, and solar-based water purification systems.
• Introduce clean energy and efficient solutions for health care centers (e.g. rooftop solar, efficient appliances, and solar-based cold storage) and promote environmental-health risk communication through these centers such as measures to protect vulnerable population during high air pollution and extreme weather events.
• Promote LED and solar streetlights for villages.
Lighting
Expand the use of LED bulbs, LED tubelights, and solar lamps to improve ef�ciency of electricity consumption and reduce expense
Household Cooking and Key Livelihood Opportunities
Cleaner cooking options to reduce indoor air pollution and drudgery; and for livelihoods – promote electric three-wheelers and solar-based appliaces such as driers and milk chillers
Cooling
Expand the use of ef�cient fans and cool roofs to increase thermal comfort, improve ef�ciency of electricity consumption, and reduce expense
Irrigation
Advance the use of solar pumps – to reduce costs and air pollution – and micro-irrigation practices to improve water use ef�ciency
Community-Level Interventions
Install solar street lights and develop green schools and green health care centres (multiple appliances) to provide reliable and clean energy services and build awareness
Group Discussions in Nagano Math (Left) and Beraniya (Right)

PAGE 4 IT TAKES A VILLAGE: ADVANCING HARIYALI CLEAN ENERGY SOLUTIONS IN RURAL INDIA
Impact Analysis
Preliminary analysis of data from our surveys in 2019 indicates that switching to more efficient appliances, just 100 fans and 200 LED bulbs in a village, can save approximately 84 MWh of electricity every year per village. This is equivalent to 77 metric tons of avoided carbon dioxide (CO
2) emissions (or the carbon sequestered by growing 1,200 tree saplings for 10 years). In
Beraniya and Nagano Math, switching 50% of diesel water pumps to solar and reducing 80% of kerosene use by adopting solar lighting can avoid another 8 tons of CO
2 emissions on an average per village every year.5
Scaling the energy plans to 100 similar villages, a mere fraction of India’s over 600,000 villages, can potetnially avoid CO2
emissions of nearly 8,500 metric tons every year.6 Moreover, implementing and scaling green village plans will have beneficial impacts beyond just energy and cost savings. Switching to more efficient and cleaner sources can reduce drudgery, reduce exposure to air pollution and improve health, and further improve livelihood and well-being.
Source: Authors calculation based on survey data, and EPA “Green House Gas Emissions Calculator,” March 2020
Replacing 200 incandescent lamps
with LEDs
Replacing 100 ceiling fans to more efficient
models
Switching to solar water pumps and reducing diesel
use by 50% (about 1200 lt./year)
Switching to solar lighting and reducing
kerosene use by 20% (about 1800 lt./year)
Total CO2 emissions avoided (t/year)
Scaled up to 100 similar villages
Avoided CO2 emissions (t/year)
Avoided CO2 emissions (t/year)
Avoided CO2 emissions (t/year)
Avoided CO2 emissions (t/year)
Avoided CO2 emissions (t/year)
Avoided CO2 emissions (t/year)
61 16 3
5 85 8533
Equivalent to the Impact of Avoided Emissions by
140,500 1.1 billionTree saplings grown for 10 years
Number of smartphones charged every year
Estimated Climate Impact of Green Measures

PAGE 5IT TAKES A VILLAGE: ADVANCING HARIYALI CLEAN ENERGY SOLUTIONS IN RURAL INDIA
I. OBJECTIVEThe objective of the Hariyali GreenVillage Plans project is to improve clean energy access for people living in rural India by supporting comprehensive policy and scalable market solutions. Working with partners, SEWA and NRDC aim to design and implement effective interventions through the Green Village Plans in two pilot villages, to be expanded initially to at least 10 villages by 2025, and potentially more in the future.
The guiding considerations for the project include increasing affordability; enhancing energy supply for household and livelihood activities; expanding clean energy and energy efficiency; improving living conditions and reducing drudgery; and improving health, air quality, and environment by reducing emissions. The goal of the Green Village Energy Plans is to work towards a policy, market, technology, financial, and social framework led by women that reduces energy poverty and enhances traditional livelihoods through climate solutions. Women typically have limited decision-making authority on household energy choices. These plans, through SEWA’s memberships, focus on involving women throughout the process: decision-making regarding energy choices, financing, implementation, and skill development for operations and maintenance of solutions.
II. METHODOLOGYThe methods to identify and design the clean energy village-level intervention included four main components. First, select criteria were applied to identify two villages to conduct the pilot. Second, government programs and market opportunities for clean energy were identified through primary and secondary research. Third, household energy use surveys and research were conducted to determine the key energy uses for both domestic and productive uses in the villages. Fourth, based on the available research and data collected, key interventions for increasing energy access were identified for implementation in the two pilot villages.
Household Surveys in Beraniya and Nagano Math

PAGE 6 IT TAKES A VILLAGE: ADVANCING HARIYALI CLEAN ENERGY SOLUTIONS IN RURAL INDIA
To select the pilot villages, criteria were developed that included: 1) strong SEWA presence; 2) high percentage of rural population; 3) low electricity access; 4) high dependence on firewood, dung cakes and other solid cooking fuels; 5) low asset ownership (TV, computer, internet, two-wheeler); 6) limited access to banking services, i.e. having bank accounts (criteria 2-6 from Census 2011); 7) vulnerability to climate change using information on the district in which the village is located in from National Initiative on Climate Resilient Agriculture; and 8) greater number of small and marginal farmers from Agriculture Census 2015-16.7 The villages selected for the pilot are Nagano Math Village in Arvalli District in Gujarat and Beraniya Village in Dungarpur District in Rajasthan.8
To identify government programs and market opportunities for clean energy, the research included literature reviews and examination of central, state and district-level policies advancing clean energy. Primary research was conducted through informational interviews with district-level government officials; state-level government officials; national ministries; government bodies, such as the Skills Council, clean energy and technical experts, civil society organizations, financial institutes, foundations and multilateral organizations, among others. The research involved identifying clean solutions to supplement or replace reliance on dirty fuels and boost livelihoods, such as solar water pumps; clean energy-based livelihood appliances; efficient appliances (domestic and productive use); cool roofs; micro-grids and skill development. Review of national and state schemes and developmental policies focused on livelihoods, energy access, and conservation and exploring potential synergies. The research also examined market programs for clean energy and programs that align with SEWA’s existing activities, such as sustainable agriculture and green energy program.
To conduct household energy use surveys and research to determine the key energy uses for domestic and productive uses in the villages, an extensive six-month survey and analysis process was undertaken. The survey helped evaluate household current energy use and supply for both productive and domestic activities; capture current expenditure on energy in a household domestic and livelihoods expenditure; and gather techno-economic data to help design and implement energy plans.
NRDC conducted three survey-instrument trainings. All surveys were conducted by trained interviewers, mostly with women as respondents. The interviewers got verbal consent of respondents before asking the questions in the local language (Gujarati or Hindi). An in-house translator converted the responses into English for the purpose of analyses and reporting. After conducting a test of ten households in each village in March 2019, the final survey sample included 177 households total in both villages (excluding test surveys), covering about 35% of the population of each village. The surveys were conducted between May and July 2019.
The total number of households in both villages combined is approximately 500 households. The survey questionnaire covered: housing type; economic characteristics; documentation availability (Aadhar, bank account); livelihoods and income levels; energy supply; energy bills and time procuring fuels; major appliances used for domestic and productive use; water consumption and travel time to collect water; and villagers’ willingness to pay for energy supply (Appendix A). Semi-structured community discussions were also conducted with the Panchayat (village mayor) and male and female groups in the village on aspirations, household objectives, and issues with energy supply and livelihood-based activities to validate survey findings to nullify the impact of any biases. NRDC and SEWA conducted four sets of interviews and discussions in both villages – December 2018, March 2019, May 2019, and August 2019. In addition, the team has sought continuous feedback and buy-in from the community through SEWA’s regular members’ meetings for the Hariyali green village plans, proposed solutions, and the implementation process.
To develop the village energy plans, the survey data was analyzed to develop and implement a comprehensive set of interventions with short, medium, and long-term steps. The plan included technical, policy, and financial solutions based
Selection
Framework for identifying districts
Select pilot villages
Review national, state, and local government policies
Identify market programs for clean energy
Complementarity with SEWA activities
Identify Opportunities
Socio-economic pro�le
Energy use: existing energy use, energy supply conditions, challenges and clean energy opportunities
Survey
Survey analysis
SEWA expertise
Social acceptance
Policy linkages
Technical and �nancial linkages
Skill requirement
Village Plans
Figure 1 Steps and Consideration for Developing Hariyali Green Village Plans

PAGE 7IT TAKES A VILLAGE: ADVANCING HARIYALI CLEAN ENERGY SOLUTIONS IN RURAL INDIA
SEWA-NRDC Survey Training
on community requirements and the five considerations listed above – increase affordability; enhance energy supply for household and livelihood activities; expand clean energy and energy efficiency; improve living conditions and reduce drudgery; and improve health, air quality, and environmental quality by reducing emissions.
III. GOVERNMENT PROGRAMS AND OPPORTUNITIESSeveral government programs at the national and state level are designed to expand clean energy and improve livelihoods in India. Some programs are aimed toward clean energy development in India’s rural areas. However, the penetration and awareness about the various clean energy and energy efficiency initiatives are often constrained. This section highlights some of the key programs. Increasing awareness of and access to these programs is a major objective of the village plans.
A. HIGHLIGHTED NATIONAL LEVEL PROGRAMS
PM-KUSUM - Pradhan Mantri-Kisan Urja Suraksha Evam Utthaan Mahabhiyan
With the objective of improving financial and water security, the PM-KUSUM scheme, launched by the Ministry of New and Renewable Energy (MNRE), aims to support installation of off-grid solar pumps in rural areas and reduce grid-dependence in grid-connected areas.9 Building on the earlier program, MNRE expanded the solar pumps program targets to implement 2 million standalone solar pumps for irrigation (component B), support solarization of 1.5 million grid-connected agricultural pumps, (component C), and set up 10,000 MW of decentralized ground/stilt mounted grid connected solar or other renewable energy based power plants up to 2 MW on fallow land or on stilts on agricultural land (Component A).10 For solar pumps, the scheme provides 30% MNRE subsidy and at least 30% state-subsidy on pumps up to 7.5 horsepower (hp) size. PM-KUSUM aims to install 25,750 MW solar capacity by 2022 with a total national government financial support of `34,422 crores (around $5 billion).11
Unnat Jyoti by Affordable LEDs for All (UJALA) – Lighting
Under the Ministry of Power, the Bureau of Energy Efficiency (BEE) has several programs to promote energy efficiency in India. For example, the UJALA program (previously called as Domestic Efficient Lighting Program) aims to reduce energy consumption in the lighting sector, reduce peak demand of distribution companies, and promote the use of efficient technologies at affordable prices.12 The program is implemented through Energy Efficiency Services Limited (EESL), a public sector company. EESL has focused on aggregating demand and bulk procurement to reduce the cost of LED bulbs. It has worked with distribution companies and state governments to roll out the program.13 In August 2020, EESL launched the Gram UJALA scheme to increase rural penetration and affordability of LED bulbs.14
Super-Efficient Equipment Program – Efficient Fans
BEE’s Super-Efficient Equipment Program (SEEP) aims to promote super-efficient appliances through financial interventions. Under SEEP, BEE offers time-bound incentives to fan manufacturers to manufacture super-efficient fans and sell them at a discounted price. The objective of SEEP is to support the introduction and deployment of super-efficient 35W ceiling fans,

PAGE 8 IT TAKES A VILLAGE: ADVANCING HARIYALI CLEAN ENERGY SOLUTIONS IN RURAL INDIA
instead of the current average 70W ceiling fans.15 Like for LEDs, EESL helps in reducing appliance rates through demand aggregation. EESL promotes efficient fans under the UJALA program and the National Building Energy Efficiency Program.16 However, the reach of the efficient fans program in rural areas is limited.
Programs to Enhance Livelihoods
MNRE’s “Scale Up of Access to Clean Energy for Rural Productive Uses” scheme aims to enhance the use of reliable and affordable renewable energy for rural productive uses/livelihoods in un-served and under-served areas in 3 states; Assam, Madhya Pradesh, and Odisha. Initiatives such as the Solar Energy Scheme for Small Powerloom Unit by the Ministry of Textiles and the Solar Charkha Mission by the Ministry of Small and Medium Enterprises provide capital subsidies solar-based looms and charkhas.17
There are also schemes at the national level, which focus on livelihood enhancement and mechanization. For example, the Pradhan Mantri Mudra Yojana – provides credit for small and micro businesses; a credit guarantee trust fund for Micro and Small Enterprises (MSEs) – to reduce the burden of producing collateral for new and existing MSEs; credit-linked capital subsidy schemes provide capital subsidy of up to 15% to upgrade technologies in MSEs; and Prime Minister Employment Generation Program provides margin money assistance to individual borrowers and groups for new self-employment ventures, projects, and micro enterprises.18 These schemes currently do not have a clean energy focus. However, including solar-powered appliances and energy efficient measures can make these programs more robust and make sustainable livelihood options more accessible.
Biogas Programs
MNRE introduced the New National Biogas and Organic Manure Program (NNBOMP) to provide clean cooking fuel, improve the organic manure system using bio-slurry from the biogas plants, and meet other thermal and small power needs of households in rural and semi-urban areas.19 The program offered subsidies and financial incentives for setting up household- biogas plants. The program was implemented for three years ending in March 2020 and is currently under evaluation.
The government launched Galvanizing Organic Bio-Agri Resources Dhan (GOBAR-DHAN) for promoting community-level biogas.20 The scheme is carried out under the Swachh Bharat Mission – Gramin (SBM-G) – clean India mission-rural, under the department of water and sanitation, Ministry of Jal Shakti (water ministry). The program’s objectives are increasing rural incomes, providing rural jobs, and improving the cleanliness of villages. The GOBAR-Dhan program is funded under SBM-G and extends financial assistance to gram panchayats to set up community-level biogas plants.21
Solar Streetlights
The Atal Jyoti Yojana was launched under MNRE to install solar street lamps in select states and aspirational parliamentary districts. Implemented by EESL, the scheme provided financial support in conjunction with the Members of Parliament Local Area Development (MPLAD) funds to install solar streetlights with LEDs. However, the scheme was suspended in April 2020.
Another program, BEE’s Street Lighting National Program (SLNP), aims to replace existing streetlights with efficient “smart lights” across the country. EESL partners with states, municipal bodies, and urban local bodies to implement this program.22 MNRE’s Off-grid and Decentralized Solar PV Applications Program – Phase III also covered solar streetlighting program providing support for solar streetlights, study lamps, and off-grid solar power plants.23
National Institute of Solar Energy (NISE)
The National Institute of Solar Energy (NISE) is an MNRE apex institute charged with undertaking research and development, testing, certification, standardization, skill development, resource assessment, and awareness in solar energy and associated technologies.24 NISE has developed and implemented solar dryer and space heating technologies, implemented the Suryamitra skill development program with Skill Council for Green Jobs for training in operations and maintenance of solar energy power projects, and has labs for testing solar photovoltaic applications (solar pumps, panels, modules etc.), and has a research and development department for solar-based applications.25
Solar Installations at NISE

PAGE 9IT TAKES A VILLAGE: ADVANCING HARIYALI CLEAN ENERGY SOLUTIONS IN RURAL INDIA
Demand Side Management Regulations
Demand Side Management (DSM) strategies at the national and state level are effective in reducing electricity demand by encouraging consumers to lower electricity consumption pattern through increased adoption of energy efficient measures. The DSM programs have two broad components – Agriculture DSM (AgDSM) and Municipal DSM (MuDSM). The objective of AgDSM program is to reduce the energy intensity of irrigation pumping for agriculture by upgrading pump efficiency. MuDSM aims at improving the overall energy used by urban local bodies and covers efficiency improvements in water pumping, sewage pumping, street lighting, and public buildings.26
National Electric Mobility Mission Plan (NEMMP)
Faster Adoption and Manufacturing of (Hybrid &) Electric Vehicles in India (FAME India) Scheme is an important part of the NEMMP. The FAME scheme aims to ramp up the manufacturing and adoption of EVs and incentivize India’s charging infrastructure. The scheme provides incentives and subsidies for the four market segments – buses, two-wheelers, three-wheelers including registered e-rickshaws, and four-wheelers. The thrust of electric mobility discourse so far has been largely urban-centric. However, there is significant scope and benefit of advancing these solutions to rural areas, particularly for the three-wheelers and two-wheelers segment coupled with decentralized charging solutions.
B. HIGHLIGHTED GUJARAT STATE PROGRAMS
Gujarat Solar Policy – 2015
The Gujarat Solar Policy 2015 aims at solar expansion in the state.27 The solar policy targets promoting rooftop solar of industrial, commercial and residential consumers, solar parks, and solar canal-top and canal bank projects. For rural applications, the policy encourages agricultural solar pumps, and off-grid solar applications as per MNRE programs. In 2019, the Gujarat government set a target of installing 30,000 MW of renewable capacity by 2022.28
Suryashakti Kisan Yojana – SKY Scheme
The Suryashakti Kisan Yojana (SKY) scheme focuses on expanding solar energy to farmers with existing grid-connected agricultural pumps.29 The scheme was announced by the Gujarat Government in June 2018 with a duration of 25 years. The SKY scheme aims to use subsidies as a one-time grant to help set up solar panels and pumps. SKY financing includes a 60% subsidy borne by the center and state governments. It allows farmers to pay minimum 5% equity down-payment with an affordable loan on the amount remaining.. The farmer will then get `7 per unit of power sold back to the grid for the first seven years with conditions, and `3.5 for each unit sold for the succeeding 18 years.
C. HIGHLIGHTED RAJASTHAN STATE PROGRAMS
Rajasthan Solar Energy Policy 2019
The Rajasthan Solar Energy Policy 2019 targets installing 30,000 MW of solar energy by 2025.30 The policy promotes new technologies in solar energy generation and storage to make solar energy more cost competitive and reliable for consumers and aims to create a better atmosphere to innovate and invest for micro, small and medium enterprises for harnessing solar energy. As the nodal agency, Rajasthan Renewable Energy Corporation (RRECL) aims to install 24,000 MW of solar parks, 4,000 MW of distributed generation, 1000 MW of rooftop solar and 1000 MW of solar pumps. The program also includes the promotion of decentralized grid-connected projects and off-grid solar applications, such as solar water pumps and home lighting systems.
In an effort to increase the use of solar energy by farmers and increase their incomes, the state promotes decentralized power projects on un-cultivable land and solarization of existing grid-connected agriculture pumps. The horticulture department in Rajasthan is the state implementing agency for PM KUSUM program.
Electric Three-Wheelers in Punjab

PAGE 10 IT TAKES A VILLAGE: ADVANCING HARIYALI CLEAN ENERGY SOLUTIONS IN RURAL INDIA
D. MARKET TRANSFORMATION THROUGH CSR INITIATIVES
Programs through Corporate Social Responsibility (CSR) Initiatives and private philanthropy are also opportunities for funding clean energy transformation in villages in India. CSR funding through local NGOs working on ground in areas of clean energy to implement solutions. While this model has been traditionally followed, sustainability of interventions is a challenge. CSR funded solutions that are developed with community participation; provide technical, financial, and skill development solutions; and have community-level monitoring built-in can be more sustainable. Another alternative is to invest CSR money in social enterprises which work on clean energy transitions.31
IV. VILLAGE PROFILES AND KEY FINDINGS
A. NAGANO MATH
Nagano Math is a village with 256 households, with most of them having 4 to 6 family members each.32 The village is located 50 km away from the block center of Bayad town in Arvalli district, Gujarat. The village has a school within walking distance but is about 7 km away from the nearest bank and even farther from the closest health care center. There is no bus service to the village, and people largely use private shared-taxis or 3-wheelers to travel. There is no major industry or factory in the vicinity of Nagano Math. SEWA recently started a dairy co-operative in the village.
Agriculture is the primary source of livelihood (100%), most respondents (83%) have small landholding (less than 5 bigha/~2 acres), and they either rent or share large farm equipment (such as tractors and threshers).33 The major crops grown in the village include wheat, cotton and corn, among other cereals and vegetables. In addition to agriculture, the main occupations include animal husbandry (76%), daily wage labor (34%), and services (20%). Household electricity supply in Nagano Math is nearly universal and available for most of the day, but there are no streetlights in the village.
Arvalli
Districts of Gujarat (Left) and Nagano Math Village (Right), Source: Wikimedia Commons and Google Earth.
Nagano Math

PAGE 11IT TAKES A VILLAGE: ADVANCING HARIYALI CLEAN ENERGY SOLUTIONS IN RURAL INDIA
Key Findings
Average annual reported income for a majority of surveyed households is less than `120,000 (~$1,700). About a third of the households surveyed reported earning even less than `30,000 (~$430) in a year (Figure 2).34
Comparing reported income with income from livelihood provides a broader understanding of income levels. 38% of households report income of `120,000 (~$1,700) or more per year from agriculture operations (i.e. `10,000 per month/~$140), and 48% of total households surveyed reported income higher than `90,000 (~$1,280) per year from agriculture. On average, most households are engaged in at least two different livelihood activities (Section VIII-Appendix B.7).
Income figures are usually associated with a higher uncertainty because of several reasons – seasonal and annual variation in income, difficulty in estimating, and social inhibitions about disclosing income. The research team analyzed other related variables like savings, reported income from livelihoods, expenses, and asset ownership to improve the best estimates of household incomes and financial health.35
Figure 2 Annual Reported Income per Household in Nagano Math
0<15000 (15000,
30000](30000,45000]
(45000,60000]
(90000,105000]
(75000,90000]
(60000,75000]
(105000,120000]
>120000
5
10
15
20
25
30
14 13
27
Annual Income per Household in 2019, Nagano Math
Annual Income per Year (INR/Year)
118
3 24
8
Nu
mb
er o
f Ho
use
ho
lds
*Note: See income and livelihood graphs in Section VIII-Appendix B.7 for a comparison between reported annual income and reported income ranges against livelihoods.
**INR: Indian Rupees
Source: NRDC-SEWA Survey36
Reported average annual savings for most households (79%) are less than `7000 (~$100): Given the low income and high expenditure of most households, it is unsurprising that most households are left with little to no savings to tide over a bad season. Of the households surveyed, around a quarter (26%) reported saving even less than `1,000 (~$14) in a year. (Figure 3). Thus, financing and affordability are critical success factors for any clean energy interventions.
Figure 3 Annual Reported Savings per Household in Nagano Math
0
5
10
15
20
25
<1000 (2000,3000]
(1000,2000]
(3000,4000]
Annual Saving per Year (INR/Year)
Annual Saving per Household in 2019, Nagano Math
(4000,5000]
(5000,6000]
(6000,7000]
(7000,8000]
(8000,9000]
(9000,10000]
>10000
23
1411
6
25
3
0 1 2
14
Nu
mb
er o
f Ho
use
ho
lds
*Note: Nine households did not respond to this question in the survey either because they had no savings or found it difficult to estimate.
Source: NRDC-SEWA Survey
Reported average annual expenditure on electricity for most households is between `700-3,500 (~$10 to $50) (Figure 4). With low appliance ownership and high use of traditional fuels like liquid fuels, biomass, and dung cakes, electricity expenses are low for most households.

PAGE 12 IT TAKES A VILLAGE: ADVANCING HARIYALI CLEAN ENERGY SOLUTIONS IN RURAL INDIA
Figure 4 Average Annual Electricity Expenditure per Household, Nagano Math
05
1015202530354045
<2000 (2000, 4000] (4000, 6000]
INR/Year
32
41
74 3
(6000, 8000] >8000
Annual Electricity Expense per Household in 2019, Nagano Math
Nu
mb
er o
f Ho
use
ho
lds
Source: NRDC-SEWA Survey
Expenditure on total energy is significantly high. Of those who responded, 26% spend more than `12,000 (~$171) on meeting their energy needs every year (Figure 5). Data indicates that energy expenditure is as high as half the stated total annual income for about 17% of the households surveyed. Interventions that save energy and increase household savings should have a high likelihood of adoption and success. Households depend primarily on biomass (93%) and dung cakes (71%) for their cooking, heating, and cooking animal feed requirements. Several households have LPG connections (35%), but usage is limited (48% use just one cylinder per annum, see Section V.D and Section VIII-Appendix B.26 for more details).
Figure 5 Average Annual Energy Expenditure per Household, Nagano Math
Annual Expense on Energy per Household in 2019, Nagano Math
12
< 2000 (2000, 4000]
(4000, 6000]
(6000, 8000]
(8000, 10000]
(10000, 12000]
INR/Year
(12000, 14000]
(14000, 16000]
(16000, 18000]
(18000, 20000]
> 20000
25
810
75
32
43
11
0
5
10
15
20
25
30
Nu
mb
er o
f Ho
use
ho
lds
*The calculations include expense figures reported by households for LPG, most of which do not account for LPG subsidy (see Section V.D for details). They exclude expenses on diesel and electricity for agriculture. Source: NRDC-SEWA Survey
A vast majority of surveyed households (61%) spend between 11 to 31 hours every week on collecting or procuring fuel to meet their energy needs (Figure 6). In addition to the high expenditure, households also spend a significant part of their time in procuring fuels like biomass and dung cakes to meet their energy needs. Fuel collection activities, particularly for firewood and dung-cakes, are carried out primarily by women and children. Interventions that reduce time spent would reduce drudgery and increase the time available for leisure or other income generating activities.

PAGE 13IT TAKES A VILLAGE: ADVANCING HARIYALI CLEAN ENERGY SOLUTIONS IN RURAL INDIA
Figure 6 Average Time Spent on Procuring Fuel per Week, Nagano Math
Weekly Time Spent on Fuel Collection per HH (hrs) in 2019, Nagano Math
< 10
20
0
10
20
30
40
50 46
72
(10, 20) (20, 30)
Hours/week
< 30
Nu
mb
er o
f Ho
use
ho
lds
Source: NRDC-SEWA Survey
Cooling solutions – ceiling fans, table fans – and lighting solutions – LEDs, incandescent lamps, and solar lamps – are the most commonly owned appliances. About a quarter of the surveyed households have refrigerators (Figure 7). Most appliances are old and are sometimes bought used. Given the hot summer temperatures, cooling solutions that save money and energy have the potential for adoption. For instance, 86% of the surveyed households use ceiling or table fans to combat high temperatures (see Section VIII-Appendix B.5 for cool strategies). Switching to energy efficient appliances offers significant energy savings potential and increase in thermal comfort.
Figure 7 Appliance Ownership, Nagano Math
68%
86%
90%
48%
24%
44%
3%
3%
59%
0% 10% 20% 30% 40% 50% 60% 70% 80% 90% 100%
Incandescent/Yellow bulb
LED bulb
Ceiling fan
Table fan
Refrigerator
Smart Mobile Phone
Cooler/Tower fan
Hot plate/Electric Stove
Solar lamp
Percentage of Households
Ownership of Appliances in 2019, Nagano Math
Source: NRDC-SEWA Survey
Most farmers rely on electricity (66%) for irrigation. This is followed by another 11% who use diesel pumps and 24% purchase water (4% did not respond to the question). The cost of purchasing water typically includes a small service fee and cost of electricity or diesel required for pumping water.

PAGE 14 IT TAKES A VILLAGE: ADVANCING HARIYALI CLEAN ENERGY SOLUTIONS IN RURAL INDIA
B. BERANIYA
Beraniya is a village with 247 households with most households having between 6-9 family members.37 The village is around 25 kms from Dungarpur town in Rajasthan. Agriculture is the primary occupation (95% of households surveyed) and most households engage in marginal farming or work as agricultural or manual laborers. Animal husbandry (92% of households surveyed), and wage labor (77%), and services (22%) are other main occupations. Average land holding in Beraniya is about 2 bighas/~1.25 acres, smaller than Nagano Math.38
There is no industry close to the village and Beraniya is not connected by public transport. The community largely rely on private taxis or three-wheelers for their transport needs. The closest bank, Bank of Baroda, as well as the primary health care center is around 10 kms away. The school within the village is within walking distance for most households. Farming is largely rainfed. The major crops grown are wheat, corn, and lentils. A few households own a well and farm across two seasons. In Beraniya, 94% of households have electricity connections. Several (~40%) were electrified only in the last two years. However, the supply of electricity is intermittent with 9 hours of supply on an average per day. Beraniya has no streetlights.
Dungarpur
Map 1 Districts of Rajasthan and Map of Beraniya; Source: Wikimedia Commons and Google Earth
Beraniya

PAGE 15IT TAKES A VILLAGE: ADVANCING HARIYALI CLEAN ENERGY SOLUTIONS IN RURAL INDIA
Key Findings
Reported average annual income for majority of the households (61%) is less than `90,000 (~$1,280). About 20% of the households surveyed, reported earning less than `45,000 ($640) in a year (Figure 8). Correlating with other variables such as income ranges from other livelihoods, we believe that reported income figures are likely to be closer to actual earnings. On an average, households are engaged in three livelihood activities.
A large share of households involved in agriculture (53%) and animal husbandry (60%) reported no income from these activities (Section VIII-Appendix B.7). In contrast to Nagano Math, a larger share of households in Beraniya are involved in daily wage labor.
Figure 8 Reported Annual Income, Beraniya
<15000 (15000,30000)
(30000,45000)
(45000,60000)
(60000,75000)
(75000,90000)
(90000,105000)
(105000,120000)
(120000,135000)
(135000,150000)
> 1500000
2
4
6
8
12
14
16
10
Annual Income per Household in 2019, Beraniya
INR/Year
4 4
15
13
10
3
12
1
5
13
7
Nu
mb
er o
f Ho
use
ho
lds
Source: NRDC-SEWA Survey
Reported average annual savings for most households are negligible. Around 13% reported savings of less than `2,200 (~$30) (Figure 9): The surveyors received very few responses (17) on the question of annual savings. For most households there are no savings at all. Among those that responded in Beraniya, the average savings are negligible, even lesser than Nagano Math (Figure 3). Once again, this finding reiterates the importance of affordability for any clean energy interventions and financing solutions.
Figure 9 Reported Annual Savings per Household in Beraniya
11
12
3
0
2
4
6
8
10
12
1200-2200 2201-3200 5200-6200 >10000
No
. of H
ou
seh
old
s
Annual Savings in INR
Annual Savings per Household in 2019, Beraniya
*Most households did not respond to the question on savings in the survey. either because they had no savings or found it difficulty to estimate.
Source: NRDC-SEWA Surv ey
Reported average expenditure on electricity for most households is between `2,000-8,000 (~$30 to $120)/year (Figure 10). Despite low appliance ownership, intermittent electricity supply, and high use of kerosene and traditional fuels biomass and dung cakes, electricity expenses are relatively high for most households.

PAGE 16 IT TAKES A VILLAGE: ADVANCING HARIYALI CLEAN ENERGY SOLUTIONS IN RURAL INDIA
Figure 10 Average Annual Electricity Expenditure per Household as a Share of Income, Beraniya
Percentage of Annual Income Spent onElectricity in 2019, Beraniya
Total No. of Respondents: 58
60%
19%
5%
7%
4%
5%
1%-5% 6%-10% 11%-15%
16%-20% 20%-25% >25%
<2000 (2000,4000)
(4000,6000)
(6000,8000)
> 8000
Expense in INR
Annual Expense on Electricity, Beraniya
6
29
14
36
0
5
10
15
20
25
30
35
Nu
mb
er o
f Ho
use
ho
lds
Source: NRDC-SEWA Survey
Expenditure on total energy is significantly higher. About half the respondents spend more than `6,000 (~ $80) on meeting their energy needs every year, while 16% spend more than `12,000 ($171)/year. (Figure 11). As mentioned for Nagano Math, interventions that save energy and increase household savings should have a high likelihood of adoption and success. Households depend primarily on biomass (98%) and dung cakes (93%) for their cooking, heating, and cooking animal feed requirements. 48% of households have LPG connections but use only two cylinders on average per year.
Figure 11 Average Annual Expenditure on Energy, Beraniya
<20000
5
10
15
20
14 14 13
18
9
23
2 1
8
(2000,4000]
(4000,6000]
(6000,8000]
(8000,10000]
INR/Year
(10000,12000]
(12000,14000]
(14000,16000]
(16000,18000]
>18000
All Fuels (with Electricity) - Annual Household Expenditure in 2019, Beraniya
Nu
mb
er o
f Ho
use
ho
lds
*The calculations include expense figures reported by households for LPG, most of which do not account for LPG subsidy.39 The calculations also exclude expense on diesel and electricity for agriculture.
Source: NRDC-SEWA Survey
A vast majority of sampled households (71%) spend up to 15 hours every week on collecting or procuring fuel to meet their energy needs (Figure 12). Like Nagano Math, procuring fuel consumes a significant time of households in Beraniya, particularly for the women and children.

PAGE 17IT TAKES A VILLAGE: ADVANCING HARIYALI CLEAN ENERGY SOLUTIONS IN RURAL INDIA
Figure 12 Average Time Spent on Fuel Procurement/Week, Beraniya
Hours/Week
All Fuels (Without LPG) - Time spent on all Collection/week in 2019, Beraniya
0
5
10
15
20
25
30
35
40 38
24
15
5 3
< 40(30, 40](20, 30](10, 20]< 10,
Nu
mb
er o
f Ho
use
ho
lds
Source: NRDC-SEWA Survey
Lighting and cooling solutions are the most commonly owned appliances in Beraniya (Figure 13). About two-thirds of the surveyed households either have ceiling fans or portable table fans while 31% do not own a cooling device. Total number of appliances owned by residents of Beraniya are lower than in Nagano Math which accentuates the difference in income levels in the two villages. As in the case of Nagano Math, switching to energy efficient fans and lamps offers significant energy savings potential. Cool roofs can help improve indoor thermal comfort at a very low cost.
Figure 13 Appliance Ownership, Beraniya
22%
86%
63%
13%
1%
8%
1%
2%
2%
0% 10% 20% 30% 40% 50% 60% 70% 80% 90% 100%
Bulb
LED Bulb
Ceiling Fan
Table Fan
Refrigerator
Smart Phone
Cooler/Tower Fan
Solar Lamp
Stated other
Percentage of Households
Ownership of Appliances in 2019, Beraniya
Source: NRDC-SEWA Survey
Given the very high summer temperatures in this part of the country, at least a few households (8%) are forced to employ other strategies like taking a bath and using hand fans to keep cool (Figure 14). Despite over two thirds of the surveyed households in Beraniya owning either ceiling or table fans their use as a cooling measure remains limited due to irregular electricity supply.

PAGE 18 IT TAKES A VILLAGE: ADVANCING HARIYALI CLEAN ENERGY SOLUTIONS IN RURAL INDIA
V. DISCUSSION AND PROPOSED INTERVENTIONS – POTENTIAL FOR REDUCING DRUDGERY, ENERGY EXPENSE, AND INTRODUCING CLEAN AND ENERGY EFFICIENT MEASURES
SEWA-NRDC’s experience in transitioning salt-farmers in the Little Rann of Kutch from diesel to solar pumps for salt productions offer lessons for developing sustainable village plans.40 Based on these experiences technical compatibility, financial viability, and skill development requirements for a seamless user-experience form the three key pillars of the village plans and proposed interventions.
Matching the intervention with household needs and priorities, such as reducing expense, increasing ease of use, and reducing air pollution, can help the solutions be successful. Since, households will likely find it difficult to invest in all options simultaneously because of high cumulative upfront costs involved, the plan envisages encouraging sequential investments. However, the adoption and transition to cleaner solutions listed below can be faster through enabling incentives and financial structures. Easy local availability of these solutions, locally skilled repairs and maintenance solutions, and household knowledge on proper operations and maintenance will further aid this transition.
Analysis of the survey, focused group discussions with communities, review of policies and case-studies, and SEWA’s inputs have helped identify interventions. These solutions will have the potential to reduce exposure to air pollution, energy expense, and human drudgery, and increase energy efficiency.
A. LIGHTING
Ownership of LED bulbs is high – 86% in both villages (Figures 7 and 13). However, the number of bulbs compared to the number of rooms is low in both villages.
In Nagano Math, more than 50% of the population has three or more rooms (Section VIII-Appendix B.2), however, only 30% have three or more LED blubs, whereas 24% of the households have one LED blub, while 31% of households have two (13% did not respond) (Section VIII-Appendix B.15). Despite a high LED ownership, 68% of the households also own and use incandescent bulbs (Figure 7). Reported use of kerosene is limited in Nagano Math – only 9% households use kerosene (Section VIII-Appendix B.21 and B.25).
Figure 14 Coping with Heat, Beraniya
Cooling Strategies, Beraniya
Do Nothing Sit Under a tree Sleep outside
Put water onthe �oor/bathe
Use hand fan No Responses
68%
24%1%
4%
1%
2%
Source: NRDC-SEWA Survey
For irrigation needs, farmers depend on rainfall (25%), or use water pumps running on electricity (35%), or diesel (16%) while about a third (34%) purchase water.

PAGE 19IT TAKES A VILLAGE: ADVANCING HARIYALI CLEAN ENERGY SOLUTIONS IN RURAL INDIA
On the other hand, in Beraniya, 54% have two rooms while only 39% have two LED bulbs and 23% have only one LED blub (14% did not respond) (Section VIII-Appendix B.2 and B.15). Typically, in Beraniya, one bulb is installed outside the house right next to the electricity meter-box as a part of the Saubhagya “Electricity for All” Scheme.41 Electricity supply in Beraniya is also intermittent (Section VIII-Appendix B.9). For indoor illumination households use alternate sources – 44% households reported kerosene use in Beraniya, mostly for lighting; and 22% use incandescent bulbs (Section VIII-Appendix B.21 and B.25, and Figure 13).
Reducing reliance on kerosene and incandescent bulbs can accrue multiple benefits to the households – lesser indoor air pollution, positive health impacts, better thermal comfort (since incandescent bulbs can lead to increase in indoor temperatures), and lower in electricity expense.
LED Bulbs
While households prefer LEDs, the reason for dependence on alternate sources of lighting are multiple. First, voltage fluctuations often cause bulbs, including LEDs, to blow out. Second, incandescent bulbs are locally available more easily and cheaper to replace than LEDs. Third, there is a limit on the number of subsidized LEDs a household can buy. Once this limit is crossed, they have to pay full cost for subsequent purchases.
Availability and Awareness
In both villages, LED bulbs are not locally available. Incentives to stock and sell LED bulbs in Common Service Centers (CSCs), electricity bill payment kiosks, and fair price shops or ration shops will help increase accessibility.42 This has been tried in a few states with some success.43
Designing standard infographics on cost benefits of LEDs over incandescent bulbs (Table 1) will help increase awareness and could potentially reduce reliance on alternatives which are cheaper in the short run.
Finance
Government programs for LEDs, have a limited quota per household. The central government’s LED demand aggregation program through EESL has helped bring down the costs of the bulbs nationally. Bulk procurement of LEDs at the district-level and distribution through the Public Distribution System (PDS), CSCs, self-help groups, and electricity kiosks can help bring down the costs further and increase accessibility.44 Option of micro-payments can help further
The analysis in Table 1 highlights that while the upfront cost of LED may be more, the expense on electricity is a fraction of an incandescent bulb.
Table 1 Comparison of Average Expense on Use of Incandescent and LED Bulbs in India
Incandescent Bulb LED**
Average Cost (`/unit) 15 150
Wattage (W) 100 9
Hours Used (Hrs/day) 10 10
Units Consumed Per Day (kWh/day) 1 0.09
Units consumed in a month (kWh/month) 30 3
Electricity Tariff* (`/kWh) 3.85 3.85
Cost of using appliance for a month (only electricity) (`/month) 116 10
Units consumed in a year (kWh) 365 33
Cost of using appliance for a year (`/year) 1,405 126
** Average cost of LED is based on what is typically available in the market. However, according to EESL the Ujjala program has helped bring down the prices of some LED bulbs to `70.
Sources: NRDC Analysis; *Jaipur Vidyut Vitran Nigam Limited, 2020.45
LED Bulb Outside a House in Beraniya

PAGE 20 IT TAKES A VILLAGE: ADVANCING HARIYALI CLEAN ENERGY SOLUTIONS IN RURAL INDIA
Skill Development
Incandescent bulbs are cheaper to replace in case of damage due to voltage fluctuations. One of the reasons why households continue to use them despite owning LEDs. Including LED repairs programs in local skill development centers can help in creating skilled technicians and potentially help in reducing the replacement costs of LED bulbs.
Solar Lamps
59% of households in Nagano Math own and use solar lamps (Figure 7). Since there is limited outdoor illumination at night, solar lamps are critical for activities post sunset. Ease of access to reliable models and repairs services has helped sustain the use of solar lamps in Nagano Math.
On the other hand, only 2% of households own solar lamps in Beraniya (Figure 13). During discussions in Beraniya we found that several households purchased solar lamps, albeit several years back, but were unhappy with its costs and performance. They also faced difficulty in getting their lamps repaired. Most households chose not to invest in another lamp because of unsatisfactory past experience, limited availability in local markets, and unreliable post-sale repairs and maintenance services. Since electricity supply is intermittent in Beraniya and use of kerosene for lighting higher, solar lamps provide a sustainable and viable alternative if these issues are addressed.
Availability and Awareness
Central government’s Solar Study Lamp scheme, which ended in 2019, distributed solar lanterns in five states – Assam, Bihar, Jharkhand, Odisha, and Uttar Pradesh.46 The scheme covered areas which had more than 50% un-electrified households, as per census, 2011, focusing on blocks with more than 50% dependence on kerosene. Higher dependence on kerosene highlights that electricity supply is either intermittent or unavailable to meet household needs. Extending the “block-level kerosene dependence” criteria across the country, can help in increasing the use solar lamps instead of kerosene.
Even in areas where there is reliable electricity supply, households need a light for stepping out of the house after sunset given limited streetlighting. Households in Nagano Math use solar lamps in their animal shed for illumination at night, as emergency lights, and for travel or work at night. These also help improve the safety of night travel.
Currently, there are no standards available for solar lamps. Introducing voluntary standards and certification and creating consumer awareness can weed out inferior technology and improve consumer choices. While there are multiple models and price ranges of solar lamps, options available at the village- and block-level are limited. As in the case of LEDs, district administrations can potentially help reduce the costs through bulk procurement. Alternately, CSCs, VLEs, electricity bill payment kiosks, and fair price shops can be incentivized to stock and sell solar lamps in partnership with private companies or individually. Increase in use of solar lamps could also encourage local shops to stock reliable models.
Finance
In Beraniya, households on an average spend `960 annually on kerosene. But these payments are made in small installments of around `80 per month to purchase kerosene. Solar lantern models can start from as low as `500. While an upfront payment can be challenging for a few households – highlighting the cost savings can encourage them to switch.
Micro-payments for individual or bundled appliance loans can be attractive options for households. Another financing option which can help with increasing the use of solar lamps is electricity bill financing. This can be offered to households with regular repayment history coupled with increased availability of appliances. This has worked well in the case of LED bulb penetration.
Building on community networks, the ration shops or CSCs can be incentivized to extend appliance-loans during the point of sale coupled with micro-payment options. Micro-credits through self-help groups linked to banks, such as the ones organized by SEWA, will also be helpful in making solar lamps more affordable to households.
Skill Development
In the case of Beraniya, households stopped using solar lamps because of unsatisfactory past experience and inability to get them repaired. Training households and local electricians in proper care and developing repair centers will help in sustaining use of solar lamps and create local employment opportunities.

PAGE 21IT TAKES A VILLAGE: ADVANCING HARIYALI CLEAN ENERGY SOLUTIONS IN RURAL INDIA
Voltage Stabilizers
Voltage stabilizers are an expensive investment for households. However, voltage fluctuations occur often in Nagano Math. In Beraniya, in addition to intermittent supply of electricity, voltage fluctuations are more frequent than Nagano Math. These fluctuations often burn out appliances, as in the case of LED bulbs. As households invest in bigger or more expensive appliances such as televisions, refrigerators, or even efficient fans, voltage stabilizers will help prevent appliance burn out.
Voltage stabilizers will be particularly useful for households that have recurring expenses on appliance repairs or replacement.
Availability and Awareness
Awareness programs on the need for voltage stabilizers, particularly at the point of appliance sales. Similar venues and institutions as those involved under LEDs and incandescent bulbs can be roped in to provide additional information as well as an option to purchase.
Financing
Households will likely find, both, purchase and installation of voltage stabilizers expensive, in the absence of incentives. However, selling voltage stabilizers as a part of a bundle of appliances linked to micro-payment options can encourage households to invest in them. Depending on technical suitability, voltage stabilizers could also be shared between two or three households to reduce costs.
Skill Development
Including training on repairs and maintenance of stabilizers will help provide local solutions to households.
B. COOLING
Summer temperatures in both villages are often higher than 45° Celsius (C). Thus, space cooling is an important requirement.
In Nagano Math, 90% of households own at least one ceiling fan (around 40% have two or more ceiling fans) (Section VIII-Appendix B.17). Households use them for an average 14 hours a day. Other cooling appliances used in Nagano Math are table fans – 48% of households, with an average use of about 9 hours per day, and small-coolers or tower fans (around 3% have them) (Section VIII-Appendix B.17). A major cooling method for households is to switch on a cooling appliance (Section VIII-Appendix B.5). However, most of these appliances are old and inefficient. No household reported owning an efficient fan, table fan, or cooler.
On the other hand, ownership and use of cooling appliances is lower in Beraniya. Around 63% households have at least one ceiling fan (only 8% of households have two or more ceiling fans) used on an average for 7 hours in day (Section VIII-Appendix B.17). 13% have table fans used for about 4 hours on average per day, and only 1 household reported owning a cooler. 31% households in Beraniya reported that they did not own any cooling appliance. Cooling methods for Beraniya largely include sitting under a shaded area, sprinkling water on the ground (Section VIII-Appendix B.5). Similar to Nagano Math, no household owns an efficient fan (ceiling or table fan).
Solar Lamps Display and Information at SEWA Offices

PAGE 22 IT TAKES A VILLAGE: ADVANCING HARIYALI CLEAN ENERGY SOLUTIONS IN RURAL INDIA
Cooling needs in both villages are likely to increase providing an opportunity to introduce efficient appliance and passive cooling measures.
Efficient Fans
A 5-star rated energy efficient fan is twice as expensive as a regular, unrated fan. But analysis indicates that the annual cost of using the efficient fan is less than half of the unrated one. In addition, households will save expense on frequent repairs required for the old fans. For example, around 50% of surveyed households in Nagano Math reported annual expenses on repairing ceiling fans.
On the other hand, no program currently exists for table or pedestal fans. These types of fans are often more suited for low-income rural housing structures with low ceilings, thatch or tin roofs, and can provide mobile cooling option.
Table 2 Comparison of Average Expense on Use of Regular Fans and LED Fans in India
Regular Fan 5 star rated Fan
Average Cost (`/unit) 1200 2600
Wattage (W) 75 35
Hours Used (Hrs/day) 12 12
Units Consumed Per Day (kWh/day) 0.9 0.42
Units consumed in a month (kWh/Month) 27 12.6
Electricity Tariff* (`/kWh) 3.85 3.85
Cost of using appliance for a month (`/Month) 103.95 48.51
Units consumed in a year (kWh/Year) 329 153
Cost of using appliance for a year (`/Year) 1,265 590
Source: NRDC Analysis; Bijli Bachao, 2017; *Jaipur Vidyut Vitran Nigam Limited, 2020.47
House in Beraniya

PAGE 23IT TAKES A VILLAGE: ADVANCING HARIYALI CLEAN ENERGY SOLUTIONS IN RURAL INDIA
Availability and Awareness
The Bureau of Energy Efficiency has a voluntary labelling program for ceiling fans. At the rural level, however, availability and knowledge about efficient fans is limited. Conducting an awareness program on the economics and benefits of efficient fans targeted for rural households in important in increasing its use. Stocking and promoting energy efficient fans at Common Service Centers and electricity bill payment kiosks, and fair price shops will also help increase accessibility.
BEE can also consider introducing a voluntary star-labelling program for table and stand fans as these are better suited for low-income housing structures.
Finance
Like for other appliances discussed earlier, bulk procurement of energy efficient fans through EESL or at the district level can help reduce costs of the ceiling-fans. This will be particularly helpful for households which currently do not own the appliance.
In several urban areas, electricity distribution companies (discoms) offer incentives to household consumers to replace their inefficient fans with more efficient models – such as discounts on product swaps. Extending discounted product swap options to rural households will it more affordable for them to switch. Other financial measures which can enable households to purchase affordable fans include on-bill (electricity) financing for those households with regular payment history; appliance micro-credits through self-help groups linked to banks; bundle efficient appliance loans at the point of sale, can help make efficient fans within reach of rural low-income households.
Skill Development
Installing and repairing efficient ceiling fans are important post-sales services which will help improve consumer experience. Ensuring skill development trainings that cover efficient fans, in addition to other appliances will help increase availability of local technicians.
Cool Roof Solutions
Passive cooling measures such as cool roofs will help improve indoor thermal comfort and reduce cooling requirements of households. This will be particularly useful for houses with tin and cement roofs.48 There are different kinds of cool roof technologies such as roofs coated with solar reflective paint, membrane cool roofs, tiled cool roofs, and green roofs.
According to studies, coating a roof with solar reflective paint can keep indoor temperatures lower by 2 to 5°C (3.6 - 9°F) compared to traditional roofs.49 Cool roofs also have benefits of reducing exposure to extreme heat conditions. We propose, solar reflective paint as a cost-effective solution for rural households.
In Nagano Math, 69% of households (56% with cement roofs and 13% with tin roofs) can benefit from this solution (Section VIII-Appendix B.2). On the other hand, cool roofs will be applicable to 12% of households in Beraniya which have cement (5%) or tin roofs (7%) (Section VIII-Appendix B.2).

PAGE 24 IT TAKES A VILLAGE: ADVANCING HARIYALI CLEAN ENERGY SOLUTIONS IN RURAL INDIA
Availability and Awareness
There are limited examples of interventions on cool roof paints and technologies at the rural level. The cities of Hyderabad and Ahmedabad initiated pilot cool roof programs in 2017 and 2018. The city of Ahmedabad promotes cool roofs through its health departments and has annual cool roof targets which are met through CSR tie-ups and some budgetary support from the municipal government.
Learning from the experiences of these two cities, state and district administrations can conduct citizen awareness campaigns, build ties with business, and have pilot cool roofs in government buildings, schools, community areas, and fair price shops. These pilots, coupled with information, education, and communication materials can help generate interest among households.
On a pilot basis, households in villages can also be painted as demonstration. Based on the response, CSCs, fair price shops, and local vendors can be roped in to sell cool roof paints.
Finance
Typically, cool roof coatings (paint) cost between `20-`40 per sq. ft. In the absence of any government or corporate programs, micro-finance can be viable alternative for cool roof solutions.
However, in the long-run integrating cool-roofs and green building design principles in central government programs on housing for all – Pradhan Mantri Awas Yojana – can help in ensuring that new houses are built incorporating such principles. State-level cool roof policies focusing on both urban and rural areas with support for low-income communities can help more households adopt this measure.
Skill Development
Coating roofs with solar reflective paint will require only information on how to maintain a roof. However, for other models such as membranes, training on how to install and maintain them will be useful to strengthen local capacity.
C. AGRICULTURE
There are three cropping seasons in Nagano Math – monsoon (kharif), winter (rabi), and summer. However, fewer farmers grow crops during the summer due to water availability challenges. All farmers have access to irrigation sources and 24% of farmers even purchase water from other farmers. Most farmers use pumped irrigation even during the kharif season. Pumped water requirement is the highest in summer, followed by rabi, and kharif (assuming normal monsoons). Reported average annual expense on electricity for irrigation is around `17,000, diesel is around `10,000, and on purchasing water is around `12,000. Majority of the farmers in Nagano Math use between 5 – 7 hp pumps.
Beraniya has two cropping seasons – kharif (monsoon) and rabi (winter). However, only those farmers who have access to irrigation resources farm during rabi. Over 25% of the households are solely dependent on rain for their irrigation needs, i.e. farm only during kharif. Even for famers with two cropping cycles, reliance on pumped irrigation is lesser in Beraniya during the kharif months compared to Nagano Math. Consequently, their expense on irrigation during these months is also lower. Reported average expense for irrigation on electricity is `9000, diesel is around `1600, and around `10,000 on purchasing water. Knowledge about pump size was limited in Beraniya. Assuming that the reported responses are correct, 50% of the farmers who responded to the question use a 2 hp pump.
House with a Tin Roof in Beraniya
Farming in Nagano Math

PAGE 25IT TAKES A VILLAGE: ADVANCING HARIYALI CLEAN ENERGY SOLUTIONS IN RURAL INDIA
Farming in Beraniya
Sustainable Use of Solar Pumps for Agriculture
Agriculture in India primarily relies on groundwater for irrigation. About 89% of the total groundwater extracted in India is used for irrigation.50 The use of groundwater for irrigation in South-Asia has doubled between 40 years from 1973-2013 and about 90% of this has been accrued to the spread of groundwater irrigation using private pumps.51
The national compilation of groundwater resources in India mentions that total groundwater extraction at all-India level is already very high at 63.33%.52 Of the total 6,881 units assessed by the government in 2017, 1186 were over-exploited and 313 were critical. Improvement in methods of irrigation increase the need to address groundwater issue.
High running cost of diesel pumps and frequent power outages have typically led to lesser ground water use. As solar pumps are used for irrigation, the marginal cost of pumping water becomes negligible. This could lead to excessive groundwater depletion, particularly in areas with low water recharge rates.53 Unrestricted expansion of groundwater use could pose a threat to sustainability of agriculture in the region.54
To prevent injudicious exploitation of groundwater resources due to excessive pumping, various policy recommendations have been suggested –
• Pump sharing – A solar water pump shared between 2-4 farmers on rotational basis could prevent overuse of groundwater as the other farmers waiting to irrigate their farms would want to assemble the equipment on their farms as soon as one has completed irrigating his field.55
• Determine the size of pump to use – Bigger is not always better. Assessing the size of the pump required by farmers based on groundwater availability, cropping patterns, and precipitation is difficult but important. This can also help reduce groundwater use. For example, in areas with high water table, micro-pumps (smaller than 1 hp) can be used for horticulture.56 But this approach is data intensive and requires significant technical support for farmers before purchase.
• Micro irrigation – Drip irrigation and other efficient irrigation technologies may limit the amount of water used to irrigate fields.57 For instance, the Rajasthan Solar Water Pumping Project successfully deployed micro-irrigation with solar pumps. Under this project, the state government provided farmers with capital subsidies to buy solar water pumps on the condition that at-least 0.5 hectares of their landholding would be irrigated through micro irrigation technologies.58 Farmers in Nagano Math and Beraniya do not use micro irrigation technologies.
• Power buyback – In places where solar panels are close to electric grids, the distribution companies can buy the solar power generated by farmers when it is not being used to irrigate the farms. The farmers get an additional income per unit of power they sell, which effectively puts a price on excess water extracted as an opportunity cost.59 International Water Management Institute in partnership with Tata Trust piloted one such project –Solar Power as Remunerative Crop (SPaRC – piloted in Anand district, Gujarat. However, power buyback has some limitations including institutional challenges, transactional costs and monitoring costs.60

PAGE 26 IT TAKES A VILLAGE: ADVANCING HARIYALI CLEAN ENERGY SOLUTIONS IN RURAL INDIA
Solar Water Pumps (and Micro-Irrigation)
Awareness and Availability
In both villages, farmers are aware about solar pumps. But most do not know about the provisions of the PM Kusum scheme, the state-offered incentives for solar pumps, and the way to access these schemes. This requires wide-spread and grassroots publicity of the solar pump schemes by involving agri-extension workers, farmer producer organizations, and grassroots groups such as SEWA to ensure that the programs are well known by the farmers.
Households also raised concerns over the quality of solar pumps and poor maintenance services based on negative prior experiences of some farmers from the nearby villages. Such experiences can derail transition. Demonstration projects at the village-level along with an easily accessible and strong grievance redressal mechanism can help build farmer confidence.
Finance
Replacing existing diesel and electric pumps with solar water pumps can help farmers reduce costs reduce electricity supply losses, and emissions in the long run. Bundling micro-irrigation with solar pumps can also be considered. This may drive up the investment cost, but could rationalize labor costs for farmers, while having a positive impact on yield and water use efficiency in the long run.
The benchmark cost of a 5 hp solar pump without subsidy is between `280,000 to `330,000.61 In addition, based on the location of the solar panels and pumps, farmers have the option of purchasing universal solar pump controller (USPC) to increase the utility of the solar PV system installed for a solar water pump. i.e. use the solar PV for other appliances such as solar driers.62 A UPSC system for a 5 hp costs between `42,000 – `50,000.63 The KUSUM scheme offers 30% central subsidy and 30% state subsidy, a loan for 30%, and 10% upfront payment by the farmer. Thus, the upfront payment for a farmer wanting to purchase a 5 hp solar pump costing `330,000 will be around `33,000 with a loan for `99,000. In addition, the farmer will have to bear installation costs, labor costs, and any taxes not covered by the subsidy. Component C of the scheme also provides for the grid-connectivity in select areas which meet technical conditions, offering with fixed tariffs and an annual ceiling for sale of excess electricity generated by the solar panels. Despite these scheme provisions, there might be some barriers in the uptake of pumps. Public sector banks could offer the most competitive interest rates and can be a good option for financing the 30% loan component. However, co-operative banks, non-banking financial institutions, and micro-finance institutions can also be other potential lenders.
Irrigation for Agriculture Micro-Solar Water Pumps in Bihar, Photo Credit: Nikhil Goveas

PAGE 27IT TAKES A VILLAGE: ADVANCING HARIYALI CLEAN ENERGY SOLUTIONS IN RURAL INDIA
First, upfront payment for an individually owned pump will be a challenge. Providing an additional loan for the upfront payment can make it easier. A similar provision was made for one of the phases of solar pumps for salt-farmers where the 10% required as down payment for the solar pump loan was also given as a loan from a different bank.64 This also helped financiers share the risk of lending.
Second, farmers with existing pumps will need to be convinced about the economic savings that can accrue to them. These will differ based on the type of pump a farmer currently uses. For instance, a loan of around `130,000 can be paid back with annual instalments of around `30,000 in seven years (at 14% interest rate per annum). Depending upon a farmer’s existing annual expense on diesel, electricity, or purchasing water for irrigation, the ownership model and loan conditions will need to be tailored. For instance:
• Expense on Diesel Pumps: For farmers in Nagano Math with diesel expense and multiple cropping seasons, shifting to individually owned solar water pumps will prove beneficial. In the case of Beraniya, diesel expense is significantly lower, and in the short-run solar pumps can prove to be an expensive investment. However, group ownership of pumps for such households is a good alternative.
• Expense on Electricity Pumps: Expense on electricty for agriculture can be quite low for some farmers in both villages, particularly in Beraniya. Such farmers are likely to be more reluctant to invest in solar pumps. In such cases, grid-connected solar pumps could be viable. This will provide an added monetary benefit through sale of electricity. In addition, assured and stable electricity supply will help farmers eliminate dependence on intermittent agricultural electricity supply and reduce expenses on pump repairs due to voltage fluctuations. But grid-connected solar pumps typically require participation from 70% farmers on the electricity feeder and, at times, giving-up their electric irrigation connection for 25 years. Ensuring participation from all the required percentage of farmers has been challenging in several areas.65
For farmers incurring higher electricity expenses, transitioning to solar pumps will be beneficial. In the near future, the structure of subsidy payments and rates of electricity for agriculture are expected to change. The
Site-Survey and Solar Pump Installations in Gujarat
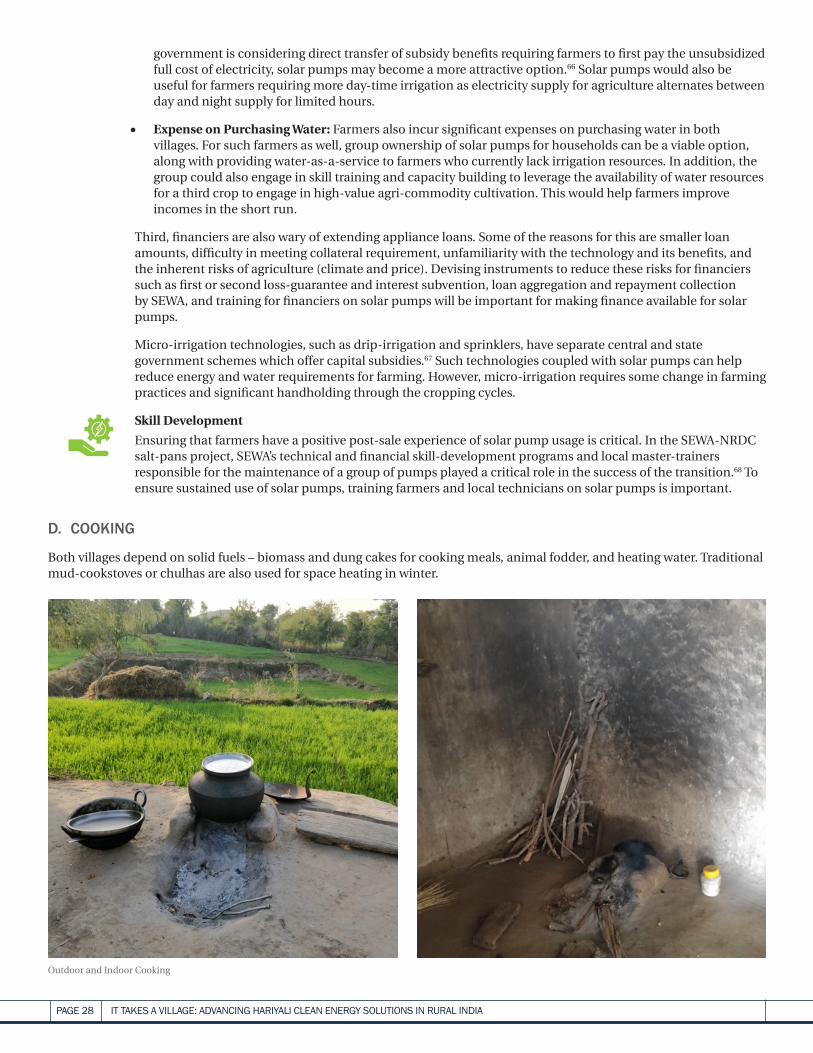
PAGE 28 IT TAKES A VILLAGE: ADVANCING HARIYALI CLEAN ENERGY SOLUTIONS IN RURAL INDIA
government is considering direct transfer of subsidy benefits requiring farmers to first pay the unsubsidized full cost of electricity, solar pumps may become a more attractive option.66 Solar pumps would also be useful for farmers requiring more day-time irrigation as electricity supply for agriculture alternates between day and night supply for limited hours.
• Expense on Purchasing Water: Farmers also incur significant expenses on purchasing water in both villages. For such farmers as well, group ownership of solar pumps for households can be a viable option, along with providing water-as-a-service to farmers who currently lack irrigation resources. In addition, the group could also engage in skill training and capacity building to leverage the availability of water resources for a third crop to engage in high-value agri-commodity cultivation. This would help farmers improve incomes in the short run.
Third, financiers are also wary of extending appliance loans. Some of the reasons for this are smaller loan amounts, difficulty in meeting collateral requirement, unfamiliarity with the technology and its benefits, and the inherent risks of agriculture (climate and price). Devising instruments to reduce these risks for financiers such as first or second loss-guarantee and interest subvention, loan aggregation and repayment collection by SEWA, and training for financiers on solar pumps will be important for making finance available for solar pumps.
Micro-irrigation technologies, such as drip-irrigation and sprinklers, have separate central and state government schemes which offer capital subsidies.67 Such technologies coupled with solar pumps can help reduce energy and water requirements for farming. However, micro-irrigation requires some change in farming practices and significant handholding through the cropping cycles.
Skill Development
Ensuring that farmers have a positive post-sale experience of solar pump usage is critical. In the SEWA-NRDC salt-pans project, SEWA’s technical and financial skill-development programs and local master-trainers responsible for the maintenance of a group of pumps played a critical role in the success of the transition.68 To ensure sustained use of solar pumps, training farmers and local technicians on solar pumps is important.
D. COOKING
Both villages depend on solid fuels – biomass and dung cakes for cooking meals, animal fodder, and heating water. Traditional mud-cookstoves or chulhas are also used for space heating in winter.
Outdoor and Indoor Cooking

PAGE 29IT TAKES A VILLAGE: ADVANCING HARIYALI CLEAN ENERGY SOLUTIONS IN RURAL INDIA
In Nagano Math, only 34% households report active LPG connections. Among those who use LPG, over 58% use two cylinders or less per annum. To put this in perspective, a family of four uses nine cylinders per year on an average. Only 15% of households that use LPG, use eight or more cylinder per year.
In Beraniya, 48% report active LPG connection. However, the use is much lower than Nagano Math. 75% of those who have LPG connections use two or less cylinders per year. While 12% use between 3-4 cylinders. No household reported using more than four cylinders. This indicates a greater dependence on solid fuels and higher exposure to indoor air pollution.
Subsidies exist for LPG these are transferred directly to beneficiary accounts post LPG purchase. Even though households cumulatively pay a lower amount (post transfer of the subsidy amount), most households in the survey perceived paying the full price of the cylinder. This indicates that households often do not realize that the transfer has taken place. In discussions conducted with women, reported difficulty in making lump upfront payment for the full cylinder cost. Reported delays in filling their refill orders, lack of doorstep delivery were other concerns. Many households stopped purchasing LPG once the market price of LPG reached `900, despite the subsidy.
Most households, largely women and children, spend several hours on firewood collection but incur limited to no expense on firewood. Some households in both villages reported an average annual expense of over `4,000 in Nagano Math and `2,300 in Beraniya on firewood. Thus, even though LPG is a cleaner fuel compared to solid fuels, concerns of household supply surety, upfront lumpy payments, and the high number of cylinders required to meet all cooking and heating needs have made it a difficult option for households. For cleaner cooking options such as biogas, LPG, and induction stoves have potential in both villages.
Biogas for Cooking
Most households in both villages have at least 2 heads of cattle. Based on survey results, average annual dung-cake use in Beraniya is 1365 kgs and 1240 kgs in Nagano Math. Biogas for cooking is a potential alternative in both villages, particularly for those households in Nagano Math which have a higher annual expense on firewood. In addition, Nagano Math also has a milk collection center in the village indicating a possibility that households may increase their investment in cattle.
Cattle Shed in Nagano Math (Left); Cattle in Beraniya (Right)

PAGE 30 IT TAKES A VILLAGE: ADVANCING HARIYALI CLEAN ENERGY SOLUTIONS IN RURAL INDIA
Awareness and Availability
Several households are aware that biogas from animal waste can be used for cooking but are hesitant to invest because of insufficient user experience. However, knowledge about government programs is limited.
The government has two programs on biogas for both, the household-level – New National Biogas and Organic Manure Program – and community-level– Gobardhan.69 Demonstration projects and focused information campaigns on the government programs covering the level of subsidies, provisions, types of bio-gasifiers, and financing schemes available for both household and community level through the gram panchayat, self-help groups, or entrepreneurs can help improve user experience and create demand.
Finance
The upfront investment required for a household-level bio-gasifier is high. A prefabricated variety with 2 cubic meter per day gas capacity costs around `15,000 post central and state government subsidies.70 Despite the higher upfront cost, households can help pay off a loan for the bio-gasifier in small monthly installments of around `500 in 3-4 years. In addition, the slurry from the bio-gasifier is an excellent bio-fertilizer filled with anerobic bacteria that can reduce demand for chemical fertilizers. Public sector banks, co-operative banks, and micro-finance banks can be potential lenders for implementing household-level biogas plants.
Skill Development
Local servicemen and household training on repairs and maintenance of biogas units will be required.
Potential for Other Livelihoods Appliances
Our study indicates that other livelihood appliances are also suitable in the pilot villages. Since these appliances have a higher investment cost and limited user experience, pilots or test-use over a few months to assess suitability will be useful. While CSR or grant based funding can be used for the test another alternative to increase awareness and allow households to test these appliances is through SEWA’s “technology library.”
1. Solar Flour-Mill: Both villages grow wheat, maize, and millets. One household each in Nagano Math and Beraniya among the surveyed households own flour mills with meager commercial sales around `2,500 or less per month. Expense on electricity or diesel to run the flourmill motor curtails their use. In addition, these costs are typically passed on to the consumers making it expensive for marginal farmers to get their produce milled. A solar mill can help reduce operational expenses and provide a cheaper alternative to other farmers.
A flour mill with a 2 hp motor and 3.5 KW solar panel costs around `3,50,000.71 Without adequate increase in business, this will be an expensive investment. Two models of ownership are possible – collective/group owners or individual entrepreneurs. The SHG can connect to SEWA’s RUDI network - a rural distribution network for small and marginal farmers to provide multiple employment opportunities and build up an integrated food value chain – in addition to catering local needs.72
2. Solar Oil Mill: 12% of farmers in Nagano Math grow castor which is an oil seed. An oil mill can help in increasing the value of agricultural produce and help in income diversification. The oil can be sold locally and through SEWA’s RUDI network. However, currently, there is no oil mill in the village. Testing an oil mill will help understand its suitability for the crop and potential to grow a business in the area.
3. Solar Milk Chiller: Nagano Math has a milk collection center which relies on grid electricity and diesel back-up. Retrofittable solar chillers with thermal storage system (TSS) for cooling during non-solar hours back-up can help reduce reliance on grid and eliminate diesel use and expense completely.73
4. Electric 3-wheelers: In both villages, households depend on diesel-run three-wheelers or private shared-taxis for travelling to the block center or large-markets. In case of private taxis, one needs to walk over a kilometer to reach motorable roads, to secure a seat in crowded shared taxis. Electric three-wheelers with charging stations can help meet rural mobility needs and improve last mile connective. Central government programs such as Faster Adoption and Manufacturing of Electric Vehicles program (FAME II) and state government incentives such as the one offered by the Gujarat government focus on urban mobility solutions. However, extending these benefits to rural areas and clubbing with CSR initiatives will help provide sustainable mobility solutions and livelihood alternatives.
Incentives to invest in clean-energy based appliances through the state and national rural livelihood missions and the governments’ programs on promoting agro-processing can help in increasing adoption these technologies.

PAGE 31IT TAKES A VILLAGE: ADVANCING HARIYALI CLEAN ENERGY SOLUTIONS IN RURAL INDIA
Solar Street Lights in Assam, Photo Credit: ShutterStock
Community-Level Interventions
Community spaces in both villages also lack access to clean energy services. For instance, the primary school in Beraniya has no electricity. There are no streetlights in either villages. Financing community interventions is often challenging. Typically, expense for community and village-level schemes come from the local gram panchayat’s, often constrained, budget, in conjunction with available block- and district-level initiatives and government programs. But clean energy interventions in community spaces can also serve as good demonstration sites for the village. CSR funds can also play a role in furthering these solutions.
Some priority measures are listed below.
1. Solutions for Government Schools: Clean energy solutions at schools can help provide much needed access to lighting, cooling, and drinking water facilities. In addition, these can also provide students and teachers with training opportunities. Four critical solutions will be useful – first, rooftop solar coupled with LED lights and efficient fans for schools which do not have electricity connections or reliable electricity connections. Second, cool roof solutions will help increase the thermal comfort for students and teachers. Third, solar pump for meeting the school’s water needs. And fourth, connecting this pump to solar-based water purification system in schools.
2. Solutions for Health Care Centers: There is a strong need to strengthen grassroots health infrastructure. Clean and energy efficient interventions can play a role. These centers can also function as rural centers for messaging and awareness building on air pollution and heat health as well. In addition to the four measures suggested above for schools, community health care centers can also benefit from decentralized cold storage.
3. Streetlights: There are no streetlights within both villages. This makes travel at night riskier. Streetlights can help improve safety at night-time, particularly for women.74 They can also help in improving the use of public spaces and can lead to economic activity in the village post sunset.75 Government programs such as the Atal Jyoti Yojana (now suspended) promote rural solar street lighting.76
Post-installation monitoring of operations and maintenance of these interventions is particularly important for community solutions. This can be done through a priori identification of roles and budget for maintenance. In addition, skill development programs are needed to ensure availability of local skilled technicians.
School in Beraniya with No Electricity Connection
VI. POTENTIAL IMPACT OF GREEN VILLAGE PLANSWe calculated energy savings per year for various appliances – primarily lighting and fans - that are currently in use in the villages versus the most efficient ones available in the market.77 Preliminary analysis indicates that switching to more efficient appliances, just 100 fans and 200 LED bulbs in a village, can save approximately 84 MWh of electricity every year per village. This is equivalent to 77 metric tons of avoided carbon dioxide (CO
2) emissions (or the carbon sequestered by growing 1,200
tree saplings for 10 years). Additionally, switching 50% of diesel water pumps to solar and reducing 80% of kerosene use by adopting solar lighting can avoid another 8 tons of CO
2 emissions per village every year.78
Factor Key Assumptions
Appliance energy savings 100 fans and 200 lamps in each village are replaced with five star rated fans and LED 9W lamps respectively.
Savings on diesel and kerosene
Assuming 50% of diesel use and 80% of kerosene use can be avoided by switching to solar water pumps and solar lighting respectively.Averaged across the two villages based on actual number of households consuming diesel and kerosene.
Emission Conversion factors Based on Central Electricity Authority 2018, and US Environment Protection Agency (EPA), 2020.79
Air pollution Based on Mittal, M.L., Sharma, C. & Singh, R. 2014.80

PAGE 32 IT TAKES A VILLAGE: ADVANCING HARIYALI CLEAN ENERGY SOLUTIONS IN RURAL INDIA
Scaling these energy plans to 100 similar villages, a mere fraction of India’s over 600,000 villages, can potentially avoid CO2
emissions of nearly 8,500 metric tons every year.81 Moreover, implementing and scaling green village plans will have beneficial impacts beyond just energy and cost savings.
Switching just one village to more efficient ceiling fans and lighting would avoid adding 418 kg of sulphur dioxide (SO2) and
168 kg of nitric oxide (NO) due to electricity savings – two major sources of air pollution – into the atmosphere. Cleaner cooking also has a significant impact on indoor air pollution from solid biomass burning. As revealed by the surveys, the households spend a considerable time in procuring their energy sources and water. Switching to cleaner efficient and cleaner sources can reduce drudgery, and further improve livelihood and well-being. It is said that India lives in its villages. Greening India’s villages would have impacts hard to quantify but potentially transformative for the entire nation.
VII. SUMMARY GREEN VILLAGE IMPLEMENTATION PLAN Implementing clean and energy efficient solutions to meet productive and domestic use requirements will require extensive community mobilization; coordination between multiple district, state, and central government bodies; and connecting the communities with multiple public and private companies (see Section VIII-Appendix C for a snapshot of different actors involved). SEWA and NRDC aim to focus on creating a robust ecosystem to ensure that communities, households, and local entrepreneurs continue to choose clean and efficient solutions to meet their energy needs. This includes:
• Strengthening “availability and awareness” by conducting awareness campaigns about the technologies and government programs and bolstering local distribution and maintenance of technologies
• Developing financial solutions suitable to the needs of the community and improving ease of access to financial Conducting skill development training for both users and local service persons to ensure seamless user experience.
Here are some suggested elements for implementing the Hariyali Green Village plans.
SNAPSHOT FOR IMPLEMENTING GREEN VILLAGE ENERGY PLANS
Efficient Appliances – LEDs, Efficient Fans, Voltage Stabilizers, Solar Lamps • Awareness program on efficient appliances for households – SEWA, NRDC, Local and state officials
− Identify households interested in bundled and/or individual appliance purchase
• Financing
− Determine household requirements to access government programs and fill necessary gaps
− Financing – individual appliance and bundled options
• Pay-as-you go model
• Bundled loans with micro-payment structures
• SEWA Bank, other financiers, and micro-finance institutions
• Skill Development
− Training the trainers
− Training community and local service providers on operations, repairs, and maintenance
• Supply-chain: Strengthening local availability of reliable products either through government shops, Community Service Centers, or SEWA members
Cool Roofs • Awareness programs on cool roofs
• Identify interested households
• Request for proposals for tenders
• Possible CSR interventions for cool roof solutions
• Balance financing – SEWA bank, micro-finance institutions

PAGE 33IT TAKES A VILLAGE: ADVANCING HARIYALI CLEAN ENERGY SOLUTIONS IN RURAL INDIA
Implementing livelihood solutions with a focus on agriculture • Solar Pumps and micro-irrigation – Community, SEWA, and NRDC
− Awareness program on solar pumps
− Identify interested households for individual and group ownership
− Irrigation Source
• Location and type of irrigation source – borewell or well
• Determine size and type of pump – This depends on multiple factors such as the type of irrigation source, depth of water table, area to be serviced, crops grown, irrigation practices, and number of users.
• Suitability of different micro-irrigation practices
− Financial Access – SEWA Bank, State and Central Governments, Financial Institutions
• Applicability of KUSUM program – state and central subsidy schemes
• Applicability of central government schemes on drip-irrigation
• Determine household requirements to access government programs and fill necessary gaps
• Balance financing from SEWA bank, public sector banks and micro-finance institutions.
• Developing financing solutions and risk mitigation instruments to lend to farmers
• Prepare loan documents for requirement for balance amounts
− Request for proposals for solar pump manufacturers with local presence
− Implementation
− Skill Development – solar pumps & micro-irrigation – SEWA, Community, State agriculture and renewable energy departments, skill development corporation, NRDC
• Connecting with agri-extension workers and institutions
• Developing periodic training modules
• Training the trainers on use of solar pumps for different types of agriculture
• Training community on operations, repairs, and maintenance
• Pilot for Other Livelihood Appliances – SEWA, Community, NRDC, and NISE
− Feasibility assessment
− Identification of demonstration opportunities and interested companies
− Determining financing avenues
• CSR funds
• Rental models
− Developing business and ownership models
− Training for use of technology
− Periodic feedback on usage experience
Community Interventions • Priority to solarize primary health care
centers and schools
• Gram panchayat and district administration budgets for proposed interventions
• Possible CSR interventions for community resources
• Community willingness to pay for services particularly drinking water systems
• Determine oversight of resources, budget for O&M activities, and O&M schedule.
House with a Small Solar Panel in Beraniya

PAGE 34 IT TAKES A VILLAGE: ADVANCING HARIYALI CLEAN ENERGY SOLUTIONS IN RURAL INDIA
APPENDICESA) APPENDIX: SURVEY QUESTIONNAIRE The questionnaire was translated to Gujarati and Hindi. Responses were recorded in local language and translated back to English.
BASELINE – DOMESTIC AND PRODUCTIVE USE ENERGY CONSUMPTION SURVEY
Name of the respondent Surveyor name
Village and State Date
Age of respondent (check one) ☐1:18-30 ☐2: 31-45 ☐3: 46-60 ☐4: Over 60Household (Survey) number
1. DEMOGRAPHIC
1.1 Total number of family members
1.2 Number of children (under 18) living in the house
1.3 How many children of school-going age don’t go to school?
1.4 Number of earning members
2. HOUSING CHARACTERISTICS
2.1 Floor type ☐1. Mud-floor ☐2. Cemented/Plaster ☐3. Tiled
2.2 Roof type ☐1. Tin ☐2. Roof shingles/tiles ☐3. Cement
2.3 Wall type ☐1. Mud-coated ☐2. Brick ☐3. Cement
2.4 Number of rooms
2.5 For household water needs ☐1. Piped water at home ☐2. Own hand-pump/Well ☐3. Other
If answer to 2.5. is Other, where do you get water from, and how far is it?
Source:
Distance:
3. EXPENSES
3.1. How much is your expenditure on household needs in a typical month?
3.2. What are your top three expenses in a month?
1.
2.
3.
3.3. How much does your household save per month or per year? /month OR /year
3.4. What is your household’s income in a typical month or year? /month OR /year

PAGE 35IT TAKES A VILLAGE: ADVANCING HARIYALI CLEAN ENERGY SOLUTIONS IN RURAL INDIA
4. DOCUMENTS
4.1. Which of the following do you or someone in your family have? Select all that apply
# Document Type Response
1. Aadhar card ☐1. Yes ☐ 2. No
2. Ration card ☐1. Yes ☐ 2. No
3. Election card ☐1. Yes. Type: ☐ 2. No
4. Bank account ☐1. Yes ☐ 2. No
Bank Name: Distance:
5. PAN card ☐1. Yes ☐ 2. No
6. Driving License ☐1. Yes ☐ 2. No
5. HOUSEHOLD ELECTRICITY
5.1. Do you have an electricity connection? ☐1. Yes (Skip Q.5.2) ☐ 2. Shared/rent electricity ☐ 3. No (Skip Q.5.3-5.7)
5.2. If you do not have an electricity connection, please state why?
☐1. Getting a connection is expensive ☐ 2. Cannot afford monthly bills
☐ 3. Don’t know how to get a connection ☐ 4. Connection cancelled because of default on bill
5.3. If yes, which year did you get the connection? ………………………………
5.4. Do you have a meter box? ☐1. Yes ☐ 2. No (Skip Q. 5.5)
5.5. If yes, does you meter box work? ☐1. Yes ☐ 2. No
5.6. How much were your last 3 household electricity bills?
1. (Month/s) (bill cycle days) (Amount)
2. (Month/s) (bill cycle days) (Amount)
3. (Month/s) (bill cycle days) (Amount)
5.7. For how many hours a day do you get electricity?
5.8. Are your current light source(s) bright enough for your daily activities at night? ☐1. Yes ☐ 2. No
5.9. Is there enough light for your children to do school work at night in your home? ☐1. Yes ☐ 2. No

PAGE 36 IT TAKES A VILLAGE: ADVANCING HARIYALI CLEAN ENERGY SOLUTIONS IN RURAL INDIA
6. LAND AND LIVELIHOOD
6.1 Ownership of land ☐1. Own
☐2. Rent ☐3. Not applicable (Skip Q. 6.2)
6.2 Please specify land size (in bigha) 1. Cultivable land: ……………………bigha
2. Non-cultivable land: ……………………bigha
6.3 Which of the following livelihood activities are you or anyone in your household involved in and how much average monthly income do you get from these activities? Please state whether primary occupation (more than 180 days) or subsidiary (Less than 180 days). Select all that apply
CODES
LIVELIHOOD TYPE:
P: Primary; S: Subsidiary
INCOME: 0: No Income; 1: Less than Rs.2,500; 2: Rs. 2,501-5,000; 3: Rs. 5,001-7,500; 4: Rs. 7,501-10,000; 5: Rs. 10,001 or more
☐P ☐S.……Thekedaari / Contractor
☐P ☐S.……Shop
☐P ☐S.……Daily wage labour
☐P ☐S.……Rent from land
☐P ☐S.…… Services (include government, factories, private jobs)
☐P ☐S.……Student
☐P ☐S.……Others specify☐P ☐S.……Agriculture
☐P ☐S.……Handicraft
☐P ☐S.……Pottery
☐P ☐S.……Weaving / Tailor
☐P ☐S.……Animal husbandry
☐P ☐S.……Dairy
☐P ☐S.……Forestry
☐P ☐S.……Selling food/ Dhaba
☐P ☐S.……Flour mill
☐P ☐S.……Blacksmith
PLEASE ENSURE THAT INCOME CODES HAVE BEEN FILLED IN Q. 6.3
7. IRRIGATION & ENERGY REQUIREMENTS
7.1. Which of the following do you use for irrigating your farm?
1: Don’t farm (Skip Q.7.2 – 7.9) ☐3. 5. Water from canal: ☐1. Yes ☐ 2. No
2. Borewell: ☐1. Yes ☐ 2. No
Depth: Pipe diameter:
6. Rainfed: ☐1. Yes ☐ 2. No
3. Tubewell: ☐1. Yes ☐ 2. No
Depth: Pipe diameter:
7: Purchase water: ☐1. Yes ☐ 2. No
4. Well: ☐1. Yes ☐ 2. No
7.2. How far is the water source from your farm? ……………………
7.3. Which type of pump do you use for your irrigation needs? Select all that apply
☐1. Diesel pump ☐2. Electric pump ☐3. Solar pump ☐4. Purchase water
7.4. What is the capacity of the pump (in hp)?
7.5. Is the pump owned or rented? ☐1. Owned ☐2. Rented
7.6. If you use an electric pump, do you have a meter for your electric pump? ☐1. Yes ☐ 2. No

PAGE 37IT TAKES A VILLAGE: ADVANCING HARIYALI CLEAN ENERGY SOLUTIONS IN RURAL INDIA
7.7. Please provide the following information about your irrigation pattern. Select all that apply.
# 1. Crop 2. During which months do you grow the crop and which months do you harvest?
3. Total number of bighas of the crop sown
4. Number of hours to irrigate one bigha once (Time in hours)
5. Quantity of diesel used to irrigate one bigha once (in litres)
6. Expense on diesel to irrigate one bigha once (in `)
7. Expense on buying water for one irrigation cycle for one bigha of the crop
(in `.)
8. Total number of irrigation cycles required per bigha per season
9. Expense on electricity (if used for irrigation) (`/month)
10. Solar (if used)
Number of Days/season
7.8. Please state the total quantity of motor oil use and expense on the oil in a year
7.8.1. Quantity of motor oil used in a year (in liters): liters
7.8.2. Expense on motor oil in a year: rupees
7.9. How much do you spend on pump repairs and maintenance of your pump?
7.10. Which of the following energy sources do you use and for which activities? Select all that apply.
# Do you use ……?(Fuel Type)
How much of the fuel do you use? (Quantity)
How much do you spend on it?(Expense)
How long do you spend for gathering/ collecting it? (Time in hrs)
How far do you have to go to collect? (Distance in km)
Which activities do you use it for?*
1. Firewood & chips
kg/week /week /week
2. Dung Cake kg/week /week /week
3. Coal kg/week /week /week
4. Charcoal kg/week /week /week
5. Kerosene liters/week /week /week
6. Diesel (other than irrigation)
liters/week /week /week
7. Petrol liters/week /week /week
8. LPG cylinder /Cylinder /Cylinder /Cylinder
9. Electricity (other than irrigation)
hrs/day /mth NA NA
10. Solar (other than irrigation)
hrs/day /mth NA NA
11. Any other _______/mth /mth /mth
**Livelihood Codes – 1: Agriculture; 2: Handicraft; 3: Pottery; 4: Tailoring; 5: Animal husbandry; 6: Dairy; 7: Forestry; 8: Dhaba/food sale; 9: Others please specify. **Household Codes – 10: Cooking; 11: Lighting; 12: Heating; 13: Heating water; 14: Cooling

PAGE 38 IT TAKES A VILLAGE: ADVANCING HARIYALI CLEAN ENERGY SOLUTIONS IN RURAL INDIA
8. APPLIANCES
8.1. Which appliances do you use? Select all that apply
# Appliance Number Hours used per day
Star Rating (If applicable)
Annual expense on repairs
1. Incandescent/Yellow bulb NA
2. LED bulb NA
3. Ceiling fan
4. Table fan NA
5. Refrigerator
6. Smart Mobile Phone NA
7. AC
8. Cooler/Tower fan
9. Hot plate/Electric Stove
10. Electric sewing machine NA
11. Electric potter’s wheel NA
12. Solar lamp NA
13. Any other, please specify
8.2. If you use a mobile phone, how much do you pay monthly for charging the battery of the phone? …………………
8.3. If you use electricity for your livelihood activities, please rate your satisfaction with the current electricity supply for your business needs.
1. Duration of supply: ☐1. Satisfied ☐2. Neutral ☐3. Unsatisfied
2. Cost of supply: ☐1. Satisfied ☐2. Neutral ☐3. Unsatisfied
8.4. How much will you be willing to spend per month for 24/7 electricity which meets your livelihood needs?
(`./month)
9. COOKING AND HEATING
9.1. Do you cook indoors or outdoors? ☐1: Indoor ☐2: Outdoor ☐3: Mixed
9.2. Does your kitchen have:
9.2.1. A window or ventilation: ☐1. Yes ☐ 2. No
9.2.2. A platform: ☐1. Yes ☐ 2. No
9.3. Do you have an active LPG connection? ☐1. Yes ☐ 2. No (Skip 9.4)
9.4. If yes, how many cylinders do you use in a year?
9.5. Which types of stoves do you have? Select all that apply.
☐1. Mud chullah ☐2. Gas stove ☐3. Kerosene stove ☐4. Improved cookstove ☐5. Any other:
9.6. Do you need heating within the house during winters? ☐1. Yes ☐ 2. No
9.7. What do you do to cool down when it is really hot? Please explain:

PAGE 39IT TAKES A VILLAGE: ADVANCING HARIYALI CLEAN ENERGY SOLUTIONS IN RURAL INDIA
B) APPENDIX: SURVEY ANALYSES For all histograms, there are no overlapping ranges – parentheses “( )” mean that the number is excluded in the range; a square brackets “[ ]” mean that the number is included in the range.
1. Demographic Characteristics
22%
65%
11%
2%
Age of Respondents, Nagano MathNo. of Respondents: 88
31-4518-30 46-60 Over 60 31-4518-30 46-60 Over 60
Age of Respondents, BeraniyaNo. of Respondents: 84
25%
50%
21%
4%
39%
28%
31%
2%
Total No. Of Family Members, Nagano Math
1-4 5-6 7-9 Above 9 1-4 5-6 7-9 Above 9
No. of Respondents: 89Total No. of Family Members, Beraniya
No. of Respondents: 87
47%
23%
24%
6%
39%
28%
31%
2%
Total No. Of Family Members, Nagano Math
1-4 5-6 7-9 Above 9 1-4 5-6 7-9 Above 9
No. of Respondents: 89Total No. of Family Members, Beraniya
No. of Respondents: 87
47%
23%
24%
6%
21 3 21 3 4
Total # of Respondents = 84
1%
54%
33%
13%
No. of Earning Members, Nagano Math No. of Respondents: 89 No. of Respondents: 84
68%
25%
6%
No. of Earning Members, Beraniya
21 3 21 3 4
Total # of Respondents = 84
1%
54%
33%
13%
No. of Earning Members, Nagano Math No. of Respondents: 89 No. of Respondents: 84
68%
25%
6%
No. of Earning Members, Beraniya
2. Housing Characteristics
18% 17%
44%
14%
7%
1 2 3 4 More than5 rooms
Perc
enta
ge o
f H
ouse
hold
s
Perc
enta
ge o
f H
ouse
hold
s
Number of Rooms
No. of Rooms, Nagano MathNo. of Respondents: 90
10%
54%
33%
3%0%
10%
20%
30%
40%
50%
60%
0%
10%
20%
30%
40%
50%
1 2 3 4
Number of Rooms
No. of Rooms, BeraniyaNo. of Respondents: 70

PAGE 40 IT TAKES A VILLAGE: ADVANCING HARIYALI CLEAN ENERGY SOLUTIONS IN RURAL INDIA
BrickMud-coated Cement BrickMud-coated Cement
81%
9%
10%
Wall Type, Beraniya
No. of Respondents: 87
28%
25%
47%
Wall Type, Nagano Math
No. of Respondents: 90
3. Kitchen Characteristics
13%
31%56%
Roof Type, Nagano Math
Tin Roof Shingles Cement Tin Roof Shingles Cement
Total # of Respondents: 90
7%
88%
5%
Roof Type, Beraniya
No. of Respondents: 87No. of Respondents: 90
13%
31%56%
Roof Type, Nagano Math
Tin Roof Shingles Cement Tin Roof Shingles Cement
Total # of Respondents: 90
7%
88%
5%
Roof Type, Beraniya
No. of Respondents: 87No. of Respondents: 90
Cooking Location, BeraniyaNo. of Respondents: 82
41%
16%
43%
Cooking Location, Nagano Math
Indoor Outdoor Mixed Indoor Outdoor Mixed
No. of Respondents: 75
33%
14%
53%
Cooking Location, BeraniyaNo. of Respondents: 82
41%
16%
43%
Cooking Location, Nagano Math
Indoor Outdoor Mixed Indoor Outdoor Mixed
No. of Respondents: 75
33%
14%
53%
59%
30%
66%
0%10%20%30%40%50%60%70%80%90%
100%
A Windowor Ventilation
Platform
Perc
enta
ge o
f H
ouse
hold
s
Kitchen Ventilation & Platform, Nagano Math
Yes No Yes No
0%10%20%30%40%50%60%70%80%90%
100%
68%
1%6%
28%
86%
A Windowor Ventilation
Platform
Perc
enta
ge o
f H
ouse
hold
s
Kitchen Ventilation & Platform, Beraniya

PAGE 41IT TAKES A VILLAGE: ADVANCING HARIYALI CLEAN ENERGY SOLUTIONS IN RURAL INDIA
4. Water Sources
42, 50%
12, 14%
30, 36%
Water Needs, Nagano Math
Piped Waterat Home
Own Hand-Pump/Well
Other Piped Waterat Home
Own Hand-Pump/Well
Other
No. of Respondents: 84
14, 17%
70, 83%
Water Needs, BeraniyaNo. of Respondents: 84
5. Cooling and Heating Needs
Yes No Yes No
67%
33%
Winter Space Heating Needs in Beraniya
No. of Respondents: 80
96%
4%
Winter Space Heating Needs in Nagano Math
No. of Respondents: 69
Cooling Strategies, Beraniya
Do Nothing Sit Under a tree
Sleep outside Put water on the�oor/bathe
Use hand fan No Responses
86%
2%
34%24%
0%
10%20%30%40%50%60%70%80%90%
Ceiling/Table Fan
Cooler Sit undera tree
Cooling Strategies, Nagano Math
Perc
enta
ge o
f H
ouse
hold
s
Sprinkle water on the
�oor/wet cloth/Bathe
68%
2%
1%
4%1%
24%
6. Expenditure
Top 5 Expenses Nagano Math % of Households Top 5 Expenses Beraniya % of Households
1 Groceries 99% 1 Illness 84%
2 Electricity 86% 2 School 63%
3 Animal Husbandry 44% 3 Food/Home 79%
4 Education 20% 4 Marriage 28%
5 Agriculture 16% 5 Electricity 21%

PAGE 42 IT TAKES A VILLAGE: ADVANCING HARIYALI CLEAN ENERGY SOLUTIONS IN RURAL INDIA
0
5
10
15
20
25
Annual Expenditure per Household, Nagano math
No. of Respondents: 88N
umbe
r of
Hou
seho
lds
INR / Year
< 15000 (15000,30000]
(30000,45000]
(45000,60000]
(60000,75000]
(75000,90000]
(90000,105000]
(105000,120000]
>120000
25
14 14
2 24
56
16
Annual Expenditure per Household, Beraniya
No. of Respondents: 87
Num
ber
of H
ouse
hold
s
< 15000 (15000, 30000]
(30000, 45000]
(45000, 60000]
(60000, 75000]
(60000, 75000]
3
8
15
36
69
(90000, 105000]
2
5
> 120000
3
0
5
10
15
20
25
30
35
40
INR / Year
(105000,120000]
7. Livelihood Diversity and Income Ranges
Agriculture Animalhusbandry
Dailywage
Services Dairy Shop Handicraft Weaving/trailor
Flour mill Thekedaari/contractor
Student
100%
76%
34%
20%
6% 4% 2% 2% 1% 1% 1%0%
10%
20%
30%
40%
50%
60%
70%
80%
90%
100%
Livelihoods, Nagano Math
Perc
enta
ge o
f H
ouse
hold
s
Types of Livelihoods

PAGE 43IT TAKES A VILLAGE: ADVANCING HARIYALI CLEAN ENERGY SOLUTIONS IN RURAL INDIA
Perc
enta
ge o
f H
ouse
hold
s
Agriculture Animalhusbandry
Daily wage Services Dairy Shop Handicraft Weaving/trailor
Flour mill Thekedaari/contractor
Student
22%
9%
2% 2% 2% 1% 1% 1%
Livelihoods, Beraniya
Types of Livelihoods
0%
10%
20%
30%
40%
50%
60%
70%
80%
90%
100% 95%92%
77%
Num
ber
of H
ouse
hold
s
< 15000 (15000,30000]
(30000,45000]
(45000,60000]
(60000,75000]
Average Annual Income per Household, Nagano Math
INR/Year
No. of Respondents: 90
(75000,90000]
(90000,105000]
(105000,120000]
>1200000
5
10
15
20
25
30
1413
11
8
3 24
8
27
INR/Year
Average Annual Income per Household, Beraniya
No. of Respondents: 87
(15000,30000]
(30000,45000]
(45000,60000]
(60000,75000]
(75000,90000]
(90000,105000]
(105000,120000]
(120000,135000]
(135000,150000]
> 150000
Num
ber
of H
ouse
hold
s
< 150000
2
4
6
8
10
12
14
16
4 4
7
15
13
10
12
1
5
13
3

PAGE 44 IT TAKES A VILLAGE: ADVANCING HARIYALI CLEAN ENERGY SOLUTIONS IN RURAL INDIA
14%6%
32%
6% 20%
100%
18%
40%
19%
33%
50%
100%
100%
9%
16%
26%
11%
25%
10
0%
4%
15%
16%
17%
25%
10%
9%
6%
6%
20%
38%
13%
28%
60%
100%
7%1%
0%
10%
20%
30%
40%
50%
60%
70%
80%
90%
100%
Income Range for Livelihoods, Nagano Math
Types of Livelihoods
No income
Agriculture Animalhusbandry
Dailywage
Serives Dairy Shop Handicraft Weaving/trailor
Flour mill Thekedaari/contractor
Student
Less than Rs.2,500 Rs. 2,501-5,000 Rs. 5,001-7,500
Rs. 7,501-10,000 Rs. 10,001 or more No response
Perc
enta
ge o
f H
ouse
hold
s
Types of Livelihoods
Perc
enta
ge o
f H
ouse
hold
s
53% 60%
4%
50%
19% 9%
28%
5% 13%
100%
100%
8%5%
27%
16%
38%
50%
100%
4%
25%
42%
25%
1%3%
11%
4%
1%
11%
16%
21% 10%
16%
25%
100%
0%
10%
20%
30%
40%
50%
60%
70%
80%
90%
100%
Agriculture Animalhusbandry
Daily Wage Services Shop Forestry Rent fromland
Student Flour Mill Thekedaari/contractor
Income Range for Livelihoods, Beraniya
No income Less than Rs.2,500 Rs. 2,501-5,000 Rs. 5,001-7,500
Rs. 7,501-10,000 Rs. 10,001 or more No response
8. Annual Savings
11
12
3
0
2
4
6
8
10
12
1200-2200
< 1
00
0
(10
00
,2
00
0]
(20
00
,3
00
0]
(30
00
,4
00
0]
(40
00
,5
00
0]
(50
00
,6
00
0]
(60
00
,7
00
0]
(70
00
,8
00
0]
(80
00
,9
00
0]
(90
00
,1
00
00
]
> 1
00
00 2201-3200 5200-6200 >10000
Num
ber
of H
ouse
hold
s
Num
ber
of H
ouse
hold
s
Savings in INR
Savings in INR
Annual Savings per Household, BeraniyaAnnual Savings per Household, Nagano Math
No. of Respondents: 17No. of Respondents: 8123
0
5
10
15
20
25
14
11
6
2
53
0 1 2
14

PAGE 45IT TAKES A VILLAGE: ADVANCING HARIYALI CLEAN ENERGY SOLUTIONS IN RURAL INDIA
9. Electricity Connections and Expenditure
76, 85%
12, 13% 2, 2%
Electricity Connection, Nagano Math
Yes Shared/Buy electricity No
82, 94%
1, 1% 4, 5%
Electricity Connection, Beraniya
Yes Shared/Buy electricity No
6
3
1
01234567
Gettingconnection
is expensive
Cannotafford
monthlybills
Connectioncancelledbecauseof default
on bill
Reason for not having a connection, Nagano MathNo. of Respondents = 10
No.
of H
ouse
hold
s
1% 1%2%
92%
4%
Hours of Electricity Supply, Nagano Math
18 20 23 24 No response No response
7%
64%
23%
5%
1%
Hours of Electricity Supply, Beraniya
1-5 6-10 11-15 No Electricity
No. of Respondents: 87
< 20000
5
10
15
20
25
30
35
40
45
(2000,4000]
(4000,6000]
(6000,8000]
> 8000
INR/Year
32
41
Annual Electricity Expense per Household, Nagano Math
Num
ber
of H
ouse
hold
s
74 3
No. of Respondents: 6
< 2000 (2000,4000]
(4000,6000]
INR/Year
6
29
14
(6000,8000]
3
(6000,8000]
6
Annual Electricity Electricity, Beraniya
Num
ber
of H
ouse
hold
s
0
5
10
15
20
25
30
35
In Beraniya:
• 75% of households got their connections on or after 2015; 42% got their connections only between 2018 and 2019
• All those who have a connection possess a working meter box
• Reasons for not having a connection (only 3 have responded) – cannot afford monthly bills, and don’t’ know procedure of getting a connection

PAGE 46 IT TAKES A VILLAGE: ADVANCING HARIYALI CLEAN ENERGY SOLUTIONS IN RURAL INDIA
10. Perceptions on Electricity
94%
6%
Is the Light Suf�cient toStudy at Night, Nagano Math
Yes No Yes No
No. of Respondents: 89
Is the Light Suf�cient toStudy at Night, Beraniya
No. of Respondents: 86
78%
22%
94%
6%
Is the Light Suf�cient toStudy at Night, Nagano Math
Yes No Yes No
No. of Respondents: 89
Is the Light Suf�cient toStudy at Night, Beraniya
No. of Respondents: 86
78%
22%
Yes No Yes No
96%
4%
Brightness (are current sourcesbright enough?), Nagano Math
No. of Respondents: 89 No. of Respondents: 85
86%
14%
Brightness (are current sourcesbright enough?), Beraniya
Yes No Yes No
96%
4%
Brightness (are current sourcesbright enough?), Nagano Math
No. of Respondents: 89 No. of Respondents: 85
86%
14%
Brightness (are current sourcesbright enough?), Beraniya
78%60%
10%
8%
8%18%
0%
20%
40%
60%
80%
100%
Duration of supply Cost of supply
Perc
enta
ge o
f H
ouse
hold
s
Perc
enta
ge o
f H
ouse
hold
s
Satisfaction with Durationand Cost of Supply, Beraniya
79%57%
4%
17%
8%7%
0%
20%
40%
60%
80%
100%
Duration of Supply Cost of Supply
Satisfaction with Duration andCost of Supply, Nagano Math
Satis�ed Neutral Unsatis�ed Satis�ed Neutral Unsatis�ed
11. Willingness to Pay for Electricity
23%24%
3%
8%
1%
10%
18%
0%
5%
10%
15%
20%
25%
30%
<=150 151-300
301-450
451-600
751-900
900-1050
>1300
% o
f H
ouse
hold
s
Expense in INR
Willingness to Pay for 24/7Electricity per Month, Nagano Math
No. of Respondents: 79
15% 15%
11%
14%
3%
0%2%4%6%8%
10%12%14%16%
0-150 151-300
451-600
901-1000
>1000
% o
f H
ouse
hold
s
Expense in INR
Willingness to Pay for 24/7 Electricityper Month, Beraniya No. of Respondents: 51

PAGE 47IT TAKES A VILLAGE: ADVANCING HARIYALI CLEAN ENERGY SOLUTIONS IN RURAL INDIA
12. Appliance Ownership
68%
86%
90%
48%
24%
44%
3%
3%
59%
0% 20% 40% 60% 80% 100%
Incandescent/Yellow bulb
Percentage of Households Percentage of Households
LED bulb
Ceiling fan
Table fan
Refrigerator
SmartMobile Phone
Cooler/Tower fan
Hot plate/Electric Stove
Solar lamp
Ownership of Appliances, Nagano Math
22%
86%
63%
13%
1%
8%
1%
2%
2%
0% 20% 40% 60% 80% 100%
Bulb
LED Bulb
Ceiling Fan
Table Fan
Refrigerator
Smart Phone
Cooler/Tower Fan
Solar Lamp
Stated other
Ownership of Appliances, Beraniya
2% 3%
22%
39%
19%
6% 3% 6%
0%5%
10%15%20%25%30%35%40%45%
Perc
enta
ge o
f H
ouse
hold
s
Perc
enta
ge o
f H
ouse
hold
s
Total Types of Appliances per Household(excluding cellphone), Nagano Math
22%
56%
15%
2% 5%0%
10%
20%
30%
40%
50%
60%
Number of AppliancesNumber of Appliances
1 2 3 4 5 6 7 NoResponse
1 2 3 4 NoResponse
Total Types of Appliances per Household(excluding cellphone), Beraniya
13. Appliances – Expenditure and Use
< 50 (50,200]
(200,350]
(350,500]
Expense in INR
(500,650]
(650,800]
> 800
37
Average Annual Household Expense per Appliance, Nagono Math
No. of Respondents: 85
20
106
4 53
0
5
10
15
20
25
30
35
40
Num
ber
of H
ouse
hold
s
Expense in INR
Average Annual Expense per Appliance, Beraniya
No. of Respondents: 85
< 50
15
(50,150]
20
(150,250]
15
(250,350]
12
(350,450]
5
(450,550]
7
(550,650]
7
(650,750]
2
> 750
2
25
20
15
10
5
0
Num
ber
of H
ouse
hold
s

PAGE 48 IT TAKES A VILLAGE: ADVANCING HARIYALI CLEAN ENERGY SOLUTIONS IN RURAL INDIA
Total Annual Expense on Appliance (Repainrs+Charging),Nagano math
No. of Respondents: 85
Expense in INR
< 250 (250,750]
(750,1250]
(1250,1750]
(1750,2250]
(2250,2750]
(2750,3250]
> 32500
510
1520
2530
35
4035
14
8 75
1 1
14
Num
ber
of H
ouse
hold
s
Total Annual Expense on Appliance (Repainrs+Charging),Beraniya
Expense in INR
< 250 (250,750]
(750,1250]
(1250,1750]
(1750,2250]
(2250,2750]
> 27500
510
1520
2530
35
40
Num
ber
of H
ouse
hold
s
No. of Respondents: 85
19
33
10 117
3 2
14. Incandescent Bulbs
36
18
6
10
5
10
15
20
25
30
35
40
1 2 3 >3
Number of Bulbs
No. of Bulbs, Nagano Math
Num
ber
of H
ouse
hold
s
No. of Respondents: 61
16
[1, 2]02468
1012141618
No. of Bulbs, Beraniya
No. of Respondents: 19
Num
ber
of H
ouse
hold
s
Number of bulbs
2
(2, 3]
1
(3, 4]
0< 3
Hours used
(3, 6] (6, 9] (9, 12] (12, 15] > 15
5
710
15
20
25
Hours Used per Day (Bulb), Nagano MathNo. of Respondents: 60
Num
ber
of H
ouse
hold
s
15
11
2 2
23
Hours used
Hours Used per Day (Bulb), BeraniyaNo. of Respondents: 16
0
2
4
6
8
10
12
Num
ber
of H
ouse
hold
s
11
4
0 0 0
[1, 3] (3, 5] (5, 7] (7, 9] (9, 11] (11, 13]
1
15. LEDs
22
28
15
75
0
5
10
15
20
25
30
1 2 3 4 >4Number of Bulbs
No. of LED Bulbs, Nagano Math
No. of Respondents: 77
Num
ber
of H
ouse
hold
s
20
34
19
20
5
10
15
20
25
30
35
40
1 Bulb 2 Bulbs 3 Bulbs 4 Bulbs
Num
ber
of H
ouse
hold
s
Number of Bulbs
No. of LED Bulbs, Bernaiya
No. of Respondents: 75
22
28
15
75
0
5
10
15
20
25
30
1 2 3 4 >4Number of Bulbs
No. of LED Bulbs, Nagano Math
No. of Respondents: 77
Num
ber
of H
ouse
hold
s
20
34
19
20
5
10
15
20
25
30
35
40
1 Bulb 2 Bulbs 3 Bulbs 4 Bulbs
Num
ber
of H
ouse
hold
s
Number of Bulbs
No. of LED Bulbs, Bernaiya
No. of Respondents: 75

PAGE 49IT TAKES A VILLAGE: ADVANCING HARIYALI CLEAN ENERGY SOLUTIONS IN RURAL INDIA
0
5
10
1512
20
25
30
Number used
Hours used per day (LED bulb), Nagano Math
No. of Respondents: 77
< 5 (5, 10] (10, 15] (15, 20] (20, 25]
11
6
20
28
Num
ber
of H
ouse
hold
s
37
[2, 4]0
5
10
15
20
25
30
35
40
Hours used per day (LED bulb), Beraniya
No. of Respondents: 72
Num
ber
of H
ouse
hold
s
Number used
27
(4, 6]
4
(6, 8]
2
(8, 10]
2
(10, 12]
16. Expense on Incandescent and LED Bulbs
Bulb - Annual Expense on Repairs, Nagano Math
No. of Respondents: 6
[100, 150]
Annual Expenditure in INR
(150, 200]0
1
2
3
4 4
2
Num
ber
of H
ouse
hold
s
Bulb - Annual Expense on Repairs, Beraniya
No. of Respondents: 19
0
1
2
3
4
5 5
4
6
4
3 3
< 50 (50,100]
(100,150]
(150,200]
> 200
Annual Expenditure in INR
Num
ber
of H
ouse
hold
s
Annual expense on repairs (LED bulb), Nagano Math
No. of Respondents: 10
0< 100 (100, 200] > 200
1
2
3
44
3 3
Annual Expenditure in INR
Num
ber
of H
ouse
hold
s
Annual expense on repairs LED bulbs, Beraniya
No. of Respondents: 65
0
5
10
15
20
25
< 150
11 11
4
7
2
8
22
(150,250]
(250,350]
(350,450]
(450,550]
(550,650]
(650,750]
Annual Expenditure in INR
Num
ber
of H
ouse
hold
s

PAGE 50 IT TAKES A VILLAGE: ADVANCING HARIYALI CLEAN ENERGY SOLUTIONS IN RURAL INDIA
17. Fans (Celling and Table)
54%
35%
7%4%
0%
10%
20%
30%
40%
50%
60%
1 Fan 2 Fans 3 Fans More than3 Fans
Number of Ceiling Fans
No. of Ceiling Fans, Nagano Math
No. of Respondents: 81
56%
6%1%
0%
10%
20%
30%
40%
50%
60%
1 Fan 2 Fans 3 Fans
Perc
enta
ge o
f H
ouse
hold
s
Perc
enta
ge o
f H
ouse
hold
s
Number of Ceiling Fans
No. of Ceiling Fans, Beraniya
No. of Respondents: 55
76, 87%
11, 13%
47, 52% 43, 48%
Ownership of Table Fan, Nagano Math
Yes No Yes No
Ownership of Table Fan, Beraniya
76, 87%
11, 13%
47, 52% 43, 48%
Ownership of Table Fan, Nagano Math
Yes No Yes No
Ownership of Table Fan, Beraniya
• All households in Nagano Math have at least one cooling device. But 31% of households surveyed in Beraniya have no cooling devices.
• In both villages, no household owns an efficient fan (ceiling or table).
Ceiling fan - Hours used per day, Nagano Math
No. of Respondents: 81
0
5
10
15
20
25
30
35
40
< 5
3
(5, 10]
17 16
8
(5, 10]
Hours used
(15, 20] > 20
37
Num
ber
of H
ouse
hold
s
< 1
2
(3, 5]
5
(1, 3]
9
(5, 7]
9
(7, 9] (9, 11]
4 4
(13,15]
2
(9,11]
12
0
2
4
6
8
10
12
14
Hours used
Num
ber
of H
ouse
hold
s
Ceiling fan - Hours used per day, Beraniya
No. of Respondents: 47

PAGE 51IT TAKES A VILLAGE: ADVANCING HARIYALI CLEAN ENERGY SOLUTIONS IN RURAL INDIA
< 5 (5, 10] (10, 15]
Hours/Day
(15, 20] > 20
14
21
21
4
0
5
10
15
20
25N
umbe
r of
Hou
seho
lds
Table Fan - Hours Used per Day, Nagano Math
No. of Respondents: 42
0
1
2
3
4
66
2 2
0
1
7
5
Num
ber
of H
ouse
hold
s
Table Fan - Hours Used per Day, Beraniya
(2, 4] (4, 6] (6, 8] (8, 10] (10, 12]
Hours/Day
No. of Respondents: 11
18. Expense on Fans
Ceiling Fan - Annual Expense on Repairs, Nagano Math
0
5
10
15
20
25
30
< 100
2
(100,300]
INR/Year
15
5
(300,500]
> 500
24
Num
ber
of H
ouse
hold
s
No. of Respondents: 46
Ceiling Fan - Annual Expense on Repairs, Beraniya
No. of Respondents: 42
INR/Year
Num
ber
of H
ouse
hold
s
[150,300]
[300,450]
[450,600]
[600,750]
[750,900]
[900,1050]
[1050,1200]
> 12000
2
4
6
8
10
12
9
1110
4
10
2
5
Num
ber
of H
ouse
hold
s
< 100 (100,300]
(300,500]
INR/Year
(500,700]
> 7000
1
2
33 3 3
5
7
4
5
6
7
8
Table Fan - Annual Expense on Repairs, Nagano MathNo. of Respondents: 21
Num
ber
of H
ouse
hold
s
0
1
2
3
INR/Year
[250,550]
[550,850]
[850,1150]
[1150,1450]
[1450,1750]
3
0
2
1 1
Table Fan - Annual Expense on Repairs, BeraniyaNo. of Respondents: 7

PAGE 52 IT TAKES A VILLAGE: ADVANCING HARIYALI CLEAN ENERGY SOLUTIONS IN RURAL INDIA
19. Refrigerators
21
10
5
10
15
20
25
1 2
Number of Refrigerators
Refrigerators – Ownership, Nagano MathN
umbe
r of
Hou
seho
lds
No. of Respondents: 22
Refrigerators - Hours Used per Day, Nagano Math
Num
ber
of H
ouse
hold
s
[4, 9]
4
(9, 14]
Hours/Day
(14, 19] (19, 24]
3
1
12
0
2
4
6
8
10
12
14 No. of Respondents: 20
20. Types of Cookstoves
92%
36%
3%0%
10%20%30%40%50%60%70%80%90%
100%
Mudchullah
Gasstove
Any other
Type of Stove, Nagano Math
No. of Respondents: 86
100%
46%
0%10%20%30%40%50%60%70%80%90%
100%
Mudchullah
Gas stove
Perc
enta
ge o
f H
ouse
hold
s
Perc
enta
ge o
f H
ouse
hold
s
Type of Stove, Beraniya
No. of Respondents: 84
Naganomath
Star Rating % of HHs with Star Rated Refrigerators
1 5%
2 9%
3 14%
5 27%
Total 55%
Just 1 household in Beraniya has a refrigerator. It is either not star-rated or the rating is not known to the household

PAGE 53IT TAKES A VILLAGE: ADVANCING HARIYALI CLEAN ENERGY SOLUTIONS IN RURAL INDIA
21. Fuel Used
99% 98%
83%
34%
9%
21%
59%
0%
20%
40%
60%
80%
100%
120%
Perc
enta
ge o
f H
ouse
hold
s
Fuels Used, Nagano Math
Firewood& chips
Electricity (otherthan irrigation)
Dung cake LPG cylinder Kerosene Petrol Solar (otherthan irrigation)
* Use of diesel of agriculture is not covered in this chart.
Firewood& chips
Electricity (otherthan irrigation)
Dungcake
LPGcylinder
Kerosene Petrol Solar (otherthan irrigation)
Diesel (otherthan irrigation)
98%94% 93%
48%44%
13%6%
1%0%
10%
20%
30%
40%
50%
60%
70%
80%
90%
100%
Fuels Used, Beraniya
Perc
enta
ge o
f H
ouse
hold
s
* Use of diesel for irrigation is not covered in this chart.
Annual Expense on Energy per Household, Nagano Math
Expense/Year
No. of Respondents: 90
< 2000
12
25
810
75
32
4 3
11
(2000,4000]
(4000,6000]
(6000,8000]
(8000,10000]
(10000,12000]
(12000,14000]
(14000,16000]
(16000,18000]
(18000,20000]
> 200000
5
10
15
20
25
30
Num
ber
of H
ouse
hold
s
*Energy expense on agriculture is not included in this.”

PAGE 54 IT TAKES A VILLAGE: ADVANCING HARIYALI CLEAN ENERGY SOLUTIONS IN RURAL INDIA
< 2000 (2000,4000]
(4000,6000]
(6000,8000]
(8000,10000]
INR/Year
(10000,12000]
(12000,14000]
(14000,16000]
(16000,18000]
> 180000
5
10
15
20
14 1413
18
9
23
21
8
Num
ber
of H
ouse
hold
s
Annual Expense on Energy per Household Expenditure, Beraniya
No. of Respondents: 84
*Energy expense for agriculture is not included in this.
22. Firewood
< 1000 (1000,1500]
(1500,2000]
(2000,2500]
Kg/year
(2500,3000]
(3000,3500]
(3000,4000]
> 4000
23
31
4
811
35
4
Firewood - Annual Quantity Used per HH, Nagano Math
No. of Respondents: 89
0
5
10
15
20
25
30
35
40
Num
ber
of H
ouse
hold
s
< 500
12
1617
21
3
1
15
(500,1000]
(1000,1500]
(1500,2000]
(2000,2500]
(2500,3000]
> 3000
Firewood - Annual Quantity Used per HH, Beraniya
No. of Respondents: 85
Quantity in kg/year
Num
ber
of H
ouse
hold
s
0
5
10
15
20
25

PAGE 55IT TAKES A VILLAGE: ADVANCING HARIYALI CLEAN ENERGY SOLUTIONS IN RURAL INDIA
Firewood - Annual Time Spent on Collection, Nagano Math
No. of Respondents: 72
< 100 (100,250]
(250,400]
Hours/Year
(400,550]
(550,700]
> 700
6 6
35
16
2
7
0
5
10
15
20
25
30
35
40N
umbe
r of
Hou
seho
lds
Firewood - Annual Time Spent on Collection, Beraniya
No. of Respondents: 86
36
27
4
Hours/Year
7
12
0
5
10
15
20
25
30
35
40
Num
ber
of H
ouse
hold
s
< 50 (50,100]
(100,150]
(150,200]
> 200
23. Firewood Uses and Expense
94%
Cooking Heating water Animal husbandry Heating Agriculture
88%
31%
9%3%
0%
10%
20%
30%
40%
50%
60%
70%
80%
90%
100%
Firewood – Activities, Nagano Math
Perc
enta
ge o
f H
ouse
hold
s
Cooking Heatingwater
Heating Animal husbandry
Handicraft LightingAgriculture
Firewood – Activities, Beraniya100%
73% 73%
9% 7%4% 2%
0%
10%
20%
30%
40%
50%
60%
70%
80%
90%
100%
Perc
enta
ge o
f H
ouse
hold
s

PAGE 56 IT TAKES A VILLAGE: ADVANCING HARIYALI CLEAN ENERGY SOLUTIONS IN RURAL INDIA
Firewood - Expense per Year per Household, Nagano MathNo. of Respondents: 24
Num
ber
of H
ouse
hold
s
0123
4
5678
910
< 2500
Expense in INR/Year
(2500,5000]
6
(5000,7500]
(7500,10000]
7
2
9
24. Dung Cakes
Dung Cake - Fuel Used (kg/year per HH), Nagano MathNo. of Respondents: 75
< 250
2
(250,750]
(750,1250]
Quantity in Kg/Year
(1250,1750]
(1750,2250]
> 2250
1820
27
6
2
0
5
10
15
20
25
30
Num
ber
of H
ouse
hold
s
Dung Cake - Total Annual Quantity/Household, BeraniyaNo. of Respondents: 81
< 250 (250,750]
(750,1250]
(1250,1750]
(1750,2250]
> 22500
5
10
15
20
25
30
Quantity in Kg/Year
9
26
22
79 8
Num
ber
of H
ouse
hold
s
Dung Cake - Time Spent on Collection, Nagano MathNo. of Respondents: 68
< 100
6
(100, 200]
8
(200, 300]
13
(300, 400]
Hrs/Year
27
(400, 450]
8
> 450
5
0
5
10
15
20
25
30
Num
ber
of H
ouse
hold
s
• 24 people in Naganomath spend money to purchase firewood, spending an average of `4,715 per year – a significant expense for households with limited incomes.
• 5 people spend money to purchase firewood in Beraniya spending an average of `2,330 per year on firewood

PAGE 57IT TAKES A VILLAGE: ADVANCING HARIYALI CLEAN ENERGY SOLUTIONS IN RURAL INDIA
Dung Cake - Time Spent on Collection, BeraniyaNo. of Respondents: 78
Hrs/Year
< 52 (52, 152] (152, 252] (252, 352] (352, 452] (452, 552] (552, 652] (652, 750] > 750
18 18
1110
9
1
3
6
2
Num
ber
of H
ouse
hold
s
0
2
4
6
8
10
12
14
16
18
20
25. Dung Cakes Uses
89%
Heatingwater
Cooking Animalhusbandry
Heating Dairy Heatingwater
AgricultureCooking Heating Animalhusbandry
Others
85%
27%
12%
1%0%
10%
20%
30%
40%
50%
60%
70%
80%
90%
100%
Dungcakes – Activities, Nagano Math Dungcakes – Activities, Uses, Beraniya
96%
58%54% 56%
16%
4%0%
10%
20%
30%
40%
50%
60%
70%
80%
90%
100%Pe
rcen
tage
of H
ouse
hold
s
Perc
enta
ge o
f H
ouse
hold
s
Dung Cake - Expense per Year (INR) per HH, Nagano Math
No. of Respondents: 14
0
11
22
33
4 4 4
Num
ber
of H
ouse
hold
s
< 2500 (2500,5500]
(5500,8500]
Expese in INR/Year
(8500,11500]
> 11500
• ung cakes are used along with firewood for cooking, heating water, and cooking animal fodder
• 7 people in Beraniya spend an average of `1,643/year on dung cakes

PAGE 58 IT TAKES A VILLAGE: ADVANCING HARIYALI CLEAN ENERGY SOLUTIONS IN RURAL INDIA
26. Kerosene
1
Kerosene - Annual Quantity Used it/HH, Beraniya
No. of Respondents: 38
0
5
10
15
20
25
30
35
7
< 20
30
(20, 30]
Liters
< 30
Num
ber
of H
ouse
hold
s
Kerosene - Household Expense Per Year, Beraniya
No. of Respondents: 38
0
5
10
15
20
25
30
35
31
< 1000
6
1
(1000, 1500]
Expense in INR
(1500, 2000]
Num
ber
of H
ouse
hold
s
• Only 8 people use an average of 80 lts of kerosene per year in Nagano Math, spending an average of `3360 per year
50%
38% 38%
13%
0%
10%
20%
30%
40%
50%
60%
Agriculture AnimalHusbandry
Lighting Cooking
Kerosene - Nagano Math Kerosene - Activities/Uses, Beraniya
87%
39%
8%
0%10%20%30%40%50%60%70%80%90%
100%
Lighting CookingActivities
HeatingWater
Perc
en
tag
e o
f Ho
use
ho
lds
Perc
en
tag
e o
f Ho
use
ho
lds
50%
38% 38%
13%
0%
10%
20%
30%
40%
50%
60%
Agriculture AnimalHusbandry
Lighting Cooking
Kerosene - Nagano Math Kerosene - Activities/Uses, Beraniya
87%
39%
8%
0%10%20%30%40%50%60%70%80%90%
100%
Lighting CookingActivities
HeatingWater
Perc
en
tag
e o
f Ho
use
ho
lds
Perc
en
tag
e o
f Ho
use
ho
lds
27. LPG Use
42, 48%
5, 6%
40, 46%31,
12, 13%
31, 35%
47, 52%
Active LPG Connections, Nagano Math Active LPG Connections, Beraniya
Yes No No Answer Yes No No Answer

PAGE 59IT TAKES A VILLAGE: ADVANCING HARIYALI CLEAN ENERGY SOLUTIONS IN RURAL INDIA
0%
10%
20%
30%
40%
50%
60%
No. of Cylinders/Year
No. of Cylinders per Year for Those with LPGConnections, Nagano Math
No. of Respondents: 31
0%5%
10%15%20%25%30%35%40%45%
35%
1
Perc
enta
ge o
f H
ouse
hold
s
Perc
enta
ge o
f H
ouse
hold
s
Number of LPG Cylinders/Year
No. of Cylinders per Year for Those with LPGConnections, Beraniya
No. of Respondents: 40
6%
12
6%
10
3%
8
16%
6
10%
5
10%
2
48%
1
13%
NoResponse
5%
4
8%
3
40%
2
28. Agriculture
0%
10%
20%
30%
40%
50%
60%
70%
80%
90%
100%
12%
Castor
42%
Corn
47%
Cotton
27%
Okra
Type of Crops, Nagano Math
Perc
enta
ge o
f H
ouse
hold
s
Wheat
94%
Aniseed
4%
Tuver
8%
Tomato
2%
Tobacco
3%
Ginger
18%
Pulses
1%
Brinjal
1%
Bajri
19%
Channa Corn Corn andlentils mixed
(urad dal)
Greenlentils
(moong)
Rice Soyabean Sugarcane Till Lentils(urad dal)
Wheat Okra
21%
71%
10%2%
19%
2% 1%
10%
42%
77%
1%0%
10%
20%
30%
40%
50%
60%
70%
80%
90%
Perc
enta
ge o
f H
ouse
hold
s
Types of Crops, Beraniya

PAGE 60 IT TAKES A VILLAGE: ADVANCING HARIYALI CLEAN ENERGY SOLUTIONS IN RURAL INDIA
1%
29%
62%
4% 3%0%
10%
20%
30%
40%
50%
60%
70%
NoAnswer
2 Crops 3 Crops 4 Crops 5 Crops
No. of Crops Grown/HH
No. of crops per Household, Nagano Math
No. of Respondents: 90
30%
20% 20% 20%
10%
0%
5%
10%
15%
20%
25%
30%
35%
1 Crop 2 Crops 3 Crops 4 Crops 5 Crops
Perc
enta
ge o
f H
ouse
hold
s
Perc
enta
ge o
f H
ouse
hold
s
Number of Crops/HH
Number of Crops Cultivated, Beraniya
No. of Respondents: 84
Cultivable Land Size, Nagano Math (Acres) Cultivable Land, Beraniya (Acres)
0.1-0.5 0.6-1 1.1-1.5 1.6-2
2.1-2.5 2.6-3 3.1+ No response
0.1-0.5 0.6-1 1.1-1.5 1.6-2
2.1-2.5 2.6-3 3.1+ No response
41%
29%
9%
5%
0%5% 6%
6%17%
13%
12%
12%
20%
6%
6%
14%
Cultivable Land Size, Nagano Math (Acres) Cultivable Land, Beraniya (Acres)
0.1-0.5 0.6-1 1.1-1.5 1.6-2
2.1-2.5 2.6-3 3.1+ No response
0.1-0.5 0.6-1 1.1-1.5 1.6-2
2.1-2.5 2.6-3 3.1+ No response
41%
29%
9%
5%
0%5% 6%
6%17%
13%
12%
12%
20%
6%
6%
14%
29. Pumps and Irrigation for Agriculture
11%
66%
20%
3%
Type of Pump, Nagano Math
Diesel Electric
Purchase Water No Response
Diesel Electric Purchase Water
No Response
16%
35%
21%
25%
3%
Types of Pump, Beraniya
Do not farm
4 HP 5 HP 7 HP 9 HP 1 HP 2 HP 3 HP 4 HP 5 HP
50%
1%
51%45%
3%
Pump Capacity in HP, Nagano Math
No. of Respondents: 65
14%
22% 14%
No. of Respondents: 14
Pump Capacity, Beraniya
4 HP 5 HP 7 HP 9 HP 1 HP 2 HP 3 HP 4 HP 5 HP
50%
1%
51%45%
3%
Pump Capacity in HP, Nagano Math
No. of Respondents: 65
14%
22% 14%
No. of Respondents: 14
Pump Capacity, Beraniya

PAGE 61IT TAKES A VILLAGE: ADVANCING HARIYALI CLEAN ENERGY SOLUTIONS IN RURAL INDIA
77%
23%
Ownership of Pumps, Nagano Math
Owned Rented Owned Rented
No. of Respondents: 83
71%
29%
Ownership of Pumps, Beraniya
No. of Respondents: 52
77%
23%
Ownership of Pumps, Nagano Math
Owned Rented Owned Rented
No. of Respondents: 83
71%
29%
Ownership of Pumps, Beraniya
No. of Respondents: 52
30. Irrigation Sources
2% 4%
70%
8%
28%24%
0%
10%
20%
30%
40%
50%
60%
70%
Types of Irrigation Sources
Borewell Tubewell well Water fromcanel
Rainfed Purchasewater
Types of Irrigation, Nagano Math
Perc
enta
ge o
f H
ouse
hold
s
3%
15%
33%
1%
83%
34%
0%
10%
20%
30%
40%
50%
60%
70%
80%
90%
Types of Irrgation Sources
Types of Irrgiation Sources, Beraniya
BorewellDon’t farm well Water fromcanel
Rainfed Purchasewater
Perc
enta
ge o
f H
ouse
hold
s

PAGE 62 IT TAKES A VILLAGE: ADVANCING HARIYALI CLEAN ENERGY SOLUTIONS IN RURAL INDIA
63%28%
6%
3%
Number of Irrigation Sources, Nagano Math
1 Source 2 Source
3 Source Farming but no answer
1 Source 2 Source
4 Source3 Source
37%
49%
11%
1% 2%
Number of Irrigation Sources per Household, Beraniya
• No farmer in Nagano Math depends solely on rainfall for irrigation
• 23% of households that farm in Beraniya depend only on rainfall for farming
31. Expense on Irrigation
Annual Expense on Diesel for Irrigation per HH, Nagano Math
No. of Respondents: 8
< 5000 (5000,15000]
Expense in INR/Year
(15000,25000]
> 250000
1
2
3
44
1 1
2
Num
ber
of H
ouse
hold
s
Annual Expense on Diesel for Irrigation per HH, Beraniya
No. of Respondents: 18
< 5000
1
2
3
4
5
6
7
8
98
(500, 1500]
4
(1500, 2500]
3
(2500, 3500]
2
(3500, 4500]
0
(4500, 5500]
1
Num
ber
of H
ouse
hold
s
Expense in INR/Year

PAGE 63IT TAKES A VILLAGE: ADVANCING HARIYALI CLEAN ENERGY SOLUTIONS IN RURAL INDIA
Total Yearly Expense on Electricity (INR per) HH, Nagano Math
No. of Respondents: 58
< 5000 < 5000,10000]
(10000,15000]
(15000,20000]
(20000,25000]
(25000,30000]
(30000,35000]
> 350000
5
10
15
20
34
1 2
78
1518
Num
ber
of H
ouse
hold
s
Expense in INR/Year
[6000, 12000]
12
(12000, 18000]
6
(18000, 24000] > 24000
2
5
0
2
4
6
8
10
12
14
Num
ber
of H
ouse
hold
s
Annual Expense on Electricity per HH for Irrigation, Beraniya
No. of Respondents: 25
Expense in INR/Year
Expense in INR/Year
Total Yearly Expense on Electricity (INR per) HH, Nagano Math
No. of Respondents: 18
< 5000 (3000,4500]
(4500,6000]
(6000,7500]
(7500,9000]
(9000,10500]
(10500,12000]
(12000,13500]
(13500,15000]
> 150000
1
2
3
44
1 1 1
2
0
3
4
1 1
Num
ber
of H
ouse
hold
s

PAGE 64 IT TAKES A VILLAGE: ADVANCING HARIYALI CLEAN ENERGY SOLUTIONS IN RURAL INDIA
Expense in INR/Year
Total Expense on Water per Year (INR) per HH, Beraniya
No. of Respondents: 26
0
2
4
6
8
10
< 3000 (3000,4500]
(4500,6000]
(6000,7500]
(7500,9000]
(9000,10500]
(10500,12000]
(12000,13500]
(13500,15000]
> 15000
8
6
3 3
1 1 10 0
5
Num
ber
of H
ouse
hold
s
32. Motor Oil and Repairs
Expense in INR/Year
Annual Expense on Motor Oil per HH (INR), Nagano Math
No. of Respondents: 49
< 250 (250, 750] (750, 1250] >12500
5
10
15
20
25
30
25
13
7
4
Num
ber
of H
ouse
hold
s
< 5000
1
2
3
4
5
6
1
(3500, 4500]
1
2
(500, 1500]
3
(1500, 2500] (2500, 3500]
5
Num
ber
of H
ouse
hold
s
Expense in INR/Year
Annual Expense on Motor Oil per HH (INR), Beraniya
No. of Respondents: 26

PAGE 65IT TAKES A VILLAGE: ADVANCING HARIYALI CLEAN ENERGY SOLUTIONS IN RURAL INDIA
Expense in INR/Year
Annual Expense on Pump Repair, Nagano Math
No. of Respondents: 51
< 1000 (1000, 2000] (2000, 3000] (3000, 4000] (4000, 5000] >50000
5
10
15
20
1618
24
1
10
Num
ber
of H
ouse
hold
s
Expense in INR/Year
Num
ber
of H
ouse
hold
s
< 1000 (1000, 2000] (2000, 3000] (3000, 4000] (4000, 5000] >5000
11
3
5
11
7
0
2
4
6
8
10
12
Annual Expense on Pump Repair, Beraniya
No. of Respondents: 29

PAGE 66 IT TAKES A VILLAGE: ADVANCING HARIYALI CLEAN ENERGY SOLUTIONS IN RURAL INDIA
C) APPENDIX: SUMMARY TABLE OF CLEAN ENERGY AND ENERGY EFFICIENT SOLUTIONS
Summary Table of Clean Energy and Energy Efficient Solutions
No. Solutions Government/Public Actors
Indicative Cost Ranges
Financing Solutions Strengthening Availability and Skill Development
A. Lighting
1 LED Bulbs • BEE
• EESL
• MNRE
• MSDE
• State energy. departments
• Distribution companies
• ̀ 70 - `150 • Govt. subsidy
• Bundled appliance loan with micro payments
• Incentives by discoms
• Increasing household awareness on cost-savings through wide-spread dissemination of IEC materials; multi-media campaigns; and community awareness camps
• Increasing local availability
• Skill development for repairing LED bulbs
2 Solar Lamps • MNRE
• EESL
• MSDE
• State energy and rural dvp. departments
• ̀ 500 or more
• Govt. subsidy
• Bundled appliance loan with micro payments
• Increasing household awareness on cost-savings – dissemination of IEC materials; multi-media campaigns, and information camps
• Increasing local availability
• Skill development for maintaining (appropriate-use) and repairing solar lamps
3 Voltage Stabilizers
• BEE
• EESL
• MNRE
• MSDE
• State energy departments
• Distribution companies
• ̀ 4,000 or more
• Individual appliance loan
• Bundled appliance loan with micro payments
• Increasing household awareness on need for stabilizers (particularly for households with larger appliances) – dissemination of IEC materials; multi-media campaigns, and information camps
• Increasing local availability
• Skill development for maintaining (appropriate-use) and repairing stabilizers
B. Cooling
4 Efficient Fans
• BEE
• EESL
• MNRE
• MSDE
• State energy departments
• Distribution companies
• ̀ 2,000 – `6,000
• Individual appliance loan
• Bundled appliance loan
• Incentives by discoms
• Increasing household awareness on cost-savings – dissemination of IEC materials; multi-media campaigns, and information camps
• Increasing local availability
• Skill development for installing and repairing efficient fans
5 Cool Roof Paint
• MoHUA
• MoRD
• State housing and rural dvp. departments
• ~ `20-40 per sq. ft.
• Govt. subsidy
• Loan with micro-payments
• Increasing household awareness on cost-savings – pilot demonstrations; dissemination of IEC materials; multi-media campaigns, and information camps
• Increasing local availability
• Skill development for maintaining painted cool roofs
C. Cooking
6 Household-level Biogas
• MNRE
• MoRD
• NDDB
• MSDE
• State energy and rural dvp. departments
• ~ `15,000 – `30,000
• Govt. subsidy
• Loan with micro-payments
• Increasing household awareness on cost and time comparisons of biogas – pilot demonstrations; dissemination of IEC materials; multi-media campaigns, and information camps
• Skill development for maintaining (appropriate-use) and repairing biogasifiers

PAGE 67IT TAKES A VILLAGE: ADVANCING HARIYALI CLEAN ENERGY SOLUTIONS IN RURAL INDIA
Summary Table of Clean Energy and Energy Efficient Solutions
No. Solutions Government/Public Actors
Indicative Cost Ranges
Financing Solutions Strengthening Availability and Skill Development
D. Agriculture
7 Solar Water Pumps (and Micro-Irrigation)
• MNRE
• EESL
• MoA
• MSDE
• State departments: Horticulture; energy; rural development
• Costs vary by size
• 3HP system: ~ `155,000 – `157,000 + GST
• 5 HP system: ~ `218,000 – `223,000 + GST
• Govt. subsidy
• Different ownership models for loans: Individual, Group, Water-as-service
• Increasing farmer awareness about solar pump scheme provisions – pilot demonstrations; dissemination of IEC materials; multi-media campaigns, and information camps; information through agri-extension workers and farmer networks
• Support for farmers to identify suitable size and type of solar pumps
• Increasing local availability
• Skill development for installing, maintaining (appropriate-use), and repairing solar pumps
E Other Livelihood Appliances
1 Solar Flour Mills
• MNRE
• MoA
• MSDE
• State departments: Agriculture; energy; rural development NRLMs and SRLMs
• Costs vary by size
• 2HP motor & 3.5 KW solar panels: ~ `350,000
• Appliance loan • Increasing household awareness about costs and paybacks of solar flour mill – pilot demonstrations; IEC materials distributed through farmer and trader networks; and targeted information camps
• Support for setting up local business
• Increasing local availability
• Skill development for installing, maintaining (appropriate-use), and repairing solar flour mill
2 Solar Oil Press
• MNRE
• MoA
• MSDE
• State departments: Agriculture; energy; rural development
• NRLMs and SRLMs
• Costs vary by size
• Appliance loan • Increasing household awareness about costs and paybacks of solar oil mill – pilot demonstrations; IEC materials distributed through farmer and trader networks; and targeted information camps
• Support for setting up local business
• Increasing local availability
• Skill development for installing, maintaining (appropriate-use), and repairing solar oil mill
3 Solar Milk Chiller
• MNRE
• MoA
• NDDB
• MSDE
• State departments: Agriculture; energy; rural
• NRLMs and SRLMs
• Capacity: 500 liters – 1,000 liters
• Temperature range: 4-8oC
• ~`800,000 – `1,000,000
• Appliance loan • Increasing household awareness about costs and paybacks of solar milk chiller – pilot demonstrations; IEC materials distributed through diary and trader networks; and targeted information camps
• Support for setting up local business
• Increasing local availability
• Skill development for installing, maintaining (appropriate-use), and repairing solar milk chiller
4 Electric Three-Wheelers (with lithium ion batteries)
• MoRTH
• MSDE
• State energy departments
• EESL
• ̀ 160,000 - 220,000
• Govt. subsidy
• Loan
• Increasing household awareness about costs and paybacks of electric three-wheelers – pilot demonstrations; IEC materials distributed; multi-media campagins; and targeted information camps
• Support for setting up local business
• Increasing local availability
• Skill development for maintaining (appropriate-use), charging, and repairing electric three-wheelers

PAGE 68 IT TAKES A VILLAGE: ADVANCING HARIYALI CLEAN ENERGY SOLUTIONS IN RURAL INDIA
Summary Table of Clean Energy and Energy Efficient Solutions
No. Solutions Government/Public Actors
Indicative Cost Ranges
Financing Solutions Strengthening Availability and Skill Development
F Community-Level Interventions
1 Solutions for Government Schools: Efficient lights and fans, cool roofs, solar drinking water systems, and micro-solar pumps
• MoWCD
• MoE
• MNRE
• MoHFW
• State deparments: Health, energy, and education.
• Costs will vary based on solutions selected.
• Govt. programs and schemes
• Increasing student and community awareness about clean and energy efficient appliances – pilot demonstrations; IEC materials distributed; multi-media campagins; and targeted information camps
• Increasing local availability of selected solutions
• Skill development for installing, maintaining (appropriate-use), and repairing selected solutions
2 Solutions for Health Care Centers: Efficient lights and fans, cool roofs, solar drinking water systems, and solar cold storage.
• MNRE
• MoHFW
• State deparments: Health, energy, and rural dvp.
• Costs will vary based on solutions selected.
• Govt. programs and schemes
• Increasing awareness among the rural health community about the cost and health benefits of clean and energy efficient solutions – pilot demonstrations; IEC materials distributed; multi-media campagins; and targeted information camps
• Increasing local availability of selected solutions
• Skill development for installing, maintaining (appropriate-use), and repairing selected solutions
3 Streetlights • MNRE
• EESL
• State departments: energy, and rural dvpt.
• Street Light : 75Wp
• Cost = `11000-15000 (includes cost of panels, 30Ah battery, cabinet, luminaire, mounting pole etc.
• Govt. programs and schemes
• Skill development for installing, maintaining (appropriate-use), and repairing streetlights
Key Acronyms used in the Table: BEE: Bureau of Energy Efficiency; Discom: Electricity Distribution Company; EESL: Energy Efficiency Services Ltd.; IEC: Information Education and Communication; MoA: Ministry of Agriculture; MoE: Ministry of Education (also know as Ministry of Human Resource Development); MoHFW: Ministry of Health and Family Welfare; MoHUA: Ministry of Housing and Urban Affiars; MNRE: Ministry of New and Renwable Energy; MoRD: Ministry of Rural Development; MoRTH: Ministry of Road Transport and Highways; MoWCD: Ministry of Women and Child Development; MSDE: Ministry of Skill Development and Enterprenurship; NDDB: National Dair Development Board; NRLM: National Rural Livelihood Mission; SRLM: State Rural Livelihood Mission; GST: Good and Services Tax.

PAGE 69IT TAKES A VILLAGE: ADVANCING HARIYALI CLEAN ENERGY SOLUTIONS IN RURAL INDIA
Endnotes
1 World Bank, “Rural Population (% of total population) – India,” 2019, https://data.worldbank.org/indicator/SP.RUR.TOTL.ZS?locations=IN (accessed on 15 July, 2020).
2 United Nations Development Program India, “271 Million Fewer Poor People in India,” 20 September, 2018, https://www.in.undp.org/content/india/en/home/sustainable-development/successstories/MultiDimesnionalPovertyIndex.html (accessed on 15 July, 2020).
3 Sreekumar Nhalur, Ann Josey, and Manabika Mandal, “Rural Electrification in India: Looking Beyond ‘Connections for All’ to ‘Power for All,’” Economic and Political Weekly, Vol, 53, 45 (17), November, 2018 citing Ministry of Power, Progress Report for Rural Electrification Schemes, 2018, www.ddugjy.gov.in/portal/progress_report/progress_report.pdf (accessed May 20, 2018). In addition, the Electricity Supply Monitoring Initiative (ESMI) shows that only 7-10% of rural locations covered in the program receive uninterrupted electricity supply during evening hours (5pm-11pm) in September 2019. ESMI is a program being implemented by Prayas (Energy Group) to improve transparency and provide evidence-based feedback about the quality of electricity supply from 436 locations spanning 92 districts in 23 states – PEG, Electricity Supply Monitoring Initiative – Watch Your Power Quality, September 2019, http://www.watchyourpower.org/download_uploaded_reports.php?f=ESMI%20Report%20-%20Sptember%202019.pdf (accessed on 09 August, 2020).
4 The surveyed sampled 9,072 households in total from six states – Bihar, Jharkhand, Madhya Pradesh, Odisha, Uttar Pradesh, and West Bengal; Abhishek Jain, Saurabh Tripathi, Sunil Mani, Sasmita Patnaik, Tauseef Shahidi, and Karthik Ganesan, Access to Clean Cooking Energy and Electricity Survey of States 2018, November 2018, Council on Energy, Environment, and Water, https://www.ceew.in/sites/default/files/CEEW-Access-to-Clean-Cooking-Energy-and-Electricity-11Jan19_0.pdf (accessed on 09 August, 2020).
5 Emission savings are based on the diesel and kerosene consumption in Beraniya and Nagano Math. Actual emission savings in other villages may vary depending on the quantities of diesel and kerosene consumed in these villages.
6 Emission savings are based on the diesel and kerosene consumption in Beraniya and Nagano Math. Actual emission savings in other villages may vary depending on the quantities of diesel and kerosene consumed in these villages.
7 Criteria 2-6: Ministry of Home Affairs, Government of India, Census 2011, https://censusindia.gov.in/2011-common/censusdata2011.html (access on 24 May 2020). Criteria 7: National Initiative on Climate Resilient Agriculture (NICRA), Central Research Institute for Dryland Agriculture, and Indian Council of Agricultural Research, Vulnerability of Indian Agriculture to Climate Change, 2013, http://www.nicra-icar.in/nicrarevised/images/publications/Vulerability_Atlas_web.pdf (accessed on 24 May 2020). Criteria 8: Ministry of Agriculture and Farmers Welfare, “Proportion of Small and Marginal Farmers,” Agriculture Census 2015-16, http://inputsurvey.dacnet.nic.in/districtsummary_sizeclass.aspx (accessed on 24 May 2020).
8 Arvalli district is also spelled as Aravalli and Aravali, for this report, we use Arvalli district. Government of Gujarat, “Collectorate of Gujarat,” 2020, https://arvalli.gujarat.gov.in (accessed on 20 November 2020).
9 Ministry of New and Renewable Energy (MNRE), “Scheme for Famers for Installation of Solar,” 8 March 2019, http://164.100.77.194/img/documents/uploads/bd0e213a2a8b4c96a59623306ac46e77.pdf (accessed on 26 May 2020).
10 PM KUSUM’s initial targets were 1.75 million standalone pumps (component B) and 1 million grid-connected pumps (component C). This was increased in the February 2020 budget announcement to 2 million for component B and 1.5 million for component C. Sudheer Singh, “Budget 2020: Major Focus on PM KUSUM Scheme to Help Farmers Generate Income from Solar Power,” Economic Times, 01 February 2020, https://energy.economictimes.indiatimes.com/news/renewable/budget-2020-major-focus-on-pm-kusum-scheme-to-help-farmers-generate-income-from-solar-power/73832492 (accessed on 26 May 2020).
11 Ibid. Conversion rate assumed in this study: $1 = `70.12 Bureau of Energy Efficiency (BEE), Ministry of Power, Government of
India, “Lighting,” Impact of Energy Efficiency Measures for the Year 2018-19, March 2020, Ch. 6, pg. 87, https://powermin.nic.in/sites/default/files/webform/notices/e-book_on_Impact_assessment_of_various_energy_efficiency_measures_taken_during_2018_19.pdf
(accessed on 01 June 2020). 13 Energy Efficiency Services Limited (EESL), “About UJALA,” https://
www.eeslindia.org/content/raj/eesl/en/Programmes/UJALA/About-UJALA.html (accessed on 01 June 2020).
14 Utpal Bhaskar, “Rural Areas to Get 600 Million LED Bulbs at `10 a Piece Without Government Subsidy,” Live Mint, 09 August, 2020, https://www.livemint.com/news/india/rural-areas-to-get-600-mln-led-bulbs-at-rs-10-apiece-without-govt-subsidy-11596971172091.html (accessed on 09 August, 2020).
15 BEE, Ministry of Power, Government of India, “Super Efficiency Equipment Program (SEEP),” 2020, https://beeindia.gov.in/content/seep-0 (accessed on 02 June 2020).
16 Bureau of Energy Efficiency (BEE), Ministry of Power, Government of India, Impact of Energy Efficiency Measures for the Year 2018-19, supra, pg. 12 and pg. 87.
17 Ministry of Textile, Government of India, “Solar Energy Scheme for Small Powerloom Units,” Press Information Bureau, 16 March, 2017, https://pib.gov.in/newsite/mberel.aspx?relid=159340 (accesed on 10 August, 2020). Ministry of Micro, Small & Medium Enterprises, Government of India, “Subsidies to Artisans Under Solar Charkha Mission,” Press Information Bureau, 05 March, 2020, https://pib.gov.in/PressReleseDetailm.aspx?PRID=1605406 (accessed on 10 August, 2020).
18 Shaily Jha, Sasmita Patnaik, and Abhishek Jain, Financing Solar-powered Livelihoods in India: Evidence from Micro Enterprises, 2019. New Delhi: Council on Energy, Environment and Water, https://www.ceew.in/sites/default/files/CEEW-Financing-Solar-powered-Livelihoods-in-India-24Sep19_compressed_0.pdf (accessed on 10 August, 2020). Micro Units Development and Refinance Agency Ltd. (MUDRA), “MUDRA Offerings,” https://www.mudra.org.in/Offerings (accessed on 10 August, 2020). Development Commissioner, Ministry of Micro, Small & Medium Enterprises, “Credit Linked Capital Subsidy Scheme for Technology Upgradation,” http://www.dcmsme.gov.in/schemes/credit_link_scheme.htm (accessed on 10 August, 2020). Ministry of Micro, Small & Medium Enterprises, “Prime Minister’s Employment Generation Programme (PMEGP),” https://msme.gov.in/11-prime-ministers-employment-generation-programme-pmegp (accessed on 10 August, 2020).
19 MNRE, “New National Biogas and Organic Manure Programme,” Schemes, 2020, https://mnre.gov.in/bio-energy/schemes (accessed on 02 June 2020).
20 Department of Drinking Water and Sanitation, Ministry of Jal Shakti, “GOBAR-Dhan,” https://sbm.gov.in/Gobardhan/SLRM_AboutUs.aspx# (accessed on 02 June, 2020).
21 Ministry of Drinking Water and Sanitation, and Ministry of Communications and Information Technology, “GOBAR-Dhan Operational Manual,” n.d., http://sbm.gov.in/gobardhan/UserManual/OperationalManual_AgencyV1.0.pdf (accessed on 02 June, 2020).
22 EESL, “About Street Lighting National Program,” 2020, https://www.eeslindia.org/content/raj/eesl/en/Programmes/SLNP/about-slnp.html (accessed on 04 June 2020).
23 Phase III of the program ended in March 2020. MNRE, “Off-grid and Decentralized Solar PV Applications Programme – Phase III,” 2020, https://mnre.gov.in/solar/schemes/ (accessed on 10 August 2020).
24 Need full citation and link: http://www.indiascienceandtechnology.gov.in/organisations/ministry-and-departments/ministry-new-and-renewable-energy-mnre/national-institute-solar-energy-nise-gurugram
25 Uma Gupta, “NISE Floats Solar Dryer Fabrication and Supply Tender,” PV Magazine, 18 April, 2020 https://www.pv-magazine-india.com/2019/04/18/nise-floats-solar-dryer-fabrication-and-supply-tender/ (accessed on 02 June 2020); NISE, “About Suryamitra,” 2020, https://suryamitra.nise.res.in/info/About-Suryamitra.html (accessed on 02 June, 2020), NISE, “About NISE,” 2020, https://nise.res.in/about-us/about-nise/#page-content (accessed on 02 June, 2020).
26 BEE, Impact of Energy Efficiency Measures for the Year 2018-19, supra, pg. 93 and 111.
27 Energy and Petrochemical Department, Government of Gujarat, Gujarat Solar Power Policy – 2015, 13 August 2015, https://geda.gujarat.gov.in/Gallery/Media_Gallery/2gujarat_solar_power_policy_2015.pdf (accessed on 04 June 2020).

PAGE 70 IT TAKES A VILLAGE: ADVANCING HARIYALI CLEAN ENERGY SOLUTIONS IN RURAL INDIA
28 Preeti Lal, “Gujarat Targets 30 GW of Renewable Capacity by 2022,” PV Magazine, 03 July, 2019, https://www.pv-magazine-india.com/2019/07/03/gujarat-targets-30-gw-of-renewable-capacity-by-2022/?utm_source=dlvr.it&utm_medium=twitter (accessed on 02 June 2020).
29 Gujarat Power Research and Development Cell, “Suryashakti Kisan Yojana (SKY),” 2019, https://www.gprd.in/sky.php (accessed on 06 June, 2020).
30 Energy Department, Government of Rajasthan, Rajasthan Solar Energy Policy 2019, https://energy.rajasthan.gov.in/content/dam/raj/energy/rrecl/pdf/Home%20Page/Rajasthan%20Solar%20Energy%20Policy2019.pdf (accessed on 02 June, 2020).
31 P R Ganapathy, “Investing CSR in Incubators – A Unique Model of Partnership,” Guest post on Samhita http://www.samhita.org/investing-csr-in-incubators-a-unique-model-of-partnerships/ (accessed on 08 June 2020).
32 According to Census 2011, Naganomath had 155 households. However, an interview with the sarpanch (administrative village head) gave the 2019 figure for Naganomath – 256 households.
33 In Gujarat, 1 acre = 2.49 bighas, based on inputs from SEWA. 34 For perspective, a basic 1.5-ton air conditioner costs ~ `25,000 to
45,000 clearly beyond the reach of most village households. 35 It is likely income figures have been underreported in Nagano Math.
For instance: 38% of households report income of `120,000 (~$1700) or more per annum from agriculture operations (i.e. `10,000 per month/~$140) and 48% of total households surveyed reported income higher than `90,000 (~$1280) per annum from agriculture (Appendix B.7). On an average, most households are engaged in at least two different livelihood activities. This indicates that average annual income figures are likely to be slightly higher.
36 For all histograms, there are no overlapping ranges – parentheses “( )” mean that the number is excluded in the range; a square brackets “[ ]” mean that the number is included in the range.
37 According to Census 2011, Beraniya had 193 households. However, an interview with the sarpanch (administrative village head) gave the 2019 figure for Beraniya – 256 households.
38 In Rajasthan, 1 acre = 1.6 bighas, based on inputs from SEWA.39 Subsidies exist for LPG these are transferred directly to beneficiary
accounts post LPG purchase. Even though households cumulatively pay a lower amount (post transfer of the subsidy amount), most households in the survey perceived paying the full price of the cylinder. This indicates that households often do not realize that the transfer has taken place. In discussions conducted with women, reported difficulty in making lump upfront payment for the full cylinder cost. Reported delays in filling their refill orders, lack of doorstep delivery were other concerns. Many households stopped purchasing LPG once the market price of LPG reached `900, despite the subsidy.
40 NRDC-SEWA, Worth Their Salt: Building Worth Their Salt: Building Skills of Women Salt Farmers in Gujarat through Clean Energy Solutions, January 2019, https://www.nrdc.org/sites/default/files/worth-their-salt-women-farmers-skills-gujarat-fs.pdf.
41 Rural Energy Corporation, “Pradhan Mantri Sahaj Bijli Har Ghar Yojaja ‘Saubhagya,’” About Saubhagya, https://saubhagya.gov.in (accessed on 10 June 2020).
42 The central government had an “Akshay Urja Shop Program” which aimed to support the establishment of a shop in each district to sell and promote solar and energy efficient appliances. The program had also encouraged NGOs and private entrepreneurs to participate. However, the program was discontinued in 2017 – Saur Energy, “Government decides to discontinue Akshay Urja Shops Programme,” 24 June, 2017, https://www.saurenergy.com/solar-energy-news/government-decides-discontinue-akshay-urja-shops-programme (accessed on 29 April, 2020). Common Service Centers (CSC) are envisaged as the access point for delivery of essential public services such as social welfare schemes, healthcare, financial, agriculture, and several business to consumer services in rural and remote areas in India – Ministry of Electronics and Information Technology, “Common Service Centres Scheme (CSC),” https://www.csc.gov.in (accessed on 12 June 2020).
43 The Hans India, “Subsidy LED Bulbs Now Available at Rations Shops,” 23 March, 2018, https://www.thehansindia.com/posts/index/Hyderabad-Tab/2018-03-23/Subsidy-LED-bulbs-now-available-at-ration-shops/368644 (accessed on 2 June 2020).
44 For example, in cities, demand aggregation online sites often offer bulk discounts for LEDs. Knowledge about these options and reach of
these sites in rural areas is limited. In addition, internet literacy can also be a challenge.
45 Jaipur Vidyut Vitran Nigam Limited, “Tariff for Supply of Electricity – 2020,” 17 February, 2020. Tariff for BPL and Astha card holders is `3.5 (for consumption upto first 50 units per month), and small domestic household for the first 50 units per month is `3.85. The tariff for Gujarat is lower – BPL households pay `1.5 for the first 50 units, non-BPL households pay `3.05 for the first 50 units; both pay Rs.3.5 for the next 50 units. Gujarat Electricity Regulatory Commission, “Truing up for FY 2018-19 and Determination of Tariff for FY 2020-21,” 31 March, 2020, http://demo.gercin.org/uploaded/document/994f2e2d-c89e-4414-a4f2-efaf131967e1.pdf. Assuming the higher rate of `3.85 for the calculations.
46 MNRE, “Seven Million Solar Study Lamp Scheme for School Going Children,” Solar Off-Grid, https://mnre.gov.in/solar/schemes/ (accessed on 10 August, 2020).
47 Abhishek Jain, “BEE 5 Star Rated Ceiling Fans: Myths and Realities,” 03 September 2017, https://www.bijlibachao.com/fans/bee-5-star-rated-ceiling-fans-myths-and-realities.html (accessed on 22 May 2020); Jaipur Vidyut Vitran Nigam Limited, “Tariff for Supply of Electricity – 2020,” supra.
48 A cool roof is a roof built from materials that retain less heat and stay cooler than traditional roofs by reflecting more sunlight. These roofs are prepared, covered or coated with materials that have special characteristics (high reflectivity & high emissivity). Cool roofs also efficiently cool itself by emitting thermal radiation partly absorbed. As a result, the roof stays cooler throughout the day, keeping buildings cooler and more comfortable – NRDC, Administrative Staff College of India, Mahila Housing Trust, and Indian Institute of Public Health Gandhinagar, Frequently Asked Questions – Cool Roofs, May 2020, https://www.nrdc.org/sites/default/files/india-cool-roofs-faq-20200527.pdf (accessed on 08 June 2020).
49 U.S. Environmental Protection Agency, “Reducing Urban Heat Islands: Compendium of Strategies – Cool Roofs”, 2008; Vishal Garg, Rajshree Kotharkar, Jayant Sathaye, Hema Rallapalli, Nilesh Kulkarni, Niranjan Reddy, Prabhakara Rao, Ashok Sarkar, “Assessment of the Impact of Cool Roofs in Rural Buildings in India”, Energy and Buildings, 2016, 114, pg. 156-163 (accessed on 02 May 2017); Akbari et al “Using Cool Roofs to Reduce Energy Use Greenhouse Gas Emissions, and Urban Heat island Effects: Findings from an India Experiment,” Environmental Energy Technologies Division Lawrence Berkeley National Laboratory (LBNL) and International Institute for Information Technology (IIIT) Hyderabad, India, 2011.
50 Nikhil Goveas, Exploring the Potential, Scope and Demand for Micro Solar Water Pumps in India: A Case Study of Vaishali, Bihar, March 2019, New Delhi: Koan-GIZ.
51 Tushaar Shah, Abhishek Rajan, Gyan Prakash Rai, Shilp Verma, and Neha Durga, Solar Pumps and South Asia’s Energy-Groundwater Nexus: Exploring Implications and Reimagining Its Future, 2019, IOP Publishing.
52 Ministry of Jal Shakti, Government of India, National Compilation on Dynamic Ground Water Resources of India 2017, July 2019, http://cgwb.gov.in/GW-Assessment/GWRA-2017-National-Compilation.pdf (accessed on 12 June 2020).
53 Shah Kishore 2012 54 Shilp Verma, Neha Durga, and Tushaar Shah. “Solar Irrigation Pumps
and India’s Energy-Irrigation Nexus,” 2018, International Water Management Institute (IWMI)-Tata Water Policy Program; Alvar Closas and Edwin Rap. “Solar-Based Groundwater Pumping for Irrigation: Sustainability, Policies, and Limitations,” Energy Policy, 2017, 104, pg. 33–37.
55 Anne Raymond and Abhishek Jain, Solar for Irrigation: A Comparative Assessment of Deployment Strategies, 2018, New Delhi: CEEW, 2018.
56 Nikhil Goveas, Exploring the Potential, Scope and Demand for Micro Solar Water Pumps in India: A Case Study of Vaishali, Bihar, Supra.
57 Avinash Kishore, Tushaar Shah, and Nidhi Prabha Tewari, “Solar Irrigation Pumps Farmers’ Experience and State Policy in Rajasthan,” Economic and Political Weekly, 2014, 49, no. 10 pg. 55–62; Ram Fishman, Naresh Devineni, and Swaminathan Raman, “Can Improved Agricultural Water Use Efficiency Save India’s Groundwater?” Environment Research Letters, 2015.
58 Avinash Kishore, et al. “Solar Irrigation Pumps Farmers’ Experience and State Policy in Rajasthan,” 2014, Supra.

PAGE 71IT TAKES A VILLAGE: ADVANCING HARIYALI CLEAN ENERGY SOLUTIONS IN RURAL INDIA
59 Franklin, Bradley. “Solar Irrigation Pumps: Can Electricity Buy-Back Curb Groundwater Over-Use?” International Commission on Irrigation and Drainage, 2015, 26th Euro-Mediterranean Regional Conference and Workshops; Avinash Kishore, et al. “Solar Irrigation Pumps Farmers’ Experience and State Policy in Rajasthan,” 2014 Supra; Shilp Verma, Divya Kashyap, Tushaar Shah, Marylaure Crettaz, and Alok Sikka, Solar Irrigation for Agriculture Resilience (SoLAR), 2018 IWMI-Tata Water Policy Program; Shilp Verma, Neha Durga, and Tushaar Shah. “Solar Irrigation Pumps and India’s Energy-Irrigation Nexus,” 2018, Supra.
60 Jeff Smith, Sunshine: India’s New Cash Crop, 2015, CGIAR-IWMI, https://wle.cgiar.org/sunshine-india-new-cash-crop (accessed on 12 June 2020).
61 MNRE, “Office Memorandum: Benchmark costs for Off-grid Solar PV Systems and Solarisation of Agricultural Pumps for the Year 2019-2020,” 25 July 2019, http://164.100.77.194/img/documents/uploads/b7bdf89068004e58b146f8e31095d34a.pdf (accessed on 22 May 2020).
62 MNRE, “Universal Solar Pump Controller (UPSC) Specifications for Stand-Alone Applications,” 17 July 2019, https://mnre.gov.in/img/documents/uploads/file_s-1584510928507.pdf (accessed on 22 May 2020).
63 MNRE, “Office Memorandum: Benchmark costs for Off-grid Solar PV Systems and Solarisation of Agricultural Pumps for the Year 2019-2020,” 25 July 2019.
64 NRDC-SEWA, “Worth Their Salt: Improving Livelihoods of Women Salt Farmers Through Clean Energy in the Saltpans of Gujarat,” September 2018, https://www.nrdc.org/sites/default/files/worth-their-salt-improving-livelihoods-of-women-salt-farmers-through-clean-energy-in-the-salt-pans-of-gujarat_2018-09-10.pdf.
65 Maulik Pathak, “Cloud Over SKY: Gujarat Scales Down Pilot Solar Project,” Times of India, 15 March 2019, https://timesofindia.indiatimes.com/city/ahmedabad/cloud-over-sky-state-scales-down-pilot-solar-project/articleshow/68416667.cms (accessed on 10 June 2020).
66 The central government has proposed amendments to introduce direct benefit transfers of electricity subsidies to transfers, i.e. farmers pay upfront the lumpy unsubsidized cost of electricity and receive the subsidy amount in their bank accounts. Experiences of DBT transfers for LPG in this sample indicate that households often find lumpy payments challenging and prefer to opt for alternatives with dispersed smaller payments. Ministry of Power, “Draft – The Electricity (Amendment) Bill 2020,” 17 April 2020, https://powermin.nic.in/sites/default/files/webform/notices/Draft_Electricity_Amendment_Bill_2020_for_comments.pdf (accessed on 22 May 2020).
67 Ministry of Agriculture and Farmers Welfare, Government of India, Pradhan Mantri Krishi Sinchayee Yojana, 2019, https://pmksy.gov.in/AboutPMKSY.aspx (accessed on 02 June 2020); Rakesh Goswami, “Women Farmers Focus of Rajasthan Government’s New Subsidy Scheme,” Hindustan Times, 14 October 2019, https://www.hindustantimes.com/jaipur/women-farmers-focus-of-rajasthan-govt-s-new-subsidy-scheme/story-H85o7FLQvWzDWPfzTTgjIL.html (accessed on 02 June 2020); Gujarat Green Revolution Company Limited, “Subsidy Norms of Micro Irrigation,” 2020, https://ggrc.co.in/webui/Content.aspx?PageId=33 (accessed on 02 June 2020).
68 SEWA and NRDC, “Worth Their Salt: Building Skills and Improving Livelihoods of Women Salt-Farmers in Gujarat Through Clean Energy Solutions,” January 2019, https://www.nrdc.org/sites/default/files/worth-their-salt-women-farmers-skills-gujarat-fs.pdf.
69 MNRE, “Administrative Sanction-cum Guidelines for Implementation of Central Sector Scheme, New National Biogas and Organic Manure
Programme,” Policies – Bio-Energy, https://mnre.gov.in/Bio%20Energy/policy-and-guidelines (accessed on 20 July, 2020). Department of Drinking Water and Sanitation, Ministry of Jal Shakti, Government of India, “GOBAR – Dhan,” 2018, https://sbm.gov.in/Gobardhan/SLRM_AboutUs.aspx (accessed on 20 July, 2020).
70 Market cost of the technology is between `30,000 and `35,000. Central and state government subsidies are around `15,000. In addition, households will have to bear labor costs for about 2 days required for installation.
71 SELCO Foundation, “Sustainable Energy Livelihoods – A Collection of Sustainable 65 appliances,” http://www.selcofoundation.org/wp-content/uploads/2019/05/SELCO-Foundation-Sustainable-Energy-Livelihoods-65-Appliances.pdf (accessed on 10 May 2020).
72 SEWA Rudi, “About Us,” http://sewarudi.com/about-us/ (accessed 10 May 2020).
73 Inficold, “Solar Cold Storage Overview,” 2020, http://www.inficold.com/products.php (accessed 10 May 2020).
74 Justice J.S. Verma, Justice Leila Seth, Justice Gopal Subramanium, Report of the Committee on Amendments to Criminal Law, “Provision of Adequate Safety Measures and Amenities in Respect of Women,” p.260, 23 January, 2013, https://www.prsindia.org/uploads/media/Justice%20verma%20committee/js%20verma%20committe%20report.pdf (accessed on 12 August, 2020).
75 Anupam Prakash, Avdhesh Kumar Shulka, Chaitali Bhowmick, and Robert Carl Michael Beyer, “Night-Time Luminosity: Does it Brighten Understanding of Economic Activity in India?” Reserve Bank of India Occasional Papers, Vol. 40, No. 1, 2019, https://www.researchgate.net/profile/Avdhesh_Shukla/publication/334811462_Night-time_Luminosity_Does_it_Brighten_Understanding_of_Economic_Activity_in_India/links/5d41decc299bf1995b5b6dde/Night-time-Luminosity-Does-it-Brighten-Understanding-of-Economic-Activity-in-India.pdf (accessed 10 August, 2020). Tarujyoti Buragohain, “Impact of Solar Energy in Rural Development in India,” International Journal of Environmental Science and Development, Vol. 3, No. 4, August 2012, http://www.ijesd.org/papers/242-B10021.pdf (accessed 14 August 2020).
76 Manu Tayal, “Govt Closes Atal Jyoti Yojana (AJAY) Phase-II Amid Covid-19 Outbreak,” 24 April, 2020, https://www.saurenergy.com/solar-energy-news/govt-closes-atal-jyoti-yojana-ajay-phase-ii-amid-covid-19-outbreak (accessed on 25 May 2020).
77 For key assumptions in impact calculations please refer to the Impact Analysis table in Appendix
78 Emission savings are based on the diesel and kerosene consumption in Beraniya and Nagano Math. Actual emission savings in other villages may vary depending on the quantities of diesel and kerosene consumed in these villages.
79 Central Electricity Authority, “CO2 Baseline Database for the Indian Power Sector,” 2018; and US Environment Protection Agency, “Greenhouse Gas Equivalencies Calculator,” March 2020, https://www.epa.gov/energy/greenhouse-gas-equivalencies-calculator (accessed on 15 August, 2020).
80 Mittal, M.L., Sharma, C. & Singh, R., “Decadal Emission Estimates of Carbon Dioxide, Sulfur Dioxide, and Nitric Oxide Emissions from Coal Burning in Electric Power Generation Plants in India,” Environ Monit Assess, 186, pg. 6857–6866 (2014). https://doi.org/10.1007/s10661-014-3894-3.
81 Emission savings are based on the diesel and kerosene consumption in Beraniya and Nagano Math. Actual emission savings in other villages may vary depending on the quantities of diesel and kerosene consumed in these villages.

PAGE 72 IT TAKES A VILLAGE: ADVANCING HARIYALI CLEAN ENERGY SOLUTIONS IN RURAL INDIA
Highlighted Resources
Worth Their Salt: Building Skills and Improving Livelihoods of Woman Salt Farmers in Gujarat through Clean Energy Solutions
https://www.nrdc.org/sites/default/files/worth-their-salt-women-farmers-skills-gujarat-fs.pdf
Worth Their Salt: Improving Livelihoods of Women Salt Farmers through Clean Energy in the Salt Pans of Gujarat
https://www.nrdc.org/sites/default/files/worth-their-salt-improving-livelihoods-of-women-salt-farmers-through-clean-energy-in-the-salt-pans-of-gujarat_2018-09-10.pdf
Growing Clean Energy Markets in India With Green Windows
https://www.nrdc.org/sites/default/files/growing-clean-energy-green-windows-202001.pdf
Powering Jobs Growth with Green Energy
https://www.nrdc.org/sites/default/files/jobs-growth-green-energy.pdf
Clean Energy for All: Framework for Catalytic Finance for Underserved Clean Energy markets in India
https://www.nrdc.org/sites/default/files/catalytic-finance-underserved-clean-energy-markets-india-report-201810.pdf
Greening India’s Workforce: Gearing up for Expansion of Solar and Wind Power in India
https://www.nrdc.org/sites/default/files/greening-india-workforce.pdf
Copyright © 2021 Natural Resources Defense Council and Self Employed Women’s Association
All rights reserved. No part of this publication may be reproduced, stored in a retrieval system or transmitted, in any form or by any means, electronic, mechanical, photocopying, recording or otherwise, without prior permission.