
Issues about the integration of passive and active monitoring for grid networks
10
Issues about the Integration of Passive and Active Monitoring for Grid Networks S. Andreozzi 2 , D. Antoniades 1 , A. Ciuffoletti 2 , A. Ghiselli 2 , E.P. Markatos 1 , M. Polychronakis 1 , P. Trimintzios 1 1 FORTH-ICS, P.O. Box 1385 – 71110, Heraklion, GREECE, {ptrim,mikepo,danton,markatos}@ics.forth.gr 2 CNAF-INFN, Via Berti Pichat 6/2 – 40126, Bologna, ITALY [email protected],{sergio.andreozzi,antonia.ghiselli}@cnaf.infn.it Abstract. We discuss the integration of passive and active techniques in a Grid monitoring system. We show the advantages obtained by us- ing the same domain-oriented overlay network to organize both kinds of monitoring. 1 Introduction Grid applications require Storage, Computing, and Communication resources, and need to know the characteristics of such resources in order to setup an optimal execution environment. At present, Storage and Computing resources monitoring is sufficiently precise, and is translated into database schemas that are used for early experiments in system resources optimization. In contrast, monitoring of Communication resources is at an early stage, due to the the complexity of the infrastructure to monitor and of the monitoring activity. According to the Global Grid Forum (GGF) schema [3], the management of network measurements (which we call observations) is divided into three distinct activities: their production, their publication, and their utilization. Here, we focus on the infrastructure related to production and publication. Our primary concern is scalability when producers are increasing in number and monitoring data output: in order to limit the quantity of observations that need to be published, we use a domain-oriented overlay network. Under this light, in Section 2 we describe alternative techniques for network monitoring, and we devise an hybrid network monitoring architecture. Section 3 addresses a number of security and privacy issues related to such architecture. 2 Classification of Monitoring Approaches and Techniques In this section we classify monitoring approaches according with two criteria: the first criterion distinguishes path and link granularity for network monitoring, while the second classification divides monitoring tools into active and passive ones.
-
Upload
independent -
Category
Documents
-
view
4 -
download
0
Transcript of Issues about the integration of passive and active monitoring for grid networks
Issues about the Integration of Passive andActive Monitoring for Grid Networks
S. Andreozzi2, D. Antoniades1, A. Ciuffoletti2, A. Ghiselli2, E.P. Markatos1,M. Polychronakis1, P. Trimintzios1
1 FORTH-ICS, P.O. Box 1385 – 71110, Heraklion, GREECE,{ptrim,mikepo,danton,markatos}@ics.forth.gr
2 CNAF-INFN, Via Berti Pichat 6/2 – 40126, Bologna, [email protected],{sergio.andreozzi,antonia.ghiselli}@cnaf.infn.it
Abstract. We discuss the integration of passive and active techniquesin a Grid monitoring system. We show the advantages obtained by us-ing the same domain-oriented overlay network to organize both kinds ofmonitoring.
1 Introduction
Grid applications require Storage, Computing, and Communication resources,and need to know the characteristics of such resources in order to setup anoptimal execution environment. At present, Storage and Computing resourcesmonitoring is sufficiently precise, and is translated into database schemas thatare used for early experiments in system resources optimization. In contrast,monitoring of Communication resources is at an early stage, due to the thecomplexity of the infrastructure to monitor and of the monitoring activity.
According to the Global Grid Forum (GGF) schema [3], the management ofnetwork measurements (which we call observations) is divided into three distinctactivities: their production, their publication, and their utilization. Here, we focuson the infrastructure related to production and publication.
Our primary concern is scalability when producers are increasing in numberand monitoring data output: in order to limit the quantity of observations thatneed to be published, we use a domain-oriented overlay network. Under thislight, in Section 2 we describe alternative techniques for network monitoring,and we devise an hybrid network monitoring architecture. Section 3 addresses anumber of security and privacy issues related to such architecture.
2 Classification of Monitoring Approaches andTechniques
In this section we classify monitoring approaches according with two criteria:the first criterion distinguishes path and link granularity for network monitoring,while the second classification divides monitoring tools into active and passiveones.

2.1 Finding a Compromise Between Link and Path Monitoring
One issue that emerges when considering network monitoring is related to itsgranularity. We envision two main alternatives:
single link - it gives the view from a single observation point. It is good formaintainers, which need a fine grained view of the network in order to lo-calize a problem, but inappropriate for Grid-aware applications, that mayneed end-to-end observations. Note that correlation of the information frommultiple single links may provide monitoring metrics appropriate for someGrid applications.
end-to-end path - it gives a view of the system that is filtered through routing:this may be sometimes confusing for maintainers, but is appropriate for Gridaware applications.
However, the scalability of the two approaches is dramatically different: letN be the number of resources in the system. A link oriented monitoring systemgrows with O(N), since the Grid can be assimilated to a bounded degree graph.In a path-oriented approach, the address space is O(N2), since, as a general rule,each resource has a distinct path to any other resource.
This consideration seems to exclude the adoption of a end-to-end path ap-proach, but there are other problems with the single-link approach:
– edges of a link are often black boxes that contain proprietary software: theremay be no way to modify or add code for monitoring purposes, or even tosimply access the stored data;
– deriving an end-to-end path performance metric from single-link observa-tions requires two critical steps: to reconstruct the link sequence, and, evenmore problematic, to obtain time correlated path performance compositionsfrom single-link observations;
We conclude that each approach exhibits severe drawbacks, and we proposea compromise: we introduce an overlay network that cluters network servicesinto domains, and restricts monitoring to inter-domain paths. Such a strategy,which resembles the BGP/OSPF dichotomy in the Internet, finds a compromisebetween the two extreme design strategies outlined above:
– like an end-to-end path strategy, it offers Grid oriented applications a valuableinsight of the path connecting two resources. However, such insight does notinclude the performance of the local network (which usually outperformsinter-domain paths), and the address space is still O(N2), but now N standsfor the number of domains, which should be significantly smaller than thenumber of resources;
– like a single link strategy, it provides the maintainers with a reasonable lo-calization of a problem. As for accounting, as long as domains are mappedto administrative entities, it gives sufficient information to account resourceutilization.

In essence, a domain-oriented approach limits the complexity of the addressspace into a range that is already managed by routing algorithms, avoids pathreconstruction, and has a granularity that is compatible with relevant tasks.The overlay view it introduces cannot be derived from a pre-existent structure:the Domain Name System (DNS) structure is not adequate to map monitor-ing domains, since the same DNS subnetwork may in principle contain severalmonitoring domains, and a domain may overlap several DNS subnetworks. Theoverlay network (or domain partition) must be separately designed, maintained,and made available to users, as explained in section 2.5.
2.2 Passive and Active Monitoring Techniques
Another classification scheme distinguishes between active and passive monitor-ing. The definition itself is slippery, and often a matter of discussion. For ourpurpose, we adopt the following classification criterion:
a monitoring tool is classified as active if its measurements are based ontraffic it induces into the network, otherwise it is passive.
Passive monitoring tools can give an extremely detailed view of the perfor-mance of the network, while active tools return a response that combines severalperformance figures.
As a general rule, effective network monitoring should exploit both kinds oftools:
– an active approach is more effective to monitor network sanity;– an active approach is suitable for application oriented observations (like jit-
ter, when related to multimedia applications);– a passive approach is appropriate to monitor gross connectivity metrics, like
throughput;– a passive approach is needed for accounting purposes.
In the following, we discuss both passive and active monitoring in the contextof monitoring data production for Grid infrastructures.
2.3 Passive Network Monitoring for Grid Infrastructures
Passive network monitoring techniques analyze network traffic by capturing andexamining individual packets passing through the monitored link, allowing forfine-grained operations, such as deep packet inspection [1].
Figure 1 illustrates a high-level view of a distributed passive network moni-toring infrastructure. Monitoring sensors are distributed across several domains,here considered for simplicity as Internet Autonomous Systems (AS). Each sen-sor may monitor the link between the domain and the Internet (as in AS 1 and3), or an internal link of a local sub-network (as in AS 2). An authorized user,who may not be located in any of the participating Autonomous Systems, can
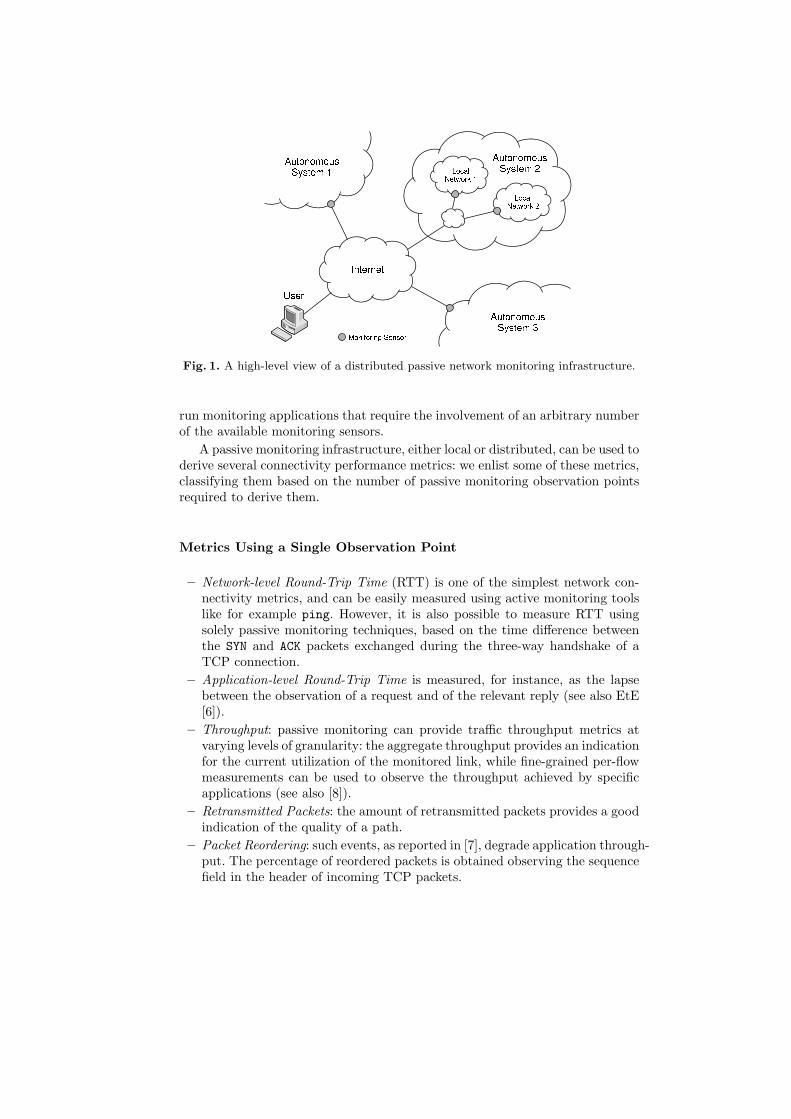
Fig. 1. A high-level view of a distributed passive network monitoring infrastructure.
run monitoring applications that require the involvement of an arbitrary numberof the available monitoring sensors.
A passive monitoring infrastructure, either local or distributed, can be used toderive several connectivity performance metrics: we enlist some of these metrics,classifying them based on the number of passive monitoring observation pointsrequired to derive them.
Metrics Using a Single Observation Point
– Network-level Round-Trip Time (RTT) is one of the simplest network con-nectivity metrics, and can be easily measured using active monitoring toolslike for example ping. However, it is also possible to measure RTT usingsolely passive monitoring techniques, based on the time difference betweenthe SYN and ACK packets exchanged during the three-way handshake of aTCP connection.
– Application-level Round-Trip Time is measured, for instance, as the lapsebetween the observation of a request and of the relevant reply (see also EtE[6]).
– Throughput: passive monitoring can provide traffic throughput metrics atvarying levels of granularity: the aggregate throughput provides an indicationfor the current utilization of the monitored link, while fine-grained per-flowmeasurements can be used to observe the throughput achieved by specificapplications (see also [8]).
– Retransmitted Packets: the amount of retransmitted packets provides a goodindication of the quality of a path.
– Packet Reordering: such events, as reported in [7], degrade application through-put. The percentage of reordered packets is obtained observing the sequencefield in the header of incoming TCP packets.

Metrics Using Multiple Observation Points
– One-Way Delay and Jitter: OWD can be measured using two passive moni-tors with synchronized clocks located at the source and the destination. Oneway delay variation (or jitter) can also be computed.
– Packet Loss Ratio: this metric can be measured using two cooperating mon-itors at the source and the destination, keeping track of the packets sent butnot received by the destination after a timeout period.
– Service Availability: a SYN packet without a SYN-ACK response indicates a re-fused connection, which gives an indication of the availability of a particulardomain/service.
2.4 Active Monitoring for Grid Infrastructures
Active tools induce a test traffic benchmark into the Grid connectivity infras-tructure, and observe the behavior of the network. As a general rule, one end (theprobe) generates a specific traffic pattern, while the other (the target) cooperatesby returning some sort of feedback: the ping tool is a well known representativeof this category.
Disregarding the characteristics of the benchmark, an active monitoring toolreports a view of the network that is near to the needs of the application: for in-stance, a ping message that uses the Internet Control Message Protocol (ICMP)gives an indication of raw transmission times, useful for applications such as mul-timedia streaming. A ping that uses UDP packets or a short ftp session may beused to gather the necessary information for optimal file transfers. Since activetools report the same network performance that the application will observe,their results are readily usable by Grid-aware applications that want to optimizetheir performance.
The coordination activity associated to active monitoring is minimal: thisis relevant for a dynamic entity, such as a Grid, where join and leave eventsare frequent. A new resource that joins the Grid enters the monitoring activitysimply by starting its probe and target related activities. However, join and leaveactivities introduce security problems, which are further addressed in Section 3.
Most of the statistics collected by active tools have a local relevance, and neednot be transmitted elsewhere: as a general rule, they are used by applicationsthat run in the domain where the probe resides. A distributed publication enginemay take advantage of that, exporting to the global view only those observationsthat are requested by remote consumers.
Network performance statistics that can be observed using active monitoringtechniques can be divided into two categories:
packet oriented: related to the behavior induced by single packet transmis-sions between the measurement points. Besides RTT, appropriate probesallow for the observation of TCP connection setup characteristics and one-way figures of packet delay and packet delay variation;

stream oriented: related to the behavior induced by a sequence of packetswith given characteristics. Such characteristics may include the specificationof the timing and the lenght of the packet stream, as well as the contentof individual packets. Examples of such streams are an ftp transfer of arandomly generated file of given length, or a back-to-back sequence of UDPpackets.
A relevant feature shared by active monitoring tools is the ability to detectthe presence of a resource, disregarding if it is used or not, since they requirean active participation of all actors (probe, target and network). This not onlyhelps fault tolerance, but may also simplify the maintenance of the Grid layout,which is needed by Grid-aware applications.
Since active monitoring consumes some resources, security rules should limitthe impact of malicious uses of such tools: this issue is also covered in Section 3.
2.5 The Domain Overlay Database
The domain overlay database is a cornerstone of our monitoring system: thecontent of such a database reflects the domain-oriented view of the Grid.
The GlueDomains [5],[4] prototype serves as a starting point for our study.GlueDomains supports the network monitoring activity of the prototype Gridinfrastructure of INFN, the Italian Institute for Nuclear Physics. GlueDomainsfollows a domain-oriented approach, as defined above. Monitoring activity resultsare published using the Globus Monitoring and Discovery System (MDS) [9].MDS is the information services component of the Globus Toolkit that providesinformation about the available resources on the Grid and their status, and isrendered through the GridICE [2] toolset.
The domain overlay maps Grid resources into domains, and introduces fur-ther concepts that are specific to the task of representing the monitoring activity.In order to represent such an overlay view, we use the Unified Model Language(UML) graph outlined in Figure 2. The classes that represent Grid resources arethe following:
Edge Service: it is a superclass that represents a resource that does not consistof connectivity, but is reached through connectivity.
Network Service: represents the interconnection between two Domains. Itsattributes include a class, corresponding to the offered service class, and astatement of expected connectivity.
Theodolite Service: a Theodolite Service monitors a number of Network El-ements. In GlueDomains, theodolites perform active network monitoring.
The following classes represent aggregations of services:
Domain: represents the partitions that compose the Grid. Its attributes includethe service class offered by its fabric.
Multihome: represents an aggregation of Edge Services that share the samehardware support, but are accessible through distinct interfaces.
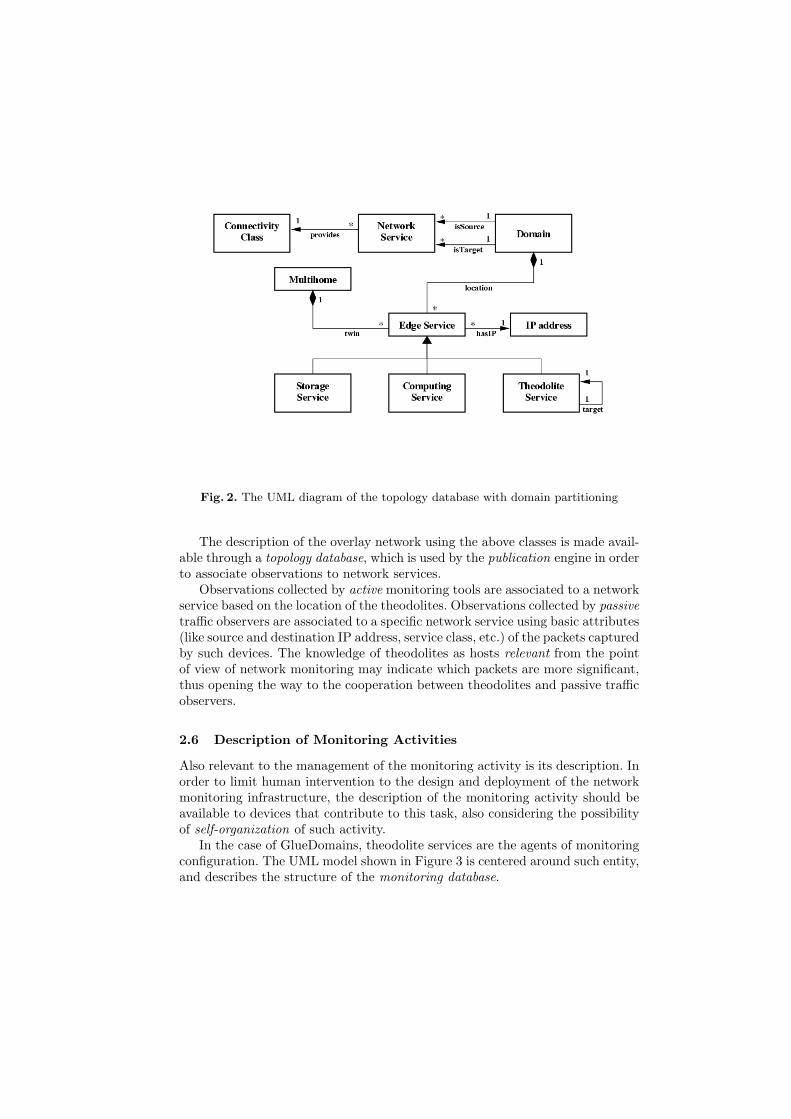
Fig. 2. The UML diagram of the topology database with domain partitioning
The description of the overlay network using the above classes is made avail-able through a topology database, which is used by the publication engine in orderto associate observations to network services.
Observations collected by active monitoring tools are associated to a networkservice based on the location of the theodolites. Observations collected by passivetraffic observers are associated to a specific network service using basic attributes(like source and destination IP address, service class, etc.) of the packets capturedby such devices. The knowledge of theodolites as hosts relevant from the pointof view of network monitoring may indicate which packets are more significant,thus opening the way to the cooperation between theodolites and passive trafficobservers.
2.6 Description of Monitoring Activities
Also relevant to the management of the monitoring activity is its description. Inorder to limit human intervention to the design and deployment of the networkmonitoring infrastructure, the description of the monitoring activity should beavailable to devices that contribute to this task, also considering the possibilityof self-organization of such activity.
In the case of GlueDomains, theodolite services are the agents of monitoringconfiguration. The UML model shown in Figure 3 is centered around such entity,and describes the structure of the monitoring database.

Fig. 3. The UML diagram of the monitoring database
Active monitoring is organized into sessions, each associated to a theodoliteand to a monitored network service. The description of the monitoring sessionindicates a monitoring tool and its configuration. Passive monitoring is repre-sented by specific session classes, and the theodolite will instruct remote passivemonitoring devices about the required activity. An authentication mechanismavoids unauthorized use of passive monitoring devices.
3 Security and Privacy
A large-scale network monitoring infrastructure is exposed to several threats:each component should be able to ensure an appropriate degree of security,depending on the role it plays.
Monitoring sensors hosting passive or active tools may become targets ofcoordinated Denial of Service (DoS) attacks, aiming to prevent legitimate usersfrom receiving a service with acceptable performance, or sophisticated intrusionattempts, aiming to compromise the monitoring hosts. Being exposed to thepublic Internet, monitoring sensors should have a rigorous security configurationin order to preserve the confidentiality of the monitored network, and resist toattacks that aim to compromise it.
The security enforcement strategy is slightly different for active and passivemonitoring tools. In the case of passive monitoring tools, the monitoring host
should ensure the identity and the capabilities associated with a host submit-ting a request. Such a request may result to the activation of a given packetfilter, or to the retrieval of the results of the monitoring activity. Each passivesensor should be equipped with a firewall, configured using a conservative pol-icy that selectively allows inbound traffic according with accepted requests, anddropping inbound traffic from any other source. One option is to consider thatonly theodolite services, whose credentials (e.g., their public keys) are recordedin the monitoring database, are able to access passive sensor configuration, andtherefore dynamically configure its firewall. Theodolite capabilities may varyaccording to a specific monitoring strategy.
In the case of active monitoring tools, the target is exposed to DoS attacks,consisting in submitting benchmark traffic from unauthorized, and possibly ma-licious, sources. One should distinguish between tools that are mainly used fordiscovery, and those that are used for monitoring purposes. The former shouldbe designed as lightweight as possible, for instance consisting of a predeterminedping pattern: firewall on probe side shouldn’t mask such packets, unless theirsource is reliably detected as threatening. The latter might result to rather re-source consuming patterns, and the probe should filter packets according to anIP based strategy: such a configuration would be based on the content of themonitoring database.
Both passive and active monitoring tools have in common the need of ensur-ing an adequate degree of confidentiality. In fact, data transfers through TCPare unprotected against eavesdropping from third-parties that have access tothe transmitted packets, since they can reconstruct the TCP stream and recoverthe transferred data. This would allow an adversary to record control messages,forge them, and replay them in order to access a monitoring sensor and im-personate a legitimate user. For protection against such threats, communicationbetween the monitoring applications and a remote sensors is encrypted using theSecure Sockets Layer protocol (SSL). Furthermore, in a distributed monitoringinfrastructure that promotes sharing of network packets and statistics betweendifferent parties, sensitive data should be anonymized before made publicly avail-able, due to security, privacy, and business competition concerns that may arisebetween the collaborating parties.
From this picture emerges the role of the monitoring database as a kind ofcertification authority, which is also used as a repository of public keys usedby the actors of the monitoring activity: the publication engine, the monitoringtools, and the theodolite services. Its distributed implementation is challenging,yet tightly bound to the scalability of the monitoring infrastructure.
4 Conclusions
This is a preliminary study of the issues behind the integration of passive andactive techniques in a domain-oriented monitoring system. We conclude that thetwo techniques are complementary for the coverage of network measurements,and a domain-oriented approach is beneficial for the scalability issues that are

typical of each technique. In fact, such an approach reduces network load foractive tools, and helps an efficient classification of the traffic captured by passiveones.
References
1. LOBSTER: Large-scale Monitoring of Broadband Internet Infrastructures. Informa-tion available at: http://www.ist-lobster.org.
2. S. Andreozzi, N. De Bortoli, S. Fantinel, A. Ghiselli, G. Tortone, and V. Cristina.Gridice: a monitoring service for the grid. In Third Cracow Grid Workshop, Cracow,Poland, October 2003.
3. R. Aydt, D. Gunter, W. Smith, M. Swany, V. Taylor, B. Tierney, and R. Wolski. Agrid monitoring architecture. Recommendation GWD-I (Rev. 16, jan. 2002), GlobalGrid Forum, 2000.
4. A. Ciuffoletti. The wandering token: Congestion avoidance of a shared resource.Technical Report TR-05-13, Universita’ di Pisa, Largo Pontecorvo - Pisa -ITALY,May 2005.
5. A. Ciuffoletti, T. Ferrari, A. Ghiselli, and C. Vistoli. Architecture of monitoringelements for the network element modeling in a grid infrastructure. In Proc. ofWorkskop on Computing in High Energy and Nuclear Physics, La Jolla (California),March 2003.
6. Y. Fu, L. Cherkasova, W. Tang, and A. Vahdat. EtE: Passive end-to-end Internetservice performance monitoring. In Proceedings of the USENIX Annual TechnicalConference, pages 115–130, 2002.
7. L. Michael and G. Lior. The effect of packet reordering in a backbone link onapplication throughput. Network, IEEE, 16(5):28–36, 2002.
8. M. Polychronakis, K. G. Anagnostakis, E. P. Markatos, and A. Øslebø. Design of anApplication Programming Interface for IP Network Monitoring. In Proceedings ofthe 9th IFIP/IEEE Network Operations and Management Symposium (NOMS’04),pages 483–496, Apr. 2004.
9. The Globus Toolkit 4.0 Documentation. GT Information Services: Monitoring &Discovery System (MDS). Available at: http://www.globus.org/toolkit/mds/.