Issue 3 – Policy DMP3 SSA Planning Limited for KFC (GB ...
61
Issue 3 – Policy DMP3 SSA Planning Limited for KFC (GB) Limited (REP\008) Brent Development Management Policies Local Plan Examination 3. Does chapter 3 set out a positively prepared strategy to provide customer choice and a diverse retail offer, which is justified, effective and consistent with national policy? With regard to the first bullet point of the ‘Takeaway’ section of policy DMP3 (the 400-metre restriction), there has been no assessment of the number or concentration of takeaways within the distance identified that would typically be either needed or conversely problematic. It is unclear what “subject to other policies within the development plan” will mean in practice. Will it mean that town centre policies will take precedence where a town centre is within 400 metres of a secondary school or further education establishment? The draft policy is negative in that it will restrict customer choice. Any customer that happens to live near a secondary school or further education establishment will have no such facilities within walking distance and are more likely then to drive to reach them. Secondary schools or further education establishments themselves are often purposely in accessible locations, so that very often this will result in the choices of large numbers of customers being restricted to uses that happen to be outside Class A5. Clearly, food high in fat, salt or sugar (HFSS) is sold at a wide variety of facilities in many classes, including many in Class A1, such as coffee or sandwich shops, bakeries or, simply, supermarkets, and focussing on Class A5 uses is both unhelpful and unfair. Furthermore, it assumes all hot food takeaways offer little choice and serve the same type and standard of food. Our client works hard with Government to reformulate and offer healthier choices, but rather than recognising the, the draft policy effectively penalises it. In many cases, for example, restaurants with hot food takeaways or drive-through facilities, the hot food takeaway element is ancillary or one component of a mixed use, the proportion of which may vary with customer trends. It is unclear how the policy will bear on this. The policy will be effective in limiting the number of takeaways within 400 metres of secondary schools or further education establishments, but there is no evidence that this will be effective in reducing the incidence of overweight or obesity.
-
Upload
khangminh22 -
Category
Documents
-
view
0 -
download
0
Transcript of Issue 3 – Policy DMP3 SSA Planning Limited for KFC (GB ...

Issue 3 – Policy DMP3 SSA Planning Limited for
KFC (GB) Limited (REP\008)
Brent Development Management Policies Local Plan Examination
3. Does chapter 3 set out a positively prepared strategy to provide customer choice and a diverse retail offer, which is justified, effective and consistent with national policy?
With regard to the first bullet point of the ‘Takeaway’ section of policy DMP3 (the 400-metre restriction), there has been no assessment of the number or concentration of takeaways within the distance identified that would typically be either needed or conversely problematic.
It is unclear what “subject to other policies within the development plan” will mean in practice. Will it mean that town centre policies will take precedence where a town centre is within 400 metres of a secondary school or further education establishment?
The draft policy is negative in that it will restrict customer choice. Any customer that happens to live near a secondary school or further education establishment will have no such facilities within walking distance and are more likely then to drive to reach them.
Secondary schools or further education establishments themselves are often purposely in accessible locations, so that very often this will result in the choices of large numbers of customers being restricted to uses that happen to be outside Class A5.
Clearly, food high in fat, salt or sugar (HFSS) is sold at a wide variety of facilities in many classes, including many in Class A1, such as coffee or sandwich shops, bakeries or, simply, supermarkets, and focussing on Class A5 uses is both unhelpful and unfair.
Furthermore, it assumes all hot food takeaways offer little choice and serve the same type and standard of food. Our client works hard with Government to reformulate and offer healthier choices, but rather than recognising the, the draft policy effectively penalises it.
In many cases, for example, restaurants with hot food takeaways or drive-through facilities, the hot food takeaway element is ancillary or one component of a mixed use, the proportion of which may vary with customer trends. It is unclear how the policy will bear on this.
The policy will be effective in limiting the number of takeaways within 400 metres of secondary schools or further education establishments, but there is no evidence that this will be effective in reducing the incidence of overweight or obesity.

Issue 3 – Policy DMP3 SSA Planning Limited for
KFC (GB) Limited (REP\008)
National policy does not refer to dietary issues or support the creation of zones within which takeaway uses will be refused based on proximity to other land uses. Indeed, it tends to support the location of such uses in accessible places.
i. What is the justification for restricting A5 uses within 400 metres of a secondary school or further education establishment? How was the distance threshold determined?
The evidence adduced by the local planning authority does not show any link between the location of hot food takeaways and the incidence of overweight, obesity or other adverse health outcomes. Indeed, much of the “evidence” simply comprises other policies and reviews.
Overall, evidence on the matter shows at the most a weak correlation in contexts outside the United Kingdom, specifically a study in the United States, which used a different and wider definition of “fast food outlets” to Class A5 and saw an effect only at very short distances.
The planning and urban context of the United Kingdom is very different to the United States, where car dependency is far higher and non-car-ownership tends to correlate with deprivation to a much greater degree, limiting the transferability of that evidence.
Diet is clearly a key determinant both of general health and obesity levels. Exercise is the other key determinant which must be considered for a complete picture. Focussing on improving access to open space, sport and recreation facilities would be a far more appropriate and clearly justifiable strategy for reducing childhood obesity.
The Strategic Review of Health Inequalities in England post-2010 (Marmot et al, 2010), concluded that studies that show association between proximity, or lack of, to healthy food, and health outcomes such as obesity or malnutrition "…should be approached with caution. They are most often observational and so do not show causality between inadequate access and health outcomes."
Indeed, The Marmot Review: Implications for Spatial Planning (Geddes et al, 2011) focussed entirely on the provision of accessible good-quality public open space, community facilities, allotments, pedestrian-friendly streets, cycle parking, public transport, mixed uses and improved access to healthy food options. It did not advocate restricting access to particular land uses.
Earlier reviews (Barton, 2009) had found that: "Studies of the location of fast food outlets affecting diet are also inconclusive. It seems that eating habits are largely a cultural, habitual matter, and are not heavily

Issue 3 – Policy DMP3 SSA Planning Limited for
KFC (GB) Limited (REP\008)
influenced by spatial planning." In this context, it is impossible to justify a policy that will certainly lead to the loss of catering and supply jobs.
More recent studies in the United Kingdom (Williams, J et al, 2014) did not find strong evidence to justify policies related to regulating the food environments around schools, recognising inconsistencies across studies in definitions of “fast food outlets” and other key variables.
This lack of evidence has been reflected on a number of occasions in appeal decisions including those identified below.
j. What is the justification for seeking to avoid concentrations of A5 units? How was the 6% and the retail frontage threshold determined?
It is unclear to us the extent to which health issues influenced these criteria. It is quite acceptable for such thresholds to be set based on an understanding of the diversity necessary to support retail health, but we know of no equivalent evidence relating to human health.
References:
(a) Appeal decision APP/A5270/13/2195221 73, Western Road, Southall, UB2 5HQ
(b) Appeal decision APP/P4415/A/11/2159082 Canklow Hotel, Canklow Road, Rotherham, S60 2JH
(c) Barton, Hugh; (2009) ‘Land use planning and health and well-being’ Land Use Policy 26S. S115–S123
(d) Marmot, Michael et al; (2010) 'Fair Society, Healthy Lives' The Strategic Review of Health Inequalities in England post-2010.
(e) Geddes, Ilaria et al; (2011) 'The Marmot Review: Implications for Spatial Planning' NICE website www.nice.org.uk retrieved on 20 January 2014.
(f) Williams, J et al (2014) ‘A systematic review of the influence of the retail food environment around schools on obesity-related outcomes ‘ Obesity Reviews 15, 359-374

www.planningportal.gov.uk/planninginspectorate
Appeal Decision Site visit made on Monday 2 September 2013
by Alan Langton DipTP CEng MRTPI MICE MCIHT
an Inspector appointed by the Secretary of State for Communities and Local Government
Decision date: 17 October 2013
Appeal ref: APP/A5270/13/2195221 73 Western Road, Southall UB2 5HQ • The appeal is made under section 174 of the Town and Country Planning Act 1990 as
amended by the Planning and Compensation Act 1991 against an enforcement notice issued by the London Borough of Ealing.
• The appeal is made by Mr Ghulam Husain Awan. • The Council's reference is COM/2012/00558. • The notice was issued on 18 February 2013. • The breach of planning control as alleged in the notice is: Without planning permission,
the unauthorised change of use of the ground floor retail unit (use class A1) to hot food take away (use class A5).
• The requirement of the notice is: Cease the use of the ground floor retail unit as hot food take-away (A5 Use).
• The period for compliance with the requirement is 12 months. • The appeal is proceeding on the grounds set out in section 174(2) (a), (b), (c) and (e) of
the Town and Country Planning Act 1990 as amended. Since the prescribed fee has been paid within the specified period, the application for planning permission deemed to have been made under section 177(5) of the Act as amended also falls to be considered.
Summary Decision: The appeal is allowed, the enforcement notice is quashed, and planning permission is granted in the terms set out below in the Formal Decision.
Preliminary matters
1. The Council did not attend the pre-arranged site visit. My internal inspection of the premises was undertaken alone, so far as circumstances permitted, and I looked at the wider area unaccompanied. There was of course no discussion regarding the appeal and the Council has since accepted the procedure.
2. The appeal form as initially submitted indicated ground (c) (that there has not been a breach of planning control) and gave some indication of an intention to appeal on ground (a) (that planning permission should be granted) albeit with no directly supporting submissions. As the fee has been paid the deemed application is before me and the Council has addressed the planning merits in the terms of ground (a). Prompted by the Planning Inspectorate’s Case Officer in the light of submissions made on the appeal form, the appellant’s agent added grounds (e) and (b) and I shall address these at the outset.
The appeal on ground (e)
3. Ground (e) concerns whether the enforcement notice was properly served on everyone with an interest in the retail unit at 73 Western Road. The submissions made actually questioned whether correspondence from the Council prior to issue of the notice had been properly addressed. That is not of itself a basis for a challenge to the notice under ground (e) and there is nothing to suggest that copies of the notice were not properly served. Also, and in any event, Section
A

Appeal Decision APP/A5270/C/13/2195221
2
176(5) of the amended 1990 Act means that I may disregard any failure to
serve the notice provided that this would not substantially prejudice the person
concerned. In this case, even were there a question regarding service of the
notice, the appellant has not been substantially prejudiced since an appeal was
duly made within time, and accordingly I would in any event disregard the
question of service. The appeal fails on ground (e).
The appeal on ground (b)
4. To succeed on Ground (b), it is necessary for the appellant to demonstrate, on a
balance of probabilities that as a matter of fact hot food take-away sales have
not been made from the unit in question. This has not been demonstrated,
rather the reverse, the submissions refer only to the difficulty in preventing
customers from taking hot food (perhaps partly consumed) off the premises.
The appeal fails on ground (b).
The appeal on ground (c)
5. To succeed on ground (c) it would be necessary for the appellant to
demonstrate, on a balance of probabilities, that hot food sales fall within the
scope of the premises’ lawful use. Planning permission for a change of use from
a sandwich shop (Class A1) to a restaurant (Class A3) was granted in November
2011 (P/2011/3822). The primary use of a restaurant (Class A3) is to serve
food for consumption by customers on the premises. Occasional take-away
sales (unless prohibited by a planning condition) or customers occasionally
choosing to take rather than complete the end of a dish, would not necessarily
be incompatible with the primary restaurant use. In this case, there is only
limited evidence from either party as to whether hot food take-away sales are at
a scale so as to amount to a primary use of the premises. In essence, the
Council says that they are and the appellant says no.
6. I saw little tangible evidence either way. Displayed price lists and promotions
made no reference to take-away sales, nor did I see any significant stock of
food containers. Conversely, neither did I see anything by way of table cutlery,
condiments or sauces. More tellingly, there were only two tables and a short
‘breakfast’ bar with a total of 8 chairs and 2 high stools, with little or no space
for more while a significant proportion is given over to a glass fronted serving
counter. In my view, the business as laid out would simply not be viable
without take-away sales, and I feel bound to add also that during my visit, from
13.00 hrs, more than one apparent customer was turned away from the
counter. The evidence is not clear cut either way but on balance it appears
more probable than not that take-away sales occur to a degree that amounts to
a breach of planning control. The appellant has not discharged the onus on him
to demonstrate otherwise, and accordingly the appeal fails on ground (c).
The appeal on ground (a) and the deemed planning application
7. The appeal premises is one of a few somewhat separated from the nearby
designated shopping frontage, and the Council raises no objection relating to
retail impact or policies in their current development plan. The Council’s
objection stems from the proximity of the entrance to Featherstone High School,
which has Health Schools Status and a Healthy Eating Policy. The Council has
an unadopted policy within its Draft Development Management Development
Plan Document (June 2012) which proposes that fast food outlets (together with
amusement arcades) are not permitted within a 10 minute walk (which will

Appeal Decision APP/A5270/C/13/2195221
3
normally equate to a 400 metre radius) of existing schools. Also that each new such unit must be separated from any similar unit or group of units by at least 2 units of other uses. The Council recently refused 2 applications on this basis for hot food take-ways in the locality, including one next door at 71 Western Road.
8. The main issue therefore concerns the likely effect of take-away sales at the appeal premises on the diet of pupils at the school.
9. I have considered this very carefully. Problems of unhealthy eating and childhood obesity are well attested, but the Council has said very little about the draft policy or any supporting reasons, and nothing regarding public or specialist consultation or the outcomes if this has been undertaken. The Draft Document as a whole was submitted in February this year for independent examination but, so far as I am aware, the outcome of that remains to be seen. I therefore accord limited weight to this draft policy pending the outcome of its examination, because it might be refined as a result of that process. I also have no information regarding any complementary actions at the school by way of rules governing pupils’ behaviour during lunch breaks, and neither is it clear whether “fast food outlets” are intended to be synonymous with all hot food take-away outlets.
10. I saw that there are 2 existing hot food take-way outlets within easy walking distance, so that as things stand the enforcement notice could actually lead to a more restricted range of meals for any pupil who regularly consumes such food. Nor do I accept the suggestion that there is in some sense too great a concentration of hot food take-way outlets locally. I saw just the two others, both within easy walking distance but considerably more than the 2 units separation from No 73 as sought in the Draft Policy.
11. I should add here that there is no suggestion that either the appeal premises or the others serve unhealthy meals in a food hygiene sense (which would be subject to separate controls). The concern is that an unbalanced diet, perhaps combined with insufficient exercise, over-reliant for example on meals with high fat and salt content, will be unhealthy, even dangerous, over a period of time. This consideration needs to be balanced against the desirable ability for individuals, including adults, to have a range and choice of eating options which might include occasional take-away meals, saving them time and causing them no harm. Upholding the notice would probably lead to the closure of the appellant’s business and, in my view, and solely with regard to the present appeal, insufficient justification has been demonstrated.
12. This leads to consideration of planning conditions. Neither party has submitted a copy of the November 2011 permission for the restaurant use, but in any event a permission now for use as a take-away business (A5) would be a new one, not governed by the terms of the previous permission. The Council has submitted 5 suggested conditions in this eventuality, which have not been questioned by the appellant or his agent. These concern equipment noise, odour abatement, opening times, deliveries and refuse storage.
13. Bearing in mind nearby residents, including on upper floors to the business premises, I have found no reason not to accept the Council’s conditions as generally reasonable and necessary. They do, however, require some redrafting to reflect the fact that the take-away use has already commenced. Also, I do not accept the need, or practicality, of seeking to limit deliveries to once a day although the suggested hours within which deliveries may be made are

Appeal Decision APP/A5270/C/13/2195221
4
reasonable. From what I saw, it may be that some of these conditions, perhaps regarding equipment and fume extraction, have already been achieved. But that is something for the appellant and Council to consider. I will specify times for all the conditions to be fully met, and draw attention to the Council’s ability to issue a Breach of Condition Notice if they are not, against which there is no right of appeal. Subject to these considerations, the appeal succeeds on ground (a) and permission will be granted.
Formal Decision
14. The appeal is allowed, the enforcement notice is quashed and planning permission is granted on the application deemed to have been made under section 177(5) of the Act as amended for the development already carried out, namely the use of the ground floor retail unit to include hot food take-away sales (use class A5) at 73 Western Road, Southall UB2 5HQ as shown on the plan attached to the notice, subject to the following conditions.
1. Unless within 3 months of the date of this decision a scheme to demonstrate that the rating noise level emitted from the existing or proposed external plant and machinery (as assessed under BS4142:1997) shall be lower than the existing background noise level by at least 5 dBA as measured at 3.5 m from the nearest ground floor sensitive façades during the relevant periods of operation is submitted in writing to the local planning authority for approval, and unless the approved scheme is implemented within 3 months of the local planning authority's approval, the use of the site shall cease until such time as a scheme is approved and implemented.
2. Unless within 3 months of the date of this decision a scheme for the installation of odour abatement equipment is submitted in writing to the local planning authority for approval, and unless the approved equipment is installed and thereafter operated and maintained in accordance with the manufacturer’s instructions within 3 months of the local planning authority's approval, the use of the site shall cease until such time as a scheme is approved and implemented.
3. Unless within 3 months of the date of this decision a scheme for refuse storage and a refuse management plan is submitted in writing to the local planning authority for approval, and unless the approved storage and management plan are implemented and thereafter retained within 3 months of the local planning authority's approval, the use of the site shall cease until such time as a scheme is approved and implemented.
4. If schemes in accordance with conditions 1, 2 and 3 above are not approved within 12 months of the date of this Appeal Decision, the use of the site as a hot food takeway outlet (A5) shall cease until such time as each of the schemes approved by the local planning authority is implemented.
5. The use hereby permitted shall not be open to customers outside the following times: 10.00 hrs to 22.00 hrs on any day, and all activity shall cease 60 minutes after closing to customers.
6. No delivery from a motor vehicle shall take place outside the following times: 10.00 hrs to 17.00 hrs Monday to Saturday; and 10.00 hrs to 16.00 hrs on Sundays and Bank Holidays.
Alan LangtonAlan LangtonAlan LangtonAlan Langton Inspector

!!
!ZZZ#SODQQLQJSRUWDO#JRY#XN0SODQQLQJLQVSHFWRUDWH!
!!!
!
$SSHDO&'HFLVLRQ&6LWH!YLVLW!PDGH!RQ!7!'HFHPEHU!:;<<!
E\&-DFTXHOLQH&1RUWK&&%6F&06F&DQ&,QVSHFWRU&DSSRLQWHG&E\&WKH&6HFUHWDU\&RI&6WDWH&IRU&&RPPXQLWLHV&DQG&/RFDO&*RYHUQPHQW&
'HFLVLRQ&GDWHA&B&-DQXDU\&CDEC&
!$SSHDO&5HIA&$33H3IIEJH$HEEHCEJBDKC&&DQNORZ&+RWHOO&&DQNORZ&5RDGO&5RWKHUKDPO&6PD&C-+&x! 7KH!DSSHDO!LV!PDGH!XQGHU!VHFWLRQ!?@!RI!WKH!7RZQ!DQG!&RXQWU\!3ODQQLQJ!$FW!<FF;!DJDLQVW!D!UHIXVDO!WR!JUDQW!SODQQLQJ!SHUPLVVLRQ#!
x! 7KH!DSSHDO!LV!PDGH!E\!4)0!*URXS!DJDLQVW!WKH!GHFLVLRQ!RI!5RWKHUKDP!0HWURSROLWDQ!%RURXJK!&RXQFLO#!
x! 7KH!DSSOLFDWLRQ!5HI!5%:;<<0;@;MN!GDWHG!:O!0D\!:;<<N!ZDV!UHIXVHG!E\!QRWLFH!GDWHG!!!!:<!-XO\!:;<<#!
x! 7KH!GHYHORSPHQW!SURSRVHG!LV!.)&!5HVWDXUDQW0'ULYH!WKURXJK!$R0$7#!&
!
'HFLVLRQ&
<#! 7KH!DSSHDO!LV!DOORZHG!DQG!SODQQLQJ!SHUPLVVLRQ!LV!JUDQWHG!IRU!D!.)&!5HVWDXUDQW0'ULYH!WKURXJK!DW!&DQNORZ!+RWHON!&DQNORZ!5RDGN!5RWKHUKDPN!!!!!!!6O;!:-+!LQ!DFFRUGDQFH!ZLWK!WKH!WHUPV!RI!WKH!DSSOLFDWLRQN!5HI!5%:;<<0;@;MN!GDWHG!:O!0D\!:;<<N!VXEMHFW!WR!WKH!DWWDFKHG!VFKHGXOH!RI!FRQGLWLRQV#!
!
0DLQ&,VVXH&
:#! 7KH!PDLQ!LVVXH!LV!WKH!HIIHFW!RI!WKH!SURSRVHG!GHYHORSPHQW!RQ!WKH!OLYLQJ!FRQGLWLRQV!RI!QHDUE\!UHVLGHQWV!KDYLQJ!SDUWLFXODU!UHJDUG!WR!D!SRWHQWLDO!LQFUHDVH!LQ!WUDIILF!DQG!RWKHU!VRXUFHV!RI!QRLVHN!VPHOON!OLWWHU!DQG!GLVWXUEDQFH#!
5HDVRQV&
R#! 7KH!DSSHDO!VLWH!LV!DQ!DUHD!RI!YDFDQW!ODQG!ZKLFK!SUHYLRXVO\!FRQWDLQHG!WKH!&DQNORZ!+RWHON!D!SXEOLF!KRXVH!ZKLFK!ZDV!GHPROLVKHG!IROORZLQJ!ILUH!GDPDJH#!!7KH!SURSRVHG!GHYHORSPHQW!FRPSULVHV!D!VLQJOH!VWRUH\!UHVWDXUDQW0WDNH!DZD\N!ZLWK!:<!GHGLFDWHG!SDUNLQJ!VSDFHV!DQG!D!GULYHUWKURXJK!ODQH!IRU!PRWRULVWV!WR!RUGHU!DQG!FROOHFW!PHDOV!IURP!WKHLU!FDUV#!!,W!LV!LQWHQGHG!WKDW!WKH!XQLW!EH!RFFXSLHG!E\!.HQWXFN\!)ULHG!&KLFNHQ!W.)&X#!
M#! 7KH!EXLOGLQJ!ZRXOG!EH!SRVLWLRQHG!DW!WKH!QRUWKHUQ!HQG!RI!WKH!VLWH!ZLWK!LWV!IURQWDJH!IDFLQJ!WKH!&DQNORZ!5RDG0&HQWHQDU\!:D\!MXQFWLRQ#!!&HQWHQDU\!:D\!LV!D!EXV\!GXDO!FDUULDJHZD\!ZKLFK!IRUPV!WKH!PDLQ!DUWHULDO!URXWH!LQWR!5RWKHUKDP!IURP!WKH!VRXWK#!!7KHUH!LV!D!VXEVWDQWLDO!LQGXVWULDO!ZRUNV!DFURVV!WKH!GXDO!FDUULDJHZD\!WR!WKH!QRUWKUZHVWN!UHVLGHQWLDO!SURSHUWLHV!WR!WKH!HDVW!DQG!&DQNORZ!:RRGV!3ULPDU\!6FKRRO!WR!WKH!VRXWKUHDVWN!DFFHVVHG!RII!:RRG!/DQH#!
/LYLQJ&&RQGLWLRQV&
7#! 7KH!SURSRVHG!UHVWDXUDQW!ZRXOG!EH!FDSDEOH!RI!SURYLGLQJ!VHDWLQJ!IRU!XS!WR!?;!FXVWRPHUV#!!7KHUH!ZRXOG!EH!<F!JHQHUDO!SXUSRVH!FDU!SDUNLQJ!VSDFHVN!LQFOXGLQJ!:!
B

$SSHDO&'HFLVLRQ&$33.3//01.$.00.2013452&&
&ZZZ7SODQQLQJSRUWDO7JRY7XN.SODQQLQJLQVSHFWRUDWH&&&&&&&&&&&2&
GLVDEOHG&ED\VA&SOXV&WZR&VKRUWCWHUP&JULOO&SDUNLQJ&ED\V7&&,Q&DGGLWLRQA&/&F\FOH&UDFNV&ZRXOG&EH&SURYLGHG7&&6HUYLFLQJ&RI&WKH&XQLW&ZRXOG&EH&E\&D&VLQJOH&+*9&GHOLYHU\&D&GD\7&&7KH&&DQNORZ&+RWHO&SURYLGHG&M2&FDU&SDUNLQJ&VSDFHV&SOXV&WKUHH&VPDOO&VSDFHV&IRU&PRWRUF\FOHV7&
N7! 7KH&IURQW&RI&WKH&UHVLGHQWLDO&SURSHUWLHV&DW&WKH&VRXWKHUQ&HQG&RI&&DQNORZ&5RDG&OLH&VRPH&01C24&PHWUHV&IURP&WKH&DSSHDO&VLWH7&&7KH&FXVWRPHU&YHKLFXODU&HQWUDQFH&ZRXOG&EH&GLUHFWO\&RSSRVLWH&1RV7&M00&DQG&M0MA&ZLWK&SDUNLQJ&IDFLQJ&RWKHU&SURSHUWLHV&RQ&&DQNORZ&5RDG7&&&
Q7! 7KH&PDLQ&VRXUFH&RI&QRLVH&LQ&WKH&DUHD&LV&WUDIILF&RQ&&HQWHQDU\&:D\&DQG&µORZ&IUHTXHQF\&UXPEOHV&ZLWK&LQWHUPLWWHQW&FUDVKHV&DQG&EDQJV¶&IURP&WKH&/RQGRQ&6FDQGLQDYLDQ&ZRUNVA&D&ODUJH&IDFWRU\&RQ&WKH&QRUWKHUQ&VLGH&RI&&HQWHQDU\&:D\7&&$Q&DFRXVWLF&DVVHVVPHQW&ZDV&XQGHUWDNHQ&E\&WKH&DSSHOODQW7&&7KH&EDFNJURXQG&QRLVH&ZDV&DOVR&PHDVXUHG&E\&WKH&&RXQFLOA&ZKLFK&YHULILHG&WKH&DSSHOODQW¶V&ILJXUHV7&&$FRXVWLF&PRGHOOLQJ&RI&WKH&SRWHQWLDO&FKDQJH&LQ&WKH&DFRXVWLF&HQYLURQPHQW&ZLWK&WKH&UHVWDXUDQW&RSHUDWLQJ&HVWLPDWHG&WKDW&WKH&QRLVH&ZKLFK&ZRXOG&UHVXOW&IURP&WKH&SURSRVDO&ZRXOG&EH&EHORZ&WKH&OHYHO&RI&WKH&H[LVWLQJ&EDFNJURXQG&QRLVH7&&&
57! $OWKRXJK&WKH&ORFDO&SODQQLQJ&DXWKRULW\&VHHNV&WR&UHODWH&WKH&LPSDFW&RI&YHKLFOHV&DWWUDFWHG&WR&WKH&SUHPLVHV&ZLWK&VLJQLILFDQWO\&LQFUHDVHG&µPD[LPXP¶&QRLVH&OHYHOVA&WKLV&ODUJHO\&LJQRUHV&WKH&H[LVWLQJ&QRLVH&FOLPDWH&DQG&WKH&OLPLWHG&WUDIILF&OLNHO\&WR&DULVH&IURP&WKH&XVH&KDYLQJ&UHJDUG&WR&SUHGLFWHG&WUDIILF&IORZV7&&2Q&WKLV&EDVLV&,&DP&VDWLVILHG&WKDW&DQ\&LPSDFW&DV&D&UHVXOW&RI&WKH&SURSRVHG&GHYHORSPHQW&ZRXOG&EH&QHJOLJLEOH&DQG&DXUDOO\&LQGLVWLQJXLVKDEOH&IURP&WKH&H[LVWLQJ&QRLVH&FOLPDWH7&&&
37! 7KHUH&PD\&EH&VRPH&QRLVH&GXH&WR&FDU&GRRUV&VODPPLQJA&PXVLF&SOD\HG&LQ&FDUV&RU&ORXG&FRQYHUVDWLRQV&IURP&FXVWRPHUV7&&+RZHYHUA&WKH&XVH&RI&DFRXVWLF&IHQFLQJ&DQG&WKH&GLVWDQFH&EHWZHHQ&WKH&FDU&SDUN&DQG&WKH&IURQW&RI&WKH&GZHOOLQJV&RQ&&DQNORZ&5RDG&ZRXOG&HQVXUH&WKDW&VXFK&QRLVH&ZRXOG&QRW&UHVXOW&LQ&KDUPIXO&FRQGLWLRQV&IRU&QHDUE\&UHVLGHQWVA&HYHQ&RQ&WKRVH&RFFDVLRQV&ZKHQ&WKHUH&LV&OLWWOH&RU&OLPLWHG&EDFNJURXQG&QRLVH&IURP&WUDIILF&RU&IURP&WKH&QHDUE\&IDFWRU\7&
047!,W&ZRXOG&DOVR&EH&SRVVLEOH&WR&LPSRVH&FRQGLWLRQV&RQ&DQ\&JUDQW&RI&SHUPLVVLRQ&WR&FRQWURO&WKH&RSHUDWLRQ&RI&WKH&XVH7&&,Q&WKLV&UHJDUGA&OLPLWLQJ&RSHQLQJ&KRXUV&WR&45Y44&WR&2MY44&KRXUVA&DV&VXJJHVWHG&E\&WKH&DSSHOODQWA&ZRXOG&VWULNH&DQ&DSSURSULDWH&EDODQFH&DQG&WKH&FORVLQJ&WLPH&ZRXOG&UHIOHFW&WKDW&RI&WKH&SXEOLF&KRXVH&ZKLFK&IRUPHUO\&RFFXSLHG&WKH&VLWH7&&
007!)XUWKHUPRUHA&LW&LV&LQWHQGHG&WR&LQVWDOO&ILOWUDWLRQ&DQG&RGRXUCVXSSUHVVLQJ&HTXLSPHQW&DQG&WR&FRQWURO&WKH&QRLVH&RI&H[WHUQDO&SODQW7&&,QGLFDWLYH&GHWDLOV&ZHUH&VXSSOLHG&DV&SDUW&RI&WKH&DSSHDO7&&,&DP&VDWLVILHG&WKDW&WKH&LQVWDOODWLRQ&RI&D&IXPH&H[WUDFWLRQ&V\VWHP&DQG&DFRXVWLF&FRQWURO&RI&HTXLSPHQW&DQG&PDFKLQHU\&ZRXOG&HQVXUH&WKDW&QHDUE\&ORFDO&UHVLGHQWV&ZRXOG&QRW&EH&VLJQLILFDQWO\&DIIHFWHG&E\&VPHOOV&RU&QRLVH&UHVXOWLQJ&IURP&WKH&RSHUDWLRQ&RI&WKH&UHVWDXUDQW7&
027!$V&WR&OLWWHUA&,&DSSUHFLDWH&WKDW&SHRSOH&VRPHWLPHV&GLVFDUG&SDFNDJLQJ&DQG&KDOICHDWHQ&IRRG7&&+RZHYHUA&WKHUH&ZRXOG&EH&OLWWHU&ELQV&WR&VHUYH&WKH&UHVWDXUDQW&DQG&.)&&RSHUDWH&D&OLWWHUCSLFNLQJ&SROLF\&ZKLFK&VKRXOG&UHGXFH&WKH&OLNHOLKRRG&RI&DQ\&QXLVDQFH&FDXVHG&E\&OLWWHU&GURSSHG&E\&FXVWRPHUV7&
0M7!7DNLQJ&DOO&WKH&DERYH&LQWR&FRQVLGHUDWLRQA&WKH&SURSRVDO&ZRXOG&QRW&UHVXOW&LQ&XQDFFHSWDEOH&KDUP&WR&WKH&OLYLQJ&FRQGLWLRQV&RI&QHDUE\&UHVLGHQWV&DQG&WKHUH&ZRXOG&EH&QR&FRQIOLFW&ZLWK&VDYHG&3ROLF\&+*0&RI&WKH&DGRSWHG&5RWKHUKDP&8QLWDU\&'HYHORSPHQW&3ODQ&]8'3^&LQ&UHVSHFW&RI&LWV&DLPV&WR&SUHYHQW&KDUP&WR&UHVLGHQWLDO&DPHQLW\&DQG&HQVXUH&WKDW&GHYHORSPHQW&LV&LQ&NHHSLQJ&ZLWK&WKH&DUHD&LQ&WHUPV&RI&

$SSHDO&'HFLVLRQ&$33.3//01.$.00.2013452&&
&ZZZ7SODQQLQJSRUWDO7JRY7XN.SODQQLQJLQVSHFWRUDWH&&&&&&&&&&&>&
LQWHQVLW\&RI&XVH7&&,Q&DGGLWLRQC&LW&ZRXOG&DFFRUG&ZLWK&VDYHG&8'3&3ROLF\&(19>7I&ZKLFK&VHHNV&WR&SUHYHQW&SRRU&HQYLURQPHQWDO&DPHQLW\&GXH&WR&QRLVHC&PDORGRXU&RU&RWKHU&SROOXWLQJ&HIIHFWV&DQG&ZLWK&JXLGDQFH&LQ&3ODQQLQJ&3ROLF\&*XLGDQFH&2/L&3ODQQLQJ'DQG'1RLVH&ZKLFK&UHTXLUHV&ORFDO&SODQQLQJ&DXWKRULWLHV&WR&HQVXUH&WKDW&GHYHORSPHQW&GRHV&QRW&FDXVH&DQ&XQDFFHSWDEOH&GHJUHH&RI&GLVWXUEDQFH7&&&
0/7!6DYHG&8'3&3ROLF\&(19>70&UHTXLUHV&GHYHORSPHQW&SURSRVDOV&WR&KDYH&UHJDUG&WR&WKH&VHFXULW\&RI&XVHUV&DQG&WKHLU&SURSHUW\7&&,&DSSUHFLDWH&WKDW&WKH&ODWH&RSHQLQJ&KRXUV&DQG&WKH&JRRGV&VROG&DW&WKH&UHVWDXUDQW&PD\&HQFRXUDJH&FXVWRPHUV&WR&FRQJUHJDWH&ODWH&RQ&D&QLJKWC&DQG&WKDW&WKH&&DQNORZ&DUHD&KDV&H[SHULHQFHG&DQWLRVRFLDO&EHKDYLRXU7&&+RZHYHUC&WKHUH&LV&QR&GHWDLOHG&HYLGHQFH&WR&LQGLFDWH&WKDW&WKH&SURSRVHG&GHYHORSPHQW&ZRXOG&UHVXOW&LQ&D&SUREOHP&GXH&WR&GLVRUGHUO\&EHKDYLRXU7&&)XUWKHUPRUHC&WKHUH&LV&QR&HYLGHQFH&EHIRUH&PH&WR&VXSSRUW&FODLPV&WKDW&WKH&VDIHW\&RI&WKH&FKLOGUHQ&DW&WKH&QHDUE\&VFKRRO&ZRXOG&EH&DW&ULVN&GXH&WR&DQ&LQFUHDVH&LQ&YLVLWRUV&WR&WKH&DUHD7&&&7KH&SUHYLRXV&EXLOGLQJ&RQ&WKH&VLWH&ZDV&D&SXEOLF&KRXVHC&RSHQ&VLPLODU&KRXUV&WR&WKH&SURSRVHG&UHVWDXUDQWC&DQG&,&VHH&QR&UHDVRQ&WR&FRQVLGHU&WKDW&WKH&QHZ&UHVWDXUDQW&ZRXOG&DWWUDFW&DQWLRVRFLDO&RU&FULPLQDO&EHKDYLRXU&WR&WKH&DUHD7&&7KH&SURSRVHG&XVH&RI&&&79&PD\&UHGXFH&WKH&LQFLGHQFH&RI&VXFK&EHKDYLRXU7&
2WKHU'0DWWHUV'
017!&HQWHQDU\&:D\&ZDV&REVHUYHG&WR&FDUU\&XS&WR&0CI5W&YHKLFOHV&VRXWKERXQG&DQG&0C0>1&QRUWKERXQG&GXULQJ&WKH&EXVLHVW&KRXU&RI&WKH&GD\7&&7KH&FDSDFLW\&RI&WKH&KLJKZD\&H[FHHGV&WKLV&DQG&WKHUH&ZHUH&QR&VLJQLILFDQW&TXHXHV&RU&GHOD\V&RQ&WKH&KLJKZD\&RU&DW&URXQGDERXWV7&&$Q&HLJKW&PHWUH&ZLGH&VHFWLRQ&RI&&DQNORZ&5RDG&IRUPV&D&OLQN&EHWZHHQ&&HQWHQDU\&:D\&DQG&WKH&ROGHUC&UHVLGHQWLDO&SDUW&RI&&DQNORZ&5RDG7&&$FFHVV&WR&WKH&UHVWDXUDQW&ZRXOG&EH&IURP&WKH&ROGHU&SDUW&RI&&DQNORZ&5RDGC&ZKLFK&LV&VXEMHFW&WR&D&24PSK&VSHHG&OLPLW&DQG&ZKHUH&WUDIILF&LV&FDOPHG&E\&D&VSHHG&UDPS7&&7UDIILF&IORZV&RQ&&DQNORZ&5RDG&DUH&UHODWLYHO\&OLJKW&ZLWK&D&PD[LPXP&RI&>44&YHKLFOHV&DQ&KRXU&DW&WKH&EXVLHVW&QRUWKHUQ&VHFWLRQ7&
0W7!7KH&OHYHO&RI&WUDIILF&DWWUDFWHG&E\&D&ODUJHU&.)&&UHVWDXUDQW&EHWZHHQ&%DUQVOH\&DQG&:DNHILHOG&ZDV&VXUYH\HG7&&7KLV&LQGLFDWHG&WKDW&WKHUH&ZRXOG&EH&DURXQG&54&YHKLFXODU&PRYHPHQWV&SHU&KRXU&DW&WKH&DSSHDO&VLWH7&&,W&LV&DQWLFLSDWHG&WKDW&PDQ\&RI&WKHVH&ZLOO&QRW&EH&QHZ&MRXUQH\V&DQG&WKDW&SDVVLQJ&WUDIILF&ZLOO&GLYHUW&WR&XVH&WKH&UHVWDXUDQW7&&$V&VXFKC&WKHUH&ZRXOG&EH&QR&QRWLFHDEOH&LQFUHDVH&LQ&WUDIILF&RQ&&HQWHQDU\&:D\7&&7KH&WUDIILF&VXUYH\&LQGLFDWHG&WKDW&WKH&SURSRVHG&GHYHORSPHQW&ZRXOG&UHVXOW&LQ&0&DGGLWLRQDO&OHIW&WXUQ&IURP&&HQWHQDU\&:D\&WR&&DQNORZ&5RDG&HYHU\&2&PLQXWHV&DW&WKH&EXVLHVW&WLPH&RI&GD\&DQG&EHWZHHQ&0&DGGLWLRQDO&YHKLFOH&HYHU\&>R1&PLQXWHV&DW&RWKHU&MXQFWLRQV.GLUHFWLRQV7&&:KLOVW&WKH&VRXWKHUQ&HQG&RI&&DQNORZ&5RDG&LV&UHODWLYHO\&OLJKWO\&WUDIILFNHGC&ZLWK&D&PD[LPXP&LQFUHDVH&RI&0&YHKLFOH&LQERXQG&DQG&0&RXWERXQG&&SHU&PLQXWH&WKH&SURSRVDO&ZRXOG&UHVXOW&LQ&QR&PDWHULDO&FKDQJH&WR&WUDIILF&FRQGLWLRQV&RU&KLJKZD\&VDIHW\&LQ&WKH&DUHD7&
0I7!7KH&DSSHDO&VLWH&LV&DFFHVVLEOH&E\&UHJXODU&DQG&IUHTXHQW&EXV&VHUYLFHV&DQG&WKHUH&DUH&EURDG&IRRWZD\V&DORQJ&&DQNORZ&5RDG&ZKLFK&ZRXOG&SURYLGH&SHGHVWULDQ&DFFHVV7&&,Q&DGGLWLRQC&&DQNORZ&5RDG&LV&GHVLJQDWHG&DQ&DGYLVRU\&F\FOH&URXWH&E\&WKH&&RXQFLO&DQG&WKHUH&ZRXOG&EH&F\FOH&SDUNLQJ&IDFLOLWLHV&DYDLODEOH&DW&WKH&UHVWDXUDQW7&&&
057!7DNLQJ&DOO&WKH&DERYH&LQWR&FRQVLGHUDWLRQC&WKHUH&ZRXOG&EH&QR&FRQIOLFW&ZLWK&VDYHG&8'3&3ROLF\&7W&DQG&3ROLF\&(&0472&RI&3ODQQLQJ&3ROLF\&6WDWHPHQW&/L&3ODQQLQJ'IRU'6XVWDLQDEOH'(FRQRPLF'*URZWK'ZKLFKC&DPRQJVW&RWKHU&WKLQJVC&VHHN&WR&SUHYHQW&WUDIILF&FRQJHVWLRQ&DQG&HQVXUH&WKDW&GHYHORSPHQW&LV&DFFHVVLEOH&E\&SULYDWH&FDUC&SXEOLF&WUDQVSRUWC&SHGHVWULDQVC&F\FOLVWV&DQG&SHRSOH&ZLWK&GLVDELOLWLHV7&&

$SSHDO&'HFLVLRQ&$33.3//01.$.00.2013452&&
&ZZZ7SODQQLQJSRUWDO7JRY7XN.SODQQLQJLQVSHFWRUDWH&&&&&&&&&&&/&
037!7KH&QHZ&UHVWDXUDQW&ZRXOG&EH&DSSUR[LPDWHO\&/4&PHWUHV&IURP&&DQNORZ&:RRGV&3ULPDU\&6FKRRO7&&7KH&VFKRRO&KROGV&D&+HDOWK\&6FKRRO&&HUWLILFDWLRQ&DQG&SURYLGHV&D&QXWULWLRQDOO\&EDODQFHG&EUHDNIDVW&DQG&OXQFK&DQG&WHDFKHV&LWV&SXSLOV&WKH&LPSRUWDQFH&RI&D&KHDOWK\&OLIHVW\OH7&&,Q&DGGLWLRQK&5RWKHUKDP&0HWURSROLWDQ&%RURXJK&&RXQFLOK&WRJHWKHU&ZLWK&WKH&/RFDO&+HDOWK&$XWKRULW\K&KDV&LQYHVWHG&D&FRQVLGHUDEOH&DPRXQW&LQ&RUGHU&WR&SURPRWH&WKH&LPSRUWDQFH&RI&KHDOWK\&HDWLQJ&WR&LPSURYH&WKH&KHDOWK&DQG&ZHOOPEHLQJ&RI&FKLOGUHQ&DQG&DGXOWV7&&7KHUH&DUH&FRQFHUQV&WKDW&WKH&SURSRVHG&UHVWDXUDQW&ZRXOG&XQGHUPLQH&WKHVH&KHDOWK\&HDWLQJ&LQLWLDWLYHV7&&
247!0\&DWWHQWLRQ&KDV&EHHQ&GUDZQ&WR&D&+LJK&&RXUW&GHFLVLRQK&5&QRQ&WKH&DSSOLFDWLRQ&RI&&RSHODQGR&±YP&7RZHU&+DPOHWV&/RQGRQ&%RURXJK&&RXQFLOK&LQ&UHVSHFW&RI&D&IDVW&IRRG&RXWOHW7&&,W&LV&P\&XQGHUVWDQGLQJ&WKDW&WKLV&UHODWHV&WR&D&WDNHDZD\&QHDU&D&VHFRQGDU\&VFKRRO&ZKHUH&SXSLOV&ZRXOG&EH&DEOH&WR&OHDYH&WKH&SUHPLVHV&DW&OXQFKPWLPH7&&:KLOVW&,&DSSUHFLDWH&WKDW&VRPH&/RFDO&$XWKRULWLHV&KDYH&DGRSWHG&SROLFLHV&ZKLFK&UHVWULFW&KRW&IRRG&WDNHDZD\V&QHDU&VFKRROV&RU&\RXWK&IDFLOLWLHVK&5RWKHUKDP&&RXQFLO&KDV&QR&SROLF\&RQ&WKLV&PDWWHU&DOWKRXJK&,&DFFHSW&WKDW&WKH&KHDOWK&DQG&ZHOOPEHLQJ&RI&UHVLGHQWV&LV&D&PDWHULDO&FRQVLGHUDWLRQ7&
207!7KH&VFKRRO&LV&D&SULPDU\&VFKRRO&ZKHUH&FKLOGUHQ&DUH&QRW&XVXDOO\&SHUPLWWHG&WR&OHDYH&WKH&SUHPLVHV&DW&PLGPGD\&DQGK&JLYHQ&WKH&DJH&RI&WKH&FKLOGUHQK&LW&LV&XQOLNHO\&WKDW&WKH\&ZRXOG&WUDYHO&WR&DQG&IURP&VFKRRO&XQDFFRPSDQLHG&E\&DQ&DGXOW7&&7KH&SXSLOV&ZRXOG&QRW&EH&DEOH&WR&HDW&WKH&IRRG&DW&WKH&SURSRVHG&UHVWDXUDQW&GXULQJ&WKH&VFKRRO&GD\7&&2XWVLGH&RI&WKH&WLPH&WKH\&DUH&DW&VFKRROK&WKH&FKLOGUHQ¶V&GLHW&LV&WKH&UHVSRQVLELOLW\&RI&WKHLU&SDUHQWV&RU&JXDUGLDQV7&&2Q&WKLV&EDVLVK&,&GR&QRW&DFFHSW&WKDW&WKH&SUHVHQFH&RI&D&.)&&UHVWDXUDQW.GULYH&WKURXJK&ZRXOG&MHRSDUGLVH&WKH&ORFDO&KHDOWK\PHDWLQJ&LQLWLDWLYHV7&
227!336/&LGHQWLILHV&UHVWDXUDQWVK&WDNHDZD\V&DQG&GULYH&WKURXJK&UHVWDXUDQWV&DV&WRZQ&FHQWUH&XVHV7&&:KHUH&VXFK&DQ&$Y&RU&$1&XVH&LV&SURSRVHG&RXWVLGH&RI&D&WRZQ&FHQWUH&&D&VHTXHQWLDO&DVVHVVPHQW&RI&DOWHUQDWLYH&VLWHV&DQGK&LQ&FHUWDLQ&FLUFXPVWDQFHVK&D&WHVW&RI&WKH&LPSDFW&RI&WKH&SURSRVDO&RQ&WKH&WRZQ&FHQWUH&DUH&UHTXLUHG7&&7KH&DSSHOODQW&FDUULHG&RXW&D&VHTXHQWLDO&DVVHVVPHQW&ZKLFK&GHPRQVWUDWHG&WKDW&WKHUH&ZDV&QR&RWKHU&VXLWDEOH&DQG&DYDLODEOH&VLWH&ZLWKLQ&5RWKHUKDP&RU&:LFNHUVOH\&WRZQ&FHQWUHV7&&,Q&DGGLWLRQK&ZKLOVW&WKH&SURSRVDO&LV&EHORZ&WKH&VL]H&FULWHULDK&WKH&DSSHOODQW&VXEPLWWHG&DQ&LPSDFW&WHVW&ZKLFK&LQGLFDWHG&WKDW&WKH&GHYHORSPHQW&ZRXOG&QRW&KDYH&DQ&DGYHUVH&LPSDFW&RQ&5RWKHUKDP&WRZQ&FHQWUH&RU&WKH&ZLGHU&DUHD7&&$V&VXFKK&WKHUH&LV&QR&FRQIOLFW&ZLWK&336/7&&&&&&&&
&RQGLWLRQV(
2Y7!7KH&&RXQFLO&VXJJHVWHG&D&QXPEHU&RI&FRQGLWLRQV&ZKLFK&,&KDYH&DVVHVVHG&LQ&WKH&OLJKW&RI&QDWLRQDO&JXLGDQFH7&&,&KDYH&LPSRVHG&D&FRQGLWLRQ&UHTXLULQJ&GHYHORSPHQW&WR&EH&LQ&DFFRUGDQFH&ZLWK&WKH&VXEPLWWHG&DQG&DPHQGHG&GUDZLQJV&DV&OLVWHG&EHORZ&LQ&RUGHU&WR&DYRLG&DQ\&GRXEW&RYHU&ZKLFK&GUDZLQJV&ZHUH&FRQVLGHUHG&DW&DSSHDO&DQG&LQ&WKH&LQWHUHVWV&RI&SURSHU&SODQQLQJ7&&,&KDYH&DOVR&LPSRVHG&FRQGLWLRQV&UHJDUGLQJ&WKH&VXEPLVVLRQ&RI&GHWDLOV&RI&WKH&H[WHUQDO&PDWHULDOV&DQG&D&GHWDLOHG&ODQGVFDSLQJ&VFKHPH&LQ&RUGHU&WR&HQVXUH&WKH&VDWLVIDFWRU\&DSSHDUDQFH&RI&WKH&VLWH7&&
2/7!,Q&RUGHU&WR&HQVXUH&WKDW&WKH&SURSRVDO&LV&QRW&KDUPIXO&WR&WKH&OLYLQJ&FRQGLWLRQV&RI&QHDUE\&UHVLGHQWV&,&KDYH&LPSRVHG&D&QXPEHU&RI&FRQGLWLRQV&WR\&UHVWULFW&WKH&KRXUV&RI&RSHQLQJ]&SURYLVLRQ&RI&FDU&SDUNLQJ&DQG&LWV&GUDLQDJH]&FRQWURO&RGRXU&DQG&QRLVH&IURP&WKH&UHVWDXUDQWK&HQVXUH&WKH&VXEPLVVLRQ&RI&GHWDLOV&RI&DQ&DFRXVWLF&EDUULHUK&D&VFKHPH&RI&VRXQG&LQVXODWLRQ]&DJUHH&DUUDQJHPHQWV&IRU&OLWWHU&FROOHFWLQJ&DQG&WKH&VWRUDJH&RI&ZDVWH]&UHVWULFW&WKH&WLPHV&RI&GHOLYHULHV]&SURYLVLRQ&RI&&&79&FDPHUDVK&DQG&GHWDLOV&RI&OLJKWLQJ7&,Q&RUGHU&WR&SURPRWH&VXVWDLQDEOH&WUDYHO&,&FRQVLGHU&LW&

$SSHDO&'HFLVLRQ&$33.3//01.$.00.2013452&&
&ZZZ7SODQQLQJSRUWDO7JRY7XN.SODQQLQJLQVSHFWRUDWH&&&&&&&&&&&1&
QHFHVVDU\&WR&LPSRVH&D&FRQGLWLRQ&UHTXLULQJ&D&WUDYHO&SODQ&WR&EH&DJUHHG&DQG&LPSOHPHQWHG7&
217!7KH&&RXQFLO&VXJJHVWHG&DGGLWLRQDO&FRQGLWLRQV&LQ&UHVSHFW&RI&GUDLQDJH&DQG&LOOXPLQDWHG&VLJQDJHG&,&FRQVLGHU&WKDW&WKHVH&DUH&QRW&QHFHVVDU\&DV&WKHVH&PDWWHUV&DUH&GHDOW&ZLWK&WKURXJK&RWKHU&OHJLVODWLRQ7&
&RQFOXVLRQ)
2I7!)RU&WKH&UHDVRQV&JLYHQ&DERYH&DQG&KDYLQJ&UHJDUG&WR&DOO&RWKHU&PDWWHUV&UDLVHGG&,&FRQFOXGH&WKDW&WKH&SURSRVDO&ZRXOG&QRW&KDUPIXO&WR&WKH&OLYLQJ&FRQGLWLRQV&RI&QHDUE\&UHVLGHQWV7&&,W&ZRXOG&FRPSO\&ZLWK&WKH&UHOHYDQW&SODQQLQJ&SROLFLHV&DQG&DFFRUGLQJO\&WKH&DSSHDO&VKRXOG&EH&DOORZHG&VXEMHFW&WR&WKH&DWWDFKHG&VFKHGXOH&RI&FRQGLWLRQV7&
! -DFTXHOLQH!1RUWK!& ,QVSHFWRU&
&
&

$SSHDO&'HFLVLRQ&$33.3//01.$.00.2013452&
&
&
ZZZ7SODQQLQJSRUWDO7JRY7XN.SODQQLQJLQVSHFWRUDWH&&&&&&&&&&&>&
6FKHGXOH(RI(&RQGLWLRQV(
&
0?! 7KH&GHYHORSPHQW&KHUHE\&SHUPLWWHG&VKDOO&EHJLQ&QRW&ODWHU&WKDQ&WKUHH&\HDUV&
IURP&WKH&GDWH&RI&WKLV&GHFLVLRQ7&
2?! 7KH&GHYHORSPHQW&KHUHE\&SHUPLWWHG&VKDOO&QRW&EH&FDUULHG&RXW&H[FHSW&LQ&
FRPSOHWH&DFFRUGDQFH&ZLWK&WKH&VXEPLWWHG&SODQVH&GUDZLQJ&1RV7&
4444.2400.$044.00J44/>&5HY&(H&4444.2400.$042.00J44/>&5HY&(&DQG&
4444.2400.$244.00J44/>&5HY&&7&&
N?! 1R&GHYHORSPHQW&VKDOO&WDNH&SODFH&XQWLO&VDPSOHV&RI&WKH&PDWHULDOV&WR&EH&XVHG&
LQ&WKH&FRQVWUXFWLRQ&RI&WKH&H[WHUQDO&VXUIDFHV&RI&WKH&EXLOGLQJ&KHUHE\&
SHUPLWWHG&KDYH&EHHQ&VXEPLWWHG&WR&DQG&DSSURYHG&LQ&ZULWLQJ&E\&WKH&ORFDO&
SODQQLQJ&DXWKRULW\7&&'HYHORSPHQW&VKDOO&EH&FDUULHG&RXW&LQ&DFFRUGDQFH&ZLWK&
WKH&DSSURYHG&GHWDLOV7&
/?! 1R&GHYHORSPHQW&VKDOO&WDNH&SODFH&XQWLO&IXOO&GHWDLOV&RI&ERWK&KDUG&DQG&VRIW&
ODQGVFDSH&ZRUNV&KDYH&EHHQ&VXEPLWWHG&WR&DQG&DSSURYHG&LQ&ZULWLQJ&E\&WKH&
ORFDO&SODQQLQJ&DXWKRULW\&DQG&WKHVH&ZRUNV&VKDOO&EH&FDUULHG&RXW&DV&DSSURYHG7&&
7KHVH&GHWDLOV&VKDOO&LQFOXGHO&WKH&H[WHQW&RI&H[LVWLQJ&SODQWLQJH&LQFOXGLQJ&
WKRVH&WUHHV&RU&DUHDV&RI&YHJHWDWLRQ&WKDW&DUH&WR&EH&UHWDLQHGP&D&GHWDLOHG&
SODQWLQJ&SODQ&DQG&VFKHGXOHP&GHWDLOV&RI&JURXQG&SUHSDUDWLRQ&ZRUNVH&WKH&
SURSRVHG&ILQLVKHG&JURXQG&OHYHOV&DQG&PHDQV&RI&HQFORVXUH7&
1?! $OO&KDUG&DQG&VRIW&ODQGVFDSH&ZRUNV&VKDOO&EH&FDUULHG&RXW&LQ&DFFRUGDQFH&ZLWK&
WKH&DSSURYHG&GHWDLOV&DQG&ZLWKLQ&D&WLPHVFDOH&SUHYLRXVO\&DJUHHG&ZLWK&WKH&
ORFDO&SODQQLQJ&DXWKRULW\7&&&
>?! $Q\&WUHHV&RU&SODQWV&ZKLFK&ZLWKLQ&D&SHULRG&RI&1&\HDUV&IURP&WKH&FRPSOHWLRQ&
RI&WKH&GHYHORSPHQW&GLHH&DUH&UHPRYHG&RU&EHFRPH&VHULRXVO\&GDPDJHG&RU&
GLVHDVHG&VKDOO&EH&UHSODFHG&LQ&WKH&QH[W&SODQWLQJ&VHDVRQ&ZLWK&RWKHUV&RI&
VLPLODU&VL]H&DQG&VSHFLHVH&XQOHVV&WKH&ORFDO&SODQQLQJ&DXWKRULW\&JLYHV&ZULWWHQ&
DSSURYDO&WR&DQ\&YDULDWLRQ7&
R?! 7KH&XVH&KHUHE\&SHUPLWWHGH&VKDOO&QRW&EH&RSHQ&WR&FXVWRPHUV&RXWVLGH&WKH&
IROORZLQJ&WLPHVO&0RQGD\&WR&6XQGD\&45744&KRXUV&WR&2N744&KRXUV7&
5?! 3ULRU&WR&WKH&SUHPLVHV&EHLQJ&EURXJKW&LQWR&XVH&WKH&FDU&SDUNLQJ&VKRZQ&RQ&
GUDZLQJ&1R7&4444.2400.$044.00J44/>&5HY&(&VKDOO&EH&SURYLGHGH&PDUNHG&
RXW&DQG&WKHUHDIWHU&PDLQWDLQHG&IRU&FDU&SDUNLQJ7&&
3?! 3ULRU&WR&WKH&SUHPLVHV&EHLQJ&EURXJKW&LQWR&XVHH&IXOO&GHWDLOV&RI&WKH&PHDQV&RI&
VXUIDFH&ZDWHU&GUDLQDJH&RI&WKH&FDU&SDUNLQJ&DUHDV&VKDOO&EH&VXEPLWWHG&WR&DQG&
DSSURYHG&LQ&ZULWLQJ&E\&WKH&ORFDO&SODQQLQJ&DXWKRULW\7&&7KH&VFKHPH&VKDOO&
WKHQ&EH&FDUULHG&RXW&LQ&DFFRUGDQFH&ZLWK&WKH&DSSURYHG&GHWDLOVH&SULRU&WR&WKH&
FRPPHQFHPHQW&RI&XVHH&DQG&VKDOO&EH&UHWDLQHG&WKHUHDIWHU7&
04?! 3ULRU&WR&WKH&LQVWDOODWLRQ&RI&DQ\&PDFKLQHU\&RU&H[WHUQDO&YHQWLODWLRQ&V\VWHP&D&VFKHPH&WR&PLWLJDWH&QRLVHH&LQFOXGLQJ&WKH&LQVWDOODWLRQ&RI&VLOHQFHUV&RQ&
HTXLSPHQWH&VKDOO&EH&VXEPLWWHG&WR&DQG&DSSURYHG&LQ&ZULWLQJ&E\&WKH&ORFDO&
SODQQLQJ&DXWKRULW\7&&7KH&DSSURYHG&VFKHPH&VKDOO&EH&LPSOHPHQWHG&SULRU&WR&
WKH&FRPPHQFHPHQW&RI&WKH&XVH&KHUHE\&SHUPLWWHGH&DQG&WKHUHDIWHU&VKDOO&EH&
UHWDLQHG7&
00?! 1R&GHYHORSPHQW&VKDOO&WDNH&SODFH&XQWLO&D&VFKHPH&IRU&WKH&LQVWDOODWLRQ&RI&HTXLSPHQW&WR&FRQWURO&WKH&HPLVVLRQ&RI&IXPHVH&KHDWLQJH&FRROLQJH&DQG&
YHQWLODWLRQ&IURP&WKH&SUHPLVHV&KDV&EHHQ&EH&VXEPLWWHG&WRH&DQG&DSSURYHG&LQ&

$SSHDO&'HFLVLRQ&$33.3//01.$.00.2013452&&
&ZZZ7SODQQLQJSRUWDO7JRY7XN.SODQQLQJLQVSHFWRUDWH&&&&&&&&&&&>&
ZULWLQJ&E\A&WKH&ORFDO&SODQQLQJ&DXWKRULW\&DQG&WKH&DSSURYHG&VFKHPH&VKDOO&EH&LPSOHPHQWHG7&&$OO&HTXLSPHQW&LQVWDOOHG&DV&SDUW&RI&WKH&VFKHPH&VKDOO&WKHUHDIWHU&EH&RSHUDWHG&DQG&PDLQWDLQHG&LQ&DFFRUGDQFH&ZLWK&WKH&PDQXIDFWXUHU¶V&LQVWUXFWLRQV7&
02H! 1RWZLWKVWDQGLQJ&WKH&GHWDLOV&RQ&GUDZLQJ&1R7&4444.2400.$044.00J44/K&5HY&(A&QR&GHYHORSPHQW&VKDOO&WDNH&SODFH&XQWLO&IXOO&GHWDLOV&RI&WKH&SURSRVHG&DFRXVWLF&IHQFLQJ&KDYH&EHHQ&VXEPLWWHG&DQG&DSSURYHG&LQ&ZULWLQJ&E\&WKH&ORFDO&SODQQLQJ&DXWKRULW\7&&'HYHORSPHQW&VKDOO&WKHQ&EH&FDUULHG&RXW&LQ&DFFRUGDQFH&ZLWK&WKH&DSSURYHG&GHWDLOVA&SULRU&WR&WKH&FRPPHQFHPHQW&RI&XVHA&DQG&WKH&DFRXVWLF&EDUULHU&VKDOO&EH&UHWDLQHG&WKHUHDIWHU7&&&&
0NH! 3ULRU&WR&WKH&SUHPLVHV&EHLQJ&EURXJKW&LQWR&XVHA&D&VFKHPH&IRU&WKH&VLWLQJ&RI&OLWWHU&ELQVA&OLWWHU&SLFNLQJ&DUUDQJHPHQWV&DQG&VWRUDJH&RI&UHIXVH&VKDOO&EH&VXEPLWWHG&WR&DQG&DSSURYHG&LQ&ZULWLQJ&E\&WKH&ORFDO&SODQQLQJ&DXWKRULW\7&7KH&VFKHPH&VKDOO&WKHQ&EH&FDUULHG&RXW&LQ&DFFRUGDQFH&ZLWK&WKH&DSSURYHG&GHWDLOVA&SULRU&WR&WKH&FRPPHQFHPHQW&RI&XVHA&DQG&VKDOO&EH&UHWDLQHG&WKHUHDIWHU7&
0/H! 3ULRU&WR&WKH&SUHPLVHV&EHLQJ&EURXJKW&LQWR&XVHA&D&VFKHPH&IRU&WKH&SURYLVLRQ&RI&&&79&VKDOO&EH&VXEPLWWHG&WR&DQG&DSSURYHG&LQ&ZULWLQJ&E\&WKH&ORFDO&SODQQLQJ&DXWKRULW\7&7KH&VFKHPH&VKDOO&WKHQ&EH&FDUULHG&RXW&LQ&DFFRUGDQFH&ZLWK&WKH&DSSURYHG&GHWDLOVA&SULRU&WR&WKH&FRPPHQFHPHQW&RI&XVHA&DQG&VKDOO&EH&UHWDLQHG&WKHUHDIWHU7&
01H! $&OLJKWLQJ&VFKHPH&VKDOO&EH&VXEPLWWHG&WR&DQG&DSSURYHG&LQ&ZULWLQJ&E\&WKH&ORFDO&SODQQLQJ&DXWKRULW\&SULRU&WR&WKH&FRPPHQFHPHQW&RI&GHYHORSPHQW&DQG&VKDOO&EH&VR&GHVLJQHG&DV&WR&RYHUFRPH&JODUHA&VSLOODJH&DQG&LQWUXVLRQ7&&7KH&OLJKWLQJ&RI&WKH&VLWH&VKDOO&RQO\&EH&FDUULHG&RXW&LQ&DFFRUGDQFH&ZLWK&WKH&DSSURYHG&VFKHPHA&SULRU&WR&WKH&FRPPHQFHPHQW&RI&WKH&XVH&KHUHE\&SHUPLWWHGA&DQG&VKDOO&EH&UHWDLQHG&WKHUHDIWHU7&
0KH! 1R&GHYHORSPHQW&VKDOO&FRPPHQFH&RQ&VLWH&XQWLO&D&WUDYHO&SODQ&KDV&EHHQ&VXEPLWWHG&WR&DQG&DSSURYHG&LQ&ZULWLQJ&E\&WKH&ORFDO&SODQQLQJ&DXWKRULW\7&&7KH&SODQ&VKDOO&LQFOXGH&GHWDLOV&RI&WKH&WLPHV&DQG&PHWKRGV&RI&GHOLYHULHVA&UHIXVH&FROOHFWLRQ&DQG&RWKHU&VHUYLFLQJA&DQG&SURSRVDOV&WR&HQFRXUDJH&WKH&XVH&RI&VXVWDLQDEOH&WUDQVSRUW&FKRLFHV&E\&VWDII&DQG&FXVWRPHUV7&&7KH&DSSURYHG&SODQ&VKDOO&EH&LPSOHPHQWHG&SULRU&WR&WKH&EXLOGLQJ&EHLQJ&EURXJKW&LQWR&XVH&DQG&VKDOO&WKHUHDIWHU&EH&UHWDLQHGA&RU&DV&VXEVHTXHQWO\&DSSURYHG&DV&SDUW&RI&D&UHYLHZ&SURFHVV7&&
&

Land Use Policy 26S (2009) S115–S123
Contents lists available at ScienceDirect
Land Use Policy
journa l homepage: www.e lsev ier .com/ locate / landusepol
Land use planning and health and well-being!
Hugh Barton ∗
WHO Collaborating Centre for Healthy Urban Environments, School of Built and Natural Environment, University of the West of England,Frenchay, Bristol BS16 1QY, United Kingdom
a r t i c l e i n f o
Article history:Received 10 September 2009Accepted 12 September 2009
Keywords:Spatial planningHealthy urban planningHealthy townsPhysical activity and planning
a b s t r a c t
This paper is concerned with the relationship between the planning of settlements and health. It gives abrief introduction to the issues before summarising the evidence in relation to a range of topics, concludingwith some more speculative thoughts on likely future findings.
Modern planning was invented in response to inhumane living conditions in 19th century cities. Butin the last century the connection was lost. Only now, with concerns over climate change and obesity,is there beginning to be the realisation that the physical environment is an important determinant ofhealth.
The paper uses a particular model of this relationship based on eco-system and health determinantstheories to structure the review of evidence. The review covers: lifestyle choices in relation to physicalactivity and diet, mental well-being and community, the local economy and income, health inequalitiesand strategic land use transport planning, pollution and urban form, and finally impacts on global ecology.
There is now a growing consensus that while personal factors are critical in determining health, theurban environment exacerbates or mitigates health and well-being outcomes.
The level of active travel (walking and cycling) and outdoor recreational activity is strongly affectedby accessibility to local facilities. Access to green, natural environments, and to local social networks, arefactors in mental well-being. The wider sub-regional pattern of housing, economic development, landuse and transport is a determinant of social exclusion and therefore health inequalities. It also affectshealth-damaging pollution, adaptability in the face of climate change and the level of carbon dioxideemissions.
We have literally been building unhealthy conditions into many of our towns and cities. But comparisonswith the best cities in Europe indicate that it is possible to reverse the less desirable trends. Successdepends, however, on more radical policies of local authority control over land and finance than anypolitical party has yet advocated. It also requires collaboration between the full range of powerful publicand private organizations that influence the built environment.
Future research is likely to further strengthen these conclusions. It will become much more obvious thatplanning for health and well-being is not only the NHS, but about creating a health-promoting physical,social and economic environment.
© 2009 Queen’s Printer and Controller of HMSO. Published by Elsevier Ltd. All rights reserved.
Introduction
Purpose and definitions
The focus of this paper is on land use planning for healthy humansettlements. It is widely recognised that the spatial planning ofhuman urban activity is affecting quality of life, health and well-being (EEA, 2009; WHO, 2009; RTPI, 2009; NICE, 2008). The paper
! While the Government Office for Science commissioned this review, the viewsare those of the author(s), are independent of Government, and do not constituteGovernment policy.
∗ Tel.: +44 0117 3283258; fax: +44 0117 3283002.E-mail address: [email protected].
gives a brief introduction to the issue and provides a frameworkfor analysis, before summarising the evidence in relation to a widerange of topics. It concentrates in particular on the crucial rela-tionship between spatial variables and physical activity, mentalwell-being and inequality.
First to give some definitions: settlements in this contextinclude cities, towns and villages. The tentacles of large settlementsspread out far beyond urban areas, into hinterlands and networks,linking places together through commuter residence and work,retail, educational and leisure activities. So there is no clear func-tional distinction between urban and rural settlements within atown or city region.
Land use planning is conventionally called ‘town and coun-try planning’ in Britain, following the 1947 Act, but since 2004
0264-8377/$ – see front matter © 2009 Queen’s Printer and Controller of HMSO. Published by Elsevier Ltd. All rights reserved.doi:10.1016/j.landusepol.2009.09.008
C

S116 H. Barton / Land Use Policy 26S (2009) S115–S123
is officially termed ‘spatial planning’, implying a more integrated,inter-agency process. In literature the term ‘built environment’ isoften used to mean the human-made environment that may besubject to planning. It does not refer only to buildings and hardinfrastructure but to all the physical elements that go to make upsettlements, including greenspace.
Health is defined broadly, in line with the World Health Orga-nization (WHO), as ‘not only the absence of disease but a state ofcomplete physical, mental and social well-being. The enjoymentof the highest attainable standard of health is one of the funda-mental rights of every human being, without distinction of race,religion, political belief or economic or social condition’ (WHO,1946). Health in this sense is linked to every aspect of life – thesocial, the economic and the environmental – and can be seen asconsonant with the anthropogenic version of sustainable devel-opment evident in the UN Brundtland definition. Just as equity(intra-generational as well as inter-generational) is a key aspectof sustainable development, so concern for health inequalities iscentral to public health policy.
Health and land use planning
Health and land use planning are historically linked. Modernplanning originated in the nineteenth century expressly in order tocombat unhealthy conditions—the unsanitary, over-crowded andinhumane conditions of the burgeoning industrial cities. It wasrecognised then, and still is, that there is an umbilical link betweenenvironmental conditions and human health. This link has beenarticulated in the modern era as permeating the human condition.The environment is seen as one of the key determinants of health,alongside inherited characteristics, lifestyles, and social and eco-nomic variables (Lalonde, 1974; Whitehead and Dahlgren, 1991).It is not only a matter of the direct physical impacts on health –for example of foul air or contaminated water – but also of indi-rect social and behavioural effects, on the exercise we take, thepeople we meet, and the degree of inequality in access to housing,employment opportunities, health services and other facilities.
According to VicHealth (the Victorian Health Promotion Foun-dation in Australia) there are four key reasons why planning healthinto the environment is positive for population health. Good plan-ning can:
• reduce the inequalities that exist in access to housing, facilitiesand transport for different socioeconomic groups and vulnerablegroups in the population, such as the elderly or children;
• increase the amount of incidental physical activity necessary toreduce the burden of disease, disability and mortality due tosedentary life styles, by improving access and providing walk-able, mixed use communities;
• contribute to the improved health of the population by thereduction of air and water pollution and greenhouse emissions,combating the threat of climate change;
• contribute to a changed social environment by improving theliveability of streets, making them safer, improving commu-nication between people and therefore improving communitycohesion (Butterworth, 2000).
All this reflects the broad WHO view of health as a positive expe-rience of well-being and not merely the absence of disease. Yetdespite the symbiotic relationship between land use planning andhealth, these connections have in practice been forgotten untilrecently. This is in part because of departmental silos. Healthauthorities have been charged with providing services for thosewho are ill. Public health programmes have concentrated on infec-
tious diseases and addiction (to tobacco, alcohol and drugs) ratherthan on healthy environments. Health and safety and environmen-tal protection agencies have been given narrow, functional remits.Planning authorities have often been equally blinkered (see a sur-vey reported in Barton and Tsourou, 2000). Local councils, guidedby national governments and local politics, have taken the viewthat the purposes of town planning are economic developmentand environmental protection rather than health promotion. Eachsphere of public policy has been pursued independently, with agen-cies adopting specific targets in order to deliver on their mission,failing to grasp, or at least failing to deal with, the interdependenceof the issues.
Partly as a result we have been quite literally building unhealthyconditions into the fabric of our cities, towns and villages. All levelsand types of planning are implicated. The report Building Health(National Heart Foundation et al., 2007) provides an accessibleoverview, showing how broad strategy, urban and transport poli-cies, urban design and greenspace management are all important,and sometimes at present counterproductive.
We are discovering that the diseases of advanced civilisations– such as cardio-vascular disease, diabetes, asthma and chronicdepression – are associated with particular social and environmen-tal conditions. The overriding impression from recent research isthat we ignore environmental factors at our peril. Attitudes arechanging fast in response, and the WHO has played a role in this.The WHO Healthy cities programme has been acting as a cata-lyst for ‘healthy urban planning’ in municipalities across Europesince 1998 (Barton, forthcoming). There is now growing recogni-tion amongst professional planners that the health-environmentlink is important, and that some current development trends com-promise health (see RTPI, 2009). But while many planners recognisethat urban planning influences health, they do not normally per-ceive it as their job to worry about it or study it. Their priorities areelsewhere.
At the same time the public health professionals are suddenlytaking a real interest in spatial planning. They have become con-scious that advocacy and specific population programmes are notenough to change behaviour (e.g. to persuade people to take moreexercise) when structural limits, the very forms of towns and cities,are working against them. In 2008, and even more in 2009, there hasbeen an explosion of demands from public health authorities forknowledge exchange and for effective contact between the healthand planning sectors. The National Institute for Health and Clin-ical Excellence has issued guidelines on physical activity and theenvironment (NICE, 2008).
Framing the debate
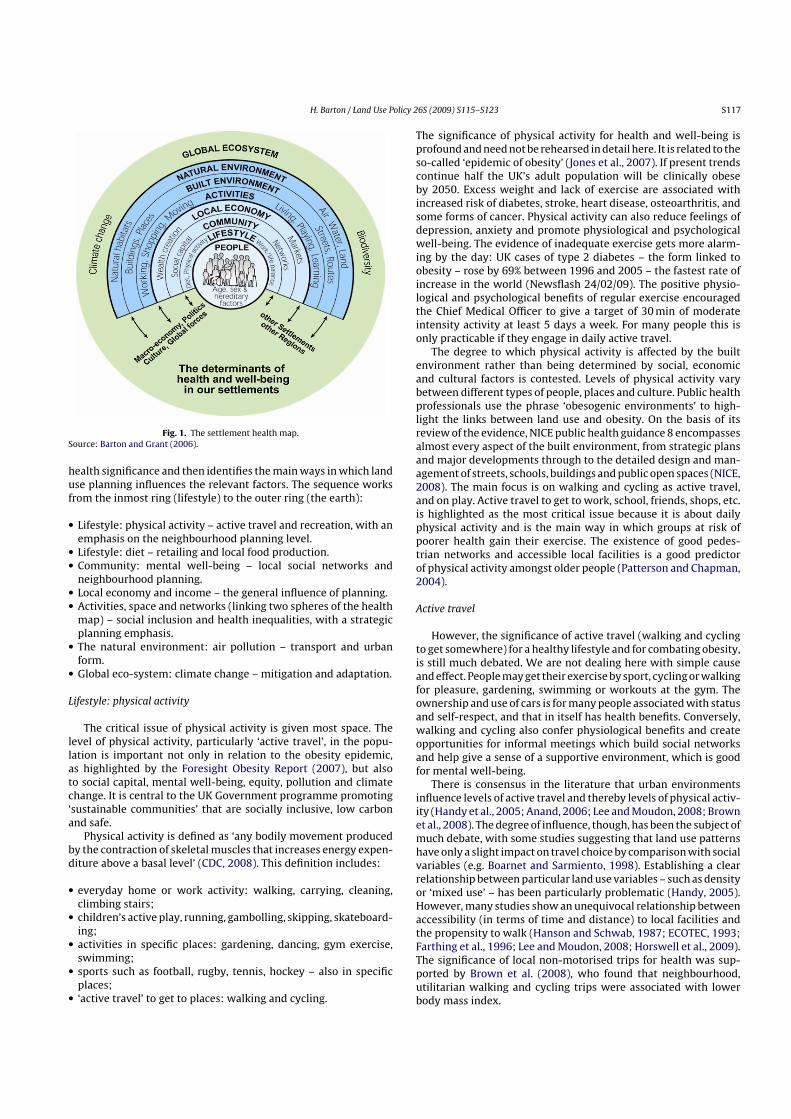
The diagram below (Fig. 1) offers a way of conceptualisingboth the way settlements work and the way the way they affecthealth. It is based on two interlocking sets of theories: about urbaneco-systems and about the determinants of health (Barton, 2005;Whitehead and Dahlgren, 1991).
Each of the layers of the model impacts on health and well-being. Equivalently each layer is influenced by land use change.The built environment layer is the sphere where land use planninghas a direct impact. A change in the structure of the built environ-ment alters the natural environment and the social and economicenvironment.
The overview in this paper draws on a wide range of evidence,including a number of broad ranging literature reviews (NICE,2008; Croucher et al., 2007; Jones et al., 2007; Davis et al., 2007;National Heart Foundation et al., 2007; Institute of Public Healthin Ireland, 2006; Transportation Research Board, 2005; Cave et al.,2004). Taking each sphere in turn, the summary first highlights its
H. Barton / Land Use Policy 26S (2009) S115–S123 S117
Fig. 1. The settlement health map.Source: Barton and Grant (2006).
health significance and then identifies the main ways in which landuse planning influences the relevant factors. The sequence worksfrom the inmost ring (lifestyle) to the outer ring (the earth):
• Lifestyle: physical activity – active travel and recreation, with anemphasis on the neighbourhood planning level.
• Lifestyle: diet – retailing and local food production.• Community: mental well-being – local social networks and
neighbourhood planning.• Local economy and income – the general influence of planning.• Activities, space and networks (linking two spheres of the health
map) – social inclusion and health inequalities, with a strategicplanning emphasis.
• The natural environment: air pollution – transport and urbanform.
• Global eco-system: climate change – mitigation and adaptation.
Lifestyle: physical activity
The critical issue of physical activity is given most space. Thelevel of physical activity, particularly ‘active travel’, in the popu-lation is important not only in relation to the obesity epidemic,as highlighted by the Foresight Obesity Report (2007), but alsoto social capital, mental well-being, equity, pollution and climatechange. It is central to the UK Government programme promoting‘sustainable communities’ that are socially inclusive, low carbonand safe.
Physical activity is defined as ‘any bodily movement producedby the contraction of skeletal muscles that increases energy expen-diture above a basal level’ (CDC, 2008). This definition includes:
• everyday home or work activity: walking, carrying, cleaning,climbing stairs;
• children’s active play, running, gambolling, skipping, skateboard-ing;
• activities in specific places: gardening, dancing, gym exercise,swimming;
• sports such as football, rugby, tennis, hockey – also in specificplaces;
• ‘active travel’ to get to places: walking and cycling.
The significance of physical activity for health and well-being isprofound and need not be rehearsed in detail here. It is related to theso-called ‘epidemic of obesity’ (Jones et al., 2007). If present trendscontinue half the UK’s adult population will be clinically obeseby 2050. Excess weight and lack of exercise are associated withincreased risk of diabetes, stroke, heart disease, osteoarthritis, andsome forms of cancer. Physical activity can also reduce feelings ofdepression, anxiety and promote physiological and psychologicalwell-being. The evidence of inadequate exercise gets more alarm-ing by the day: UK cases of type 2 diabetes – the form linked toobesity – rose by 69% between 1996 and 2005 – the fastest rate ofincrease in the world (Newsflash 24/02/09). The positive physio-logical and psychological benefits of regular exercise encouragedthe Chief Medical Officer to give a target of 30 min of moderateintensity activity at least 5 days a week. For many people this isonly practicable if they engage in daily active travel.
The degree to which physical activity is affected by the builtenvironment rather than being determined by social, economicand cultural factors is contested. Levels of physical activity varybetween different types of people, places and culture. Public healthprofessionals use the phrase ‘obesogenic environments’ to high-light the links between land use and obesity. On the basis of itsreview of the evidence, NICE public health guidance 8 encompassesalmost every aspect of the built environment, from strategic plansand major developments through to the detailed design and man-agement of streets, schools, buildings and public open spaces (NICE,2008). The main focus is on walking and cycling as active travel,and on play. Active travel to get to work, school, friends, shops, etc.is highlighted as the most critical issue because it is about dailyphysical activity and is the main way in which groups at risk ofpoorer health gain their exercise. The existence of good pedes-trian networks and accessible local facilities is a good predictorof physical activity amongst older people (Patterson and Chapman,2004).
Active travel
However, the significance of active travel (walking and cyclingto get somewhere) for a healthy lifestyle and for combating obesity,is still much debated. We are not dealing here with simple causeand effect. People may get their exercise by sport, cycling or walkingfor pleasure, gardening, swimming or workouts at the gym. Theownership and use of cars is for many people associated with statusand self-respect, and that in itself has health benefits. Conversely,walking and cycling also confer physiological benefits and createopportunities for informal meetings which build social networksand help give a sense of a supportive environment, which is goodfor mental well-being.
There is consensus in the literature that urban environmentsinfluence levels of active travel and thereby levels of physical activ-ity (Handy et al., 2005; Anand, 2006; Lee and Moudon, 2008; Brownet al., 2008). The degree of influence, though, has been the subject ofmuch debate, with some studies suggesting that land use patternshave only a slight impact on travel choice by comparison with socialvariables (e.g. Boarnet and Sarmiento, 1998). Establishing a clearrelationship between particular land use variables – such as densityor ‘mixed use’ – has been particularly problematic (Handy, 2005).However, many studies show an unequivocal relationship betweenaccessibility (in terms of time and distance) to local facilities andthe propensity to walk (Hanson and Schwab, 1987; ECOTEC, 1993;Farthing et al., 1996; Lee and Moudon, 2008; Horswell et al., 2009).The significance of local non-motorised trips for health was sup-ported by Brown et al. (2008), who found that neighbourhood,utilitarian walking and cycling trips were associated with lowerbody mass index.

S118 H. Barton / Land Use Policy 26S (2009) S115–S123
The importance of local or neighbourhood trips is evident.Neighbourhoods in this context may be defined simply as localservice catchments areas, based on walking distance (Barton andHills, 2005). Yet neighbourhoods have often been perceived asdying or even dead, as mobility and virtual communication increase(Webber, 1964; Dennis, 1968; Giddens, 1990). And indeed, thecharacteristics that go to make a viable neighbourhood – suchas a certain level of density, local shops, services and schools,the presence of pavements and footpaths, an attractive andsafe environment – are not present in many modern suburbanestates.
Where facilities are not conveniently located, the propensityfor active travel reduces markedly (Lee and Moudon, 2008). OneUS study which systematically compared the ‘walkability’ of local-ities found that only 18% of those living in the lowest quartile ofwalkability recorded 30 min or more of physical activity on at least1 day, compared with 37.5% of those in the highest quartile (Franket al., 2005). In England a recent survey of 12 suburban and exur-ban neighbourhoods found that the proportion of ‘local’ trips byfoot and pedal varied between 18% and 62%. Some of the differ-ence was accounted for by car ownership levels and local culture,but the biggest factor was distance: there was some consistencyacross neighbourhoods in terms of how far people would walk,but some places had far fewer facilities accessible (Horswell et al.,2009). The implication is that the structure of localities – specifi-cally the location and accessibility of facilities and the quality of theroute network – is a critical determinant of the amount of activetravel.
There is more to accessibility than simple distance. The qual-ity and safety of the pedestrian and cycling environment isimportant—particularly the perception of these things (Pikora etal., 2003). Parental consent for children to walk or cycle to school,friends or playground is notoriously low in the UK by compar-ison with much of Europe, due to real or perceived traffic andstranger danger. Children’s freedom to roam has been curtailed.Physical improvement to route continuity, directness, safety, infor-mal surveillance and aesthetic quality is a part of any strategy tochange perceptions and culture. Once there are some more peopleon the streets, perceptions begin to change and we have a virtuouscircle (Hume et al., 2005).
There remain questions about particular built environment andbehavioural variables. Density, for example, may not be as key afactor as it is often portrayed, while households’ choice of dwellinglocation to suit their lifestyle could be significant. The huge vari-ation in behaviour between people in different countries (e.g. theUS, Britain and the Netherlands – the latter with 70% of all tripsby active travel modes in some towns) has not been adequatelyaddressed. The degree to which people change behaviour, or moreprecisely the conditions which foster change when accessibility isimproved, also needs more investigation.
Despite the research uncertainties, official policy for sustain-able development has for some while laid great stress on theneed to revive neighbourhoods and enhance the availability offacilities within walking distance of people’s homes (DETR, 1998;Urban Task Force, 1999; Social Exclusion Unit, 2000). The benefitswould (it is hoped) be better accessibility for the transport-disadvantaged, improved social capital and health, and reducedtransport emissions. Particular models of neighbourhood designhave been advocated as likely to promote the use of local facil-ities as well as walking and cycling (Urban Villages Group,1992; Calthorpe, 1993; Urban Task Force, 1999; Barton et al.,2003).
Local authorities are employing specific accessibility criteria inpolicy. Some such standards are very widely used across WesternEurope, such as the criterion that dwellings should be within 400 m
of a bus stop. Others have rapidly gained currency in recent years,such as the principle of an 800 m ‘ped-shed’ around local shoppingcentres (Llewelyn Davies, 1998). The research underpinning thesestandards from the physical activity viewpoint is weak, but currentresearch at UWE is beginning to provide evidence (Horswell et al.,2009).
Recreational activity
Recreational physical activity comes in many forms, from chil-dren’s play to gardening, from organized sports, swimming or gymactivity to walking or cycling for pleasure. It therefore relies onmany different kinds of spatial provision. Some aspects of provi-sion – notably the availability of greenspace – have been studied ingreater depth than others, but before turning to them it is importantto note the spatial planning significance of
• private gardens for both gardening and young children’s play;• allotments and community gardens (more on this under ‘food’);• tennis courts, squash courts, swimming pools, leisure centres and
gyms;• hard surface provision for team sports or youth games.
All these require land, careful planning and appropriate mecha-nisms for implementation and management, and have importancefor levels of physical activity. For some activities people may bewilling to travel a considerable distance to reach the club or activityof their choice, but the participation of the less mobile is importantin order to combat health inequalities. Accessibility from home istherefore critical.
Apart from provision for specific activities, the natural envi-ronment itself plays a significant part in facilitating physicalactivity: ‘evidence consistently shows that accessible and safeurban greenspaces have a positive influence on levels of phys-ical activity’ (Croucher et al., 2007). Evaluation of programmesfor encouraging exercise indicates that attractive, green environ-ments close to the home or work provide the best opportunitiesto encourage daily exercise, walking or cycling. People also keepexercising longer in natural surroundings (Bird, 2004). The effecton children seems particularly marked. Children who have easyaccess to safe greenspaces (parks, playgrounds, kick-about areas)are more likely to be physically active than those who are not soclose, and this has a positive effect on health, particularly for thosefrom low income families (Mitchell and Popham, 2008). One analy-sis of a European cross-sectional survey suggests that the likelihoodof being physically active is three times greater, and the preva-lence of obesity 40% less, in neighbourhoods with high levels ofgreenspace as opposed to those with low levels (Ellaway et al.,2005).
Greenspace Scotland has undertaken a comprehensive litera-ture review (Croucher et al., 2008), selecting 87 studies from 550identified across the world (a third from the UK), and advises thatphysical activity (which can sometimes be an incidental benefitfrom other priorities, such as relief from stress) is influenced bythese attributes:
• distance of residence from greenspace;• ease of access in terms of routes and entry points;• size of greenspace in relation to levels of population use;• connectivity to residential and commercial areas (allowing
through routes);• the range of amenities for formal and informal activities;• perceived safety of the greenspace;• the quality of maintenance.

H. Barton / Land Use Policy 26S (2009) S115–S123 S119
Lifestyle: diet
The relationship of spatial planning to diet is less clear. Therehas been much speculation in the past about food deserts (places,normally outlying estates, with relatively low car ownership andlacking local access to fresh food). But empirical evidence so fardoes not lend credence to this theory. One longitudinal study ofthe effect of a supermarket opening in a poor outer estate foundthat the impact on fresh food purchase was negligible – the localresidents changed their diet at the same rate as the city as a whole.However, the study did find a marked affect on active travel. Manymore people walked to the superstore because it was now close(Cummins et al., 2005). Studies of the location of fast food outletsaffecting diet are also inconclusive. It seems that eating habits arelargely a cultural, habitual matter, and are not heavily influencedby spatial planning.
However, household choice on whether to grow fruit andvegetables is itself affected by the options presented by thebuilt environment. Many places, including most modern hous-ing estates, have been built at relatively high densities with smallgardens or none at all for flats. This militates against home foodproduction. Allotments are often at an inconvenient distance fromhome, and many cities now have waiting lists for them. Few recenthousing developments have provided accessible allotments, andover the past few decades some allotments have been sold off forhousing. There is clearly a need for new research and policy whichwill enhance local food production.
Community and mental well-being
Community is defined here in terms of social networks of mutualsupport. Social networks are critical to mental and emotional well-being (Halpern, 1995). Many people have social networks whichare numerous, varied and geographically widespread, with a basisin a range of shared interests. Some are virtual. But the networks ofvulnerable groups are often very local. These groups include elderlypeople, infirm or disabled people, young parents (especially singleparents) and their children, some teenagers, and unemployed andunskilled people. For them the local social networks in their ownneighbourhood are particularly critical.
The quality of social networks is affected by people’s percep-tion of the safety of their locality and their sense of belonging. Onestudy of an inner London suburb found that residents experienced‘time-space inequality’ as a consequence of crime and fear of crime,resulting in feelings of isolation and low self esteem (Whitley andPrince, 2005).
Research is unequivocal in relating people’s perception of theirneighbourhood both to objective indicators of its physical andsocial quality and to health and well-being (Truong and Ma, 2006;Croucher et al., 2007). It is less clear exactly what physical featuresor characteristics have particular significance. Causality is also dif-ficult to establish. But one study pursued a rare quasi-experimentalapproach by placing difficult families randomly into affluent locali-ties. It found that their mental well-being improved by comparisonto those placed in poor communities (Levanthal and Brooks-Gunn,2003).
Supportive social networks are also affected by traffic levels andby access to local facilities. Addenbrooke’s classic research in theUS has been reproduced in this country with similar findings: thatlevels of social interaction and the extent of the perceived hometerritory vary inversely to traffic levels (Hart, 2008). Lack of avail-ability of local schools, health facilities and libraries can also havenegative social impacts and affect both physical and mental well-being (Lavin et al., 2006). A current study is finding a strong positiverelationship between the local availability of shops and services,
the density of social networks, the perceptions of social capital andmental well-being. The fact of being able to walk easily to facilities,meeting people either by accident or arrangement, appears to bekey to these relationships (Calve-Blanco, 2009).
Greenspaces facilitate physical activity, and can also promotesocial interaction and social cohesion (Croucher et al., 2008). Closeaccess to greenspace promotes the sense of well-being, stress reliefand speed of recovery from illness. Residents of urban social hous-ing who can see trees or open space from their homes demonstrategreater ability to deal with stress than those who have no suchviews (Kuo, 2001). People who are more locally based – older res-idents, the unemployed and single parents – benefit especiallyfrom such access (Orsega-Smith et al., 2004; De Vries et al., 2003).However, the quality and safety of open space is important. If thecommunity perceives the risk of assault or intimidation to be high,the benefits of greenspace largely evaporate (Croucher et al., 2007).Social problems are compounded if park maintenance is poor. In2000 only 44% of local greenspace managers considered the qual-ity of their parks to be stable or improving. However, the positivenews is that by 2005 this had risen to 84% (National Audit Office,2006).
Overall, then, and contrary to earlier social science assumptions(Giddens, 1990; Dennis, 1968; Webber, 1964) it seems that spatialplanning is important for social networks and for mental well-being. This is particularly so for poorer and less mobile groups,who are more likely to be to be locally based. The structure ofthe housing market and the allocation of affordable housing meanthat vulnerable households tend to be clustered in less desirablelocations, reinforcing patterns of deprivation. The significance forhealth inequalities and social exclusion is clear.
Local economy and income issues
Employment and income are clearly related. Both are determi-nants of health and both impact on social status, which is also a keydeterminant of wellness (Marmot, 2004). It is generally acceptedthat mortality and mental illness increase when unemploymentrises (Cave et al., 2004). Individuals who are long-term unemployedare much more likely to suffer depression and physical illness thanthose in satisfying work, because of both relative poverty and lackof purpose in life. Poverty itself (whether due to unemployment ornot) is associated with poor housing, limited mobility, reduced lifechances and increased stress, all of which are likely to impact onhealth and well-being.
Spatial planning effects the local economy broadly, through itseffects on the dynamics and growth patterns of regions and set-tlements, and more specifically through land availability, planningpermission for commercial and retail land and buildings, retrainingprogrammes, regeneration strategies and infrastructure provision(improved roads, new stations) that can encourage enterprise.Planning may also affect the economy indirectly through the hous-ing market and the general quality of the environment. For exampleWelsh valley towns, suffering from terminal decline of traditionalindustries and poor population health, find it difficult to attractentrepreneurs because of the limitations of the housing stock andfacilities available.
Governments attach high value to a successful economy, whilehealth professionals recognise the importance of income and thestatus that work gives. But research linking health and economicdevelopment policy is not evident in the broad reviews of evidence.
Activities, space and networks
Spatial planning influences activities through decisions oninfrastructure, land and buildings (the ‘built environment’), while

S120 H. Barton / Land Use Policy 26S (2009) S115–S123
the activities themselves are pursued by individuals, households,firms and institutions. The focus here is on equity and social inclu-sion.
Spatial planning is deeply implicated in social exclusion andhealth inequalities. Land use decisions, particularly in relation tohousing, transport and economic development, are key determi-nants of where people live, and therefore of the population profilein any particular area. For example, the distribution of social hous-ing determines where low income groups in housing need tend tolive. The most important variables apart from income are probablyhousehold status and culture or ethnicity. The social segrega-tion that can occur as a result of the housing market can lead togeographical health inequalities to a sometimes alarming degree.Glasgow provides an extreme example, with life expectancy in onedeprived suburb being 54 years, while in an affluent suburb notfar away it is 82 years. These figures can be compared with theall-India life expectancy of 61 (Hanlon et al., 2006). The concen-tration of poverty and unemployment in ghettos causes individualmisfortune to be magnified and reinforced.
The strategic planning of housing numbers and land require-ments – a cause of continuing political conflict – have profoundimplications for health. If supply is unduly constrained and pricesare high in relation to incomes, social exclusion in the housing mar-ket increases (Barker, 2004; Bramley, 2009). Health inequalities areexacerbated as poorer households have difficulty in finding ade-quate accommodation at a price they can afford in a convenientlocation. The recent report by Knight Frank (2009) cites evidencefrom Oxford to show how green belt and housing policies arecompromising the options for poorer households, and notes theincreasing backlog of affordable units.
The situation of poorer households is also worsened by theprevailing fashion for low density, edge-of-city commercial devel-opment, in the form of business parks, retail and leisure parks(National Heart Foundation et al., 2007). This pattern of devel-opment increases dependency on the car, and disenfranchiseshouseholds which do not have access to a car (or two). Conversely,it can force them to buy and run a vehicle they can ill afford.
These edge city locational patterns relate to overall land use andtransport strategies. Despite many brave words from local plan-ning authorities, the reality is that new suburban development isproceeding in a way which does not support viable public transportservices and which discourages walking and cycling. The public andprivate sectors are both implicated in this trend, including hospi-tal trusts which close inner city facilities in favour of edge-of-townfacilities.
We now appreciate that if households find themselves hav-ing to live in over-crowded conditions far from their main socialconnections, they will be more prone to stress and ill-health. A par-ticular problem, currently becoming more common in both urbanand rural areas as energy costs rise, is fuel poverty. Houses whichare poorly insulated, draughty, and with inadequate or expensiveheating systems, are frequently occupied by those least able tocope with these conditions. The result is ‘spatial shrink’ (when oldpeople live in their one heated room), vulnerability to illness, andhypothermia. Rehabilitation and renewal programmes, aimed atbringing all houses up to standard, are therefore important fromthe health perspective (DETR, 2001).
The local bioregion
The relationship between environmental pollution and healthwas, as noted earlier, one original reason for developing a land useplanning system. Basic life support depends on the quality of theair, the availability and quality of water, and lack of contaminationof soils when they are used to grow food. This section focuses on
air pollution as the most significant environmental health risk inthe UK.
The risks associated with poor air quality come mainly fromtransport and to a lesser extent industry and energy use. Envi-ronmental pollutants including particulate matter, ozone, carbonmonoxide, nitrogen oxides, sulphur dioxide and benzene causelung and heart disease, while fresh air contributes to a sense ofwell-being. In the UK these concerns are institutionalised and aregenerally effectively managed through the Environment Agencyand Environmental Health departments. The Royal Commission onEnvironmental Pollution has spelt out all the aspects of pollution,including its relationship to health and to the natural and builtenvironments (RCEP, 2007).
In terms of land use, the health impacts of air pollution aregreater in urban areas with high traffic levels and high built den-sities, more people and lower air dispersal characteristics (RCEP,2007). Here there is a complicated balance of conflicting param-eters: more compact urban centres reduce the amount of percapita travel but at the same time, greater density results inincreased vehicle trips in any given area, with higher congestionwhich itself increases pollution (Frank et al., 2005). With regardto health inequality, a study reporting on England found that themost deprived wards were those with highest pollutant concentra-tions. “The number of people in wards above pollution thresholdsincreases progressively with increasing deprivation” (Walker et al.,2003). However, this pattern is not universal, and in Wales forinstance, both the least and the most deprived areas on averageexperience similar levels because of their particular spatial distri-bution (Pye et al., 2006). The key point is that there are large clustersof wards experiencing pollution above health thresholds in largercities.
Pollution can be tackled at source (through better vehicles,changed power sources, improved industrial processes and heatingsystems, more efficient buildings, etc.), but can also be managed bygood urban form and the management of the urban environment. Interms of urban form, concentrations of pollution can be moderatedand pollutants absorbed by linear parkways and green lungs thatbreak up the urban area and almost literally let it breathe (Hough,1995). Urban heat domes (associated with excess summer deathsas the climate warms) can be effectively managed by greening thecity – not just by open spaces but also by tree planting and havingliving green surfaces as widespread as possible.
All this points to the critical importance of seeing settlementsnot simply as human artifacts but also as part of the natural world,affecting it and dependent on it. The phrase ‘green infrastructure’hints at this relationship. It is vital to see the planning of greeninfrastructure in the broadest sense, embracing the management ofkey environmental assets (air quality, water, energy, biodiversity)as well as providing for physical activity, community activities andpsychological well-being.
Global ecology
The interdependence of humans and nature becomes obviouswhen we consider climate change. Global warming and sea levelrise are the biggest risks to health in the world – and possibly to theUK specifically, as the Inter-Governmental Panel on Climate Change(2007), the World Health Assembly (WHA, 2008) and Costelloe et al.(2009) have shown. The main threats to health come from regionalweather changes, which affect heat stress, flooding, water securityand food production, and from sea level rise, with huge implicationsfor coastal settlements, economic dislocation, forced migration anddisease.
Settlements, both rural and urban, are profoundly implicated inthe causes of climate change. Land transport accounts for 28% of end

H. Barton / Land Use Policy 26S (2009) S115–S123 S121
user carbon dioxide emissions, and is tending to rise (DEFRA, 2008).Spatial policy to combat climate change touches every element: ofthe energy efficiency of new and existing buildings, carbon-neutralenergy generation, a progressive and massive reduction of relianceon carbon-fuelled transport, and the planning of town and countryfor easy accessibility and active travel. While certain aspects of thisagenda are being actively pursued in the UK, the current plans forfuture of cities and regions involve growing transport energy con-sumption (and carbon emissions) over the next 20 years at least(Echenique et al., 2009). Much more radical measures are neededif the UK is to achieve its targets.
Urban and rural areas will have to adapt to some level of cli-mate change, whether mitigation is effective or not. This includesthe proper planning of the water cycle, including flood risk man-agement and sustainable urban drainage, reducing the urban heatisland effect by greening the city, constructing buildings that main-tain a comfortable temperature without energy use, and copingwith the broad social and economic changes caused by climatechange. It is salutary to note that many of the measures needed tocombat global warming are similar to those needed to cope with it.
Overview: a wicked problem
This brief review points up a vital realisation: the relationshipbetween health and land use, especially urban land use, is hugelycomplex. The various aspects of human social and economic activ-ity, development patterns, planning and environmental policy andhealth and well-being interact in a myriad ways. Inevitably, manydifferent agencies need to be involved in cooperating to createa healthy environment. This highlights the desperate need for acoherent, shared philosophy. Health (which we all believe in) drawstogether all the main policy themes: it is closely tied to economichealth because of the importance of jobs and income; it relies on thereduction of inequality, building inclusive and supportive commu-nities, and it helps drive the need for environmental sustainability.
While the UK is spending more on the National Health Service,it should also aim to reduce illness through investing in healthyenvironments. In many towns and cities in Western Europe, prior-ity has been given to the quality of the environment and to inclusiveaccessibility, and the culture allows children to play in and roamtheir public realm.
The UK community of planning practitioners is beginning to beinfluenced by continental European experience. Comparative stud-ies of UK experience with specific cities and neighbourhoods inGermany, France, the Netherlands and Scandinavia are startling.In terms of equity, active travel, accessibility, environmental qual-ity and robustness in the face of the climate change threat, thebest UK cities are far behind their continental equivalents (Falk andHall, 2009). Our UK research, and other English language research,mainly from the US, seem sometimes to miss the point. In someplaces in Europe we see experimental evidence of behaviour whichis very different from that which prevails in the UK, amongst pop-ulations that are in other ways quite similar. There is also generalevidence that this different behaviour is affecting health and well-being. The comparative study of child health and well-being inOECD countries puts British children as amongst the least healthyand least happy (UNICEF, 2007). Spatial planning in its broad sense,and the character of settlements, are part of the UK problem, andneed to become part of the solution.
Future directions and expected findings of future research
Below are some of the expected insights which research will beable to afford us in the future, chosen from instances where already
one can see clear trends in findings and the conviction with whichresearchers are able and willing to put them across. It is interest-ing to note the relative speed with which the research communityacts once a new agenda – such as climate change or the obesityepidemic – takes hold. In the field of physical activity and urbanform, for example, the main research effort (following the work ofsome early pioneers) has occurred this decade. For a while much ofthe research used methods which searched for aggregate averagepatterns and which were often not very revealing. It used spatialvariables, such as density, which proved not to be so critical as manyhad believed. But just in the last few years, we have found more cru-cial variables and the weight of evidence is becoming impressive,allowing more discriminating judgements to be made.
My belief is that the inter-linkage of health and spatial planningresearch literature will continue apace, and progressively leave lit-tle excuse for inaction. A major shift in political priorities, however,will be necessary if action is to be effective. Part of that shift will beincreased autonomy and financial muscle for local authorities, sothat they can innovate and shape the future of their communitiesto a much greater degree, as we see in continental European exam-ples. Also necessary is a shift in the control of land for development,so that vested interests do not dominate over the common good. Atpresent, the main political parties show little sign of shifts in sucha direction. We await a crisis (possibly due to climate change) togalvanise the political classes and public opinion.
The research areas in which we might expect interesting resultsin this area include:
• Integrated settlement theory: current research is hampered by theinadequacy of human settlement theory. Each discipline providesits own perspective but they are not integrated. Various attemptshave been made to integrate them, none yet fully convincing. Thenext 40 years will see the development of an integrated theoryof settlement function, form and evolution. It will be based ineco-system theory, linking human activity and well-being withdevelopment processes, the structure of the built environmentand the natural bioregion.
• Normative planning strategies: partly as result of the integratedtheory, and partly as a result of gathering comparative evi-dence from around the globe, clear normative principles will beidentified in relation to the processes of urban governance anddecision-making and the spatial structures that are successful atdelivering healthy, sustainable human settlements. These prin-ciples are already being articulated but not are widely accepted.
• Health well-being and spatial planning: much more research willbe undertaken to help us understand the links between healthand urban land use, including strategic policies for housing, com-merce and transport. This is still a new research arena. The areasof uncertainty will be progressively reduced, and the more signif-icant determinants of health will be separated from less criticalfactors. The relative significance of, and dynamic relationshipbetween, social, cultural, environmental and economic driversof personal behaviour will be much better understood.
• Population, social mix and health inequalities: the evidence willbecome compelling that if long-term productivity, health andquality of life for all (avoiding the crippling societal costs ofpoor health) are priorities, then the social structure of populationwithin a neighbourhood or town is a matter of central policy con-cern. The socially polarised geographies in the UK which resultfrom current housing mechanisms and urban forms will be con-demned as exacerbating social and health inequalities and fortheir high cost to society.
• Lifestyle: physical activity and the built environment: the growingbut still contended evidence that urban form, settlement pat-terns and local environments have a major impact on behaviour,

S122 H. Barton / Land Use Policy 26S (2009) S115–S123
especially the levels of physical activity and therefore obesity,will be full and clear. The significance and dangers of obesogenicenvironments – again with a cost tag which will influence theTreasury – will be accepted. Local greenspace, retail, social andeducational facilities, and the cycling routes and walkways whichgive access to them, will become recognised as important forpublic health and well-being.
• Community networks, mental well-being: The still uncertainrelationship between community networks, the physical envi-ronment and mental well-being will have been sorted. There willbe a recognition that it is impossible to generalise about this topic,because of the increasingly diverse patterns of social connectionwhich people have. Nevertheless, for those who are obliged, orchoose, to live locally, the importance of local facilities and casualpedestrian meetings will be established. In an aging population,with more retired people, this will be especially important.
• Children, education and locality: the crisis brought on by a gener-ation of obese children becoming adults, with consequent healthproblems, will focus the minds of politicians and academics.There will be research showing that it is vital for children toexperience their environment, engage in active play and freesocialising, and learn about the world, in the context of a moreholistic educational approach, if they are to be happy and healthy.The dangers of exaggerated fear of strangers, fortress schools andcar-dependence will be accepted – though the aftermath of thecurrent situation will still impede progress.
Given the strong direction of research, and the urgent necessity ofplanning the human habitat so that it promotes health and sustain-ability, a maxim of Goethe’s is apposite:
Whatever you can do, or dream you can, begin it. Boldness hasgenius, power and magic in it.
References
Anand, S., 2006. Commentary – obesity: the emerging cost of economic prosperity.Canadian Medical Association Journal 175 (9), 1081–1082.
Barker, K., 2004. Review of Housing Supply: Final Report and Recommendations.HMSO, London.
Barton, H., 2005. A health map for urban planners: towards a conceptual model forhealthy sustainable settlements. Built Environment 31 (4).
Barton, H., forthcoming. Healthy Urban Planning: review of progress. Health Pro-motion International.
Barton, H., Grant, M., 2006. A health map for the local human habitat. Journal for theRoyal Society for the Promotion of Health 126 (6), 252–253.
Barton, H., Hills, S., 2005. Neighbourhood accessibility and social inclusion: literatureand pilot study. In: Paper Presented to the SOLUTIONS Conference, December2005.
Barton, H., Grant, M., Guise, R., 2003. Shaping Neighbourhoods for Health Sustain-ability and Vitality. Spon, London.
Barton, H., Tsourou, C., 2000. Healthy Urban Planning. Spon, London.Bird, W., 2004. Natural Fit: Can Greenspace and Biodiversity Increase Levels of Phys-
ical Activity? Royal Society for the Protection of Birds, London.Bramley, G., 2009. Meeting demand. In: Malpass, P., Rowlands, R. (Eds.), Housing,
Markets and Policy. Routledge, London.Boarnet, M., Sarmiento, S., 1998. Can land use policy really affect travel behaviour?
A study of the link between non-work travel and land use characteristics. UrbanStudies 35 (7), 1155–1169.
Brown, A., Khattak, A., Rodriguez, A., 2008. Neighborhood types, travel and bodymass: a study of new urbanistand suburban neighborhoods in the US. UrbanStudies 45, 963–988.
Butterworth, I., 2000. The Relationship Between the Built Environment and Well-being: Opportunities for Health Promotion in Urban Planning. Victorian HealthPromotion Foundation, Melbourne.
Calthorpe, P., 1993. The Next American Metropolis: Ecology, Community and theAmerican Dream. Princetown Architectural Press, NY.
Calve-Blanco, T., 2009. Mental well-being, social capital and neighbourhood formunpublished PhD draft, WHO Collaborating Centre for healthy urban environ-ments, University of the West of England, Bristol.
Cave, B., Molyneux, P., Coutts, A., 2004. Healthy Sustainable Communities: WhatWorks? Milton Keynes and South Midlands Sub-region NHS and BCA, Brighton.
CDC, 2008. Centre for Disease Control and Prevention –www.cdc.gov/physicalactivity, accessed 5 May 2009.
Costelloe, A., et al., 2009. Managing the health effects of climate change. Lancet 373,1693–1733.
Croucher, K., Myers, L., Bretherton, J., 2008. Greenspace Scotland Research Report:The Links Between Greenspace and Health: A Critical Literature Review.Greenspace, Stirling.
Croucher, K., et al., 2007. Health and the Physical Characteristics of Urban Neigh-bourhoods: A Critical Literature Review. Glasgow Centre for Population Health,Glasgow.
Cummins, S., Findley, A., Petticrew, M., Sparks, L., 2005. Healthy cities: the impactof food retail led regeneration on food access, choice and retail structure. BuiltEnvironment (4).
Davis, A., Valsecchi, A., Furgusson, M., 2007. Unfit for Purpose: How Car Use FuelsClimate Change and Obesity. Institute for European Environmental Policy, Lon-don.
Dennis, N., 1968. The popularity of the neighbourhood community idea. In: Pahl, R.(Ed.), Readings in Urban Sociology. Pergamon Press, Oxford.
DEFRA, 2008. The Environment in Your Pocket 2008. DEFRA, London.DETR, 1998. Planning for Sustainable Development: Towards Better Practice. HMSO,
London.DETR, 2001. Fuel Poverty Strategy 2001. HMSO, London.De Vries, S., Verheeij, R., Groenewegen, P., 2003. Natural environments? An
exploratory analysis of the relationship between greenspace and health. Envi-ronment and Planning A 35, 1717–1731.
Echenique, M., Hargreaves, A., Mitchell, G., 2009. Draft chapter ‘London and theWider South East Study’. In: Echenique, M., Barton, H. (Eds.), The SOLUTIONSfinal report in preparation for Routledge, London.
ECOTEC, 1993. Reducing Transport Emissions Through Planning. Department of theEnvironment, HMSO, London.
EEA, 2009. Ensuring quality of life in European cities and towns. EEA report no 5.Office for Official Publications of the EU, Luxembourg.
Ellaway, A., Macintyre, S., Bonnefoy, X., 2005. Graffiti, greenery and obesity in adults:secondary analysis of European cross-sectional survey. British Medical Journal331, 611–612.
Falk, N., Hall, P., 2009. Why not here? Town and Country Planning 78, 1.Farthing, S., Winter, J., Coombes, T., 1996. Travel behaviour and local accessibility
to services and facilities. In: Jenks, et al. (Eds.), The Compact City: A sustainableurban form? E & F Spon, London, pp. 181–189.
Foresight – Butland, B., et al., 2007. Tackling Obesities: Future Choices – projectreport. 2nd edition. Government Office for Science, London.
Frank, L., Schmid, T., Sallis, J., et al., 2005. Linking objectively measured physi-cal activity with objectively measured urban form: findings from SMARTRAQ.American Journal of Preventative Medicine 28 (2S2), 117–125.
Giddens, A., 1990. The Consequences of Modernity. Polity Press, Oxford.Halpern, D., 1995. Mental Health and the Built Environment. Taylor and Francis,
London.Handy, S., 2005. Does the Built Environment Influence Physical Activity: Examining
the Evidence. Transportation Research Board, Washington D.C.Handy, S., Cao, X., Mokhtarian, P., 2005. Correlation or causality between the
built environment and travel behaviour? Evidence from Northern Califor-nia. Transportation Research Part D: Transport and Environment 10 (6),427–444.
Hanlon, Walsh and White. (2006) World health report: let Glasgow flourish.Hanson, S., Schwab, M., 1987. Accessibility and intra urban travel. Environment and
Planning A 19, 735–748.Hart, J., 2008. Driven to excess: impacts of motor vehicle traffic on residential quality
of life in Bristol, UK. Unpublished MA Dissertation. School of Built and NaturalEnvironment, University of the West of England, Bristol.
Horswell, M., Barton, H., Calvert, T., 2009. The Significance of the Location andAccessibility of Local Neighbourhood Facilities for Levels of Active Travel andCar Dependence. WHO Collaborating Centre for Healthy Urban Environments,University of the West of England, www.suburbansolutions.ac.uk.
Hough, M., 1995. Cities and Natural Processes. Routledge, London.Hume, C., Salmon, J., Ball, K., 2005. Children’s perception of their home and
neighbourhood environment, and their association with objectively measuredphysical activity. Health Education Research 20 (1), 1–13.
Institute of Public Health in Ireland, 2006. Health Impacts of the Built Environment:A Review. The Institute of Public Health in Ireland, Dublin.
Inter-Governmental. Panel on Climate Change, 2007. Fourth assessment report:Climate Change: the scientific basis – summary for policy makers.
Jones, A., Bentham, G., Foster, C., Hillsdon, M., Panter, J., 2007. Obesogenic Envi-ronments: Evidence Review Foresight Tackling Obesities: Future Choices. DIUS,London.
Knight Frank, 2009. The future of residential development: unlocking the housingmarket. www.knightfrank.co.uk.
Kuo, F., 2001. Coping with poverty: impacts of environment and attention in theinner city. Environment and Behaviour 33, 5–34.
Lalonde, M., 1974. A New Perspective on the Health of Canadians. Health and Wel-fare, Canada, Ottawa.
Lavin, T., Higgins, C., Metcalfe, O., Jordan, A., 2006. Health Effects of the Built Envi-ronment: A Review. The Institute of Public Health in Ireland, Dublin.
Lee, C., Moudon, A., 2008. Neighbourhood design and physical activity. BuildingResearch and Information 36 (5), 395–411.
Levanthal, T., Brooks-Gunn, J., 2003. Moving to opportunity: an experimental studyof neighbourhood effects on mental health. American Journal of Public Health98 (8), 380–386.

H. Barton / Land Use Policy 26S (2009) S115–S123 S123
Llewelyn Davies, 1998. Sustainable Residential Quality—New Approaches to UrbanLiving. LPAC, London.
Marmot, M., 2004. The Status Syndrome: How Social Standing Affects our Healthand Longevity. Times Books, London.
Mitchell, R., Popham, F., 2008. Effect of exposure to natural environment on healthinequalities and observational population study. Lancet 372, 1655–1660.
National Audit Office, 2006. Enhancing Urban Green Space. NAO, London.National Heart Foundation, et al., 2007. Building Health: Creating and Enhancing
Places for Healthy Active Lives. National Heart Forum, Living Streets and CABE,London.
NICE, 2008. Public health guidance 8: physical activity and the environment.www.nice.org.uk/PH008.
Orsega-Smith, E., Mowen, A., Payne, L., Godbey, G., 2004. The interaction of stressand park use on psycho-physiological health in older adults. Journal of LeisureResearch 36 (2), 232–256.
Patterson, P., Chapman, N., 2004. Urban form and older residents service use, walk-ing, driving, quality of life and neighbourhood satisfaction. American Journal ofHealth Promotion 19 (1), 45–52.
Pikora, T., Giles-Corti, B., Bull, F., Jamrozik, K., Donovan, R., 2003. Developing a frame-work for assessment of the environmental determinants of walking and cycling.Social Science and Medicine 56, 1693–1703.
Pye, S., King, K., Sturman, J., 2006. Air quality and social deprivation in the UK:an environmental inequalities analysis Final report – AEAT/ENV/R/2170 – toDEFRA.
Royal Commission on Environmental Pollution, 2007. Twenty Sixth Report: TheUrban Environment. HMSO, London.
RTPI, 2009. Good practice note 5: delivering healthy communities.www.rtpi.org.uk/item/1795/23/5/3.
Social Exclusion Unit, 2000. National Strategy for Neighbourhood Renewal. SEU,London.
Transportation Research Board, 2005. Does the Built Environment Influence Phys-ical Activity? Examining the Evidence. Institute of Medicine of the NationalAcademies, Washington, DC.
Truong, K., Ma, S., 2006. A systematic review of relations between neighbour-hood and mental health. Journal of Mental Health Politics and Economics 9,137–154.
Urban Task Force, 1999. Towards an Urban Renaissance. Spon/HMSO, London.UNICEF: Innocenti Research Centre, 2007. An overview of child well-being in rich
countries. The United Nations Children’s Fund: www.unicef.org.irc.Urban Villages Group, 1992. Urban Villages: A Concept for Creating Mixed Use Urban
Development on a Sustainable Scale. UVG, London.Walker G, Fairburn J, Smith G and Mitchell G. (2003) Environmental quality and
social deprivation R & D project record E2-067/1/TR Environment Agency.Webber, M., 1964. The urban place and non place urban realm. In: Webber, M., et
al. (Eds.), Explorations into Urban Structure. UPP, Philadelphia, pp. 79–153.Whitehead, M., Dahlgren, G., 1991. What can be done about inequalities in health?
The Lancet 338, 1059–1063.Whitley, R., Prince, M., 2005. Fear of crime and inner city health in inner city London.
Social Science and Medicine 61, 1678–1688.WHA, 2008. World Health Assembly Resolution on Climate Change and Health WHA
61.19. WHO International.WHO, 1946. Constitution of the World Health Organization WHO, New York.WHO, 2009. Zagreb Declaration for Healthy Cities: Health and Equity in all Local
Policies. WHO regional Office for Europe, Copenhagen.


Fair Society, Healthy Lives
The Marmot Review
D

Fair Society, Healthy Lives
The Marmot Review

—
in these determinants. The London Congestion Charge is applied across central London only, but it has reduced the gradient in air pollution propor-tionately across the social gradient, with increasing impact in the more deprived areas – Figure 4.8.
Improving the food environment in local areas across the social gradientDietary change can also play a key role not only in mitigating climate change and adaptation strate-gies, but also in promoting health by reducing the consumption of saturated fat from meat and dairy sources. Food preparation and production contrib-utes around 19 per cent of the UK’s greenhouse gas emissions; half of these emissions are attributable to the agricultural stage. Food systems have the potential to provide direct health benefits through the nutritional quality of the foods they supply.439 Improving the food envi-ronment involves addressing issues concerning the accessibility of affordable and nutritious food that is sustainably produced, processed and delivered.
Internationally, studies show that among low-income groups price is the greatest motivating factor in food choice. In the US, price reductions have seen posi-tive increases in the sales of low-fat foods and fruit and vegetables.440 The era of cheap food may be approaching its end, but consumer expectations are still of low prices, which fail to include the full environmental costs.441 There are studies that show association between proximity, or lack of, to healthy food, and health outcomes such as obesity or malnutrition, but these studies should be approached with caution. They are most often observational and so do not show causality between inadequate access and health out-comes.442 One study in the UK on the greater access to unhealthy food has shown this may dispropor-tionately affect those in more deprived areas.443 Data from the US shows more substantial links between schools and proximity to fast food outlets, as well as proximity to fast food outlets and obesity but the food environment in the US is very different to the UK’s.444
The UK Public Health Association (UKPHA) brings together individuals and organisations from all sectors who share a common commitment to promoting the public’s health and it is leading the delivery of an innovative and integrated fuel pov-erty programme. Starting with understanding the current evidence, engaging with key partners then implementing a pilot, the project is a good example of the delivery of integrated and evidence-based interventions to reduce health inequalities. The programme originates from the UKPHA’s Health Housing and Fuel Poverty Forum, funded by DEfRA. The forum, made up national figures from the health, housing and energy sectors, and practitioners from across England, developed the ‘Central Clearing House’ model. Their research concluded that a model of local area partnerships that linked health, housing and fuel poverty services was the most effective approach for directing serv-ices to the vulnerable. The CCH model identified the key systems and processes necessary to access the vulnerable fuel poor, identify high risk groups, streamline referral and delivery systems and imple-ment monitoring and evaluation processes. The CCH model was first piloted in Manchester, with the implementation of the Affordable Warmth Access Referral Mechanism (AWARM). Funded by the Department of Health, the pilot was a part-nership with Salford City Council and Primary Care Trust. Manchester Business School is evalu-ating the programme for the mismatch between theory and practice and an assessment of what ‘fit for purpose’ should look like.
Greater Manchester invested approximately £100,000 each year into AWARM. Since April 2008 AWARM activity resulted in over £600,000 of investment and majority of cases are still open so many households will receive further invest-ment. AWARM resulted in a dramatic increase in referrals from across the social and care sectors, but the number of referrals from health profes-sionals (mainly GPs) remains low. In 12 months the programme trained 1,359 professionals, a third in health, with the remainder in social services, voluntary/community services, local government and housing. The lessons learned from the pilot include:
There are numerous opportunities to share —data between local authorities, GPs and PCTs to improve how referrals are targeted A pop-up system on GP patient electronic —records would help to immediately direct refer-ral to a one-stop-shop Involving energy companies as active project —partners can help identify novel ways to target vulnerable individuals and neighbourhoods.
The funding received ends in 2010, yet the project is improving local delivery systems, increasing the numbers receiving funding to reduce fuel poverty. Like many other ill health prevention projects, funding only invests in a pilot, regardless of the outcomes. In this case, this means a project show-ing successful short-term outcomes may not be rolled out.
For more information see www.ukpha.org.uk/fuel-poverty.aspx
Case Study Working in partnership to reduce fuel poverty

Availability of healthy food, and in particular fresh produce, is often worse in deprived areas due to the mix of shops that tend to locate in these neigh-bourhoods.445 A study of the location of McDonald’s outlets in England and Scotland showed per capita outlet provision was four times higher in the most deprived census output areas than in the least deprived areas.446 Low-income groups are more likely to consume fat spreads, non-diet soft drinks, meat dishes, pizzas, processed meats, whole milk and table sugar than the better-off.447 The creation of food deserts is likely to be a by-product of a complex interaction between local planning, regulatory and economic factors and the national location policies of large supermarket com-panies. 448 In a controlled ‘before/after’ study follow-ing the opening of a new supermarket in Scotland, there were no differences between the control and experimental groups: both increased their daily intake of fruit and vegetable portions.449 However, there is still a suggestion that residents of deprived areas could benefit from policies aimed at low-mobil-ity groups, increasing their access to better shopping facilities and healthier food alternatives.450
Improving energy efficiency of housing across the social gradient The existing housing stock emits 13 per cent of our carbon dioxide and as such, there is a compelling case for improving the environmental standards of housing across all sectors. Poor housing conditions
and design have substantial impacts on health inequalities. It is estimated that reducing household energy emissions but examining the effects of fabric, ventilation, fuel switching, and behavioural changes, could lead, in one year, to 850 fewer disability-adjusted life-years (DALYs – a method of estimating the negative lifetime impact of premature mortality and disability) and a saving of 0.6 megatonnes of CO2 per million population.451 The annual cost to the NHS of both cold homes and falls is estimated to be over £1 billion. The ageing housing stock requires consistent reinvestment, particularly to reduce the carbon emissions from older homes.452 Living in cold conditions is a health risk. A house-hold is in fuel poverty if it needs to spend more than 10 per cent of its income on fuel to sustain satisfac-tory heating. In 2006, 11.5 per cent of households in England were fuel poor, either spending more than this 10 per cent or under-consuming energy to save money; over half of these households were single persons. The Government set statutory targets to eradicate fuel poverty among vulnerable households in England by 2010 and all households in England by 2016 as far as is reasonably practicable. It is estimated that these targets will not be met and the most recent figures state that 2.8 million households in England are in fuel poverty.453 The risks of fuel poverty are higher in rural areas – in 2006, 21 per cent in rural areas were in fuel poverty compared with 11 per cent in suburban and 10 per cent in urban areas.454 The risk of fuel poverty rises sharply as household income
0
5
10
15
20
25
30
35
Household income quintiles
Percent of households in fuel poverty
Poorest fifth 2nd Middle fifth 4th Richest fifth
Source: English House Conditions Survey, Department of Communities and Local Government 455Note: Percent in fuel poverty relates to households in fuel poverty after deducting housing costs
Figure 4.9 The risk of fuel poverty according to household income, 2009
—

—
falls. Very few households with above-average incomes are in fuel poverty – see Figure 4.9. Other factors besides household income affect whether a household is in fuel poverty or not, such as housing costs and type of ownership. As a propor-tion of the total number of households for a given tenure, for example private rented, owner occupier or social housing, households living in private rented accommodation have higher likelihood of living in fuel poverty – 16 per cent of which were in fuel poverty compared with 11 per cent in other tenures.456 However, more of the fuel poor live in owner-occupied properties, with over two thirds of fuel poor household living in that sector. The government programme Warm Front, which provides a package of insulation and heating improvements to qualifying households, has been shown to have a positive impact on mental health, alleviating respiratory problems in children and reducing deaths among older people.457 Despite this policy and others such as the Winter Fuel Payment, the number of fuel poor households in England dra-matically increased between 2004 and 2008. The cold winter of 2008/9 saw the highest number of extra deaths in England and Wales since 1999/2000, with 36,700 excess deaths. Much of the increase in fuel poverty in 2008/9 was due to the increased costs of energy and it is estimated that in the long term, energy costs will increase.458 Improvements in housing conditions have been shown to have a number of positive impacts on health, including lower rates of mortality, improved mental health and lower rates of contact with GPs. Significant improvements in health-related quality of life were found in a randomised controlled trial of home insulation, which concluded that target-ing home improvements at low-income households significantly improved social functioning and both physical and emotional well-being (including res-piratory symptoms).459 Adequate heating systems improve asthma symptoms and reduce the number of days off school. 460 Following the introduction of the Housing Health and Safety Rating System by the Department for Communities and Local Government (CLG) a number of the initiatives addressing the problems of cold homes and the impacts of housing on health. Many of the difficulties in addressing the issue of cold homes is that the effects of the problem are the responsibility of one government department, the Department of Health, but the responsibility for solutions lies with the CLG and with the Department of Energy and Climate Change (DECC). The 2004 Housing Act gave local authorities the powers to tackle poor housing, setting out statu-tory minimum standards. The Housing Health and Safety Rating System evaluates the potential risks to health and safety from any deficiencies identified in dwellings. The introduction of the Housing Health and Safety Rating System, together with other devel-opments in calculating the cost of the impact of poor housing on health, has led to increased activity between local housing authorities and health part-ners in reducing health inequalities. This work is at
a relatively early stage but it has the potential to help reduce the numbers of people in fuel poverty, to help maintain independence and lead to improvements in health and well-being. Health inequalities also relate to the shortage of new homes. It is estimated that three million new homes are needed by 2020 to meet the rate of new household formation. Many are waiting for new homes. Close to two million are on council waiting lists, with 500,000 in overcrowded conditions and 70,000 in temporary accommodation. The Decent Homes programme sought to improve the quality of homes and by 2010, 95 per cent of social housing will reach the Decent Homes Standard. The programme had invested over £40 billion by 2010 and work has been completed on 3.6 million social homes, with improvements for 8 mil-lion people in total, including 2.5 million children. Continued investment is needed to maintain this standard; housing associations will need funding to continue to invest in the ageing housing stock. The impact of this investment on health needs to be better understood; it is important that these policies and investments are assessed for their impact on health inequalities.
Summary There are co-benefits to addressing both health —inequalities and climate change. The NHS has implemented some strategies to —reduce carbon emissions and improve environ-mental sustainability but can go further. Strategies are needed to enable access to good —quality, active transport across the social gradient. Good quality green and open spaces improve —physical and mental health. Green and open spaces have more of an impact —if they are close to where people live. Fuel poverty is a significant problem and likely —to grow as the cost of fuel increases. Investments to improve housing need to be —sustained.
E.2.2 Integrate planning, transport, housing, environmental and health policies to address the social determinants of health
Recommendation: Fully integrate the plan-ning, transport, housing, environmental and health systems to address the social determinants of health in each locality.
An important step in tackling the social determinants of health at a local level would be greater integration of health, planning, transport, environment and housing departments and personnel. At present, the planning process at local and national levels is not systematically concerned with impact on health and health equity.461 Currently, Policy Planning Statement (PPS) 17 deals with health issues, ‘Planning for open space, sport and recreation’. However, the lack of attention paid to

health and health inequalities in the planning process can lead to unintended and negative consequences. A policy planning statement on health would help incorporate health equity into planners’ roles.462 The Healthy Urban Development Unit and CABE demonstrate in numerous reports how good planning can have a positive impact on public health and that designers can influence people’s well-being and design neighbourhoods in a manner that pro-motes health and well-being.463 A new Planning Policy Statement on health could ensure that new developments are assessed for their impact on health inequalities, for example limiting the number of fast food outlets in a Super Output Area. This tool could help to provide a lever for local authorities to change the way neighbourhoods are designed. Existing tools such as the Joint Strategic Needs Assessments are another lever to facilitate inte grated approaches at a local level. However, as CABE reports,
‘producing needs analysis data does not in itself lead to change’.464 Integrated working, such as making PCTs statutory partners in local planning decisions, should be decided at local levels. Training local authority managers and officers in planning, housing, environment and transport in health equity issues could improve commitments to local development frameworks.465 Related profes-sional bodies can make health equity mandatory in professional development. Equally, local planning should ensure services are easier to access and more joined up locally. The design of neighbourhoods can have an impact on community participation – good neighbourhood design can avoid putting up barriers to participa-tion, and actively encourage it, for example through ensuring accessible transport, well-located services and amenities, and the provision of facilities and activities which encourage integration.
Liverpool City Council’s Healthy Homes Programme (HHP) seeks to prevent premature death and ill health caused by poor housing condi-tions and accidents in the home. It is aimed at the rented sector and seeks to help the most vulnerable residents in Liverpool. Based on national estimates, poor housing conditions are a significant contribu-tor in up to 500 deaths and around 5,000 illnesses needing medical attention in Liverpool each year. The city has one of the highest rates of excess winter deaths in the UK; between 2004 and 2007, there were 242 excess winter deaths per year. Liverpool PCT commissioned the City Council to assist in the reduction of health inequalities and improve morbidity and mortality statistics through the HHP. The HHP proactively targets and surveys a large number of the worst proper-ties that house the most vulnerable occupants. In tackling sub-standard housing conditions and knitting together the wide range of health-related services the city has to offer, the hardest to reach and most vulnerable residents are actively engaged and encouraged to take advantage of available health services from a single point of contact. This partnership confronts head-on health inequali-ties in a city that has some of the worst levels of deprivation and health disparity in the country. The programme will identify approximately 15,000 properties for an initial survey, and priori-tise 2,750 for full health and safety inspection to develop a personalised home improvement plan. Following the inspections of the properties, the necessary improvements are secured by the team’s Environmental Health Officers through advice and enforcement. This programme is delivered initially over three years and is controlling the most signifi-cant and life threatening hazards in these homes, including: poor heating and insulation; bad internal
arrangements (to prevent accidents); dampness and mould (combating respiratory illness). In addition to inspecting housing conditions, the health and well-being needs of all occupants are investigated and advice on accident prevention and health promotion provided. Referrals to relevant agencies are also made where specific health and well-being problems are identified. The programme works in partnership with a number of related agencies such as Merseyside Fire and Rescue Service and initiatives such as energy efficiency and making neighbourhoods cleaner and healthier. HHP also works with primary care by increasing awareness of the programme in neigh-bourhood General Practices and creates referral systems for clinicians. Health professionals can then actively address the causes of some respiratory complaints and other chronic diseases. Advice and education on health promotion and home accident prevention are also integral to the programme. Vulnerable households such as those housing black and minority ethnic groups, the elderly and young are being specifically targeted. The programme is designed to:
Prevent up to 100 premature deaths when fully —implemented Reduce the number of GP consultations and —hospital admissions by an estimated 1000 cases Improve clinical understanding of poor hous- —ing on local health via communication with GPs and other clinical services Reduce reliance on secondary and tertiary —treatment Increase community capacity to support hous- —ing improvements.
For more information seewww.liverpool.gov.uk/healthyhomes
Case Study Improving private rented housing in Liverpool
—

—
Summary Integrated planning, transport, housing, envi- —ronmental and health systems are needed. Training in health for planning, transport, hous- —ing and environmental professionals should be implemented. A Policy Planning Statement on health is —needed.
E.2.3 Create and develop communities
Recommendation: Support locally developed and evidence-based community regeneration programmes that:
Remove barriers to community participation —and action Reduce social isolation. —
Community or social capital is shaped both by the ability of communities to define and organise themselves, and by the extent to which national and local organisations seek to involve and enagage with communities. It is comprised of different factors in different communities, and can include community networks, civic engagement, a sense of belonging and equality, cooperation with others and trust in the community. Community capital needs to be built at a local level to ensure that policies are drawn on and owned by those most affected and are shaped by their experiences.
Communities with less community capital dif-fer from stronger communities in many ways. For example, there is less volunteering/unpaid work in neighbourhoods that are perceived to be less safe, and less socialising and less trust in others.466 In the last decade, the level of volunteering/unpaid work has remained fairly constant. According to the Joseph Rowntree Foundation, ‘[b]etween 35 per cent and 40 per cent engaged in some form of civic participation, around 20 per cent in civic consulta-tion and 10 per cent in civic activism. Around 35 per cent volunteered informally, and 25 per cent formally over the period.’467
Evidence for causal associations between social capital and health is improving. In many communi-ties facing multiple deprivation, stress, isolation and depression are all too common.468 Residents of busy streets have less than one quarter the number of local friends than those living on similar streets with little traffic.469 The most powerful sources of stress are low status and lacking social networks, particularly for parents with young children.470 Low levels of social integration, and loneliness, significantly increase mortality.471 Several longitudinal studies have shown that social networks and social participation appear to act as a protective factor against dementia or cogni-tive decline over the age of 65 and social networks are consistently and positively associated with reduced morbidity and mortality. 472 There is strong evidence that social relationships can also reduce the risk of depression.473 People with stronger networks are
0
10
20
30
40
50
Severe lack
Some lack
Least deprived
Most deprived
Secondquintile
Thirdquintile
Fourthquintile
12% 13% 13% 16% 19%
23% 25% 24% 25% 26%
0
10
20
30
40
50
Severe lack
Some lack
Least deprived
Most deprived
Secondquintile
Thirdquintile
Fourthquintile
12% 13% 13% 16% 19%
23% 25% 24% 25% 26%
Source: Health Survey for England475
Figure 4.10 Percentage of those lacking social support, by deprivation of residential area, 2005

healthier and happier. Making resources available to address the association between poor health and poor social networks and break the cycle of depriva-tion can also decrease costs of health care.474
Remove barriers to community participation and actionAddressing the psychosocial effects of neighbour-hood deprivation is a difficult task as identifying methods to improve community capital can be difficult. Those living in deprived areas often find their communities lack social support (Figure 4.10) and, according to the Joseph Rowntree Foundation, ‘people in more deprived areas [are] more likely than others to think that certain issues [represent] a seri-ous problem in their area. For example, over half of people in the most deprived areas [feel] that drug use or dealing, litter and vandalism [are] serious prob-lems where they [live]. This compare[s] to between one-quarter and one-third in other areas.’476
In the UK, neighbourhood regeneration pro-grammes have demonstrated improvements in aver-age employment rates, educational achievements, household income and housing quality, all of which may contribute to a reduction in inequalities in health, but they can also increase housing costs, rendering residents poorer, as regeneration displaces the original residents.477 Numerous policies across government depart-ments have sought to improve community capital and to tackle concentrated deprivation in deprived neighbourhood, such as Communities for Health (Department of Health) and the National Strategy for Neighbourhood Renewal (CLG). The latter was underpinned by investment in area-based regeneration and community renewal, primarily through the Neighbourhood Renewal Fund (NRF – refocused since 2008/9 on employment as the ‘Working Neighbourhoods Fund’), but also through the New Deal for Communities (NDC) and the Neighbourhood Management Pathfinders (NMP) programmes. Evaluation evidence from across these pro-grammes identified some positive trends – for example, the proportion of young people getting good GCSEs and residents’ satisfaction with local services, such as police and street cleaning. A review of the NDC478 found more than half of residents said the area improved as a place to live. The feeling of being part of a local community increased from 35 per cent in 2002 to 42 per cent in 2006, still below the national average at 53 per cent, but nonetheless showing an increase in deprived communities, where improvements are more difficult to achieve. Self-reported health rose slightly from 77 per cent feeling that their health was good or fairly good in 2002 to 80 per cent in 2006 (still below the national average at 87 per cent). Overall, despite these efforts, the proportion of people who do not feel they could affect decisions locally has not changed since the start of the decade and in the last 20 years a consistent number of adults, around two-fifths, have felt that their neighbourhood was not the type of area where people would help
each other.479 Other evaluations have identified that a failure to commit to mainstreaming and a lack of ability to think strategically about how core services could work better in regeneration areas meant that progress was limited.480 While the NDC programme highlighted some real challenges on engaging and developing communities, it did provide long-term funding, which alleviates funding stresses from local communities who often survive on year-to-year funding programmes. Engagement of residents tends to have been most successful at the neighbourhood level and where there is engagement in individual projects and initia-tives rather than at strategic or general consultative level. The National Strategy for Neighbourhood Renewal has had most success in influencing main-stream services to adopt a greater focus on deprived neighbourhoods where complemented by existing national policies and targets. The experience of these programmes offers some important lessons for the future and what has and has not been most effective in supporting deprived neighbourhoods. For example:
A need to focus more on underlying economic —drivers of deprivation, such as the wider labour market, which will most likely operate at a higher spatial level than the neighbourhood A need to engage with mainstream agencies and —ensure core services work better in regeneration areas
Communities need to be involved in developing and delivering their own regeneration programmes and initiatives – but that involvement needs to be real and fit for purpose (i.e. at the right spatial level and reflecting the capacity of local communities). Interventions work best with national guidance but accompanied by local freedom to develop relevant local programmes. As indicated in section E2.2, the design of neighbourhoods can also have an impact on community participation. To achieve sustainable change it is necessary to take an integrated and appropriately sequenced approach that considers the social, economic and physical problems of an area and the interactions between them, and how best to complement the interventions of other agencies.
Reduce social isolationReducing social isolation, and increasing individual and community empowerment and health outcomes, is challenging but much needed as the number of one-person households increases. In 1991 26.3 per cent of households contained one person, rising to 30 per cent in 2001, but social isolation and exclusion concerns more than just those living alone. Social exclusion encompasses social, political, cultural and economic dimensions and has different impacts at different stages in a person’s life. It is the multiple disadvantages experienced by particular groups and individuals existing outside the ‘mainstream’ of society.481 Social isolation impacts on health: social networks and social participation act as protective factors against dementia or cognitive decline over the age
—

—
of 65.482 Individuals who are socially isolated are between two and five times more likely than those who have strong social ties to die prematurely. Social networks have a larger impact on the risk of mortality than on the risk of developing disease, that is, it is not so much that social networks stop you from getting ill, but that they help you to recover when you do get ill.483 Four pathways suggest the interventions and policies that could reduce social isolation and exclusion:
First, identifying population needs better quality information from communities. In theory this can lead to health improvements and reduced health inequalities through an increased uptake of more effective services, particularly preventative services, and/or more effective interventions. Second, improving governance and guardian-ship and promoting and supporting communities to participate in directing and controlling local services and/or interventions. This will help to improve the appropriateness and accessibility of services and interventions, increase uptake and effectiveness and influence health outcomes. A third way to reduce social isolation is to develop social capital by enhancing community empowerment. This helps to develop relation-ships of trust, reciprocity and exchange within communities, strengthening social capital. Lastly, increasing control and community empowerment may result in communities act-ing to change their social, material and political environments.484
Summary Understanding of the relationship between social —and community capital and health is growing. Communities facing multiple deprivation —often have high levels of stress, isolation and depression. Social networks and participation can improve —mental health inequalities. Area-based initiatives have demonstrated some —limited successes. Social isolation can lead to increased risk of —premature death. Including communities and individuals in —designing interventions to address social isola-tion will help improve their effectiveness.

E.3 Policy Recommendations
Time period: 2011–2015 Prioritise policies and interventions that reduce both health inequalities and mitigate climate change, by: Increasing active travel across the social —gradient Improving access and quality of open and green —spaces available across the social gradient Improving local food environments across the —social gradient Improving energy efficiency of housing and —reducing fuel poverty.
Prioritise integration of planning, transport, housing, environmental and health policies to address the social determinants of health in each locality.
Support locally developed and evidence-based community regeneration programmes, that: Remove barriers to community participation —and action Emphasise a reduction in social isolation. —
Time period: 2016–2020 Implement policies and interventions that both reduce health inequalities and mitigate climate change, including: Maintaining active travel across the social —gradient Maintaining access and quality of open —and green spaces available across the social gradient Sustained and continued upgrade of housing —stock.
Implement greater integration of the planning, transport, housing, environmental and health systems to address the social determinants of health in each locality.
Increase development of locally designed and evidence-based community regeneration programmes, by making long-term funding available for evidence-based community regen-eration programmes.
Time period: 2020 and beyond Monitor policies and interventions that both reduce health inequalities and mitigate climate change for complementarity: Maintain and monitor active travel across the —social gradient Monitor access and quality of open and green —spaces available across the social gradient.
Fully integrate the planning, transport, hous-ing, environmental and health systems to address the social determinants of health in each locality.
Make sustainable investments in community engagement and neighbourhood renewal.
—

1
The Marmot Review: implications for Spatial Planning.
The Marmot Review Team Report authors: Ilaria Geddes, Jessica Allen, Matilda Allen, Lucy Morrisey.
People with higher socioeconomic position in society have a greater array of life chances and more opportunities to lead a flourishing life. They also have better health. The two are linked: the more favoured people are, socially and economically, the better their health. This link between social conditions and health is not a footnote to the ‘real’ concerns with health – health care and unhealthy behaviours – it should become the main focus.
Summary ................................................................................................................................................................... 2 Introduction ............................................................................................................................................................. 3 Health and planning ................................................................................................................................................ 4 The Marmot Review findings ................................................................................................................................ 6 The social gradient in health .................................................................................................................................. 8 The social gradient in environmental disadvantage ........................................................................................... 9 Implementing the Review’s recommendations ................................................................................................ 16 Area assessment tools ........................................................................................................................................... 20 Reducing health inequalities through spatial planning .................................................................................... 25 Development assessment tools ........................................................................................................................... 32 Post-development indicators ............................................................................................................................... 34 Conclusions ............................................................................................................................................................ 35 References .............................................................................................................................................................. 36
E

2
Summary
1. This report is intended to inform the NICE work on evidence relating to spatial planning and health It aims to provide evidence on the relationship between aspects of spatial planning, the built environment, health and health inequalities. 2. The elements identified as having a significant impact on health, as well as relating to socio-economic status are:
Pollution Green and Open Space Transport Food Housing Community Participation and Social Isolation
3. There is a social gradient in health: those living in the most deprived neighbourhoods die earlier and spend more time in ill health than those living in the least deprived neighbourhoods. Such health inequalities are determined by social inequalities, including environmental inequalities; there is a gradient in the distribution of environmental disadvantages: those living in the most deprived neighbourhood are more exposed to environmental conditions, which negatively affect health. 4. In order to reduce health inequalities, universal action is needed, but with a scale and intensity that is proportionate to the level of disadvantage – this is called proportionate universalism. The same principle should be applied to reduce environmental inequalities. 5. The Marmot Review recommends 3 main policy actions to tackle the problem areas highlighted above and to try to ensure that the built environment promotes health and reduces inequalities for all local populations. All actions should be applied across the social gradient.
Prioritise policies and interventions that both reduce health inequalities and mitigate climate change by: o Improving active travel o Improving good quality open and green spaces o Improving the quality of food in local areas o Improving the energy efficiency of housing
Fully integrate the planning, transport, housing, environmental and health systems to address the social determinants of health in each locality
Support locally developed and evidence-based community regeneration programmes that: o Remove barriers to community participation and action o Reduce social isolation
6. There are a number of tools to assess areas’ needs and to assess the potential impact of development and regeneration programmes, which are describe in this paper.

6
The Marmot Review findings
The Marmot Review was commissioned by the Secretary of State for Health in November 2008. The Review was to include policies and interventions that address the social determinants of health and reduce health inequalities, including identifying the evidence most relevant to underpinning future policy and action and show how this evidence could be translated into practice.
The review showed that socio-economic inequalities, including the built environment, have a clear effect on the health outcomes of the population. It confirmed that there is a social gradient in health, and related to that showed that there is a social gradient in environmental disadvantage. The Review was published in February 2010 and proposed 6 policy objectives and related interventions aimed at reducing the gap in life expectancy between people of lower and higher socio-economic backgrounds. The 6 key policy objectives are:
Give every child the best start in life Enable all children, young people and adults to maximise their capabilities and have control
over their lives Create fair employment and good work for all Ensure a healthy standard of living for all Create and develop healthy and sustainable places and communities Strengthen the role and impact of ill health prevention.
Although spatial planning has an impact on many aspects of all the above, the fifth objective, which focuses on places and communities, is the one directly relevant to spatial planning. The Review identified a number of factors for which the evidence of the relationship with health was particularly strong. The evidence was reviewed by two task groups of independent experts, one task group on sustainable development and one task group on the built environment. Each task group included a former member of the global Commission on Social Determinants of Health, who provided international expertise. The task groups presented their evidence to the Review, including the strengths and shortcomings of the evidence, and made recommendations for policy and practice interventions. With respect to ‘sustainable places and health, the elements identified as having a significant impact on health are listed below and the evidence also showed that these and their disadvantages or benefits were also relation to social and economic distribution. They are:
Pollution There is clear evidence of the adverse effects of outdoor air pollution, especially for cardio-respiratory mortality and morbidity14-16. Poorer communities tend to experience higher concentrations of pollution and have a higher prevalence of cardio-respiratory and other diseases. Sixty-six per cent of carcinogenic chemicals emitted into the air are released in the 10 per cent most deprived wards17. There is strong evidence that reductions in traffic to reduce air pollution are successful in improving health18.
Green/open Space Numerous studies point to the direct benefits of green space to both physical and mental health and well-being19-22. Green spaces have been associated with a decrease in health complaints23 blood pressure and cholesterol, improved mental health and reduced stress levels24;25, perceived better general health26 and the ability to face problems27. There is strong evidence that provision of green space effectively improves mental health and less strong/inconclusive evidence that it improves levels of physical activity18.
Transport Transport accounts for around 29 per cent of the UK’s CO2 emissions28. The relationships between transport and health are multiple and complex, and transport also provides access to work, education, social networks and services, which can improve people’s opportunities29.

7
There is strong evidence that traffic interventions reduce road accidents, while there is some inconclusive evidence that they improve physical activity18. The impact of transport on health inequalities is greatest when looking at deaths from road traffic injuries, especially for children, as they are four times more likely to be hit by a car in the 10 per cent most deprived wards than in the least deprived wards30. Fatal accidents on the road are also particularly high among children of parents classified as never having worked or as long-term unemployed31;32.
Food Low income and area deprivation are both barriers to purchasing fresh or unfamiliar foods33, while lower income households are the harder hit by food price fluctuations. However, there is only anectodal evidence that local access to healthy foods improves diets18, although there are indications that residents in deprived areas could benefit from interventions aimed at low-mobility groups, increasing their access to better shopping facilities34. Studies of proximity to healthy food do not show causality between inadequate access and health outcomes35, and studies on greater access to unhealthy food in the UK has shown that this may disproportionately affect those in more deprived areas34;36;37.
Housing Over the past 20 years, the poorest groups have become concentrated in social housing38, and the association between social housing and negative outcomes applies across several domains, including health, education, self-efficacy and income39. A study suggested that children in bad housing are more likely to have mental health problems, such as anxiety and depression, to contract meningitis, have respiratory problems, experience long-term ill health and disability, slow physical growth and delayed cognitive development40. Cold housing is also a risk to health, affecting the levels of winter deaths and respiratory diseases. Evaluation of home insulation programmes concluded that targeting home improvements at low-income households significantly improved social functioning, as well as physical and emotional well-being41-43. Adequate heating systems improve asthma and reduce the number of days off at school44.
Community Participation and Social Isolation
Community capital differs in areas of deprivation, with less volunteering and unpaid work, less socialising and less trust in others, in the neighbourhoods that are perceived to be less safe45. Evidence of the association between social capital and health is significant and improving: in many communities facing multiple deprivation, stress, isolation and depression are all very common46, and low levels of social integration, and loneliness, significantly increase mortality47.Social participation acts as a protective factor against dementia and cognitive decline over the age of 6548;49 and also have an impact on the risk of mortality by aiding recovery when becoming ill50. Furthermore, there is some evidence that increasing community empowerment may result in communities acting to change their social, material and political environments46.
During the Review, expert task groups analysed all these factors and proposed strategies and interventions aimed at reducing the social-economic inequalities in exposure to such factors. The MRT drew on the task groups’ work to develop policy recommendations aimed at addressing the problem of environmental inequalities – three recommendations were put forward:
1. Prioritise policies and interventions that both reduce health inequalities and mitigate climate change by:
a. Improving active travel across the social gradient b. Improving good quality open and green spaces available across the social gradient c. Improving energy efficiency of housing across the social gradient
2. Fully integrate the planning, transport, housing, environmental and health systems to address the social determinants of health in each locality.
3. Support locally developed and evidence-based community regeneration programmes that: a. Remove barriers to community participation and action b. Reduce social isolation

16
Implementing the Review’s recommendations
This paper suggests that the Review’s findings on the relationship between the built environment and health inequalities can provide a basis to assess how different groups are distributed proximally to environmental burdens and whether interventions, developments and regeneration projects are addressing the gradient in environmental disadvantage. This would highlight how different environmental burdens and benefits are experienced by migrant groups and provide a framework to evaluate interventions on the environment aimed at reducing health inequalities experienced by specific population groups. Many interventions are planned specifically to have an impact on the gradient and are not assessed for their impact on health equity. Area-based interventions, such as the New Deal for Communities, target specific highly-deprived areas, and have shown little measureable success in terms of health outcomes, perhaps due to the timescale needed to affect such outcomes. However, such targeted interventions, even if successful, are unlikely to affect the gradient as a whole, while some universal interventions have shown impact on the gradient by reducing environmental inequalities proportionately (the effect is proportionate because the distribution of pollution is proportionately greater down the gradient) across the socio-economic gradient; such an example is the London Congestion Charge.
Fig. 9 Modelled changes in air pollution concentration due to London Congestion Charge, by area of London and level of socio-economic
deprivation, 2003-2007. Source: Tonne et al.72 This graph shows that after the congestion charge was introduced, levels of pollution decreased across the social gradient: pollution levels decreased progressively more in the more deprived neighbourhoods. Considering the inequalities in pollution distribution – (disadvantaged communities suffer disproportionately higher levels of pollution compared to more advantaged communities) - the effect of these comparative decreases in pollution are likely to decrease the steepness of the social gradient in pollution distribution. The importance of green space to good health has already been mentioned and one study has shown that in areas in England with more green spaces the gradient in deaths from circulatory disease by income deprivation is reduced – this suggests that the amount and the distribution of green space has great potential to reduce health inequalities, as shown in figure 10.

17
Fig. 10 Deaths from circulatory disease by income group and exposure to green space, where income group 4 is the most deprived. Source: Mitchell and Popham, 200873.
The Marmot Review recommends 3 main policy actions to tackle the problem areas highlighted above and to try to ensure that the built environment promotes health and reduces inequalities for all local populations.
1. Prioritise policies and interventions that both reduce health inequalities and mitigate climate change, by:
a. Improving active travel across the social gradient.
Interventions to encourage active travel include investing in better walking and cycling routes, reducing car speed to improve road safety, and improving public transport. For example, better cycling infrastructure often leads to long-term increases in cycling, and much lower numbers of cyclists killed or seriously injured. Lower speed limits also decrease the risk of death and serious injuries. Designing local areas so that they are easy and safe to walk around, and providing many destinations within walking distance, increases their ‘walkability’ and consequently, activity levels. All interventions should be targeted progressively across the social gradient.
b. Improving good quality open and green spaces across the social gradient This includes providing more green space, of better quality, that is well designed, and close to people’s homes. Providing more green space is affordable – CABE estimates that the budget for new road building until 2014 could instead provide 1,000 new parks (2 for each local authority in England). This would also reduce CO2 output by approximately 74,000 tonnes. Design is also important: school playgrounds that stimulate active games are associated with a 20% long term increase in physical activity. Natural play environments at school also help reduce bullying, improve concentration and promote feelings of self-worth. In underprivileged neighbourhoods, good quality green space can increase levels of social contact and integration. Finally, the proximity of green space is essential to good health. Having green space that residents can walk to will provide clear health benefits for the local community – prevalence rates for diabetes, cancer, migraine/severe headaches and depression are lower in areas with more green space within a one kilometre radius.
c. Improving the quality of food in local areas across the social gradient Residents of deprived areas could particularly benefit from policies which aim to improve availability of healthier food options and better access to shopping facilities. Having local shops within walking distance and generally high accessibility to shops which stock healthy food is likely to improve health within these areas, especially when coupled with planning restrictions on the density of fast food outlets within deprived areas.

18
d. Improving the energy efficiency of housing across the social gradient.
This would go some way to decreasing the fuel poverty of households in deprived areas, although increases in income are also necessary. It also decreases energy related emissions which helps to tackle climate change and has positive health impacts.
2. Fully integrate the planning, transport, housing, environmental and health systems to address the social determinants of health in each locality:
Addressing health inequalities requires action across all the social determinants of health and this will require different stakeholders to work in partnership to effectively deliver health equity. Cross-government working at national and local level within planning and between different departments can be encouraged and achieved in a number of ways:
A planning policy statement on health. This would incorporate health equity into planning processes and locate it more centrally in the work of spatial planners. Good planning can have a positive impact on public health and designers can create neighbourhoods that fulfil this possibility.
Better use of existing tools. Existing tools such as Joint Strategic Needs Assessments could be used to encourage and facilitate integrated local planning procedures, as well as informing development and regeneration plans.
Training:
There should be more information and training provided on health equity issues for local authority managers and officers in planning, housing, environment and transport. Additionally, related professional bodies could make health equity mandatory in professional development. This would improve commitments to local development frameworks and aid integrated working between health authorities and local planers.
Local Planning:
Local planning has a huge potential to positively affect health through the design of neighbourhoods. Planners can ensure that services are joined up and easier to access. They can also encourage community participation and cohesion by providing accessible transport and well located services, and make it easier for people to pursue healthy lifestyles by promoting active travel and use of green space
3. Support locally developed and evidence-based community regeneration programmes that:
a. Remove barriers to community participation and action Regeneration programmes should involve local communities in the development and delivery of local plans. This should happen in a way that reflects the capacity of local communities - often interventions work best where national guidance is provided and used by local communities who are free to develop their own, locally suitable programmes. Local areas should be designed in a way that facilitates and encourages community participation.
b. Reduce social isolation There are four recommended pathways to reducing social isolation:
1. Collecting better information from communities to identify population needs. 2. Providing the support and space for communities to direct and control local interventions and services. 3. Enhance community empowerment 4. Which can, in turn, result in communities acting to positively affect their social, material and political environments.
These have relevance to spatial planning in terms of designing for the local population needs and for service accessibility, but in terms of the local physical environment the point that was made above - that the spatial design of local areas can act to prevent or promote social contact, cohesion and participation, especially for vulnerable people – is particularly relevant. It is recommended that specific groups such as the elderly and the disabled should be consulted on the design of the physical environment in order to

19
ensure that this does not impede opportunities for these groups to take advantage of opportunities for social contact within their neighbourhoods.

34
Post-development indicators
Below is a framework for assessing the health equity impact of developments and regeneration programmes.
Policy Recommendations Process Indicators Output Indicators Outcome Indicators
Prioritise policies and interventions that both reduce health inequalities and mitigate climate change, by;
Greater accessibility to active models of travel in all areas. Improved road Layouts/separation of modes of travel. Street safety initiatives.
Increase in active miles travelled/people using active modes of travel. Reduction in traffic accident rates involving active travel and in street crime and disorder.
Improved fitness levels across the social gradient. Reduction in car travel.
(i) Improving active travel across the social gradient
Increased sustainable travel. Improved fitness levels across the social gradient. Reduced levels of pollution.
(ii) Improving quality open and green spaces available across the social gradient
Reduction in walking distance to quality green space. Street and park safety initiatives.
Reduced social gradient in stress, greater levels of exercise. Reduction in crime and disorder in streets and parks.
Health benefits associated with healthy eating across the social gradient.
(iii) Improving the food environment in local areas across the social gradient
Reduction in local concentration of fast food outlets. Improved food options in local shops.
Reduction in consumption of unhealthy food across the social gradient and increases in healthy eating.
Health benefits associated with healthy eating across the social gradient.
(iv) Improving energy efficiency of housing across the social gradient
Affordability of fuel for those in poverty. Reduction of numbers in poorly insulated housing. Reduction in use of high energy alternatives (e.g transport, heating, lighting)
Reduced energy usage across the social gradient.
Fuel poverty outcomes. Carbon footprints.
Fully integrate the planning, transport, housing, environmental and health systems to address the social determinants of health in each locality
Greater travel options. Reduction in car use. Increase in walking and cycling.
Reduction in stress associated with living in isolated and deprived neighbourhoods.
Reduced ill health gradients in ill health associated with social isolation and adverse impacts of travel e.g pollution and accidents.
Support locally developed and evidence-based community regeneration programmes that:
(i) remove barriers to community participation and action
Increased opportunities for participation and community activity among local residents.
Greater participation and community activity among local residents.
Improved well-being of local residents affected by regeneration.
(ii) Reduce social isolation Increased opportunities for participation and community activity among local residents. Integrated transport links and street safety initiatives.
Reduction in social isolation of elderly/deprived communities.
Reduced gradients in ill health associated with social isolation and area deprivation. Reduce mental health problems and improve self reported health and well being.

35
Conclusions
The lack of an integrated strategy across policy areas serves to perpetuate and possibly increase the disadvantages documented in the areas above. While separate working in silos continues, it will be harder to address these issues and tackle inequalities in environmental disadvantage. In order to address the exposure to multiple negative environmental conditions that deprived communities face, planning will need to consistently take into account the spatial distribution of environmental disadvantages and assess how they impact on the communities that are exposed to them. Aligned strategies that are formed through informed, co-operative, communicative work will be more likely to effectively tackle the range of disadvantages that poorer communities face. Data, tools for analysis and design guidance are available to professionals for assessing areas’ needs in relation to deprivations and plan the intensity of interventions needed to effectively reduce the gradient in environmental disadvantage. The planning policy statements summarised earlier on in the paper show this – they are not systematically concerned with the impact of planning decisions on health and health equity. The dissolution of regional spatial strategies may serve to increase this disconnection, and policies that have unintended and/or negative consequences for health may be continue to be approved. In this context it is vital that planners, developers and design professionals are aware of the health equity impact of their work and proactively address environmental disadvantage through their practice. The main components for implementing the Marmot Review’s recommendations and addressing health inequalities through spatial planning are:
addressing the gradient in environmental disadvantage. establishing a benchmark for area assessment analysis which includes an equity component. addressing the elements of the built environment which affect health across the social
gradient according to the area’s needs.

Public Health
A systematic review of the influence of theretail food environment around schools onobesity-related outcomes
J. Williams1, P. Scarborough1, A. Matthews1, G. Cowburn1, C. Foster1, N. Roberts2 and M. Rayner1
1British Heart Foundation Health Promotion
Research Group, Nuffield Department of
Population Health, University of Oxford,
Oxford, UK; 2Bodleian Health Care Libraries,
University of Oxford, Oxford, UK
Received 25 September 2013; revised 11
December 2013; accepted 11 December
2013
Address for correspondence: Ms J Williams,
British Heart Foundation Health Promotion
Research Group, Nuffield Department of
Population Health, University of Oxford, Old
Road Campus, OX3 7LF Oxford, UK.
E-mail: [email protected]
SummaryThe high prevalence of childhood obesity has led to questions about the influenceof ‘obesogenic’ environments on children’s health. Public health interventionstargeting the retail food environment around schools have been proposed, but itis unclear if they are evidence based. This systematic review investigates associa-tions between food outlets near schools and children’s food purchases, consump-tion and body weight. We conducted a keyword search in 10 databases. Inclusioncriteria required papers to be peer reviewed, to measure retailing around schoolsand to measure obesity-related outcomes among schoolchildren. Thirty paperswere included. This review found very little evidence for an effect of the retail foodenvironment surrounding schools on food purchases and consumption, but someevidence of an effect on body weight. Given the general lack of evidence forassociation with the mediating variables of food purchases and consumption, andthe observational nature of the included studies, it is possible that the effect onbody weight is a result of residual confounding. Most of the included studies didnot consider individual children’s journeys through the food environment, sug-gesting that predominant exposure measures may not account for what individualchildren actually experience. These findings suggest that future interventionstargeting the food environment around schools need careful evaluation.
Keywords: Child obesity, food environment, schools, systematic review.
Abbreviations: AOR, adjusted odds ratio; BMI, body mass index; CS, conveniencestore; FF, fast food; FFR, fast food restaurant; FO, food outlet; FRI, food retailindex; HEI, healthy eating index; HFAI, healthy food availability retail index;HFSS, high in fat, sugar or salt; HFZ, healthy fitness zone; IRR, incidence rateratio; OR, odds ratio; OW, overweight; SE, standard error; SM, supermarket;TA, takeaway.
obesity reviews (2014) 15, 359–374
Introduction
The prevalence of childhood obesity in the world hasincreased dramatically over the past three decades and isconsidered by the World Health Organization to be one of
the most serious public health problems of the 21st century(1,2). Overweight or obese children are likely to remainoverweight as adults and have an increased risk of devel-oping chronic conditions such as cardiovascular disease ortype 2 diabetes. Swinburn and Egger coined the term the
obesity reviews doi: 10.1111/obr.12142
359© 2014 The Authorsobesity reviews © 2014 International Association for the Study of Obesity 15, 359–374, May 2014
F

‘obesogenic environment’ in 1997, and since then agrowing body of research has looked at ways that externalfactors (such as access to food outlets) may influencedietary behaviours (3).
Despite significant methodological and conceptual limi-tations in research about the environment and health (4–8),there has been interest in potential environmental interven-tions to support healthy dietary behaviours (9,10). This hasled to regulation of the food environment within schools(11) – but these policies aimed at improving the foodenvironment for children do not generally extend beyondschool boundaries. Planning or licensing controls to restrictunhealthy food retailing operations around schools havebeen proposed (and in a few cases implemented) in the UK,United States and Australia (12–20), but it is unclearwhether such interventions are effective. Some of this lackof clarity is due to a conflicted and equivocal evidence base.
Existing systematic reviews
Despite a growing body of primary research examining theretail food environment surrounding schools and its poten-tial influence on children, we were unable to find anysystematic reviews that focus specifically on food retailingaround schools and its associated outcomes among school-children. Existing reviews have considered the broadersubject of possible environmental determinants of health(4,5,7,8,21–23), but they have not focused specifically onthe retailing around schools. For the first time, our reviewtackles this knowledge gap by examining associationsbetween these environmental exposures and obesity-relatedoutcomes, as well as how they were defined and measured.
Aim of this review: focusing on school foodenvironment studies
The primary aim of this systematic review was to examinethe associations between the retail food environmentaround schools and dietary intake, weight status or foodpurchasing behaviour among school-age children. Ourhypothesis was that the food environment around schoolsinfluences food purchasing behaviour of schoolchildren atthree points in the day: (i) on the journey to school; (ii) atlunchtime during ‘breaks’ from school and (iii) on thejourney from school. We also hypothesize that the influenceon food purchasing behaviour results in changes in dietaryintake and changes in weight status. Our secondary aimwas to catalogue and critique the various methodsemployed within this body of literature.
Methods
We developed a full protocol that is available from theauthors on request.
Search strategies
We conducted a search using a combination of free-textterms and subject headings to describe schools and school-children, the retail food environment and our outcomes ofinterest: food purchasing, food consumption and bodyweight (please see Supporting Information Appendix S1 forthe Medline strategy). The following publication databaseswere searched from database inception to 24 October2013: MEDLINE (OvidSP, 1946-), EMBASE (OvidSP,1974-), Global Health (OvidSP, 1973-), CINAHL(EBSCOHost, 1982-), Education Resources InformationCentre (ERIC, Proquest, 1966-), Web of Science (ThomsonReuters, 1945-), the Cochrane Public Health Group Spe-cialized Register, PsychINFO(OvidSP, 1967-), Dissertations& Theses (Proquest, 1637-), LILACS(Virtual HealthLibrary) and Science Direct. Additionally, we hand-searched the reference lists of articles for additional rel-evant papers with an end search date of October 2013. Wedid not conduct a Cochrane review because of the smallnumber of intervention studies at present and the observa-tional nature of most of the studies we were considering.
Inclusion/exclusion criteria
Studies were required to include at least one measurementof the school food environment. We defined this as theretailing in the area surrounding schools that schoolchil-dren encounter either on the journey to or from school, orat a lunchtime break from school. We used this definitionbecause we wanted to consider environmental exposuresthat children were likely to encounter during the schoolday. This definition included food stores (e.g. supermar-kets, convenience stores, farmers’ markets) and cateringoutlets (e.g. fast food, full-service restaurants) but excludedfood provision within the school building (e.g. cafeterias,vending machines, school tuckshops). Additionally, werequired studies to include outcome data for schoolchildren5–18 years old. The outcome data needed to include at leastone of the following: (i) food purchases; (ii) dietary intakeand (iii) body weight.
Study selection
One researcher examined the titles, abstracts and full-textarticles. After the first researcher scanned titles and identi-fied exclusions, a second researcher checked a 10% sampleof exclusions and identified three papers where there wassome disagreement. The title scan was then conducted for asecond time, and the second researcher checked a differentsample of exclusions and there was complete agreement.The same two researchers reviewed and cross-checkedabstracts and full papers.
360 Retailing around schools J. Williams et al. obesity reviews
© 2014 The Authorsobesity reviews © 2014 International Association for the Study of Obesity15, 359–374, May 2014

Classifying and coding the studies
We initially planned to group the studies by exposure andoutcome and then, if possible, to perform a meta-analysisof the results. However, because of differences amongstudy research questions, exposure measurements, outcomemeasurements and methods, formal meta-analysis was notpossible, so we followed a semi-quantitative procedureused by Sallis et al. (24) and Dunton et al. (25). For eachstudy, we identified how the food environment was definedand measured (e.g. type of food outlet, the size of theschool neighbourhood) and whether or not it was associ-ated with increased frequency of food purchases, increasedconsumption of specific foods or increased body weight.We identified whether or not the finding was statisticallysignificant, which we defined as a result that confirmed thehypothesis and had an associated P value of less than orequal to 0.05.
The aim of this semi-quantitative method was to allow arapid assessment of the strength of the evidence of anassociation between the exposure and the outcomes ofinterest by reducing a range of results from heterogeneousanalytical designs to two binary questions: Did the studyshow a positive association between the school food envi-ronment and the outcome of interest? If so, was this findingstatistically significant (P < 0.05)?
Quality assessment
We assessed study quality using standard criteria forreviewing primary research papers that are not randomized
controlled trials and following the guidelines presented byZaza et al. (26,27). Because of the heterogeneity of studydesigns and the lack of a robust framework for rankingstudies, we adopted a descriptive approach. Quality wasassessed according to study methods (e.g. use of randomsampling, use of objective or validated outcome measures,controlling for potential confounders) and reporting (e.g.defining exposure and outcome measures, describing thesample) (see Supporting Information Appendix S2).
After the team established the quality assessment criteria,one researcher completed an initial evaluation of thestudies. A second researcher independently completedquality assessments for a 10% sample of the papers and thescores were checked for inter-rater reliability. The qualitychecks were sent to the corresponding authors of theincluded studies for verification.
Results
The search retrieved 5,789 articles (see Fig. 1). Resultscome from 30 papers and 29 studies, featuring results frommore than 10,000 schools and 1.5 million students (seeTable 1).
General characteristics of included studies
The earliest publication was in 2008 and about three quar-ters of the papers (n = 23) were published between 2011and 2013. The papers were largely cross-sectional, butthere were two longitudinal exceptions from Rossen et al.
1 additional record identifiedthrough other source
3457 titles scanned
410 abstracts scanned
54 full-text articles screened
30 included
356 excluded
24 excluded
–18 did not include a measureof the school food environment
–2 did not provide outcomedata on currently enrolledschoolchildren (5-18 years)
–4 did not provide outcomedata on food purchase, consumption or body weight
3047 excluded
5788 records retrievedthrough database search
2332 excluded:
–2253 duplicates
–79 pre-1981
Figure 1 Processing the articles for inclusionin this review.
obesity reviews Retailing around schools J. Williams et al. 361
© 2014 The Authorsobesity reviews © 2014 International Association for the Study of Obesity 15, 359–374, May 2014

Tabl
e1
Des
crip
tion
ofin
clud
edst
udie
son
asso
ciat
ions
betw
een
food
outle
tsar
ound
scho
ols
and
stud
entf
ood
purc
hase
s,co
nsum
ptio
nan
dbo
dyw
eigh
t
Aut
hor,
year
Cou
ntry
Age
inye
ars
(gra
de)*
Num
ber
ofst
uden
ts(s
choo
ls)
Expo
sure
Type
offo
odou
tlet
Out
com
eC
ovar
iate
s/st
ratifi
catio
n
An
2012
(46)
Uni
ted
Stat
es5–
1713
,462
GIS
:den
sity
with
in0.
1,0.
5,1.
0an
d1.
5m
ileci
rcul
arbu
ffer
ofsc
hool
CS,
FFR
,gro
cery
stor
esan
dSM
s,
smal
lfoo
dst
ores
Die
tSR:F
,V,F
F,ju
ice,
milk
,sod
a,hi
gh-s
ugar
food
s
Age
,gen
der,
hous
ehol
dsi
ze,e
duca
tion,
pare
ntw
eigh
t,ra
ce/e
thni
city
,sur
vey
wav
e
Buc
k20
13(6
7)G
erm
any
6–9
610
GIS
:clu
ster
ing
arou
ndsc
hool
s,fo
odre
tail
inde
x(k
erne
lden
sity
estim
ates
ofFO
spe
rkm
2 )
Bak
erie
s,FF
R,k
iosk
s,SM
sB
MIM
,Die
tSR:J
unk
food
(SSB
,cho
cola
te,c
risps
,et
c.)
Age
,sex
,hou
seho
ldin
com
e,pa
rent
educ
atio
n,un
der
and
over
-rep
ortin
g
Chi
ang
2011
(38)
Taiw
an6–
132,
283
GIS
:den
sity
with
in50
0-m
circ
ular
buffe
rof
scho
olC
S,FF
R,f
resh
prod
uce
mar
kets
,st
reet
vend
ors
BM
IMA
ge,e
thni
city
,fat
her’s
educ
atio
n,ho
useh
old
inco
me,
pock
etm
oney
,birt
hw
eigh
t,tim
esp
entw
atch
ing
TVon
wee
kday
s,di
etqu
ality
,reg
ion
Cur
rie20
10(4
3)U
nite
dSt
ates
14–1
5(9
)8,
373
GIS
:pre
senc
ew
ithin
0.1,
0.25
and
0.5
mile
stra
ight
line
buffe
rFF
RB
ody
fatM
Cen
sus
dem
ogra
phic
sof
near
estb
lock
,et
hnic
ity,f
ree
scho
olm
eals
,sch
ool
char
acte
ristic
s,sc
hool
test
scor
es,
stud
ent:
teac
her
ratio
Dav
is20
09(3
9)U
nite
dSt
ates
12–1
7(7
–12)
529,
367
GIS
:pre
senc
ew
ithin
0.25
,0.2
5–0.
5an
d0.
5–0.
75m
ilest
raig
htlin
ebu
ffer.
Den
sity
with
in3
mile
s
FFR
,‘ot
her
rest
aura
nts’
BM
ISRan
ddi
et:F
,V,
juic
e,so
da,f
ried
pota
toes
Age
,gen
der,
grad
e,ph
ysic
alac
tivity
,FSM
elig
ibili
ty,r
ace/
ethn
icity
,sch
ooll
ocat
ion
type
,sch
oolt
ype
Fors
yth
2012
(68)
Uni
ted
Stat
es11
–14
(6−9
)2,
724
(20)
GIS
:Den
sity
with
in80
0-m
stre
etne
twor
kbu
ffer
FFR
:tra
ditio
nal,
pizz
a,su
bs/s
andw
iche
s,ot
her
FFD
iet:
FFEt
hnic
ity/ra
ce,g
rade
leve
l,ge
nder
,SES
Geb
rem
aria
m20
12(3
0)N
orw
ay11
–12
(6)
1,42
5(3
5)Su
rvey
ofsc
hool
staf
f:pr
esen
ce‘w
ithin
wal
king
dist
ance
from
scho
ol’
‘Foo
dou
tlets
whe
refo
odor
drin
ksco
uld
bepu
rcha
sed’
Die
tSR:F
,V,s
nack
s,SS
B,
fruit
drin
ksC
ante
en/fo
odbo
oth
atsc
hool
,foo
dou
tlets
pres
ent,
gend
er,p
aren
tedu
catio
n,sc
hool
nutri
tion
com
mitt
ee,s
choo
l’spe
rcei
ved
resp
onsi
bilit
yfo
rst
uden
tdie
t,tw
opa
rent
s
Gill
iland
2012
(34)
Can
ada
10–1
41,
048
(28)
GIS
:pre
senc
ew
ithin
500
and
800-
mst
raig
htlin
ebu
ffer,
stre
etne
twor
kbu
ffer
and
scho
olw
alks
hed†
CS,
FFR
BM
ISRA
ge,s
ex
Grie
r20
13(4
0)U
nite
dSt
ates
12–1
71,
000
GIS
:stra
ight
line
dist
ance
tocl
oses
tout
let
FFR
BM
ISRan
ddi
etSR
:sod
aA
ge,g
rade
,sex
,phy
sica
lact
ivity
,ra
ce/e
thni
city
,sch
oolt
ime,
perc
ente
ligib
lefo
rFS
M,s
choo
lurb
anic
ity
Har
ris20
11(6
9)U
nite
dSt
ates
14–1
7(9
–12)
552
(11)
GIS
:den
sity
with
in2
km(1
.24
mile
)st
raig
htlin
ebu
ffer
ofsc
hool
,dis
tanc
eto
clos
est
stor
e
Bag
elsh
ops,
bake
ries,
coffe
esh
ops,
FFR
(bur
ger/f
ries
orM
exic
an),
fried
chic
ken
rest
aura
nt,i
cecr
eam
shop
s,pi
zza
parlo
urs,
sand
wic
h/su
bsh
ops,
sit-d
own
rest
aura
nts,
snac
kba
rs
BM
ISRA
ge,b
irth
wei
ght,
diet
qual
ity,e
thni
city
,fa
ther
’sed
ucat
ion,
hous
ehol
din
com
e,po
cket
mon
ey,r
egio
n,tim
esp
entw
atch
ing
TVon
wee
kday
s
Har
rison
2011
(33)
Engl
and
9–10
1,99
5G
IS:d
ensi
tyw
ithin
800-
mpe
dest
rian
netw
ork
buffe
rw
eigh
ted
sum
ofth
edi
stan
ceto
ever
yfa
cilit
yw
ithin
6km
ofho
me
and
scho
ol
‘Hea
lthy
outle
ts’(
SMs
and
gree
ngr
ocer
s),‘
unhe
alth
you
tlets
’(C
San
dta
keaw
ay)
Fatm
ass
inde
xMA
ge,s
ex,p
aren
tedu
catio
n,m
ode
oftra
vel
tosc
hool
He
2012
(45)
Can
ada
11–1
3(7
–8)
810
(21)
GIS
:den
sity
with
in1-
kmst
raig
htlin
ebu
ffer;
shor
test
netw
ork
dist
ance
tone
ares
tout
let
CS,
FFR
Food
purc
hase
SRM
ode
oftra
nspo
rtat
ion,
fath
er’s
educ
atio
n,la
ndus
em
ix
He
2012
(35)
Can
ada
11–1
3(7
–8)
810
(21)
GIS
:den
sity
with
in1-
kmst
raig
htlin
ebu
ffer;
shor
test
netw
ork
dist
ance
tone
ares
tout
let
CS,
FFR
Die
tSR:H
EIG
ende
r,gr
ade
leve
l,ne
ighb
ourh
ood
dist
ress
scor
e,an
nual
fam
ilyin
com
e,et
hnic
ity,f
amily
stru
ctur
e,pa
rent
educ
atio
n
Her
oux
2012
(65)
Can
ada,
Scot
land
,U
nite
dSt
ates
13–1
526
,778
(687
)G
IS:d
ensi
tyw
ithin
1-km
stra
ight
line
buffe
rC
S,ch
ain
FFR
rest
aura
nts
and
café
sB
MISR
Fam
ilyaf
fluen
ce,g
rade
,sex
How
ard
2011
(44)
Uni
ted
Stat
es14
–15
(9)
(879
)G
IS:P
rese
nce
with
in80
0-m
netw
ork
buffe
rC
S,FF
RB
MIM
Ethn
icity
,per
cent
age
ofst
uden
tsre
ceiv
ing
free
mea
ls,u
rban
icity
362 Retailing around schools J. Williams et al. obesity reviews
© 2014 The Authorsobesity reviews © 2014 International Association for the Study of Obesity15, 359–374, May 2014

Tabl
e1
Con
tinue
d
Aut
hor,
year
Cou
ntry
Age
inye
ars
(gra
de)*
Num
ber
ofst
uden
ts(s
choo
ls)
Expo
sure
Type
offo
odou
tlet
Out
com
eC
ovar
iate
s/st
ratifi
catio
n
Lang
ellie
r20
12(7
0)U
nite
dSt
ates
10–1
5(5
–9)
(1,6
94)
GIS
:pre
senc
ew
ithin
800-
mne
twor
kbu
ffer
Cor
ner
stor
es,F
FRB
MIM
Elig
ibili
tyfo
rtit
le1
fund
ing,
race
/eth
nici
ty,
scho
olty
pe,u
rban
icity
Lask
a20
10(7
1)U
nite
dSt
ates
11–1
833
4G
IS:d
ensi
tyw
ithin
800,
1,60
0an
d3,
200
mne
twor
kbu
ffer
Bak
erie
s/do
ughn
utsh
ops,
FFR
,gas
stat
ions
,gro
cery
stor
es,v
arie
tyst
ores
BM
ISRA
ge,p
aren
tedu
catio
n,sc
hool
and
area
-leve
lSES
,sex
Leat
herd
ale
2011
(72)
Can
ada
9–13
(5–8
)2,
429
(30)
GIS
:den
sity
with
in1-
kmst
raig
htlin
ebu
ffer
Any
reta
ilfa
cilit
ies,
CS,
FFR
,gro
cery
stor
esB
MISR
Ethn
icity
,gen
der,
grad
e,ph
ysic
alac
tivity
Li20
11(3
6)C
hina
11–1
71,
792
(30)
Surv
eyof
scho
olst
aff:
‘pre
senc
ew
ithin
10-m
inw
alk
ofsc
hool
’W
este
rnFF
RB
MIM
Age
,hou
seho
ldw
ealth
,par
entB
MI,
pare
nted
ucat
ion
Nix
on20
11(4
1)U
nite
dSt
ates
14–1
5(9
)(4
1)G
IS:d
ensi
tyw
ithin
400-
and
800-
mst
raig
htlin
ebu
ffer,
clos
estf
acili
ty,d
egre
eof
clus
terin
gar
ound
scho
ols
FFR
BM
ISRSc
hool
lunc
hpo
licy,
perc
enta
geof
stud
ents
rece
ivin
gfre
em
eals
,rac
e/et
hnic
ity,
perc
enta
geof
stud
ents
inta
lent
eded
ucat
ion
prog
ram
,par
ente
duca
tion
leve
l
Park
2013
(37)
Sout
hK
orea
9–15
(4–9
)1,
342
Surv
ey:d
ensi
tyw
ithin
500-
mra
dius
ofsc
hool
SM,t
radi
tiona
lmar
kets
,Fan
dV
mar
kets
,stre
etve
ndor
s,sn
ack
bars
,C
S,FF
O,d
ough
nuts
,ice
crea
m,
bake
rysh
ops,
full-
serv
ice
rest
aura
nts
BM
IM,H
EIA
ge,s
ex,s
cree
ntim
e,fa
mily
afflu
ence
,m
othe
r’sem
ploy
men
t,sc
hool
nutri
tion
envi
ronm
ent(
com
posi
tein
dex)
,soc
ial
safe
tyne
tpro
gram
part
icip
ants
Ric
hmon
d20
13(7
3)U
nite
dSt
ates
11–1
4(6
–8)
18,2
81(4
7)G
IS:d
ensi
tyw
ithin
a1,
500-
mst
raig
htlin
ebu
ffer
FFR
,CS
Die
tSR:S
SBA
ge,s
ex,r
ace/
ethn
icity
,per
cent
age
ofst
uden
tsre
ceiv
ing
free
scho
olm
eals
Ros
sen
2013
(28)
Uni
ted
Stat
es8–
1331
9G
IS:m
ean
heal
thy
food
avai
labi
lity
inde
x(H
FAI),
dens
ityof
outle
tsw
ithin
100
mof
shor
test
stre
etne
twor
kpa
thbe
twee
nho
me
and
scho
ol
CS,
SM/G
S,C
S,re
stau
rant
s(fu
llse
rvic
eor
carr
y-ou
t),ga
sst
atio
nsB
MIM
,wai
stci
rcum
fere
nce
(bas
elin
ean
d1
year
)
Age
,gen
der,
race
/eth
nici
ty,n
umbe
rof
sibl
ings
,rec
eipt
offre
eor
redu
ced
pric
elu
nch,
wal
king
tosc
hool
stat
us,d
ista
nce
tosc
hool
(log
km),
scho
olvi
olen
cest
rata
,ce
nsus
-trac
tdep
rivat
ion
inde
x
Sánc
hez
2012
(42)
Uni
ted
Stat
es10
–15
(5–9
)92
6,01
8(6
,362
)G
IS:d
ensi
tyw
ithin
800-
mst
raig
htlin
ebu
ffer
arou
ndsc
hool
CS,
FFR
BM
IMA
ge,s
ex,s
choo
l-lev
elch
arac
teris
tics
and
inte
ract
ions
with
race
/eth
nici
ty
Scha
fft20
09(7
4)U
nite
dSt
ates
10–1
3(5
,7)
243
scho
oldi
stric
tsG
IS:a
bsen
ceof
‘larg
egr
ocer
yst
ore’
with
in10
mile
stra
ight
line
buffe
rar
ound
‘pop
ulat
ion
base
dce
ntro
id’o
fthe
scho
oldi
stric
t
Larg
egr
ocer
yst
ore:
groc
ery
orre
tail
food
stor
ew
ithm
ore
than
50em
ploy
ees
BM
IM
edia
nfa
mily
inco
me,
perc
entm
obile
hom
ere
side
nce,
perc
enti
ncom
plet
eki
tche
n
Selis
ke20
09(7
5)C
anad
a11
–16
7,28
1(1
78)
GIS
:den
sity
with
in1
and
5km
stra
ight
line
buffe
rC
S,do
ughn
ut/c
offe
esh
ops,
FFR
,fu
ll-se
rvic
ere
stau
rant
s,su
b/sa
ndw
ich
shop
s
BM
ISR‡
BM
I,fa
mily
afflu
ence
scal
e,ph
ysic
alac
tivity
,sex
,urb
anic
ity
Smith
2013
(29)
Engl
and
11–1
61,
382
(29)
GIS
:den
sity
with
in40
0an
d80
0-m
road
netw
ork
buffe
r,m
edia
nan
dm
inim
umdi
stan
ceto
groc
eror
TA
TA,g
roce
r/SM
/CS
Die
tqua
lity:
‘Hea
lthy’
or‘U
nhea
lthy’
(agg
rega
tesc
ore)
Age
,gen
der,
FSM
elig
ibili
ty,e
thni
city
,sc
hool
-leve
ldep
rivat
ion
Svas
tisal
ee20
12(4
7)D
enm
ark
11–1
5(5
–9)
6,03
4(8
0)G
IS:‘
Expo
sure
:’nu
mbe
rof
FOs
divi
ded
byto
talr
oad
segm
ents
with
in30
0m
ofsc
hool
sFF
R,S
Ms
Die
tSR:F
,VA
ge,f
amily
soci
alcl
ass,
sex
Tim
perio
2009
(32)
Aus
tralia
5–12
816
GIS
:den
sity
with
in50
mbu
ffer
alon
gro
ute
tosc
hool
,Pre
senc
eof
FOal
ong
rout
eC
afes
,FFR
,res
taur
ants
,tak
eaw
ayst
ores
Die
tSR:F
For
take
away
Age
,SES
van
der
Hor
st20
08(3
1)N
ethe
rland
s12
–15
1,29
3(1
5)G
IS:d
ensi
tyw
ithin
500-
mst
raig
htlin
ebu
ffer
Bak
ery,
FFR
,fru
it/ve
geta
ble
stor
e,la
rge
SM,s
mal
lfoo
dst
ore
Die
tSR:S
SBan
dsn
acks
Dat
eof
mea
sure
men
t,et
hnic
ity,e
duca
tion
Buf
fer
size
inbo
ldin
dica
tes
the
buffe
rdi
stan
ceth
atw
eus
edin
our
anal
ysis
.*W
hen
pape
rsre
port
edst
uden
tgra
dele
velo
nly,
we
infe
rred
age
inye
ars
from
the
grad
ede
scrib
edin
pare
nthe
ses.
† The
wal
kshe
dis
the
terr
itory
with
ina
scho
ol’s
catc
hmen
ttha
tenc
ompa
sses
only
thos
est
uden
tsliv
ing
with
inw
alki
ngdi
stan
ce.
‡ Out
com
ew
aspe
rcen
tage
ofst
uden
tsfa
lling
with
ina
‘hea
lthy
fitne
sszo
ne’,
whi
chin
clud
esbo
thfit
ness
mea
sure
san
dB
MI.
BM
I,bo
dym
ass
inde
x;C
S,co
nven
ienc
est
ore;
F,fru
it;FF
,fas
tfoo
d;FF
R,f
astf
ood
rest
aura
nt;F
O,f
ood
outle
t;FS
M,f
ree
scho
olm
eal;
HEI
,hea
lthy
eatin
gin
dex
(aco
mpo
site
varia
ble
that
refle
cts
over
alld
ietq
ualit
y);M
,m
easu
red;
SES,
soci
oeco
nom
icst
atus
;SM
,sup
erm
arke
t;SR
,sel
f-rep
ort;
SSB
,sug
ar-s
wee
tene
dbe
vera
ge;V
,veg
etab
le.
obesity reviews Retailing around schools J. Williams et al. 363
© 2014 The Authorsobesity reviews © 2014 International Association for the Study of Obesity 15, 359–374, May 2014

(28) and Smith et al. (29). Most of the studies took place inNorth America (United States: n = 14; Canada: n = 5) butthere were also studies from Europe (n = 6), Asia (n = 3)and Australia (n = 1). One multi-country study from theUnited States, Scotland and Canada was also included.Participant age ranged from 5 to 17 years. Sample sizesranged widely from 334 to 926,018 students and morethan three quarters of the studies had more than 1,000students. Most of the papers did not explicitly identify thetheoretical model informing their work, but those that did(30,31) cited social ecological models.
Methods for defining and measuring the schoolfood environment
Studies varied in their methods of constructing exposuremeasures in terms of the level of the exposure (whether ornot it accounted for individual variation) and the source ofinformation (primary vs. secondary sources).
Level of exposure: area-level vs.individual-level exposures
Area-level exposures were based on a static area such as abuffer around the school or the school’s census tract. Mostof the included studies used area-level measures, defined atthe level of the school, which meant that all studentsattending the same school had a shared exposure value(n = 21). The alternative approach of using an individual-level exposure, where quantification of food outletsaccounted for individual factors such as a student’s homeaddress, was used by nine studies. Three papers (28,32,33)accounted for the student’s journey through the food envi-ronment by taking the student’s school and residentialaddress and calculating the number of outlets falling alongthe route between the two locations. Gilliland et al. (34)used multilevel structural equation modelling techniques tosimultaneously test the effects of the school-environmentand home-environment predictors on body mass index(BMI) scores and He et al. (35) calculated individual par-ticipants’ ‘junk food density’ based on the density of storesaround both students’ home and school address.
Geographical information systems vs.survey-based measures of exposure
The predominant method of characterizing the food envi-ronment exposure was by using geographical informationsystems (GIS) (n = 27). Most commonly, this was donethrough use of a software program to construct a bufferzone (straight line, street or pedestrian network) around thechild’s school or the route between home and school andthen counting the number of food outlets within that area(density). For studies using this density method, the buffer
distances ranged from 0.1 to 3.0 miles (about 160–4,800m) for the area around schools and from 50 to 100 m forthe area around routes. For the former category, the mostfrequently used buffer distance was half a mile (about 800m). Most of the papers using buffer zones provided ration-ale for using the buffer distance that they did (n = 25) andfor about one-third of them (n = 12), at least one of thecited reasons was to be consistent with earlier studies.Another GIS method calculated the distance from theschool to the nearest outlet (proximity). For these GIS-based studies, information about the locations, names andtypes of food outlets came predominantly from large sec-ondary data sources including private companies and localbusiness directories (n = 18) or public records such ascensus data, tax registry documents or government foodpremise databases (n = 8). Harris et al. collected store datausing a global positioning system (GPS) unit and addingthese geo-referenced points to a digital map.
Subjective measures of the retail food environmentincluded the use of questionnaires. Two studies identifiedfood outlets via a questionnaire in which school adminis-trators identified the presence of food outlets ‘withinwalking distance’ (30) or within ‘ten minutes’ walk’ (36) ofthe school. Park et al. (37) used an audit tool to recordobservations of the various types of food outlets foundwithin a 500-m radius of the school.
Defining types of food outlets
Food outlet definitions and categories varied betweenpapers and, in the instances when they were explicitlydefined, often depended on the definitions provided by theoriginal data source. A range of food outlets were included,but most of the studies narrowed their measures to a fewspecific types. The most common types of outlets to beincluded were fast food restaurants (n = 23), conveniencestores (n = 10), supermarkets (n = 6) and grocery stores(n = 7).
Types of outcomes: food purchasing behaviour,consumption and body weight
Of the three outcomes we considered in this review, the mostcommon was body weight, with 20 papers evaluating envi-ronmental associations with BMI (n = 18) and fat mass(n = 2). The second most common outcome was food con-sumption, with 14 papers evaluating associations betweenthe environment and diet. Food consumption was predomi-nantly assessed as daily or habitual consumption (ratherthan food consumption at school). A range of specific foodswere measured, but the most frequently evaluated were fruitand vegetables (n = 4), soda or sugar-sweetened beverages(n = 7), or fast food (n = 4). Three papers used a compositevariable such as a Healthy Eating Index (HEI; n = 2) or a
364 Retailing around schools J. Williams et al. obesity reviews
© 2014 The Authorsobesity reviews © 2014 International Association for the Study of Obesity15, 359–374, May 2014

healthy diet score (n = 1). Of the three types of outcomes weconsidered, food purchases were measured least frequently,with only one paper including it as an outcome. Thismeasure was based on participant’s self-report of purchas-ing fast food at least once in the previous week.
Quality assessment
We assessed the quality of studies using 13 criteria thatincluded whether or not studies randomly selected partici-pants, provided clear definitions of the study area, validatedtheir exposure and outcome measurements, or attempted tocontrol for potential confounders. When it was applicable,most papers randomly selected schools (n = 18) and stu-dents (n = 19), and defined the area of measurement (i.e. the‘school neighbourhood’) in terms of a defined spatial size(n = 27). Nine studies validated their exposure measures viaground-truthing and three via Google Maps. Nine of the 14studies measuring diet used a validated instrument. Twelveof the 20 studies with BMI or weight as an outcome usedobjective measures and eight relied on self-report. Almostall of the studies adjusted for potential confounders intheir final analysis with the most common adjustments forsocioeconomic status (n = 26), race/ethnicity (n = 20) andurbanicity/population density (n = 8).
Results from the included studies
The results below are organized according to their out-come measures. Because of the heterogeneity in studydesign, we report the following results in terms of increasedfood purchases, increased consumption or increasedbody weight. We chose an arbitrary level of significance(P = 0.05).
Because of a diverse range of exposures, outcomes, levelsof adjustments and the number of analyses reported byindividual studies, and to avoid over-representing resultsfrom papers that reported many results, we used the fol-lowing criteria to determine which results to feature inTables 2–4. When papers presented results using multiplelevels of adjustment, we took the most adjusted. Whenresults were stratified using categorical variables (e.g. eth-nicity), we included all results, but when they were strati-fied using ordered variables (e.g. grade or social class) wetook the result from the highest and lowest levels only.When papers presented results using multiple exposuremeasures (varying buffer sizes and types, GIS methods,and means of quantifying food outlets), we included thenetwork buffer size closest to 800 m and the ‘density’ vari-able that accounted for the most individual-level variation.When papers presented results of multiple outcomes relatedto weight (BMI, waist circumference, triceps skinfold thick-ness), we used the outcome closest to our primary outcomeof interest (BMI). All of the results (both included and
excluded) have been provided (Supporting InformationAppendixes S3–S5).
Food outlets and body weightTwenty papers looked at the relationship between foodoutlets and body weight. Of the 72 associations (reportedin Table 2), 43 showed a positive relationship betweenbody weight and exposure to food outlets. Nineteen ofthese positive relationships were significant, with most inthe expected direction after adjustments. These includedpositive associations between exposure to fast food outletsand BMI (34,36,38–40), obesity (37) and the proportionof overweight (41,42) or obese (43) students. Positiveassociations were also observed between the presence of‘unhealthy outlets’ (convenience stores and takeaways) andadiposity among girls who walk or cycle to school (33) orconvenience stores and proportion of overweight students(42,44).
Food outlets and food purchasesAlthough three studies reported measuring food purchases,only one paper provided results. He et al. found that highfast food outlet density was positively correlated withstudent report of fast food purchases in the past week andthis was significant (P < 0.05) (45) (see Table 3).
Food outlets and consumption of foods high in fat,sugar or saltTen papers measured associations between food outlets andconsumption of foods high in fat, sugar or salt, the mostcommon of which were sugar-sweetened beverages (n = 6)and ‘fast-food’ (including fried potatoes) (n = 4) or anaggregate variable that took these foods into account) (seeTable 3). In total, 54 associations between these foodsand retail outlets were reported and in about half (n = 28),food outlets were associated with increased consumption.However, only two of these results were significant(P < 0.05); Smith et al. found that unhealthy diet scores(reflecting frequency of consuming crisps, sweets, biscuits,fried food, fizzy drinks) were negatively correlated with theminimum distance to grocery stores and takeaways within800 m (29).
Food outlets and consumption of fruits, vegetables oroverall diet qualityFour papers considered associations between food outletsand fruit and vegetable consumption (see Table 4) (30,39,46,47). A total of 32 associations were reported and inabout half (n = 18), exposure to food outlets was associ-ated with increased consumption of fruit and vegetables.Three of these associations were significant (P < 0.05) andthey all related to fast food outlets. An (46) observed posi-tive association between the presence of fast food outletsand vegetable consumption among adolescents and Davis
obesity reviews Retailing around schools J. Williams et al. 365
© 2014 The Authorsobesity reviews © 2014 International Association for the Study of Obesity 15, 359–374, May 2014

Table 2 Summary of findings: food outlets around schools and student body weight
Author Type of food outlet Outcome Increasesweight?
P < 0.05
Buck 2013 (67) β P valueFRI BMI z score 0.110 0.17 Yes No
Chiang 2011 (38) # within 500 m BMI z score βCS Boys 0.010 Yes NoFF 0.080 Yes YesCS Girls 0.020 Yes NoFF 0.030 Yes No
Currie 2009 (76) FO within 800 m* % obese β SEFFR Ninth graders −0.0391 0.4475 No NoOther 0.4638 0.4881 Yes NoFFR Fifth graders 0.4341 0.1844 Yes YesOther FO 0.2879 0.2312 Yes No
Davis 2009 (39) FO within 800 m* BMI b 95% CIFF 0.10 0.03, 0.16 Yes YesOther FO 0.08 0.01, 0.14 Yes Yes
Gilliland 2012 (34) FO within school walkshed BMI z score Estimate SEFFR 0.073 0.034 Yes YesPresence of CS (school walkshed) 0.020 0.021 Yes No
Grier 2013 (77) Distance Β 95% CIFFR BMI −0.050 −.10, .00 Yes† Yes
Harris 2011 (69) # within 2 km BMI β PRestaurants 0.010 0.31 Yes NoPre-packed food stores 3 × 10⁻⁴ 0.96 Yes NoGrocery stores 0.046 0.53 Yes NoOther stores 0.020 0.78 Yes NoStores overall 0.000 0.66 Yes No
Harrison 2011 (33) School access (high vs. low) FMI for girls B 95% CIHealthy FOs Car, bus or train 0.020 −0.068, 0.110 Yes NoUnhealthy FOs 0.010 −0.107, 0.130 Yes NoHealthy FOs Walk or cycle −0.090 −0.183, −0.006 No NoUnhealthy FOs 0.140 0.009, 0.280 Yes YesRoute to school access (present vs. not)Healthy FOs present Car, bus or train −0.021 −0.104, 0.062 No NoUnhealthy FOs present 0.041 −0.029, 0.110 Yes NoHealthy FOs present Walk or cycle −0.032 0.143, 0.078 No NoUnhealthy FOs present 0.007 −0.068, −0.082 Yes No
Heroux 2012 (65) # within 1 km (ref: 0) OW/obesity OR 95% CIAll FOs (5+) Canada 0.97 0.80, 1.18 No NoCS (5+) 1.00 0.79, 1.26 No NoFFR (5+) 0.81 0.63, 1.06 No NoCafes (3+) 0.79 0.53, 1.21 No NoAll FOs (5+) Scotland 0.89 0.61, 1.29 No NoCS (5+) 1.05 0.61, 1.80 Yes NoFFR (5+) 0.60 0.32, 1.15 No NoCafes (3+) 0.66 0.42, 1.03 No NoAll FOs (5+) United States 1.01 0.84, 1.23 Yes NoCS (5+) 1.11 0.87, 1.40 Yes NoFFR (5+) 0.99 0.81, 1.22 No NoCafes (3+) 0.98 0.66, 1.41 No No
Howard 2011 (44) FO within 800 m % OW β SEFFR −0.010 0.58 No NoCS 0.050 0.59 Yes YesSM −0.010 0.65 No No
366 Retailing around schools J. Williams et al. obesity reviews
© 2014 The Authorsobesity reviews © 2014 International Association for the Study of Obesity15, 359–374, May 2014

(39) observed a negative association between proximity tofast food and fruit or vegetable consumption.
Food outlets and healthy eating indexesThree papers included composite variables that reflectedoverall diet quality (29,37,45) (see Table 4). Of seven asso-
ciations, four were positively correlated with increasedhealthy eating scores. Among these, there were two signifi-cant (P < 0.05) findings. He et al. (35) looked at associa-tions between food outlets around schools and the HEIscore, which reflects overall diet quality, and found thatstudents attending schools with a convenience store or fast
Table 2 Continued
Author Type of food outlet Outcome Increasesweight?
P < 0.05
Langellier 2012 (70) FO within 800 m* % OW β SECorner store or liquor store 1.63 0.61 Yes YesFFR 0.35 0.52 Yes No
Laska 2010 (71) Presence within 800 m β 95% CIAny restaurant BMI z score −0.28 −0.50, −0.07 No Yes
Leatherdale 2011(78)
# within 1 km OW (vs. normal weight) AOR 95% CIGas stations 1.46 0.79, 2.68 Yes NoFFO 0.96 0.82, 1.13 No NoBakeries/doughnut shops 0.89 0.68, 1.15 No NoVariety stores 0.82 0.59, 1.13 No NoGrocery stores 1.10 0.86, 1.42 Yes No
Li 2011 (36) # within 10 min walk (ref: 0) BMI β 95% CIFFR (1) 0.60 −0.02, 1.1 Yes NoFFR (≥2) 0.80 0.1, 1.4 Yes Yes
Nixon 2011 (41) FFR clustering % not within HFZ* Moran’s I index* P value400 m 1.24 P < 0.01 Yes Yes800 m 0.37 P < 0.05 Yes Yes
Park 2013 (37) FO density (low: ref) Obese OR 95% CIMarkets (SM, traditional, FV) 1.04 .99, 1.11 Yes NoStreet vendors, snack bars, CS 0.98 .95,1.01 No NoFFR, doughnuts, ice cream, bakery shops 1.02 1.00,1.04 Yes YesFull-service restaurants 0.99 .98, 1.01 No No
Rossen 2013 (79) FO within 100-m path to school 1 year change b 95% CIHFAI* BMI −0.15 −0.26, −0.13 No Yes
Sánchez 2012 (42) Presence within 800 m % OW APR 95% CIFFR (≥1 vs. 0) 1.02 1.01, 1.03 Yes Yes
White 1.02 1.00, 1.04 Yes YesHispanic 1.02 1.01, 1.03 Yes YesBlack 1.03 1.00, 1.06 Yes YesAsian 0.94 0.91, 0.97 No Yes
CS (per additional FO) 1.01 1.00, 1.01 Yes YesFifth grade 1.01 1.00, 1.02 Yes YesNinth grade 1.00 0.99, 1.01 No No
Schafft 2009 (74) Absence within 10 miles % OW/at risk b SELarge grocery or SM 0.044 0.020 No† Yes
Seliske 2009 (75) Presence within 1 km (ref: 0 vs. high) OW vs. normal OR 95% CIFFR 0.83 0.70, 0.98 No YesSub/sandwich shops 0.78 0.64, 0.93 No YesDoughnut/coffee shops 0.81 0.68, 0.96 No YesTotal FRI 0.70 0.61, 0.81 No Yes
*Approximate: rounded from 1⁄2 mile (804.7 m).†Measure is the distance from food outlet and weight outcome or the absence of food outlet and weight outcome.AOR, adjusted odds ratio; APR, adjusted prevalence ratio; BMI, body mass index; CS, convenience store; FFR, fast food restaurant; FO, food outlet;FRI, food retail index (# of FOs per 1,000 residents); HFAI, healthy food availability index (based on the availability of foods from eight food groupswithin each outlet); HFZ, healthy fitness zone (accounts for school fitness levels and student BMI); IRR, incidence rate ratio; OR, odds ratio;OW, overweight; SE, standard error.
obesity reviews Retailing around schools J. Williams et al. 367
© 2014 The Authorsobesity reviews © 2014 International Association for the Study of Obesity 15, 359–374, May 2014

Table 3 Summary of findings: food outlets around schools and student consumption or purchase of foods high in fat, sugar or salt (HFSS)
Author Type of food outlet Outcome Increasesconsumption
P < 0.05
An 2012 (46) # within 500 m ChildIRR SE
FFR Soda 1.006 0.011 Yes NoHigh-sugar food 0.998 0.008 No NoFast food 0.991 0.01 No No
CS Soda 0.984 0.036 No NoHigh-sugar food 0.986 0.027 No NoFast food 0.987 0.033 No No
Small FO Soda 1.002 0.011 Yes NoHigh-sugar food 0.999 0.007 No NoFast food 1.006 0.009 Yes No
Grocery Soda 1.013 0.039 Yes NoHigh-sugar food 1.022 0.025 Yes NoFast food 1.029 0.035 Yes No
Large SM Soda 0.995 0.035 No NoHigh-sugar food 0.955 0.024 No NoFast food 1.008 0.031 Yes No
AdolescentFFR Soda 0.989 0.011 No No
High-sugar food 1.029 0.016 Yes NoFast food 0.993 0.012 No No
CS Soda 0.984 0.039 No NoHigh-sugar food 1.051 0.055 Yes NoFast food 1.005 0.032 Yes No
Small FO Soda 1.002 0.009 Yes NoHigh-sugar food 1.013 0.015 Yes NoFast food 1.01 0.009 Yes No
Grocery Soda 1.023 0.036 Yes NoHigh-sugar food 0.96 0.047 No NoFast food 1.042 0.043 Yes No
Large SM Soda 1.038 0.039 Yes NoHigh-sugar food 1.033 0.04 Yes NoFast food 1.06 0.036 Yes No
Buck 2013 (67) # per 1,000 people Exp β P valueFRI Junk food* 1.04 0.57 Yes No
Simple sugar food† 0.99 0.87 Yes No
Davis 2009 (39) Proximity # of servings b 95% CIFFR Soda 0.02 −0.01, 0.04 Yes No
Fried potatoes 0 0.02, 0.02 No No
Forsyth 2013 (80) # within 800 m Adjusted weekly frequency Dif P value‡
FFR type BoysTraditional§ 0 1.0
1+ 0.7 0.066 No NoPizza 0 0.9
1+ 0.9 0.998 No NoSandwiches 0 0.8
1+ 0.9 0.341 Yes NoOther 0 1.2
1+ 1.2 0.832 No NoAll types 0 3.6
1–2 43+ 4.4 Yes NoTrend P value** 0.644
GirlsTraditional 0 1.0
1+ 0.9 0.673 No NoPizza 0 0.9
1+ 0.9 0.822 No NoSandwiches 0 0.8
1+ 0.8 0.949 No NoOther 0 1.2
1+ 1.2 0.927 No NoAll types
0 3.61–2 4.33+ 3.2 No NoTrend P value** 0.299
Gebremariam 2012 (30) # within walking distance β SEFOs Snacks −0.193 0.494 No No
SSB −0.002 0.153 No No
368 Retailing around schools J. Williams et al. obesity reviews
© 2014 The Authorsobesity reviews © 2014 International Association for the Study of Obesity15, 359–374, May 2014

food outlet farther than 1 km away had a significantlyhigher HEI score than students with an outlet within 1 km(35). Smith et al. found a positive correlation between dis-tance to grocers and healthy diet scores.
Discussion
Principal findings
This review examined associations between the food envi-ronment around schools and children’s food purchases,consumption or body weight. The methods for definingand measuring the food environment varied widelybetween studies and few consistent findings emerged. Wefound little reported evidence for an effect of the schoolfood environment on food consumption patterns andlimited evidence of an effect on food purchases, but someevidence of an effect on body weight. However, theseresults should be interpreted cautiously. These studies wereobservational and therefore susceptible to confounding.With only two exceptions (from the longitudinal studies ofSmith et al. and Rossen et al.), the evidence base is com-posed almost entirely of cross-sectional data. Measurementbias is likely, particularly with the diet-related outcomes,where misreports have been shown to vary children’scharacteristics (age, sex, weight) and social factors (48).Reporting bias is possible, which is suggested by the factthat several papers reported significant results only.
Strengths and weaknesses
We were unable to assess pooled effects as there were manydefinitions and measures of the food environment sur-rounding schools (6). One strength of this review was thatit provided some focus by honing in on one specific elementof the food environment – the presence of retail foodoutlets in the area surrounding schools. However, thisstrength was also a weakness; this definition does notaccount for all of the other relevant obesogenic environ-ments that a child will encounter over the course of a day(49,50) and it prevented us from considering researchabout the other elements of food access, such as availa-bility, accessibility, affordability and accommodation(5,7,51). The recent review by Caspi et al. provides ahelpful overview of these other influences (5). Additionally,the focused nature of this review kept us from consideringthe environment within retail outlets (e.g. product avail-ability or placement within stores), but another recentreview by Ni Mhurchu et al. suggests that this aspect ofthe food environment is not consistently associated withdietary outcomes (52). As here, methodological heteroge-neity makes it difficult to draw firm conclusions.
As noted earlier, given the heterogeneity of the studiesand the wide range in the number of exposures, outcomesand analyses that individual papers reported, we did notinclude every single result that every paper provided in ouroverall assessment. We used a consistent and transparent
Table 3 Continued
Author Type of food outlet Outcome Increasesconsumption
P < 0.05
Grier 2013 (81) Distance from school β 95% CIFFR Soda −0.01 −.03,.04 Yes** No
Richmond 2013 (73) # within 1,500 m Mediational effect¶ β SEFFR and CS SSB (servings per day) 0.0001 0.001 Yes No
Smith 2013 (29) Distance to school (min) Unhealthy diet β 95% CIGrocer (800 m) −0.001 −0.003, 0.000 Yes** YesTakeaway (800 m) −0.002 −0.004, 0.000 Yes** Yes
Timperio 2009 (32) Access along route to school AOR 95% CI# of FF or TA Consumed ≥1/wk 1 1.0, 1.0 No No
van der Horst 2008 (31) # within 500 m Litres per day βSM Soft drinks 0.077 Yes NoFFR −0.055 No NoSmall food stores −0.259 No Yes
Food outlets and purchases of HFSS foodsHe, 2012 (35) # within 1 km Previous week OR 95% CI
FFR FF purchase 1.4 1.1, 1.7 Yes Yes
*SSB, chocolate, nut-based spreads, crisps, chocolate bars, candies.†Fruit juice, SSB, sugar-added cereals, chocolate, candy, etc.‡Dif P value: difference between those with 0 and those with 1 at P < 0.05; t-test.§Traditional FF: burgers and fries.¶Mediational effect of FO density on association of race/ethnicity and SSB consumption.**Exposure is expressed as distance to food outlet.AOR, adjusted odds ratio; CS, convenience store; FF, fast food; FFR, fast food restaurant; FO, food outlet; FRI, food retail index (# of FOs per 1,000 residents);HFAI, healthy food availability index (based on the availability of foods from eight food groups within each outlet); OR, odds ratio; OW, overweight; SM,supermarket.
obesity reviews Retailing around schools J. Williams et al. 369
© 2014 The Authorsobesity reviews © 2014 International Association for the Study of Obesity 15, 359–374, May 2014
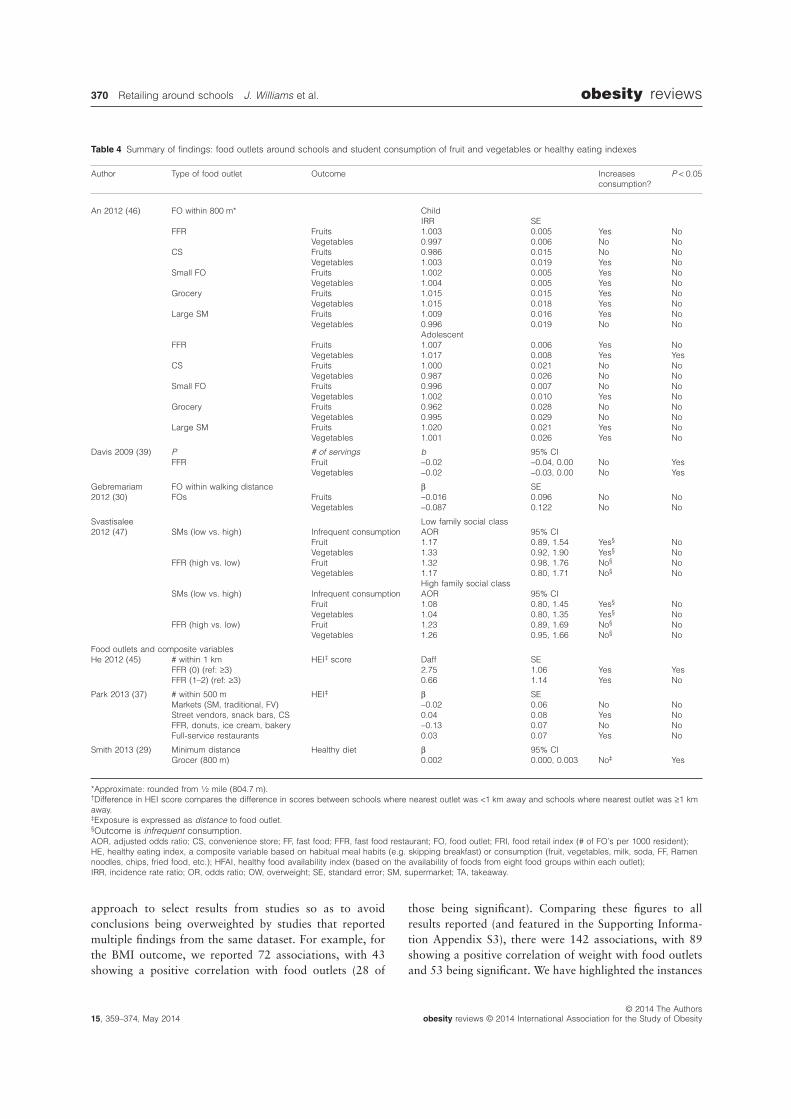
approach to select results from studies so as to avoidconclusions being overweighted by studies that reportedmultiple findings from the same dataset. For example, forthe BMI outcome, we reported 72 associations, with 43showing a positive correlation with food outlets (28 of
those being significant). Comparing these figures to allresults reported (and featured in the Supporting Informa-tion Appendix S3), there were 142 associations, with 89showing a positive correlation of weight with food outletsand 53 being significant. We have highlighted the instances
Table 4 Summary of findings: food outlets around schools and student consumption of fruit and vegetables or healthy eating indexes
Author Type of food outlet Outcome Increasesconsumption?
P < 0.05
An 2012 (46) FO within 800 m* ChildIRR SE
FFR Fruits 1.003 0.005 Yes NoVegetables 0.997 0.006 No No
CS Fruits 0.986 0.015 No NoVegetables 1.003 0.019 Yes No
Small FO Fruits 1.002 0.005 Yes NoVegetables 1.004 0.005 Yes No
Grocery Fruits 1.015 0.015 Yes NoVegetables 1.015 0.018 Yes No
Large SM Fruits 1.009 0.016 Yes NoVegetables 0.996 0.019 No No
AdolescentFFR Fruits 1.007 0.006 Yes No
Vegetables 1.017 0.008 Yes YesCS Fruits 1.000 0.021 No No
Vegetables 0.987 0.026 No NoSmall FO Fruits 0.996 0.007 No No
Vegetables 1.002 0.010 Yes NoGrocery Fruits 0.962 0.028 No No
Vegetables 0.995 0.029 No NoLarge SM Fruits 1.020 0.021 Yes No
Vegetables 1.001 0.026 Yes No
Davis 2009 (39) P # of servings b 95% CIFFR Fruit −0.02 −0.04, 0.00 No Yes
Vegetables −0.02 −0.03, 0.00 No Yes
Gebremariam2012 (30)
FO within walking distance β SEFOs Fruits −0.016 0.096 No No
Vegetables −0.087 0.122 No No
Svastisalee2012 (47)
Low family social classSMs (low vs. high) Infrequent consumption AOR 95% CI
Fruit 1.17 0.89, 1.54 Yes§ NoVegetables 1.33 0.92, 1.90 Yes§ No
FFR (high vs. low) Fruit 1.32 0.98, 1.76 No§ NoVegetables 1.17 0.80, 1.71 No§ No
High family social classSMs (low vs. high) Infrequent consumption AOR 95% CI
Fruit 1.08 0.80, 1.45 Yes§ NoVegetables 1.04 0.80, 1.35 Yes§ No
FFR (high vs. low) Fruit 1.23 0.89, 1.69 No§ NoVegetables 1.26 0.95, 1.66 No§ No
Food outlets and composite variablesHe 2012 (45) # within 1 km HEI‡ score Daff SE
FFR (0) (ref: ≥3) 2.75 1.06 Yes YesFFR (1–2) (ref: ≥3) 0.66 1.14 Yes No
Park 2013 (37) # within 500 m HEI‡ β SEMarkets (SM, traditional, FV) −0.02 0.06 No NoStreet vendors, snack bars, CS 0.04 0.08 Yes NoFFR, donuts, ice cream, bakery −0.13 0.07 No NoFull-service restaurants 0.03 0.07 Yes No
Smith 2013 (29) Minimum distance Healthy diet β 95% CIGrocer (800 m) 0.002 0.000, 0.003 No‡ Yes
*Approximate: rounded from 1⁄2 mile (804.7 m).†Difference in HEI score compares the difference in scores between schools where nearest outlet was <1 km away and schools where nearest outlet was ≥1 kmaway.‡Exposure is expressed as distance to food outlet.§Outcome is infrequent consumption.AOR, adjusted odds ratio; CS, convenience store; FF, fast food; FFR, fast food restaurant; FO, food outlet; FRI, food retail index (# of FO’s per 1000 resident);HE, healthy eating index, a composite variable based on habitual meal habits (e.g. skipping breakfast) or consumption (fruit, vegetables, milk, soda, FF, Ramennoodles, chips, fried food, etc.); HFAI, healthy food availability index (based on the availability of foods from eight food groups within each outlet);IRR, incidence rate ratio; OR, odds ratio; OW, overweight; SE, standard error; SM, supermarket; TA, takeaway.
370 Retailing around schools J. Williams et al. obesity reviews
© 2014 The Authorsobesity reviews © 2014 International Association for the Study of Obesity15, 359–374, May 2014
when there were significant associations that varied fromwhat we reported (either in terms of direction or signifi-cance) in the Supporting Information Appendix. Davis et al.(39) presented associations on the school food environmentand body weight within three buffer sizes: 0–0.25 miles,0.25–0.5 miles and 0.5–0.75 miles. We showed the resultsfrom 0.5 miles, which again were in the same direction ofassociation as the other two buffer sizes, although theassociation between fast food outlets and BMI was notsignificant at the 0.5–0.75 mile area of exposure while it wassignificant at the two smaller sizes. Therefore, choosing topresent the results as we did may have altered our assessmentof the number of associations that are significant comparedto if we had chosen to use the larger buffer. Finally, Currie(43) presented associations with exposure at 0.1, 0.25 and0.5 mile buffers and we presented the latter. For exposure to‘other restaurants’, the results are in the same direction andat the same significance level, but for fast food exposure, theassociations were not significant at the smaller buffer sizes(as they were at the larger size for fifth graders). For dietaryoutcomes, please see the Supporting Information Appendixfor a full list of results and how our inclusion decision mayhave altered the assessment. For example, Svastisalee et al.reported additional analyses assessing interactions betweenfast food and supermarkets and associations with fruit andvegetable consumption according to social class and foundthat children from low and middle social class backgroundsattending schools with high fast food and low supermarketexposure were most likely to report infrequent fruit intake.A final limitation is that despite a comprehensive searchin 10 databases and hand-searching references, we failedto identify one paper that did not have MeSH head-ings attached. Fortunately, this paper was identified by areviewer and it is represented here.
Implications for policy
Overall, this review did not find strong evidence at this timeto support policies aimed at regulating food environmentsaround schools. However, given that food retailing isalready influenced by a number of other policy drivers(related to economics, antisocial behaviour, litter and pol-lution, food hygiene, etc.), it is important that broaderpublic health evidence is also considered. However, it is notpossible to draw conclusions until a higher quality evidencebase is developed.
Implications for research
To improve the quality of the evidence base, future longitu-dinal data are required to account for changes that mayoccur in the food environment over time. As earlier reviewsfound (7), the research has relied on cross-sectional datawith the most common approach to characterizing the retail
food environment in this body of literature being to calculatethe density or proximity of outlets within a buffer usingindirect sources of food outlet data (such as directories orlarge databases). These methods bring up several questionsabout data accuracy and comprehensiveness, especiallygiven that food outlet data are imperfect (53), which mayhave implications for exposure assessment accuracy. Ques-tions also remain about which types of outlets to focus on.Earlier reviews noted a focus on fast food outlets andrecommended that future studies include other types ofoutlets in their exposure measures (7), but we found that amuch wider range of food outlet types were included, such asfast food, convenience stores, grocery stores and supermar-kets. While this may provide a more comprehensive pictureof the retail food environment, it brings up questions aboutthe best way to classify a food outlet and how to compareresults from studies using different classification systems. Toenable between-study comparisons, future work shouldintegrate validated classification systems into the design(54). Future studies should also explore the capacity ofalternative methods for validating exposure data, includingGoogle Street View (55,56).
Additionally, future work should also incorporate achild’s usual mode of travel to and from school into deci-sions about appropriate buffer distances. We found onlythree of the studies in this review accounted for mode oftravel in their final analyses. If buffers are to reflect the realability of children to walk or cycle to school (and hencetheir real exposure to environments), it is important thatstudies account for transport exposure and adjust for activevs. motorized transport as Harrison’s (33) study did. Cap-turing this individual-level data may become easier asadvances in measurement technologies foster a new era of‘people-based’ rather than ‘place-based’ exposure measures(57–59). Promising examples include the use of GPSdevices or interactive mapping tools to capture individualmobility patterns, characterize the individual’s activityspace and then quantify outlets within that space (60–62).The specificity that individual-level measures of exposureto the food environment would allow is vital if we are toaccurately measure what is likely to be a small-effect size.
In addition to improving these GIS-based measures ofthe food environment (e.g. density of food outlets), futurework may benefit from collecting complementary measuresof both qualitative (participant perception-based) andquantitative measures of food access (63).
Future research needs to collect outcome measures thatare appropriate relative to the exposures. For example, allof the papers assessed daily or habitual diet patterns, butthese outcomes cannot be linked to the school food envi-ronment without knowing the time or place of consump-tion, and where the food was originally sourced. Futurestudies concerned with specific environments should collectthis additional contextual information.
obesity reviews Retailing around schools J. Williams et al. 371
© 2014 The Authorsobesity reviews © 2014 International Association for the Study of Obesity 15, 359–374, May 2014

The age range of included studies encompassed bothprimary and secondary school settings and there are poten-tially important theoretical differences regarding how agemay influence a child’s interaction with the food environ-ment as he grows older and develops more autonomy. Thismay lead to differences in travel time, distance travelled,availability of pocket change and other factors.
Another issue related to between-country generali-zability. As Feng noted in his review, most of the associa-tions came from North America, but food environmentsvary between countries (6,64). It was promising to seethat one included study by Heroux et al. (65) looked atbetween-country food environments and outcomes. Futurework is needed to develop standardized tools to monitorlocal food environments across countries (66).
Conclusions
In conclusion, we did not find strong evidence at this timeto justify policies related to regulating the food environ-ments around schools. Our findings may provide sometimely insight to debate about prevention of obesity amongchildren. Future work with longitudinal cohorts and morerefined exposure and outcome measures may lead to higherquality evidence that may inform more effective publichealth interventions. Additionally, these improvements willallow researchers to better understand how this particularcomponent of the food environment in the school neigh-bourhood interacts with other components of a child’senvironment and investigate the effects this may have onobesity risk.
Conflict of interest statement
None declared.
Author contributions
PS was the PI, supervised the data collection and contrib-uted to finalization of the manuscript. NR conducted thekeyword search. JW and AM completed the data extrac-tion. JW drafted the manuscript. AM, CF, GC, NR, PS andMR assisted with writing the manuscript.
Acknowledgements
Funding for the study was provided by the National HealthService (NHS) Berkshire (JW) and the British Heart Foun-dation (PS, AM, GC, CF, MR, JW).
Supporting information
Additional Supporting Information may be found in theonline version of this article, http://dx.doi.org/10.1111/obr.12142
Appendix S1. Medline search termsAppendix S2. Quality assessment of studies assessing therelationship between the school food environment andfood purchase, consumption or body weightAppendix S3. Food outlets around schools and studentbody weight (all results)Appendix S4. Food outlets around schools and studentconsumption or purchase of food high in fat, sugar or salt(HFSS) (all results)Appendix S5. Food outlets around schools and studentconsumption of fruit and vegetables and healthy eatingindexes (all results)*
References
1. Han JC, Lawlor DA, Kimm SYS. Childhood obesity. Lancet2010; 375: 1737–1748.2. Lobstein T, Baur L, Uauy R. Obesity in children and youngpeople: a crisis in public health. Obes Rev 2004; 5: 4–85.3. Egger G, Swinburn B. An ‘ecological’ approach to the obesitypandemic. BMJ 1997; 315: 477–480.4. Holsten JE. Obesity and the community food environment: asystematic review. Public Health Nutr 2009; 12: 397–405.5. Caspi CE, Sorensen G, Subramanian SV, Kawachi I. The localfood environment and diet: a systematic review. Health Place2012; 18: 1172–1187.6. Feng J, Glass TA, Curriero FC, Stewart WF, Schwartz BS. Thebuilt environment and obesity: a systematic review of the epide-miologic evidence. Health Place 2010; 16: 175–190.7. Charreire H, Casey R, Salze P et al. Measuring the food envi-ronment using geographical information systems: a methodologi-cal review. Public Health Nutr 2010; 13: 1773–1785.8. de Vet E, de Ridder DTD, de Wit JBF. Environmental correlatesof physical activity and dietary behaviours among young people: asystematic review of reviews. Obes Rev 2011; 12: e130–e142.9. Caraher M, O’Keefe E, Lloyd S, Madelin T The planningsystem and fast food outlets in London: lessons for health promo-tion practice. Revista Portuguesa de Saúde Pública, 2013.10. Harrison F, Jones AP. A framework for understanding schoolbased physical environmental influences on childhood obesity.Health Place 2012; 18: 639–648.11. Adamson A, Spence S, Reed L et al. School food standards inthe UK: implementation and evaluation. Public Health Nutr 2013;16: 968–981.12. Mitchell C, Cowburn G, Foster C. Assessing the options forlocal government to use legal approaches to combat obesity inthe UK: putting theory into practice. Obes Rev 2011; 12: 660–667.13. Dugan E. Pupils Face Takeaway Ban in Bid to Fight Child-hood Obesity. The Independent: London, 2013.14. Parker L, Burns AC, Sanchez E. Local Government Actions toPrevent Childhood Obesity. National Academies Press: Washing-ton, DC, 2009.15. Model Healthy Food Zone Ordinance. National Policy andLegal Analysis Network to Prevent Childhood Obesity: 2009.16. Coveney J. Residents revolt against planned McDonald’s nearprimary school. The conversation 2012.17. School Food Trust. Barking and Dagenham Council pressrelease: ‘Council defeats hot food takeaway giant at planningappeal’. 2011.18. Healthyplaces. Barking and Dagenham planning policy onnew hot food takeaways ‘Saturation Point’. Case studies: 2011.
372 Retailing around schools J. Williams et al. obesity reviews
© 2014 The Authorsobesity reviews © 2014 International Association for the Study of Obesity15, 359–374, May 2014

19. London Food Board and Chartered Institute of EnvironmentalHealth. Takeaways Toolkit. A London Food Board and CharteredInstitute of Environmental Health Publication Based on a Consul-tancy Report by Food Matters, London, 2012.20. Public Health England. Healthy people, healthy places brief-ing. Obesity and the environment: regulating the growth of fastfood outlets. In: Chartered Institute of Environmental Health,Local Government Association (ed.). Obesity and the Environ-ment Briefing: regulating the Growth of Fast Food Oultets. PublicHealth England: London, 2013, pp. 1–11.21. Fleischhacker SE, Evenson KR, Rodriguez DA, AmmermanAS. A systematic review of fast food access studies. Obes Rev2011; 12: e460–e471.22. Leal C, Chaix B. The influence of geographic life environmentson cardiometabolic risk factors: a systematic review, a methodo-logical assessment and a research agenda. Obes Rev 2011; 12:217–230.23. Williams AJ, Wyatt KM, Hurst AJ, Williams CA. A systematicreview of associations between the primary school built environ-ment and childhood overweight and obesity. Health Place 2012;18: 504–514.24. Sallis JF, Prochaska JJ, Taylor WC. A review of correlates ofphysical activity of children and adolescents. Med Sci Sports Exerc2000; 32: 963–975.25. Dunton GF, Kaplan J, Wolch J, Jerrett M, Reynolds KD.Physical environmental correlates of childhood obesity: a system-atic review. Obes Rev 2009; 10: 393–402.26. Zaza S, Wright-De Agüero LK, Briss PA et al. Data collectioninstrument and procedure for systematic reviews in the guide tocommunity preventive services. Am J Prev Med 2000; 18: 44–74.27. Kmet LMLR, Cook LS. Standard Quality Assessment Criteriafor Evaluating Primary Research Papers from a Variety of Fields.Alberta Heritage Foundation for Medical Research (AHFMR):Edmonton, 2004.28. Rossen LM, Curriero FC, Cooley-Strickland M, Pollack KM.Food availability en route to school and anthropometric change inurban children. J Urban Health 2013; 90: 653–666.29. Smith D, Cummins S, Clark C, Stansfeld S. Does the local foodenvironment around schools affect diet? Longitudinal associationsin adolescents attending secondary schools in East London. BMCPublic Health 2013; 13: 70.30. Gebremariam MK, Andersen LF, Bjelland M et al. Does theschool food environment influence the dietary behaviours of Nor-wegian 11-year-olds? The HEIA study. Scand J Public Health2012; 40: 491–497.31. van der Horst K, Timperio A, Crawford D, Roberts R, Brug J,Oenema A. The school food environment: associations with ado-lescent soft drink and snack consumption. Am J Prev Med 2008;35: 217–223.32. Timperio AF, Ball K, Roberts R, Andrianopoulos N,Crawford DA. Children’s takeaway and fast-food intakes: asso-ciations with the neighbourhood food environment. Public HealthNutr 2009; 12: 1960–1964.33. Harrison F, Jones AP, van Sluijs EM, Cassidy A, Bentham G,Griffin SJ. Environmental correlates of adiposity in 9–10 year oldchildren: considering home and school neighbourhoods and routesto school. Soc Sci Med 2011; 72: 1411–1419.34. Gilliland JA, Rangel CY, Healy MA et al. Linking childhoodobesity to the built environment: a multi-level analysis of homeand school neighbourhood factors associated with body massindex. Can J Public Health Revue Canadienne de Sante Publique2012; 103: eS15–eS21.35. He M, Tucker P, Irwin JD, Gilliland J, Larsen K, Hess P.Obesogenic neighbourhoods: the impact of neighbourhood restau-
rants and convenience stores on adolescents’ food consumptionbehaviours. Public Health Nutr 2012; 15: 2331–2339.36. Li M, Dibley MJ, Yan H. School environment factors wereassociated with BMI among adolescents in Xi’an City, China.BMC Public Health 2011; 11: 792.37. Park S, Choi BY, Wang Y, Colantuoni E, Gittelsohn J. Schooland neighborhood nutrition environment and their associationwith students’ nutrition behaviors and weight status in Seoul,South Korea. J Adolesc Health 2013; 53: 655–662, e12.38. Chiang P-H, Wahlqvist ML, Lee M-S, Huang L-Y, Chen H-H,Huang ST-Y. Fast-food outlets and walkability in schoolneighbourhoods predict fatness in boys and height in girls: aTaiwanese population study. Public Health Nutr 2011; 14: 1601–1609.39. Davis B, Carpenter C. Proximity of fast-food restaurants toschools and adolescent obesity. Am J Public Health 2009; 99:505–510.40. Grier S, Davis B. Are all proximity effects created equal? Fastfood near schools and body weight among diverse adolescents.J Public Policy Mark 2013; 32: 116–128.41. Nixon H, Doud L. Do fast food restaurants cluster aroundhigh schools? A geospatial analysis of proximity of fast foodrestaurants to high schools and the connection to childhoodobesity rates. J Agric, Food Syst Community Dev 2011; 2: 181–194.42. Sánchez BN, Sanchez-Vaznaugh EV, Uscilka A, Baek J, ZhangL. Differential associations between the food environment nearschools and childhood overweight across race/ethnicity, gender,and grade. Am J Epidemiol 2012; 175: 1284–1293.43. Currie J, DellaVigna S, Moretti E, Pathania V. The effect offast food restaurants on obesity and weight gain. Am Econ J-EconPolicy 2010; 2: 32–63.44. Howard PH, Fitzpatrick M, Fulfrost B. Proximity of foodretailers to schools and rates of overweight ninth grade students:an ecological study in California. BMC Public Health 2011; 11:68.45. He M, Tucker P, Gilliland J, Irwin JD, Larsen K, Hess P. Theinfluence of local food environments on adolescents’ food purchas-ing behaviors. Int J Environ Res Public Health [Electron Resour]2012; 9: 1458–1471.46. An R, Sturm R. School and residential neighborhood foodenvironment and diet among California youth. Am J Prev Med2012; 42: 129–135.47. Svastisalee CM, Holstein BE, Due P. Fruit and vegetableintake in adolescents: association with socioeconomic status andexposure to supermarkets and fast food outlets. J Nutr Metab2012; 2012: 185484.48. Börnhorst C, Huybrechts I, Ahrens W et al. Prevalence anddeterminants of misreporting among European children in proxy-reported 24 h dietary recalls. Br J Nutr 2012; 1: 1–9.49. Matthews SA (ed). Spatial polygamy and the heterogeneity ofplace: studying people and place via egocentric methods. In: Com-munities, Neighborhoods, and Health. Springer: New York, NY,2011, pp. 35–55.50. Cummins S. Commentary: investigating neighbourhoodeffects on health – avoiding the ‘Local Trap’. Int J Epidemiol 2007;36: 355–357.51. Penchansky R, Thomas JW. The concept of access: definitionand relationship to consumer satisfaction. Med Care 1981; 19:127–140.52. Ni Mhurchu C, Vandevijver S, Waterlander W et al. Monitor-ing the availability of healthy and unhealthy foods and non-alcoholic beverages in community and consumer retail foodenvironments globally. Obes Rev 2013; 14: 108–119.
obesity reviews Retailing around schools J. Williams et al. 373
© 2014 The Authorsobesity reviews © 2014 International Association for the Study of Obesity 15, 359–374, May 2014

53. Cummins S, Macintyre S. Are secondary data sources onthe neighbourhood food environment accurate? Case-study inGlasgow, UK. Prev Med 2009; 49: 527–528.54. Lake AA, Burgoine T, Greenhalgh F, Stamp E, Tyrrell R. Thefoodscape: classification and field validation of secondary datasources. Health Place 2010; 16: 666–673.55. Rundle AG, Bader MD, Richards CA, Neckerman KM, TeitlerJO. Using Google Street View to audit neighborhood environ-ments. Am J Prev Med 2011; 40: 94–100.56. Miller DK. Using Google Street View to audit the built envi-ronment: inter-rater reliability results. Anns Behav Med 2013; 45:108–112.57. Rainham D, McDowell I, Krewski D, Sawada M. Conceptu-alizing the healthscape: contributions of time geography, locationtechnologies and spatial ecology to place and health research. SocSci Med 2010; 70: 668–676.58. Kwan M-P. From place-based to people-based exposure meas-ures. Soc Sci Med 2009; 69: 1311–1313.59. Doherty AR, Hodges SE, King AC et al. Wearable cameras inhealth: the state of the art and future possibilities. Am J Prev Med2013; 44: 320–323.60. Gustafson A, Christian J, Lewis S, Moore K. Jilcott S. Foodvenue choice, consumer food environment, but not food venueavailability within daily travel patterns are associated with dietaryintake among adults, Lexington Kentucky 2011. Nutr J 2013; 12:17.61. Zenk SN, Schulz AJ, Matthews SA et al. Activity space envi-ronment and dietary and physical activity behaviors: a pilot study.Health Place 2011; 17: 1150–1161.62. Chaix B, Kestens Y, Perchoux C, Karusisi N, Merlo J, LabadiK. An interactive mapping tool to assess individual mobility pat-terns in neighborhood studies. Am J Prev Med 2012; 43: 440–450.63. Moore LV, Roux AVD, Brines S. Comparing perception-basedand geographic information system (GIS)-based characterizationsof the local food environment. J Urban Health 2008; 85: 206–216.64. Cummins S, Macintyre S. Food environments and obesity –neighbourhood or nation? Int J Epidemiol 2006; 35: 100–104.65. Heroux M, Iannotti RJ, Currie D, Pickett W, Janssen I. Thefood retail environment in school neighborhoods and its relationto lunchtime eating behaviors in youth from three countries.Health Place 2012; 18: 1240–1247.66. Thornton L, Cameron A, McNaughton S et al. Does the avail-ability of snack foods in supermarkets vary internationally? Int JBehav Nutr Phys Act 2013; 10: 56.67. Buck C, Bornhorst C, Pohlabeln H et al. Clustering ofunhealthy food around German schools and its influence ondietary behavior in school children: a pilot study. Int J Behav NutrPhys Act 2013; 10: 65.
68. Forsyth A, Wall M, Larson N, Story M, Neumark-Sztainer D.Do adolescents who live or go to school near fast-food restaurantseat more frequently from fast-food restaurants? Health Place2012; 18: 1261–1269.69. Harris DE, Blum JW, Bampton M et al. Location of foodstores near schools does not predict the weight status of Mainehigh school students. J Nutr Educ Behav 2011; 43: 274–278.70. Langellier BA. The food environment and student weightstatus, Los Angeles County, 2008–2009. Prev Chronic Dis 2012;9: E61.71. Laska MN, Hearst MO, Forsyth A, Pasch KE, Lytle L. Neigh-bourhood food environments: are they associated with adolescentdietary intake, food purchases and weight status? Public HealthNutr 2010; 13: 1757.72. Leatherdale ST, Pouliou T, Church D, Hobin E. The associa-tion between overweight and opportunity structures in the builtenvironment: a multi-level analysis among elementary schoolyouth in the PLAY-ON study. Int J Public Health 2011; 56: 237–246.73. Richmond TK, Spadano-Gasbarro JL, Walls CE et al. Middleschool food environments and racial/ethnic differences in sugar-sweetened beverage consumption: findings from the HealthyChoices study. Prev Med 2013; 57: 735–738.74. Schafft KA, Jensen EB, Hinrichs CC. Food deserts and over-weight schoolchildren: evidence from Pennsylvania. Rural Sociol2009; 74: 153–177.75. Seliske LM, Pickett W, Boyce WF, Janssen I. Associationbetween the food retail environment surrounding schools andoverweight in Canadian youth. Public Health Nutr 2009; 12:1384–1391.76. Currie, J., DellaVigna, S., Moretti, E., Pathania, V. The Effectof Fast Food Restaurants on Obesity and Weight Gain (No.w14721). National Bureau of Economic Research, 2009.77. Grier S, Davis B. Are All Proximity Effects Created Equal?Fast Food Near Schools and Body Weight Among Diverse Adoles-cents. J Public Policy Mark 2013; 32, 116–128.78. Leatherdale ST, Pouliou T, Church D, Hobin E. The associa-tion between overweight and opportunity structures in the builtenvironment: a multi-level analysis among elementary schoolyouth in the PLAY-ON study. Int J of Public Health 2011, 56:237–246.79. Rossen LM, Curriero FC, Cooley-Strickland M, Pollack KM.Food availability en route to school and anthropometric change inurban children. J Urban Health 2013; 90: 653–666.80. Forsyth A, Wall M, Larson N, Story M, Neumark-Sztainer D.Do adolescents who live or go to school near fast-food restaurantseat more frequently from fast-food restaurants?. Health Place2012; 18: 1261–1269.81. Grier, S., & Davis, B. Are all proximity effects created equal?Fast food near schools and body weight among diverse adoles-cents. J Public Policy Mark 2013; 32: 116–128.
374 Retailing around schools J. Williams et al. obesity reviews
© 2014 The Authorsobesity reviews © 2014 International Association for the Study of Obesity15, 359–374, May 2014