ISSN 2303-1174 Alfian R.H. Tanawal. Johan Tumiwa ...
12
ISSN 2303-1174 Alfian R.H. Tanawal. Johan Tumiwa. Analysis of Financial… Jurnal EMBA 697 Vol.2 No.3 September 2014, Hal. 697-708 ANALYSIS OF FINANCIAL PERFORMANCE BEFORE AND AFTER SPIN-OFF IN PT. BNI (PERSERO) TBK by Alfian Ryan Henry Tanawal 1 Johan Tumiwa 2 1,2, Faculty of Economics and Business International Business Administration (IBA), Management Program University of Sam Ratulangi Manado email: 1 [email protected] 2 [email protected] ABSTRACT Many company must have the own competitive advantage in order to survive in its environment, actually after the global economic crisis. To keep survive and living in that global competition, commonly every company has built their own strategies as well as gather a profit maximization. Over the past decade, merger, acquisition, spin-off and other forms of expansion in operations have declined sharply, and many conglomerates have resorted to downsizing and focusing their businesses on their core competencies Some corporate take the spin-off decision to gain the more benefit. The purpose of this research is to analyze whether there is significant difference on financial performance of PT. BNI Tbk (Persero) before and after spin-off with PT. BNI Syariah in 2010. This research is comparative study. This current research has used judgment sampling method. This research concern on BNI spin-off in 2010, and then the research needs three years data before and three years data after 2010. The Paired Samples T-Test is deployed to accomplish the research’s objectives. From nine variables that have been tested with this research’s tools, six of those variables show the significant different after BNI did spin-off, and three of them show there is no significant different. PT. BNI Tbk (Persero) should concern about a spin-off policy, since there is a significant difference on ROA, ROE, current ratio, CAR, OEOI and EPS before and after spin-off. Keywords: spin-off, financial, fundamental factor INTRODUCTION Research Background The global economic crisis that happened in year 2008 actually began from economic crisis in United States and then spread to the other countries around the world, including Indonesia. Economic crisis in United States began from the over willingness of consumption. The most American people live in consumerism lifestyle that beyond the limits of their own income. They live in debt, spending with credit cards, and mortgages. As a result, financial institutions those provide credit going bankrupt because of loss of liquidity, because the debt of the company to creditors housing has been mortgaged to the lending institution. At the end these companies went bankrupt because they could not pay all of their debts those have the due date at the same time. In that time the economic crisis of United States became the global economic crisis because of many countries are relied on United States economic, such as investors, foreign exchanges and the important one is export. Therefore, Indonesia also got the impact of the global economic crisis. At fact, our country still depended on the flow of funds from foreign investors, with the global crisis in 2008 made foreign investors took away their funds from Indonesia. That made the value of rupiah currency collapsed. The flow of foreign funds had to be used for economic development and for running the companies disappear suddenly. Many companies in Indonesia become powerless at that time, in the end our country had to bear back bank debt and private companies. Therefore United States and any financial market has impact from this financial crisis
-
Upload
khangminh22 -
Category
Documents
-
view
0 -
download
0
Transcript of ISSN 2303-1174 Alfian R.H. Tanawal. Johan Tumiwa ...

ISSN 2303-1174 Alfian R.H. Tanawal. Johan Tumiwa. Analysis of Financial…
Jurnal EMBA 697 Vol.2 No.3 September 2014, Hal. 697-708
ANALYSIS OF FINANCIAL PERFORMANCE BEFORE AND AFTER SPIN-OFF IN
PT. BNI (PERSERO) TBK
by
Alfian Ryan Henry Tanawal1
Johan Tumiwa2
1,2,Faculty of Economics and Business
International Business Administration (IBA), Management Program
University of Sam Ratulangi Manado
email: [email protected]
ABSTRACT
Many company must have the own competitive advantage in order to survive in its environment, actually
after the global economic crisis. To keep survive and living in that global competition, commonly every
company has built their own strategies as well as gather a profit maximization. Over the past decade, merger,
acquisition, spin-off and other forms of expansion in operations have declined sharply, and many conglomerates
have resorted to downsizing and focusing their businesses on their core competencies Some corporate take the
spin-off decision to gain the more benefit. The purpose of this research is to analyze whether there is significant
difference on financial performance of PT. BNI Tbk (Persero) before and after spin-off with PT. BNI Syariah in
2010. This research is comparative study. This current research has used judgment sampling method. This
research concern on BNI spin-off in 2010, and then the research needs three years data before and three years
data after 2010. The Paired Samples T-Test is deployed to accomplish the research’s objectives. From nine
variables that have been tested with this research’s tools, six of those variables show the significant different
after BNI did spin-off, and three of them show there is no significant different. PT. BNI Tbk (Persero) should
concern about a spin-off policy, since there is a significant difference on ROA, ROE, current ratio, CAR, OEOI
and EPS before and after spin-off.
Keywords: spin-off, financial, fundamental factor
INTRODUCTION
Research Background
The global economic crisis that happened in year 2008 actually began from economic crisis in United
States and then spread to the other countries around the world, including Indonesia. Economic crisis in United
States began from the over willingness of consumption. The most American people live in consumerism
lifestyle that beyond the limits of their own income. They live in debt, spending with credit cards, and
mortgages. As a result, financial institutions those provide credit going bankrupt because of loss of liquidity,
because the debt of the company to creditors housing has been mortgaged to the lending institution. At the end
these companies went bankrupt because they could not pay all of their debts those have the due date at the same
time.
In that time the economic crisis of United States became the global economic crisis because of many
countries are relied on United States economic, such as investors, foreign exchanges and the important one is
export. Therefore, Indonesia also got the impact of the global economic crisis. At fact, our country still
depended on the flow of funds from foreign investors, with the global crisis in 2008 made foreign investors took
away their funds from Indonesia. That made the value of rupiah currency collapsed. The flow of foreign funds
had to be used for economic development and for running the companies disappear suddenly. Many companies
in Indonesia become powerless at that time, in the end our country had to bear back bank debt and private
companies. Therefore United States and any financial market has impact from this financial crisis

ISSN 2303-1174 Alfian R.H. Tanawal. Johan Tumiwa. Analysis of Financial…
698 Jurnal EMBA Vol.2 No.3 September 2014, Hal. 697-708
Over the past decade, merger, acquisition, and other forms of expansion in operations have declined
sharply, and many conglomerates have resorted to downsizing and focusing their businesses on their core
competencies (Bhana, 2004). Those strategies are the ways how company to keep survive in global competition.
There is also one strategy that can be used; it is called “Spin-off”.
This study will discuss more about the corporate spin off, actually will analyze the main reason why the
company want to take the spin off decision, by give the evidence data from company before and after it spin-off.
The object of this research is BNI before and after spin off with BNI Syariah. The spin off was part of BNI’s
strategy in response to external and internal factors. At June 19th 2010, BNI officially launch PT Bank BNI
Syariah as an independent entity, following the spinoff of Syariah Business unit from BNI. However company
need to show the good report to the world and their customers about the condition after they did spinoff.
Research Objective
The objectives of this research are to analyze the difference on: ROA, ROE, current ratio, NIM, CAR,
CIR, OEOI, LDR, and EPS of PT. BNI Tbk before and after spin-off with PT. BNI Syariah in 2010
THEORETICAL FRAMEWORK
Finance
Paramasivan and Subramanian (2009:17) defined finance has the meaning about the way of manage
money. It includes financial service and financial instruments. Finance also is referred as the provision of
money at the time when it is needed. Finance has a function procurement of funds and their effective utilization
in business concerns. There are several concepts of finance such as capital, funds, money, and amount. Each
word is having unique meaning. Brigham and Houston (2010:11) said finance has many facets, which makes it
difficult to provide a clear and concise definition. Finance grew out of economics and accounting.
Financial Management
Financial management, also called corporate finance, focuses on decisions relating to how much and what
types of assets to acquire, how to raise the capital need to buy assets, and how to run the firm so as to maximize
its value. The same principles apply to both for profit a non-for-profit organization (Brigham and Houston,
2010). Paramasivan and Subramanian (2009:22) stated financial management is mainly concerned with the
effective funds management in the business. In simple words, Financial Management as practiced by business
firms can be called as Corporation Finance or Business Finance.
Financial Statement
A financial statement is an official document of the firm, which explores the entire financial information
of the firm. The main aim of the financial statement is to provide information and understand the financial
aspects of the firm. Hence, preparation of the financial, statement is important as much as the financial decisions
(Paramasivan and Subramanian, 2009:23)
Financial Fundamental Factors
Paramasivan and Subramanian (2009:37) said ratio analysis is a commonly used tool of financial
statement analysis. Ratio is a mathematical relationship between one numbers to another number. Ratio is used
as an index for evaluating the financial performance of the business concern. An accounting ratio shows the
mathematical relationship between two figures, which have meaningful relation with each other.
Spin-Off
Brigham and Houston (2010:58) stated that in a spin-off, the firm’s existing stockholders are given new
stock representing separate ownership rights in the division that was divested. The division establishes its own
board of directors and officers, and it becomes a separate company. The stockholders end up owning shares of
two firms instead of one, but no cash has been transferred. Jongbloed (2004) corporate spin-offs are important
corporate restructurings that are associated with significant positive abnormal stock returns at their
announcement. A spin-off separates diverse units of the firm and results in two companies that have dissimilar
assets.
ISSN 2303-1174 Alfian R.H. Tanawal. Johan Tumiwa. Analysis of Financial…
Jurnal EMBA 699 Vol.2 No.3 September 2014, Hal. 697-708
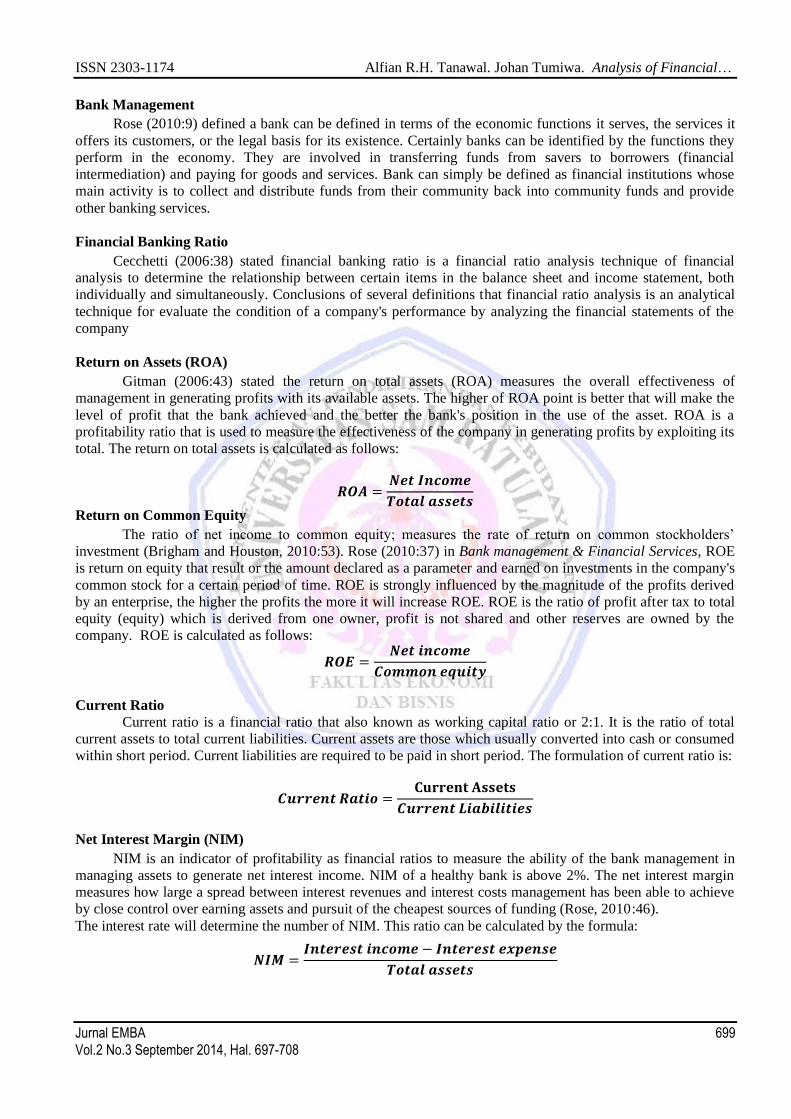
Bank Management
Rose (2010:9) defined a bank can be defined in terms of the economic functions it serves, the services it
offers its customers, or the legal basis for its existence. Certainly banks can be identified by the functions they
perform in the economy. They are involved in transferring funds from savers to borrowers (financial
intermediation) and paying for goods and services. Bank can simply be defined as financial institutions whose
main activity is to collect and distribute funds from their community back into community funds and provide
other banking services.
Financial Banking Ratio
Cecchetti (2006:38) stated financial banking ratio is a financial ratio analysis technique of financial
analysis to determine the relationship between certain items in the balance sheet and income statement, both
individually and simultaneously. Conclusions of several definitions that financial ratio analysis is an analytical
technique for evaluate the condition of a company's performance by analyzing the financial statements of the
company
Return on Assets (ROA)
Gitman (2006:43) stated the return on total assets (ROA) measures the overall effectiveness of
management in generating profits with its available assets. The higher of ROA point is better that will make the
level of profit that the bank achieved and the better the bank's position in the use of the asset. ROA is a
profitability ratio that is used to measure the effectiveness of the company in generating profits by exploiting its
total. The return on total assets is calculated as follows:
𝑹𝑶𝑨 =𝑵𝒆𝒕 𝑰𝒏𝒄𝒐𝒎𝒆
𝑻𝒐𝒕𝒂𝒍 𝒂𝒔𝒔𝒆𝒕𝒔
Return on Common Equity
The ratio of net income to common equity; measures the rate of return on common stockholders’
investment (Brigham and Houston, 2010:53). Rose (2010:37) in Bank management & Financial Services, ROE
is return on equity that result or the amount declared as a parameter and earned on investments in the company's
common stock for a certain period of time. ROE is strongly influenced by the magnitude of the profits derived
by an enterprise, the higher the profits the more it will increase ROE. ROE is the ratio of profit after tax to total
equity (equity) which is derived from one owner, profit is not shared and other reserves are owned by the
company. ROE is calculated as follows:
𝑹𝑶𝑬 =𝑵𝒆𝒕 𝒊𝒏𝒄𝒐𝒎𝒆
𝑪𝒐𝒎𝒎𝒐𝒏 𝒆𝒒𝒖𝒊𝒕𝒚
Current Ratio
Current ratio is a financial ratio that also known as working capital ratio or 2:1. It is the ratio of total
current assets to total current liabilities. Current assets are those which usually converted into cash or consumed
within short period. Current liabilities are required to be paid in short period. The formulation of current ratio is:
𝑪𝒖𝒓𝒓𝒆𝒏𝒕 𝑹𝒂𝒕𝒊𝒐 =𝐂𝐮𝐫𝐫𝐞𝐧𝐭 𝐀𝐬𝐬𝐞𝐭𝐬
𝑪𝒖𝒓𝒓𝒆𝒏𝒕 𝑳𝒊𝒂𝒃𝒊𝒍𝒊𝒕𝒊𝒆𝒔
Net Interest Margin (NIM)
NIM is an indicator of profitability as financial ratios to measure the ability of the bank management in
managing assets to generate net interest income. NIM of a healthy bank is above 2%. The net interest margin
measures how large a spread between interest revenues and interest costs management has been able to achieve
by close control over earning assets and pursuit of the cheapest sources of funding (Rose, 2010:46).
The interest rate will determine the number of NIM. This ratio can be calculated by the formula:
𝑵𝑰𝑴 =𝑰𝒏𝒕𝒆𝒓𝒆𝒔𝒕 𝒊𝒏𝒄𝒐𝒎𝒆 − 𝑰𝒏𝒕𝒆𝒓𝒆𝒔𝒕 𝒆𝒙𝒑𝒆𝒏𝒔𝒆
𝑻𝒐𝒕𝒂𝒍 𝒂𝒔𝒔𝒆𝒕𝒔

ISSN 2303-1174 Alfian R.H. Tanawal. Johan Tumiwa. Analysis of Financial…
700 Jurnal EMBA Vol.2 No.3 September 2014, Hal. 697-708
Capital Adequacy Ratio (CAR)
Cecchetti (2006:32) stated definition of the Capital Adequacy Ratio (CAR) is the ratio between capital
and Risk Weighted Assets (RWA) and this ratio is used as a measure of capital adequacy. Rose (2010:47) said
capital is one of the important factors in development of business and accommodates the risk of loss, the higher
CAR, the stronger the ability of these banks separately bear the risk of any credit / productive assets at risk. If
the value of high CAR (based on BI’s standard 8%) means that the bank is able to finance the operations of the
bank, the bank favorable state will contribute significantly to the profitability. CAR is measured as follows:
𝑪𝑨𝑹 =𝑶𝒘𝒏 𝒄𝒂𝒑𝒊𝒕𝒂𝒍
𝑹𝒊𝒔𝒌 𝑾𝒆𝒊𝒈𝒉𝒕𝒆𝒅 𝑨𝒔𝒔𝒆𝒕𝒔 (𝑹𝑾𝑨)
Cost Income Ratio (CIR)
A popular measure for productivity and efficiency in banking is the Cost Income Ratio (CIR).
Productivity and efficiency in banks is mostly based on the Cost Income Ratio (CIR), which is also known as
efficiency ratio. Even though the predication power of the CIR is not clear at all, this ratio is widely regarded as
a yardstick when comparing productivity and efficiency of banks (Burger, 2008)
The formula is:
𝑪𝑰𝑹 = 𝑪𝒐𝒔𝒕
𝑰𝒏𝒄𝒐𝒎𝒆
Operating Expense to Operating Income (OEOI)
OEOI is a group of financial ratios that measure operational efficiency and effectiveness of a company
by comparing one against the others. The various amount of income from income statement and balance sheet
figures. OEOI ratio is the ratio between operating expenses and operating income. This ratio is used to measure
the level of efficiency and ability to conduct operations in the tub (Tugas, 2012). The lower OEOI of the bank
means more efficient in controlling operational costs, with the cost efficiency of bank profits will be even
greater. The calculation of OEOI ratio is:
𝑶𝑬𝑶𝑰 = 𝒐𝒑𝒆𝒓𝒂𝒕𝒊𝒏𝒈 𝒆𝒙𝒑𝒆𝒏𝒔𝒆𝒔
𝒐𝒑𝒆𝒓𝒂𝒕𝒊𝒏𝒈 𝒊𝒏𝒄𝒐𝒎𝒆
Loan Deposit Ratio (LDR)
Loan to Deposit Ratio (LDR) is a ratio that measures a bank's ability to fulfill the financial obligations
that must be met. Obligations in the form of call money that must be met at the time the obligation of clearing,
where fulfillment is carried out of the current assets of the company (Rose, 2009:28).
𝑳𝑫𝑹 = 𝑳𝒐𝒂𝒏 𝒈𝒊𝒗𝒆𝒏
𝑭𝒖𝒏𝒅𝒔 𝒓𝒆𝒄𝒆𝒊𝒗𝒆𝒅
Earnings per Share (EPS)
The firm’s earnings per share (EPS) are generally of interest to present of prospective stockholders and
management. EPS represents the number of dollar earned during the period on behalf of each outstanding share
of common stock (Gitman, 2006:52). Earnings per share are calculated as follows:
Earnings per share =𝑵𝒆𝒕 𝒊𝒏𝒄𝒐𝒎𝒆
𝑵𝒖𝒎𝒃𝒆𝒓 𝒐𝒇 𝒔𝒉𝒂𝒓𝒆𝒔 𝒐𝒇 𝒄𝒐𝒎𝒎𝒐𝒏 𝒔𝒕𝒐𝒄𝒌 𝒐𝒖𝒕𝒔𝒕𝒂𝒏𝒅𝒊𝒏𝒈
Previous Research
Jongbloed (2004) explores implications for the organization and optimal corporate policies of these new
firms. The impossibility to implement these dissimilar optimal policies in the original firm likely has aggravated
the problems leading to the spin-off. Bhana (2004) stated that value created by spin-offs was measured by the
long-term portfolio performance of parents firms and their spin-offs. Chemmanura and Yan (2003) stated that
spin-offs will be associated with positive announcement effects and increases in long-term operating
performance. Further, certain categories of spin-off will exhibit long-term positive abnormal stock returns.

ISSN 2303-1174 Alfian R.H. Tanawal. Johan Tumiwa. Analysis of Financial…
Jurnal EMBA 701 Vol.2 No.3 September 2014, Hal. 697-708
Research Hypothesis
There is significant difference on:
H1 : ROA of PT. BNI Tbk before and after spinoff with PT. BNI Syariah in 2010
H2 : ROE of PT. BNI Tbk before and after spinoff with PT. BNI Syariah in 2010
H3 : Current Ratio of PT. BNI Tbk before and after spinoff with PT. BNI Syariah in 2010
H4 : NIM of PT. BNI Tbk before and after spinoff with PT. BNI Syariah in 2010
H5 : CAR of PT. BNI Tbk before and after spinoff with PT. BNI Syariah in 2010
H6 : CIR of PT. BNI Tbk before and after spinoff with PT. BNI Syariah in 2010
H7 : OEOI of PT. BNI Tbk before and after spinoff with PT. BNI Syariah in 2010
H8 : LDR of PT. BNI Tbk before and after spinoff with PT. BNI Syariah in 2010
H9 : EPS of PT. BNI Tbk before and after spinoff with PT. BNI Syariah in 2010
Conceptual Framework
Figure 1. Conceptual Framework
Source: Theoretical Review
RESEARCH METHOD
Type of Research
This research is comparative study, because the purpose is to analyze and compare the data before and
after company spin-off. This research used a quantitative approach with secondary data from company’s annual
reports as the analysis tools. The purpose of this research is to analyze the difference on financial performance
of PT. BNI before and after spin-off with PT. BNI Syariah in 2010.
Place and Time of Research
The study was conducted to BNI in Indonesia. PT. BNI is the one of company in Indonesia that did spin-
off, so that is suitable to make that company as the subject of this research. The objects of this research are
provided in BNI’s annual reports. The researcher analyses the annual reports started from June 2014.
Population and Sample
Population is the entire group of people, events or things of interest that the researcher wishes to
investigate. It is the group of people, events, or things of interest for which the researcher wants to make
inferences (Sekaran and Bougie 2009:46). Population in this research is the annual report each year of PT.BNI,
which had annual reports from year 2001 until 2013 on its official website. This research has used judgment
sampling method. The sample of this research will be financial report from year 2007, 2008 and 2009 (before or
pre event), and; 2011, 2012 and 2013 (after or post event). Those data are taken from the official website of PT.
BNI Tbk.
PT. BNI before spin-off
with PT. BNI Syariah
PT. BNI after spin-off
with PT. BNI Syariah
Financial Ratios:
1. Current ratio
2. ROA
3. ROE
4. NIM
5. CAR
6. CIR
7. OEOI
8. LDR
9. EPS (Rp)
ISSN 2303-1174 Alfian R.H. Tanawal. Johan Tumiwa. Analysis of Financial…
702 Jurnal EMBA Vol.2 No.3 September 2014, Hal. 697-708
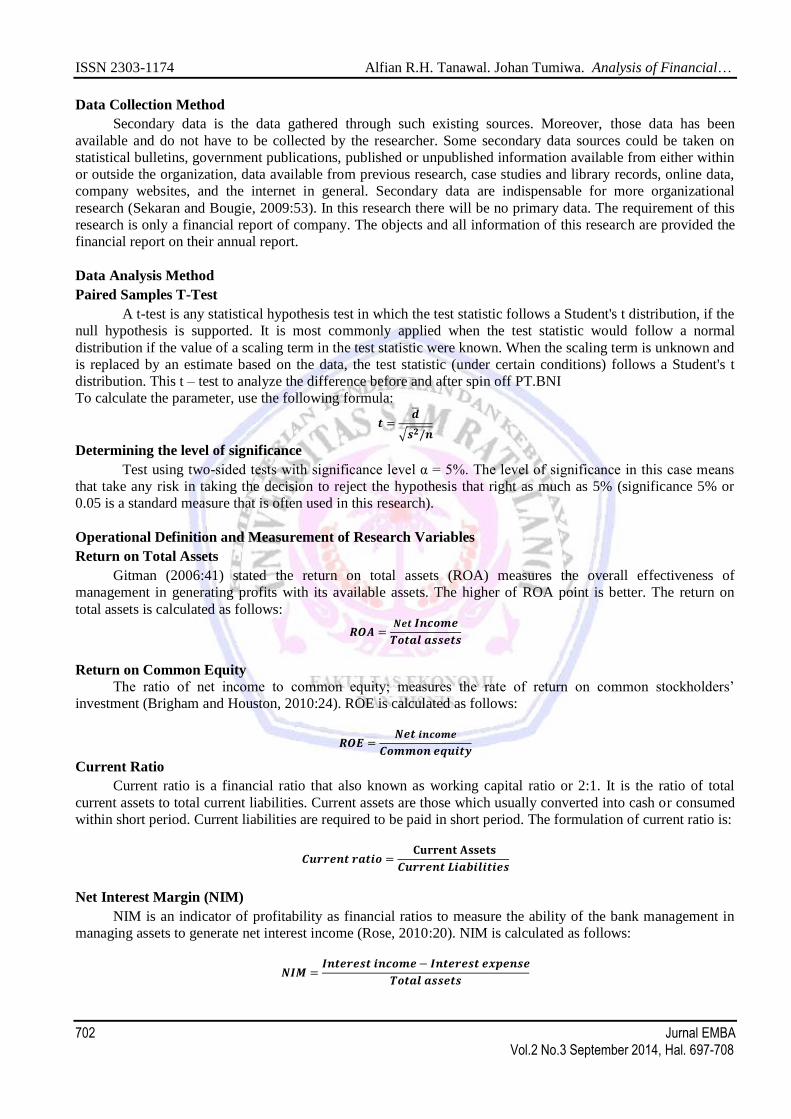
Data Collection Method
Secondary data is the data gathered through such existing sources. Moreover, those data has been
available and do not have to be collected by the researcher. Some secondary data sources could be taken on
statistical bulletins, government publications, published or unpublished information available from either within
or outside the organization, data available from previous research, case studies and library records, online data,
company websites, and the internet in general. Secondary data are indispensable for more organizational
research (Sekaran and Bougie, 2009:53). In this research there will be no primary data. The requirement of this
research is only a financial report of company. The objects and all information of this research are provided the
financial report on their annual report.
Data Analysis Method
Paired Samples T-Test
A t-test is any statistical hypothesis test in which the test statistic follows a Student's t distribution, if the
null hypothesis is supported. It is most commonly applied when the test statistic would follow a normal
distribution if the value of a scaling term in the test statistic were known. When the scaling term is unknown and
is replaced by an estimate based on the data, the test statistic (under certain conditions) follows a Student's t
distribution. This t – test to analyze the difference before and after spin off PT.BNI
To calculate the parameter, use the following formula:
𝒕 =𝒅
𝒔𝟐/𝒏
Determining the level of significance
Test using two-sided tests with significance level α = 5%. The level of significance in this case means
that take any risk in taking the decision to reject the hypothesis that right as much as 5% (significance 5% or
0.05 is a standard measure that is often used in this research).
Operational Definition and Measurement of Research Variables
Return on Total Assets
Gitman (2006:41) stated the return on total assets (ROA) measures the overall effectiveness of
management in generating profits with its available assets. The higher of ROA point is better. The return on
total assets is calculated as follows:
𝑹𝑶𝑨 =𝑵𝒆𝒕 𝑰𝒏𝒄𝒐𝒎𝒆
𝑻𝒐𝒕𝒂𝒍 𝒂𝒔𝒔𝒆𝒕𝒔
Return on Common Equity
The ratio of net income to common equity; measures the rate of return on common stockholders’
investment (Brigham and Houston, 2010:24). ROE is calculated as follows:
𝑹𝑶𝑬 =𝑵𝒆𝒕 𝒊𝒏𝒄𝒐𝒎𝒆
𝑪𝒐𝒎𝒎𝒐𝒏 𝒆𝒒𝒖𝒊𝒕𝒚
Current Ratio
Current ratio is a financial ratio that also known as working capital ratio or 2:1. It is the ratio of total
current assets to total current liabilities. Current assets are those which usually converted into cash or consumed
within short period. Current liabilities are required to be paid in short period. The formulation of current ratio is:
𝑪𝒖𝒓𝒓𝒆𝒏𝒕 𝒓𝒂𝒕𝒊𝒐 = 𝐂𝐮𝐫𝐫𝐞𝐧𝐭 𝐀𝐬𝐬𝐞𝐭𝐬
𝑪𝒖𝒓𝒓𝒆𝒏𝒕 𝑳𝒊𝒂𝒃𝒊𝒍𝒊𝒕𝒊𝒆𝒔
Net Interest Margin (NIM)
NIM is an indicator of profitability as financial ratios to measure the ability of the bank management in
managing assets to generate net interest income (Rose, 2010:20). NIM is calculated as follows:
𝑵𝑰𝑴 =𝑰𝒏𝒕𝒆𝒓𝒆𝒔𝒕 𝒊𝒏𝒄𝒐𝒎𝒆− 𝑰𝒏𝒕𝒆𝒓𝒆𝒔𝒕 𝒆𝒙𝒑𝒆𝒏𝒔𝒆
𝑻𝒐𝒕𝒂𝒍 𝒂𝒔𝒔𝒆𝒕𝒔
ISSN 2303-1174 Alfian R.H. Tanawal. Johan Tumiwa. Analysis of Financial…
Jurnal EMBA 703 Vol.2 No.3 September 2014, Hal. 697-708
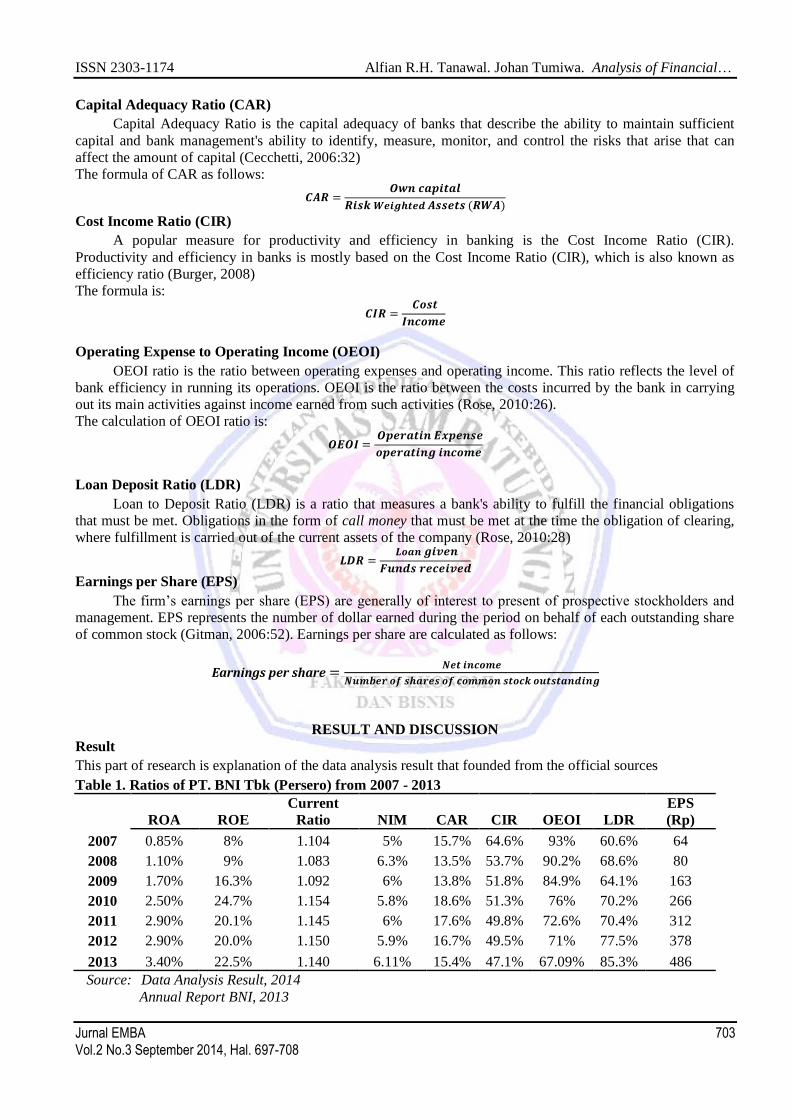
Capital Adequacy Ratio (CAR)
Capital Adequacy Ratio is the capital adequacy of banks that describe the ability to maintain sufficient
capital and bank management's ability to identify, measure, monitor, and control the risks that arise that can
affect the amount of capital (Cecchetti, 2006:32)
The formula of CAR as follows:
𝑪𝑨𝑹 =𝑶𝒘𝒏 𝒄𝒂𝒑𝒊𝒕𝒂𝒍
𝑹𝒊𝒔𝒌 𝑾𝒆𝒊𝒈𝒉𝒕𝒆𝒅 𝑨𝒔𝒔𝒆𝒕𝒔 (𝑹𝑾𝑨)
Cost Income Ratio (CIR)
A popular measure for productivity and efficiency in banking is the Cost Income Ratio (CIR).
Productivity and efficiency in banks is mostly based on the Cost Income Ratio (CIR), which is also known as
efficiency ratio (Burger, 2008)
The formula is:
𝑪𝑰𝑹 = 𝑪𝒐𝒔𝒕
𝑰𝒏𝒄𝒐𝒎𝒆
Operating Expense to Operating Income (OEOI)
OEOI ratio is the ratio between operating expenses and operating income. This ratio reflects the level of
bank efficiency in running its operations. OEOI is the ratio between the costs incurred by the bank in carrying
out its main activities against income earned from such activities (Rose, 2010:26).
The calculation of OEOI ratio is:
𝑶𝑬𝑶𝑰 = 𝑶𝒑𝒆𝒓𝒂𝒕𝒊𝒏 𝑬𝒙𝒑𝒆𝒏𝒔𝒆
𝒐𝒑𝒆𝒓𝒂𝒕𝒊𝒏𝒈 𝒊𝒏𝒄𝒐𝒎𝒆
Loan Deposit Ratio (LDR)
Loan to Deposit Ratio (LDR) is a ratio that measures a bank's ability to fulfill the financial obligations
that must be met. Obligations in the form of call money that must be met at the time the obligation of clearing,
where fulfillment is carried out of the current assets of the company (Rose, 2010:28)
𝑳𝑫𝑹 = 𝑳𝒐𝒂𝒏 𝒈𝒊𝒗𝒆𝒏
𝑭𝒖𝒏𝒅𝒔 𝒓𝒆𝒄𝒆𝒊𝒗𝒆𝒅
Earnings per Share (EPS)
The firm’s earnings per share (EPS) are generally of interest to present of prospective stockholders and
management. EPS represents the number of dollar earned during the period on behalf of each outstanding share
of common stock (Gitman, 2006:52). Earnings per share are calculated as follows:
Earnings per share =𝑵𝒆𝒕 𝒊𝒏𝒄𝒐𝒎𝒆
𝑵𝒖𝒎𝒃𝒆𝒓 𝒐𝒇 𝒔𝒉𝒂𝒓𝒆𝒔 𝒐𝒇 𝒄𝒐𝒎𝒎𝒐𝒏 𝒔𝒕𝒐𝒄𝒌 𝒐𝒖𝒕𝒔𝒕𝒂𝒏𝒅𝒊𝒏𝒈
RESULT AND DISCUSSION
Result
This part of research is explanation of the data analysis result that founded from the official sources
Table 1. Ratios of PT. BNI Tbk (Persero) from 2007 - 2013
ROA ROE
Current
Ratio NIM CAR CIR OEOI LDR
EPS
(Rp)
2007 0.85% 8% 1.104 5% 15.7% 64.6% 93% 60.6% 64
2008 1.10% 9% 1.083 6.3% 13.5% 53.7% 90.2% 68.6% 80
2009 1.70% 16.3% 1.092 6% 13.8% 51.8% 84.9% 64.1% 163
2010 2.50% 24.7% 1.154 5.8% 18.6% 51.3% 76% 70.2% 266
2011 2.90% 20.1% 1.145 6% 17.6% 49.8% 72.6% 70.4% 312
2012 2.90% 20.0% 1.150 5.9% 16.7% 49.5% 71% 77.5% 378
2013 3.40% 22.5% 1.140 6.11% 15.4% 47.1% 67.09% 85.3% 486
Source: Data Analysis Result, 2014
Annual Report BNI, 2013

ISSN 2303-1174 Alfian R.H. Tanawal. Johan Tumiwa. Analysis of Financial…
704 Jurnal EMBA Vol.2 No.3 September 2014, Hal. 697-708
Table 1 above shows the result of financial performance ratios of PT. BNI Tbk (Persero). The table 1 shows
that:
1. ROA has the highest point at 3.40% in 2013 and the lowest point at 0.85% in 2007
2. ROE has the highest point at 24.7% in 2010 and the lowest point at 8% in 2007
3. Current ratio has the highest point at 1.154 in 2010 and the lowest point at 1.083 in 2008
4. NIM has the highest point at 6.3% in 2008 and the lowest point at 5% in 2007
5. CAR has the highest point at 18.6% in 2010 and the lowest point at 13.5% in 2008
6. CIR has the highest point at 64.6% in 2007 and the lowest point at 47.1% in 2013
7. OEOI has the highest point at 93% in 2007 and the lowest point at 67.09% in 2013
8. LDR has the highest point at 85.3% in 2013 and the lowest point at 60.6% in 2007
9. EPS has the highest point at 486 in 2013 and the lowest point at 64 in 2007
Source: SPSS data processed 2014
Table 2 above shows that T-Test will test the significant different level of each variable. T-test is used to
determine whether there is a significant different or not. T-test value is obtained by comparing value of tcount
with ttable. If tcount is higher that ttable, then H0 is rejected and H1 is accepted. From the results of statistical
calculations using paired sample t-test, obtained the following results:
1. ROA before - ROA after
Reject H0 if tcount > ttable or Accept H0 if tcount < ttable
tcount of ROA before - ROA after is -17.774. Since there is a level of significant 5%, then the t table will
be t95;0.025 = 4.303. By comparing the tcount with ttable : 17.774 > 4.303 then the tcount is higher than ttable,
meaning H1 is accepted and H0 is rejected. The negative result of ttable shows the increased mean of ROA
after BNI spin-off. Therefore ROA before has significant difference with ROA after spin-off.
Table 2. Result of Paired Sample T-Test
Paired Sample Test
Sig. t Df
Sig. (2-
tailed)
Mean
Differen
ce
Std. Error
Mean
95% Confidence
Interval of the
Difference
Lower Upper
ROA before - ROA
after
.185 -17.774 2 .003 -.01850 .00104 -.02298 -.01402
ROE before - ROE
after
.093 -5.392 2 .033 -.09767 .01811 -.17560 -.01973
Current Ratio before -
Current Ratio after
.719 -6.695 2 .022 -.05200 .00777 -.08542 -.01858
NIM before - NIM
after
.876 -.579 2 .621 -.00237 .00409 -.01997 .01523
CAR before - CAR
after
.480 -4.548 2 .045 -.02233 .00491 -.04346 -.00121
CIR before - CIR after .514 2.288 2 .149 .07900 .03453 -.06957 .22757
OEOI before - OEOI
after
.039 25.572 2 .002 .19137 .00748 .15917 .22357
LDR before - LDR
after
.730 -3.360 2 .078 -.13300 .03959 -.30332 .03732
EPS before - EPS
after
.149 -13.138 2 .006 -289.667 22.04793 -384.531 -194.802

ISSN 2303-1174 Alfian R.H. Tanawal. Johan Tumiwa. Analysis of Financial…
Jurnal EMBA 705 Vol.2 No.3 September 2014, Hal. 697-708
2. ROE before - ROE after
Reject H0 if tcount > ttable or Accept H0 if tcount < ttable
tcount of ROE before - ROE after is -5.392. Since there is a level of significant 5%, then the t table will be
t95;0.025 = 4.303. By comparing the tcount with ttable : 5.392 > 4.303 then the tcount is higher than ttable,
meaning H2 is accepted and H0 is rejected. The negative result of ttable shows the increased mean of ROE
after BNI spin-off. Therefore ROE before has significant difference with ROE after spin-off.
3. Current Ratio before - Current Ratio after
Reject H0 if tcount > ttable or Accept H0 if tcount < ttable
tcount of Current Ratio before - Current Ratio after is -6.695. Since there is a level of significant 5%, then
the t table will be t95;0.025 = 4.303. By comparing the tcount with ttable : 6.695 > 4.303 then the tcount is higher
than ttable, meaning H3 is accepted and H0 is rejected. The negative result of ttable shows the higher mean of
Current Ratio after BNI spin-off. Therefore Current Ratio before has significant difference with Current
Ratio after spin-off.
4. NIM before - NIM after
Reject H0 if tcount > ttable or Accept H0 if tcount < ttable
tcount of NIM before - NIM after is -.579. Since there is a level of significant 5%, then the t table will be
t95;0.025 = 4.303. By comparing the tcount with ttable : -.579 < 4.303 then the tcount is lower than ttable, meaning
H4 is rejected and H0 is accepted. The negative result of ttable shows the increased mean of NIM after BNI
spin-off. Therefore NIM before has no significant difference with NIM after spin-off.
5. CAR before - CAR after
Reject H0 if tcount > ttable or Accept H0 if tcount < ttable
tcount of CAR before - CAR after is -4.548. Since there is a level of significant 5%, then the t table will be
t95;0.025 = 4.303. By comparing the tcount with ttable : 4.548> 4.303 then the tcount is higher than ttable, meaning
H5 is accepted and H0 is rejected. The negative result of ttable shows the increased mean of CAR after BNI
spin-off. Therefore CAR before has significant difference with CAR after spin-off.
6. CIR before - CIR after
Reject H0 if tcount > ttable or Accept H0 if tcount < ttable
tcount of CIR before - CIR after is 2.288. Since there is a level of significant 5%, then the t table will be
t95;0.025 = 4.303. By comparing the tcount with ttable : 2.288 < 4.303 then the tcount is lower than ttable, meaning
H6 is rejected and H0 is accepted. The positive result of ttable shows the decreased mean of CIR after BNI
spin-off. Therefore CIR before has no significant difference with CIR after spin-off.
7. OEOI before - OEOI after
Reject H0 if tcount > ttable or Accept H0 if tcount < ttable
tcount of OEOI before - OEOI after is 25.572. Since there is a level of significant 5%, then the t table will
be t95;0.025 = 4.303. By comparing the tcount with ttable : 25.572 > 4.303 then the tcount is higher than ttable,
meaning H7 is accepted and H0 is rejected. The positive result of ttable shows the decreased mean of OEOI
after BNI spin-off. Therefore OEOI before has significant difference with OEOI after spin-off.
8. LDR before - LDR after
Reject H0 if tcount > ttable or Accept H0 if tcount < ttable
tcount of LDR before - LDR after is -3.360. Since there is a level of significant 5%, then the t table will be
t95;0.025 = 4.303. By comparing the tcount with ttable : -3.360 < 4.303 then the tcount is higher than ttable,
meaning H8 is rejected and H0 is accepted. The negative result of ttable shows the increased mean of LDR
after BNI spin-off. Therefore LDR before has no significant difference with LDR after spin-off.
9. EPS before - EPS after
Reject H0 if tcount > ttable or Accept H0 if tcount < ttable
tcount of EPS before - EPS after is -13.138. Since there is a level of significant 5%, then the t table will be
t95;0.025 = 4.303. By comparing the tcount with ttable : 13.138 > 4.303 then the tcount is higher than ttable,

ISSN 2303-1174 Alfian R.H. Tanawal. Johan Tumiwa. Analysis of Financial…
706 Jurnal EMBA Vol.2 No.3 September 2014, Hal. 697-708
meaning H9 is accepted and H0 is rejected. The negative result of ttable shows the increased mean of EPS
after BNI spin-off. Therefore EPS before has significant difference with EPS after spin-off.
Discussion
In June 19th
2010, PT. BNI Tbk (Persero) has done the spin-off with PT.BNI Syariah. To find out if
there are any significant differences, this research compares the company performance from before and after
spin-off. The mean difference of ROA before and after is -.01850. The t-value is bigger than t-table 4.303 and
the p-value is smaller than 0.05 indicates that the mean difference of ROA before and after are significant. The
negative mean shows ROA after spin-off is better than ROA before. Company that had done the spin-off has a
motive for the healthy performance, the general level of profitability of the company will be better. Where the
return on assets (ROA) will be increased. This result is supported by other research conducted by Jongbloed
(2004) in his article about Spin-Offs: Implications for Corporate Policies, he said that spin-offs separates diverse
units and will result in two companies that have different investment opportunity sets. Bhana also said in his
article that the result of spin-offs indicate that size of the share price gains achieved by spun-off companies is
associated with changes in operating variables such as return on assets, sales growth and market-to-book ratio.
ROE is an important indicator for owners of the bank, because it shows the rate of return on invested
capital or investment in the banking industry. Higher ROE figures give an indication to shareholders that the
rate of return on investment in the banking sector is getting higher. High ROE figures that will attract
shareholders to increase capital. The increased of ROE from before to after spin-off indicates BNI maintained
well its total assets and total equity. It means company has gain the profit from the spin-off, and got the benefit
from this policy. This spin-off improves investment incentives and economic performance. This result is
powered by Bhana (2004), he said in his article about Performance of Corporate Restructurings through Spin-
Offs that the parent and spin-offs firms experience increases in real assets growth, and parents firms experience
significant improvements in cash flow margins on sales. Current result is the ratio most commonly used to look
at the balance sheet debt exposure. The relationship of current assets and current liabilities is an attempt to
demonstrate safety claims if the company fails to pay a debt. The current ratio measures how much current
assets available to pay current liabilities. This increased of current ratio shows BNI can improve its ability to
pay short-term obligations through the spin-off policy. This result is support by Bhana (2004) from his article
about Performance of Corporate Restructurings through Spin-Offs; he said the operating performance of
divested units did improve significantly after spin-off event.
Spin-off allows each company to gain capital consistently with its own operations and each company
can raise capital according to the way capital markets affect each company's business. However for this
company the increased of NIM from before and after is not significant. This is result can be tested with different
studies that report different results from companies involved in spin-offs. Studies by the investment firm
Oppenheimer and Co. indicate that companies increase their value at the time of the spin-off announcement, but
also show that value may stagnate or decrease over a longer period. The higher CAR is the better the bank's
ability to bear the risk of any credit / productive assets at risk. If the value is high then the bank's CAR is able to
fund operations and contributed significantly to profitability. This post effect of spin-off brings the good impact
to company, because it can rise up the CAR.
Productivity and efficiency in banks is mostly based on the Cost Income Ratio (CIR), which is also
known as efficiency ratio. The ratio gives a view of how efficiently the bank is. The lower the ratio means more
profitable the bank. But if the ratio is increasing, it means the costs are rising at a higher rate than income.
However the decreased trend shows company has the good effort to minimize its cost and keep increase the
income level. At fact, when company did the spin-off the operating cost will decrease, because it has been split
into two companies.
The OEOI is the ratio between operating expenses and operating income. The ratio of operating costs is
used to measure the level of efficiency and ability to conduct operations. The lower ROA of the bank means
more efficient in controlling operational costs, with the good maintain of cost, the company will be more
profitable. This decreased trend describe that company can maintain well the cost and become efficiency after it
did the spin-off. Bank Indonesia has regulations, standards magnitude value Loan to Deposit Ratio (LDR)
according to Bank Indonesia is between 85% -100%. Purposes of calculating the Loan to Deposit Ratio (LDR)
is to investigate and assess the extent to which a bank has a healthy condition in the course of its operations. In
other words, the Loan to Deposit Ratio (LDR) is used as an indicator to determine the level of vulnerability of a

ISSN 2303-1174 Alfian R.H. Tanawal. Johan Tumiwa. Analysis of Financial…
Jurnal EMBA 707 Vol.2 No.3 September 2014, Hal. 697-708
bank. From before and after spin-off, the data result shows BNI has the increased trend of LDR, it means BNI
has increased the number funds that were distributed to customers in the form of loan. This will lead to the
increasing of earned interest. The result of current data analysis about LDR is powered by Jongbloed (2004) in
his article with title Spin-Offs: Implications for Corporate Policies, he said that “economies of scale arise when
the costs of administration, raising funds, marketing and distribution are lower in big firms than in smaller
disjoint units”
EPS is used to measure the success of management in achieving profits for business owners. Low ratio
means that management does not result in good performance with regard revenues earned. High ratio means that
the company is already well established. EPS as well as the ROE, which is when the use of debt carried by the
company increases, will give effect in the total assets of the company be increased. Assets of the company are
used by the company for the operations of the company for the purpose of generating profit. Then with
increasing expected corporate assets profit generated by the company will also increase as well. With increasing
income means earnings per share (EPS) will also increase, for that matter, financial leverage also increased due
to the increased use of debt carried by the company. By decreasing the company's assets, the profit generated by
the company will also decrease. The increased mean of EPS indicates that BNI can maximize its financial and
marketing performance even though it did the spin-off.
CONCLUSION AND RECOMMENDATION
Conclusion
Several financial ratios that have been test from PT. BNI (Persero) Tbk financial performance, this
research finally get the conclusions that the mean of:
1. ROA after spin-off is larger than mean of ROA before spin-off. There is a significant difference on ROA of
PT. BNI Tbk before and after spinoff with PT. BNI Syariah in 2010
2. ROE after spin-off is larger than mean of ROE before spin-off. There is a significant difference on ROE of
PT. BNI Tbk before and after spinoff with PT. BNI Syariah in 2010
3. Current Ratio after spin-off is larger than mean of current ratio before spin-off. There is a significant
difference on current ratio of PT. BNI Tbk before and after spinoff with PT. BNI Syariah in 2010
4. NIM after spin-off is larger than mean of NIM before spin-off. There is no significant difference on NIM of
PT. BNI Tbk before and after spinoff with PT. BNI Syariah in 2010
5. CAR after spin-off is larger than mean of CAR before spin-off. There is a significant difference on ROA of
PT. BNI Tbk before and after spinoff with PT. BNI Syariah in 2010
6. CIR after spin-off is smaller than mean of CIR before spin-off. There is no significant difference on CIR of
PT. BNI Tbk before and after spinoff with PT. BNI Syariah in 2010
7. OEOI after spin-off is smaller than mean of OEOI before spin-off. There is a significant difference on
OEOI of PT. BNI Tbk before and after spinoff with PT. BNI Syariah in 2010
8. LDR after spin-off is larger than mean of LDR before spin-off. There is no significant difference on LDR
of PT. BNI Tbk before and after spinoff with PT. BNI Syariah in 2010
9. EPS after spin-off is larger than mean of EPS before spin-off. There is a significant difference on EPS of
PT. BNI Tbk before and after spinoff with PT. BNI Syariah in 2010.
Recommendation
The policy about spin-off has brought significant impact to PT. BNI (Persero) Tbk. As long a company
follows the spin-off procedures, the both parents company and spun-off company will be receiving the
advantages. There are some recommendations from author as follows:
1. For the company should concern about a spin-off policy, since there is a significant difference on ROA,
ROE, Current Ratio, CAR, OEOI and EPS before and after company did spin-off.
2. For the next researcher should provide more variables to make a better further research.

ISSN 2303-1174 Alfian R.H. Tanawal. Johan Tumiwa. Analysis of Financial…
708 Jurnal EMBA Vol.2 No.3 September 2014, Hal. 697-708
REFERENCES
Bank Negara Indonesia. 2013. Annual Report 2013. http://www.bni.co.id/Portals/0/Hub-inv/bni-
ar2013indofin.pdf, Jakarta. Accessed on May 22nd
2014.
Bhana, N. 2004. Performance of Corporate Restructurings through Spin-Offs: Evidence from JSE-Listed
Companies. Investment Analysts Journal. No.60, Vol. XLIV www.iassa.co.za/wp-
content/uploads/2009/06/No602004Bhana.pdf. Accessed on May 20th 2014. Pp. 5-15.
Brigham, Eugene F., Houston, Joel F. 2010. Essentials of Financial Management 2nd ed. Cengage Learning
Asia, Singapore.
Burger, Andreas. 2008. Productivity in banks: myths & truths of the Cost Income Ratio. Banks and Bank
Systems, ISSN 2356-2186 Volume 3, Issue 4, 2008, http://www.businessperspectives.org/journals_
free/bbs/2008/BBS_en_2008_4_Burger.pdf. Accessed on May 21st 2014. Pp 85-94.
Cecchetti, Stephen G. 2006. Money, Banking, and Financial Markets. McGraw-Hill education, Singapore .
Chemmanura, Thomas J., Yan, An. 2003. A theory of corporate spin-offs. Journal of Financial Economics 00
(2003) 000-000, ISSN 2651-1546 https://www2.bc.edu/~chemmanu/paper/spinoff60103.pdf. Accessed
on May 21st 2014. Pp 1-38.
Gitman, Lawrence J. 2006. Principles of Managerial Finance 4th ed. Addison-Wesley Longman, United States.
Jongbloed, A. 2004. Spin-Offs: Implications for Corporate Policies. Journal Tijdschrift voor Economie en
Management. ISSN 2319-2193 Vol. XLIX,4. https://lirias.kuleuven.be/bitstream/123456789/
85622/1/TEM_4-04_03_jongbloed.pdf. Accessed on May 21st 2014. Pp 569- 588.
Paramasivan, C., Subramanian, T. 2009. Financial Management. New Age International, New Delhi.
Rose, Peter S. 2010. Bank Management & Financial Services. McGraw-Hill education, Singapore.
Sekaran, U., Bougie, R. 2009. Research Methods for Business 5th ed. Wiley, Americas, New York.
Tugas, Florenz C. 2012. A Comparative Analysis of the Financial Ratios of Listed Firms. International Journal
of Business and Social Science. Vol.3 No.21. http://ijbssnet.com/journals/Vol_3_
No_21_November_2012/19.pdf. Accessed on May 22nd
2014. Pp 173-190.