ISSN 1835-9728 Environmental Economics Research Hub
30
ISSN 1835-9728 Environmental Economics Research Hub Research Reports Household perceptions of climate change and preferences for mitigation action: the case of the Carbon Pollution Reduction Scheme in Australia Sonia Akter 1 and Jeff Bennett 1 Research Report No. 19 February 2009 1 Crawford School of Economics and Government, The Australian National University, Canberra, ACT 2601, Australia, Tel: +61 2 6125 6556, Fax: +61 2 6125 5570 About the authors Sonia Akter is a PhD student in the Crawford School of Economics and Government at the Australian National University. Jeff Bennett is Professor in the Crawford School of Economics and Government at the Australian National University.
Transcript of ISSN 1835-9728 Environmental Economics Research Hub

ISSN 1835-9728
Environmental Economics Research Hub Research Reports
Household perceptions of climate change and preferences for mitigation action the case of
the Carbon Pollution Reduction Scheme in Australia
Sonia Akter1 and Jeff Bennett1
Research Report No 19
February 2009
1Crawford School of Economics and Government The Australian National University Canberra ACT 2601
Australia Tel +61 2 6125 6556 Fax +61 2 6125 5570
About the authors
Sonia Akter is a PhD student in the Crawford School of Economics and Government at the Australian National University
Jeff Bennett is Professor in the Crawford School of Economics and Government at the Australian National
University
Environmental Economics Research Hub Research Reports are published by The Crawford
School of Economics and Government Australian National University Canberra 2601 Australia
These Reports present work in progress within the Environmental Economics Research Hub
(EERH) The EERH is funded by the Department of Environment and Water Heritage and the
Arts under the Commonwealth Environment Research Facility
The views and interpretations expressed in these Reports are those of the author(s) and should
not be attributed to any organisation associated with the EERH
Because these reports present the results of work in progress they should not be reproduced in
part or in whole without the authorisation of the EERH Director Professor Jeff Bennett (e-mail
jeffbennettanueduau)
Crawford School of Economics and Government
THE AUSTRALIAN NATIONAL UNIVERSITY
httpwwwcrawfordanueduau
ii
Table of Contents
Abstractiv
1 Introduction1
2 Literature Review hellip3
3 Description of the Survey4
4 Sample characteristics and perceptions helliphelliphelliphelliphelliphelliphelliphelliphelliphelliphelliphelliphelliphelliphelliphelliphellip5
5 WTP Resultshelliphelliphelliphelliphelliphelliphelliphelliphelliphelliphelliphelliphelliphelliphelliphelliphelliphelliphelliphelliphelliphelliphelliphelliphelliphelliphellip9
51 Responses to the WTP questionshelliphelliphelliphelliphelliphelliphelliphelliphelliphelliphelliphelliphelliphelliphelliphellip9
52 The cumulative distribution function of WTPhelliphelliphelliphelliphelliphelliphelliphelliphelliphelliphellip11
6 Estimation of economic benefithelliphelliphelliphelliphelliphelliphelliphelliphelliphelliphelliphelliphelliphelliphelliphelliphelliphelliphelliphellip12
61 Multivariate regression resultshelliphelliphelliphelliphelliphelliphelliphelliphelliphelliphelliphelliphelliphelliphelliphellip12
62 WTP estimateshelliphelliphelliphelliphelliphelliphelliphelliphelliphelliphelliphelliphelliphelliphelliphelliphelliphelliphelliphelliphelliphelliphellip16
63 Aggregation of WTP estimateshelliphelliphelliphelliphelliphelliphelliphelliphelliphelliphelliphelliphelliphelliphelliphelliphellip18
7 Discussionshelliphelliphelliphelliphelliphelliphelliphelliphelliphelliphelliphelliphelliphelliphelliphelliphelliphelliphelliphelliphelliphelliphelliphelliphelliphelliphelliphellip19
8 Conclusionshelliphelliphelliphelliphelliphelliphelliphelliphelliphelliphelliphelliphelliphelliphelliphelliphelliphelliphelliphelliphelliphelliphelliphelliphelliphelliphelliphellip21
Referenceshelliphelliphelliphelliphelliphelliphelliphelliphelliphelliphelliphelliphelliphelliphelliphelliphelliphelliphelliphelliphelliphelliphelliphelliphelliphelliphellip22
iii
Abstract
The study aims to reveal Australian householdsrsquo perceptions of climate change and their
preferences for climate change mitigation actions A web-based survey was conducted in
November 2008 in which about 600 New South Wales households were asked for their
willingness to bear extra household expenditure to support the lsquoCarbon Pollution Reduction
Scheme (CPRS)rsquo as proposed by the Australian government The Contingent Valuation Method
(CVM) a widely used non-market valuation technique was applied using the single bounded
dichotomous choice elicitation format Results of the study demonstrate that currently there is a
positive demand for climate change mitigation action in Australia The main motivation for this
positive demand stems from a desire to avoid climate change However societyrsquos willingness to
pay (WTP) for climate change mitigation is shown to be significantly curbed by uncertainties
regarding the extent of climate change and the effectiveness of climate change policy Global co-
operation (major greenhouse gas emitting countries implementing similar scheme) plays an
important role in determining Australian householdsrsquo support for the CPRS Only when a zero
unit non-response bias is assumed do the benefits of the CPRS as estimated by respondentsrsquo
WTP exceed its costs
Key words Contingent valuation climate change Carbon Pollution Reduction Scheme
willingness to pay uncertainty Australia
iv
1 Introduction
In 2006 Australia emitted a total of 576 million tonnes of carbon dioxide equivalent into
the earthrsquos biosphere (Department of Climate Change 2009) This is less than two
percent of total world emissions Despite this relatively low level of greenhouse gas
(GHG) emissions in the global context the Australian Government has ratified the Kyoto
Protocol a legally binding international agreement under the United Nations Framework
Convention on Climate Change (UNFCCC) As part of fulfilling its Kyoto protocol
obligation the Australian Government has proposed a national emissions trading scheme
known as the Carbon Pollution Reduction Scheme (CPRS) The aims of the CPRS are to
reduce emissions by 60 per cent of the 2000 level by 2050 and to encourage the
development and use of low emission technologies (Department of Climate Change
2008)
A significant debate surrounds the implication of the CPRS for the Australian economy
The first concern arises from the lsquoglobal public goodrsquo aspect of climate change policy
Any effective mitigation of climate change requires all actual and potential emitters to
comply with a similar set of emission reduction objectives (Karl and Trenberth 2003)
However under the Kyoto protocol two major GHG emitting countriesndashChina Indiandashare
not required to comply with the protocol obligations while the USA the second largest
GHG emitting country in 2006 (UNFCCC 2007) has chosen not to ratify the protocol
Given that three major GHG emitting countries are outside the current multilateral
framework for global climate change mitigation the implementation of the CPRS in
Australia is not expected to make any significant contribution to preventing climate
change
The second concern surrounding the CPRS is related to the numerous gaps in climate
scientistsrsquo understanding about the complex interaction among atmospheric variables
Due to a lack of information disagreement about what is known or knowable statistical
variation measurement error subjective judgment and disagreement about structural
models (Carter 2007) projections about climate change are associated with large
confidence intervals For instance according to Fourth Assessment Report of
Intergovernmental Panel of Climate Change (IPCC) the global average surface warming
1
following a doubling of carbon dioxide concentrations relative to the pre-industrial era is
ldquolikelyrdquo (66 to 90 percent probability) to be between 2degC to 45degC (IPCC 2007)
Furthermore the extent of the benefits to be enjoyed from climate policy interventions
eg the CPRS is poorly understood Due to inadequate scientific knowledge about the
nature of interactions and a potential nonlinear response pattern among the biophysical
factors there is a weak linkage between policy actions over time and the climate change
likely to be avoided (Jacoby 2004 Webster et al 2003)
Some studies have attempted to estimate the value of the benefits of climate change
mitigation While Stern (2006) estimates the cost of climate change his analysis
presumes that mitigation strategies can avoid all these costs and so he equates the benefits
of strategies with the costs Clearly this is an overstatement of benefits Peoplesrsquo
willingness to pay (WTP) to avoid the costs of climate change was not taken into
consideration The current study aims to explore how the Australian community
perceives the CPRS More specifically the study investigates how the absence of global
co-operation to limit GHG emissions and the various sources of uncertainties surrounding
climate change influence householdsrsquo preferences for the CPRS This study combines
two aspects of climate change uncertainty ndash scenario and policy ndash and seeks to examine
how public perceptions influence peoplesrsquo decisions to support the CPRS with and
without the achievement of broader global co-operation A single bounded dichotomous
choice (DC) contingent valuation (CV) study was carried out in Sydney the state capital
of New South Wales in November 2008 About 600 households were asked for their
willingness to bear extra household expenditures to support the CPRS
The rest of the paper is organised as follows Section 2 contains a review of the stated
preference literature concerning climate change followed by a description of the survey in
Section 3 In Section 4 respondentsrsquo perceptions of climate change are discussed Section
5 sets out the WTP results while Section 6 presents results from the econometric
modelling including multivariate WTP estimates Section 7 provides a discussion of the
results and includes some concluding remarks
2
2 Literature review
Different stated preference (SP) application vehicles have been applied to estimate
societyrsquos WTP for climate change mitigation costs They range from tree plantation for
carbon sequestration (Layton and Brown 2000 Brouwer et al 2008) investment in
green energy to replace carbon dioxide (CO2) intensive electricity (Roe et al 2001
Batley et al 2001 Rowlands et al 2001) installation of energy saving technology
(Banfi et al 2008 Poortinga et al 2003 Sadler 2003) imposition of a fuel surcharge
(Viscusi and Zeckhauser 2006) through to climate change policy in general (Cameron
2005) Besides household disposable income and the bid level respondentsrsquo WTP to
support climate change policy has generally been found to be influenced by respondentsrsquo
gender (Viscusi and Zeckhauser 2006 Berk and Fovell 1999) education (Berk and
Fovell 1999 Wiser 2007) awareness of the impacts of CO2 emissions (Brouwer et al
2008) perceptions of responsibility for climate change (Brouwer et al 2008) increases
in temperature during the summer and decrease in precipitation during the winter (Berk
and Fovell 1999) the scope of the climate change impact (Layton and Brown 2000)
and the provision rule (eg collective and voluntary payment vehicles government and
private provider) (Wiser 2007)
The impact of uncertainty associated with climate change on individual decisions
regarding support for climate change policy was first examined by Cameron (2005) That
study used a Bayesian information updating model in a single bounded CV framework to
estimate individual option price for future climate change using a convenience sample of
college students Regional annual average temperature rise was used as an indicator of
climate change Cameron (2005) found a quadratic relationship between expected future
temperature change and individual support for climate change policy This implies that
respondents were willing to pay more with increased expected future temperature change
but the amount increased at a decreasing rate Individual support for climate change
mitigation policies furthermore varied negatively with the level of uncertainty
(measured by the variance of the subjective estimate of future temperature rise) ie the
more uncertain the respondents were about the expected increase in average
temperatures the less they were willing to pay to prevent such an increase
3
A similar approach was taken by Viscusi and Zeckhauser (2006) They conducted a CV
study where a payment card method was applied using a gas tax as the payment
mechanism Over 250 Harvard University graduate students were recruited for the survey
using convenience sampling The respondents were asked to provide an upper bound
lower bound and best guess of temperature rise in Boston by 2100 Like Cameron (2005)
Viscusi and Zeckhauser (2006) showed that respondentsrsquo expected temperature increases
had a significant positive effect on their WTP However the relationship between
respondentsrsquo climate change expectation and their WTP was found to be linear Contrary
to Cameronrsquos (2005) results Viscusi and Zeckhauser (2006) showed that greater climate
change uncertainty leads to higher support for policy action
3 Description of the survey
Following Cameron (2005) and Viscusi and Zeckhauser (2006) increases in future
temperature were used as an indicator to reflect climate change expectations
Respondents were asked to indicate their perceptions about future temperature change in
Australia in 2100 relative to the current year in the form of a best guess a high guess and
a low guess The best guess of future temperature change is used as a measure of climate
change expectations whereas the difference between high guess and low guess estimate
of temperature change was treated as a measure of ambiguity (Riddel and Shaw 2006) A
numerical probability scale was used to elicit respondentsrsquo perceptions of policy
uncertainty Respondents were asked two separate questions to distinguish policy
uncertainty arising from a lack of scientific knowledge that caused by a lack of global co-
operation Global co-operation was defined as a situation where in addition to European
Union countries and Australia at least three major greenhouse gas emitting countries ie
US China and India implement a similar emission reduction scheme
In the valuation part of the questionnaire respondents were asked two sequential WTP
questions First respondents were asked if they would be willing to bear (specified) extra
household expenses each month on behalf of their entire household to support the CPRS
(hereafter called the lsquofirst WTP questionrsquo) Increased prices of goods and services were
used as the payment vehicle Eight different bids ranging from AUS$20 to AUS$400 per
4
month per household were randomly assigned across the respondents1 Respondents were
not given any information about the potential for global co-operation at this stage
Instead they were advised to keep their perceptions about the likelihood of reaching a
broader global consensus about emissions reduction targets in mind when answering the
first WTP question The respondents who said lsquoNorsquo to the first WTP question were
followed up with a second WTP question (hereafter called the lsquosecond WTP questionrsquo) in
which they were asked whether they would be willing to pay the offered bid amount if
global co-operation could be achieved
A web-based survey was conducted with 634 respondents in Sydney from the third week
of November 2008 until the first week of December 2008 The questionnaire was
primarily developed based on a series of focus group discussions with up to 12
participants in each session During the first focus group participants were asked to
provide feedback on the level of comprehensibility of the information provided in the
questionnaire Participants were furthermore asked if the questionnaire appeared to be
biasing their responses Based on the feedback received from the first focus group the
questionnaire was revised and tested in a second round of focus groups Before pilot
testing the questionnaire was sent to two climate change policy experts2 in Australia in
order to ensure that the information included in the questionnaire was consistent with
existing scientific knowledge and policy prescriptions
4 Sample characteristics and perceptions
Table 1 compares the socio-economic characteristics of the 634 sampled households with
the regional and national population statistics A chi-square test of proportions revealed
that the differences between the sample and the Sydney population and the Australian
population with respect to sex ratio are not statistically significant However although the
educational attainments of the sample were not found to be significantly different than
the Sydney population (chi square=024 p=97) they were significantly different than the
educational attainments of the Australian population (chi square=1626 plt001)
1 These bid amounts were based on responses obtained from an open-ended WTP question asked during the first round focus group The bid amounts were tested in a second round of focus groups and a pilot survey 2 Dr Frank Jotzo and Dr Stephen Howes are gratefully acknowledged for their inputs
5
Table 1 Summary statistics of respondentsrsquo socio-economic characteristics
Respondent characteristic Sample Sydney average
National average
Sex ratio (malefemale) 90 116 99Respondent median age (years)
34 35 37
Highest level of education ()
Year 12 or below 32 36 51
Certificate 30 21 16 Bachelorrsquos degree or
above 38 44 22
Gross average household income (AUS$week)
1450 1360 1305
Source Australian Bureau of Statistics (2008)
Finally Z tests for mean difference revealed that the sample respondentsrsquo age and weekly
household income are not significantly different than the median age and weekly average
income of the Sydney population and the national population These test results
demonstrate that the sample is representative of the Sydney population as well as the
Australian population at least with respect to sex ratio age and household income
Less than a quarter (20 percent) of the respondents indicated that they were ldquohighly
concernedrdquo about the impact of climate change in Australia The majority (40 percent)
were ldquoconcernedrdquo About a third of the respondents said that they were ldquosomewhat
concernedrdquo while around ten percent of the respondents were ldquonot so concernedrdquo or ldquonot
at all concernedrdquo about climate change As expected respondentsrsquo levels of concern
about climate change were found to be positively associated with their levels of media
exposure Those respondents who had watched the movie lsquoAn Inconvenient Truthrsquo or TV
newsdocumentaries about climate change or read newspaper articles about climate
change on average stated significantly higher levels of concern about climate change
than other respondents (see Table 2) These findings are consistent with empirical
evidence that reveals the significant role the media plays in shaping public perceptions of
climate change issues (Lowe et al 2006 Sampei and Aoyagi-Usui forthcoming)
6
Table 2 Pearson correlation coefficients between respondentsrsquo levels of concern and exposure to mass media
Levels of concern about climate change
Watched the movie ldquoAn Inconvenient Truthrdquo
Read newspaper articles on climate change
Watched the TV news andor documentaries on climate change
Levels of concern about climate change
1
Watched the movie ldquoAn Inconvenient Truthrdquo
020 1
Read newspaper articles on climate change
0142 0164 1
Watched the TV news andor documentaries on climate change
0182 0177 0390 1
Correlation is significant at the 001 level (2-tailed)
Respondents were asked to rank five policy issues (climate change education health
care law and order and the economy) in Australia according to their levels of relative
importance Twelve percent of the respondents ranked climate change as the most
important policy issue in Australia (see Figure 1) About a third of the respondents
indicated the economy is the most important policy issue while a further third felt that
health care facility is the top priority Respondentsrsquo levels of concern about climate
change and the levels of relative importance they attached to climate change as a policy
issue as expected were positively correlated (r=0301 plt0001)
Figure 1 Policy issue ranking
0
5
10
15
20
25
30
35
Climate change Education Health care Law and order Economy
o
f res
pond
ents
7
Over a quarter (27) of the respondents expressed strong agreement with the statement that
climate change is caused by human activity Almost half of the sample respondents (49)
indicated a moderate level of agreement Sixteen percent of the respondents neither agreed nor
disagreed and the rest opposed the statement A statistically significant positive correlation
(r=0425 plt0001) was observed between respondentsrsquo levels of agreement towards this
statement and their levels of concern about climate change This implies on average
respondents who stated higher levels of concern about climate change also believed that human
actions were responsible for the changing climatic conditions
Figure 2 Respondentsrsquo perceptions of climate change impact on Australia
Decrease in agricultural production
12
increase in agricultural production
1
decrease water supply13
increase water supply
2
Damage to the Great Barrier Reef
12
Damage to the Kakadu wetlands
10
Loss of biodiversity10
More natural disasters
12
More droughts12
Health problems10
Warssecurity problems
4no impact
1Other1
Figure 2 presents respondentsrsquo expectations of the effect of unmitigated climate change
Decreases in water supply and in agricultural production and increases in drought events and
damage to the Great Barrier Reef were cited by a majority of the respondents as impacts that
Australia would experience due to anticipated climate change Loss of biodiversity damage to
Kakadu wetlands and increased health problems were also mentioned by respondents as expected
consequences of climate change Respondents were asked to indicate how they expected their
households would be affected by climate change if no climate change mitigation action was
8
undertaken The responses to this question are summarised in Figure 3 Higher prices for food
and water resulting from lower food and water supplies were the major concerns reported at the
household level Discomfort due to hotter weather and overall decreases in standard of living
were also mentioned About seven percent of the total respondents nevertheless referred to
some positive impacts of climate change such as increased amount of outdoor activities and
relatively warmer weather during winter time
Figure 3 Respondentsrsquo perceptions of climate change impact of climate change on
households
Warmer w eather in w inter w ill be more
comfortable5
My familyrsquos standard of living w ill decrease
13
There w ill be more outdoor activities due to w armer w eather
2
There w ill be food shortageshigher food
price24
Chances of serious illness w ill increase
12
There w ill be discomfort from hotter
w eather in summer19
There w ill be w ater shortageshigher
w ater price23
no impact1
Other1
5 WTP Results
51 Responses to the WTP questions
67 percent of the 634 respondents interviewed rejected their offered bid Although this
percentage of rejection appears to be relatively higher than other CV studies such high rates of
refusal are not rare (eg Jones et al 2008 Alberini et al 2005 Dziegielewska and Mendelsohn
2005 Kenyon 2001 Halvorsen 1996) Respondents who were willing to pay were primarily
9
motivated by their levels of concern and care about environment (25) urge to avoid future
natural disasters (24) and responsibility for their contribution to climate change (21)
Respondents who rejected the bid amount were asked in a follow-up question to indicate their
reasons for not paying Some of the reasons mentioned by the respondents are common to most
CV studies concerning to the provision of public good financial constraints (18) and holding
other parties (Government polluters) responsible for paying (33) Some respondents refused to
support the CPRS because of reasons that could be broadly translated into the imprecision of
climate science Five percent of those who refused to pay expressed their disbelief about the
effectiveness of the CPRS in slowing down climate change while eight percent indicated the lack
of scientific evidence about climate change as the reason for not wanting to pay Eleven percent
stated that they did not want to pay because they were not told what to expect in terms of climate
change benefit if they did pay About eight percent of the respondents indicated that they would
pay on the condition that major GHG emitting countries had implemented a similar scheme
Figure 4 Responses to the WTP questions
I do not know (13)
Definitely Yes (5)
Maybe Yes (49)
Maybe No (16)
Definitely No (17)
1st WTP question
Yes (33)
No (67) 2nd WTP question
Figure 4 summerises the responses to the first and the second WTP questions All of the 67
percent of the respondents who replied lsquoNorsquo to the first WTP question were asked the second
WTP question using a polychotomous (PC) choice format (I donrsquot know Definitely Yes Maybe
Yes Definitely No Maybe No) They were asked whether they would be willing to pay the
offered bid amount if a global co-operation could be reached A PC response format was applied
to allow respondents to express their levels of confidence with their decision (Whitehead et al
1998) Five percent (n=21) of those who said lsquoNorsquo to the first WTP question indicated that they
10
would definitely pay if the major GHG emitting countries implement a similar scheme while
about fifty percent (n=208) selected the lsquoMaybe Yesrsquo option as a response to this question
Thirteen percent of the respondents said that they were unsure about their preferences and the
rest said that they would not pay
52 The cumulative distribution function of WTP
The cumulative distribution function (CDF) of the stated WTP for the CPRS based on a total of
634 valid observations for the WTP question is presented in Figure 5 The CDF function falls
sharply starting from bid level $20 up to bid level $300 At the bid level $400 the proportion of
lsquoYesrsquo responses rises instead of approaching towards zero This pattern of the CDF function
suggests the presence of a lsquofat tailrsquo (Boyle et al 1988)
Figure 5 Cumulative probability distribution function of the stated WTP
0
01
02
03
04
05
06
07
08
09
1
0 50 100 150 200 250 300 350 400
Bid
o
f Y
es r
espo
nses
Two reasons are generally held responsible for generating a fat tail in the distribution of WTP
responses First the so called lsquoyea-sayingrsquo bias which indicates that the respondents tend to
agree to pay regardless of the bid level (Blamey et al 1999 and Michelle and Carson 1989)
Second the highest range of the bid level was too low to pull the tail of CDF down to zero
Given the low rate of lsquoYesrsquo responses (33) to the first WTP question and the well-behaved
shape of the CDF until the highest bid ($400) the potential for lsquoyea-sayingrsquo as a suspect for the
11
fat tail problem can be disregarded3 Solving the fat tail problem is important to avoiding an
overestimation of true WTP A range of suggested statistical approaches can mitigate this
problem (eg Bishop and Heberlein 1979 Boyle et al 1988 Ready and Hu 1995) A common
and relatively simple statistical approach is to truncate the distribution of individual WTP at
some upper limit usually the largest bid (Bishop and Heberlein 1979)
6 Estimation of economic benefit
61 Multivariate regression results
Based on the findings of other empirical studies and expectations from behavioural decision
theories (eg Ellsberg 1961 Khan and Sarin 1988) WTP for the CPRS is expected to vary
depending on individual respondent characteristics (INDCHR) such as respondent attitudes
knowledge and familiarity with the policy age sex income and educational attainment
expectations of climate change (TEM) climate change uncertainty (TEM_UN) policy
uncertainty (POLICY) policy ambiguity (POLICY_AM) income and bid price (Bid)
AMTEMTEMSQTEMINDCHRBidIncomeY _654321 ββββββα ++++++=
AMPOLICYPOLICYSQPOLICY _657 βββ +++ (1)
where Y refers to the probability that the respondent accepts the offered bid level and α is a
constant A quadratic relationship between subjective climate change expectation and WTP for
climate policy is hypothesized based on the findings of Cameron (2005)
Table 3 presents descriptive statistics of the explanatory variables included in the regression
analysis The binary logistic regression approach was applied to estimate the effects of the
explanatory variables on the binary discrete choice of paying for the CPRS
3 The differences in socio-economic characteristics of two groups of respondents ndash those who were presented with the $400 amount and all othersndashwere examined No statistically significant differences were observed in terms of age education income or occupation
12
Table 3 Descriptive statistics of the independent variables
Variable Name Description Mean SD BID 20 50 100 150 200 250 300 400 185 122 TEM Best guess of temperature change in 100 years
time 372 286
TEMSQ Square of TEM 22 30 TEM_UN Uncertainty (differences between subjective high
guess and low guess of temperature change) over best guess tem change
090 088
POLICY Best guess probability of the CPRS not being effective in slowing down climate change
55 26
POLICYSQ Square of POLICY 3787 3120 POLICY_AM Policy ambiguity over policy uncertainty 605 1281
INCOME Household yearly income ($0-7800 to $104000-120000)
71777 31175
AGE Respondentsrsquo age group (1-24=1 25-34=2 35-44=3 45-54=4 55-64=5 65 and above=6)
282 133
HUMAN Climate change caused by human actions (Strongly disagree=1 Strongly agree=5)
392 096
IPCC Respondents have read or heard discussions about IPCC report (Yes=1 No=0)
018 038
CPRS Respondents have heard of CPRS (Yes=1 No=0) 055 049 OFFSET Respondents have purchased carbon offset (Yes=1
No=0) 011 031
SOLAR Respondents have installed solar panel in their house (Yes=1 No=0)
012 032
In Table 4 a series of multivariate regression results for three different models is set out The
models vary based on the different WTP responses used as the dependent variable The lsquoYesNorsquo
responses to the first WTP question were used as the dependent variable in Model 1 To create
the dependent variables for analysis of WTP when global co-operation was assured the lsquoNorsquo
responses obtained from the first WTP question were calibrated (recoded to lsquoYesrsquo) based on the
responses to the second WTP question Two different calibration exercises were undertaken
First if respondents replied lsquoDefinitely Yesrsquo to the second WTP question then the corresponding
lsquoNorsquo responses to the first WTP question were recoded to lsquoYesrsquo These recoded responses were
13
used as dependent variable in Model 2 Second the lsquoNorsquo responses to the first WTP question
were recoded to lsquoYesrsquo if the respondents replied lsquoDefinitely Yesrsquo or lsquoMaybe Yesrsquo to the second
WTP question These recoded responses were used as the dependent variable in Model 3
Table 4 Estimated linear-logistic WTP models (lsquoYesNorsquo replies to DC WTP question is response variable)
Variable Name Model 1 a Model 2 b Model 3 c Constant -008
(762) 113
(763) -582 (730)
BID -006 (001)
-005 (001)
-003 (001)
Expected scenarios uncertainty and ambiguity TEM 250
(123) 174
(115) 108
(106) TEMSQ -027
(012) -020 (011)
-012 (010)
TEM_UN -281 (143)
-248 (132)
-041 (105)
POLICY -043 (017)
-042 (017)
-010 (018)
POLICYSQ -000 (000)
000 (000)
000 (000)
POLICY_AM -013 (001)
-116 (138)
000 (008)
Socio-economic INCOME 000
(000) 000 (000)
000 (000)
AGE -070 (075)
-050 (072)
002 (071)
SOLAR 569 (293)
575 (285)
101 (300)
Attitude knowledge information and experience HUMAN 210
(115) 253 (111)
414 (104)
IPCC 499 (253)
509 (254)
550 (276)
CPRS 0412 (199)
312 (191)
198 (192)
OFFSET 551 (293)
333 (287)
408 (326)
Model fit statistics -2 Log-likelihood 670412 710960 703437 Wald 2 127636
(df=14 plt0001) 115006
(df=14 plt0001) 94305
(df=14 plt0001) Nagelkerke R Square 025 023 019
14
Percentage correctly predicted
76 74 71
N 634 634 634 Explanatory notes a Responses to the first WTP question as dependent variable b lsquoNorsquo response to the first WTP question was recoded to lsquoYesrsquo if response to the second WTP question was lsquoDefinitely Yesrsquo c lsquoNorsquo response to the first WTP question was recoded to lsquoYesrsquo if response to the second WTP question was either lsquoDefinitely Yesrsquo or lsquoMay be Yesrsquo Standard errors of the parameter estimates between brackets plt001 plt005 plt010 Although all the estimated regression models presented in Table 4 are statistically significant at
less than one percent level Model 1 is the best fitting in terms of Nagelkerke R Square In all
models the coefficients of the variable BID the extra monthly expenses households were asked
to pay for the CPRS are statistically significant and show the a priori expected negative sign
(the higher the bid the lower the probability that respondents were willing to pay ceteris
paribus) Household income as expected shows a significant positive impact on stated WTP for
the CPRS (the higher the income level the higher the likelihood that respondents were willing to
pay the offered bid) Furthermore respondentsrsquo attitudes towards climate change (respondentsrsquo
levels of agreement with the statement lsquoClimate change is caused by human actionrsquo) and their
knowledge about the IPCC have statistically significant influences on WTP in all three models
The coefficients of the variable lsquoCPRSrsquo (respondentsrsquo familiarity with the CPRS) and OFFSET
(respondents purchased a carbon offset certificate) are significant only in Model 1 This implies
that when global co-operation about climate change mitigation action is not guaranteed
respondents who are familiar with the CPRS or who purchased a carbon offset certificate to
reduce their carbon footprint were significantly more likely to accept the offered bid level
However the influences of these two variables become statistically insignificant on household
decision of supporting the CPRS when major emitting countries commit towards limiting their
national emission levels
The coefficients of the variables TEM TEMSQ TEM_AM are all statistically significant with
theoretically expected signs in Model 1 The signs of the coefficients of variables TEM (positive)
and TEMSQ (negative) demonstrate that the utility function is concave in climate change
expectations As expected future temperatures increase the likelihood of paying for the CPRS
increases However the likelihood increases at a decreasing rate The coefficient of climate
15
change uncertainty (TEM_UN) exhibits a negative sign This means that ceteris paribus as
respondents become more unsure about the scale of climate changed impact the likelihood that
they would accept the offered bid amount decreases The coefficients of the variables POLICY
and POLICYSQ are statically significant in Model 1 This implies that ceteris paribus the
respondents were willing to pay less with increasing policy risk uncertainty WTP decreases at
an increasing rate as the policy uncertainty increases The coefficient of the variable
POLICY_AM was statistically insignificant in all models
The expectations and uncertainty variables associated with climate change and climate policy
start loosing significance in explaining individual decisions to supporting the CPRS when the
dependent variable is calibrated depending on the responses to the second WTP question In
Model 2 the coefficients of TEM and POLICYSQ become insignificant Uncertainty concerning
to climate change expectations and uncertainty associated with CPRS success were found to
have statistically significant influences on respondentsrsquo likelihood of accepting the offered bid
level in Model 2 When a more stringent calibration is undertaken for Model 3 all the subjective
expectations and uncertainty variables are insignificant
62 WTP estimates
The estimated WTP values and their confidence intervals are presented in Table 5 Referendum
CVM programs in GAUSS written (Cooper 1999) were used to estimate the Krinsky and Robb
(1986) confidence intervals for the point estimates of mean WTP The estimation of mean WTP
involved exclusion of variables that were not statistically significant at the ten percent level as
inclusion of these variables inflates the confidence intervals Note that a truncation operation was
undertaken at this stage at bid level $400 to overcome the fat tail problem associated with the
CDF function However in order to compare the impact of truncation on the estimated social
benefit of the CPRS WTP estimate was also obtained from an untruncated CDF function
The lowest value of mean WTP $135 per household per month is obtained from Model 1
(WTP1) The mean WTP from Model 2 (WTP2) is $150 which is eleven percent higher than
WTP1 The confidence intervals around the mean WTP obtained from Model 1 and Model 2 it is
apparent that these confidence intervals overlap each other This indicates that there is no
statistical difference between the WTP1 (without global co-operation) and WTP2 (with global co-
operation) The WTP estimate obtained from Model 3 (WTP3) is higher again ($414) The
16
confidence interval around WTP3 furthermore does not overlap with the confidence interval
obtained for WTP1 and WTP2 This implies that WTP3 is significantly different than WTP1 and
WTP2 However WTP3 is associated with larger confidence intervals and as a result performs
poorly on efficiency grounds4 in comparison with WTP1 and WTP2 The inefficiency associated
with the WTP3 is attributed to the lack of confidence manifested in respondentsrsquo decision about
supporting the CPRS Thirty percent of respondents included in Model 3 were not certain about
their decisions Their lack of confidence in turn translates into larger confidence intervals of the
estimated WTP This implies that although WTP3 shows substantial increase in welfare gain
under the condition of global co-operation the estimate is less reliable as a base for inference
Table 5 Krinsky and Robb confidence intervals of Mean WTP for the CPRS using 1000 repetitions Per householdper month
(AUS$)
Truncated Models
Untruncated Model Model 1 Model 2 Model 3
Mean WTP 172 135 150 414
99 CI 138 to 286 108 to 191 120 to 210 289 to 813
95 CI 145 to 242 113 to 166 126 to 188 307 to 630
90 CI 149 to 224 117 to 160 130 to 180 317 to 565
The mean WTP estimate obtained from untruncated CDF distribution (WTPU) is as expected
higher than both WTP1 and WTP2 However the confidence intervals around the WTPU overlap
with the confidence intervals around WTP1 and WTP2 This again indicates that there is no
statistical difference between the WTPU and WTP1 and WTP2 On efficiency grounds WTPU
performs worse than WTP1 and WTP2 The efficiency score for the WTPU calculated at the 95
percent confidence interval equaled 06 which is higher than the efficiency scores obtained for
WTP1 and WTP2 (04) This implies that WTP1 and WTP2 are the most reliable estimators
4 Efficiency of the mean WTP estimate was calculated base on the following formula Efficiency= 95 confidence interval of WTPmean WTP The efficiency score for WTP1 and WTP2 were 4 whereas the efficiency score of WTP3 was 07
17
63 Aggregation of WTP estimates
The estimated mean WTP values were extrapolated across the whole population (81 million
households in Australia) to calculate the aggregate benefit from the CPRS This approach was
considered appropriate given that the key socio-economic characteristics of the sample
respondents are not significantly different than the population characteristics While aggregating
the estimated average WTP values it is important to take into consideration any potential unit
non-response bias Unit non-response bias occurs when part of the sample frame does not
participate in the survey Mitchell and Carson (1989) suggested the following way to treat unit
non response bias
sumsum +=nm
WTPWTPPTW )(λ (2)
In equation 2 PTW refers to the weighted aggregated WTP m refers to the proportion of
respondents n refers to the proportion of non- respondents and λ is the multiplier or weight
attached to the WTP of non-respondent population Different values of λ can be assumed For
example λ =1 implies that non-respondents have the same mean WTP as respondents ie unit
non-response bias equals to zero Similarly λ =0 means non-respondents have zero WTP These
are two extreme assumptions The former is the most generous and the later is the most
conservative Any value of λ in between these two extremes can also be assumed
Out of 17000 chosen respondents 5100 (30 percent) respondents attempted to complete the
survey5 2142 respondents actually completed the survey6 We assume that the 5100
respondent who attempted to complete the survey have the same mean WTP as those
respondents who completed the survey This assumption produces a relatively higher response
rate of thirty percent This implies a non-response rate of seventy percent Three different
assumptions were made about the values that these non-respondents hold First we assumed that
non-respondents had a zero WTP ( λ =0) The second assumption was that the non-respondentsrsquo
mean WTP was half of the respondents mean WTP ( λ =05) Finally we assumed a zero unit
5 Eighteen percent of those who opened the e-mail could not complete the survey because of technical problems eleven percent dropped out one percent was screened out through a quality control device and the rest did not meet the representativeness criteria 6 Note that the number of completed survey indicates the number of responses obtained for the whole project The full project was divided into six split samples It was not possible to record a split sample specific response rate
18
non-response bias This assumption implies that the non-respondents hold the same WTP as the
respondents
The results of the benefit aggregation exercise are presented in Table 6 As expected the λ =0
assumption generate the lowest aggregate benefits of the CPRS and the λ =1 assumption
produces the highest values The estimated economic benefits of the CPRS under different values
of λ are compared with the cost estimate The estimated economic cost of the CPRS is $147
billion per year for a five percent emission reduction target by 2020 (The Commonwealth
Treasury 2008) This is equivalent to $150 per month per household When a value of λ = 0 is
assumed the estimated economic cost of CPRS consistently exceeds its gain By relaxing the
assumption about non-respondents WTP from zero to half of respondentsrsquo mean WTP ( λ =5)
economic benefit exceeds economic costs only in case of WTP3 the least efficient WTP estimate
Finally under the most generous assumption about unit non-response bias ( λ = 1) estimated
economic benefit approximately equals the estimated economic cost
Table 6 Aggregation of mean WTP estimates
λ = 0 λ = 05 λ = 1 WTP
household month (A$)
Aggregate benefits per year (bn A$)
Benefit-cost ratio
Aggregate benefits per year (bn A$)
Benefit-cost ratio
Aggregate benefits per year (bn A$)
Benefit-cost ratio
Aggregation approach
WTPU 172 502 03 1087 07 1672 11 WTP1 135 394 03 853 06 1312 09 WTP2 150 437 03 948 06 1458 10 WTP3 414 1207 08 2616 18 4024 27
7 Discussions This study aims to understand Australian householdsrsquo perceptions of climate change and their
preferences for the proposed CPRS Sample households attached relatively low levels of
importance to climate change in comparison to other competing policy issues in Australia
Consistent with their priorities a majority of 67 percent of the respondents rejected the prospect
of paying more for their householdsrsquo consumption in a DC CV question It was observed that
19
respondents were willing to trade off more money as the expectations of temperature increases
rose However that WTP increased at a decreasing rate The estimated relationship between
expected future temperature change and individual support for climate change policy
corresponds with the finding reported in Cameron (2005) Climate change uncertainty was found
to affect individual decisions to support the CPRS This result is consistent with the empirical
findings of Cameron (2005) Furthermore the negative sign of the coefficient of scenario
uncertainty reflecting uncertainty aversion behaviour is consistent to the empirical results
documented by Cameron (2005)
The study provides an estimate of the economic benefits associated with the CPRS The results
indicate that there is a demand for climate change mitigation action Respondents were found to
place a positive value on climate change risk mitigation The estimated WTP (WTP1) is about
two percent of average monthly household income of the sample population In comparison the
option price estimated by Cameron (2005) was close to five percent of average expected future
monthly income while Viscusi and Zeckhauser (2006) found the mean WTP to be three percent
of sample monthly income The difference between the values of welfare estimate can be
attributed to a number of factors First the studies conducted by Cameron (2005) and Viscusi
and Zeckhauser (2006) involved convenience sample (a group of college students were recruited
as sample) whereas the current study involved a public survey Second Cameron (2005) and
Viscusi and Zeckhauser (2006) did not incorporate policy uncertainty in the decision model The
current study takes the impact of policy uncertainty into consideration which has been found to
have a negative impact on individual WTP to support climate change policy Eliminating the
policy uncertainty of climate change (ie setting Pπμ and (
Pπμ )2 = 0) increases mean WTP for
the CPRS to $319 per household per month Adjusting for inflation rate and exchange rate this
amount turns out to be 90 percent of the welfare estimate calculated by Cameron (2005)
The mean WTP estimates obtained from different models were aggregated across the whole
population Various assumptions were made about unit non-response bias during the aggregation
exercise The aggregated economic benefits from the CPRS were compared against the estimated
economic costs of the CPRS The benefit cost ratio (BCR) of the CPRS has been found
20
insensitive to the calibration techniques except WTP3 However the BCR of the CPRS has been
found to be sensitive to the assumptions made about unit non-response bias Only under the most
generous assumption of a zero unit non-response bias do the economic benefits obtained from
the CPRS exceed its estimated cost Any departure from this assumption generates lower benefit
estimates and lower BCR Although global co-operation played an important role in respondentsrsquo
decision of paying for the CPRS a proportion of the respondents were not certain about their
decisions When respondentsrsquo uncertainty about their WTP when global co-operation was
assumed is taken into account using a liberal recoding policy (WTP3) WTP is significantly
higher Only in that case do the benefits of the CPRS exceed its costs under the assumption that
non-respondents have a positive WTP
8 Conclusions In this study two aspects of climate change uncertainty ndash scenario and policy ndash are considered
We examined how these two distinct forms of uncertainty influence peoplesrsquo decisions to
support climate policy intervention The WTP for climate change mitigation was found to be
significantly reduced by the uncertainty associated with the expectations of future temperature
increases This indicates that the social benefit of the CPRS could be enhanced if more certain
forecasts of climate change were available Furthermore the WTP for the CPRS was found to be
negatively affected by respondentsrsquo lack of confidence in the CPRS being effective in slowing
down climate change This implies that the welfare gain from the CPRS would increase if the
general public were more convinced about the effectiveness of the CPRS
Finally the results of the current study convey useful message for researchers seeking to
estimate the social benefits arising from public policy intervention in the event of multi
dimensional uncertainty Our results demonstrate that in addition to scenario uncertainty (as
previously shown by Riddel and Shaw (2006) and Cameron (2005)) policy uncertainty
significantly influences societyrsquos WTP to support a proposed policy action Ignoring such an
important element in individual decision making framework may potentially overestimate the
economic benefit of public policy intervention
21
References Alberini A Rosato P Longo A and Zanatta V (2005) Information and willingness to pay in
a contingent valuation study the value of S Erasmo in the Lagoon of Venice Journal of
Environmental Planning and Management 48 pp155ndash175
Australian Bureau of Statistics (2008) 2008 Year Book of Australia Australian Bureau of
Statistics Canberra
Banfi S Farsi M Filippini M and Jakob M (2008) Willingness to pay for energy-saving
measures in residential buildings Energy Economics 30 (2) pp503-516
Batley S Colbourne D Fleming P and Urwin P (2001) Citizen versus consumer challenges
in the UK green power marketrsquo Energy Policy 29(6) pp479-87
Berk R A and R G Fovell (1999) Public perceptions of climate change A willingness to pay
assessment Climatic Change 41 pp413-446
Bishop RC and Heberlein TA (1979) Measuring values of extra-market goods are indirect
measures biased American Journal of Agricultural Economics 61 pp 926ndash930
Blamey RK Bennett JW and Morrison MD (1999) Yea-saying in contingent valuation
surveys Land Economics 75(1) pp126ndash141
Boyle KJ Welsh MP and Bishop RC (1988) Validation of empirical measures of welfare
change comment Land Economics 64 pp94-98
Brouwer R Brander L and Beukering P Van (2008) A convenient truth air travel passengers
willingness to pay offset their CO2 emissions Climatic Change 90 (3) pp299ndash313
Cameron TA (2005) Individual option prices for climate change mitigation Journal of Public
Economics 89(2-3) 283-301
Carter RM (2007) The myth of dangerous human-caused climate change The AusMM New
Leaders Conference Brisbane May 3 2007
url httpmembersiinetnetau~glrmcnew_page_1htm
Cooper JC (1999) Referendum CVM programs Economic Research Service USDA
Washington DC
Department of Climate Change (2009) National Greenhouse Gas Inventory 2006 Accounting for
the Kyoto Target url httpwwwclimatechangegovauinventory2006indexhtml
Department of Climate Change (2008) Carbon Pollution reduction Scheme Green Paper url
httpwwwclimatechangegovaugreenpapersummarypubsgreenpaper-summarypdf
22
Dziegielewska DAP and Mendelsohn R (2005) Valuing air quality in Poland Environmental
and Resource Economics 30 pp 131ndash163
Ellsberg D (1961) Risk ambiguity and the savage axioms Quarterly Journal of Economics
75 pp 643ndash669
Halvorsen B (1996) Ordering effects in contingent valuation surveys willingness to pay for
reduced health damage from air pollution Environmental and Resource Economics 8
pp 485ndash499
International Panel on Climate Change (IPCC) (2007) IPCC fourth assessment report climate
change 2007 url httpwwwipccchpdfassessment-reportar4syrar4_syrpdf
Jacoby H (2004) Informing Climate Policy Given Incommensurable Benefits Estimates
Global Environmental Change 14(3) pp 287-297
Jones N Sophoulis C M and Malesios C (2008) Economic valuation of coastal water
quality and protest responses A case study in Mitilini Greece Journal of Socio-
Economics 37(6) pp 2478-2491
Kahn BE and Sarin RK (1988) Modeling ambiguity in decisions under uncertainty Journal
of Consumer Research 15 pp 265ndash272
Karl T R and Trenberth K E (2003) Modern global climate change Science 302 pp1719ndash
1723
Kenyon E (2001) The use of economic and participatory approaches to assess forest
development a case study in the Ettrick Valley Forest Policy and Economics 3 pp 69ndash
80
Krinsky I and Robb A L (1986) On Approximating the Statistical Properties of Elasticities
Review of Economic and Statistics 68 pp 715-719
Layton DF and Brown G (2000) Heterogeneous preferences regarding global climate change
The Review of Economics and Statistics 82 (4) pp 616ndash624
Lowe T Brown K Dessai S de Franccedila Doria M Haynes K Vincent K (2006) Does
tomorrow ever come Disaster narrative and public perceptions of climate change Public
Understanding of Science 15 pp 435ndash457
Michelle R and Carson RT (1989) Using Surveys to Value Public Goods The Contingent
Valuation Method Resources for the Future Washington DC
23
Poortinga W Steg L Vlek C and Wiersma G (2003) Household preferences for energy-
saving measures A conjoint analysis Journal of Economic Psychology 24 pp49-64
Ready RC and Hu D (1995) Statistical approaches to the fat tail problem for dichotomous
choice contingent valuation Land Economics 71 pp 491-499
Riddel M and Shaw WD (2006) A theoretically-consistent empirical model of non-expected
utility an application to nuclear-waste transport Journal of Risk and Uncertainty 32 pp
131ndash150
Roe B Teisl M Levy A and Russell M (2001) US consumers willingness to pay for green
electricityrsquo Energy Policy 29(11) pp 917-25
Rowlands I Scott D and Parker P (2001) Ready to go green The prospects for premium-
priced green electricity in Waterloo Region Ontariorsquo Environments 28(3) pp 100-119
Sadler M (2003) Home Energy Preferences amp Policy Applying Stated choice Modeling to a
Hybrid Energy Economic Model Report to Natural Resources Canada Simon Fraser
University September 2003
Sampei Y and Aoyagi-Usui M (forthcoming) Mass-media coverage its influence on public
awareness of climate-change issues and implications for Japanrsquos national campaign to
reduce greenhouse gas emissions Global Environmental Change
Stern N 2006 The economics of climate change the stern review Cambridge University Press
Cambridge UK
The Commonwealth Treasury (2008) Australiarsquos low pollution future the economics of climate
change mitigation url
httpwwwtreasurygovaulowpollutionfuturereportdownloadsALPF_consolidatedpdf
United Nations Framework Convention on Climate Change (UNFCCC) (2007) GHG data from
UNFCCC url
httpunfcccintghg_dataghg_data_unfccctime_series_annex_iitems3814php
Viscusi W K Zeckhauser RJ (2006) The perception and valuation of the risks of climate
change a rational and behavioral blend Climatic Change 77 pp151ndash177
Webster M Forest C Reilly J Babiker M Kicklighter D Mayer M Prinn R Sarofim
M Sokolov A Stone P Wang A C (2003) Uncertainty Analysis Of Climate Change
and Policy Response Climatic Change 61 pp 295ndash320
24
Whitehead JC Huang JC Blomquist GC and Ready RC (1998) Construct validity of
dichotomous and polychotomous choice contingent valuation questions Environment
and Resource Economics 11 pp 107ndash116
Wiser R (2007) Using contingent valuation to explore willingness to pay for renewable energy
a comparison of collective and voluntary payment vehicles Ecological Economics 62
pp 419ndash432
25
- Table of Contents
-
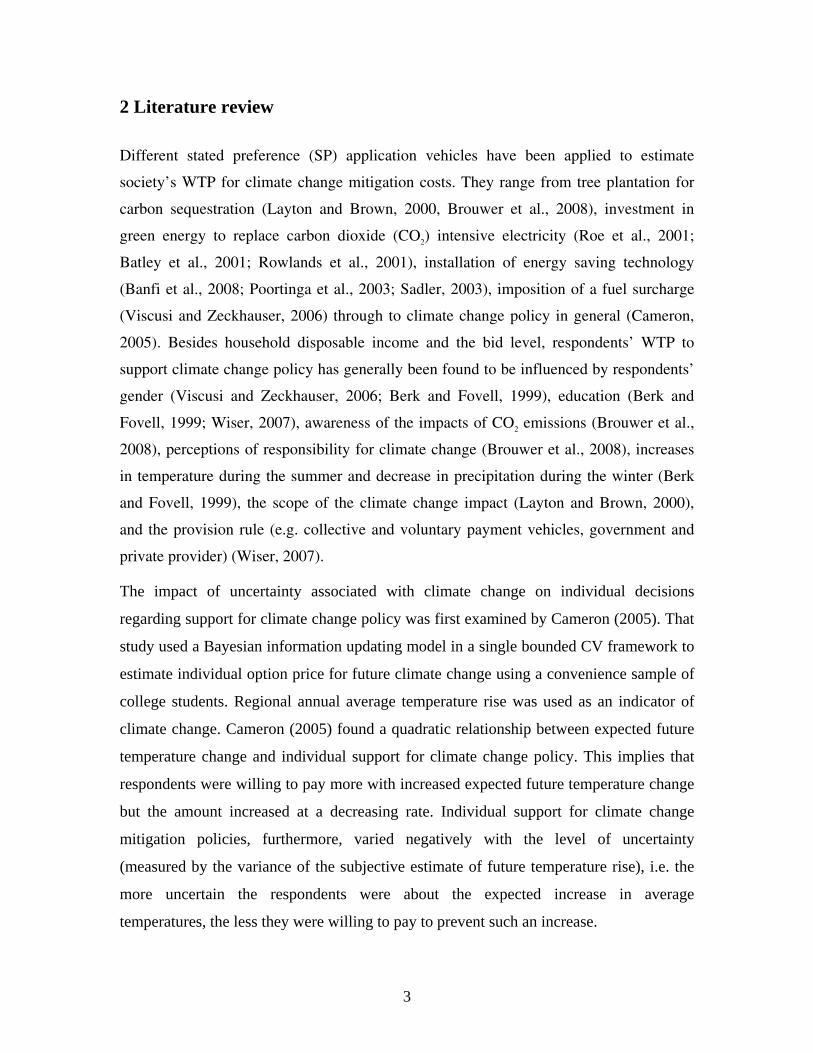
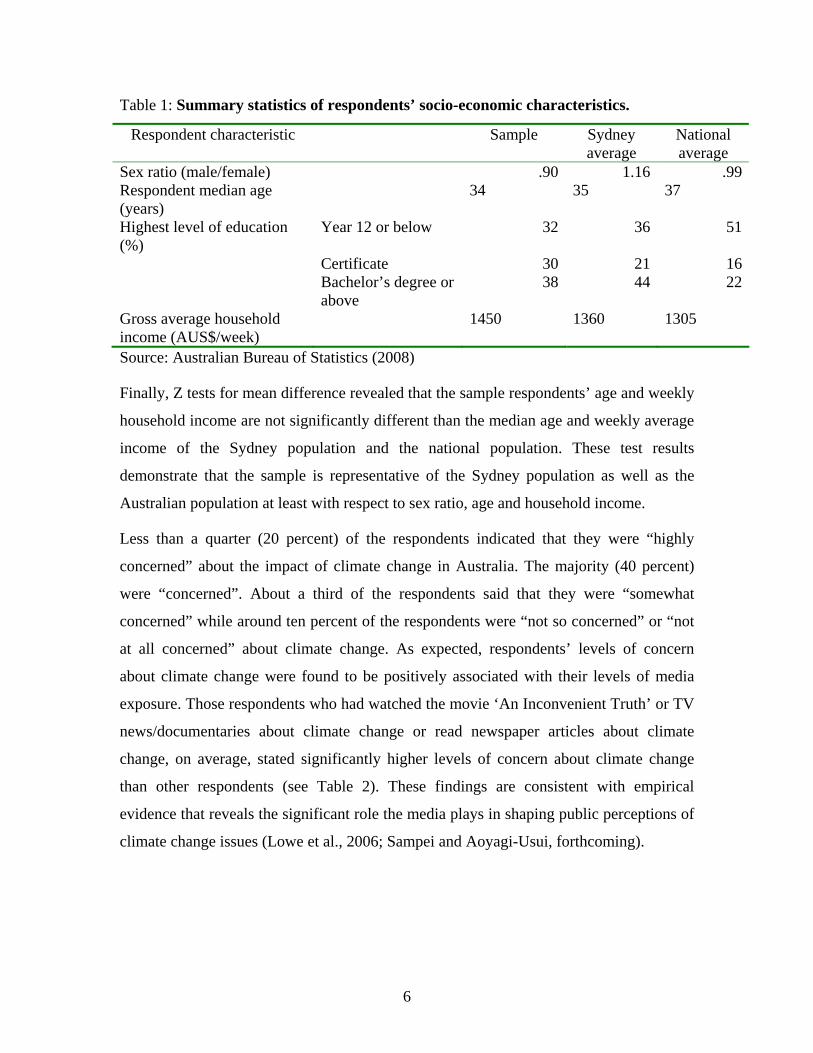
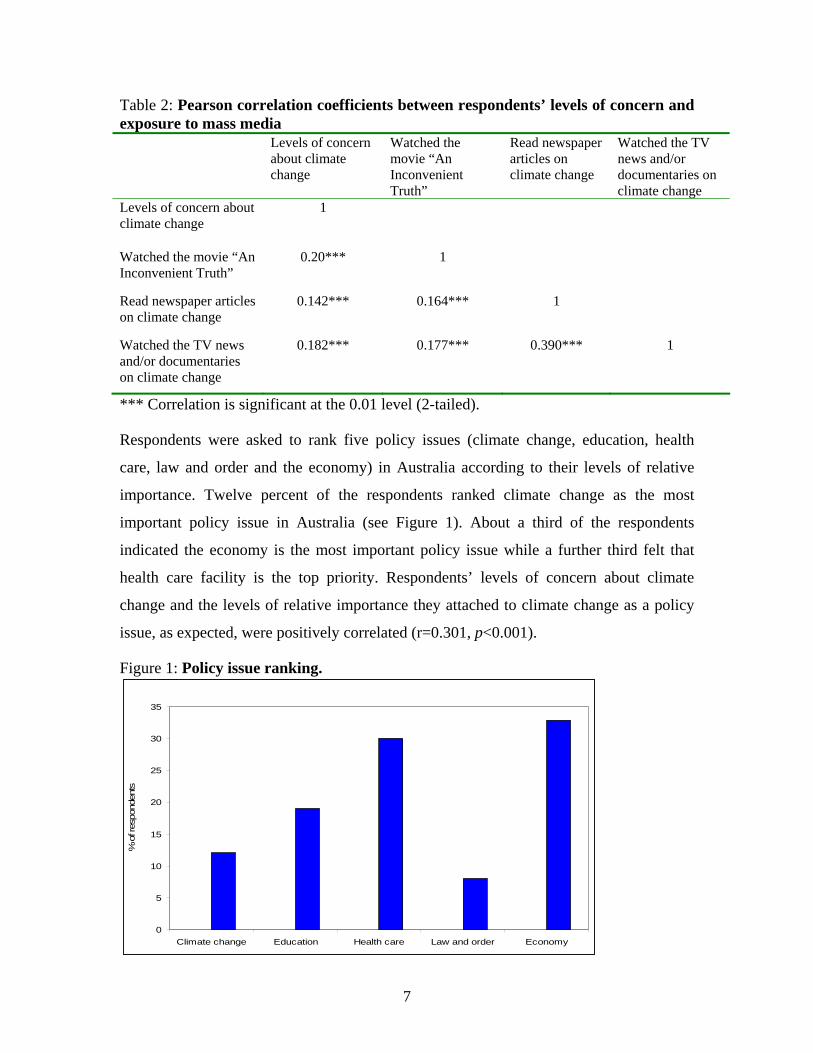
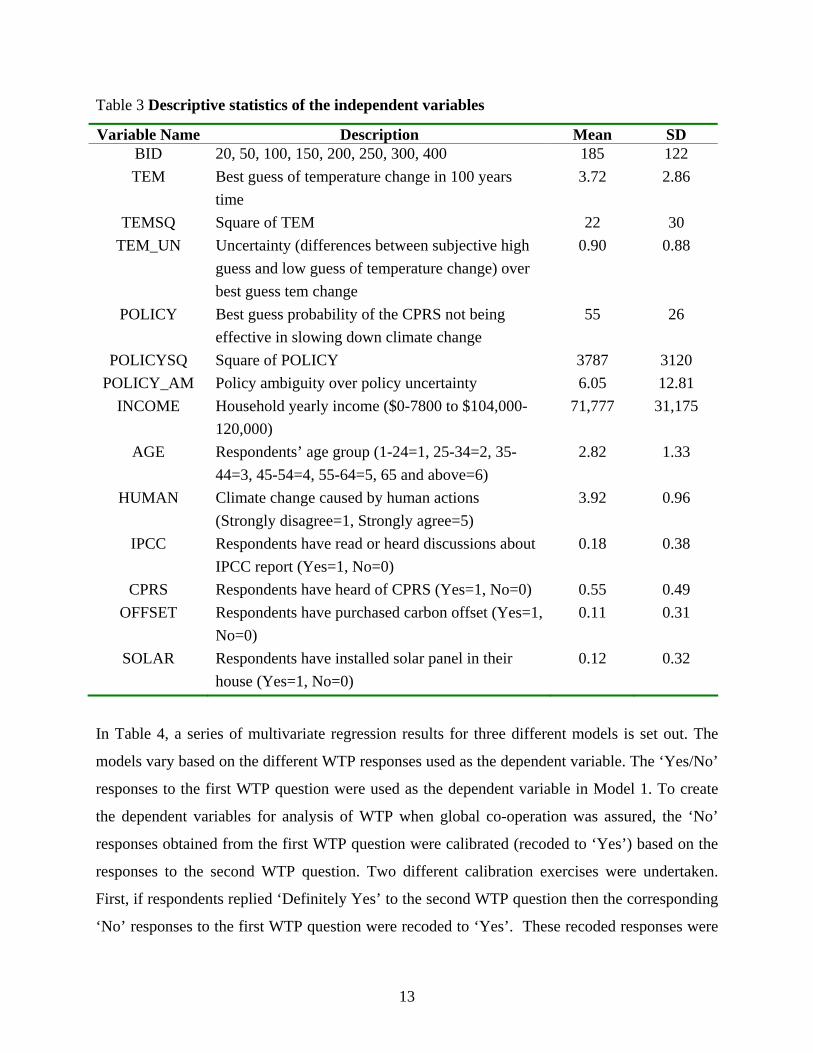
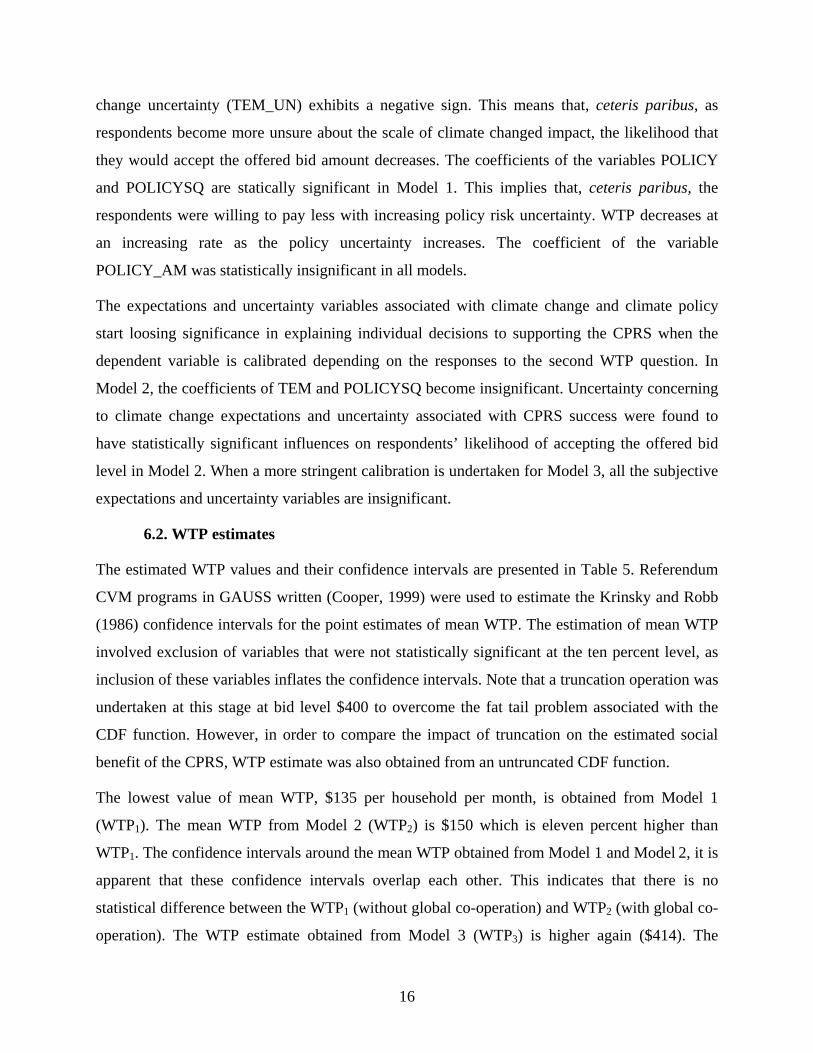
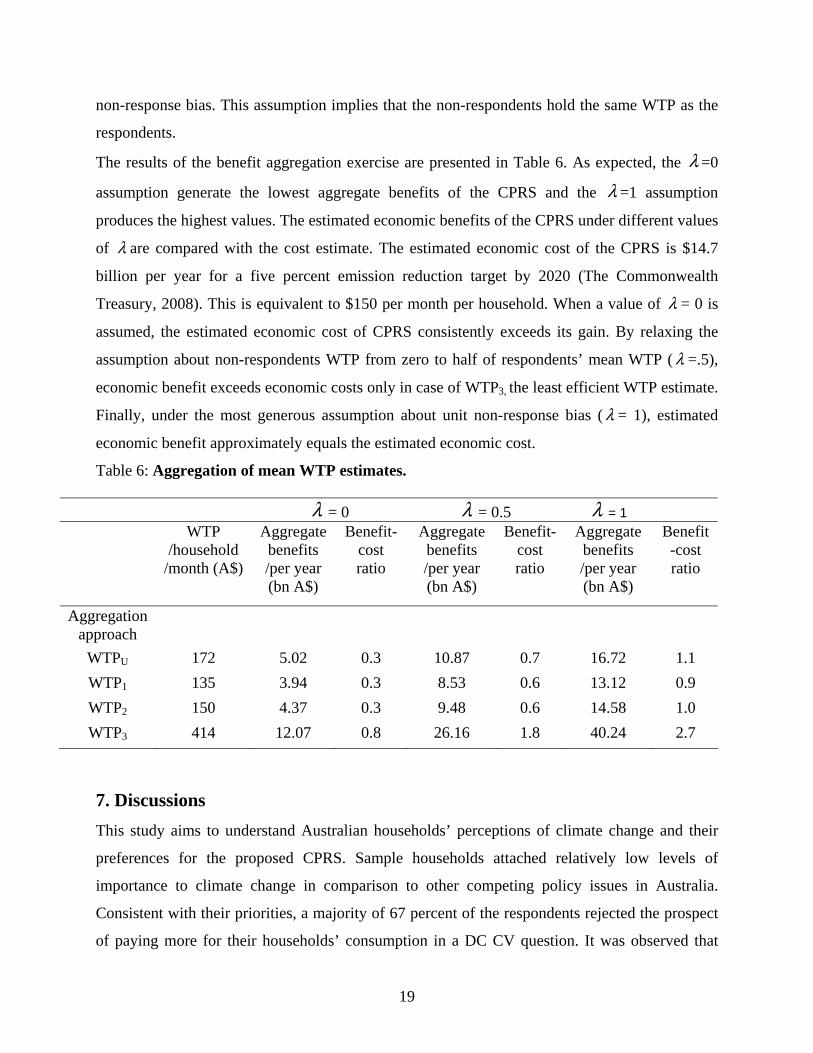

- Table of Contents
-