ISBN 978-623-7482-41-3 Diterbitkan Percetakan Undiksha 1 ...
236
ISBN 978-623-7482-41-3 Diterbitkan Percetakan Undiksha 1 Juni 2020
-
Upload
khangminh22 -
Category
Documents
-
view
2 -
download
0
Transcript of ISBN 978-623-7482-41-3 Diterbitkan Percetakan Undiksha 1 ...
i
ISBN 978-623-7482-41-3 Diterbitkan Percetakan Undiksha 1 Juni 2020

ii
PROSIDING
The 2nd
International Conference on Mathematics and Natural
Sciences
"Developing Mathematics, Natural Sciences, Marine, and
Educational Researches Oriented to Sustainable
Development Goals” ”
Disunting oleh :
Dr. I Wayan Puja Astawa, M.Stat.Sci. Putu Kartika Dewi, M.Sc.
Putu Widiarini, M.Pd., M.Sc. Ni Luh Putu Ananda Saraswati, M.Si.
Luh Mitha Priyanka, M.Pd.
Diselenggarakan di Singaraja pada 30-31 Agustus 2019
Diselenggarakan oleh :
Fakultas Matematika dan Ilmu Pengetahuan Alam
Universitas Pendidikan Ganesha
Singaraja
UNDIKSHA PRESS
2019

iii
The 2nd
International Conference on Mathematics and Natural Sciences
Tema : “Developing Mathematics, Natural Sciences, Marine, and Educational
Researches Oriented to Sustainable Development Goals”
Advisory Board
Prof. Dr. I Nengah Suparta, M.Si. (Ganesha University of Education, Indonesia)
Prof. Dr. Ida Bagus Jelantik Swasta, M.Si (Ganesha University of Education, Indonesia)
Dr. I Gusti Lanang Wiratma, M.Si. (Ganesha University of Education, Indonesia)
Dr. Sri Handayani ( Universitas Negeri Yogyakarta)
Dr. Jane Sylvia Annatje Sumarauw (Universitas Negeri Manado)
Dr. Suyatno, M.Si ( Institut Teknologi Sepuluh November Surabaya)
Dr. I Gusti Made Ngurah Budiana, S.Si., M.Si. ( Universitas Nusa Cendana NTT)
Prof. Dr. Sabine Fechner (Paderborn University, Germany)
Prof. Ernesto Mollo, Instituto Di Chimica Biomolecolare, Italia.
Prof. Kazuhito Kawakita, Ph.D (Nagoya University)
Prof. Sathoshi Ohkura, Ph.D (Nagoya University)
Dr. Eliani Ardi, Astrophysic (Kyoto International University)
Dr. Martina Restuati, M.Si (Universitas Negeri Medan)
Prof Nyoman Adi Asmara Giri (BBRPBL, Gondol Buleleng)
Scientific Committee :
Drs. I Wayan Muderawan, M.S.,Ph.D.
Dr. rer. nat. I Wayan Karyasa, S.Pd., M.Sc.
Prof. Dr. Phil I Gusti Putu Sudiarta, M.Si.
Prof.Dr. I Gusti Putu Suharta,M.Si
Prof.Dr. I Wayan Santiasa, M.Si
Prof. Dr. I Wayan Suastra, M.Pd.
Prof.Dr. Ketut Suma,MS
Prof. Drs. I Wayan Subagia,M.Sc, PhD
Prof.Dr . Wayan Redhana,M.Si
Prof. Dr. Made Sutajaya,M.Kes
Dr. rer. nat. I Gusti Ngurah Agung Suryaputra, S.T., M.Sc.
I Wayan Mudianta, S.Pd., M.Phil., Ph.D.
Dr. I Nyoman Sukajaya, M.T.
Dr. I Wayan Sukrawarpala, M.Sc.
Dr. I Nyoman Dodik Prasetya,S.Si, M.Si
Prof. Dr. Ni Putu Ristiati, M.Pd.
Dr. I Gede Ari Yudasmara, M.Si.
Dr. Ida Bagus Putu Mardana
Dr . Ir Ketut Sri Marheni Julyasih,M.Si
Editor:
Dr. I Wayan Puja Astawa, M.Stat.Sci.
Putu Kartika Dewi, M.Sc.
Putu Widiarini, M.Pd., M.Sc.
Ni Luh Putu Ananda Saraswati, M.Si.
Luh Mitha Priyanka, M.Pd.

iv
Panitia Pelaksana:
Ketua Pelaksana : Dr . I Gede Aris Gunadi, S.Si, M.Kom
Sekretaris : Dr. Gede Iwan Setiabudi.,S.Pd.,M.Si Bendahara : Kadek Swandewi,A.Md
Humas dan Acara : Ni Putu Kartika Dewi, S.Pd,M.Sc .
Internal Editor : Drs. I Wayan Muderawan, M.S.,Ph.D.
Sekretariat : Putu Pasek Suryawan.,S.Pd,M.Pd
Prosiding : Dr. I Wayan Puja Astawa, M.Stat.Sci.
IT Support : Made Suarsana, S.Pd, MSi Diterbitkan oleh: Undiksha Press
Jalan Udayana No. 11 Telp. +62 362 26609 Fax. +62 362 25735 Email [email protected] Singaraja-Bali
ISBN 978-623-7482-41-3

v
WELCOME ADDRESS: CHAIR OF THE COMMITTEE Om Swastyastu, Assalamualaikum Wr. Wb., Namo Buddhaya, Shalom,
The honourable Rector of Universitas Pendidikan Ganesha , and all Vice Rectors.
The Head of Research Institute and Community Service Universitas
Pendidikan Ganesha.
The Dean of the Faculty of Mathematics and Natural Sciences and all Vice
Deans,
The Speakers and Participants,
Ladies and Gentlemen,
First of all, let us praise and thank The Almighty God for His graces bestowed upon us.
Allow me to heartily welcome all participants to Bali. It is my pleasure and privilege to
extend our warmest welcome to all participants of the IConMNS 2019, the 2nd International
Conference on Mathematics and Natural Sciences 2019 with the theme of “Developing
Mathematics, Natural Sciences, Marine, and Educational Researches Oriented to Sustainable
Development Goals”. The purpose of this conference is to promote and encourage the
exchange of thoughts and ideas of the advanced research in the fields of mathematics, natural
sciences, education, marine, and computer science.
The Faculty of Mathematics and Natural Sciences, Universitas Pendidikan Ganesha is proud
to organized and host this conference. We received 217 abstract submissions, of which 194
manuscripts will be presented tomorrow on 31st of August. Moreover, the conference is also
attended by 34 non-presenter participants. To all presenters and participants, thank for your
enthusiastic responses to the conference. Your present in this conference is highly
appreciated.
In this special occasion, let me also give a special welcome to our keynote and invite
speakers who are pleased to make contributions to our conference and share their new
research ideas with us. They are Prof. Dr. Susanne Bogeholz from Department of Biology
Education, Faculty of Biology and Psychology Albrecht-von-Haller-Institute for Plant
Sciences Waldweg, Gottingen, Germany; Prof. Dr. Ernesto Mollo from Institute of
Biomolecular Chemistry, Italia; Prof. Kazuhito Kawakita, Ph.D from Nagoya University,
Japan; Prof. Sathoshi Ohkura from Nagoya University, Japan; Prof. Dr. Phil IGP. Sudiarta
from Universitas Pendidikan Ganesha, Indonesia; Dr. Eliani Ardi from Osaka University,
Japan; Prof. I Nyoman Adi Asmara Giri from Institute for Mariculture Research and Fishes
Extension (IMRAFE), Gondol Buleleng Indonesia.
On 31st August, we have 7 parallel presentation sessions including mathematics education,
mathematics, computer science, environmental science, marine and fisheries science,
chemistry, chemistry education, natural science education, physics, and physics educations.
The platform is ready, so please seize this opportunity to show your thoughts, ideas, and
innovations confidently.

vi
Wish you will enjoy this conference, contribute effectively toward it and bring home the
knowledge, experiences, relations, and happy memories. Thank you for your attention and
have a nice day.
Om, Shanti, Shanti, Shanti, Om; Wassalamualaikum Wr. Wb.; Sadhu, Sadhu, Sadhu;
Shalom
Denpasar, August 30th, 2019
Chair,
I Gede Aris Gunadi
vii
DAFTAR ISI
Judul Hal
The Prediction of Ination Rate in Denpasar City Using Arti cial Neural Network
by Considering Foodstuffs Prices
Restu Wiranata, Emik Sapitri, and Eka N. Kencana 1-6
Predicting the gold jewellery price in Bali: an ANN Approach
Putu Adi Gunawan, Nasyaldha Indrianto, and Eka N Kencana
7-12
Fuzzy Logic in The Navigation of Line Follower Robot
C Widyawati and Sugiyarto
13-19
Decision Support System for Outstanding Lecturers Selection at Dhyana Pura
University by the Combination of Analytical Hierarchy Process Methods and
Simple Additive Weighting
P W Rahayu, I G A Gunadi, and I M Candiasa 20- 26
Help With Math: A Serious Game For the 3rd Grade Elementary School
Students in Plane Geometry
Kadek Arya Teguh Raharja, and Sukajaya I N 27-35
Captain Math: An Educational Game For The 5th Grade of Elementary School
Students In Weight-Unit Conversion
Damurrosysyi and Sukajaya I 36-45
Story of Math: A Serious Game Based-Learning for Improvement of Students
Achievement in Time Unit Conversion
P Rika Sahriana, and Sukajaya I N 46-60
A Lower Bound For Irregularity Strength of The Complete Graph of Power
Two Vertices
Kadek Riska Savitri, and I Nengah Suparta 61-64

viii
Developing Geogebra Mathlet On Geometry Transformation Oriented Ikrar
Strategy To Improve Students Mathematical Problem Solving Skills
I Dewa Gede Putra Ardinata, I Gusti Putu Sudiarta, and I Gusti Putu Suharta 65- 70
The Influence of Edmodo Assignment Method towards Students’ Motivation and
Achievement on Learning Matemathics
Mahayukti, Gst Ayu, Dinda Nirmala Suci, Ni Gst Ayu Made, and Sariyasa 71-78
Development of Contextual Fable Module Charged with Characters in Problem
Based Learning to Improve Students Concept Understanding and Mathematical
Motivation
N M W Pradnyawati, I G P Suharta, and I N Suparta 79-84
Development of Geogebra-Based Assessments to Increase Student Motivation
and Literacy in Mathematics
Ida ayu Kade Suryani, I Made Ardana, and I Gusti Putu Suharta 85-88
Development Of Problem-Based Physics Learning Module To Improve Students
Critical Thinking Ability
Aditya, T. P., Dewi, R. I. L., Sari, N. M. D. M. P., Suma, K., Gunadi, I. G. A 89-96
Development of STEM-Based PhET Simulation Students Woorksheet To
Improve Creative Thinking Skills of Class XI in High School
I Made Astra,and Hannah Yessi Pricilia 97-102
Analysis of insulation ability on partition room compartment
Dewi oktofa Rahmawati, and I Gede Aris Gunadi
103-109
The Effect of Chitosan Immersion to Physical and Breaking Strength of
Pineapple Leaves Rope for Fishing Gear
Muth Mainnah, Diniah, Budi Hascaryo, and Made Mahendra Jaya 110-118
The Implementation of 7E Learning Cycle Model in Improving the Social
Attitude And Physics Learning Achievement of the XI MIPA 3 Class Students of
in the Academic Year of 2018/2019 119-128

ix
I Made Tri Pramana Putra, I Wayan Suastra, and A. A. I. Agung Rai Sudiatmika
The Effect Of Problem Based Learning Model toward Formal Reasoning Ability
And Science Process Skills Of Junior High School
Pratiwi Ni Luh Gede Sri, Suastra I W , and Siti Maryam 129-135
Fish Abundance in The Estuary of Cianjur, West Java Based on Temporal of
Lunar Cycles and Spatial Differences
E Paujiah, A Mas’ud, and Wilman Taupik Ardiansyah 136-139
Water Quality Management for Surface Water Resources: System Dynamics
(SD) Approach
Hendra Andiananta Pradana, Elida Novita, Bambang Herry Purnomo, and Amelia
Ika Puspitasari 140-147
The Development Of Student Worksheet On Science Subject SMK Based On
Internet Learning Resources To Improve Learning Outcomes
Made Shita Prajnitya, I Wayan Subagia, and Desak Made Citrawathi 148-154
Development of Chemistry Learning Book Based on Case Study to Improve
Students’ Learning Outcome
L A Widiandari, I W Redhana, and A A I A R Sudiatmika 155-160
Development of Multiple Representations Chemistry Learning Book to Improve
Students’ Learning Outcomes
K Widiastari, I W Redhana, and N K Rapi 161-168
Analysis of Students’ Learning Interest toward Chemistry
L G Suryani, I N Suardana, and I W Redhana
169-173
Website Based Multimedia Development as Learning Media on Wave and Sound
Vibration Materials to Increase Student Motivation and Learning Outcomes
Ni Putu Dewi Masyuni , Ketut Suma
and I Dewa Ketut Sastrawidana 174-180

x
The Effect of Self-Efficacy, Achievement Motivation, and Study Habits to
Science Literacy at Junior High School Students
I Gede Sandi Wiarsana, I Wayan Sadia, and Ida Bagus Putu Arnyana 181-191
The Academic Supervision Process by Principal in Science Learning at SMPN
Satap 1 Tembuku
I W Winarsa, I W Subagia, and N L P M Widayanti 192-197
Levels of serum glutamate oxaloacetate transaminase (sgot) white rat (Rattus
norvegicus) wistar strain after administration Katsuwonus pelamis L. which has
been soaked using the leaf extract of Moringa oleifera L.
N L P M Widiyant , N P Ristiati
, D M Citrawathi, D W Wahyuni
198-205
The implementation of flipped learning model in classroom: literature review
L P R Ukirsari, I W Subagia and N P Ristiati
206 -212
The effect of science environment technological and society learning model
(SETS) on the students' critical thinking skill and learning achievement
D A P D O Lestari, K Suma and I W Suja
213-217
The Development of Local Wisdom-based Learning Material for Science
Instruction in Junior High School
I Wayan Sukra Warpala
218-225

xi

1
The Prediction of In ation Rate in Denpasar City Using
Artificial Neural Network by Considering Foodstu s Prices
Restu Wiranata1, Emik Sapitri2, and Eka N. Kencana3
1 Department of Mathematics, Udayana University
E-mail:
Abstract. In ation is a phenomenon of price increases that are general and continuous on one
item which can extends to most other item types. Foodstu s prices can a ected by in ation. It is
necessary to predict in ation rate so the people can anticipate the increases of foodstu s prices.
The signi cance between each of 5 types of foodstu that found on Indonesian National
Strategic Food Price Information Center (Pusat Informasi Harga Pangan Strategis Nasional
Indonesia) and in ation rate in Denpasar were checked by ANOVA. The result showed among
5 checked foodstu s i.e. rice, red onion, beef, chicken, and cayenne pepper, only the last has
signi cance e ect on in ation in Denpasar City. Therefore, this study uses cayenne pepper
prices data in Denpasar City from July 2016 until June 2019 to predict in ation rate on June
2019. The in ation data are obtained from Badan Pusat Statistik Provinsi Bali. In ation rate in
Denpasar City will be predicted using arti cial neural networks that are processed by
Jupyterlab 0.31.5. After testing the architecture with hidden unit size from 1 to 15, the 1-11-1
architecture chosen as best architecture for predicting in ation rate. The predicted in ation rate
in June 2019 is 0.1587. So, this study has contributed to predicting the latest in ation rate in
Denpasar City. 1. Introduction Denpasar is the capital of Bali Province, one of small island in Indonesia. Commonly, before
traditional ceremonies in Bali, price uctuations usually occurs on some commodities, which one is
food commodities. Food commodities are everything that can be consumed and traded comes from
the soil and require the help of water as well as biological and animal sources that can be used and
traded by humans as foodstu s [1] [2]. Foodstu s’ prices can be a ected by in ation. In ation is a
phenomenon of price increases that are general and continuous on one item which can extends to most
other item types and become great problem for the developing countries [3]. Friedman (1956) and
Lim & Papi (1997) in [3] said that in ation is always occur in monetary phenomenon and the key to in
ation is an increase in money supply. In ation can be classi ed into food in ation, in which the prices of
food items are increased [3]. Uncontrolled in ation negatively a ects the society, noting an increase in goods and services’ price
will automatically reduce people purchasing power. Then, it is necessary to predict in ation rate so the people may anticipate the increases of foodstu s’ prices. For that reason, this study aimed to forecast the in ation rate of Denpasar City from the best Arti cial Neural Network (ANN) model.
2
ANN is computing model of the processing elements (called neurons) and the relationship between them with the coe cient (weight) is tied to the connection that consist training and testing algorithms [4]. ANN can be used in forecasting [5]. So, ANN can process some data to estimate something in the future. ANN model need some inputs data [6]. To get the best input for ANN models, this study use the Multiple Regression Analysis to check the relationship amongst foodstu s’ prices and the in ation rate of Denpasar City. ANN model(s) were built refers to signi cant price(s). Setiawan & Hardianto (2014) [7] examined the price of food commodities that have an impact on in
ation in Banten Province. As a result, commodity prices for corn, rice, pedigree meat, purebred
chicken eggs and curly red chili are expected to have an impact on increasing in ation in Banten
Province. Based on that reference and on data obtained from Pusat Informasi Harga Pangan Strategis
Nasional (PIHPSN) Indonesia, this study utilizes the prices of ve food items: rice, onion, beef, chicken
meat, and cayenne pepper to test the signi cance of in ation in the city Denpasar with the Multiple
Regression Analysis. Multivariate regression analysis is a regression models with one dependent variable and more than one
independent variable [8]. Green & Salkind (2012) in [9] said that for examining the relationship
between variables, researchers can use the Multiple Regression Analysis especially t-test or ANOVA
to compare the means of two groups on the dependent variable. The main di erence between t-test and
ANOVA is that t-test can only be used to compare two groups while ANOVA can be used to compare two or more groups [9]. ANN used in this study is a follow up of the ANOVA test results. Food price data that signi cantly a
ect in ation in the city of Denpasar will be used as input to predict the in ation rate in the city of
Denpasar in the most recent month when this research was conducted, namely June 2019. Previously,
several network architectures will be tested to get the best model to predict the in ation rate. Thus, this
research will produce the latest predictions of in ation rates in the city of Denpasar.
2. Method This study utilizes two kinds of data, such as:
The prices of ve food items, namely: rice, onion, beef, chicken meat, and cayenne pepper in Denpasar City. These data were obtained from Indonesian National Strategic Food Price Information Center (Pusat Informasi Harga Pangan Strategis Nasional Indonesia), for period July 2016 until June 2019.
The in ation rate data at Denpasar for period July 2016 until May 2019 were collected from Bali Statistics O ce (BPS Bali).
This study aimed to forecast the in ation rate of Denpasar City from the best ANN model. To built
best model, we need to know the signi cant variable amongst the ve food items as best inputs for the ANN model. For that reason, this study use multiple regression to check the relationship amongst foodstu s’ prices and the in ation rate of Denpasar City.
To conduct regression analysis, we used SPSS for Windows. The dependent variable is the in ation
rate of Denpasar City (INF), while the independent variables are the prices of rice (RIC), onion (ONI), beef (BEE), chicken meat (CHI), and cayenne pepper (CAY). The multiple regression equation will
built from the signi cant price(s). The multiple regression equation is formulated as [8]:
y=β0+β1x1+β2x2+...+βnxn+ (1)

3
where y refer to in ation rate, xi refer(s) to the signi cant price(s), i is parameter, and is error. On the next steps, the signi cant price(s) will use as input(s) data for the ANN model(s). Before
built the ANN models, the data must be transform to range 0 to 1. This process called normalization. On this study, the min-max formula is used to normalize the data. The formula is [10]:
Xnorm = (Xk − Xmin) ∗ (1 − 0) / Xmax − Xmin ; fork = 1, 2, 3, , n (2)
After do the normalization process, the data should be separate as training and testing data. This
study use 80% : 20% as a proportion for separate the data [11]. So, training data contains 80% of data and testing data contains 20%.
The training and testing data uses to built some ANN models. The ANN models that were built is
only di er from the number of neurons on hidden layer. One hidden layer is de ned between those layers with its neuron varied from 1 to 15. Every ANN model is processed by applying JupyterLab 0.31.5 with Python programming language. The total iteration was set as much as 2000 iteration [16].
To get the optimal number of neurons in hidden layer, a training process is carried out using the backpropagation algorithm. Then, the regularization process will be conducted to minimize over tting. Regularization utilizes lambda parameters to avoid all parameters except intercepts so that the model generalizes data and will not over t [12].
To choose the best ANN model, the average forecasting error rates (AFER) per iteration will be calculated. The best model is chosen based on its AFER, where the model with the smallest AFER is the best ANN model.
The AFER that will be calculated is the average error after the regularization process. AFER is calculated by the formula:
(3) where n represents many iterations, Ji represents the value of the cost function in the i iteration for
training data, and testJi states the cost function value in the i iteration for the test data. The best ANN model will be used to forecast the in ation rate of Denpasar City on the next month.
This study use Jupyterlab 0.31.5 to get the forecast result. The forecast result obtained from Jupyterlab
0.31.5 is still a normalized result. For this reason, a de-normalization process must be carried out to
obtain the actual results. De-normalization is carried out according to the normalization formula. The
de-normalization formula is shown below:
Xrealresult = Xnormresult ∗ (Xmax − Xmin) / (1 − 0) + Xmin (4)
3. Result The regression analysis result is listed on table 1. From table 1, can be seen that only the P-Value of
cayenne pepper (CAY) that approaching the value of = 0:05. This means that data cayenne pepper
(CAY) is signi cant a ects the in ation rate [13]. Refers to the regression result that shows cayenne
pepper (CAY) is the only variable signi cantly a ects the infation rate, then we built single regression
to study the causal relationship between INF and CAY. We got the regression equation between these
variables as follows:

4
Table 1. Regressions’ Results Predictor Standardized t-Value p-Value VIF
RIC 0.236 1.089 0.285 1.756
ONI 0.189 0.941 0.355 1.518
BEE { 0.079 { 0.434 0.667 1.241
CHI 0.112 0.521 0.606 1.727
CAY 0.375 1.989 0.056 1.330
INF = 0:375CAY + ^
This equation is signi cant [14] and has a coe cient of determination (R
2) as much as 37.5 percent.
This means the in uence of cayenne pepper (CAY) amounted 37.5 percent to in ation rate (INF) and as much as 62.5 percent are in uenced by factors outside the model.
By believing CAY is the signi cant determinant of the INF, we decided to build an ANN model where its input and output layers are CAY and INF, respectively. So, the normalize form of CAY and INF are calculated.
After normalize the CAY and INF data with min-max formula, the data will separate into training and testing data. This study use normalize data of cayenne pepper (CAY) for period July 2016 until June 2019 and in ation rate data at Denpasar for period July 2016 until May 2019. So, training data contains 28 data and training data contains 7 data.
Some ANN models were bulit. One hidden layer is de ned between input and output layer with its
neuron varied from 1 to 15 [15]. Every model is processed by applying JupyterLab 0.31.5. In addition,
the average forecasting errors rates (AFER) for each architecture is recorded. The best model is chosen based on its AFER, where the model with the smallest AFER is the best
ANN model. The AFERs were listed on Table 2.
Table 2. The AFERs Neuron AFER Neuron AFER Neuron AFER
1 0.00282 6 0.00189 11 0.00169
2 0.00326 7 0.00193 12 0.00176
3 0.00208 8 0.00190 13 0.00200
4 0.00189 9 0.00174 14 0.00181
5 0.00193 10 0.00170 15 0.00195
Refers to those AFERs, the best model is the ANN architecture with 1 input (CAY), 1 output (INF), and 1 hidden layer with 11 neurons with AFER = 0.00169. The iterations’ error on best ANN model were displayed on Figure 1.
By using 1-11-1 model, the in ation rate on June 2019 will forecast. The forecasts’ result is 0.3554 and the de-normalize form is 0.1587.

5
Figure 1. Iterations’ error on 1-11-1 model 4. Conclusion Based on the results on research and discussion, the researchers concluded the following:
The 1-11-1 ANN architecture was chosen as the best model in predicting the in ation rate of Denpasar City noting it has the smallest AFER;
The predicted in ation in June 2019 is 0.1587 which has an AFER as much as 0.00169
Comparing to the real data of in ation rate for June 2019 as much 0.04, the out-of sample forecast error is quite big, i.e. 74.89 percent. This nding signals the small in-sample forecasting error does not warrant small out-of-sample error.
If the coe cient of determination (R
2) value is below 50 percent, it is not good enough to model
it, it is justifying through ANN apparently with ANN indicating that the error is in high out-of-sample.
References [1] S. K R S, A Study of Commodity Futures in India Asia Paci c J. Res., vol. 2, no. 4, pp. 19, 2013. [2] C. Saparinto and D. Hidayati, Bahan Tambahan Pangan 2006. [3] A. Qayyum and B. Sultana, Factors of Food In ation: Evidence from Time Series of Pakistan J.
Bank. Financ. Manag., vol. 1, no. 2, pp. 2330, 2018. [4] S. Shanmuganathan and S. Samarasinghe, Arti cial Neural Network Modelling, 2016. [5] F. D. Syah tra, R. Syahputra, and K. T. Putra, Implementation of Backpropagation Arti cial Neural
Network as a Forecasting System of Power Transformer Peak Load at Bumiayu Substation, vol.
1, no. 3, pp. 118125, 2017. [6] Y. Singh and A. S. Chauhan, Neural Networks in Data Mining, J. Theor. Appl. Inf. Technol.,
2009. [7] A. F. Setiawan and A. Hardianto, Fluktuasi Harga Komoditas Pangan dan Dampaknya Terhadap
In asi di Provinsi Banten, J. Agric. Resour. Environ. Econ., vol. 2, no. 2, pp. 8197, 2014. [8] N. G. Gulden Kaya Uyanik, A Study on Multiple Linear Regression Analysis, Procedia - Soc.
Behav. Sci., vol. 106, pp. 234240, 2013. [9] M. T. Sow, Using ANOVA to Examine the Relationship between Safety & Security and Human
Development, J. Int. Bus. Econ., vol. 2, no. 4, pp. 101106, 2014. [10] A. S. Eesa and W. Arabo, A Normalization Methods for Backpropagation: A Comparative Study,
Sci. J. Univ. Zakho, vol. 5, no. 4, pp. 319323, 2017.

6
[11] S. P. Mohanty, D. P. Hughes, and M. Salath, Using Deep Learning for Image-Based Plant
Disease Detection, Tech. Adv. Plant Sci. a Sect. J. Front. Plant Sci., vol. 7, pp. 110, 2016.
[12] A. Nagpal, Over- tting and Regularization Towards Data Science, 2017. [Online].
Available: https://towardsdatascience.com/over- tting-and-regularization-64d16100f45c. [Accessed: 07-
May-2019]. [13] N. J. SALKIND, Ed., Encyclopedia of Measurement and Statistics. 2007. [14] O. Hssjer, On the coe cient of determination for mixed regression models, J of Statistical
Planning and Inference,vol. 138, no. 2008, pp. 3022 3038. 2007. [15] K. Kumar and P. Sahoo, Arti cial Neural Network Modeling for the Prediction of Surface
Roughness in Arti cial Neural Network Modeling for the Prediction of Surface Roughness in
ECM, Int. J. Appl. Eng. Res., vol. 9, no. 26, 2014. [16] H. Huang, J. Li, and C. Xiao, A proposed iteration optimization approach integrating
backpropagation neural network with genetic algorithm, Expert Syst. Appl., vol. 42, no. 1, pp. 146155, 2015.

7
Predicting the gold jewellery price in Bali: an ANN approach
1Putu Adi Gunawan, 2Nasyaldha Indrianto, 3Eka N Kencana
1 Department of Mathematics, Udayana University|Kampus Bukit Jimbaran, ID
2,3Centre of Excellence in Tourism, Udayana University|Kampus Sudirman,
ID
E-mail: [email protected],
[1]. Corresponding author.
Abstract. The development of trend fashion in Indonesia is in uenced by many factors such as
fashion designers, culture, as well gold jewellery price. Gold jewellery is very common in the
fashion with its price could be a ected by the gold price. In addition, the gold price is also in
uenced by some macroeconomic variables, for example, in ation and the exchange rate. By
making a good prediction of gold jewellery price, the designers can optimise their pro t
through the products were sold. This study aims to predict the gold jewellery price (GJP) by
considering two macroeconomic variables, namely the monthly in ation rate in Bali (INF), and
the exchange rate (EXC) of Rupiah on AUD. The second aim is to build model that is capable
to predicts the contribution of GJP on Bali’s Gross Regional Domestic Products (GRDP).
Two arti cial neural network (ANN) models are built by putting GJP, INF, and EXC in the
input layer. All of the variables combination are tested. We found that the architecture with 1
neuron in the input layer represents INF in current month, 8 neurons in the hidden layer, and 1
neuron in the output layer represents the GJP, is the best model to predict the next month’s
GJP. The obtained model has an average MSE equals to 0.25 percent and it has a low over
tting level, so the model is quite good in predicting the gold jewellery price. In addition, our
second ANN architecture to predict the GJP’s contribution for Bali’s GRDP has an average
MSE 0:184 percent. We conclude our models are worth to predict the gold jewellery price as
well its contribution to the Bali’s GRDP.
1. Introduction Fashion, a creative industry [1], is rapidly growing in Indonesia. According to Kisfaludy [2], fashion
can be interpreted as something that someone wears such as clothing and accessories, that be in
uenced by all of life aspects. Likes the other businesses, fashion is also a ected by some environment
factors such as its internal environment, microeconomic, as well macroeconomic environment [3]. For
Bali, the 2018 data showed fashion industries such as textile and apparel industries grew 39:62
percent and 6:38 percent, respectively. In addition, both contribute 0:41 percent of Bali’s Gross
Regional Domestic Product (GRDP) [4]. Meanwhile, fashion accessories especially gold jewellery, has a great market in Bali. The demand
for gold jewellery has increased over time, especially near the holiday or Hindu ritual days. In order
to help the fashion designers make right decision in buying gold jewellery, prediction the gold
jewellery price is important. Furthermore, the price of gold jewellery is also used by the end users to
invest [6]. Previous research had con rmed the demand of gold
8
jewellery correlated with the gold price volatility [7], and the gold price has a relationship with the in ation rate [8], as well the exchange rate [9].
Refer to the signi cant raising of fashion industry as well the increasing demand of gold jewellery
in Bali, this paper aims to predict the gold jewellery price (GJP) by considering the monthly in ation
rate (INF), the exchange rate of Rupiah on AUD (EXC), and previous GJP. In addition, the
contribution of gold jewellery on Bali’s GRDP is also forecasted. Both aims is done by building arti
cial neural network (ANN), a soft modeling technique that, nowadays, is utilised more often than other
soft techniques such as ARIMA, support vector machine (SVM), and random forest (RF) algorithm.
2. Reseach methods To predict the GJP and forecast its contribution on Bali’s GRDP, the supervised learning ANN were
built with 1 input, 1 hidden, and 1 output layer [10]. The monthly data of GJP, INF, and EXC for
January 2011 to December 2016 as well the yearly data of textile and apparel industry contribution on
Bali’s GRDP for the year 2011{2016 were collected from Bali Statistics O ce. The matrix data with
total 72 observations is divided into 2 subsets; the rst subset with 54 observations is set as the training
data, and the second subset with 18 observations is set for the validation process. The maximum
number of iteration is a hundred [11]. Each of ANN architectures were built and tested in JupyLab
software. Knowing the variables have di erent unit of measurement, before entering the architecture, GJP,
INF, and EXC were normalized by applying Min{Max function (Eq. 1) so its values lie within [0; 1] interval [12]. On Eq. 1, XMax and XMin represent the maximum and the minimum value of each variable being normalised.
(1)
In general, computing process of neurons’ weight on ANN architecture involves two sequential
steps, i.e. computation on feedforward neural network (FNN), and computation on backward neural
networks (BNN) [14, 15]. For the rst step (FNN), a set of neurons’ initial weight were randomly
generated and these weights enter the selected activation function to generate prediction value. For the
second step, BNN is taken place to adjust the weights. Adjustment is needed to minimise the
prediction error. It is common to express the prediction error by counting the mean square error (MSE)
[16] that is de ned as
(2)
where W
(1), W
(2), and X represent the neurons’ weight connecting the input and the hidden layers; the
neurons’ weight connecting the hidden and the output layers; and the neurons’ values on the input layer, respectively. The f( ) =
1 x is a binary sigmoid function to get the
predicted 1+e
value. After the prediction has been made on FNN step, weights adjustment were conducted on BNN step [17]. This study utilised the gradient descent method to adjust the neurons weight. This method adjusts W
(2) and W
(1).

9
3. Result and Discussion 3.1. Modeling the Gold Jewellery Price To predict GJP on certain month, 7 ANN’s architectures were tested and ran for 5 to 25 neurons on the hidden layer with 100 iterations. The architectures is described on Table 1.
Table 1. ANN’s Architectures in Predicting Gold Jewellery Price
Architecture Input(s) Output
A1 INF In ation Rate Gold Jewellery Price
A2 EXC Exchange Rate Gold Jewellery Price
A3 GJP Gold Jewellery Price Gold Jewellery Price
A4 INF In ation Rate Gold Jewellery Price
EXC Exchange Rate
A5 INF In ation Rate Gold Jewellery Price
GJP Gold Jewellery Price
A6 EXC Exchange Rate Gold Jewellery Price
GJP Gold Jewellery Price
A7 INF In ation Rate Gold Jewellery Price
EXC Exchange Rate
GJP Gold Jewellery Price
The results showed that A1 architecture|1 neuron on input layer represents current INF, 8 neurons
on the hidden layer, and 1 neuron on output layer represents current GJP; is the best architecture
because of its smallest MSE as much as 0.0028 compares to others architectures. Despite this nding,
we found some architectures experienced over tting in predicting GJP because the neurons (nodes) on
the hidden layer (HL) greater than the trained samples. According Long et al. [18], an ANN’s
architecture should has the nodes on its hidden layer less than the number of trained observations. To
overcome this problem, we add a small constant = 0:0001 for the activation value biwi
2 that connect the hidden with the output layer. This process is
called the regularization of ANN architecture [18]. Table 2 lists the MSEs for all of the architectures after adding = 0:0001.
Table 2. The MSEs of ANN architectures Architecture neuron The MSE
P of on HL
A1 8 0.00250 A2 24 0.01350
A3 23 0.01189
A4 25 0.00953
A5 16 0.01102
A6 20 0.01173
A7 16 0.01103

10
Table 2 shows the best architecture is A1 with its MSE as much as 0.0025, slightly less than the MSE before regularization process. The plot of MSE for A1 before and after the regularization is depicted on Fig. 1 and Fig. 2.
Figure 1. Before Regularization 0:0028 Figure 2. After Regularization 0:0025
After observing the A1 architecture is still the best compared to others, then we used it to predict
the GJPs for January{July 2017 using in ation rates at the same period. The prediction and the errors
are listed on Table 3 and plot of MSE is depicted on Fig. 3. From Table 3, we know the out-of-sample
average forecasting error rate (AFER) as much as 6.43 percent, an indication that ANN architecture
with 1, 8, 1 nodes on each of input, hidden, and output layers has good performance to predict the
GJP based-on the in ation rate.
Date Actual Prediction jErrorj
Jan 2017 508 843.8 489 811.2 19 032.6
Feb 2017 508 843.8 484 535.3 24 308.5
Mar 2017 522 504.3 487 940.0 34 564.3
Apr 2017 519 730.3 479 495.6 40 234.7
May 2017 508 436.1 477 277.4 31 158.7
Jun 2017 519 330.6 476 741.8 42 588.8
Jul 2017 524 804.2 483 772.7 41 031.5
Table 3. Predicting the GJPs and Errors Figure 3. Plot of GJPs and the Prediction 3.2. Modeling the Gold Jewellery Price The second aim of this paper is to make an ANN architecture in predicting the contribution of gold jewellery to the formation of Bali’s GRDP. Previously, we decomposed the yearly GRDP data into monthly terms by utilizing the following formula:
(3) where i = 1; 2;; 12; and t represents the transformed year, t = 2011; ; 2016.

11
The ANN architecture for this purpose is built by putting 12 neurons represent 12 consecutive
months of GJP in the input layer, 5{25 neurons in HL, and one neuron represents the monthly Bali’s
GRDP on the same year. All architectures were ran for 100 iterations on JupyLab software. A
regularization value ( = 0:0001) is also applied in evaluating the performance of the architectures. The
best architecture is chosen for the lowest MSE. Table 4 summarises
the MSE for all number of nodes on hidden layer were tested. The error plot of the best architecture is drawn on Fig. 4. We found the best ANN architecture for counting the gold jewellery contribution on Bali’s GRDP is 12, 15, 1 nodes on the input, the hidden, and the output layers. The MSE for this architecture is 0:18 percent.
Nodes MSE Node MSE
5 0.00473 16 0.00372
6 0.00453 17 0.00342
7 0.00554 18 0.00267
8 0.00420 19 0.00445
9 0.00646 20 0.00407
10 0.00485 21 0.00360
11 0.00393 22 0.00357
12 0.00480 23 0.00468
13 0.00373 24 0.00408
14 0.00367 25 0.00374
15 0.00184
Figure 4. Plot of Errors for 15 Nodes Table 4. The MSE of Architectures
4. Conclusion and Suggestion For the best of our knowledge, research regarding the gold jewellery as an integral part of fashion industry is very limited. By doing this study we hope we could ll the gap. Our research found some interesting conclusion, namely:
[12] Soft modeling technique, i.e. arti cial neural network, can be applied to model the gold jewelerry price based-on some determinants such as in ation rate, currency exchange rate, as well the gold jewellery price on previous period;
[13] The best ANN architecture for predicting the gold jewellery price is an 1{8{1 architecture with a
single node on the input layer represents the in ation rate on current month, and a single node on the output layer represents the gold jewellery price on current month;
[14] The in-sample and out-of-sample AFER for the best architecture as much as 0.25 percent and
6.43 percent, respectively; and [15] The best ANN architecture for determining the contribution of gold jewellery on Bali’s GRDP is
an 12-15-1 architecture with the MSE as much as 0.18 percent.
We suggest the next similar research is conducted by trying another activation function as well as adding another determinant such as household’s income or another microeconomic variables in predicting the gold jewellery price.
References [14] E. Astuty, A. Rahayu, Disman, and L. A. Wibowo, 2018 Breakthrough in Indonesian Creative
Industry through Soft Innovation Inter. J. Entrepreneurship 22 1-10 [15] M. Kisfaludy, 2008 Fashion and Innovation Acta Polytechnica Hungarica 5 59-64

12
[16] R. B. Chavan, 2018 Analysis of Fashion Industry Business Environtment trends in textile and fash design 4 212-219
[17] Bali Provicial Statistics Center, Produk Domestik Regional Bruto Provinsi Bali Menurut Penyeluaran 2014-2018, BPS Bali, 2019
[18] N. Oktaviana and N. Amalia, 2018 Gross Regional Domestic Product Forecasts using Trend
Analysis: Case Study of Bangka Belitung Province J. Ekonomi dan Studi Pembangunan 19
142-151
[17] P. L. Rompas, 2015 A Qualitative Research of Woman Perception of Gold Jewelry as Investment in Manado J. EMBA 3 192-200
[18] R. Grynberg, T. Kaulihowa, and F. Singogo, 2018 Gold Jewellery Demand and Gold Price Volatility: A Global Perspective J. Economics, Management, and Trade 10 1-13
[19] S. Tufail and S. Batool, 2013 An Analysis of the Relationship between In ation and Gold Prices: Evidence from Pakistan The Lahore J. Economics 18 1-35
[20] G. K. Nair, N. Coundhary, and H. Purohit, 2015 The Relationship between Gold Prices and Exchange Value of US Dollar in India Emerging Markets Journal 5 16-25
[21] Christopher M. Bishop, Pattern Recognition and Machine Learning. Springer, 2006. [22] E. O. Salawu, M. Abdulraheem, A. Shoyombo, A. Adepeju, S. Davies, O. Akinsola, and B.
Nwagu, 2014 Using Arti cial Neural Network to Predict Body Weights of Rabbits Open J. Animal Sciences 4 182-186
[23] M. K. O. Ayomoh, 2012 Neural Network Modeling of a Tuned PID Controller European J. Scienti c Research 71 283-297
[24] S. Tasdemir, B. Yaniktepe, and A. B. Guher, 2018 The E ect on the Wind Power Performance of
Di erent Normalization Methods by using Multilayer Feed-forward Backpropagation Neural
Network I. J. Energy App. and Tech. 5 131-139 [25] A. J. Izenman, Modern Multivariate Statistical Techniques Regression, Classi cation, and
Manifold Learning. Springer, 2008. [26] K. Vora and S. Yagnik, 2014 A Survey on Backpropagation Algorithm for Feedforward Neural
Networks IJEDR 1 193-197 [27] M. M. Zahra, M. H. Essai, and A. R. A. Ellah, 2013 Robust Neural Network Classi er IJEDR 1
326-331 [28] N. Kayarvizhy, S. Kanmani, and R. V. Uthariaraj, 2014 ANN Models Optimized using Swarm
Intelligence Algorithm WSEAS Transactions on Computers 13 501-519 [29] J. Long, K. Xueyuan, H. Haihong, Q. Shinian, and W. Yehong, 2004 Study on the Over tting of
the Arti cial Neural Network Forecasting Models Acta Meteorologica Sinica 19 (2) 216{225

13
Fuzzy Logic in The Navigation of Line Follower Robot
C Widyawati 1 and Sugiyarto 2
Department of Mathematics, Ahmad Dahlan University,
South Ringroad, Yogyakarta, Indonesian
e-mail : 1 [email protected]
Abstract. Fuzzy controllers are widely used because the control design is relatively easy,
flexible and efficient compared to conventional controllers. The purpose of this research is to
compare the results between the triangular and gbell fuzzifier method to determine which
system is more accure to use. This research transform to fuzzy logic controls on the line
follower robot from the PID (Proportional-Integral-Derivative) machine that has been installed
in the robot microcontroller to control the movement of the robot. The research method used is
triangular fuzzifier and gbell with the largest maximum defuzzification method. The input
variables needed include the distance, angle and speed variables. The three entries are then
processed by the fuzzy logic controller to obtain the output value in the form of the robot time
moves. The error in the triangular fuzzifier is smaller than the gbell so that the triangular
fuzzifier is more accurate than the use of gbell fuzzifier on the system.
Introduction
Nowadays fuzzy logic is widely applied to solve problems that occur in daily life, one of which is in
controlling a work process. One solution that can be done to control it is that to use the Fuzzy Logic
Controller (FLC) system. FLC is a fuzzy system known as a basic or basic system of rules. This fuzzy
system is known as the IF-THEN fuzzy rule.At present there are many control methods used.
Controllers based on fuzzy logic are the controlling methods included in the FLC. The purpose of the
FLC system is to control complex processes by means of human experience [1]. Completion of the
case using FLC does not require a mathematical model of the system, because this method works
based on the rules according to the input data that has been given previously. Previous research,
Puspitasari [2] conducted Fuzzy Logic research on the Two Wheeled Robot Equilibrium System by
using a triangular fuzzifier and the largest of maximum defuzzifier method produced time data for
robot movement and compared with the factual results. Meanwhile, Zhao's [3] research on Mobile
Robot Navigation using Optimized Fuzzy Controller by Genetic Algorithm by means of optimizing
fuzzy controllers so that robots reach their destination faster. The difference which is being carried out
in this study is the method used, namely in the fuzzifier stage, the triangular fuzzifier with Gbell
fuzzifier is compared, as well as the use of the largest of maximum defuzzifier at the defuzzifier stage.
In this study, the discussion will be FLC in the navigation systems of line follower robots. Line
follower robots can detect the color of the track they are going to in accordance with the color they
recognize (black) [4]. The core step needed is to analyze the primary data on the line follower robot
which are on the distance of the sensor with the aim to be achieved, the time needed by the robot to
move, the speed of movement of the robot and the angle of movement of the robot. Based on this
background the researcher was interested in discussing "Fuzzy Logic in the Navigation of Line
Follower Robot".
2. Fuzzy Logic Control
The general control using fuzzy stages on the line follower robot is shown in Figure 1.
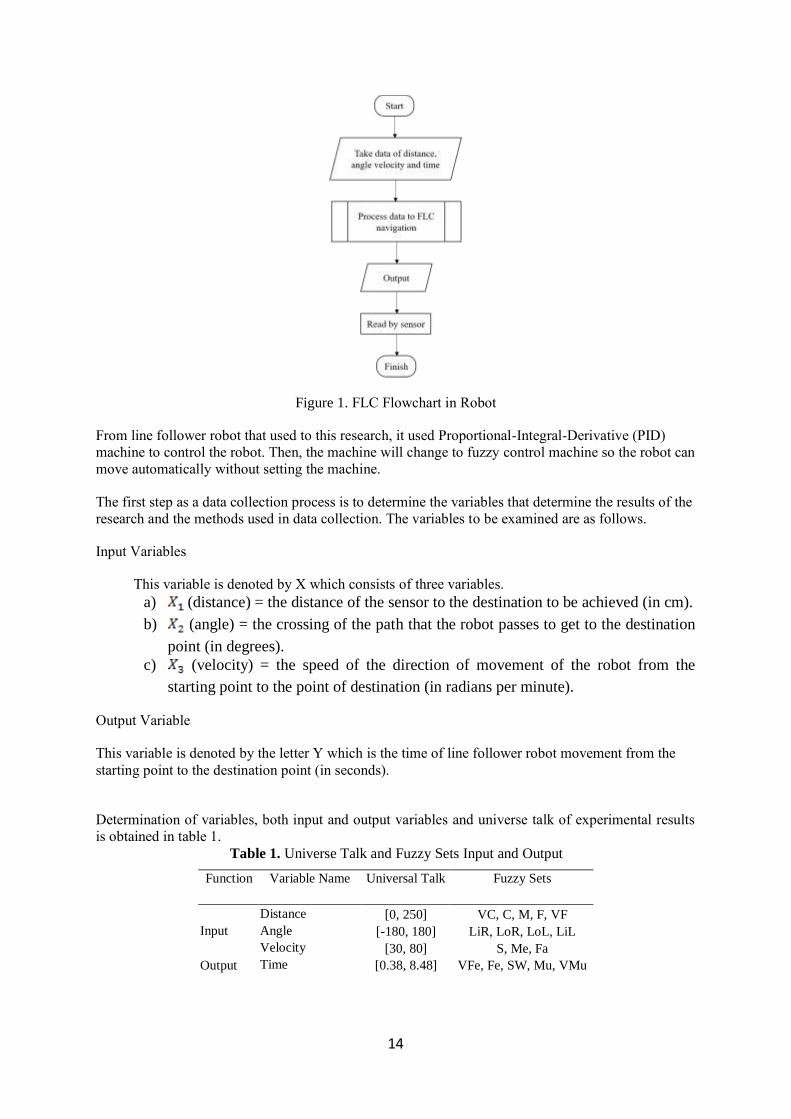
14
Figure 1. FLC Flowchart in Robot
From line follower robot that used to this research, it used Proportional-Integral-Derivative (PID)
machine to control the robot. Then, the machine will change to fuzzy control machine so the robot can
move automatically without setting the machine.
The first step as a data collection process is to determine the variables that determine the results of the
research and the methods used in data collection. The variables to be examined are as follows.
Input Variables
This variable is denoted by X which consists of three variables.
a) (distance) = the distance of the sensor to the destination to be achieved (in cm).
b) (angle) = the crossing of the path that the robot passes to get to the destination
point (in degrees).
c) (velocity) = the speed of the direction of movement of the robot from the
starting point to the point of destination (in radians per minute).
Output Variable
This variable is denoted by the letter Y which is the time of line follower robot movement from the
starting point to the destination point (in seconds).
Determination of variables, both input and output variables and universe talk of experimental results
is obtained in table 1.
Table 1. Universe Talk and Fuzzy Sets Input and Output
Function Variable Name Universal Talk Fuzzy Sets
Input
Distance [0, 250] VC, C, M, F, VF
Angle [-180, 180] LiR, LoR, LoL, LiL
Velocity [30, 80] S, Me, Fa
Output Time [0.38, 8.48] VFe, Fe, SW, Mu, VMu

15
The meaning of each fuzzy sets as follows, very close (VC), close (C), medium (M), far (F) and very
far (VF) on the distance input variable. The fuzzy parameters on the input variable angles include a
little right turn (LiR), turn right a lot (LoR), turn left a lot (LoL) and turn left a little (LiL), while the
input variable speed includes a slow (S), medium (Me) and fast (Fa). Time output variables consist of
very few (VFe), few (Fe), somewhat (SW), much (Mu) and very much (VMu).
Variable of distance get the number of universal talk from the track that made before. Variable of
angle get the number because the robot just know turn left or turn right. The universal talk’s value of
velocity got from PID machine that installed in the line follower robot and finally for variable of time
get the number from the results of this experiment.
2.1 Fuzzification
As a robot is designed, so that a robot can move according to the instructions. The robot must have a
performance design. The focus of the research was the transformation of the PID machine installed on
the robot microcontroller to the fuzzy control method in the robot's navigation settings. Input
variables obtained previously are transformed into a particular linguistic variable. The data that has
been obtained is represented by a triangle curve and gbell.
2.1.1 Triangular Curve
This method is a combination of the two linear lines, namely linear up and linear down. The
membership function is defined as
(1)
Figure 2. Triangular Curve Membership Function
2.1.2 Gbell Curve
In general, the bell curve has the following functions.

16
(2)
with a is half the width of the curve, b is the slope of the curve and c is the center point.
Figure 3. Gbell Curve Membership Function
Rule Base
The next step to solve this case is the fuzzy rule base stage or the determination of fuzzy basic rules.
Determining the rules of fuzzy logic rules in this study is based on experience because there are no
specific rules in the organization. The number of fuzzy rules formed is obtained from the
multiplication of the number of fuzzy sets that exist in each input variable, so that the total rules
formed in this study are 60 rules. The form of IF-THEN rules is
(3)
Defuzzification
Defuzzification is the process of converting fuzzy output to crisp output. After obtaining the
evaluation rule results from these rules, the last step to get the FLC result is to work on the defuzzifier
stage. The defuzzifier stage in this case will be solved using the largest of maximum defuzzifier
method. This method formula is defined as follows
(4)
with
(5)
Determining the crisp value of each of these rules is determined by returning the fuzzy value of the
previous rule evaluation results to the consequent initial membership function.

17
3. Data Testing and Analysis
From data research, then the data will be form to fuzzy number by triangular and gbell fuzzifier. The
membership functions of input and output can be seen in figure 4 and 5.
Figure 4. Triangular Curve Membership Function Figure 5. Gbell Curve Membership Function
After that, from the data value then the value will represent in fuzzy rule base. The fuzzy rule base
that had make before are representing by table 2.
Table 2. Fuzzy Rule Base
Rule If and Then y
R1 Very Close Little Turn Right Slow Few
R2 Very Close Little Turn Right Medium Few
R3 Very Close Little Turn Right Fast Very Few
R58 Very Far Little Turn Left Slow Very Much
R59 Very Far Little Turn Left Medium Much
R60 Very Far Little Turn Left Fast Much
By substituting the value of fuzzification stage to fuzzy rule base, so from this stage will get the
conclusion of the data. Then, the number will be find the actual results on defuzzification stage.
Because there are use two methods in fuzzification, so there has two results too in the last stage. The
results of the FLC system testing as a whole can be seen in figure 6.
Figure 6. The Results of FLC System

18
Based on the graph, it can be seen that the defuzzification of the triangular fuzzifier method is more
accurate than the gbell fuzzifier. The results of using triangular fuzzifier have less difference
compared to the FLC results with gbell fuzzifier.
After the FLC process finished, then the value of defuzzification use triangular fuzzifier compared
with results of gbell fuzzifier. To obtain the error of the two fuzzifier used relatif error formula as
(6)
The results relatif error of triangular and gbell fuzzifier representation can be seen in figure 7.
Figure 7. Error on the Results of Triangular and Gbell Fuzzifier
The error rate results in the triangular fuzzifier method between 0%-36% while the results of
gbell fuzzifier method between 0%-53%. Difference results in the triangular and gbell
fuzzifier method show that triangular fuzzifier more accurate than gbell for the results of
research. The results of this experiment show that PID machine can be transformed into fuzzy
solutions (in this case is fuzzy controller).
4. Conclusions
The application of FLC on line follower robots in this experiment uses triangular and gbell fuzzifier
methods. The stages in compiling a FLC system successively form a fuzzy set in the fuzzifier process
by using triangular fuzzifier and gbell fuzzifier methods, followed by determination of IF - THEN
rules and the final stage is the defuzzifier process. The comparison of the results of the triangular
fuzzifier algorithm with gbell fuzzifier on the experimental results can be seen from the error between
the two methods along with the results of the experiments obtained. Based on the FLC that has been
formed, triangular fuzzifiers generally produce more accurate results than gbell fuzzifiers because the
error of triangular fuzzifier more little than gbell fuzzifier. Meanwhile, the factors that can hinder the
course of the FLC in this system include the formation of membership functions in the system and the
measurement of experimental results that are less accurate on the results of the time of the robot
movement.

19
5. Acknowledgments
The authors would like to say thank you to University of Ahmad Dahlan for the funding and
permission to publish this paper.
References
[1] Zimmermann H-J 1996 Fuzzy Set Theory and Its Applications (London: Kluwer Academic)
[2] Puspitasari S, Nusantoro G D, and Muslim M A 2015 Implementasi Kontrol Logika Fuzzy pada
Sistem Kesetimbangan Robot Beroda Dua 2 1-6
[3] Zhao R, Lee D H and Lee H K 2015 Mobile Robot Navigation using Optimized Fuzzy
Controller by Genetic Algorithm 15 12-9
[4] David 2016 Kendali Logika Fuzzy pada Robot Line Follower 3 15-25
[5] Dewantoro G, Susilo D and Adi P P 2017 Implementasi Pengendali Logika Fuzzy pada
Navigasi Robot Penjejak Dinding 16 72-7
[6] Kusumadewi S, etc 2006 Fuzzy Multi-Attribute Decision Making (Fuzzy MADM) (Yogyakarta:
Graha Ilmu)
[7] Hernadi, J 2017 Teori dan Praktikum Metode Numerik-1 (East Java: Umpo)
[8] Supani, A and Azwardi 2015 Applying Fuzzy Logic and Pulse Width Modulation for Speed
Control System of Line Follower Robot 9 1-10
[9] Wajiansyah A, Bramanto A, Supriadi and Nur S 2018 Implementasi Fuzzy Logic pada Robot
Line Follower 5 395-402

20
Decision Support System for Outstanding Lecturers Selection
at Dhyana Pura University by the Combination of Analytical
Hierarchy Process Methods and Simple Additive Weighting
P W Rahayu1, I G A Gunadi2, I M Candiasa3 1, 2, 3
Magister Program of Computer Science Universitas Pendidikan Ganesha
E-mail : [email protected], [email protected]
2,
Abstract. The outstanding lecturer selection at Dhyana Pura University still done manually by
ranking and assessment methods which influenced by the viewers' point of view. Based on
these problems, this study aimed propose a Decision Support System based on the
combination of the Analytical Hierarchy Process (AHP) methods and Simple Additive
Weighting (SAW). AHP was chosen because in the selection process there was no method
applied to give a score to each candidate along with the criteria. Whereas, SAW was chosen
because in the process of the selection, it is required a method to rank the final score which
had been given in the AHP process. Based on the condition that the experts scored more than
one candidate, it is necessary to combine the score of criteria and sub-criteria using the
Geometric Mean Method (GMM) and the Weighted Arithmetic Mean Method (WAMM).
GMM was assumption if each expert has the same score in building an opinion, while the
WMM was assumption if each expert has an unequal score. The results obtained by the
university and the previous system were tested using Mean Average Precision. The results
accuracy obtained from the comparison was 60%, which can be concluded that the DSS was feasible to be applied at Dhyana Pura University.
1. Introduction
The selection of lecturer achievers at Dhyana Pura University was carried out by the Institute for
Research and Community Service (LP2M). However, until now the selection of lecturer achievers at
Dhyana Pura University is still done manually by ranking and assessment methods that are still
influenced by the viewers’ point of view. The plot of manual lecturer selection begins by determining
the top five ranks of lecturer achievers. The names of the selected lecturers would be taken to the
rector to be concluded together and from the results of the meeting determined one lecturer achiever.
Seeing the selection system of lecturer achiever who are still manual and influenced by the assessors’
point of view, required a system that can help management to resolving fewer objective results in the
selection of outstanding lecturers at Dhyana Pura University. Decision makers sometimes use their
experience and often use intuition to make decisions and sometimes the results are inappropriate
decisions. For this reason, decision-making methods are very important in helping decision makers
make decisions [1].
This study aimed to propose a Decision Support System. Decision support system (DSS) is a
computer-based system which designed to improve the effectiveness of decision makers in solving
problems that are semi-structured or unstructured. Decision support system is also referred to as the
science of compiling decision making which is more precise than a number of criteria which are
mostly not fixed on a condition and a rule, but more than two rules [2]. The Analytical Hierarchy
Process (AHP) method [3] was chosen because in the process of selecting lecturer achievers at
Dhyana Pura University, there is no method used to give quality to each lecturer achievers and their
criteria. Meanwhile, the Simple Additive Weighting (SAW) method [4] was chosen because in the
process of selecting lecturer achievers, a method is needed to rank the final values that have been
given weight in the weighting process by the AHP. Because the AHP and SAW methods are methods
that are in accordance with the problems experienced by Dhyana Pura University, this research will
propose a computerized Decision Support System that can help the process of selecting outstanding
lecturers, which methods used in the DSS are AHP and SAW.

21
2. Research Method
2.1. Research Procedure
Figure 1. Research Design
2.2. Data Collection
In conducting research to obtain data and information, the methods used in the data collection process
are carried out as follows:
2.2.1. Interview
It is a method of collecting data by means of question and answer directly to experts who become
informants in this study.
2.2.2. Literature Review
Review the documents of lecturers' excellent achievements in the fields of education and
learning, research, and community service at Dhyana Pura University in 2015, 2016 and
2017, the lecturer guidance document of Kementerian Riset dan Pendidikan Tinggi
(Kemenristekdikti) [5] and related journals with the method used in this study.
2.3. Transformation, Normalization, and Cleaning Data
Transformation
Is a process of processing raw data obtained by removing some of the attributes that have no
connection with the research topic.
Normalization
Normalization of data in question is to select the data used to avoid data redundancy and remove the
redundancy.
Cleaning Data
It is a process of cleaning up irrelevant data including lost data and outlier data.

22
2.4. Determination of Criteria and Sub-Criteria
Determination of criteria and sub-criteria begins with matching the Outstanding Lecturer Criteria in
the Ministry of Research, Technology and Higher Education (Kemenristekdikti) version. It is based
on the Outstanding Lecturer Criteria at Dhyana Pura University that obtained from the results of
interviews with informants, namely the Vice Rector of Academic, Head and Staff of research and
community service institutions. Then, a screening process was carried out on the two criteria to obtain
the outstanding lecturers criteria that will be used as a reference in determining the outstanding
lecturers at Dhyana Pura University for this year and the following year.
Table 1. Criteria for Outstanding Lecturers proposed as a reference for the selection
of Outstanding Lecturers at Dhyana Pura University
No Criteria Source
1 Education and Learning Kemenristekdikti
A. Education Level Undhira
1) S2 Undhira
2) S3 Undhira
B. Textbook/Text Undhira
2 Research Criteria Kemenristekdikti
A. Writing Publication Kemenristekdikti
1) International Journal Undhira
2) Accredited National Journal Kemenristekdikti
3) Non-Accredited National Journal (Has ISSN) Undhira
B. Scientific Forum Kemenristekdikti
1) Ordinary International Speakers Undhira
2) International Keynote Speakers Kemenristekdikti
3) Ordinary National Speakers Undhira
4) National Keynote Speakers Kemenristekdikti
3 Community Service Criteria Kemenristekdikti
A. Empowerment Community Model Kemenristekdikti
B. Partnership Development Model Kemenristekdikti
2.5. Weighting Criteria and Sub-Criteria by Using the AHP Method Manually
The first step is distributing the criteria and criteria weighting questionnaire which will be filled out
by 4 respondents. The respondents in question are the Rector of Dhyana Pura University, Vice Rector
of Academic, Head and Staff of the Institute for Research and Community Service (LP2M). The next
step is to calculate the results of each questionnaire using the AHP method manually (using a
spreadsheet application) to get the weight of each criterion and sub-criteria. The third step, conduct a
consistency test on the assessment of the questionnaire that has been done. If consistent, the weights
of each criterion and sub-criteria are valid.
2.6. Combining the Criteria and Sub-Criteria Weight by Using GMM and WAMM Method Manually
After getting the weights of each criterion and sub-criteria based on a questionnaire from each
respondent, the next step is to unite the criteria weights using GMM and WAMM to get one weight of
criteria and sub-criteria (using a spreadsheet application).
2.7. Do Ranking by Using SAW Method Manually
After getting the weight calculation using the AHP method and uniting the weights using GMM and
WAMM the next step is to rank each alternative that has been collected. The alternative in question is
the data of Dhyana Pura University lecturers. The ranking process is done by multiplying the weights
by alternatives so that the sequence of outstanding lecturers is obtained based on the highest total
scores.
23
3. Research results
3.1. Geometric Mean Method
The result of the combination of the AHP weights from the sub-criteria obtained from the
questionnaire from the Rector of Dhyana Pura University, Vice Rector of Academic, Head and Staff
of the Institute of Research and Community Service.
Table 2. AHP & GMM Calculation results
N
o
Sub-Criteria Rector Vice
Rector of
Academi
c
Head of
the
Research
and
Communit
y Service
Institute
Staff the
Research
and
Communit
y Service
Institute
GMM
1 S2 0.07 0.12 0.11 0.25 0.12
2 S3 0.21 0.36 0.34 0.25 0.28
3 Textbook/Text 0.06 0.16 0.15 0.10 0.11
4 International Journal 0.19 0.06 0.10 0.11 0.10
5 Accredited National
Journal 0.07 0.14 0.04 0.05 0.06
6 Non-Accredited
National Journal (Has
ISSN)
0.02 0.02 0.01 0.01 0.02
7 Ordinary International
Speakers 0.01 0.01 0.01 0.01 0.01
8 International Keynote
Speakers 0.02 0.02 0.02 0.01 0.02
9 Ordinary National
Speakers 0.005 0.003 0.003 0.004 0.003
10 National Keynote
Speakers 0.00 0.02 0.02 0.01 0.01
11 Empowerment
Community Model
0.17 0.03 0.13 0.18 0.10
12 Partnership
Development Model
0.17 0.08 0.07 0.03 0.07
3.2. Weighted Arithmetic Mean Method
The weight of each expert / respondent who involved in decision making was Rector = 2, Vice Rector
of Academic = 2, Head of the Research and Community Service Institute = 3, and Staff of the
Research and Community Service Institute = 3. The weight was obtained by looking at the conditions
at Dhyana Pura University. The Rector and Vice Rector of Academic only decide on the outstanding
lecturers in accordance with the rank of outstanding lecturers that have been made by the Head and
Staff of the Research and Community Service Institute.
Table 3. AHP & WAMM Calculation results
No Sub-Criteria Rector Vice
Rector of
Academic
Head of the
Research
and
Community
Staff the
Research
and
Community
WAMM
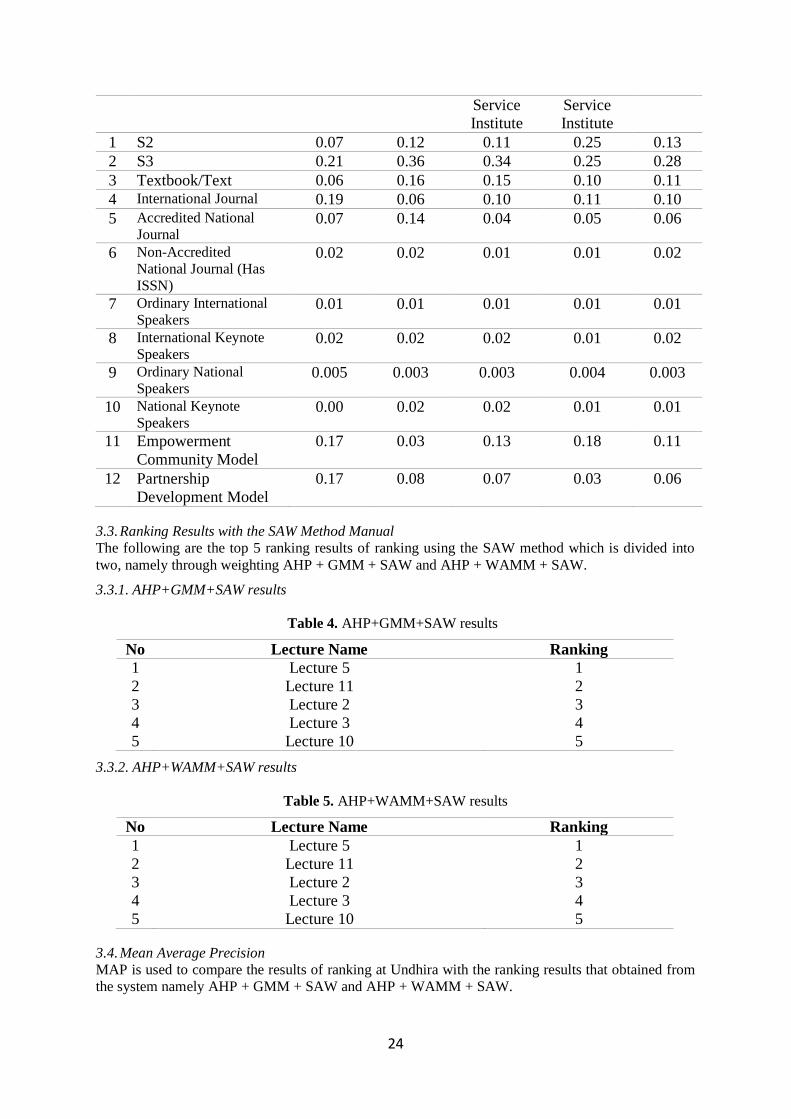
24
Service Institute
Service Institute
1 S2 0.07 0.12 0.11 0.25 0.13
2 S3 0.21 0.36 0.34 0.25 0.28
3 Textbook/Text 0.06 0.16 0.15 0.10 0.11
4 International Journal 0.19 0.06 0.10 0.11 0.10
5 Accredited National
Journal 0.07 0.14 0.04 0.05 0.06
6 Non-Accredited
National Journal (Has
ISSN)
0.02 0.02 0.01 0.01 0.02
7 Ordinary International
Speakers 0.01 0.01 0.01 0.01 0.01
8 International Keynote
Speakers 0.02 0.02 0.02 0.01 0.02
9 Ordinary National
Speakers 0.005 0.003 0.003 0.004 0.003
10 National Keynote
Speakers 0.00 0.02 0.02 0.01 0.01
11 Empowerment
Community Model
0.17 0.03 0.13 0.18 0.11
12 Partnership
Development Model
0.17 0.08 0.07 0.03 0.06
3.3. Ranking Results with the SAW Method Manual
The following are the top 5 ranking results of ranking using the SAW method which is divided into
two, namely through weighting AHP + GMM + SAW and AHP + WAMM + SAW.
3.3.1. AHP+GMM+SAW results
Table 4. AHP+GMM+SAW results
No Lecture Name Ranking
1 Lecture 5 1
2 Lecture 11 2
3 Lecture 2 3
4 Lecture 3 4
5 Lecture 10 5
3.3.2. AHP+WAMM+SAW results
Table 5. AHP+WAMM+SAW results
No Lecture Name Ranking
1 Lecture 5 1
2 Lecture 11 2
3 Lecture 2 3
4 Lecture 3 4
5 Lecture 10 5
3.4. Mean Average Precision
MAP is used to compare the results of ranking at Undhira with the ranking results that obtained from
the system namely AHP + GMM + SAW and AHP + WAMM + SAW.

25
3.4.1. MAP AHP+GMM+SAW results
The following are the results of MAP AHP+GMM+SAW.
Table 6. MAP AHP+GMM+SAW results
AHP+GMM+SAW results
Rank R/T Recall Precision
1 R 1 1
2 T 0 0
3 T 0 0
4 R 1 1
5 R 1 1
AP 0,6
MAP 60%
3.4.2. MAP AHP+WAMM+SAW results
The following are the results of dari MAP AHP+WAMM+SAW.
Table 7. MAP AHP+WAMM+SAW results
AHP+WAMM+SAW results
Rank R/T Recall Precision
1 R 1 1
2 T 0 0
3 T 0 0
4 R 1 1
5 R 1 1
AP 0,6
MAP 60%
4. Conclusion
Based on the results of the study, the conclusions obtained from this study include the following:
1. This system is designed using a combination of AHP and SAW methods in which the AHP
method is used to give the weight to each criterion and the outstanding lecturer sub-criteria while
SAW is used to rank from the weighting results of the AHP method. Data on criteria is obtained
through the merging of Kemenristekdikti criteria with the criteria that exsist at Undhira. And then,
uses the GMM and WAMM method to combine the weight of each expert's questionnaire.
2. The Implementation of this Outstanding Lecturer Decision Support System has been tested to
assess 2018 Outstanding Lecturers at Undhira. This system was tried in March 2019. The trial
began with the administrator inputting lecturer data, the Outstanding Lecturer criteria data,
lecturers' tri dharma history data and configuration. The expert filled out the Outstanding
Lecturer's questionnaire. Public can see the ranking results for the configuration year (2018).
3. Referring to the results of the MAP AHP + GMM + SAW & AHP + WAMM + SAW the results
were 60%. 60% is a good accuracy, but there are still a number of different ranking results at
Undhira with the results of the AHP + GMM + SAW & AHP + WAMM + SAW system because
ranking at Undhira is identified to still contain elements of subjectivity. Subjectivity in question is
the criteria used are not clear. Whereas the results obtained in the GMM & WAMM system were
obtained from the merging of the Ministry of Research, Technology and Higher Education
(Kemenristekdikti) criteria with Undhira criteria which obtained a new criteria. To get the weight
on the new criteria was used AHP method, and also used the GMM & WAMM method to
combine the weight of questionnaires of each expert, and the SAW method for ranking
outstanding lecturers. After going through the process of analyzing the system using MAP, it can
be concluded that the DSS of Achieving Lecturers is feasible to be applied in the Undhira

26
References
[1] B. Surarso and E. A. Sarwoko, “Sensitivity Analysis of The AHP and TOPSIS Methods for
The Selection of The Best Lecturer Base on The Academic Achievement,” pp. 2–8, 2010.
[2] T. Limbong, “Implementasi Metode Simple Additive Weighting (Saw) Untuk Pemilihan
Pekerjaan Bidang Informatika,” Semin. Nas. Ilmu Komput. 2013 FIKOM Univ. Methodist
Indones. Medan, no. August, pp. 111–115, 2013.
[3] T. L. Saaty, “Analytical Hierarchy Process (AHP),” in Analytical Hierarchy Process (AHP),
New York: McGraw-Hill, 1980.
[4] P. . Fishburn, Additive Utilities with Incomplete Product Set: Application to Priorities and
Assignments. 1967.
[5] Kemenristekdikti, “Pedoman Pemilihan Dosen Berprestasi Kategori Sains Teknologi dan
Sosial Humaniora Tahuan Anggaran 2018,” 2018.

27
Help With Math: A Serious Game For the 3rd
Grade
Elementary School Students in Plane Geometry
Kadek Arya Teguh Raharja1)
and Sukajaya I N2)
1,2 Educational Mathematics Department, FMIPA, Universitas Pendidikan
Ganesha
Abstract. Let's Help With Math is a serious game based-learning used as mathematics learning media in understanding the concept of plane geometry for the 3
rd elementary school.
It is a single player serious game of adventuring genre. The game’s challenges are distributed into 3 levels of game. The first and second level is regarding basic characteristics of a quadrilateral is categorized as a rectangle from low and medium level of difficulty. The third level is about the circumference of rectangle. For the players who did not get the problems' solution yet, the game displays twice hint gradually from hidden to unhide hint. The players who solve all problems from those three levels of challenges is stated as winners, but they who did not and have submitted wrong solution three times are stated failed (game over). Those players who are stated as winners are classified mastery in rectangle's subject. We implemented the 4D model of game development which is practically conducted only until the third step. The game's prototype has been tested by seven students from 3
rd grade of
elementary schools. Five among seven students looked very enthusiastic during playing the game. They also more interested in learning because the game raises real life problems associated with the properties and circumference of a rectangle. We conclude that the delivery of plane geometry subject, especially the properties and circumference of rectangles through learning media based on the game "Let's Help With Math" is more interesting than conventional learning.
Keyword: Serious Game Based-learning, Plane Geometry, Rectangle Learning Media.
1. Introduction
The development of technology from day to day is getting faster. One sector that is affected
is education, namely easy access to learning resources that can be utilized by students.
Education does not have to be based on books, but rather optimizes the utilization of
technology. Teachers as educators must be able to follow the development of technology and
information and be able to develop subject matter based on technology and information as
learning media. Learning media are learning aids that are used to display certain facts,
concepts, principles or procedures to be seen more clearly (Sujoko, 2013). These tools can
provide a more tangible experience, and can increase students' understanding of learning
material. The learning process becomes more interesting if the teacher can provide
appropriate learning media to students. One of the interesting learning media and utilizing
technology is game-based learning media Game development can be used as an alternative learning. Games in general are a means of
entertainment, but now the game has begun to be developed as a learning tool. In accordance
with the nature of the game that is entertaining, learning through games can package the
delivery of subject matter to students to be fun, so the lessons become easier to understand.

28
The essence of game-based learning is as a supporter and provider of experiential learning
environments in building knowledge independently. Through games, children experience learning (Widyastuti, 2010). Learning material will be
more easily absorbed by children if the material is inserted into the game. One alternative
learning media that can be used is learning media in the form of serious games. Serious game
is a game that has the intent and purpose of more than just a means of entertainment, but there
is also an educational element that is delivered. Mathematics is abstract ideas which are given symbols arranged hierarchically and
deductive reasoning, so learning mathematics is a high mental activity. These abstract ideas
can be more easily understood if there are visualizations in serious games. Most students find
it easier to remember things when they see and are given a picture or directly involved in it.
This shows the importance of real visualization for students to understand something. This is
where the role of serious games is to provide learning media that can provide visualization
and give students the opportunity to play a role in it the mathematics Problems experienced by elementary school students lies in understanding
the concept. One way to overcome this is to provide a visualization of the subject matter and
provide a pleasant learning environment. properties and circumference of rectangles in third
elementary school tend to be more easily understood by students if the material is lifted from
objects that are around, The limited time available does not allow students to go directly to the
field. This can be tricked by using serious games, because this game raises the problems that
are around. In addition, with serious game based learning, students tend to be more active and
interested in following the lessons. Several studies have shown that serious games play an important role in education,
including Ahmad Fariq Arbor (2012) entitled “Mathematics Adventure Games” berbasis Role
Playing Game (RPG) sebagai media pembelajaran mata pelajaran matematika kelas VI SD
Negeri Jetis 1” stated that the application "Mathematics Adventure Games" that was
developed was suitable to be used as a medium in the process of learning Mathematics in
class
VI of SDN Negeri 1 Jetis. In a Fuqoha (2015) is study titled “Pengembangan Game RPG
(Role Play Game) sebagai Media Pembelajaran Berbasis Guide Inquiry pada Materi
Segiempat dan Segitiga untuk Siswa SMP Kelas VII” states that the RPG Game (Role Play
Game) developed can be used for junior high school students in class VII B of SMPN 4
Purbalingga or other students who have similar characteristics. Based on this, in this paper will discuss about game-based learning media in mathematics
learning, entitled “Let’s Help With Math: A Serious Game For the 3rd
Grade Elementary
School Students in Plane Geometry”
2. Literature Review
2.1Conventional Learning and Technological Based Learning Conventional learning is a teacher centered learning model. (Sudjana, 2001) states
that teacher-centered learning activities emphasize the importance of teacher atifita in
teaching students. Students act as passive followers and recipients of the learning activities
carried out.
Information Technology based learning is a learning process that uses a variety of
information technology as learning media. In IT-based learning, the teacher's role as the sole
authority of knowledge is transformed into a facilitator for students to interact with various
learning resources

29
2.2Learning Media According to (Pribadi, 2004) learning media is something that can bring information
and messages from the sender or source of information to the recipient or learner. Learning
media is a tool that serves to convey learning messages. The more learning objectives that can
be achieved with the help of learning media, the better the media.
(Ena, 2000) proposes six criteria for assessing interactive learning media, namely a)
Ease of navigation, a program must be designed as simple as possible so that students do not
need to learn computer first to be able to use it as interactive learning media; b) The content
of cognition, interactive learning must contain cognition or knowledge in accordance with the
expected learning objectives; c) Knowledge and presentation of information, knowledge or
information must be conveyed and presented correctly; d) Media integration, media must be
designed in such a way that it can integrate aspects and skills that students must learn; e)
Aesthetics, to attract students' interest, interactive learning must have an artistic appearance.
Therefore aesthetics are also a criterion that must receive important attention; and f) The
function as a whole, the interactive learning program developed must provide the learning
desired by students, so that when students finish running a program students feel they have
learned something.
2.3Serious Game Serious games can be interpreted as games that are built for non-entertainment
purposes without omitting the entertainment function (Trisna Hady, 2016). Serious game can
also be interpreted as an application that is designed so that students can engage in a fun and
challenging learning environment that is conditioned so that it is similar to the real situation in
the real world (Eko, 2016). Based on these explanations, it can be concluded that serious
games are digital games created not with the primary purpose of pure entertainment, but with
the intention of serious use as in training, education and health care.
The main objective of serious games is to grow, educate, and motivate players for
a particular purpose. The purpose of the serious game in this paper is to instill the concept
of the properties and circumference of a rectangle to grade 3 students of primary schools,
with fun and interactive learning. Serious games can make students tend to easily absorb
knowledge through role playing (Cheng, 2013). With role playing, students feel
participating in the game. According to (Prensky, 2002), by using serious games into the
learning process, in addition to learning more fun, interesting and interesting, but also
more effective and efficient. A number of studies show that in its development, serious
games can improve students' competence in terms of problem solving skills, making
decisions, collaborating (E Klopfer, 2005) including in terms of honing their ability in
language and mastering science and mathematics lessons (Mayo, 2007).
3 . Research Methodology
3.1Type of Research This research was conducted with a research and development approach. Research
and development is carried out to produce specific products and test the quality of these
products. Based on this understanding, this study aims to produce research products in the
form of game-based multimedia 3.2Research Design
This study was designed based on the Four D (4D) research and development
model. The stages of the development of the 4D model consist of four stages, namely the
stages of defining, designing, developing and disseminating. However, due to limited time,

30
cost, and ability of researchers, this research was only carried out until the development
stage (develop) 3.3Research Procedure
In this research, the 4D development model is only carried out until the third
stage, namely the stage of defining, designing, and developing. The following will be
given Table 3.1 which outlines the stages of development activities along with the
expected outcomes and indicators of achievement.
Table 1. Expected Stages of Activities, Outputs and Indicators of Achievement
Steps Activities Outputs and Indicators of Achievement
Definition a) Identify the problem at Identification of problems in learning
hand mathematics sub-subject of the properties
and circumference of a rectangle
b) Analyze the curriculum Known sub-material boundaries of the
properties and circumference of the
rectangle
Design a) Designing the game The game storyline is composed with sub-
storyline subjects of the properties and
circumference of the rectangle
b) Make a game interface The game interface is generated
c) Implementing game The resulting multimedia product is in the
storyline into multimedia form of a serious game in accordance with
in the form of serious the scenario that has been designed
games
Development a) Evaluating developed The resulting multimedia learning has
multimedia learning been evaluated by the supervisor
products
b) Make improvements to the The resulting learning multimedia has
developed multimedia been improved by the supervisor
learning products
c) Testing Obtained results about the practicality and
efficiency of multimedia in the form of
serious games
3.3.1 Define Stage
The first stage carried out in the development of multimedia based on serious
games is the define stage. At this stage the author observes the material in mathematics
that is felt to require visualization in understanding the material, and the material is
obtained geometry that is the properties and circumference of a rectangle. this material can
also be learned by using the topic of objects around the environment. Furthermore, the
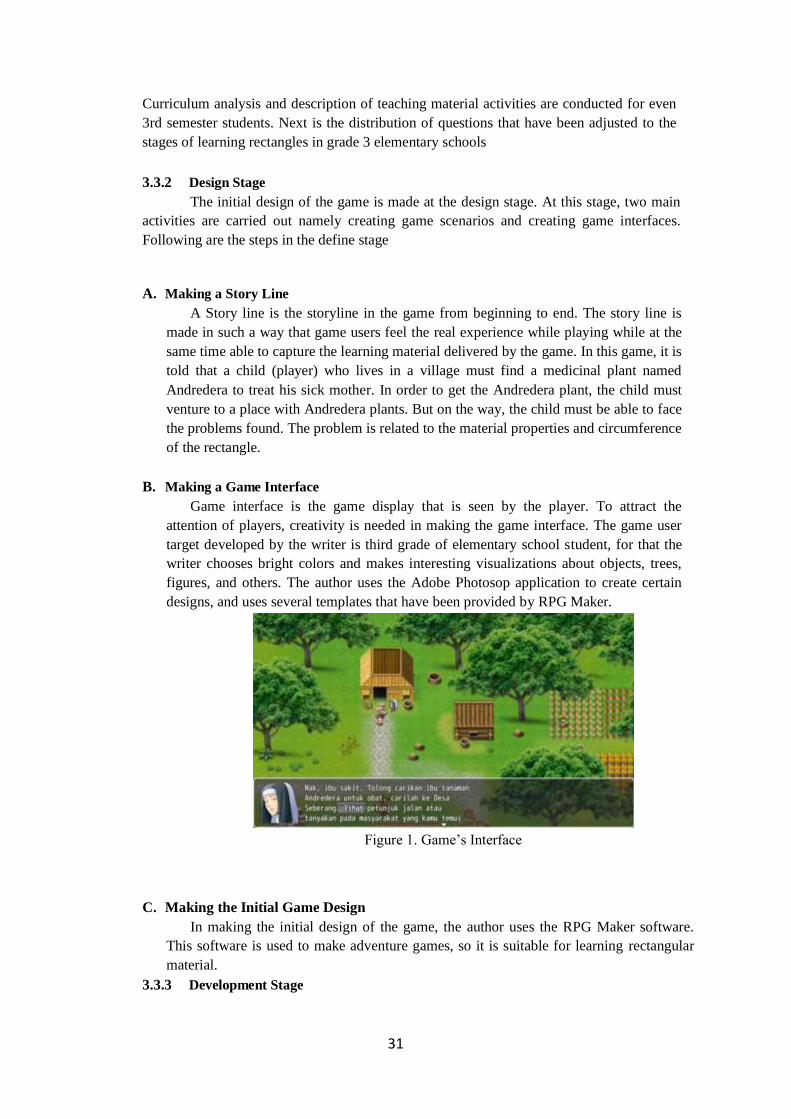
31
Curriculum analysis and description of teaching material activities are conducted for even
3rd semester students. Next is the distribution of questions that have been adjusted to the
stages of learning rectangles in grade 3 elementary schools
3.3.2 Design Stage
The initial design of the game is made at the design stage. At this stage, two main
activities are carried out namely creating game scenarios and creating game interfaces.
Following are the steps in the define stage
A. Making a Story Line A Story line is the storyline in the game from beginning to end. The story line is
made in such a way that game users feel the real experience while playing while at the
same time able to capture the learning material delivered by the game. In this game, it is
told that a child (player) who lives in a village must find a medicinal plant named
Andredera to treat his sick mother. In order to get the Andredera plant, the child must
venture to a place with Andredera plants. But on the way, the child must be able to face
the problems found. The problem is related to the material properties and circumference
of the rectangle.
B. Making a Game Interface
Game interface is the game display that is seen by the player. To attract the
attention of players, creativity is needed in making the game interface. The game user
target developed by the writer is third grade of elementary school student, for that the
writer chooses bright colors and makes interesting visualizations about objects, trees,
figures, and others. The author uses the Adobe Photosop application to create certain
designs, and uses several templates that have been provided by RPG Maker.
Figure 1. Game’s Interface
C. Making the Initial Game Design In making the initial design of the game, the author uses the RPG Maker software.
This software is used to make adventure games, so it is suitable for learning rectangular
material. 3.3.3 Development Stage

32
The development phase is carried out through three main stages, namely product
evaluation, limited trials and the revision stage. The details of the stages can be described as
follows: A. Evaluating Products
After the game has been designed, the supervisors conduct an evaluation before the
game is tested. Evaluation is done in terms of appearance and game scenarios. The
activity carried out by the supervisor is to review game products and provide suggestions
for improvement regarding deficiencies found in the game. B. Fixing Product Deficiencies
From the results of evaluating the multimedia game in the form of a serious game, it
will be known that the shortcomings. Product improvement is done by taking into account
recommendations and suggestions from experts, so that a prototype is ready to be tested C. Testing
This game was tested on 7 third grade of elementary school children. Where
previously the seven children had obtained material about the properties and
circumference of the rectangle through conventional learning. The obstacles faced by the
seven children are difficulties in understanding the concept of material and visualization
of rectangular material. This game was tested on the seven children in turn through a
computer provided by the author.
4 . Result
In this sub-chapter, the results obtained during the development of serious games will
be explained as follows: 4.1 General Description of Let’s Help With Math
Lets Help With Math is a serious adventure game (adventure) tells the adventures of a
child (main character) trying to find medicinal plants in a place for his sick mother. In the
journey to find the drug he must solve the challenges encountered on the road and solve the
challenges of certain characters during the trip. These challenges and problems are related to
the resolution of questions about the nature and circumference of squares and rectangles. In
this game there are 3 levels which contain several questions. Players must be able to solve
problems in each challenge to advance to the next level. This game is intended for users of
3rd grade age. this is because in this game in addition to entertainment there is an educational
element that can increase knowledge for children. This game takes place in a rural setting, in
which there are rural roads, rivers, gardens and houses. When logging in the game, the game
will be display a tile screen and than the player chooses "start game". Then the player will be
directed to the next stage 4.2 Continue to the next or Stop up to current level The game’s challenges are distributed into 3 levels of game The first and second level is
regarding basic characteristics of a quadrilateral is categorized as a rectangle from low and
medium level of difficulty. The third level is about the circumference of rectangle. For the
players who did not get the problems' solution yet, the game displays twice hint gradually
from hidden to unhide hint.

33
Figure 2. The Game’s Hint 4.3 A Winner State
The players who solve all problems from those three levels of challenges is stated as
winners, but they who did not and have submitted wrong solution three times are stated failed
(game over). Those players who are stated as winners are classified mastery in rectangle's
subject. When the player successfully completes all the challenges, the player will get the
Andredera plant that is sought, then the player goes home and gives the plant to his mother
Figure 3. Winner State
Information: F1= False I F2= False II F3=False III
4.4 Experimental Result This table is the result obtained from testing a prototype game on seven students of
the third grade elementary school Table 3. The Result of testing prototype
Player Completed level Result
Player 1 Second level Good
Player 2 First level Not good
Player 3 Second level Good
Player 4 Second level Good
Player 5 Third level Very good
Player 6 First Level Not good
Player 7 Second level Good
From the seven children who were given learning using the game Let’s Help With
Math, 5 children felt more interested and more understanding about the material nature and
circumference on the rectangle. Real visualization according to the conditions in the field
34
makes students more enthusiastic in learning and understanding the concept of the nature and
circumference of a rectangle
5. Conclusion
This paper describes the development of a serious game-based learning media called
Let’s Help With Math. This game is used as mathematics learning media in understanding the
concept of plane geometry for the 3rd elementary school. The game's challenges are
distributed into 3 levels of game. The first and second level is regarding basic characteristics
of a quadrilateral is categorized as a rectangle from low and medium level of difficulty. The
third level is about the circumference of rectangle. We implemented the 4D model of game
development which is practically conducted only until the third step. . Five of the seven
students looked very enthusiastic during playing the game. We conclude that the delivery of
plane geometry subject, especially the properties and circumference of rectangles through
learning media based on the game "Let's Help With Math" is more interesting than
conventional learning.
References
[1] C. S. Loh, Y. S. (n.d.). Serious game analytics. Theoretical Framework.
[2] Cheng, Y. M. (2013). Investigating elementar school students technology acceptance by
applying digital game based learning to environmental education. Australasian Journal
of Education Technology.
[3] E Klopfer, S. Y. (2005). Developing games and simulations for today and tomorrow's tech
Savvy Youth. Tech trends: Linking Research & Pratice to Improve Learning.
[4] Eko, I. R. (2016). Kajian penerapan konsep serious game dalam bingkai pedagogis: Mencari
konteks pemenuhan kebutuhan pembelajaran modern.
[5] Ena, O. T. (2000). Membuat media pembeljaran interaktif dengan piranti lunak prestasi.
[6] J., M. M. (2007). Games for science and engineering education . Communication of the
ACM.
[7] Mayo. (2007). Games for science and engineering education. Communication of the ACM.
[8] N, S. (2001). Penilaian hasil proses belajar mengajar . Bandung: Remaja.
[9]Prensky, M. (2002). The motivation of gameplay . On the Horizon.
[10]Pribadi, B. A. (2004). Ketersediaan dan pemanfaatan media dan teknologi pembelajaran di
perguruan tinggi. Jurnal pendidikan.
[11]S, W. (2010). Metode mendidik anak secara komunikatif. Jurnal Pendidikan .
[12]Sudjana, N. (2001). Penilaian hasil proses belajar mengajar. Bandung: Remaja.
[13] Sujoko. (2013). Pemanfaatan teknologi informasi dan komunikasi sebagai media
pembelajaran .
Jurnal Pengembangan Pendidikan, 71-77.

35
[14]Trisna Hady, P. (2016). Serious game jaringan komputer berbasis simple additive
weighting.
Singaraja: Universitas Pendidikan Ganesha.
[15]Widyastuti, S. (2010). Metode mendidik anak secara komunikatif. Jurnal Pendidikan.

36
Captain Math: An Educational Game For The 5th
Grade of
Elementary School Students In Weight-Unit Conversion
Damurrosysyi M1 and Sukajaya I N
2
1,2Educational Mathematics Departmen, FMIPA, Universitas Pendidikan Ganesha
1)
Abstract. In the 21st century; the study about educational game was greatly improved. It is
due to that educational game is believed having positive impact toward the advancement of
education. In this research, we developed an educational game for learning weight-unit
conversion for 5th grade of elementary school students.The game was developed as a single
player game of adventuring genre and divided into three levels of play.Each level follows
content semantic of subject: sequence, conversion, and implementation. The first level
contained challengein the form of sortingweight unit from the largest (kg) to smallest (mg).
For the second level; playersare challenged to determine a value that is similarto a given value
from other weight unit. The last level has the highest difficulty challenge, in which players are
challenged to look for an answer to a problem given as the operation of weight-unit. This
game was developed following 4D principle: define, design, develop, and disseminate. This
game also available in two versions: a computer and a mobile version. For a mobile version it
has been designed in two operating systems: Android and Windows Phone. The prototype of
this game has been tested involving 15 players who were 5th grade of elementary school
student. An interesting interface display in this game makes students especially like this game
and it seems there is discussion among them to complete the challenge. The learning process
looks more optimal through Captain Math.
Keywords: Educational Game, Elementary School Students, WeightUnit Conversion
1. Introduction The change of curriculum that always been done by the Government provides various impacts to education in Indonesia. It started from the beginning of its changes in 1947 until its final change to
the curriculum 2013 or K13. These impacts are certainly felt immediately by educational actors from the teacher to student. If you see urgency in education, curriculum change is very necessary because it
is always needed renewal in various aspects that are required to always follow the times. But a significant curriculum change was evident in the year 2013 that then changed the KTSP to K13.
K13 is a competency based curriculum that was actually previously initiated on the Kurikulum
Berbasis Kompetensi (KBK) 2004, but had not been resolved due to strong urges to directly
implement KTSP 2006. In addition, the establishment of K13 also according to the mandate of UU
No. 20 year 2003 about national education and also Peraturan Presiden year 2010 about national mid-
scale development plan. The curriculum changes from KTSP to K13 can be said to have the most
significant influence because of the many completely changing systems and directly affects teachers
and student.

37
One of the things that is very influential for the KTSP to K13 is the Student Learning Center
implementation. This approach is not a new thing in the education but a new thing in education in
Indonesia since the curriculum changes to K13. Characteristic of Student Learning Center which is the
type of learning that initially only teachers and student become teachers-student-the natural
environment-as well as other media sources (including the Internet). In student learning center,
students are required to seek their own learning resources from some of the surrounding media. It is
expected to increase the competency for student. But in fact, this increasingly makes students not
focus is caused by some of the negative impacts of the use K13 such as the learning time due to the
added hours of the lesson so that it is difficult for student. This must also happen to student of
elementary school and will be very risky because understanding the initial concept are all given in
elementary school. Therefore, it needs special attention when the negative impact of the use of this K13 occurs in student of elementary school. And student of elementary school will be difficult to accept the concept of
lessons especially mathematics. Because of that the developer thinks there are several solutions for elementary school mathematics learning. And one of the solutions that will have a good impact we think is the use of educational games on learning mathematics in elementary school. The use of educational games for learning is also not something new because the development of the game in the world increasingly dash every time including in Indonesia. Games gave many important
roles as a means of entertainment even on education or training facilities for all ages ranging from
children to parents. Now crowded games are digital based games that are very easy to get in the providers free paid apps. Besides being useful as entertainment, many aslo use this media game as a
means of education and usually used for learning media read, write, calculate for early childhood. Attractive interface and colorfull design will be relevant if this digital game is used for math learning
media especially for elementary schools. With the help of educational game, mathematics learning in
elementary school will be more optimal than using classical medai in learning like pencil and paper.
By implementating educational games in some mathematical materials especially in the planting of
cocepts, then the negative effects of the use K13 on elementary school students as they have been
contested will be resolved little by little. For example in the summation material given summation educational game, later student of
elementary school will be more challenged to solve the problems given about the summation material.
If the student is already interested, then the student’s desire to seek and deepen himself more about
the material he gets will be done by itself. Therefore, indirectly the expectation of the use of K13 is
that students seek their own teaching materials from various sources will be slightly carried out and
the result will be much more optimal. From here, developer are interested in making “Captain Math” educational games with elementary school mathematics material. Because understanding the concept is important then the developers
makes an educational game with weight unit conversion material. This simple material is one of the basic mathematical materials of elementary school that many are not interested by student of
elementary school due elaborate depictions and explanatons. Captain Math educational game is given an interesting visualization of this material as well as a challenging game that allow studets to also be challenged to understand the weight unit conversion
material to complete all the challenges of the Captain Math game. So the transformation of science from teacher to student will also be much easier with Captain Math. 2. Literature Review 2.1 Serious Game Since ancient times games have often been used as a tool for learning. Various aspects of learning
many use the game as a medium. As for social learning skills, psychological, to physical. "Non-digital
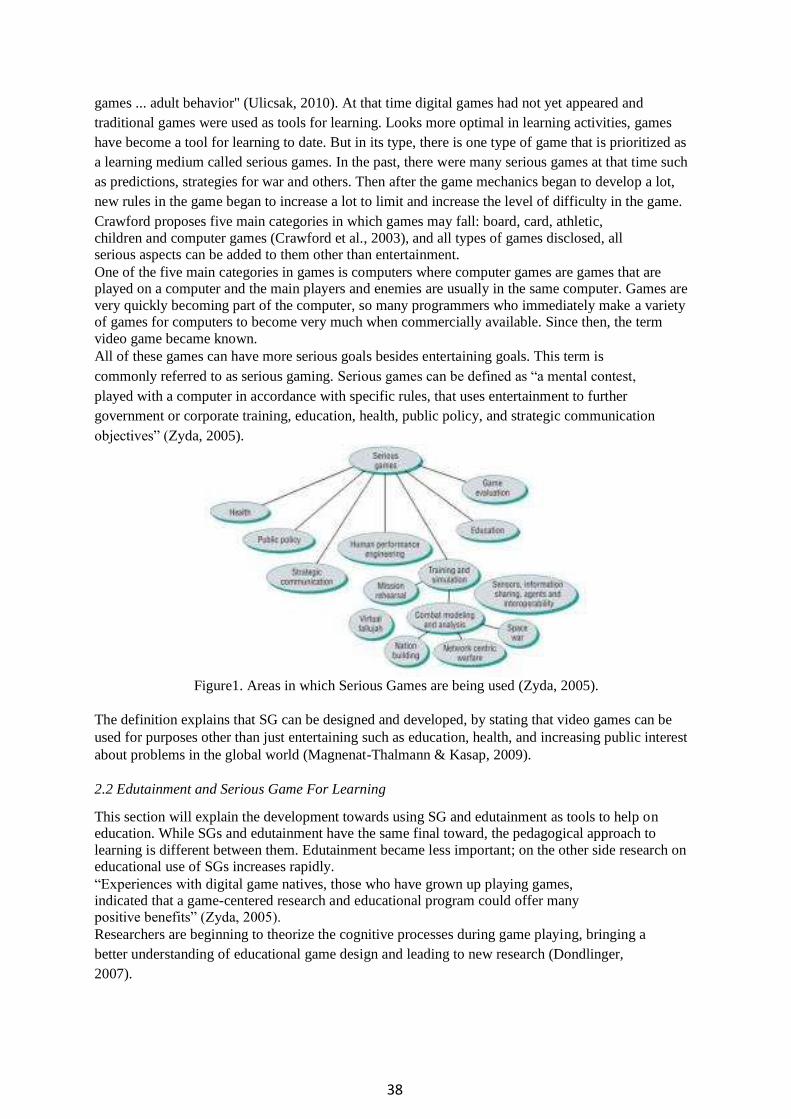
38
games ... adult behavior" (Ulicsak, 2010). At that time digital games had not yet appeared and
traditional games were used as tools for learning. Looks more optimal in learning activities, games
have become a tool for learning to date. But in its type, there is one type of game that is prioritized as
a learning medium called serious games. In the past, there were many serious games at that time such
as predictions, strategies for war and others. Then after the game mechanics began to develop a lot,
new rules in the game began to increase a lot to limit and increase the level of difficulty in the game. Crawford proposes five main categories in which games may fall: board, card, athletic, children and computer games (Crawford et al., 2003), and all types of games disclosed, all serious aspects can be added to them other than entertainment. One of the five main categories in games is computers where computer games are games that are played on a computer and the main players and enemies are usually in the same computer. Games are
very quickly becoming part of the computer, so many programmers who immediately make a variety of games for computers to become very much when commercially available. Since then, the term
video game became known. All of these games can have more serious goals besides entertaining goals. This term is
commonly referred to as serious gaming. Serious games can be defined as “a mental contest,
played with a computer in accordance with specific rules, that uses entertainment to further
government or corporate training, education, health, public policy, and strategic communication
objectives” (Zyda, 2005).
Figure1. Areas in which Serious Games are being used (Zyda, 2005).
The definition explains that SG can be designed and developed, by stating that video games can be
used for purposes other than just entertaining such as education, health, and increasing public interest
about problems in the global world (Magnenat-Thalmann & Kasap, 2009).
2.2 Edutainment and Serious Game For Learning This section will explain the development towards using SG and edutainment as tools to help on education. While SGs and edutainment have the same final toward, the pedagogical approach to
learning is different between them. Edutainment became less important; on the other side research on educational use of SGs increases rapidly. “Experiences with digital game natives, those who have grown up playing games, indicated that a game-centered research and educational program could offer many positive benefits” (Zyda, 2005). Researchers are beginning to theorize the cognitive processes during game playing, bringing a
better understanding of educational game design and leading to new research (Dondlinger,
2007).
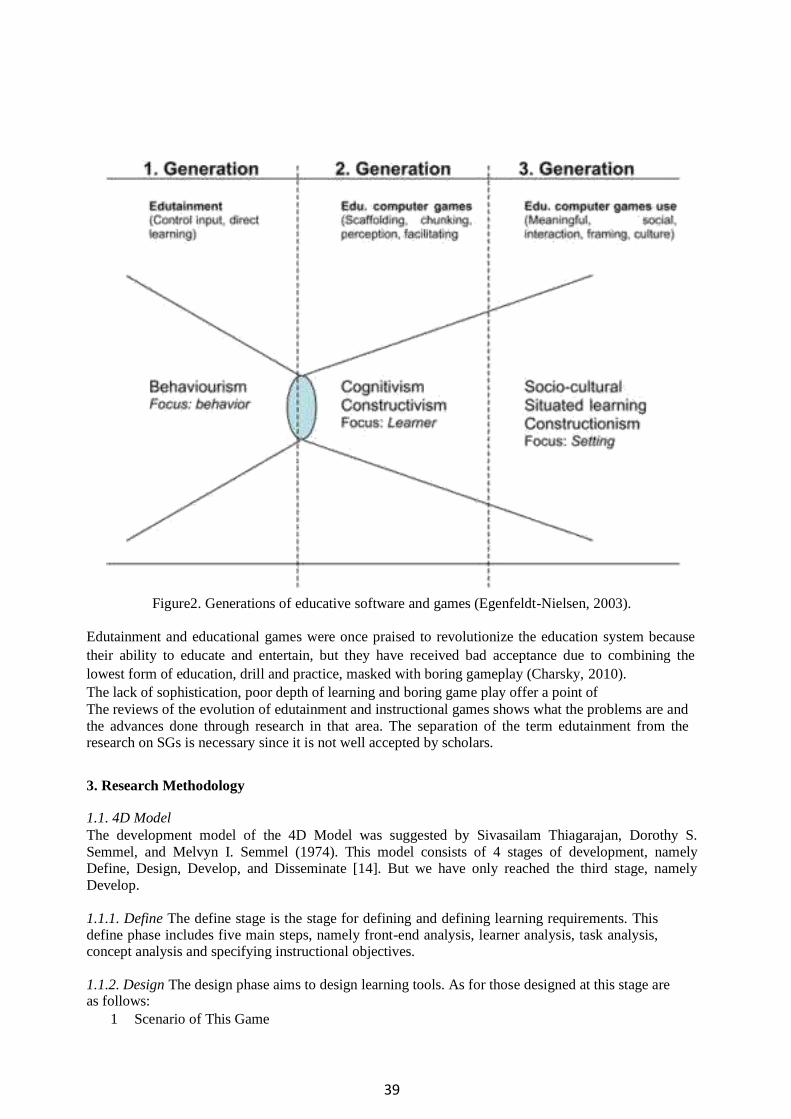
39
Figure2. Generations of educative software and games (Egenfeldt-Nielsen, 2003).
Edutainment and educational games were once praised to revolutionize the education system because
their ability to educate and entertain, but they have received bad acceptance due to combining the
lowest form of education, drill and practice, masked with boring gameplay (Charsky, 2010).
The lack of sophistication, poor depth of learning and boring game play offer a point of The reviews of the evolution of edutainment and instructional games shows what the problems are and
the advances done through research in that area. The separation of the term edutainment from the research on SGs is necessary since it is not well accepted by scholars.
3. Research Methodology 1.1. 4D Model The development model of the 4D Model was suggested by Sivasailam Thiagarajan, Dorothy S.
Semmel, and Melvyn I. Semmel (1974). This model consists of 4 stages of development, namely Define, Design, Develop, and Disseminate [14]. But we have only reached the third stage, namely
Develop.
1.1.1. Define The define stage is the stage for defining and defining learning requirements. This define phase includes five main steps, namely front-end analysis, learner analysis, task analysis, concept analysis and specifying instructional objectives.
1.1.2. Design The design phase aims to design learning tools. As for those designed at this stage are as follows:
1 Scenario of This Game

40
The scenario in this game is an alien story that will attack and rule the earth. With his crime, aliens will face their enemies who will always guard the earth namely Captain Math. Captain
Math will defeat and frustrate the plans of the evil aliens who will rule the earth in three levels. At each level Captain Math must defeat the evil aliens with the concept of the Heavy
Unit Conversion. At the first level, the challenge accepted by Captain Math is a matter of a terminology
meaning an introduction to the concept of unit weight conversion. Captain Math is required to sort the weight units from the largest to the smallest. Surely the evil aliens will continue to
block Captain Math. On the second level, the challenge of captain math is getting more difficult namely having to
find blocks containing numbers that are worth the questions given. The challenge will be more
difficult when aliens also have the additional power of shooting. At the third level, the final and most difficult challenge is that Captain Math must find a block
which is the completion of the operation of two different units of weight. Coupled with more
difficult challenges captain math will be more difficult to solve challenges on the third level. [2]. Rule of The Game
Win Players will be declared victorious if they successfully complete all the challenges at each level. But each player will get a different point. Point-points are obtained from picking up gems, getting answers, killing aliens. If at every level the player kills many aliens and takes
the gems, Then the final point gained will also be more.
Lose Players will be declared defeated if all life given (5 lives) has expired. And life will be reduced by one if : Touching Alien
Exposed Alien Shots
Falling into the abyss/outside of the arena
Wrong take an answer
1.1.3. Develop The development phase is the stage to produce development products which are carried
out through two steps, namely: (1) expert appraisal followed by revision, (2) developmental testing.
The purpose of this development phase is to produce a final form of learning tools after going through
revisions based on expert or practitioner input and trial data.
2.1 Challenges
In each level, we provide different challenges. Semakin tinggi level, maka semakin susah tantangan dan soalnya. Berikut rangkaian soal dari game Captain Math.
Table1. Distribution of Material Concept
Level Material
Quantity
Diffiqulty Question
E M H
1 short the 7 7
weight unit
from the
largest
(kg) to the
smallest (mg).
2 find the 6 3 3
number

41
worth of the
given problem. 3 seek the 5 3 2 completion of
different
weight unit conversion
4. Result
4.1 Interface Game Captain Math
Figure3. Interface of Main Menu
Figure4. Interface Of Map
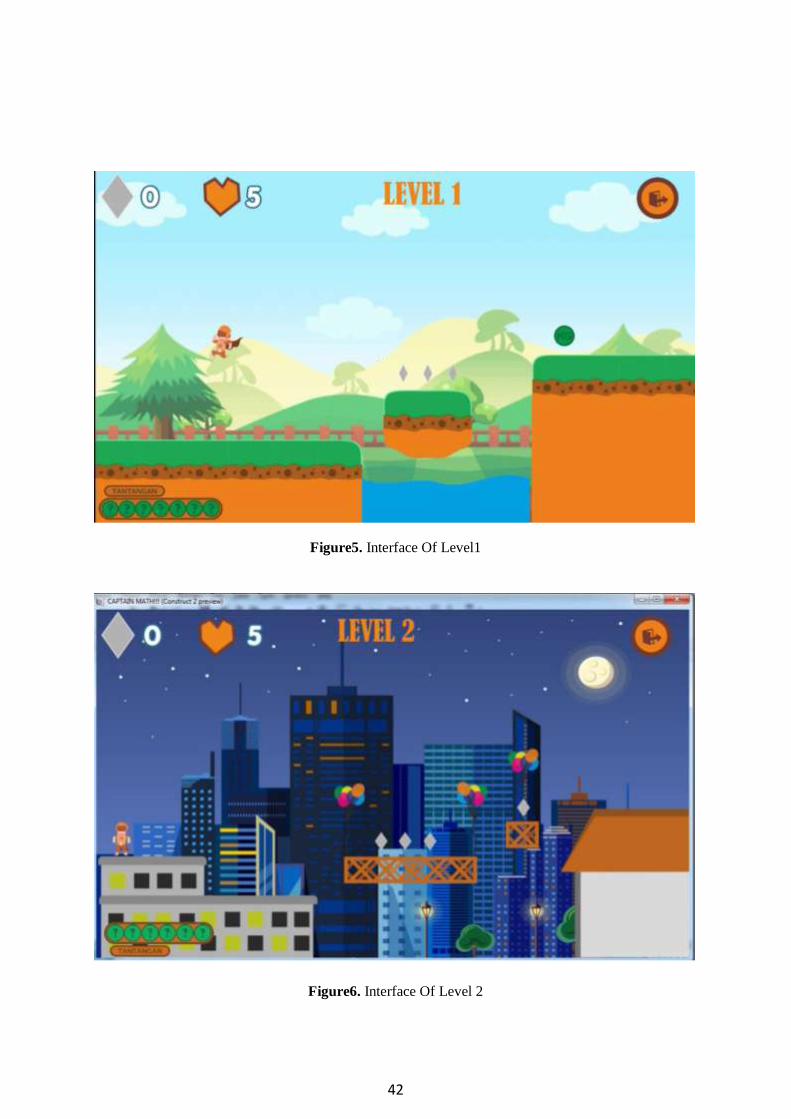
42
Figure5. Interface Of Level1
Figure6. Interface Of Level 2
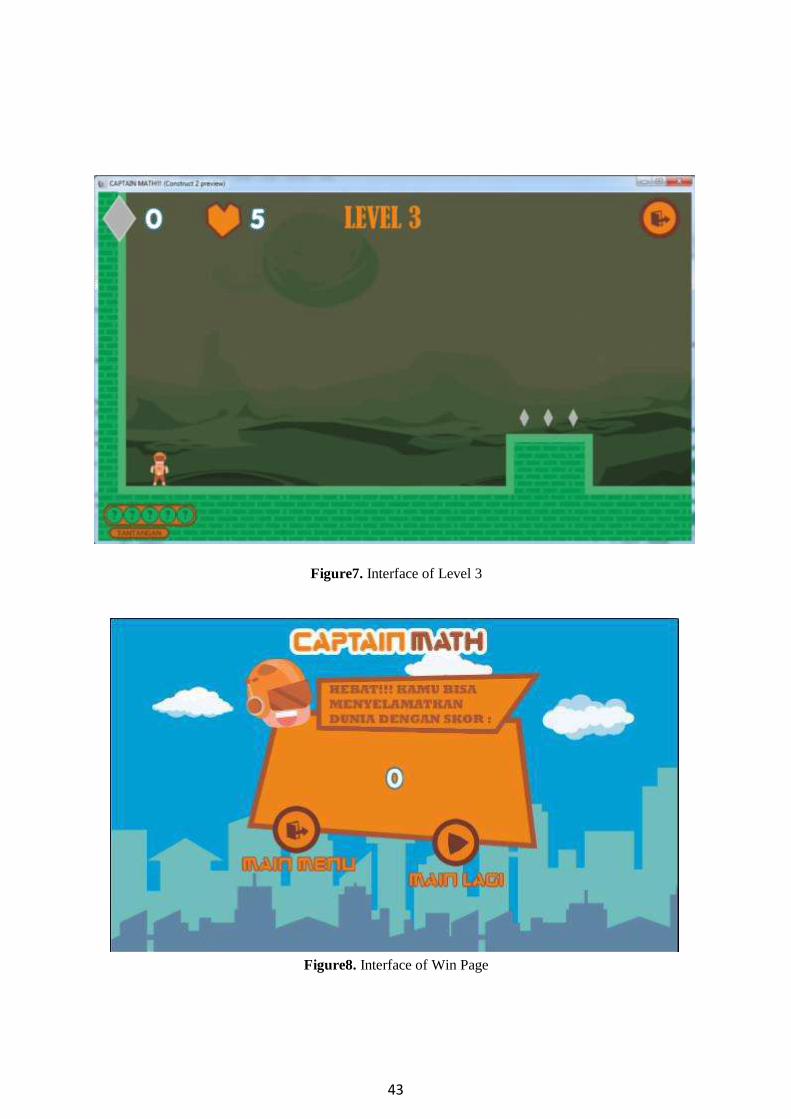
43
Figure7. Interface of Level 3
Figure8. Interface of Win Page

44
Figure9. Interface of Lost Page those are the display pictures of this game from the start page to the end page. The interface is filled with attractive colors so students can comfortably play and finish the game well.
4.7 Players Score The score in this game is determined by picking gems, killing aliens, and get the true answer. From
3 student who can finishing this game until last level, the result are shown in the table below.
Table 2. Players Score
Name Final Score
Gusta 125 Dedi 277
Karmawan 252
Desak 157
Nanang 170 This score shows the enthusiasm of players in completing this game. If the score has been obtained, it means that the player has completed this game to the last level well even with different scores from each other. 5. Conclusion The prototype of this game has been tested involving 15 players who were 5th grade of
elementary school student. An interesting interface display in this game makes students
especially like this game and it seems there is discussion among them to complete the
challenge. The learning process looks more optimal through Captain Math.

45
Captain Math is able to answer it because the output of the use of Captain Math as a learning math
media is The creation of discussion activities between students to solve challenges, and critical
thinking will appear automatically in the discussion activities and Finally Formula 4c will be formed
in class. This really helps the SCL activity done optimally. And with this, it is hoped that many new innovations in education will have an impact on improving the quality of education in Indonesia.
References
[1] Drigas, A. S., & Pappas, M. A. (2015). On line and other game-based learning for mathematics.
International Journal of Online Engineering, 11(4), 62–67. ttps://doi.org/10.3991/ijoe.v11i4.4742 [2] Kato, Enrique, Ricardo Goncalves, Joao Xavier, and Antonio Coelho. 2011. Serious Game for
Introductory Programming. Lecture Notes in Computer Science 6944: 1-12. [3] Novak, Jeannie. 2008. Game Development Essentials: An Introduction 2nd ed Canada: Delmar Cengage learning. [4] Akkerman, S., Admiraal,W., & Huizenga, J. (2008). Storification in history education: a mobile game in and about medieval Amsterdam. Computers & Education, 52(2), 449–459. [5] Ishaq Madeain. 2010. Desain Pengembangan Pembelajaran Berbasis Teknologi Informasi dan
Komunikasi (TIK) Pada Mata Kuliah Aplikasi Komputer.[Tesis]. Makassar (ID). Universitas Muhammadiyah Makassar. [6] Thiagarajan, S., Semmel, D. S & Semmel, M. I. 1974. Instructional Development for Training Teachers of Expectional Children. Minneapolis, Minnesota: Leadership Training Institute/Special Education, University of Minnesota. [7] Crawford, Chris, Sue Peabody, The Art, Computer Game Design, World Wide Web, and Donna Loper. 2003. The Art of Computer Game Design. Osborne/McGraw-Hill. [8] Magnenat-Thalmann, Nadia, and Zerrin Kasap. 2009. Virtual Humans in Serious
Games. 2009. International Conference on CyberWorlds: 71-79. doi:10.1109/CW.2009.17.
http://ieeexplore.ieee.org/lpdocs/epic03/wrapper.htm?arnumber=5279708. [9] Bandura, A., Ross, D. & Ross, S. 1961. Transmission of aggression through imitation of aggresive models. Journal of Abnormal and Social Psychology, 63, 575-682.

46
Story of Math: A Serious Game Based-Learning for
Improvement of Students Achievement in Time Unit
Conversion
P Rika Sahriana1 and Sukajaya I N1
1 Educational Mathematics Department, FMIPA, Ganesha University of Education
Abstract. We developed a serious game entitled ″Story of Math″. The game is developed as a
learning media in understanding a subject matter of 3rd grade of elementary school students,
that is Time Unit Conversion. The development model which is implemented in developing
the Story of Math is 4D model (Define, Design, Develop, and Disseminate). We only
conducted the first three among four procedures of the 4D model. The Story of Math game is
a single player game of adventuring genre. Challenges are presented as time unit conversion's
problems distributed in three levels. Problems for the first level involve time unit conversion
from hours to minutes, minutes to seconds, and hours to minutes. For the second, problems
involve conversion from minutes to hours, seconds to minutes, and seconds to hours. For the
last, problems involve addition and subtraction operations for operand from either similar or
different time unit. Feasibility of the game implementation has been tested through User
Acceptance Test involving 5 students of 3rd grade elementary school students. The results
shows that students are very interested and enthusiastic in playing game. The response was
reflected in gestures and expressions of their faces look so curious. They have no problem or
easily understand how to play this serious game. They also understand the subject that is
integrated into the game showed through quick response for the quiz given after playing the
game. It infers that the Story of Math serious game is interesting and potentially help the
students to understand the concept of subject time unit conversion.
Keyword: Serious Game Based-learning, Time Unit Conversion, Improvement of Students Achievement
3. Introduction
In the era of globalization, the use of technology has certainly become commonplace. Almost
everyone has a capable gadget. This certainly has a positive impact if it can be used appropriately.
Most children use these gadgets to look for entertainment such as watching videos, surfing the internet
or playing games. Most games have an addictive effect on children because they make them forget the
time, so fun to play games. It also causes children to put aside their study time and instead spend a lot
of time playing games.
The impact of addiction in playing games is huge, ranging from decreased learning achievement
and lazy to learn. To be able to take part in learning at school properly, surely they must increase their
study hours at home because they cannot rely solely on study hours at school. The large number of
subjects is also sometimes a reason for children to be lazy to learn, not to mention there are lessons
they do not like. Mathematics is one of the lessons that students dislike, the reasons are very diverse.
Some of them, namely: 1) Because it is not comfortable with the teacher who teaches, 2) The number
of materials that only use numbers or abstracts, 3) There are negative experiences in the process of
learning mathematics, 4) There is an assumption that mathematics is a difficult subject and scary.
Because of these factors, not a few Indonesian children become "phobias" towards learning
mathematics so that the right method is needed to overcome them. In addition to the factors mentioned
above, Indonesia's geographical factor which is a large country, consisting of many islands, each of
which has different conditions, also greatly influences the abilities of children in each of these regions.
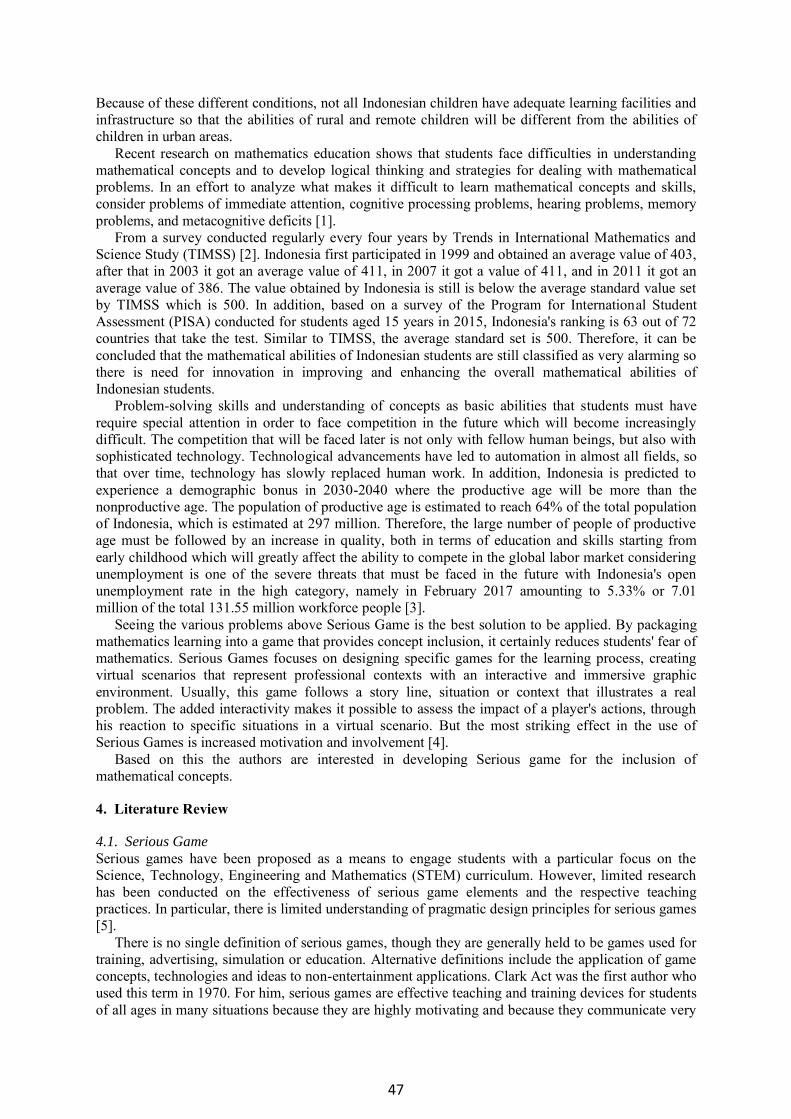
47
Because of these different conditions, not all Indonesian children have adequate learning facilities and
infrastructure so that the abilities of rural and remote children will be different from the abilities of
children in urban areas.
Recent research on mathematics education shows that students face difficulties in understanding
mathematical concepts and to develop logical thinking and strategies for dealing with mathematical
problems. In an effort to analyze what makes it difficult to learn mathematical concepts and skills,
consider problems of immediate attention, cognitive processing problems, hearing problems, memory
problems, and metacognitive deficits [1].
From a survey conducted regularly every four years by Trends in International Mathematics and
Science Study (TIMSS) [2]. Indonesia first participated in 1999 and obtained an average value of 403,
after that in 2003 it got an average value of 411, in 2007 it got a value of 411, and in 2011 it got an
average value of 386. The value obtained by Indonesia is still is below the average standard value set
by TIMSS which is 500. In addition, based on a survey of the Program for International Student
Assessment (PISA) conducted for students aged 15 years in 2015, Indonesia's ranking is 63 out of 72
countries that take the test. Similar to TIMSS, the average standard set is 500. Therefore, it can be
concluded that the mathematical abilities of Indonesian students are still classified as very alarming so
there is need for innovation in improving and enhancing the overall mathematical abilities of
Indonesian students.
Problem-solving skills and understanding of concepts as basic abilities that students must have
require special attention in order to face competition in the future which will become increasingly
difficult. The competition that will be faced later is not only with fellow human beings, but also with
sophisticated technology. Technological advancements have led to automation in almost all fields, so
that over time, technology has slowly replaced human work. In addition, Indonesia is predicted to
experience a demographic bonus in 2030-2040 where the productive age will be more than the
nonproductive age. The population of productive age is estimated to reach 64% of the total population
of Indonesia, which is estimated at 297 million. Therefore, the large number of people of productive
age must be followed by an increase in quality, both in terms of education and skills starting from
early childhood which will greatly affect the ability to compete in the global labor market considering
unemployment is one of the severe threats that must be faced in the future with Indonesia's open
unemployment rate in the high category, namely in February 2017 amounting to 5.33% or 7.01
million of the total 131.55 million workforce people [3].
Seeing the various problems above Serious Game is the best solution to be applied. By packaging
mathematics learning into a game that provides concept inclusion, it certainly reduces students' fear of
mathematics. Serious Games focuses on designing specific games for the learning process, creating
virtual scenarios that represent professional contexts with an interactive and immersive graphic
environment. Usually, this game follows a story line, situation or context that illustrates a real
problem. The added interactivity makes it possible to assess the impact of a player's actions, through
his reaction to specific situations in a virtual scenario. But the most striking effect in the use of
Serious Games is increased motivation and involvement [4].
Based on this the authors are interested in developing Serious game for the inclusion of
mathematical concepts.
4. Literature Review
4.1. Serious Game
Serious games have been proposed as a means to engage students with a particular focus on the
Science, Technology, Engineering and Mathematics (STEM) curriculum. However, limited research
has been conducted on the effectiveness of serious game elements and the respective teaching
practices. In particular, there is limited understanding of pragmatic design principles for serious games
[5].
There is no single definition of serious games, though they are generally held to be games used for
training, advertising, simulation or education. Alternative definitions include the application of game
concepts, technologies and ideas to non-entertainment applications. Clark Act was the first author who
used this term in 1970. For him, serious games are effective teaching and training devices for students
of all ages in many situations because they are highly motivating and because they communicate very

48
efficiently the concepts and facts of many subjects. They offer us a rich field for a risk free active
exploration of serious intellectual and social problems [6].
Serious games are simulations of real-world events or processes designed for the purpose of
solving a problem [7]. Although serious games can be entertaining, their main purpose is to train or
educate users, they may also have other purposes such as marketing or advertising. Serious games are,
in a very general sense, “any form of interactive computer-based game software for one or multiple
players to be used on any platform and that has been developed with the intention to be more than
entertainment [8]. Serious Games focus on the specific design of games for the learning
process, creating virtual scenarios representing professional contexts with interactive and immersive
graphical environments [9].
Normally, these games follow a story, situation or context lines that portrait a real issue. Added
interactivity makes possible to assess the impact of the player’s actions, through its reaction to those
specific situations in the virtual scenario [10]. But the most striking effect in the use of Serious
Games is an increased motivation and engagement. This was seen in the all the sectors that currently
use Serious Games like education, defense and health.
4.2. Serious Game for Mathematics Learning
Previous work on the educational use of games has highlighted strategies for employing popular
commercial games (e.g., Rovio's Angry Birds) in a Physics course [11], but it has not provided any
actual implementation of the respective concepts. Several studies describe what the optimal conditions
are for learning math. Cognitive research has shown that learning mathematics is most effective when
four fundamental characteristics are present: 1) Active engagement, 2) Participation in groups, 3)
Frequent interaction and feedback, and 4. Connections to real world contexts [12]. That means in
addition to actively constructing knowledge from experience, interpretation and structured interactions
with peers and teachers, there must be meaningful math problem solving connected to real world
contexts. Engaging prior understanding, and self-monitoring opportunities, in addition to factual and
conceptual information are also important components of learning mathematics [13].
Games are an ideal way to test understanding because the player is continuously being assessed,
and can only advance if they master the system (provided the game is well-designed). Moreover,
testing is part of the gameplay as opposed to a separate activity that students fear. Players can be
rewarded for creativity and group work, as well as content specific knowledge. There have been
several studies that propose using serious games as assessment tools. Performance assessment is
intertwined with game play. Especially at the end of a level, the player can have a chance to solve
problems that encompass concepts learned up to that point before advancing to higher levels. Level
assessment can also be determined by the system's artificial intelligence to follow the player's learning
curve and provide assistance when needed. All of that data can be collected and analysed and sent to
the teacher as well as the player to inform them what they know best and what they need to work on.
Otherwise, there can be a divide on how material was presented and how students must show
understanding.
There are several things that need to be considered in making a good serious game, namely:
1. Integration
When developing a learning game, we need to install learning and the game integrates with each
other. The point is that between games and learning objectives must be combined or join a complete
association and to complete this game, we must master the learning objectives in it.
2. Motivation
We have to make sure this game provides possible motivation. The main key to providing
motivation is to make games interesting and fun. Motivation must be in line with the requirements of
the game, which are given such as balance, an appropriate reward system, consideration in the game
and fast feedback from players. In a game some of these requirements are referred to as "challenges".
When a player gets a challenge or challenge, he will be asked to be motivated to complete the
challenge given.
3. Game Focus
The last thing that is important in making a good learning game is "game focus" or game focus.
The aim of the game is aimed at the players. Providing clear goals for the players can help provide

49
concentrated learning in accordance with learning objectives that are integrated with the game being
made.
One reason for the effective use of serious games in education is because it can help the mood of
students or players. Playing games as a means of entertainment can also change moods according to
the roles or characters we use, for example roles in characters that are increasing complexity such as
sadness, happiness, and increasing can change the hearts of players. Serious games that effectively
form a positive mood to encourage players to continue the game, which leads to increased interest in
the game, as well as better academic improvement.
4.3. Time Unit Conversion
Conversion of time units is changing time units to other time units, from the smallest value to the
largest or vice versa. The time unit itself is a time interval that is used as a determinant of the duration
of time or an event. Units of time generally indicate a period of time, for example such as hours,
minutes, seconds, days, weeks, years, years, decades, centuries and many other units of time.
5. Research Methodology
5.1. 4D Model
The development model of the 4D Model was suggested by Sivasailam Thiagarajan, Dorothy S.
Semmel, and Melvyn I. Semmel (1974). This model consists of 4 stages of development, namely
Define, Design, Develop, and Disseminate [14]. But in this study, we have only reached the third
stage, namely Develop.
3.1. Define The define stage is the stage for defining and defining learning requirements.
Activities carried out at this stage are initial analysis and curriculum analysis. Preliminary analysis is
conducted to find out common problems that occur in the field related to learning time unit conversion
material. This initial analysis activity was carried out by conducting interviews with several
mathematics teachers at SDN 3 Kesiman. Furthermore, curriculum analysis activities are carried out
to find out basic competencies, learning indicators and time unit conversion teaching material
description for grade III students. The results of this stage are identified common problems in learning
and known limitations in unit time conversion material for grade III students.
3.2. Design The design phase aims to design or prepare the Serious Game prototype and its
evaluation tools. The initial step of this stage is the creation of a Serious Game design based on the
results obtained at the defining stage. The design of a building or storyboard is a series of texts that
contain descriptions, flow and simple descriptions of the components that will be contained in the
Serious Game from start to finish. With the design of the building will facilitate the process of making
the Serious Game. Furthermore, the design was implemented to be Prototype I Serious Game: Story of
Math with the help of Adobe Photoshop software as an application for making maps and characters,
Kinemaster as an application for editing videos and RPG Maker Mv as the main application in making
this Serious Game. Prototype 1 which will be used in a limited trial which later when the results of the
limited trial comply with good criteria, prototype 1 can be said to have reached the final prototype.
The design phase aims to design learning tools. The complete description of the designed device is as
follows:
Game Scenario
Story of math game is a single player game that adopts the flow of folklore. The aim is in addition to
planting mathematical concepts, it is hoped that players insights about folklore will also increase. At
the time of starting the game, the player will be given instructions on what to do. The challenges in
this game in the form of a way for players to help each non-player character encountered.
In the story of math, adopt the story of Rama and Shinta. Players will act as the main character
who will help Rama to save the goddess Shinta. When entering the game, the player can move the
characters in the game to the right, left, front, back using the keyboard, and to continue the dialogue /

50
conversation with the NPC can use the left click on the mouse or can press the enter key. Players will
look for instructions by walking around on the map available in the game.
There are 3 places that become the main map in this game, namely forests, mountains and castles.
Each of these places has different levels of difficulty. Problems for the first level involve time unit
conversion from hours to minutes, minutes to seconds, and hours to minutes. For the second, problems
involve conversion from minutes to hours, seconds to minutes, and seconds to hours. For the last,
problems involve addition and subtraction operations for operations from either similar or different
time units.
For each level 9 questions will be scattered in various challenges. In answering 1 question will be
given the opportunity to answer 3 times. When a player fails to answer for the first time, a clue is
given to help the player, but still makes the player think. If on the second occasion the player is still
wrong then there will be a more detailed clue than before. If on the third occasion the player still
answers incorrectly, the player will get the game over and must repeat the game from the save point.
When the player successfully answers a question, another question will appear that has the same
level of difficulty at that level. Until the player answers 9 questions in different scenes and completes
one object on the map, the level for the next question will increase. By giving 3 times the opportunity
to answer and give a clue to the player, the player is expected to have a strong understanding of the
concept.
Rule of Game
As explained earlier, when players get challange will be given 3 times the opportunity to answer
the challenge. When a player answers incorrectly at the first opportunity, a clue is given which aims to
direct the player's thoughts towards the right answer. Then if the player answers incorrectly on the
second chance, the clue given will be even more detailed than the previous clue but still makes the
player think in determining the answer. On the last occasion, namely the third chance, if the player is
still wrong answer will be given a game over, which player must restart at the specified save point.
The chart below shows the clue system contained in the story of math game. When a player starts the
game, the player will follow the story or the storyline contained in the game. During the storyline, the
player will be confronted with a challenge in the form of questions relating to the unit time conversion
material. The black line at the bottom shows the normal flow, but when the player answers a question
incorrectly there will be 2 more chances so that the player can return to the correct channel to finish
the game. The beer line shows when a player uses his second chance to answer a question, while the
yellow line shows a player using his last chance to answer a question. In brief, the clue system in this
game can be shown in the following chart.
Figure 1. Question and clue system
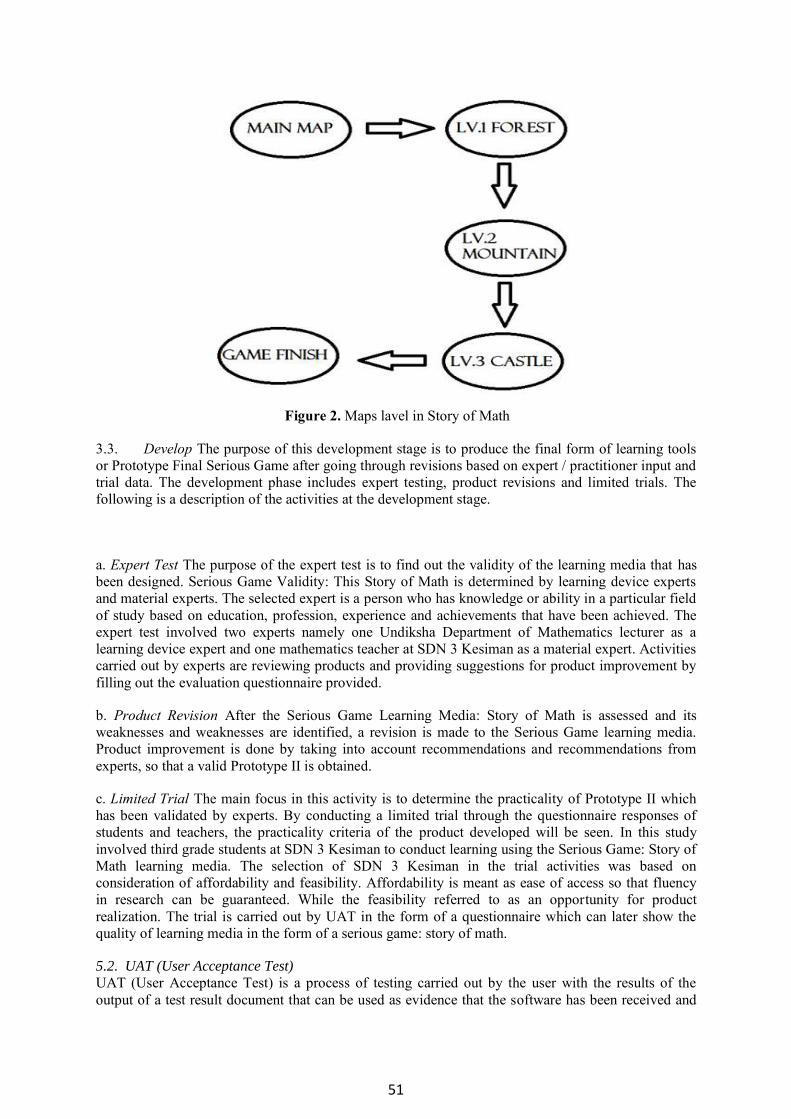
51
Figure 2. Maps lavel in Story of Math
3.3. Develop The purpose of this development stage is to produce the final form of learning tools
or Prototype Final Serious Game after going through revisions based on expert / practitioner input and
trial data. The development phase includes expert testing, product revisions and limited trials. The
following is a description of the activities at the development stage.
a. Expert Test The purpose of the expert test is to find out the validity of the learning media that has
been designed. Serious Game Validity: This Story of Math is determined by learning device experts
and material experts. The selected expert is a person who has knowledge or ability in a particular field
of study based on education, profession, experience and achievements that have been achieved. The
expert test involved two experts namely one Undiksha Department of Mathematics lecturer as a
learning device expert and one mathematics teacher at SDN 3 Kesiman as a material expert. Activities
carried out by experts are reviewing products and providing suggestions for product improvement by
filling out the evaluation questionnaire provided.
b. Product Revision After the Serious Game Learning Media: Story of Math is assessed and its
weaknesses and weaknesses are identified, a revision is made to the Serious Game learning media.
Product improvement is done by taking into account recommendations and recommendations from
experts, so that a valid Prototype II is obtained.
c. Limited Trial The main focus in this activity is to determine the practicality of Prototype II which
has been validated by experts. By conducting a limited trial through the questionnaire responses of
students and teachers, the practicality criteria of the product developed will be seen. In this study
involved third grade students at SDN 3 Kesiman to conduct learning using the Serious Game: Story of
Math learning media. The selection of SDN 3 Kesiman in the trial activities was based on
consideration of affordability and feasibility. Affordability is meant as ease of access so that fluency
in research can be guaranteed. While the feasibility referred to as an opportunity for product
realization. The trial is carried out by UAT in the form of a questionnaire which can later show the
quality of learning media in the form of a serious game: story of math.
5.2. UAT (User Acceptance Test)
UAT (User Acceptance Test) is a process of testing carried out by the user with the results of the
output of a test result document that can be used as evidence that the software has been received and

52
has met the requirements requested. Feasibility of the game implementation has been tested through
User Acceptance Test involving 5 students of 3rd grade elementary school students from SDN 3
Kesiman. Students will be given a questionnaire with a Likert scale. Likert scale is a scale used to
measure perceptions, attitudes or opinions of a person or group regarding an event or social
phenomenon, based on operational definitions set by the researcher. In the questionnaire given
questions that emphasize the psychological aspects of the player when playing Story of Math. The
questions given in the questionnaire were 5 items. In that question, there are 5 points, namely Strongly
Agree (SS), Agree (S), Doubt (RG), Disagree (TS) and Strongly Disagree (STS). The assessment
applied is to give a score of 1 to 5 on the related unit. Finally the scores from each respondent are
matched with the available categorization intervals.
Table 1. Answer categories on the questionnaire
Categories Point
Strongly Agree (SS) 5
Agree (S) 4
Doubt (RG) 3
Disagree (TS) 2
Strongly Disagree (STS) 1
Table 2. Evaluation interval for questionnaire answers
Interval Categories
0% - 19,9% Very Poor
20% - 39,9% Poor
40% - 59,9% Enough
60% - 79,9% Good
80% - 100% Very Good
6. Result
6.1. Interface Game Story of Math
The story of math game has an initial menu display that is new game, continue and options.
Illustration as follows:

53
Figure 3. Initial display before starting the game
Figure 4. Display World Map of Rama and Shinta
Figure 3 shows the main display when the player starts the game. There are several menu choices,
including New Game, Continou and Option. The function of New Game is to start the game from the
beginning, Contiou to continue the game that has been previously saved, and Option to adjust the
volume of background music and the sound of character music. Whereas in Figure 4 the world of
Rama and Shinta is shown where the forest and mountains seen on the map will allow the player to
enter there.
6.2. Non-Playing Character
Non-Playing Character (NPC) is any character in a game which is not controlled by player. The
function of NPC is to help or provide instructions to players in completing the game. The following is
an illustration of the NPC in the story of math game:
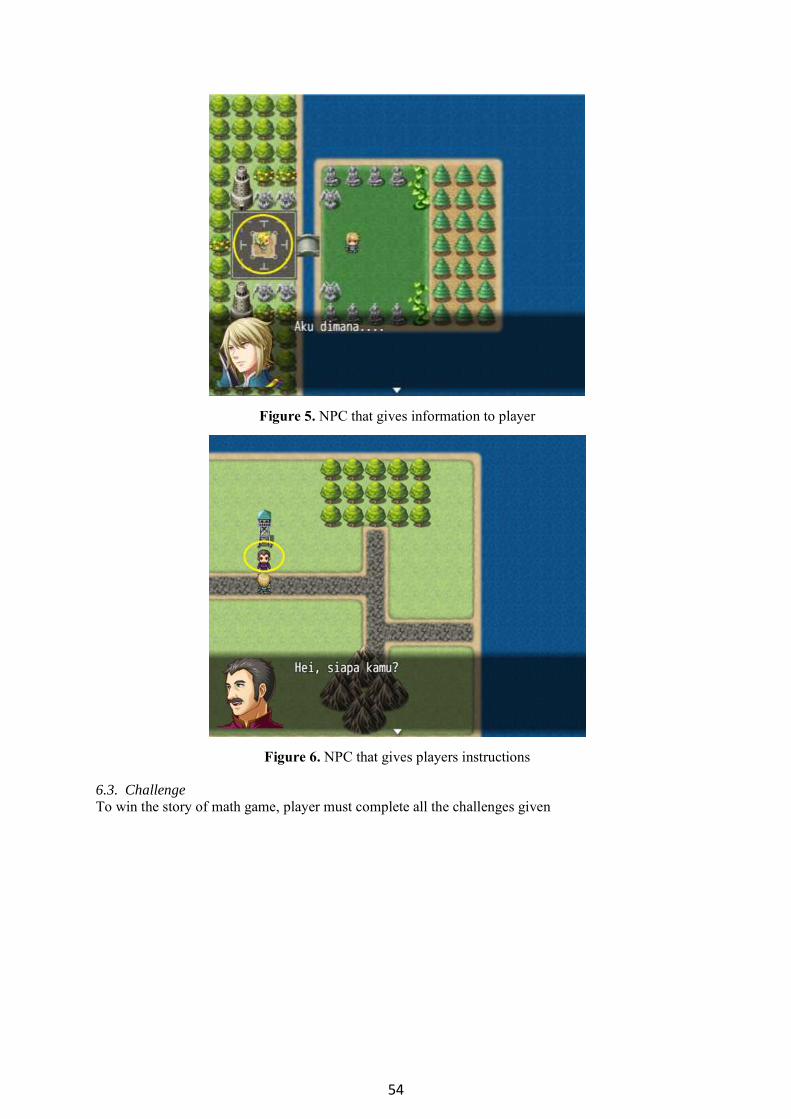
54
Figure 5. NPC that gives information to player
Figure 6. NPC that gives players instructions
6.3. Challenge
To win the story of math game, player must complete all the challenges given

55
Figure 7. The challenges given by the NPC are in the form of questions
6.4. Clue
If a player makes a mistake in answering the question, then the player will given a clue related to the
problem, so it is hoped that the next question the player can answer correctly. In Figure 8, one
example of CLUE is used in the game story of math. The clu is a digital clock video illustration
showing changes in numbers in minutes and seconds. When seconds show the number 60, the minutes
change to 1.
Figure 8. Examples of clues given to players
6.5. Last Boss
So that the game gets a pleasant playing experience, at the end is given a challenge to fight Rahwana
who is the last boss in this game. In figure 9 an illustration is shown when the player is dealing with
Ravana, the player must defeat Ravana in order to save the goddess Shinta.

56
Figure 9. Display when fighting against Rahwana
6.6. Win/Lose Condition
The condition to win the story of math game is to complete all challenges until Shinta is saved.
Meanwhile the condition of losing is when the player fails to complete the challenge given.
Figure 10. Display when the player wins

57
Figure 11. Display when the player loses
6.7. Serious Game Performance Against The Students
When testing students, there are no significant obstacles. Students are very enthusiastic and interested
when trying to play this game. The clue system used is very helpful for students in understanding the
concept of unit time conversion material. When players answer incorrectly, they get a chance to
answer back which was previously given a clue so that they better understand the problem given. By
using serious games as learning media, students become more interested compared to using
conventional methods that are usually used in schools in general, namely using textbooks. Inserting
learning material in the game reduces student anxiety in learning because students feel that they are
playing a game, not learning. It also provides a sense of relax and makes it easier for them to
understand the concepts inserted in the game.
6.8. Players Score
As explained before, the score in this game is determined by the duration in playing this game. Which
is played by students is the result of prototype 1 game story of math. From 5 students who took the
trial test, the results are shown in the table below.
Table 3. Players Score
Name Time Played Game Over
Pradnyan 25 minutes 1 times
Adit 29 minutes 3 times
Ryan 26 minutes 2 times
Anggi 35 minutes 5 times
Lili 31 minutes 3 times
6.9. Questionnaire
Likert scale questionnaire is given to players after they play the game of math story which is still in
the form of portotype 1, while the results were as follows:

58
Table 4. Results of players' responses to the questionnaire
N
o
Statement SS S RG TS ST
S
1 The story of math game provides a fun math
learning experience
3 2
2 The story of math game makes it easy to
learn unit time conversions
2 2 1
3 The story of math game is easy to play 4 1
4 The instructions provided in the game story
of math are very helpful in solving
challenges
1 3 1
5 The challenges given in the story of math
game are easy to understand
4 1
Max score = 5 x 5 = 25
Min score = 5 x 1 = 5
Statement 1
Answer SS = 3 respondents x 5 = 15
Answer S = 2 respondents x 4 = 8
Total score = 23
Index (%) = 23
100 92%25
x
Statement 2
Answer SS = 2 respondents x 5 = 10
Answer S = 2 respondents x 4 = 8
RG Answer = 1 respondent x 3 = 3
Total score = 21
Index (%) = 21
100 84%25
x
Statement 3
Answer SS = 4 respondents x 5 = 20
Answer S = 1 respondent x 4 = 4
Total score = 24
Index (%) = 24
100 96%25
x
Statement 4
Answer SS = 1 respondent x 5 = 5
Answer S = 3 respondents x 4 = 12
RG Answer = 1 respondent x 3 = 3
Total score = 20
Index (%) = 20
100 80%25
x
Statement 5
Answer SS = 4 respondents x 5 = 20
Answer S = 1 respondent x 4 = 4
Total score = 24
59
Index (%) = 24
100 96%25
x
So in accordance with table 2. Then the category for all statements is VERY GOOD
From the five statements above, all received very good categories so that prototype 1 from the
game story of math can be said to have fulfilled the practical criteria in a learning medium, which then
prototype 1 could be the final prototype.
7. Conclusion
From the players data scores at table 3, we can see the students who completing the Story of Math
succeed in getting the fastest time of 25 minutes and 1 game over. While the longest is 35 minutes,
and get game over 5 times. If we get game over many times it is make we need the longer time to
complete the game. Seen in the Anggi’s case, because she have many times game over, it means that
students understanding of concepts still needs to be improved. It different with Pradnyan’s case who
only get 1 times game over and finished with a faster duration of time, which indicated that students
had a good understanding of the concepts.
From the questionnaire we can conclude that the story of math game can help students learn
mathematics fun, especially in learning to convert time units.
So overall serious games have great potential to be used as a learning media because they are very
positive effects on the learning process of its users. The mechanisms used in serious games also
strengthen learning in a dynamic, interactive, motivating and entertaining way.
References
[1] Drigas, A. S., & Pappas, M. A. (2015). On line and other game-based learning for mathematics.
International Journal of Online Engineering, 11(4), 62–67.
https://doi.org/10.3991/ijoe.v11i4.4742
[2] [Kementrian Pendidikan dan Kebudayaan. Peringkat dan Capaian PISA Indonesia Mengalami
Peningkatan.
https://www.google.co.id/url?q=https://www.kemdikbud.go.id/main/blog/2016/12/peringkat
-dan-capaian-pisa-indonesia-mengalami-
peningkatan&sa=U&ved=2ahUKEwjPxNCNjfncAhVROSsKHYHFBt8QFjAAegQIBBAB
&usg=AOvVaw3KuX5wW 47RbkZbvV5Nzbx.
[3] Badan Pusat Statistik. Tingkat Pengangguran Terbuka (TPT) Sebesar 5,33 Persen.
https://www.bps.go.id/pressrelease/2017/05/05/1376/tingkat-pengangguran-terbuka--tpt--
sebesar-5-33-persen.html.
[4] Andrade, A., Gouveia, D., Escudeiro, P., & Van De Carvalho, C. (2014). Can SME managers
learn from games? ACM International Conference Proceeding Series, 10-12-September-
2014, 560–586. https://doi.org/10.1145/2662253.2662349
[5] Chorianopoulos, K., Giannakos, M. N., & Chrisochoides, N. (2014). Design Principles for Serious
Games in Mathematics. (June), 1–5. https://doi.org/10.1145/2645791.2645843
[6] Abt, C (1970). Serious Games. New York: Viking Press
[7]Sawyer, B. (2002). Improving public policy through game-based learning and simulation, foresight
and governance project: Woodrow Wilson International Center for Scholars, publication
20002-1
[8] Ritterfeld, U., Shen,C., Wang, H., Nocera,L. & Wong, W.L. (2009). Multimodality and
Interactivity: Connecting Properties of Serious Games with Educational Outcomes.
Cyberpsychology & Behavior 12 (6), .DOI:
10.1089=cpb.2009.0099.
[9] Carlos Vaz de Carvalho, Games for e-Learning, IJITCS - International Journal of Information
Technology & Computer Science, pp. 61-67, Vol. 4, Issue Jul/Aug 2012,
ISSN 2091 – 1610
[10] Ricardo Baptista, Carlos Vaz de Carvalho, TimeMesh – A Serious Game for European
Citizenship, EAI Transactions on Game-Based Learning 13(01-06): e2, ISSN: 2034-8800
[11]Rodrigues, M., & Carvalho, P. S. (2013). Teaching physics with Angry Birds: exploring the
kinematics and dynamics of the game. Physics Education, 48(4), 431.

60
[12]Roschelle, J.M., Pea, R.D., Hoadley, C.M., Gordin, D.N. & Means B.M. (2000). Changing How
and What Children Learn in School with Computer-Based Technologies. The Future of
Children 10 (2), 76-101.
[13] Donovan, S. & Bransford, J. (2005). Ch 9: Scientific Inquiry and How People Learn. In How
students learn: history, mathematics, and science in the classroom. Retrieved from
http://books.google.se/books?id=2wwwnKJ69UAC&pg=PA397&lpg=PA397&dq=donovan
+and+bransford&source=bl&ots=yUyGlF9QgK&sig=6F9qQcyPgD6xzXpPsWq1oOZv1GU
&hl=sv&ei=j0nITdykNo_xsgbJmr2oAw&sa=X&oi
=book_result&ct=result&resnum=5&ved=0CD0Q6AEwB A#v=onepage&q&f=false
[14] Thiagarajan, S., Semmel, D. S & Semmel, M. I. 1974. Instructional Development for Training
Teachers of Expectional Children. Minneapolis, Minnesota: Leadership Training
Institute/Special Education, University of Minnesota.
61
A Lower Bound For Irregularity Strength of The Complete
Graph of Power Two Vertices
Kadek Riska Savitri1)
I Nengah Suparta2)
1,2Educational Mathematics Department, FMIPA, Universitas Pendidikan
Ganesha
Abstract. Let G(V,E) be a graph with vertex set V(G) and edge set E(G). A vertex k labeling
φ : V(G)→ {1,2,3,...k} is called k-labeling for some positive integer k. The weight of an edge
xy in E(G), denoted by
WΦ (xy), is the sum of the labels of two vertices x and y which are incident with edge xy or Wφ
(xy) = φ(x) + φ(y) if Wφ(UV) ≠ if Wφ(xy) for any distinct edges uv and xy in E(G), we call
φ as an edge irregular k-labeling. The minimum k for which the graph G has an edge irregular
k-labeling is called the edge irregularity strength of G, and is denoted by e s(G). In this talk,
we introduce a lower bound for es (Kn) where Kn is the complete graph of n = 2m
vertices
for some positive integer m ≥ 2 . For these complete graph Kn , we show that
Keywords : edge irregularity strength, k-labeling, complete graph.
1.Introduction The graph is a data structure that is defined by two components which are vertices and edges.
The first problem in graph theory dates to 1736, and is called the Saven Bridges of Kӧnigsberg. The
idea to solve this bridge problem using graph was sparked by L.Euler, mathematician from
switzerland.
The two parts most important in a graph’s representation are vertices and edges. So it can be
said that a graph is a set of vertices and edges. There are so many kind of the graph, thus are simple
graph, connected graph, bipartite graph, etc.
In mathematical discipline of graph theory, a graph labeling is the assignment of labels,
traditionally represented by integers, to edges and/orb vertices of a graph. There are three labeling
based on element that given label thus are vertex labeling, edges labeling, and total labeling. There are
the types of graph labeling, thus are magic label, antimagic labeling, and iregular labeling. In this
article, we talk about an edge irregular k-labeling.
2. Definition And Notation A Graph G consists of a pair (V,E), where V is the set of vertices and E is the set of edges (K.
Thulasiraman, 2011). We write V(G) for the vertices of G and E(G) for the edges of G. The number of
vertices on a graph G is called an order graph, denoted by V (G) , and the number of the edges on a
graph G is called size graph, denoted by E(G) . If no two edges have the same endpoints we say there are no multiple edges, and if no edge has a single vertex as both endpoints we say there are no
loops. There are so many kind of graph, for example is simple graph.

62
Let G is called a simple graph if it does undirected graph that has no loops (edges connected
at both ends to the same vertex) and no more than one edges between any two different vertices
(Jonathan L. Gross, 2003). One of simple graph is complete graph. A complete graph with n-vertex,
denoted by K n . Complete graph is a simple graph with n-vertex and every two distinct vertices
connected by an edge. Because each vertex on the complete graph is connected to each other through
the edges, the degree of each vertex in a complete graph G is n −1 . So that the number of edges in a
complete graph G is n(n −1)
.
2
Picture 1. Complete Graph
A graph labeling is an assignment of integer to the vertices or edges or both with subject to
certain condition(s) (Gallian, 2018). There are three labeling based on element that given label thus
are vertex labeling, edges labeling, and total labeling. Vertex labeling is the labeling with gives label
on the vertex only and the domain of the mapping is the set of vertices. Edge labeling is the labelling
with gives label on the edge only and the domain of the mapping is the set of edges. Total labeling is
the labelling with gives label on the vertex and edge. The domain is V (G) E(G).
In this talk, we intruduce about edge irregularity strength. A vertex k-labeling :V → 1,2,3,..., k
is called k-labeling for some positive integer k. The weight of an edge xy in
E(G), denoted by w (xy) is the sum of the labels of two vertices x and y which are incident with edge
xy or w (xy) = (x)+ (y). If w (uv) w (xy) for any distinct edges uv and xy in E(G), we call as an edge irregular k-labeling. The minimum k for which the graph G has an edge irregular k-
labeling is called the edge irregularity strength of G, and is denoted by es(G).
6 Main Results
Theorem 1.1 by Ahmad A., Gupta A., Simanjuntak R.,
Theorem 1.1 Let G = (V , E)be a simple graph
es(G) max E(G)+1
, (G)
2
es(K
In this talk, we introduce a lower bound for n
n = 2m
vertices for some positive integer m 2 .
E(K n ) = 1 + 2 + 3 + ... + (n −1)
=
n (n −1)
2
For n = 2 m
2m (2m −1)
E(K n ) =
2
E(K n )
= 2m−
1 (2m −1)
in (Ahmad A., 2018).
(G). Then, with maximum degree
) where K n is the complete graph of

63
Because one and two is imposible as weight of the edge in graph K
the edge is higher than or same with 2 m−1 (2 m −1)+ 2 . The highest
n , therefore the highest weight of
lable of point should more than or
2 m−1 (2 m −1)+
same with 2
or more distinct points, we more than or equal to 2 m−2
2 2
. Because
have to raise (2 m −1)+ 2 .
m−1 (2 m −1)+ 2
= 2 m−2 (2 m −1)+1
cannot be a label of two
2
one of the endpoint labels. So that, the highest label of point
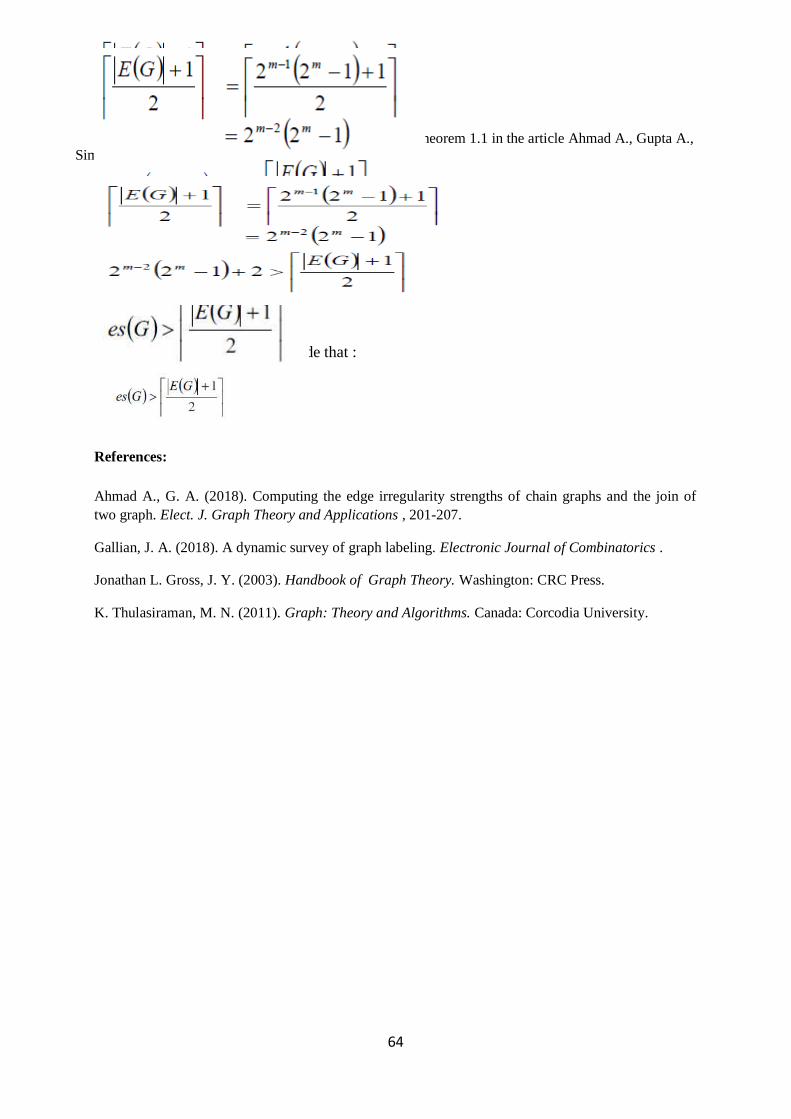
64
If 2
m−2 (2 m −1)+ 2 is associated with Theorem 1.1 in the article Ahmad A., Gupta A.,
Simanjuntak R., in (Ahmad A., 2018), it is obtained:
so for Graph Kn , we can Conclude that :
References:
Ahmad A., G. A. (2018). Computing the edge irregularity strengths of chain graphs and the join of
two graph. Elect. J. Graph Theory and Applications , 201-207. Gallian, J. A. (2018). A dynamic survey of graph labeling. Electronic Journal of Combinatorics . Jonathan L. Gross, J. Y. (2003). Handbook of Graph Theory. Washington: CRC Press. K. Thulasiraman, M. N. (2011). Graph: Theory and Algorithms. Canada: Corcodia University.
65
Developing Geogebra Mathlet On Geometry Transformation
Oriented Ikrar Strategy To Improve Students Mathematical
Problem Solving Skills
I Dewa Gede Putra Ardinata1, I Gusti Putu Sudiarta2, I Gusti Putu Suharta3
1SMA Negeri 4 Denpasar, Jl. Gunung Rinjani. Denpasar, Bali, Indonesia
2Ganesha University of Education, Jl.Udayana No.11 Singajara, Bali,
Indonesia
[email protected], [email protected],[email protected]
Abstract. One of the problems faced by junior high school teachers in teaching geometry
transformation is the difficulty of students to understand the concept of geometry
transformation. This study aims to obtain learning device (Media of GeoGebra) oriented to
IKRAR Strategy to improve mathematical problem solving for grade VII students at SMP
Negeri 7 Denpasar. The development of learning device follows the design research procedure
of Plomp (preliminary research, prototyping phase, and assessment phase). Data were collected
using validity sheets, observation sheets, student response questionnaires, teacher response
questionnaires, and tests of mathematical problem solving skill. The collected data is then
analyzed descriptively. The results showed that the learning device fulfilled the criteria: (1)
valid, based on the opinion of two validators; (2) practical, based on the implementation of
easy-to-use learning device based on the observer's point of view, teacher's response, and
student's response; (3) effective, based on completeness of students in learning material that
exceeds KKM. Characteristics of GeoGebra media include: (1) presenting close daily problems
of student activities; (2) Conveying understanding of material concepts easily and structured;
(3) Has an attractive display so that it can increase student motivation, (4) provide practice exercises that hone students mathematical problem solving skills.
1. Introduction
Transformation geometry is a branch of geometry where students learn to identify and draw
the movement of a point or build up the geometry [7]. According to Edward [2] geometric
transformation is very useful for students to build spatial abilities, geometric reasoning
abilities, and strengthen mathematical proofs. These skills are important for students to
explore mathematical concepts; so that, they will be expected to be succeses in solving
mathematical problems in the future [10].
The ability to solve mathematical problems is one of the competencies of student skills
which must be achieved in mathematics learning [11]. [9] considered problem-solving skills
as the primary goal of mathematics education. In relation to this, the concept of geometric
transformation must be completely mastered by the students. Because of a strong
understanding of concepts, students are able to use the concept in order to solve problems in
mathematics, problems in other sciences and problems in everyday life [3]; [13].
Based on the observations of researcher at SMP Negeri 7 Denpasar, the material of geometry transformation was often felt difficult when it was studied by students. Students
found it difficult to imagine the result of the reflection, rotation and dilatation of a plane.
Some students had not been able to generalize that the reflection of point A (x, y) to X axis

66
would produce a shadow A '(x, -y). This was also supported by the student's learning
outcomes that still did not meet the Minimum Exhaustiveness Criteria (KKM) established in
the school. In the international context, the same problem was found [4] which revealed that
students had difficulty in understanding the concepts and variations which was showed in
identifying transformations including translation, reflection, and rotation. In addition, students
also had difficulty in building evidence of algebraic geometric transformation [8]. Therefore,
visualization aid plays an important role in understanding the concept of geometric
transformation [1]. The same thing was proposed by [16] which concludes that educators
should teach geometry transformation materials with clear drawings to be easily understood
by students. This was also supported by [8] which states that the most effective technique for
understanding the material of geometry transformation is learning with a combination of
visualization and analytics.
In order to overcome these problems and to open opportunities students understand, try,
train a variety of visualization on the subject of geometry transformation then one of the right
media used is GeoGebra. Lavisca in [5] states that GeoGebra can encourage the process of
discovery and experimentation of learners in the classroom. The features contained in
GeoGebra can effectively help learners to visualize algebraic and geometric concepts that
tend to be abstract. So that the use media of GeoGebra is very beneficial for teachers and
learners [14]. But if the media of GeoGebra is created without the right strategy then the
media function will resemble a tool for finding results regardless of the delivery or the unclear
concept to be taught [6]. Therefore, in order to optimize the function media of GeoGebra, it
needs the right strategy, so that students are able to understand the concept easily and able to
apply the concept in handling a problem in mathematics especially on Geometry
Transformation material. Based on that there is a strategy that is aimed at students to be able
to handle a problem by understanding the concept and construction of student knowledge first
by applying the IKRAR strategy. The IKRAR strategy is a constructivist learning strategy that
adopts and modifies the problem-oriented learning model through the process of adaptation of
the values contained in the social life of Indonesian society as well as the characteristics of
students with the aim to overcome the problems of mathematics learning experienced by
students [15].
Based on this the focus of this research is to answer the following problems; (1) how the
characteristics media of GeoGebra are oriented to IKRAR strategies which can improve
students' mathematical problem solving abilities. Therefore, this research is conducted as an
effort to overcome the problems found by developing mathematics-teaching learning
materials in the form media of GeoGebra for transformation geometry materials oriented
IKRAR strategy that is valid, practical, and effective.
2. Methods
This study aims to develop learning device (media of GeoGebra) for geometric
transformation materials oriented to IKRAR Strategy in an effort to improve students
mathematical problem solving skills. Criteria of developed learning media must be valid,
practical and effective [12]. Learning media are said to be valid if they meet the content
validity and construct validity. Learning media are said to meet content validity if the media
developed is based on a development theory that is used as guidelines and in accordance with
curriculum demands. While the construct validity is seen from the consistent linkages of each
component of the learning media that is developed with the characteristics of the applied
learning model. Meanwhile, learning media are said to be practical if the developed media are
useful and easy to use by teachers and students. Then learning media are said to be effective if

67
they can achieve the stated learning goals, in this case able to improve students' mathematical
problem solving abilities.
The procedure of developing learning device (Media of GeoGebra) based on Plomp Model
consist of (1) Preliminary Research, conducted an analysis of the learning situation to find
problems in the learning process in class. Literature review is also carried out to support the
problems found and design solutions (2) Prototype Phase, aims to create and test learning
device (Media of GeoGebra) in the field; (3) The Assessment Phase is carried out to obtain
the final product from the developed learning. The final product has valid, practical, and
effective characters that are obtained based on the validator's advice, field trials, as well as the
advice of teachers and students who have used the media of GeoGebra.
This research was held at SMP Negeri 7 Denpasar. The sample of this study were students
who had the same level of ability based on the choice of the teacher and the results of tests at
school, so as many as 81 students were obtained to be used as research samples. There are
several instruments that were used in this study, namely : Table 1. Research instruments
Num. Instrumen Subjek Data type Time
1. Questionnaire Teacher Teacher Teaching Skills Preliminary
Research
2. Observation Sheet Students The Activities of Problem
Solving Ability
Preliminary
Research
3. Validation Sheet Validator
Validity of instructional
devices and research
instruments (valid)
Prototype Phase
4. Observation Sheet Observer Learning implementation
(practical)
Limited Test, Field
Test I, Field Test II
5. Student Questionnaire Students
The response of the students
toward learning process being
implemented (practical)
Field Test I & Field
Test II
6. Teacher
Questionnaire Teacher
The response of the teacher
toward learning process being
implemented (practical)
Field Test I & Field
Test II
7.
Mathematical
Problem Solving Test
(Essay)
Student The score of Problem Solving
Skill (effective)
Field Test I & Field
Test II
So, this research will get quantitative data based on the use of the above instrumentes. This
quantitative data will be matched with a criterion so that it is known whether the media of
GeoGebra have valid, practical and effective criteria.
3. Results and Discussion
Based on the research methods and procedures above, it was found that the developed media
of GeoGebra had valid, practical and effective criteria. Media of GeoGebra can be valid
because this media fulfilment of the content validity and the construct validity based on expert
judgement, and media of GeoGebra can be fullfilment of the practical aspects because easy to
use by students and teachers, which can be seen from the results of the analysis of the
implementation of learning device, student questionnaire responses, and teacher response
questionnaires. The fulfillment effectiveness aspects of learning device (Media of GeoGebra)
too due to the achievement of the expected learning objectives that can improve students
mathematical problem solving skills which can be seen also from the results of trials that have
been carried out where the average test scores of students mathematical problem solving
abilities above the minimum criteria of mastery learning (KKM) determined by the school.

68
Media of GeoGebra was used to grow enthusiastic learners in learning geometry especially
geometry transformation, because the media of GeoGebra provided an elegant look and had
interesting pictures with colorful mixed innovations in order to impress the learning
atmosphere more alive and exhilarating so that it could increase the interest of the students in
following learning. Media of GeoGebra and teacher manuals were written with words,
sentences, and languages which made it easier for teachers and students to understand the
purpose and objectives of each learning activity. Many students had understood the concept of
geometri transformation, because media of GeoGebra presented a sequential and systematic
understanding of the material supported by visualization, so that students easily connected
between concepts and problems. Besides being used as an introduction to the understanding
of material concepts, the developed media GeoGebra was also able to improve students' math
problem solving skills. Because media GeoGebra presented challenging and non-routine
questions that could hone students' thinking skills. This can be seen from the results of each
student's problem solving test scores on field trials above the minimum criteria of mastery
learning (KKM).
The characteristics of learning using media of GeoGebra oriented by IKRAR strategy that
is; 1) Inisiasi, learning begins with introducing students to real phenomena and problems in
daily life related to the material being studied. The daily phenomenon that be related with the
lesson can be obtained through observations or directions given by the teacher in the form of
questions such as the GeoGebra figure 1 below.
Figure 1. Examples of learning using media of GeoGebra at the Inisiasi stage
2) Konstruksi, train students very easily and structured to understand mathematical concepts
visually. In this study students are given direction assistance in each step in finding
mathematical concepts in accordance with the desired goals. The assistance provided can be
in the form of instructions and warnings so that this helps students find a concept and arrange
it in a conclusion. The example of learning is shown in Figure 2 below.
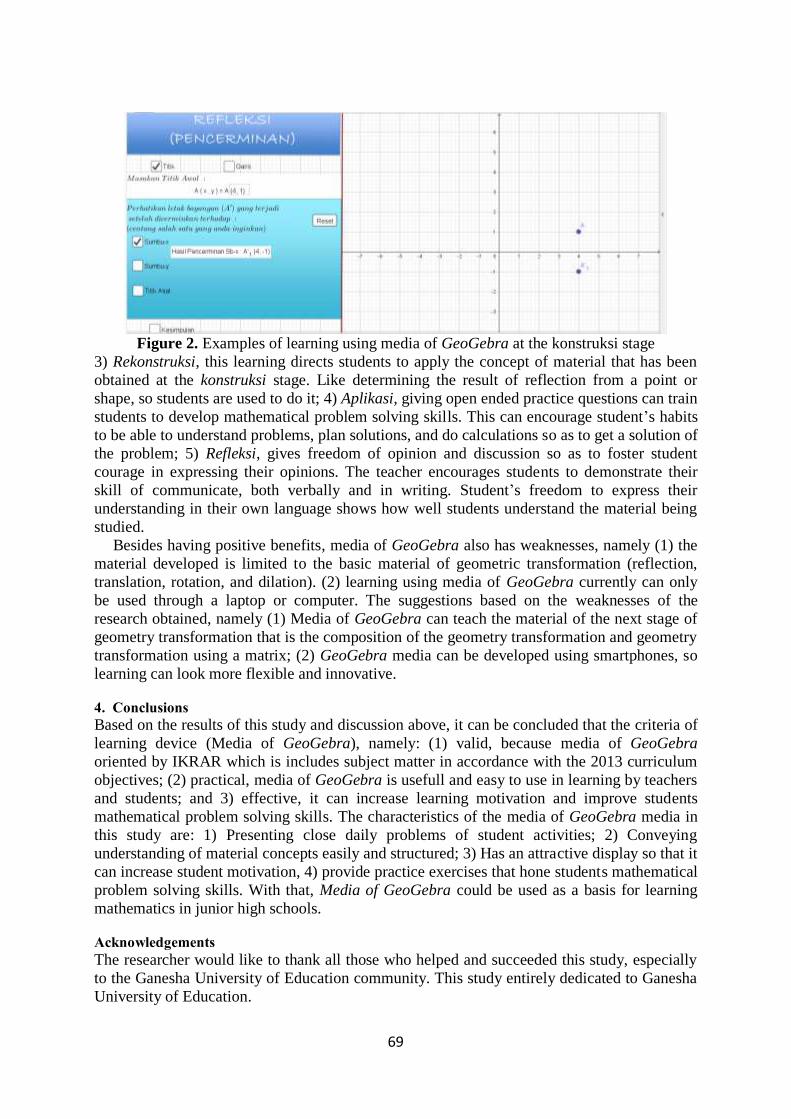
69
Figure 2. Examples of learning using media of GeoGebra at the konstruksi stage
3) Rekonstruksi, this learning directs students to apply the concept of material that has been
obtained at the konstruksi stage. Like determining the result of reflection from a point or
shape, so students are used to do it; 4) Aplikasi, giving open ended practice questions can train
students to develop mathematical problem solving skills. This can encourage student’s habits
to be able to understand problems, plan solutions, and do calculations so as to get a solution of
the problem; 5) Refleksi, gives freedom of opinion and discussion so as to foster student
courage in expressing their opinions. The teacher encourages students to demonstrate their
skill of communicate, both verbally and in writing. Student’s freedom to express their
understanding in their own language shows how well students understand the material being
studied.
Besides having positive benefits, media of GeoGebra also has weaknesses, namely (1) the
material developed is limited to the basic material of geometric transformation (reflection,
translation, rotation, and dilation). (2) learning using media of GeoGebra currently can only
be used through a laptop or computer. The suggestions based on the weaknesses of the
research obtained, namely (1) Media of GeoGebra can teach the material of the next stage of
geometry transformation that is the composition of the geometry transformation and geometry
transformation using a matrix; (2) GeoGebra media can be developed using smartphones, so
learning can look more flexible and innovative.
4. Conclusions
Based on the results of this study and discussion above, it can be concluded that the criteria of
learning device (Media of GeoGebra), namely: (1) valid, because media of GeoGebra
oriented by IKRAR which is includes subject matter in accordance with the 2013 curriculum
objectives; (2) practical, media of GeoGebra is usefull and easy to use in learning by teachers
and students; and 3) effective, it can increase learning motivation and improve students
mathematical problem solving skills. The characteristics of the media of GeoGebra media in
this study are: 1) Presenting close daily problems of student activities; 2) Conveying
understanding of material concepts easily and structured; 3) Has an attractive display so that it
can increase student motivation, 4) provide practice exercises that hone students mathematical
problem solving skills. With that, Media of GeoGebra could be used as a basis for learning
mathematics in junior high schools.
Acknowledgements
The researcher would like to thank all those who helped and succeeded this study, especially
to the Ganesha University of Education community. This study entirely dedicated to Ganesha
University of Education.

70
References
[1] Aktas, G. S., & Ünlü, M. (2017). Understanding of Eight Grade Students about
Transformation Geometry: Perspectives on Students’ Mistakes. Journal of Education and
Training Studies, 5(5), 103–119.
[2] Albab, I. U., Hartono, Y., & Darmawijoyo, D. (2014). Kemajuan belajar siswa pada
geometri transformasi menggunakan aktivitas refleksi geometri. Cakrawala Pendidikan, (3).
[3] Fatqurhohman, F. (2016). Transition Process of Procedural to Conceptual Understanding
in Solving Mathematical Problems. International Education Studies, 9(9), 182.
[4] Guven, B. (2012). Using dynamic geometry software to improve eight grade students’
understanding of transformation geometry. Australasian Journal of Educational Technology,
28(2).
[5] Hohenwarter, dkk. (2004). Combination of dynamic geometry, algebra and calculus in
the software system GeoGebra. Computer Algebra Systems and Dynamic Geometry Systems
in Mathematics Teaching Conference.
[6] Irene, M. (2016). Feasibility of Using Geogebra in the Teaching and Learning
......_2.pdf. Thesis. Tidak Diterbitkan.
[7] Kirby, J. ., & Boulter, D. . (1999). Spatial ability and transformational geometry.
European Journal of Psychology of Education, 14(2), 283–294.
[8] Naidoo, J. (2010). Strategies Used by Grade 12 Mathematics Learners in Transformation
Geometry. Natal: University of Kwazulu.
[9] NCTM (Ed.). (2000). Principles and standards for school mathematics. Reston, VA:
National Council of Teachers of Mathematics.
[10] Novrika, D., Putri, R. I. I., & Hartono, Y. (2016). DESAIN PEMBELAJARAN MATERI
REFLEKSI MENGGUNAKAN MOTIF KAIN BATIK UNTUK SISWA KELAS VII.
Prosiding Seminar Nasional Matematika Dan Pendidikan Matematika.
[11] Özcan, dkk. (2017). Analysis of Sixth Grade Students’ Think-Aloud Processes While
Solving a Non-Routine Mathematical Problem. Educational Sciences: Theory and Practice,
17(1), 129–144.
[12] Plomp, T., & Nieveen, N. (2013). Educational Design Research, Part A. An
Introduction. Enschede: The Netherlands (SLO).
[13] Quinnell, L. (2010). Why are mathematical investigations important? Australian
Mathematics Teacher, The, 66(3), 35.
[14] Seloraji, P., & Eu, L. K. (2017). Students’ Performance in Geometrical Reflection Using
GeoGebra. Malaysian Online Journal of Educational Technology, 5(1), 65–77.
[15] Sudiarta, I. G. P. (2012). Pembelajaran Matematika Inovatif berbasis IKRAR. Jakarta:
Prestasi Pustaka.
[16] Thaqi, X. (2011). Prospective Teacher’s Understanding of Geometric Transformation.
12th International Congress on Mathematical Education. Seoul:TSG10.
71
The Influence of Edmodo Assignment Method towards
Students’ Motivation and Achievement on Learning
Matemathics
Mahayukti, Gst Ayu1, Dinda Nirmala Suci, Ni Gst Ayu Made
2& Sariyasa
3
3,1Prodi Pendidikan Matematika
2
Alumni Prodi Pendidikan Matematika
Abstract. This research focused on testing the influence of the Edmodo assignment method
towards students’ motivation and achievement of learning mathematics in the form of post-test-
only-control-group design. The population of this research was the 10th grade students of the
Natural Science (MIPA) of SMA Negeri 3, Singaraja, year 2018/2019. Those students were
divided into 4 groups and samples are determined by the cluster random sampling technique.
The data of students’ learning motivation was taken by giving questionnaires while academic
achievement is taken by giving an academic test. Then, the data was tested by using
MANOVA test and one-sided t-test with 5% significance. The pre-condition test was
performed before the hypothetical test that used normality test, homogeneity variance,
homogeneity matrix variance/covariance, and collinearity. Based on the MANOVA test, it can
be seen that there were differences upon motivation and achievement of learning Mathematics
between students who follow Edmodo assignment method and those who follow conventional
learning method. The one-sided t-test showed that partially, the motivation and achievement of
learning for those who follow the Edmodo assignment method was better than those who
follow conventional learning method. Therefore, it can be concluded that Edmodo assignment method gives positive impact both simultaneously and partially.
Keywords: academic achievement, assignment method, edmodo, mathematics, motivation
1. Introduction
The success of the teaching and learning process can be seen through students’ academic achievement
in certain subject [1]. Through formal education in school, students are expected to be able to gain
academic achievement maximally. Nonetheless, the formal education is not yet able to guide students
to gain academic achievement maximally, especially in mathematics. It can be seen on the average
national test score in mathematics that tends to decrease for the last 3 years both in Natural Science
and Social Science programs. In Natural Science program, the decrement of national test score drops
by 11.01 and 9.88 points simultaneously. While in Social Science program, it drops by 9.01 and 8.91
points simultaneously [2]. Hakim, Sulistiawati & Samsul [3] revealed that there are still a lot of
students who do not increase academic achievement yet in mathematics.
Ahmad [4] stated that no matter how good a curriculum is, how complete the medium is, and how
great a teacher manages the teaching and the learning process, it will be pointless if the students do not
follow the process seriously. It is supported by Wina Sanjaya who argued that in the learning process,
motivation is a very important aspect [5]. Students who have strong motivation are encouraged to
learn more seriously, while those who have less motivation will worsen the decrement of ability in
learning mathematics [6]. This statement is similar to one by Trisnawati & Dhoriva [7] who argued
that if students learn with strong motivation, then the learning process can be done seriously and
excitedly. In contrast, those who learn with less motivation tend to get lazy even do not want to do the
assignment or things relating to learning activities.

72
Teacher has an important role in students’ success. It is because the key of students’ success is not
only supported by their own ability and their own motivation but also supported by the learning
application of the teachers i.e. the learning method they use. One of methods that can be implemented
in school is assignment method. It means that teachers give assignment to their students and the
students have to be responsible with the assignment. Notwithstanding, in the process, there are
problems by which teacher can develop a better modified method [8]. As stated by Roschelle, Mingyu
& Robert [9] that "One prominent issue is that students may not receive timely feedback or help as
they practice." It is similar to the argument by Seob & Patrick [10] who argued that “Feedback
provides information about one's competence and success in a specific assignment. This information is
critical for student motivation because it serves as a basis for self-evaluation and self-improvement".
The solution for that issue is modify the assignment method by using today’s technology
advancement. This is similar to the argument by Sudiarta, Sukajaya, & Suharta [11] that in the 21st
century, education in mathematics has changed a lot and need some ability to take advantage from
internet technology in the learning process. By using such technology, giving the feedback to students
in accordance wit the assignment surely can be done fast and more easily.
The usage of information technology in education is known as e-learning. It is a kind of effort to
make a transformation of learning and teaching process in school digitally which is based on internet
technology [12]. Harahap, Nanda, and Binari [13] stated that "The use of technology such as internet
in improving the education achievement has increased rapidly." It is because the learning process can
be performed by reading, watching, listening, communicating, and discussing anytime and anywhere.
The research based on the usage of e-learning shows varied results. The research by Joordens, et al
[14] showed that e-learning had no influence on the students’ academic achievement significantly.
They said that the reason why this happens is because there are different characteristics of students
when they learn. Nonetheless, other researchers show different results for example, Leong &
Alexander [15] stated that e-learning had important role in students’ learning results because there is a
fast feedback so that their level of understanding towards lesson learnt increases. Alzahrani [16] also
stated that by online discussion, students can get better learning results. Social interaction and
collaboration among students in online discussion are considered the reason why there is increment
towards academic achievement. Based on the explanation above, it can be concluded that online
discussion has good potent to help students do the assignment given online.
One of the platforms that can be used to implement e-learning is Edmodo. It has a similar design
with Facebook’s, so it is easy to learn even for novice. In order to support online learning process,
Edmodo is equipped with several activities namely quiz, assignment, file and link, library, and many
more.
The use of Edmodo as a medium of doing assignment and a place to discuss things which are
related to given assignments is expected to increase students’ motivation and achievement of learning.
It is believed that Edmodo is able to increase learning motivation because it helps teacher in giving
appraisal and feedback for students’ work. One of the best Edmodo’s features is award badges. This
feature enable teacher in giving reward to students in the form of utterances namely good question,
homework helper, student of the month, and the likes. Assignment can also increase student’s
academic achievement because it triggers them to practice or to re-learn subjects. Furthermore,
Edmodo enables students to interact and to discuss online with other students or teacher in accordance
with given assignment. It is similar to the argument by Sukawijaya & Sudiarta [17]. They stated that
online discussion makes students ask questions faster and solve problems without waiting for offline
class meeting. That makes them prepare themselves for offline class so that the learning process can
run smoothly.
Some researchers also have shown that Edmodo is able to help learning activities. For example, a
research by Hikmawan and Alit [18] that showed the use of learning media had strong and significant
influence toward students’ learning motivation. Notwithstanding, the research does not explain the
implementation of Edmodo features specifically in order to increase learning motivation. While in this
research, the researcher use the Edmodo features i.e. award badges to increase students’ learning
motivation. In addition, the research by Try Hikmawan and Alit Sarino, only focuses on the
measurement towards motivation, meanwhile in this research focuses on motivation and academic
achievement.

73
Based on the explanation above, the researcher assumes that Edmodo assignment method is able to
increase motivation and academic achievement in mathematics simultaneously and partially. The
formulations of the problems are as follows (1) Are there any differences in motivation and academic
achievement in learning mathematics between students who follow Edmodo assignment method and
ones who follow conventional learning method? (2) Is motivation of students who follow Edmodo
assignment method better than ones who follow conventional learning method? (3) Is academic
achievement of students who follow Edmodo assignment method better than ones who follow
conventional learning method?
2. Literature Review
2.1. Assignment Method
The assignment method is a kind of method in which teacher gives a certain assignment to students so
that they can do the leaning activities [19]. The method is used because there are many materials that
students have to master while the learning time is limited. Therefore, teacher needs to give an
assignment out of school hours. This method is used to increase academic achievement because by
giving assignment, students are triggered to practice or re-learn the school subjects previously, so that
the students’ experience in learning something can be more integrated [20]. It is supported by the
theory of Stimulus-Response (S-R) in the Law of Exercise. The theory says that the more frequently a
thing is repeated or trained, the stronger the relation between stimulus and response [21]. This
principle shows that the key of successful learning is by repetition. The more repetition, the more
successfully students master the material.
The assignment method is divided into three phases or steps namely the phase of giving
assignment, the phase of doing the assignment, and the phase of being responsible for the given
assignment [19]. The assignment given to students has to focus on these following things namely (1)
the purpose of giving the assignment, (2) suitable with students’ ability, (3) there are clues or source
that can help them do the assignment, and (4) there is time to do the assignment. In the phase of doing
the assignment, students should be encouraged first by the teacher before they do it. In the phase of
being responsible for the given assignment, the students have to make report orally and written all the
things they have done. The next step is discuss the assignment in class in order to know whether the
students really understand or not. The last step is make judgment towards the students’ work by the
teacher.
2.2. Edmodo Assignment Method
In this research, the assignment is given based on the assignment feature in Edmodo. The usage of this
method is expected to help students appreciate the process of doing the assignment instead of getting
score only. The steps of Edmodo assignment method consist of three main steps. The first step is
called giving assignment by the teacher who uses the assignment feature in Edmodo and sets the
deadline. The second step is called doing the assignment in which they can discuss the assignment
with their teacher and friends online if they find any problem or obstacle. In this step, the teacher
monitors how the students can figure out the assignment before the score is uploaded. The third step is
called being responsible for the assignment in which the students upload their work before the
deadline.
3. Method
3.1. Research Design
This research is quasi experimental with post-test-only-control-group design. It was performed in
SMA Negeri 3, Singaraja on January 15th
until March 5th
2019. The population in this research was the
10th grade students from Natural Science program in the year 2018/2019 that amounts to 117 divided
in 4 classes. By using the cluster-random-sampling technique, 2 classes were chosen i.e. the 10th grade
of Natural Science Program (MIPA) 1 and the 10th
grade of Natural Science Program (MIPA) 3.
Before determining control group and the experimental one, a test was performed to measure their
equality by using two-sided t-test. Then a result showed that both of those classes were equal. The next

74
step was performing the draw to determine which one is the control group and which one is the
experimental group. From the draw, obtained that the 10th
grade of Natural Science program (MIPA) 1
is the experimental group while the 10th
grade of Natural Science program (MIPA) 3 is the control
group.
3.2. Data Collection and Analysis
The instrument that was used to collect the learning motivation data was questionnaires while the
instrument to collect the academic achievement data was test. The next step was expert judgment's test
by three expert lecturers for assignment, motivation questionnaires, and essay test which was
quantified by using Aiken’s V formula. For the assignment itself, it can be seen that there was index
range of 0.83 until 0.92, while based on motivation questionnaires it can be seen that the index range
was 0.83 until 1, while academic achievement test produces the index range of 0.75 until 0.92. It
means that the instrument is worth it according to the experts. The instrument was tested in SMA
Negeri 2, Singaraja. After that, the validity test was performed towards 30 questions that produce 25
valid statements and continued with reliability test that produces the degree of reliability of 0.86 (very
high). The test towards the validity of academic achievement is done with 9 valid questions and
continued with reliability test that produces the degree of reliability of 0.72 (high).
The analytical data with the MANOVA test was performed in order to know the differences of
motivation and academic achievement in mathematics between students who follow the Edmodo
assignment method and ones who follow conventional learning method. Then the analysis was
performed by using one-sided t-test to know partially (1) whether the students’ motivation who follow
the Edmodo assignment method is better than ones who follow the conventional learning method, and
(2) whether the academic achievement of students who follow the Edmodo assignment method is
better than one who follow the conventional learning method.
4. Findings
According to Mertasari [22] there are eight indicators in learning motivation namely active in learning
mathematics, looking for the new things that related with mathematics, independence, avoid teacher
punishment, getting the good result, getting praise, make parents proud, and gain recognition. In this
research, the maximum score for each statement in motivation questionnaires was 5. The average
score of each indicator are shown in Table 1 while the summary of motivation data analysis can be
seen on Table 2.
Table 1: The Average Score of each Indicators of Learning Motivation
Indicator Research Class
Experimental Control
Active in learning mathematics 4.2 3.7
Looking for the new things that
related with mathematics
3.5 3.1
Independence 3.9 3.5
Avoid teacher punishment 4.3 3.9
Getting the good result 4 3.9
Getting praise 4 3.7
Make parents proud 4.2 3.9
Gain recognition 4.1 3.8
Table 2: The Summary of Motivation Data Analysis
Variable Group
Experiment Control
N 28 29
X 100.39 91.59
SD 10.22 9.91

75
Based on the Table 1 and Table 2, the average score of students’ motivation who follow the
Edmodo assignment method is higher than the average score of those who follow the conventional
learning method both for each indicators and generally. Other paragraphs are indented
(BodytextIndented style).
The average score of each cognitive dimension are shown in Table 3 while the summary of
academic achievement data can be seen on the Table 4.
Table 3: The Average Score of Each Cognitive Dimension of Academic Achievement
Cognitive dimension Research Class
Experimental Control
C2 (understand) 6.43 6.15
C3 (apply) 8.17 4.38
Table 4: The Summary of Academic Achievement Data Analysis
Variable Group
Experiment Control
N 28 29
X 61.36 51.86
SD 3.85 5.59
The data in Table 3 and Table 4 shows that the average score of students’ academic achievement in
mathematics who follow the Edmodo assignment method is higher than the average score of those
who follow the conventional learning method both for each cognitive dimension and generally.
Before the hypothetical test was performed, the test towards assumption was performed beforehand
like normality test, homogeneity variance, homogeneity matrix variance/covariance and collinearity
score towards learning motivation and score towards academic achievement in mathematics. The
result of the normality test with Lilliefors Test can be seen on the Table 5.
Table 5: The Summary of Liliefors Test Result
Research Class Lmeasurement Ltable Conclusion
Experimental Class
Learning Motivation 0.06 0.17 Normal
Academic
Achievement 0.12 0.17 Normal
Control Class
Learning Motivation 0.11 0.16 Normal
Academic
Achievement 0.11 0.16 Normal
Based on the Table 5, the result of normality test with the Lilliefors test shows that the distributive
data is normal.
The score of homogeneity variance test towards learning motivation and academic achievement
was taken by Levene test. The W score for learning motivation is 0.03 while the W score for academic
achievement is 3.60. Ftable is determined with significant rate of 5%, while the degree of free numerator
equals 1, and the degree of free denominator equals 55. Therefore, the Ftable is 4.02. The W score for
learning motivation is less than Ftable therefore, the score for learning motivation in mathematics in the
experimental group and the control group homogeneous. The same thing goes to the W score for
academic achievement which is less than Ftable therefore the score for academic achievement in
mathematics from experimental and control group homogeneous.
The result of homogeneity matrix variance/covariance test produces the value of Box’s M that
amounts to 5.94 with 0.13 of significance which is means more than 0.05 so that it can be concluded
that the matrix variance/covariance between motivation and academic achievement in mathematics is
homogenous.
The result of collinearity test of motivation and academic achievement in mathematics from the
experimental group is ry1y2=0.59 which means it less than 0.8. Therefore, collinearity among variables
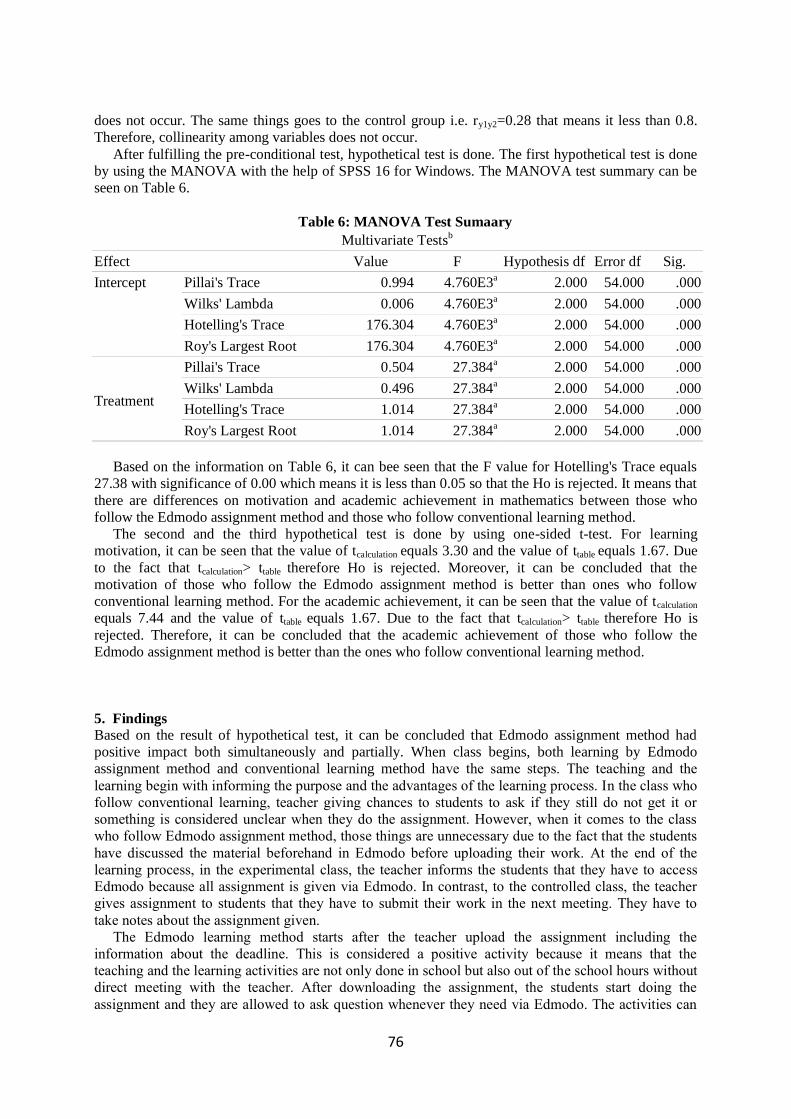
76
does not occur. The same things goes to the control group i.e. ry1y2=0.28 that means it less than 0.8.
Therefore, collinearity among variables does not occur.
After fulfilling the pre-conditional test, hypothetical test is done. The first hypothetical test is done
by using the MANOVA with the help of SPSS 16 for Windows. The MANOVA test summary can be
seen on Table 6.
Table 6: MANOVA Test Sumaary
Multivariate Testsb
Effect Value F Hypothesis df Error df Sig.
Intercept Pillai's Trace 0.994 4.760E3a 2.000 54.000 .000
Wilks' Lambda 0.006 4.760E3a 2.000 54.000 .000
Hotelling's Trace 176.304 4.760E3a 2.000 54.000 .000
Roy's Largest Root 176.304 4.760E3a 2.000 54.000 .000
Treatment
Pillai's Trace 0.504 27.384a 2.000 54.000 .000
Wilks' Lambda 0.496 27.384a 2.000 54.000 .000
Hotelling's Trace 1.014 27.384a 2.000 54.000 .000
Roy's Largest Root 1.014 27.384a 2.000 54.000 .000
Based on the information on Table 6, it can bee seen that the F value for Hotelling's Trace equals
27.38 with significance of 0.00 which means it is less than 0.05 so that the Ho is rejected. It means that
there are differences on motivation and academic achievement in mathematics between those who
follow the Edmodo assignment method and those who follow conventional learning method.
The second and the third hypothetical test is done by using one-sided t-test. For learning
motivation, it can be seen that the value of tcalculation equals 3.30 and the value of ttable equals 1.67. Due
to the fact that tcalculation> ttable therefore Ho is rejected. Moreover, it can be concluded that the
motivation of those who follow the Edmodo assignment method is better than ones who follow
conventional learning method. For the academic achievement, it can be seen that the value of tcalculation
equals 7.44 and the value of ttable equals 1.67. Due to the fact that tcalculation> ttable therefore Ho is
rejected. Therefore, it can be concluded that the academic achievement of those who follow the
Edmodo assignment method is better than the ones who follow conventional learning method.
5. Findings
Based on the result of hypothetical test, it can be concluded that Edmodo assignment method had
positive impact both simultaneously and partially. When class begins, both learning by Edmodo
assignment method and conventional learning method have the same steps. The teaching and the
learning begin with informing the purpose and the advantages of the learning process. In the class who
follow conventional learning, teacher giving chances to students to ask if they still do not get it or
something is considered unclear when they do the assignment. However, when it comes to the class
who follow Edmodo assignment method, those things are unnecessary due to the fact that the students
have discussed the material beforehand in Edmodo before uploading their work. At the end of the
learning process, in the experimental class, the teacher informs the students that they have to access
Edmodo because all assignment is given via Edmodo. In contrast, to the controlled class, the teacher
gives assignment to students that they have to submit their work in the next meeting. They have to
take notes about the assignment given.
The Edmodo learning method starts after the teacher upload the assignment including the
information about the deadline. This is considered a positive activity because it means that the
teaching and the learning activities are not only done in school but also out of the school hours without
direct meeting with the teacher. After downloading the assignment, the students start doing the
assignment and they are allowed to ask question whenever they need via Edmodo. The activities can

77
alter the common presumption about assignment as burden to students. The discussion between
student and teacher can minimize boredom in doing assignment. This good progress can increase
students’ motivation.
The Edmodo assignment method prioritizes how the students can learn and do the assignment
happily and meaningfully so that they can increase their academic achievement. By the presence of
assignment, the students are trained to rememorize, to increase their understanding towards the
material given in school and also to be able to apply the knowledge to the assignment given. The
uploaded questions by the students are answered by other students who understand or by the teacher
who guide them until they understand by themselves what to do.
The next step is that the students upload the work based on the deadline given by the teacher. Then,
the teacher has to check out each student’s work as soon as possible and then gives the feedback. The
faster the feedback is given, the faster the students notice their errors. It is better than doing the same
thing in the next meeting. After that, in order to increase the learning motivation, the teacher uses
award badges feature. With this feature, the teacher gives reward to the students for their hard work. In
addition, the teacher gives appreciation frequently through praises and encouragement so that they can
get more motivated.
The research by Sabriani [23] which is similar to this research stated that giving structured
assignment by including feedback can increase the academic achievement and motivation in the
teaching and the learning process upon the 10th grade students of SMK Negeri 6, Watampone. In this
research, by implementing the Edmodo assignment method, feedback can be given faster. It increases
the students’ motivation and academic achievement. Based on the above explanation, it can be
concluded that the Edmodo assignment method gives positive impact towards students’ academic
achievement and motivation in mathematics.
6. Conclusion
Based on the result of hypothetical test, it can be concluded that (1) there are differences on motivation
from learning achievement in learning mathematics between a group of students who follow learning
process with Edmodo assignment method and ones who follow conventional learning, (2) motivation
of students who follow the learning with Edmodo assignment method is better than achievement of
those who follow conventional learning, (3) the achievement of students who follow Edmodo
assignment method is better than those who follow conventional learning. Those things signify that
Edmodo assignment method gives positive impact both simultaneously and partially.
References
[1] Yasna L T 2016 ‘Pembelajaran matematika dengan pendekatan cooperative learning ditinjau dari
prestasi belajar, motivasi, dan ahlak mulia siswa’ Phytagoras: J. Pendidikan Matematika 11
45-58
[2] Ministry of Education and Culture 2017
[3]Hakim A R, Sulistiawati and Samsul A 2018 ‘Hubungan antara kecerdasan emosional dan motivasi
belajar dengan prestasi belajar matematika siswa SMP’ J. Teorema: Teori dan Riset
Matematika 3 165-176
[4] Ahmad R S 2016 ‘Pengaruh math pobia, self efficacy, adversity quotient dan motivasi berprestasi
terhadap prestasi belajar matematika siswa SMP’ J. Riset dan Pendidikan Matematika 3 259-
272
[5]Emda A 2018 ‘Kedudukan motivasi belajar siswa dalam pembelajaran’ Lantanida Journal 5 172-
182
[6] Syaripah 2016 ‘Pengaruh persepsi pembelajaran matematika terhadap motivasi belajar siswa dalam
bidang matematika di SMAN 1 Curup T.P 2014/2015’ J. Edutech 2 40-57
[7] Trisnawati and Dhoriva U W 2015 ‘Perbandingan keefektifan quantum teaching dan TGT pada
pembelajaran matematika ditinjau dari prestasi dan motivasi’ J. Riset Pendidikan
Matematika 2 297-307
[8] Try S 2012 ‘Pengaruh pemberian tugas terstruktur terhadap hasil belajar siswa pada mata diklat
78
otomotif dasar siswa kelas X teknik kendaraan ringan SMK Muhammadiyah 3 Yogyakarta’
Thesis Universitas Negeri Yogyakarta
[9]Roschelle J, Mingyu F and Robert F 2016 Online mathematics homework increases student
achievement Aera Open 2 1-12
[10]Seob t and Patrick 2010 The effect of peer-and self-referenced feedback on student's motivation
and academic performance in online learning ebvironments MERLOT Journal of Online
Learning and Teaching 6
[11]Sudiarta I G P, Sukajaya I N and Suharta I G P 2017 Investigation on student's mathematical
online discussion: a case study in grade 8 SMPN 1 Denpasar Journal of Physics: Conference
Series
[12]Hernawati K 2012 ‘Desain e-learning adaptif berbasis cognitive style untuk pembelajaran
matematika SMA kelas XII IPA’ Phytagoras: J. Pendidikan Matematika 7 43-56
[13] Harahap F, Nanda E A N and Binari M 2019 The effect of blended learning on student's learning
achievement and science process skills in plant tissue culture course International Journal of
Instruction 12 521-538
[14]Joordens S, Le A, Grinell R and Chryostomou S 2009 Eating your lectures and having them too: is
online lecture availability especially helpful in "skill-based" course? Electron. J. E Learn 7
281-288
[15]Leong K E and Alexander N 2013 Exploring attitudes and achievement of web-based homework
in developmental algebra Turk Online J. Educ. Technol 12 75-79
[16]Alzahrani M G 2017 The effect of using online discussion forum on student's learning TOJET:
The Turkish Online Journal of Educational Technology 16 164-176
[17]Sukawijaya I M G and Sudiarta I G P 2018 Developing blended learning environment to improve
learning performance and self-reliance for junior high school students Journal of Physics:
Conference Series
[18]Hikmawan T and Alit S 2018 ‘Pemanfaatan media pembelajaran berbasis edmodo terhadap
motivasi belajar siswa sekolah menengah kejuruan’ J. Pendidikan Manajemen Perkantoran
1 78-85
[19]Djamarah S B 2009 Strategi belajar mengajar (Jakarta: Rineka Cipta)
[20]Roestiyah 2008 Strategi belajar mengajar (Jakarta: Rineka Cipta)
[21]Hergenhahn and Matthew H O 2008 Teori belajar (Jakarta: Prenadamedia Group)
[22][Mertasari N M S 2003 Pengaruh model tes terhadap motivasi belajar dengan mempertimbangkan
kesukaran tes (eksperimen pada Sekolah Lanjutan Tingkat Pertama di Kota Singaraja) Thesis
IKIP Negeri Singaraja
[23]Sabriani S 2013 ‘Penerapan pemberian tugas terstruktur disertai umpan balik pada pembelajaran
langsung untuk meningkatkan motivasi dan hasil belajar siswa (studi pada materi pokok
struktur atom kelas X6 SMA Negeri 3 Watampone)’ CHEMICA 13 39-46

79
Development of Contextual Fable Module Charged with
Characters in Problem Based Learning to Improve Students
Concept Understanding and Mathematical Motivation
N M W Pradnyawati1, I G P Suharta2, I N Suparta3 1SMP PGRI 8 Denpasar, Jl. Cokroaminoto Gang Angsoka Denpasar, Bali, Indonesia
2,3Ganesha University of Education, Jl.Udayana No.11 Singajara, Bali, Indonesia
[email protected], [email protected]
Abstract The purpose of this study was to obtained contextual fable modules (student’s
modules, and teacher’s book) that was made based on Problem Based Learning in focus to
increase students’ concept understanding and mathematical motivation. This research is
development research with design research by Plomp (preliminary research, prototyping phase,
and assessment phase). Data were collected by using validation sheets (validity assessment),
implementation sheet, student’s response questionnaire, teacher’s response questionnaire
(practicality assessment), and concept understanding test and mathematical motivation test
(effectiveness assessment). The collected data were analyzed descriptively. The result of this
research showed that developing mathematics-fable module are categorized: (1) valid, with
average scores equal to 3.48; (2) practice, with average scores equal to 3.16, (3) effective, with
average scores equal to 77.75 and 58.56. The student’s book contained: (1) basic competencies
and learning objectives; (2) guided exercises to construct students concept understanding; (3)
character values; (4) contextual problems; and (5) spaces for students to write conclusions and
reflections. The teacher’s guidance book contained: (1) learning steps and matching with
student module, (2) notes for teacher how to develops student character; and (3) alternative
actions and alternative answers.
1 Introduction
Learning mathematics in elementary schools is the basis for learning mathematic at the next level.
Zulkardi states that "mathematics lessons emphasize understanding concepts", meaning that in
learning mathematics, students must understand mathematical concepts in order to be able to apply
these learning in the real life [1]. If understanding concepts in mathematics learning is not achieved, it
will reduce students' interest in learning mathematics and students will assume mathematics is difficult
[2]. Based on the researcher’s random survey on primary and junior high schools students, they enjoy
reading the fable stories because that books contain interesting and colorful picture stories [3].
Therefore story can be used as invaluable resources that can support children with contextualization in
classroom learning [4]. One example is the fable story.
Fables is fictional or imaginary stories that tell the lives of animals that behave like humans [5].
The characters contained in these animals are considered to represent human characters and are told to
be able to speak and act like humans [6]. Coles said that fables can improve memory, the ability to
recall, the application of concepts in new situations, understanding and enthusiasm for learning on
subject topics [7]. Fable stories that contain many moral values and advice can help students shape the
expected character in the education process [8]. In accordance with Cengizhan, there are three effect
factors that they managed to get by making the concept of fable; the level of interaction in the
classroom, how much accuracy the students have, and the role of the teacher [9]. Based on this, fables
are the right media to create fun mathematics learning and can contribute to the growth of character
education values.
The problem found by the writer when making observations at SD N 2 Padangsambian is
that students seem less enthusiastic about learning mathematics. When given a problem,

80
especially a story problem, many students complain that the questions given are difficult, not
in the book, and do not match the example so they are lazy to work on it. This shows that
students do not have a motivation to learn. Based on the results of interviews with
mathematics teachers, the learning resources used by teachers only rely on textbooks and
Student Worksheets which according to the teacher that have more questions and there are
still few activities that can help students find concepts independently. Seeing these problems,
the idea emerged to combine the attractiveness and benefits of fables as a medium for the
introduction of mathematics in teaching materials in the form of modules. Module is a learning material of instructional that is relatively short and specific content that is
arranged to achieve the learning objectives. The module usually has a well-coordinated series of
activities related to material , media and evaluation [10]. Modules can make students learn
independently so they can support the teacher's role in the learning process [11]. Fable is inserted
into the module as a medium for delivering problems where the fable contains several problems that
have been adapted to the learning material. The fable used should be contextual fable which includes
characters and stories that involve an environment that is close to students so that students easily
understand the characters in the story. This contextual fable module is organized based on problem
based learning where this model provides opportunities for students to hone their creativity in
problems solving related to the concepts [12] and can deliver students to the steps of the discovery of
mathematical concepts, relationships between concepts, especially related to the material [13]. In
addition, this module provides opportunities for students to solve problems related to their daily lives
such as those contained in fables so that students feel motivated. Especially in the fable module
contain interesting animal stories and colorful images so students are more interested in reading
modules. High motivation from students can make students learn without waiting for instructions
directly from the teacher [14]. That is, students have their own initiative to learn about the material
being discussed.
Based on the description above it is important to develop teaching materials that are fun for
students and increasing mathematical concepts understanding. The learning device developed is a
contextual fabel module charged with character consisting of student modules and teacher's books and
also learning plan arranged based on a problem-based learning model. in this study it is important to
discuss the characteristics and quality of learning modules in order to obtain quality modules and give
consideration to the development of innovative mathematics learning modules.
1 Methods
This type of research used in this research is Research and Development. It was conducted at
grade IV of SD N 2 Padangsambian in Academic Year 2018/2019 on the subject of matter
and multiples of number. The development research steps used were adapted from the model
developed by Plomp . The brief description of the module development pathway in
the mathematical fable media is as follows: At the Preliminary Research stage the researcher
looks at an overview of the state of the school, namely: (1) analyzing the Mathematics
Textbook. 2013 curriculum class IV textbooks are divided into two types of books, namely
student books and teacher manuals, (2) conducting interviews with teachers and students of
mathematics textbooks to obtain constraints and information about implementing mathematics
books that have been used in the learning process takes place according to the 2013
curriculum.
Next is the prototype phase, the results at the preliminary research stage are used to design
the prototype, which is the module with contextual fable media. The results of this design
are then referred as Prototype I. Prototype I was compiled later validated by two teachers in
mathematics education based on consideration into the mastery and experience possessed of
two lecturers from the University of Education Ganesha and one mathematic's teacher from
SD N 2 Padangsambian. Then a revision of the prototype I was conducted which was

81
validated by the validator, so that the prototype II was obtained which was valid and ready to
be tested.
The next step is to do a limited trial. This limited trial was carried out in one class, the
results of a limited trial were used to revise the prototype II, in order to obtain prototype III
with improved quality. Next, do a field trial I involving one class. The focus of this trial is to
improve the quality of learning tools and characteristics of learning with problem-based
learning models. In this trial an assessment of the implementation of the learning module was
carried out, formative evaluation involving teachers and students, using observation
techniques, tests and questionnaires. The results obtained in the first field trial were used to
revise prototype III, to obtain prototype IV.
At the stage of assessment conducted field trials II. The final stage of the trial was carried
out semi-summative. The assessment results are used as material for revision of prototype IV,
so that the student module learning tools and teacher instruction modules are valid, practical
and effective so that the final product is obtained.
The instruments used in this study are: 1) Instruments to see the validity of learning
devices developed include: student module validation sheets and teacher book, 2) Instruments
to see the practicality of learning devices developed include: observation sheets for learning
device implementation, student response questionnaires towards student modules
developed , and teacher response questionnaires to learning devices namely student modules
and teacher instruction modules, 3) Instruments to see the effectiveness of developed learning
tools include: instruments for evaluating student motivation and tests of understanding
mathematical concepts to understand the understanding of students' mathematical concepts
after participating in learning using media developed in this research.
3. Results and Discussion
Learning media that have been successfully developed in this study are learning media in the
form of student modules and teacher book that are media contextual fables for grade IV
elementary school students on Factors and Multiples. Furthermore, the quality of the
instructional media developed will be measured. The quality of learning media includes three
things, namely validity, practicality, and effectiveness. To see the validity of contextual fable module (student modules and teacher book)
developed in this study involved two lecturers in the Mathematics Education Study Program
at the University of Education, Ganesha and a mathematics teacher (Mathematics Teacher
who teaching grade IV in SD N 2 Padangsambian). The validation process is done after the
researcher has successfully realized the learning device in the form of prototype I.
Table 1. The Result of Contextual Fable Module Validity
Validator Student Module Teacher’s book Lesson Plan
1 3.00 3.00 4.04
2 3.21 3.20 4.09
3 3.36 3.30 4.14
Average 3.19 3.16 4.10
Criteria Valid Valid Valid
It can be seen based on Table 1 that (1) the student module is valid, which means that the student
module has fulfilled student activities based on problem based learning and is able to combine the
uniqueness of fable with mathematics learning; (2) Teacher's book is valid, which means that the
teacher's book has fulfilled the steps of problem-based learning and has been equipped with answers in
the student module, alternatives provided by students and teacher's activities can support the teacher in
learning to achieve the expected learning objectives; (3) The lesson plan is valid, which means that the
lesson plan has met the steps of the problem based learning model. This can help teachers in teaching

82
students about material factors and multiples and supports teachers to direct students to be actively
involved in the learning process, so that they can construct concepts independently and increase
students' mathematical motivation. This validity is caused: (1).the components of the learning media in
accordance with the indicator indicators needed on the instrument validity; (2) The learning tools that
are arranged are in accordance with the demands of the curriculum in the school; (3) Teacher's books
and lesson plans which refer to the problem-based learning stage.
The instruments used to measure practicality and effectiveness such as implementation
sheet of the learning devices, students’ and teacher’s responses questionnaire, as well as the
student’s concept understanding and mathematical motivation were also categorized valid.
The prototype I which was validated and declared to be suitable for use was subsequently
revised according to the advice of the experts. The revised results of prototype I are then
referred to as prototype II which is ready for limited testing in grade IV C and the teacher.
During the limited trial implementation, several flaws were found on the learning devices,
which were suspected to contribute to the disturbance of the learning implementation on the
next trial. The results of the revision of prototype II are called prototype III which is then
retested. Field trial I was conducted for all of grade IV A’s students and a teacher, some
students showed a positive attitude towards the developed learning device, but there were still
some weaknesses. All the results of the first field trial were used as material to revise
prototype III. which was then retested. The trial hereinafter referred to as the field trial II was
carried out on all of grade IV B’ students and one teacher. The following is the summary of
the practicality of the learning devices.
Table 2. The Summary of the Practicality of Contextual Fable Module in Limited Trial
Phase Sr Category
Implementation Sheet 2.80 Practical
Student’s Responses 2.98 Practical
Teacher’s Responses 3.00 Practical
Average 2.93 Practical
Based on table 2, The practical category obtained by researchers in this limited trial is one reason in making a decision that this learning device can be tested in the next stage, namely
the first field trial.
Table 3. The Summary of Practicality of the Contextual Fable Module Based in Field Trial I
Phase Sr Category
Implementation Sheet 3.24 Practical
Student’s Responses 3.03 Practical
Teacher’s Responses 3.23 Practical
Average 3.17 Practical
Based on Table 3, the practical category obtained by the researcher in this field trial I was
one of the reasons in making a decision that this learning device could be tested in the next
stage, namely field trials II. .
Table 4. The Summary of the Practicality of the Contextual Fable Module Based in Field Trial II
Phase Sr Category
Limited Trial 3.33 Practical
Field Trial I 3.11 Practical
Field Trial II 3.47 Practical
Average 3.38 Practical
Based on Table 4, Based on the description, the results show that the learning device
developed is in accordance with the expectations of the researcher, namely the learning device
meets the criteria of practicality as a learning device developed. Based on practicality tests, learning devices developed are categorized as Practical. This shows that
the overall lesson plan can be implemented as expected. learning using modules can be done well. this
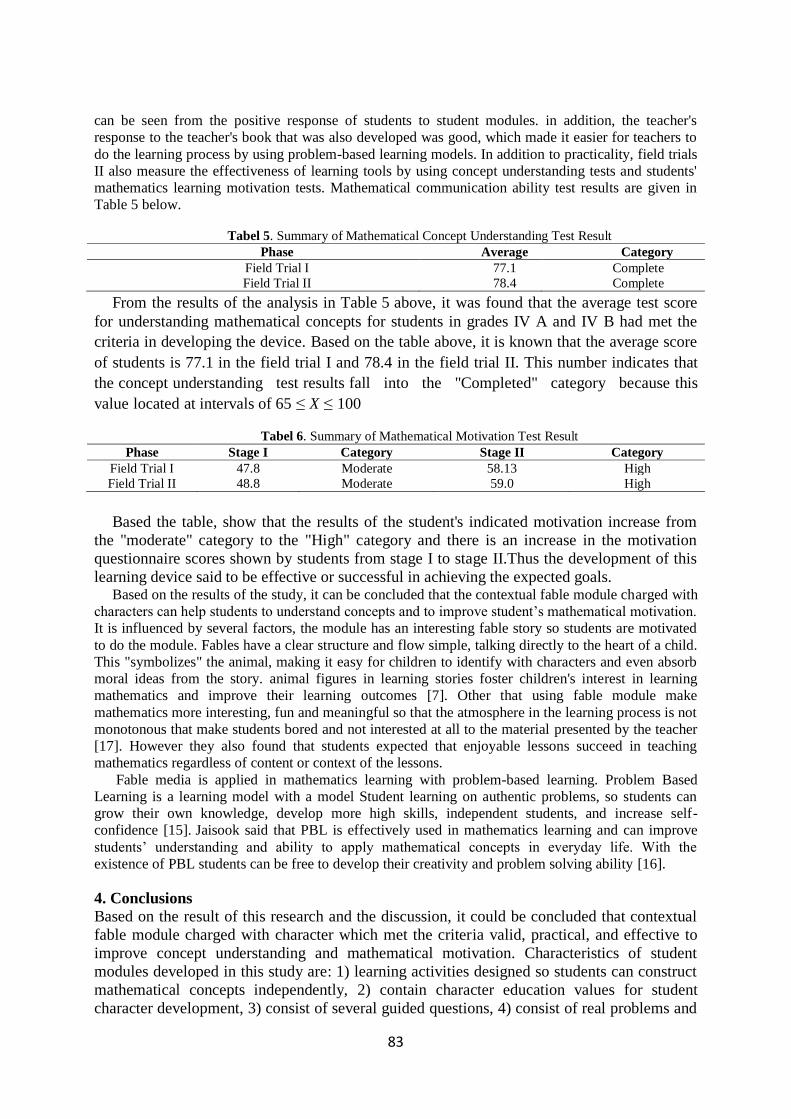
83
can be seen from the positive response of students to student modules. in addition, the teacher's
response to the teacher's book that was also developed was good, which made it easier for teachers to
do the learning process by using problem-based learning models. In addition to practicality, field trials
II also measure the effectiveness of learning tools by using concept understanding tests and students'
mathematics learning motivation tests. Mathematical communication ability test results are given in
Table 5 below.
Tabel 5. Summary of Mathematical Concept Understanding Test Result
Phase Average Category
Field Trial I 77.1 Complete
Field Trial II 78.4 Complete
From the results of the analysis in Table 5 above, it was found that the average test score
for understanding mathematical concepts for students in grades IV A and IV B had met the
criteria in developing the device. Based on the table above, it is known that the average score
of students is 77.1 in the field trial I and 78.4 in the field trial II. This number indicates that
the concept understanding test results fall into the "Completed" category because this
value located at intervals of 65 ≤ X ≤ 100
Tabel 6. Summary of Mathematical Motivation Test Result
Phase Stage I Category Stage II Category
Field Trial I 47.8 Moderate 58.13 High
Field Trial II 48.8 Moderate 59.0 High
Based the table, show that the results of the student's indicated motivation increase from
the "moderate" category to the "High" category and there is an increase in the motivation
questionnaire scores shown by students from stage I to stage II.Thus the development of this
learning device said to be effective or successful in achieving the expected goals. Based on the results of the study, it can be concluded that the contextual fable module charged with
characters can help students to understand concepts and to improve student’s mathematical motivation.
It is influenced by several factors, the module has an interesting fable story so students are motivated
to do the module. Fables have a clear structure and flow simple, talking directly to the heart of a child.
This "symbolizes" the animal, making it easy for children to identify with characters and even absorb
moral ideas from the story. animal figures in learning stories foster children's interest in learning
mathematics and improve their learning outcomes [7]. Other that using fable module make
mathematics more interesting, fun and meaningful so that the atmosphere in the learning process is not
monotonous that make students bored and not interested at all to the material presented by the teacher
[17]. However they also found that students expected that enjoyable lessons succeed in teaching
mathematics regardless of content or context of the lessons.
Fable media is applied in mathematics learning with problem-based learning. Problem Based
Learning is a learning model with a model Student learning on authentic problems, so students can
grow their own knowledge, develop more high skills, independent students, and increase self-
confidence [15]. Jaisook said that PBL is effectively used in mathematics learning and can improve
students’ understanding and ability to apply mathematical concepts in everyday life. With the
existence of PBL students can be free to develop their creativity and problem solving ability [16].
4. Conclusions
Based on the result of this research and the discussion, it could be concluded that contextual
fable module charged with character which met the criteria valid, practical, and effective to
improve concept understanding and mathematical motivation. Characteristics of student
modules developed in this study are: 1) learning activities designed so students can construct
mathematical concepts independently, 2) contain character education values for student
character development, 3) consist of several guided questions, 4) consist of real problems and

84
close to students' daily lives, 5) there is room for students to write down the results of their
reflections on the learning that has taken place. The characteristics of the teacher book are: 1)
facilitating the teacher in the learning process in class, because it contains clear learning steps
and adapted to the student's book, 2) contains notes related to the way the teacher attempts to
develop student character according to the implementation of values value of character
education, 3) contains alternative actions and equipped with alternative answers so as to
facilitate the teacher in directing students to the expected answers.
Based on the conclusions above, the researchers recommend that (1) Modules with
contextual fable modul can be considered by teachers as alternative teaching materials in
schools; (2) Problem-based learning models can be considered by teachers to help students
understand concepts; (3) Further research examining the effect of contextual fable media
modules on various aspects of the material is also more diverse.
5. References
[1] W Ellissi and A M Aroran “The Analysis Of Student Thinking In Mathematical Understanding
Of 7th Grade Of Bopkri I Junior High” 278–286.
[2] R. Sahrida 2010 “Upaya Meningkatkan Pemahaman Konsep Matematis Siswa di Kelas IV SD
pada Materi Bangun Datar Melalui Permainan Tradisional”
[3] M Abrar 2016 “Learning from Fables: Moral Values in Three Selected English Stories,” Din.
Ilmu 16(1) 47
[4] R Yıldırım and F Pınar Torun 2014 “Exploring the value of animated stories with young
English language learners,” Turkish Online J. Educ. Technol 13(4) 47–60
[5] O Zulkifli 2013 “Belajar Bahasa Secara Holistik : Apakah Pandangan Murid?,” J. Pendidik.
Bhs. dan Sastra 13(2) 102–117
[6] H D Syafutri and F Hidayati “Dalam Pembelajaran Sastra Anak Fable : an Alternative of
Character Educational in the Children ’ S Literature Learning” 123–134.
[7] N Rohmah 2016 “Pengembangan Bahan Ajar Matematika Berbasis Hasil Belajar Tematik
Materi Bangun Datar Kelas IV A SD Islam As-Salam Malang,” 24
[8] Z Habsari 2017 “Dongeng Sebagai Pembentuk Karakter Anak,” BIBLIOTIKA J. Kaji. Perpust.
dan Inf 1(1) 21–29
[9] A Kaplan and M Öztürk 2015 “The effect of concept cartoons to academic achievement in
instruction on the topics of divisibility,” Int. Electron. J. Math. Educ 10(2) 67–76
[10] Y N T B Sinaga, Mukhtar, and E Surya 2017 “Development of Mathemtics Module Based on
Metacognitive Strategy in Improving Students’ Mathematical Problem Solving Ability at High
School,” J. Educ. Dev. Math. Modul. Based Metacognitive Strateg. Improv. Students’ Math.
Probl. Solving Abil. High Sch. J. Educ 8(19) 73-80
[11] N L Fitriyanti, Y L Sukestiyarno, and N K Dwidayati 2019 “The Development of Module
Containing Local Culture with Realistic Approach for Mathematical Literation of Elementary
School Students” 10(2) 181–191
[12] D B Widjajanti 2011 “Problem-Based Learning dan Implementasinya,” J. Kependidikan 1 2–8
[13] F Khayati, I Sujadi, and D R S Saputro 2016 “Pengembangan Modul Matematika untuk
Pembelajaran Berbasis Masalah (Problem Based Learning) Pada Materi Pokok Persamaan
Garis Lurus Kelas VIII SMP,” J. Pembelajaran Mat 4(7) 608–621
[14] E. Warti 2018 “Pengaruh Motivasi Belajar Siswa terhadap Hasil Belajar Matematika Siswa di
SD Angkasa 10 Halim Perdana Kusuma Jakarta Timur,” Mosharafa J. Pendidik. Mat 5(2) 177–
185
[15] Juand. 2018 Eksplorasi Nilai Fabel sebagai Sarana Alternatif Edukasi Siswa. Bandung Jurnal
Pendidikan Bahasa dan Sastra 18 Universitas Pendidikan Indonesia
[16] S Jaisook, S Chidmongkol, and S Thongthew 2013 “the Development of Instructional Model
By Integrating Problem-Based Learning and Collaborative Learning Approach To Enhance
Mathematical Problem Solving, Communication and Connection Abilities,” 7th Int. Technol.
Educ. Dev. Conf 13(2) 3196–3204
[17] Foss D H and Kleinsasser R 1996 Teaching and Leacher Education12 429-442

85
Development of Geogebra-Based Assessments to Increase
Student Motivation and Literacy in Mathematics
Ida ayu Kade Suryani1*
, I Made Ardana2, and I Gusti Putu Suharta 2
1,2,3Ganesha University of Education, Jl.Udayana No.11 Singajara, Bali, Indonesia
Email: [email protected]
Abstrak The purpose of this study is to describe the effectiveness and practicality of using GeoGebra
in mathematics learning. The method used in this study is a study that is guided by the procedure for
developing the Plomp model. Based on the results of the analysis showed quite diverse results in the
world of education. The results of the literature study show that (1) The results of the study show
that the assessment of two material expert validators in the geogebra-assisted transformation
geometry module developed has an average total score of 3.38 with very good criteria, whereas for
media expert validators it has an average total score 3.21 with very good criteria. Excellent criteria
from the results of the validation of media experts and material experts indicate that the geometry
module transformation is assisted by geogebra and is valid for use as teaching material in lectures
and there are also other articles that show the results that Improving student learning outcomes by
using economic mathematics learning materials based on cycles GeoGebra software-assisted
learning is better than students who do not use economic mathematics learning materials based on
GeoGebra software-assisted learning cycles. (2) the results of the analysis show that by searching
geogebra based development keywords in Scholar. Then found 227 articles. There are 4 articles that
contain it, this article is in the tertiary level and high school level.
Keywords: Geogebra, Development, LiteracyIntroduction
1. Introduction
Quality education is a reflection of the progress of a nation. Education plays an important role
in preparing human resources who are able to compete in the development of contemporary science
and technology. Technology itself has an important role in the learning process in the classroom,
especially in learning mathematics. The role of technology in mathematics learning is very helpful in
supporting student understanding in building cognitive knowledge. One important thing in learning
mathematics is students' understanding of mathematics procedurally and conceptually. But in reality in
the field of mathematics learning, most teachers still use traditional learning so it tends to make
86
students bored participating in learning. Not only that, mathematics learning is more emphasized on
the calculation of abstract concepts and memorizing mathematical formulas that cause students to get
bored in learning them. This is what makes students' understanding of learning mathematics still
lacking so it impacts on the lack of motivation and mathematics literacy in students. Therefore,
innovation is needed in the packaging of mathematics learning to make it more interesting for
students. One of the things that can be done by combining learning with the use of technology.
Of course, in learning mathematics, software technology such as GeoGebra is needed to
support the learning process. In addition, in the face of educational development, the industrial
revolution 4.0 has become a challenge for education practitioners and education stakeholders in
adjusting the harmony between learning and technology in various developments. The role of
GeoGebra in mathematics learning is beneficial for teachers and students. For teachers, the role of
Geogebra helps in facilitating the learning process. As for students, GeoGebra's role is to help imagine
geometry in a flat form and build more real space, design mathematical models and build cognitive
knowledge in combining abstract concepts with virtualization.Development of Geometry Models and
Assisted Learning Devices in Open Geogebra Software [2]. The formulation of the problem there are
two components that can affect student learning outcomes. First, the students' critical thinking ability
demands to be able to understand the material. Second, the need to integrate technology capable of
providing visual and dynamic facilities as well as a bridge for students to understand the material. This
study aims to develop models and learning tools for Geometry open field assisted Geometrics courses
that are expected to improve students' critical thinking skills.
Application of Geogebra-Aided Problem-Based Learning To Improve Motivation and
Learning Achievement of Transformational Composition Material. It was concluded that the
application of GeoGebra-aided problem-based learning can improve motivation and learning
achievement in mathematics in the composition of transformation material [3]. According to the
researchers 'experience and the results of discussions with colleagues students' learning motivation in
learning mathematics material transformation especially in class XII MIPA-6 is low. It was proven
when the teacher explained that there were still many students who did not pay attention. Students
when asked by teachers tend to be silent, told to ask questions if they encounter difficulties are also
silent, only a few students are active in the learning process. While most students do not have the
courage to ask questions and express opinions. This results in student achievement. The 2016/2017
odd midterm test results show that out of 38 students only 21.05% were able to achieve the Minimum
Mastery Criteria (KKM) specified for mathematics subjects, which was 75. The average student
learning outcomes only reached 62.97 with the highest value of 100 and the lowest value of 34. This
study aims to improve learning motivation and learning achievement in mathematics. This research is
a class action research. The sample of this study was students of class XII MIPA-6 of SMA Negeri 1
Jepara.
2. Method
This type of research is development research. This research development uses descriptive
experimental and not hypothesis testing. The research data collection was taken from articles
published by online journals. The online journal chosen as the object of analysis in this study is the
Education Resource Information Center (ERIC).
From the results of content analysis in research (1) [1]. Development of Mathematics
Learning Tools with Geogebra-Aided Scientific Approaches in Efforts to Improve Communication
Skills and Mathematical Learning Activities for Class VIII Middle School Students. This type of
research is design research conducted through the preliminary research, prototyping stage, and
assessment phase. This study involved eighth grade students of SMPN 1 Denpasar as research
87
subjects. Data were collected using observation sheets of the implementation of learning tools, student
response questionnaire, teacher response questionnaire, observation sheet of mathematics learning
activities, observation sheet of mathematical communication skills, and written test description. The
data obtained were then processed and analyzed descriptively. Development of Geometry Assisted
Open Source Geogebra Models and Learning Devices [2]. The learning model developed is a
reasoning and problem solving learning model assisted by Geogebra's open software. Learning tools
developed include textbooks, instructions / guidelines for using Geogebra software and student
worksheets. Model development and learning tools are carried out using the 4 D model from
Thiagarajan, Semmel and Semmel. (3) Sugiarto, Application of Problem-Based Learning Based on
Geogebra to Improve Motivation and Learning Achievement of Transformation Composition Material
[3]. This research is a class action research. The sample of this study was students of class XII MIPA-
6 of SMA Negeri 1 Jepara. Data collection through tests and non-tests. Test techniques to determine
learning achievement using items while non-test techniques to determine the development of learning
motivation using observation sheets.
From exposure to content analysis, they have the same but different interactive media-assisted
research methods so that the results of the study refer to the results described above.
3. Results
From the results of content analysis for the results obtained from the following research:
[1] . Development of Mathematics Learning Tools with Geogebra Assisted Scientific Approach in an
Effort to Improve Communication Skills and Mathematical Learning Activities for Class VIII Middle
School Students. The results showed that the mathematics learning device developed was in the very
valid category. Development of Geometry Models and Assisted Learning Devices in Open Geogebra
Software [2]. The results showed that the learning model and device developed had fulfilled Nieveen's
version of product quality requirements, namely valid, practical, and effective, and could improve
students' critical thinking skills . Application of Geogebra-Aided Problem-Based Learning To
Improve Motivation and Learning Achievement of Transformational Composition Material [3]. The
results showed that students 'learning motivation increased from low to high and the average value of
students' mathematics learning achievement rose 31.86% from 62.97 to 83.03 with the level of
completeness almost tripled from 21.05% to 81, 58%, so it was concluded the application of
GeoGebra-aided problem-based learning can improve motivation and learning achievement of
mathematics composition transformation material.
4. Conclusion
From the exposure to the results of the content analysis it can be concluded that the learning
tools based on geogebra software have advantages. Where these advantages, can help students
understand more deeply not only based on paper and pencil. Not only that, interactive media in the
form of Geogebra software can also provide advantages that can motivate students and student literacy
in mathematics. Especially in learning the system of linear equations as well, so that students can
display directly visually the results of student work. Because of these advantages, GeoGebra learning
media is expected to reduce student learning difficulties in learning linear equation systems and be
able to increase student motivation.
So from the superiority of the media, it will try to conduct research in developing an authentic
Geogebra-based authentic assessment that can guide students in conducting investigations or problem
solving activities. Especially in the form of assessment of student performance in learning conducted
in class. In learning that is designed to be used in mathematics learning activities that contain material
in the Linear Equation System which will be assisted by GeoGebra which involves student literacy
towards mathematics, especially in technology literacy, it can understand well. Therefore authentic

88
geogebra-based assessments are not just scores, but as feedback in learning using interactive media.
Learning media can also facilitate understanding of concepts and increase student motivation and
literacy in learning Linear Equation Systems. This enables students to become accustomed to drawing
graphs, determine intersection points on a graph with more accurate results and determine the Linear
Equation System using graphs.
Therefore, the teacher's act of facilitating students is very important and very influential on the
learning process. This is very related to an ongoing assessment process. So that what is felt necessary
to be done by teachers to be able to overcome these problems is to use learning media designed with
Geogebra software. Geogebra is a mathematics education computer software. As the name implies,
geogebra can be used for learning (visualization, computing, exploration, and experimentation) and
teaching geometry, algebra, and calculus material. From the results of the content analysis that
mathematics-aided learning of technology, especially in geogebra software, has a very positive
advantage in its use in a variety of purposes.
5. References
[1] Agus Indrawan, 2014. Development of Mathematics Learning Tools with a Geogebra-Aided
Scientific Approach in an Effort to Improve Communication Skills and Mathematical Learning
Activities for Class VIII Middle School Students. Journal entry. Published: January 2017
[2] Wisna Ariawan, 2012. Development of Geometry Models and Assisted Devices in the Field of
Open Software Geogebra. Journal entry. Published: January 2012
[3] Sugiarto, 2017. Application of Problem-Based Learning Assisted by Geogebra to Improve
Motivation and Learning Achievement of Transformational Composition Material. Journal entry.
Published: January 2017
89
Development of Problem-Based Physics Learning Module to
Improve Students Critical Thinking Ability
Aditya, T. P.1, Dewi, R. I. L., Sari2, N. M. D. M. P3., Suma, K4., Gunadi, I. G. A.5
Physics Education Departement
Universitas Pendidikan Ganesha
Singaraja, Indonesia
e-mail: [email protected], [email protected],
[email protected], [email protected],
Abstract The aim of this study was to produce a physics module based on problem to improve
student critical thinking ability in physics learning. The subject of the module concerning
sound and light wave. Basic competencies and indicators used in accordance with curriculum
2013 and syllabus that applied at the Negera 1 senior high school. This study was Research and
Development based on Santyasa design is called AM3PU3 model. Critical thinking ability test
tried for all of the grade XI students consisting of 104 students at Seririt 1 senior high school.
The field test tried for 35 students grade XI MIA 6 Negara 1 senior high school. This study
used one group pre-post test design. The subject of this study was 2 media expert, 2 content
expert, 2 design expert, 10 physics teachers as practitioners, 1 field test physic teacher, student
of XI MIA 6 Negara 1 senior high school consisting of 35 students, 9 students of small group
test, and 3 students of individual trial test. Data of this study were obtained by using
questionnaire and test of critical thinking. The results of this study reveal first, the module is
valid due to: a) very good qualified by the media and content experts, b) the average score of
design expert is 239 points (very good qualified), c) the practitioners teacher test stated that
module is good qualified with an average score of 161,5, d) the individual trial test stated that
module is very good qualified with an average score of 164, e). the small group test stated that
module is good qualified with an average score of 159,7. Second, the module is stated as
practically due to: a) the respond of teachers is good qualified with an average score of 45, b)
the respond of students is good qualified with an average score of 70,14, c) the test of module
implementation stated that module is good qualified with average score of 44,75. Third, the
module is stated effectively by the result of t-test > t-table (t-test of the sound and light wave
subject is 33,58, t-table = 2,05), so the Ha is accepted and H0 is rejected. Ha is stated that there
are differences of problem critical thinking of the student after the module is applied. The
average score of the post test is 89,01 for the sound and light wave subject, the score are
greater than the minimum criteria of mastery learning score for physics subject in Negara 1
senior high school.
Keywords: Module, PBL, Critical Thinking Ability
1. Introduction
The hope of education in Indonesia is in accordance with the objectives of education according to
Law No. 20 of 2003 concerning the National Education System is developing the potential of students
to become human beings who believe and fear God Almighty, have noble character, are healthy,
knowledgeable, capable, creative, independent and become democratic and responsible citizens. The
purpose of education in Indonesia is to form a smart society to shape the independence of a nation [7]

90
. The formation of intelligent societies is closely related to the quality of education, so the quality of
education needs to be built in order to form intelligent students by giving students the opportunity to
be actively involved in
building the concepts and theories they learn [6]
The Indonesian government always trying to improve the quality of education by improving the
curriculum, developing learning models, learning tools, completing educational facilities and others.
One of the ways that the government has done is to improve the curriculum, according to the Tim
Pengembang MKDP (2013) the curriculum plays a significant role in education because the
curriculum emphasizes plans and arrangements about competencies to achieve goals and how to
achieve them according to circumstances, regional capabilities and school. Seeing the magnitude of
the influence caused by the curriculum, the government has made improvements to the old curriculum
by establishing the 2013 curriculum emphasizing character education possessed by students guided by
scientific approach principles in the learning process in the hope of being able to improve students'
critical thinking ability (Permendikbud, 2013).
The facts show that students' critical thinking ability in Indonesia are still low. Based on the results
of a study by TIMSS (Trend in the International Mathematics and Science Study) shows that in 2015
Indonesia was ranked 45th
out of 50 countries with a score of 397. This rating shows that students'
critical thinking ability in Indonesia are still below the international average score. In addition, the
results of research by the OECD (Organization for Economic Cooperation and Development) in 2015
using the PISA test (Program for International Student Assessment) stated that students' critical
thinking ability in Indonesia were ranked 64th
out of 72 countries that participated in PISA. This
proves that students' critical thinking ability in Indonesia are still relatively low.
Reality in the field, schools that have implemented the 2013 Curriculum have not been able to
improve students' critical thinking ability, including schools in the province of Bali. Almost all schools
in the province of Bali have applied 2013 Curriculum in the learning process. However, students'
critical thinking ability still has not experienced a significant increase. Jembrana is one of the districts
in Bali. Negara 1 high school is one of the superior high schools in Jembrana Regency that has
implemented the 2013 Curriculum. Based on the initial observations that have been made, students'
critical thinking sbility are still relatively low, especially in Physics subjects.
The gap between expectations and facts in the application of the 2013 curriculum to improve
students' critical thinking ability in physics subject can be caused by many influencing factors, namely
student characteristics, teaching method (teachers), school facilities, learning models, and materials
teaching that is used during the learning process in class. Based on preliminary observations made at
Negara 1 senior high schools, researchers found that scores on Basic Competence-3 related to
cognitive students had been quite high, but students still could not work on modification questions
linking formulas and concepts in everyday life. In the learning process the teacher still uses a
conventional learning model that causes teacher centered learning. In addition, teaching materials used
by students during the learning process are still minimal. Student teaching materials are only in the
form of worksheets that explain material in a level and contain questions that only relate to
mathematical formulas. Based on the results of these observations, it can be concluded that the factors
causing students' critical thinking ability in Negara 1 senior high school are still relatively low due to
the learning model still using conventional models and minimal teaching materials.
The solution to overcome this gap is to develop teaching materials based on learning models to
improve critical thinking ability. Teaching materials that can be developed to improve students'
critical thinking ability in the form of learning modules. The learning module is one form of teaching
material that is packaged in a complete and systematic manner, in which it contains a set of planned
learning experiences and is designed to help students master specific learning goals [10] . In the
module contains material in full and complete and adapted to the basic competencies and learning
objectives at each meeting. While the learning model can be used so that student-centered learning is a
Problem Based Learning model. This model is able to improve student interaction during the learning
process in the classroom, both student interaction and student-teacher interaction. According to Awan
et al. (2017), a student-centered Problem-Based Learning model can increase student activity in the
classroom. In addition, [11] also emphasizes that through the application of Problem-Based Learning
models can foster interest and train students' critical thinking ability by linking to events that exist in

91
everyday life. The learning module that will be developed is in accordance with the syntax of the
Problem-Based Learning model so that the learning process is better structured. In the module to be
compiled, requires students to be able to be able to answer the problems that exist in everyday life by
linking with concepts and formulas with relating to answering problems according to concepts and
material learned in order to improve students' critical thinking ability. According to [13] the use of
problem-based e-modules is quite effective in helping students understand concepts and examples of
real-life phenomena and can be an alternative in presenting learning material, so as to improve
students' critical thinking ability. The research conducted by [20] also shows that the development of
problem-based physics modules can improve students 'learning motivation so students' critical
thinking abilities. In addition, [1] also emphasizes that Problem-Based Learning modules can
improve students' critical thinking ability contextually because the material contained in the module
can be studied in a systematic and systematic way.
According to [10], (2016) the learning module is one form of teaching material that is packaged
intact and systematically, in it contains a set of planned learning experiences and is designed to help
students master specific learning goals. The learning module can make students more quickly master
the learning material. [14] state that the module is a unit of teaching programs arranged in a certain
form for learning purposes. According to the Indonesian Departement of National Education (in
Rahiyanta, 2016), to produce a good module, the preparation must be according to the following
characteristics: 1) Self instructional, 2) Self contained, 3) Stand alone, 4) Adaptive, and 5) User
friendly.
Student-centered learning has the aim that students have high motivation and the ability to learn
independently and are responsible for always enriching and developing knowledge, ability and
attitudes. One model student-centered learning is Problem-Based Learning model. Duch (1997)
suggests that Problem-Based Learning model is a learning model that presents a real problem relevant
to the subject, so that students can experience learning process independently to understand the
material from the basic to the complex. [12] asserts that Problem-Based Learning model is designed in
a learning procedure that begins with a problem and uses the instructor as a metacognitive (self-
reflecting) trainer. According to Barrows and Myers (in[12] ) the learning steps with Problem-Based
Learning model are starting a new class, starting a new problem, problem follow-up, perfomance
presentation, and after conclusion of problem.
Critical thinking ability according [3] states that critical thinking consists of self-awareness of a
series of interrelated critical questions, abilities, and willingness to respond and carry out the question
correctly. [19] asserts that critical thinking is a cognitive ability to say something with confidence
because it relies on logical reasons and strong empirical evidence. Students can understand and
express complete problem solving through critical thinking. This is because the critical thinking
process of students is determined by the number of relationships between the objects observed and the
scheme they have (Rasiman, 2013).
Problem-based physics learning modules are defined as print-based teaching materials that are
intact and systematically designed to include physical material content based on context problems, as
well as evaluations that can be used independently by each student to improve critical thinking ability.
yuliono in [2] shows the that effectiveness of physics learning modules compiled based on
problems can improve students’ critical thinking ability. In addition, [16] shows that Problem-Based
Learning models that are student-centered can provide opportunities for students to develop the ability
to think critically about a problem. [8] in his research also showed that the products produced in the
form of e-modules were able to improve students' critical thinking ability. The results of his research
indicate that the module developed is appropriate and has aquality very goodmodule so that it can be
used as an alternative teaching material for students, especially in improving critical thinking ability.
2. Research Method
This study belongs to Research and Development/R&D. The research design used was the design
of AM3PU3 model development research according to Santyasa. The AM3PU3 model consists of
several stages including: the first stage (determining module material), the second stage (needs
analysis), the third stage (development draft), the fourth stage (preparation draft), and the fifth stage

92
(expert review) (Santyasa, 2015).
The development trials were carried out through several stages, namely: (1) validation by experts,
(2) responses through individual trials, (3) responses through small group trials, (4) trial of practitioner
teachers, and (5) responses through field tests. Subjects consisted of 2 content experts, 2 media
experts, 2 design experts, 10 physics teachers as practitioners, 1 physics teacher in the field test, XI
MIA 6 class students totaling 35 people, 9 students in group trials small, and 3 students in individual
trials.
The design of the field test in this study used one group pretest test post-test design without a
control group [15]. The subjects of the trial in this study were divided into four types of subjects,
namely: (a) expert test subjects, (b) individual test subjects and small group trial subjects, (c)
practitioner teacher subjects, and (d) field trial subjects. The results obtained from the trial subjects
were converted to the level of achievement of scale 5 according to [17] with a range of 90% - 100%.
All data obtained according to its nature can be divided into two groups, namely quantitative data
and qualitative data. The collected data are grouped into three parts, namely: (1) the first part includes
data on content expert test results, data on expert media content test results, and data from design
expert test results; (2) the second part includes data on the results of individual trials, small group
trials, and practitioner teachers; and (3) the third part includes data on the results of field trials
involving 1 teacher and class XI students of MIA 6 Negara 1 senior high school. The method used to
collect data includes questionnaires, observation sheets, and tests of students' critical thinking ability
before and after the application of problem-based physics modules.
The instruments used in the study were first tested related to content validity, grain difficulty
index, difference power index, and internal consistency of items and tests. The critical thinking ability
test consists of one chapter with a total of 22 essay questions. The assessment rubric used is the
critical thinking ability test rubric according to [5] which consists of focusing questions, analyzing
arguments, answering questions clarification, considering the credibility of a source, observing and
considering observations, making deductions and considering the results of deduction, making
induction and consider induction, make and consider the value of decisions, define terms, consider
definitions, identify assumptions, and decide on an action. T-test done to test the significance of
differences in pre-test and post-test on critical thinking ability test.
3. Results Of Research
The results of this research is a physics-based module product in the material issue of sound and
light waves to enhance the critical thinking ability of students in class XI MIA is valid, practical and
effective.
The results of the module validity level were obtained from: 1) the results of reviews by content
experts and media experts who showed criteria for content validity of 1 with the percentage of
questionnaire responses by content experts and media by 100%, so there was no need to revise, 2) the
results of expert design reviews showed an average the total score of the two design experts is 239
with very good qualifications so that it does not need to be revised, 3) the results of individual student
trials give a total average score of 164 which are very good qualifications and do not need to be
revised, 4) small group trials produce an average score of 159 , 67 with very good qualifications, 5) the
trial of ten practitioners' teachers produced a mean score of 161.5 that was very well qualified. Based
on these five results shows that the problem-based physics learning module fullfill the validity criteria.
The results of the module practicality level were obtained from: 1) the results of the teacher's
response questionnaire showed a total score on the application of problem-based physics modules
namely 45 with good qualifications so that revisions were needed as needed, 2) the results of student
questionnaire responses as module users showed a qualified total score of 70.14 well. Very good
response was given by 7 respondents (20% of the total respondents), good responses were given by 25
respondents (71.43% of the total respondents), enough responses were given by 3 respondents (8.57%
of the total respondents), 3) results the module implementation questionnaire showed a mean score of
44.75 with good qualifications. Based on the three results, the problem-based physics module fullfill
the practicality criteria.

93
The results of the module effectiveness level are based on the following results: 1) feasibility test
that is the average value of the pretest for the sound and light wave material that is 33.58 while the
posttest mean value for the sound and light wave material is 89.01. The results of the analysis obtained
after testing with SPSS are obtained thitung for sound wave and light material is 33.58. In this study
using N = 35, the degrees of freedom or db = 35-1. The significance level used is 5%, meaning the
confidence level is 95%. Based on the degree of freedom and significance level used and the list of
two-tails, the price of the table obtained is 2.03. Based on the test conditions if tcount> ttable, then the
rejection of H0 gives the meaning that the product of research in the form of problem-based physics
learning module is feasible to apply to sound wave material and light. 2) Criteria for the success of the
product are determined by comparing the posttest results with minimum criteria of mastery learning
score for physics subject. Based on the data obtained that minimum criteria of mastery learning score
for physics subject in class XI Negara 1 senior high school with 2013 Curriculum is equal to 70. The
acquisition of the average posttest value for sound wave and light material is shown in Table 1.
Table 1. Obtaining the average pre-post test
Materi Nilai pretest Nilai
Posttest Gelombang
Bunyi dan
Cahaya 33,58 89,01
Based on Table 1, the results of the pre-post test showed that the posttest value of sound and
light wave material was greater than the minimum score. This gives the meaning that the product
developed has met the criteria of success.
Significance testing of differences in pretest and posttest scores was carried out by paired t-test at
a significance level of 0.05. The requirement for the t-test is that the distribution of data must be
normally distributed, so that before the paired t-test is carried out, the data distribution normality test is
carried out first. The results of the data distribution normality test are presented in Table 2.
Table 2. Normality test results distribution of sound and light wave material data
Kolmogorov-Smirnova Shapiro-Wilk
Statistic df Sig. Statistic df Sig.
Pretest .130 35 .140 .963 35 .285
Postest .122 35 .200* .983 35 .845
*. This is a lower bound of the true significance.
a. Lilliefors Significance Correction

94
Based on Table 2, it can be seen that the significance value of all data is greater than 0.05 so
that the data from the pretest and posttest results can be said to be normally distributed. Prerequisite
tests have been carried out so that the pairing t-test can be done. The results of paired t-test for all data
groups are presented in Table 3.
Table 3. Hasil Uji-t Berpasangan untuk Materi Gelombang Bunyi dan Cahaya
Paired Differences
t df
Sig. (2-
tailed) Mean
Std.
Deviation
Std.
Error
Mean
95% Confidence
Interval of the
Difference
Lower Upper
Pair
1
Pretes -
Postes -46.88889 8.26134 1.39642 -49.72676 -44.05102 -33.578 34 .000
Based on the results in Table 3, it shows that tcount for sound and light wave material is 33.57.
The t-test results obtained a significance value below 0.05. In this study using N = 35 and db = 25-1
and a significance level of 5% (95% confidence level), so that the two-tails ttable value obtained was
2.03. Based on this, tcount>ttable, so that the value of the pretest and posttest in the sound wave and light
material has a significant difference. Ha is hypothesis which states "there are differences in critical
thinking ability of students before and after using problem-based physics modules" is accepted.
Acceptance Ha means that a problem-based physics learning module is effectively applied in
physics learning to improve students' critical thinking ability.
4. Discussion
Hypothesis test results show there are differences in students' critical thinking ability after a
problem-based physics learning module is applied in learning. The results of this study are in
accordance with theoretical studies and existing empirical studies, where the application of problem-
based physics learning modules can improve students' critical thinking ability. The modules
developed are certainly influenced by the learning model that is applied at every step.
Awan et al. (2017) in his study showed that students who were treated using the Problem-Based
Learning model could improve critical thinking ability and attitudes of students compared to students
who used conventional learning models. [18] showed that the effect of the problem-based learning
model was effective in improving students' critical thinking ability and learning competencies in the
cognitive, affective, and psychomotor domains. Based on his research shows the results that PBL-
based learning devices are appropriate to be used to enhance critical thinking ability. The modules
developed are also categorized as very good and effective to use.
The excellent qualifications of content experts and media experts are due to several factors,
namely products are developed in accordance with the scope of material in the 2013 Curriculum and
the problems developed by open ended. In general, the content of the material on the research product
includes facts, concepts, principles, and procedures. Learning objectives are clear and in accordance
with indicators. In general, the content of the material on the research product includes facts,
concepts, principles, and procedures. Improvements to suggestions are also in accordance with one of
the attractive requirements of a module according to the Indonesian Departement of National
Education, which is if it is user friendly, that is to be friendly with the user.
Qualifications are very good which means that the product is valid in terms of media which is
certainly influenced by the accuracy of the media contained in the module. Availability of images,
tables, and charts can be used as a medium that helps students understand the products being
developed. The product developed is a problem-based physics learning module that meets the
characteristics of graphic media. [9] stated that learning assisted with learning media in the form of
images, photos or videos can help students understand the concepts or events that occur.

95
There are several suggestions relating to the media in the form of images, namely the image is
less clear and the image is too small, so that repairs are made in the form of replacing with a clearer
image and enlarging the image size.
The problem-based physics learning module has the advantage of getting a very good response
from students, namely: first because individual students are interested in problem-based physics
modules that are usually different from teaching materials, second factor because the questions
contained in the module are not only related to physics formula but more related to real events. This is
supported by research conducted by [13] states that students' mind set about physics subjects is
difficult to overcome through giving problems according to events in everyday life, not only related to
the formula.
5. Conclusion
Based on the results of the research and discussion, the following three conclusions can be
described: 1) problem-based physics modules are stated to have met valid criteria, 2) problem-based
physics modules meet practicality criteria, 3) there are differences in students' critical thinking
abilities after a problem-based physics module is applied. This gives the meaning of effective
problem-based physics modules to improve students' critical thinking ability.
The results of the practitioner teacher test show that the qualifications are caused by several
factors, namely: (1) interesting modules; (2) complete scope of material in accordance with the basic
competencies stated in the 2013 Curriculum; (3) problem-based that is able to arouse students'
enthusiasm and be active in learning; (4) can be studied independently by students even though the
teacher is unable to attend; (5) equipped with practicum; (6) problem-based physics learning modules
up to date to be applied; (7) not only train students to apply formulas, but also guide students to think
critically and almost all teachers want to apply the module in learning. This is based on the fact that
problem-based physics learning modules can increase student motivation and learning outcomes
which are demonstrated through improving students' critical thinking ability and scientific processes
[20].
The low results of the pretest are caused by students who are not used to answering questions
about critical thinking ability. Based on the results of product feasibility and product success criteria,
it can be concluded that the problem-based physics learning module is effective to be applied. This
result is also in accordance with the results of a study by [13] that through modules based on PBL
models that are developed are quite effective in presenting physics learning material so that students'
critical thinking ability increase.
Suggestions that can be given from this research are to curriculum developers, especially
physics subjects through seminars, MGMP, and physics teacher training and training so that they can
apply teaching materials in the form of learning modules prepared by the teacher. The module in this
case is a problem-based physics learning module because the problem-based physics learning module
can improve critical thinking ability. Suggestions for students who want to develop this product, in
order to develop thinking ability indicators that get low scores in posttest.
REFERENCES
[1] Asmuri., Sarwanto., & Masykuri, M. (2018). Pengembangan modul IPA terpadu SMP/MTS kelas
VIII berbasis SETS untuk meningkatkan kemampuan berpikir kritis siswa pada tema
makanan dan kesehatan tubuh. Jurnal Biologi Universitas Jember, 13(1), 73-80. Retrieved
from https://jurnal.unej.ac.id.
[2] Awan, R.N., Hussain, H., & Anwar, N. (2017). Effects of problem based learning on student’s
critical thinking skills, attitudes towards learning and achievement. Jurnal of Educational
Research, 20(2), 28-41. Retrieved from http://admission.iub.edu.pk.
[3] Browne, M.N., & Keeley, S.M. (2010). Asking the right question: A guide to critical thinking.
New Jersey: Pearson Education.
[4] Duch, B.J. (1997). Problem-based learning in physics: Making connections with the real world.
Retrieved from https://aip.scitation.org/.

96
[5] Ennis, R.H. (1993). Critical thinking assessment. Retrieved from
https://www.tandfonline.com/doi/abs/.
[6] Erawanto, U., & Santoso, E. (2016). Pengembangan modul pembelajaran berbasis masalah untuk
membantu meningkatkan berpikir kreatif mahasiswa. Jurnal Inovasi Pembelajaran, 2(2),
427-436. Retrieved from www.e-journal.umm.ac.id.
[7] Mulyasa, E. (2017). Manajemen berbasis sekolah. Bandung: Remaja Rosdakarya.
[8] Nikita, P. M., Leksmono, A.D., & Harijanto, A. (2018). Pengembangan e-modul materi fluida
dinamis untuk meningkatkan kemampuan berpikir kritis siswa SMA kelas XI. Jurnal
Pembelajaran Fisika Universitas Jember, 7(2), 175-180. Retrieved from
https://jurnal.unej.ac.id.
[9] Putranta, H. & Kuswanto, H. (2018). Improving student’s critical thinking ability using problem
based learning (PBL) learning model based on PhET simulation. Journal of Association for
Information Communication Technology, Education and Science, 1(3), 77-87. Retrieved from
https://www.sarjournal.com.
[10] Rahdiyanta, D. (2016). Teknik penyusunan modul. Retrieved from http://staff.uny.ac.id.
[11] Rokhim, A.R., Suparmi., & Prayitno, B.A. (2018). Pengembangan modul IPA berbasis problem
based learning pada materi kalor dan perpindahan untuk meningkatkan kemampuan berpikir
kritis siswa SMP kelas VII. Jurnal Inkuiri, 7(1), 143-150. Retrieved from https://jurnal.uns.
ac.id.
[12] Sadia, I W. (2014). Model-model pembelajaran sains konstruktivistik. Yogyakarta: Graha Ilmu.
[13] Serevina, V., Sunaryo., Raihanati, Astra, I M., & Sari, I.J. (2018). Development of e-module
based on problem based learning (PBL) on heat and temperature to improve student’s science
process skill. The Turkish Online Journal of Education Technology, 17(3), 26-36. Retrieved
from https://www.tojet.net.
[14] Sudjana, N., & Rivai, A. (2003). Teknologi pengajaran. Bandung: Sinar Baru Algesindo.
[15] Sugiyono. (2009). Metode penelitian kuantitatif dan R&D. Bandung: Alfabeta.
[16] Sulisworo, D., & Syarif, F. (2018). The utilization of open educational resources in the
collaborative learning environment to enhance the critical thinking skill. International
Journal of Learning and Development, 8(1), 73-83. Retrieved from http://ijld.
macrothink.org.
[17] Tegeh, I M., Jampel, I N., & Pudjawan, K. (2014). Model penelitian pengembangan. Yogyakarta:
Graha Ilmu.
[18] Yanto, E.A. & Yerizon. (2018). Effect of problem based learning model towards students’
critical thinking and learning competences in grade VIII in SMPN 21 Padang. International
Journal of Sciences and High Technologies, 9(2), 199-205. Retrieved from http://ijpsat.ijsht-
journals.org.
[19] Yaumi, M. (2012). Pembelajaran berbasis multiple intelligences. Jakarta: Dian Rakyat.
[20] Yuliono, S. N., Sarwanto., & Cari. (2018). Physics-based scientific learning module to improve
students motivation and results. Journal of Education and Learning (EduLearn), 2(1), 137-
142. Retrieved from http://journal. uad.ac.id.

97
Development of STEM-Based PhET Simulation Students
Woorksheet To Improve Creative Thinking Skills of Class XI
in High School
I Made Astra1*, Hannah Yessi Pricilia2* 1Prodi Pendidikan Fisika, FMIPA, Universitas Negeri Jakarta, Jl. Rawamangun Muka
No 1, Pulo Gadung, Kota Jakarta Timur 13220, Indonesia 2Prodi Pendidikan Fisika, FMIPA, Universitas Negeri Jakarta, Jl. Rawamangun Muka
No 1, Pulo Gadung, Kota Jakarta Timur 13220, Indonesia
*[email protected] , [email protected]
Abstract. The development of this research aims to produce STEM (science, technology,
engineering, and mathematics) -based PhET Simulation Student Worksheets to Improve
Creative Thinking Skills of High School XI Students. One learning approach used to practice
creative thinking skills is the STEM learning approach. This development is based on learning
objectives that are in accordance with the principles of the Indonesian Curriculum 2013,
students can learn anytime and anywhere with a guide to student worksheets and the PheT
Simulation application. The preparation of this student worksheet uses the syntax of the
STEM learning approach, that are: observe, new idea, innovation, creativity, society. The
research method used is Research and Development (R&D) with ADDIE development
models, that are: Analysis, Design, Development, Implementation, and Evaluation. Validation
tests have been carried out consisting of material, media, and learning expert tests as well as
field tests by physics teachers and students stating that the product is suitable for use as a
learning medium. Gain test results through pre-test and post-test gained 0.4 in interpretation
which means that the STEM-based PhET Simulation students woorksheet is effective in
improving students' creative thinking skills.
1. Introduction
Learning is one of the most important aspects in the world of education. Permendikbud No.
65 of 2013 concerning Basic and Secondary Education Standards has signaled the need for a learning
process that is combined with the principles of a scientific / scientific approach. Learning activities in
schools that aim to improve the process skills and social skills of students that are fun and explore
creativity to produce graduates who have the ability according to graduate competency standards, it is
necessary to develop learning for each competency systematically, integratedly and thoroughly [1].
In this life, both in education, work and other professions, need resources that have high-
level skills that require individuals and society to have the habit to always learn, reason, think
creatively, make decisions, and solve problems [2]. Creativity is often described as the ability to think
differently, be sensitive to problems, the ability to solve problems, and look for unusual solutions to
those problems [3]. Chua (2010) describes that creative thinking has characteristics such as:
generating unique ideas; generate ideas not normally thought of; imaginative; able to produce ideas in
a fixed time; the tendency to see problems directly from various perspectives [4]. According to
Guilford in Alghafri and Nizam (2014) there are four main components of creative thinking skills
which include: fluency (flexibility), flexibility (originality) and originality (elaboration) [5].
In Indonesia, it uses an integrative approach in seeking graduates who have the ability to
associate the knowledge gained with real life. The integrative approach is a learning approach that is
carried out using several disciplines. One of the disciplines that is expected to improve the creative
thinking skills and science process of students is STEM (science, technology, engineering and
mathematic). The purpose of STEM education (STEM education) for all students is to apply and

98
practice the basic content of STEM in situations they face or find in life, belonging to STEM (STEM
literacy) [6]. The STEM curriculum involves "4C" of 21st century skills which include creativity,
critical thinking, collaboration, and communication [7]. The application of this STEM requires
teachers to be more creative and innovative in learning so that teaching materials are needed that can
influence the skills of students
One of the processes used to train basic skills is through scientific experiments which are
carried out and improved through practicum activities in the laboratory [8]. The purpose of practicum
in the laboratory is to train students to work according to scientific procedures in order to acquire
scientific skills, knowledge and values [9]. According to BSNP, one way to achieve competence in
learning is to use LKPD that has been adapted to the characteristics of students in subjects, namely by
applying learning that includes processes of exploration, elaboration, and confirmation [10]. LKPD is
a worksheet containing tasks done by students, containing instructions, steps to complete a task in the
form of theory or practice. Student worksheets can be used to improve students' creative thinking
skills which involve activities by hand such as inquiry and thinking activities such as analyzing the
results of inquiry.
Based on the results of observations made at SMA N 77 Jakarta in the odd semester of the
2018/2019 school year XI MIA 3 class shows that students are classified as active in participating in
the learning process both in class and in the laboratory and the use of technology. According to the
results of discussions with physics teachers at the school, it was found that students were still weak in
mastering the science process skills, namely formulating problems, proposing hypotheses, interpreting
data and analyzing hooks in daily life.
The results of the discussion and the needs questionnaire distributed to students about
practicum at school obtained information that not all material was developed by conducting
experiments in the laboratory or using technology due to several obstacles, even though students were
very interactive to conduct experiments in the laboratory. In addition, it is known that teachers have
not used laboratory support learning tools such as student worksheets or effective guidebooks and the
methods used are still conventional so that students have not gotten good learning skills especially
creative thinking skills. Complete practicum tools and technology provided by schools already exist
that are not yet utilized to the maximum in supporting students' creative thinking skills.
Based on the conditions and information obtained, the writer tries to provide an alternative
by making a Student Worksheet (LKPD) that is used as a tool that makes it easy for students and
teachers in the learning process [11]. This LKPD was developed with the STEM approach and PhET
Simulation tools which can later be used wherever and whenever to improve creative thinking skills
on Dynamic Fluid material.
2. Method
2.1. Research methods
This development research was conducted at SMAN 77 Jakarta in class XI MIA 3. The
research method used was development (Research and Development) to develop teaching media in
the form of student worksheets (LKPD). Research and Development (RnD) is a research process used
to produce certain products and test the effectiveness of products made [12]. In terms of using the
ADDIE model which has 4 stages, namely: the analysis phase (Analyze), the design stage (Design),
the development stage (Develop), the implementation phase (Implementation), the evaluation stage
(Evaluate) [13].
In the needs analysis phase, an analysis of physics learning materials for class XI high
school, learning media used, learning media in practicum and the impact of technological
development. At the design stage is carried out to determine the content specifications of the
developed media and assessment strategies. At the product development stage, the process consists of
making worksheets for STEM-based PHET simulation students, validation tests, field tests and
product revisions. The validation test aims to determine the feasibility of a phet simulation student
worksheet with the developed STEM learning model. The validation test is carried out by material
experts, learning experts and media experts. During the implementation phase, a product field trial
was conducted on physics teachers and class XI high school students. At the evaluation stage, it is
assumed that the formative evaluation form is in the development stage, which means that the actual
99
evaluation phase can be carried out from the previous four stages. The final results of this evaluation
will be used to make decisions about the product being developed.
2.2. Product Description Developed
The product produced from this development research is a learning media in the form of
STEM-based pheth learners simulation worksheets on the dynamic fluid material of class XI SMA.
With the learning media in the form of LKPD, it is hoped that enthusiastic students will learn physics
directly in virtual laboratories by utilizing technology, so that students can more easily understand
physics material and its relationship with daily life.
The STEM-based LKPD PhET Simulation component in high school dynamic XI fluid
material consists of:
1. Cover
LKPD skin consists of a front cover that explains the title, author's name, material drawings,
supervisors and column names for students and LKPD back cover contains the origin of the
agency.
2. Page II
This section explains the instructions for use, understanding the model used (STEM) and the
application of the PhET simulation.
3. Page III
This section contains a concept map of the material that is the subject of LKPD and a brief
theory of the subject.
4. ill in LKPD
The contents of the developed LKPD consist of five stages which are divided into seven steps.
The steps are arranged based on a learning model that has been integrated with a scientific
approach, namely STEM (Science, Technology, Engineering and Mathematics). In this
developed LKPD there are STEM characteristics such as Science as a process, Technology as
an application, Engineering as an engineering science, and Mathematics as a tool. The
preparation of LKPD steps refers to the syntax of STEM, namely: observe, new idea,
innovation, creativity, and society (value). The syntax is divided into three stages, namely:
Preliminary
At this stage contains basic competencies, illustration of the application of material and a
brief theory related to the material. In the next section the students determine the hypotheses
related to the illustrations and material discussed then write down the variables after watching
the video illustration of the PhET practicum.
Practice
At this stage students do practicum according to information obtained from the steps of the
work, then write down the results of the data obtained in the observation table. After writing
down the data, students analyze by answering the questions and summarizing the results of
the practicum.
Pacsa Practicum
Students are presented pictures and illustrations of the application of the material. Students
are asked to connect concepts with the problems found and provide examples of other
applications in everyday life.
This student worksheet will be printed using A4 size paper with a portrait display and
intended for high school class XI students.
The following is the syntax of STEM (science, technology, engineering and mathematics)
that guides the preparation to woorksheet :

100
Figure 2.1 Woorksheet
3. Results And Discussion
The results of this development are in the form of STEM-based phet simulation learners to
improve the creative thinking skills of high school class XI students on the subject of dynamic fluid.
The developed LKPD aims to improve students' creative thinking skills. After the product is finished
being developed, the product is then validated by a material, media and learning expert who is a
physics lecturer at the Faculty of Mathematics and Natural Sciences UNJ by using a validation test
instrument which is interpreted using a Likert scale. The results of the material feasibility test consist
of 2 aspects, namely the appropriateness of the contents / content of the material and the feasibility of
the language obtained by an average percentage of all aspects showing that the learning media
developed by LKPD included in the interpretation is very feasible. The results are obtained from
conformity with basic competencies and learning objectives as well as learning material relating to
applications in daily life especially those related to science, technology, engineering and mathematics.
Learning feasibility test results consist of 3 aspects, namely the steps of the learning model
(STEM), LKPD assessment and the feasibility of the language used to obtain a category that is very
feasible to be developed as a learning medium. This is obtained from the suitability of the contents
with the STEM syntax, the presentation contains illustrations of the application of STEM and content
according to dynamic fluid material. The third test is the feasibility test of the media which consists of
2 aspects, namely graphics and linguistics which obtain a very appropriate category as a learning
medium. This is obtained through improvements related to the suitability of softer color compositions
so that students are directed to the writing / contents of LKPD, a composition of images and writing
that are coherent so that students can understand the contents of LKPD and are given concrete
explanations related to the application of dynamic fluid material.
Based on the results of the validation by the material, media and learning experts, the
worksheet products of these students are fit to be used as learning media. The following are the
average values of the results of the validation test by material, media and learning experts:

101
Figure 3.1 Graph of Feasibility Test
Next is the trial of product use in class XI MIA 3 SMAN 77 Jakarta. The trial results of
using the product obtained from the pre-test and post-test scores to see the effectiveness of STEM-
Based LKET PhET Simulation to improve students' creative thinking skills is the value of the Gain
test. From the results of the pre-test and post-test conducted by 33 students, the Gain test value was
obtained with moderate classification.
Tabel 3.1 The Result of Gain Value
No Bentuk Tes Nilai Rata-rata Nilai Gain Interpretasi
1 Pre- test 36.67 0.4 Sedang
2 Post – test 62.50
This shows that STEM Based LKPD is feasible and effective in improving students'
creative thinking skills on dynamic fluid material. This is in line with the research of Pertiwi et al,
(2017) which states that STEM-based LKPD (science, technology, engineering and mathematics) is
effective in training students' thinking skills on each indicator. Students are taught to look for data
through problem solving activities as well as through detailed and systematic steps so that students are
able to answer various questions in a varied manner and all indicators of creative thinking are
achieved. In addition, based on the effectiveness test, it is also in line with research conducted by
Rissanen (2014) which states that the incubation stage which is a phase of the unconscious mind in
the creative process contributes to creative thinking skills, while each individual has different abilities
in reaching the stage the. But overall the results obtained state that STEM-based learning is quite
good in improving students' creative thinking skills in understanding learning material.
4.Conclusion
Based on the results of the feasibility test by experts, field trials by physics teachers and
high school students as well as pre-test and post-test can be concluded that the learning media of
STEM-Based PhET Simulation Students Worksheet To Enhance Creative Thinking Skills of XI High
School Students the criteria are fit to be used as learning media and effectively improve students'
creative thinking skills on dynamic fluid material.
References
[1] Ministry of National Education (2008). Guidelines for Development of Teaching Materials.
Jakarta: Ministry of National Education. Directorate General of Primary and Secondary
Education Management. Directorate of High School Development
[2] Pusfarini, Abdurrahman, and Jalmo, Tri. (2016). The Effectiveness of LKPD Science
Oriented Problem Based Learning Models in Growing Creative Thinking Skills. Journal of
Progressive Education, Vol. 6 (1), 86-96
[3] Bacanli, H., Dombayci, M. A., Demir, M., & Tarhan, S. (2011). Quadruple thinking;
Creative thinking. Procedia-Social and Behavioral Sciences, 12, 536-544.
[4] Chua, Y. P. (2010). Building a test to assess creative and critical thinking simultaneously.
Procedia Social and Behavioral Science 2. 551-559.
[5] Alghafri, A. S. R., & Ismail, H. N. B. (2014). The Effects of Integrating Creative and
Critical Thinking on Students Thinking Schools. International Journal of Social Science and
Humanity, 4 (6), 518.
[6] Borg and Gall. (1983). Educational Research, An Intriductioun. New York and London:
Longman Inc., 772

102
[7] Beers, S. (2011). 21st Century Skills: Preparing Students For Their Future. Accessed from
http://www.yinghuaacademy.org/wp-content/uploads/2019/07/11st_century_skills.pdf
[8] Subagyo, Y. Wiyanto and Marwoto. (2008). Learning with the Science Process Skill
Approach to Enhance Mastery of the Concept of Temperature and Expansion. Indonesian
Journal of Physical Education. Vol. 5 (1).
[9] Ministry of National Education. (2004). General Guidelines for Developing High School
Teaching Materials. Ministry of National Education, Directorate of General Secondary
Education.
[10] BSNP. (2007). Regulation of the Minister of National Education of the Republic of
Indonesia Number 41 of 2007 concerning Process Standards for Primary and Secondary
Education Units. Jakarta: Ministry of National Education Education Research and
Development Agency.
[11] Bybee ,. R. (2013). The case for STEM education: Challeges and Oppurtunity, NSTA press;
Arlington, Virginia.
[12] Tegeh, I. M., Jampel, I. N., & Pudjawan, K.,. (2014). Development Research Model.
Yogyakarta: Graha Science.
[13] Pertiwi, S., Abdurahman, and Rosidin, UU. 2017. Effectiveness of STEM LKS to Train
Students' Creative Thinking Skills. Journal of Physics Learning, Vol.5 (2), 11-19.
[14] Rissanen, A. (2014). Active and Peer Learning in STEM Education Strategy. Science
Education International, Vol. 25 (1), 1-7.
103
The Ability of insulation Sound In Partition Room (Case
study in Undiksha physics department 's room)
Dewi Oktofa Rachmawati1, Gede Aris Gunadi2, Ni Ketut Rapi3
1,2,3 Departement of Physics Education Universitas Pendidikan Ganesha
Email:[email protected]
Abstract. Noise is unexpected noise and can disturb the comfort of the listener. Noise can
come from the compartment room partition. In the Department of Physics FMIPA, there are
several compartment rooms with various partitions. The partition used has not been able to
insulate sound optimally. Disorders of loss of cosmetics are often felt and have an impact on
lecturer performance. The combination of materials in a partition determines the ability of the
partition to sound insulation. This study analyzed the sound insulation level of compartment
room partitions in the lecturer room, the laboratory coordinator room and the room study
program coordinator room for the Physics Department. Data were analyzed by SRI and STC
techniques. The lecturer room partition is a combination of double plywood doors, double-
sided plaster brick walls, glass walls, and wood vents. Laboratory coordinator room partitions
are a combination of double-sided plaster brick walls, glass walls, and wooden vents. And the
partition of the study program coordinator room is composed of double plywood. The total
area of partitions in each room is 7.68 m2, 10.50 m2 and 12.00 m2. Noise levels that can be
muted by the partition in the lecturer room, laboratory coordinator room and study program
coordinator room are shown by SRI values of 20.83 dB, 20.27 dB, and 26.90 dB, respectively.
The effectiveness of sound insulation in the lecturer room partition is shown by the STC value
of 25.75 dB. The STC in the laboratory coordinator room is 26.07 db, and the laboratory coordinator room is 27.29 dB
1. Introduction
Noise is unwanted sound and its presence can disturb comfort and endanger human health. The
impact of noise in the form of disorders kosentarsi, emotional, hearing, other psychological disorders,
and decreased work productivity. Noise is heard after sound through the transmission media.
Therefore noise control is needed in the room so that according to the fulfillment of the function of
space based on the Decree of the Minister of Environment No. 48 of 1996 concerning Noise Level
Standards.
Compartment space is a contiguous space separated by a partition (partition). This space is often
found in buildings such as hospitals, schools, offices and settlements. The compartment room is
inseparable from noise. Noise control in the compartment room must be the center of attention. Noise
control in the compartment room can be done by selecting or using an appropriate partition or barrier.
Usually, the use of artificial barriers such as coatings with sound absorbent materials can be an option
when noise reduction does not provide maximum reduction. This use is considered to be more
effective at reducing sound compared to adjusting the distance between the receiver and the noise
source, the influence of wind, and air absorption.
The lecturer room, laboratory coordinator room and study program coordinator room in the
Faculty of Mathematics and Natural Sciences-Undiksha have compartment room designs. Partitions
that separate space have different characteristics. Composed of materials with different absorption
coefficients. The combination of compartment space compartment material has not yet considered the
concept of noise control. The ability to reduce sound partitioning is not in accordance with the
allotment of space, causing noise in the next room. The combination of these constituent
compartments is interesting to study in its ability to reduce noise and its ability as a sound insulator
Sound waves that hit the partition, some of the energy will be reflected from the surface, some
absorbed and other parts are transmitted. If the surface of the partition is more massive, the higher the
sound energy portion is reflected. Consequently the sound energy that is absorbed and transmitted

104
becomes smaller. Sound absorption occurs when sound energy is lost when it hits the surface of an
area of space.
Sound transmission can be generated from sound transmission through structure-borne and airborne
(Mediastiaka, Christine E., 2005). Airborne sound propagation is sound propagation in the open air.
Airborne sound propagation generated in a room by a sound source can be transformed into the sound
of a borne structure when sound waves hit the boundary wall of a room.
A measure of how much sound energy is reduced due to the transmission process is called
transmission loss. This magnitude represents the performance of the material in transmitting sound.
The greater the loss of sound transmission the greater the ability of the partition or object to reduce
sound. Sound transmission (TL) loss can be calculated using the equation:
= sound pressure level in the source chamber (dB)
= sound pressure level in the reciever chamber (dB)
S = Area of room (m2).
A2 = total of absortion of Room (m2)
His value depends only on the construction of the partition, it changes with the sound
frequency and does not depend on the acoustic properties of the two spaces separated by the partition
Partition construction with a porous soft surface structure very much absorbs sound vibrations. This
partition construction is able to block the sound energy or vibration when propagating and does not
produce resonance. Conversely, the construction of partitions with hard surface structure is reflected
sound energy.
Sound waves that pass through the partition weaken the vibration of sound energy. This
vibration produces sound pressure lower than the sound pressure before propagation. Reducing the
sound pressure level (L1) in the room where the sound source is with the sound pressure level in the
receiving room (L2) is called Noise Reduction. (NR) or sound reduction (Reynold, Douglas D.,
1981). Sound reduction is a quantity which indicates the insulation power of the material.
Mathematically given with the equation: NR = L_1 (f) -L_2 (f) in units of dB or
with = Area of Partition, ( m
2)
= Constata of room (m2)
The surface characteristics of the material making up the space are illustrated by the reverberation
time value (RT). Sound absorption by the surface of the material is getting bigger, the RT value is
getting shorter. The size of the RT value depends on the volume of space and the coefficient of
absorption of surface material. Space with a small volume, RT value does not depend on frequency.
The everberation time can affect the atmosphere created in a space. RT values that are too short cause
space to feel dead, while long RTs give a more lively atmosphere to the space (Satwiko, 2009: 91).
The RT calculation formula under normal conditions is as follows:
RT = 0.161V / A
where RT = Reverberation Time (seconds)
V = space volume (m3)
A = total absorption surface area (m2)
= Σ s.α = Σ surface area x absorption coefficient
The absorption coefficient describes the ability of the material to absorb sound. Material that is able to
eliminate or minimize sound transmission is a good sound insulation material. The criteria used to
measure the ability of a partition as a sound insulator is the Sound Reduction Index (SRI). SRI value
indicates the level of noise that can be muted by the object. The SRI of an object can be determined
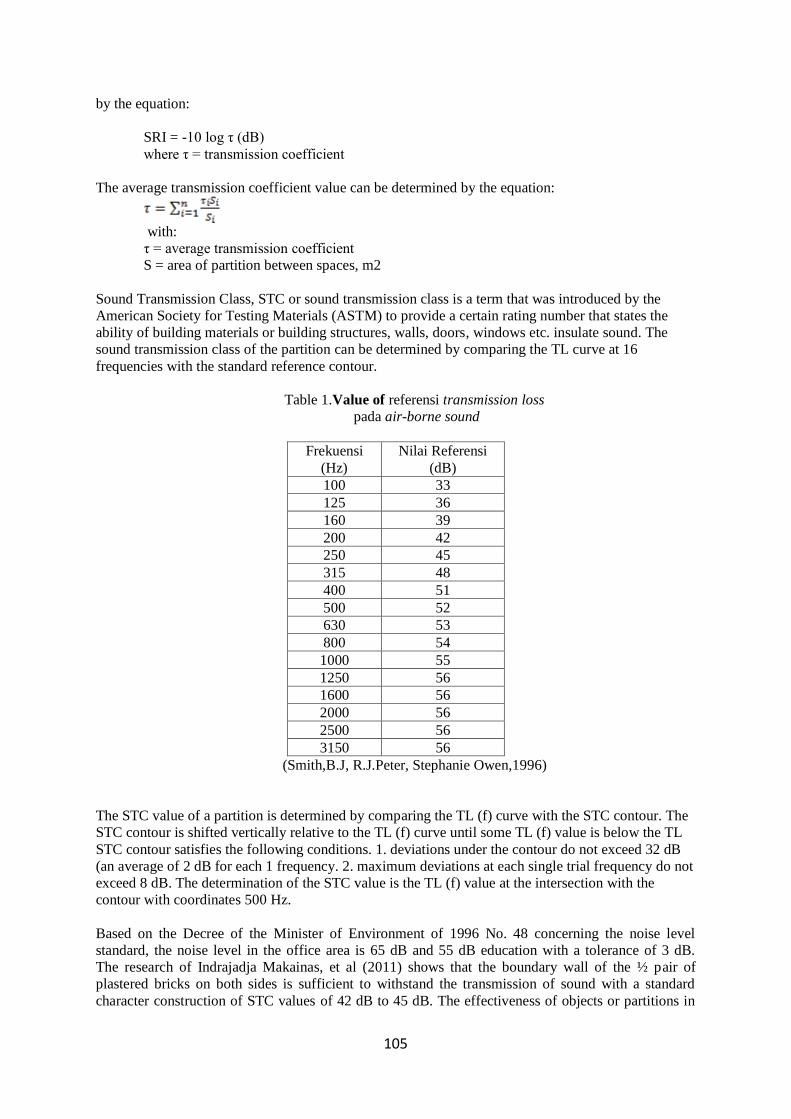
105
by the equation:
SRI = -10 log τ (dB)
where τ = transmission coefficient
The average transmission coefficient value can be determined by the equation:
with:
τ = average transmission coefficient
S = area of partition between spaces, m2
Sound Transmission Class, STC or sound transmission class is a term that was introduced by the
American Society for Testing Materials (ASTM) to provide a certain rating number that states the
ability of building materials or building structures, walls, doors, windows etc. insulate sound. The
sound transmission class of the partition can be determined by comparing the TL curve at 16
frequencies with the standard reference contour.
Table 1.Value of referensi transmission loss
pada air-borne sound
Frekuensi
(Hz)
Nilai Referensi
(dB)
100 33
125 36
160 39
200 42
250 45
315 48
400 51
500 52
630 53
800 54
1000 55
1250 56
1600 56
2000 56
2500 56
3150 56
(Smith,B.J, R.J.Peter, Stephanie Owen,1996)
The STC value of a partition is determined by comparing the TL (f) curve with the STC contour. The
STC contour is shifted vertically relative to the TL (f) curve until some TL (f) value is below the TL
STC contour satisfies the following conditions. 1. deviations under the contour do not exceed 32 dB
(an average of 2 dB for each 1 frequency. 2. maximum deviations at each single trial frequency do not
exceed 8 dB. The determination of the STC value is the TL (f) value at the intersection with the
contour with coordinates 500 Hz.
Based on the Decree of the Minister of Environment of 1996 No. 48 concerning the noise level
standard, the noise level in the office area is 65 dB and 55 dB education with a tolerance of 3 dB.
The research of Indrajadja Makainas, et al (2011) shows that the boundary wall of the ½ pair of
plastered bricks on both sides is sufficient to withstand the transmission of sound with a standard
character construction of STC values of 42 dB to 45 dB. The effectiveness of objects or partitions in

106
compartment space in sound isolation refers to the STC value. This value measures the ability of a
partition as a sound insulator. This study focuses on the analysis of Sound Transmission Loss (TL)
compartment space partitions and the effectiveness of compartment space reducing sound. The
compartment room partition studied is a composite wall that has a glass window, ventilation door.
2. Methods
The subject of this research is the compartment room partition in the lecturer room, study
program coordinator room and laboratory coordinator room of the Physics Education Study Program.
The room was chosen because it has different partitioning characteristics from one another. The
partition in the lecturer room is a combination of 16 cm thick double-sided plastered brick walls, 3 cm
double plywood doors, 2 ml glass, and wooden vents. The lecturer room is adjacent to the laboratory
room. Partition in the study program coordinator room combination of double plywood walls 8 cm.
The study program coordinator room is adjacent to the study room coordinator room. Room
coordinator room laoratorium combination of two-sided plastered brick walls 16 cm thick, 2 ml glass,
and plastic-enclosed wooden vents. The laoratorium coordinator room is adjacent to the laboratory
room.
This research method is an experiment that is the measurement of the sound pressure level in
the source room and receiver room simultaneously. Measurements were made at one point, namely at
a distance of 1.2 m from the partition. Considering the size of the room is very small. The sound
source uses the digital function generator-amplifier PI 9586. Measurements are carried out for 1
minute. (60 seconds) at the sound frequencies of 250Hz, 500Hz, 800Hz and 1000Hz.
Data were analyzed with SRI and STC. The SRI value is based on the absorption coefficient of each
material as a component making up the partition. The STC value is based on the intersection of the
TL value with the STC contour.
3. Result
Material characteristics of the arrangement of the partition and lecturer room are double-sided plaster
brick walls, with an area of 3.18 m2, 1.53 m2 wide plastic covered wood vents, double plywood doors
with an area of 1.8 m2, 3 ml thick glass of 1.53 m2 in area. Partition compilation material in the lab
coordinator room. is a double-sided plaster brick wall with an area of 5.61 m2, plastic vents covered
in wood with an area of 1.65 m2, 3 ml thick glass with an area of 3.30 m2. The study program
coordinator room partition is only composed of double plywood with an area of 12 m2.
The partition area in the lecturer room, laboratory coordinator room, and study room room are
respectively 7.68 m2, 10.5 m2 and 12.0 m
2.
Table 2. Property room Partisi Komponen Penyusun Ukuran
(lbr x tinggi x tebal) Volume Ruang
Lectures's Room
2-sided plaster brick wall 240 cm x 70 cm x 14.5 cm Vrecieiver = 2.5 m x 3.5 m x 3.0 m = 26.25 m
3
Wood vents covered in
plastic
240 cm x 50 cm
Glass 150 cm x 102 cm x 3 ml
Double plywood door 90 cm x 200 cm x 3 cm
2-sided plaster brick wall 150 cm x 100 cm x 16 cm
Head of Laboratorium 's
Room
2-sided plaster brick wall 330 cm x 70 cm x 16 cm Vreciever = 3.5 m x 4.0 m x 3.0 m = 42.0 m
3
Wood vents covered in
plastic
330 cm x 50 cm
Glass 330 cm x 100 cm x 3 ml
2-sided plaster brick wall 330 cm x 120 cm x 16 cm
Head of Physics Departement
2-sided plywood wall 4 m x 3 m x 8.5 cm Vreceiver = 4 m x 3 m x 3m = 36.0 m
3

107
Measurement of sound pressure level in the receiving room is 1.2 m from the partition. The sound
source is placed at a distance of 1.2 m from the partition. While the measurement of sound pressure
level in the laboratory coordinator room is 2.1 m from the partition.
Sound wave signals in the source room and reception room in the lecturer room, laboratory
coordinator, and study program coordinator at a frequency of 500 Hz are respectively presented in
Figure 1.
(a)
(b)
(c)
(d)
(e)
(f)
Fig 1 sound wave characteristics ; (a) Sound wave Source Chamber in lecturer's room ; (b)
Sound wave in receiver Chamber in lecturer's room , (c) Sound wave Source Chamber in Head
of Laboratory's room ; (d) Sound wave in receiver Chamber in Head of Laboratory 's room ,
(e) Sound wave Source Chamber in Head of Departement 's room ; (b) Sound wave in receiver
Chamber in Head of Departement 's room
The number of waves in the receiving chamber in the 3rd chamber for 1 minute in order 106. The
amplitude of the waves after going through the partition has decreased which varies per receiver
chamber. indicates sound wave absorption after going through a partition.
Partition area data, NR, at a frequency of 250 Hz-1000 Hz and SRI values, and STC are presented in
Table 3.
Table 23 Value of SRI and STC . Frekuensi (Hz) Luas Partisi (m
2) NR (dB) SRI (dB) STC (dB)
250 7.68 21.4 20.83 25.75
500 24.1
800 23.9
1000 25.7
250 10.5 23.8 20.27 26.07
500 25.1
800 24.2
1000 24.7
250 12.0 23.5 26.90 27.29
500 24.1
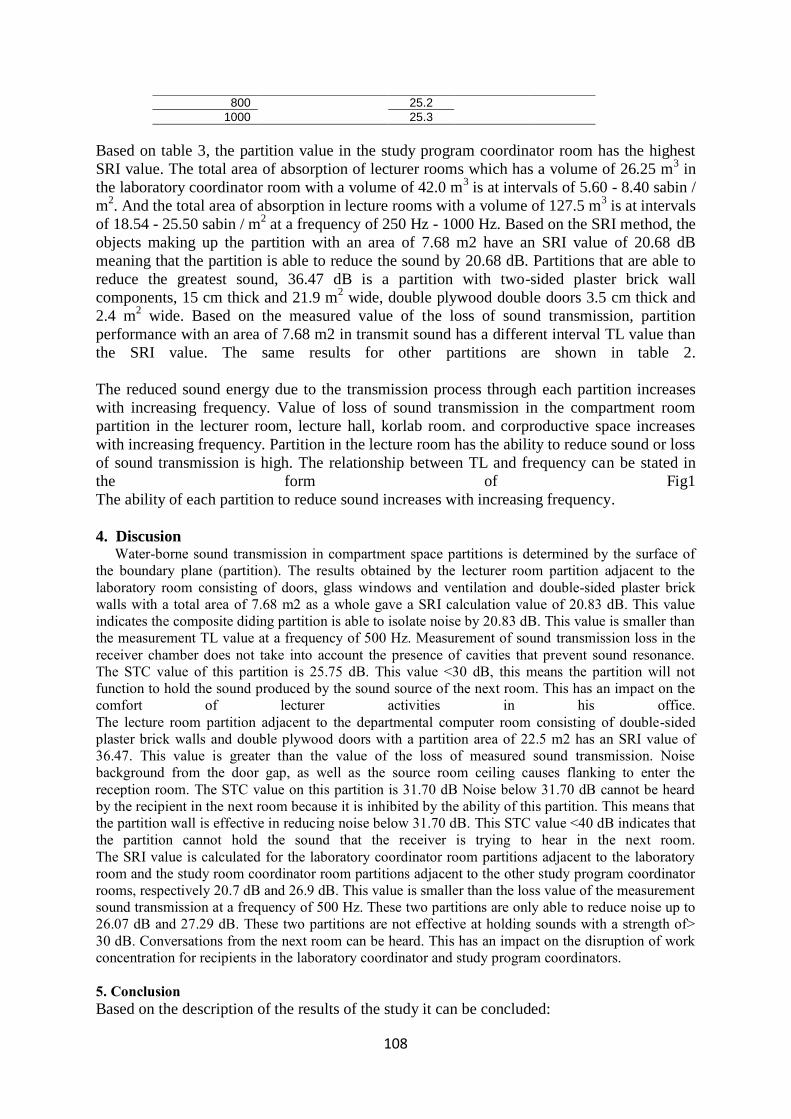
108
800 25.2
1000 25.3
Based on table 3, the partition value in the study program coordinator room has the highest
SRI value. The total area of absorption of lecturer rooms which has a volume of 26.25 m3 in
the laboratory coordinator room with a volume of 42.0 m3 is at intervals of 5.60 - 8.40 sabin /
m2. And the total area of absorption in lecture rooms with a volume of 127.5 m
3 is at intervals
of 18.54 - 25.50 sabin / m2 at a frequency of 250 Hz - 1000 Hz. Based on the SRI method, the
objects making up the partition with an area of 7.68 m2 have an SRI value of 20.68 dB
meaning that the partition is able to reduce the sound by 20.68 dB. Partitions that are able to
reduce the greatest sound, 36.47 dB is a partition with two-sided plaster brick wall
components, 15 cm thick and 21.9 m2 wide, double plywood double doors 3.5 cm thick and
2.4 m2 wide. Based on the measured value of the loss of sound transmission, partition
performance with an area of 7.68 m2 in transmit sound has a different interval TL value than
the SRI value. The same results for other partitions are shown in table 2.
The reduced sound energy due to the transmission process through each partition increases
with increasing frequency. Value of loss of sound transmission in the compartment room
partition in the lecturer room, lecture hall, korlab room. and corproductive space increases
with increasing frequency. Partition in the lecture room has the ability to reduce sound or loss
of sound transmission is high. The relationship between TL and frequency can be stated in
the form of Fig1
The ability of each partition to reduce sound increases with increasing frequency.
4. Discusion Water-borne sound transmission in compartment space partitions is determined by the surface of
the boundary plane (partition). The results obtained by the lecturer room partition adjacent to the
laboratory room consisting of doors, glass windows and ventilation and double-sided plaster brick
walls with a total area of 7.68 m2 as a whole gave a SRI calculation value of 20.83 dB. This value
indicates the composite diding partition is able to isolate noise by 20.83 dB. This value is smaller than
the measurement TL value at a frequency of 500 Hz. Measurement of sound transmission loss in the
receiver chamber does not take into account the presence of cavities that prevent sound resonance.
The STC value of this partition is 25.75 dB. This value <30 dB, this means the partition will not
function to hold the sound produced by the sound source of the next room. This has an impact on the
comfort of lecturer activities in his office.
The lecture room partition adjacent to the departmental computer room consisting of double-sided
plaster brick walls and double plywood doors with a partition area of 22.5 m2 has an SRI value of
36.47. This value is greater than the value of the loss of measured sound transmission. Noise
background from the door gap, as well as the source room ceiling causes flanking to enter the
reception room. The STC value on this partition is 31.70 dB Noise below 31.70 dB cannot be heard
by the recipient in the next room because it is inhibited by the ability of this partition. This means that
the partition wall is effective in reducing noise below 31.70 dB. This STC value <40 dB indicates that
the partition cannot hold the sound that the receiver is trying to hear in the next room.
The SRI value is calculated for the laboratory coordinator room partitions adjacent to the laboratory
room and the study room coordinator room partitions adjacent to the other study program coordinator
rooms, respectively 20.7 dB and 26.9 dB. This value is smaller than the loss value of the measurement
sound transmission at a frequency of 500 Hz. These two partitions are only able to reduce noise up to
26.07 dB and 27.29 dB. These two partitions are not effective at holding sounds with a strength of>
30 dB. Conversations from the next room can be heard. This has an impact on the disruption of work
concentration for recipients in the laboratory coordinator and study program coordinators.
5. Conclusion
Based on the description of the results of the study it can be concluded:

109
1. (a) composite partition wall consisting of doors, glass and ventilation windows and double-
sided plaster brick walls with a partition area of 7.68 m2 capable of inhibiting the
sound of 25.75 dB with an insulation level of 20.83 dB.
(b) partition with double-sided plaster brick walls and double plywood doors, partition
area of 22.5 m2 is able to reduce the sound of 31.70 dB with an SRI value of 36.47
dB.
( c) composite partition walls consisting of glass windows and vents and double-sided
plaster brick walls with a partition area of 10.5 m2 capable of inhibiting noise by
26.07 dB with an insulation level of 20.27 dB.,
(d) partitioning with double plywood material capable of reducing sound 27.29 dB with an
SRI value 26.9 dB.
2. a) The partition wall with a partition area of 7.68 m2 is ineffective as a sound barrier (STC
= 25.75 dB),
b) a partition wall with an area of 22.5 m2 effective as a sound barrier under 31.70 dB
c) a partition wall with an area of 10.5 m2 is not effective as a barrier sound (STC = 26.07
dB),
d) the partition wall with an area of 12.0 m2 is not effective as a sound barrier (STC = 26.9
dB)
References
[1] Benny Adi Nugraha, dkk. 2013. Peningkatan Insulasi Akustik Dinding Luar Kamar Hotel Studi
Kasus Di Dalam Bandar Udara. JURNAL TEKNIK POMITS Vol. 2, No. 2, 2013).Online
download.portalgaruda.org/article.php?article=89200&val=4186. Diakses tgl. 27 Nopember 2017.
[2] Cox, T.J. and D’Antonio, P. 2009. Acoustics Absorbers and Diffuses : Teory, Design and
Application 2nd
Edition.Taylor and Frances. London.
[3] Indradjaja Makainas, dkk.2011. Kompartemen Akustik Ruang. Jurnal Sabua Vol.3, No.2: 15-25,
Agustus 2011. Online
http://download.portalgaruda.org/article.php?article=16086&val=1034&title=KOMPARTEMEN
%20AKUSTIK%20RUANG. Diakses tgl. 27 Nopember 2017.
[4] Mashuri. 2007. Penggunaan Akustika Luar-Ruangan Dalam Menanggulangi Kebisingan Pada
Bangunan. Jurnal SMARTek, Vol. 5, No. 3, Agustus 2007: 196 – 206. Online
http://download.portalgaruda.org/article.php?article=10673&val=750. diakses tgl. 27 Nopember
2017
[5] Mediastika, Christina E. 2005. Akustika Bangunan: Prinsip‐prinsip dan Penerapannya di Indonesia.
Jakarta: Erlangga.
[6] Rettinger,Michael. 1973. Acoustic Design and Noise Control. New York. Chemical Publishing
Co. Inc.
[7] Reynolds, Douglas D. 1981. Engineering Principles of Acoustics Noise and Vibration Control.
Massachusetts: Allyn and Bascon. Inc.
[8] Smith, B.J., Peters R.J., Owen, S. 1982. Acoustics and Noise Control. Second Edition. UK:
Addison Wesley Longman.

110
The Effect of Chitosan Immersion to Physical and Breaking
Strength of Pineapple Leaves Rope for Fishing Gear
Muth Mainnah1*
, Diniah2, Budi Hascaryo
2, Made Mahendra Jaya1
1 Lecturer of Marine and Fisheries Polythecnic of Jembrana
2 Lecturer of IPB University
*Corresponding author: [email protected]
Abstract. We need some natural materials for fishing gear in order to reduce the use of
synthetic materials in the manufacture of fishing gear. It needs preservatives to gain its
breaking strength like chitosan in this research. There are differences of chitosan usage to fibre
physical of pineapple leaves, such as the colour, diameter, touch impression, water content,
specific weight and also breaking strength. Pineapple leaves rope has a brown color, the touch
impression are coarse and stiff and the presentation of the difference in diameter size before
and after soaking chitosan is 0,06%. The average value of pineapple leaves water content with
chitosan is greater 56,7% than the water content of pineapple leaves rope without chitosan.
Chitosan is able to increase the breaking strength of pineapple leaves rope, as seen from the
results of breaking strength of the pineapple leaves rope (172,0734 kgf / cm2) is greater than
the breaking strength of pineapple leaves rope without chitosan (153,4089 kgf / cm2).
Keywords: natural fibre, pineapple leaves rope, breaking strength, chitosan, fishing gear
material
1. Introduction
Some example of fibre that made from synthetic materials for fishing gear that used
by many fishermen such as polyamide, polyethylene and polyvinyl chloride. The synthetic
fibre is derived from non-renewable materials, so it is not good for our environment. From
this thing, we need some natural material for fishing gear in order to reduce the use of
syntetic materials in the manufacture of fishing gear. Therefore it needs to develop
technology for natural fibers specifically in fishing gear materials.
One of the best natural fibers that has many advantages in many sectors is pineapple
leaves fibre. There are no specific research on pineapple leaves fiber that can be used for
fishing gear material. Other materials from natural plant fibers that can be used as fishing
gear include Boehmeria nivea [1], Fimbristylis sp. [2], and the results of recent research,
namely Scirpus grossus [3].
One of deficiencies of natural fiber is easy to absorb water and susceptible to decay.
Because of that, it needs fiber coating material, including chitosan to inhibit the growth of
bacteria that cause spoilage. Chitosan was chosen because of its ability to suppress bacterial
growth, chitosan has positively charged polycation which is able to inhibit the growth of
bacteria and mold [4]. Chitosan is easily degraded biologically, non-toxic, insoluble in water
and soluble only by dilute inorganic acids [5]. Chitosan comes from fisheries waste that is
easily to get [6], such as from shrimp shell waste [7]; [8]; [9], crab shell waste [10]; [11];
[12]; [13], as well as shellfish waste [14].
Based on environmental problems caused by synthetic materials from fishermen's
fishing tools, especially in the rigging section, this study aims to resolve that problem. The
solution of this problem is to use rigging material from natural materials of pineapple leaves
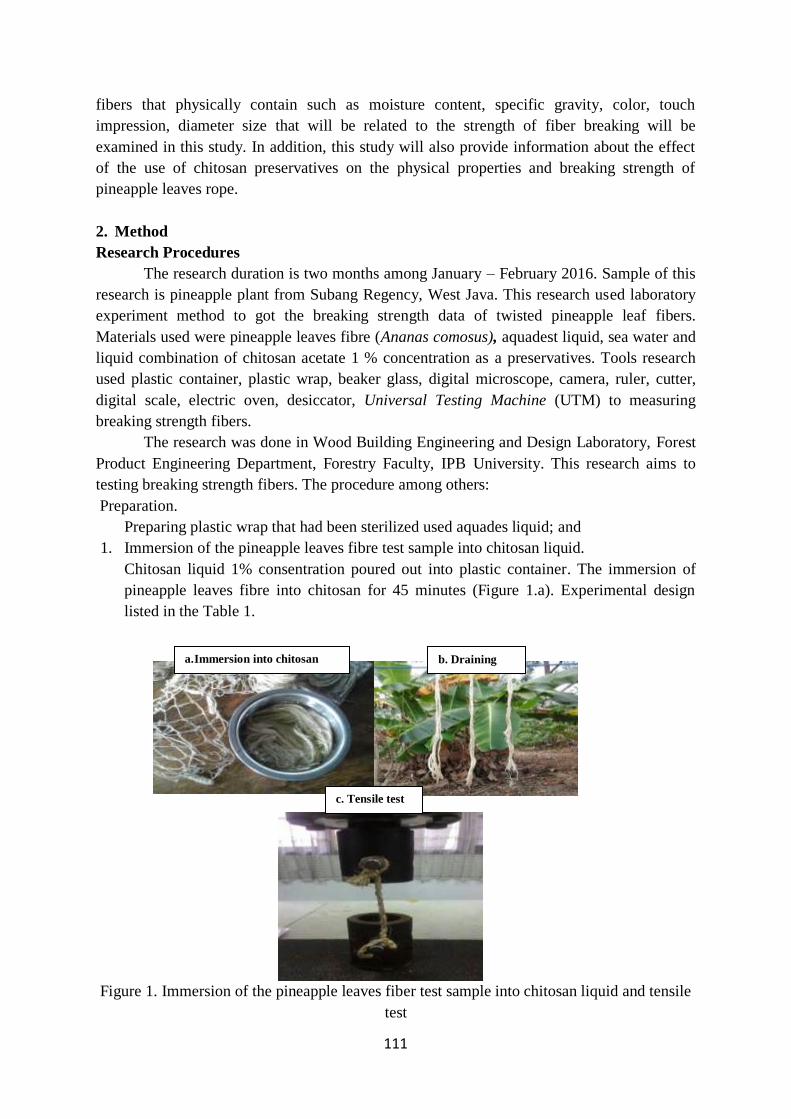
111
fibers that physically contain such as moisture content, specific gravity, color, touch
impression, diameter size that will be related to the strength of fiber breaking will be
examined in this study. In addition, this study will also provide information about the effect
of the use of chitosan preservatives on the physical properties and breaking strength of
pineapple leaves rope.
2. Method
Research Procedures
The research duration is two months among January – February 2016. Sample of this
research is pineapple plant from Subang Regency, West Java. This research used laboratory
experiment method to got the breaking strength data of twisted pineapple leaf fibers.
Materials used were pineapple leaves fibre (Ananas comosus), aquadest liquid, sea water and
liquid combination of chitosan acetate 1 % concentration as a preservatives. Tools research
used plastic container, plastic wrap, beaker glass, digital microscope, camera, ruler, cutter,
digital scale, electric oven, desiccator, Universal Testing Machine (UTM) to measuring
breaking strength fibers.
The research was done in Wood Building Engineering and Design Laboratory, Forest
Product Engineering Department, Forestry Faculty, IPB University. This research aims to
testing breaking strength fibers. The procedure among others:
Preparation.
Preparing plastic wrap that had been sterilized used aquades liquid; and
1. Immersion of the pineapple leaves fibre test sample into chitosan liquid.
Chitosan liquid 1% consentration poured out into plastic container. The immersion of
pineapple leaves fibre into chitosan for 45 minutes (Figure 1.a). Experimental design
listed in the Table 1.
Figure 1. Immersion of the pineapple leaves fiber test sample into chitosan liquid and tensile
test
a. Immersion into chitosan
b. Draining
c. Tensile test

112
Table 1. Experimental design of pineapple leaves rope immersion into chitosan liquid
Repetition σ (kgf/cm
2) (i)
Without chitosan Chitosan
1 X.1 X.1
2 X.2 X.2
3 X.3 X.3
… … …
10 X.10 X.10
where:
i = 1, 2, 3,...,10 = kgf/cm2
1. Draining
Fibers draining is done by hanging it on the clothesline under sunshine for around two
hours ( Figure 1.b);
2. The twisting of pineapple leaves fibre with chitosan
Twisting pineapple leaves fibre for 60 strands of fibre in 1 twisted. Twisted yarn of
pineapple leaves fibre prepared trough the length of 70 – 80 cm, diameter 0,04 - 0,05 cm.
After twisted, the diameter becomes 0,50–0,55 cm and length per each ropes 25 cm.
Pineapple leaves fibre twisted manually where S twisting direction.
3. Water content and specific weight determination (Figure 2)
Sample test water content counted by formula [15]:
where:
WC = water content (%);
FW = first weight (g); and
ODW = oven dry weight of material (g).
Specific weight of test sample is counted by formula [15]:
where:
Sw = specific weight;
ODW = oven-dry weight of material (g);
V = volume of material (cm3); and
w = density of water (1 g/cm3).

113
Weighing first
weight of test
fibre
Weighing volume
of test fibre
Weighing oven-dry
weight of material
Put the weight result of test fibre in
water content and specific weight
fomula
The value of water content
and specific weight
Figure 2. Process of water content and specific weight of test fibre
3. Breaking strength process (Figure 1.d).
a. To preparing breaking strength tester and its monitor;
b. Tie up the both ends of the test sample in each top and bottom grib. The space between
grib was setted 25 cm, according to breaking strength fibre test standard in Indonesian
National Standard (SNI);
c. To connencting the bottom grib in tester machine to voltage sensor by joint; and
d. To recording the data of sample test breaking strength. Test was done by 10 times of
repetition.
4. To counting the breaking strength of pineapple leaves rope based on the data obtained by
using this formula [16] :
where:
σ = breaking strength (kgf/cm2);
P = strain (kgf); and
A = area (cm2).
2. Results And Discussion
The length of pineapple leaves fiber before and after chitosan additional is stable, while
the average diameter value is difference 0,05 μm be measured by using digital microscope. It
is bigger than pineapple leaves fiber without one. Physical of its look visually is the color and
fineness of fibers. The fibers that is dipped into chitosan has more coarse texture of fiber but
not stiff, while its color turns brown (Table 5).

114
Table 2. Physical of test pineapple leaves rope
Parameter Without chitosan Chitosan
Colour bright brown dark brown
Touch impression stiff and coarse coarse and not stiff
Diameter (μm) 80-90 80,05 – 90
Water Content of Pineapple Leaves Rope
Water content of pineapple leaves rope around 6,0606 – 36,0000% and its average
14,9149 % and pineapple leaves rope without chitosan 4,5455 - 13,7931 % and its average
9,5154 %. The difference of average value of water content for pineapple leaves rope with
and without chitosan is 0,0461 %. Generally, the water content value of pineapple leaves rope
with chitosan is higher than it without one. Distribution of it for water content value among
pineapple leaves rope with and without chitosan can be seen in Table 3.
Table 3. Water content of pineapple leaves rope with and without chitosan
Repitition Water content (%)
Without chitosan Chitosan
1 11,4286 36,0000
2 4,5455 19,2308
3 11,1111 6,0606
4 4,7619 20,8333
5 9,5238 13,3333
6 9,5238 10,3448
7 6,4516 8,1081
8 11,1111 8,5714
9 12,9032 16,6667
10 13,7931 10,0000
Average 9,5154 14,9149
The water content is affected to stickiness of preservative that is used in material.
According to [17], the effect of it depends on inherent ability among it and preserved fibers.
The inherent ability to fiber depends on water content of it. Chemical reaction such as
oxidation is affected by water content number in a material. Based on morphological analysis
research by [18] used surface morphological analysis by Scanning Electrone Microscope
(SEM) method, can be seen the content, composition and compactness of pineapple leaf
structure as listed in Table 3.
Water content of pineapple leaves fiber is very high till 81,6 %. The extraction result of it
is 5% [19]. Its number is less than water content number of this research, it is 9,5154 %. It
can be caused by difference of pineapple plant type, its planting location and method to
extracting the pineapple leaves become fiber, sun intensity, rainfall and also difference of
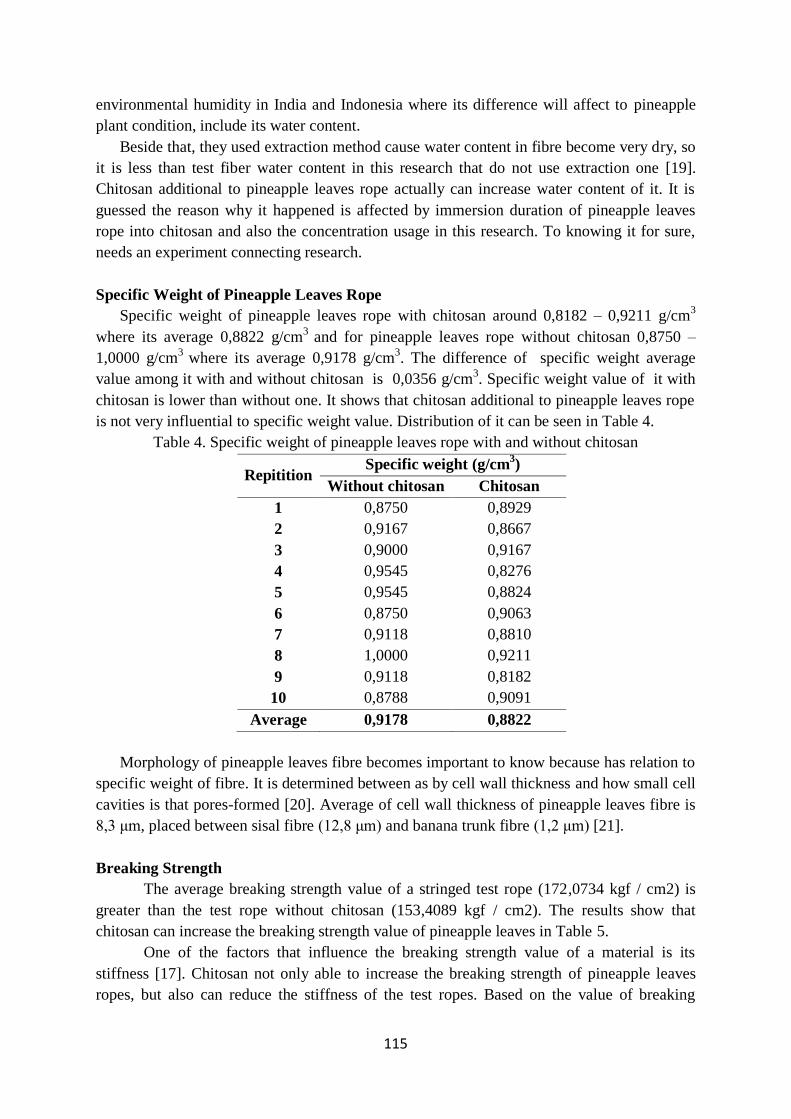
115
environmental humidity in India and Indonesia where its difference will affect to pineapple
plant condition, include its water content.
Beside that, they used extraction method cause water content in fibre become very dry, so
it is less than test fiber water content in this research that do not use extraction one [19].
Chitosan additional to pineapple leaves rope actually can increase water content of it. It is
guessed the reason why it happened is affected by immersion duration of pineapple leaves
rope into chitosan and also the concentration usage in this research. To knowing it for sure,
needs an experiment connecting research.
Specific Weight of Pineapple Leaves Rope
Specific weight of pineapple leaves rope with chitosan around 0,8182 – 0,9211 g/cm3
where its average 0,8822 g/cm3
and for pineapple leaves rope without chitosan 0,8750 –
1,0000 g/cm3
where its average 0,9178 g/cm3. The difference of specific weight average
value among it with and without chitosan is 0,0356 g/cm3. Specific weight value of it with
chitosan is lower than without one. It shows that chitosan additional to pineapple leaves rope
is not very influential to specific weight value. Distribution of it can be seen in Table 4.
Table 4. Specific weight of pineapple leaves rope with and without chitosan
Repitition Specific weight (g/cm
3)
Without chitosan Chitosan
1 0,8750 0,8929
2 0,9167 0,8667
3 0,9000 0,9167
4 0,9545 0,8276
5 0,9545 0,8824
6 0,8750 0,9063
7 0,9118 0,8810
8 1,0000 0,9211
9 0,9118 0,8182
10 0,8788 0,9091
Average 0,9178 0,8822
Morphology of pineapple leaves fibre becomes important to know because has relation to
specific weight of fibre. It is determined between as by cell wall thickness and how small cell
cavities is that pores-formed [20]. Average of cell wall thickness of pineapple leaves fibre is
8,3 μm, placed between sisal fibre (12,8 μm) and banana trunk fibre (1,2 μm) [21].
Breaking Strength
The average breaking strength value of a stringed test rope (172,0734 kgf / cm2) is
greater than the test rope without chitosan (153,4089 kgf / cm2). The results show that
chitosan can increase the breaking strength value of pineapple leaves in Table 5.
One of the factors that influence the breaking strength value of a material is its
stiffness [17]. Chitosan not only able to increase the breaking strength of pineapple leaves
ropes, but also can reduce the stiffness of the test ropes. Based on the value of breaking

116
strength, pineapple leaves rope without chitosan is able to withstand a load of 153,4089 kgf
per area of 1 cm2, while a pineapple leaves rope with chitosan is able to withstand an even
greater load of 172,0734 kgf per 1 cm2 area. This shows that the pineapple leaves rope is
classified as strong. Chitosan used as a preservative a polysaccharide that can be absorbed
and isolated in pineapple leaves fibers. This is supported by the results of research through
the Scanning Electron Microscope (SEM) image which states that the pineapple leaves fiber
structure is multicellular with a hollow surface and has a dense tissue structure, capable of
absorbing and isolating the liquid very well (Figure 8) [23]. This makes the pineapple leaves
fiber stiffness decrease and the breaking strength increases, where it has a positive impact.
The positive charge of chitosan is known to be able to interact with the bacterial cell surface
which is negatively charged, so it can interfere with the growth of bacteria that cause damage
[24].
Table 5. Pineapple leaves breaking strength value with chitosan and without chitosan
Repitition σ (g/cm
3)
Without chitosan Chitosan
1 170,4968 161,2804
2 159,2357 115,3312
3 146,2446 165,2659
4 140,4944 164,3033
5 152,8753 104,1693
6 189,4013 277,9618
7 119,3074 148,2588
8 100,1783 228,3033
9 200,5993 171,8105
10 189,1606 140,1449
Average 153,4089 172,0734
Figure 8. Pineapple leaves fiber structure through SEM image [22]
The mechanism of anti-microbial substances in general is to break the main structures
of microbial cells such as cell walls, cytoplasm, ribosomes and cytoplasmic membranes. The
presence of chitosan preservative anti-microbial substances, will cause denaturation of
proteins. This situation will cause enzyme interactions, so that the metabolic system is
disrupted or become broke and ultimately there is no activity from microbial cell [25].
117
3. Conclusion
The conclusion of this research are:
1. Pineapple leaves rope has a brown color, the touch impression are coarse and stiff and the
presentation of the difference in diameter size before and after chitosan immersion is
0,06%. The average value of pineapple leaves water content with chitosan is greater
56,7% than the water content of pineapple leaves rope without chitosan;
2. Chitosan is able to increase the breaking strength of pineapple leaves rope, as seen from
the results of breaking strength of the pineapple leaves rope (172,0734 kgf / cm2) is greater
than the breaking strength of pineapple leaves rope without chitosan (153,4089 kgf / cm2);
3. Pineapple leaves rope is potential to use for fishing gear based on its physical form and
breaking strength number. How strong it is when used on fishing gear will be known by an
experiment connecting research in the field.
5. Acknowledgment
Our special thanks to IPB University, especially to the Head of Wood Building
Engineering and Design Laboratory, Forest Product Engineering Department, Forestry
Faculty, for all facilities that had given to us so this research can be finished and collect all
data we need.
6. References
[1]. Lenkosmanerri. 1998. Break Resistance and thread stretching of poly amide (pa),
soaked cotton and hemp in extra cassava bark (adinandar acuminate korth).
Faculty of Fisheries and marine science Riau University Pekanbaru. 50p (not
published)
[2]. Nofrizal, Ahmad M, Syofyan I, Habibie I. 2011. Puzzle Grass (Fimbristylis sp), linggi
(Penicum sp) and cyanic (Carex sp) as a natural fiber for fishing gaer. Riau
(ID):Riau University. Jurnal Natur Indonesia. 14(1):100-106.
[3]. Zuldry A, Syofyan I, Nofrizal. 2015. Study on bundung grass (Scirpus Grossus L.) as
the natural fibre for fishing gear material with the sinking speed and absorption
test. Riau (ID): University of Riau. Jurnal Natur Indonesia. 14(1):120-126.
[4]. Wardaniati RA, Setyaningsih S. 2009. Chitosan making from shrimp shell and its
application for meatball preservation. Semarang (ID): Diponegoro University.
[5]. Kurita, K. 2001. Controlled functionalization of the polysaccharide chitin. Journal of
Polimer Science. 26, 1921–71.
[6]. Younes I, Rinaudo M. 2015. Chitin and Chitosan Preparation from Marine Sources.
Structure, Properties and Applications. Journal of Marine Drugs. 13(10):1133-
1174.
[7]. Hargono, Abdullah, Sumantri I. 2008. Making Chitosan from Shrimp Shell Waste and
Its Application for Reducing Goat Fat Cholesterol. Jurnal Reaktor. 12(1): 53-57.
[8]. Purwanti A. 2014. Evaluation of Shrimp Skin Waste Treatment Process To Improve
Quality of Chitosan Produced. Jurnal Teknologi. 7(1):83-90.
[9]. Hossain MS, Iqbal A. 2014. Production and Characterization of Chitosan from
Shrimp Waste. Journal Bangladesh Agricultural University. 12(1):153–160.

118
[10]. Trisnawati E, Andesti D, Saleh A. 2013. Making chitosan from crab shell waste as
duku fruit preservatives with variation of preservation time. Jurnal Teknik Kimia.
2(19): 17-26.
[11]. Lesbani A, Yusuf S, Meiviana RAM. 2011. Characteristics of chitin and chitosan
from mangrove crab shells (Scylla serrata).Jurnal Penelitian Sains. 14(3):32-36.
[12]. Sakthivel D, Vijaykumar N, Anandan V. 2015. Extraction of Chitin and Chitosan
from Mangrove Crab Sesarmaplicatum from Thengaithittu Estuary Pondicherry
Southeast Coast of India. Human Journals. 4(1):12-24.
[13]. Arbia W, Adour L, Arbia L, Amrane A. 2013. Chitin Extraction from Crustacean
Shells Using Biological Methods – A Review. Journal of Biotechology. 51(1):12–
25.
[14]. Wahyuni S, Asnani, Nur I. 2008. Analysis of deprotenation and demineralization
waste analysis on the making of chitosan from local abalone shellfish (Haliotis
asiniar) Lokal. Jurnal Warta-Wiptek. 16(2):123-127.
[15]. Diniah. 2010. Mechanical of betung bamboo for fishing gear material. Bogor: IPB
University.
[16]. Mardikanto TR, Karlinasari L, Bahtiar ET. 2011. Mechanical of Wood. Bogor: IPB
Press.
[17]. Klust. 1987. Netting Material for Fishing Equipment II. Team Translation BPPI.
Semarang : Fishing News Book Ltd.
[18]. Daud Z, Hatta MZ, Kassim ASM, Awang H, Aripin AM. 2014. Exploring of agro
waste (pineapple leaf, corn stalk, and napier grass) by chemical composition and
morphology study. Journal of BioResources. 9(1):872-880.
[19]. Dey SK, Satapathy KK. 2011. A Combined Technology Package for Extraction of
Pineapple Leaf Fibre-An Agrowaste, Utilization of biomass and for application in
Textiles. National Institute of Research on Jute and Allied Fibre Technology Indian
Council of Agricultural Research 1-9.
[20]. Dumanauw JF. 2001. Getting to know wood. Semarang: Kanisisus publisher.
[21]. Hidayat P. 2008. The utilizing pineapple leaf fiber technology as an alternative textile
raw material. Yogyakarta. Jurnal Teknoin. 13(2):31-35. ISSN: 0853-697.
[22]. Yusof Y, Yahya SA, Adam A. 2015. Novel technology for sustainable pineapple leaf
fibers productions. Science Direct. 26:756-750.
[23]. Dhanabalan V, Laga S, Rashmi J. 2015. Pineapple fibers: properties and uses.
[internet]. Downloaded 2016 Juni 24] on www.slideshare.com.
[24]. Fitriawati N. 2012. The effectiveness of four types of plants and chitosan againts
Xanthomonas campestris pv. Campestris causes black rot in cabbage [tesis].
Bogor: IPB University.
[25]. Volk WA, Wheeler MF. 1990. Basic of Microbiologi, volume 2. 5th
edition. Jakarta:
Erlangga publisher.

119
The Implementation of 7E Learning Cycle Model in
Improving the Social Attitude And Physics Learning
Achievement of the XI MIPA 3 Class Students of in the
Academic Year of 2018/2019
I Made Tri Pramana Putra, I Wayan Suastra., A. A. I. Agung Rai Sudiatmika.
Universitas Pendidikan Ganesha, Indonesia, Jalan Udayana 11 Singaraja Bali
81116 Indonesia
[email protected], [email protected], [email protected]
Abstract. This study aimed at improving social attitude and physics learning achievement of
the students of XI MIPA 3 class of SMAN 3 Singaraja through the implementation of 7E
learning cycle model. The type of this research was Classroom Action Research. The research
subjects were 33 students of XI MIPA 3 class. The object of this research was the 7E learning
cycle model, social attitude, learning achievement, and students’ responses. The research
instruments were social attitude observation sheets, social attitude questionnaires, learning
achievement tests, and students’ responses questionnaires. The data was analyzed
descriptively quantitatively. The results of the study showed that (1) There was an increase in
social attitude based on observation (in the first cycle, the obtained score was 57.59, while in
the second cycle the obtained score was 62.28). There was an increase in social attitude based
on the questionnaire (in the first cycle, the obtained score was 112.64, while in the second
cycle the obtained score was 120.6 ). 2) In the first cylce, the students’ learning achievement
had not reached the research success criteria X = 72.88, SD = 9.44, KK = 54.55%), while in
the second cycle it reached the research success criteria X 82.42, SD .815, KK
8 .88 ). 3) Students’ responses toward the learning cycle model were highly positive
X =80.76). The conclusion of this study showed that the implementation of 7E learning cycle
model was able to improve students’ social attitude and physics learning achievement in XI
MIPA 3 class of SMAN 3 Singaraja.
1. Introduction
Education is an important aspect in the life of the country and the nation. The government holds
vital role in nation’s efforts in conducting the expected education. The implementation of 2013
curriculum is one of such efforts that the government does to improve the quality of the graduates in
accordance to the educational objective. The implementation of 2013 curriculum is expected to be
able to improve the attitude, knowledge and skill competences. Based on the research done by
Gusviani (2016), social attitude arises more in the 2013 curriculum. This is in accordance to the
essence of 2013 curriculum that states that the learning process is designed into three areas, namely
attitude, knowledge and skills. Students’ social attitude in the classroom learning process can affect
their learning achievements. This is in accordance to the research done by Zahara et al. (2017), who
state that there was a significant influence of students’ social attitude towards their learning outcome.
In fact, based on the observation data in XI MIPA 3 class of SMA N 3 Singaraja, students’ social
attitude and their physics learning achievement were still low. This statement was supported by the
data of their daily test scores as seen on Table 1.

120
Table 1. Daily Test Scores of the Students of XI MIPA 3 Class of SMA N 3 Singaraja
Aspect XI
MIPA 1
XI
MIPA 2
XI
MIPA 3
The Number of
Students 35 33
32
The Number of
Passing Students 5 2
1
Average 54.6 43.9 31.8
Passing Ratio 14,3% 6,06% 3,03%
Highest Score 81 78 76
Lowest Score 36 18 3
Based on the observation result done at di SMA N 3 Singaraja through interview with the physics
teacher in XI MIPA 3 class, direct observation in XI MIPA 3 class, and interview with 3 students of
XI MIPA 3 class, several causes of the low physics learning achievement and students’ low social
attitude in XI MIPA 3 class were revealed. Among others were: (1) 60% of the learning process
conducted by the teacher implemented lecturing method; (2) there were only 2-3 students out of 33
students who participated during the learning process; (3) there were students who were not honest in
doing daily tests; (4) the teacher had not delivered the learning objectives that would be
accomplished, so that the students did not have any preexisting perception on the learning process that
was conducted on that day; (5) the learning process was still dominated by the teacher; (6) discussion,
question-and-answer and expressing opinion activities were not done frequently; (7) according to the
students, physics was difficult because there were many formulas that should be memorized; (8)
students tended to be bored when learning physics due to the teaching technique of the teacher was
less interesting according to the students.
The problem of low social attitude commonly happened to the students. Bachtiar, S., Siti Z.,
Aloysius D. C., & Sri E. I. (2018) state that the learning process conducted at school does not
facilitate students’ social attitude development. This may cause the students to be less honest in doing
their tasks, they may cheat on their friends’ work, they may not be discipline, less polite to their
friends, and may cause little practical activities.
This also happens to their learning achievement. The low learning achievement has been a global
problem. The research of Trends in Mathematics and Science Study (TIMSS) of 2015, showed that in
the field of science, Indonesia is ranked low, i.e. 45 out of 47 countries. This is in line with the
problem disclosed by Naade et al. 2018) who state that students’ physics learning achievement was
still low. Many students found difficulties in learning physics because it needed strong concept
comprehension. Sulastri et al. (2018), state that most of the students were still unable to achieve the
competence in physics subject.
Based on several identified problems, most of them were due to the not-optimal learning process.
The teachers were yet to be able to implement innovative learning models which can evoke students
to be active in the classroom learning process (teacher centered learning). The use of learning model
can affect the learning in processing the obtained information (Sarac, 2018). The classroom learning
process familiarizes the students to always receive knowledge from the teacher without knowing its
application in daily life. This is in accordance to the argument of Sulastri et al. (2018), who state that
physics learning process tends to place physic as a number of information that should be delivered
and memorized. During the learning process, the students only were only listening and being less
involved in investigating new matters such as conducting several experiments. Such activities cause
students to be not active in the learning activities. Based on such problem, an appropriate solution is
required to improve students’ social attitude and learning achievement. Such solution is in the form of
the implementation of an innovative learning model.

121
Such problem can be overcome by implementing an innovative learning model. According to
Santyasa (2005), an innovative learning is a type of learning that provides opportunities for the
students to reconstruct knowledge independently (self-directed) and is mediated by their peers (peer-
mediated instruction). This is because in the innovative learning model, the learning process is
centered on the students. One of the innovative learnings is constructivism-based learning.
In the constructivism learning, individuals form their own concept and adjust it with the new
situation by utilizing their preexisting knowledge (Yaman & Karasah, 2018). Such knowledge can be
the basis of receiving the next information. One of the learning models that adheres to the
constructivism view is 7E learning cycle.
7E learning cycle model provides affects the teaching material development process, interest in
the lesson, skills and attitude (Sarac & Tarhan, 2017). According to Eisenkraft (2003), the use of 7E
model assures the disclosure of students’ preexisting knowledge. 7E learning cycle emphasize on the
importance of preexisting knowledge and on expanding or transferring scientific concepts and
principles of a subject.
The selection of E learning cycle model to improve students’ social attitude and learning
achievement was supported by several researches. According to Naade et al. (2018), 7E learning cycle
model affects positively towards the students’ learning achievement. The interactive nature of the use
of 7E learning cycle model could motivate students, so that it evoked their interest and improved
deeper and broader concept comprehension. This is in line with Sulastri et al. (2018), who state that
E learning cycle model provided positive result on students’ physics learning achievement. This was
because the 7E learning cycle model could ease the students in understanding concepts, because the
students directly interact with the learning objects. Students’ interaction with the learning objects
indicated enthusiast attitude of the students in receiving the lesson.
7E learning cycle model was believed to be able to improve social attitude and learning
achievement. Social attitude is a positive or negative reaction of a person towards particular object in
the social environment. Kerlinger (1972) states that social attitude is a part of the attitude domain that
has a reference of various general social relevance with many people in terms of religion, economy,
politic, education, ethnicity, and other social aspects. Furthermore, Gerungan (2004) states that social
attitude is ways of behavior which are repeatedly expressed towards particular social subjects and is
usually not just by a person, but also other persons who are in the same group or community.
According to Ahmadi (2007), social attitude is individual’s awareness that determines real, repeated
actions towards social objects. Social attitude is not only expressed by a person, but is also noticed by
the people in his/her community. Generally, social attitude is an individual’s ability in understanding
other people’s feelings accompanied by the tendency to behave/act related to the social activities
experienced by such individual. In this research, the used dimensions of social attitude were
criticality, diligence, honesty, caution, curiosity, responsibility, cooperation, and openness.
Learning achievement can be defined as an educational evaluation regarding students’ progress in
all the things that they have learned at school relating to knowledge and skill that is expressed after
the evaluation result. According to Djamarah (1994), learning achievement consists of two words,
namely “achievement” and “learning”. Achievement is the result of a particular activity that has been
done, created, both individually and in groups. Meanwhile, learning is an activity that is done
consciously to gain a number of impression from the learned material. Learning itself can be
interpreted as an activity that processes and is a highly fundamental element in the administration of
any type and level of education (Syah, 2007). This shows that, the success or failure of the
educational objective accomplishment depends on the learning process experienced by the students
both at school and in their living environment. In this research, the used dimension on the learning
achievement was the cognitive dimension, which comprised remembering (C1), understanding (C2),
applying (C3), analyzing (C4), evaluating (C5), and creating (C6).
122
There were 7 phases in the learning activity in 7E learning cycle model, namely eliciting,
engaging, exploring, explaining, elaborating, evaluating, and extending. In the eliciting phase, the
students would be invited to recognize the given initial problem, the developed social attitude was
critical, while the targeted learning achievement dimension was remembering. In the engaging phase,
the students would be motivated by the teacher by giving phenomena so that the students would be
more active and more curious, the developed social attitude was curiosity, while the targeted learning
achievement dimension was analyzing. In the exploring phase, the students would be invited to find
concepts on the learning materials through experiments, the developed social attitude was criticality,
dilligence, curiosity, cooperation, and caution, while the targeted learning achievement dimension
was understanding and analyzing. In the explaining phase, the students communicate their concept
findings; the developed social attitude was openness and criticality, while the targeted learning
achievement dimension was understanding. In the elaborating phase, students’ concept findings were
applied on the given problem by the teacher, the developed social attitude was responsibility, while
the targeted learning achievement dimension was applying. In the evaluating phase, feed backing was
conducted on the obtained concept, the developed social attitude was honesty, while the targeted
learning achievement dimension was evaluating. In the extending phase, students developed their
conceived concepts into the more complex daily life problem; the developed social attitude was
diligence and criticality, while the targeted learning achievement dimension was creating.
Based on the above arguments, then it was deemed necessary for the learning process
improvement by implementing 7E learning cycle model to improve the social attitude and physics
learning achievement of the XI MIPA 3 class students of SMA N 3 Singaraja in the academic year of
2018/2019. According to such problem, then the writer proposed a classroom action research with the
title of “The Implementation of E Learning Cycle Model to Improve the Social Attitude and Physics
Learning Achievement of the XI MIPA 3 Class Students of SMA N 3 Singaraja in the Academic Year
of 2018/2019”.
2. Method
This research utilized classroom-action-research method. This research aimed at improving social
students and physics learning achievement of the XI MIPA 3 class students of SMA N 3 Singaraja in
the academic year of 2018/2019 by implementing 7E learning cycle model. This research was
conducted in two cycles. Each cycle consisted of four main stages, namely action planning, action
implementation, observation/evaluation, and reflection.
The subject of this research was the students of XI MIPA 3 class with the total number of 33
students. The object of this research was 7E learning cycle model, social attitude, learning
achievement, and students’ responses. The data of social attitude was obtained from the observation
result and questionnaire. The observation was conducted in each meeting, meanwhile the
questionnaire was given at the end of cycle I and cycle II. The data of the learning achievement was
obtained from the learning achievement test at the end of cycle I and cycle II. The data of students’
responses was obtained from the students’ responses questionnaire that was given at the end of cycle
II. The obtained data was then analyzed by using descriptive quantitative analysis technique.
3. Result and Discussion
Based on the observation, during the first meeting of cycle I, the number of students who
obtained the score of social attitude on highly positive category was 7 students, on positive category
was 19 students, and on adequate category was 3 students. In the second meeting, the number of
students who gained social attitude score on highly positive category was 8 students and on positive
category was 23 students. In the third meeting, the number of students who gained social attitude
score on highly positive category was 11 students and on positive category was 17 students.
The result of data analysis of the three meetings in cycle I showed that the average score of the
students’ social attitude in cycle I was 5 .9 with the standard deviation of 4.09. Based on the
categorization criteria of the students’ social attitude, the average score of the social attitude of the XI
MIPA 3 class students of SMA N 3 Singaraja in the academic year of 2018/2019 in cycle I was on the

123
positive category. This accomplishment had met the research success criteria, which had been set
previously.
In the first meeting of cycle II, the number of students who obtained the score of social attitude
on highly positive category was 14 students and on positive category was 16 students. In the second
meeting, the number of students who gained social attitude score on highly positive category was 18
orang and on positive category was 13 students. In the third meeting, the number of students who
gained social attitude score on highly positive category was 22 students and on positive category was
10 students.
The result of data analysis of the three meetings in cycle II showed that the average score of the
students’ social attitude in cycle II was 62.28 with the standard deviation of 3.49. Based on the
categorization criteria of the students’ social attitude, the average score of the social attitude of the XI
MIPA 3 class students of SMA N 3 Singaraja in the academic year of 2018/2019 in cycle II was on
the highly positive category. This accomplishment had met the research success criteria that had been
set previously.
Based on the result of the observation, students’ social attitude in every meeting had experienced
improvement from cycle I until cycle II. The improvement of the social attitude is provided in Figure
1
Figure 1. The Comparison of Social Attitude Score of Cycle I and Cycle II Graph Based on
Observation
Based on the questionnaire evaluation, in cycle I, the number of students who gained highly
positive category on their social attitude score was 10 students, who gained positive category was 21
students, and who gained adequate category was 2 students. In cycle II, the number of students who
gained highly positive category on their social attitude score was 21 students, and the ones who
gained positive category was 12 students.
Based on the analysis, the average score of students’ social attitude in XI MIPA 3 class in cycle I
had met the success criteria. The gained average score was 112.64 and was on the positive category.
Meanwhile, in cycle II, the average score of students’ social attitude in XI MIPA 3 class was 120.76,
which was on the highly positive category. This result showed that there was an improvement in the
social attitude score from cycle I to cycle II. The improvement of students’ social attitude score in XI
MIPA 3 class based on the questionnaire is provided on Figure 2.
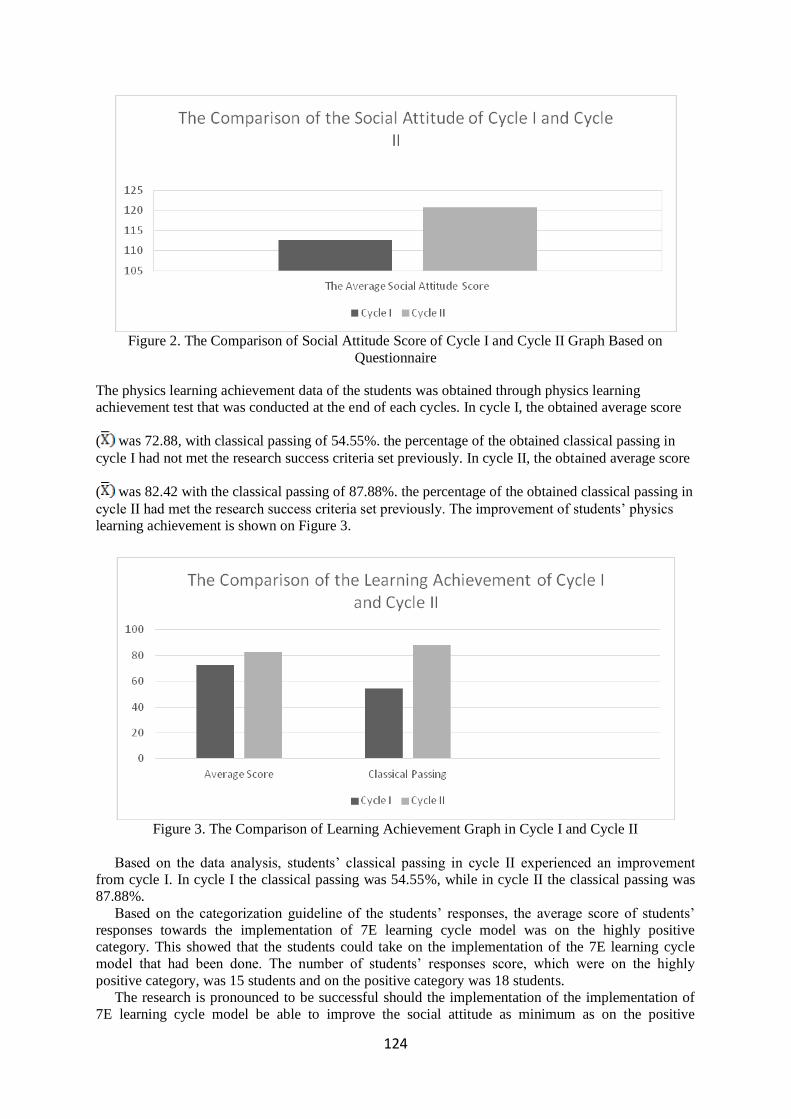
124
Figure 2. The Comparison of Social Attitude Score of Cycle I and Cycle II Graph Based on
Questionnaire
The physics learning achievement data of the students was obtained through physics learning
achievement test that was conducted at the end of each cycles. In cycle I, the obtained average score
( was 72.88, with classical passing of 54.55%. the percentage of the obtained classical passing in
cycle I had not met the research success criteria set previously. In cycle II, the obtained average score
( was 82.42 with the classical passing of 87.88%. the percentage of the obtained classical passing in
cycle II had met the research success criteria set previously. The improvement of students’ physics
learning achievement is shown on Figure 3.
Figure 3. The Comparison of Learning Achievement Graph in Cycle I and Cycle II
Based on the data analysis, students’ classical passing in cycle II experienced an improvement
from cycle I. In cycle I the classical passing was 54.55%, while in cycle II the classical passing was
87.88%.
Based on the categorization guideline of the students’ responses, the average score of students’
responses towards the implementation of 7E learning cycle model was on the highly positive
category. This showed that the students could take on the implementation of the 7E learning cycle
model that had been done. The number of students’ responses score, which were on the highly
positive category, was 15 students and on the positive category was 18 students.
The research is pronounced to be successful should the implementation of the implementation of
7E learning cycle model be able to improve the social attitude as minimum as on the positive
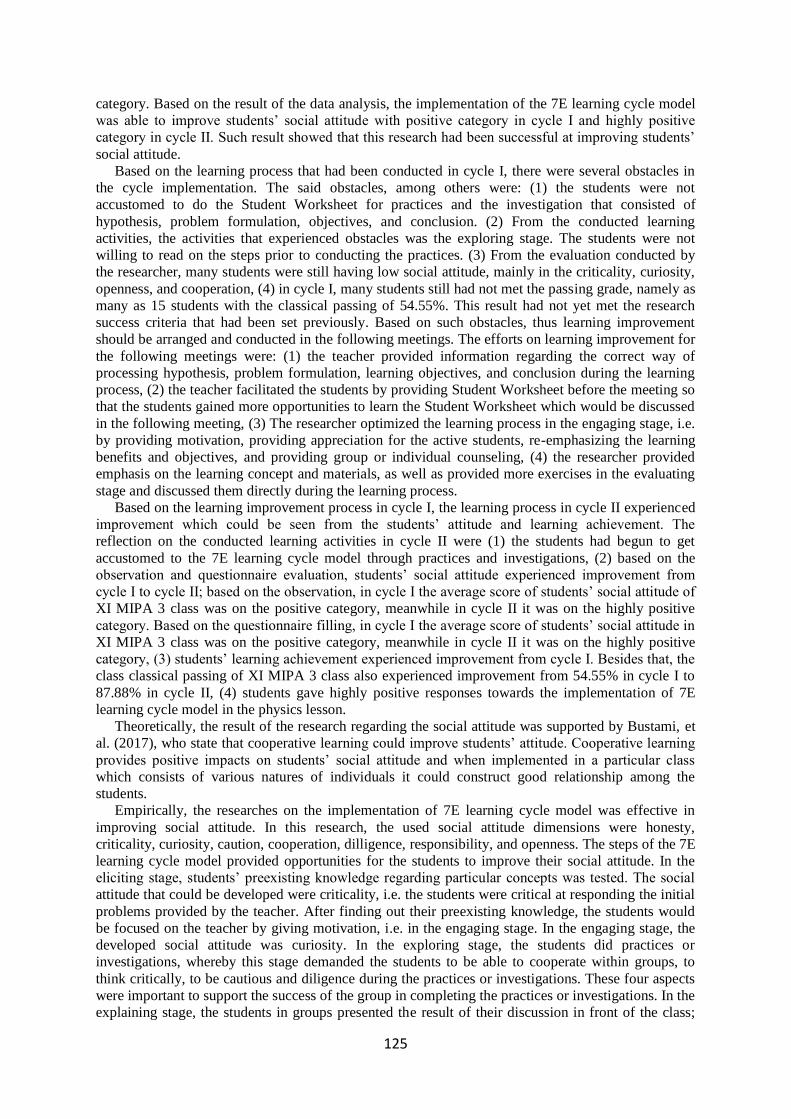
125
category. Based on the result of the data analysis, the implementation of the 7E learning cycle model
was able to improve students’ social attitude with positive category in cycle I and highly positive
category in cycle II. Such result showed that this research had been successful at improving students’
social attitude.
Based on the learning process that had been conducted in cycle I, there were several obstacles in
the cycle implementation. The said obstacles, among others were: (1) the students were not
accustomed to do the Student Worksheet for practices and the investigation that consisted of
hypothesis, problem formulation, objectives, and conclusion. (2) From the conducted learning
activities, the activities that experienced obstacles was the exploring stage. The students were not
willing to read on the steps prior to conducting the practices. (3) From the evaluation conducted by
the researcher, many students were still having low social attitude, mainly in the criticality, curiosity,
openness, and cooperation, (4) in cycle I, many students still had not met the passing grade, namely as
many as 15 students with the classical passing of 54.55%. This result had not yet met the research
success criteria that had been set previously. Based on such obstacles, thus learning improvement
should be arranged and conducted in the following meetings. The efforts on learning improvement for
the following meetings were: (1) the teacher provided information regarding the correct way of
processing hypothesis, problem formulation, learning objectives, and conclusion during the learning
process, (2) the teacher facilitated the students by providing Student Worksheet before the meeting so
that the students gained more opportunities to learn the Student Worksheet which would be discussed
in the following meeting, (3) The researcher optimized the learning process in the engaging stage, i.e.
by providing motivation, providing appreciation for the active students, re-emphasizing the learning
benefits and objectives, and providing group or individual counseling, (4) the researcher provided
emphasis on the learning concept and materials, as well as provided more exercises in the evaluating
stage and discussed them directly during the learning process.
Based on the learning improvement process in cycle I, the learning process in cycle II experienced
improvement which could be seen from the students’ attitude and learning achievement. The
reflection on the conducted learning activities in cycle II were (1) the students had begun to get
accustomed to the 7E learning cycle model through practices and investigations, (2) based on the
observation and questionnaire evaluation, students’ social attitude experienced improvement from
cycle I to cycle II; based on the observation, in cycle I the average score of students’ social attitude of
XI MIPA 3 class was on the positive category, meanwhile in cycle II it was on the highly positive
category. Based on the questionnaire filling, in cycle I the average score of students’ social attitude in
XI MIPA 3 class was on the positive category, meanwhile in cycle II it was on the highly positive
category, (3) students’ learning achievement experienced improvement from cycle I. Besides that, the
class classical passing of XI MIPA 3 class also experienced improvement from 54.55% in cycle I to
87.88% in cycle II, (4) students gave highly positive responses towards the implementation of 7E
learning cycle model in the physics lesson.
Theoretically, the result of the research regarding the social attitude was supported by Bustami, et
al. (2017), who state that cooperative learning could improve students’ attitude. Cooperative learning
provides positive impacts on students’ social attitude and when implemented in a particular class
which consists of various natures of individuals it could construct good relationship among the
students.
Empirically, the researches on the implementation of 7E learning cycle model was effective in
improving social attitude. In this research, the used social attitude dimensions were honesty,
criticality, curiosity, caution, cooperation, dilligence, responsibility, and openness. The steps of the 7E
learning cycle model provided opportunities for the students to improve their social attitude. In the
eliciting stage, students’ preexisting knowledge regarding particular concepts was tested. The social
attitude that could be developed were criticality, i.e. the students were critical at responding the initial
problems provided by the teacher. After finding out their preexisting knowledge, the students would
be focused on the teacher by giving motivation, i.e. in the engaging stage. In the engaging stage, the
developed social attitude was curiosity. In the exploring stage, the students did practices or
investigations, whereby this stage demanded the students to be able to cooperate within groups, to
think critically, to be cautious and diligence during the practices or investigations. These four aspects
were important to support the success of the group in completing the practices or investigations. In the
explaining stage, the students in groups presented the result of their discussion in front of the class;

126
meanwhile the other students expressed their questions to the presenting group regarding the
discussed material. The developed social attitude in this stage was criticality and openness. In the
elaborating stage, the students applied their obtained concept on the new problems. The developed
social attitude was responsibility and diligence in solving the newly presented problems. The
evaluating stage also provided opportunities for the students to be able to improve their social attitude,
namely the honesty aspect. The students who had not understood the presented material could ask
questions to the teacher to be discussed with the class. However, should the students not be honest in
expressing the gained knowledge, it would affect the said students in the future. The last stage was
extending stage. The students developed their owned knowledge on the more complex problems. In
this stage, the social attitude that could be developed was criticality. Through the possessed concept,
the students were more critical in responding the presented problems.
The result of the data analysis of the students’ physics learning achievement showed that there was
improvement in the physics learning achievement through the implementation of the 7E learning
cycle model. In cycle I, the classical passing was 54.55%. This result had not met the success criteria.
This was because in cycle I, the students were constrained by mathematical calculations in working
on the problems. Besides that, in cycle I there were students who were not willing to follow teacher’s
instruction to do the exercises. In cycle II, the classical passing improved to 87.88%. This was
because the students had been willing to do the exercises given by the teacher, so that the students
gained more understanding and were more prepared to do the learning achievement test.
The research success criteria of the learning achievement aspect should at least meet the classical
passing of 75%. The result of the research in cycle II had met the research success criteria. Such
improvement of the classical passing indicated the success of the implementation of 7E learning cycle
model in improving the students’ physics learning achievement.
Theoretically, this research was supported by Eisenkraft (2003), who states that the
implementation of 7E learning cycle model could generate students’ preexisting knowledge. By using
the 7E learning cycle model, the teacher would evoke the students’ preexisting knowledge (elicit) and
focus the students on the teacher (engage). Meanwhile, the students would apply the concepts on
other problems (elaborate) and develop them (extend). According to Balta and Sarac (2016), the
implementation of 7E learning cycle model in science education could improve students’ academic
achievement and conceptual because this model provides opportunities for the students to dig
knowledge through experiments and investigations. Besides that, according to Colburn and Clough
(1997), learning cycle model is a learning technic in which the teacher can estimate and change
students’ concept regarding scientific principles, whilst simultaneously, the students will gain direct
practice experiences as a part of the science.
Empirically, this research was supported by similar researches that had been previously conducted.
The research conducted by Naade et al. (2018) showed that 7E learning cycle model with
constructivism approach can improve students’ physics learning achievement. Furthermore, the
research of Sulastri et al. (2018) showed that there was positive impact of 7E learning cycle model
towards physics learning achievement. The experimental class that used 7E learning cycle model
showed greater improvement on learning achievement compared to the control class that used
conventional model. The result of this research was also in accordance to the meta-analysis research
of Sarac (2018), which showed that the learning cycle model affected positively on the students’
learning achievement.
Based on the result of the questionnaire analysis of the students’ responses, the average score of
the students’ responses towards the implementation of 7E learning cycle model was 80.76 with highly
positive category. The research is pronounced to be successful should the students’ responses be at
least on the positive category. The result of this research showed that the students accepted the
implementation of the 7E learning cycle model that was given in the physics lesson well.
Based on the reflection that was conducted at the end of the cycles, it was revealed that several
obstacles were experienced during the implementation of the 7E learning cycle model in XI MIPA 3
class of SMA N 3 Singaraja. The obstacles that were experienced during the learning process of cycle
I among others were: (1) the students had not been accustomed to do the Student Worksheet for
practices and investigations that consisted of hypothesis, problems formulation, objectives, and
conclusion. (2) In the exploring stage, the students were not willing to read on the steps before
conducting the practices. (3) Many students still had low social attitude, mainly criticality, curiosity,

127
openness and cooperation. (4) 15 students gained scores below the passing grade, with the classical
passing of 54.55%. This result had not met the research success criteria that was set previously. The
applied solution to overcome such problems among others were: (1) the teacher provided information
regarding the correct way of doing hypothesis, problems formulation, learning objectives, and
conclusion during the learning process. (2) The teacher facilitated the students by giving Student
Worksheet before the meeting so that the students gained more opportunities to learn the Student
Worksheet that would be discussed during the following meeting. (3) The researcher optimized the
learning in the engaging stage, namely by providing motivation, providing appreciation for the active
students, re-emphasizing on the learning benefits and objectives, and providing counselling both in
groups and individually. (4) The researcher provided emphasis on the learning concept and material,
as well as providing more exercises in the evaluating stage.
The reflection of the conducted learning activities in cycle II among others were: (1) the students had
begun to be accustomed to the 7E learning cycle model through practices and investigations. The
practice and investigation reports of the students were better than in cycle I. (2) based on the
observation and questionnaire evaluation, students social attitude experienced improvement from
cycle I to cycle II. (3) The students’ learning achievement experienced improvement from cycle I.
Besides that, the classical passing of XI MIPA 3 class also experienced improvement from 54.55% in
cycle I to 87.88% in cycle II.
4. Conclusion and Suggestion
Based on the result of the research and the discussion, then it can be concluded the followings.
1. The implementation of 7E learning cycle model could improve students’ social attitude of the XI
MIPA 3 class SMA N 3 Singaraja in the academic year of 2018/2019. Based on the observation,
students’ average social attitude score in cycle I was 57.95 on the positive category, meanwhile
in cycle II it was 62.28 on the highly positive category. Based on the questionnaire evaluation,
students’ average social attitude score in cycle I was 112.64 on the positive category, meanwhile
in cycle II it was 120.76 on the highly positive category.
2. The implementation of 7E learning cycle model was able to improve the students’ physics
learning achievement of the XI MIPA 3 class of SMA N 3 Singaraja in the academic year of
2018/2019. The average learning achievement score obtained in cycle I was 72.88 with the
classical passing of 54.55%, while in cycle II it improved into 82.42 with the classical passing of
87.88%.
3. The students’ responses towards the implementation of 7E learning cycle model in the physics
lesson in XI MIPA 3 class of SMA N 3 Singaraja in the academic year of 2018/2019 obtained the
average score of 80.76 on the highly positive category.
Based on the findings, discussion, and conclusion, several suggestions that could be proposed were
drawn as follows.
1. In implementing the 7E learning cycle model the teacher should be able to dig students’
preexisting knowledge.
2. The teacher is suggested to form heterogeneous groups, so that there would not be any social
jealousy among the students.
3. The teacher can adjust the time allocation as good as possible for each step of the prepared 7E
learning cycle model, so that the learning activities can be conducted effectively.
References
[1] Ahmadi H A 2007 Jakarta: PT Rineka Cipta
[2] Bachtiar S, Siti Z, Aloysius D C, & Sri E I 2018 Issues in Educational Research 28 2 254-270
[3] Balta N & Hakan S 2016 European J. of Educational Reearch 5 2 61-72
[4] Djamarah B S 1994 Surabaya: Usaha Nasional
[5] Eisenkraft B S 2003 The Science Teacher J. 70 6 56-71

128
[6] Gerungan W A 2004 Bandung: PT Refika Aditama
[7] Kerlinger F N 1972 Educational and Physicological Measurement 32 3 613-630
[8] Naade N B, Alamina J I, & Okwelle P c 2018 J. of Education, Society and Behavioural
Science 24 3 1-9
[9] Santyasa I W 2005 papers presented in upgrading middle, high school and vocational school
teachers on June-July 2005, at Jembrana
[10] Sarac H 2018 International J. of Educational Methodology 4 1 1-18
[11] Sarac h & Tarha D 2017 European J. of Eduactional Research 6 3 299-311
[12] Sulastri E H & I W G 2018 J. Pendidikan Fisika dan Teknologi 4 1 56-65
[13] Syah M 2007 Bandung: PT Remaja Rosdakarya
[14] Yaman S & Karasah S 2018 J. of Baltic Science Education 17 1 65-83

129
The Effect Of Problem Based Learning Model toward Formal
Reasoning Ability And Science Process Skills Of Junior High
School
Pratiwi Ni Luh Gede Sri 1, Suastra I W2, Siti Maryam3
Postgraduate Program of Science Education, Mathematics and Science Faculty Ganesha University Of Education, Bali-Indonesia, 81116
Email :
2iwsuastra @undiksha.ac.id ,
,
Abstract. This research is aimed to analyze the differences: (1) Formal Reasoning Ability
and Science Process Skills, (2) Formal Reasoning Ability, and (3) Science Process Skills
between the students learning with Problem Based Learning and Direct Instruction. The focus
of this research problem is the effect of problem based learning to the formal reasoning
ability and science process skills. This research was quasi experiment with Posttest Only
Control Group Design. The number of the population was 288 students. The sample in this
research is class VIIIB and VIIIC selected by random sampling. Data obtained, then analyzed
with descriptive statistics and MANOVA. This research discovered that (1) there are
significant difference of formal reasoning ability and science process skills between student
learning by using problem based learning model with students learning by direct instruction
(F=45,390, p<0.05), (2) there is significant difference of reasoning ability between students
who are learning by using problem based learning model with students who learn by direct
instruction, (F=37,796, p<0.05), and (3) there is a significant difference of science process
skills between students who learn with problem based learning model with students who
learn by direct intruction ( MPL) (F=54,494, p<0.05). The group of student learning with
problem based learning model got better formal reasoning ability and science process skills
than those learning with direct intruction.
Key words:Problem Based Learning, Reasoning Ability, Science Process Skills
1. Introduction
The quality of a nation is not supported by the only its natural resources but also the excellence of
human resources that able to face the globalization era. Education is the key of all the advances and
the development of the better nation because humans who get good education can consummate
potential in themselves as both a person and the citizen, (Amri & Ahmadi, 2010). It also a process for
changing the attitude and behavior of humans in an efforts to maturing people in the learning steps.
The educational process will lead to the formation of attitudes also in evolve of both intellectual and
skills so what is the aim of it can be reached. In this time, the priority off the education just focused
on developing 21st century skills such as technology of information and communication skills,
problem solving skills, critical thinking skills and the ability to cooperate.
each other as humans. Nowadays, the improvement and the development in education intensively
carried out by the government to form better human resources.
School is the place where we can get the knowledge, one of the most popular is about science.
Science contributes to the goals of the national education progress greatly. Science focused to give the
real experience for the students to make they are able to exploring and understand about the nature
scientifically. Carin (1993) states that science directed to help students to “find out” and “acts” for
gain a deeper understanding about nature around them. Science as a systematic and well organized
knowledge is generally accepted and formed by the data that collected with the observations and
130
experiments. The learning process became meaningful when the students can get it lesson by
connecting the materials in daily which is using scientific methods, (Wilhelm, in Hendrik 2017).
Referring to the competencies above, besides knowledge, learning science also has to developing
aspect of process for the students among others science process skills and the formal reasoning
abilities. Harlen, 1992 states that science process skills are physical and mental skills related to the
fundamental abilities that are owned, mastered and applied in the scientific activities, therefore
scientists are able to find something new. The science process skills are the skills of thinking used by
scientist to construct knowledge for solve the problems and formulate the results, (Ozgelen 2012).
According to Tawil, Physics as the one part of science is always deals with the symbols in its. The
concept which is added symbols of Physics could help the students to manipulate the rules that used
in Physics, (2005).The learning process will run well if the students could connect the new
information to the relevant concepts in its cognitive structure, (Dahar, 2006) The capability to
associate new information is related to the ability of formal reasoning. The enhancement of students
reasoning abilities during the learning process are highly necessary to determine it is success.
Piaget (in Hergenhahn, 2008) states that students could develop their thinking skills in regular
phases. At some phase a certain scheme where the success of it depends on the previous phases.
Junior high school is the transition step where the childhood is change to adolescence, also the way
they think will be different from the concrete to the abstract. Base on Pigaet’s development level,
junior high school student with the range of age 11-15 years old are the level of the evolve of formal
operation. In this step, they start to realize the limitations of themselves and begin to wrestle with the
concepts outside from their experiences. The reality shows, that many students are knows just about
the theory and hard to practice it in real life. Supposedly, learning science in this case Physics the
students are accustomed to using the ability of reasoning, especially formal reasoning skills or
analytical logical thinking. It will make the students are not just memorize the theories and they can
apply it in real situations so that the learning process will become meaningful. The poor quality of
science learning process is the impact in using inappropriate learning model. The learning model
which is used now is the direct learning model (MPL) that emphasizes only the product and it does
not involve the students in a whole practice also lack of emphasis in competence and attitude. The
effects of direct learning models during the learning process are demeaning their scientific skills and
formal reasoning abilities because the learning processes just focus for transferring knowledge from
the teacher to the student. The often things happen this time is lack of practical activities because of
deficient of time in study and less of the adequate facilities.
Starting to the gap that described above, then we need to improve the process and the models of
learning that innovative in order to develop students’ abilities in their study of science. To make it
real, we could use one of learning process that is Problem Based Learning, it will be not only
empower science as a product but also as a process and attitude especially for the improvement of
formal reasoning abilities and science process skills. There are some characteristics of problem based
learning (1) student-centered used in learning process. (2) Form the small groups in study section (4)
teachers as adviser and as who give some facilities (5) through self-direct learning students can get a
new information and the last (6) Problems can be the way to hone problem solving skills. The use of
problem based learning is expected can increase student abilities in formal reasoning and science
process skills.
This study aims to analyze differences such as (1) Formal reasoning skills and science process skills
abilities. (2) To find out the comparison between the students use direct learning model with the
student use problem based learning in school.
2. Methods The types of research
This research was made to compare between two different kinds of learning models. These
two models have an impact on the two dependent variables that is formal reasoning skills and science
process skills. This research is a quasi-experimental because its variables and the conditions of the
experiment are not regulated tightly.

131
Research Design Posttest control only group design used in this research. It is aim to probe differences in formal
reasoning abilities and students’ science process skills between the control group and experiment
group where the students are different.
The Population and the Samples of the research
The population of this study is the second grade student from Junior high school at Gerokgak
Buleleng, Bali in first semester on 2019/2020. There are 288 students follow this research which is
spread in nine classes. Simple random sampling is the way how to choose the sample as the class
control and experiment class (Sugiyono, 2014). Before being as a research sample, classes have to test
for equality to make sure that the classes used as a sample are equivalent to one and another. To know
it has equivalence, we can see it from the result of their science exam in second semester in
2018/2019 school year. The next step is to analyze it using the t-test for an independent sample.
Variable of Research There are two variables in this research, one of them is Independent variable and the other one is
Dependent variable. We use (X) for Independent Variable, then for both formal reasoning skills (Y1)
and science process skills (Y2) that is Dependent Variables.
Technique of Data Collection The techniques that used in this study are non-test technique and test technique. We choose exam with
multiple choice to know about formal reasoning skills of the students, these exam held a few
minutes before class have done (Posttest). And for science process skills the test that given to the
students are analysis test for testing technique and observation sheet for non-testing technique.
Instrument of this research are Lesson Plan, Students Work Sheet and an Essay of science process
skills, Observation sheet and test with multiple choice of formal reasoning skills.
3. Research and Discussion
The result of this data research is a students’ posttest score that taken a few minutes before the
learning process end. The score of each formal reasoning and science process skills among
experiment group and control group analyzed with parametric test as known as MANOVA test. This
test used to determine significant differences among control group and experiment group. The first
test that we have to do before conducting the MANOVA test is to test it with prerequisite tests there
are the test for normality, homogeneity and co-llinearity test. The average comparison of the value for
formal reasoning abilities and science process skills in both students who studied with the problem
based learning and the students who studied with the direct learning model can be seen on the Fig 1.
100 83.78
77.94
78.82
67.42
50
0
KPF
KPS
Eksperimen
Kontrol
Fig.1 a comparison of average posttest result of the formal reasoning abilities and science process skills.

132
The average value for formal reasoning abilities with problem based learning is 83,78 which
is in the high category. And the value for formal reasoning abilities that studied use direct learning
process is 77,94, it can be describe that the score for formal reasoning abilities use problem based
learning is higher than direct learning process. The description of the posttest data from process
science skills that use study of problem based learning model have the average value in 78,82 that’s in
high category. And the average value of the process science skills data posttest where the learning
model is direct learning get the score 67,42 it is in enough category. Hypothesis test result of the
effect of problem based learning on formal reasoning abilities and science process skills are presented
in table 1.
Table 1 . Multivariate Testsb
Hypothe Error Signifi
Effect Value F sis df df kansi
Intercept Pillai's Trace 0,998 1,614 x 104a
2 61 0,001
Wilks' Lambda 0,002 1,614 x 104a
2 61 0,001
Hotelling's Trace 529,307 1,614 x 104a
2 61 0,001
Roy's Largest
529,307
1,614 x 104a
2 61 0,001
Root
Learning Pillai's Trace 0,598 45,390a
2 61 0,001
Wilks' Lambda 0,402 45,390a
2 61 0,001
Hotelling's Trace 1,488 45,390a
2 61 0,001
Roy's Largest
1,488
45,390a
2 61 0,001
Root
a. Exact statistic
b. Design: Intercept + Learning
Based on the table number 1 is obtained the statistic value Pillai’s Trace, Wilks’Lambda,
Hotelling’s Trace,dan Roy’s Largest Root each F=45,3900 and have significance 0,000 less than 0,05
with the result that is rejected. So, this result explain that the students’ formal reasoning skills and
process science skills which is studied in problem based learning model is have differences with both
of them studied in directly learning models. The result of analyze second hypothesis are done by
looking at the table test of between subject effect at the outcome of MANOVA test. It is presented in
the following table 2 below.

133
From the table 2, we get the value F at the variable formal reasoning in the amount
of 37,796 with Tests of Between-Subjects Effects
Signi
Type III Sum Mean fican
Source Dependent Variable of Squares Df Square F ces
Corrected Formal Reasoning 95,063a
1 95,063 37,796 0,001
Model
Science_process_
333,063b
1 333,063 54,494 0,001
skills
Intercept Formal Reasoning 60025,000 1 60025,000 2,38 x10⁴
0,001
Science_process_ 54756,000 1 54756,000 8,959x103 0,001
skills
Pembelajaran Formal Reasoning 95,062 1 95,062 37,796 0,001
Science_process_
333,062 1 333,062 54,494 0,001
skills
Error Formal Reasoning 155,938 62 2,515
Science_process_
378,938 62 6,112
Skills
Total Formal Reasoning 60276,000 64
Science_process_
55468,000 64
skills
Corrected Formal Reasoning 251,000 63
Total
Science_process_
712,000 63
skills
a. R Squared = 0,379 (Adjusted R Squared = 0,369)
b. R Squared = 0,468 (Adjusted R Squared = 0,459)
the significance score 0,000. If it compared to 5% of significance level, its significance value is
smaller, it can be decided to refuse . Therefore, can be conclude that there are differences between
formal reasoning skills of the students who studied with the problem based learning model and they
who studied use directly learning model.

134
The result of the analysis of the third hypothesis in table test of between subject effects at
the output of MANOVA test. It will be in table 3.
Table 3. Tests of Between-Subjects Effects
Signi
Type III Sum Mean fikan
Source Dependent Variable of Squares df Square F si
Corrected Formal Reasoning 95,063a
1 95,063 37,796 0,001
Model
Science_process_
333,063b
1 333,063 54,494 0,001
skills
Intercept Formal Reasoning 60025,000 1 60025,000 2,38 x10⁴
0,001
Science_process_ 54756,000 1 54756,000 8,959x103 0,001
skills
Pembelajaran Formal Reasoning 95,062 1 95,062 37,796 0,001
Science_process_
333,062 1 333,062 54,494 0,001
skills
Error Formal Reasoning 155,938 62 2,515
Science_process_
378,938 62 6,112
Skills
Total Formal Reasoning 60276,000 64
Science_process_
55468,000 64
skills
Corrected Formal Reasoning 251,000 63
Total
Science_process_
712,000 63
skills
a. R Squared = 0,379 (Adjusted R Squared = 0,369)
b. R Squared = 0,468 (Adjusted R Squared = 0,459)
In table 3 obtained the F value on the variable science process skills is about 54,494 with
the significance value 0,000. If it compared to 5% significance level then the significance value that
found is smaller. It is mean refused. Therefore, can be conclude that there are differences between
formal reasoning skills of the students who studied with the problem based learning model and they
who studied use Directly Learning Model.
135
The analysis data researched of the Problem Based Learning model have a significant effect
to the formal reasoning skills and science process skills of the students. It can be found in the
differences of the average result that the problem based learning better than Directly Learning Model.
Based on the MANOVA test the student that studied with the Problem Based Learning have
a better value of formal reasoning skills and science process skills than the students that studied with
the Directly Learning Model.
It can be seen from the analysis of Pillai's Trace, Wilks' Lambda, Hotelling's Trace, dan
Roy's Largest Root that indicate Fcount = 45,390 and p(0,000) <0,05 so that H0 refused and H1
received, which is means there is significant differences in Formal Reasoning Skills and Science
Process Skills that have studied with Problem Based learning Model and Directly Learning Model.
4. Conclution
The result of the research about the effect of Problem Based Learning Model to Formal
Reasoning Skills and Science Process Skill are there are significant differences between both of the
learning models that the students who studied in Problem Based Learning model are have the better
value and they can increase their skills higher than the students who use Directly Learning Model.
References [1] Amri, S. & Ahmadi, I.K. 2010. Proses pembelajaran kreatif dan inovatif dalam kelas. Jakarta:
PT.Prestasi Pustakarya. [2] Carin, Arthur. A. 1993. Teaching modern science. New York: Macmillan Publishing
Company. [3]Dahar, R W. 2006. Teori Belajar dan Pembelajaran. Jakarta: Erlangga. [4] Harlen, W. 1992. Teahing of science. London: David Fulton Publisher.
[5] Hergenhahn. 2008. Theories of leraning. Edisi Ketujuh. Jakarta: Kencana Pranada.
[6]Ozgelen, S. (2012). Students science process skills within a cognitive domain framework. Eurasia Journal of Mathematics Science & Technology Education. 8(4). 238-292.
[7] Sadia, I. W. 2014. Model-model pembelajaran sains kontruktivistik. Yogyakarta: Graha
Ilmu. [8] Sugiyono. 2014. Metode penelitian kuantitatif, kualitatif, dan r&d. Bandung: Alfabeta. [9] Tawil, M. 2005. Pengaruh Kemampuan Penalaran Formal Terhadap Hasil Belajar Fisika Siswa
Kelas II SLTP Negeri 1 Sungguminasa Kabupaten Goa. Skripsi. Makasar: FMIPA UMN.
136
Fish Abundance in The Estuary of Cianjur, West Java Based
on Temporal of Lunar Cycles and Spatial Differences
E Paujiah*1 A Mas’ud
1, Wilman Taupik Ardiansyah
1
1Department of Biology Eduction, Faculty of Tarbiyah and Teacher Training, UIN
Sunan Gunung Djati, Bandung, Jl. AH. Nasution, No. 105, Cibiru, Bandung
Corresponding author: [email protected]
Abstract. Information on the abundance of resources in time and space is a prerequisite for
the success of any fishing operation. The present study is an attempt to evaluate the effect of
the lunar cycle and spatial differences on the abundance of fish. Catch rates recorded at
different place and time (29.5-d lunar cycles) and was catched using line gear with mesh size
of 0,5”, 1” and 2”. Observations made on new moon, full moon and during both quarters
revealed variations in total catch as well as individual species catch in gillnetters. The results
of the present study indicated that there is a significant effect of the lunar cycle on the catch
rate of fish community occurring in the estuaries in Cianjur Regency, West Java. In trawl
catches, Mystus gulio and Terapon jarbua were caught in all lunar phase. There are 10 species
can found in one of lunar phase. Based on spatial differences, Glossogobius circumspectus,
Gerres filamentosus, Mystus gulio, Liza tade and Terapon jarbua can found at all location. Results suggest that lunar cycles influence catch rates for some of the estuaries fish species
examined. In addition, this habitat plays an important role in the maintenance of the ecological
functioning of the estuarine–coastal ecosystem.
1. Introduction
The Estuary ecosystem with its characteristics that have a high habitat complexity becomes an
interesting study in studying the structure of animal communities, especially fish as residents of the
aquatic environment. The existence of environmental changes caused by natural and artificial
processes can have an effect on the presence of organisms in it such as fish [1] [2]. Fish communities
in estuarine habitats have different dynamic patterns based on time as well as the moon phase [3] and
location [4]. Based on time, this month's phase can affect fishing performance, capture time and
survival of fish [5]. Whereas based on location, the characteristics of different habitats can determine
differences in fish species that inhabit it [6].
The estuary of Cianjur Regency, West Java, Indonesia is an estuary whose waters originate from a
combination of several large river basins with each different river characteristics. This estaury has
water conditions where the proces of mixing sea water and river does not always take place. Another
characteristics in this estuary is the existence of environmental degradation [7] such as over-use of
sand which can disrupt the presence of animal species in it [8] if not managed properly. This is an
interesting thing to study considering the complexity of habitat and time into an appropriate
combination in determining the existence of a species.
The study of the structure of fish communities, especially those related to different times and
places at the river mouth, has not been reported. As for [9], only studied the fish community in one of
the estuaries, the Cisadea River. Not only additional about information of fish biodiversity, but this
information can used for decision of catching fish time. As the first step for conservation about
existance of animal water especially fish community. The objective of the present paper is to measure
the effect of lunar phase, spatial differences and their interactions on the abundance of fish
assemblages in the estuarine environments.
2. Methods
The sampling survey was udertaken at the mouth of estuaries in Cianjur, West Java, Indonesia. This
area features two tidal cycles per day, with a higher difference between high and low waters, ranging
from 30-150 cm (based on preliminary research in dry season). Sampling areas were distributed as
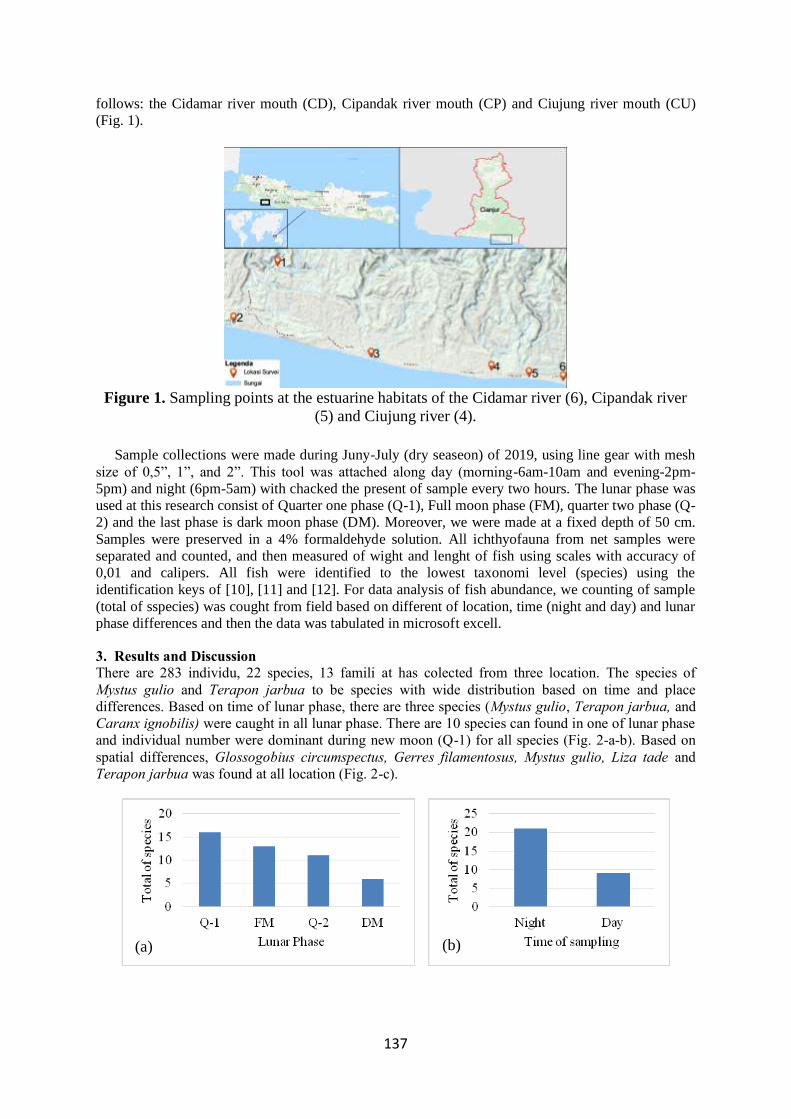
137
follows: the Cidamar river mouth (CD), Cipandak river mouth (CP) and Ciujung river mouth (CU)
(Fig. 1).
Figure 1. Sampling points at the estuarine habitats of the Cidamar river (6), Cipandak river
(5) and Ciujung river (4).
Sample collections were made during Juny-July (dry seaseon) of 2019, using line gear with mesh
size of 0,5”, 1”, and 2”. This tool was attached along day (morning-6am-10am and evening-2pm-
5pm) and night (6pm-5am) with chacked the present of sample every two hours. The lunar phase was
used at this research consist of Quarter one phase (Q-1), Full moon phase (FM), quarter two phase (Q-
2) and the last phase is dark moon phase (DM). Moreover, we were made at a fixed depth of 50 cm.
Samples were preserved in a 4% formaldehyde solution. All ichthyofauna from net samples were
separated and counted, and then measured of wight and lenght of fish using scales with accuracy of
0,01 and calipers. All fish were identified to the lowest taxonomi level (species) using the
identification keys of [10], [11] and [12]. For data analysis of fish abundance, we counting of sample
(total of sspecies) was cought from field based on different of location, time (night and day) and lunar
phase differences and then the data was tabulated in microsoft excell.
3. Results and Discussion
There are 283 individu, 22 species, 13 famili at has colected from three location. The species of
Mystus gulio and Terapon jarbua to be species with wide distribution based on time and place
differences. Based on time of lunar phase, there are three species (Mystus gulio, Terapon jarbua, and
Caranx ignobilis) were caught in all lunar phase. There are 10 species can found in one of lunar phase
and individual number were dominant during new moon (Q-1) for all species (Fig. 2-a-b). Based on
spatial differences, Glossogobius circumspectus, Gerres filamentosus, Mystus gulio, Liza tade and
Terapon jarbua was found at all location (Fig. 2-c).
(a) (b)
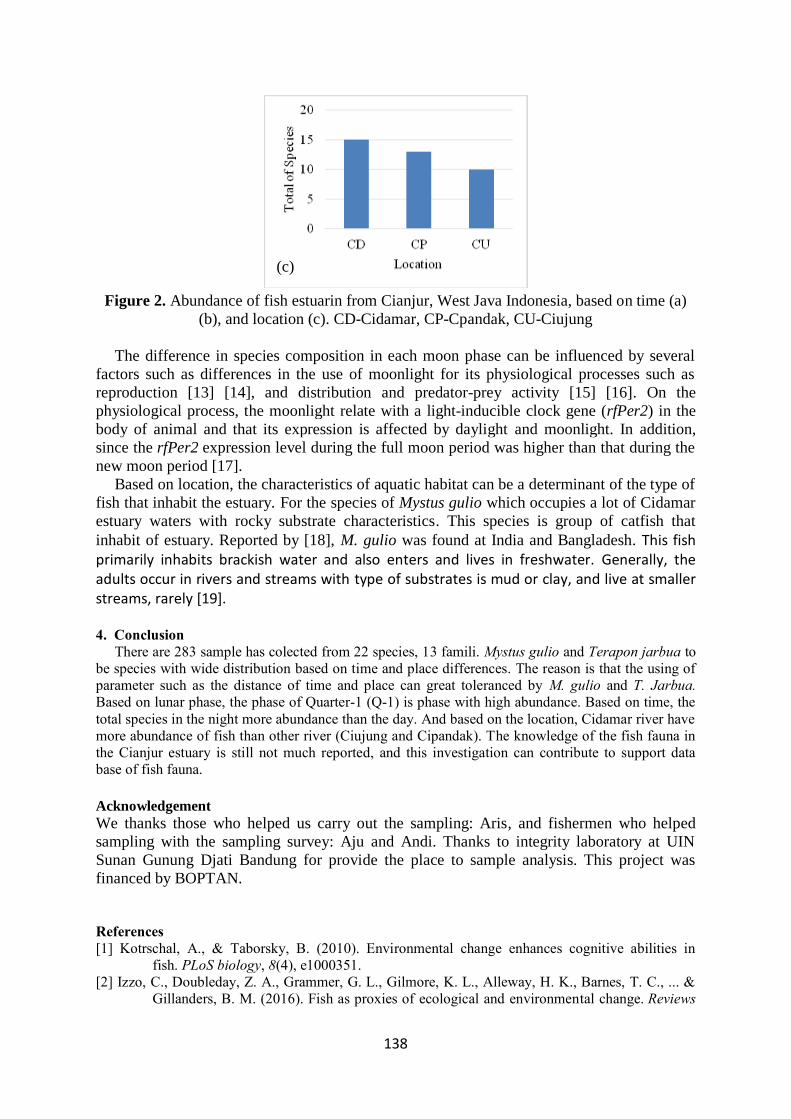
138
Figure 2. Abundance of fish estuarin from Cianjur, West Java Indonesia, based on time (a)
(b), and location (c). CD-Cidamar, CP-Cpandak, CU-Ciujung
The difference in species composition in each moon phase can be influenced by several
factors such as differences in the use of moonlight for its physiological processes such as
reproduction [13] [14], and distribution and predator-prey activity [15] [16]. On the
physiological process, the moonlight relate with a light-inducible clock gene (rfPer2) in the
body of animal and that its expression is affected by daylight and moonlight. In addition,
since the rfPer2 expression level during the full moon period was higher than that during the
new moon period [17].
Based on location, the characteristics of aquatic habitat can be a determinant of the type of
fish that inhabit the estuary. For the species of Mystus gulio which occupies a lot of Cidamar
estuary waters with rocky substrate characteristics. This species is group of catfish that
inhabit of estuary. Reported by [18], M. gulio was found at India and Bangladesh. This fish primarily inhabits brackish water and also enters and lives in freshwater. Generally, the adults occur in rivers and streams with type of substrates is mud or clay, and live at smaller streams, rarely [19].
4. Conclusion
There are 283 sample has colected from 22 species, 13 famili. Mystus gulio and Terapon jarbua to
be species with wide distribution based on time and place differences. The reason is that the using of
parameter such as the distance of time and place can great toleranced by M. gulio and T. Jarbua.
Based on lunar phase, the phase of Quarter-1 (Q-1) is phase with high abundance. Based on time, the
total species in the night more abundance than the day. And based on the location, Cidamar river have
more abundance of fish than other river (Ciujung and Cipandak). The knowledge of the fish fauna in
the Cianjur estuary is still not much reported, and this investigation can contribute to support data
base of fish fauna.
Acknowledgement
We thanks those who helped us carry out the sampling: Aris, and fishermen who helped
sampling with the sampling survey: Aju and Andi. Thanks to integrity laboratory at UIN
Sunan Gunung Djati Bandung for provide the place to sample analysis. This project was
financed by BOPTAN.
References
[1] Kotrschal, A., & Taborsky, B. (2010). Environmental change enhances cognitive abilities in
fish. PLoS biology, 8(4), e1000351.
[2] Izzo, C., Doubleday, Z. A., Grammer, G. L., Gilmore, K. L., Alleway, H. K., Barnes, T. C., ... &
Gillanders, B. M. (2016). Fish as proxies of ecological and environmental change. Reviews
(c)
139
in Fish Biology and Fisheries, 26(3), 265-286.
[3] Lacerda, C. H. F., Barletta, M., & Dantas, D. V. (2014). Temporal patterns in the intertidal faunal
community at the mouth of a tropical estuary. Journal of fish biology, 85(5), 1571-1602.
[4] Robinson, T. P., Wint, G. W., Conchedda, G., Van Boeckel, T. P., Ercoli, V., Palamara, E., ... &
Gilbert, M. (2014). Mapping the global distribution of livestock. PloS one, 9(5), e96084.
[5] Poisson, F., Gaertner, J. C., Taquet, M., Durbec, J. P., & Bigelow, K. (2010). Effects of lunar
cycle and fishing operations on longline-caught pelagic fish: fishing performance, capture
time, and survival of fish. Fishery Bulletin, 108(3), 268-281.
[6]Pittman, S. J., & Brown, K. A. (2011). Multi-scale approach for predicting fish species
distributions across coral reef seascapes. PloS one, 6(5), e20583.
[7]Rosyadi, R. (2014). Sistem pengetahuan lokal masyarakat Cidaun–Cianjur Selatan sebagai wujud
adaptasi budaya. Patanjala: Jurnal Penelitian Sejarah dan Budaya, 6(3), 431-446.
[8]Furlan, N., Esteves, K. E., & Quináglia, G. A. (2013). Environmental factors associated with fish
distribution in an urban neotropical river (Upper Tietê River Basin, São Paulo,
Brazil). Environmental biology of fishes, 96(1), 77-92.
[9]Paujiah, E., Solihin, D. D., & Affandi, R. (2017). Struktur trofik komunitas ikan di Sungai Cisadea
Kabupaten Cianjur, Jawa Barat [Trophic structure of fish community in Cisadea River,
Cianjur, Jawa Barat]. Jurnal Iktiologi Indonesia, 13(2), 133-143.
[10]Kottelat M, Whitten AJ, Kartikasari SN, Wirjoatodjo S. (1993). Freshwater fishes of Western
Indonesia and Sulawesi. Hongkong: Periplus Editions. 291 p.
[11]Lim KKP, Ng PKL. (2000). A Guide to The Freshwater Fishes of Singapore. Singapore:
Singapore Science Centre. 160 p.
[12]Rachmatika I. (2003). Fish Fauna of The Gunung Halimun National Park, West Java. Jakarta:
Biodiversity Conservation Project LIPI-JICA-PHKA. 126 p.
[13][14]Ikegami, T., Takeuchi, Y., Hur, S. P., & Takemura, A. (2014). Impacts of moonlight on fish
reproduction. Marine genomics, 14, 59-66. [15]Takemura, A., Susilo, E. S., Rahman, M. S., & Morita, M. (2004). Perception and possible
utilization of moonlight intensity for reproductive activities in a lunar‐ synchronized
spawner, the golden rabbitfish. Journal of Experimental Zoology Part A: Comparative
Experimental Biology, 301(10), 844-851.
[16]Kronfeld-Schor, N., Dominoni, D., de la Iglesia, H., Levy, O., Herzog, E. D., Dayan, T., &
Helfrich-Forster, C. (2013). Chronobiology by moonlight. Proceedings of the Royal Society
B: Biological Sciences, 280(1765), 20123088. [17]Griffin, P. C., Griffin, S. C., Waroquiers, C., & Mills, L. S. (2005). Mortality by moonlight:
predation risk and the snowshoe hare. Behavioral Ecology, 16(5), 938-944.
[18]Sugama, N., Park, J. G., Park, Y. J., Takeuchi, Y., Kim, S. J., & Takemura, A. (2008). Moonlight
affects nocturnal Period2 transcript levels in the pineal gland of the reef fish Siganus
guttatus. Journal of Pineal Research, 45(2), 133-141. [19]Alam, M. J., Begum, M., Islam, M. A., & Pal, H. K. (2006). Spawning behaviour and induced
breeding of an estuarine catfish, Mystus gulio (Ham.). Bangladesh Journal of Fisheries
Research, 10(2), 101-109. [20]Talwar P.K., Jhingran A.G. (1991). Inland fishes of India and adjacent countries. Vol-1 and Vol-
2. Oxford and IBH Publishing Co. Pvt. Ltd. New Delhi, Bombay and Calcutta. 1063 p.

140
Water Quality Management for Surface Water Resources:
System Dynamics (SD) Approach
Hendra Andiananta Pradana1, Elida Novita2*, Bambang Herry Purnomo2, Amelia Ika Puspitasari1
1Agricultural of Water Resources Management, Postgraduate University of Jember,
Jember, Indonesia 2Faculty of Agricultural Technology, University of Jember, Jember, Indonesia
*E-mail: [email protected]
Abstract. Water resources pollution is one of the crucial problems in the world. The
dynamics of watersheds affect water pollution in the river. The approach to water
quality management in the river must be holistic or comprehensive and sustainable.
System Dynamics (SD) as an approach for described water quality management in
watershed such us social, economic, and environmental aspects. The simulation
represented positive and negative feedback of the overall aspect in SD as input for
water quality management. The focus of the research was described the construction
of a dynamic system model of pollution load flow as a basis for sustainable Bedadung
River water management efforts based on social, economic, and environmental
components. Input aspect in causal loop diagram (CLD) was social (domestics
wastewater), economic (agricultural, livestock, hospital, and industry), and
environmental (carrying capacity of the watershed). The CLD of SD simulation
described positive and negative feedback mutual aspects for the water quality of the
river. Negative feedback in SD was wastewater runoff from domestic, agricultural,
livestock, and industrial. Positive feedback in SD was a total maximum daily load
(TMDL). The water quality management in watershed used SD model as
consideration to decision making support of sustainable river condition by
stakeholder and government.
Keywords: system dynamics (SD), pollution load, bedadung watershed, sustainable
1. Introduction The environment is dynamically changing from time to time. Living beings must adapt to
survive in the environment. One of the environmental adaptation is water resource management.
Water resource management is related to watersheds [1]. The management must consider the
condition of quality and quantity of water resources which fluctuates frequently.
The watershed has an important role as a provider of surface water sources. However, several
studies state that some of the Big Rivers in Indonesia have bad water quality [2]. The results of the
2016 Asian Development Bank report explained that several rivers in Indonesia are polluted [3]. The
phenomenon of river water pollution is caused by the changing of natural processes and
anthropogenic activities. This phenomenon occurs in several major rivers in East Java [4]. Some of
the major rivers in East Java that have been hit by pollutants are Brantas River, Surabaya River, and
Bedadung River. The study conducted by Suwari et al. (2011) on the status of Surabaya River water
quality show in heavily polluted conditions[5]. In line with these conditions, Bedadung River has a
Water Quality Index value in 2016 of 50.75 which belongs to the lowest parameters of BOD, COD,
TSS and Total Coli [6]. Another study stated that urban activities in Jember Regency make Bedadung
River becomes heavily polluted. Some districts that belong to Bedadung River is in Patrang,
Sumbersari, Kaliwates and Mangli Districts [7]. The consequence of this decreased water quality is to
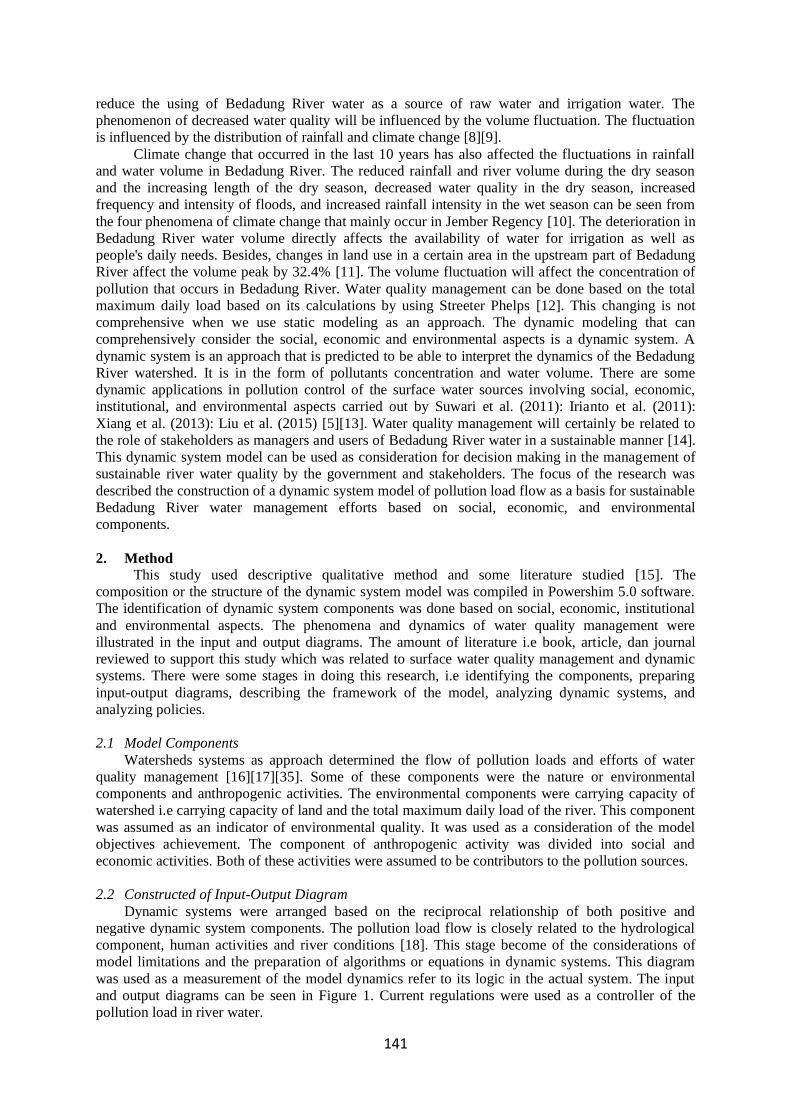
141
reduce the using of Bedadung River water as a source of raw water and irrigation water. The
phenomenon of decreased water quality will be influenced by the volume fluctuation. The fluctuation
is influenced by the distribution of rainfall and climate change [8][9].
Climate change that occurred in the last 10 years has also affected the fluctuations in rainfall
and water volume in Bedadung River. The reduced rainfall and river volume during the dry season
and the increasing length of the dry season, decreased water quality in the dry season, increased
frequency and intensity of floods, and increased rainfall intensity in the wet season can be seen from
the four phenomena of climate change that mainly occur in Jember Regency [10]. The deterioration in
Bedadung River water volume directly affects the availability of water for irrigation as well as
people's daily needs. Besides, changes in land use in a certain area in the upstream part of Bedadung
River affect the volume peak by 32.4% [11]. The volume fluctuation will affect the concentration of
pollution that occurs in Bedadung River. Water quality management can be done based on the total
maximum daily load based on its calculations by using Streeter Phelps [12]. This changing is not
comprehensive when we use static modeling as an approach. The dynamic modeling that can
comprehensively consider the social, economic and environmental aspects is a dynamic system. A
dynamic system is an approach that is predicted to be able to interpret the dynamics of the Bedadung
River watershed. It is in the form of pollutants concentration and water volume. There are some
dynamic applications in pollution control of the surface water sources involving social, economic,
institutional, and environmental aspects carried out by Suwari et al. (2011): Irianto et al. (2011):
Xiang et al. (2013): Liu et al. (2015) [5][13]. Water quality management will certainly be related to
the role of stakeholders as managers and users of Bedadung River water in a sustainable manner [14].
This dynamic system model can be used as consideration for decision making in the management of
sustainable river water quality by the government and stakeholders. The focus of the research was
described the construction of a dynamic system model of pollution load flow as a basis for sustainable
Bedadung River water management efforts based on social, economic, and environmental
components.
2. Method
This study used descriptive qualitative method and some literature studied [15]. The
composition or the structure of the dynamic system model was compiled in Powershim 5.0 software.
The identification of dynamic system components was done based on social, economic, institutional
and environmental aspects. The phenomena and dynamics of water quality management were
illustrated in the input and output diagrams. The amount of literature i.e book, article, dan journal
reviewed to support this study which was related to surface water quality management and dynamic
systems. There were some stages in doing this research, i.e identifying the components, preparing
input-output diagrams, describing the framework of the model, analyzing dynamic systems, and
analyzing policies.
2.1 Model Components
Watersheds systems as approach determined the flow of pollution loads and efforts of water
quality management [16][17][35]. Some of these components were the nature or environmental
components and anthropogenic activities. The environmental components were carrying capacity of
watershed i.e carrying capacity of land and the total maximum daily load of the river. This component
was assumed as an indicator of environmental quality. It was used as a consideration of the model
objectives achievement. The component of anthropogenic activity was divided into social and
economic activities. Both of these activities were assumed to be contributors to the pollution sources.
2.2 Constructed of Input-Output Diagram
Dynamic systems were arranged based on the reciprocal relationship of both positive and
negative dynamic system components. The pollution load flow is closely related to the hydrological
component, human activities and river conditions [18]. This stage become of the considerations of
model limitations and the preparation of algorithms or equations in dynamic systems. This diagram
was used as a measurement of the model dynamics refer to its logic in the actual system. The input
and output diagrams can be seen in Figure 1. Current regulations were used as a controller of the
pollution load in river water.
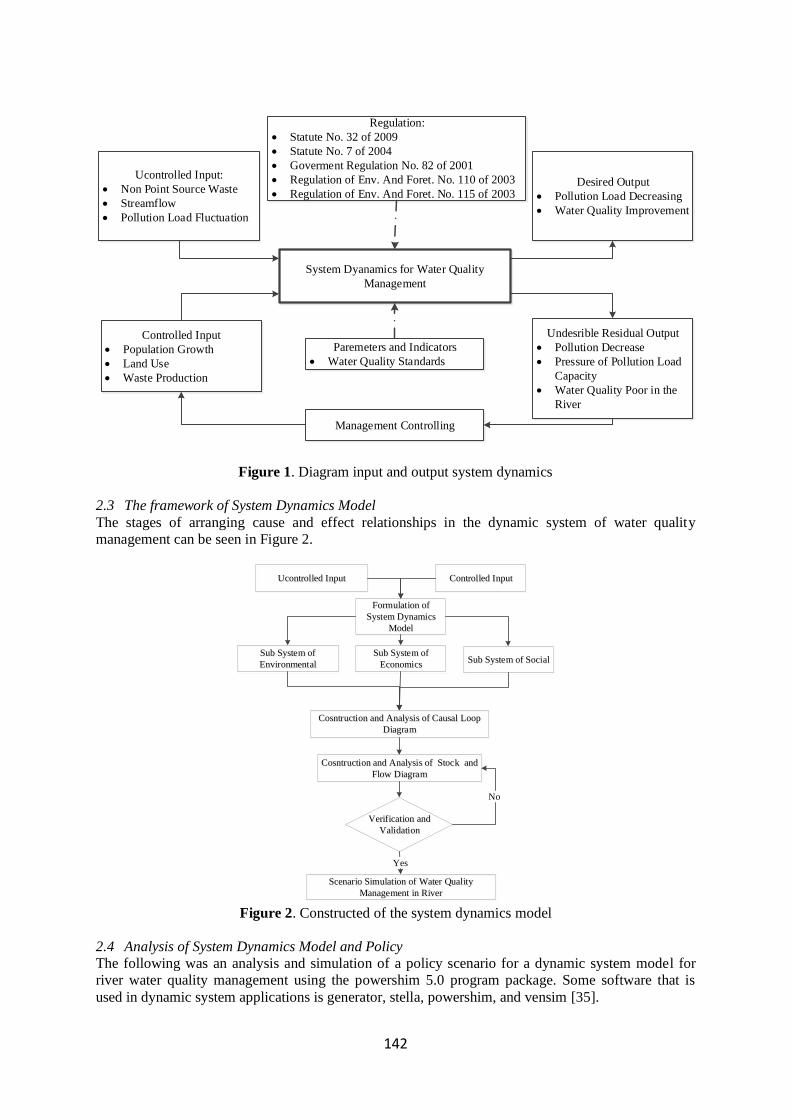
142
System Dyanamics for Water Quality
Management
Paremeters and Indicators
Water Quality Standards
Regulation:
Statute No. 32 of 2009
Statute No. 7 of 2004
Goverment Regulation No. 82 of 2001
Regulation of Env. And Foret. No. 110 of 2003
Regulation of Env. And Foret. No. 115 of 2003
Ucontrolled Input:
Non Point Source Waste
Streamflow
Pollution Load Fluctuation
Controlled Input
Population Growth
Land Use
Waste Production
Desired Output
Pollution Load Decreasing
Water Quality Improvement
Undesrible Residual Output
Pollution Decrease
Pressure of Pollution Load
Capacity
Water Quality Poor in the
River
Management Controlling
Figure 1. Diagram input and output system dynamics
2.3 The framework of System Dynamics Model
The stages of arranging cause and effect relationships in the dynamic system of water quality
management can be seen in Figure 2.
Controlled InputUcontrolled Input
Formulation of
System Dynamics
Model
Sub System of SocialSub System of
Environmental
Cosntruction and Analysis of Causal Loop
Diagram
Cosntruction and Analysis of Stock and
Flow Diagram
Scenario Simulation of Water Quality
Management in River
Sub System of
Economics
Verification and
Validation
Yes
No
Figure 2. Constructed of the system dynamics model
2.4 Analysis of System Dynamics Model and Policy
The following was an analysis and simulation of a policy scenario for a dynamic system model for
river water quality management using the powershim 5.0 program package. Some software that is
used in dynamic system applications is generator, stella, powershim, and vensim [35].

143
a. The model design was done with a top-down approach, which means the main model was built
first then later will be broken down into sub-models to determine the causal relationship between
components, variables, and parameters of the model.
b. Causal Loop Diagrams were used in the inventory of data. The data from initial observations were
then identified to obtain some patterns of interaction between variables and parameters in the real
system of river water quality management. This diagram represented the interactions between
some components of both positive and negative model. The variables in the causal loop diagram
were still intact general variables which will then be broken down according to the requirements
in the Stock and Flow Diagram (SFD) in the form of Bedadung River water quality conditions,
land use, domestic activities, and economic activities in the Bedadung River Watershed in Jember
Regency.
c. The next step is to insert the formulation into the dynamic system model and continue the process
with testing [19]. This test consists of system verification and validation. Verification is used to
compare the structure of the model and its behavior with the structure and behavior of the system
in actual conditions so that the model can represent the real system and can be simulated in the
SFD [20][21].
d. The policy analysis was carried out based on scenarios created after the results of the SFD output
are simulated. This scenario considered some expectations of the likelihood of occurrence or
expectations of the possibility of anticipatory policies due to the adoption of land use policies on
river water quality in Bedadung River watershed based on their allotment [22][23].
e. The decision was made based on the results of policy analysis. The policy analysis refers to a
simulation of the total dynamic potential of the pollution load. Then it was associated with the
total maximum daily load (TDML) as an environmental indicator. This comparison was used as
an alternative strategy for river water quality management based on the achievement timing of
river quality standards according to their allocations.
3. Result dan Discussion 3.1 Model Conceptualization
The dynamic system approach simplifies the actual phenomenon of pollution loads flow of
the river in the form of simple simulations in the 5.0 powershim program. The results of the
conceptualization of pollution loads flow of the river can be seen in Figure 3. The concept of river
water quality management must consider the sustainable component in the form of social, economic,
and environmental aspects [24]. There is a reference to the development and application of dynamic
system models in Indonesia related to surface water quality management which was carried out by
Suwari et al. (2011) and Irianto et al. (2011). The results of the study in the Surabaya River show that
the pollution dynamics and community participation can be described by a dynamic system [5]. In
line with this research, the dynamic system can represent the dynamics of effluent nutrients N and P
to the Jatiluhur Reservoir from anthropogenic activity [13]. These components were then inputted to
some variables and parameters of surface water quality management, specifically rivers.
The results of the conceptualization of the pollution load as a consideration of sustainable
water quality management are described in the component relationships in the causal loop diagram
(CLD). The explanation is obtained founded on a break down of some relations between variables and
parameters qualitatively [19]. The following was a component description in the dynamic system sub-
models.
a. Sub System of Environmental
The dynamics or environmental behavior described in the CLD i.e the carrying capacity of
land and the total maximum daily load of the river. The indicator of environmental quality was
approached as the carrying capacity of a watershed. The factors that influence pollution load were the
concentration of pollutants and river water discharge. The dynamics or discharge fluctuations are
influenced by rainfall and hydrological conditions of a certain area [9]. The prediction of discharge is
influenced by rainfall values [25]. This condition was able to reflect the influence of climate-changing
on the pollution loads dynamics. The relationship between discharge and pollution load is positive

144
feedback. However, the correlation of pollution loads with water quality is negative feedback. High
pollution load value has the potential to deteriorate the river water quality. The key parameters of
water quality aspects are Total Solid Suspended (TSS), Chemical Oxygen Demand (COD), and
Biochemical Oxygen Demand (BOD). This parameter becomes one of the reference parameters in the
management of river water quality based on physical and chemical parameters of pollutants [2], [26].
These three key parameters are used as a basis for determining Total maximum daily load. The results
of the study by Musemic et al. (2015), the BOD auto purification comparison can be modeled with a
dynamic system [27]. Thus, indicators of the achievement of model objectives based on water quality
parameters are under their allotment.
The dynamics of the land capacity in Bedadung watershed depend on the proportion of land
use for industries, settlements, hospitals, agriculture, and stockbreeding. The total land area is the
capacity of available land. It is used as sub variable input. If the total land was not able to meet the
manifestations of land use. The assumption of land-use change can be applied to this sub-model.
Agricultural land contributes directly to the pollution load in rivers. Therefore, the dynamic changes
in agricultural land will affect the potential pollution load in the agricultural sector [28], [29].
b. Sub System of Social
The social sub-model as input for the environmental sub-model is the domestic activity.
These activities will produce wastewater and solid waste (garbage) and will be a contributor to the
pollution load in the river [5],[30]. The factors that influence the accumulation of pollution load from
domestic activities were delivery load (DL), the effluent factor of each parameter, and the equivalent
ratio. Solid waste or rubbish also contributes to the river pollution load, especially organic waste [31].
The relationship between organic waste and pollution load were BOD, COD, and TSS emission
factors. It was influenced by the amount of unprocessed waste. The relationship between inorganic
waste and river pollution load was indirect. However, the consequences of exposure to inorganic
waste in rivers caused the river looks worse. It also reduced the oxygen supply in water which causes
anaerobic waters. It can cause the flood to happen. The dominant factor influencing the dynamics of
potential domestic pollution loads was the population growth.
c. Sub System of Economics
The industrial, livestock and agricultural activities were identified as contributors to the
pollution load in the sub-economic model. Industrial activities will affect the Gross Domestic Product
(GDP) and waste production [17][19][32]. Industrial and hospital sub-models (services) as
contributors to pollution load have the same pattern and structure. The pollution load which is
generated from the two sectors is the multiplication of the concentrations of COD, BOD, TSS and the
amount of waste generated each day. The number of industries and hospitals influences the dynamics
of the production of potential pollution load. Meanwhile, the sub-model of the agricultural sector
which includes stockbreeding and cultivation of agricultural plants has a different structure.
Farming and agricultural sub-models will be influenced by several components of emission or
effluent factors in generating pollution loads [29]. Livestock pollution load was influenced by the
emissions value of the COD and BOD parameters and the number of livestock. Both components are
directly proportional to the potential pollution load from the livestock activities. The potential
pollution load from the activities of agricultural crop cultivation are agricultural land area, delivery
load, and effluent factors. The dynamics of the potential pollution load from the livestock and
agriculture sub-models in the sequence was the number of livestock, agricultural land area, and
delivery load.

145
Stream
Flow
Pollution
Load
Water
Quality
Rainfall
TSS, COD,
and BOD
Parameters
+
Population
GrowthDomestic
Wastewater
Wastewater
Concentration
Solid
Wastewater
Economic
Activities
+
+
+
AgricultureIndustry
Hospital
+
+
+
+
+
Agricultural
Area
Settlement
Area
Conservation
Area
-
+
-
+
+
Enviromental
Aspect
+
+
Economic Aspect
Social Aspect
Livestock
+
+
Enviromental
Management
Cost
+
+
-
+
-
+
--+
-
-
Figure 3. Causal loop diagram for water quality management
The conceptualization of the water quality management model would be used as the basis for
the construction of a stock and flow diagram (SFD). Stock as a component of the model used a fixed
variable input or level. These stages will include algorithms and equations. This variable and
component simulation is done based on dynamic system equations and algorithms. It will
quantitatively describe the dynamics of the pollution load and the capacity of the river pollution load.
The feasibility of this dynamic system application was gained based on the results of testing the
structure of the model and the consistency of the output model. Moreover, to examine the level of
confidence in this model, the model testing needs to be done.
Model testing was categorized into two methods, i.e the verification and validation of
dynamic system models. Model verification consists of the model structure that describes the actual or
logical condition, the consistency of the unit, and the behavior of the model. This comparison is done
by comparing real behavior (quantitative comparison behavior). Model validation is in the form of
theoretical validation and output validation with an absolute mean error or means absolute percentage
error [19],[33],[34]. This test is used as a basis for the feasibility of a dynamic system model for river
water quality management in policy-making based on scenarios according to the expectations or
objectives of the model. The test is utilized to assess the effectiveness of scenarios which carried out
with a sensitivity test.
4. Conclusion
Watershed (DAS) has a complex mechanism. The phenomenon of river pollution is influenced by the
dynamics of the watershed. These consequences arise due to hydrological conditions and

146
anthropogenic activity. The hydrological component is in the form of rainfall and water discharge.
The anthropogenic activity as a contributor to the pollution load is in the form of solid and liquid
domestic, industrial, and hospital waste. The SD simulation described positive and negative feedback
mutual aspects based on causal loop diagram. Negative feedback in SD was wastewater runoff from
domestic, agricultural, livestock, and industrial for water quality of the river. Positive feedback in SD
was the total maximum daily load for the water quality of the river. The feasibility testing of the
model is categorized into two methods, i.e the verification and validation of the dynamic system
model. The water quality management in watershed used SD model as consideration to decision
making support of sustainable river conditions by stakeholders and government both in terms of Gross
Domestic Product (GDP), pollution funding or pricing, and environmental management facilities, and
environmental carrying capacity.
5. Acknowledgment
Sending our gratitude to the Ministry of Research, Technology and Higher Education in Grants
project of The Master Thesis Research that has been funding the research and we highly appreciate
related parties who assisted us to finish this research.
6. References [1] R. M. Sánchez-román, M. V. Folegatti, A. M. Guadalupe, O. González, and R. Teixeira,
“Dynamics system approach to assess and manage water resources in river basins,” Sci. Agric.,
vol. 66, no. 4, pp. 427–435, 2009.
[2] R. Y. Tallar and J. Suen, “Identification of waterbody status in Indonesia by using a predictive
index assessment tool,” Int. Soil Water Conserv. Res., vol. 3, no. 3, pp. 224–238, 2015.
[3] Asian Development Bank, Indonesia Country Water Assessment. Manila, 2016.
[4] K. K. Vade, J. Wang, L. Cao, T. Yuan, A. J. McCarthy, and R. Sejar, “Assesment of water
quality and identification of pollution risk locations in Tiaxi River (Taihu Watershed),” Water,
vol. 10, no. 183, pp. 1–18, 2018.
[5] Suwari, E. Riani, B. Pramudya, and I. Djuwita, “A dynamic model for water pollution
controlling in the Surabaya River,” J. Bumi Lestari, vol. 2, no. 11, pp. 234–248, 2011.
[6] Dinas Lingkungan Hidup Provinsi Jawa Timur, an Information document on the performance of environmental management in East Java Province in 2016. 2017.
[7] U. Nurjanah, “Macro bentoz diversity study as a bioindicator of water quality of Bedadung River Jember,” pp. 202–209, 2015.
[8] P. Rejekiningrum, “Impact of climate change on water resources: identification, simulation, and action plan,” J. Sumber Daya Lahan, vol. 8, no. 1, pp. 1–15, 2014.
[9] N. El-jabi, D. Caissie, and N. Turkkan, “Water quality index assessment under climate
change,” J. Water Resour. Prot., vol. 6, pp. 533–542, 2014.
[10] H. Ashari, Z. Hanif, and A. Supriyanto, “Study of extreme climate impacts of high rainfall (La-Nina) on Siam Orange (Citrus Nobilis var. Microcarpa) in Banyuwangi, Jember and Lumajang Regencies,” Planta Trop. J. Agro Sci., vol. 2, no. 1, pp. 49–55, 2017.
[11] R. G. N. Fauzi, D. H. Utomo, and D. Taryana, “The effect of land-use change on peak discharge in Penggung Sub-watershed in Jember Regency,” J. Pendidik. Geogr., vol. 23, no. 1,
pp. 50–61, 2018.
[12] Government Regulation of the Republic of Indonesia No.82 of 2001 about Water Quality
Management and Pollution Control.” Jakarta, pp. 1–32, 2001.
[13] E. W. Irianto, R. Triweko, and D. Yudianto, “Long-term dynamic estimates of water quality
for eutrophication control in the Waduk Jatiluhur,” J. Tek. Hidraul., vol. 3, no. 1, pp. 1–16,
2011.
[14] W. Hatmoko, R. W. Triweko, Radhika, and R. Firmansyah, “Analysis of water resources management policies in river basins with analysis of the main components,” J. Sosek Pekerj.
Umum, vol. 10, no. 1, pp. 1–15, 2018.
[15] H. A. Pradana, E. Novita, S. Wahyuningsih, and R. Pamungkas, “Analysis of deoxygenation

147
and reoxygenation rate in the Indonesia River (a case study: Bedadung River East Java),” in
IOP Conference Series: Earth and Environmental Science, 2019, vol. 243, no. 1.
[16] Y. Wang, X. Zhou, and B. Engel, “Water environment carrying capacity in Bosten Lake
basin,” J. Clean. Prod., vol. 199, pp. 574–583, 2018.
[17] H. Liu, G. Benoit, T. Liu, Y. Liu, and H. Guo, “An integrated system dynamics model
developed for managing lake water quality at the watershed scale,” J. Environ. Manage., vol.
155, pp. 11–23, 2015.
[18] A. Elshorbagy and L. Ormsbee, “Object-oriented modeling approach to surface water quality
management,” Environ. Model. Softw., vol. 21, no. 5, pp. 689–698, 2006.
[19] I. Sharawat, R. P. Dahiya, R. Dahiya, and S. Kumari, “System dynamics approach: a novel
water resource management tool,” Int. J. Environ. Research Dev., vol. 4, no. 4, pp. 297–302,
2014.
[20] E. C. Manfredi et al., “Solid waste and water quality management models for sagarmatha
national park and buffer zone, Nepal,” Mt. Res. Dev., vol. 30, no. 2, pp. 127–142, 2010.
[21] S. Park, B. J. Kim, and S. Y. Jung, “Simulation methods of a system dynamics model for
efficient operations and planning of the capacity expansion of activated-sludge wastewater
treatment plants,” Procedia Eng., vol. 70, pp. 1289–1295, 2014.
[22] H. A. Pradana, E. Novita, S. Wahyuningsih, and R. Pamungkas, “Analysis of deoxygenation
and reoxygenation rate in the Indonesia River (a case study: Bedadung River East Java),” IOP
Conf. Ser. Earth Environ. Sci., vol. 243, no. 1, 2019.
[23] C. B. Yackulic, “Influence of land use on water quality in a tropical landscape : a multi-scale
analysis,” Landsc. Ecol., vol. 26, pp. 1151–1164, 2011.
[24] N. Xiang, J. Sha, J. Yan, and F. Xu, “Dynamic modeling and simulation of water environment
management with a focus on water recycling,” Water (Switzerland), vol. 6, no. 1, pp. 17–31,
2014.
[25] B. Zhang et al., “Quantifying the impact of climate change on streamflow dynamics of two
major rivers of the Northern Lake Erie Basin in Canada,” Sustainability, vol. 10, pp. 1–23,
2018.
[26] N. Pasisingi, N. TM Pratiwi, and M. Krisanti, “Water quality of the Cileungsi River upstream
based on physical-chemical conditions,” Depik, vol. 3, no. 1, pp. 56–64, 2014.
[27] R. Musemic, A. Halac, and M. Alispahic, “Oxygen depletion modeling in polluted river-
testing by actual example,” J. Trens Dev. Mach. Assoc. Technol., vol. 19, no. 1, pp. 137–140,
2015.
[28] A. Razali, S. Norkhadijah, S. Ismail, S. Awang, and S. M. Praveena, “Land use change in the
highland area and its impact on river water quality : a review of case studies in Malaysia,”
Ecol. Process., vol. 7, no. 19, pp. 1–17, 2018.
[29] J. Mateo-Sagatas, S. M. Zadeh, and H. Turral, Water Pollution from Agriculture: A Global
Review Executive Summary. Colombo: Food and Agriculture Organization of the United
Nations, 2017.
[30] I. Puspita, L. Ibrahim, and D. Hartono, “Influence of the behavior of citizens residing in
riverbanks to the decrease of water quality in the river of Karang Anyar Tarakan City,” J. Mns.
dan Lingkung., vol. 23, no. 2, pp. 249–258, 2016.
[31] W. Yang, M. J. Chen, Y. Liu, and F. Y. Jin, “A system dynamics model for water quality
management - waste load allocation,” Adv. Mater. Res., vol. 291–294, pp. 1781–1785, 2011.
[32] S. P. Saraswati, M. V. Ardion, Y. H. Widodo, and S. Hadisusanto, “Water quality index
performance for river pollution control based on better ecological point of view (a case study
in Code, Winongo, Gadjah Wong streams),” J. Civ. Eng. Forum, vol. 5, no. 1, p. 47, 2019.
[33] Muhammadi, E. Aminullah, and B. Soesilo, Analsis Sistem Dinamis Lingkungan, Sosial,
Ekonomi, dan Manajemen. Jakarta: UMJ Press, 2001.
[34] A. F. Walukow, “Environmental based on policy analysis about the decrease of forest area in
Sentani Watershed,” J. Mns. dan Lingkung., vol. 19, no. 1, pp. 74–84, 2012.
[35] Ford, A. Modeling the Environment: An Introduction To System Dynamics Model Of
Environmental System. Wasington D.C: Island Press.1999.

148
The Development Of Student Worksheet On Science
Subject SMK Based On Internet Learning Resources To
Improve Learning Outcomes
Made Shita Prajnitya, . I Wayan Subagia, Desak Made Citrawathi
Postgraduate Program of Science Education, Mathematics and Science Faculty Ganesha University Of Education, Bali-Indonesia, 81116
E-mail: [email protected], [email protected], [email protected]
Abstract. This study aims to: (1) describe and explain the characteristics of Student
Worksheets (LKS) on Natural Sciences Vocational Schools based on internet learning
resources; (2) describe and explain the validity of Student Worksheets (LKS) for Vocational
Natural Science subjects based on internet learning resources; (3) describe and explain the
practicality of Student Worksheets (LKS) for Natural Sciences Vocational Schools based on
internet learning resources; and (4) describe and explain the effectiveness of Student
Worksheets (LKS) for vocational science subjects based on internet learning resources. This
type of research is research and development. The development model used in this study is the
modified Borg and Gall development model. The developed Student Worksheet consists of
five topics. Characteristics of student worksheets developed are: (1) there is an introduction to
the material from each worksheet; (2) given the problem of a phenomenon and students can
identify the problem of the phenomenon then be able to make questions of each problem
found; (3) there are several conceptual questions in the worksheet. (4) internet learning
resources are available to find answers; (5) there is a column to fill in the summary of learning
outcomes. The average score of validation for the content and construction feasibility aspects
is within the valid criteria and the average score for the validation of the worksheet for each
aspect is in very good criteria and both linguistic aspects. The practicality of student
worksheets for the aspects of learning in the learning process are in very practical criteria. The
grades obtained by students are above the KKM and achieve 100% completeness. This
indicates that the LKS science-based learning resources are effectively developed to improve
learning outcomes.
1. Introduction
Education is one important component in improving the quality of human resources. Quality
education produces people who have good quality and quantity in terms of knowledge, morals, and
character. Through national education can be developed and formed the character and civilization of a
dignified nation in order to educate the life of the nation (RI Law number 20 of 2003 concerning the
National Education System). Development of Education in Indonesia continues to experience
development in a more advanced direction. This can be seen from the implementation of the 2013
curriculum. Learning in the 2013 curriculum requires a student-centered through scientific methods.
In accordance with the mandate of the 2013 curriculum, the learning process that takes place in
schools must be in accordance with a scientific approach. One of them is a science (science) lesson. Science is the study of phenomena in the universe, including this earth, so that concepts and
principles are formed (Wedyawati, 2010). Science includes knowledge, processes (skills and
attitudes), and situations / contexts about nature (OECD, 2012). Science learning implemented by
teachers is still menoton and less varied so that constraints in developing and organizing learning.
149
This is supported by the results of research conducted by Septiana, et al. (2018), teachers still find it difficult to understand all the material taught because teachers must teach integrated material namely
physics, biology, and chemistry while their expertise is still separate and the use of learning media is not
optimal because in schools there are learning media available but teachers still have not used it because of
lack of knowledge about the use of media, there are also schools that still do not have media that support learning.
Science learning outcomes are also influenced by the media and learning resources used by
teachers. According to Widyawati and Wijayanti (2019), that the use of comic-based media obtained an
average learning outcome of 86.77, while the control class obtained an average learning outcome of 77.53. Based on this the teacher in designing learning must be creative in creating learning media that is
innovative, varied, interesting, contextual and in accordance with the needs of students. Learning media
used by teachers today are also less developed so that the learning process is still impressed in one
direction. The results of research conducted by Tania and Fadiwati (2015) show that only 25% of teachers
have used e-books downloaded from the internet and teachers have never developed e-books and other
learning media. However, in this case the learning media referred to is the Student Worksheet.
Worksheets are printed teaching materials in the form of sheets of paper containing material, summaries,
and instructions for the implementation of learning tasks that must be done by students and refer to the
basic competencies that must be achieved (Prastowo, 2011). Worksheet is one of the media that can be used by teachers to help students to find a concept and
at the same time improve student learning outcomes. Hanim et al. (2017) states that the worksheet is able
to improve student learning outcomes. Good worksheet in learning will provide the broadest opportunity
for students to be able to develop student creativity in finding a concept or in solving a problem. Alfana,
et al. (2015) stated that student worksheets had a positive effect on learning outcomes and were able to
develop students' creative thinking abilities so that they could be used in learning. Furthermore, Ernawati
and Yulia (2014) stated that student worksheets make students more interested and effectively used in
learning. The worksheets used by science teachers are still lacking in guiding students to think critically
and construct their own knowledge. The results of observations made on January 10, 2019 at SMK Negeri 1 Singaraja, SMK Negeri 1
Seririt, SMK Negeri 2 Seririt and SMK Negeri 1 Busungbiu show that teachers who teach science
subjects only use science textbooks in learning. The book used is the science book of SMK 1 MAK Class X in the field of business and management expertise of the 2017 Erlangga publisher. The
science book used also contains practice questions. The practice questions provided in the book are only
impressed to move the sentences contained in the reference book so that the answers are fully filled.
Another problem found is that worksheets are still rarely used by teachers in the learning process.
Teachers sometimes make worksheets that only contain practice questions without giving problems
related to the material being taught. In addition, there are no problems in LKS to guide students in solving
problems by finding other learning resources such as internet learning resources. Then the unavailability
of internet learning resources in the worksheet can be used by students in finding answers. Existing student worksheets make students rely only on textbooks without looking for other sources in accordance
with the development of the industrial revolution 4.0. In the era of the industrial revolution 4.0, 75% of the work involved the ability of science,
technology, engineering and mathematics, internet of things (IoT), and lifelong learning (Zimmerman in
Yuliati & Saputra, 2019). Education in the era of 4.0 requires learning that is able to apply between
knowledge and technology in solving existing problems. The learning process is
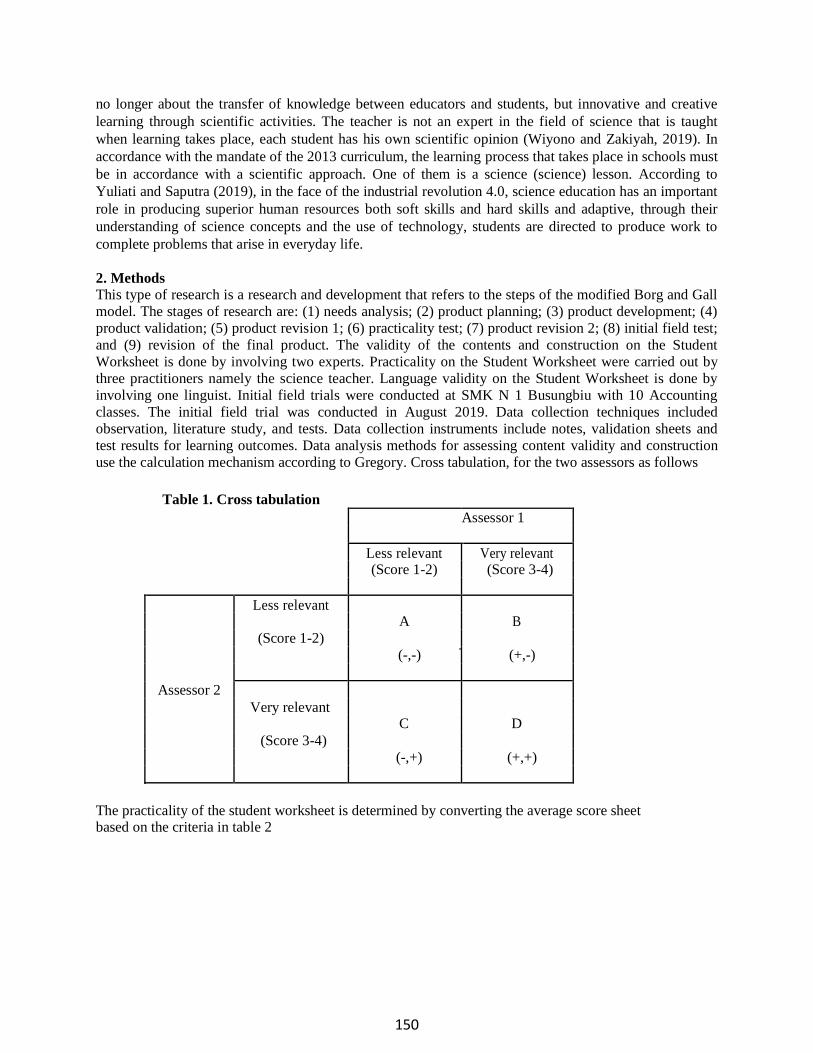
150
no longer about the transfer of knowledge between educators and students, but innovative and creative
learning through scientific activities. The teacher is not an expert in the field of science that is taught
when learning takes place, each student has his own scientific opinion (Wiyono and Zakiyah, 2019). In
accordance with the mandate of the 2013 curriculum, the learning process that takes place in schools must
be in accordance with a scientific approach. One of them is a science (science) lesson. According to
Yuliati and Saputra (2019), in the face of the industrial revolution 4.0, science education has an important
role in producing superior human resources both soft skills and hard skills and adaptive, through their
understanding of science concepts and the use of technology, students are directed to produce work to
complete problems that arise in everyday life.
2. Methods This type of research is a research and development that refers to the steps of the modified Borg and Gall
model. The stages of research are: (1) needs analysis; (2) product planning; (3) product development; (4)
product validation; (5) product revision 1; (6) practicality test; (7) product revision 2; (8) initial field test;
and (9) revision of the final product. The validity of the contents and construction on the Student
Worksheet is done by involving two experts. Practicality on the Student Worksheet were carried out by
three practitioners namely the science teacher. Language validity on the Student Worksheet is done by
involving one linguist. Initial field trials were conducted at SMK N 1 Busungbiu with 10 Accounting
classes. The initial field trial was conducted in August 2019. Data collection techniques included
observation, literature study, and tests. Data collection instruments include notes, validation sheets and
test results for learning outcomes. Data analysis methods for assessing content validity and construction
use the calculation mechanism according to Gregory. Cross tabulation, for the two assessors as follows
Table 1. Cross tabulation Assessor 1
Less relevant Very relevant (Score 1-2) (Score 3-4)
Less relevant A B
(Score 1-2)
(-,-) (+,-)
Assessor 2
Very relevant C D
(Score 3-4)
(-,+) (+,+)
The practicality of the student worksheet is determined by converting the average score sheet based on the criteria in table 2
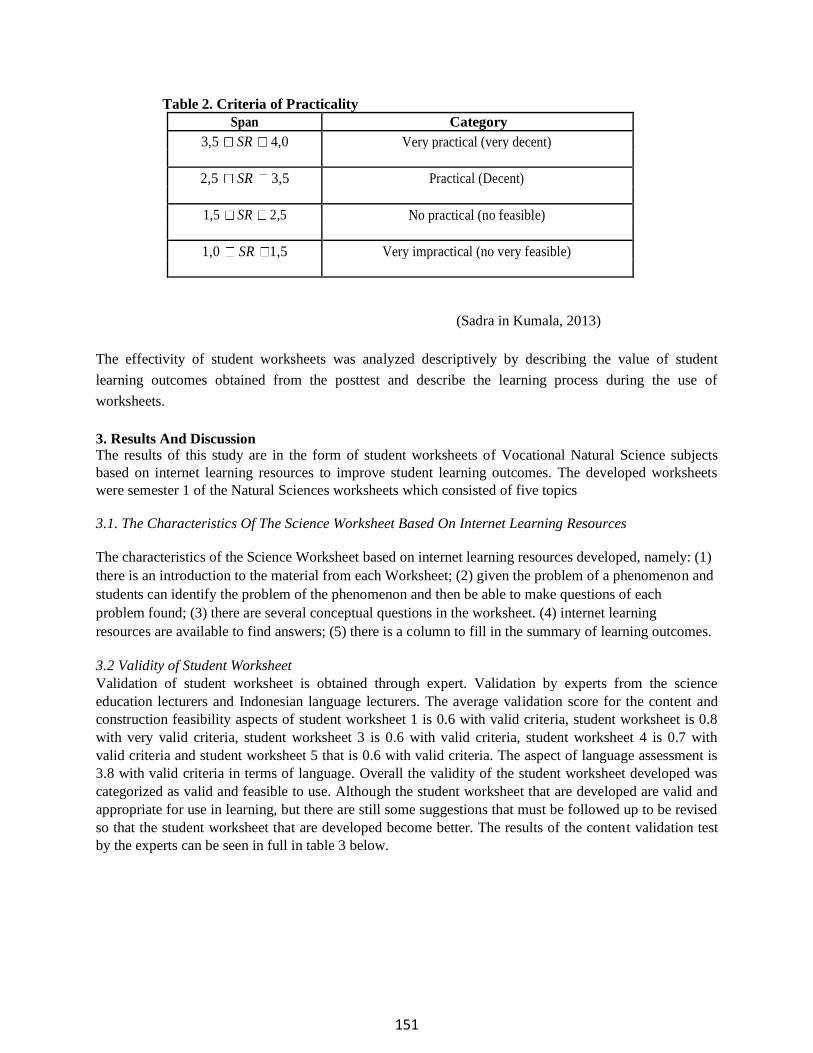
151
Table 2. Criteria of Practicality
Span Category
3,5 SR 4,0 Very practical (very decent)
2,5 SR 3,5 Practical (Decent)
1,5 SR 2,5 No practical (no feasible)
1,0 SR 1,5 Very impractical (no very feasible)
(Sadra in Kumala, 2013)
The effectivity of student worksheets was analyzed descriptively by describing the value of student
learning outcomes obtained from the posttest and describe the learning process during the use of
worksheets.
3. Results And Discussion The results of this study are in the form of student worksheets of Vocational Natural Science subjects
based on internet learning resources to improve student learning outcomes. The developed worksheets
were semester 1 of the Natural Sciences worksheets which consisted of five topics
3.1. The Characteristics Of The Science Worksheet Based On Internet Learning Resources
The characteristics of the Science Worksheet based on internet learning resources developed, namely: (1)
there is an introduction to the material from each Worksheet; (2) given the problem of a phenomenon and
students can identify the problem of the phenomenon and then be able to make questions of each
problem found; (3) there are several conceptual questions in the worksheet. (4) internet learning
resources are available to find answers; (5) there is a column to fill in the summary of learning outcomes.
3.2 Validity of Student Worksheet Validation of student worksheet is obtained through expert. Validation by experts from the science
education lecturers and Indonesian language lecturers. The average validation score for the content and
construction feasibility aspects of student worksheet 1 is 0.6 with valid criteria, student worksheet is 0.8
with very valid criteria, student worksheet 3 is 0.6 with valid criteria, student worksheet 4 is 0.7 with
valid criteria and student worksheet 5 that is 0.6 with valid criteria. The aspect of language assessment is
3.8 with valid criteria in terms of language. Overall the validity of the student worksheet developed was
categorized as valid and feasible to use. Although the student worksheet that are developed are valid and
appropriate for use in learning, but there are still some suggestions that must be followed up to be revised
so that the student worksheet that are developed become better. The results of the content validation test
by the experts can be seen in full in table 3 below.
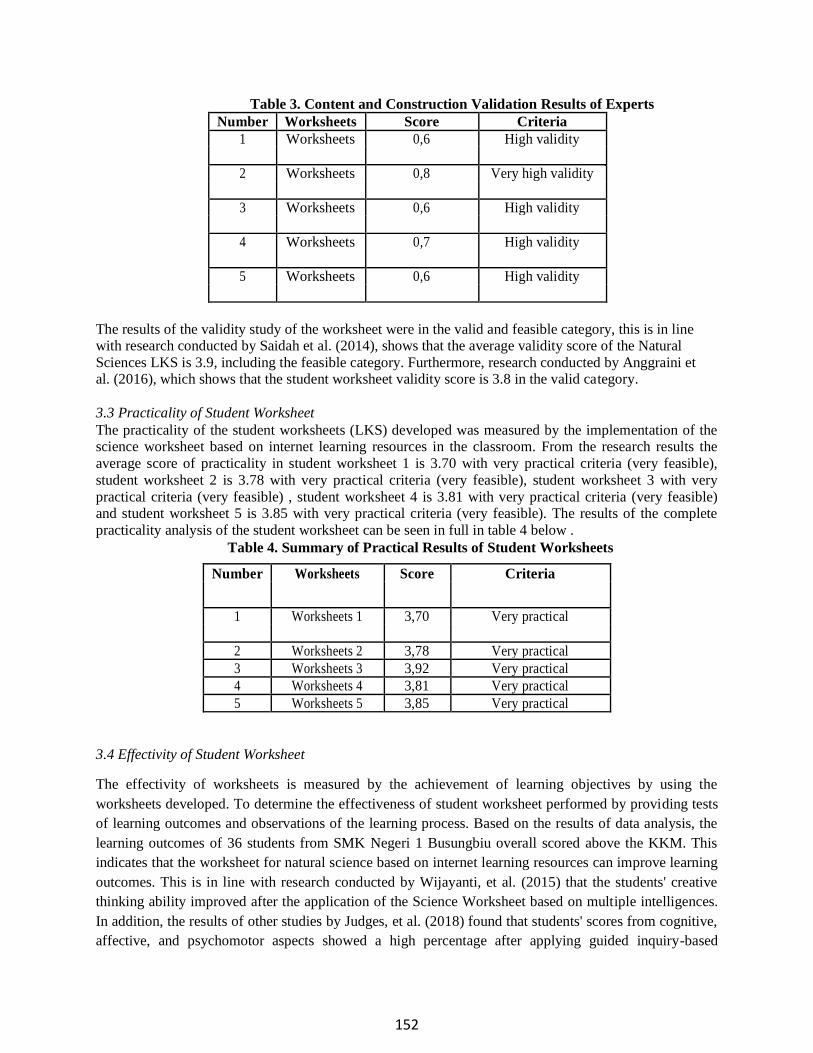
152
Table 3. Content and Construction Validation Results of Experts
Number Worksheets Score Criteria
1 Worksheets 0,6 High validity
2 Worksheets 0,8 Very high validity
3 Worksheets 0,6 High validity
4 Worksheets 0,7 High validity
5 Worksheets 0,6 High validity
The results of the validity study of the worksheet were in the valid and feasible category, this is in line with research conducted by Saidah et al. (2014), shows that the average validity score of the Natural
Sciences LKS is 3.9, including the feasible category. Furthermore, research conducted by Anggraini et al. (2016), which shows that the student worksheet validity score is 3.8 in the valid category.
3.3 Practicality of Student Worksheet The practicality of the student worksheets (LKS) developed was measured by the implementation of the science worksheet based on internet learning resources in the classroom. From the research results the
average score of practicality in student worksheet 1 is 3.70 with very practical criteria (very feasible),
student worksheet 2 is 3.78 with very practical criteria (very feasible), student worksheet 3 with very
practical criteria (very feasible) , student worksheet 4 is 3.81 with very practical criteria (very feasible) and student worksheet 5 is 3.85 with very practical criteria (very feasible). The results of the complete
practicality analysis of the student worksheet can be seen in full in table 4 below . Table 4. Summary of Practical Results of Student Worksheets
Number Worksheets Score Criteria
1 Worksheets 1 3,70 Very practical
2 Worksheets 2 3,78 Very practical
3 Worksheets 3 3,92 Very practical
4 Worksheets 4 3,81 Very practical
5 Worksheets 5 3,85 Very practical
3.4 Effectivity of Student Worksheet The effectivity of worksheets is measured by the achievement of learning objectives by using the
worksheets developed. To determine the effectiveness of student worksheet performed by providing tests
of learning outcomes and observations of the learning process. Based on the results of data analysis, the
learning outcomes of 36 students from SMK Negeri 1 Busungbiu overall scored above the KKM. This
indicates that the worksheet for natural science based on internet learning resources can improve learning
outcomes. This is in line with research conducted by Wijayanti, et al. (2015) that the students' creative
thinking ability improved after the application of the Science Worksheet based on multiple intelligences.
In addition, the results of other studies by Judges, et al. (2018) found that students' scores from cognitive,
affective, and psychomotor aspects showed a high percentage after applying guided inquiry-based
153
worksheets on reaction rate subjects. Based on observations during the application of the student
worksheet, students are more active in learning. This is shown from students actively asking when finding
problems after observing the contextual phenomena that exist in the LKS. In addition, students are able to
find answers to each of the questions given. During the learning process using student worksheet based
internet learning resources, students are able to find answers from each learning source that is referenced.
4. Conclusions And Suggestions
Based on the results and discussion, it can be concluded that as follows: (1) Natural science student
worksheet based on internet learning resources is declared valid from the aspect of content validity and
construction; (2) Natural science student worksheet based on internet learning resources is declared
practical from the aspect of implementation in learning; (3) Natural science student worksheet based on
internet learning resources is declared effective in the learning process and can improve student learning
outcomes. Some of the suggestions are as follows: (1) Natural science student worksheet based on
internet learning resources should be used as a learning medium in various schools; (2) Natural science
student worksheet based on internet learning resources should be used as a reference for developing
student worksheet in other subjects.
References [1]. Alfana, M., Dewi, R, N & Sukaesih, S. 2015. Pengembangan Lembar Kerja Siswa IPA Terpadu
Berbasis Konstruktivisme Tema Energi Dalam Kehidupan Untuk Siswa SMP. Journal USEJ. 4(1): 720-727.
[2]. Anggraini, R., Wahyuni, S., & Lesmono, A.D. 2016. Pengembangan Lembar Kerja Siswa (LKS)
Berbasis keterampilan Proses Di SMAN 4 Jember. Jurnal Pembelajaran Fisika. 4(4):350-356.
[3]. Ernawati, M. D. W, & Yulia. 2014. Pengembangan Lembar Kerja Siswa Berbasis Laboratorium
Materi Titrasi Asam-Basa untuk Siswa Kelas XI SMA Negeri 3 Kota Jambi. J. Ind. Soc. Chem. 6(1): 41-50.
[4]. Effendi, E. & Zhuang, H. 2005. E-learning, Konsep dan Aplikasi. Yogyakarta: CV.Andi Offset. [5]. Hakim, L., Sugiarta & Jusniar. 2018. Pengembangan Lembar Kerja Siswa (Lks) Berbasis Inkuiri
Terbimbing Pada Materi Pokok Laju Reaksi Untuk Siswa Kelas XI IPA SMA. Jurnal Nalar
Pendidikan. ISSN 2339-0749. 6(1). 47-54. [6]. Hanim, F., Suyanti, R.D., & Harahap, F. 2017. The Effect Of Students’ Worksheet Based On Skill
Of Science And Motivation Process Toward Learning Outcomes At Grade 4 Sdnegeri 164330
Tebingtinggi. Journal of Research & Method in Education. ISSN 2320-7388. 7(5): 57-61. [7]. OECD. 2012. PISA 2012 Result: What Students Know and Can Do-Student Performance In
Reading, Mathematics and Science, Vol I. Paris: OECD Publishing. [8]. Saidah, N., Parmin., & Dewi.N.R. 2014. Pengembangan LKS IPA Terpadu Berbasis Problem
Based Learning Melalui Lesson Study Tema Ekosistem Dan Pelestarian Lingkungan. Journal USEJ. ISSN 2252-6617. 3(2):549-556
[9]. Sari, R., Harijanto, A & Wahyuni, S. 2018. Pengembangan LKS IPA Berbasis Kearifan Lokal Kopi
Pada Pokok Bahasan Usaha dan Energi Di SMP. Jurnal Pembelajaran Fisika. 7(1): 70-77.
[10]. Septiana, N., Rohmadi, M., Nasir, M & Nastiti, L.R. 2018. Kesulitan Guru IPA SMP/MTS Mengajarkan IPA Terpadu Di Kalimantan Tengah. Jurnal Pendidikan Sains & Matematika. ISSN 2338-4387. 6(1):1-11
[11]. Setyanto, H., Sudarmin & Dewi, N.R. 2015. Pengembangan LKS IPA Berbasis Problem Based Learning Pada Tema Pencemaran Lingkungan Guna Menumbuhkan Kemandirian Siswa. Journal USEJ. ISSN 2252-6617. 4(3): 990-997.

154
[12]. Tania, L & Fadiawati, N. 2015. The Development Of Interactive E-Book Based Chemistry Representations Referred To The Curriculum Of 2013. Jurnal Pendidikan IPA Indonesia.
4(2):164-169 [13]. Turer, B & Kunt, H. 2015. A Review of Relationship between Prospective Science Teacher’s
Attitudes Towards Science Education and Their Self-Efficacy. Journal of Education and Training Studies. 3(6): 166-178.
[14]. Wedyawati, N. 2010. Ilmu Alamiah Dasar. Nanga Pinoh: Sekolah Tinggi Keguruan dan Ilmu Pendidikan Melawi.
[15]. Widyawati, A & Wijayanti, A. 2019. Pengaruh Media Komik Sains Berbasis Karakter Terhadap
Minat Baca Dan Hasil Belajar Mahasiswa Pendidikan IPA. Jurnal LP3M. 5(1):66-77

155
Development of Chemistry Learning Book Based on Case Study
to Improve Students’ Learning Outcome
L A Widiandari1, I W Redhana,
2 and A A I A R Sudiatmika
3
Universitas Pendidikan Ganesha, Indonesia, Jalan Udayana 11 Singaraja Bali 81116
Indonesia *[email protected], [email protected], [email protected]
Abstract. This study aimed to describe the characteristics, validity, practicality, and effectiveness
of case study based chemistry learning books. This type of research is research and development
by adopting a 4-D model by Thiagarajan. The research phase carried out is until develop step,
namely validity, practicality, and effectiveness. The study design used one group pretest-posttest.
Data analysis techniques used descriptive statistics for validity, practicality, and effectiveness of
learning books. The research product was in the form of chemistry learning books based on case
studies of class XI on colloid topics. Research data includes needs analysis data (literature studies
and field studies), product planning results data, validity results data, practicality results data, and
effectiveness of chemistry learning books. The results of the study showed that (1) the
characteristics of the learning books developed presented cases related to chemical materials, (2)
the validity of learning books that were developed received very valid categories in terms of
content and media, (3) the practicality of learning books developed that were very practical, and
(4) the learning books developed were effective in improving student learning outcomes viewed
from the test results of the proportion of one sample amounted to 0.86 and supported by a
normalized gain score of 0.59 (medium category).
1. Introduction
Chemistry is a science that has special characteristics. One of the peculiarities is to study
abstract concepts, but chemistry is actually very closely related to daily life. Chemistry is also
related to analyzing and resolving cases [1]. In studying chemistry, students assume that
chemistry lessons are difficult to understand, especially in solving analytical problems related to
problem solving skills. This can be proven when students are offered chemical problems related
to real life [2]. Students have not been able to apply the knowledge (theories and concepts) they
have to solve these problems. Most students are unable to make a link between what they are
learning and how that knowledge can be utilized. Respond to the problem, to optimize the
quality of education and to help students relate theories (concepts) with context, it is very
suitable if learning is managed by applying learning to case study methods.
The case study method is a method that involves a process of analysis using a variety of
techniques, materials, and equipment regarding symptoms or problems in groups [3]. This
method teaches students an alternative understanding of the concept based on cases. Learning
involves cases that are scenarios based on everyday life as well as learning questions related to
cases, which allow students to discuss their ideas [4].
The application of learning case study methods makes students motivated to learn and
understand material, integrate cases with concepts of knowledge, and encourage students to
develop professional skills such as collaboration and communication [5]. The use of case study
methods can also improve critical thinking skills, increase student enthusiasm in attending
lectures, and create a democratic environment in learning [6]. Similarly, the results of [1] show

156
that learning chemistry through the application of module-assisted case study methods can
improve critical thinking skills and increase enthusiasm student for learning. Meanwhile, the
results of the study [7] shows that the process of solving cases in discussions can provide
opportunities for students to think and give satisfaction to find new knowledge for students. In
addition, the case study method implemented in the discussion activities can develop the ability
of students to test their own ideas and understanding so as to facilitate the learning process and
improve learning outcomes. Based on this, the case study method is suitable to be applied in
chemistry learning, given that chemistry is closely related to daily life so that by giving cases
can make it easier for students to solve problems.
The application of the case study method can be applied to learning books. Based on
preliminary studies conducted by ten teacher chemistry high school in Denpasar city, learning
books are very important in chemistry learning. Learning books used by students are like books
from Erlangga and Yudistira publishers. 80% of teachers say that the learning books used have
not been able to help the learning process. In addition, as many as 70% of teachers said that the
learning books used did not present cases related to chemical materials while the rest said that
the books had presented cases, but the percentage of case presentation was still very low (0-
20%). There are no students who use learning books developed by teachers, so the concept of
existing learning books has not been developed based on the characteristics and needs of
students. Therefore, learning books do not meet the standards on accordance with the
characteristics of students, which are listed in the curriculum 2013.
Analysis of class XI chemistry learning books was also carried out to support the results of
the preliminary study. The result is learning book has presented a case, but the percentage of
case presentation is still very low. Not all chapters in learning books present cases, so they do
not train students thinking skills. One of the cases presented in the textbook is smoke and fog.
Based on the problems above, it is need to develop chemistry learning books based on case
studies. The cases presented are related to chemical material and more cases are presented. This
research is research and development. This research adopted from 4-D model by Thiagarajan,
such as define, design, develop and disseminate. The purpose of define stage is stipulate and
define instructional requirements. The purpose of design stage is to design prototype
instructional material. The purpose of develop stage is to modify the prototype instructional
material, and the purpose of disseminate step is deploy product. On this stage, only reached until
develop stage due to time and cost limitations.
2. Method
This type of research is research and development. This research adopted from 4-D model by
Thiagarajan, such as define, design, develop and disseminate. On this stage, only reached until
develop stage due to time and cost limitations. This research was conducted at SMA Negeri 6
Denpasar semester II of the 2018/2019 school year in class XI MIPA 5, with 36 students. The
research procedure starts from the stages: (1) define stage including front-end analysis, students’
analysis, task analysis, concept analysis, and specifying instructional learning objectives, (2)
design stage including designing a case study learning book, (3) develop stage including testing
of validity, practicality and effectiveness of the case study learning book. The instruments used
in this study were questionnaires, case study book assessment sheets, and tests. The types of tests
used in this study are objective tests and descriptions. The data in this study were analyzed using
descriptive analysis techniques. Validity and practicality data can be determined by calculating
the average score. Data of effectiveness can be determined using one sample proportion test and

157
supported by normalized gain score. Test results of the proportion of one sample are calculated
with the SPSS-PC 16.0 program for Windows. While, the normalized gain score can be
determined using the formula as follow.
Information:
g = normalized gain score
Sf = average score of posttest
Si = average score of pretest
3. Result and Discussion
Case study-based chemistry learning books are products that have been developed and have
passed the stages of research and development of the 4-D model according to Thiagarajan. The
stages taken include define, design, and develop stages. In the define stage, obtained (1) need
analysis data of teachers and students by distributing questionnaires about case study learning
book. The results of teachers’ need analysis data state that the percentage of case presentation in
book used by students is still very low at 0-20%, so teachers thought case study learning book
need to developed. The results of students’ need analysis data show that 27.1% of students are
not able to understand the chemical material in the books. (2) The results of students' analysis
data seen from the shape of learning style showed 41.67% of students’ tend to visual learning
styles. The results of students’ analysis data seen from the shape of learning motivation showed sufficient category with the level of student motivation of 75.75%. Next, the results of students'
ability data were obtained from the students’ chemistry test. The results of students’ ability data
showed that 58.33% of students’ chemistry test results have not exceeded the KKM. (3) The
results of task analysis data show that task given by the teacher to students on the topic of
colloids is project for making sulfur soles and gelatin. (4) The concept of analysis data on the
topic of colloids shows 36% is a type of concept based on principles. (5) The specifications of
learning objectives are formulated based on core competencies and basic competencies used to
design learning tools, then integrated into the material in case study learning books. In the design
stage, the design of learning devices and the characteristics of case study learning book are
obtained. The characteristics of case study learning book are presenting cases related to chemical
material. Characteristics of case study learning book can be seen in Figure 1.
Figure 1. The Characteristics of Case Study Learning Books

158
In the develop stage, the validity of learning book is tested first. Validity test is conducted to
determine the validity of learning book content and media. This validation involved two
chemistry lecturers and two chemistry teachers. The results of validity test showed the validity of
learning book content and media were respectively very valid with scores of 4.58 and 4.61.
Similarly, the results of [8] that the development of learning books oriented to problem solving is
classified as very valid because, the results of the criteria for expert validity and related to
instrument indicators amounted to 85.46%. Research of [9] declare a developed learning books
obtain a very valid assessment from experts, refinements, and students, as well as all parameters
proposed in the component which were responded to very positively by respondents. In addition
to providing an assessment, the validator gave a positive response to the case study learning book
and some suggestions for improving the learning book. All input provided by the validator has
been improved, since the improvement is important to perfect the learning book developed.
Research of [10] states that products that have been validated by experts will be known to be
deficiencies of the products developed so that the deficiencies of these products are then tried to
be reduced by improving the product. The product developed is expected to be able and feasible
to be used in chemistry learning and can be tested on students.
Readability test data conducted by nine students at SMA Negeri 6 Denpasar showed that the
readability of the case study learning books was good and very good. The practicality test on the
case study learning book involved three chemistry teachers and 36 students of class XI.
Practicality data shows that the case study learning book is very practical with an average score
of 4.36.
The effectiveness test of the case study learning book involved 36 students of class XI in
SMA Negeri 6 Denpasar. Data were analyzed using a normalized gain score and the results of
one sample proportion test. Normalized gain score calculation is seen from the average pretest
and posttest scores of students, while the test of one sample proportion is seen from the results of
posttest students who passed the percentage of classical completeness. A Summary of students’
learning outcome can be seen in Table 1.
Table 1. Summary Study Result
Description Score
Pretest Posttest
Min 23,33 60,00
Max 70,00 90,00
Average 44,44 77,50
Deviation Standard 12,29 7,14
Gain Normalized 0,59
Normalized gain scores indicate that student learning outcomes using chemistry learning
book based on case studies have increased in the moderate category. Furthermore, the data were
analyzed by the test of one sample proportion seen from the posttest results of students who
passed the classical completeness of 0.85.
In the test of one sample proportion, if the value of sig. < from 0.05 then, H0 is rejected and
Ha is accepted, conversely if the value of sig. > from 0.05 then H0 is accepted and Ha is rejected.
The hypothesis tested in this study is as follows.
H0: π ≤ 0.85: learning books developed are not effective in improving student learning
outcomes.
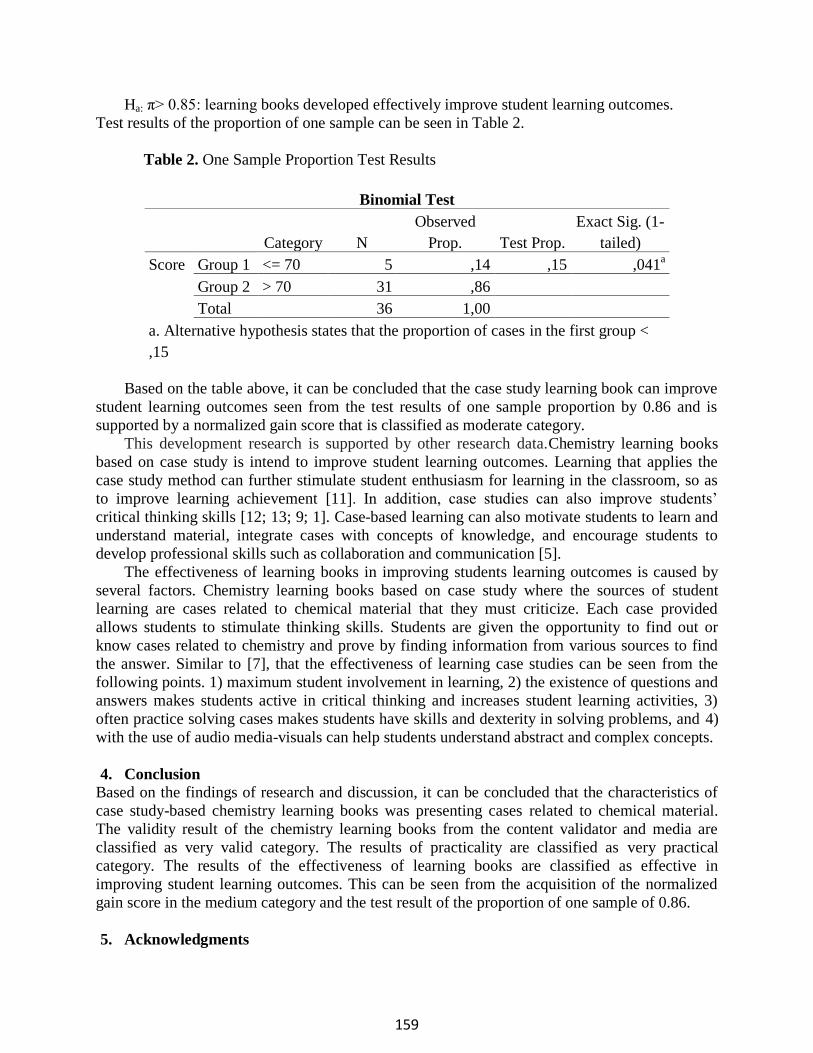
159
Ha: π> 0.85: learning books developed effectively improve student learning outcomes.
Test results of the proportion of one sample can be seen in Table 2.
Table 2. One Sample Proportion Test Results
Binomial Test
Category N
Observed
Prop. Test Prop.
Exact Sig. (1-
tailed)
Score Group 1 <= 70 5 ,14 ,15 ,041a
Group 2 > 70 31 ,86
Total 36 1,00
a. Alternative hypothesis states that the proportion of cases in the first group <
,15
Based on the table above, it can be concluded that the case study learning book can improve
student learning outcomes seen from the test results of one sample proportion by 0.86 and is
supported by a normalized gain score that is classified as moderate category.
This development research is supported by other research data.Chemistry learning books
based on case study is intend to improve student learning outcomes. Learning that applies the
case study method can further stimulate student enthusiasm for learning in the classroom, so as
to improve learning achievement [11]. In addition, case studies can also improve students’
critical thinking skills [12; 13; 9; 1]. Case-based learning can also motivate students to learn and
understand material, integrate cases with concepts of knowledge, and encourage students to
develop professional skills such as collaboration and communication [5].
The effectiveness of learning books in improving students learning outcomes is caused by
several factors. Chemistry learning books based on case study where the sources of student
learning are cases related to chemical material that they must criticize. Each case provided
allows students to stimulate thinking skills. Students are given the opportunity to find out or
know cases related to chemistry and prove by finding information from various sources to find
the answer. Similar to [7], that the effectiveness of learning case studies can be seen from the
following points. 1) maximum student involvement in learning, 2) the existence of questions and
answers makes students active in critical thinking and increases student learning activities, 3)
often practice solving cases makes students have skills and dexterity in solving problems, and 4)
with the use of audio media-visuals can help students understand abstract and complex concepts.
4. Conclusion
Based on the findings of research and discussion, it can be concluded that the characteristics of
case study-based chemistry learning books was presenting cases related to chemical material.
The validity result of the chemistry learning books from the content validator and media are
classified as very valid category. The results of practicality are classified as very practical
category. The results of the effectiveness of learning books are classified as effective in
improving student learning outcomes. This can be seen from the acquisition of the normalized
gain score in the medium category and the test result of the proportion of one sample of 0.86.
5. Acknowledgments

160
Acknowledgments are addressed to: the supervisors for advice and input provided during the
study, the head of SMA Negeri 6 Denpasar for permission so that this study could be carried out
properly, the teachers who had helped in collecting data about this study, extended families who
have provided support, advice and input during the study, and colleagues who have provided
assistance so that study can run smoothly.
6. References
[1] Arum D R and Minangwati S 2014 Journal Chemistry in Education 3 2
[2] Surakarta I N, Sudiana I K and Sastrawidana I D K 2010 Jurnal Pendidikan dan
Pengajaran 43 3 199-206
[3] Mantiri J 2017 Jurnal Forum Pendidikan 13 2 69–78
[4] Yalçinkaya E, Taştan-Kirik O, Boz Y, and Yildiran D 2012 Research in Science and
Technological Education 30 2 151–172
[5] Brown K, Commandant M, Kartolo A, Rowed C, Sultan H, Toor K, and Wininger V 2009
Interdisciplinary Journal of Health Sciences 48–66
[6] Anggraeni L 2012 Jurnal Media Komunikasi FIS 11 1 1–15
[7] Sumarni W, Soeprodjo, and Rahayu K P 2009 Jurnal Inovasi Pendidikan Kimia 3 345–353
[8] Hanik U and Rusmini 2016 Unesa Journal of Chemical Education 5 2 223–231
[9] Situmorang M 2013 Prosiding Semirata FMIPA Universitas Lampung
[10] Sugiyono 2014 Metode Penelitian Pendidikan (Bandung: Alfabeta)
[11] Ksaid N H 2015 Edukasi Alternatif Wacana Pendidikan XI 183-198
[12] Gholami M, Saki M, Toulabi T, Moghadam P K, Pour A H, and Dostizadeh R 2016
Journal of Professional Nursing
[13] Huang Y, Chen H, Yeh M, and Chung Y 2012 International Journal of Nursing Studies 49
6
161
Development of Multiple Representations Chemistry Learning
Book to Improve Students’ Learning Outcomes
K Widiastari, I W Redhana, and N K Rapi
Science Education Magister Study Program, Department of Science Education, Faculty of
Mathematics and Natural Sciences, Universitas Pendidikan Ganesha, Jalan Udayana 11 Singaraja
Bali 81116 Indonesia
*[email protected], [email protected], [email protected]
Abstract. This study aimed to produce a multiple representations chemistry learning book. The
study was a research and development by adopting a 4-D model by Thiagarajan. The study
included define, design, develop, and disseminate steps. However, the disseminate step was not
carried out. The data needed on this study were data from define phase (front-end analysis,
students’ analysis, task analysis, concept analysis, and specifying instructional objectives), product
design data from design phase, and product development data (validity, practicality, effectivity).
The data were analyzed by descriptive analysis techniques. The results showed (1) teachers and
students considered that the learning book was important to use in chemistry learning, (2) the
learning book contained three levels of representations of chemistry concepts, including
macroscopic, sub-microscopic, and symbolic, (3) the learning book had included very valid, very
practical, and effective categories. Based on the study, the learning book could be applied to
improve the students’ learning outcomes.
Keywords: learning book, learning outcomes, multiple representations
1. Introduction Chemistry is considered a difficult subject for students. This is due to the abstract nature of chemical
concepts, how teacher teach chemistry in the classroom, the lack of teaching tools and difficulties in
chemical terms [1]. Lack understanding of the nature of chemistry is also one of the causes [2]. Chemistry
is the study of composition, properties, changes in matter, interactions between matter and energy that
accompany it. The abstract characteristics of chemistry can be well understood by paying more attention
to three levels of chemical representation. First, visible (macroscopic) level, the invisible (sub-
microscopic) level, and the symbolic level [3].
If the three level of chemistry concepts is well understood by students, then it’ll contribute to the
quality of students' understanding of chemistry which will be reflected in students' mental models in
explaining chemical phenomena [4]. Because of that, it is important for students to have a complete
understanding of three levels of chemical representations (multiple representations).
Multiple representations take a role as a limitation for students in interpreting new representations that
they don’t know yet, so that students will avoid the misconceptions [5]. Other than that, multiple
representations can also be used by students in solving problems. In the learning process, students can
choose to use which representations that are appropriate to the situation of the problems they face [6].
From several studies that had been done, the representation ability of students in chemistry learning is
still low. The results of research conducted by Desyana et al. showed the highest ability of students is
known in the symbolic level, especially in the problem of determining elements that are included in the
metal [7]. While, the lowest ability of students is in the sub-microscopic level is in the problem of
determining the solute and solvent. Inayati and Melati research found that most students have not been
able to connect macroscopic, sub-microscopic and symbolic aspects, so that students' answers and reasons
are sometimes incompatible with chemical concepts, for example: iron which is turned into a pot is said to
form new substances [8]. Wiyarsi research shows that the ability of chemical representation in reaction
rate topic is low, especially at the sub-microscopic level, for example: students misrepresent particles [9].
162
Based on that studies, it can be concluded that the ability of students in multiple representations is still
low at all levels, especially at the sub-microscopic level, so it is not surprising that chemistry is
considered a difficult subject.
There are several causes of the low multiple representations ability of students. First, the chemistry
learning process that lacks integration of the three chemical levels [7] [8] [9]. Second, students cannot
imagine and cannot visualize sub-micro aspects [10]. Third, students are not able to explain if the three
aspects were changed their representation [10]. Therefore, teachers must be creative in managing
chemistry learning.
Chemistry learning that links three levels of chemical concepts can be presented in the form of
multiple representations learning book. Helsy et al. state that multiple representations are the factor in
making students success in enhancing the ability to link the macroscopic, submicroscopic and symbolic
levels [11]. Research conducted by Karacop & Doymus shows that learning with multiple representations
helps improve students' understanding of chemistry [12]. In addition, research by Ernida, et al. shows that
multiple representations can improve students' critical thinking [13]. All of that will certainly have a
direct impact in improving students’ learning outcomes in chemistry. Based on that, we were interested to
develop multiple representations chemistry learning books to improve student learning outcomes.
2. Method
This study was done by conducting 4-D model by Thiagarajan [14]. However, this research did not
carry out the disseminate stage. This study consists of three main phases, namely: 1) define including
front-end analysis, students’ analysis, task analysis, concept analysis, and specifying instructional
objectives, 2) design including preparation of syllabus, lesson plan and the multiple representations
chemistry learning book, 3) develop testing of validity, practicality and effectivity of the book. The
instruments used in this study were questionnaires, learning book assessment sheets and test.
Data in this study including data from define phase, product design data from design phase, and
product development data (validity, practicality, effectivity) from develop phase. We also got teachers
and students response data as an additional data to know how was their responses after using the learning
book.
Data from define phase obtained by distributing questionnaires to 64 students and 10 teachers
randomly in Denpasar area, product design data obtained after the initial draft of learning book produced,
validity data is obtained by distributing learning book and assessment sheets to two lecturers of Undiksha
Chemistry Department and one chemistry teacher at SMAN 5 Denpasar, practicality data obtained by
distributing practicality assessment sheets to two chemistry teachers from SMAN 4 Denpasar and one
chemistry teacher from SMAN 5 Denpasar, and effectivity data obtained by conducting a limited test
involving 35 students of grade XI from SMAN 4 Denpasar. Teacher and student response data obtained
by distributing questionnaires to teachers and students who use the multiple representations chemistry
learning book.
The data is then analyzed with descriptive analysis techniques. The categories of validation and
practicality are presented in Table 1.
Table 1. The qualitative categories of validity and practicality of learning book
Score Range Qualitative Category
≥ 4 Very Valid / Very Practical
3,3 ≤ < 4 Valid / Practical
2,7 ≤ < 3,3 Enough
2,0 ≤ < 2,7 Invalid / Impractical
< 2,0 Very Invalid / Very Impractical

163
Data of effectivity was concluded with a normalized gain score analysis. The calculation of the
gain score normalization is as follows.
(1)
Information:
g = normalized gain score
Sf = average score of posttest
Si = average score of pretest
The categorization of the normalized gain score is presented in Table 2.
Table 2. Categorization of the normalized gain score
g Value Qualitative Category
g ≥ 0.7 High
0.7> g ≥ 0.3 Moderate
g <0.3 Low
3. Result
3.1 Define phase
On this phase, we knew teachers agreed that chemistry learning book is important in learning
chemistry. However, the learning book that used by students were not based on multiple representations.
Teachers also agreed that multiple representations chemistry learning book need to be developed. The
teacher also gave several suggestions on developing a multiple representations chemistry learning book,
including: 1) the introduction of topic should starts with a concrete example that attracts students'
attention that is clarified with sub-microscopic and symbolic representations; 2) multiple representations
should be displayed clearly and attractively so that students enjoy learning chemistry; 3) the learning
book should be easily understood, interesting and in accordance with the curriculum; 4) multiple
representations should presented correctly according to the concept of chemistry and its presentation can
be easily understood by students.
In other hand, on students side we knew they also agreed learning book is important things that
students must have. Students also convey a number of things that students need in chemistry learning
book, including: 1) exercises and discussion need to be added; 2) need more images and colors to make it
interesting; 3) the explanation of the topic should be simplified, so that it is easy to understand; and 4)
should added more practical/experimental activities.
The students’ analysis results are divide into students’ learning style, motivation, and of students’
completeness. Based on the learning style (according to VAK learning style), the percentage of students
who have a visual learning style is the highest. So that, it can be concluded students are more inclined to
the visual learning style. Based on the analysis of student motivation data, the level of student motivation
classified in sufficient category. The last, the results of the analysis of students' completeness seen from
the completeness of the daily tests of chemistry it was found that 56% of students had not passed the
minimum standard.
Task analysis results was accordance with 2013 curriculum. Students are required to have a
competence to make a food or other products that are involved colloidal principles. From that, we know
the learning book need to add activities to make a food or other products that are involved colloidal
principles. From the concept analysis, we found colloidal concept consist of 14.29% abstract with
concrete examples concepts, 33.33% concrete concepts, 42.86% principal based concept, and 9,52%
concepts that describe process. Accordance to 2013 curriculum we specified six instructional learning
objectives on colloidal that used in developed a multiple representations chemistry learning book.
3.2 Design phase

164
The multiple representations chemistry learning book contains explanation of the concept by
presenting three levels of chemistry concepts (macroscopic, sub-microscopic, and symbolic). The learning
book also using various colors, images, and contain interesting info.
3.3 Develop phase
The results of this phase are divided into several parts, including: 1) validity, 2) practicality, 3)
effectivity, and 4) teacher and student responses to the use of the learning book.
The validity test divided into two, content validity and media validity. The results showed that the
learning book was classified very valid as presented in Table 3.
Table 3. Validity test results
No Aspects Score Category
1 Content validity 4.12 Very valid
2 Media validity 4.46 Very valid
During the validation process, the validator also provides comments and suggestions for revising the
book, so that we can produced the better one for use in the learning process.
Practicality assessment covers several aspects: ease of carrying, ease of distribution and storage, ease
of use, usefulness for users, efficient in time, and language. The results showed that the learning book was
classified very practical as presented in Table 4.
Table 4. Practicality test results
No Aspects Score Category
1 Practicality
(from teachers)
4.52 Very practical
2 Practicality
(from students)
4.42 Very practical
The effectivity test was carried out by conducting pretest and posttest involving 35 students from
SMAN 4 Denpasar. The summary of pretest, posttest and normalized gain scores that obtained are
presented in Table 5.
Table 5. Summary of pretest, posttest and normalized gain scores
Description Score
Figure 1. The layout of multiple representations chemistry learning book
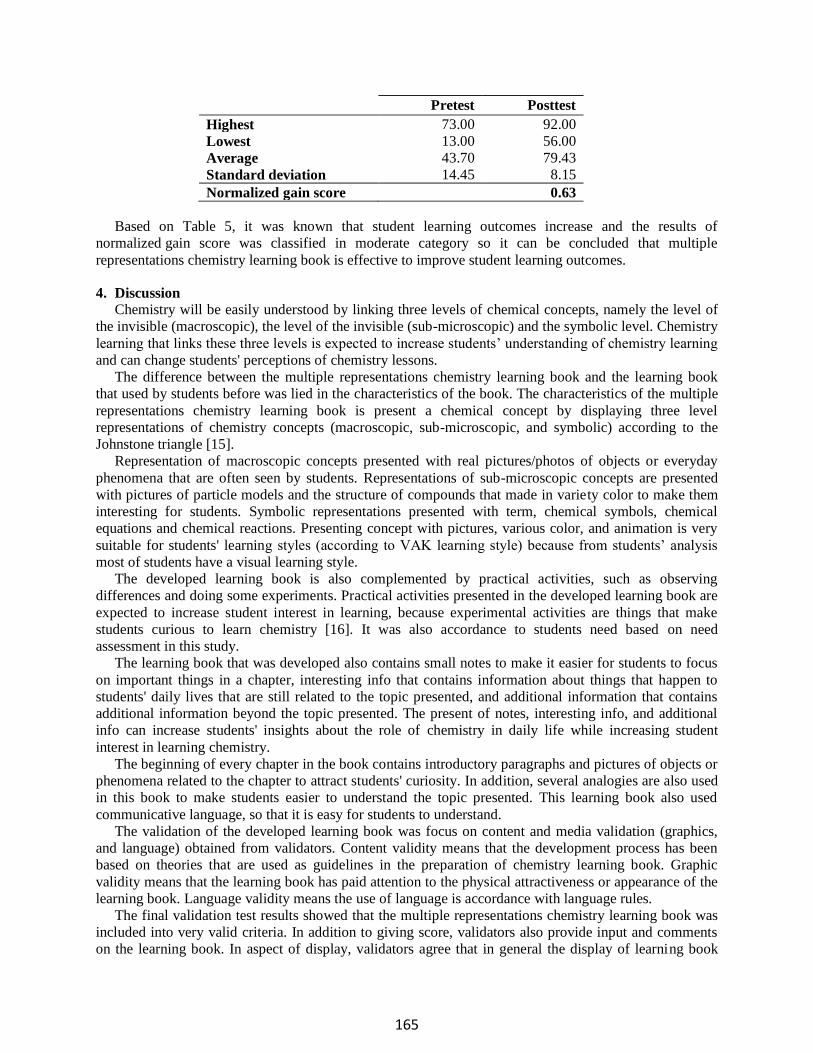
165
Pretest Posttest
Highest 73.00 92.00
Lowest 13.00 56.00
Average 43.70 79.43
Standard deviation 14.45 8.15
Normalized gain score 0.63
Based on Table 5, it was known that student learning outcomes increase and the results of
normalized gain score was classified in moderate category so it can be concluded that multiple
representations chemistry learning book is effective to improve student learning outcomes.
4. Discussion
Chemistry will be easily understood by linking three levels of chemical concepts, namely the level of
the invisible (macroscopic), the level of the invisible (sub-microscopic) and the symbolic level. Chemistry
learning that links these three levels is expected to increase students’ understanding of chemistry learning
and can change students' perceptions of chemistry lessons.
The difference between the multiple representations chemistry learning book and the learning book
that used by students before was lied in the characteristics of the book. The characteristics of the multiple
representations chemistry learning book is present a chemical concept by displaying three level
representations of chemistry concepts (macroscopic, sub-microscopic, and symbolic) according to the
Johnstone triangle [15].
Representation of macroscopic concepts presented with real pictures/photos of objects or everyday
phenomena that are often seen by students. Representations of sub-microscopic concepts are presented
with pictures of particle models and the structure of compounds that made in variety color to make them
interesting for students. Symbolic representations presented with term, chemical symbols, chemical
equations and chemical reactions. Presenting concept with pictures, various color, and animation is very
suitable for students' learning styles (according to VAK learning style) because from students’ analysis
most of students have a visual learning style.
The developed learning book is also complemented by practical activities, such as observing
differences and doing some experiments. Practical activities presented in the developed learning book are
expected to increase student interest in learning, because experimental activities are things that make
students curious to learn chemistry [16]. It was also accordance to students need based on need
assessment in this study.
The learning book that was developed also contains small notes to make it easier for students to focus
on important things in a chapter, interesting info that contains information about things that happen to
students' daily lives that are still related to the topic presented, and additional information that contains
additional information beyond the topic presented. The present of notes, interesting info, and additional
info can increase students' insights about the role of chemistry in daily life while increasing student
interest in learning chemistry.
The beginning of every chapter in the book contains introductory paragraphs and pictures of objects or
phenomena related to the chapter to attract students' curiosity. In addition, several analogies are also used
in this book to make students easier to understand the topic presented. This learning book also used
communicative language, so that it is easy for students to understand.
The validation of the developed learning book was focus on content and media validation (graphics,
and language) obtained from validators. Content validity means that the development process has been
based on theories that are used as guidelines in the preparation of chemistry learning book. Graphic
validity means that the learning book has paid attention to the physical attractiveness or appearance of the
learning book. Language validity means the use of language is accordance with language rules.
The final validation test results showed that the multiple representations chemistry learning book was
included into very valid criteria. In addition to giving score, validators also provide input and comments
on the learning book. In aspect of display, validators agree that in general the display of learning book

166
was good. In the aspect of content, comments were given regarding the depiction of concept maps, the use
of chemical terms, completeness of summaries, and exercises that have not led to multiple
representations.
The level of media validation (graphic and language) was included into very valid criteria. In the
graphic aspect, comment was given regarding additional introduction to the term multiple representations
at the beginning of the book. In the language aspect, comments were given regarding the procedures for
writing numbers and replacing terms that less familiar to students. All entries given by validators were
followed up with improvements. Most improvements were made to the procedures for writing and
presenting figures and tables. The revisions was aimed to perfect the product so that it is fit for use in
chemistry learning, and can be tested on students.
The level of practicality of developed learning book was classified into very practical categories for
use by teachers and students. Based on the effectivity test, the use of learning book is known to be
effective in improving student learning outcomes as shown by the normalized gain scores of students who
are classified as moderate (0.63).
Multiple representations learning book is effective in improving student learning outcomes because
they present three levels of chemical concepts, macroscopic, sub-microscopic and symbolic levels
according to the characteristics of chemistry [15]. The presentation of multiple representations in the
learning book makes it easy for students to understand the chemical phenomena that are mostly related to
the sub-microscopic level because visualize concepts at the particle level is one solution to improves
students’ understanding in chemical phenomena [17][18]. Other than that, chemistry would be easier to
understand if students could connect the sub-microscopic level with other concept levels, macroscopic
and symbolic levels [19][20].
Learning with multiple representations can also improve students' ability to change and connect
macroscopic, sub-microscopic and symbolic phenomena [11][21] and optimize students' imagination
abilities in solving chemical problems [22]. If students can already understand the macroscopic, sub-
microscopic and symbolic levels, then students can choose to use representations that are appropriate to
the problems they face [6].
Paying attention to the three levels of chemical concepts can also increase students' reasoning abilities
[22][23] so that students' understanding becomes meaningful and last longer in the brain [24]. In addition,
learning with multiple representations is also known to increase students' critical thinking [13], improve
student understanding [12][25][26][27][28][29], and reduce student misconceptions [30][31].
Teachers who implement the multiple representations learning book gave a very good response to the
use of the book in this learning chemistry. The most good responses were on two aspects, the developed
learning book can help teachers in guiding students in learning and presenting the material in accordance
with the level of student development. The teacher agrees if the learning book that used in learning is
based on multiple representations. The teacher also comments that the book developed is good and easy
to understand.
In line with the responses given by the teacher, students who use the developed learning book also
gave a very good response overall. The most good response is given to the statement most students enjoy
learning by using the developed learning book. Some students also commented on the use of the learning
book that were developed: 1) I like this book because this book emphasizes the concept so that I quickly
understand, hopefully all chemicals can be recorded like this, 2) I become more understanding of colloids
after reading this book because the language is simple and easy to understand, 3) this book is complete
and interesting, the book design is very good, it's just need to pay attention to some word typing errors.
5. Conclusion
Based on the results and discussion of this study, several things can be concluded. The conclusions of
this study are:
167
1) characteristics of multiple representations chemistry learning book was presented chemical concepts
with three chemical concept representations (macroscopic, sub- microscopic, and symbolic).
Presentation of concepts with multiple representations makes easy for students to connect three levels
of chemical concepts. Representation of macroscopic concepts is presented with real pictures/photos
of objects or everyday phenomena that are often seen by students. Representations of sub-microscopic
concepts are presented with pictures of particle models and the structure of compounds made in color
to make them interesting for students. Symbolic representations were presented with terms, chemical
symbols, chemical equations, and chemical reactions. This book also equipped with small notes,
interesting info, summaries, practical activities, and practice questions,
2) the content and media validity of multiple representations chemistry learning book were 4.12 and 4.46,
that means the learning book was included into very valid criteria,
3) the practicality of multiple representations chemistry learning book from teachers and students were
4.52 and 4.42 which means that the learning book was included into very practical categories for use
by teachers and students,
4) the effectivity of multiple representations chemistry learning book was seen from the average
of normalized gain score. The average value of the normalized gain score obtained is 0.63 which is
included in the medium category so that the developed learning book is said to be effective in
improving student learning outcomes.
6. Acknowledgments
We would like to express our highest gratitude to the head of SMA Negeri 4 Denpasar and SMA Negeri 5
Denpasar for the permissions so that this study could be carried out properly. We also expressed our
gratitude to the teachers and students who helped us in collecting data on this study.
References
[1] Woldeamanuel M M, Atagana, H, & Engida, T 2014 Special Issue 4 2 31–43
[2] Osman K & Sukor N S 2013 American Journal of Applied Studies 10 5 433–441
[3] Wu H, Krajcik J S, & Soloway E 2001 Journal of Research in Science Teaching 38 7 821–842
[4] Stieff M 2005 Journal of Chemical Education 82 3 489–493
[5] Ainsworth S 2006 Learning and Instruction 16 3 183–198
[6] Rosengrant D, Etkina E, & Heuvelen A Van 2007 Proceeding: AIP Conference 149–153
[7] Desyana V, Erlina, & Melati H A 2014 Jurnal Pendidikan dan Pembelajaran 3 11
[8] Inayati N, & Melati H 2014 Jurnal Pendidikan dan Pembelajaran 1–19
[9] Wiyarsi A 2018 Proceeding: The 2nd International Seminar on Chemical Education
[10] Gilbert J K & Treagust D F 2009 International Journal of Science Education 31 16 2271–2273
[11] Helsy I, Maryamah, Farida I, & Ramdhani M A 2017 Journal of Physics: International
Conference on Mathematics and Science Education (ICMScE)
[12] Karacop A & Doymus K 2013 Journal of Science Education and Technology 22 2 186–203
[13] Ernida R, Hamid A, & Nurdiniah H S 2017 Journal of Chemistry and Education (JCAE) 1 1 119–
130
[14] Thiagarajan S, Semmel D S, & Semmel M I 1974 Instructional Development for Training
Teachers of Exceptional Children Indiana University
[15] Johnstone A H 1991 Journal of Computer Assisted Learning 7 75-83
[16] Sausan I, Saputro S, Indriyanti N Y 2018 Advances in Intelligent Systems Research (AISR) 157
42-45
[17] Gabel D L 1993 Journal of Chemical Education 70 3 193-194
[18] Tang H & Abraham M R 2016 Journal of Chemistry Education 93 31-38
[19] Bain K, Moon A, Mack M R, & Towns M H 2014 Chemistry Education Research and Practice
15 320-335
[20] Hernández G E, Criswell B A, Kirk N J, Sauder D G & Rushton G T 2014 Chemistry Education
Research & Practice 15 3 354–365

168
[21] Sunyono, Yuanita L, & Ibrahim M 2013 Pendidikan Progresif 3 1 65–79
[22] Yuanita L, Ibrahim M & Sunyono 2015 Science Education Internasional 26 2 104-125
[23] Jaber L Z & BouJaoude S 2012 International Journal of Science Education 34 7 973–998
[24] Yakmaci-Guzel B, & Adadan E 2013 International Journal of Environmental and Science
Education 8 1 109–130
[25] Rizal M 2014 Jurnal Pendidikan Sains 2 3 159–165
[26] Kurnaz M A & Arslan A S 2014 Procedia Social Behavorial Sciences Science Direct 116 627–
632
[27] Anwar K, Sunyono & Kadaritna N 2015 Jurnal Pendidikan dan Pembelajaran Kimia 4 3 795–
806
[28] Davidowitz B, Chittleborough G, & Murray E 2010 The Royal Society of Chemistry 11 154–164
[29] Merchant Z, Goetz E T, Keeney-kennicutt W, Kwok O, Cifuentes L & Davis T J 2012 Computers
& Education 59 2 551–568
[30] Nilawati P A, Subandi & Utomo Y 2015 Proseding Seminar Nasional Teknologi Pendidikan UM
[31] Rahayu A D P & Nasrudin H 2014 Unesa Journal of Chemical Education 3 2 88–98

169
Analysis of Students’ Learning Interest toward Chemistry
L G Suryani, I N Suardana, and I W Redhana
Universitas Pendidikan Ganesha, Indonesia, Jalan Udayana 11 Singaraja Bali
81116 Indonesia
Abstract. This study aimed to describe the profiles of student’s learning interest toward chemistry
of public senior high schools in Tabanan City, Bali Province, Indonesia and the factors that affect
that interest. The study was survey research. The population consisted of 418 the tenth- and
eleventh-grade students of Mathematics and Natural Sciences Classes of public senior high
schools in Tabanan City, Bali Province, Indonesia in a school year of 2018/2019. The number of
samples used in the study was 223 students of SMA Negeri 1 Tabanan and 195 students of SMA
Negeri 2 Tabanan taken using proportionate a stratified random sampling technique. Data were
collected by using a questionnaire, an observation sheet, and an interview sheet, while the factors
that affect that interest were collected using the questionnaire and the interview sheet. The results
showed that in general, the profiles of students’ learning at public senior high schools were very
high (6%), high (45%), moderate (32%), low (17%), and very low (2%). The students’ learning
interest was affected by internal and external factors. The internal factors included intelligence,
motivation, and learning styles. Meanwhile, the external ones included families, teachers, teaching
materials, as well as school and social environment.
Keywords: chemistry, learning interest, public senior high schools
1. Introduction
Education is a conscious and planned effort to create an atmosphere of learning and learning process so
the students can actively develop their potential to have spiritual strength, self-control, personality,
intelligence, noble character, and the skills needed by themselves and the community. Education has an
important role to create qualified and potential human beings because education is the main tool in efforts
to increase human resources. Recognizing the importance of the education sector, each country is
competing to improve the quality of education in order to produce people who have high human resources
in order to compete in the global world. In the era of globalization, the development of science and
technology growing very rapidly, one of them is chemistry.
Chemistry is a branch of natural science. Chemistry is seen as a process and a product. As a process,
it can be interpreted as a scientific activity to make knowledge perfect and to find a new knowledge. As a
product, chemistry is interpreted as a result of process in the form of facts, concepts, principles, and laws
as well as theoretical findings of chemical scientists. Chemistry is very important to learn in senior high
school but in the reality, high school students are less interested in learning chemistry. Akram, et al [1]
stated that not all of high school students had a high interest in learning and students’ motivation to learn
chemistry is low.
Interest is the main key in the field of education [2]. According to Hidi, interest is a unique
psychological state that occurs during interactions between people and the objects that they are interested
in [3]. When students are asked what conditions or conditions most influence their learning success, they
usually said that an interest in what is taught [4]. Interest in learning is one of the internal factors that can
affect student learning achievement. Interest is one of the most important aspects in encouraging learning
success because it will bring up good memories for students. When students lose their interest in learning,
they will forget the subject easily [5]. Hidi, Renniger, and Krapp [6] state that interest refers to attention,
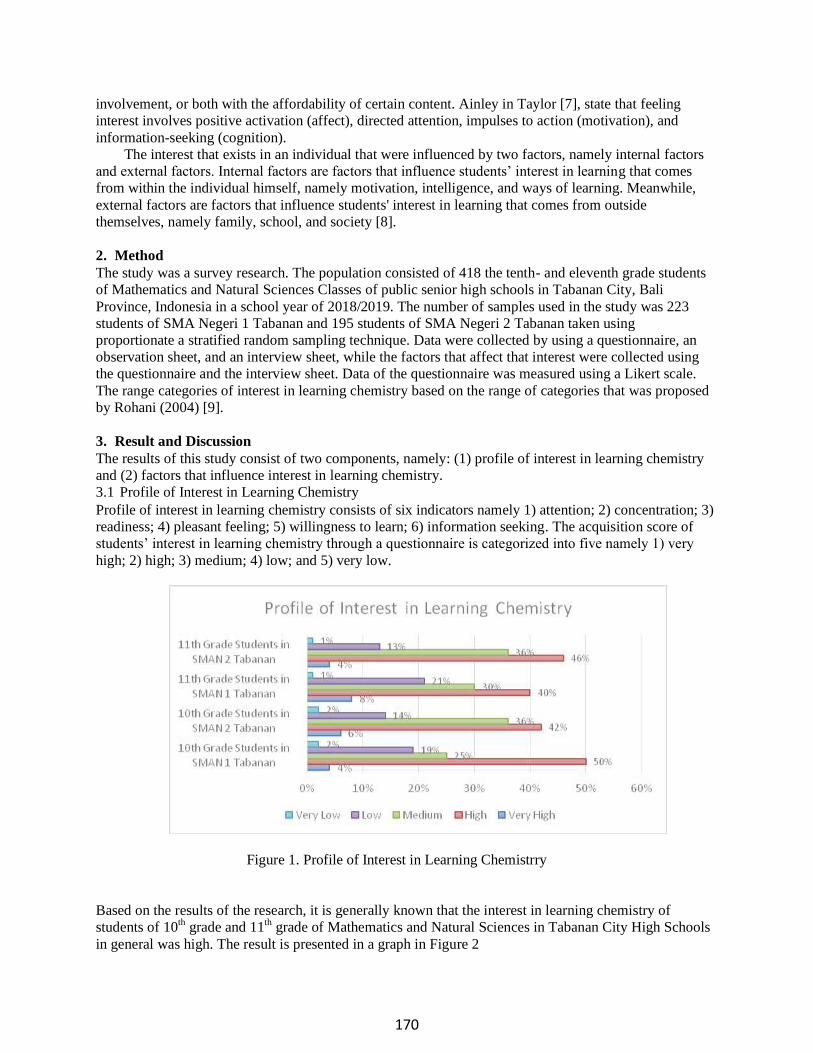
170
involvement, or both with the affordability of certain content. Ainley in Taylor [7], state that feeling
interest involves positive activation (affect), directed attention, impulses to action (motivation), and
information-seeking (cognition).
The interest that exists in an individual that were influenced by two factors, namely internal factors
and external factors. Internal factors are factors that influence students’ interest in learning that comes
from within the individual himself, namely motivation, intelligence, and ways of learning. Meanwhile,
external factors are factors that influence students' interest in learning that comes from outside
themselves, namely family, school, and society [8].
2. Method
The study was a survey research. The population consisted of 418 the tenth- and eleventh grade students
of Mathematics and Natural Sciences Classes of public senior high schools in Tabanan City, Bali
Province, Indonesia in a school year of 2018/2019. The number of samples used in the study was 223
students of SMA Negeri 1 Tabanan and 195 students of SMA Negeri 2 Tabanan taken using
proportionate a stratified random sampling technique. Data were collected by using a questionnaire, an
observation sheet, and an interview sheet, while the factors that affect that interest were collected using
the questionnaire and the interview sheet. Data of the questionnaire was measured using a Likert scale.
The range categories of interest in learning chemistry based on the range of categories that was proposed
by Rohani (2004) [9].
3. Result and Discussion
The results of this study consist of two components, namely: (1) profile of interest in learning chemistry
and (2) factors that influence interest in learning chemistry.
3.1 Profile of Interest in Learning Chemistry
Profile of interest in learning chemistry consists of six indicators namely 1) attention; 2) concentration; 3)
readiness; 4) pleasant feeling; 5) willingness to learn; 6) information seeking. The acquisition score of
students’ interest in learning chemistry through a questionnaire is categorized into five namely 1) very
high; 2) high; 3) medium; 4) low; and 5) very low.
Figure 1. Profile of Interest in Learning Chemistrry
Based on the results of the research, it is generally known that the interest in learning chemistry of
students of 10th
grade and 11th
grade of Mathematics and Natural Sciences in Tabanan City High Schools
in general was high. The result is presented in a graph in Figure 2
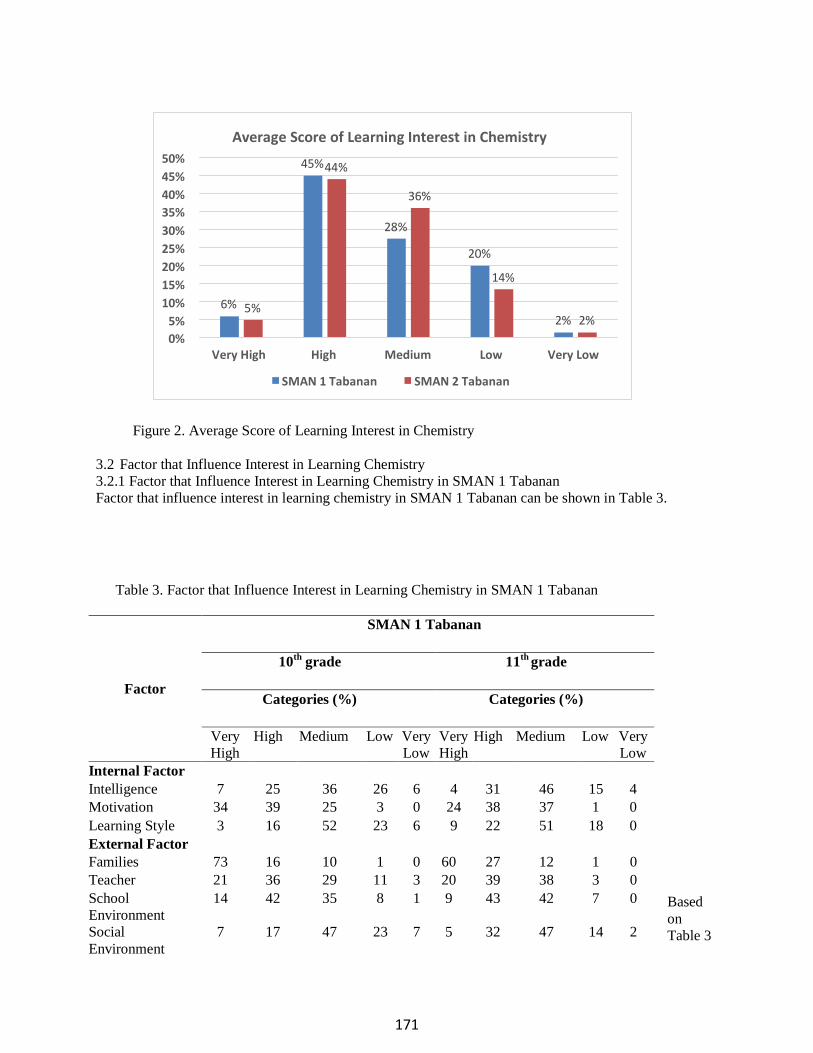
171
Figure 2. Average Score of Learning Interest in Chemistry
3.2 Factor that Influence Interest in Learning Chemistry
3.2.1 Factor that Influence Interest in Learning Chemistry in SMAN 1 Tabanan
Factor that influence interest in learning chemistry in SMAN 1 Tabanan can be shown in Table 3.
Based
on
Table 3
Table 3. Factor that Influence Interest in Learning Chemistry in SMAN 1 Tabanan
Factor
SMAN 1 Tabanan
10th
grade 11th
grade
Categories (%) Categories (%)
Very
High
High Medium Low Very
Low
Very
High
High Medium Low Very
Low
Internal Factor
Intelligence 7 25 36 26 6 4 31 46 15 4
Motivation 34 39 25 3 0 24 38 37 1 0
Learning Style 3 16 52 23 6 9 22 51 18 0
External Factor
Families 73 16 10 1 0 60 27 12 1 0
Teacher 21 36 29 11 3 20 39 38 3 0
School
Environment
14 42 35 8 1 9 43 42 7 0
Social
Environment
7 17 47 23 7 5 32 47 14 2
6 %
45 %
% 28
% 20
% 2 % 5
% 44
% 36
14 %
2 % % 0 % 5 % 10
15 % % 20
25 % 30 % 35 % 40 %
% 45 50 %
Very High High Medium Low Very Low
Average Score of Learning Interest in Chemistry
SMAN 1 Tabanan SMAN 2 Tabanan
172
it can be seen that the most important internal factors influencing students 'interest in learning chemistry
are motivational factors, while the external factors that most influence students' interest in learning
chemistry are family environment factors.
3.2.2 Factor that Influence Interest in Learning Chemistry in SMAN 2 Tabanan
Factor that influence interest in learning chemistry in SMAN 2 Tabanan can be shown in Table 4.
Based on Table 4 it can be seen that the most important internal factors influencing students 'interest in
learning chemistry are motivational factors, while the external factors that most influence students'
interest in learning chemistry are family environment factors.
The students’ learning interest were affected by internal and external factors. The internal factors
included intelligence, motivation, and learning styles. Meanwhile, the external ones included families,
teachers, teaching materials, as well as school and social environment. Tytler and Symington [10]
mentioned that the students’ personal motivation and learning styles are important for the chemistry
learning . The teachers are doing well but not best for developing students’ interest in chemistry. Their
teachers teaching style were satisfactory but they did not use enough charts, models, and daily life
examples to make students interest in learning chemistry [11]. The role of the family is to provide the
facilities needed by students to increase student interest in chemistry. The role is to accompany students
while learning, give directions, give advice, provide the necessary facilities, and other supports that will
be able to increase students' interest in learning chemistry.
Based on the interview, students assumed that chemistry is abstract and uses too many formulas so that
students have difficulty learning chemistry. Gabel [12] stated that abstractness in chemistry makes
chemistry a complex subject. Yunus and Ali [13] also stated that students in Malaysian secondary schools
considered most topics on chemistry subjects is difficult and require a long time to study. Friends or
social environment also had a strong influence on the formation of character and behavior of children in
Table 4. Factor that Influence Interest in Learning Chemistry in SMAN 2 Tabanan
Factor
SMAN 2 Tabanan
10th
grade 11th
grade
Categories (%) Categories (%)
Very
High
High Medium Low Very
Low
Very
High
High Medium Low Very
Low
Internal Factor
Intelligence 2 20 58 17 3 6 46 28 18 4
Motivation 32 49 17 1 1 33 47 19 1 0
Learning Style 3 16 62 15 4 7 23 52 18 0
External Factor
Families 50 44 5 1 0 78 17 4 1 0
Teacher 24 56 18 2 0 44 43 12 0 0
School
Environment
10 43 45 3 0 14 49 31 6 0
Social
Environment
9 32 32 20 7 12 34 40 6 8

173
school. Peer influence is important for child development. Interaction between friends as will encourage
intellectual development and potential towards a better direction.
4. Conclusion
Based on the results of the study and discussion can be concluded as follows. The profiles of the students’
learning interest of SMA Negeri in Tabanan city are as follows. The profiles of the students’ learning
interest in SMA Negeri 1 Tabanan were very high (6%), high (45%), moderate (28%), low (20%), and
very low (1%).The profiles of the students’ learning interest in SMA Negeri 2 Tabanan were very high
(5%), high (44%), moderate (36%), low (14%), and very low (2%). In general, the profiles of students’
learning at public senior high schools were very high (6%), high (45%), moderate (32%), low (17%), and
very low (2%).
The student’s learning interest was affected by internal and external factors. The internal factors
included intelligence, motivation, and learning styles. Meanwhile, the external ones included families,
teachers, teaching materials, as well as school and social environment. Analysis of students 'interest in
learning chemistry can help schools especially teachers to find out students' interest in learning chemistry
and overcome problems of student interest in learning so the process of learning chemistry is much better.
5. Acknowledgments
We would like to express our highest gratitude to the head of SMA Negeri 1 Tabanan and SMA Negeri 2 Tabanan for permission so that this study could be carried out properly. We also expressed our gratitude to the teachers who helped us in collecting data on this study.
6. References
[1] Akram T M Ijaz A and Ikram, H 2017 Int. Journal of Information and Edu. Technology, 7(2), p
88–94.
[2] Krapp and Prenzel 2011 Int. Journal of Science Education, 331, 27-50
[3] Hidi. 2006 Interest: A unique motivational variable, Educational Research Review, vol. 1, no. 2, pp. 69- 82
[4] Gräber W 2011 German High School Students’ Interest in Chemistry – A Comparison between 1990 and 2008, 22(2), 134-140
[5] Adodo S O and Gbore L O 2012. Int. Journal of Psychology and Counselling, 4(6), 68-72.
[6] Renniger, Hidi, and Krapp 2014 The Role of Interest in Learning and Development
[7] Taylor W 2012 Studying and Understanding Motivation
[8] Slameto 2010 Belajar dan Faktor – Faktor yang Memengaruhi
[9] Rohani 2004 Pengelolaan Pengajaran
[10] Tytler and Symington 2006 Science in school and society,Teaching Science:The Journal of the Australian Science Teachers Associations, vol. 52, no. 3, pp. 10-15,
[11] Akram T M Ijaz A and Ikram, H 2017 Int. Journal of Information and Edu. Technology, 7(2), p
88–94.
[12] Gabel D 1999 Improving Teaching and Learning through Chemistry Education Research: A Look
to the Future. Journal of Chemical Edu. 76 (4), 548-553.
[13] Yunus and Ali 2013 Journal of Asian Behavioral Students, 3(1).

174
Website Based Multimedia Development as Learning Media on
Wave and Sound Vibration Materials to Increase Student
Motivation and Learning Outcomes
Ni Putu Dewi Masyuni 1, Ketut Suma
2 and I Dewa Ketut Sastrawidana
3
1Universitas Pendidikan Ganesha
2Universitas Pendidikan Ganesha
3Universitas Pendidikan Ganesha
Email: [email protected], [email protected], [email protected]
Abstract. This study aims to produce a product in the form of a multimedia-based website as a
learning media that is valid, practical and effective to improve student learning outcomes and
motivation. Design of study consisted 1) Define, 2) Design, 3) Develop, and 4) Disseminate. The
data collected in this study are product validity test data, practicality test data, and effectiveness
test data. The results of this study is (1)The validity of experts on multimedia based websites as
learning media gets results, content experts 0,9 with a very valid category, media experts 0,72 are
categorized valid, and design experts 0,84 are categorized very valid. (2) the practicality of a
multimedia-based website in terms of 3 things: readability with a score of 4.42 with a very
practical category, teacher response score of 4.55 a very practical category, response of small
group students a score of 4.12 practical categories (3) Effectiveness of a website based multimedia
is reviewed through student learning outcomes with an average score of 86.31 with a classical
completeness of 86%. Based on the learning outcomes data obtained it can be concluded that the
application of multimedia-based websites as learning media can improve learning outcomes.
Introduction
The era of the industrial revolution 4.0 also changed the perspective of education. Changes
made are not just ways of teaching, but are far more essential, namely changes in the way of
viewing the concept of education itself. The relationship of the industrial revolution 4.0 with the
education system related to the impact of industry 4.0 with the ' Digitalization System '. The
learning system and media which were originally based on face to face directly in the classroom,
is not impossible to be replaced with systems and learning media that are integrated through the
internet network (online learning).
Learning with an online system can maximize the learning process in the classroom that tends
to be short of time (Rusman, 2011). Online learning is a process in the application of website -
based learning media . Muhtar (1992) states that the teacher becomes a facilitator to help
students transform online learning activities so that the potential possessed by students becomes
useful for these students. Learning activities expect teachers to always provide new innovations
to the learning media used so that students are able to gain new experiences and increase student
motivation in the learning process. The learning process in the classroom does not only come
from textbooks but also requires interesting and interactive media so that the learning process
can take place dynamically.
In fact, the use of instructional media that has not been utilized in teaching and learning
activities, makes the learning process monotonous and boring. This will certainly affect student
learning motivation to decrease (Safiral, 2018). The learning process created tends to direct
students only to accept material without having to reason it, so that the potential possessed by
students tends not to be honed to the maximum (Natalia et al. , 2016). The teacher helps students
175
transform the potential possessed by students into abilities and skills which when developed will
benefit the student's life (Muhtar, 1992). This ability can be developed through learning activities
that innovate more dynamically and interactively.
Rachmadtullah (2018) states that innovation in learning activities is needed so that the
learning process becomes fun and interesting so that students who are initially low in learning
motivation will increase. This innovation can be in the form of developing learning media and
learning methods. The examples of learning media are power points learning videos, interactive
multimedia, and others. Development is carried out to create interesting learning media. Media
and interesting learning methods will make it easier for teachers to increase student motivation
and understanding in absorbing learning material (Natalia, 2016).
Based on Sudjana (2013), learning media can increase motivation and student learning
outcomes. The reason with respect to the benefits of learning media in the learning process of
students include: 1) teaching will attract more attention of students so that it fosters motivation to
learn, 2) teaching material will be clearer so that it will be better understood by students and
enable students to better master teaching objectives, 3) teaching methods will be more varied,
and 4) students do more learning activities because they not only listen to the teacher's
description but also do other activities such as observing, reasoning, demonstrating, and others.
Interactive multimedia-based learning media will provide a different atmosphere that can
change students' perceptions of learning. Multimedia brings a good impact for teachers, because
with multimedia teachers have the opportunity to develop learning techniques so that they can
improve learning outcomes for the better. Multimedia for students is expected to make it easier
for them to absorb lesson material quickly and efficiently and independent learning can be
applied. The use of interactive multimedia-based learning media in the learning process will shift
boring learning into enjoyable learning. Utilizing interactive multimedia can make teachers no
longer the only source of student learning and multimedia is expected to make students active in
learning.
Student interest in interactive multimedia-based learning media will also increase student
motivation (Ningrum, 2016). Astawa et al. (2016) Multimedia learning provides opportunities
for students to learn independently, so learning can be done anytime. Learning media is used to
attract attention and make students active in the learning process, one of which is to use
interactive multimedia-based learning media using website -based multimedia.
The packaging of learning material in the form of audio-visual shows can capture 90% of the
entry channels of messages or information into the human soul through the eyes and ears. Audio
visual media can make people generally remember 50% of what they see even if little or only
aired once. Or in general people will remember 85% of what they see from an impression after 3
hours later, and 65% after 3 days later (Akhlis, 2018). Therefore website-based multimedia can
facilitate students in capturing learning material. Website-based multimedia is a combination of
text, sound, video and animation. This integration can present learning that is fun, interesting,
easy to understand, and clear, so that the information conveyed will be easily absorbed and
understood (Mawardi, 2016).
SMP Negeri 7 Denpasar is one of the junior high schools that have implemented UNBK and
obtained an average UNBK score in science subjects in 2018 of 73.06. SMP Negeri 7 Denpasar
ranks 21st out of 36 SMPs in Denpasar that have conducted UNBK . It is known that the
facilities at SMP Negeri 7 Denpasar are adequate, including LCD in each class, and has a
computer laboratory. In addition, some students are known to have brought laptops to school and
in class VIII students it is known that most students are familiar with the website. Information

176
was also obtained that online-based learning is still not very developed. The school area has also
been equipped with wifi in each building. The facilities in the school are possible to be
developed, but teachers still do not utilize the existing facilities.
Based on the description above, it is necessary to conduct research and development. The
research in question is the development of website-based multimedia with the research title
"Website- Based Multimedia Development as Learning Media on Wave and Sound Vibration
Materials to Increase Motivation and Learning Outcomes of Class VIII Students of SMP Negeri
7 Denpasar". Based on the above background, formulated per issue an namely: how to validity, practicality,
effectiveness of multimedia -based website as a medium of learning the material vibration and sound
waves to increase motivation and learning outcomes of the eighth grade students of SMP Negeri 7
Denpasar ?
Method
This type of research is research and development (R & D). This type of research is used to produce
products in the form of learning websites, and test the feasibility of these products. 4-D development
procedures developed by Thiagarajan et al. (1974). This development procedure consists of four stages,
namely 1) Define, 2) Design, 3) Develop, and 4) Dessiminate. Website-based multimedia developed was
tested based on 3 aspects, namely validity, practicality and effectiveness. Validity test is done based on
the assessment of experts to provide an assessment based on three aspects: media, design and content /
material. The practicality test in this study was assessed from 3 aspects, namely the readability test, the
responses of teachers and students as website users. The effectiveness test is assessed based on the results
of the posttest t given to students at the end of the meeting. Posttest is done by giving multiple choice
tests consisting of 20. The population of this study is students of class VIII of SMP Negeri 7 Denpasar
and the sample in this study is students of class VIII-1 and VIII-2 sampling in this study using simple
random sampling technique.
Result and Discussion
1.1. Characteristics of Website-Based Multimedia
The result of developing a website-based multimedia as a learning medium is a website / website that has
been uploaded online with the url address: http://imphysicopedia.com. The following is a menu content
contained in website-based multimedia as a media. The Home page is the main page or Home page. Users
will go directly to this page when typing the website address. On the main page, there is a greeting from
the author for users to better know about the website that will be used as a learning medium. Sign Up
page is a page that contains a form to register as a member in the discussion forum. On this page the user
who wants to register as a member so they can discuss the tasks and material in learning. Introductory
page, contains details of learning activities on website-based multimedia and basic competencies that
must be achieved in the learning process. Structurally this page aims to make it easier for users to use this
media to learn the vibrations of waves and sound. This page contains science learning materials for class
VIII semester II, namely wave and sound vibrations. This material is the main content of this learning
media. It contains exposure to basic competencies and indicators of the material in accordance with the
applicable curriculum. The material page is divided into 3 sub namely: 1) Vibration, 2) Waves and 3)
Sound. The download page contains material and media that can be downloaded so that users can learn
material vibration waves and sounds offline. The download page contains power points, video and flash
that are relevant to the material of the vibrations of waves and sounds. In addition to the students' needs,
the download page is also included with a learning tool in the form of lesson plans for vibration and
sound waves that can help the teacher in the learning process.
1.2. Website Based Multimedia Validation

177
Websites that have been designed at the design stage called draft I will be tested at the
development stage. The trial is carried out in three stages, namely (1) the feasibility assessment
of the first draft by experts, (2) the feasibility assessment by a small group of 9 students in the
second draft which will be used for practicality test data and the feasibility assessment will be
done through a questionnaire teacher response to readability on the website (3) the feasibility
assessment of the draft III field to test the effectiveness of multimedia-based learning websites as
a learning medium in the learning process in class.
The first draft of a website-based multimedia as a learning medium is assessed by content
experts, design experts and media experts to get an assessment and input. The assessment is done
by 2 experts (Drs. Ida Bagus Putu Mardana, M.Sc and Prof. Dr. I Wayan Redhana, M.Sc. The
assessment results from the experts are used as a basis for revisions and improvements to the
website. Based on the results of the validation assessment by the experts the two experts in the
first draft were revised to produce a draft II. The draft I of the research product was declared
valid after being analyses through Gregory's analysis. Following are the results of Gregory's
expert validation analysis. Material / content validation with a score of 0.9 is in the very valid
category. Media validation score of 0.72 category valid. Design validation with a score of 0.84 in
the category is very valid.
Based on the results of the validation analysis by the experts in first draft. The validation of
development products based on material, media and village design of website-based multimedia
development products as learning media can be tested on a small group scale.
1.3. Practicality Tests for Multimedia-Based Websites
Website-based multimedia practicality test is done by conducting a small group test consisting of
9 students and 4 science teachers at SMP Negeri 7 Denpasar. Practicality analysis analyses is
done by using an analysis of the website-based multimedia readability test in the form of a
teacher's response questionnaire and student response questionnaire. The results of the
practicality test will be used as input to reform the website-based multimedia II so that it will get
website-based multimedia called draft III.
The results of all three aspects are tested as follows. The readability of teachers and students
with a score of 4.42 falls into the very practical category. Teacher responses with a score of 4.55
are in the very practical category. Small group student responses with a score of 4.12 fall into the
practical category. Website-based multimedia practicality test there are a number of things that
occur in small-scale group testing, which are recorded and used as references, improved for later
applied in field trials. Revisions are made referring to suggestions and comments from users. The
suggestions and input that have been summarized are: (1) providing practice questions on the
website that can be downloaded to be done manually, (2) providing worksheets or worksheets
complete with demonstration media, (3) providing instructions for using the quiz creator so that
it can be used just easily. In addition, in this study a practical test was also carried out in the field
test using a practicality test questionnaire given to all samples in this study. The following is a
practical test analysis table in the field test.
1.4. Multimedia-Based Website Effectiveness Test
Website-based multimedia effectiveness test as a learning media is done with limited field trials.
This limited field trial was carried out in Denpasar 7 Public Middle School by using two classes,
namely VIII-1 and VIII-2 classes. This limited trial was conducted for 6 meetings. After the treatment is completed, the students are given a final test in the form of a test of
learning outcomes (post-test) as well as capturing student responses to the learning process using
178
website-based multimedia as a learning medium and analysed student learning motivation in the
learning process.
The post-test is done at the end of the lesson with a total of 20 items in the form of multiple
choice. The data obtained from 72 students a grade point average of 89 with 86% mastery
learning. The test results were analysed by looking for grade averages and classical learning
completeness criteria.
Based on the results of the post-test shows that student learning outcomes are complete,
because it is in accordance with the provisions of the Ministry of National Education in Trianto
(2010) that the learning process in class is said to be classically complete if 85% of students in
the class get a value of ≥ 77. A complete analysis of learning completeness is presented in
attachment 03.
After analysing the completion of the study a proportion test is performed to see the overall
percentage of students (population) who have completed the learning process. The average post-
test value was 86.31 with a minimum value of 69 and a maximum of 100. While a significant 5%
obtained a standard deviation (standard deviation) of 8.75. Based on this, the decision H0 is
taken and Ha is rejected. So, the dependent variable in this study is the learning outcomes
significantly (p> 0.05) greater than 77 (in the high category)
In table 4.11 we can see that the value of sig. (1-tailed) of 0.524. Because the sig value is
0.524> 0.05, H0 is accepted. This means that the average value of learning outcomes after using
website-based multimedia as a learning medium exceeds the KKM which is 77. In other words it
can be said that the average value of student learning outcomes after using multimedia-based
websites as teaching media is higher than KKM . This study also looked at students' learning
motivation. High learning motivation is one of the factors needed to improve student learning
outcomes. Therefore, an assessment of students' learning motivation is carried out by giving a
learning motivation questionnaire to all students who were sampled in this study. The learning
motivation questionnaire consisted of 43 statements graded according to a Likert scale.
Based on the results of the questionnaire, it was found that the mean score of students
'learning motivation was equal to a standard deviation of 77.25, a maximum score of 215 and a
minimum score of 131. The mean scores indicated that students' learning motivation was in the
high category according to the learning motivation questionnaire given to students. Thus it can
be said that students are motivated to learn in learning activities with website-based multimedia
as a learning medium.
Conclusions and Suggestions
Based on the results of the research and discussion described previously, three conclusions can
be made according to the formulation of the problem presented, among others as follows.
1) A multimedia-based website as a learning media consists of several menu pages, namely:
home, introduction, material, quizzes, forum and contact us. This multimedia-based website has
a website address, www.imphysicopedia.com. The multimedia based learning website will
contain the subject matter of wave and sound vibrations.
2) The validity of a multimedia-based website based on the assessment of two experts is in the
valid category. The mean score of multimedia-based website validity test by the two experts as
follows the content expert validation is in the very high category, media expert validation is in
the high category, and design validation is in the very high category. Based on the results of the
analysis, multimedia-based websites as learning media are said to be valid in material / content,
media and design.
179
3) The practicality of multimedia-based websites in this study was assessed based on 3
aspects, namely (1) readability, (2) teacher responses (3) student responses to multimedia-based
websites. The average practicality score for the three types of data is the readability of
multimedia-based websites as learning media are in the very practical category, the responses of
the teacher's response are in the very practical category and the responses students get are in the
practical category. Based on these results the multimedia-based website generated from this
research is in the practical category.
4) Multimedia-based website as an effective learning media to improve student learning
outcomes. This is in accordance with the results of analysis of student learning outcomes using
the proportion test statistic with an average value of 86, 31 with mastery learning by 86% so that
it has exceeded the classical completeness of 85%.
References
[1] Akhlis I and Aryani P 2018 Development of multimedia web-based physics learning tools to
strengthen students' characters Unnes Science Education Journal (Available at https://www.
journal.unnes.ac.id)
[2] Astawa I N W, Tegeh I M and Sudhita W R 2016 Development of interactive learning
multimedia science subjects to improve student achievement in class VII Edutech e-Journal of
Ganesha University of Education Department of Educational Technology 5(2) (Available at
https: // www. ejournal.undiksha.ac.id)
[3] Hutapea N, Nyeneng I DP and Suana W 2016 Development of interactive learning media on
impulse and momentum material with a scientific approach Journal of FKIP Lampung
University (Available on https: // www. portalgaruda.org)
[4] Mawardi I 2016 ICT (information and communication technology) as a vehicle for educational
transformation. Journal of Islamic research and education (Available at https://www.
en.portalgaruda.org)
[5] Muhtar 1992 Guidance for teacher guidance in teaching and learning (Jakarta:PGK & PTK
Ministry of Education)
[6] Natalia E, Nyeneng I DP and Suyatna A 2016 Development of e-learning with schoology on
rigid body dynamics material (Available at https://www. urnal.fkip.unila.ac.id)
[7] Purnomo A, Ratnawati N, and Aristin NF 2016 Development of blended learning learning in
generation z Journal of Social Theory and Praxis of Learning 1(1) (Available at
journal.um.ac.id)
[8] Rachmadtullah R, Zulela and Sumantri M 2018 Development of computer-based interactive
multimedia: study on learning in elementary education International Journal of Engineering &
Technology 7(4) (Available at https: // www. sciencepubco.com)
[9] Safira I, Ismail and Mushawwir T 2018 Development of web-based biology learning media on
the concept of the digestive system in high school UNM Journal of Biological Education 1(2)
(Available at https://ojs.unm.ac.id)
[10] Ningrum P, Sri E and Widiatmoko S 2016 Development of web-based learning media to
improve the ability to determine the relationship between units of time, between units of weight,
between long units of students in grade 4 at SDN Burengan 2 Kedir Journal Simki Pedagogia
1(1) (Available at https://simki.unpkediri.ac.id)
[11] Rusman Kurniawan D and Riyana C 2011 Information and communication technology based
learning (Jakarta: Rajawali Press)

180
[12] Thiagarajan S, Semmel D and Semmel M 1974 Instructional development for training teachers
of exceptional children .roomington (Indiana University)

181
The Effect of Self-Efficacy, Achievement Motivation, and Study
Habits to Science Literacy at Junior High School Students
I Gede Sandi Wiarsana1, I Wayan Sadia2 and Ida Bagus Putu Arnyana3
1Universitas Pendidikan Ganesha
2Universitas Pendidikan Ganesha
3Universitas Pendidikan Ganesha
Email: [email protected], [email protected],
Abstract. This study aimed to describe and explain the effect of self-efficacy, achievement
motivation, and study habits to science literacy at junior high school students. This type of study is
a quantitave with ex-post facto design. The total population in this study was 3880 students. The
selection of school samples is determined by regional sample techniques. The research sample
used was 410 students. Data collection using questionnaires and tests. The data was analysed by
descriptive analyses and hypotheses was tested by path analyses. The results showed that there
were: (1) direct effect coefficient of self efficacy on science literacy is 0.345, (2) indirect effect
coefficient of self efficacy through achievement motivation on science literacy is 0,130, (3)
indirect effect coefficient of self efficacy through study habits on science literacy is 0,286, (4)
indirect effect coefficient of self efficacy through achievement motivation and study habits on
science literacy is 0.139, (5) direct effect coefficient of achievement motivation on literacy is
0.165, (6) indirect effect coefficient of achievement motivation through study habits on science
literacy is 0.176, (7) direct effect coefficient of study habits on science literacy is 0.489. Keyword: science literacy, self efficacy, achievement motivation, study habits
1. Introduction Education has a role in showing the quality of a country's human resources. Based on Muelas & Navarro
(2015), quality education is not only determined by education providers, but also by students because
education places students as the main characters in the teaching and learning process. Students are
expected to be able to process actively by utilizing all the potential they have in building knowledge,
skills, and attitudes so that the learning achievements achieved are more optimal. Achievement of student
learning achievement and scientific literacy optimally characterizes the improvement in the quality of
education. Science education is responsible for scientific literacy of students, therefore the quality of
science learning needs to be improved in order to achieve a sustainable level of development (Liliasari,
2011). This goal will be achieved if supported by conducive learning and psychological factors of
students. Science literacy is very important for every student, according to Widiyanti et al. (2015) that
developed countries have built scientific literacy for a long time which is integrated in learning. The
survey program that assists in the assessment of scientific literacy is the PISA-OECD which
focuses on practical knowledge, answers questions

182
scientifically, identifies relevant evidence, evaluates conclusions critically and connects scientific ideas (PISA, 2016).
In fact, based on the results of the Program for International Student Achievement or PISA (PISA, 2016), the quality of scientific literacy in Indonesia is still relatively low, where shows that Indonesia is ranked 62
nd out of 70 participating countries with an average score of 403, while the international
average score is 500 (PISA, 2016). Whereas in the Human Development Index or HDI 2016, Indonesia is in position 113 of 188 countries in the category of human resource development. These results indicate that the achievement of the quality of education in Indonesia is still low. The gap that occurs between effort and reality is caused by many factors that will lead to a decrease in the quality of education. Some of the factors that cause low quality of education in Indonesia are lack of student literacy, poor quality standardization, less developed educational innovations, and low student achievement (Yuliati, 2017).
The low quality of education is reflected in the scientific literacy of students who tend to be still
not optimal, because scientific literacy is a tangible result that can be used as a guide for measuring the quality of education in Indonesia (Adams-Budde et al., 2013). According to Sandhu (2014), there are
two factors that influence students' literacy, namely internal factors that originate in students
(psychological) and external factors that originate from outside of students. In this study only focused
on the realm of psychology or internal factors of the students themselves that can influence students' scientific literacy.
Judging from the internal factors of students include attitudes towards learning, achievement motivation, learning concentration, processing learning materials, storing acquisition of scientific
literacy, exploring stored scientific literacy, achievement ability, self efficacy or self-confidence, intelligence and learning success, study habits and goals students 'ideals which in the end as a
benchmark are students' scientific literacy in the learning process (Gucluer & Kesercioglu, 2012). Judging from the external factors students can be in the form of objectives of the learning process
undertaken by the teacher, strategies, models or learning methods used, facilities in the learning process, assessment policies and implementation of school curricula have not referred to student
literacy (Rathburn, 2015). Learning outcomes and optimal scientific literacy from students are the goals of the learning
process. Optimal student performance is definitely done by students seriously and has high self
efficacy in achieving achievements. This is certainly a positive thing for students where students have scientific literacy based on the student's self-efficacy. If students do not have self efficacy in their
lives, the students will not be able to develop in achieving achievements and tend to feel pessimistic in
achieving something. Based on Sultan et al. (2018) states that learning is controlled by internal aspects
of self efficacy , so that one of the psychological factors that influence science literacy can be said that one of them is student's self efficacy
Ozgen (2013) revealed that self efficacy has a positive impact on the achievement of scientific
literacy and student learning achievement. Individuals who have high self efficacy believe that they
can effectively deal with the situations and conditions they face and continue to build up optimistic expectations of success in overcoming problems and strive to display tireless perseverance (Riyadi et
al., 2018). (Bulent, 2015) in his research also found that Intrinsic motivation and self efficacy are
predictive variables for scientific literacy. In addition, based on research by (Rosyida et al., 2016), self
efficacy significantly influences direct study habits or study habits and scientific literacy. High self-efficacy of students will directly influence the study habits of these students. Based on the explanation,
self efficacy can influence achievement motivation, study habits and scientific literacy of students. On the other hand, achievement motivation also plays a role and influences the achievement of
scientific literacy and study habits of students. Based on Suresh (2015) revealed that there is a positive
relationship between achievement motivation and study habits together on students' learning
achievement and scientific literacy. Study habits begin with the achievement motivation or desire to
achieve. Good study habits are difficult to implement if students do not have ambition to achieve
something, this means that study habits are predicted by achievement motivation. In addition, based
on

183
Atkinson & Feather (1966) stated that self efficacy is one of the aspects needed to build achievement
motivation. Based on Mudjijanti (2013) the condition of students or students who are lazy, lack
enthusiasm in learning, indifferent, less like tasks that are challenging and prefer tasks that are easy
and not much require thinking are indicative of low student achievement motivation. On the contrary students who have high achievement motivation appear in diligent behavior, passionate in learning,
active, like challenging task assignments. The third psychological factor that influences student achievement and scientific literacy is the
study habits of students. Students' satisfying scientific literacy can only be achieved by diligent,
regular, and gradual learning efforts. In other words, maximum learning success can be achieved if
students have good study habits (Garner-O’Neale et al., 2015). Student achievement certainly has different study habits that will generate knowledge that different (Chaudhari, 2013). Sandhu (2014)
also revealed that poor study habits would lead to low academic achievement. Garner-O’Neale et al.
(2015) suggest that there is a significant positive correlation between study habits and students'
scientific literacy. The better the study habits students have, the higher academic achievement is achieved, so academic achievement is influenced by study habits .
Departing from this The researcher wanted to do research with the title "The Effect of Self Efficacy, Achievement Motivation and Study Habits of Students on Science Literacy of Class VIII
Students of All Cities in Denpasar". The reason for conducting this research is because based on the
results of the research that has been presented, the internal factors of students do more influence
scientific literacy, especially self efficacy, achievement motivation, and study habits . Data collection is carried out in Denpasar because the progress of education or renewal of the learning system is more
dynamic so that the improvement in the quality of learning is more significant in Denpasar. Based on the background , problems are formulated including 1) whether there is a direct influence
between students' self efficacy on science literacy of class VIII students in science subjects in
Denpasar City Middle Schools? 2) is there an indirect effect of students' self-efficacy through
achievement motivation on science literacy of class VIII students in science subjects in Denpasar City
Middle Schools? 3) Is there an indirect effect of students' self efficacy through study habits of science
literacy of class VIII students in science subjects in Denpasar City Middle Schools? 4) is there an
indirect effect between self efficacy through achievement motivation and study habits of science
literacy of class VIII students in science subjects in Denpasar City Middle Schools? 5) is there an
indirect influence between achievement motivation on science literacy of class VIII students in science
subjects in Denpasar Public Middle Schools? 6) whether there is an indirect influence between
achievement motivation through a study habits of scientific literacy of class VIII students in science
subjects in Denpasar Public Middle Schools? 7) is there a direct influence of study habits on science
literacy of class VIII students in natural science subjects in Denpasar City Middle Schools? Based on the formulation of the problem, the purpose of this research will be in line with
describing and explaining the problems in each formulation
2. Method This type of research is quantitative research with research design ex post facto to a statistical model
of path analysis (path analysis). The total population studied was 3880 students. Selection of school
samples using area techniques sampling while the selection of research samples in each school was determined using the proportionate stratified random sampling technique. Determination of a sample
of the population can use the Krejcie and Morgan tables. Based on the table, if the population is 4000
students (3880 rounded to 4000) then the number of samples taken in the study amounted to 351
students with an error rate of 5%.
JS
n
(0,90)(0,95)
Based on these calculations obtained the number of samples taken to 410 students. From the total sample obtained, the number of classes required if the number of class students in Denpasar is around

184
35 people is 12 classes. Researchers used six junior high schools in Denpasar, namely SMPN 1
Denpasar, SMPN 4 Denpasar, SMPN 5 Denpasar, SMPN 7 Denpasar, SMPN 10 Denpasar, and SMPN 11 Denpasar. The reasons for selecting 6 schools out of the 12 schools are (1) Because the new junior high school admission system now uses the regional system, it is difficult to determine whether or not to favorite schools, so researchers divide them based on districts in the city of Denpasar. (2) Consideration of adjusting the ratio of the number of schools per district in the city of Denpasar. This
was done because of differences in the number of schools in each district. (3) In addition, the number of schools studied was only 6, due to the efficient allocation of time and funds. According to researchers, 6 schools are sufficient to represent the overall population of 12 existing schools. Based on the total number of samples obtained, the percentage of samples in each school was determined again by the formula:
= ⁄ × 100%
Determination of proportions is done using the formula:
= ×
Table 1. Samples of Class VIII Students in Each School
No School Sub-district Total
1 SMP Negeri 4 Denpasar Denpasar Utara 67
2 SMP Negeri 5 Denpasar Denpasar Utara 63
3 SMP Negeri 10 Denpasar Denpasar Utara 80
4 SMP Negeri 1 Denpasar Denpasar Timur 67
5 SMP Negeri 7 Denpasar Denpasar Barat 75
6 SMP Negeri 11 Denpasar Denpasar Selatan 58
Total 410
The method of data collection uses an instrument in the form of a self efficacy questionnaire,
achievement motivation questionnaire, study habits questionnaire, and scientific literacy test. Before being used to obtain data, questionnaires and tests must pass the instrument trial phase. The trials for
each instrument go through the stage of content validity test, item internal consistency test, and
reliability test. The data analysis technique was done by descriptive analysis and then analysis
prerequisite tests which included data distribution normality test, data linearity test, significance of the regression direction, and heterokedastity test. Then proceed with the hypothesis test.
The reliability values of the self efficacy questionnaire, achievement motivation questionnaire, study habits questionnaire, and scientific literacy tests were: 0.935, 0.933, 0.906, and 0.608.
Data were analyzed by descriptive analysis and hypotheses were tested by path analysis techniques.
Figure 01 shows the path diagram model set by the researcher.
Figure 1. Research Path Diagram Model.
185
Based on the path diagram, X1 is self efficacy, X2 is achievement motivation, X3 is study habits,
dan X4 is science literacy. In this research design, variable X1 has a direct relationship path with
variables X2, X3, and X4. Variable X1 also has an indirect relationship path with X3 because it must
pass X2 and an indirect relationship path with X4 because it must pass X2 and X3. Variable X2 has a direct relationship with variables X3 and X4. Variable X2 also has an indirect relationship path with
X4 because it must pass X3. Variable X3 has a direct relationship with X4.
3. Result and Discussion The results showed that the average score or Mean (M) of data self-efficacy of students at 155.70. Based on the criteria set, the tendency of self efficacy is included in the high category. Average or Mean Score (M) data on student achievement motivation amounting to 165.10. Based on the criteria set, the tendency of achievement motivation included in the high category. Average or Mean Score 1 students study habits data amounted to 167.59. Based on the established criteria, the tendency of study habits is included in the high category. Average score or Mean (M) science literacy data of students is 60.97. Based on the established criteria, the tendency of scientific literacy included in the high category.
Based on the results of these studies, self efficacy, achievement motivation, and study habits of class VIII students of State Junior High Schools in Denpasar City have been able to stimulate strongly
the increase in students' scientific literacy. This was due to the competitive environment of the schools
in Denpasar due to the school entrance selection system that uses the zoning system or the regional system, resulting in equal distribution of students' abilities. From this equality students tend to want to
compete to be the best so as to create positive competition between students to improve their learning
achievement.
3.1. The Effect of Self Efficacy on Science Literacy of Class VIII Middle School Students in
Denpasar City The results of this study indicate that there is a direct effect of self efficacy on scientific literacy of students with a direct effect value of ρ = 0.345 and significance of (p <0.05). The value of ρ = 0.345
means that the effect of the variable self efficacy on the scientific literacy variable is 0.345. This means that student self-efficacy has a direct impact significantly on the junior high school students'
science literacy as the city of Denpasar. Self efficacy what is meant in this research is the perception of one's willingness to produce action.
This willingness is a form of the level of individual confidence in his competence in achieving goals. Self efficacy directs someone to face challenges that occur in everyday life (Saraih et al., 2018)
High self efficacy levels will help a person to create a feeling of calm in facing difficult problems or
activities. Someone with low self efficacy will easily give up, tend to be stressed, depressed, and have a narrow vision of what is best to solve the problem. However, people who have strong self-efficacy in competence will maintain their business despite difficulties (Riyadi et al., 2018).
Students with high self efficacy will say that they are able to learn the material given in class and have the confidence that it can work well. Students who have higher self efficacy will help them to
build a sense of calm in facing certain tasks. The level of self efficacy can be considered as a predictor of students' scientific literacy (Ismail et al., 2017).
In addition, the findings about the direct effect of students'self efficacy on students' scientific literacy are in line with the results of previous studies, namely: (1) research conducted by (Sultan et
al., 2018) which shows that there is a significant direct effect between self efficacy on scientific
literacy, where to increase and optimize the scientific literacy of students, one of them is by increasing
the self-efficacy of students; (2) research conducted by Taran et al. (2015) found that someone who has high self efficacy believes that he is capable of doing the activities that will be carried out.
Conversely, someone who has low self efficacy is not sure about the ability to carry out an activity
and this will greatly influence his scientific literacy;
186
Based on this, the results of this study reinforce the theory that students'self efficacy directly influences students' scientific literacy.
In addition to reviewing the value of direct influence, researchers also reviewed the indirect effect of students' self efficacy on students' scientific literacy by considering the existence of other factors as intervening / mediating variables between students' self efficacy and scientific literacy.
First, the researchers examined the indirect effect of students' self efficacy on scientific literacy through achievement motivation variables. The path coefficient calculation is done manually. The path
taken for this relationship is as much as two paths, namely the path of self efficacy of students (X1)
towards achievement motivation (X2), then the path of achievement motivation (X2) towards student scientific literacy (X4). The value of the indirect effect of the pattern of self- efficacy on students'
scientific literacy through achievement motivation is the result of multiplication between path
coefficients X1 to X2 (ρ21) with path coefficients X2 to X4 (ρ42). The value of indirect influence
obtained is 0.130. It is known that both the path coefficient values multiplied are significant (p<0.05). This shows that self efficacy has a significant indirect effect on students' scientific literacy through
achievement motivation of junior high school students throughout Denpasar. Self efficacy is closely related to achievement motivation. A person's high self efficacy level can
arouse someone's motivation to struggle to reach their goals. Motivated people can be seen from the
characteristics that exist in the person, namely diligent in facing the task, resilient facing difficulties, showing interest in various problems, preferring to work independently, get bored quickly on routine
tasks, can maintain his opinion, it is not easy to let go of things that are believed, and like to find and solve problems (Sardiman, 2014).
The findings of the indirect effect of self efficacy on students' scientific literacy through student
achievement motivation are relevant to the results of previous studies, namely as follows. (1) Results of research conducted by Liu and Cheng (2018) showed a direct influence and indirect effect of self
efficacy through achievement motivation on students' scientific literacy. This shows the meditative
role of achievement motivation and learning strategies towards the relationship of self efficacy with
scientific literacy. (2) Bulent, (2015) in his research found that the students' self-efficacy aspects had a significant and linear effect on motivation for achievement. The better and higher self efficacy in
students will be followed by an increase in student achievement motivation, and vice versa. Based on the explanation above, the researcher can conclude that is to improve students 'scientific
literacy, we really need to pay attention to students' self efficacy. By using path diagram techniques,
we can get the total influence of the self efficacy variable which consists of direct influence or indirect influence.
Second, researchers examined the indirect effect of self efficacy on students' scientific literacy
through a study habits variable . The path coefficient calculation is done manually. The path taken for
this relationship is as much as two paths, namely the path of self efficacy (X1) to study habits (X3) , then the path of study habits (X3) to students' scientific literacy (X4). The value of students ' indirect
self efficacy on students' scientific literacy through study habits is the result of multiplication between
path coefficients X1 against X3 (ρ31) with path coefficient X3 against X4 (ρ43). The value of the indirect effect is 0.286. It is known that both the multiplied path coefficient values are significant
(p<0.05). This shows that students' self-efficacy has a significant indirect effect on students' scientific
literacy through the study of the habits of junior high school students throughout Denpasar. Based on the research of Sukmawati et al. (2013) where self efficacy and study habits have a
positive and significant relationship to scientific literacy and student achievement because these two things have an influence on student's affection during the learning process. Thus it can be said that the
higher the study habits and self efficacy of students, the better the learning outcomes. Third, the researcher examined the indirect effect of students' self efficacy on scientific literacy of
students through achievement motivation variables and study habits . The path coefficient calculation
is done manually. The path taken for this relationship is as many as three paths, namely the path of self efficacy (X1) towards achievement motivation (X2), then the path of achievement motivation (X2) to
study habits (X3), as well as the path of study habits (X3) to students' scientific literacy (X4). The
value

187
of students ' indirect self-efficacy influence on students' scientific literacy through achievement
motivation and study habits is the result of multiplication between path coefficients X1 against X2
(ρ21) with path coefficients X2 against X3 (ρ32), as well as path coefficients X3 against X4 (ρ43).
The value of the indirect effect is 0.139. It is known that the three path coefficient values multiplied are significant (p<0.05). This shows that students ' self efficacy has a significant indirect effect on
students' scientific literacy through achievement motivation and study habits of junior high school
students throughout Denpasar. Based on the pathway of the influence of self efficacy on scientific literacy of students through
achievement motivation and study habits , the value of the effect of total self efficacy on scientific
literacy is 0.139. The value of this influence is smaller than the value of direct influence. The
difference in value between direct influence and total influence due to self efficacy can directly
influence scientific literacy without affecting other variables first, namely achievement motivation and study habits. Self-efficacy of students plays an important role in shaping interest, motivation, and
study habits of students. In this study, it was explained that self efficacy not only affects students'
learning achievement directly but can be influenced indirectly through the contribution of two
variables together, namely achievement motivation variables and study habits . The findings of the indirect effect of self efficacy on scientific literacy through achievement
motivation and student study habits are in line with the results of previous studies, namely as follows. [3]. Ghobadi et al. (2016) in their study found that self efficacy has a positive important role to predict
student achievement motivation. (2) (Yusuf, 2011) also found that self efficacy can significantly improve learning achievement. Self efficacy determines how a person feels, thinks, motivates, and
acts. Based on this, it can be stated that when students' self-efficacy increases, their learning
achievements and scientific literacy will also increase and vice versa. In other words, self efficacy is a
predictor of student achievement motivation and scientific literacy. Based on the explanation above, the researcher can conclude that to improve students 'scientific
literacy, we really need to pay attention to students' self efficacy . By using path diagram techniques, we can obtain the total influence of the students' self efficacy variables which consist of direct influence or indirect influence.
3.2. The Effect of Achieving Motivation on Science Literacy of Class VIII Middle School Students in
Denpasar City Based on the results of the analysis it can be concluded that there is a direct effect of achievement
motivation on scientific literacy of students with an influence value of 0.165 and significance (p<0.05). This means that students' achievement motivation has a significant direct effect on the
scientific literacy of junior high school students in Denpasar City. The most important motivation in the psychology of education is achievement motivation.
According to McClelland (1987) achievement motivation is an effort to achieve success or success in
competition with a measure of excellence that can be in the form of other people's achievements or their own achievements. An effective learning process is formed when students have high motivation.
Someone with high achievement motivation tends to struggle to achieve success, especially in the
world of education. Students who have the motivation to excel will realize that the learning process is
important, so that the willingness to learn will come from themselves, not because they have to. Motivation for achievement is very important for students, because with a strong desire to learn,
students can avoid stress. Kartal & Kutlu (2017) states that the achievement motivation has a very high positive correlation
premises n scientific literacy that shows students with better achievement motivation has given
students better scientific literacy . Students who have good achievement motivation are characterized
by a number of things, namely: students try to excel in competition, complete tasks well, be rational in achieving success, like challenges, accept responsibility for social interests, like work situations for
personal responsibility, feedback back, and middle level risk.

188
In addition, the findings about the direct effect of achievement motivation on students' scientific
literacy are relevant to the results of previous studies, namely as follows. (1) Based on the findings of
Yazdani et al. (2014) stated that achievement motivation has a very high positive correlation with
science literacy that shows students with better achievement motivation has provided better academic achievement and scientific literacy . (2) Research conducted by Daniel (2015) shows that achievement
motivation has a significant impact on scientific literacy. Increasing students' scientific literacy in line
with the increase in achievement motivation. Based on this, the results of this study reinforce the theory that achievement motivation directly
influences students' scientific literacy and learning achievement. In addition to reviewing the value of direct influence, the researchers also reviewed the indirect
effect of achievement motivation on scientific literacy through study habits. The path coefficient
calculation is done manually. The path taken for this relationship is as many as two paths, namely the
path of achievement motivation (X2) towards study habits (X3) , then track the study habits of
students (X3) on students' scientific literacy (X4). Value of indirect effect of achievement motivation
(X2) towards student scientific literacy through study habits (X3) is the result of multiplication
between path coefficient X2 against X3 (ρ32) with path coefficient X3 against X4 (ρ43). The value of
the indirect effect is 0.176. It is known that both the multiplied path coefficient values are significant
(p<0.05). This shows that achievement motivation has a significant indirect effect on students'
scientific literacy through study habits of junior high school students throughout Denpasar. The effect
of total achievement motivation on scientific literacy is 0.341. Achievement motivation is closely related to study habits. High achievement motivation will also
have implications for the study habits of students, where based on the results of research several
sources state that study habits begin with the presence of achievement motivation or the desire to achieve.
In the millennial era like today, there are many students who have their own views and dreams in achieving this, this will lead to differences in the study habits of each student to achieve the desired
achievement. So good study habits are difficult to implement if students do not have ambition to achieve something, this means that study habits are predicted by achievement motivation.
The findings about the indirect effect of achievement motivation on students' scientific literacy
through study habits are relevant to the results of previous studies, namely as follows. (1) The results of a study conducted by Suresh (2015) showed a positive relationship between achievement
motivation and study habits together on student achievement. Study habits begin with the achievement
motivation or desire to achieve. Study habits the good is difficult if the students do not have ambition
to achieve something. (2) Mudjijanti (2013) in his research on the condition of students or students who are lazy, lack enthusiasm in learning, ignorant, less like tasks that are challenging and prefer tasks
that are easy and don't require much thinking are indicative of low student achievement motivation.
On the contrary students who have high achievement motivation appear in diligent behavior, passionate in learning, active, like challenging task assignments.
Based on the above explanation, researchers can draw a red thread, namely to improve students'
scientific literacy, we really need to pay attention to student achievement motivation. By using path diagram techniques, we can obtain a large total effect of achievement motivation variables consisting
of direct influence or indirect influence.
3.3. The Effect of Study Habits on Science Literacy of Class VIII Students of Middle School in
Denpasar City Based on the results of the analysis it can be concluded that there is a direct influence of study habits
on scientific literacy with an influence value of 0.489 and significance (p<0.05). This means that study habits have a significant direct influence on the scientific literacy of junior high school students in
Denpasar City. The total influence of the variable achievement motivation on learning achievement in science is the same as direct influence because it only consists of one path.

189
Study habits are learning patterns carried out by students regularly with good techniques and
effective and efficient learning time. Good study habits will be able to improve student learning
achievement, whereas study habits that are not good tend to cause student learning achievement to be
low (Suresh, 2015). According to Crede & Kuncel (2008), study habits are learning patterns carried out by students, regularly, and are familiar with good techniques and effective and efficient learning
time, so learning becomes a necessity. In addition, the findings about the direct influence between study habits on students' scientific
literacy are relevant to the results of previous studies, namely as follows. (1) In the study of Yazdani et
al. (2014), it was shown that overall study habits had a very high positive correlation with students'
scientific literacy, so better study habits led to better scientific literacy. (2) Research conducted by Rosyida et al. (2016) shows that differences in student learning outcomes in class are caused by
differences in methods of learning, reading, and making notes. These three indicators are included in
the study habits students. If the three indicators are high, the learning outcomes will be better. Study habits play an important role in learning, where successful learning or satisfying learning
achievement can only be achieved by diligent, regular, and gradual learning efforts. In other words, scientific literacy and maximum learning achievement can be achieved if students have good study
habits. This indicates that it is reasonably suspected that study habits have a direct effect on students' scientific literacy.
4. Conclusions and Suggestions Based on data and results of data analysis, and discussion on this study, the following conclusions can
be drawn. (1) There is a direct effect of self efficacy (X1) on student literacy (X4) class VIII on
science subjects in junior high schools throughout Denpasar with a direct effect coefficient of 0.345.
(2) There is an indirect effect of self efficacy (X1) through achievement motivation (X2) on scientific
literacy of students (X4) class VIII in science subjects in junior high schools throughout the city of Denpasar with an indirect effect coefficient of 0.130. (3) There is an indirect effect of self efficacy
(X1) through study habits (X3) on student literacy (X4) class VIII on science subjects in junior high
schools throughout Denpasar with an indirect effect coefficient of 0.286. (4) There is an indirect effect
of self efficacy (X1) through achievement motivation (X2) and study habits (X3) on student literacy
(X4) class VIII on science subjects in junior high schools throughout Denpasar with a coefficient of
influence indirect amounting to 0.139. (5) There is a direct effect of achievement motivation (X2) on
students' scientific literacy (X4) class VIII in science subjects in junior high schools throughout the
city of Denpasar with a direct effect coefficient of 0.165. (6) There is an indirect effect of achievement
motivation (X2) through study habits (X3) on student literacy (X4) class VIII on science subjects in
junior high schools throughout Denpasar City with an indirect effect coefficient of 0.176. (7) There is
a direct influence of study habits (X3) on student literacy (X4) class VIII in science subjects in junior
high schools throughout the city of Denpasar with a direct effect coefficient of 0.489. Based on discussion, and conclusions, then some suggestions can be proposed as follows. (1) The
headmaster can provide a mandate to counseling teachers to provide sharing services related to the
study habits problems experienced by students at home, especially related to effective learning
methods and learning skills. (2) For teachers, can help develop self-efficacy students externally
through verbal persuasion and social esteem, it will increase the dimensions of the level and strength
in students. Students will be able to sort out the difficulty level of a task, and will be able to compete
in solving a problem. Student achievement activation can be developed with several adequate
techniques, such as discussion, giving scaffolding and giving rewards. teacher can provide counseling
to students related to problems of study habits were less effective at home. The teacher must also pay
attention and understand the curriculum study contained in the syllabus in order to improve students'
scientific literacy. (3) For parents as an effort to improve self efficacy , achievement motivation, study
habits and scientific literacy of students is parents should meet the needs of children, especially in the
form of attention which can also be used to build warmth between the two parties. Parents' attention
has an impact on children's sociocognitive development. (4) Teenagers, especially junior high school

190
students who are still in the search for identity. Adolescents should use their time to interact more with
parents. Increase cooperative spirit in oneself so that it is more motivated to learn, strengthen each
other between friends, and learning goals can be achieved. Teenagers who have self efficacy high in
the community will be able to carry out all the tasks that are delegated to him, one of which is to take part in organizational activities in the banjar. In addition, teenagers who have motivation and positive
study habits will find it easier to mingle with the community.
5. References 3. Adams-Budde, M. E., Howard, C. M., Jolliff, G. D., & Myers, J. K. (2013). Examining the
literacy histories of doctoral students in an educational studies program through surveys and
interviews: A mixed methods study. Journal of the Scholarship of Teaching and Learning.
https://doi.org/10.14434/josotl.v14i1.3327 4. Al Sultan, A., Henson, H., & Fadde, P. J. (2018). Pre-Service Elementary Teachers’
Scientific Literacy and Self-Efficacy in Teaching Science. IAFOR Journal of Education.
https://doi.org/10.22492/ije.6.1.02 7 Atkinson J W and Feather N T 1966 A theory of achievement motivation (New York: Wiley)
8 Bulent, A. (2015). The influence of self-efficacy and motivational factors on academic performance in general chemistry course: A modeling study. Educational Research and
Reviews. https://doi.org/10.5897/err2014.2003 [16] Crede, M., & Kuncel, N. R. (2008). Study Habits , Skills , and Attitudes. Perspectives on
Psychological Science. https://doi.org/10.1111/j.1745-6924.2008.00089.x [17] Daniel A 2015 Influence of achievement motivation and study habits on students academic
achievement in Mathematics Indian J. Applied Research 5(8) 562-65 [18] Garner-O’Neale, L., & Ogunkola, B. (2015). Effects of Interest in Science, Study Habits,
Sex and Level of Study on the Nature of Science Literacy Level of Undergraduate
Chemistry Students of the University of the West Indies, Barbados. Journal of Educational
and Social Research. https://doi.org/10.5901/jesr.2015.v5n2p267 [19] Ghobadi B, Batmani S, Mohammadi Y and Bamani P 2016 Relationship between parenting
styles and self-efficacy with academic achievement’s motivation among male students in Sanandaj City J. Admin. Management Education and Training 12(4) 202-10
[20] Gucluer, E., & Kesercioglu, T. (2012). The Effect of Using Activities Improving Scientific
Literacy on Students’ Achievement in Science and Technology Lesson. Online Submission. [21] Ismail M, Aziz F H, Fajil M F, Ismail M F and Shah A 2017 The relationship between self-
efficacy and GPA grade scores of students Inter. J. Applied Psychology 7(2) 44-7 [22] Kartal, S. K., & Kutlu, Ö. (2017). Identifying the Relationships between Motivational
Features of High and Low Performing Students and Science Literacy Achievement in
PISA 2015 Turkey. Journal of Education and Training Studies.
https://doi.org/10.11114/jets.v5i12.2816 [23] Liliasari. (2011). Membangun Masyarakat Melek Sains Berkarakter Bangsa Melalui
Pembelajaran. Prosiding Seminar Nasional FMIPA UNNES. [24] Liu L and Cheng L 2018 The relationship between self-efficacy and achievement motivation
in adolescents: A moderated mediating model of self-identity and hope J. Psychology and Behavioral Sciences 7(3) 39-46
[25] McClelland D 1987 Human motivation (New York: Cambridge University)
[26] Mudjijanti F 2013 Pengaruh motivasi berprestasi dan kebiasaan belajar terhadap keberhasilan belajar mahasiswa program studi bimbingan dan konseling tahun akademis 2011/2012 Widya Warta 2(2) 236-54
[16] Muelas, A., & Navarro, E. (2015). Learning Strategies and Academic Achievement.
191
Procedia - Social and Behavioral Sciences. https://doi.org/10.1016/j.sbspro.2014.12.625 [30] Ozgen, K. (2013). Self-Efficacy Beliefs In Mathematical Literacy And Connections Between
Mathematics And Real World: The Case Of High School Students. Journal of
International Education Research (JIER). https://doi.org/10.19030/jier.v9i4.8082 [31] PISA. (2016). PISA 2015 Results in Focus. In
OECD. https://doi.org/10.1787/9789264266490-
en [32] Rathburn, M. K. (2015). Building Connections Through Contextualized Learning in an
Undergraduate Course on Scientific and Mathematical Literacy. Georgia
Educational Researcher. https://doi.org/10.20429/ijsotl.2015.090111 [33] Riyadi, T., Sunyono, & Efkar, T. (2018). Hubungan Kemampuan Metakognisi dan Self
Efficacy dengan Literasi Kimia Siswa Menggunakan Model SiMaYang. Jurnal
Pendidikan Dan Pembelajaran Kimia. [34] Rosyida, F., Utaya, S., & Budijanto, B. (2016). Pengaruh Kebiasaan Belajar dan
Self-Efficacy terhadap Hasil Belajar Geografi Di SMA. Jurnal Pendidikan
Geografi. https://doi.org/10.17977/um017v21i22016p017 [35] Sandhu S S 2014 Academic achievement of adolescents in relation to achievement
motivation and study habits Inter. Multidisciplinary Research J. 11(1) 1-10
[23] Saraih, U. N., Zin Aris, A. Z., Abdul Mutalib, S., Tunku Ahmad, T. S., Abdullah, S., & Harith Amlus, M. (2018). The Influence of Self-Efficacy on Entrepreneurial Intention
among Engineering Students. MATEC Web of Conferences. https://doi.org/10.1051/matecconf/201815005051
[24] Sardiman, A. (2014). Interaksi Dan Motivasi Belajar Mengajar. In Interaksi &
Motivasi Belajar Mengajar. [25] Sukmawati N P F, Suarni N K and Renda N T 2013 Hubungan antara efikasi diri dan
kebiasaan belajar terhadap prestasi belajar siswa kelas V SDN di Kelurahan
Kaliuntu Singaraja Online Article (Available At http://download.portalgaruda.org/article.php?article=1 05368&val=1342)
[26] Suresh K 2015 A study on study habits, achievement motivation and academic achievement of high school student EPRA Inter. J. Economic and Business Review 3(10) 138-41
[27] Taran H, Kalantari S, Dahaghin F and Abhari Z S 2015 The relationship among parenting styles, self-efficacy, and academic achievement among students Inter J. Academic Research in Progressive Education and Development 4(1) 219-22
[28] Yazdani, K., Godbole, V. S., & Pradesh-india, A. (2014). Studying the role of habits and
achievement motivation in improving students ’ academic performance. European
Online Journal of Natural and Social Science. [29] Yuliati, Y. (2017). LITERASI SAINS DALAM PEMBELAJARAN IPA. Jurnal
Cakrawala Pendas. https://doi.org/10.31949/jcp.v3i2.592 [30] Yusuf, M. (2011). The impact of self-efficacy, achievement motivation, and self-regulated
learning strategies on students’ academic achievement. Procedia - Social and
Behavioral Sciences. https://doi.org/10.1016/j.sbspro.2011.04.158
192
The Academic Supervision Process by Principal in Science
Learning at SMPN Satap 1 Tembuku
I W Winarsa, I W Subagia, and N L P M Widayanti
Post Graduate of Science Education Departmen, Mathematic and Science Faculty,
Ganesha University Department, Bali-Indonesia, 81116
E-mail: [email protected], [email protected], [email protected]
Abstract. The main purpose of this research was to explain and described the supervision by
principal towards the learning process in science learning at SMPN Satap (Satu Atap) 1
Tembuku. This research is a descriptive qualitative research that reveals the supervision
process by principal. Data was taken by interview technique. The source triangulation
technique is carried out to obtain the validity of data. Interviews were conducted with
principals and science teacher. The results showed that the supervision by principal towards
the learning planning process was carried out by observing and assessing the administrative
completeness and also organize a workshop. Supervision of learning process is done by
visiting class to observe the learning activities. Supervision of the assessment process is
carried out by confirmation and guiding the determination of minimum completeness criteria
for science learning. Principal supervision has been optimally. The kind of supporting factor
for supervision is an agreement for documents plan are legalize by one basic competence. The
different expertise between teacher and principal in terms of subjects are the kind of barrier
factor in the supervision.
1. Introduction
Education has a very big impact to improving the quality of human resources. Good quality of
education will impact the quality of humanc resources. The government should maintain and continue
to develop the quality of education in order to maintain the quality of human resources. The
development of education quality in Indonesia starts at the school level that must be done with equal
distribution in all sectors.
Ironically, the distribution of quality education in each region. The opportunity to have an
education cannot be felt in some areas. This problem is certainly one of the barrier factors to create
the qualified of human resources. The government is trying to fix these problems to make the
equitable education in Indonesia. The educational equalization program in Indonesia has been planned
by the government through 12-year education program. Based on [8], efforts to achieve the program
are by expanding and increasing access to quality secondary education to accelerate the availability of
educated people. The goverment establishing a Satap school (2 or more different level of education
located in 1 area) in sub-districts that do not yet have a secondary education unit. The 12-year
education program needs to be realized in all area of the country to improve the quality of human
resources as one of the assets and the main potential of national development.
The implementation of that program is expected to be able to fix the problems of equal distribution
services and improve the quality of education that has not been realized optimally. There are still a
big gaps of the education quality between urban and rural areas, especially in isolated areas. In
accordance with [8], the government made an effort by establishing integrated schools or commonly
called Satap. Satap school is a model of education that differs between elementary and secondary
schools but the learning activities take place in one location. This model is intended to bring
educational institutions closer to the community, especially in isolated areas, to create an equal
distribution of education. Elementary school integrated junior high school program or commonly
known as Satap. Satap is an education organization that includes elementary and junior high schools
whose location or management are integrated.
The establishment of a Satap school aims to accelerate the completion of the 12-year education
program and improve the quality of education, especially in isolated areas. The establishment of a
193
Satap is also expected to open access to education, so the human resources can be created even in
isolated areas. The establishment of a Satap school was carried out because the secondary schools is
unavailable in that area. The Satap management generally has a low economy, located in rural areas,
hills. The majority of residents are usually farmers or ranchers so the economic level of the area is
still low.
Bangli Regency is one of the regions has a Satap in Bali. Bangli regency consists of 4 sub-districts
namely, Bangli, Susut, Kintamani and Tembuku. Three of each sub-district has schools that are still in
the same status. Specifically for Kintamani Subdistrict, there are 4 of Satap, SMPN Satap 1 Kintamani
located in Kayu Selem Village and SMPN 2 Kintamani Satap in Gunungbau Village, SMPN Satap 3
Kintamani located in Songan Village, and SMPN Satap 4 Kintamani located in Pinggan Village.
SMPN Satap 1 Tembuku is located in Yangapi Village, Tembuku District, meanwhile SMPN Satap 1
Susut located in Susut District. Bangli sub-district did not establish a single school because there were
already many regular schools.
Mostly Satap has so much problem. Based on [10] found that learning management of Satap
school in Karangasem District had constraints such as bad quality of facilities and infrastructure,
unuseable computer, as well as academic and non-academic achievements needs to be improved. A
similar result was also found by [11] who found that SMPN Satap 4 in Pongkar Village, Tebing
District, Karimun Regency, Riau Islands has obstacles in the management of learning like supporting
facilities and infrastructure, the number of educators and education staff is still low and the motivation
of the community to send their children to school is still low. The results of the preliminary study
indicated some obstacles found, especially in the supervision of the learning process at SMPN Satap 2
Kintamani. The learning process is not optimal, including the attendance and motivation of students
are still low. Supervision of teachers and employees is also not optimal. Supervision activities
undertaken by the principal have not been implemented regularly. The presence of a few minimal
teachers is also one of the obstacles in the learning process. This certainly has a major impact on the
quality of education, especially in SMPN 2 Kintamani.
Following on these problems, the authors conducted a further study at SMPN Satap 1 Tembuku.
The geographical and social conditions almost similar, so the study was conducted at that school.
Unically, the quality of education in SMPN Satap 1 Tembuku are special. Initial findings indicate the
learning process carried out very well. The motivation and attendance of students are good. SMPN
Satap 1 Tembuku also has a lot of achievement in acacdemic and non academic programs. It shows
that the quality of education in SMPN Satap 1 Tembuku is already good than the other Satap in
another area in Bangli. Based on the above findings, it can be concluded that the quality of learning in
Satap 1 Tembuku is unic. This certainly has an impact on the quality of education in the same school.
The quality of education must be maintained by providing systematic supervision [3]. [15] also
revealed that supervisors or education supervisors must understand the problem so that it can help and
improve the quality of learning. The empirical data shows that there is a link between supervision and
quality of education.
The quality of education in schools can be started by providing good supervision. The school is
one of the agencies that desire every employee and teacher work optimally in order to achieve the
educational goals that have been stated in the school's vision. Supervision is certainly needed as a
function of coaching and supervising the school. Teacher competency needs to be maintained because
teachers are the frontline in improving the quality of learning in schools. Coaching is very necessary
to maintain the main goal. Teachers need to be nurtured or supervised through supervision or
supervision by supervisors who are usually called supervisors [8]. Supervisors have the duty to guide
and supervise teachers and staff in a school.
Supervisors are usually principals and senior teachers. The principal or senior teacher supervises
the staff and the teacher. Supervision or supervision is a coaching activity that is planned to help
teachers and staff so that the main tasks can be done effectively. Supervision will create schools of
good quality. Supervision creates a school that is conducive and in accordance with government
expectations. According to [2], supervision has the following objectives: 1) increasing the
effectiveness and efficiency of learning, 2) controlling the implementation of educational technical
fields in schools in accordance with the provisions and policies set, 3) ensuring that school activities
take place in accordance with applicable regulations, 4) assessing the schools in carrying out their
duties, and 5) providing guidance to correct existing deficiencies.
194
Supervision has a big impact to the school. Good supervision of schools will contribute actively in
the formation of increasingly advanced schools. Supervision does not only supervise, but also provide
input and guidance to the existing shortcomings. Input should be used as a reference for creating
better academic activities. Supervision activities can be interpreted as a process that requires students
and supervisors to consciously engage with each other in a spirit of professionalism, respect,
togetherness and an open mind [1]. This can be interpreted that the principal as a supervisor and
teacher or employee as students, have an attachment to each other in forming a maximum educational
situation.
Based on [6] concerning standar process for primary and secondary education units, it states that:
1) supervision of the learning process is carried out at the planning, implementation, and assessment
of learning outcomes, 2) supervision of learning is carried out by providing examples, discussion,
training and consultations, and 3) supervision is carried out by the principal or senior teacher and
supervisor of the education unit. This shows that there is no single stage in the school especially in the
academic field that is independent of supervision activities, in other words supervision has a strategic
role in efforts to improve the quality of education.
[6] revealed that supervision consists of two aspects, namely managerial and academic. Academic
supervision is an oversight activity that is shown to improve the quality of students through efforts to
motivate, guide, foster and direct people related to academic activities. Managerial supervision is
oversight in the administrative field related to school administration. Supervision in this study focuses
on the academic supervision process carried out at SMPN Satap 1 Tembuku, particularly on planning,
implementing, and evaluating science learning. Academic supervision directly influences teacher
behavior, especially in academic process. It show that academic supervision will create better quality
of learning. Implementation of academic supervision that is routinely carried out by the principal can
improve the quality of learning if done in accordance with applicable principles. Principals are
required to supervise with the maximum so that the quality of learning is getting better.
Based on the explanation above, the author conducted a study entitled "The Academic Supervision
Process by Principal in Science Learning at SMPN Satap 1 Tembuku". The objectives of this study
are as follows: 1) Explain and describe the process of supervision of learning planning in SMPN
Satap 1 Tembuku. 2) Explain and describe the process of supervision of the implementation of
learning in SMPN Satap 1 Tembuku. 3) Explain and describe the process of supervision of learning
assessment in SMPN Satap 1 Tembuku. The following is a further explanation related to the process
of academic supervision in learning science learning at SMPN Satap 1 Tembuku in 2018/2019
academic year.
2. Research Method
This research uses descriptive method with a qualitative approaches. [13] revealed that qualitative
research is used to examine the condition of objects in a natural and researchers as the main
instrument. Data collected by interview, observation, and documentation techniques. The informants
in this study were the principal, one science teacher at SMPN Satap 1 Tembuku, and one o external
supervisor of Bangli Regency. The credibility of this data is carried out with triangulation techniques,
discussions with peers, and member checks. This research was conducted for 2 months, from June to
August 2019.
3. Result and Discussion
Based on the data obtained the following is a presentation related to the results and discussion of this
study.
3.1. Supervision Process of Learning Plan
The learning plan preparation process carried out at SMPN Satap Tembuku is prepared in the
workshop period which is held every early semester before effective learning activities. The workshop
discussed related to teacher administration preparations that will be used in the whole fo next
semester in the form of lesson plan, syllabus, annual programs, semester programs, effective weeks
and other administrations. Through the workshop also seen the preparation of teacher learning plan.
195
The syllabus used by the teacher refers to the goverment. Through these activities the teacher designs
a learning plan which is adopted from science teacher assosiation and will be used in each school.
The planning activities carried out by science teachers at SMPN Satap 1 Tembuku, based on [6],
learning planning activities carried out by science teachers already going well. The learning process
planning of a lesson plan containing subject identity, competency standards, basic competencies,
indicators of competency achievement, learning objectives, teaching materials, time allocation,
learning methods, learning activities, assessment learning outcomes, and learning resources [7]. [5]
revealed that planning is one of the important aspects that must be considered in curriculum
implementation. Planning will determine the overall quality of learning.
Supervision of the planning process by the teacher is needed by the supervisor, in this case the
principal is a internal supervisor. Based on the results of interviews conducted, the teacher carried out
administrative in order. Teachers who have not yet completed the administration of learning are
usually given a penalty through teacher elvaluation. The assesment of science teacher is done by the
Principal. The teacher evaluation is carried out continuously by the school principal. Teacher
evaluation scores can indicate the level of work of teacher. The results of the teacher evaluation can
have an impact on teacher certified. This triggers proffesional teacher to work with discipline so that
they get good grades when the teacher assessment is conducted.
Completeness of teacher administration will always be controlled by the Principal. The teacher
who wants to do the learning process checks the administration in the principal's office. The check is
through the authorization of administration which will be used when learning later. The assignments
of learning plan document is conducted step by step. The validation of the document is only for the 1
week period. The document was not validated in its entirety (for example directly 6 month) but by one
week, or by one basic competency.
According to [6], the supervisory process standards are as follows. Supervision of the learning
process includes observation, supervision, evaluation, reporting, and follow-up activities. The
observation of learning process is conducted from planning, implementation, and evaluation stages of
learning outcomes. Obsertavion carried out by means of focus group discussions, observations,
recording, interviews, and documentation. Obsertavion activities are carried out by the headmaster
and supervisor of the education unit. Supervision of the learning process is carried out at the planning,
implementation and evaluation stages of learning outcomes. Supervision of learning is conducted by
providing examples, discussion, training, and consultation.
Supervision activities conducted by principals and senior teacher as internal supervisors and
supervisors of education units as a external supervisors. The school principal is given the authority to
supervise a maximum of 12 teachers. Senior teachers can be vice-principals or teachers who already
have more experience compared to other teachers. Evaluation of the learning process is carried out to
determine the overall quality of learning, including the planning stages of the learning process, the
implementation of the learning process, and the assessment of learning outcomes. Evaluation of the
learning process is carried out by (a) comparing the learning process implemented by the teacher with
the standard process, (b) identifying the teacher's performance in the learning process in accordance
with the teacher's competence. Evaluation of the learning process focuses on the overall performance
of the teacher in the learning process.
Supervision of the planning process is important to do. [4] revealed that the making of lesson plans
has an important role in the learning process. The lesson plan is a point for the teacher in
implementing the learning process. [12] revealed that a lot of teachers did not make learning plan
documents, but only download the documents from the internet. Surely its impact on implementation
of learning, besides the procession of the teacher as a planner of the learning process is not in
accordance with the expectations or ideas of the teacher. Making a design document can also change
the teacher's perspective in its application. Planning oversight also needs to be done by school
principals and supervisors of learning by improving the quality of teachers and learning [15].
3.2. The Supervision Process of Learning Implementation
Supervision of the implementation of learning at SMPN Satap 1 Tembuku was carried out by the
Principal and one of the senior teachers. Supervision is carried out to provide input when constraints
occur in learning in class. Supervision of the implementation process is carried out by visiting class to
observe the learning activities. Supervision takes place continuously to keep the consistency in

196
implementing the learning process properly. Based on the results of interviews conducted, it shows
that the supervisor has carried out the provisions of the supervision process in accordance with [6].
3.3. The Suppervision Process of Learning Assessment
The minimum criteria is determined by each teacher in each subject. The establishment of minimum
criteria is done during the workshop periods together with other administrative collections. That
because the establishment of the minimum criteria is one of the administrative documents that must
be collected together with the leraning plan, syllabus and etc. Stages of assessment usually refer to
summative and formative tests. The test is carried out in stages of daily tests, midterms, and end of
semester exams. During daily tests and midterm exams, questions are made by the teacher, while in
the final semester exams the questions are made from the service through teacher association. These
activities are closely monitored, so as to create pure results from the abilities of students.
4. Conclusion
The supervision process carried out at SMPN Satap 1 Tembuku, namely; first for supervision of the
planning process coducted by carrying out the rules so the teacher prepare the learning plan
regularly. Administration in the form of lesson plans and syllabus and other documents are collected
in early of the semester. The process of making these documents is usually
through workshops conducted at the beginning of the semester. Teachers who do not perform
administrative according to the rules will be given a warning based on teacher evaluation
value conducted by the Principal. The interesting thing about the preparation supervision process is
carried out by principal. The asignment of learning plan is done by 1 basic competence. This
supervision will impact the teacher to make learning plan regularly and implemented in class.
Second, the process of supervision of the implementation of learning. The supervision process is
carried out by the school principal in the context of supervision which is carried out routinely by the
school. Supervision begins with an examination of planning documents that will be carried out by the
teacher in the learning process. Examination of these documents refers to [7]. Inspection of the
document is carried out to check whether there is a deficiency or input that must be given by the
Principal in this matter as a supervisor in the activity. Furthermore, activities will be carried out in the
classroom. The school principal observes the learning process conducted by the teacher. The teacher
brings the lesson plans into class which can be used as a reference in carrying out the learning
stages. These activities usually refer to three stages, namely introduction, core and closing
activities. The next stage is, giving input to the teacher if there are deficiencies that occur during the
learning process in class. The input is certainly a reference for learning activities that will take place
during the next semester to be better.
Third, the process of the assessment supervision at SMPN Satap 1 Tembuku was carried out well
done. Assessment documents in the form of minimum criteria provisions are collected by the teacher
at the beginning of the semester. The minimum criteria determination refers to three main
components, namely, the complexity of the material, the absorption of students, and supporting
facilities/infrastructure in the school. Assessment at SMPN Satap 1 Tembuku refers to three aspects,
namely psychomotor, cognitive and affective students. Supervision of the assessment is also carried
out on summative and formative tests carried out. The supervision is in the form of forming a
committee and conducting tests conducted with high integrity. This is evident from the ministry's
award won by the school as a school with high integrity in the implementation of the National
Examination in 2015.
Based on the explanation above, the supervision aspect is one of the most important aspects in the
management of learning. Supervision that is done regurally will creates a systematic planning,
implementation and assessment process. Supervision in of a planning process is carried out by
principal with a validation of learnig plan an syllabus only for a few basic competencies. This causes
the teacher to be more disciplined and prepare planning documents as well. A good planning process
will have an impact on the implementation process. Supervision by the principal is usually done by
visiting the class. The visittation is carried out at the supervision stage which is carried out routinely
every semester. The activity was conducted as a reflection to carry out the learning process going
forward. Stages of assessment are also done well. This stage is done to maintain the purity of student
197
learning outcomes in school. Assessment is carried out with high integrity so that it is able to maintain
the credibility of the school as a good nationality examination implementation.
There are supporting and barriers factors in the supervision process at SMPN Satap 1
Tembuku. This is a description of the supporting factors of the supervision process at SMPN Satap 1
Tembuku; 1) The supervision conducted intensively at the planning stage. The headmaster validate
only a few basic competencies so that supervision is more stringent and maintained so that teachers
are more disciplined in completing administration, 2) supervision is carried out continuously at the
beginning of each semester in accordance with [6], 3) the exercise of workshops so the teachers are
given the opportunity to have more concept to prepared the learning plan, and 4) giving a warning and
sanctions if the teacher makes a mistake and giving rewards to teachers who have good
performance. The barriers factors of supervision in SMPN Satap 1 Tembuku are follows; 1) Teacher's
with undisciplined behavior in collecting administration so that supervision of planning is not
fulfilled, 2) Limited expertise of supervisors because of the different basics knowledge between
supervisors and supervised teachers.
References
[1]. Abiddin N Z, Ismail A and Ismail A 2011 Effective Supervisory Approach in Enhancing
Postgraduate Research Studies. International Journal of Humanities and Social Science vol 1
(2). 206-217
[2]. Burhanuddin 2007 Supervisi Pendidikan dan Pengajaran (Malang: Rosindo)
[3]. Iskandar D and Wibowo U B 2016 Peran Pengawas Pendidikan dalam Peningkatan Mutu
Pendidikan SMP di Kabupaten Bima Provinsi Nusa Tenggara Barat. Jurnal Penelitian Ilmu
Pendidikan vol 9 (2) pp 179-195
[4]. Kanellopulou E M and Darra M 2018 The Planning of Teaching in The Context of Lesson
Study: Research Findings. International Education Studies Vol 11 (2) pp 67-82
[5]. Mulyasa E 2008 Menjadi Guru Profesional (Bandung: PT Remaja Rosdakarya)
[6]. Permendikbud 2013 Nomor 65 Tahun 2013 tentang Standar Proses Pendidikan
Menengah (Jakarta: Kementerian Pendidikan dan Kebudayaan) [7]. Permendikbud 2014 Nomor 103 tahun 2014 tentang Pembelajaran pada Pendidikan Dasar
dan Pendidikan Menengah (Jakarta: Kementrian Pendidikan dan Kebudayaan)
[8]. Permendikbud 2015 Nomor 22 tahun 2015 tentang Rencana Strategis: Kementrian
Pendidikan dan Kebudayaan (Jakarta: Kementrian Pendidikan dan Kebudayaan)
[9]. Sahertian 2008 Konsep Dasar & Teknik Supervisi Pendidikan (Jakarta: PT Rineka Cipta)
[10]. Sanjaya I K A, Marhaeni A A I N, and Suarni N K 2013 Studi Evaluasi Tingkat Efektifitas
Pelaksanaan Pengembangan SD-SMP Satu Atap di Kabupaten Karangasem E-Journal
Program Pascasarjana Universitas Pendidikan Ganesha vol 2(1) pp 1-11
[11]. Sawirdi 2016 Implementasi Kebijakan SD-SMP Negeri 4 Satu Atap di Desa Pongkar
Kecamatan Tebing Kabupaten Karimun Jurnal Pendidikan vol 17(2) pp 114-120
[12]. Sudjito D N, Keliat N R and Hastuti P S 2018 Integrated Science Learning Using Scientific
Apporach in Junior High Schools in Semarang Regency Indonesian Journal of Science and
Education vol 2(1) pp 69-74
[13]. Sugiyono 2013 Metode Penelitian Kuantitatif, Kualitatif, dan R & D (Jakarta: Alfabeta)
[14]. Wiles J & Bondi J 1986 Supervision: A Guide to Practice. Second Edition (Columbus:
Charles E. Merrill Publishing Company)
[15]. Yummeti Y 2018 Implementation of Lesson Study in Physich Teaching by Group of Teacher
in Solok West Sumatera Journal of Physics: Conference Series. Article

198
Levels of serum glutamate oxaloacetate transaminase (sgot)
white rat (Rattus norvegicus) wistar strain after
administration Katsuwonus pelamis L. which has been soaked
using the leaf extract of Moringa oleifera L.
N L P M Widiyanti
1,2,3, N P Ristiati
1,2,3, D M Citrawathi
1,2,3, D W Wahyuni
1
1Department of Biology and Marine Fisheries, Faculty of Mathematics and Science,
Universitas Pendidikan Ganesha, Bali-Indonesia, 81116 2Postgraduate Natural Science Department of Education, Faculty of Mathematics and
Science, Universitas Pendidikan Ganesha, Bali-Indonesia, 81116 3Department Biology of Education, Faculty of Mathematics and Science, Universitas
Pendidikan Ganesha, Bali-Indonesia, 81116
e-mail: [email protected]/[email protected],
[email protected], [email protected]
Abstract.The purpose of this research were: to know levels of Serum Glutamate
Oxosaloacetate Transaminase (SGOT) Rattus norvegicus wistar strain after administration
cakalang (Katsuwonus pelamis L ) which has been soaked using formalin and various
concentrations moringa leaf extract and to analyze the concentration of moringa leaf extract is
best used as a natural preservative of skipjack. This research design is post test only control
group design. Levels of SGOT were analyzed using anova one way. The results of this study
showed that levels of significance different of SGOT, then H0 rejected and H1 accepted so
there was a difference in SGOT levels of male white rat (Rattus norvegicus) wistar strain after
administration of cakalang which has been soaked using various concentrations moringa leaf
extract. The concentration of moringa leaf extract most effectively used as a natural
preservative of cakalang is the concentration of 25%.
Key words : moringa or merunggai leaf extract, Katsuwonus pelamis L, Rattus norvegicus
wistar strain, SGOT levels
1. Introduction
Indonesia is an archipellago is the largest island country in the world. The breadth of the sea
water area is owned, causing Indonesia to be dubbed as maritime country. The production of
fish caught 4.72% to 5.03% million tons (especially tuna fish), while the resulting fish
production rose 3.98% to 10.07% million tons until the third quarter of the year 2015.
One of the waters in Indonesia that has increased production of fish catches and cultivation
is the waters of North Bali with an area of ± 3,850.03 km2 that includes coastal waters along
Regency of Buleleng [1]. Based on this great potential, the sea of Buleleng has long been
utilized by coastal communities as a source of livelihood, especially in the field of capture
fisheries. The potential of sustainable fisheries in the marine waters of Buleleng based on the
data of the Marine and Fisheries Service Bali Province in year 2015 is 3,196.5 tons in year
2015, consisting of pelagic fish large and small, demersal fish, and coral fishes. The
dominant type of fish caught by fishermen one of them is skipjack fish or cakalang (Katsuwonus pelamis L).
Based on the results that have been observed in some traditional markets in Buleleng and the
results of interviews with some fish traders, it is known that Skipjack is one of the fish that consumers
are interested in buying. This is because skipjack fish has a high nutrient content and is complete

199
especially the protein and tender meat. But in reality in the field there is an inequality between
consumer demand with the least availability of skipjack sold by merchants who do not dare to provide
too much tuna. This is because the cakalang is a large pelagic fish that is prone to decay. Generally,
the decomposition of fish is caused by the activity of microorganisms, both inside and outside of fish.
The use of formalin is widely abused and often used as a preservative for food such as
fish that can cause liver damage. [2] has conducted tests on the influence of fish exposure to
formalin and its influence in rats occurred functional hepar disorder. Based on the problem, it
can be solved by utilizing natural preservatives. One is the moringa (Moringa oleifera L.).
The research conducted by [3] by testing the moringa leaf extract as a natural preservative of
skipjack fish (Katsuwonus pelamis L.) has been observed that the results of moringa leaf
extract can cause a barrier zone on bacterial growth. To observe the potential of moringa leaf
extract as a natural preservative in skipjack fish and its impact for consumers, then this
research is done by determining the serum levels of glutamate oxaloacetate in liver
transaminases (sgot). This test was done on the animal model namely male white rats (Rattus
norvegicus) wistar strains by giving feed in the form of cakalang fish pellets. Skipjack fish
have been soaked in moringa leaf extract for further made pellets.
2. Methods
2.1 Research design
The research design used in this study is true experimental with a complete randomized
design (CRD) with the design of the randomized post test only control group design. The
population in this study was the male white mouse (Rattus norvegicus) wistar strain with a
body weight is 150 – 200 grams, aged 2-3 months.The research samples was 24 male white
mouse (Rattus norvegicus) wistar strain have been randomized selected and have been
divided into 3 treatment groups and 1 control group. Repetition has been done 6 times,
according to the formula of Federer (t – 1) (n – 1) ≥ 15 [4]. There are three types of sample
criteria are :
1. Inclusion criteria are : male white mouse (Rattus norvegicus) wistar strain, age 2-3
months, weight 150-200 grams, healthy.
2. Drop out criteria : visible physical defects, death during research.
3. Exclusion criteria : female white mouse, the other species and strain.
2.2 Research variables
2.2.1. Independent Variable
The independent variable in the study is administration feeding pellet of skipjack fish which
has been soaked with formalin and moringa leaf extract with various concentrations (25%,
50%, 75%) on mice
2.2.2. Dependent variable
Dependent variable in this study were SGOT levels in male white rats (Rattus norvegicus)
wistar strain.
2.3 Data Collection Techniques
The Data needed in this research have been gathered through three phases namely the
preparation stage, implementation stage and observation stage.
2.3.1. Preparation phase and preliminary test
1. Preparing tools and research materials
2. The manufacture of moringa leaf extract (Moringa oleifera L.)
3. Make cakalang fish pellets
4. Animal preparation test
2.3.2 Implementation stage
1. Feeding pellet from cakalang fish
2. Collection of blood
2.3.2. Observation Stage

200
1. Observation of SGOT levels. Measurement of SGOT levels is measured with Evogen
brand SGOT Kit reagent. Measurement of SGOT activity is conducted on each treat group.
SGOT examination, as follows:
A. Provide SGOT kit (Evogen volume 100 ml).
B. Create a working reagent by mixing 4 ml of reagent 1 (R1) + 1 ml of reagent 2 (R2) into
the test tube then in homogenization.
C. To inject work reagents, samples, and controls at working temperature (30oC).
D. Regulate spectrophotometer on absorbance 0 with aquadest at 340 nm wavelength.
E. To enter work reagents as much as 1 ml and the sample (blood serum) of 100 ml into the
cuvet was then homogenized and incubated for 1 minute at working temperature (30oC).
F. Insert the cuvet into a spectrophotometry cell holder.
G. Read the absorption in minutes 1, 2, and 3.
H. Calculate differences between absorbance
I. Calculate the previous average absorbancy difference to obtain a value of absorbance per
minute (δa/min).
J. Multiply the value of absorbance per minute (δa/min) with the SGOT factor (1746) so that
the value of SGOT rate is in μ/l.
2.4. Technic of data analysis
2.4.1. Hypotesis
The hypothesis test was conducted using the analysis of variance test (ANOVA) one way
with the equivalent significance (α) = 0.05.
3. Results and Discussion
3.1. Results
The male white mouse (Rattus norvegicus) wistar strains have been given 30-days treatment with the
feeding pellet of skipjack fish. The end of the treatment has been surgically performed in rats to take
the blood serum, and an average levels of SGOT measured using a spectrophotometer with a
wavelength 340 nm.
3.1.1Descriptive analysis results
Data on the measurement result has been done by measuring the average SGOT rats can be seen in
Table 1.
Table 1. The average SGOT of rats
Variabels Average
(µ/l)
Standard
deviation
Levels of SGOT positive control (μ/L) 95.39 4.541
Levels of SGOT Treatment1 (μ/L) 77.843 5.828
Levels of SGOT Treatment2 (μ/L) 62.274 4.044
Levels of SGOT Treatment3(μ/L) 45.833 5.888
Based on Table 2 obtained that control criteria has increased SGOT with average SGOT
level of 95.73 μ/l, while for treatment1 (moringa leaf extract 25%) has decreased SGOT
average with an average of 77.84 μ/l. Treatment 2 (moringa leaf extract 50%) with an
average SGOT 62.27 μ/l tends to have decreased and has undergone a decline in the
treatment. Treatment 3 (moringa leaf extract 75%) with average SGOT is 45.83 μ/l.
3.1.2 The normality analysis result
The test results of normality that has been done by measuring the SGOT level of male white
mouse (Rattus norvegicus) wistar strain can be presented in Table 2.
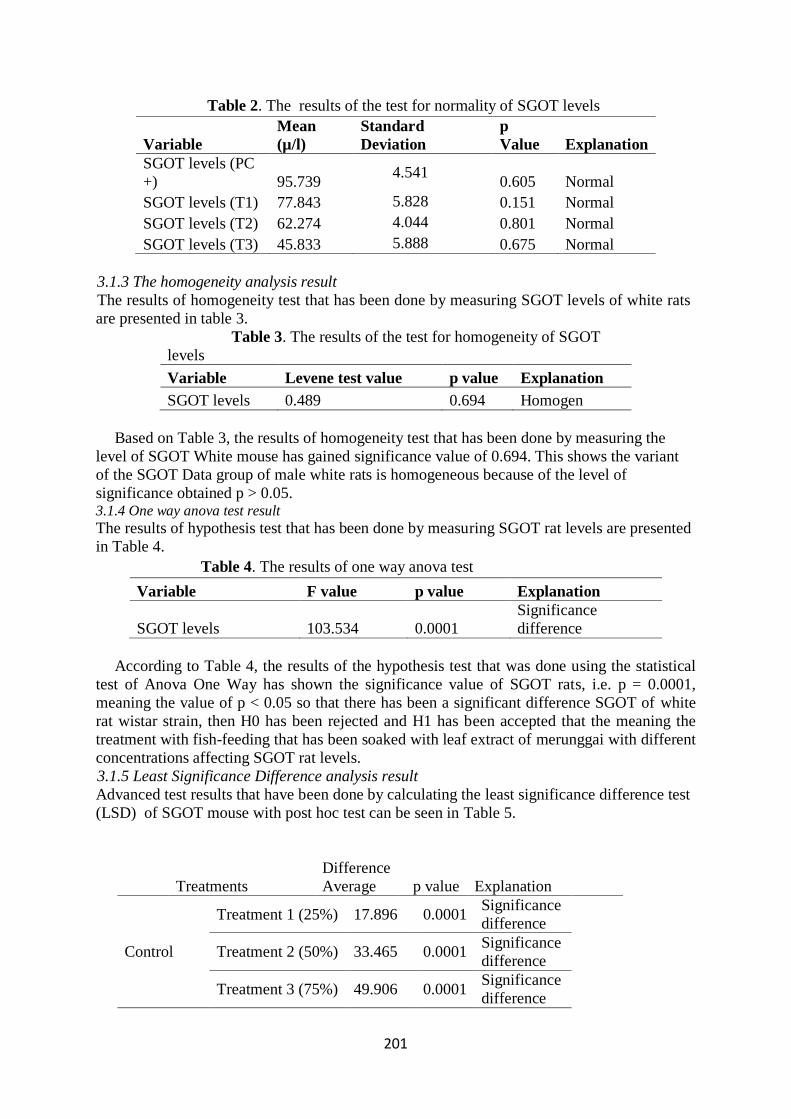
201
Table 2. The results of the test for normality of SGOT levels
Variable
Mean
(µ/l)
Standard
Deviation
p
Value Explanation
SGOT levels (PC
+) 95.739 4.541
0.605 Normal
SGOT levels (T1) 77.843 5.828 0.151 Normal
SGOT levels (T2) 62.274 4.044 0.801 Normal
SGOT levels (T3) 45.833 5.888 0.675 Normal
3.1.3 The homogeneity analysis result
The results of homogeneity test that has been done by measuring SGOT levels of white rats
are presented in table 3.
Table 3. The results of the test for homogeneity of SGOT
levels
Variable Levene test value p value Explanation
SGOT levels 0.489 0.694 Homogen
Based on Table 3, the results of homogeneity test that has been done by measuring the
level of SGOT White mouse has gained significance value of 0.694. This shows the variant
of the SGOT Data group of male white rats is homogeneous because of the level of
significance obtained p > 0.05. 3.1.4 One way anova test result
The results of hypothesis test that has been done by measuring SGOT rat levels are presented
in Table 4.
Table 4. The results of one way anova test
Variable F value p value Explanation
SGOT levels 103.534 0.0001
Significance
difference
According to Table 4, the results of the hypothesis test that was done using the statistical
test of Anova One Way has shown the significance value of SGOT rats, i.e. p = 0.0001,
meaning the value of p < 0.05 so that there has been a significant difference SGOT of white
rat wistar strain, then H0 has been rejected and H1 has been accepted that the meaning the
treatment with fish-feeding that has been soaked with leaf extract of merunggai with different
concentrations affecting SGOT rat levels.
3.1.5 Least Significance Difference analysis result
Advanced test results that have been done by calculating the least significance difference test
(LSD) of SGOT mouse with post hoc test can be seen in Table 5.
Treatments
Difference
Average p value Explanation
Control
Treatment 1 (25%) 17.896 0.0001 Significance
difference
Treatment 2 (50%) 33.465 0.0001 Significance
difference
Treatment 3 (75%) 49.906 0.0001 Significance
difference

202
Treatment 1
(25%)
Treatment 2 (50%) 15.568 0.0001 Significance difference
Treatment 3 (75%) 32.010 0.0001 Significance
difference
Treatment 2
(50%) Treatment 3 (75%) 16.441 0.0001
Significance
difference
The average of SGOT rat levels are presented in figure 1.
Figure 1. SGOT levels of male white rats
3.2 Discussion
This study has used male rats as a test animal as it has a more stable biological condition
compared to female rats. The 2-3-month-old male mouse is a young adult rat with optimal
physiological conditions. The mouse was adapted for 14 days in order to adapt to the
environment during study.
Based on the results of the research done and the results of data analysis that has been
done using ANOVA one way indicates that the value p = 0.0001 which means there is a
meaningful difference between the experiment group and the control group. SGOT level
activities were measured using a spectrophotometer with a wavelength of 340 nm. The results
of measurements have shown that in the control group using formalin as a preservative of
skipjack fish obtained level SGOT is 95.739 μ/L which has meant that SGOT has been
measured to exceed the level limit of normal SGOT white rats as already stated by
Mangkoewidjoyo, 1988 (in [5]), that SGOT level in normal white mouse is 45.7-80.8 μ/L.
SGOT level mice in control groups that have been given skipjack that has been soaked
with formalin tend to increase from the treatment group which has been given a various of
the concentration of moringa leaf extract. The skipjack feed that has been preserved by using
formalin causes increased levels of SGOT compared to the use of moringa leaf extract
(Moringa oleifera). This research has been in line with the results of research conducted by
[2] which has stated that the results of data analysis showed that formaldehyde treatment in
fish can increase the level of SGOT compared to the group control (fish without formalin).
In this research that has been done, there has been increased levels of SGOT Rattus
norvegicus which has been caused due to exposure to fish against formalin chemicals that

203
have been administered for 30 days at a dose of 0.25%. According to [6] that formalin is an
irritant substance, in which the formalin compound enters into the body will be detoxifying
and metabolized by hepar, as well as producing xenobiotic substances that can damage liver
function. Damage to hepar structure due to exposure to xenobiotic material will cause
impaired liver function. Formalin that has entered into the body will be metabolized into a
format acid compound. The acid format in the body will circulate through the port vein
thereby entering the hepar tissue. In the hepar tissue there are the kuppfer cells that will
directly activate reactive oxygen species (ROS) which are toxic compounds. ROS production
has resulted in damage to fatty tissues that can cause damage to the cell structure, i.e. in the
mitochondrial membrane. Formite acid that has been produced in the metabolic process of
formalin in the body will inhibit the metabolic activity process of mitochondrial oxidase of
cytochrome P450 thereby resulting in tissue hypoxia in hepar cells. Prolonged hypoxia will
result in damage to the hepar tissues. Damage can result in a hepar injury so that an increase
in SGOT levels. Increased levels of SGOT occur due to the output of glutamate oxaloacetate
into the serum when the tissue suffered damage. [7] stated that SGOT limit that indicates
liver damage can reach 20-100 times the highest normal limit.
Based on the results of [2] research, has reported that formaldehyde treatment in fish has
been able to increase SGOT levels. Damage to cell structures has led to functional enzymes
such as SGOT detected in the cytosol as well as mitochondria to enter into the blood
circulation system. Therefore, high levels of SGOT contained in the blood can indicate the
occurrence of damage to the hepatic cells. Similarly [6] has stated that the SGOT level of
Rattus norvegicus that has been given a formalin through the mouth has been expressed
higher SGOT rate than placebo control
The results of SGOT mouse measurements that have been done in this research with the
treatment of skipfack pellets that have been preserved with moringa leaf extract with various
concentrations, have shown different SGOT levels with the control group . The difference is
seen in the results of SGOT measurement group treatment with control group, indicating that
the treatment group that has been given skipjack that has been soaked with leaf extract
moringa 25%, 50%, and 75% has shown SGOT level lower than the positive control group
(soaking the skipjack using formalin).
SGOT activities in all treatment groups during the treatment period show that it is still
included in the normal range, normal SGOT level in rats is 45.7 – 80.8 μ/l. SGOT level on
moringa leaf extract 25%, 50%, and 75% have shown that concentrations of these moringa
leaf extracts are concentrations that can be exposed to the rat body on a daily basis, as they
have high anti-bacterial and anti-oxidant doses to ward off free radicals that can be accepted
by body.
One of the food sources that serves as hepatoprotector is moringa leaf are plants that
contain beneficial chemical compounds, among which are flavonoids compounds that can
capture free radicals that cause damage to the hepar [8].
Based on the results of the phytochemical studies, the moringa leaf contains metabolic
compounds of secondary flavonoids, alkaloids, phenols, quercetin and may also inhibit
bacterial activity [9]. [10] stated the phytochemical compounds of saponin, and tannins have
also been found on the moringa leaf extract..
The usefulness of moringa leaves as a natural preservative to inhibit microbial growth has
been extensively researched, some of which are [11] has stated that merunggai leaf extract
can be used as a Pseudomonas aeruginosa antibacterial is one of the bacteria that causes
decay to fish. The active ingredient contained in the leaves of the merunggai n are flavonoids,
phenols, quercetin, and alkaloids are the active ingredients of the antimicrobial compound
[9]. The research that has been done by [3] has stated that the coarse extract of the moringa
leaves (Moringa oleifera L.) as a natural preservative of skipjack fish (Katsuwonus Pelamis

204
L.) has been able to cause a diameter zone barrier in bacterial growth with the concentration
used is 25%, 50%, and 75% and the freshness level of skipjack fish that has been soaked with
moringa leaf extract can last up to 12 hours with the freshest quality at a concentration of
75%.
Quercetin has antioxidant activity that allows flavonoids to capture or neutralize free
radicals associated with the OH phenolic group to improve the state of the damaged tissues
and the inflammatory process can be obstructed [12]. [13] stated Silymarin has a
hepatotherapy effect because it can increase the speed of protein synthesis that stimulates
cells to regenerate faster, namely by replacing old or damaged cells with new cells.
Increased serum in the enzyme liver transaminases consisting of aspartate amino
transaminases/glutamate oxaloacetate transaminase (AST/GOT) is a more specific initial
marker for the detection of the damage of hepar [14]. One mechanism that contributes to the
damage of hepar is the buildup of free radicals. Excessive free radicals will cause oxidative
stress that triggers the peroxidation process against lipids, thereby causing cancer,
inflammation, atherolerosis, and accelerating the aging process [15].
From the results of studies that have been conducted, has shown that the level of SGOT in
rats that had been feed fish that had been preserved with moringa leaf extract with
concentrations of 25%, 50%, and 75% had shown that the extract had been able to inhibit
increased levels of SGOT at normal levels, where normal SGOT in rats is 45.7 – 80.8 μ/L.
When the liver cells do not suffer damage, the SGOT enzyme does not enter the blood
circulation in large quantities. Thus, it has been demonstrated that the use of moringa leaf
extracts with concentrations of 25%, 50%, and 75% in this experiment did not cause impaired
liver function in test animals.
Based on the data on the level of SGOT Rattus norvegicus which has been obtained in
Table 1 shows the average level of SGOT Rattus norvegicus after given the feeding of
skipjack fish that has been preserved with moringa leaf extract has obtained a treatment that
most effective at a concentration of 25% which can be seen in the LSD test which at a
concentration of 25% has shown differences and decreased levels of SGOT Rattus
norvegicus compared with the positive control group (using formalin). In research conducted
by [3] about moringai leaf extract as a natural preservative skipjack fish has been known that
moringa leaf extract at a concentration of 25% is anti-bacterial because of its concentration
antibacterial compounds have been optimally diffused into the body of bacteria. The
concentration of moringa leaf extract of 25% contains an active antibacterial compound that
has been able to damage the consortium's defense system test bacteria. It has also been
reported by [16], that moringa leaf extracts with a concentration of 25% have been able to
inhibit E. coli pathogenic bacteria.
The results of studies that have been conducted, has shown declining levels of SGOT
white rats at a concentration of 25% which is the lowest concentration that has been used in
this study, has shown that the active compounds in the leaf extract of the moringa in a dose of
25% has been able to lower SGOT levels compared to positive control (soaked using
formalin).
4. Conclusion
Based on the research that has been done, the conclusion in this study is as follows.
1. There is a difference in the level of SGOT white mouse (Rattus norvegicus) strains wistar the
male after eating skipjack fish that has been preserved with merunggai leaf extract as a
natural preservative with varying concentrations.
2. The most effective concentration of merunggai leaf extract used as a natural preservative of
skipjack fish is the concentration of 25%.
5. Recommendation

205
For the community especially fish traders, it is advisable to use natural ingredients for the purpose of
food preservation, especially in this case to maintain the freshness of fish. This is done considering
that natural ingredients are more effective and do not give a bad effect on the body when compared to
synthetic preservatives.
6. Acknowledgments
Authors wishing to acknowledge assistance or encouragement from colleagues :who have helped
directly or indirectly, so that this research can be resolved.
References
[36] Dinas Kelautan dan Perikanan Provinsi Bali 2008 Potensi Perikanan Bali (Bali : Dinas
Kelautan dan Perikanan Provinsi Bali)
[37] Maramis A A, Mohamad A, Sumarno S dan Aloysius D C 2010 Pengaruh Paparan Berulang
Ikan Berformalin Terhadap Gangguan Fungsional Hepar Mencit Seminas Pend Biol FKIP
UNS
[38] Wulandari N K M 2017 Ekstrak Kasar Daun Kelor (Moringa oleifera) Sebagai Pengawet
Alami Ikan Cakalang (Katsuwonus pelamis L.) Skripsi (Bali : Jur Pend Biol Univ
Pendidikan Ganesha).
[39] Federer W 1963 Experimental Design Theory and Application ( Oxford : Oxford and Lbh
Publish Hinco ).
[40] Wahyuni S 2005 Pengaruh Daun Sambiloto (Andrographis paniculata) Terhadap Kadar SGPT
dan SGOT Tikus Putih GAMMA vol 1 num 1 pp 45-53
[41] Peanasari A R I, Djamil S L and Rohmani A 2015 Pengaruh Formalin Peroral Terhadap Kadar
SGOT dan SGPT Tikus Wistar J KedokMuhammadiyah vol 2 number 1 pp 36-37
[42] Sadikin M 2002 Biokimia Enzim (Jakarta:WidyaMedika)
[43] Caceres A and Saravia A 1992 Pharmacologic Properties of Moringa Oleifera. 2: Screening
for Antispasmodik, antiinflamatory and Diuretic Activity J Ethnopharmacol vol 36 pp 233-
237.
[44] Pandey A, Pandey R D, Tripathi P, Gupta P P, Haider J, Bhatt S, and Singh A V 2012 Moringa
oleifera Lam (Sahijan) – A Plant With a Plethora Diverse Theraupic Benefits: An Update
Retropectio Medicinal & Aromatic Plants vol 1 p 101
Bukar A, Uba A, and Oyeyi TI 2010 Antimicrobial Profile of Moringa oleifera Lam Extracts Against
Some Food – Borne Microorganisme Bajopas vol 3 num 1 pp 43-48.
Widowati I, Siti E, dan Sari W 2014 Uji Aktivitas Antibakteri Ekstrak Daun Kelor (Moringa oleifera)
Terhadap Bakteri Pembusuk Ikan Segar (Pseudomonas Aeruginosa) Jurnal Penelitian Sains
& Teknologi Universitas Negeri Yogyakarta vol 9 num 2.
[45] Ikalinus R, Widyastuti S K, Setiasih N E 2015 Skrining fitokimia ekstrak etanol kulit batang
kelor (Moringa oleifera) Indonesia Mediacus Veterinus vol 4 num 1 pp 71-79
Krisnadi D A 2014 Kelor Super Nutrisi Pusat Informasi dan Pengembangan Tanaman Kelor
Indonesia, Lembaga Swadaya Masyarakat – Media Peduli Lingkungan (LSM-MEPELING).
[46] Koh D dan Jeratnam 2009. Buku Ajar dan Praktik Kedokteran Kerja (Jakarta:EGC)
[47] Ramatina 2011 Efektifitas Berbagai Suplemen Antioksidan Terhadap Penurunan Status
Oksidatif Malondialdehyd (MDA Plasma) Pada Mahasiswa Alih jenis IPB Skripsi (Bogor :
Institut Pertanian Bogor)
[48] Nugraha A 2013 Bioaktivitas Ekstrak Daun Kelor (Moringa oleifera) Terhadap Escherichia
coli Penyebab Kolibasilosis Pada Babi Tesis (Denpasar : Program Studi Kedokteran Hewan
Program Pascasarjana Universitas Udayana).

206
The implementation of flipped learning model in classroom:
literature review L P R Ukirsari
1, I W Subagia
2 and N P Ristiati
3
1,2,3
Science Education Master Study Program, Departement of Physics and Science
Teaching, Faculty of Mathematics and Natural Sciences, Ganesha University of Education
Abstract. This paper aims to described and explain the implementation of flipped learning model in
classroom. Literature review was used for developing this paper involving 22 international articles.
Those articles then categorized based on the research objectives, research method, and the factors
affecting flipped learning model implementation. Based on the objectives of the study, 40.9% of the
research were compared the use of flipped learning models and traditional learning models. There
were 59% of articles that aim to find out students' perceptions and motivations in participating in
learning.The result revealed that there were 22.7% of researchers used qualitative methods and
77.3% of studies using mixed methods. Factors affecting flipped learning model implementation
were student, teacher, school, and parents. Overall, the results of the study shows that the
implementation of the flipped learning model has a positive impact on the learning process.
Keyword: flipped learning model, classroom, literature review
1. Introduction
The development of science and technology in the form of internet, computers/laptops, handphones,
etc., must be used in a good way. This development must be used in education field. At present,
learning tends to use traditional methods where instruction is given by teaching and students are given
assignments to do at home without being guided. Students will tend to be trapped and unable to
complete these tasks [1]. Although there are some teachers use a learning model with scientific
approach, but lack of time is one of the problems. Teaching and learning process in schools must
started to apply technology. Utilization of the internet to find various information needed in the
learning process is one of the goals of technology implementation. The flipped learning model is one
of learning models that can be used in applying internet technology. Flipped learning model is very
different from the traditional learning model in various aspects. In the traditional learning model,
students in class tend to record the material delivered by teacher and then do the work given by
teacher at home. Unlike the flipped learning model, before students enter the classroom they are
equipped with sufficient information to answer various problems regarding learning to be carried out.
Information is given to students by utilizing internet facilities, such as by using google classroom,
group chat, Facebook, or etc. When students enter the classroom, the student already has information
about the material to be studied. Activities in class are answering questions that cannot be understood
by students. Educators are no longer as information providers, instead they share the responsibility of
learning procedures with students [2].
Teachers in educating students must utilize various ways and techniques in improving the quality
of knowledge obtained by students. The flipped learning model not only emphasizes how students
watch videos at home, but how students gain learning experiences in meeting their needs [3]. In the
flipped learning model, the teacher gives a video, text or phenomenon that will be read or watched at
home. Students are also allowed to find other learning resources related to the material being
discussed. At school, students only discuss material that is not yet understood and work on questions
related to the material. The teacher usually gives lectures in the form of videos as homework, and uses
the time in class to practice active learning and direct involvement with students. There are seven
steps in applying the flipped learning model, which are as follows [4].
a. Determine learning outcomes and main concepts
b. Planning an implementation strategy
c. Develop pre-class learning activities and checkpoints

207
d. Develop and connect class activities
e. Delivering class
f. Link with advanced class activities and assessments
g. Class evaluations
Theoritically, flipped learning model implementation will produces a good learning outcomes. But
pratical evidence is needed, so that it can be stated literally about the effectiveness of flipped learning
model. Currently, research on the flipped learning model implementation has been carried out in
various educational circles in the world, from elementary to university level. Various methods and
approaches are used to achieve the research objectives. Many researchers compare the effectiveness
of implementing the flipped learning model with other learning models [5,6,7,8,9,10,11,12,13]. There
are also studies using questionnaires and interviews to find out students' perceptions about the flipped
learning model [8,14,15,16]. The result of the studies showed varies result according to their
objectives. There needs a literature review to find out all the information from a collection of articles
that research about flipped learning model. The results of the literature review will showed the
objective and method used in the research being studied. The factors affecting flipped learning model
will also be seen. This literature review can be used as a reference or guideline in implementing
flipped learning model or as input if need to do a research about flipped learning model.
2. Method This literature review was made by systematic searching of related articles in five websites, namely
AJET, ERIC, Free Full PDF, Google Scholar, and Science Direct. The keyword used in finding the
article was flipped learning. Articles were reduces in such a way, adjusting to the purpose of making
this literature review. Articles used were published in 2008 - September 2018. The search results
returned 66 articles. Furthermore, the abstracts from the 66 articles were read and resulted 22 articles.
The criteria used in determining the article used were contain flipped learning, how the model
influences the learning process, as well as the perceptions of educators or students about the
application of this model. The articles used is only focused on research objectives, research methods,
and factors affecting flipped learning model implementation. The research places and subjects used by
researchers were not taken into account.
The 22 articles then categorized based on research objectives, research methods, and factors
affecting flipped learning model implementation. The research objectives of the articles were
collected and divided based on similar objectives. It is also done in research method and the factor
affecting flipped learning model implementation. The group of each similar criteria then analyzed.
From that data, the reasons of choosing research objectives and research methods will be known.
Factors affecting of flipped learning model will be analyzed from all the articles.
3. Results
Based on the results of the literature review, it can be categorized as follows (Figure 1.).

208
Figure 1. Results of Literature Review
3.1. Research objectives
The 22 articles are further categorized based on the purpose of the research conducted. There are
40.9% of research articles used traditional learning as a control group and flipped learning models as
an experimental group. This study aims to determine the effectiveness of flipped learning model
compared with traditional learning models in the learning process. The results showed that the use of
flipped learning model was more effective than the traditional learning model [5,6,7,8,9,10,11,12].
This is evident by the level of student achievement in learning material higher than using traditional
learning model. Only 11.1% said that there was no significant difference between the use of the
flipped learning model and the traditional learning model [13].
Furthermore, there are 59% of research articles that examine the motivation and perceptions of
students towards the flipped learning model. This information was obtained through the use of
questionnaires and interviews with research samples. The results showed that the use of flipped
learning model can increase student motivation in learning participation [17,18,19,20,21,22].
3.2. The research method used
The 22 articles were categorized based on the method used by the researchers. There are two types of
research methods used in research on flipped learning, namely qualitative methods and mixed
methods. The qualitative method is carried out by giving questionnaires, observations or interviews
with informants. There are 22.7% of articles that use qualitative methods, namely [15,23,24,25,26].
The instruments used are observation, interview and document collection. Observations done to know
the student motivation in learning participation by applying the flipped learning model. The
involvement and interest of students in participating in learning is also observed. Information about
students' perspectives, interests and perceptions is collected through semi-structured interviews.
Documents, in the form of student attendance, shows the interest and motivation of students in
learning participation. Furthermore, there were 77.3% of studies that used mixed methods and 35.3%
of them used quasi-experimental research designs. Pre-test and post-test was conducted to determine
the increase in student knowledge after using flipped learning model.
3.3. Factors affecting flipped learning model implementation
The factors affecting flipped learning model implementation are as follows.
3.3.1. Teachers and students must have adequate IT literacy skills. Based on the results of the study,
100% of the research conducted revealed that teachers must be active and can use computers to
make or search for online videos. Students must also be able to use computer/laptop and the
internet properly. It will easier to watch videos or read the learning material provided.
3.3.2. An internet connection. Students are expected to have internet facilities besides computer at
home. This can be seen from 86.4% of research using internet facilities to provide video or

209
learning material to students. Based on these results, 5.26% of them use social media
(facebook) in providing material, and some also create a special website to provide material
(5.26%).
3.3.3. There are support from the school (university), parents, environment, students and teachers
themselves.
4. Discussion
4.1. Research objectives
Based on the research objectives, out of 22 articles, 40.9% of research articles use traditional learning
as a control group and the flipped learning model as an experimental group. Lubbe [5] analyzes the
application of flipped learning model to accounting subjects at North West University. In the research
conducted, Lubbe [5] provides learning with traditional methods in semester 1 and flipped learning
models in semester 2. The results of the study showed that the flipped learning model implementation
is better than using traditional learning methods. This is evident from the higher survey percentage
after using flipped learning model. Furthermore, Paristiowati [6] examined the use of flipped learning
model. Paristiowati [6] used the inquiry-flipped learning group as an experimental group and the
guided inquiry group as a control group. The results showed that student achievement using flipped
learning model was higher than using guided inquiry. This shows that, a comparison of two teaching
methods is carried out to put more emphasis on measuring student learning outcomes towards the
flipped learning model implementation. Comparison used by researchers to find out the position of
flipped learning model towards other learning model.
Other research was conducted to determine students' perceptions and motivations. Based on the 22
articles reviewed, there were 59% of researchers whose studies aimed to find out the opinions of the
research objects. D'addato and Miller [24] conducted a study of 4th grade mathematics students. This
study aimed to determine the impact of using the flipped learning model. The instruments used were
observation sheets, teacher reflection sheets, and survey sheets for students and parents. The results
showed that flipped learning model had a positive impact on the learning process. The teacher feels
that flipped learning model provides a higher advantage when compared to conventional learning
models. In addition, the implementation of this model is felt to be a challenge for teachers themselves.
Smallhorn [15] conducted research on second-year students taking Genetics, Evolution and
Biodiversity courses. The teacher applies the flipped learning model in teaching to find out his
involvement in the learning process. Students are given a reflection questionnaire to determine the
effectiveness of the learning model applied. The results showed that student involvement in learning
increased as evidenced by their presence during the learning process.
Other research that also examines students' motivation towards the application of the flipped
learning model is research conducted by Akbel [25]. This study aims to determine the opinions of
students and instructors on the flipped learning model implementation in Cello Education Turkish
Music. Semi-structured interviews are used to find out the opinions of students and instructors. The
results showed that students and instructors were motivated by the use of the flipped learning model.
This kind of objectives used to know the student’s views on the flipped learning model
implementation. Opinions from students, teachers, and parents are needed to know the effectiveness
of this model.
4.2. The research method used
In general, there are two research methods namely qualitative and quantitative. However, it is not
uncommon for researchers to use both methods in one study. The results showed that, from 22 articles
examined, there were 22.7% of articles used qualitative methods. It means that only a few researchers
who wants to know the perception or motivation of students. They only wants the data about
effectiveness of flipped learning model using observation or interviews. They don’t care about the
score of students who used flipped learning model, or the position of flipped learning model towards
other learning model in the form of numbers. Qualitative methods are widely used to find out
opinions or perceptions of research objects about an issue. Qualitative research is a study that aims to
describe a situation, phenomenon, problem or activity [27]. This research is a research in which data
in the form of words from interviews or questionnaires and will later form a new theory. Through

210
qualitative research, various subjects can be explored including the understanding, experience, and
imagination of research participants, the ways in which social processes, institutions, work
relationships, and meanings are produced [28]. The characteristic of qualitative research is its purpose
which is related to understanding several aspects of social life, and its methods which (in general)
produce words, not numbers, as data for analysis [29].
Besides, there are 77.3% of studies used mixed methods and 35.3% of them used quasi-
experimental research designs. Pretest and posttest were conducted to find out the increase in students'
knowledge after using the flipped learning model. The quantitative method used aims to measure the
effectiveness of the model implementation while the qualitative method is used to determine student’
perceptions and motivation in learning participation. The combination of the two methods is carried
out in order to find out more closely about the impact of using the model. Based on this result, it is
showed that more researchers want to know the position of flipped learning model towards other
learning model as well as the perception of student about this model. The data carried out by the
researchers in the form of numbers and words. This data then can be generated to get the conclusión
of the study. This kind of data is more complex, valid, and comprehensive.
4.3. Factors affecting flipped learning model implementation
The flipped learning model implementation is influenced by several factors as follows.
4.3.1. Based on the literature review conducted, there is 100% research that requires teachers to have
adequate IT literacy. There are 22.7% of articles mentioning that researchers make their own
videos that are used to provide material to their students [5,7,8,9,25]. Sojayapan and Khlaisang
[8] created a special website to provide learning material to students. Lin and Hwang [19] use
social media facilities such as Facebook to provide learning videos for students. Teachers who
cannot make videos (59%) used internet facilities to find videos that are suitable with the
learning material. The skills of a teacher and students in using computer technology and the
internet become one of the important factors in the flipped learning model implementation.
Without this skill, the implementation of this model will not do well. Flipped learning model
as a technology learning model need a technology to do it. Computer skill as one of the basic
skill that required by the teachers.
4.3.2. In addition to IT literacy capabilities, internet connection is another factor that must be present.
Providing videos or learning materials from teachers to students requires an internet
connection. This can be seen from 86.4% of research using internet facilities to provide video
or learning material to students. Based on these data, 5.26% of them use social media
(facebook) in giving out material, and there are also those who create special websites to
provide material (5.26%). Students must have an internet connection in watching or reading
material provided by the teacher.
4.3.3. The flipped learning model will not be implemented properly if there is no support, from the
school (university), parents, the surrounding environment, students and the teacher itself.
Overall articles (100%) showed that the flipped learning model implementation is strongly
influenced by the students' own will. If students do not want to read or watch videos provided
by the teacher, then the application of this model cannot be optimally implemented. The
teacher is also very influential in the application of this model. Teacher readiness in preparing
material for students at home becomes a very important supporting factor in the
implementation of the model. The teacher must also be prepared to provide answers to
questions raised by students in online discussions. Shih and Tsai [19] provide online
discussions in their research in addition to providing learning material. Besides the willingness
of students and teachers, support from schools (universities) and parents in setting up facilities
is very much needed. The intended facilities are computer / laptop, good internet connection
and training for teachers to be able to apply the flipped learning model properly.
5. Conclusion
5.1 The objectives of the researches was categorized into two, namely determining the effectiveness
of flipped learning model compared with traditional learning models and the motivation and
perceptions of students towards flipped learning model.

211
5.2 Method used by researchers were qualitative method and mixed method.
5.3 Factors that affecting the flipped learning model implementation were IT literacy skill, internet
connection and support from student, teacher, school, environment and parents.
6. Acknowledgement
We thank to the article’s authors used in this literature review. Thanks also to the family, colleagues,
and mentors who always supprot and motivate in developing this paper.
References
[1] Bergmann J and Sams A 2014 The flipped classroom 17
[2] Uguten S D and Balci O 2017 Flipped learning (University Institute of Social Sciences: Article of
Suleyman Demirel
[3] Bray B, Cradler J, Craven, R R M, Day K, Deets D, Landeck T, and Thornburg D 2013 On CUE
flipped teaching & learning. First Edition. (CUE: Spring)
[4] Karanicolas S, Snelling C, and Winning T 2015 7 Steps to Flipping: With A Framework (The
University of Adelaide)
[5] Lubbe E 2016 Innovative teaching in accounting subjects: analysis of the flipped classroom 8 63-
74
[6] Paristiowati M, Fitriani E, and Aldi N H 2017 The effect of inquiry-flipped classroom model
toward students’ achievement on chemical reaction rate (Indonesia: American Institute of
Physics)
[7] Sojayapan C and Khlaisang J 2018 The effect of a flipped classroom with online group
investigation on students’ team learning ability 5 1-6
[8] Unal Z and Unal A 2017. Comparison of student performance, student perception, and teacher
satisfaction with traditional versus flipped classroom models 10 145-164
[9] Camilin M K 2017 The flipped classroom: teaching the basic science process skills to high-
performing 2nd grade students of Miriam college lower school 5 213-230
[10] Elian S A and Hamaidi D A 2018 The effect of using flipped classroom strategy on the academic
achievement of fourth grade students in Jordan 13 110-125
[11] Qiang J 2017 Effects of digital flipped classroom teaching method integrated cooperative
learning model on learning motivation and outcome 6 2213-2220
[12] Abdelshaheed B S M 2017 Using flipped learning model in teaching english language among
female english majors in Majmaah University 10 96-110
[13] Cabi E 2018 The impact of the flipped classroom model on students’ academic achievement 19
202-221
[14] McCubbins O, Paulsen T H, and Anderson R G 2016 Student perceptions concerning their
experience in a flipped undergraduate capstone course 57 70-86
[15] Smallhorn M 2017 The flipping classroom: a learning model to increase student engagement not
academic achievement 8 43-53
[16] Chen L, Chen T L, and Chen N S 2015 Students’ perspectives of using cooperative learning in a
flipped statistics classroom 621-640
[17] Osterlie O Can flipped learning enhance adolescents’ motivation in physical education? An
intervention study (Norway: Creative Common Attribution)
[18] Lin C J and Hwang G J 2018 A learning analytics approach to investigating factors affecting efl
students’ oral performance in a flipped classroom 21 205-219
[19] Shih W L and Tsai C Y 2017 Students’ perception of a flipped classroom approach to
facilitating online project-based learning in marketing research courses 33 32-49
[20] Katsa M, Sergis S, and Sampson D G 2016 Investigating the potential of the flipped classroom
model in k-12 mathematics teaching and learning (Australia: 13th
International Conference on
Cognition and Exploratory Learning in Digital Age)
[21] Deng L 2018 The project-based flipped learning model in business english translation course:
learning, teaching and assessment 11 118-128
[22] Akkaraju S 2016 The role of flipped learning in managing the cognitive load of a threshold
concept in physiology 16 28-43

212
[23] Fatima S S, Arain F M, and Enam A 2017 Flipped classroom instructional approach in
undergraduate medical education 33 1424-1428
[24] D’addato T and Miller L R 2016 An inquiry into flipped learning in fourth grade math
instruction 17 33-55
[25] Akbel B A 2018 Students’ and instructors’ opinions on the implementation of flipped learning
model for cello education in Turkish music 6 1-11
[26] Yamashita K and Yasueda H 2017 Project–based learning in out-of-class activities: flipped
learning based on communities created in real and virtual spaces 5 1044-1053
[27] Kumar R 2011 Research methodology: A step – by – step guide for beginners 3rd Edition
(Singapore: SAGE Publications Asia-Pasific Pte. Ltd)
[28] Mason J 2002 Qualitative researching: second edition (London: SAGE Publications Ltd.)
[29] Patton M Q and Cochran M 2002 A guide to using qualitative research methodology (Medecins
Sans Frontieres, https://cloudfront.ualberta.ca/)

213
The effect of science environment technological and society
learning model (SETS) on the students' critical thinking skill
and learning achievement
D A P D O Lestari
1, K Suma
2 and I W Suja
3
1,2,3
Faculty of Mathematics and Natural Sciences, Ganesha University of Education
Abstract. The purpose of this study is to find out and describe the differences in
critical thinking skills and student learning outcomes between study with the SETS
model compared to study with the DI model. This type of research is a pretest-posttest
nonequivalent control group design. The population in this study were all class VIII
students of SMPN 1 Banjarangkan. Samples were taken using simple random
sampling technique to the class so that two experimental classes and two control
classes were obtained. Data was collected using instruments in the form of tests of
critical thinking skills and learning outcomes. Data were analyzed by hypothesis was
tested by the Manova technique. The normalized gain score results of critical thinking
skills and the learning outcomes of students. The results showed that: (1) There were
differences in critical thinking skills and student learning outcomes between studied
with the SETS model compared to the DI model (F=49.78; p<0.05). (2) There were
differences in critical thinking skills between studying with the SETS model
compared to the DI model (F=45.31; p<0.05; LSD=0.08). (3) There were differences
in student learning outcomes between studying with the SETS model compared to the
DI model (F=55.28; p <0.05; LSD=0.06).
1. Introduktion
In the current 4.0 industrial revolution, the development of science and technology has become a
fundamental foundation in determining the quality of life of a nation. This era is marked by the
occurrence of unlimited communication that impacts on the dissemination of information that is not
necessarily true. In this condition, the community as recipients of information must be able to think
critically to sort and select information that is reliable truth. The ability to think critically in
responding to information is not innate so it must be learned early on [1].
As part of high-level thinking, critical thinking ability is also a way of thinking is reflective and
reasoned that focused on decision-making to solve the problem [2]. Critical thinking allows the child
to understand the problem and determine the selection and draw conclusions with smart. For this
reason, if children are accustomed to using learning that hones their ability to think at a higher level,
they will eventually get used to and be able to distinguish truth from lies, facts and opinions,
knowledge and beliefs.
To train students to think critically, learning the industrial revolution era 4.0 requires that teachers
as educators are able to keep abreast of fast-growing science and technology. The teacher needs to
look for issues or problems that develop in daily life related to the technology that is around him, or
that are related to the needs of students, then students can creatively solve problems by using relevant
concepts either independently or with teacher guidance [3]. If the teacher is able to follow the
development of science and technology, then students will be able to learn all the facts and concepts
of science and be able to apply in their lives.
Components of critical thinking skills students need to have include: interpretation, analysis,
evaluation, inference, and ekplanasi [4].
214
The reality found in the field is very much different. The learning applied by the teacher is still
more dominant in the introduction of aspects of knowledge and understanding of concepts, not yet
requiring students to be active in thinking and discovering their own concepts. Students tend to
memorize concepts without knowing how to find the concepts. conditions that result in a lack of
students' ability to think for problem solving [5]. The most dominant learning model used is the direct
learning model that emphasizes lecture, discussion and question and answer activities that are directly
conducted by the teacher [6]. The application of the learning model directly impacts the low critical
thinking skills of students due to the absence of skills training processes such as the link between
lessons and the real world and the process of problem solving in daily life.
The low scientific literacy and high-level thinking skills of Indonesian students are recorded
through research conducted by international institutions. The me for International Student Assessment
(PISA) program in 2015 stipulates that Indonesia is ranked 62 out of 70 participating countries in
terms of scientific literacy skills, which includes readiness for student involvement in learning,
readiness in problem solving, and student self-confidence.
Gaps occur between the 2013 curriculum targets which require students to think critically in
solving problems with the reality that occurs in learning in school. One effort that can be done is to
vary the application of learning models to make students comfortable in learning. The influence of
ICT (Information, Communication, and Technology) in education requires students to be creative,
innovative and think critically in the hope that knowledge can be applied in the community
environment. One learning model that can be applied is the community and environmental technology
(SETS) learning model. This learning model answers the problems experienced by the government.
This learning model causes students to pay more attention to the surrounding environment as a
medium of learning and pay attention to the technology developing in today's society. Students are
also able to develop critical thinking skills in sorting information and using appropriate technology in
accordance with their functions.
The results also showed that there were significant differences in the understanding of concepts
and attitudes to care for the environment between students who took part in learning with Science,
Environment, Technology And Society (SETS) learning devices and those who did not use these
learning tools [7]. The results of other studies show that applying the SETS splitting model can attract
students' interest in learning compared to classes that do not apply the model. All students said that
they enjoyed the SETS learning method and hoped to continue learning according to the same
methods in their school [8].
The application of the SETS learning model is a fun and meaningful learning model for students
and can improve understanding of concepts and attitudes of caring for the environment [9].
Distinctive Approach SETS is learning that the link between science and technology, environment
and society, as well as provide learning experiences for students to identify problems, collect data,
consider alternative solutions, and to consider based mindset for certain decisions [10]. The learning
model Science Environment Technology and Society (SETS) is a learning model that me Mandang
forward against the notion that everything that is faced in life contain aspects of science, environment,
technology, and society which is a unity and mutual influence reciprocally [11].
The fundamental difference between the above research with the research that I will do is, seeing
from the SETS learning model which is a learning model that suppresses learning in solving problems
that occur in the community related to technology. In resolving problems that occur require high
thinking to solve.Therefore I associate SETS learning models with critical thinking skills possessed
by students. With students improving critical thinking skills it will be able to improve learning
outcomes.
2. Method
This type of research is quasi-experimental. This study uses a Pretest-Posttest Non Equivalent
Control Group Design research design. The total population studied was 307 students. The sample
selection was used by Simple Random Sampling technique. The research sample used was 124
students. Data collection for critical thinking skills variables and student learning outcomes using
objective tests. The value of the reliability of the critical thinking skills test and the test of learning
outcomes respectively: 0.89 and 0.83. The figure also shows the degree of reliability of the test is at a
very high level.

215
Data were analyzed by descriptive analysis, analysis prerequisite test, hypothesis testing. To
describe the data used descriptive statistics and to test the hypothesis multivariant analysis techniques
(MANOVA) are used. As a further test of MANOVA is the significance test of the average value
between groups using Least Significant Diference (LSD). The results of the study were analyzed in
stages, namely data description, analysis prerequisite tests, and hypothesis testing. The prerequisite
tests conducted were the test data normality test, the variance homogeneity test, the intercorrelation
test.
3. Results and discussion
Differences in Critical Thinking Skills and Student Learning Outcomes between the SETS
Learning Model and the DI Learning Model. Based on the analysis results obtained a significant value
of Pillai's Trace, Wik Lamda, Hotelling Trance, Roy's Large Root showed a value (F = 49.777; p
<0.05). So it can be concluded that H0 is rejected and H1 is accepted, in other words there are
differences in critical thinking skills and student learning outcomes between groups of students
learning with SETS learning models and groups of students learning with DI learning models
Based on the results and application of learning in the classroom, the SETS model starts learning
by linking events in the surrounding environment to the material being taught. With this students pay
more attention to the environment around them. With this learning model, the teaching of science will
be more meaningful if the principles, concepts and theories of science are designed to relate to society
and technology. During the learning process students are emphasized to analyze and find themselves
the problems experienced in order to improve higher order thinking skills. Enhancing higher order
thinking skills can be done by linking science, technology, society and the environment.
The findings of this study are in line with the results of the study. His research shows that the
SETS learning model successfully stimulates the development of productive learning activities.
Productivity of learning outcomes in question is an increase in student learning outcomes and an
increase in the level of student activity in the learning process. There is a significant difference
between understanding biological concepts and critical thinking skills between students who take
learning with the SETS model and conventional learning models [12].
The same opinion, teachers and students gave positive responses both regarding the application of
science learning that was developed with the SETS vision. Application of SETS-based learning makes
students accustomed to having a comprehensive mindset (comprehensive) in viewing material in
Biology as a science integrated with the environment, technology and society [13].
Differences in Critical Thinking Skills between SETS Learning Models and DI Learning Models.
Based on the analysis results obtained values (F = 45.307; p <0.05; LSD = 0.0841). So it can be
concluded that H0 is rejected and H2 is accepted, in other words there are differences in students'
critical thinking skills between groups of students learning with SETS learning models and groups of
students learning with DI learning models. With a total influence of 0.265 or 26.5%.
The results of the descriptive analysis of the average value of critical thinking skills dimensions
indicated the lowest value was in the evaluation dimension in the control class with an average of
60.94 with moderate qualifications and the interpretation dimension in the experimental class had an
average of 66.45 with moderate qualifications. The highest value is in the dimensions of analysis in
the experimental class has an average of 74.68 with high qualifications and in the control class the
analysis dimension is 66.45 with medium qualifications.
Judging from the mean gain score, the dimensions of interpretation of critical thinking skills in
the experimental class have an average gain score of 0.12 with low qualifications, while in the control
class it has an average gain score of 0.05 with low qualifications. the interpretation dimension has the
lowest qualifications compared to other dimensions. This is because because some students are still
confused when connecting new learning with previous learning, students are still confused linking the
experiences they have experienced to the concept of learning science they learn.
This is not too much of an obstacle, because most students have been able to identify the
relationship of questions, concepts, descriptions, and various models used to reflect their thoughts,
views, beliefs, decisions, reasons, information and opinions. During the learning process students
discuss the opinions raised by their friends and analyze the truths found this is in line with the results
of the average gain score dimensions of critical thinking skills analysis of the experimental class that

216
is 0.56 with moderate qualifications, while the average gain score of the control class is 0.31 with
moderate qualifications.
The average gain score of the evaluation dimensions of the experimental class is 0.32 with
moderate qualifications, while the average gain score of the control class is -0.04 with low
qualifications. In this phase, students in the experimental class develop their own concepts, students
discuss and provide solutions to problems found related to the material being studied and other
learning materials used in reflecting student thinking.
In the dimension of inference the average gain score of the experimental class was 0.39 with
moderate qualifications, while the control class model was 0.23 with low qualifications. In this phase
students in the ekeprimen class are able to find information for the preparation of conclusions. In the
explanatory dimension in the experimental class, the average gain score is 0.30 with moderate
qualifications, while in the control class the average gain score is 0.25 with low qualifications, this
shows that in the STML learning model students have dared to state the results of thought, explain
reasons based on consideration of available evidence.
The presentation of discrimination in critical thinking skills applied with the SETS learning model
is better than the DI teaching model because the SETS learning model emphasizes the active
participation of students in constructing knowledge with a comfortable and pleasant environment.
This learning model can increase student involvement in learning. In this method students are given
the freedom to express their ideas and ideas. This situation requires students to be active, explore
information from various supporting sources. In contrast, the DI learning model emphasizes the
function of the teacher as a source of information. Students only listen to the teacher's explanation
without being actively involved. Explanation of the concept of Science has been set up in such a way
by the teacher, starting with an explanation of the theory, giving examples, then given a question
exercise on the worksheet. In this case, students only learn to complete the assignment given by the
teacher.
[14] shows that the illumination of the SETS learning model in the experimental class has a very
good category. It was seen that there was a positive response from students at 85.70%. Thus it can be
concluded that the inquiry learning model with the SETS approach can be applied in physics learning
to improve students' critical thinking skills.
Differences in Student Learning Outcomes between the SETS Learning Model and the DI
Learning Model. Based on the analysis results obtained values (F = 55.28; p <0.05; LSD = 0.06). So it
can be concluded that H0 is rejected and H3 is accepted, in other words, there are differences in
student learning outcomes between groups of students learning with the SETS learning model and
groups of students learning with the DI learning model. With a total effect of 0.306 or 30.6%.
Based on the descriptive results of student learning outcomes have increased both in the control
class and experimental class. Learning outcomes in the control class with high qualifications has a
percentage of 41.9% while in the experimental class 54.8%. Seen in the experimental class has a
higher value. The same thing is also seen in the very high qualifications of learning outcomes in the
control class with a percentage of 1.6% while in the experimental class 14.5%. Based on the
percentage of very high ability students in the experimental class have higher grades than those in the
control class.
This shows learning outcomes in the application of the SETS learning model are superior to the
DI learning model. In the classroom experiment learning that is implemented is directly related to
daily life which results in a deeper understanding of students. Students discover their own concepts
and understanding in this learning. While on direct learning the teacher gives a theoretical explanation
including practice questions so that students' understanding is not exhaustive of the material being
taught.
The findings of this study are in line with the results of study which states the SETS learning
model can improve student learning outcomes. The results showed the average learning outcomes in
the experimental group were 78.33 with an increase of 15.73 (25.12%), while the average learning
value of the control group was 70.10 with an increase of 6.87 (10.86 %). This shows SETS learning
model is able to improve student learning outcomes [15].
In addition to these things that affect student learning outcomes, namely motivation in receiving
and understanding the material being studied. When students have motivation in learning to eat will
affect the results obtained. In addition to motivation there are also other factors that can affect student

217
learning outcomes, namely the teacher as a supporting facilitator must be able to find interest and
know the student's learning style in understanding the material [16].
4. Conclusions Based on the results of hypothesis testing and discussion of research results, the following
conclusions can be drawn.
First, there are differences in critical thinking skills and student learning outcomes between
groups of students learning with the SETS learning model compared to groups of students learning
with a direct learning model (Direct Instruction). This can be seen from the MANOVA test results
that were obtained (F = 49.777; p <0.05).
Second, there is a difference in the critical thinking skills of groups of students who learn with the
SETS learning model compared to groups of students who learn by direct learning models. This can
be seen from the MANOVA test results obtained (F = 45.307; p <0.05; LSD = 0.0841).
Third, there are differences in student learning outcomes of groups of students who learn with the
SETS learning model compared to groups of students who study with a direct learning model (Direct
Instruction). This can be seen from the MANOVA test results that (F = 55.285; p <0.05; LSD =
0.05841).
5. Acknowledgments
Acknowledgments are addressed to: the supervisors for advice and input provided during the study,
the head of SMPN 1 Banjarangkan for permission so that this study could be carried out properly, the
teachers who had helped in collecting data about this study, extended families who have provided
support, advice and input during the study, and colleagues who have provided assistance so that study
can run smoothly.
6. References
[1] Imbriale P and Zapalska A 2019 European Journal of Education Studies 6 1
[2] Enis R H 1993 Critical Tingking Assessment Theory into practice. 32 3
[3] Afni N Kharitil & Abdullah 2014 biotic journal 2 2
[4] Facione P A 2011 Critical Thinking: What it is and Why it Counts Millbrae CA Measured Reasons
and The California Academic Press
[5] Ristiasari T Priyono B 2012 Unnes Journal of Biology Education 1 3
[6] Sadia I W 2008 Undiksha Education and Teaching Journal 41 2
[7] Mahlianurrahman 2017 Development of Science, Environment, Technology and Society (SETS)
Learning Tools to Improve Understanding of the Concepts and Attitudes of Environmental Care
of Primary School Students 6 2
[8] Bar V Azaiza E Azaiza D Shirtz A S 2016 Teaching Electrolysis Using STSE Method,
Multidisciplinary Approach. 3 2
[9] Stephen A M & Megan D 2012 The Impact of an STS Approach on the Development of Aspects
of Scientific Literacy of Grade 10 Learners. Paper presented at SAARMSTE Conference 11
[10] Bernadete I D R 2009 Journal of Higher Education Research Science and Technology Section 6
281 [11] Zunicha Sunarno W & Suparmi 2017 Inquiry journal 6 3
[12] Marliani N Hasanuddin & Nurmaliah C 2017 the EduBio Tropical journal 5 1
[13] Nygren T Haglund J Samuelsson C R Geijerstam A A and Prytz J 2019 Education Inquiry 10 1
[14] Umami R and Jatmiko B 2013 Journal of Physics Education Innovation 2 3
[15] Saputro D T 2016 Implementation of Learning Approaches Sets (Science, Environment,
Technology, Society) In Learning Basic Automotive Engineering Work (Pto) To Improve Student
Learning Outcomes. Unnes Journal
[16] Piliang I R Rusdi and Miarsyah M 2018 Indonesian Journal of Science and Education 3 1
218
The Development of Local Wisdom-based Learning Material
for Science Instruction in Junior High School
I Wayan Sukra Warpala
Biology Education Department of Universitas Pendidikan Ganesha
Abstract. This research aims to give contribution in improving education quality, especially
for the science instruction in junior high school level through development of local wisdom-
based learning material. The learning material that has been developed consists of content
learning material, instructional procedure, and assessment method. Data have been collected by
questioner, interview, observation, validation sheet, and documentations study. Data were
analyzed descriptively and compared with the existing criteria. The result shows that the
learning material has been developed gives positive contribution for improving concept
understanding and students’ scientific skill. Besides that, it has been obtained the contextual-
based learning material that valid, practice, and effective to support the science teaching
learning process.
Key words: science’s learning material, science instruction, local wisdom
1. Introduction
Science instruction at junior high school level has undergone a fundamental change, namely
the application of the idea of integrating biology and physics subjects into science subjects, as well as
the introduction of some chemical material explicitly. Thus, the science subjects studied at the junior
secondary level currently consist of three basic science fields, namely biology, physics, and chemistry.
Changes in the content of these science subjects bring several consequences to the learning of science
related to the existence of science teachers at junior high school level. The facts show that almost all
of the science teachers have not a chemistry background at junior high school. Furthermore, this
situation has an impact on the existence of science learning in schools.
The facts show that learning science at the junior secondary level is mostly done partially
according to the mastery of the teacher. Other facts show that the chemistry aspect as one of the
contents of the junior high school natural science material often escapes the teacher's emphasis
because the teacher lacks mastery of the field of science. In line with changes in curriculum
development, the orientation of science learning at the junior secondary level has also changed. At the
junior high school level, science is recommended to be taught in an integrated manner. The integration
of science learning in SMP is emphasized on the interdisciplinary integration model because science
subjects in SMP cover the fields of biology, physics, and chemistry. Interdisciplinary integration of
science learning requires the ability of teachers to develop teaching materials in an integrated manner.
The issue of teaching materials is a crucial issue that is no less important in improving the quality of
science learning.
219
One of the causes of the lack of success in implementing the curriculum in schools is the
unavailability of teaching materials that are relevant to the demands of learning. One of the demands
of learning is the use of diverse learning resources (multiple-learning resources). Particularly in natural
science learning, the use of multi-site learning resources (diverse) has been shown to improve student
learning processes and outcomes (Warpala, 2006; 2007a). The facts show, although the curriculum
(Syllabus and RPP) has been developed by teachers in schools, but in implementing learning in the
classroom teachers still use more single learning resources which are generally in the form of
textbooks held by students. Another phenomenon, there are teachers who only use the worksheet that
contains a set of questions (Warpala, 2006). Science learning is done from page to page in accordance
with textbooks held by students is not the desired way of learning science in accordance with the
applicable curriculum. This can be seen as one of the obstacles in the implementation of the science
curriculum in schools.
The second crucial issue is the potential of local wisdom that is relevant for the development
of SMP science teaching materials. Lately, the development of science learning that leads to the use of
local wisdom, both the content of subject matter and pedagogy, has received high attention from
researchers and educational developers. This is driven by the awareness that the development of
learning cannot be separated from the role of the nearest environment, both the physical environment
(natural) and the socio-cultural environment. According to Aikenhead & Jegede (1999), the cultural
background students possess and are brought into the classroom during the learning process plays a
very important role in the process of mastering subject matter. The same was expressed also by
Wahyudi (2003) that the cultural background of students has a greater effect in the educational process
than the effect contributed by the provision of subject matter.
In relation to the role of the environment in learning, it is realized that both the physical
(natural) environment and the socio-cultural environment possessed by the Balinese people have
various potentials that can be explored and developed as a supplement to teaching materials supporting
science’s learning in schools. In terms of the physical (natural) environment, in Bali there are a variety
of flora, fauna, and the results of community technology that have not been identified and developed
as teaching materials supporting science learning. In terms of the socio-cultural environment, the
Balinese have various traditions, technologies, life habits, life values that have been used for
generations as a guide in navigating their lives. Some of these life habits and values are almost always
present in Balinese life and survive sustainably (sustainable). In this case the local wisdom of the
Balinese is defined as the abilities (competencies) possessed by the Balinese that have been proven to
be preserved to date. These abilities can be knowledge, skills, attitudes and values that are
operationalized in daily life.
Based on the central issues above, the research development of science learning materials for
junior high schools based on local wisdom is very urgent. In accordance with the will of the use of
diverse learning resources it needs to be said that "learning material is not a textbook." Learning
material is a set of various materials for learning that prepared by the teacher for students to learn in
accordance with the lesson plans made by the teacher. In teaching materials there are two main
components, namely learning material (content) that students will learn and learning procedures
(pedagogy) that students must follow. Thus, the development of teaching materials based on local
wisdom becomes very strategic in supporting the learning process to improve the quality of student
learning.

220
2. Method
This research is a developmental research that developing a learning material for science
instruction in junior high school. The development of the learning material used Kemp Model (1977)
that was conducted by some procedures are as follows at Figure 1.
Figure 1. Schema flow of the learning material development
Based on Figure 1, the development process is preceded by analyzing the needs of the
science curriculum implementation and identifying the potential of local wisdom in Bali. The needs
analysis of the science curriculum implementation was carried out in several junior high schools in
Badung, Tabanan, Bangli, and Buleleng Regencies. While the identification of the potentials of local
wisdom was carried out through field studies in Sangeh Village, Alas Kedaton Forest, Penglipuran
Village, Banjar District (Buleleng), and Lebih Village (Gianyar). After carrying out the needs analysis,
proceed with the writing phase of teaching materials. Writing teaching materials are arranged with the
draft content as follows: a) Identity of Subjects; b) Learning Objectives; c) Description of Material
(concerning the description of the material in accordance with the subtitle of the topic of the lesson,
which contains an introduction to local wisdom to reinforce facts, concepts, procedures, and / or new
information); d) Learning Procedures (includes learning steps based on local wisdom and innovative
learning); and e) Assessment of Learning Outcomes; and f) Bibliography. Furthermore, testing of
teaching materials is done through three phases, namely testing by experts and users, testing small
groups through focus group discussions, and testing in schools through CAR. Data collection uses the
following instruments: a) questionnaire for the analysis of the curriculum of science lessons
(availability of learning resources and analysis of learning problems faced by teachers and students);
b) interview guidelines and field notes for identification of local wisdom; c) questionnaire for expert
review; c) sheet/list suitable for conducting focus group discussions. Furthermore, the data are
analyzed descriptively, which is then compared with existing criteria for the purpose of making
decisions regarding the appropriateness of this development product.
DOING NEED ANALYSIS
(1)
CURRICULUM ANALYSIS
OF SCIENCES
INSTRUCTION (2)
DEVELOPING LEARNING
MATERIAL
(4)
VALIDATING &
EVALUATING
LEARNING MATERIAL (5)
REPORTING AND
PUBLICATION
(6)
IDENTIFICATION OF
LOCAL WISDOM’S
POTENCIES (3)

221
3. Research Finding
3.1 Identification of local wisdom for supporting junior high school’s science instruction
After conducting curriculum analysis and field observation, there was done an identification of
local wisdom that can be integrated to support science instruction. The results were shown in Table 1.
Table 1. The potential of local wisdom to support sciences instruction Subject Matter Topics Local Wisdom
Structure and function of
living things
Identifying structure and
function of plant tissue
Root
Stem
Flower
Fruit
Living things and Unsur Panca Maha
Butha
Tumpek kandang
Plant that used for Balinese ceremony
Nature conservation
Defining ecosystem and
relationship between its
components
Identifying the importance of
living things diversity in teh
preservation of ecosystem
Ecosystem
Living things’
interdependence
Biodiversity
conservation
Customary village-based
Environmental management.
Konsep Rta (natural law concept)
Konsep Panca Maha Butha (the five
constituent element of living things)
Tumpek kandang and tumpek bubuh
Alas duwe/alas angker
Concept of Tri Hita Karana
Apropriate Technology
Describing the concept of sound
in everyday life
Sound (Its
properties,
Marsenne's Law,
Sound Tone,
Resonance, and
Sound Reflection)
Instruments of traditional music
(gamelan), such as gong gangsa,
jegir, rebab, and kendang.
Keplug-keplugan
Bamboo balinese tradisional music
(rindik, suling)
Matter and Its Function
Describing te concept of density
in daily life
Substance and its
state (phase)
density of substance
Nandusin (making coconut oil
traditionally in balinese people)
Food Technology
Describing natural and artificial
chemicals in packaging food and
food ingredients
Food processing
Food preservation
Making product of balinese traditional
food (tape ketan, sere colek, tempe,
kepel)
Activities of balinese traditional
preservation (fermentation process
used natural chemicals, punapi,
cacah, pindang, and telur asin)
3.2 The development of science’s learning material
a) The result of learning material’s validation by expert and user
The result of learning material’s review by two expert and two user can be reported in Table 2.
Table 2. The review result of expert and user
No ASPECT/SUB ASPECT Scored by Experts and Users
Exp-I Exp-II User-I User-II
A Aspect of Content
1 Completeness of content (3 indicators) 21 21 21 21
2 Accuracy of content (3 indicators) 21 17 21 21
3 There are learning activities that support content
(2 indicators)
12 12 12 14
4 There are effort to increase science’s competencies (2 12 12 12 12

222
indicators)
5 There are content that stimulate students to conduct an
inquiry relating to local wisdom (3 indicators)
17 15 17 17
Score total of validator (1st aspect) 83 77 83 85
Score mean (by score total = 91) 91,2 84,6 91,2 93,4
Judgement Very
Good
Very
Good
Very
Good
Very
Good
B Aspect of presentation
1 Organisation of general presentation (2 indicator) 14 12 14 14
2 General appearance of science’s learning material (3
indicators)
17 13 17 17
3 Presentation organisation of science’s learning material
(2 indicators)
12 10 12 14
4 Presentation develops a process of knowledge
construction (3 indicators)
15 15 19 17
Score total of validator (2st aspect) 58 50 62 62
Score mean (by score total = 70) 82,9 71,4 88,6 88,6
Judgement Very
Good
Good Very
Good
Very
Good
Based on Table 3, it can be described that two experts and two users (teachers) stated that the
sciences’ learning material product was very good (feasible) in terms of material aspects.
Meanwhile, in terms of presentation aspects, one expert and two teachers stated that it was very
good, only one expert stated that it was good (worthy) for further testing.
b) The result of learning material’s validation by small group through FGD
Validation of local wisdom-based learning material through Focus Group Discussions (FGD)
is oriented to assess the learning materials in terms of practicality (possible level of performance in
learning) and effectiveness (its support for increasing students’ activity and students’ learning
outcomes). The results obtained in the implementation of the FGD are listed in Table 3.
Table 3 The result of practicality and effectiveness of science’s learning material
SCORE
INDICATORS
4 3 2 1
T S T S T S T S
A. The practicality of learning material
1. Comformity to Standard of Competency 2 - 8 10 - - - -
2. Comformity to Basic Competency 2 - 8 10 - - - -
3. Comformity to Learning Objective 10 10 - - - - - -
4. Supporting the Learning Resources 2 - 8 5 - 5 - -
5. Comformity to Time Allocation 3 - 7 5 - 5 - -
B. The effectiveness of learning material
1. Increasing minds-on activities
Not available
Available (score)
-
10
-
2
-
-
8
-
-
-
-
-
-
-
-
2. Increasing hands-on activities
Not available
Available (score)
-
-
-
4
-
10
-
6
-
-
-
-
-
-
-
-
3. Increasing learning outcome 2 10 8 - - - -
Teacher and student responses to implementation
of instructional process
Their opinion:
Teachers give a positive response to the
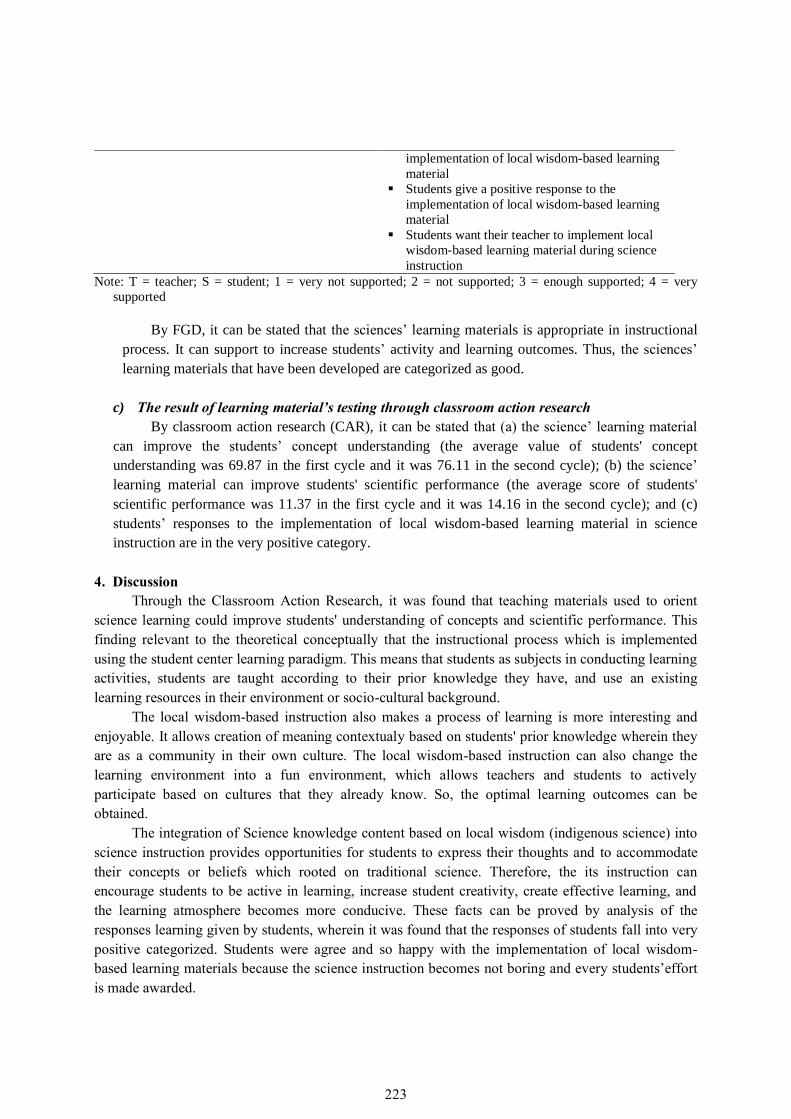
223
implementation of local wisdom-based learning
material
Students give a positive response to the
implementation of local wisdom-based learning
material
Students want their teacher to implement local
wisdom-based learning material during science
instruction
Note: T = teacher; S = student; 1 = very not supported; 2 = not supported; 3 = enough supported; 4 = very
supported
By FGD, it can be stated that the sciences’ learning materials is appropriate in instructional
process. It can support to increase students’ activity and learning outcomes. Thus, the sciences’
learning materials that have been developed are categorized as good.
c) The result of learning material’s testing through classroom action research
By classroom action research (CAR), it can be stated that (a) the science’ learning material
can improve the students’ concept understanding (the average value of students' concept
understanding was 69.87 in the first cycle and it was 76.11 in the second cycle); (b) the science’
learning material can improve students' scientific performance (the average score of students'
scientific performance was 11.37 in the first cycle and it was 14.16 in the second cycle); and (c)
students’ responses to the implementation of local wisdom-based learning material in science
instruction are in the very positive category.
4. Discussion
Through the Classroom Action Research, it was found that teaching materials used to orient
science learning could improve students' understanding of concepts and scientific performance. This
finding relevant to the theoretical conceptually that the instructional process which is implemented
using the student center learning paradigm. This means that students as subjects in conducting learning
activities, students are taught according to their prior knowledge they have, and use an existing
learning resources in their environment or socio-cultural background.
The local wisdom-based instruction also makes a process of learning is more interesting and
enjoyable. It allows creation of meaning contextualy based on students' prior knowledge wherein they
are as a community in their own culture. The local wisdom-based instruction can also change the
learning environment into a fun environment, which allows teachers and students to actively
participate based on cultures that they already know. So, the optimal learning outcomes can be
obtained.
The integration of Science knowledge content based on local wisdom (indigenous science) into
science instruction provides opportunities for students to express their thoughts and to accommodate
their concepts or beliefs which rooted on traditional science. Therefore, the its instruction can
encourage students to be active in learning, increase student creativity, create effective learning, and
the learning atmosphere becomes more conducive. These facts can be proved by analysis of the
responses learning given by students, wherein it was found that the responses of students fall into very
positive categorized. Students were agree and so happy with the implementation of local wisdom-
based learning materials because the science instruction becomes not boring and every students’effort
is made awarded.

224
Based on the results of focus group discussions, it was found that the teacher and students
argued the local wisdom-based learning materials had an appropriate level of implementation and
could support increased student activity and learning outcomes. The point of views that expressed by
teachers and students have a conceptually reason. In general, according to Aikenhead & Jegede
(1999), the influence of students’cultural backgrounds have two point of view on the learning process
of science. Firstly, a positive influence will emerge if the science’s learning material (which is being
studied) is in harmony with the daily knowledge (culture) of students. In this situation the learning
process supports the way students look at the natural surroundings. This learning process is called an
enculturation process. Secondly, the science learning process in the classroom becomes a 'bully' when
the science’s learning material is not in harmony with the students’ cultural background. It means that
the teacher tries to impose the truth of the science content by marginalizing students' prior knowledge.
By empirically, it is also illustrated that the science instruction based on students’ cultural
background (or based on local wisdom) is very helpful in mastering concepts and skills. Therefore, it
can be stated that the success of the science instructional process in schools is very much influenced
by the cultural background of students or the community. If the science instruction is harmonious with
students' daily lives, then science instruction will be more easily understood by students. This is
because the science instruction is considered as a cultural transmission so that the instructional process
in the classroom can be likened to the process of cultural acquisition by students from the learning
resources.
Wahyudi (2003) states that students' cultural backgrounds have a greater effect than the effects
of contributed by the provision of subject matter content in the educational process. In other words, the
effects of the instructional process carried out in class by the teacher are 'lost' by the effects of the
community culture that has been absorbed by students and brought into the instructional process. On
the other hand, Suastra (2005; 2006) states that many of the local wisdoms of the Balinese people (in
the form of documents or practices of daily community behavior) synergize with learning science in
schools. The integration of Balinese local wisdom in learning science will be a source of inspiration
and support the learning process of science in schools.
5. Coclussion
Based on the research finding and discussion, it can be concluded are as follows. Firstly, the
development of local wisdom-based learning materials, that have been validated, contribute to the
improvement of the students' concepts understanding and the scientific performance. Secondly, local
wisdom-based learning materials have practicality and effectiveness that are appropriate and it can
support the learning process of science (increased activity and learning outcomes). Thirdly, the
integration of selected local wisdom concepts must consider to the diversity of students' cultural
backgrounds. Fourthly, to optimize the scientific performance of each individual student, the teacher
should accommodate individual patterns of interaction by giving unstructured independent
assignments.
References
Aikenhead, G. S., & Jegede, O. J. (1999). Cross-cultural science education: A cognitive explanation of
a cultural phenomenon. Journal of Research in Science Teaching, 36(3), 269-287.
Anggreni. 2008. Identifikasi konsep-konsep IPA asli (indigeneus chemistry) yang relevan dengan
konsep-konsep kimia dalam pembelajaran IPA di SMP. Skripsi. Karya Tidak Diterbitkan.
Singaraja: Universitas Pendidikan Ganesha.

225
Depdiknas. 2007. Permendiknas Nomor 41 Tahun 2007 tentang Standar Proses Pembelajaran.
Jakarta: BSNP
Suastra, I W. 2005. Merekontruksi IPA Asli (Indigenius Science) dalam rangka Mengembangkan
Pendidikan IPA Berbasis Budaya Lokal di Sekolah: Studi Etnogenis pada Masyarakat
Penglipuran Bali. Disertasi. Karya Tidak Diterbitkan. Bandung: Program Pasca Sarjana
Universitas Pendidikan Indonesia.
Suastra, I W. 2006. Merekontruksi IPA Asli (Indigenius Science) dalam rangka Mengembangkan
Pendidikan IPA Berbasis Budaya Lokal di Sekolah: Studi Etnogenis pada Masyarakat
Penglipuran Bali. Jurnal Pendidikan dan Pengajaran IKIP Negeri Singaraja, No. 3. Tahun
XXXVIII.
Wahyudi. 2003. Tinjauan Aspek Budaya Pada Pembelajaran IPA: Pentingnya Kurikulum IPA
Berbasis Kebudayaan Lokal. Jurnal Pendidikan dan Kebudayaan No. 040, Tahun ke-9.
Januari 2005.
Warpala, I. W. S. 2006. Pengaruh Pendekatan Pembelajaran dan Strategi Belajar Kooperatif yang
Berbeda terhadap Pemahaman dan Keterampilan Berpikir Kritis dalam Pembelajaran IPA SD.
Disertasi. PSSJ Teknologi Pembelajaran, PPS Universitas Negeri Malang.
Warpala, I. W. S. 2007(a). Pengaruh Pendekatan Pembelajaran dalam Seting Kooperatif STAD
terhadap Keterampilan Berpikir pada Pembelajaran IPA. Laporan Penelitian Mandiri. Karya
tidak diterbitkan. Singaraja: Lemlit Undiksha.
Warpala, I. W. S., dkk. 2007(b). Pengembangan Desain Pembelajaran Biologi Bilingual untuk Sekolah
Menengah Atas Bertaraf Internasioal (SMA-BI). Laporan Penelitian Hibah Research Grant.
Karya Tidak Diterbitkan. Singaraja: Program I-MHERE Universitas Pendidikan Ganesha.