"The Revival of the Orient, Pan-Semitism and Pan-Asianism within Zionist Discourse"

This article was downloaded by: [Tartu Uellikooli]On: 15 May 2014, At: 02:06Publisher: RoutledgeInforma Ltd Registered in England and Wales Registered Number: 1072954 Registeredoffice: Mortimer House, 37-41 Mortimer Street, London W1T 3JH, UK
Eurasian Geography and EconomicsPublication details, including instructions for authors andsubscription information:http://www.tandfonline.com/loi/rege20
Is institutional trust related to pro-immigrant attitudes? A pan-EuropeanevidenceVivika Halapuua, Tiiu Paasa, Tiit Tammarub & Aire Schütza
a Faculty of Economics and Business Administration, University ofTartu, Narva Rd 4, Tartu 51009, Estoniab Department of Geography, University of Tartu, Vanemuise 46,Tartu 51014, EstoniaPublished online: 12 May 2014.
To cite this article: Vivika Halapuu, Tiiu Paas, Tiit Tammaru & Aire Schütz (2014): Is institutionaltrust related to pro-immigrant attitudes? A pan-European evidence, Eurasian Geography andEconomics
To link to this article: http://dx.doi.org/10.1080/15387216.2014.908313
PLEASE SCROLL DOWN FOR ARTICLE
Taylor & Francis makes every effort to ensure the accuracy of all the information (the“Content”) contained in the publications on our platform. However, Taylor & Francis,our agents, and our licensors make no representations or warranties whatsoever as tothe accuracy, completeness, or suitability for any purpose of the Content. Any opinionsand views expressed in this publication are the opinions and views of the authors,and are not the views of or endorsed by Taylor & Francis. The accuracy of the Contentshould not be relied upon and should be independently verified with primary sourcesof information. Taylor and Francis shall not be liable for any losses, actions, claims,proceedings, demands, costs, expenses, damages, and other liabilities whatsoever orhowsoever caused arising directly or indirectly in connection with, in relation to or arisingout of the use of the Content.
This article may be used for research, teaching, and private study purposes. Anysubstantial or systematic reproduction, redistribution, reselling, loan, sub-licensing,systematic supply, or distribution in any form to anyone is expressly forbidden. Terms &Conditions of access and use can be found at http://www.tandfonline.com/page/terms-and-conditions

Is institutional trust related to pro-immigrant attitudes? Apan-European evidence
Vivika Halapuua, Tiiu Paasa, Tiit Tammarub* and Aire Schütza
aFaculty of Economics and Business Administration, University of Tartu, Narva Rd 4, Tartu51009, Estonia; bDepartment of Geography, University of Tartu, Vanemuise 46, Tartu 51014,Estonia
(Received 23 September 2013; accepted 22 March 2014)
This paper examines the factors that are related to attitudes toward immigrants inEurope, with a particular focus on the role of institutional trust in shaping these atti-tudes. We go one step further compared to previous studies by investigating sepa-rately two different groups of people – members of the ethnic majority and ethnicminority populations in European countries. We use data from the European SocialSurvey fifth round database for 25 countries. The results of the paper show that trustin institutions is the variable that is most strongly associated with the attitudestoward immigrants implying on the importance of fair and supportive operation ofpolitical institutions to move toward more immigrant-tolerant environment andbecome an attractive destination country in the global competition of talents. Thefindings also indicate that not all of the main determinants of the attitudes towardimmigrants drawn from the most common theoretical explanations seem to explainthe variation of the attitudes toward immigrants among ethnic minority populationsthe same way as they explain it in the case of ethnic majority populations.
Keywords: immigration; attitudes; trust in institutions; minority/majority populations
JEL Classification: J61, J15, C31, P51
1. Introduction
European countries are becoming ethnically more and more diverse as a result of migra-tion all across the globe (Castles and Miller 2009). Along with the positive effects ofimmigrants on European societies, such as slowing down the trend of population agingand filling up the important segments of the labor market, a growing trend of intoler-ance toward immigrants among members of native majority populations has also beenwitnessed. The European Commission against Racism and Intolerance highlighted in its2011 annual report (Council of Europe 2012) that racism and intolerance towardimmigrants were both on rise in Europe. This is not a recent trend – a racism surveypublished in 2005 (European Monitoring Center on Racism and Xenophobia 2005) alsodemonstrated that Europeans were becoming more and more xenophobic, whereas intol-erance was found to be at the highest levels in the Baltic States. Furthermore, accordingto the OECD International Migration Outlook (2010), even people who recognize bene-fits arising from immigration prefer a slowdown of immigration flows in the future.
*Corresponding author. Email: [email protected]
© 2014 Taylor & Francis
Eurasian Geography and Economics, 2014http://dx.doi.org/10.1080/15387216.2014.908313
Dow
nloa
ded
by [
Tar
tu U
ellik
ooli]
at 0
2:06
15
May
201
4
Research interest in factors shaping the attitudes toward immigrants has, therefore,grown during the last decade as well (e.g. Espenshade and Hempstead 1996; Husfeldt2006; O’Rourke and Sinnott 2006; Masso 2009; McLaren 2010; Rustenbach 2010;Andreescu 2011). The focus of these studies is often on socioeconomic factors and con-tacts of natives with immigrants in different life domains. This study aims to find outwhether institutional trust is related to the attitudes toward immigrants in Europe. Trustis an important clue within society that ties people together with each other andstimulates cooperation between them (Simmel 1950, 326). Institutional trust, in turn, isone of the key dimensions of trust in society (Stokes 1962; Miller 1974; Hetherington1998).
This paper uses data from European Social Survey (ESS) fifth round database (25countries) to provide pan-European evidence on the association between institutionaltrust and attitudes toward immigrants. We will first implement principal component fac-tor analysis in order to construct aggregated indicators of pro-immigrants attitudes andtrust in institutions. Next, institutional trust will be regressed on aggregated indicators ofEuropean peoples’ attitudes toward immigrants. We also examine the differences in atti-tudes toward immigrants between members of minority and majority populations. Tothe best of our knowledge this is so far one of the first papers on the attitudes towardimmigration that uses this kind of distinction. We find this distinction important sinceethnic minorities are an increasing part of the population in several countries, and theirattitudes toward immigrants might be rather different from those of ethnic majority pop-ulations and might require elaboration and implementation of different policy measuresfor the integration of ethnically diverse societies.
The paper is organized as follows. Section 2 gives an overview of the literature onthe theoretical approaches that explain the sources of attitudes toward immigrants withthe emphasis on the relationship between the attitudes and trust in institutions. Section 3introduces the data, methodology, and the results of empirical analysis. Section 4 con-cludes the main findings of the paper and policy implications of these.
2. Framework for examining institutional trust and attitudes toward immigrants
We start with a brief discussion of the key concepts of this study: trust and its variousdimensions, including trust in institutions. Delhey and Newton (2005) define trust as abelief that others will not, at worst, knowingly or willingly do you harm, and will,at best, act in your interests. Social scientists see trust as a key element of society(Espenshade and Hempstead 1996), as it makes people to put themselves into vulnerablesituations where another subject of society might harm them. Trust exists in variousforms. Newton (2001, 203) emphasizes the differences between social and political trust.Social trust is essential for cultivating ground for stability and peaceful relations that area basis for productive cooperation between people; i.e. social trust pertains to trust inother people (Putnam 2000; Newton 2001), including strangers (Herreros and Criado2009, 339). Social trust is, thus, an individual property, and it is associated with individ-ual characteristics such as class, education, income, age, and gender.
Political trust characterizes the basic evaluative orientation toward the governmentand how well it operates according to people’s normative expectations (Stokes 1962;Miller 1974; Hetherington 1998). Similar to social trust, it assumes trusting strangers.At the same time it is different from social trust. While social trust pertains to individualcharacteristics, political trust is also associated – in addition to individual characteristics– with a set of political variables (Newton 2001, 204). The latter includes one’s policy
2 V. Halapuu et al.
Dow
nloa
ded
by [
Tar
tu U
ellik
ooli]
at 0
2:06
15
May
201
4
considerations as well as evaluations of institutions (Hetherington 1998). In other words,trust in institutions is part of the overall political trust. The focus of this paper is ontrust in institutions (also institutional trust) that we define according to Delhey andNewton (2005) as people’s belief that a country’s institutions will not, at worst,knowingly or willingly do them harm, and will, at best, act in everybody’s interests.Following previous studies, we do not confine our study to political institutions such asparliament and political parties, but we also consider trust in non-political institutionssuch as police and the legal system (e.g. Husfeldt 2006; van Oorschot 2008; Rothsteinand Stolle 2008; Freitag and Bühlmann 2009).
2.1. Why does trust in institutions matter in the context of attitudes towardimmigrants?
Trust in institutions is essential for the functioning of society. Newton and Norris(1999) argue that the decrease in trust in institutions, especially in political institutions,is a more severe threat to democracy than the decrease of trust in other people. Institu-tional trust might also have an impact on attitudes toward other people (e.g. Rothsteinand Stolle 2008). If people do not see that institutions are able to protect them, if theysee institutions to be corrupt and weak in sanctioning uncooperative behavior, if thejudicial system is dysfunctional, then their tolerance toward immigration might decrease(Freitag and Bühlmann 2009). However, there are not many studies that have exploredthe relationship between institutional trust and attitudes toward immigrants.
Espenshade and Hempstead (1996) find that lower socioeconomic security leads tolower trust in institutions. They argue that people with lower socioeconomic security maystart blaming institutions for being responsible for their problems. Espenshade andHempstead (1996) further found that social and political alienation do have an importantimpact on attitudes toward immigrants – people who are more dissatisfied with differentaspects of their lives and who feel that politicians do not care about their needs have morenegative attitudes toward immigrants than people who are more satisfied with their life.
Husfeldt (2006) studied students’ attitudes toward immigrants and sources of thesebased on an IEA Civic Education Study and found that trust in institutions tends to pre-vent students from having negative attitudes toward immigrants. McLaren (2010) stud-ied the relationship between the attitudes and trust in institutions based on data fromESS. Even though she assumed an opposite direction of the causality, she reported simi-lar findings; i.e. she argued that negative attitudes toward immigrants decrease one’strust in institutions.
Despite the association between the two variables, the direction of causality betweentrust in institutions and attitudes toward immigrants remains controversial. In this paper,instead of emphasizing the explicit causality running from institutional trust to attitudestoward immigrants, we rather aim to provide new evidence on the relationship betweenthe two variables across Europe. We do so by examining the attitudes toward immi-grants among two different groups of people – members of minority and majority popu-lations – whom we expect to differ from each other since members of the majoritypopulation do not typically have migration-related background.
2.2. Attitudes toward immigrants: explanations and operationalization
To test the hypotheses about the relationship between institutional trust and attitudestoward immigrants we will take into account other, intervening, explanations as well.
Eurasian Geography and Economics 3
Dow
nloa
ded
by [
Tar
tu U
ellik
ooli]
at 0
2:06
15
May
201
4
We follow mostly Rustenbach (2010), who has given a succinct overview of the maintheoretical explanations related to attitudes toward immigrants. These explanationsinclude societal integration, labor market competition, the role of human capital, contacttheory, and cultural marginality.
The societal integration explanation focuses on social trust. This approach is beingtested because several papers have shown its importance in understanding attitudestoward immigrants. Based on the concept of social intelligence, Herreros and Criado(2009) claim that high level of social or interpersonal trust does not only increase trustin people with similar cultural background but extends to people from different culturalor ethnic background too. The willingness to trust people with different cultural back-ground comes from the understanding that cooperating with strangers might be in one’sown interest and, therefore, it is not reasonable to distrust anyone unless they havecheated them. The experiences of cross-cultural interaction, both positive and negative,lead to acquisition of social intelligence; i.e. understanding one’s own and other people’sattitudes (Yamagishi, Kikuchi, and Kosugi 1999, 155). Increased social intelligence, inturn, diminishes the chances of blaming immigrants for social problems and contributesto more positive attitudes toward immigrants. Several other authors (e.g. Husfeldt 2006;Rustenbach 2010) confirm that people with a higher level of social trust have morepositive attitudes toward immigrants. However, it has also been shown that interpersonaltrust is lower in more diverse communities (Alesina and La Ferrara 2000; Putnam2007). In our study, we control for the societal integration explanation by including thevariable “trust in other people” in the analysis.
Contact theory (Allport 1954) claims that diversity reduces ethnocentric attitudes andfosters out-group trust and solidarity. In other words, the theory states that more personalcontacts with immigrants lead to a higher level of tolerance because knowledge of immi-grants will improve among members of the native population, and they will no longer seeimmigrants as a social threat (Pettigrew 1998; McLaren 2003; Andreescu 2011; Valentovaand Berzosa 2012). We do not control for contact theory by including some additionalexplanatory variable into our models. Instead, we use ethnicity, the variable that separatestwo different groups – ethnic majorities and ethnic minorities – in our study, since thesetwo groups represent different attitudes toward immigrants. Even though ethnic minoritiesare not necessarily immigrants, they often have migrant background as a source of self-identification, which for some ethnic groups in Europe can date back far in history. Thedistinction between members of ethnic minority and majority populations in this study ismade based on the respondents’ answers to the question “Do you belong to a minority eth-nic group in [country]?” and thus reflects the self-perceived belonging of people to theminority group.
The cultural marginality explanation focuses on one’s ability to relate oneself toimmigrants and is similar to contact theory but has a stronger focus on personal experi-ences of discrimination. It claims that people with personal experience with discrimina-tion can relate themselves to other groups of people in similar situations, and thus havemore tolerant attitudes toward them (shown by Allport 1954). Relying on this argumentand to control for a cultural marginality explanation, we use variables that describe (1)whether or not one has ever belonged to a group that has been discriminated againstand (2) whether or not one has ever worked abroad for more than 6 months during thepast 10 years. The support for adding the firstly outlined variable comes directly fromAllport’s statement. In the second case, we believe that people who have the experienceof living and working abroad are also more tolerant toward immigrants, as they havebeen in the same situation themselves.
4 V. Halapuu et al.
Dow
nloa
ded
by [
Tar
tu U
ellik
ooli]
at 0
2:06
15
May
201
4
The labor market competition explanation takes off from neoclassical economictheory and trade theory and claims that individuals with lower levels of human capital(i.e. with a lower level of education) and economic security (fewer financial resources)tend to be more intolerant toward immigrants than individuals with higher levels ofhuman capital and economic security. When labor supply increases due to immigration,competition on the labor market increases as well. Moreover, the wages of natives (atleast in some skill groups) will come under pressure. As immigrants tend to be over-represented in low-skilled jobs, low-skilled natives are more likely to have anti-immigrant attitudes. Contrary to that, highly skilled individuals are more tolerant towardimmigrants than low-skilled ones. This effect has been found to be greater in richercountries than in poorer ones and in countries with lower levels of economic inequalitythan in more unequal ones (O’Rourke and Sinnott 2006). In our models we use vari-ables “Employment status” and “Household’s total net income” to test the explanation.
The human capital explanation is built on human capital theory and claims that ahigher level of education leads to a higher level of tolerance. One channel for this is viaimproved skills and higher qualifications. Economic security acquired in this way repo-sitions individuals so that they do not have to compete with immigrants on the labormarket (Mayda 2006). Another channel involves the eye-opening effects of schooling –a higher level of education broadens people’s horizons, which might lead to increasedtolerance. The human capital theory will be tested using information about respondents’highest level of education.
We also control for age, gender, and domicile. The reason for adding domicile liesin the fact that people living in large cities with a sizeable immigrant population areoften more tolerant toward immigrants than people living in towns or rural areas(Schiller and Çağlar 2009; Hedberg and Tammaru 2013).
3. Empirical evidence: the determinants of people’s attitudes toward immigrants
3.1. Data
We use the ESS fifth round database in order to explore whether trust in institutions isrelated to the attitudes toward immigrants (Round 5, 2010). The data were collected in2010/2011. We estimate OLS regression models based on data from 29,240 respondentsfrom 25 countries. Our focus is on the relationship between trust in institutions and atti-tudes toward immigrants, controlling for several other variables that enable us to takeinto consideration the most common theoretical approaches revealing the sources of theattitudes. The analyses are run for both trust and attitudes on the entire sample and sep-arately for ethnic majority and ethnic minority populations. The full list of variablesused in the study is presented in Table 1.
In the case of some variables the initial indicators of the ESS (Round 5) database wererecoded and/or aggregated into a smaller number of groups. Information about labormarket status is presented in three categories: 0 – employed, 1 – unemployed, and 2 – outof labor force. The ISCED-97 (International Standard Classification of Education) codingsystem was used to present information about the respondents’ highest level of education.Based on that, three groups were composed: (1) people with a low level of education,representing those whose highest level of education corresponds to ISCED 0-2 (0 – notcompleted primary education; 1 – primary or first stage of basic education; and 2 – lowersecondary or second stage of basic education); (2) people with a middle level of educationrepresenting ISCED 3 and 4 (3 – upper secondary education, 4 – post secondary,
Eurasian Geography and Economics 5
Dow
nloa
ded
by [
Tar
tu U
ellik
ooli]
at 0
2:06
15
May
201
4

non-tertiary education); and (3) people with a high level of education, which correspondsto ISCED 5 and 6 (5 – first stage of tertiary; 6 – second stage of tertiary). The areas whererespondents live (respondents’ domicile) were coded into three groups: (1) rural – afarmhouse or home in countryside; (2) village or town – a village in the countryside or atown or a small city; (3) city – a big city, suburb, or outskirts of a big city. The full list ofthe indicators and their categories is presented in Appendix 1.
Our analysis includes people aged 15 and over. There are 27,660 members of ethnicmajority populations and 1580 members of ethnic minority population in our data-set.More detailed descriptive statistics are presented in Table 2. The composition of bothgroups is largely similar. The biggest differences pertain to employment status andincome. The share of unemployed people is 4.5% among the ethnic majority and 8.5%among the ethnic minority population. The income of ethnic minorities is also smallercompared to ethnic majorities. It is not very surprising that the share of people whohave ever belonged to any discriminated group is more than four times higher amongethnic minorities. However, even among ethnic majorities there are 5.3% of people whoclaim that they have belonged to some discriminated group. The share of people whohad worked abroad for six months or longer during the last 10 years before the surveyis a bit higher among ethnic minorities. The descriptive statistics about respondents’place of residence shows that ethnic minorities are somewhat more over-represented inmetropolitan areas.
Table 1. List of variables used in the study.
Theoretical approach Variables
Dependent variable:Attitudes toward immigrants Immigration bad or good for country’s economy
Country’s cultural life undermined or enriched byimmigrantsImmigrants make country worse or better place to live
Independent variables:Trust in institutions Trust in parliament
Trust in legal systemTrust in the policeTrust in political parties
Societal integration explanation Trust in other peopleLabor market competition
explanationEmployment statusHousehold’s total net income
Human capital explanation Highest level of educationContact theory explanation Belonging to ethnic minority groupa
Cultural marginality explanation Respondent being discriminated againstWorking abroad for more than 6 months during past 10years
Other control variables AgeGenderDomicile
Source: Composed by authors.aThe distinction between members of the ethnic minority and majority populations is made based on therespondents’ answers to the question: “Do you belong to a minority ethnic group in [country]”, and thusreflects the self-perceived belonging of people to one or the other group. Belonging to an ethnic minoritygroup is not used as an independent variable in the regression models, but as a variable for separating groupsfor which the regression models were run separately.
6 V. Halapuu et al.
Dow
nloa
ded
by [
Tar
tu U
ellik
ooli]
at 0
2:06
15
May
201
4

3.2. Results of factor analysis
We use principal components factor analysis to create the aggregated indicators of atti-tudes toward immigrants and trust in a country’s institutions. Respondents’ attitudestoward immigrants are expressed by three initial variables: attitudes related to the impactof immigration on economy, culture, and a country as a place of living. Trust in institu-tions is expressed by four variables: trust in country’s parliament, legal system, police,and political parties. Factor analysis enables us to aggregate these initial and evidentlycorrelated variables into single aggregated factors. We find this important, as both of thephenomena are multifaceted, and treating only one aspect of these would leave someimportant parts of them uncovered. A similar approach has also been used in earlierstudies (Husfeldt 2006; Rothstein and Stolle 2008; Freitag and Bühlmann 2009).
The results of the factor analysis are presented in Table 3. In the subsequent regres-sion analysis we use factor scores of Factor 1 (attitudes toward immigration) as ourdependent variable and factor scores of Factor 2 (trust in institutions) as the explanatoryvariable of main interest.1 Factor scores are standardized indicators, and their valuesrange between −3 and +3. The average level is indicated as zero.
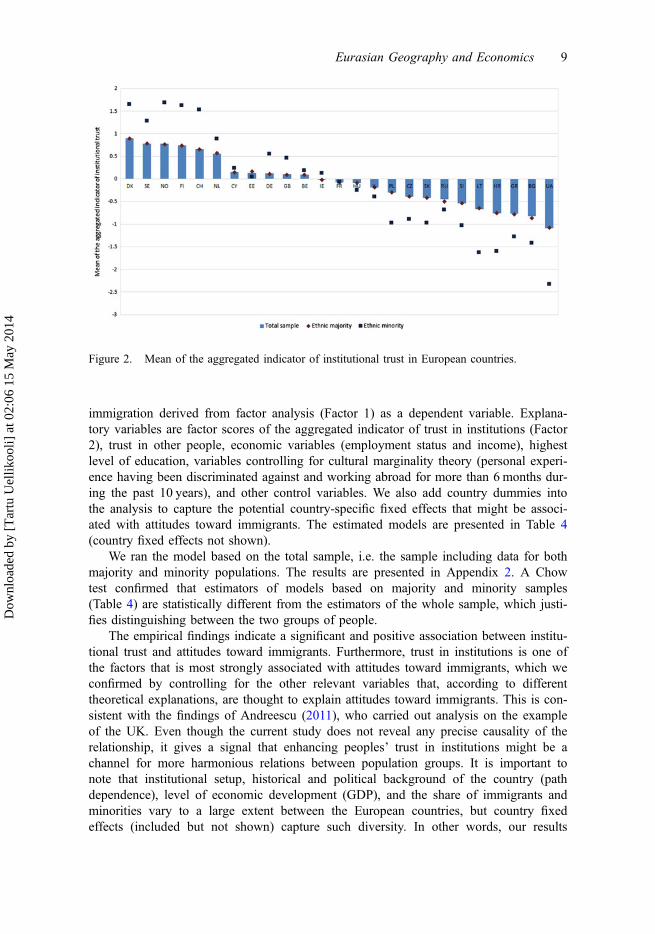
To get the first insight into the differences in attitudes toward immigrants across thecountries we visualized the country means of attitudes toward immigrants in Figure 1.The means are the highest in Nordic countries, the Netherlands, and Switzerland, andthe lowest in Greece, Russia, and Cyprus. West European countries, including largeimmigrant countries such as the UK, Germany, and France, are in the middle of therange. Another important thing to note is that ethnic minorities’ attitudes toward immi-grants differ from those of the ethnic majorities and that the average level of the atti-tudes toward immigrants across countries follows largely the pattern of average level oftrust in institutions: in the countries where trust in institutions is more positive, the
Table 2. Descriptive statistics: share of selected sample.
Variable Majority Minority Total
Employment statusEmployed 0.554 0.562 0.544Out of labor force 0.412 0.353 0.409Unemployed 0.045 0.085 0.047IncomeLow 0.414 0.517 0.420Medium 0.326 0.303 0.325High 0.259 0.180 0.255Highest level of educationLow 0.225 0.282 0.228Medium 0.543 0.453 0.538High 0.232 0.266 0.234Belongs to a discriminated group 0.053 0.297 0.066Has worked abroad for more than six months during past 10 years 0.050 0.103 0.053Gender – female 0.518 0.480 0.516DomicileRural 0.357 0.258 0.352Town 0.303 0.317 0.303Metropolitan 0.340 0.425 0.344Number of cases (N) 27,660 1580 29,240
Source: Authors’ calculations based on the ESS data (Round 5, 2010).
Eurasian Geography and Economics 7
Dow
nloa
ded
by [
Tar
tu U
ellik
ooli]
at 0
2:06
15
May
201
4

attitudes are also more positive (Figure 2). It has to be kept in mind that the smallersample of ethnic minorities leads to wider confidence intervals of the estimates of themean, but despite that fact the differences are statistically significant in many cases.
3.3. Results of regression analysis
Next, we present the results of the OLS regression models of the determinants of theattitudes toward immigrants using the aggregated indicator of peoples’ attitudes toward
Table 3. The results of the factor analysis: factor loadings and factors.
Question
Factors
Attitudes towardimmigrants Factor 1
Trust in institutionsFactor 2
1. Immigration bad or good for country’seconomy
0.870
2. Country’s cultural life undermined orenriched by immigrants
0.891
3. Immigrants make country worse or betterplace to live
0.898
4. Trust in country’s parliament 0.8775. Trust in the legal system 0.8816. Trust in the police 0.8057. Trust in political parties 0.838KMO, Measure of sampling adequacy 0.733 0.761Percent of variance 78.5 72.3
Source: Authors’ calculations based on the ESS data (Round 5, 2010).Method: Principal Components, weighted by DWEIGHT.
Figure 1. Mean of the aggregated indicator of individuals’ attitudes towards immigrants inEuropean countries.
8 V. Halapuu et al.
Dow
nloa
ded
by [
Tar
tu U
ellik
ooli]
at 0
2:06
15
May
201
4
immigration derived from factor analysis (Factor 1) as a dependent variable. Explana-tory variables are factor scores of the aggregated indicator of trust in institutions (Factor2), trust in other people, economic variables (employment status and income), highestlevel of education, variables controlling for cultural marginality theory (personal experi-ence having been discriminated against and working abroad for more than 6 months dur-ing the past 10 years), and other control variables. We also add country dummies intothe analysis to capture the potential country-specific fixed effects that might be associ-ated with attitudes toward immigrants. The estimated models are presented in Table 4(country fixed effects not shown).
We ran the model based on the total sample, i.e. the sample including data for bothmajority and minority populations. The results are presented in Appendix 2. A Chowtest confirmed that estimators of models based on majority and minority samples(Table 4) are statistically different from the estimators of the whole sample, which justi-fies distinguishing between the two groups of people.
The empirical findings indicate a significant and positive association between institu-tional trust and attitudes toward immigrants. Furthermore, trust in institutions is one ofthe factors that is most strongly associated with attitudes toward immigrants, which weconfirmed by controlling for the other relevant variables that, according to differenttheoretical explanations, are thought to explain attitudes toward immigrants. This is con-sistent with the findings of Andreescu (2011), who carried out analysis on the exampleof the UK. Even though the current study does not reveal any precise causality of therelationship, it gives a signal that enhancing peoples’ trust in institutions might be achannel for more harmonious relations between population groups. It is important tonote that institutional setup, historical and political background of the country (pathdependence), level of economic development (GDP), and the share of immigrants andminorities vary to a large extent between the European countries, but country fixedeffects (included but not shown) capture such diversity. In other words, our results
Figure 2. Mean of the aggregated indicator of institutional trust in European countries.
Eurasian Geography and Economics 9
Dow
nloa
ded
by [
Tar
tu U
ellik
ooli]
at 0
2:06
15
May
201
4

Table 4. OLS estimators of the model describing European majority and minority people’sattitudes toward immigration, robust standard errors in brackets.
Majority Minority
UnstandardizedCoefficients
StandardizedCoefficients
UnstandardizedCoefficients
StandardizedCoefficients
Trust in institutions 0.242*** (0.008) 0.241 0.182*** (0.030) 0.186
Social trust 0.062*** (0.003) 0.152 0.035*** (0.012) 0.083
Employment status(ref: employed)
Unemployed −0.010 (0.031) −0.002 −0.006 (0.095) −0.002
Inactive −0.013 (0.015) −0.006 0.021 (0.069) 0.010
Income (ref: low)Medium 0.029** (0.014) 0.014 −0.021 (0.060) −0.009
High 0.090*** (0.016) 0.041 0.068 (0.080) 0.026
Highest level of education (ref: low)Medium 0.157*** (0.015) 0.079 0.085 (0.065) 0.040
High 0.387*** (0.018) 0.166 0.257*** (0.078) 0.108
Belongs to adiscriminatedgroup
−0.001 (0.028) −0.000 0.033 (0.058) 0.014
Has worked abroad 0.183*** (0.027) 0.040 0.282*** (0.091) 0.079
Gender – female 0.003 (0.011) 0.002 −0.075 (0.055) −0.035
Age 0.004* (0.002) 0.063 −0.004 (0.010) −0.067
Age squared −0.000*** (0.000) −0.105 −0.000 (0.000) −0.025
Domicile (ref: rural)Small town 0.062*** (0.014) 0.028 0.268*** (0.073) 0.115
City 0.121*** (0.014) 0.058 0.280*** (0.068) 0.131
Country fixed effects Yes YesConstant −0.708*** (0.056) 0.221 (0.271)
Number of cases (N) 27,660 1580Prob > F 0.000 0.000R2 0.283 0.277
Note: Dependent variable: factor scores of the aggregated indicator of individuals’ attitudes toward immigrantsand immigration. Weighted by DWEIGHT.Source: Authors’ calculations based on the ESS data (Round 5, 2010).***p < 0.01.**p < 0.05.*p < 0.1.
10 V. Halapuu et al.
Dow
nloa
ded
by [
Tar
tu U
ellik
ooli]
at 0
2:06
15
May
201
4
suggest that higher trust in institutions is important and that it is associated withpro-immigrant attitudes independent of the exact institutional setup of the country.
In addition to trust in institutions, social trust is also strongly related to attitudes.The higher the trust in other people, the more welcoming is the attitude toward immi-grants. Interestingly, however, trust in institutions is more strongly associated with atti-tudes toward immigrants than social trust, which implies that more than trusting peoplein general, people need to know that politics and other political institutions operatefairly and honestly and act for their well-being in order to be willing to face the risksthat associate with living in a culturally diverse society. We also found that associationbetween both attitudes toward immigrants and institutional trust and between attitudesand social trust is stronger among ethnic majorities, leaving more room for other vari-ables to explain minority populations’ attitudes toward immigrants.
Variables controlling for the labor market competition explanation perform differ-ently and not always according to expectations. Given the fact that the economic situa-tion was still unstable during the period when the data used in the analysis werecollected, it could have been assumed that economic aspects were more strongly associ-ated with attitudes. Interestingly, the results of the regression analysis show that employ-ment status does not matter. Unemployed people and people out of the labor force donot have ceteris paribus statistically different attitudes toward immigrants compared toemployed people who should be economically more secure and, hence, have more wel-coming attitudes toward immigrants. In the case of ethnic minority households, total netincome is also statistically not related to attitudes toward immigrants. Yet there is apositive relationship between income and attitudes in the total sample and among ethnicmajorities. This confirms partly the expectation of the microeconomic theory that eco-nomic security affects attitudes toward immigrants.
The results of the regression analysis also show that a higher level of education ispositively associated with pro-immigrant attitudes. In the case of ethnic majorities, peo-ple whose highest level of education corresponds to ISCED 3-4 or ISCED 5-6 are onaverage more positive-minded about immigration than people with a low education level(ISCED 0-2). The relationship holds for ethnic minorities too, but in this case the differ-ence is statistically significant only between the categories of low and high levels ofeducation. The results of our analysis are hereby in accordance with the views of thehuman capital theory, which has been widely empirically validated in earlier researchtoo (e.g. Hainmueller and Hiscox 2007).
The cultural marginality explanation is confirmed only on the basis of one of thetwo variables included in the analysis. Contrary to expectations, the results show thatwhether one has ever belonged to a group discriminated against or not is unrelated toone’s attitude toward immigrants. Based on European countries, a similar outcome hasalso been pointed out by Rustenbach (2010). It might be due to the fact that the ques-tion in the ESS involved discrimination on a very different basis, including, for exam-ple, grounds such as age, gender, disability, etc. According to the theory, belonging to agroup that is in a similar position to the immigrants in a country should give people abetter chance to relate themselves to immigrants. It might be that only the people whohave experienced discrimination very similar can relate themselves to the immigrants’position. That might also be the reason why the association between the other variableused for controlling for the cultural marginality explanation – experience of workingabroad – is positively associated with attitudes toward immigrants. People who haveworked abroad have been in the shoes of immigrants. In addition, they might have more
Eurasian Geography and Economics 11
Dow
nloa
ded
by [
Tar
tu U
ellik
ooli]
at 0
2:06
15
May
201
4

close contacts with immigrants, touching the explanation of contact theory, all of whichmight contribute to more positive attitudes.
As expected, people who live in rural areas are least tolerant, and people livingin big cities are most tolerant toward immigrants. This might partly be caused bylower competition in the labor market, as there are probably more vacancies in moredensely populated areas. But it also confirms the understanding of large cities andtheir metropolitan areas as the most cosmopolitan environments, which are moreopen to population diversity than other parts of a country. This is an important rela-tionship given the increase of the share of people living in large metropolitan areasin Europe.
The results are more versatile when it comes to another control variable, gender.According to our main model (Table 4), gender is not statistically significantly relatedto the attitudes toward immigrants. This is, however, the only variable for which weobtained some additional information based on the separate analysis run for each of thesingle questions about one’s attitudes toward different aspects of immigration (seeAppendices 3–6). It seems that women are more negatively minded about the impact ofimmigration on a country’s economy. This is true for both ethnic minorities and majori-ties and is in accordance with the theory, as women are often in a worse situation in thelabor market. On the other hand, women seem to be more positively minded about theimpact of immigration on a country’s cultural life. The latter relationship only holds inthe case of ethnic majorities though. All in all, the relationship between gender and atti-tudes toward immigrants was the only one that varied across models. For the other vari-ables the results were robust across models.
In addition to the respondents’ personal characteristics and their attitudes towardcountry institutions, the collective determinants depending on country-specific condi-tions measured by country dummies also explain people’s attitudes toward immigra-tion. Possible country-specific conditions that may form the respondents’ attitudestoward immigration besides their individual characteristics may include the number ofmigrants in a country, composition of the migrant group, country size, historical andpolitical background of the country (path dependence), level of economic development(GDP pc), etc. Appendix 6 presents the country-specific effects that can reflect differ-ent reasons for the variability of the respondents’ attitudes toward immigrants at thecountry level in the case of the full sample. Country-specific effects estimated on thebasis of majority and minority samples are presented in Appendix 7. In the case ofseparately estimated models the sample sizes are smaller, and in many cases (particu-larly in minority samples) the effects are not statistically significant. As a rule (seeAppendix 6), country effects are positive in economically and socially advancedNordic countries and negative in the majority of post-socialist countries, with theexception of Poland and Bulgaria. Both Poland and Bulgaria lost a lot of their popu-lation during the recent emigration processes, and that is probably also expressed inpeople’s better attitudes toward immigrants. Country-specific effects are remarkablynegative in the case of Greece, a country that is seriously suffering from issues withrefugees. The country-specific attitudes are also negative, even though to a smallerextent, in the UK. The latter indicates that despite the advanced level of economicdevelopment, the country might face a special threat of increase of tensions caused bythe multinational societies.
12 V. Halapuu et al.
Dow
nloa
ded
by [
Tar
tu U
ellik
ooli]
at 0
2:06
15
May
201
4

4. Conclusions
This paper sheds some new light on the increasingly important discussions about atti-tudes toward immigrants in Europe against the background of increasing share of immi-grants on the one hand and increasing xenophobic attitudes toward immigrants on theother. The main results of the paper reveal that (1) higher trust in institutions is posi-tively related to pro-immigrant attitudes in Europe, and this result is valid in bothgroups of people – members of the ethnic majority and ethnic minority populations inEuropean countries; and (2) not all of the main determinants of attitudes toward immi-grants drawn from the most common theoretical explanations seem to explain the varia-tion of attitudes toward immigrants among ethnic minority populations the same way asthey explain it in the case of ethnic majority populations.
The results of our study, theoretical arguments (Espenshade and Hempstead 1996),and earlier findings (Andreescu 2011) all show that if people cannot be sure that thosein power would act in their best interest and that criminal or otherwise unwanted behav-ior would be fairly punished, the risks related to trusting immigrants and also favoringimmigration increase. Moreover, according to our findings, trust in institutions is thevariable that is most strongly associated with attitudes toward immigrants. This associa-tion is stronger among ethnic majority populations than among ethnic minorities, indi-cating that in the case of ethnic minorities the impact of some other determinants mightbe stronger or there might be a different set of determinants explaining their attitudestoward immigrants. Our findings confirm the indication. The model run based on dataof ethnic minorities only shows that many theoretical explanations on the determinantsof attitudes toward immigrants do not apply to them, i.e. they pertain to the members ofthe ethnic majority population only. Since the share of ethnic minorities is growing as aresult of migration, attention should also be paid to the factors that are associated withattitudes toward immigrants among ethnic minorities as well.
Even though causality is outside of the scope of this paper, the findings are impor-tant because they offer one explanation for what could be done to move toward a moreimmigrant-tolerant environment and become an attractive destination country in the glo-bal competition of talents. The results of our paper set trustworthy institutions in thefocus of the recommendations, emphasizing the importance of being fair, selfless, andtransparent governance and trust in institutions in creating a tolerant environment thatmight help to better harness ethnic diversity for social and economic development inaging European societies. To increase trust in institutions, more attention should be paidto procedural fairness of the institutions and improving people’s feelings of safety andprotection, according to earlier studies (Rothstein and Stolle 2008). These are things thatcan be influenced by the right policy decisions. It also has to be kept in mind that thepolicy measures addressed for ethnic minorities are not necessarily the same as thosefor ethnic majorities. A closer look at variables that explain ethnic minorities’ attitudestoward immigrants should be taken in future analysis.
Further research should also try to clarify causal links in order to give more precisepolicy recommendations and deepen the understanding of cross-country differences inthe link between institutional trust and attitudes toward immigrants. In addition, moreattention should be paid to changes taking place over time.
AcknowledgmentsFinancial support from NORFACE research program on Migration in Europe – Social, Economic,Cultural, and Policy Dynamics is acknowledged.
Eurasian Geography and Economics 13
Dow
nloa
ded
by [
Tar
tu U
ellik
ooli]
at 0
2:06
15
May
201
4
FundingResearch by Tiit Tammaru was partly financed by Institutional Research Grant IUT2-17 on SpatialPopulation Mobility and Geographical Changes in Urban Regions and the Estonian ScienceFoundation [grant number 8774].
Note1. However, analyses were also run using all three single items that were used for creating the
aggregated indicator of attitudes toward immigrants separately as dependent variables of themodels. The results (see Appendices 3–5) confirm the robustness of the results of the mainmodel presented in Table 4.
ReferencesAlesina, Alberto, and Eliana La Ferrara. 2000. “Participation in Heterogeneous Communities.”
Quarterly Journal of Economics 115: 847–904.Allport, Gordon Willard. 1954. The Nature of Prejudice. Cambridge, MA: Addison-Wesley.Andreescu, Viviana. 2011. “Attitudes toward Immigrants and Immigration Policy in United
Kingdom.” Journal of Identify and Migration Studies 5: 61–85.Castles, Stephen, and Mark J. Miller. 2009. The Age of Migration. New York: Palgrave
Macmillan.Council of Europe. 2012. Annual Report on ECRI’s Activities. http://www.coe.int/t/dghl/monitoring/
ecri/activities/Annual_Reports/Annual%20report%202011.pdfDelhey, Jan, and Kenneth Newton. 2005. “Predicting Cross-national Levels of Social Trust: Glo-
bal Pattern or Nordic Exceptionalism?” European Sociological Review 21: 311–327.Espenshade, Thomas J., and Katherine Hempstead. 1996. “Contemporary American Attitudes
toward U.S. Immigration.” International Migration Review 30: 535–570.European Monitoring Centre on Racism and Xenophobia. 2005. Majorities’ Attitudes towards
Minorities: Key Findings from the Eurobarometer and the European Social Survey. http://fra.europa.eu/sites/default/files/fra_uploads/146-EB2005-summary.pdf
Freitag, Markus, and Marc Buhlmann. 2009. “Crafting Trust: The Role of Political Institutions ina Comparative Perspective.” Comparative Political Studies 42: 1537–1566.
Hainmueller, Jens, and Michael J. Hiscox. 2007. “Educated Preferences: Explaining Attitudestoward Immigration in Europe.” International Organization 61: 399–442.
Hedberg, Charlotta, and Tiit Tammaru. 2013. “‘Neighborhood Effects’ and ‘City Effects’: TheEntry of Newly Arrived Immigrants into the Labor Market.” Urban Studies 50: 1163–1180.
Herreros, Francisco, and Henar Criado. 2009. “Social Trust, Social Capital and Perceptions ofImmigration.” Political Studies 57: 337–355.
Hetherington, Marc J. 1998. “The Political Relevance of Political Trust.” The American PoliticalScience Review 92: 791–808.
Husfeldt, Vera. 2006. “Extreme Negative Attitudes Towards Immigrants: An Analysis of Factorsin Five Countries.” Prospects 36 (3): 355–374.
Masso, Anu. 2009. “A Readiness to Accept Immigrants in Europe? Individual and Country-levelCharacteristics.” Journal of Ethnic and Migration Studies 35: 251–270.
Mayda, Anna Maria. 2006. “Who is against Immigration? A Cross-country Investigation of Indi-vidual Attitudes toward Immigrants.” Review of Economics and Statistics 88: 510–530.
McLaren, Lauren M. 2003. “Anti-immigrant Prejudice in Europe: Contact, Threat Perception, andPreferences for the Exclusion of Migrants.” Social Forces 81: 909–936.
McLaren, Lauren M. 2010. Cause for Concern? The Impact of Immigration on Political Trust.Policy Network. Online publication. Accessed January 2014. http://www.policy-network.net/publications/3889/Cause-for-concern?-The-impact-of-immigration-on-political-trust
Miller, Arthur H. 1974. “Rejoinder to ‘Comment’ by Jack Citrin: Political Discontent or Ritual-ism?” American Political Science Review 68: 989–1001.
Newton, Kennth. 2001. “Trust, Social Capital, Civil Society, and Democracy.” International Polit-ical Science Review 22: 201–214.
14 V. Halapuu et al.
Dow
nloa
ded
by [
Tar
tu U
ellik
ooli]
at 0
2:06
15
May
201
4
Newton, Ken, and Pippa Norris. 1999. “Confidence in Public Institutions: Faith, Culture orPerformance?” At the Annual Meeting of the American Political Science Association, Atlanta,GA, September 1–5.
OECD. 2010. International Migration Outlook: SOPEMI 2010. Paris: OECD.van Oorschot, Wim. 2008. “Solidarity towards Immigrants in European Welfare States.” Interna-
tional Journal of Social Welfare 17: 3–14.O’Rourke, Kevin H., and Richard Sinnott. 2006. “The Determinants of Individual Attitudes
towards Immigration.” European Journal of Political Economy 22: 838–861.Pettigrew, Thomas F. 1998. “Intergroup Contact Theory.” Annual Review of Psychology 49: 65–85.Putnam, Robert D. 2000. Bowling Alone. The Collapse and Revival of American Community.
New York: Simon and Schuster.Putnam, Robert D. 2007. “E Pluribus Unum: Diversity and Community in the Twenty-first
Century the 2006 Johan Skytte Prize Lecture.” Scandinavian Political Studies 30: 137–174.Rothstein, Bo, and Dietlind Stolle. 2008. “The State and Social Capital: An Institutional Theory
of Generalized Trust.” Comparative Politics 40: 441–459.Round 5, ESS. 2010. European Social Survey round 5 Data. 3.0. ed. http://www.
europeansocialsurvey.org/data/download.html?r=5Rustenbach, Elisa. 2010. “Sources of Negative Attitudes toward Immigrants in Europe: A
Multi-level Analysis.” International Migration Review 44: 53–77.Schiller, Nina Glick, and Ayse Çağlar. 2009. “Towards a Comparative Theory of Locality in
Migration Studies: Migrant Incorporation and City Scale.” Journal of Ethnic and MigrationStudies 35: 177–202.
Simmel, Georg. 1950. The Sociology of Georg Simmel, Translated and edited by K. H. Wolff.New York: Free Press.
Stokes, Donald E. 1962. “Popular Evaluations of Government: And Empirical Assessment.” InEthics and Bigness: Scientific, Academic, Religious, Political, and Military, edited byH. Cleveland and H. D. Lasswell, 61–72. New York: Harper and Brothers.
Valentova, Marie, and Guayarmina Berzosa. 2012. “Attitudes toward Immigrants in Luxembourg.Do Contacts Matter?” International Review of Sociology 22: 341–363.
Yamagishi, Toshio, Masako Kikuchi, and Motoko Kosugi. 1999. “Trust, Gullibility, and SocialIntelligence.” Asian Journal of Social Psychology 2: 145–161.
Eurasian Geography and Economics 15
Dow
nloa
ded
by [
Tar
tu U
ellik
ooli]
at 0
2:06
15
May
201
4
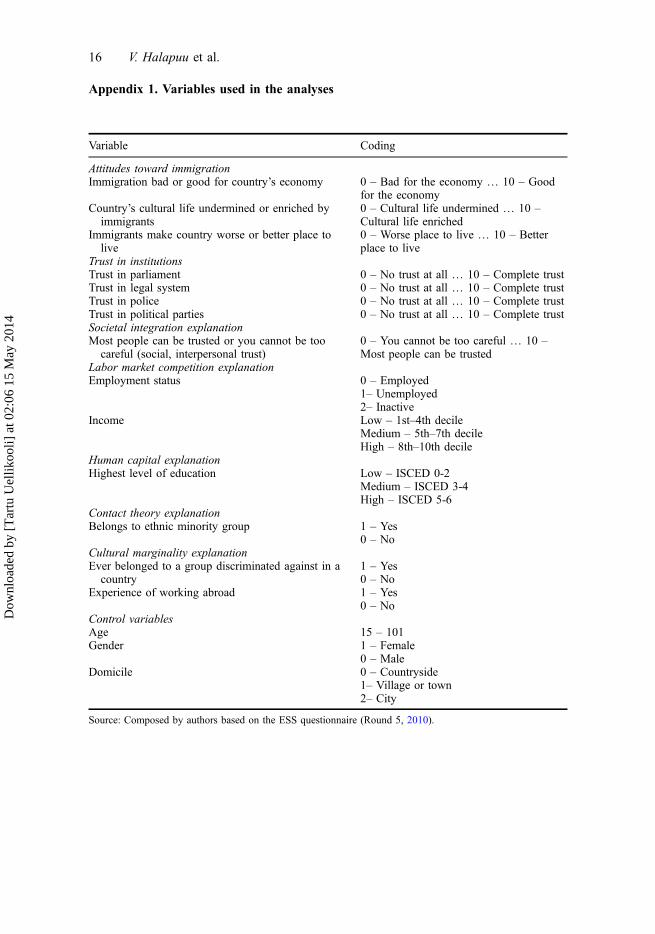
Appendix 1. Variables used in the analyses
Source: Composed by authors based on the ESS questionnaire (Round 5, 2010).
Variable Coding
Attitudes toward immigrationImmigration bad or good for country’s economy 0 – Bad for the economy … 10 – Good
for the economyCountry’s cultural life undermined or enriched by
immigrants0 – Cultural life undermined … 10 –Cultural life enriched
Immigrants make country worse or better place tolive
0 – Worse place to live … 10 – Betterplace to live
Trust in institutionsTrust in parliament 0 – No trust at all … 10 – Complete trustTrust in legal system 0 – No trust at all … 10 – Complete trustTrust in police 0 – No trust at all … 10 – Complete trustTrust in political parties 0 – No trust at all … 10 – Complete trustSocietal integration explanationMost people can be trusted or you cannot be too
careful (social, interpersonal trust)0 – You cannot be too careful … 10 –Most people can be trusted
Labor market competition explanationEmployment status 0 – Employed
1– Unemployed2– Inactive
Income Low – 1st–4th decileMedium – 5th–7th decileHigh – 8th–10th decile
Human capital explanationHighest level of education Low – ISCED 0-2
Medium – ISCED 3-4High – ISCED 5-6
Contact theory explanationBelongs to ethnic minority group 1 – Yes
0 – NoCultural marginality explanationEver belonged to a group discriminated against in a
country1 – Yes0 – No
Experience of working abroad 1 – Yes0 – No
Control variablesAge 15 – 101Gender 1 – Female
0 – MaleDomicile 0 – Countryside
1– Village or town2– City
16 V. Halapuu et al.
Dow
nloa
ded
by [
Tar
tu U
ellik
ooli]
at 0
2:06
15
May
201
4
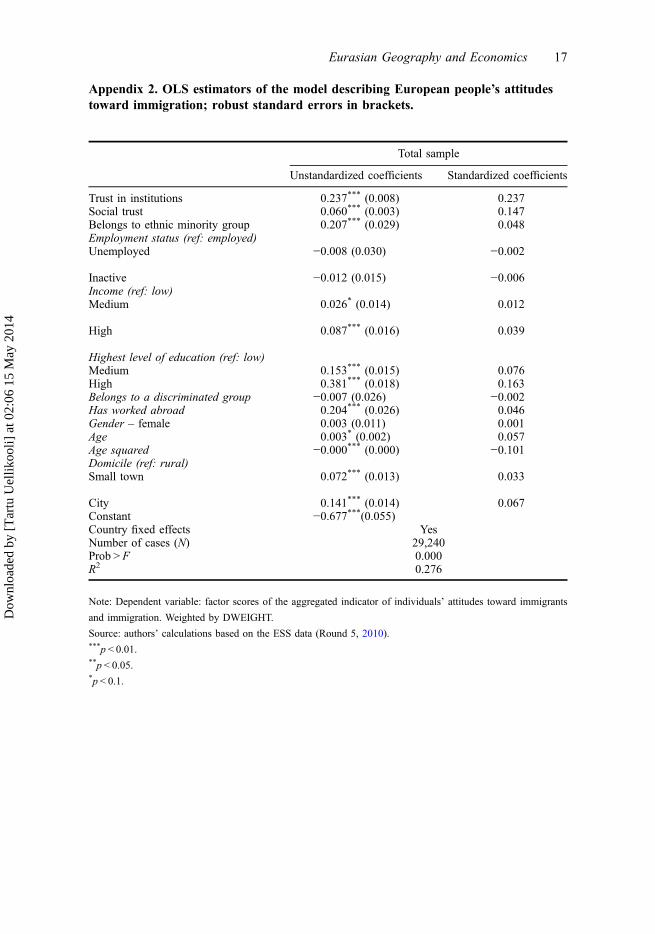
Appendix 2. OLS estimators of the model describing European people’s attitudestoward immigration; robust standard errors in brackets.
Note: Dependent variable: factor scores of the aggregated indicator of individuals’ attitudes toward immigrants
and immigration. Weighted by DWEIGHT.
Source: authors’ calculations based on the ESS data (Round 5, 2010).***p < 0.01.**p < 0.05.*p < 0.1.
Total sample
Unstandardized coefficients Standardized coefficients
Trust in institutions 0.237*** (0.008) 0.237Social trust 0.060*** (0.003) 0.147Belongs to ethnic minority group 0.207*** (0.029) 0.048Employment status (ref: employed)Unemployed −0.008 (0.030) −0.002
Inactive −0.012 (0.015) −0.006Income (ref: low)Medium 0.026* (0.014) 0.012
High 0.087*** (0.016) 0.039
Highest level of education (ref: low)Medium 0.153*** (0.015) 0.076High 0.381*** (0.018) 0.163Belongs to a discriminated group −0.007 (0.026) −0.002Has worked abroad 0.204*** (0.026) 0.046Gender – female 0.003 (0.011) 0.001Age 0.003* (0.002) 0.057Age squared −0.000*** (0.000) −0.101Domicile (ref: rural)Small town 0.072*** (0.013) 0.033
City 0.141*** (0.014) 0.067Constant −0.677***(0.055)Country fixed effects YesNumber of cases (N) 29,240Prob > F 0.000R2 0.276
Eurasian Geography and Economics 17
Dow
nloa
ded
by [
Tar
tu U
ellik
ooli]
at 0
2:06
15
May
201
4
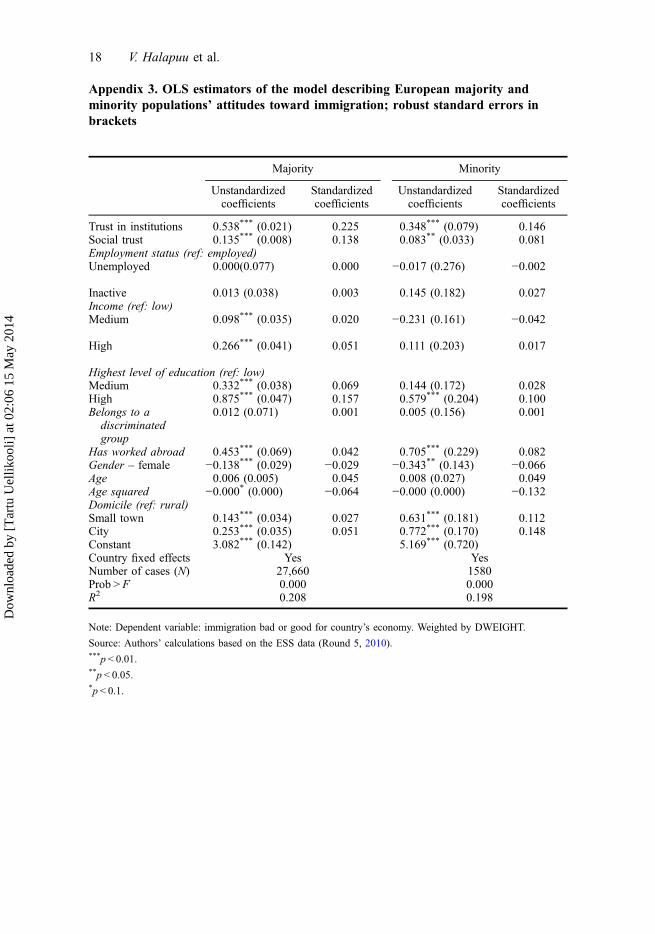
Appendix 3. OLS estimators of the model describing European majority andminority populations’ attitudes toward immigration; robust standard errors inbrackets
Note: Dependent variable: immigration bad or good for country’s economy. Weighted by DWEIGHT.
Source: Authors’ calculations based on the ESS data (Round 5, 2010).***p < 0.01.**p < 0.05.*p < 0.1.
Majority Minority
Unstandardizedcoefficients
Standardizedcoefficients
Unstandardizedcoefficients
Standardizedcoefficients
Trust in institutions 0.538*** (0.021) 0.225 0.348*** (0.079) 0.146Social trust 0.135*** (0.008) 0.138 0.083** (0.033) 0.081Employment status (ref: employed)Unemployed 0.000(0.077) 0.000 −0.017 (0.276) −0.002
Inactive 0.013 (0.038) 0.003 0.145 (0.182) 0.027Income (ref: low)Medium 0.098*** (0.035) 0.020 −0.231 (0.161) −0.042
High 0.266*** (0.041) 0.051 0.111 (0.203) 0.017
Highest level of education (ref: low)Medium 0.332*** (0.038) 0.069 0.144 (0.172) 0.028High 0.875*** (0.047) 0.157 0.579*** (0.204) 0.100Belongs to a
discriminatedgroup
0.012 (0.071) 0.001 0.005 (0.156) 0.001
Has worked abroad 0.453*** (0.069) 0.042 0.705*** (0.229) 0.082Gender – female −0.138*** (0.029) −0.029 −0.343** (0.143) −0.066Age 0.006 (0.005) 0.045 0.008 (0.027) 0.049Age squared −0.000* (0.000) −0.064 −0.000 (0.000) −0.132Domicile (ref: rural)Small town 0.143*** (0.034) 0.027 0.631*** (0.181) 0.112City 0.253*** (0.035) 0.051 0.772*** (0.170) 0.148Constant 3.082*** (0.142) 5.169*** (0.720)Country fixed effects Yes YesNumber of cases (N) 27,660 1580Prob > F 0.000 0.000R2 0.208 0.198
18 V. Halapuu et al.
Dow
nloa
ded
by [
Tar
tu U
ellik
ooli]
at 0
2:06
15
May
201
4
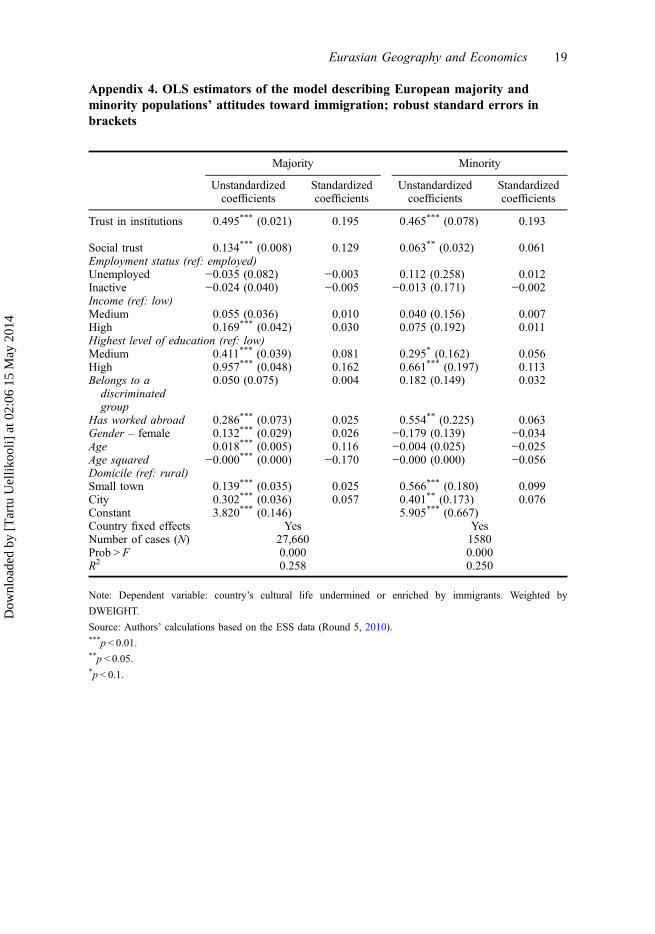
Appendix 4. OLS estimators of the model describing European majority andminority populations’ attitudes toward immigration; robust standard errors inbrackets
Note: Dependent variable: country’s cultural life undermined or enriched by immigrants. Weighted by
DWEIGHT.
Source: Authors’ calculations based on the ESS data (Round 5, 2010).***p < 0.01.**p < 0.05.*p < 0.1.
Majority Minority
Unstandardizedcoefficients
Standardizedcoefficients
Unstandardizedcoefficients
Standardizedcoefficients
Trust in institutions 0.495*** (0.021) 0.195 0.465*** (0.078) 0.193
Social trust 0.134*** (0.008) 0.129 0.063** (0.032) 0.061Employment status (ref: employed)Unemployed −0.035 (0.082) −0.003 0.112 (0.258) 0.012Inactive −0.024 (0.040) −0.005 −0.013 (0.171) −0.002Income (ref: low)Medium 0.055 (0.036) 0.010 0.040 (0.156) 0.007High 0.169*** (0.042) 0.030 0.075 (0.192) 0.011Highest level of education (ref: low)Medium 0.411*** (0.039) 0.081 0.295* (0.162) 0.056High 0.957*** (0.048) 0.162 0.661*** (0.197) 0.113Belongs to a
discriminatedgroup
0.050 (0.075) 0.004 0.182 (0.149) 0.032
Has worked abroad 0.286*** (0.073) 0.025 0.554** (0.225) 0.063Gender – female 0.132*** (0.029) 0.026 −0.179 (0.139) −0.034Age 0.018*** (0.005) 0.116 −0.004 (0.025) −0.025Age squared −0.000*** (0.000) −0.170 −0.000 (0.000) −0.056Domicile (ref: rural)Small town 0.139*** (0.035) 0.025 0.566*** (0.180) 0.099City 0.302*** (0.036) 0.057 0.401** (0.173) 0.076Constant 3.820*** (0.146) 5.905*** (0.667)Country fixed effects Yes YesNumber of cases (N) 27,660 1580Prob > F 0.000 0.000R2 0.258 0.250
Eurasian Geography and Economics 19
Dow
nloa
ded
by [
Tar
tu U
ellik
ooli]
at 0
2:06
15
May
201
4

Appendix 5. OLS estimators of the model describing European majority andminority populations’ attitudes toward immigration; robust standard errors inbrackets
Note: Dependent variable: immigrants make country worse or better place to live. Weighted by DWEIGHT.
Source: Authors’ calculations based on the ESS data (Round 5, 2010).***p < 0.01.**p < 0.05.*p < 0.1.
Majority Minority
Unstandardizedcoefficients
Standardizedcoefficients
Unstandardizedcoefficients
Standardizedcoefficients
Trust in institutions 0.510*** (0.020) 0.221 0.356*** (0.074) 0.156Social trust 0.130***(0.007) 0.138 0.075*** (0.029) 0.077
Employment status (ref: employed)Unemployed −0.031 (0.073) −0.003 −0.120 (0.242) −0.014Inactive −0.070* (0.036) −0.015 0.006 (0.160) 0.001Income (ref: low)Medium 0.032 (0.033) 0.007 0.052 (0.143) 0.010High 0.144*** (0.038) 0.029 0.238 (0.194) 0.039Highest level of education (ref: low)Medium 0.268*** (0.036) 0.058 0.116 (0.154) 0.023High 0.661*** (0.044) 0.123 0.415** (0.186) 0.075Belongs to a
discriminatedgroup
−0.061 (0.067) −0.006 0.032 (0.136) 0.006
Has worked abroad 0.422*** (0.066) 0.040 0.545*** (0.209) 0.066Gender – female 0.028 (0.027) 0.006 0.030 (0.132) 0.006Age 0.001 (0.005) 0.007 −0.031 (0.024) −0.197Age squared −0.000 (0.000) −0.044 0.000 (0.000) 0.117Domicile (ref: rural)Small town 0.117*** (0.033) 0.023 0.516*** (0.173) 0.096City 0.222*** (0.034) 0.046 0.608*** (0.156) 0.122Constant 3.512*** (0.135) 5.296*** (0.661)Country fixed effects Yes YesNumber of cases (N) 27,660 1580Prob > F 0.000 0.000R2 0.232 0.249
20 V. Halapuu et al.
Dow
nloa
ded
by [
Tar
tu U
ellik
ooli]
at 0
2:06
15
May
201
4

Appendix 6. Country-specific marginal effects associated with attitudes towardsimmigrants from the model describing European people’s attitudes towardsimmigration estimated on total sample
Note: Comparison country is Belgium. Country-specific effects that are statistically significant at the 0.05
confidence level are presented in blue, insignificant ones in dark gray.
Eurasian Geography and Economics 21
Dow
nloa
ded
by [
Tar
tu U
ellik
ooli]
at 0
2:06
15
May
201
4

Appendix 7. Country-specific marginal effects associated with attitudes towardsimmigrants from the models describing European people’s attitudes towardsimmigration estimated on data of majority populations and minority populations
Note: Comparison country is Belgium. Country-specific effects that are statistically significant at the 0.05
confidence level are presented in blue, insignificant ones in dark gray.
22 V. Halapuu et al.
Dow
nloa
ded
by [
Tar
tu U
ellik
ooli]
at 0
2:06
15
May
201
4
Copyright © 2022 FDOKUMEN